
ASV Holdings, Inc. Q3 2018 Earnings Conference Call November 1, 2018 Ex 99.2
This presentation contains forward-looking statements. In some cases, you can identify forward-looking statements by terminology such as “may,” “should,” “expects,” “plans,” “anticipates,” “believes,” “estimates,” “predicts,” “potential,” “intends” or “continue,” and other similar expressions that are predictions of or indicate future events and future trends, or the negative of these terms or other comparable terminology. Forward-looking statements in this presentation include, without limitation: (1) projections of revenue, earnings, capital structure and other financial items, (2) statements of our plans and objectives, (3) statements regarding the capabilities and capacities of our business operations, (4) statements of expected future economic conditions and the effect on us and on dealers or OEM customers, (5) expected benefits of our cost reduction measures, and (6) assumptions underlying statements regarding us or our business. Our actual results may differ from information contained in these forward looking-statements for many reasons, including those described in the section entitled “Risk Factors” in our Form 10-K and are available on our EDGAR page at www.sec.gov. These statements are only current predictions and are subject to known and unknown risks, uncertainties and other factors that may cause our or our industry’s actual results, levels of activity, performance or achievements to be materially different from those anticipated by the forward-looking statements. We discuss many of these risks in greater detail under the heading “Risk Factors” and elsewhere in the Form 10-K. You should not rely upon forward-looking statements as predictions of future events. Although we believe that the expectations reflected in the forward-looking statements are reasonable, we cannot guarantee future results, levels of activity, performance or achievements. Except as required by law, after the date of this presentation, we are under no duty to update or revise any of the forward-looking statements, whether as a result of new information, future events or otherwise. We obtained the industry, market and competitive position data in this presentation from our own internal estimates and research as well as from industry and general publications and research surveys and studies conducted by third parties. While we believe that each of these studies and publications is reliable, we have not independently verified market and industry data from third-party sources. While we believe our internal company research is reliable and the market definitions we use are appropriate, neither such research nor these definitions have been verified by any independent source. We from time to time refer to various non-GAAP financial measures in this presentation. We believe that this information is useful to understanding our operating results by excluding certain items that may not be indicative of our core operating results and business outlook. Reference to these non-GAAP financial measures should not be considered as a substitute for, or superior to, results that are presented in a manner consistent with GAAP. Rather, the non-GAAP financial information should be considered in addition to results that are presented in a manner consistent with GAAP. A reconciliation of non-GAAP financial measures referred to in this presentation is provided in the tables at the conclusion of this presentation. Forward-Looking Statements & Non – GAAP Financial Measures
Year-over-year third quarter revenue up $2.2 million or 7.2%. Seventh consecutive quarter of year-over-year quarterly machine revenue growth. Q3-18 total machine sale growth of 16.4%; North America machine sales growth of 40%. Q3-18 “same dealer” sales growth of 30% - dealer sell through improving. Successful Q3 dealer meeting resulted in bookings for approximately $39 million in machines into backlog. Q3-18 Adjusted EBITDA of $2.4 million, 7.3% of sales; Adjusted Earnings per share of $0.05. Supply chain challenges in Q3-18 and for balance of year. Rising material costs reduced Q3-2018 gross margin by $0.9 million or 270 basis points. Net impact after surcharges of approximately $0.05 EPS. Industry demand levels impacting component lead times (e.g. engines). Summary
North America Market Factors Housing Market*: Privately-owned housing starts in September 2018 were at a SAAR of 1.2 million. This is 3.7 percent above the September 2017 rate. Household formations up 39.2% in June, to 2.94 million. U.S. Construction Spending*:Total Construction spending during August 2018 was estimated at a SAAR of $1.3 trillion. August 2018 is 6.5 percent above the August 2017 estimate. Year to date, year over year growth of 5.3%. Rental Market**: 2017 rental penetration index at 53.0%, flat with 2016. February forecast for total rental revenue in the U.S. of 4.5 % growth in 2018, and 5.6% in 2019. CAGR of 4.3% to 2020. Australia: *** 2018 GDP growth of 3.4% in twelve months to June 30, 2018. Fastest rate of growth since September 2012. Industry & Market Overview Source: *US Census Bureau: ** American Rental Association (ARA) ***Australian Bureau of Statistics September 2018 SAAR: “Seasonally adjusted annual rate”
Expanding network by adding distribution and penetrating rental – foundation for growth. 270 dealer and rental account locations 9/30/18 (222 @ 12/31/17). Same dealer sales growth of 30% in Q3-18. Increasing focus on dealer network performance to increase sell through rates. Launched new brand materials; videos, dealer marketing material. Dealer support and management – Dealer meeting in Q3-2018 had approximately 140 dealer attendees. Driving retail to dealers – launched new dealer programs, marketing support Aftermarket and service support – continue to improve parts availability and delivery. Product development. Launched two new Posi-Track® machines in Q3-18: The RT25, ”The World’s Most Compact Track Loader” & the RT65. ASV Strategic Growth Drivers
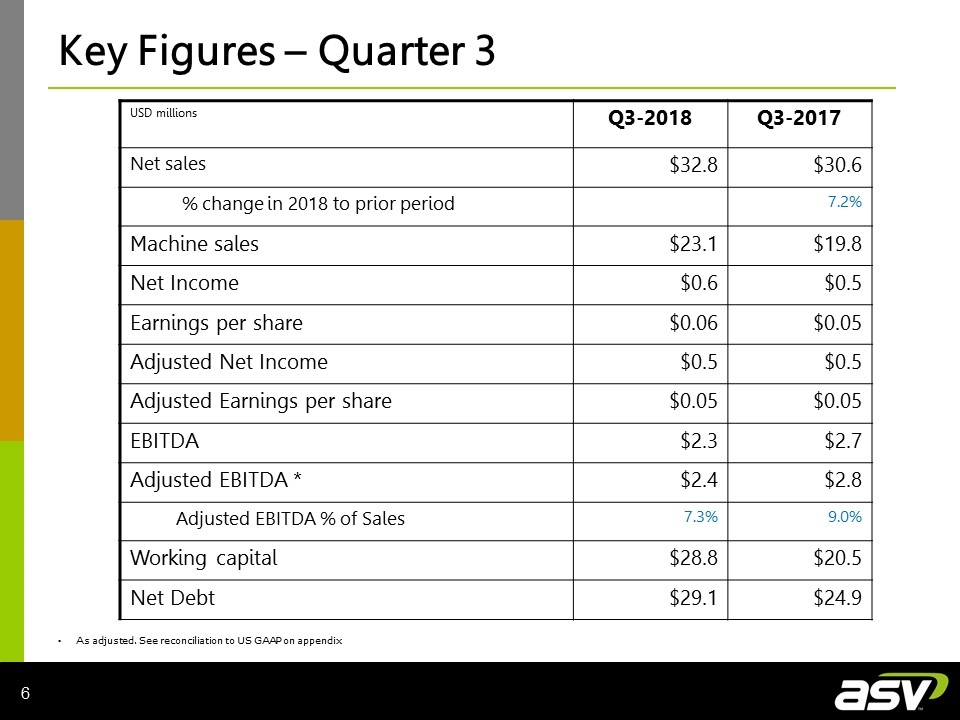
USD millions Q3-2018 Q3-2017 Net sales $32.8 $30.6 % change in 2018 to prior period 7.2% Machine sales $23.1 $19.8 Net Income $0.6 $0.5 Earnings per share $0.06 $0.05 Adjusted Net Income $0.5 $0.5 Adjusted Earnings per share $0.05 $0.05 EBITDA $2.3 $2.7 Adjusted EBITDA * $2.4 $2.8 Adjusted EBITDA % of Sales 7.3% 9.0% Working capital $28.8 $20.5 Net Debt $29.1 $24.9 As adjusted. See reconciliation to US GAAP on appendix Key Figures – Quarter 3
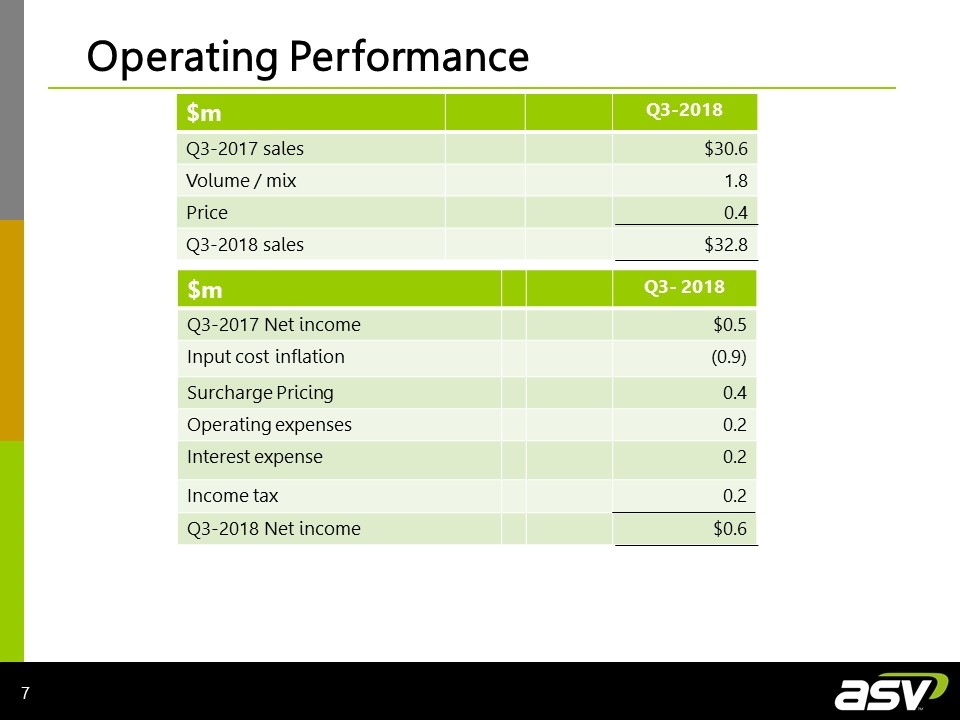
$m Q3-2018 Q3-2017 sales $30.6 Volume / mix 1.8 Price 0.4 Q3-2018 sales $32.8 $m Q3- 2018 Q3-2017 Net income $0.5 Input cost inflation (0.9) Surcharge Pricing 0.4 Operating expenses 0.2 Interest expense 0.2 Income tax 0.2 Q3-2018 Net income $0.6 Operating Performance
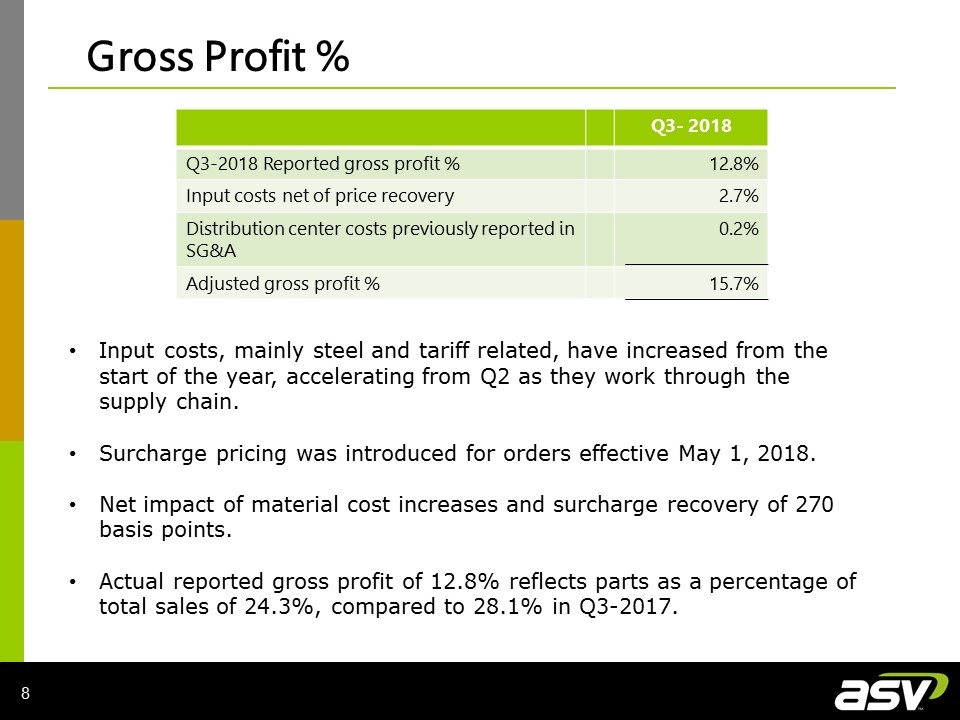
Q3- 2018 Q3-2018 Reported gross profit % 12.8% Input costs net of price recovery 2.7% Distribution center costs previously reported in SG&A 0.2% Adjusted gross profit % 15.7% Gross Profit % Input costs, mainly steel and tariff related, have increased from the start of the year, accelerating from Q2 as they work through the supply chain. Surcharge pricing was introduced for orders effective May 1, 2018. Net impact of material cost increases and surcharge recovery of 270 basis points. Actual reported gross profit of 12.8% reflects parts as a percentage of total sales of 24.3%, compared to 28.1% in Q3-2017.
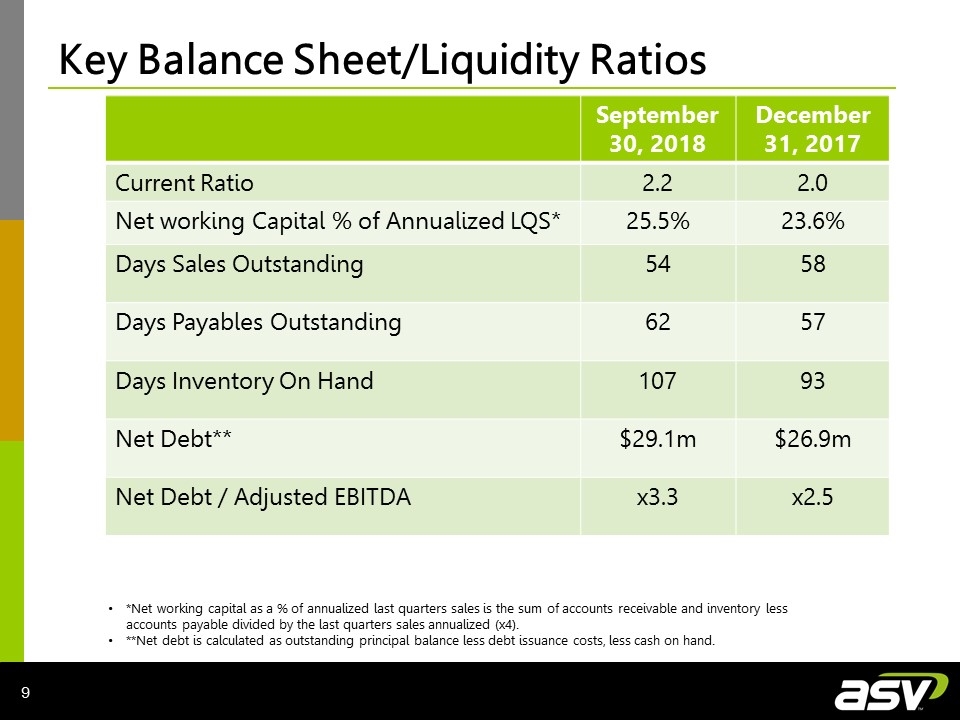
Key Balance Sheet/Liquidity Ratios September 30, 2018 December 31, 2017 Current Ratio 2.2 2.0 Net working Capital % of Annualized LQS* 25.5% 23.6% Days Sales Outstanding 54 58 Days Payables Outstanding 62 57 Days Inventory On Hand 107 93 Net Debt** $29.1m $26.9m Net Debt / Adjusted EBITDA x3.3 x2.5 *Net working capital as a % of annualized last quarters sales is the sum of accounts receivable and inventory less accounts payable divided by the last quarters sales annualized (x4). **Net debt is calculated as outstanding principal balance less debt issuance costs, less cash on hand.
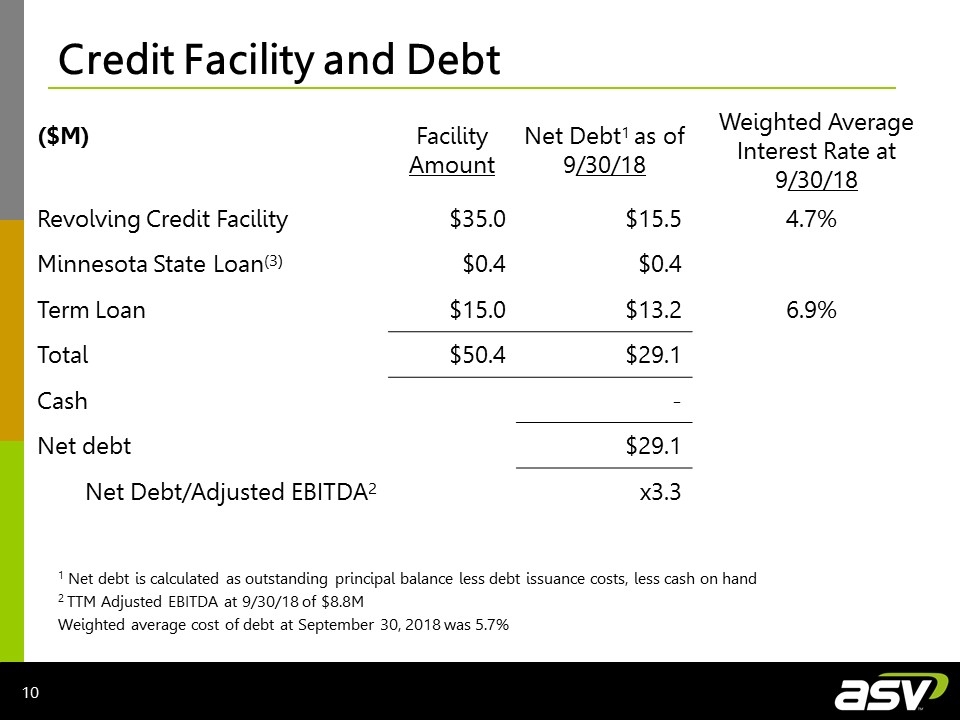
Credit Facility and Debt 1 Net debt is calculated as outstanding principal balance less debt issuance costs, less cash on hand 2 TTM Adjusted EBITDA at 9/30/18 of $8.8M Weighted average cost of debt at September 30, 2018 was 5.7% ($M) Facility Amount Net Debt1 as of 9/30/18 Weighted Average Interest Rate at 9/30/18 Revolving Credit Facility $35.0 $15.5 4.7% Minnesota State Loan(3) $0.4 $0.4 Term Loan $15.0 $13.2 6.9% Total $50.4 $29.1 Cash - Net debt $29.1 Net Debt/Adjusted EBITDA2 x3.3
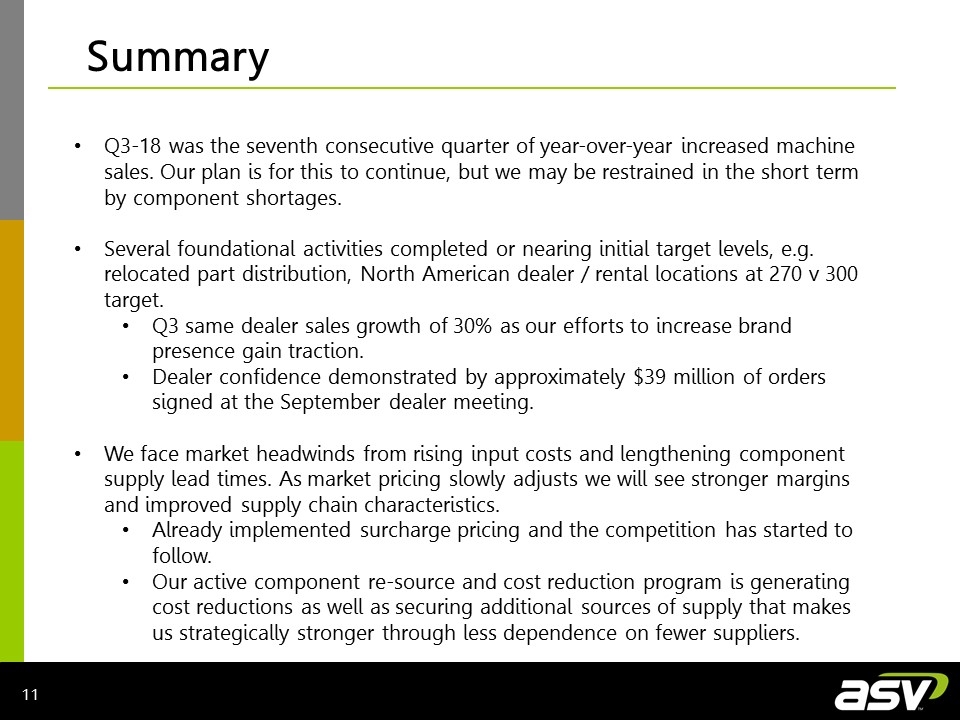
Summary Q3-18 was the seventh consecutive quarter of year-over-year increased machine sales. Our plan is for this to continue, but we may be restrained in the short term by component shortages. Several foundational activities completed or nearing initial target levels, e.g. relocated part distribution, North American dealer / rental locations at 270 v 300 target. Q3 same dealer sales growth of 30% as our efforts to increase brand presence gain traction. Dealer confidence demonstrated by approximately $39 million of orders signed at the September dealer meeting. We face market headwinds from rising input costs and lengthening component supply lead times. As market pricing slowly adjusts we will see stronger margins and improved supply chain characteristics. Already implemented surcharge pricing and the competition has started to follow. Our active component re-source and cost reduction program is generating cost reductions as well as securing additional sources of supply that makes us strategically stronger through less dependence on fewer suppliers.
Appendix
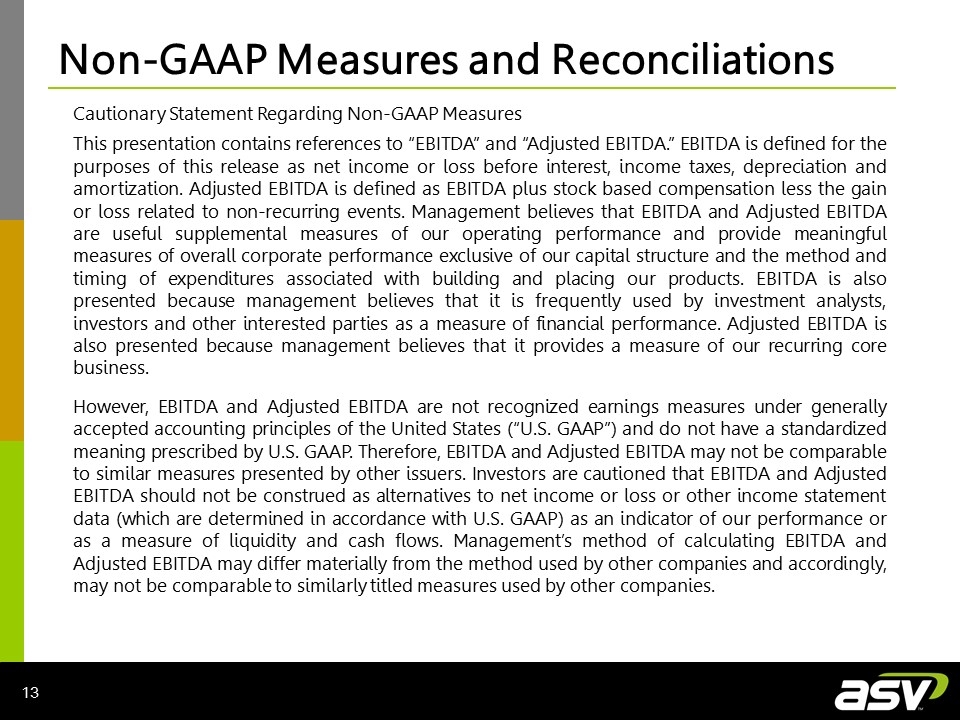
Non-GAAP Measures and Reconciliations Cautionary Statement Regarding Non-GAAP Measures This presentation contains references to “EBITDA” and “Adjusted EBITDA.” EBITDA is defined for the purposes of this release as net income or loss before interest, income taxes, depreciation and amortization. Adjusted EBITDA is defined as EBITDA plus stock based compensation less the gain or loss related to non-recurring events. Management believes that EBITDA and Adjusted EBITDA are useful supplemental measures of our operating performance and provide meaningful measures of overall corporate performance exclusive of our capital structure and the method and timing of expenditures associated with building and placing our products. EBITDA is also presented because management believes that it is frequently used by investment analysts, investors and other interested parties as a measure of financial performance. Adjusted EBITDA is also presented because management believes that it provides a measure of our recurring core business. However, EBITDA and Adjusted EBITDA are not recognized earnings measures under generally accepted accounting principles of the United States (“U.S. GAAP”) and do not have a standardized meaning prescribed by U.S. GAAP. Therefore, EBITDA and Adjusted EBITDA may not be comparable to similar measures presented by other issuers. Investors are cautioned that EBITDA and Adjusted EBITDA should not be construed as alternatives to net income or loss or other income statement data (which are determined in accordance with U.S. GAAP) as an indicator of our performance or as a measure of liquidity and cash flows. Management’s method of calculating EBITDA and Adjusted EBITDA may differ materially from the method used by other companies and accordingly, may not be comparable to similarly titled measures used by other companies.
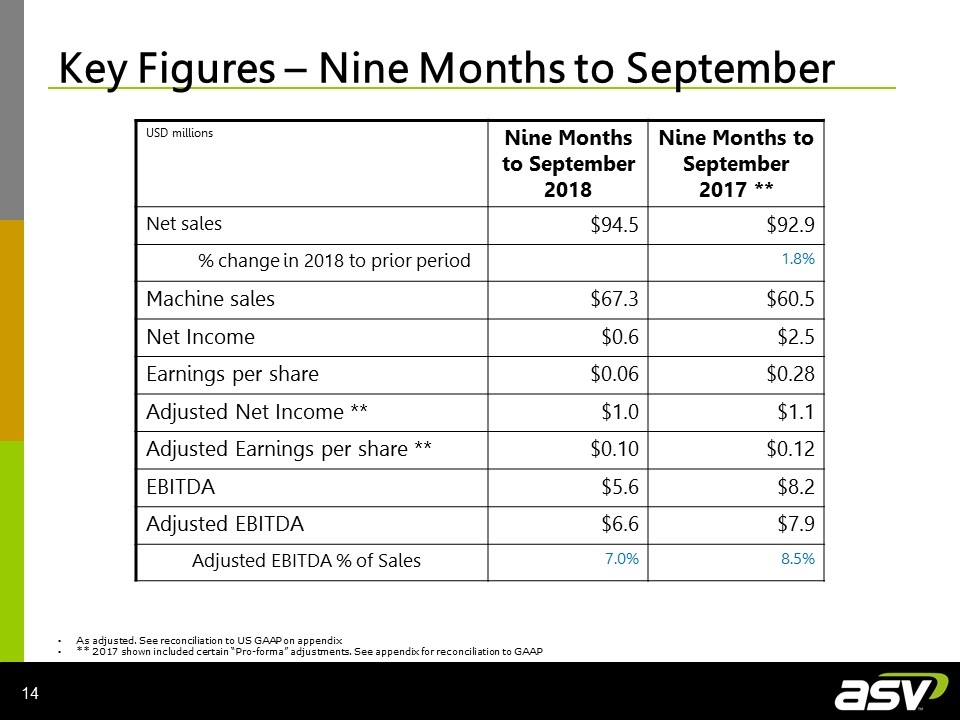
USD millions Nine Months to September 2018 Nine Months to September 2017 ** Net sales $94.5 $92.9 % change in 2018 to prior period 1.8% Machine sales $67.3 $60.5 Net Income $0.6 $2.5 Earnings per share $0.06 $0.28 Adjusted Net Income ** $1.0 $1.1 Adjusted Earnings per share ** $0.10 $0.12 EBITDA $5.6 $8.2 Adjusted EBITDA $6.6 $7.9 Adjusted EBITDA % of Sales 7.0% 8.5% As adjusted. See reconciliation to US GAAP on appendix ** 2017 shown included certain “Pro-forma” adjustments. See appendix for reconciliation to GAAP Key Figures – Nine Months to September
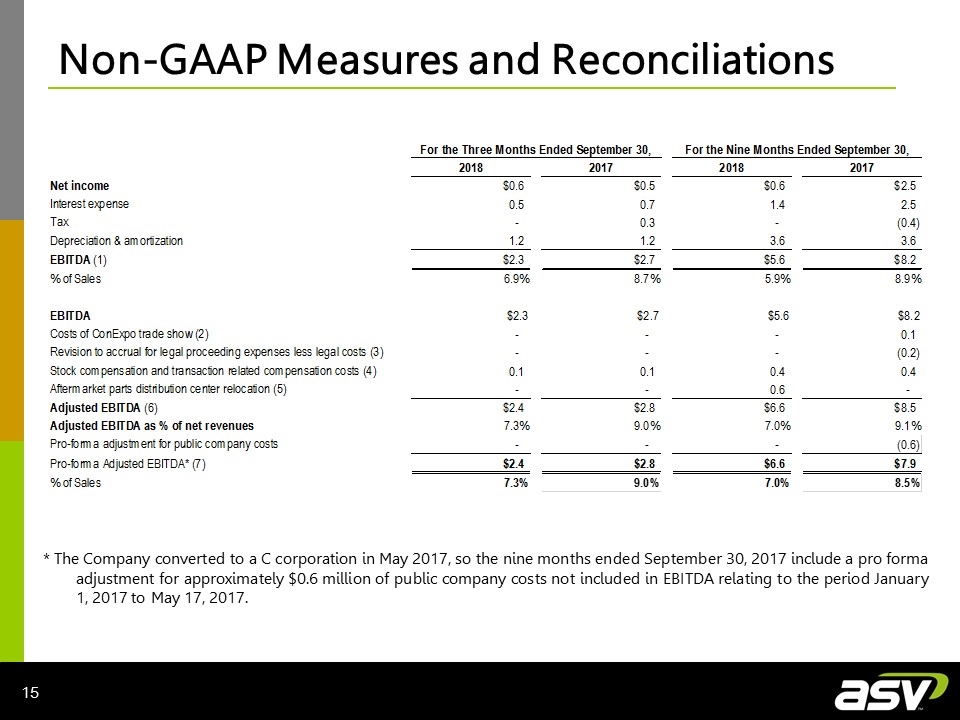
Non-GAAP Measures and Reconciliations * The Company converted to a C corporation in May 2017, so the nine months ended September 30, 2017 include a pro forma adjustment for approximately $0.6 million of public company costs not included in EBITDA relating to the period January 1, 2017 to May 17, 2017.
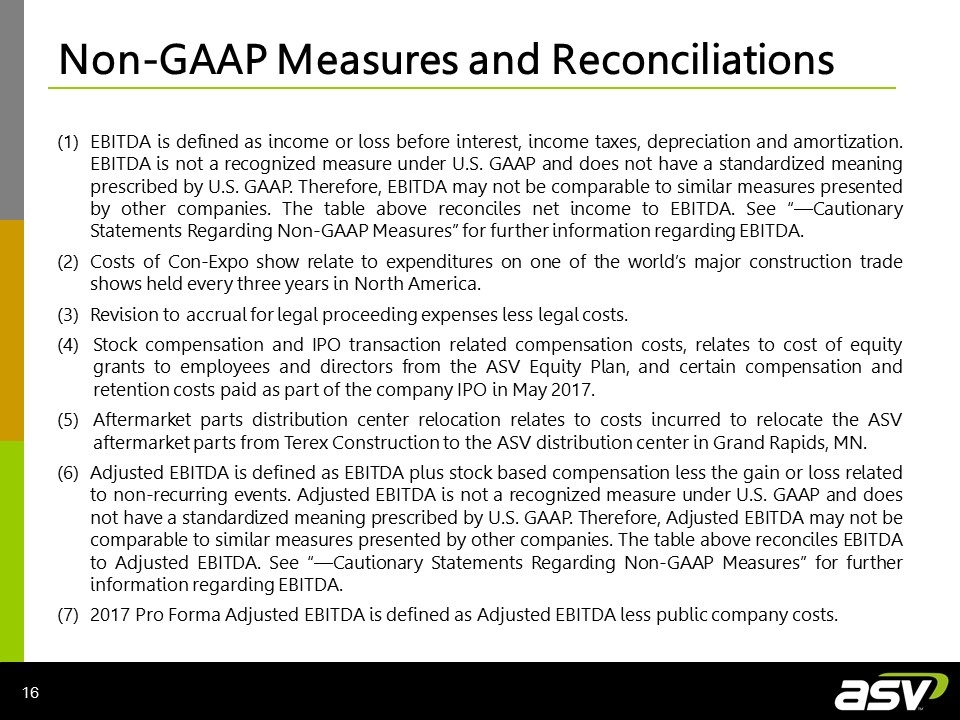
Non-GAAP Measures and Reconciliations (1)EBITDA is defined as income or loss before interest, income taxes, depreciation and amortization. EBITDA is not a recognized measure under U.S. GAAP and does not have a standardized meaning prescribed by U.S. GAAP. Therefore, EBITDA may not be comparable to similar measures presented by other companies. The table above reconciles net income to EBITDA. See “—Cautionary Statements Regarding Non-GAAP Measures” for further information regarding EBITDA. (2)Costs of Con-Expo show relate to expenditures on one of the world’s major construction trade shows held every three years in North America. (3)Revision to accrual for legal proceeding expenses less legal costs. Stock compensation and IPO transaction related compensation costs, relates to cost of equity grants to employees and directors from the ASV Equity Plan, and certain compensation and retention costs paid as part of the company IPO in May 2017. Aftermarket parts distribution center relocation relates to costs incurred to relocate the ASV aftermarket parts from Terex Construction to the ASV distribution center in Grand Rapids, MN. (6)Adjusted EBITDA is defined as EBITDA plus stock based compensation less the gain or loss related to non-recurring events. Adjusted EBITDA is not a recognized measure under U.S. GAAP and does not have a standardized meaning prescribed by U.S. GAAP. Therefore, Adjusted EBITDA may not be comparable to similar measures presented by other companies. The table above reconciles EBITDA to Adjusted EBITDA. See “—Cautionary Statements Regarding Non-GAAP Measures” for further information regarding EBITDA. (7)2017 Pro Forma Adjusted EBITDA is defined as Adjusted EBITDA less public company costs.
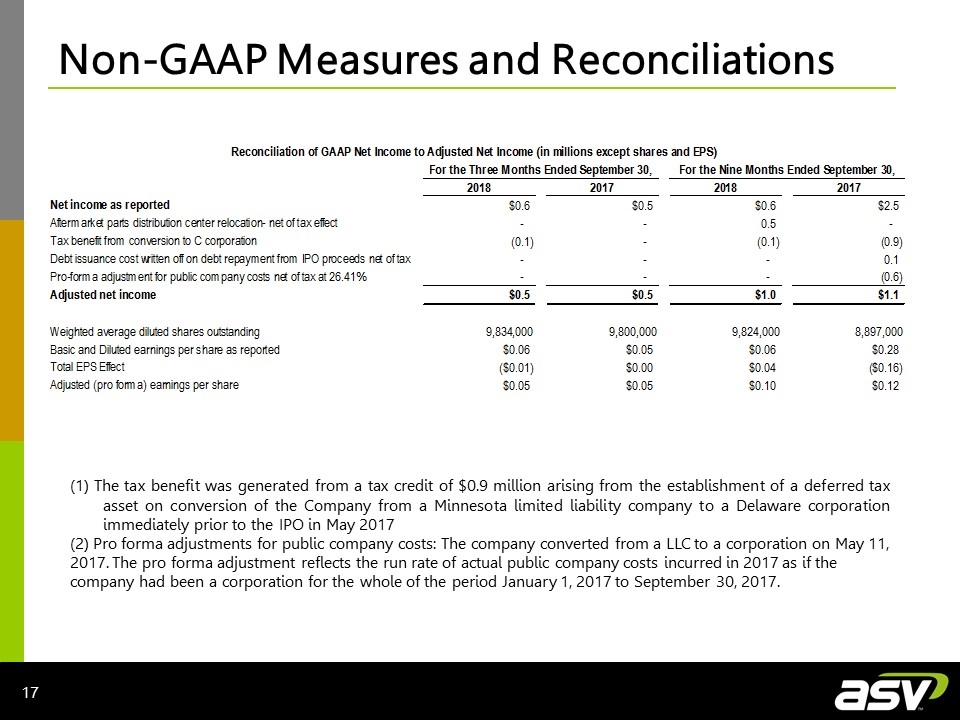
Non-GAAP Measures and Reconciliations (1) The tax benefit was generated from a tax credit of $0.9 million arising from the establishment of a deferred tax asset on conversion of the Company from a Minnesota limited liability company to a Delaware corporation immediately prior to the IPO in May 2017 (2) Pro forma adjustments for public company costs: The company converted from a LLC to a corporation on May 11, 2017. The pro forma adjustment reflects the run rate of actual public company costs incurred in 2017 as if the company had been a corporation for the whole of the period January 1, 2017 to September 30, 2017.
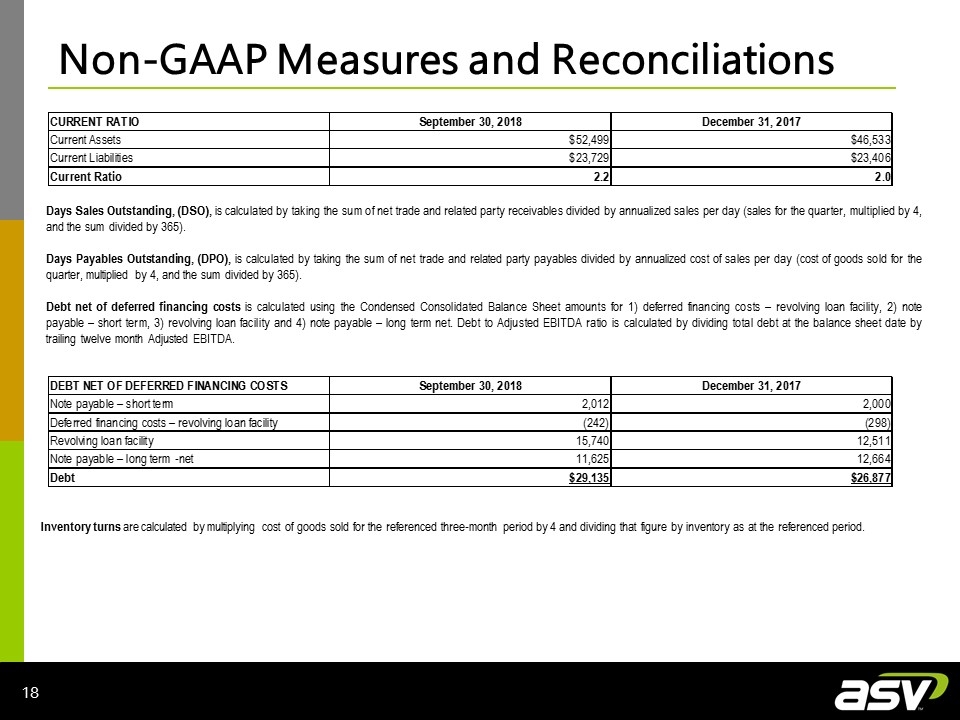
Non-GAAP Measures and Reconciliations Days Sales Outstanding, (DSO), is calculated by taking the sum of net trade and related party receivables divided by annualized sales per day (sales for the quarter, multiplied by 4, and the sum divided by 365). Days Payables Outstanding, (DPO), is calculated by taking the sum of net trade and related party payables divided by annualized cost of sales per day (cost of goods sold for the quarter, multiplied by 4, and the sum divided by 365). Debt net of deferred financing costs is calculated using the Condensed Consolidated Balance Sheet amounts for 1) deferred financing costs – revolving loan facility, 2) note payable – short term, 3) revolving loan facility and 4) note payable – long term net. Debt to Adjusted EBITDA ratio is calculated by dividing total debt at the balance sheet date by trailing twelve month Adjusted EBITDA. Inventory turns are calculated by multiplying cost of goods sold for the referenced three-month period by 4 and dividing that figure by inventory as at the referenced period.

Non-GAAP Measures and Reconciliations Net working capital as a % of annualized last quarter’s sales is the sum of accounts receivable and inventory less accounts payable divided by the last quarter’s sales annualized (x4). Working capital is calculated as total current assets less total current liabilities
ASV Holdings, Inc. Q3 2018 Earnings Conference Call November 1, 2018 At ASV Holdings, Inc. Andrew Rooke, Chairman & C.E.O. 1-218-327-5389 Contact: At Darrow Associates, Inc. Peter Seltzberg, IR for ASV 1-516-419-9915


