
ASV Holdings, Inc. Q1-2019 Earnings Conference Call – May 2, 2019 EX 99.2
Forward-Looking Statements & Non-GAAP Financial Measures This presentation contains forward-looking statements. In some cases, you can identify forward-looking statements by terminology such as “may,” “should,” “expects,” “plans,” “anticipates,” “believes,” “estimates,” “predicts,” “potential,” “intends” or “continue,” and other similar expressions that are predictions of or indicate future events and future trends, or the negative of these terms or other comparable terminology. Forward-looking statements in this presentation include, without limitation: (1) projections of revenue, earnings, capital structure and other financial items, (2) statements of our plans and objectives, (3) statements regarding the capabilities and capacities of our business operations, (4) statements of expected future economic conditions and the effect on us and on dealers or OEM customers, (5) expected benefits of our cost reduction measures, and (6) assumptions underlying statements regarding us or our business. Our actual results may differ from information contained in these forward looking-statements for many reasons, including those described in the section entitled “Risk Factors” in our Form 10-K and are available on our EDGAR page at www.sec.gov. These statements are only current predictions and are subject to known and unknown risks, uncertainties and other factors that may cause our or our industry’s actual results, levels of activity, performance or achievements to be materially different from those anticipated by the forward-looking statements. We discuss many of these risks in greater detail under the heading “Risk Factors” and elsewhere in the Form 10-K. You should not rely upon forward-looking statements as predictions of future events. Although we believe that the expectations reflected in the forward-looking statements are reasonable, we cannot guarantee future results, levels of activity, performance or achievements. Except as required by law, after the date of this presentation, we are under no duty to update or revise any of the forward-looking statements, whether as a result of new information, future events or otherwise. We obtained the industry, market and competitive position data in this presentation from our own internal estimates and research as well as from industry and general publications and research surveys and studies conducted by third parties. While we believe that each of these studies and publications is reliable, we have not independently verified market and industry data from third-party sources. While we believe our internal company research is reliable and the market definitions we use are appropriate, neither such research nor these definitions have been verified by any independent source. We from time to time refer to various non-GAAP financial measures in this presentation. We believe that this information is useful to understanding our operating results by excluding certain items that may not be indicative of our core operating results and business outlook. Reference to these non-GAAP financial measures should not be considered as a substitute for, or superior to, results that are presented in a manner consistent with GAAP. Rather, the non-GAAP financial information should be considered in addition to results that are presented in a manner consistent with GAAP. A reconciliation of non-GAAP financial measures referred to in this presentation is provided in the tables at the conclusion of this presentation.
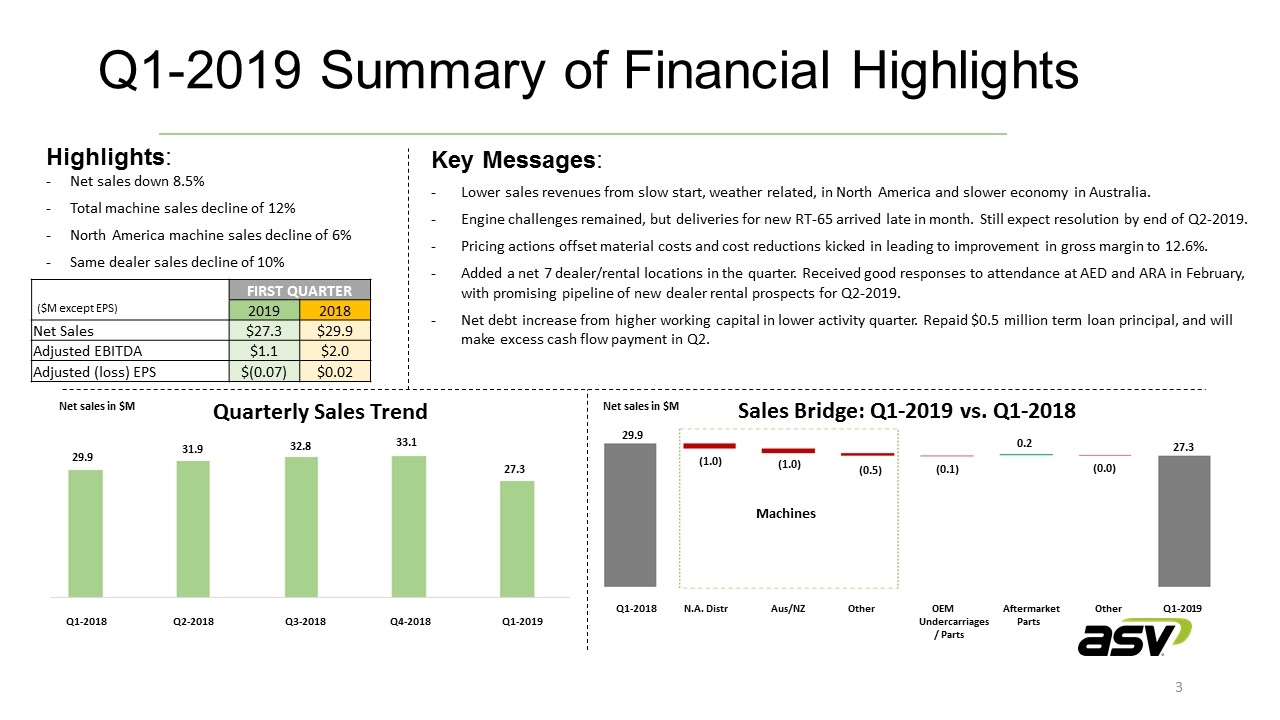
Q1-2019 Summary of Financial Highlights Key Messages: Lower sales revenues from slow start, weather related, in North America and slower economy in Australia. Engine challenges remained, but deliveries for new RT-65 arrived late in month. Still expect resolution by end of Q2-2019. Pricing actions offset material costs and cost reductions kicked in leading to improvement in gross margin to 12.6%. Added a net 7 dealer/rental locations in the quarter. Received good responses to attendance at AED and ARA in February, with promising pipeline of new dealer rental prospects for Q2-2019. Net debt increase from higher working capital in lower activity quarter. Repaid $0.5 million term loan principal, and will make excess cash flow payment in Q2. Highlights: Net sales down 8.5% Total machine sales decline of 12% North America machine sales decline of 6% Same dealer sales decline of 10% FIRST QUARTER ($M except EPS) 2019 2018 Net Sales $27.3 $29.9 Adjusted EBITDA $1.1 $2.0 Adjusted (loss) EPS $(0.07) $0.02 29.9 31.9 32.8 33.1 Q1-2018 Q2-2018 Q3-2018 Q4-2018 Q1-2019 Quarterly Sales Trend Net sales in $M 27.3 Net sales in $M Sales Bridge: Q1-2019 vs. Q1-2018 Q1-2018 N.A. Distr Aus/NZ Other OEM Aftermarket Other Q1-2019 Undercarriages Parts / Parts Machines 29.9 (0.1) 0.2 (0.0) 27.3 (1.0) (1.0) (0.5)
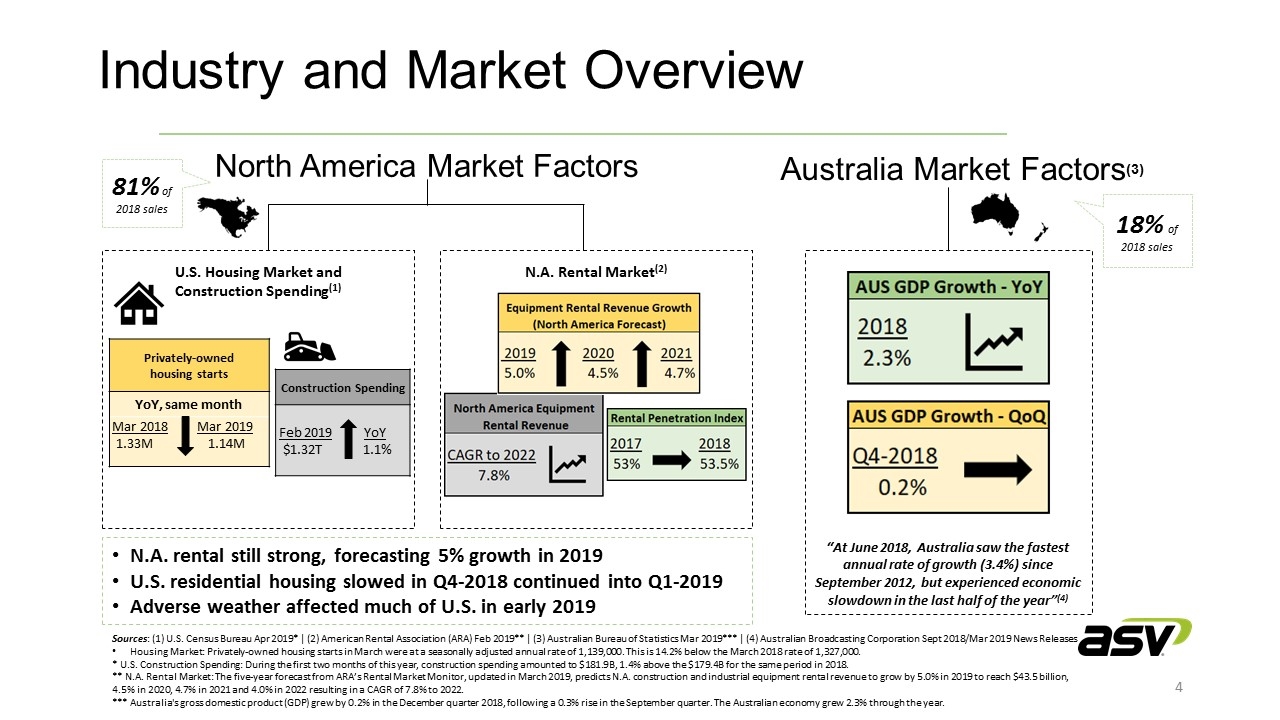
Industry and Market Overview Sources: (1) U.S. Census Bureau Apr 2019* | (2) American Rental Association (ARA) Feb 2019** | (3) Australian Bureau of Statistics Mar 2019*** | (4) Australian Broadcasting Corporation Sept 2018/Mar 2019 News Releases Housing Market: Privately‐owned housing starts in March were at a seasonally adjusted annual rate of 1,139,000. This is 14.2% below the March 2018 rate of 1,327,000. * U.S. Construction Spending: During the first two months of this year, construction spending amounted to $181.9B, 1.4% above the $179.4B for the same period in 2018. ** N.A. Rental Market: The five-year forecast from ARA’s Rental Market Monitor, updated in March 2019, predicts N.A. construction and industrial equipment rental revenue to grow by 5.0% in 2019 to reach $43.5 billion, 4.5% in 2020, 4.7% in 2021 and 4.0% in 2022 resulting in a CAGR of 7.8% to 2022. *** Australia's gross domestic product (GDP) grew by 0.2% in the December quarter 2018, following a 0.3% rise in the September quarter. The Australian economy grew 2.3% through the year. Australia Market Factors(3) “At June 2018, Australia saw the fastest annual rate of growth (3.4%) since September 2012, but experienced economic slowdown in the last half of the year”(4) 18% of 2018 sales North America Market Factors U.S. Housing Market and Construction Spending(1) N.A. Rental Market(2) 81% of 2018 sales N.A. rental still strong, forecasting 5% growth in 2019 U.S. residential housing slowed in Q4-2018 continued into Q1-2019 Adverse weather affected much of U.S. in early 2019 Privately-owned housing starts YoY, same month Mar 2018 Mar 2019 1.33M 1.14M Construction Spending Feb 2019 YoY $1.32T 1.1%
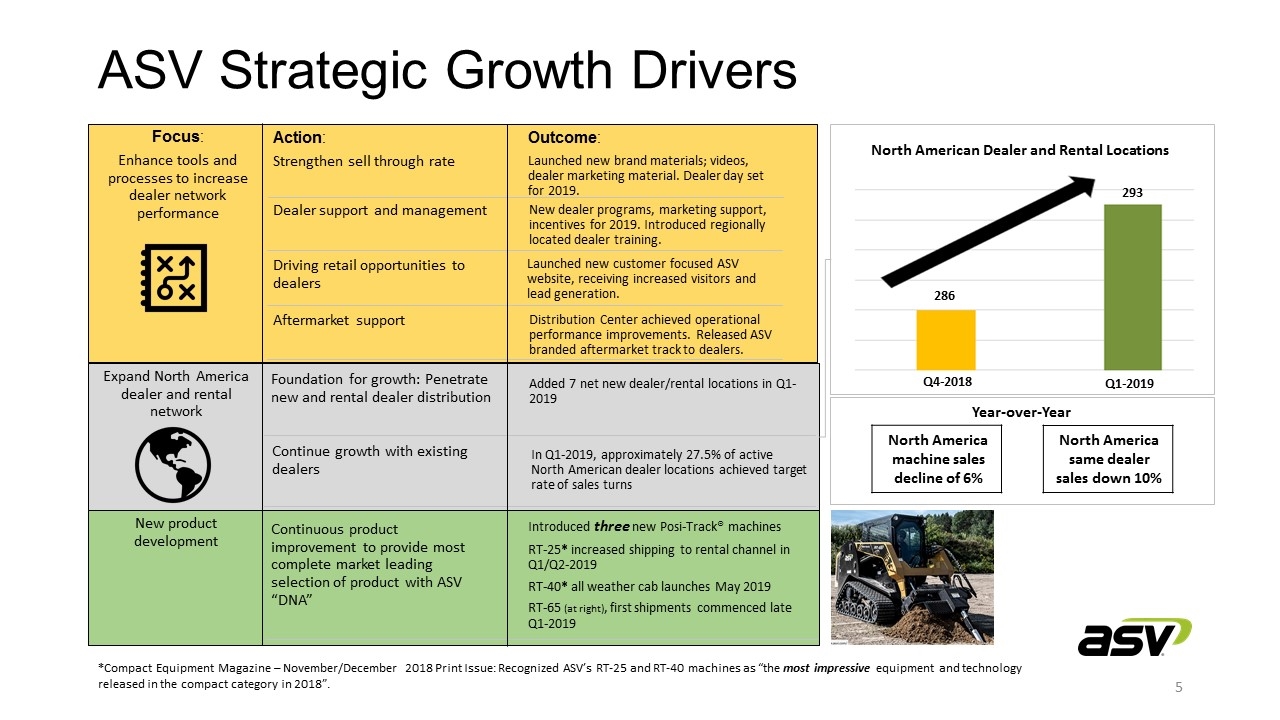
ASV Strategic Growth Drivers *Compact Equipment Magazine – November/December 2018 Print Issue: Recognized ASV’s RT-25 and RT-40 machines as “the most impressive equipment and technology released in the compact category in 2018”. North American Dealer and Rental Locations Year-over-Year 293 286 Q4-2018 Q1-2019 North America same dealer sales down 10% North America machine sales decline of 6% Focus : Enhance tools and processes to increase dealer network performance New dealer programs, marketing support, incentives for 2019. Introduced regionally located dealer training. Distribution Center achieved operational performance improvements. Released ASV branded aftermarket track to dealers. Launched new customer focused ASV website, receiving increased visitors and lead generation. Aftermarket support Driving retail opportunities to dealers Dealer support and management Outcome : Launched new brand materials; videos, dealer marketing material. Dealer day set for 2019. Action : Strengthen sell through rate Expand North America dealer and rental network Foundation for growth: Penetrate new and rental dealer distribution Continue growth with existing dealers Added 7 net new dealer/rental locations in Q1-2019 In Q1-2019, approximately 27.5% of active North American dealer locations achieved target rate of sales turns New product development Continuous product improvement to provide most complete market leading selection of product with ASV “DNA” Introduced three new Posi-Track® machines RT-25 * increased shipping to rental channel in Q1/Q2-2019 RT-40 * all weather cab launches May 2019 RT-65 (at right) , first shipments commenced late Q1-2019
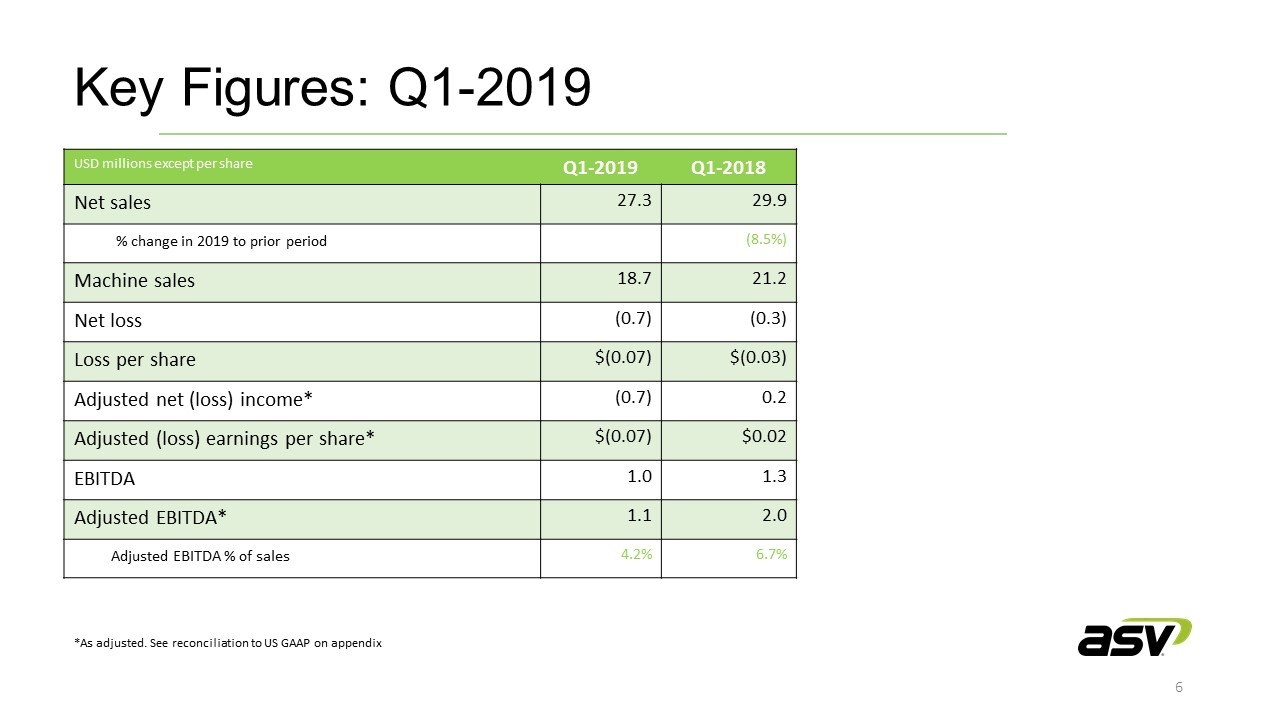
Key Figures: Q1-2019 *As adjusted. See reconciliation to US GAAP on appendix USD millions except per share Q1-2019 Q1-2018 Net sales 27.3 29.9 % change in 2019 to prior period (8.5%) Machine sales 18.7 21.2 Net loss (0.7) (0.3) Loss per share $(0.07) $(0.03) Adjusted net (loss) income* (0.7) 0.2 Adjusted (loss) earnings per share* $(0.07) $0.02 EBITDA 1.0 1.3 Adjusted EBITDA* 1.1 2.0 Adjusted EBITDA % of sales 4.2% 6.7%
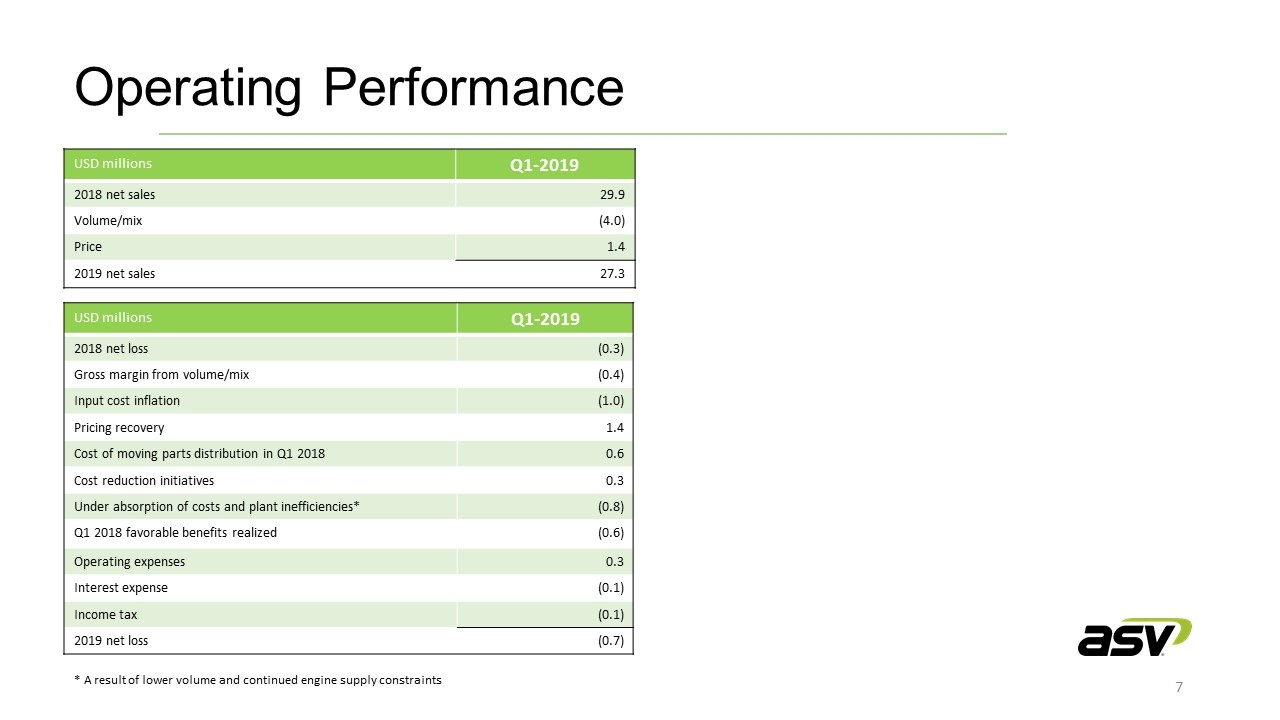
Operating Performance USD millions Q1-2019 2018 net sales 29.9 Volume/mix (4.0) Price 1.4 2019 net sales 27.3 USD millions Q1-2019 2018 net loss (0.3) Gross margin from volume/mix (0.4) Input cost inflation (1.0) Pricing recovery 1.4 Cost of moving parts distribution in Q1 2018 0.6 Cost reduction initiatives 0.3 Under absorption of costs and plant inefficiencies* (0.8) Q1 2018 favorable benefits realized (0.6) Operating expenses 0.3 Interest expense (0.1) Income tax (0.1) 2019 net loss (0.7) * A result of lower volume and continued engine supply constraints
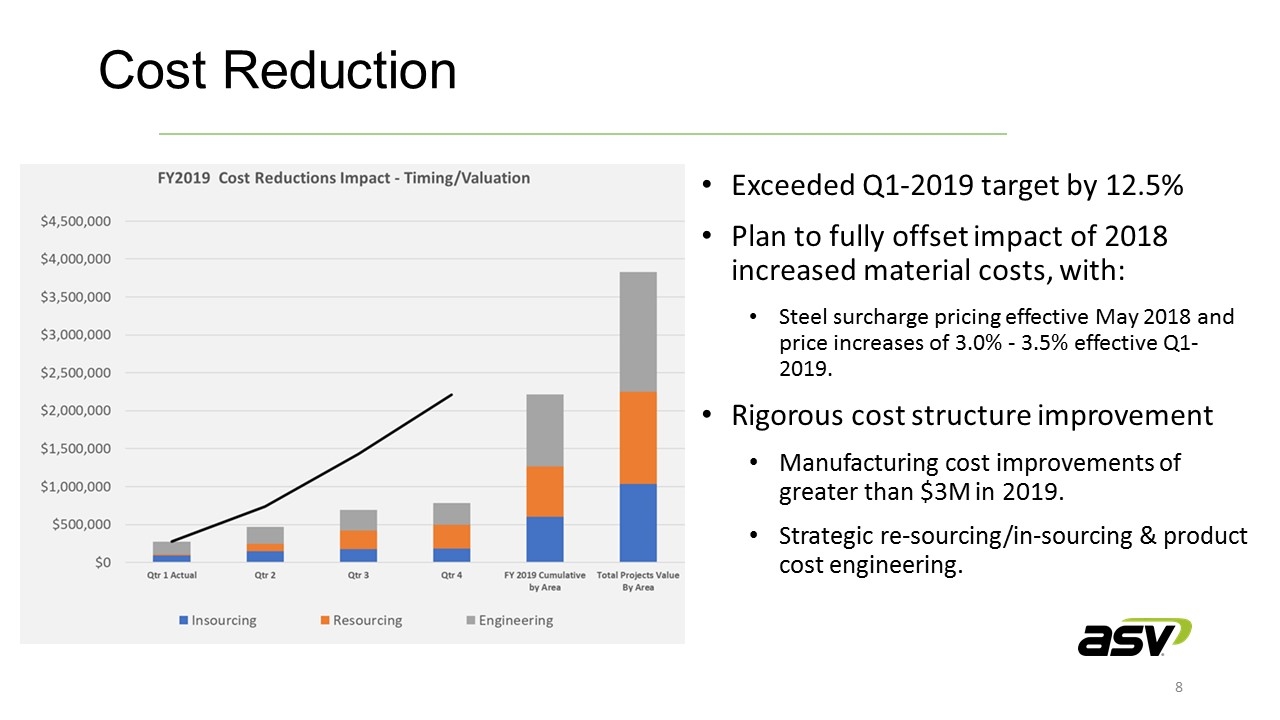
Exceeded Q1-2019 target by 12.5% Plan to fully offset impact of 2018 increased material costs, with: Steel surcharge pricing effective May 2018 and price increases of 3.0% - 3.5% effective Q1-2019. Rigorous cost structure improvement Manufacturing cost improvements of greater than $3M in 2019. Strategic re-sourcing/in-sourcing & product cost engineering. Cost Reduction
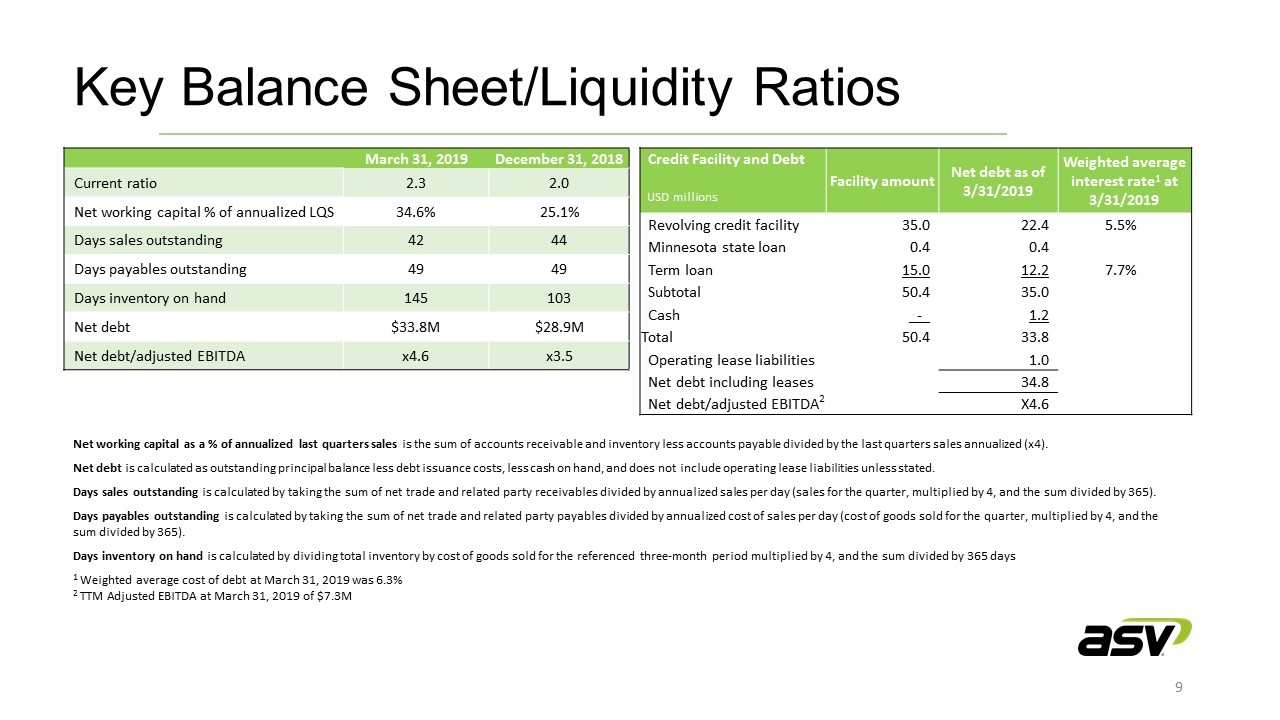
Net working capital as a % of annualized last quarters sales is the sum of accounts receivable and inventory less accounts payable divided by the last quarters sales annualized (x4). Net debt is calculated as outstanding principal balance less debt issuance costs, less cash on hand, and does not include operating lease liabilities unless stated. Days sales outstanding is calculated by taking the sum of net trade and related party receivables divided by annualized sales per day (sales for the quarter, multiplied by 4, and the sum divided by 365). Days payables outstanding is calculated by taking the sum of net trade and related party payables divided by annualized cost of sales per day (cost of goods sold for the quarter, multiplied by 4, and the sum divided by 365). Days inventory on hand is calculated by dividing total inventory by cost of goods sold for the referenced three-month period multiplied by 4, and the sum divided by 365 days 1 Weighted average cost of debt at March 31, 2019 was 6.3% 2 TTM Adjusted EBITDA at March 31, 2019 of $7.3M Key Balance Sheet/Liquidity Ratios March 31, 2019 December 31, 2018 Current ratio 2.3 2.0 Net working capital % of annualized LQS 34.6% 25.1% Days sales outstanding 42 44 Days payables outstanding 49 49 Days inventory on hand 145 103 Net debt $33.8M $28.9M Net debt/adjusted EBITDA x4.6 x3.5 Credit Facility and Debt USD millions Facility amount Net debt as of 3/31/2019 Weighted average interest rate1 at 3/31/2019 Revolving credit facility 35.0 22.4 5.5% Minnesota state loan 0.4 0.4 Term loan 15.0 12.2 7.7% Subtotal 50.4 35.0 Cash _-_ 1.2 Total 50.4 33.8 Operating lease liabilities 1.0 Net debt including leases 34.8 Net debt/adjusted EBITDA2 X4.6
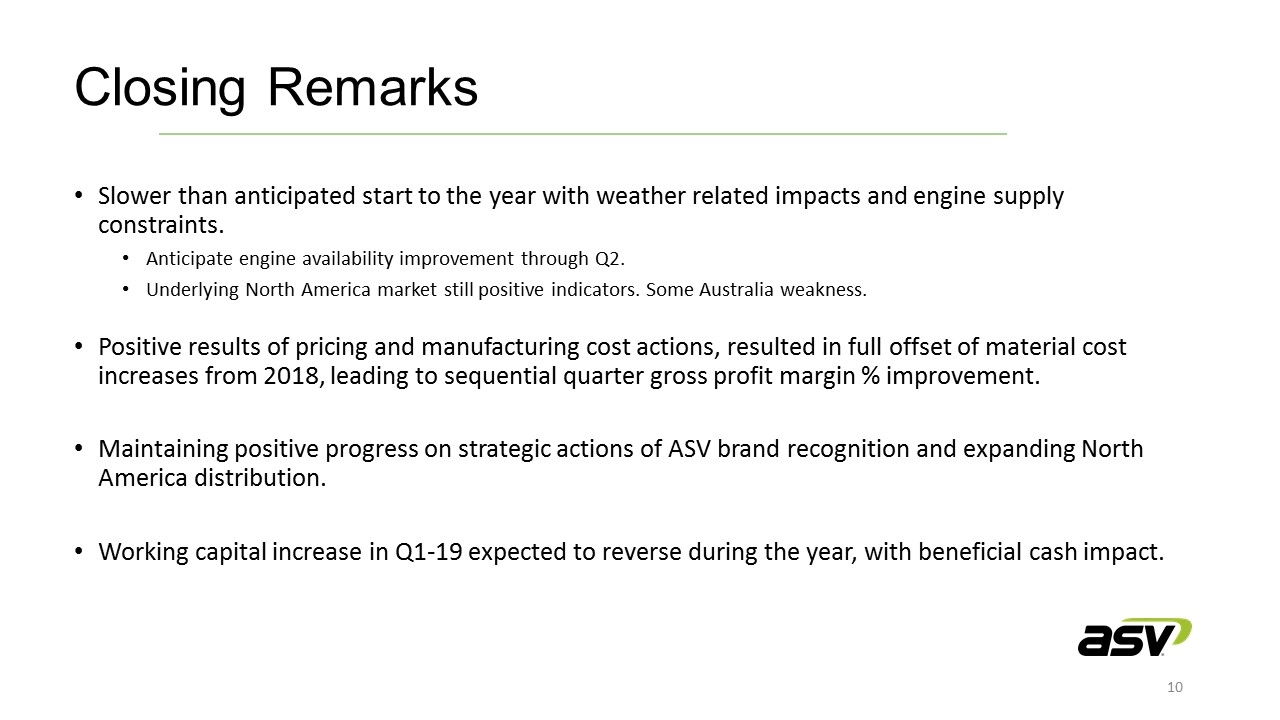
Closing Remarks Slower than anticipated start to the year with weather related impacts and engine supply constraints. Anticipate engine availability improvement through Q2. Underlying North America market still positive indicators. Some Australia weakness. Positive results of pricing and manufacturing cost actions, resulted in full offset of material cost increases from 2018, leading to sequential quarter gross profit margin % improvement. Maintaining positive progress on strategic actions of ASV brand recognition and expanding North America distribution. Working capital increase in Q1-19 expected to reverse during the year, with beneficial cash impact.

Appendix
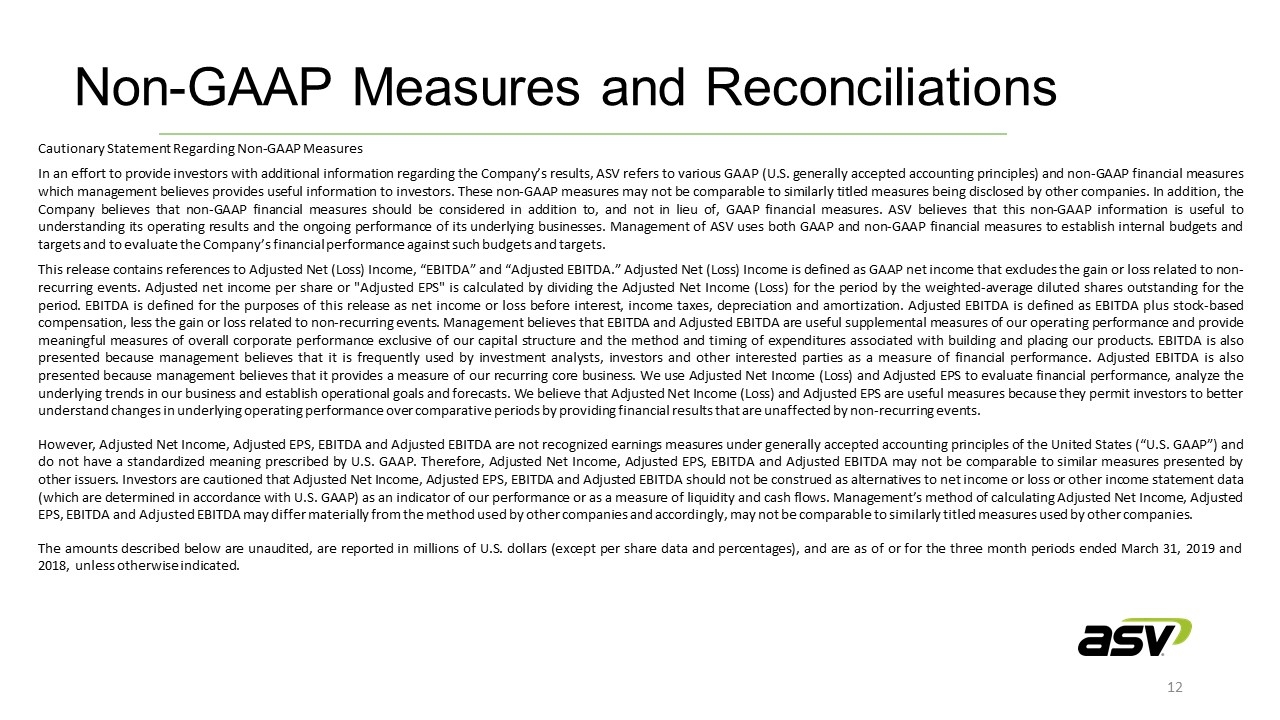
Non-GAAP Measures and Reconciliations Cautionary Statement Regarding Non-GAAP Measures In an effort to provide investors with additional information regarding the Company’s results, ASV refers to various GAAP (U.S. generally accepted accounting principles) and non-GAAP financial measures which management believes provides useful information to investors. These non-GAAP measures may not be comparable to similarly titled measures being disclosed by other companies. In addition, the Company believes that non-GAAP financial measures should be considered in addition to, and not in lieu of, GAAP financial measures. ASV believes that this non-GAAP information is useful to understanding its operating results and the ongoing performance of its underlying businesses. Management of ASV uses both GAAP and non-GAAP financial measures to establish internal budgets and targets and to evaluate the Company’s financial performance against such budgets and targets. This release contains references to Adjusted Net (Loss) Income, “EBITDA” and “Adjusted EBITDA.” Adjusted Net (Loss) Income is defined as GAAP net income that excludes the gain or loss related to non-recurring events. Adjusted net income per share or "Adjusted EPS" is calculated by dividing the Adjusted Net Income (Loss) for the period by the weighted-average diluted shares outstanding for the period. EBITDA is defined for the purposes of this release as net income or loss before interest, income taxes, depreciation and amortization. Adjusted EBITDA is defined as EBITDA plus stock-based compensation, less the gain or loss related to non-recurring events. Management believes that EBITDA and Adjusted EBITDA are useful supplemental measures of our operating performance and provide meaningful measures of overall corporate performance exclusive of our capital structure and the method and timing of expenditures associated with building and placing our products. EBITDA is also presented because management believes that it is frequently used by investment analysts, investors and other interested parties as a measure of financial performance. Adjusted EBITDA is also presented because management believes that it provides a measure of our recurring core business. We use Adjusted Net Income (Loss) and Adjusted EPS to evaluate financial performance, analyze the underlying trends in our business and establish operational goals and forecasts. We believe that Adjusted Net Income (Loss) and Adjusted EPS are useful measures because they permit investors to better understand changes in underlying operating performance over comparative periods by providing financial results that are unaffected by non-recurring events. However, Adjusted Net Income, Adjusted EPS, EBITDA and Adjusted EBITDA are not recognized earnings measures under generally accepted accounting principles of the United States (“U.S. GAAP”) and do not have a standardized meaning prescribed by U.S. GAAP. Therefore, Adjusted Net Income, Adjusted EPS, EBITDA and Adjusted EBITDA may not be comparable to similar measures presented by other issuers. Investors are cautioned that Adjusted Net Income, Adjusted EPS, EBITDA and Adjusted EBITDA should not be construed as alternatives to net income or loss or other income statement data (which are determined in accordance with U.S. GAAP) as an indicator of our performance or as a measure of liquidity and cash flows. Management’s method of calculating Adjusted Net Income, Adjusted EPS, EBITDA and Adjusted EBITDA may differ materially from the method used by other companies and accordingly, may not be comparable to similarly titled measures used by other companies. The amounts described below are unaudited, are reported in millions of U.S. dollars (except per share data and percentages), and are as of or for the three month periods ended March 31, 2019 and 2018, unless otherwise indicated.
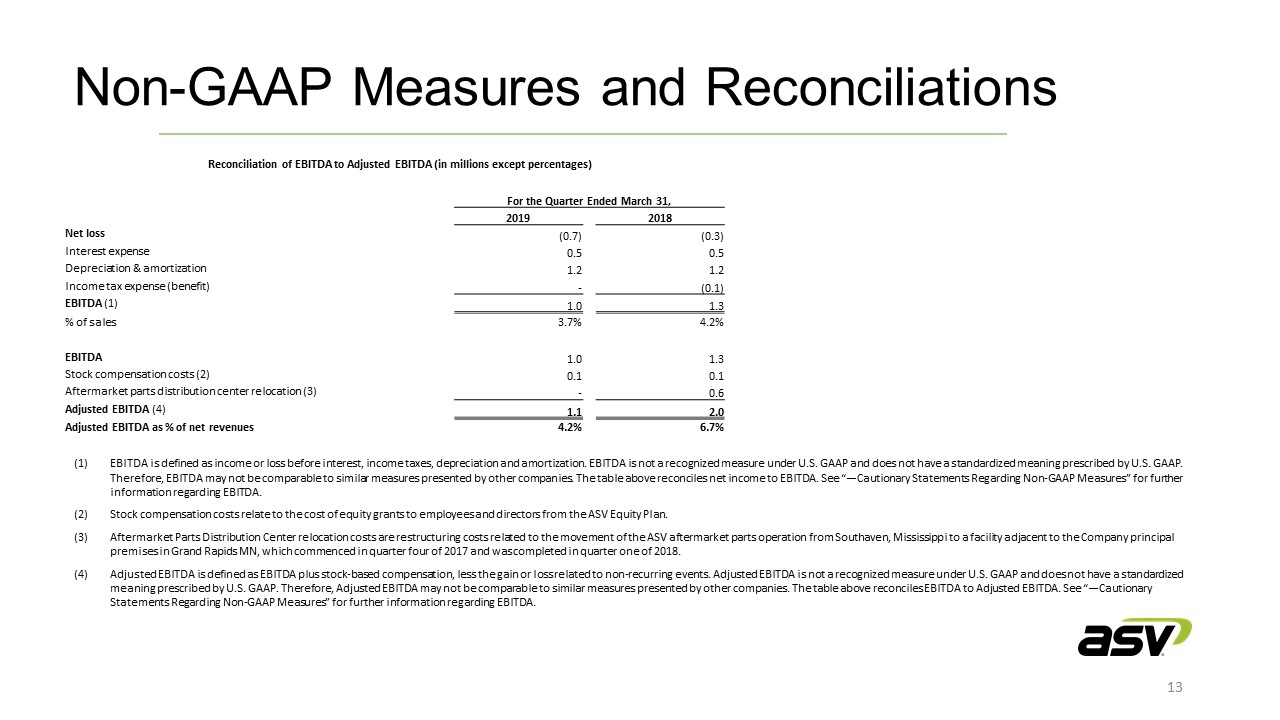
Non-GAAP Measures and Reconciliations Reconciliation of EBITDA to Adjusted EBITDA (in millions except percentages) For the Quarter Ended March 31, 2019 2018 Net loss (0.7) (0.3) Interest expense 0.5 0.5 Depreciation & amortization 1.2 1.2 Income tax expense (benefit) - (0.1) EBITDA (1) 1.0 1.3 % of sales 3.7% 4.2% EBITDA 1.0 1.3 Stock compensation costs (2) 0.1 0.1 Aftermarket parts distribution center relocation (3) - 0.6 Adjusted EBITDA (4) 1.1 2.0 Adjusted EBITDA as % of net revenues 4.2% 6.7% EBITDA is defined as income or loss before interest, income taxes, depreciation and amortization. EBITDA is not a recognized measure under U.S. GAAP and does not have a standardized meaning prescribed by U.S. GAAP. Therefore, EBITDA may not be comparable to similar measures presented by other companies. The table above reconciles net income to EBITDA. See “—Cautionary Statements Regarding Non-GAAP Measures” for further information regarding EBITDA. Stock compensation costs relate to the cost of equity grants to employees and directors from the ASV Equity Plan. Aftermarket Parts Distribution Center relocation costs are restructuring costs related to the movement of the ASV aftermarket parts operation from Southaven, Mississippi to a facility adjacent to the Company principal premises in Grand Rapids MN, which commenced in quarter four of 2017 and was completed in quarter one of 2018. Adjusted EBITDA is defined as EBITDA plus stock-based compensation, less the gain or loss related to non-recurring events. Adjusted EBITDA is not a recognized measure under U.S. GAAP and does not have a standardized meaning prescribed by U.S. GAAP. Therefore, Adjusted EBITDA may not be comparable to similar measures presented by other companies. The table above reconciles EBITDA to Adjusted EBITDA. See “—Cautionary Statements Regarding Non-GAAP Measures” for further information regarding EBITDA.
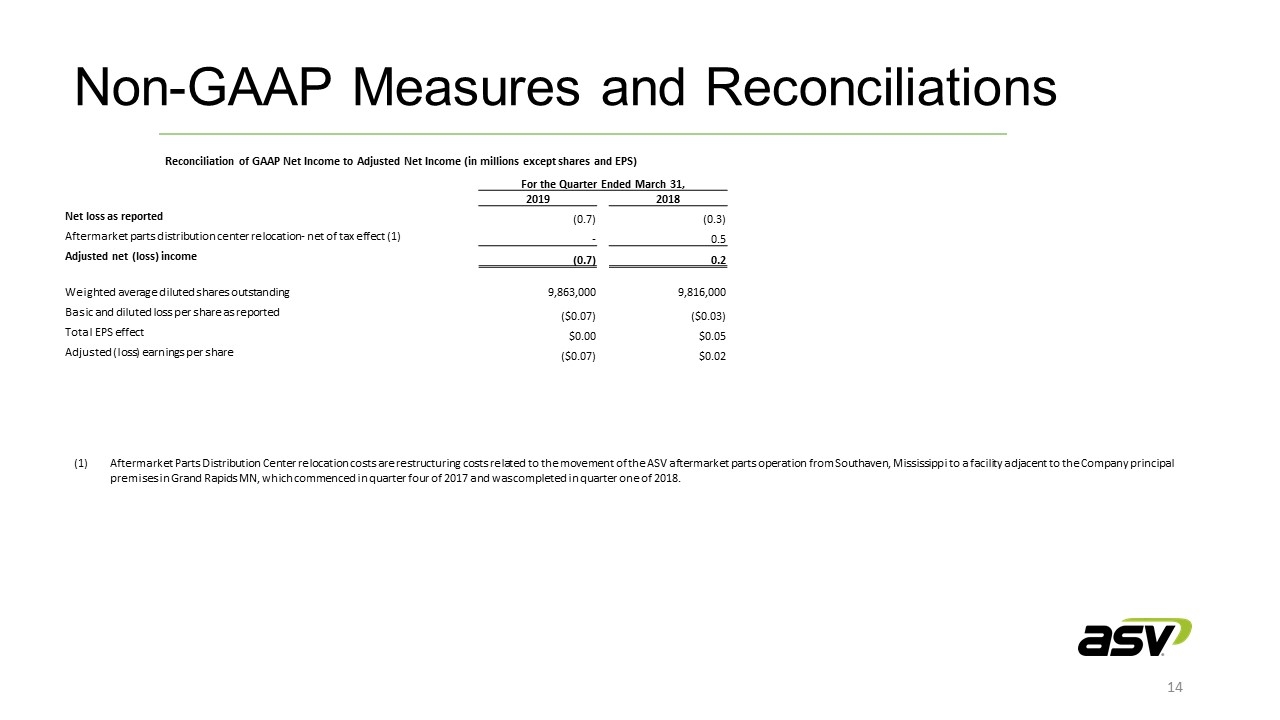
Non-GAAP Measures and Reconciliations Reconciliation of GAAP Net Income to Adjusted Net Income (in millions except shares and EPS) For the Quarter Ended March 31, 2019 2018 Net loss as reported (0.7) (0.3) Aftermarket parts distribution center relocation- net of tax effect (1) - 0.5 Adjusted net (loss) income (0.7) 0.2 Weighted average diluted shares outstanding 9,863,000 9,816,000 Basic and diluted loss per share as reported ($0.07) ($0.03) Total EPS effect $0.00 $0.05 Adjusted (loss) earnings per share ($0.07) $0.02 Aftermarket Parts Distribution Center relocation costs are restructuring costs related to the movement of the ASV aftermarket parts operation from Southaven, Mississippi to a facility adjacent to the Company principal premises in Grand Rapids MN, which commenced in quarter four of 2017 and was completed in quarter one of 2018.
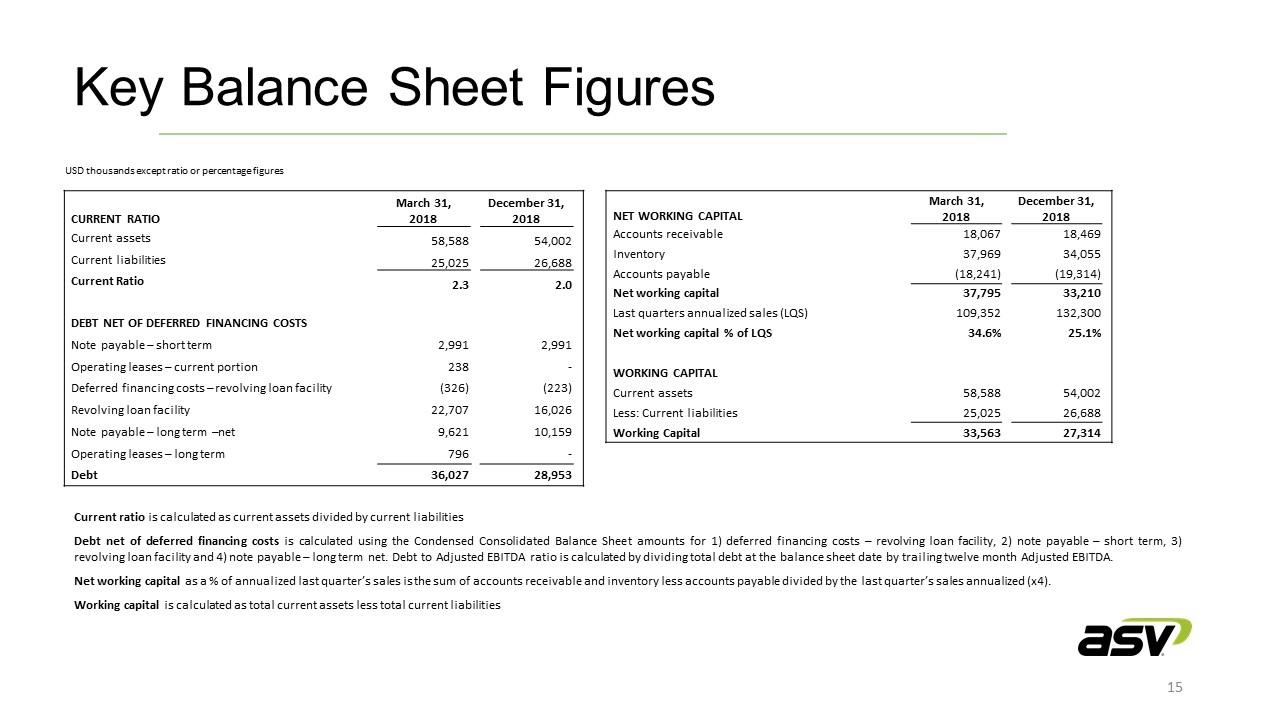
Key Balance Sheet Figures CURRENT RATIO March 31, 2018 December 31, 2018 Current assets 58,588 54,002 Current liabilities 25,025 26,688 Current Ratio 2.3 2.0 DEBT NET OF DEFERRED FINANCING COSTS Note payable – short term 2,991 2,991 Operating leases – current portion 238 - Deferred financing costs – revolving loan facility (326) (223) Revolving loan facility 22,707 16,026 Note payable – long term –net 9,621 10,159 Operating leases – long term 796 - Debt 36,027 28,953 Current ratio is calculated as current assets divided by current liabilities Debt net of deferred financing costs is calculated using the Condensed Consolidated Balance Sheet amounts for 1) deferred financing costs – revolving loan facility, 2) note payable – short term, 3) revolving loan facility and 4) note payable – long term net. Debt to Adjusted EBITDA ratio is calculated by dividing total debt at the balance sheet date by trailing twelve month Adjusted EBITDA. Net working capital as a % of annualized last quarter’s sales is the sum of accounts receivable and inventory less accounts payable divided by the last quarter’s sales annualized (x4). Working capital is calculated as total current assets less total current liabilities NET WORKING CAPITAL March 31, 2018 December 31, 2018 Accounts receivable 18,067 18,469 Inventory 37,969 34,055 Accounts payable (18,241) (19,314) Net working capital 37,795 33,210 Last quarters annualized sales (LQS) 109,352 132,300 Net working capital % of LQS 34.6% 25.1% WORKING CAPITAL Current assets 58,588 54,002 Less: Current liabilities 25,025 26,688 Working Capital 33,563 27,314 USD thousands except ratio or percentage figures

ASV Holdings, Inc. Q1 2019 Earnings Conference Call May 2, 2019 At ASV Holdings, Inc. Andrew Rooke, Chairman & C.E.O. 1-218-327-5389 Contact: At Darrow Associates, Inc. Peter Seltzberg, IR for ASV 1-516-419-9915


