Table of Contents
As filed with the Securities and Exchange Commission on February 7, 2017
Registration No. 333-215052
UNITED STATES
SECURITIES AND EXCHANGE COMMISSION
WASHINGTON, D.C. 20549
PRE-EFFECTIVE AMENDMENT NO. 2 TO
FORM S-1
REGISTRATION STATEMENT
UNDER
THE SECURITIES ACT OF 1933
PCSB Financial Corporation
PCSB Bank 401(k) Savings Plan
(Exact Name of Registrant as Specified in Its Charter)
| Maryland | 6036 | 81-4710738 | ||
(State or Other Jurisdiction of Incorporation or Organization) | (Primary Standard Industrial Classification Code Number) | (I.R.S. Employer Identification Number) |
2651 Strang Blvd., Suite 100
Yorktown Heights, NY 10598
(914) 248-7272
(Address, Including Zip Code, and Telephone Number, Including Area Code, of Registrant’s Principal Executive Offices)
Joseph D. Roberto
President and Chief Executive Officer
PCSB Financial Corporation
2651 Strang Blvd., Suite 100
Yorktown Heights, NY 10598
(914) 248-7272
(Address, Including Zip Code, and Telephone Number, Including Area Code, of Agent for Service)
Copies to:
Kip A. Weissman, Esq.
Victor L. Cangelosi, Esq.
Luse Gorman, PC
5335 Wisconsin Avenue, N.W., Suite 780
Washington, D.C. 20015
(202) 274-2000
Approximate date of commencement of proposed sale to the public:As soon as practicable after this registration statement becomes effective.
If any of the securities being registered on this Form are to be offered on a delayed or continuous basis pursuant to Rule 415 under the Securities Act of 1933, check the following box: ☒
If this Form is filed to register additional shares for an offering pursuant to Rule 462(b) under the Securities Act, please check the following box and list the Securities Act registration statement number of the earlier effective registration statement for the same offering: ☐
If this Form is a post-effective amendment filed pursuant to Rule 462(c) under the Securities Act, check the following box and list the Securities Act registration statement number of the earlier effective registration statement for the same offering: ☐
If this Form is a post-effective amendment filed pursuant to Rule 462(d) under the Securities Act, check the following box and list the Securities Act registration statement number of the earlier effective registration statement for the same offering: ☐
Indicate by check mark whether the registrant is a large accelerated filer, an accelerated filer, a non-accelerated filer, or a smaller reporting company. See the definitions of “large accelerated filer,” “accelerated filer” and “smaller reporting company” in Rule 12b-2 of the Exchange Act. (Check one):
| Large accelerated filer | ☐ | Accelerated filer | ☐ | |||
| Non-accelerated filer | ☒ (Do not check if a smaller reporting company) | Smaller reporting company | ☐ | |||
CALCULATION OF REGISTRATION FEE
| ||||||||
Title of each class of securities to be registered | Amount to be registered | Proposed maximum offering price per share | Proposed maximum aggregate offering price | Amount of registration fee | ||||
Common Stock, $0.01 par value per share | 23,583,481 shares | $10.00 | $235,834,810 (1) | $27,334 (2) | ||||
Participation Interests | 1,437,734 (3) | (3) | ||||||
| ||||||||
| ||||||||
| (1) | Estimated solely for the purpose of calculating the registration fee. |
| (2) | Previously paid. |
| (3) | The securities to be purchased by the PCSB Bank 401(k) Savings Plan are included in the amount shown for the common stock. Accordingly, no separate fee is required for the participation interests. |
The registrant hereby amends this registration statement on such date or dates as may be necessary to delay its effective date until the registrant shall file a further amendment which specifically states that this registration statement shall thereafter become effective in accordance with Section 8(a) of the Securities Act of 1933 or until the registration statement shall become effective on such date as the Securities and Exchange Commission, acting pursuant to said Section 8(a), may determine.
Table of Contents
Prospectus Supplement
Interests in
PCSB BANK 401(k) SAVINGS PLAN
Offering of Participation Interests in up to 1,437,734 Shares of
PCSB FINANCIAL CORPORATION
Common Stock
In connection with the conversion of PCSB Bank, a New York mutual savings bank headquartered in Yorktown Heights, New York, from the mutual to the stock form of organization, PCSB Financial Corporation (“PCSB Financial”), a newly formed Maryland corporation and the proposed holding company of PCSB Bank, is offering shares of common stock for sale at $10.00 per share. Accordingly, in connection with the conversion, PCSB Financial is allowing participants in the PCSB Bank 401(k) Savings Plan (the “401(k) Plan”) to invest all or a portion of their 401(k) Plan accounts in the common stock of PCSB Financial (the “Common Stock”). Based upon the value of the 401(k) Plan assets at September 30, 2016, the trustee of the 401(k) Plan trustee could purchase up to 1,437,734 shares of PCSB Financial Common Stock, at the purchase price of $10.00 per share. This prospectus supplement relates to the election of 401(k) Plan participants to direct the trustee of the 401(k) Plan to invest all or a portion of their 401(k) Plan accounts in PCSB Financial Common Stock at the time of the stock offering.
Before you consider investing, you should read the prospectus of PCSB Financial dated February 10, 2017, which is provided with this prospectus supplement. It contains detailed information regarding the conversion, the stock offering of PCSB Financial and the financial condition, results of operations and business of PCSB Bank. This prospectus supplement provides information regarding the 401(k) Plan. You should read this prospectus supplement together with the prospectus and keep both for future reference.
For a discussion of risks that you should consider, see “Risk Factors” beginning on page 14 of the prospectus.
The interests in the 401(k) Plan and the offering of the shares of PCSB Financial Common Stock have not been approved or disapproved by the Board of Governors of the Federal Reserve System, the Securities and Exchange Commission, the New York State Department of Financial Services, the Federal Deposit Insurance Corporation or any other federal or state agency. Any representation to the contrary is a criminal offense.
The securities offered in this prospectus supplement are not deposits or accounts and are not insured or guaranteed by the Federal Deposit Insurance Corporation or any other government agency.
Table of Contents
This prospectus supplement may be used only in connection with offers and sales by PCSB Financial, in the stock offering, of PCSB Financial Common Stock acquired by the 401(k) Plan. No one may use this prospectus supplement to reoffer or resell interests in shares of PCSB Financial Common Stock acquired through the 401(k) Plan.
You should rely only on the information contained in this prospectus supplement and the prospectus. PCSB Financial, PCSB Bank and the 401(k) Plan have not authorized anyone to provide you with different information.
This prospectus supplement does not constitute an offer to sell or solicitation of an offer to buy any securities in any jurisdiction to any person to whom it is unlawful to make an offer or solicitation in that jurisdiction. Neither the delivery of this prospectus supplement and the prospectus nor any sale of PCSB Financial Common Stock shall under any circumstances imply that there has been no change in the affairs of PCSB Financial, PCSB Bank, or the 401(k) Plan since the date of this prospectus supplement, or that the information contained in this prospectus supplement or incorporated by reference is correct as of any time after the date of this prospectus supplement.
The date of this prospectus supplement is February 10, 2017.
Table of Contents
| S-1 | ||||
| S-1 | ||||
| S-2 | ||||
| S-2 | ||||
| S-3 | ||||
| S-4 | ||||
| S-5 | ||||
| S-5 | ||||
| S-6 | ||||
| S-6 | ||||
| S-6 | ||||
| S-7 | ||||
| S-8 | ||||
| S-8 | ||||
| S-8 | ||||
| S-9 | ||||
| S-9 | ||||
| S-10 | ||||
| S-10 | ||||
| S-11 | ||||
| S-12 | ||||
| S-14 | ||||
| S-15 | ||||
| S-15 | ||||
| S-15 | ||||
| S-17 | ||||
| S-17 | ||||
Securities and Exchange Commission Reporting and Short-Swing Profit Liability | S-18 | |||
| S-19 | ||||
| S-19 | ||||
Table of Contents
Table of Contents
S-2
Table of Contents
S-3
Table of Contents
S-4
Table of Contents
S-5
Table of Contents
S-6
Table of Contents
S-7
Table of Contents
DESCRIPTION OF THE 401(K) PLAN
PCSB Bank (formerly, Putnam County Savings Bank) originally adopted the 401(k) Plan effective as of April 1, 1991, and subsequently amended and restated the 401(k) Plan on several occasions, most recently, as of May 1, 2015. The 401(k) Plan is a tax-qualified plan established in accordance with the requirements under Section 401(a) and Section 401(k) of the Internal Revenue Code of 1986, as amended (the “Code”).
PCSB Bank intends that the 401(k) Plan, in form and operation, will comply with the requirements under Section 401(a) and Section 401(k) of the Code. PCSB Bank will adopt any amendments to the 401(k) Plan that may be necessary to ensure the continuing qualified status of the 401(k) Plan under the Code and applicable Treasury Regulations.
Employee Retirement Income Security Act (“ERISA”). The 401(k) Plan is an “individual account plan” other than a “money purchase pension plan” within the meaning of ERISA. As such, the 401(k) Plan is subject to all of the provisions of Title I (Protection of Employee Benefit Rights) and Title II (Amendments to the Code Relating to Retirement Plans) of ERISA, except for the funding requirements contained in Part 3 of Title I of ERISA which by their terms do not apply to an individual account plan (other than a money purchase plan). The 401(k) Plan is not subject to Title IV (Plan Termination Insurance) of ERISA. The funding requirements contained in Title IV of ERISA are not applicable to participants or beneficiaries under the 401(k) Plan.
Reference to Full Text of 401(k) Plan. The following portions of this prospectus supplement summarize certain provisions of the 401(k) Plan. They are not complete and are qualified in their entirety by the full text of the 401(k) Plan and the Summary Plan Description. Copies of the 401(k) Plan and the Summary Plan Description are available to all employees by filing a request with the 401(k) Plan administrator at PCSB Bank, 2651 Strang Blvd., Suite 100, Yorktown Heights, New York 10598. You are urged to read carefully the full text of the 401(k) Plan.
Employees who are at least age 21 and complete twelve months of service (a “period of service”) are eligible to participate in the 401(k) Plan on the first day of the payroll period following the date the employee satisfies the eligibility requirements.
As of September 30, 2016, there were approximately 170 employees and former employees eligible to participate in the 401(k) Plan and 139 employees were actually participating in the 401(k) by making deferrals. The 401(k) Plan Year is January 1 to December 31.
S-8
Table of Contents
Contributions under the 401(k) Plan
Salary Deferrals.You are permitted to defer, on a pre-tax basis, a specific percentage or dollar amount of your compensation, subject to certain restrictions imposed by the Code, and to have that amount contributed to the 401(k) Plan on your behalf. The 401(k) Plan imposes a limit on your deferrals, which is no less than 1% and no more than 25% of your compensation each year up to the tax law limit on elective deferrals, which for 2017, is $18,000. For purposes of the 401(k) Plan, “compensation” generally means your total compensation that is subject to income tax and paid to you during the plan year. In accordance with Internal Revenue Service (the “IRS”) limitations, the annual compensation of each participant taken into account under the 401(k) Plan, for 2017, is limited to $270,000 (and as may be increased annually by the IRS). You may change the contribution rate of your pre-tax deferrals four times per year.
Matching Employer Contributions. PCSB Bank will make a matching employer contribution equal to 75% of a participant’s elective deferrals (including employee catch-up contributions), on up to 6% of a participant’s compensation.
Employer Profit Sharing Contribution. Effective for employees hired on or after October 1, 2012 who become participants in the 401(k) Plan, PCSB Bank will make a profit sharing contribution equal to 5% of the compensation of all participants eligible to share in allocations.
Limitations on Employee Salary Deferrals. For the 401(k) Plan Year beginning January 1, 2017, the amount of your before-tax contributions may not exceed $18,000 per calendar year. In addition, if you are at least 50 years old in 2017, you will be able to make a “catch-up” contribution of up to $6,000 in addition to the $18,000 limit. The “catch-up” contribution limit may be adjusted periodically by law, based on changes in the cost of living. Contributions in excess of these limits, as applicable to you, are known as excess deferrals. If you defer amounts in excess of these limitations, as applicable to you, your gross income for federal income tax purposes will include the excess in the year of the deferral. In addition, unless the excess deferral is distributed before April 15 of the following year, it will be taxed again in the year distributed. Income on the excess deferral distributed by April 15 of the immediately succeeding year will be treated, for federal income tax purposes, as earned and received by you in the tax year in which the contribution is made.
Contribution Limit. Generally, the law imposes a maximum limit on the amount of contributions you may receive under the 401(k) Plan. This limit applies to all contributions to the 401(k) Plan, including your salary deferrals and all other employer contributions made on your behalf during the year, excluding earnings and any transfers/rollovers. For the 401(k) Plan Year beginning January 1, 2017, this total cannot exceed the lesser of $54,000 or 100% of your annual compensation.
S-9
Table of Contents
Benefits under the 401(k) Plan
Vesting. At all times, you have a fully vested, non-forfeitable interest in the salary deferrals you have made to the 401(k) Plan. In addition, rollover contributions and actual earnings thereon are 100% vested at all times.
Employer profit sharing contributions and matching contributions are subject to the following vesting schedule:
| Vesting Schedule | ||||
| Profit Sharing and/or Matching Contributions | ||||
Period of Service | Vested Percentage | |||
Less than 2 years | 0 | % | ||
2 years | 20 | % | ||
3 years | 40 | % | ||
4 years | 60 | % | ||
5 years | 80 | % | ||
6 years | 100 | % | ||
You will be credited with a “period of service” for each twelve-month period from your date of employment until the date you terminate employment, however, periods of service before age 18 will not count nor will periods during which you have terminated employment. You will also become fully vested in your accounts if you attain your early retirement date (the first day of the month after you attain age 60) or if you attain your normal retirement date (the first day of the month coinciding with or following your attainment of age 65) or if you die or become disabled.
Withdrawals and Distributions from the 401(k) Plan
Applicable federal law requires the 401(k) Plan to impose substantial restrictions on the right of a 401(k) Plan participant to withdraw amounts held for his or her benefit under the 401(k) Plan before the participant’s termination of employment with the employer.
In-Service Withdrawals. In-service withdrawals are permitted with respect to employee pre-tax elective deferrals and the earnings thereon, and are limited to two per year. In-service withdrawals of employee rollover contribution and earnings, and employer matching contributions and earnings are permitted only in the event of hardship or attainment of age 59 1/2.
Withdrawals upon Termination. You may request a distribution from your account following your termination of employment. Following your termination, you may elect to leave your account balance in the 401(k) Plan and defer commencement of receipt of your vested balance until no later than April 1 of the calendar year following the calendar year in which you attain age 70 1⁄2, except to the extent your vested account balance as of the date of termination is less than $1,000, in which case your interest in the 401(k) Plan will be cashed out. You may make withdrawals from your account at any time after terminating employment and may continue to change investment instructions with respect to your remaining account balance.
S-10
Table of Contents
Disability. If you become disabled in accordance with the definition of disability under the 401(k) Plan, you will be entitled to the same withdrawal rights as if terminating employment.
Form of Distribution. Your benefits under the 401(k) Plan will be distributed to you or your beneficiary in one of the following forms: (i) a single lump-sum payment; or (ii) substantially equal installments not to exceed 10 years. Notwithstanding the foregoing, if your account balance does not exceed $5,000 your vested account balance can only be distributed to you in a single lump-sum payment.
Pre-Retirement Death. If you die, the value of your account will be payable to your beneficiary. Payment will be made in a lump sum, unless the payment would exceed $5000. If the payment exceeds $5,000, then your beneficiary may elect to receive the benefit in either a lump sum or in annual installments over a period not to exceed 10 years.
Loans. Loans will be permitted from your account under the 401(k) Plan, subject to certain restrictions. Loans will not be made in an amount less than $1,000 or greater than $50,000.
Investment of Contributions and Account Balances
All amounts credited to your accounts under the 401(k) Plan are held in the 401(k) Plan trust (the “Trust”) which is administered by the trustee appointed by PCSB Bank’s board of directors. Before the effective date of the offering, you were provided the opportunity to direct the investment of your account into one of the following investment options:
| 1. | American Beacon Large Cap Value Fund |
| 2. | American Funds EuroPacific Growth Fund |
| 3. | DFA U.S. Small Cap Portfolio |
| 4. | Fidelity 500 Index Fund (Inv) |
| 5. | Pentegra Adv. Aggressive Asset Allocation Strategy (O) |
| 6. | Pentegra Adv Conservative Asset Allocation Strategy (O) |
| 7. | Pentegra Adv Moderate Asset Allocation Strategy (O) |
| 8. | Pentegra Adv Moderate Aggressive Allocation Strategy (O) |
| 9. | Pentegra Adv Moderate Conservative Asset Allocation Strategy (O) |
| 10. | T. Rowe Price Blue Chip Growth Fund |
| 11. | Vanguard Mid-Cap Index Fund (Adm) |
| 12. | Vanguard Total Bond Market Fund (Adm) |
| 13. | Wells Fargo Stable Value Fund (J) |
| 14. | PCSB Financial Stock Fund |
S-11
Table of Contents
Performance History and Description of Funds
The following provides performance data with respect to the investment options available under the 401(k) Plan:
Fund Name | Performance as of September 30, 2016 | |||||||||||||||||||
| Last 3-Months | Last 12 Months | Trail 3 Year Annualized | Trail 5 Year Annualized | Trail 10 Year Annualized | ||||||||||||||||
American Beacon Large Cap Value Fund | 5.73 | % | 10.99 | % | 6.79 | % | 14.85 | % | 5.46 | % | ||||||||||
American Funds EuroPacific Growth Fund | 8.23 | % | 8.52 | % | 3.34 | % | 9.11 | % | 4.19 | % | ||||||||||
DFA U.S. Small Cap Portfolio | 7.00 | % | 13.82 | % | 7.28 | % | 16.84 | % | 8.21 | % | ||||||||||
Fidelity 500 Index Fund (Inv) | 3.84 | % | 15.34 | % | 11.07 | % | 16.28 | % | 7.17 | % | ||||||||||
Pentegra Adv. Aggressive Asset Allocation Strategy (O) | 3.89 | % | 10.64 | % | N/A | N/A | 4.92 | %* | ||||||||||||
Pentegra Adv Conservative Asset Allocation Strategy (O) | 1.60 | % | 5.89 | % | N/A | N/A | 3.23 | %* | ||||||||||||
Pentegra Adv Moderate Asset Allocation Strategy (O) | 2.87 | % | 8.70 | % | N/A | N/A | 4.49 | %* | ||||||||||||
Pentegra Adv Moderate Aggressive Allocation Strategy (O) | 3.42 | % | 9.70 | % | N/A | N/A | 4.80 | %* | ||||||||||||
Pentegra Adv Moderate Conservative Asset Allocation Strategy (O) | 2.32 | % | 7.60 | % | N/A | N/A | 4.18 | % | ||||||||||||
T. Rowe Price Blue Chip Growth Fund | 7.52 | % | 11.34 | % | 11.56 | % | 17.86 | % | 9.11 | % | ||||||||||
Vanguard Mid-Cap Index Fund (Adm) | 5.18 | % | 12.64 | % | 9.90 | % | 16.52 | % | 8.20 | % | ||||||||||
Vanguard Total Bond Market Fund (Adm) | 0.41 | % | 5.31 | % | 3.98 | % | 3.00 | % | 4.77 | % | ||||||||||
Wells Fargo Stable Value Fund (J) | 0.24 | % | 0.91 | % | 0.80 | % | 0.94 | % | 1.95 | % | ||||||||||
PCSB Financial Stock Fund | N/A | N/A | N/A | N/A | N/A | ** | ||||||||||||||
| * | Since fund inception. |
| ** | The fund is effective February 10, 2017 and therefore it does not have an investment history. |
The following is a description of each of the 401(k) Plan’s investment funds and other investments:
American Beacon Large Cap Value Fund. The Fund seeks long-term capital appreciation and current Income. The Fund invests primarily in equity securities of large-cap U.S. companies. The assets of the Fund are allocated among different sub-advisors who typically seek to invest in companies believed to be undervalued at the time of purchase
American Funds EuroPacific Growth Fund. The Fund seeks long-term growth of capital. The Funds invests primarily in common stocks of issuers in Europe and the Pacific Basin that the investment adviser believes have the potential for growth. Growth stocks are stocks that the investment adviser believes have the potential for above-average capital appreciation. The Fund may invest a portion of its assets in common stocks and other securities of companies in emerging markets.
DFA U.S. Small Cap Portfolio.The Fund seeks long-term capital appreciation. The Fund purchases a broad and diverse group of readily marketable securities of U.S. small cap companies. The Fund may use derivatives to adjust market exposure based on actual or expected cash inflows to or outflows from the Fund.
S-12
Table of Contents
Fidelity 500 Index Fund (Inv). The Fund seeks investment results that correspond to the total return performance of common stocks publicly traded in the United States. The Fund normally invests primarily in common stocks included in the S&P 500 Index, which broadly represents the performance of common stocks publicly traded in the U.S.
Pentegra Adv. Aggressive Asset Allocation Strategy (O). The Fund seeks a total return through capital appreciation. The Fund is a “fund of funds” that invests primarily in a diversified portfolio of equity, fixed-income and cash equivalents funds that meets the Fund’s investment criteria. The Fund targets 80% to equity funds and 20% to fixed income and cash equivalents funds. The Sub-Adviser combines both qualitative and quantitative factors in its analysis of potential and selected investment strategies for the Funds.
Pentegra Adv Conservative Asset Allocation Strategy (O). The Fund seeks a combination of current income and capital appreciation. The Fund is a “fund of funds” that invests primarily in a diversified portfolio of equity, fixed-income and cash equivalents funds that meets the Fund’s investment criteria. The Fund targets 20% to equity funds and 80% to fixed income and cash equivalents funds. The Sub-Adviser combines both qualitative and quantitative factors in its analysis of potential and selected investment strategies for the Funds.
Pentegra Adv Moderate Asset Allocation Strategy (O). The Fund seeks a combination of capital appreciation and current income. The Fund is a “fund of funds” that invests primarily in a diversified portfolio of equity, fixed-income and cash equivalents funds that meets the Fund’s investment criteria. The Fund targets 50% to equity funds and 50% to fixed income and cash equivalents funds. The Sub-Adviser combines both qualitative and quantitative factors in its analysis of potential and selected investment strategies for the Funds.
Pentegra Adv Moderate Aggressive Allocation Strategy (O). The Fund seeks a total return, consisting of capital appreciation and current income. The Fund is a “fund of funds” that invests primarily in a diversified portfolio of equity, fixed-income and cash equivalents funds that meets the Fund’s investment criteria. The Fund targets 65% to equity funds and 35% to fixed income and cash equivalents funds. The Sub-Adviser combines both qualitative and quantitative factors in its analysis of potential and selected investment strategies for the Funds.
Pentegra Adv Moderate Conservative Asset Allocation Strategy (O). The Fund seeks a combination of current income and capital appreciation. The Fund is a “fund of funds” that invests primarily in a diversified portfolio of equity, fixed-income and cash equivalents funds that meets the Fund’s investment criteria. The Fund targets 35% to equity funds and 65% to fixed income and cash equivalents funds. The Sub-Adviser combines both qualitative and quantitative factors in its analysis of potential and selected investment strategies for the Funds.
T. Rowe Price Blue Chip Growth Fund. The Fund seeks long-term capital growth; income is a secondary objective. The Fund will normally invest primarily in the common stocks of large- and medium-sized blue chip growth companies. It focuses on companies with leading market positions, seasoned management, and strong financial fundamentals. The Fund may sell securities for a variety of reasons, such as to secure gains, limit losses, or redeploy assets into more promising opportunities.
S-13
Table of Contents
Vanguard Mid-Cap Index Fund (Adm). The Fund seeks to track the performance of the CRSP US Mid Cap Index, a broadly diversified index of stocks of mid-size U.S. companies. The Fund invests all, or substantially all, of its assets in the stocks that make up the Index, holding each stock in approximately the same proportion as its weighting in the Index.
Vanguard Total Bond Market Fund (Adm).The Fund seeks to track the performance of the Barclays U.S. Aggregate Float Adjusted Index, which represents a wide spectrum of public, investment-grade, taxable, fixed income securities in the U.S. The Fund invests by sampling the Index, holding a broadly diversified collection of securities that, in the aggregate, approximates the full Index.
Wells Fargo Stable Value Fund (J). The Wells Fargo Stable Value Fund is managed to protect principal while providing the potential for higher rates of return than other conservative investments, such as money market funds. The Fund invests in a diversified pool of investment contracts issued by high quality financial institutions. These assets include guaranteed investment contracts (GICs), bank investment contracts (BICs), and security backed contracts.
PCSB Financial Stock Fund. In connection with the stock offering, you may, in the manner described earlier, direct the trustee to invest all or a portion of your 401(k) Plan account in PCSB Financial Common Stock (excluding any investment in the current PCSB Financial Stock Fund). The trustee will use all amounts elected by participants to acquire shares of PCSB Financial Common Stock in the conversion and common stock offering, subject to the purchase priorities described herein. After the offering, you may elect to invest all or a portion of your payroll deduction contributions or employer contributions in PCSB Financial Common Stock. You may also elect to invest in PCSB Financial Common Stock with all or a portion of your accounts currently invested in other funds under the 401(k) Plan. It is expected that all purchases will be made at prevailing market prices. Pending investment in PCSB Financial Common Stock, amounts allocated towards the purchase of shares in the offering will be held in a separate account maintained by the 401(k) Plan. In the event of an oversubscription, any earnings that result therefrom will be reinvested among the other funds of the 401(k) Plan in accordance with your then existing investment election.For a discussion of material risks of investing in PCSB Financial Common Stock, you should read the “Risk Factors” section of the accompanying prospectus and the section of the prospectus supplement called “Your Rights Concerning Employer Securities” (see below).
An investment in any of the investment options listed above is not a deposit of a bank and is not insured or guaranteed by the Federal Deposit Insurance Corporation or any other government agency. As with any investment option, there is always a risk that you may lose money on your investment in any of the investment options listed above.
Administration of the 401(k) Plan
The Trustee and Custodian. The trustee of the 401(k) Plan assets, including the PCSB Financial Stock Fund, is Pentegra Trust Company. Reliance Trust Company serves as the custodian of all 401(k) Plan assets, including the PCSB Financial Stock Fund.
S-14
Table of Contents
401(k) Plan Administrator. Pursuant to the terms of the 401(k) Plan, the 401(k) Plan is administered by the 401(k) Plan administrator, PCSB Bank. The address of the 401(k) Plan administrator is 2651 Strang Blvd., Suite 100, Yorktown Heights, New York 10598, telephone number (914) 248-7272. The 401(k) Plan administrator is responsible for the administration of the 401(k) Plan, interpretation of the provisions of the 401(k) Plan, prescribing procedures for filing applications for benefits, preparation and distribution of information explaining the 401(k) Plan, maintenance of 401(k) Plan records, books of account and all other data necessary for the proper administration of the 401(k) Plan, preparation and filing of all returns and reports relating to the 401(k) Plan which are required to be filed with the U.S. Department of Labor and the Internal Revenue Service, and for all disclosures required to be made to participants, beneficiaries and others under Sections 104 and 105 of ERISA.
Reports to 401(k) Plan Participants. The 401(k) Plan administrator will provide access to your statement at least quarterly showing the balance in your account as of the end of that period, the amount of contributions allocated to your account for that period, and any adjustments to your account to reflect earnings or losses (if any).
PCSB Bank intends to continue the 401(k) Plan indefinitely. Nevertheless, PCSB Bank may terminate the 401(k) Plan at any time. If the 401(k) Plan is terminated in whole or in part, then regardless of other provisions in the 401(k) Plan, you will have a fully vested interest in your accounts. PCSB Bank reserves the right to make any amendment or amendments to the 401(k) Plan which do not cause any part of the trust to be used for, or diverted to, any purpose other than the exclusive benefit of participants or their beneficiaries; provided, however, that PCSB Bank may make any amendment it determines necessary or desirable, with or without retroactive effect, to comply with ERISA.
Merger, Consolidation or Transfer
In the event of the merger or consolidation of the 401(k) Plan with another plan, or the transfer of the trust assets to another plan, the 401(k) Plan requires that you would, if either the 401(k) Plan or the other plan terminates, receive a benefit immediately after the merger, consolidation or transfer which is equal to or greater than the benefit you would have been entitled to receive immediately before the merger, consolidation or transfer, if the 401(k) Plan had then terminated.
Federal Income Tax Consequences
The following is a brief summary of the material federal income tax aspects of the 401(k) Plan. You should not rely on this summary as a complete or definitive description of the material federal income tax consequences relating to the 401(k) Plan. Statutory provisions change, as do their interpretations, and their application may vary in individual circumstances. Finally, the consequences under applicable state and local income tax laws may not be the same as under the federal income tax laws. Please consult your tax advisor with respect to any distribution from the 401(k) Plan and transactions involving the 401(k) Plan.
S-15
Table of Contents
As a “tax-qualified retirement plan,” the Code affords the 401(k) Plan special tax treatment, including:
| (1) | the sponsoring employer is allowed an immediate tax deduction for the amount contributed to the 401(k) Plan each year; |
| (2) | participants pay no current income tax on amounts contributed by the employer on their behalf; and |
| (3) | earnings of the 401(k) Plan are tax-deferred, thereby permitting the tax-free accumulation of income and gains on investments. |
PCSB Bank will administer the 401(k) Plan to comply with the requirements of the Code as of the applicable effective date of any change in the law.
Lump-Sum Distribution. A distribution from the 401(k) Plan to a participant or the beneficiary of a participant will qualify as a lump-sum distribution if it is made within one taxable year, on account of the participant’s death, disability or separation from service, or after the participant attains age 59 1⁄2, and consists of the balance credited to participants under the 401(k) Plan and all other profit sharing plans, if any, maintained by PCSB Bank. The portion of any lump-sum distribution required to be included in your taxable income for federal income tax purposes consists of the entire amount of the lump-sum distribution, less the amount of after-tax contributions, if any, you have made to this 401(k) Plan and any other profit sharing plans maintained by PCSB Bank, which is included in the distribution.
PCSB Financial Common Stock Included in Lump-Sum Distribution. If a lump-sum distribution includes PCSB Financial Common Stock, the distribution generally will be taxed in the manner described above, except that the total taxable amount may be reduced by the amount of any net unrealized appreciation with respect to PCSB Financial Common Stock; that is, the excess of the value of PCSB Financial Common Stock at the time of the distribution over its cost or other basis of the securities to the trust. The tax basis of PCSB Financial Common Stock, for purposes of computing gain or loss on its subsequent sale, equals the value of PCSB Financial Common Stock at the time of distribution, less the amount of net unrealized appreciation. Any gain on a subsequent sale or other taxable disposition of PCSB Financial Common Stock, to the extent of the amount of net unrealized appreciation at the time of distribution, will constitute long-term capital gain, regardless of the holding period of PCSB Financial Common Stock. Any gain on a subsequent sale or other taxable disposition of PCSB Financial Common Stock, in excess of the amount of net unrealized appreciation at the time of distribution, will be considered long-term capital gain. The recipient of a distribution may elect to include the amount of any net unrealized appreciation in the total taxable amount of the distribution, to the extent allowed by regulations to be issued by the Internal Revenue Service.
Distributions: Rollovers and Direct Transfers to Another Qualified Plan or to an IRA. You may roll over virtually all distributions from the 401(k) Plan to another qualified plan or to an individual retirement account in accordance with the terms of the other plan or account.
S-16
Table of Contents
Before Making a Decision to Invest, Please Review Your Rights Concerning Employer Securities and The Importance of Diversification
Federal law provides specific rights concerning investments in employer securities. Because you may in the future have investments in PCSB Financial Common Stock under the 401(k) Plan, you should take the time to read the following information carefully.
Your Rights Concerning Employer Securities. The 401(k) Plan allows you to elect to move any portion of your account that is invested in PCSB Financial Common Stock from that investment into other investment alternatives under the 401(k) Plan. You may contact the 401(k) Plan administrator shown above for specific information regarding this right, including how to make this election. In deciding whether to exercise this right, you will want to give careful consideration to the information below that describes the importance of diversification. All of the investment options under the 401(k) Plan are available to you if you decide to diversify out of your investment in PCSB Financial Common Stock.
The Importance of Diversifying Your Retirement Savings. To help achieve long-term retirement security, you should give careful consideration to the benefits of a well-balanced and diversified investment portfolio. Spreading your assets among different types of investments can help you achieve a favorable rate of return, while minimizing your overall risk of losing money. This is because market or other economic conditions that cause one category of assets, or one particular security, to perform very well often cause another asset category, or another particular security, to perform poorly. If you invest more than 20% of your retirement savings in any one company or industry, your savings may not be properly diversified. Although diversification is not a guarantee against loss, it is an effective strategy to help you manage investment risk.
In deciding how to invest your retirement savings, you should take into account all of your assets, including any retirement savings outside of the 401(k) Plan. No single approach is right for everyone because, among other factors, individuals have different financial goals, different time horizons for meeting their goals, and different tolerance for risk. Therefore, you should carefully consider the rights described here and how these rights affect the amount of money that you invest in employer common stock through the 401(k) Plan.
It is also important to periodically review your investment portfolio, your investment objectives, and the investment options under the 401(k) Plan to help ensure that your retirement savings will meet your retirement goals.
Additional ERISA Considerations
As noted above, the 401(k) Plan is subject to certain provisions of ERISA, including special provisions relating to control over the 401(k) Plan’s assets by participants and beneficiaries. The 401(k) Plan’s feature that allows you to direct the investment of your account balances is intended to satisfy the requirements of Section 404(c) of ERISA relating to control over 401(k) Plan assets by a participant or beneficiary. The effect of this is two-fold. First, you will not be deemed a “fiduciary” because of your exercise of investment discretion. Second, no person who otherwise is a fiduciary, such as PCSB Bank, the 401(k) Plan administrator, or the 401(k) Plan’s trustee is liable under the fiduciary responsibility provisions of ERISA for any loss which results from your exercise of control over the assets in your 401(k) Plan account.
S-17
Table of Contents
Because you will be entitled to invest all or a portion of your account balance in the 401(k) Plan in PCSB Financial Common Stock, the regulations under Section 404(c) of the ERISA require that the 401(k) Plan establish procedures that ensure the confidentiality of your decision to purchase, hold, or sell employer securities, except to the extent that disclosure of such information is necessary to comply with federal or state laws not preempted by ERISA. These regulations also require that your exercise of voting and similar rights with respect to PCSB Financial Common Stock be conducted in a way that ensures the confidentiality of your exercise of these rights.
Securities and Exchange Commission Reporting and Short-Swing Profit Liability
Section 16 of the Exchange Act imposes reporting and liability requirements on officers, directors, and persons beneficially owning more than 10% of publicly traded companies, such as PCSB Financial. Section 16(a) of the Securities Exchange Act of 1934 requires the filing of reports of beneficial ownership. Within 10 days of becoming an officer, director or person beneficially owning more than 10% of the shares of PCSB Financial, a Form 3 reporting initial beneficial ownership must be filed with the Securities and Exchange Commission. Changes in beneficial ownership, such as purchases, sales and gifts generally must be reported periodically, either on a Form 4 within two business days after the change occurs, or annually on a Form 5 within 45 days after the close of PCSB Financial’s fiscal year. Discretionary transactions in and beneficial ownership of PCSB Financial Common Stock by officers, directors and persons beneficially owning more than 10% of PCSB Financial Common Stock generally must be reported to the Securities and Exchange Commission by such individuals.
In addition to the reporting requirements described above, Section 16(b) of the Exchange Act provides for the recovery by PCSB Financial of profits realized by an officer, director or any person beneficially owning more than 10% of PCSB Financial Common Stock resulting from non-exempt purchases and sales of PCSB Financial Common Stock within any six-month period.
The Securities and Exchange Commission has adopted rules that provide exemptions from the profit recovery provisions of Section 16(b) for all transactions in employer securities within an employee benefit plan, provided certain requirements are met. These requirements generally involve restrictions upon the timing of elections to acquire or dispose of employer securities for the accounts of Section 16(b) persons.
Except for distributions of PCSB Financial Common Stock due to death, disability, retirement, termination of employment or under a qualified domestic relations order, persons affected by Section 16(b) are required to hold shares of PCSB Financial Common Stock distributed from the 401(k) Plan for six months following such distribution and are prohibited from directing additional purchases of PCSB Financial Common Stock for six months after receiving such a distribution.
S-18
Table of Contents
Financial Information Regarding 401(k) Plan Assets
Financial information representing the net assets available for 401(k) Plan benefits and the change in net assets available for 401(k) Plan benefits at December 31, 2016, is available upon written request to the 401(k) Plan administrator at the address shown above.
The validity of the issuance of PCSB Financial Common Stock has been passed upon by Luse Gorman, PC, Washington, D.C., which firm is acting as special counsel to PCSB Bank in connection with PCSB Financial’s stock offering.
S-19
Table of Contents
Special Investment Election Form
PCSB Bank 401(k) Savings Plan (the “401(k) Plan”)
THIS IS A SPECIAL, ONE-TIME INVESTMENT ELECTION FORM TO BE USED IN CONNECTION WITH THE PCSB FINANCIAL CORPORATION STOCK OFFERING.
IF YOU WISH TO PLACE A STOCK ORDER THROUGH THE 401(k) PLAN, PLEASE RETURN THIS FORM TO RUTH LESER, AT PCSB BANK, BY HAND DELIVERY, REGULAR MAIL OR FACSIMILE, TO BE RECEIVED NO LATER THAN 5:00 P.M., EASTERN TIME, ON MARCH 7, 2017.
SECTION A: NAME / SOCIAL SECURITY #
|
|
|
| - - | ||||
| PLEASE PRINT: | Last Name | First Name | Middle | Social Security # |
SECTION B: SPECIAL ONE-TIME INVESTMENT ELECTION
Participants with existing 401(k) plan account balances may invest all or a portion of their account in PCSB Financial Corporation common stock in connection with the initial public offering. The purchase price of the common stock in the offering is $10.00 per share. You must purchase a minimum of 25 shares ($250) and your combined orders for stock in the offering inside and outside the 401(k) Plan cannot exceed 20,000 shares ($200,000). Participants may transfer a portion of any current investment fund to the “PCSB Financial Stock Fund” in the 401(k) Plan, which will be held in a short-term interest bearing account for several weeks until it is invested in common stock at the completion of the reorganization. The amount transferred will be rounded down to the nearest whole $10 value.
Indicate the percentage(s), in multiples of not less than 1%, of each existing investment option that you want transferred from your current plan investment(s) to the PCSB Financial Stock Fund.
Source of Funds to be Transferred | Amount to be Transferred | |||
American Beacon Large Cap Value Fund | % | |||
American Funds EuroPacific Growth Fund | % | |||
DFA U.S. Small Cap Portfolio | % | |||
Fidelity 500 Index Fund (Inv) | % | |||
Pentegra Adv. Aggressive Asset Allocation Strategy (O) | % | |||
Pentegra Adv Conservative Asset Allocation Strategy (O) | % | |||
Pentegra Adv Moderate Asset Allocation Strategy (O) | % | |||
Pentegra Adv Moderate Aggressive Allocation Strategy (O) | % | |||
Pentegra Adv Moderate Conservative Asset Allocation Strategy (O) | % | |||
T. Rowe Price Blue Chip Growth Fund | % | |||
Vanguard Mid-Cap Index Fund (Adm) | % | |||
Vanguard Total Bond Market Fund (Adm) | % | |||
Wells Fargo Stable Value Fund (J) | % | |||
SECTION C: IMPORTANT CONSIDERATIONS
If, when your election is processed, your election would result in the transfer of less than $250 to the PCSB Financial Stock Fund for the purchase of PCSB Financial Corporation common stock, your election will not be processed, and the funds will be reinvested in the other investment options in accordance with your then existing investment election for future contributions.
Please note that your election to invest all or a portion of your account in the PCSB Financial Stock Fund will beIRREVOCABLE. As you know, you are permitted to change your investment election among the various investment funds in the 401(k) Plan on a daily basis. However, you will not be permitted to change your investment election with respect to that portion of your account that you indicated above will be invested in the PCSB Financial Stock Fund in the stock offering. After this form has been submitted and processed, the dollar amount transferred in accordance with Section B above will be transferred to an interest-bearing cash account, pending the completion of
Table of Contents
the reorganization. You will not have access to the amounts placed in the interest-bearing cash account during the offering. Following the completion of the reorganization and offering, you will be permitted to change your investment elections, including diversifying out of the investment in common stock. If some or all of the amount that you direct to be invested in the PCSB Financial Stock Fund cannot be used to purchase stock in the offering because the offering is oversubscribed, following the conclusion of the stock offering, the trustee will reinvest unused funds in the other investment funds in accordance with your then existing investment election for future contributions. Following the stock offering, you will have the opportunity to purchase additional shares of PCSB Financial Corporation (with your Plan assets), and you will be able to direct the Plan trustee to sell your shares of PCSB Financial Corporation
SECTION D: PURCHASER INFORMATION
| ☐ | Eligible Account Holder—Check here if you were a depositor with at least $100 on deposit with PCSB Bank as ofSeptember 30, 2015.Enter information below for all deposit accounts that you had an interest in (IRA, individual, joint) at PCSB Bank as of the close of business onSeptember 30, 2015. |
| ☐ | Supplemental Eligible Account Holder (but not eligible for Priority One)—Check here if were a depositor (other than a trustee or officer of PCSB Bank or an associate thereof) with at least $100 on deposit with PCSB Bank as of the close of business onDecember 31, 2016. Enter information below for all deposit accounts that you had an interest in (IRA, individual, joint) at PCSB Bank as of the close of business onDecember 31, 2016. |
| ☐ | No Priority. I do not have a priority in my individual capacity in the subscription offering, but wish to place an order through the 401(k) Plan. |
| ☐ | No Election – I do not wish to make an election to purchase stock in the offering through my 401(k) Plan account. |
| Please Note: | Failure to list all of your accounts may result in the loss of part or all of your stock allocation in the event of oversubscription. |
Account Title (Name(s) on Accounts) | Account Number | |
SECTION E: PARTICIPANT AUTHORIZATION
I certify that I received a copy of the Prospectus of PCSB Financial Corporation which provides detailed information with respect to the offering of PCSB Financial Corporation common stock and the accompanying Prospectus Supplement relating to the election to direct investments under the 401(k) Plan to common stock. I understand that the value of the investments may fluctuate over time and that risks are associated with investing in the investment options I have selected. Furthermore, I authorize the Plan Administrator to execute my directions as set forth above. I understand these directions are irrevocable.
Participant Signature Date
IMPORTANT: PLEASE KEEP A COPY OF YOUR COMPLETED FORM FOR YOUR RECORDS
2
Table of Contents
PROSPECTUS
PCSB FINANCIAL CORPORATION
(Proposed Holding Company for PCSB Bank)
Up to 20,125,000 Shares of Common Stock
(Subject to increase to up to 23,143,750 Shares)
We are offering shares of common stock for sale in connection with the conversion of PCSB Bank from the mutual to stock form of organization. In addition to the shares that we will sell in the offering, we intend to establish a charitable foundation in connection with the conversion and contribute to it shares of common stock equal to 1.9% of the shares sold in the offering plus an amount of cash so that the total contribution will equal $5.0 million. Currently, there is no established trading market for our common stock. We expect to list our common stock on the Nasdaq Capital Market under the symbol “PCSB.” We are an “emerging growth company” as defined in the Jumpstart Our Business Startups Act of 2012.
The shares of common stock are first being offered in a subscription offering to eligible depositors of PCSB Bank and to PCSB Bank’stax-qualified employee benefit plans. Shares not purchased in the subscription offering may be offered for sale to the general public in a community offering, with a preference given to residents of the communities served by PCSB Bank. Any shares of common stock not purchased in the subscription or community offerings may be offered for sale to the public in a syndicated offering through a syndicate of broker-dealers or in a separate firm commitment offering. The syndicated offering and the firm commitment offering may commence before the subscription and community offerings (including any extensions) have expired. However, shares purchased in the subscription offering or the community offering will not be issued until the completion of any syndicated offering or firm commitment offering. The subscription, community, syndicated community and firm commitment offerings are collectively referred to as the “offerings.”
We may sell up to 23,143,750 shares of common stock as a result of demand for the shares of common stock or changes in market conditions, without resoliciting subscribers. We must sell a minimum of 14,875,000 shares in order to complete the offering.
The minimum order is 25 shares of common stock. Generally, no individual may purchase more than 20,000 shares of common stock, and no individual or other person, along with their associates and those with whom they are acting in concert, may purchase more than 30,000 shares of common stock. The subscription and community offerings are expected to expire at 5:00 p.m., Eastern Time, on March 14, 2017. We may extend this expiration time and date, without notice to you, until April 28, 2017. Once submitted, stock orders are irrevocable unless the subscription and community offerings are terminated or extended, with regulatory approval, beyond April 28, 2017, or the number of shares of common stock offered for sale is increased to more than 23,143,750 shares or decreased to less than 14,875,000 shares. If the subscription and community offerings are extended beyond April 28, 2017, we will notify all subscribers and give them an opportunity to confirm, change or cancel their orders. If you do not respond to this notice, we will promptly return your funds with interest or cancel your deposit account withdrawal authorization. If the number of shares to be sold in the offering is increased to more than 23,143,750 shares or decreased to less than 14,875,000 shares, we will resolicit subscribers, and all funds delivered to us to purchase shares of common stock in the subscription and community offerings will be returned promptly with interest. Funds received in the subscription and the community offerings will be held in a segregated account at PCSB Bank and will earn interest at 0.10% per annum until completion or termination of the offering.
We expect our trustees and executive officers, together with their associates, to subscribe for an aggregate of 252,500 shares of common stock. They will pay the same $10.00 per share offering price as paid by all other persons who purchase shares in the offering.
Sandler O’Neill & Partners, L.P. is assisting us in selling the shares on a best efforts basis in the subscription and community offerings, and will serve as sole manager for any syndicated offering and firm commitment offering. Sandler O’Neill & Partners, L.P. is not required to purchase any shares of common stock that are sold in the subscription offering, community offering or syndicated community offering.
OFFERING SUMMARY
Price: $10.00 per Share
| Minimum | Midpoint | Maximum | Adjusted Maximum | |||||||||||||
Number of shares | 14,875,000 | 17,500,000 | 20,125,000 | 23,143,750 | ||||||||||||
Gross offering proceeds | $ | 148,750,000 | $ | 175,000,000 | $ | 201,250,000 | $ | 231,437,500 | ||||||||
Estimated offering expenses, excluding selling agent fees and expenses | $ | 1,721,000 | $ | 1,721,000 | $ | 1,721,000 | $ | 1,721,000 | ||||||||
Selling agent fees and expenses (1) | $ | 1,317,070 | $ | 1,534,061 | $ | 1,751,052 | $ | 2,000,591 | ||||||||
Estimated net proceeds | $ | 145,711,930 | $ | 171,744,939 | $ | 197,777,948 | $ | 227,715,909 | ||||||||
Estimated net proceeds per share | $ | 9.80 | $ | 9.81 | $ | 9.83 | $ | 9.84 | ||||||||
| (1) | Assumes all shares are sold in the subscription and community offerings with a selling agent fee of 0.90% payable on all shares other than those purchased by our insiders and by our employee stock ownership plan, for which no fee will be payable. A fee of 5.0% will be payable on any shares sold in a syndicated offering or firm commitment offering. See“Pro Forma Data” and“The Conversion and Offering—Plan of Distribution; Selling Agent Compensation” for information regarding compensation to be received by Sandler O’Neill & Partners, L.P. in the subscription and community offerings and the compensation to be received by Sandler O’Neill & Partners, L.P. and other participating broker-dealers in the syndicated offering or firm commitment offering. If all shares are sold in the syndicated offering or firm commitment offering, excluding those purchased by our insiders and by our employee stock ownership plan, for which no selling agent fee will be paid, the selling agent fees and expenses would be approximately $6.8 million, $8.0 million, $9.2 million and $10.6 million at the minimum, midpoint, maximum, and adjusted maximum of the offering range, respectively. |
This investment involves a degree of risk, including the possible loss of principal.
See “Risk Factors” beginning on page 14.
Shares of our common stock are not deposits or accounts and are not insured or guaranteed by the Federal Deposit Insurance Corporation or by any other government agency. Neither the Securities and Exchange Commission, the New York State Department of Financial Services, the Board of Governors of the Federal Reserve System, the Federal Deposit Insurance Corporation, nor any state securities regulator has approved or disapproved of these securities or determined if this prospectus is accurate or complete. Any representation to the contrary is a criminal offense.
Sandler O’Neill + Partners, L.P.
For assistance, please contact the Stock Information Center at (914) 248-4444.
The date of this prospectus is February 10, 2017.
Table of Contents

Table of Contents
| Page | ||||
| 1 | ||||
| 14 | ||||
| 25 | ||||
| 28 | ||||
| 34 | ||||
| 35 | ||||
| 37 | ||||
| 37 | ||||
| 38 | ||||
| 40 | ||||
| 42 | ||||
COMPARISON OF VALUATION AND PRO FORMA INFORMATION WITH AND WITHOUT THE CHARITABLE FOUNDATION | 49 | |||
| 51 | ||||
| 51 | ||||
MANAGEMENT’S DISCUSSION AND ANALYSIS OF FINANCIAL CONDITION AND RESULTS OF OPERATIONS | 59 | |||
| 90 | ||||
| 102 | ||||
| 103 | ||||
| 120 | ||||
| 121 | ||||
| 139 | ||||
| 142 | ||||
| 148 | ||||
| 149 | ||||
| 149 | ||||
| 149 | ||||
| 150 | ||||
| 151 | ||||
i
Table of Contents
The following summary explains material information in this prospectus, but it may not contain all of the information that is important to you. Before making an investment decision, you should read carefully this entire document, including the consolidated financial statements and the notes thereto and the section entitled “Risk Factors.” The terms “we,” “our,” and “us” refer to PCSB Financial and PCSB Bank, unless the context indicates another meaning.
PCSB Financial Corporation
PCSB Financial Corporation, a Maryland corporation, was incorporated in December 2016. The offering of common stock by means of this prospectus is being made by PCSB Financial in connection with the conversion of PCSB Bank from a mutual savings bank to a stock savings bank. Upon completion of the conversion, PCSB Financial will become the bank holding company for PCSB Bank by owning all of the outstanding shares of capital stock of PCSB Bank, and will be regulated by the Federal Reserve Board and the New York State Department of Financial Services (the “NYSDFS”). To date, PCSB Financial has engaged in organizational activities only. Following the conversion, PCSB Financial’s primary business activity will relate to owning all of the outstanding shares of capital stock of PCSB Bank.
PCSB Bank
PCSB Bank is a New York-chartered mutual savings bank that serves the banking needs of customers in the Lower Hudson Valley of New York State. We operate from our executive offices/headquarters and 15 banking offices located in Dutchess (3 offices), Putnam (3 offices), Rockland (1 office) and Westchester (8 offices) Counties, New York. Our primary business activity is attracting deposits from the general public and using those funds primarily to originate and purchase commercial real estate and business loans, originateone-to four-family loans and purchase investment securities. We are subject to comprehensive regulation and examination by the NYSDFS and by the Federal Deposit Insurance Corporation.
At September 30, 2016, we had consolidated total assets of $1.25 billion, total deposits of $1.12 billion and equity of $111.5 million. Our executive offices/headquarters are located at 2651 Strang Blvd., Suite 100, Yorktown Heights, NY 10598 and our main banking office is located at 2477 Route 6, Brewster, NY 10509. Our website address iswww.pcsb.com. Information on our website is not and should not be considered a part of this prospectus.
From our founding in 1871 until 2012, we operated as a traditional savings bank. In 2012, we promoted Joseph D. Roberto to President and Chief Executive Officer. Under his leadership, we significantly upgraded our operations, controls and management and began to broaden our focus to serve businesses as well as individuals in our primary market area. Among other things, we have enhanced our commercial real estate and commercial business lending infrastructure and increased our commercial real estate and commercial business lending team from five to eleven individuals and our commercial credit review team from three to ten individuals.
Since 2012, we have assembled an experienced executive management team. In addition to the appointment of Mr. Roberto as President and Chief Executive Officer, we hired Scott Nogles as Chief Financial Officer, Richard Petrone as Chief Credit Officer and Michael Goldrick as Chief Loan Officer. In addition, in 2016, we hired Clifford Weber, an experienced banking lawyer, as General Counsel and Chief Risk Officer.
In April 2015, we acquired the former CMS Bank in White Plains, NY. At acquisition, CMS Bank had $267.1 million in total assets, operated five offices in southern Westchester County and maintained significant portfolios of commercial real estate and commercial business loans. Westchester County’s southern border is contiguous to the Bronx, which is the northern most borough of New York City. This acquisition expanded our geographical footprint into populous and economically vibrant areas of southern Westchester County, which offer significant opportunities for growth.
1
Table of Contents
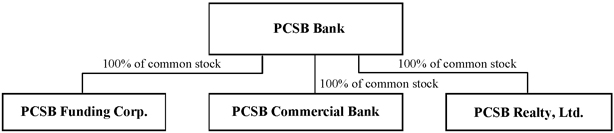
Our Current and Proposed Organizational Structures
The following diagram illustrates our currentpre-conversion organizational structure:
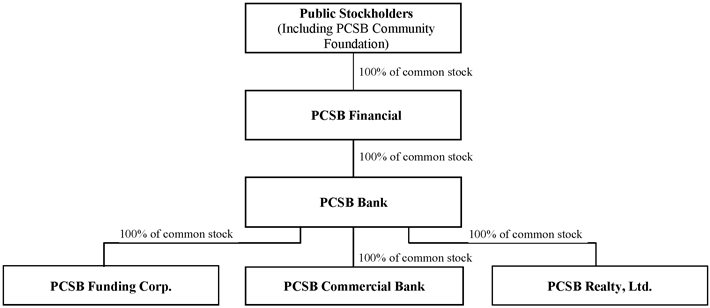
The following diagram illustrates our proposed post-conversion organizational structure:
Business Strategy
Based on an extensive review of the current opportunities in our principal market area as well as our resources and capabilities, the Board has adopted the following business strategy:
| • | Focus on commercial lending.We believe that commercial lending offers an opportunity to enhance our profitability while managing credit, interest rate and operational risk. We intend to continue to expand our originations and, to a lesser extent, purchases of commercial real estate and commercial business loans in our primary market area. We anticipate that a majority of our commercial real estate loan originations will range in size from $500,000 to $10.0 million while a majority of our commercial business loan originations will range in size from $100,000 to $5.0 million. |
| • | Expand banking activities in Southern Westchester County.Southern Westchester County is one of the more populous and economically vibrant areas of New York State. We intend to use our four offices in Southern Westchester County to expand both our commercial and retail activities in this market area. At the same time, we will remain committed to our other market areas and maintain a strong level of banking activities in these areas. |
2
Table of Contents
| • | Increase core deposits, including demand deposits.Deposits are our primary source of funds for lending and investment. We intend to focus on core deposits (which we define as all deposits except for certificates of deposit and municipal deposits), particularlynon-interest bearing demand deposits, because they are the lowest cost funds and are less sensitive to withdrawal when interest rates fluctuate. Core deposits represented 67.3% of our total deposits at September 30, 2016. Going forward, we will seek to increase our core deposits through enhancing our commercial activities and deepening our relationships with our retail customers. |
| • | Manage credit risk to maintain a low level ofnon-performing assets.We believe that strong asset quality is a key to long-term financial success. Our strategy for credit risk management focuses on an experienced team of credit professionals, well-defined credit policies and procedures, appropriate loan underwriting criteria and active credit monitoring. Ournon-performing loans to total loans ratio was 1.14% at September 30, 2016. |
| • | Balance Sheet Growth.As a result of our efforts to build our management and infrastructure, and given our attractive market area, we believe we are well-positioned to increase the size of our balance sheet without a proportional increase in overhead expense or operating risk. Accordingly, we intend to increase, on a managed basis, our assets and liabilities, particularly loans and deposits. |
Reasons for the Conversion
Our primary reasons for converting and raising additional capital through the offering are to:
| • | Enhance our capital base to support continued growth on a prudent basis. We intend to continue to grow our franchise, both organically and through strategic transactions as opportunities arise, on a prudent basis. While we currently exceed all regulatory capital requirements, the offering proceeds will strengthen our capital position and support our planned growth. In addition, the offering proceeds will enhance our lending capacity by increasing our legal lending limit and we intend to increase our internal lending limits. We believe this increased capacity will improve our competitive position relative to the many larger banks operating in our market area. |
| • | Offer our depositors, employees and trustees an equity ownership interest in PCSB Bank.We believe that offering stock to our depositors will provide them with an economic interest in our future success should they decide to invest. The offering will also further enable us to attract and retain trustees, management and employees through various stock-based benefit plans, including an employee stock ownership plan and one or more equity incentive plans. |
| • | Support our local communities through establishing and funding a charitable foundation.The contribution to the charitable foundation will complement our existing charitable activities, and should enable the communities that we serve to share in our long-term growth. |
| • | Facilitate future mergers and acquisitions, if available, on a prudent basis. Although we do not currently have any understandings or agreements regarding any specific transactions, the additional capital raised in the offering may be used to finance mergers with, and acquisitions of, other financial institutions, asset portfolios and branch offices when and if attractive opportunities arise. |
Terms of the Offering
We are offering between 14,875,000 and 20,125,000 shares of common stock in a subscription offering to eligible depositors of PCSB Bank and to ourtax-qualified employee benefit plans, and, to the extent shares remain
3
Table of Contents
available, to the general public in a community offering. If necessary, we will also offer shares to the general public in a syndicated offering or a firm commitment offering. The number of shares of common stock to be sold may be increased to up to 23,143,750 shares as a result of demand for the shares of common stock in the offering or changes in market conditions. Unless the number of shares of common stock to be offered is increased to more than 23,143,750 shares or decreased to fewer than 14,875,000 shares, or the subscription and community offerings are extended beyond April 28, 2017, subscribers will not have the opportunity to change or cancel their stock orders once submitted. If the subscription and community offerings are extended past April 28, 2017, all subscribers will be notified and given an opportunity to confirm, change or cancel their orders. If you do not respond to this notice, your order will be cancelled and we will promptly return your funds with interest at 0.10% per annum or cancel your deposit account withdrawal authorization. If the number of shares to be sold is increased to more than 23,143,750 shares or decreased to less than 14,875,000 shares, all subscribers’ stock orders will be canceled, all withdrawal authorizations will be canceled and funds delivered to us to purchase shares of common stock in the subscription and community offerings will be returned promptly with interest at the same rate. We will then resolicit subscribers, giving them an opportunity to place new orders for a period of time. No shares purchased in the subscription offering and community offering will be issued until the completion of any syndicated offering or firm commitment offering.
The purchase price of each share of common stock offered for sale in the offering is $10.00. All investors will pay the same purchase price per share, regardless of whether the shares are purchased in the subscription offering, the community offering, the syndicated offering or the firm commitment offering. Investors will not be charged a commission to purchase shares of common stock in the offering. Sandler O’Neill & Partners, L.P., our marketing agent in the subscription and community offerings, will use its best efforts to assist us in selling shares of our common stock in the subscription and community offerings but is not obligated to purchase any shares of common stock in the subscription and community offerings.
How We Determined the Offering Range and the $10.00 per Share Offering Price
The amount of common stock we are offering for sale is based on an independent appraisal of the estimated market value of PCSB Financial, assuming the offering has been completed and the charitable foundation has been established and the contribution of shares of common stock and cash to it has been made. RP Financial, LC., our independent appraiser, has estimated that, at November 11, 2016 and as updated as of January 20, 2017, and assuming we were undertaking the offering, this market value, including the shares to be issued to the charitable foundation, was $178.3 million. Based on applicable regulations, this market value forms the midpoint of a valuation range with a minimum of $151.6 million and a maximum of $205.1 million. Based on this valuation range and the offering price of $10.00 per share, PCSB Financial is offering for sale a range of shares of common stock, from 14,875,000 shares to 20,125,000 shares. The $10.00 per share price was selected primarily because it is the price most commonly used inmutual-to-stock conversion transactions undertaken by financial institutions. If demand for shares or market conditions warrant, the appraisal can be increased by up to 15%, which would result in an appraised value of $235.8 million, and we may sell up to 23,143,750 shares of common stock.
RP Financial advised the board of directors that the appraisal was prepared in conformance with the regulatory appraisal methodology, which requires a valuation based on an analysis of the trading prices of comparable public companies whose stock have traded for at least one year prior to the valuation date. RP Financial selected a group of 10 comparable public companies for this analysis.
RP Financial considered adjustments to the pro forma market value based on a comparison of PCSB Financial with the peer group. RP Financial advised the board of directors that the valuation conclusion took into consideration that relative to the peer group slight upward adjustments were applied for: (i) financial condition; and (ii) primary market area. RP Financial made a moderate downward adjustment for profitability growth and viability of earnings, and made no adjustments for: (i) asset growth; (ii) dividends; (iii) liquidity of the shares; (iv) marketing of the issue; (v) management; and (vi) effect of government regulations and regulatory reform.
4
Table of Contents
The appraisal is based in part on PCSB Bank’s financial condition and results of operations, the pro forma effect of the additional capital raised by the sale of shares of common stock in the offering, and an analysis of a peer group of 10 publicly-traded bank holding companies and savings and loan holding companies that RP Financial considers comparable to PCSB Financial. The appraisal peer group consists of the following companies, all of which are traded on the Nasdaq Stock Market.
Company Name | Ticker | Headquarters | Total Assets at September 30, 2016 | |||||
| (In millions) | ||||||||
BSB Bancorp, Inc. | BLMT | Belmont, MA | $ | 2,074 | ||||
Clifton Bancorp, Inc. | CSBK | Clifton, NJ | $ | 1,312 | ||||
ESSA Bancorp, Inc. | ESSA | Stroudsburg, PA | $ | 1,772 | ||||
First Capital, Inc. | FCAP | Corydon, IN | $ | 742 | ||||
HMN Financial, Inc. | HMNF | Rochester, MN | $ | 686 | ||||
Malvern Bancorp, Inc. | MLVF | Paoli, PA | $ | 821 | ||||
Pathfinder Bancorp, Inc. | PBHC | Oswego, NY | $ | 717 | ||||
SI Financial Group, Inc. | SIFI | Willimantic, CT | $ | 1,538 | ||||
Waterstone Financial, Inc. | WSBF | Wauwatosa, WI | $ | 1,795 | ||||
Wellesley Bancorp, Inc. | WEBK | Wellesley, MA | $ | 666 | ||||
The following table presents a summary of selected pricing ratios for PCSB Financial (on a pro forma basis) at and for the12-months ended December 31, 2016, and for the peer group companies based on earnings and other information at and for the12-months ended September 30, 2016, with stock prices at January 20, 2017, as reflected in the appraisal report. Compared to the average pricing of the peer group, our pro forma pricing ratios at the midpoint of the offering range indicated a discount of 44.8% on aprice-to-book value basis, a discount of 45.6% on aprice-to-tangible book value basis and a premium of 306.5% on aprice-to-earnings basis.
| Price-to-earnings multiple (1) | Price-to-book value ratio | Price-to-tangible book value ratio | ||||||||||
PCSB Financial (pro forma assuming completion of offering) (2) | ||||||||||||
Adjusted Maximum | 128.83 | x | 75.30 | % | 76.92 | % | ||||||
Maximum | 100.96 | x | 71.58 | % | 73.31 | % | ||||||
Midpoint | 80.85 | x | 67.75 | % | 69.54 | % | ||||||
Minimum | 63.68 | x | 63.21 | % | 65.02 | % | ||||||
Valuation of peer group companies (historical) | ||||||||||||
Averages | 19.89 | x | 122.77 | % | 127.76 | % | ||||||
Medians | 21.34 | x | 121.20 | % | 124.13 | % | ||||||
| (1) | Price-to-earnings multiples calculated by RP Financial are based on an estimate of “core” or recurring earnings. These ratios are different than those presented in “Pro Forma Data.” |
| (2) | Pro forma pricing rates for PCSB Financial are based on pro forma data at and for the12-months ended December 31, 2016, and are different than the pro forma pricing ratios presented in “Pro Forma Data”. |
The pro forma calculations for PCSB Financial are based on the following assumptions:
| • | A number of shares equal to 8% of the shares sold in the offering and contributed to the charitable foundation are purchased by the employee stock ownership plan, with the expense to be amortized over 15 years; |
| • | A number of shares equal to 4% of the shares sold in the offering and contributed to the charitable foundation are purchased by a stock-based benefit plan, with the expense to be amortized over five years; and |
5
Table of Contents
| • | A number of options equal to 10% of the shares sold in the offering and contributed to the charitable foundation are granted under a stock-based benefit plan, with option expense of $2.34 per option amortized over five years. |
The independent appraisal does not indicate trading market value. Do not assume or expect that our valuation as indicated in the appraisal means that after the offering the shares of our common stock will trade at or above the $10.00 per share price. Furthermore, RP Financial used the pricing ratios presented in the appraisal to estimate our pro formaappraised value for regulatory purposes and not to compare the relative value of shares of our common stock with the value of the capital stock of the peer group. The value of the capital stock of a particular company may be affected by a number of factors such as financial performance, asset size and market location.
For a more complete discussion of the amount of common stock we are offering for sale and the independent appraisal, see “The Conversion and Offering—Stock Pricing and Number of Shares to be Issued.”
How We Intend to Use the Proceeds from the Offering
We intend to invest at least 50% of the net proceeds from the offering in PCSB Bank, fund the loan to our employee stock ownership plan to finance its purchase of shares of common stock in the offering, contribute up to $2.2 million to the charitable foundation and retain the remainder of the net proceeds at PCSB Financial.
Assuming we sell 17,500,000 shares of common stock in the offering at the midpoint of the offering range, resulting in estimated net proceeds of $171.7 million, we intend to invest $85.9 million in PCSB Bank, lend $14.3 million to our employee stock ownership plan to fund its purchase of shares of common stock (which may include, subject to market conditions, open market purchases after the completion of the conversion and offering if the employee stock ownership plan is unable to purchase its shares in the subscription offering due to an oversubscription by our eligible account holders), use approximately $1.7 million of the net proceeds to fund the cash contribution to the charitable foundation and retain the remaining $69.9 million of the net proceeds at PCSB Financial. Assuming we sell 23,143,750 shares of common stock in the offering at the adjusted maximum of the offering range, resulting in estimated net proceeds of $227.7 million, we intend to invest $113.9 million in PCSB Bank, lend $18.9 million to our employee stock ownership plan to fund its purchase of shares of common stock, use approximately $603,000 of the net proceeds to fund the cash contribution to the charitable foundation and retain the remaining $94.4 million of the net proceeds at PCSB Financial.
PCSB Financial may use the funds it retains for investment, to repurchase shares of common stock, to acquire other financial institutions or financial services companies, to pay cash dividends and for other general corporate purposes. PCSB Bank may use the proceeds it receives to support increased lending and investment or to acquire other financial institutions or financial services companies. We do not currently have any agreement or understanding regarding any acquisition transaction.
See “How We Intend to Use the Proceeds from the Offering” for more information on the proposed use of the proceeds from the offering.
Persons Who May Order Shares of Common Stock in the Offering
We are offering the shares of common stock in a subscription offering in the following descending order of priority:
| (i) | To depositors with deposit account(s) at PCSB Bank with aggregate balances of at least $100.00 at the close of business on September 30, 2015. |
| (ii) | To ourtax-qualified employee benefit plans (including PCSB Bank’s employee stock ownership plan and its 401(k) plan), which may subscribe for, in the aggregate, up to 10% of the shares of common stock sold in the offering and contributed to the charitable foundation. We expect our employee stock ownership plan to purchase 8% of the shares of common stock sold in the offering and contributed to the charitable foundation. |
6
Table of Contents
| (iii) | To depositors (other than officers and trustees of PCSB Bank, and their associates) with deposit account(s) at PCSB Bank with aggregate balances of at least $100.00 at the close of business on December 31, 2016, who are not eligible in the first priority. |
Shares of common stock not purchased in the subscription offering may be offered for sale to the general public in a community offering, with a preference given first to natural persons residing in Dutchess, Putnam, Rockland and Westchester Counties in New York. The community offering may begin concurrently with, during or promptly after the subscription offering. We also may offer for sale shares of common stock not purchased in the subscription offering and the community offering through a syndicated offering or a firm commitment offering. Sandler O’Neill & Partners, L.P. will act as sole manager for the syndicated offering or firm commitment offering. We have the right to accept or reject, in our sole discretion and reasonably consistent with achieving a reasonably wide distribution of the common stock, orders received in the community offering or syndicated offering, and our interpretation of the terms and conditions of the plan of conversion will be final. Any determination to accept or reject stock orders in the community offering or syndicated offering will be based on the facts and circumstances then available to us.
If we receive orders for more shares than we are offering, we may not be able to fully or partially fill your order. See “The Conversion and Offering” for a detailed description of the subscription offering, the community offering, the syndicated offering and the firm commitment offering, as well as a discussion regarding allocation procedures.
Limits on How Much Common Stock You May Purchase
The minimum number of shares of common stock that may be purchased is 25 shares.
Generally, no individual may purchase more than 20,000 shares ($200,000) of common stock. If any of the following persons purchase shares of common stock, their purchases, in all categories of the offering, when combined with your purchases, cannot exceed 30,000 shares ($300,000) of common stock:
| • | most companies, trusts or other entities in which you are a senior officer, partner, trustee or have a substantial beneficial interest; or |
| • | your spouse or any relative of you or your spouse living in your house or who is a director, trustee, or officer of PCSB Financial or PCSB Bank; or |
| • | other persons who may be your associates or persons acting in concert with you. |
Unless we determine otherwise, persons having the same address and persons exercising subscription rights through qualifying deposit accounts registered to the same address will be subject to the overall purchase limitation of 30,000 shares ($300,000).
Subject to regulatory approval, we may increase or decrease the purchase limitations at any time. See “The Conversion and Offering—Additional Limitations on Common Stock Purchases.”
7
Table of Contents
How You May Purchase Shares of Common Stock in the Subscription Offering and the Community Offering
In the subscription offering and community offering, you may pay for your shares only by:
| (i) | personal check, bank check or money order made payable to PCSB Financial Corporation; or |
| (ii) | authorizing us to withdraw available funds from your deposit account(s) at PCSB Bank. |
PCSB Bank is prohibited from lending funds to anyone to purchase shares of common stock in the offering. Additionally, you may not use a line of credit check from PCSB Bank or any type of third party check (such as a check payable to you and endorsed over to PCSB Financial) to pay for shares of common stock. Do not submit cash. No wire transfer will be accepted without our prior approval. You may not authorize direct withdrawal from an individual retirement account (“IRA”) at PCSB Bank. See “—Using Individual Retirement Account Funds to Purchase Shares of Common Stock.”
You may subscribe for shares of common stock in the subscription and community offerings by delivering a signed and completed original stock order form, together with full payment payable to PCSB Financial Corporation or authorization to withdraw funds from one or more of your deposit accounts at PCSB Bank, provided thatwe receive your stock order form before 5:00 p.m., Eastern Time, on March 14, 2017, which is the end of the subscription offering period. You may submit your stock order form and payment by mail using the stock order reply envelope provided or by overnight delivery to our Stock Information Center, which is located at 2651 Strang Blvd., Suite 100, Yorktown Heights, NY 10598. You may also hand-deliver stock order forms to the Stock Information Center. We will accept hand-delivered stock order forms only at this location. We will not accept stock order forms at our banking offices.Do not mail stock order forms to any of PCSB Bank’s banking offices.
See “The Conversion and Offering—Procedure for Purchasing Shares in Subscription and Community Offerings—Payment for Shares” for a complete description of how to purchase shares in the subscription and community offerings.
Using IRA Funds to Purchase Shares of Common Stock
You may be able to subscribe for shares of common stock using funds in your IRA. If you wish to use some or all of the funds in an IRA at PCSB Bank, the applicable funds must be transferred to a self-directed account maintained by an independent trustee, such as a brokerage firm, and the purchase must be made through that account. If you do not have such an account, you will need to establish one before placing your stock order. Aone-time and/or annual administrative fee may be payable to the independent trustee. Because individual circumstances differ and the processing of retirement fund orders takes additional time, we recommend that you contact our Stock Information Center promptly, preferably at least two weeks before the March 14, 2017 offering deadline, for assistance with purchases using your IRA or other retirement account you may have at PCSB Bankor elsewhere. Whether you may use such funds to purchase shares in the offering may depend on timing constraints and, possibly, limitations imposed by the institution where the funds are held.
See “The Conversion and Offering—Procedure for Purchasing Shares in Subscription and Community Offerings—Payment for Shares” and “—Using Individual Retirement Account Funds.”
Market for Common Stock
We expect that our common stock will be traded on the Nasdaq Capital Market under the symbol “PCSB.” Sandler O’Neill & Partners, L.P. has advised us that it intends to make a market in our common stock following the offering, but is not obligated to do so.
8
Table of Contents
Our Dividend Policy
Following completion of the conversion and offering, our board of directors will have the authority to declare dividends on our shares of common stock, subject to statutory and regulatory requirements. We currently intend to pay quarterly cash dividends but have not determined the amount or when payment would start. For information regarding our proposed dividend policy, see “Our Dividend Policy.”
Stock Purchases by Trustees and Executive Officers
We expect our trustees and executive officers, together with their associates, to subscribe for 252,500 shares of common stock in the offering, representing 1.7% of shares to be outstanding at the minimum of the offering range and 1.2% of shares to be sold in the offering at the maximum of the offering range. They will pay the same $10.00 per share price that will be paid by all other persons who purchase shares of common stock in the offering. See “Subscriptions by Directors and Executive Officers.”
Deadline for Orders of Shares of Common Stock in the Subscription and Community Offerings
The deadline for ordering shares of common stock in the subscription and community offerings is 5:00 p.m., Eastern Time, on March 14, 2017, unless we extend this deadline. If you wish to order shares of common stock, a properly completed and signed original stock order form, together with full payment, must be received (not postmarked) by this time.
Although we will make reasonable attempts to provide this prospectus and offering materials to holders of subscription rights, the subscription offering and all subscription rights will expire at 5:00 p.m., Eastern Time, on March 14, 2017, whether or not we have been able to locate each person entitled to subscription rights.
See “The Conversion and Offering— Procedure for Purchasing Shares in Subscription and Community Offerings—Expiration Date” for a complete description of the deadline for ordering shares in the offering.
You May Not Sell or Transfer Your Subscription Rights
Applicable regulations prohibit you from transferring your subscription rights. If you order shares of common stock in the subscription offering, you must sign a written certification that you are purchasing the common stock for yourself and that you have no agreement or understanding to sell or transfer your subscription rights or the shares that you are purchasing. We intend to take legal action, including reporting persons to federal or state agencies, against anyone who we believe has sold or transferred his or her subscription rights. We will not accept your order if we have reason to believe that you have sold or transferred your subscription rights. On the order form, you cannot add the names of other individuals for joint stock registration unless they are also named on the qualifying deposit account, and you cannot delete names of other individuals except in the case of certain orders placed through an IRA, Keogh, 401(k) or similar plan or unless a named eligible depositor has died. Doing so may jeopardize your subscription rights. In addition, the stock order form requires that you list all deposit accounts, giving all names on each account and the account number at the applicable eligibility date. Failure to provide this information, or providing incomplete or incorrect information, may result in a loss of part or all of your share allocation if there is an oversubscription.
Delivery of Shares of Common Stock
All shares of common stock sold will be issued in book entry form. Stock certificates will not be issued. A statement reflecting ownership of shares of common stock issued in the subscription and community offerings will be mailed by our transfer agent to the persons entitled thereto at the registration address noted by them on their stock order forms as soon as practicable following consummation of the offering. We expect trading in the stock to begin on the day of completion of the offering or the next business day. The offering is expected to be completed as soon as practicable following satisfaction of the conditions described below in “—Conditions to Completion of the Conversion.”Until a statement reflecting ownership of shares of common stock is available and delivered to
9
Table of Contents
purchasers, purchasers might not be able to sell the shares of common stock that they purchased, even though the common stock will have begun trading.Your ability to sell your shares of common stock before receiving your statement will depend on arrangements you may make with a brokerage firm.
Conditions to Completion of the Conversion
We cannot complete the conversion and offering unless:
| • | The plan of conversion is approved by the required votes of the depositors of PCSB Bank at a special meeting of depositors to be held on March 31, 2017; |
| • | We receive orders for at least the minimum number of shares of common stock offered in the offering; |
| • | We receive final regulatory approval from the NYSDFS, the Federal Reserve Board and the Federal Deposit Insurance Corporation to complete the conversion and offering. |
Steps We May Take if We Do Not Receive Orders for the Minimum Number of Shares
If we do not receive orders for at least 14,875,000 shares of common stock, we may take several steps in order to sell the minimum number of shares of common stock in the offering range. Specifically, we may:
| (i) | increase the purchase and ownership limitations; and/or |
| (ii) | seek regulatory approval to extend the offering beyond April 28, 2017, so long as we resolicit subscribers who previously submitted subscriptions in the offering. |
If we extend the offering past April 28, 2017, all subscribers will be notified and given an opportunity to confirm, change or cancel their orders. If you do not respond to this notice, we will cancel your stock order and promptly return your funds with interest at 0.10% per annum for funds received in the subscription and community offering or cancel your deposit account withdrawal authorization. If one or more purchase limitations are increased, subscribers in the subscription offering who ordered the maximum amount will be given the opportunity to increase their subscriptions up to the then-applicable limit.
Possible Change in the Offering Range
RP Financial will update its appraisal before we complete the offering. If, as a result of demand for the shares or changes in market conditions, RP Financial determines that our pro forma market value has increased, we may sell up to 23,143,750 shares in the offering without further notice to you. If, however, the updated appraisal indicates our pro forma market value is either below $151.6 million or above $235.8 million, then, after consulting with the Federal Deposit Insurance Corporation and the NYSDFS, we may:
| • | terminate the offering and promptly return all funds (with interest paid on funds received in the subscription and community offerings); |
| • | set a new offering range; or |
| • | take such other actions as may be permitted by the Federal Deposit Insurance Corporation, the NYSDFS and the Securities and Exchange Commission. |
If we set a new offering range, we will promptly return funds, with interest at 0.10% per annum for funds received for purchases in the subscription and community offerings, and cancel any authorization to withdraw funds from deposit accounts for the purchase of shares of common stock. We will then resolicit subscribers, allowing them to place a new stock order for a period of time.
10
Table of Contents
Possible Termination of the Offering
We may terminate the offering at any time with regulatory approval. If we terminate the offering, we will promptly return your funds with interest at 0.10% per annum, and we will cancel deposit account withdrawal authorizations.
Our Contribution of Shares of Common Stock to the Charitable Foundation
To further our commitment to our local community, we intend to establish and fund a charitable foundation as part of the conversion and offering. Assuming we receive regulatory approval, we intend to contribute to the charitable foundation a number of shares of our common stock equal to 1.9% of the shares sold in the offering and an amount of cash so that the total contribution will equal $5.0 million, based on the offering price of $10.00 per share. At the minimum, midpoint, maximum and adjusted maximum of the offering range, we would contribute to the charitable foundation 282,625, 332,500, 382,375 and 439,731 shares of common stock and approximately $2.2 million, $1.7 million, $1.2 million and $603,000 in cash, respectively. As a result of the contribution, we expect to record anafter-tax expense of approximately $3.3 million during the quarter in which the conversion and offering is completed.
The charitable foundation will be dedicated exclusively to supporting charitable causes and community development activities in the communities in which we operate. The contribution of common stock and cash to the charitable foundation will:
| • | with respect to the contribution of shares of common stock, dilute the voting interests of purchasers of shares of our common stock in the offering; and |
| • | result in an expense, and a reduction in capital, during the quarter in which the contribution is made, equal to the full amount of the contribution to the charitable foundation, offset in part by a corresponding tax benefit. |
The amount of common stock that we would offer for sale would be greater if the offering were to be completed without the establishment and funding of the charitable foundation. For a further discussion of the financial impact of the charitable foundation, including its effect on those who purchase shares in the offering, see “Risk Factors—The contribution to the charitable foundation will dilute your ownership interest and adversely affect net income in 2017”, “Risk Factors—Our contribution to the charitable foundation may not be tax deductible, which could reduce our profits”, “Comparison of Valuation and Pro Forma Information With and Without the Charitable Foundation” and “PCSB Community Foundation.”
Benefits to Management and Potential Dilution to Shareholders Resulting from the Offering
We expect our employee stock ownership plan, which is atax-qualified retirement plan for the benefit of all employees of PCSB Bank, to purchase up to 8% of the shares of common stock we sell in the offering. If market conditions warrant, in the judgment of its trustees, the employee stock ownership plan’s subscription order will not be filled and the employee stock ownership plan may elect to purchase shares in the open market following the completion of the offering, subject to the approval of the NYSDFS and the Federal Deposit Insurance Corporation.
We intend to implement one or more new stock-based benefit plans no earlier than six months after completion of the offering. Shareholder approval of these plans would be required. We have not determined whether we will adopt the plans within 12 months following the completion of the offering or more than 12 months following the completion of the offering. If we implement stock-based benefit plans within 12 months following the completion of the offering, the stock-based benefit plans would reserve a number of shares (i) up to 4% of the shares of common stock sold in the offering and contributed to the charitable foundation, for awards of restricted stock to
11
Table of Contents
key employees and directors, at no cost to the recipients, and (ii) up to 10% of the shares of common stock sold in the offering and contributed to the charitable foundation, for issuance pursuant to the exercise of stock options by key employees and directors. These percentage limitations are required by Federal Deposit Insurance Corporation regulations and NYSDFS regulations. If the stock-based benefit plans are adopted more than 12 months after the completion of the offering, they would not be subject to the percentage limitations set forth above.
The following table summarizes the number of shares of common stock and the aggregate dollar value of grants that are available under one or more stock-based benefit plans if such plans reserve for restricted stock awards and stock options, respectively, a number of shares of common stock equal to 4% and 10% of the shares sold in the offering and contributed to our charitable foundation. The table shows the dilution to shareholders if all such shares are issued from authorized but unissued shares, instead of shares purchased in the open market. The table also sets forth the number of shares of common stock to be acquired by the employee stock ownership plan for allocation to all qualifying employees.
| Number of Shares to be Granted or Purchased | Value of Grants (In thousands) (1) | |||||||||||||||||||||||||||
| At Minimum of Offering Range | At Adjusted Maximum of Offering Range | As a Percentage of Common Stock to be Sold in the Offering and Contributed to the Charitable Foundation | As a Percentage of Common Stock to be Outstanding | Dilution Resulting From Issuance of Shares for Stock-Based Benefit Plans | At Minimum of Offering Range | At Adjusted Maximum of Offering Range | ||||||||||||||||||||||
Employee stock ownership plan | 1,212,610 | 1,886,679 | 8.00 | % | 8.00 | % | 0.00 | % | $ | 12,126 | $ | 18,867 | ||||||||||||||||
Restricted stock awards | 606,305 | 943,339 | 4.00 | 4.00 | 3.85 | % | 6,063 | 9,433 | ||||||||||||||||||||
Stock options | 1,515,763 | 2,358,348 | 10.00 | 10.00 | 9.09 | % | 3,547 | 5,519 | ||||||||||||||||||||
|
|
|
|
|
|
|
|
|
|
|
| |||||||||||||||||
Total | 3,334,678 | 5,188,366 | 22.00 | % | 22.00 | % | 12.28 | % | $ | 21,736 | $ | 33,819 | ||||||||||||||||
|
|
|
|
|
|
|
|
|
|
|
| |||||||||||||||||
| (1) | The actual value of restricted stock awards will be determined based on their fair value at the date of grant. For purposes of this table, fair value for stock awards is assumed to be the same as the offering price of $10.00 per share. The fair value of stock options has been estimated at $2.34 per option using the Black-Scholes option pricing model with the following assumptions: a grant-date share price and option exercise price of $10.00; an expected option term of 10 years; no dividend yield; a risk-free rate of return of 1.60%; and expected volatility of 12.81%. The actual value of option grants will be determined by the grant-date fair value of the options, which will depend on a number of factors, including the valuation assumptions used and the option pricing model ultimately adopted. |
| (2) | No dilution is reflected for the employee stock ownership plan because such shares are assumed to be purchased in the offering. |
Tax Consequences
PCSB Financial and PCSB Bank have received an opinion of counsel, Luse Gorman, PC, regarding the material federal income tax consequences, and have received the opinion of Crowe Horwath LLP regarding the material New York State income tax consequences, of the conversion and offering. As a general matter, the conversion and offering will not be a taxable transaction for purposes of federal or state income taxes to PCSB Financial, PCSB Bank or persons eligible to subscribe for shares of stock in the subscription offering.
Emerging Growth Company Status
We qualify as an “emerging growth company” under the Jumpstart Our Business Startups Act of 2012. For as long as we so qualify we exempt ourselves from various reporting requirements applicable to other public companies but not to emerging growth companies. See “Risk Factors—We are an emerging growth company, and any decision on our part to comply only with certain reduced reporting and disclosure requirements applicable to emerging growth companies could make our common stock less attractive to investors” and “Supervision and Regulation—Emerging Growth Company Status.”
An emerging growth company may elect to comply with new or amended accounting pronouncements in the same manner as a private company, but must make such election when the company is first required to file a registration statement. Such an election is irrevocable during the period a company is an emerging growth company. We have instead elected to comply with new or amended accounting pronouncements in the same manner as a public company.
12
Table of Contents
How You Can Obtain Additional Information—Stock Information Center
Our banking personnel may not, by law, assist with investment-related questions about the offering. If you have any questions regarding the conversion and offering, call our Stock Information Center at (914) 248-4444. The Stock Information Center is open Monday through Friday between 10:00 a.m. and 4:00 p.m., Eastern Time. The Stock Information Center will be closed on weekends and bank holidays.
13
Table of Contents
You should consider carefully the following risk factors in evaluating an investment in the shares of our common stock.
Risks Related to Our Business
Our emphasis on commercial real estate and commercial business lending involves risks that could adversely affect our financial condition and results of operations.
We intend to continue to originate and purchase commercial real estate and commercial business loans. At September 30, 2016, our commercial real estate and commercial business loans totaled $458.5 million, or 59.8% of our loan portfolio. While these types of loans are potentially more profitable than residential mortgage loans, they are generally more sensitive to regional and local economic conditions, making loss levels more difficult to predict. These loans also generally have relatively large balances to single borrowers or related groups of borrowers. Accordingly, any charge-offs may be larger on a per loan basis than those incurred with our residential or consumer loan portfolios. See “Business of PCSB Bank—Loan Underwriting Risks.”
The level of our commercial real estate loan portfolio subjects us to additional regulatory scrutiny.
The Federal Deposit Insurance Corporation and the other federal bank regulatory agencies have promulgated joint guidance on sound risk management practices for financial institutions with concentrations in commercial real estate lending. Under the guidance, a financial institution that, like us, is actively involved in commercial real estate lending should perform a risk assessment to identify concentrations. A financial institution may have a concentration in commercial real estate lending if, among other factors, (i) total reported loans for construction, land acquisition and development, and other land represent 100% or more of total risk-based capital, or (ii) total reported loans secured by multi-family andnon-owner occupied,non-farm,non-residential properties, loans for construction, land acquisition and development and other land, and loans otherwise sensitive to the general commercial real estate market, including loans to commercial real estate related entities, represent 300% or more of total risk-based capital. Based on these factors we have a concentration in loans of the type described in (ii), above, which represents 321% of our total risk-based capital at September 30, 2016. The purpose of the guidance is to assist banks in developing risk management practices and capital levels commensurate with the level and nature of real estate concentrations. The guidance states that management should employ heightened risk management practices including board and management oversight and strategic planning, development of underwriting standards, risk assessment and monitoring through market analysis and stress testing. Our bank regulators could require us to implement additional policies and procedures consistent with their interpretation of the guidance that may result in additional costs to us or that may result in a curtailment of our multi-family and commercial real estate lending and/or the requirement that we maintain higher levels of regulatory capital, either of which would adversely affect our loan originations and profitability.
If our allowance for loan losses is not sufficient to cover actual loan losses, our earnings could decrease.
We maintain an allowance for loan losses, which is established through a provision for loan losses that represents management’s best estimate of probable incurred losses within the existing portfolio of loans. We make various assumptions and judgments about the collectability of our loan portfolio, including the creditworthiness of borrowers and the value of the real estate and other assets serving as collateral for the repayment of loans. In determining the adequacy of the allowance for loan losses, we rely on our experience and our evaluation of economic conditions. If our assumptions prove to be incorrect, our allowance for loan losses may not be sufficient to cover losses inherent in our loan portfolio and adjustment may be necessary to allow for different economic conditions or adverse developments in our loan portfolio. Consequently, a problem with one or more loans could require us to significantly increase the level of our provision for loan losses. In addition, federal and state regulators periodically review our allowance for loan losses and may require us to increase our provision for loan losses or recognize further loan charge-offs. Material additions to the allowance would materially decrease our net income.
14
Table of Contents
A worsening of economic conditions could reduce demand for our products and services and/or result in increases in our level ofnon-performing loans, which could have an adverse effect on our results of operations.
Unlike larger financial institutions that are more geographically diversified, our profitability depends primarily on the general economic conditions in our primary market area. Local economic conditions have a significant impact on our residential real estate, commercial real estate, construction and consumer loans, the ability of the borrowers to repay these loans and the value of the collateral securing these loans.
Deterioration in economic conditions could result in the following consequences, any of which could have a material adverse effect on our business, financial condition, liquidity and results of operations:
| • | demand for our products and services may decline; |
| • | loan delinquencies, problem assets and foreclosures may increase; |
| • | collateral for loans, especially real estate, may decline in value, in turn reducing customers’ future borrowing power, and reducing the value of assets and collateral associated with existing loans; |
| • | the value of our securities portfolio may decline; and |
| • | the net worth and liquidity of loan guarantors may decline, impairing their ability to honor commitments to us. |
Moreover, a significant decline in general economic conditions, caused by inflation, recession, acts of terrorism, an outbreak of hostilities or other international or domestic calamities, unemployment or other factors beyond our control could further impact these local economic conditions and could further negatively affect the financial results of our banking operations. In addition, deflationary pressures, while possibly lowering our operating costs, could have a significant negative effect on our borrowers, especially our business borrowers, and the values of underlying collateral securing loans, which could negatively affect our financial performance.
A continuation of the historically low interest rate environment may hurt our net interest income and operating results.
During the past seven years it has been the policy of the Federal Reserve Board to maintain interest rates at historically low levels through its targeted federal funds rate and the purchase of mortgage-backed securities. As a result, market rates on the loans we have originated and the yields on securities we have purchased have been at lower levels than available before 2008. As a general matter, our interest-bearing liabilities reprice or mature more quickly than our interest-earning assets, which can lower interest expense as interest rates decrease. However, our ability to lower our interest expense will be limited at these interest rate levels while the average yield on our interest-earning assets may continue to decrease. Although the Federal Reserve Board has increased interest rates recently, market interest rates are still at historically low levels. A continuation of a low interest rate environment may adversely affect our net interest income, which in turn would likely have an adverse effect on our profitability.
Changes in interest rates could hurt our profits.
Our profitability, like that of most financial institutions, depends to a large extent upon our net interest income, which is the difference between our interest income on interest-earning assets, such as loans and securities, and our interest expense on interest-bearing liabilities, such as deposits and borrowed funds. Accordingly, our results of operations depend largely on movements in market interest rates and our ability to manage our interest-rate-sensitive assets and liabilities in response to these movements. Factors such as inflation, recession and instability in financial markets, among other factors beyond our control, may affect interest rates.
15
Table of Contents
If interest rates rise, and if rates on our deposits reprice upwards faster than the rates on our long-term loans and investments, we would experience compression of our interest rate spread, which would have a negative effect on our profitability. Furthermore, increases in interest rates may adversely affect the ability of our borrowers to make loan repayments on adjustable-rate loans, as the interest owed on such loans would increase as interest rates increase. Conversely, decreases in interest rates can result in increased prepayments of loans and mortgage-related securities, as borrowers refinance to reduce their borrowing costs. Under these circumstances, we are subject to reinvestment risk as we may have to redeploy such loan or securities proceeds into lower-yielding assets, which might also negatively impact our income. If interest rates rise, we expect that our net portfolio value of equity would decrease. Net portfolio value of equity represents the present value of the expected cash flows from our assets less the present value of the expected cash flows arising from our liabilities adjusted for the value ofoff-balance sheet contracts. At September 30, 2016, and assuming a 400 basis point increase in market interest rates, we estimate that our net portfolio value of equity would decrease by $45.7 million, or 28.92%. See “Management’s Discussion and Analysis of Financial Condition and Results of Operations—Management of Market Risk—Net Portfolio Value Simulation.”
Any substantial, unexpected, prolonged change in market interest rates could have a material adverse effect on our financial condition, liquidity and results of operations. While we pursue an asset/liability strategy designed to mitigate our risk from changes in interest rates, changes in interest rates can still have a material adverse effect on our financial condition and results of operations. Changes in the level of interest rates also may negatively affect our ability to originate real estate loans, the value of our assets and our ability to realize gains from the sale of our assets, all of which ultimately affect our earnings. Also, our interest rate risk modeling techniques and assumptions likely may not fully predict or capture the impact of actual interest rate changes on our balance sheet or projected operating results. For further discussion of how changes in interest rates could impact us, see “Management’s Discussion and Analysis of Financial Condition and Results of Operations—Management of Market Risk.”
Changes in the valuation of our securities portfolio could hurt our profits and reduce our capital levels.
Our securities portfolio may be impacted by fluctuations in market value, potentially reducing accumulated other comprehensive income and/or earnings. Fluctuations in market value may be caused by changes in market interest rates, lower market prices for securities and limited investor demand. Management evaluates securities for other-than-temporary impairment on a quarterly basis, with more frequent evaluation for selected issues. In analyzing a debt issuer’s financial condition, management considers whether the securities are issued by the federal government or its agencies, whether downgrades by bond rating agencies have occurred, industry analysts’ reports and, to a lesser extent given the relatively insignificant levels of depreciation in our debt portfolio, spread differentials between the effective rates on instruments in the portfolio compared to risk-free rates. In analyzing an equity issuer’s financial condition, management considers industry analysts’ reports, financial performance and projected target prices of investment analysts within aone-year time frame. If this evaluation shows impairment to the actual or projected cash flows associated with one or more securities, a potential loss to earnings may occur. Changes in interest rates can also have an adverse effect on our financial condition, as ouravailable-for-sale securities are reported at their estimated fair value, and therefore are impacted by fluctuations in interest rates. We increase or decrease our shareholders’ equity by the amount of change in the estimated fair value of theavailable-for-sale securities, net of taxes. Declines in market value could result in other-than-temporary impairments of these assets, which would lead to accounting charges that could have a material adverse effect on our net income and capital levels. See “Management’s Discussion and Analysis of Financial Condition and Results of Operations—Securities Portfolio.”
Changes in laws and regulations and the cost of regulatory compliance with new laws and regulations may adversely affect our operations and/or increase our costs of operations.
We are subject to extensive regulation, supervision and examination by our banking regulators. Such regulation and supervision governs the activities in which an institution and its holding company may engage and are intended primarily for the protection of insurance funds and the depositors and borrowers of PCSB Bank rather than for holders of our common stock. Regulatory authorities have extensive discretion in their supervisory and enforcement activities, including the imposition of restrictions on our operations, the classification of our assets and
16
Table of Contents
determination of the level of our allowance for loan losses. These regulations, along with the currently existing tax, accounting, securities, deposit insurance, monetary laws, rules, standards, policies, and interpretations control the methods by which financial institutions conduct business, implement strategic initiatives and tax compliance, and govern financial reporting and disclosures. Any change in such regulation and oversight, whether in the form of regulatory policy, regulations, legislation or supervisory action, may have a material impact on our operations. Further, changes in accounting standards can be both difficult to predict and involve judgment and discretion in their interpretation by us and our independent accounting firms. These changes could materially impact, potentially retroactively, how we report our financial condition and results of operations as could our interpretation of those changes.
Strong competition within our market area could hurt our profits and slow growth.
We face intense competition in making loans and attracting deposits. Price competition for loans and deposits sometimes results in us charging lower interest rates on our loans and paying higher interest rates on our deposits and may reduce our net interest income. Competition also makes it more difficult and costly to attract and retain qualified employees. Many of the institutions with which we compete have substantially greater resources and lending limits than we have and may offer services that we do not provide. Our competitors often aggressively price loan and deposit products when they enter into new lines of business or new market areas. If we are not able to effectively compete in our market area, our profitability may be negatively affected. The greater resources and broader offering of deposit and loan products of some of our competitors may also limit our ability to increase our interest-earning assets. For more information about our market area and the competition we face, see “Business of PCSB Bank—Market Area” and “—Competition.”
We have become subject to more stringent capital requirements, which may adversely impact our return on equity, require us to raise additional capital, or constrain us from paying dividends or repurchasing shares.
In July 2013, the federal banking agencies approved a new rule that has substantially amended regulatory risk-based capital rules. The final rule implements the regulatory capital reforms from the Basel Committee on Banking Supervision (“Basel III”) and changes required by the Dodd-Frank Act.
The final rule includes new minimum risk-based capital and leverage ratios, which were effective for us on January 1, 2015, and refines the definition of what constitutes “capital” for purposes of calculating these ratios. The new minimum capital requirements are: (i) a new common equity Tier 1 capital ratio of 4.5%; (ii) a Tier 1 to risk-based assets capital ratio of 6% (increased from 4%); (iii) a total capital ratio of 8% (unchanged from prior rules); and (iv) a Tier 1 leverage ratio of 4%. The final rule also requires unrealized gains and losses on certain“available-for-sale” securities holdings to be included for purposes of calculating regulatory capital requirements unless aone-timeopt-out is exercised. We have elected to exercise ourone-time option toopt-out of the requirement under the final rule to include certain“available-for-sale” securities holdings for purposes of calculating our regulatory capital requirements. The final rule also establishes a “capital conservation buffer” of 2.5%, and, when fully phased in, will result in the following minimum ratios: (i) a common equity Tier 1 capital ratio of 7.0%, (ii) a Tier 1 to risk-based assets capital ratio of 8.5%, and (iii) a total capital ratio of 10.5%. The new capital conservation buffer requirement has been phased in beginning in January 2016 at 0.625% of risk-weighted assets and would increase each year until fully implemented in January 2019. An institution will be subject to limitations on paying dividends, engaging in share repurchases, and paying discretionary bonuses if its capital level falls below the buffer amount. These limitations will establish a maximum percentage of eligible retained income that can be utilized for such actions.
We have analyzed the effects of these new capital requirements, and we believe that, upon completion of the offering, we would meet all of these new requirements, including the full 2.5% capital conservation buffer, as if these new requirements had been in effect since September 30, 2016.
The application of more stringent capital requirements could, among other things, result in lower returns on equity, require the raising of additional capital, and result in regulatory actions if we were to be unable to comply with such requirements. Furthermore, the imposition of liquidity requirements in connection with the implementation of Basel III could result in our having to lengthen the term of our funding, restructure our business
17
Table of Contents
models, and/or increase our holdings of liquid assets. Implementation of changes to asset risk weightings for risk-based capital calculations, items included or deducted in calculating regulatory capital and/or additional capital conservation buffers could result in management modifying its business strategy, and could limit our ability to make distributions, including paying out dividends or buying back shares. See “Supervision and Regulation—Federal Bank Regulation—Capital Requirements.”
Non-compliance with the USA PATRIOT Act, Bank Secrecy Act, or other laws and regulations could result in fines or sanctions.
The USA PATRIOT and Bank Secrecy Acts require financial institutions to develop programs to prevent financial institutions from being used for money laundering and terrorist activities. If such activities are detected, financial institutions are obligated to file suspicious activity reports with the U.S. Treasury’s Office of Financial Crimes Enforcement Network. These rules require financial institutions to establish procedures for identifying and verifying the identity of customers seeking to open new financial accounts. Failure to comply with these regulations could result in fines or sanctions, including restrictions on conducting acquisitions or establishing new branches. During the last year, several banking institutions have received large fines fornon-compliance with these laws and regulations. While we have developed policies and procedures designed to assist in compliance with these laws and regulations, these policies and procedures may not be effective in preventing violations of these laws and regulations.
Legal and regulatory proceedings and related matters could adversely affect us or the financial services industry in general.
We, and other participants in the financial services industry upon whom we rely to operate, have been and may in the future become involved in legal and regulatory proceedings. Most of the proceedings we consider to be in the normal course of our business or typical for the industry; however, it is inherently difficult to assess the outcome of these matters, and other participants in the financial services industry or we may not prevail in any proceeding or litigation. There could be substantial cost and management diversion in such litigation and proceedings, and any adverse determination could have a materially adverse effect on our business, brand or image, or our financial condition and results of our operations.
Our funding sources may prove insufficient to replace deposits at maturity and support our future growth.
We must maintain sufficient funds to respond to the needs of depositors and borrowers. As a part of our liquidity management, we use a number of funding sources in addition to core deposit growth and repayments and maturities of loans and investments. These additional sources consist primarily of advances from the Federal Home Loan Bank. As we continue to grow, we are likely to become more dependent on these sources. Adverse operating results or changes in industry conditions could lead to difficulty or an inability in accessing these additional funding sources. Our financial flexibility will be severely constrained if we are unable to maintain our access to funding or if adequate financing is not available to accommodate future growth at acceptable interest rates. If we are required to rely more heavily on more expensive funding sources to support future growth, our revenues may not increase proportionately to cover our costs. In this case, our operating margins and profitability would be adversely affected.
Our success depends on retaining certain key personnel.
Our performance largely depends on the talents and efforts of highly skilled individuals who comprise our senior management team. We rely on key personnel to manage and operate our business, including major revenue generating functions such as loan and deposit generation. The loss of key staff may adversely affect our ability to maintain and manage these functions effectively, which could negatively affect our revenues. In addition, loss of key personnel could result in increased recruiting and hiring expenses, which could cause a decrease in our net income. Our continued ability to compete effectively depends on our ability to attract new employees and to retain and motivate our existing employees.
18
Table of Contents
System failure or breaches of our network security could subject us to increased operating costs as well as litigation and other liabilities.
The computer systems and network infrastructure we and our third-party service providers use could be vulnerable to unforeseen problems. Our operations are dependent upon our ability to protect our computer equipment against damage from physical theft, fire, power loss, telecommunications failure or a similar catastrophic event, as well as from security breaches, denial of service attacks, viruses, worms and other disruptive problems caused by hackers. Any damage or failure that causes an interruption in our operations could have a material adverse effect on our financial condition and results of operations. Computerbreak-ins, phishing and other disruptions could also jeopardize the security of information stored in and transmitted through our computer systems and network infrastructure, which may result in significant liability to us and may cause existing and potential customers to refrain from doing business with us. Although we, with the help of third-party service providers, intend to continue to implement security technology and establish operational procedures designed to prevent such damage, our security measures may not be successful. In addition, advances in computer capabilities, new discoveries in the field of cryptography or other developments could result in a compromise or breach of the algorithms we and our third-party service providers use to encrypt and protect customer transaction data. A failure of such security measures could have a material adverse effect on our financial condition and results of operations.
It is possible that a significant amount of time and money may be spent to rectify the harm caused by a breach or hack. While we have general liability insurance, there are limitations on coverage as well as dollar amount. Furthermore, cyber incidents carry a greater risk of injury to our reputation. Finally, depending on the type of incident, banking regulators can impose restrictions on our business and consumer laws may require reimbursement of customer losses.
Our business may be adversely affected by fraud and other financial crimes.
Our loans to businesses and individuals and our deposit relationships and related transactions are subject to exposure to the risk of loss due to fraud and other financial crimes. While we have policies and procedures designed to prevent such losses, losses may still occur.
Managing reputational risk is important to attracting and maintaining customers, investors and employees.
Threats to our reputation can come from many sources, including adverse sentiment about financial institutions generally, unethical practices, employee misconduct, failure to deliver minimum standards of service or quality, compliance deficiencies, and questionable or fraudulent activities of our customers. We have policies and procedures in place to protect our reputation and promote ethical conduct, but these policies and procedures may not be fully effective. Negative publicity regarding our business, employees, or customers, with or without merit, may result in the loss of customers and employees, costly litigation and increased governmental regulation, all of which could adversely affect our operating results.
Changes in management’s estimates and assumptions may have a material impact on our consolidated financial statements and our financial condition or operating results.
In preparing this prospectus as well as periodic reports we will be required to file under the Securities Exchange Act of 1934, including our consolidated financial statements, our management is and will be required under applicable rules and regulations to make estimates and assumptions at a specified date. These estimates and assumptions are based on management’s best estimates and experience at that date and are subject to substantial risk and uncertainty. Materially different results may occur as circumstances change and additional information becomes known. Areas requiring significant estimates and assumptions by management include our valuation of investment securities, our determination of our income tax provision, our determination of goodwill impairment, and our evaluation of the adequacy of our allowance for loan losses.
19
Table of Contents
Our risk management framework may not be effective in mitigating risk and reducing the potential for significant losses.
Our risk management framework is designed to minimize risk and loss to us. We seek to identify, measure, monitor, report and control our exposure to risk, including strategic, market, liquidity, compliance and operational risks. While we use a broad and diversified set of risk monitoring and mitigation techniques, these techniques are inherently limited because they cannot anticipate the existence or future development of currently unanticipated or unknown risks. Recent economic conditions and heightened legislative and regulatory scrutiny of the financial services industry, among other developments, have increased our level of risk. Accordingly, we could suffer losses as a result of our failure to properly anticipate and manage these risks.
We are subject to environmental liability risk associated with lending activities.
A significant portion of our loan portfolio is secured by real estate, and we could become subject to environmental liabilities with respect to one or more of these properties. During the ordinary course of business, we may foreclose on and take title to properties securing defaulted loans. In doing so, there is a risk that hazardous or toxic substances could be found on these properties. If hazardous conditions or toxic substances are found on these properties, we may be liable for remediation costs, as well as for personal injury and property damage, civil fines and criminal penalties regardless of when the hazardous conditions or toxic substances first affected any particular property. Environmental laws may require us to incur substantial expenses to address unknown liabilities and may materially reduce the affected property’s value or limit our ability to use or sell the affected property. In addition, future laws or more stringent interpretations or enforcement policies with respect to existing laws may increase our exposure to environmental liability. Although we have policies and procedures to perform an environmental review before initiating any foreclosure action on nonresidential real property, these reviews may not be sufficient to detect all potential environmental hazards. The remediation costs and any other financial liabilities associated with an environmental hazard could have a material adverse effect on us.
Risks Related to the Offering
The future price of our shares of common stock may be less than the $10.00 offering price per share.
If you purchase shares of common stock in the offering, you may not be able to sell them later at or above the $10.00 offering price. In many cases, shares of common stock issued by newly converted savings institutions have traded below the initial offering price. The aggregate purchase price of the shares of common stock sold in the offering will be based on an independent appraisal. The independent appraisal is not intended, and should not be construed, as a recommendation of any kind as to the advisability of purchasing shares of common stock. The independent appraisal is based on certain estimates, assumptions and projections, all of which are subject to change from time to time. After the shares begin trading, the trading price of our common stock will be determined by the marketplace, and may be influenced by many factors, including prevailing interest rates, the overall performance of the economy, changes in federal tax laws, new regulations, investor perceptions of PCSB Financial and the outlook for the financial services industry in general. Price fluctuations in our common stock may be unrelated to our operating performance.
Our failure to effectively deploy the net proceeds may have an adverse effect on our financial performance.
We intend to invest between $72.9 million and $98.9 million of the net proceeds of the offering (or $113.9 million at the adjusted maximum of the offering range) in PCSB Bank. We may use the remaining net proceeds to invest in short-term investments and for general corporate purposes, including, subject to regulatory limitations, the repurchase of shares of common stock and the payment of dividends. We also expect to use a portion of the net proceeds we retain to fund a loan to our employee stock ownership plan to purchase shares of common stock in the offering. PCSB Bank may use the net proceeds it receives to fund new loans, expand its retail banking franchise by establishing or acquiring new branches or by acquiring other financial institutions or other financial services companies, or for other general corporate purposes. However, except for funding the loan to the employee stock ownership plan and funding the charitable foundation, we have not allocated specific amounts of the net proceeds for any of these purposes. Therefore, we will have significant flexibility in determining the amount of the net proceeds we apply to different uses and when we apply or reinvest such proceeds. Also, certain of these uses, such as opening new branches or acquiring other financial institutions, may require prior regulatory approval. We have
20
Table of Contents
not established a timetable for reinvesting the net proceeds, and we cannot predict how long it will take to reinvest the net proceeds. Our failure to utilize these funds effectively and timely would reduce our profitability and may adversely affect the value of our common stock.
Our return on equity may be low following the offering and this could negatively affect the trading price of our shares of common stock.
Net income divided by average shareholders’ equity, known as “return on equity,” is a ratio many investors use to compare the performance of financial institutions. Our return on equity may be low until we are able to leverage the additional capital we receive from the offering. Our return on equity will be negatively affected by added expenses associated with our employee stock ownership plan and the stock-based benefit plans we intend to adopt. Until we can increase our net interest income andnon-interest income and deploy the capital raised in the offering, we expect our return on equity to be low, which may reduce the market price of our shares of common stock. At the midpoint of the offering range, PCSB Financial’s pro forma consolidated return on equity for the three months ended September 30, 2016 would have equaled 1.76% (annualized), compared to PCSB Bank’s return on equity for the three months ended September 30, 2016 of 5.24% (annualized).
We are an emerging growth company, and any decision by us to comply only with certain reduced reporting and disclosure requirements applicable to emerging growth companies could make our common stock less attractive to investors.
We are an emerging growth company, and, for as long as we continue to be an emerging growth company, we may choose to take advantage of exemptions from various reporting requirements applicable to other public companies but not to “emerging growth companies,” including, but not limited to, reduced disclosure obligations regarding executive compensation in our periodic reports and proxy statements, and exemptions from the requirements of holding a nonbinding advisory vote on executive compensation and shareholder approval of any golden parachute payments not previously approved. As an emerging growth company, we also will not be subject to Section 404(b) of the Sarbanes-Oxley Act of 2002, which would require that our independent auditors review and attest as to the effectiveness of our internal control over financial reporting. We could be an emerging growth company for up to five years following the completion of this offering. We will cease to be an emerging growth company upon the earliest of: (i) the end of the fiscal year following the fifth anniversary of this offering, (ii) the first fiscal year after our annual gross revenues are $1.0 billion or more, (iii) the date on which we have, during the previous three-year period, issued more than $1.0 billion innon-convertible debt securities or (iv) the end of any fiscal year in which the market value of our common stock held bynon-affiliates exceeded $700 million at the end of the second quarter of that fiscal year. Investors may find our common stock less attractive if we choose to rely on these exemptions. If some investors find our common stock less attractive as a result of any choices to reduce future disclosure, there may be a less active trading market for our common stock and the price of our common stock may be more volatile.
We will need to implement additional financial and accounting systems, procedures and controls in order to satisfy our new public company reporting requirements.
Upon completion of the conversion and offering, we will become a public reporting company. The federal securities laws and regulations of the Securities and Exchange Commission require that we file annual, quarterly and current reports, and that we maintain effective disclosure controls and procedures and internal controls over financial reporting. We expect that the obligations of being a public company, including substantial public reporting obligations, will require significant expenditures and place additional demands on our management team. These obligations will increase our operating expenses and could divert management’s attention from our banking operations.
Our stock-based benefit plans will increase our expenses and reduce our income.
We intend to adopt one or more new stock-based benefit plans after the conversion and offering, subject to shareholder approval, which will increase our annual compensation and benefit expenses related to the stock options
21
Table of Contents
and stock awards granted to participants under the new stock-based benefit plans. The actual amount of these new stock-related compensation and benefit expenses will depend on the number of options and stock awards actually granted under the plans, the fair market value of our stock or options on the date of grant, the vesting period, and other factors that we cannot predict at this time. If we adopt stock-based benefit plans within 12 months following the offering, the total shares of common stock reserved for issuance pursuant to awards of restricted stock and grants of options under such plans would be limited to 4% and 10%, respectively, of the total shares of our common stock sold in the offering and contributed to the charitable foundation. If we award restricted shares of common stock or grant options in excess of these amounts under stock-based benefit plans adopted more than 12 months after the completion of the offering, our costs would increase further.
In addition, we will recognize expense for our employee stock ownership plan when shares are committed to be released to participants’ accounts, and we will recognize expense for restricted stock awards and stock options over the vesting period of awards made to recipients. The expense in the first year following the offering for shares purchased in the offering and for our new stock-based benefit plans has been estimated to be approximately $4.2 million ($3.1 million after tax) at the adjusted maximum of the offering range as set forth in the pro forma financial information under “Pro Forma Data,” assuming the $10.00 per share offering price as fair market value. Actual expense may be higher if the price of our common stock at the time the shares are allocated or awarded is greater than $10.00 per share. For further discussion of our proposed stock-based plans, see “Management—Benefits to be Considered Following Completion of the Offering.”
The implementation of stock-based benefit plans may dilute your ownership interest. Historically, shareholders have approved these stock-based benefit plans.
We intend to adopt one or more new stock-based benefit plans following the offering. These plans may be funded either through open market purchases or from the issuance of authorized but unissued shares of common stock. Our ability to repurchase shares of common stock to fund these plans will be subject to many factors, including applicable regulatory restrictions on common stock repurchases, the availability of stock in the market, the trading price of the stock, our capital levels, alternative uses for our capital and our financial performance. While our intention is to fund the new stock-based benefit plans through open market purchases, shareholders would experience a 12.3% dilution in ownership interest if newly issued shares of our common stock are used to fund stock options and shares of restricted common stock in amounts equal to 10% and 4%, respectively, of the shares sold in the offering and contributed to the charitable foundation. If we adopt the plans more than 12 months following the offering, new stock-based benefit plans would not be subject to these limitations and shareholders could experience greater dilution.
Although the implementation of new stock-based benefit plans would be subject to shareholder approval, historically, the overwhelming majority of stock-based benefit plans adopted by savings institutions and their holding companies followingmutual-to-stock conversions have been approved by shareholders.
We have not determined when we will adopt one or more new stock-based benefit plans. Stock-based benefit plans adopted more than 12 months following the completion of the offering may exceed regulatory restrictions on the size of stock-based benefit plans adopted within 12 months, which would further increase our costs.
If we adopt stock-based benefit plans more than 12 months following the completion of the offering, then grants of shares of common stock or stock options under our existing and proposed stock-based benefit plans may exceed 4% and 10%, respectively, of shares of common stock sold in the offering and contributed to the charitable foundation. Stock-based benefit plans that provide for awards in excess of these amounts would increase our costs beyond the amounts estimated in “—Our stock-based benefit plans will increase our expenses and reduce our income.” Stock-based benefit plans that provide for awards in excess of these amounts could also result in dilution to shareholders in excess of that described in “—The implementation of stock-based benefit plans may dilute your ownership interest. Historically, shareholders have approved these stock-based benefit plans.” Although the implementation of stock-based benefit plans would be subject to shareholder approval, the timing of the implementation of such plans will be at the discretion of our board of directors.
22
Table of Contents
Various factors may make takeover attempts more difficult to achieve.
Certain provisions of our articles of incorporation and bylaws and state and federal banking laws, including regulatory approval requirements, could make it more difficult for a third party to acquire control of PCSB Financial without our board of directors’ prior approval.
Under Federal Reserve Board regulations, for a period of three years following completion of the conversion and offering, no person may directly or indirectly acquire or offer to acquire beneficial ownership of more than 10% of our common stock without prior approval of the Federal Reserve Board. Under federal law, subject to certain exemptions, a person, entity or group must notify the Federal Reserve Board before acquiring control of a bank holding company. Acquisition of 10% or more of any class of voting stock of a bank holding company creates a rebuttable presumption that the acquirer “controls” the bank holding company. Also, a bank holding company must obtain the prior approval of the Federal Reserve Board and the NYSDFS before, among other things, acquiring direct or indirect ownership or control of more than 5% of any class of voting shares of any bank, including PCSB Bank.
There also are provisions in our articles of organization that may be used to delay or block a takeover attempt, including a provision that prohibits any person from voting more than 10% of the shares of common stock outstanding. Furthermore, shares of restricted stock and stock options that we have granted or may grant to employees and directors, stock ownership by our management and directors, employment agreements that we have entered into with our executive officers and other factors may make it more difficult for companies or persons to acquire control of PCSB Financial without the consent of our board of directors. Taken as a whole, these statutory provisions and provisions in our articles of incorporation could result in our being less attractive to a potential acquirer and thus could adversely affect the market price of our common stock.
For additional information, see “Restrictions on Acquisition of PCSB Financial Corporation,” “Management—Employment Agreements”and “—Benefits to be Considered Following Completion of the Offering.”
Our stock value may be negatively affected by applicable regulations that restrict stock repurchases.
Applicable regulations restrict us from repurchasing any of our shares of common stock during the first year following the offering and limit us from repurchasing our shares of common stock during the second and third years following the offering, unless we obtain prior approval from the NYSDFS that relieves us from these restrictions and limitations. Stock repurchases are a capital management tool that can enhance the value of a company’s stock, and our inability to repurchase any of our shares of common stock during the first year following the offering and limitations on our ability to repurchase our shares of common stock during the second and third years following the offering may negatively affect our stock price.
We have never issued common stock to the public, and there is no guarantee that a liquid market will develop.
We have never issued common stock to the public and there is no established market for our common stock. We expect that our common stock will be listed for trading on the Nasdaq Capital Market under the symbol “PCSB”, subject to completion of the offering and compliance with certain conditions, including the presence of at least three registered and active market makers. Sandler O’Neill & Partners, L.P. has advised us that it intends to make a market in shares of our common stock following the offering, but it is not obligated to do so or to continue to do so once it begins. While we will attempt before completion of the offering to obtain commitments from at least two other broker-dealers to make a market in shares of our common stock, we may not be able to obtain such commitments. This would result in our common stock not being listed for trading on the Nasdaq Capital Market, which could reduce the liquidity of our common stock.
23
Table of Contents
You may not revoke your order to purchase common stock in the subscription or community offerings after you send us your order form.
Funds submitted or automatic withdrawals authorized in connection with the purchase of shares of common stock in the subscription and community offerings will be held by us until the completion or termination of the offering, including any extension of the expiration date and consummation of a syndicated offering or firm commitment offering. Because completion of the offering will be subject to regulatory approvals and an update of the independent appraisal prepared by RP Financial, among other factors, there may be one or more delays in completing the offering. Orders submitted in the subscription and community offerings are irrevocable, and purchasers will have no access to their funds unless the offering is terminated, or extended beyond April 28, 2017, or the number of shares to be sold in the offering is increased to more than 23,143,750 shares or decreased to fewer than 14,875,000 shares.
The distribution of subscription rights could have adverse income tax consequences.
If the subscription rights granted to eligible current or former depositors of PCSB Bank are deemed to have an ascertainable value, receipt of the rights may be taxable in an amount equal to the ascertained value. Whether subscription rights are considered to have ascertainable value is an inherently factual determination. We have received an opinion of counsel, Luse Gorman, PC, that it is more likely than not that subscription rights have no ascertainable value; however, the opinion is not binding on the Internal Revenue Service.
Risks Related to the Charitable Foundation
The contribution to the charitable foundation will dilute your ownership interest and adversely affect net income in 2017.
We intend to establish and fund a new charitable foundation in connection with the conversion and offering. We intend to contribute shares of our common stock equal to 1.9% of the shares sold in the offering and an amount of cash so that the total contribution equals $5.0 million. At the minimum, midpoint, maximum and adjusted maximum of the offering range, we will contribute to the charitable foundation 282,625, 332,500, 382,375 and 439,731 shares of common stock and approximately $2.2 million, $1.7 million, $1.2 million and $603,000 in cash, respectively. The contribution will have an adverse effect on our net income for the quarter and year in which we make the issuance and contribution to the charitable foundation. Theafter-tax expense of the contribution is expected to reduce net income in fiscal 2017 by approximately $3.3 million. Our fiscal 2016 net income was $2.9 million. In addition, persons purchasing shares in the offering will have their ownership and voting interests in PCSB Financial diluted by up to 1.9% due to the contribution of shares of common stock to the charitable foundation.
Our contribution to the charitable foundation may not be tax deductible, which could reduce our profits.
We may not have sufficient profits to be able to fully use the tax deduction from our contribution to the charitable foundation. Under the Internal Revenue Code, an entity is permitted to deduct up to 10% of its taxable income (generally income before federal income taxes and charitable contributions expense) in any one year for charitable contributions. Any contribution in excess of the 10% limit may be deducted for federal income tax purposes over each of the five years following the year in which the charitable contribution is made. Accordingly, a charitable contribution could, if necessary, be deducted over asix-year period.
24
Table of Contents
SELECTED CONSOLIDATED FINANCIAL AND OTHER DATA
The following tables set forth selected consolidated historical financial and other data for PCSB Bank at the dates and for the periods indicated. It is only a summary and it should be read in conjunction with the business and financial information contained elsewhere in this prospectus, including the consolidated financial statements beginning on pageF-1. The information at September 30, 2016 and for the three months ended September 30, 2016 and 2015 is not audited but, in the opinion of management, includes all adjustments necessary for a fair presentation. All adjustments are normal and recurring. The results of operations for the three months ended September 30, 2016 are not necessarily indicative of the results that may be expected for the entire year. The information at June 30, 2016 and 2015 and for the years ended June 30, 2016 and 2015 is derived in part from the audited consolidated financial statements appearing in this prospectus. The information at June 30, 2014, 2013 and 2012 and for the years ended June 30, 2014, 2013 and 2012 is derived in part from audited consolidated financial statements not appearing in this prospectus.
| At September 30, | At June 30, | |||||||||||||||||||||||
| 2016 | 2016 | 2015 | 2014 | 2013 | 2012 | |||||||||||||||||||
| (Dollars in thousands) | ||||||||||||||||||||||||
Selected Financial Condition Data: | ||||||||||||||||||||||||
Total assets | $ | 1,254,444 | $ | 1,262,071 | $ | 1,200,750 | $ | 976,630 | $ | 969,433 | $ | 975,643 | ||||||||||||
Cash and cash equivalents | 60,423 | 41,578 | 77,761 | 105,250 | 147,166 | 138,776 | ||||||||||||||||||
Securitiesheld-to-maturity | 265,071 | 270,679 | 269,913 | 267,146 | 260,629 | 266,540 | ||||||||||||||||||
Securitiesavailable-for-sale | 109,591 | 112,351 | 84,943 | 72,109 | 88,015 | 86,818 | ||||||||||||||||||
Loans receivable, net | 763,915 | 782,336 | 727,134 | 507,161 | 449,577 | 466,231 | ||||||||||||||||||
Goodwill and other intangibles | 6,772 | 6,808 | 6,703 | — | — | — | ||||||||||||||||||
Total liabilities | 1,142,938 | 1,152,122 | 1,090,479 | 864,991 | 860,058 | 870,583 | ||||||||||||||||||
Deposits | 1,116,837 | 1,112,695 | 1,060,505 | 856,518 | 851,540 | 857,697 | ||||||||||||||||||
Federal Home Loan Bank advances | 11,051 | 20,081 | 14,000 | — | — | — | ||||||||||||||||||
Total equity | 111,506 | 109,949 | 110,271 | 111,639 | 109,375 | 105,060 | ||||||||||||||||||
| For the Three Months Ended September 30, | For the Year Ended June 30, | |||||||||||||||||||||||||||
| 2016 | 2015 | 2016 | 2015 | 2014 | 2013 | 2012 | ||||||||||||||||||||||
| (Dollars in thousands) | ||||||||||||||||||||||||||||
Selected Operating Data: | ||||||||||||||||||||||||||||
Interest and dividend income | $ | 10,109 | $ | 9,663 | $ | 39,044 | $ | 28,827 | $ | 25,864 | $ | 26,273 | $ | 30,468 | ||||||||||||||
Interest expense | 1,334 | 1,179 | 4,812 | 3,884 | 3,634 | 4,306 | 6,238 | |||||||||||||||||||||
|
|
|
|
|
|
|
|
|
|
|
|
|
| |||||||||||||||
Net interest income | 8,775 | 8,484 | 34,232 | 24,943 | 22,230 | 21,967 | 24,230 | |||||||||||||||||||||
Provision for loan losses | 26 | 41 | 1,859 | 1,326 | 903 | 741 | 1,923 | |||||||||||||||||||||
|
|
|
|
|
|
|
|
|
|
|
|
|
| |||||||||||||||
Net interest income after provision for loan losses | 8,749 | 8,443 | 32,373 | 23,617 | 21,327 | 21,226 | 22,307 | |||||||||||||||||||||
Non-interest income | 552 | 428 | 1,951 | 1,567 | 1,650 | 1,298 | 1,244 | |||||||||||||||||||||
Non-interest expense(1) | 7,198 | 7,047 | 30,265 | 23,974 | 20,651 | 20,306 | 19,769 | |||||||||||||||||||||
|
|
|
|
|
|
|
|
|
|
|
|
|
| |||||||||||||||
Income before income tax expense | 2,103 | 1,824 | 4,059 | 1,210 | 2,326 | 2,218 | 3,782 | |||||||||||||||||||||
Income tax expense | 647 | 568 | 1,133 | 702 | 699 | 732 | 1,304 | |||||||||||||||||||||
|
|
|
|
|
|
|
|
|
|
|
|
|
| |||||||||||||||
Net income | $ | 1,456 | $ | 1,256 | $ | 2,926 | $ | 508 | $ | 1,627 | $ | 1,486 | $ | 2,478 | ||||||||||||||
|
|
|
|
|
|
|
|
|
|
|
|
|
| |||||||||||||||
| (1) | Non-interest expense for the three months ended September 30, 2015 and the years ended June 30, 2016 and 2015 include merger expenses of $122,000, $790,000 and $1.1 million, respectively. |
25
Table of Contents
| At or For the Three Months Ended September 30, | At or For the Year Ended June 30, | |||||||||||||||||||||||||||
| 2016 | 2015 | 2016 | 2015 | 2014 | 2013 | 2012 | ||||||||||||||||||||||
Selected Financial Ratios (1): | ||||||||||||||||||||||||||||
Return on average assets (2) | 0.46 | % | 0.41 | % | 0.24 | % | 0.05 | % | 0.17 | % | 0.15 | % | 0.26 | % | ||||||||||||||
Return on average equity (3) | 5.24 | 4.50 | 2.59 | 0.45 | 1.47 | 1.39 | 2.33 | |||||||||||||||||||||
Non-interest income to average assets | 0.17 | 0.14 | 0.16 | 0.15 | 0.17 | 0.14 | 0.13 | |||||||||||||||||||||
Non-interest expense to average assets | 2.27 | 2.33 | 2.48 | 2.34 | 2.14 | 2.11 | 2.07 | |||||||||||||||||||||
Net interest margin (4) | 2.89 | 2.90 | 2.92 | 2.50 | 2.30 | 2.29 | 2.53 | |||||||||||||||||||||
Efficiency ratio (5) | 77.39 | 79.44 | 88.17 | 95.20 | 89.88 | 90.15 | 83.94 | |||||||||||||||||||||
Average interest-earning assets to average interest-bearing liabilities | 120.00 | 120.35 | 120.01 | 122.55 | 125.00 | 125.35 | 125.23 | |||||||||||||||||||||
Loans to deposits | 68.40 | 69.59 | 70.31 | 68.56 | 59.21 | 52.80 | 54.36 | |||||||||||||||||||||
Equity to assets (6) | 8.76 | 9.22 | 9.27 | 11.03 | 11.47 | 11.11 | 11.09 | |||||||||||||||||||||
Tangible equity to tangible assets (7) | 8.27 | 8.72 | 8.77 | 10.93 | 11.47 | 11.11 | 11.09 | |||||||||||||||||||||
Capital Ratios: | ||||||||||||||||||||||||||||
Tier 1 capital (to adjusted total assets) | 8.85 | 9.09 | 8.92 | 8.88 | 11.73 | 11.64 | 11.51 | |||||||||||||||||||||
Tier I capital (to risk-weighted assets) | 13.89 | 14.62 | 13.47 | 15.47 | 22.49 | 23.68 | 22.74 | |||||||||||||||||||||
Total capital (to risk-weighted assets) | 14.39 | 15.14 | 13.96 | 16.03 | 23.29 | 24.52 | 23.75 | |||||||||||||||||||||
Common equity Tier 1 capital (to risk- weighted assets) | 13.89 | 14.62 | 13.47 | 15.47 | 22.49 | 23.68 | 22.74 | |||||||||||||||||||||
Asset Quality Ratios: | ||||||||||||||||||||||||||||
Allowance for loan losses as a percent of total loans | 0.53 | 0.54 | 0.51 | 0.54 | (8) | 0.80 | 0.88 | 1.05 | ||||||||||||||||||||
Allowance for loan losses as a percent ofnon-performing loans | 46.50 | 25.73 | 32.17 | 18.69 | 22.70 | 17.91 | 28.31 | |||||||||||||||||||||
Net charge-offs to average outstanding loans during the period | — | 0.01 | 0.23 | 0.27 | 0.17 | 0.37 | 1.11 | |||||||||||||||||||||
Non-performing loans as a percent of total loans | 1.14 | 2.08 | 1.60 | 2.87 | 3.51 | 4.92 | 3.72 | |||||||||||||||||||||
Non-performing assets as a percent of total assets | 0.78 | 1.32 | 1.07 | 1.78 | 1.85 | 2.35 | 1.90 | |||||||||||||||||||||
Other Data: | ||||||||||||||||||||||||||||
Number of full-service offices | 15 | 15 | 15 | 15 | 10 | 9 | 9 | |||||||||||||||||||||
Number of full-time equivalent employees | 171 | 173 | 169 | 174 | 138 | 133 | 133 | |||||||||||||||||||||
| (1) | Ratios for the three months ended September 30, 2016 and 2015 are annualized. |
| (2) | Represents net income divided by average total assets. |
| (3) | Represents net income divided by average equity. |
| (4) | Represents net interest income as a percent of average interest-earning assets. |
| (5) | Representsnon-interest expense divided by the sum of net interest income andnon-interest income. |
| (6) | Represents average equity divided by average total assets. |
26
Table of Contents
| (7) | Average tangible equity to average tangible assets is anon-GAAP financial measure and represents average tangible equity calculated as a percentage of average tangible assets for the period presented. We believe that a disclosure of tangible equity to tangible assets may be helpful for those investors who seek to evaluate our equity without giving effect to goodwill and other intangible assets. The following table presents a reconciliation of average tangible equity to average tangible assets for the periods presented: |
| For the Three Months Ended September 30, | For the Year Ended June 30, | |||||||||||||||||||||||||||
| 2016 | 2015 | 2016 | 2015 | 2014 | 2013 | 2012 | ||||||||||||||||||||||
| (Dollars in thousands) | ||||||||||||||||||||||||||||
Average equity | $ | 111,235 | $ | 111,722 | $ | 112,955 | $ | 112,760 | $ | 110,671 | $ | 106,812 | $ | 106,201 | ||||||||||||||
Less: Goodwill and other intangibles | 6,796 | 6,713 | 6,663 | 1,158 | — | — | — | |||||||||||||||||||||
|
|
|
|
|
|
|
|
|
|
|
|
|
| |||||||||||||||
Average tangible equity | $ | 104,439 | $ | 105,009 | $ | 106,292 | $ | 111,602 | $ | 110,671 | $ | 106,812 | $ | 106,201 | ||||||||||||||
Average assets | $ | 1,269,707 | $ | 1,211,435 | $ | 1,218,073 | $ | 1,022,363 | $ | 964,700 | $ | 961,024 | $ | 957,329 | ||||||||||||||
Less: Goodwill and other intangibles | 6,796 | 6,713 | 6,663 | 1,158 | — | — | — | |||||||||||||||||||||
|
|
|
|
|
|
|
|
|
|
|
|
|
| |||||||||||||||
Average tangible assets | $ | 1,262,911 | $ | 1,204,722 | $ | 1,211,410 | $ | 1,021,205 | $ | 964,700 | $ | 961,024 | $ | 957,329 | ||||||||||||||
Tangible equity to tangible assets | 8.27 | % | 8.72 | % | 8.77 | % | 10.93 | % | 11.47 | % | 11.11 | % | 11.09 | % | ||||||||||||||
| (8) | Loans acquired in the CMS Bancorp, Inc./CMS Bank acquisition were recorded at their estimated fair value at the acquisition date and did not include a carry-over of the relatedpre-acquisition allowance for loan losses. |
27
Table of Contents
The following tables set forth selected consolidated historical financial and other data of PCSB Bank at the dates and for the periods indicated. This is only a summary and should be read in conjunction with the business and financial information contained elsewhere in this prospectus. The information at June 30, 2016 is derived in part from the audited consolidated financial statements that appear in this prospectus. The information at December 31, 2016 and for the three months and six months ended December 31, 2016 and 2015 is not audited but, in the opinion of management, includes all adjustments necessary for a fair presentation. All adjustments are normal and recurring. The results of operations for the three months and six months ended December 31, 2016 are not necessarily indicative of the results that may be expected for the entire year.
| At December 31, 2016 | At June 30, 2016 | |||||||
| (Dollars in thousands) | ||||||||
Selected Financial Condition: | ||||||||
Total assets | $ | 1,240,883 | $ | 1,262,071 | ||||
Cash and cash equivalents | 48,327 | 41,578 | ||||||
Securitiesheld-to-maturity | 272,591 | 270,679 | ||||||
Securitiesavailable-for-sale | 95,363 | 112,351 | ||||||
Loans receivable, net | 766,681 | 782,336 | ||||||
Goodwill and other intangibles | 6,735 | 6,808 | ||||||
Total liabilities | 1,128,126 | 1,152,122 | ||||||
Deposits | 1,107,720 | 1,112,695 | ||||||
Federal Home Loan Bank advances | 4,022 | 20,081 | ||||||
Total equity | 112,757 | 109,949 | ||||||
| Three Months Ended December 31, | Six Months Ended December 31, | |||||||||||||||
| 2016 | 2015 | 2016 | 2015 | |||||||||||||
| (Dollars in thousands) | ||||||||||||||||
Selected Operating Data: | ||||||||||||||||
Interest and dividend income | $ | 9,850 | $ | 9,558 | $ | 19,959 | $ | 19,221 | ||||||||
Interest expense | 1,323 | 1,187 | 2,657 | 2,366 | ||||||||||||
|
|
|
|
|
|
|
| |||||||||
Net interest income | 8,527 | 8,371 | 17,302 | 16,855 | ||||||||||||
Provision for loan losses | 562 | 356 | 588 | 397 | ||||||||||||
|
|
|
|
|
|
|
| |||||||||
Net interest income after provision for loan losses | 7,965 | 8,015 | 16,714 | 16,458 | ||||||||||||
|
|
|
|
|
|
|
| |||||||||
Non-interest income | 2,259 | 470 | 2,811 | 898 | ||||||||||||
Non-interest expense(1) | 7,794 | 7,480 | 14,992 | 14,527 | ||||||||||||
|
|
|
|
|
|
|
| |||||||||
Income before income taxes | 2,430 | 1,005 | 4,533 | 2,829 | ||||||||||||
Income tax expense | 758 | 278 | 1,405 | 846 | ||||||||||||
|
|
|
|
|
|
|
| |||||||||
Net income | $ | 1,672 | $ | 727 | $ | 3,128 | $ | 1,983 | ||||||||
|
|
|
|
|
|
|
| |||||||||
| (1) | Non-interest expense for the three and six months ended December 31, 2015 include merger expenses of $39,000 and $161,000, respectively. |
28
Table of Contents
| At or For the Three Months Ended December 31, | At or For the Six Months Ended December 31, | |||||||||||||||
| 2016 | 2015 | 2016 | 2015 | |||||||||||||
| (Dollars in thousands) | ||||||||||||||||
Selected Financial Ratios (1): | ||||||||||||||||
Return on average assets (2) | 0.54 | % | 0.24 | % | 0.50 | % | 0.33 | % | ||||||||
Return on average equity (3) | 5.95 | 2.59 | 5.59 | 3.54 | ||||||||||||
Non-interest income to average assets | 0.73 | 0.16 | 0.45 | 0.15 | ||||||||||||
Non-interest expense to average assets | 2.51 | 2.49 | 2.39 | 2.41 | ||||||||||||
Net interest margin (4) | 2.89 | 2.88 | 2.89 | 2.89 | ||||||||||||
Efficiency ratio (5) | 76.23 | 88.16 | 76.78 | 83.70 | ||||||||||||
Average interest-earning assets to average interest-bearing liabilities | 119.42 | 120.69 | 119.71 | 120.52 | ||||||||||||
Loans to deposits | 69.21 | 69.54 | 69.21 | 69.54 | ||||||||||||
Equity to assets (6) | 9.07 | 9.35 | 8.91 | 9.29 | ||||||||||||
Tangible equity to tangible assets (7) | 8.57 | 8.85 | 8.42 | 8.78 | ||||||||||||
Capital Ratios: | ||||||||||||||||
Tier 1 capital (to adjusted total assets) | 9.28 | 9.30 | 9.28 | 9.30 | ||||||||||||
Tier I capital (to risk-weighted assets) | 14.05 | 14.40 | 14.05 | 14.40 | ||||||||||||
Total capital (to risk-weighted assets) | 14.62 | 14.93 | 14.62 | 14.93 | ||||||||||||
Common equity Tier 1 capital (to risk- weighted assets) | 14.05 | 14.40 | 14.05 | 14.40 | ||||||||||||
Asset Quality Ratios: | ||||||||||||||||
Allowance for loan losses as a percent of total loans | 0.60 | 0.56 | 0.60 | 0.56 | ||||||||||||
Allowance for loan losses as a percent ofnon-performing loans | 53.41 | 25.23 | 53.41 | 25.23 | ||||||||||||
Net charge-offs to average outstanding loans during the period | 0.07 | 0.11 | 0.03 | 0.05 | ||||||||||||
Non-performing loans as a percent of total loans | 1.12 | 2.21 | 1.12 | 2.21 | ||||||||||||
Non-performing assets as a percent of total assets | 0.88 | 1.46 | 0.88 | 1.46 | ||||||||||||
Other Data: | ||||||||||||||||
Number of full-service offices | 15 | 15 | 15 | 15 | ||||||||||||
Number of full-time equivalent employees | 169 | 168 | 169 | 168 | ||||||||||||
| (1) | Ratios for the three months and six months ended December 31, 2016 and 2015 are annualized. |
| (2) | Represents net income divided by average total assets. |
| (3) | Represents net income divided by average equity. |
| (4) | Represents net interest income as a percent of average interest-earning assets. |
| (5) | Representsnon-interest expense divided by the sum of net interest income andnon-interest income. |
| (6) | Represents average equity divided by average total assets. |
29
Table of Contents
| (7) | Average tangible equity to average tangible assets is anon-GAAP financial measure and represents average tangible equity calculated as a percentage of average tangible assets for the period presented. We believe that a disclosure of tangible equity to tangible assets may be helpful for those investors who seek to evaluate our equity without giving effect to goodwill and other intangible assets. The following table presents a reconciliation of average tangible equity to average tangible assets for the periods presented: |
| For the Three Months Ended December 31, | For the Six Months Ended December 31, | |||||||||||||||
| 2016 | 2015 | 2016 | 2015 | |||||||||||||
Average equity | $ | 112,494 | $ | 112,456 | $ | 111,865 | $ | 112,089 | ||||||||
Less: Goodwill and other intangibles | 6,759 | 6,671 | 6,778 | 6,692 | ||||||||||||
|
|
|
|
|
|
|
| |||||||||
Average tangible equity | $ | 105,735 | $ | 105,785 | $ | 105,087 | $ | 105,397 | ||||||||
Average assets | $ | 1,240,141 | $ | 1,202,466 | $ | 1,254,924 | $ | 1,206,949 | ||||||||
Less: Goodwill and other intangibles | 6,759 | 6,671 | 6,778 | 6,692 | ||||||||||||
|
|
|
|
|
|
|
| |||||||||
Average tangible assets | $ | 1,233,382 | $ | 1,195,795 | $ | 1,248,146 | $ | 1,200,257 | ||||||||
Tangible equity to tangible assets | 8.57 | % | 8.85 | % | 8.42 | % | 8.78 | % | ||||||||
| (8) | Loans acquired in the CMS Bancorp, Inc./CMS Bank acquisition were recorded at their estimated fair value at the acquisition date and did not include a carry-over of the relatedpre-acquisition allowance for loan losses. |
Comparison of Financial Condition at December 31, 2016 and June 30, 2016
Total Assets. Total assets decreased $21.2 million, or 1.7%, to $1.2 billion at December 31, 2016 from $1.3 billion at June 30, 2016. The decrease is primarily the result of decreases of $15.7 million in net loans and $15.1 million in securities, partially offset by an increase of $6.7 million in cash and equivalents.
Cash and Cash Equivalents. Cash and cash equivalents increased $6.7 million, or 16.2%, to $48.3 million at December 31, 2016 from $41.6 million at June 30, 2016. The increase is due primarily to the proceeds from a $15.7 million decrease in net loans and a $15.1 million decrease in securities, partially offset by a $5.0 million decrease in deposits and $16.1 million in maturing Federal Home Loan Bank advances.
SecuritiesHeld-to-Maturity.Total securities held to maturity increased $1.9 million, or 0.7%, to $272.6 million at December 31, 2016 from $270.7 million at June 30, 2016. This increase was primarily caused by $7.4 million of net purchases of mortgage and asset-backed securities and $1.0 million of net purchases of municipal securities, partially offset by $6.5 million of net maturities of U.S. government and agency obligations.
Securities Available for Sale. Total securitiesavailable-for-sale decreased $17.0 million, or 15.1%, to $95.4 million at December 31, 2016 from $112.4 million at June 30, 2016. This decline was primarily due to $15.6 million of net maturities of U.S. government and agency obligations.
Net Loans. Net loans decreased $15.7 million, or 2.0%, to $766.7 million at December 31, 2016 from $782.3 million at June 30, 2016. The decrease is primarily due to net repayments of $13.9 million, or 15.3%, in commercial loans, $6.5 million, or 2.9%, in residential mortgages, $1.5 million, or 9.0%, in other loans and $1.0 million, or 2.5%, in home equity lines of credit, partially offset by net originations of $8.0 million, or 32.1%, in construction loans.
Deposits. Total deposits decreased $5.0 million, or 0.4%, to $1.1 billion at December 31, 2016 from $1.1 billion at June 30, 2016. This decrease primarily reflects a $17.0 million decrease in certificates of deposit, partially offset by an $8.4 million increase in demand accounts and a $3.9 million increase in savings accounts. The $12.3 million increase in demand and savings accounts reflects our strategy of raising low cost core deposits.
Federal Home Loan Bank Advances. Federal Home Loan Bank advances decreased $16.1 million, or 80.0%, to $4.0 million at December 31, 2016 from $20.1 million at June 30, 2016. The decrease was due to the maturity of advances used to fund a leveraging strategy initiated two years ago, which has been completed as of December 31, 2016.
Total Equity. Total equity increased $2.8 million, or 2.6%, to $112.7 million at December 31, 2016 from $109.9 million at June 30, 2016 as a result of net income of $3.1 million, partially offset by an increase in accumulated other comprehensive loss of $320,000.
30
Table of Contents
Comparison of Operating Results for the Three Months Ended December 31, 2016 and 2015
General. Net income increased $945,000, or 130.3%, to $1.7 million for the three months ended December 31, 2016 compared to $727,000 for the three months ended December 31, 2015. The increase was primarily due to a $156,000 increase in net interest income and a $1.8 million increase innon-interest income, partially offset by a $314,000 increase innon-interest expense, a $205,000 increase in the provision for loan losses and a $480,000 increase in income tax expense.
Net Interest Income. Net interest income increased $156,000, or 1.9%, to $8.5 million for the three months ended December 31, 2016 compared to $8.4 million for the three months ended December 31, 2015. The increase primarily reflects a one basis point increase in the net interest margin to 2.89% from 2.88% for the three months ended December 31, 2016, partially offset by a $6.9 million decrease in net interest-earning assets as growth in interest-bearing liabilities outpaced growth in interest-earning assets.
Interest and Dividend Income.Interest and dividend income increased $292,000, or 3.1%, to $9.9 million at December 31, 2016 compared to $9.6 million at December 31, 2015. The increase primarily reflects a $20.2 million increase in the average balance on interest-earning assets and a four basis point increase in the average yield to 3.33% from 3.29% for the three months ended December 31, 2015 primarily due to an increase in the average balance of higher yielding loans.
Interest income on loans increased $196,000 primarily due to a $24.9 million increase in the average balance to $762.5 million for the three months ended December 31, 2016 from $737 .6 million for the three months ended December 31, 2015, partially offset by a four basis point decrease in the average yield on loans to 4.32% from 4.36% for the same period last year.
Interest income on other interest-earning assets increased $16,000 primarily due to a 17 basis point increase in the average yield on other interest-earning assets to 0.58% for the three months ended December 31, 2016 from 0.41% for the three months ended December 31, 2015 primarily due to an increase in market interest rates, partially offset by an $8.5 million decrease in the average balance on other interest-earning assets.
Interest income on securities increased $80,000 primarily due to a $3.9 million increase in the average balance of securities to $363.0 million for the three months ended December 31, 2016 from $359.1 million for the three months ended December 31, 2015 and an eight basis point increase in the average yield on securities to 1.69% for the current-year period primarily due to an increase in market interest rates.
Interest Expense. Interest expense increased $136,000, or 11.5%, to $1.3 million for the three months ended December 31, 2016 compared to $1.2 million for the three months ended December 31, 2015. The increase primarily reflects a $27.2 million increase in the average balance on interest-bearing liabilities and a four basis point increase in the average cost to 0.53% from 0.49% for the three months ended December 31, 2015, due to growth in medium-term and long-term time certificates of deposit.
Interest expense on interest-bearing deposits increased $150,000 primarily due to a $45.1 million increase in the average balance to $983.1 million for the three months ended December 31, 2016 from $938.0 million for the three months ended December 31, 2015 and a four basis point increase in the average rate paid on interest-bearing deposits to 0.52% from 0.48% for the three months ended December 31, 2015, due to growth in medium-term and long-term certificates of deposit.
Interest expense on Federal Home Loan Bank advances decreased $14,000 primarily due to a $17.8 million decrease in the average balance to $6.4 million for the three months ended December 31, 2016 from $24.2 million for the three months ended December 31, 2015, due to the maturities of advances, partially offset by a 124 basis point increase in the average cost to l.96% for the three months ended December 31, 2016 from 0.73% for the same period last year primarily due to maturities of lower cost advances.
31
Table of Contents
Provision for Loan Losses. We recorded provision for loan losses of $562,000 for the three months ended December 31, 2016, primarily as a result of an increase in specific reserves on impaired loans. We recorded provision for loan losses of $356,000 for the three months ended December 31, 2015 primarily reflecting charge-offs on residential loans, as well as growth in the overall loan portfolio.
Non-Interest Income.Non-interest income increased $1.8 million to $2.3 million for the three months ended December 31, 2016 compared to $470,000 for the three months ended December 31, 2015. The increase was caused primarily by the receipt of $1.6 million in settlement of a loancharged-off by CMS Bank before the 2015 merger.
Non-Interest Expense.Non-interest expense increased $314,000, or 4.2%, to $7.8 million for the three months ended December 31, 2016 compared to $7.5 million for the three months ended December 31, 2015.
Income Tax Expense. Income tax expense increased $480,000, or 172.7%, to $758,000 for the three months ended December 31, 2016 from $278,000 for the three months ended December 31, 2015. The increase was caused primarily by a $1.4 million, or 141.8%, increase inpre-tax income. The effective tax rate was 31.2% and 27.7% for the three months ended December 31, 2016 and 2015, respectively.
Comparison of Operating Results for the Six Months Ended December 31, 2016 and 2015
General. Net income increased $1.1 million, or 57.7%, to $3.1 million for the six months ended December 31, 2016 compared to $2.0 million for the six months ended December 31, 2015. The increase was primarily due to a $447,000 increase in net interest income and a $1.9 million increase innon-interest income, partially offset by a $465,000 increase innon-interest expense, a $559,000 increase in income tax expense and a $191,000 increase in provision for loan losses.
Net Interest Income. Net interest income increased $447,000, or 2.7%, to $17.3 million for the six months ended December 31, 2016 from $16.9 million for the six months ended December 31, 2015. The increase primarily reflects a $738,000 increase in interest and dividend income, partially offset by a $291,000 increase in interest expense.
Interest and Dividend Income. Interest and dividend income increased $738,000, or 3.8%, to $20.0 million for the six months ended December 31, 2016 from $19.2 million for the six months ended December 31, 2015. The increase primarily reflects a $31.3 million increase in the average balance on interest-earning assets and a four basis point increase in the average yield to 3.33% from 3.29% for the six months ended December 31, 2015 primarily due to an increase in the average balance of higher yielding loans.
Interest income on loans increased $563,000 primarily due to a $34.1 million increase in the average balance to $769.3 million for the six months ended December 31, 2016 from $735.2 million for the six months ended December 31, 2015, partially offset by a five basis point decrease in the average yield on loans to 4.35% from 4.40% for the same period last year.
Interest income on other interest-earning assets increased $62,000 primarily due to a 24 basis point increase in the average yield on other interest-earning assets to 0.62% for the six months ended December 31, 2016 from 0.38% for the six months ended December 31, 2015 primarily due to an increase in market interest rates, partially offset by a $5.1 million decrease in the average balance on other interest-earning assets.
Interest income on securities increased $113,000 primarily due to a $2.3 million increase in the average balance of securities to $368.9 million for the six months ended December 31, 2016 from $366.6 million for the six months ended December 31, 2015 and a five basis point increase in the average yield on securities to l.63% for the current year period primarily due to an increase in market interest rates.
Interest Expense. Interest expense increased $291,000, or 12.3%, to $2.7 million for the six months ended December 31, 2016 from $2.4 million for the six months ended December 31, 2015. The increase primarily reflects
32
Table of Contents
a $32.7 million increase in the average balance on interest-bearing liabilities and a five basis point increase in the average cost to 0.53% from 0.48% for the six months ended December 31, 2015, due to growth in medium-term and long-term certificates of deposit.
Interest expense on interest-bearing deposits increased $303,000 primarily due to a $48.2 million increase in the average balance to $989.8 million for the six months ended December 31, 2016 from $941.6 million for the six months ended December 31, 2015 and a four basis point increase in the average rate paid on interest-bearing deposits to 0.52% from 0.48% for the six months ended December 31, 2015, due to growth in medium-term and long-term certificates of deposit.
Interest expense on Federal Home Loan Bank advances decreased $12,000 primarily due to a $15.5 million decrease in the average balance to $10.9 million for the six months ended December 31, 2016 from $26.4 million for the six months ended December 31, 2015, due to the maturities of advances, partially offset by a 78 basis point increase in the average cost to 1.48% for the six months ended December 31, 2016 from 0.70% for the same period last year primarily due to the maturities of lower cost advances.
Provision for Loan Losses. We recorded a provision for loan losses of $588,000 and $397,000 for the six months ended December 31, 2016 and 2015, respectively. The increase was caused primarily by an increase in specific reserves on impaired loans in the current year period.
Non-Interest Income.Non-interest income increased $1.9 million to $2.8 million for the six months ended December 31, 2016 compared to $898,000 for the six months ended December 31, 2015. The increase was caused primarily by the receipt of $1.6 million in settlement on a loancharged-off by CMS Bank before the 2015 merger.
Non-Interest Expense.Non-interest expense increased $465,000, or 3.2%, to $15.0 million for the six months ended December 31, 2016 compared to $14.5 million for the six months ended December 31, 2015.
Income Tax Expense. Income tax expense increased $559,000, or 66.1%, to $1.4 million for the six months ended December 31, 2016 from $846,000 for the six months ended December 31, 2015. The increase was caused primarily by a $1.7 million, or 60.2%, increase inpre-tax income. The effective tax rate was 31.0% and 29.9% for the six months ended December 31, 2016 and 2015, respectively.
33
Table of Contents
This prospectus contains forward-looking statements, which can be identified by the use of words such as “estimate,” “project,” “believe,” “intend,” “anticipate,” “plan,” “seek,” “expect” and words of similar meaning. These forward-looking statements include, but are not limited to:
| • | statements of our goals, intentions and expectations; |
| • | statements regarding our business plans, prospects, growth and operating strategies; |
| • | statements regarding the quality of our loan and investment portfolios; and |
| • | estimates of our risks and future costs and benefits. |
These forward-looking statements are based on current beliefs and expectations of our management and are inherently subject to significant business, economic and competitive uncertainties and contingencies, many of which are beyond our control. In addition, these forward-looking statements are subject to assumptions with respect to future business strategies and decisions that are subject to change.
The following factors, among others, could cause actual results to differ materially from the anticipated results or other expectations expressed in the forward-looking statements:
| • | general economic conditions, either nationally or in our market areas, that are worse than expected; |
| • | changes in the level and direction of loan delinquencies and charge-offs and changes in estimates of the adequacy of the allowance for loan losses; |
| • | our ability to access cost-effective funding; |
| • | fluctuations in real estate values and both residential and commercial real estate market conditions; |
| • | demand for loans and deposits in our market area; |
| • | our ability to continue to implement our business strategies; |
| • | competition among depository and other financial institutions; |
| • | inflation and changes in the interest rate environment that reduce our margins and yields, reduce the fair value of financial instruments or reduce the origination levels in our lending business, or increase the level of defaults, losses and prepayments on loans we have made and make whether held in portfolio or sold in the secondary markets; |
| • | adverse changes in the securities markets; |
| • | changes in laws or government regulations or policies affecting financial institutions, including changes in regulatory fees and capital requirements, including as a result of Basel III; |
| • | our ability to manage market risk, credit risk and operational risk in the current economic conditions; |
34
Table of Contents
| • | our ability to enter new markets successfully and capitalize on growth opportunities; |
| • | our ability to successfully integrate any assets, liabilities, customers, systems and management personnel we may acquire into our operations and our ability to realize related revenue synergies and cost savings within expected time frames and any goodwill charges related thereto; |
| • | changes in consumer spending, borrowing and savings habits; |
| • | changes in accounting policies and practices, as may be adopted by the bank regulatory agencies, the Financial Accounting Standards Board, the Securities and Exchange Commission or the Public Company Accounting Oversight Board; |
| • | our ability to retain key employees; |
| • | our compensation expense associated with equity allocated or awarded to our employees; and |
| • | changes in the financial condition, results of operations or future prospects of issuers of securities that we own. |
Because of these and other uncertainties, our actual future results may be materially different from the results indicated by these forward-looking statements. See “Risk Factors” beginning on page 14.
HOW WE INTEND TO USE THE PROCEEDS FROM THE OFFERING
Although we cannot determine what the actual net offering proceeds will be until the offering is completed, we estimate that the net proceeds will be between $145.7 million and $197.8 million, or $227.7 million if the offering range is increased by 15%.
We intend to distribute the net proceeds as follows:
| Based Upon the Sale at $10.00 Per Share of | ||||||||||||||||||||||||||||||||
| 14,875,000 Shares | 17,500,000 Shares | 20,125,000 Shares | 23,143,750 Shares (1) | |||||||||||||||||||||||||||||
| Amount | Percent of Net Proceeds | Amount | Percent of Net Proceeds | Amount | Percent of Net Proceeds | Amount | Percent of Net Proceeds | |||||||||||||||||||||||||
| (Dollars in thousands) | ||||||||||||||||||||||||||||||||
Gross offering proceeds | $ | 148,750 | $ | 175,000 | $ | 201,250 | $ | 231,438 | ||||||||||||||||||||||||
Less: offering expenses | 3,038 | 3,255 | 3,472 | 3,722 | ||||||||||||||||||||||||||||
|
|
|
|
|
|
|
| |||||||||||||||||||||||||
Net offering proceeds | $ | 145,712 | 100.0 | % | $ | 171,745 | 100.0 | % | $ | 197,778 | 100.0 | % | $ | 227,716 | 100.0 | % | ||||||||||||||||
|
|
|
|
|
|
|
| |||||||||||||||||||||||||
Distribution of net proceeds: | ||||||||||||||||||||||||||||||||
Proceeds contributed to PCSB Bank | $ | 72,856 | 50.0 | % | $ | 85,872 | 50.0 | % | $ | 98,889 | 50.0 | % | $ | 113,858 | 50.0 | % | ||||||||||||||||
Loan to employee stock ownership plan | $ | 12,126 | 8.3 | % | $ | 14,266 | 8.3 | % | $ | 16,406 | 8.3 | % | $ | 18,867 | 8.3 | % | ||||||||||||||||
Cash contribution to the charitable foundation | $ | 2,174 | 1.5 | % | $ | 1,675 | 1.0 | % | $ | 1,176 | 0.6 | % | $ | 603 | 0.3 | % | ||||||||||||||||
|
|
|
|
|
|
|
|
|
|
|
|
|
|
|
| |||||||||||||||||
Proceeds retained by PCSB Financial | $ | 58,556 | 40.2 | % | $ | 69,932 | 40.7 | % | $ | 81,307 | 41.1 | % | $ | 94,388 | 41.4 | % | ||||||||||||||||
|
|
|
|
|
|
|
| |||||||||||||||||||||||||
| (1) | As adjusted to give effect to an increase in the number of shares, which increase could occur due to a 15% increase in the offering range to reflect demand for the shares or changes in market conditions following the commencement of the offering. |
Payments for shares of common stock made through withdrawals from existing deposit accounts will not result in the receipt of new funds for investment but will reduce PCSB Bank’s deposits. The net proceeds may vary because total expenses relating to the offering may be more or less than our estimates. For example, our expenses would increase if fewer shares were sold in the subscription and community offerings and more in the syndicated offering than we have assumed.
35
Table of Contents
PCSB Financial may use the proceeds it retains from the offering:
| • | to invest in securities; |
| • | to repurchase shares of our common stock, including repurchases to fund stock-based benefit plans; |
| • | to finance the potential acquisition of financial institutions or financial services companies, although we do not currently have any agreements or understandings regarding any specific acquisition transaction; |
| • | to pay cash dividends to shareholders; and |
| • | for other general corporate purposes. |
See “Our Dividend Policy” for a discussion of our expected dividend policy following the completion of the offering. Under NYSDFS regulations, we may not repurchase shares of our common stock during the first year following the completion of the conversion and, in the second and third years, we may not repurchase more than 5% of our then-outstanding shares of common stock in each of those years without the prior approval of the NYSDFS.
PCSB Bank may use the net proceeds it receives from the offering:
| • | to fund new loans; |
| • | to invest in securities; |
| • | to expand its retail banking franchise by establishing or acquiring new branches or by acquiring other financial institutions or other financial services companies as opportunities arise, although we do not currently have any understandings or agreements to acquire a financial institution or other entity; and |
| • | for other general corporate purposes. |
Initially, a substantial portion of the net proceeds will be invested in short-term investment securities of the type currently held by PCSB Bank. We have not determined specific amounts of the net proceeds that would be used for the purposes described above. The use of the proceeds outlined above may change based on many factors, including, but not limited to, changes in interest rates, equity markets, laws and regulations affecting the financial services industry, the attractiveness of potential acquisitions to expand our operations, and overall market conditions.
We expect our return on equity to be low until we are able to effectively deploy the additional capital raised in the offering. See “Risk Factors—Risks Related to the Offering—Our failure to effectively deploy the net proceeds may have an adverse effect on our financial performance.”
36
Table of Contents
Following completion of the conversion, our board of directors will have the authority to declare dividends on our shares of common stock, subject to statutory and regulatory requirements. We currently intend to pay quarterly cash dividends but have not determined the amount or when payment would start. The payment and amount of dividends would depend upon a number of factors, including: regulatory capital requirements; our financial condition and results of operations; our other uses of funds for the long-term value of stockholders; tax considerations; statutory and regulatory limitations; and general economic conditions. No assurances can be given that any dividends will be paid or that, if paid, they will not be reduced or eliminated in the future. Special cash dividends, stock dividends or returns of capital, to the extent permitted by applicable law, regulations and policy, may be paid in addition to, or in lieu of, regular cash dividends.
We will file a consolidated federal tax return with PCSB Bank. Accordingly, it is anticipated that any cash distributions that we make to our stockholders would be treated as cash dividends and not as anon-taxable return of capital for federal and state tax purposes. Additionally, pursuant to applicable regulations, during the three-year period following the offering, we will not take any action to declare an extraordinary dividend to stockholders that would be treated by recipients as atax-free return of capital for federal income tax purposes.
Pursuant to our articles of incorporation, we are authorized to issue preferred stock. If we issue preferred stock, the holders thereof may have a priority over the holders of our shares of common stock with respect to the payment of dividends. For a further discussion concerning the payment of dividends on our shares of common stock, see “Description of Capital Stock of PCSB Financial—Common Stock.” Dividends we can declare and pay will depend, in part, upon receipt of dividends from PCSB Bank, because initially we will have no source of income other than dividend income from PCSB Bank and earnings from the investment of the net proceeds from the sale of shares of common stock retained by us and interest payments received in connection with the loan to the employee stock ownership plan. New York banking law imposes limitations on capital distributions (including dividends) by PCSB Bank. See “Supervision and Regulation—New York Banking Laws and Supervision—Dividends.”
Any payment of dividends by PCSB Bank to us that would be deemed to be drawn out of PCSB Bank’s bad debt reserves, if any, would require a payment of taxes at the then-current tax rate by PCSB Bank on the amount of earnings deemed to be removed from the reserves for such distribution. PCSB Bank does not intend to make any distribution to us that would create such a federal tax liability.
We have never issued capital stock and there is no established market for our shares of common stock. We expect that our shares of common stock will be listed for trading on the Nasdaq Capital Market under the symbol “PCSB”, subject to completion of the conversion and compliance with certain listing conditions, including the presence of at least three registered and active market makers. Sandler O’Neill & Partners, L.P. has advised us that it intends to make a market in shares of our common stock following the offering, but it is not obligated to do so or to continue to do so once it begins. While we will attempt before completion of the offering to obtain commitments from at least two other broker-dealers to make a market in shares of our common stock, there can be no assurance that we will be successful in obtaining such commitments.
The development and maintenance of a public market, having the desirable characteristics of depth, liquidity and orderliness, depends on the existence of willing buyers and sellers, the presence of which is not within our control or that of any market maker. The number of active buyers and sellers of shares of our common stock at any particular time may be limited, which may have an adverse effect on the price at which shares of our common stock can be sold. There can be no assurance that persons purchasing the shares of common stock will be able to sell their shares at or above the $10.00 offering purchase price per share.
37
Table of Contents
HISTORICAL AND PRO FORMA REGULATORY CAPITAL COMPLIANCE
At September 30, 2016, PCSB Bank exceeded all applicable regulatory capital requirements and was considered “well capitalized.” The table below sets forth, at September 30, 2016, the historical equity capital and regulatory capital and the pro forma equity capital and regulatory capital of PCSB Bank after giving effect to the sale of shares of common stock at $10.00 per share. The tabular data assumes the receipt by PCSB Bank of 50% of the net offering proceeds. See “How We Intend to Use the Proceeds from the Offering.”
| PCSB Bank Historical at September 30, 2016 | Pro Forma at September 30, 2016 Based Upon the Sale in the Offering of: | |||||||||||||||||||||||||||||||||||||||
| 14,875,000 Shares | 17,500,000 Shares | 20,125,000 Shares | 23,143,750 Shares (1) | |||||||||||||||||||||||||||||||||||||
| Amount | Percent of Assets (2) | Amount | Percent of Assets (2) | Amount | Percent of Assets (2) | Amount | Percent of Assets (2) | Amount | Percent of Assets (2) | |||||||||||||||||||||||||||||||
| (Dollars in thousands) | ||||||||||||||||||||||||||||||||||||||||
Equity capital | $ | 111,506 | 8.89 | % | $ | 166,173 | 12.52 | % | $ | 175,979 | 13.13 | % | $ | 185,786 | 13.73 | % | $ | 197,063 | 14.40 | % | ||||||||||||||||||||
Tier 1 leverage capital | $ | 112,246 | 8.85 | % | $ | 166,913 | 12.44 | % | $ | 176,719 | 13.05 | % | $ | 186,526 | 13.64 | % | $ | 197,803 | 14.31 | % | ||||||||||||||||||||
Tier 1 leverage requirement | 63,430 | 5.00 | % | 67,073 | 5.00 | % | 67,724 | 5.00 | % | 68,375 | 5.00 | % | 69,123 | 5.00 | % | |||||||||||||||||||||||||
|
|
|
|
|
|
|
|
|
|
|
|
|
|
|
|
|
|
|
| |||||||||||||||||||||
Excess | $ | 48,816 | 3.85 | % | $ | 99,840 | 7.44 | % | $ | 108,995 | 8.05 | % | $ | 118,151 | 8.64 | % | $ | 128,680 | 9.31 | % | ||||||||||||||||||||
|
|
|
|
|
|
|
|
|
|
|
|
|
|
|
|
|
|
|
| |||||||||||||||||||||
Tier 1 risk-based capital (3) | $ | 112,246 | 13.89 | % | $ | 166,913 | 20.29 | % | $ | 176,719 | 21.41 | % | $ | 186,526 | 22.53 | % | $ | 197,803 | 23.80 | % | ||||||||||||||||||||
Tier 1 risk-based requirement | 64,660 | 8.00 | % | 65,826 | 8.00 | % | 66,034 | 8.00 | % | 66,243 | 8.00 | % | 66,482 | 8.00 | % | |||||||||||||||||||||||||
|
|
|
|
|
|
|
|
|
|
|
|
|
|
|
|
|
|
|
| |||||||||||||||||||||
Excess | $ | 47,586 | 5.89 | % | $ | 101,087 | 12.29 | % | $ | 110,685 | 13.41 | % | $ | 120,283 | 14.53 | % | $ | 131,321 | 15.80 | % | ||||||||||||||||||||
|
|
|
|
|
|
|
|
|
|
|
|
|
|
|
|
|
|
|
| |||||||||||||||||||||
Total risk-based capital (3) | $ | 116,311 | 14.39 | % | $ | 170,978 | 20.78 | % | $ | 180,784 | 21.90 | % | $ | 190,591 | 23.02 | % | $ | 201,868 | 24.29 | % | ||||||||||||||||||||
Total risk-based requirement | 80,825 | 10.00 | % | 82,283 | 10.00 | % | 82,543 | 10.00 | % | 82,803 | 10.00 | % | 83,103 | 10.00 | % | |||||||||||||||||||||||||
|
|
|
|
|
|
|
|
|
|
|
|
|
|
|
|
|
|
|
| |||||||||||||||||||||
Excess | $ | 35,486 | 4.39 | % | $ | 88,695 | 10.78 | % | $ | 98,241 | 11.90 | % | $ | 107,788 | 13.02 | % | $ | 118,765 | 14.29 | % | ||||||||||||||||||||
|
|
|
|
|
|
|
|
|
|
|
|
|
|
|
|
|
|
|
| |||||||||||||||||||||
Common equity tier 1 capital | $ | 112,246 | 13.89 | % | $ | 166,913 | 20.29 | % | $ | 176,719 | 21.41 | % | $ | 186,526 | 22.53 | % | $ | 197,803 | 23.80 | % | ||||||||||||||||||||
Common equity tier 1 requirement | 52,537 | 6.50 | % | 53,484 | 6.50 | % | 53,653 | 6.50 | % | 53,822 | 6.50 | % | 54,017 | 6.50 | % | |||||||||||||||||||||||||
|
|
|
|
|
|
|
|
|
|
|
|
|
|
|
|
|
|
|
| |||||||||||||||||||||
Excess | $ | 59,709 | 7.39 | % | $ | 113,429 | 13.79 | % | $ | 123,066 | 14.91 | % | $ | 132,704 | 16.03 | % | $ | 143,786 | 17.30 | % | ||||||||||||||||||||
|
|
|
|
|
|
|
|
|
|
|
|
|
|
|
|
|
|
|
| |||||||||||||||||||||
Reconciliation: |
| |||||||||||||||||||||||||||||||||||||||
Net proceeds infused into PCSB Bank |
| $ | 72,856 | $ | 85,872 | $ | 98,889 | $ | 113,858 | |||||||||||||||||||||||||||||||
Less: Common stock acquired by employee stock ownership plan |
| $ | (12,126 | ) | $ | (14,266 | ) | $ | (16,406 | ) | $ | (18,867 | ) | |||||||||||||||||||||||||||
Less: Common stock acquired by stock-based benefit plan |
| $ | (6,063 | ) | $ | (7,133 | ) | $ | (8,203 | ) | $ | (9,433 | ) | |||||||||||||||||||||||||||
|
|
|
|
|
|
|
| |||||||||||||||||||||||||||||||||
Pro forma increase in tier 1 and risk-based capital |
| $ | 54,667 | $ | 64,473 | $ | 74,280 | $ | 85,558 | |||||||||||||||||||||||||||||||
|
|
|
|
|
|
|
| |||||||||||||||||||||||||||||||||
| (1) | As adjusted to give effect to an increase in the number of shares, which increase could occur due to a 15% increase in the offering range to reflect demand for the shares or changes in market conditions following the commencement of the offering. |
| (2) | Equity and Tier 1 leverage capital levels are shown as a percentage of total average assets. Risk-based capital levels are shown as a percentage of risk-weighted assets. |
| (3) | Pro forma amounts and percentages assume net proceeds are invested in assets that carry a 20% risk weighting. |
38
Table of Contents
If, at September 30, 2016, PCSB Financial had been subject to the consolidated regulatory capital requirements applicable to bank holding companies, which are identical to the regulatory capital requirements applicable to PCSB Bank, PCSB Financial would have exceeded all applicable consolidated regulatory capital requirements and would have been considered “well capitalized.” The table below sets forth, at September 30, 2016, the historical equity capital and regulatory capital of PCSB Bank and the pro forma consolidated equity capital and regulatory capital of PCSB Financial after giving effect to the sale of shares of common stock at $10.00 per share. The tabular data assumes that PCSB Financial will invest 50% of the net offering proceeds in PCSB Bank, lend a portion of net offering proceeds to our employee stock ownership plan, and retain the remaining net offering proceeds. See “How We Intend to Use the Proceeds from the Offering.”
| PCSB Bank Historical at September 30, 2016 | Pro Forma at September 30, 2016 Based Upon the Sale in the Offering of: | |||||||||||||||||||||||||||||||||||||||
| 14,875,000 Shares | 17,500,000 Shares | 20,125,000 Shares | 23,143,750 Shares (1) | |||||||||||||||||||||||||||||||||||||
| Amount | Percent of Assets (2) | Amount | Percent of Assets (2) | Amount | Percent of Assets (2) | Amount | Percent of Assets (2) | Amount | Percent of Assets (2) | |||||||||||||||||||||||||||||||
| (Dollars in thousands) | ||||||||||||||||||||||||||||||||||||||||
Equity capital | $ | 111,506 | 8.89 | % | $ | 238,555 | 17.27 | % | $ | 261,877 | 18.64 | % | $ | 285,199 | 19.97 | % | $ | 312,019 | 21.45 | % | ||||||||||||||||||||
Tier 1 leverage capital | $ | 112,246 | 8.85 | % | $ | 239,295 | 17.15 | % | $ | 262,617 | 18.51 | % | $ | 285,939 | 19.83 | % | $ | 312,759 | 21.29 | % | ||||||||||||||||||||
Tier 1 leverage requirement | 63,430 | 5.00 | 69,783 | 5.00 | 70,949 | 5.00 | 72,115 | 5.00 | 73,456 | 5.00 | ||||||||||||||||||||||||||||||
|
|
|
|
|
|
|
|
|
|
|
|
|
|
|
|
|
|
|
| |||||||||||||||||||||
Excess | $ | 48,816 | 3.85 | % | $ | 169,512 | 12.15 | % | $ | 191,668 | 13.51 | % | $ | 213,824 | 14.83 | % | $ | 239,303 | 16.29 | % | ||||||||||||||||||||
|
|
|
|
|
|
|
|
|
|
|
|
|
|
|
|
|
|
|
| |||||||||||||||||||||
Tier 1 risk-based capital (3) | $ | 112,246 | 13.89 | % | $ | 239,295 | 28.70 | % | $ | 262,617 | 31.33 | % | $ | 285,939 | 33.92 | % | $ | 312,759 | 36.87 | % | ||||||||||||||||||||
Tier 1 risk-based requirement | 64,660 | 8.00 | 66,693 | 8.00 | 67,066 | 8.00 | 67,439 | 8.00 | 67,869 | 8.00 | ||||||||||||||||||||||||||||||
|
|
|
|
|
|
|
|
|
|
|
|
|
|
|
|
|
|
|
| |||||||||||||||||||||
Excess | $ | 47,586 | 5.89 | % | $ | 172,602 | 20.70 | % | $ | 195,551 | 23.33 | % | $ | 218,500 | 25.92 | % | $ | 244,890 | 28.87 | % | ||||||||||||||||||||
|
|
|
|
|
|
|
|
|
|
|
|
|
|
|
|
|
|
|
| |||||||||||||||||||||
Total risk-based capital (3) | $ | 116,311 | 14.39 | % | $ | 243,360 | 29.19 | % | $ | 266,682 | 31.81 | % | $ | 290,004 | 34.40 | % | $ | 316,824 | 37.35 | % | ||||||||||||||||||||
Total risk-based requirement | 80,825 | 10.00 | 83,366 | 10.00 | 83,833 | 10.00 | 84,299 | 10.00 | 84,836 | 10.00 | ||||||||||||||||||||||||||||||
|
|
|
|
|
|
|
|
|
|
|
|
|
|
|
|
|
|
|
| |||||||||||||||||||||
Excess | $ | 35,486 | 4.39 | % | $ | 159,994 | 19.19 | % | $ | 182,849 | 21.81 | % | $ | 205,705 | 24.40 | % | $ | 231,988 | 27.35 | % | ||||||||||||||||||||
|
|
|
|
|
|
|
|
|
|
|
|
|
|
|
|
|
|
|
| |||||||||||||||||||||
Common equity tier 1 capital | $ | 112,246 | 13.89 | % | $ | 239,295 | 28.70 | % | $ | 262,617 | 31.33 | % | $ | 285,939 | 33.92 | % | $ | 312,759 | 36.87 | % | ||||||||||||||||||||
Common equity tier 1 requirement | 64,660 | 8.00 | 66,693 | 8.00 | 67,066 | 8.00 | 67,439 | 8.00 | 67,869 | 8.00 | ||||||||||||||||||||||||||||||
|
|
|
|
|
|
|
|
|
|
|
|
|
|
|
|
|
|
|
| |||||||||||||||||||||
Excess | $ | 47,586 | 5.89 | % | $ | 172,602 | 20.70 | % | $ | 195,551 | 23.33 | % | $ | 218,500 | 25.92 | % | $ | 244,890 | 28.87 | % | ||||||||||||||||||||
|
|
|
|
|
|
|
|
|
|
|
|
|
|
|
|
|
|
|
| |||||||||||||||||||||
Reconciliation: |
| |||||||||||||||||||||||||||||||||||||||
Net proceeds infused from the offering |
| $ | 145,712 | $ | 171,745 | $ | 197,778 | $ | 227,716 | |||||||||||||||||||||||||||||||
Plus: Tax benefit of contribution to charitable foundation |
| $ | 1,700 | $ | 1,700 | $ | 1,700 | $ | 1,700 | |||||||||||||||||||||||||||||||
Less: Cash contribution to charitable foundation |
| $ | (2,174 | ) | $ | (1,675 | ) | $ | (1,176 | ) | $ | (603 | ) | |||||||||||||||||||||||||||
Less: Common stock acquired by employee stock ownership plan |
| $ | (12,126 | ) | $ | (14,266 | ) | $ | (16,406 | ) | $ | (18,867 | ) | |||||||||||||||||||||||||||
Less: Common stock acquired by stock-based benefit plan |
| $ | (6,063 | ) | $ | (7,133 | ) | $ | (8,203 | ) | $ | (9,433 | ) | |||||||||||||||||||||||||||
|
|
|
|
|
|
|
| |||||||||||||||||||||||||||||||||
Pro forma increase in tier 1 and risk-based capital |
| $ | 127,049 | $ | 150,371 | $ | 173,693 | $ | 200,513 | |||||||||||||||||||||||||||||||
|
|
|
|
|
|
|
| |||||||||||||||||||||||||||||||||
| (1) | As adjusted to give effect to an increase in the number of shares, which increase could occur due to a 15% increase in the offering range to reflect demand for the shares or changes in market conditions following the commencement of the offering. |
| (2) | Equity and Tier 1 leverage capital levels are shown as a percentage of total average assets. Risk-based capital levels are shown as a percentage of risk-weighted assets. |
| (3) | Pro forma amounts and percentages assume net proceeds are invested in assets that carry a 20% risk weighting. |
39
Table of Contents
The following table presents, at September 30, 2016, the historical consolidated capitalization of PCSB Bank and the pro forma consolidated capitalization of PCSB Financial after giving effect to the conversion and offering based upon the assumptions set forth under “Pro Forma Data.”
| PCSB Bank Historical at September 30, 2016 | PCSB Financial Pro Forma at September 30, 2016 Based upon the Sale in the Offering at $10.00 per Share of: | |||||||||||||||||||
| 14,875,000 Shares | 17,500,000 Shares | 20,125,000 Shares | 23,143,750 Shares (1) | |||||||||||||||||
| (Dollars in thousands) | ||||||||||||||||||||
Deposits (2) | $ | 1,116,837 | $ | 1,116,837 | $ | 1,116,837 | $ | 1,116,837 | $ | 1,116,837 | ||||||||||
Borrowings | 11,051 | 11,051 | 11,051 | 11,051 | 11,051 | |||||||||||||||
|
|
|
|
|
|
|
|
|
| |||||||||||
Total deposits and borrowed funds | $ | 1,127,888 | $ | 1,127,888 | $ | 1,127,888 | $ | 1,127,888 | $ | 1,127,888 | ||||||||||
|
|
|
|
|
|
|
|
|
| |||||||||||
Shareholders’ equity: | ||||||||||||||||||||
Preferred stock, $0.01 par value, 10,000,000 shares authorized | — | — | — | — | — | |||||||||||||||
Common stock, $0.01 par value, 200,000,000 shares authorized; shares to be issued as reflected (3) | — | 152 | 178 | 205 | 236 | |||||||||||||||
Additionalpaid-in capital | — | 148,386 | 174,892 | 201,397 | 231,877 | |||||||||||||||
Tax benefit of contribution to the charitable foundation | — | 1,700 | 1,700 | 1,700 | 1,700 | |||||||||||||||
Retained earnings (4) | 119,375 | 119,375 | 119,375 | 119,375 | 119,375 | |||||||||||||||
Accumulated other comprehensive income | (7,869 | ) | (7,869 | ) | (7,869 | ) | (7,869 | ) | (7,869 | ) | ||||||||||
Less: | ||||||||||||||||||||
Expense of contribution to the charitable foundation | — | (5,000 | ) | (5,000 | ) | (5,000 | ) | (5,000 | ) | |||||||||||
Common stock to be acquired by employee stock ownership plan (5) | — | (12,126 | ) | (14,266 | ) | (16,406 | ) | (18,867 | ) | |||||||||||
Common stock to be acquired by stock-based benefit plan (6) | — | (6,063 | ) | (7,133 | ) | (8,203 | ) | (9,433 | ) | |||||||||||
|
|
|
|
|
|
|
|
|
| |||||||||||
Total shareholders’ equity | $ | 111,506 | $ | 238,555 | $ | 261,877 | $ | 285,199 | $ | 312,019 | ||||||||||
|
|
|
|
|
|
|
|
|
| |||||||||||
Pro Forma Shares Outstanding | ||||||||||||||||||||
Total shares issued | — | 15,157,625 | 17,832,500 | 20,507,375 | 23,583,481 | |||||||||||||||
Shares issued to charitable foundation | — | 285,625 | 332,500 | 382,375 | 439,731 | |||||||||||||||
Shares sold in the offering | — | 14,875,000 | 17,500,000 | 20,125,000 | 23,143,750 | |||||||||||||||
Total shareholders’ equity as a percentage of total assets | 8.89 | % | 17.27 | % | 18.64 | % | 19.97 | % | 21.45 | % | ||||||||||
Tangible equity as a percentage of tangible assets (7) | 8.39 | % | 16.86 | % | 18.25 | % | 19.59 | % | 21.08 | % | ||||||||||
| (1) | As adjusted to give effect to an increase in the number of shares, which increase could occur due to a 15% increase in the offering range to reflect demand for the shares or changes in market conditions following the commencement of the offering. |
| (2) | Does not reflect withdrawals from deposit accounts at PCSB Bank for the purchase of shares of common stock. These withdrawals would reduce pro forma deposits and assets by the amount of the withdrawals. |
| (3) | No effect has been given to the issuance of additional shares of common stock pursuant to the exercise of options under one or more stock-based benefit plans. If the plans are implemented within the first year after the closing of the offering, an amount up to 10% of the shares of common stock sold in the offering and contributed to the charitable foundation will be reserved for issuance upon the exercise of options under the plans. See “Management.” |
| (4) | The retained earnings of PCSB Bank will be substantially restricted after the offering. See “Supervision and Regulation—New York Banking Laws and Supervision—Dividends.” |
| (5) | Assumes that 8% of the shares sold in the offering and contributed to the charitable foundation will be acquired by the employee stock ownership plan financed by a loan from PCSB Financial. The loan will be repaid principally from PCSB Bank’s contributions to the employee stock ownership plan. Since PCSB Financial will finance the employee stock ownership plan debt, this debt will be eliminated through consolidation and no liability will be reflected on PCSB Financial’s consolidated balance sheet. Accordingly, the amount of shares of common stock acquired by the employee stock ownership plan is shown in this table as a reduction of total shareholders’ equity. |
40
Table of Contents
| (6) | Assumes a number of shares of common stock equal to 4% of the shares of common stock to be sold in the offering and contributed to the charitable foundation will be purchased for grant by one or more stock-based benefit plans. The funds to be used by such plans to purchase the shares will be provided by PCSB Financial. The dollar amount of common stock to be purchased is based on the $10.00 per share offering price and represents unearned compensation. This amount does not reflect possible increases or decreases in the value of common stock relative to the offering price. PCSB Financial will accrue compensation expense to reflect the vesting of shares pursuant to such stock-based benefit plans and will credit capital in an amount equal to the charge to operations. Implementation of such plans will require shareholder approval. |
| (7) | At September 30, 2016, intangible assets totaled $6.8 million. |
41
Table of Contents
The following tables summarize historical and pro forma data of PCSB Financial at and for the three months ended September 30, 2016 and at and for the year ended June 30, 2016. This information is based on assumptions set forth below and in the table, and should not be used as a basis for projections of market value of the shares of common stock following the offering.
The net proceeds in the table are based upon the following assumptions:
| (i) | all shares of common stock will be sold in the subscription and community offerings; |
| (ii) | our trustees, executive officers, and their associates will purchase 252,500 shares of common stock; |
| (iii) | our employee stock ownership plan will purchase 8% of the shares of common stock sold in the offering and contributed to the charitable foundation with the proceeds of a loan from PCSB Financial. The loan will be repaid in substantially equal payments of principal and interest (at the prime rate of interest, calculated at the date of the loan origination)over a15-year period. Interest income that we earn on the loan will offset the interest paid by PCSB Bank; |
| (iv) | PCSB Financial will contribute $2.2 million, $1.7 million, $1.2 million and $603,000 in cash to the charitable foundation at the minimum, midpoint, maximum and adjusted maximum of the offering range, respectively; |
| (v) | we will pay Sandler O’Neill & Partners, L.P. a fee equal to 0.90% of the aggregate amount of common stock sold in the subscription and community offerings; |
| (vi) | no fee will be paid with respect to shares of common stock purchased by ourtax-qualified andnon-qualified employee stock benefit plans, or stock purchased by our officers, trustees and employees, and their immediate families; and |
| (vii) | total expenses of the offering, other than the fees and commissions to be paid to Sandler O’Neill & Partners, L.P. and other broker-dealers, will be $1.7 million. |
We calculated pro forma consolidated net income for the three months ended September 30, 2016 and the year ended June 30, 2016 as if the estimated net proceeds had been invested at the beginning of the period at an assumed interest rate of 1.14% (0.75%after-tax). This rate represents the yield on the five-year U.S. Treasury Note at September 30, 2016, which, in light of current market interest rates, we consider to more accurately reflect the pro forma reinvestment rate than the arithmetic average of the weighted average yield earned on our interest earning assets and the weighted average rate paid on our deposits, which is the reinvestment rate generally required by applicable regulations.
We further believe that the reinvestment rate is factually supportable because:
| • | the yield on the U.S Treasury Note can be determined and/or estimated from third-party sources; and |
| • | we believe that U.S. Treasury securities are not subject to credit losses due to a U.S. Government guarantee of payment of principal and interest. |
We calculated historical and pro forma per share amounts by dividing historical and pro forma amounts of consolidated net income and shareholders’ equity by the indicated number of shares of common stock. For purposes of pro forma earnings per share calculations, we adjusted these figures to give effect to the shares of common stock purchased by the employee stock ownership plan. We computed per share amounts as if the shares of common stock were outstanding at the beginning of the year, but we did not adjust per share historical or pro forma shareholders’ equity to reflect the earnings on the estimated net proceeds.
42
Table of Contents
The pro forma tables give effect to the implementation of one or more stock-based benefit plans. Subject to the receipt of shareholder approval, we have assumed that stock-based benefit plans will acquire for restricted stock awards a number of shares of common stock equal to 4% of the shares of common stock sold in the offering and contributed to the charitable foundation at the same price for which they were sold in the offering. We assume that awards of common stock granted under such plans vest over a five-year period.
We have also assumed that options will be granted under stock-based benefit plans to acquire shares of common stock equal to 10% of the shares of common stock sold in the offering and contributed to the charitable foundation. In preparing the table below, we assumed that shareholder approval was obtained, that the exercise price of the stock options and the market price of the stock at the date of grant were $10.00 per share and that the stock options had a term of ten years and vested over five years. We applied the Black-Scholes option pricing model to estimate a grant-date fair value of $2.34 for each option. In addition to the terms of the options described above, the Black-Scholes option pricing model assumed an estimated volatility rate of 12.81% for the shares of common stock, no dividend yield, an expected option term of 10 years and a risk-free rate of return of 1.60%.
We may grant options and award shares of common stock under one or more stock-based benefit plans in excess of 10% and 4%, respectively, of the shares of common stock sold in the offering and contributed to the charitable foundation and that vest sooner than over a5-year period if the stock-based benefit plans are adopted more than one year following the offering.
As discussed under “How We Intend to Use the Proceeds from the Offering,” we intend to contribute 50% of the net offering proceeds to PCSB Bank, and we will retain the remainder of the net offering proceeds. We will use a portion of the proceeds we retain for the purpose of funding a loan to the employee stock ownership plan and retain the rest of the proceeds for future use.
The pro forma table does not give effect to:
| • | withdrawals from deposit accounts at PCSB Bank to purchase shares of common stock in the offering; |
| • | our results of operations after the offering; |
| • | increased fees that we would pay Sandler O’Neill & Partners, L.P. and other broker-dealers if we would have to conduct a syndicated offering; or |
| • | changes in the market price of the shares of common stock after the offering. |
The following pro forma information may not be representative of the financial effects of the offering at the dates on which the offering actually occurs, and should not be taken as indicative of future results of operations. Pro forma consolidated shareholders’ equity represents the difference between the stated amounts of our assets and liabilities. The pro forma shareholders’ equity is not intended to represent the fair market value of the shares of common stock and may be different than the amounts that would be available for distribution to shareholders if we liquidated. Moreover, pro forma shareholders’ equity per share does not give effect to the liquidation account to be established by PCSB Bank or, in the unlikely event of a liquidation of PCSB Bank, to the tax effect of the recapture of the bad debt reserve.
43
Table of Contents
| At or for the Three Months Ended September 30, 2016 Based Upon the Sale at $10.00 Per Share of: | ||||||||||||||||
| 14,875,000 Shares | 17,500,000 Shares | 20,125,000 Shares | 23,143,750 Shares (1) | |||||||||||||
| (Dollars in thousands, except per share amounts) | ||||||||||||||||
Gross proceeds of stock offering | $ | 148,750 | $ | 175,000 | $ | 201,250 | $ | 231,438 | ||||||||
Plus:market value of shares issued to charitable foundation | 2,826 | 3,325 | 3,824 | 4,397 | ||||||||||||
|
|
|
|
|
|
|
| |||||||||
Pro forma market capitalization | $ | 151,576 | $ | 178,325 | $ | 205,074 | $ | 235,835 | ||||||||
|
|
|
|
|
|
|
| |||||||||
Gross proceeds of stock offering | $ | 148,750 | $ | 175,000 | $ | 201,250 | $ | 231,438 | ||||||||
Less: expenses | 3,038 | 3,255 | 3,472 | 3,722 | ||||||||||||
|
|
|
|
|
|
|
| |||||||||
Estimated net proceeds | 145,712 | 171,745 | 197,778 | 227,716 | ||||||||||||
Less: Cash contribution to charitable foundation | (2,174 | ) | (1,675 | ) | (1,176 | ) | (603 | ) | ||||||||
Less: Common stock purchased by employee stock ownership plan | (12,126 | ) | (14,266 | ) | (16,406 | ) | (18,867 | ) | ||||||||
Less: Common stock purchased by stock-based benefit plans | (6,063 | ) | (7,133 | ) | (8,203 | ) | (9,433 | ) | ||||||||
|
|
|
|
|
|
|
| |||||||||
Estimated net proceeds, as adjusted | $ | 125,349 | $ | 148,671 | $ | 171,993 | $ | 198,813 | ||||||||
|
|
|
|
|
|
|
| |||||||||
For the Three Months Ended September 30, 2016 | ||||||||||||||||
Consolidated net earnings: | ||||||||||||||||
Historical | $ | 1,456 | $ | 1,456 | $ | 1,456 | $ | 1,456 | ||||||||
Pro forma income on net proceeds | 236 | 280 | 324 | 374 | ||||||||||||
Pro forma employee stock ownership plan adjustment (2) | (133 | ) | (157 | ) | (180 | ) | (208 | ) | ||||||||
Pro forma stock award adjustment (3) | (200 | ) | (235 | ) | (271 | ) | (311 | ) | ||||||||
Pro forma stock option plan adjustment (4) | (162 | ) | (191 | ) | (220 | ) | (252 | ) | ||||||||
|
|
|
|
|
|
|
| |||||||||
Pro forma net income (5)(6) | $ | 1,197 | $ | 1,153 | $ | 1,109 | $ | 1,059 | ||||||||
|
|
|
|
|
|
|
| |||||||||
Per share net income: | ||||||||||||||||
Historical | $ | 0.10 | $ | 0.08 | $ | 0.07 | $ | 0.06 | ||||||||
Pro forma income on net proceeds | 0.02 | 0.02 | 0.02 | 0.02 | ||||||||||||
Pro forma employee stock ownership plan adjustment (2) | (0.01 | ) | (0.01 | ) | (0.01 | ) | (0.01 | ) | ||||||||
Pro forma stock award adjustment (3) | (0.01 | ) | (0.01 | ) | (0.01 | ) | (0.01 | ) | ||||||||
Pro forma stock option plan adjustment(4) | (0.01 | ) | (0.01 | ) | (0.01 | ) | (0.01 | ) | ||||||||
|
|
|
|
|
|
|
| |||||||||
Pro forma earnings per share (5)(6) | $ | 0.09 | $ | 0.07 | $ | 0.06 | $ | 0.05 | ||||||||
|
|
|
|
|
|
|
| |||||||||
Stock price as a multiple of pro forma earnings per share | 27.78 | x | 35.71 | x | 41.67 | x | 50.00 | x | ||||||||
Shares used for calculating pro forma earnings per share | 13,965,225 | 16,429,677 | 18,894,128 | 21,728,247 | ||||||||||||
At September 30, 2016 | ||||||||||||||||
Shareholders’ equity: | ||||||||||||||||
Historical | $ | 111,506 | $ | 111,506 | $ | 111,506 | $ | 111,506 | ||||||||
Estimated net proceeds | 145,712 | 171,745 | 197,778 | 227,716 | ||||||||||||
Plus: market value of shares issued to charitable foundation | 2,826 | 3,325 | 3,824 | 4,397 | ||||||||||||
Plus: tax benefit of contribution to charitable foundation | 1,700 | 1,700 | 1,700 | 1,700 | ||||||||||||
Less: expense of contribution to charitable foundation | (5,000 | ) | (5,000 | ) | (5,000 | ) | (5,000 | ) | ||||||||
Less: common stock acquired by employee stock ownership plan (2) | (12,126 | ) | (14,266 | ) | (16,406 | ) | (18,867 | ) | ||||||||
Less: common stock acquired by stock-based benefit plans (3) | (6,063 | ) | (7,133 | ) | (8,203 | ) | (9,433 | ) | ||||||||
|
|
|
|
|
|
|
| |||||||||
Pro forma shareholders’ equity (7)(8) | 238,555 | 261,877 | 285,199 | 312,019 | ||||||||||||
Intangible assets | (6,772 | ) | (6,772 | ) | (6,772 | ) | (6,772 | ) | ||||||||
|
|
|
|
|
|
|
| |||||||||
Pro forma tangible shareholders’ equity | $ | 231,783 | $ | 255,105 | $ | 278,427 | $ | 305,247 | ||||||||
|
|
|
|
|
|
|
| |||||||||
Shareholders’ equity per share: | ||||||||||||||||
Historical | $ | 7.36 | $ | 6.25 | $ | 5.44 | $ | 4.72 | ||||||||
Estimated net proceeds | 9.61 | 9.63 | 9.64 | 9.66 | ||||||||||||
Plus: market value of shares issued to charitable foundation | 0.19 | 0.19 | 0.19 | 0.19 | ||||||||||||
Plus: tax benefit of contribution to charitable foundation | 0.11 | 0.10 | 0.08 | 0.07 | ||||||||||||
Less: tax expense of stock contribution to charitable foundation | (0.33 | ) | (0.28 | ) | (0.24 | ) | (0.21 | ) | ||||||||
Less: common stock acquired by employee stock ownership plan (2) | (0.80 | ) | (0.80 | ) | (0.80 | ) | (0.80 | ) | ||||||||
Less: common stock acquired by stock-based benefit plans (3) | (0.40 | ) | (0.40 | ) | (0.40 | ) | (0.40 | ) | ||||||||
|
|
|
|
|
|
|
| |||||||||
Pro forma shareholders’ equity per share (7)(8) | 15.74 | 14.69 | 13.91 | 13.23 | ||||||||||||
Intangible assets | (0.45 | ) | (0.38 | ) | (0.33 | ) | (0.29 | ) | ||||||||
|
|
|
|
|
|
|
| |||||||||
Pro forma shareholders’ equity per share | $ | 15.29 | $ | 14.31 | $ | 13.58 | $ | 12.94 | ||||||||
|
|
|
|
|
|
|
| |||||||||
Offering price as percentage of equity per share (8) | 63.53 | % | 68.07 | % | 71.89 | % | 75.59 | % | ||||||||
Offering price as percentage of tangible equity per share | 65.40 | % | 69.88 | % | 73.64 | % | 77.28 | % | ||||||||
Shares used for pro forma shareholders’ equity per share | 15,157,625 | 17,832,500 | 20,507,375 | 23,583,481 | ||||||||||||
(footnotes begin on following page)
44
Table of Contents
| (1) | As adjusted to give effect to an increase in the number of shares, which increase could occur due to a 15% increase in the offering range to reflect demand for the shares or changes in market conditions following the commencement of the offering. |
| (2) | Assumes that 8% of the shares of common stock sold in the offering and contributed to the charitable foundation will be purchased by the employee stock ownership plan. For purposes of this table, the funds used to acquire these shares are assumed to have been borrowed by the employee stock ownership plan from PCSB Financial. PCSB Bank intends to make annual contributions to the employee stock ownership plan in an amount at least equal to the required principal and interest payments on the debt. PCSB Bank’s total annual payments on the employee stock ownership plan debt are based upon 15 equal annual installments of principal and interest. ASC718-40 requires that an employer record compensation expense in an amount equal to the fair value of the shares committed to be released to employees. The pro forma adjustments assume that the employee stock ownership plan shares are allocated in equal annual installments based on the number of loan repayment installments assumed to be paid by PCSB Bank, the fair value of the common stock remains equal to the subscription price and the employee stock ownership plan expense reflects an effective combined federal and state tax rate of 34.0%. The unallocated employee stock ownership plan shares are reflected as a reduction of shareholders’ equity. No reinvestment is assumed on proceeds contributed to fund the employee stock ownership plan. The pro forma net income further assumes that 20,210, 23,777, 27,343 and 31,445 shares were committed to be released during the period at the minimum, midpoint, maximum, and adjusted maximum of the offering range, respectively, and according to ASC718-40, only the employee stock ownership plan shares committed to be released during the period were considered outstanding for purposes of net income per share calculations. |
| (3) | Assumes that one or more stock-based benefit plans purchase an aggregate number of shares of common stock equal to 4% of the shares to be sold in the offering and contributed to the charitable foundation. Shareholder approval of the plans and purchases by the plans may not occur earlier than six months after the completion of the offering. The shares may be acquired directly from PCSB Financial or through open market purchases. Shares in the stock-based benefit plan are assumed to vest over a period of five years. The funds to be used to purchase the shares will be provided by PCSB Financial. The table assumes that (i) the stock-based benefit plan acquires the shares through open market purchases at $10.00 per share, (ii) 5.0% of the amount contributed to the plan is amortized as an expense during the three months ended September 30, 2016, and (iii) the plan expense reflects an effective combined federal and state tax rate of 34.0%. The issuance of authorized but unissued shares of common stock to fund these awards would dilute shareholders’ ownership and voting interests by approximately 3.8%. |
| (4) | Assumes that options are granted under one or more stock-based benefit plans to acquire an aggregate number of shares of common stock equal to 10% of the shares to be sold in the offering and contributed to the charitable foundation. Shareholder approval of the plans may not occur earlier than six months after the completion of the offering. In calculating the pro forma effect of the stock-based benefit plans, it is assumed that the exercise price of the stock options and the trading price of the common stock at the date of grant were $10.00 per share, the estimated grant-date fair value determined using the Black-Scholes option pricing model was $2.34 for each option, the aggregate grant-date fair value of the stock options was amortized to expense on a straight-line basis over a5-year vesting period of the options, and that 25% of the amortization expense (or the assumed portion relating to options granted to directors) resulted in a tax benefit using an assumed tax rate of 34.0%. The actual expense will be determined by the grant-date fair value of the options, which will depend on a number of factors, including the valuation assumptions used and the option pricing model ultimately adopted. Under the above assumptions, the adoption of the stock-based benefit plans will result in no additional shares under the treasury stock method for purposes of calculating earnings per share. There can be no assurance that the actual exercise price of the stock options will be equal to the $10.00 price per share. If a portion of the shares used to satisfy the exercise of options comes from authorized but unissued shares, our net income per share and shareholders’ equity per share would decrease. The issuance of authorized but unissued shares of common stock pursuant to the exercise of options under such plan would dilute shareholders’ ownership and voting interests by approximately 9.1%. |
| (5) | Net income per share computations are determined by taking the number of shares assumed to be sold in the offering and contributed to the charitable foundation and, according to ASC718-40, subtracting the employee stock ownership plan shares which have not been committed for release during the year. See footnote 1 above. The number of shares of common stock actually sold and the corresponding number of outstanding shares may be more or less than the assumed amounts. |
| (6) | Does not give effect to thenon-recurring expense that will be recognized during fiscal 2017 as a result of the contribution to the charitable foundation. The following table shows the estimatedafter-tax expense associated with the contribution to the charitable foundation, as well as pro forma net income and pro forma net income per share assuming the contribution to the charitable foundation had been expensed during the three months ended September 30, 2016. |
| For the Three Months Ended September 30, 2016 Based upon the Sale at $10.00 Per Share of: | ||||||||||||||||
| 14,875,000 Shares | 17,500,000 Shares | 20,125,000 Shares | 23,143,750 Shares | |||||||||||||
| (In thousands, except per share amounts) | ||||||||||||||||
After-tax expense of stock and cash contribution to charitable foundation | $ | 3,300 | $ | 3,300 | $ | 3,300 | $ | 3,300 | ||||||||
Pro forma net income, adjusted for foundation contribution | (2,103 | ) | (2,147 | ) | (2,191 | ) | (2,241 | ) | ||||||||
Pro forma net income (loss) per share | (0.15 | ) | (0.13 | ) | (0.12 | ) | (0.10 | ) | ||||||||
The pro forma data assume that we will realize 100% of the income tax benefit as a result of the contribution to the charitable foundation based on a 34.0% combined federal and state tax rate. The realization of the tax benefit is generally limited annually to 10% of our annual taxable income. However, for federal and state tax purposes, we can carry forward any unused portion of the deduction for five years following the year in which the contribution is made.
| (7) | The retained earnings of PCSB Bank will be substantially restricted after the offering. See “Our Dividend Policy,” and “Supervision and Regulation—New York Banking Laws and Supervision—Dividends.” |
| (8) | At September 30, 2016, intangible assets totaled $6.8 million. |
45
Table of Contents
| At or for the Year Ended June 30, 2016 Based upon the Sale at $10.00 Per Share of: | ||||||||||||||||
| 14,875,000 Shares | 17,500,000 Shares | 20,125,000 Shares | 23,143,750 Shares (1) | |||||||||||||
| (Dollars in thousands, except per share amounts) | ||||||||||||||||
Gross proceeds of stock offering | $ | 148,750 | $ | 175,000 | $ | 201,250 | $ | 231,438 | ||||||||
Plus: market value of shares issued to charitable foundation | 2,826 | 3,325 | 3,824 | 4,397 | ||||||||||||
|
|
|
|
|
|
|
| |||||||||
Pro forma market capitalization | $ | 151,576 | $ | 178,325 | $ | 205,074 | $ | 235,835 | ||||||||
|
|
|
|
|
|
|
| |||||||||
Gross proceeds of stock offering | $ | 148,750 | $ | 175,000 | $ | 201,250 | $ | 231,438 | ||||||||
Less: expenses | 3,038 | 3,255 | 3,472 | 3,722 | ||||||||||||
|
|
|
|
|
|
|
| |||||||||
Estimated net proceeds | 145,712 | 171,745 | 197,778 | 227,716 | ||||||||||||
Less: cash contribution to charitable foundation | (2,174 | ) | (1,675 | ) | (1,176 | ) | (603 | ) | ||||||||
Less: common stock purchased by employee stock ownership plan | (12,126 | ) | (14,266 | ) | (16,406 | ) | (18,867 | ) | ||||||||
Less: common stock purchased by stock-based benefit plans | (6,063 | ) | (7,133 | ) | (8,203 | ) | (9,433 | ) | ||||||||
|
|
|
|
|
|
|
| |||||||||
Estimated net proceeds, as adjusted | $ | 125,349 | $ | 148,671 | $ | 171,993 | $ | 198,813 | ||||||||
|
|
|
|
|
|
|
| |||||||||
For the Year Ended June 30, 2016 | ||||||||||||||||
Consolidated net earnings: | ||||||||||||||||
Historical | $ | 2,926 | $ | 2,926 | $ | 2,926 | $ | 2,926 | ||||||||
Pro forma income on net proceeds | 943 | 1,119 | 1,294 | 1,4966 | ||||||||||||
Pro forma employee stock ownership plan adjustment (2) | (534 | ) | (628 | ) | (722 | ) | (830 | ) | ||||||||
Pro forma stock award adjustment (3) | (800 | ) | (942 | ) | (1,083 | ) | (1,245 | ) | ||||||||
Pro forma stock option plan adjustment (4) | (649 | ) | (764 | ) | (878 | ) | (1,010 | ) | ||||||||
|
|
|
|
|
|
|
| |||||||||
Pro forma net income (5)(6) | $ | 1,886 | $ | 1,711 | $ | 1,537 | $ | 1,337 | ||||||||
|
|
|
|
|
|
|
| |||||||||
Per share net income: | ||||||||||||||||
Historical | $ | 0.21 | $ | 0.18 | $ | 0.16 | $ | 0.14 | ||||||||
Pro forma income on net proceeds | 0.07 | 0.07 | 0.07 | 0.07 | ||||||||||||
Pro forma employee stock ownership plan adjustment (2) | (0.04 | ) | (0.04 | ) | (0.04 | ) | (0.04 | ) | ||||||||
Pro forma stock award adjustment (3) | (0.06 | ) | (0.06 | ) | (0.06 | ) | (0.06 | ) | ||||||||
Pro forma stock option plan adjustment (4) | (0.05 | ) | (0.05 | ) | (0.05 | ) | (0.05 | ) | ||||||||
|
|
|
|
|
|
|
| |||||||||
Pro forma net income per share (5)(6) | $ | 0.13 | $ | 0.10 | $ | 0.08 | $ | 0.06 | ||||||||
|
|
|
|
|
|
|
| |||||||||
Stock price as a multiple of pro forma earnings per share | 76.92 | x | 100.00 | x | 125.00 | x | 166.67 | x | ||||||||
Shares used for calculating pro forma earnings per share | 14,025,856 | 16,501,007 | 18,976,158 | 21,822,581 | ||||||||||||
At June 30, 2016 | ||||||||||||||||
Shareholders’ equity: | ||||||||||||||||
Historical | $ | 109,949 | $ | 109,949 | $ | 109,949 | $ | 109,949 | ||||||||
Estimated net proceeds | 145,712 | 171,745 | 197,778 | 227,716 | ||||||||||||
Plus: market value of shares issued to charitable foundation | 2,826 | 3,325 | 3,824 | 4,397 | ||||||||||||
Plus: tax benefit of contribution to charitable foundation | 1,700 | 1,700 | 1,700 | 1,700 | ||||||||||||
Less: expense of contribution to charitable foundation | (5,000 | ) | (5,000 | ) | (5,000 | ) | (5,000 | ) | ||||||||
Less: common stock acquired by employee stock ownership plan (2) | (12,126 | ) | (14,266 | ) | (16,406 | ) | (18,867 | ) | ||||||||
Less: common stock acquired by stock-based benefit plans (3) | (6,063 | ) | (7,133 | ) | (8,203 | ) | (9,433 | ) | ||||||||
|
|
|
|
|
|
|
| |||||||||
Pro forma shareholders’ equity (7)(8) | 236,998 | 260,320 | 283,642 | 310,462 | ||||||||||||
Intangible assets | (6,808 | ) | (6,808 | ) | (6,808 | ) | (6,808 | ) | ||||||||
|
|
|
|
|
|
|
| |||||||||
Pro forma tangible shareholders equity | $ | 230,190 | $ | 253,512 | $ | 276,834 | $ | 303,654 | ||||||||
|
|
|
|
|
|
|
| |||||||||
Shareholders’ equity per share: | ||||||||||||||||
Historical | $ | 7.26 | $ | 6.16 | $ | 5.36 | $ | 4.65 | ||||||||
Estimated net proceeds | 9.61 | 9.63 | 9.64 | 9.66 | ||||||||||||
Plus: market value of shares issued to charitable foundation | 0.19 | 0.19 | 0.19 | 0.19 | ||||||||||||
Plus: tax benefit of contribution to charitable foundation | 0.11 | 0.10 | 0.08 | 0.07 | ||||||||||||
Less: expense of contribution to charitable foundation | (0.33 | ) | (0.28 | ) | (0.24 | ) | (0.21 | ) | ||||||||
Less: common stock acquired by employee stock ownership plan (2) | (0.80 | ) | (0.80 | ) | (0.80 | ) | (0.80 | ) | ||||||||
Less: common stock acquired by stock-based benefit plans (3) | (0.40 | ) | (0.40 | ) | (0.40 | ) | (0.40 | ) | ||||||||
|
|
|
|
|
|
|
| |||||||||
Pro forma shareholders’ equity per share (7)(8) | 15.64 | 14.60 | 13.83 | 13.16 | ||||||||||||
Intangible assets | (0.45 | ) | (0.38 | ) | (0.33 | ) | (0.29 | ) | ||||||||
|
|
|
|
|
|
|
| |||||||||
Pro forma tangible shareholders equity per share | $ | 15.19 | $ | 14.22 | $ | 13.50 | $ | 12.87 | ||||||||
|
|
|
|
|
|
|
| |||||||||
Offering price as percentage of equity per share (8) | 63.94 | % | 68.49 | % | 72.31 | % | 75.99 | % | ||||||||
Offering price as percentage of tangible equity per share (8) | 65.83 | % | 70.32 | % | 74.07 | % | 77.70 | % | ||||||||
Shares used for pro forma shareholders’ equity per share | 15,157,625 | 17,832,500 | 20,507,375 | 23,583,481 | ||||||||||||
(footnotes begin on following page)
46
Table of Contents
| (1) | As adjusted to give effect to an increase in the number of shares, which increase could occur due to a 15% increase in the offering range to reflect demand for the shares or changes in market conditions following the commencement of the offering. |
| (2) | Assumes that 8% of the shares of common stock sold in the offering and contributed to the charitable foundation will be purchased by the employee stock ownership plan. For purposes of this table, the funds used to acquire these shares are assumed to have been borrowed by the employee stock ownership plan from PCSB Financial. PCSB Bank intends to make annual contributions to the employee stock ownership plan in an amount at least equal to the required principal and interest payments on the debt. PCSB Bank’s total annual payments on the employee stock ownership plan debt are based upon 15 equal annual installments of principal and interest. Financial Accounting Standards Board Accounting Standards Codification (“ASC”)718-40, “Compensation—Stock Compensation—Employee Stock Ownership Plans” (“ASC718-40”) requires that an employer record compensation expense in an amount equal to the fair value of the shares committed to be released to employees. The pro forma adjustments assume that the employee stock ownership plan shares are allocated in equal annual installments based on the number of loan repayment installments assumed to be paid by PCSB Bank, the fair value of the common stock remains equal to the offering price and the employee stock ownership plan expense reflects an effective combined federal and state tax rate of 34.0%. The unallocated employee stock ownership plan shares are reflected as a reduction of shareholders’ equity. No reinvestment is assumed on proceeds contributed to fund the employee stock ownership plan. The pro forma net income further assumes that 80,841, 95,107, 109,373 and 125,779 shares were committed to be released during the year at the minimum, midpoint, maximum, and adjusted maximum of the offering range, respectively, and according to ASC718-40, only the employee stock ownership plan shares committed to be released during the period were considered outstanding for purposes of net income per share calculations. |
| (3) | Assumes that one or more stock-based benefit plans purchase an aggregate number of shares of common stock equal to 4% of the shares to be sold in the offering and contributed to the charitable foundation. Shareholder approval of the plans and purchases by the plans may not occur earlier than six months after the completion of the offering. The shares may be acquired directly from PCSB Financial or through open market purchases. Shares in the stock-based benefit plan are assumed to vest over a period of five years. The funds to be used to purchase the shares will be provided by PCSB Financial. The table assumes that (i) the stock-based benefit plan acquires the shares through open market purchases at $10.00 per share, (ii) 20% of the amount contributed to the plan is amortized as an expense during the year ended June 30, 2016, and (iii) the plan expense reflects an effective combined federal and state tax rate of 34.0%. The issuance of authorized but unissued shares of common stock to fund these awards would dilute shareholders’ ownership and voting interests by approximately 3.8%. |
| (4) | Assumes that options are granted under one or more stock-based benefit plans to acquire an aggregate number of shares of common stock equal to 10% of the shares to be sold in the offering and contributed to the charitable foundation. Shareholder approval of the plans may not occur earlier than six months after the completion of the offering. In calculating the pro forma effect of the stock-based benefit plans, it is assumed that the exercise price of the stock options and the trading price of the common stock at the date of grant were $10.00 per share, the estimated grant-date fair value determined using the Black-Scholes option pricing model was $2.34 for each option, the aggregate grant-date fair value of the stock options was amortized to expense on a straight-line basis over a5-year vesting period of the options, and that 25% of the amortization expense (or the assumed portion relating to options granted to directors) resulted in a tax benefit using an assumed combined federal and state tax rate of 34.0%. The actual expense will be determined by the grant-date fair value of the options, which will depend on a number of factors, including the valuation assumptions used and the option pricing model ultimately adopted. Under the above assumptions, the adoption of the stock-based benefit plans will result in no additional shares under the treasury stock method for purposes of calculating earnings per share. There can be no assurance that the actual exercise price of the stock options will be equal to the $10.00 price per share. If a portion of the shares used to satisfy the exercise of options comes from authorized but unissued shares, our net income per share and shareholders’ equity per share would decrease. The issuance of authorized but unissued shares of common stock pursuant to the exercise of options under such plan would dilute shareholders’ ownership and voting interests by approximately 9.1%. |
| (5) | Net income per share computations are determined by taking the number of shares assumed to be sold in the offering and contributed to the charitable foundation and, according to ASC718-40, subtracting the employee stock ownership plan shares which have not been committed for release during the year. See footnote 1 above. The number of shares of common stock actually sold and the corresponding number of outstanding shares may be more or less than the assumed amounts. |
(footnotes continue on following page)
47
Table of Contents
(continued from previous page)
| (6) | Does not give effect to thenon-recurring expense that will be recognized during fiscal 2017 as a result of the contribution to the charitable foundation. The following table shows the estimatedafter-tax expense associated with the contribution to the charitable foundation, as well as pro forma net income and pro forma net income per share assuming the contribution to the charitable foundation had been expensed during the year ended June 30, 2016. |
| For the Year Ended June 30, 2016 Based upon the Sale at $10.00 Per Share of: | ||||||||||||||||
| 14,875,000 Shares | 17,500,000 Shares | 20,125,000 Shares | 23,143,750 Shares | |||||||||||||
| (In thousands, except per share amounts) | ||||||||||||||||
After-tax expense of stock and cash contribution to charitable foundation | $ | 3,300 | $ | 3,300 | $ | 3,300 | $ | 3,300 | ||||||||
Pro forma net income, adjusted for foundation contribution | (1,414 | ) | (1,589 | ) | (1,763 | ) | (1,963 | ) | ||||||||
Pro forma net income (loss) per share | (0.10 | ) | (0.10 | ) | (0.09 | ) | (0.09 | ) | ||||||||
The pro forma data assume that we will realize 100% of the income tax benefit as a result of the contribution to the charitable foundation based on a combined federal and state tax rate of 34.0%. The realization of the tax benefit is generally limited annually to 10% of our annual taxable income. However, for federal and state tax purposes, we can carry forward any unused portion of the deduction for five years following the year in which the contribution is made.
| (7) | The retained earnings of PCSB Bank will be substantially restricted after the offering. See “Our Dividend Policy,” and “Supervision and Regulation—New York Banking Laws and Supervision—Dividends.” |
| (8) | At June 30, 2016, intangible assets totaled $6.8 million. |
48
Table of Contents
COMPARISON OF VALUATION AND PRO FORMA INFORMATION
WITH AND WITHOUT THE CHARITABLE FOUNDATION
As reflected in the table below, if the charitable foundation is not established and funded in connection with the conversion and offering, RP Financial estimates that our pro forma valuation would be greater and, as a result, a greater number of shares of common stock would be issued in the offering. At the minimum, midpoint, maximum, and adjusted maximum of the valuation range, our pro forma valuation is $151.6 million, $178.3 million, $205.1 million and $235.8 million, respectively, with the charitable foundation, as compared to $155.6 million, $183.0 million, $210.5 million and $242.0 million, respectively, without the charitable foundation. There is no assurance that if the charitable foundation were not formed, the appraisal prepared at that time would conclude that our pro forma market value would be the same as that estimated in the table below. Any appraisal prepared at that time would be based on the facts and circumstances existing at that time, including, among other things, market and economic conditions.
For comparative purposes only, set forth below are certain pricing ratios, financial data and ratios at and for the three months ended September 30, 2016 at the minimum, midpoint, maximum, and adjusted maximum of the offering range, assuming the offering was completed at the beginning of the period, with and without the charitable foundation.
| Minimum of Offering Range | Midpoint of Offering Range | Maximum of Offering Range | Adjusted Maximum of Offering Range | |||||||||||||||||||||||||||||
| With Foundation | Without Foundation | With Foundation | Without Foundation | With Foundation | Without Foundation | With Foundation | Without Foundation | |||||||||||||||||||||||||
| (Dollars in thousands, except per share amounts) | ||||||||||||||||||||||||||||||||
Estimated offering amount | $ | 148,750 | $ | 155,550 | $ | 175,000 | $ | 183,000 | $ | 201,250 | $ | 210,450 | $ | 231,438 | $ | 242,018 | ||||||||||||||||
Pro forma market capitalization | 151,576 | 155,550 | 178,325 | 183,000 | 205,074 | 210,450 | 235,835 | 242,018 | ||||||||||||||||||||||||
Total assets | 1,381,493 | 1,388,232 | 1,404,815 | 1,412,160 | 1,428,137 | 1,436,089 | 1,454,957 | 1,463,607 | ||||||||||||||||||||||||
Total liabilities | 1,142,938 | 1,142,938 | 1,142,938 | 1,142,938 | 1,142,938 | 1,142,938 | 1,142,938 | 1,142,938 | ||||||||||||||||||||||||
Pro forma shareholders’ equity | 238,555 | 245,294 | 261,877 | 269,222 | 285,199 | 293,151 | 312,019 | 320,669 | ||||||||||||||||||||||||
Pro forma net income (1) | 1,197 | 1,199 | 1,153 | 1,154 | 1,109 | 1,110 | 1,059 | 1,058 | ||||||||||||||||||||||||
Pro forma shareholders’ equity per share | 15.74 | 15.77 | 14.69 | 14.71 | 13.91 | 13.93 | 13.23 | 13.25 | ||||||||||||||||||||||||
Pro forma net income per share | 0.09 | 0.08 | 0.07 | 0.07 | 0.06 | 0.06 | 0.05 | 0.05 | ||||||||||||||||||||||||
Pro forma pricing ratios: | ||||||||||||||||||||||||||||||||
Offering price as a percentage of pro forma shareholders’ equity per share | 63.53 | % | 63.41 | % | 68.07 | % | 67.98 | % | 71.89 | % | 71.79 | % | 75.59 | % | 75.47 | % | ||||||||||||||||
Offering price to pro forma net income per share | 27.78 | x | 31.25 | x | 35.71 | x | 35.71 | x | 41.67 | x | 41.67 | x | 50.00 | x | 50.00 | x | ||||||||||||||||
Pro forma financial ratios: | ||||||||||||||||||||||||||||||||
Return on assets (annualized) | 0.35 | % | 0.35 | % | 0.33 | 0.33 | % | 0.31 | % | 0.31 | % | 0.29 | % | 0.29 | % | |||||||||||||||||
Return on equity (annualized) | 2.01 | % | 1.96 | % | 1.76 | % | 1.71 | % | 1.56 | % | 1.51 | % | 1.36 | % | 1.32 | % | ||||||||||||||||
Equity to assets | 17.27 | % | 17.67 | % | 18.64 | % | 19.06 | % | 19.97 | % | 20.41 | % | 21.45 | % | 21.91 | % | ||||||||||||||||
Total shares issued | 15,157,625 | 15,555,000 | 17,832,500 | 18,300,000 | 20,507,375 | 21,045,000 | 23,583,481 | 24,201,750 | ||||||||||||||||||||||||
(footnotes on following page)
49
Table of Contents
| (1) | The following table shows the estimatedafter-tax expense associated with the contribution to the charitable foundation, as well as pro forma net income, pro forma net income per share, pro forma return on assets and pro forma return on shareholders’ equity assuming the contribution to the charitable foundation was expensed during the three months ended September 30, 2016. |
| Minimum of Offering Range | Midpoint of Offering Range | Maximum of Offering Range | Adjusted Maximum of Offering Range | |||||||||||||
| (Dollars in thousands, except per share amounts) | ||||||||||||||||
After-tax expense of stock and cash contribution to foundation | $ | 3,300 | $ | 3,300 | $ | 3,300 | $ | 3,300 | ||||||||
Pro forma net income (loss) | $ | (2,103 | ) | $ | (2,147 | ) | $ | (2,191 | ) | $ | (2,241 | ) | ||||
Pro forma net income (loss) per share | $ | (0.15 | ) | $ | (0.13 | ) | $ | (0.12 | ) | $ | (0.10 | ) | ||||
Offering price to pro forma net income (loss) per share | * | * | * | * | ||||||||||||
Pro forma return on assets (annualized) | (0.61 | )% | (0.61 | )% | (0.61 | )% | (0.62 | )% | ||||||||
Pro forma return on equity (annualized) | (3.53 | )% | (3.28 | )% | (3.07 | )% | (2.87 | )% | ||||||||
| * | Not meaningful. |
50
Table of Contents
BUSINESS OF PCSB FINANCIAL CORPORATION
PCSB Financial is a Maryland corporation and has not engaged in any business to date, other than organizational activities. Upon completion of the conversion and offering, PCSB Financial will own all of the issued and outstanding capital stock of PCSB Bank. We intend to contribute at least 50% of the net offering proceeds to PCSB Bank. PCSB Financial will retain the remainder of the net offering proceeds. We intend to use and invest those proceeds as discussed under “How We Intend to Use the Proceeds from the Offering.” PCSB Financial’s executive offices/headquarters are located at 2651 Strang Blvd., Suite 100, Yorktown Heights, NY 10598, and its telephone number is (914)248-7272.
After the conversion and the offering are completed, PCSB Financial, as the holding company of PCSB Bank, will be authorized to pursue other business activities permitted by applicable laws and regulations, which may include the acquisition of banking and financial services companies. We currently have no understandings or agreements to acquire other financial institutions or financial services companies, although we may determine to do so in the future.
Following the conversion and offering, our cash flow will depend on earnings from the investment of the net offering proceeds and from any dividends we receive from PCSB Bank. PCSB Bank is subject to regulatory limitations on the amount of dividends that it may pay. Initially, PCSB Financial will not own or lease any property, but instead will pay a fee to PCSB Bank for the use of its premises, furniture and equipment. Presently, we intend to employ as officers of PCSB Financial only persons who are officers of PCSB Bank. We will use, however, the support staff of PCSB Bank from time to time. We will pay a fee to PCSB Bank for the time devoted to PCSB Financial by employees of PCSB Bank; however, these individuals will not be separately compensated by PCSB Financial. PCSB Financial may hire additional employees, as appropriate, to the extent it expands its business in the future.
Founded in 1871, PCSB Bank is a New York-chartered savings bank that operates 15 banking offices located in Dutchess, Putnam, Rockland and Westchester Counties in New York. We consider these four counties, and the surrounding areas, as our primary market area for our business operations. We attract deposits from the general public and use those funds primarily to originate and purchase residential real estate, commercial real estate and business loans, and to purchase investment securities. At September 30, 2016, we had consolidated total assets of $1.25 billion, total deposits of $1.12 billion and equity of $111.5 million. PCSB Bank is subject to comprehensive regulation and examination by the NYSDFS and the Federal Deposit Insurance Corporation. Our website address is www.pcsb.com. Information on this website is not and should not be considered a part of this prospectus.
Market Area
Our primary market area encompasses Dutchess, Putnam, Rockland and Westchester Counties in New York, which are the counties in which our offices are located, and the surrounding areas. We view Westchester County, which borders the Bronx (New York City’s northern most borough) and is more populous than the other counties, as a primary area for growth, particularly for commercial lending and deposit opportunities. Westchester County includes a high concentration of office, medical, retail, industrial, mixed use and multi-family real estate buildings and businesses. Our primary focus in this marketplace is small to middle market businesses in these segments. Rising real estate values and lack of available commercial space in Brooklyn and Manhattan has caused businesses to migrate to central and lower Westchester County, which has increased the demand for flex-industrial and multi-family loans in our market area. Dutchess, Putnam and Rockland Counties offer similar commercial opportunities to Westchester County, but on a significantly smaller scale, and provide greater opportunities in residential mortgage lending and consumer lending and in retail deposit gathering. The close proximity of Bronx County, New York City, Fairfield County, Connecticut, and Bergen County, New Jersey, to our market area also creates a secondary area of opportunity for office, industrial and multi-family property loans.
51
Table of Contents
Based on published statistics, the U.S. unemployment rate and the New York State unemployment rate were both 5.0% in September 2016. The four counties in our primary market area each had a lower unemployment rate (Dutchess County, 4.2%; Putnam County, 4.1%; Rockland County, 4.3%; and Westchester County, 4.4%). Likewise, median household income in each county exceeds both the U.S. and the New York State figures. Based on published statistics, median household income is $72,471 in Dutchess County, $96,262 in Putnam County, $85,808 in Rockland County and $83,422 in Westchester County, compared to $56,516 in the U.S. and $58,005 in New York State. Based on published statistics, the 2015 estimated population was 295,754 in Dutchess County, 99,042 in Putnam County, 326,037 in Rockland County and 976,396 in Westchester County.
Competition
We face significant competition for deposits and loans. Our most direct competition for deposits has historically come from the many financial institutions operating in our market area, many of which are significantly larger than we are and, therefore, have greater resources. We compete with these larger institutions particularly in our Westchester County market area. We also face competition for investors’ funds from other financial service companies such as brokerage firms, money market funds, mutual funds and other corporate and government securities. Based on data from the Federal Deposit Insurance Corporation at June 30, 2016 (the latest date for which information is available), we had 2.24% of the Federal Deposit Insurance Corporation-insured deposit market share in Dutchess County among the 19 institutions with offices in the county, 22.91% in Putnam County among the 11 institutions with offices in the county, 0.12% in Rockland County among the 15 institutions with offices in the county, and 0.64% in Westchester County among the 36 institutions with offices in the county. In all four counties, the top three institutions were either New York City money center banks (i.e., JP Morgan Chase, NA, Morgan Stanley Private Bank, NA and Citibank, NA) or large regional banks (i.e., Manufacturers and Traders Trust Company, Citizens Bank, NA and Sterling Bank). This market share data excludes deposits held by credit unions because their deposits are not insured by the Federal Deposit Insurance Corporation.
Competition for loans comes primarily from the many financial institutions operating in our market area. Our experience in recent years has been that many financial institutions in our market area, especially community banks seeking to expand their commercial loan portfolios and institutions located in highly competitive Westchester County, have been willing to price commercial loans aggressively in order to gain market share.
Lending Activities
Commercial Real Estate Loans.At September 30, 2016, commercial real estate loans were $375.9 million, or 49.0%, of our total loan portfolio. Our commercial real estate loans are generally secured by properties used for business purposes such as office buildings, industrial facilities and retail facilities, and multi-family properties. At September 30, 2016 multi-family residential real estate loans, which are described below, totaled $70.4 million. Excluding multi-family loans, $77.2 million of our commercial real estate portfolio was owner occupied real estate and $228.3 million was secured by income producing, ornon-owner occupied real estate.
At September 30, 2016, substantially all of our commercial real estate loans were secured by properties located in the lower Hudson Valley; however, we will originate commercial real estate loans on properties located outside this area based on an established relationship with a strong borrower.We intend to continue to grow our commercial real estate loan portfolio while maintaining prudent underwriting standards. In addition to originating these loans, we also purchase and participate in commercial real estate loans with other financial institutions. Such loans are independently underwritten according to our policies and require satisfactory documentation review by our legal counsel before we will purchase or participate in such loans.
We originate a variety of adjustable-rate commercial real estate loans with terms and amortization periods generally up to 25 years, which may include balloon loans. Interest rates and payments on our adjustable-rate loans adjust every five, seven or ten years and generally are indexed to the prime rate or the corresponding Treasury rate, plus a margin. We generally includepre-payment penalties on commercial real estate loans we originate.
52
Table of Contents
In underwriting commercial real estate loans we consider a number of factors, which include the projected net cash flow to the loan’s debt service requirement (generally requiring a minimum of 120%), the age and condition of the collateral, the financial resources and income level of the borrower and the borrower’s experience in owning or managing similar properties. Commercial real estate loans are generally originated in amounts up to 75% of the appraised value or the purchase price of the property securing the loan, whichever is lower. When circumstances warrant, guarantees are obtained from commercial real estate customers. In addition, the borrower’s and guarantor’s financial information on such loans is monitored on an ongoing basis by requiring periodic financial statement updates.
If we foreclose on a commercial real estate loan, the marketing and liquidation period to convert the real estate asset to cash can be a lengthy process with substantial holding costs. In addition, vacancies, deferred maintenance, repairs and market stigma can result in prospective buyers expecting sale price concessions to offset their real or perceived economic losses for the time it takes them to return the property to profitability. Depending on the individual circumstances, initial charge-offs and subsequent losses on commercial real estate loans can be unpredictable and substantial.
At September 30, 2016, our largest commercial real estate loan had an outstanding balance of $10.1 million and is secured by anon-owner occupied industrial property. At September 30, 2016, this loan was performing according to its original terms.
Multi-Family Residential Real Estate Loans.At September 30, 2016, multi-family real estate loans were $70.4 million, or 9.2%, of our total loan portfolio. Our multi-family real estate loans are generally secured by properties consisting of five to 100 rental units in our market area. In addition to originating these loans, we also purchase and participate in multi-family residential real estate loans with other financial institutions. Such loans are independently underwritten according to our policies and require satisfactory documentation review by our legal counsel before we will purchase or participate in such loans.
We originate a variety of adjustable-rate multi-family residential real estate loans with terms and amortization periods generally up to 30 years, which may include balloon loans. Interest rates and payments on our adjustable-rate loans adjust every five, seven or ten years and generally are indexed to the prime rate or the corresponding Treasury rate, plus a margin. We generally includepre-payment penalties on multi-family residential real estate loans we originate.
In underwriting multi-family residential real estate loans we consider a number of factors, which include the projected net cash flow to the loan’s debt service requirement (generally requiring a minimum of 120%), the age and condition of the collateral, the financial resources and income level of the borrower and the borrower’s experience in owning or managing similar properties. Multi-family residential real estate loans are generally originated in amounts up to 75% of the appraised value or the purchase price of the property securing the loan, whichever is lower. When circumstances warrant, guarantees are obtained from multi-family residential real estate customers. In addition, the borrower’s and guarantor’s financial information on such loans is monitored on an ongoing basis by requiring periodic financial statement updates.
If we foreclose on a multi-family real estate loan, the marketing and liquidation period to convert the real estate asset to cash can be a lengthy process with substantial holding costs. In addition, vacancies, deferred maintenance, repairs and market stigma can result in prospective buyers expecting sale price concessions to offset their real or perceived economic losses for the time it takes them to return the property to profitability. Depending on the individual circumstances, initial charge-offs and subsequent losses on commercial real estate loans can be unpredictable and substantial.
At September 30, 2016, our largest multi-family residential real estate loan had an outstanding balance of $7.5 million and is secured by a208-unit apartment complex. At September 30, 2016, this loan was performing according to its original terms.
53
Table of Contents
Commercial Business Loans.We originate commercial term loans and variable lines of credit to a variety of small and medium sized businesses in our market area. These loans are generally secured by business assets, and we may support this collateral with junior liens on real property. At September 30, 2016, commercial business loans were $82.6 million, or 10.8% of our total loan portfolio. We intend to increase the amount of commercial business loans that we originate. Customers for these loans include professional businesses, multi-generational family-owned businesses, and not for profit businesses. We encourage our commercial business borrowers to maintain their primary deposit accounts with us, which enhances our interest rate spread and overall profitability.
The commercial business loans we offer include term loans and revolving lines of credit. Commercial loans and lines of credit are made with either variable or fixed rates of interest. Variable rates are based on the prime rate, plus a margin. Commercial business loans typically have shorter terms to maturity and higher interest rates than commercial real estate loans, but may involve more credit risk because of the type and nature of the collateral.
When making commercial loans, we consider the financial statements of the borrower, our lending history with the borrower, the debt service capabilities and global cash flows of the borrower and other guarantors, the projected cash flows of the business and the value of the collateral, accounts receivable, inventory and equipment. Depending on the collateral used to secure the loans, commercial loans are made in amounts of up to 75% of the value of the collateral securing the loan. All of these loans are secured by assets of the respective borrowers.
At September 30, 2016, $17.3 million of business loans are to developers to purchase land. These loans are underwritten for projects with appropriate construction or development approvals already in place, have variable rates of interest and terms up to 3 years. Additionally, these loans are made in amounts up to 50% of the land value.
At September 30, 2016, our largest commercial business loan had an outstanding balance of $7.0 million and is secured by a commercial condominium property. At September 30, 2016, this loan was performing according to its original terms.
Construction Loans.We originate loans to established local developers to finance the construction ofone- to four-family residential properties, and commercial and multi-family properties. At September 30, 2016, construction and land development loans were $28.8 million, or 3.76% of our total loan portfolio, consisting of $5.3 million ofone- to four-family residential construction loans and $23.5 million of commercial and multi-family real estate construction loans. The majority of these loans are secured by properties located in our primary market area. PCSB will occasionally, through a local nonprofit, fund the construction oflow-income multi-family properties.
Most of our construction loans are interest-only loans that provide for the payment of interest during the construction phase, which is usually up to 12 to 24 months. Interest is generally a variable rate based on the prime rate, plus a margin. At the end of the construction phase, the loan may convert to a permanent mortgage loan or the loan may be payable in full. Loans generally can be made with a maximumloan-to-value ratio of 75% of the appraised market value upon completion of the project. Before making a commitment to fund a construction loan, we generally require an appraisal of the property by an independent licensed appraiser for construction and land development loans. We also generally require an inspection of the property before disbursement of funds during the term of the construction loan. Loan proceeds are disbursed periodically in increments as construction progresses and as inspection by our approved inspectors warrant.
At September 30, 2016, our largest construction and land development loan had an outstanding balance of $5.4 million and is secured by an82-unit senior and work-force housing project. At September 30, 2016, this loan was performing according to its original terms.
Residential Mortgage Loans.Ourone- to four-family residential loan portfolio consists of mortgage loans that enable borrowers to purchase or refinance existing homes, most of which serve as the primary residence of the owner. At September 30, 2016,one- to four-family residential real estate loans were $222.8 million, or 29.05% of our total loan portfolio, consisting of $190.9 million of fixed-rate loans and $31.9 million of adjustable-rate loans.
54
Table of Contents
We offer fixed-rate and adjustable-rate residential mortgage loans with maturities up to 30 years. Some of the properties includetwo- to four-unit properties, all of which are classified as residential mortgage loans. Ourone- to four-family residential mortgage loans that we originate or purchase are generally underwritten according to Fannie Mae and Freddie Mac guidelines, and we refer to loans that conform to such guidelines as “conforming loans.” We generally originate both fixed- and adjustable-rate mortgage loans in amounts up to the maximum conforming loan limits as established by the Federal Housing Finance Agency. We also originate loans above the conforming limits, which are referred to as “jumbo loans.” We generally underwrite jumbo loans, whether originated or purchased, in a manner similar to conforming loans. Jumbo loans are common in our market area. We generally retainone- to four-family residential mortgage loans in our portfolio.
We originate our adjustable-rateone- to four-family residential mortgage loans with initial interest rate adjustment periods of one, three, five, seven or ten years, based on changes in a designated market index. These loans are limited to a 200 basis point initial increase in their interest rate, a 200 basis point increase in their interest rate annually after the initial adjustment, and a maximum upward adjustment of 400 to 600 basis points over the life of the loan. We determine whether a borrower qualifies for an adjustable-rate mortgage loan in conformance with the underwriting guidelines set forth by Fannie Mae and Freddie Mac in the secondary mortgage market. In particular, we determine whether a borrower qualifies for an adjustable-rate mortgage loan with an initial fixed-rate period of five years or less based on the ability to repay both principal and interest using an interest rate which is 2.0% above the initial interest rate, including a reasonable estimate of real estate taxes and insurance, and taking into account the maximumdebt-to-income ratio stipulated in the underwriting guidelines in the secondary mortgage market. The qualification for an adjustable-rate mortgage loan with an initial fixed-rate period exceeding five years is based on the borrower’s ability to repay at the initial fixed interest rate.
We will originateone- to four-family residential mortgage loans withloan-to-value ratios up to 80% without private mortgage insurance. We will originate loans withloan-to-value ratios of up to 95% with private mortgage insurance and where the borrower’s debt does not exceed 45% of the borrower’s monthly cash flow. To encourage lending tolow- and moderate-income home buyers, we have severalin-house developed programs which can include low down payments, a lower than market interest rate, or a grant to be used towards closing costs.
We generally do not offer “interest only” mortgage loans onone- to four-family residential properties. We do not offer loans that provide for negative amortization of principal, such as “Option ARM” loans, where the borrower can pay less than the interest owed on the loan, resulting in an increased principal balance during the life of the loan. Additionally, outside of the loan programs mentioned previously, we do not offer “subprime loans” (loans that are made with low down-payments to borrowers with weakened credit histories typically characterized by payment delinquencies, previous charge-offs, judgments, bankruptcies, or borrowers with questionable repayment capacity as evidenced by low credit scores or high debt-burden ratios) orAlt-A loans (defined as loans having less than full documentation).
Home Equity Lines of Credit.At September 30, 2016, the outstanding balance owed on home equity lines of credit was $40.4 million, or 5.27% of our total loan portfolio. Home equity lines of credit have adjustable rates of interest that are indexed to the prime rate, plus a margin.
The procedures for underwriting home equity lines of credit include an assessment of the applicant’s payment history on other debts and ability to meet existing obligations and payments on the proposed loan. Although the applicant’s creditworthiness is a primary consideration, the underwriting process also includes a comparison of the value of the collateral to the proposed loan amount.
The home equity lines of credit that we originate are revolving lines of credit which generally have a term of 25 years, with draws available for the first ten years. Our25-year lines of credit are interest only during the first ten years, and amortize on a fifteen year basis thereafter. We generally originate home equity lines of credit withloan-to-value ratios of up to 75% when combined with the principal balance of the existing first mortgage loan, althoughloan-to-value ratios may occasionally exceed 75% on acase-by-case basis. Maximumloan-to-value ratios are determined based on an applicant’s credit score, property value, loan amount anddebt-to-income ratio. Rates are adjusted monthly based on changes in a designated market index.
55
Table of Contents
Other Loans.We offer consumer and business installment loans. At September 30, 2016, other loans were $16.4 million, or 2.14% of total loans, and included $322,000 of personal loans and $16.1 million of business installment loans. The procedures for underwriting consumer and installment loans include an assessment of the applicant’s and guarantor’s, if applicable, payment history on other debts and ability to meet existing obligations and payments on the proposed loan.
Loan Underwriting Risks
Commercial and Multi-Family Real Estate Loans.Loans secured by commercial and multi-family real estate generally have larger balances and involve a greater degree of risk thanone- to four-family residential mortgage loans. Of primary concern in commercial and multi-family real estate lending is the borrower’s creditworthiness and the feasibility and cash flow potential of the project. Payments on loans secured by income properties often depend on successful operation and management of the properties. As a result, repayment of such loans may be subject to a greater extent than residential real estate loans, to adverse conditions in the real estate market or the economy. To monitor cash flows on income properties, we require borrowers and loan guarantors, if any, to provide annual financial statements on commercial and multi-family real estate loans. In reaching a decision on whether to make a commercial or multi-family real estate loan, we consider and review a global cash flow analysis of the borrower and consider the net operating income of the property, the borrower’s expertise, credit history and profitability and the value of the underlying property. We have generally required that the properties securing these real estate loans have debt service coverage ratios (the ratio of earnings before debt service to debt service) of at least 1.20x. An environmental phase one report is obtained when the possibility exists that hazardous materials may have existed on the site, or the site may have been impacted by adjoining properties that handled hazardous materials.
Construction Loans.Our construction loans are based upon estimates of costs and values associated with the completed project. Underwriting is focused on the borrowers’ financial strength, credit history and demonstrated ability to produce a quality product and effectively market and manage their operations. All construction loans for which the builder does not have a binding purchase agreement must be approved by senior loan officers.
Construction lending involves additional risks when compared with permanent residential lending because funds are advanced upon the security of the project, which is of uncertain value before its completion. Because of the uncertainties inherent in estimating construction costs, as well as the market value of the completed project and the effects of governmental regulation of real property, it is relatively difficult to evaluate accurately the total funds required to complete a project and the relatedloan-to-value ratio. This type of lending also typically involves higher loan principal amounts and is often concentrated with a small number of builders. In addition, generally during the term of a construction loan, interest may be funded by the borrower or disbursed from an interest reserve set aside from the construction loan budget. These loans often involve the disbursement of substantial funds with repayment substantially dependent on the success of the ultimate project and the ability of the borrower to sell or lease the property or obtain permanenttake-out financing, rather than the ability of the borrower or guarantor to repay principal and interest. If the appraised value of a completed project proves to be overstated, we may have inadequate security for the repayment of the loan upon completion of construction of the project and may incur a loss. A discounted cash flow analysis is utilized for determining the value of any construction project of five or more units. Our ability to continue to originate a significant amount of construction loans is dependent on the strength of the housing market in our market areas.
Commercial Business Loans.Unlike residential mortgage loans, which generally are made on the basis of the borrower’s ability to make repayment from his or her employment or other income, and which are secured by real property whose value tends to be more easily ascertainable, commercial business loans are of higher risk and typically are made on the basis of the borrower’s ability to make repayment from the cash flow of the borrower’s business and the collateral securing these loans may fluctuate in value. Our commercial business loans are originated primarily based on the identified cash flow of the borrower and secondarily on the underlying collateral provided by the borrower. Most often, this collateral consists of real estate, accounts receivable, inventory or equipment. Credit support provided by the borrower for most of these loans and the probability of repayment is based on the liquidation of the pledged collateral and enforcement of a personal guarantee, if any. As a result, the
56
Table of Contents
availability of funds for the repayment of commercial business loans may depend substantially on the success of the business itself. Further, any collateral securing such loans may depreciate over time, may be difficult to appraise and may fluctuate in value.
Adjustable-Rate Loans.While we anticipate that adjustable-rate loans will better offset the adverse effects of an increase in interest rates as compared to fixed-rate loans, an increased monthly payment required of adjustable-rate loan borrowers in a rising interest rate environment could cause an increase in delinquencies and defaults. The marketability of the underlying property also may be adversely affected in a high interest rate environment. In addition, although adjustable-rate loans make our asset base more responsive to changes in interest rates, the extent of this interest sensitivity is somewhat limited by the annual and lifetime interest rate adjustment limits on residential loans.
Consumer Loans.Consumer loans may entail greater risk than residential mortgage loans, particularly in the case of consumer loans that are unsecured or secured by assets that depreciate rapidly, such as motor vehicles. Repossessed collateral for a defaulted consumer loan may not provide an adequate source of repayment for the outstanding loan and a small remaining deficiency often does not warrant further substantial collection efforts against the borrower. Consumer loan collections depend on the borrower’s continuing financial stability, and therefore are likely to be adversely affected by various factors, including job loss, divorce, illness or personal bankruptcy. Furthermore, the application of various federal and state laws, including federal and state bankruptcy and insolvency laws, may limit the amount that can be recovered on such loans.
Loan Approval Procedures and Authority
Our lending activities follow written,non-discriminatory, underwriting standards and loan origination procedures established by our board of trustees and management. The board of trustees has granted loan approval authority to certain senior officers up to prescribed limits not exceeding $2.0 million depending on the officer’s experience. Loans approved under these officer authorities require dual signatures of the loan officer assigned to the loan and the officer with the appropriate approval authority. Loans in excess of $2.0 million require approval of the Loan Committee of the board of trustees, as do any extensions of credit to classified borrowers or extensions of credit in excess of $1.0 million. Loans that involve exceptions to policy, including loans in excess of our internalloans-to-one borrower limitation, must be authorized by the Loan Committee of the board of trustees. Exceptions are reported to the board of trustees monthly.
Loans-to-One Borrower
Under New York banking law, our total loans or extensions of credit to a single borrower or group of related borrowers cannot exceed, with specified exceptions, 15% of our capital stock, surplus fund and undivided profits. We may lend additional amounts up to 10% if the loans or extensions of credit are fully secured by readily-marketable collateral. At September 30, 2016, our regulatory limit onloans-to-one borrower was $17.4 million and our internalloans-to-one borrower limit was $11.0 million. Both our regulatory and internal limits will increase following completion of the offering. We expect to increase our post-conversion internal limit to $20.0 million.
At September 30, 2016, our largest lending relationship consisted of 2 loans aggregating $10.8 million, secured by twonon-owner occupied multi-purpose flex office, warehouse and retail properties. At September 30, 2016, each loan in this relationship was performing according to its original repayment terms. At September 30, 2016, we had two additional lending relationships with loan balances outstanding and available credit limits greater than $10.0 million, which were performing according to their original terms.
Investment Activities
We have legal authority to invest in various types of investment securities and liquid assets, including U.S. Treasury obligations, securities of various government-sponsored enterprises, residential mortgage-backed securities and municipal government securities, deposits at the Federal Home Loan Bank of New York, certificates of deposit of federally insured institutions, investment grade corporate bonds. We also are required to maintain an investment
57
Table of Contents
in Federal Home Loan Bank of New York stock, which investment is based on the level of our Federal Home Loan Bank borrowings. Although we have the authority under applicable law to invest in derivative securities, we had no investments in derivative securities at September 30, 2016. At September 30, 2016, our investment portfolio had a fair value of $377.8 million and consisted primarily of U.S. Government securities, U.S. Government agency securities, including residential and collateralized mortgage-backed securities, and investment grade corporate bonds.
Our investment objectives are to provide and maintain liquidity, to establish an acceptable level of interest rate and credit risk, to provide a use of funds when demand for loans is weak and to generate a favorable return. Our board of trustees has the overall responsibility for the investment portfolio, including approval of our investment policy. Our management is responsible for implementation of the investment policy and monitoring our investment performance. The board of trustees reviews the status of our investment portfolio monthly. See Note 2 to Notes to Consolidated Financial Statements.
Sources of Funds
General.Deposits have traditionally been our primary source of funds for our lending and investment activities. We also use borrowings, primarily Federal Home Loan Bank of New York advances, to supplement cash flow needs, as needed. In addition, funds are derived from scheduled loan payments, investment maturities, loan prepayments, retained earnings and income on earning assets. While scheduled loan payments and income on earning assets are relatively stable sources of funds, deposit inflows and outflows can vary widely and are influenced by prevailing interest rates, market conditions and levels of competition.
Deposit Accounts.The substantial majority of our deposits are from depositors who reside in our primary market area. Deposits are attracted through the offering of a broad selection of deposit instruments for both individuals and businesses. At September 30, 2016, our deposits totaled $1.12 billion and included $44.2 million of municipal deposits held by our commercial bank subsidiary, PCSB Commercial Bank.
Deposit account terms vary according to the minimum balance required, the time period that funds must remain on deposit, and the interest rate, among other factors. In determining the terms of our deposit accounts, we consider the rates offered by our competition, our liquidity needs, profitability, and customer preferences and concerns. We generally review our deposit mix and pricing on a weekly basis. Our deposit pricing strategy has generally been to offer competitive rates and services and to periodically offer special rates in order to attract deposits of a specific type or term.
Borrowings.We primarily utilize advances from the Federal Home Loan Bank of New York to supplement our supply of investable funds. The Federal Home Loan Bank functions as a central reserve bank providing credit for its member financial institutions. As a member, we are required to own capital stock in the Federal Home Loan Bank and are authorized to apply for advances on the security of such stock and certain of our whole first mortgage loans and other assets (principally securities which are obligations of, or guaranteed by, the United States), provided certain standards related to creditworthiness have been met. Advances are made under several different programs, each having its own interest rate and range of maturities. Depending on the program, limitations on the amount of advances are based either on a fixed percentage of an institution’s net worth or on the Federal Home Loan Bank’s assessment of the institution’s creditworthiness. At September 30, 2016, we had $202.3 million of available borrowing capacity with the Federal Home Loan Bank of New York and had $11.1 million in advances outstanding. All of our borrowings from the Federal Home Loan Bank are secured by investment securities. At September 30, 2016, we also had an available line of credit with the Federal Reserve Bank of New York’s discount window program of $80.8 million, none of which was outstanding at that date.
Personnel
At September 30, 2016, we had 155 full-time and 22 part-time employees, none of whom is represented by a collective bargaining unit. We believe we have a good working relationship with our employees.
58
Table of Contents
Subsidiaries
Upon completion of the conversion and offering, PCSB Bank will be the sole and wholly-owned subsidiary of PCSB Financial. PCSB Bank has three wholly-owned subsidiaries: PCSB Commercial Bank, PCSB Funding Corp. and PCSB Realty Ltd. PCSB Commercial Bank, a New York-chartered commercial bank, is authorized to accept deposits from New York municipalities. PCSB Funding Corp., a Delaware corporation, is a real estate investment trust that holds certain mortgage assets. PCSB Realty Ltd., a New York corporation, holds title to real estate properties foreclosed upon by PCSB Bank.
Legal Proceedings
Periodically, there have been various claims and lawsuits against us, such as claims to enforce liens, condemnation proceedings on properties in which we hold security interests, claims involving the making and servicing of real property loans and other issues incident to our business. We are not a party to any pending legal proceedings that we believe would have a material adverse effect on our financial condition, results of operations or cash flows.
Properties
At September 30, 2016, we conducted business through our administrative/headquarters office in Yorktown Heights and our 15 banking offices located in Brewster (main banking office), Eastchester, Fishkill, Greenburgh, Jefferson Valley, Kent, Mahopac, Mount Kisco, Mount Vernon, New City, Pawling (2 branch offices), East White Plains, Somers, and Yorktown Heights, all of which are located in New York. We own four and lease 12 of our properties. At September 30, 2016, the net book value of our land, buildings, furniture, fixtures and equipment was $10.8 million.
MANAGEMENT’S DISCUSSION AND ANALYSIS OF FINANCIAL CONDITION
AND RESULTS OF OPERATIONS
This discussion and analysis reflects our consolidated financial statements and other relevant statistical data, and is intended to enhance your understanding of our financial condition and results of operations. The information in this section has been derived in part from the audited financial statements that appear beginning on pageF-1 of this prospectus and other audited financial statements that are not included herein. You should read the information in this section in conjunction with the business and financial information regarding PCSB Financial and PCSB Bank and the consolidated financial statements appearing in this prospectus.
Overview
Income. Our primary source of income is net interest and dividend income. Net interest and dividend income is the difference between interest and dividend income, which is the income that we earn on our loans and investments, and interest expense, which is the interest that we pay on our deposits and borrowings. Other sources of income include earnings from customer service fees (mostly from service charges on deposit accounts), bank-owned life insurance and gains on the sale of securities.
Provision for Loan Losses. The allowance for loan losses is maintained at a level representing management’s best estimate of probable incurred losses in the loan portfolio, based upon management’s evaluation of the portfolio’s collectibility. The allowance is established through the provision for loan losses, which is charged against income. Charge-offs are charged to the allowance. Subsequent recoveries, if any, are credited to the allowance. Allocation of the allowance may be made for specific loans or pools of loans, but the entire allowance is available for the entire loan portfolio.
Expenses. The noninterest expenses we incur in operating our business consist of salaries and employee benefits, occupancy and equipment, data processing, federal deposit insurance and other general and administrative expenses. Following the offering, our noninterest expenses are likely to increase as a result of operating as a public company. These additional expenses will consist primarily of legal and accounting fees, expenses of stockholder communications and meetings and stock exchange listing fees.
59
Table of Contents
Salaries and employee benefits consist primarily of salaries and wages paid to our employees, payroll taxes, and expenses for health insurance, retirement plans and other employee benefits. Following the conversion and offering, we will recognize additional annual employee compensation expenses stemming from the adoption of new equity benefit plans. We cannot determine the actual amount of these new stock-related compensation and benefit expenses at this time because applicable accounting practices require that they be based on the fair market value of the shares of common stock or stock options at specific points in the future. For an illustration of these expenses, see “Pro Forma Data.”
Occupancy and equipment expenses, which are the fixed and variable costs of buildings and equipment, consist primarily of depreciation charges, rental expenses, furniture and equipment expenses, maintenance, real estate taxes and costs of utilities. Depreciation of premises and equipment is computed using a straight-line method based on the estimated useful lives of the related assets or the expected lease terms, if shorter. Data processing expenses are the fees we pay to third parties for the use of their software and for processing customer information, deposits and loans.
Federal deposit insurance premiums are payments we make to the Federal Deposit Insurance Corporation for insurance of our deposit accounts.
Other expenses include expenses for professional services, advertising, office supplies, postage, telephone, insurance and other miscellaneous operating expenses.
Business Strategy
Based on an extensive review of the current opportunities in our principal market area as well as our resources and capabilities, the Board has adopted the following business strategy:
| • | Focus on commercial lending.We believe that commercial lending offers an opportunity to enhance our profitability while managing credit, interest rate and operational risk. We intend to continue to expand our originations and, to a lesser extent, purchases of commercial real estate and commercial business loans in our primary market area. We anticipate that a majority of our commercial real estate loan originations will range in size from $500,000 to $10.0 million while a majority of our commercial business loan originations will range in size from $100,000 to $5.0 million. |
| • | Expand banking activities in Southern Westchester County.Southern Westchester County is one of the more populous and economically vibrant areas of New York State. We intend to use our four offices in Southern Westchester County to expand both our commercial and retail activities in this market area. At the same time, we will remain committed to our other market areas and maintain a strong level of banking activities in these areas. |
| • | Increase core deposits, including demand deposits.Deposits are our primary source of funds for lending and investment. We intend to focus on core deposits (which we define as all deposits except for certificates of deposit and municipal deposits), particularlynon-interest bearing demand deposits, because they are the lowest cost funds and are less sensitive to withdrawal when interest rates fluctuate. Core deposits represented 67.3% of our total deposits at September 30, 2016. Going forward, we will seek to increase our core deposits through enhancing our commercial activities and deepening our relationships with our retail customers. |
| • | Manage credit risk to maintain a low level ofnon-performing assets.We believe that strong asset quality is a key to long-term financial success. Our strategy for credit risk management focuses on an experienced team of credit professionals, well-defined credit policies and procedures, appropriate loan underwriting criteria and active credit monitoring. Ournon-performing loans to total loans ratio was 1.14% at September 30, 2016. |
60
Table of Contents
| • | Balance Sheet Growth.As a result of our efforts to build our management and infrastructure, and given our attractive market area, we believe we are well-positioned to increase the size of our balance sheet without a proportional increase in overhead expense or operating risk. Accordingly, we intend to increase, on a managed basis, our assets and liabilities, particularly loans and deposits. |
Critical Accounting Policies
A summary of our accounting policies is described in Note 1 to Notes to Consolidated Financial Statements. Critical accounting estimates are necessary in the application of certain accounting policies and procedures and are particularly susceptible to significant change. Critical accounting policies are defined as those involving significant judgments and assumptions by management that could have a material impact on the carrying value of certain assets or on income under different assumptions or conditions. Management believes that the most critical accounting policies, which involve the most complex or subjective decisions or assessments, are as follows:
Allowance for Loan Losses.The allowance for loan losses is established as probable losses are estimated to have occurred through a provision for loan losses charged to earnings. Loan losses are charged against the allowance when management believes the uncollectibility of a loan balance is confirmed. Subsequent recoveries, if any, are credited to the allowance. See Note 1 to Notes to Consolidated Financial Statements for a complete discussion of the allowance for loan losses.
Income Taxes.We recognize income taxes under the asset and liability method. Under this method, deferred tax assets and liabilities are established for the temporary differences between the accounting basis and the tax basis of our assets and liabilities at enacted tax rates expected to be in effect when the amounts related to such temporary differences are realized or settled. See Note 9 to Notes to Consolidated Financial Statements for a complete discussion of income taxes.
Goodwill. Goodwill resulting from business combination transactions is generally determined as the excess of the fair value of the consideration transferred, plus the fair value of anynon-controlling interests in the acquiree, over the fair value of the net assets acquired and liabilities assumed as of the acquisition date. We recognized goodwill in connection with our acquisition of CMS Bancorp, Inc and CMS Bank. See Notes 1 and 8 to Notes to Consolidated Financial Statements for a complete discussion of our accounting for goodwill and the goodwill created in connection with the acquisition of CMS Bancorp, Inc. and CMS Bank.
Loan Portfolio
General. Loans are our primary interest-earning asset. At September 30, 2016, net loans represented 60.9% of our total assets. The following tables set forth certain information about our loan portfolio.
61
Table of Contents
Loan Portfolio Analysis.The following table sets forth the composition of our loan portfolio by type of loan at the dates indicated.
| At September 30, 2016 | At June 30, | |||||||||||||||||||||||||||||||||||||||||||||||
| 2016 | 2015 | 2014 | 2013 | 2012 | ||||||||||||||||||||||||||||||||||||||||||||
| Amount | Percent | Amount | Percent | Amount | Percent | Amount | Percent | Amount | Percent | Amount | Percent | |||||||||||||||||||||||||||||||||||||
| (Dollars in thousands) | ||||||||||||||||||||||||||||||||||||||||||||||||
Mortgage Loans: | ||||||||||||||||||||||||||||||||||||||||||||||||
Residential | $ | 222,750 | 29.05 | % | $ | 226,073 | 28.79 | % | $ | 240,448 | 32.93 | % | $ | 161,740 | 31.74 | % | $ | 117,924 | 26.07 | % | $ | 120,223 | 25.58 | |||||||||||||||||||||||||
Commercial | 375,896 | 49.01 | 385,827 | 49.14 | 324,574 | 44.47 | 188,741 | 37.03 | 163,807 | 36.20 | 165,647 | 35.26 | ||||||||||||||||||||||||||||||||||||
Construction | 28,802 | 3.76 | 25,050 | 3.19 | 11,886 | 1.63 | 19,517 | 3.83 | 20,292 | 4.49 | 21,618 | 4.60 | ||||||||||||||||||||||||||||||||||||
|
|
|
|
|
|
|
|
|
|
|
|
|
|
|
|
|
|
|
|
|
|
|
| |||||||||||||||||||||||||
Total | 627,448 | 81.82 | 636,950 | 81.12 | 576,908 | 79.03 | 369,998 | 72.60 | 302,023 | 66.76 | 307,488 | 65.44 | ||||||||||||||||||||||||||||||||||||
Commercial business | 82,604 | 10.77 | 90,600 | 11.54 | 99,699 | 13.66 | 96,349 | 18.91 | 103,931 | 22.97 | 114,410 | 24.35 | ||||||||||||||||||||||||||||||||||||
Home equity lines of credit | 40,396 | 5.27 | 41,180 | 5.24 | 40,605 | 5.56 | 33,952 | 6.66 | 38,089 | 8.42 | 39,163 | 8.33 | ||||||||||||||||||||||||||||||||||||
Other loans | 16,407 | 2.14 | 16,476 | 2.10 | 12,858 | 1.76 | 9,307 | 1.83 | 8,349 | 1.85 | 8,847 | 1.88 | ||||||||||||||||||||||||||||||||||||
|
|
|
|
|
|
|
|
|
|
|
|
|
|
|
|
|
|
|
|
|
|
|
| |||||||||||||||||||||||||
Total loans receivable | 766,855 | 100.00 | % | 785,206 | 100.00 | % | 730,070 | 100.00 | % | 509,606 | 100.00 | % | 452,392 | 100.00 | % | 469,908 | 100.00 | % | ||||||||||||||||||||||||||||||
|
|
|
|
|
|
|
|
|
|
|
| |||||||||||||||||||||||||||||||||||||
Plus: net deferred loan origination costs and fees | 1,125 | 1,172 | 985 | 1,612 | 1,170 | 1,268 | ||||||||||||||||||||||||||||||||||||||||||
Less: allowance for loan losses | (4,065 | ) | (4,042 | ) | (3,921 | ) | (4,057 | ) | (3,985 | ) | (4,945 | ) | ||||||||||||||||||||||||||||||||||||
|
|
|
|
|
|
|
|
|
|
|
| |||||||||||||||||||||||||||||||||||||
Loans receivable, net | $ | 763,915 | $ | 782,336 | $ | 727,134 | $ | 507,161 | $ | 449,577 | $ | 466,231 | ||||||||||||||||||||||||||||||||||||
|
|
|
|
|
|
|
|
|
|
|
| |||||||||||||||||||||||||||||||||||||
62
Table of Contents
Loan Maturity.The following tables set forth certain information at September 30, 2016 and June 30, 2016 regarding the dollar amount of loan principal repayments becoming due during the periods indicated. The tables do not include any estimate of prepayments that significantly shorten the average loan life and may cause actual repayment experience to differ from that shown below. Demand loans, which are loans having no stated repayment schedule or no stated maturity, are reported as due in one year or less.
| At September 30, 2016 | ||||||||||||||||||||||||||||
| Residential Mortgage Loans | Commercial Real Estate Loans | Construction Loans | Commercial Business Loans | Home Equity Lines of Credit | Other Loans | Total Loans | ||||||||||||||||||||||
| (Dollars in thousands) | ||||||||||||||||||||||||||||
Amounts due in: | ||||||||||||||||||||||||||||
One year or less | $ | 1,193 | $ | 6,498 | $ | 16,444 | $ | 42,714 | — | $ | 447 | $ | 67,296 | |||||||||||||||
More than one year through two years | 1,089 | 4,166 | 12,113 | 8,535 | 6 | 741 | 26,650 | |||||||||||||||||||||
More than two years through three years | 1,285 | 8,309 | 245 | 10,220 | — | 1,034 | 21,093 | |||||||||||||||||||||
More than three years through five years | 1,600 | 14,567 | — | 3,847 | 20 | 3,442 | 23,476 | |||||||||||||||||||||
More than five years through ten years | 8,208 | 112,199 | — | 9,656 | 378 | 10,611 | 141,052 | |||||||||||||||||||||
More than ten years through fifteen years | 39,408 | 67,953 | — | 3,793 | 2,848 | — | 114,002 | |||||||||||||||||||||
More than fifteen years | 169,967 | 162,204 | — | 3,839 | 37,144 | 132 | 373,286 | |||||||||||||||||||||
|
|
|
|
|
|
|
|
|
|
|
|
|
| |||||||||||||||
Total | $ | 222,750 | $ | 375,896 | $ | 28,802 | $ | 82,604 | $ | 40,396 | $ | 16,407 | $ | 766,855 | ||||||||||||||
|
|
|
|
|
|
|
|
|
|
|
|
|
| |||||||||||||||
| At June 30, 2016 | ||||||||||||||||||||||||||||
| Residential Mortgage Loans | Commercial Real Estate Loans | Construction Loans | Commercial Business Loans | Home Equity Lines of Credit | Other Loans | Total Loans | ||||||||||||||||||||||
| (Dollars in thousands) | ||||||||||||||||||||||||||||
Amounts due in: | ||||||||||||||||||||||||||||
One year or less | $ | 1,226 | $ | 10,888 | $ | 11,600 | $ | 52,702 | — | $ | 456 | $ | 76,872 | |||||||||||||||
More than one year through two years | 769 | 4,063 | 11,527 | 4,275 | 9 | 990 | 21,633 | |||||||||||||||||||||
More than two years through three years | 1,832 | 8,311 | 1,923 | 14,510 | — | 1,202 | 27,778 | |||||||||||||||||||||
More than three years through five years | 1,827 | 15,417 | — | 954 | 32 | 3,089 | 21,319 | |||||||||||||||||||||
More than five years through ten years | 9,422 | 113,754 | — | 11,052 | 105 | 10,713 | 145,046 | |||||||||||||||||||||
More than ten years through fifteen years | 39,393 | 70,102 | — | 3,842 | 3,298 | — | 116,635 | |||||||||||||||||||||
More than fifteen years | 171,604 | 163,292 | — | 3,265 | 37,736 | 26 | 375,923 | |||||||||||||||||||||
|
|
|
|
|
|
|
|
|
|
|
|
|
| |||||||||||||||
Total | $ | 226,073 | $ | 385,827 | $ | 25,050 | $ | 90,600 | $ | 41,180 | $ | 16,476 | $ | 785,206 | ||||||||||||||
|
|
|
|
|
|
|
|
|
|
|
|
|
| |||||||||||||||
The following table sets forth the dollar amount of all loans at September 30, 2016 that are due after September 30, 2017 and have either fixed interest rates or floating or adjustable interest rates. The amounts shown below exclude unamortized purchase premiums and discounts.
| Fixed Rates | % | Floating or Adjustable Rates | % | Total | ||||||||||||||||
| (Dollars in thousands) | ||||||||||||||||||||
Residential mortgage loans | $ | 189,552 | 85.61 | % | $ | 31,872 | 14.39 | % | $ | 221,424 | ||||||||||
Commercial mortgage loans | 73,424 | 19.90 | 295,616 | 80.10 | 369,040 | |||||||||||||||
Construction loans | 1,895 | 15.33 | 10,463 | 84.67 | 12,358 | |||||||||||||||
Commercial business loans | 33,552 | 84.32 | 6,240 | 15.68 | 39,792 | |||||||||||||||
Home equity lines of credit | 192 | 0.48 | 40,203 | 99.52 | 40,395 | |||||||||||||||
Other loans | 15,635 | 97.96 | 326 | 2.04 | 15,961 | |||||||||||||||
|
|
|
|
|
|
|
|
|
| |||||||||||
Total | $ | 314,250 | 44.96 | % | $ | 384,720 | 55.04 | % | $ | 698,970 | ||||||||||
|
|
|
|
|
|
|
|
|
| |||||||||||
63
Table of Contents
The following table sets forth the dollar amount of all loans at June 30, 2016 that are due after June 30, 2017 and have either fixed interest rates or floating or adjustable interest rates. The amounts shown below exclude unamortized purchase premiums and discounts.
| Fixed Rates | % | Floating or Adjustable Rates | % | Total | ||||||||||||||||
| (Dollars in thousands) | ||||||||||||||||||||
Residential mortgage loans | $ | 192,197 | 85.53 | % | $ | 32,522 | 14.47 | % | $ | 224,719 | ||||||||||
Commercial mortgage loans | 77,232 | 20.62 | 297,329 | 79.38 | 374,561 | |||||||||||||||
Construction loans | 280 | 2.08 | 13,170 | 97.92 | 13,450 | |||||||||||||||
Commercial business loans | 31,052 | 82.20 | 6,723 | 17.80 | 37,775 | |||||||||||||||
Home equity lines of credit | 219 | 0.53 | 40,961 | 99.47 | 41,180 | |||||||||||||||
Other loans | 15,745 | 98.29 | 274 | 1.71 | 16,019 | |||||||||||||||
|
|
|
|
|
|
|
|
|
| |||||||||||
Total | $ | 316,725 | 44.75 | % | $ | 390,979 | 55.25 | % | $ | 707,704 | ||||||||||
|
|
|
|
|
|
|
|
|
| |||||||||||
Loan Originations, Purchases and Sales. Loan originations come from a variety of sources. The primary sources of loan originations are current customers, business development by our relationship managers,walk-in traffic, referrals from customers, and brokers. We generally originate loans for our portfolio rather than for sale in the secondary market.
We occasionally purchase whole loans and loan participation interests from other financial institutions. In 2014, we purchased a $48.3 million residential loan portfolio from a New Jersey bank, consisting primarily of jumbo, adjustable rate mortgage loans secured by properties located in New Jersey. At September 30, 2016, this portfolio had an outstanding balance of $27.8 million. Purchased loan participation interests primarily consist of participation interests in commercial real estate loans and multi-family mortgage loans in our primary market area. At September 30, 2016, we had $27.2 million in purchased participation interests.
64
Table of Contents
The following table sets forth our loan origination, purchase and sale activity for the periods indicated.
| Three Months Ended September 30, | Year Ended June 30, | |||||||||||||||||||
| 2016 | 2015 | 2016 | 2015 | 2014 | ||||||||||||||||
| (In thousands) | ||||||||||||||||||||
Total loans at beginning of period | $ | 785,206 | $ | 730,070 | $ | 730,070 | $ | 509,606 | $ | 452,392 | ||||||||||
Loans originated: | ||||||||||||||||||||
Residential mortgage loans | 6,005 | 8,682 | 22,377 | 24,319 | 15,497 | |||||||||||||||
Commercial mortgage loans | 9,091 | 15,971 | 74,764 | 62,998 | 58,975 | |||||||||||||||
Construction loans | 4,439 | 4,063 | 12,732 | 6,632 | 4,579 | |||||||||||||||
Commercial business loans | 8,589 | 12,504 | 35,488 | 44,679 | 36,181 | |||||||||||||||
Home equity lines of credit | 1,704 | 1,756 | 6,587 | 10,916 | 4,858 | |||||||||||||||
Other loans | 903 | 1,168 | 7,818 | 6,644 | 4,211 | |||||||||||||||
|
|
|
|
|
|
|
|
|
| |||||||||||
Total loans originated | 30,731 | 44,144 | 159,766 | 156,188 | 124,301 | |||||||||||||||
|
|
|
|
|
|
|
|
|
| |||||||||||
Loans purchased: | ||||||||||||||||||||
Residential mortgage loans | — | — | — | — | 48,933 | |||||||||||||||
Commercial mortgage loans | — | 7,644 | 35,043 | 2,075 | 4,511 | |||||||||||||||
Construction loans | — | — | 8,938 | 1,563 | 3,778 | |||||||||||||||
Commercial business loans | — | — | — | — | — | |||||||||||||||
Home equity lines of credit | — | — | — | — | — | |||||||||||||||
Other loans | — | — | — | — | 200 | |||||||||||||||
|
|
|
|
|
|
|
|
|
| |||||||||||
Total loans purchased | — | 7,644 | 43,981 | 3,638 | 57,422 | |||||||||||||||
|
|
|
|
|
|
|
|
|
| |||||||||||
Loans acquired by merger: | ||||||||||||||||||||
Residential mortgage loans | — | — | — | 86,564 | — | |||||||||||||||
Commercial mortgage loans | — | — | — | 111,118 | — | |||||||||||||||
Construction loans | — | — | — | 326 | — | |||||||||||||||
Commercial business loans | — | — | — | 7,834 | — | |||||||||||||||
Home equity lines of credit | — | — | — | 9,099 | — | |||||||||||||||
Other loans | — | — | — | — | — | |||||||||||||||
|
|
|
|
|
|
|
|
|
| |||||||||||
Total loans acquired by merger | — | — | — | 214,941 | — | |||||||||||||||
|
|
|
|
|
|
|
|
|
| |||||||||||
Less: | ||||||||||||||||||||
Loan principal repayments | (45,386 | ) | (44,299 | ) | (148,611 | ) | (152,417 | ) | (123,571 | ) | ||||||||||
Loan sales | (3,696 | ) | — | — | (1,886 | ) | (938 | ) | ||||||||||||
|
|
|
|
|
|
|
|
|
| |||||||||||
Net loan activity | (18,351 | ) | 7,489 | 55,136 | 220,464 | 57,214 | ||||||||||||||
|
|
|
|
|
|
|
|
|
| |||||||||||
Total loans at end of period | $ | 766,855 | $ | 737,559 | $ | 785,206 | $ | 730,070 | $ | 509,606 | ||||||||||
|
|
|
|
|
|
|
|
|
| |||||||||||
Asset Quality
Credit Risk Management.Our strategy for credit risk management focuses on having well-defined credit policies and uniform underwriting criteria and providing prompt attention to potential problem loans. Management of asset quality is accomplished by internal controls, monitoring and reporting of key risk indicators, and both internal and independent third-party loan reviews. The primary objective of our loan review process is to measure borrower performance and assess risk for the purpose of identifying loan weakness in order to minimize loan loss exposure. From the time of loan origination through final repayment, commercial real estate, construction and land development and commercial business loans are assigned a risk rating based onpre-determined criteria and levels of risk. The risk rating is monitored annually for most loans; however, it may change during the life of the loan as appropriate.
Internal and independent third-party loan reviews vary by loan type, as well as the nature and complexity of the loan. Depending on the size and complexity of the loan, some loans may warrant detailed individual review, while other loans may have less risk based upon size, or be of a homogeneous nature reducing the need for detailed individual analysis. Assets with these characteristics, such as consumer loans and loans secured by residential real estate, may be reviewed on the basis of risk indicators such as delinquency or credit rating. In cases of significant concern, a totalre-evaluation of the loan and associated risks are documented by completing a loan risk assessment and action plan. Some loans may bere-evaluated in terms of their fair market value or net realizable value in order to determine the likelihood of potential loss exposure and, consequently, the adequacy of specific and general loan loss reserves.
65
Table of Contents
When a borrower fails to make a required loan payment, we take a number of steps to have the borrower cure the delinquency and restore the loan to current status, including contacting the borrower by letter and phone at regular intervals. When the borrower is in default, we may commence collection proceedings. If a foreclosure action is instituted and the loan is not brought current, paid in full, or refinanced before the foreclosure sale, the real property securing the loan generally is sold at foreclosure. Management informs the board of directors monthly of the amount of loans delinquent more than 30 days.
66
Table of Contents
Delinquent Loans.The following tables set forth our loan delinquencies, includingnon-accrual loans, by type and amount at the dates indicated.
| At September 30, 2016 | At June 30, 2016 | |||||||||||||||||||||||||||||||
| 30-89 Days | 90 Days or More | 30-89 Days | 90 Days or More | |||||||||||||||||||||||||||||
| Number of Loans | Principal Balance | Number of Loans | Principal Balance | Number of Loans | Principal Balance | Number of Loans | Principal Balance | |||||||||||||||||||||||||
| (In thousands) | ||||||||||||||||||||||||||||||||
Residential mortgage loans | 1 | $ | 208 | 13 | $ | 3,890 | 4 | $ | 1,735 | 12 | $ | 3,305 | ||||||||||||||||||||
Commercial mortgage loans | — | — | 2 | 827 | 1 | — | 2 | 820 | ||||||||||||||||||||||||
Construction loans | — | — | 2 | 144 | — | — | 2 | 144 | ||||||||||||||||||||||||
Commercial business loans | — | — | 3 | 102 | 1 | 760 | 7 | 1,715 | ||||||||||||||||||||||||
Home equity lines of credit | — | — | 3 | 419 | 1 | 296 | 3 | 310 | ||||||||||||||||||||||||
Other loans | 1 | 1 | 4 | 354 | 1 | 5 | 10 | 589 | ||||||||||||||||||||||||
|
|
|
|
|
|
|
|
|
|
|
|
|
|
|
| |||||||||||||||||
Total | 2 | $ | 209 | 27 | $ | 5,736 | 7 | $ | 2,796 | 36 | $ | 6,883 | ||||||||||||||||||||
|
|
|
|
|
|
|
|
|
|
|
|
|
|
|
| |||||||||||||||||
| At June 30, | ||||||||||||||||||||||||||||||||
| 2015 | 2014 | |||||||||||||||||||||||||||||||
| 30-89 Days | 90 Days or More | 30-89 Days | 90 Days or More | |||||||||||||||||||||||||||||
| Number of Loans | Principal Balance | Number of Loans | Principal Balance | Number of Loans | Principal Balance | Number of Loans | Principal Balance | |||||||||||||||||||||||||
| (In thousands) | ||||||||||||||||||||||||||||||||
Residential mortgage loans | 3 | $ | 553 | 14 | $ | 5,539 | 2 | $ | 69 | 13 | $ | 3,185 | ||||||||||||||||||||
Commercial mortgage loans | 1 | 498 | 6 | 1,195 | 1 | 414 | 8 | 1,427 | ||||||||||||||||||||||||
Construction loans | — | — | 5 | 2,020 | — | — | 7 | 5,951 | ||||||||||||||||||||||||
Commercial business loans | 1 | 1,474 | 11 | 2,355 | — | — | 17 | 1,888 | ||||||||||||||||||||||||
Home equity lines of credit | — | — | 4 | 424 | — | — | 2 | 132 | ||||||||||||||||||||||||
Other loans | 8 | 259 | 10 | 118 | 1 | 1 | — | — | ||||||||||||||||||||||||
|
|
|
|
|
|
|
|
|
|
|
|
|
|
|
| |||||||||||||||||
Total | 13 | $ | 2,784 | 50 | $ | 11,651 | 4 | $ | 484 | 47 | $ | 12,583 | ||||||||||||||||||||
|
|
|
|
|
|
|
|
|
|
|
|
|
|
|
| |||||||||||||||||
67
Table of Contents
Non-performing Assets.Non-performing assets include loans that are 90 or more days past due or onnon-accrual status, including troubled debt restructurings onnon-accrual status, and real estate and other loan collateral acquired through foreclosure and repossession. Troubled debt restructurings include loans for which either a portion of interest or principal has been forgiven, or loans modified at interest rates materially less than current market rates. Loans 90 days or greater past due may remain on an accrual basis if adequately collateralized and in the process of collection. Fornon-accrual loans, interest previously accrued but not collected is reversed and charged against income at the time a loan is placed onnon-accrual status. Loans are returned to accrual status when all the principal and interest amounts contractually due are brought current and future payments are reasonably assured.
Real estate that we acquire as a result of foreclosure or bydeed-in-lieu of foreclosure is classified as foreclosed real estate until it is sold. When property is acquired, it is initially recorded at the fair value less costs to sell at the date of foreclosure, establishing a new cost basis. Holding costs and declines in fair value after acquisition of the property result in charges against income.
The following table sets forth information regarding ournon-performing assets at the dates indicated.
| At September 30, 2016 | At June 30, | |||||||||||||||||||||||
| 2016 | 2015 | 2014 | 2013 | 2012 | ||||||||||||||||||||
| (Dollars in thousands) | ||||||||||||||||||||||||
Non-accrual loans and troubled debt restructurings: | ||||||||||||||||||||||||
Residential mortgage loans | $ | 4,505 | $ | 5,881 | $ | 4,389 | $ | 3,659 | $ | 3,745 | $ | 2,894 | ||||||||||||
Commercial mortgage loans | 307 | 300 | 6,308 | 2,562 | 7,385 | 2,502 | ||||||||||||||||||
Construction loans | 144 | 144 | 2,020 | 5,951 | 2,748 | 3,431 | ||||||||||||||||||
Commercial business loans | 2,768 | 5,048 | 7,011 | 5,361 | 5,809 | 8,060 | ||||||||||||||||||
Home equity lines of credit | 662 | 602 | 424 | 132 | 204 | 171 | ||||||||||||||||||
Other loans | 356 | 584 | 310 | — | — | — | ||||||||||||||||||
|
|
|
|
|
|
|
|
|
|
|
| |||||||||||||
Total | 8,742 | 12,559 | 20,462 | 17,665 | 19,891 | 17,058 | ||||||||||||||||||
|
|
|
|
|
|
|
|
|
|
|
| |||||||||||||
Accruing loans past due 90 days or more: | ||||||||||||||||||||||||
Residential mortgage loans | — | — | — | — | 18 | 410 | ||||||||||||||||||
Commercial mortgage loans | — | — | — | — | 95 | — | ||||||||||||||||||
Construction loans | — | — | — | — | 2,067 | — | ||||||||||||||||||
Commercial business loans | — | — | 514 | 204 | 175 | — | ||||||||||||||||||
Home equity lines of credit | — | — | — | — | — | — | ||||||||||||||||||
Other loans | — | 4 | 4 | — | — | — | ||||||||||||||||||
|
|
|
|
|
|
|
|
|
|
|
| |||||||||||||
| — | 4 | 518 | 204 | 2,355 | 410 | |||||||||||||||||||
|
|
|
|
|
|
|
|
|
|
|
| |||||||||||||
| 8,742 | 12,563 | 20,980 | 17,869 | 22,246 | 17,468 | |||||||||||||||||||
Real estate owned | 1,059 | 905 | 368 | 211 | 571 | 1,024 | ||||||||||||||||||
|
|
|
|
|
|
|
|
|
|
|
| |||||||||||||
Totalnon-performing assets | $ | 9,801 | $ | 13,468 | $ | 21,384 | $ | 18,080 | $ | 22,817 | $ | 18,492 | ||||||||||||
|
|
|
|
|
|
|
|
|
|
|
| |||||||||||||
Troubled debt restructurings (accruing): | ||||||||||||||||||||||||
Residential mortgage loans | $ | 371 | $ | 378 | $ | 2,319 | $ | 423 | $ | — | $ | — | ||||||||||||
Commercial mortgage loans | 5,140 | 8,977 | 1,388 | 1,394 | 1,403 | — | ||||||||||||||||||
Construction loans | — | — | — | — | 3,207 | 3,707 | ||||||||||||||||||
Commercial business loans | 3,848 | 3,909 | 7,901 | 7,113 | 8,144 | 2,823 | ||||||||||||||||||
Home equity lines of credit | 11 | 11 | — | — | — | — | ||||||||||||||||||
Other loans | — | — | 72 | 2,040 | — | — | ||||||||||||||||||
|
|
|
|
|
|
|
|
|
|
|
| |||||||||||||
Total troubled debt restructurings (accruing) | $ | 9,370 | $ | 13,275 | $ | 11,680 | $ | 10,970 | $ | 12,754 | $ | 6,530 | ||||||||||||
|
|
|
|
|
|
|
|
|
|
|
| |||||||||||||
Total troubled debt restructurings (accruing) and totalnon-performing assets | $ | 19,171 | $ | 26,743 | $ | 33,028 | $ | 29,050 | $ | 35,571 | $ | 25,002 | ||||||||||||
|
|
|
|
|
|
|
|
|
|
|
| |||||||||||||
Totalnon-performing loans to total loans | 1.14 | % | 1.60 | % | 2.87 | % | 3.51 | % | 4.92 | % | 3.72 | % | ||||||||||||
Totalnon-performing loans to total assets | 0.70 | 1.00 | 1.75 | 1.83 | 2.29 | 1.79 | ||||||||||||||||||
Totalnon-performing assets and troubled debt restructurings (accruing) to total assets | 1.53 | 2.12 | 2.75 | 2.97 | 3.67 | 2.56 | ||||||||||||||||||
68
Table of Contents
Interest income that would have been recorded for the three months ended September 30, 2016 hadnon-accruing loans been current according to their original terms, amounted to $178,000. We did not recognize any interest income on these loans for the three months ended September 30, 2016.
Interest income that would have been recorded for the year ended June 30, 2016 hadnon-accruing loans been current according to their original terms, amounted to $872,000. We did not recognize any interest income on these loans for the year ended June 30, 2016.
Potential Problem Loans.Certain loans are identified during our loan review process that are currently performing according to their contractual terms and we expect to receive payment in full of principal and interest, but it is deemed probable that we will be unable to collect all the scheduled payments of principal or interest when due according to the contractual terms of the loan agreement. This may result from deteriorating conditions such as cash flows, collateral values or creditworthiness of the borrower. These loans are classified as impaired but are not accounted for on anon-accrual basis.
Other potential problem loans are those loans that are currently performing, but where known information about possible credit problems of the borrowers causes us to have concerns as to the ability of such borrowers to comply with contractual loan repayment terms. At September 30, 2016, other potential problem loans totaled loans totaled $11.1 million.
Classified Assets.The following table sets forth information regarding our classified assets, as defined under applicable regulatory standards, at the dates indicated.
| At September 30, 2016 | At June 30, | |||||||||||||||
| 2016 | 2015 | 2014 | ||||||||||||||
| (In thousands) | ||||||||||||||||
Special mention | $ | 4,275 | $ | 5,368 | $ | 8,550 | $ | 23,768 | ||||||||
Substandard | 27,703 | 35,265 | 41,866 | 34,988 | ||||||||||||
Doubtful | 349 | 349 | — | — | ||||||||||||
Loss | — | — | — | — | ||||||||||||
|
|
|
|
|
|
|
| |||||||||
Total | $ | 32,327 | $ | 40,982 | $ | 50,416 | $ | 58,756 | ||||||||
|
|
|
|
|
|
|
| |||||||||
Allowance for Loan Losses.The allowance for loan losses is maintained at levels considered adequate by management to provide for probable incurred loan losses inherent in the loan portfolio at the consolidated balance sheet reporting dates. The allowance for loan losses is based on management’s assessment of various factors affecting the loan portfolio, including portfolio composition, delinquent andnon-accrual loans, national and local business conditions and loss experience and an overall evaluation of the quality of the underlying collateral.
69
Table of Contents
The following table sets forth activity in our allowance for loan losses for the years indicated.
| Three Months Ended September 30, | Year Ended June 30, | |||||||||||||||||||||||||||
| 2016 | 2015 | 2016 | 2015 | 2014 | 2013 | 2012 | ||||||||||||||||||||||
| (Dollars in thousands) | ||||||||||||||||||||||||||||
Allowance for loan losses at beginning of period | $ | 4,042 | $ | 3,921 | $ | 3,921 | $ | 4,057 | $ | 3,985 | $ | 4,945 | $ | 8,445 | ||||||||||||||
Provision for loan losses | 26 | 41 | 1,859 | 1,326 | 903 | 741 | 1,923 | |||||||||||||||||||||
Charge-offs: | ||||||||||||||||||||||||||||
Residential mortgage loans | 38 | — | 400 | 175 | 105 | 217 | 293 | |||||||||||||||||||||
Commercial mortgage loans | — | — | 10 | 361 | — | 122 | 300 | |||||||||||||||||||||
Construction loans | — | — | — | 327 | — | 446 | 1,342 | |||||||||||||||||||||
Commercial business loans | 324 | 188 | 1,668 | 1,181 | 743 | 857 | 3,236 | |||||||||||||||||||||
Home equity lines of credit | — | — | 24 | 43 | — | 76 | — | |||||||||||||||||||||
Other loans | — | 14 | 31 | 104 | 28 | 4 | 281 | |||||||||||||||||||||
|
|
|
|
|
|
|
|
|
|
|
|
|
| |||||||||||||||
Total charge-offs | 362 | 202 | 2,133 | 2,191 | 876 | 1,722 | 5,452 | |||||||||||||||||||||
Recoveries: | ||||||||||||||||||||||||||||
Residential mortgage loans | 70 | — | — | 5 | 16 | — | — | |||||||||||||||||||||
Commercial mortgage loans | 18 | — | 178 | 8 | 10 | 5 | — | |||||||||||||||||||||
Construction loans | — | 192 | 192 | — | — | — | — | |||||||||||||||||||||
Commercial business loans | 271 | — | — | 710 | 3 | 6 | 1 | |||||||||||||||||||||
Home equity lines of credit | — | — | — | 6 | — | — | — | |||||||||||||||||||||
Other loans | — | — | 25 | — | 16 | 10 | 28 | |||||||||||||||||||||
|
|
|
|
|
|
|
|
|
|
|
|
|
| |||||||||||||||
Total recoveries | 359 | 192 | 395 | 729 | 45 | 21 | 29 | |||||||||||||||||||||
|
|
|
|
|
|
|
|
|
|
|
|
|
| |||||||||||||||
Net charge-offs | 3 | 10 | 1,738 | 1,462 | 831 | 1,701 | 5,423 | |||||||||||||||||||||
|
|
|
|
|
|
|
|
|
|
|
|
|
| |||||||||||||||
Allowance for loan losses at end of period | $ | 4,065 | $ | 3,952 | $ | 4,042 | $ | 3,921 | $ | 4,057 | $ | 3,985 | $ | 4,945 | ||||||||||||||
|
|
|
|
|
|
|
|
|
|
|
|
|
| |||||||||||||||
Allowance for loan losses tonon-performing loans at end of period | 46.50 | % | 25.73 | % | 32.17 | % | 18.69 | % | 22.70 | % | 17.91 | % | 28.31 | % | ||||||||||||||
Allowance for loan losses to total loans outstanding at end of period | 0.53 | 0.54 | 0.51 | 0.54 | (1) | 0.80 | 0.88 | 1.05 | ||||||||||||||||||||
Net charge-offs to average loans outstanding during period | — | 0.01 | 0.23 | 0.27 | 0.17 | 0.37 | 1.11 | |||||||||||||||||||||
| (1) | Loans acquired in the CMS Bancorp, Inc./CMS Bank acquisition were recorded at their estimated fair value at the acquisition date and did not include a carry-over of the relatedpre-acquisition allowance for loan losses. |
70
Table of Contents
Allocation of Allowance for Loan Losses.The following tables set forth the allowance for loan losses allocated by loan category. The allowance for loan losses allocated to each category is not necessarily indicative of future losses in any particular category and does not restrict the use of the allowance to absorb losses in other categories.
| At September 30, 2016 | At June 30, | |||||||||||||||||||||||||||||||||||
| 2016 | 2015 | |||||||||||||||||||||||||||||||||||
| Amount | Percent of Allowance to Total Allowance | Percent of Loans in Category to Total Loans | Amount | Percent of Allowance to Total Allowance | Percent of Loans in Category to Total Loans | Amount | Percent of Allowance to Total Allowance | Percent of Loans in Category to Total Loans | ||||||||||||||||||||||||||||
| (Dollars in thousands) | ||||||||||||||||||||||||||||||||||||
Residential mortgage loans | $ | 238 | 5.85 | % | 29.05 | % | $ | 237 | 5.86 | % | 28.79 | % | $ | 193 | 4.92 | % | 32.93 | % | ||||||||||||||||||
Commercial mortgage loans | 2,121 | 52.18 | 49.02 | 2,149 | 53.17 | 49.14 | 1,766 | 45.04 | 44.46 | |||||||||||||||||||||||||||
Construction loans | 302 | 7.43 | 3.76 | 269 | 6.66 | 3.19 | 100 | 2.55 | 1.63 | |||||||||||||||||||||||||||
Commercial business loans | 920 | 22.63 | 10.77 | 1,001 | 24.76 | 11.54 | 1,682 | 42.90 | 13.66 | |||||||||||||||||||||||||||
Home equity lines of credit | 70 | 1.72 | 5.27 | 73 | 1.81 | 5.24 | 69 | 1.76 | 5.56 | |||||||||||||||||||||||||||
Other loans | 414 | 10.18 | 2.14 | 313 | 7.74 | 2.10 | 111 | 2.83 | 1.76 | |||||||||||||||||||||||||||
|
|
|
|
|
|
|
|
|
|
|
|
|
|
|
|
|
| |||||||||||||||||||
Total | $ | 4,065 | 100.00 | % | 100.00 | % | $ | 4,042 | 100.00 | % | 100.00 | % | $ | 3,921 | 100.00 | % | 100.00 | % | ||||||||||||||||||
|
|
|
|
|
|
|
|
|
|
|
|
|
|
|
|
|
| |||||||||||||||||||
| At June 30, | ||||||||||||||||||||||||||||||||||||
| 2014 | 2013 | 2012 | ||||||||||||||||||||||||||||||||||
| Amount | Percent of Allowance to Total Allowance | Percent of Loans in Category to Total Loans | Amount | Percent of Allowance to Total Allowance | Percent of Loans in Category to Total Loans | Amount | Percent of Allowance to Total Allowance | Percent of Loans in Category to Total Loans | ||||||||||||||||||||||||||||
| (Dollars in thousands) | ||||||||||||||||||||||||||||||||||||
Residential mortgage loans | $ | 219 | 5.40 | % | 31.74 | % | $ | 196 | 4.92 | % | 26.07 | % | $ | 165 | 3.34 | % | 25.58 | % | ||||||||||||||||||
Commercial mortgage loans | 1,622 | 39.98 | 37.04 | 1,409 | 35.36 | 36.21 | 1,549 | 31.32 | 35.25 | |||||||||||||||||||||||||||
Construction loans | 828 | 20.41 | 3.83 | 601 | 15.08 | 4.49 | 259 | 5.24 | 4.60 | |||||||||||||||||||||||||||
Commercial business loans | 1,080 | 26.62 | 18.91 | 1,512 | 37.94 | 22.97 | 2,685 | 54.30 | 24.35 | |||||||||||||||||||||||||||
Home equity lines of credit | 186 | 4.58 | 6.66 | 161 | 4.04 | 8.42 | 200 | 4.04 | 8.33 | |||||||||||||||||||||||||||
Other loans | 122 | 3.01 | 1.83 | 106 | 2.66 | 1.85 | 87 | 1.76 | 1.88 | |||||||||||||||||||||||||||
|
|
|
|
|
|
|
|
|
|
|
|
|
|
|
|
|
| |||||||||||||||||||
Total | $ | 4,057 | 100.00 | % | 100.00 | % | $ | 3,985 | 100.00 | % | 100.00 | % | $ | 4,945 | 100.00 | % | 100.00 | % | ||||||||||||||||||
|
|
|
|
|
|
|
|
|
|
|
|
|
|
|
|
|
| |||||||||||||||||||
71
Table of Contents
See Note 1 to Notes to Consolidated Financial Statements for a complete discussion of the allowance for loan losses. Although we believe that we use the best information available to establish the allowance for loan losses, future adjustments to the allowance for loan losses may be necessary and our results of operations could be adversely affected if circumstances differ substantially from the assumptions used in making the determinations. Furthermore, while we believe we have established our allowance for loan losses in conformity with generally accepted accounting principles in the United States of America, there can be no assurance that regulators, in reviewing our loan portfolio, will not require us to increase our allowance for loan losses. In addition, because future events affecting borrowers and collateral cannot be predicted with certainty, there can be no assurance that the existing allowance for loan losses is adequate or that increases will not be necessary should the quality of any loans deteriorate as a result of the factors discussed above. Any material increase in the allowance for loan losses may adversely affect our financial condition and results of operations.
72
Table of Contents
Securities Portfolio
The following table sets forth the amortized cost and estimated fair value of ouravailable-for-sale securities portfolio at the dates indicated.
| At September 30, | At June 30, | |||||||||||||||||||||||||||||||
| 2016 | 2016 | 2015 | 2014 | |||||||||||||||||||||||||||||
| Amortized Cost | Fair Value | Amortized Cost | Fair Value | Amortized Cost | Fair Value | Amortized Cost | Fair Value | |||||||||||||||||||||||||
| (In thousands) | ||||||||||||||||||||||||||||||||
Securitiesheld-to-maturity: | ||||||||||||||||||||||||||||||||
U.S. government and agency obligations | $ | 139,572 | $ | 139,856 | $ | 145,896 | $ | 146,202 | $ | 169,027 | $ | 169,067 | $ | 202,842 | $ | 202,527 | ||||||||||||||||
Corporate and other debt securities | — | — | — | — | 226 | 227 | 450 | 455 | ||||||||||||||||||||||||
Mortgage-backed securities – residential | 71,052 | 72,715 | 72,842 | 74,139 | 59,675 | 59,818 | 42,994 | 43,410 | ||||||||||||||||||||||||
Mortgage-backed securities – collateralized mortgage obligations | 32,856 | 33,196 | 30,268 | 30,580 | 21,150 | 21,098 | 7,341 | 7,294 | ||||||||||||||||||||||||
Mortgage-backed securities – commercial | 21,591 | 22,480 | 21,673 | 22,396 | 19,835 | 19,967 | 13,519 | 13,536 | ||||||||||||||||||||||||
|
|
|
|
|
|
|
|
|
|
|
|
|
|
|
| |||||||||||||||||
Total | $ | 265,071 | $ | 268,247 | $ | 270,679 | $ | 273,317 | $ | 269,913 | $ | 270,177 | $ | 267,146 | $ | 267,222 | ||||||||||||||||
|
|
|
|
|
|
|
|
|
|
|
|
|
|
|
| |||||||||||||||||
Securitiesavailable-for-sale: | ||||||||||||||||||||||||||||||||
U.S. government and agency obligations | $ | 60,408 | $ | 60,595 | $ | 65,953 | $ | 66,132 | $ | 47,036 | $ | 46,917 | $ | 42,060 | $ | 41,735 | ||||||||||||||||
Corporate and other debt securities | 8,500 | 8,720 | 8,514 | 8,646 | 4,530 | 4,409 | 305 | 306 | ||||||||||||||||||||||||
Mortgage-backed securities – residential | 39,688 | 40,227 | 37,043 | 37,524 | 32,791 | 33,568 | 28,998 | 30,018 | ||||||||||||||||||||||||
Equity securities | 49 | 49 | 49 | 49 | 49 | 49 | 50 | 50 | ||||||||||||||||||||||||
|
|
|
|
|
|
|
|
|
|
|
|
|
|
|
| |||||||||||||||||
Total | $ | 108,645 | $ | 109,591 | $ | 111,559 | $ | 112,351 | $ | 84,406 | $ | 84,943 | $ | 71,413 | $ | 72,109 | ||||||||||||||||
|
|
|
|
|
|
|
|
|
|
|
|
|
|
|
| |||||||||||||||||
At September 30, 2016, we had no investments in a single issuer, other than securities issued by the U.S. government and government agency, which had an aggregate book value in excess of 10% of our equity.
73
Table of Contents
Securities Portfolio Maturities and Yields.The following tables set forth the stated maturities and weighted average yields of investment securities at September 30, 2016 and June 30, 2016. Certain mortgage-backed securities have adjustable interest rates and will reprice annually within the various maturity ranges. These repricing schedules are not reflected in the table below. Weighted average yield calculations on investment securities available for sale do not give effect to changes in fair value that are reflected as a component of equity. At September 30, 2016 and June 30, 2016, we did not have any investments in any private-label collateralized mortgage obligations.
At September 30, 2016:
| One Year or Less | More than One Year to Five Years | More than Five Years to Ten Years | More than Ten Years | Total | ||||||||||||||||||||||||||||||||||||||||
| Amortized Cost | Weighted Average Yield | Amortized Cost | Weighted Average Yield | Amortized Cost | Weighted Average Yield | Amortized Cost | Weighted Average Yield | Amortized Cost | Fair Value | Weighted Average Yield | ||||||||||||||||||||||||||||||||||
| (Dollars in thousands) | ||||||||||||||||||||||||||||||||||||||||||||
Securitiesheld-to-maturity: | ||||||||||||||||||||||||||||||||||||||||||||
U.S. government and agency obligations | $ | 25,484 | 0.87 | % | $ | 104,035 | 1.21 | % | $ | 2,000 | 1.60 | % | $ | 8,053 | 2.33 | % | $ | 139,572 | $ | 139,856 | 1.22 | % | ||||||||||||||||||||||
Mortgage-backed securities – residential | 6 | 4.23 | 2,082 | 2.87 | 12,628 | 1.87 | 56,336 | 2.30 | 71,052 | 72,715 | 2.24 | |||||||||||||||||||||||||||||||||
Mortgage-backed securities – collateralized mortgage obligations | — | — | 2,014 | 1.68 | 2,034 | 2.35 | 28,808 | 1.93 | 32,856 | 33,196 | 1.94 | |||||||||||||||||||||||||||||||||
Mortgage-backed securities – commercial | — | — | 5,441 | 2.17 | 14,227 | 2.63 | 1,923 | 3.42 | 21,591 | 22,480 | 2.59 | |||||||||||||||||||||||||||||||||
|
|
|
|
|
|
|
|
|
|
|
| |||||||||||||||||||||||||||||||||
Total | $ | 25,490 | 0.87 | $ | 113,572 | 1.30 | $ | 30,889 | 2.23 | $ | 95,120 | 2.21 | $ | 265,071 | $ | 268,247 | 1.69 | |||||||||||||||||||||||||||
|
|
|
|
|
|
|
|
|
|
|
| |||||||||||||||||||||||||||||||||
Securitiesavailable-for-sale: | ||||||||||||||||||||||||||||||||||||||||||||
U.S. government and agency obligations | $ | 20,999 | 0.63 | % | $ | 36,531 | 1.25 | % | — | — | % | $ | 2,878 | 1.03 | % | $ | 60,408 | $ | 60,595 | 1.02 | % | |||||||||||||||||||||||
Corporate and other debt securities | — | — | 3,378 | 2.39 | $ | 5,122 | 2.53 | — | — | 8,500 | 8,720 | 2.47 | ||||||||||||||||||||||||||||||||
Mortgage-backed securities – residential | — | — | — | — | 2,808 | 2.22 | 36,880 | 1.89 | 39,688 | 40,227 | 1.91 | |||||||||||||||||||||||||||||||||
Equity securities | — | — | — | — | — | — | 49 | — | 49 | 49 | — | |||||||||||||||||||||||||||||||||
|
|
|
|
|
|
|
|
|
|
|
| |||||||||||||||||||||||||||||||||
Total | $ | 20,999 | 0.63 | $ | 39,909 | 1.34 | $ | 7,930 | 2.42 | $ | 39,807 | 1.82 | $ | 108,645 | $ | 109,591 | 1.46 | |||||||||||||||||||||||||||
|
|
|
|
|
|
|
|
|
|
|
| |||||||||||||||||||||||||||||||||
74
Table of Contents
At June 30, 2016:
| One Year or Less | More than One Year to Five Years | More than Five Years to Ten Years | More than Ten Years | Total | ||||||||||||||||||||||||||||||||||||||||
| Amortized Cost | Weighted Average Yield | Amortized Cost | Weighted Average Yield | Amortized Cost | Weighted Average Yield | Amortized Cost | Weighted Average Yield | Amortized Cost | Fair Value | Weighted Average Yield | ||||||||||||||||||||||||||||||||||
| (Dollars in thousands) | ||||||||||||||||||||||||||||||||||||||||||||
Securitiesheld-to-maturity: | ||||||||||||||||||||||||||||||||||||||||||||
U.S. government and agency obligations | $ | 22,005 | 0.72 | % | $ | 118,947 | 1.22 | % | $ | 632 | 1.46 | % | $ | 4,312 | 2.66 | % | $ | 145,896 | $ | 146,202 | 1.19 | % | ||||||||||||||||||||||
Mortgage-backed securities – residential | 10 | 4.86 | 263 | 4.47 | 15,205 | 1.93 | 57,364 | 2.28 | 72,842 | 74,139 | 2.21 | |||||||||||||||||||||||||||||||||
Mortgage-backed securities – collateralized mortgage obligations | — | — | 2,019 | 1.68 | 2,036 | 2.35 | 26,213 | 1.94 | 30,268 | 30,580 | 1.95 | |||||||||||||||||||||||||||||||||
Mortgage-backed securities – commercial | — | — | 5,481 | 2.17 | 14,271 | 2.63 | 1,921 | 3.43 | 21,673 | 22,396 | 2.58 | |||||||||||||||||||||||||||||||||
|
|
|
|
|
|
|
|
|
|
|
| |||||||||||||||||||||||||||||||||
Total | $ | 22,015 | 0.72 | $ | 126,710 | 1.27 | $ | 32,144 | 2.26 | $ | 89,810 | 2.22 | $ | 270,679 | $ | 273,317 | 1.66 | |||||||||||||||||||||||||||
|
|
|
|
|
|
|
|
|
|
|
| |||||||||||||||||||||||||||||||||
Securitiesavailable-for-sale: | ||||||||||||||||||||||||||||||||||||||||||||
U.S. government and agency obligations | $ | 19,490 | 0.49 | % | $ | 43,516 | 1.18 | % | — | — | % | $ | 2,947 | 1.03 | % | $ | 65,953 | $ | 66,132 | 0.97 | % | |||||||||||||||||||||||
Corporate and other debt securities | — | — | 3,386 | 2.39 | $ | 5,128 | 2.52 | — | — | 8,514 | 8,646 | 2.47 | ||||||||||||||||||||||||||||||||
Mortgage-backed securities – residential | — | — | — | — | 2,823 | 2.22 | 34,220 | 1.81 | 37,043 | 37,524 | 1.84 | |||||||||||||||||||||||||||||||||
Equity securities | — | — | — | — | — | — | 49 | — | 49 | 49 | — | |||||||||||||||||||||||||||||||||
|
|
|
|
|
|
|
|
|
|
|
| |||||||||||||||||||||||||||||||||
Total | $ | 19,490 | 0.49 | $ | 46,902 | 1.26 | $ | 7,951 | 2.42 | $ | 37,216 | 1.75 | $ | 111,559 | $ | 112,351 | 1.37 | |||||||||||||||||||||||||||
|
|
|
|
|
|
|
|
|
|
|
| |||||||||||||||||||||||||||||||||
75
Table of Contents
Each reporting period, we evaluate all securities with a decline in fair value below the amortized cost of the investment to determine whether or not the impairment is deemed to be other-than-temporary. Other-than-temporary impairment (“OTTI”) is required to be recognized if (1) we intend to sell the security; (2) it is more likely than not that we will be required to sell the security before recovery of its amortized cost basis; or (3) for debt securities, the present value of expected cash flows is not sufficient to recover the entire amortized cost basis. Marketable equity securities are evaluated for OTTI based on the severity and duration of the impairment and, if deemed to be other than temporary, the declines in fair value are reflected in earnings as realized losses. For impaired debt securities that we intend to sell, or more likely than not will be required to sell, the full amount of the depreciation is recognized as OTTI, resulting in a realized loss that is a charged to earnings through a reduction in our noninterest income. For all other impaired debt securities, credit-related OTTI is recognized through earnings andnon-credit related OTTI is recognized in other comprehensive income/loss, net of applicable taxes. We did not recognize any OTTI during the three months ended September 30, 2016 and the years ended June 30, 2016 and 2015.
Deposits
Deposits have traditionally been our primary source of funds for our lending and investment activities. The substantial majority of our deposits are from depositors who reside in our primary market area. Deposits are attracted through the offering of a broad selection of deposit instruments for both individuals and businesses. The following table sets forth the distribution of total deposits by account type at the dates indicated.
| At September 30, | At June 30, | |||||||||||||||||||||||||||||||
| 2016 | 2016 | 2015 | 2014 | |||||||||||||||||||||||||||||
| Amount | Percent | Amount | Percent | Amount | Percent | Amount | Percent | |||||||||||||||||||||||||
| (In thousands) | ||||||||||||||||||||||||||||||||
Non-interest bearing demand accounts | $ | 135,756 | 12.16 | % | $ | 122,740 | 11.03 | % | $ | 129,520 | 12.21 | % | $ | 94,873 | 11.08 | % | ||||||||||||||||
NOW accounts | 107,595 | 9.63 | 111,455 | 10.02 | 82,890 | 7.82 | 70,066 | 8.18 | ||||||||||||||||||||||||
Money market accounts | 32,149 | 2.88 | 31,194 | 2.80 | 33,109 | 3.12 | 11,114 | 1.30 | ||||||||||||||||||||||||
Savings accounts | 520,128 | 46.57 | 516,249 | 46.40 | 500,470 | 47.19 | 455,011 | 53.12 | ||||||||||||||||||||||||
Certificates of deposit: | ||||||||||||||||||||||||||||||||
Less than $100,000 | 176,652 | 15.82 | 181,827 | 16.34 | 185,103 | 17.45 | 150,509 | 17.57 | ||||||||||||||||||||||||
Greater than or equal to $100,000 | 144,557 | 12.94 | 149,230 | 13.41 | 128,542 | 12.12 | 74,945 | 8.75 | ||||||||||||||||||||||||
|
|
|
|
|
|
|
|
|
|
|
|
|
|
|
| |||||||||||||||||
Total | $ | 1,116,837 | 100.00 | % | $ | 1,112,695 | 100.00 | % | $ | 1,060,505 | 100.00 | % | $ | 856,518 | 100.00 | % | ||||||||||||||||
|
|
|
|
|
|
|
|
|
|
|
|
|
|
|
| |||||||||||||||||
At September 30, 2016, and June 30, 2016, 2015 and 2014, we had municipal deposits of $44.2 million, $49.4 million, $35.2 million and $29.0 million, respectively. Municipal deposits are held by our commercial bank subsidiary, PCSB Commercial Bank.
The following tables indicate the amount of jumbo certificates of deposit by time remaining until maturity at September 30, 2016 and June 30, 2016. Jumbo certificates of deposit require minimum deposits of $100,000.
Maturity Period | Dollar Amount | |||
| (In thousands) | ||||
At September 30, 2016: | ||||
Three months or less | $ | 20,198 | ||
Over three through six months | �� | 17,544 | ||
Over six through twelve months | 23,188 | |||
Over twelve months | 83,627 | |||
|
| |||
Total | $ | 144,557 | ||
|
| |||
At June 30, 2016: | ||||
Three months or less | $ | 28,203 | ||
Over three through six months | 20,019 | |||
Over six through twelve months | 29,006 | |||
Over twelve months | 72,002 | |||
|
| |||
Total | $ | 149,230 | ||
|
| |||
76
Table of Contents
The following tables set forth time deposit accounts classified by rate and maturity at September 30, 2016 and June 30, 2016.
At September 30, 2016:
| Amount Due | ||||||||||||||||||||||||
| Less Than One Year | More Than One Year to Two Years | More Than Two Years to Three Years | More Than Three Years | Total | Percent of Total Time Deposit Accounts | |||||||||||||||||||
| (Dollars in thousands) | ||||||||||||||||||||||||
0.00 - 1.00% | $ | 94,025 | $ | 22,479 | $ | 3,604 | $ | 5,594 | $ | 125,702 | 39.14 | % | ||||||||||||
1.01 – 2.00% | 42,545 | 27,047 | 77,392 | 38,848 | 185,832 | 57.87 | ||||||||||||||||||
2.01 – 3.00% | 7,505 | — | — | 2,091 | 9,596 | 2.99 | ||||||||||||||||||
3.01% and above | — | — | — | — | — | — | ||||||||||||||||||
|
|
|
|
|
|
|
|
|
|
|
| |||||||||||||
Total | $ | 144,705 | $ | 49,526 | $ | 80,996 | $ | 46,533 | $ | 321,130 | 100.00 | % | ||||||||||||
|
|
|
|
|
|
|
|
|
|
|
| |||||||||||||
At June 30, 2016:
| Amount Due | ||||||||||||||||||||||||
| Less Than One Year | More Than One Year to Two Years | More Than Two Years to Three Years | More Than Three Years | Total | Percent of Total Time Deposit Accounts | |||||||||||||||||||
| (Dollars in thousands) | ||||||||||||||||||||||||
0.00 - 1.00% | $ | 102,584 | $ | 19,906 | $ | 6,234 | $ | 1,079 | $ | 129,803 | 39.23 | % | ||||||||||||
1.01 - 2.00% | 54,583 | 25,259 | 41,426 | 66,302 | 187,570 | 56.68 | ||||||||||||||||||
2.01 - 3.00% | 11,456 | — | 2,080 | — | 13,536 | 4.09 | ||||||||||||||||||
3.01% and above | — | — | — | — | — | — | ||||||||||||||||||
|
|
|
|
|
|
|
|
|
|
|
| |||||||||||||
Total | $ | 168,623 | $ | 45,165 | $ | 49,740 | $ | 67,381 | $ | 330,909 | 100.00 | % | ||||||||||||
|
|
|
|
|
|
|
|
|
|
|
| |||||||||||||
Borrowings
We primarily utilize advances from the Federal Home Loan Bank of New York to supplement our supply of investable funds. At September 30, 2016, we had $202.3 million of available borrowing capacity with the Federal Home Loan Bank of New York and had $11.1 million in advances outstanding. At September 30, 2016, we also had an available line of credit with the Federal Reserve Bank of New York’s discount window program of $80.8 million, none of which was outstanding at that date. The following table sets forth information concerning our borrowings at the dates and for the periods indicated.
| Three Months Ended September 30, | Year Ended June 30, | |||||||||||||||||||
| 2016 | 2015 | 2016 | 2015 | 2014 | ||||||||||||||||
| (Dollars in thousands) | ||||||||||||||||||||
Maximum balance outstanding at anymonth-end during period: | ||||||||||||||||||||
Federal Home Loan Bank advances | $ | 20,071 | $ | 34,000 | $ | 34,000 | $ | 54,050 | — | |||||||||||
Average balance outstanding during period: | ||||||||||||||||||||
Federal Home Loan Bank advances | 15,474 | 28,680 | 23,974 | 14,902 | — | |||||||||||||||
Weighted average interest rate during period: | ||||||||||||||||||||
Federal Home Loan Bank advances | 1.29 | % | 0.67 | % | 0.83 | % | 0.48 | % | — | |||||||||||
Balance outstanding at end of period: | ||||||||||||||||||||
Federal Home Loan Bank advances | $ | 11,051 | $ | 27,000 | $ | 20,081 | $ | 14,000 | — | |||||||||||
Weighted average interest rate at end of period: | ||||||||||||||||||||
Federal Home Loan Bank advances | 1.50 | % | 0.71 | % | 1.16 | % | 0.52 | % | — | |||||||||||
77
Table of Contents
Average Balance Sheets and Related Yields and Rates
The following tables present information regarding average balances of assets and liabilities, the total dollar amounts of interest income and dividends from average interest-earning assets, the total dollar amounts of interest expense on average interest-bearing liabilities, and the resulting annualized average yields and costs. The yields and costs for the periods indicated are derived by dividing income or expense by the average balances of assets or liabilities, respectively, for the periods presented. Average balances have been calculated using daily balances. Nonaccrual loans are included in average balances only. Loan fees are included in interest income on loans and are not material.
| Three Months Ended September 30, | ||||||||||||||||||||||||
| 2016 | 2015 | |||||||||||||||||||||||
| Average Balance | Interest and Dividends | Yield/Cost | Average Balance | Interest and Dividends | Yield/Cost | |||||||||||||||||||
| (Dollars in thousands) | ||||||||||||||||||||||||
Assets: | ||||||||||||||||||||||||
Loans | $ | 776,142 | $ | 8,525 | 4.39 | % | $ | 732,817 | $ | 8,158 | 4.45 | % | ||||||||||||
Securities | 372,866 | 1,480 | 1.59 | 371,619 | 1,447 | 1.56 | ||||||||||||||||||
Other interest-earning assets | 65,444 | 104 | 0.63 | 67,633 | 58 | 0.34 | ||||||||||||||||||
|
|
|
|
|
|
|
| |||||||||||||||||
Total interest-earning assets | 1,214,452 | 10,109 | 3.33 | 1,172,069 | 9,663 | 3.30 | ||||||||||||||||||
|
|
|
| |||||||||||||||||||||
Non-interest-earning assets | 55,255 | 39,366 | ||||||||||||||||||||||
|
|
|
| |||||||||||||||||||||
Total assets | $ | 1,269,707 | $ | 1,211,435 | ||||||||||||||||||||
|
|
|
| |||||||||||||||||||||
Liabilities and equity: | ||||||||||||||||||||||||
NOW accounts | $ | 109,959 | $ | 44 | 0.16 | $ | 84,167 | $ | 34 | 0.16 | ||||||||||||||
Money market accounts | 31,410 | 21 | 0.27 | 34,145 | 23 | 0.27 | ||||||||||||||||||
Savings accounts | 529,381 | 327 | 0.25 | 513,149 | 397 | 0.31 | ||||||||||||||||||
Certificates of deposit | 325,793 | 892 | 1.09 | 313,740 | 677 | 0.86 | ||||||||||||||||||
|
|
|
|
|
| |||||||||||||||||||
Total interest-bearing deposits | 996,543 | 1,284 | 0.51 | 945,201 | 1,131 | 0.48 | ||||||||||||||||||
Federal Home Loan Bank advances | 15,474 | 50 | 1.29 | 28,680 | 48 | 0.67 | ||||||||||||||||||
|
|
|
|
|
|
|
| |||||||||||||||||
Total interest-bearing liabilities | 1,012,017 | 1,334 | 0.52 | 973,881 | 1,179 | 0.48 | ||||||||||||||||||
|
|
|
| |||||||||||||||||||||
Non-interest-bearing deposits | 130,768 | 117,577 | ||||||||||||||||||||||
Othernon-interest-bearing liabilities | 15,687 | 8,225 | ||||||||||||||||||||||
|
|
|
| |||||||||||||||||||||
Total liabilities | 1,158,472 | 1,099,713 | ||||||||||||||||||||||
Total equity | 111,235 | 111,722 | ||||||||||||||||||||||
|
|
|
| |||||||||||||||||||||
Total liabilities and equity | $ | 1,269,707 | $ | 1,211,435 | ||||||||||||||||||||
|
|
|
| |||||||||||||||||||||
Net interest income | $ | 8,775 | $ | 8,484 | ||||||||||||||||||||
|
|
|
| |||||||||||||||||||||
Interest rate spread | 2.80 | 2.81 | ||||||||||||||||||||||
Net interest margin | 2.89 | 2.90 | ||||||||||||||||||||||
Average interest-earning assets to average interest-bearing liabilities | 120.00 | % | 120.35 | % | ||||||||||||||||||||
78
Table of Contents
| Year Ended June 30, | ||||||||||||||||||||||||||||||||||||
| 2016 | 2015 | 2014 | ||||||||||||||||||||||||||||||||||
| Average Balance | Interest and Dividends | Yield/Cost | Average Balance | Interest and Dividends | Yield/Cost | Average Balance | Interest and Dividends | Yield/Cost | ||||||||||||||||||||||||||||
| (Dollars in thousands) | ||||||||||||||||||||||||||||||||||||
Assets: | ||||||||||||||||||||||||||||||||||||
Loans | $ | 743,995 | $ | 32,832 | 4.41 | % | $ | 550,281 | $ | 23,245 | 4.23 | % | $ | 488,572 | $ | 21,237 | 4.35 | % | ||||||||||||||||||
Securities | 365,593 | 5,897 | 1.61 | 376,716 | 5,360 | 1.42 | 340,849 | 4,340 | 1.27 | |||||||||||||||||||||||||||
Other interest-earning assets | 62,034 | 315 | 0.51 | 70,319 | 222 | 0.32 | 107,979 | 287 | 0.27 | |||||||||||||||||||||||||||
|
|
|
|
|
|
|
|
|
|
|
| |||||||||||||||||||||||||
Total interest-earning assets | 1,171,622 | 39,044 | 3.33 | 997,316 | 28,827 | 2.89 | 937,400 | 25,864 | 2.76 | |||||||||||||||||||||||||||
|
|
|
|
|
| |||||||||||||||||||||||||||||||
Non-interest-earning assets | 46,451 | 25,047 | 27,301 | |||||||||||||||||||||||||||||||||
|
|
|
|
|
| |||||||||||||||||||||||||||||||
Total assets | $ | 1,218,073 | $ | 1,022,363 | $ | 964,701 | ||||||||||||||||||||||||||||||
|
|
|
|
|
| |||||||||||||||||||||||||||||||
Liabilities and equity: | ||||||||||||||||||||||||||||||||||||
NOW accounts | $ | 92,165 | $ | 146 | 0.16 | $ | 72,549 | $ | 106 | 0.15 | $ | 46,951 | $ | 62 | 0.13 | |||||||||||||||||||||
Money market accounts | 32,770 | 89 | 0.27 | 16,272 | 39 | 0.24 | 12,327 | 24 | 0.20 | |||||||||||||||||||||||||||
Savings accounts | 512,321 | 1,487 | 0.29 | 465,951 | 1,442 | 0.31 | 465,565 | 1,471 | 0.32 | |||||||||||||||||||||||||||
Certificates of deposit | 315,028 | 2,891 | 0.92 | 244,159 | 2,225 | 0.91 | 225,062 | 2,077 | 0.92 | |||||||||||||||||||||||||||
|
|
|
|
|
|
|
|
|
|
|
| |||||||||||||||||||||||||
Total interest-bearing deposits | 952,284 | 4,613 | 0.49 | 798,931 | 3,812 | 0.48 | 749,905 | 3,634 | 0.48 | |||||||||||||||||||||||||||
Federal Home Loan Bank advances | 23,974 | 199 | 0.83 | 14,902 | 72 | 0.49 | — | — | — | |||||||||||||||||||||||||||
|
|
|
|
|
|
|
|
|
| |||||||||||||||||||||||||||
Total interest-bearing liabilities | 976,258 | 4,812 | 0.49 | 813,833 | 3,884 | 0.48 | 749,905 | 3,634 | 0.48 | |||||||||||||||||||||||||||
|
|
|
|
|
| |||||||||||||||||||||||||||||||
Non-interest-bearing deposits | 118,871 | 88,103 | 95,894 | |||||||||||||||||||||||||||||||||
Othernon-interest-bearing liabilities | 9,989 | 7,667 | 8,230 | |||||||||||||||||||||||||||||||||
|
|
|
|
|
| |||||||||||||||||||||||||||||||
Total liabilities | 1,105,118 | 909,603 | 854,029 | |||||||||||||||||||||||||||||||||
Total equity | 112,955 | 112,760 | 110,671 | |||||||||||||||||||||||||||||||||
|
|
|
|
|
| |||||||||||||||||||||||||||||||
Total liabilities and equity | $ | 1,218,073 | $ | 1,022,363 | $ | 964,700 | ||||||||||||||||||||||||||||||
|
|
|
|
|
| |||||||||||||||||||||||||||||||
Net interest income | $ | 34,232 | $ | 24,943 | $ | 22,230 | ||||||||||||||||||||||||||||||
|
|
|
|
|
| |||||||||||||||||||||||||||||||
Interest rate spread | 2.84 | 2.41 | 2.27 | |||||||||||||||||||||||||||||||||
Net interest margin | 2.92 | 2.50 | 2.30 | |||||||||||||||||||||||||||||||||
Average interest-earning assets to average interest-bearing liabilities | 120.01 | % | 122.55 | % | 125.00 | % | ||||||||||||||||||||||||||||||
79
Table of Contents
Rate/Volume Analysis
The following table sets forth the effects of changing rates and volumes on our net interest income. The rate column shows the effects attributable to changes in rate (changes in rate multiplied by prior volume). The volume column shows the effects attributable to changes in volume (changes in volume multiplied by prior rate). The net column represents the sum of the prior columns. Changes attributable to changes in both rate and volume that cannot be segregated have been allocated proportionally based on the changes due to rate and the changes due to volume.
| Three Months Ended September 30, 2016 Compared to Three Months Ended September 30, 2015 | Year Ended June 30, 2016 Compared to Year Ended June 30, 2015 | Year Ended June 30, 2015 Compared to Year Ended June 30, 2014 | ||||||||||||||||||||||||||||||||||
| Increase (Decrease) Due to | Increase (Decrease) Due to | Increase (Decrease) Due to | ||||||||||||||||||||||||||||||||||
| Rate | Volume | Net | Rate | Volume | Net | Rate | Volume | Net | ||||||||||||||||||||||||||||
| (In thousands) | ||||||||||||||||||||||||||||||||||||
Interest income: | ||||||||||||||||||||||||||||||||||||
Loans receivable | $ | (175 | ) | $ | 542 | $ | 367 | $ | 819 | $ | 8,768 | $ | 9,587 | $ | (911 | ) | $ | 2,919 | $ | 2,008 | ||||||||||||||||
Securities | (15 | ) | 48 | 33 | 320 | 217 | 537 | 257 | 831 | 1,088 | ||||||||||||||||||||||||||
Other interest-earning assets | 49 | (3 | ) | 46 | 125 | (32 | ) | 93 | (34 | ) | (99 | ) | (113 | ) | ||||||||||||||||||||||
|
|
|
|
|
|
|
|
|
|
|
|
|
|
|
|
|
| |||||||||||||||||||
Total interest-earning assets | (141 | ) | 587 | 446 | 1,264 | 8,953 | 10,217 | (688 | ) | 3,651 | 2,963 | |||||||||||||||||||||||||
|
|
|
|
|
|
|
|
|
|
|
|
|
|
|
|
|
| |||||||||||||||||||
Interest expense: | ||||||||||||||||||||||||||||||||||||
NOW accounts | — | 10 | 10 | �� | 10 | 30 | 40 | 8 | 36 | 44 | ||||||||||||||||||||||||||
Money market accounts | (1 | ) | (1 | ) | (2 | ) | 6 | 44 | 50 | 5 | 10 | 15 | ||||||||||||||||||||||||
Savings accounts | (82 | ) | 12 | (70 | ) | (41 | ) | 86 | 45 | (21 | ) | (8 | ) | (29 | ) | |||||||||||||||||||||
Certificates of deposit | 189 | 26 | 215 | 16 | 650 | 666 | (23 | ) | 171 | 148 | ||||||||||||||||||||||||||
Federal Home Loan Bank advances | 31 | (29 | ) | 2 | 69 | 58 | 127 | — | 72 | 72 | ||||||||||||||||||||||||||
|
|
|
|
|
|
|
|
|
|
|
|
|
|
|
|
|
| |||||||||||||||||||
Total interest-bearing liabilities | 137 | 18 | 155 | 60 | 868 | 928 | (31 | ) | 281 | 250 | ||||||||||||||||||||||||||
|
|
|
|
|
|
|
|
|
|
|
|
|
|
|
|
|
| |||||||||||||||||||
Net increase (decrease) in net interest income | $ | (278 | ) | $ | 569 | $ | 291 | $1,204 | $ | 8,085 | $ | 9,289 | $ | (657 | ) | $ | 3,370 | $ | 2,713 | |||||||||||||||||
|
|
|
|
|
|
|
|
|
|
|
|
|
|
|
|
|
| |||||||||||||||||||
80
Table of Contents
Comparison of Financial Condition at September 30, 2016 and June 30, 2016
Total Assets.Total assets decreased $7.6 million or 0.6% to $1.3 billion at September 30, 2016 from $1.3 billion at June 30, 2016. The decrease is primarily the result of decreases of $18.4 million in net loans and $8.4 million in securitiesheld-to-maturity and securitiesheld-for-sale, partially offset by an increase of $18.8 million in cash and cash equivalents.
Cash and Cash Equivalents.Cash and cash equivalents increased $18.8 million, or 45.3% to $60.4 million at September 30, 2016 from $41.6 million at June 30, 2016. The increase is due primarily to the proceeds from an $18.4 million decrease in net loans and an $8.4 million decrease in securitiesheld-to-maturity and securitiesheld-for-sale, and a $4.1 million increase in deposits, partially offset by $9.0 million in maturing advances.
SecuritiesHeld-to-Maturity.Total securities held to maturity decreased $5.6 million, or 2.1% to $265.1 million at September 30, 2016 from $270.7 million at June 30, 2016. This decline was primarily caused by a $6.3 million decrease in US government and agency obligations.
Securities-Available-for-Sale.Total securitiesavailable-for-sale decreased $2.8 million, or 2.5%, to $109.6 million at September 30, 2016 from $112.4 million at June 30, 2016. This decline was caused by a decrease of $5.5 million in US government and agency obligations, partially offset by an increase of $2.7 million in residential mortgage-backed securities.
Net Loans.Net loans decreased $18.4 million, or 2.4% to $763.9 million at September 30, 2016 from $782.3 million at June 30, 2016. The decrease is primarily due to decreases of $9.9 million, or 2.6% in commercial mortgage loans, $8.0 million, or 8.8% in commercial loans, and $3.3 million, or 1.5% in residential mortgage loans, partially offset by a $3.8 million, or 15.0% increase in construction loans. The $21.3 million decrease in commercial mortgage loans, commercial loans, and residential mortgage loans primarily reflects net repayments which include a $6.9 million decrease in impaired loans. The $3.8 million increase in construction loans primarily reflects new originations and advances on existing loans.
Deposits.Total deposits increased $4.1 million or 0.4% to $1.1 billion at September 30, 2016 from $1.1 billion at June 30, 2016. The growth in deposits reflects increases of $13.0 million in demand accounts, $3.9 million in savings accounts and $1.0 million in money market accounts, partially offset by decreases of $9.8 million in certificates of deposit and $3.9 million in NOW accounts. The overall $17.9 million increase in demand, savings and money market accounts reflects the Banks strategy of raising low cost core deposits.
Federal Home Loan Bank Advances.Federal Home Loan Bank advances decreased $9.0 million, or 45.0%, to $11.1 million at September 30, 2016 from $20.1 million at June 30, 2016. The decrease was due to the maturity of advances used to fund a leveraging strategy initiated two years ago.
Total Equity.Total equity increased $1.6 million, or 1.4%, to $111.5 million at September 30, 2016 from $109.9 million at June 30, 2016. The increase was caused by net income of $1.5 million and a decrease in accumulated other comprehensive loss of $101,000.
Comparison of Financial Condition at June 30, 2016 and June 30, 2015
Total Assets.Total assets increased $61.3 million, or 5.1%, to $1.3 billion at June 30, 2016 from $1.2 billion at June 30, 2015. The increase was primarily due to increases of $55.2 million, or 7.6% in net loans, and $27.4 million, or 32.3% in securities available for sale, partially offset by a $36.2 million, or 46.5%, decrease in cash and cash equivalents.
Cash and Cash Equivalents.Total cash and cash equivalents decreased $36.2 million, or 46.5%, to $41.6 million at June 30, 2016 from $77.8 million at June 30, 2015. This decrease primarily reflects the strategy of repositioning the balance sheet away from lower yielding short-term investments and into higher yielding loans.
81
Table of Contents
Securities Available for Sale.Total securitiesavailable-for-sale increased $27.4 million, or 32.3%, to $112.4 million at June 30, 2016 from $84.9 million at June 30, 2015. The increase was primarily due to additional purchases of securities used to collateralize a $14.2 million increase in municipal deposits held at PCSB Bank’s commercial bank subsidiary, PCSB Commercial Bank.
Net Loans.Net loans increased $55.2 million, or 7.6%, to $782.3 million at June 30, 1026 from $727.1 million at June 30, 2015. The increase is primarily due to increases of $61.3 million, or 18.9% in commercial mortgage loans and $13.2 million, or 110.8%, in construction loans, partially offset by decreases of $14.4 million, or 6.0%, in residential loans and $9.0 million, or 9.1%, in commercial business loans. The overall increase in net loans is part of the strategy to diversify the balance sheet into higher-yielding loans.
Deposits.Total deposits increased $52.2 million, or 4.9%, to $1.1 billion at June 30, 2016 from $1.1 billion at June 30, 2015. The growth in deposits reflects increases of $28.6 million, or 34.5% in NOW accounts, $16.5 million, or 5.3%, in certificates of deposit, and a $15.8 million, or 3.2% in savings accounts, partially offset by decreases of $6.8 million, or 5.2% in demand accounts and $1.9 million, or 5.8% in money market accounts. The $44.3 million increase in Now and savings accounts reflect the Bank’s strategy of raising low cost core deposits.
Federal Home Loan Bank Advances.Federal Home Loan Bank advances increased $6.1 million, or 43.4%, to $20.1 million at June 30, 2016 from $14.0 million at June 30, 2015. The increase was due to additional advances taken to fund part of a leveraging strategy employed during the period.
Total Equity.Total equity decreased $322,000, or 0.3%, to $109.9 million at June 30, 2016 from $110.3 million at June 30, 2015. The decrease was caused by a $3.2 million increase in accumulated other comprehensive loss, partially offset by $2.9 million of net income for the year ended June 30, 2016.
Comparison of Operating Results for the Three Months Ended September 30, 2016 and September 30, 2015
General. Net income increased by $200,000, or 15.9%, to $1.5 million for the three months ended September 30, 2016 compared to $1.3 million for the three months ended September 30, 2015. The increase was primarily due to a $291,000 increase in net interest income and a $124,000 increase innon-interest income, partially offset by a $151,000 increase in noninterest expense and a $79,000 increase in income tax expense.
Net Interest Income. Net interest income increased $291,000 to $8.8 million for the three months ended September 30, 2016 from $8.5 million for the three months ended September 30, 2015. The increase primarily reflects a $4.2 million increase in average net interest-earning assets as growth in interest-earning assets outpaced growth in interest-bearing liabilities, partially offset by a one basis point decrease in the interest rate spread to 2.80% from 2.81% for the three months ended September 30, 2015.
Interest and Dividend Income. Interest and dividend income increased $446,000, or 4.6%, to $10.1 million for the three months ended September 30, 2016 from $9.7 million for the three months ended September 30, 2015. The increase primarily reflects a $42.4 million increase in the average balance on interest-earning assets and a 3 basis point increase in average yield to 3.33% from 3.30% for the three months ended September 30, 2015.
Interest income on loans increased $367,000 primarily due to a $43.3 million increase in the average balance to $776.1 million for the three months ended September 30, 2016 from $732.8 million for the three months ended September 30, 2015, partially offset by a 6 basis point decrease in the average yield on loans to 4.39% from 4.45% for the same period.
Interest income on other interest-earning assets increased $46,000 primarily due to a 29 basis point increase in the average yield on other interest-earning assets to 0.49% for the three months ended September 30, 2016 from 0.34% for the three months ended September 30, 2015, partially offset by a $2.2 million decrease in the average balance on other interest-earning assets for the same period.
82
Table of Contents
Interest income on securities increased $33,000 primarily due to a $1.3 million increase in the average balance of securities to $372.9 million for the three months ended September 30, 2016 from $371.6 million for the three months ended September 30, 2015 and a 3 basis point increase in the average yield on securities to 1.59% for the same period.
Interest Expense. Interest expense increased $155,000, or 13.2%, to $1.3 million for the three months ended September 30, 2016 from $1.2 million for the three months ended September 30, 2015. The increase primarily reflects a $38.1 million increase in the average balance on interest-bearing liabilities and a 4 basis point increase in the average cost to 0.52% from 0.48% for the three months ended September 30, 2015.
Interest expense on interest-bearing deposits increased $153,000 primarily due to a $51.3 million increase in the average balance to $996.5 million for the three months ended September 30, 2016 from $945.2 million for the three months ended September 30, 2015 and a 3 basis point increase in the average rate paid on interest-bearing deposits to 0.51% from 0.48% for the same period.
Interest expense on Federal Home Loan Bank advances increased $2,000 primarily due to a 62 basis points increase in the average cost to 1.29% for the three months ended September 30, 2016 from 0.67% for the three months ended September 30, 2015, partially offset by a $13.2 million decrease in the average balance to $15.5 million from $28.7 million for the same period.
Provision for Loan Losses. We recorded provisions for loan losses of $26,000 and $41,000 for the three months ended September 30, 2016 and 2015, respectively.
Noninterest Income. Noninterest income increased $124,000, or 29.0%, to $552,000 for the three months ended September 30, 2016 from $428,000 for the three months ended September 30, 2015. The increase was caused primarily by a $92,000 increase in the cash surrender value of bank owned life insurance, due to the $11.3 million additional investment during fiscal 2016.
Noninterest Expense. Noninterest expense increased $151,000, or 2.1%, to $7.2 million for the three months ended September 30, 2016 from $7.0 million for the three months ended September 30, 2015. The $151,000 increase was caused primarily by a $196,000 increase in occupancy and equipment expense and a $133,000 increase in salaries and employee benefits expense, partially offset by a $122,000 decrease in merger-related expenses. The $196,000 increase in occupancy and equipment costs was driven primarily by increased expenses for our new headquarters which was completed in December 2015 and additional expenses for the Pawling branch which was completed in June 2016. The $133,000 increase in salaries and employee benefits was caused by a $112,000 increase in retirement expense due to the updated valuation analysis for fiscal 2017. The $122,000 decrease in merger-related expenses was caused by data conversion expenses recorded in the three month period ended September 30, 2015.
Income Tax Expense. Income tax expense increased $79,000, or 13.9%, to $647,000 for the three months ended September 30, 2016 compared to $568,000 for the three months ended September 30, 2015. The increase was caused by a $279,000, or 15.3%, increase inpre-tax income. The effective tax rate was 30.8% and 31.1% for the three months ended September 30, 2016 and 2015, respectively.
Comparison of Operating Results for the Years Ended June 30, 2016 and June 30, 2015
General. Net income increased by $2.4 million, or 476.0%, to $2.9 million for the year ended June 30, 2016 from $508,000 for the year ended June 30, 2015. The increase was primarily due to a $9.3 million increase in net interest income and a $384,000 increase in noninterest income, partially offset by a $6.3 million increase in noninterest expense, a $533,000 increase in provision for loan losses and a $431,000 increase in income tax expense. The comparison of operating results between 2016 and 2015 are affected significantly by the fact that the year ended June 30, 2016 contains the full 12 months of operating results from the CMS Bank acquisition, compared to only 2 months for the year ended June 30, 2015.
83
Table of Contents
Net Interest Income. Net interest income increased $9.3 million, or 37.2%, to $34.2 million for the year ended June 30, 2016 compared to $24.9 million for the year ended June 30, 2015. The increase reflects an $11.9 million increase in average net interest-earning assets to $195.4 million for the year ended June 30, 2016 from $183.5 million for the year ended June 30, 2015 and a 43 basis point increase in the interest rate spread to 2.84% for the year ended June 30, 2016 from 2.41% for the year ended June 30, 2015.
Interest and Dividend Income. Interest and dividend income increased $10.2 million, or 35.4%, to $39.0 million for the year ended June 30, 2016, compared to $28.8 million for the year ended June 30, 2015. The increase primarily reflects a $174.3 million increase in the average balance on interest-earning assets and a 44 basis point increase in the average yield to 3.33% from 2.89% for the year ended June 30, 2015.
Interest on loans increased $9.6 million primarily due to a $193.7 million increase in the average balance to $744.0 million for the year ended June 30, 2016 from $550.3 million for the year ended June 30, 2015 and an 18 basis point increase in the average yield to 4.41% from 4.23% for the same period.
Interest income on securities increased $537,000 primarily due to a 19 basis point increase in the average yield to 1.61% for the year ended June 30, 2016 from 1.42% for the year ended June 30, 2015, partially offset by a $11.1 million decrease in the average balance to $365.6 million from $376.7 million for the same period.
Interest Expense. Interest expense increased $928,000, or 23.9%, to $4.8 million for the year ended June 30, 2016 from $3.9 million for the year ended June 30, 2015. The increase primarily reflects a $162.4 million increase in the average balance on interest-bearing liabilities and a 1 basis point increase in the average cost to 0.49% from 0.48% for the year ended June 30, 2016.
Interest expense on interest-bearing deposits increased $801,000, or 21.0%, primarily due to a $153.4 million increase in the average balance to $952.3 million for the year ended June 30, 2016 from $798.9 million for the year ended June 30, 2015 and a 1 basis point increase in the average rate paid on interest-bearing deposits to 0.49% from 0.48% for the same period.
Interest expense on Federal Home Loan Bank advances increased $127,000, primarily due to a $9.1 million increase in the average balance to $24.0 million for the year ended June 30, 2016 from $14.9 million for the year ended June 30, 2015 and a 34 basis point increase in the average cost to 0.83% from 0.49% for the same period.
Provision for Loan Losses. We recorded a provision for loan losses of $1.9 million for the year ended June 30, 2016 compared to $1.3 million for the year ended June 30, 2015. The growth in the provision reflected management’s assessment of the risks inherent in our loan portfolio and was necessary so that the allowance for loan losses could keep pace with the growth in the loan portfolio for the year ended June 30, 2016.
Noninterest Income. Noninterest income increased $384,000, or 24.5%, to $2.0 million for the year ended June 30, 2016 from $1.6 million for the year ended June 30, 2015. The increase was caused by a $161,000 increase in the cash value of bank owned life insurance, a $125,000 increase in other noninterest income and a $98,000 increase in fees and service charges. The increase in cash value of bank owned life insurance was due to the $11.3 million additional investment in bank owned life insurance during the year ended June 30, 2016. The increase in othernon-interest income and fees and service charges was due to increased income from the higher amount of loan and deposit accounts resulting from the CMS Bancorp acquisition.
Noninterest Expense. Noninterest expense increased $6.3 million, or 26.2%, to $30.3 million for the year ended June 30, 2016 from $24.0 million for the year ended June 30, 2015. The increase is due primarily to the year ended June 30, 2016 containing a full year of expenses related to the CMS Bancorp acquisition. The $6.3 million increase is primarily comprised of a $3.3 million increase in salaries and employee benefits, a $1.1 million increase in occupancy and equipment expenses, a $994,000 increase in other operating expenses and a $668,000 increase in professional fees.
84
Table of Contents
Income Tax Expense. Income tax expense increased $431,000, or 61.40%, to $1.1 million for the year ended June 30, 2016 from $702,000 for the year ended June 30, 2015. The increase was caused primarily by the $2.8 million increase inpre-tax income, partially offset by a reduction ofnon-deductible merger expenses in the year ended June 30, 2016 compared to June 30, 2015. The effective tax rate was 27.9% and 58.0% for the years ended June 30, 2016 and 2015, respectively, primarily as a result of the reduction innon-deductible merger expenses.
Management of Market Risk
General. The majority of our assets and liabilities are monetary in nature. Consequently, our most significant form of market risk is interest rate risk. Our assets, consisting primarily of loans, have longer maturities than our liabilities, consisting primarily of deposits. As a result, a principal part of our business strategy is to manage our exposure to changes in market interest rates. Accordingly, we have established a management-level Asset/Liability Management Committee, which takes initial responsibility for developing an asset/liability management process and related procedures, establishing and monitoring reporting systems and developing asset/liability strategies. On at least a quarterly basis, the Asset/Liability Management Committee reviews asset/liability management with the Investment Asset/Liability Committee that has been established by the board of directors. This committee also reviews any changes in strategies as well as the performance of any specific asset/liability management actions that have been implemented previously. On a quarterly basis, an outside consulting firm provides us with detailed information and analysis as to asset/liability management, including our interest rate risk profile. Ultimate responsibility for effective asset/liability management rests with our board of directors.
We have sought to manage our interest rate risk in order to minimize the exposure of our earnings and capital to changes in interest rates. We have implemented the following strategies to manage our interest rate risk: originating loans with adjustable interest rates; promoting core deposit products; and adjusting the interest rates and maturities of funding sources, as necessary. By following these strategies, we believe that we are better positioned to react to changes in market interest rates.
Net Portfolio Value Simulation.We analyze our sensitivity to changes in interest rates through a net portfolio value of equity (“NPV”) model. NPV represents the present value of the expected cash flows from our assets less the present value of the expected cash flows arising from our liabilities adjusted for the value ofoff-balance sheet contracts. The NPV ratio represents the dollar amount of our NPV divided by the present value of our total assets for a given interest rate scenario. NPV attempts to quantify our economic value using a discounted cash flow methodology while the NPV ratio reflects that value as a form of capital ratio. We estimate what our NPV would be at a specific date. We then calculate what the NPV would be at the same date throughout a series of interest rate scenarios representing immediate and permanent, parallel shifts in the yield curve. We currently calculate NPV under the assumptions that interest rates increase 100, 200, 300 and 400 basis points from current market rates and that interest rates decrease 100 basis points from current market rates.
The following table presents the estimated changes in our NPV that would result from changes in market interest rates at September 30, 2016. All estimated changes presented in the table are within the policy limits approved by our Board of Trustees.
| NPV | NPV as Percent of Portfolio Value of Assets | |||||||||||||||||||
| (Dollars in thousands) | ||||||||||||||||||||
Basis Point Change in Interest Rates | Dollar Amount | Dollar Change | Percent Change | NPV Ratio | Change | |||||||||||||||
400 | $ | 112,206 | $ | (45,655 | ) | (28.92 | )% | 9.75 | % | (2.64 | )% | |||||||||
300 | 126,448 | (31,413 | ) | (19.90 | ) | 10.70 | (1.69 | ) | ||||||||||||
200 | 140,169 | (17,692 | ) | (11.21 | ) | 11.56 | (0.83 | ) | ||||||||||||
100 | 152,578 | (5,283 | ) | (3.35 | ) | 12.26 | (0.13 | ) | ||||||||||||
0 | 157,861 | — | — | 12.39 | — | |||||||||||||||
(100) | 165,145 | 7,284 | 4.61 | 12.71 | 0.32 | |||||||||||||||
85
Table of Contents
Certain shortcomings are inherent in the methodologies used in the above interest rate risk measurements. Modeling changes requires making certain assumptions that may or may not reflect the manner in which actual yields and costs respond to changes in market interest rates. The above table assumes that the composition of our interest-sensitive assets and liabilities existing at the date indicated remains constant uniformly across the yield curve regardless of the duration or repricing of specific assets and liabilities. Accordingly, although the table provides an indication of our interest rate risk exposure at a particular point in time, such measurements are not intended to and do not provide a precise forecast of the effect of changes in market interest rates on our NPV and will differ from actual results.
Liquidity and Capital Resources
Liquidity. Liquidity is the ability to meet current and future financial obligations of a short-term nature. Our primary sources of funds consist of deposit inflows, loan repayments and maturities and sales of securities. While maturities and scheduled amortization of loans and securities are predictable sources of funds, deposit flows and mortgage prepayments are greatly influenced by general interest rates, economic conditions and competition.
We regularly review the need to adjust our investments in liquid assets based upon our assessment of: (1) expected loan demand, (2) expected deposit flows, (3) yields available on interest-earning deposits and securities, and (4) the objectives of our asset/liability management program. Excess liquid assets are invested generally in interest-earning deposits and short- and intermediate-term securities.
Our most liquid assets are cash and cash equivalents. The levels of these assets are dependent on our operating, financing, lending and investing activities during any given period. At September 30, 2016, cash and cash equivalents totaled $60.4 million. Securities classified asavailable-for-sale, which provide an additional source of liquidity, totaled $109.6 million at September 30. 2016.
At September 30, 2016, we had the ability to borrow up to $202.3 million from the Federal Home Loan Bank of New York, $11.1 million of which was outstanding. At September 30, 2016, we also had an available line of credit with the Federal Reserve Bank of New York’s discount window program of $80.8 million, none of which was outstanding at that date.
We have no material commitments or demands that are likely to affect our liquidity other than as set forth below. If loan demand was to increase faster than expected, or any unforeseen demand or commitment was to occur, we could access our borrowing capacity with the Federal Home Loan Bank of New York or the Federal Reserve Bank of New York.
At September 30, 2016, we had $92.1 million of loan commitments outstanding and $53.3 million of approved, but unadvanced, funds to borrowers. We also had $742,000 in outstanding letters of credit at September 30, 2016.
Certificates of deposit due within one year of September 30, 2016 totaled $144.1 million. If these deposits do not remain with us, we will be required to seek other sources of funds, including other certificates of deposit and Federal Home Loan Bank of New York advances. Depending on market conditions, we may be required to pay higher rates on such deposits or other borrowings than we currently pay on the certificates of deposit at September 30, 2016. We believe, however, based on past experience that a significant portion of our certificates of deposit will remain with us. We have the ability to attract and retain deposits by adjusting the interest rates offered.
86
Table of Contents
Liquidity is needed for financing and investing activities. The following table sets forth our investing and financing activities for the periods presented.
| Three Months Ended September 30, | Year Ended June 30, | |||||||||||||||||||
| 2016 | 2015 | 2016 | 2015 | 2014 | ||||||||||||||||
| (In thousands) | ||||||||||||||||||||
Investing activities: | ||||||||||||||||||||
Loan purchases | $ | — | $ | (7,644 | ) | $ | (43,981 | ) | $ | (3,638 | ) | $ | (57,422 | ) | ||||||
Loan originations | (30,731 | ) | (44,144 | ) | (159,766 | ) | (156,188 | ) | (124,301 | ) | ||||||||||
Loan principal repayments | 45,386 | 44,299 | 148,611 | 152,417 | 123,571 | |||||||||||||||
Loan sales | 3,696 | — | — | 1,886 | 938 | |||||||||||||||
Proceeds from maturities and calls of securitiesheld-to-maturity | 27,805 | 33,911 | 107,656 | 97,971 | 93,953 | |||||||||||||||
Proceeds from maturities and calls of securitiesavailable-for-sale | 13,109 | 5,986 | 33,058 | 21,295 | 23,996 | |||||||||||||||
Proceeds from sales of securitiesavailable-for-sale | — | — | — | 23,701 | — | |||||||||||||||
Purchases of securitiesheld-to-maturity | (22,334 | ) | (27,985 | ) | (112,896 | ) | (94,178 | ) | (100,606 | ) | ||||||||||
Purchases of securities available for sale | (10,269 | ) | (15,997 | ) | (56,420 | ) | (25,952 | ) | (8,024 | ) | ||||||||||
Financing activities: | ||||||||||||||||||||
Net increase (decrease) in deposits | $ | 4,212 | $ | (4,869 | ) | $ | 52,778 | $ | (4,274 | ) | $ | 4,978 | ||||||||
Increase (decrease) in Federal Home Loan Bank advances | (9,030 | ) | 13,000 | 6,081 | (22,050 | ) | — | |||||||||||||
Capital Resources. PCSB Bank is subject to various regulatory capital requirements administered by NYSDFS and the Federal Deposit Insurance Corporation. At September 30, 2016, PCSB Bank exceeded all applicable regulatory capital requirements, and was considered “well capitalized” under regulatory guidelines. See “Historical and Pro Forma Regulatory Capital Compliance” and Note 11 of Notes to the Consolidated Financial Statements.
The net offering proceeds will significantly increase our liquidity and capital resources. Over time, the initial level of liquidity will be reduced as net offering proceeds are used for general corporate purposes, including the funding of loans. Our financial condition and results of operations will be enhanced by the net offering proceeds, resulting in increased net interest-earning assets and net interest income. However, due to the increase in equity resulting from the net offering proceeds, as well as other factors associated with the offering, our return on equity will be adversely affected following the offering. See “Risk Factors—Our return on equity may be low following the offering. This could negatively affect the trading price of our shares of common stock.”
87
Table of Contents
Contractual Obligations andOff-Balance Sheet Arrangements
Contractual Obligations.In the ordinary course of our operations, we enter into certain contractual obligations. The following tables present our contractual obligations at September 30, 2016 and June 30, 2016.
| Payments Due by Period | ||||||||||||||||||||
Contractual Obligations | Total | Less Than One Year | One to Three Years | Three to Five Years | More Than Five Years | |||||||||||||||
| (In thousands) | ||||||||||||||||||||
At September 30, 2016: | ||||||||||||||||||||
Federal Home Loan Bank advances | $ | 11,051 | $ | 7,119 | $ | 247 | $ | 261 | $ | 3,424 | ||||||||||
Operating lease obligations | 16,522 | 2,444 | 3,697 | 2,468 | 7,913 | |||||||||||||||
|
|
|
|
|
|
|
|
|
| |||||||||||
Total | $ | 27,573 | $ | 9,563 | $ | 3,944 | $ | 2,729 | $ | 11,337 | ||||||||||
|
|
|
|
|
|
|
|
|
| |||||||||||
At June 30, 2016: | ||||||||||||||||||||
Federal Home Loan Bank advances | $ | 20,081 | $ | 16,118 | $ | 246 | $ | 259 | $ | 3,458 | ||||||||||
Operating lease obligations | 17,160 | 2,501 | 3,900 | 2,570 | 8,189 | |||||||||||||||
|
|
|
|
|
|
|
|
|
| |||||||||||
Total | $ | 37,241 | $ | 18,619 | $ | 4,146 | $ | 2,829 | $ | 11,647 | ||||||||||
|
|
|
|
|
|
|
|
|
| |||||||||||
Off-Balance Sheet Arrangements.We are a party to financial instruments withoff-balance sheet risk in the normal course of business to meet the financing needs of our customers. These financial instruments include commitments to originate loans, unused lines of credit and standby letters of credit, which involve elements of credit and interest rate risk in excess of the amount recognized in the consolidated balance sheets. Our exposure to credit loss is represented by the contractual amount of the instruments. We use the same credit policies in making commitments as we do foron-balance sheet instruments. See Note 13 of Notes to the Consolidated Financial Statements.
Recent Accounting Pronouncements
The pronouncements discussed below are not intended to be anall-inclusive list, but rather only those pronouncements that could potentially have an impact on our financial position, results of operations or disclosures.
In May 2014, the Financial Accounting Standards Board (“FASB”) issued Accounting Standards Update (“ASU”)2014-09 “Revenue from Contracts with Customers.” The amendments in ASU2014-09 provide a comprehensive framework for addressing revenue recognition issues that can be applied to all contracts with customers. While the guidance in ASU2014-09 supersedes most existing industry-specific revenue recognition accounting guidance, much of PCSB Bank’s revenue comes from financial instruments such as debt securities and loans that are outside the scope of the guidance. The amendments in ASU2014-09 also include improved disclosures to enable users of financial statements to better understand the nature, amount, timing and uncertainty of revenue that is recognized. For public entities, ASU2014-09, as amended, is effective for interim and annual reporting periods beginning after December 15, 2017. Early adoption is permitted for interim and annual reporting periods beginning after December 15, 2016. Management is currently evaluating the impact that the amendments in ASU2014-09 could have on PCSB Bank’s consolidated financial position, results of operations and disclosures.
In January 2016, the FASB issued ASU2016-01 “Financial Instruments – Overall.” The amendments in ASU2016-01 are intended to improve the recognition, measurement, presentation and disclosure of financial assets and liabilities to provide users of financial statements with information that is more useful for decision-making purposes. Among other changes, ASU2016-01 would require equity securities to be measured at fair value with changes in fair value recognized through net income, but would allow equity securities that do not have readily determinable fair values to bere-measured at fair value either upon the occurrence of an observable price change or upon identification of an impairment. The amendments would simplify the impairment assessment of such equity securities and would require enhanced disclosure about these investments. ASU2016-01 would also require separate presentation of financial assets and liabilities by measurement category and type of instrument, such as securities or loans, on the balance sheet or in the notes, and would eliminate certain other disclosures relating to the methods and
88
Table of Contents
assumptions used to estimate fair value. For public entities, the amendments in ASU2016-01 are effective for interim and annual reporting periods beginning after December 15, 2017. Early adoption is not permitted. ASU2016-01 is not expected to have a material impact on PCSB Bank’s consolidated financial position, results of operations or disclosures.
In February 2016, the FASB issued ASU2016-02 “Leases.” ASU2016-02 affects any entity that enters into a lease and is intended to increase the transparency and comparability of financial statements among organizations. The ASU requires, among other changes, a lessee to recognize on its balance sheet a lease asset and a lease liability for those leases previously classified as operating leases. The lease asset would represent the right to use the underlying asset for the lease term and the lease liability would represent the discounted value of the required lease payments to the lessor. The ASU would also require entities to disclose key information about leasing arrangements. ASU2016-02 is effective for interim and annual reporting periods beginning after December 15, 2018. Early adoption is permitted. Management is currently evaluating the impact that ASU2016-02 will have on PCSB Bank’s consolidated financial position, results of operations and disclosures.
In March 2016, the FASB issued ASU2016-09 “Improvements to Employee Share-Based Payment Accounting.” ASU2016-09 affects any entity that issues share-based payment awards to its employees. The ASU involves the simplification of several aspects of the accounting for employee share-based payment transactions, including income tax consequences, classification of awards as either equity or liabilities, and classification on the statement of cash flows. ASU2016-09 is effective for interim and annual reporting periods beginning after December 15, 2016. Early adoption is permitted. ASU2016-09 is not expected to have a material impact on PCSB Bank’s consolidated financial position, results of operations or disclosures.
In June 2016, the FASB issued ASU2016-13 “Measurement of Credit Losses on Financial Instruments.” ASU2016-13 affects entities holding financial assets that are not accounted for at fair value through net income, including loans, debt securities, and other financial assets. The ASU requires financial assets measured at amortized cost basis to be presented at the net amount expected to be collected by recording an allowance for current expected credit losses. ASU2016-13 is effective for interim and annual reporting periods beginning after December 15, 2019. Early adoption is permitted beginning after December 15, 2018, including interim periods within those fiscal years. Management is currently evaluating the impact that ASU2016-13 will have on PCSB Bank’s consolidated financial position, results of operations and disclosures.
In August 2016, the FASB issued ASU2016-15 “Classification of Certain Cash Receipts and Cash Payments.” ASU2016-15 affects all entities that are required to present a statement of cash flows under Topic 230, Statement of Cash Flows, and other Topics, addressing eight specific cash flow issues with the objective of reducing diversity in practice. ASU2016-13 is effective for interim and annual reporting periods beginning after December 15, 2017. Early adoption is permitted, including adoption in an interim period. ASU2016-15 is not expected to have a material impact on PCSB Bank’s consolidated financial position, results of operations or disclosures.
Effect of Inflation and Changing Prices
The consolidated financial statements and related financial data included in this prospectus have been prepared according to generally accepted accounting principles in the United States of America, which require the measurement of financial position and operating results in terms of historical dollars without considering the change in the relative purchasing power of money over time due to inflation. The primary impact of inflation on our operations is reflected in increased operating costs. Unlike most industrial companies, virtually all the assets and liabilities of a financial institution are monetary in nature. As a result, interest rates generally have a more significant impact on a financial institution’s performance than do general levels of inflation. Interest rates do not necessarily move in the same direction or to the same extent as the prices of goods and services.
89
Table of Contents
General
PCSB Bank is a New York-chartered savings bank. Its deposits are insured up to applicable limits by the Federal Deposit Insurance Corporation. PCSB Bank is subject to extensive regulation by the NYSDFS, as its chartering agency, and by the Federal Deposit Insurance Corporation, as its deposit insurer. PCSB Bank is required to file reports with, and is periodically examined by, the Federal Deposit Insurance Corporation and the NYSDFS concerning its activities and financial condition and must obtain regulatory approvals before entering into certain transactions, including, but not limited to, mergers with or acquisitions of other financial institutions. PCSB Bank is a member of the Federal Home Loan Bank of New York.
The regulation and supervision of PCSB Bank establish a comprehensive framework of activities in which an institution can engage and are intended primarily for the protection of depositors and borrowers and, for purposes of the Federal Deposit Insurance Corporation, the protection of the insurance fund. The regulatory structure also gives the regulatory authorities extensive discretion in connection with their supervisory and enforcement activities and examination policies, including policies with respect to the classification of assets and the establishment of adequate loan loss reserves for regulatory purposes.
PCSB Financial will be required to comply with the rules and regulations of the Federal Reserve Board and NYSDFS. It will be required to file certain reports with the Federal Reserve Board and will be subject to examination by and the enforcement authority of the Federal Reserve Board and the NYSDFS. PCSB Financial will also be subject to the rules and regulations of the Securities and Exchange Commission under the federal securities laws.
The Dodd-Frank Act made extensive changes in the regulation of depository institutions and their holding companies. The Dodd-Frank Act created a new Consumer Financial Protection Bureau as an independent bureau of the Federal Reserve Board. The Consumer Financial Protection Bureau is responsible for the implementation of the federal financial consumer protection and fair lending laws and regulations, a function previously assigned to prudential regulators, and now has the authority to impose new requirements. However, institutions of less than $10 billion in assets, such as PCSB Bank, continue to be examined for compliance with consumer protection and fair lending laws and regulations by, and be subject to the enforcement authority of, their federal prudential regulator, although the Consumer Financial Protection Bureau hasback-up authority to examine and enforce consumer protection laws against all institutions, including institutions with less than $10 billion in assets.
In addition to creating the Consumer Financial Protection Bureau, the Dodd-Frank Act, among other things, directed changes in the way that institutions are assessed for deposit insurance, mandated the imposition of tougher consolidated capital requirements on holding companies, required the issuance of regulations requiring originators of securitized loans to retain a percentage of the risk for the transferred loans, imposed regulatory rate-setting for certain debit card interchange fees, repealed restrictions on the payment of interest on commercial demand deposits and contained a number of reforms related to mortgage originations. Many of the provisions of the Dodd-Frank Act are subject to delayed effective dates and/or still require the issuance of implementing regulations. Their impact on operations cannot yet be fully assessed. However, there is significant possibility that the Dodd-Frank Act will, at a minimum, result in increased regulatory burden, compliance costs and interest expense for PCSB Bank and PCSB Financial.
The Dodd-Frank Act contained theso-called “Volcker Rule,” which generally prohibits banking organizations from engaging in proprietary trading and from investing in, sponsoring or having certain relationships with hedge or private equity funds (“covered funds”). The federal agencies have issued a final rule implementing the Volcker Rule which, among other things, requires banking organizations to restructure and limit certain of their investments in and relationships with covered funds.
90
Table of Contents
Any change in applicable laws or regulations, whether by the NYSDFS, the Federal Deposit Insurance Corporation, the Federal Reserve Board, New York State or the U.S. Congress, could have a material adverse impact on the operations and financial performance of PCSB Financial and PCSB Bank. In addition, PCSB Financial and PCSB Bank will be affected by the monetary and fiscal policies of various agencies of the United States Government, including the Federal Reserve Board. In view of changing conditions in the national economy and in the money markets, it is impossible for management to accurately predict future changes in monetary policy or the effect of such changes on the business or financial condition of PCSB Financial and PCSB Bank.
Set forth below is a brief description of material regulatory requirements that are or will be applicable to PCSB Bank and PCSB Financial. The description is limited to certain material aspects of the statutes and regulations that are addressed, and is not intended to be a complete description of such statutes and regulations and their effects on PCSB Bank and PCSB Financial.
New York Banking Laws and Supervision
PCSB Bank, as a New York savings bank, is regulated and supervised by the NYSDFS. The NYSDFS is required to regularly examine each state-chartered bank. The approval of the NYSDFS is required to establish or close branches, to merge with another bank, to issue stock and to undertake many other activities. Any New York savings bank that does not operate according to the regulations, policies and directives of the NYSDFS may be sanctioned. The NYSDFS may suspend or remove directors or officers of a savings bank who have violated the law, conducted a bank’s business in a manner that is unsafe, unsound or contrary to the depositors’ interests, or been negligent in the performance of their duties. In addition, the NYSDFS has the authority to appoint a receiver or conservator if it is determined that the savings bank is conducting its business in an unsafe or unauthorized manner, and under certain other circumstances.
The powers that New York-chartered savings banks can exercise under these laws include, but are not limited to, the following:
Lending Activities.A New York-chartered savings bank may make a wide variety of mortgage loans including fixed-rate loans, adjustable-rate loans, variable-rate loans, participation loans, graduated payment loans, construction and development loans, condominium andco-operative loans, second mortgage loans and other types of loans that may be made according to applicable regulations. Commercial loans may be made to corporations and other commercial enterprises with or without security. Consumer and personal loans may also be made with or without security.
Investment Activities.In general, PCSB Bank may invest in certain types of debt securities (including certain corporate debt securities, and obligations of federal, state, and local governments and agencies), certain types of corporate equity securities, and certain other assets. However, these investment authorities are constrained by federal law. See “—Federal Bank Regulation—Investment Activities” for such federal restrictions.
Loans to One Borrower Limitations.Under the New York Banking Law, PCSB Bank’s total loans or extensions of credit to a single borrower or group of related borrowers cannot exceed, with specified exceptions, 15% of its capital stock, surplus fund and undivided profits. PCSB Bank may lend additional amounts up to 10% if the loans or extensions of credit are fully secured by readily-marketable collateral. At September 30, 2016, PCSB Bank complied with theseloans-to-one-borrower limitations. At September 30, 2016, PCSB Bank’s largest aggregate amount of loans to one borrower was $10.8 million.
Dividends. Under New York banking law, PCSB Bank, following the completion of the conversion, will be permitted to declare and pay dividends out of its net profits, unless there is an impairment of capital. Additionally, the approval of the NYSDFS is required if the total of all dividends declared in a calendar year would exceed the total of its net profits for that year combined with its retained net profits of the preceding two years, subject to certain adjustments provided for in the applicable law.
91
Table of Contents
Loans to Trustees and Executive Officers. Under applicable NYSDFS regulations (which are substantially similar to applicable federal banking regulations), PCSB Bank generally may not make a loan or other extension of credit to any of its executive officers or trustees unless the loan or other extension of credit (i) is made on terms, including interest rate and collateral, that are not more favorable to the executive officer or trustee than those customarily offered by PCSB Bank to persons who are not executive officers or trustees and who are not employed by PCSB Bank, and (ii) does not involve more than the normal risk of repayment or present other unfavorable features. Depending on the size of the loan or other extension of credit, prior approval of PCSB Bank’s board of trustees (with the interested party, if a trustee, abstaining from participating directly or indirectly in the voting) may be required.
Assessments. As a New York state-chartered savings bank, PCSB Bank is required to pay to the NYSDFS a general assessment fee in connection with the NYSDFS’ regulation and supervision (including examination) of PCSB Bank. Each state institution is billed five times per each fiscal year, with four estimated quarterly assessments set as approximately 25% of the annual amount based on the NYSDFS’ estimated annual budget at the time of the billing, and a final assessment, or“true-up,” based on the NYSDFS’ actual expenses for the fiscal year. The Federal Deposit Insurance Corporation does not charge a state bank for supervision, although as discussed below, it charges all insured depository institutions deposit insurance assessments in connection with its administration of the Deposit Insurance Fund.
Regulatory Enforcement Authority.Any New York bank that does not operate according to the regulations, policies and directives of the NYSDFS may be subject to sanctions fornon-compliance, including seizure of the property and business of the savings bank and suspension or revocation of its charter. The NYSDFS may, under certain circumstances, suspend or remove officers or directors who have violated the law, conducted the savings bank’s business in a manner which is unsafe, unsound or contrary to the depositors interests or been negligent in the performance of their duties. In addition, upon finding that a bank has engaged in an unfair or deceptive act or practice, the NYSDFS may issue an order to cease and desist and impose a fine on the savings bank concerned. New York consumer protection and civil rights statutes applicable to PCSB Bank permit private individual and class action law suits and provide for the rescission of consumer transactions, including loans, and the recovery of statutory and punitive damage and attorney’s fees in the case of certain violations of those statutes.
Recent New York Legislative and Regulatory Developments. The NYSDFS has adopted and proposed new laws and regulations and issued new guidance in a number of areas affecting PCSB Bank’s operations. These include:
| • | In June 2016, the New York Legislature enacted legislation to address “zombie properties”, meaning residential property abandoned by a homeowner after the initiation, but prior to the completion of, a foreclosure proceeding. Under this law, a mortgagee bank has a duty to maintain and secure a residential real property where there is a reasonable basis to believe it is vacant and abandoned, and faces civil penalties up to $500 per violation, per property, per day for failing to do so. As enacted, the legislation does not apply to PCSB Bank because we originate, own, service and maintain our own mortgages and we originate less than 0.3 percent ofone- to four-family real property mortgages in New York. However, there can be no assurance that any future amendments to this law will not include us. |
| • | In June 2016, the NYSDFS adopted a regulation that requires New York chartered banks to maintain programs to monitor and filter transactions for potential Bank Secrecy Act and anti-money laundering violations and prevent transactions with sanctioned entities. The regulation requires regulated institutions annually to submit a board resolution or senior officer compliance finding confirming steps taken to ascertain compliance with the regulation. Under the new regulation, which will be effective January 1, 2017, banks are required to review their transaction-monitoring and filtering programs and ensure that they are reasonably designed to comply with risk-based safeguards. The institutions also must adopt (at the institution’s option) an annual board resolution or senior officer compliance finding to certify compliance with the regulation beginning April 15, 2018. The resolution or finding must state that documents, reports, certifications and |
92
Table of Contents
opinions of officers and other relevant parties have been reviewed by the board of directors or senior official to certify compliance with the regulation. We are assessing the extent to which the new regulation duplicates the federal Bank Secrecy Act compliance requirements and whether it will require us to augment our compliance resources. |
| • | In September 2016, the NYSDFS proposed a new regulation to require New York chartered banks to establish and maintain a cybersecurity program designed to protect consumers and ensure the safety and soundness of the savings bank. The regulation, which is similar to guidance issued by the federal bank regulators, requires regulated financial institutions to establish a cybersecurity program; adopt a written cybersecurity policy; designate a Chief Information Security Officer responsible for implementing, overseeing and enforcing its new program and policy; and have policies and procedures designed to ensure the security of information systems and nonpublic information accessible to, or held by, third-parties, along with a variety of other requirements to protect the confidentiality, integrity and availability of information systems. We believe that our cybersecurity policies and procedures will comply with the new regulation if it is adopted as proposed. |
| • | In October 2016, the NYSDFS issued guidance regarding incentive compensation. The guidance prohibits the payment by New York chartered banks of incentive compensation tied to employee performance indicators, such as the number of accounts opened, or the number of products sold per customer, without effective risk management, oversight and control. Banks considering the adoption of such incentive compensation plans must balance between risks and rewards, emplace effective controls and risk management and have strong corporate governance, including active and effective oversight by the board of directors. We will ensure that any incentive compensation plan we adopt will conform to this guidance. See “Management—Executive Compensation-Proposed Short-Term Incentive Plan”. |
New York has other statutes and regulations that are similar to the federal provisions discussed below.
Federal Bank Regulation
Capital Requirements.Under Federal Deposit Insurance Corporation regulations, federally insured state-chartered banks that are not members of the Federal Reserve System (“statenon-member banks”), such as PCSB Bank, are required to comply with minimum leverage capital requirements. The minimum capital leverage requirement is a ratio of Tier 1 capital to total assets that is not less than 4.0%. Tier 1 capital consists of “CET1” and “Additional Tier 1 capital” instruments meeting specified requirements. CET1 is defined as common stock, plus related surplus, and retained earnings plus limited amounts of minority interest in the form of common stock, less the majority of the regulatory deductions.
The Federal Deposit Insurance Corporation regulations require statenon-member banks to maintain certain levels of regulatory capital in relation to regulatory risk-weighted assets. The ratio of regulatory capital to regulatory risk-weighted assets is referred to as a bank’s “risk-based capital ratio.” Risk-based capital ratios are determined by allocating assets and specifiedoff-balance sheet items (including recourse obligations, direct credit substitutes and residual interests) to risk-weighted categories ranging from 0.0% to 200.0%, with higher levels of capital being required for the categories perceived as representing greater risk.
Statenon-member banks must maintain a minimum ratio of total capital to risk-weighted assets of at least 8.0%, of which at leastone-half must be Tier 1 capital. Total capital consists of Tier 1 capital and Tier 2 capital. Tier 1 capital consists of common stock, plus related surplus and retained earnings. Under the new capital rules, for most banking organizations, the most common form of Additional Tier 1 capital is noncumulative perpetual preferred stock and the most common form of Tier 2 capital is subordinated notes and a portion of the allowance for loan and lease losses, in each case, subject to the new capital rules’ specific requirements. Banks that engage in specified levels of trading activities are subject to adjustments in their risk based capital calculation to ensure the maintenance of sufficient capital to support market risk.
93
Table of Contents
In July 2013, the Federal Deposit Insurance Corporation and the other federal bank regulatory agencies issued a final rule that has revised their leverage and risk-based capital requirements and the method for calculating risk-weighted assets to make them consistent with agreements that were reached by the Basel Committee on Banking Supervision and certain provisions of the Dodd-Frank Act. Among other things, the rule establishes a new common equity Tier 1 minimum capital requirement (4.5% of risk-weighted assets), increases the minimum Tier 1 capital to risk-based assets requirement (from 4% to 6% of risk-weighted assets), sets the leverage ratio at a uniform 4% of total assets and assigns a higher risk weight (150%) to exposures that are more than 90 days past due or are onnon-accrual status and to certain commercial real estate facilities that finance the acquisition, development or construction of real property. The final rule also requires unrealized gains and losses on certain“available-for-sale” securities holdings to be included for purposes of calculating regulatory capital requirements unless aone-timeopt-out is exercised. PCSB Bank has elected to exercise itsone-time option toopt-out of the requirement under the final rule to include certain“available-for-sale” securities holdings for purposes of calculating its regulatory capital requirements. The rule limits a banking organization’s capital distributions and certain discretionary bonus payments to executive officers if the banking organization does not hold a “capital conservation buffer” which, when fully phased in, will consist of 2.5% of common equity Tier 1 capital to risk-weighted assets in addition to the amount necessary to meet its minimum risk-based capital requirements. The final rule became effective on January 1, 2015. The “capital conservation buffer” will be phased in from January 1, 2016 to January 1, 2019, when the full capital conservation buffer will be effective.
The Federal Deposit Insurance Corporation Improvement Act required each federal banking agency to revise its risk-based capital standards for insured institutions to ensure that those standards take adequate account of interest-rate risk, concentration of credit risk, and the risk of nontraditional activities, as well as to reflect the actual performance and expected risk of loss on multi-family residential loans. The Federal Deposit Insurance Corporation, along with the other federal banking agencies, adopted a regulation providing that the agencies will take into account the exposure of a bank’s capital and economic value to changes in interest rate risk in assessing a bank’s capital adequacy. The Federal Deposit Insurance Corporation also has authority to establish individual minimum capital requirements in appropriate cases upon determination that an institution’s capital level is, or is likely to become, inadequate in light of the particular circumstances.
Standards for Safety and Soundness.As required by statute, the federal banking agencies adopted final regulations and Interagency Guidelines Establishing Standards for Safety and Soundness to implement safety and soundness standards. The guidelines set forth the safety and soundness standards that the federal banking agencies use to identify and address problems at insured depository institutions before capital becomes impaired. The guidelines address internal controls and information systems, internal audit system, credit underwriting, loan documentation, interest rate exposure, asset growth, asset quality, earnings and compensation, fees and benefits. The agencies have also established standards for safeguarding customer information. If the appropriate federal banking agency determines that an institution fails to meet any standard prescribed by the guidelines, the agency may require the institution to submit to the agency an acceptable plan to achieve compliance with the standard.
Investment Activities.All state-chartered Federal Deposit Insurance Corporation-insured banks, including savings banks, are generally limited in their investment activities to principal and equity investments of the type and in the amount authorized for national banks, notwithstanding state law, subject to certain exceptions. For example, state chartered banks may, with Federal Deposit Insurance Corporation approval, continue to exercise state authority to invest in common or preferred stocks listed on a national securities exchange or the Nasdaq Global Market and in the shares of an investment company registered under the Investment Company Act of 1940. The maximum permissible investment is 100% of Tier 1 Capital, as specified by the Federal Deposit Insurance Corporation’s regulations, or the maximum amount permitted by New York law, whichever is less.
In addition, the Federal Deposit Insurance Corporation is authorized to permit such a state bank to engage in state-authorized activities or investments not permissible for national banks (other thannon-subsidiary equity investments) if it meets all applicable capital requirements and it is determined that such activities or investments do not pose a significant risk to the Deposit Insurance Fund. The Federal Deposit Insurance Corporation has adopted procedures for institutions seeking approval to engage in such activities or investments. In addition, a nonmember bank may control a subsidiary that engages in activities as principal that would only be permitted for a national bank to conduct in a “financial subsidiary” if a bank meets specified conditions and deducts its investment in the subsidiary for regulatory capital purposes.
94
Table of Contents
Interstate Banking and Branching.Federal law permits well capitalized and well managed bank holding companies to acquire banks in any state, subject to Federal Reserve Board approval, certain concentration limits and other specified conditions. Interstate mergers of banks are also authorized, subject to regulatory approval and other specified conditions. In addition, among other things, recent amendments made by the Dodd-Frank Act permit banks to establish de novo branches on an interstate basis provided that branching is authorized by the law of the host state for the banks chartered by that state.
Prompt Corrective Regulatory Action.Federal law requires, among other things, that federal bank regulatory authorities take “prompt corrective action” with respect to banks that do not meet minimum capital requirements. For these purposes, the law establishes five capital categories: well capitalized, adequately capitalized, undercapitalized, significantly undercapitalized and critically undercapitalized.
The Federal Deposit Insurance Corporation has adopted regulations to implement the prompt corrective action legislation. An institution is deemed to be “well capitalized” if it has a total risk-based capital ratio of 10.0% or greater, a Tier 1 risk-based capital ratio of 8.0% or greater, a leverage ratio of 5.0% or greater and a common equity Tier 1 ratio of 6.5% or greater. An institution is “adequately capitalized” if it has a total risk-based capital ratio of 8.0% or greater, a Tier 1 risk-based capital ratio of 6.0% or greater, a leverage ratio of 4.0% or greater and a common equity Tier 1 ratio of 4.5% or greater. An institution is “undercapitalized” if it has a total risk-based capital ratio of less than 8.0%, a Tier 1 risk-based capital ratio of less than 6.0%, a leverage ratio of less than 4.0% or a common equity Tier 1 ratio of less than 4.5%. An institution is deemed to be “significantly undercapitalized” if it has a total risk-based capital ratio of less than 6.0%, a Tier 1 risk-based capital ratio of less than 4.0%, a leverage ratio of less than 3.0% or a common equity Tier 1 ratio of less than 3.0%. An institution is considered to be “critically undercapitalized” if it has a ratio of tangible equity (as defined in the regulations) to total assets that is equal to or less than 2.0%. At September 30, 2016, PCSB Bank was classified as a “well capitalized” institution.
At each successive lower capital category, an insured depository institution is subject to more restrictions and prohibitions, including restrictions on growth, restrictions on interest rates paid on deposits, restrictions or prohibitions on payment of dividends, and restrictions on the acceptance of brokered deposits. Furthermore, if an insured depository institution is classified in one of the undercapitalized categories, it is required to submit a capital restoration plan to the appropriate federal banking agency, and the holding company must guarantee the performance of that plan. Based upon its capital levels, a bank that is classified as well-capitalized, adequately capitalized, or undercapitalized may be treated as though it were in the next lower capital category if the appropriate federal banking agency, after notice and opportunity for hearing, determines that an unsafe or unsound condition, or an unsafe or unsound practice, warrants such treatment. An undercapitalized bank’s compliance with a capital restoration plan is required to be guaranteed by any company that controls the undercapitalized institution in an amount equal to the lesser of 5.0% of the institution’s total assets when deemed undercapitalized or the amount necessary to achieve the status of adequately capitalized. If an “undercapitalized” bank fails to submit an acceptable plan, it is treated as if it is “significantly undercapitalized.” “Significantly undercapitalized” banks must comply with one or more of a number of additional restrictions, including but not limited to an order by the Federal Deposit Insurance Corporation to sell sufficient voting stock to become adequately capitalized, requirements to reduce total assets, cease receipt of deposits from correspondent banks or dismiss directors or officers, and restrictions on interest rates paid on deposits, compensation of executive officers and capital distributions by the parent holding company. “Critically undercapitalized” institutions are subject to additional measures including, subject to a narrow exception, the appointment of a receiver or conservator within 270 days after it obtains such status.
Transaction with Affiliates and Regulation W of the Federal Reserve Regulations.Transactions between banks and their affiliates are governed by federal law. An affiliate of a bank is any company or entity that controls, is controlled by or is under common control with the bank. In a holding company context, the parent bank holding company and any companies which are controlled by such parent holding company are affiliates of the bank (although subsidiaries of the bank itself, except financial subsidiaries, are generally not considered affiliates). Generally, Section 23A of the Federal Reserve Act and the Federal Reserve Board’s Regulation W limit the extent
95
Table of Contents
to which the bank or its subsidiaries may engage in “covered transactions” with any one affiliate to an amount equal to 10.0% of such institution’s capital stock and surplus, and with all such transactions with all affiliates to an amount equal to 20.0% of such institution’s capital stock and surplus. Section 23B applies to “covered transactions” as well as to certain other transactions and requires that all such transactions be on terms substantially the same, or at least as favorable, to the institution or subsidiary as those provided to anon-affiliate. The term “covered transaction” includes the making of loans to, purchase of assets from, and issuance of a guarantee to an affiliate, and other similar transactions. Section 23B transactions also include the provision of services and the sale of assets by a bank to an affiliate. In addition, loans or other extensions of credit by the financial institution to the affiliate are required to be collateralized according to the requirements set forth in Section 23A of the Federal Reserve Act.
Sections 22(h) and (g) of the Federal Reserve Act place restrictions on loans to a bank’s insiders, i.e., executive officers, directors and principal shareholders. Under Section 22(h) of the Federal Reserve Act, loans to a director, an executive officer and to a greater than 10.0% shareholder of a financial institution, and certain affiliated interests of these, together with all other outstanding loans to such person and affiliated interests, may not exceed specified limits. Section 22(h) of the Federal Reserve Act also requires that loans to directors, executive officers and principal shareholders be made on terms substantially the same as offered in comparable transactions to other persons and also requires prior board approval for certain loans. In addition, the aggregate amount of extensions of credit by a financial institution to insiders cannot exceed the institution’s unimpaired capital and surplus. Section 22(g) of the Federal Reserve Act places additional restrictions on loans to executive officers.
Enforcement.The Federal Deposit Insurance Corporation has extensive enforcement authority over insured state savings banks, including PCSB Bank. The enforcement authority includes, among other things, the ability to assess civil money penalties, issue cease and desist orders and remove directors and officers. In general, these enforcement actions may be initiated in response to violations of laws and regulations, breaches of fiduciary duty and unsafe or unsound practices. The Federal Deposit Insurance Corporation is required, with certain exceptions, to appoint a receiver or conservator for an insured statenon-member bank if that bank was “critically undercapitalized” on average during the calendar quarter beginning 270 days after the date on which the institution became “critically undercapitalized.” It may also appoint itself as conservator or receiver for an insured statenon-member bank under specified circumstances, including: (1) insolvency; (2) substantial dissipation of assets or earnings through violations of law or unsafe or unsound practices; (3) existence of an unsafe or unsound condition to transact business; (4) insufficient capital; or (5) the incurrence of losses that will deplete substantially all of the institution’s capital with no reasonable prospect of replenishment without federal assistance.
Federal Insurance of Deposit Accounts.PCSB Bank is a member of the Deposit Insurance Fund, which is administered by the Federal Deposit Insurance Corporation. Deposit accounts in PCSB Bank are insured up to a maximum of $250,000 for each separately insured depositor.
The Federal Deposit Insurance Corporation imposes an assessment for deposit insurance on all depository institutions. Under its risk-based assessment system, insured institutions are assigned to risk categories based on supervisory evaluations, regulatory capital levels and certain other factors. An institution’s assessment rate depends upon the category to which it is assigned and certain adjustments specified by regulation, with less risky institutions paying lower rates. Assessment rates (inclusive of possible adjustments) currently range from 2 1/2 to 45 basis points of each institution’s total assets less tangible capital. The Federal Deposit Insurance Corporation may increase or decrease the scale uniformly, except that no adjustment can deviate by more than two basis points from the base scale without notice and comment rulemaking. The Federal Deposit Insurance Corporation’s current system represents a change, required by the Dodd-Frank Act, from its prior practice of basing the assessment on an institution’s volume of deposits.
The Dodd-Frank Act increased the minimum target Deposit Insurance Fund ratio from 1.15% of estimated insured deposits to 1.35% of estimated insured deposits. The Federal Deposit Insurance Corporation must seek to achieve the 1.35% ratio by September 30, 2020. Insured institutions with assets of $10 billion or more are supposed to fund the increase. The Dodd-Frank Act eliminated the 1.5% maximum fund ratio, instead leaving it to the discretion of the Federal Deposit Insurance Corporation. It has recently exercised that discretion by establishing a long range fund ratio of 2%.
96
Table of Contents
The Federal Deposit Insurance Corporation has authority to increase insurance assessments. A significant increase in insurance premiums would likely have an adverse effect on the operating expenses and results of operations of PCSB Bank. Future insurance assessment rates cannot be predicted.
Insurance of deposits may be terminated by the Federal Deposit Insurance Corporation upon a finding that the institution has engaged in unsafe or unsound practices, is in an unsafe or unsound condition to continue operations or has violated any applicable law, regulation, rule order or regulatory condition imposed in writing. We do not know of any practice, condition or violation that might lead to termination of PCSB Bank’s deposit insurance.
In addition to the Federal Deposit Insurance Corporation assessments, the Financing Corporation (“FICO”) is authorized to impose and collect, with the approval of the Federal Deposit Insurance Corporation, assessments for anticipated payments, issuance costs and custodial fees on bonds issued by the FICO in the 1980s to recapitalize the former Federal Savings and Loan Insurance Corporation. The bonds issued by the FICO are due to mature in 2017 through 2019.
Privacy Regulations.Federal Deposit Insurance Corporation regulations generally require that PCSB Bank disclose its privacy policy, including identifying with whom it shares a customer’s“non-public personal information,” to customers at the time of establishing the customer relationship and annually thereafter. In addition, PCSB Bank is required to provide its customers with the ability to“opt-out” of having their personal information shared with unaffiliated third parties and not to disclose account numbers or access codes tonon-affiliated third parties for marketing purposes. PCSB Bank currently has a privacy protection policy in place and believes that such policy is in compliance with the regulations.
Community Reinvestment Act.Under the Community Reinvestment Act, or CRA, as implemented by Federal Deposit Insurance Corporation, a statenon-member bank has a continuing and affirmative obligation, consistent with its safe and sound operation, to help meet the credit needs of its entire community, including low and moderate income neighborhoods. The CRA does not establish specific lending requirements or programs for financial institutions nor does it limit an institution’s discretion to develop the types of products and services that it believes are best suited to its particular community, consistent with the CRA. The CRA requires the Federal Deposit Insurance Corporation, in connection with its examination of a statenon-member bank, to assess the institution’s record of meeting the credit needs of its community and to take such record into account in its evaluation of certain applications by such institution, including applications to acquire branches and other financial institutions. The CRA requires the Federal Deposit Insurance Corporation to provide a written evaluation of an institution’s CRA performance utilizing a four-tiered descriptive rating system. PCSB Bank’s latest Federal Deposit Insurance Corporation CRA rating was “Satisfactory.”
New York has its own statutory counterpart to the CRA, which is applicable to PCSB Bank. New York law requires the NYSDFS to consider a bank’s record of performance under New York law in considering any application by the bank to establish a branch or other deposit-taking facility, to relocate an office or to merge or consolidate with or acquire the assets and assume the liabilities of any other banking institution. PCSB Bank’s most recent rating under New York law was “Satisfactory.”
Consumer Protection and Fair Lending Regulations.New York savings banks are subject to a variety of federal and New York statutes and regulations that are intended to protect consumers and prohibit discrimination in the granting of credit. These statutes and regulations provide for a range of sanctions fornon-compliance with their terms, including imposition of administrative fines and remedial orders, and referral to the Attorney General for prosecution of a civil action for actual and punitive damages and injunctive relief. Certain of these statutes, including Section 5 of the Federal Trade Commission Act, which prohibits unfair and deceptive acts and practices against consumers, authorize private individual and class action lawsuits and the award of actual, statutory and punitive damages and attorneys’ fees for certain types of violations. New York’s Attorney General has vigorously enforced fair lending and other consumer protection laws. The Dodd Frank Act added a new statute that prohibits unfair, deceptive or abusive acts practices against consumers, which can be enforced by the Consumer Financial Protection Bureau, the Federal Deposit Insurance Corporation and state Attorneys General.
97
Table of Contents
USA Patriot Act.PCSB Bank is subject to the USA PATRIOT Act, which gave federal agencies additional powers to address terrorist threats through enhanced domestic security measures, expanded surveillance powers, increased information sharing, and broadened anti-money laundering requirements. By way of amendments to the Bank Secrecy Act, Title III of the USA PATRIOT Act provided measures intended to encourage information sharing among bank regulatory agencies and law enforcement bodies. Further, certain provisions of Title III impose affirmative obligations on a broad range of financial institutions, including banks, thrifts, brokers, dealers, credit unions, money transfer agents, and parties registered under the Commodity Exchange Act.
Other Regulations
Interest and other charges collected or contracted for by PCSB Bank are subject to state usury laws and federal laws concerning interest rates. Loan operations are also subject to state and federal laws applicable to credit transactions, such as the:
| • | Truth in Lending Act, which requires lenders to disclose the terms and conditions of consumer credit; |
| • | Real Estate Settlement Procedures Act, which requires lenders to disclose the nature and costs of the real estate settlement process and prohibits specific practices, such as kickbacks, and places limitations upon the use of escrow accounts; |
| • | Home Mortgage Disclosure Act of 1975, requiring financial institutions to provide information to enable the public and public officials to determine whether a financial institution is fulfilling its obligation to help meet the housing needs of the community it serves; |
| • | Equal Credit Opportunity Act and the New York Executive Law, prohibiting discrimination on the basis of race, creed or other prohibited factors in extending credit; |
| • | Fair Credit Reporting Act of 1978, governing the use and provision of information to credit reporting agencies; and |
| • | Rules and regulations of the various federal and state agencies charged with the responsibility of implementing such federal and state laws. |
The deposit operations of PCSB Bank also are subject to, among others, the:
| • | Truth in Savings Act, which requires financial institutions to disclose the terms and conditions of their deposit accounts; |
| • | Expedited Funds Availability Act, which requires banks to make funds deposited in transaction accounts available to their customers within specified time frames; |
| • | Right to Financial Privacy Act, which imposes a duty to maintain confidentiality of consumer financial records and prescribes procedures for complying with administrative subpoenas of financial records; |
| • | Check Clearing for the 21st Century Act (also known as “Check 21”), which gives “substitute checks,” such as digital check images and copies made from that image, the same legal standing as the original paper check; |
98
Table of Contents
| • | Electronic Funds Transfer Act and Regulation E promulgated thereunder, which govern automatic deposits to and withdrawals from deposit accounts and customers’ rights and liabilities arising from the use of automated teller machines and other electronic banking services; and |
| • | New York banking laws and regulations, which governs deposit powers. |
Federal Reserve System
Federal Reserve Board regulations require depository institutions to maintainnon-interest-earning reserves against their transaction accounts (primarily NOW and regular checking accounts). The regulations generally require that reserves be maintained against aggregate transaction accounts as follows: for that portion of transaction accounts aggregating $115.1 million or less (which may be adjusted by the Federal Reserve Board) the reserve requirement is 3.0% and the amounts greater than $115.1 million require a 10.0% reserve (which may be adjusted annually by the Federal Reserve Board between 8.0% and 14.0%). The first $15.5 million of otherwise reservable balances (which may be adjusted by the Federal Reserve Board) are exempted from the reserve requirements. PCSB Bank is in compliance with these requirements.
Federal Home Loan Bank System
PCSB Bank is a member of the Federal Home Loan Bank System, which consists of 12 regional Federal Home Loan Banks. The Federal Home Loan Bank provides a central credit facility primarily for member institutions. Members of the Federal Home Loan Bank are required to acquire and hold shares of capital stock in the Federal Home Loan Bank. PCSB Bank complied with this requirement at September 30, 2016. Based on redemption provisions of the Federal Home Loan Bank of New York, the stock has no quoted market value and is carried at cost. PCSB Bank reviews for impairment based on the ultimate recoverability of the cost basis of the Federal Home Loan Bank of New York stock. At September 30, 2016, no impairment has been recognized.
At its discretion, the Federal Home Loan Bank of New York may declare dividends on the stock. The Federal Home Loan Banks are required to provide funds for certain purposes including the resolution of insolvent thrifts in the late 1980s and to contributing funds for affordable housing programs. These requirements could reduce the amount of dividends that the Federal Home Loan Banks pay to their members and result in the Federal Home Loan Banks imposing a higher rate of interest on advances to their members. There can be no assurance that such dividends will continue in the future. Further, there can be no assurance that the impact of recent or future legislation on the Federal Home Loan Banks also will not cause a decrease in the value of the Federal Home Loan Bank of New York stock held by PCSB Bank.
Holding Company Regulation
Upon completion of the conversion, PCSB Financial will be a bank holding company within the meaning of Bank Holding Company of 1956, as amended. As such, PCSB Financial will be registered with the Federal Reserve Board and be subject to regulations, examinations, supervision and reporting requirements applicable to bank holding companies. In addition, the Federal Reserve Board has enforcement authority over PCSB Financial and itsnon-savings bank subsidiaries. Among other things, this authority permits the Federal Reserve Board to restrict or prohibit activities that are determined to be a serious risk to the subsidiary savings bank.
A bank holding company is generally prohibited from engaging innon-banking activities, or acquiring direct or indirect control of more than 5% of the voting securities of any company engaged innon-banking activities. One of the principal exceptions to this prohibition is for activities found by the Federal Reserve Board to be so closely related to banking or managing or controlling banks as to be a proper incident thereto. Some of the principal activities that the Federal Reserve Board has determined by regulation to be so closely related to banking are: (i) making or servicing loans; (ii) performing certain data processing services; (iii) providing discount brokerage services; (iv) acting as fiduciary, investment or financial advisor; (v) leasing personal or real property; (vi) making investments in corporations or projects designed primarily to promote community welfare; and (vii) acquiring a savings and loan association whose direct and indirect activities are limited to those permitted for bank holding companies.
99
Table of Contents
The Gramm-Leach-Bliley Act of 1999 authorized a bank holding company that meets specified conditions, including being “well capitalized” and “well managed,” to opt to become a “financial holding company” and thereby engage in a broader array of financial activities than previously permitted. Such activities can include insurance underwriting and investment banking.
PCSB Financial will be subject to the Federal Reserve Board’s capital adequacy guidelines for bank holding companies (on a consolidated basis), which have historically been similar to, though less stringent than, those of the Federal Deposit Insurance Corporation for PCSB Bank. The Dodd-Frank Act, however, required the Federal Reserve Board to promulgate consolidated capital requirements for depository institution holding companies that are no less stringent, both quantitatively and in terms of components of capital, than those applicable to institutions themselves. Instruments such as cumulative preferred stock and trust preferred securities would no longer be includable as Tier 1 capital, as is currently the case with bank holding companies, subject to certain grandfathering rules. The previously discussed final rule regarding regulatory capital requirements implements the Dodd-Frank Act as to bank holding company capital standards. Consolidated regulatory capital requirements identical to those applicable to the subsidiary banks apply to bank holding companies (with greater than $1.0 billion of assets) at January 1, 2015. As is the case with institutions themselves, the capital conservation buffer will be phased-in between 2016 and 2019.
A bank holding company is generally required to give the Federal Reserve Board prior written notice of any purchase or redemption of then outstanding equity securities if the gross consideration for the purchase or redemption, when combined with the net consideration paid for all such purchases or redemptions during the preceding 12 months, is equal to 10% or more of the company’s consolidated net worth. The Federal Reserve Board may disapprove such a purchase or redemption if it determines that the proposal would constitute an unsafe and unsound practice, or would violate any law, regulation, Federal Reserve Board order or directive, or any condition imposed by, or written agreement with, the Federal Reserve Board. There is an exception to this approval requirement for well-capitalized bank holding companies that meet certain other conditions.
The Federal Reserve Board has issued a policy statement regarding capital distributions, including dividends, by bank holding companies. In general, the policies provide that dividends should be paid only out of current earnings and only if the prospective rate of earnings retention by the bank holding company appears consistent with the organization’s capital needs, asset quality and overall financial condition. The policies also require that a bank holding company serve as a source of financial strength to its subsidiary banks by standing ready to use available resources to provide adequate capital funds to those banks during periods of financial stress or adversity and by maintaining the financial flexibility and capital-raising capacity to obtain additional resources for assisting its subsidiary banks where necessary. The Dodd-Frank Act codified the source of strength doctrine. Under the prompt corrective action laws, the ability of a bank holding company to pay dividends may be restricted if a subsidiary bank becomes undercapitalized. These regulatory policies could affect the ability of PCSB Financial to pay dividends or otherwise engage in capital distributions.
Under the Federal Deposit Insurance Act, depository institutions are liable to the Federal Deposit Insurance Corporation for losses suffered or anticipated by the Federal Deposit Insurance Corporation in connection with the default of a commonly controlled depository institution or any assistance provided by the Federal Deposit Insurance Corporation to such an institution in danger of default.
The status of PCSB Financial as a registered bank holding company under the Bank Holding Company Act of 1956 will not exempt it from certain federal and state laws and regulations applicable to corporations generally, including, without limitation, certain provisions of the federal securities laws.
New York Holding Company Regulation.Upon completion of the conversion, PCSB Financial will be subject to regulation under New York banking law. Among other requirements, PCSB Financial will have to receive the approval of the NYSDFS before acquiring 10% or more of the voting stock of another banking institution, or to otherwise acquire a banking institution by merger or purchase.
100
Table of Contents
Federal Securities Laws
PCSB Financial’s common stock will be registered with the Securities and Exchange Commission after the offering. PCSB Financial will be subject to the information, proxy solicitation, insider trading restrictions and other requirements under the Securities Exchange Act of 1934.
The registration under the Securities Act of 1933 of shares of common stock issued in the offering does not cover the resale of those shares. Shares of common stock purchased by persons who are not affiliates of PCSB Financial may be resold without registration. Shares purchased by an affiliate of PCSB Financial will be subject to the resale restrictions of Rule 144 under the Securities Act of 1933. If PCSB Financial meets the current public information requirements of Rule 144 under the Securities Act of 1933, each affiliate that complies with the other conditions of Rule 144, including those that require the affiliate’s sale to be aggregated with those of other persons, would be able to sell in the public market, without registration, a number of shares not to exceed, in any three-month period, the greater of 1% of the outstanding shares of PCSB Financial, or the average weekly volume of trading in the shares during the preceding four calendar weeks.
Emerging Growth Company Status
The Jumpstart Our Business Startups Act (the “JOBS Act”), which was enacted in April 2012, has made numerous changes to the federal securities laws to facilitate access to capital markets. Under the JOBS Act, a company with total annual gross revenues of less than $1.0 billion during its most recently completed fiscal year qualifies as an “emerging growth company.” PCSB Financial qualifies as an emerging growth company under the JOBS Act.
An “emerging growth company” may choose not to hold shareholder votes to approve annual executive compensation (more frequently referred to as“say-on-pay” votes) or executive compensation payable in connection with a merger (more frequently referred to as“say-on-golden parachute” votes). An emerging growth company also is not subject to the requirement that its auditors attest to the effectiveness of the company’s internal control over financial reporting, and can provide scaled disclosure regarding executive compensation. Finally, an emerging growth company may elect to comply with new or amended accounting pronouncements in the same manner as a private company, but must make such election when the company is first required to file a registration statement. Such an election is irrevocable during the period a company is an emerging growth company. PCSB Financial has elected to comply with new or amended accounting pronouncements in the same manner as a public company.
A company loses emerging growth company status on the earlier of: (i) the last day of the fiscal year of the company during which it had total annual gross revenues of $1.0 billion or more; (ii) the last day of the fiscal year of the issuer following the fifth anniversary of the date of the first sale of common equity securities of the company pursuant to an effective registration statement under the Securities Act of 1933; (iii) the date on which such company has, during the previous three-year period, issued more than $1.0 billion innon-convertible debt; or (iv) the date on which such company is deemed to be a “large accelerated filer” under Securities and Exchange Commission regulations (generally, at least $700 million of voting andnon-voting equity held bynon-affiliates).
Sarbanes-Oxley Act of 2002
The Sarbanes-Oxley Act of 2002 is intended to improve corporate responsibility, to provide for enhanced penalties for accounting and auditing improprieties at publicly traded companies and to protect investors by improving the accuracy and reliability of corporate disclosures pursuant to the securities laws. Upon completion of the conversion, PCSB Financial will have in place policies, procedures and systems designed to comply with these regulations, and PCSB Financial will review and document such policies, procedures and systems to ensure continued compliance with these regulations.
101
Table of Contents
Change in Control Regulations
Under the Change in Bank Control Act, no person, or group of persons acting in concert, may acquire control of a bank holding company, such as PCSB Financial, unless the Federal Reserve Board has been given 60 days’ prior written notice and not disapproved the proposed acquisition. The Federal Reserve Board considers several factors in evaluating a notice, including the financial and managerial resources of the acquirer and competitive effects. Control, as defined under the applicable regulations, means the power, directly or indirectly, to direct the management or policies of the company or to vote 25% or more of any class of voting securities of the company. Acquisition of more than 10% of any class of a bank holding company’s voting securities constitutes a rebuttable presumption of control under certain circumstances, including where, as will be the case with PCSB Financial, the issuer has registered securities under Section 12 of the Securities Exchange Act of 1934.
In addition, federal regulations provide that no company may acquire control (as defined in the Bank Holding Company Act) of a bank holding company without the prior approval of the Federal Reserve Board. Any company that acquires such control becomes a “bank holding company” subject to registration, examination and regulation by the Federal Reserve Board.
Federal Taxation
General. PCSB Financial and PCSB Bank are subject to federal income taxation in the same general manner as other corporations, with some exceptions discussed below. The following discussion of federal taxation is intended only to summarize material federal income tax matters and is not a comprehensive description of the tax rules applicable to PCSB Financial and PCSB Bank.
Method of Accounting. For federal income tax purposes, PCSB Bank currently reports its income and expenses on the accrual method of accounting and uses a tax year ending December 31 for filing its federal income tax returns.
Minimum Tax. The Internal Revenue Code of 1986, as amended, imposes an alternative minimum tax at a rate of 20% on a base of regular taxable income plus certain tax preferences, less an exemption amount, referred to as “alternative minimum taxable income.” The alternative minimum tax is payable to the extent tax computed this way exceeds tax computed by applying the regular tax rates to regular taxable income. Net operating losses can, in general, offset no more than 90% of alternative minimum taxable income. Certain payments of alternative minimum tax may be used as credits against regular tax liabilities in future years. At September 30, 2016, PCSB Bank had $32,000 of alternative minimum tax credit carryforwards.
Net Operating Loss Carryovers. Generally, a financial institution may carry back net operating losses to the preceding two taxable years and forward to the succeeding 20 taxable years. See Note 9 to Notes to Consolidated Financial Statements for additional information.
Capital Loss Carryovers.Generally, a financial institution may carry back capital losses to the preceding three taxable years and forward to the succeeding five taxable years. Any capital loss carryback or carryover is treated as a short-term capital loss for the year to which it is carried. As such, it is grouped with any other capital losses for the year to which carried and is used to offset any capital gains. Any undeducted loss remaining after the five year carryover period is not deductible. At September 30, 2016, PCSB Bank had no capital loss carryovers.
Corporate Dividends. We may generally exclude from our income 100% of dividends received from PCSB Bank as a member of the same affiliated group of corporations.
Audit of Tax Returns. PCSB Bank’s federal income tax returns and New York State income tax returns have not been audited in the last three years.
102
Table of Contents
State Taxation
In March 2014, tax legislation was enacted that changed the manner in which financial institutions and their affiliates are taxed in New York State. Taxable income is apportioned to New York State based on the location of the taxpayer’s customers, with special rules for income from certain financial transactions. The location of the taxpayer’s offices and branches are not relevant to the determination of income apportioned to New York State. The statutory tax rate is currently 6.5%. An alternative tax of 0.15% on apportioned capital is imposed to the extent that it exceeds the tax on apportioned income. The New York State alternative tax is capped at $5 million for a tax year and is gradually phased out over asix-year period. Thrift institutions that maintain a qualified residential loan portfolio are entitled to a specially computed modification that reduces the income taxable to New York State.
Shared Management Structure
The directors of PCSB Financial are the same persons who are the trustees of PCSB Bank. In addition, each executive officer of PCSB Financial is also an executive officer of PCSB Bank. PCSB Financial and PCSB Bank expect to maintain this shared management structure until there is a business reason to establish separate management structures.
Our Directors
Directors of PCSB Financial serve three-year staggered terms so that approximatelyone-third of the directors are elected at each annual meeting. The trustees of PCSB Bank are elected annually. The following table sets forth for each director of PCSB Financial, his name, his age at September 30, 2016, the year in which he began serving as a trustee of PCSB Bank and the year when his current term as a director of PCSB Financial expires.
Name (1) | Position(s) | Age | Director Since | Current Term Expires | ||||
William V. Cuddy, Jr. | Director | 58 | 2015 | 2019 | ||||
Kevin B. Dwyer | Director | 55 | 2013 | 2019 | ||||
Willard I. Hill, Jr. | Director | 61 | 2017 | 2019 | ||||
Jeffrey D. Kellogg | Director | 67 | 2011 | 2018 | ||||
Robert C. Lusardi | Director | 62 | 2012 | 2018 | ||||
Matthew G. McCrosson | Director | 66 | 2015 | 2018 | ||||
Joseph D. Roberto | Chairman of the Board, President and Chief Executive Officer | 64 | 2012 | 2019 | ||||
Karl A. Thimm | Director | 69 | 2008 | 2017 | ||||
Michael T. Weber | Director | 61 | 2005 | 2017 | ||||
Richard F. Weiss | Vice Chairman of the Board and Lead Independent Director | 71 | 2004 | 2017 |
| (1) | The mailing address for each individual is 2651 Strang Blvd., Suite 100, Yorktown Height, NY 10598. |
The business experience for the past five years of each director of PCSB Financial is set forth below. Each individual’s biography also contains information regarding his experience, qualifications, attributes or skills that caused the board of directors to determine that he should serve as a director. Unless otherwise indicated, each individual has held his position for the past five years.
William V. Cuddy, Jr.serves as Executive Vice President of CBRE, Inc. providing commercial real estate consulting and brokerage services to corporations and other institutions for over 30 years. He leads a team of professionals in providing corporate real estate services including tenant representation (regional and national), as well as agency sales and leasing. CBRE, Inc. has recognized Mr. Cuddy as its top producing broker numerous times and he was awarded the NAIOP Deal of the Year six times for various sales and lease transactions.
103
Table of Contents
Mr. Cuddy’s present and past leadership positions have included serving as a director of The Burke Hospital Foundation since 2009; director of the Burke Research Institute since 2006; and Director (2001-2009) and Past President of The Burke Rehabilitation Hospital (2007-2009). Member, Board of Stewards and Past President (2007) with the Friendly Sons of St. Patrick in Westchester County; Board member at Mercy College (1996-2005); and Director of the Westchester County Association since 2010.
Before joining the PCSB Bank Board of Trustees Mr. Cuddy had been a Director at CMS Bank which was acquired by PCSB Bank in 2015. The Board of Trustees values the depth of Mr. Cuddy’s background and expertise in real estate matters. In particular, he provides the board of directors and PCSB Bank with an extensive knowledge of the regional commercial real estate market, and provides valuable assistance in fostering relationships with owners, investors, developers and the corporate community. Mr. Cuddy is also valued for his marketing and transaction skills.
Kevin B. Dwyeris the owner of Dwyer Agency, LLC, a real estate agency, and of Dwyer Agency of Mahopac LLC an insurance agency. Dwyer Agency, LLC has been providing the Putnam and surrounding communities with residential and commercial real estate and insurance opportunities since 1927.
Mr. Dwyer is actively involved in many community organizations serving on the Board of Putnam Hospital Center Foundation, St. John’s Parish Mahopac Finance Committee, Friendly Sons of St. Patrick, Lake Mahopac Rotary and Mahopac Chamber of Commerce. His professional organizations include NY State Commercial Association of Realtors, Hudson Valley Commercial Association of Realtors, NYS and National Association of Realtors, International Council of Shopping Centers and Independent Insurance Agents of NY State.
Mr. Dwyer’s real estate and insurance expertise provides the board of directors and PCSB Bank with valuable insight into the local real estate market and into the insurance needs of the Bank.
Willard I. Hill, Jr., now retired, is an attorney who served as Managing Director, Chief Marketing and Communications Officer and Head of Government Relations for MBIA Inc., a major financial guarantee insurance company. He previously served on MBIA’s executive management team as global Chief Compliance Officer, and separately as Head of Investor Relations. Mr. Hill retired from MBIA in 2013. Earlier in his career, he was president of the government deferred compensation business at ING US Financial Services (now Voya Financial) and he held senior executive positions in the legal and business divisions at Aetna, Inc.
Mr. Hill earned his MBA from the University of Connecticut School of Business in 1991. He earned a Juris Doctor from Howard University School of Law in 1979 and a B.A. from Fisk University in 1976. He is a member of the bar in several states, including New York. Mr. Hill serves on the Board of Directors on the Council for Economic Education and of the Food Bank for Westchester.
Mr. Hill’s deep expertise in corporate, insurance and financial services law, government relations and strategic communications and his leadership experience as a senior executive with public companies will be a significant strategic resource for the Company and the Bank.
Jeffrey D. Kellogg, now retired, served as the Senior Vice President of Development and Community affairs at Putnam Hospital Center and as Executive Director of the Putnam Hospital Center Foundation. In this capacity, for 21 years, Mr. Kellogg was responsible for all fund raising initiatives as well as the hospital’s marketing and communications, public relations, volunteer/auxiliary program, community outreach and guest services department. Professionally, in 2005 he was recognized as a Fellow of the Association for Philanthropy, which is the highest level of achievement in the field of health care philanthropy.
Before his positions with Putnam Hospital Center, Mr. Kellogg began his business career building and managing a chain of a dozen area sporting goods stores throughout Westchester, Dutchess, Putnam and New
104
Table of Contents
Fairfield Ct. Counties. Throughout his career Mr. Kellogg has been active in the community and has served on many boards and held numerous leadership positions. These include positions and membership with the Putnam County Economic Development Corporation, the American Heart Association, Cornell Cooperative Extension, Grace Lutheran Church of Yorktown, the Putnam Alliance and Boy Scouts of America. Most recently, Mr. Kellogg has joined the board of Putnam Family and Community Services which services clients throughout the Hudson Valley.
Mr. Kellogg holds a bachelor’s degree in Economics from St. Lawrence University and a master’s degree in Health Care Administration from Western Connecticut State University. His strong leadership skills and extensive community involvement provides the Board of Directors and PCSB Bank with valuable insight the needs of the Bank’s local communities.
Robert C. Lusardi, Esq.is a partner in the law firm of Daniels, Porco and Lusardi LLP located in Carmel, N.Y. He practices primarily in the areas of Real Estate and Zoning Litigation, Civil Litigation, Mortgage Foreclosure and Commercial Litigation. Mr. Lusardi is admitted to practice in New York, Connecticut and the U.S. District Courts for the Southern and Eastern Districts of New York. He has served as Assistant District Attorney, Putnam County, NY, Village Attorney, Village of Nelsonville Assistant Town Attorney, Town of Phillipstown, and Special Litigation Counsel, Town of Putnam County. Mr. Lusardi is a member of the Zoning Board of Appeals of the Town of Putnam Valley NY, a member of Preserve Putnam, a local charity, the Carmel-Mahopac Chamber of Commerce, and the Putnam County and New York State Bar Associations.
Mr. Lusardi attended The College of Holy Cross where he received his B.A. and Syracuse University College of Law where he received his J.D. His more than 35 years of experience in commercial and real estate litigation provides the board of directors with valuable experience in real estate litigation matters as well as other legal matters.
Matthew G. McCrossonis a partner with the accounting and advisory firm of PKF O’Connor Davies, LLP where he has been employed since 2000. Mr. McCrosson provides performance improvement based advisory services in addition to organizational and operational reviews. He has assisted many clients in reviewing their technology platforms in terms of alternative systems and system selection and implementation coordination.
Before joining PKF O’Connor Davies, LLP in 2000, Mr. McCrosson was with KPMG Consulting, in the firm’s Public Services line of business. Earlier in his career, Mr. McCrosson served as chief financial officer and chief operation officer of several national and regionalnot-for-profit organizations. He serves on the Boards of the Business Council of Westchester and Westchester Community College Foundation. He is a past Chairman of the Westchester Community Foundation.
Before joining the PCSB Bank Board Mr. McCrosson had been a Director at CMS Bank which had been acquired by PCSB Bank in 2015. The Board of Trustees values Mr. McCrosson’s unique combination of financial and accounting expertise and knowledge of technology matters along with his designation as an “audit committee financial expert,” as that term is defined by Securities and Exchange Commission regulations.
Joseph D. Roberto has served as President and Chief Executive Officer of PCSB Bank since January 2012 and as its Chairman of the Board since January 2012. He served as Chief Financial Officer of PCSB Bank from October 2005 to December 2011. Mr. Roberto’s banking career spans more than 40 years serving in various financial management and executive positions for other financial institutions. Before joining PCSB Bank, Mr. Roberto began his career at Yonkers Savings and Loan Association and served as Chief Financial Officer for both Yonkers Financial Corporation and Yonkers Savings and Loan Association, a public community bank, from 1996 to 2002. In 2004 and 2005 he served as Executive Vice President and Chief Financial Officer of Empire State Bank, a public commercial bank.
Mr. Roberto is actively involved in various organizations in both Putnam and Westchester Counties, currently serving on the boards of the Putnam Economic Development Committee, as its Chairman, the Putnam Hospital Center Foundation and the Westchester County Association. Mr. Roberto is also actively involved with the American Heart Association and its Putnam Heart Walk leading PCSB Bank’s efforts in fund raising and heart healthy awareness.
105
Table of Contents
Mr. Roberto’s extensive knowledge of the banking industry and strong leadership skills provide PCSB Bank with invaluable insight and guidance into the business and regulatory requirements of today’s banking environment.
Karl A. Thimmis the President, owner and founder of Karlen Inc. DBA Appliance Sales Plus, a leading Westchester based retail and commercial appliance provider located in Somers NY. He also sits on the Executive Board of Intercounty Appliance Corporation, a retail applianceco-op in Medford, NY. Prior to starting Karlen Incorporated, Mr. Thimm was in the appliance sales division of General Electric Company where he maintained relationships with many retail companies. He sits on the board of the Putnam Hospital Center.
Mr. Thimm’s entrepreneurship and over 40 years of business experience provide PCSB Bank with insight and guidance with its small business lending and account relationships.
Michael T. Weberwas the Chief Executive Officer of Health Quest a multi-hospital healthcare system located in the lower Hudson Valley until his retirement in 2013. Prior to retiring, he grew the system to a $700 million operation with multiple healthcare related entities including home care agencies, urgent care centers, a nursing home and physician practices, which helped in making Health Quest the leader it is today.
Before his position as CEO of Health Quest in 2007, Mr. Weber began his career in Buffalo, NY and from 1979 to 1986 he was Director of Fiscal Services at a local hospital. In 1986 he accepted the position of Chief Financial Officer at Putnam Hospital Center, in Carmel, NY. During that time Mr. Weber earned a Masters in Healthcare Administration from Western Connecticut State University and was promoted to the hospital’s Chief Executive Officer. Over the next seven years he successfully improved the hospital’s financial position, completed several major building projects, enlarged the medical staff and enhanced the reputation of the hospital.
During his years in healthcare administration, Mr. Weber was involved in many community activities including Chairman of the American Heart Association, committee membership with both the American Hospital Association and the NYS Healthcare Association and Chairman of the Northern Metropolitan Hospital Association. Mr. Weber’s administration and financial background provides the board with valuable insight into PCSB Bank’s strategic planning goals.
Richard F. Weiss,having been in the financial services industry for over 40 years, is a Certified Public Accountant and a Certified Financial Planner with an emphasis on Estate and Trust planning. Currently, he works as a consultant to Weiss Financial Group and Weiss Advisory Group LLC firms specializing in tax compliance and personal financial, estate and trust planning and compliance.
Before his current position, Mr. Weiss began his career working for several leading CPA firms in New York City, including the prestigious firm S.D. Leidesdorf & Co. which subsequently merged with the current firm of Ernst & Young. Before establishing his private practice in Mahopac, he was partner at the firm of Kamerman, Shapiro, Jacobs & Weiss, a boutique New York City based firm specializing in international and domestic corporate taxation, estate, trust and individual planning and taxation.
Mr. Weiss is a firm believer in giving back to the community and, toward that end, he serves as a board member and Treasurer of the Putnam County Housing Corp. and a board member of the Putnam Economic Development Committee. He also enjoys volunteering as a local broadcast television announcer for Mahopac High School sporting events.
Mr. Weiss’s extensive tax and financial expertise is an invaluable resource to PCSB Bank and is designated as an “audit committee financial expert” as that term is defined by Securities and Exchange Commission regulations. Mr. Weiss also serves as our lead independent director.
106
Table of Contents
Executive Officers Who Are Not Directors
Carol Bray,age 52, is Senior Vice President and Chief Information Officer, a position she has held since January 2016. Previously, she was PCSB Bank’s Information Technology Manager beginning in December 2001. With over 25 years of experience, Ms. Bray is responsible for the security of customer information and oversees the Information Technology and Systems Operations Departments. Before joining PCSB Bank, she spent 13 years as Vice President and Systems Operations Manager at Premier Bank, a $1.6 billion community financial institution.
Robert Farrier, age 45, is Senior Vice President and Retail Banking Officer, a position he has held since January 2006. Before joining PCSB Bank, Mr. Farrier has held various positions in the retail banking sector since 1996 where he began his career at Marine Midland Bank and graduated from their Officer’s Development Program. Throughout his career he has worked at several large banking institutions such as Bank of New York, First Union, and Fleet Bank (Bank of America), in which he has held positions in the retail sector from Branch Manager to District Manager of a twenty branch region. Mr. Farrier holds an MBA from Marist College.
Michael P. Goldrick, age 51, is Executive Vice President and Chief Lending Officer, a position he has held since October 2012. Before joining PCSB Bank, Mr. Goldrick has held various management and executive positions in the banking industry since 1987 where he began his career at North Fork Bank & Trust Company as a loan officer. From 2001 to 2005, Mr. Goldrick was Vice President, Commercial Loans, M&T Bank, specializing in middle market loans. From 2005 to 2008 he was Executive Vice President, for Business and Professional Banking at Hudson Valley Bank an executive position accountable for direct and indirect management of a $1.5 billion loan and $1.7 billion deposit portfolio. From 2008 to 2012 Mr. Goldrick was a Senior Vice President, Team Leader Commercial Banking for Provident Bank responsible for loan expansion into Westchester, Putnam, Bronx and Fairfield Ct. Mr. Goldrick holds an MBA in Finance from Fordham University.
Ruth Leser,age 52, is Senior Vice President and has been Director of Human Resources since January 1996. During her time with PCSB Bank, Ms. Leser has administered PCSB Bank’s growth from 99 employees to the current number of 177. Prior to joining PCSB Bank, she spent 9 years as a Human Resources Officer at First Union Bank, formerly Union Trust Bank in Connecticut. Ms. Leser holds a BBA in Human Resources Management.
David McNamara,age 46, is Senior Vice President Compliance and CRA Officer, a position he has held since June 2014. From March 2003 until June 2014, Mr. McNamara was Vice President, Compliance and CRA for Newtown Savings Bank. From January 1997 until March 2003, he was a consultant for RSM McGladrey, Inc. in their Financial Services Practice, specializing in Bank Regulatory Compliance for Community Banks. Mr. McNamara is also an attorney admitted in the State of Connecticut since August 1999.
Scott D. Nogles, age 47, is Executive Vice President and Chief Financial Officer, a position he has held since October 2011. Before joining PCSB Bank, Mr. Nogles has held various financial management and executive positions for other financial institutions. He began his career in 1993 at KPMG, a big four accounting firm, and specialized in auditing community and regional banks. From 2004 to 2011 Mr. Nogles was Executive Vice President and Chief Financial officer of New England Bank, a $700 million public community bank in Enfield CT. Mr. Nogles holds an MBA from the University of Connecticut and is a former CPA.
Richard J. Petrone,age 58, is Senior Vice President and Chief Credit Officer, a position he has held since August 2012. Before joining PCSB Bank, Mr. Petrone has held various credit administrative positions for other financial institutions since 1982 where he began his banking career at North Houston Bank, in Houston Texas. From 1992 to 2007 Mr. Petrone was a Vice President and Business Banking Risk Manager for Wachovia Bank responsible for credit structuring, underwriting, originating, renewing and credit grading of business banking clients from $5.0 million to $50.0 million. From 2007 to 2012 he was a Vice President and Commercial Credit Manager for TD Bank, NA responsible for managing an underwriting team of four in support of a Westchester Commercial/Middle market lending team.
107
Table of Contents
Clifford S. Weber,age 66, is Senior Vice President, Chief Risk Officer and General Counsel, a position he has held since January 2016. Mr. Weber brings more than twenty five years representing banks, bank and thrift holding companies and other financial service providers in regulatory, corporate, securities and transactional matters. He has spent his career advising senior management and governing boards of community banks and their holding companies on strategic issues, transactions, corporate structure, investments and activities. In addition, Mr. Weber was General Counsel to the Community Bankers Association of New York State, Chairman of the New York Bar Association Banking Law Committee and Counsel to the New York Assembly Insurance Committee. From 2000 to 2015, Mr. Weber was a partner with Hinman, Howard & Kattell LLP, a law firm specializing in banking and financial services regulation. Mr. Weber earned his law degree from Brooklyn Law School. He is a director of the Food Bank for Westchester and the Town of Yorktown Industrial and Commercial Board.
Board Independence
The board of directors has determined that each of our directors, except for Messrs. Lusardi and Roberto, is “independent” as defined in, and for purposes of satisfying the listing standards of, the Nasdaq Stock Market. Mr. Roberto is not considered independent because he is an executive officer of PCSB Financial and PCSB Bank. Mr. Lusardi is not considered independent because of the aggregate amount of legal fees paid by PCSB Bank and by borrowers of PCSB Bank to his law firm during the fiscal year ended June 30, 2016 for legal services rendered to or on behalf of PCSB Bank.
In determining the independence of our directors, the board of directors considered the following relationships between PCSB Bank and our directors and officers, which is not required to be reported under “ —Transactions With Certain Related Persons” below. Daniels, Porco and Lusardi LLP, the law firm in which Mr. Lusardi is a partner, received from PCSB Bank legal fees of $247,000 for the year ended June 30, 2016 and $33,000 for the three months ended September 30, 2016. Mr. Thimm acts as a guarantor on a residential mortgage loan to an affiliated party. Mr. Weiss acts as a guarantor on a residential mortgage loan to a family member.
Transactions With Certain Related Persons
Federal law generally prohibits publicly traded companies from making loans to their executive officers and directors, but it contains a specific exemption from the prohibition for loans made by federally insured financial institutions, such as PCSB Bank, to their executive officers and directors in compliance with federal banking regulations. At September 30, 2016, all of our loans to directors and executive officers were made in the ordinary course of business, were made on substantially the same terms, including interest rates and collateral, as those prevailing at the time for comparable loans with persons not related to PCSB Bank, and did not involve more than the normal risk of collectability or present other unfavorable features. These loans were performing according to their original terms at September 30, 2016, and were made in compliance with federal banking regulations.
Committees of the Board of Directors
We conduct business through meetings of our board of directors and its committees. The board of directors of PCSB Financial has established standing committees, including a Compensation Committee, an Audit Committee and a Nominating/Corporate Governance Committee. Each of these committees operates under a written charter, which governs its composition, responsibilities and operations. PCSB Bank also has standing committees of its Board of Trustees.
108
Table of Contents
The table below sets forth the directors of each of the listed standing committees. The board of directors of PCSB Financial has designated both Messrs. McCrosson and Weiss as an “audit committee financial expert,” as that term is defined by the rules and regulations of the Securities and Exchange Commission.
Compensation Committee | Audit Committee | Nominating/Corporate Governance Committee | ||
William V. Cuddy, Jr. | Willard I. Hill, Jr. | William V. Cuddy, Jr. | ||
Jeffrey D. Kellogg | Jeffrey D. Kellogg | Kevin B. Dwyer | ||
Karl A. Thimm (Chair) | Matthew G. McCrosson | Willard I. Hill, Jr. | ||
Michael T. Weber | Karl A. Thimm | Jeffrey D. Kellogg (Chair) | ||
Richard F. Weiss | Richard F. Weiss (Chair) | Karl A. Thimm |
Executive Compensation – Summary Compensation Table
The following table sets forth for the year ended June 30, 2016, certain information as to the total remuneration paid by PCSB Bank to Joseph D. Roberto, Scott D. Nogles and Michael P. Goldrick (referred to as our “Named Executive Officers”).
| Fiscal Year Ended June 30, 2016 | ||||||||||||||||||||||||
Name and principal position | Salary ($) | Bonus ($) | Non-equity incentive plan compensation ($) | Nonqualified deferred compensation earnings ($) | All other compensation ($) | Total ($) | ||||||||||||||||||
Joseph D. Roberto | ||||||||||||||||||||||||
Chairman, President and Chief Executive Officer | 529,231 | 60,000 | — | — | 37,094 | 626,325 | ||||||||||||||||||
Scott D. Nogles | ||||||||||||||||||||||||
Executive Vice President and Chief Financial Officer | 290,616 | 40,000 | — | — | 22,064 | 352,860 | ||||||||||||||||||
Michael P. Goldrick | ||||||||||||||||||||||||
ExecutiveVice Presidentand Chief Lending Officer | 250,925 | 16,000 | — | — | 34,556 | 301,481 | ||||||||||||||||||
| (1) | Consists of the following payments: |
Officer | Year Ended | Automobile ($) | Golf Club Membership ($) | 401(k) ($) | Split Dollar ($) | Total ($) | ||||||||||||||||
Joseph D. Roberto | June 30, 2016 | 8,400 | 10,825 | 11,338 | 6,531 | 37,094 | ||||||||||||||||
Scott D. Nogles | June 30, 2016 | 8,400 | — | 13,448 | 216 | 22,064 | ||||||||||||||||
Michael P. Goldrick | June 30, 2016 | 8,400 | — | 26,156 | — | 34,556 | ||||||||||||||||
Benefit Plans
Proposed Employment Agreements.PCSB Financial and PCSB Bank (the “employers”) intend to enter into employment agreements (“agreements”) with Messrs. Roberto, Nogles and Goldrick. The agreements will be entered into in connection with the conversion and stock offering and will have a term that initially ends on December 31, 2019, in the case of Mr. Roberto’s agreement and December 31, 2018 in the case of Messrs. Nogles and Goldrick’s agreements. Each agreement will extend automatically for one additional year on January 1 of each year beginning January 1, 2018 unless either the employers or the applicable executive gives notice no later than 90 days before such anniversary date that an agreement will not be renewed.
109
Table of Contents
Each agreement specifies the executive’s base salary, which initially will be $560,000 for Mr. Roberto, $295,920 for Mr. Nogles and $255,505 for Mr. Goldrick. The base salary will be reviewed not less frequently than once every twelve months and may be increased in the board’s discretion. In addition to the base salary, the agreements provide that the executives shall be eligible to participate in short-term and long-term incentive compensation, determined and payable at the discretion of the Compensation Committee. The executives shall also be entitled to continue participation in any fringe benefit arrangements in which he was participating on the effective date of the employment agreement. In addition, the agreements provide for reimbursement of reasonable travel and other business expenses incurred in connection with the performance of the executive’s duties. The agreement for Mr. Roberto provides that he will be entitled to a personal benefits allotment of $30,000 annually which will be used by him, in his sole discretion, towards a car allowance, country club membership, tax or financial advice or such other perquisites as he deems to be appropriate. Each executive will also be entitled to reimbursement of reasonable attorney’s fees incurred in the review and negotiation of the agreement.
If the executive’s employment is terminated by PCSB Bank without cause, including a resignation for good reason (as defined in the agreement) during the term of the agreement, but excluding termination for cause or due to death, disability, retirement or following a change in control, the executive would be entitled to a payment equal to a multiple (i.e., three times for Mr. Roberto, two times for Mr. Nogles and one times for Mr. Goldrick) of the sum of: (i) his average base salary (or, in the case of Mr. Goldrick, his current base salary)plus (ii) his average annual incentive cash compensation awarded during the three (in the case of Mr. Roberto) and two (in the case of Messrs. Nogles and Goldrick) most recent fiscal years ending before the executive’s termination. The severance payment shall be paid to the executive within 30 days (or 60 days in certain circumstances) of the termination date, subject to the receipt of a signed release of claims from the executive within the time frame set forth in the agreement. In the case of Mr. Roberto, the payment shall also include a sum equal to three times his personal benefits allotment and a cash lump sum payment equal to the applicableco-payment percentage that PCSB Bank pays for his continuing life, medical and dental coverage, based on the costs of such coverage on the effective date of Mr. Roberto’s termination. Assuming Messrs. Nogles and Goldrick elect continued medical and dental coverage under COBRA, PCSB Bank and/or PCSB Financial will pay the applicable employerco-pay percentage for a period of 18 months, in the case of Mr. Nogles, and 12 months, in the case of Mr. Goldrick. Such coverage will be paid on apre-tax basis, if providing such coverage did not result in excise taxes or penalties to PCSB Bank or PCSB Financial, otherwise such coverage would be provided on anafter-tax basis. In addition, if Mr. Nogles elected continued COBRA coverage, PCSB Bank would also provide Mr. Nogles with a cash lump sum payment equal to the applicable employerco-pay percentage of such coverage for a period of an additional six months (based on the cost of such coverage at his termination date). PCSB Bank will also provide each executive with a cash lump sum payment equal to the cost of 24 months of life insurance premiums under the PCSB Bank-sponsored life insurance arrangements, in the case of Mr. Nogles, and 12 months, in the case of Mr. Goldrick (based on the cost of such coverage at the executive’s termination date). In addition, each executive would fully vest in any benefits under any nonqualified deferred compensation plans in which such executive is participating.
If the executive’s employment is terminated during the term of the agreement by PCSB Bank without cause, including a resignation for good reason (as defined in the agreements) within 24 months after a change in control (as also defined in the agreements), the executive would be entitled to a payment equal a multiple (i.e., three times for Messrs. Roberto and Nogles and two times for Mr. Goldrick) of the sum of: (i) his current base salary (or his base salary in effect immediately before the change in control, if higher) plus (ii) his highest annual incentive cash compensation awarded during the three (in the case of Messrs. Roberto and Nogles) and two (in the case of Mr. Goldrick) most recent fiscal years ending before the executive’s termination. The severance payment shall be paid to the executive within five business days of the termination date. In the case of Mr. Roberto, the payment shall also include a sum equal to three times his personal benefits allotment and a cash lump sum payment equal to the cost of providing continued life, medical and dental coverage for 36 months following termination, at no cost to the executive, based on the costs of such coverage on the effective date of Mr. Roberto’s date of termination. Assuming Messrs. Nogles and Goldrick elect continued medical and dental coverage under COBRA, the employers will pay the entire cost of such coverage for a period of 18 months. Such coverage will be paid on apre-tax basis, if
110
Table of Contents
possible, or if providing such coverage does not result in excise taxes or penalties to PCSB Bank or PCSB Financial, otherwise such coverage would be provided on anafter-tax basis. In addition, if Messrs. Nogles and Goldrick elect continued COBRA coverage, the employers will also provide the executive with a cash lump sum payment equal to the cost of such coverage for a period of an additional 18 months, in the case of Mr. Nogles, and six months, in the case of Mr. Goldrick (based on the cost of such coverage at his termination date). The employers will also provide each executive with a cash lump sum payment equal to 36 months of life insurance coverage, in the case of Mr. Nogles, and 24 months, in the case of Mr. Goldrick (based on the cost of such coverage at the executive’s termination date). In addition, Messrs. Roberto and Nogles would fully vest in any benefits under any nonqualified deferred compensation plans in which such executive is participating.
For purposes of the executive’s ability to resign and receive a payment under the agreement, “good reason” would include the occurrence of any of the following events: (i) a failure of the employers to continue the executive in the executive’s position or, in the case of Messrs. Roberto and Nogles, the issuance by the employers of a notice to the executive that the term of the employment agreement will not be extended; (ii) a material adverse change in the nature or scope of executive’s responsibilities, title, authorities, powers, functions or duties or the duties normally exercised by someone in his executive position, without his consent, (iii) an involuntary reduction in his base salary, except in connection with anacross-the-board salary reduction affecting substantially all management employees and based on the employer’s financial performance, (iv) an involuntary relocation of executive’s principal place of employment by more than 35 miles driving distance from such office as determined at the date of the agreement, or (v) a material breach by the employers of the compensation provisions or any other provision of the agreement which continues for more than 10 days following notice given by the executive. If an event constituting “good reason” occurs, the executive is required to give the employers notice within 60 days and the employers will have 30 days to correct the good reason, however, the 30 day period may be waived by the employers.
If the payments to the executives under their employment agreements with the employers made in connection with a change in control would result in an excise tax under Sections 280G and 4999 of the Internal Revenue Code, the severance amounts payable to Messrs. Nogles and Goldrick would be reduced to avoid an excess parachute payment. The employment agreements with Mr. Roberto are silent with respect to any reduction.
If an executive’s employment is terminated for a reason entitling him to a severance payment under the employment agreement before the occurrence of a change in control, he would receive an aggregate cash severance payment of approximately $1.6 million, in the case of Mr. Roberto, $970,000, in the case of Mr. Nogles, and $269,000, in the case of Mr. Goldrick, assuming the event of termination occurs in 2017, based on current levels of compensation. If the termination occurs following a change in control in 2017, based upon current levels of compensation and without regard to the possible reduction to avoid an excess parachute payment, the cash severance payment would be approximately $2.0 million, in the case of Mr. Roberto, $1.1 million, in the case of Mr. Nogles, and $565,000, in the case of Mr. Goldrick.
Under the employment agreements, if the executive is terminated due to disability (as defined in his employment agreement), the employment agreement will terminate. For these purposes, disability is defined as any medically determinable physical or mental impairment that can be expected to result in death or can be expected to last for a continuous period of not less than 12 months and that renders the executive unable to engage in any substantial gainful activity. If the executive dies while employed, the employers will continue to provide his base salary to his designated beneficiary for three months following his death.
Upon retirement of an executive according to any retirement policy established by the employers’ boards and consented to by the executive, the executive will be entitled to benefits under any retirement plans to which he is a party but shall not be entitled to any amount or benefits under the employment agreement.
The employment agreements require the executives not to compete with PCSB Bank for a period of one year following a termination of employment for which the executive receives severance payments as the result of an involuntary termination or resignation for good reason (other than a termination of employment following a change in control). The employment agreements further require that the executives not solicit business, customers or employees of PCSB Bank or PCSB Financial for a 12 month period following termination (other than a termination of employment following a change in control) and require the executives to maintain confidential information.
111
Table of Contents
The employment agreements with PCSB Financial make clear that there will be no obligation of payment or benefits paid under the PCSB Bank and PCSB Financial employment agreements. To the extent that a payment is made or a benefit is received from PCSB Bank, the same payment or benefit will not be paid or received from PCSB Financial.
Proposed Change in Control Agreements. PCSB Financial and PCSB Bank (collectively, the “employers”) intend to enter into change in control agreements with six senior officers. Although all change in control agreements have a term of two years, two of the agreements provide a payment equal to two years’ base salary and average bonus if a covered termination (as described below) occurs following a change in control and four of the agreements provide a payment equal to one year’s base salary and average bonus if a covered termination occurs following a change in control, as specified below. Commencing on the first anniversary of the effective date of the agreements, the agreements may be renewed by the boards of the employers for an additional 12 months, such that the continuing terms shall be for 24 months. If the boards determine not to renew a change in control agreement, the employers must give the covered executive notice at least 30 days before such anniversary date that the agreement will not be renewed. In such event, the change in control agreement will terminate at the end of the then term. Notwithstanding the foregoing, if the change in control agreement is in effect on the effective date of a change in control, the agreement will automatically renew on such date and will expire 24 months following the change in control.
If a change in control (as defined in the agreement) occurs and is followed by the senior officer’s involuntary termination of employment (other than for cause, death or disability) or his resignation for good reason (as defined in the agreement), the executive will receive a cash severance payment equal to two times, in the case of two senior officers, and one times, in the case of four senior officers, the sum of: (i) the officer’s highest rate of base salary paid during the current or two prior calendar years and (ii) the average annual cash incentive compensation received during the current and two immediately preceding calendar years. In addition, the employers will maintain the executive’s medical and dental insurance coverage in effect following their date of termination, at the sole expense of the employer, for a period of 18 months, or 12 months, depending on the particular agreement. If providing such medical and dental coverage on apre-tax basis would result in an excise tax or penalties to the employers, the employer would provide such benefits on anafter-tax basis.
The change in control agreements with PCSB Financial make clear that there will be no obligation of payment or benefits paid under the PCSB Bank and PCSB Financial change in control agreements. To the extent that a payment is made or a benefit is received from PCSB Bank, the same payment or benefit will not be paid or received from PCSB Financial.
Proposed Short-Term Incentive Plan and Clawback Policy. PCSB Bank intends to adopt an annual incentive compensation plan for the benefit of its officers and employees for the year ending June 30, 2018, including its named executive officers. Under the incentive compensation plan, the named executive officers can achieve a bonus based on a percentage of salary, depending on whether the performance goals are achieved at a threshold, target or maximum level. In addition, an employee is expected to achieve goals that are weighted between bank-level goals and individual goals. For the plan to be funded, a net income threshold, determined by the Compensation Committee each year, must be achieved. In conjunction with PCSB Bank’s adoption of a short-term incentive plan, PCSB Financial intends to adopt a clawback policy providing for the right to clawback incentive compensation from certain officers if the Compensation Committee determines that the materialnon-compliance with any financial reporting requirement under the securities laws requires PCSB Financial to prepare an accounting restatement. PCSB Bank has not previously adopted a clawback policy because PCSB Bank has not previously paid incentive compensation.
Supplemental Executive Retirement Plan for Joseph D. Roberto.In 2012, PCSB Bank adopted a Supplemental Executive Retirement Plan for Mr. Joseph D. Roberto. Under the Supplemental Executive Retirement Plan, which is a nonqualified deferred compensation plan subject to Section 409A of the Internal Revenue Code,
112
Table of Contents
Mr. Roberto will be entitled to a normal retirement benefit if he separates from service after his normal retirement age of 68. The normal retirement benefit payable at age 68 is calculated as an annuity of $223,642 per year, payable in monthly installments for his lifetime with 15 years certain. If Mr. Roberto has a separation from service before his normal retirement age (other than for cause or due to his death), his benefit will be reduced by 12.5% per year, for each year before his normal retirement age in which his separation occurs. If Mr. Roberto works beyond his normal retirement age, his normal retirement benefit will be increased by multiplying the number of years beyond his normal retirement age that he works by 3% (i.e., retirement occurring five years beyond normal retirement age would result in a benefit equal to 115% of the normal retirement benefit). If PCSB Bank has a change in control (as defined in the Supplemental Executive Retirement Plan), Mr. Roberto’s benefit becomes fully vested. Upon Mr. Roberto’s separation from service, Mr. Roberto will be entitled to a benefit equal to the normal retirement benefit. If Mr. Roberto’s becomes disabled before attainment of his normal retirement age, Mr. Roberto’s disability benefit would be equal to the benefit payable at his normal retirement age, payable in the form of a life annuity. If he is terminated for cause (as defined in the plan), Mr. Roberto forfeits his right to any benefit under the Supplemental Executive Retirement Plan. Mr. Roberto’s right to a benefit under the Supplemental Executive Retirement Plan is conditioned on his agreement that for a period of one year following his termination of employment, he agrees not to solicit employees or customers of PCSB Bank to terminate their relationship with the bank, and further agrees not to otherwise compete with PCSB Bank within a 15 mile radius of the location in which PCSB Bank or its affiliates has business operations or has filed an application for regulatory approval to establish an office as of the date of Mr. Roberto’s termination, provided that the requirement not to compete will not apply if Mr. Roberto’s termination occurs following a change in control.
Contemporaneously with the adoption of the Supplemental Executive Retirement Plan, PCSB Bank purchased bank-owned life insurance and entered into a Supplemental Life Insurance Agreement (described below) with Mr. Roberto which would pay a death benefit to Mr. Roberto’s beneficiary if he dies while employed at PCSB Bank. If Mr. Roberto dies before retirement, his beneficiaries will receive a benefit under the life insurance agreement in lieu of any benefit under the Supplemental Executive Retirement Plan.
In connection with the adoption of the Supplemental Executive Retirement Plan, Mr. Roberto entered into a participation agreement with PCSB Bank confirming his participation in the plan. The participation agreement permitted Mr. Roberto to elect to receive his benefits under the plan in a lump sum payment rather than in a life annuity with 15 years certain. Mr. Roberto elected to receive a lump sum payment under each payment alternative set forth above.
Supplemental Life Insurance Agreement for Joseph D. Roberto.In conjunction with the adoption of the Supplemental Executive Retirement Plan for Mr. Roberto, PCSB Bank also entered into a Supplemental Life Insurance Agreement with Mr. Roberto. In connection with the adoption of the Supplemental Life Insurance Agreement, PCSB Bank acquired one or more life insurance policies on Mr. Roberto’s life. PCSB Bank is the owner of the policy or policies and has entered into an endorsement form with Mr. Roberto to endorse a portion of the death benefits to Mr. Roberto or his beneficiary (such arrangements are referred to as “split dollar agreements”). If Mr. Roberto dies before the payment of his retirement benefit commences under the Supplemental Executive Retirement Plan, his beneficiary would be entitled to a cash lump sum payment from the Supplemental Life Insurance Agreement, in lieu of any benefit under the Supplemental Executive Retirement Plan, equal to the lesser of (i) $2,517,841 or (ii) the net death proceeds available under the Supplemental Life Insurance Agreement. For these purposes, the “net death proceeds” are defined as the total death proceeds in the policy or policies on Mr. Roberto’s life, minus the greater of (i) the cash surrender value of the policy or (ii) the aggregate premiums paid by PCSB Bank on the policy or policies. If Mr. Roberto dies after his retirement benefits have commenced under the Supplemental Executive Retirement Plan, his beneficiary will be entitled to receive a benefit under the Supplemental Life Insurance Agreement equal to the lesser of (i) the present value of the remaining retirement benefits that would have been paid to him under the Supplemental Executive Retirement Plan had he lived for 15 years after retirement, using a 5% discount rate (or such other reasonable rate as the board determines) and (ii) the net death proceeds. Since Mr. Roberto elected to receive his retirement benefit under the Supplemental Executive Retirement Plan in a lump sum payment following his separation from service, it is expected that no further benefit would be payable to him under this plan following his retirement.
113
Table of Contents
Supplemental Retirement Plan for Senior Executives. In 2016, PCSB Bank adopted a Supplemental Retirement Plan for Senior Executives, effective January 1, 2017. Mr. Nogles and Mr. Goldrick are the only participants in the Supplemental Retirement Plan for Senior Executives. Each executive will be required to enter into a participation agreement evidencing his participation in the plan.
Under the Supplemental Retirement Plan for Senior Executives, which is a nonqualified deferred compensation plan subject to Section 409A of the Internal Revenue Code, the participating executive will be entitled to a yearly benefit amount for 15 years if he separates from service after reaching the benefit age of age 65. The “yearly benefit amount” for Mr. Nogles and for Mr. Goldrick is $75,000 and $50,000, respectively. The benefit will be paid in a single lump sum payment equal of the present value of the yearly benefit amount unless the executive makes a timely election to be paid in installments. If the executive has a separation from service before reaching the benefit age (other than due to death, disability, the occurrence of a change in control or for cause), the executive will be entitled to the yearly benefit amount multiplied by his applicable vested percentage.
If the executive dies prior to attaining his benefit age while employed at PCSB Bank, the executive will be in entitled to the yearly benefit amount and payment will commence on the first day of the second month following the executive’s death. If the executive dies following separation from service and after becoming vested in any portion of the yearly benefit amount but prior to commencement of benefit payments, the executive will be entitled to the amount otherwise payable to the executive and payment will commence on the first day of the second month following the executive’s death.
If the executive becomes disabled prior to separation from service and prior to reaching the benefit age, the executive will receive the yearly benefit as if the executive had reached his benefit age prior to disability. The payment will be made in a lump sum within 30 days of the disability determination, unless the executive timely elected to receive the disability benefit at his benefit age.
If PCSB Bank has a change in control (as defined in the Supplemental Retirement Plan for Senior Executives) and the executive’s employment is involuntary terminated (including a good reason termination by the executive) following the change in control, the executive will be entitled to the yearly benefit amount. If the executive’s employment is involuntarily terminated within two years following the change in control, the executive’s benefit will be the present value of the yearly benefit amount paid in a lump sum. If the executive’s employment terminates more than two years following the change in control (other than due to death or disability), the executive will be entitled to the yearly benefit amount, present valued and paid in a lump sum, or if a timely election was made by the executive, paid in installments over 15 years. If the change in control occurs after the executive commences receiving the yearly benefit amount paid in the form of installment payments and the executive has made an election in the participation agreement to receive a lump sum payment of the remaining amounts due following a change in control, the present value of the remaining payments will be determined and made payable no later than 30 days after the occurrence of the change in control.
If the executive is terminated for cause, he forfeits his rights to any benefit under the Supplemental Retirement Plan for Senior Executives. The benefits provided under the Supplemental Retirement Plan for Senior Executives are conditioned on the executive’s covenant that for a period of one year following the executive’s termination of employment (other than following a change in control), the executive will not compete with PCSB Bank in any city, town, or county in which the executive’s normal business office is located and PCSB Bank or the Company has an office or has filed an application for a regulatory approval to establish an office. In addition, the executive shall not hire or attempt to hire any employee of PCSB Bank or solicit any business from any customer of PCSB Bank or their subsidiaries.
Supplemental Life Insurance Plan. PCSB Bank maintains a Supplemental Life Insurance Plan for the benefit of certain executives, other than Mr. Roberto, who have been selected to participate in the plan. Both of Messrs. Nogles and Goldrick are participants in the Supplemental Life Insurance Plan. The plan provides for a death benefit payment equal to the lesser of: (i) one andone-half times a participant’s highest rate of base salary, as in existence in the 2012 calendar year, or (ii) the executive’s net death proceeds if he dies while employed with PCSB Bank. For these purposes, the “net death proceeds” are defined as the total death proceeds in the officer’s policy
114
Table of Contents
minus the greater of the cash surrender value of the policy or the aggregate premiums paid by PCSB Bank on the policy. An officer’s participation in the Supplemental Life Insurance Plan will terminate: (i) if any regulatory agency requires PCSB Bank to sever its relationship with the executive; (ii) if PCSB Bank is subjected to regulatory restrictions limiting its ability to pay the compensation under the plan; (iii) in the event of insolvency, receivership or dissolution of PCSB Bank, (iv) upon termination of the executive’s employment, or (v) as otherwise may be determined by the board in good faith.
Tax-Qualified Plans
Pension Plan.PCSB Bank maintains a Retirement Plan in RSI Retirement Trust, a qualified noncontributory defined benefit plan (the “pension plan”) for employees. PCSB Bank froze participation in the pension plan to persons hired after October 1, 2012 (i.e., a “soft freeze”). Employees of PCSB Bank before October 1, 2012, who completed one year of service, attained age 21, and were not in one of the excluded classifications were (and remain) eligible to accrue benefits under the pension plan. Contributions to the Plan are made in order to satisfy the actuarially determined minimum funding requirements according to the Employee Retirement Income Security Act of 1974, as amended (“ERISA”). A participant will become 100% vested in his or her accrued benefit under the plan after five years of service with PCSB Bank.
Upon attainment of normal retirement age (age 65) or upon termination after early retirement age (age 60), a participant who is not married and has accrued benefits in excess of $1,000 will receive a life annuity for the participant’s life, unless the participant elects another form of payment. If the participant is married and the present lump sum value of his accrued benefit exceeds $1,000, the normal form of payment will be a joint and survivor annuity, with a percentage of the participant’s benefit continuing to the participant’s spouse upon the participant’s death. In the even the participant’s vested account balance is $1,000 or less, the participant will receive a cash distribution as soon as practicable. A participant’s accrued benefit will become fully vested upon the participant’s death. If a participant dies while the participant is still employed by PCSB Bank or if the participant dies after he retires or terminates employment but before benefit payments start, the surviving spouse will be entitled to a life annuity based on the value of the participant’s vested accrued benefit.
The basic normal retirement benefit is calculated by multiplying the participant’s average of his highest three consecutive years of service by 2% for each year of credited service, up to a maximum of 30 years. A reduced benefit is payable upon early retirement at or after age 60. In the event of late retirement, the late retirement benefit will be the actuarial equivalent of the basic normal retirement benefit plus credit for accruals after attainment of normal retirement age.
PCSB Bank intends to freeze participation in the pension plan to all employees in early 2017 (i.e., a “hard freeze”). After the hard freeze, no further benefits will accrue to the benefit of participants under the pension plan.
401(k) Plan. PCSB Bank maintains a 401(k) Plan, which is a qualified,tax-exempt profit sharing plan with a salary deferral feature under Section 401(k) of the Code (the “401(k) Plan”). All employees except for union employees, leased employees, and employees compensated on an hourly basis or commission basis are eligible to participate in the plan with respect to making elective salary deferrals, provided the employee has attained age 21 and completed one year of service with PCSB Bank. Employees are permitted to make elective salary deferrals in an amount no less than one percent of compensation and up to the lesser of 25% of compensation (as defined by the 401(k) Plan) or $18,000 (as indexed annually). An employee may also contribute rollover contributions to the plan from another eligible retirement plan. Employees who have attained age 50 before the end of a plan year are also eligible to makecatch-up contributions during the year in an amount not to exceed $6,000 (as indexed annually). All employee elective salary deferrals,catch-up contributions and “rollover” contributions are fully and immediately vested.
In addition, PCSB Bank will make an employer matching contribution equal to 75% of up to 6% of a participant’s compensation that the participant defers to the plan as an elective salary deferral. In addition, employees who were hired on or after October 1, 2012, who are not eligible to participate in the pension plan due to its “soft freeze,” receive a profit sharing contribution equal to 5% of their compensation. After the “hard freeze,”
115
Table of Contents
PCSB Bank intends to discontinue this 5% profit sharing contribution. Profit sharing contributions and employer matching contributions are subject to a six year vesting schedule, such that the participant is not vested in such contributions for the first two years, and thereafter, a participant vests in 20% of his or her account attributable to profit sharing and employer matching contributions each year until fully vested after six years. Generally, a participant is not entitled to anin-service distribution of his or her salary deferrals until the participant attains age59-1/2. However, a participant may withdraw salary deferrals if the participant suffers a financial hardship, subject to certain limitations. After age59-1/2, a participant may receive no more than twoin-service distributions per year from certain accounts. In addition, the 401(k) Plan permits loans to participants within the limits set forth in the Internal Revenue Code and according to loan procedures established by PCSB Bank. Participants are entitled to benefit payments upon termination of employment due to normal retirement at or after age 65, early retirement at or after age 60, disability or death. Benefits will be distributed in the form of lump sum, which is the normal form of distribution, or installment payments at the election of the participant. PCSB Bank has established an employer stock fund in the 401(k) Plan so that participants can acquire an interest in the common stock of PCSB Financial through their accounts in the 401(k) Plan.
Employee Stock Ownership Plan.PCSB Bank expects to adopt an employee stock ownership plan for eligible employees, effective as of January 1, 2017, in connection with the stock offering. Eligible employees who have attained age 21 and have completed one year of service on or before the closing date of the offering, will begin participation in the employee stock ownership plan, retroactively, as of January 1, 2017, the plan’s effective date. All employees except for union employees, leased employees, nonresident aliens and employees compensated on an hourly basis or commission basis are eligible to participate in the employee stock ownership plan. Employees who do not satisfy the eligibility requirements on the closing date of the offering will become eligible to enter the plan on the first entry date commencing on or after both attainment of age 21 and completion of one year of service.
The employee stock ownership plan trustee is expected to purchase, on behalf of the employee stock ownership plan, 8% of the total number of shares of PCSB Financial common stock issued in the offering (including shares contributed to the Foundation). We anticipate that the employee stock ownership plan will fund its stock purchase with a loan from PCSB Financial equal to the aggregate purchase price of the common stock. The loan will be repaid principally through PCSB Bank’s contribution to the employee stock ownership plan and dividends payable on common stock held by the employee stock ownership plan over the anticipated15-year term of the loan. The interest rate for the employee stock ownership plan loan is expected to be an adjustable-rate equal to the prime rate, as published in The Wall Street Journal, on the closing date of the offering. Thereafter the interest rate will adjust annually and will be the prime rate on the first business day of the calendar year, retroactive to January 1 of such year.
The trustee will hold the shares purchased by the employee stock ownership plan in an unallocated suspense account. Shares will be released from the suspense account on apro-rata basis as the employee stock ownership plan repays the loan. The trustee will allocate the shares released among participants on the basis of each participant’s proportional share of compensation relative to all participants. Participants will become 100% vested in their benefit after six years of credited service. Participants who were employed by PCSB Bank immediately before the offering will receive credit for vesting purposes for years of service before adoption of the employee stock ownership plan. Participants also will become fully vested upon normal retirement, death or disability, a change in control, or termination of the employee stock ownership plan. Generally, participants will receive distributions from the employee stock ownership plan after severance from employment. The employee stock ownership plan reallocates any unvested shares forfeited upon termination of employment among the remaining participants.
The employee stock ownership plan permits participants to direct the trustee as to how to vote the shares of common stock allocated to their accounts. The trustee votes unallocated shares and allocated shares for which participants do not provide instructions on any matter in the same ratio as those shares for which participants provide instructions, subject to fulfillment of the trustee’s fiduciary responsibilities.
Under applicable accounting requirements, PCSB Bank will record a compensation expense for the employee stock ownership plan at the fair market value of the shares as they are committed to be released from the
116
Table of Contents
unallocated suspense account to participants’ accounts. The compensation expense resulting from the release of the common stock from the suspense account and allocation to plan participants will result in a corresponding reduction in PCSB Financial’s earnings.
Trustees’ Compensation
The following table sets forth for the year ended June 30, 2016 certain information as to the total remuneration paid by PCSB Bank to trustees other than Mr. Roberto, who receives no compensation for being a trustee. No additional fees are earned for service to PCSB Financial. Mr. Hill is excluded from the following table because his service as a trustee began in January 2017.
Fiscal Year Ended June 30, 2016 | ||||||||||||||||
Name | Fees earned or paid in cash ($)(1) | Nonqualified deferred compensation earnings ($) (2) | All Other Compensation ($) | Total ($) | ||||||||||||
Weiss, Richard F. | 74,000 | — | — | 74,000 | ||||||||||||
Cuddy, William V. | 74,000 | 30 | — | 74,030 | ||||||||||||
Dwyer, Kevin B. | 74,000 | — | — | 74,000 | ||||||||||||
Kellogg, Jeffrey D. | 74,000 | — | — | 74,000 | ||||||||||||
Lusardi, Robert C. | 74,000 | 6 | — | 74,006 | ||||||||||||
McCrosson, Matthew G. | 74,000 | 5 | — | 74,005 | ||||||||||||
Thimm, Karl A. | 74,000 | — | — | 74,000 | ||||||||||||
Weber, Michael T. | 74,000 | — | — | 74,000 | ||||||||||||
| (1) | The amounts in this column represent, with respect to each trustee, a $50,000 annual retainer and $2,000 per month for a period of 12 months (i.e., $24,000 in total) for attendance at monthly board meetings. Mr. Cuddy defers all, and Messrs. Lusardi and McCrosson defer a portion, of their compensation into the Trustee Fee Deferral Plan. |
| (2) | The amounts reflected in this column represent the above market interest earned by the applicable trustee under the Trustee Fee Deferral Plan for the fiscal year ended June 30, 2016. |
Trustee Fee Deferral Plan.PCSB Bank maintains the Trustee Fee Deferral Plan fornon-employee members of the board of PCSB Bank. The Trustee Fee Deferral Plan is anon-qualified deferred compensation plan subject to the requirements of Section 409A of the Internal Revenue Code. A participant in the plan is eligible to defer a fixed percentage of the periodic fees the participant would be entitled to receive by entering into an election form and submitting such form to PCSB Bank before initial participation, and thereafter, if desired, before the beginning of each plan year. As of the last day of each plan year, PCSB Bank will credit each participant’s account with interest equal to the prime rate as reported in The Wall Street Journal on the first business day of the plan year, compounded annually, provided, that the crediting rate will not be less than 3% nor greater than 10%. The participant’s deferred fees and earnings will be held by PCSB Bank until distributed to the participant. The participants account balances will remain subject to the claims of PCSB Bank’s creditors in the event of PCSB Bank’s insolvency until distributed to the participants.
Each participant is entitled to elect, by filing a timely election form, whether to receive payment of the participant’s account balance on either of: (i) separation from service or (ii) a specified date. In addition, the participant may elect to receive payment in installments or in a lump sum distribution. If the participant fails to make an election, the participant’s account will be distributed in a lump sum distribution at the appropriate time. In addition, if a participant dies, becomes disabled or upon the occurrence of a change in control of PCSB Bank, the participant’s benefit will be distributed in a lump sum distribution.
Trustee Supplemental Life Insurance Plan. In 2016, PCSB Bank adopted a Trustee Supplemental Life Insurance Plan fornon-employee trustees of PCSB Bank. Eligible trustees participating in the Trustee Supplemental Life Insurance Plan include Jeffrey Kellogg, Matthew McCrosson, William Cuddy, Robert Lusardi, Karl Thimm, Kevin Dwyer, and Richard Weiss.
117
Table of Contents
The Trustee Supplemental Insurance Plan provides for a death benefit to the beneficiaries if the trustee was in service with PCSB Bank at the time of his death. During a trustee’s period of coverage, the trustee is entitled to designate the beneficiary of his death benefit under the Trustee Supplemental Insurance Plan. The death benefit will be the lesser of (i) $100,000 or (ii) the net death benefit. For these purposes, the “net death benefit” is defined as the net amount at risk under the policy or policies, i.e., the difference between the cash surrender value of the policy and the total proceeds payable under the policy at the death of the insured as of a given date. PCSB Bank is the sole owner of the policies covering the trustees and has entered into split dollar endorsements with each trustee endorsing the applicable amount of death benefit to the trustee’s beneficiaries in the event of the trustee’s death. A trustee’s participation in the Trustee Supplemental Life Insurance Plan will terminate if: (i) the trustee’s service with PCSB Bank is terminated for reasons other than death or (ii) the Trustee Supplemental Life Insurance Plan is terminated.
Death Benefit Only Plan.Trustee Michael T. Weber is a participant in a separate Death Benefit Only Plan with PCSB and does not participate in the Trustee Supplemental Life Insurance Plan. Under the Death Benefit Only Plan, in the event of Mr. Weber’spre-retirement death, his beneficiary is entitled to a death benefit equal to $153,850. The death benefit will be paid to his beneficiary in a single lump sum within 90 days following his death. Mr. Weber’s participation in the Death Benefit Only Plan will terminate in the event of his termination of service or in the event the Death Benefit Only Plan is terminated. During his service, Mr. Weber is entitled to designate his beneficiary or to substitute another beneficiary on written notice to PCSB Bank.
Benefits to be Considered Following Completion of the Stock Offering
Following the stock offering, we intend to adopt a stock-based benefit plan that will provide for grants of stock options and restricted common stock awards. According to applicable regulations, if adopted within the first year after the offering, we anticipate that the plan will authorize a number of stock options and a number of shares of restricted stock, not to exceed 10% and 4%, respectively, of the shares issued in the offering, including shares contributed to the Foundation. These limitations will not apply if the plan is implemented more than one year after the consummation date of the conversion.
The stock-based benefit plan will not be established sooner than six months after the conversion is completed and, if adopted within one year after the conversion, would require the approval by stockholders owning a majority of the outstanding shares of common stock of PCSB Financial. If the stock-based benefit plan is established after one year after the conversion, it would require the approval of our stockholders by a majority of votes cast.
The following additional restrictions would apply to our stock-based benefit plan only if the plan is adopted within one year after the completion of the conversion:
| • | equity awards must vest at a rate not to exceed 20% per year, except in the case of death, disability or a change in control; |
| • | non-employee trustees/directors in the aggregate may not receive more than 30% of the options and restricted stock awards authorized under the plan; |
| • | anynon-employee trustee/director may not receive more than 5% of the options and restricted stock awards authorized under the plan; and |
| • | any officer or employee may not receive more than 25% of the options and restricted stock awards authorized under the plan. |
These restrictions do not apply to plans adopted after one year following the completion of the stock offering.
The actual value of restricted stock grants will be determined based on their fair value (the closing market price of shares of common stock of PCSB Financial) as of the date grants are made. The following table presents the total value of all shares to be available for awards of restricted stock under the stock-based benefit plan, assuming the shares for the plan are purchased or issued in a range of market prices from $8.00 per share to $14.00 per share at the time of grant.
118
Table of Contents
Exercise Price | Shares at Minimum of Offering Range | Shares at Midpoint of Offering Range | Shares at Maximum of Offering Range | Shares at Adjusted Maximum of Offering Range | ||||||||||||||
| (In thousands, except exercise price and fair value per option information) | ||||||||||||||||||
| $ 8.00 | $ | 4,850 | $ | 5,706 | $ | 6,562 | $ | 7,547 | ||||||||||
| 10.00 | 6,063 | 7,133 | 8,203 | 9,433 | ||||||||||||||
| 12.00 | 7,276 | 8,560 | 9,844 | 11,320 | ||||||||||||||
| 14.00 | 8,488 | 9,986 | 11,484 | 13,207 | ||||||||||||||
The grant-date fair value of the stock options granted under the stock-based benefit plans will be based, in part, on the closing price of shares of common stock of PCSB Financial on the date the options are granted. The fair value will also depend on the various assumptions utilized in the option-pricing model ultimately adopted. The following table presents the total estimated value of the stock options to be available for grant under the stock-based benefit plans, assuming the range of market prices for the shares is $8.00 per share to $14.00 per share at the time of grant.
Share Price | Grant-Date Fair Value Per Option | Options Awarded at Minimum of Offering Range | Options Awarded at Midpoint of Offering Range | Options Awarded at Maximum of Offering Range | Options Awarded at Adjusted Maximum of Offering Range | |||||||||||||||
| (In thousands, except share price information) | ||||||||||||||||||||
| $ 8.00 | $ | 1.87 | $ | 2,834 | $ | 3,335 | $ | 3,835 | $ | 4,410 | ||||||||||
| 10.00 | 2.34 | 3,547 | 4,173 | 4,799 | 5,519 | |||||||||||||||
| 12.00 | 2.81 | 4,259 | 5,011 | 5,763 | 6,627 | |||||||||||||||
| 14.00 | 3.28 | 4,972 | 5,849 | 6,726 | 7,735 | |||||||||||||||
The tables presented above are provided for informational purposes only. There can be no assurance that our stock price will not trade below the offering price of $10.00 per share. Before you make an investment decision, we urge you to carefully read this prospectus, including, but not limited to, the section entitled “Risk Factors.”
119
Table of Contents
SUBSCRIPTIONS BY DIRECTORS AND EXECUTIVE OFFICERS
The table below sets forth, for each of PCSB Financial’s and PCSB Bank’s directors, trustees and executive officers, including their associates, and for all of these individuals as a group, the proposed purchases of subscription shares. There can be no assurance that any listed individual, or the directors and executive officers as a group, will purchase any specific number of shares of our common stock. If the individual maximum purchase limitation is increased, persons subscribing for the maximum amount may increase their purchase order. See “The Conversion and Offering—Additional Limitations on Common Stock Purchases.” Directors, trustees and officers will purchase shares of common stock at the same $10.00 purchase price per share and on the same terms as other purchasers in the offering. This table excludes shares of common stock to be purchased by the employee stock ownership plan, as well as any stock awards or stock option grants that may be made no earlier than six months after the completion of the offering. Federal and state regulations prohibit our trustees and officers from selling the shares they purchase in the offering for one year after the date of purchase. Subscriptions by management through our 401(k) plan are included in the proposed purchases set forth below and will be counted as part of the maximum number of shares such individuals may subscribe for in the offering and as part of the maximum number of shares trustees and officers may purchase in the offering.
Name of Beneficial Owner | Number of Shares | Aggregate Purchase Price | Percentage of Shares Outstanding at Minimum of Offering Range (1) | |||||||||
Directors/Trustees: | ||||||||||||
William V. Cuddy, Jr. | 20,000 | $ | 200,000 | * | ||||||||
Kevin B. Dwyer | 6,500 | 65,000 | * | |||||||||
Willard I. Hill, Jr.(2) | — | — | * | |||||||||
Jeffrey D. Kellogg. | 10,000 | 100,000 | * | |||||||||
Robert C. Lusardi. | 20,000 | 200,000 | * | |||||||||
Matthew G. McCrosson | 15,000 | 150,000 | * | |||||||||
Joseph D. Roberto(3) | 30,000 | 300,000 | * | |||||||||
Karl A. Thimm | 7,500 | 75,000 | * | |||||||||
Michael T. Weber | 10,000 | 100,000 | * | |||||||||
Richard F. Weiss | 10,000 | 100,000 | * | |||||||||
Executive Officers: | ||||||||||||
Carol Bray | 20,000 | 200,000 | * | |||||||||
Robert Farrier | 4,500 | 45,000 | * | |||||||||
Michael P. Goldrick | 20,000 | 200,000 | * | |||||||||
Ruth Leser | 20,000 | 200,000 | * | |||||||||
David McNamara | 20,000 | 200,000 | * | |||||||||
Scott D. Nogles | 20,000 | 200,000 | * | |||||||||
Richard J. Petrone | 4,000 | 40,000 | * | |||||||||
Clifford S. Weber | 15,000 | 150,000 | * | |||||||||
|
|
|
|
|
| |||||||
Total for Directors/Trustees and Executive Officers | 252,500 | $ | 2,525,000 | 1.7 | % | |||||||
|
|
|
|
|
| |||||||
| * | Less than 1%. |
| (1) | At the adjusted maximum of the offering range, trustees and executive officers would beneficially own 1.1% of our outstanding shares of common stock. |
| (2) | Mr. Hill did not have a qualifying deposit account at either the September 30, 2015 eligibility record date or the December 31, 2016 supplemental eligibility record date. |
| (3) | Includes proposed purchases by Mr. Roberto and his associates. |
120
Table of Contents
PCSB Bank’s board of trustees has unanimously approved the plan of conversion. PCSB Bank has filed its conversion application with the NYSDFS and a notice of intent to convert with the Federal Deposit Insurance Corporation. These agencies have permitted us to commence the offering. However, the final approval of the NYSDFS and the finalnon-objection of the Federal Deposit Insurance Corporation are required before we can consummate the conversion and issue shares of common stock. The Federal Deposit Insurance Corporation has issued its written intent to issue a letter ofnon-objection to the conversion, subject to certain conditions. The Federal Reserve Board has issued its approval required in connection with the conversion. However, these approvals andnon-objections do not constitute a recommendation or endorsement of the plan of conversion by any of these regulatory agencies.
General
The board of trustees of PCSB Bank unanimously adopted the plan of conversion on December 7, 2016. Pursuant to the plan of conversion, PCSB Bank will convert from the mutual form of organization to the stock form of organization. In connection with the conversion, PCSB Bank has organized a new Maryland stock holding company named PCSB Financial Corporation, which will sell shares of common stock to the public in this offering. When the conversion and offering are completed, all of the outstanding capital stock of PCSB Bank will be owned by PCSB Financial, and all of the common stock of PCSB Financial will be owned by stockholders. PCSB Bank also intends to form a charitable foundation, PCSB Community Foundation, and fund it with shares of PCSB Financial common stock equal to 2.1% of the shares sold in the offering and an amount of cash so that the total contribution will equal $5.0 million, based on the offering price of $10.00 per share.
Pursuant to the plan of conversion, we will offer shares of common stock for sale in the subscription offering to our eligible account holders and ourtax-qualified employee benefit plans, including our employee stock ownership plan and 401(k) plans. To the extent shares remain available for sale, we may offer common stock for sale in a community offering to members of the general public, with a preference given to natural persons residing in Dutchess, Putnam, Rockland and Westchester Counties in New York.
We have the right to accept or reject, in whole or in part, any orders to purchase shares of the common stock received in the community offering. The community offering may begin concurrently with, during or promptly after the subscription offering and must be completed within 45 days after the completion of the subscription offering unless otherwise extended by the NYSDFS. See “—Community Offering.”
We also may offer for sale shares of common stock not purchased in the subscription or community offerings through a syndicated offering or a firm commitment offering in which Sandler O’Neill & Partners, L.P. will be sole manager. See “—Syndicated Offering.”
We intend to retain between $58.6 million and $81.3 million of the net proceeds of the offering (or $94.4 million at the adjusted maximum of the offering range) and to invest between $72.9 million and $98.9 million of the net proceeds in PCSB Bank (or $113.9 million at the adjusted maximum of the offering range). The offering will be consummated only upon the issuance of at least the minimum number of shares of our common stock offered pursuant to the plan of conversion.
We determined the number of shares of common stock to be offered in the offering based upon an independent valuation of the estimated pro forma market value of PCSB Financial. All shares of common stock to be sold in the offering will be sold at $10.00 per share. Investors will not be charged a commission to purchase shares of common stock. The independent valuation will be updated and the final number of the shares of common stock to be issued in the offering will be determined at the completion of the offering. See “—Stock Pricing and Number of Shares to be Issued” for more information as to the determination of the estimated pro forma market value of the common stock.
121
Table of Contents
The following is a brief summary of the plan of conversion and is qualified in its entirety by reference to the provisions of the plan of conversion. The plan of conversion should be consulted for further information about the conversion and offering. A copy of the plan of conversion is available for inspection at each office of PCSB Bank. The plan of conversion is also filed as an exhibit to PCSB Bank’s conversion application, of which this prospectus is a part, copies of which may be obtained from the NYSDFS, and as an exhibit to PCSB Bank’s notice of intent to convert, of which this prospectus is a part, copies of which may be obtained from the Federal Deposit Insurance Corporation. The plan of conversion is also filed as an exhibit to the registration statement we have filed with the Securities and Exchange Commission, of which this prospectus is a part, copies of which may be obtained from the Securities and Exchange Commission or online at the Securities and Exchange Commission’s website,www.sec.gov. See “Where You Can Find Additional Information.” A copy of the plan of conversion is also included as an appendix to the proxy statement for PCSB Bank’s special meeting of depositors.
Reasons for the Conversion
Our primary reasons for converting and raising additional capital through the offering are to:
| • | Enhance our capital base to support continued growth on a prudent basis. We intend to continue to grow our franchise, both organically and through strategic transactions as opportunities arise, on a prudent basis. While we currently exceed all regulatory capital requirements, the offering proceeds will strengthen our capital position and support our planned growth. In addition, the offering proceeds will enhance our lending capacity by increasing our legal lending limits and we intend to increase our internal lending limits. We believe this increased capacity will improve our competitive position relative to the many larger banks operating in our market area. |
| • | Offer our depositors, employees and trustees an equity ownership interest in PCSB Bank.We believe that offering stock to our depositors will provide them with an economic interest in our future success should they decide to invest. The offering will also further enable us to attract and retain trustees, management and employees through various stock-based benefit plans, including an employee stock ownership plan and one or more equity incentive plans. |
| • | Support our local communities through establishing and funding a charitable foundation.The contribution to the charitable foundation will complement our existing charitable activities, and should enable the communities that we serve to share in our long-term growth. |
| • | Facilitate future mergers and acquisitions, if available, on a prudent basis. Although we do not currently have any understandings or agreements regarding any specific transactions, the additional capital raised in the offering may be used to finance mergers with, and acquisitions of, other financial institutions, asset portfolios and branch offices when and if attractive opportunities arise. |
Approvals Required
The affirmative vote of (i) 75% of the total amount of deposit liabilities of PCSB Bank, and (ii) a majority of the total votes eligible to be cast by the depositors of PCSB Bank, in each case represented in person or by proxy, are required to approve the plan of conversion. A special meeting of depositors to consider and vote upon the plan of conversion has been called for March 31, 2017. The plan of conversion also must be approved by the NYSDFS, which issued its conditional approval of the plan of conversion on February 10, 2017. The Federal Deposit Insurance Corporation must also issue its intent not to object to the plan of conversion. The Federal Deposit Insurance Corporation issued its intent not to object on February 10, 2017. Additionally, on February 10, 2017, the Federal Reserve Board conditionally approved our holding company application. We cannot consummate the conversion and offering without satisfying the conditions contained in these approvals andnon-objections.
122
Table of Contents
Effects of Conversion on Depositors and Borrowers
Continuity. While the conversion is being accomplished, our normal business of accepting deposits and making loans will continue without interruption. After the conversion, we will continue to offer existing services to depositors, borrowers and other customers. The trustees serving PCSB Bank at the time of the conversion will be the directors of PCSB Bank and of PCSB Financial after the conversion. The officers of PCSB Bank at the time of the conversion will retain their positions after the conversion.
Effect on Deposit Accounts. Pursuant to the plan of conversion, each depositor of PCSB Bank at the time of the conversion will automatically continue as a depositor after the conversion, and the deposit balance, interest rate and other terms of such deposit accounts will not change as a result of the conversion. Each such account will be insured by the Federal Deposit Insurance Corporation, without interruption, to the same extent as before the conversion. Depositors will continue to hold their existing certificates, passbooks and other evidences of their accounts.
Effect on Loans. No loan outstanding from PCSB Bank will be affected by the conversion, and the amount, interest rate, maturity and security for each loan will remain as it was contractually fixed before the conversion.
Effect on Voting Rights of Depositors. In its current mutual form, voting rights and control of PCSB Bank are vested exclusively in its board of trustees. Upon completion of the conversion, direction of PCSB Bank will be under the control of its board of directors and all voting rights in PCSB Bank will be vested in PCSB Financial as the sole stockholder of PCSB Bank. After the conversion, the stockholders of PCSB Financial will possess exclusive voting rights with respect to PCSB Financial common stock.
Tax Effects. We have received opinions of counsel and our tax advisors with regard to the federal and state income tax consequences of the conversion to the effect that the conversion will not be taxable for federal or state income tax purposes to PCSB Bank or its depositors. See “—Material Income Tax Consequences.”
Effect on Liquidation Rights. Each depositor of PCSB Bank has both a deposit account in PCSB Bank and a pro rata ownership interest in the net worth of PCSB Bank based upon the deposit balance in his or her account. This ownership interest is tied to the depositor’s account and has no tangible market value separate from the deposit account. This interest may only be realized upon a complete liquidation of PCSB Bank. Any depositor who opens a deposit account obtains a pro rata ownership interest in PCSB Bank without any additional payment beyond the amount of the deposit. A depositor who reduces or closes his or her account receives a portion or all, respectively, of the balance in the deposit account but nothing for his or her ownership interest in the net worth of PCSB Bank, which is lost to the extent that the balance in the account is reduced or closed. Consequently, depositors in a mutual savings bank normally have no way of realizing the value of their ownership interest, which has realizable value only in the unlikely event that the institution is completely liquidated. If this occurs, the depositors of record at that time, as owners, would share pro rata in any residual surplus and reserves of PCSB Bank after other claims, including claims of depositors to the amounts of their deposits, are paid.
In the unlikely event that PCSB Bank were to liquidate after the conversion, all claims of creditors, including those of depositors, also would be paid first, followed by distribution of a “liquidation account” to depositors at September 30, 2015 and December 31, 2016, who continue to maintain their deposit accounts at the date of liquidation, with any assets remaining thereafter distributed to PCSB Financial as the holder of PCSB Bank’s capital stock. See “—Liquidation Rights.”
Stock Pricing and Number of Shares to be Issued
The plan of conversion and applicable regulations require that the aggregate purchase price of the common stock sold in the offering must be based on the appraised pro forma market value of the common stock, as determined by an independent valuation. We have retained RP Financial to prepare an independent valuation. For its services in preparing the initial valuation, RP Financial will receive a fee of $110,000, as well as payment for
123
Table of Contents
reimbursable expenses and an additional $10,000 for each updated valuation prepared. We have paid RP Financial no other fees during the previous three years. We have agreed to indemnify RP Financial and its employees and affiliates against specified losses, including any losses in connection with claims under the federal securities laws, arising out of its services as independent appraiser, except where such liability results from RP Financial’s bad faith or negligence.
The independent valuation was prepared by RP Financial in reliance upon the information contained in this prospectus, including the consolidated financial statements of PCSB Bank. RP Financial also considered the following factors, among others:
| • | the present results and financial condition of PCSB Bank and the projected consolidated results and financial condition of PCSB Financial; |
| • | the economic and demographic conditions in PCSB Bank’s existing market area; |
| • | certain historical, financial and other information relating to PCSB Bank; |
| • | a comparative evaluation of the operating and financial characteristics of PCSB Bank with those of other publicly traded savings institutions; |
| • | the effect of the offering on our shareholders’ equity and earnings potential; |
| • | the proposed dividend policy of PCSB Financial; and |
| • | the trading market for securities of comparable institutions and general conditions in the market for such securities. |
The independent valuation is also based on an analysis of a peer group of publicly traded bank holding companies and savings and loan holding companies that RP Financial considered comparable to PCSB Financial under regulatory guidelines applicable to the independent valuation. Under these guidelines, a minimum of ten peer group companies are selected from the universe of all publicly-traded financial institutions with relatively comparable resources, strategies and financial and other operating characteristics. Such companies must also be traded on an exchange (such as Nasdaq or the New York Stock Exchange). The peer group companies selected for PCSB Financial also consisted of fully-converted stock institutions that were not subject to an actual or rumored acquisition and that had been in fully-converted form for at least one year. In addition, RP Financial limited the peer group companies to the following three selection criteria: (i) institutions located in theMid-Atlantic with assets between $650 million and $2 billion, tangibleequity-to-assets ratios of greater than 7.5%, positive core earnings, and core return on average equity ratios of less than 10.0%; (ii) institutions located in the Northeast with assets between $650 million and $2 billion, tangibleequity-to-assets ratios of greater than 7.5%, positive core earnings, and core return on average equity ratios of less than 10.0%; and (iii) institutions located in the Midwest with assets between $650 million and $2 billion, tangibleequity-to-assets ratios of greater than 7.5%, positive core earnings, and core return on average equity ratios of less than 10.0%.
The independent valuation considered the pro forma effect of the offering. Consistent with regulatory appraisal guidelines, the appraisal applied three primary methodologies: (i) the pro formaprice-to-book value approach applied to both reported book value and tangible book value; (ii) the pro formaprice-to-earnings approach applied to reported and core earnings; and (iii) the pro formaprice-to-assets approach. The market value ratios applied in the three methodologies were based on the current market valuations of the peer group companies. RP Financial placed the greatest emphasis on theprice-to-earnings andprice-to-book approaches in estimating pro forma market value. RP Financial did not consider a pro formaprice-to-assets approach to be as meaningful in preparing the appraisal, as this approach is more meaningful when a company has low equity or earnings. Theprice-to-assets approach is less meaningful for a company like us, as we have equity in excess of regulatory capital requirements and positive reported and core earnings.
124
Table of Contents
In applying each of the valuation methods, RP Financial considered adjustments to the pro forma market value based on a comparison of PCSB Financial with the peer group. RP Financial made slight upward adjustments for: (i) financial condition; and (ii) primary market area. RP Financial made a moderate downward adjustment for profitability growth and viability of earnings, and made no adjustments for: (i) dividends; (ii) liquidity of the shares; (iii) marketing of the issue; (iv) management; and (v) effect of government regulations and regulatory reform. The slight upward adjustment applied for financial condition was due to PCSB Financial’s more favorable balance sheet liquidity, more favorable funding composition and stronger pro forma capital position. The slight upward adjustment applied for primary market area took into consideration Westchester County’s relatively favorable demographic measures with respect to population growth and income levels compared to the peer group’s primary market area counties. The moderate downward adjustment applied for profitability, growth and viability of earnings took into consideration PCSB Financial’s less favorable efficiency ratio, higher implied credit risk exposure, and lower pro forma returns as a percent of assets and equity relative to the comparable peer group measures.
Included in RP Financial’s independent valuation were certain assumptions as to the pro forma earnings of PCSB Financial after the offering used in determining the appraised value. These assumptions included estimated expenses, an assumedafter-tax rate of return of 0.75% at September 30, 2016 on the net offering proceeds and purchases in the open market of common stock by the stock-based benefit plan at the $10.00 per share purchase price. See “Pro Forma Data” for additional information concerning assumptions included in the independent valuation and used in preparing pro forma data. The use of different assumptions may yield different results.
The independent valuation states that at November 11, 2016, as updated as of January 20, 2017, the estimated pro forma market value of PCSB Financial was $178.3 million (inclusive of the shares to be contributed to PCSB Charitable Foundation). Based on applicable regulations, this market value forms the midpoint of a range with a minimum of $151.6 million and a maximum of $205.1 million. The aggregate offering price of the shares will be equal to the valuation range multiplied by offering price of $10.00 per share. The number of shares offered will be equal to the aggregate offering price of the shares divided by the $10.00 price per share. Based on the valuation range and the $10.00 offering price per share, the minimum of the offering range is 14,875,000 shares, the midpoint of the offering range is 17,500,000 shares and the maximum of the offering range is 20,125,000 shares.
Following commencement of the subscription offering, the maximum of the valuation range may be increased by up to 15%, or up to $235.8 million, without resoliciting subscribers, which will result in a corresponding increase of up to 15% in the maximum of the offering range, to up to 23,143,750 shares, to reflect changes in the market and financial conditions or demand for the shares. We will not decrease the minimum of the valuation range and the minimum of the offering range without a resolicitation of subscribers. The offering price of $10.00 per share will remain fixed. See “—Additional Limitations on Common Stock Purchases” as to the method of distribution of additional shares to be issued upon an increase in the offering range to up to 23,143,750 shares.
The board of trustees of PCSB Bank reviewed the independent valuation and, in particular, considered the following:
| • | PCSB Bank’s financial condition and results of operations; |
| • | a comparison of financial performance ratios of PCSB Bank to those of other financial institutions of similar size; and |
| • | market conditions generally and in particular for financial institutions. |
All of these factors are set forth in the independent valuation. The board of trustees also reviewed the methodology and the assumptions used by RP Financial to prepare the independent valuation and believes that such assumptions were reasonable. The offering range may be amended with the approval of the NYSDFS and the Federal Deposit Insurance Corporation, if required, as a result of subsequent developments in the financial condition of PCSB Bank or market conditions generally. If the independent valuation is updated to amend the pro forma market value of PCSB Financial to less than $151.6 million or to more than $235.8 million, the appraisal will be filed with the Securities and Exchange Commission by a post-effective amendment to PCSB Financial’s registration statement.
125
Table of Contents
The following table presents a summary of selected pricing ratios for PCSB Financial (on a pro forma basis) at and for the12-months ended December 31, 2016, and for the peer group companies based on earnings and other information at and for the12-months ended September 30, 2016, with stock prices at January 20, 2017, as reflected in the appraisal report. Compared to the average pricing of the peer group, our pro forma pricing ratios at the midpoint of the offering range indicated a discount of 44.8% on aprice-to-book value basis, a discount of 45.6% on aprice-to-tangible book value basis and a premium of 306.5% on aprice-to-earnings basis. Our board of trustees, in reviewing and approving the appraisal, considered the range ofprice-to-earnings multiples and the range ofprice-to-book value andprice-to-tangible book value ratios at the different amounts of shares to be sold in the offering. The appraisal did not consider one valuation approach to be more important than the other. The estimated appraised value and the resulting premium/discount took into consideration the potential financial effect of the offering.
| Price-to-earnings multiple (1) | Price-to-book value ratio | Price-to-tangible book value ratio | ||||||||||
PCSB Financial (on a pro forma basis, assuming completion of the offering) (2) | ||||||||||||
Adjusted Maximum | 128.83 | X | 75.30 | % | 76.92 | % | ||||||
Maximum | 100.96 | X | 71.58 | % | 73.31 | % | ||||||
Midpoint | 80.85 | X | 67.75 | % | 69.54 | % | ||||||
Minimum | 63.68 | X | 63.21 | % | 65.02 | % | ||||||
Valuation of peer group companies, all of which are fully converted (on an historical basis) | ||||||||||||
Averages | 19.89 | X | 122.77 | % | 127.76 | % | ||||||
Medians | 21.34 | X | 121.20 | % | 124.13 | % | ||||||
| (1) | Price-to-earnings multiples calculated by RP Financial are based on an estimate of “core,” or recurring, earnings. These ratios are different than those presented in “Pro Forma Data.” |
| (2) | Pro forma pricing ratios for PCSB Financial are based on pro forma data at and for the12-months ended December 31, 2016, and are different than the pro forma pricing ratios presented in “Pro Forma Data.” |
The independent valuation is not intended, and must not be construed, as a recommendation of any kind as to the advisability of purchasing our shares of common stock. RP Financial did not independently verify our consolidated financial statements and other information that we provided to them, nor did RP Financial independently value our assets or liabilities. The independent valuation considers PCSB Bank as a going concern and should not be considered as an indication of the liquidation value of PCSB Bank. Moreover, because the valuation is necessarily based upon estimates and projections of a number of matters, all of which may change from time to time, no assurance can be given that persons purchasing our common stock in the offering will thereafter be able to sell their shares at prices at or above the $10.00 price per share.
If the update to the independent valuation at the conclusion of the offering results in an increase in the maximum of the valuation range to more than $235.8 million and a corresponding increase in the offering range to more than 23,143,750 shares, or a decrease in the minimum of the valuation range to less than $151.6 million and a corresponding decrease in the offering range to less than 14,875,000 shares, then we will promptly return with interest at 0.10% per annum all funds previously delivered to us to purchase shares of common stock in the subscription and community offerings and cancel deposit account withdrawal authorizations and, after consulting with the Federal Deposit Insurance Corporation and receiving the approval of the NYSDFS, we may terminate the plan of conversion. Alternatively, we may establish a new offering range, extend the offering period and commence a resolicitation of purchasers or take other actions as permitted by the NYSDFS and the Federal Deposit Insurance Corporation in order to complete the offering. If we extend the offering and conduct a resolicitation due to a change in the independent valuation, we will notify subscribers of the extension of time and of the rights of subscribers to place a new stock order for a specified period of time. Any single offering extension will not exceed 60 days and aggregate extensions may not conclude beyond February 10, 2019, which is two years after the date on which the NYSDFS approved the plan of conversion.
126
Table of Contents
An increase in the number of shares to be issued in the offering would decrease both a subscriber’s ownership interest and PCSB Financial’s pro forma earnings and shareholders’ equity on a per share basis while increasing shareholders’ equity on an aggregate basis. A decrease in the number of shares to be issued in the offering would increase both a subscriber’s ownership interest and PCSB Financial’s pro forma earnings and shareholders’ equity on a per share basis, while decreasing shareholders’ equity on an aggregate basis.
A copy of the independent valuation report of RP Financial, together with the detailed memorandum setting forth the method and assumptions used in the appraisal report, is filed as an exhibit to each of the documents specified under “Where You Can Find Additional Information.”
Subscription Offering and Subscription Rights
According to the plan of conversion, rights to subscribe for shares of common stock in the subscription offering have been granted in the following descending order of priority. The filling of all subscriptions that we receive will depend on the availability of common stock after satisfaction of all subscriptions of all persons having prior rights in the subscription offering and on the purchase and ownership limitations set forth in the plan of conversion and as described below under “—Additional Limitations on Common Stock Purchases.”
Priority 1: Eligible Account Holders. Each depositor of PCSB Bank with aggregate deposit account balances of $100.00 or more (a “Qualifying Deposit”) at the close of business on September 30, 2015 (an “Eligible Account Holder”) will receive, without payment, nontransferable subscription rights to purchase, subject to the overall purchase limitations, up to the greater of $200,000 (20,000 shares) of our common stock, 0.10% of the total number of shares of common stock issued in the offering, or 15 times the product of the number of subscription shares offered multiplied by a fraction of which the numerator is the aggregate Qualifying Deposit account balances of the Eligible Account Holder and the denominator is the aggregate Qualifying Deposit account balances of all Eligible Account Holders (approximately $1.032 billion at September 30, 2015). See “—Additional Limitations on Common Stock Purchases.” If there are not sufficient shares available to satisfy all subscriptions, shares will first be allocated so as to permit each Eligible Account Holder to purchase a number of shares sufficient to make his or her total allocation equal to the lesser of 100 shares or the number of shares for which he or she subscribed. Thereafter, any remaining unallocated shares will be allocated to each remaining Eligible Account Holder whose subscription remains unfilled in same the proportion that the amount of his or her Qualifying Deposit bears to the total amount of Qualifying Deposits of all subscribing Eligible Account Holders whose subscriptions remain unfilled. If an amount so allocated exceeds the amount subscribed for by any one or more Eligible Account Holders, the excess shall be reallocated among those Eligible Account Holders whose subscriptions are not fully satisfied until all available shares have been allocated.
To ensure proper allocation of our shares of common stock, each Eligible Account Holder must list on his or her stock order form all deposit accounts in which he or she has an ownership interest on September 30, 2015. If there is an oversubscription, failure to list an account could result in fewer shares being allocated than if all accounts had been disclosed. If there is an oversubscription, the subscription rights of Eligible Account Holders who are also trustees or officers of PCSB Bank or who are associates of such persons will be subordinated to the subscription rights of other Eligible Account Holders to the extent attributable to their increased deposits in the 12 months preceding September 30, 2015.
Priority 2:Tax-Qualified Plans. Ourtax-qualified employee plans, including PCSB Bank’s employee stock ownership plan and 401(k) plan, will receive, without payment, nontransferable subscription rights to purchase in the aggregate up to 10% of the shares of common stock sold in the offering and contributed to the charitable foundation, although our employee stock ownership plan intends to purchase 8% of the shares of common stock sold in the offering and contributed to the foundation. If market conditions warrant, in the judgment of its trustees, the employee stock ownership plan may instead elect to purchase shares in the open market following the completion of the offering, subject to the approval of the NYSDFS and the Federal Deposit Insurance Corporation. The amount of the subscription requests by the 401(k) plan will be determined by its participants, who will have the right to invest all or a portion of their 401(k) plan accounts in our common stock, subject to the maximum purchase limitations.
127
Table of Contents
Priority 3: Supplemental Eligible Account Holders. To the extent that there are sufficient shares of common stock remaining after satisfaction of subscriptions by Eligible Account Holders and bytax-qualified plans, each depositor of PCSB Bank (other than trustees and officers of PCSB Bank, and their associates) with a Qualifying Deposit at the close of business on December 31, 2016, who is not an Eligible Account Holder (a “Supplemental Eligible Account Holder”) will receive, without payment, nontransferable subscription rights to purchase, subject to the overall purchase limitations, up to the greater of $200,000 (20,000 shares) of our common stock, 0.10% of the total number of shares of common stock issued in the offering, or 15 times the product of the number of subscription shares offered multiplied by a fraction of which the numerator is the aggregate Qualifying Deposit account balances of the Supplemental Eligible Account Holder and the denominator is the aggregate Qualifying Deposit account balances of all Supplemental Eligible Account Holders (approximately $1.108 billion at December 31, 2016). See “—Additional Limitations on Common Stock Purchases.” If there are not sufficient shares available to satisfy all subscriptions, shares will first be allocated so as to permit each Supplemental Eligible Account Holder to purchase a number of shares sufficient to make his or her total allocation equal to the lesser of 100 shares or the number of shares for which he or she subscribed. Thereafter, any remaining unallocated shares will be allocated to each remaining Supplemental Eligible Account Holder whose subscription remains unfilled in same the proportion that the amount of his or her Qualifying Deposit bears to the total amount of Qualifying Deposits of all subscribing Supplemental Eligible Account Holders whose subscriptions remain unfilled. If an amount so allocated exceeds the amount subscribed for by any one or more Supplemental Eligible Account Holders, the excess shall be reallocated among those Supplemental Eligible Account Holders whose subscriptions are not fully satisfied until all available shares have been allocated.
To ensure proper allocation of our shares of common stock, each Supplemental Eligible Account Holder must list on his or her stock order form all deposit accounts in which he or she has an ownership interest on December 31, 2016. If there is an oversubscription, failure to list an account could result in fewer shares being allocated than if all accounts had been disclosed.
Expiration Date. The subscription offering will expire at 5:00 p.m., Eastern Time, on March 14, 2017, unless extended by us for up to 45 days or such additional periods with the approval of the NYSDFS and, if necessary, the Federal Deposit Insurance Corporation. Subscription rights will expire whether or not each eligible depositor can be located. We may decide to extend the expiration date of the subscription offering for any reason, whether or not subscriptions have been received for shares at the minimum, midpoint, maximum or adjusted maximum of the offering range. Subscription rights which have not been exercised before the expiration date will become void.
We will not execute orders until at least the minimum number of shares of common stock has been sold in the offering. If at least 14,875,000 shares have not been sold in the offering by April 28, 2017 and the NYSDFS and the Federal Deposit Insurance Corporation, if necessary, have not consented to an extension, all funds delivered to us to purchase shares of common stock in the offering will be returned promptly, with interest at 0.10% per annum for funds received in the subscription and community offerings, and all deposit account withdrawal authorizations will be canceled. If an extension beyond April 28, 2017 is necessary and granted by the NYSDFS and, if necessary, by the Federal Deposit Insurance Corporation, we will resolicit purchasers in the offering as described under “—Procedure for Purchasing Shares in Subscription and Community Offerings—Expiration Date.”
Community Offering
To the extent that shares of common stock remain available for purchase after satisfaction of all subscriptions by Eligible Account Holders, by ourtax-qualified employee stock benefit plans and by Supplemental Eligible Account Holders, we will offer shares pursuant to the plan of conversion to members of the general public in a community offering. Shares will be offered in the community offering with the following preferences:
| (i) | Natural persons residing in Dutchess, Putnam, Rockland and Westchester Counties in New York; and |
| (ii) | Other members of the general public. |
128
Table of Contents
Subscribers in the community offering may purchase up to $200,000 (20,000 shares) of common stock, subject to the overall purchase limitations. See “—Additional Limitations on Common Stock Purchases.”The opportunity to purchase shares of common stock in the community offering category is subject to our right, in our sole discretion and reasonably consistent with achieving a reasonably wide distribution of the common stock, to accept or reject any such orders in whole or in part either at the time of receipt of an order or as soon as practicable following the expiration date of the offering.
If we do not have sufficient shares of common stock available to fill the orders of natural persons residing in Dutchess, Putnam, Rockland and Westchester Counties in New York, we will allocate the available shares among those persons in a manner that permits each of them, to the extent possible, to purchase the lesser of 100 shares or the number of shares subscribed for by such person. Thereafter, unallocated shares will be allocated among natural persons residing in that geographical area whose orders remain unsatisfied on an equal number of shares basis per order. In connection with the allocation process, orders received for shares of common stock in the community offering will first be filled up to a maximum of 2% of the shares sold in the offering, and thereafter any remaining shares will be allocated on an equal number of shares basis per order until all shares have been allocated.
The term “residing” or “resident” as used in this prospectus with respect to Dutchess, Putnam, Rockland and Westchester Counties in New York means any Person who occupies a dwelling within the local community, has a present intent to remain within the local community for a period of time, and manifests the genuineness of that intent by establishing an ongoing physical presence within the local community together with an indication that such presence within the local community is something other than merely transitory in nature. We may utilize deposit or loan records or other evidence provided to us to determine whether a person is a resident. In all cases, however, the determination shall be in our sole discretion.
Expiration Date.The community offering may begin concurrently with, during or promptly after the subscription offering, and is currently expected to terminate at the same time as the subscription offering, and must terminate no more than 45 days following the subscription offering, unless extended with the approval of the NYSDFS. We may decide to extend the community offering for any reason and are not required to give purchasers notice of any such extension unless such period extends beyond April 28, 2017, in which event we will resolicit purchasers.
Syndicated Offering and Firm Commitment Offering
If feasible, our board of directors may decide to offer for sale shares of common stock not subscribed for or purchased in the subscription and community offerings in a syndicated offering or a firm commitment offering, subject to such terms, conditions and procedures as we may determine, subject to any approvals required from the NYSDFS or the Federal Deposit Insurance Corporation, in a manner that will achieve a wide distribution of our shares of common stock.
If a syndicated offering or firm commitment offering is held, Sandler O’Neill & Partners, L.P. will serve as sole manager. If shares of common stock are sold in a syndicated offering or firm commitment offering, we will pay fees of 5.0% of the aggregate amount of common stock sold in the syndicated offering or firm commitment offering to Sandler O’Neill & Partners, L.P. and any other broker-dealers included in the syndicated offering or firm commitment offering. The shares of common stock will be sold at the same price per share ($10.00 per share) that the shares are sold in the subscription offering and the community offering.
If there is a syndicated offering, it is currently expected that investors would follow the same general procedures applicable to purchasing shares in the subscription and community offerings (the use of order forms and the submission of funds directly to PCSB Financial for the payment of the purchase price of the shares ordered) except that payment must be in immediately available funds (bank checks, money orders, deposit account withdrawals from accounts at PCSB Bank or wire transfers). See “—Procedure for Purchasing Shares in Subscription and Community Offerings.” “Sweep” arrangements and delivery versus payment settlement will only be used in a syndicated offering to the extent consistent with Rules10b-9 and15c2-4 under the Securities Exchange Act of 1934 and then-existing guidance and interpretations thereof of the Securities and Exchange Commission regarding the conduct of “min/max” offerings.
129
Table of Contents
If there is a firm commitment offering, the proposed underwriting agreement will not be entered into with Sandler O’Neill & Partners, L.P. and any other underwriters named in the underwriting agreement and PCSB Financial until immediately before the completion of the firm commitment offering. At that time, Sandler O’Neill & Partners, L.P. and any other underwriters included in the firm commitment offering will represent that they have received sufficient indications of interest to complete the firm commitment offering. Pursuant to the terms of the underwriting agreement, and subject to certain customary provisions and conditions to closing, upon execution of the underwriting agreement, Sandler O’Neill & Partners, L.P. and any other underwriters named in the underwriting agreement will be obligated to purchase all the shares subject to the firm commitment offering.
If for any reason we cannot undertake a syndicated offering or firm commitment offering of shares of common stock not purchased in the subscription and community offerings, or if there are an insignificant number of shares remaining unsold after such offerings, we will try to make other arrangements for the sale of unsubscribed shares. The Federal Deposit Insurance Corporation, the NYSDFS and the Financial Industry Regulatory Authority must approve any such arrangements.
Additional Limitations on Common Stock Purchases
The plan of conversion includes the following additional limitations on the number of shares of common stock that may be purchased in the offering:
| • | No individual, or group of individuals exercising subscription rights through a single qualifying deposit account held jointly, may purchase more than $200,000 (20,000 shares) in the offering; |
| • | Except for the employee stock ownership plan and the 401(k) plan, as described above, no person or entity, together with associates or persons acting in concert with such person or entity, may purchase more than $300,000 (30,000 shares) of common stock in all categories of the offering combined; |
| • | Tax qualified employee benefit plans, including our employee stock ownership plan and 401(k) plan, may purchase in the aggregate up to 10% of the shares of common stock sold in the offering and contributed to the charitable foundation, including shares issued upon an increase in the offering range of up to 15%; |
| • | No person may purchase fewer than 25 shares of common stock, to the extent those shares are available for purchase; and |
| • | The aggregate number of shares of common stock that may be purchased in all categories of the offering by officers, directors and trustees of PCSB Financial and PCSB Bank and their associates may not exceed 25% of the total shares sold in the offering. |
Depending upon market or financial conditions, our board of directors, with regulatory approval and without further approval of the depositors of PCSB Bank, may decrease or increase the purchase limitations. If a purchase limitation is increased, subscribers in the subscription offering who ordered the maximum amount will be given the opportunity to increase their orders up to the then applicable limit. The effect of this type of resolicitation will be an increase in the number of shares of common stock owned by persons who choose to increase their orders.
If there is an increase in the offering range to up to 23,143,750 shares of common stock, shares will be allocated in the following order of priority according to the plan of conversion:
| (i) | if there is an oversubscription at the Eligible Account Holder level, to fill unfilled subscriptions of these subscribers according to their respective priorities; |
130
Table of Contents
| (ii) | to fill the subscriptions of ourtax-qualified employee benefit plans, specifically our employee stock ownership plan and our 401(k) plan, for up to 10% of the total number of shares of common stock sold in the offering and contributed to the charitable foundation; |
| (iii) | if there is an oversubscription at the Supplemental Eligible Account Holder level, to fill unfilled subscriptions of these subscribers according to their respective priorities; and |
| (iv) | to fill unfilled subscriptions in the community offering, with preference given first to natural persons residing in Dutchess, Putnam, Rockland and Westchester Counties in New York, and then to members of the general public. |
The term “associate” of a person means:
| (i) | any corporation or organization (other than PCSB Bank, PCSB Financial or a majority-owned subsidiary of any of those entities) of which the person is a senior officer, partner or, directly or indirectly, 10% beneficial shareholder; |
| (ii) | any trust or other estate in which the person has a substantial beneficial interest or serves as a trustee or in a similar fiduciary capacity; and |
| (iii) | any relative or spouse of such person, or any relative of such spouse, who either has the same home as the person or who is a director, trustee or officer of PCSB Bank or PCSB Financial. |
The term “acting in concert” means persons seeking to combine or pool their voting or other interests in the securities of an issuer for a common purpose, pursuant to any contract, understanding, relationship, agreement or other arrangement, whether written or otherwise. When persons act together for such purpose, their group is deemed to have acquired their stock. The determination of whether a group is acting in concert shall be made solely by us and may be based on any evidence upon which we choose to rely, including, without limitation, joint account relationships or the fact that such persons have filed joint Schedules 13D with the Securities and Exchange Commission with respect to other companies; provided, however, that the determination of whether a group is acting in concert remains subject to review by the NYSDFS. Persons with the same address, whether or not related, and persons exercising subscription rights through qualifying deposit accounts registered to the same address will be deemed to be acting in concert unless we determine otherwise. Our directors and trustees are not treated as associates of each other solely because of their membership on the boards of directors or trustees.
Common stock purchased in the offering will be freely transferable except for shares purchased by directors and certain officers of PCSB Financial or PCSB Bank and except as described below. Any purchases made by any associate of PCSB Financial or PCSB Bank for the explicit purpose of meeting the minimum number of shares of common stock required to be sold in order to complete the offering shall be made for investment purposes only and not with a view toward redistribution. In addition, under Financial Industry Regulatory Authority guidelines, members of the Financial Industry Regulatory Authority and their associates are subject to certain restrictions on transfer of securities purchased according to subscription rights and to certain reporting requirements upon purchase of these securities. For a further discussion of limitations on purchases of our shares of common stock at the time of offering and thereafter, see “—Certain Restrictions on Purchase or Transfer of Our Shares After the Offering” and “Restrictions on Acquisition of PCSB Financial Corporation.”
131
Table of Contents
Plan of Distribution; Selling Agent and Underwriting Compensation
Subscription and Community Offerings. To assist in the marketing of our shares of common stock in the subscription and community offerings, we have retained Sandler O’Neill & Partners, L.P., which is a broker-dealer registered with the Financial Industry Regulatory Authority. Sandler O’Neill & Partners, L.P. will assist us on a best efforts basis in the subscription and community offerings by:
| • | consulting as to the marketing implications of the plan of conversion; |
| • | reviewing with the boards the financial impact of the offering on us, based upon the independent appraiser’s appraisal of the common stock; |
| • | reviewing all offering documents, including the prospectus, stock order forms and related marketing materials; |
| • | assisting us in the design and implementation of a marketing strategy for the offering; |
| • | assisting our management in scheduling and preparing for meetings with potential investors and/or other broker-dealers in connection with the offering; and |
| • | providing such other general advice and assistance as may be requested to promote the successful completion of the offering. |
For these services, Sandler O’Neill & Partners, L.P. will receive a fee of 0.90% of the aggregate dollar amount of all shares of common stock sold in the subscription and community offerings. No fee will be payable to Sandler O’Neill & Partners, L.P. with respect to shares purchased by directors, trustees, officers, employees or their immediate families and their personal trusts, shares purchased by our employee benefit plans or trusts established for the benefit of our directors, officers and employees, and shares issued to the charitable foundation.
Syndicated Offering or Firm Commitment Offering.If shares of common stock are sold in a syndicated offering or firm commitment offering, we will pay fees of 5.0% of the aggregate dollar amount of common stock sold in the syndicated offering or firm commitment offering to Sandler O’Neill & Partners, L.P. and any other broker-dealers included in the syndicated offering or firm commitment offering.
Expenses.Sandler O’Neill & Partners, L.P. also will be reimbursed for reasonableout-of-pocket accountable expenses, including legal fees, in an amount not to exceed $110,000 (or up to $125,000 if there is a syndicated offering or a firm commitment offering). Sandler O’Neill & Partners, L.P. will reimburse any amounts paid or advanced by us in excess of their actual reasonableout-of-pocket accountable expenses. If the plan of conversion is terminated or if Sandler O’Neill & Partners, L.P.’s engagement is terminated according to the provisions of the agency agreement, Sandler O’Neill & Partners, L.P. will only receive reimbursement of its reasonableout-of-pocket expenses. We have separately agreed to pay Sandler O’Neill & Partners, L.P. up to $55,000 in fees and expenses for serving as records agent, as described below.
Records Management
We have also engaged Sandler O’Neill & Partners, L.P. as records agent in connection with the subscription and community offerings. In its role as records agent, Sandler O’Neill & Partners, L.P., will assist us in the offering by:
| • | consolidating deposit accounts and depositor vote calculation; |
| • | assisting in designing and preparing stock order forms and depositor proxy forms; |
132
Table of Contents
| • | organizing and supervising our Stock Information Center; |
| • | coordinating proxy solicitation and vote tabulation; and |
| • | providing subscription services. |
Sandler O’Neill & Partners, L.P. will receive fees of $30,000 for these services, all of which will be due and payable upon the mailing of the proxy solicitation and stock offering materials to depositors. Sandler O’Neill & Partners, L.P. also will be reimbursed for reasonableout-of-pocket accountable expenses in an amount not to exceed $25,000 (plus an additional $20,000 if there is a material delay in the offering). Sandler O’Neill & Partners, L.P. will reimburse any amounts paid or advanced by us in excess of their actual reasonableout-of-pocket accountable expenses.
Indemnity
We will indemnify Sandler O’Neill & Partners, L.P. against liabilities and expenses, including legal fees, incurred in connection with certain claims or litigation arising out of or based upon untrue statements or omissions contained in the offering materials for the common stock, including liabilities under the Securities Act of 1933, as well as certain other claims and litigation arising out of Sandler O’Neill & Partners, L.P.’s engagement with respect to the offering.
Solicitation of Offers by Officers and Directors
Some of our directors and executive officers may participate in the solicitation of offers to purchase common stock in the subscription and community offerings. These persons will be reimbursed for their reasonableout-of-pocket expenses incurred in connection with the solicitation, whichout-of-pocket expenses, if any, are expected to be insignificant. Other regular employees of PCSB Bank may assist in the offering, but only in ministerial capacities, and may provide clerical work in effecting a sales transaction. No offers or sales may be made by tellers or at the teller counters. Investment-related questions of prospective purchasers will be directed to executive officers or registered representatives of Sandler O’Neill & Partners, L.P. Our other employees have been instructed not to solicit offers to purchase shares of common stock or provide advice regarding the purchase of common stock. We will rely on Rule3a4-1 under the Securities Exchange Act of 1934, and sales of common stock will be conducted within the requirements of Rule3a4-1, so as to permit officers, directors and employees to participate in the sale of common stock. None of our officers, directors or employees will be compensated in connection with their participation in the offering.
Procedure for Purchasing Shares in Subscription and Community Offerings
Expiration Date. The subscription and community offerings will expire at 5:00 p.m., Eastern Time, on March 14, 2017, unless we extend one or both for up to 45 days, with the approval of the NYSDFS. This extension may be approved by us, in our sole discretion, without notice to purchasers in the offering. Any extension of the subscription and/or community offering beyond April 28, 2017 would require the NYSDFS’s approval. If the offering is so extended, all subscribers will be notified and given an opportunity to confirm, change or cancel their orders. If you do not respond to this notice, we will promptly return your funds with interest at 0.10% per annum or cancel your deposit account withdrawal authorization. If the offering range is decreased below the minimum of the offering range or is increased above the adjusted maximum of the offering range, all subscribers’ stock orders will be cancelled, their deposit account withdrawal authorizations will be cancelled, and funds submitted to us will be returned promptly, with interest at 0.10% per annum for funds received in the subscription and community offerings. We will then resolicit the subscribers, giving them an opportunity to place a new stock order for a period of time.
We reserve the right in our sole discretion to terminate the offering at any time and for any reason (subject to any required regulatory approvals), in which case we will cancel any deposit account withdrawal authorizations and promptly return all funds submitted, with interest at 0.10% per annum from the date of receipt as described above.
133
Table of Contents
Use of Order Forms in the Subscription and Community Offerings. In order to purchase shares of common stock in the subscription and community offerings, you must properly complete an original stock order form and remit full payment. We are not required to accept orders submitted on photocopied or facsimiled order forms. All order forms must be received (not postmarked) before 5:00 p.m., Eastern Time, on March 14, 2017. We are not required to accept order forms that are not received by that time, are not signed or are otherwise executed defectively or are received without full payment or without appropriate deposit account withdrawal instructions. We are not required to notify subscribers of incomplete or improperly executed order forms, and we have the right to waive or permit the correction of incomplete or improperly executed order forms. We do not represent, however, that we will do so and we have no affirmative duty to notify any prospective subscriber of any such defects. You may submit your order form and payment by mail using the stock order return envelope provided, or by overnight delivery to our Stock Information Center, which will be located at our administrative office, 2651 Strang Blvd., Suite 100, Yorktown Heights, New York 10598. You may also hand-deliver stock order forms to the Stock Information Center. Hand-delivered stock order forms will only be accepted at this location. We will not accept stock order forms at our other banking offices. Please do not mail stock order forms to PCSB Bank’s other offices.
Once tendered, an order form cannot be modified or revoked without our consent. We reserve the absolute right, in our sole discretion and reasonably consistent with achieving a reasonably wide distribution of the common stock, to reject orders received in the community offering, in whole or in part, at the time of receipt or at any time before completion of the offering. If you are ordering shares in the subscription offering, you must represent that you are purchasing shares for your own account and that you have no agreement or understanding with any person for the sale or transfer of the shares. We have the right to reject any order submitted in the offering by a person who we believe is making false representations or who we otherwise believe, either alone or acting in concert with others, is violating, evading, circumventing, or intends to violate, evade or circumvent the terms and conditions of the plan of conversion. Our interpretation of the terms and conditions of the plan of conversion and of the acceptability of the order forms will be final.
By signing the order form, you will be acknowledging that the common stock is not a deposit or savings account and is not federally insured or otherwise guaranteed by PCSB Bank, the Federal Deposit Insurance Corporation or any other government agency, and that you received a copy of this prospectus. However, signing the order form will not result in you waiving your rights under the Securities Act of 1933 or the Securities Exchange Act of 1934.
Payment for Shares. Payment for all shares of common stock must accompany all completed order forms for the purchase to be valid. Payment for shares in the subscription and community offerings may be made by:
| (i) | personal check, bank check or money order, made payable to PCSB Financial Corporation; or |
| (ii) | authorization of withdrawal of available funds from your PCSB Bank deposit accounts. |
Appropriate means for designating withdrawals from deposit accounts at PCSB Bank are provided on the order form. The funds designated must be available in the account(s) at the time the order form is received. A hold will be placed on these funds, making them unavailable to the depositor. Funds authorized for withdrawal will continue to earn interest within the account at the contractual rate until the offering is completed, at which time the designated withdrawal will be made. Interest penalties for early withdrawal applicable to certificate accounts will not apply to withdrawals authorized for the purchase of shares of common stock; however, if a withdrawal results in a certificate account with a balance less than the applicable minimum balance requirement, the certificate will be canceled at the time of withdrawal without penalty and the remaining balance will earn interest at the current passbook rate after the withdrawal. In the case of payments made by personal check, these funds must be available in the account(s). Checks and money orders received in the subscription and community offerings will be immediately cashed and placed in a segregated account at PCSB Bank and will earn interest at 0.10% per annum from the date payment is processed until the offering is completed or terminated.
You may not remit cash, PCSB Bank line of credit checks or any type of third-party checks (including those payable to you and endorsed over to PCSB Financial). You may not designate on your stock order form direct
134
Table of Contents
withdrawal from a retirement account held at PCSB Bank. See “—Using Individual Retirement Account Funds.” If permitted by the NYSDFS, if we resolicit large purchasers, as described above in “—Additional Limitations on Common Stock Purchases,” such purchasers who wish to increase their purchases will not be able to use personal checks to pay for the additional shares, but instead must pay for the additional shares using immediately available funds. We may accept wire transfers at our sole discretion.
Once we receive your executed stock order form, it may not be modified, amended or rescinded without our consent, unless the offering is not completed by April 28, 2017. If the subscription and community offerings are extended past April 28, 2017, all subscribers will be notified and given an opportunity to confirm, change or cancel their orders. If you do not respond to this notice, we will promptly return your funds with interest at 0.10% per annum or cancel your deposit account withdrawal authorization. We may resolicit purchasers for a specified period of time.
NYSDFS regulations prohibit PCSB Bank from lending funds or extending credit to any persons to purchase shares of common stock in the offering.
We shall have the right, in our sole discretion, to permit institutional investors to submit irrevocable orders together with the legally binding commitment for payment and to thereafter pay for the shares of common stock for which they subscribe in the community offering at any time before 48 hours before the completion of the offering. This payment may be made by wire transfer.
If our employee stock ownership plan purchases shares in the offering, it will not be required to pay for such shares until completion of the offering, provided that there is a loan commitment from an unrelated financial institution or PCSB Financial to lend to the employee stock ownership plan the necessary amount to fund the purchase. In addition, if our 401(k) plan purchases shares in the offering, it will not be required to pay for such shares until completion of the offering.
Using Individual Retirement Account Funds. If you are interested in using funds in your individual retirement account or other retirement account to purchase shares of common stock, you must do so through a self-directed retirement account. By regulation, PCSB Bank’s retirement accounts are not self-directed, so they cannot be invested in our shares of common stock. Therefore, if you wish to use funds that are currently in a retirement account held at PCSB Bank, you may not designate on the order form that you wish funds to be withdrawn from the account for the purchase of common stock. The funds you wish to use for the purchase of common stock will instead have to be transferred to an independent trustee or custodian, such as a brokerage firm, offering self-directed retirement accounts. The purchase must be made through that account. If you do not have such an account, you will need to establish one before placing a stock order. Aone-time and/or annual administrative fee may be payable to the independent trustee or custodian. There will be no early withdrawal or Internal Revenue Service interest penalties for these transfers. Individuals interested in using funds in an individual retirement account or any other retirement account, whether held at PCSB Bank or elsewhere, to purchase shares of common stock should contact our Stock Information Center for guidance as soon as possible, preferably at least two weeks before the March 14, 2017 offering deadline. Processing such transactions takes additional time, and whether such funds can be used may depend on limitations imposed by the institutions where such funds are currently held. We cannot guarantee that you will be able to use such funds.
Delivery of Shares of Common Stock. All shares of common stock sold will be issued in book entry form. Stock certificates will not be issued. A statement reflecting ownership of shares of common stock issued in the subscription and community offerings will be mailed by our transfer agent to the persons entitled thereto at the registration address noted by them on their stock order forms as soon as practicable following consummation of the offering. We expect trading in the stock to begin on the day of completion of the offering or the next business day.Until a statement reflecting ownership of shares of common stock is available and delivered to purchasers, purchasers might not be able to sell the shares of common stock that they ordered, even though the shares of common stock will have begun trading.Your ability to sell the shares of common stock before receiving your statement will depend on arrangements you may make with a brokerage firm.
135
Table of Contents
Other Restrictions. Notwithstanding any other provision of the plan of conversion, no person is entitled to purchase any shares of common stock to the extent the purchase would be illegal under any federal or state law or regulation, including state “blue sky” regulations, or would violate regulations or policies of the Financial Industry Regulatory Authority, particularly those regarding free riding and withholding. We may ask for an acceptable legal opinion from any purchaser as to the legality of his or her purchase and we may refuse to honor any purchase order if an opinion is not timely furnished. In addition, we are not required to offer shares of common stock to any person who resides in a foreign country, or in a State of the United States with respect to which any of the following apply:
| (i) | a small number of persons otherwise eligible to subscribe for shares under the plan of conversion reside in such state; |
| (ii) | the offer or sale of shares of common stock to such persons would require us or our employees to register, under the securities laws of such state, as a broker or dealer or to register or otherwise qualify our securities for sale in such state; or |
| (iii) | such registration or qualification would be impracticable for reasons of cost or otherwise. |
Restrictions on Transfer of Subscription Rights and Shares
Applicable banking regulations prohibit any person with subscription rights, including the Eligible Account Holders and Supplemental Eligible Account Holders, from transferring or entering into any agreement or understanding to transfer the legal or beneficial ownership of the subscription rights issued under the plan of conversion or the shares of common stock to be issued upon their exercise. These rights may be exercised only by the person to whom they are granted and only for his or her account. When registering your stock purchase on the order form, you cannot add the name(s) of others for joint stock registration unless they are also named on the qualifying deposit account, and you cannot delete names of others except for certain orders placed through an IRA, Keogh, 401(k) or similar plan and for the death of the named eligible depositor. Doing so may jeopardize your subscription rights. Each person exercising subscription rights will be required to certify that he or she is purchasing shares solely for his or her own account and that he or she has no agreement or understanding regarding the sale or transfer of such shares. The regulations also prohibit any person from offering or making an announcement of an offer or intent to make an offer to purchase subscription rights or shares of common stock to be issued upon their exercise before completion of the offering.
We will pursue any and all legal and equitable remedies if we become aware of the transfer of subscription rights, and we will not honor orders that we believe involve the transfer of subscription rights.
Stock Information Center
Our banking office personnel may not, by law, assist with investment-related questions about the offering. If you have any questions regarding the offering, please call our Stock Information Center. The telephone number is (914) 248-4444. The Stock Information Center is open Monday through Friday between 10:00 a.m. and 4:00 p.m., Eastern Time. The Stock Information Center will be closed on weekends and bank holidays.
Liquidation Rights
In the unlikely event of a complete liquidation of PCSB Bank before the conversion, all claims of creditors of PCSB Bank, including those of its depositors (to the extent of their deposit balances), would be paid first, with any remaining assets distributed to PCSB Bank’s depositors. In the unlikely event that PCSB Bank were to liquidate after the conversion, all claims of creditors, including those of depositors, would be paid first, followed by distribution of the “liquidation account” to certain depositors, with any assets remaining thereafter distributed to PCSB Financial as the sole holder of PCSB Bank capital stock.
136
Table of Contents
The plan of conversion provides for the establishment, upon the completion of the conversion, of a special “liquidation account” for the benefit of Eligible Account Holders and Supplemental Eligible Account Holders in an amount equal to the total equity of PCSB Bank at the date of its latest balance sheet contained in this prospectus. The purpose of the liquidation account is to provide Eligible Account Holders and Supplemental Eligible Account Holders who maintain their deposit accounts with PCSB Bank after the conversion with a liquidation interest in the unlikely event of the complete liquidation of PCSB Bank after the conversion. Each Eligible Account Holder and Supplemental Eligible Account Holder that continues to maintain his or her deposit account at PCSB Bank would be entitled, on a complete liquidation of PCSB Bank after the conversion, to an interest in the liquidation account before any payment to the stockholders of PCSB Financial. Each Eligible Account Holder would have an initial interest in the liquidation account for each deposit account, including savings accounts, transaction accounts such as negotiable order of withdrawal accounts, money market deposit accounts, and certificates of deposit, with a balance of $100 or more held in PCSB Bank on September 30, 2015. Each Eligible Account Holder would have a pro rata interest in the total liquidation account for each such deposit account, based on the proportion that the balance of each such deposit account on September 30, 2015 bears to the balance of all such deposit accounts in PCSB Bank on such date. Each Supplemental Eligible Account Holder would have an initial interest in the liquidation account for each deposit account, including savings accounts, transaction accounts such as negotiable order of withdrawal accounts, money market deposit accounts, and certificates of deposit, with a balance of $100 or more held in PCSB Bank on December 31, 2016. Each Supplemental Eligible Account Holder would have a pro rata interest in the total liquidation account for each such deposit account, based on the proportion that the balance of each such deposit account on December 31, 2016 bears to the balance of all such deposit accounts in PCSB Bank on such date.
If, however, on any June 30 annual closing date commencing on or after the effective date of the conversion, the amount in any such deposit account is less than the amount in the deposit account on September 30, 2015 or December 31, 2016, respectively, or any other annual closing date, then the interest in the liquidation account relating to such deposit account would be reduced from time to time by the proportion of any such reduction, and such interest will cease to exist if such deposit account is closed. In addition, no interest in the liquidation account would ever be increased despite any subsequent increase in the related deposit account. Payment pursuant to liquidation rights of Eligible Account Holders and Supplemental Eligible Account Holders would be separate and apart from the payment of any insured deposit accounts to such depositor. Any assets remaining after the above liquidation rights of Eligible Account Holders and Supplemental Eligible Account Holders are satisfied would be distributed to PCSB Financial, as the sole stockholder of PCSB Bank.
Material Income Tax Consequences
Consummation of the conversion is subject to the prior receipt of an opinion of counsel or tax advisor with respect to federal and state income taxation that the conversion will not be a taxable transaction to PCSB Bank, PCSB Financial, Eligible Account Holders and Supplemental Eligible Account Holders. Unlike private letter rulings, opinions of counsel or tax advisors are not binding on the Internal Revenue Service or any state taxing authority, and such authorities may disagree with such opinions. If there is such disagreement, there can be no assurance that PCSB Bank or PCSB Financial would prevail in a judicial proceeding.
PCSB Financial and PCSB bank have received an opinion of counsel, Luse Gorman, PC, regarding all of the material federal income tax consequences of the conversion, which includes the following:
| 1. | The conversion of PCSB Bank to a New York-chartered stock savings bank will qualify as atax-free reorganization within the meaning of Section 368(a)(1)(F) of the Internal Revenue Code. |
| 2. | PCSB Bank will not recognize any gain or loss upon the receipt of money from PCSB Financial in exchange for shares of common stock of PCSB Bank. |
| 3. | The basis and holding period of the assets received by PCSB Bank, in stock form, from PCSB Bank, in mutual form, will be the same as the basis and holding period in such assets immediately before the conversion. |
137
Table of Contents
| 4. | No gain or loss will be recognized by account holders of PCSB Bank, including Eligible Account Holders and Supplemental Eligible Account Holders, upon the issuance to them of withdrawable deposit accounts in PCSB Bank, in stock form, in the same dollar amount and under the same terms as held at PCSB Bank, in mutual form. In addition, Eligible Account Holders and Supplemental Eligible Account Holders will not recognize gain or loss upon receipt of an interest in a liquidation account in PCSB Bank in exchange for their ownership interests in PCSB Bank. |
| 5. | The basis of the account holders’ deposit accounts in PCSB Bank, in stock form, will be the same as the basis of their deposit accounts in PCSB Bank, in mutual form. The basis of the Eligible Account Holders and, Supplemental Eligible Account Holders interests in the liquidation account will be zero, which is the cost of such interest to such persons. |
| 6. | It is more likely than not that the nontransferable subscription rights have no value, based on the fact that these rights are acquired by the recipients without cost, are nontransferable and of short duration, and afford the recipients the right only to purchase the common stock at a price equal to its estimated fair market value, which will be the same price as the subscription price for the shares of common stock in the offering. Accordingly, no gain or loss will be recognized by Eligible Account Holders or Supplemental Eligible Account Holders upon distribution to them of nontransferable subscription rights to purchase shares of PCSB Financial common stock, provided that the amount to be paid for PCSB Financial common stock is equal to the fair market value of PCSB Financial common stock. |
| 7. | The basis of the shares of PCSB Financial common stock purchased in the offering will be the purchase price. The holding period of the PCSB Financial common stock purchased pursuant to the exercise of nontransferable subscription rights will commence on the date on which the right to acquire such stock was exercised. |
| 8. | No gain or loss will be recognized by PCSB Financial on the receipt of money in exchange for shares of PCSB Financial common stock sold in the offering. |
In the view of RP Financial (which is acting as independent appraiser of the value of the shares of PCSB Financial common stock in connection with the conversion), the subscription rights do not have any value for the reasons set forth in paragraph 6 above. RP Financial’s view is not binding on the Internal Revenue Service. If the subscription rights granted to Eligible Account Holders and Supplemental Eligible Account Holders are deemed to have an ascertainable value, receipt of these rights could result in taxable gain to those Eligible Account Holders and Supplemental Eligible Account Holders who exercise the subscription rights in an amount equal to their value, and PCSB Financial could recognize gain on a distribution. Eligible Account Holders and Supplemental Eligible Account Holders are encouraged to consult with their own tax advisors as to the tax consequences if such subscription rights are deemed to have an ascertainable value.
The opinion of Luse Gorman, PC, unlike a letter ruling issued by the Internal Revenue Service, is not binding on the Internal Revenue Service and the conclusions expressed therein may be challenged at a future date. The Internal Revenue Service has issued favorable rulings for transactions substantially similar to the proposed conversion and offering, but any such ruling may not be cited as precedent by any taxpayer other than the taxpayer to whom the ruling is addressed. We do not plan to apply for a letter ruling concerning the transactions described herein.
An opinion regarding the New York State income tax consequences consistent with the federal tax opinion has been issued by Crowe Horwath LLP.
The federal and state tax opinions have been filed with the Securities and Exchange Commission as exhibits to PCSB Financial’s registration statement.
138
Table of Contents
Certain Restrictions on Purchase or Transfer of Our Shares After the Offering
All shares of common stock purchased in the offering by a director, trustee, or certain officers of PCSB Financial or PCSB Bank, as well as their associates, generally may not be sold for a period of one year following the closing of the offering, except upon death or judicial declaration of incompetency of the individual. Each statement of ownership for restricted shares will bear a legend giving notice of this restriction on transfer, and instructions will be issued to PCSB Financial’s transfer agent to the effect that any transfer within this time period of any record ownership of the shares other than as provided above is a violation of the restriction. Any shares of common stock issued at a later date as a stock dividend, stock split, or otherwise, with respect to the restricted stock will be similarly restricted. The directors and executive officers of PCSB Financial also will be restricted by the insider trading rules under the Securities Exchange Act of 1934.
Purchases of shares of our common stock by any of our directors, trustees, certain officers and their associates, during the three-year period following the closing of the offering may be made only through a broker or dealer registered with the Securities and Exchange Commission, except with the prior written approval of the NYSDFS. This restriction does not apply, however, to purchases of our common stock by our stock option plan or any of ourtax-qualified employee stock benefit plans ornon-tax-qualified employee stock benefit plans, including any restricted stock plans.
NYSDFS regulations prohibit PCSB Financial from repurchasing its shares of common stock during the first year following the offering and from repurchasing more than 5% of its outstanding shares of common stock in each of the second and third years following the offering, unless, in each case, PCSB Financial receives the prior approval of the NYSDFS. In addition, the repurchase of shares of common stock is subject to Federal Reserve Board policy related to repurchases of shares by bank holding companies.
General
In furtherance of our commitment to the communities in our market area, the plan of conversion provides that we will establish a new charitable foundation, PCSB Community Foundation, as anon-stock, nonprofit Delaware corporation in connection with the conversion and offering. The charitable foundation will be funded with cash and shares of our common stock, as further described below. By further enhancing our visibility and reputation in the communities within our market area, we believe that the charitable foundation will enhance the long-term value of PCSB Bank’s community banking franchise. The conversion and offering presents us with a unique opportunity to provide a substantial and continuing benefit to our community through the charitable foundation.
Purpose of the Charitable Foundation
In connection with the closing of the conversion and offering, PCSB Bank intends to contribute to the charitable foundation shares of its common stock equal to 2.1% of the shares sold in the offering and an amount of cash so that the total contribution will equal $5.0 million. At the minimum, midpoint, maximum and adjusted maximum of the offering range, we would contribute to the charitable foundation 282,625, 332,500, 382,375 and 439,731 shares of common stock and approximately $2.2 million, $1.7 million, $1.2 million and $603,000 in cash, respectively.
The purpose of the charitable foundation is to provide financial support to charitable organizations in our market area and to enable the communities that we serve to share in our long-term growth. The charitable foundation will be dedicated completely to community activities and the promotion of charitable causes, and may be able to support such activities in ways that are not presently available to us. It will also support our ongoing obligations to the community under the Community Reinvestment Act. PCSB Bank received a “Satisfactory” rating in its most recent Community Reinvestment Act examination.
139
Table of Contents
Funding the charitable foundation with shares of our common stock is also intended to allow our communities to share in our potential growth and success after the offering is completed because the charitable foundation will benefit directly from any increases in the value of our shares of common stock. In addition, the charitable foundation will maintain close ties with PCSB Bank, thereby forming a partnership within the communities in which PCSB Bank operates.
Structure of the Charitable Foundation
The charitable foundation will be incorporated under Delaware law as anon-stock, nonprofit corporation. The certificate of incorporation of the charitable foundation will provide that the corporation is organized exclusively for charitable purposes as set forth in Section 501(c)(3) of the Internal Revenue Code. The certificate of incorporation will further provide that no part of the net earnings of the charitable foundation will inure to the benefit of, or be distributable to, its members, directors or officers or to private individuals.
The charitable foundation will be governed by a board of directors, initially consisting of Jeffrey D. Kellogg (a trustee of PCSB Bank), Scott D. Nogles (an executive officer of PCSB Bank) and Clifford S. Weber (an executive officer of PCSB Bank). We are required to select one person to serve on the initial board of directors who is not one of our officers or directors and who has experience with local charitable organizations and grant making. As of the date of this prospectus, we have not selected the individual to serve as the director to satisfy these requirements. For five years after the conversion and offering, one seat on the charitable foundation’s board of directors will be reserved for a person from our local community who has experience with local community charitable organizations and grant making and who is not one of our officers, directors or employees, and at least one seat on the charitable foundation’s board of directors will be reserved for one of PCSB Bank’s directors.
The board of directors of the charitable foundation will be responsible for establishing its grant and donation policies, consistent with the purposes for which it was established. As directors of a nonprofit corporation, the directors of the charitable foundation will at all times be bound by their fiduciary duty to advance the charitable foundation’s charitable goals, to protect its assets and to act in a manner consistent with the charitable purposes for which the charitable foundation is established. The directors also will be responsible for directing the activities of the charitable foundation, including the management and voting of the shares of our common stock held by the charitable foundation. However, as required by applicable regulations, all shares of our common stock held by the charitable foundation must be voted in the same ratio as all other shares of our common stock on all proposals considered by our shareholders.
The charitable foundation’s place of business will be located at our administrative offices. The board of directors of the charitable foundation will appoint such officers and employees as may be necessary to manage its operations. To the extent applicable, we will comply with the affiliates restrictions set forth in Sections 23A and 23B of the Federal Reserve Act and applicable NYSDFS regulations governing transactions between PCSB Bank and the charitable foundation.
The charitable foundation will receive working capital from the initial cash contribution and:
| (1) | any dividends that may be paid on our shares of common stock in the future; |
| (2) | within the limits of applicable federal and state laws, loans collateralized by the shares of common stock; and |
| (3) | the proceeds of the sale of any of the shares of common stock in the open market from time to time. |
As a private foundation under Section 501(c)(3) of the Internal Revenue Code, the charitable foundation will be required to distribute annually in grants or donations a minimum of 5% of the average fair market value of its net investment assets.
140
Table of Contents
Tax Considerations
We believe that an organization created for the above purposes should qualify as a Section 501(c)(3) exempt organization under the Internal Revenue Code and should be classified as a private foundation. As long as the charitable foundation files an application fortax-exempt status within 27 months of the last day of the month in which it was organized, and provided the Internal Revenue Service approves the application, its effective date as a Section 501(c)(3) organization will be the date of its organization. We have not received a tax opinion as to whether the charitable foundation’s tax exempt status will be affected by the regulatory requirement that all shares of our common stock held by it must be voted in the same ratio as all other outstanding shares of our common stock on all proposals considered by our shareholders.
We believe that our contribution of shares of our common stock to the charitable foundation should not constitute an act of self-dealing and that we should be entitled to a deduction in the amount of the fair market value of the stock at the time of the contribution less the nominal amount that the charitable foundation is required to pay us for such stock. We are permitted to deduct for charitable purposes only an amount equal to 10% of our annual taxable income in any one year. We are permitted under the Internal Revenue Code to carry the excess contribution over the five-year period following the contribution to the charitable foundation. We estimate that all of the contribution should be deductible over thesix-year period (i.e., the year in which the contribution is made and the succeeding five-year period). However, we do not have any assurance that the Internal Revenue Service will granttax-exempt status to the charitable foundation. In such event, our contribution to the charitable foundation would be expensed without a tax benefit, resulting in a reduction in earnings in the year in which the Internal Revenue Service makes such a determination. Furthermore, even if the contribution is deductible, we may not have sufficient earnings to be able to use the deduction in full. Any such decision to continue to make additional contributions to the charitable foundation in the future would be based on an assessment of, among other factors, our financial condition at that time, the interests of our shareholders and depositors, and the financial condition and operations of the foundation.
As a private foundation, earnings and gains, if any, from the sale of common stock or other assets are exempt from federal and state income taxation. However, investment income, such as interest, dividends and capital gains, is generally taxed at a rate of 1%. The charitable foundation will be required to file an annual return with the Internal Revenue Service within four andone-half months after the close of its fiscal year. The charitable foundation will be required to make its annual return available for public inspection. The annual return for a private foundation includes, among other things, an itemized list of all grants made or approved, showing the amount of each grant, the recipient, any relationship between a grant recipient and the foundation’s managers and a concise statement of the purpose of each grant. The charitable foundation will also be required to file an annual report with the Office of the New York Attorney General.
Regulatory Requirements Imposed on the Charitable Foundation
The NYSDFS and the Federal Deposit Insurance Corporation require that, before our board of directors adopted the plan of conversion, the board of directors had to identify its members that will serve on the charitable foundation’s board, and these directors could not participate in our board’s discussions concerning contributions to the charitable foundation, and could not vote on the matter. Our board of directors complied with this regulation in adopting the plan of conversion.
The NYSDFS and the Federal Deposit Insurance Corporation will generally not object if a well-capitalized savings bank contributes to a charitable foundation an aggregate amount of 8% or less of the shares or proceeds issued in a offering. PCSB Bank qualifies as a well-capitalized savings bank for purposes of this limitation, and the contribution to the charitable foundation will not exceed this limitation.
141
Table of Contents
The NYSDFS and the Federal Deposit Insurance Corporation impose the following additional requirements on the establishment of the charitable foundation:
| • | the charitable foundation’s primary purpose must be to serve and make grants in our local community; |
| • | the NYSDFS and the Federal Deposit Insurance Corporation may examine the charitable foundation at the foundation’s expense; |
| • | the charitable foundation must comply with all supervisory directives imposed by the NYSDFS and the Federal Deposit Insurance Corporation; |
| • | the charitable foundation must provide annually to the Federal Deposit Insurance Corporation and the NYSDFS a copy of the annual report that the charitable foundation submits to the Internal Revenue Service; |
| • | the charitable foundation must operate according to written policies adopted by its board of directors, including a conflict of interest policy; |
| • | the charitable foundation may not engage in self-dealing and must comply with all laws necessary to maintain itstax-exempt status under the Internal Revenue Code; and |
| • | the charitable foundation must vote its shares of our common stock in the same ratio as all of the other shares voted on each proposal considered by our shareholders. |
RESTRICTIONS ON ACQUISITION OF PCSB FINANCIAL
Although the board of directors of PCSB Financial is not aware of any effort that might be made to obtain control of PCSB Financial after the conversion, the board of directors believes that it is appropriate to include certain provisions in PCSB Financial’s articles of incorporation and bylaws to protect the interests of PCSB Financial and its stockholders from takeovers which our board of directors might conclude are not in the best interests of PCSB Financial, its stockholders or PCSB Bank.
The following discussion is a general summary of the material provisions of PCSB Financial’s articles of incorporation and bylaws, PCSB Bank’s stock charter, Maryland corporation law and certain other regulatory provisions that may be deemed to have an “anti-takeover” effect. The following description of certain of these provisions is necessarily general and, with respect to provisions contained in PCSB Financial’s articles of incorporation and bylaws and PCSB Bank’s stock charter, reference should be made in each case to the document in question, each of which is part of PCSB Bank’s conversion application filed with the NYSDFS, and except for PCSB Bank’s stock charter, PCSB Financial’s registration statement filed with the Securities and Exchange Commission. See “Where You Can Find Additional Information.”
PCSB Financial’s Articles of Incorporation and Bylaws
PCSB Financial articles of incorporation and bylaws contain a number of provisions relating to corporate governance and rights of stockholders that might discourage future takeover attempts. As a result, stockholders who might desire to participate in such transactions may not have an opportunity to do so. In addition, these provisions will also render the removal of PCSB Financial’s board of directors or management more difficult.
Directors.The board of directors will be divided into three classes. The members of each class will be elected for a term of three years and only one class of directors will be elected annually. Therefore, it would take at least two annual elections to replace a majority of our directors. The bylaws establish qualifications for board members, including:
| • | a prohibition on service as a director by a person who is a director, trustee, officer, employee or a 10% stockholder of a competitor of PCSB Bank or any other subsidiary of PCSB Financial; |
142
Table of Contents
| • | a prohibition on service as a director by a person (i) who has been convicted of a crime involving dishonesty or breach of trust that is punishable by imprisonment for a term exceeding one year under state or federal law, (ii) who is currently charged in an information, indictment or other complaint with the commission of or participation in such a crime, or (iii) who has been the subject of a supervisory or enforcement action by a financial or securities regulatory agency that resulted in a cease and desist or other formal order or an agreement or other written statement which is subject to public disclosure by such agency; |
| • | a prohibition on any director who does not confirm in writing that he or she is not party to any agreement or understanding with respect to how he or she would act or vote on any issue or question before the board of directors or that would otherwise impact his or her ability to discharge his or her fiduciary duties as a director; |
| • | a prohibition on any director who does not agree in writing to comply with all of the PCSB Financial policies applicable to directors, in addition to written confirmation that such director is qualified to serve; |
| • | a requirement that any person proposed to serve as director (other than the initial directors and other than directors who are also officers of PCSB Financial or PCSB Bank) have maintained his or her principal residence or principal place of business within 15 miles of an office of PCSB Financial, or a subsidiary of PCSB Financial for a period of at least one year before his or her election or appointment to the board of directors; |
| • | a prohibition on service as a director by a person who has lost more than one election for service as a director of PCSB Financial; and |
| • | a prohibition on service by nominees or representatives (as defined in applicable Federal Reserve Board regulations) of another person who would not be eligible for service or of an entity the partners or controlling persons of which would not be eligible for service. |
Further, the bylaws impose notice and information requirements in connection with the nomination by stockholders of candidates for election to the board of directors or the proposal by stockholders of business to be acted upon at an annual meeting of stockholders. Such notice and information requirements are applicable to all stockholder business proposals and nominations, and are in addition to any requirements under the federal securities laws.
Evaluation of Offers. The articles of incorporation of PCSB Financial provide that its board of directors, when evaluating a transaction that would or may involve a change in control of PCSB Financial (whether by purchases of its securities, merger, consolidation, share exchange, dissolution, liquidation, sale of all or substantially all of its assets, proxy solicitation or otherwise), may, in connection with the exercise of its business judgment in determining what is in the best interests of PCSB Financial and its stockholders and in making any recommendation to the stockholders, give due consideration to all relevant factors, including, but not limited to:
| • | the economic effect, both immediate and long-term, upon PCSB Financial’s stockholders, including stockholders, if any, who do not participate in the transaction; |
| • | the social and economic effect on the present and future employees, creditors and customers of, and others dealing with, PCSB Financial and its subsidiaries and on the communities in which PCSB Financial and its subsidiaries operate or are located; |
| • | whether the proposal is acceptable based on the historical, current or projected future operating results or financial condition of PCSB Financial; |
143
Table of Contents
| • | whether a more favorable price could be obtained for PCSB Financial’s stock or other securities in the future; |
| • | the reputation and business practices of the other entity to be involved in the transaction and its management and affiliates as they would affect the employees of PCSB Financial and its subsidiaries; |
| • | the future value of the stock or any other securities of PCSB Financial or the other entity to be involved in the proposed transaction; |
| • | any antitrust or other legal and regulatory issues that are raised by the proposal; |
| • | the business and historical, current or expected future financial condition or operating results of the other entity to be involved in the transaction, including, but not limited to, debt service and other existing financial obligations, financial obligations to be incurred in connection with the proposed transaction, and other likely financial obligations of the other entity to be involved in the proposed transaction; and |
| • | the ability of PCSB Financial to fulfill its objectives as a financial institution holding company and on the ability of its subsidiary financial institution(s) to fulfill the objectives of a federally insured financial institution under applicable statutes and regulations. |
If the board of directors determines that any proposed transaction should be rejected, it may take any lawful action to defeat such transaction.
Restrictions on Calling Special Meetings. The bylaws provide that special meetings of stockholders can be called by only the Chairperson of the Board, the Vice Chairperson of the Board, the Chief Executive Officer, or a majority of the total number of directors that PCSB Financial would have if there were no vacancies on the board of directors, or the Secretary upon the written request of stockholders entitled to cast at least a majority of all votes entitled to vote at the meeting.
Prohibition of Cumulative Voting. The articles of incorporation prohibit cumulative voting for the election of directors.
Limitation of Voting Rights. The articles of incorporation provide that in no event will any person who beneficially owns more than 10% of the then-outstanding shares of common stock, be entitled or permitted to vote any of the shares of common stock held in excess of the 10% limit. The 10% limit shall not apply if, before the stockholder acquires shares in excess of the 10% limit, the acquisition is approved by a majority of the directors who are not affiliated with the holder and who were members of the board of directors before the time of the acquisition (or who were chosen to fill any vacancy of an otherwise unaffiliated director by a majority of the unaffiliated directors).
Restrictions on Removing Directors from Office. The articles of incorporation provide that directors may be removed only for cause, and only by the affirmative vote of the holders of a majority of the voting power of all of our then-outstanding capital stock entitled to vote generally in the election of directors (after giving effect to the limitation on voting rights discussed above in “—Limitation of Voting Rights”), voting together as a single class.
Stockholder Nominations and Proposals.The bylaws provide that any stockholder desiring to make a nomination for the election of directors or a proposal for new business at an annual meeting of stockholders must submit written notice to PCSB Financial at least 90 days prior and not earlier than 120 days before the anniversary date of the proxy statement relating to the previous year’s annual meeting. However, if less than 90 days’ prior public disclosure of the date of the meeting is given to stockholders and the date of the annual meeting is advanced by more than 30 days, or delayed by more than 30 days from the anniversary date of the preceding year’s annual meeting, then stockholders must submit written notice to PCSB Financial no later than 10 days following the day on which public disclosure of the date of the meeting is first made.
144
Table of Contents
Authorized but Unissued Shares. After the conversion, PCSB Financial will have authorized but unissued shares of common and preferred stock. See “Description of Capital Stock of PCSB Financial.” The articles of incorporation authorize 200,000,000 shares of common stock and 10,000,000 shares of serial preferred stock. PCSB Financial is authorized to issue preferred stock from time to time in one or more series, subject to applicable provisions of law, and the board of directors is authorized to fix the preferences, conversion and other rights, voting powers, restrictions, limitations as to dividends, qualifications and terms and conditions of redemption of such shares. In addition, the articles of incorporation provide that a majority of the total number of directors that PCSB Financial would have if there were no vacancies on the board of directors may, without action by the stockholders, amend the articles of incorporation to increase or decrease the aggregate number of shares of stock of any class or series that PCSB Financial has the authority to issue. If there is a proposed merger, tender offer or other attempt to gain control of PCSB Financial that the board of directors does not approve, it would be possible for the board of directors to authorize the issuance of a series of preferred stock with rights and preferences that would impede the completion of the transaction. An effect of the possible issuance of preferred stock therefore may be to deter a future attempt to gain control of PCSB Financial. The board of directors has no present plan or understanding to issue any preferred stock.
Amendments to Articles of Incorporation and Bylaws.Except as provided under“— Authorized but Unissued Shares,” above, regarding the amendment of the articles of incorporation by the board of directors to increase or decrease the number of shares authorized for issuance, or as otherwise allowed by law, any amendment to the articles of incorporation must be approved by our board of directors and also bytwo-thirds of the outstanding shares of our voting stock (or a majority of the outstanding shares of our voting stock if the amendment is approved bytwo-thirds of our board of directors); provided, however, that approval by at least 80% of the outstanding voting stock is generally required to amend the following provisions:
| (i) | The limitation on voting rights of persons who directly or indirectly beneficially own more than 10% of the outstanding shares of common stock; |
| (ii) | The management of PCSB Financial by the board of directors and division of the board of directors into three staggered classes; |
| (iii) | The ability of the board of directors to fill vacancies on the board; |
| (iv) | the prohibition of cumulative voting; |
| (v) | The requirement that at least a majority of the voting power of the stockholders must vote to remove directors, and can only remove directors for cause; |
| (vi) | The ability of the board of directors to amend and repeal the bylaws and the required stockholder vote to amend or repeal the bylaws; |
| (vii) | The ability of the board of directors to evaluate a variety of factors in evaluating offers to purchase or otherwise acquire PCSB Financial; |
| (viii) | The authority of the board of directors to provide for the issuance of preferred stock; |
| (ix) | The validity and effectiveness of any action lawfully authorized by the affirmative vote of the holders of a majority of the total number of outstanding shares of common stock; |
| (x) | The number of stockholders constituting a quorum or required for stockholder consent; |
| (xi) | The provision regarding stockholder proposals and nominations; |
145
Table of Contents
| (xii) | The indemnification of current and former directors and officers, as well as employees and other agents, by PCSB Financial; |
| (xiii) | The limitation of liability of officers and directors to PCSB Financial for money damages; and |
| (xiv) | The provision of the articles of incorporation requiring approval of at least 80% of the outstanding voting stock to amend the provisions of the articles of incorporation set forth in (i) through (xii) of this list and the provisions related to amendment of the articles of incorporation and bylaws. |
The articles of incorporation also provide that the bylaws may be amended by the affirmative vote of a majority of the total number of directors that PCSB Financial would have if there were no vacancies on the board of directors or by the stockholders by the affirmative vote of at least 80% of the votes entitled to be cast in the election of directors (after giving effect to the limitation on voting rights discussed above in“—Limitation of Voting Rights”).
Maryland Corporate Law
Business Combinations. Under Maryland law, “business combinations” between a Maryland corporation and an interested stockholder or an affiliate of an interested stockholder are prohibited for five years after the most recent date on which the interested stockholder becomes an interested stockholder. These business combinations include a merger, consolidation, statutory share exchange or, in circumstances specified in the statute, certain transfers of assets, certain stock issuances and transfers, liquidation plans and reclassifications involving interested stockholders and their affiliates or issuance or reclassification of equity securities. Maryland law defines an interested stockholder as: (i) any person who beneficially owns 10% or more of the voting power of a corporation’s voting stock after the date on which the corporation had 100 or more beneficial owners of its stock; or (ii) an affiliate or associate of the corporation at any time after the date on which the corporation had 100 or more beneficial owners of its stock who, within thetwo-year period before the date in question, was the beneficial owner of 10% or more of the voting power of the then-outstanding voting stock of the corporation. A person is not an interested stockholder under the statute if the board of directors approved in advance the transaction by which the person otherwise would have become an interested stockholder. However, in approving a transaction, the board of directors may provide that its approval is subject to compliance, at or after the time of approval, with any terms and conditions determined by the Board.
After the five-year prohibition, any business combination between the Maryland corporation and an interested stockholder generally must be recommended by the board of directors of the corporation and approved by the affirmative vote of at least: (i) 80% of the votes entitled to be cast by holders of outstanding shares of voting stock of the corporation; and(ii) two-thirds of the votes entitled to be cast by holders of voting stock of the corporation other than shares held by the interested stockholder with whom or with whose affiliate the business combination is to be effected or held by an affiliate or associate of the interested stockholder. These super-majority vote requirements do not apply if the corporation’s common stockholders receive a minimum price, as defined under Maryland law, for their shares in the form of cash or other consideration in the same form as previously paid by the interested stockholder for its shares.
Control Share Acquisitions. The Maryland General Corporation Law provides that “control shares” of a Maryland corporation acquired in a “control share acquisition” have no voting rights except to the extent approved by a vote oftwo-thirds of the shares entitled to be voted on the matter, excluding shares of stock owned by the acquiror or by officers or directors who are employees of the corporation. “Control shares” are voting shares of stock which, if aggregated with all other such shares of stock previously acquired by the acquiror, or in respect of which the acquiror is able to exercise or direct the exercise of voting power except solely by virtue of a revocable proxy, would entitle the acquiror to exercise voting power in electing directors within one of the following ranges of voting power:
| (i) | one-tenth or more but less thanone-third; |
146
Table of Contents
| (ii) | one-third or more but less than a majority; or |
| (iii) | a majority of all voting power. |
Control shares do not include shares the acquiring person is then entitled to vote as a result of having previously obtained stockholder approval. A “control share acquisition” means the acquisition of control shares, subject to certain exceptions for shares acquired through descent or distribution, in satisfaction of a pledge or in a merger, consolidation or share exchange to which the corporation is a party. The control share acquisition statute applies to any Maryland corporation with 100 or more beneficial owners of its stock other than a close corporation or an investment company.
A person who has made or proposes to make a control share acquisition, upon satisfaction of certain conditions (including an undertaking to pay expenses and delivery of an “acquiring person statement”), may compel the corporation’s Board of Directors to call a special meeting of stockholders to be held within 50 days of demand to consider the voting rights of the shares. If no request for a meeting is made, the corporation may itself present the question at any stockholders’ meeting. If voting rights are not approved at the meeting or if the acquiring person does not deliver an acquiring person statement within 10 days following a control share acquisition then, subject to certain conditions and limitations, the corporation may redeem any or all of the control shares (except for those which voting rights have previously been approved) for fair value, determined without regard to the absence of voting rights for the control shares, at the date of the last control share acquisition or of any meeting of stockholders at which the voting rights of such shares are considered and not approved. Moreover, if voting rights for control shares are approved at a stockholders’ meeting and the acquiror becomes entitled to exercise or direct the exercise of a majority or more of all voting power, other stockholders may exercise appraisal rights. The fair value of the shares as determined for purposes of such appraisal rights may not be less than the highest price per share paid by the acquiror in the control share acquisition. The foregoing provisions may be modified by a Maryland corporation’s charter or bylaws. Although PCSB Financial’s bylaws provide that the Maryland Control Share Acquisition law will be inapplicable to acquisitions of the Company’s common stock, this bylaw provision may be repealed at any time by a majority vote of the whole board of directors, in whole or in part, at any time, whether before or after a control share acquisition and may be applied to any prior or subsequent control share acquisition.
PCSB Bank’s Stock Charter
The charter of PCSB Bank provides that for a period of three years from the closing of the conversion and offering, no person (including a group acting in concert) other than PCSB Financial may offer directly or indirectly to acquire the beneficial ownership of more than 10% of any class of equity security of PCSB Bank. This provision does not apply to anytax-qualified employee benefit plan of PCSB Bank or PCSB Financial, or to an underwriter or member of an underwriting or selling group involving the public sale or resale of securities of PCSB Bank or any of its subsidiaries, so long as after the sale or resale, no underwriter or member of the selling group is a beneficial owner, directly or indirectly, of more than 10% of any class of equity securities of PCSB Bank. In addition, during this five-year period, all shares owned over the 10% limit may not be voted on any matter submitted to stockholders for a vote.
Conversion Regulations
NYSDFS regulations provide that, before the completion of the conversion, no person shall make any offer, or any announcement of an offer, to purchase or acquire stock in a converting institution or its holding company in excess of the maximum purchase limitations contained in the converting institution’s approved plan of conversion. The NYSDFS has defined “person” to include any corporation, partnership, trust, unincorporated association, any other entity or natural person. In addition, Federal Reserve Board regulations provide that, except with the prior approval of the Federal Reserve Board, no person for a period of three years following the date the completion of the conversion shall directly or indirectly acquire or offer to acquire the beneficial ownership of more than 10% of any class of capital stock of the converting institution or its holding company.
147
Table of Contents
Change in Control Regulations
Under the Change in Bank Control Act, no person, or group of persons acting in concert, may acquire control of a bank holding company such as PCSB Financial unless the Federal Reserve Board has been given 60 days’ prior written notice and not disapproved the proposed acquisition. The Federal Reserve Board considers several factors in evaluating a notice, including the financial and managerial resources of the acquirer and competitive effects. Control, as defined under the applicable regulations, means the power, directly or indirectly, to direct the management or policies of the company or to vote 25% or more of any class of voting securities of the company. Acquisition of more than 10% of any class of a bank holding company’s voting securities constitutes a rebuttable presumption of control under certain circumstances, including where, as will be the case with PCSB Financial, the issuer has registered securities under Section 12 of the Securities Exchange Act of 1934.
In addition, federal regulations provide that no company may acquire control (as defined in the Bank Holding Company Act) of a bank holding company without the prior approval of the Federal Reserve Board. Any company that acquires such control becomes a “bank holding company” subject to registration, examination and regulation by the Federal Reserve Board.
DESCRIPTION OF CAPITAL STOCK OF PCSB FINANCIAL
General
PCSB Financial is authorized to issue 200,000,000 shares of common stock, par value of $0.01 per share, and 10,000,000 shares of preferred stock, par value $0.01 per share. PCSB Financial currently expects to issue up to 20,507,375 shares of common stock (which number includes 382,375 shares expected to be contributed to the charitable foundation) in the conversion and offering. It will not issue shares of preferred stock in the conversion and offering. Each share of common stock will have the same relative rights as, and will be identical in all respects to, each other share of common stock. Upon payment of the subscription price for the common stock according to the plan of conversion all of the shares of common stock will be duly authorized, fully paid andnon-assessable.
The shares of common stock will representnon-withdrawable capital, will not be an account of an insurable type, and will not be insured by the Federal Deposit Insurance Corporation or any other government agency.
Common Stock
Dividends. PCSB Financial can pay dividends on its common stock if, after giving effect to such distribution, (i) it would be able to pay its indebtedness as the indebtedness comes due in the usual course of business and (ii) its total assets exceed the sum of its liabilities and the amount needed, if it were to be dissolved at the time of the distribution, to satisfy the preferential rights upon dissolution of any holders of capital stock who have a preference upon dissolution. The holders of common stock will be entitled to receive and share equally in dividends as may be declared by our board of directors out of funds legally available therefor. If PCSB Financial issues shares of preferred stock, the holders thereof may have a priority over the holders of the common stock with respect to dividends.
Voting Rights. Upon consummation of the conversion, the holders of common stock will have exclusive voting rights in PCSB Financial. They will elect its board of directors and act on other matters as are required to be presented to them under Maryland law or as are otherwise presented to them by the board of directors. Generally, each holder of common stock will be entitled to one vote per share and will not have any right to cumulate votes in the election of directors. Any person who beneficially owns more than 10% of the then-outstanding shares of common stock, however, will not be entitled or permitted to vote any shares of common stock held in excess of the 10% limit absent certain exceptions discussed previously. If PCSB Financial issues shares of preferred stock, holders of the preferred stock may also possess voting rights. Amendments to the articles of incorporation generally require, in addition to majority approval by the board of directors, atwo-thirds approval of the outstanding shares eligible to vote, and certain amendments require the approval of 80% of the outstanding shares eligible to vote.
As a New York stock savings bank, corporate powers and control of PCSB Bank will be vested in its board of directors, who elect the officers of PCSB Bank and who fill any vacancies on the board of directors. Voting
148
Table of Contents
rights in PCSB Bank will be vested exclusively in the sole owner of the shares of capital stock of PCSB Bank, which will be PCSB Financial, and voted at the direction of PCSB Financial’s board of directors. Consequently, the holders of the common stock of PCSB Financial will not have direct control of PCSB Bank.
Liquidation. Upon any liquidation, dissolution or winding up of PCSB Bank, PCSB Financial, as the holder of 100% of PCSB Bank’s capital stock, would be entitled to receive all assets of PCSB Bank available for distribution, after payment or provision for payment of all debts and liabilities of PCSB Bank, including all deposit accounts and accrued interest thereon, and after distribution of the balance in the liquidation account to Eligible Account Holders and Supplemental Eligible Account Holders. Upon any liquidation, dissolution or winding up of PCSB Financial, the holders of its common stock would be entitled to receive, after payment or provision for payment of all its debts and liabilities, all of the assets of PCSB Financial available for distribution. If preferred stock is issued, the holders thereof may have a priority over the holders of the common stock upon any liquidation or dissolution.
Preemptive Rights; Redemption. Holders of the common stock of PCSB Financial will not be entitled to preemptive rights with respect to any shares that may be issued, unless such preemptive rights are approved by the board of directors. The common stock is not subject to redemption.
Dissenters’ Rights of Appraisal. PCSB Financial’s articles of incorporation provide that PCSB Financial’s stockholders will not be entitled to dissenters’ rights of appraisal with respect to a merger or consolidation of PCSB Financial with another corporation unless the board of directors determines by a resolution approved by a majority of directors then in office that dissenters’ rights shall apply to all or any classes of stock.
Preferred Stock
None of PCSB Financial’s authorized shares of preferred stock will be issued as part of the offering or the conversion. Preferred stock may be issued with preferences and designations as our board of directors may from time to time determine. The board of directors may, without stockholder approval, issue shares of preferred stock with voting, dividend, liquidation and conversion rights that could dilute the voting strength of the holders of the common stock and may assist management in impeding an unfriendly takeover or attempted change in control.
The transfer agent and registrar for our common stock is American Stock Transfer & Trust Company, LLC, New York, New York.
The consolidated financial statements of PCSB Bank and subsidiaries at June 30, 2016 and 2015 and for the years then ended have been included in this prospectus and in the registration statement of which this prospectus is a part, in reliance on the report of Crowe Horwath LLP, independent registered public accounting firm, which is included herein, upon the authority of said firm as experts in accounting and auditing.
RP Financial, LC. has consented to the publication herein of the summary of its report setting forth its opinion as to the estimated pro forma market value of the shares of common stock upon completion of the conversion and offering and its letter with respect to subscription rights.
Luse Gorman, PC, Washington, D.C., counsel to PCSB Financial and PCSB Bank, has issued to PCSB Financial its opinion regarding the legality of the common stock and the federal income tax consequences of the conversion and offering. Crowe Horwath LLP has provided its opinion to us regarding the New York income tax consequences of the conversion and offering. Certain legal matters will be passed upon for Sandler O’Neill & Partners, L.P. by Silver, Freedman, Taff & Tiernan LLP, Washington, D.C.
149
Table of Contents
WHERE YOU CAN FIND ADDITIONAL INFORMATION
PCSB Financial has filed with the Securities and Exchange Commission a registration statement under the Securities Act of 1933 with respect to the shares of common stock offered hereby. As permitted by the rules and regulations of the Securities and Exchange Commission, this prospectus does not contain all the information set forth in the registration statement. Such information, including the appraisal report which is an exhibit to the registration statement, can be examined without charge at the public reference facilities of the Securities and Exchange Commission located at 100 F Street, N.E., Washington, D.C. 20549, and copies of such material can be obtained from the Securities and Exchange Commission at prescribed rates. The Securities and Exchange Commission’s telephone number is1-800-SEC-0330. In addition, the Securities and Exchange Commission maintains a web site (http://www.sec.gov) that contains reports, proxy and information statements and other information regarding registrants that file electronically with the Securities and Exchange Commission, including PCSB Financial. The statements contained in this prospectus as to the contents of any contract or other document filed as an exhibit to the registration statement are, of necessity, brief descriptions of the material terms of, and should be read in conjunction with, such contract or document.
PCSB Bank has filed with the NYSDFS an application with respect to the conversion. This prospectus omits certain information contained in such application. The conversion application may be inspected, without charge, at the offices of the NYSDFS, One State Street, New York, New York. The plan of conversion is available, upon request, at each of PCSB Bank’s offices.
In connection with the offering, PCSB Financial will register its common stock under Section 12(b) of the Securities Exchange Act of 1934 and, upon such registration, PCSB Financial and the holders of its common stock will become subject to the proxy solicitation rules, reporting requirements and restrictions on common stock purchases and sales by directors, officers and greater than 10% shareholders, the annual and periodic reporting and certain other requirements of the Securities Exchange Act of 1934. Under the plan of conversion, PCSB Financial has undertaken that it will not terminate such registration for a period of at least three years following the conversion and offering.
150
Table of Contents
INDEX TO CONSOLIDATED FINANCIAL STATEMENTS OF PCSB BANK
| F-1 | ||||
| F-2 | ||||
| F-3 | ||||
| F-4 | ||||
| F-5 | ||||
| F-6 | ||||
| F-8 | ||||
This prospectus does not include separate financial statements for PCSB Financial because it has not engaged in any significant activities, has no significant assets, and has no contingent liabilities, revenues or expenses.
All financial statement schedules are omitted because the required information either is inapplicable or is included in the financial statements or related notes.
151
Table of Contents
Report of Independent Registered Public Accounting Firm
Board of Trustees
PCSB Bank and Subsidiaries
Brewster, New York
We have audited the accompanying consolidated statements of financial condition of PCSB Bank and Subsidiaries (the “Bank”) as of June 30, 2016 and 2015, and the related consolidated statements of income, comprehensive income (loss), changes in equity, and cash flows for the years then ended. These consolidated financial statements are the responsibility of the Bank’s management. Our responsibility is to express an opinion on these consolidated financial statements based on our audits.
We conducted our audits in accordance with the standards of the Public Company Accounting Oversight Board (United States). Those standards require that we plan and perform the audit to obtain reasonable assurance about whether the consolidated financial statements are free of material misstatement. An audit includes examining, on a test basis, evidence supporting the amounts and disclosures in the consolidated financial statements. An audit also includes assessing the accounting principles used and significant estimates made by management, as well as evaluating the overall financial statement presentation. We believe that our audits provide a reasonable basis for our opinion.
In our opinion, the consolidated financial statements referred to above present fairly, in all material respects, the financial position of the Bank as of June 30, 2016 and 2015, and the results of its operations and its cash flows for the years then ended, in conformity with U.S. generally accepted accounting principles.
/s/ Crowe Horwath LLP |
Crowe Horwath LLP |
Livingston, New Jersey
October 25, 2016
F-1
Table of Contents
CONSOLIDATED STATEMENTS OF FINANCIAL CONDITION
(In thousands)
| September 30, | June 30, | |||||||||||
| 2016 | 2016 | 2015 | ||||||||||
| (unaudited) | ||||||||||||
ASSETS | ||||||||||||
Cash and due from banks | $ | 56,181 | $ | 36,258 | $ | 73,367 | ||||||
Federal funds sold | 4,242 | 5,320 | 4,394 | |||||||||
|
|
|
|
|
| |||||||
Total cash and cash equivalents | 60,423 | 41,578 | 77,761 | |||||||||
Securities: | ||||||||||||
Held to maturity, at amortized cost (fair value of $268,247, $273,317 and $270,177, respectively) | 265,071 | 270,679 | 269,913 | |||||||||
Available-for-sale securities, at fair value | 109,591 | 112,351 | 84,943 | |||||||||
|
|
|
|
|
| |||||||
Total securities | 374,662 | 383,030 | 354,856 | |||||||||
Loans receivable, net of allowance for loan losses of $4,065, $4,042 and $3,921, respectively | 763,915 | 782,336 | 727,134 | |||||||||
Accrued interest receivable | 3,287 | 3,361 | 3,234 | |||||||||
Federal Home Loan Bank (FHLB) stock | 1,641 | 2,047 | 1,719 | |||||||||
Bank premises and equipment, net | 10,818 | 10,774 | 7,979 | |||||||||
Deferred tax asset, net | 5,435 | 6,164 | 4,884 | |||||||||
Other real estate owned (OREO) | 1,059 | 905 | 368 | |||||||||
Bank owned life insurance (BOLI) | 22,724 | 22,557 | 10,824 | |||||||||
Goodwill | 6,106 | 6,106 | 5,843 | |||||||||
Other intangible assets, net | 666 | 702 | 860 | |||||||||
Other assets | 3,708 | 2,511 | 5,288 | |||||||||
|
|
|
|
|
| |||||||
Total assets | $ | 1,254,444 | $ | 1,262,071 | $ | 1,200,750 | ||||||
|
|
|
|
|
| |||||||
LIABILITIES AND EQUITY | ||||||||||||
Liabilities | ||||||||||||
Deposits | ||||||||||||
Interest bearing deposits | $ | 981,083 | $ | 990,032 | $ | 930,864 | ||||||
Noninterest bearing deposits | 135,754 | 122,663 | 129,641 | |||||||||
|
|
|
|
|
| |||||||
Total deposits | 1,116,837 | 1,112,695 | 1,060,505 | |||||||||
Mortgages escrow funds | 4,204 | 7,023 | 6,638 | |||||||||
Federal Home Loan Bank advances | 11,051 | 20,081 | 14,000 | |||||||||
Other liabilities | 10,846 | 12,323 | 9,336 | |||||||||
|
|
|
|
|
| |||||||
Total liabilities | 1,142,938 | 1,152,122 | 1,090,479 | |||||||||
Equity | ||||||||||||
Retained earnings | 119,375 | 117,919 | 114,993 | |||||||||
Accumulated other comprehensive loss, net of income taxes | (7,869 | ) | (7,970 | ) | (4,722 | ) | ||||||
|
|
|
|
|
| |||||||
Total equity | 111,506 | 109,949 | 110,271 | |||||||||
|
|
|
|
|
| |||||||
Total liabilities and equity | $ | 1,254,444 | $ | 1,262,071 | $ | 1,200,750 | ||||||
|
|
|
|
|
| |||||||
See accompanying notes to consolidated financial statements.
F-2
Table of Contents
CONSOLIDATED STATEMENTS OF INCOME
(In thousands)
| Three Months Ended September 30, | Years Ended June 30, | |||||||||||||||
| 2016 | 2015 | 2016 | 2015 | |||||||||||||
| (unaudited) | ||||||||||||||||
Interest and dividend income | ||||||||||||||||
Loans | $ | 8,525 | $ | 8,158 | $ | 32,832 | $ | 23,245 | ||||||||
Securities | 1,480 | 1,447 | 5,897 | 5,360 | ||||||||||||
Federal funds sold and other | 104 | 58 | 315 | 222 | ||||||||||||
|
|
|
|
|
|
|
| |||||||||
Total interest and dividend income | 10,109 | 9,663 | 39,044 | 28,827 | ||||||||||||
Interest expense | ||||||||||||||||
Deposits | 1,267 | 1,116 | 4,562 | 3,783 | ||||||||||||
Mortgages escrow funds | 17 | 15 | 51 | 29 | ||||||||||||
Federal Home Loan Bank advances | 50 | 48 | 199 | 72 | ||||||||||||
|
|
|
|
|
|
|
| |||||||||
Total interest expense | 1,334 | 1,179 | 4,812 | 3,884 | ||||||||||||
|
|
|
|
|
|
|
| |||||||||
Net interest income | 8,775 | 8,484 | 34,232 | 24,943 | ||||||||||||
Provision for loan losses | 26 | 41 | 1,859 | 1,326 | ||||||||||||
|
|
|
|
|
|
|
| |||||||||
Net interest income after provision for loan losses | 8,749 | 8,443 | 32,373 | 23,617 | ||||||||||||
Non-interest income | ||||||||||||||||
Fees and service charges | 242 | 256 | 1,053 | 955 | ||||||||||||
Earnings from cash surrender value of BOLI | 167 | 75 | 458 | 297 | ||||||||||||
Other | 143 | 97 | 440 | 315 | ||||||||||||
|
|
|
|
|
|
|
| |||||||||
Total non-interest income | 552 | 428 | 1,951 | 1,567 | ||||||||||||
Non-interest expense | ||||||||||||||||
Salaries and employee benefits | 4,250 | 4,117 | 16,961 | 13,666 | ||||||||||||
Occupancy and equipment | 1,291 | 1,095 | 5,122 | 4,018 | ||||||||||||
FDIC assessment | 215 | 217 | 888 | 709 | ||||||||||||
Professional fees | 309 | 353 | 1,644 | 976 | ||||||||||||
Postage, printing, stationary and supplies | 133 | 167 | 681 | 460 | ||||||||||||
Advertising | 139 | 43 | 388 | 332 | ||||||||||||
Merger and acquisition related expenses | — | 122 | 790 | 1,147 | ||||||||||||
Amortization of intangible assets | 36 | 40 | 158 | 27 | ||||||||||||
Other operating expenses | 825 | 893 | 3,633 | 2,639 | ||||||||||||
|
|
|
|
|
|
|
| |||||||||
Total non-interest expense | 7,198 | 7,047 | 30,265 | 23,974 | ||||||||||||
|
|
|
|
|
|
|
| |||||||||
Income before income tax expense | 2,103 | 1,824 | 4,059 | 1,210 | ||||||||||||
Income tax expense | 647 | 568 | 1,133 | 702 | ||||||||||||
|
|
|
|
|
|
|
| |||||||||
Net income | $ | 1,456 | $ | 1,256 | $ | 2,926 | $ | 508 | ||||||||
|
|
|
|
|
|
|
| |||||||||
See accompanying notes to consolidated financial statements.
F-3
Table of Contents
CONSOLIDATED STATEMENTS OF COMPREHENSIVE INCOME (LOSS)
(In thousands)
| Three Months Ended September 30, | Years Ended June 30, | |||||||||||||||
| 2016 | 2015 | 2016 | 2015 | |||||||||||||
| (unaudited) | ||||||||||||||||
Net income | $ | 1,456 | $ | 1,256 | $ | 2,926 | $ | 508 | ||||||||
Other comprehensive income (loss) | ||||||||||||||||
Unrealized gains (losses) on securities | ||||||||||||||||
Unrealized holding gain (loss) arising during the period | 154 | 318 | 255 | (159 | ) | |||||||||||
Less tax effect | 53 | 127 | 55 | (64 | ) | |||||||||||
|
|
|
|
|
|
|
| |||||||||
Net of tax | 101 | 191 | 200 | (95 | ) | |||||||||||
Defined benefit pension and SERP plans | ||||||||||||||||
Net loss arising during the period | — | — | (4,933 | ) | (2,807 | ) | ||||||||||
Reclassification adjustment for amortization of prior service cost and net gain (loss) included in salaries and employee benefits expense | — | — | 482 | (142 | ) | |||||||||||
Less tax effect | — | — | (1,003 | ) | (1,168 | ) | ||||||||||
|
|
|
|
|
|
|
| |||||||||
Net of tax | — | — | (3,448 | ) | (1,781 | ) | ||||||||||
Total other comprehensive income (loss) | 101 | 191 | (3,248 | ) | (1,876 | ) | ||||||||||
|
|
|
|
|
|
|
| |||||||||
Comprehensive income (loss) | $ | 1,557 | $ | 1,447 | $ | (322 | ) | $ | (1,368 | ) | ||||||
|
|
|
|
|
|
|
| |||||||||
See accompanying notes to consolidated financial statements.
F-4
Table of Contents
CONSOLIDATED STATEMENTS OF CHANGES IN EQUITY
Three Months Ended September 30, 2016 (unaudited) and Years ended June 30, 2016 and 2015
(In thousands)
| Retained Earnings | Accumulated Other Comprehensive Loss | Total Equity | ||||||||||
Balance at July 1, 2014 | $ | 114,485 | $ | (2,846 | ) | $ | 111,639 | |||||
Net income | 508 | — | 508 | |||||||||
Other comprehensive loss | — | (1,876 | ) | (1,876 | ) | |||||||
|
|
|
|
|
| |||||||
Balance at June 30, 2015 | 114,993 | (4,722 | ) | 110,271 | ||||||||
Net income | 2,926 | — | 2,926 | |||||||||
Other comprehensive loss | — | (3,248 | ) | (3,248 | ) | |||||||
|
|
|
|
|
| |||||||
Balance at June 30, 2016 | 117,919 | (7,970 | ) | 109,949 | ||||||||
Net income | 1,456 | — | 1,456 | |||||||||
Other comprehensive income | — | 101 | 101 | |||||||||
|
|
|
|
|
| |||||||
Balance at September 30, 2016 (unaudited) | $ | 119,375 | $ | (7,869 | ) | $ | 111,506 | |||||
|
|
|
|
|
| |||||||
See accompanying notes to consolidated financial statements.
F-5
Table of Contents
CONSOLIDATED STATEMENTS OF CASH FLOWS
(in thousands)
| Three Months Ended September 30, | Years Ended June 30, | |||||||||||||||
| 2016 | 2015 | 2016 | 2015 | |||||||||||||
| (unaudited) | ||||||||||||||||
Cash flows from operating activities | ||||||||||||||||
Net income | $ | 1,456 | $ | 1,256 | $ | 2,926 | $ | 508 | ||||||||
Adjustments to reconcile net income to net cash (used in) provided by operating activities: | ||||||||||||||||
Provision for loan losses | 26 | 41 | 1,859 | 1,326 | ||||||||||||
Depreciation and amortization | 347 | 291 | 1,265 | 752 | ||||||||||||
Amortization of net premiums on securities and net deferred loan origination costs | 299 | 234 | 943 | 971 | ||||||||||||
Deferred income tax expense, net of valuation reserve | 677 | 50 | 1,299 | 586 | ||||||||||||
Net decrease (increase) in accrued interest receivable | 74 | (58 | ) | (127 | ) | 45 | ||||||||||
Net gain on sale of OREO | (30 | ) | (3 | ) | (9 | ) | (1 | ) | ||||||||
Write-downs on OREO | — | — | 30 | 87 | ||||||||||||
Earnings from cash surrender value of BOLI | (167 | ) | (75 | ) | (458 | ) | (297 | ) | ||||||||
Net accretion of purchase accounting adjustments | (243 | ) | (386 | ) | (1,352 | ) | (132 | ) | ||||||||
Other adjustments, principally net changes in other assets and liabilities | (2,675 | ) | 745 | (431 | ) | (2,203 | ) | |||||||||
|
|
|
|
|
|
|
| |||||||||
Net cash (used in) provided by operating activities | (236 | ) | 2,095 | 5,945 | 1,642 | |||||||||||
Cash flows from investing activities | ||||||||||||||||
Purchases of securities: | ||||||||||||||||
Held to maturity | (22,334 | ) | (27,985 | ) | (112,896 | ) | (94,178 | ) | ||||||||
Available for sale | (10,269 | ) | (15,997 | ) | (56,420 | ) | (25,952 | ) | ||||||||
Proceeds from maturities, calls and sales of securities: | ||||||||||||||||
Held to maturity | 27,805 | 33,911 | 107,656 | 97,971 | ||||||||||||
Available for sale | 13,109 | 5,986 | 33,058 | 44,996 | ||||||||||||
Disbursements for loan originations, net of principal repayments | 18,102 | (31 | ) | (14,314 | ) | (3,221 | ) | |||||||||
Purchase of loans | — | (7,644 | ) | (43,981 | ) | (3,638 | ) | |||||||||
Acquisition, net cash paid | — | — | — | (20,649 | ) | |||||||||||
Net redemption (purchase) of FHLB stock | 406 | (585 | ) | (328 | ) | 1,167 | ||||||||||
Purchase of bank premises and equipment | (355 | ) | (855 | ) | (3,902 | ) | (549 | ) | ||||||||
Purchase of BOLI | — | — | (11,275 | ) | — | |||||||||||
Proceeds from sale of OREO | 254 | 159 | 1,030 | 183 | ||||||||||||
|
|
|
|
|
|
|
| |||||||||
Net cash provided by (used in) investing activities | 26,718 | (13,041 | ) | (101,372 | ) | (3,870 | ) | |||||||||
Cash flows from financing activities | ||||||||||||||||
Net increase (decrease) in deposits | 4,212 | (4,869 | ) | 52,778 | (4,274 | ) | ||||||||||
Proceeds from Federal Home Loan Bank advances | — | 20,000 | 24,100 | 20,000 | ||||||||||||
Repayment of Federal Home Loan Bank advances | (9,030 | ) | (7,000 | ) | (18,019 | ) | (42,050 | ) | ||||||||
Net (decrease) increase in mortgage escrow funds | (2,819 | ) | (3,141 | ) | 385 | 1,063 | ||||||||||
|
|
|
|
|
|
|
| |||||||||
Net cash (used in) provided by financing activities | (7,637 | ) | 4,990 | 59,244 | (25,261 | ) | ||||||||||
|
|
|
|
|
|
|
| |||||||||
Net increase (decrease) in cash and cash equivalents | 18,845 | (5,956 | ) | (36,183 | ) | (27,489 | ) | |||||||||
Cash and cash equivalents at beginning of period | 41,578 | 77,761 | 77,761 | 105,250 | ||||||||||||
|
|
|
|
|
|
|
| |||||||||
Cash and cash equivalents at end of period | $ | 60,423 | $ | 71,805 | $ | 41,578 | $ | 77,761 | ||||||||
|
|
|
|
|
|
|
| |||||||||
See accompanying notes to consolidated financial statements.
F-6
Table of Contents
PCSB BANK AND SUBSIDIARIES
CONSOLIDATED STATEMENTS OF CASH FLOWS
(in thousands)
(Continued)
| Three Months Ended September 30, | Years Ended June 30, | |||||||||||||||
| 2016 | 2015 | 2016 | 2015 | |||||||||||||
| (unaudited) | ||||||||||||||||
Supplemental information | ||||||||||||||||
Interest payments | $ | 1,351 | $ | 1,174 | $ | 4,814 | $ | 3,832 | ||||||||
Income tax payments, net of refunds | 134 | 36 | (351 | ) | 424 | |||||||||||
Loans transferred to OREO | 378 | 320 | 1,575 | 243 | ||||||||||||
Acquisition of noncash assets and liabilities | ||||||||||||||||
Assets acquired | — | — | — | 264,101 | ||||||||||||
Liabilities assumed | — | — | — | 249,295 | ||||||||||||
See accompanying notes to consolidated financial statements.
F-7
Table of Contents
NOTES TO CONSOLIDATED FINANCIAL STATEMENTS
Three months ended September 30, 2016 and 2015 (unaudited)
and Years ended June 30, 2016 and 2015
NOTE 1 – SUMMARY OF SIGNIFICANT ACCOUNTING POLICIES
PCSB Bank (“the Bank”) is a community-oriented financial institution that provides financial services to individuals and businesses within its market area of Putnam, Southern Dutchess, Rockland and Westchester counties in New York. The Bank is a state-chartered mutual savings bank and its deposits are insured up to applicable limits by the Deposit Insurance Fund of the Federal Deposit Insurance Corporation (FDIC). The Bank’s primary regulators are the FDIC and the New York State Department of Financial Services.
Merger with CMS Bancorp: On April 28, 2015, CMS Bancorp and CMS Bank merged with and into PCSB Bank.
Basis of Presentation: The consolidated financial statements have been prepared in conformity with accounting principles generally accepted in the United States of America, and include the accounts of the Bank and its three subsidiaries – PCSB Funding Corp., PCSB Commercial Bank and PCSB Realty Ltd. PCSB Funding Corp. is a real estate investment trust that holds certain mortgage assets. PCSB Commercial Bank is a state-chartered commercial bank authorized to accept the deposits of local governments in New York State. PCSB Realty Ltd. is a corporation that holds certain properties foreclosed upon by the Bank. All significant intercompany transactions and balances have been eliminated in consolidation.
The unaudited consolidated financial statements for the three months ended September 30, 2016 and 2015 reflect all normal recurring adjustments that are, in the opinion of management, necessary for a fair presentation of the results for the interim periods presented. The annualized results of operations for the three months ended September 30, 2016 are not necessarily indicative of the results of operations that may be expected for the entire fiscal year. Certain information and note disclosures normally included in the financial statements prepared in accordance with GAAP have been condensed or omitted pursuant to the rules and regulations of the Securities and Exchange Commission.
Use of Estimates: To prepare financial statements in conformity with accounting principles generally accepted in the United States of America, management makes estimates and assumptions based on available information. These estimates and assumptions affect the amounts reported in the financial statements and the disclosures provided, and actual results could differ.
Cash Flows: Cash and cash equivalents include cash, deposits with other financial institutions, and federal funds sold. Net cash flows are reported for customer loan and deposit transactions, and interest bearing deposits in other financial institutions.
Securities: Certain debt securities are classified as held to maturity and carried at amortized cost when management has the positive intent and ability to hold them to maturity. All other debt and equity securities are classified as available for sale. The Bank has no trading securities.
Securities available for sale are reported at fair value. Unrealized gains and losses on securities available for sale are excluded from earnings and reported as accumulated other comprehensive income or loss (a separate component of equity), net of related income taxes.
Premiums and discounts on debt securities are amortized to interest income on a level-yield basis over the terms of the securities. Realized gains and losses on sales of securities are determined based on the amortized cost of the specific securities sold.
(Continued)
F-8
Table of Contents
PCSB BANK AND SUBSIDIARIES
NOTES TO CONSOLIDATED FINANCIAL STATEMENTS
Three months ended September 30, 2016 and 2015 (unaudited)
and Years ended June 30, 2016 and 2015
NOTE 1 – SUMMARY OF SIGNIFICANT ACCOUNTING POLICIES(Continued)
Management evaluates securities for other-than-temporary impairment (OTTI) on at least a quarterly basis, and more frequently when economic or market conditions warrant such an evaluation. For securities in an unrealized loss position, management considers the extent and duration of the unrealized loss, and the financial condition and near-term prospects of the issuer. Management also assesses whether it intends to sell, or it is more likely than not that it will be required to sell, a security in an unrealized loss position before recovery of its amortized cost basis. If either of the criteria regarding intent or requirement to sell is met, the entire difference between amortized cost and fair value is recognized as impairment through earnings. For debt securities that do not meet the aforementioned criteria, the amount of impairment is split into two components as follows: 1) OTTI related to credit loss, which must be recognized in the income statement and 2) OTTI related to other factors, which is recognized in other comprehensive income. The credit loss is defined as the difference between the present value of the cash flows expected to be collected and the amortized cost basis. For equity securities, the entire amount of impairment is recognized through earnings.
Loans: The Bank originates mortgage loans generally secured by existing single-family residential and commercial real estate properties and, to a lesser extent, properties under construction and development. The Bank also originates commercial business loans and certain types of consumer loans. A substantial portion of the Bank’s loan portfolio is secured by real estate properties located in the New York counties of Putnam, Westchester, and Dutchess, and to a lesser extent, New York City and the adjacent New York counties of Orange and Rockland. The ability of the Bank’s borrowers to make principal and interest payments is dependent upon, among other things, the level of overall economic activity and the real estate market conditions prevailing within the Bank’s concentrated lending area.
Loans that management has the intent and ability to hold for the foreseeable future or until maturity or payoff are reported at the principal balance outstanding, net of deferred loan fees and costs, unamortized purchase premiums and discounts, and an allowance for loan losses. Interest income is accrued on the unpaid principal balance. Interest income on loans is discontinued at the time the loan is ninety days delinquent unless the loan is well secured and in process of collection. Loan purchase premiums and discounts are amortized over the contractual term of the loans. When loans are placed on non-accrual status, previously accrued but unpaid interest is reversed from income. Interest received on non-accrual loans is generally applied directly against the principal balance. Loans are returned to accrual status when all the principal and interest contractually due are brought current and future payments are reasonably assured.
Loan origination fees and certain direct loan origination costs are deferred and amortized to interest income as an adjustment to yield over the contractual term of the loans. Unamortized fees and costs on prepaid loans are recognized in interest income at the time of prepayment.
Purchased Credit Impaired Loans: The Bank purchases individual loans and groups of loans, some of which have shown evidence of credit deterioration since origination. These purchased credit impaired loans are recorded at the amount paid, such that there is no carryover of the seller’s allowance for loan losses. After acquisition, losses are recognized by an increase in the allowance for loan losses.
(Continued)
F-9
Table of Contents
PCSB BANK AND SUBSIDIARIES
NOTES TO CONSOLIDATED FINANCIAL STATEMENTS
Three months ended September 30, 2016 and 2015 (unaudited)
and Years ended June 30, 2016 and 2015
NOTE 1 – SUMMARY OF SIGNIFICANT ACCOUNTING POLICIES(Continued)
Such purchased credit impaired loans are accounted for individually or aggregated into pools of loans based on common risk characteristics, such as credit score, loan type, and date of origination. The Bank estimates the amount and timing of expected cash flows for each loan or pool, and the expected cash flows in excess of amount paid is recorded as interest income over the remaining life of the loan or pool (accretable yield). The excess of the loan’s or pool’s contractual principal and interest over expected cash flows is not recorded (nonaccretable difference).
Over the life of the loan or pool, expected cash flows continue to be estimated. If the present value of expected cash flows is less than the carrying amount, a loss is recorded as a provision for loan losses. If the present value of expected cash flows is greater than the carrying amount, it is recognized as part of future interest income.
Allowance for Loan Losses: The allowance for loan losses is a valuation allowance for probable incurred loan losses. The allowance for loan losses is increased by provisions for loan losses charged to income. Losses are charged to the allowance for loan losses when all or a portion of a loan is deemed to be uncollectible. Recoveries of loans previously charged off are credited to the allowance when realized. In management’s judgment, the allowance for loan losses is adequate to absorb probable incurred losses in the existing loan portfolio.
Establishing the allowance for loan losses involves significant management judgments utilizing the best information available at the time. Those judgments are subject to further review by the Bank’s regulators. Future adjustments to the allowance for loan losses may be necessary based on changes in economic and real estate market conditions, further information obtained regarding known problem loans, the identification of additional problem loans, and other factors.
The allowance consists of specific and general components. The specific component relates to loans that are individually classified as impaired.
A loan is considered impaired when, based on current information and events, it is probable that the Bank will be unable to collect the scheduled payments of principal or interest when due according to the contractual terms of the loan agreement. Factors considered by management in determining impairment include payment status, collateral value, and the probability of collecting scheduled principal and interest payments when due. Loans that experience insignificant payment delays and payment shortfalls generally are not classified as impaired. Management determines the significance of payment delays and payment shortfalls on a case-by-case basis, taking into consideration all of the circumstances surrounding the loan and the borrower, including length of the delay, the reasons for the delay, the borrower’s prior payment record, and the amount of the shortfall in relation to the principal and interest owed. Impairment is measured on a loan-by-loan basis for loans evaluated under the Bank’s normal loan review procedures. Smaller balance homogeneous loans are collectively evaluated for impairment (such as one-to-four family residential mortgage loans and consumer loans). Loans evaluated on an individual basis for impairment may be measured by the present value of expected future cash flows discounted at the loan’s effective interest rate, the loan’s observable market price, or the fair value of the collateral if the loan is collateral dependent.
The Bank’s impaired loans are generally collateral dependent. If the fair value of an impaired loan is less than its recorded investment, an impairment allowance is recognized and included in the allowance for loan losses.
(Continued)
F-10
Table of Contents
PCSB BANK AND SUBSIDIARIES
NOTES TO CONSOLIDATED FINANCIAL STATEMENTS
Three months ended September 30, 2016 and 2015 (unaudited)
and Years ended June 30, 2016 and 2015
NOTE 1 – SUMMARY OF SIGNIFICANT ACCOUNTING POLICIES(Continued)
Troubled debt restructurings are separately identified for impairment disclosures and are measured at the present value of estimated future cash flows using the loan’s effective rate at inception. If a troubled debt restructuring is considered to be a collateral dependent loan, the loan is reported at the fair value of the collateral. For troubled debt restructurings that subsequently default, the Bank determines the amount of reserve in accordance with the accounting policy for the allowance for loan losses.
The general component of the allowance covers non-impaired loans and is based on historical loss experience adjusted for current factors. The historical loss experience is determined by portfolio segment and is based on the actual loss history experienced by the Bank over a thirty-six month period, with heaviest weight placed on the most recent periods. This actual loss experience is supplemented with other economic factors based on the risks present for each portfolio segment. These economic factors include consideration of the following: lending policies, underwriting, charge-off and collection procedures; national and local economic trends and conditions; trends in nature and volume of the loan portfolio; experience, ability, and depth of lending management and other relevant staff; trends in delinquencies, classified loans and restructurings; quality of the loan review system and Board oversight; value of underlying collateral for collateral dependent loans; existence and effect of concentrations and levels; and effects of external factors, such as competition, legal and regulatory factors. The following portfolio segments have been identified: residential, other loans secured, commercial mortgage, construction, commercial, home equity and consumer and installment loans.
The risk characteristics of each of the identified portfolio segments are as follows:
Residential Loans– residential loans are generally made on the basis of the borrower’s ability to make repayment from his or her employment income or other income, and are secured by real property whose value tends to be more easily ascertainable. Repayment of residential loans is subject to adverse employment conditions in the local economy leading to increased default rate and decreased market values from oversupply in a geographic area. In general, these loans depend on the borrower’s continuing financial stability and, therefore, are likely to be adversely affected by various factors, including job loss, divorce, illness, or personal bankruptcy. Furthermore, the application of various federal and state laws, including federal and state bankruptcy and insolvency laws, may limit the amount that can be recovered on such loans.
Other Loans Secured– other loans secured by real estate are commercial loans extended for business purposes where a lien is recorded on real estate as collateral in addition to the business assets. Commercial loans are generally of higher risk than other types of loans as repayment is dependent on the borrower’s ability through business activities to generate sufficient cash flow to repay the loan. However, these loans carry less risk than commercial loans as the real estate collateral provides an additional source of repayment of the debt through the sale of the real estate in the event business conditions erode the borrowers’ capability to repay the debt through cash flow. In addition, the sale of the collateral property would require that any sales proceeds be applied to repay the Bank’s loan in order to satisfy the recorded lien.
(Continued)
F-11
Table of Contents
PCSB BANK AND SUBSIDIARIES
NOTES TO CONSOLIDATED FINANCIAL STATEMENTS
Three months ended September 30, 2016 and 2015 (unaudited)
and Years ended June 30, 2016 and 2015
NOTE 1 – SUMMARY OF SIGNIFICANT ACCOUNTING POLICIES(Continued)
Commercial Mortgage Loans– commercial and multifamily real estate loans are secured by multifamily and nonresidential real estate and generally have larger balances and involve a greater degree of risk than residential real estate loans. Repayment of commercial and multifamily real estate loans depend on the global cash flow analysis of the borrower and the net operating income of the property, the borrower’s expertise, credit history and profitability, and the value of the underlying property. Of primary concern in commercial real estate lending is the borrower’s creditworthiness and the cash flow generated from the property securing the loan. As a result, repayment of such loans may be subject, to a greater extent than residential real estate loans, to adverse conditions in the real estate market or the economy. Commercial and multifamily real estate is also subject to adverse market conditions that cause a decrease in market value or lease rates, obsolescence in location or function and market conditions associated with over supply of units in a specific region.
Construction Loans– construction financing is generally considered to involve a higher degree of risk of loss than long-term financing on improved, occupied real estate. Risk of loss on a construction loan depends largely upon the accuracy of the initial estimate of the property’s value at completion of construction and the estimated cost of construction. During the construction phase, a number of factors could result in delays and cost overruns. If the estimate of construction costs proves to be inaccurate, additional funds may be required to be advanced in excess of the amount originally committed to permit completion of the building. If the estimate of value proves to be inaccurate, the value of the building may be insufficient to assure full repayment if liquidation is required. If foreclosure is required on a building before or at completion due to a default, there can be no assurance that all of the unpaid balance of, and accrued interest on, the loan as well as related foreclosure and holding costs will be recovered.
Commercial Loans– commercial loans are generally of higher risk than other types of loans and typically are made on the basis of the borrower’s ability to make repayment from the cash flow of the borrower’s business. As a result, the availability of funds for the repayment of commercial loans may depend substantially on the success of the business itself. Furthermore, any collateral securing such loans may depreciate over time, may be difficult to appraise, and may fluctuate in value.
Home Equity Lines of Credit– home equity lines of credit consist of both fixed and variable interest rate products. These are primarily home equity loans to residential mortgage customers within the footprint of the primary lending territory. These loans generally will not exceed a combined (i.e., first and second mortgage) loan-to-value ratio of 75 percent at origination.
Consumer and Installment Loans– consumer and other loans generally have shorter terms and higher interest rates than one-to-four family mortgage loans. In addition, consumer and other loans expand the products and services we offer to better meet the financial services needs of our customers. Consumer and other loans generally involve greater credit risk than residential mortgage loans because of the difference in the underlying collateral. Repossessed collateral for a defaulted consumer loan may not provide an adequate source of repayment of the outstanding loan balance because of the greater likelihood of damage to, loss of, or depreciation in the underlying collateral. The remaining deficiency often does not warrant further substantial collection efforts against the borrower beyond obtaining a deficiency judgment. In addition, consumer loan collections depend on the borrower’s personal financial stability. Furthermore, the application of various federal and state laws, including federal and state bankruptcy and insolvency laws, may limit the amount that can be recovered on such loans.
(Continued)
F-12
Table of Contents
PCSB BANK AND SUBSIDIARIES
NOTES TO CONSOLIDATED FINANCIAL STATEMENTS
Three months ended September 30, 2016 and 2015 (unaudited)
and Years ended June 30, 2016 and 2015
NOTE 1 – SUMMARY OF SIGNIFICANT ACCOUNTING POLICIES(Continued)
Other Real Estate Owned (OREO): Assets acquired through or instead of loan foreclosure are initially recorded at fair value less costs to sell when acquired, establishing a new cost basis. These assets are subsequently accounted for at lower of cost or fair value less estimated costs to sell. If fair value declines subsequent to foreclosure, a valuation allowance is recorded through expense. Operating costs after acquisition are expensed.
Federal Home Loan Bank (FHLB) Stock: The Bank is a member of the FHLB system. Members are required to own a certain amount of stock based on the level of borrowings and other factors, and may invest in additional amounts. FHLB stock is carried at cost, classified as a restricted security, and periodically evaluated for impairment based on ultimate recovery of par value. Both cash and stock dividends are reported as income.
Bank Premises and Equipment: Bank premises and equipment are reported at cost less accumulated depreciation and amortization, except for land which is carried at cost. Depreciation expense is recognized on a straight-line basis over the estimated useful lives of the related assets. Amortization of leasehold improvements is recognized on a straight-line basis over the term of the lease or the life of the improvement, whichever is shorter. Costs incurred to improve or extend the life of the existing assets are capitalized. Repairs and maintenance, as well as renewals and replacements of a routine nature, are charged to expense as incurred.
Bank Owned Life Insurance (BOLI): BOLI policies are reflected on the consolidated statements of financial condition at cash surrender value, net of any deferred fees or loans. Changes in the net cash surrender value of the policies, as well as insurance proceeds received, are reflected in non-interest income on the consolidated statements of income and are not subject to income taxes.
Goodwill and Other Intangible Assets: Goodwill resulting from business combinations is generally determined as the excess of the fair value of the consideration transferred, plus the fair value of any noncontrolling interests in the acquiree, over the fair value of the net assets acquired and liabilities assumed as of the acquisition date. Goodwill and intangible assets acquired in a purchase business combination and determined to have an indefinite useful life are not amortized, but tested for impairment at least annually or more frequently if events and circumstances exists that indicate that a goodwill impairment test should be performed. The Bank has selected March 31st as the date to perform the annual impairment test. Intangible assets with definite useful lives are amortized over their estimated useful lives to their estimated residual values. Goodwill is the only intangible asset with an indefinite life on our balance sheet.
Other intangible assets, consisting of a core deposit intangible asset arising from a whole bank acquisition, are amortized on an accelerated method over their estimated useful lives of 10 years.
Loan Commitments and Related Financial Instruments: Financial instruments include off-balance-sheet credit instruments, such as commitments to make loans and commercial letters of credit, issued to meet customer financing needs. The face amount for these items represents the exposure to loss, before considering customer collateral or ability to repay. Such financial instruments are recorded when they are funded.
(Continued)
F-13
Table of Contents
PCSB BANK AND SUBSIDIARIES
NOTES TO CONSOLIDATED FINANCIAL STATEMENTS
Three months ended September 30, 2016 and 2015 (unaudited)
and Years ended June 30, 2016 and 2015
NOTE 1 – SUMMARY OF SIGNIFICANT ACCOUNTING POLICIES(Continued)
Income Taxes: Income tax expense is the total of current period income tax due or refundable and the change in net deferred tax assets. Deferred tax assets and liabilities are recognized for the estimated future tax effects attributable to “temporary differences” between the financial statement carrying amounts and tax bases of existing assets and liabilities. Deferred tax assets are reduced by a valuation allowance if, based on an analysis of available evidence, management determines that it is more likely than not that some portion or all of the deferred tax assets will not be realized. Adjustments to increase or decrease the valuation allowance are charged or credited, respectively, to income tax expense.
Deferred tax assets and liabilities are measured using the enacted tax rates expected to apply to taxable income in future years. The effect on deferred tax assets and liabilities of a change in tax laws or rates is recognized in the period that includes the enactment date of the change.
A tax position is recognized as a benefit only if it is “more likely than not” that the tax position would be sustained in a tax examination, with a tax examination being presumed to occur. The amount recognized is the largest amount of tax benefit that is greater than 50% likely of being realized on examination. For tax positions not meeting the “more likely than not” test, no tax benefit is recorded.
The Bank recognizes interest and/or penalties related to income tax matters in income tax expense.
Retirement Plans: Pension expense is the net of service and interest cost, return on plan assets and amortization of gains and losses not immediately recognized. Employee 401(k) expense is the amount of matching contributions. Supplemental retirement plan expense allocates the benefits over years of service.
Loss Contingencies: Loss contingencies, including claims and legal actions arising in the ordinary course of business, are recorded as liabilities when the likelihood of loss is probable and an amount or range of loss can be reasonably estimated. Management does not believe there are such matters that will have a material effect on the financial statements.
Fair Value of Financial Instruments: Fair values of financial instruments are estimated using relevant market information and other assumptions, as more fully disclosed in a separate note. Fair value estimates involve uncertainties and matters of significant judgment regarding interest rates, credit risk, prepayments, and other factors, especially in the absence of broad markets for particular items. Changes in assumptions or in market conditions could significantly affect the estimates.
Segment Reporting: While management monitors the revenue streams of the various products and services, the identifiable segments are not material and operations are managed and financial performance is evaluated on a Bank-wide basis. Accordingly, all of the financial service operations are considered by management to be aggregated in one reportable operating segment.
Reclassifications: Certain prior period amounts have been reclassified to conform to the current presentation. Reclassifications had no effect on prior period net income or equity.
(Continued)
F-14
Table of Contents
PCSB BANK AND SUBSIDIARIES
NOTES TO CONSOLIDATED FINANCIAL STATEMENTS
Three months ended September 30, 2016 and 2015 (unaudited)
and Years ended June 30, 2016 and 2015
NOTE 2 – SECURITIES
The fair value of available-for-sale securities and the related gross unrealized gains and losses recognized in accumulated other comprehensive loss were as follows (in thousands):
| Amortized Cost | Gross Unrealized Gains | Gross Unrealized Losses | Fair Value | |||||||||||||
September 30, 2016 (unaudited) | ||||||||||||||||
U. S. Government and agency obligations | $ | 60,408 | $ | 217 | $ | (30 | ) | $ | 60,595 | |||||||
Corporate and other debt securities | 8,500 | 219 | — | 8,719 | ||||||||||||
Mortgage-backed securities - residential | 39,688 | 582 | (42 | ) | 40,228 | |||||||||||
Equity securities | 49 | — | — | 49 | ||||||||||||
|
|
|
|
|
|
|
| |||||||||
Total available for sale | $ | 108,645 | $ | 1,018 | $ | (72 | ) | $ | 109,591 | |||||||
|
|
|
|
|
|
|
| |||||||||
June 30, 2016 | ||||||||||||||||
U. S. Government and agency obligations | $ | 65,953 | $ | 204 | $ | (25 | ) | $ | 66,132 | |||||||
Corporate and other debt securities | 8,514 | 132 | — | 8,646 | ||||||||||||
Mortgage-backed securities - residential | 37,043 | 542 | (61 | ) | 37,524 | |||||||||||
Equity securities | 49 | — | — | 49 | ||||||||||||
|
|
|
|
|
|
|
| |||||||||
Total available for sale | $ | 111,559 | $ | 878 | $ | (86 | ) | $ | 112,351 | |||||||
|
|
|
|
|
|
|
| |||||||||
June 30, 2015 | ||||||||||||||||
U. S. Government and agency obligations | $ | 47,036 | $ | 36 | $ | (155 | ) | $ | 46,917 | |||||||
Corporate and other debt securities | 4,530 | — | (121 | ) | 4,409 | |||||||||||
Mortgage-backed securities - residential | 32,791 | 788 | (11 | ) | 33,568 | |||||||||||
Equity securities | 49 | — | — | 49 | ||||||||||||
|
|
|
|
|
|
|
| |||||||||
Total available for sale | $ | 84,406 | $ | 824 | $ | (287 | ) | $ | 84,943 | |||||||
|
|
|
|
|
|
|
| |||||||||
(Continued)
F-15
Table of Contents
PCSB BANK AND SUBSIDIARIES
NOTES TO CONSOLIDATED FINANCIAL STATEMENTS
Three months ended September 30, 2016 and 2015 (unaudited)
and Years ended June 30, 2016 and 2015
NOTE 2 – SECURITIES(Continued)
The carrying amount, unrecognized gains and losses, and fair value of securities held to maturity were as follows (in thousands):
| Amortized Cost | Gross Unrecognized Gains | Gross Unrecognized Losses | Fair Value | |||||||||||||
September 30, 2016 (unaudited) | ||||||||||||||||
U. S. Government and agency obligations | $ | 139,572 | $ | 308 | $ | (24 | ) | $ | 139,856 | |||||||
Mortgage-backed securities – residential | 71,052 | 1,684 | (21 | ) | 72,715 | |||||||||||
Mortgage-backed securities – commercial mortgage obligations | 32,856 | 384 | (44 | ) | 33,196 | |||||||||||
Mortgage-backed securities – commercial | 21,591 | 889 | — | 22,480 | ||||||||||||
|
|
|
|
|
|
|
| |||||||||
Total held to maturity | $ | 265,071 | $ | 3,265 | $ | (89 | ) | $ | 268,247 | |||||||
|
|
|
|
|
|
|
| |||||||||
June 30, 2016 | ||||||||||||||||
U. S. Government and agency obligations | $ | 145,896 | $ | 357 | $ | (51 | ) | $ | 146,202 | |||||||
Mortgage-backed securities – residential | 72,842 | 1,342 | (45 | ) | 74,139 | |||||||||||
Mortgage-backed securities – commercial mortgage obligations | 30,268 | 350 | (38 | ) | 30,580 | |||||||||||
Mortgage-backed securities – commercial | 21,673 | 723 | — | 22,396 | ||||||||||||
|
|
|
|
|
|
|
| |||||||||
Total held to maturity | $ | 270,679 | $ | 2,772 | $ | (134 | ) | $ | 273,317 | |||||||
|
|
|
|
|
|
|
| |||||||||
June 30, 2015 | ||||||||||||||||
U. S. Government and agency obligations | $ | 169,027 | $ | 340 | $ | (300 | ) | $ | 169,067 | |||||||
Corporate and other debt securities | 226 | 1 | — | 227 | ||||||||||||
Mortgage-backed securities – residential | 59,675 | 585 | (442 | ) | 59,818 | |||||||||||
Mortgage-backed securities – commercial mortgage obligations | 21,150 | 105 | (157 | ) | 21,098 | |||||||||||
Mortgage-backed securities – commercial | 19,835 | 204 | (72 | ) | 19,967 | |||||||||||
|
|
|
|
|
|
|
| |||||||||
Total held to maturity | $ | 269,913 | $ | 1,235 | $ | (971 | ) | $ | 270,177 | |||||||
|
|
|
|
|
|
|
| |||||||||
The Bank did not sell any securities during the three months ended September 30, 2016 or 2015 or the year ended June 30, 2016. During the year ended June 30, 2015, the Bank sold 10 securities classified as available for sale with a carrying amount of $23.7 million, recognizing no gains or losses.
(Continued)
F-16
Table of Contents
PCSB BANK AND SUBSIDIARIES
NOTES TO CONSOLIDATED FINANCIAL STATEMENTS
Three months ended September 30, 2016 and 2015 (unaudited)
and Years ended June 30, 2016 and 2015
NOTE 2 – SECURITIES(Continued)
The following table presents the fair value and carrying amount of debt securities at September 30, 2016 and June 30, 2016, by contractual maturity (in thousands). Expected maturities may differ from contractual maturities if borrowers have the right to call or prepay obligations with or without call or prepayment penalties.
Securities not due at a single maturity date, primarily mortgage-backed securities, are shown separately.
| Held to Maturity | Available For Sale | |||||||||||||||
| Carrying Amount | Fair Value | Amortized Cost | Fair Value | |||||||||||||
September 30, 2016 (unaudited) | ||||||||||||||||
Due in one year or less | $ | 25,484 | $ | 25,526 | $ | 20,999 | $ | 21,017 | ||||||||
Due from one to five years | 106,035 | 106,168 | 39,909 | 40,161 | ||||||||||||
Due from five to ten years | — | — | 5,122 | 5,264 | ||||||||||||
Due after ten years | 8,053 | 8,162 | 2,878 | 2,873 | ||||||||||||
Mortgage-backed securities | 125,499 | 128,391 | 39,688 | 40,227 | ||||||||||||
|
|
|
|
|
|
|
| |||||||||
Total | $ | 265,071 | $ | 268,247 | $ | 108,596 | $ | 109,542 | ||||||||
|
|
|
|
|
|
|
| |||||||||
June 30, 2016 | ||||||||||||||||
Due in one year or less | $ | 22,005 | $ | 22,033 | $ | 19,490 | $ | 19,495 | ||||||||
Due from one to five years | 118,946 | 119,120 | 46,902 | 47,149 | ||||||||||||
Due from five to ten years | 632 | 637 | 5,127 | 5,187 | ||||||||||||
Due after ten years | 4,313 | 4,412 | 2,948 | 2,947 | ||||||||||||
Mortgage-backed securities | 124,783 | 127,115 | 37,043 | 37,524 | ||||||||||||
|
|
|
|
|
|
|
| |||||||||
Total | $ | 270,679 | $ | 273,317 | $ | 111,510 | $ | 112,302 | ||||||||
|
|
|
|
|
|
|
| |||||||||
Securities pledged at September, 30, 2016, June 30, 2016 and 2015 had carrying amounts of $79.6 million, $93.1 million and $96.7 million, respectively, and were pledged principally to secure FHLB advances and public deposits.
(Continued)
F-17
Table of Contents
PCSB BANK AND SUBSIDIARIES
NOTES TO CONSOLIDATED FINANCIAL STATEMENTS
Three months ended September 30, 2016 and 2015 (unaudited)
and Years ended June 30, 2016 and 2015
NOTE 2 – SECURITIES(Continued)
Securities with unrealized losses at September 30, 2016, June 30, 2016 and 2015, aggregated by investment category and length of time that individual securities have been in a continuous unrealized loss position, are as follows (in thousands):
| Less Than 12 Months | 12 Months or Longer | Total | ||||||||||||||||||||||
| Fair Value | Unrealized Loss | Fair Value | Unrealized Loss | Fair Value | Unrealized Loss | |||||||||||||||||||
September 30, 2016 (unaudited) | ||||||||||||||||||||||||
Available for sale | ||||||||||||||||||||||||
U. S. Government and agency obligations | $ | 12,350 | $ | (29 | ) | $ | 1,007 | $ | (1 | ) | $ | 13,357 | $ | (30 | ) | |||||||||
Mortgage-backed securities – residential | 7,608 | (37 | ) | 551 | (5 | ) | 8,159 | (42 | ) | |||||||||||||||
|
|
|
|
|
|
|
|
|
|
|
| |||||||||||||
Total available for sale | $ | 19,958 | $ | (66 | ) | $ | 1,558 | $ | (6 | ) | $ | 21,516 | $ | (72 | ) | |||||||||
|
|
|
|
|
|
|
|
|
|
|
| |||||||||||||
Held to maturity | ||||||||||||||||||||||||
U.S. Government and agency obligations | $ | 20,010 | $ | (23 | ) | $ | 1,999 | $ | (1 | ) | $ | 22,009 | $ | (24 | ) | |||||||||
Mortgage-backed securities – residential | 5,106 | (21 | ) | — | — | 5,106 | (21 | ) | ||||||||||||||||
Mortgage-backed securities – commercial mortgage obligations | 5,924 | (26 | ) | 3,540 | (18 | ) | 9,464 | (44 | ) | |||||||||||||||
|
|
|
|
|
|
|
|
|
|
|
| |||||||||||||
Total held to maturity | $ | 31,040 | $ | (70 | ) | $ | 5,539 | $ | (19 | ) | $ | 36,579 | $ | (89 | ) | |||||||||
|
|
|
|
|
|
|
|
|
|
|
| |||||||||||||
June 30, 2016 | ||||||||||||||||||||||||
Available for sale | ||||||||||||||||||||||||
U. S. Government and agency obligations | $ | 19,462 | $ | (22 | ) | $ | 1,007 | $ | (3 | ) | $ | 20,469 | $ | (25 | ) | |||||||||
Mortgage-backed securities – residential | 11,912 | (52 | ) | 676 | (9 | ) | 12,588 | (61 | ) | |||||||||||||||
|
|
|
|
|
|
|
|
|
|
|
| |||||||||||||
Total available for sale | $ | 31,374 | $ | (74 | ) | $ | 1,683 | $ | (12 | ) | $ | 33,057 | $ | (86 | ) | |||||||||
|
|
|
|
|
|
|
|
|
|
|
| |||||||||||||
Held to maturity | ||||||||||||||||||||||||
U.S. Government and agency obligations | $ | 22,000 | $ | (44 | ) | $ | 7,993 | $ | (7 | ) | $ | 29,993 | $ | (51 | ) | |||||||||
Mortgage-backed securities – residential | 6,886 | (19 | ) | 4,895 | (26 | ) | 11,781 | (45 | ) | |||||||||||||||
Mortgage-backed securities – commercial mortgage obligations | 4,420 | (20 | ) | 1,333 | (18 | ) | 5,753 | (38 | ) | |||||||||||||||
|
|
|
|
|
|
|
|
|
|
|
| |||||||||||||
Total held to maturity | $ | 33,306 | $ | (83 | ) | $ | 14,221 | $ | (51 | ) | $ | 47,527 | $ | (134 | ) | |||||||||
|
|
|
|
|
|
|
|
|
|
|
| |||||||||||||
(Continued)
F-18
Table of Contents
PCSB BANK AND SUBSIDIARIES
NOTES TO CONSOLIDATED FINANCIAL STATEMENTS
Three months ended September 30, 2016 and 2015 (unaudited)
and Years ended June 30, 2016 and 2015
NOTE 2 – SECURITIES(Continued)
| Less Than 12 Months | 12 Months or Longer | Total | ||||||||||||||||||||||
| Fair Value | Unrealized Loss | Fair Value | Unrealized Loss | Fair Value | Unrealized Loss | |||||||||||||||||||
June 30, 2015 | ||||||||||||||||||||||||
Available for sale | ||||||||||||||||||||||||
U. S. Government and agency obligations | $ | 14,925 | $ | (82 | ) | $ | 8,938 | $ | (73 | ) | $ | 23,863 | $ | (155 | ) | |||||||||
Corporate and other debt securities | 4,409 | (121 | ) | — | — | 4,409 | (121 | ) | ||||||||||||||||
Mortgage-backed securities – residential | 3,733 | (7 | ) | 1,076 | (4 | ) | 4,809 | (11 | ) | |||||||||||||||
|
|
|
|
|
|
|
|
|
|
|
| |||||||||||||
Total available for sale | $ | 23,067 | $ | (210 | ) | $ | 10,014 | $ | (77 | ) | $ | 33,081 | $ | (287 | ) | |||||||||
|
|
|
|
|
|
|
|
|
|
|
| |||||||||||||
Held to maturity | ||||||||||||||||||||||||
U.S. Government and agency obligations | $ | 26,174 | $ | (71 | ) | $ | 42,759 | $ | (229 | ) | $ | 68,933 | $ | (300 | ) | |||||||||
Mortgage-backed securities – residential | 21,835 | (152 | ) | 11,254 | (290 | ) | 33,089 | (442 | ) | |||||||||||||||
Mortgage-backed securities – commercial mortgage obligations | 5,097 | (106 | ) | 1,545 | (51 | ) | 6,642 | (157 | ) | |||||||||||||||
Mortgage-backed securities – commercial | 4,403 | (50 | ) | 1,605 | (22 | ) | 6,008 | (72 | ) | |||||||||||||||
|
|
|
|
|
|
|
|
|
|
|
| |||||||||||||
Total held to maturity | $ | 57,509 | $ | (379 | ) | $ | 57,163 | $ | (592 | ) | $ | 114,672 | $ | (971 | ) | |||||||||
|
|
|
|
|
|
|
|
|
|
|
| |||||||||||||
As of September 30, 2016, the Bank’s security portfolio consisted of $374.7 million in securities, of which 37 securities with a fair value of $58.1 million were in an unrealized loss position. The majority of unrealized losses are related to the Bank’s U.S. Government and agency obligations and mortgage-backed securities.
As of June 30, 2016, the Bank’s security portfolio consisted of $383.0 million in securities, of which 52 securities with a fair value of $80.6 million were in an unrealized loss position. The majority of unrealized losses are related to the Bank’s U.S. Government and agency obligations and mortgage-backed securities.
As of June 30, 2015, the Bank’s security portfolio consisted of $354.9 million in securities, of which 90 securities with a fair value of $147.8 million were in an unrealized loss position. The majority of unrealized losses are related to the Bank’s U.S. Government and agency obligations and mortgage-backed securities.
There were no securities for which the Bank believes it is not probable that it will collect all amounts due according to the contractual terms of the security as of September 30, 2016. The unrealized losses are a result of a change in interest rates. The Bank has determined that it does not intend to sell, or it is not more likely than not that it will be required to sell, its securities that are in an unrealized loss position prior to the recovery of its amortized cost basis. Therefore, the Bank did not consider any securities to be other-than-temporarily impaired as of September 30, 2016.
(Continued)
F-19
Table of Contents
PCSB BANK AND SUBSIDIARIES
NOTES TO CONSOLIDATED FINANCIAL STATEMENTS
Three months ended September 30, 2016 and 2015 (unaudited)
and Years ended June 30, 2016 and 2015
NOTE 3 – LOANS RECEIVABLE
Loans receivable are summarized as follows (in thousands):
| September 30, | June 30, | |||||||||||
| 2016 | 2016 | 2015 | ||||||||||
| (unaudited) | ||||||||||||
Mortgage Loans | ||||||||||||
Residential | $ | 222,750 | $ | 226,073 | $ | 240,448 | ||||||
Commercial | 375,896 | 385,827 | 324,574 | |||||||||
Construction | 28,802 | 25,050 | 11,886 | |||||||||
Net deferred loan origination costs | 319 | 319 | 187 | |||||||||
|
|
|
|
|
| |||||||
| 627,767 | 637,269 | 577,095 | ||||||||||
Commercial and consumer loans | ||||||||||||
Commercial loans | 33,823 | 40,607 | 48,054 | |||||||||
Other loans secured | 48,781 | 49,993 | 51,645 | |||||||||
Home equity lines of credit | 40,396 | 41,180 | 40,605 | |||||||||
Consumer and installment loans | 16,407 | 16,476 | 12,858 | |||||||||
Net deferred loan origination costs | 806 | 853 | 798 | |||||||||
|
|
|
|
|
| |||||||
| 140,213 | 149,109 | 153,960 | ||||||||||
|
|
|
|
|
| |||||||
Total loans receivable | 767,980 | 786,378 | 731,055 | |||||||||
Allowance for loan losses | (4,065 | ) | (4,042 | ) | (3,921 | ) | ||||||
|
|
|
|
|
| |||||||
Loans receivable, net | $ | 763,915 | $ | 782,336 | $ | 727,134 | ||||||
|
|
|
|
|
| |||||||
The Bank did not purchase any loans for the three months ended September 30, 2016. The Bank purchased $44.0 million of commercial mortgage and construction loans for the year ended June 30, 2016. Exclusive of the CMS Bank acquisition, the Bank purchased $3.6 million of loans in 2015.
(Continued)
F-20
Table of Contents
PCSB BANK AND SUBSIDIARIES
NOTES TO CONSOLIDATED FINANCIAL STATEMENTS
Three months ended September 30, 2016 and 2015 (unaudited)
and Years ended June 30, 2016 and 2015
NOTE 3 – LOANS RECEIVABLE(Continued)
The following table presents the activity in the allowance for loan losses by portfolio segment for the three months ended September 30, 2016 and 2015 and the years ended June 30, 2016 and 2015 (in thousands):
| Residential Mortgages | Commercial Mortgages | Construction Loans | Commercial Loans | Other Loans Secured | Home Equity Lines of Credit | Consumer and Installment | Total | |||||||||||||||||||||||||
September 30, 2016 (unaudited) | ||||||||||||||||||||||||||||||||
Originated loans: | ||||||||||||||||||||||||||||||||
Beginning balance | $ | 237 | $ | 2,149 | $ | 269 | $ | 604 | $ | 397 | $ | 73 | $ | 313 | $ | 4,042 | ||||||||||||||||
Provision | (69 | ) | (46 | ) | 33 | (218 | ) | 190 | (3 | ) | 101 | (12 | ) | |||||||||||||||||||
Loan (charge-offs) | — | — | — | — | (324 | ) | — | — | (324 | ) | ||||||||||||||||||||||
Recoveries | 70 | 18 | — | 173 | 98 | — | — | 359 | ||||||||||||||||||||||||
|
|
|
|
|
|
|
|
|
|
|
|
|
|
|
| |||||||||||||||||
Total ending allowance balance | $ | 238 | $ | 2,121 | $ | 302 | $ | 559 | $ | 361 | $ | 70 | $ | 414 | $ | 4,065 | ||||||||||||||||
|
|
|
|
|
|
|
|
|
|
|
|
|
|
|
| |||||||||||||||||
Acquired loans: | ||||||||||||||||||||||||||||||||
Beginning balance | $ | — | $ | — | $ | — | $ | — | $ | — | $ | — | $ | — | $ | — | ||||||||||||||||
Provision | 38 | — | — | — | — | — | — | 38 | ||||||||||||||||||||||||
Loan (charge-offs) | (38 | ) | — | — | — | — | — | — | (38 | ) | ||||||||||||||||||||||
Recoveries | — | — | — | — | — | — | — | |||||||||||||||||||||||||
|
|
|
|
|
|
|
|
|
|
|
|
|
|
|
| |||||||||||||||||
Total ending allowance balance | $ | — | $ | — | $ | — | $ | — | $ | — | $ | — | $ | — | $ | — | ||||||||||||||||
|
|
|
|
|
|
|
|
|
|
|
|
|
|
|
| |||||||||||||||||
Total loans: | ||||||||||||||||||||||||||||||||
Beginning balance | $ | 237 | $ | 2,149 | $ | 269 | $ | 604 | $ | 397 | $ | 73 | $ | 313 | $ | 4,042 | ||||||||||||||||
Provision | (31 | ) | (46 | ) | 33 | (218 | ) | 190 | (3 | ) | 101 | 26 | ||||||||||||||||||||
Loan (charge-offs) | (38 | ) | — | — | — | (324 | ) | — | — | (362 | ) | |||||||||||||||||||||
Recoveries | 70 | 18 | — | 173 | 98 | — | — | 359 | ||||||||||||||||||||||||
|
|
|
|
|
|
|
|
|
|
|
|
|
|
|
| |||||||||||||||||
Total ending allowance balance | $ | 238 | $ | 2,121 | $ | 302 | $ | 559 | $ | 361 | $ | 70 | $ | 414 | $ | 4,065 | ||||||||||||||||
|
|
|
|
|
|
|
|
|
|
|
|
|
|
|
| |||||||||||||||||
(Continued)
F-21
Table of Contents
PCSB BANK AND SUBSIDIARIES
NOTES TO CONSOLIDATED FINANCIAL STATEMENTS
Three months ended September 30, 2016 and 2015 (unaudited)
and Years ended June 30, 2016 and 2015
NOTE 3 – LOANS RECEIVABLE(Continued)
| Residential Mortgages | Commercial Mortgages | Construction Loans | Commercial Loans | Other Loans Secured | Home Equity Lines of Credit | Consumer and Installment | Total | |||||||||||||||||||||||||
September 30, 2015 | ||||||||||||||||||||||||||||||||
Originated loans: | ||||||||||||||||||||||||||||||||
Beginning balance | $ | 193 | $ | 1,766 | $ | 100 | $ | 1,266 | $ | 416 | $ | 69 | $ | 111 | $ | 3,921 | ||||||||||||||||
Provision | (6 | ) | 123 | (188 | ) | 97 | (7 | ) | (4 | ) | 26 | 41 | ||||||||||||||||||||
Loan (charge-offs) | — | — | — | (188 | ) | — | — | (14 | ) | (202 | ) | |||||||||||||||||||||
Recoveries | — | — | 192 | — | — | — | — | 192 | ||||||||||||||||||||||||
|
|
|
|
|
|
|
|
|
|
|
|
|
|
|
| |||||||||||||||||
Total ending allowance balance | $ | 187 | $ | 1,889 | $ | 104 | $ | 1,175 | $ | 409 | $ | 65 | $ | 123 | $ | 3,952 | ||||||||||||||||
|
|
|
|
|
|
|
|
|
|
|
|
|
|
|
| |||||||||||||||||
June 30, 2016 | ||||||||||||||||||||||||||||||||
Originated loans: | ||||||||||||||||||||||||||||||||
Beginning balance | $ | 193 | $ | 1,766 | $ | 100 | $ | 1,266 | $ | 416 | $ | 69 | $ | 111 | $ | 3,921 | ||||||||||||||||
Provision | 444 | 215 | (23 | ) | 1,006 | (19 | ) | 28 | 208 | 1,859 | ||||||||||||||||||||||
Loan (charge-offs) | (400 | ) | (10 | ) | — | (1,668 | ) | — | (24 | ) | (31 | ) | (2,133 | ) | ||||||||||||||||||
Recoveries | — | 178 | 192 | — | — | 25 | 395 | |||||||||||||||||||||||||
|
|
|
|
|
|
|
|
|
|
|
|
|
|
|
| |||||||||||||||||
Total ending allowance balance | $ | 237 | $ | 2,149 | $ | 269 | $ | 604 | $ | 397 | $ | 73 | $ | 313 | $ | 4,042 | ||||||||||||||||
|
|
|
|
|
|
|
|
|
|
|
|
|
|
|
| |||||||||||||||||
June 30, 2015 | ||||||||||||||||||||||||||||||||
Originated loans: | ||||||||||||||||||||||||||||||||
Beginning balance | $ | 219 | $ | 1,622 | $ | 828 | $ | 516 | $ | 564 | $ | 186 | $ | 122 | $ | 4,057 | ||||||||||||||||
Provision | 144 | 497 | (401 | ) | 1,221 | (148 | ) | (80 | ) | 93 | 1,326 | |||||||||||||||||||||
Loan (charge-offs) | (175 | ) | (361 | ) | (327 | ) | (1,181 | ) | — | (43 | ) | (104 | ) | (2,191 | ) | |||||||||||||||||
Recoveries | 5 | 8 | — | 710 | — | 6 | — | 729 | ||||||||||||||||||||||||
|
|
|
|
|
|
|
|
|
|
|
|
|
|
|
| |||||||||||||||||
Total ending allowance balance | $ | 193 | $ | 1,766 | $ | 100 | $ | 1,266 | $ | 416 | $ | 69 | $ | 111 | $ | 3,921 | ||||||||||||||||
|
|
|
|
|
|
|
|
|
|
|
|
|
|
|
| |||||||||||||||||
Loans acquired in 2015 did not incur any charge-offs or recoveries or result in additional provision for loss as of June 30, 2016 or 2015.
(Continued)
F-22
Table of Contents
PCSB BANK AND SUBSIDIARIES
NOTES TO CONSOLIDATED FINANCIAL STATEMENTS
Three months ended September 30, 2016 and 2015 (unaudited)
and Years ended June 30, 2016 and 2015
NOTE 3 – LOANS RECEIVABLE(Continued)
The following tables present the balance in the allowance for loan losses and the recorded investment in loans, excluding net deferred fees and accrued interest due to immateriality, by portfolio segment, and based on impairment method as of September 30, 2016, June 30, 2016 and 2015 (in thousands):
| Residential Mortgages | Commercial Mortgages | Construction Loans | Commercial Loans | Other Loans Secured | Home Equity Lines of Credit | Consumer and Installment | Total | |||||||||||||||||||||||||
September 30, 2016 (unaudited) | ||||||||||||||||||||||||||||||||
Allowance for loan losses: | ||||||||||||||||||||||||||||||||
Ending allowance balance attributable to loans: | ||||||||||||||||||||||||||||||||
Individually evaluated for impairment | $ | — | $ | — | $ | 84 | $ | 3 | $ | — | $ | — | $ | 175 | $ | 262 | ||||||||||||||||
Collectively evaluated for impairment | 238 | 2,121 | 218 | 556 | 361 | 70 | 239 | 3,803 | ||||||||||||||||||||||||
Acquired with deteriorated credit quality | — | — | — | — | — | — | — | — | ||||||||||||||||||||||||
|
|
|
|
|
|
|
|
|
|
|
|
|
|
|
| |||||||||||||||||
Total ending allowance balance | $ | 238 | $ | 2,121 | $ | 302 | $ | 559 | $ | 361 | $ | 70 | $ | 414 | $ | 4,065 | ||||||||||||||||
|
|
|
|
|
|
|
|
|
|
|
|
|
|
|
| |||||||||||||||||
Loans: | ||||||||||||||||||||||||||||||||
Loans individually evaluated for impairment | $ | 4,876 | $ | 5,447 | $ | 144 | $ | 924 | $ | 5,537 | $ | 674 | $ | 349 | $ | 17,951 | ||||||||||||||||
Loans collectively evaluated for impairment | 216,569 | 368,666 | 28,658 | 32,899 | 43,244 | 39,542 | 15,984 | 745,562 | ||||||||||||||||||||||||
Loans acquired with deteriorated credit quality | 1,305 | 1,783 | — | — | — | 180 | 74 | 3,342 | ||||||||||||||||||||||||
|
|
|
|
|
|
|
|
|
|
|
|
|
|
|
| |||||||||||||||||
Total ending loans balance | $ | 222,750 | $ | 375,896 | $ | 28,802 | $ | 33,823 | $ | 48,781 | $ | 40,396 | $ | 16,407 | $ | 766,855 | ||||||||||||||||
|
|
|
|
|
|
|
|
|
|
|
|
|
|
|
| |||||||||||||||||
(Continued)
F-23
Table of Contents
PCSB BANK AND SUBSIDIARIES
NOTES TO CONSOLIDATED FINANCIAL STATEMENTS
Three months ended September 30, 2016 and 2015 (unaudited)
and Years ended June 30, 2016 and 2015
NOTE 3 – LOANS RECEIVABLE(Continued)
| Residential Mortgages | Commercial Mortgages | Construction Loans | Commercial Loans | Other Loans Secured | Home Equity Lines of Credit | Consumer and Installment | Total | |||||||||||||||||||||||||
June 30, 2016 | ||||||||||||||||||||||||||||||||
Allowance for loan losses: | ||||||||||||||||||||||||||||||||
Ending allowance balance attributable to loans: | ||||||||||||||||||||||||||||||||
Individually evaluated for impairment | $ | — | $ | — | $ | 83 | $ | — | $ | 2 | $ | — | $ | 175 | $ | 260 | ||||||||||||||||
Collectively evaluated for impairment | 237 | 2,149 | 186 | 604 | 395 | 73 | 138 | 3,782 | ||||||||||||||||||||||||
Acquired with deteriorated credit quality | — | — | — | — | — | — | — | — | ||||||||||||||||||||||||
|
|
|
|
|
|
|
|
|
|
|
|
|
|
|
| |||||||||||||||||
Total ending allowance balance | $ | 237 | $ | 2,149 | $ | 269 | $ | 604 | $ | 397 | $ | 73 | $ | 313 | $ | 4,042 | ||||||||||||||||
|
|
|
|
|
|
|
|
|
|
|
|
|
|
|
| |||||||||||||||||
Loans: | ||||||||||||||||||||||||||||||||
Loans individually evaluated for impairment | $ | 5,483 | $ | 9,277 | $ | 144 | $ | 2,494 | $ | 6,465 | $ | 417 | $ | 585 | $ | 24,865 | ||||||||||||||||
Loans collectively evaluated for impairment | 219,310 | 374,772 | 24,906 | 38,113 | 43,528 | 40,583 | 15,807 | 757,019 | ||||||||||||||||||||||||
Loans acquired with deteriorated credit quality | 1,280 | 1,778 | — | — | — | 180 | 84 | 3,322 | ||||||||||||||||||||||||
|
|
|
|
|
|
|
|
|
|
|
|
|
|
|
| |||||||||||||||||
Total ending loans balance | $ | 226,073 | $ | 385,827 | $ | 25,050 | $ | 40,607 | $ | 49,993 | $ | 41,180 | $ | 16,476 | $ | 785,206 | ||||||||||||||||
|
|
|
|
|
|
|
|
|
|
|
|
|
|
|
| |||||||||||||||||
(Continued)
F-24
Table of Contents
PCSB BANK AND SUBSIDIARIES
NOTES TO CONSOLIDATED FINANCIAL STATEMENTS
Three months ended September 30, 2016 and 2015 (unaudited)
and Years ended June 30, 2016 and 2015
NOTE 3 – LOANS RECEIVABLE(Continued)
| Residential Mortgages | Commercial Mortgages | Construction Loans | Commercial Loans | Other Loans Secured | Home Equity Lines of Credit | Consumer and Installment | Total | |||||||||||||||||||||||||
June 30, 2015 | ||||||||||||||||||||||||||||||||
Allowance for loan losses: | ||||||||||||||||||||||||||||||||
Ending allowance balance attributable to loans: | ||||||||||||||||||||||||||||||||
Individually evaluated for impairment | $ | — | $ | 34 | $ | — | $ | 675 | $ | — | $ | — | $ | 29 | $ | 738 | ||||||||||||||||
Collectively evaluated for impairment | 193 | 1,732 | 100 | 591 | 416 | 69 | 82 | 3,183 | ||||||||||||||||||||||||
Acquired with deteriorated credit quality | — | — | — | — | — | — | — | — | ||||||||||||||||||||||||
|
|
|
|
|
|
|
|
|
|
|
|
|
|
|
| |||||||||||||||||
Total ending allowance balance | $ | 193 | $ | 1,766 | $ | 100 | $ | 1,266 | $ | 416 | $ | 69 | $ | 111 | $ | 3,921 | ||||||||||||||||
|
|
|
|
|
|
|
|
|
|
|
|
|
|
|
| |||||||||||||||||
Loans: | ||||||||||||||||||||||||||||||||
Loans individually evaluated for impairment | $ | 7,082 | $ | 9,422 | $ | 2,020 | $ | 4,617 | $ | 10,677 | $ | 438 | $ | 380 | $ | 34,636 | ||||||||||||||||
Loans collectively evaluated for impairment | 231,396 | 313,414 | 9,866 | 43,437 | 40,968 | 39,985 | 12,355 | 691,421 | ||||||||||||||||||||||||
Loans acquired with deteriorated credit quality | 1,970 | 1,738 | — | — | — | 182 | 123 | 4,013 | ||||||||||||||||||||||||
|
|
|
|
|
|
|
|
|
|
|
|
|
|
|
| |||||||||||||||||
Total ending loans balance | $ | 240,448 | $ | 324,574 | $ | 11,886 | $ | 48,054 | $ | 51,645 | $ | 40,605 | $ | 12,858 | $ | 730,070 | ||||||||||||||||
|
|
|
|
|
|
|
|
|
|
|
|
|
|
|
| |||||||||||||||||
(Continued)
F-25
Table of Contents
PCSB BANK AND SUBSIDIARIES
NOTES TO CONSOLIDATED FINANCIAL STATEMENTS
Three months ended September 30, 2016 and 2015 (unaudited)
and Years ended June 30, 2016 and 2015
NOTE 3 – LOANS RECEIVABLE(Continued)
The following table presents information related to loans individually evaluated for impairment (excluding loans acquired with deteriorated credit quality) by class of loans as of and for the three months ended September 30, 2016 and years ended June 30, 2016 and 2015 (in thousands):
| Unpaid Principal Balance | Recorded Investment | Allowance for Loan Losses Allocated | Average Recorded Investment | Interest Income Recognized | Cash Basis Interest Recognized | |||||||||||||||||||
September 30, 2016 (unaudited) | ||||||||||||||||||||||||
With no related allowance recorded: | ||||||||||||||||||||||||
Residential mortgages | $ | 5,068 | $ | 4,876 | $ | — | $ | 5,044 | $ | 27 | $ | 46 | ||||||||||||
Commercial mortgages | 6,431 | 5,447 | — | 7,341 | 88 | 97 | ||||||||||||||||||
Construction | 12 | 12 | — | 12 | — | — | ||||||||||||||||||
Commercial loans | 2,114 | 832 | — | 1,644 | 1 | 1 | ||||||||||||||||||
Other loans secured | 6,697 | 5,537 | — | 5,954 | 80 | 111 | ||||||||||||||||||
Home equity lines of credit | 694 | 674 | — | 545 | 5 | (3 | ) | |||||||||||||||||
Consumer and installment | 78 | — | — | 118 | — | — | ||||||||||||||||||
With an allowance recorded: | ||||||||||||||||||||||||
Construction | 1,324 | 132 | 84 | 132 | — | — | ||||||||||||||||||
Other loans secured | 92 | 92 | 3 | 93 | 1 | (1 | ) | |||||||||||||||||
Consumer and installment | 353 | 349 | 175 | 349 | — | — | ||||||||||||||||||
|
|
|
|
|
|
|
|
|
|
|
| |||||||||||||
Total | $ | 22,863 | $ | 17,951 | $ | 262 | $ | 21,232 | $ | 202 | $ | 251 | ||||||||||||
|
|
|
|
|
|
|
|
|
|
|
| |||||||||||||
June 30, 2016 | ||||||||||||||||||||||||
With no related allowance recorded: | ||||||||||||||||||||||||
Residential mortgages | $ | 5,683 | $ | 5,483 | $ | — | $ | 6,434 | $ | 53 | $ | 72 | ||||||||||||
Commercial mortgages | 9,947 | 9,277 | — | 12,253 | 504 | 485 | ||||||||||||||||||
Construction | 12 | 12 | — | 393 | 7 | 7 | ||||||||||||||||||
Commercial loans | 5,250 | 2,494 | — | 3,781 | 6 | 7 | ||||||||||||||||||
Other loans secured | 7,762 | 6,408 | — | 6,901 | 159 | 201 | ||||||||||||||||||
Home equity lines of credit | 445 | 417 | — | 692 | — | 1 | ||||||||||||||||||
Consumer and installment | 314 | 236 | — | 322 | — | 2 | ||||||||||||||||||
With an allowance recorded: | ||||||||||||||||||||||||
Construction | 1,324 | 132 | 83 | 132 | — | — | ||||||||||||||||||
Other loans secured | 57 | 57 | 2 | 35 | 2 | 1 | ||||||||||||||||||
Consumer and installment | 353 | 349 | 175 | 70 | 10 | 10 | ||||||||||||||||||
|
|
|
|
|
|
|
|
|
|
|
| |||||||||||||
Total | $ | 31,147 | $ | 24,865 | $ | 260 | $ | 31,013 | $ | 741 | $ | 786 | ||||||||||||
|
|
|
|
|
|
|
|
|
|
|
| |||||||||||||
(Continued)
F-26
Table of Contents
PCSB BANK AND SUBSIDIARIES
NOTES TO CONSOLIDATED FINANCIAL STATEMENTS
Three months ended September 30, 2016 and 2015 (unaudited)
and Years ended June 30, 2016 and 2015
NOTE 3 – LOANS RECEIVABLE(Continued)
| Unpaid Principal Balance | Recorded Investment | Allowance for Loan Losses Allocated | Average Recorded Investment | Interest Income Recognized | Cash Basis Interest Recognized | |||||||||||||||||||
June 30, 2015 | ||||||||||||||||||||||||
With no related allowance recorded: | ||||||||||||||||||||||||
Residential mortgages | $ | 7,064 | $ | 7,082 | $ | — | $ | 6,216 | $ | 146 | $ | 144 | ||||||||||||
Commercial mortgages | 9,395 | 9,121 | — | 7,365 | 242 | 257 | ||||||||||||||||||
Construction | 1,984 | 2,020 | — | 4,271 | — | — | ||||||||||||||||||
Commercial loans | — | — | — | 3,266 | 175 | 179 | ||||||||||||||||||
Other loans secured | 11,528 | 10,634 | — | 11,570 | 587 | 591 | ||||||||||||||||||
Home equity lines of credit | 457 | 438 | — | 254 | 1 | 1 | ||||||||||||||||||
Consumer and installment | 5 | 5 | — | 1 | — | — | ||||||||||||||||||
With an allowance recorded: | ||||||||||||||||||||||||
Commercial mortgages | 511 | 301 | 34 | 60 | — | — | ||||||||||||||||||
Commercial loans | 5,800 | 4,617 | 675 | 1,669 | 18 | 18 | ||||||||||||||||||
Other loans secured | 43 | 43 | — | 36 | — | — | ||||||||||||||||||
Consumer and installment | 478 | 375 | 29 | 131 | 5 | 5 | ||||||||||||||||||
|
|
|
|
|
|
|
|
|
|
|
| |||||||||||||
Total | $ | 37,265 | $ | 34,636 | $ | 738 | $ | 34,839 | $ | 1,174 | $ | 1,195 | ||||||||||||
|
|
|
|
|
|
|
|
|
|
|
| |||||||||||||
The following table presents the recorded investment in nonaccrual and loans past due over 90 days still on accrual by class of loans as of September 30, 2016 and June 30, 2016 and 2015 (in thousands):
| Nonaccrual | Loans Past Due Over 90 Days Still Accruing | |||||||||||||||||||||||
| 9/30/16 | 6/30/16 | 6/30/15 | 9/30/16 | 6/30/16 | 6/30/15 | |||||||||||||||||||
| (unaudited) | (unaudited) | |||||||||||||||||||||||
Originated loans: | ||||||||||||||||||||||||
Residential mortgages | $ | 3,575 | $ | 4,717 | $ | 4,389 | $ | — | $ | — | $ | — | ||||||||||||
Commercial mortgages | 307 | 300 | 6,308 | — | — | — | ||||||||||||||||||
Construction | 144 | 144 | 2,020 | — | — | — | ||||||||||||||||||
Commercial loans | 155 | 1,615 | 3,254 | — | — | — | ||||||||||||||||||
Other loans secured | 2,613 | 3,433 | 3,757 | — | — | 514 | ||||||||||||||||||
Home equity lines of credit | 366 | 405 | 424 | — | — | — | ||||||||||||||||||
Consumer and installment | 352 | 584 | 310 | — | 4 | 4 | ||||||||||||||||||
|
|
|
|
|
|
|
|
|
|
|
| |||||||||||||
Total originated loans | $ | 7,512 | $ | 11,198 | $ | 20,462 | $ | — | $ | 4 | $ | 518 | ||||||||||||
|
|
|
|
|
|
|
|
|
|
|
| |||||||||||||
Acquired loans: | ||||||||||||||||||||||||
Residential mortgages | $ | 930 | $ | 1,164 | $ | — | $ | — | $ | — | $ | — | ||||||||||||
Home equity lines of credit | 296 | 197 | — | — | — | — | ||||||||||||||||||
Consumer and installment | 4 | — | — | — | — | — | ||||||||||||||||||
|
|
|
|
|
|
|
|
|
|
|
| |||||||||||||
Total acquired loans | $ | 1,230 | 1,361 | $ | — | $ | — | $ | — | $ | — | |||||||||||||
|
|
|
|
|
|
|
|
|
|
|
| |||||||||||||
Total | $ | 8,742 | $ | 12,559 | $ | 20,462 | $ | — | $ | 4 | $ | 518 | ||||||||||||
|
|
|
|
|
|
|
|
|
|
|
| |||||||||||||
(Continued)
F-27
Table of Contents
PCSB BANK AND SUBSIDIARIES
NOTES TO CONSOLIDATED FINANCIAL STATEMENTS
Three months ended September 30, 2016 and 2015 (unaudited)
and Years ended June 30, 2016 and 2015
NOTE 3 – LOANS RECEIVABLE(Continued)
Nonperforming loans include both smaller-balance homogeneous loans that are collectively evaluated for impairment and individually classified impaired loans. The table above excludes acquired loans that are accounted for as purchased credit impaired loans totaling $3.3 million, $3.3 million and $4.0 million, respectively, as of September 30, 2016, June 30, 2016 and 2015. Such loans are excluded because the loans are in pools that are considered performing. The discounts arising from recording these loans at fair value upon acquisition were due in part to credit quality and the accretable yield is being recognized as interest income over the life of the loans based on expected cash flows.
The following table presents the aging of the recorded investment in past due loans by class of loans as of September 30, 2016, June 30, 2016 and 2015 (in thousands):
| 30 -59 Days Past Due | 60 -89 Days Past Due | Greater than 90 Days Past Due | Total Past Due | Loans Not Past Due | Total | |||||||||||||||||||
September 30, 2016 (unaudited) | ||||||||||||||||||||||||
Originated loans: | ||||||||||||||||||||||||
Residential mortgages | $ | — | $ | 208 | $ | 2,421 | $ | 2,629 | $ | 150,633 | $ | 153,262 | ||||||||||||
Commercial mortgages | — | — | 307 | 307 | 285,948 | 286,255 | ||||||||||||||||||
Construction | — | — | 144 | 144 | 28,342 | 28,486 | ||||||||||||||||||
Commercial loans | — | — | — | — | 31,401 | 31,401 | ||||||||||||||||||
Other loans secured | — | — | 102 | 102 | 45,944 | 46,046 | ||||||||||||||||||
Home equity lines of credit | — | — | 122 | 122 | 33,833 | 33,955 | ||||||||||||||||||
Consumer and installment loans | — | — | 352 | 352 | 15,666 | 16,018 | ||||||||||||||||||
|
|
|
|
|
|
|
|
|
|
|
| |||||||||||||
Total originated | $ | — | $ | 208 | $ | 3,448 | $ | 3,656 | $ | 591,767 | $ | 595,423 | ||||||||||||
|
|
|
|
|
|
|
|
|
|
|
| |||||||||||||
Acquired loans: | ||||||||||||||||||||||||
Residential mortgages | $ | — | $ | — | $ | 1,469 | $ | 1,469 | $ | 68,019 | $ | 69,488 | ||||||||||||
Commercial mortgages | — | — | 520 | 520 | 89,121 | 89,641 | ||||||||||||||||||
Construction | — | — | — | — | 316 | 316 | ||||||||||||||||||
Commercial loans | — | — | — | — | 2,422 | 2,422 | ||||||||||||||||||
Other loans secured | — | — | — | — | 2,735 | 2,735 | ||||||||||||||||||
Home equity lines of credit | — | — | 296 | 296 | 6,145 | 6,441 | ||||||||||||||||||
Consumer and installment loans | — | 1 | 3 | 4 | 385 | 389 | ||||||||||||||||||
|
|
|
|
|
|
|
|
|
|
|
| |||||||||||||
Total acquired | $ | — | $ | — | $ | 2,288 | $ | 2,288 | $ | 169,144 | $ | 171,432 | ||||||||||||
|
|
|
|
|
|
|
|
|
|
|
| |||||||||||||
Total | $ | — | $ | 209 | $ | 5,736 | $ | 5,944 | $ | 760,911 | $ | 766,855 | ||||||||||||
|
|
|
|
|
|
|
|
|
|
|
| |||||||||||||
(Continued)
F-28
Table of Contents
PCSB BANK AND SUBSIDIARIES
NOTES TO CONSOLIDATED FINANCIAL STATEMENTS
Three months ended September 30, 2016 and 2015 (unaudited)
and Years ended June 30, 2016 and 2015
NOTE 3 – LOANS RECEIVABLE(Continued)
| 30 -59 Days Past Due | 60 -89 Days Past Due | Greater than 90 Days Past Due | Total Past Due | Loans Not Past Due | Total | |||||||||||||||||||
June 30, 2016 | ||||||||||||||||||||||||
Originated loans: | ||||||||||||||||||||||||
Residential mortgages | $ | 430 | $ | 573 | $ | 2,232 | $ | 3,235 | $ | 150,010 | $ | 153,245 | ||||||||||||
Commercial mortgages | — | — | 300 | 300 | 291,044 | 291,344 | ||||||||||||||||||
Construction | — | — | 144 | 144 | 24,590 | 24,734 | ||||||||||||||||||
Commercial loans | — | 760 | 1,615 | 2,375 | 35,621 | 37,996 | ||||||||||||||||||
Other loans secured | — | — | 100 | 100 | 47,175 | 47,275 | ||||||||||||||||||
Home equity lines of credit | — | — | 113 | 113 | 34,340 | 34,453 | ||||||||||||||||||
Consumer and installment loans | 5 | — | 589 | 594 | 15,280 | 15,874 | ||||||||||||||||||
|
|
|
|
|
|
|
|
|
|
|
| |||||||||||||
Total originated | $ | 435 | $ | 1,333 | $ | 5,093 | $ | 6,861 | $ | 598,060 | $ | 604,921 | ||||||||||||
|
|
|
|
|
|
|
|
|
|
|
| |||||||||||||
Acquired loans: | ||||||||||||||||||||||||
Residential mortgages | $ | 732 | $ | — | $ | 1,073 | $ | 1,805 | $ | 71,023 | $ | 72,828 | ||||||||||||
Commercial mortgages | — | — | 520 | 520 | 93,963 | 94,483 | ||||||||||||||||||
Construction | — | — | — | — | 316 | 316 | ||||||||||||||||||
Commercial loans | — | — | — | — | 2,611 | 2,611 | ||||||||||||||||||
Other loans secured | — | — | — | — | 2,718 | 2,718 | ||||||||||||||||||
Home equity lines of credit | 296 | — | 197 | 493 | 6,234 | 6,727 | ||||||||||||||||||
Consumer and installment loans | — | — | — | — | 602 | 602 | ||||||||||||||||||
|
|
|
|
|
|
|
|
|
|
|
| |||||||||||||
Total acquired | $ | 1,028 | $ | — | $ | 1,790 | $ | 2,818 | $ | 177,467 | $ | 180,285 | ||||||||||||
|
|
|
|
|
|
|
|
|
|
|
| |||||||||||||
Total | $ | 1,463 | $ | 1,333 | $ | 6,883 | $ | 9,679 | $ | 775,527 | $ | 785,206 | ||||||||||||
|
|
|
|
|
|
|
|
|
|
|
| |||||||||||||
June 30, 2015 | ||||||||||||||||||||||||
Originated loans: | ||||||||||||||||||||||||
Residential mortgages | $ | — | $ | 553 | $ | 4,062 | $ | 6,290 | $ | 151,807 | $ | 156,422 | ||||||||||||
Commercial mortgages | — | — | 1,195 | 1,195 | 215,519 | 216,714 | ||||||||||||||||||
Construction | — | — | 2,020 | 2,020 | 9,550 | 11,570 | ||||||||||||||||||
Commercial loans | — | 1,475 | 1,692 | 3,254 | 37,602 | 40,769 | ||||||||||||||||||
Other loans secured | — | — | 663 | 663 | 50,663 | 51,326 | ||||||||||||||||||
Home equity lines of credit | — | — | 424 | 481 | 32,562 | 32,986 | ||||||||||||||||||
Consumer and installment loans | 47 | 211 | 118 | 376 | 11,269 | 11,645 | ||||||||||||||||||
|
|
|
|
|
|
|
|
|
|
|
| |||||||||||||
Total originated | $ | 47 | $ | 2,239 | $ | 10,174 | $ | 14,279 | $ | 508,972 | $ | 521,432 | ||||||||||||
|
|
|
|
|
|
|
|
|
|
|
| |||||||||||||
Acquired loans: | ||||||||||||||||||||||||
Residential mortgages | $ | — | $ | — | $ | 1,477 | $ | 1,477 | $ | 82,549 | $ | 84,026 | ||||||||||||
Commercial mortgages | — | 498 | — | 498 | 107,362 | 107,860 | ||||||||||||||||||
Construction | — | — | — | — | 316 | 316 | ||||||||||||||||||
Commercial loans | — | — | — | — | 7,285 | 7,285 | ||||||||||||||||||
Other loans secured | — | — | — | — | 319 | 319 | ||||||||||||||||||
Home equity lines of credit | — | — | — | — | 7,619 | 7,619 | ||||||||||||||||||
Consumer and installment loans | — | — | — | — | 1,213 | 1,213 | ||||||||||||||||||
|
|
|
|
|
|
|
|
|
|
|
| |||||||||||||
Total acquired | $ | — | $ | 498 | $ | 1,477 | $ | 1,975 | $ | 206,663 | $ | 208,638 | ||||||||||||
|
|
|
|
|
|
|
|
|
|
|
| |||||||||||||
Total | $ | 47 | $ | 2,737 | $ | 11,651 | $ | 14,434 | $ | 715,635 | $ | 730,070 | ||||||||||||
|
|
|
|
|
|
|
|
|
|
|
| |||||||||||||
(Continued)
F-29
Table of Contents
PCSB BANK AND SUBSIDIARIES
NOTES TO CONSOLIDATED FINANCIAL STATEMENTS
Three months ended September 30, 2016 and 2015 (unaudited)
and Years ended June 30, 2016 and 2015
NOTE 3 – LOANS RECEIVABLE(Continued)
Troubled Debt Restructurings
During the years ended June 30, 2016 and 2015, the terms of certain loans were modified as troubled debt restructurings. The modification of the terms of such loans included one or a combination of the following: a reduction of the stated interest rate of the loan; an extension of the maturity date at a stated rate of interest lower than the current market rate for new debt with similar risk; or a permanent reduction of the recorded investment in the loan.
As of September 30, 2016, June 30, 2016 and 2015, the Bank had 24, 26 and 31 loans classified as troubled debt restructurings totaling $13.9 million, $18.6 million and $22.5 million, respectively, of which $9.4 million, $13.3 million and $11.7 million are performing in accordance with their modified terms. The Bank has allocated $3,000, $2,000 and $124,000 of specific reserves to customers whose loan terms have been modified in troubled debt restructurings as of September 30, 2016, June 30, 2016 and 2015, and has not committed to lend additional amounts to customers with outstanding loans that are classified as troubled debt restructurings.
The Bank did not modify any loans as troubled debt restructurings during the three month ended September 30, 2016. The following table presents loans by class modified as troubled debt restructurings that occurred during the years ended June 30, 2016 and 2015 (in thousands):
| Number of Loans | Pre- Modification Outstanding Recorded Investment | Post- Modification Outstanding Recorded Investment | ||||||||||
June 30, 2016 | ||||||||||||
Troubled debt restructurings: | ||||||||||||
Residential | 3 | $ | 1,697 | $ | 1,697 | |||||||
Commercial mortgages | 1 | 1,178 | 1,178 | |||||||||
Other loans secured | 1 | 64 | 64 | |||||||||
Home equity lines of credit | 1 | 200 | 200 | |||||||||
|
|
|
|
|
| |||||||
Total | 6 | $ | 3,319 | $ | 3,319 | |||||||
|
|
|
|
|
| |||||||
June 30, 2015 | ||||||||||||
Troubled debt restructurings: | ||||||||||||
Residential | 4 | $ | 2,080 | $ | 2,080 | |||||||
Commercial mortgages | 3 | 4,103 | 4,103 | |||||||||
Construction | 1 | 1,742 | 1,742 | |||||||||
Commercial loans | 3 | 1,071 | 1,071 | |||||||||
Other loans secured | 3 | 183 | 183 | |||||||||
Home equity lines of credit | 1 | 8 | 8 | |||||||||
|
|
|
|
|
| |||||||
Total | 15 | $ | 9,187 | $ | 9,187 | |||||||
|
|
|
|
|
| |||||||
(Continued)
F-30
Table of Contents
PCSB BANK AND SUBSIDIARIES
NOTES TO CONSOLIDATED FINANCIAL STATEMENTS
Three months ended September 30, 2016 and 2015 (unaudited)
and Years ended June 30, 2016 and 2015
NOTE 3 – LOANS RECEIVABLE(Continued)
There were no troubled debt restructurings for which there was a subsequent payment default following the modification for the three months ended September 30, 2016 or the years ended June 30, 2016 and June 30, 2015.
In order to determine whether a borrower is experiencing financial difficulty, an evaluation is performed of the probability that the borrower will be in payment default on any of its debt in the foreseeable future without the modification. This evaluation is performed under the Bank’s internal underwriting policy.
Certain loans, which were modified during the periods presented, did not meet the definition of a troubled debt restructuring, as the modification was a delay in a payment, ranging from thirty days to six months, which was considered to be insignificant.
Credit Quality Indicators
The Bank categorizes loans into risk categories based on relevant information about the ability of borrowers to service their debt such as: current financial information, historical payment experience, credit documentation, public information, and current economic trends, among other factors. The Bank analyzes loans individually by classifying the loans as to credit risk. This analysis includes non-homogeneous loans, such as commercial and commercial real estate loans. This analysis is performed on a monthly basis. The Bank utilized the same grading process for acquired loans as it does for originated loans. The Bank uses the following definitions for risk ratings:
Special Mention –Loans classified as special mention have a potential weakness that deserves management’s close attention. If left uncorrected, these potential weaknesses may result in deterioration of the repayment prospects for the loan or of the institution’s credit position at some future date.
Substandard –Loans classified as substandard are inadequately protected by the current net worth and paying capacity of the obligor or of the collateral pledged, if any. Loans so classified have a well-defined weakness or weaknesses that jeopardize the liquidation of the debt. They are characterized by the distinct possibility that the institution will sustain some loss if the deficiencies are not corrected.
Doubtful –Loans classified as doubtful have all the weaknesses inherent in those classified as substandard, with the added characteristic that the weaknesses make collection or liquidation in full, on the basis of currently existing facts, conditions, and values, highly questionable and improbable.
(Continued)
F-31
Table of Contents
PCSB BANK AND SUBSIDIARIES
NOTES TO CONSOLIDATED FINANCIAL STATEMENTS
Three months ended September 30, 2016 and 2015 (unaudited)
and Years ended June 30, 2016 and 2015
NOTE 3 – LOANS RECEIVABLE(Continued)
Loans not meeting the criteria above that are analyzed individually as part of the above-described process and loans in groups of homogenous loans are considered to be pass rated loans. These loans are monitored based on delinquency and performance as disclosed in a previous table. Based on the most recent analysis performed, the risk category of loans by class of loans is as follows (in thousands):
| Pass | Special Mention | Substandard | Doubtful | Total | ||||||||||||||||
September 30, 2016 (unaudited) | ||||||||||||||||||||
Originated: | ||||||||||||||||||||
Residential mortgages | $ | 149,111 | $ | 101 | $ | 4,050 | $ | — | $ | 153,262 | ||||||||||
Commercial mortgages | 277,912 | 1,993 | 6,350 | — | 286,255 | |||||||||||||||
Construction | 28,342 | — | 144 | — | 28,486 | |||||||||||||||
Commercial loans | 26,660 | 1,235 | 3,506 | — | 31,401 | |||||||||||||||
Other loans secured | 38,207 | — | 7,839 | — | 46,046 | |||||||||||||||
Home equity lines of credit | 33,589 | — | 366 | — | 33,955 | |||||||||||||||
Consumer and installment | 15,510 | 3 | 156 | 349 | 16,018 | |||||||||||||||
|
|
|
|
|
|
|
|
|
| |||||||||||
Total originated | $ | 569,331 | $ | 3,332 | $ | 22,411 | $ | 349 | $ | 595,423 | ||||||||||
|
|
|
|
|
|
|
|
|
| |||||||||||
Acquired: | ||||||||||||||||||||
Residential mortgages | $ | 66,824 | $ | — | $ | 2,664 | $ | — | $ | 69,488 | ||||||||||
Commercial mortgages | 86,563 | 943 | 2,135 | — | 89,641 | |||||||||||||||
Construction | 316 | — | — | — | 316 | |||||||||||||||
Commercial loans | 2,422 | — | — | — | 2,422 | |||||||||||||||
Other loans secured | 2,735 | — | — | — | 2,735 | |||||||||||||||
Home equity lines of credit | 5,948 | — | 493 | — | 6,441 | |||||||||||||||
Consumer and installment | 389 | — | — | — | 389 | |||||||||||||||
|
|
|
|
|
|
|
|
|
| |||||||||||
Total acquired | $ | 165,197 | $ | 943 | $ | 5,292 | $ | — | $ | 171,432 | ||||||||||
|
|
|
|
|
|
|
|
|
| |||||||||||
Total | $ | 734,528 | $ | 4,275 | $ | 27,703 | $ | 349 | $ | 766,855 | ||||||||||
|
|
|
|
|
|
|
|
|
| |||||||||||
(Continued)
F-32
Table of Contents
PCSB BANK AND SUBSIDIARIES
NOTES TO CONSOLIDATED FINANCIAL STATEMENTS
Three months ended September 30, 2016 and 2015 (unaudited)
and Years ended June 30, 2016 and 2015
NOTE 3 – LOANS RECEIVABLE(Continued)
| Pass | Special Mention | Substandard | Doubtful | Total | ||||||||||||||||
June 30, 2016 | ||||||||||||||||||||
Originated: | ||||||||||||||||||||
Residential mortgages | $ | 147,944 | $ | 181 | $ | 5,120 | $ | — | $ | 153,245 | ||||||||||
Commercial mortgages | 278,491 | 2,101 | 10,752 | — | 291,344 | |||||||||||||||
Construction | 24,590 | — | 144 | — | 24,734 | |||||||||||||||
Commercial loans | 30,916 | 2,004 | 5,076 | — | 37,996 | |||||||||||||||
Other loans secured | 38,382 | 109 | 8,784 | — | 47,275 | |||||||||||||||
Home equity lines of credit | 34,047 | — | 406 | — | 34,453 | |||||||||||||||
Consumer and installment | 15,069 | 24 | 432 | 349 | 15,874 | |||||||||||||||
|
|
|
|
|
|
|
|
|
| |||||||||||
Total originated | $ | 569,439 | $ | 4,419 | $ | 30,714 | $ | 349 | $ | 604,921 | ||||||||||
|
|
|
|
|
|
|
|
|
| |||||||||||
Acquired: | ||||||||||||||||||||
Residential mortgages | $ | 70,629 | $ | — | $ | 2,199 | $ | — | $ | 72,828 | ||||||||||
Commercial mortgages | 91,380 | 949 | 2,154 | — | 94,483 | |||||||||||||||
Construction | 316 | — | — | — | 316 | |||||||||||||||
Commercial loans | 2,611 | — | — | — | 2,611 | |||||||||||||||
Other loans secured | 2,718 | — | — | — | 2,718 | |||||||||||||||
Home equity lines of credit | 6,529 | — | 198 | — | 6,727 | |||||||||||||||
Consumer and installment | 602 | — | — | — | 602 | |||||||||||||||
|
|
|
|
|
|
|
|
|
| |||||||||||
Total acquired | $ | 174,785 | $ | 949 | $ | 4,551 | $ | — | $ | 180,285 | ||||||||||
|
|
|
|
|
|
|
|
|
| |||||||||||
Total | $ | 744,224 | $ | 5,368 | $ | 35,265 | $ | 349 | $ | 785,206 | ||||||||||
|
|
|
|
|
|
|
|
|
| |||||||||||
June 30, 2015 | ||||||||||||||||||||
Originated: | ||||||||||||||||||||
Residential mortgages | $ | 418,781 | $ | 444 | $ | 7,197 | $ | — | $ | 156,422 | ||||||||||
Commercial mortgages | 206,540 | 835 | 9,339 | — | 216,714 | |||||||||||||||
Construction | 9,550 | — | 2,020 | — | 11,570 | |||||||||||||||
Commercial loans | 30,567 | 2,393 | 7,809 | — | 40,769 | |||||||||||||||
Other loans secured | 38,771 | 3,087 | 9,468 | — | 51,326 | |||||||||||||||
Home equity lines of credit | 32,190 | 358 | 438 | — | 32,986 | |||||||||||||||
Consumer and installment | 10,876 | 389 | 380 | — | 11,645 | |||||||||||||||
|
|
|
|
|
|
|
|
|
| |||||||||||
Total originated | $ | 477,275 | $ | 7,506 | $ | 36,651 | $ | — | $ | 521,432 | ||||||||||
|
|
|
|
|
|
|
|
|
| |||||||||||
Acquired: | ||||||||||||||||||||
Residential mortgages | $ | 82,056 | $ | — | $ | 1,970 | $ | — | $ | 84,026 | ||||||||||
Commercial mortgages | 103,876 | 1,044 | 2,940 | — | 107,860 | |||||||||||||||
Construction | 316 | — | — | — | 316 | |||||||||||||||
Commercial loans | 7,285 | — | — | — | 7,285 | |||||||||||||||
Other loans secured | 319 | — | — | — | 319 | |||||||||||||||
Home equity lines of credit | 7,437 | — | 182 | — | 7,619 | |||||||||||||||
Consumer and installment | 1,090 | — | 123 | — | 1,213 | |||||||||||||||
|
|
|
|
|
|
|
|
|
| |||||||||||
Total acquired | $ | 202,379 | $ | 1,044 | $ | 5,215 | $ | — | $ | 208,638 | ||||||||||
|
|
|
|
|
|
|
|
|
| |||||||||||
Total | $ | 679,654 | $ | 8,550 | $ | 41,866 | $ | — | $ | 730,070 | ||||||||||
|
|
|
|
|
|
|
|
|
| |||||||||||
(Continued)
F-33
Table of Contents
PCSB BANK AND SUBSIDIARIES
NOTES TO CONSOLIDATED FINANCIAL STATEMENTS
Three months ended September 30, 2016 and 2015 (unaudited)
and Years ended June 30, 2016 and 2015
NOTE 3 – LOANS RECEIVABLE(Continued)
Purchased Credit Impaired Loans
The Bank acquired loans in 2015 for which there was, at acquisition, evidence of deterioration of credit quality since origination and it was probable, at acquisition, that all contractually required payments would not be collected. The carrying amount of those loans as of September 30, 2016, June 30, 2016 and 2015 is as follows (in thousands):
| 9/30/16 | 6/30/16 | 6/30/15 | ||||||||||
| (unaudited) | ||||||||||||
Residential mortgages | $ | 1,305 | $ | 1,280 | $ | 1,970 | ||||||
Commercial mortgages | 1,783 | 1,778 | 1,738 | |||||||||
Home equity lines of credit | 180 | 180 | 182 | |||||||||
Consumer and installment | 74 | 84 | 123 | |||||||||
|
|
|
|
|
| |||||||
Carrying amount, net of allowance of $0 | $ | 3,342 | $ | 3,322 | $ | 4,013 | ||||||
|
|
|
|
|
| |||||||
For those purchased credit impaired loans disclosed above, the Bank did not increase or reverse the allowance for loan losses during any period presented.
Accretable yield, or income expected to be collected, for acquired loans is as follows (in thousands) for the three months ended September 30, 2016 and for the years ended June 30, 2016 and 2015:
| 9/30/16 | 6/30/16 | 6/30/15 | ||||||||||
| (unaudited) | ||||||||||||
Beginning balance | $ | 578 | $ | 713 | $ | — | ||||||
New loans acquired | — | 750 | ||||||||||
Accretion of income | (46 | ) | (185 | ) | (37 | ) | ||||||
Reclassification from nonaccretable difference | — | 132 | — | |||||||||
Disposals | — | (82 | ) | — | ||||||||
|
|
|
|
|
| |||||||
Ending balance | $ | 532 | $ | 578 | $ | 713 | ||||||
|
|
|
|
|
| |||||||
(Continued)
F-34
Table of Contents
PCSB BANK AND SUBSIDIARIES
NOTES TO CONSOLIDATED FINANCIAL STATEMENTS
Three months ended September 30, 2016 and 2015 (unaudited)
and Years ended June 30, 2016 and 2015
NOTE 4 – BANK PREMISES AND EQUIPMENT
Bank premises and equipment are summarized as follows (in thousands):
| 9/30/16 | 6/30/16 | 6/30/15 | ||||||||||
| (unaudited) | ||||||||||||
Land | $ | 1,997 | $ | 1,997 | $ | 1,997 | ||||||
Buildings and leasehold improvements | 11,110 | 9,601 | 8,755 | |||||||||
Furniture, fixtures and equipment | 5,218 | 4,946 | 3,528 | |||||||||
Construction and improvements in process | 541 | 1,967 | 329 | |||||||||
|
|
|
|
|
| |||||||
| 18,866 | 18,511 | 14,609 | ||||||||||
Less: accumulated depreciation and amortization | (8,048 | ) | (7,737 | ) | (6,630 | ) | ||||||
|
|
|
|
|
| |||||||
Total Bank premises and equipment, net | $ | 10,818 | $ | 10,774 | $ | 7,979 | ||||||
|
|
|
|
|
| |||||||
Depreciation expense was $311,000, $251,000, $1.1 million and $725,000 for the three months ended September 30, 2016 and 2015 and years ended June 30, 2016 and 2015, respectively.
NOTE 5 – GOODWILL AND INTANGIBLE ASSETS
The change in goodwill during the 3 months ended September 30, 2016 and years ended June 30, 2016 and 2015 are as follows (in thousands):
| 9/30/16 | 6/30/16 | 6/30/15 | ||||||||||
| (unaudited) | ||||||||||||
Beginning balance | $ | 6,106 | $ | 5,843 | $ | — | ||||||
Acquired goodwill – CMS Bancorp | — | — | 5,843 | |||||||||
Adjustment to CMS goodwill | — | 263 | — | |||||||||
Impairment | — | — | — | |||||||||
|
|
|
|
|
| |||||||
Ending balance | $ | 6,106 | $ | 6,106 | $ | 5,843 | ||||||
|
|
|
|
|
| |||||||
Impairment exists when a reporting unit’s carrying value of goodwill exceeds its fair value. At September 30, 2016, the Bank had positive equity and the Bank elected to perform a qualitative assessment to determine if it was more likely than not that the fair value of the reporting unit exceeded its carrying value, including goodwill. The qualitative assessment indicated that it was more likely than not that the fair value of the reporting unit exceeded its carrying value, resulting in no impairment.
(Continued)
F-35
Table of Contents
PCSB BANK AND SUBSIDIARIES
NOTES TO CONSOLIDATED FINANCIAL STATEMENTS
Three months ended September 30, 2016 and 2015 (unaudited)
and Years ended June 30, 2016 and 2015
NOTE 5 – GOODWILL AND INTANGIBLE ASSETS(Continued)
Acquired Intangible Assets: Acquired intangible assets were as follows (in thousands):
| 9/30/16 | 6/30/16 | 6/30/15 | ||||||||||||||||||||||
| Gross Carrying Amount | Accumulated Amortization | Gross Carrying Amount | Accumulated Amortization | Gross Carrying Amount | Accumulated Amortization | |||||||||||||||||||
| (unaudited) | ||||||||||||||||||||||||
Amortized intangible assets: | ||||||||||||||||||||||||
Core deposit intangible | $ | 887 | $ | (221 | ) | $ | 887 | $ | (185 | ) | $ | 887 | $ | (27 | ) | |||||||||
|
|
|
|
|
|
|
|
|
|
|
| |||||||||||||
Total | $ | 887 | $ | (221 | ) | $ | 887 | $ | (185 | ) | $ | 887 | $ | (27 | ) | |||||||||
|
|
|
|
|
|
|
|
|
|
|
| |||||||||||||
Aggregate amortization expense was $36,000, $40,000, $158,000 and $27,000 for the three months ended September 30, 2016 and 2015 and years ended June 30, 2016 and 2015, respectively.
Estimated amortization expense for each of the next five fiscal years ended June 30 (in thousands):
| 9/30/16 | 6/30/2016 | |||||||
| (unaudited) | ||||||||
2017 | $ | 106 | $ | 143 | ||||
2018 | 126 | 126 | ||||||
2019 | 110 | 110 | ||||||
2020 | 94 | 94 | ||||||
2021 | 78 | 78 | ||||||
NOTE 6 – DEPOSITS
Deposit balances are summarized as follows (in thousands):
| 9/30/16 | 6/30/16 | 6/30/15 | ||||||||||
| (unaudited) | ||||||||||||
Demand | $ | 135,754 | $ | 122,740 | $ | 129,520 | ||||||
NOW accounts | 107,595 | 111,455 | 82,890 | |||||||||
Money market accounts | 32,149 | 31,194 | 33,109 | |||||||||
Savings | 520,130 | 516,249 | 500,470 | |||||||||
Time deposits | 321,209 | 331,057 | 314,516 | |||||||||
|
|
|
|
|
| |||||||
Total | $ | 1,116,837 | $ | 1,112,695 | $ | 1,060,505 | ||||||
|
|
|
|
|
| |||||||
Time deposits that meet or exceed the FDIC insurance limit of $250,000 were $51.3 million, $53.3 million and $37.3 million at September 30, 2016, June 30, 2016 and 2015, respectively.
(Continued)
F-36
Table of Contents
PCSB BANK AND SUBSIDIARIES
NOTES TO CONSOLIDATED FINANCIAL STATEMENTS
Three months ended September 30, 2016 and 2015 (unaudited)
and Years ended June 30, 2016 and 2015
NOTE 6 – DEPOSITS(Continued)
Scheduled maturities of time deposits were as follows as of September 30 and June 30 and exclude fair value adjustments on acquired time deposits (in thousands):
| 9/30/16 | 6/30/2016 | |||||||
| (unaudited) | ||||||||
Within 1 year | $ | 144,075 | $ | 169,135 | ||||
1 year to 2 years | 49,526 | 44,739 | ||||||
2 years to 3 years | 46,533 | 49,745 | ||||||
3 years to 4 years | 26,996 | 26,782 | ||||||
4 years to 5 years | 53,982 | 40,490 | ||||||
Thereafter | 19 | 18 | ||||||
|
|
|
| |||||
Total | $ | 321,131 | $ | 330,909 | ||||
|
|
|
| |||||
Deposits of local governments held by PCSB Commercial Bank were $44.2 million, $49.4 million and $35.2 million at September 30, 2016, June 30, 2016 and 2015, respectively.
NOTE 7 – FEDERAL HOME LOAN BANK ADVANCES AND OTHER BORROWINGS
Borrowings consist of advances from the Federal Home Loan Bank of New York. As of September 30, 2016, FHLB advances consisted of $7.0 million of short term advances with original maturities ranging from 10 to 16 months, as well as a $4.1 million amortizing term loan with a balloon payment of $2.8 million in 2026. The maturity schedule of advances is summarized as follows as of September 30, 2016 and June 30, 2016 (in thousands):
| September 30, 2016 | June 30, 2016 | |||||||||||||||
| (unaudited) | ||||||||||||||||
| Amount Due | Weighted Average Rate | Amount Due | Weighted Average Rate | |||||||||||||
Year of maturity: | ||||||||||||||||
Within 1 year | $ | 7,000 | 0.85 | % | $ | 16,000 | 0.79 | % | ||||||||
1 year to 2 years | — | — | — | — | ||||||||||||
2 years to 3 years | — | — | — | — | ||||||||||||
3 years to 4 years | — | — | — | — | ||||||||||||
4 years to 5 years | — | — | — | — | ||||||||||||
Thereafter | 4,051 | 2.62 | % | 4,081 | 2.62 | % | ||||||||||
|
|
|
| |||||||||||||
Total | 11,051 | 1.50 | % | $ | 11,081 | 1.16 | % | |||||||||
|
|
|
| |||||||||||||
As a member of the FHLB of New York, the Bank had access to funds in the form of FHLB advances of approximately $202.3 million at September 30, 2016. Advances are secured by the Bank’s investment in FHLB stock and by a blanket security agreement. This agreement requires the Bank to maintain as collateral certain qualifying assets (such as U.S. Government agency and MBSs) with a discounted fair value, as defined, at least equal to 110% of any outstanding advances.
(Continued)
F-37
Table of Contents
PCSB BANK AND SUBSIDIARIES
NOTES TO CONSOLIDATED FINANCIAL STATEMENTS
Three months ended September 30, 2016 and 2015 (unaudited)
and Years ended June 30, 2016 and 2015
NOTE 7 – FEDERAL HOME LOAN BANK ADVANCES AND OTHER BORROWINGS(Continued)
At September 30, 2016, the Bank also had access to funds of approximately $80.8 million in the form of secured borrowings through the discount window of the Federal Reserve Bank of New York. Collateral for these borrowings may include qualifying assets, such as one-to-four family residential loans. The Bank had no outstanding FRB borrowings as of September 30, 2016 or June 30, 2016 or 2015.
NOTE 8 – BUSINESS COMBINATIONS
On April 28, 2015, the Bank acquired all of the outstanding shares of CMS Bancorp. The business combination expanded the Bank’s presence in Westchester County and enhanced opportunities for business, customer relationships and the communities served by the Bank.
On the acquisition date, CMS Bancorp had 1,941,944 outstanding common shares, net of 192,362 shares of treasury stock, and shareholders’ equity of $17.8 million. CMS shareholders received $13.25 per share in cash resulting in a consideration value of $23.2 million.
The assets and liabilities in the CMS Bank acquisition were recorded at their fair value based on management’s best estimate based on information available at the date of acquisition. The acquisition was accounted for under the acquisition method of accounting in accordance with FASB ASC 805, “Business Combinations.” Accordingly, the assets acquired and liabilities assumed were recorded at their respective acquisition date fair values, and identifiable intangible assets were recorded at fair value. The resulting goodwill is not deductible for tax purposes.
| Recognized amounts of identifiable assets acquired and (liabilities) assumed (in thousands): | As Originally Reported | Measurement Period Adjustments | As Adjusted | |||||||||
| (6/30/15) | (6/30/16) | |||||||||||
Cash consideration paid to CMS shareholders | $ | 23,182 | $ | — | $ | 23,182 | ||||||
|
|
|
|
|
| |||||||
Cash | $ | 2,533 | $ | — | $ | 2,533 | ||||||
Available for sale investment securities | 41,082 | — | 41,082 | |||||||||
Loans | 214,941 | (163 | ) a | 214,778 | ||||||||
Premises and equipment | 3,042 | — | 3,042 | |||||||||
Other real estate owned | 183 | — | 183 | |||||||||
Core deposit intangible | 887 | — | 887 | |||||||||
Deferred tax assets, net | 1,887 | 135 | b | 2,022 | ||||||||
Other assets | 2,079 | (177 | ) c | 1,902 | ||||||||
Deposits | (208,261 | ) | — | (208,261 | ) | |||||||
Federal Home Loan Bank advances | (36,050 | ) | — | (36,050 | ) | |||||||
Other liabilities | (4,984 | ) | (58 | ) c | (5,042 | ) | ||||||
|
|
|
|
|
| |||||||
Total identifiable net assets | $ | 17,339 | $ | (263 | ) | $ | 17,076 | |||||
|
|
|
|
|
| |||||||
Goodwill | $ | 5,843 | $ | 263 | $ | 6,106 | ||||||
|
|
|
|
|
| |||||||
(Continued)
F-38
Table of Contents
PCSB BANK AND SUBSIDIARIES
NOTES TO CONSOLIDATED FINANCIAL STATEMENTS
Three months ended September 30, 2016 and 2015 (unaudited)
and Years ended June 30, 2016 and 2015
NOTE 8 – BUSINESS COMBINATIONS(Continued)
Explanation of fair value adjustments:
| a) | The adjustment represents the write down of the book value of loans to their estimated fair value based on current interest rates and expected cash flows, which includes an estimate of expected loan loss inherent in the portfolio. |
| b) | The adjustment represents the net deferred tax asset resulting from the fair value adjustments related to acquired assets and liabilities, as well as identifiable intangibles. |
| c) | The adjustment represents the write down of receivables and accrued liabilities to their net realizable value. |
NOTE 9 – INCOME TAXES
The components of income tax expense (benefit) are summarized as follows (in thousands):
| Three months ended September 30, | Years ended June 30, | |||||||||||||||
| 2016 | 2015 | 2016 | 2015 | |||||||||||||
| (unaudited) | ||||||||||||||||
Current tax expense (benefit) | ||||||||||||||||
Federal | $ | (19 | ) | $ | 510 | $ | (6 | ) | $ | 406 | ||||||
State | (11 | ) | 8 | (476 | ) | (290 | ) | |||||||||
|
|
|
|
|
|
|
| |||||||||
| (30 | ) | 518 | (482 | ) | 116 | |||||||||||
Deferred tax expense (benefit) | ||||||||||||||||
Federal | 630 | 58 | 1,216 | 183 | ||||||||||||
State | 120 | (10 | ) | 250 | (53 | ) | ||||||||||
|
|
|
|
|
|
|
| |||||||||
| 750 | 48 | 1,466 | 130 | |||||||||||||
|
|
|
|
|
|
|
| |||||||||
State tax valuation allowance, net of federal benefit | (73 | ) | 2 | 149 | 456 | |||||||||||
|
|
|
|
|
|
|
| |||||||||
Total | $ | 647 | $ | 568 | $ | 1,133 | $ | 702 | ||||||||
|
|
|
|
|
|
|
| |||||||||
Effective tax rates differ from federal statutory rate of 34% applied to income before income taxes due to the following (in thousands):
| Three months ended September 30, | Years ended June 30, | |||||||||||||||
| 2016 | 2015 | 2016 | 2015 | |||||||||||||
| (unaudited) | ||||||||||||||||
Tax at federal statutory rate of 34% | $ | 715 | $ | 620 | $ | 1,380 | $ | 411 | ||||||||
State taxes, net of federal benefit | — | — | — | 229 | ||||||||||||
Tax-exempt interest income | (11 | ) | (27 | ) | (49 | ) | (56 | ) | ||||||||
BOLI income | (57 | ) | (25 | ) | (156 | ) | (101 | ) | ||||||||
Non-deductible acquisition related costs | — | — | — | 139 | ||||||||||||
Other, net | — | — | (42 | ) | 80 | |||||||||||
|
|
|
|
|
|
|
| |||||||||
Total | $ | 647 | $ | 568 | $ | 1,133 | $ | 702 | ||||||||
|
|
|
|
|
|
|
| |||||||||
(Continued)
F-39
Table of Contents
PCSB BANK AND SUBSIDIARIES
NOTES TO CONSOLIDATED FINANCIAL STATEMENTS
Three months ended September 30, 2016 and 2015 (unaudited)
and Years ended June 30, 2016 and 2015
NOTE 9 – INCOME TAXES(Continued)
Period-end deferred tax assets and liabilities were due to the following (in thousands):
| 9/30/16 | 6/30/16 | 6/30/15 | ||||||||||
| (unaudited) | ||||||||||||
Deferred tax assets: | ||||||||||||
Allowance for loan losses | $ | 1,569 | $ | 1,568 | $ | 1,557 | ||||||
Deferred compensation | 936 | 911 | 800 | |||||||||
Purchase accounting adjustments | 457 | 542 | 1,094 | |||||||||
Deferred rent | 255 | 263 | 266 | |||||||||
Other comprehensive loss (defined benefit plans) | 4,375 | 4,375 | 3,363 | |||||||||
Depreciation of premises and equipment | 412 | 417 | 227 | |||||||||
NOL carryforward | 1,396 | 1,066 | 194 | |||||||||
Other | 873 | 854 | 801 | |||||||||
|
|
|
|
|
| |||||||
Total deferred tax assets | 10,273 | 9,996 | 8,302 | |||||||||
|
|
|
|
|
| |||||||
Deferred tax liabilities: | ||||||||||||
Prepaid pension costs | 3,458 | 2,393 | 2,200 | |||||||||
Deferred loan costs and fees, net | 435 | 463 | 397 | |||||||||
Other comprehensive income (securities) | 321 | 269 | 215 | |||||||||
Other | 92 | 102 | 150 | |||||||||
|
|
|
|
|
| |||||||
Total deferred tax liabilities | 4,306 | 3,227 | 2,962 | |||||||||
|
|
|
|
|
| |||||||
Deferred tax asset valuation allowance | (532 | ) | (605 | ) | (456 | ) | ||||||
|
|
|
|
|
| |||||||
Net deferred tax asset | 5,435 | $ | 6,164 | $ | 4,884 | |||||||
|
|
|
|
|
| |||||||
Period-end deferred tax assets include the allowance for loan losses, nonaccrual loan interest income, purchase accounting adjustments, accrued supplemental retirement plan (“SERP”) liability, fixed assets, deferred rent, other assets, net unrealized losses on pension and SERP obligations and NOL carryforwards. Period-end deferred tax liabilities include bond discount accretion, prepaid pension, net deferred loan fees and net unrealized gains on available-for-sale securities.
At June 30, 2016, after consideration of pre-transaction net operating losses due to the IRC section 382 limitation, the Bank had federal net operating loss carryforwards of approximately $1,866,000, which will begin to expire in 2035. The Bank has an apportioned New York State net operating loss carryforward of approximately $7,848,000 which will begin to expire in 2034. In addition, the Bank has Connecticut and New Jersey net operating losses of $265,000, which will begin to expire in 2036.
In 2014, New York State enacted comprehensive tax reform provisions with significant impact on financial institutions. As a result of this legislation, beginning on January 1, 2015, the Bank calculated its tax obligation to New York based upon the largest of a calculated income tax liability, a tax liability based upon average equity capital or a fixed minimum fee. It is more likely than not the Bank will generate New York losses in future years and therefore calculate its New York tax liability on the basis of average equity capital or a fixed minimum fee. Consequently, the Bank recorded a valuation allowance against its net New York deferred tax asset as of June 30, 2015, as it is unlikely this deferred tax asset will impact the Bank’s New York tax liability in future years.
(Continued)
F-40
Table of Contents
PCSB BANK AND SUBSIDIARIES
NOTES TO CONSOLIDATED FINANCIAL STATEMENTS
Three months ended September 30, 2016 and 2015 (unaudited)
and Years ended June 30, 2016 and 2015
NOTE 9 – INCOME TAXES(Continued)
Management has determined that it is not required to establish a valuation allowance against any other deferred tax assets in accordance with accounting principles generally accepted in the United States of America since it is more likely than not that the deferred tax assets will be fully utilized in future periods. In assessing the need for a valuation allowance, management considers the scheduled reversal of the deferred tax liabilities, the level of historical taxable income, and the projected future taxable income over the periods that the temporary differences comprising the deferred tax assets will be deductible.
As a thrift institution, the Bank is subject to special provisions in the federal tax laws regarding its allowable tax bad debt deductions and related tax bad debt reserves. Tax bad debt reserves consist of a defined base-year amount, plus additional amounts (excess reserves) accumulated after the base year. Deferred tax liabilities are recognized with respect to such excess reserves, as well as any portion of the base-year amount that is expected to become taxable (or recaptured) in the foreseeable future. The Bank’s base-year tax bad debt reserves totaled $2.8 million at September 30, 2016, June 30, 2016 and 2015, respectively. Associated deferred tax liabilities of $1.1 million have not been recognized at September 30, 2016, June 30, 2016 and 2015, since the Bank does not expect that the base-year reserves will become taxable in the foreseeable future. Taxation of the base-year reserve would occur only in very limited circumstances.
The Bank is subject to U.S. federal income tax as well as income tax of the state of New York. The Bank’s federal and state income tax returns are subject to examination for years after December 31, 2012. The audit of the Bank’s 2010 and 2011 federal income tax returns were completed by the Internal Revenue Service. The assessments were not material and were paid in 2013.
At September 30, 2016, June 30, 2016 and 2015, the Bank had no unrecognized tax benefits recorded. The Bank does not expect the total amount of unrecognized tax benefits to significantly increase or decrease in the next twelve months.
NOTE 10 – COMPREHENSIVE INCOME (LOSS)
The following is a summary of the accumulated other comprehensive income balances, net of tax (in thousands):
| Balance at June 30, 2016 | Current Period Change | Balance at September 30 2016 | ||||||||||
| (unaudited) | ||||||||||||
Unrealized gains on securities available for sale | $ | 323 | $ | 101 | $ | 424 | ||||||
Unrealized loss on pension benefits | (7,683 | ) | — | (7,683 | ) | |||||||
Unrealized loss on SERP benefits | (810 | ) | — | (810 | ) | |||||||
|
|
|
|
|
| |||||||
Total | $ | (7,970 | ) | $ | 101 | $ | (7,869 | ) | ||||
|
|
|
|
|
| |||||||
(Continued)
F-41
Table of Contents
PCSB BANK AND SUBSIDIARIES
NOTES TO CONSOLIDATED FINANCIAL STATEMENTS
Three months ended September 30, 2016 and 2015 (unaudited)
and Years ended June 30, 2016 and 2015
NOTE 10 – COMPREHENSIVE INCOME (LOSS)(Continued)
| Balance at June 30, 2015 | Current Period Change | Balance at September 30 2015 | ||||||||||
| (unaudited) | ||||||||||||
Unrealized gains on securities available for sale | $ | 323 | $ | 191 | $ | 424 | ||||||
Unrealized loss on pension benefits | (4,311 | ) | — | (4,311 | ) | |||||||
Unrealized loss on SERP benefits | (734 | ) | — | (734 | ) | |||||||
|
|
|
|
|
| |||||||
Total | $ | (4,722 | ) | $ | 191 | $ | (4,531 | ) | ||||
|
|
|
|
|
| |||||||
| Balance at June 30, 2015 | Current Period Change | Balance at June 30, 2016 | ||||||||||
Unrealized gains on securities available for sale | $ | 323 | $ | 200 | $ | 523 | ||||||
Unrealized loss on pension benefits | (4,311 | ) | (3,372 | ) | (7,683 | ) | ||||||
Unrealized loss on SERP benefits | (734 | ) | (76 | ) | (810 | ) | ||||||
|
|
|
|
|
| |||||||
Total | $ | (4,722 | ) | $ | (3,248 | ) | $ | (7,970 | ) | |||
|
|
|
|
|
| |||||||
| Balance at June 30, 2014 | Current Period Change | Balance at June 30, 2015 | ||||||||||
Unrealized gains on securities available for sale | $ | 418 | $ | (95 | ) | $ | 323 | |||||
Unrealized loss on pension benefits | (2,622 | ) | (1,689 | ) | (4,311 | ) | ||||||
Unrealized loss on SERP benefits | (642 | ) | (92 | ) | (734 | ) | ||||||
|
|
|
|
|
| |||||||
Total | $ | (2,846 | ) | $ | (1,876 | ) | $ | (4,722 | ) | |||
|
|
|
|
|
| |||||||
(Continued)
F-42
Table of Contents
PCSB BANK AND SUBSIDIARIES
NOTES TO CONSOLIDATED FINANCIAL STATEMENTS
Three months ended September 30, 2016 and 2015 (unaudited)
and Years ended June 30, 2016 and 2015
NOTE 11 – REGULATORY CAPITAL MATTERS
As of January 1, 2015, the Bank became subject to new capital rules set forth by the FDIC. The new capital rules revise the banking agencies’ leverage and risk-based capital requirements and the method for calculating risk weighted assets to make them consistent with agreements that were reached by the Basel Committee on Banking Supervision and certain provisions of the Dodd-Frank Act (the Basel III Capital Rules).
The Basel III Capital Rules establish a new minimum common equity Tier 1 capital requirement of 4.5% of risk-weighted assets; increased the minimum Tier 1 capital to risk-weighted assets requirement from 4% to 6%; and retained the minimum total capital to risk weighted assets requirement at 8.0%. A “well-capitalized” institution must generally maintain capital ratios 100-200 basis points higher than the minimum guidelines. Additionally, community banking institutions must maintain a capital conservation buffer of common equity Tier 1 capital in an amount greater than 2.5% of total risk-weighted assets to avoid being subject to limitations on capital distributions and discretionary bonus payments to executive officers. The implementation of the capital conservation buffer began on January 1, 2016 at the 0.625% level and will be phased in over a four-year period (increasing by that amount on each subsequent January 1, until it reaches 2.5% on January 1, 2019).
The Basel III Capital Rules also change the risk weights assigned to certain assets. The Basel III Capital Rules assigned a higher risk weight (150%) to loans that are more than 90 days past due or are on nonaccrual status and to certain commercial real estate facilities that finance the acquisition, development or construction of real property. The Basel III Capital Rules also alter the risk weighting for other assets, including marketable equity securities that are risk weighted generally at 300%. The Basel III Capital Rules require certain components of accumulated other comprehensive income (loss) to be included for purposes of calculating regulatory capital requirements unless a one-time opt-out is exercised. The Bank did exercise its opt-out option and will exclude the unrealized gain (loss) on investment securities component of accumulated other comprehensive income (loss) from regulatory capital.
Under its prompt corrective action regulations, the FDIC is required to take certain supervisory actions (and may take additional discretionary actions) with respect to an undercapitalized bank. Such actions could have a direct material effect on a bank’s financial statements. The regulations establish a framework for the classification of banks into five categories: well capitalized, adequately capitalized, undercapitalized, significantly undercapitalized and critically undercapitalized. Generally, a bank is considered well capitalized if it has a leverage (Tier 1) capital ratio of at least 5.0%, a Tier 1 risk-based capital ratio of at least 6.0%, and a total risk-based capital ratio of at least 10.0%.
The foregoing capital ratios are based in part on specific quantitative measures of assets, liabilities and certain off-balance sheet items as calculated under regulatory accounting practices. Capital amounts and classifications are also subject to qualitative judgments by the FDIC about capital components, risk weightings and other factors.
Management believes that, as of September 30, 2016, June 30, 2016 and 2015, the Bank met all capital adequacy requirements to which it was subject. Further, the most recent FDIC notification categorized the Bank as a well-capitalized institution under the prompt corrective action regulations. There have been no conditions or events since that notification that management believes have changed the Bank’s capital classification.
(Continued)
F-43
Table of Contents
PCSB BANK AND SUBSIDIARIES
NOTES TO CONSOLIDATED FINANCIAL STATEMENTS
Three months ended September 30, 2016 and 2015 (unaudited)
and Years ended June 30, 2016 and 2015
NOTE 11 – REGULATORY CAPITAL MATTERS(Continued)
The following is a summary of the Bank’s actual capital amounts and ratios as of September 30, 2016, June 30, 2016 and 2015, compared to the required ratios for minimum capital adequacy and for classification as well capitalized (dollars in thousands):
| FDIC Required Ratios | ||||||||||||||||||||||||
| Bank Actual | Adequacy | As Well Capitalized | ||||||||||||||||||||||
| Amount | Ratio | Amount | Ratio | Amount | Ratio | |||||||||||||||||||
September 30, 2016 (unaudited) | ||||||||||||||||||||||||
Leverage (Tier 1) | $ | 112,246 | 8.9 | % | $ | 50,744 | 4.0 | % | $ | 63,430 | 5.0 | % | ||||||||||||
Risk Based: | ||||||||||||||||||||||||
Common Tier 1 | 112,246 | 13.9 | 36,371 | 4.5 | 52,537 | 6.5 | ||||||||||||||||||
Tier 1 | 112,246 | 13.9 | 48,495 | 6.0 | 64,600 | 8.0 | ||||||||||||||||||
Total | 116,311 | 14.4 | 64,600 | 8.0 | 80,825 | 10.0 | ||||||||||||||||||
June 30, 2016 | ||||||||||||||||||||||||
Leverage (Tier 1) | $ | 110,888 | 8.9 | % | $ | 49,748 | 4.0 | % | $ | 62,185 | 5.0 | % | ||||||||||||
Risk Based: | ||||||||||||||||||||||||
Common Tier 1 | 110,888 | 13.5 | 37,036 | 4.5 | 53,497 | 6.5 | ||||||||||||||||||
Tier 1 | 110,888 | 13.5 | 49,382 | 6.0 | 65,842 | 8.0 | ||||||||||||||||||
Total | 114,930 | 14.0 | 65,842 | 8.0 | 82,303 | 10.0 | ||||||||||||||||||
June 30, 2015 | ||||||||||||||||||||||||
Leverage (Tier 1) | $ | 108,805 | 8.9 | % | $ | 49,024 | 4.0 | % | $ | 61,280 | 5.0 | % | ||||||||||||
Risk Based: | ||||||||||||||||||||||||
Common Tier 1 | 108,805 | 15.5 | 31,650 | 4.5 | 45,717 | 6.5 | ||||||||||||||||||
Tier 1 | 108,805 | 15.5 | 42,200 | 6.0 | 56,267 | 8.0 | ||||||||||||||||||
Total | 112,726 | 16.0 | 56,267 | 8.0 | 70,334 | 10.0 | ||||||||||||||||||
The risk-based capital requirements of Common Tier 1 capital, Tier 1 capital and total capital to risk-weighted assets of 4.5%, 6.0% and 8.0% also apply to PCSB Commercial Bank, which satisfied each of these requirements at September 30, 2016, June 30, 2016 and 2015, respectively.
The Bank makes a quarterly transfer of 10% of net income to a surplus account in accordance with New York State Banking Regulations. Such a transfer is not required if equity exceeds 10% of deposits at the end of a quarter. Use of the surplus account is subject to certain regulatory restrictions. The balance of the surplus account included in retained earnings was $15.1 million, $14.6 million and $14.3 million at September 30, 2016, June 30, 2016 and 2015, respectively.
(Continued)
F-44
Table of Contents
PCSB BANK AND SUBSIDIARIES
NOTES TO CONSOLIDATED FINANCIAL STATEMENTS
Three months ended September 30, 2016 and 2015 (unaudited)
and Years ended June 30, 2016 and 2015
NOTE 12 – EMPLOYEE BENEFIT PLANS
Employee Pension Plan: The Bank maintains a non-contributory defined benefit pension plan that covers employees meeting specific requirements as to age and length of service. The Bank’s contributions to this qualified plan are determined on the basis of (i) the maximum amount that can be deducted for federal income tax purposes, and (ii) the amount determined by a consulting actuary as necessary to avoid an accumulated funding deficiency as defined by the Employee Retirement Income Security Act of 1974 (ERISA). Contributions are intended to provide not only for benefits attributed to service to date, but also those expected to be earned in the future.
Amendment to Employee Pension Plan: The Board of Trustees approved on August 8, 2012, an amendment to the Bank’s non-contributory defined benefit pension plan. The modification to this plan was effective as of October 1, 2012, and reduced the Bank’s contribution from 2% to 1% for those employees meeting the specific requirements as to age and length of service. In addition, any employee hired after October 1, 2012, is not eligible to participate in the defined benefit plan; instead, they will receive a contribution to their 401(k) account equal to 5% of their salary.
The following is a summary of the plan’s funded status (in thousands) as of June 30, 2016 and 2015 (the measurement date for financial reporting purposes):
| 2016 | 2015 | |||||||
Change in benefit obligation: | ||||||||
Beginning benefit obligation | $ | 25,021 | $ | 22,438 | ||||
Service Cost | 626 | 582 | ||||||
Interest Cost | 1,086 | 949 | ||||||
Actuarial loss | 2,923 | 1,882 | ||||||
Benefits paid | (822 | ) | (831 | ) | ||||
Settlements | (164 | ) | — | |||||
|
|
|
| |||||
Ending benefit obligation | 28,670 | 25,020 | ||||||
Change in plan assets, at fair value: | ||||||||
Beginning plan assets | $ | 24,503 | $ | 23,286 | ||||
Actual return | (302 | ) | 548 | |||||
Employer contribution | — | 1,500 | ||||||
Benefits paid | (822 | ) | (831 | ) | ||||
Settlements | (164 | ) | — | |||||
|
|
|
| |||||
Ending plan assets | 23,215 | 24,503 | ||||||
Funded status | $ | (5,455 | ) | $ | (517 | ) | ||
|
|
|
| |||||
Accumulated benefit obligation | $ | 28,167 | $ | 24,712 | ||||
|
|
|
| |||||
(Continued)
F-45
Table of Contents
PCSB BANK AND SUBSIDIARIES
NOTES TO CONSOLIDATED FINANCIAL STATEMENTS
Three months ended September 30, 2016 and 2015 (unaudited)
and Years ended June 30, 2016 and 2015
NOTE 12 – EMPLOYEE BENEFIT PLANS(Continued)
The following is a summary of net period pension cost, contributions and benefits paid for the year ended June 30 (in thousands):
| 2016 | 2015 | |||||||
Net period pension cost | $ | 483 | $ | 47 | ||||
Employer contributions | — | 1,500 | ||||||
Benefits paid | 821 | 831 | ||||||
Amounts recognized in accumulated other comprehensive loss at June 30 consist of (in thousands):
| 2016 | 2015 | |||||||
Net loss | $ | 12,751 | $ | 8,584 | ||||
Prior service credit | (1,110 | ) | (1,398 | ) | ||||
|
|
|
| |||||
| $ | 11,641 | $ | 7,186 | |||||
|
|
|
| |||||
Net periodic pension cost and other amounts recognized in other comprehensive income for the year ended June 30 (in thousands):
| 2016 | 2015 | |||||||
Net periodic benefit cost | $ | 483 | $ | 47 | ||||
Net loss (gain) | 5,021 | 3,044 | ||||||
Amortization of prior service cost | 288 | 288 | ||||||
Amortization of prior net loss | (854 | ) | (513 | ) | ||||
New past service liability | — | — | ||||||
|
|
|
| |||||
Total recognized in other comprehensive income | 4,455 | 2,819 | ||||||
|
|
|
| |||||
Total recognized loss in net periodic benefit cost and other comprehensive income | $ | 4,938 | $ | 2,866 | ||||
|
|
|
| |||||
Net periodic benefit cost recognized for the three months ended September 30, 2016 and 2015 was $229,000 and $121,000, respectively.
The estimated net loss and past service cost for the pension plan that will be amortized from accumulated other comprehensive income into net periodic benefit costs during the year ended June 30, 2017, are $1.4 million and $(288,000), respectively.
Contributions: The Bank contributed $3.0 million to the plan during the quarter ended September 30, 2016 and expects to make no additional contributions for the plan year ended June 30, 2017.
(Continued)
F-46
Table of Contents
PCSB BANK AND SUBSIDIARIES
NOTES TO CONSOLIDATED FINANCIAL STATEMENTS
Three months ended September 30, 2016 and 2015 (unaudited)
and Years ended June 30, 2016 and 2015
NOTE 12 – EMPLOYEE BENEFIT PLANS(Continued)
Estimated Future Payments: The following benefit payments, which reflect expected future service, are expected for the years ending June 30 (in thousands):
2017 | $ | 1,183 | ||
2018 | 1,255 | |||
2019 | 1,319 | |||
2020 | 1,346 | |||
2021 | 1,398 | |||
Following five years | 7,570 |
Assumptions: Weighted-average assumptions used to determine pension benefit obligations:
| 2016 | 2015 | |||||||
Discount rate | 3.61 | % | 4.44 | % | ||||
Rate of compensation increase | 3.00 | 3.00 | ||||||
Weighted-average assumptions used to determine net periodic pension cost:
| 2016 | 2015 | |||||||
Discount rate | 4.44 | % | 4.33 | % | ||||
Expected return on plan assets | 7.50 | 7.50 | ||||||
Rate of compensation increase | 3.00 | 3.00 | ||||||
Plan Assets
Plan assets are invested in a series of diversified investment funds of RSI Retirement Trust (“the Trust”). The investment funds include equity mutual funds, bond mutual funds, or commingled trust funds, each with its own investment objectives, investment strategies and risks. The Trust has been given discretion by the Bank to determine the appropriate strategic asset allocation, as governed by the Trust’s Statement of Investment Objectives and Guidelines. The long-term objective is to be invested 65% in equity securities (equity mutual funds), 34% in debt securities (bond mutual funds) and 1% in cash equivalents. The bond fund portion may be temporarily increased to 50% in order to lessen the volatility of asset values. Asset rebalancing is performed at least annually, with interim adjustments made if the investment mix varies by more than 10% from the target allocation.
The weighted average expected long-term rate of return is estimated based on current trends in the plan assets as well as projected future rates of returns on those assets. The long-term rate of return assumption was set based on historical returns earned by equities and fixed income securities, adjusted to reflect expectations of future returns as applied to the plan’s target allocation of asset classes. Equities and fixed income securities were assumed to earn real rates of return in the ranges of 3% to 10% and (1)% to 6%, respectively. The long-term inflation rate was estimated to be 3%. When these overall return expectations are applied to the plan’s target allocation, the result is an expected rate of return of approximately 2% to 9%.
The plan is only permitted to invest in assets approved by the RSI Trustee Board. All other investments are prohibited.
(Continued)
F-47
Table of Contents
PCSB BANK AND SUBSIDIARIES
NOTES TO CONSOLIDATED FINANCIAL STATEMENTS
Three months ended September 30, 2016 and 2015 (unaudited)
and Years ended June 30, 2016 and 2015
NOTE 12 – EMPLOYEE BENEFIT PLANS(Continued)
The Bank’s actual pension plan asset allocation, target allocation and expected long-term rate of return by asset category are as follows:
| Target | Percentage of Plan Assets at Year-End | Weighted- Average Expected Long-Term Rate | ||||||||||||||
Asset Category | Allocation | 2016 | 2015 | of Return | ||||||||||||
Equity mutual funds and common/collective trusts | 65 | % | 58 | % | 56 | % | 3-10 | % | ||||||||
Fixed income common/collective trusts | 34 | 37 | 37 | (1)-6 | % | |||||||||||
Cash equivalents | 1 | 5 | 7 | — | % | |||||||||||
|
|
|
|
|
|
|
| |||||||||
Total | 100 | % | 100 | % | 100 | % | 2-9 | % | ||||||||
|
|
|
|
|
|
|
| |||||||||
Equity, Debt, Investment Funds and Other Securities: The fair values for investment securities are determined by quoted market prices, if available (Level 1). For securities where quoted prices are not available, fair values are calculated based on market prices of similar securities (Level 2). For securities where quoted prices or market prices of similar securities are not available, fair values are calculated using discounted cash flows or other market indicators (Level 3). Discounted cash flows are calculated using spread to swap and the London Interbank Offered Rate (LIBOR) curves that are updated to incorporate loss severities, volatility, credit spread and optionality. During times when trading is more liquid, broker quotes are used (if available) to validate the model. Rating agency and industry research reports as well as defaults and deferrals on individual securities are reviewed and incorporated into the calculations.
The fair value of the plan assets at June 30, 2016 and 2015, by asset category, is as follows (in thousands):
| Fair Value Measurements Using | ||||||||||||||||
| Carrying Value | Quoted Prices In Active Markets for Identical Assets (Level 1) | Significant Other Observable Inputs (Level 2) | Significant Unobservable Inputs (Level 3) | |||||||||||||
June 30, 2016 | ||||||||||||||||
Plan assets | ||||||||||||||||
Equity mutual funds and common/collective trusts | $ | 13,500 | $ | — | $ | 13,500 | $ | — | ||||||||
Fixed income common/ collective trusts | 8,684 | — | 8,684 | — | ||||||||||||
Cash and cash equivalents | 1,031 | 1,031 | — | — | ||||||||||||
|
|
|
|
|
|
|
| |||||||||
Total | $ | 23,215 | $ | 1,031 | $ | 22,184 | $ | — | ||||||||
|
|
|
|
|
|
|
| |||||||||
(Continued)
F-48
Table of Contents
PCSB BANK AND SUBSIDIARIES
NOTES TO CONSOLIDATED FINANCIAL STATEMENTS
Three months ended September 30, 2016 and 2015 (unaudited)
and Years ended June 30, 2016 and 2015
NOTE 12 – EMPLOYEE BENEFIT PLANS(Continued)
| Fair Value Measurements Using | ||||||||||||||||
| Carrying Value | Quoted Prices In Active Markets for Identical Assets (Level 1) | Significant Other Observable Inputs (Level 2) | Significant Unobservable Inputs (Level 3) | |||||||||||||
June 30, 2015 | ||||||||||||||||
Plan assets | ||||||||||||||||
Equity mutual funds and common/collective trusts | $ | 13,709 | $ | — | $ | 13,709 | $ | — | ||||||||
Fixed income common/ collective trusts | 9,072 | — | 9,072 | — | ||||||||||||
Cash and cash equivalents | 1,722 | 1,722 | — | — | ||||||||||||
|
|
|
|
|
|
|
| |||||||||
Total | $ | 24,503 | $ | 1,722 | $ | 22,781 | $ | — | ||||||||
|
|
|
|
|
|
|
| |||||||||
Defined Contribution Retirement Plan: The Bank maintains a defined contribution plan for eligible employees hired after October 1, 2012. All full-time employees who have attained age twenty-one and have a minimum of one year of service will receive a contribution to their 401(k) account equal to 5% of their salary. Plan expense was $39,000, $39,000, $162,000 and $60,000 for the three months ended September 30, 2016 and 2015 and years ended June 30, 2016 and 2015, respectively.
401(k) Plan: The Bank maintains a defined contribution plan for eligible employees under Section 401(k) of the Internal Revenue Code. All full-time employees who have attained age twenty-one and have a minimum of one year of service may elect to participate in the plan, by making contributions ranging from 2% to 10% of their compensation. The Bank makes matching contributions equal to 75% of the participant’s contributions that are not in excess of 6% of compensation. Savings plan expense was $100,000, $99,000, $410,000 and $339,000 for the three months ended September 30, 2016 and 2015 and for the years ended June 30, 2016 and 2015, respectively.
Acquired Pension Plan: As part of the CMS acquisition, the Bank acquired the pension plan of CMS Bank, which was frozen prior to and in the process of termination as of the acquisition date, a process which was not complete as of the acquisition date. During the year ended June 30, 2016, the CMS pension plan was terminated, resulting in a $629,000 charge to earnings.
Supplemental Retirement Plans: The Bank also maintains unfunded and non-qualified supplemental retirement plans to provide pension benefits in addition to those provided under the qualified pension plan.
The accrued benefit cost for the supplemental plans was approximately $3.5 million and $3.3 million at June 30, 2016 and 2015 (included in other liabilities in the consolidated statements of financial condition). Included in accumulated other comprehensive income were net losses of $1.2 million for the supplemental retirement plans as of June 30, 2016 and 2015, respectively. The projected benefit obligation and accumulated benefit obligation were $3.5 million as of the June 30, 2016 measurement date and $3.3 million as of June 30, 2015 measurement date.
Pension expense for the supplemental plans was $539,000 and $490,000 for the years ended June 30, 2016 and 2015, respectively.
(Continued)
F-49
Table of Contents
PCSB BANK AND SUBSIDIARIES
NOTES TO CONSOLIDATED FINANCIAL STATEMENTS
Three months ended September 30, 2016 and 2015 (unaudited)
and Years ended June 30, 2016 and 2015
NOTE 12 – EMPLOYEE BENEFIT PLANS(Continued)
Supplemental retirement plans benefits of $272,000 were paid in both years ended June 30, 2016 and 2015.
Net periodic pension cost and other amounts recognized in other comprehensive income for the years ended June 30 (in thousands):
| 2016 | 2015 | |||||||
Net periodic benefit cost | $ | 539 | $ | 490 | ||||
Net gain | 89 | 237 | ||||||
Amortization of prior net loss | (84 | ) | (84 | ) | ||||
|
|
|
| |||||
Total recognized in other comprehensive income | 5 | 153 | ||||||
|
|
|
| |||||
Total recognized in net periodic benefit cost and other comprehensive income | $ | 544 | $ | 643 | ||||
|
|
|
| |||||
Net periodic benefit cost recognized for the three months ended September 30, 2016 and 2015 was $133,000 and $129,000, respectively.
The estimated net loss for the supplemental plans that will be amortized from accumulated other comprehensive income into net periodic benefit costs during the year ended June 30, 2017, is $93,000.
The following benefit payments, which reflect expected future service, are expected for the years ending June 30 (in thousands):
2017 | $ | 272 | ||
2018 | 272 | |||
2019 | 272 | |||
2020 | 272 | |||
2021 | 3,021 | |||
Following five years | 1,031 |
The assumed discount rates used for the supplemental plans range from 3.61% to 3.70%. The rates of compensation increases used are the same as those used for the employee pension plan.
NOTE 13 – COMMITMENTS AND CONTINGENCIES
Financial Instruments with Off-Balance-Sheet Risk: The Bank is a party to commitments to originate loans, unused lines of credit and standby letters of credit (“credit-related financial instruments”) that involve, to varying degrees, elements of credit risk and interest rate risk in addition to the risks associated with loans recognized in the consolidated statements of condition. Substantially all of these credit-related financial instruments have been entered into with customers in the Bank’s primary lending area described in Note 1.
(Continued)
F-50
Table of Contents
PCSB BANK AND SUBSIDIARIES
NOTES TO CONSOLIDATED FINANCIAL STATEMENTS
Three months ended September 30, 2016 and 2015 (unaudited)
and Years ended June 30, 2016 and 2015
NOTE 13 – COMMITMENTS AND CONTINGENCIES(Continued)
The contract amounts of credit-related financial instruments reflect the extent of the Bank’s involvement with those classes of financial instruments. The Bank’s exposure to credit loss in the event of non-performance by the counterparty is represented by the contract amount. The Bank uses the same credit policies in extending commitments, lines of credit and standby letters of credit as it does for on-balance sheet instruments.
The contract amounts of credit-related financial instruments at September 30, 2016, June 30, 2016 and 2015, are summarized below (in thousands):
| 9/30/16 | 6/30/16 | 6/30/15 | ||||||||||
| (unaudited) | ||||||||||||
Commitments to originate loans | $ | 92,122 | $ | 62,773 | $ | 71,674 | ||||||
Unused lines of credit | 53,267 | 58,788 | 53,686 | |||||||||
Standby letters of credit | 742 | 732 | 667 | |||||||||
Lines of credit (including undisbursed construction loans) and commitments to originate loans are agreements to lend to a customer as long as there is no violation of any condition established in the contract. These agreements generally have fixed expiration dates or other termination clauses, and may require payment of a fee. Since certain lines of credit and commitments are expected to expire without being funded, the contract amounts do not necessarily represent future cash requirements. In extending lines of credit and commitments, the Bank evaluates each customer’s creditworthiness on a case-by-case basis. The amount of collateral obtained, if deemed necessary by the Bank upon extension of credit, is based on management’s credit evaluation of the customer.
The Bank issues financial standby letters of credit that are irrevocable undertakings by the Bank to guarantee payment of a specified financial obligation. Most of the Bank’s financial standby letters of credit arise in connection with lending relationships and have terms of one year or less. The maximum potential future payments the Bank could be required to make equals the contract amount of standby letters of credit shown in the preceding table. The Bank’s recognized liability for financial standby letters of credit was insignificant at September 30, 2016, June 30, 2016 and 2015.
Operating Lease Commitments: The Bank leases certain branch properties and equipment under operating leases. Rent expense was $543,000, $399,000, $2.1 million and $1.9 million for the three months ended September 30, 2016 and 2015 and years ended June 30, 2016 and 2015, respectively. Rent commitments, before considering renewal options that generally are present, were as follows for the years ending June 30 (in thousands):
| 9/30/16 | 6/30/2016 | |||||||
| (unaudited) | ||||||||
2017 | $ | 1,863 | $ | 2,501 | ||||
2018 | 2,194 | 2,194 | ||||||
2019 | 1,706 | 1,706 | ||||||
2020 | 1,417 | 1,417 | ||||||
2021 | 1,153 | 1,153 | ||||||
Thereafter | 8,189 | 8,189 | ||||||
|
|
|
| |||||
Total | $ | 16,522 | $ | 17,160 | ||||
|
|
|
| |||||
(Continued)
F-51
Table of Contents
PCSB BANK AND SUBSIDIARIES
NOTES TO CONSOLIDATED FINANCIAL STATEMENTS
Three months ended September 30, 2016 and 2015 (unaudited)
and Years ended June 30, 2016 and 2015
NOTE 13 – COMMITMENTS AND CONTINGENCIES(Continued)
Legal Proceedings: In the normal course of business, the Bank is involved in certain legal proceedings. In the opinion of management, the consolidated financial statements of the Bank are not expected to be affected materially by the outcome of such legal proceedings.
NOTE 14 – FAIR VALUE
Fair value is the exchange price that would be received for an asset or paid to transfer a liability (exit price) in the principal or most advantageous market for the asset or liability in an orderly transaction between market participants on the measurement date. There are three levels of inputs that may be used to measure fair values:
Level 1: Quoted prices (unadjusted) for identical assets or liabilities in active markets that the entity has the ability to access as of the measurement date.
Level 2: Significant other observable inputs other than Level 1 prices such as quoted prices for similar assets or liabilities; quoted prices in markets that are not active; or other inputs that are observable or can be corroborated by observable market data.
Level 3: Significant unobservable inputs that reflect a reporting entity’s own assumptions about the assumptions that market participants would use in pricing an asset or liability.
A description of the valuation methodologies used for assets and liabilities measured at fair value, as well as general classification of such instruments pursuant to the valuation hierarchy, is set forth below. While management believes the Bank’s valuation methodologies are appropriate and consistent with other financial institutions, the use of different methodologies or assumptions to determine the fair value of certain financial instruments could result in a different estimate of fair value at the reporting date.
Investment Securities: The fair values of securities available for sale are determined by obtaining quoted prices on nationally recognized securities exchanges (Level 1 inputs) or matrix pricing, which is a mathematical technique widely used in the industry to value debt securities without relying exclusively on quoted prices for the specific securities but rather by relying on the securities’ relationship to other benchmark quoted securities (Level 2 inputs).
Impaired Loans: The fair value of impaired loans with specific allocations of the allowance for loan losses is generally based on recent real estate appraisals. Appraisals are generally obtained annually and may utilize a single valuation approach or a combination of approaches including comparable sales and the income approach. Adjustments are routinely made in the appraisal process by the appraisers to adjust for differences between the comparable sales and income data available. Such adjustments are typically significant and result in a Level 3 classification of the inputs for determining fair value. Management performs a review of all appraisals, including any such adjustments.
OREO: Assets acquired through or instead of loan foreclosure are initially recorded at fair value, less costs to sell when acquired, establishing a new cost basis. These assets are subsequently accounted for at lower cost or fair value, less estimated costs to sell. Fair value is commonly based on recent real estate appraisals which are updated no less frequently than annually. These appraisals may utilize a single valuation approach or a combination of approaches including comparable sales and the income approach. Adjustments are routinely made in the appraisal process by the independent appraisers to adjust for differences between the comparable sales and income data available. Such adjustments are usually significant and typically result in a Level 3 classification of the inputs for determining fair value.
(Continued)
F-52
Table of Contents
PCSB BANK AND SUBSIDIARIES
NOTES TO CONSOLIDATED FINANCIAL STATEMENTS
Three months ended September 30, 2016 and 2015 (unaudited)
and Years ended June 30, 2016 and 2015
NOTE 14 – FAIR VALUE(Continued)
Real estate owned properties are evaluated on a quarterly basis for additional impairment and adjusted accordingly.
Appraisals for both collateral-dependent impaired loans and real estate owned are performed by certified general appraisers (for commercial properties) or certified residential appraisers (for residential properties) whose qualifications and licenses have been reviewed and verified by the Bank. Once received, a member of the Credit Department reviews the assumptions and approaches utilized in the appraisal as well as the overall resulting fair value in comparison with independent data sources such as recent market data or industry-wide statistics. Once appraisals are considered appropriate, management discounts the appraised value for estimated selling costs, such as legal, broker, and property maintenance and insurance costs. The most recent analysis performed indicated discount rates ranging between 10% and 20% should be applied to properties with appraisals performed.
Assets and liabilities measured at fair value are summarized below (in thousands):
| Fair Value Measurements | ||||||||||||||||
| Quoted Prices In Active Markets for Identical Assets (Level 1) | Significant Other Observable Inputs (Level 2) | Significant Unobservable Inputs (Level 3) | Total | |||||||||||||
September 30, 2016 (unaudited) | ||||||||||||||||
Measured on a recurring basis: | ||||||||||||||||
Available-for-sale securities: | ||||||||||||||||
U.S. Government and agency obligations | $ | — | $ | 60,595 | $ | — | $ | 60,595 | ||||||||
Corporate and other debt securities | — | 8,719 | — | 8,719 | ||||||||||||
Mortgage-backed securities | — | 40,228 | — | 40,228 | ||||||||||||
Equity securities | — | 49 | — | 49 | ||||||||||||
|
|
|
|
|
|
|
| |||||||||
Total assets at fair value | $ | — | $ | 109,591 | $ | — | $ | 109,591 | ||||||||
|
|
|
|
|
|
|
| |||||||||
Measured on a non-recurring basis: | ||||||||||||||||
Impaired loans: | ||||||||||||||||
Mortgage loans: | ||||||||||||||||
Residential | $ | — | $ | — | $ | 1,219 | $ | 1,219 | ||||||||
Construction | — | — | 48 | 48 | ||||||||||||
Commercial and consumer loans: | ||||||||||||||||
Commercial loans | — | — | 89 | 89 | ||||||||||||
Consumer and installment loans | — | — | 175 | 175 | ||||||||||||
OREO – residential | — | — | 1,059 | 1,059 | ||||||||||||
|
|
|
|
|
|
|
| |||||||||
Total assets at fair value | $ | — | $ | — | $ | 2,590 | $ | 2,590 | ||||||||
|
|
|
|
|
|
|
| |||||||||
(Continued)
F-53
Table of Contents
PCSB BANK AND SUBSIDIARIES
NOTES TO CONSOLIDATED FINANCIAL STATEMENTS
Three months ended September 30, 2016 and 2015 (unaudited)
and Years ended June 30, 2016 and 2015
NOTE 14 – FAIR VALUE(Continued)
| Fair Value Measurements | ||||||||||||||||
| Quoted Prices In Active Markets for Identical Assets (Level 1) | Significant Other Observable Inputs (Level 2) | Significant Unobservable Inputs (Level 3) | Total | |||||||||||||
June 30, 2016 | ||||||||||||||||
Measured on a recurring basis: | ||||||||||||||||
Available-for-sale securities: | ||||||||||||||||
U.S. Government and agency obligations | $ | — | $ | 66,132 | $ | — | $ | 66,132 | ||||||||
Corporate and other debt securities | — | 8,646 | — | 8,646 | ||||||||||||
Mortgage-backed securities | — | 37,524 | — | 37,524 | ||||||||||||
Equity securities | — | 49 | — | 49 | ||||||||||||
|
|
|
|
|
|
|
| |||||||||
Total assets at fair value | $ | — | $ | 112,351 | $ | — | $ | 112,351 | ||||||||
|
|
|
|
|
|
|
| |||||||||
Measured on a non-recurring basis: | ||||||||||||||||
Impaired loans: | ||||||||||||||||
Mortgage loans: | ||||||||||||||||
Residential | $ | — | $ | — | $ | 913 | $ | 913 | ||||||||
Construction | — | — | 49 | 49 | ||||||||||||
Commercial and consumer loans: | ||||||||||||||||
Other loans secured | — | — | 54 | 54 | ||||||||||||
Consumer and installment loans | — | — | 175 | 175 | ||||||||||||
OREO – residential | — | — | 681 | 681 | ||||||||||||
OREO – commercial | — | — | 224 | 224 | ||||||||||||
|
|
|
|
|
|
|
| |||||||||
Total assets at fair value | $ | — | $ | — | $ | 2,096 | $ | 2,096 | ||||||||
|
|
|
|
|
|
|
| |||||||||
(Continued)
F-54
Table of Contents
PCSB BANK AND SUBSIDIARIES
NOTES TO CONSOLIDATED FINANCIAL STATEMENTS
Three months ended September 30, 2016 and 2015 (unaudited)
and Years ended June 30, 2016 and 2015
NOTE 14 – FAIR VALUE(Continued)
| Fair Value Measurements | ||||||||||||||||
| Quoted Prices In Active Markets for Identical Assets (Level 1) | Significant Other Observable Inputs (Level 2) | Significant Unobservable Inputs (Level 3) | Total | |||||||||||||
June 30, 2015 | ||||||||||||||||
Measured on a recurring basis: | ||||||||||||||||
Available-for-sale securities: | ||||||||||||||||
U.S. Government and agency obligations | $ | — | $ | 46,917 | $ | — | $ | 46,917 | ||||||||
Corporate and other debt securities | — | 4,409 | — | 4,409 | ||||||||||||
Mortgage-backed securities | — | 33,568 | — | 33,568 | ||||||||||||
Equity securities | — | 49 | — | 49 | ||||||||||||
|
|
|
|
|
|
|
| |||||||||
Total assets at fair value | $ | — | $ | 84,943 | $ | — | $ | 84,943 | ||||||||
|
|
|
|
|
|
|
| |||||||||
Measured on a non-recurring basis: | ||||||||||||||||
Impaired loans: | ||||||||||||||||
Mortgage loans: | ||||||||||||||||
Residential | $ | — | $ | — | $ | 3,028 | $ | 3,028 | ||||||||
Commercial mortgages | — | — | 3,788 | 3,788 | ||||||||||||
Construction | — | — | 1,910 | 1,910 | ||||||||||||
Commercial and consumer loans: | ||||||||||||||||
Commercial loans | — | — | 3,942 | 3,942 | ||||||||||||
Other loans secured | — | — | 876 | 876 | ||||||||||||
Home equity credit lines | — | — | 189 | 189 | ||||||||||||
Consumer and installment loans | — | — | 469 | 469 | ||||||||||||
OREO – residential | — | — | 156 | 156 | ||||||||||||
OREO – commercial | — | — | 212 | 212 | ||||||||||||
|
|
|
|
|
|
|
| |||||||||
Total assets at fair value | $ | — | $ | — | $ | 14,570 | $ | 14,570 | ||||||||
|
|
|
|
|
|
|
| |||||||||
Impaired loans in the table above had a carrying amount of $1.8 million, a remaining valuation allowance of $261,000 at September 30, 2016, incurred $38,000 of net charge-offs during the quarter ended September 30, 2016, which resulted in an additional provision for loan losses of $40,000 for the quarter. Impaired loans in the table above had a carrying amount of $1.5 million, a remaining valuation allowance of $259,000 at June 30, 2016, and incurred no net charge-offs during the year ended June 30, 2016, which resulted in an additional provision for loan losses of $175,000 for the year. Impaired loans had a carrying amount of $14.9 million, a remaining valuation allowance of $0.7 million at June 30, 2015, and incurred $1.7 million in charge-offs during the year ended June 30, 2015, which resulted in an additional provision for loan losses of $2.4 million for the year.
(Continued)
F-55
Table of Contents
PCSB BANK AND SUBSIDIARIES
NOTES TO CONSOLIDATED FINANCIAL STATEMENTS
Three months ended September 30, 2016 and 2015 (unaudited)
and Years ended June 30, 2016 and 2015
NOTE 14 – FAIR VALUE(Continued)
The following tables present quantitative information about Level 3 fair value measurements for selected financial instruments measured at fair value on a non-recurring basis at September 30, 2016 (unaudited) (in thousands):
| Fair value | Valuation Technique(s) | Unobservable Input(s) | Range or Rate Used | |||||||
Impaired loans–residential mortgages | $ | 1,219 | Sales comparison | Adjustment for differences between comparable sales | -2.2% to 13.3% | |||||
Impaired loans–construction | $ | 48 | Discounted cash flow | Discount rate | 1.00% | |||||
Impaired loans–commercial loans | $ | 89 | Discounted cash flow | Discount rate | 4.50% | |||||
Impaired loans–consumer and installment loans | $ | 175 | Discounted cash flow | Discount rate | 4.25% | |||||
OREO–residential | $ | 1,059 | Sales comparison | Adjustment for differences between comparable sales | -14% to 8% | |||||
The following tables present quantitative information about Level 3 fair value measurements for selected financial instruments measured at fair value on a non-recurring basis at June 30, 2016 (in thousands):
| Fair value | Valuation Technique(s) | Unobservable Input(s) | Range or Rate Used | |||||||
Impaired loans–residential mortgages | $ | 913 | Sales comparison | Adjustment for differences between comparable sales | -2.0% to 13.3% | |||||
Impaired loans–construction | $ | 49 | Discounted cash flow | Discount rate | 1.00% | |||||
Impaired loans–other loans secured | $ | 54 | Discounted cash flow | Discount rate | 4.50% | |||||
Impaired loans–consumer and installment loans | $ | 175 | Discounted cash flow | Discount rate | 4.25% | |||||
OREO–residential | $ | 681 | Sales comparison | Adjustment for differences between comparable sales | -14% to 8% | |||||
OREO–commercial | $ | 224 | Sales contract | N/A | N/A | |||||
F-56
Table of Contents
PCSB BANK AND SUBSIDIARIES
NOTES TO CONSOLIDATED FINANCIAL STATEMENTS
Three months ended September 30, 2016 and 2015 (unaudited)
and Years ended June 30, 2016 and 2015
NOTE 14 – FAIR VALUE(Continued)
The following tables present quantitative information about Level 3 fair value measurements for selected financial instruments measured at fair value on a non-recurring basis at June 30, 2015 (in thousands):
| Fair value | Valuation Technique(s) | Unobservable Input(s) | Range or Rate Used | |||||||
Impaired loans–residential mortgages | $ | 3,028 | Sales comparison | Adjustment for differences between comparable sales | -13.7% to +13.3% | |||||
| Discounted cash flow | Discount rate | 8.0% | ||||||||
Impaired loans–commercial mortgages | $ | 3,787 | Sales comparison | Adjustment for differences between comparable sales | -17.3% to +9.6% | |||||
| Income Approach | Cap rate | 7.1% to 8.8% | ||||||||
| Discounted cash flow | Discount rate | 6.0% to 8.0% | ||||||||
Impaired loans–construction | $ | 1,910 | Discounted cash flow | Discount rate | 1.0% | |||||
| Income approach | Cap rate | 9.5% | ||||||||
Impaired loans–commercial loans | $ | 3,942 | Discounted cash flow | Discount rate | 0.3% to 6.0% | |||||
Impaired loans–other loans secured | $ | 876 | Discounted cash flow | Discount rate | 4.5% to 12.5% | |||||
Impaired loans–home equity credit lines | $ | 189 | Sales comparison | Adjustment for differences between comparable sales | -13.4% to -8.7% | |||||
| Discounted cash flow | Discount rate | 8.0% | ||||||||
Impaired loans–consumer and installment loans | $ | 469 | Discounted cash flow | Discount rate | 6.0% to 8.0% | |||||
F-57
Table of Contents
PCSB BANK AND SUBSIDIARIES
NOTES TO CONSOLIDATED FINANCIAL STATEMENTS
Three months ended September 30, 2016 and 2015 (unaudited)
and Years ended June 30, 2016 and 2015
NOTE 14 – FAIR VALUE(Continued)
The following is a summary of the carrying amounts and estimated fair values of the Bank’s financial assets and liabilities (in thousands) (none of which are held for trading purposes):
| Fair Value Measurements | ||||||||||||||||||||
| Carrying Amount | Level 1 | Level 2 | Level 3 | Total | ||||||||||||||||
September 30, 2016 (unaudited) | ||||||||||||||||||||
Financial Assets: | ||||||||||||||||||||
Cash and cash equivalents | $ | 60,423 | $ | 60,423 | $ | — | $ | — | $ | 60,423 | ||||||||||
Securities held to maturity | 265,071 | — | 267,966 | 281 | 268,247 | |||||||||||||||
Securities available for sale | 109,591 | — | 109,591 | — | 109,591 | |||||||||||||||
Loans receivable, net | 763,915 | — | — | 780,076 | 780,076 | |||||||||||||||
Accrued interest receivable | 3,287 | — | 952 | 2,335 | 3,287 | |||||||||||||||
FHLB Stock | 1,641 | N/A | N/A | N/A | N/A | |||||||||||||||
Financial Liabilities: | ||||||||||||||||||||
Demand, NOW, money market deposits and savings deposits | $ | 795,628 | $ | 795,628 | $ | — | $ | — | $ | 795,628 | ||||||||||
Time certificate accounts | 321,209 | — | 324,506 | — | 324,506 | |||||||||||||||
Mortgage escrow funds | 4,204 | 4,204 | — | — | 4,204 | |||||||||||||||
FHLB Advances | 11,051 | — | 11,144 | — | 11,144 | |||||||||||||||
June 30, 2016 | ||||||||||||||||||||
Financial Assets: | ||||||||||||||||||||
Cash and cash equivalents | $ | 41,578 | $ | 41,578 | $ | — | $ | — | $ | 41,578 | ||||||||||
Securities held to maturity | 270,679 | — | 273,032 | 285 | 273,317 | |||||||||||||||
Securities available for sale | 112,351 | — | 112,351 | — | 112,351 | |||||||||||||||
Loans receivable, net | 782,336 | — | — | 799,242 | 799,242 | |||||||||||||||
Accrued interest receivable | 3,361 | — | 958 | 2,403 | 3,361 | |||||||||||||||
FHLB Stock | 2,047 | N/A | N/A | N/A | N/A | |||||||||||||||
Financial Liabilities: | ||||||||||||||||||||
Demand, NOW, money market deposits and savings deposits | $ | 781,638 | $ | 781,638 | $ | — | $ | — | $ | 781,638 | ||||||||||
Time certificate accounts | 331,057 | — | 334,290 | — | 334,290 | |||||||||||||||
Mortgage escrow funds | 7,023 | 7,023 | — | — | 7,023 | |||||||||||||||
FHLB Advances | 20,081 | — | 20,171 | — | 20,171 | |||||||||||||||
F-58
Table of Contents
PCSB BANK AND SUBSIDIARIES
NOTES TO CONSOLIDATED FINANCIAL STATEMENTS
Three months ended September 30, 2016 and 2015 (unaudited)
and Years ended June 30, 2016 and 2015
NOTE 14 – FAIR VALUE(Continued)
| Fair Value Measurements | ||||||||||||||||||||
| Carrying Amount | Level 1 | Level 2 | Level 3 | Total | ||||||||||||||||
June 30, 2015 | ||||||||||||||||||||
Financial Assets: | ||||||||||||||||||||
Cash and cash equivalents | $ | 77,761 | $ | 77,761 | $ | — | $ | — | $ | 77,761 | ||||||||||
Securities held to maturity | 269,913 | — | 269,833 | 344 | 270,177 | |||||||||||||||
Securities available for sale | 84,943 | — | 84,943 | — | 84,943 | |||||||||||||||
Loans receivable, net | 727,134 | — | — | 734,103 | 734,103 | |||||||||||||||
Accrued interest receivable | 3,234 | — | 876 | 2,358 | 3,234 | |||||||||||||||
FHLB Stock | 1,719 | N/A | N/A | N/A | N/A | |||||||||||||||
Financial Liabilities: | ||||||||||||||||||||
Demand, NOW, money market deposits and savings deposits | $ | 745,989 | $ | 745,989 | $ | — | $ | — | $ | 745,989 | ||||||||||
Time certificate accounts | 314,516 | — | 316,431 | — | 316,431 | |||||||||||||||
Mortgage escrow funds | 6,638 | 6,638 | — | — | 6,638 | |||||||||||||||
FHLB Advances | 14,000 | — | 14,008 | — | 14,008 | |||||||||||||||
The methods and assumptions, not previously presented, used to estimate fair values are described as follows:
Cash and Cash Equivalents: The carrying amounts of cash and short-term instruments approximate fair values and are classified as Level 1.
Loans Receivable, Net: For valuation purposes, the loan portfolio was segregated into its significant categories such as one-to-four family residential mortgage loans, other mortgage loans, consumer loans and commercial loans. These categories were further analyzed, where appropriate, into components based on significant financial characteristics such as type of interest rate (adjustable or fixed). For adjustable rate loans that reprice frequently and with no significant change in credit risk, fair values are based on carrying values. Fair values for other loans are estimated using discounted cash flow analyses, using interest rates currently being offered for loans with similar terms to borrowers of similar credit quality. Impaired loans are valued at the lower of cost or fair value as described previously. The methods utilized to estimate the fair value of loans do not necessarily represent an exit price. The fair value of loans are considered Level 3.
FHLB Stock: It is not practical to determine the fair value of FHLB stock due to restrictions placed on its transferability.
Accrued Interest Receivable/Payable: The carrying amount of accrued interest approximates fair value.
Deposits: The fair values disclosed for demand deposits (e.g., non-interest bearing demand, NOW, money market, savings deposits and escrow accounts) are, by definition, equal to the amount payable on demand at the reporting date (i.e., their carrying amount) and are considered Level 1. Fair values for time certificates of deposit are estimated using a discounted cash flows calculation that applies interest rates currently being offered on certificates to a schedule of aggregated expected monthly maturities on time deposits, resulting in a Level 2 classification.
FHLB Advances: Fair value of the advances is estimated using a discounted cash flow calculation that applies current FHLB interest rates for advances of similar maturity to the Bank’s current advances maturities schedule, resulting in a Level 2 classification.
F-59
Table of Contents
PCSB BANK AND SUBSIDIARIES
NOTES TO CONSOLIDATED FINANCIAL STATEMENTS
Three months ended September 30, 2016 and 2015 (unaudited)
and Years ended June 30, 2016 and 2015
NOTE 14 – FAIR VALUE(Continued)
Off-Balance Sheet Instruments: Fair values of the off-balance-sheet loan commitments, unused lines of credit and standby letters of credit described in Note 13 were estimated based on an analysis of the interest rates and fees currently charged to enter into similar transactions, considering the remaining terms of the instruments and the creditworthiness of the potential borrowers. At September 30, 2016, June 30, 2016 and 2015, the fair values of these instruments approximated the related carrying amounts (deferred fees), which were not material.
NOTE 15 – PLAN OF CONVERSION (unaudited)
On December 7, 2016, the Board of Trustees of the Bank adopted a plan of conversion (“Plan”). The Plan is subject to the approval of the FDIC, New York State Department of Financial Services, and the Board of Governors of the Federal Reserve System, and must be approved by the affirmative vote of at least a majority of the total votes eligible to be cast by the voting members of the Bank at a special meeting. The Plan sets forth that the Bank proposes to convert into a stock savings bank structure with the establishment of a stock holding company, PCSB Financial, Inc. (the “Company”), as parent of the Bank. The Bank will convert to the stock form of ownership, followed by the issuance of all of the Bank’s outstanding stock to the Company. Pursuant to the Plan, the Bank will determine the total offering value and number of shares of common stock based upon a valuation by an independent appraiser. The stock will be priced at $10.00 per share. The Bank’s Board of Trustees will adopt an employee stock ownership plan (ESOP) which will subscribe 8% of the common stock sold in the offering. The Company is being organized as a corporation incorporated under the laws of the State of Maryland and will own all of the outstanding common stock of the Bank upon completion of the conversion.
The costs of issuing the common stock will be deferred and deducted from the sales proceeds of the offering. If the conversion is unsuccessful, all deferred costs will be charged to operations. The Bank has no deferred conversion costs as of September 30, 2016 or June 30, 2016. The transaction is subject to approval by regulatory authorities and members of the Bank. At the completion of the conversion to stock form, the Bank will establish a liquidation account in the amount of retained earnings contained in the final prospectus. The liquidation account will be maintained for the benefits of eligible savings account holders who maintain deposit accounts in the Bank after conversion.
The conversion will be accounted for as a change in corporate form with the historic basis of the Bank’s assets, liabilities and equity unchanged as a result.
F-60
Table of Contents
No person has been authorized to give any information or to make any representation other than as contained in this prospectus and, if given or made, such other information or representation must not be relied upon as having been authorized by PCSB Financial or PCSB Bank. This prospectus does not constitute an offer to sell or a solicitation of an offer to buy any of the securities offered hereby to any person in any jurisdiction in which such offer or solicitation is not authorized or in which the person making such offer or solicitation is not qualified to do so, or to any person to whom it is unlawful to make such offer or solicitation in such jurisdiction. Neither the delivery of this prospectus nor any sale hereunder shall under any circumstances imply that there has been no change in the affairs of PCSB Financial or PCSB Bank since any of the dates as of which information is furnished herein or since the date hereof.
PCSB Financial Corporation
(Proposed Holding Company for PCSB Bank)
Up to 20,125,000 Shares
(Subject to increase to up to 23,143,750 Shares)
COMMON STOCK
PROSPECTUS
Sandler O’Neill + Partners, L.P.
February 10, 2017
These securities are not deposits or accounts and are not insured or guaranteed.
Until March 14, 2017, all dealers that effect transactions in these securities, whether or not participating in this offering, may be required to deliver a prospectus. This is in addition to the dealers’ obligation to deliver a prospectus when acting as underwriters and with respect to their unsold allotments or subscriptions.
Table of Contents
| PART II: | INFORMATION NOT REQUIRED IN PROSPECTUS |
| Item 13. | Other Expenses of Issuance and Distribution |
| Estimated Amount | ||||
Registrant’s Legal Fees and Expenses | $ | 725,000 | ||
Registrant’s Accounting Fees and Expenses | 200,000 | |||
Marketing Agent Fees and Expenses(1) | 1,838,000 | |||
Records Management Fees and Expenses | 55,000 | |||
Appraisal Fees and Expenses | 130,500 | |||
Printing, Postage, Mailing and EDGAR Fees | 300,000 | |||
Filing Fees (NASDAQ, FINRA, NYSDFS and SEC) | 220,500 | |||
Transfer Agent Fees and Expenses | 20,000 | |||
Business Plan Fees and Expenses | 40,000 | |||
Stock Certificate Fees and Expenses | 10,000 | |||
Other | 20,000 | |||
|
| |||
Total | $ | 3,559,000 | ||
|
| |||
| (1) | Estimated at the adjusted maximum of the offering range, assuming 100% of the shares are sold in the subscription offering. |
| Item 14. | Indemnification of Directors and Officers |
Article 10 of the Articles of Incorporation of PCSB Financial Corporation (the “Corporation”) sets forth the circumstances under which directors, officers, employees and agents of the Corporation may be insured or indemnified against liability which they may incur in their capacities as such:
ARTICLE 10. Indemnification, etc. of Directors and Officers.
A.Indemnification. The Corporation shall indemnify (1) its current and former directors and officers, whether serving the Corporation or at its request any other entity, to the fullest extent required or permitted by the Maryland General Corporation Law (the “MGCL”) now or hereafter in force, including the advancement of expenses under the procedures and to the fullest extent permitted by law, and (2) other employees and agents to such extent as shall be authorized by the Board of Directors and permitted by law; provided, however, that, except as provided in Section B of this Article 10 with respect to proceedings to enforce rights to indemnification, the Corporation shall indemnify any such indemnitee in connection with a proceeding (or part thereof) initiated by such indemnitee only if such proceeding (or part thereof) was authorized by the Board of Directors of the Corporation.
B.Procedure. If a claim under Section A of this Article 10 is not paid in full by the Corporation within sixty (60) days after a written claim has been received by the Corporation, except in the case of a claim for an advancement of expenses, in which case the applicable period shall be twenty (20) days, the indemnitee may at any time thereafter bring suit against the Corporation to recover the unpaid amount of the claim. If successful in whole or in part in any such suit, or in a suit brought by the Corporation to recover an advancement of expenses pursuant to the terms of an undertaking, the indemnitee shall also be entitled to be reimbursed the expense of prosecuting or defending such suit. It shall be a defense to any action for advancement of expenses that the Corporation has not received both (i) an undertaking as required by law to repay such advances if it shall ultimately be determined that the standard of conduct has not been met and (ii) a written affirmation by the indemnitee of his or her good faith belief that the standard of conduct necessary for indemnification by the Corporation has been met. In (i) any suit brought by the indemnitee to enforce a right to indemnification hereunder (but not in a suit brought by the indemnitee to enforce a right to an advancement of expenses) it shall be a defense that, and (ii) any suit by the Corporation to recover an advancement of expenses pursuant to the terms of an undertaking the Corporation shall be entitled to recover such expenses upon a final adjudication that, the indemnitee has not met the applicable standard for indemnification set forth in the MGCL. Neither the failure of the Corporation (including its Board of Directors, independent legal counsel, or its stockholders) to have made a determination before the commencement of such suit that indemnification of the indemnitee is proper in the circumstances because the indemnitee has met the applicable
II-1
Table of Contents
standard of conduct set forth in the MGCL, nor an actual determination by the Corporation (including its Board of Directors, independent legal counsel, or its stockholders) that the indemnitee has not met such applicable standard of conduct, shall create a presumption that the indemnitee has not met the applicable standard of conduct, or, in the case of such a suit brought by the indemnitee, be a defense to such suit. In any suit brought by the indemnitee to enforce a right to indemnification or to an advancement of expenses hereunder, or by the Corporation to recover an advancement of expenses pursuant to the terms of an undertaking, the burden of proving that the indemnitee is not entitled to be indemnified, or to such advancement of expenses, under this Article 10 or otherwise, shall be on the Corporation.
C.Non-Exclusivity. The rights to indemnification and to the advancement of expenses conferred in this Article 10 shall not be exclusive of any other right that any Person may have or hereafter acquire under any statute, these Articles, the Corporation’s Bylaws, any agreement, any vote of stockholders or the Board of Directors, or otherwise.
D.Insurance. The Corporation may maintain insurance, at its expense, to insure itself and any director, officer, employee or agent of the Corporation or another corporation, partnership, joint venture, trust or other enterprise against any expense, liability or loss, whether or not the Corporation would have the power to indemnify such Person against such expense, liability or loss under the MGCL.
E.Miscellaneous. The Corporation shall not be liable for any payment under this Article 10 in connection with a claim made by any indemnitee to the extent such indemnitee has otherwise actually received payment under any insurance policy, agreement, or otherwise, of the amounts otherwise indemnifiable hereunder. The rights to indemnification and to the advancement of expenses conferred in Sections A and B of this Article 10 shall be contract rights and such rights shall continue as to an indemnitee who has ceased to be a director or officer and shall inure to the benefit of the indemnitee’s heirs, executors and administrators.
F.Limitations Imposed by Federal Law.Notwithstanding any other provision set forth in this Article 10, in no event shall any payments made by the Corporation pursuant to this Article 10 exceed the amount permissible under applicable federal law, including, without limitation, Section 18(k) of the Federal Deposit Insurance Act and the regulations promulgated thereunder.
Any repeal or modification of this Article 10 by the stockholders of the Corporation or the Board of Directors shall not in any way diminish any rights to indemnification or advancement of expenses of such director or officer or the obligations of the Corporation arising hereunder with respect to events occurring, or claims made, while this Article 10 is in force.
| Item 15. | Recent Sales of Unregistered Securities |
Not Applicable.
| Item 16. | Exhibits and Financial Statement Schedules |
The exhibits and financial statement schedules filed as part of this registration statement are:
| (a) | List of Exhibits |
| 1.1 | Engagement Letter between PCSB Bank and Sandler O’Neill & Partners, L.P. (marketing agent services)* | |
| 1.2 | Engagement Letter between PCSB Bank and Sandler O’Neill & Partners, L.P. (records management agent services)* | |
| 1.3 | Form of Agency Agreement between PCSB Financial Corporation, PCSB Bank, and Sandler O’Neill & Partners, L.P.* | |
| 2 | Plan of Conversion of PCSB Bank, As Amended* | |
| 3.1 | Articles of Incorporation of PCSB Financial Corporation* | |
| 3.2 | Bylaws of PCSB Financial Corporation* | |
| 4 | Form of Common Stock Certificate of PCSB Financial Corporation* | |
II-2
Table of Contents
| 5 | Opinion of Luse Gorman, PC regarding legality of securities being registered* | |
| 8.1 | Federal Income Tax Opinion of Luse Gorman, PC* | |
| 8.2 | State Income Tax Opinion of Crowe Horwath LLP* | |
| 10.1 | Form of PCSB Bank Employee Stock Ownership Plan* | |
| 10.2 | Form of Employment Agreement between PCSB Bank and Joseph D. Roberto* | |
| 10.3 | Form of Employment Agreement between PCSB Bank and Scott N. Nogles* | |
| 10.4 | Form of Employment Agreement between PCSB Bank and Michael P. Goldrick* | |
| 10.5 | Form of Employment Agreement between PCSB Financial Corporation and Joseph D. Roberto* | |
| 10.6 | Form of Employment Agreement between PCSB Financial Corporation and Scott N. Nogles* | |
| 10.7 | Form of Employment Agreement between PCSB Financial Corporation and Michael P. Goldrick* | |
| 10.8 | Form of One-Year Change in Control Agreement between PCSB Bank, PCSB Financial Corporation and certain executive officers* | |
| 10.9 | Form of Two-Year Change in Control Agreement between PCSB Bank, PCSB Financial Corporation and certain executive officers* | |
| 10.10 | Supplemental Executive Retirement Plan for Joseph D. Roberto* | |
| 10.11 | Supplemental Life Insurance Agreement for Joseph D. Roberto* | |
| 10.12 | Supplemental Life Insurance Plan for Senior Executives* | |
| 10.13 | Form of Supplemental Executive Retirement Plan for Senior Executives* | |
| 10.14 | PCSB Bank Trustee Fee Deferral Plan* | |
| 10.15 | PCSB Bank Trustee Supplemental Life Insurance Plan* | |
| 10.16 | PCSB Bank Death Benefit Only Plan for Michael T. Weber* | |
| 21 | Subsidiaries of PCSB Financial Corporation* | |
| 23.1 | Consent of Luse Gorman, PC (contained in Opinions included as Exhibits 5 and 8.1)* | |
| 23.2 | Consent of RP Financial, LC.* | |
| 23.3 | Consent of Crowe Horwath LLP* | |
| 24 | Power of Attorney (set forth on signature page) | |
| 99.1 | Appraisal Agreement between PCSB Bank and RP Financial, LC.* | |
| 99.2 | Letter of RP Financial, LC. with respect to value of Subscription Rights* | |
| 99.3 | Updated Appraisal Report of RP Financial, LC.* | |
| 99.4 | Marketing Materials* | |
| 99.5 | Stock Order and Certification Form* | |
| * | Previously filed |
| (b) | Financial Statement Schedules |
No financial statement schedules are filed because the required information is inapplicable or is included in the consolidated financial statements and related notes.
| Item 17. | Undertakings |
The undersigned Registrant hereby undertakes:
(1) To file, during any period in which offers or sales are being made, a post-effective amendment to this registration statement:
(i) To include any prospectus required by Section 10(a)(3) of the Securities Act of 1933;
(ii) To reflect in the prospectus any facts or events arising after the effective date of the registration statement (or the most recent post-effective amendment thereof) which, individually or in the aggregate, represent a fundamental change in the information set forth in the registration statement. Notwithstanding the foregoing, any increase or decrease in volume of securities offered (if the total dollar value of securities offered would not exceed that which was registered) and any deviation from the low or high end of the estimated maximum offering range may be reflected in the form of prospectus filed with the
II-3
Table of Contents
Commission pursuant to Rule 424(b) if, in the aggregate, the changes in volume and price represent no more than a 20 percent change in the maximum aggregate offering price set forth in the “Calculation of Registration Fee” table in the effective registration statement;
(iii) To include any material information with respect to the plan of distribution not previously disclosed in the registration statement or any material change to such information in the registration statement.
(2) That, for the purpose of determining any liability under the Securities Act of 1933, each such post-effective amendment shall be deemed to be a new registration statement relating to the securities offered therein, and the offering of such securities at that time shall be deemed to be the initial bona fide offering thereof.
(3) To remove from registration by means of a post-effective amendment any of the securities being registered which remain unsold at the termination of the offering.
(4) That, for the purpose of determining liability of the registrant under the Securities Act of 1933 to any purchaser in the initial distribution of the securities:
The undersigned registrant undertakes that in a primary offering of securities of the undersigned registrant pursuant to this registration statement, regardless of the underwriting method used to sell the securities to the purchaser, if the securities are offered or sold to such purchaser by means of any of the following communications, the undersigned registrant will be a seller to the purchaser and will be considered to offer or sell such securities to such purchaser:
(i) Any preliminary prospectus or prospectus of the undersigned registrant relating to the offering required to be filed pursuant to Rule 424 (§230.424 of this chapter);
(ii) Any free writing prospectus relating to the offering prepared by or on behalf of the undersigned registrant or used or referred to by the undersigned registrant;
(iii) The portion of any other free writing prospectus relating to the offering containing material information about the undersigned registrant or its securities provided by or on behalf of the undersigned registrant; and
(iv) Any other communication that is an offer in the offering made by the undersigned registrant to the purchaser.
(5) That, for purposes of determining any liability under the Securities Act of 1933, the information omitted from the form of prospectus filed as part of this registration statement in reliance upon Rule 430A and contained in a form of prospectus filed by the registrant pursuant to Rule 424(b)(1) or (4) or 497(h) under the Securities Act shall be deemed to be part of this registration statement as of the time it was declared effective.
(6) That, for the purpose of determining any liability under the Securities Act of 1933, each post-effective amendment that contains a form of prospectus shall be deemed to be a new registration statement relating to the securities offered therein, and the offering of such securities at that time shall be deemed to be the initial bona fide offering thereof.
(7) The undersigned registrant hereby undertakes to provide to the underwriter at the closing specified in the underwriting agreement, certificates in such denominations and registered in such names as required by the underwriter to permit prompt delivery to each purchaser.
(8) Insofar as indemnification for liabilities arising under the Securities Act of 1933 may be permitted to directors, officers and controlling persons of the registrant pursuant to the foregoing provisions, or otherwise, the registrant has been advised that in the opinion of the Securities and Exchange Commission such indemnification is
II-4
Table of Contents
against public policy as expressed in the Act, and is, therefore, unenforceable. In the event that a claim for indemnification against such liabilities (other than the payment by the registrant of expenses incurred or paid by a director, officer or controlling person of the registrant in the successful defense of any action, suit or proceeding) is asserted by such director, officer or controlling person in connection with the securities being registered, the registrant will, unless in the opinion of its counsel the matter has been settled by controlling precedent, submit to a court of appropriate jurisdiction the question whether such indemnification by it is against public policy as expressed in the Act and will be governed by the final adjudication of such issue.
II-5
Table of Contents
SIGNATURES
Pursuant to the requirements of the Securities Act of 1933, the registrant has duly caused this registration statement to be signed on its behalf by the undersigned, thereunto duly authorized in the City of Yorktown Heights, State of New York on February 7, 2017.
| PCSB FINANCIAL CORPORATION | ||
| By: | /s/ Joseph D. Roberto | |
| Joseph D. Roberto | ||
| Chairman, President and Chief Executive Officer (Duly Authorized Representative) | ||
POWER OF ATTORNEY
We, the undersigned directors and officers of PCSB Financial Corporation (the “Corporation”) hereby severally constitute and appoint Joseph D. Roberto as our true and lawful attorney and agent, to do any and all things in our names in the capacities indicated below which said individual may deem necessary or advisable to enable the Corporation to comply with the Securities Act of 1933, as amended, and any rules, regulations and requirements of the Securities and Exchange Commission, in connection with the registration statement on Form S-1 relating to the offering of the Corporation’s common stock, including specifically, but not limited to, power and authority to sign for us in our names in the capacities indicated below the registration statement and any and all amendments (including post-effective amendments) thereto; and we hereby approve, ratify and confirm all that said individual shall do or cause to be done by virtue thereof.
Pursuant to the requirements of the Securities Act of 1933, this registration statement has been signed by the following persons in the capacities and on the dates indicated.
Signatures | Title | Date | ||
/s/ Joseph D. Roberto Joseph D. Roberto | Chairman, President and Chief Executive Officer (Principal Executive Officer) | February 7, 2017 | ||
/s/ Scott Nogles* Scott Nogles | Executive Vice President and Chief Financial Officer (Principal Financial and Accounting Officer) | February 7, 2017 | ||
/s/ William L. Cuddy, Jr.* William L. Cuddy, Jr. | Director | February 7, 2017 | ||
/s/ Kevin B. Dwyer* Kevin B. Dwyer | Director | February 7, 2017 | ||
/s/ Willard I. Hill, Jr.* Willard I. Hill, Jr. | Director | February 7, 2017 | ||
/s/ Jeffrey Kellogg* Jeffrey Kellogg | Director | February 7, 2017 | ||
/s/ Robert Lusardi* Robert Lusardi | Director | February 7, 2017 | ||
/s/ Matthew G. McCrosson* Matthew G. McCrosson | Director | February 7, 2017 | ||
/s/ Karl A. Thimm* Karl A. Thimm | Director | February 7, 2017 | ||
/s/ Michael T. Weber* Michael T. Weber | Director | February 7, 2017 | ||
/s/ Richard F. Weiss* Richard F. Weiss | Director | February 7, 2017 | ||
| * | Pursuant to the Power of Attorney contained on the signature page to the Registration Statement, as initially filed on December 12, 2016 and subsequently filed on February 1, 2017. |