
Shareholder Letter Q2 2021
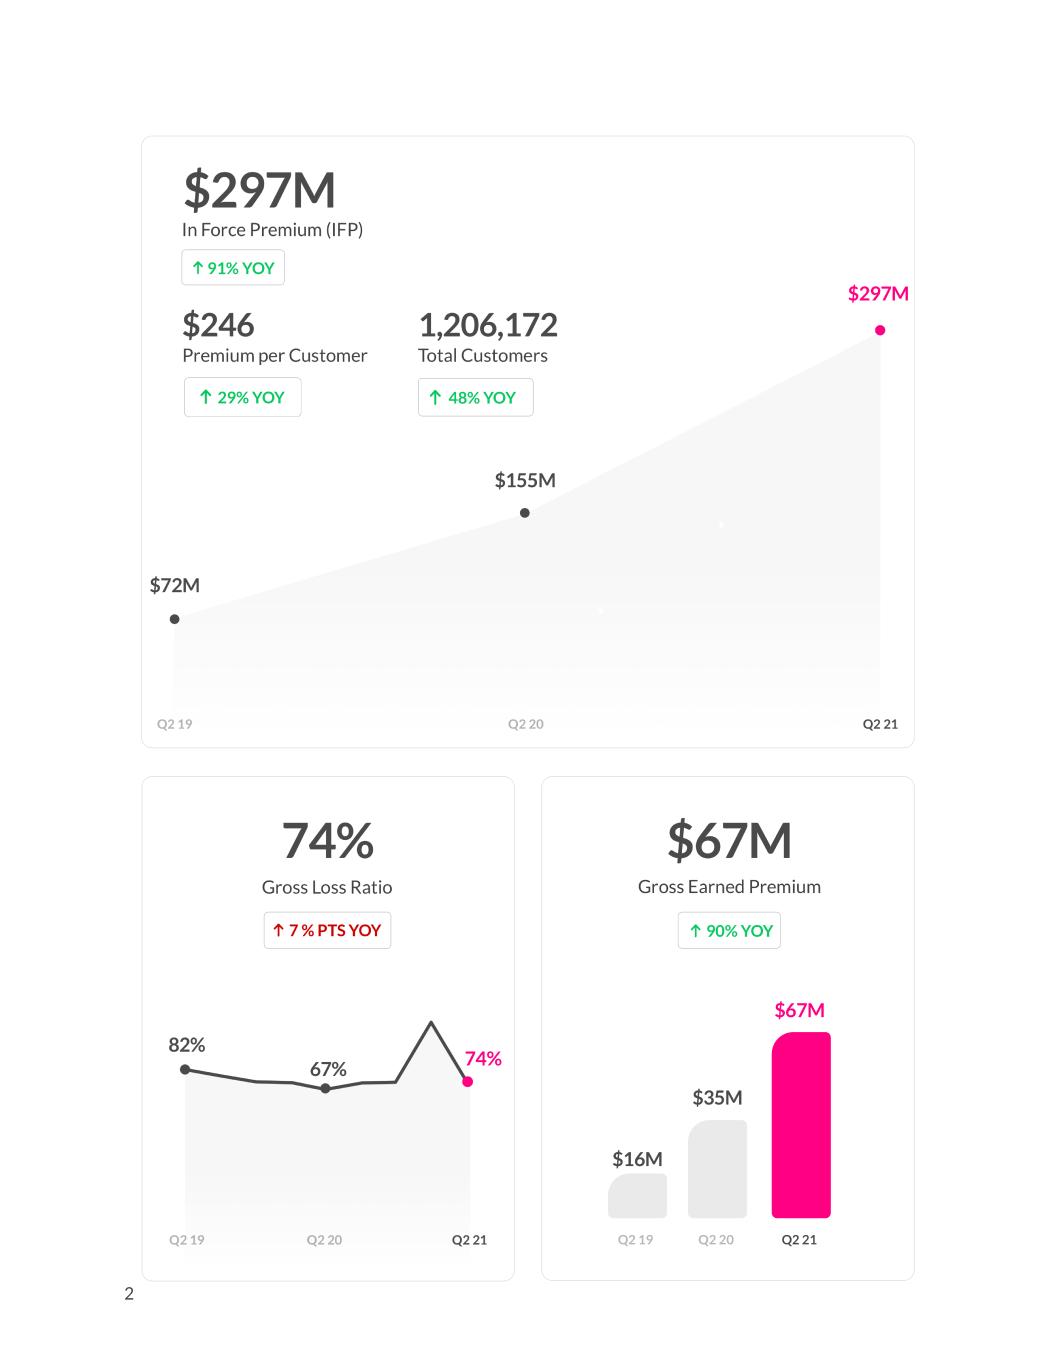
2
Dear Shareholders, We're happy to report that Q2 saw positive trends and metrics across the board. With healthy unit economics and robust customer demand, the overarching theme of Q1 21 was leaning in to growth investment, and this happily characterized Q2 21 too. We saw accelerating IFP growth for the second consecutive quarter, with IFP increasing by 91% year-over-year (relative to 89% in Q1 21 and 87% in Q4 20). We concluded Q2 21 with IFP of $297 million, and about 1.2 million customers. Separately, for the fourth consecutive quarter, we saw accelerating growth in premium per customer. This metric increased year-over-year by an all- time record of 29% to $246. This acceleration reflects the sustained diversification of our business mix to higher premium products, and the increasing prevalence of Lemonade customers with multiple policies. We'll discuss these concepts in more detail in an upcoming section of this letter. As we look ahead, from our vantage point, it's all systems go for a second half with similar dynamics. During this high-growth phase of our business, if growth investment opportunities present themselves that demonstrate attractive long-term unit economics, we intend to make those investments and prioritize long term value maximization over near-term EBITDA optimization. 3

Lemonade Car Last quarter, we announced the upcoming launch of Lemonade Car, and it has been gratifying to see how much our community - shareholders and customers alike - appear to share our excitement. In the intervening months, we've made real strides on all aspects of our car roadmap: product, technology, recruiting, and regulatory approvals. As it relates to product and technology, we've been co-creating with our prospective customers. We recently sent a survey out to our rapidly growing Lemonade Car waitlist, and nearly 10,000 customers shared what's most important to them in a car insurance experience. With such rich input from existing Lemonade customers, we’ve swiftly completed the development (from scratch) of an end to end, digital-first car policy management system. In all aspects of our product strategy, we have stayed true to our values and have prioritized the delivery of a delightful customer experience that is simple, fast, and - wherever possible - automated. We’ll use telematics data to implement a nuanced and segmented pricing structure that will provide a fair price for safe drivers, and ensure we build a strong, low-risk book of business. The Lemonade Car team continues to grow considerably. We have recruited some of the best talent in the industry to lead our car insurance operation and have started staffing up our customer-facing teams in preparation for launch. Notwithstanding our good progress on the development of Lemonade Car, given our dependency on regulatory approvals - the timing of which is hard to tie down - we are not at this stage announcing a concrete launch date, nor are we including anticipated IFP associated with Lemonade Car in our guidance for FY 21. 4
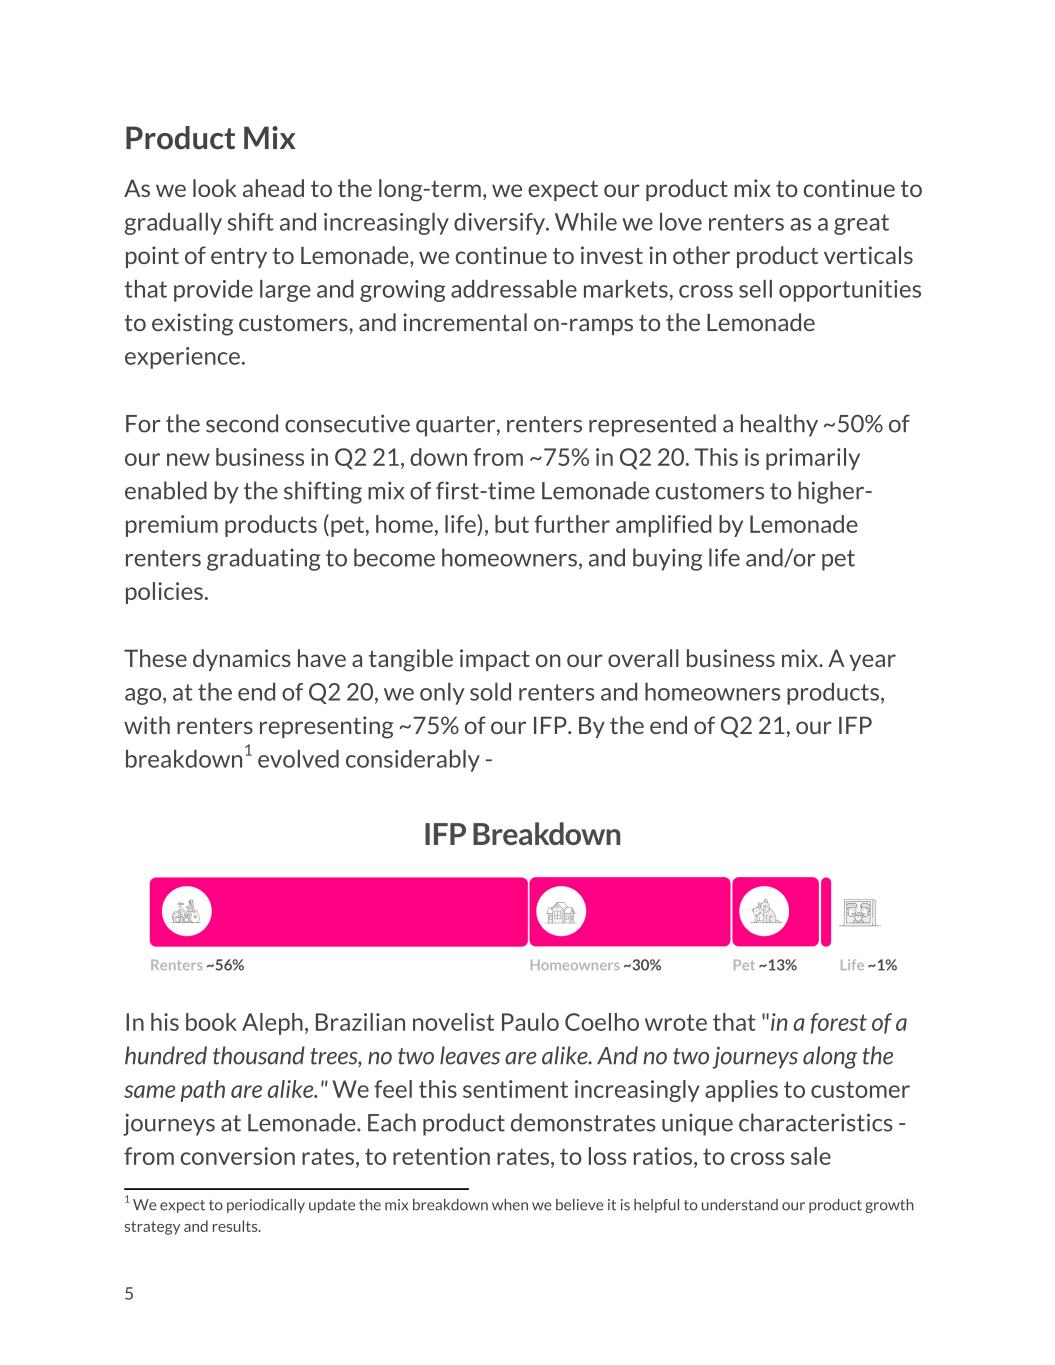
Product Mix As we look ahead to the long-term, we expect our product mix to continue to gradually shift and increasingly diversify. While we love renters as a great point of entry to Lemonade, we continue to invest in other product verticals that provide large and growing addressable markets, cross sell opportunities to existing customers, and incremental on-ramps to the Lemonade experience. For the second consecutive quarter, renters represented a healthy ~50% of our new business in Q2 21, down from ~75% in Q2 20. This is primarily enabled by the shifting mix of first-time Lemonade customers to higher- premium products (pet, home, life), but further amplified by Lemonade renters graduating to become homeowners, and buying life and/or pet policies. These dynamics have a tangible impact on our overall business mix. A year ago, at the end of Q2 20, we only sold renters and homeowners products, with renters representing ~75% of our IFP. By the end of Q2 21, our IFP breakdown1 evolved considerably - In his book Aleph, Brazilian novelist Paulo Coelho wrote that "in a forest of a hundred thousand trees, no two leaves are alike. And no two journeys along the same path are alike." We feel this sentiment increasingly applies to customer journeys at Lemonade. Each product demonstrates unique characteristics - from conversion rates, to retention rates, to loss ratios, to cross sale 5 1 We expect to periodically update the mix breakdown when we believe it is helpful to understand our product growth strategy and results.
opportunities - and the array of multi-product combinations significantly impacts (for the better) on each of these standalone characteristics. While it is early days for some of our products, we are working to map these dynamics so as to optimize lifetime value (LTV) of our customers. In this spirit, we'll provide some updates around the performance of each of our products. Let's begin with pet, which recently celebrated its first birthday (or should it be its 7th?). At roughly 13% of our total book of business, the product has blown past our internal goals. And notably, we've had great success selling pet to both new and existing Lemonade customers. • New customers: For our homeowners products it took us a few years to achieve profitable unit economics, as measured by LTV to CAC (customer acquisition cost) ratios. It took just a matter of months to do the same for pet. This has given us confidence to lean in and ramp up spend volume that targets new-to-Lemonade pet customers. • Existing customers: Pet has also been a great case study that demonstrates the willingness of our existing customers to purchase additional policies with us. We have made tens of thousands of pet cross sales, which represent about 30% of our total pet IFP as of Q2 21. Relative to pet, our life product has been a bit slower out of the gate. Given we were primarily working through product improvements in Q1 21, Q2 21 is the first time we allocated meaningful advertising dollars to the product. While the dollars were still small relative to the scope of our total business, the signals were strong, with tangible traction and conversion funnel improvement achieved in this first quarter of growth investment. We are encouraged by the trends we are seeing in the life business and look forward to life representing a meaningful slice of the Lemonade IFP pie over time. In Q2 21, our homeowners book continued to deliver robust triple digit year- over-year growth rates. While we have continued to see strong performance in our direct channels, we have been positively surprised by other means of acquisition. In Q2 21, these other distribution channels (primarily agent 6
partners and Lemonade graduates) more than doubled their share of homeowner sales relative to Q2 20. Our renters business continues to grow fast - even as its share in our book slims down - clocking in roughly 50% year-over-year growth in Q2 21. Even as we invest more meaningfully in new products, we are highly encouraged by the trajectory of our renters' unit economics over time. We've seen consistent a downward trend on CAC, driven by funnel optimization and channel diversification. Simultaneously, we've seen an upward slope on LTV due to loss ratio improvement and the increasing prevalence of renters buying additional policies with us. Geographic Mix Today, at least one Lemonade product is available for purchase in each of the 50 US states, and we continue to push towards being able to service 100% of our customers’ insurance needs regardless of where they live. We recently made meaningful progress in pursuit of this goal, with the launch of our renters insurance product in Florida. The renters insurance market in Florida is the fourth largest in the nation, as measured by total gross written premium. By first focusing on renters insurance in Florida, we will be able to fine-tune our approach in a risky CAT state before we develop our homeowners products there. We look forward to bringing a Lemonade renters experience to Floridians and anticipate our product suite in the state will expand over time. As a tech-enabled business, we are uniquely able to address our business mix across continents. To date, our investment has heavily favored the United States as that is where we have seen the most compelling unit economics. In response to favorable recent trends around improving conversion rates and steadily declining loss ratios that we are observing in Europe, we've started investing more meaningfully in R&D in Europe - i.e. optimizing the 7
distribution model and product experience for each market. As a result, we have recently won a number of awards: • 5-stars for Best Product Quality on MoneyView Research, a Dutch rating company for insurers • Best Product (with a score of 9.3) from Consumentenbond, a Dutch consumer protection organization • Best Score for a digital service offering - published by Focus Money, a German financial review publication and based on research by ServiceValue, a market-leading German customer research firm We are anticipating that the underlying positive trends in our unit economics and our speedy development of a best-in-class regional product experience will lead to a step-change in growth investment levels in the continent in 2022 and beyond - we'll certainly keep you posted. Reinsurance Renewal & Loss Ratio A year ago, we transitioned to a quota share reinsurance program. We agreed to cede 75% of our premium to a panel of partners, thus retaining 25% of the risk on our own balance sheet2. This strategy limited our volatility exposure and enabled our financial model to be capital-light. In Q1 21, when the Texas Freeze had a major impact on our gross loss ratio, this reinsurance program worked exactly as designed, shielding our bottom line from 75% of this impact. Our reinsurance partners, of course, are for-profit institutions, and more reinsurance ultimately means more costs. Therefore, as our business grows and diversifies - lowering our book's volatility - we plan to gradually reduce the portion of premium that we cede over time. 8 2 Note that the entire book is protected by our Non-Proportional Reinsurance Contracts which include property per risk & facultative coverages. Starting in Q3 21, we also have CAT protection on a majority of the book.
When we entered into the quota share reinsurance program in July 2020, we secured 55 of the 75 points on a 3-year term, while the remaining 20 points were up for renewal annually. We are pleased to share that despite meaningful noise and volatility in the reinsurance market, which has anecdotally been a point of concern for some of our shareholders, we were able to secure similar financial terms on the portion of the quota share that we renewed. Consistent with the discussion above, we made a modest reduction in the scope of our quota share program - stepping down from 75% to 70% (i.e. we renewed 15 of 20 points that were up for renewal). Our panel of reinsurers continue to be great partners for us. They appreciate our long-term strategy, and are unfazed by the new business penalty. As they well know, when we step into new lines of business, there will naturally be some upward pressure on near-term loss ratios driven by a greater concentration of typically weaker first year customers and nascent machine learning models. In fact, if we compare our Q2 21 gross loss ratio of 74% to the prior year result of 67%, much of the increase is attributable to our rapidly growing new business lines. As we've discussed previously, we plan to push past these forces and continue to grow our new customers, and our new products. Notwithstanding these headwinds, we expect to be able to maintain a firm- wide loss ratio that averages less than 75% on a multi-year basis. In this context, we are heartened by the return of our gross loss ratio to our target range in Q2 21 following the significant impact of the Texas Freeze on our results last quarter. 9
Giveback We recently announced our donation of $2,303,381 to 65 nonprofits chosen by our customers in this year's annual Lemonade Giveback - more than double the prior year amount, and more than 4,000% up since the program's inception in 2017. This year, we made our largest individual donation ever, with nearly $300,000 going to SPCA International, a global animal rescue organization. Lemonade's Pet Insurance offering triggered a notable rise in donations to animal rights causes, with over $360,000 shared among 11 nonprofits. As a Certified B-Corp and Public Benefit Corporation, our commitment to worthy causes that our customers care about is hardwired in our DNA and our core business model - as our business continues to grow dramatically, we are hopeful that the Giveback program will continue to enjoy this momentum. 10
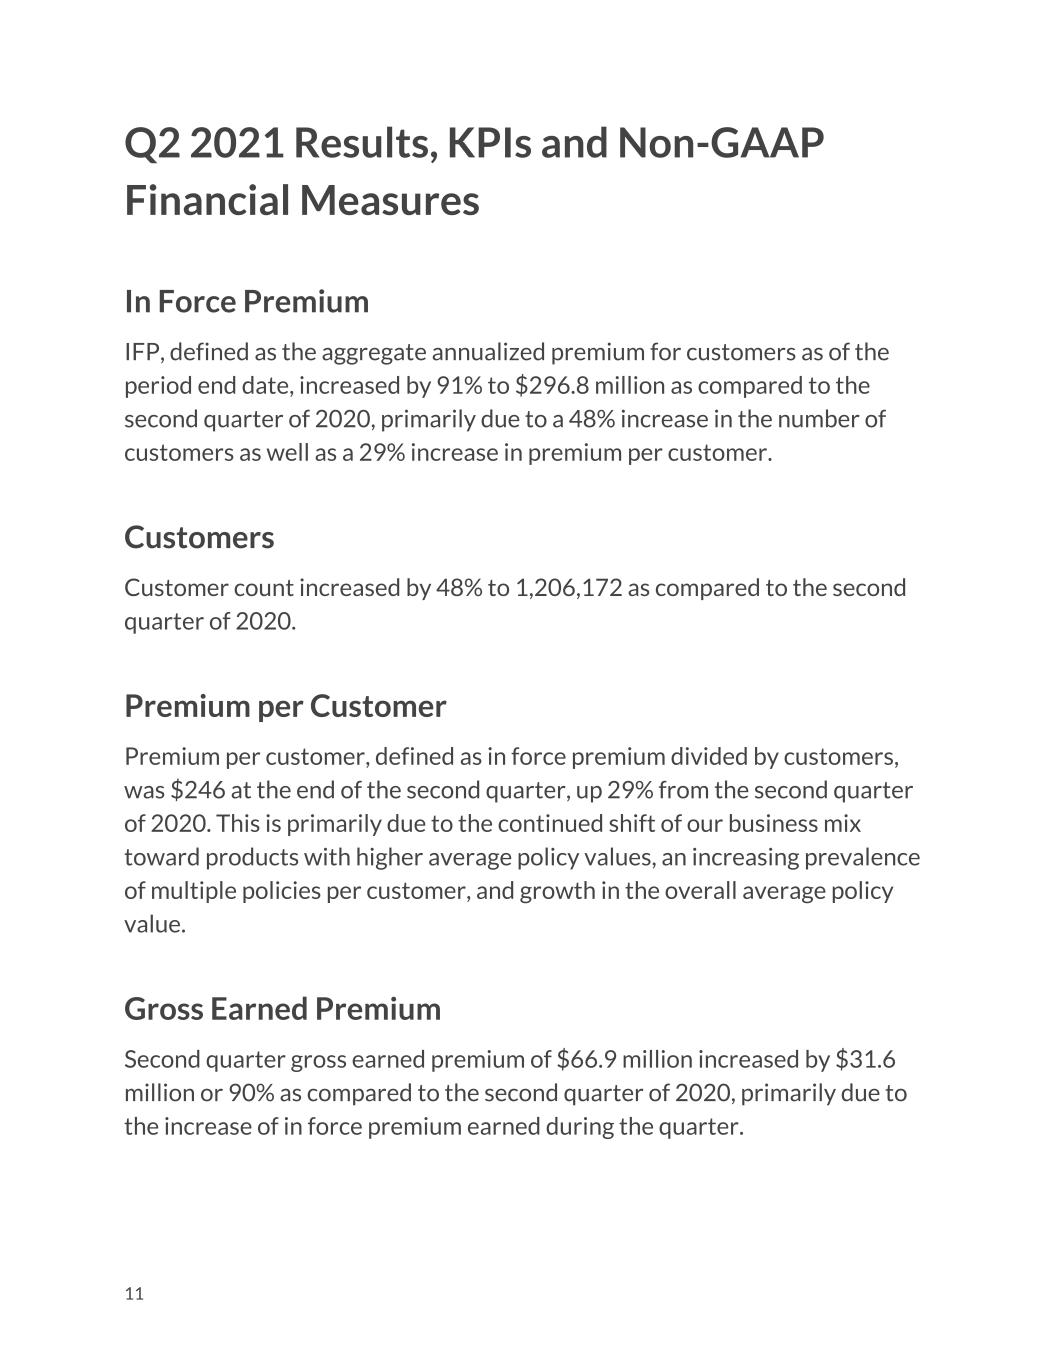
Q2 2021 Results, KPIs and Non-GAAP Financial Measures In Force Premium IFP, defined as the aggregate annualized premium for customers as of the period end date, increased by 91% to $296.8 million as compared to the second quarter of 2020, primarily due to a 48% increase in the number of customers as well as a 29% increase in premium per customer. Customers Customer count increased by 48% to 1,206,172 as compared to the second quarter of 2020. Premium per Customer Premium per customer, defined as in force premium divided by customers, was $246 at the end of the second quarter, up 29% from the second quarter of 2020. This is primarily due to the continued shift of our business mix toward products with higher average policy values, an increasing prevalence of multiple policies per customer, and growth in the overall average policy value. Gross Earned Premium Second quarter gross earned premium of $66.9 million increased by $31.6 million or 90% as compared to the second quarter of 2020, primarily due to the increase of in force premium earned during the quarter. 11
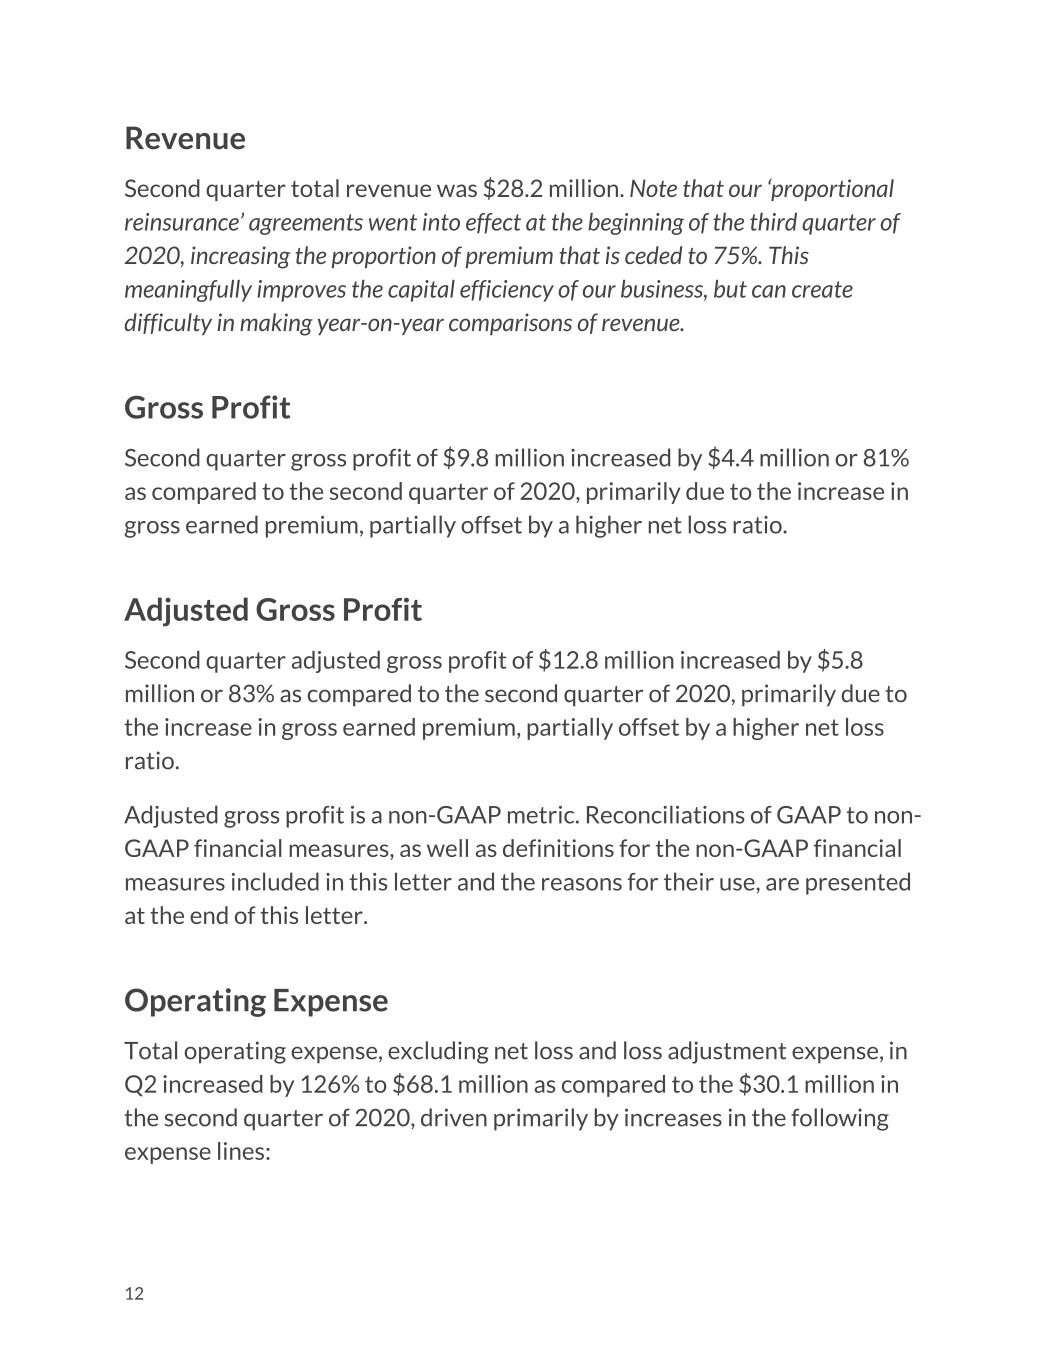
Revenue Second quarter total revenue was $28.2 million. Note that our ‘proportional reinsurance’ agreements went into effect at the beginning of the third quarter of 2020, increasing the proportion of premium that is ceded to 75%. This meaningfully improves the capital efficiency of our business, but can create difficulty in making year-on-year comparisons of revenue. Gross Profit Second quarter gross profit of $9.8 million increased by $4.4 million or 81% as compared to the second quarter of 2020, primarily due to the increase in gross earned premium, partially offset by a higher net loss ratio. Adjusted Gross Profit Second quarter adjusted gross profit of $12.8 million increased by $5.8 million or 83% as compared to the second quarter of 2020, primarily due to the increase in gross earned premium, partially offset by a higher net loss ratio. Adjusted gross profit is a non-GAAP metric. Reconciliations of GAAP to non- GAAP financial measures, as well as definitions for the non-GAAP financial measures included in this letter and the reasons for their use, are presented at the end of this letter. Operating Expense Total operating expense, excluding net loss and loss adjustment expense, in Q2 increased by 126% to $68.1 million as compared to the $30.1 million in the second quarter of 2020, driven primarily by increases in the following expense lines: 12

• Sales & marketing: primarily driven by an increased investment in advertising and employee-related expenses to support our continued growth and expansion into new products and markets • Technology development: primarily driven by increased employee- related expenses to support our continued growth and product development initiatives • General & administrative: primarily driven by increased employee- related expenses and overhead costs to support our continued growth, along with the compliance requirements to operate as a public company Net Loss Net loss in Q2 was $55.6 million, or $(0.90) per share, as compared to $21.0 million, or $(1.77) per share, in the second quarter of 2020. Adjusted EBITDA Adjusted EBITDA loss of $40.4 million increased by $22.2 million as compared to the second quarter of 2020, primarily due to increased operating expenses. Adjusted EBITDA is a non-GAAP metric. Reconciliations of GAAP to non- GAAP financial measures, as well as definitions for the non-GAAP financial measures included in this letter and the reasons for their use, are presented at the end of this letter. Cash The Company’s cash, cash equivalents, and investments totaled $1.2 billion at June 30, 2021 as compared to $578 million as of December 31, 2020, primarily reflecting the net proceeds from our follow-on offering of 13
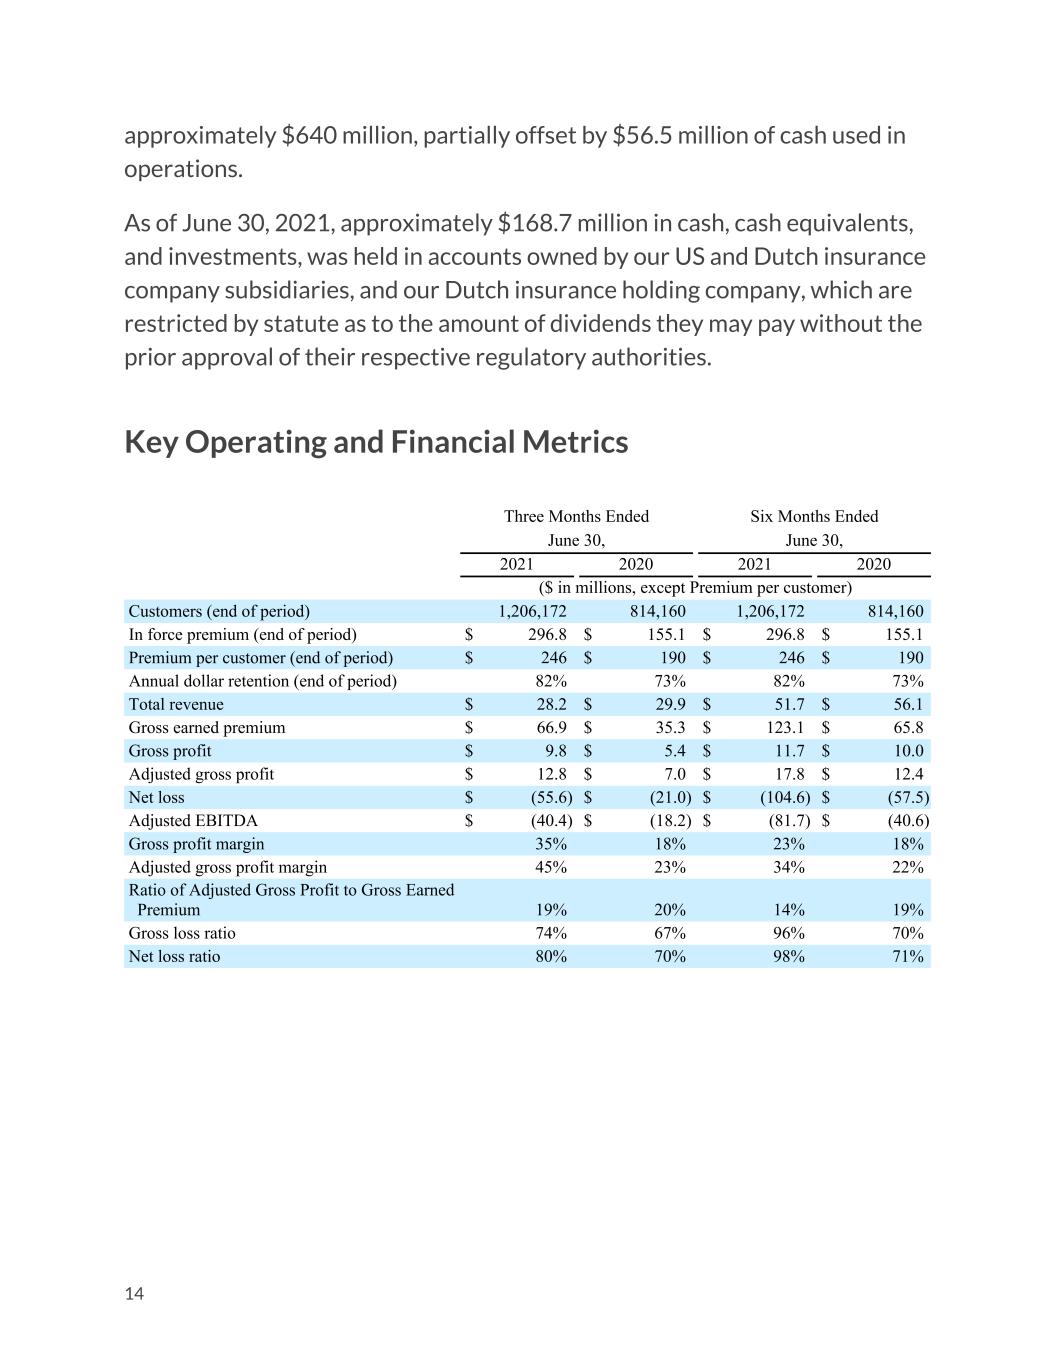
approximately $640 million, partially offset by $56.5 million of cash used in operations. As of June 30, 2021, approximately $168.7 million in cash, cash equivalents, and investments, was held in accounts owned by our US and Dutch insurance company subsidiaries, and our Dutch insurance holding company, which are restricted by statute as to the amount of dividends they may pay without the prior approval of their respective regulatory authorities. Key Operating and Financial Metrics Three Months Ended June 30, Six Months Ended June 30, 2021 2020 2021 2020 ($ in millions, except Premium per customer) Customers (end of period) 1,206,172 814,160 1,206,172 814,160 In force premium (end of period) $ 296.8 $ 155.1 $ 296.8 $ 155.1 Premium per customer (end of period) $ 246 $ 190 $ 246 $ 190 Annual dollar retention (end of period) 82% 73% 82% 73% Total revenue $ 28.2 $ 29.9 $ 51.7 $ 56.1 Gross earned premium $ 66.9 $ 35.3 $ 123.1 $ 65.8 Gross profit $ 9.8 $ 5.4 $ 11.7 $ 10.0 Adjusted gross profit $ 12.8 $ 7.0 $ 17.8 $ 12.4 Net loss $ (55.6) $ (21.0) $ (104.6) $ (57.5) Adjusted EBITDA $ (40.4) $ (18.2) $ (81.7) $ (40.6) Gross profit margin 35% 18% 23% 18% Adjusted gross profit margin 45% 23% 34% 22% Ratio of Adjusted Gross Profit to Gross Earned Premium 19% 20% 14% 19% Gross loss ratio 74% 67% 96% 70% Net loss ratio 80% 70% 98% 71% 14
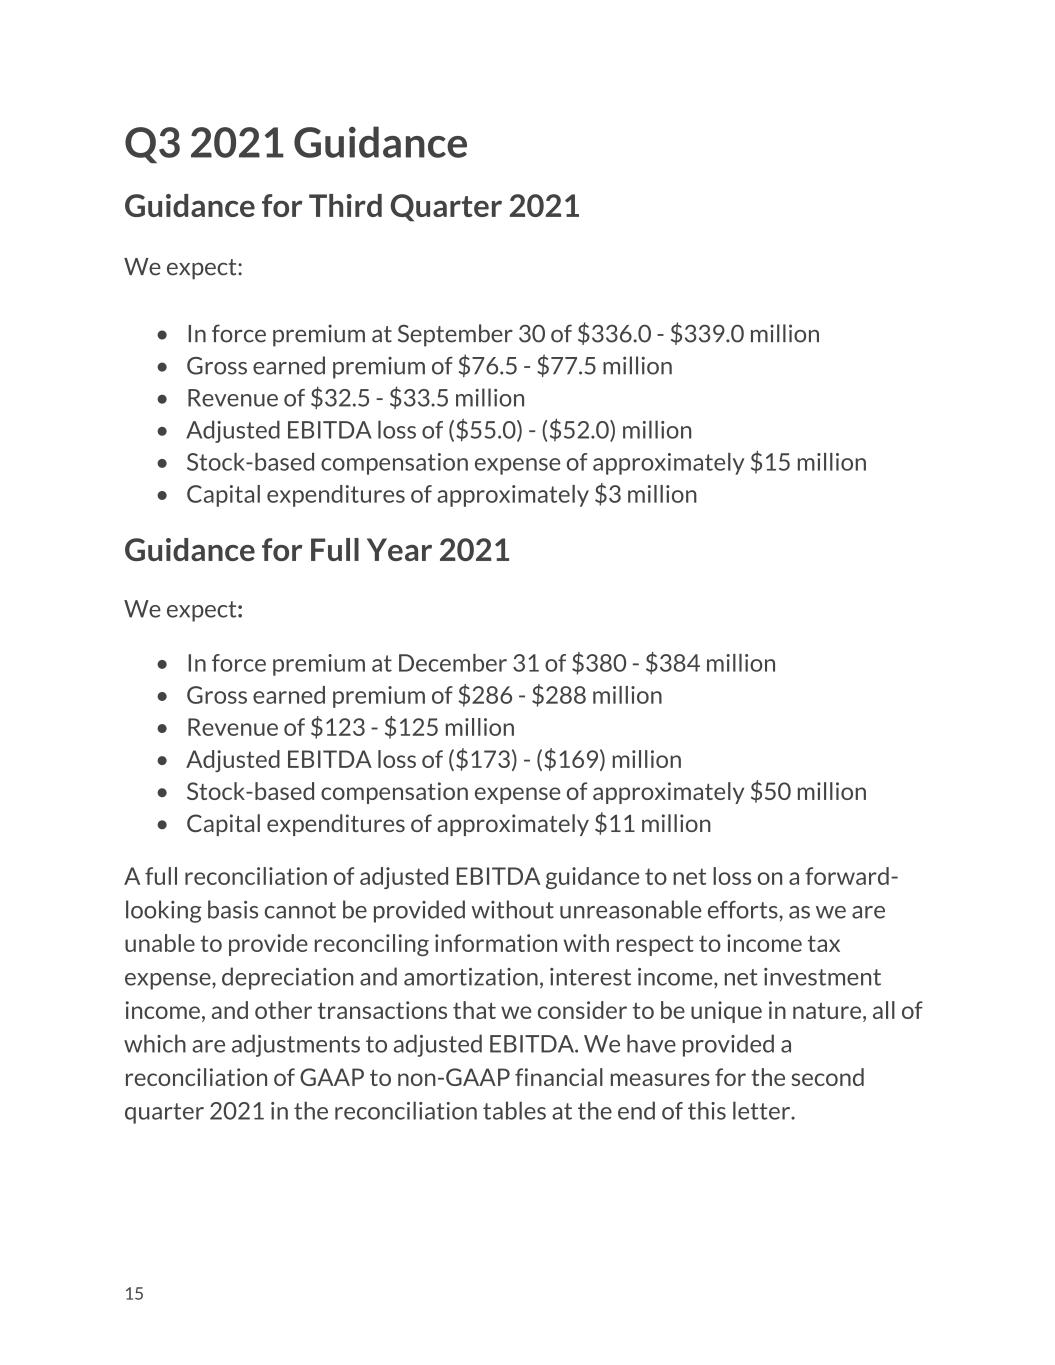
Q3 2021 Guidance Guidance for Third Quarter 2021 We expect: • In force premium at September 30 of $336.0 - $339.0 million • Gross earned premium of $76.5 - $77.5 million • Revenue of $32.5 - $33.5 million • Adjusted EBITDA loss of ($55.0) - ($52.0) million • Stock-based compensation expense of approximately $15 million • Capital expenditures of approximately $3 million Guidance for Full Year 2021 We expect: • In force premium at December 31 of $380 - $384 million • Gross earned premium of $286 - $288 million • Revenue of $123 - $125 million • Adjusted EBITDA loss of ($173) - ($169) million • Stock-based compensation expense of approximately $50 million • Capital expenditures of approximately $11 million A full reconciliation of adjusted EBITDA guidance to net loss on a forward- looking basis cannot be provided without unreasonable efforts, as we are unable to provide reconciling information with respect to income tax expense, depreciation and amortization, interest income, net investment income, and other transactions that we consider to be unique in nature, all of which are adjustments to adjusted EBITDA. We have provided a reconciliation of GAAP to non-GAAP financial measures for the second quarter 2021 in the reconciliation tables at the end of this letter. 15
Non-GAAP financial measures and key operating metrics The non-GAAP financial measures used in this letter to shareholders are adjusted gross profit, Ratio of Adjusted Gross Profit to Gross Earned Premium, and adjusted EBITDA. We define adjusted EBITDA as net loss excluding interest expense, income tax expense, depreciation, amortization, stock-based compensation, net investment income, and other transactions that we consider to be unique in nature. We exclude these items from adjusted EBITDA because we do not consider them to be directly attributable to our underlying operating performance. We use adjusted EBITDA as an internal performance measure in the management of our operations because we believe it gives our management and other customers of our financial information useful insight into our results of operations and our underlying business performance. Adjusted EBITDA should not be viewed as a substitute for net loss calculated in accordance with GAAP, and other companies may define adjusted EBITDA differently. We define adjusted gross profit as gross profit excluding net investment income, plus fixed costs and overhead associated with our underwriting operations including employee-related costs and professional fees and other, and depreciation and amortization allocated to cost of revenue. After these adjustments, the resulting calculation is inclusive of only those variable costs of revenue incurred in the successful acquisition of business and without the volatility of investment income. We use adjusted gross profit as a key measure of our progress toward profitability and to consistently evaluate the variable contribution to our business from underwriting operations from period to period. We define Ratio of Adjusted Gross Profit to Gross Earned Premium as the ratio of adjusted gross profit to gross earned premium. The Ratio of Adjusted Gross Profit to Gross Earned Premium measures the relationship between the underlying business volume and gross economic benefit generated by our 16
underwriting operations, on the one hand, and our underlying profitability trends, on the other. We rely on this measure, which supplements our gross profit ratio as calculated in accordance with GAAP, because it provides management with insight into our underlying profitability trends over time. The non-GAAP financial measures used in this letter to shareholders have not been calculated in accordance with GAAP and should be considered in addition to results prepared in accordance with GAAP and should not be considered as a substitute for, or superior to, GAAP results. In addition, adjusted gross profit and adjusted EBITDA should not be construed as indicators of our operating performance, liquidity or cash flows generated by operating, investing and financing activities, as there may be significant factors or trends that they fail to address. We caution investors that non- GAAP financial information, by its nature, departs from traditional accounting conventions. Therefore, its use can make it difficult to compare our current results with our results from other reporting periods and with the results of other companies. Our management uses these non-GAAP financial measures, in conjunction with GAAP financial measures, as an integral part of managing our business and to, among other things: (i) monitor and evaluate the performance of our business operations and financial performance; (ii) facilitate internal comparisons of the historical operating performance of our business operations; (iii) facilitate external comparisons of the results of our overall business to the historical operating performance of other companies that may have different capital structures and debt levels; (iv) review and assess the operating performance of our management team; (v) analyze and evaluate financial and strategic planning decisions regarding future operating investments; and (vi) plan for and prepare future annual operating budgets and determine appropriate levels of operating investments. 17
Investors are encouraged to review the reconciliation of these non-GAAP financial measures to their most directly comparable GAAP financial measures as provided in the tables accompanying this letter to shareholders. This letter to shareholders also includes key performance indicators, including customers, in force premium, premium per customer, annual dollar retention, gross earned premium, gross loss ratio and net loss ratio. We define customers as the number of current policyholders underwritten by us or placed by us with third-party insurance partners (who pay us recurring commissions) as of the period end date. A customer that has more than one policy counts as a single customer for the purposes of this metric. We view customers as an important metric to assess our financial performance because customer growth drives our revenue, expands brand awareness, deepens our market penetration, creates additional upsell and cross-sell opportunities and generates additional data to continue to improve the functioning of our platform. We define in force premium ("IFP") as the aggregate annualized premium for customers as of the period end date. At each period end date, we calculate IFP as the sum of: (i) In force written premium — the annualized premium of in force policies underwritten by us; and (ii) In force placed premium — the annualized premium of in force policies placed with third party insurance companies for which we earn a recurring commission payment. In force placed premium currently reflects less than 1% of IFP. The annualized value of premiums is a legal and contractual determination made by assessing the contractual terms with our customers. The annualized value of contracts is not determined by reference to historical revenues, deferred revenues or any other GAAP financial measure over any period. IFP is not a forecast of future revenues nor is it a reliable indicator of revenue expected to be earned in any given period. We believe that our calculation of IFP is useful to analysts and investors because it captures the impact of growth in customers and premium per customer at the end of each reported period, without 18
adjusting for known or projected policy updates, cancellations, rescissions and non-renewals. We use IFP because we believe it gives our management useful insight into the total reach of our platform by showing all in force policies underwritten and placed by us. Other companies, including companies in our industry, may calculate IFP differently or not at all, which reduces the usefulness of IFP as a tool for comparison. We define premium per customer as the average annualized premium customers pay for products underwritten by us or placed by us with third- party insurance partners. We calculate premium per customer by dividing IFP by customers. We view premium per customer as an important metric to assess our financial performance because premium per customer reflects the average amount of money our customers spend on our products, which helps drive strategic initiatives. We define annual dollar retention ("ADR"), as the percentage of IFP retained over a twelve month period, inclusive of changes in policy value, changes in number of policies, changes in policy type, and churn. To calculate ADR we first aggregate the IFP from all active customers at the beginning of the period and then aggregate the IFP from those same customers at the end of the period. ADR is then equal to the ratio of ending IFP to beginning IFP. We believe that our calculation of ADR is useful to analysts and investors because it captures our ability to retain customers and sell additional products and coverage to them over time. We view ADR as an important metric to measure our ability to provide a delightful end-to-end customer experience, satisfy our customers’ evolving insurance needs and maintain our customers’ trust in our products. Our customers become more valuable to us every year they continue to subscribe to our products. Other companies, including companies in our industry, may calculate ADR differently or not at all, which reduces the usefulness of ADR as a tool for comparison. Gross earned premium is the earned portion of our gross written premium. We use this operating metric as we believe it gives our management and 19
other users of our financial information useful insight into the gross economic benefit generated by our business operations and allows us to evaluate our underwriting performance without regard to changes in our underlying reinsurance structure. Unlike net earned premium, gross earned premium excludes the impact of premiums ceded to reinsurers, and therefore should not be used as a substitute for net earned premium, total revenue, or any other measure presented in accordance with GAAP. We define gross loss ratio, expressed as a percentage, as the ratio of losses and loss adjustment expense to gross earned premium. We define net loss ratio, expressed as a percentage, as the ratio of losses and loss adjustment expense, less amounts ceded to reinsurers, to net earned premium. Links The information contained on, or that can be accessed through, hyperlinks included herein is deemed not to be incorporated in or part of this shareholder letter. Earnings teleconference information The Company will discuss its second quarter 2021 financial results during a teleconference on August 5, 2021, at 8:00 AM ET. The conference call can be accessed at 1-844-200-6205, participant access code 616470. A live audio webcast of the call will also be available simultaneously at https://investor.lemonade.com 20

Following completion of the call, a recorded replay of the webcast will be available on the investor relations section of Lemonade’s website. Additional investor information can be accessed at https://investor.lemonade.com About Lemonade Lemonade offers renters, homeowners, pet, and life insurance. Powered by artificial intelligence and behavioral economics, Lemonade’s full stack insurance carriers in the US and the EU replace brokers and bureaucracy with bots and machine learning, aiming for zero paperwork and instant everything. A Certified B-Corp, Lemonade gives unused premiums to nonprofits selected by its community, during its annual Giveback. Lemonade is currently available in the United States, Germany, the Netherlands, and France, and continues to expand globally. For more information, please visit www.lemonade.com, and follow Lemonade on Twitter or Instagram. Media inquiries: press@lemonade.com Investor contact: ir@lemonade.com Forward-looking statement safe harbor This letter to shareholders contains forward-looking statements within the meaning of the Private Securities Litigation Reform Act of 1995. All statements contained in this letter to shareholders that do not relate to matters of historical fact should be considered forward-looking statements, including statements regarding our anticipated financial performance, including our financial outlook for the third quarter of 2021 and the full year 2021, our industry, business strategy, plans, goals and expectations concerning our market position, future operations and other financial and operating information. 21
These statements are neither promises nor guarantees, but involve known and unknown risks, uncertainties and other important factors that may cause our actual results, performance or achievements to be materially different from any future results, performance or achievements expressed or implied by the forward-looking statements, including, but not limited to, the following: Our history of losses and the fact that we may not achieve or maintain profitability in the future; our ability to retain and expand our customer base; the fact that the “Lemonade” brand may not become as widely known as incumbents’ brands or the brand may become tarnished; the denial of claims or our failure to accurately and timely pay claims; our ability to attain greater value from each user; the novelty of our business model and its unpredictable efficacy and susceptibility to unintended consequences; the possibility that we could be forced to modify or eliminate our Giveback, which could undermine our business model; the examinations and other targeted investigations by our primary and other state insurance regulators that could result in adverse examination findings and necessitate remedial actions; our limited operating history; our ability to manage our growth effectively; the impact of intense competition in the segments of the insurance industry in which we operate on our ability to attain or increase profitability; the unavailability of reinsurance at current levels and prices, which could limit our ability to write new business; our ability to renew reinsurance contracts on comparable duration and terms to those currently in effect; our exposure to counterparty risks as a result of reinsurance; the loss of personal customer information, damage to our reputation and brand, or harm to our business and operating results as a result of security incidents or real or perceived errors, failures or bugs in our systems, website or app; our actual or perceived failure to protect customer information and other data, respect customers’ privacy, or comply with data privacy and security laws and regulations; our ability to comply with extensive insurance industry regulations and the need to incur additional costs or devote additional resources to comply with changes to existing regulations; our exposure to 22
additional regulatory requirements specific to other vertical markets that we enter or have entered, including auto, pet and life insurance, and the need to devote additional resources to comply with these regulations; and our inability to predict the lasting impacts of COVID-19 to our business in particular, and the global economy generally. These and other important factors are discussed under the caption “Risk Factors” in our Form 10-K filed with the SEC on March 8, 2021 and in our other filings with the SEC could cause actual results to differ materially from those indicated by the forward-looking statements made in this shareholder letter. Any such forward-looking statements represent management’s beliefs as of the date of this press release. While we may elect to update such forward-looking statements at some point in the future, we disclaim any obligation to do so, even if subsequent events cause our views to change. 23

Condensed Consolidated Statements of Operations and Comprehensive Loss $ in millions, except per share amounts, unaudited Three Months Ended June 30, Six Months Ended June 30, 2021 2020 2021 2020 Revenue Net earned premium $ 16.3 $ 29.2 $ 30.1 $ 54.5 Ceding commission income 10.6 0.4 19.6 0.4 Net investment income 0.2 0.2 0.4 1.1 Commission and other income 1.1 0.1 1.6 0.1 Total revenue 28.2 29.9 51.7 56.1 Expense Loss and loss adjustment expense, net 13.0 20.5 29.5 38.7 Other insurance expense 5.2 4.0 10.0 7.3 Sales and marketing 33.1 16.1 62.2 35.3 Technology development 14.0 4.2 21.1 7.7 General and administrative 15.8 5.8 29.9 24.0 Total expense 81.1 50.6 152.7 113.0 Loss before income taxes (52.9) (20.7) (101.0) (56.9) Income tax expense 2.7 0.3 3.6 0.6 Net loss $ (55.6) $ (21.0) $ (104.6) $ (57.5) Other comprehensive income, net of tax Unrealized (loss) gain on investments (0.2) 0.2 (0.1) 0.2 Foreign currency translation adjustment 0.3 — 1.0 — Comprehensive loss $ (55.5) $ (20.8) $ (103.7) $ (57.3) Per share data: Net loss per share attributable to common stockholders—basic and diluted $ (0.90) $ (1.77) $ (1.72) $ (4.89) Weighted average common shares outstanding —basic and diluted 61,444,958 11,891,979 60,643,764 11,750,198 24
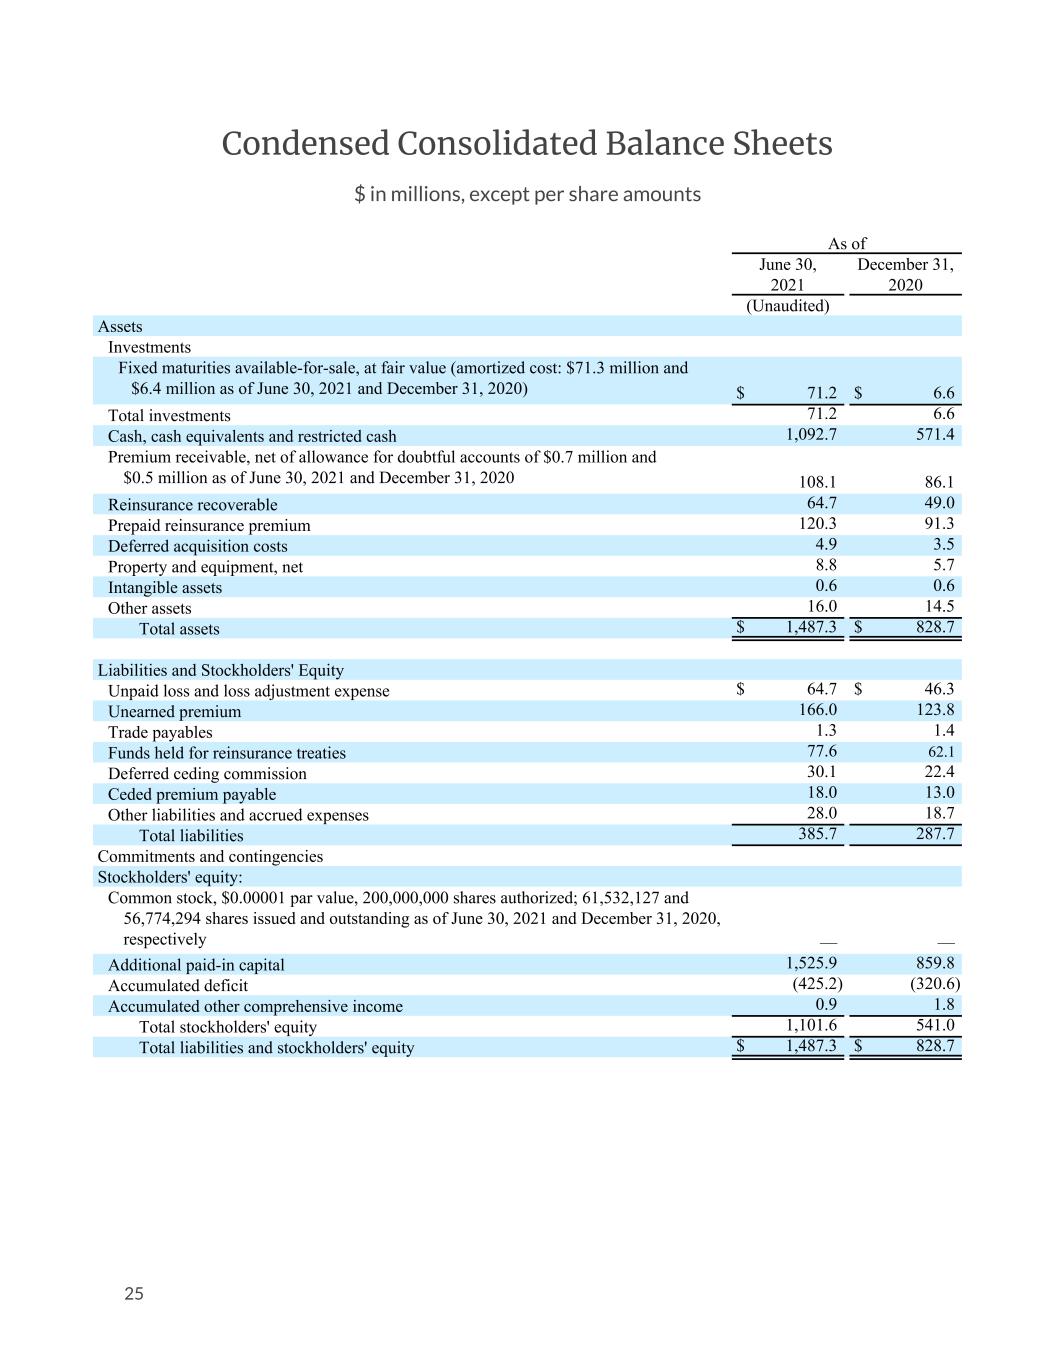
Condensed Consolidated Balance Sheets $ in millions, except per share amounts As of June 30, December 31, 2021 2020 (Unaudited) Assets Investments Fixed maturities available-for-sale, at fair value (amortized cost: $71.3 million and $6.4 million as of June 30, 2021 and December 31, 2020) $ 71.2 $ 6.6 Total investments 71.2 6.6 Cash, cash equivalents and restricted cash 1,092.7 571.4 Premium receivable, net of allowance for doubtful accounts of $0.7 million and $0.5 million as of June 30, 2021 and December 31, 2020 108.1 86.1 Reinsurance recoverable 64.7 49.0 Prepaid reinsurance premium 120.3 91.3 Deferred acquisition costs 4.9 3.5 Property and equipment, net 8.8 5.7 Intangible assets 0.6 0.6 Other assets 16.0 14.5 Total assets $ 1,487.3 $ 828.7 Liabilities and Stockholders' Equity Unpaid loss and loss adjustment expense $ 64.7 $ 46.3 Unearned premium 166.0 123.8 Trade payables 1.3 1.4 Funds held for reinsurance treaties 77.6 62.1 Deferred ceding commission 30.1 22.4 Ceded premium payable 18.0 13.0 Other liabilities and accrued expenses 28.0 18.7 Total liabilities 385.7 287.7 Commitments and contingencies Stockholders' equity: Common stock, $0.00001 par value, 200,000,000 shares authorized; 61,532,127 and 56,774,294 shares issued and outstanding as of June 30, 2021 and December 31, 2020, respectively — — Additional paid-in capital 1,525.9 859.8 Accumulated deficit (425.2) (320.6) Accumulated other comprehensive income 0.9 1.8 Total stockholders' equity 1,101.6 541.0 Total liabilities and stockholders' equity $ 1,487.3 $ 828.7 25

Condensed Consolidated Statements of Cash Flows $ in millions, unaudited Six Months Ended June 30, 2021 2020 Cash flows from operating activities: Net loss $ (104.6) $ (57.5) Adjustments to reconcile net loss to net cash used in operating activities: Depreciation 1.7 0.7 Stock-based compensation 18.0 4.6 Amortization of discount on bonds — (0.3) Provision for bad debts 2.3 0.9 Common share contribution to the Lemonade Foundation — 12.2 Changes in operating assets and liabilities: Premium receivable (24.4) (11.6) Reinsurance recoverable (15.7) (5.9) Prepaid reinsurance premium (29.0) 1.0 Deferred acquisition costs (1.4) (0.7) Other assets (1.5) (3.5) Unpaid loss and loss adjustment expense 18.4 7.1 Unearned premium 42.2 18.9 Trade payables (0.1) 0.1 Funds held for reinsurance treaties 15.5 — Deferred ceding commissions 7.7 — Ceded premium payable 5.0 1.6 Other liabilities and accrued expenses 9.4 (2.9) Net cash used in operating activities (56.5) (35.3) Cash flows from investing activities: Proceeds from short-term investments sold or matured — 40.0 Proceeds from bonds sold or matured — 2.2 Cost of short-term investments acquired — (14.9) Cost of bonds acquired (64.6) (2.9) Purchases of property and equipment (4.7) (1.9) Net cash (used in) provided by investing activities (69.3) 22.5 Cash flows from financing activities: Proceeds from Follow-on Offering, net of underwriting discounts and commissions and offering costs 640.3 — Proceeds from release of shares upon repayment — 1.3 Proceeds from stock exercises 7.8 0.1 Net cash provided by financing activities 648.1 1.4 Effect of exchange rate changes on cash, cash equivalents and restricted cash (1.0) (0.1) Net increase (decrease) in cash, cash equivalents and restricted cash 521.3 (11.5) Cash, cash equivalents and restricted cash at beginning of period 571.4 270.3 Cash, cash equivalents and restricted cash at end of period $ 1,092.7 $ 258.8 Supplemental disclosure of cash flow information: Cash paid for income taxes $ 1.1 $ 0.8 26
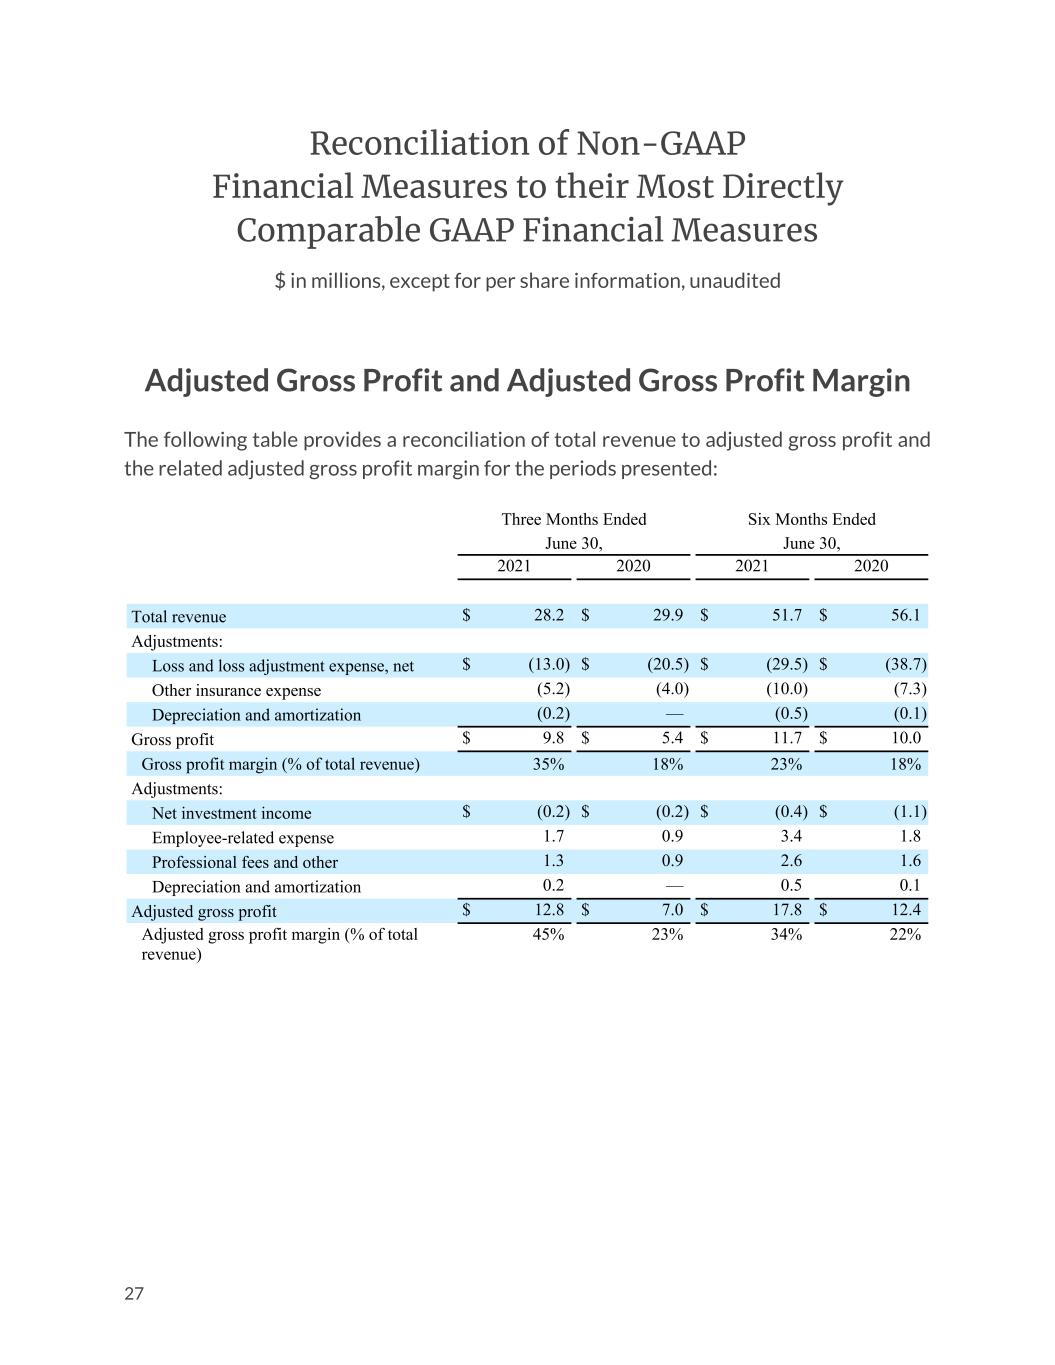
Reconciliation of Non-GAAP Financial Measures to their Most Directly Comparable GAAP Financial Measures $ in millions, except for per share information, unaudited Adjusted Gross Profit and Adjusted Gross Profit Margin The following table provides a reconciliation of total revenue to adjusted gross profit and the related adjusted gross profit margin for the periods presented: Three Months Ended June 30, Six Months Ended June 30, 2021 2020 2021 2020 Total revenue $ 28.2 $ 29.9 $ 51.7 $ 56.1 Adjustments: Loss and loss adjustment expense, net $ (13.0) $ (20.5) $ (29.5) $ (38.7) Other insurance expense (5.2) (4.0) (10.0) (7.3) Depreciation and amortization (0.2) — (0.5) (0.1) Gross profit $ 9.8 $ 5.4 $ 11.7 $ 10.0 Gross profit margin (% of total revenue) 35% 18% 23% 18% Adjustments: Net investment income $ (0.2) $ (0.2) $ (0.4) $ (1.1) Employee-related expense 1.7 0.9 3.4 1.8 Professional fees and other 1.3 0.9 2.6 1.6 Depreciation and amortization 0.2 — 0.5 0.1 Adjusted gross profit $ 12.8 $ 7.0 $ 17.8 $ 12.4 Adjusted gross profit margin (% of total revenue) 45% 23% 34% 22% 27

Ratio of Adjusted Gross Profit to Gross Earned Premium The following table sets forth our calculation of the Ratio of Adjusted Gross Profit to Gross Earned Premium for the periods presented: Three Months Ended June 30, Six Months Ended June 30, 2021 2020 2021 2020 Numerator: Adjusted gross profit $ 12.8 $ 7.0 $ 17.8 $ 12.4 Denominator: Gross earned premium $ 66.9 $ 35.3 $ 123.1 $ 65.8 Ratio of Adjusted Gross Profit to Gross Earned Premium 19% 20% 14% 19% Adjusted EBITDA The following table provides a reconciliation of adjusted EBITDA to net loss for the periods presented: Three Months Ended June 30, Six Months Ended June 30, 2021 2020 2021 2020 Net loss $ (55.6) $ (21.0) $ (104.6) $ (57.5) Adjustments: Income tax expense $ 2.7 $ 0.3 $ 3.6 $ 0.6 Depreciation and amortization 0.8 0.4 1.7 0.7 Stock-based compensation 11.9 2.4 18.0 4.6 Contribution to the Lemonade Foundation — — — 12.2 Interest income — (0.1) — (0.1) Net investment income (0.2) (0.2) (0.4) (1.1) Adjusted EBITDA $ (40.4) $ (18.2) $ (81.7) $ (40.6) 28
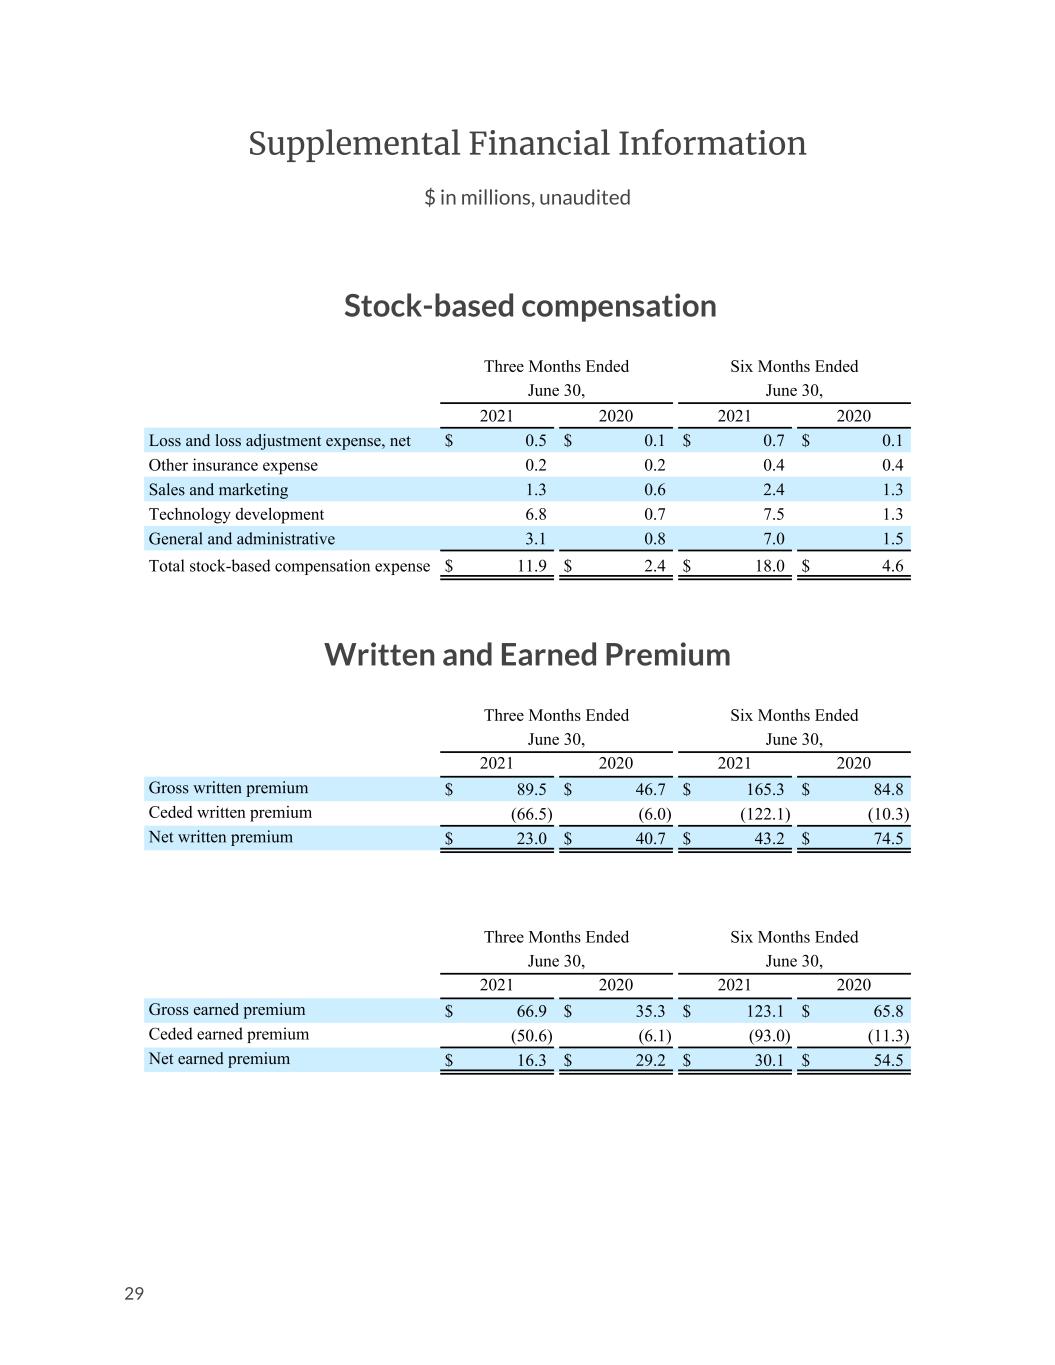
Supplemental Financial Information $ in millions, unaudited Stock-based compensation Three Months Ended June 30, Six Months Ended June 30, 2021 2020 2021 2020 Loss and loss adjustment expense, net $ 0.5 $ 0.1 $ 0.7 $ 0.1 Other insurance expense 0.2 0.2 0.4 0.4 Sales and marketing 1.3 0.6 2.4 1.3 Technology development 6.8 0.7 7.5 1.3 General and administrative 3.1 0.8 7.0 1.5 Total stock-based compensation expense $ 11.9 $ 2.4 $ 18.0 $ 4.6 Written and Earned Premium Three Months Ended June 30, Six Months Ended June 30, 2021 2020 2021 2020 Gross written premium $ 89.5 $ 46.7 $ 165.3 $ 84.8 Ceded written premium (66.5) (6.0) (122.1) (10.3) Net written premium $ 23.0 $ 40.7 $ 43.2 $ 74.5 Three Months Ended June 30, Six Months Ended June 30, 2021 2020 2021 2020 Gross earned premium $ 66.9 $ 35.3 $ 123.1 $ 65.8 Ceded earned premium (50.6) (6.1) (93.0) (11.3) Net earned premium $ 16.3 $ 29.2 $ 30.1 $ 54.5 29
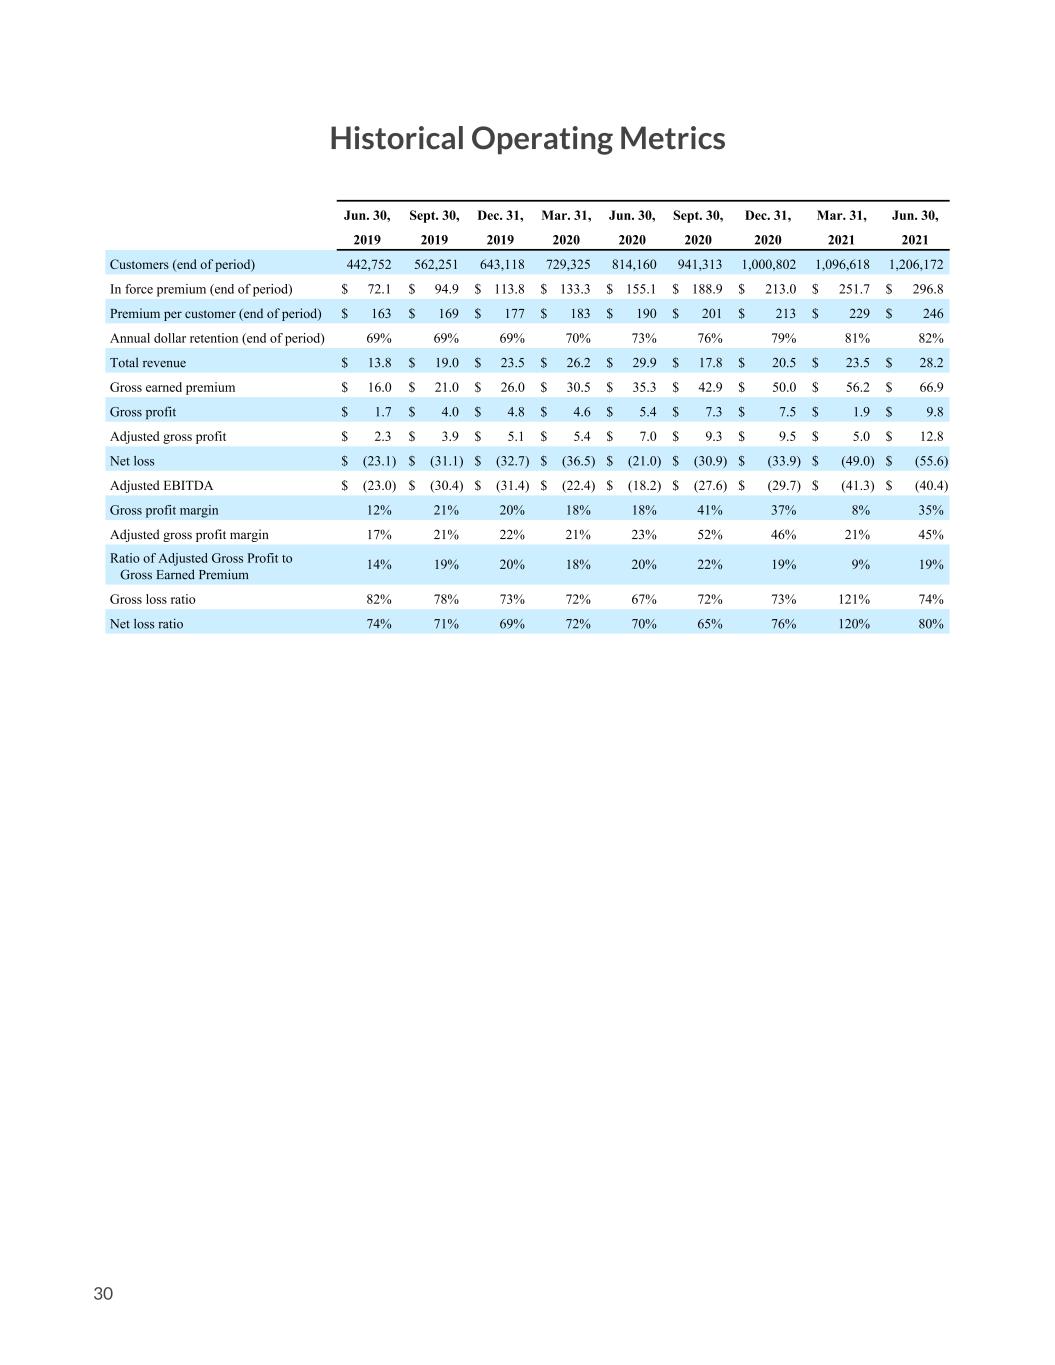
Historical Operating Metrics Jun. 30, Sept. 30, Dec. 31, Mar. 31, Jun. 30, Sept. 30, Dec. 31, Mar. 31, Jun. 30, 2019 2019 2019 2020 2020 2020 2020 2021 2021 Customers (end of period) 442,752 562,251 643,118 729,325 814,160 941,313 1,000,802 1,096,618 1,206,172 1,206,172 In force premium (end of period) $ 72.1 $ 94.9 $ 113.8 $ 133.3 $ 155.1 $ 188.9 $ 213.0 $ 251.7 $ 296.8 Premium per customer (end of period) $ 163 $ 169 $ 177 $ 183 $ 190 $ 201 $ 213 $ 229 $ 246 Annual dollar retention (end of period) 69% 69% 69% 70% 73% 76% 79% 81% 82% Total revenue $ 13.8 $ 19.0 $ 23.5 $ 26.2 $ 29.9 $ 17.8 $ 20.5 $ 23.5 $ 28.2 Gross earned premium $ 16.0 $ 21.0 $ 26.0 $ 30.5 $ 35.3 $ 42.9 $ 50.0 $ 56.2 $ 66.9 Gross profit $ 1.7 $ 4.0 $ 4.8 $ 4.6 $ 5.4 $ 7.3 $ 7.5 $ 1.9 $ 9.8 Adjusted gross profit $ 2.3 $ 3.9 $ 5.1 $ 5.4 $ 7.0 $ 9.3 $ 9.5 $ 5.0 $ 12.8 Net loss $ (23.1) $ (31.1) $ (32.7) $ (36.5) $ (21.0) $ (30.9) $ (33.9) $ (49.0) $ (55.6) Adjusted EBITDA $ (23.0) $ (30.4) $ (31.4) $ (22.4) $ (18.2) $ (27.6) $ (29.7) $ (41.3) $ (40.4) Gross profit margin 12% 21% 20% 18% 18% 41% 37% 8% 35% Adjusted gross profit margin 17% 21% 22% 21% 23% 52% 46% 21% 45% Ratio of Adjusted Gross Profit to Gross Earned Premium 14% 19% 20% 18% 20% 22% 19% 9% 19% Gross loss ratio 82% 78% 73% 72% 67% 72% 73% 121% 74% Net loss ratio 74% 71% 69% 72% 70% 65% 76% 120% 80% 30

Appendix to the Q2 2021 Shareholder Letter
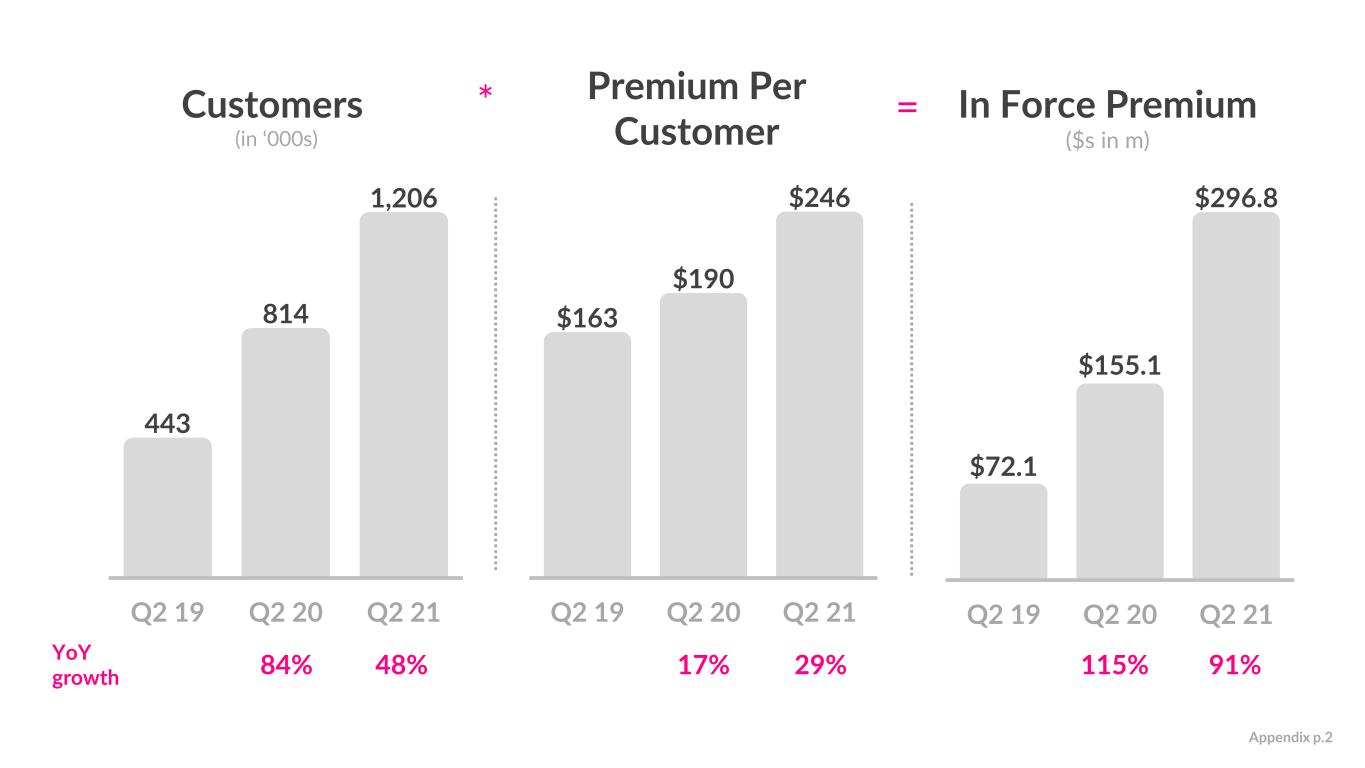
Customers (in ‘000s) In Force Premium ($s in m) 48% 84% YoY growth 91%115% 443 814 1,206 Q2 19 Q2 20 Q2 21 $72.1 $155.1 $296.8 Q2 19 Q2 20 Q2 21 $163 $190 $246 Q2 19 Q2 20 Q2 21 Premium Per Customer 29% 17% * = Appendix p.2
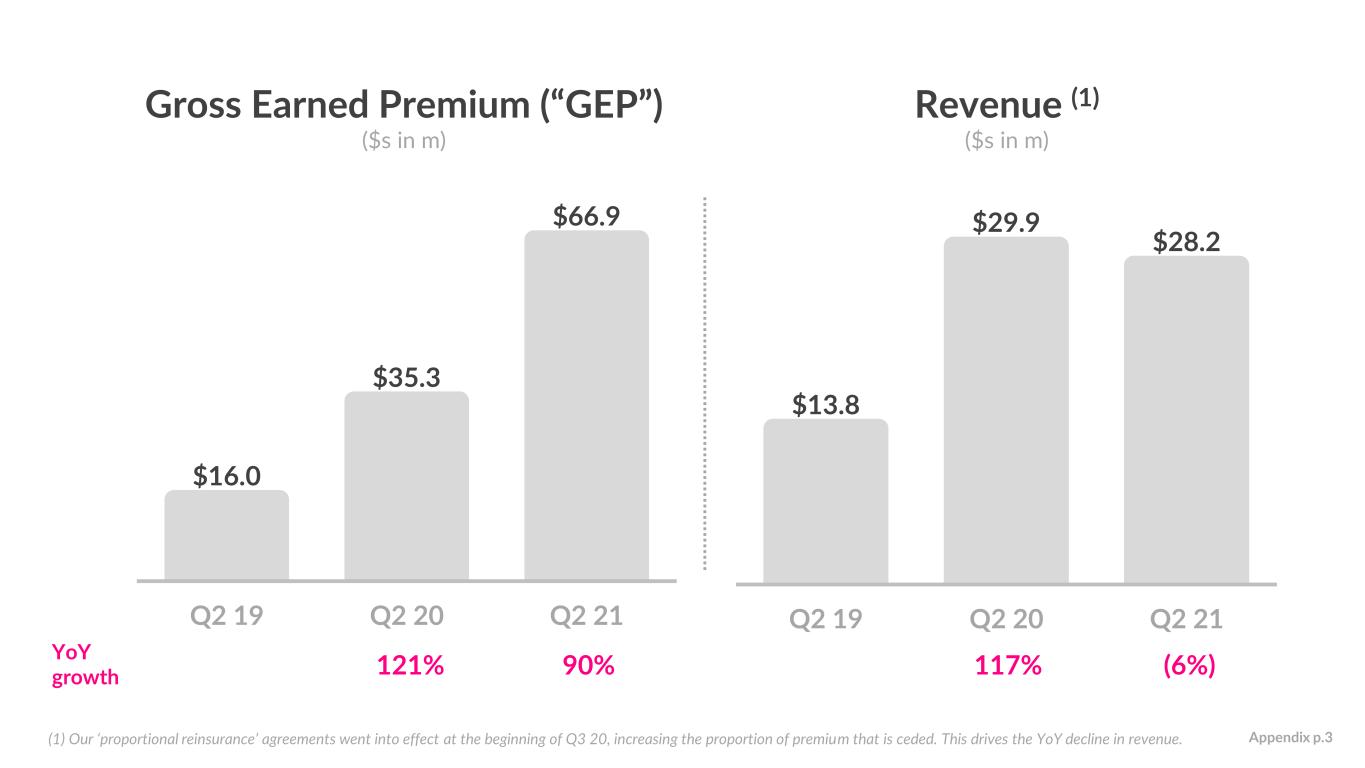
Gross Earned Premium (“GEP”) ($s in m) Revenue (1) ($s in m) $13.8 $29.9 $28.2 Q2 19 Q2 20 Q2 21 (6%)117% YoY growth $16.0 $35.3 $66.9 Q2 19 Q2 20 Q2 21 90% 121% (1) Our ‘proportional reinsurance’ agreements went into effect at the beginning of Q3 20, increasing the proportion of premium that is ceded. This drives the YoY decline in revenue. Appendix p.3

Loss Ratio Gross Loss Ratio (1) Net Loss Ratio (1) (1) We define gross loss ratio, expressed as a percentage, as the ratio of losses and loss adjustment expense to gross earned premium, and net loss ratio, expressed as a percentage, as the ratio of losses and loss adjustment expense, less amounts ceded to reinsurers, to net earned premium. Appendix p.4 87% 82% 78% 73% 72% 67% 72% 73% 121% 74%75% 74% 71% 69% 72% 70% 65% 76% 120% 80% Q1 19 Q2 19 Q3 19 Q4 19 Q1 20 Q2 20 Q3 20 Q4 20 Q1 21 Q2 21

Gross Profit ($s in m) Gross Profit Margin 81%218% 12% 18% 35% Q2 19 Q2 20 Q2 21 YoY growth Appendix p.5 $1.7 $5.4 $9.8 Q2 19 Q2 20 Q2 21
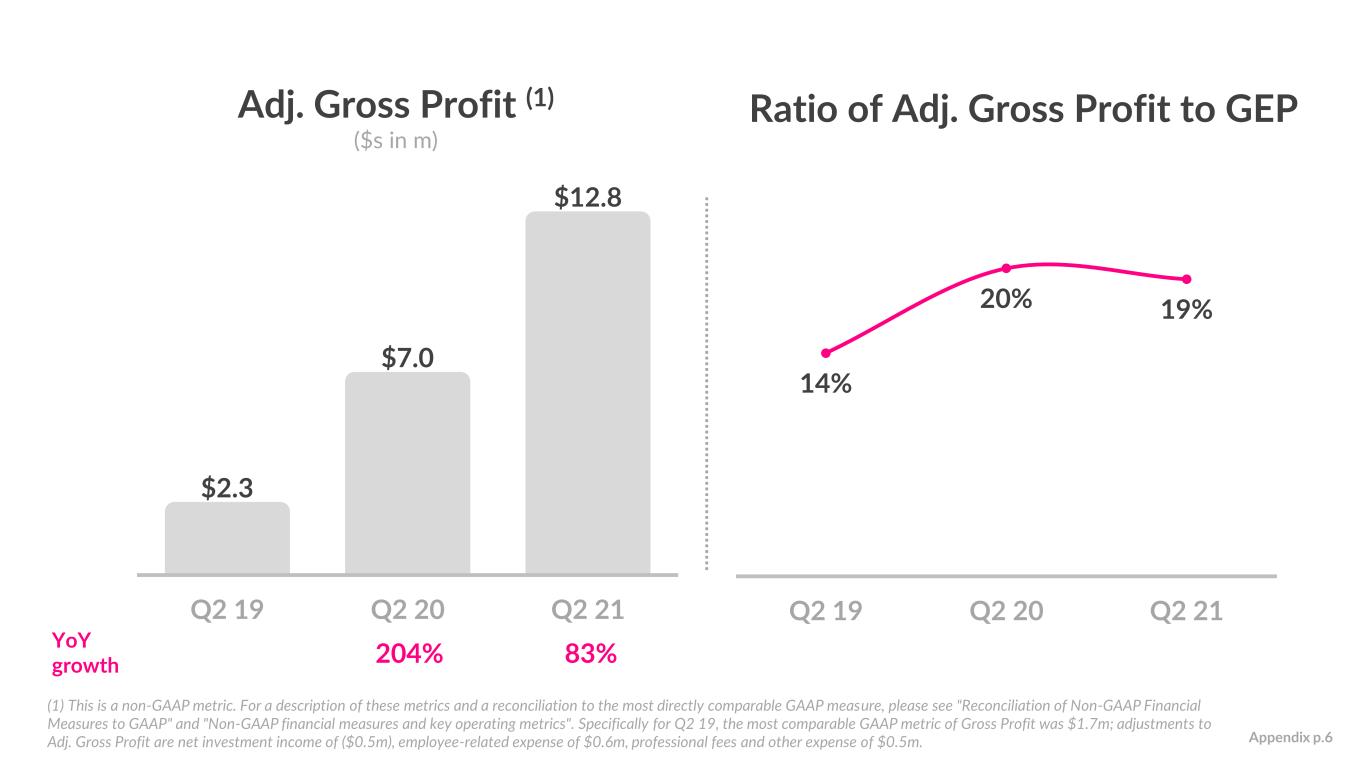
Adj. Gross Profit (1) ($s in m) Ratio of Adj. Gross Profit to GEP $2.3 $7.0 $12.8 Q2 19 Q2 20 Q2 21 83%204% (1) This is a non-GAAP metric. For a description of these metrics and a reconciliation to the most directly comparable GAAP measure, please see "Reconciliation of Non-GAAP Financial Measures to GAAP" and "Non-GAAP financial measures and key operating metrics". Specifically for Q2 19, the most comparable GAAP metric of Gross Profit was $1.7m; adjustments to Adj. Gross Profit are net investment income of ($0.5m), employee-related expense of $0.6m, professional fees and other expense of $0.5m. 14% 20% 19% Q2 19 Q2 20 Q2 21 YoY growth Appendix p.6
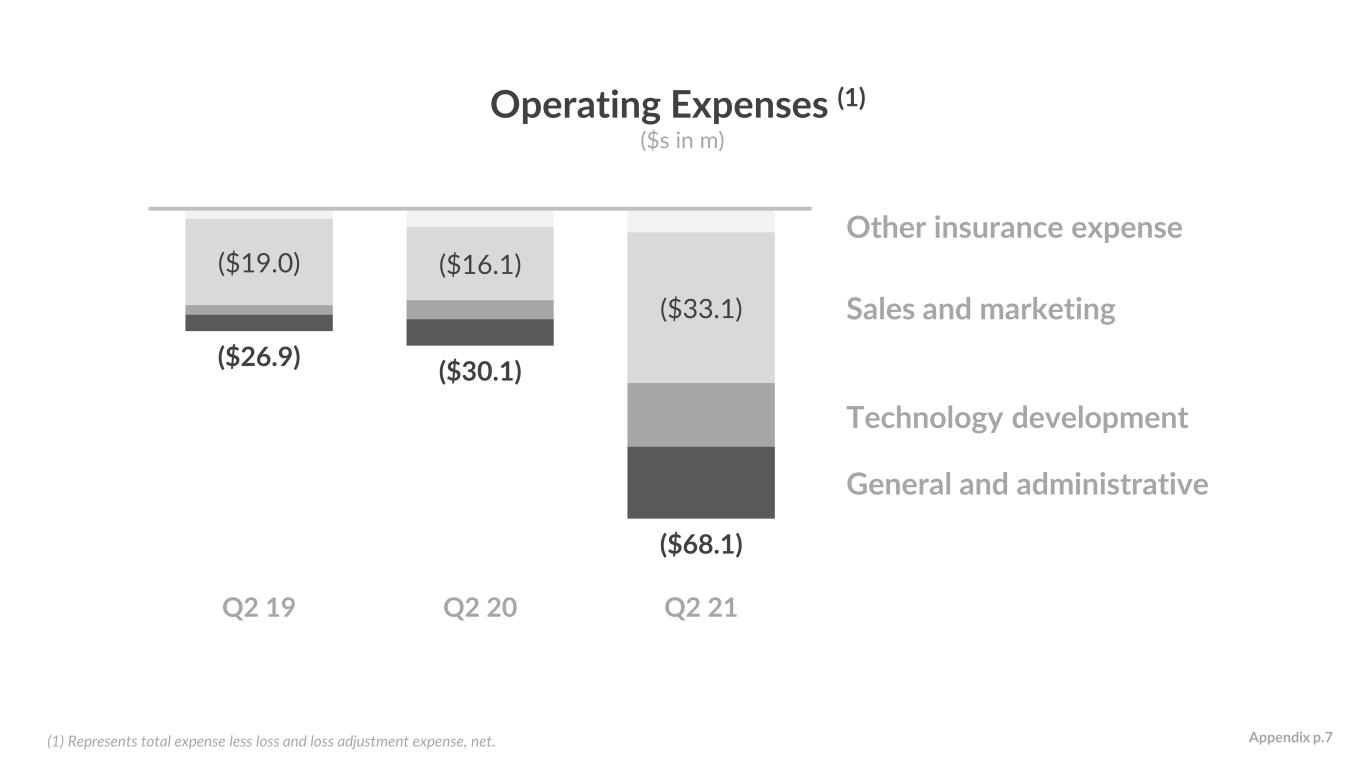
($19.0) ($16.1) ($33.1) ($26.9) ($30.1) ($68.1) Q2 19 Q2 20 Q2 21 Other insurance expense Sales and marketing Technology development General and administrative Operating Expenses (1) ($s in m) (1) Represents total expense less loss and loss adjustment expense, net. Appendix p.7

Net Loss ($s in m) Adj. EBITDA (1) ($s in m) (122%)21% YoY growth (165%) 9% (1) This is a non-GAAP metric. For a description of these metrics and a reconciliation to the most directly comparable GAAP measure, please see "Reconciliation of Non-GAAP Financial Measures to GAAP" and "Non-GAAP financial measures and key operating metrics". Specifically for Q2 19, the most comparable GAAP metric of Net Loss was ($23.1m); adjustments to Adj. EBITDA are income tax expense of $0.1m, depreciation and amortization of $0.1m, stock-based compensation expense of $0.4m and net investment income expense of ($0.5m). Appendix p.8 ($23.1) ($21.0) ($55.6) Q2 19 Q2 20 Q2 21 ($23.0) ($18.2) ($40.4) Q2 19 Q2 20 Q2 21
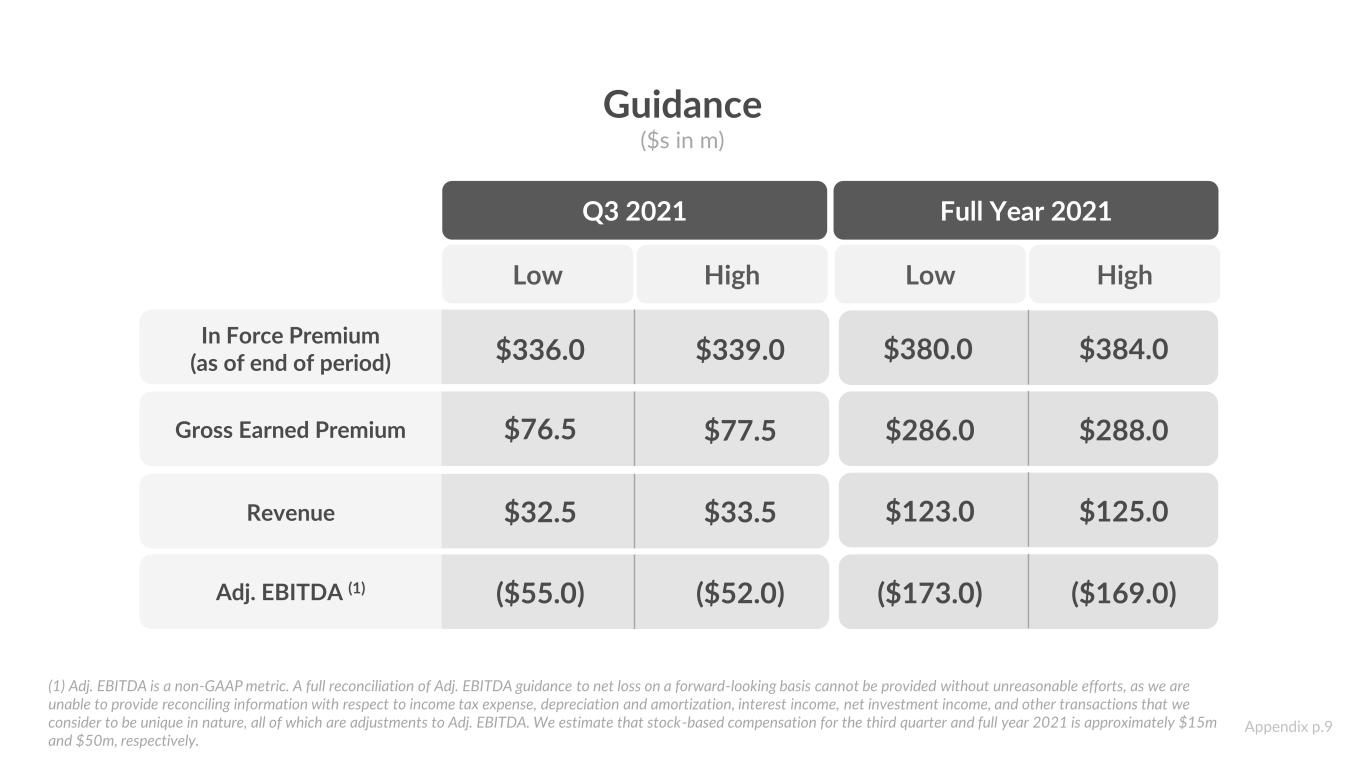
Guidance ($s in m) Q3 2021 Full Year 2021 $336.0 $339.0 $76.5 $77.5 $32.5 $33.5 ($55.0) ($52.0) ($173.0) ($169.0) $123.0 $125.0 $286.0 $288.0 $380.0 $384.0 Low High Low High In Force Premium (as of end of period) Gross Earned Premium Revenue Adj. EBITDA (1) (1) Adj. EBITDA is a non-GAAP metric. A full reconciliation of Adj. EBITDA guidance to net loss on a forward-looking basis cannot be provided without unreasonable efforts, as we are unable to provide reconciling information with respect to income tax expense, depreciation and amortization, interest income, net investment income, and other transactions that we consider to be unique in nature, all of which are adjustments to Adj. EBITDA. We estimate that stock-based compensation for the third quarter and full year 2021 is approximately $15m and $50m, respectively. Appendix p.9


