UNITED STATES
SECURITIES AND EXCHANGE COMMISSION
Washington, D.C. 20549
FORM N-CSR
CERTIFIED SHAREHOLDER REPORT OF REGISTERED MANAGEMENT
INVESTMENT COMPANIES
Investment Company Act file number: 811-23218
Name of Fund: BlackRock 2022 Global Income Opportunity Trust (BGIO)
Fund Address: 100 Bellevue Parkway, Wilmington, DE 19809
Name and address of agent for service: John M. Perlowski, Chief Executive Officer, BlackRock 2022 Global Income Opportunity Trust, 55 East 52nd Street, New York, NY 10055
Registrant’s telephone number, including area code: (800) 882-0052, Option 4
Date of fiscal year end: 12/31/2017
Date of reporting period: 12/31/2017
Item 1 – Report to Stockholders
DECEMBER 31, 2017
| | |
ANNUAL REPORT | |  |
BlackRock 2022 Global Income Opportunity Trust (BGIO)
|
| Not FDIC Insured • May Lose Value • No Bank Guarantee |
The Markets in Review
Dear Shareholder,
In the 12 months ended December 31, 2017, risk assets, such as stocks and high-yield bonds, continued to deliver strong performance. The equity market advanced, month after month, despite geopolitical uncertainty and relatively high valuations, while bond returns were constrained by higher interest rates.
Rising interest rates worked against high-quality assets with more interest rate sensitivity. Consequently, longer-term U.S. Treasuries posted modest returns, as rising energy prices, modest wage increases, and steady job growth led to expectations of higher inflation and interest rate increases by the U.S. Federal Reserve (the “Fed”).
The market’s performance reflected reflationary expectations early in the reporting period, as investors began to sense that a global recovery was afoot. Thereafter, many countries throughout the world experienced sustained and synchronized growth for the first time since the financial crisis. Growth rates and inflation are still relatively low, but they are finally rising together.
The Fed responded to these positive developments by increasing short-term interest rates three times and setting expectations for additional interest rate increases. The Fed also began reducing the vast balance sheet reserves that had accumulated in the wake of the financial crisis. In October 2017, the Fed reduced its $4.5 trillion balance sheet by only $10 billion, while setting expectations for additional modest reductions and rate hikes in 2018.
By contrast, the European Central Bank (“ECB”) and the Bank of Japan (“BoJ”) both continued to expand their balance sheets despite nascent signs of sustained economic growth. The Eurozone and Japan are both approaching the limits of central banks’ ownership share of national debt, which is a structural pressure point that limits their capacity to deliver additional monetary stimulus. In October 2017, the ECB announced plans to cut the amount of its bond purchases in half for 2018, while the BoJ reiterated its commitment to economic stimulus until the inflation rate rises to its target of 2%.
Emerging market growth also stabilized, as accelerating growth in China, the second largest economy in the world and the most influential of all developing economies, improved the outlook for corporate profits and economic growth across most developing nations. Chinese demand for commodities and other raw materials allayed concerns about the country’s banking system, leading to rising equity prices and foreign investment flows.
While escalating tensions between the United States and North Korea and our nation’s divided politics are concerning, benign credit conditions, modest inflation, solid corporate earnings, and the positive outlook for growth in the world’s largest economies have kept markets relatively tranquil.
Rising consumer confidence and improving business sentiment are driving momentum for the U.S. economy. If the Fed maintains a measured pace of stimulus reduction, to the extent that inflation rises, it’s likely to be accompanied by rising real growth and higher wages. That could lead to a favorable combination of moderately higher inflation, steadily rising interest rates, and improving growth in 2018.
Further fueling optimism, Congress passed a sweeping tax reform bill in December 2017. The U.S. tax overhaul is likely to accentuate the reflationary themes already in place, including faster growth and rising interest rates. Changing the corporate tax rate to a flat 21% will create many winners and losers among high-and-low tax companies, while the windfall from lower taxes could boost business and consumer spending.
In this environment, investors need to think globally, extend their scope across a broad array of asset classes, and be nimble as market conditions change. We encourage you to talk with your financial advisor and visit blackrock.com for further insight about investing in today’s markets.
Sincerely,

Rob Kapito
President, BlackRock Advisors, LLC

Rob Kapito
President, BlackRock Advisors, LLC
| | | | |
| Total Returns as of December 31, 2017 |
| | | 6-month | | 12-month |
U.S. large cap equities
(S&P 500® Index) | | 11.42% | | 21.83% |
U.S. small cap equities
(Russell 2000® Index) | | 9.20 | | 14.65 |
International equities
(MSCI Europe, Australasia,
Far East Index) | | 9.86 | | 25.03 |
Emerging market equities
(MSCI Emerging Markets Index) | | 15.92 | | 37.28 |
3-month Treasury bills
(ICE BofAML 3-Month U.S. Treasury Bill Index) | | 0.55 | | 0.86 |
U.S. Treasury securities
(ICE BofAML 10-Year U.S. Treasury Index) | | (0.01) | | 2.07 |
U.S. investment grade bonds
(Bloomberg Barclays U.S.
Aggregate Bond Index) | | 1.24 | | 3.54 |
Tax-exempt municipal bonds
(S&P Municipal Bond Index) | | 1.64 | | 4.95 |
U.S. high yield bonds
(Bloomberg Barclays U.S. Corporate High Yield 2% Issuer
Capped Index) | | 2.46 | | 7.50 |
| Past performance is no guarantee of future results. Index performance is shown for illustrative purposes only. You cannot invest directly in an index. |
| | |
| 2 | | THIS PAGEISNOT PARTOF YOUR FUND REPORT |
Table of Contents
| | |
| Trust Summary as of December 31, 2017 | | BlackRock 2022 Global Income Opportunity Trust |
Investment Objective
BlackRock 2022 Global Income Opportunity Trust’s (BGIO) (the “Trust”) investment objective is to seek to distribute a high level of current income and to earn a total return, based on the net asset value of the Trust’s common shares of beneficial interest, that exceeds the return on the Bloomberg Barclays 1-3 Month U.S. Treasury Bill Index by 500 basis points (or 5.00%) on an annualized basis over the life of the Trust, under normal market conditions
No assurance can be given that the Trust’s investment objective will be achieved. Risks relating to the Trust’s investment objective are described in further detail in the Notes to Financial Statements.
Trust Information
| | |
Symbol on New York Stock Exchange (“NYSE”) | | BGIO |
Initial Offering Date | | February 27, 2017 |
Current Distribution Rate on Closing Market Price as of December 31, 2017 ($9.80)(a) | | 6.12% |
Current Monthly Distribution per Common Share(b) | | $0.0500 |
Current Annualized Distribution per Common Share(b) | | $0.6000 |
Economic Leverage as of December 31, 2017(c) | | 31% |
| | (a) | Current Distribution Rate on closing market price is calculated by dividing the current annualized distribution per share by the closing market price. The current distribution rate consists of income, net realized gains and/or a return of capital. Past performance does not guarantee future results. | |
| | (b) | The distribution rate is not constant and is subject to change. A portion of the distribution may be deemed a return of capital or net realized gain. | |
| | (c) | Represents reverse repurchase agreements as a percentage of total managed assets, which is the total assets of the Trust, including any assets attributable to reverse repurchase agreements, minus the sum of liabilities (other than borrowings representing financial leverage). For a discussion of leveraging techniques utilized by the Trust, please see The Benefits and Risks of Leveraging on page 7. | |
Market Price and Net Asset Value Per Share Summary
| | | | | | | | | | | | | | | | | | | | |
| | | 12/31/17 | | | 02/27/17 (a) | | | Change | | | High | | | Low | |
Market Price | | | 9.80 | | | | 10.00 | | | | (2.00 | )% | | $ | 10.23 | | | $ | 9.40 | |
Net Asset Value | | | 9.99 | | | | 9.85 | | | | 1.42 | | | | 10.07 | | | | 9.71 | |
| | (a) | Commencement of operations. | |
Market Price and Net Asset Value History Since Inception
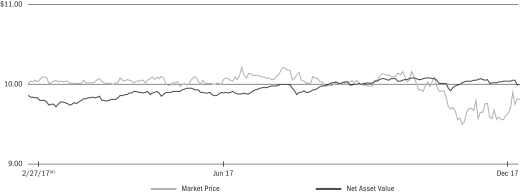
| (a) | Commencement of operations. |
| | |
| 4 | | 2017 BLACKROCK ANNUAL REPORTTO SHAREHOLDERS |
| | |
| Trust Summary as of December 31, 2017 (continued) | | BlackRock 2022 Global Income Opportunity Trust |
Performance and Portfolio Management Commentary
Returns for the period ended December 31, 2017 were as follows:
| | | | |
| | | Aggregate
Total Returns | |
| | | Since
Inception(a) | |
Trust at NAV(b)(c) | | | 6.87 | % |
Trust at Market Price(b)(c) | | | 3.26 | |
Bloomberg Barclays 1-3 Month U.S. Treasury Bill Index(d) | | | 0.74 | |
| | (a) | The Trust commenced operations on February 27, 2017. | |
| | (b) | All returns reflect reinvestment of dividends and/or distributions at actual reinvestment prices. Performance results reflect the Trust’s use of leverage. | |
| | (c) | The Trust moved to a discount to NAV during the period, which accounts for the difference between performance based on market price and performance based on NAV. | |
| | (d) | An unmanaged index that tracks the market for treasury bills used by the U.S. government that have a maturity of more than 1 month and less than 3 months, are rated investment grade and have a minimum $300 million par amount outstanding. | |
Performance results may include adjustments made for financial reporting purposes in accordance with U.S. generally accepted accounting principles.
Past performance is not indicative of future results.
The Trust’s investment objective is, in part, to earn a total return that exceeds the return on the Bloomberg Barclays 1-3 Month U.S. Treasury Bill Index (the “Index”) by 500 basis points (or 5.00%) on an annualized basis over the life of the Trust, under normal market conditions. The Trust’s investment policies do not contemplate any meaningful amount of investment in securities that comprise the Index under normal market conditions; rather, the Trust uses the Index as a proxy for a risk-free rate of return that its investment objective seeks to exceed. Because the achievement of the Trust’s investment objective is measured on an annualized basis over the life of the Trust, the Trust’s performance may be more or less than the spread over the Index contained in the Trust’s investment objective during individual annual periods or for any period of time shorter than the life of the Trust. The Board considers certain factors to evaluate the Trust’s performance, such as the performance of the Trust relative to its investment objective and/or other information provided by BlackRock Advisors, LLC (the “Manager”).
More information about the Trust’s historical performance can be found in the “Closed End Funds” section of http://www.blackrock.com.
The following discussion relates to the Trust’s absolute performance based on NAV:
What factors influenced performance?
The Trust’s positions in emerging markets, high yield corporate bonds and investment grade corporate bonds were the largest positive contributors to return for the 12-month period. The Trust’s allocation to asset backed securities (“ABS”), non-agency residential mortgage-backed securities (“RMBS”) and commercial mortgage-backed securities (“CMBS”) also supported absolute returns.
The Trust’s stance with respect to duration (sensitivity to interest rate movements) and exposure to U.S. Treasuries detracted from performance during the period.
The Trust used Treasury futures during the period to manage duration and yield curve exposure. The use of derivatives had a negative impact on performance.
Describe recent portfolio activity.
At the beginning of the period, the Trust was positioned with a diversified exposure to securitized assets, emerging markets and corporate bonds. This positioning was based on the view that the global economy could continue to strengthen, driven by accommodative central bank policies, recovery of commodity markets and strong corporate profits. In addition, the investment adviser believed that demand for income would remain robust, driven by low interest rates, aging populations and accommodative central banks.
As the period progressed, the Trust’s exposure to emerging markets was increased to take advantage of the strong global economic growth and weaker U.S. dollar. At the same time, exposure to investment grade and high yield corporate bonds was maintained, while exposure to securitized assets including ABS, RMBS and CMBS was increased.
At the end of the period, the Trust continued to favor assets that should provide a relatively high level of income and benefit from strong economic growth, such as emerging market and corporate bonds. The Trust’s duration was slightly increased to take advantage of higher yields and serve as a means to manage risk in case of an increase in market volatility.
Describe portfolio positioning at period end.
At period end, the Trust maintained diversified exposure across non-government sectors, including emerging markets, high yield corporate bonds, ABS, investment grade corporate bonds, CMBS, RMBS and non-agency RMBS.
The views expressed reflect the opinions of BlackRock as of the date of this report and are subject to change based on changes in market, economic or other conditions. These views are not intended to be a forecast of future events and are no guarantee of future results.
| | |
| Trust Summary as of December 31, 2017 (continued) | | BlackRock 2022 Global Income Opportunity Trust |
Overview of the Trust’s Total Investments
PORTFOLIO COMPOSITION
| | | | |
| Asset Type | | 12/31/17 | |
Corporate Bonds | | | 47 | % |
Asset-Backed Securities | | | 19 | |
Foreign Agency Obligations | | | 14 | |
Non-Agency Mortgage-Backed Securities | | | 11 | |
U.S. Government Sponsored Agency Securities | | | 6 | |
Floating Rate Loan Interests | | | 2 | |
Short-Term Securities | | | 2 | |
Capital Trusts | | | — | (a) |
TBA Sale Commitments | | | (1 | ) |
| | (a) | Representing less than 1% of the Trust’s total investments. | |
CREDIT QUALITY ALLOCATION (b)(c)
| | | | |
| Credit Rating | | 12/31/17 | |
AAA(d) | | | 5 | % |
AA | | | 1 | |
A | | | 3 | |
BBB | | | 21 | |
BB | | | 23 | |
B | | | 25 | |
CCC | | | 4 | |
C | | | 2 | |
D | | | 1 | |
NR | | | 15 | |
| | (b) | For financial reporting purposes, credit quality ratings shown above reflect the highest rating assigned by either Standard & Poor’s (“S&P”) or Moody’s Investors Service (“Moody’s”) if ratings differ. These rating agencies are independent, nationally recognized statistical rating organizations and are widely used. Investment grade ratings are credit ratings of BBB/Baa or higher. Below investment grade ratings are credit ratings of BB/Ba or lower. Investments designated N/R are not rated by either rating agency. Unrated investments do not necessarily indicate low credit quality. Credit quality ratings are subject to change. | |
| | (c) | Excludes Short-Term Securities and To-be-announced (“TBA”) Sale Commitments. | |
| | (d) | The investment adviser evaluates the credit quality of not-rated investments based upon certain factors including, but not limited to, credit ratings for similar investments and financial analysis of sectors, individual investments and/or issuer. Using this approach, the investment adviser has deemed U.S. Government Sponsored Agency Securities and U.S. Treasury Obligations as AAA/Aaa. | |
| | |
| 6 | | 2017 BLACKROCK ANNUAL REPORTTO SHAREHOLDERS |
The Benefits and Risks of Leveraging
The Trust may utilize leverage to seek to enhance the distribution rate on, and net asset value (“NAV”) of, its common shares (“Common Shares”). However, these objectives cannot be achieved in all interest rate environments.
In general, the concept of leveraging is based on the premise that the financing cost of leverage, which is based on short-term interest rates, is normally lower than the income earned by the Trust on its longer-term portfolio investments purchased with the proceeds from leverage. To the extent that the total assets of the Trust (including the assets obtained from leverage) are invested in higher-yielding portfolio investments, the Trust’s shareholders benefit from the incremental net income. The interest earned on securities purchased with the proceeds from leverage is paid to shareholders in the form of dividends, and the value of these portfolio holdings is reflected in the per share NAV.
To illustrate these concepts, assume the Trust’s capitalization is $100 million and it utilizes leverage for an additional $30 million, creating a total value of $130 million available for investment in longer-term income securities. If prevailing short-term interest rates are 3% and longer-term interest rates are 6%, the yield curve has a strongly positive slope. In this case, the Trust’s financing costs on the $30 million of proceeds obtained from leverage are based on the lower short-term interest rates. At the same time, the securities purchased by the Trust with the proceeds from leverage earn income based on longer-term interest rates. In this case, the Trust’s financing cost of leverage is significantly lower than the income earned on the Trust’s longer-term investments acquired from such leverage proceeds, and therefore the holders of Common Shares (“Common Shareholders”) are the beneficiaries of the incremental net income.
However, in order to benefit shareholders, the return on assets purchased with leverage proceeds must exceed the ongoing costs associated with the leverage. If interest and other costs of leverage exceed the Trust’s return on assets purchased with leverage proceeds, income to shareholders is lower than if the Trust had not used leverage. Furthermore, the value of the Trust’s portfolio investments generally varies inversely with the direction of long-term interest rates, although other factors can influence the value of portfolio investments. In contrast, the value of the Trust’s obligations under its leverage arrangement generally does not fluctuate in relation to interest rates. As a result, changes in interest rates can influence the Trust’s NAVs positively or negatively. Changes in the future direction of interest rates are very difficult to predict accurately, and there is no assurance that the Trust’s intended leveraging strategy will be successful.
The use of leverage also generally causes greater changes in the Trust’s NAV, market price and dividend rates than comparable portfolios without leverage. In a declining market, leverage is likely to cause a greater decline in the NAV and market price of the Trust’s shares than if the Trust were not leveraged. In addition, the Trust may be required to sell portfolio securities at inopportune times or at distressed values in order to comply with regulatory requirements applicable to the use of leverage or as required by the terms of leverage instruments, which may cause the Trust to incur losses. The use of leverage may limit the Trust’s ability to invest in certain types of securities or use certain types of hedging strategies. The Trust incurs expenses in connection with the use of leverage, all of which are borne by shareholders and may reduce income to the shareholders. Moreover, to the extent the calculation of the Trust’s investment advisory fees includes assets purchased with the proceeds of leverage, the investment advisory fees payable to the Trust’s investment adviser will be higher than if the Trust did not use leverage.
The Trust may utilize leverage through reverse repurchase agreements as described in the Notes to Financial Statements.
Under the Investment Company Act of 1940, as amended (the “1940 Act”), the Trust is permitted to issue debt up to 33 1⁄3% of its total managed assets. The Trust may voluntarily elect to limit its leverage to less than the maximum amount permitted under the 1940 Act.
If the Trust segregates or designates on its books and records cash or liquid assets having a value not less than the value of the Trust’s obligations under the reverse repurchase agreement (including accrued interest), then such transaction is not considered a senior security and is not subject to the foregoing limitations and requirements imposed by the 1940 Act.
Derivative Financial Instruments
The Trust may invest in various derivative financial instruments. These instruments are used to obtain exposure to a security, commodity, index, market, and/or other assets without owning or taking physical custody of securities, commodities and/or other referenced assets or to manage market, equity, credit, interest rate, foreign currency exchange rate, commodity and/or other risks. Derivative financial instruments may give rise to a form of economic leverage and involve risks, including the imperfect correlation between the value of a derivative financial instrument and the underlying asset, possible default of the counterparty to the transaction or illiquidity of the instrument. The Trust’s successful use of a derivative financial instrument depends on the investment adviser’s ability to predict pertinent market movements accurately, which cannot be assured. The use of these instruments may result in losses greater than if they had not been used, may limit the amount of appreciation the Trust can realize on an investment and/or may result in lower distributions paid to shareholders. The Trust’s investments in these instruments, if any, are discussed in detail in the Notes to Financial Statements.
| | | | |
| THE BENEFITSAND RISKSOF LEVERAGING / DERIVATIVE FINANCIAL INSTRUMENTS | | | 7 | |
| | |
Schedule of Investments December 31, 2017 | | BlackRock 2022 Global Income Opportunity Trust (Percentages shown are based on Net Assets) |
| | | | | | | | | | | | |
| Security | | | | | Par
(000) | | | Value | |
Asset-Backed Securities — 28.2% | |
| Asset-Backed Securities — 28.2% | |
Ajax Mortgage Loan Trust, Series 2017-D, Class A, 3.75%, 12/25/57(a)(b)(e) | | | USD | | | | 260 | | | $ | 260,000 | |
ALM VI Ltd., Series 2012-6A, Class DRR, (3 mo. LIBOR US + 5.45%), 6.81%, 07/15/26(b)(c) | | | | | | | 1,000 | | | | 1,008,202 | |
ALM XIV Ltd., Series 2014-14A, Class C, (3 mo. LIBOR US + 3.45%), 4.83%, 07/28/26(b)(c) | | | | | | | 1,000 | | | | 1,000,145 | |
AMMC CLO 18 Ltd., Series 2016-18A, Class E1, (3 mo. LIBOR US + 6.67%), 8.13%, 05/26/28(b)(c) | | | | | | | 750 | | | | 763,047 | |
Anchorage Capital CLO Ltd.(b)(c): | | | | | | | | | | | | |
Series 2014-4A, Class CR, (3 mo. LIBOR US + 3.40%), 4.78%, 07/28/26 | | | | | | | 1,000 | | | | 1,007,401 | |
Series 2016-9A, Class D, (3 mo. LIBOR US + 4.00%), 5.36%, 01/15/29 | | | | | | | 1,000 | | | | 1,021,344 | |
Anchorage Capital Ltd., Series 2013-1A, Class DR, 8.16%, 10/13/30(a)(b) | | | | | | | 1,000 | | | | 1,011,873 | |
Apidos CLO XVIII, Series 2014-18A, Class D, (3 mo. LIBOR US + 5.20%), 6.56%, 07/22/26(b)(c) | | | | | | | 1,000 | | | | 1,000,573 | |
Apidos CLO XXI, Series 2015-21A, Class D, (3 mo. LIBOR US + 5.55%), 6.90%, 07/18/27(b)(c) | | | | | | | 500 | | | | 507,189 | |
Ares XXVIII CLO Ltd., Series 2013-3A, Class DR, (3 mo. LIBOR US + 3.25%), 4.60%, 10/17/24(b)(c) | | | | | | | 1,000 | | | | 1,004,545 | |
Ares XXXIV CLO Ltd., Series 2015-2A, Class E2, (3 mo. LIBOR US + 5.20%), 6.58%, 07/29/26(b)(c) | | | | | | | 1,000 | | | | 1,000,484 | |
Atrium X, Series 10A, Class E, (3 mo. LIBOR US + 4.50%), 5.86%, 07/16/25(b)(c) | | | | | | | 500 | | | | 500,292 | |
Ballyrock CLO LLC, Series 2014-1A, Class CR, (3 mo. LIBOR US + 3.65%), 5.01%, 10/20/26(b)(c) | | | | | | | 1,500 | | | | 1,503,292 | |
Bayview Financial Revolving Asset Trust, Series 2005-E, Class A1, (1 mo. LIBOR + 1.00%), 2.34%, 12/28/40(b)(c) | | | | | | | 2,502 | | | | 2,263,658 | |
Benefit Street Partners CLO II Ltd., Series 2013-IIA, Class CR, (3 mo. LIBOR US + 3.70%), 5.06%, 07/15/29(b)(c) | | | | | | | 1,500 | | | | 1,532,318 | |
BlueMountain CLO Ltd.(b)(c): | | | | | | | | | | | | |
Series 2014-1A, Class E, (3 mo. LIBOR US + 4.75%), 6.13%, 04/30/26 | | | | | | | 1,000 | | | | 1,004,933 | |
Series 2014-3A, Class D, (3 mo. LIBOR US + 5.10%), 6.46%, 10/15/26 | | | | | | | 1,000 | | | | 1,004,323 | |
C-BASS Trust, Series 2007-CB1, Class AF4, 3.71%, 01/25/37(d) | | | | | | | 2,398 | | | | 1,184,366 | |
Carlyle Global Market Strategies CLO Ltd.(b): | | | | | | | | | | | | |
Series 2014-3A, Class D1, (3 mo. LIBOR US + 5.10%), 6.47%, 07/27/26(c) | | | | | | | 1,000 | | | | 1,005,253 | |
Series 2014-4A, Class E, (3 mo. LIBOR US + 5.20%), 6.56%, 10/15/26(c) | | | | | | | 1,000 | | | | 1,003,490 | |
Series 2015-3A, Class D, 7.08%, 07/28/28(a) | | | | | | | 1,000 | | | | 1,016,084 | |
CIFC Funding III Ltd., Series 2015-3A, Class E, (3 mo. LIBOR US + 6.05%), 7.41%, 10/19/27(b)(c) | | | | | | | 1,000 | | | | 1,020,969 | |
CIFC Funding Ltd., Series 2014-1A, Class E, (3 mo. LIBOR US + 4.50%), 5.85%, 04/18/25(b)(c) | | | | | | | 1,000 | | | | 1,003,046 | |
Conseco Finance Corp., Series 2001-D, Class B1, (1 mo. LIBOR + 2.50%), 3.98%, 11/15/32(c) | | | | | | | 1,147 | | | | 1,142,503 | |
Conseco Finance Securitizations Corp., Series 2002-1, Class M2, 9.55%, 12/01/33(a) | | | | | | | 2,500 | | | | 2,690,906 | |
Conseco Financial Corp., Series 1997-2, Class M1, 7.54%, 06/15/28(a) | | | | | | | 1,861 | | | | 1,866,358 | |
Credit-Based Asset Servicing & Securitization LLC, Series 2006-MH1, Class B1, 6.25%, 10/25/36(b)(d) | | | | | | | 1,000 | | | | 1,028,565 | |
CSMC Trust, Series 2017-1TR, 4.50%, 03/25/21 | | | | | | | 1,288 | | | | 1,298,220 | |
CWABS Asset-Backed Certificates Trust, Series 2005-17, Class 1AF4, 4.61%, 05/25/36(d) | | | | | | | 850 | | | | 1,014,908 | |
Deutsche Financial Capital Securitization LLC, Series 1991-I, Class M, 6.80%, 04/15/28 | | | | | | | 1,435 | | | | 1,503,212 | |
| | | | | | | | | | | | |
| Security | | | | | Par
(000) | | | Value | |
| Asset-Backed Securities (continued) | |
Dryden 31 Senior Loan Fund”, Series 2014-31A, Class DR, (3 mo. LIBOR US + 3.35%), 4.70%, 04/18/26(b)(c) | | | USD | | | | 1,000 | | | $ | 1,007,055 | |
Dryden 34 Senior Loan Fund, Series 2014-34A, Class DR, (3 mo. LIBOR US + 3.40%), 4.76%, 10/15/26(b)(c) | | | | | | | 1,250 | | | | 1,266,794 | |
First Franklin Mortgage Loan Trust, Series 2006-FF16, Class 2A3, (1 mo. LIBOR US + 0.14%), 1.69%, 12/25/36(c) | | | | | | | 725 | | | | 451,108 | |
GoldenTree Loan Opportunities IX Ltd., Series 2014-9A, Class D, 4.88%, 10/29/26(a)(b) | | | | | | | 750 | | | | 754,487 | |
Highbridge Loan Management Ltd.(c): | | | | | | | | | | | | |
Series 5A-2015, Class E, (3 mo. LIBOR US + 5.35%), 6.73%, 01/29/26(b) | | | | | | | 750 | | | | 754,048 | |
Series 5X-2015, Class E, (3 mo. LIBOR US + 5.35%), 6.73%, 01/29/26 | | | | | | | 1,000 | | | | 1,005,397 | |
Lehman ABS Manufactured Housing Contract Trust, Series 2002-A, Class C, 0.00%, 06/15/33(l) | | | | | | | 2,655 | | | | 2,162,139 | |
Long Beach Mortgage Loan Trust(c): | | | | | | | | | | | | |
Series 2006-2, Class 2A4, (1 mo. LIBOR US + 0.29%), 1.84%, 03/25/46 | | | | | | | 761 | | | | 396,676 | |
Series 2006-4, Class 2A4, (1 mo. LIBOR US + 0.26%), 1.81%, 05/25/36 | | | | | | | 981 | | | | 514,453 | |
Series 2006-5, Class 2A3, (1 mo. LIBOR US + 0.15%), 1.70%, 06/25/36 | | | | | | | 1,264 | | | | 748,531 | |
Madison Park Funding XIV Ltd., Series 2014-14A, Class E, (3 mo. LIBOR US + 4.75%), 6.11%, 07/20/26(b)(c) | | | | | | | 1,750 | | | | 1,765,298 | |
Merrill Lynch Mortgage Investors Trust, Series 2006-OPT1, Class M1, (1 mo. LIBOR US + 0.26%), 1.81%, 08/25/37(c) | | | | | | | 2,097 | | | | 568,387 | |
MP CLO VI Ltd., Series 2014-2A, Class DR, (3 mo. LIBOR US + 3.50%), 4.86%, 01/15/27(b)(c) | | | | | | | 750 | | | | 761,141 | |
Neuberger Berman CLO XV, Series 2013-15A, Class DR, 4.41%, 10/15/29(a)(b) | | | | | | | 1,000 | | | | 1,006,853 | |
Oak Hill Credit Partners X Ltd., Series 2014-10A, Class DR, (3 mo. LIBOR US + 3.25%), 4.61%, 07/20/26(b)(c) | | | | | | | 1,500 | | | | 1,508,555 | |
OHA Credit Partners IX Ltd., Series 2013-9A, Class DR, (3 mo. LIBOR US + 3.30%), 4.66%, 10/20/25(b)(c) | | | | | | | 1,000 | | | | 1,007,364 | |
OZLM Funding V Ltd., Series 2013-5A, Class D, (3 mo. LIBOR US + 4.75%), 6.10%, 01/17/26(b)(c) | | | | | | | 3,000 | | | | 3,014,872 | |
OZLM VII Ltd., Series 2014-7A, Class CR, (3 mo. LIBOR US + 3.50%), 4.85%, 07/17/26(b)(c) | | | | | | | 1,000 | | | | 1,006,416 | |
Palmer Square CLO Ltd., Series 2013-2A, Class CR, (3 mo. LIBOR US + 3.60%), 4.95%, 10/17/27(b)(c) | | | | | | | 1,000 | | | | 1,010,516 | |
Park Avenue Institutional Advisers CLO Ltd., Series 2016-1A, Class D, (3 mo. LIBOR US + 7.00%),
8.31%, 08/23/28(b)(c) | | | | | | | 500 | | | | 506,494 | |
Rockford Tower CLO Ltd., Series 2017-1A, Class D, (3 mo. LIBOR US + 3.25%), 4.61%, 04/15/29(b)(c) | | | | | | | 1,000 | | | | 1,013,920 | |
RSO REPO SPE Trust, 5.20%, 09/15/20(e) | | | | | | | 1,500 | | | | 1,496,100 | |
Sound Point CLO V Ltd., Series 2014-1A, Class E, (3 mo. LIBOR US + 4.25%), 5.60%, 04/18/26(b)(c) | | | | | | | 1,000 | | | | 998,778 | |
THL Credit Wind River CLO Ltd., Series 2014-3A, Class DR, (3 mo. LIBOR US + 3.35%), 4.71%, 01/22/27(b)(c) | | | | | | | 1,000 | | | | 1,003,740 | |
TIAA CLO II Ltd., Series 2017-1A, Class E, (3 mo. LIBOR US + 5.85%), 7.21%, 04/20/29(b)(c) | | | | | | | 1,000 | | | | 1,003,257 | |
York CLO 1 Ltd., Series 2014-1A(b)(c): | | | | | | | | | | | | |
Class DR, (3 mo. LIBOR US + 3.40%), 4.76%, 01/22/27 | | | | | | | 500 | | | | 501,207 | |
Class E, (3 mo. LIBOR US + 5.45%), 6.81%, 01/22/27 | | | | | | | 1,000 | | | | 1,000,422 | |
| | | | | | | | | | | | |
Total Asset-Backed Securities — 28.2%
(Cost — $61,574,165) | | | | | | | | 62,405,507 | |
| | | | | | | | | | | | |
| | |
| 8 | | 2017 BLACKROCK ANNUAL REPORTTO SHAREHOLDERS |
| | |
Schedule of Investments (continued) December 31, 2017 | | BlackRock 2022 Global Income Opportunity Trust (Percentages shown are based on Net Assets) |
| | | | | | | | | | | | |
| Security | | | | | Par
(000) | | | Value | |
Corporate Bonds — 70.7% | | | | | | | | | | | | |
| Argentina — 5.9% | |
Aeropuertos Argentina 2000 SA, 6.88%, 02/01/27(b)(f) | | | USD | | | | 1,078 | | | $ | 1,165,566 | |
AES Argentina Generacion SA, 7.75%, 02/02/24(b)(f) | | | | | | | 1,078 | | | | 1,167,517 | |
Arcor SAIC, 6.00%, 07/06/23(b)(f) | | | | | | | 557 | | | | 591,116 | |
Cablevision SA, 6.50%, 06/15/21(b)(f) | | | | | | | 557 | | | | 591,640 | |
Cia Latinoamericana de Infraestructura & Servicios SA, 9.50%, 07/20/23(b)(f) | | | | | | | 1,098 | | | | 1,169,425 | |
Generacion Mediterranea SA/Generacion Frias SA/Central Termica Roca SA, 9.63%, 07/27/23(b)(f) | | | | | | | 1,078 | | | | 1,204,180 | |
Genneia SA, 8.75%, 01/20/22(b)(f) | | | | | | | 1,098 | | | | 1,206,691 | |
Pampa Energia SA, 7.50%, 01/24/27(b)(f) | | | | | | | 1,069 | | | | 1,170,705 | |
Tarjeta Naranja SA, (Argentina Deposit Rates Badlar Pvt Banks + 3.50%), 24.71%, 04/11/22(b)(c)(f) | | | | | | | 779 | | | | 757,577 | |
YPF SA: | | | | | | | | | | | | |
(Argentina Deposit Rates Badlar Pvt Banks + 4.00%), 25.46%, 07/07/20(c) | | | | | | | 2,935 | | | | 2,681,409 | |
8.50%, 07/28/25 | | | | | | | 1,098 | | | | 1,273,680 | |
| | | | | | | | | | | | |
| | | | | | | | | | | 12,979,506 | |
| Bahrain — 0.1% | |
Oil and Gas Holding Co. BSCC, 7.50%, 10/25/27 | | | | | | | 200 | | | | 204,795 | |
| | | | | | | | | | | | |
| Bermuda — 0.6% | |
China Singyes Solar Technologies Holdings Ltd., 7.95%, 02/15/19 | | | | | | | 500 | | | | 500,052 | |
Digicel Group Ltd., 8.25%, 09/30/20(b)(f) | | | | | | | 558 | | | | 548,955 | |
Geopark Ltd., 6.50%, 09/21/24(b) | | | | | | | 200 | | | | 205,142 | |
| | | | | | | | | | | | |
| | | | | | | | | | | 1,254,149 | |
| British Virgin Islands — 1.2% | |
Arcos Dorados Holdings, Inc., 5.88%, 04/04/27(b)(f) | | | | | | | 745 | | | | 787,584 | |
Central American Bottling Corp., 5.75%, 01/31/27(b)(f) | | | | | | | 659 | | | | 692,972 | |
New Lion Bridge Co. Ltd., 9.75%, 10/10/20 | | | | | | | 200 | | | | 202,500 | |
Prime Bloom Holdings Ltd., 6.95%, 07/05/22 | | | | | | | 200 | | | | 188,500 | |
Rock International Investment Co., 6.63%, 03/27/20 | | | | | | | 750 | | | | 718,188 | |
| | | | | | | | | | | | |
| | | | | | | | | | | 2,589,744 | |
| Canada — 3.3% | |
Canbriam Energy, Inc., 9.75%, 11/15/19(b)(f) | | | | | | | 1,540 | | | | 1,566,950 | |
Enbridge, Inc., (3 mo. LIBOR US + 3.42%), 5.50%, 07/15/77(g) | | | | | | | 350 | | | | 347,813 | |
Niska Gas Storage Ltd./Niska Gas Storage Canada Finance Corp., 6.50%, 04/01/19(f) | | | | | | | 1,172 | | | | 1,186,650 | |
NOVA Chemicals Corp., 5.25%, 06/01/27(b)(f) | | | | | | | 1,495 | | | | 1,491,262 | |
Stoneway Capital Corp., 10.00%, 03/01/27(b)(f) | | | | | | | 1,663 | | | | 1,768,251 | |
Valeant Pharmaceuticals International, Inc., 9.00%, 12/15/25(b) | | | | | | | 844 | | | | 879,617 | |
| | | | | | | | | | | | |
| | | | | | | | | | | 7,240,543 | |
| Cayman Islands — 2.7% | |
Alibaba Group Holding, Ltd.: | | | | | | | | | | | | |
3.40%, 12/06/27 | | | | | | | 296 | | | | 295,925 | |
4.40%, 12/06/57 | | | | | | | 200 | | | | 208,351 | |
Anton Oilfield Services Group, 9.75%, 12/05/20 | | | | | | | 200 | | | | 201,500 | |
CFLD Cayman Investment, Ltd., 6.50%, 12/21/20 | | | | | | | 200 | | | | 199,812 | |
China Evergrande Group: | | | | | | | | | | | | |
7.50%, 06/28/23 | | | | | | | 200 | | | | 203,286 | |
8.75%, 06/28/25 | | | | | | | 200 | | | | 207,287 | |
China Huiyuan Juice Group, Ltd., 6.50%, 08/16/20 | | | | | | | 200 | | | | 198,931 | |
Emirates Reit Sukuk, Ltd., 5.13%, 12/12/22 | | | | | | | 200 | | | | 199,702 | |
Energuate Trust, 5.88%, 05/03/27(b)(f) | | | | | | | 503 | | | | 519,926 | |
Fantasia Holdings Group Co., 7.95%, 07/05/22 | | | | | | | 200 | | | | 200,501 | |
Jiayuan International Group, Ltd., 8.25%, 11/14/18 | | | | | | | 200 | | | | 200,199 | |
Kaisa Group Holdings, Ltd., 7.25%, 06/30/20 | | | | | | | 200 | | | | 195,094 | |
KWG Property Holding, Ltd., 5.88%, 11/10/24 | | | | | | | 200 | | | | 194,832 | |
| | | | | | | | | | | | |
| Security | | | | | Par (000) | | | Value | |
| Cayman Islands (continued) | |
Latam Finance Ltd., 6.88%, 04/11/24(b)(f) | | | USD | | | | 645 | | | $ | 672,413 | |
Logan Property Holdings Co. Ltd., 5.25%, 02/23/23 | | | | | | | 200 | | | | 189,988 | |
Pearl Holding III, Ltd., 9.50%, 12/11/22 | | | | | | | 200 | | | | 199,280 | |
Times Property Holdings, Ltd., 6.60%, 03/02/23 | | | | | | | 200 | | | | 198,259 | |
Vale Overseas Ltd., 6.25%, 08/10/26(f) | | | | | | | 704 | | | | 815,584 | |
Yankuang Group Cayman, Ltd., 4.75%, 11/30/20 | | | | | | | 200 | | | | 197,783 | |
Yuzhou Properties Co. Ltd.: | | | | | | | | | | | | |
6.00%, 10/25/23 | | | | | | | 500 | | | | 502,624 | |
5.38%(a)(h) | | | | | | | 200 | | | | 191,101 | |
| | | | | | | | | | | | |
| | | | | | | | | | | 5,992,378 | |
| Chile — 0.7% | |
Baoxin Auto Finance I, Ltd., 5.63%(a)(h) | | | | | | | 200 | | | | 197,267 | |
Celeo Redes Operacion Chile SA,
5.20%, 06/22/47(b)(f) | | | | | | | 750 | | | | 759,375 | |
Colbun SA, 3.95%, 10/11/27(b) | | | | | | | 360 | | | | 359,100 | |
Shandong Iron And Steel Xinheng International Co., Ltd., 6.50%, 06/14/21 | | | | | | | 200 | | | | 200,000 | |
| | | | | | | | | | | | |
| | | | | | | | | | | 1,515,742 | |
| Colombia — 0.5% | |
Credivalores-Crediservicios SAS, 9.75%, 07/27/22(b) | | | | | | | 400 | | | | 415,000 | |
SURA Asset Management SA, 4.38%, 04/11/27(b)(f) | | | | | | | 650 | | | | 656,500 | |
| | | | | | | | | | | | |
| | | | | | | | | | | 1,071,500 | |
| Dominican Republic — 0.6% | |
Aeropuertos Dominicanos Siglo XXI SA, 6.75%, 03/30/29(b)(f) | | | | | | | 1,128 | | | | 1,235,160 | |
| | | | | | | | | | | | |
| France — 0.6% | |
BNP Paribas SA, 4.63%, 03/13/27(b)(f) | | | | | | | 800 | | | | 853,425 | |
BPCE SA, 3.50%, 10/23/27(b)(f) | | | | | | | 550 | | | | 541,195 | |
| | | | | | | | | | | | |
| | | | | | | | | | | 1,394,620 | |
| Germany — 0.9% | |
Deutsche Bank AG, 4.88%, 12/01/32(a) | | | | | | | 425 | | | | 423,512 | |
Unitymedia GmbH, 6.13%, 01/15/25(b)(f) | | | | | | | 1,540 | | | | 1,624,700 | |
| | | | | | | | | | | | |
| | | | | | | | | | | 2,048,212 | |
| Honduras — 0.2% | |
Inversiones Atlantida SA, 8.25%, 07/28/22(b) | | | | | | | 400 | | | | 413,500 | |
| | | | | | | | | | | | |
| India — 0.3% | |
JSW Steel Ltd., 5.25%, 04/13/22 | | | | | | | 400 | | | | 409,043 | |
Lodha Developers International Ltd., 12.00%, 03/13/20 | | | | | | | 200 | | | | 213,152 | |
| | | | | | | | | | | | |
| | | | | | | | | | | 622,195 | |
| Indonesia — 0.2% | |
Bukit Makmur Mandiri Uta, 7.75%, 02/13/22(f) | | | | | | | 300 | | | | 321,763 | |
Jasa Marga Persero Tbk PT, 7.50%, 12/11/20 | | | IDR | | | | 2,000,000 | | | | 149,414 | |
| | | | | | | | | | | | |
| | | | | | | | | | | 471,177 | |
| Ireland — 1.1% | |
AerCap Ireland Capital DAC/AerCap Global Aviation Trust, 3.65%, 07/21/27 | | | USD | | | | 169 | | | | 167,253 | |
AerCap Ireland Capital Ltd./AerCap Global Aviation Trust, 5.00%, 10/01/21(f) | | | | | | | 600 | | | | 639,592 | |
Ardagh Packaging Finance PLC/Ardagh Holdings USA, Inc., 6.00%, 02/15/25(b)(f) | | | | | | | 1,540 | | | | 1,620,850 | |
| | | | | | | | | | | | |
| | | | | | | | | | | 2,427,695 | |
| Italy — 0.9% | |
Intesa Sanpaolo SpA(b): | | | | | | | | | | | | |
5.02%, 06/26/24(f) | | | | | | | 750 | | | | 767,942 | |
3.88%, 07/14/27 | | | | | | | 325 | | | | 324,848 | |
UniCredit SpA, (5 year USD ICE Swap + 3.70%), 5.86%, 06/19/32(b)(f)(g) | | | | | | | 804 | | | | 856,709 | |
| | | | | | | | | | | | |
| | | | | | | | | | | 1,949,499 | |
| | | | |
| SCHEDULE OF INVESTMENTS | | | 9 | |
| | |
Schedule of Investments (continued) December 31, 2017 | | BlackRock 2022 Global Income Opportunity Trust (Percentages shown are based on Net Assets) |
| | | | | | | | | | | | |
| Security | | | | | Par
(000) | | | Value | |
| Japan — 0.1% | |
Universal Entertainment Corp., (8.50% Cash or 6.00% PIK), 8.50%, 08/24/20(b)(i) | | | USD | | | | 258 | | | $ | 260,081 | |
| | | | | | | | | | | | |
| Luxembourg — 1.4% | |
Actavis Funding SCS, 4.55%, 03/15/35 | | | | | | | 175 | | | | 185,179 | |
Minerva Luxembourg SA, 6.50%, 09/20/26(b)(f) | | | | | | | 557 | | | | 572,317 | |
Rumo Luxembourg Sarl, 7.38%, 02/09/24(b)(f) | | | | | | | 1,128 | | | | 1,213,841 | |
Telecom Italia Capital SA, 6.38%, 11/15/33 | | | | | | | 385 | | | | 447,563 | |
VM Holdings SA, 5.38%, 05/04/27(b)(f) | | | | | | | 750 | | | | 795,000 | |
| | | | | | | | | | | | |
| | | | | | | | | | | 3,213,900 | |
| Mexico — 2.2% | |
Banco Inbursa SA Institucion de Banca Multiple, 4.13%, 06/06/24(b)(f) | | | | | | | 640 | | | | 644,000 | |
Cydsa SAB de C.V., 6.25%, 10/04/27(b)(f) | | | | | | | 800 | | | | 807,000 | |
Docuformas SAPI de C.V., 9.25%, 10/11/22(b) | | | | | | | 400 | | | | 395,000 | |
Mexichem SAB de CV(b): | | | | | | | | | | | | |
4.00%, 10/04/27 | | | | | | | 440 | | | | 435,600 | |
5.50%, 01/15/48 | | | | | | | 460 | | | | 447,925 | |
Mexico City Airport Trust, 5.50%, 07/31/47(b)(f) | | | | | | | 200 | | | | 197,500 | |
Petroleos Mexicanos, 6.50%, 03/13/27(b) | | | | | | | 439 | | | | 479,827 | |
Trust F/1401, 6.95%, 01/30/44 | | | | | | | 1,392 | | | | 1,513,800 | |
| | | | | | | | | | | | |
| | | | | | | | | | | 4,920,652 | |
| Mongolia — 0.0% | |
Energy Resources LLC, 8.00%, 09/30/22(a) | | | | | | | 75 | | | | 76,254 | |
| | | | | | | | | | | | |
| Netherlands — 3.1% | |
Enel Finance International NV(b): | | | | | | | | | | | | |
3.63%, 05/25/27 | | | | | | | 400 | | | | 397,421 | |
3.50%, 04/06/28 | | | | | | | 286 | | | | 279,745 | |
Greenko Dutch BV, 5.25%, 07/24/24 | | | | | | | 200 | | | | 202,460 | |
ING Bank NV, 5.80%, 09/25/23(b)(f) | | | | | | | 350 | | | | 392,782 | |
Jababeka International BV, 6.50%, 10/05/23 | | | | | | | 500 | | | | 515,774 | |
Marfrig Holdings Europe BV, 8.00%, 06/08/23(b)(f) | | | | | | | 557 | | | | 580,673 | |
NXP BV/NXP Funding LLC, 4.13%, 06/01/21(b) | | | | | | | 250 | | | | 255,000 | |
Petrobras Global Finance BV(f): | | | | | | | | | | | | |
6.13%, 01/17/22 | | | | | | | 1,136 | | | | 1,205,580 | |
8.75%, 05/23/26 | | | | | | | 659 | | | | 787,505 | |
6.00%, 01/27/28(b) | | | | | | | 707 | | | | 708,767 | |
Ziggo Secured Finance BV, 5.50%, 01/15/27(b)(f) | | | | | | | 1,540 | | | | 1,528,450 | |
| | | | | | | | | | | | |
| | | | | | | | | | | 6,854,157 | |
| Panama — 0.6% | |
AES Panama SRL, 6.00%, 06/25/22(b)(f) | | | | | | | 571 | | | | 598,836 | |
Avianca Holdings SA/Avianca Leasing LLC/Grupo Taca Holdings Ltd., 8.38%, 05/10/20 | | | | | | | 757 | | | | 761,732 | |
| | | | | | | | | | | | |
| | | | | | | | | | | 1,360,568 | |
| Singapore — 0.3% | |
APL Realty Holdings Pte Ltd., 5.95%, 06/02/24 | | | | | | | 200 | | | | 203,085 | |
Medco Straits Services Pte Ltd., 8.50%, 08/17/22 | | | | | | | 200 | | | | 212,135 | |
Modernland Overseas Pte Ltd., 6.95%, 04/13/24 | | | | | | | 200 | | | | 204,128 | |
| | | | | | | | | | | | |
| | | | | | | | | | | 619,348 | |
| Spain — 0.1% | |
Telefonica Emisiones SAU, 5.21%, 03/08/47 | | | | | | | 200 | | | | 226,970 | |
| | | | | | | | | | | | |
| Switzerland — 0.3% | |
UBS Group Funding Switzerland AG,
4.25%, 03/23/28(b)(f) | | | | | | | 709 | | | | 747,065 | |
| | | | | | | | | | | | |
| Thailand — 0.1% | |
PTTEP Treasury Center Co. Ltd., (5 year CMT + 2.72%), 4.60%(g)(h) | | | | | | | 200 | | | | 202,833 | |
| | | | | | | | | | | | |
| United Kingdom — 2.2% | |
Anglo American Capital PLC, 4.00%, 09/11/27(b) | | | | | | | 200 | | | | 198,664 | |
| | | | | | | | | | | | |
| Security | | | | | Par
(000) | | | Value | |
| United Kingdom (continued) | |
Aon PLC: | | | | | | | | | | | | |
4.45%, 05/24/43 | | | USD | | | | 200 | | | $ | 209,219 | |
4.75%, 05/15/45(f) | | | | | | | 225 | | | | 250,176 | |
Barclays PLC, 4.84%, 05/09/28 | | | | | | | 554 | | | | 576,625 | |
HSBC Holdings PLC(f): | | | | | | | | | | | | |
4.38%, 11/23/26 | | | | | | | 400 | | | | 417,607 | |
(3 mo. LIBOR US + 1.55%), 4.04%, 03/13/28(g) | | | | | | | 300 | | | | 312,642 | |
Lloyds Banking Group PLC, 3.57%, 11/07/28(a) | | | | | | | 281 | | | | 278,357 | |
MARB BondCo PLC, 7.00%, 03/15/24 | | | | | | | 200 | | | | 200,750 | |
Royal Bank of Scotland Group PLC: | | | | | | | | | | | | |
(3 mo. LIBOR US + 1.47%), 2.89%, 05/15/23(c) | | | | | | | 396 | | | | 400,338 | |
(3 mo. LIBOR US + 1.48%), 3.50%, 05/15/23(g) | | | | | | | 257 | | | | 257,560 | |
3.88%, 09/12/23 | | | | | | | 300 | | | | 305,083 | |
Santander UK Group Holdings PLC, 3.82%, 11/03/28(a) | | | | | | | 250 | | | | 250,580 | |
Trinity Acquisition PLC, 4.63%, 08/15/23(f) | | | | | | | 400 | | | | 423,757 | |
Vedanta Resources PLC, 7.13%, 05/31/23 | | | | | | | 500 | | | | 538,150 | |
Venator Finance Sarl/Venator Materials LLC, 5.75%, 07/15/25(b) | | | | | | | 200 | | | | 211,000 | |
| | | | | | | | | | | | |
| | | | | | | | | | | 4,830,508 | |
| United States — 40.5% | |
AES Corp., 5.13%, 09/01/27(f) | | | | | | | 400 | | | | 420,000 | |
Aetna, Inc., 3.88%, 08/15/47(f) | | | | | | | 275 | | | | 271,017 | |
Air Lease Corp., 3.63%, 04/01/27 | | | | | | | 155 | | | | 154,877 | |
Amazon.com, Inc., 3.88%, 08/22/37(b)(f) | | | | | | | 139 | | | | 147,493 | |
American Tower Corp., 3.55%, 07/15/27 | | | | | | | 381 | | | | 378,215 | |
Amgen, Inc., 4.40%, 05/01/45(f) | | | | | | | 300 | | | | 326,412 | |
Analog Devices, Inc.(f): | | | | | | | | | | | | |
3.50%, 12/05/26 | | | | | | | 250 | | | | 252,994 | |
4.50%, 12/05/36 | | | | | | | 397 | | | | 427,966 | |
5.30%, 12/15/45 | | | | | | | 250 | | | | 297,125 | |
Andeavor, 5.13%, 12/15/26(b) | | | | | | | 350 | | | | 384,623 | |
Andeavor Logistics LP, Series A, 6.88%(a)(h) | | | | | | | 500 | | | | 507,600 | |
Andeavor Logistics LP/Tesoro Logistics Finance Corp.: | | | | | | | | | | | | |
4.25%, 12/01/27 | | | | | | | 36 | | | | 36,309 | |
5.20%, 12/01/47 | | | | | | | 261 | | | | 272,211 | |
Apple, Inc., 4.25%, 02/09/47(f) | | | | | | | 150 | | | | 166,684 | |
Applied Materials, Inc., 4.35%, 04/01/47(f) | | | | | | | 127 | | | | 142,467 | |
Arconic, Inc., 6.75%, 01/15/28(f) | | | | | | | 1,540 | | | | 1,814,596 | |
AT&T, Inc.(f): | | | | | | | | | | | | |
4.25%, 03/01/27 | | | | | | | 250 | | | | 254,854 | |
4.90%, 08/14/37 | | | | | | | 250 | | | | 253,149 | |
4.75%, 05/15/46 | | | | | | | 150 | | | | 146,707 | |
5.15%, 02/14/50 | | | | | | | 450 | | | | 455,609 | |
Autodesk, Inc., 3.50%, 06/15/27 | | | | | | | 302 | | | | 296,240 | |
Baker Hughes a GE Co. LLC/Baker Hughes Co-Obligor, Inc.(b): | | | | | | | | | | | | |
3.34%, 12/15/27 | | | | | | | 150 | | | | 149,748 | |
4.08%, 12/15/47 | | | | | | | 159 | | | | 161,713 | |
Bank of America Corp.: | | | | | | | | | | | | |
4.45%, 03/03/26(f) | | | | | | | 200 | | | | 213,481 | |
4.25%, 10/22/26(f) | | | | | | | 425 | | | | 447,880 | |
(3 mo. LIBOR US + 1.51%), 3.71%, 04/24/28(f)(g) | | | | | | | 325 | | | | 333,578 | |
Series L, 4.18%, 11/25/27 | | | | | | | 150 | | | | 156,640 | |
BAT Capital Corp.(b): | | | | | | | | | | | | |
3.56%, 08/15/27 | | | | | | | 400 | | | | 400,519 | |
4.39%, 08/15/37 | | | | | | | 300 | | | | 315,031 | |
Broadcom Corp. / Broadcom Cayman Finance, Ltd., 3.13%, 01/15/25(b) | | | | | | | 307 | | | | 293,481 | |
Caesars Growth Properties Holdings LLC/Caesars Growth Properties Finance, Inc., 9.38%, 05/01/22(f) | | | | | | | 1,540 | | | | 1,647,800 | |
Calpine Corp., 5.75%, 01/15/25(f) | | | | | | | 1,540 | | | | 1,455,300 | |
Carrizo Oil & Gas, Inc., 7.50%, 09/15/20(f) | | | | | | | 958 | | | | 975,962 | |
| | |
| 10 | | 2017 BLACKROCK ANNUAL REPORTTO SHAREHOLDERS |
| | |
Schedule of Investments (continued) December 31, 2017 | | BlackRock 2022 Global Income Opportunity Trust (Percentages shown are based on Net Assets) |
| | | | | | | | | | | | |
| Security | | | | | Par
(000) | | | Value | |
| United States (continued) | |
CCO Holdings LLC/CCO Holdings Capital Corp.(b): | | | | | | | | | | | | |
4.00%, 03/01/23 | | | USD | | | | 242 | | | $ | 239,580 | |
5.13%, 05/01/27(f) | | | | | | | 1,540 | | | | 1,516,900 | |
Centennial Resource Production LLC, 5.38%, 01/15/26(b) | | | | | | | 250 | | | | 254,688 | |
Charter Communications Operating LLC/Charter Communications Operating Capital: | | | | | | | | | | | | |
3.75%, 02/15/28(f) | | | | | | | 375 | | | | 359,328 | |
4.20%, 03/15/28 | | | | | | | 96 | | | | 95,287 | |
6.48%, 10/23/45 | | | | | | | 200 | | | | 233,186 | |
5.38%, 05/01/47(f) | | | | | | | 567 | | | | 581,373 | |
Cheniere Corpus Christi Holdings LLC,
5.13%, 06/30/27(f) | | | | | | | 1,789 | | | | 1,850,542 | |
Cheniere Energy Partners LP, 5.25%, 10/01/25(b)(f) | | | | | | | 1,136 | | | | 1,155,880 | |
Cheniere Energy, Inc., 4.88%, 05/28/21(b)(i)(j) | | | | | | | 600 | | | | 623,841 | |
Cimarex Energy Co., 3.90%, 05/15/27 | | | | | | | 300 | | | | 306,756 | |
Citigroup, Inc.(f): | | | | | | | | | | | | |
4.45%, 09/29/27 | | | | | | | 225 | | | | 238,208 | |
(3 mo. LIBOR US + 1.39%), 3.67%, 07/24/28(g) | | | | | | | 500 | | | | 507,275 | |
4.13%, 07/25/28 | | | | | | | 385 | | | | 396,802 | |
Commercial Metals Co., 5.38%, 07/15/27 | | | | | | | 95 | | | | 96,900 | |
Concho Resources, Inc.: | | | | | | | | | | | | |
3.75%, 10/01/27 | | | | | | | 244 | | | | 247,186 | |
4.88%, 10/01/47 | | | | | | | 238 | | | | 258,808 | |
Cox Communications, Inc., 4.60%, 08/15/47(b) | | | | | | | 223 | | | | 225,070 | |
Crown Castle International Corp.: | | | | | | | | | | | | |
3.20%, 09/01/24 | | | | | | | 170 | | | | 168,237 | |
3.65%, 09/01/27(f) | | | | | | | 500 | | | | 498,776 | |
4.75%, 05/15/47(f) | | | | | | | 421 | | | | 443,186 | |
CSC Holdings LLC: | | | | | | | | | | | | |
5.25%, 06/01/24 | | | | | | | 325 | | | | 320,125 | |
10.88%, 10/15/25(b)(f) | | | | | | | 1,268 | | | | 1,508,920 | |
DaVita, Inc., 5.00%, 05/01/25(f) | | | | | | | 1,540 | | | | 1,539,538 | |
Diamondback Energy, Inc., 5.38%, 05/31/25(f) | | | | | | | 1,540 | | | | 1,584,275 | |
Discover Financial Services, 4.10%, 02/09/27(f) | | | | | | | 350 | | | | 358,516 | |
Discovery Communications LLC: | | | | | | | | | | | | |
4.88%, 04/01/43 | | | | | | | 350 | | | | 347,578 | |
5.20%, 09/20/47 | | | | | | | 200 | | | | 208,744 | |
Endeavor Energy Resources LP/EER Finance, Inc., 5.50%, 01/30/26(b) | | | | | | | 390 | | | | 396,825 | |
Energy Transfer LP: | | | | | | | | | | | | |
4.90%, 03/15/35 | | | | | | | 150 | | | | 148,379 | |
5.15%, 02/01/43 | | | | | | | 275 | | | | 260,413 | |
5.30%, 04/15/47 | | | | | | | 250 | | | | 248,065 | |
Enterprise Products Operating LLC(a): | | | | | | | | | | | | |
Series D, 4.88%, 08/16/77 | | | | | | | 350 | | | | 350,875 | |
Series E, 5.25%, 08/16/77 | | | | | | | 228 | | | | 225,720 | |
Extraction Oil & Gas, Inc., 7.38%, 05/15/24(b)(f) | | | | | | | 1,500 | | | | 1,601,250 | |
Five Point Operating Co. LP/Five Point Capital Corp., 7.88%, 11/15/25(b)(f) | | | | | | | 1,050 | | | | 1,068,375 | |
Ford Motor Co., 5.29%, 12/08/46(f) | | | | | | | 200 | | | | 217,642 | |
Frontier Communications Corp., 7.13%, 03/15/19(f) | | | | | | | 1,540 | | | | 1,478,400 | |
General Motors Co., 5.20%, 04/01/45(f) | | | | | | | 325 | | | | 343,408 | |
Goldman Sachs Group, Inc., 4.02%, 10/31/38(a) | | | | | | | 350 | | | | 359,937 | |
Great Lakes Dredge & Dock Corp., 8.00%, 05/15/22 | | | | | | | 150 | | | | 156,938 | |
Halcon Resources Corp., 6.75%, 02/15/25(b) | | | | | | | 373 | | | | 387,920 | |
HCA, Inc., 5.88%, 02/15/26(f) | | | | | | | 1,540 | | | | 1,628,550 | |
Hess Corp.: | | | | | | | | | | | | |
5.60%, 02/15/41 | | | | | | | 150 | | | | 161,755 | |
5.80%, 04/01/47 | | | | | | | 150 | | | | 166,919 | |
IPALCO Enterprises, Inc., 3.70%, 09/01/24(b) | | | | | | | 82 | | | | 81,926 | |
Iron Mountain US Holdings, Inc., 5.38%, 06/01/26(b)(f) | | | | | | | 1,540 | | | | 1,582,350 | |
| | | | | | | | | | | | |
| Security | | | | | Par
(000) | | | Value | |
| United States (continued) | |
JPMorgan Chase & Co.(f): | | | | | | | | | | | | |
4.13%, 12/15/26 | | | USD | | | | 200 | | | $ | 210,983 | |
4.25%, 10/01/27 | | | | | | | 200 | | | | 212,570 | |
(3 mo. LIBOR US + 1.36%), 3.88%, 07/24/38(g) | | | | | | | 800 | | | | 822,374 | |
K Hovnanian Enterprises, Inc.(b)(f): | | | | | | | | | | | | |
10.00%, 07/15/22 | | | | | | | 1,500 | | | | 1,650,000 | |
10.50%, 07/15/24 | | | | | | | 1,500 | | | | 1,721,250 | |
Kaiser Aluminum Corp., 5.88%, 05/15/24(f) | | | | | | | 1,540 | | | | 1,636,250 | |
KFC Holding Co./Pizza Hut Holdings LLC/Taco Bell of America LLC, 5.00%, 06/01/24(b)(f) | | | | | | | 800 | | | | 825,000 | |
Kinder Morgan Energy Partners LP: | | | | | | | | | | | | |
5.00%, 03/01/43 | | | | | | | 125 | | | | 126,882 | |
5.50%, 03/01/44 | | | | | | | 125 | | | | 133,149 | |
Kinder Morgan, Inc., 5.55%, 06/01/45(f) | | | | | | | 400 | | | | 437,758 | |
Lockheed Martin Corp., 3.60%, 03/01/35 | | | | | | | 200 | | | | 201,611 | |
Massachusetts Mutual Life Insurance Co., 4.90%, 04/01/77(b) | | | | | | | 195 | | | | 221,694 | |
MGM Growth Properties Operating Partnership LP/MGP Finance Co-Issuer, Inc., 4.50%, 09/01/26(f) | | | | | | | 1,600 | | | | 1,592,000 | |
MHGE Parent LLC/MHGE Parent Finance, Inc., (8.5% Cash or 9.25% PIK), 8.50%, 08/01/19(b)(f)(i) | | | | | | | 286 | | | | 284,484 | |
Monsanto Co., 4.40%, 07/15/44(f) | | | | | | | 200 | | | | 213,109 | |
Morgan Stanley: | | | | | | | | | | | | |
3.88%, 01/27/26(f) | | | | | | | 225 | | | | 234,532 | |
4.35%, 09/08/26 | | | | | | | 250 | | | | 261,965 | |
3.95%, 04/23/27 | | | | | | | 275 | | | | 279,257 | |
(3 mo. LIBOR US + 1.34%), 3.59%, 07/22/28(f)(g) | | | | | | | 350 | | | | 353,221 | |
(3 mo. LIBOR US + 1.46%), 3.97%, 07/22/38(f)(g) | | | | | | | 350 | | | | 362,423 | |
4.38%, 01/22/47(f) | | | | | | | 250 | | | | 274,045 | |
Newmont Mining Corp., 4.88%, 03/15/42(f) | | | | | | | 200 | | | | 221,941 | |
NextEra Energy Operating Partners LP(b): | | | | | | | | | | | | |
4.25%, 09/15/24 | | | | | | | 121 | | | | 123,118 | |
4.50%, 09/15/27 | | | | | | | 371 | | | | 369,145 | |
NGPL PipeCo LLC(b): | | | | | | | | | | | | |
4.38%, 08/15/22 | | | | | | | 137 | | | | 139,312 | |
7.77%, 12/15/37(f) | | | | | | | 1,000 | | | | 1,232,500 | |
NiSource Finance Corp., 4.38%, 05/15/47(f) | | | | | | | 200 | | | | 219,215 | |
Oracle Corp., 4.00%, 07/15/46(f) | | | | | | | 125 | | | | 133,001 | |
Owens-Brockway Glass Container, Inc., 6.38%, 08/15/25(b)(f) | | | | | | | 1,495 | | | | 1,670,662 | |
Parsley Energy LLC/Parsley Finance Corp.(b): | | | | | | | | | | | | |
5.38%, 01/15/25(f) | | | | | | | 1,540 | | | | 1,555,400 | |
5.63%, 10/15/27 | | | | | | | 94 | | | | 96,115 | |
Pioneer Energy Services Corp., 6.13%, 03/15/22(f) | | | | | | | 1,540 | | | | 1,262,338 | |
Plains All American Pipeline LP, Series B, 6.13%(a)(h) | | | | | | | 173 | | | | 172,741 | |
Post Holdings, Inc., 5.00%, 08/15/26(b)(f) | | | | | | | 1,540 | | | | 1,514,975 | |
Quicken Loans, Inc., 5.75%, 05/01/25(b)(f) | | | | | | | 1,638 | | | | 1,695,346 | |
Resolute Energy Corp., 8.50%, 05/01/20(f) | | | | | | | 1,725 | | | | 1,755,187 | |
RSP Permian, Inc., 6.63%, 10/01/22(f) | | | | | | | 1,540 | | | | 1,615,075 | |
Sabine Pass Liquefaction LLC: | | | | | | | | | | | | |
5.63%, 04/15/23 | | | | | | | 350 | | | | 384,380 | |
4.20%, 03/15/28 | | | | | | | 250 | | | | 252,945 | |
Sable Permian Resources Land LLC/AEPB Finance Corp., 13.00%, 11/30/20(b)(f) | | | | | | | 1,400 | | | | 1,610,000 | |
Santander Holdings USA, Inc.(b): | | | | | | | | | | | | |
3.40%, 01/18/23 | | | | | | | 103 | | | | 102,599 | |
4.40%, 07/13/27 | | | | | | | 72 | | | | 73,631 | |
SBA Communication Corp., 4.00%, 10/01/22(b) | | | | | | | 220 | | | | 220,275 | |
Scientific Games International, Inc.: | | | | | | | | | | | | |
7.00%, 01/01/22(b) | | | | | | | 55 | | | | 57,956 | |
10.00%, 12/01/22(f) | | | | | | | 1,500 | | | | 1,646,250 | |
SEACOR Holdings, Inc., 3.00%, 11/15/28(j) | | | | | | | 1,500 | | | | 1,416,562 | |
Sprint Corp., 7.88%, 09/15/23(f) | | | | | | | 1,540 | | | | 1,640,100 | |
| | | | |
| SCHEDULE OF INVESTMENTS | | | 11 | |
| | |
Schedule of Investments (continued) December 31, 2017 | | BlackRock 2022 Global Income Opportunity Trust (Percentages shown are based on Net Assets) |
| | | | | | | | | | | | |
| Security | | | | | Par
(000) | | | Value | |
| United States (continued) | |
Sprint Spectrum Co. LLC/Sprint Spectrum Co. II LLC/Sprint Spectrum Co. III LLC, 3.36%, 03/20/23(b)(f) | | | USD | | | | 563 | | | $ | 566,016 | |
Sunoco Logistics Partners Operations LP: | | | | | | | | | | | | |
5.35%, 05/15/45(f) | | | | | | | 200 | | | | 198,743 | |
5.40%, 10/01/47 | | | | | | | 150 | | | | 151,013 | |
T-Mobile USA, Inc., 6.50%, 01/15/26(f) | | | | | | | 1,540 | | | | 1,680,525 | |
Talen Energy Supply LLC, 10.50%, 01/15/26(b) | | | | | | | 1,500 | | | | 1,484,700 | |
Teachers Insurance & Annuity Association of America, 4.27%, 05/15/47(b)(f) | | | | | | | 300 | | | | 317,262 | |
Team Health Holdings, Inc., 6.38%, 02/01/25(b)(f) | | | | | | | 1,500 | | | | 1,338,750 | |
Time Warner, Inc., 4.65%, 06/01/44 | | | | | | | 150 | | | | 152,536 | |
TransDigm, Inc., 6.50%, 05/15/25(f) | | | | | | | 1,540 | | | | 1,574,650 | |
Valeant Pharmaceuticals International, Inc., 5.38%, 03/15/20(b) | | | | | | | 531 | | | | 531,664 | |
Verizon Communications, Inc.(f): | | | | | | | | | | | | |
4.50%, 08/10/33 | | | | | | | 400 | | | | 419,532 | |
4.81%, 03/15/39 | | | | | | | 250 | | | | 261,552 | |
VICI Properties 1 LLC/VICI FC, Inc.: | | | | | | | | | | | | |
4.85%, 10/15/22(a) | | | | | | | 1,080 | | | | 1,080,000 | |
8.00%, 10/15/23 | | | | | | | 450 | | | | 502,785 | |
Walgreens Boots Alliance, Inc.: | | | | | | | | | | | | |
3.45%, 06/01/26 | | | | | | | 200 | | | | 197,771 | |
4.80%, 11/18/44 | | | | | | | 100 | | | | 107,665 | |
Weekley Homes LLC/Weekley Finance Corp., 6.63%, 08/15/25(b)(f) | | | | | | | 1,859 | | | | 1,849,705 | |
Wells Fargo & Co.(f): | | | | | | | | | | | | |
(3 mo. LIBOR US + 1.31%), 3.58%, 05/22/28(g) | | | | | | | 168 | | | | 171,269 | |
4.40%, 06/14/46 | | | | | | | 425 | | | | 448,222 | |
4.75%, 12/07/46 | | | | | | | 350 | | | | 391,174 | |
Zayo Group LLC/Zayo Capital, Inc., 5.75%, 01/15/27(b)(f) | | | | | | | 1,540 | | | | 1,570,800 | |
| | | | | | | | | | | | |
| | | | | | | | | | | 89,221,093 | |
| | | | | | | | | | | | |
Total Corporate Bonds — 70.7%
(Cost — $154,315,922) | | | | 155,943,844 | |
| | | | | | | | | | | | |
|
Floating Rate Loan Interests(k) — 2.8% | |
|
| United States — 2.8% | |
California Resources Corp., 2017 1st Lien Term Loan, 3.24%, 11/08/22 | | | | | | | 893 | | | | 888,535 | |
Chesapeake Energy Corp., Term Loan, 3.74%, 08/23/21 | | | | | | | 1,500 | | | | 1,594,500 | |
LSTAR Securities Financing Vehicle, LPN Term Loan(e): | | | | | | | | | | | | |
3.24%, 06/16/25 | | | | | | | 397 | | | | 392,347 | |
3.74%, 05/10/25 | | | | | | | 1,771 | | | | 1,754,950 | |
Pioneer Energy Services Corp., Term Loan, 9.16%, 11/02/22(e) | | | | | | | 1,504 | | | | 1,530,320 | |
| | | | | | | | | | | | |
Total Floating Rate Loan Interests — 2.8%
(Cost — $6,096,376) | | | | 6,160,652 | |
| | | | | | | | | | | | |
|
Foreign Agency Obligations — 20.4% | |
|
| Argentina — 1.9% | |
Argentine Republic Government International Bond(f): | | | | | | | | | | | | |
5.63%, 01/26/22 | | | | | | | 1,080 | | | | 1,139,400 | |
6.88%, 01/26/27 | | | | | | | 2,869 | | | | 3,134,382 | |
| | | | | | | | | | | | |
| | | | | | | | | | | 4,273,782 | |
| Bahrain — 0.3% | |
Bahrain Government International Bond: | | | | | | | | | | | | |
6.75%, 09/20/29 | | | | | | | 200 | | | | 197,047 | |
6.75%, 09/20/29(b) | | | | | | | 564 | | | | 555,673 | |
| | | | | | | | | | | | |
| | | | | | | | | | | 752,720 | |
| | | | | | | | | | | | |
| Security | | | | | Par (000) | | | Value | |
| Brazil — 1.2% | |
Brazil Letras do Tesouro Nacional, 0.00%, 01/01/19(l) | | | BRL | | | | 9,275 | | | $ | 2,617,753 | |
| | | | | | | | | | | | |
| Egypt — 1.9% | |
Egypt Government International Bond: | | | | | | | | | | | | |
5.75%, 04/29/20 | | | USD | | | | 3,166 | | | | 3,310,325 | |
8.50%, 01/31/47(b) | | | | | | | 728 | | | | 835,817 | |
| | | | | | | | | | | | |
| | | | | | | | | | | 4,146,142 | |
| Greece — 0.2% | |
Hellenic Republic Government Bond: | | | | | | | | | | | | |
3.50%, 01/30/23 | | | EUR | | | | 79 | | | | 94,004 | |
3.75%, 01/30/28 | | | | | | | 107 | | | | 124,244 | |
3.90%, 01/30/33 | | | | | | | 111 | | | | 125,243 | |
4.00%, 01/30/37 | | | | | | | 89 | | | | 98,742 | |
4.20%, 01/30/42 | | | | | | | 87 | | | | 96,804 | |
| | | | | | | | | | | | |
| | | | | | | | | | | 539,037 | |
| Indonesia — 4.3% | |
Indonesia Government International Bond: | | | | | | | | | | | | |
3.75%, 04/25/22 | | | USD | | | | 1,598 | | | | 1,645,283 | |
4.75%, 01/08/26 | | | | | | | 2,442 | | | | 2,652,847 | |
Indonesia Treasury Bond: | | | | | | | | | | | | |
7.88%, 04/15/19 | | | IDR | | | | 33,231,000 | | | | 2,524,816 | |
11.00%, 11/15/20 | | | | | | | 14,498,000 | | | | 1,214,335 | |
8.38%, 09/15/26 | | | | | | | 16,710,000 | | | | 1,391,556 | |
| | | | | | | | | | | | |
| | | | | | | | | | | 9,428,837 | |
| Lebanon — 0.7% | |
Lebanon Government International Bond, 6.85%, 03/23/27 | | | USD | | | | 1,709 | | | | 1,649,725 | |
| | | | | | | | | | | | |
| Maldives — 0.1% | |
Republic of Maldives Ministry of Finance and Treasury Bond, 7.00%, 06/07/22 | | | | | | | 200 | | | | 200,032 | |
| | | | | | | | | | | | |
| Mexico — 0.9% | |
Mexican Bonos: | | | | | | | | | | | | |
8.00%, 06/11/20 | | | MXN | | | | 8,000 | | | | 410,161 | |
7.50%, 06/03/27 | | | | | | | 31,100 | | | | 1,563,423 | |
| | | | | | | | | | | | |
| | | | | | | | | | | 1,973,584 | |
| Pakistan — 0.1% | |
Pakistan Government International Bond, 6.88%, 12/05/27 | | | USD | | | | 200 | | | | 200,525 | |
| | | | | | | | | | | | |
| Russia — 3.2% | |
Russian Federal Bond — OFZ: | | | | | | | | | | | | |
6.40%, 05/27/20 | | | RUB | | | | 31,609 | | | | 543,044 | |
7.05%, 01/19/28 | | | | | | | 134,388 | | | | 2,267,280 | |
Russian Foreign Bond — Eurobond: | | | | | | | | | | | | |
4.75%, 05/27/26(b) | | | USD | | | | 1,200 | | | | 1,272,590 | |
4.75%, 05/27/26 | | | | | | | 400 | | | | 424,197 | |
4.25%, 06/23/27 | | | | | | | 2,400 | | | | 2,470,800 | |
| | | | | | | | | | | | |
| | | | | | | | | | | 6,977,911 | |
| South Africa — 2.0% | |
Republic of South Africa Government Bond, 6.25%, 03/31/36 | | | ZAR | | | | 9,530 | | | | 554,224 | |
Republic of South Africa Government International Bond: | | | | | | | | | | | | |
5.50%, 03/09/20(f) | | | USD | | | | 1,209 | | | | 1,269,111 | |
5.88%, 05/30/22(f) | | | | | | | 1,779 | | | | 1,942,668 | |
4.88%, 04/14/26 | | | | | | | 200 | | | | 204,412 | |
5.65%, 09/27/47 | | | | | | | 450 | | | | 459,225 | |
| | | | | | | | | | | | |
| | | | | | | | | | | 4,429,640 | |
| Turkey — 3.6% | |
Turkey Government Bond: | | | | | | | | | | | | |
8.50%, 07/10/19 | | | TRY | | | | 2,368 | | | | 587,236 | |
| | |
| 12 | | 2017 BLACKROCK ANNUAL REPORTTO SHAREHOLDERS |
| | |
Schedule of Investments (continued) December 31, 2017 | | BlackRock 2022 Global Income Opportunity Trust (Percentages shown are based on Net Assets) |
| | | | | | | | | | | | |
| Security | | | | | Par
(000) | | | Value | |
| Turkey (continued) | |
Turkey Government Bond (continued) : | | | | | | | | | | | | |
10.50%, 01/15/20 | | | TRY | | | | 2,778 | | | $ | 701,371 | |
11.00%, 03/02/22 | | | | | | | 665 | | | | 168,947 | |
Turkey Government International Bond(f): | | | | | | | | | | | | |
7.00%, 06/05/20 | | | USD | | | | 1,758 | | | | 1,896,566 | |
7.38%, 02/05/25 | | | | | | | 3,401 | | | | 3,916,388 | |
6.00%, 03/25/27 | | | | | | | 705 | | | | 750,625 | |
| | | | | | | | | | | | |
| | | | | | | | | | | 8,021,133 | |
| | | | | | | | | | | | |
Total Foreign Agency Obligations — 20.4%
(Cost — $44,877,388) | | | | 45,210,821 | |
| | | | | | | | | | | | |
|
Non-Agency Mortgage-Backed Securities — 17.0% | |
|
| Collateralized Mortgage Obligations — 1.7% | |
Alternative Loan Trust, Series 2007-AL1, Class A1, (1 mo. LIBOR US + 0.25%), 1.80%, 06/25/37(c) | | | | | | | 965 | | | | 731,240 | |
ARI Investments LLC, 1.60%, 01/06/25(a)(e) | | | | | | | 1,000 | | | | 1,000,000 | |
LSTAR Securities Investment Ltd., Series 2017-3, Class A1, (1 mo. LIBOR US + 2.00%), 3.36%, 04/01/22(b)(c)(e) | | | | | | | 610 | | | | 614,054 | |
RALI Trust, Series 2006-QO6, Class A1, (1 mo. LIBOR US + 0.18%), 1.73%, 06/25/46(c) | | | | | | | 3,295 | | | | 1,523,555 | |
| | | | | | | | | | | | |
| | | | | | | | | | | 3,868,849 | |
| Commercial Mortgage-Backed Securities — 15.3% | |
245 Park Avenue Trust, Series 2017-245P, Class E, 3.66%, 06/05/37(a)(b) | | | | | | | 380 | | | | 357,106 | |
Arbor Realty Commercial Real Estate Notes Ltd., Series 2017-FL1, Class B, (1 mo. LIBOR US + 2.50%), 3.98%, 04/15/27(b)(c) | | | | | | | 438 | | | | 443,289 | |
Atrium Hotel Portfolio Trust, Series 2017-ATRM, Class E, 4.53%, 11/15/19(a)(b)(e) | | | | | | | 190 | | | | 187,872 | |
Bayview Commercial Asset Trust, Series 2007-6A, Class A4A, (1 mo. LIBOR + 1.50%), 3.05%, 12/25/37(b)(c) | | | | | | | 2,000 | | | | 1,476,664 | |
BBCMS Trust, Series 2015-STP, Class E,
4.28%, 09/10/28(a)(b) | | | | | | | 1,000 | | | | 968,924 | |
BHMS Mortgage Trust, Series 2014-ATLS, Class BFX, 4.24%, 07/05/33(b) | | | | | | | 1,000 | | | | 1,009,773 | |
Bsprt Issuer Ltd., Series 2017-FL1, Class A, (1 mo. LIBOR US + 1.35%), 2.83%, 06/15/27(b)(c)(e) | | | | | | | 280 | | | | 280,616 | |
BXP Trust, Series 2017-CC(a)(b)(e): | | | | | | | | | | | | |
Class D, 3.55%, 08/13/37 | | | | | | | 180 | | | | 172,129 | |
Class E, 3.55%, 08/13/37 | | | | | | | 350 | | | | 310,187 | |
CFCRE Commercial Mortgage Trust, Series 2011-C1, Class C, 6.08%, 04/15/44(a)(b) | | | | | | | 1,000 | | | | 1,070,541 | |
Chicago Skyscraper Trust, Series 2017(b)(c): | | | | | | | | | | | | |
Class D, (1 mo. LIBOR + 2.25%), 3.73%, 02/15/30 | | | | | | | 244 | | | | 245,515 | |
Class E, (1 mo. LIBOR + 3.30%), 4.78%, 02/15/30 | | | | | | | 1,250 | | | | 1,257,760 | |
Class F, (1 mo. LIBOR + 4.10%), 5.58%, 02/15/30 | | | | | | | 280 | | | | 281,737 | |
Citigroup Commercial Mortgage Trust(a): | | | | | | | | | | | | |
Series 2015-GC27, Class C, 4.43%, 02/10/48 | | | | | | | 1,000 | | | | 951,788 | |
Series 2016-P3, Class D, 2.80%, 04/15/49(b) | | | | | | | 540 | | | | 414,064 | |
CLNS Trust, Series 2017-IKPR, Class E, (1 mo. LIBOR + 3.50%), 4.93%, 06/11/32(b)(c) | | | | | | | 790 | | | | 791,727 | |
Commercial Mortgage Trust(a): | | | | | | | | | | | | |
Series 2015-CR23, Class C, 4.25%, 05/10/48 | | | | | | | 1,050 | | | | 1,041,350 | |
Series 2015-CR23, Class CMC, 3.68%, 05/10/48(b) | | | | | | | 1,000 | | | | 1,003,697 | |
Series 2015-CR23, Class CMD, 3.68%, 05/10/48(b) | | | | | | | 1,150 | | | | 1,137,013 | |
Series 2015-CR23, Class XD, 1.02%, 05/10/48(b) | | | | | | | 13,697 | | | | 914,686 | |
Series 2017-DLTA, Class F, 4.06%, 08/15/35(b) | | | | | | | 250 | | | | 246,215 | |
Core Industrial Trust, Series 2015-WEST, Class E, 4.23%, 02/10/37(a)(b) | | | | | | | 1,000 | | | | 1,007,187 | |
| | | | | | | | | | | | |
| Security | | | | | Par
(000) | | | Value | |
| Commercial Mortgage-Backed Securities (continued) | |
DBJPM Mortgage Trust, Series 2017-C6, Class XD, 1.00%, 06/10/50(a) | | | USD | | | | 11,000 | | | $ | 763,840 | |
DBUBS Mortgage Trust(a)(b): | | | | | | | | | | | | |
Series 2017-BRBK, Class F, 3.53%, 10/10/34(e) | | | | | | | 390 | | | | 355,114 | |
Series 2011-LC1A, Class E, 5.70%, 11/10/46 | | | | | | | 1,000 | | | | 1,043,701 | |
GS Mortgage Securities Corp. Trust, Series 2017-500K(b)(c): | | | | | | | | | | | | |
Class D, (1 mo. LIBOR + 1.30%), 2.78%, 07/15/32 | | | | | | | 120 | | | | 120,120 | |
Class E, (1 mo. LIBOR + 1.50%), 2.98%, 07/15/32 | | | | | | | 240 | | | | 240,208 | |
Class F, (1 mo. LIBOR + 1.80%), 3.28%, 07/15/32 | | | | | | | 110 | | | | 110,160 | |
Class G, (1 mo. LIBOR + 2.50%), 3.98%, 07/15/32 | | | | | | | 70 | | | | 70,020 | |
GS Mortgage Securities Trust(b): | | | | | | | | | | | | |
Series 2014-GC22, Class D, 4.65%, 06/10/47(a) | | | | | | | 613 | | | | 516,751 | |
Series 2017-GS7, Class D, 3.00%, 08/10/50 | | | | | | | 375 | | | | 323,279 | |
Series 2017-GS7, Class E, 3.00%, 08/10/50 | | | | | | | 300 | | | | 248,363 | |
JPMBB Commercial Mortgage Securities Trust, Series 2015-C33, Class D1, 4.12%, 12/15/48(a)(b) | | | | | | | 1,190 | | | | 1,135,498 | |
JPMorgan Chase Commercial Mortgage Securities Trust(a)(b): | | | | | | | | | | | | |
Series 2003-PM1A, Class G, 6.14%, 08/12/40(e) | | | | | | | 959 | | | | 977,645 | |
Series 2017-JP5, Class D, 4.65%, 03/15/50 | | | | | | | 1,240 | | | | 1,224,484 | |
Lone Star Portfolio Trust, Series 2015-LSP, Class E,
(1 mo. LIBOR + 5.60%), 7.08%, 09/15/28(b)(c) | | | | | | | 1,024 | | | | 1,039,743 | |
LSTAR Commercial Mortgage Trust, Series 2017-5(a)(b): | | | | | | | | | | | | |
Class C, 4.87%, 03/10/50 | | | | | | | 1,000 | | | | 912,907 | |
Class X, 1.23%, 03/10/50 | | | | | | | 13,969 | | | | 695,245 | |
MAD Mortgage Trust, Series 2017-330M(a)(b): | | | | | | | | | | | | |
Class D, 3.98%, 08/15/34 | | | | | | | 130 | | | | 130,450 | |
Class E, 4.03%, 08/15/34 | | | | | | | 180 | | | | 172,939 | |
MASTR Reperforming Loan Trust, Series 2005-1, Class 1A5, 8.00%, 08/25/34(b) | | | | | | | 1,169 | | | | 1,248,184 | |
Morgan Stanley Bank of America Merrill Lynch Trust, Class D: | | | | | | | | | | | | |
Series 2015-C23, 4.13%, 07/15/50(a)(b) | | | | | | | 1,000 | | | | 870,944 | |
Series 2015-C25, 3.07%, 10/15/48 | | | | | | | 80 | | | | 64,951 | |
Morgan Stanley Capital I, Inc., Series 2017-JWDR, Class E, 4.30%, 11/15/34(a)(b) | | | | | | | 160 | | | | 160,101 | |
Morgan Stanley Capital I Trust, Series 2017-H1(b): | | | | | | | | | | | | |
Class D, 2.55%, 06/15/50 | | | | | | | 1,010 | | | | 820,999 | |
Class XD, 2.20%, 06/15/50(a) | | | | | | | 8,625 | | | | 1,324,972 | |
Natixis Commercial Mortgage Securities Trust, Series 2017-75B, Class E, 4.06%, 04/09/37(a)(b) | | | | | | | 170 | | | | 162,013 | |
Olympic Tower Mortgage Trust, Series 2017-OT(a)(b): | | | | | | | | | | | | |
Class D, 3.95%, 05/10/39 | | | | | | | 140 | | | | 138,848 | |
Class E, 3.95%, 05/10/39 | | | | | | | 290 | | | | 277,045 | |
RAIT Trust, Series 2017-FL7, Class C, (1 mo. LIBOR + 2.50%), 3.88%, 06/15/37(b)(c) | | | | | | | 260 | | | | 259,999 | |
Resource Capital Corp. Ltd., Series 2017-CRE5, Class B, (1 mo. LIBOR + 2.00%), 3.48%, 07/15/34(b)(c) | | | | | | | 590 | | | | 589,998 | |
Wells Fargo Commercial Mortgage Trust, Class D(a): | | | | | | | | | | | | |
Series 2015-NXS4, 3.60%, 12/15/48 | | | | | | | 710 | | | | 643,316 | |
Series 2016-NXS5, 4.88%, 01/15/59 | | | | | | | 500 | | | | 488,602 | |
Wells Fargo Mortgage Backed Securities Trust, Series 2008-AR1, Class A2, 3.52%, 03/25/38(a) | | | | | | | 1,146 | | | | 1,025,295 | |
| | | | | | | | | | | | |
| | | | | | | | | | | 33,725,574 | |
| | | | | | | | | | | | |
Total Non-Agency Mortgage-Backed Securities — 17.0%
(Cost — $37,367,857) | | | | 37,594,423 | |
| | | | | | | | | | | | |
Preferred Securities — 0.9% | | | | | | | | | | | | |
| | | |
| Capital Trusts — 0.9% | | | | | | | | | |
| Canada — 0.2% | |
Transcanada Trust, 5.30%(g) | | | | | | | 475 | | | | 489,844 | |
| | | | | | | | | | | | |
| | | | |
| SCHEDULE OF INVESTMENTS | | | 13 | |
| | |
Schedule of Investments (continued) December 31, 2017 | | BlackRock 2022 Global Income Opportunity Trust (Percentages shown are based on Net Assets) |
| | | | | | | | | | | | |
| Security | | | | | Par
(000) | | | Value | |
| Cayman Islands — 0.1% | |
King Talent Management, Ltd., 5.60%(a)(f)(h) | | | USD | | | | 200 | | | $ | 199,466 | |
| | | | | | | | | | | | |
| Hong Kong — 0.1% | |
Yancoal International Resources Development Co. Ltd., 5.75%(g)(h) | | | | | | | 235 | | | | 237,690 | |
| | | | | | | | | | | | |
| United States — 0.5% | |
Discover Financial Services, Series C, 5.50%(a)(h) | | | | | | | 313 | | | | 322,390 | |
Goldman Sachs Group, Inc., Series P, 5.00%(a)(h) | | | | | | | 460 | | | | 452,640 | |
JPMorgan Chase & Co., Series CC, 4.63%(a)(h) | | | | | | | 350 | | | | 342,125 | |
| | | | | | | | | | | | |
| | | | | | | | | | | 1,117,155 | |
| | | | | | | | | | | | |
Total Preferred Securities — 0.9%
(Cost — $2,033,000) | | | | 2,044,155 | |
| | | | | | | | | | | | |
|
U.S. Government Sponsored Agency Securities — 9.4% | |
|
| Collateralized Mortgage Obligations — 1.8% | |
Fannie Mae Connecticut Avenue Securities, Series 2017-C03(c): | | | | | | | | | | | | |
Class 1M2, (1 mo. LIBOR US + 3.00%), 4.55%, 10/25/29 | | | | | | | 106 | | | | 111,610 | |
Class 1B1, (1 mo. LIBOR US + 4.85%), 6.40%, 10/25/29 | | | | | | | 1,000 | | | | 1,093,374 | |
Freddie Mac Structured Agency Credit Risk Debt Notes, Series 2017-DNA2 (c): | | | | | | | | | | | | |
Class M2, (1 mo. LIBOR US + 3.45%), 5.00%, 10/25/29 | | | | | | | 1,465 | | | | 1,593,677 | |
Class B1, (1 mo. LIBOR US + 5.15%), 6.70%, 10/25/29 | | | | | | | 1,000 | | | | 1,113,395 | |
| | | | | | | | | | | | |
| | | | | | | | | | | 3,912,056 | |
| Mortgage-Backed Securities — 7.6% | |
Fannie Mae Mortgage-Backed Securities(m): | | | | | | | | | | | | |
3.00%, 01/01/48 | | | | | | | 10,255 | | | | 10,255,000 | |
3.50%, 01/01/48 — 02/01/48 | | | | | | | 3,200 | | | | 3,284,438 | |
Freddie Mac Mortgage-Backed Securities(m): | | | | | | | | | | | | |
3.00%, 01/01/48 | | | | | | | 1,500 | | | | 1,499,765 | |
3.50%, 01/01/48 | | | | | | | 1,700 | | | | 1,745,776 | |
| | | | | | | | | | | | |
| | | | | | | | | | | 16,784,979 | |
| | | | | | | | | | | | |
Total U.S. Government Sponsored Agency Securities — 9.4%
(Cost — $20,320,024) | | | | 20,697,035 | |
| | | | | | | | | | | | |
Total Long-Term Investments — 149.4%
(Cost — $326,584,732) | | | | 330,056,437 | |
| | | | | | | | | | | | |
|
Short-Term Securities — 2.5% | |
|
| Foreign Agency Obligations — 1.1% | |
Egypt Treasury Bills(l): | | | | | | | | | | | | |
0.00%, 09/04/18 | | | EGP | | | | 13,000 | | | | 652,478 | |
0.00%, 10/16/18 | | | | | | | 1,725 | | | | 85,337 | |
| | | | | | | | | | | | |
| Security | | | | | Par (000) | | | Value | |
|
| Foreign Agency Obligations (continued) | |
Egypt Treasury Bills(l) (continued): | | | | | | | | | | | | |
0.00%, 11/13/18 | | | EGP | | | | 31,050 | | | $ | 1,517,763 | |
0.00%, 12/11/18 | | | | | | | 2,700 | | | | 129,502 | |
| | | | | | | | | | | | |
| | | | | | | | | | | 2,385,080 | |
| Money Market Funds — 1.4% | |
BlackRock Liquidity Funds, T-Fund, Institutional Class, 1.17%(n)(o) | | | | | | | 3,180,865 | | | | 3,180,865 | |
| | | | | | | | | | | | |
Total Short-Term Securities — 2.5%
(Cost — $5,579,567) | | | | 5,565,945 | |
| | | | | | | | | | | | |
Total Investments Before TBA Sale Commitments — 151.9%
(Cost — $332,164,299) | | | | 335,622,382 | |
| | | | | | | | | | | | |
|
TBA Sale Commitments — (1.4)% | |
| | | |
| Mortgage-Backed Securities — (1.4)% | | | | | | | | | |
Fannie Mae Mortgage-Backed Securities(m): | | | | | | | | | | | | |
3.00%, 01/01/48 | | | USD | | | | 1,514 | | | | (1,513,950 | ) |
3.50%, 01/01/48 | | | | | | | 1,600 | | | | (1,644,250 | ) |
| | | | | | | | | | | | |
Total TBA Sale Commitments
(Proceeds — $3,160,816) — (1.4)% | | | | (3,158,200 | ) |
| | | | | | | | | | | | |
Total Investments, Net of TBA Sale Commitments — 150.5%
(Cost — $329,003,483) | | | | 332,464,182 | |
Liabilities in Excess of Other Assets — (50.5)% | | | | (111,473,296 | ) |
| | | | | | | | | | | | |
Net Assets — 100.0% | | | $ | 220,990,886 | |
| | | | | | | | | | | | |
| (a) | Variable or floating rate security, which interest rate adjusts periodically based on changes in current interest rates and prepayments on the underlying pool of assets. Rate shown is the rate in effect as of period end. |
| (b) | Security exempt from registration pursuant to Rule 144A under the Securities Act of 1933, as amended. These securities may be resold in transactions exempt from registration to qualified institutional investors. |
| (c) | Floating rate security. Rate shown is the rate in effect as of period end. |
| (d) | Step-up bond that pays an initial coupon rate for the first period and then a higher coupon rate for the following periods. Rate as of period end. |
| (e) | Security is valued using significant unobservable inputs and is classified as Level 3 in the fair value hierarchy. |
| (f) | All or a portion of the security has been pledged as collateral in connection with outstanding reverse repurchase agreements. |
| (g) | Variable rate security. Security may be issued at a fixed coupon rate, which converts to a variable rate at a specified date. Rate shown is the rate in effect as of period end. |
| (h) | Perpetual security with no stated maturity date. |
| (i) | Payment-in-kind security which may pay interest/dividends in additional par/shares and/or in cash. Rates shown are the current rate and possible payment rates. |
| (k) | Variable rate security. Rate shown is the rate in effect as of period end. |
| (m) | Represents or includes a To-be-announced (“TBA”) transaction. As of period end, unsettled TBA transactions were as follows: |
| | | | | | | | |
| Counterparty | | Value | | | Unrealized
Appreciation
(Depreciation) | |
Barclays Bank PLC | | $ | 1,973,000 | | | $ | 6,579 | |
Credit Suisse Securities (USA) LLC | | | 596,645 | | | | 1,574 | |
Goldman Sachs & Co. | | | 3,473,225 | | | | 5,016 | |
J.P. Morgan Securities LLC | | | (1,457,429 | ) | | | 2,443 | |
Jefferies & Co. | | | 669,000 | | | | 418 | |
| | |
| 14 | | 2017 BLACKROCK ANNUAL REPORTTO SHAREHOLDERS |
| | |
Schedule of Investments (continued) December 31, 2017 | | BlackRock 2022 Global Income Opportunity Trust |
| | | | | | | | |
| Counterparty | | Value | | | Unrealized
Appreciation
(Depreciation) | |
Merrill Lynch Pierce Fenner & Smith | | $ | 2,793,000 | | | $ | 11,352 | |
Mizuho Securities USA, Inc. | | | 597,672 | | | | 2,122 | |
Morgan Stanley & Co. LLC | | | 1,687,938 | | | | 4,581 | |
Nomura Securities | | | 1,546,784 | | | | 2,825 | |
RBC Capital Markets LLC | | | 1,746,944 | | | | 1,851 | |
| | (n) | Annualized 7-day yield as of period end. | |
| | (o) | During the period ended December 31, 2017, investments in issuers considered to be affiliates of the Trust for purposes of Section 2(a)(3) of the Investment Company Act of 1940, as amended, and/or related parties of the Trust were as follows: | |
| | | | | | | | | | | | | | | | | | | | | | | | | | | | |
| Affiliate Persons and/or Related Parties | | Shares
Purchased | | | Shares Sold | | | Shares
Held at
12/31/17 | | | Value at
12/31/17 | | | Income | | | Net
Realized
Gain (Loss) (a) | | | Change in
Unrealized
Appreciation
(Depreciation) | |
BlackRock Liquidity Funds, T-Fund, Institutional Class | | | 3,180,865 | (b) | | | — | | | | 3,180,865 | | | $ | 3,180,865 | | | $ | 68,728 | | | $ | 14 | | | $ | — | |
iShares iBoxx $ High Yield Corporate Bond ETF | | | 75,000 | | | | (75,000 | ) | | | — | | | | — | | | | 28,222 | | | | 15,747 | | | | — | |
| | | | | | | | | | | | | | | | | | | | | | | | | | | | |
| | | | | | | | | | | | | | $ | 3,180,865 | | | $ | 96,950 | | | $ | 15,761 | | | $ | — | |
| | | | | | | | | | | | | | | | | | | | | | | | | | | | |
| | (a) | Includes net capital gain distributions, if applicable. | |
| | (b) | Represents net shares purchased. | |
Reverse Repurchase Agreements
| | | | | | | | | | | | | | | | | | | | | | | | |
| Counterparty | | Interest
Rate | | | Trade
Date | | | Maturity
Date (a) | | | Face Value | | | Face Value
Including
Accrued Interest | | | Type of Non-Cash
Underlying Collateral | | Remaining Contractual
Maturity of the Agreements (a) |
RBC Capital Markets LLC | | | 1.95 | % | | | 04/06/17 | | | | Open | | | $ | 1,378,300 | | | $ | 1,398,178 | | | Corporate Bonds | | Open/Demand |
RBC Capital Markets LLC | | | 1.95 | % | | | 04/06/17 | | | | Open | | | | 1,332,100 | | | | 1,348,631 | | | Corporate Bonds | | Open/Demand |
RBC Capital Markets LLC | | | 1.95 | % | | | 04/06/17 | | | | Open | | | | 1,255,100 | | | | 1,272,715 | | | Corporate Bonds | | Open/Demand |
RBC Capital Markets LLC | | | 1.95 | % | | | 04/06/17 | | | | Open | | | | 1,248,000 | | | | 1,265,515 | | | Corporate Bonds | | Open/Demand |
RBC Capital Markets LLC | | | 1.95 | % | | | 04/06/17 | | | | Open | | | | 1,262,800 | | | | 1,280,523 | | | Corporate Bonds | | Open/Demand |
RBC Capital Markets LLC | | | 1.95 | % | | | 04/06/17 | | | | Open | | | | 1,255,100 | | | | 1,272,715 | | | Corporate Bonds | | Open/Demand |
RBC Capital Markets LLC | | | 1.95 | % | | | 04/07/17 | | | | Open | | | | 1,256,640 | | | | 1,274,039 | | | Corporate Bonds | | Open/Demand |
RBC Capital Markets LLC | | | 1.95 | % | | | 04/07/17 | | | | Open | | | | 1,305,920 | | | | 1,324,002 | | | Corporate Bonds | | Open/Demand |
RBC Capital Markets LLC | | | 1.95 | % | | | 04/07/17 | | | | Open | | | | 1,318,240 | | | | 1,336,492 | | | Corporate Bonds | | Open/Demand |
RBC Capital Markets LLC | | | 1.95 | % | | | 04/10/17 | | | | Open | | | | 1,301,300 | | | | 1,319,256 | | | Corporate Bonds | | Open/Demand |
RBC Capital Markets LLC | | | 1.95 | % | | | 04/10/17 | | | | Open | | | | 1,278,200 | | | | 1,295,837 | | | Corporate Bonds | | Open/Demand |
RBC Capital Markets LLC | | | 1.95 | % | | | 04/10/17 | | | | Open | | | | 1,197,350 | | | | 1,213,872 | | | Corporate Bonds | | Open/Demand |
RBC Capital Markets LLC | | | 1.95 | % | | | 04/10/17 | | | | Open | | | | 1,135,750 | | | | 1,151,422 | | | Corporate Bonds | | Open/Demand |
RBC Capital Markets LLC | | | 1.95 | % | | | 04/12/17 | | | | Open | | | | 1,366,750 | | | | 1,385,480 | | | Corporate Bonds | | Open/Demand |
RBC Capital Markets LLC | | | 1.95 | % | | | 04/12/17 | | | | Open | | | | 1,374,450 | | | | 1,393,286 | | | Corporate Bonds | | Open/Demand |
RBC Capital Markets LLC | | | 1.59 | % | | | 04/21/17 | | | | Open | | | | 188,000 | | | | 190,026 | | | Corporate Bonds | | Open/Demand |
RBC Capital Markets LLC | | | 1.59 | % | | | 04/21/17 | | | | Open | | | | 236,875 | | | | 239,428 | | | Corporate Bonds | | Open/Demand |
RBC Capital Markets LLC | | | 1.59 | % | | | 04/21/17 | | | | Open | | | | 324,592 | | | | 328,090 | | | Corporate Bonds | | Open/Demand |
RBC Capital Markets LLC | | | 1.59 | % | | | 04/21/17 | | | | Open | | | | 188,500 | | | | 190,531 | | | Corporate Bonds | | Open/Demand |
RBC Capital Markets LLC | | | 1.59 | % | | | 04/21/17 | | | | Open | | | | 217,125 | | | | 219,465 | | | Corporate Bonds | | Open/Demand |
RBC Capital Markets LLC | | | 1.59 | % | | | 04/21/17 | | | | Open | | | | 194,500 | | | | 196,596 | | | Corporate Bonds | | Open/Demand |
RBC Capital Markets LLC | | | 1.59 | % | | | 04/21/17 | | | | Open | | | | 286,500 | | | | 289,587 | | | Corporate Bonds | | Open/Demand |
RBC Capital Markets LLC | | | 1.59 | % | | | 04/21/17 | | | | Open | | | | 240,000 | | | | 242,586 | | | Corporate Bonds | | Open/Demand |
RBC Capital Markets LLC | | | 1.59 | % | | | 04/21/17 | | | | Open | | | | 193,500 | | | | 195,585 | | | Corporate Bonds | | Open/Demand |
RBC Capital Markets LLC | | | 1.59 | % | | | 04/21/17 | | | | Open | | | | 303,875 | | | | 307,150 | | | Corporate Bonds | | Open/Demand |
RBC Capital Markets LLC | | | 1.59 | % | | | 04/21/17 | | | | Open | | | | 216,562 | | | | 218,896 | | | Corporate Bonds | | Open/Demand |
RBC Capital Markets LLC | | | 1.59 | % | | | 04/21/17 | | | | Open | | | | 286,500 | | | | 289,587 | | | Corporate Bonds | | Open/Demand |
RBC Capital Markets LLC | | | 1.59 | % | | | 04/21/17 | | | | Open | | | | 216,562 | | | | 218,896 | | | Corporate Bonds | | Open/Demand |
RBC Capital Markets LLC | | | 1.59 | % | | | 04/21/17 | | | | Open | | | | 297,412 | | | | 300,618 | | | Corporate Bonds | | Open/Demand |
RBC Capital Markets LLC | | | 1.59 | % | | | 04/21/17 | | | | Open | | | | 266,250 | | | | 269,119 | | | Corporate Bonds | | Open/Demand |
RBC Capital Markets LLC | | | 1.59 | % | | | 04/21/17 | | | | Open | | | | 397,375 | | | | 401,657 | | | Corporate Bonds | | Open/Demand |
RBC Capital Markets LLC | | | 1.59 | % | | | 04/21/17 | | | | Open | | | | 185,000 | | | | 186,994 | | | Corporate Bonds | | Open/Demand |
RBC Capital Markets LLC | | | 1.59 | % | | | 04/21/17 | | | | Open | | | | 213,750 | | | | 216,053 | | | Corporate Bonds | | Open/Demand |
RBC Capital Markets LLC | | | 1.59 | % | | | 04/21/17 | | | | Open | | | | 341,250 | | | | 344,927 | | | Corporate Bonds | | Open/Demand |
RBC Capital Markets LLC | | | 1.59 | % | | | 04/21/17 | | | | Open | | | | 237,500 | | | | 240,059 | | | Corporate Bonds | | Open/Demand |
RBC Capital Markets LLC | | | 1.59 | % | | | 04/27/17 | | | | Open | | | | 146,250 | | | | 147,788 | | | Corporate Bonds | | Open/Demand |
RBC Capital Markets LLC | | | 1.95 | % | | | 04/27/17 | | | | Open | | | | 1,316,700 | | | | 1,333,812 | | | Corporate Bonds | | Open/Demand |
| | | | |
| SCHEDULE OF INVESTMENTS | | | 15 | |
| | |
Schedule of Investments (continued) December 31, 2017 | | BlackRock 2022 Global Income Opportunity Trust |
Reverse Repurchase Agreements (continued)
| | | | | | | | | | | | | | | | | | | | | | | | |
| Counterparty | | Interest
Rate | | | Trade
Date | | | Maturity
Date (a) | | | Face Value | | | Face Value
Including
Accrued Interest | | | Type of Non-Cash
Underlying Collateral | | Remaining Contractual
Maturity of the Agreements (a) |
RBC Capital Markets LLC | | | 1.95 | % | | | 05/02/17 | | | | Open | | | $ | 1,293,600 | | | $ | 1,310,167 | | | Corporate Bonds | | Open/Demand |
RBC Capital Markets LLC | | | 1.95 | % | | | 05/02/17 | | | | Open | | | | 1,316,700 | | | | 1,333,563 | | | Corporate Bonds | | Open/Demand |
RBC Capital Markets LLC | | | 1.95 | % | | | 05/02/17 | | | | Open | | | | 1,332,100 | | | | 1,349,160 | | | Corporate Bonds | | Open/Demand |
RBC Capital Markets LLC | | | 1.95 | % | | | 05/02/17 | | | | Open | | | | 1,308,125 | | | | 1,324,878 | | | Corporate Bonds | | Open/Demand |
RBC Capital Markets LLC | | | 1.95 | % | | | 05/02/17 | | | | Open | | | | 961,040 | | | | 973,348 | | | Corporate Bonds | | Open/Demand |
Deutsche Bank Securities, Inc. | | | 1.95 | % | | | 05/22/17 | | | | Open | | | | 481,000 | | | | 486,706 | | | Corporate Bonds | | Open/Demand |
Deutsche Bank Securities, Inc. | | | 1.95 | % | | | 05/22/17 | | | | Open | | | | 523,000 | | | | 529,204 | | | Corporate Bonds | | Open/Demand |
Deutsche Bank Securities, Inc. | | | 1.95 | % | | | 05/22/17 | | | | Open | | | | 594,000 | | | | 601,046 | | | Corporate Bonds | | Open/Demand |
RBC Capital Markets LLC | | | 1.59 | % | | | 05/22/17 | | | | Open | | | | 574,500 | | | | 580,028 | | | Corporate Bonds | | Open/Demand |
RBC Capital Markets LLC | | | 1.59 | % | | | 05/22/17 | | | | Open | | | | 591,000 | | | | 596,687 | | | Corporate Bonds | | Open/Demand |
RBC Capital Markets LLC | | | 1.95 | % | | | 07/10/17 | | | | Open | | | | 1,226,790 | | | | 1,238,419 | | | Corporate Bonds | | Open/Demand |
RBC Capital Markets LLC | | | 1.59 | % | | | 07/11/17 | | | | Open | | | | 231,360 | | | | 233,138 | | | Corporate Bonds | | Open/Demand |
RBC Capital Markets LLC | | | 1.95 | % | | | 07/27/17 | | | | Open | | | | 1,288,179 | | | | 1,299,204 | | | Corporate Bonds | | Open/Demand |
Credit Suisse Securities (USA) LLC | | | 2.00 | % | | | 08/07/17 | | | | Open | | | | 556,808 | | | | 561,324 | | | Corporate Bonds | | Open/Demand |
Credit Suisse Securities (USA) LLC | | | 2.00 | % | | | 08/07/17 | | | | Open | | | | 726,160 | | | | 732,050 | | | Corporate Bonds | | Open/Demand |
Credit Suisse Securities (USA) LLC | | | 2.00 | % | | | 08/07/17 | | | | Open | | | | 1,321,650 | | | | 1,332,370 | | | Corporate Bonds | | Open/Demand |
Credit Suisse Securities (USA) LLC | | | 2.00 | % | | | 08/07/17 | | | | Open | | | | 727,320 | | | | 733,219 | | | Corporate Bonds | | Open/Demand |
Credit Suisse Securities (USA) LLC | | | 2.00 | % | | | 08/07/17 | | | | Open | | | | 737,760 | | | | 743,744 | | | Corporate Bonds | | Open/Demand |
Credit Suisse Securities (USA) LLC | | | 2.00 | % | | | 08/07/17 | | | | Open | | | | 764,450 | | | | 770,650 | | | Corporate Bonds | | Open/Demand |
Credit Suisse Securities (USA) LLC | | | 2.00 | % | | | 08/07/17 | | | | Open | | | | 755,160 | | | | 761,285 | | | Corporate Bonds | | Open/Demand |
Credit Suisse Securities (USA) LLC | | | 2.00 | % | | | 08/07/17 | | | | Open | | | | 1,308,353 | | | | 1,318,965 | | | Corporate Bonds | | Open/Demand |
Credit Suisse Securities (USA) LLC | | | 2.00 | % | | | 08/07/17 | | | | Open | | | | 762,120 | | | | 768,302 | | | Corporate Bonds | | Open/Demand |
Credit Suisse Securities (USA) LLC | | | 2.00 | % | | | 08/07/17 | | | | Open | | | | 444,904 | | | | 448,512 | | | Corporate Bonds | | Open/Demand |
Credit Suisse Securities (USA) LLC | | | 2.00 | % | | | 08/07/17 | | | | Open | | | | 508,744 | | | | 512,870 | | | Corporate Bonds | | Open/Demand |
Credit Suisse Securities (USA) LLC | | | 2.00 | % | | | 08/07/17 | | | | Open | | | | 740,080 | | | | 746,083 | | | Corporate Bonds | | Open/Demand |
Credit Suisse Securities (USA) LLC | | | 2.00 | % | | | 08/07/17 | | | | Open | | | | 560,820 | | | | 565,369 | | | Corporate Bonds | | Open/Demand |
Credit Suisse Securities (USA) LLC | | | 2.00 | % | | | 08/07/17 | | | | Open | | | | 510,956 | | | | 515,101 | | | Corporate Bonds | | Open/Demand |
Credit Suisse Securities (USA) LLC | | | 2.00 | % | | | 08/07/17 | | | | Open | | | | 1,827,281 | | | | 1,842,103 | | | Foreign Agency Obligations | | Open/Demand |
Credit Suisse Securities (USA) LLC | | | 2.00 | % | | | 08/07/17 | | | | Open | | | | 1,136,200 | | | | 1,145,416 | | | Corporate Bonds | | Open/Demand |
Credit Suisse Securities (USA) LLC | | | 2.00 | % | | | 08/07/17 | | | | Open | | | | 465,535 | | | | 469,311 | | | Corporate Bonds | | Open/Demand |
Credit Suisse Securities (USA) LLC | | | 2.00 | % | | | 08/07/17 | | | | Open | | | | 750,520 | | | | 756,608 | | | Corporate Bonds | | Open/Demand |
Credit Suisse Securities (USA) LLC | | | 2.00 | % | | | 08/07/17 | | | | Open | | | | 576,563 | | | | 581,239 | | | Corporate Bonds | | Open/Demand |
Credit Suisse Securities (USA) LLC | | | 2.00 | % | | | 08/07/17 | | | | Open | | | | 447,689 | | | | 451,320 | | | Corporate Bonds | | Open/Demand |
RBC Capital Markets LLC | | | 1.59 | % | | | 08/14/17 | | | | Open | | | | 472,500 | | | | 475,422 | | | Corporate Bonds | | Open/Demand |
RBC Capital Markets LLC | | | 1.95 | % | | | 08/14/17 | | | | Open | | | | 1,459,315 | | | | 1,470,382 | | | Corporate Bonds | | Open/Demand |
RBC Capital Markets LLC | | | 1.95 | % | | | 08/14/17 | | | | Open | | | | 997,500 | | | | 1,005,064 | | | Corporate Bonds | | Open/Demand |
RBC Capital Markets LLC | | | 1.59 | % | | | 09/20/17 | | | | Open | | | | 470,000 | | | | 472,117 | | | Corporate Bonds | | Open/Demand |
RBC Capital Markets LLC | | | 1.59 | % | | | 09/20/17 | | | | Open | | | | 408,370 | | | | 410,210 | | | Corporate Bonds | | Open/Demand |
RBC Capital Markets LLC | | | 1.59 | % | | | 09/20/17 | | | | Open | | | | 332,500 | | | | 333,998 | | | Corporate Bonds | | Open/Demand |
RBC Capital Markets LLC | | | 1.59 | % | | | 09/20/17 | | | | Open | | | | 386,000 | | | | 387,739 | | | Corporate Bonds | | Open/Demand |
RBC Capital Markets LLC | | | 1.59 | % | | | 09/20/17 | | | | Open | | | | 403,000 | | | | 404,816 | | | Corporate Bonds | | Open/Demand |
RBC Capital Markets LLC | | | 1.59 | % | | | 09/20/17 | | | | Open | | | | 332,500 | | | | 333,998 | | | Corporate Bonds | | Open/Demand |
RBC Capital Markets LLC | | | 1.59 | % | | | 09/20/17 | | | | Open | | | | 760,000 | | | | 763,424 | | | Corporate Bonds | | Open/Demand |
RBC Capital Markets LLC | | | 1.59 | % | | | 09/29/17 | | | | Open | | | | 115,312 | | | | 115,776 | | | Corporate Bonds | | Open/Demand |
RBC Capital Markets LLC | | | 1.59 | % | | | 10/03/17 | | | | Open | | | | 162,960 | | | | 163,601 | | | Corporate Bonds | | Open/Demand |
RBC Capital Markets LLC | | | 1.59 | % | | | 10/03/17 | | | | Open | | | | 138,750 | | | | 139,295 | | | Corporate Bonds | | Open/Demand |
Credit Suisse Securities (USA) LLC | | | 2.00 | % | | | 10/11/17 | | | | Open | | | | 527,106 | | | | 529,478 | | | Corporate Bonds | | Open/Demand |
Credit Suisse Securities (USA) LLC | | | 2.00 | % | | | 10/11/17 | | | | Open | | | | 332,500 | | | | 333,996 | | | Corporate Bonds | | Open/Demand |
Credit Suisse Securities (USA) LLC | | | 2.00 | % | | | 10/11/17 | | | | Open | | | | 461,083 | | | | 463,157 | | | Corporate Bonds | | Open/Demand |
Credit Suisse Securities (USA) LLC | | | 2.00 | % | | | 10/11/17 | | | | Open | | | | 608,081 | | | | 610,818 | | | Corporate Bonds | | Open/Demand |
Credit Suisse Securities (USA) LLC | | | 2.00 | % | | | 10/11/17 | | | | Open | | | | 496,650 | | | | 498,885 | | | Corporate Bonds | | Open/Demand |
RBC Capital Markets LLC | | | 1.59 | % | | | 10/11/17 | | | | Open | | | | 199,000 | | | | 199,721 | | | Corporate Bonds | | Open/Demand |
RBC Capital Markets LLC | | | 1.59 | % | | | 10/11/17 | | | | Open | | | | 240,625 | | | | 241,497 | | | Corporate Bonds | | Open/Demand |
RBC Capital Markets LLC | | | 1.59 | % | | | 10/11/17 | | | | Open | | | | 263,312 | | | | 264,266 | | | Corporate Bonds | | Open/Demand |
RBC Capital Markets LLC | | | 1.59 | % | | | 10/11/17 | | | | Open | | | | 129,857 | | | | 130,328 | | | Corporate Bonds | | Open/Demand |
RBC Capital Markets LLC | | | 1.59 | % | | | 10/11/17 | | | | Open | | | | 415,000 | | | | 416,503 | | | Corporate Bonds | | Open/Demand |
RBC Capital Markets LLC | | | 1.59 | % | | | 10/11/17 | | | | Open | | | | 298,500 | | | | 299,581 | | | Corporate Bonds | | Open/Demand |
RBC Capital Markets LLC | | | 1.59 | % | | | 10/11/17 | | | | Open | | | | 377,125 | | | | 378,491 | | | Corporate Bonds | | Open/Demand |
RBC Capital Markets LLC | | | 1.59 | % | | | 10/11/17 | | | | Open | | | | 133,092 | | | | 133,575 | | | Corporate Bonds | | Open/Demand |
RBC Capital Markets LLC | | | 1.59 | % | | | 10/11/17 | | | | Open | | | | 200,000 | | | | 200,724 | | | Corporate Bonds | | Open/Demand |
RBC Capital Markets LLC | | | 1.59 | % | | | 10/11/17 | | | | Open | | | | 200,500 | | | | 201,226 | | | Corporate Bonds | | Open/Demand |
RBC Capital Markets LLC | | | 1.59 | % | | | 10/11/17 | | | | Open | | | | 316,875 | | | | 318,023 | | | Corporate Bonds | | Open/Demand |
| | |
| 16 | | 2017 BLACKROCK ANNUAL REPORTTO SHAREHOLDERS |
| | |
Schedule of Investments (continued) December 31, 2017 | | BlackRock 2022 Global Income Opportunity Trust |
Reverse Repurchase Agreements (continued)
| | | | | | | | | | | | | | | | | | | | | | | | |
| Counterparty | | Interest
Rate | | | Trade
Date | | | Maturity
Date (a) | | | Face Value | | | Face Value
Including
Accrued Interest | | | Type of Non-Cash
Underlying Collateral | | Remaining Contractual
Maturity of the Agreements (a) |
RBC Capital Markets LLC | | | 1.95 | % | | | 10/11/17 | | | | Open | | | $ | 1,351,000 | | | $ | 1,357,001 | | | Corporate Bonds | | Open/Demand |
RBC Capital Markets LLC | | | 1.95 | % | | | 10/11/17 | | | | Open | | | | 928,680 | | | | 932,805 | | | Corporate Bonds | | Open/Demand |
Credit Suisse Securities (USA) LLC | | | 2.00 | % | | | 11/07/17 | | | | Open | | | | 1,226,225 | | | | 1,229,972 | | | Corporate Bonds | | Open/Demand |
Credit Suisse Securities (USA) LLC | | | 2.00 | % | | | 11/07/17 | | | | Open | | | | 641,000 | | | | 642,959 | | | Corporate Bonds | | Open/Demand |
RBC Capital Markets LLC | | | 1.95 | % | | | 11/07/17 | | | | Open | | | | 522,460 | | | | 524,017 | | | Corporate Bonds | | Open/Demand |
RBC Capital Markets LLC | | | 1.95 | % | | | 11/07/17 | | | | Open | | | | 1,046,250 | | | | 1,049,367 | | | Corporate Bonds | | Open/Demand |
RBC Capital Markets LLC | | | 1.95 | % | | | 11/07/17 | | | | Open | | | | 1,338,750 | | | | 1,342,738 | | | Corporate Bonds | | Open/Demand |
RBC Capital Markets LLC | | | 1.95 | % | | | 11/07/17 | | | | Open | | | | 1,305,000 | | | | 1,308,888 | | | Corporate Bonds | | Open/Demand |
Credit Suisse Securities (USA) LLC | | | 2.00 | % | | | 11/08/17 | | | | Open | | | | 427,050 | | | | 428,307 | | | Corporate Bonds | | Open/Demand |
Credit Suisse Securities (USA) LLC | | | 1.55 | % | | | 11/13/17 | | | | Open | | | | 185,500 | | | | 185,883 | | | Corporate Bonds | | Open/Demand |
Credit Suisse Securities (USA) LLC | | | 2.00 | % | | | 11/21/17 | | | | Open | | | | 684,000 | | | | 685,520 | | | Corporate Bonds | | Open/Demand |
RBC Capital Markets LLC | | | 1.59 | % | | | 11/22/17 | | | | Open | | | | 200,000 | | | | 200,336 | | | Corporate Bonds | | Open/Demand |
RBC Capital Markets LLC | | | 1.95 | % | | | 11/28/17 | | | | Open | | | | 299,223 | | | | 299,774 | | | Corporate Bonds | | Open/Demand |
RBC Capital Markets LLC | | | 1.95 | % | | | 11/28/17 | | | | Open | | | | 483,203 | | | | 484,067 | | | Corporate Bonds | | Open/Demand |
BNP Paribas | | | 1.80 | % | | | 11/30/17 | | | | Open | | | | 1,430,000 | | | | 1,432,217 | | | Corporate Bonds | | Open/Demand |
BNP Paribas | | | 1.85 | % | | | 11/30/17 | | | | Open | | | | 1,532,000 | | | | 1,534,441 | | | Corporate Bonds | | Open/Demand |
BNP Paribas | | | 1.85 | % | | | 11/30/17 | | | | Open | | | | 601,000 | | | | 601,957 | | | Corporate Bonds | | Open/Demand |
BNP Paribas | | | 1.85 | % | | | 11/30/17 | | | | Open | | | | 1,540,000 | | | | 1,542,453 | | | Corporate Bonds | | Open/Demand |
BNP Paribas | | | 1.85 | % | | | 11/30/17 | | | | Open | | | | 932,000 | | | | 933,485 | | | Corporate Bonds | | Open/Demand |
J.P. Morgan Securities LLC | | | 0.25 | % | | | 12/08/17 | | | | Open | | | | 296,250 | | | | 296,293 | | | Foreign Agency Obligations | | Open/Demand |
J.P. Morgan Securities LLC | | | 0.85 | % | | | 12/08/17 | | | | Open | | | | 607,775 | | | | 608,076 | | | Foreign Agency Obligations | | Open/Demand |
J.P. Morgan Securities LLC | | | 0.95 | % | | | 12/08/17 | | | | Open | | | | 199,750 | | | | 199,861 | | | Foreign Agency Obligations | | Open/Demand |
RBC Capital Markets LLC | | | 2.20 | % | | | 12/15/17 | | | | Open | | | | 235,950 | | | | 236,137 | | | Corporate Bonds | | Open/Demand |
Barclays Capital, Inc. | | | 2.00 | % | | | 12/18/17 | | | | Open | | | | 492,938 | | | | 493,294 | | | Corporate Bonds | | Open/Demand |
Barclays Capital, Inc. | | | 2.00 | % | | | 12/18/17 | | | | Open | | | | 414,562 | | | | 414,862 | | | Corporate Bonds | | Open/Demand |
Barclays Capital, Inc. | | | 2.00 | % | | | 12/18/17 | | | | Open | | | | 1,754,539 | | | | 1,755,806 | | | Foreign Agency Obligations | | Open/Demand |
Barclays Capital, Inc. | | | 2.05 | % | | | 12/18/17 | | | | Open | | | | 593,600 | | | | 594,039 | | | Corporate Bonds | | Open/Demand |
Barclays Capital, Inc. | | | 2.15 | % | | | 12/18/17 | | | | Open | | | | 610,188 | | | | 610,661 | | | Corporate Bonds | | Open/Demand |
Barclays Capital, Inc. | | | 2.25 | % | | | 12/18/17 | | | | Open | | | | 3,605,060 | | | | 3,607,989 | | | Foreign Agency Obligations | | Open/Demand |
Barclays Capital, Inc. | | | 2.25 | % | | | 12/18/17 | | | | Open | | | | 531,000 | | | | 531,431 | | | Corporate Bonds | | Open/Demand |
Barclays Capital, Inc. | | | 2.25 | % | | | 12/18/17 | | | | Open | | | | 534,720 | | | | 535,154 | | | Corporate Bonds | | Open/Demand |
Barclays Capital, Inc. | | | 2.25 | % | | | 12/18/17 | | | | Open | | | | 484,138 | | | | 484,531 | | | Corporate Bonds | | Open/Demand |
Barclays Capital, Inc. | | | 2.25 | % | | | 12/18/17 | | | | Open | | | | 509,873 | | | | 510,287 | | | Corporate Bonds | | Open/Demand |
Barclays Capital, Inc. | | | 2.25 | % | | | 12/18/17 | | | | Open | | | | 488,588 | | | | 488,985 | | | Foreign Agency Obligations | | Open/Demand |
Barclays Capital, Inc. | | | 2.25 | % | | | 12/18/17 | | | | Open | | | | 587,813 | | | | 588,290 | | | Corporate Bonds | | Open/Demand |
Barclays Capital, Inc. | | | 2.25 | % | | | 12/18/17 | | | | Open | | | | 1,160,640 | | | | 1,161,583 | | | Foreign Agency Obligations | | Open/Demand |
RBC Capital Markets LLC | | | 1.84 | % | | | 12/20/17 | | | | Open | | | | 419,688 | | | | 419,923 | | | Corporate Bonds | | Open/Demand |
RBC Capital Markets LLC | | | 2.20 | % | | | 12/20/17 | | | | Open | | | | 289,625 | | | | 289,820 | | | Corporate Bonds | | Open/Demand |
RBC Capital Markets LLC | | | 2.20 | % | | | 12/20/17 | | | | Open | | | | 1,497,650 | | | | 1,498,657 | | | Corporate Bonds | | Open/Demand |
RBC Capital Markets LLC | | | 2.20 | % | | | 12/20/17 | | | | Open | | | | 1,224,300 | | | | 1,225,123 | | | Corporate Bonds | | Open/Demand |
Deutsche Bank Securities, Inc. | | | 2.20 | % | | | 12/22/17 | | | | Open | | | | 1,534,000 | | | | 1,534,937 | | | Corporate Bonds | | Open/Demand |
RBC Capital Markets LLC | | | 2.20 | % | | | 12/28/17 | | | | Open | | | | 772,560 | | | | 772,749 | | | Corporate Bonds | | Open/Demand |
| | | | | | | | | | | | | | | | | | | | | | | | |
| | | $ | 100,267,606 | | | $ | 100,981,588 | | | | | |
| | | | | | | | | | | | | |
| | (a) | Certain agreements have no stated maturity and can be terminated by either party at any time. | |
Derivative Financial Instruments Outstanding as of Period End
Futures Contracts
| | | | | | | | | | | | | | | | |
| Description | | Number of
Contracts | | | Expiration
Date | | | Notional
Amount (000) | | | Value/
Unrealized
Appreciation
(Depreciation) | |
Long Contracts | | | | | | | | | | | | | | | | |
10-Year U.S Ultra Long Treasury Note | | | 14 | | | | 03/20/18 | | | $ | 1,870 | | | $ | (9,533 | ) |
2-Year U.S. Treasury Note | | | 21 | | | | 03/29/18 | | | | 4,496 | | | | (4,947 | ) |
5-Year U.S. Treasury Note | | | 17 | | | | 03/29/18 | | | | 1,975 | | | | (2,193 | ) |
| | | | | | | | | | | | | | | | |
| | | | | | | | | | | | | | | (16,673 | ) |
| | | | | | | | | | | | | | | | |
| | | | |
| SCHEDULE OF INVESTMENTS | | | 17 | |
| | |
Schedule of Investments (continued) December 31, 2017 | | BlackRock 2022 Global Income Opportunity Trust |
Derivative Financial Instruments Outstanding as of Period End (continued)
Futures Contracts (continued)
| | | | | | | | | | | | | | | | |
| Description | | Number of
Contracts | | | Expiration
Date | | | Notional
Amount (000) | | | Value/
Unrealized
Appreciation
(Depreciation) | |
Short Contracts | | | | | | | | | | | | | | | | |
10-Year U.S. Treasury Note | | | 491 | | | | 03/20/18 | | | $ | 60,907 | | | $ | 245,099 | |
Long U.S. Treasury Bond | | | 19 | | | | 03/20/18 | | | | 2,907 | | | | 5,883 | |
U.S. Ultra Bond | | | 48 | | | | 03/20/18 | | | | 8,048 | | | | (45,337 | ) |
| | | | | | | | | | | | | | | | |
| | | | | | | | | | | | | | | 205,645 | |
| | | | | | | | | | | | | | | | |
| | | | | | | | | | | | | | $ | 188,972 | |
| | | | | | | | | | | | | | | | |
Forward Foreign Currency Exchange Contracts
| | | | | | | | | | | | | | | | | | | | |
| Currency Purchased | | | Currency Sold | | | Counterparty | | Settlement Date | | | Unrealized
Appreciation
(Depreciation) | |
| USD | | | 451,536 | | | EUR | | | 387,216 | | | Bank of America N.A. | | | 01/30/18 | | | $ | (14,865 | ) |
| | | | | | | | | | | | | | | | | | | | |
Centrally Cleared Interest Rate Swaps
| | | | | | | | | | | | | | | | | | | | | | | | | | | | | | | | |
| Paid by the Trust | | Received by the Trust | | Effective
Date | | | Termination
Date | | | Notional
Amount (000) | | | Value | | | Upfront
Premium
Paid
(Received) | | | Unrealized
Appreciation
(Depreciation) | |
| Rate | | Frequency | | Rate | | Frequency | | | | | | |
| 3-Month LIBOR | | Quarterly | | 2.14% | | Semi-annual | | | N/A | | | | 02/28/22 | | | USD | | | 6,900 | | | $ | (20,663 | ) | | $ | 90 | | | $ | (20,753 | ) |
| | | | | | | | | | | | | | | | | | | | | | | | | | | | | | | | |
OTC Credit Default Swaps — Sell Protection
| | | | | | | | | | | | | | | | | | | | | | | | | | | | | | | | | | | | |
| Reference Obligation/Index | | Financing
Rate Received
by the Trust | | | Payment
Frequency | | | Counterparty | | Termination
Date | | | Credit
Rating (a) | | Notional
Amount
(000) (b) | | | Value | | | Upfront
Premium Paid (Received) | | | Unrealized
Appreciation
(Depreciation) | |
CMBX.NA.9.BBB- | | | 3.00 | % | | | Monthly | | | Morgan Stanley & Co. International | | | 09/17/58 | | | BBB- | | | USD | | | | 5,000 | | | $ | (551,367 | ) | | $ | (544,963 | ) | | $ | (6,404 | ) |
CMBX.NA.9.BBB- | | | 3.00 | % | | | Monthly | | | Morgan Stanley & Co. International | | | 09/17/58 | | | BBB- | | | USD | | | | 3,000 | | | | (330,821 | ) | | | (323,187 | ) | | | (7,634 | ) |
CMBX.NA.9.BBB- | | | 3.00 | % | | | Monthly | | | Morgan Stanley & Co. International | | | 09/17/58 | | | BBB- | | | USD | | | | 2,000 | | | | (220,547 | ) | | | (231,217 | ) | | | 10,670 | |
| | | | | | | | | | | | | | | | | | | | | | | | | | | | | | | | | | | | |
| | | | | | | | | | | | | | | | | | | | | | | | | | $ | (1,102,735 | ) | | $ | (1,099,367 | ) | | $ | (3,368 | ) |
| | | | | | | | | | | | | | | | | | | | | | | | | | | | | | | | | | | | |
| | (a) | Using Standard & Poor’s (“S&P”) rating of the issuer or the underlying securities of the index, as applicable. | |
| | (b) | The maximum potential amount the Trust may pay should a negative credit event take place as defined under the terms of the agreement. | |
Balances Reported in the Statement of Assets and Liabilities for Centrally Cleared Swaps and OTC Derivatives
| | | | | | | | | | | | | | | | |
| | | Swap Premiums Paid | | | Swap Premiums
Received | | | Unrealized Appreciation | | | Unrealized Depreciation | |
Centrally Cleared Swaps(a) | | $ | 90 | | | $ | — | | | $ | — | | | $ | (20,753 | ) |
OTC Derivatives | | $ | — | | | $ | (1,099,367 | ) | | $ | 10,670 | | | $ | (14,038 | ) |
| | (a) | Includes cumulative appreciation (depreciation) on centrally cleared swaps, as reported in the Schedule of Investments. Only current day’s variation margin is reported within the Statement of Assets and Liabilities and is net of any previously paid (received) swap premium amounts. | |
| | |
| 18 | | 2017 BLACKROCK ANNUAL REPORTTO SHAREHOLDERS |
| | |
Schedule of Investments (continued) December 31, 2017 | | BlackRock 2022 Global Income Opportunity Trust |
Derivative Financial Instruments Categorized by Risk Exposure
As of period end, the fair values of derivative financial instruments located in the Statement of Assets and Liabilities as follows:
| | | | | | | | | | | | | | | | | | | | | | | | | | | | |
| | | Commodity
Contracts | | | Credit
Contracts | | | Equity
Contracts | | | Foreign
Currency
Exchange
Contracts | | | Interest
Rate
Contracts | | | Other
Contracts | | | Total | |
Assets — Derivative Financial Instruments | | | | | | | | | | | | | | | | | | | | | | | | | | | | |
Futures contracts | | | | | | | | | | | | | | | | | | | | | | | | | | | | |
Net unrealized appreciation(a) | | $ | — | | | $ | — | | | $ | — | | | $ | — | | | $ | 250,982 | | | $ | — | | | $ | 250,982 | |
Swaps — OTC | | | | | | | | | | | | | | | | | | | | | | | | | | | | |
Unrealized appreciation on OTC swaps; Swap premiums paid | | | — | | | | 10,670 | | | | — | | | | — | | | | — | | | | — | | | | 10,670 | |
| | | | | | | | | | | | | | | | | | | | | | | | | | | | |
| | $ | — | | | $ | 10,670 | | | $ | — | | | $ | — | | | $ | 250,982 | | | $ | — | | | $ | 261,652 | |
| | | | | | | | | | | | | | | | | | | | | | | | | | | | |
Liabilities — Derivative Financial Instruments | | | | | | | | | | | | | | | | | | | | | | | | | | | | |
Futures contracts | | | | | | | | | | | | | | | | | | | | | | | | | | | | |
Net unrealized depreciation(a) | | $ | — | | | $ | — | | | $ | — | | | $ | — | | | $ | 62,010 | | | $ | — | | | $ | 62,010 | |
Forward foreign currency exchange contracts | | | | | | | | | | | | | | | | | | | | | | | | | | | | |
Unrealized depreciation on forward foreign currency exchange contracts | | | — | | | | — | | | | — | | | | 14,865 | | | | — | | | | — | | | | 14,865 | |
Swaps — centrally cleared | | | | | | | | | | | | | | | | | | | | | | | | | | | | |
Net unrealized depreciation(a) | | | — | | | | — | | | | — | | | | — | | | | 20,753 | | | | — | | | | 20,753 | |
Swaps — OTC | | | | | | | | | | | | | | | | | | | | | | | | | | | | |
Unrealized depreciation on OTC swaps; Swap premiums received | | | — | | | | 1,113,405 | | | | — | | | | — | | | | — | | | | — | | | | 1,113,405 | |
| | | | | | | | | | | | | | | | | | | | | | | | | | | | |
| | $ | — | | | $ | 1,113,405 | | | $ | — | | | $ | 14,865 | | | $ | 82,763 | | | $ | — | | | | 1,211,033 | |
| | | | | | | | | | | | | | | | | | | | | | | | | | | | |
| | (a) | Includes cumulative appreciation (depreciation) on futures contracts and centrally cleared swaps, if any, as reported in the Schedule of Investments. Only current day’s variation margin is reported within the Statement of Assets and Liabilities. | |
For the period ended December 31, 2017, the effect of derivative financial instruments in the Statement of Operations was as follows:
| | | | | | | | | | | | | | | | | | | | | | | | | | | | |
| | | Commodity
Contracts | | | Credit
Contracts | | | Equity
Contracts | | | Foreign
Currency
Exchange
Contracts | | | Interest
Rate
Contracts | | | Other
Contracts | | | Total | |
Net Realized Gain (Loss) from: | | | | | | | | | | | | | | | | | | | | | | | | | | | | |
Futures contracts | | $ | — | | | $ | — | | | $ | (165,972 | ) | | $ | — | | | $ | (1,075,047 | ) | | $ | — | | | $ | (1,241,019 | ) |
Forward foreign currency exchange contracts | | | — | | | | — | | | | — | | | | (655,762 | ) | | | — | | | | — | | | | (655,762 | ) |
Options purchased(a) | | | — | | | | — | | | | — | | | | — | | | | (665 | ) | | | — | | | | (665 | ) |
Swaps | | | — | | | | 176,671 | | | | — | | | | — | | | | — | | | | — | | | | 176,671 | |
| | | | | | | | | | | | | | | | | | | | | | | | | | | | |
| | $ | — | | | $ | 176,671 | | | $ | (165,972 | ) | | $ | (655,762 | ) | | $ | (1,075,712 | ) | | $ | — | | | $ | (1,720,775 | ) |
| | | | | | | | | | | | | | | | | | | | | | | | | | | | |
Net Change in Unrealized Appreciation (Depreciation) on: | | | | | | | | | | | | | | | | | | | | | | | | | | | | |
Futures contracts | | $ | — | | | $ | — | | | $ | — | | | $ | — | | | $ | 188,972 | | | $ | — | | | $ | 188,972 | |
Forward foreign currency exchange contracts | | | — | | | | — | | | | — | | | | (14,865 | ) | | | — | | | | — | | | | (14,865 | ) |
Swaps | | | — | | | | (3,368 | ) | | | — | | | | — | | | | (20,753 | ) | | | — | | | | (24,121 | ) |
| | | | | | | | | | | | | | | | | | | | | | | | | | | | |
| | $ | — | | | $ | (3,368 | ) | | $ | — | | | $ | (14,865 | ) | | $ | 168,219 | | | $ | — | | | $ | 149,986 | |
| | | | | | | | | | | | | | | | | | | | | | | | | | | | |
| | (a) | Options purchased are included in net realized gain (loss) from investments. | |
Average Quarterly Balances of Outstanding Derivative Financial Instruments
| | | | |
Futures contracts: | | | | |
Average notional value of contracts — long | | $ | 2,085,240 | |
Average notional value of contracts — short | | $ | 72,074,264 | |
Forward foreign currency exchange contracts: | | | | |
Average amounts purchased — in USD | | $ | 8,612,330 | |
Average amounts sold — in USD | | $ | 10,379,028 | (a) |
Options: | | | | |
Average value of option contracts purchased | | $ | 1,656 | (a) |
Credit default swaps: | | | | |
Average notional value — buy protection | | $ | 358,000 | (a) |
Average notional value — sell protection | | $ | 7,000,000 | |
Interest rate swaps: | | | | |
Average notional value — receives fixed rate | | $ | 1,725,000 | |
| | (a) | Actual amounts for the period are shown due to limited outstanding derivative financial instruments as of each quarter end. | |
| | | | |
| SCHEDULE OF INVESTMENTS | | | 19 | |
| | |
Schedule of Investments (continued) December 31, 2017 | | BlackRock 2022 Global Income Opportunity Trust |
For more information about the Trust’s investment risks regarding derivative financial instruments, refer to the Notes to Financial Statements.
Derivative Financial Instruments — Offsetting as of Period End
The Trust’s derivative assets and liabilities (by type) were as follows:
| | | | | | | | |
| | | Assets | | | Liabilities | |
Futures contracts | | $ | — | | | $ | 119,237 | |
Swaps — Centrally cleared | | | 5,063 | | | | — | |
Swaps — OTC(a) | | | 10,670 | | | | 1,113,405 | |
Forward foreign currency exchange contracts | | | — | | | | 14,865 | |
| | | | | | | | |
Total derivative assets and liabilities in the Statement of Assets and Liabilities | | $ | 15,733 | | | $ | 1,247,507 | |
Derivatives not subject to a Master Netting Agreement or similar agreement (“MNA”) | | | (5,063 | ) | | | (119,237 | ) |
| | | | | | | | |
Total derivative assets and liabilities subject to an MNA | | $ | 10,670 | | | $ | 1,128,270 | |
| | | | | | | | |
| | (a) | Includes unrealized appreciation (depreciation) on OTC swaps and swap premiums (paid/received) in the Statement of Assets and Liabilities. | |
The following table presents the Trust’s derivative assets (and liabilities) by counterparty net of amounts available for offset under an MNA and net of the related collateral received (and pledged) by the Trust:
| | | | | | | | | | | | | | | | | | | | |
| Counterparty | | Derivative
Assets Subject to
an MNA by
Counterparty | | | Derivatives
Available
for Offset (a) | | | Non-cash
Collateral
Received | | | Cash
Collateral
Received | | | Net Amount
of Derivative
Assets (b) | |
Morgan Stanley & Co. International | | $ | 10,670 | | | $ | (10,670 | ) | | $ | — | | | $ | — | | | $ | — | |
| | | | | | | | | | | | | | | | | | | | |
| | | | | | | | | | | | | | | | | | | | |
| Counterparty | | Derivative
Liabilities Subject to
an MNA by
Counterparty | | | Derivatives
Available
for Offset (a) | | | Non-cash
Collateral
Pledged | | | Cash
Collateral
Pledged (c) | | | Net Amount
of Derivative
Liabilities (d) | |
Bank of America N.A. | | $ | 14,865 | | | $ | — | | | $ | — | | | $ | — | | | $ | 14,865 | |
Morgan Stanley & Co. International | | | 1,113,405 | | | | (10,670 | ) | | | — | | | | (1,102,735 | ) | | | — | |
| | | | | | | | | | | | | | | | | | | | |
| | $ | 1,128,270 | | | $ | (10,670 | ) | | $ | — | | | $ | (1,102,735 | ) | | $ | 14,865 | |
| | | | | | | | | | | | | | | | | | | | |
| | (a) | The amount of derivatives available for offset is limited to the amount of derivative asset and/or liabilities that are subject to an MNA. | |
| | (b) | Net amount represents the net amount receivable from the counterparty in the event of default. | |
| | (c) | Excess of collateral pledged to the individual counterparty is not shown for financial reporting purposes. | |
| | (d) | Net amount represents the net amount payable due to counterparty in the event of default. Net amount may be offset further by the options written receivable/payable on the Statement of Assets and Liabilities. | |
Fair Value Hierarchy as of Period End
Various inputs are used in determining the fair value of investments and derivative financial instruments. For information about the Trust’s policy regarding valuation of investments and derivative financial instruments, refer to the Notes to Financial Statements.
The following tables summarize the Trust’s investments and derivative financial instruments categorized in the disclosure hierarchy:
| | | | | | | | | | | | | | | | |
| | | Level 1 | | | Level 2 | | | Level 3 | | | Total | |
Assets: | | | | | | | | | | | | | | | | |
Investments: | | | | | | | | | | | | | | | | |
Long-Term Investments: | | | | | | | | | | | | | | | | |
Asset-Backed Securities | | $ | — | | | $ | 60,649,407 | | | $ | 1,756,100 | | | $ | 62,405,507 | |
Corporate Bonds | | | — | | | | 155,943,844 | | | | — | | | | 155,943,844 | |
Floating Rate Loan Interests | | | — | | | | 2,483,035 | | | | 3,677,617 | | | | 6,160,652 | |
Foreign Agency Obligations | | | — | | | | 45,210,821 | | | | — | | | | 45,210,821 | |
Non-Agency Mortgage-Backed Securities | | | — | | | | 33,696,806 | | | | 3,897,617 | | | | 37,594,423 | |
Preferred Securities | | | — | | | | 2,044,155 | | | | — | | | | 2,044,155 | |
U.S. Government Sponsored Agency Securities | | | — | | | | 20,697,035 | | | | — | | | | 20,697,035 | |
Short-Term Securities: | | | | | | | | | | | | | | | | |
Foreign Agency Obligations | | | — | | | | 2,385,080 | | | | — | | | | 2,385,080 | |
Money Market Funds | | | 3,180,865 | | | | — | | | | — | | | | 3,180,865 | |
Liabilities: | | | | | | | | | | | | | | | | |
Investments: | | | | | | | | | | | | | | | | |
TBA Sale Commitments | | | — | | | | (3,158,200 | ) | | | — | | | | (3,158,200 | ) |
| | | | | | | | | | | | | | | | |
| | $ | 3,180,865 | | | $ | 319,951,983 | | | $ | 9,331,334 | | | $ | 332,464,182 | |
| | | | | | | | | | | | | | | | |
| | |
| 20 | | 2017 BLACKROCK ANNUAL REPORTTO SHAREHOLDERS |
| | |
Schedule of Investments (continued) December 31, 2017 | | BlackRock 2022 Global Income Opportunity Trust |
| | | | | | | | | | | | | | | | |
| | | Level 1 | | | Level 2 | | | Level 3 | | | Total | |
Derivative Financial Instruments(a) | | | | | | | | | | | | | | | | |
Assets: | | | | | | | | | | | | | | | | |
Credit contracts | | $ | — | | | $ | 10,670 | | | $ | — | | | $ | 10,670 | |
Interest rate contracts | | | 250,982 | | | | — | | | | — | | | | 250,982 | |
Liabilities: | | | | | | | | | | | | | | | | |
Credit contracts | | | — | | | | (14,038 | ) | | | — | | | | (14,038 | ) |
Interest rate contracts | | | (62,010 | ) | | | (20,753 | ) | | | — | | | | (82,763 | ) |
Foreign currency exchange contracts | | | — | | | | (14,865 | ) | | | — | | | | (14,865 | ) |
| | | | | | | | | | | | | | | | |
| | $ | 188,972 | | | $ | (38,986 | ) | | $ | — | | | $ | 149,986 | |
| | | | | | | | | | | | | | | | |
| | (a) | Derivative financial instruments are swaps, futures contracts and forward foreign currency exchange contracts. Swaps, futures contracts and forward foreign currency exchange contracts are valued at the unrealized appreciation (depreciation) on the instrument. | |
The Trust may hold assets and/or liabilities in which the fair value approximates the carrying amount or face value, including accrued interest, for financial statement purposes. As of period end, reverse repurchase agreements payable of $100,981,588 is categorized as Level 2 within the disclosure hierarchy.
During the period ended December 31, 2017, there were no transfers between levels.
A reconciliation of Level 3 investments is presented when the Trust had a significant amount of Level 3 investments at the beginning and/or end of the period in relation to net assets. The following table is a reconciliation of Level 3 investments for which significant unobservable inputs were used in determining fair value:
| | | | | | | | | | | | | | | | |
| | | Asset-Backed
Securities | | | Floating Rate Loan
Interests | | | Non-Agency Mortgage- Backed Securities | | | Total | |
Assets: | | | | | | | | | | | | | | | | |
Opening Balance, as of February 27, 2017(a) | | $ | — | | | $ | — | | | $ | — | | | $ | — | |
Transfers into Level 3 | | | — | | | | — | | | | — | | | | — | |
Transfers out of Level 3 | | | — | | | | — | | | | — | | | | — | |
Accrued discounts/premiums | | | — | | | | — | | | | (1,217 | ) | | | (1,217 | ) |
Net realized gain (loss) | | | — | | | | 7,683 | | | | (4,879 | ) | | | 2,804 | |
Net change in unrealized appreciation (depreciation)(b)(c) | | | — | | | | 55,756 | | | | (193,017 | ) | | | (137,261 | ) |
Purchases | | | 1,756,100 | | | | 4,419,851 | | | | 4,526,884 | | | | 10,702,835 | |
Sales | | | — | | | | (805,673 | ) | | | (430,154 | ) | | | (1,235,827 | ) |
| | | | | | | | | | | | | | | | |
Closing Balance, as of December 31, 2017 | | $ | 1,756,100 | | | $ | 3,677,617 | | | $ | 3,897,617 | | | $ | 9,331,334 | |
| | | | | | | | | | | | | | | | |
Net change in unrealized appreciation (depreciation) on investments still held at December 31, 2017(c) | | $ | — | | | $ | 55,756 | | | $ | (193,017 | ) | | $ | (137,261 | ) |
| | | | | | | | | | | | | | | | |
| | (a) | Commencement of operations. | |
| | (b) | Included in the related net change in unrealized appreciation (depreciation) in the Statement of Operations. | |
| | (c) | Any difference between net change in unrealized appreciation (depreciation) and net change in unrealized appreciation (depreciation) on investments still held at December 31, 2017 is generally due to investments no longer held or categorized as Level 3 at period end. | |
The Trust’s investments that are categorized as Level 3 were valued utilizing third party pricing information without adjustment. Such valuations are based on unobservable inputs. A significant change in third party information could result in a significantly lower or higher value of such Level 3 investments.
See notes to financial statements.
| | | | |
| SCHEDULE OF INVESTMENTS | | | 21 | |
Statement of Assets and Liabilities
December 31, 2017
| | | | |
| | | BGIO | |
|
ASSETS | |
Investments at value — unaffiliated (cost — $328,983,434) | | $ | 332,441,517 | |
Investments at value — affiliated (cost — $3,180,865) | | | 3,180,865 | |
Cash | | | 5,403 | |
Cash pledged: | |
Collateral — OTC derivatives | | | 1,370,000 | |
Centrally cleared swaps | | | 120,000 | |
Futures contracts | | | 726,000 | |
Foreign currency at value (cost — $2,189,531) | | | 2,184,715 | |
Receivables: | |
Interest — unaffiliated | | | 4,137,910 | |
TBA sale commitments | | | 3,160,816 | |
Investments sold | | | 295,852 | |
Principal paydowns | | | 53,846 | |
Variation margin on centrally cleared swaps | | | 5,063 | |
Dividends — affiliated | | | 1,064 | |
Unrealized appreciation on OTC derivatives | | | 10,670 | |
Prepaid expenses | | | 6,941 | |
| | | | |
Total assets | | | 347,700,662 | |
| | | | |
|
LIABILITIES | |
Cash received as collateral for reverse repurchase agreements | | | 40,000 | |
Reverse repurchase agreements | | | 100,981,588 | |
TBA sale commitments at value (proceeds — $3,160,816) | | | 3,158,200 | |
Payables: | |
Investments purchased | | | 19,452,458 | |
Income dividends | | | 1,524,304 | |
Investment advisory fees | | | 163,585 | |
Variation margin on futures contracts | | | 119,237 | |
Trustees’ and Officer’s fees | | | 4,845 | |
Other accrued expenses | | | 137,289 | |
Swap premiums received | | | 1,099,367 | |
Unrealized depreciation on: | |
Forward foreign currency exchange contracts | | | 14,865 | |
OTC derivatives | | | 14,038 | |
| | | | |
Total liabilities | | | 126,709,776 | |
| | | | |
| |
NET ASSETS | | $ | 220,990,886 | |
| | | | |
|
NET ASSETS CONSIST OF | |
Paid-in capital | | $ | 217,531,215 | |
Undistributed net investment income | | | 19,340 | |
Accumulated net realized loss | | | (163,990 | ) |
Net unrealized appreciation (depreciation) | | | 3,604,321 | |
| | | | |
NET ASSETS | | $ | 220,990,886 | |
| | | | |
|
NET ASSET VALUE: | |
Based on net assets of $220,990,886 and 22,128,879 shares outstanding, unlimited number of shares authorized, $0.001 par value | | $ | 9.99 | |
| | | | |
See notes to financial statements.
| | |
| 22 | | 2017 BLACKROCK ANNUAL REPORTTO SHAREHOLDERS |
Statement of Operations
Period February 27, 2017(a) to December 31, 2017
| | | | |
| | | BGIO | |
|
INVESTMENT INCOME | |
Interest — unaffiliated | | $ | 13,570,576 | |
Dividends — unaffiliated | | | 284,584 | |
Dividends — affiliated | | | 96,950 | |
Foreign taxes withheld | | | (24,660 | ) |
| | | | |
Total investment income | | | 13,927,450 | |
| | | | |
|
EXPENSES | |
Investment advisory | | | 1,491,877 | |
Professional | | | 89,052 | |
Custodian | | | 57,416 | |
Transfer agent | | | 24,308 | |
Accounting services | | | 22,667 | |
Trustees and Officer | | | 21,926 | |
Printing | | | 15,845 | |
Miscellaneous | | | 8,197 | |
| | | | |
Total expenses excluding interest expense | | | 1,731,288 | |
Interest expense | | | 1,218,042 | |
| | | | |
Total expenses | | | 2,949,330 | |
Less fees waived and/or reimbursed by the Manager | | | (11,169 | ) |
| | | | |
Total expenses after fees waived | | | 2,938,161 | |
| | | | |
Net investment income | | | 10,989,289 | |
| | | | |
|
REALIZED AND UNREALIZED GAIN (LOSS) | |
Net realized gain (loss) from: | |
Investments — unaffiliated | | | 2,033,692 | |
Investments — affiliated | | | 15,747 | |
Futures contracts | | | (1,241,019 | ) |
Forward foreign currency exchange contracts | | | (655,762 | ) |
Foreign currency transactions | | | 12,915 | |
Capital gain distributions from investment companies — affiliated | | | 14 | |
Swaps | | | 176,671 | |
| | | | |
| | | 342,258 | |
| | | | |
Net change in unrealized appreciation (depreciation) on: | | | | |
Investments — unaffiliated | | | 3,460,699 | |
Futures contracts | | | 188,972 | |
Forward foreign currency exchange contracts | | | (14,865 | ) |
Foreign currency translations | | | (6,364 | ) |
Swaps | | | (24,121 | ) |
| | | | |
| | | 3,604,321 | |
| | | | |
Net realized and unrealized gain | | | 3,946,579 | |
| | | | |
NET INCREASE IN NET ASSETS RESULTING FROM OPERATIONS | | $ | 14,935,868 | |
| | | | |
| (a) | Commencement of operations. |
See notes to financial statements.
Statement of Changes in Net Assets
| | | | |
| | | BGIO | |
| | | Period February 27, 2017(a) to December 31, 2017 | |
|
INCREASE (DECREASE) IN NET ASSETS | |
|
OPERATIONS | |
Net investment income | | $ | 10,989,289 | |
Net realized gain | | | 342,258 | |
Net change in unrealized appreciation (depreciation) | | | 3,604,321 | |
| | | | |
Net increase in net assets resulting from operations | | | 14,935,868 | |
| | | | |
|
DISTRIBUTIONS TO SHAREHOLDERS(b) | |
From net investment income | | | (11,218,021 | ) |
From net realized gain | | | (258,176 | ) |
| | | | |
Decrease in net assets resulting from distributions to shareholders | | | (11,476,197 | ) |
| | | | |
|
CAPITAL SHARE TRANSACTIONS | |
Net proceeds from the issuance of shares(c) | | | 206,850,000 | |
Net proceeds from the underwriter’s over allotment option exercised(d) | | | 10,624,952 | |
Reinvestment of common distributions | | | 321,692 | |
Capital charges with respect to the issuance of shares | | | (365,431 | ) |
| | | | |
Net increase in net assets derived from capital share transactions | | | 217,431,213 | |
| | | | |
|
NET ASSETS | |
Total increase in net assets | | | 220,890,884 | |
Beginning of period | | | 100,002 | |
| | | | |
End of period | | $ | 220,990,886 | |
| | | | |
Undistributed net investment income, end of period | | $ | 19,340 | |
| | | | |
| (a) | Commencement of operations. |
| (b) | Distributions for annual periods determined in accordance with U.S. federal income tax regulations. |
| (c) | Net of sales load paid of $3,150,000. |
| (d) | Net of sales load paid of $161,796. |
See notes to financial statements.
| | |
| 24 | | 2017 BLACKROCK ANNUAL REPORTTO SHAREHOLDERS |
Statement of Cash Flows
Period February 27, 2017(a) to December 31, 2017
| | | | |
| | | BGIO | |
|
CASH USED FOR OPERATING ACTIVITIVES | |
Net increase in net assets resulting from operations | | $ | 14,935,868 | |
Adjustments to reconcile net increase in net assets resulting from operations to net cash used for operating activities: | |
Proceeds from sales of long-term investments and principal paydowns | | | 347,966,257 | |
Purchases of long-term investments | | | (653,642,776 | ) |
Net Purchases of short-term securities | | | (5,579,567 | ) |
Amortization of premium and accretion of discount on investments and other fees | | | 248,801 | |
Net realized gain on investments | | | (2,049,439 | ) |
Net unrealized gain on investments, swaps and foreign currency translations | | | (3,442,466 | ) |
| (Increase) decrease in assets: | |
Cash pledged: | | | | |
Futures contracts | | | (726,000 | ) |
Centrally cleared swaps | | | (120,000 | ) |
Collateral — OTC derivatives | | | (1,370,000 | ) |
Receivables: | | | | |
Interest — unaffiliated | | | (4,137,910 | ) |
Dividends — affiliated | | | (1,064 | ) |
Variation margin on centrally cleared swaps | | | (5,063 | ) |
Prepaid expenses | | | (6,940 | ) |
| Increase (decrease) in liabilities: | |
Cash received for reverse repurchase agreements | | | 40,000 | |
Payables: | | | | |
Investment advisory fees | | | 163,585 | |
Interest expense and fees | | | 713,982 | |
Organization costs | | | (76,500 | ) |
Officer’s and Directors’ fees | | | 4,845 | |
Variation margin on futures contracts | | | 119,237 | |
Other accrued expenses | | | 137,289 | |
Swap premiums received | | | 1,099,367 | |
| | | | |
Net cash used for operating activities | | | (305,728,494 | ) |
| | | | |
|
CASH PROVIDED BY FINANCING ACTIVITIVES | |
Proceeds from issuance of Common Shares | | | 206,850,000 | |
Net proceeds from the underwriter’s over allotment option exercised | | | 10,624,952 | |
Capital charges with respect to the issuance of shares | | | (365,431 | ) |
Net borrowing of reverse repurchase agreements | | | 100,267,606 | |
Cash dividends paid to Common Shareholders | | | (9,630,201 | ) |
| | | | |
Net cash provided by financing activities | | | 307,746,926 | |
| | | | |
|
CASH IMPACT FROM FOREIGN EXCHANGE FLUCTUATIONS | |
Cash impact from foreign exchange fluctuations | | $ | (4,816 | ) |
| | | | |
|
CASH AND FOREIGN CURRENCY | |
Net increase in cash and foreign currency at value | | | 2,013,616 | |
Cash and foreign currency at value at beginning of period | | | 176,502 | |
| | | | |
Cash and foreign currency at value at end of period | | $ | 2,190,118 | |
| | | | |
|
SUPPLEMENTAL DISCLOSURE OF CASH FLOW INFORMATION | |
Cash paid during the period for interest expense | | $ | 504,060 | |
| | | | |
|
NON-CASH FINANCING ACTIVITIES | |
Capital shares issued in reinvestment of distributions paid to Common Shareholders | | | 321,692 | |
| | | | |
| (a) | Commencement of operations. |
See notes to financial statements.
Financial Highlights
(For a share outstanding throughout each period)
| | | | |
| | | BGIO | |
| | | Period February 27, 2017(a) to
December 31, 2017 | |
Net asset value, beginning of period | | $ | 9.85 | (b) |
| | | | |
Net investment income(c) | | | 0.50 | |
Net realized and unrealized gain | | | 0.18 | |
| | | | |
Net increase from investment operations | | | 0.68 | |
| | | | |
| Distributions:(d) | | | |
From net investment income | | | (0.51 | ) |
From net realized gain | | | (0.01 | ) |
| | | | |
Total distributions | | | (0.52 | ) |
| | | | |
Capital charges with respect to the issuance of shares | | | (0.02 | ) |
| | | | |
Net asset value, end of period | | $ | 9.99 | |
| | | | |
Market price, end of period | | $ | 9.80 | |
| | | | |
|
Total Return(e) | |
Based on net asset value | | | 6.87 | %(f) |
| | | | |
Based on market price | | | 3.26 | %(f) |
| | | | |
|
Ratios to Average Net Assets(g)(h) | |
Total expenses | | | 1.60 | %(i) |
| | | | |
Total expenses after fees waived | | | 1.59 | %(i) |
| | | | |
Total expenses after fees waived and excluding interest expense | | | 0.93 | %(i) |
| | | | |
Net investment income | | | 5.99 | %(i) |
| | | | |
|
Supplemental Data | |
Net assets, end of period (000) | | $ | 220,991 | |
| | | | |
Borrowings outstanding, end of period (000) | | $ | 100,982 | |
| | | | |
Portfolio turnover rate(j) | | | 125 | % |
| | | | |
| (a) | Commencement of operations. |
| (b) | Net asset value, beginning of period, reflects a reduction of $0.15 per share sales charge from the initial offering price of $10.00 per share. |
| (c) | Based on average shares outstanding. |
| (d) | Distributions for annual periods determined in accordance with U.S. federal income tax regulations. |
| (e) | Total returns based on market price, which can be significantly greater or less than the net asset value, may result in substantially different returns. Where applicable, excludes the effects of any sales charges and assumes the reinvestment of distributions at actual reinvestment prices. |
| (f) | Aggregate total return. |
| (g) | Excludes expenses incurred indirectly as a result of investments in underlying funds of 0.03%. |
| (h) | Audit costs were not annualized in the calculation of the expense ratios and net investment income ratio. If these expenses were annualized, the total expenses would have been 1.61%, 1.60%, 0.94% and 5.99%, respectively. |
| (j) | Includes Mortgage Dollar Rolls (“MDRs”). Excluding MDRs, the portfolio turnover rate would be 93%. |
See notes to financial statements.
| | |
| 26 | | 2017 BLACKROCK ANNUAL REPORTTO SHAREHOLDERS |
Notes to Financial Statements
BlackRock 2022 Global Income Opportunity Trust (the “Trust”) is registered under the Investment Company Act of 1940, as amended (the “1940 Act”). The Trust is registered as a non-diversified, closed-end management investment company. The Trust is organized as a Delaware statutory trust. The Trust determines and makes available for publication the net asset value (“NAV”) of its Common Shares on a daily basis.
The Trust, together with certain other registered investment companies advised by BlackRock Advisors, LLC (the “Manager”) or its affiliates, is included in a complex of closed-end funds referred to as the Closed-End Complex.
Prior to commencement of operations on February 27, 2017, the Trust had no operations other than those relating to organizational matters and the sale of 17,919 Common Shares on December 2, 2016 to BlackRock Holdco. 2, Inc., an affiliate of the Trust, for $176,502. Investment operations for the Trust commenced on February 27, 2017.
| 2. | SIGNIFICANT ACCOUNTING POLICIES |
The financial statements are prepared in conformity with accounting principles generally accepted in the United States of America (“U.S. GAAP”), which may require management to make estimates and assumptions that affect the reported amounts of assets and liabilities in the financial statements, disclosure of contingent assets and liabilities at the date of the financial statements and the reported amounts of increases and decreases in net assets from operations during the reporting period. Actual results could differ from those estimates. The Trust is considered an investment company under U.S. GAAP and follows the accounting and reporting guidance applicable to investment companies. Below is a summary of significant accounting policies:
Investment Transactions and Income Recognition: For financial reporting purposes, investment transactions are recorded on the dates the transactions are entered into (the “trade dates”). Realized gains and losses on investment transactions are determined on the identified cost basis. Interest income, including amortization and accretion of premiums and discounts on debt securities, is recognized on an accrual basis.
Foreign Currency Translation: The Trust’s books and records are maintained in U.S. dollars. Securities and other assets and liabilities denominated in foreign currencies are translated into U.S. dollars using exchange rates determined as of the close of trading on the New York Stock Exchange (“NYSE”). Purchases and sales of investments are recorded at the rates of exchange prevailing on the respective dates of such transactions. Generally, when the U.S. dollar rises in value against a foreign currency, the investments denominated in that currency will lose value; the opposite effect occurs if the U.S. dollar falls in relative value.
The Trust does not isolate the portion of the results of operations arising as a result of changes in the exchange rates from the changes in the market prices of investments held or sold for financial reporting purposes. Accordingly, the effects of changes in exchange rates on investments are not segregated in the Statement of Operations from the effects of changes in market prices of those investments, but are included as a component of net realized and unrealized gain (loss) from investments. The Trust reports realized currency gains (losses) on foreign currency related transactions as components of net realized gain (loss) for financial reporting purposes, whereas such components are generally treated as ordinary income for U.S. federal income tax purposes.
Segregation and Collateralization: In cases where the Trust enters into certain investments (e.g., dollar rolls, To-be-announced (“TBA”) sale commitments, futures contracts, forward foreign currency exchange contracts and swaps) or certain borrowings (e.g., reverse repurchase transactions) that would be treated as “senior securities” for 1940 Act purposes, the Trust may segregate or designate on its books and records cash or liquid assets having a market value at least equal to the amount of its future obligations under such investments or borrowings. Doing so allows the investment or borrowings to be excluded from treatment as a “senior security.” Furthermore, if required by an exchange or counterparty agreement, the Trust may be required to deliver/deposit cash and/or securities to/with an exchange, or broker-dealer or custodian as collateral for certain investments or obligations.
Distributions: Distributions from net investment income are declared monthly and paid monthly. Distributions of capital gains are recorded on the ex-dividend date and made at least annually. The character and timing of distributions are determined in accordance with U.S. federal income tax regulations, which may differ from U.S. GAAP.
Deferred Compensation Plan: Under the Deferred Compensation Plan (the “Plan”) approved by Trust’s Board, the independent Trustees (“Independent Trustees”) may defer a portion of their annual complex-wide compensation. Deferred amounts earn an approximate return as though equivalent dollar amounts had been invested in common shares of certain other BlackRock Closed-End Funds selected by the Independent Trustees. This has the same economic effect for the Independent Trustees as if the Independent Trustees had invested the deferred amounts directly in certain other BlackRock Closed-End Funds.
The Plan is not funded and obligations thereunder represent general unsecured claims against the general assets of the Trust, if applicable. Deferred compensation liabilities are included in the officer’s and trustees’ fees payable in the Statement of Assets and Liabilities and will remain as a liability of the Trust until such amounts are distributed in accordance with the Plan.
Organization and Offering Costs: Prior to commencement of operations, organization costs associated with the establishment of the Trust were expensed by the Trust. All offering costs exceeding $0.02 per share, other than sales charges, are paid by the Manager. The Trust paid offering costs of $365,431, which was recorded as a capital charge with respect to the issuance of shares.
Recent Accounting Standards: In November 2016, the Financial Accounting Standards Board issued Accounting Standards Update “Restricted Cash” which will require entities to include the total of cash, cash equivalents, restricted cash, and restricted cash equivalents in the beginning and ending cash balances in the Statement of Cash Flows. The guidance will be applied retrospectively and is effective for fiscal years beginning after December 15, 2017, and interim periods within those years. Management is evaluating the impact, if any, of this guidance on the Trust’s presentation in the Statement of Cash Flows.
In March 2017, the Financial Accounting Standards Board issued Accounting Standards Update “Premium Amortization of Purchased Callable Debt Securities” which amends the amortization period for certain purchased callable debt securities. Under the new guidance, the premium amortization of purchased callable debt securities
| | | | |
| NOTESTO FINANCIAL STATEMENTS | | | 27 | |
Notes to Financial Statements (continued)
that have explicit, non-contingent call features and are callable at fixed prices will be amortized to the earliest call date. The guidance will be applied on a modified retrospective basis and is effective for fiscal years, and their interim periods, beginning after December 15, 2018. Management is currently evaluating the impact of this guidance to the Trust.
Indemnifications: In the normal course of business, the Trust enters into contracts that contain a variety of representations that provide general indemnification. The Trust’s maximum exposure under these arrangements is unknown because it involves future potential claims against the Trust, which cannot be predicted with any certainty.
Other: Expenses directly related to the Trust are charged to the Trust. Other operating expenses shared by several funds, including other funds managed by the Manager, are prorated among those funds on the basis of relative net assets or other appropriate methods.
| 3. | INVESTMENT VALUATION AND FAIR VALUE MEASUREMENTS |
Investment Valuation Policies: The Trust’s investments are valued at fair value (also referred to as “market value” within the financial statements) as of the close of trading on the NYSE (generally 4:00 p.m., Eastern time) (or if the reporting date falls on a day the NYSE is closed, investments are valued at fair value as of the period end). U.S. GAAP defines fair value as the price the Trust would receive to sell an asset or pay to transfer a liability in an orderly transaction between market participants at the measurement date. The Trust determines the fair values of its financial instruments using various independent dealers or pricing services under policies approved by the Board of Trustees of the Trust (the “Board”). The BlackRock Global Valuation Methodologies Committee (the “Global Valuation Committee”) is the committee formed by management to develop global pricing policies and procedures and to oversee the pricing function for all financial instruments.
Fair Value Inputs and Methodologies: The following methods and inputs are used to establish the fair value of the Trust’s assets and liabilities:
| | • | | Fixed-income securities for which market quotations are readily available are generally valued using the last available bid prices or current market quotations provided by independent dealers or third party pricing services. Floating rate loan interests are valued at the mean of the bid prices from one or more independent brokers or dealers as obtained from a third party pricing service. Pricing services generally value fixed-income securities assuming orderly transactions of an institutional round lot size, but a fund may hold or transact in such securities in smaller, odd lot sizes. Odd lots may trade at lower prices than institutional round lots. The pricing services may use matrix pricing or valuation models that utilize certain inputs and assumptions to derive values, including transaction data (e.g., recent representative bids and offers), credit quality information, perceived market movements, news, and other relevant information. Certain fixed-income securities, including asset-backed and mortgage related securities may be valued based on valuation models that consider the estimated cash flows of each tranche of the entity, establish a benchmark yield and develop an estimated tranche specific spread to the benchmark yield based on the unique attributes of the tranche. The amortized cost method of valuation may be used with respect to debt obligations with sixty days or less remaining to maturity unless the Manager determines such method does not represent fair value. |
Generally, trading in foreign instruments is substantially completed each day at various times prior to the close of trading on the NYSE. Occasionally, events affecting the values of such instruments may occur between the foreign market close and the close of trading on the NYSE that may not be reflected in the computation of the Trust’s net assets.
| | • | | Exchange-traded funds (“ETFs”) traded on a recognized securities exchange are valued at the official closing price each day, if available. For ETFs traded on more than one exchange, the official closing price on the exchange where the stock is primarily traded is used. ETFs traded on a recognized exchange for which there were no sales on that day may be valued at the last available bid (long positions) or ask (short positions) price. |
| | • | | Investments in open-end U.S. mutual funds are valued at NAV each business day. |
| | • | | Futures contracts traded on exchanges are valued at their last sale price. |
| | • | | Forward foreign currency exchange contracts are valued at the mean between the bid and ask prices and are determined as of the close of trading on the NYSE. Interpolated values are derived when the settlement date of the contract is an interim date for which quotations are not available. |
| | • | | Exchange-traded options are valued at the mean between the last bid and ask prices at the close of the options market in which the options trade. An exchange-traded option for which there is no mean price is valued at the last bid (long positions) or ask (short positions) price. If no bid or ask price is available, the prior day’s price will be used, unless it is determined that the prior day’s price no longer reflects the fair value of the option. Over-the-counter (“OTC”) options are valued by an independent pricing service using a mathematical model, which incorporates a number of market data factors, such as the trades and prices of the underlying instruments. |
| | • | | Swap agreements are valued utilizing quotes received daily by the Trust’s pricing service or through brokers, which are derived using daily swap curves and models that incorporate a number of market data factors, such as discounted cash flows, trades and values of the underlying reference instruments. |
| | • | | TBA commitments are valued on the basis of last available bid prices or current market quotations provided by pricing services. |
If events (e.g., a company announcement, market volatility or a natural disaster) occur that are expected to materially affect the value of such investments, or in the event that the application of these methods of valuation results in a price for an investment that is deemed not to be representative of the market value of such investment, or if a price is not available, the investment will be valued by the Global Valuation Committee, or its delegate, in accordance with a policy approved by the Board as reflecting fair value (“Fair Valued Investments”). The fair valuation approaches that may be used by the Global Valuation Committee will include market approach, income approach and cost approach. Valuation techniques such as discounted cash flow, use of market comparables and matrix pricing are types of valuation approaches and are typically used in determining fair value. When determining the price for Fair Valued Investments, the Global Valuation Committee, or its delegate, seeks to determine the price that the Trust might reasonably expect to receive or pay from the current sale or purchase of that asset or liability in an arm’s-length transaction. Fair value determinations shall be based upon all available factors that the Global Valuation Committee, or its delegate, deems relevant and consistent with the principles of fair value measurement.
| | |
| 28 | | 2017 BLACKROCK ANNUAL REPORTTO SHAREHOLDERS |
Notes to Financial Statements (continued)
The Global Valuation Committee, or its delegate, employs various methods for calibrating valuation approaches for investments where an active market does not exist, including regular due diligence of the Trust’s pricing vendors, regular reviews of key inputs and assumptions, transactional back-testing or disposition analysis to compare unrealized gains and losses to realized gains and losses, reviews of missing or stale prices and large movements in market values and reviews of any market related activity. The pricing of all Fair Valued Investments is subsequently reported to the Board or a committee thereof on a quarterly basis. As a result of the inherent uncertainty in valuation of these investments, the fair values may differ from the values that would have been used had an active market existed.
For investments in equity or debt issued by privately held companies or funds (“Private Company” or collectively, the “Private Companies”) and other Fair Valued Investments, the fair valuation approaches that are used by third party pricing services utilize one or a combination of, but not limited to, the following inputs.
| | |
| | | Standard Inputs Generally Considered By Third Party Pricing Services |
Market approach | | (i) recent market transactions, including subsequent rounds of financing, in the underlying investment or comparable issuers; (ii) recapitalizations and other transactions across the capital structure; and (iii) market multiples of comparable issuers. |
Income approach | | (i) future cash flows discounted to present and adjusted as appropriate for liquidity, credit, and/or market risks; (ii) quoted prices for similar investments or assets in active markets; and (iii) other risk factors, such as interest rates, yield curves, volatilities, prepayment speeds, loss severities, credit risks, recovery rates, liquidation amounts and/or default rates. |
Cost approach | | (i) audited or unaudited financial statements, investor communications and financial or operational metrics issued by the Private Company; (ii) changes in the valuation of relevant indices or publicly traded companies comparable to the Private Company; (iii) relevant news and other public sources; and (iv) known secondary market transactions in the Private Company’s interests and merger or acquisition activity in companies comparable to the Private Company. |
Investments in series of preferred stock issued by Private Companies are typically valued utilizing Market approach in determining the enterprise value of the company. Such investments often contain rights and preferences that differ from other series of preferred and common stock of the same issuer. Valuation techniques such as an option pricing model (“OPM”), a probability weighted expected return model (“PWERM”) or a hybrid of those techniques are used in allocating enterprise value of the company, as deemed appropriate under the circumstances. The use of OPM and PWERM techniques involve a determination of the exit scenarios of the investment in order to appropriately allocate the enterprise value of the company among the various parts of its capital structure.
The Private Companies are not subject to the public company disclosure, timing, and reporting standards as other investments held by the Trust. Typically, the most recently available information by a Private Company is as of a date that is earlier than the date the Trust is calculating its NAV. This factor may result in a difference between the value of the investment and the price the Trust could receive upon the sale of the investment.
Fair Value Hierarchy: Various inputs are used in determining the fair value of investments and derivative financial instruments. These inputs to valuation techniques are categorized into a fair value hierarchy consisting of three broad levels for financial statement purposes as follows:
| | • | | Level 1 — Unadjusted price quotations in active markets/exchanges for identical assets or liabilities that the Trust has the ability to access |
| | • | | Level 2 — Other observable inputs (including, but not limited to, quoted prices for similar assets or liabilities in markets that are active, quoted prices for identical or similar assets or liabilities in markets that are not active, inputs other than quoted prices that are observable for the assets or liabilities (such as interest rates, yield curves, volatilities, prepayment speeds, loss severities, credit risks and default rates) or other market–corroborated inputs) |
| | • | | Level 3 — Unobservable inputs based on the best information available in the circumstances, to the extent observable inputs are not available (including the Trust’s own assumptions used in determining the fair value of investments and derivative financial instruments) |
The hierarchy gives the highest priority to unadjusted quoted prices in active markets for identical assets or liabilities (Level 1 measurements) and the lowest priority to unobservable inputs (Level 3 measurements). Accordingly, the degree of judgment exercised in determining fair value is greatest for instruments categorized in Level 3. The inputs used to measure fair value may fall into different levels of the fair value hierarchy. In such cases, for disclosure purposes, the fair value hierarchy classification is determined based on the lowest level input that is significant to the fair value measurement in its entirety. Investments classified within Level 3 have significant unobservable inputs used by the Global Valuation Committee in determining the price for Fair Valued Investments. Level 3 investments include equity or debt issued by Private Companies. There may not be a secondary market, and/or there are a limited number of investors. Level 3 investments may also be adjusted to reflect illiquidity and/or non-transferability, with the amount of such discount estimated by the Global Valuation Committee in the absence of market information.
Changes in valuation techniques may result in transfers into or out of an assigned level within the hierarchy. In accordance with the Trust’s policy, transfers between different levels of the fair value hierarchy are deemed to have occurred as of the beginning of the reporting period. The categorization of a value determined for investments and derivative financial instruments is based on the pricing transparency of the investments and derivative financial instruments and is not necessarily an indication of the risks associated with investing in those securities.
| 4. | SECURITIES AND OTHER INVESTMENTS |
Asset-Backed and Mortgage-Backed Securities: Asset-backed securities are generally issued as pass-through certificates or as debt instruments. Asset-backed securities issued as pass-through certificates represent undivided fractional ownership interests in an underlying pool of assets. Asset-backed securities issued as debt instruments, which are also known as collateralized obligations, are typically issued as the debt of a special purpose entity organized solely for the purpose of owning such assets and issuing such debt. Asset-backed securities are often backed by a pool of assets representing the obligations of a number of different parties. The yield
| | | | |
| NOTESTO FINANCIAL STATEMENTS | | | 29 | |
Notes to Financial Statements (continued)
characteristics of certain asset-backed securities may differ from traditional debt securities. One such major difference is that all or a principal part of the obligations may be prepaid at any time because the underlying assets (i.e., loans) may be prepaid at any time. As a result, a decrease in interest rates in the market may result in increases in the level of prepayments as borrowers, particularly mortgagors, refinance and repay their loans. An increased prepayment rate with respect to an asset-backed security will have the effect of shortening the maturity of the security. In addition, a trust may subsequently have to reinvest the proceeds at lower interest rates. If a trust has purchased such an asset-backed security at a premium, a faster than anticipated prepayment rate could result in a loss of principal to the extent of the premium paid.
For mortgage pass-through securities (the “Mortgage Assets”) there are a number of important differences among the agencies and instrumentalities of the U.S. Government that issue mortgage-related securities and among the securities that they issue. For example, mortgage-related securities guaranteed by Ginnie Mae are guaranteed as to the timely payment of principal and interest by Ginnie Mae and such guarantee is backed by the full faith and credit of the United States. However, mortgage-related securities issued by Freddie Mac and Fannie Mae, including Freddie Mac and Fannie Mae guaranteed mortgage pass-through certificates, which are solely the obligations of Freddie Mac and Fannie Mae, are not backed by or entitled to the full faith and credit of the United States, but are supported by the right of the issuer to borrow from the U.S. Treasury.
Non-agency mortgage-backed securities are securities issued by non-governmental issuers and have no direct or indirect government guarantees of payment and are subject to various risks. Non-agency mortgage loans are obligations of the borrowers thereunder only and are not typically insured or guaranteed by any other person or entity. The ability of a borrower to repay a loan is dependent upon the income or assets of the borrower. A number of factors, including a general economic downturn, acts of God, terrorism, social unrest and civil disturbances, may impair a borrower’s ability to repay its loans.
Collateralized Debt Obligations: Collateralized debt obligations (“CDOs”), including collateralized bond obligations (“CBOs”) and collateralized loan obligations (“CLOs”), are types of asset-backed securities. A CDO is an entity that is backed by a diversified pool of debt securities (CBOs) or syndicated bank loans (CLOs). The cash flows of the CDO can be split into multiple segments, called “tranches,” which will vary in risk profile and yield. The riskiest segment is the subordinated or “equity” tranche. This tranche bears the greatest risk of defaults from the underlying assets in the CDO and serves to protect the other, more senior, tranches from default in all but the most severe circumstances. Since it is shielded from defaults by the more junior tranches, a “senior” tranche will typically have higher credit ratings and lower yields than their underlying securities, and often receive investment grade ratings from one or more of the nationally recognized rating agencies. Despite the protection from the more junior tranches, senior tranches can experience substantial losses due to actual defaults, increased sensitivity to future defaults and the disappearance of one or more protecting tranches as a result of changes in the credit profile of the underlying pool of assets.
Multiple Class Pass-Through Securities: Multiple class pass-through securities, including collateralized mortgage obligations (“CMOs”) and commercial mortgage-backed securities, may be issued by Ginnie Mae, U.S. Government agencies or instrumentalities or by trusts formed by private originators of, or investors in, mortgage loans. In general, CMOs are debt obligations of a legal entity that are collateralized by a pool of residential or commercial mortgage loans or Mortgage Assets. The payments on these are used to make payments on the CMOs or multiple pass-through securities. Multiple class pass-through securities represent direct ownership interests in the Mortgage Assets. Classes of CMOs include interest only (“IOs”), principal only (“POs”), planned amortization classes and targeted amortization classes. IOs and POs are stripped mortgage-backed securities representing interests in a pool of mortgages, the cash flow from which has been separated into interest and principal components. IOs receive the interest portion of the cash flow while POs receive the principal portion. IOs and POs can be extremely volatile in response to changes in interest rates. As interest rates rise and fall, the value of IOs tends to move in the same direction as interest rates. POs perform best when prepayments on the underlying mortgages rise since this increases the rate at which the principal is returned and the yield to maturity on the PO. When payments on mortgages underlying a PO are slower than anticipated, the life of the PO is lengthened and the yield to maturity is reduced. If the underlying Mortgage Assets experience greater than anticipated prepayments of principal, the Trust’s initial investment in the IOs may not fully recoup.
Stripped Mortgage-Backed Securities: Stripped mortgage-backed securities are typically issued by the U.S. Government, its agencies and instrumentalities. Stripped mortgage-backed securities are usually structured with two classes that receive different proportions of the interest (IOs) and principal (POs) distributions on a pool of Mortgage Assets. Stripped mortgage-backed securities may be privately issued.
Zero-Coupon Bonds: Zero-coupon bonds are normally issued at a significant discount from face value and do not provide for periodic interest payments. These bonds may experience greater volatility in market value than other debt obligations of similar maturity which provide for regular interest payments.
Capital Securities and Trust Preferred Securities: Capital securities, including trust preferred securities, are typically issued by corporations, generally in the form of interest-bearing notes with preferred securities characteristics. In the case of trust preferred securities, an affiliated business trust of a corporation issues these securities, generally in the form of beneficial interests in subordinated debentures or similarly structured securities. The securities can be structured with either a fixed or adjustable coupon that can have either a perpetual or stated maturity date. For trust preferred securities, the issuing bank or corporation pays interest to the trust, which is then distributed to holders of these securities as a dividend. Dividends can be deferred without creating an event of default or acceleration, although maturity cannot take place unless all cumulative payment obligations have been met. The deferral of payments does not affect the purchase or sale of these securities in the open market. These securities generally are rated below that of the issuing company’s senior debt securities and are freely callable at the issuer’s option.
Floating Rate Loan Interests: Floating rate loan interests are typically issued to companies (the “borrower”) by banks, other financial institutions, or privately and publicly offered corporations (the “lender”). Floating rate loan interests are generally non-investment grade, often involve borrowers whose financial condition is troubled or uncertain and companies that are highly leveraged or in bankruptcy proceedings. In addition, transactions in floating rate loan interests may settle on a delayed basis, which may result in proceeds from the sale not being readily available for a trust to make additional investments or meet its redemption obligations. Floating rate loan interests may include fully funded term loans or revolving lines of credit. Floating rate loan interests are typically senior in the corporate capital structure of the borrower. Floating rate loan interests generally pay interest at rates that are periodically determined by reference to a base lending rate plus a premium. Since the rates reset only periodically, changes in prevailing interest rates (and particularly sudden and significant changes) can be expected to cause some fluctuations in the NAV of a trust to the extent that it invests in floating rate loan interests. The base lending rates are generally the lending rate offered by one or more European banks, such as the London Interbank Offered Rate (“LIBOR”), the prime rate offered by one or more U.S. banks or the certificate of deposit rate. Floating rate loan interests may involve foreign borrowers, and investments may be denominated in foreign currencies. These investments are treated as investments in debt securities for purposes of a trust’s investment policies.
| | |
| 30 | | 2017 BLACKROCK ANNUAL REPORTTO SHAREHOLDERS |
Notes to Financial Statements (continued)
When a trust purchases a floating rate loan interest, it may receive a facility fee and when it sells a floating rate loan interest, it may pay a facility fee. On an ongoing basis, a trust may receive a commitment fee based on the undrawn portion of the underlying line of credit amount of a floating rate loan interest. Facility and commitment fees are typically amortized to income over the term of the loan or term of the commitment, respectively. Consent and amendment fees are recorded to income as earned. Prepayment penalty fees, which may be received by a trust upon the prepayment of a floating rate loan interest by a borrower, are recorded as realized gains. A trust may invest in multiple series or tranches of a loan. A different series or tranche may have varying terms and carry different associated risks.
Floating rate loan interests are usually freely callable at the borrower’s option. A trust may invest in such loans in the form of participations in loans (“Participations”) or assignments (“Assignments”) of all or a portion of loans from third parties. Participations typically will result in a trust having a contractual relationship only with the lender, not with the borrower. A trust has the right to receive payments of principal, interest and any fees to which it is entitled only from the lender selling the Participation and only upon receipt by the lender of the payments from the borrower. In connection with purchasing Participations, a trust generally will have no right to enforce compliance by the borrower with the terms of the loan agreement, nor any rights of offset against the borrower. A trust may not benefit directly from any collateral supporting the loan in which it has purchased the Participation. As a result, a trust assumes the credit risk of both the borrower and the lender that is selling the Participation. A trust’s investment in loan participation interests involves the risk of insolvency of the financial intermediaries who are parties to the transactions. In the event of the insolvency of the lender selling the Participation, a trust may be treated as a general creditor of the lender and may not benefit from any offset between the lender and the borrower. Assignments typically result in a trust having a direct contractual relationship with the borrower, and a trust may enforce compliance by the borrower with the terms of the loan agreement.
Forward Commitments and When-Issued Delayed Delivery Securities: The trust may purchase securities on a when-issued basis and may purchase or sell securities on a forward commitment basis. Settlement of such transactions normally occurs within a month or more after the purchase or sale commitment is made. The trust may purchase securities under such conditions with the intention of actually acquiring them, but may enter into a separate agreement to sell the securities before the settlement date. Since the value of securities purchased may fluctuate prior to settlement, the trust may be required to pay more at settlement than the security is worth. In addition, the trust is not entitled to any of the interest earned prior to settlement. When purchasing a security on a delayed delivery basis, the trust assumes the rights and risks of ownership of the security, including the risk of price and yield fluctuations. In the event of default by the counterparty, the trust’s maximum amount of loss is the unrealized appreciation of unsettled when-issued transactions.
TBA Commitments: TBA commitments are forward agreements for the purchase or sale of mortgage-backed securities for a fixed price, with payment and delivery on an agreed upon future settlement date. The specific securities to be delivered are not identified at the trade date. However, delivered securities must meet specified terms, including issuer, rate and mortgage terms. When entering into TBA commitments, a trust may take possession of or deliver the underlying mortgage-backed securities but can extend the settlement or roll the transaction. TBA commitments involve a risk of loss if the value of the security to be purchased or sold declines or increases, respectively, prior to settlement date.
In order to better define contractual rights and to secure rights that will help a trust mitigate its counterparty risk, TBA commitments may be entered into by a trust under Master Securities Forward Transaction Agreements (each, an “MSFTA”). An MSFTA typically contains, among other things, collateral posting terms and netting provisions in the event of default and/or termination event. The collateral requirements are typically calculated by netting the mark-to-market amount for each transaction under such agreement and comparing that amount to the value of the collateral currently pledged by a trust and the counterparty. Cash collateral that has been pledged to cover the obligations of a trust and cash collateral received from the counterparty, if any, is reported separately on the Statement of Assets and Liabilities as cash pledged as collateral for TBA commitments or cash received as collateral for TBA commitments, respectively. Non-cash collateral pledged by a trust, if any, is noted in the Schedule of Investments. Typically, a trust is permitted to sell, re-pledge or use the collateral it receives; however, the counterparty is not permitted to do so. To the extent amounts due to a trust is not fully collateralized, contractually or otherwise, a trust bears the risk of loss from counterparty non-performance.
Mortgage Dollar Roll Transactions: The trust may sell TBA mortgage-backed securities and simultaneously contract to repurchase substantially similar (i.e., same type, coupon and maturity) securities on a specific future date at an agreed upon price. During the period between the sale and repurchase, a trust is not entitled to receive interest and principal payments on the securities sold. Mortgage dollar roll transactions are treated as purchases and sales and realize gains and losses on these transactions. Mortgage dollar rolls involve the risk that the market value of the securities that a trust is required to purchase may decline below the agreed upon repurchase price of those securities.
Reverse Repurchase Agreements: Reverse repurchase agreements are agreements with qualified third party broker dealers in which a trust sells securities to a bank or broker-dealer and agrees to repurchase the same securities at a mutually agreed upon date and price. A trust receives cash from the sale to use for other investment purposes. During the term of the reverse repurchase agreement, a trust continues to receive the principal and interest payments on the securities sold. Certain agreements have no stated maturity and can be terminated by either party at any time. Interest on the value of the reverse repurchase agreements issued and outstanding is based upon competitive market rates determined at the time of issuance. A trust may utilize reverse repurchase agreements when it is anticipated that the interest income to be earned from the investment of the proceeds of the transaction is greater than the interest expense of the transaction. Reverse repurchase agreements involve leverage risk. If a trust suffers a loss on its investment of the transaction proceeds from a reverse repurchase agreement, a trust would still be required to pay the full repurchase price. Further, a trust remains subject to the risk that the market value of the securities repurchased declines below the repurchase price. In such cases, a trust would be required to return a portion of the cash received from the transaction or provide additional securities to the counterparty.
Cash received in exchange for securities delivered plus accrued interest due to the counterparty is recorded as a liability in the Statement of Assets and Liabilities at face value including accrued interest. Due to the short-term nature of the reverse repurchase agreements, face value approximates fair value. Interest payments made by a trust to the counterparties are recorded as a component of interest expense in the Statement of Operations. In periods of increased demand for the security, a trust may receive a fee for the use of the security by the counterparty, which may result in interest income to a trust.
For the year ended December 31, 2017, the average amount of reverse repurchase agreements outstanding and the daily weighted average interest rate for the Trust were $77,819,170 and 1.86%, respectively.
Reverse repurchase transactions are entered into by a trust under Master Repurchase Agreements (each, an “MRA”), which permit a trust, under certain circumstances, including an event of default (such as bankruptcy or insolvency), to offset payables and/or receivables under the MRA with collateral held and/or posted to the counterparty
| | | | |
| NOTESTO FINANCIAL STATEMENTS | | | 31 | |
Notes to Financial Statements (continued)
and create one single net payment due to or from a trust. With reverse repurchase transactions, typically a trust and counterparty under an MRA are permitted to sell, re-pledge, or use the collateral associated with the transaction. Bankruptcy or insolvency laws of a particular jurisdiction may impose restrictions on or prohibitions against such a right of offset in the event of the MRA counterparty’s bankruptcy or insolvency. Pursuant to the terms of the MRA, a trust receives or posts securities as collateral with a market value in excess of the repurchase price to be paid or received by a trust upon the maturity of the transaction. Upon a bankruptcy or insolvency of the MRA counterparty, a trust is considered an unsecured creditor with respect to excess collateral and, as such, the return of excess collateral may be delayed.
As of period end, the following table is a summary of the Trust’s open reverse repurchase agreements by counterparty which are subject to offset under an MRA on a net basis:
| | | | | | | | | | | | | | | | |
| Counterparty | | Reverse Repurchase
Agreements | | | Fair Value of Non-cash Collateral
Pledged Including
Accrued Interest (a) | | | Cash Collateral
Pledged/Received | | | Net Amount | |
Barclays Capital, Inc. | | $ | 11,776,912 | | | $ | (11,776,912 | ) | | $ | — | | | $ | — | |
BNP Paribas | | | 6,044,553 | | | | (6,044,553 | ) | | | — | | | | — | |
Credit Suisse Securities (USA) LLC | | | 21,364,816 | | | | (21,364,816 | ) | | | — | | | | — | |
Deutsche Bank Securities, Inc. | | | 3,151,893 | | | | (3,151,893 | ) | | | — | | | | — | |
J.P. Morgan Securities LLC | | | 1,104,230 | | | | (1,104,230 | ) | | | — | | | | — | |
RBC Capital Markets LLC | | | 57,539,184 | | | | (57,539,184 | ) | | | — | | | | — | |
| | | | | | | | | | | | | | | | |
| | $ | 100,981,588 | | | $ | (100,981,588 | ) | | $ | — | | | $ | — | |
| | | | | | | | | | | | | | | | |
| | (a) | Net collateral, including accrued interest, with a value of $122,447,957 has been pledged/received in connection with open reverse repurchase agreements. Excess of net collateral pledged to the individual counterparty is not shown for financial reporting purposes. | |
In the event the counterparty of securities under an MRA files for bankruptcy or becomes insolvent, a trust’s use of the proceeds from the agreement may be restricted while the counterparty, or its trustee or receiver, determines whether or not to enforce a trust’s obligation to repurchase the securities.
| 5. | DERIVATIVE FINANCIAL INSTRUMENTS |
The Trust engages in various portfolio investment strategies using derivative contracts both to increase the returns of the Trust and/or to manage its exposure to certain risks such as credit risk, equity risk, interest rate risk, foreign currency exchange rate risk, commodity price risk or other risks (e.g., inflation risk). Derivative financial instruments categorized by risk exposure are included in the Schedule of Investments. These contracts may be transacted on an exchange or OTC.
Futures Contracts: Futures contracts are purchased or sold to gain exposure to, or manage exposure to, changes in interest rates (interest rate risk), changes in the value of equity securities (equity risk) or foreign currencies (foreign currency exchange rate risk).
Futures contracts are agreements between the Trust and a counterparty to buy or sell a specific quantity of an underlying instrument at a specified price and on a specified date. Depending on the terms of a contract, it is settled either through physical delivery of the underlying instrument on the settlement date or by payment of a cash amount on the settlement date. Upon entering into a futures contract, the Trust is required to deposit initial margin with the broker in the form of cash or securities in an amount that varies depending on a contract’s size and risk profile. The initial margin deposit must then be maintained at an established level over the life of the contract.
Securities deposited as initial margin are designated in the Schedule of Investments and cash deposited, if any, is shown as cash pledged for futures contracts in the Statement of Assets and Liabilities. Pursuant to the contract, the Trust agrees to receive from or pay to the broker an amount of cash equal to the daily fluctuation in market value of the contract (“variation margin”). Variation margin is recorded as unrealized appreciation (depreciation) and, if any, shown as variation margin receivable (or payable) on futures contracts in the Statement of Assets and Liabilities. When the contract is closed, a realized gain or loss is recorded in the Statement of Operations equal to the difference between the notional amount of the contract at the time it was opened and the notional amount at the time it was closed. The use of futures contracts involves the risk of an imperfect correlation in the movements in the price of futures contracts and interest, foreign currency exchange rates or underlying assets.
Forward Foreign Currency Exchange Contracts: Forward foreign currency exchange contracts are entered into to gain or reduce exposure to foreign currencies (foreign currency exchange rate risk).
A forward foreign currency exchange contract is an agreement between two parties to buy and sell a currency at a set exchange rate on a specified date. These contracts help to manage the overall exposure to the currencies in which some of the investments held by the Trust are denominated and in some cases, may be used to obtain exposure to a particular market.
The contract is marked-to-market daily and the change in market value is recorded as unrealized appreciation (depreciation) in the Statement of Assets and Liabilities. When a contract is closed, a realized gain or loss is recorded in the Statement of Operations equal to the difference between the value at the time it was opened and the value at the time it was closed. Non-deliverable forward foreign currency exchange contracts are settled with the counterparty in cash without the delivery of foreign currency. The use of forward foreign currency exchange contracts involves the risk that the value of a forward foreign currency exchange contract changes unfavorably due to movements in the value of the referenced foreign currencies.
Options: The Trust purchases and writes call and put options to increase or decrease its exposure to the risks of underlying instruments, including equity risk, interest rate risk and/or commodity price risk and/or, in the case of options written, to generate gains from options premiums.
A call option gives the purchaser (holder) of the option the right (but not the obligation) to buy, and obligates the seller (writer) to sell (when the option is exercised) the underlying instrument at the exercise or strike price at any time or at a specified time during the option period. A put option gives the holder the right to sell and obligates the writer to buy the underlying instrument at the exercise or strike price at any time or at a specified time during the option period.
| | |
| 32 | | 2017 BLACKROCK ANNUAL REPORTTO SHAREHOLDERS |
Notes to Financial Statements (continued)
Premiums paid on options purchased and premiums received on options written, as well as the daily fluctuation in market value, are included in investments at value — unaffiliated and options written at value, respectively, in the Statement of Assets and Liabilities. When an instrument is purchased or sold through the exercise of an option, the premium is offset against the cost or proceeds of the underlying instrument. When an option expires, a realized gain or loss is recorded in the Statement of Operations to the extent of the premiums received or paid. When an option is closed or sold, a gain or loss is recorded in the Statement of Operations to the extent the cost of the closing transaction exceeds the premiums received or paid. When the Trust writes a call option, such option is typically “covered,” meaning that it holds the underlying instrument subject to being called by the option counterparty. When the Trust writes a put option, such option is covered by cash in an amount sufficient to cover the obligation.
In purchasing and writing options, the Trust bears the risk of an unfavorable change in the value of the underlying instrument or the risk that it may not be able to enter into a closing transaction due to an illiquid market. Exercise of a written option could result in the Trust purchasing or selling a security when it otherwise would not, or at a price different from the current market value.
Swaps: Swap contracts are entered into to manage exposure to issuers, markets and securities. Such contracts are agreements between the Trust and a counterparty to make periodic net payments on a specified notional amount or a net payment upon termination. Swap agreements are privately negotiated in the OTC market and may be entered into as a bilateral contract (“OTC swaps”) or centrally cleared (“centrally cleared swaps”).
For OTC swaps, any upfront premiums paid and any upfront fees received are shown as swap premiums paid and swap premiums received, respectively, in the Statement of Assets and Liabilities and amortized over the term of the contract. The daily fluctuation in market value is recorded as unrealized appreciation (depreciation) on OTC Swaps in the Statement of Assets and Liabilities. Payments received or paid are recorded in the Statement of Operations as realized gains or losses, respectively. When an OTC swap is terminated, a realized gain or loss is recorded in the Statement of Operations equal to the difference between the proceeds from (or cost of) the closing transaction and the Trust’s basis in the contract, if any. Generally, the basis of the contract is the premium received or paid.
In a centrally cleared swap, immediately following execution of the swap contract, the swap contract is novated to a central counterparty (the “CCP”) and the Trust’s counterparty on the swap agreement becomes the CCP. The Trust is required to interface with the CCP through the broker. Upon entering into a centrally cleared swap, the Trust is required to deposit initial margin with the broker in the form of cash or securities in an amount that varies depending on the size and risk profile of the particular swap. Securities deposited as initial margin are designated in the Schedule of Investments and cash deposited is shown as cash pledged for centrally cleared swaps in the Statement of Assets and Liabilities. Pursuant to the contract, the Trust agrees to receive from or pay to the broker an amount of cash equal to the daily fluctuation in market value of the contract (“variation margin”). Variation margin is recorded as unrealized appreciation (depreciation) and shown as variation margin receivable (or payable) on centrally cleared swaps in the Statement of Assets and Liabilities. Payments received from (paid to) the counterparty, including at termination, are recorded as realized gains (losses) in the Statement of Operations.
| | • | | Credit default swaps — Credit default swaps are entered into to manage exposure to the market or certain sectors of the market, to reduce risk exposure to defaults of corporate and/or sovereign issuers or to create exposure to corporate and/or sovereign issuers to which a trust is not otherwise exposed (credit risk). |
The Trust may either buy or sell (write) credit default swaps on single-name issuers (corporate or sovereign), a combination or basket of single-name issuers or traded indexes. Credit default swaps are agreements in which the protection buyer pays fixed periodic payments to the seller in consideration for a promise from the protection seller to make a specific payment should a negative credit event take place with respect to the referenced entity (e.g., bankruptcy, failure to pay, obligation acceleration, repudiation, moratorium or restructuring). As a buyer, if an underlying credit event occurs, the Trust will either (i) receive from the seller an amount equal to the notional amount of the swap and deliver the referenced security or underlying securities comprising the index, or (ii) receive a net settlement of cash equal to the notional amount of the swap less the recovery value of the security or underlying securities comprising the index. As a seller (writer), if an underlying credit event occurs, the Trust will either pay the buyer an amount equal to the notional amount of the swap and take delivery of the referenced security or underlying securities comprising the index or pay a net settlement of cash equal to the notional amount of the swap less the recovery value of the security or underlying securities comprising the index.
| | • | | Interest rate swaps — Interest rate swaps are entered into to gain or reduce exposure to interest rates or to manage duration, the yield curve or interest rate (interest rate risk). |
Interest rate swaps are agreements in which one party pays a stream of interest payments, either fixed or floating, in exchange for another party’s stream of interest payments, either fixed or floating, on the same notional amount for a specified period of time. In more complex interest rate swaps, the notional principal amount may decline (or amortize) over time.
Swap transactions involve, to varying degrees, elements of interest rate, credit and market risk in excess of the amounts recognized in the Statement of Assets and Liabilities. Such risks involve the possibility that there will be no liquid market for these agreements, that the counterparty to the agreements may default on its obligation to perform or disagree as to the meaning of the contractual terms in the agreements, and that there may be unfavorable changes in interest rates and/or market values associated with these transactions.
Master Netting Arrangements: In order to define its contractual rights and to secure rights that will help it mitigate its counterparty risk, the Trust may enter into an International Swaps and Derivatives Association, Inc. Master Agreement (“ISDA Master Agreement”) or similar agreement with its counterparties. An ISDA Master Agreement is a bilateral agreement between the Trust and a counterparty that governs certain OTC derivatives and typically contains, among other things, collateral posting terms and netting provisions in the event of a default and/or termination event. Under an ISDA Master Agreement, the Trust may, under certain circumstances, offset with the counterparty certain derivative financial instruments’ payables and/or receivables with collateral held and/or posted and create one single net payment. The provisions of the ISDA Master Agreement typically permit a single net payment in the event of default including the bankruptcy or insolvency of the counterparty. Bankruptcy or insolvency laws of a particular jurisdiction may restrict or prohibit the right of offset in bankruptcy, insolvency or other events.
Collateral Requirements: For derivatives traded under an ISDA Master Agreement, the collateral requirements are typically calculated by netting the mark-to-market amount for each transaction under such agreement and comparing that amount to the value of any collateral currently pledged by the Trust and the counterparty.
| | | | |
| NOTESTO FINANCIAL STATEMENTS | | | 33 | |
Notes to Financial Statements (continued)
Cash collateral that has been pledged to cover obligations of the Trust and cash collateral received from the counterparty, if any, is reported separately on the Statement of Assets and Liabilities as cash pledged as collateral and cash received as collateral, respectively. Non-cash collateral pledged by the Trust, if any, is noted in the Schedule of Investments. Generally, the amount of collateral due from or to a counterparty is subject to a certain minimum transfer amount threshold before a transfer is required, which is determined at the close of business of the Trust. Any additional required collateral is delivered to/pledged by the Trust on the next business day. Typically, the counterparty is not permitted to sell, re-pledge or use cash and non-cash collateral it receives. The Trust generally agrees not to use non-cash collateral that it receives but may, absent default or certain other circumstances defined in the underlying ISDA Master Agreement, be permitted to use cash collateral received. In such cases, interest may be paid pursuant to the collateral arrangement with the counterparty. To the extent amounts due to the Trust from its counterparties are not fully collateralized, it bears the risk of loss from counterparty non-performance. Likewise, to the extent the Trust has delivered collateral to a counterparty and stands ready to perform under the terms of its agreement with such counterparty, it bears the risk of loss from a counterparty in the amount of the value of the collateral in the event the counterparty fails to return such collateral. Based on the terms of agreements, collateral may not be required for all derivative contracts.
For financial reporting purposes, the Trust does not offset derivative assets and derivative liabilities that are subject to netting arrangements, if any, in the Statement of Assets and Liabilities.
| 6. | INVESTMENT ADVISORY AGREEMENT AND OTHER TRANSACTIONS WITH AFFILIATES |
The PNC Financial Services Group, Inc. is the largest stockholder and an affiliate of BlackRock, Inc. (“BlackRock”) for 1940 Act purposes.
Investment Advisory: The Trust entered into an Investment Advisory Agreement with the Manager, the Trust’s investment adviser, an indirect, wholly-owned subsidiary of BlackRock, to provide investment advisory and administrative services. The Manager is responsible for the management of the Trust’s portfolio and provides the personnel, facilities, equipment and certain other services necessary to the operations of the Trust.
For such services, the Trust pays the Manager a monthly fee at an annual rate equal to 0.60% of the average daily value of the Trust’s managed assets (including any assets attributable to money borrowed for investment purposes). For purposes of calculating this fee, “managed assets” mean the total assets of the Trust minus the sum of its accrued liabilities (other than money borrowed for investment purposes).
The Manager entered into a sub-advisory agreement with BlackRock International Limited (“BIL”) and BlackRock (Singapore) Limited (“BRS”), each an affiliate of the Manager. The Manager pays BIL and BRS, for services they provide, a monthly fee that is a percentage of the investment advisory fees paid by the Trust to the Manager.
Expense Waivers: With respect to the Trust, the Manager voluntarily agreed to waive its investment advisory fees by the amount of investment advisory fees the Trust pays to the Manager indirectly through its investment in affiliated money market funds (the “affiliated money market fund waiver”). This amount is included in fees waived and/or reimbursed by the Manager in the Statement of Operations. For the period ended December 31, 2017, the amount waived was $8,224.
The Manager contractually agreed to waive its investment advisory fee with respect to any portion of the Trust’s assets invested in affiliated equity and fixed-income mutual funds and affiliated exchange-traded funds that have a contractual management fee through June 30, 2018. The agreement can be renewed for annual periods thereafter, and may be terminated on 90 days’ notice by a majority of the Trust’s Independent Trustees. This amount is included in fees waived and/or reimbursed by the Manager in the Statement of Operations. For the period ended December 31, 2017, the Trust waived $2,945 in investment advisory fees pursuant to this arrangement.
Officers and Trustees: Certain Trustees and/or officers of the Trust are trustees and/or officers of BlackRock or its affiliates. The Trust reimburses the Manager for a portion of the compensation paid to the Trust’s Chief Compliance Officer, which is included in Trustees and Officer in the Statement of Operations.
Other Transactions: The Trust may purchase securities from, or sell securities to, an affiliated fund provided the affiliation is due solely to having a common investment adviser, common officers, or common trustees. For the period ended December 31, 2017, the purchase and sale transactions and any net realized gains (losses) with an affiliated fund in compliance with Rule 17a-7 under the 1940 Act were as follows:
| | | | |
| Purchases | | Sales | | Net Realized Gain (Loss) |
| $8,525,015 | | $577,899 | | $21,429 |
For the period ended December 31, 2017, purchases and sales of investments, including paydowns and excluding short-term securities, were $673,095,234 and $351,475,586, respectively.
For the period ended December 31, 2017, purchases and sales related to mortgage dollar rolls were $89,940,262 and $90,073,145, respectively.
It is the Trust’s policy to comply with the requirements of the Internal Revenue Code of 1986, as amended, applicable to regulated investment companies, and to distribute substantially all of its taxable income to its shareholders. Therefore, no U.S. federal income tax provision is required.
The Trust files U.S. federal and various state and local tax returns. No income tax returns are currently under examination. The statute of limitations on the Trust’s U.S. federal tax returns generally remains open for the period ended December 31, 2017. The statutes of limitations on the Trust’s state and local tax returns may remain open for an additional year depending upon the jurisdiction.
Management has analyzed tax laws and regulations and their application to the Trust as of December 31, 2017, inclusive of the open tax return years, and does not believe that there are any uncertain tax positions that require recognition of a tax liability in the Trust’s financial statements.
| | |
| 34 | | 2017 BLACKROCK ANNUAL REPORTTO SHAREHOLDERS |
Notes to Financial Statements (continued)
US GAAP requires that certain components of net assets be adjusted to reflect permanent differences between financial and tax reporting. These reclassifications have no effect on net assets or net asset values per share. As of period end, the following permanent differences attributable to the accounting for foreign currency transactions, accounting for swap agreements and the characterization of expenses were reclassified to the following accounts:
| | | | |
Paid-in capital | | $ | (76,500 | ) |
Undistributed net investment income | | | 324,572 | |
Accumulated net realized loss | | | (248,072 | ) |
The tax character of distributions paid was as follows:
| | | | |
| | | 12/31/17 | |
Ordinary income | | $ | 11,476,197 | |
As of period end, the tax components of accumulated net earnings (losses) were as follows:
| | | | |
Undistributed ordinary income | | $ | 134,434 | |
Net unrealized gains(a) | | | 3,325,237 | |
| | | | |
| | $ | 3,459,671 | |
| | | | |
| | (a) | The difference between book-basis and tax-basis net unrealized gains was attributable primarily to the tax deferral of losses on wash sales and straddles, the realization for tax purposes of unrealized gains/losses on certain futures and foreign currency contracts, the accounting for swap agreements and the classification of investments. | |
As of December 31, 2017, gross unrealized appreciation and depreciation for investments and derivatives based on cost for U.S. federal income tax purposes were as follows:
| | | | |
Tax cost | | $ | 332,197,096 | |
| | | | |
Gross unrealized appreciation | | | 6,253,830 | |
Gross unrealized depreciation | | | (2,856,806 | ) |
| | | | |
Net unrealized appreciation | | $ | 3,397,024 | |
| | | | |
In the normal course of business, the Trust invests in securities or other instruments and may enter into certain transactions, and such activities subject the Trust to various risks, including among others, fluctuations in the market (market risk) or failure of an issuer to meet all of its obligations. The value of securities or other instruments may also be affected by various factors, including, without limitation: (i) the general economy; (ii) the overall market as well as local, regional or global political and/or social instability; (iii) regulation, taxation or international tax treaties between various countries; or (iv) currency, interest rate and price fluctuations.
Investments in the securities of issuers domiciled in countries with emerging capital markets involve certain additional risks that do not generally apply to investments in securities of issuers in more developed capital markets, such as (i) low or nonexistent trading volume, resulting in a lack of liquidity and increased volatility in prices for such securities; (ii) uncertain national policies and social, political and economic instability, increasing the potential for expropriation of assets, confiscatory taxation, high rates of inflation or unfavorable diplomatic developments; and (iii) possible fluctuations in exchange rates, differing legal systems and the existence or possible imposition of exchange controls, custodial restrictions or other foreign or U.S. governmental laws or restrictions applicable to such investments.
The Trust may be exposed to prepayment risk, which is the risk that borrowers may exercise its option to prepay principal earlier than scheduled during periods of declining interest rates, which would force the Trust to reinvest in lower yielding securities. The Trust may also be exposed to reinvestment risk, which is the risk that income from the Trust’s portfolio will decline if the Trust invests the proceeds from matured, traded or called fixed-income securities at market interest rates that are below the Trust portfolio’s current earnings rate.
The Trust is not a target term fund and thus does not seek to return its initial public offering price of $10.00 per common share upon termination. The final distribution of net assets upon termination may be more than, equal to or less than $10.00 per common share.
Investment Objective Risk: There is no assurance that the Trust will achieve its investment objective. A variety of circumstances may make it extremely difficult for the Trust to achieve its investment objective. Such circumstances include, but may not be limited to, the existence of an inverted yield curve, a rapid and significant increase in interest rates, a significant decrease in issuer credit quality generally and/or increased defaults, increased volatility in currency markets and/or in currency exchange rates and negative economic, market, political and/or social developments impacting emerging markets. Additionally, the limited term of the Trust may increase the risk that the Trust may not meet its investment objective. A limited term limits the period during which the Trust can generate returns and increases the potential impact that a disruptive market event or one or more of the conditions outlined above could have on the Trust’s annualized returns.
Valuation Risk: The price the Trust could receive upon the sale of any particular portfolio investment may differ from the Trust’s valuation of the investment, particularly for securities that trade in thin or volatile markets or that are valued using a fair valuation technique or a price provided by an independent pricing service. Changes to significant unobservable inputs and assumptions (i.e., publicly traded company multiples, growth rate, time to exit) due to the lack of observable inputs may significantly impact the resulting fair value and therefore the Trust’s results of operations. As a result, the price received upon the sale of an investment may be less than the value ascribed by the Trust, and the Trust could realize a greater than expected loss or lesser than expected gain upon the sale of the investment. The Trust’s ability to value its investments may also be impacted by technological issues and/or errors by pricing services or other third party service providers.
| | | | |
| NOTESTO FINANCIAL STATEMENTS | | | 35 | |
Notes to Financial Statements (continued)
Counterparty Credit Risk: The Trust may be exposed to counterparty credit risk, or the risk that an entity may fail to or be unable to perform on its commitments related to unsettled or open transactions. The Trust manages counterparty credit risk by entering into transactions only with counterparties that the Manager believes have the financial resources to honor its obligations and by monitoring the financial stability of those counterparties. Financial assets, which potentially expose the Trust to market, issuer and counterparty credit risks, consist principally of financial instruments and receivables due from counterparties. The extent of the Trust’s exposure to market, issuer and counterparty credit risks with respect to these financial assets is approximately their value recorded in the Statement of Assets and Liabilities, less any collateral held by the Trust.
A derivative contract may suffer a mark-to-market loss if the value of the contract decreases due to an unfavorable change in the market rates or values of the underlying instrument. Losses can also occur if the counterparty does not perform under the contract.
The Trust’s risk of loss from counterparty credit risk on OTC derivatives is generally limited to the aggregate unrealized gain less the value of any collateral held by the Trust.
For OTC options purchased, the Trust bears the risk of loss in the amount of the premiums paid plus the positive change in market values net of any collateral held by the Trust should the counterparty fail to perform under the contracts. Options written by the Trust do not typically give rise to counterparty credit risk, as options written generally obligate the Trust, and not the counterparty, to perform. The Trust may be exposed to counterparty credit risk with respect to options written to the extent the Trust deposits collateral with its counterparty to a written option.
With exchange-traded options purchased, futures and centrally cleared swaps, there is less counterparty credit risk to the Trust since the exchange or clearinghouse, as counterparty to such instruments, guarantees against a possible default. The clearinghouse stands between the buyer and the seller of the contract; therefore, credit risk is limited to failure of the clearinghouse. While offset rights may exist under applicable law, the Trust does not have a contractual right of offset against a clearing broker or clearinghouse in the event of a default (including the bankruptcy or insolvency). Additionally, credit risk exists in exchange-traded futures and centrally cleared swaps with respect to initial and variation margin that is held in a clearing broker’s customer accounts. While clearing brokers are required to segregate customer margin from their own assets, in the event that a clearing broker becomes insolvent or goes into bankruptcy and at that time there is a shortfall in the aggregate amount of margin held by the clearing broker for all its clients, typically the shortfall would be allocated on a pro rata basis across all the clearing broker’s customers, potentially resulting in losses to the Trust.
Concentration Risk: The Trust may invest in securities that are rated below investment grade quality (sometimes called “junk bonds”), which are predominantly speculative, have greater credit risk and generally are less liquid and have more volatile prices than higher quality securities.
The Trust invests a significant portion of its assets in fixed-income securities and/or uses derivatives tied to the fixed-income markets. Changes in market interest rates or economic conditions may affect the value and/or liquidity of such investments. Interest rate risk is the risk that prices of bonds and other fixed-income securities will increase as interest rates fall and decrease as interest rates rise. The Trust may be subject to a greater risk of rising interest rates due to the current period of historically low rates.
The Trust invests a significant portion of its assets in securities backed by commercial or residential mortgage loans or in issuers that hold mortgage and other asset-backed securities. Investment percentages in these securities are presented in the Schedule of Investments. Changes in economic conditions, including delinquencies and/or defaults on assets underlying these securities, can affect the value, income and/or liquidity of such positions.
| 10. | CAPITAL SHARE TRANSACTIONS |
The Trust is authorized to issue an unlimited numbers of shares, all of which were initially classified as Common Shares. The Board is authorized, however, to reclassify any unissued Common Shares without the approval of Common Shareholders.
Shares issued and outstanding for the period February 27, 2017 to December 31, 2017, increased by 32,321 as a result of dividend reinvestment and 21,000,000 from the initial public offering and 1,078,639 from the underwriters’ exercising the over-allotment option.
At December 31, 2017, shares owned by BlackRock HoldCo 2, Inc., an affiliate of the Trust, was 17,919.
Management’s evaluation of the impact of all subsequent events on the Trust’s financial statements was completed through the date the financial statements were issued and the following items were noted:
The Trust paid a net investment income dividend in the amount of $0.050 per share on January 9, 2018 to Common shareholders of record on December 29, 2017.
Additionally, the Trust declared a net investment income dividend of $0.050 per share on February 1, 2018 payable to Common Shareholders of record on February 15, 2018.
| | |
| 36 | | 2017 BLACKROCK ANNUAL REPORTTO SHAREHOLDERS |
Report of Independent Registered Public Accounting Firm
To the Shareholders and the Board of Trustees of BlackRock 2022 Global Income Opportunity Trust:
Opinion on the Financial Statements and Financial Highlights
We have audited the accompanying statement of assets and liabilities, including the schedule of investments, of BlackRock 2022 Global Income Opportunity Trust (the “Fund”), as of December 31, 2017, the related statements of operations, cash flows, changes in net assets, the financial highlights for the period from February 27, 2017 (commencement of operations) to December 31, 2017, and the related notes. In our opinion, the financial statements and financial highlights present fairly, in all material respects, the financial position of the Fund as of December 31, 2017, and the results of its operations, the changes in its net assets, its cash flows, and the financial highlights for the period from February 27, 2017 to December 31, 2017, in conformity with accounting principles generally accepted in the United States of America.
Basis for Opinion
These financial statements and financial highlights are the responsibility of the Fund’s management. Our responsibility is to express an opinion on the Fund’s financial statements and financial highlights based on our audit. We are a public accounting firm registered with the Public Company Accounting Oversight Board (United States) (PCAOB) and are required to be independent with respect to the Fund in accordance with the U.S. federal securities laws and the applicable rules and regulations of the Securities and Exchange Commission and the PCAOB.
We conducted our audit in accordance with the standards of the PCAOB. Those standards require that we plan and perform the audit to obtain reasonable assurance about whether the financial statements and financial highlights are free of material misstatement, whether due to error or fraud. The Fund is not required to have, nor were we engaged to perform, an audit of its internal control over financial reporting. As part of our audit we are required to obtain an understanding of internal control over financial reporting but not for the purpose of expressing an opinion on the effectiveness of the Fund’s internal control over financial reporting. Accordingly, we express no such opinion.
Our audit included performing procedures to assess the risks of material misstatement of the financial statements and financial highlights, whether due to error or fraud, and performing procedures that respond to those risks. Such procedures included examining, on a test basis, evidence regarding the amounts and disclosures in the financial statements and financial highlights. Our audit also included evaluating the accounting principles used and significant estimates made by management, as well as evaluating the overall presentation of the financial statements and financial highlights. Our procedures included confirmation of securities owned as of December 31, 2017, by correspondence with the custodian and brokers; when replies were not received from brokers, we performed other auditing procedures. We believe that our audit provide a reasonable basis for our opinion.
Deloitte & Touche LLP
Boston, Massachusetts
February 23, 2018
We have served as the auditor of one or more BlackRock investment companies since 1992.
Important Tax Information (unaudited)
During the fiscal year ended December 31, 2017, the following information is provided with respect to the ordinary income distributions paid by the Fund:
| | | | | | |
| | | Months Paid | | | |
Interest-Related Dividends and Qualified Short-Term Gains for Non-U.S. Residents(a) | | April 2017 — January 2018 | | | 37.24 | % |
| | (a) | Represents the portion of the taxable ordinary distributions eligible for exemption from U.S. withholding tax for nonresident aliens and foreign corporations. | |
| | | | |
| REPORT OF INDEPENDENT REGISTERED PUBLIC ACCOUNTING FIRM / IMPORTANT TAX INFORMATION | | | 37 | |
Automatic Dividend Reinvestment Plan
Pursuant to the Trust’s Dividend Reinvestment Plan (the “Reinvestment Plan”), Common Shareholders are automatically enrolled to have all distributions of dividends and capital gains and other distributions reinvested by Computershare Trust Company, N.A. (the “Reinvestment Plan Agent”) in the respective Trust’s Common Shares pursuant to the Reinvestment Plan. Shareholders who do not participate in the Reinvestment Plan will receive all distributions in cash paid by check and mailed directly to the shareholders of record (or if the shares are held in street name or other nominee name, then to the nominee) by the Reinvestment Plan Agent, which serves as agent for the shareholders in administering the Reinvestment Plan.
After the Trust declares a dividend or determines to make a capital gain or other distribution, the Reinvestment Plan Agent will acquire shares for the participants’ accounts, depending upon the following circumstances, either (i) through receipt of unissued but authorized shares from the Trust (“newly issued shares”) or (ii) by purchase of outstanding shares on the open market or on the Trust’s primary exchange (“open-market purchases”). If, on the dividend payment date, the net asset value per share (“NAV”) is equal to or less than the market price per share plus estimated brokerage commissions (such condition often referred to as a “market premium”), the Reinvestment Plan Agent will invest the dividend amount in newly issued shares acquired on behalf of the participants. The number of newly issued shares to be credited to each participant’s account will be determined by dividing the dollar amount of the dividend by the NAV on the date the shares are issued. However, if the NAV is less than 95% of the market price on the dividend payment date, the dollar amount of the dividend will be divided by 95% of the market price on the dividend payment date. If, on the dividend payment date, the NAV is greater than the market price per share plus estimated brokerage commissions (such condition often referred to as a “market discount”), the Reinvestment Plan Agent will invest the dividend amount in shares acquired on behalf of the participants in open-market purchases. If the Reinvestment Plan Agent is unable to invest the full dividend amount in open-market purchases, or if the market discount shifts to a market premium during the purchase period, the Reinvestment Plan Agent will invest any un-invested portion in newly issued shares. Investments in newly issued shares made in this manner would be made pursuant to the same process described above and the date of issue for such newly issued shares will substitute for the dividend payment date.
You may elect not to participate in the Reinvestment Plan and to receive all dividends in cash by contacting the Reinvestment Plan Agent, at the address set forth below.
Participation in the Reinvestment Plan is completely voluntary and may be terminated or resumed at any time without penalty by notice if received and processed by the Reinvestment Plan Agent prior to the dividend record date. Additionally, the Reinvestment Plan Agent seeks to process notices received after the record date but prior to the payable date and such notices often will become effective by the payable date. Where late notices are not processed by the applicable payable date, such termination or resumption will be effective with respect to any subsequently declared dividend or other distribution.
The Reinvestment Plan Agent’s fees for the handling of the reinvestment of distributions will be paid by the Trust. However, each participant will pay a pro rata share of brokerage commissions incurred with respect to the Reinvestment Plan Agent’s open-market purchases in connection with the reinvestment of all distributions. The automatic reinvestment of all distributions will not relieve participants of any U.S. federal, state or local income tax that may be payable on such dividends or distributions.
The Trust reserves the right to amend or terminate the Reinvestment Plan. There is no direct service charge to participants in the Reinvestment Plan; however, the Trust reserves the right to amend the Reinvestment Plan to include a service charge payable by the participants. Participants that request a sale of shares are subject to a $2.50 sales fee and a $0.15 per share fee. Per share fees include any applicable brokerage commissions the Reinvestment Plan Agent is required to pay. All correspondence concerning the Reinvestment Plan should be directed to Computershare Trust Company, N.A. through the internet at http://www.computershare.com/blackrock, or in writing to Computershare, P.O. Box 505000, Louisville, KY 40233, Telephone: (800) 699-1236. Overnight correspondence should be directed to the Reinvestment Plan Agent at Computershare, 462 South 4th Street, Suite 1600, Louisville, KY 40202.
| | |
| 38 | | 2017 BLACKROCK ANNUAL REPORTTO SHAREHOLDERS |
Trustee and Officer Information
| | | | | | | | |
| Independent Trustees (a) |
| | | | | |
Name Year of Birth (b) | | Position(s) Held
(Length of Service) (c) | | Principal Occupation(s) During Past Five Years | | Number of BlackRock-Advised
Registered Investment Companies
(“RICs”) Consisting of
Investment Portfolios
(“Portfolios”) Overseen (d) | | Public Company and
Investment Company
Directorships During
Past Five Years |
Richard E. Cavanagh 1946 | | Chair of the Board and Trustee (Since 2017) | | Director, The Guardian Life Insurance Company of America since 1998; Board Chair, Volunteers of America (a not-for-profit organization) since 2015 (board member since 2009); Director, Arch Chemical (chemical and allied products) from 1999 to 2011; Trustee, Educational Testing Service from 1997 to 2009 and Chairman thereof from 2005 to 2009; Senior Advisor, The Fremont Group since 2008 and Director thereof since 1996; Faculty Member/Adjunct Lecturer, Harvard University since 2007; President and Chief Executive Officer, The Conference Board, Inc. (global business research organization) from 1995 to 2007. | | 74 RICs consisting of 74 Portfolios | | None |
Karen P. Robards 1950 | | Vice Chair of the Board and Trustee (Since 2017) | | Principal of Robards & Company, LLC (consulting and private investing) since 1987; Co-founder and Director of the Cooke Center for Learning and Development (a not-for-profit organization) since 1987; Investment Banker at Morgan Stanley from 1976 to 1987. | | 74 RICs consisting of 74 Portfolios | | Greenhill & Co., Inc.; AtriCure, Inc. (medical devices) from 2000 until 2017 |
Michael J. Castellano 1946 | | Trustee (Since 2017) | | Chief Financial Officer of Lazard Group LLC from 2001 to 2011; Chief Financial Officer of Lazard Ltd from 2004 to 2011; Director, Support Our Aging Religious (non-profit) from 2009 to June 2015 and since 2017; Director, National Advisory Board of Church Management at Villanova University since 2010; Trustee, Domestic Church Media Foundation since 2012; Director, CircleBlack Inc. (financial technology company) since 2015. | | 74 RICs consisting of 74 Portfolios | | None |
Cynthia L. Egan 1955 | | Trustee (Since 2017) | | Advisor, U.S. Department of the Treasury from 2014 to 2015; President, Retirement Plan Services for T. Rowe Price Group, Inc. from 2007 to 2012; executive positions within Fidelity Investments from 1989 to 2007. | | 74 RICs consisting of 74 Portfolios | | Unum (insurance); The Hanover Insurance Group (insurance); Envestnet (investment platform) from 2013 until 2016 |
Frank J. Fabozzi 1948 | | Trustee (Since 2017) | | Editor of and Consultant for The Journal of Portfolio Management since 2006; Professor of Finance, EDHEC Business School since 2011; Visiting Professor, Princeton University from 2013 to 2014 and since 2016; Professor in the Practice of Finance and Becton Fellow, Yale University School of Management from 2006 to 2011. | | 74 RICs consisting of 74 Portfolios | | None |
Jerrold B. Harris 1942 | | Trustee (Since 2017) | | Trustee, Ursinus College from 2000 to 2012; Director, Ducks Unlimited — Canada (conservation) since 2015; Director, Waterfowl Chesapeake (conservation) since 2014; Director, Ducks Unlimited, Inc. since 2013; Director, Troemner LLC (scientific equipment) from 2000 to 2016; Director of Delta Waterfowl Foundation from 2010 to 2012; President and Chief Executive Officer, VWR Scientific Products Corporation from 1990 to 1999. | | 74 RICs consisting of 74 Portfolios | | BlackRock Capital Investment Corp. (business development company) |
R. Glenn Hubbard 1958 | | Trustee (Since 2017) | | Dean, Columbia Business School since 2004; Faculty member, Columbia Business School since 1988. | | 74 RICs consisting of 74 Portfolios | | ADP (data and information services); Metropolitan Life Insurance Company (insurance) |
| | | | |
| TRUSTEEAND OFFICER INFORMATION | | | 39 | |
Trustee and Officer Information (continued)
| | | | | | | | |
| Independent Trustees (a) |
| | | | | |
Name Year of Birth (b) | | Position(s) Held
(Length of Service) (c) | | Principal Occupation(s) During Past Five Years | | Number of BlackRock-Advised
Registered Investment Companies
(“RICs”) Consisting of
Investment Portfolios
(“Portfolios”) Overseen (d) | | Public Company and
Investment Company
Directorships During
Past Five Years |
W. Carl Kester 1951 | | Trustee (Since 2017) | | George Fisher Baker Jr. Professor of Business Administration, Harvard Business School since 2008, Deputy Dean for Academic Affairs from 2006 to 2010, Chairman of the Finance Unit, from 2005 to 2006, Senior Associate Dean and Chairman of the MBA Program from 1999 to 2005; Member of the faculty of Harvard Business School since 1981. | | 74 RICs consisting of 74 Portfolios | | None |
Catherine A. Lynch 1961 | | Trustee (Since 2017) | | Chief Executive Officer, Chief Investment Officer and various other positions, National Railroad Retirement Investment Trust from 2003 to 2016; Associate Vice President for Treasury Management, The George Washington University from 1999 to 2003; Assistant Treasurer, Episcopal Church of America from 1995 to 1999. | | 74 RICs consisting of 74 Portfolios | | None |
| | | | | | | | |
| Interested Trustees (e) |
Barbara G. Novick 1960 | | Trustee (Since 2017) | | Vice Chairman of BlackRock, Inc. since 2006; Chair of BlackRock’s Government Relations Steering Committee since 2009; Head of the Global Client Group of BlackRock, Inc. from 1988 to 2008. | | 100 RICs consisting of 218 Portfolios | | None |
John M. Perlowski 1964 | | Trustee (Since 2017) President and Chief Executive Officer (Since 2011) | | Managing Director of BlackRock, Inc. since 2009; Head of BlackRock Global Accounting and Product Services since 2009; Managing Director and Chief Operating Officer of the Global Product Group at Goldman Sachs Asset Management, L.P. from 2003 to 2009; Treasurer of Goldman Sachs Mutual Funds from 2003 to 2009 and Senior Vice President thereof from 2007 to 2009; Director of Goldman Sachs Offshore Funds from 2002 to 2009; Advisory Director of Family Resource Network (charitable foundation) since 2009. | | 127 RICs consisting of 316 Portfolios | | None |
(a) The address of each Trustee is c/o BlackRock, Inc., 55 East 52nd Street, New York, NY 10055. |
(b) Each Independent Trustee will serve until his or her successor is elected and qualifies, or until his or her earlier death, resignation, retirement or removal, or until December 31 of the year in which he or she turns 75. The maximum age limitation may be waived as to any Trustee by action of a majority of the Trustees upon finding of good cause therefor. |
(c) Following the combination of Merrill Lynch Investment Managers, L.P. (“MLIM”) and BlackRock, Inc. (“BlackRock”) in September 2006, the various legacy MLIM and legacy BlackRock fund boards were realigned and consolidated into three new fund boards in 2007. As a result, although the chart shows certain Independent Trustees as joining the Board in 2007, each Trustee first became a member of the boards of other legacy MLIM or legacy BlackRock funds as follows: Richard E. Cavanagh, 1994; Frank J. Fabozzi, 1988; Jerrold B. Harris, 1999; R. Glenn Hubbard, 2004; W. Carl Kester, 1995 and Karen P. Robards, 1998. |
(d) For purposes of this chart, “RICs” refers to investment companies registered under the 1940 Act and “Portfolios” refers to the investment programs of the BlackRock-advised funds. The Closed-End Complex is comprised of 74 RICS. Ms. Novick and Mr. Perlowski are also board members of certain complexes of BlackRock registered open-end funds. Ms. Novick is also a board member of the BlackRock Equity-Liquidity Complex and Mr. Perlowski is also a board member of the BlackRock Equity-Bond Complex and the BlackRock Equity-Liquidity Complex. |
(e) Ms. Novick and Mr. Perlowski are both “interested persons,” as defined in the 1940 Act, of the Trust based on their positions with BlackRock and its affiliates. Ms. Novick and Mr. Perlowski are also board members of certain complexes of BlackRock registered open-end funds. Ms. Novick is also a board member of the BlackRock Equity-Liquidity Complex and Mr. Perlowski is also a board member of the BlackRock Equity-Bond Complex and the BlackRock Equity-Liquidity Complex. Interested Trustees serve until their resignation, removal or death, or until December 31 of the year in which they turn 72. The maximum age limitation may be waived as to any Trustee by action of a majority of the Trustees upon a finding of good cause therefor. |
| | |
| 40 | | 2017 BLACKROCK ANNUAL REPORTTO SHAREHOLDERS |
Trustee and Officer Information (continued)
| | | | |
| Officers Who Are Not Trustees (a) |
| | | |
Name Year of Birth (b) | | Position(s) Held
(Length of Service) | | Principal Occupation(s) During Past Five Years |
Jonathan Diorio 1980 | | Vice President (Since 2015) | | Managing Director of BlackRock, Inc. since 2015; Director of BlackRock, Inc. from 2011 to 2015; Director of Deutsche Asset & Wealth Management from 2009 to 2011. |
Neal J. Andrews 1966 | | Chief Financial Officer (Since 2007) | | Managing Director of BlackRock, Inc. since 2006; Senior Vice President and Line of Business Head of Fund Accounting and Administration at PNC Global Investment Servicing (U.S.) Inc. from 1992 to 2006. |
Jay M. Fife 1970 | | Treasurer (Since 2007) | | Managing Director of BlackRock, Inc. since 2007; Director of BlackRock, Inc. in 2006; Assistant Treasurer of the MLIM and Fund Asset Management, L.P. advised funds from 2005 to 2006; Director of MLIM Fund Services Group from 2001 to 2006. |
Charles Park 1967 | | Chief Compliance Officer (Since 2014) | | Anti-Money Laundering Compliance Officer for the BlackRock-advised Funds in the Equity-Bond Complex, the Equity-Liquidity Complex and the Closed-End Complex from 2014 to 2015; Chief Compliance Officer of BlackRock Advisors, LLC and the BlackRock-advised Funds in the Equity-Bond Complex, the Equity-Liquidity Complex and the Closed-End Complex since 2014; Principal of and Chief Compliance Officer for iShares® Delaware Trust Sponsor LLC since 2012 and BlackRock Fund Advisors (“BFA”) since 2006; Chief Compliance Officer for the BFA-advised iShares® exchange traded funds since 2006; Chief Compliance Officer for BlackRock Asset Management International Inc. since 2012. |
Janey Ahn 1975 | | Secretary (Since 2012) | | Managing Director of BlackRock, Inc. since 2018; Director of BlackRock, Inc. from 2009 to 2017; Assistant Secretary of the funds in the Closed-End Complex from 2008 to 2012. |
(a) The address of each Officer is c/o BlackRock, Inc., 55 East 52nd Street, New York, NY 10055. |
(b) Officers of the Trust serve at the pleasure of the Board. |
Effective December 31, 2017, Jerrold B. Harris retired as a Trustee of the Trust.
Effective February 16, 2018, Barbara G. Novick resigned, and Robert Fairbairn was appointed, as an Interested Trustee of the Trust.
Effective February 28, 2018, the portfolio managers of the Trust are Rick Rieder, Amer Bisat, Trevor Slaven and Robert Wuertz. Mr. Slaven has been a Director of BlackRock, Inc. since 2018; a Vice President from 2015 to 2017; and an Associate from 2010 to 2014. Mr. Wuertz has been a Director of BlackRock, Inc. since 2012.
| | |
| Investment Adviser | | Transfer Agent |
BlackRock Advisors, LLC Wilmington, DE 19809 | | Computershare Trust Company, N.A. Canton, MA 02021 |
|
| Sub-Adviser | | Independent Registered Public Accounting Firm |
BlackRock International Limited Edinburgh, EH3 8BL United Kingdom | | Deloitte & Touche LLP Boston, MA 02116 |
|
| BlackRock (Singapore) Limited | | Legal Counsel |
| 079912 SIngapore | | Skadden, Arps, Slate, Meagher & Flom LLP Boston, MA 02116 |
|
| Accounting Agent and Custodian | | Address of the Trust |
State Street Bank and Trust Company Boston, MA 02111 | | 100 Bellevue Parkway Wilmington, DE 19809 |
| | | | |
| TRUSTEEAND OFFICER INFORMATION | | | 41 | |
Additional Information
Proxy Results
The Annual Meeting of Shareholders was held on July 25, 2017 for shareholders of record on May 30, 2017, to elect trustee nominees for the Trust. There were no broker non-votes with regard to the Trust.
Approved the Trustees as follows:
| | | | | | | | | | | | | | | | | | | | | | | | |
| | | Michael J. Castellano | | | Cynthia L. Egan | | | Catherine A. Lynch | |
| | | Votes For | | | Votes Withheld | | | Votes For | | | Votes Withheld | | | Votes For | | | Votes Withheld | |
BGIO | | | 19,696,370 | | | | 126,428 | | | | 19,694,370 | | | | 128,428 | | | | 19,691,764 | | | | 131,034 | |
For the Trust listed above, Trustees whose term of office continued after the Annual Meeting of Shareholders because they were not up for election are Richard E. Cavanagh, W. Carl Kester, Frank J. Fabozzi, Jerrold B. Harris, R. Glenn Hubbard, Barbara G. Novick (resigned effective February 16, 2018), John M. Perlowski and Karen P. Robards.
Trust Certification
The Trust is listed for trading on the NYSE and has filed with the NYSE its annual chief executive officer certification regarding compliance with the NYSE’s listing standards. The Trust filed with the Securities and Exchange Commission (“SEC”) the certification of its chief executive officer and chief financial officer required by section 302 of the Sarbanes-Oxley Act.
Dividend Policy
The Trust’s dividend policy is to distribute all or a portion of its net investment income to its shareholders on a monthly basis. In order to provide shareholders with a more stable level of dividend distributions, the distributions paid by the Trust for any particular month may be more or less than the amount of net investment income earned by the Trust during such month. The portion of distributions that exceeds the Trust’s current and accumulated earnings and profits, which are measured on a tax basis, will constitute a nontaxable return of capital. Distributions in excess of the Trust’s taxable income and net capital gains, but not in excess of the Trust’s earnings and profits, will be taxable to shareholders as ordinary income and will not constitute a nontaxable return of capital. The Trust’s current accumulated but undistributed net investment income, if any, is disclosed in the Statement of Assets and Liabilities, which comprises part of the financial information included in this report.
General Information
The Trust does not make available copies of its Statement of Additional Information because the Trust’s shares are not continuously offered, which means that the Statement of Additional Information of the Trust has not been updated after completion of the respective Trust’s offerings and the information contained in the Trust’s Statement of Additional Information may have become outdated.
During the period, there were no material changes in the Trust’s investment objectives or policies or to the Trust’s charters or by-laws that would delay or prevent a change of control of the Trust that were not approved by the shareholders or in the principal risk factors associated with investment in the Trust. There have been no changes in the persons who are primarily responsible for the day-to-day management of the Trust’s portfolio.
In accordance with Section 23(c) of the Investment Company Act of 1940, as amended, the Trust from time to time may purchase its common shares in the open market or in private transactions.
Quarterly performance, semi-annual and annual reports, current net asset value and other information regarding the Trust may be found on BlackRock’s website, which can be accessed at http://www.blackrock.com. Any reference to BlackRock’s website in this report is intended to allow investors public access to information regarding the Trust and does not, and is not intended to, incorporate BlackRock’s website in this report.
Electronic Delivery
Shareholders can sign up for e-mail notifications of quarterly statements, annual and semi-annual shareholder reports by enrolling in the electronic delivery program. Electronic copies of shareholder reports are available on BlackRock’s website.
To enroll in electronic delivery:
Shareholders Who Hold Accounts with Investment Advisers, Banks or Brokerages:
Please contact your financial advisor. Please note that not all investment advisers, banks or brokerages may offer this service.
Householding
The Trust will mail only one copy of shareholder documents, annual and semi-annual reports and proxy statements, to shareholders with multiple accounts at the same address. This practice is commonly called “householding” and is intended to reduce expenses and eliminate duplicate mailings of shareholder documents. Mailings of your shareholder documents may be householded indefinitely unless you instruct us otherwise. If you do not want the mailing of these documents to be combined with those for other members of your household, please call the Trust at (800) 882-0052.
| | |
| 42 | | 2017 BLACKROCK ANNUAL REPORTTO SHAREHOLDERS |
Additional Information (continued)
Availability of Quarterly Schedule of Investments
The Trust files its complete schedule of portfolio holdings with the SEC for the first and third quarters of each fiscal year on Form N-Q. The Trust’s Form N-Q is available on the SEC’s website at http://www.sec.gov and may also be reviewed and copied at the SEC’s Public Reference Room in Washington, D.C. Information on the operation of the Public Reference Room or how to access documents on the SEC’s website without charge may be obtained by calling (800) SEC-0330. The Trust’s Form N-Q may also be obtained upon request and without charge by calling (800) 882-0052.
Availability of Proxy Voting Policies and Procedures
A description of the policies and procedures that the Trust uses to determine how to vote proxies relating to portfolio securities is available upon request and without charge (1) by calling (800) 882-0052; (2) at http://www.blackrock.com; and (3) on the SEC’s website at http://www.sec.gov.
Availability of Proxy Voting Record
Information about how the Trust voted proxies relating to securities held in the Trust’s portfolio during the most recent 12-month period ended June 30 is available upon request and without charge (1) at http://www.blackrock.com; or by calling (800) 882-0052 and (2) on the SEC’s website at http://www.sec.gov.
Availability of Trust Updates
BlackRock will update performance and certain other data for the Trust on a monthly basis on its website in the “Closed-end Funds” section of http://www.blackrock.com as well as certain other material information as necessary from time to time. Investors and others are advised to check the website for updated performance information and the release of other material information about the Trust. This reference to BlackRock’s website is intended to allow investors public access to information regarding the Trust and does not, and is not intended to, incorporate BlackRock’s website in this report.
BlackRock Privacy Principles
BlackRock is committed to maintaining the privacy of its current and former fund investors and individual clients (collectively, “Clients”) and to safeguarding their non-public personal information. The following information is provided to help you understand what personal information BlackRock collects, how we protect that information and why in certain cases we share such information with select parties.
If you are located in a jurisdiction where specific laws, rules or regulations require BlackRock to provide you with additional or different privacy-related rights beyond what is set forth below, then BlackRock will comply with those specific laws, rules or regulations.
BlackRock obtains or verifies personal non-public information from and about you from different sources, including the following: (i) information we receive from you or, if applicable, your financial intermediary, on applications, forms or other documents; (ii) information about your transactions with us, our affiliates, or others; (iii) information we receive from a consumer reporting agency; and (iv) from visits to our websites.
BlackRock does not sell or disclose to non-affiliated third parties any non-public personal information about its Clients, except as permitted by law or as is necessary to respond to regulatory requests or to service Client accounts. These non-affiliated third parties are required to protect the confidentiality and security of this information and to use it only for its intended purpose.
We may share information with our affiliates to service your account or to provide you with information about other BlackRock products or services that may be of interest to you. In addition, BlackRock restricts access to non-public personal information about its Clients to those BlackRock employees with a legitimate business need for the information. BlackRock maintains physical, electronic and procedural safeguards that are designed to protect the non-public personal information of its Clients, including procedures relating to the proper storage and disposal of such information.
Glossary of Terms Used in this Report
| | |
| Portfolio Abbreviations |
| |
| ABS | | Asset-Backed Security |
| CLO | | Collateralized Loan Obligation |
| ETF | | Exchange-Traded Fund |
| EUR | | Euro |
| OTC | | Over-the-Counter |
| PIK | | Payment-In-Kind |
| USD | | U.S. Dollar |
| | | | |
| ADDITIONAL INFORMATION | | | 43 | |
This report is intended for current holders. It is not a prospectus. Past performance results shown in this report should not be considered a representation of future performance. The Trust has leveraged its Common Shares, which creates risks for Common Shareholders, including the likelihood of greater volatility of net asset value and market price of the Common Shares, and the risk that fluctuations in short-term interest rates may reduce the Common Shares’ yield. Statements and other information herein are as dated and are subject to change.

| | |
| BGIO-12/17-AR | |  |
| Item 2 – | Code of Ethics – The registrant (or the “Fund”) has adopted a code of ethics, as of the end of the period covered by this report, applicable to the registrant’s principal executive officer, principal financial officer, principal accounting officer or controller, or persons performing similar functions. During the period covered by this report, the code of ethics was amended to clarify an inconsistency as to whom persons covered by the code should report suspected violations of the code. The amendment clarifies that such reporting should be made to BlackRock Advisors, LLC’s (“Investment Adviser” or “BlackRock”) General Counsel, and retains the alternative option of anonymous reporting following “whistleblower” policies. Other non-material changes were also made in connection with this amendment. During the period covered by this report, there have been no waivers granted under the code of ethics. The registrant undertakes to provide a copy of the code of ethics to any person upon request, without charge, who calls 1-800-882-0052, option 4. |
| Item 3 – | Audit Committee Financial Expert – The registrant’s board of directors (the “board of directors”), has determined that (i) the registrant has the following audit committee financial experts serving on its audit committee and (ii) each audit committee financial expert is independent: |
Michael Castellano
Frank J. Fabozzi
W. Carl Kester
Catherine A. Lynch
Karen P. Robards
The registrant’s board of directors has determined that W. Carl Kester and Karen P. Robards qualify as financial experts pursuant to Item 3(c)(4) of Form N-CSR.
Prof. Kester has a thorough understanding of generally accepted accounting principles, financial statements and internal control over financial reporting as well as audit committee functions. Prof. Kester has been involved in providing valuation and other financial consulting services to corporate clients since 1978. Prof. Kester’s financial consulting services present a breadth and level of complexity of accounting issues that are generally comparable to the breadth and complexity of issues that can reasonably be expected to be raised by the registrant’s financial statements.
Ms. Robards has a thorough understanding of generally accepted accounting principles, financial statements and internal control over financial reporting as well as audit committee functions. Ms. Robards has been President of Robards & Company, a financial advisory firm, since 1987. Ms. Robards was formerly an investment banker for more than 10 years where she was responsible for evaluating and assessing the performance of companies based on their financial results. Ms. Robards has over 30 years of experience analyzing financial statements. She also is a member of the audit committee of one publicly held company and a non-profit organization.
Under applicable securities laws, a person determined to be an audit committee financial expert will not be deemed an “expert” for any purpose, including without limitation for the purposes of Section 11 of the Securities Act of 1933, as a result of being designated or identified as an audit committee financial expert. The designation or identification as an audit committee financial expert does not impose on such person any duties, obligations, or liabilities greater than the duties, obligations, and liabilities imposed on such person as a member of the audit committee and board of directors in the absence of such designation or identification. The designation or identification of a person as an audit committee financial expert does not affect the duties, obligations, or liability of any other member of the audit committee or board of directors.
2
| Item 4 – | Principal Accountant Fees and Services |
The following table presents fees billed by Deloitte & Touche LLP (“D&T”) in each of the last two fiscal years for the services rendered to the Fund:
| | | | | | | | | | | | | | | | |
| | | (a) Audit Fees | | (b) Audit-Related Fees1 | | (c) Tax Fees2 | | (d) All Other Fees |
| Entity Name | | Current
Fiscal Year
End | | Previous
Fiscal Year
End | | Current
Fiscal Year
End | | Previous
Fiscal Year
End | | Current
Fiscal Year
End | | Previous
Fiscal Year
End | | Current
Fiscal Year
End | | Previous
Fiscal Year
End |
| BlackRock 2022 Global Income Opportunity Trust | | $56,916 | | N/A | | $0 | | N/A | | $15,402 | | N/A | | $0 | | N/A |
The following table presents fees billed by D&T that were required to be approved by the registrant’s audit committee (the “Committee”) for services that relate directly to the operations or financial reporting of the Fund and that are rendered on behalf of BlackRock and entities controlling, controlled by, or under common control with BlackRock (not including any sub-adviser whose role is primarily portfolio management and is subcontracted with or overseen by another investment adviser) that provide ongoing services to the Fund (“Affiliated Service Providers”):
| | | | |
| | | Current Fiscal Year End | | Previous Fiscal Year End |
| (b) Audit-Related Fees1 | | $0 | | $0 |
| (c) Tax Fees2 | | $0 | | $0 |
| (d) All Other Fees3 | | $2,129,000 | | $2,154,000 |
1 The nature of the services includes assurance and related services reasonably related to the performance of the audit or review of financial statements not included in Audit Fees, including accounting consultations, agreed-upon procedure reports, attestation reports, comfort letters, out-of-pocket expenses and internal control reviews not required by regulators.
2 The nature of the services includes tax compliance and/or tax preparation, including services relating to the filing or amendment of federal, state or local income tax returns, regulated investment company qualification reviews, taxable income and tax distribution calculations.
3 Non-audit fees of $2,129,000 and $2,154,000 for the current fiscal year and previous fiscal year, respectively, were paid to the Fund’s principal accountant in their entirety by BlackRock, in connection with services provided to the Affiliated Service Providers of the Fund and of certain other funds sponsored and advised by BlackRock or its affiliates for a service organization review and an accounting research tool subscription. These amounts represent aggregate fees paid by BlackRock and were not allocated on a per fund basis.
(e)(1) Audit Committee Pre-Approval Policies and Procedures:
The Committee has adopted policies and procedures with regard to the pre-approval of services. Audit, audit-related and tax compliance services provided to the registrant on an annual basis require specific pre-approval by the Committee. The Committee also must approve other non-audit services provided to the registrant and those non-audit services provided to the Investment Adviser and Affiliated Service Providers that relate directly to the operations and the financial reporting of the registrant. Certain of these non-audit services that the Committee believes are (a) consistent with the SEC’s auditor independence rules and (b) routine and recurring services that will not impair the independence of the independent accountants may be approved by the Committee without consideration on a specific case-by-case basis (“general pre-approval”). The term of any general pre-approval is 12 months from the date of the pre-approval, unless the Committee provides for a different period. Tax or other non-audit services provided to the registrant which have a direct impact on the operations or financial reporting of the registrant will only be deemed pre-approved
3
provided that any individual project does not exceed $10,000 attributable to the registrant or $50,000 per project. For this purpose, multiple projects will be aggregated to determine if they exceed the previously mentioned cost levels.
Any proposed services exceeding the pre-approved cost levels will require specific pre-approval by the Committee, as will any other services not subject to general pre-approval (e.g., unanticipated but permissible services). The Committee is informed of each service approved subject to general pre-approval at the next regularly scheduled in-person board meeting. At this meeting, an analysis of such services is presented to the Committee for ratification. The Committee may delegate to the Committee Chairman the authority to approve the provision of and fees for any specific engagement of permitted non-audit services, including services exceeding pre-approved cost levels.
(e)(2) None of the services described in each of Items 4(b) through (d) were approved by the Committee pursuant to the de minimis exception in paragraph (c)(7)(i)(C) of Rule 2-01 of Regulation S-X.
(f) Not Applicable
(g) The aggregate non-audit fees, defined as the sum of the fees shown under “Audit-Related Fees,” “Tax Fees” and “All Other Fees,” paid to the accountant for services rendered by the accountant to the registrant, the Investment Adviser and the Affiliated Service Providers were:
| | | | | | |
| | | Entity Name | | Current Fiscal Year
End | | Previous Fiscal Year
End |
| | BlackRock 2022 Global Income Opportunity Trust | | $15,402 | | N/A |
Additionally, the amounts billed by D&T in connection with services provided to the Affiliated Service Providers of the Fund and of other funds sponsored or advised by BlackRock or its affiliates during the current and previous fiscal years for a service organization review and an accounting research tool subscription were:
| | |
Current Fiscal Year End | | Previous Fiscal
Year End |
| $2,129,000 | | $2,154,000 |
These amounts represent aggregate fees paid by BlackRock and were not allocated on a per fund basis.
(h) The Committee has considered and determined that the provision of non-audit services that were rendered to the Investment Adviser, and the Affiliated Service Providers that were not pre-approved pursuant to paragraph (c)(7)(ii) of Rule 2-01 of Regulation S-X is compatible with maintaining the principal accountant’s independence.
4
| Item 5 – | Audit Committee of Listed Registrants |
| | (a) | The following individuals are members of the registrant’s separately-designated standing audit committee established in accordance with Section 3(a)(58)(A) of the Securities Exchange Act of 1934 (15 U.S.C. 78c(a)(58)(A)): |
Michael Castellano
Frank J. Fabozzi
W. Carl Kester
Catherine A. Lynch
Karen P. Robards
(a) The registrant’s Schedule of Investments is included as part of the Report to Stockholders filed under
Item 1 of this Form.
(b) Not Applicable due to no such divestments during the semi-annual period covered since the previous
Form N-CSR filing.
| Item 7 – | Disclosure of Proxy Voting Policies and Procedures for Closed-End Management Investment Companies – The board of directors has delegated the voting of proxies for the Fund’s portfolio securities to the Investment Adviser pursuant to the Investment Adviser’s proxy voting guidelines. Under these guidelines, the Investment Adviser will vote proxies related to Fund securities in the best interests of the Fund and its stockholders. From time to time, a vote may present a conflict between the interests of the Fund’s stockholders, on the one hand, and those of the Investment Adviser, or any affiliated person of the Fund or the Investment Adviser, on the other. In such event, provided that the Investment Adviser’s Equity Investment Policy Oversight Committee, or a sub-committee thereof (the “Oversight Committee”) is aware of the real or potential conflict or material non-routine matter and if the Oversight Committee does not reasonably believe it is able to follow its general voting guidelines (or if the particular proxy matter is not addressed in the guidelines) and vote impartially, the Oversight Committee may retain an independent fiduciary to advise the Oversight Committee on how to vote or to cast votes on behalf of the Investment Adviser’s clients. If the Investment Adviser determines not to retain an independent fiduciary, or does not desire to follow the advice of such independent fiduciary, the Oversight Committee shall determine how to vote the proxy after consulting with the Investment Adviser’s Portfolio Management Group and/or the Investment Adviser’s Legal and Compliance Department and concluding that the vote cast is in its client’s best interest notwithstanding the conflict. A copy of the Fund’s Proxy Voting Policy and Procedures are attached as Exhibit 99.PROXYPOL. Information on how the Fund voted proxies relating to portfolio securities during the most recent 12-month period ended June 30 is available without charge, (i) at www.blackrock.com and (ii) on the SEC’s website at http://www.sec.gov. |
| Item 8 – | Portfolio Managers of Closed-End Management Investment Companies |
(a)(1) As of the date of filing this Report:
The registrant is managed by a team of investment professionals comprised of Amer Bisat, Managing Director at BlackRock, Rick Rieder, Managing Director at BlackRock, Trevor Slaven, Director at BlackRock, and Robert Wuertz, Director at BlackRock. Messrs. Bisat, Rieder, Slaven and Wuertz are the Fund’s portfolio managers and are responsible for the day-to-day management of
5
the Fund’s portfolio and the selection of its investments. Messrs. Bisat, and Rieder have been members of the Fund’s portfolio management team since 2017. Messrs. Slaven and Wuertz have been members of the Fund’s portfolio management team since 2018.
| | |
| Portfolio Manager | | Biography |
| Amer Bisat | | Managing Director of BlackRock, Inc. since 2013; Partner at Traxis from 2007 to 2013; Partner at Rubicon from 2004 to 2007; Portfolio Manager at UBS from 2002 to 2004; Portfolio Manager at Morgan Stanley Investment Management from 1999 to 2002. Senior economist at the IMF from 1991 to 1998. |
| Rick Rieder | | Global Chief Investment Officer of Fixed Income, Co-head of BlackRock’s Global Fixed Income platform, member of Global Operating Committee and Chairman of the BlackRock firmwide Investment Council. Managing Director of BlackRock, Inc. since 2009. President and Chief Executive Officer of R3 Capital Partners from 2008 to 2009; Managing Director of Lehman Brothers from 1994 to 2008. |
| Trevor Slaven | | Director of BlackRock, Inc. since 2018; a Vice President from 2014 to 2017; and an Associate from 2010 to 2014. |
| Robertz Wuertz | | Director of BlackRock, Inc. since 2012. |
(a)(2) As of December 31, 2017:
| | | | | | | | | | | | |
| | | (ii) Number of Other Accounts Managed and Assets by Account Type | | (iii) Number of Other Accounts and Assets for Which Advisory Fee is Performance-Based |
(i) Name of Portfolio Manager | | Other Registered Investment Companies | | Other Pooled Investment Vehicles | | Other Accounts | | Other Registered Investment Companies | | Other Pooled Investment Vehicles | | Other Accounts |
Amer Bisat | | 15 | | 10 | | 0 | | 0 | | 0 | | 0 |
| | | $55.51 Billion | | $16.38 Billion | | $0 | | $0 | | $0 | | $0 |
Rick Rieder | | 11 | | 14 | | 1 | | 0 | | 0 | | 0 |
| | | $55.67 Billion | | $16.42 Billion | | $392.2 Million | | $0 | | $0 | | $0 |
Trevor Slaven | | 1 | | 1 | | 0 | | 0 | | 0 | | 0 |
| | | $233.5 Million | | $51.81 Million | | $0 | | $0 | | $0 | | $0 |
Robert Wuertz | | 0 | | 1 | | 0 | | 0 | | 0 | | 0 |
| | | $0 | | $2.35 Billion | | $0 | | $0 | | $0 | | $0 |
(iv) Portfolio Manager Potential Material Conflicts of Interest
6
BlackRock has built a professional working environment, firm-wide compliance culture and compliance procedures and systems designed to protect against potential incentives that may favor one account over another. BlackRock has adopted policies and procedures that address the allocation of investment opportunities, execution of portfolio transactions, personal trading by employees and other potential conflicts of interest that are designed to ensure that all client accounts are treated equitably over time. Nevertheless, BlackRock furnishes investment management and advisory services to numerous clients in addition to the Fund, and BlackRock may, consistent with applicable law, make investment recommendations to other clients or accounts (including accounts which are hedge funds or have performance or higher fees paid to BlackRock, or in which portfolio managers have a personal interest in the receipt of such fees), which may be the same as or different from those made to the Fund. In addition, BlackRock, Inc., its affiliates and significant shareholders and any officer, director, shareholder or employee may or may not have an interest in the securities whose purchase and sale BlackRock recommends to the Fund. BlackRock, Inc., or any of its affiliates or significant shareholders, or any officer, director, shareholder, employee or any member of their families may take different actions than those recommended to the Fund by BlackRock with respect to the same securities. Moreover, BlackRock may refrain from rendering any advice or services concerning securities of companies of which any of BlackRock, Inc.’s (or its affiliates’ or significant shareholders’) officers, directors or employees are directors or officers, or companies as to which BlackRock, Inc. or any of its affiliates or significant shareholders or the officers, directors and employees of any of them has any substantial economic interest or possesses material non-public information. Certain portfolio managers also may manage accounts whose investment strategies may at times be opposed to the strategy utilized for a fund. It should also be noted that Messrs. Bisat, Rieder, Slaven and Wuertz may be managing hedge fund and/or long only accounts, or may be part of a team managing hedge fund and/or long only accounts, subject to incentive fees. Messrs. Bisat, Rieder, Slaven and Wuertz may therefore be entitled to receive a portion of any incentive fees earned on such accounts.
As a fiduciary, BlackRock owes a duty of loyalty to its clients and must treat each client fairly. When BlackRock purchases or sells securities for more than one account, the trades must be allocated in a manner consistent with its fiduciary duties. BlackRock attempts to allocate investments in a fair and equitable manner among client accounts, with no account receiving preferential treatment. To this end, BlackRock, Inc. has adopted policies that are intended to ensure reasonable efficiency in client transactions and provide BlackRock with sufficient flexibility to allocate investments in a manner that is consistent with the particular investment discipline and client base, as appropriate.
(a)(3) As of December 31, 2017:
Portfolio Manager Compensation Overview
The discussion below describes the portfolio managers’ compensation as of December 31, 2017.
BlackRock’s financial arrangements with its portfolio managers, its competitive compensation and its career path emphasis at all levels reflect the value senior management places on key resources. Compensation may include a variety of components and may vary from year to year based on a number of factors. The principal components of compensation include a base salary, a performance-based discretionary bonus, participation in various benefits programs and one or more of the incentive compensation programs established by BlackRock.
7
Base Compensation. Generally, portfolio managers receive base compensation based on their position with the firm.
Discretionary Incentive Compensation
Discretionary incentive compensation is a function of several components: the performance of BlackRock, Inc., the performance of the portfolio manager’s group within BlackRock, the investment performance, including risk-adjusted returns, of the firm’s assets under management or supervision by that portfolio manager relative to predetermined benchmarks, and the individual’s performance and contribution to the overall performance of these portfolios and BlackRock. In most cases, these benchmarks are the same as the benchmark or benchmarks against which the performance of the Funds or other accounts managed by the portfolio managers are measured. Among other things, BlackRock’s Chief Investment Officers make a subjective determination with respect to each portfolio manager’s compensation based on the performance of the Funds and other accounts managed by each portfolio manager relative to the various benchmarks. Performance of fixed income funds is measured on a pre-tax and/or after-tax basis over various time periods including 1-, 3- and 5- year periods, as applicable. With respect to these portfolio managers, such benchmarks for the Fund and other accounts are:
| | |
| Portfolio Manager | | Applicable Benchmarks |
| Amer Bisat | | A combination of market-based indices (e.g., EMBI Global Non-Diversified Index) and certain fund industry peer groups. |
Rick Rieder
Trevor Slaven
Robert Wuertz | | A combination of market-based indices (e.g., Bloomberg Barclays U.S. Aggregate Bond Index), certain customized indices and certain fund industry peer groups. |
Distribution of Discretionary Incentive Compensation -
Discretionary incentive compensation is distributed to portfolio managers in a combination of cash, deferred BlackRock, Inc. stock awards, and/or deferred cash awards that notionally track the return of certain BlackRock investment products.
Typically, the cash portion of the discretionary incentive compensation, when combined with base salary, represents more than 60% of total compensation for the portfolio managers.
Portfolio managers generally receive deferred BlackRock, Inc. stock awards as part of their discretionary incentive compensation. Paying a portion of discretionary incentive compensation in the form of deferred BlackRock, Inc. stock puts compensation earned by a portfolio manager for a given year “at risk” based on BlackRock’s ability to sustain and improve its performance over future periods. Deferred BlackRock, Inc. stock awards are generally granted in the form of BlackRock, Inc. restricted stock units that vest ratably over a number of years and, once vested, settle in BlackRock, Inc. common stock. In some cases, additional deferred BlackRock, Inc. stock may be granted to certain key employees as part of a long-term incentive award to aid in retention, align their interests with long-term shareholder interests and motivate performance. Such equity awards are generally granted in the form of BlackRock, Inc. restricted stock units that vest pursuant to the terms of the applicable plan and, once vested, settle in BlackRock, Inc. common stock. The portfolio managers of this Fund have deferred BlackRock, Inc. stock awards.
8
For some portfolio managers, discretionary incentive compensation is also distributed in the form of deferred cash awards that notionally track the returns of select BlackRock investment products they manage. Providing a portion of discretionary incentive compensation in deferred cash awards that notionally track the BlackRock investment products they manage provides direct alignment with investment product results. Deferred cash awards vest ratably over a number of years and, once vested, settle in the form of cash. Any portfolio manager who is either a managing director or director at BlackRock with compensation above a specified threshold is eligible to participate in the deferred compensation program.
Other Compensation Benefits. In addition to base salary and discretionary incentive compensation, portfolio managers may be eligible to receive or participate in one or more of the following:
Incentive Savings Plans — BlackRock, Inc. has created a variety of incentive savings plans in which BlackRock, Inc. employees are eligible to participate, including a 401(k) plan, the BlackRock Retirement Savings Plan (RSP), and the BlackRock Employee Stock Purchase Plan (ESPP). The employer contribution components of the RSP include a company match equal to 50% of the first 8% of eligible pay contributed to the plan capped at $5,000 per year, and a company retirement contribution equal to 3-5% of eligible compensation up to the Internal Revenue Service limit ($270,000 for 2017). The RSP offers a range of investment options, including registered investment companies and collective investment funds managed by the firm. BlackRock, Inc. contributions follow the investment direction set by participants for their own contributions or, absent participant investment direction, are invested into a target date fund that corresponds to, or is closest to, the year in which the participant attains age 65. The ESPP allows for investment in BlackRock, Inc. common stock at a 5% discount on the fair market value of the stock on the purchase date. Annual participation in the ESPP is limited to the purchase of 1,000 shares of common stock or a dollar value of $25,000 based on its fair market value on the purchase date. All of the eligible portfolio managers are eligible to participate in these plans.
(a)(4) Beneficial Ownership of Securities – As of December 31, 2017.
| | |
| Portfolio Manager | | Dollar Range of Equity Securities of
the Fund Beneficially Owned |
Amer Bisat | | None |
Rick Rieder | | Over $1 Million |
Trevor Slaven | | None |
Robert Wuertz | | None |
(b) Not Applicable
9
| Item 9 – | Purchases of Equity Securities by Closed-End Management Investment Company and Affiliated Purchasers – Not Applicable due to no such purchases during the period covered by this report. |
| Item 10 – | Submission of Matters to a Vote of Security Holders – There have been no material changes to these procedures. |
| Item 11 – | Controls and Procedures |
(a) – The registrant’s principal executive and principal financial officers, or persons performing similar functions, have concluded that the registrant’s disclosure controls and procedures (as defined in Rule 30a-3(c) under the Investment Company Act of 1940, as amended (the “1940 Act”)) are effective as of a date within 90 days of the filing of this report based on the evaluation of these controls and procedures required by Rule 30a-3(b) under the 1940 Act and Rule 13a-15(b) under the Securities Exchange Act of 1934, as amended.
(b) – There were no changes in the registrant’s internal control over financial reporting (as defined in Rule 30a-3(d) under the 1940 Act) that occurred during the second fiscal quarter of the period covered by this report that have materially affected, or are reasonably likely to materially affect, the registrant’s internal control over financial reporting.
| Item 12 – | Disclosure of Securities Lending Activities for Closed-End Management Investment Companies |
(a) The following table shows the dollar amounts of income, and dollar amounts of fees and/or compensation paid, relating to the Fund’s securities lending activities during the fiscal year ended December 31, 2017. The Fund did not engage in any securities lending activity during the fiscal year ended December 31, 2017.
BlackRock 2022 Global Income Opportunity Trust
| | | | | | | | |
| (1) | | Gross income from securities lending activities | | | $0 | |
| (2) | | Fees and/or compensation for securities lending activities and related services | | | | |
| | (a) | | Securities lending income paid to BIM for services as securities
lending agent | | | $0 | |
| | (b) | | Collateral management expenses (including fees deducted from a polled cash collateral vehicle) not included in (a) | | | $0 | |
| | (c) | | Administrative fees not included in (a) | | | $0 | |
| | (d) | | Indemnification fees not included in (a) | | | $0 | |
| | (e) | | Rebate (paid to borrowers) | | | $0 | |
| | (f) | | Other fees not included in (a) | | | $0 | |
| (3) | | Aggregate fees/compensation for securities lending activities | | | $0 | |
| (4) | | Net income from securities lending activities | | | $0 | |
(b) BlackRock Investment Management, LLC (“BIM”) serves as securities lending agent for the Fund and in that role administers the Fund’s securities lending program pursuant to the terms of a securities lending agency agreement entered into between the Fund and BIM.
| Item 13 – | Exhibits attached hereto |
10
(a)(1) – Code of Ethics – See Item 2
(a)(2) – Certifications – Attached hereto
(a)(3) – Not Applicable
(a)(4) – Not Applicable
(b) – Certifications – Attached hereto
11
Pursuant to the requirements of the Securities Exchange Act of 1934 and the Investment Company Act of 1940, the registrant has duly caused this report to be signed on its behalf by the undersigned, thereunto duly authorized.
| | |
| BlackRock 2022 Global Income Opportunity Trust |
| |
| By: | | /s/ John M. Perlowski |
| | John M. Perlowski |
| | Chief Executive Officer (principal executive officer) of |
| | BlackRock 2022 Global Income Opportunity Trust |
|
| Date: March 8, 2018 |
|
| Pursuant to the requirements of the Securities Exchange Act of 1934 and the Investment Company Act of 1940, this report has been signed below by the following persons on behalf of the registrant and in the capacities and on the dates indicated. |
| |
| By: | | /s/ John M. Perlowski |
| | John M. Perlowski |
| | Chief Executive Officer (principal executive officer) of |
| | BlackRock 2022 Global Income Opportunity Trust |
|
| Date: March 8, 2018 |
| |
| By: | | /s/ Neal J. Andrews |
| | Neal J. Andrews |
| | Chief Financial Officer (principal financial officer) of |
| | BlackRock 2022 Global Income Opportunity Trust |
|
| Date: March 8, 2018 |
12