As filed with the U.S. Securities and Exchange Commission on June 5, 2023
UNITED STATES
SECURITIES AND EXCHANGE COMMISSION
Washington, D.C. 20549
FORM N-CSR
CERTIFIED SHAREHOLDER REPORT OF REGISTERED
MANAGEMENT INVESTMENT COMPANIES
Investment Company Act file number 811-23219
USQ Core Real Estate Fund
(Exact name of registrant as specified in charter)
235 Whitehorse Lane, Suite 200
Kennett Square, PA 19348
(Address of principal executive offices) (Zip code)
Union Square Capital Partners, LLC
235 Whitehorse Lane, Suite 200
Kennett Square, PA 19348
(Name and address of agent for service)
(484) 731-3101
Registrant's telephone number, including area code
Date of fiscal year end: March 31
Date of reporting period: March 31, 2023
Item 1. Reports to Stockholders.

|
USQ Core Real Estate Fund
|
Annual Report
March 31, 2023
Must be preceded or accompanied by a prospectus.
The USQ Core Real Estate Fund is distributed by Quasar Distributors LLC.
USQ Core Real Estate Fund | TABLE OF CONTENTS |
| | |
| | |
Letter to Shareholders | 1 |
Schedule of Investments | 7 |
Statement of Assets & Liabilities | 8 |
Statement of Operations | 9 |
Statements of Changes in Net Assets | 10 |
Statement of Cash Flows | 12 |
Financial Highlights | 13 |
Notes to Financial Statements | 15 |
Report of Independent Registered Public Accounting Firm | 25 |
Additional Information | 26 |
Trustees & Officers | 27 |
Privacy Policy | 29 |
USQ Core Real Estate Fund | Letter to Shareholders |
| | March 31, 2023 (Unaudited) |
Dear Shareholder,
We are pleased to present this annual report for the USQ Core Real Estate Fund for the fiscal year ending March 31, 2023 (the “Reporting Period”). The report includes a discussion of Fund performance, a schedule of the Fund’s investments, and its audited financial statements.
In managing the Fund, Union Square Capital Partners seeks to provide shareholders with current income and capital appreciation with moderate volatility and low correlation to the broader markets. We believe the Fund continued to deliver in each of these four ways during the period ended March 31, 2023. Although the past year has resulted in a negative -3.02% return, the Fund’s since inception track record remains within long-term expectations at +6.16% annualized return. The Fund’s private real estate allocation continues to be invested exclusively in private real estate funds that are constituents of the NCREIF Fund Index – Open-end Diversified Core Equity (the “NFI-ODCE”). The NFI-ODCE is considered a premier “core” institutional real estate index in the industry. To be included in the NFI-ODCE, the funds must adhere to strict risk and reporting standards.
The performance data quoted represents past performance and is no guarantee of future results. Investment return and principal value of an investment will fluctuate so that an investor’s shares, when redeemed, may be worth more or less than their original cost. Current performance may be lower or higher than the performance data quoted. For the most recent month-end performance, please call 1-833-877-3863 or visit the Fund’s website at www.usq.com.
Market Review
Heading into the Reporting Period, inflation, and more importantly the Federal Reserve’s reaction to high inflation, was the top worry for investors. That worry was certainly warranted as the Fed took rates higher by more than 500 basis points in just over a year. By the end of the Reporting Period, the repercussions of such aggressive tightening started to take hold with the collapse of Silicon Valley Bank, which was just the beginning of the turmoil within the regional banks. We expect more fallout from this aggressive action and believe the Fed will likely have to reverse course if the pressure on the U.S. banking system continues.
Commercial real estate has been very resilient during this period. For the first two quarters of the Reporting Period, the Fund produced positive returns. However, the Fund did experience modest declines during the final two quarters of the Reporting Period as cap rates pushed higher due to higher interest rates. Although higher interest rates generally have a negative effect on commercial real estate, operating fundamentals in the current environment remain incredibly strong. We have continued to see above average rent growth in industrial and multi-family properties, which make up about two-thirds of the portfolio. Additionally, retail properties (about 8% of the portfolio) have also started to experience rent growth as retailers are opening new stores.
The one area of commercial real estate that is facing the most headwinds continues to be office, which is now just 18% of the portfolio. As the return to office has been slower than expected, many of the NFI-ODCE managers have significantly written down their office portfolios. However, what should be noted is that not all office is created equal. Class A office buildings that offer best in class amenities are winning in this environment, experiencing strong leasing activity and, in some cases, increasing rents. Given NFI-ODCE funds predominantly focus on the much more resilient Class A office, we believe the majority of the declines have already been taken in the office properties held within the Fund.
We continue to believe that the Fund provides exposure to the highest quality core commercial real estate in the U.S. The Fund continues to deliver on its goals of low correlation to broader markets, a stable quarterly distribution, and has been a ballast in our investors’ portfolios. Furthermore, it should be highlighted, especially in this environment, that the NFI-ODCE managers utilize very low leverage (~24%) and the majority of their outstanding debt does not mature until after 2026. We believe that if investors are going to own commercial real estate, this is the type of real estate they should want to own.
Annual Report | March 31, 2023 | 1 |
USQ Core Real Estate Fund | Letter to Shareholders |
| | March 31, 2023 (Unaudited) |
Manager Discussion of Fund Performance
Below is the Fund’s current sector allocations and geographic weightings. We believe the fund is well diversified and favorably positioned to be a beneficiary of existing trends in commercial real estate and broader economic environment. The majority (~65%) of the Fund is allocated to the industrial and multi-family property types. These property types have experienced the strongest growth, but more importantly, are also well positioned to benefit from current real estate trends.
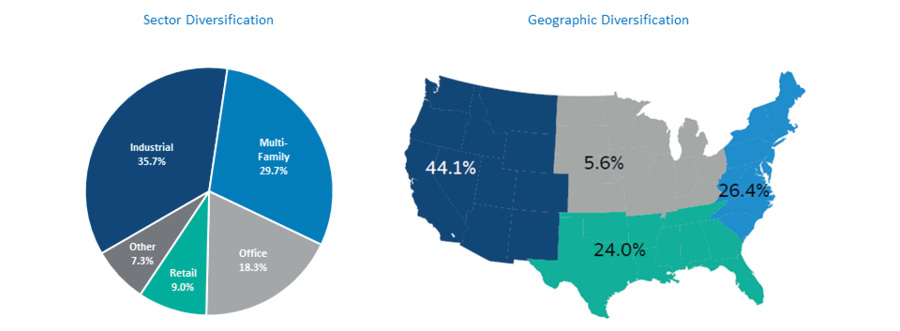
Portfolio sector and geographic weightings are with respect to the portion of the Fund invested in private funds
as of 4/1/23 and are subject to change. Diversification does not ensure profit or prevent losses.
The industrial and retail property types were the strongest performers over the previous year. Industrial properties (unlevered) returned more than 2% during the Reporting Period while retail properties (unlevered) returned approximately 1%. Multi-family (unlevered) returns were flat while office (unlevered) experienced negative returns of approximately -9%. Not surprisingly, the underlying funds that were overweighted to the industrial property type were the strongest performers for the Reporting Period. Additionally, it should be noted that the Fund maintained an above average allocation to cash over the last two quarters of the Reporting Period. This position also positively contributed to performance.
Over the twelve months ended March 31, 2023, the Fund’s Class I and Class IS shares delivered a total return of -3.02% and -2.95%, respectively. During the same period, broad-based equity markets delivered a -7.73% return (S&P 500 TR), while fixed income was also negative posting a return of -4.78% (Bloomberg U.S. Aggregate Bond Index TR). This highlights the lack of correlation to the publicly traded markets and exemplifies why we believe it is important to have an allocation to private real estate.
The Fund’s distribution policy is to make quarterly distributions to shareholders. During the twelve-month period ended March 31, 2023, the Fund made distributions to shareholders totaling $1.195 per share, of which we expect substantially all will be treated as a return of capital for tax purposes given the Fund’s investments in real estate which are generally exempt from corporate taxes and have favorable tax treatment on distributions. This equates to an annualized distribution rate of 4.04%, which is calculated by taking the average of the prior four quarterly distribution rates. The quarterly distribution rates are calculated by annualizing the actual distribution and dividing by the net asset value for the distribution date. There is no assurance that the Fund will continue to declare distributions or that they will continue at these rates. See additional disclosures below.
Annual Report | March 31, 2023 | 2 |
USQ Core Real Estate Fund | Letter to Shareholders |
| | March 31, 2023 (Unaudited) |
Performance Information
Growth of an Assumed $10,000 Investment

The Fund’s performance compared to its benchmarks for the periods ended March 31, 2023.
| | 1 Year | 3 Year | 5 Year | Since Inception
9/27/2017 |
USQ Core Real Estate I (USQIX) | -3.02% | 6.97% | 6.25% | 6.16% |
USQ Core Real Estate IS (USQSX) | -2.95% | 7.03% | 6.29% | 6.19% |
S&P 500 TR | -7.73% | 18.62% | 11.19% | 11.35% |
Bloomberg U.S. Aggregate Bond TR | -4.78% | -2.77% | 0.91% | 0.64% |
MSCI U.S. REIT GR Index | -19.17% | 12.00% | 6.02% | 4.28% |
NFI-ODCE NR | -3.69% | 8.17% | 7.13% | 7.21% |
The performance quoted represents past performance. Past performance does not guarantee future results. The current performance may be lower or higher than the performance data quoted. The investment return and principal value of the Fund will fluctuate; an investor’s shares, when redeemed, may be worth more or less than their original cost. Performance data current to the most recent month end may be obtained by calling 1-833-877-3863.
Fund returns reflect actual fee waivers for the time periods represented. Had fees and expenses not been waived, returns would have been lower. See the prospectus for more information on current fees and expenses. All investing involves risk, including the possible loss of principal. Performance for periods less than one year is not annualized. Since Inception performance of the NFI-ODCE NR is as of 10/2/2017, due to quarterly calculation of the index. Class I gross expenses are 1.35% and net expenses are 0.95%. Class IS gross expenses are 1.60% and net expenses are 1.20%. Net fees are based on a contractual fee waiver and reimbursement agreement that will continue indefinitely until terminated by mutual agreement of the Adviser and the Fund, including consent of the Fund’s Board.
The graph shown above represents historical performance of a hypothetical investment of $10,000 in the Fund since inception. Past performance is not indicative of future results. Investment return and the principal value of an investment will fluctuate. Shares may be worth more or less than original cost when redeemed. Investing involves risk, including loss of principal. Fund performance includes
Annual Report | March 31, 2023 | 3 |
USQ Core Real Estate Fund | Letter to Shareholders |
| | March 31, 2023 (Unaudited) |
reinvestment of distributions and reflects management fees and other expenses. The Fund return does not reflect the deduction of all fees, including third-party brokerage commissions or third-party investment advisory fees paid by investors to a financial intermediary for brokerage services. If the deduction of such fees was reflected, the performance would be lower. Returns shown do not reflect the deduction of taxes that a shareholder would pay on Fund distributions or the redemption of Fund shares. Performance data current to the most recent month end may be obtained by calling 1-833-877-3863. An investment cannot be made in an index, which is unmanaged and has returns that do not reflect any trading, management, or other costs. Index performance does not represent actual Fund or portfolio performance, nor does it represent actual performance of the Fund’s Adviser.
Outlook
While the public markets have not been kind to investors across the board, it is important to remember that declines are a natural part of investing, and actually necessary to keep markets functioning properly. While the private markets are generally less volatile, the Fund also experienced negative returns over the last two quarters of the Reporting Period, albeit to a much lesser extent. However, we believe the majority of the declines are now behind us. Private real estate has consistently proven its ability to be a non-correlated asset and a true diversifier. For the calendar year 2022, private real estate was one of the few asset classes that delivered positive returns.
As it relates to commercial real estate specifically, we continue to believe the asset class is well-positioned in the current environment. While we may see some slight declines in the first half of 2023, we are expecting returns to normalize by the second half of the year. Also, it is important to remember fundamentals remain healthy - occupancy remains at near record highs of 93.4%, leverage remains low at 25.1%, and leasing activity is strengthening. We are hopeful interest rates will also retreat as inflation trends down, which should provide a tailwind for the asset class. High quality commercial real estate, which is the hallmark of NFI-ODCE index in which the Fund invests, remains in high demand.

| 
|
Thomas Miller, CFA
CEO and Chief Investment Officer | Michael Achterberg, CAIA
Senior Portfolio Manager |
This letter represents the opinions of the Fund’s management and are subject to change, are not guaranteed and should not be considered recommendations to buy or sell any security. The information provided is not intended to be, and is not, a forecast of future events, a guarantee of results, or investment advice.
Definitions
Correlation is a statistic that measures the extent to which two asset classes (or securities) move in relation to each other. Two asset classes that have a high correlation move in the same direction as markets rise and fall. Two asset classes with negative or inverse correlation move in opposite directions as markets rise and fall. The closer the correlation statistic between two asset classes is to zero, the more independently the asset classes move with respect to each other.
Cap Rates represents the rate of return based on the income that the property is expected to generate.
Basis point equals one hundredth of one percent.
Leverage refers to the total amount of debt financing on a property relative to its current market value.
Annual Report | March 31, 2023 | 4 |
USQ Core Real Estate Fund | Letter to Shareholders |
| | March 31, 2023 (Unaudited) |
Indexes
Bloomberg U.S. Aggregate Bond Index The Bloomberg U.S. Aggregate Bond Index is an unmanaged market value-weighted index for U.S. dollar denominated investment-grade fixed-rate debt issues, including government, corporate, asset-backed, and mortgage-backed securities with maturities of at least one year.
The MSCI US REIT Index is a free float-adjusted market capitalization index that is comprised of equity REITs. With 126 constituents, it represents about 99% of the US REIT universe and securities are classified in the Equity REITs Industry (under the Real Estate sector) according to the Global Industry Classification Standard (GICS®). It however excludes Mortgage REIT and selected Specialized REITs.
NFI-ODCE The NCREIF Fund Index — Open-end Diversified Core Equity (NFI-ODCE) consists of private real estate equity funds that meet certain criteria with respect to such things as leverage (less than 35%), operations (at least 75% invested in properties that are 75% or more leased), sector and geographic diversification, and investment in core real estate (at least 75% in office, industrial, apartment and retail properties).
S&P 500 Index S&P 500 Index is a market capitalization-weighted index of 500 common stocks chosen for market size, liquidity, and industry group representation to represent U.S. equity performance.
One cannot invest directly in an index.
Risk Disclosures
Investing in the Fund’s shares involves substantial risks, including the risks set forth in the “Risk Factors” section of this prospectus, which include, but are not limited to the following:
| | ● | Investing in real estate entails special risks, including (i) changes in general economic and market conditions; (ii) changes in the value of real estate properties; (iii) risks related to local economic conditions, overbuilding, and increased competition; (iv) increases in property taxes and operating expenses; (v) changes in zoning laws; (vi) casualty and condemnation losses; (vii) variations in rental income, neighborhood values, or the appeal of property to tenants; (viii) the availability of financing and (ix) changes in interest rates and leverage. There are also special risks associated with particular real estate sectors, or real estate operations generally. |
| | ● | The Fund is not intended to be a complete investment program, but instead as a way to help investors diversify into real estate. Diversification does not ensure a profit or guarantee against a loss. |
| | ● | There currently is no secondary market for the Fund’s shares and the Adviser does not expect that a secondary market will develop. Limited liquidity is provided to shareholders only through the Fund’s quarterly Repurchase Offers for no less than 5% of the Fund’s shares outstanding at net asset value. There is no guarantee that shareholders will be able to sell all of the shares they desire in a quarterly Repurchase Offer. |
Other Important Disclosures
The Fund’s distribution policy is to make quarterly distributions to shareholders. The level of quarterly distributions (including any return of capital) is not fixed. However, this distribution policy is subject to change. Shareholders should not assume that the source of a distribution from the Fund is net profit. A portion of the distributions consist of a return of capital based on the character of the distributions received from the underlying holdings, primarily Real Estate Investment Trusts. The final determination of the source and tax characteristics of all distributions will be made after the end of the year. Shareholders should note that return of capital will reduce the tax basis of their shares and potentially increase the taxable gain, if any, upon disposition of their shares. Distribution rates are not performance and there is no assurance that the Fund will continue to declare distributions or that they will continue at these rates.
Annual Report | March 31, 2023 | 5 |
USQ Core Real Estate Fund | Letter to Shareholders |
| | March 31, 2023 (Unaudited) |
By investing in the Fund, a shareholder will not be deemed to be an investor in any underlying fund in which the Fund invests and will not have the ability to exercise any rights attributable to an investor in any such underlying fund.
Before investing in the Fund, you should carefully consider the Fund’s investment objectives, risks, fees, and expenses. For a copy of a prospectus which contains this and other information, please visit our website at www.usq.com or call 1-833-877-3863. Please read the Fund’s prospectus carefully before investing.
The USQ Core Real Estate Fund is a continuously-offered, non-diversified, registered closed-end fund with limited liquidity.
The USQ Core Real Estate Fund is distributed by Quasar Distributors LLC.
Annual Report | March 31, 2023 | 6 |
USQ Core Real Estate Fund | Schedule of Investments |
| | March 31, 2023 |
Description | | Shares | | | Fair Value | |
Real Estate Investments — 91.1% | | | | | | | | |
Private Equity Real Estate Funds — 91.1% (1)(2) | | | | | | | | |
AEW Core Property (U.S.), LP | | | 5,939 | | | $ | 7,034,730 | |
ARA Core Property Fund, LP | | | 29 | | | | 4,240,447 | |
ASB Allegiance Real Estate Fund, LP | | | 4,474 | | | | 7,931,515 | |
Bailard Real Estate Investment Trust, Inc. | | | 276,955 | | | | 9,596,499 | |
Barings Core Property Fund, LP | | | 54,273 | | | | 7,837,064 | |
BGO Daily Value Fund — Class F | | | 422,712 | | | | 6,026,979 | |
BGO Diversified US Property Fund | | | 752 | | | | 2,174,647 | |
BlackRock US Core Property Fund, LP (3) | | | — | | | | 7,256,150 | |
CBRE U.S. Core Partners, LP | | | 10,843,973 | | | | 19,933,537 | |
CIM UII Onshore, LP | | | 6,101 | | | | 8,818,463 | |
Clarion Lion Properties Fund, LP | | | 9,333 | | | | 16,944,400 | |
GWL USPF LP (4) | | | — | | | | 9,207,603 | |
Madison Core Property Fund LP | | | 6,365 | | | | 16,974,232 | |
MetLife Core Property Fund, LP | | | 1,178 | | | | 2,052,554 | |
PGIM Retirement Real Estate II LP | | | 1,218,767 | | | | 2,221,443 | |
Prime Property Fund, LLC | | | 217 | | | | 4,753,004 | |
PRISA, LP | | | 3,998 | | | | 9,016,651 | |
RREEF America II LP | | | 22,939 | | | | 3,382,333 | |
Smart Markets Fund, LP | | | 4,824 | | | | 9,399,794 | |
Strategic Property Fund | | | 743,184 | | | | 9,426,063 | |
TA Realty Core Property Fund, LP | | | 7,621 | | | | 11,307,651 | |
Trumbull Property Fund, LP | | | 142 | | | | 1,474,646 | |
U.S. Real Estate Investment Fund, LLC | | | 3,342 | | | | 4,849,393 | |
U.S. Real Property Income Fund, LP (5) | | | — | | | | 1,434,294 | |
Total Real Estate Investments (Cost $163,780,065) | | | | | | | 183,294,092 | |
| | | | | | | | | |
Short—Term Investments — 8.4% | | | | | | | | |
Money Market Fund — 8.4% | | | | | | | | |
Invesco Government & Agency — Institutional Shares, 4.73% (6) | | | 16,882,098 | | | | 16,882,098 | |
Total Short—Term Investments (Cost $16,882,098) | | | | | | | | |
| | | | | | | | | |
Total Investments — 99.5% (Cost $180,662,163) | | | | | | $ | 200,176,190 | |
Other Assets Less Liabilities — 0.5% | | | | | | | 1,109,758 | |
Net Assets — 100.0% | | | | | | $ | 201,285,948 | |
| | | Percentages are stated as a percent of net assets. |
| | | LLC - Limited Liability Company |
(1) | Securities considered illiquid and restricted. As of March 31, 2023, the value of these investments was $183,294,092 or 91.1% of the Fund’s net assets. |
(2) | In accordance with ASC 820-10, Private Investment Funds are valued using the practical expedient methodology. |
(3) | Partnership is not designated in units. The Fund owns approximately 0.27% at March 31, 2023. |
(4) | Partnership is not designated in units. The Fund owns approximately 1.50% at March 31, 2023. |
(5) | Partnership is not designated in units. The Fund owns approximately 0.07% at March 31, 2023. |
(6) | Rate reflects seven-day effective yield on March 31, 2023. |
See Notes to Financial Statements.
Annual Report | March 31, 2023 | 7 |
USQ Core Real Estate Fund | Statement of Assets & Liabilities |
| | March 31, 2023 |
Assets | | | | |
Investments at value (Cost $180,662,163) | | $ | 200,176,190 | |
Dividends receivable | | | 522,846 | |
Receivable for investments sold | | | 400,000 | |
Receivable for capital shares sold | | | 321,863 | |
Interest receivable | | | 66,118 | |
Prepaid assets and other assets | | | 15,333 | |
Total assets | | | 201,502,350 | |
| | | | | |
Liabilities | | | | |
Payable to Adviser, net of waiver (Note 3) | | | 72,932 | |
Audit fees payable | | | 35,250 | |
Administration fees payable (Note 3) | | | 33,678 | |
Transfer agency fees payable (Note 3) | | | 17,992 | |
Trustees’ fees payable (Note 3) | | | 15,081 | |
Reports to shareholders payable | | | 9,544 | |
Compliance fees payable | | | 6,500 | |
Legal fees payable | | | 5,343 | |
Accrued expenses and other liabilities | | | 20,082 | |
Total liabilities | | | 216,402 | |
Net assets | | $ | 201,285,948 | |
Commitments and Contingencies (See Note 7).
Net Assets Consist of | | | | |
Paid-in capital | | $ | 183,248,017 | |
Total distributable earnings | | | 18,037,931 | |
Net assets | | $ | 201,285,948 | |
| | | | | |
Class I | | | | |
Net assets applicable to outstanding shares | | $ | 201,147,263 | |
Shares of beneficial interest outstanding (unlimited shares authorized, no par value) | | | 7,268,362 | |
Net asset value per share outstanding | | $ | 27.67 | |
| | | | | |
Class IS | | | | |
Net assets applicable to outstanding shares | | $ | 138,685 | |
Shares of beneficial interest outstanding (unlimited shares authorized, no par value) | | | 5,002 | |
Net asset value per share outstanding | | $ | 27.73 | |
See Notes to Financial Statements.
Annual Report | March 31, 2023 | 8 |
USQ Core Real Estate Fund | Statement of Operations |
| | Year Ended March 31, 2023 |
Investment Income | | | | |
Dividends | | $ | 1,359,692 | |
Interest | | | 470,602 | |
Total investment income | | | 1,830,294 | |
| | | | | |
Expenses | | | | |
Management fees | | | 1,388,279 | |
Administrator fees | | | 211,538 | |
Professional fees | | | 183,025 | |
Shareholder service fees - Class I | | | 159,504 | |
Transfer agent fees | | | 105,047 | |
Compliance fees | | | 77,999 | |
Trustees’ fees | | | 59,800 | |
Registration fees | | | 55,885 | |
Reports to shareholders | | | 26,700 | |
Insurance expense | | | 23,396 | |
Custodian fees and expenses | | | 19,774 | |
Total expenses | | | 2,310,947 | |
Less fees waived/expense reimbursement by Adviser (Note 3) | | | (336,001 | ) |
Net Fund Expenses | | | 1,974,946 | |
Net Investment Loss | | | (144,652 | ) |
| | | | | |
Realized and Unrealized Gain/(Loss) on Investments | | | | |
Long term capital gain distributions | | | 1,736,115 | |
Net realized gain on unaffiliated investments | | | 1,060,069 | |
Net realized gain on affiliated investments | | | 109,917 | |
Net change in unrealized appreciation/(depreciation) of unaffiliated investments | | | (9,906,048 | ) |
Net change in unrealized appreciation/(depreciation) of affiliated investments | | | (731,994 | ) |
Net Realized and Unrealized Loss on Investments | | | (7,731,941 | ) |
Decrease in Net Assets Resulting from Operations | | $ | (7,876,593 | ) |
See Notes to Financial Statements.
Annual Report | March 31, 2023 | 9 |
USQ Core Real Estate Fund | Statements of Changes in Net Assets |
| | |
| | Year Ended
March 31, 2023 | | | Year Ended
March 31, 2022 | |
Operations | | | | | | | | |
Net investment loss | | $ | (144,652 | ) | | $ | (423,989 | ) |
Net realized gain/(loss) on investments | | | 2,906,101 | | | | (213,252 | ) |
Net change in unrealized appreciation/(depreciation) on investments | | | (10,638,042 | ) | | | 26,572,620 | |
Net increase/(decrease) in net assets resulting from operations | | | (7,876,593 | ) | | | 25,935,379 | |
Distributions to Shareholders | | | | | | | | |
Distributable earnings | | | | | | | | |
Class I | | | (2,642,110 | ) | | | (457,769 | ) |
Class IS | | | (1,798 | ) | | | (540 | ) |
From return of capital | | | | | | | | |
Class I | | | (5,918,590 | ) | | | (4,170,700 | ) |
Class IS | | | (4,029 | ) | | | (4,647 | ) |
Decrease in net assets from distributions | | | (8,566,527 | ) | | | (4,633,656 | ) |
Capital Share Transactions | | | | | | | | |
Class I | | | | | | | | |
Proceeds from sales of shares | | | 54,863,274 | | | | 93,563,395 | |
Distributions reinvested | | | 2,993,782 | | | | 2,097,669 | |
Cost of shares redeemed | | | (29,780,219 | ) | | | (8,583,856 | ) |
Net increase from capital shares transactions | | | 28,076,837 | | | | 87,077,208 | |
Class IS | | | | | | | | |
Proceeds from sales of shares | | | 19,500 | | | | 6,000 | |
Distributions reinvested | | | 5,827 | | | | 5,187 | |
Cost of shares redeemed | | | (26,045 | ) | | | — | |
Net increase/(decrease) from capital shares transactions | | | (718 | ) | | | 11,187 | |
Net increase in net assets | | | 11,632,999 | | | | 108,390,118 | |
Net Assets | | | | | | | | |
Beginning of year | | | 189,652,949 | | | | 81,262,831 | |
End of year | | $ | 201,285,948 | | | $ | 189,652,949 | |
See Notes to Financial Statements.
Annual Report | March 31, 2023 | 10 |
USQ Core Real Estate Fund | Statements of Changes in Net Assets |
| | |
| | Year Ended
March 31, 2023 | | | Year Ended
March 31, 2022 | |
Other Information | | | | | | | | |
Beneficial Interest Transactions: | | | | | | | | |
Class I | | | | | | | | |
Beginning shares | | | 6,345,390 | | | | 3,270,279 | |
Shares sold | | | 1,818,341 | | | | 3,311,900 | |
Distributions reinvested | | | 101,340 | | | | 76,862 | |
Shares redeemed | | | (996,709 | ) | | | (313,651 | ) |
Net Increase in shares outstanding | | | 922,972 | | | | 3,075,111 | |
Ending shares | | | 7,268,362 | | | | 6,345,390 | |
Class IS | | | | | | | | |
Beginning shares | | | 5,013 | | | | 4,616 | |
Shares sold | | | 640 | | | | 206 | |
Distributions reinvested | | | 197 | | | | 191 | |
Shares redeemed | | | (848 | ) | | | — | |
Net increase/(decrease) in shares outstanding | | | (11 | ) | | | 397 | |
Ending shares | | | 5,002 | | | | 5,013 | |
See Notes to Financial Statements.
Annual Report | March 31, 2023 | 11 |
USQ Core Real Estate Fund | Statement of Cash Flows |
| | As of March 31, 2023 |
Cash Flow from Operating Activities: | | | | |
Net increase in net assets resulting from operations | | $ | (7,876,593 | ) |
Adjustments to reconcile net increase in net assets resulting from operations to net cash used in operating activities: | | | | |
Purchase of investments | | | (44,969,440 | ) |
Proceeds from sales | | | 8,031,265 | |
Net sales of short term investments | | | 11,959,850 | |
Long term capital gain distributions | | | (1,736,115 | ) |
Net realized gain on unaffiliated investments | | | (1,060,069 | ) |
Net realized gain on affiliated investments | | | (109,917 | ) |
Net change in unrealized (appreciation)/depreciation of unaffiliated investments | | | 9,906,048 | |
Net change in unrealized (appreciation)/depreciation of affiliated investments | | | 731,994 | |
Return of capital distributions received | | | 1,542,922 | |
Long term capital gain distributions received | | | 1,736,115 | |
(Increase)/decrease in assets: | | | | |
Receivable from Adviser | | | — | |
Receivable for investments sold | | | (400,000 | ) |
Receivable for capital shares sold | | | 12,182 | |
Investments paid in advance | | | 2,750,000 | |
Dividends receivable | | | 2,190 | |
Interest receivable | | | (62,659 | ) |
Prepaid expenses and other assets | | | 16,256 | |
Increase/(decrease) in liabilities: | | | | |
Payable to Adviser | | | 6,698 | |
Audit fees payable | | | 2,250 | |
Trustees’ fees payable | | | (16,919 | ) |
Administration fees payable | | | 10,178 | |
Legal fees payable | | | 99 | |
Transfer agency fees payable | | | 1,871 | |
Compliance fees payable | | | — | |
Reports to shareholders payable | | | 6,361 | |
Accrued expenses and other liabilities | | | 5,841 | |
Net cash used in operating activities | | | (19,509,592 | ) |
| | | | | |
Cash Flows from Financing Activities: | | | | |
Proceeds from shares sold | | | 54,882,774 | |
Payment on shares redeemed | | | (29,806,264 | ) |
Cash distributions paid | | | (5,566,918 | ) |
Net cash provided by financing activities | | | 19,509,592 | |
| | | | | |
Net decrease in cash | | | — | |
Cash, beginning of year | | $ | — | |
Cash, end of year | | $ | — | |
Supplemental Disclosure of non-cash activity: | | | | |
Non-cash financing activities not included herein consist of reinvestment of distributions of: | | $ | 2,999,609 | |
Non-cash operating activities not included herein consist of reinvestment of dividends from underlying investments: | | $ | 1,730,302 | |
See Notes to Financial Statements.
Annual Report | March 31, 2023 | 12 |
USQ Core Real Estate Fund - Class I | Financial Highlights |
| | For a Share Outstanding Throughout the Years Presented |
| | Year Ended
March 31, 2023 | | | Year Ended
March 31, 2022 | | | Year Ended
March 31, 2021 | | | Year Ended
March 31, 2020 | | | Year Ended
March 31, 2019 | |
Net Asset Value, Beginning of Year(1) | | $ | 29.86 | | | $ | 24.81 | | | $ | 25.56 | | | $ | 25.65 | | | $ | 25.08 | |
| | | | | | | | | | | | | | | | | | | | | |
Income from Investment Operations | | | | | | | | | | | | | | | | | | | | |
Net investment income/(loss)(2) | | | (0.02 | ) | | | (0.11 | ) | | | 0.01 | | | | 0.02 | | | | 0.60 | |
Net realized and unrealized gain/(loss) on investments | | | (0.97 | ) | | | 6.25 | | | | 0.24 | | | | 0.93 | | | | 1.00 | |
Total income/(loss) from investment operations | | | (0.99 | ) | | | 6.14 | | | | 0.25 | | | | 0.95 | | | | 1.60 | |
| | | | | | | | | | | | | | | | | | | | | |
Distributions to Shareholders | | | | | | | | | | | | | | | | | | | | |
From net investment income | | | (0.37 | ) | | | (0.11 | ) | | | (0.15 | ) | | | (0.36 | ) | | | (0.44 | ) |
From return of capital | | | (0.83 | ) | | | (0.98 | ) | | | (0.85 | ) | | | (0.68 | ) | | | (0.59 | ) |
Total distributions | | | (1.20 | ) | | | (1.09 | ) | | | (1.00 | ) | | | (1.04 | ) | | | (1.03 | ) |
Increase/(Decrease) in Net Asset Value | | | (2.19 | ) | | | 5.05 | | | | (0.75 | ) | | | (0.09 | ) | | | 0.57 | |
Net Asset Value, End of Year(1) | | $ | 27.67 | | | $ | 29.86 | | | $ | 24.81 | | | $ | 25.56 | | | $ | 25.65 | |
| | | | | | | | | | | | | | | | | | | | | |
Total Return(1)(3) | | | (3.53 | )% | | | 25.29 | % | | | 0.88 | % | | | 4.00 | % | | | 6.47 | % |
| | | | | | | | | | | | | | | | | | | | | |
Supplemental Data and Ratios | | | | | | | | | | | | | | | | | | | | |
Net assets, end of year (000s) | | $ | 201,147 | | | $ | 189,503 | | | $ | 81,148 | | | $ | 49,646 | | | $ | 30,391 | |
| | | | | | | | | | | | | | | | | | | | | |
Ratio of expenses to average net assets, before waiver(4) | | | 1.08 | % | | | 1.31 | % | | | 1.83 | % | | | 2.34 | % | | | 2.94 | % |
Ratio of expenses to average net assets, after waiver(4) | | | 0.92 | % | | | 0.91 | % | | | 0.89 | % | | | 0.87 | % | | | 0.85 | % |
Ratio of net investment income to average net assets, before waiver(4) | | | (0.23 | )% | | | (0.79 | )% | | | (0.93 | )% | | | (1.38 | )% | | | 0.25 | % |
Ratio of net investment income to average net assets, after waiver(4) | | | (0.07 | )% | | | (0.39 | )% | | | 0.02 | % | | | 0.09 | % | | | 2.34 | % |
| | | | | | | | | | | | | | | | | | | | | |
Portfolio turnover rate | | | 4.12 | % | | | 0.13 | % | | | 5.35 | % | | | 1.54 | % | | | 10 | % |
| | (1) | Includes adjustments in accordance with accounting principles generally accepted in the United States and, consequently, the net asset value for financial reporting purposes and returns based upon those net asset values may differ from the net asset values and returns for shareholder transactions. |
| | (2) | Calculated using the average shares method. |
| | (3) | Total returns shown are historical in nature and assume changes in share price, reinvestment of dividends and capital gains distributions, if any. Had the Adviser not waived/reimbursed a portion of Fund expenses, total returns would have been lower. |
| | (4) | Ratios do not include expenses of underlying private investment funds in which the Fund invests. |
See Notes to Financial Statements.
Annual Report | March 31, 2023 | 13 |
USQ Core Real Estate Fund - Class IS | Financial Highlights |
| | For a Share Outstanding Throughout the Years Presented |
| | Year Ended
March 31, 2023 | | | Year Ended
March 31, 2022 | | | Year Ended
March 31, 2021 | | | Year Ended
March 31, 2020 | | | Year Ended
March 31, 2019 | |
Net Asset Value, Beginning of Year(1) | | $ | 29.92 | | | $ | 24.85 | | | $ | 25.55 | | | $ | 25.66 | | | $ | 25.08 | |
| | | | | | | | | | | | | | | | | | | | | |
Income from Investment Operations | | | | | | | | | | | | | | | | | | | | |
Net investment income/(loss)(2) | | | (0.05 | ) | | | (0.07 | ) | | | 0.02 | | | | 0.22 | | | | 0.60 | |
Net realized and unrealized gain/(loss) on investments | | | (0.94 | ) | | | 6.23 | | | | 0.28 | | | | 0.71 | | | | 1.01 | |
Total income/(loss) from investment operations | | | (0.99 | ) | | | 6.16 | | | | 0.30 | | | | 0.93 | | | | 1.61 | |
| | | | | | | | | | | | | | | | | | | | | |
Distributions to Shareholders | | | | | | | | | | | | | | | | | | | | |
From net investment income | | | (0.37 | ) | | | (0.11 | ) | | | (0.15 | ) | | | (0.36 | ) | | | (0.44 | ) |
From return of capital | | | (0.83 | ) | | | (0.98 | ) | | | (0.85 | ) | | | (0.68 | ) | | | (0.59 | ) |
Total distributions | | | (1.20 | ) | | | (1.09 | ) | | | (1.00 | ) | | | (1.04 | ) | | | (1.03 | ) |
Increase/(Decrease) in Net Asset Value | | | (2.19 | ) | | | 5.07 | | | | (0.70 | ) | | | (0.11 | ) | | | 0.58 | |
Net Asset Value, End of Year(1) | | $ | 27.73 | | | $ | 29.92 | | | $ | 24.85 | | | $ | 25.55 | | | $ | 25.66 | |
| | | | | | | | | | | | | | | | | | | | | |
Total Return(1)(3) | | | (3.52 | )% | | | 25.33 | % | | | 1.04 | % | | | 3.96 | % | | | 6.51 | % |
| | | | | | | | | | | | | | | | | | | | | |
Supplemental Data and Ratios | | | | | | | | | | | | | | | | | | | | |
Net assets, end of year (000s) | | $ | 139 | | | $ | 150 | | | $ | 115 | | | $ | 113 | | | $ | 109 | |
| | | | | | | | | | | | | | | | | | | | | |
Ratio of expenses to average net assets, before waiver(4) | | | 1.01 | % | | | 1.26 | % | | | 1.85 | % | | | 2.39 | % | | | 2.94 | % |
Ratio of expenses to average net assets, after waiver(4) | | | 0.85 | % | | | 0.85 | % | | | 0.85 | % | | | 0.85 | % | | | 0.85 | % |
Ratio of net investment income to average net assets, before waiver(4) | | | (0.33 | )% | | | (0.67 | )% | | | (0.93 | )% | | | (0.68 | )% | | | 0.25 | % |
Ratio of net investment income to average net assets, after waiver(4) | | | (0.17 | )% | | | (0.26 | )% | | | 0.08 | % | | | 0.86 | % | | | 2.34 | % |
| | | | | | | | | | | | | | | | | | | | | |
Portfolio turnover rate | | | 4.12 | % | | | 0.13 | % | | | 5.35 | % | | | 1.54 | % | | | 10 | % |
| | (1) | Includes adjustments in accordance with accounting principles generally accepted in the United States and, consequently, the net asset value for financial reporting purposes and returns based upon those net asset values may differ from the net asset values and returns for shareholder transactions. |
| | (2) | Calculated using the average shares method. |
| | (3) | Total returns shown are historical in nature and assume changes in share price, reinvestment of dividends and capital gains distributions, if any. Had the Adviser not waived/reimbursed a portion of Fund expenses, total returns would have been lower. |
| | (4) | Ratios do not include expenses of underlying private investment funds in which the Fund invests. |
See Notes to Financial Statements.
Annual Report | March 31, 2023 | 14 |
USQ Core Real Estate Fund | Notes to Financial Statements |
| | March 31, 2023 |
1. ORGANIZATION
The USQ Core Real Estate Fund (the “Fund”) is registered under the Investment Company Act of 1940, as amended (the “1940 Act”), as a non-diversified, closed-end management company. The Fund engages in a continuous offering of shares and operates as an interval fund that offers quarterly repurchases of shares at net asset value (“NAV”). The Fund’s investment adviser is Union Square Capital Partners, LLC (the “Adviser”). The investment objective of the Fund is to generate a return comprised of both current income and capital appreciation with moderate volatility and low correlation to the broader markets.
The Fund is organized as a statutory trust under the laws of the State of Delaware. The Fund commenced operations on September 27, 2017.
The Fund currently offers Class I and Class IS shares. All classes of shares have equal voting privileges except that each class has exclusive voting rights with respect to its service and/or distribution plans. The Fund’s income, expenses (other than class specific distribution fees and shareholder servicing expenses), and realized and unrealized gains and losses are allocated proportionately each day based upon the relative net assets of each class.
2. SIGNIFICANT ACCOUNTING POLICIES
The following is a summary of significant accounting policies followed by the Fund in preparation of its financial statements. The policies are in conformity with accounting principles generally accepted in the United States of America (“U.S. GAAP”). The Fund is an investment company and, accordingly, follows the investment company accounting and reporting guidance of the Financial Accounting Standards Board (FASB) Accounting Standards Codification (ASC) Topic 946, Financial Services - Investment Companies.
Valuation of Private Investment Funds
The private institutional real estate investment funds in which the Fund invests (“Private Investment Funds”) are not publicly traded. The Private Investment Funds measure their investment assets at fair value and report a NAV per share on a calendar quarter basis. In accordance with Accounting Standards Codification (“ASC”) 820, the Fund applies the practical expedient to value its investments in Private Investment Funds at their respective NAVs at each quarter – as this method more accurately estimates the actual value of each Private Investment Fund at quarter-end. For non-calendar quarter-end days, the Adviser, as the Board of Trustees’ “valuation designee” under 1940 Act Rule 2a-5, may consider certain information provided by a Private Investment Fund’s investment manager to determine the estimated value of the Fund’s holdings in such Private Investment Funds. The valuation provided by the investment manager as of a specific date may vary from the actual sale price that may be obtained if such investment were sold to a third party. To determine the estimated value of the Fund’s investment in Private Investment Funds, the Adviser considers, among other things, information provided by the Private Investment Funds, including quarterly unaudited financial statements.
Valuation of Public Investments
Readily marketable portfolio securities listed on the New York Stock Exchange (“NYSE”) are valued at the last sale price reflected on the consolidated tape at the close of the NYSE on the business day as of which such value is being determined. If there has been no sale on such day, the securities are valued at the mean of the closing bid and ask prices on such day. If no bid or ask prices are quoted on such day or if market prices may be unreliable because of events occurring after the close of trading, then the security is valued by such method as the Adviser shall determine in good faith to reflect its fair market value. Readily marketable securities not listed on the NYSE but listed on other domestic or foreign securities exchanges are valued in a like manner. Portfolio securities traded on more than one securities exchange are valued at the last sale price on the business day as of which such value is being determined as reflected on the consolidated tape at the close of the exchange representing the principal market for such securities. Securities trading on The NASDAQ Stock Market (“NASDAQ”) are valued at the NASDAQ official closing price.
Annual Report | March 31, 2023 | 15 |
USQ Core Real Estate Fund | Notes to Financial Statements |
| | March 31, 2023 |
Third-Party Pricing Agents
The Adviser may contract with independent, third-party pricing agents to provide primary and secondary valuation coverage. Generally, there will be only one primary pricing agent identified for each type of security within the Fund’s portfolio.
Use of Independent Brokers to Value Securities
If a security price cannot be obtained from an independent, third-party pricing agent, the Adviser shall seek to obtain a bid price from at least one independent broker. The Adviser shall report to the Board on any use of an independent broker to value securities.
Fair Value Pricing Procedures
Securities for which market prices are not “readily available,” or which cannot be valued using the methodologies described in these procedures, will be valued in accordance with the Adviser’s Valuation Policy as approved by the Board. Notwithstanding the foregoing, a security shall not be required to be fair valued in accordance with the Adviser’s Valuation Policy if the aggregate impact to the Fund’s NAV would be less than $0.01. For purposes of measuring the $0.01 threshold, it is assumed that all securities that would otherwise be required to be fair valued were worthless to provide a hypothetical worst-case scenario. In such cases, the most recent available market value for such security may be used.
Fair Value Measurements
In applying the valuation procedures described in this Valuation Policy, the Adviser maximizes the use of “observable” versus “unobservable” inputs in markets which are active or markets where there has not been a significant decrease in the volume and frequency of transactions, as stressed by ASC Topic 820. Observable inputs are defined as inputs that reflect the assumptions market participants would use in pricing an asset or liability developed based on market data obtained from sources independent of the reporting entity. Unobservable inputs are defined as inputs that reflect the Adviser’s own assumptions about the assumptions market participants would use in pricing an asset or liability developed based on the best information available in the circumstances. To clarify observable versus unobservable inputs and increase consistency and comparability in Fair Value measurements, ASC Topic 820 establishes a Fair Value hierarchy (the “Fair Value Hierarchy”) that prioritizes valuation inputs into three levels, which is utilized by the Adviser. The Fair Value Hierarchy is described below in further detail.
Level 1 - Level 1 inputs (“Level 1 Inputs”) are quoted prices (unadjusted) in active markets for identical assets or liabilities that the Adviser has the ability to access at the valuation date. As defined in ASC Topic 820, an active market (“Active Market”) for an asset or liability is a market in which transactions for the asset or liability occur with sufficient frequency and volume to provide pricing information on an ongoing basis. The portfolio has investments in actively traded securities and therefore are valued through the use of Level 1 Inputs in accordance with the Fair Value Hierarchy. In accordance with ASC Topic 820, when applicable Level 1 Inputs are available for a particular security, the Fair Value of the security is equal to the quoted price multiplied by the quantity held. Adjustments are not applied to the quoted price due to the size of a position relative to trading volume (i.e., blockage).
Level 2 - Level 2 inputs (“Level 2 Inputs”) are inputs other than quoted prices included within Level 1 Inputs that are observable for the asset or liability, either directly or indirectly. Level 2 Inputs can include: quoted prices for identical or similar assets or liabilities in markets that are not active; inputs other than quoted prices that are observable for the asset or liability (i.e., interest rates, volatilities, prepayment speeds, loss severities, credit risks, default rates, etc.); and observable market-based inputs.
Level 3 - Level 3 inputs (“Level 3 Inputs”) are unobservable inputs for the asset or liability. Unobservable inputs are used in the absence of observable inputs. Level 3 Inputs reflect the Adviser’s own assumptions about the assumptions that market participants would use in pricing the asset or liability.
The inputs or methodology used for valuing securities are not necessarily an indication of the risk associated with investing in those securities.
Annual Report | March 31, 2023 | 16 |
USQ Core Real Estate Fund | Notes to Financial Statements |
| | March 31, 2023 |
These inputs are summarized in the three broad levels that follow.
Investments in Securities at Value | | Level 1 | | | Level 2 | | | Level 3 | | | Total | |
Private Equity Real Estate Funds(a) | | $ | — | | | $ | — | | | $ | — | | | $ | 183,294,092 | |
Short-Term Investments | | | 16,882,098 | | | | — | | | | — | | | | 16,882,098 | |
Total | | $ | 16,882,098 | | | $ | — | | | $ | — | | | $ | 200,176,190 | |
(a) | In accordance with ASC 820-10, certain investments that are measured at fair value using the NAV per share (or its equivalent) practical expedient have not been classified in the fair value hierarchy. The fair value amounts presented in this table are intended to permit reconciliation of the fair value hierarchy to the amounts presented in the Statement of Assets & Liabilities. |
Use of Estimates
The preparation of the financial statements in accordance with U.S. GAAP requires management to make estimates and assumptions that affect the reported amounts of assets and liabilities and disclosures of contingencies at the date of the financial statements. The Fund believes that these estimates utilized in preparing the financial statements are reasonable and prudent; however, actual results could differ from these estimates.
Indemnifications
In the normal course of business, the Fund enters into contracts that contain a variety of representations which provide general indemnifications. The Fund’s maximum exposure under these arrangements is unknown as this would involve future claims that may be made against the Fund that have not yet occurred. However, the Fund expects the risk of loss to be remote.
Federal Income Taxes
The Fund intends to continue to qualify as a regulated investment company and comply with the provisions available to certain investment companies as defined in Subchapter M of the Internal Revenue Code of 1986, as amended, and to make distributions from net investment income and from net realized capital gains sufficient to relieve it from all, or substantially all, federal income taxes.
The Fund evaluates tax positions taken (or expected to be taken) in the course of preparing the Fund’s tax provisions to determine whether these positions meet a “more-likely-than-not” standard that, based on the technical merits, have a more than 50 percent likelihood of being sustained by a taxing authority upon examination. A tax position that meets the “more-likely-than-not” recognition threshold is measured to determine the amount of benefit to recognize in the financial statements.
As of September 30, 2022, the Fund’s most recent tax year end, the Fund did not have a liability for any unrecognized tax benefits. The Fund recognizes interest and penalties, if any, related to unrecognized tax benefits as income tax expenses in the Statement of Operations. The Fund files U.S. federal, state, and local tax returns as required. The Fund’s tax returns are subject to examination by the relevant tax authorities until expiration of the applicable statute of limitations which is generally three years after the filing of the tax return for federal purposes and four years for most state returns. Tax returns for open years have incorporated no uncertain tax positions that require a provision for income taxes.
Investment Transactions
Investment security transactions are accounted for on trade date. Gains and losses on securities sold are determined on a specific identification basis.
Annual Report | March 31, 2023 | 17 |
USQ Core Real Estate Fund | Notes to Financial Statements |
| | March 31, 2023 |
Distributions to Shareholders
Distributions from investment income are declared and paid quarterly. Distributions from net realized capital gains, if any, are declared and paid annually and are recorded on the ex-dividend date. The character of income and gains to be distributed is determined in accordance with income tax regulations, which may differ from GAAP. Shareholders will be informed of the tax characteristics of the distributions after the close of each fiscal year.
Investment Income
Interest income is accrued and recorded on a daily basis including amortization of premiums, accretion of discounts, and income earned from money market funds. Dividend income is recorded on the ex-dividend date, except that certain dividends from private investment funds are recorded as soon as the information is available to the Fund. Distributions received from the Fund’s investments in private investment funds generally are comprised of investment income, capital gains, and return of capital. For financial statement purposes, the Fund uses investment income, capital gains, and return of capital estimates to allocate the distribution income received. Such estimates are based on historical information available from each private investment and other industry sources. These estimates may subsequently be revised based on information received from the private investment funds after their tax reporting periods are concluded, as the actual character of these distributions is not known until after the fiscal year end of the Fund. The Fund estimates the allocation of investment income, capital gains, and return of capital for the distributions received from private investment funds with the Statement of Operations. For the year ended March 31, 2023, the Fund has estimated approximately 26.1%, 22.7%, and 51.2% of the distributions from private investment funds to be investment income, capital gains, and return of capital, respectively. The Fund records the character of distributions received during the year based on estimates available. The characterization of distributions received by the Fund may be subsequently revised based on the information received from the private investment funds after their tax reporting periods conclude.
3. ADVISORY FEES AND OTHER RELATED PARTY TRANSACTIONS AND OTHER FEES
The Adviser serves as the investment adviser to the Fund. Under the terms of the Investment Advisory Agreement (the “Agreement”), the Adviser, subject to the supervision of the Board of Trustees (the “Board”), provides or arranges to be provided to the Fund such investment advice as it deems advisable and will furnish or arrange to be furnished a continuous investment program for the Fund consistent with the Fund’s investment objectives and policies. As compensation for its management services, the Fund agrees to pay to the Adviser a monthly fee in dollars at the annual rate of 0.65% (as a percentage of daily net assets) on assets up to $500 million, 0.50% on assets of $500 million and more but less than $1 billion, 0.40% on assets of $1 billion and more but less than $5 billion, and 0.30% on assets of $5 billion and more, payable at the end of each calendar month. During the year ended March 31, 2023, the Fund accrued $1,388,279 in management fees.
The Adviser has contractually agreed to waive its fees and/or pay Fund expenses so that the total annual operating expenses of the Fund for Class I and Class IS shares (excluding taxes, interest, trading costs, acquired fund fees and expenses, distribution fees, and shareholder servicing expenses), as a percentage of average daily net assets, do not exceed 0.85%. The Expense Limitation Agreement will continue indefinitely until revised or terminated by mutual agreement by the Fund and the Adviser, with the consent of the Board. Under the Expense Limitation Agreement, the Adviser may request and receive reimbursement from the Fund for advisory fees waived or other expenses reimbursed by the Adviser pursuant to the Expense Limitation Agreement at a date not to exceed three years from the month in which the corresponding waiver or reimbursement to the Fund was made. However, no reimbursement may be made unless the total annual expense ratio of the class making such reimbursement is no higher than the amount of the expense limitation that was in place at the time the Adviser waived the fees or reimbursed the expenses and does not cause the expense ratio to exceed the current expense limitation.
Annual Report | March 31, 2023 | 18 |
USQ Core Real Estate Fund | Notes to Financial Statements |
| | March 31, 2023 |
Fees and reimbursed Fund expenses, including prior year expenses, are subject to potential recoupment by year of expiration. The Adviser’s waived fees and reimbursed expenses that are subject to potential recoupment are as follows:
Fiscal Period
Incurred | | Amount
Waived | | | Amount
Recouped(a) | | | Amount Subject
to Potential Recoupment | | | Expiration
Date | |
March 31, 2021 | | $ | 499,126 | | | | — | | | $ | 499,126 | | | | March 31, 2024 | |
March 31, 2022 | | | 421,060 | | | | — | | | | 421,060 | | | | March 31, 2025 | |
March 31, 2023 | | | 336,001 | | | | — | | | | 336,001 | | | | March 31, 2026 | |
Total | | $ | 1,256,187 | | | $ | — | | | $ | 1,256,187 | | | | | |
(a) | Amounts to be recouped will be in compliance with the Expense Limitation Agreement, and will not cause the total Fund’s expense ratio to exceed 0.85%. |
Certain Officers of the Fund are also Officers of the Adviser. Trustees and Officers, other than the Chief Compliance Officer, affiliated with the Adviser are not compensated by the Fund for their services. Effective March 9, 2023, each Trustee who is not an affiliated person of the Adviser receives an aggregate annual retainer fee of $27,500 per calendar year from the USQ Complex, which includes the Fund and PREDEX. In addition, each Independent Trustee shall receive compensation of $2,500 for each meeting attended in person and $500 for each meeting attended telephonically. The Audit Committee Chair shall also receive an annual compensation of $7,500 per calendar year from the USQ Complex. Prior to March 9, 2023, each Trustee who is not an affiliated person of the Adviser receives an aggregate annual retainer fee of $30,000 per calendar year from the USQ Complex. In addition, each Independent Trustee shall receive compensation of $2,500 for each meeting attended in person and $500 for each meeting attended telephonically.
The Adviser also provides a Chief Compliance Officer to the Fund. For these services, the Fund pays the Adviser a monthly fee of $6,500, which is included in Compliance fees in the Statement of Operations.
Quasar Distributors, LLC (“Quasar”), a wholly-owned broker-dealer subsidiary of Foreside Financial Group, LLC (“Foreside”), serves as the Fund’s distributor. The Fund has adopted a plan of distribution consistent with Rule 12b-1 of the 1940 Act applicable to Class IS shares. Under the plan, 12b-1 distribution fees at an annual rate of 0.25% of average daily net assets of Class IS shares are paid to the distributor or others for distribution services. For the year ended March 31, 2023, the Fund had not incurred any 12b-1 fees. The Fund has also adopted a shareholder servicing plan applicable to Class I and Class IS shares. Under the plan, shareholder servicing fees at an annual rate up to a maximum of 0.10% and 0.25% of average daily net assets of Class I and Class IS shares are paid for shareholder services, respectively. For the year ended March 31, 2023, the Fund incurred shareholder servicing fees of $159,504 for Class I and $0 for Class IS.
The custodian to the Fund is U.S. Bank National Association. The administrator and transfer agent to the Fund is U.S. Bancorp Fund Services, LLC, d/b/a U.S. Bank Global Fund Services (“Fund Services”). See the effect of expenses on Statement of Operations.
Annual Report | March 31, 2023 | 19 |
USQ Core Real Estate Fund | Notes to Financial Statements |
| | March 31, 2023 |
4. AFFILIATED INVESTMENTS
Issuers that are considered affiliates, as defined in Section 2(a)(3) of the 1940 Act, of the Fund at year-end are noted in the Fund’s Schedule of Investments. The table below reflects transactions during the period with entities that are affiliates as of March 31, 2023 and may include acquisitions of new investments, prior year holdings that become affiliated during the year, and prior year affiliated holdings that are no longer affiliated as of year-end.
Non-Controlled Affiliates | | Beginning
Fair Value
April 1, 2022 | | | Purchases or
Contributions | | | Sales or
Distributions | | | Change in
Unrealized
Appreciation
(Depreciation) | | | Net Realized
Gain (Loss) | | | Ending
Fair Value
March 31, 2023 | | | Investment
Income | |
BGO Daily Value Fund - Class F* | | $ | 6,787,084 | | | $ | — | | | $ | (706,215 | ) | | $ | (163,807 | ) | | $ | 109,917 | | | $ | 6,026,979 | | | $ | — | |
Total Non-Controlled Affiliates | | $ | 6,787,084 | | | $ | — | | | $ | (706,215 | ) | | $ | (163.807 | ) | | $ | 109,917 | | | $ | 6,026,979 | | | $ | — | |
* | This security is no longer an affiliate of the Fund as of March 31, 2023. The amount shown on the Statement of Operations includes a change in unrealized appreciation (depreciation) of $(568,187) from this security which was the entire amount of unrealized appreciation of the security as of March 31, 2023. |
5. INVESTMENT TRANSACTIONS
The cost of purchases and proceeds from the sale of securities, other than short-term securities, for the year ended March 31, 2023 amounted to $44,969,400 and $8,031,265, respectively.
6. TAX BASIS INFORMATION
The amount and character of income and capital gain distribution to be paid, if any, are determined in accordance with federal income tax regulations, which may differ from U.S. GAAP. These differences are primarily due to differences in the timing of recognition of gains or losses on investments. Permanent book and tax basis differences, if any, may result in reclassifications to total distributable earnings and additional paid-in capital.
The following reclassifications, which had no impact on results of operations or net assets, were recorded to reflect tax character.
| | Paid-in Capital | | | Total
Distributable Earnings | |
| | $ | (30,659 | ) | | $ | 30,659 | |
Under current tax law, net capital losses realized after October 31st and net ordinary losses incurred after December 31st may be deferred and treated as occurring on the first day of the following fiscal year. As of September 30, 2022, the Fund deferred, on a tax basis, late-year investment losses of $1,121,373.
As of March 31, 2023, the unrealized appreciation and depreciation of investments, based on cost for federal income tax purposes, were as follows:
| | Investments | |
Cost of investments for tax purposes | | $ | 180,999,665 | |
Gross tax unrealized appreciation | | $ | 22,555,928 | |
Gross tax unrealized depreciation | | | (3,379,403 | ) |
Net tax unrealized appreciation (depreciation) | | $ | 19,176,525 | |
Annual Report | March 31, 2023 | 20 |
USQ Core Real Estate Fund | Notes to Financial Statements |
| | March 31, 2023 |
As of September 30, 2022, the Fund’s most recent tax year end, the tax basis of distributable earnings (accumulated deficit) were as follows:
| | Investments | |
Undistributed ordinary income | | $ | — | |
Undistributed long-term capital gains | | | — | |
Tax accumulated earnings | | $ | — | |
Accumulated capital and other losses | | | (1,121,373 | ) |
Unrealized appreciation on investments | | $ | 36,996,966 | |
Total accumulated earnings | | $ | 35,875,593 | |
Difference between book and tax basis net unrealized appreciation relates to outstanding partnership basis adjustments.
During the tax years ended September 30, 2022 and September 30, 2021, the tax character of distributions paid by the Fund was as follows:
| | Tax Year Ended
September 30, 2022 | | | Tax Year Ended
September 30, 2021 | |
Ordinary income | | $ | — | | | $ | 66,837 | |
Long-term capital gain | | | 982,877 | | | | 96,183 | |
Return of capital | | | 6,193,222 | | | | 2,983,082 | |
| | | $ | 7,176,099 | | | $ | 3,146,102 | |
7. REPURCHASE OFFERS
The Fund operates as an interval fund pursuant to Rule 23c-2 under the 1940 Act and, as such, has adopted a fundamental policy to make quarterly repurchase offers, at NAV, of no less than 5% and no more than 25% of the Fund’s shares outstanding on the Repurchase Request Deadline (as defined below). There is no guarantee that shareholders will be able to sell all of the shares they desire to sell in a quarterly repurchase offer, although each shareholder will have the right to require the Fund to purchase at least 5% of such shareholder’s shares in each quarterly repurchase. Liquidity will be provided to shareholders only through the Fund’s quarterly repurchases. Shareholders will be notified in writing of each quarterly repurchase offer and the date the repurchase offer ends (the “Repurchase Request Deadline”). Shares will be repurchased at the NAV per share determined as of the close of regular trading on the NYSE no later than the 14th day after the Repurchase Request Deadline, or the next business day if the 14th day is not a business day (each a “Repurchase Pricing Date”).
During the year ended March 31, 2023, the Fund completed four repurchase offers. In this offer, the Fund offered to repurchase up to 5% of the number of its outstanding shares as of the Repurchase Pricing Dates. The result of the repurchase offers are as follows:
Commencement Date | April 8, 2022 | July 8, 2022 | October 7, 2022 | January 6, 2023 |
Repurchase Request Deadline | April 29, 2022 | July 29, 2022 | October 28, 2022 | January 27, 2023 |
Repurchase Pricing Date | April 29, 2022 | July 29, 2022 | October 28, 2022 | January 27, 2023 |
Amount Repurchased | $ 6,005,302 | $ 7,948,300 | $ 5,737,274 | $ 9,698,962 |
Shares Repurchased | 198,917 | 257,477 | 187,677 | 339,362 |
Annual Report | March 31, 2023 | 21 |
USQ Core Real Estate Fund | Notes to Financial Statements |
| | March 31, 2023 |
8. RESTRICTED SECURITIES
Restricted securities include securities that have not been registered under the Securities Act of 1933, as amended, and securities that are subject to restrictions on resale. The Fund may invest in restricted securities that are consistent with the Fund’s investment objective and investment strategies. Investments in restricted securities are valued at net asset value as practical expedient for fair value, or fair value as determined in good faith in accordance with procedures adopted by the Board. It is possible that the estimated value may differ significantly from the amount that might ultimately be realized in the near term, and the difference could be material.
As of March 31, 2023, the Fund invested in the following restricted securities:
Initial
Acquisition Date | | Cost | | | Fair Value | | Real Estate Investment Funds | | Redemption
Frequency(1) | | | Redemption
Notice (Days) | | | Commitments as
of March 31, 2023 | |
1/2/2018 | | $ | 6,689,755 | | | $ | 7,034,730 | | AEW Core Property (U.S.), LP | | | Quarterly | | | | 45 | | | $ | 0 | |
10/2/2017 | | | 3,539,209 | | | | 4,240,447 | | ARA Core Property Fund, LP | | | Quarterly | | | | 10 | | | | 0 | |
10/2/2017 | | | 7,351,784 | | | | 7,931,515 | | ASB Allegiance Real Estate Fund, LP | | | Quarterly | | | | 30 | | | | 0 | |
4/1/2021 | | | 8,245,793 | | | | 9,596,499 | | Bailard Real Estate Investment Trust, Inc. | | | Quarterly | | | | 30 | | | | 0 | |
10/2/2017 | | | 7,731,366 | | | | 7,837,064 | | Barings Core Property Fund, LP | | | Quarterly | | | | 60 | | | | 0 | |
10/18/2019 | | | 5,458,792 | | | | 6,026,979 | | BGO Daily Value Fund - Class F | | | Daily | | | | N/A | (2) | | | 0 | |
10/2/2017 | | | 1,525,775 | | | | 2,174,647 | | BGO Diversified US Property Fund | | | Quarterly | | | | 45 | | | | 0 | |
10/2/2017 | | | 6,119,904 | | | | 7,256,150 | | BlackRock US Core Property Fund, LP | | | Quarterly | | | | 60 | | | | 0 | |
10/2/2017 | | | 17,738,587 | | | | 19,933,537 | | CBRE U.S. Core Partners, LP | | | Quarterly | | | | 60 | | | | 0 | |
7/1/2021 | | | 8,571,490 | | | | 8,818,463 | | CIM UII Onshore, LP | | | Quarterly | | | | 90(3 | ) (3) | | | 0 | |
10/2/2017 | | | 14,914,911 | | | | 16,944,400 | | Clarion Lion Properties Fund, LP | | | Quarterly | | | | 90 | | | | 0 | |
10/2/2017 | | | 8,182,284 | | | | 9,207,603 | | GWL USPF LP | | | Quarterly | | | | 90 | | | | 0 | |
7/1/2019 | | | 14,756,712 | | | | 16,974,232 | | Madison Core Property Fund LP | | | Quarterly | | | | 90 | | | | 0 | |
10/1/2018 | | | 1,580,455 | | | | 2,052,554 | | MetLife Core Property Fund, LP | | | Quarterly | | | | 60 | | | | 0 | |
2/28/2022 | | | 2,250,300 | | | | 2,221,443 | | PGIM Retirement Real Estate II LP | | | Daily | | | | 5 | (2) | | | 0 | |
6/30/2022 | | | 5,098,738 | | | | 4,753,004 | | Prime Property Fund, LLC | | | Quarterly | | | | 90 | | | | 0 | |
10/2/2017 | | | 7,912,532 | | | | 9,016,651 | | PRISA, LP | | | Quarterly | | | | 90 | | | | 0 | |
10/2/2017 | | | 2,848,804 | | | | 3,382,333 | | RREEF America II LP | | | Quarterly | | | | 45 | | | | 0 | |
10/2/2017 | | | 6,987,337 | | | | 9,399,794 | | Smart Markets Fund, LP | | | Quarterly | | | | 45 | | | | 0 | |
4/1/2022 | | | 9,951,322 | | | | 9,426,063 | | Strategic Property Fund | | | Quarterly | | | | 30 | | | | 0 | |
1/2/2020 | | | 9,821,110 | | | | 11,307,650 | | TA Realty Core Property Fund, LP | | | Quarterly | | | | 45 | (4) | | | 0 | |
10/2/2017 | | | 1,487,507 | | | | 1,474,646 | | Trumbull Property Fund, LP | | | Quarterly | | | | 60 | | | | 0 | |
10/1/2019 | | | 3,964,247 | | | | 4,849,393 | | U.S. Real Estate Investment Fund, LLC | | | Quarterly | | | | 90 | | | | 0 | |
7/2/2018 | | | 1,051,351 | | | | 1,434,294 | | U.S. Real Property Income Fund, LP | | | Quarterly | | | | 90 | | | | 0 | |
1. | While redemptions can be requested at the frequency listed above, there is no guarantee the Fund will be paid all or any of the redemption amount at the time requested. Each of the following Private Investment Funds can temporarily suspend redemptions or pay out a pro-rata portion of redemption requests if the general partner or its respective Board deems it in the best interest of its shareholders. |
2. | Daily redemptions are accepted up to an aggregate 10% of the Net Asset Value during the quarter. |
3. | Redemptions are subject to a three-year holding period from date of the initial capital call. Partial redemptions are subject to the value of remaining units of at least $5 million. Redemption requirements may be waived as the sole discretion of the general partner. |
4. | Redemption subject to a six-month holding period for the shares being redeemed. |
Annual Report | March 31, 2023 | 22 |
USQ Core Real Estate Fund | Notes to Financial Statements |
| | March 31, 2023 |
9. RISKS AND UNCERTAINTIES
In the normal course of business, the Fund faces certain risks and uncertainties. Set forth below is a summary of certain principal risks associated with the Fund. The following is not intended to be a complete list of all the potential risks associated with the Fund. For a more comprehensive list of potential risks the Fund may be subject to, please refer to the Fund’s Prospectus and Statement of Additional Information.
Valuation of Private Investment Funds. Private Investment Funds are not publicly traded. Accordingly, the Adviser may consider information provided by the institutional asset manager to determine the estimated value of the Fund’s investment therein. The valuation provided by an institutional asset manager as of a specific date may vary from the actual sale price that may be obtained if such investment were sold to a third party, if a secondary market for such investment existed. For information about the value of the Fund’s investment in Private Investment Funds, the Adviser will be dependent on information provided by the Private Investment Funds, including quarterly unaudited financial statements, which if inaccurate could adversely affect the Adviser’s ability to value accurately the Fund’s shares. Accordingly, there can be no assurance that the stated NAV of the Fund, as calculated based on such information, will be accurate on any given date, nor can there be any assurance that the sale of any property would be at a price equivalent to the last estimated value of such property. Further, the NAV of the Fund, as determined based on the fair value of its investments in Private Investment Funds, may vary from the amount the Fund would realize on the withdrawal of its investments from the Private Investment Funds. Such discrepancies can result in shareholders experiencing a windfall or shortfall, or dilution of their interest in the Fund.
Real Estate Industry Concentration Risk. The Fund does not invest in real estate directly, but, because the Fund concentrates its investments in securities of real estate investment trusts (“REITs”) and other real estate industry issuers, its portfolio will be significantly impacted by the performance of the real estate market and may experience more volatility and be exposed to greater risk than a more diversified portfolio. The value of companies engaged in the real estate industry is affected by: (i) changes in general economic and market conditions; (ii) changes in the value of real estate properties; (iii) risks related to local economic conditions, overbuilding, and increased competition; (iv) increases in property taxes and operating expenses; (v) changes in zoning laws; (vi) casualty and condemnation losses; (vii) variations in rental income, neighborhood values, or the appeal of property to tenants; (viii) the availability of financing and (ix) changes in interest rates and leverage. There are also special risks associated with particular real estate sectors, or real estate operations generally. To the extent that a significant portion of the Fund is invested directly or indirectly in real estate located in a particular geographic region or in a particular property type, the Fund is subject to greater risks of adverse developments specific to that geographic region or property type.
Interest Rate Risk. Rising interest rates generally cause the value of the Fund’s portfolio to decline, as the price of a debt security typically falls when interest rates rise, and securities with longer maturities tend to be more sensitive to interest rate changes than those with shorter maturities. Rising interest rates could result in higher costs of capital for real estate companies, which could negatively impact a real estate company’s ability to meet its payment obligations. Additionally, real estate companies may use leverage (and some may be highly leveraged), which increases investment risk and the risks normally associated with debt financing and could adversely affect a real estate company’s operations and market value in periods of rising interest rates. Increases in interest rates also typically lower the present value of a REIT’s future earnings stream, and may make financing property purchases and improvements more costly. The risks associated with rising interest rates are heightened in view of the US Federal Reserve Bank’s decision to raise the federal funds rates, and may continue to raise interest rates if considered necessary to reduce inflation to acceptable levels.
Private Investment Fund Risk. Private Investment Funds, like the other underlying funds in which the Fund may invest, are subject to specific risks, depending on the nature of the vehicle, including the frequency and amount of redemptions paid to the Fund, and also may employ leverage such that their returns are more than one times that of their benchmark which could amplify losses suffered by the Fund when compared to unleveraged investments. With respect to the frequency and amounts of redemptions paid to the Fund, there is no guarantee that the Fund will be paid all or any of the redemption amount at the time requested. Further, each of the Private
Annual Report | March 31, 2023 | 23 |
USQ Core Real Estate Fund | Notes to Financial Statements |
| | March 31, 2023 |
Investment Funds can suspend redemptions or pay a pro-rata portion of redemption requests if the general partner or its respective board deems it in the best interest of its shareholders. Shareholders of Private Investment Funds are not entitled to the protections of the 1940 Act. For example, Private Investment Funds need not have independent boards, shareholder approval of advisory contracts may not be required, the funds may leverage to an unlimited extent, and the funds may engage in joint transactions with affiliates. The majority of Private Investment Funds permit redemptions only quarterly (the others are more frequent) and these withdrawal limitations restrict the Adviser’s ability to terminate investments in Private Investment Funds. If values are falling, the Fund may not be able to sell its Private Investment Funds and the value of Fund shares will decline. These characteristics present additional risks for shareholders.
10. SUBSEQUENT EVENTS
Effective May 5, 2023, the Fund entered into a secured line of credit agreement with Royal Bank of Canada for the purpose of providing the Fund with an additional source of liquidity subject to the limitations of the 1940 Act for borrowings. As collateral for borrowings under the line of credit, the Fund grants Royal Bank of Canada a first position security interest in and lien on securities held by the Fund in a collateral account. The Fund has no outstanding or scheduled borrowings.
The Fund completed a quarterly repurchase offer on April 28, 2023, which resulted in 219,044.597 of Fund shares being repurchased for $6,034,679.
Subsequent events after the date of the Statement of Assets and Liabilities have been evaluated through the date the financial statements were issued. Management has determined that no events or transactions occurred requiring adjustment or disclosure in the financial statements other than the above.
Annual Report | March 31, 2023 | 24 |
USQ Core Real Estate Fund | Report of Independent Registered Public Accounting Firm |
| | March 31, 2023 |
To the Shareholders and Board of Trustees of
USQ Core Real Estate Fund
Opinion on the Financial Statements
We have audited the accompanying statement of assets and liabilities, including the schedule of investments, of USQ Core Real Estate Fund (“the Fund”) as of March 31, 2023, the related statements of operations and cash flows for the year then ended, the statements of changes in net assets for each of the two years in the period then ended, the related notes, and the financial highlights for each of the five years in the period then ended (collectively referred to as the “financial statements”). In our opinion, the financial statements present fairly, in all material respects, the financial position of the Fund as of March 31, 2023, the results of its operations and its cash flows for the year then ended, the changes in net assets for each of the two years in the period then ended, and the financial highlights for each of the five years in the period then ended, in conformity with accounting principles generally accepted in the United States of America.
Basis for Opinion
These financial statements are the responsibility of the Fund’s management. Our responsibility is to express an opinion on the Fund’s financial statements based on our audits. We are a public accounting firm registered with the Public Company Accounting Oversight Board (United States) (“PCAOB”) and are required to be independent with respect to the Fund in accordance with the U.S. federal securities laws and the applicable rules and regulations of the Securities and Exchange Commission and the PCAOB.
We conducted our audits in accordance with the standards of the PCAOB. Those standards require that we plan and perform the audit to obtain reasonable assurance about whether the financial statements are free of material misstatement whether due to error or fraud.
Our audits included performing procedures to assess the risks of material misstatement of the financial statements, whether due to error or fraud, and performing procedures that respond to those risks. Such procedures included examining, on a test basis, evidence regarding the amounts and disclosures in the financial statements. Our procedures included confirmation of securities owned as of March 31, 2023, by correspondence with the custodian and underlying fund administrators. Our audits also included evaluating the accounting principles used and significant estimates made by management, as well as evaluating the overall presentation of the financial statements. We believe that our audits provide a reasonable basis for our opinion.
We have served as the Fund’s auditor since 2017.

COHEN & COMPANY, LTD.
Cleveland, Ohio
May 30, 2023
Annual Report | March 31, 2023 | 25 |
USQ Core Real Estate Fund | Additional Information |
| | March 31, 2023 (Unaudited) |
1. PROXY VOTING POLICIES AND VOTING RECORD
A description of the policies and procedures that the Fund uses to determine how to vote proxies relating to portfolio securities owned by the Fund and information regarding how the Fund voted proxies relating to the portfolio securities during the most recent 12-month period ended June 30 is available to shareholders without charge by visiting the Securities and Exchange Commission’s (“SEC”) web site at www.sec.gov.
2. QUARTERLY PORTFOLIO HOLDINGS
The Fund files a complete listing of portfolio holdings for the Fund with the SEC as of first and third quarters of each fiscal year on Form N-PORT, within 60 days after the end of the period. The filings are available on the SEC’s website at http://www.sec.gov.
Annual Report | March 31, 2023 | 26 |
USQ Core Real Estate Fund | Trustees & Officers |
| | March 31, 2023 (Unaudited) |
Management of the Fund
Board of Trustees
The management and affairs of the Fund are supervised by the Board. The Board currently consists of three individuals, all of whom are not “interested persons” of the Fund, as that term is defined in the 1940 Act (the “Independent Trustees”). The Board establishes policies for the operation of the Fund and appoints the officers who conduct the daily business of the Fund. The current Trustees and officers of the Fund and their years of birth are listed below with their addresses, present positions with the Fund, term of office with the Fund and length of time served, principal occupations over at least the last five years and other directorships/trusteeships held.
Name,
Year of Birth
and Address | Position
with the
Fund | Term of Office
and Length of
Time Served | Principal Occupations
During the Past Five Years | Number of
Portfolios in
Fund Complex
Overseen by
Trustee(1) | Other Directorship/
Trusteeship Positions
held by Trustee
During the Past 5 Years |
Independent Trustees |
Gregory Fairchild (1963) 235 Whitehorse Lane
Suite 200
Kennett Square, PA 19348 | Trustee | Indefinite; Since 2017 | Dr. Fairchild is Professor at the University of Virginia, Darden GSBA. Dean and CEO, UVA | Northern Virginia (2021 to present). | 2 | None |
Havilah Mann, CPA (1975) 235 Whitehorse Lane
Suite 200
Kennett Square, PA 19348 | Trustee | Indefinite; Since 2017 | Ms. Mann is a Certified Public Accountant, Fractional Chief Financial Officer and Business Development Advisor of HSM Resources (accounting infrastructure and internal control consulting services). | 2 | None |
Edward P. Mooney Jr. (1970) 235 Whitehorse Lane
Suite 200
Kennett Square, PA 19348 | Trustee | Indefinite; Since 2020 | Mr. Mooney is a private investor and a Limited Partner of Golden Angels Investors LLC (since 2018). Previously, Mr. Mooney was a Managing Director with Artisan Partners Limited Partnership (investment management) until his retirement in 2014. | 2 | Board of Directors, Christian Brothers Investment Services (2016 to present) and Board of Managers, Ocean Square Asset Management (2017 to 2018). |
| | (1) | The term “Fund Complex” as used herein includes the Fund and PREDEX. |
Annual Report | March 31, 2023 | 27 |
USQ Core Real Estate Fund | Trustees & Officers |
| | March 31, 2023 (Unaudited) |
Name,
Year of Birth
and Address | Position
with the
Fund | Term of Office
and Length of
Time Served | Principal Occupations
During the Past Five Years |
Officers Who Are Not Trustees |
G. Keith Downing* (1972) 235 Whitehorse Lane
Suite 200
Kennett Square, PA 19348 | Chief Operating Officer and Treasurer | Indefinite; Since 2017 | Mr. Downing is Chief Operating Officer of the Adviser since its inception. From August 2011 to December 2016, Mr. Downing was Director of Fund Administration of Nationwide Investment Management Group. |
Thomas E. Miller, CFA* (1983) 235 Whitehorse Lane
Suite 200
Kennett Square, PA 19348 | President, Chief Executive Officer and Chief Investment Officer | Indefinite; President and Chief Executive Officer since 2021; Chief Investment Officer since 2017 | Dr. Miller is Chief Executive Officer of the Adviser since 2021. Dr. Miller is Chief Investment Officer of the Adviser since inception. From 2017 to 2021, Dr. Miller served as Vice President of the Fund. From April 2016 to April 2017, Dr. Miller was Associate Vice President, Head of Manager Strategies of Nationwide Investment Management Group. From February 2013 to April 2016, Dr. Miller was Associate Vice President, Product Management and Research of Nationwide Investment Management Group. |
Mary K. Ziegler* (1972) 235 Whitehorse Lane
Suite 200
Kennett Square, PA 19348 | Chief Compliance Officer and AML Compliance Officer | Indefinite; Since 2018 | Ms. Ziegler is Chief Legal and Compliance Officer of the Adviser since February 2018. She also serves as General Counsel of Chatham Financial Corp., an affiliate of the Adviser, since May 2020. From November to May 2020, Ms. Ziegler served as the Global Head of Compliance for Chatham Financial Corp., and from July 2019 to November she also served as Interim Chief Compliance Officer. From June 2012 to February 2018, Ms. Ziegler was Chief Compliance Officer of TFS Capital LLC (investment adviser). |
Michael Achterberg* (1963) 235 Whitehorse Lane
Suite 200
Kennett Square, PA 19348 | Secretary | Indefinite; Since Dec. 2022 | Senior Portfolio Manager, Union Square Capital Partners, LLC, Aug. 2022 to present. President, PREDEX Capital Management, LLC, June 2018 to July 2022; Chief Operating Officer, PREDEX Capital Management, LLC, Mar. 2013 to May 2018. |
| | * | Each Officer of the Fund serves at the pleasure of the Board. |
Annual Report | March 31, 2023 | 28 |
USQ Core Real Estate Fund | Privacy Policy |
| | March 31, 2023 (Unaudited) |
As the investment adviser for USQ Core Real Estate Fund (the “Fund”), Union Square Capital Partners, LLC (the “Adviser”) invests the assets of the Fund and manages their day-to-day business. We appreciate your business and the trust you have placed in us. Our privacy philosophy reflects the value of your trust. We are committed to protecting the personal data we obtain about you. On behalf of the Fund and the Adviser (collectively, “USQ”), we make the following assurance of your privacy.
Not Using Your Personal Data for our Financial Gain
USQ has never sold shareholder information to any other party, nor have we disclosed such data to any other organization, except as permitted by law. We have no plans to do so in the future. We will notify you prior to making any change in this policy.
How We Do Use Your Personal and Financial Data
We use your information primarily to complete your investment transactions. We may also use it to communicate with you about other financial products that we offer.
The Information We Collect About You
You typically provide personal information when you complete a USQ account application or when you request a transaction that involves USQ, either directly or through a brokerage firm. This information may include your:
| | ● | Name, address, and phone numbers |
| | ● | Social security or taxpayer identification number |
| | ● | Birth date and beneficiary information (for IRA applications) |
| | ● | Basic trust document information (for trusts only) |
How We Protect Your Personal Information
As emphasized above, we do not sell information about current or former shareholders or their accounts to third parties. We occasionally share such information to the extent permitted by law to complete transactions at your request, or to make you aware of related financial products that we offer. Here are the details:
| | ● | To complete certain transactions or account changes that you direct, it may be necessary to provide identifying information to companies, individuals, or groups that are not affiliated with USQ. For example, if you ask to transfer assets from another financial institution to USQ, we will need to provide certain information about you to that company to complete the transaction. |
| | ● | In certain instances, we may contract with non-affiliated companies to perform services for us, such as processing orders for share purchases and repurchases and distribution of shareholder letters. Where necessary, we will disclose information about you to these third parties. In all such cases, we provide the third party with only the information necessary to carry out its assigned responsibilities (in the case of shareholder letters, only your name and address) and only for that purpose. We require these third parties to treat your private information with the same high degree of confidentiality that we do. |
| | ● | Finally, we will release information about you if you direct us to do so, if we are compelled by law to do so, or in other legally limited circumstances (for example, to protect your account from fraud). |
How We Safeguard Your Personal Information
We restrict access to your information to those USQ representatives who need to know the information to provide products or services to you. We maintain physical, electronic, and procedural safeguards to protect your personal information.
Purchasing Shares of the Fund through Brokerage Firms
USQ shareholders may purchase their shares through brokerage firms. Please contact those firms for their own policies with respect to privacy issues.
What You Can Do
For your protection, we recommend that you do not provide your account information, user name, or password to anyone except a USQ representative as appropriate for a transaction or to set up an account. If you become aware of any suspicious activity relating to your account, please contact us immediately.
We’ll Keep You Informed
If we change our privacy policy with regard to disclosing your confidential information, we are required by law to notify you and provide you with a revised notice. You can access our privacy policy from our website.
Annual Report | March 31, 2023 | 29 |
Investment Adviser
Union Square Capital Partners, LLC
235 Whitehorse Lane, Suite 200
Kennett Square, PA 19348
Distributor
Quasar Distributors LLC
111 East Kilbourn Ave.
Suite 1250
Milwaukee, WI 53202
Legal Counsel
Thompson Hine LLP
41 South High Street, Suite 1700
Columbus, OH 43215
Independent Registered Public Accounting Firm
Cohen & Company, Ltd.
1350 Euclid Avenue, Suite 800
Cleveland, Ohio 44115

| USQ Core Real Estate Fund
235 Whitehorse Lane Suite 200 Kennett Square, PA 19348
www.usqfunds.com 833.USQ.Fund
|
Item 2. Code of Ethics.
The registrant has adopted a code of ethics that applies to the registrant’s principal executive officer and principal financial officer. The registrant has not made any substantive amendments to its code of ethics during the period covered by this report. The registrant has not granted any waivers from any provisions of the code of ethics during the period covered by this report.
A copy of the registrant’s Code of Ethics is filed herewith.
Item 3. Audit Committee Financial Expert.
The registrant’s board of trustees has determined that there is at least one audit committee financial expert serving on its audit committee. Havilah Mann is the “audit committee financial expert” and is considered to be “independent” as each term is defined in Item 3 of Form N-CSR.
Item 4. Principal Accountant Fees and Services.
The registrant has engaged its principal accountant to perform audit services, audit-related services, tax services and other services during the past fiscal year. “Audit services” refer to performing an audit of the registrant's annual financial statements or services that are normally provided by the accountant in connection with statutory and regulatory filings or engagements for those fiscal years. “Audit-related services” refer to the assurance and related services by the principal accountant that are reasonably related to the performance of the audit. “Tax services” refer to professional services rendered by the principal accountant for tax compliance, tax advice, and tax planning. There were no “other services” provided by the principal accountant. The following table details the aggregate fees billed or expected to be billed for each of the last two fiscal years for audit fees, audit-related fees, tax fees and other fees by the principal accountant.
| | | FYE 3/31/2023 | | FYE 3/31/2022 |
| (a) Audit Fees | | $ | 30,000 | | | $ | 28,000 | |
| (b) Audit-Related Fees | | | - | | | | - | |
| (c) Tax Fees | | $ | 5,250 | | | $ | 5,000 | |
| (d) All Other Fees | | | - | | | | - | |
| (e) | (1) | The audit committee has adopted pre-approval policies and procedures that require the audit committee to pre-approve all audit and non-audit services of the registrant, including services provided to any entity affiliated with the registrant. |
| (2) | The percentage of fees billed by Cohen & Company applicable to non-audit services pursuant to waiver of pre-approval requirement were as follows: |
| | | FYE 3/31/2023 | | FYE 3/31/2022 |
| Audit-Related Fees | | | 0 | % | | | 0 | % |
| Tax Fees | | | 0 | % | | | 0 | % |
| All Other Fees | | | 0 | % | | | 0 | % |
(f) All of the principal accountant’s hours spent on auditing the registrant’s financial statements were attributed to work performed by full-time permanent employees of the principal accountant. (If more than 50 percent of the accountant’s hours were spent to audit the registrant's financial statements for the most recent fiscal year, state how many hours were attributed to work performed by persons other than the principal accountant's full-time, permanent employees.)
(g) The following table indicates the non-audit fees billed or expected to be billed by the registrant’s accountant for services to the registrant and to the registrant’s investment adviser (and any other controlling entity, etc.—not sub-adviser) for the last two years.
| Non-Audit Related Fees | FYE 3/31/2023 | FYE 3/31/2022 |
| Registrant | None | None |
| Registrant’s Investment Adviser | None | None |
(h) The audit committee of the board of trustees/directors has considered whether the provision of non-audit services that were rendered to the registrant's investment adviser is compatible with maintaining the principal accountant's independence and has concluded that the provision of such non-audit services by the accountant has not compromised the accountant’s independence.
(i) Not applicable.
(j) Not applicable.
Item 5. Audit Committee of Listed Registrants.
The registrant is an issuer as defined in Rule 10A-3 under the Securities Exchange Act of 1934, (the “Act”) and has a separately-designated standing audit committee established in accordance with Section 3(a)(58)(A) of the Act. The independent members of the committee are as follows: Gregory Fairchild, Havilah Mann, and Edward Mooney.
Item 6. Investments.
| (a) | Schedule of Investments is included as part of the report to shareholders filed under Item 1 of this Form. |
Item 7. Disclosure of Proxy Voting Policies and Procedures for Closed-End Management Investment Companies.
PROXY VOTING
Policy
Adviser accepts responsibility for voting proxies for portfolio securities held within Client accounts, unless otherwise required by law, regulation or contract. If the Adviser decides to accept proxy voting responsibility, it will establish written policies and procedures as to the handling, research, voting and reporting of proxy voting and makes appropriate disclosures about Adviser’s proxy policies and practices. The Adviser may utilize the services of a third-party voting agent.
Background & Description
Proxy voting is an important right of shareholders and reasonable care and diligence must be undertaken to ensure that such rights are properly and timely exercised. The purpose of these proxy voting policies and procedures are to set forth the principles, guidelines and procedures by which an adviser may vote the securities owned by its clients for which Adviser exercises voting authority and discretion (the “Proxies”). These policies and procedures have been designed to ensure that Proxies are voted in the best interests of clients in accordance with fiduciary duties and Rule 206(4)-6 under the Advisers Act. Investment Advisers registered with the SEC, and which exercise voting authority with respect to client securities, are required by Rule 206(4)-6 of the Advisers Act to (a) adopt and implement written policies and procedures that are reasonably designed to ensure that client securities are voted in the best interests of clients, which must include how an Adviser addresses material conflicts that may arise between an Adviser's interests and those of its clients; (b) to disclose to clients how they may obtain information from the Adviser with respect to the voting of proxies for their securities; (c) to describe to clients a summary of its proxy voting policies and procedures and, upon request, furnish a copy to its clients; and (d) maintain certain records relating to the Adviser's proxy voting activities when the Adviser does have proxy voting authority. Responsibility for voting the Proxies is generally established by advisory agreements or comparable documents with clients, and proxy voting guidelines are tailored to reflect these specific contractual obligations. In addition, proxy guidelines reflect the fiduciary standards and responsibilities for accounts subject to the Employment Retirement Income Security Act of 1974, as amended (“ERISA”) set out idol Bulletin 94-2. These policies and procedures apply to any Client that has contractually delegated authority and discretion for proxy voting to the Adviser. These proxy voting policies and procedures are available to all Clients upon request, subject to the provision that these policies and procedures are subject to change at any time without notice.
Responsibility
The Investment Committee is responsible for ensuring that the appropriate written documentation and disclosures are in place representing that the Adviser votes proxies. The Investment Committee will be responsible for the implementation and monitoring of Adviser’s Proxy Voting Policies and Procedures, including associated practices, disclosures and recordkeeping, as well as oversight of a third-party voting agent, if applicable. The Investment Committee may delegate responsibility for the performance of these activities but oversight and ultimate responsibility remain with the Investment Committee.
Procedures
Adviser has adopted various procedures to implement the firm’s Proxy Voting policy and reviews to monitor and ensure that the firm’s policy is observed, implemented properly and amended or updated, as appropriate. The procedures are as follows:
PROXY VOTING GUIDELINES
The guiding principle by which Adviser votes on all matters submitted to security holders is the maximization of the ultimate economic value of our Clients’ holdings. Adviser does not permit voting decisions to be influenced in any manner that is contrary to, or dilutive of, the guiding principle set forth above. It is our policy to avoid situations where there is any conflict of interest or perceived conflict of interest affecting our voting decisions. Any conflicts of interest, regardless of whether actual or perceived, will be addressed in accordance with these policies and procedures.
It is the general policy of Adviser to vote on all matters presented to security holders in any Proxy, and these policies and procedures have been designed with that in mind. However, Adviser reserves the right to abstain on any particular vote or otherwise withhold its vote on any matter if in the judgment of Adviser, the costs associated with voting such Proxy outweigh the benefits to Clients or if the circumstances make such an abstention or withholding otherwise advisable and in the best interest of our Clients, in the judgment of Adviser. While the guidelines included in the procedures are intended to provide a benchmark for voting standards, each vote is ultimately cast on a case-bycase basis, taking into consideration Adviser’s contractual obligations to our Clients and all other relevant facts and circumstances at the time of the vote (such that these guidelines may be overridden to the extent Adviser believes appropriate). Adviser may vote proxies related to the same security differently for each Client.
In the event that Adviser acts as investment adviser to a closed-end and/or open-end registered investment company and is responsible for voting their proxies, such proxies will be voted in accordance with any applicable investment restrictions of the fund and, to the extent applicable, any proxy voting procedures or resolutions or other instructions approved by an authorized person of the Fund Client.
Absent any legal or regulatory requirement to the contrary, it is generally the policy of Adviser to maintain the confidentiality of the particular votes that it casts on behalf of its Clients. Any registered investment companies managed by Adviser disclose the votes cast on their behalf in accordance with all legal and regulatory requirements. Any Client of Adviser can obtain details of how Adviser has voted the securities in its account by contacting a service representative at Adviser. Adviser does not, however, generally disclose the results of voting decisions to third parties.
CONFLICTS OF INTEREST IN CONNECTION WITH PROXY VOTING
The Investment Committee has responsibility to monitor proxy voting decisions for any conflicts of interest, regardless of whether they are actual or perceived. In addition, all Supervised Persons are expected to perform their tasks relating to the voting of Proxies in accordance with the principles set forth above, according the first priority to the economic interests of Adviser’s Clients. If at any time any Supervised Person becomes aware of any potential or actual conflict of interest or perceived conflict of interest regarding the voting policies and procedures described herein or any particular vote on behalf of any Client, he or she should contact any member of the Investment Committee or the CCO. If any Supervised Person is pressured or lobbied either from within or outside of Adviser with respect to any particular voting decision, he or she should contact any member of the Investment Committee or the CCO. The full Investment Committee will use its best judgment to address any such conflict of interest and ensure that it is resolved in the best interest of the Clients. The Investment Committee may cause any of the following actions to be taken in that regard:
| · | vote the relevant Proxy in accordance with the vote indicated by these guidelines; |
| · | vote the relevant Proxy as an exception to these guidelines, provided that the reasons behind the voting decision are in the best interest of the Client, are reasonably documented and are approved by the CCO; or |
| · | direct a third-party Proxy Voter to vote in accordance with its independent assessment of the matter. |
COMMITTEE RESPONSIBILITIES
The administration of these Proxy Voting policies and procedures is governed by the Investment Committee.
The Investment Committee has regular meetings, and may meet other times as deemed necessary by the Chair or any member of the Investment Committee. At each regular meeting, minutes will be taken and on an annual basis the Investment Committee will review the existing proxy voting guidelines and recommend any changes to those guidelines. In addition, the Investment Committee will review any exceptions that have occurred since the previous meeting of the Investment Committee. On all matters, the Investment Committee will make its decisions by a vote of a majority of its members. Any matter for which there is no majority agreement among members of the Investment Committee shall be referred to Operating Committee or its designee.
PROXY VOTING PROCEDURES
The Adviser is not required to vote every Fund security, and refraining from voting should not necessarily be construed as a violation of the Adviser’s fiduciary obligations. The Adviser will not ignore or neglect its security voting responsibilities, but there may be times when refraining from voting is in a Fund’s best interest.
Upon receipt of a proxy solicitation by the Adviser, either directly or as provided by the Administrator, will present to the Investment Committee members the terms of the solicitation. The Investment Committee will determine whether or how the proxy should be voted, in accordance with the Adviser’s Proxy Voting Policies and Procedures. The Investment Committee will document the result of the discussion in its meeting minutes and the Adviser will coordinate the voting of the proxy with the Administrator.
The above Proxy Voting Policies and Procedures are designed to ensure that Client Account proxies are properly voted, material conflicts are avoided and fiduciary obligations are fulfilled. Because Supervised Persons are discouraged from engaging in any material business other than providing investment management services to Client Accounts, it is highly unlikely that any specific Client Account proxy will result in a material conflict of interest between Adviser and any Supervised Person.
In the unlikely event that (i) a specific proxy is not addressed by any of the guidelines above, and (ii) Adviser or any of its Supervised Persons has a material conflict with Client Accounts in connection with the voting of proxies, as determined by Adviser, in its sole discretion, Adviser shall (A) prohibit any conflicted Supervised Person from participating in and/or having any influence on Adviser’s evaluation of the proxy vote; (B) vote in accordance with the proxy voting recommendations of a majority of Client Accounts; or (C) follow the proxy voting recommendation of an independent third-proxy voting specialist.
Procedure for Documentation
Adviser shall maintain: (i) its voting policies and procedures; (ii) corporate action and proxy statements received; (iii) records how and when votes were submitted; (iv) records of its Client’s requests for voting information; and (v) any documents prepared by Adviser that were material to making a decision on how to vote. All votes will be documented and maintained by the Adviser.
Rule 30b1-4 under the Investment Company Act requires registered investment companies to file their complete proxy voting records on “Form N-PX” for the 12-month period ended June 30 by August 31 of each year. The Fund CCO will review all reports on Form N-PX and oversee the timely filings of all such reports on Form N-PX.
Item 8. Portfolio Managers of Closed-End Management Investment Companies.
Thomas E. Miller, CFA
Dr. Thomas E. Miller, CFA has served as the Chief Executive Officer of the Adviser since 2021 and Chief Investment Officer since inception of the Adviser. Previously, Dr. Miller was Head of Manager Research at Nationwide Investment Management Group where he was responsible for the oversight and implementation of the Quantitative Research, Qualitative Review, Risk Analysis, and Monitoring process for the Nationwide Funds, a $60 billion mutual fund family. Dr. Miller’s responsibilities included the selection, monitoring, and de-selection of the investment managers utilized across multiple platforms. Prior to leading the Manager Strategies team, Dr. Miller was an Associate Vice President, Product Management and Research at Nationwide Investment Management Group. In that role, he was responsible for the day to day management of the Product Management team, which oversaw over 100 investment products that support Nationwide Financial’s retirement, annuity, life insurance and retail mutual fund businesses. Prior to joining Nationwide, Dr. Miller held positions at The Vanguard Group Inc. and Delaware Investments. Dr. Miller holds a Bachelor’s degree in Business from the Pennsylvania State University, an MBA from West Chester University, and earned his Doctorate from Drexel University’s LeBow School of Business. He also holds the Chartered Financial Analyst Designation (CFA).
Michael D. Achterberg
Michael D. Achterberg, CAIA serves as Senior Portfolio Manager of the Adviser, a position held since August 2022. Previously, Mr. Achterberg served as President of PREDEX Capital Management, LLC from May 2018 through July 2022 and Chief Operating Officer of PREDEX Capital Management, LLC from March 2013 through May 2018. Mr. Achterberg has 30 years of experience in the fund management industry. He has extensive experience in fund management including due diligence, allocation of capital and general supervision for multi-manager funds. Previously, Mr. Achterberg served as Chief Financial Officer for more than two years at CITIC Securities International Partners ("CSIP") where Michael managed the valuations and investor reporting for the Hong Kong private equity advisor. He also was the FINOP for the U.S. broker-dealer which provided comprehensive advisory services relating to M&A and corporate finance for inbound and outbound transactions involving China. Prior to that Mr. Achterberg was a partner for fifteen years at Strome Investment Management. Until 1994 he was a CPA and Audit Manager for Coopers & Lybrand working exclusively in the investment industry with advisers and funds. While there he served on the national quality review program for the Investment Company practice. Mr. Achterberg holds a Bachelor’s degree in Business from California State University, Long Beach. He also holds the Chartered Alternative Investment Analyst Association designation (CAIA).
Portfolio Manager Compensation
The portfolio managers receive their compensation from the Adviser in the form of salary, bonus, retirement plan benefits, and restricted stock. Each portfolio manager’s bonus is variable and generally is based on (1) an evaluation of the portfolio manager’s ability to remain compliant with investment management guidelines and regulatory requirements, and (2) the results of a peer and/or management review of the portfolio manager, which takes into account skills and attributes such as team participation, investment process, communication and professionalism. In evaluating investment performance, the Adviser generally considers the performance of mutual funds and other accounts managed by the portfolio manager, if any, relative to the benchmarks and peer groups.
The size of the overall bonus pool each year is determined by the Adviser and depends on, among other factors, the levels of compensation generally in the investment management industry (based on market compensation data) and the Adviser’s profitability for the year, which is largely determined by assets under management. Part of the bonus is based on a qualitative assessment of an individual’s contribution to the management of the fund in addition to compliance with investment guidelines and regulatory mandates.
As of March 31, 2023, Dr. Miller managed one other registered investment company. As of March 31, 2023, Dr. Miller owned shares of the Fund with a value greater than $100,000.
As of March 31, 2023, Mr. Achterberg managed one other registered investment company. As of March 31, 2023, Mr. Achterberg owned zero shares of the Fund.
Item 9. Purchases of Equity Securities by Closed-End Management Investment Company and Affiliated Purchasers.
| Period | | (a)
Total Number of Shares (or Units) Purchased | | (b)
Average Price Paid per Share (or Unit) | | (c)
Total Number of Shares (or Units) Purchased as Part of Publicly Announced Plans or Programs | | (d)
Maximum Number (or Approximate Dollar Value) of Shares (or Units) that May Yet Be Purchased Under the Plans or Programs |
| | Month #1 10/1/22-10/31/22 (1) | | | | - | | | | - | | | | - | | | | - | |
| | Month #2 11/1/22-11/30/22 | | | | 187,676.598 | | | | 30.57 | | | | 187,676.598 | | | | - | |
| | Month #3 12/1/22-12/31/22 | | | | - | | | | - | | | | - | | | | - | |
| | Month #4 1/1/23-1/31/23 (2) | | | | - | | | | - | | | | - | | | | - | |
| | Month #5 2/1/23-2/28/23 | | | | 339,361.886 | | | | 28.58 | | | | 339,361.886 | | | | - | |
| | Month #6 3/1/23-3/31/23 | | | | - | | | | - | | | | - | | | | - | |
| | Total | | | | 527,038.484 | | | | - | | | | 527,038.484 | | | | - | |
(1) On October 7, 2022 the Registrant offered to repurchase up to 5% of the Registrant’s total outstanding shares as of October 28, 2022 (the "Repurchase Request Deadline"). On the Repurchase Request Deadline, 370,328.32 shares represented 5% of the Registrant's total outstanding shares.
(2) On January 6, 2023 the Registrant offered to repurchase up to 5% of the Registrant’s total outstanding shares as of January 27, 2023 (the "Repurchase Request Deadline"). On the Repurchase Request Deadline, 371,838.71 shares represented 5% of the Registrant's total outstanding shares.
Item 10. Submission of Matters to a Vote of Security Holders.
There have been no material changes to the procedures by which shareholders may recommend nominees to the registrant’s board of trustees.
Item 11. Controls and Procedures.
| (a) | The Registrant’s Chief Executive Officer and Chief Operating Officer have reviewed the Registrant's disclosure controls and procedures (as defined in Rule 30a-3(c) under the Investment Company Act of 1940 (the “Act”)) as of a date within 90 days of the filing of this report, as required by Rule 30a-3(b) under the Act and Rules 13a-15(b) or 15d-15(b) under the Securities Exchange Act of 1934. Based on their review, such officers have concluded that the disclosure controls and procedures are effective in ensuring that information required to be disclosed in this report is appropriately recorded, processed, summarized and reported and made known to them by others within the Registrant and by the Registrant’s service provider. |
| (b) | There were no changes in the Registrant's internal control over financial reporting (as defined in Rule 30a-3(d) under the Act) that occurred during the second fiscal quarter of the period covered by this report that have materially affected, or are reasonably likely to materially affect, the Registrant's internal control over financial reporting. |
Item 12. Disclosure of Securities Lending Activities for Closed-End Management Investment Companies
The registrant did not engage in securities lending activities during the fiscal period reported on this Form N-CSR.
Item 13. Exhibits.
(2) A separate certification for each principal executive officer and principal financial officer pursuant to Section 302 of the Sarbanes-Oxley Act of 2002. Filed herewith.
(3) Any written solicitation to purchase securities under Rule 23c-1 under the Act sent or given during the period covered by the report by or on behalf of the registrant to 10 or more persons. Not applicable.
(4) Change in the registrant’s independent public accountant. There was no change in the registrant’s independent public accountant for the period covered by this report.
SIGNATURES
Pursuant to the requirements of the Securities Exchange Act of 1934 and the Investment Company Act of 1940, the registrant has duly caused this report to be signed on its behalf by the undersigned, thereunto duly authorized.
| | (Registrant) | USQ Core Real Estate Fund | |
| | | | |
| | By (Signature and Title) | /s/ Thomas E. Miller | |
| | | Thomas E. Miller, President | |
| | | | |
| | Date | 5/30/2023 | |
Pursuant to the requirements of the Securities Exchange Act of 1934 and the Investment Company Act of 1940, this report has been signed below by the following persons on behalf of the registrant and in the capacities and on the dates indicated.
| | By (Signature and Title) | /s/ Thomas E. Miller | |
| | | Thomas E. Miller, President | |
| | | | |
| | Date | 5/30/2023 | |
| | | | |
| | By (Signature and Title) | /s/ G. Keith Downing | |
| | | G. Keith Downing, Treasurer | |
| | | | |
| | Date | 5/30/2023 | |