UNITED STATES
SECURITIES AND EXCHANGE COMMISSION
Washington, D.C. 20549
_____________________________________________________________________________
FORM 10-K
_____________________________________________________________________________ | | | | | |
| ☒ | ANNUAL REPORT PURSUANT TO SECTION 13 OR 15(d) OF THE SECURITIES EXCHANGE ACT OF 1934 |
For the fiscal year ended December 31, 2024
OR | | | | | |
| ☐ | TRANSITION REPORT PURSUANT TO SECTION 13 OR 15(d) OF THE SECURITIES EXCHANGE ACT OF 1934 |
For the transition period from to
Commission File Number: 001-38054
_____________________________________________________________________________
Schneider National, Inc.
(Exact Name of Registrant as Specified in Its Charter)
_____________________________________________________________________________
| | | | | | | | | | | | | | | | | | | | |
| Wisconsin | | | | | | 39-1258315 |
| (State of Incorporation) | | | | | | (IRS Employer Identification No.) |
| | |
| | 3101 South Packerland Drive | | |
| | Green Bay, | Wisconsin | 54313 | | |
| | (Address of Registrant’s Principal Executive Offices and Zip Code) | | |
(920) 592-2000
(Registrant’s Telephone Number, Including Area Code)
_____________________________________________________________________________
Securities registered pursuant to Section 12(b) of the Act: | | | | | | | | | | | | | | |
| Title of each class | | Trading symbol | | Name of each exchange on which registered |
| Class B common stock, no par value | | SNDR | | New York Stock Exchange |
Securities registered pursuant to Section 12(g) of the Act: None
Indicate by check mark if the registrant is a well-known seasoned issuer, as defined in Rule 405 of the Securities Act.
Yes ☒ No ☐
Indicate by check mark if the registrant is not required to file reports pursuant to Section 13 or Section 15(d) of the Act.
Yes ☐ No ☒
Indicate by check mark whether the registrant (1) has filed all reports required to be filed by Section 13 or 15(d) of the Securities Exchange Act of 1934 during the preceding 12 months (or for such shorter period that the registrant was required to file such reports), and (2) has been subject to such filing requirements for the past 90 days.
Yes ☒ No ☐
Indicate by check mark whether the registrant has submitted electronically every Interactive Data File required to be submitted pursuant to Rule 405 of Regulation S-T (§ 232.405 of this chapter) during the preceding 12 months (or for such shorter period that the registrant was required to submit such files).
Yes ☒ No ☐
Indicate by check mark whether the registrant is a large accelerated filer, an accelerated filer, a non-accelerated filer, a smaller reporting company, or an emerging growth company. See the definitions of “large accelerated filer,” “accelerated filer,” “smaller reporting company,” and “emerging growth company” in Rule 12b-2 of the Exchange Act.
| | | | | | | | | | | | | | |
| Large accelerated filer | ☒ | | Accelerated filer | ☐ |
| | | |
| Non-accelerated filer | ☐ | | Smaller reporting company | ☐ |
| | | |
| | | Emerging growth company | ☐ |
If an emerging growth company, indicate by check mark if the registrant has elected not to use the extended transition period for complying with any new or revised financial accounting standards provided pursuant to Section 13(a) of the Exchange Act. ☐
Indicate by check mark whether the registrant has filed a report on and attestation to its management’s assessment of the effectiveness of its internal control over financial reporting under Section 404(b) of the Sarbanes-Oxley Act (15 U.S.C. 7262(b)) by the registered public accounting firm that prepared or issued its audit report. ☒
If securities are registered pursuant to Section 12(b) of the Act, indicate by check mark whether the financial statements of the registrant included in the filing reflect the correction of an error to previously issued financial statements. ☐
Indicate by check mark whether any of those error corrections are restatements that required a recovery analysis of incentive-based compensation received by any of the registrant’s executive officers during the relevant recovery period pursuant to §240.10D-1(b). ☐
Indicate by check mark whether the registrant is a shell company (as defined in Rule 12b-2 of the Act).
Yes ☐ No ☒
The aggregate market value of Class B common stock held by non-affiliates on June 30, 2024, the last business day of the registrant’s most recently completed second fiscal quarter, was approximately $1,275.1 million. The registrant’s Class A common stock is not listed on a national securities exchange or traded in an organized over-the-counter market, but each share of the registrant’s Class A common stock is convertible into one share of the registrant’s Class B common stock.
As of February 19, 2025, the registrant had 83,029,500 shares of Class A common stock, no par value, outstanding and 92,458,180 shares of Class B common stock, no par value, outstanding.
DOCUMENTS INCORPORATED BY REFERENCE
Portions of the Proxy Statement for the registrant’s 2025 Annual Meeting of Shareholders are incorporated by reference into Part III of this Form 10-K.
SCHNEIDER NATIONAL, INC.
ANNUAL REPORT ON FORM 10-K
For the Fiscal Year Ended December 31, 2024
TABLE OF CONTENTS | | | | | | | | | | | | | | |
| | | | Page |
|
| ITEM 1. | | | |
| ITEM 1A. | | | |
| ITEM 1B. | | | |
| ITEM 1C. | | | |
| ITEM 2. | | | |
| ITEM 3. | | | |
| ITEM 4. | | | |
|
| ITEM 5. | | | |
| ITEM 6. | | | |
| ITEM 7. | | | |
| ITEM 7A. | | | |
| ITEM 8. | | | |
| | | |
| | | |
| | | |
| | | |
| | | |
| | | |
| | | Page | |
| Note 1 | | | |
| Note 2 | | | |
| Note 3 | | | |
| Note 4 | | | |
| Note 5 | | | |
| Note 6 | | | |
| Note 7 | | | |
| Note 8 | | | |
| Note 9 | | | |
| Note 10 | | | |
| Note 11 | | | |
| Note 12 | | | |
| Note 13 | | | |
| Note 14 | | | |
| ITEM 9. | | | |
| ITEM 9A. | | | |
| ITEM 9B. | | | |
| ITEM 9C. | | | |
| | | | |
| | | | |
| | | | |
| | | | |
| | | | |
| | | | | | | | | | | | | | |
|
| ITEM 10. | | | |
| ITEM 11. | | | |
| ITEM 12. | | | |
| ITEM 13. | | | |
| ITEM 14. | | | |
|
| ITEM 15. | | | |
| ITEM 16. | | | |
| | | |
GLOSSARY OF TERMS
| | | | | |
| 3PL | Provider of outsourced logistics services. In logistics and supply chain management, it means a company’s use of third-party businesses, the 3PL(s), to outsource elements of the company’s distribution, fulfillment, and supply chain management services. |
| ACF | Advanced Clean Fleets |
| ACT | Advanced Clean Trucks |
| ASC | Accounting Standards Codification |
| ASU | Accounting Standards Update |
| BEV | Battery-electric vehicle |
| Board | Board of Directors |
| BRG | Business Resource Group |
| CARB | California Air Resources Board |
| |
CO2 | Carbon dioxide |
| CAT | CDL Apprenticeship Training |
| CCA | Cloud Computing Arrangement |
| CDL | Commercial Driver’s License |
| ChemDirect | Fortem Invenio, Inc. |
| CITO | Chief Innovation and Technology Officer |
| CODM | Chief Operating Decision Maker |
| Cowan Systems | Cowan Systems, LLC; Cowan Transport Holdings, LLC; and Cowan Equipment Leasing, LLC |
| deBoer | deBoer Transportation, Inc. |
| DHS | Department of Homeland Security |
| DOL | Department of Labor |
| DOT | Department of Transportation |
| DSU | Deferred Stock Unit |
| EBITDA | Earnings Before Interest, Taxes, Depreciation & Amortization |
| EPA | United States Environmental Protection Agency |
| FASB | Financial Accounting Standards Board |
| ERC | Enterprise Risk Council |
| ERM | Enterprise Risk Management |
| ESG | Environmental, Social, and Governance |
| FLSA | Fair Labor Standards Act of 1938 |
| FMCSA | Federal Motor Carrier Safety Administration |
| GAAP | United States Generally Accepted Accounting Principles |
| GHG | Greenhouse Gas |
| HOS | Hours of Service |
| ILA | International Longshoremen’s Association |
| ILWU | International Longshore and Warehouse Union |
| IPO | Initial Public Offering |
| IRS | Internal Revenue Service |
| KPI | Key Performance Indicator |
| LTL | Less than Truckload. LTL carriers pick up and deliver multiple shipments, each typically weighing less than 10,000 pounds, for multiple customers in a single trailer. |
| M&M | M&M Transport Services, LLC |
| MLS | Midwest Logistics Systems, Ltd. and affiliated entities holding assets comprising substantially all of its business. |
| MLSI | Mastery Logistics Systems, Inc. |
| MSSP | Managed Security Service Provider |
| NASDAQ | National Association of Securities Dealers Automated Quotations |
| NHTSA | National Highway Traffic Safety Administration |
| | | | | |
| NYSE | New York Stock Exchange |
| OEM | Original Equipment Manufacturers |
| OSHA | Occupational Safety and Health Administration |
| PSI | Platform Science, Inc. |
| PSU | Performance-based Restricted Stock Unit |
| RSU | Restricted Stock Unit |
| rTSR | Relative Total Shareholder Return |
| SaaS | Software as a Service |
| SCDM | Supply Chain and Distribution Management operating segment |
| SDIS | Senior Director of Information Security |
| SEC | United States Securities and Exchange Commission |
| SNL | Schneider National Leasing, Inc., a wholly-owned subsidiary of the Company |
| Term SOFR | The CME Term SOFR Reference Rate administered by CME Group Benchmark Administration Limited |
| TMS | Transportation Management System |
| TuSimple | TuSimple Holdings, Inc. (formerly TuSimple (Cayman) Limited) |
| UP | Union Pacific Railroad Company |
| U.S. | United States |
| USMX | U.S. Maritime Alliance |
| Voting Trust | Schneider National, Inc. Voting Trust |
| VTL | Van Truckload |
| VCMDA | Voluntary Carbon Market Disclosures Business Regulation Act |
| WBCL | Wisconsin Business Corporation Law |
| WSL | Watkins and Shepard Trucking, Inc. and Lodeso, Inc. These businesses were acquired simultaneously in June 2016. |
| ZEV | Zero-emission vehicles |
PART I
ITEM 1. BUSINESS
Certain acronyms and terms used throughout this Annual Report are specific to our Company, commonly used in our industry, or are otherwise frequently used throughout our document. Definitions for these acronyms and terms are provided in the “Glossary of Terms” available at the front of this document. References to “Notes” are to the notes to consolidated financial statements included in this Annual Report on Form 10-K.
Company Overview
Schneider National, Inc. and its subsidiaries (together “Schneider,” the “Company,” “we,” “us,” or “our”) are among the largest providers of multimodal surface transportation and logistics solutions in North America. We offer a scaled portfolio of services and an array of capabilities and resources that leverage artificial intelligence, data science, and analytics to provide innovative solutions that coordinate the timely, safe, and efficient movement of customer products. The Company offers truckload, intermodal, and logistics services to a diverse customer base throughout the continental U.S., Canada, and Mexico. We were founded in 1935 and have been a publicly held holding company since our IPO in 2017. Our stock is publicly traded on the NYSE under the ticker symbol “SNDR.” Schneider was added to the S&P SmallCap 600 Index in July 2024.
Our portfolio of complementary service offerings enables us to serve the diverse needs of our customers and to allocate capital in a manner that seeks to maximize returns across all market cycles and economic conditions. Our service offerings include transportation of full-truckload freight, which we directly transport utilizing our company-owned transportation equipment and company drivers, owner-operators, or third-party carriers under contract with us. We have arrangements with most of the major North American rail carriers to transport freight in containers. We also provide customized freight movement, transportation equipment, labor, systems, and delivery services tailored to meet individual customer requirements, which typically involve long-term contracts. These arrangements are generally referred to as dedicated services and may include multiple pickups and drops, local deliveries, freight handling, specialized equipment, and freight network optimization. In addition, we provide comprehensive logistics services with a network of over 20,700 qualified third-party carriers. We are able to expand capacity through our Power Only offering by leveraging our nationwide trailer pool to match customer demand with third-party carriers. We categorize our operations into the following reportable segments:
•Truckload – Over-the-road freight transportation via dry van, bulk, temperature-controlled, and flat-bed trailers across either dedicated or network configurations. Freight is transported and delivered by our company-employed drivers in company trucks and by owner-operators with company-owned trailers and executed through long-haul or regional services, including customized solutions for high-value or time-sensitive loads throughout North America.
•Intermodal – Door-to-door container on flat car service through a combination of rail and dray transportation, in association with our rail providers. Our intermodal business uses company-owned containers, chassis, and trucks with primarily company dray drivers, augmented by third-party dray capacity.
•Logistics – Asset-light freight brokerage (including both traditional brokerage and Power Only services which leverage our nationwide company-owned trailer pools to match third-party capacity with customer demand), supply chain (including 3PL), warehousing, and import/export services. Our logistics business provides value-added services using both our assets and third-party capacity, augmented by our trailing assets, to manage and move customers’ freight.
Consistent with the transportation industry, our business can be seasonal across each of our segments, which generally translates to our reported revenues and operating expenses being the lowest in the first quarter and highest in the fourth quarter. Operating expenses tend to be higher in the winter months, primarily due to colder weather, which causes higher maintenance expense and fuel consumption from increased idle time.
For more information on our reportable segments, see Note 14, Segment Reporting.
Additionally, we lease equipment to third parties through our wholly owned subsidiary, Schneider Finance, Inc., which is primarily engaged in leasing trucks to owner-operators including, but not limited to, owner-operators with whom we contract, and we provide insurance for both company drivers and owner-operators through our wholly owned insurance subsidiary.
Our Mission and Strategy
We are driven by our uncompromising values to safely deliver goods that enhance the lives of people everywhere. We forge long-term relationships with our customers as an integral partner in, and extension of, their supply chains. Our strategy is based
on delivering superior experiences to our customers utilizing an integrated, multimodal approach to provide capacity-oriented solutions centered on delivering customer value and industry-leading service. We believe our operating strategy adds value to customers, fuels our earnings, and generates shareholder returns. We continually analyze opportunities for capital investment and effective capital deployment to provide additional value for our customers and increase returns for our shareholders.
Business Developments
Acquisitions
On December 2, 2024, the Company completed the acquisition of Cowan Systems, a privately held truckload carrier based in Baltimore, Maryland that offers customized delivery solutions for retail and food manufacturing customers. Cowan Systems provides mainly dedicated and logistics services that complement our operations. The operating results of Cowan Systems are reported in our Dedicated and Logistics operations as part of our Truckload and Logistics segments beginning on the closing date of the acquisition.
On August 1, 2023, the Company completed the acquisition of M&M, a privately held truckload carrier based in West Bridgewater, Massachusetts that primarily provides specialty solutions for retail and manufacturing customers. M&M is a dedicated carrier that complements our growing dedicated operations. The operating results of M&M are reported in Dedicated operations as part of our Truckload segment beginning in the third quarter of 2023.
Refer to Note 2, Acquisitions, for additional details on our acquisitions of Cowan Systems and M&M.
Industry and Competition
Truckload
The trucking industry plays a vital role in providing both growth and stability in the U.S. economy and moves the vast majority of freight volume in the U.S. It is a highly competitive and fragmented industry, characterized by numerous small to mid-sized carriers. Increased regulations and initiatives to improve the safety and reduce emissions of the U.S. trucking industry have impacted industry dynamics in recent years and are discussed in the Regulation section below. Our Truckload segment competes with thousands of dry van and specialty equipment carriers. While we compete with many smaller carriers on a regional basis, only a limited number of carriers represent competition in all markets across North America.
Intermodal
The domestic intermodal market is highly consolidated amongst three of the largest intermodal providers, including our Intermodal segment. Our Intermodal segment competes with intermodal providers and other transportation service companies, including truckload carriers. We have agreements with three precision-scheduled Class I railroad providers, which
augments our company dray differentiation in the market and allows for increased freight reliability.
Logistics
The logistics industry is a large, fast-growing, and fragmented market representing an integral part of the economy. Logistics plans, implements, and controls the movement and storage of goods, generally using the assets of others. Our Logistics segment competes with other logistics companies, brokerage businesses, and truckload carriers.
Customers
During the year ended December 31, 2024, we offered our services to approximately 7,850 customers across our portfolio (excluding customers from our recent Cowan Systems acquisition), including 134 Fortune 500 companies, and 22 of our top 25 customers used services from all three of our reportable segments. Our Logistics segment manages over 20,700 qualified carrier relationships and managed approximately $2.4 billion of third-party freight in 2024.
Our revenue is derived from a diverse customer base across a broad end-market footprint, encompassing numerous industries including consumer products, retail, auto, chemicals, electronics and appliances, e-commerce, home improvement, and food and beverage. Our diversified revenue mix and customer base allow for revenue and yield management stability throughout the year, despite the fact that many of our customers are affected by seasonal fluctuations.
Transportation Equipment
Our company-owned transportation equipment fleet was comprised of the following as of December 31, 2024:
| | | | | | | | |
| Transportation Equipment Type | | Approximate Number of Units |
| Over-the-road sleeper cab tractors | | 8,000 |
| Day cab tractors | | 4,100 |
| Other tractors (yard tractors, straight trucks, and training tractors) | | 400 |
| Trailers | | 54,400 |
| Containers | | 27,000 |
| Chassis | | 23,900 |
Human Capital Management
Schneider is committed to promoting an inclusive culture that values and respects the varied talents and perspectives of our associates. We recognize the advantage of hiring and retaining associates who contribute to the creation of value for our shareholders.
Associates and Workforce
As of December 31, 2024, we employed approximately 19,400 associates, 69% of whom are drivers, with the remaining 31% consisting of mechanics and warehouse personnel, managers, and other corporate office associates. Approximately 12% of our associates are based out of our headquarters in Green Bay, Wisconsin. We have not experienced any work stoppages and consider our associate relations to be good. Currently, five of our company drivers are members of an organized labor union, as a result of a commitment we made in the 1980s to allow this group of drivers to finish their careers at Schneider while remaining union members. None of our other associates are represented by a labor union.
We have a highly engaged workforce deployed over a diverse set of positions across our segments, geographies, and businesses. Where consistent with our operational needs, we offer a variety of flexible working arrangements to associates, including remote and blended work configurations.
Associate Recruitment, Development, and Retention
•Company drivers – Our drivers play an essential role in the ability to serve our customers, and we remain focused on making our driver experience the best in the industry. We employ measures to improve retention which include offering drivers competitive salaries and benefits, establishing driver pay scales which provide for increasing pay by experience level and performance, offering both live and remote driver training by experienced driving instructors, and maintaining a modern truck fleet with the latest safety technology, all of which focus on improving the overall driver experience.
•Non-driver Company associates – Our mechanics, warehouse personnel, managers, and other corporate office associates help to facilitate and coordinate service to customers, ensure equipment is operational and well-maintained, and generally support our operations. As we strive to offer best-in-class service to our customers, we focus on hiring top talent and providing them with opportunities for development and growth within their roles and throughout the organization. We utilize a performance management system that incorporates goals and development plans that are assessed semiannually to better position associates for future career growth. Succession planning is regularly performed to help identify and develop a pipeline of talent in critical roles within our organization. We further our talent development through a comprehensive learning program that offers associates classroom, virtual, and web-based training options. Additionally, we routinely conduct market analyses to evaluate the competitiveness of our wages and benefits.
Associate Engagement
We promote associate engagement throughout our organization. We conduct biennial associate surveys to measure associate satisfaction and garner ideas to improve workforce engagement. Survey results are used to implement programs that will enhance associate connectivity with the Company which is believed to lead to increased innovation, productivity, and profitability.
In 2023, we opened The Grove, a state-of-the-art innovation center located on the campus of our headquarters which is a curated, collaborative workspace for associates and customers aimed at driving innovation in transportation and logistics with a focus on technology.
Compensation Structure and Benchmarking
Our comprehensive compensation and benefits package is designed to enable us to attract and retain high quality talent across the wide variety of roles in the Company. We routinely benchmark pay and benefits against peers and companies in jurisdictions where we operate to evaluate whether our total package is fair, competitive, and meets the needs of our associates. Our comprehensive package includes competitive pay, tuition reimbursement, medical, dental, vision, wellness programs, mental health support, 401(k) savings and retirement, work schedule flexibility, paid time off, disability benefits and a wide variety of other voluntary insurance options, recognition programs, and development and career growth opportunities. Some of our driver pay packages include minimum guarantees while providing increasing pay by experience level and incentivizing for performance. Our non-driver pay varies by job, is market competitive, and includes short and long-term incentive programs that motivate associates and reward high performance.
Driver Turnover Rate
As a result of retirements, high turnover rates for new entrants to the driver market, and the challenges of attracting drivers, the industry and the long-haul truckload sector, in particular, have been characterized by persistent shortages of truck drivers. In response to the driver shortage and high driver turnover rate in our industry, we recruit recent driver training school graduates as a source of new drivers or hire driver candidates to participate in our own nationwide network of 19 training academies. These drivers have completed a training program at a private driver training school and hold a CDL. For areas of the country where truck driver jobs are in demand and demographics don’t support many qualified drivers, we have established CAT for candidates with no previous truck driving experience. Our CAT Program enables these candidates to earn their CDL in their first few weeks of training then continue training under the supervision of experienced driver trainers to strengthen and hone their driving skills.
Inclusive Culture
We believe an engaged and inclusive workforce fuels innovation, improves strategic thinking, and cultivates leadership. We value diversity of thought, race, ethnicity, gender, age, religion, sexual orientation, experience, and background. We nurture an environment where associates feel safe, supported, and empowered to share their creativity, experiences, and ideas throughout our hiring processes, training and development programs, performance management, and community giving programs. Creating communities rooted in a culture of belonging is the ultimate goal of Schneider’s Business Resource Groups (BRGs). Our BRG’s are for associates who share identity, life experience, or common purpose, and who come together to fulfill both individual and group goals that tie directly to business strategies and objectives. Finally, we are proud supporters of military veterans and continue to be recognized as a top military-friendly employer, as well as consecutively being recognized as a top company for women in transportation.
Safety
“Safety first and always” is a Schneider core value, and we believe we have a responsibility to our associates, customers, and the community to operate safely. Our safety culture is built on five key components:
•Driver hiring and drug testing – We hire both experienced drivers and drivers new to the industry through a comprehensive hiring process. As part of that process, we voluntarily choose to use hair testing in addition to mandated urine-based drug testing. While costing more per driver, hair testing is generally more accurate than urine-based testing.
•Military drivers – We support service members and veterans and employ many drivers with military experience. This experience produces quality truck drivers due to the discipline instilled through military training programs.
•Training – Initial training is complemented by regularly scheduled follow-up training to sustain and enhance basic skills. We operate company-sponsored driver training facilities and have invested in simulators for both initial and sustainment training.
•Equipment and technology – We invest in trucks that are configured with roll stability, collision mitigation, lane departure warning, MirrorEye, and/or forward, side, and rear-facing cameras. Driving behavior is electronically monitored, alerts are provided to the driver situationally, and performance is documented for subsequent coaching. We also employ electronic logging to improve HOS compliance and reduce fatigue occurrences.
•Active management – Driver leaders and safety coordinators have real-time access to activity in the truck, facilitating situational and scheduled coaching. We have invested in predictive analytics that assist in proactively identifying drivers with potential safety issues and recommending remediation paths.
Truckload carriers share safety performance information in monitored peer-to-peer forums. We have always maintained a satisfactory DOT safety rating, which is the highest available rating.
Owner-Operators
In addition to the company drivers we employ, we enter into contracts with independent contractors who work as “owner-operators.” Owner-operators are small business owners who own and maintain their own trucks, may employ drivers they hire, and provide us with services under a contractual arrangement whereby they are generally responsible for the costs of truck ownership and operating expenses. Owner-operators select their own load assignments, have control over their schedule, and are compensated on a per load basis. Owner-operators tend to be experienced drivers and represented approximately 10% of driver capacity as of December 31, 2024.
Environmental, Social, and Governance
We seek to do business responsibly and embrace that we have a role to play in the betterment of society. At Schneider, we define sustainability broadly as safe and responsible practices that strengthen the economy and create a safer world. We seek to accomplish this by maintaining a modern fleet to maximize fuel and energy efficiency, leveraging our intermodal service to convert loads from truck to rail, consolidating freight whenever possible, and continuing to introduce technologies to coordinate the movement of products timely, safely, and efficiently. Additionally, we continue to evaluate alternative fuel vehicles, and our efforts to improve overall fleet fuel efficiency and reduce GHG emissions are ongoing.
We have deployed nearly 100 Class 8 BEVs in our Intermodal fleet to further the Company’s efforts to make our fleet more efficient and reduce emissions and are focused on improving sustainability at our operating facilities including upgrading to high-efficiency lighting and enhancing existing programs for recycling motor oil, tires, and batteries. We are an EPA SmartWay® Transport Partner and are proud to be one of only four freight carriers to receive the EPA’s SmartWay® Award of Excellence each year since the award was created. In 2024, all three of our reportable segments achieved the highest SmartWay® performance ranking. We are the only company to receive all three of the National Safety Council’s Green Cross for Safety Award for Safety Advocacy, Excellence, and Innovation. We established GREEN, an internal BRG, which focuses on educating associates on how to enhance sustainability and improve the environmental health of communities where we operate. Finally, we opened The Grove on our main Green Bay, WI campus in 2023. This state-of-the-art facility leverages both geothermal and solar energy to maximize resource efficiency. The interior of The Grove contains furniture made of post-industrial materials as part of our commitment to sustainability.
Fuel
We actively manage our fuel purchasing network in an effort to maintain adequate fuel supplies. In 2024, we made 99% of our fuel purchases through negotiated volume purchase discounts. We store fuel in underground storage tanks at five locations and in above-ground storage tanks at ten locations. We believe that we are in material compliance with applicable environmental laws relating to fuel storage.
In response to fluctuations in fuel prices, we use surcharge programs to adjust fuel costs charged to our customers. We believe the most cost-effective protection against variability in fuel costs is to continue the fuel surcharge programs and invest in a fuel-efficient fleet; however, due to the timing of changes in fuel prices and data used to calculate our fuel surcharge rate, our surcharges historically have not always protected us against the full effect of increases in diesel fuel prices and may not in the future. As an additional measure, we leverage fuel consumption metrics in evaluating drivers’ performance, and drivers utilize a fuel optimizer program where they purchase fuel at the most cost-effective locations based on distance to empty and fuel purchase commitments.
We seek to find ways to reduce our CO2 emissions including increasing the fuel efficiency of our current fleet, exploring alternative fuel vehicles, and deploying BEVs. In recent years, we invested in our existing diesel fleet to improve truck aerodynamics, reduce trailer drag, and implement electric-powered heating, ventilating, and air conditioning systems, which translates to emissions reductions and fuel savings. We are currently exploring alternative fuel vehicles, including hydrogen vehicles, and have nearly 100 BEVs in our fleet which replaced existing diesel trucks and helped reduce our diesel fuel usage.
Regulation
Our operations as a for-hire motor carrier are regulated and licensed by various federal, state, and local government agencies in North America, including the U.S. DOT, FMCSA, U.S. DHS, NHTSA, EPA, and OSHA. These regulatory authorities have broad powers over matters relating to authorized motor carrier operations, as well as motor carrier registration, safety and fitness of transportation equipment and drivers, transportation of hazardous materials, certain mergers and acquisitions, and periodic financial reporting. Our driver associates and owner-operators must also comply with carrier qualifications and enacted governmental regulations regarding safety, equipment, and operating methods, including DOT regulation of equipment weight and drug and alcohol testing of our current and prospective driver associates and FMCSA regulation of driver HOS. In addition, we are subject to compliance with cargo-security and transportation regulations issued by the Transportation Security Administration and Customs and Border Protection within the DHS, and our cross-border operations in Canada and Mexico are subject to regulation by each of those countries.
We are also subject to various environmental laws and regulations dealing with, among other aspects of our operations, the handling of hazardous materials, underground fuel storage tanks at our terminals, emissions from our vehicles and facilities, engine idling, and discharge and retention of storm water.
Additionally, we are subject to a variety of laws and regulations which are targeted at reducing GHG emissions, improving air quality and fuel efficiency at a national level, and accelerating a large-scale transition to medium and heavy-duty ZEVs. Prominent among those regulations are certain environmental regulations in effect in the State of California which have been adopted by CARB, including:
•The Heavy-Duty Vehicle GHG Emission Reduction Regulation which was issued to reduce GHG emissions from certain long-haul tractor-trailers that operate in California by requiring owners of such vehicles or equipment to retrofit their vehicles with aerodynamic elements and accessories and implement technologies that improve fuel efficiency (regardless of where the vehicle is registered);
•CARB’s ACT regulation, as enacted, is intended to accelerate the adoption of zero-emission trucks in California by 2035. Under ACT, an increasing percentage of tractors sold in California will need to be zero-emission by 2045. As of the date of this Annual Report on Form 10-K, the following states have also adopted the ACT regulation: Connecticut, Colorado, Delaware, Maine, Maryland, Massachusetts, Minnesota, Nevada, New Jersey, New Mexico, New York, Oregon, Pennsylvania, Rhode Island, Vermont, Virginia, Washington and Washington D.C.
California has passed three climate reporting laws which mandate all companies conducting business in California to make climate-related disclosures beginning in 2026. SB 253 requires companies with revenues greater than $1 billion doing business in California to report their emissions comprehensively, including their Scope 1 and 2 beginning in 2026 and Scope 3 beginning in 2027. SB 253 also requires reporting companies to obtain third-party auditor assurance of their reports on their Scope 1 and 2 emissions; for Scope 3 emissions, assurance requirements will be determined by 2027. SB 261 requires large U.S. businesses with annual revenues over $500 million operating in California to bi-annually disclose climate-related financial risks and their mitigation strategies to the public. Other states are now considering mandatory GHG emissions disclosures and other climate-related risks. Several business groups including the U.S. Chamber of Commerce, the California Chamber of Commerce, and the American Farm Federation have filed a lawsuit seeking to overturn SB 253 and SB 261. As of the date of this Annual Report on Form 10-K, that lawsuit remains pending. Lastly, in a significant step toward implementing transparency in voluntary carbon markets, California enacted AB 1305 - the VCMDA. The VCMDA requires that companies operating in California which market or sell voluntary carbon offsets or make claims regarding the achievement of net zero emissions, carbon neutral status, or significant carbon emissions reductions publicly disclose information documenting how the claim was determined to be accurate or accomplished and the measurement of interim progress. Companies that purchase carbon credits in conjunction with certain climate-related claims are required to publicly disclose information documenting how the claim was determined to be accurate or accomplished and the measurement of interim progress. At times, in conjunction with delivering freight transportation services to certain of its customers, the Company purchases carbon credits or offsets to enable or assist such customers with achieving their carbon reduction targets.
In March 2024, prior to the election of President Trump, the SEC released a final version of their Climate Disclosure rule which, among other things, would require companies to disclose specified financial statement disclosures of severe weather events and other natural conditions, certain carbon offsets and RECs, and material impacts on financial estimates and assumptions that are due to severe weather events and other natural conditions or disclose climate related targets or transition plans. In response to multiple separate lawsuits filed by certain business groups, the SEC has voluntarily stayed its Climate Disclosure rule making. Several lawsuits were consolidated later in 2024 and are currently pending before the Eighth Circuit.
On February 11, 2025, SEC Acting Chair Mark Uyeda – in a major step toward the Trump Administration reversing course on the Biden SEC’s Climate Disclosure Rule, issued a statement saying the Climate Disclosure Rule “… is deeply flawed and could inflict significant harm on the capital markets and our economy” and subsequently directed the Commission staff to notify the Court of the changed circumstances and request that the Court not schedule the case for argument to provide time for the Commission to deliberate and determine the appropriate next steps in these cases.” If the SEC decides to continue to defend and the rule survives this legal challenge, the SEC has indicated it will provide a new effective date for the rule. As a result, we cannot predict when or if these rules will go into effect or whether they will have any impact on the Company’s results of operations.
These laws and regulations historically have resulted in increased costs, decreased equipment productivity, risks, and/or increased liabilities associated with our operations, and have the potential to further increase such costs, risks, and/or liabilities, particularly if costs are not offset by potential fuel savings. We cannot predict the extent to which our operations and productivity will be impacted. We continue to monitor and evaluate the proposed rule makings of the SEC, DOT, FMCSA, NHTSA, EPA, State of California, and other federal and state regulatory agencies to determine the expected impact on our operations.
Technology
Our business is executed through an integrated technology platform that encompasses an end-to-end process design focused on information accessibility and connectivity across our value chain. Our platform enables an integrated approach to cash processing including load/order acceptance based on driver and network optimization, vehicle dispatch, continuous quote monitoring, and visibility to loads from pick-up to delivery and customer collection. Proprietary decision support tools are embedded throughout the platform and assist our associates in making the right trade-offs for drivers’ needs for earnings and work-life balance, customers’ needs for reliable capacity and service, and our business and its shareholders’ needs for an adequate return. Decision support tools improve our ability to, among other things, situationally coach drivers, minimize fuel costs, and maintain the fleet in the most cost-effective manner to maximize shareholder value.
Schneider FreightPower® for carriers and shippers digitally connects the benefits of our integrated technology platform with the strength of our trailer network and carrier relationships to service our customers. We continue to expand our business capabilities by extending our foundational integrated technology platform, making advancements to our in-cab technology, and leveraging mobile applications to better connect with company drivers and customers. Through our investment in MLSI, in which we are collaborating to develop a TMS using MLSI’s SaaS technology, we aim to further complement our technology platform and enable enhanced decision making, resource allocation, and visibility for our supply chain partners. Our Power Only business has been using MLSI’s TMS since 2022, our Brokerage business began its migration at the end of 2024, and we are currently planning for the transition of our Dedicated business.
Our in-cab telematics platform delivers on-board technology through our private application store to enable communication, regulatory compliance, and driver productivity. This comprehensive platform includes messaging capabilities, applications that scan and automate paperwork, and customer and location specific step-by-step work assignments. Our telematics platform is fully integrated with our back-office planning and execution systems and delivers real-time data in our business. Trailer and container fleets are equipped with monitoring devices which function both when tethered to a tractor or standing alone. Our tractors are equipped with stability control and collision mitigation technology, lane departure warning, MirrorEye, and/or forward, side, and rear-facing cameras. All tractor technology interfaces with the in-cab device and provides the driver and the driver’s leader with real-time performance data. We are constantly reevaluating our existing technology to find efficiencies and drive innovation, with some of our current efforts focused on exploring autonomous trucking and additional safety technologies.
Available Information
We make a number of reports and other information available free of charge on our website, www.schneider.com, including our annual reports on Form 10-K, quarterly reports on Form 10-Q, current reports on Form 8-K, and all amendments to those reports as soon as reasonably practicable after such material is electronically filed with or furnished to the SEC pursuant to Section 13(a) or 15(d) of the Securities Exchange Act of 1934.
The “Investors” section of our website contains corporate governance guidelines, our code of ethics, Board committee charters, and other corporate policies. The information on our website is not, and shall not be deemed to be, a part of this Annual Report on Form 10-K or incorporated into any other filings we make with the SEC.
ITEM 1A. RISK FACTORS
Cautionary Statement Concerning Forward-Looking Statements
This Annual Report on Form 10-K contains certain statements regarding business strategies, market potential, future financial performance, future action, results, and any other statements that do not directly relate to any historical or current fact which are “forward-looking” statements within the meaning of the Securities Act of 1933, as amended (the “Securities Act”), the Exchange Act, and the Private Securities Litigation Reform Act of 1995. The words “believe,” “expect,” “anticipate,” “project,” “estimate,” “budget,” “continue,” “could,” “intend,” “may,” “plan,” “potential,” “predict,” “seek,” “should,” “will,” “would,” “expect,” “objective,” “forecast,” “goal,” “guidance,” “outlook,” “effort,” “target,” among others, generally identify forward-looking statements, which speak only as of the date the statements were made.
In particular, information included under the sections entitled “Business,” “Risk Factors,” and “Management’s Discussion and Analysis of Financial Condition and Results of Operations” contains forward-looking statements.
Readers are cautioned that the matters discussed in these forward-looking statements are subject to risks, uncertainties, assumptions, and other factors that are difficult to predict, and which could cause actual results to differ materially from those projected, anticipated, or implied in the forward-looking statements. Where, in any forward-looking statement, an expectation or belief as to future results or events is expressed, such expectation or belief is based on current plans and expectations of management and expressed in good faith and believed to have a reasonable basis, but there can be no assurance that the expectation or belief will be achieved or accomplished. Many factors that could cause actual results or events to differ materially from those anticipated include those matters described under the sections entitled “Risk Factors” and “Management’s Discussion and Analysis of Financial Condition and Results of Operations.” We caution you not to place undue reliance on these forward-looking statements, which speak only as of the date of this Annual Report on Form 10-K, and we do not assume any obligation to update any forward-looking statement as a result of new information, future events, or otherwise, except as required by applicable law. All forward-looking statements, expressed or implied, included in this Annual Report on Form 10-K are expressly qualified in their entirety by this cautionary statement. This cautionary statement should also be considered in connection with any subsequent written or oral forward-looking statements that we may make or persons acting on our behalf may issue.
You should consider each of the following factors, as well as the other information in this Annual Report on Form 10-K, including our financial statements and the related notes, in evaluating our business and our prospects. The risks and uncertainties described below are not the only ones we face. In general, we are subject to the same general risks and uncertainties that impact many other companies such as general economic, industry, and/or market conditions and growth rates; risks and uncertainties associated with or arising out of possible future pandemics; possible future terrorist threats or armed conflicts and their effect on the worldwide economy; and changes in laws or accounting rules. Additional risks and uncertainties not presently known to us, or that we currently consider immaterial, may also impair our business operations. If any of these risks occur, our business and financial results could be harmed. In that case, the trading price of our common stock could decline.
Risks Related to Our Business, Industry, and Strategy
Our operating results may be adversely affected by unfavorable economic and market conditions.
Our business and results of operations are sensitive to changes in overall economic conditions, public health crises, tariffs, and other geopolitical issues that impact customer shipping volumes, industry freight demand, industry truck capacity, inflation, and our operating costs. Announced import tariffs on certain imported goods by the Trump administration have led to the threat or imposition of reciprocal tariffs by several foreign governments on certain goods imported from the U.S. The imposition of additional tariffs or quotas or changes to certain trade agreements, could, among other things, negatively impact customer demand or increase our operating costs. Economic conditions, tariffs, or other issues that decrease shipping demand can exert downward pressure on rates and equipment utilization or increase the cost of our equipment, fuel, and other operating costs. We cannot predict future economic conditions, whether proposed or threatened tariffs will be enacted, or how consumer demand, purchasing cycles, or our input costs could be affected by such conditions. In general, significant decreases in shipping volumes within the industry or increases in available truck capacity could result in more aggressive freight pricing as carriers compete for loads and truck productivity. Likewise, we are also subject to cost increases outside our control that could materially reduce our profitability if we are unable to offset such increases through rate increases or cost reductions. Such cost increases include, but are not limited to, driver wages, third-party carrier costs, fuel and energy prices, taxes and interest rates, tolls, license and registration fees, insurance premiums, regulatory compliance costs, transportation equipment and related maintenance costs, and healthcare and other employee benefit costs. We cannot predict whether, or in what form, or at what rate any such cost increases could occur. Any such cost increase or event could adversely affect our results of operations or cash flows.
We operate in a highly competitive and fragmented industry that is characterized by intense price competition which could have a materially adverse effect on our results of operations.
Our operating segments compete with many other truckload carriers, logistics, brokerage, and transportation service providers of varying sizes, and to a lesser extent, LTL carriers, railroads, and other transportation or logistics companies, some of which have larger fleets, greater access to equipment, preferential customer contracts, greater capital resources, or other competitive advantages. Competition for the freight we transport or manage is based primarily on service, efficiency, available capacity, and to some degree, on freight rates alone. Our competitors periodically reduce their freight rates to gain business, especially when economic conditions negatively impact customer shipping volumes, truck capacities, or operating costs. Moreover, to limit the number of approved carriers to a manageable number, some of our customers select “core carriers” as approved transportation service providers, and in some instances, we may not be selected. Other of our customers periodically accept bids from multiple carriers for their shipping needs, which also periodically results in the loss of business to competitors. Some of our customers have used or expanded their own private fleets rather than outsource loads to us, and others may do so in the future. Finally, our existing competitors, as well as new market entrants, have and continue to introduce new brokerage platforms or technologies, which has increased competition. Although we believe we are well positioned and have adopted technologies, developed strategies, and heavily invested in our own digital service offerings to deter, compete with, or supplant existing competitors and new market entrants, there can be no assurance that our investments, technologies, or strategies will be successful in enabling us to sustain or grow our current market share in each of our segments. These competitive dynamics could have an adverse effect on the number of shipments we transport and the freight rates we receive, which could limit our growth opportunities and reduce our profitability.
We derive a significant portion of our revenues from our major customers, the loss of one or more of which could have a materially adverse effect on our business.
We strive to maintain a diverse customer base; however, a significant portion of our operating revenues is generated from a number of major customers, the loss of one or more of which could have a material adverse effect on our business. Aside from our dedicated operations and customer relationships where we manage such customers’ supply chains, we generally do not have long-term contractual relationships, rate agreements, or minimum volume guarantees with our customers. Furthermore, certain of the long-term contracts in our dedicated operations are subject to cancellation. There is no assurance any of our customers, including our dedicated customers, will continue to utilize our services, renew our existing contracts, or continue at the same volume levels. Despite the existence of contractual arrangements, certain of our customers may engage in competitive bidding processes that could negatively impact our contractual relationships. In addition, certain of our major customers may increasingly use their own truckload and delivery fleets, which would reduce our freight volumes. A reduction in or termination of our services by one or more of our major customers, including our dedicated customers, could have a materially adverse effect on our business, financial condition, and results of operations.
Difficulties attracting and retaining qualified drivers could materially, adversely affect our profitability and ability to maintain or grow our fleet.
The trucking industry historically has and may continue to experience difficulty attracting and retaining sufficient numbers of qualified drivers, both new and experienced, including owner-operators, and such shortages have and could continue to require us to significantly increase driver compensation, rely more on higher-cost third-party carriers, idle transportation equipment, or dispose of the equipment altogether, any of which could adversely affect our growth and profitability. The challenge with attracting and retaining qualified drivers is driven by several factors including intense market competition for a limited pool of qualified drivers, driver compensation, the preference among drivers to work closer to home and be home most nights, and our highly selective hiring standards.
Our turnover rate requires us to continually recruit a substantial number of company and owner-operator drivers to support our operations. Owner-operator availability is generally affected by operating cost increases for which the owner-operator is responsible. Economic conditions drive overall increases in customer demand and heightened competition for owner-operators from other carriers. When shortages of owner-operators occur, we may have to increase settlement rates paid to them and increase company driver pay rates to attract and retain a sufficient number of drivers. These increases could negatively affect our results of operations to the extent that we would be unable to obtain corresponding freight rate increases.
We face risks associated with unionization.
Although the number of our associates who are currently represented by a labor union is not significant, we face ongoing risks associated with the potential unionization of certain associates. Over the last several years we have been the subject of isolated unionization efforts involving a relatively small number of associates, which efforts were, in each case, unsuccessful. Overall, we believe our relations with our associates are good; however, should a significant number of our associates opt to be represented by a labor union, we could experience a significant disruption of, or inefficiencies in, our operations or incur higher labor costs, which could have a material adverse effect on our business, results of operations, financial condition, and liquidity.
Additionally, our responses to any union organizing efforts could negatively impact how our brand is perceived and have adverse effects on our business, including on our financial results. These responses could also expose us to legal risk or reputational harm and cause us to incur costs to defend legal and regulatory actions. Moreover, any labor disputes or work stoppages, whether or not such actions culminate in a successful unionization campaign, could disrupt our operations and have a material adverse effect on our financial results.
The success of our businesses depends on our strong reputation and ability to maintain the Schneider brand value.
Because the transportation and logistics services we offer are primarily marketed under the Schneider brand, the Schneider brand name is our most valuable sales and marketing tool. Press coverage, lawsuits, regulatory investigations, or other adverse publicity that assert some form of wrongdoing or that depict the Company or any of our executives, associates, contractors, or agents in a negative light, regardless of the factual basis of the assertions being made, could negatively impact public or customer perceptions of the Company resulting in a loss of brand equity. If we do not maintain and protect our brand image and reputation, demand for our services could wane and thus have an adverse effect on our financial condition, liquidity, and results of operations, as well as require additional resources to rebuild our reputation and restore the value of our brand.
If fuel prices rise or fall significantly, our results of operations could be adversely affected.
Our truckload operations are largely dependent on diesel fuel, and accordingly, significant increases in diesel fuel costs could materially and adversely affect our truckload operations, and if we are unable to pass increased costs on to customers through rate increases or fuel surcharges or if shippers opt for intermodal rail over trucking their freight, our results of operations and financial condition could be adversely affected. Likewise, if diesel fuel prices decrease significantly, the results of our intermodal operations could be adversely affected as shippers shift intermodal freight to over-the-road trucking. Prices and availability of petroleum products are subject to political, economic, geographic, weather-related, and market factors that are generally outside our control and each of which may lead to fluctuations in the cost and availability of diesel fuel.
Our fuel surcharge program does not protect us against the full effect of increases in diesel fuel prices, and the terms of our fuel surcharge agreements vary by customer. In addition, because our fuel surcharge recovery lags behind changes in diesel fuel prices, our fuel surcharge recovery may not capture the increased costs we pay for fuel, especially when prices are rising. There is variability in the compensatory nature of individual customer fuel surcharge programs that can affect inflationary cost recovery of fuel.
There is no assurance that such fuel surcharges can be maintained indefinitely or will be sufficiently effective. Our results of operations would be negatively affected to the extent we cannot recover higher fuel costs or fail to improve our fuel price protection through our fuel surcharge program. Increases in diesel fuel prices, or a shortage or rationing of diesel fuel, could also materially and adversely affect our results of operations. During 2024, we did not enter into any derivative financial instruments that served to hedge or reduce our exposure to fuel price fluctuations.
We depend on railroads and access to the nation’s ports of call in the operation of our intermodal business, and therefore, our ability to offer intermodal services or our results of operations could be adversely impacted if our rail partners or certain ports of call were to perform poorly or experience service disruptions.
Our Intermodal segment utilizes railroads and, in some cases, third-party drayage carriers to transport freight for our intermodal customers. The majority of these services are provided pursuant to contracts with our service partners which are subject to periodic renewal. While we have had agreements with all of the Class I railroads, our primary contracts for railroad transportation in support of our intermodal operations are currently with CSX Transportation, the UP, and the CPKC.
In certain areas of the U.S., rail service is limited to a few railroads, or even a single railroad due to the lack of competition. Our ability to provide intermodal services in certain traffic lanes is, therefore, likely to be adversely affected if any of the Class I railroads were to discontinue service in certain lanes, or if any of our rail partners experience service interruptions, or if the overall quality of their rail service were to deteriorate. In addition, our intermodal business may be adversely affected by declines in service and volume levels provided by the railroads.
All of the Class I railroads in the U.S., including our current rail partners, are unionized and have a recent history of disruption due to labor disputes and collective action, including strikes. While there is currently a contract in place between the Class I Railroads and the unions representing rail workers, underlying labor issues remain including, most prominently, precision-scheduled railroading, the business model adopted in recent years by Class I rail carriers which has been blamed by railroad unions as the reason for a dramatic reduction in the freight rail workforce, increased supply-chain congestion, and deteriorating railroad safety. As a result, we cannot predict whether or when a labor dispute involving our rail partners could occur, the duration of such dispute, and the impact, if any, on our results of operations. Any strike or labor related disruption at any of the Class I railroads can be expected to have an adverse impact on the results of operations of our Intermodal or Truckload segments.
In addition, a portion of the freight we deliver through both our Intermodal and Truckload segments is imported to the U.S. through ports of call where workers are represented by the ILWU, a labor union which primarily represents a significant number of longshore workers at 29 ports across the West Coast, or the ILA, the largest union of maritime workers in North America, which represents a larger number of longshoremen on the Atlantic and Gulf Coasts, Great Lakes, major U.S. rivers, Puerto Rico, and Eastern Canada. The west and east coast ports have long been the primary gateways for cargo coming into and leaving the U.S. and have a long history of labor and other port disputes, protracted collective bargaining, and contract negotiations which, in the past, have involved port disputes and closures, as well as threats of a strike that would have disrupted domestic supply chains. For example, the ILA went on strike for three days in October 2024 following disputes with the USMX regarding pay and job security in connection with the negotiation of a new master contract. The strike ended when ILA and USMX agreed to a short-term extension of their existing master contract. In January 2025, the ILA again threatened to strike when the previous master contract extension expired on January 15, 2025, although this strike was avoided when the ILA and USMX agreed to a new six-year master contract. There can be no guarantee that work stoppages or further disruptions at the west or east coast ports will not occur.
Our strategic investments in technology companies and strategic partners are inherently risky, and the valuation of these investments is subject to volatility which could result in a significant charge to earnings.
We engage in strategic transactions and continue to make strategic investments, including investments in new technologies and potentially disruptive startup companies, which are focused on establishing a competitive advantage in transportation and logistics services offered by the Company or exploiting new market opportunities. Such strategic investments naturally entail risks and uncertainties, some of which are beyond our control and, as a result, the market valuation of any of our strategic investments may experience substantial price volatility which, when accounted for under GAAP, in any given period, could adversely impact the Company’s results of operations. Refer to Note 5, Investments, to our consolidated financial statements for information on our strategic investments. In addition, we may not be able to derive value from strategic investments, or we may incur higher than expected costs in realizing a return on such investments or overestimate the benefits that we receive or realize from such investments. Therefore, we cannot provide assurance that any of our strategic investments will generate anticipated financial returns. If our strategic investments fail to meet our expectations, our business and results of operations may be adversely impacted.
We may be unsuccessful in realizing all or any part of the anticipated benefits of any recent or future acquisitions within the expected time period or at all. The cost, integration, and performance of any such acquisition may adversely affect our business, results of operations, financial condition, and cash flows.
As part of our strategy to grow and expand our service offerings and create shareholder value, we have actively been engaged in identifying acquisition targets which meet our acquisition criteria and recently consummated several acquisitions in this regard. We may be unable to generate sufficient revenue or earnings from these acquisitions, or any future acquired business, to offset our acquisition or investment costs, and the acquired business may otherwise fail to meet our operational or strategic expectations. Difficulties encountered in integrating acquired operations could prevent us from realizing the full anticipated benefits, within the anticipated timeframe, and could adversely impact our business, results of operations, and financial condition.
The possible risks involved in recent or future acquisitions include, among others:
•difficulties integrating operations of the companies, including the integration of the workforces, while continuing to provide consistent, high-quality service to customers;
•unanticipated issues in the assimilation and consolidation of information technology, communications, and other systems, including additional systems training and other labor inefficiencies;
•potentially unfavorable pre-existing contractual relationships;
•delays in consolidation of corporate and administrative infrastructures;
•inability to apply and maintain our internal controls and compliance with regulatory requirements;
•other unanticipated issues, expenses, and liabilities, including previously unknown liabilities associated with the acquired business for which we have no, or are unable to secure, recourse under applicable indemnification or insurance provisions.
We continue to evaluate acquisition candidates and may acquire assets and businesses that we believe complement our existing assets and business or enhance our service offerings. The complex and time-consuming processes of evaluating acquisitions and performing due diligence procedures include risks that may adversely impact the success of our selection of candidates, pricing of the transaction, and ability to integrate critical functional areas of the acquired business. Future acquisitions, if any, may require substantial capital or the incurrence of substantial indebtedness or may involve the dilutive issuance of equity securities, which may negatively impact our capitalization and financial position. Further, we may not be able to acquire any additional companies at all or on terms favorable to us, even though we may have incurred expenses in evaluating and pursuing strategic transactions.
Our variable rate indebtedness subjects us to interest rate risk, which could cause our debt service obligations to increase significantly.
Borrowings under our Receivables Purchase Agreement, revolving credit facility, and delayed-draw term loan facility are at variable interest rates and expose us to interest rate risk. If interest rates increase, our debt service obligations on variable rate indebtedness will increase even though the amount borrowed remains the same. Our net income and cash flows, including our cash available for servicing our indebtedness, will correspondingly decrease.
We depend on third-party capacity providers, and issues of performance, availability, or pricing with these transportation providers could increase our operating costs, reduce our ability to offer intermodal and logistics services, and limit growth in our brokerage and logistics operations, which could adversely affect our revenue, results of operations, and customer relationships.
Our Logistics segment is highly dependent on the services of third-party capacity providers, such as other truckload carriers, LTL carriers, railroads, ocean carriers, and airlines. Many of those providers face the same economic challenges as we do and, therefore, are actively and competitively soliciting business. These economic conditions may have an adverse effect on the performance, availability, and cost of third-party capacity. If we are unable to secure the services of these third-party capacity providers at reasonable rates, our results of operations could be adversely affected.
Severe weather, climate, and similar events could harm our results of operations or make our results more volatile.
From time to time, we may suffer impacts from severe weather, climate, and similar events, such as tornadoes, hurricanes, blizzards, ice storms, floods, fires, earthquakes, and explosions, which may become more severe in the future as a result of climate change. These events may disrupt freight shipments or routes, affect regional economies, destroy our assets, disrupt fuel supplies, increase fuel costs, cause lost revenue and productivity, increase our maintenance costs, or adversely affect the business or financial condition of our customers, any of which could harm our results of operations or make our results of operations more volatile.
Risks Relating to Our Financial Condition, Taxation, and Capital Requirements
Our goodwill, other intangible assets, internal use software, or long-lived assets may become impaired, which could result in a significant charge to earnings.
We hold significant amounts of goodwill and long-lived assets, and the balances of these categories of assets could increase in the future if we acquire other businesses. As of December 31, 2024, the balance of our goodwill, other intangible assets, internal use software, and long-lived assets was $3.4 billion, and the total market value of the Company’s outstanding shares was $5.1 billion. Under GAAP, our goodwill, other intangible assets, internal use software, and long-lived assets are subject to an impairment analysis when events or changes in circumstances indicate the carrying value of such assets may not be recoverable. In addition, we test goodwill for impairment annually. Factors that may be considered a change in circumstances indicating that the carrying value of our goodwill, other intangible assets, internal use software, and long-lived assets may not be recoverable include, but are not limited to, a sustained decline in stock price and market capitalization, an increase in interest rates, significant negative variances between actual and expected financial results, reduced future cash flow estimates, adverse changes in applicable laws or regulations or legal proceedings, changes to technology, failure to realize anticipated synergies from acquisitions, and slower growth rates in our industry. We may be required to record a significant charge to earnings in our consolidated financial statements during the period in which any impairment of our goodwill, other intangible assets, internal use software, and long-lived assets is determined to exist, negatively impacting our results of operations. If our market capitalization was to fall below the book value of our total stockholders’ equity for a sustained period, we may conclude that the fair value of certain of our long-lived assets is materially impaired. In this case, we would be required under GAAP to record a noncash charge to our earnings which could have a material adverse effect on our business, results of operations, and financial condition.
We have significant ongoing capital requirements that could affect our profitability if we either fail or are unable to match the timing of our capital investments with customer demand, or we are otherwise unable to generate sufficient returns on our invested capital.
Our truckload and intermodal operations are capital-intensive, and our strategic decision to invest in newer equipment requires us to expend significant amounts in capital expenditures annually. The amount and timing of such capital expenditures depend on various factors, including anticipated freight demand and the price and availability of new or used tractors. If anticipated freight volume differs materially from our forecasts or customer demand, our truckload operations may have too many or too few assets. During periods of decreased customer demand, our asset utilization is challenged, and we may be forced to sell equipment on the open market in order to right-size our fleet. This could cause us to incur losses on such sales, particularly during times of a softer used equipment market, either of which could have a materially adverse effect on our profitability. Our leasing business could also be at risk of inventory impairment if truck deliveries are not aligned with owner-operator demand, which could also have a materially adverse effect on our profitability. Should demand for freight shipments weaken or our
margins suffer due to increased competition or general economic conditions, we may have to limit our fleet size or operate our transportation equipment for longer periods, either of which could have a materially adverse effect on our operations and profitability.
Our effective tax rate may fluctuate, which would impact our future financial results.
Our effective tax rate may be adversely impacted by, among other things, changes in the regulations relating to capital expenditure deductions, or changes in tax laws where we operate, including the uncertainty of future tax rates. We cannot give any assurance as to the stability or predictability of our effective tax rate in the future because of, among other things, uncertainty regarding the tax laws and policies of the countries where we operate. Our tax returns are subject to periodic reviews or audits by domestic and international authorities, and these audits may result in adjustments to our provision for taxes or allocations of income or deductions that result in tax assessments different from amounts that we have estimated. We regularly assess the likelihood of an adverse outcome resulting from these audits to determine the adequacy of our provision for taxes. There can be no assurance as to the outcome of these audits or that our tax provisions will not change materially or be adequate to satisfy any associated tax liability. If our effective tax rates were to increase or if our tax liabilities exceed our estimates and provisions for such taxes, our financial results could be adversely affected.
Insurance and claims expenses could significantly reduce our earnings.
We self-insure, or insure through our wholly-owned captive insurance company, a significant portion of our claims exposure resulting from auto liability, general liability, cargo, and property damage claims, as well as workers’ compensation. In addition to insuring portions of our risk, our captive insurance company provides insurance coverage to our owner-operator drivers. We are also responsible for our legal expenses relating to such claims, which can be significant both on an aggregate and individual claim basis. Although we reserve for anticipated losses and expenses and periodically evaluate and adjust our claims reserves to reflect our experience, estimating the number and severity of claims, as well as related costs to settle or resolve them, is inherently difficult, and such costs could exceed our estimates. Accordingly, our actual losses associated with insured claims may differ materially from our estimates and adversely affect our financial condition and results of operations in material amounts.
As a supplement to our self-insurance program, we maintain insurance with excess insurance carriers for potential losses, which exceed the amounts we self-insure. Although we believe our aggregate insurance limits should be sufficient to cover our historic claims amounts both individually and in the aggregate, the commercial trucking industry has experienced a wave of so-called “nuclear verdicts,” where juries have awarded tens or even hundreds of millions of dollars to accident victims and their families. Given this recent trend, it is possible that one or more claims could exceed our aggregate coverage limits. If any claim were to exceed our aggregate insurance coverage, we would bear the excess, in addition to our other self-insured amounts.
Given the current truck litigation environment, the amount of coverage available from excess insurance carriers is decreasing, and the premiums for this excess coverage are increasing significantly. For the foregoing reasons, our insurance and claims expenses may increase, or we could increase our self-insured retention as policies are renewed or replaced. In addition, we may assume additional risk within our captive insurance company that we may or may not reinsure. Our results of operations and financial condition could be materially and adversely affected if (1) our costs or losses significantly exceed our aggregate coverage limits, (2) we are unable to obtain insurance coverage in amounts we deem sufficient, (3) our insurance carriers fail to pay on our insurance claims, or (4) we experience a claim for which coverage is not provided.
Risks Relating to Our Governance Structure
Voting control of the Company is concentrated with a Voting Trust that was established for certain members of the Schneider family, which limits the ability of our other shareholders to influence major corporate transactions.
We currently have a dual class common stock structure consisting of (1) Class A common stock, entitled to ten votes per share and (2) Class B common stock, entitled to one vote per share. The Schneider family, including trusts established for the benefit of certain members of the Schneider family, collectively beneficially own 100% of our outstanding Class A common stock and approximately 41% of our outstanding Class B common stock, representing approximately 94% of the total voting power of all of our outstanding common stock and approximately 69% of our total outstanding common stock.
A Voting Trust holds the shares of Class A common stock that are beneficially owned by the Schneider family. The directors who are members of our Corporate Governance Committee and are not Schneider family members serve as trustees of the Voting Trust, and in general, those directors have full power and discretion to vote the Class A shares included in the Voting Trust with two exceptions. First, in the case of any Major Transaction (as defined under our Amended and Restated Bylaws, including, most notably, a transaction resulting in more than 40% of the voting power of our common stock being held outside of the Schneider family), the independent directors of our Corporate Governance Committee must vote the shares of common Class A stock held in the Voting Trust as directed by the trustees of certain trusts which have been established for the benefit of
certain Schneider family members. As a result, the outcome of the vote on any Major Transaction is not within the discretion of the Voting Trustees. Second, the independent directors of our Corporate Governance Committee must vote the shares of common Class A stock held in the Voting Trust in accordance with a nomination process agreement pursuant to which two specified Schneider family members will be nominated to serve on our Board on an annual, rotating basis.
As a result of these arrangements, the Voting Trust controls the outcome of major corporate transactions that require or may be accomplished by shareholder approval, and our Class B shareholders would be unable to affect the outcome of such transactions should any be proposed.
We are a “controlled company” within the meaning of the rules of the NYSE and, as a result, qualify for, and intend to rely on, exemptions from certain corporate governance requirements relating to our Compensation and Corporate Governance Committees. Our shareholders will not have the same protections afforded to shareholders of other companies that are subject to such requirements.
The Voting Trust has more than 50% of the voting power for the election of directors. As a result, we qualify as a “controlled company” under the corporate governance rules for NYSE-listed companies. As a controlled company, certain exemptions under the NYSE listing standards exempt us from the obligation to comply with certain NYSE corporate governance requirements, including the requirement that we have a Compensation Committee and a Corporate Governance Committee that are composed entirely of independent directors.
We have elected to take advantage of this “controlled company” exemption, and therefore, the holders of our Class B common stock may not have the same protections afforded to shareholders of companies that are subject to all of the corporate governance rules for NYSE-listed companies. Our status as a controlled company could therefore make our Class B common stock less attractive to some investors or otherwise depress our stock price.
The price of our Class B common stock has been and may continue to be volatile and may fluctuate significantly, which may adversely impact investor confidence and increase the likelihood of securities class action litigation.
Our Class B common stock price has experienced volatility in the past and may remain volatile in the future. Volatility in our stock price can be driven by many factors including divergence between our actual or anticipated financial results and published expectations of analysts or the expectations of the market, the gain or loss of customers, announcements that we, our competitors, our customers, or our vendors or other key partners may make regarding their operating results and other factors which are beyond our control such as market conditions in our industry, new market entrants, technological innovations, and economic and political conditions or events. These and other factors may cause the market price and demand for our Class B common stock to fluctuate substantially. During 2024, the closing stock price of our Class B common stock ranged from a low of $20.65 per share to a high of $33.61 per share. Our Class B common stock is also included in certain market indices, and any change in the composition of these indices to exclude our company may adversely affect our stock price. Increased volatility in the financial markets and/or overall economic conditions may reduce the amounts that we realize in the future on our cash equivalents and/or marketable securities and may reduce our earnings as a result of any impairment charges that we record to reduce recorded values of marketable securities to their fair values.
Further, securities class action litigation is often brought against a public company following periods of volatility in the market price of its securities. Due to changes in our stock price, we may be the target of securities litigation in the future. Securities litigation could result in substantial uninsured costs and divert management’s attention and our resources.
Certain provisions in our certificate of incorporation, by-laws, and Wisconsin law may prevent or delay an acquisition of the Company, which could decrease the trading price of our Class B common stock.
Each of our certificate of incorporation, our by-laws, and Wisconsin law, as currently in effect, contain provisions that are intended to deter coercive takeover practices and inadequate takeover bids by making such practices or bids unacceptably expensive to a bidder and to encourage prospective acquirers to negotiate with our Board rather than to attempt a hostile takeover. These provisions include, among others:
•a dual class common stock structure, which provides the Voting Trust the ability to control the outcome of matters requiring shareholder approval, even if the Voting Trust beneficially owns significantly less than a majority of the shares of our outstanding Class A and Class B common stock;
•a requirement that certain transactions be conditioned upon approval by 60% of the voting power of our capital stock, including any transaction which results in the Schneider family holding less than 40% of the voting power of our capital stock, a sale of substantially all of our assets, and a dissolution;
•no provision for cumulative voting in the election of directors, which would otherwise allow holders of less than a majority of stock to elect some directors;
•the inability of shareholders to call a special meeting except when the holders of at least ten percent of all votes entitled to be cast on the proposed issue submit a written demand;
•advance notice procedures for the nomination of candidates for election as directors or for proposing matters that can be acted upon at shareholder meetings;
•the ability of our directors, without a stockholder vote, to fill vacancies on our Board (including those resulting from an enlargement of the Board);
•the requirement that both 75% of the directors constituting the full Board and stockholders holding at least 80% of our voting stock are required to amend certain provisions in our certificate of incorporation and our by-laws; and
•the right of our Board to issue preferred stock without stockholder approval.
Our status as a Wisconsin corporation and the anti-takeover provisions of the WBCL may discourage, delay, or prevent a change in control even if a change in control would be beneficial to our shareholders by prohibiting us from engaging in a business combination with any person that is the beneficial owner of at least 10% of the voting power of our outstanding voting stock (an “interested shareholder”) for a period of three years after such person becomes an interested shareholder, unless our Board has approved, before the date on which the shareholder acquired the shares, that a business combination or the purchase of stock made by such interested stockholder on such stock acquisition date. In addition, we may engage in a business combination with an interested shareholder after the expiration of the three-year period with respect to that shareholder only if one or more of the following conditions is satisfied: (1) our Board approved the acquisition of the stock before the date on which the shareholder acquired the shares, (2) the business combination is approved by a majority of our outstanding voting stock not beneficially owned by the interested shareholder, or (3) the consideration to be received by shareholders meets certain fair price requirements of the WBCL with respect to form and amount.
These provisions could have the effect of discouraging, delaying, or preventing a transaction involving a change in control of our company. These provisions could also have the effect of discouraging proxy contests and making it more difficult for our non-controlling shareholders to elect directors of their choosing, causing us to take other corporate actions. In light of present circumstances, we believe these provisions taken as a whole protect our stockholders from coercive or otherwise unfair takeover tactics by requiring potential acquirers to negotiate with our Board and by providing our Board with more time to assess any acquisition proposal. These provisions are not intended to make us immune from takeovers or prevent the removal of incumbent directors. However, these provisions could delay or prevent an acquisition that our Board determines is not in the best interests of the Company and all of our stockholders.
We may change our dividend policy at any time.
The declaration and amount of any future dividends, including the payment of special dividends, is dependent on multiple factors, including our financial performance and capital needs, and is subject to the discretion of our Board. The Board may, in its discretion, determine to cut, cancel, or eliminate our dividend and, therefore, the declaration of any dividend, at any frequency, as it is not assured. Each quarter, the Board considers whether the declaration of a dividend is in the best interest of our shareholders and in compliance with applicable laws and agreements. Although we expect to continue to pay dividends to holders of our Class A and Class B common stock, we have no obligation to do so, and our dividend policy may change at any time without notice. Future dividends may also be affected by factors that our Board deems relevant, including our potential future capital requirements for investments, legal risks, changes in federal and state income tax laws, or corporate laws and contractual restrictions such as financial or operating covenants in our debt arrangements. As a result, we may not pay dividends at any rate or at all.
Risks Related to Legal Compliance
If the independent contractors with whom we engage under our alternative owner-operator business model are deemed by law to be employees, our business, financial condition, and results of operations could be adversely affected.
Like many of our competitors, in certain of our service offerings we offer an alternative owner-operator business model, which provides opportunities for small business owners and private entrepreneurs who own tractors to selectively contract with us as independent contractors to transport freight, which they choose, at contracted rates. Were such independent contractors subsequently determined to be our employees, we would be liable under various federal and state laws for a variety of taxes, wages, and other compensation and benefits, including for prior periods, which were not timely paid or remitted. In the U.S., the regulatory and statutory landscape relating to the classification status of independent contractors (or workers) who work in temporary or flexible jobs and who are paid by the task or project is evolving. Various federal and state regulatory authorities, as well as independent contractors themselves, have asserted that independent contractor drivers in the trucking industry, such as those operating under our “owner-operator choice model”, are employees rather than independent contractors for a variety of purposes, including income tax withholding, workers’ compensation, wage and hour compensation, unemployment, and other
issues. Some state and federal authorities have enacted, or are considering, new laws to make it harder to classify workers as independent contractors and easier for tax and other authorities to reclassify independent contractors as employees.
Under current DOL regulations, employers must consider six criteria and employ a “totality of the circumstances” analysis to determine whether a worker is an employee or a contractor, without predetermining whether one criterion outweighs the other. The six factors, which are non-exhaustive, include a worker's opportunity for profit or loss; investments made by the worker and the potential employer; the degree of permanence of the work relationship; and the degree of control an employer has over the work. The factors also include the extent to which work performed is integral to the employer's business and the use of a worker's skill and initiative. Although current DOL regulations increase the likelihood of an employee determination and, could dramatically limit the circumstances under which we may classify our current independent contractor owner-operators as independent contractors under FLSA, the DOL under the incoming Trump administration recently requested a pause in oral arguments regarding the current Independent Contractor Rule which may indicate that the new administration may not defend the rule. However, any legislation or regulation which limits our ability to classify owner-operators as independent contractors could result in driver shortages or adversely impact our freight capacity which, in turn, could adversely impact our results of operations.
Additionally, courts in certain jurisdictions have issued decisions that could result in a greater likelihood that independent contractors will be judicially classified as employees. As a result, we are, from time to time, party to administrative proceedings and litigation, including class actions, alleging violations of the FLSA and other state and federal laws which seek retroactive reclassification of certain current and former independent contractors as employees. An adverse decision in such legal proceedings in an amount that materially exceeds our reserves or federal or state legislation in this area which render the owner-operator model either impractical or extinct thereby curtailing our revenue opportunities could have an adverse effect on our results of operations and profitability.
We operate in a regulated industry, and increased direct and indirect costs of compliance with, or liability for violation of, existing or future regulations could have a material adverse effect on our business.
In the U.S., the DOT, FMCSA, and various state agencies exercise broad powers over our business, generally governing matters including authorization to engage in motor carrier service, equipment operation, safety, financial reporting, and leasing arrangements with independent contractors. We are audited periodically by the DOT to ensure that we are in compliance with various safety, HOS, and other rules and regulations. If we were found to be out of compliance, the DOT could restrict or otherwise impact our operations. We also operate in various Canadian provinces and contract with third-party carriers to transport freight into Mexico. Our failure to comply with any applicable laws, rules, or regulations to which we are subject, whether actual or alleged, could expose us to fines, penalties, or potential litigation liabilities, including costs, settlements, and judgments. Further, these agencies or governments could institute new laws, rules or regulations, or issue interpretation changes to existing regulations at any time. The short and long-term impacts of changes in legislation or regulations are difficult to predict and could materially and adversely affect our earnings and results of operations.
In recent years, the EPA and the NHTSA have either finalized or proposed regulations which aim to require truck OEMs to develop and sell a new generation of clean vehicles and engines to reduce GHG emissions. The OEMs’ compliance with those regulations, as well as similar state or federal regulations, has increased, and will likely continue to increase, the cost of our new tractors and, may increase the cost of new trailers, may require us to retrofit certain of our trailers, may increase our maintenance costs, and could impair equipment productivity and increase our operating costs, particularly if such costs are not offset by potential fuel savings. These adverse effects, combined with the uncertainty as to the reliability of the newly designed diesel engines and any related negative impact on the residual values of our equipment, could materially increase our costs or otherwise adversely affect our business or operations. However, we cannot predict the extent to which our operations and productivity will be impacted. We will continue monitoring our compliance with federal and state GHG regulations.
Federal and state lawmakers are considering a variety of other climate-change proposals related to carbon and GHG emissions. The proposals could potentially limit carbon emissions within certain states and municipalities, which would restrict the location and amount of time that diesel-powered tractors may idle. Such proposals could result in decreased productivity or increased driver turnover. Regulatory requirements and changes in regulatory requirements may affect our business or the economics of the industry by requiring changes in operating practices that could influence the demand for and increase the costs of providing transportation services. If current regulatory requirements become more stringent or new environmental laws and regulations regarding climate change are introduced, we could be required to make significant capital expenditures or discontinue certain activities. Refer to Item 1. Business, for additional details on recent climate-related regulation and laws that impact our operations.
Our operations are subject to various environmental laws and regulations, the violation of which could result in substantial fines or penalties.
We are subject to various environmental laws and regulations dealing with emissions from our tractor fleet, the handling of hazardous materials, underground fuel storage tanks, and discharge and retention of storm water. We operate in industrial areas where truck terminals and other industrial activities are located and where groundwater or other forms of environmental contamination have occurred. Our operations involve the risks of fuel spillage or seepage, environmental damage, and hazardous waste disposal, among others. Certain of our facilities have waste oil or fuel storage tanks and fueling islands. If a spill or other accident involving hazardous substances occurs, if there are releases of hazardous substances we transport, if soil or groundwater contamination is found at our facilities or results from our operations, or if we are found to be in violation of applicable laws or regulations, we could be liable for cleanup costs, other damages, fines, or penalties, any of which could be in material amounts or have a materially adverse effect on our business and operating results.
We are subject to various regulations which are aimed at reducing GHG emissions and mandating GHG emissions disclosures, which could adversely impact our results of operations.
Currently the long-haul trucking industry in North America is diesel fuel-based, and long-haul trucking operations powered by electricity, natural gas, or hydrogen-based powertrains rather than diesel are not commercially feasible at scale in North America. Significant challenges remain with respect to the economic feasibility of these trucks, and further development of this technology is necessary considering power, torque, range, efficiency and other performance requirements of long-haul trucking operations. Moreover, the extensive nationwide charging/fueling infrastructure and maintenance network that would be necessary to support such operations does not exist. Nevertheless, federal, state, and local governmental agencies continue to engage in efforts to support legislation and regulations mandating the transition of diesel fuel-based commercial motor vehicles, such as Class 8 tractors operated by the Company’s independent owner operators and third-party brokerage carriers, to ZEVs.
In 2024, the SEC adopted climate disclosure rules to enhance and standardize climate-related disclosures by public companies and in public offerings. Among other things, the final rules will require a registrant to disclose: (a) climate-related risks that have had or are reasonably likely to have a material impact on the registrant’s business strategy, results of operations, or financial condition; (b) the actual and potential material impacts of any identified climate-related risks on the registrant’s strategy, business model, and outlook; (c) for large accelerated filers and accelerated filers like us that are not otherwise exempted, information about material Scope 1 and Scope 2 emissions; and (d) for those required to disclose Scope 1 and/or Scope 2 emissions (which would include us), an assurance report at the limited assurance level, which, following an additional transition period, will be at the reasonable assurance level. In addition, California and other states have enacted laws which mandate certain climate-related disclosures. As a result, we have and, expect that we will need to continue to expand our climate-related disclosures to comply with the SEC’s and other state disclosure requirements. Should the Company fail to implement appropriate policies and procedures to accurately track or report all of the information required under these regulations and laws, it could be determined that the Company has weaknesses in its internal controls, and the Company would not be able to obtain the required third-party attestation report or file them timely and could lose customers. Should any of those events occur, the Company could face fines and penalties from the SEC and other states and the Company’s share price could be negatively impacted.
At the state level, CARB has withdrawn its request for an EPA waiver to enforce its ACF rule. The withdrawal means CARB is no longer seeking to enforce its ZEV mandate on fleets. Other states have enacted similar legislation to the ACF and, in the wake of CARB’s decision, it is uncertain whether that legislation will be enforced. Mandates requiring the transition to ZEVs would create substantial costs for the Company’s third-party capacity providers and, in turn, increase the cost of purchased transportation to the Company. An increase in the costs to purchase, lease, or maintain tractor equipment or in purchased transportation cost caused by existing or new regulations, without a corresponding increase in price to the customer, could adversely affect our results of operations and financial condition. Due primarily to the uncertainty of the timing of availability of compliant tractors from OEMs and the timing of the effectiveness of such laws and regulations, we are not currently able to forecast whether such impact will be material.
We, and others, currently do not expect that long-haul trucking operations powered by electricity, natural gas, or hydrogen-based powertrains rather than diesel, will become commercially viable at scale throughout North America in the near term. However, as various technology alternatives continue to develop and mature and investment in infrastructure continues, local or regional service in certain geographic areas utilizing Class 8 tractors powered by electricity, natural gas, or hydrogen-based powertrains may become commercially viable in such time frame. We continue to actively monitor, evaluate, and test developments in the trucking industry related to the design, manufacture, operation, and support of heavy-duty trucks powered by electricity, natural gas, or hydrogen-based powertrains in order to consider the implementation of initiatives involving those technologies, as those technologies and the related infrastructure needed to support them may mature in the future. An increase
in costs to implement these initiatives without a corresponding increase in price to the customer could adversely affect our results of operations and financial condition.
Refer to Item 1. Business, for additional details on the ACT Regulations, the SEC Climate Disclosure Rule, California SB 253 and SB 261, and the VCMDA.
General Risk Factors
We rely significantly on our information technology systems, a disruption, failure, or security breach of which could have a material adverse effect on our business.
We rely on information technology throughout all areas of our business and operations to receive, track, accept, and complete customer orders; process financial and non-financial data; compile results of operations for internal and external reporting; and achieve operating efficiencies and growth. Such data and information remain vulnerable to cyber-attacks, cybersecurity breaches, ransomware attacks, hackers, theft, or other unauthorized disclosure. Like other companies in the transportation industry, we have identified, and expect to continue to identify, attempted cyberattacks and cybersecurity incidents, but none of the attempted cyberattacks or cybersecurity incidents identified as of the filing date of this Annual Report on Form 10-K has had a material impact on us, except as the continued presence of cybersecurity threats has resulted, and is expected to continue to result, in significant investments in cybersecurity risk management programs, processes, and tools. If a cyberattack, cybersecurity breach, ransomware, or other similar attack on us is successful, this could result in the disclosure of confidential customer or commercial data, loss of valuable intellectual property, or system disruptions, and subject us to civil liability and fines or penalties, damage our brand and reputation, or otherwise harm our business, any of which could be material. In addition, delayed sales, lower margins, or lost customers resulting from security breaches or network disruptions could materially reduce our revenues, materially increase our expenses, damage our reputation, and have a material adverse effect on our stock price.
Our information technology systems may also be susceptible to interruptions or failures for a variety of reasons including software or hardware failure, user error, power outages, natural disasters, computer viruses, or other types of interruptions. For example, in 2022 our operations were temporarily disrupted due to a firmware defect (which was not related to a cyber event and did not involve a breach of data) in a third-party vendor’s equipment, which caused certain critical computer applications to not function properly. As a result of this incident, we were required to rely on manual processes to book freight, execute loads, and pay carriers for two business days and otherwise execute our business continuity plans. While this disruption resulted in lost revenue and operating profit, it did not have a material impact on our annual results of operations. However, despite our ability to potentially utilize manual processes, a significant disruption or failure in our computer networks or applications, of any duration, could have a material adverse effect on our business, including operational disruptions, loss of confidential information, external reporting delays or errors, legal claims, or damage to our business reputation.
Our success depends on our ability to attract and retain key employees, and if we are unable to attract and retain such qualified employees, our business and our ability to execute our business strategies may be materially impaired.
Our future success depends largely on the continued service and efforts of our executive officers and other key management and technical personnel and on our ability to continue to identify, attract, retain, and motivate them. Although we believe we have an experienced and highly qualified management team, the loss of the services of these key personnel could have a significant adverse impact on us and our future profitability. Additionally, we must continue to recruit, develop, and retain skilled and experienced operations, technology, and sales managers if we are to realize our goal of expanding our operations and continuing our growth. Failure to recruit, develop, and retain a core group of service center managers could have a materially adverse effect on our business.
As a result of the nature and scope of our operations, we are subject to various claims and lawsuits in the ordinary course of business, which could adversely affect us.
As a result of the nature and scope of our operations, we are involved in various legal proceedings and claims and exposed to a variety of litigation, including those related to accidents involving our trucks and our brokerage operations, cargo claims, commercial disputes, property damage, and environmental liability, which may not be fully covered by our insurance. Such litigation may include claims by current or former employees or third parties, and certain proceedings may be certified or purport to be class actions. In appropriate cases, we have taken and will seek subrogation from third parties who are responsible for losses or damages that we may become legally obligated to pay to claimants.
In particular, the defense of trucking accidents is challenging for a variety of reasons, one of which is the recent rise in the industry of nuclear verdicts which typically involve excessive jury awards that surpass what would generally be regarded as reasonable or rational compensation for the injuries or damages suffered. Another challenge facing trucking companies is
devising strategies to defend or offset the various tactics employed by plaintiff’s counsel, inside and outside the courtroom, that have and continue to contribute to the rise in nuclear verdicts and the use by plaintiffs’ lawyers of third party litigation funding and litigation advertising, which enables speculative claims by third-party litigation and drives award demands up, thereby widening the gap for parties to negotiate a reasonable settlement.
Litigation is inherently uncertain, and the costs of defending litigation, particularly class-action litigation, may be substantial, and in any period, we could experience significant adverse results, which could have an adverse effect on our financial condition or results of operations. While we purchase insurance coverage at levels we deem adequate, future litigation may exceed our insurance coverage or may not be covered by insurance. In addition, adverse publicity surrounding an allegation or claim that results in litigation may cause significant reputational harm that could have a significant adverse effect on our financial condition or results of operations.
Increasing scrutiny from investors and other stakeholders regarding ESG related matters may have a negative impact on our business.
Companies across all industries are facing increasing scrutiny from investors and other stakeholders related to ESG matters, including practices and disclosures related to environmental stewardship, social responsibility, and diversity and inclusion. Organizations that provide information to investors on corporate governance and related matters have developed ratings processes for evaluating companies on their approach to ESG matters. Such ratings are used by some investors to inform their investment and voting decisions. Unfavorable ESG ratings may lead to negative investor sentiment toward us, which could have a negative impact on our stock price and our access to and costs of capital. We have developed certain initiatives and goals relating to ESG matters. Our ability to successfully execute these initiatives and accurately report our progress presents numerous operational, financial, legal, reputational, and other risks, many of which are outside our control, and all of which could have a material negative impact on our business. Additionally, the implementation of these initiatives imposes additional costs on us. If our ESG initiatives and goals do not meet the expectations of our investors or other stakeholders, which continue to evolve, then our reputation, our attractiveness as an investment and business partner, and our ability to attract or retain employees could be negatively impacted. Similarly, our failure, or perceived failure, to pursue or fulfill our goals, targets, and objectives or to satisfy various reporting standards in a timely manner, or at all, could also have similar negative impacts and expose us to government enforcement actions and private litigation.
Our long-term sustainability and GHG reduction goals are predicated on large scale customer adoption of intermodal services, the operational feasibility and reliability of heavy-duty ZEVs, and the corresponding build-out of a national support infrastructure to reasonably and efficiently manufacture, distribute, or store electricity or alternative fuels for ZEVs, none of which can be assured.
A critical component of our multi-pronged plan to reduce our carbon emissions and comply with California’s and other states’ zero or reduced emission requirements is the deployment of ZEVs in significant numbers in these states together with leveraging our intermodal capability. As an early adopter of ZEVs, there can be no assurance that we will be successful deploying ZEVs in our operations in significant numbers, that we will be successful converting more over-the-road freight to intermodal, that the national support infrastructure, including the nation’s electricity grid, for heavy-duty ZEVs will be built-out as expected. Should any of those things fail to occur, we may fail to meet our published sustainability goals, which could result in losing the support of our investors, customers, and other stakeholders; our becoming subject to regulatory enforcement actions; or suffering reputational harm which, in any case, may increase the cost of providing transportation services or adversely affect our financial condition, results of operations, and liquidity.
ITEM 1B. UNRESOLVED STAFF COMMENTS
None.
ITEM 1C. CYBERSECURITY
Risk Management and Strategy
As a large, multinational transportation and logistics company, we and our subsidiaries each face a range of risks from cybersecurity threats in connection with our operations due to our inherent dependence on information systems, software, and digital technologies to operate safely, efficiently, and effectively. Such risks include, but are not limited to, those related to cyberattacks, network breaches, ransomware, malware or denial-of-service attacks, phishing and other scams, theft, and unauthorized disclosure, any of which, if successful, could result in the disclosure of confidential customer or commercial data, loss of valuable intellectual property, or systems disruption, and subject us to civil liability, fines, penalties, damage of our brand or reputation, or otherwise harm our business, any of which, could be material. We and our subsidiaries are each exposed to such risks both through direct attacks on our own information systems and, indirectly, as a result of our engagement of third-party service providers, software vendors, and independent contractors, such as cloud computing providers. Certain of our third-party service providers or software vendors provide us with computing services which, in certain cases, involve hosting our data or processes on third-party servers, which exposes us to the risk that our data may be compromised or our operations disrupted if such third-party servers are compromised. Other third-party service providers provide us with contracted labor to whom we necessarily grant access to certain of our information systems, which indirectly exposes us to additional risks of network breaches and cybersecurity threats. In addition, because the trucking industry has been designated by the federal government as part of the critical U.S. infrastructure, as a leading provider of truckload, intermodal, and logistics services, we face increased risks from cybersecurity threats, cybercriminals, and bad actors, both foreign and domestic.
Cyber risk management has become a vital part of our broader ERM efforts. To manage and mitigate cyber risks, we have a dedicated information security team that has been charged with monitoring and managing cyber threats to our information systems, and the data that is stored on those systems, using our cyber risk management methodology. Our information security team is led by our SDIS and overseen by our CITO. Our cybersecurity risk management framework encompasses, among other things, ongoing systematic processes to identify, analyze, prioritize, manage, and monitor potential cyber risks to the information systems that we own or use and the cybersecurity threats to which we are exposed as a result of our reliance on third-party service providers and third-party software. Our cyber risk management methodology is comprised of the following core tasks:
•Risk identification – Our internal information security team works with an MSSP and other external security partners to identify existing and new threats to our information systems. Our information security team, working in partnership with our MSSP, monitors our information systems to identify malicious and anomalous activity, uncover potential cybersecurity threats, and assess risks to information systems.
•Risk analysis – Our information security team, working in partnership with relevant cybersecurity and technology experts, analyzes identified threats to determine the likelihood of the actualization of a threat and the potential business impacts, including evaluating the potential for data loss, data corruption, disruption to business operations, and financial impact.
•Risk evaluation – Identified risks are evaluated to determine whether gaps in our controls or risk mitigation strategies exist that could result in material risk to the Company. If it is determined that our existing processes, strategies, or technology may be insufficient to effectively mitigate or manage an identified risk, it is escalated to our CITO and SDIS to assess and implement potential responsive or corrective actions in our processes, strategies, or technology to address the risk.
•Risk mitigation – Our senior executive team, which includes our CITO, using input from our information security team and our broader information technology (or IT) department, develop and approve budgets, strategies, technology roadmaps and programs which are designed to effectively manage our cyber risks, safeguard our information resources, and reduce the likelihood or impact of cybersecurity incidents.
Our cybersecurity risk management framework is integrated into our overall ERM process which is managed, administered, and governed by our senior executive team under the oversight of the Board. As part of our ERM program, our senior executive team collaborates with the ERC, which is comprised of executives from various operating segments and functional departments across the Company, in the initial identification and assessment of the Company’s leading risks to an ERC, inclusive of information security.
Although both we, and the third parties who provide services to us, commit resources to the design, implementation, monitoring, and protection of the information systems we own or use, there is no guarantee that either our or those third parties’ cybersecurity measures will effectively manage the multitude of cyber risks to which we are exposed.
For more information regarding the risks from cybersecurity threats that may impact our business strategy, results of operations, or financial condition, see Part I, “Item 1A. Risk Factors” of this Annual Report on Form 10-K.
Governance
Board Oversight of Risks from Cybersecurity Threats
Our Board believes that evaluating management’s oversight, administration, and governance of the risks confronting the Company, including risks related to cybersecurity, is one of its most important areas of oversight. In carrying out this responsibility, the Board is assisted by each of its standing committees, which each considers risks that are within its areas of chartered responsibility, and each of which apprises the full Board of any significant risks which are considered by the committee and management’s response to those risks. The Audit Committee of the Board (“Audit Committee”) is charged with the primary responsibility for overseeing our design, execution, and administration of our ERM process and, with regard to cybersecurity risks, setting expectations and accountability for management and reviewing our internal auditors’ assessment of the effectiveness of our cybersecurity controls, including policies and procedures to address our cyber risks, and overseeing the Company’s cybersecurity disclosures. The Audit Committee receives semiannual updates, and the Board receives annual updates, from our senior executive team (including our CITO and the SDIS) on our cybersecurity risks, threats, and initiatives including evolving cybersecurity threats and trends, cybersecurity technologies and solutions that have been deployed internally, policies and procedures to address major cyber risk areas and threats to the Company, third-party assessments of the adequacy of our cybersecurity resources, and attendance by members of our information security team at various seminars and conferences on emerging cybersecurity risks and threats. In addition to these regular updates, the Audit Committee or the Board may receive additional updates if deemed appropriate.
Management’s Role in Assessing and Managing Material Risks from Cybersecurity Threats
Cybersecurity is a key component of our technology strategy, which is architected and managed by our CITO and reviewed and monitored by our senior executive team, with oversight from our Board and the Audit Committee, as described above. Our CITO’s experience and expertise in cybersecurity includes 20 years of practitioner experience as an information security advisor across multiple industry verticals where he has served in security analyst, architect, and security program leadership roles, and has led information security teams to deliver large scale information security programs for multiple Fortune 500 companies. Our cybersecurity risk management program is managed by our SDIS, who reports directly to the CITO. Our SDIS’s experience and expertise in cybersecurity includes 32 years of working in the information technology field as an analyst, architect, and leader and 14 years leading information security teams at multiple enterprises. The processes by which the CITO and SDIS are informed about and monitor the prevention, detection, mitigation, and remediation of cybersecurity incidents are described above under “Risk Management and Strategy.”
ITEM 2. PROPERTIES
As of December 31, 2024, we owned or leased approximately 280 properties across 40 states and Mexico. Our expansive network includes approximately 61 operating centers, 7 distribution warehouses, 20 offices, and over 180 drop yards, and we physically operate at several customer locations. The operating centers we own or lease throughout the U.S. offer on-site management to support our transportation network for our Truckload and Intermodal segments. Often, our facilities include customer service centers, fuel and maintenance stations, and other amenities to support our drivers. Our facility network also includes warehouse capacity to further enhance our supply chain solutions. The following table provides a list of 47 properties that are central to our transportation network and indicates the functional capability at each site as of December 31, 2024. Approximately half of the properties are owned and the remainder are leased.
| | | | | | | | | | | | | | | | | | | | | | | | | | | | | | | | | | | | | | | | |
| | | | | | Facility Capabilities | | |
| Location | | Owned or Leased | | Segment | | Customer Service | | Operations | | Fuel | | Maintenance | | |
| Alexander, AR | | Owned | | Truckload | | X | | X | | | | X | | |
| Atlanta, GA | | Owned | | Truckload | | X | | X | | | | X | | |
| Boaz, AL | | Owned | | Truckload | | X | | X | | | | X | | |
| Baltimore, MD (two locations) | | Owned | | Truckload | | X | | X | | X | | X | | |
| Baltimore, MD | | Leased | | Truckload | | X | | X | | | | | | |
| Burlington, NJ | | Leased | | Truckload | | X | | X | | | | X | | |
| Carlisle/Harrisburg, PA | | Leased | | Truckload | | X | | X | | X | | X | | |
| Celina, OH | | Leased | | Truckload | | X | | X | | | | | | |
| Charlotte, NC | | Owned | | Truckload | | X | | X | | X | | X | | |
| Chicago, IL | | Leased | | Logistics | | X | | X | | | | | | |
| Chicago, IL (three locations) | | Leased | | Intermodal | | | | X | | | | X | | |
| Dallas/Wilmer, TX | | Owned | | Truckload | | X | | X | | | | X | | |
| Dallas, TX | | Leased | | Logistics | | X | | X | | | | | | |
| Des Moines, IA | | Leased | | Truckload | | | | X | | | | | | |
| Edwardsville, IL | | Owned | | Truckload | | X | | X | | X | | X | | |
| Gary, IN | | Owned | | Truckload | | X | | X | | X | | X | | |
| Green Bay, WI | | Owned | | Truckload | | | | X | | | | X | | |
| Green Bay, WI (two facilities) | | Owned | | Other | | X | | X | | | | | | |
| Houston, TX | | Leased | | Truckload | | X | | X | | | | X | | |
| Houston, TX | | Leased | | Truckload | | | | X | | | | | | |
| Indianapolis, IN | | Owned | | Truckload | | X | | X | | | | X | | |
| Jacksonville, FL | | Owned | | Truckload | | X | | X | | | | X | | |
| Joliet, IL | | Leased | | Intermodal | | | | X | | | | | | |
| Laredo, TX | | Leased | | Truckload | | X | | X | | X | | X | | |
| Lima, OH | | Leased | | Truckload | | X | | X | | | | X | | |
| Lincoln, AL | | Owned | | Truckload | | X | | X | | | | X | | |
| London, KY | | Owned | | Truckload | | X | | X | | | | X | | |
| Marysville, OH | | Owned | | Truckload | | X | | X | | X | | X | | |
| Mechanicsburg, PA | | Owned | | Truckload | | X | | X | | | | X | | |
| Mexico City, Mexico | | Leased | | Multiple | | X | | X | | | | | | |
| New Castle, IN | | Owned | | Truckload | | X | | X | | | | X | | |
| Obetz, OH | | Leased | | Truckload | | X | | X | | | | X | | |
| Phoenix, AZ | | Owned | | Truckload | | X | | X | | | | X | | |
| Portland, OR | | Owned | | Truckload | | X | | X | | | | X | | |
| Rainbow City, AL | | Owned | | Truckload | | X | | X | | | | X | | |
| Reserve, LA | | Leased | | Truckload | | | | X | | | | X | | |
| Salt Lake City, UT | | Leased | | Truckload | | X | | X | | | | X | | |
| San Antonio, TX | | Leased | | Truckload | | X | | X | | | | X | | |
| San Bernardino, CA | | Leased | | Intermodal | | | | X | | | | | | |
| Shrewsbury, MA | | Leased | | Truckload | | X | | X | | | | X | | |
| Upton, KY | | Owned | | Truckload | | X | | X | | | | X | | |
| West Memphis, AR | | Owned | | Truckload | | X | | X | | X | | X | | |
| Woodhaven, MI | | Leased | | Truckload | | X | | X | | | | X | | |
ITEM 3. LEGAL PROCEEDINGS
We are currently, directly or indirectly, involved in certain litigation or claims arising from the normal conduct of our business. Where appropriate, we have accrued for these matters or notified our insurance carriers of the potential loss. Based on present knowledge of the facts, and in certain cases, opinions of outside counsel and available liability insurance, we believe the resolution of these claims and pending litigation will not have a material adverse effect on our financial condition, results of operations, or liquidity.
For a description of certain pending legal proceedings, see Note 13, Commitments and Contingencies, of the notes to consolidated financial statements, which is incorporated herein by reference.
ITEM 4. MINE SAFETY DISCLOSURES
Not applicable.
PART II
ITEM 5. MARKET FOR REGISTRANT’S COMMON EQUITY, RELATED STOCKHOLDER MATTERS, AND ISSUER PURCHASES OF EQUITY SECURITIES
Common Stock
Our common equity consists of our Class B common stock, entitled to one vote per share, and our Class A common stock, entitled to 10 votes per share. Our Class B common stock has traded on the NYSE under the symbol “SNDR” since our IPO in April 2017. Our Class A common stock is held by the Voting Trust for the benefit of members of the Schneider family. Each share of Class A common stock is convertible into one share of Class B common stock. There is no public trading market for our Class A common stock.
Holders of Record
As of February 19, 2025, there was one holder of record of our Class A common stock, the Voting Trust, and 28 holders of record of our Class B common stock. Because many of our shares of Class B common stock are held by brokers and other institutions on behalf of shareholders, we are unable to estimate the total number of shareholders represented by these record holders.
Dividend Policy
We have a policy of paying quarterly cash dividends to holders of our Class A and Class B common stock. The declaration and amount of any future dividends is subject to the discretion of our Board and will depend on our financial condition, earnings, capital requirements, legal requirements, certain debt agreements we are then party to, and other factors our Board deems relevant and, therefore, is not assured.
Purchases of Equity Securities by the Issuer and Affiliated Purchasers
The Company did not repurchase any equity securities during the three months ended December 31, 2024.
Equity Compensation Plan Disclosure
The remaining information required by Item 5 is incorporated herein by reference to the information set forth under the caption “Equity Compensation Plan Information” under Item 12, Security Ownership of Certain Beneficial Owners and Management and Related Stockholder Matters.
Stock Performance Graph
The following performance graph and related information shall not be deemed “soliciting material” or to be “filed” with the SEC, nor shall such information be incorporated by reference into any future filing under the Securities Act of 1933 or securities Exchange Act of 1934, each as amended, except to the extent the Company specifically incorporates such information by reference into such filing.
The following graph compares the cumulative total shareholder return on our Class B common stock to the cumulative total return of the Standard and Poor’s 500 Stock Index, the Dow Jones Transportation Index, and a customized peer group for the period from December 31, 2019 through December 31, 2024. The 2020 peer group, which was used by the Board’s Compensation Committee for 2021 compensation decisions, consisted of ArcBest Corp., JB Hunt Transport Services, Inc., Ryder System, Inc., Avis Budget Group, Inc., Knight-Swift Transportation Holdings Inc., C.H. Robinson Worldwide, Landstar System, Inc., Werner Enterprises, Inc., Expeditors International of Washington, Inc., Old Dominion Freight Line, Inc., XPO Logistics, Hub Group, Inc., Kirby Corporation, and Saia. There were no changes to the peer group used to make 2022, 2023, or 2024 compensation decisions. The comparison assumes $100 was invested on December 31, 2019 in our Class B common stock and in each of the foregoing indices and peer group and assumes reinvestment of dividends. The stock performance shown on the graph below represents historical stock performance and is not necessarily indicative of future stock price performance.
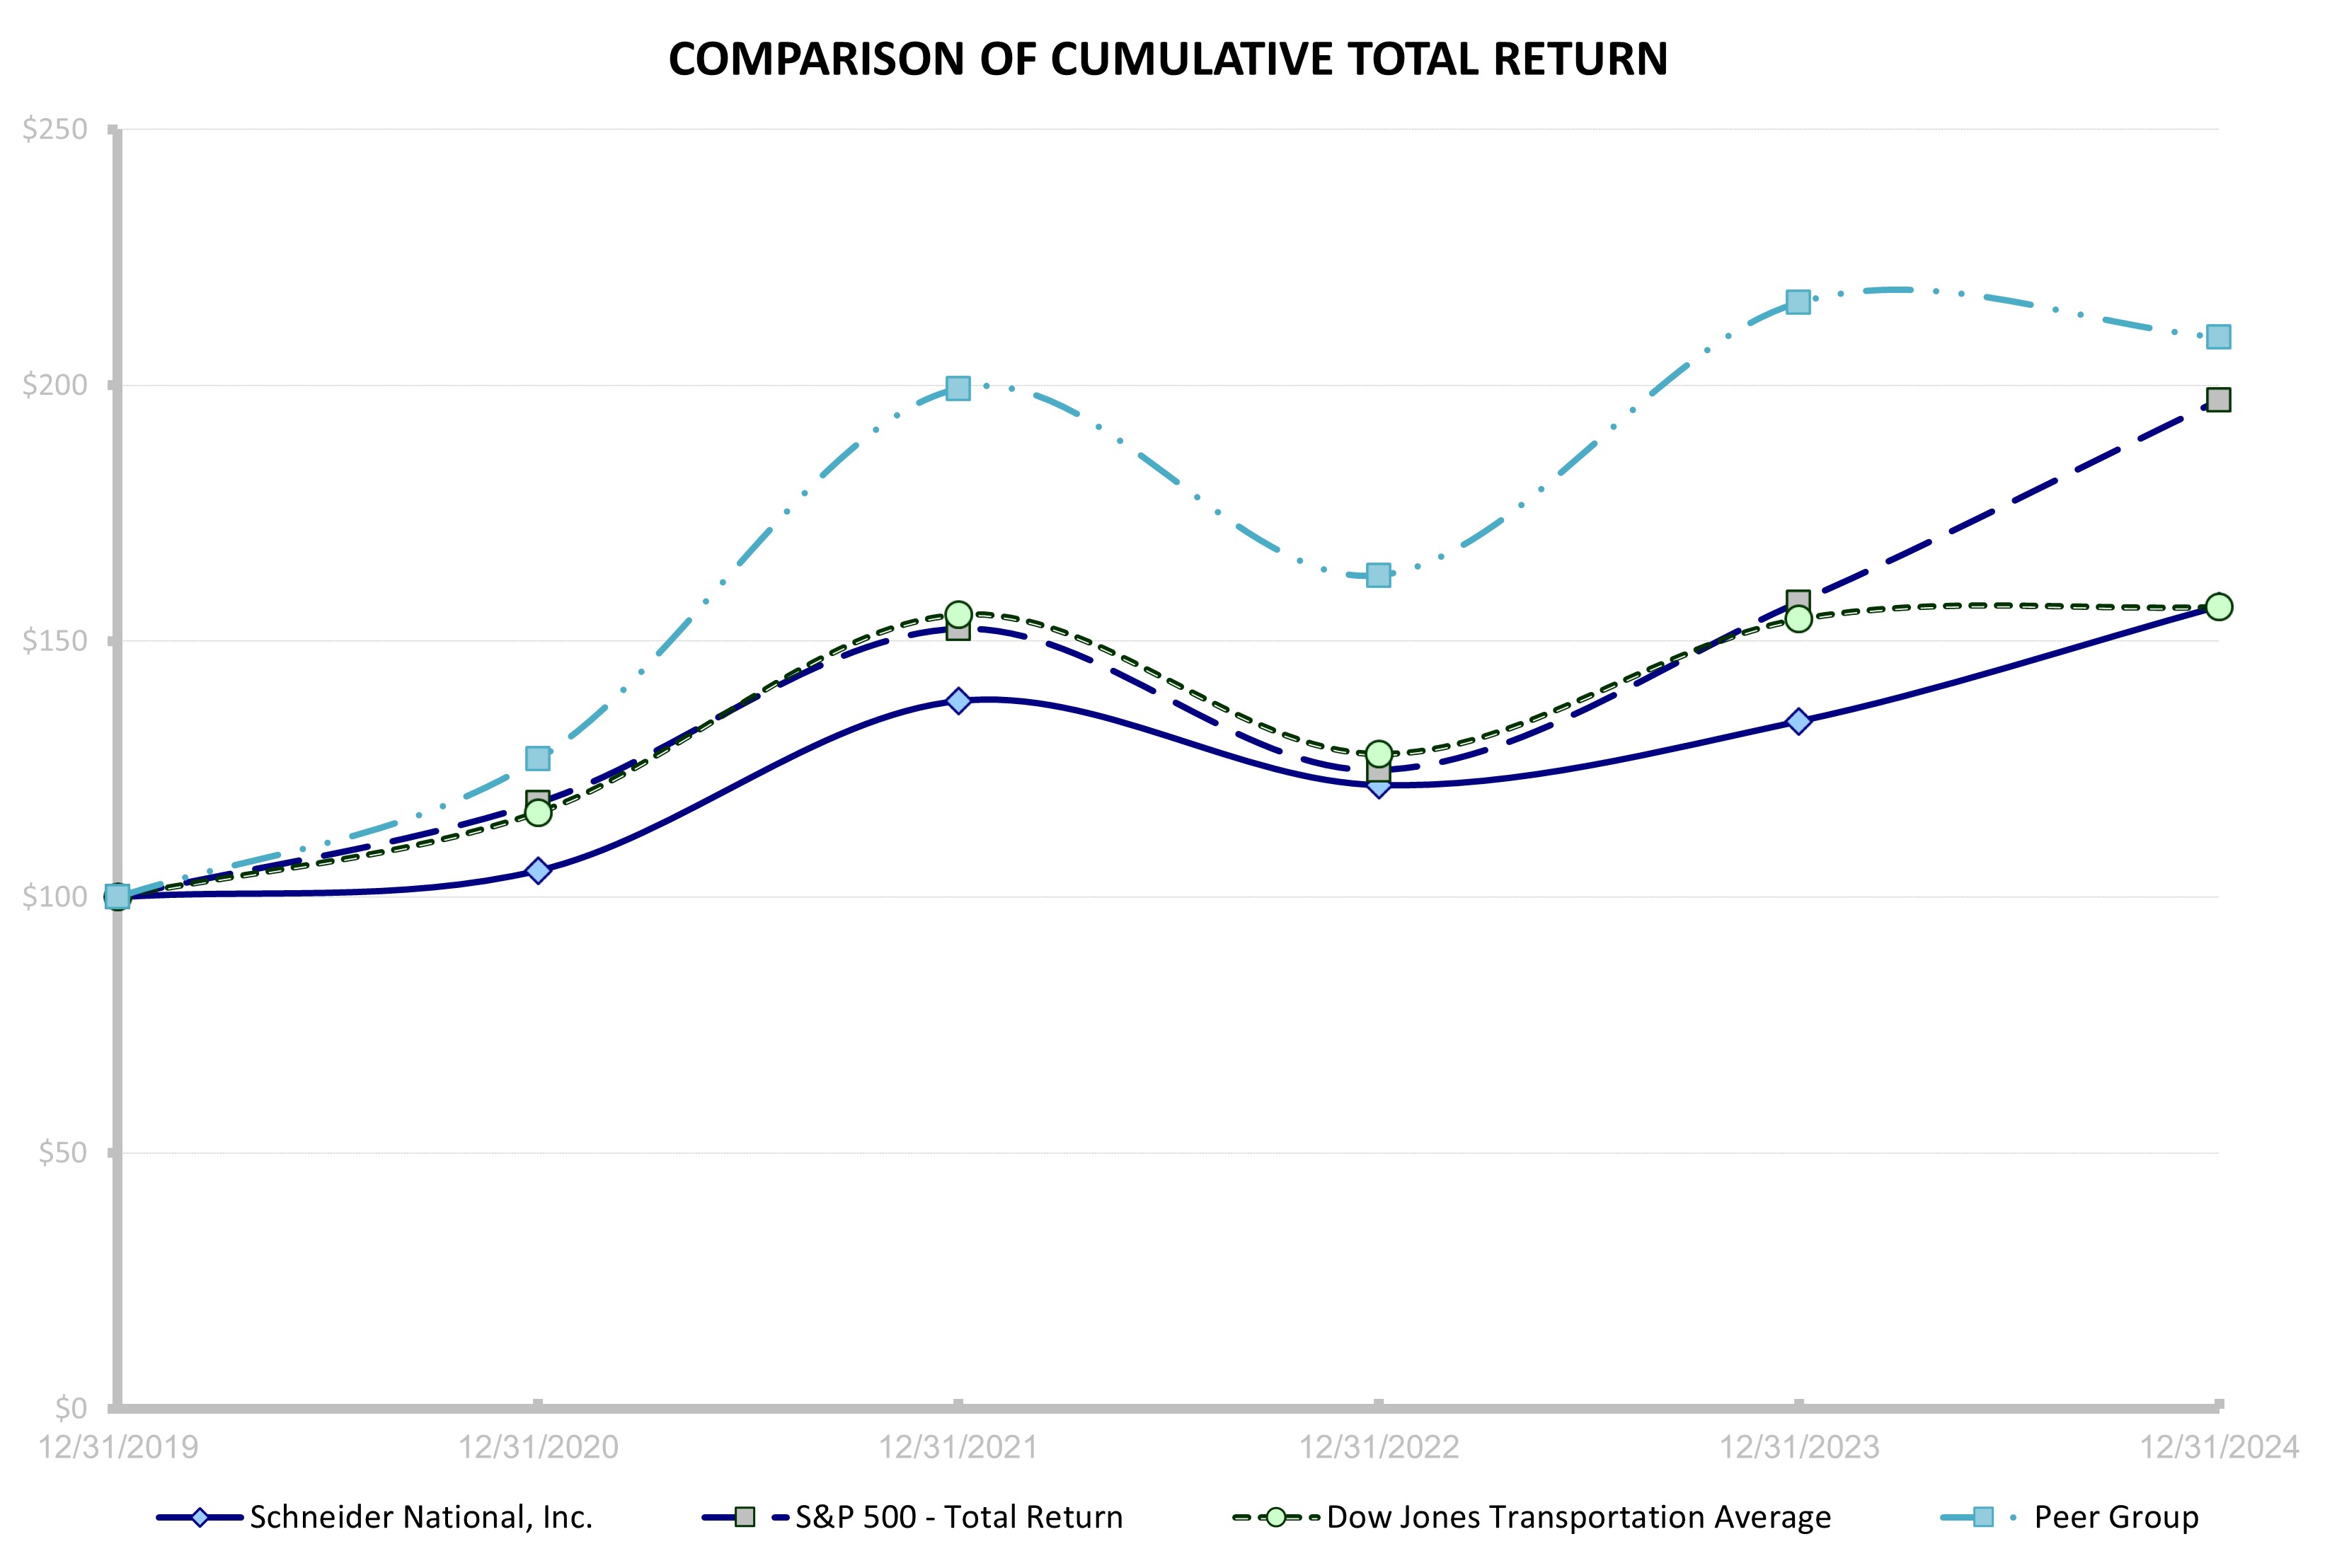
| | | | | | | | | | | | | | | | | | | | | | | | | | | | | | | | | | | |
| 12/31/2019 | | 12/31/2020 | | 12/31/2021 | | 12/31/2022 | | 12/31/2023 | | 12/31/2024 |
| Schneider National, Inc. | $ | 100.00 | | | $ | 105.18 | | | $ | 138.33 | | | $ | 121.90 | | | $ | 134.36 | | | $ | 156.87 | |
| S&P 500 - Total Returns | 100.00 | | | 118.40 | | | 152.39 | | | 124.79 | | | 157.59 | | | 197.02 | |
| Dow Jones Transportation | 100.00 | | | 116.52 | | | 155.22 | | | 127.96 | | | 154.31 | | | 156.71 | |
| Peer Group | 100.00 | | | 126.90 | | | 199.29 | | | 162.82 | | | 216.08 | | | 209.31 | |
ITEM 6. [RESERVED]
ITEM 7. MANAGEMENT’S DISCUSSION AND ANALYSIS OF FINANCIAL CONDITION AND RESULTS OF OPERATIONS
The following discussion and analysis should be read in conjunction with the accompanying consolidated financial statements and related notes.
INTRODUCTION
Company Overview
We are a transportation and logistics services company providing a multimodal portfolio of truckload, intermodal, and logistics solutions. Our diversified portfolio of complementary service offerings combines truckload services with intermodal and logistics offerings, enabling us to serve our customers’ varied transportation needs.
Recent Developments
Acquisitions
On December 2, 2024, the Company completed the acquisition of Cowan Systems, a privately held truckload carrier based in Baltimore, Maryland. Cowan Systems provides mainly dedicated and logistics services for retail and manufacturing customers that complement our operations. The operating results of Cowan Systems are reported in Dedicated and Logistics operations as part of our Truckload and Logistics segments beginning on the closing date of the acquisition. Refer to Note 2, Acquisitions, for additional details on our recent acquisitions.
Strategy
We seek to deliver a superior portfolio of services that enables our business to grow revenue, profitability, and shareholder returns and perform resiliently through economic and freight cycles. We believe our competitive strengths position us to pursue
our strategy as follows:
Leverage core strengths to drive organic growth and advance our market position
We intend to drive organic growth by leveraging our existing customer relationships, as well as expanding our customer base. We believe our broad portfolio of services, with different asset intensities, and our North American footprint allow for supply chain alternatives, which enable new and existing customer growth. We also plan to drive revenue growth by increasing our marketing to customers that seek to outsource their transportation services. Our growth decisions are based on our “Value Triangle,” which represents profitable growth while balancing the needs of our customers, associates, and shareholders. Our integrated technology platform serves as an instrumental factor, which drives profitability as it enables real-time, data-driven decision support science on every load/order and assists our associates in proactively managing our services across our network. Together with our highly incentivized and proactive sales organization, we believe that our platform will continue to provide a high level of service and foster organic growth in each of our reportable segments.
Expand capabilities in the specialty and dedicated freight markets and continue growing our asset-light and non-asset businesses
We believe that our capabilities position us to grow in the specialty and dedicated freight markets, which have higher barriers to entry, greater stability through freight/market cycles, potentially more resilient margins, and lasting customer relationships. The complexity and time-sensitivity of the loads often require increased collaboration with, and greater understanding of, our customers’ business needs and processes. The transportation of specialty freight requires specially trained drivers with appropriate licenses and certain hauling permits, as well as equipment that can handle items with unique requirements in terms of temperature, freight treatment, size, and shape. As such, there are few carriers that have comparable scale and capabilities in the specialty and dedicated markets, which we believe will allow us to grow profitably.
As an asset-based intermodal provider, we have more control over our equipment, perform most of our own drays, and retain strong contractual and differentiated rail relationships across the western, eastern, and southern/Mexico-based portions of our network. We believe our integrated technology platform will enable us to experience certain benefits of complete end-to-end control, including increased pick-up and delivery predictability, better visibility, and the ability to source and retain capacity.
Freight brokerage, which is a significant part of our Logistics segment, is a business that is expected to be a driver of continued growth. As shippers increasingly consolidate their business with fewer freight brokers, we continue to be well-positioned due to our customer service; Schneider FreightPower® digital marketplace; an established, dense network of qualified third-party carriers; and access to our sizable trailer network via our Power Only offering. We believe shippers see the value of working with providers like us that have scale, capacity, and lane density. Brokerage serves as an asset-light innovation hub for Schneider, particularly in the areas of predictive analytics, process automation, and new customer relationship generation.
Improve our operations and margins by leveraging benefits from investments in technology and business transformation
We continue to benefit from our technology and business transformation by improving the effectiveness with which we use data to increase revenue and lower costs. Visibility into each driver’s profile allows us to increase driver satisfaction and retention by matching drivers to loads and routes that better fit their individual needs. We can improve our customer service, retain drivers, lower costs, and generate business by anticipating our customers’ and drivers’ needs and preferences in a dynamic network. We believe the implementation of simple and intuitive customer interfaces will also enable a stronger connection with our customers through increased interaction and an enhanced user experience. Our Schneider FreightPower® online marketplace, for example, digitally connects our asset-based network capabilities with the strength of our trailer network and carrier relationships to service our customers. Additionally, through our investment in MLSI, with which we are collaborating to develop a TMS using MLSI’s SaaS technology, we aim to further complement our technology platform and enable enhanced decision making, resource allocation, and visibility with our supply chain partners. We expect additional margin improvement as we continue to leverage data analytics within our integrated technology platform. Along with our revenue management discipline, our integration of technology and systems through leading, third-party providers will allow us to continue to incorporate new technologies and build additional capabilities into the platform over time, maintaining our competitive edge and setting the foundation for future growth.
Allocate capital across businesses to maximize return on capital while pursuing strategic organic and inorganic growth opportunities
Our broad portfolio of services provides us with a greater opportunity to allocate capital within our portfolio in a manner that maximizes returns across all market cycles and economic conditions. For example, we can efficiently move our equipment between services and regions when we see opportunities to maximize our return on capital. We continually monitor our performance and market conditions to ensure appropriate allocation of capital and resources to grow our businesses, while optimizing returns across reportable segments. Furthermore, our strong balance sheet and financial position enable us to carry out an acquisition strategy that strengthens our overall portfolio. We are positioned to leverage our scalable platform and experienced operations team to acquire high-quality businesses that meet our disciplined selection criteria to enhance our service offerings and broaden our customer base.
Create differentiated driver and associate experiences that enable us to attract and retain top talent at all levels
Our people are our strongest assets, and we believe they are key to growing our customer base and driving our performance. Our goal is to be the employer of choice; attract, develop, engage, and retain the best talent in the industry. We strive for a high-performance culture that seeks individuals who are passionate about our business and commit to work together in an inclusive and collaborative environment. We value the direct relationship we have with our associates, and we intend to continue working together to provide professional growth opportunities and a quality work environment for all. Our compensation structure is performance-based and aligns with our strategic objectives.
We seek to maintain our reputation as a preferred carrier of choice within the driver community through our continued focus on improving the driver experience and to attract and retain high-quality, safe drivers that meet or exceed our qualification standards. We invest in the well-being of our associates through our commitment to ensure a differentiated driver experience and efforts to improve time at home, pay stability, and the quality of drivers’ touchpoints. We provide mandatory physical check-ups which cover sleep apnea and hair or urine-based drug testing, among other things. We believe that investing in the health of our associates helps maintain a high-quality driver base.
Our technology platform facilitates the application, screening, and onboarding of top talent. As an industry leader with both a respected “safety first and always” culture and underlying core value, we believe that we will continue to be the employer of choice for both driving and non-driving associates.
RESULTS OF OPERATIONS
A discussion regarding our financial condition and results of operations for fiscal 2024 compared to fiscal 2023 is presented below. A discussion regarding our financial condition and results of operations for fiscal 2023 compared to fiscal 2022 can be found under Part II, Item 7, “Management’s Discussion and Analysis of Financial Condition and Results of Operations,” in our Annual Report on the Form 10-K for the fiscal year ended December 31, 2023, which was filed with the SEC on February 23, 2024 and is available on the SEC’s website, www.sec.gov, as well as the “Investors” section of our website at www.schneider.com.
Non-GAAP Financial Measures
In this section of our report, we present the following non-GAAP financial measures: (1) revenues (excluding fuel surcharge), (2) adjusted income from operations, (3) adjusted total operating expenses, net of fuel surcharge revenues, (4) adjusted operating ratio, (5) adjusted net income, (6) adjusted EBITDA, and (7) free cash flow. We also provide reconciliations of these measures to the most directly comparable financial measures calculated and presented in accordance with GAAP.
Management believes the use of each of these non-GAAP measures assists investors in understanding our business by (1) removing the impact of items from our operating results that, in our opinion, do not reflect our core operating performance, (2) providing investors with the same information our management uses internally to assess our core operating performance, and (3) presenting comparable financial results between periods. In addition, in the case of revenues (excluding fuel surcharge) and adjusted total operating expenses, net of fuel surcharge revenues, we believe these measures are useful to investors because they isolate volume, price, and cost changes directly related to industry demand and the way we operate our business from the external factor of fluctuating fuel prices and the programs we have in place to manage such fluctuations. Fuel-related costs and their impact on our industry are important to our results of operations, but they are often independent of other, more relevant factors affecting our results of operations and our industry. Free cash flow is used as a measure to assess overall liquidity and does not represent residual cash flow available for discretionary expenditures as it excludes certain mandatory expenditures such as repayment of maturing debt.
Although we believe these non-GAAP measures are useful to investors, they have limitations as analytical tools and may not be comparable to similar measures disclosed by other companies. You should not consider the non-GAAP measures in this report in isolation or as substitutes for, or alternatives to, analysis of our results as reported under GAAP. The exclusion of unusual or infrequent items or other adjustments reflected in the non-GAAP measures should not be construed as an inference that our future results will not be affected by unusual or infrequent items or other items similar to such adjustments. Our management compensates for these limitations by relying primarily on our GAAP results in addition to using the non-GAAP measures.
Enterprise Summary
The following table includes key GAAP and non-GAAP financial measures for the consolidated enterprise. Adjustments to arrive at non-GAAP measures are made at the enterprise level, with the exception of fuel surcharge revenues, which are not included in segment revenues.
| | | | | | | | | | | | | | | | |
| | | Year Ended December 31, |
| (in millions, except ratios) | | 2024 | | 2023 | | |
| Operating revenues | | $ | 5,290.5 | | | $ | 5,498.9 | | | |
Revenues (excluding fuel surcharge) (1) | | 4,714.3 | | | 4,814.6 | | | |
| Income from operations | | 165.2 | | | 296.4 | | | |
Adjusted income from operations (2) | | 172.2 | | | 302.9 | | | |
| Operating ratio | | 96.9 | % | | 94.6 | % | | |
Adjusted total operating expenses, net of fuel surcharge revenues (3) | | 4,542.1 | | | 4,511.7 | | | |
Adjusted operating ratio (4) | | 96.3 | % | | 93.7 | % | | |
| Net income | | $ | 117.0 | | | $ | 238.5 | | | |
Adjusted net income (5) | | 122.3 | | | 243.4 | | | |
Adjusted EBITDA (6) | | 580.2 | | | 699.6 | | | |
| Cash flow from operations | | 686.1 | | | 680.0 | | | |
Free cash flow (7) | | 305.8 | | | 106.2 | | | |
(1)We define “revenues (excluding fuel surcharge)” as operating revenues less fuel surcharge revenues, which are excluded from revenues at the segment level. Included below is a reconciliation of operating revenues, the most closely comparable GAAP financial measure, to revenues (excluding fuel surcharge).
(2)We define “adjusted income from operations” as income from operations, adjusted to exclude material items that do not reflect our core operating performance. Included below is a reconciliation of income from operations, which is the most directly comparable GAAP measure, to adjusted income from operations. Excluded items for the periods shown are explained in the table and notes below.
(3)We define “adjusted total operating expenses, net of fuel surcharge revenues” as total operating expenses, adjusted to exclude fuel surcharge revenues and certain expenses that do not reflect our core operating performance. Excluded expenses for the periods shown are explained below under our explanation of “adjusted income from operations.”
(4)We define “adjusted operating ratio” as total operating expenses, adjusted to exclude material items that do not reflect our core operating performance, divided by revenues (excluding fuel surcharge). Included below is a reconciliation of operating ratio, which is the most directly comparable GAAP measure, to adjusted operating ratio. Excluded expenses for the periods shown are explained below under our explanation of “adjusted income from operations.”
(5)We define “adjusted net income” as net income, adjusted to exclude material items that do not reflect our core operating performance. Included below is a reconciliation of net income, which is the most directly comparable GAAP measure, to adjusted net income. Excluded expenses for the periods shown are explained below under our explanation of “adjusted income from operations.”
(6)We define “adjusted EBITDA” as net income, adjusted to exclude net interest expense, our provision for income taxes, depreciation and amortization, and certain items that do not reflect our core operating performance. Included below is a reconciliation of net income, which is the most directly comparable GAAP measure, to adjusted EBITDA.
(7)We define “free cash flow” as net cash provided by operating activities less net cash used for capital expenditures. Included below is a reconciliation of net cash provided by operating activities, which is the most directly comparable GAAP measure, to free cash flow.
Revenues (excluding fuel surcharge)
| | | | | | | | | | | | | | | | |
| | | Year Ended December 31, |
| (in millions) | | 2024 | | 2023 | | |
| Operating revenues | | $ | 5,290.5 | | | $ | 5,498.9 | | | |
| Less: Fuel surcharge revenues | | 576.2 | | | 684.3 | | | |
| Revenues (excluding fuel surcharge) | | $ | 4,714.3 | | | $ | 4,814.6 | | | |
Adjusted income from operations
| | | | | | | | | | | | | | | | |
| | | Year Ended December 31, |
| (in millions) | | 2024 | | 2023 | | |
| Income from operations | | $ | 165.2 | | | $ | 296.4 | | | |
Litigation and audit assessments (1) | | — | | | 2.9 | | | |
Acquisition-related costs (2) | | 2.0 | | | 0.9 | | | |
| | | | | | |
| | | | | | |
Amortization of intangible assets (3) | | 5.0 | | | 2.7 | | | |
| | | | | | |
| | | | | | |
| Adjusted income from operations | | $ | 172.2 | | | $ | 302.9 | | | |
(1)Includes $2.9 million in charges related to an adverse audit assessment for prior period state sales tax on rolling stock equipment used within that state for the year ended December 31, 2023. Refer to Note 13, Commitments and Contingencies, for more information.
(2)Advisory, legal, and accounting costs related to the Company’s acquisitions. Refer to Note 2, Acquisitions, for additional details.
(3)Amortization expense related to intangible assets acquired through recent business acquisitions. Refer to Note 6, Goodwill and Other Intangible Assets, for additional details. As we finalized our purchase accounting adjustments related to intangible assets, and to better reflect our ongoing operations, we made the decision to exclude the related amortization expense from non-GAAP income beginning in the fourth quarter of 2023. See Note 1, Summary of Significant Accounting Policies, for additional details.
Adjusted operating ratio
| | | | | | | | | | | | | | | | |
| | Year Ended December 31, |
| (in millions, except ratios) | | 2024 | | 2023 | | |
| GAAP Presentation | | | | | | |
| Operating revenues | | $ | 5,290.5 | | | $ | 5,498.9 | | | |
| Total operating expenses | | 5,125.3 | | | 5,202.5 | | | |
| Income from operations | | $ | 165.2 | | | $ | 296.4 | | | |
| | | | | | |
Operating ratio (1) | | 96.9 | % | | 94.6 | % | | |
| | | | | | |
| Non-GAAP Presentation | | | | | | |
| Operating revenues | | $ | 5,290.5 | | | $ | 5,498.9 | | | |
| Less: Fuel surcharge revenues | | 576.2 | | | 684.3 | | | |
| Revenues (excluding fuel surcharge) | | $ | 4,714.3 | | | $ | 4,814.6 | | | |
| | | | | | |
| Total operating expenses | | $ | 5,125.3 | | | $ | 5,202.5 | | | |
| Adjusted for: | | | | | | |
| Fuel surcharge revenues | | (576.2) | | | (684.3) | | | |
| Litigation and audit assessments | | — | | | (2.9) | | | |
| Acquisition-related costs | | (2.0) | | | (0.9) | | | |
| | | | | | |
| | | | | | |
| Amortization of intangible assets | | (5.0) | | | (2.7) | | | |
| | | | | | |
| | | | | | |
Adjusted total operating expenses, net of fuel surcharge revenues (2) | | $ | 4,542.1 | | | $ | 4,511.7 | | | |
| | | | | | |
Adjusted operating ratio (3) | | 96.3 | % | | 93.7 | % | | |
(1) Calculated as total operating expenses divided by operating revenues.
(2) Adjusted total operating expenses, net of fuel surcharge revenues are defined as total operating expenses, adjusted to exclude fuel surcharge revenues and certain expenses that do not reflect our core operating performance.
(3) Calculated as adjusted total operating expenses, net of fuel surcharge revenues divided by revenues (excluding fuel surcharge).
Adjusted net income
| | | | | | | | | | | | | | | | |
| | | Year Ended December 31, |
| (in millions) | | 2024 | | 2023 | | |
| Net income | | $ | 117.0 | | | $ | 238.5 | | | |
| Litigation and audit assessments | | — | | | 2.9 | | | |
| Acquisition-related costs | | 2.0 | | | 0.9 | | | |
| | | | | | |
| | | | | | |
| | | | | | |
| Amortization of intangible assets | | 5.0 | | | 2.7 | | | |
| | | | | | |
Income tax effect of non-GAAP adjustments (1) | | (1.7) | | | (1.6) | | | |
| Adjusted net income | | $ | 122.3 | | | $ | 243.4 | | | |
(1)Our estimated tax rate on non-GAAP items is determined annually using the applicable consolidated federal and state effective tax rate, modified to remove the impact of tax credits and adjustments that are not applicable to the specific items. Due to differences in the tax treatment of items excluded from non-GAAP income, as well as the methodology applied to our estimated annual tax rates as described above, our estimated tax rate on non-GAAP items may differ from our GAAP tax rate and from our actual tax liabilities.
Adjusted EBITDA
| | | | | | | | | | | | | | |
| | Year Ended
December 31, |
| (in millions) | | 2024 | | 2023 |
| Net income | | $ | 117.0 | | | $ | 238.5 | |
| Interest expense, net | | 12.3 | | | 7.2 | |
| Provision for income taxes | | 35.2 | | | 67.6 | |
| Depreciation and amortization | | 413.7 | | | 382.5 | |
| Litigation and audit assessments | | — | | | 2.9 | |
| Acquisition-related costs | | 2.0 | | | 0.9 | |
| Adjusted EBITDA | | $ | 580.2 | | | $ | 699.6 | |
Free cash flow
| | | | | | | | | | | | | | |
| | Year Ended
December 31, |
| (in millions) | | 2024 | | 2023 |
| Net cash provided by operating activities | | $ | 686.1 | | | $ | 680.0 | |
| | | | |
| Purchases of transportation equipment | | (414.0) | | | (660.1) | |
| Purchases of other property and equipment | | (65.1) | | | (42.3) | |
| Proceeds from sale of property and equipment | | 98.8 | | | 128.6 | |
| | | | |
| | | | |
| Net capital expenditures | | (380.3) | | | (573.8) | |
| | | | |
| Free cash flow | | $ | 305.8 | | | $ | 106.2 | |
Year Ended December 31, 2024 Compared to Year Ended December 31, 2023
Enterprise Results Summary
Enterprise net income decreased $121.5 million, approximately 51%, for the year ended December 31, 2024 compared to 2023, driven by a $131.2 million decrease in income from operations and a $22.7 million unfavorable change in total other expense (income)—net primarily related to our equity investments, partially offset by the corresponding decrease in the provision for income taxes. Pre-tax equity investment net gains were $2.3 million and $19.7 million for 2024 and 2023, respectively.
Adjusted net income decreased $121.1 million, approximately 50%, for the same reasons discussed above.
Components of Enterprise Net Income
Enterprise Revenues
Enterprise operating revenues decreased $208.4 million, approximately 4%, for the year ended December 31, 2024 compared to 2023.
Factors contributing to the decrease were as follows:
•a $112.4 million decrease in Logistics segment revenues (excluding fuel surcharge) driven by decreased revenue per order and a decline in brokerage volumes related to freight market conditions, partially offset by revenues recorded from the Cowan Systems acquisition;
•a $108.1 million decrease in fuel surcharge revenues resulting from decreased fuel prices in 2024 compared to 2023;
•a $15.0 million decrease in Truckload segment revenues (excluding fuel surcharge) driven by declines within our Network business mainly from decreases in Network trucks, partially offset by Dedicated growth, including the M&M and Cowan Systems acquisitions, and increases in Dedicated revenue per truck per week; and
•a $9.5 million decrease in Intermodal segment revenues (excluding fuel surcharge) related to a decrease in revenue per order, partially offset by an increase in volume.
Enterprise revenues (excluding fuel surcharge) decreased $100.3 million, approximately 2% for the same reasons discussed above, excluding fuel surcharge.
Enterprise Income from Operations and Operating Ratio
Enterprise income from operations decreased $131.2 million, approximately 44%, for the year ended December 31, 2024 compared to 2023, primarily due to a decrease in net revenue per order in Logistics, rate per loaded mile and volume within Network, revenue per order in Intermodal, and volume declines within our brokerage business. Other factors were an increase in cost of goods sold in our leasing business, increased insurance premiums and claims reserves, increased depreciation due to higher revenue equipment counts and cost per unit, and reduced gains on revenue equipment sales. These decreases were partially offset by an increase in Dedicated volumes from organic and acquisitive growth, inclusive of the M&M and Cowan Systems acquisitions, increased rate per total mile in Dedicated, increased volumes within Intermodal, reduced purchased transportation costs, and lower other general expenses driven by improvements in bad debt experience and professional fee spend.
Adjusted income from operations decreased $130.7 million, approximately 43%.
Enterprise operating ratio (operating expenses as a percentage of operating revenues) increased on both a GAAP and adjusted basis when compared to the same period in 2023.
Enterprise Operating Expenses
Key operating expense fluctuations are described below.
•Purchased transportation decreased $193.2 million, or 9%, year over year, primarily resulting from decreased third-party carrier costs within Logistics due to lower purchased transportation costs per order and brokerage volumes, as well as a decline in owner-operator purchased transportation costs from a reduction in owner-operator capacity within Truckload.
•Salaries, wages, and benefits increased $50.6 million, or 4%, year over year. Apart from the effects of the M&M and Cowan Systems acquisitions, salaries, wages, and benefits were comparable to the prior year as incentives and healthcare increases were partially offset by lower wages.
•Fuel and fuel taxes for company trucks decreased $39.2 million, or 9%, year over year, driven by a decrease in cost per gallon, partially offset by an increase in company driver miles within Dedicated. A significant portion of fuel costs are recovered through our fuel surcharge programs.
•Depreciation and amortization increased $31.2 million, or 8%, year over year, mainly due to additional depreciation expense resulting from trailer and tractor growth within Dedicated (inclusive of Cowan and M&M), ongoing impacts from the increased cost of equipment, and incremental depreciation and amortization expense related to the M&M and Cowan Systems acquisitions.
•Operating supplies and expenses—net increased $60.5 million, or 11%, year over year, driven by higher cost of goods sold in our leasing business due to an increase in lease adds and a reduction in gains on equipment sales due to a decrease in average sales price per unit. These factors were partially offset by lower rail storage expense and a decrease in equipment rental expense as a result of improved port fluidity.
•Insurance and related expenses increased $37.2 million, or 33%, year over year, primarily due to an increase in auto liability insurance costs related to an increase in premiums and claims development arising from prior claim periods.
•Other general expenses decreased $24.3 million, or 16%, year over year, largely related to improvements in bad debt experience and a decrease in professional services.
Total Other Expenses (Income)
Total other income decreased $22.7 million for the year ended December 31, 2024 compared to 2023, driven by pre-tax net gains on our equity investments of $2.3 million in 2024 compared to $19.7 million in 2023. Interest income decreased $2.7 million in 2024 compared to 2023 primarily due to lower rates and less excess cash invested in marketable securities, and interest expense increased $2.4 million due to increased borrowings. See Note 5, Investments, for more information on our equity investments.
Income Tax Expense
Our provision for income taxes decreased $32.4 million, approximately 48%, for the year ended December 31, 2024 compared to 2023 due to lower taxable income, partially offset by a higher effective income tax rate. Our effective income tax rate was 23.1% for the year ended December 31, 2024 compared to 22.1% in 2023. While we anticipate that our ongoing effective tax rate will be 23.0% - 24.0%, our provision for income taxes may fluctuate in future periods to the extent there are changes to tax laws and regulations.
Revenues and Income (Loss) from Operations by Segment
The following tables summarize revenues and income (loss) from operations by segment.
| | | | | | | | | | | | | | |
| | Year Ended December 31, |
Revenues by Segment (in millions) | | 2024 | | 2023 |
| Truckload | | $ | 2,170.7 | | | $ | 2,155.7 | |
| Intermodal | | 1,041.2 | | | 1,050.7 | |
| Logistics | | 1,281.3 | | | 1,393.7 | |
| Other | | 383.9 | | | 333.4 | |
| Fuel surcharge | | 576.2 | | | 684.3 | |
| Inter-segment eliminations | | (162.8) | | | (118.9) | |
| Operating revenues | | $ | 5,290.5 | | | $ | 5,498.9 | |
| | | | | | | | | | | | | | | | | |
| | Year Ended December 31, |
Income (Loss) from Operations by Segment (in millions) | | 2024 | | 2023 |
| Truckload | | $ | 89.1 | | | $ | 170.7 | |
| Intermodal | | 54.5 | | | 71.0 | |
| Logistics | | 32.7 | | | 45.9 | |
| Other | | (11.1) | | | 8.8 | |
| Income from operations | | 165.2 | | | 296.4 | |
| Adjustments: | | | | |
| Litigation and audit assessments | | — | | | 2.9 | |
| Acquisition-related costs | | 2.0 | | | 0.9 | |
| | | | |
| | | | |
| | | | |
| Amortization of intangible assets | | 5.0 | | | 2.7 | |
| | | | |
| Adjusted income from operations | | $ | 172.2 | | | $ | 302.9 | |
We monitor and analyze a number of KPIs in order to manage our business and evaluate our financial and operating performance.
Truckload
The following table presents our Truckload segment KPIs for the periods indicated, consistent with how revenues and expenses are reported internally for segment purposes. The two operations that make up our Truckload segment are as follows:
•Dedicated - Transportation services with equipment devoted to customers under long-term contracts.
•Network - Transportation services of one-way shipments.
Cowan Systems’ dedicated operations and M&M impacts are included in Dedicated beginning in the fourth quarter of 2024 and third quarter of 2023, respectively.
| | | | | | | | | | | | | | |
| | | Year Ended December 31, |
| | | 2024 | | 2023 |
| Dedicated | | | | |
Revenues (excluding fuel surcharge) (1) | | $ | 1,410.6 | | | $ | 1,272.0 | |
Average trucks (2) (3) | | 6,829 | | | 6,233 | |
Revenue per truck per week (4) | | $ | 4,041 | | | $ | 4,011 | |
| Network | | | | |
Revenues (excluding fuel surcharge) (1) | | $ | 760.3 | | | $ | 884.5 | |
Average trucks (2) (3) | | 3,926 | | | 4,374 | |
Revenue per truck per week (4) | | $ | 3,788 | | | $ | 3,974 | |
| Total Truckload | | | | |
Revenues (excluding fuel surcharge) (5) | | $ | 2,170.7 | | | $ | 2,155.7 | |
Average trucks (2) (3) | | 10,755 | | | 10,607 | |
Revenue per truck per week (4) | | $ | 3,948 | | | $ | 3,996 | |
Average company trucks (3) | | 9,244 | | | 8,695 | |
Average owner-operator trucks (3) | | 1,511 | | | 1,912 | |
Trailers (6) | | 54,459 | | | 47,460 | |
Operating ratio (7) | | 95.9 | % | | 92.1 | % |
(1)Revenues (excluding fuel surcharge), in millions, exclude revenue in transit.
(2)Includes company and owner-operator trucks.
(3)Calculated based on beginning and end of month counts and represents the average number of trucks available to haul freight over the specified timeframe.
(4)Calculated excluding fuel surcharge and revenue in transit, consistent with how revenue is reported internally for segment purposes, using weighted workdays.
(5)Revenues (excluding fuel surcharge), in millions, include revenue in transit at the operating segment level and, therefore does not sum with amounts presented above.
(6)Includes entire fleet of owned trailers, including trailers with leasing arrangements between Truckload and Logistics.
(7)Calculated as segment operating expenses divided by segment revenues (excluding fuel surcharge) including revenue in transit and related expenses at the operating segment level.
Truckload revenues (excluding fuel surcharge) increased $15.0 million, approximately 1%, for the year ended December 31, 2024 compared to 2023. Dedicated volume increased 6% due to organic new business growth and the acquisitions of M&M and Cowan Systems, offset by a reduction in Network volume and rate per loaded mile related to market conditions.
Truckload income from operations decreased $81.6 million, approximately 48%, for the year ended December 31, 2024 compared to 2023. Factors contributing to the decrease include the revenue impacts of Network listed above and increases in depreciation expense as a result of growth within Dedicated (including the M&M and Cowan Systems acquisitions), insurance premium expense and additional reserves from claims developments arising from prior claims periods, and a decrease in gains on equipment sales. These decreases were partially offset by an increase in Dedicated revenue per truck per week, reduced purchased transportation costs arising from a reduction in owner-operator capacity, and lower other general expenses related to professional fees and bad debts.
Intermodal
The following table presents the KPIs for our Intermodal segment for the periods indicated.
| | | | | | | | | | | | | | |
| | | Year Ended December 31, |
| | | 2024 | | 2023 |
Orders (1) | | 419,833 | | | 415,095 | |
| Containers | | 26,553 | | | 26,991 | |
Trucks (2) | | 1,413 | | | 1,485 | |
Revenue per order (3) | | $ | 2,474 | | | $ | 2,530 | |
Operating ratio (4) | | 94.8 | % | | 93.2 | % |
(1)Based on delivered rail orders.
(2)Includes company and owner-operator trucks at the end of the period.
(3)Calculated using rail revenues excluding fuel surcharge and revenue in transit, consistent with how revenue is reported internally for segment purposes.
(4)Calculated as segment operating expenses divided by segment revenues (excluding fuel surcharge) including revenue in transit and related expenses at the operating segment level.
Intermodal revenues (excluding fuel surcharge) decreased $9.5 million, approximately 1%, for the year ended December 31, 2024 compared to 2023. This was driven by market conditions which led to a decrease in revenue per order of $56, or 2%, partially offset by an increase in volume.
Intermodal income from operations decreased $16.5 million, approximately 23%, for the year ended December 31, 2024 compared to 2023 mainly resulting from the decreased revenue per order, partially offset by improved dray productivity.
Logistics
The following table presents the KPI for our Logistics segment for the periods indicated. Cowan Systems’ logistics operations are included in Logistics beginning in December 2024.
| | | | | | | | | | | | | | |
| | | Year Ended December 31, |
| | | 2024 | | 2023 |
Operating ratio (1) | | 97.4 | % | | 96.7 | % |
(1)Calculated as segment operating expenses divided by segment revenues (excluding fuel surcharge) including revenue in transit and related expenses at the operating segment level.
Logistics revenues (excluding fuel surcharge) decreased $112.4 million, approximately 8%, for the year ended December 31, 2024 compared to 2023. This was mainly the result of decreases in revenue per order and volume within our brokerage business, as well as reduced port dray revenues, partially offset by revenues recorded for the logistics operations for Cowan Systems.
Logistics income from operations decreased $13.2 million, approximately 29%, for the year ended December 31, 2024 compared to 2023 primarily due to reductions in net revenue per order and volume, partially offset by the Cowan acquisition.
Other
Other income from operations decreased $19.9 million for the year ended December 31, 2024 compared to the same period in 2023 driven by a decrease in earnings within our leasing business, partially offset by $2.9 million of additional interest and penalties related to the sales tax audit assessment recorded in the second quarter of 2023. See Note 13, Commitments and Contingencies, for more information.
LIQUIDITY AND CAPITAL RESOURCES
Our primary uses of cash are working capital requirements, capital expenditures, dividend payments, share repurchases, and debt service requirements. Additionally, we may use cash for acquisitions and other investing and financing activities. Working capital is required principally to ensure we are able to run the business and have sufficient funds to satisfy maturing short-term debt and operational expenses. Our capital expenditures consist primarily of transportation equipment and information technology.
Historically, our primary source of liquidity has been cash flow from operations. In addition, we have a $250.0 million revolving credit facility maturing in November 2027 and a $200.0 million receivables purchase agreement maturing in May 2027, for which our combined available capacity as of December 31, 2024 was $281.8 million. Our revolving credit facility allows us to request an additional increase in total commitment by up to $150.0 million. We also have a $400.0 million delayed-draw term loan facility with available capacity of $100.0 million as of December 31, 2024 and available to be drawn through August 2025. We anticipate that cash generated from operations, together with amounts available under our credit and receivables purchase agreements and delayed-draw term loan facility, will be sufficient to meet our requirements for the foreseeable future. To the extent additional funds are necessary to meet our long-term liquidity needs as we continue to execute our business strategy, we anticipate that we will obtain these funds through additional borrowings, equity offerings, or a combination of these potential sources of liquidity. Our ability to fund future operating expenses and capital expenditures, as well as our ability to meet future debt service obligations or refinance our indebtedness, will depend on our future operating performance, which will be affected by general economic, financial, and other factors beyond our control.
The following table presents our cash and cash equivalents, marketable securities, and outstanding debt and finance lease obligations as of the dates shown.
| | | | | | | | | | | | | | |
| (in millions) | | December 31, 2024 | | December 31, 2023 |
| Cash and cash equivalents | | $ | 117.6 | | | $ | 102.4 | |
| Marketable securities | | 47.9 | | | 57.2 | |
| Total cash, cash equivalents, and marketable securities | | $ | 165.5 | | | $ | 159.6 | |
| | | | |
| Debt: | | | | |
| Senior notes | | $ | 145.0 | | | $ | 185.0 | |
| Receivables purchase agreement | | 70.0 | | | 60.0 | |
| Credit agreement | | — | | | 45.0 | |
| Delayed-draw term loan facility | | 300.0 | | | — | |
| Finance leases | | 8.4 | | | 12.1 | |
| Total debt and finance lease obligations | | $ | 523.4 | | | $ | 302.1 | |
Debt
On December 31, 2024, we were in compliance with all financial covenants under our credit agreements and the agreements governing our senior notes. See Note 7, Debt and Credit Facilities, for information about our financing arrangements.
Cash Flows
The following table summarizes the changes to our net cash flows provided by (used in) operating, investing, and financing activities for the periods indicated.
| | | | | | | | | | | | | | | | | | | |
| | | Year Ended December 31, |
| (in millions) | | 2024 | | 2023 | | |
| Net cash provided by operating activities | | $ | 686.1 | | | $ | 680.0 | | | |
| Net cash used in investing activities | | (791.5) | | | (907.6) | | | |
| Net cash provided by (used in) financing activities | | 120.6 | | | (55.7) | | | |
Operating Activities
Net cash provided by operating activities increased $6.1 million, approximately 1%, during 2024 compared to 2023. The increase resulted from of an increase in cash provided by working capital, mostly offset by a decrease in net income adjusted for various noncash charges. Working capital changes were driven by increases in cash provided by other liabilities related to timing of payments for accrued wages and incentive compensation; receivables primarily from tax receivables offset partially by changes to trade receivables and bad debt adjustments; claims reserves from higher auto insurance accruals; and other assets.
Investing Activities
Net cash used in investing activities decreased $116.1 million, approximately 13%, during 2024 compared to 2023. The decrease was primarily driven by a decrease in net capital expenditures and purchases of lease equipment, partially offset by an increase in cash used for acquisitions related to the 2024 acquisition of Cowan Systems compared to 2023 acquisition of M&M.
Net Capital Expenditures
The following table sets forth our net capital expenditures for the periods indicated.
| | | | | | | | | | | | | | | | | | | |
| | | Year Ended December 31, |
| (in millions) | | 2024 | | 2023 | | |
| Purchases of transportation equipment | | $ | 414.0 | | | $ | 660.1 | | | |
| Purchases of other property and equipment | | 65.1 | | | 42.3 | | | |
| Proceeds from sale of property and equipment | | (98.8) | | | (128.6) | | | |
| Net capital expenditures | | $ | 380.3 | | | $ | 573.8 | | | |
Net capital expenditures decreased $193.5 million in 2024 compared to 2023. The decrease was driven by a $246.1 million decrease in purchases of transportation equipment mainly due to higher spend on growth and replacement equipment in 2023, partially offset by $31.1 million of real estate purchases related to Cowan Systems in 2024. Proceeds from sale of property and equipment decreased year over year primarily due to lower proceeds per sale.
We currently anticipate 2025 net capital expenditures to be $400.0 - $450.0 million.
Financing Activities
Net cash provided by financing activities increased $176.3 million, approximately 317%, during 2024 compared to 2023 primarily due to an increase of $250.0 million in proceeds from long-term debt used to partially fund the acquisition of Cowan Systems, a $37.3 million decrease in treasury stock repurchases, and a $30.0 million decrease in payments on our senior notes, partially offset by a $121.0 million decrease in proceeds from our revolving credit agreements and a $19.0 million increase in payments on our revolving credit agreements.
Off-Balance Sheet Arrangements
As of December 31, 2024, we had no off-balance sheet arrangements that have, or are reasonably likely to have, a current or future material effect on our consolidated financial condition, results of operations, liquidity, capital expenditures, or capital resources.
Contractual Obligations
As of December 31, 2024, we had contractual obligations related to our long-term debt, inclusive of our credit and receivables purchase agreement, of $515.0 million and $101.4 million for principal borrowings and interest, respectively, which become due through 2029. See Note 7, Debt and Credit Facilities, for additional information regarding our debt obligations. We also have contractual obligations for finance and operating leases and purchase commitments related to agreements to purchase transportation equipment. See Note 8, Leases, and Note 13, Commitments and Contingencies, respectively, for additional information regarding our lease and purchase commitment obligations.
CRITICAL ACCOUNTING ESTIMATES
The preparation of our consolidated financial statements in accordance with GAAP requires management to make estimates and assumptions that impact the amounts reported in our consolidated financial statements and accompanying notes. Therefore, these estimates and assumptions affect reported amounts of assets, liabilities, revenue, expenses, and associated disclosures of contingent liabilities. Management evaluates these estimates on an ongoing basis, using historical experience, consultation with third parties, and other methods considered reasonable in the particular circumstances. Nevertheless, actual results may differ significantly from our estimates. Any effects on our business, financial position, or results of operations resulting from revisions to these estimates are recognized in the accounting period in which the facts that give rise to the revision become known.
The estimates discussed below include the financial statement elements that are either the most judgmental or involve the selection or application of alternative accounting policies and are material to our consolidated financial statements. Management has discussed the development and selection of these critical accounting estimates with the Audit Committee of our Board and with our independent registered public accounting firm.
Claims Accruals
Reserves are established based on estimated or expected losses for claims. The primary claims arising for the Company consist of accident-related claims for personal injury, collision, and comprehensive compensation, in addition to workers’ compensation, property damage, cargo, and wage and benefit claims. We maintain self-insurance levels for these various areas of risk and have established reserves to cover self-insured liabilities. The amounts of self-insurance change from time to time based on measurement dates, policy expiration dates, policy exhaustion, and claim type. We also maintain insurance to cover liabilities in excess of the self-insurance amounts to limit our exposure to catastrophic claim costs or damages. We are substantially self-insured for loss of and damage to our owned and leased equipment. The current claims litigation and settlement environment within the industry has resulted in increases in our insurance premiums and claims expense, as well as excess insurance carriers decreasing coverage.
Our reserves represent accruals for the estimated self-insured and reinsured portions of pending claims, including adverse development of known claims, as well as incurred but not reported claims. Our estimates require judgments concerning the nature and severity of the claim, historical trends, advice from third-party administrators and insurers, consultation with actuarial experts, the specific facts of individual cases, the jurisdictions involved, estimates of future claims development, and the legal and other costs to settle or defend the claims. The actual cost to settle our self-insured claim liabilities can differ from our reserve estimates because of a number of uncertainties, including the inherent difficulty in estimating the severity of a claim and the potential amount to defend and settle a claim. As of December 31, 2024 and 2023, we had net accruals of $236.6 million and $178.4 million, respectively, for estimated claims inclusive of $54.2 million and $3.5 million of reinsurance receivables.
We have significant exposure to fluctuations in the number and severity of claims. If there is an increase in the frequency and/or severity of claims, we are required to accrue or pay additional amounts if the claims prove to be more severe than originally assessed or exceed the limits of our insurance coverage, and our profitability would be adversely affected. In addition to estimates within our self-insured retention, we also must make judgments concerning our coverage limits. If any claim were to exceed our coverage limits, we would have to accrue for the excess amount. Our critical estimates include evaluating whether a claim may exceed such limits and, if so, by how much. Currently, we are not aware of any such claims. If one or more claims were to exceed our effective coverage limits, our financial condition and results of operations could be materially and adversely affected.
Our claims accrual policy for all self-insured claims is to recognize a liability at the time of the incident based on our analysis of the nature and severity of the claims and analyses provided by third-party claims administrators or outside counsel, as well as legal, economic, and regulatory factors. Our insurance and claims personnel work directly with representatives from the insurance companies to provide updated estimates of the potential loss associated with each tendered claim. The ultimate cost of a claim is developed over time as additional information regarding the nature, timing, and extent of damages claimed becomes
available.
Goodwill
To expand our business offerings, we have, acquired other companies. In a business combination, the consideration is first assigned to identifiable assets and liabilities based on estimated fair values, with any excess recorded as goodwill. Determining fair value requires significant estimates and assumptions based on an evaluation of a number of factors, such as marketplace participants, history, future expansion and profitability expectations, amount and timing of future cash flows, and the discount
rate applied to the cash flows. Goodwill is not amortized but is assessed for impairment at least annually and more frequently if a triggering event indicates that impairment may exist.
Our goodwill balance as of December 31, 2024 and 2023 was $377.9 million and $331.7 million, respectively. Goodwill is evaluated for impairment annually at the reporting unit level, or more frequently if events or circumstances indicate the carrying value is not recoverable. A reporting unit can be a segment or business within a segment, and reporting units can be aggregated to the extent they share similar economic characteristics. When reviewing goodwill for impairment, we consider the amount of excess fair value over the carrying value of each reporting unit, the period of time since a reporting unit’s last quantitative test, the extent a reorganization or disposition changes the composition of one or more of our reporting units, and other factors to determine whether or not to first perform a qualitative test. When performing a qualitative test, we assess numerous factors to determine whether it is more likely than not that the fair values of our reporting units are less than their respective carrying values. Examples of qualitative factors that are assessed include our share price, financial performance, market and competitive factors in our industry, and other events specific to our reporting units. If we conclude that it is more likely than not that the fair value of a reporting unit is less than its carrying value, we perform a quantitative impairment test. In the quantitative impairment evaluation, the carrying value of a reporting unit, including goodwill, is compared with its fair value. We base our fair value estimation on a valuation, which uses a combination of (1) an income approach based on the present value of estimated future cash flows and (2) market approaches based on EBITDA valuation multiples of comparable companies and transactions. If the carrying value of a reporting unit exceeds its fair value, an impairment loss is recorded equal to that excess. Significant judgment is necessary to evaluate the impact of operating and macroeconomic changes and to estimate future cash flows. Assumptions used in impairment evaluations, such as forecasted growth rates and our cost of capital, are based on the best available market information and are consistent with our internal forecasts and operating plans. These assumptions could be adversely impacted by certain risks discussed earlier in this document.
The Company acquired Cowan Systems on December 2, 2024 and M&M on August 1, 2023. As a result of these acquisitions, we recorded additions to goodwill of $46.2 million and $103.5 million, respectively, within the Dedicated reporting unit. The amount for Cowan Systems is preliminary and may be adjusted as we finalize our purchase price allocations.
We completed the required annual goodwill impairment assessment for our two reporting units with goodwill as of October 31, 2024 using quantitative assessments. The fair values of our Dedicated and Import/Export reporting units were substantially in excess of their respective carrying values.
There were no triggering events identified from the date of our assessment through December 31, 2024 that would require updates to our annual impairment test. If future operating performance of our Dedicated or Import/Export reporting units is below our expectations, or there are changes to forecasted growth rates or our cost of capital, a decline in the fair value of the reporting units could result, and we may be required to record a goodwill impairment charge. See Note 6, Goodwill and Other Intangible Assets, for more information.
Business Combinations
We record assets acquired and liabilities assumed in a business combination under the acquisition method of accounting where consideration is first assigned to identifiable assets and liabilities based on estimated fair values, with any excess recorded as goodwill. During the measurement period, which is up to one year from the acquisition date, we may adjust provisional amounts that were recognized at the acquisition date to reflect new information obtained about facts and circumstances that existed as of the acquisition date.
Determining the fair value of assets acquired and liabilities assumed requires significant judgment, including the selection of valuation methodologies. For our recent acquisitions, fair value estimates of acquired property and equipment were based on independent appraisals that gave consideration to the highest and best use of the assets. The transportation equipment; land, buildings, and improvements; and other property and equipment appraisals used one, or a combination, of the market, income (direct capitalization), or sales comparison approaches. Significant estimates and assumptions, including recent sales prices of similar equipment, asset condition, and current and anticipated market trends, were used in determining the fair values of these assets. The assistance of an independent third-party valuation firm was used to determine the estimated fair values and useful lives of finite-lived intangible assets including customer relationships and trademarks. Valuation methods used were based on income-based approaches including the multi-period excess earnings method and relief from royalty method for customer relationships and trademarks, respectively. Non-compete agreements were recorded based on amounts paid at closing. Assumptions used in the intangible valuations include forecasted revenue growth rates, future cash flows, useful lives of intangible assets acquired, and our cost of capital.
ITEM 7A. QUANTITATIVE AND QUALITATIVE DISCLOSURES ABOUT MARKET RISK
We are exposed to market risk from changes in certain commodity prices, inflation, and interest rates or other economic conditions that decrease shipping demand. All of these market risks arise in the normal course of business, as we do not engage in speculative trading activities. We have established policies, procedures, and internal processes governing our management of market risk and the use of financial instruments to manage our exposure to such risk.
Commodity Risk
We have commodity exposure with respect to fuel used in company-owned tractors. Increases in fuel prices will raise our operating costs, even after applying fuel surcharge revenues. Historically, we have been able to recover a majority of fuel price increases from our customers in the form of fuel surcharges. The average diesel price per gallon in the U.S., as reported by the Department of Energy, decreased from $4.23 per gallon for fiscal year 2023 to $3.77 per gallon for fiscal year 2024. We cannot predict the extent or speed of potential changes in fuel prices in the future, the degree to which the lag effect of our fuel surcharge programs will impact us as a result of the timing and magnitude of such changes, or the extent to which effective fuel surcharges can be maintained and collected to offset future increases. We generally have not used derivative financial instruments to hedge our fuel price exposure in the past but continue to evaluate this possibility.
Inflation Risk
Inflation can have an unfavorable impact on our operating costs, and a prolonged period of inflation could cause interest rates, fuel, wages, healthcare and other employee benefits, transportation equipment and related maintenance, insurance premiums, and other costs to increase, which would adversely affect our results of operations unless freight rates correspondingly increase. Although inflation has eased since historic highs in 2021, we have seen carryover effects of price inflation where we experienced increases in our fuel, transportation equipment, labor and third-party capacity, tire, and maintenance costs. A resumption of an upward inflationary environment could harm our business, financial condition, and results of operations.
Interest Rate Risk
We have exposure from variable interest rates primarily related to borrowings under our accounts receivable securitization facility, revolving credit facility, and delayed-draw term loan facility which bear interest based on the Term SOFR. See Note 7, Debt and Credit Facilities. We manage interest rate exposure through a mix of variable and fixed rate debt and lease financing. As of December 31, 2024, our weighted average interest rate for our variable rate debt instruments was 6.16%. Based on our level of borrowings as of December 31, 2024, our annual interest expense would increase by $3.8 million assuming a one percentage point increase in interest rates.
ITEM 8. FINANCIAL STATEMENTS AND SUPPLEMENTARY DATA
REPORT OF INDEPENDENT REGISTERED PUBLIC ACCOUNTING FIRM
To the shareholders and the Board of Directors of Schneider National, Inc.
Opinion on the Financial Statements
We have audited the accompanying consolidated balance sheets of Schneider National, Inc. and subsidiaries (the "Company") as of December 31, 2024 and 2023, the related consolidated statements of comprehensive income, shareholders' equity, and cash flows, for each of the three years in the period ended December 31, 2024, and the related notes and the schedule listed in the Index at Item 15 (collectively referred to as the "financial statements"). In our opinion, the financial statements present fairly, in all material respects, the financial position of the Company as of December 31, 2024 and 2023, and the results of its operations and its cash flows for each of the three years in the period ended December 31, 2024, in conformity with accounting principles generally accepted in the United States of America.
We have also audited, in accordance with the standards of the Public Company Accounting Oversight Board (United States) (PCAOB), the Company's internal control over financial reporting as of December 31, 2024, based on criteria established in Internal Control — Integrated Framework (2013) issued by the Committee of Sponsoring Organizations of the Treadway Commission and our report dated February 21, 2025, expressed an unqualified opinion on the Company's internal control over financial reporting.
Basis for Opinion
These financial statements are the responsibility of the Company's management. Our responsibility is to express an opinion on the Company's financial statements based on our audits. We are a public accounting firm registered with the PCAOB and are required to be independent with respect to the Company in accordance with the U.S. federal securities laws and the applicable rules and regulations of the Securities and Exchange Commission and the PCAOB.
We conducted our audits in accordance with the standards of the PCAOB. Those standards require that we plan and perform the audit to obtain reasonable assurance about whether the financial statements are free of material misstatement, whether due to error or fraud. Our audits included performing procedures to assess the risks of material misstatement of the financial statements, whether due to error or fraud, and performing procedures that respond to those risks. Such procedures included examining, on a test basis, evidence regarding the amounts and disclosures in the financial statements. Our audits also included evaluating the accounting principles used and significant estimates made by management, as well as evaluating the overall presentation of the financial statements. We believe that our audits provide a reasonable basis for our opinion.
Critical Audit Matters
The critical audit matter communicated below is a matter arising from the current-period audit of the financial statements that was communicated or required to be communicated to the audit committee and that (1) relates to accounts or disclosures that are material to the financial statements and (2) involved our especially challenging, subjective, or complex judgments. The communication of critical audit matters does not alter in any way our opinion on the financial statements, taken as a whole, and we are not, by communicating the critical audit matter below, providing separate opinions on the critical audit matter or on the accounts or disclosures to which it relates.
Accident-related and Workers Compensation Claims Accruals — Refer to Note 1 to the financial statements
Critical Audit Matter Description
The Company is self-insured for various claims, which primarily relate to accident-related claims for personal injury, collision, and comprehensive compensation, along with workers' compensation. Claims accruals represent accruals for pending claims, including adverse development of known claims, as well as incurred but not reported claims. The claims accruals are based on estimated or expected losses for claims considering the nature and severity of each claim, historical trends, advice from third-party administrators and insurers, consultation with actuarial experts, the specific facts of individual cases, the jurisdictions involved for each case, estimates of future claims development, and the legal and other costs to settle or defend the claims.
We identified the estimation of certain accident-related claims for personal injury, collision, and comprehensive compensation, along with workers' compensation claims accruals as a critical audit matter. The subjectivity of estimating these claims accruals for pending claims and incurred but not reported claims requires a high degree of auditor judgment and an increased extent of effort, including the need to involve our actuarial specialists, when performing audit procedures to evaluate whether these claims accruals are appropriately stated as of December 31, 2024.
How the Critical Audit Matter Was Addressed in the Audit
Our audit procedures related to these claims accruals included the following, among others:
•We tested the effectiveness of internal controls related to these claims accruals, including those over the projected development of known claims and incurred but not reported claims.
•We evaluated the methods and assumptions used by management to estimate certain claims accruals by:
◦Testing the underlying data and inputs for completeness and accuracy that served as the basis for the actuarial analysis, including reconciling the claims data to the Company’s actuarial analysis, testing the annual exposure data, and testing current year claims and payment data.
◦Comparing management’s selected claims accrual estimates to the range provided by their third-party actuary and to historical trends.
◦With the assistance of our actuarial specialists, we developed an independent range of estimates of certain claims accruals, utilizing loss development factors from the Company’s historical data and industry claim development factors, and compared our estimated range to management’s recorded reserve.
/s/ Deloitte & Touche LLP
Milwaukee, Wisconsin
February 21, 2025
We have served as the Company’s auditor since 2002.
REPORT OF INDEPENDENT REGISTERED PUBLIC ACCOUNTING FIRM
To the shareholders and the Board of Directors of Schneider National, Inc.
Opinion on Internal Control over Financial Reporting
We have audited the internal control over financial reporting of Schneider National, Inc. and subsidiaries (the “Company”) as of December 31, 2024, based on criteria established in Internal Control — Integrated Framework (2013) issued by the Committee of Sponsoring Organizations of the Treadway Commission (COSO). In our opinion, the Company maintained, in all material respects, effective internal control over financial reporting as of December 31, 2024, based on criteria established in Internal Control — Integrated Framework (2013) issued by COSO.
We have also audited, in accordance with the standards of the Public Company Accounting Oversight Board (United States) (PCAOB), the consolidated financial statements as of and for the year ended December 31, 2024, of the Company and our report dated February 21, 2025, expressed an unqualified opinion on those financial statements.
As described in Management’s Report on Internal Control over Financial Reporting, management excluded from its assessment the internal control over financial reporting at Cowan Systems, which was acquired on December 2, 2024, and whose financial statements constitute 9.4% of total assets of the consolidated financial statement total assets and 0.9% of operating revenues of the consolidated financial statement operating revenues as of and for the year ended December 31, 2024. Accordingly, our audit did not include the internal control over financial reporting at Cowan Systems.
Basis for Opinion
The Company’s management is responsible for maintaining effective internal control over financial reporting and for its assessment of the effectiveness of internal control over financial reporting, included in the accompanying Management's Report on Internal Control over Financial Reporting. Our responsibility is to express an opinion on the Company’s internal control over financial reporting based on our audit. We are a public accounting firm registered with the PCAOB and are required to be independent with respect to the Company in accordance with the U.S. federal securities laws and the applicable rules and regulations of the Securities and Exchange Commission and the PCAOB.
We conducted our audit in accordance with the standards of the PCAOB. Those standards require that we plan and perform the audit to obtain reasonable assurance about whether effective internal control over financial reporting was maintained in all material respects. Our audit included obtaining an understanding of internal control over financial reporting, assessing the risk that a material weakness exists, testing and evaluating the design and operating effectiveness of internal control based on the assessed risk, and performing such other procedures as we considered necessary in the circumstances. We believe that our audit provides a reasonable basis for our opinion.
Definition and Limitations of Internal Control over Financial Reporting
A company’s internal control over financial reporting is a process designed to provide reasonable assurance regarding the reliability of financial reporting and the preparation of financial statements for external purposes in accordance with generally accepted accounting principles. A company’s internal control over financial reporting includes those policies and procedures that (1) pertain to the maintenance of records that, in reasonable detail, accurately and fairly reflect the transactions and dispositions of the assets of the company; (2) provide reasonable assurance that transactions are recorded as necessary to permit preparation of financial statements in accordance with generally accepted accounting principles, and that receipts and expenditures of the company are being made only in accordance with authorizations of management and directors of the company; and (3) provide reasonable assurance regarding prevention or timely detection of unauthorized acquisition, use, or disposition of the company’s assets that could have a material effect on the financial statements.
Because of its inherent limitations, internal control over financial reporting may not prevent or detect misstatements. Also, projections of any evaluation of effectiveness to future periods are subject to the risk that controls may become inadequate because of changes in conditions, or that the degree of compliance with the policies or procedures may deteriorate.
/s/ Deloitte & Touche LLP
Milwaukee, Wisconsin
February 21, 2025
SCHNEIDER NATIONAL, INC.
CONSOLIDATED STATEMENTS OF COMPREHENSIVE INCOME
(in millions, except per share data)
| | | | | | | | | | | | | | | | | |
| | | | | |
| Year Ended December 31, |
| | 2024 | | 2023 | | 2022 |
| Operating revenues | $ | 5,290.5 | | | $ | 5,498.9 | | | $ | 6,604.4 | |
| Operating expenses: | | | | | |
| Purchased transportation | 1,991.3 | | | 2,184.5 | | | 2,902.9 | |
| Salaries, wages, and benefits | 1,409.7 | | | 1,359.1 | | | 1,376.0 | |
| Fuel and fuel taxes | 398.2 | | | 437.4 | | | 521.0 | |
| Depreciation and amortization | 413.7 | | | 382.5 | | | 350.0 | |
| Operating supplies and expenses—net | 636.5 | | | 576.0 | | | 534.0 | |
| Insurance and related expenses | 151.5 | | | 114.3 | | | 103.0 | |
| Other general expenses | 124.4 | | | 148.7 | | | 217.1 | |
| | | | | |
| | | | | |
| Total operating expenses | 5,125.3 | | | 5,202.5 | | | 6,004.0 | |
| Income from operations | 165.2 | | | 296.4 | | | 600.4 | |
| Other expenses (income): | | | | | |
| Interest income | (4.3) | | | (7.0) | | | (2.9) | |
| Interest expense | 16.6 | | | 14.2 | | | 9.6 | |
| Other expenses (income)—net | 0.7 | | | (16.9) | | | (10.3) | |
| Total other expenses (income)—net | 13.0 | | | (9.7) | | | (3.6) | |
| Income before income taxes | 152.2 | | | 306.1 | | | 604.0 | |
| Provision for income taxes | 35.2 | | | 67.6 | | | 146.2 | |
| Net income | 117.0 | | | 238.5 | | | 457.8 | |
| Other comprehensive income (loss): | | | | | |
| Foreign currency translation adjustment—net | (0.9) | | | 0.5 | | | (1.5) | |
| Net unrealized gains (losses) on marketable securities—net of tax | 0.5 | | | 1.1 | | | (3.5) | |
| Total other comprehensive income (loss)—net | (0.4) | | | 1.6 | | | (5.0) | |
| Comprehensive income | $ | 116.6 | | | $ | 240.1 | | | $ | 452.8 | |
| | | | | |
| Weighted average shares outstanding | 175.5 | | | 177.3 | | | 177.9 | |
| Basic earnings per share | $ | 0.67 | | | $ | 1.35 | | | $ | 2.57 | |
| | | | | |
| Weighted average diluted shares outstanding | 176.1 | | | 178.2 | | | 178.8 | |
| Diluted earnings per share | $ | 0.66 | | | $ | 1.34 | | | $ | 2.56 | |
| | | | | |
| Dividends per share of common stock | $ | 0.38 | | | $ | 0.36 | | | $ | 0.32 | |
See notes to consolidated financial statements.
SCHNEIDER NATIONAL, INC.
CONSOLIDATED BALANCE SHEETS
(in millions, except share data)
| | | | | | | | | | | |
| | | |
| December 31, 2024 | | December 31, 2023 |
| Assets | | | |
| Current Assets: | | | |
| Cash and cash equivalents | $ | 117.6 | | | $ | 102.4 | |
| Marketable securities | 47.9 | | | 57.2 | |
| Trade accounts receivable—net of allowance of $8.0 million and $15.0 million, respectively | 600.0 | | | 575.7 | |
| Other receivables | 54.2 | | | 61.9 | |
| Current portion of lease receivables—net of allowance of $0.8 million and $1.0 million, respectively | 85.3 | | | 93.3 | |
| Inventories—net | 89.8 | | | 117.9 | |
| Prepaid expenses and other current assets | 120.5 | | | 102.5 | |
| Total current assets | 1,115.3 | | | 1,110.9 | |
| Noncurrent Assets: | | | |
| Property and equipment: | | | |
| Transportation equipment | 4,162.2 | | | 3,781.0 | |
| Land, buildings, and improvements | 264.8 | | | 226.1 | |
| Other property and equipment | 111.9 | | | 180.2 | |
| Total property and equipment | 4,538.9 | | | 4,187.3 | |
| Less accumulated depreciation | 1,669.5 | | | 1,605.6 | |
| Net property and equipment | 2,869.4 | | | 2,581.7 | |
| Lease receivables | 133.1 | | | 130.2 | |
| Internal use software and other noncurrent assets | 438.0 | | | 402.7 | |
| Goodwill | 377.9 | | | 331.7 | |
| Total noncurrent assets | 3,818.4 | | | 3,446.3 | |
| Total Assets | $ | 4,933.7 | | | $ | 4,557.2 | |
| Liabilities and Shareholders’ Equity | | | |
| Current Liabilities: | | | |
| Trade accounts payable | $ | 253.1 | | | $ | 241.3 | |
| Accrued salaries, wages, and benefits | 90.6 | | | 66.7 | |
| Claims accruals—current | 139.6 | | | 89.2 | |
| Current maturities of debt and finance lease obligations | 106.0 | | | 104.5 | |
| | | |
| Other current liabilities | 115.2 | | | 104.5 | |
| Total current liabilities | 704.5 | | | 606.2 | |
| Noncurrent Liabilities: | | | |
| Long-term debt and finance lease obligations | 420.8 | | | 197.6 | |
| Claims accruals—noncurrent | 151.2 | | | 92.7 | |
| Deferred income taxes | 565.6 | | | 595.7 | |
| Other noncurrent liabilities | 104.7 | | | 108.2 | |
| Total noncurrent liabilities | 1,242.3 | | | 994.2 | |
| Total Liabilities | 1,946.8 | | | 1,600.4 | |
| Commitments and Contingencies (Note 13) | | | |
| Shareholders’ Equity: | | | |
| Preferred shares, no par value, 50,000,000 shares authorized, no shares issued or outstanding | — | | | — | |
| Class A common shares, no par value, 250,000,000 shares authorized, 83,029,500 shares issued and outstanding | — | | | — | |
| Class B common shares, no par value, 750,000,000 shares authorized, 96,031,098 and 95,796,669 shares issued, and 92,221,383 and 92,931,242 shares outstanding, respectively | — | | | — | |
| Additional paid-in capital | 1,605.3 | | | 1,595.2 | |
| Retained earnings | 1,481.8 | | | 1,431.9 | |
| Accumulated other comprehensive loss | (3.8) | | | (3.4) | |
| Treasury stock at cost (3,795,036 and 2,505,267 shares) | (96.4) | | | (66.9) | |
| Total Shareholders’ Equity | 2,986.9 | | | 2,956.8 | |
| Total Liabilities and Shareholders’ Equity | $ | 4,933.7 | | | $ | 4,557.2 | |
See notes to consolidated financial statements.
SCHNEIDER NATIONAL, INC.
CONSOLIDATED STATEMENTS OF CASH FLOWS (in millions) | | | | | | | | | | | | | | | | | |
| Year Ended December 31, |
| 2024 | | 2023 | | 2022 |
| Operating Activities: | | | | | |
| Net income | $ | 117.0 | | | $ | 238.5 | | | $ | 457.8 | |
| Adjustments to reconcile net income to net cash provided by operating activities: | | | | |
| Depreciation and amortization | 413.7 | | | 382.5 | | | 350.0 | |
| | | | | |
| Gains on sales of property and equipment—net | (3.5) | | | (28.7) | | | (85.7) | |
| | | | | |
| Proceeds from lease receipts | 62.0 | | | 74.9 | | | 83.5 | |
| Loss on sale of business | — | | | — | | | 5.0 | |
| Deferred income taxes | 3.9 | | | 55.8 | | | 83.0 | |
| Long-term incentive and share-based compensation expense | 12.6 | | | 15.8 | | | 16.5 | |
| Gains on investments in equity securities—net | (2.3) | | | (19.7) | | | (13.7) | |
| | | | | |
| Other noncash items—net | 2.3 | | | 0.5 | | | (15.2) | |
| Changes in operating assets and liabilities: | | | | | |
| Receivables | 70.1 | | | 42.4 | | | 51.6 | |
| Other assets | (6.5) | | | (21.2) | | | (43.4) | |
| Claims reserves and receivables—net | 38.0 | | | 9.4 | | | 8.5 | |
| Payables | (32.7) | | | (32.6) | | | (42.2) | |
| Other liabilities | 11.5 | | | (37.6) | | | 0.7 | |
| Net cash provided by operating activities | 686.1 | | | 680.0 | | | 856.4 | |
| Investing Activities: | | | | | |
| Purchases of transportation equipment | (414.0) | | | (660.1) | | | (535.1) | |
| Purchases of other property and equipment | (65.1) | | | (42.3) | | | (52.9) | |
| Proceeds from sale of property and equipment | 98.8 | | | 128.6 | | | 126.3 | |
| Proceeds from sale of off-lease inventory | 32.7 | | | 34.6 | | | 25.8 | |
| Purchases of lease equipment | (60.2) | | | (105.2) | | | (105.6) | |
| Proceeds from government grants | 2.2 | | | 14.6 | | | — | |
| Proceeds from marketable securities | 11.8 | | | 6.2 | | | 6.2 | |
| Purchases of marketable securities | (1.9) | | | (16.2) | | | (7.6) | |
| Investments in equity securities and equity method investment | (0.1) | | | (17.6) | | | (24.2) | |
| Investments in notes receivable | (2.5) | | | (10.0) | | | — | |
| Business acquisitions, net of cash acquired | (393.2) | | | (240.2) | | | (31.7) | |
| Net cash used in investing activities | (791.5) | | | (907.6) | | | (598.8) | |
| Financing Activities: | | | | | |
| Proceeds under revolving credit agreements | 65.0 | | | 186.0 | | | — | |
| Payments under revolving credit agreements | (100.0) | | | (81.0) | | | — | |
| Proceeds from long-term debt | 300.0 | | | 50.0 | | | — | |
| Payments of debt and finance lease obligations | (44.5) | | | (73.9) | | | (62.0) | |
| Dividends paid | (66.6) | | | (63.6) | | | (55.7) | |
| Repurchases of common stock | (29.5) | | | (66.9) | | | — | |
| Other financing activities | (3.8) | | | (6.3) | | | 1.0 | |
| Net cash provided by (used in) financing activities | 120.6 | | | (55.7) | | | (116.7) | |
| Net increase (decrease) in cash and cash equivalents | 15.2 | | | (283.3) | | | 140.9 | |
| Cash and Cash Equivalents: | | | | | |
| Beginning of period | 102.4 | | | 385.7 | | | 244.8 | |
| End of period | $ | 117.6 | | | $ | 102.4 | | | $ | 385.7 | |
| | | | | |
| | | | | |
| | | | | | | | | | | | | | | | | |
| Year Ended December 31, |
| 2024 | | 2023 | | 2022 |
| Additional Cash Flow Information: | | | | | |
| Noncash investing and financing activity: | | | | | |
| Transportation and lease equipment purchases in accounts payable | $ | 5.2 | | | $ | 8.7 | | | $ | 13.0 | |
| Dividends declared but not yet paid | 17.4 | | | 16.9 | | | 16.2 | |
| Noncash equity method investment | — | | | 3.3 | | | — | |
| Sale of assets in exchange for notes receivable | 4.0 | | | — | | | 2.3 | |
| Cash paid (refunded) during the period for: | | | | | |
| Interest | 14.3 | | | 10.2 | | | 9.3 | |
| Income taxes—net of refunds | (0.2) | | | 67.6 | | | 52.8 | |
See notes to consolidated financial statements.
SCHNEIDER NATIONAL, INC.
CONSOLIDATED STATEMENTS OF SHAREHOLDERS’ EQUITY
(in millions, except per share data) | | | | | | | | | | | | | | | | | | | | | | | | | | | | | | | | | | | | | | |
| | | Common Stock | | Additional Paid-In Capital | | Retained Earnings | | Accumulated Other Comprehensive Loss | | Treasury Stock | | Total |
|
| Balance—December 31, 2021 | | $ | — | | | $ | 1,566.0 | | | $ | 857.8 | | | $ | — | | | $ | — | | | $ | 2,423.8 | |
| Net income | | — | | | — | | | 457.8 | | | — | | | — | | | 457.8 | |
| Other comprehensive loss | | — | | | — | | | — | | | (5.0) | | | — | | | (5.0) | |
| Share-based compensation expense | | — | | | 17.2 | | | — | | | — | | | — | | | 17.2 | |
| Dividends declared at $0.32 per share of Class A and Class B common shares | | — | | | — | | | (57.8) | | | — | | | — | | | (57.8) | |
| Share issuances | | — | | | 0.2 | | | — | | | — | | | — | | | 0.2 | |
| Exercise of employee stock options | | — | | | 3.4 | | | — | | | — | | | — | | | 3.4 | |
| Shares withheld for employee taxes | | — | | | (2.4) | | | — | | | — | | | — | | | (2.4) | |
| Balance—December 31, 2022 | | — | | | 1,584.4 | | | 1,257.8 | | | (5.0) | | | — | | | 2,837.2 | |
| Net income | | — | | | — | | | 238.5 | | | — | | | — | | | 238.5 | |
| Other comprehensive income | | — | | | — | | | — | | | 1.6 | | | — | | | 1.6 | |
| Share-based compensation expense | | — | | | 17.0 | | | — | | | — | | | — | | | 17.0 | |
| Dividends declared at $0.36 per share of Class A and Class B common shares | | — | | | — | | | (64.4) | | | — | | | — | | | (64.4) | |
| Repurchases of common stock | | — | | | — | | | — | | | — | | | (66.9) | | | (66.9) | |
| Share issuances | | — | | | 0.1 | | | — | | | — | | | — | | | 0.1 | |
| Exercise of employee stock options | | — | | | 0.1 | | | — | | | — | | | — | | | 0.1 | |
| Shares withheld for employee taxes | | — | | | (6.4) | | | — | | | — | | | — | | | (6.4) | |
| Balance—December 31, 2023 | | — | | | 1,595.2 | | | 1,431.9 | | | (3.4) | | | (66.9) | | | 2,956.8 | |
| Net income | | — | | | — | | | 117.0 | | | — | | | — | | | 117.0 | |
| Other comprehensive loss | | — | | | — | | | — | | | (0.4) | | | — | | | (0.4) | |
| Share-based compensation expense | | — | | | 13.9 | | | — | | | — | | | — | | | 13.9 | |
| Dividends declared at $0.38 per share of Class A and Class B common shares | | — | | | — | | | (67.1) | | | — | | | — | | | (67.1) | |
| Repurchases of common stock | | — | | | — | | | — | | | — | | | (29.5) | | | (29.5) | |
| | | | | | | | | | | | |
| Exercise of employee stock options | | — | | | 2.6 | | | — | | | — | | | — | | | 2.6 | |
| Shares withheld for employee taxes | | — | | | (6.4) | | | — | | | — | | | — | | | (6.4) | |
| Balance—December 31, 2024 | | $ | — | | | $ | 1,605.3 | | | $ | 1,481.8 | | | $ | (3.8) | | | $ | (96.4) | | | $ | 2,986.9 | |
| | | | | | | | | | | | |
| | | | | | | | | | | | |
| | | | | | | | | | | | |
| | | | | | | | | | | | |
| | | | | | | | | | | | |
| | | | | | | | | | | | |
| | | | | | | | | | | | |
| | | | | | | | | | | | |
| | | | | | | | | | | | |
| | | | | | | | | | | | |
| | | | | | | | | | | | |
| | | | | | | | | | | | |
| | | | | | | | | | | | |
| | | | | | | | | | | | |
| | | | | | | | | | | | |
| | | | | | | | | | | | |
| | | | | | | | | | | | |
| | | | | | | | | | | | |
| | | | | | | | | | | | |
| | | | | | | | | | | | |
| | | | | | | | | | | | |
| | | | | | | | | | | | |
| | | | | | | | | | | | |
| | | | | | | | | | | | |
| | | | | | | | | | | | |
| | | | | | | | | | | | |
| | | | | | | | | | | | |
| | | | | | | | | | | | |
| | | | | | | | | | | | |
| | | | | | | | | | | | |
| | | | | | | | | | | | |
| | | | | | | | | | | | |
| | | | | | | | | | | | |
| | | | | | | | | | | | |
| | | | | | | | | | | | |
| | | | | | | | | | | | |
| | | | | | | | | | | | |
| | | | | | | | | | | | |
| | | | | | | | | | | | |
| | | | | | | | | | | | |
| | | | | | | | | | | | |
| | | | | | | | | | | | |
| | | | | | | | | | | | |
| | | | | | | | | | | | |
| | | | | | | | | | | | |
| | | | | | | | | | | | |
| | | | | | | | | | | | |
| | | | | | | | | | | | |
| | | | | | | | | | | | |
| | | | | | | | | | | | |
| | | | | | | | | | | | |
| | | | | | | | | | | | |
| | | | | | | | | | | | |
| | | | | | | | | | | | |
| | | | | | | | | | | | |
| | | | | | | | | | | | |
| | | | | | | | | | | | |
| | | | | | | | | | | | |
| | | | | | | | | | | | |
| | | | | | | | | | | | |
| | | | | | | | | | | | |
| | | | | | | | | | | | |
| | | | | | | | | | | | |
| | | | | | | | | | | | |
| | | | | | | | | | | | |
| | | | | | | | | | | | |
| | | | | | | | | | | | |
See notes to consolidated financial statements.
SCHNEIDER NATIONAL, INC.
NOTES TO CONSOLIDATED FINANCIAL STATEMENTS
1. SUMMARY OF SIGNIFICANT ACCOUNTING POLICIES
Nature of Operations
We are one of the largest providers of surface transportation and logistics solutions in North America that, through our wholly owned subsidiaries, provides safe, reliable, and innovative truckload, intermodal, and logistics services to a diverse group of customers throughout the continental U.S., Canada, and Mexico.
Principles of Consolidation and Basis of Presentation
Our consolidated financial statements have been prepared in conformity with GAAP and include all of our wholly owned subsidiaries. All intercompany transactions have been eliminated in consolidation.
Use of Estimates
We make estimates and assumptions that affect assets, liabilities, the disclosure of contingent liabilities at the date of the consolidated financial statements, and the reported amounts of revenues and expenses during the reporting period. Actual results may differ from these estimates.
Cash and Cash Equivalents
Cash in excess of current operating requirements is invested in short-term, highly liquid investments. We consider all highly liquid investments purchased with original maturities of three months or less to be cash equivalents.
Receivables and Allowance
Our trade accounts receivable is recorded net of an allowance for doubtful accounts and revenue adjustments. The allowance is based on an aging analysis using historical experience, as well as any current and forecasted trends or uncertainties related to customer billing and account collectability. The adequacy of our allowance is reviewed at least quarterly, and reserves for receivables not expected to be collected are established. In circumstances where we are aware of a customer’s inability to meet its financial obligations, a specific reserve is recorded to reduce the net receivable to the amount we reasonably expect to collect. Bad debt expense is included in other general expenses in the consolidated statements of comprehensive income.
We record our lease receivables net of an allowance for doubtful accounts based on an aging analysis to reserve amounts expected to be uncollectible. The terms of the lease agreements generally give us the ability to take possession of the underlying asset in the event of default. We may incur credit losses in excess of recorded allowances if the full amount of anticipated proceeds from the sale or re-lease of the asset supporting the third party’s financial obligation, which can be impacted by economic conditions, is not realized.
Inventory
Our inventories consist of tractors owned by our equipment leasing company to be sold or leased to owner-operators, as well as parts, tires, supplies, and fuel for use in our Company operations. These inventories are valued at the lower of cost or net realizable value using specific identification or average cost. The following table shows the components of our inventory balances as of the dates shown.
| | | | | | | | | | | | | | |
| (in millions) | | December 31, 2024 | | December 31, 2023 |
| Tractors for sale or lease | | $ | 72.1 | | | $ | 99.0 | |
| Replacement parts | | 16.1 | | | 17.5 | |
| Tires and other | | 1.6 | | | 1.4 | |
| Total | | $ | 89.8 | | | $ | 117.9 | |
Investments in Marketable Securities
Our marketable securities are classified as available-for-sale and carried at fair value in current assets on the consolidated balance sheets. While our intent is to hold our securities to maturity, sudden changes in the market or to our liquidity needs may cause us to sell certain securities in advance of their maturity date.
Our marketable securities are accounted for under ASU 2016-13, Financial Instruments - Credit Losses: Measurement of Credit Losses on Financial Instruments. Under this guidance, credit losses are recorded through an allowance for credit losses rather than as a direct write-down to the security, and unrealized gains and losses, net of tax, are included as a component of accumulated other comprehensive income on the consolidated balance sheets, unless we determine that the amortized cost basis is not recoverable. If we determine that the amortized cost basis of the impaired security is not recoverable, we recognize the credit loss by increasing the allowance for those losses. We did not have an allowance for credit losses on our marketable securities as of December 31, 2024 and 2023. Cost basis is determined using the specific identification method.
We elected to continue to present the accrued interest receivable balance associated with our investments in marketable securities separate from the marketable securities line in the consolidated balance sheets. In addition, we elected the practical expedient provided under the guidance to exclude the applicable accrued interest from the amortized cost basis disclosure of our marketable securities. We have also elected not to measure an allowance for credit losses on our accrued interest receivable and to write off accrued interest receivable by reversing interest income when it is not considered collectible.
Fair Value
Fair value is the estimated price that would be received to sell an asset or paid to transfer a liability. Inputs to valuation techniques used to measure fair value fall into three broad levels (Levels 1, 2, and 3) as follows:
Level 1—Observable inputs that reflect quoted prices for identical assets or liabilities in active markets that we have the ability to access at the measurement date.
Level 2—Observable inputs, other than quoted prices included in Level 1, for the asset or liability or prices for similar assets and liabilities.
Level 3—Unobservable inputs reflecting the reporting entity’s estimates of the assumptions that market participants would use in pricing the asset or liability (including assumptions about risk).
Assets and liabilities are classified in their entirety based on the lowest level of input that is significant to the fair value measurement.
Property and Equipment
Property and equipment are recorded at cost. Depreciation is calculated using the straight-line method based on the estimated useful lives and residual values. Generally, the estimated useful lives are as follows:
| | | | | | | | |
| | 2024 |
| Tractors | | 3 - 8 years |
| Trailing equipment | | 6 - 20 years |
| Other transportation equipment | | 4 - 5 years |
| Buildings and improvements | | 5 - 25 years |
| Other property | | 3 - 10 years |
Salvage values, when applicable, generally range from 0% - 30% or 0% - 25% of the original cost for tractors and trailing equipment, respectively, and reflect agreements with tractor suppliers for residual or trade-in values for certain new equipment.
Long-lived assets require an impairment review when events or circumstances indicate that the carrying amount may not be recoverable. We base our evaluation of other long-lived assets on the presence of impairment indicators such as the future economic benefit of the assets, any historical or future profitability measurements, and other external market conditions or factors. The carrying amount of tangible long-lived assets held and used is considered not recoverable if the carrying amount exceeds the undiscounted sum of cash flows expected to result from the use and eventual disposition of the asset. If the carrying amount is not recoverable, the impairment loss is measured as the excess of the asset’s carrying amount over its fair value.
Gains and losses on the sale or other disposition of equipment are based on the difference between the proceeds received less costs to sell and the net book value of the assets disposed. Gains and losses are recognized at the time of sale or disposition and are classified in operating supplies and expenses—net in the consolidated statements of comprehensive income. For the years ended December 31, 2024, 2023, and 2022, we recognized $3.5 million of net gains, $28.7 million of net gains, and $85.7 million of net gains on the sale of property and equipment, respectively. Net gains for 2022 were primarily related to the sale of the Company’s Canadian facility.
Assets Held for Sale
Assets held for sale consist of transportation equipment and are included in prepaid expenses and other current assets on the consolidated balance sheets. Reclassification to assets held for sale occurs when the required criteria, as defined by ASC 360, Property, Plant and Equipment, are satisfied.
Assets held for sale are evaluated for impairment when transferred to held for sale status or when impairment indicators are present. The carrying amount of assets held for sale is not recoverable if the carrying amount exceeds the fair value less estimated costs to sell the asset. An impairment loss is recorded for the excess of the asset’s carrying amount over its fair value less estimated costs to sell. Impairment losses are recorded in operating supplies and expenses—net in the consolidated statements of comprehensive income. We recorded no significant impairment for the years ended December 31, 2024, 2023, or 2022.
Assets held for sale by segment as of December 31, 2024 and 2023 were as follows:
| | | | | | | | | | | | | | |
| (in millions) | | 2024 | | 2023 |
| Truckload | | $ | 12.8 | | | $ | 22.1 | |
| Intermodal | | 3.2 | | | 6.7 | |
| Total | | $ | 16.0 | | | $ | 28.8 | |
Internal Use Software and Cloud Computing Arrangements
We capitalize certain costs incurred to acquire, develop, or modify software to meet the Company’s internal needs. Only costs incurred during the application development stage are capitalized once the preliminary project stage is complete and management has committed to funding the project. Internal use software costs are amortized on a straight-line basis primarily over five years, or the expected useful life if different, with amortization expense recorded within depreciation and amortization on the consolidated statements of comprehensive income. We recorded $25.8 million, $25.2 million, and $24.5 million of amortization expense related to internal use software during the years ended December 31, 2024, 2023, and 2022, respectively.
Under ASU 2018-15, we capitalize certain implementation costs for internal use software incurred in a CCA that is a service contract. CCA implementation costs are amortized on a straight-line basis over the term of the related hosting agreement, taking into consideration renewal options, if any. The renewal period is included in the amortization period if determined that the option is reasonably certain to be exercised. Amortization expense is recorded within operating supplies and expenses—net on the consolidated statements of comprehensive income, similar to the related hosting fees. We recorded $6.7 million, $4.7 million, and $1.3 million of amortization expense related to CCA implementation costs during the years ended December 31, 2024, 2023, and 2022, respectively.
Capitalized computer costs are evaluated for impairment on an ongoing basis. If events or changes in circumstances (such as the manner in which the hosting arrangement is expected to be used) indicate that the carrying value may not be recoverable, the
Company will evaluate the asset for impairment. If impairment is identified, it is recorded in operating supplies and expenses—net in the consolidated statements of comprehensive income.
The following table provides information related to our internal use software and CCA implementation costs as of the dates shown.
| | | | | | | | | | | | | | |
| (in millions) | | December 31, 2024 | | December 31, 2023 |
| Internal use software | | $ | 338.0 | | | $ | 325.6 | |
| Less accumulated amortization | | 261.7 | | | 242.3 | |
| Net internal use software | | $ | 76.3 | | | $ | 83.3 | |
| | | | |
| CCA implementation costs | | $ | 39.3 | | | $ | 35.9 | |
| Less accumulated amortization | | 13.8 | | | 7.0 | |
Net CCA implementation costs (1) | | $ | 25.5 | | | $ | 28.9 | |
(1)On the consolidated balance sheets, the current portion of CCA implementation costs are included within prepaid expenses and other current assets and amounted to $6.7 million for the years ended December 31, 2024 and 2023, and the noncurrent portion is included in internal use software and other noncurrent assets and amounted to $18.8 million and $22.2 million for the years ended December 31, 2024 and 2023, respectively.
Goodwill
Goodwill is tested for impairment annually in October, or more frequently if impairment indicators exist. The carrying amount of a reporting unit’s goodwill is considered not recoverable and an impairment loss is recorded if the carrying amount of the reporting unit exceeds the reporting unit’s fair value, as determined based on the combination of income and market approaches. See Note 6, Goodwill and Other Intangible Assets, for more information on our goodwill.
Revenue Recognition
We recognize revenue during the delivery period based on relative transit time in each reporting period, in accordance with ASC 606, with expenses recognized as incurred. Accordingly, a portion of the total revenue that will be billed to the customer once a load is delivered is recognized in each reporting period based on the percentage of the freight delivery service that has been completed at the end of the reporting period.
When we use third-party carriers, we generally record revenues on the gross basis at amounts charged to our customers because we are the primary obligor, we are a principal in the transaction, we invoice our customers and retain all credit risks, and we maintain discretion over pricing. Additionally, we are responsible for selection of third-party transportation providers to the extent they are used to satisfy customer freight requirements.
We record revenues net of pass-through taxes in our consolidated statements of comprehensive income.
For the years ended December 31, 2024, 2023, and 2022, no customer accounted for more than 10% of our consolidated revenues.
Income Taxes
Income taxes are accounted for under the liability method. Deferred tax assets and liabilities are recognized for the future tax consequences attributable to differences between the financial statement carrying amounts of existing assets and liabilities and their respective tax bases and operating loss and tax credit carryforwards. Deferred tax assets and liabilities are measured using enacted tax rates expected to apply to taxable income in the years in which those temporary differences are expected to be recovered or settled. The effect on deferred tax assets and liabilities of a change in tax rates is recognized as income or expense in the period that includes the enactment date. We record valuation allowances for deferred tax assets to the extent we do not believe these assets are more likely than not to be realized through the reversal of existing taxable temporary differences, projected future taxable income, or tax-planning strategies. We record a liability for unrecognized tax benefits when the benefits of tax positions taken on a tax return are not more likely than not to be sustained upon audit. Interest and penalties related to uncertain tax positions are classified as income tax expense in the consolidated statements of comprehensive income.
Earnings Per Share
We compute basic earnings per share by dividing net income available to common stockholders by the weighted average number of common shares outstanding for the reporting period. Diluted earnings per share reflects the potential dilution that could occur if holders of unvested restricted and performance share units or options were to exercise or convert their holdings into common stock. Awards that would have an anti-dilutive impact are excluded from the calculation.
Treasury Stock
In 2023, the Board approved a stock repurchase program (the “Share Repurchase Program”) in which it periodically purchases its own common stock to offset the dilutive effects of equity grants to employees over time. The Inflation Reduction Act of 2022 subjects repurchases to a 1% nondeductible excise tax, which is included in the cost. The repurchased stock is classified as treasury stock on the consolidated balance sheets and is held at cost.
Share-based Compensation
We have share-based compensation plans covering certain employees, including officers and directors. We account for share-based compensation using the fair value recognition provisions of current accounting standards for share-based payments. These awards have historically consisted of restricted shares, RSUs, performance-based restricted shares, PSUs, and non-qualified stock options. We recognize compensation expense over the requisite service periods within each award. See Note 12, Share-Based Compensation, for more information about our plans.
Claims Accruals
We are self-insured for loss of and damage to our owned and leased transportation equipment. We purchase insurance coverage for a portion of expenses related to employee injuries, vehicular accidents, and cargo damage. Certain insurance arrangements include a level of self-insurance (deductible) coverage applicable to each claim. We have excess policies to limit our exposure to catastrophic claim costs. The amounts of self-insurance change from time to time based on measurement dates, policy expiration dates, and claim type.
Our claims accrual policy for all self-insured claims is to recognize a liability at the time of the incident based on our analysis of the nature and severity of the claims and analyses provided by third-party claims administrators, as well as legal, economic, and regulatory factors. The ultimate cost of a claim develops over time as additional information regarding the nature, timing, and extent of damages claimed becomes available. Accordingly, we use an actuarial method to develop current claim information to derive an estimate of our ultimate claim liability. This process involves the use of loss-development factors based on our historical claims experience and includes a contractual premium adjustment factor, if applicable. In doing so, the recorded liability considers future claims growth and provides an allowance for incurred but not reported claims. We do not discount our estimated losses. As of December 31, 2024 and 2023, we had a net accrual of $236.6 million and $178.4 million, respectively, for estimated claims which includes receivables recorded for the reinsurance we expect to receive on claims; as of December 31, 2024 and 2023, we recorded $54.2 million and $3.5 million in estimated reinsurance receivables. In addition, we are required to pay certain advanced deposits and monthly premiums. As of December 31, 2024 and 2023, we had an aggregate prepaid insurance asset of $10.6 million and $9.6 million, respectively, which represented prefunded premiums and deposits.
Government Grants
We have received grants from various California state organizations to be used towards the electrification of our fleet, inclusive of BEVs and charging stations. As there is no specific guidance under GAAP, we have elected to account for such grants under IAS 20, Accounting for Government Grants and Disclosure of Government Assistance, using the gross presentation model for the balance sheet and the net presentation model for the income statement. In accordance with IAS 20’s net presentation model, government grants can be offset against the related expenditures on the income statement when there is reasonable assurance that (1) the recipient will comply with the relevant conditions and (2) the grant will be received.
During 2023, the Company placed assets in service that were purchased using grants from the EPA’s Targeted Airshed Grant (administered by the CARB) and the South Coast Air Quality Management District’s Joint Electric Truck Scaling Initiative. The Company believes it met the requirements during 2023, and for the years ended December 31, 2024 and 2023, depreciation and amortization expense was reduced by $2.2 million and $1.3 million, respectively, in the consolidated statements of comprehensive income. As of December 31, 2024, the Company’s consolidated balance sheets included $0.2 million of grant receivables within other receivables and $2.4 million and $11.1 million in deferred grant income within other current liabilities and other noncurrent liabilities, respectively. As of December 31, 2023 the Company’s consolidated balance sheets included
$2.1 million of grant receivables within other receivables and $2.4 million and $13.5 million in deferred grant income within other current liabilities and other noncurrent liabilities, respectively.
Sale of Business
On November 30, 2022, the Company entered into a management buyout agreement to sell 100% of its China-based logistics operations to certain members of Asia’s management team, ceasing Schneider’s Asia operations. The sale resulted in the recognition of a $5.0 million loss, which was recorded within operating supplies and expenses—net in the consolidated statements of comprehensive income, and operating results through the date of sale are included within Other. In conjunction with the management buyout agreement, a $4.1 million payment was made and is included within acquisitions and sale of business, net of cash acquired on the consolidated statements of cash flows.
Accounting Standards Issued but Not Yet Adopted
On December 14, 2023, the FASB issued ASU 2023-09, Income Taxes (Topic 740), Improvements to Income Tax Disclosures. This ASU expands the disclosures related to rate reconciliations by requiring entities to disclose items meeting a quantitative threshold and eight categories. The standard is effective for fiscal years beginning after December 15, 2024, with early adoption permitted. We believe this standard will expand our disclosures but will not impact our consolidated financial statements. We will adopt this standard in the fourth quarter of 2025.
On November 4, 2024, the FASB issued ASU 2024-03, Income Statement - Reporting Comprehensive Income - Expense Disaggregation Disclosures (Subtopic 220-40. This ASU expands disclosures related to certain costs and expenses included within each relevant expense caption presented on the face of the income statement. We believe this standard will require us to expand our disclosures but will not have a material effect on our consolidated financial statements. This will be effective for fiscal years beginning after December 15, 2026 with early adoption permitted. We will adopt this standard in the fourth quarter of 2027.
2. ACQUISITIONS
Cowan Systems
On December 2, 2024, we acquired 100% of the membership interest of Cowan Systems and affiliated entities holding assets comprising substantially all of Cowan Systems’ business for approximately $398.6 million inclusive of cash and other working capital adjustments. On December 30, 2024, we paid $31.1 million for select Cowan Systems real estate assets in a separate transaction. The acquisition was financed through a combination of cash on hand and borrowings under a new $400.0 million delayed-draw term loan facility. See Note 7, Debt and Credit Facilities for more information on the delayed-draw term loan facility.
Cowan Systems is primarily a dedicated carrier with a portfolio of complementary services including brokerage, drayage, and warehousing, based in Baltimore, MD, operating primarily in the Eastern and Mid-Atlantic regions of the U.S. which we believe complements our growing dedicated operations.
The acquisition of Cowan Systems was accounted for under the acquisition method of accounting, which requires that assets acquired and liabilities assumed be recognized on the consolidated balance sheets at their fair values as of the acquisition date. These inputs represent Level 3 measurements in the fair value hierarchy and required significant judgments and estimates at the time of valuation. Fair value estimates of acquired property and equipment were based on an independent appraisal, giving consideration to the highest and best use of the assets. Key assumptions used in the transportation equipment appraisals were based on the market approach, while key assumptions used in the land, buildings and improvements, and other property and equipment appraisals were based on a combination of the income (direct capitalization) and sales comparison approaches, as appropriate.
The excess of the purchase price over preliminary estimates of the fair values of assets acquired and liabilities assumed was recorded as goodwill within the Truckload segment. The goodwill is attributable to expected synergies and growth opportunities within our dedicated business and is expected to be deductible for tax purposes.
Acquisition-related costs consisting of fees incurred for advisory, legal, and accounting services were $2.0 million and were primarily included in other general expenses in the Company’s consolidated statements of comprehensive income for the period ended December 31, 2024.
Certain amounts recorded in connection with the acquisition are still considered preliminary as we continue to gather the necessary information to finalize our fair value estimates and provisional amounts. Provisional amounts include items related to working capital adjustments, intangibles, and deferred taxes.
The following table summarizes the preliminary purchase price allocation for Cowan Systems, which may be adjusted as we finalize our fair value estimates and provisional amounts.
| | | | | | | | | | | | | | |
Recognized amounts of identifiable assets acquired and liabilities assumed (in millions) | | December 2, 2024
Opening Balance Sheet | | | | |
| Cash and cash equivalents | | $ | 5.4 | | | | | |
| Trade accounts receivable—net of allowance | | 81.0 | | | | | |
| | | | | | |
| Prepaid expenses and other current assets | | 30.5 | | | | | |
| Net property and equipment | | 297.9 | | | | | |
| Internal use software and other noncurrent assets | | 1.5 | | | | | |
| Goodwill | | 46.2 | | | | | |
| Total assets acquired | | 462.5 | | | | | |
| | | | | | |
| Trade accounts payable | | 11.1 | | | | | |
| Accrued salaries, wages, and benefits | | 10.6 | | | | | |
| Claims accruals—current | | 20.2 | | | | | |
| Other current liabilities | | 17.6 | | | | | |
| | | | | | |
| Other noncurrent liabilities | | 4.4 | | | | | |
| Total liabilities assumed | | 63.9 | | | | | |
| | | | | | |
| Net assets acquired | | $ | 398.6 | | | | | |
Combined unaudited pro forma operating revenues of the Company and Cowan Systems would have been approximately $5,870.0 million and $6,165.6 million for the years ended December 31, 2024 and 2023, respectively, and our earnings for the same periods would not have been materially different.
M&M Transport Services, LLC
On August 1, 2023, we acquired 100% of the membership interest in M&M for $243.8 million, inclusive of cash and other working capital adjustments. The purchase price allocation was considered final as of June 30, 2024 and resulted in $103.5 million of goodwill being recorded in the Truckload reportable segment. M&M is a dedicated trucking company located primarily in New England which complements our dedicated operations, and their operating results are included in our consolidated results of operations beginning on the date acquired.
The acquisition of M&M was accounted for under the acquisition method of accounting, which requires that assets acquired and liabilities assumed be recognized on the consolidated balance sheets at their fair value as of the Acquisition Date. Fair value estimates of acquired transportation equipment were based on an independent appraisal, giving consideration to the highest and best use of the assets with key assumptions based on the market approach. These inputs represent Level 3 measurements in the fair value hierarchy and required significant judgments and estimates at the time of valuation. The assistance of an independent third-party valuation firm was used to determine the estimated fair values and useful lives of finite-lived intangible assets including customer relationships and trademarks. Valuation methods used were the multi-period excess earnings method and relief from royalty method for customer relationships and trademarks, respectively. Non-compete agreements were recorded based on the amount paid at closing.
Acquisition-related costs, which consist of fees incurred for advisory, legal, and accounting services, were not material for the period ended December 31, 2024. They were $0.9 million for the period ended December 31, 2023 and were included in other general expenses in the Company’s consolidated statements of comprehensive income.
The following table summarizes the final purchase price allocation for M&M, including adjustments during the measurement period.
| | | | | | | | | | | | | | | | | | | | |
Recognized amounts of identifiable assets acquired and liabilities assumed (in millions) | | August 1, 2023
Opening Balance Sheet | | Adjustments | | Adjusted
August 1, 2023
Opening Balance Sheet |
| Cash and cash equivalents | | $ | 3.6 | | | $ | — | | | $ | 3.6 | |
| Trade accounts receivable—net of allowance | | 15.1 | | | — | | | 15.1 | |
| Prepaid expenses and other current assets | | 3.0 | | | — | | | 3.0 | |
| Net property and equipment | | 77.8 | | | — | | | 77.8 | |
| Internal use software and other noncurrent assets | | 56.9 | | | 0.5 | | | 57.4 | |
| Goodwill | | 104.6 | | | (1.1) | | | 103.5 | |
| Total assets acquired | | 261.0 | | | (0.6) | | | 260.4 | |
| | | | | | |
| Trade accounts payable | | 1.4 | | | — | | | 1.4 | |
| Accrued salaries, wages, and benefits | | 5.3 | | | — | | | 5.3 | |
| Claims accruals—current | | 1.8 | | | — | | | 1.8 | |
| Other current liabilities | | 4.2 | | | (1.3) | | | 2.9 | |
| Other noncurrent liabilities | | 5.2 | | | — | | | 5.2 | |
| Total liabilities assumed | | 17.9 | | | (1.3) | | | 16.6 | |
| | | | | | |
| Net assets acquired | | $ | 243.1 | | | $ | 0.7 | | | $ | 243.8 | |
The above adjustments made during the measurement period were primarily related to working capital, accrued taxes, and intangible assets. No material adjustments were made during the year ended December 31, 2024.
The following unaudited pro forma revenues give effect to the acquisition had it been effective January 1, 2022. Combined unaudited pro forma operating revenues of the Company and M&M would have been approximately $5,569.6 million during the year ended December 31, 2023 and $6,729.6 million during the year ended December 31, 2022. Our earnings for the same periods would not have been materially different.
deBoer Transportation, Inc.
We entered into a Securities Purchase Agreement, dated June 7, 2022, to acquire 100% of the outstanding equity of deBoer, a regional, dedicated carrier headquartered in Blenker, WI. The acquisition provided Schneider the opportunity to expand our tractor and trailer fleet primarily within our dedicated Truckload operations, as well as our company driver capacity.
The aggregate purchase price of the acquisition was approximately $34.6 million inclusive of certain cash and net working capital adjustments, and the assets acquired consisted primarily of rolling stock. The acquisition was accounted for under the acquisition method of accounting, which requires that assets acquired and liabilities assumed be recognized on the consolidated balance sheets at their fair values as of the acquisition date. The fair values of net assets acquired were determined using Level 3 inputs. The excess of the purchase price over the estimated fair value of the net assets was recorded as goodwill within the Truckload segment.
Acquisition-related costs, which consisted of fees incurred for advisory, legal, and accounting services, were $0.3 million and were included in other general expenses in the Company’s consolidated statements of comprehensive income for the period ended December 31, 2022.
Operating results for deBoer are included in our consolidated results of operations from the acquisition date. Pro forma information for this acquisition is not provided as it did not have a material impact on the Company’s consolidated operating results.
3. REVENUE RECOGNITION
Disaggregated Revenues
The majority of our revenues are related to transportation and have similar characteristics. M&M, MLS, and deBoer revenues since the acquisition dates are included within Transportation revenues, consistent with the remainder of our Truckload segment. Beginning on December 2, 2024, Cowan Systems revenues are included in Transportation revenues, consistent with our other Truckload and Logistics segments. The following table summarizes our revenues by type of service, which are explained in greater detail below.
| | | | | | | | | | | | | | | | | | | | |
| | Year Ended December 31, |
Disaggregated Revenues (in millions) | | 2024 | | 2023 | | 2022 |
| Transportation | | $ | 4,867.1 | | | $ | 5,102.0 | | | $ | 6,119.9 | |
| Logistics Management | | 208.5 | | | 190.1 | | | 274.2 | |
| Other | | 214.9 | | | 206.8 | | | 210.3 | |
| Total operating revenues | | $ | 5,290.5 | | | $ | 5,498.9 | | | $ | 6,604.4 | |
Transportation
Transportation revenues are generated from our Truckload and Intermodal segments, as well as from our brokerage business, which is included in the Logistics segment.
In the Transportation portfolio, our service obligations to customers are satisfied over time. We do not believe there is a significant impact on the nature, amount, timing, and uncertainty of revenue or cash flows based on the mode of transportation. The economic factors that impact our transportation revenues are generally consistent across these modes given the relatively short-term nature of each contract. For the majority of our transportation business, the “contract with a customer” is identified as an individual order under a negotiated agreement. Some consideration is variable in that a final transaction price is uncertain and is susceptible to factors outside of the Company’s influence, such as the weather or the accumulation of accessorial charges. Pricing information is supplied by rate schedules that accompany negotiated contracts. Occasionally we provide freight movements to customers in exchange for non-monetary services. The fair value of non-monetary consideration on these freight movements is included in operating revenues on the consolidated statements of comprehensive income and consists primarily of transportation equipment. There were no revenues recorded in 2024 and 2023 for freight movements in exchange for non-monetary consideration. The amount of operating revenues recorded for these services was $16.0 million in 2022.
Transportation orders are short-term in nature generally having terms of significantly less than one year. They do not include significant financing components. A small portion of revenues in our transportation business relate to fixed payments in our Truckload segment. These payments are due regardless of volumes, and in these arrangements, the master agreement rather than the individual order may be considered the “contract.” Refer to the Remaining Performance Obligations table below for more information on these fixed payments.
Under ASC 606, we recognize revenue over the period transportation services are provided to the customer, including service performed as of the end of the reporting period for loads currently in transit, in order to recognize the value transferred to a customer over the course of the transportation service.
We determine revenue in transit using the input method, under which revenue is recognized based on time lapsed from the departure date to the arrival date. Measurement of revenue in transit requires the application of significant judgment. We calculate the estimated percentage of an order’s transit time that is complete at period end, and we apply that percentage of completion to the order’s estimated revenue.
In certain transportation arrangements, an unrelated party contributes a specified service to our customer. For example, we contract with third-party carriers to perform transportation services on behalf of our customers in our brokerage business, and we use third-party rail carriers in our Intermodal segment. In situations that include the contributions of third parties, we act as principal in the arrangement, and accordingly, we recognize gross revenues from these transactions.
Logistics Management
Logistics Management revenues relate to our SCDM operating segment, which is included in our Logistics segment. Within this portfolio, the key service we provide to customers is management of freight shipping and/or storage.
The “contracts” in our Logistics Management portfolio are negotiated agreements, which contain both fixed and variable components. The variability of revenues is driven by volumes and transactions, which are known as of an invoice date. Refer to the Remaining Performance Obligations table below for additional information. SCDM contracts typically have terms that extend beyond one year and do not include financing components.
Under ASC 606, we have elected to use the right to invoice practical expedient, which reflects the fact that a customer obtains the benefit associated with logistics services as they are provided (output method), and therefore, we recognize revenue under these contracts over time.
In our supply chain management business, we subcontract third parties to perform a portion of the services. We are responsible for ensuring the services are performed and are acceptable to the customer; therefore, we are considered the principal in these arrangements.
Other
Other revenues relate to activities that are out of scope for purposes of ASC 606, including our leasing and captive insurance businesses.
Quantitative Disclosure
The following table provides information related to transactions and expected timing of revenue recognition for performance obligations that are fixed in nature and relate to contracts with terms greater than one year as of the date shown.
| | | | | | | | |
Remaining Performance Obligations (in millions) | | December 31, 2024 |
| Expected to be recognized within one year | | |
| Transportation | | $ | 24.7 | |
| Logistics Management | | 12.5 | |
| Expected to be recognized after one year | | |
| Transportation | | 33.9 | |
| Logistics Management | | 18.6 | |
| Total | | $ | 89.7 | |
This disclosure does not include revenue related to performance obligations that are part of a contract with an original expected duration of one year or less, nor does it include expected consideration related to performance obligations for which the Company elects to recognize revenue in the amount it has a right to invoice (e.g., usage-based pricing terms).
The following table provides information related to contract balances associated with our contracts with customers as of the dates shown.
| | | | | | | | | | | | | | | | | | | | |
Contract Balances (in millions) | | December 31, 2024 | | December 31, 2023 | | December 31, 2022 |
| Other current assets—Contract assets | | $ | 22.2 | | | $ | 23.7 | | | $ | 27.0 | |
| Other current liabilities—Contract liabilities | | — | | | — | | | 2.6 | |
We generally receive payment within 40 days of completion of performance obligations. Contract assets in the table above relate to revenue in transit at the end of the reporting period. Contract liabilities relate to amounts customers paid in advance of the associated service.
Practical Expedients
We elected to use the following practical expedients under ASC 606: (1) not to adjust the promised amount of consideration for the effects of a significant financing component when we expect, at contract inception, that the period between our transfer of a promised service to a customer and when the customer pays for that service will be one year or less; (2) to apply ASC 606 to a portfolio of contracts (or performance obligations) with similar characteristics, as we reasonably expect that the effects on the consolidated financial statements of applying this guidance to the portfolio would not differ materially from applying this guidance to the individual contracts (or performance obligations) within that portfolio; and (3) to recognize revenue in the Logistics Management portfolio as the amount of consideration to which we have a right to invoice, that corresponds directly with the value to the customer of the service completed to date.
4. FAIR VALUE
The table below sets forth the Company’s financial assets that are measured at fair value on a recurring, monthly basis in accordance with ASC 820.
| | | | | | | | | | | | | | | | | | | | |
| | | | Fair Value on |
| (in millions) | | Level in Fair
Value Hierarchy | | December 31, 2024 | | December 31, 2023 |
Equity investment in TuSimple (1) | | 1 | | $ | 0.1 | | | $ | 0.3 | |
Marketable securities (2) | | 2 | | 47.9 | | | 57.2 | |
(1)Our equity investment in TuSimple is classified as Level 1 in the fair value hierarchy as shares of TuSimple’s Class A common stock are traded on an Over the Counter (“OTC”) market beginning February 8, 2024 and the NASDAQ prior to that date. See Note 5, Investments, for additional information.
(2)Marketable securities are classified as Level 2 in the fair value hierarchy as they are valued based on quoted prices for similar assets in active markets or quoted prices for identical or similar assets in markets that are not active. See Note 5, Investments, for additional information.
The fair value of the Company’s unsecured debt was $145.9 million and $183.2 million as of December 31, 2024 and 2023, respectively. The carrying value of the Company’s debt was $145.0 million and $185.0 million as of December 31, 2024 and 2023, respectively. The fair value of our debt was calculated using a fixed rate debt portfolio with similar terms and maturities, which is based on the borrowing rates available to us in the applicable year. This valuation used Level 2 inputs.
The recorded values of cash, trade accounts receivable, lease receivables, trade accounts payable, and amounts outstanding under revolving credit agreements and the delayed-draw term loan facility approximate fair values.
We measure non-financial assets, such as assets held for sale and other long-lived assets, at fair value when there is an indicator of impairment and only when we recognize an impairment loss. The table below sets forth the Company’s non-financial assets that were measured at fair value on a non-recurring basis during 2024.
| | | | | | | | | | | | | | |
| (in millions) | | Level in Fair
Value Hierarchy | | Fair Value on December 31, 2024 |
Assets held for sale (1) | | 2 | | $ | 3.8 | |
| | | | |
| | | | |
| | | | |
| | | | |
(1)Our held for sale transportation equipment is evaluated for impairment using market data upon classification as held for sale or as impairment indicators are present. If the carrying value of the assets held for sale exceeds the fair value, an impairment is recorded. All assets held for sale as of December 31, 2024 were recorded at fair value. Refer to Note 1, Summary of Significant Accounting Policies, for further details on impairment charges.
As part of our acquisitions, certain assets acquired and liabilities assumed were recorded at their fair values as of the acquisition date. Refer to Note 2, Acquisitions, for further details.
5. INVESTMENTS
Marketable Securities
The following table presents the remaining maturities and values of our marketable securities as of the dates shown.
| | | | | | | | | | | | | | | | | | | | | | | | | | | | | | | | |
| | | December 31, 2024 | | December 31, 2023 |
| (in millions, except maturities in months) | | Remaining Maturities | | Amortized Cost | | Fair Value | | Amortized Cost | | Fair Value |
| U.S. treasury and government agencies | | 5 to 74 months | | $ | 21.0 | | | $ | 19.2 | | | $ | 24.9 | | | $ | 22.9 | |
| | | | | | | | | | |
| Corporate debt securities | | 5 to 100 months | | 15.3 | | | 14.9 | | | 20.0 | | | 19.2 | |
| State and municipal bonds | | 3 to 166 months | | 14.2 | | | 13.8 | | | 15.5 | | | 15.1 | |
| | | | | | | | | | |
| Total marketable securities | | | | $ | 50.5 | | | $ | 47.9 | | | $ | 60.4 | | | $ | 57.2 | |
Equity Investments without Readily Determinable Fair Values
The Company’s primary strategic equity investments without readily determinable fair values include PSI, a provider of telematics and fleet management tools; MLSI, a transportation technology development company; and ChemDirect, a business- to-business digital marketplace for the chemical industry. These investments are being accounted for under ASC 321, Investments - Equity Securities, using the measurement alternative, and their combined values as of December 31, 2024 and 2023 were $124.4 million and $121.8 million, respectively. If the Company identifies observable price changes for identical or similar securities of the same issuer, the equity security is measured at fair value as of the date the observable transaction occurred using Level 3 inputs. In addition to our investment in MLSI, we also hold a $10.0 million note receivable from MLSI as of December 31, 2024 and 2023. The note was funded during the first quarter of 2023, is subject to interest over its term, and matures in March 2030. We also hold a $2.5 million note receivable from PSI as of December 31, 2024. This note was executed and funded during the second quarter of 2024, is subject to interest over its term, and matures in March 2027.
Subsequent to December 31, 2024, the Company entered into a short-term note receivable with MLSI for the amount of $13.0 million.
The following table summarizes the activity related to these equity investments during the periods presented.
| | | | | | | | | | | | | | | | | | | | |
| | Year Ended December 31, |
| (in millions) | | 2024 | | 2023 | | 2022 |
| Investment in equity securities | | $ | 0.2 | | | $ | 15.8 | | | $ | 24.0 | |
| | | | | | |
Upward adjustments (1) | | 2.5 | | | 20.0 | | | 25.8 | |
| Cumulative upward adjustments | | 74.5 | | | | | |
(1)Our updated investment values were determined using the backsolve method, a valuation approach that primarily uses an option pricing model to value shares based on the price paid for recently issued shares.
Equity Investments with Readily Determinable Fair Values
Our non-controlling interest in TuSimple is accounted for under ASC 321, Investments - Equity Securities. Our net investment and activity were not material for the years ended December 31, 2024, and 2023; in 2022 we recognized a pre-tax net loss of $12.1 million. See Note 4, Fair Value, for additional information on the fair value of our investment in TuSimple.
Equity Method Investment
In the second quarter of 2023, the Company invested $5.0 million consisting primarily of internal use software and cash in exchange for a 50% non-controlling ownership interest in Scope 23 LLC, an entity that provides a platform for shippers to track and manage their greenhouse gas emissions. Our interest is being accounted for under ASC 323, Investments - Equity Method and Joint Ventures. For the years ended December 31, 2024 and 2023, activity was not material. The carrying value of our investment was $4.5 million and $4.9 million as of December 31, 2024 and December 31, 2023, respectively.
All of our equity investments, as well as our notes receivable from MLSI and PSI, are included in internal use software and other noncurrent assets on the consolidated balance sheets. Gains or losses on our equity investments are recognized within other expenses (income)—net on the consolidated statements of comprehensive income.
6. GOODWILL AND OTHER INTANGIBLE ASSETS
Goodwill represents the excess of the purchase price of acquisitions over the fair value of the identifiable net assets acquired. The following table shows changes to our goodwill balances by segment during the years ended December 31, 2024 and 2023.
| | | | | | | | | | | | | | | | | | | | |
| (in millions) | | Truckload | | Logistics | | Total |
| Balance on December 31, 2022 | | $ | 214.0 | | | $ | 14.2 | | | $ | 228.2 | |
| Acquisition (see Note 2) | | 104.6 | | | — | | | 104.6 | |
| Acquisition adjustments (see Note 2) | | (1.1) | | | — | | | (1.1) | |
| | | | | | |
| Balance on December 31, 2023 | | 317.5 | | | 14.2 | | | 331.7 | |
| Acquisition (see Note 2) | | 46.2 | | | — | | | 46.2 | |
| | | | | | |
| | | | | | |
| Balance on December 31, 2024 | | $ | 363.7 | | | $ | 14.2 | | | $ | 377.9 | |
During the year ended December 31, 2024, we recorded goodwill in conjunction with the acquisition of Cowan Systems which was recorded within the Truckload segment. Refer to Note 2, Acquisitions, for further details.
As of December 31, 2024 and 2023, our Truckload segment had accumulated goodwill impairment charges of $34.6 million.
Goodwill is tested for impairment at least annually using the discounted cash flow, guideline public company, and guideline transaction methods to calculate the fair values of our reporting units. Key inputs used in the discounted cash flow approach include growth rates for sales and operating profit, perpetuity growth assumptions, and discount rates. Key inputs used in the guideline public company and guideline transaction methods include EBITDA valuation multiples of comparable companies and transactions. If interest rates rise, growth rates decrease, or EBITDA valuation multiples of comparable companies and transactions decline, the calculated fair values of our reporting units will decrease, which could impact the results of our goodwill impairment tests.
During the fourth quarter of 2024 and 2023, annual impairment tests were performed for our reporting units with goodwill as of October 31, our assessment date. In 2023, as a result of reorganizing the operating segments within Truckload, two goodwill impairment tests were performed within our Truckload segment, one before the operating segment reorganization and one after the operating segment reorganization. Refer to Note 14, Segment Reporting, for further details on the segment reorganization. No impairments resulted as part of the 2024 or 2023 annual impairment tests.
The identifiable finite lived intangible assets other than goodwill listed below are included in internal use software and other noncurrent assets on the consolidated balance sheets.
| | | | | | | | | | | | | | | | | | | | | | | | | | | | | | | | | | | | | | |
| | December 31, 2024 | | December 31, 2023 |
| (in millions) | | Gross
Carrying
Amount | | Accumulated Amortization | | Net
Carrying
Amount | | Gross
Carrying
Amount | | Accumulated Amortization | | Net
Carrying
Amount |
| Customer relationships | | $ | 43.5 | | | $ | 4.8 | | | $ | 38.7 | | | $ | 43.5 | | | $ | 1.8 | | | $ | 41.7 | |
| Trademarks | | 10.9 | | | 2.4 | | | 8.5 | | | 10.9 | | | 1.5 | | | 9.4 | |
| Non-compete agreements | | 5.4 | | | 1.5 | | | 3.9 | | | 5.4 | | | 0.4 | | | 5.0 | |
| Total intangible assets | | $ | 59.8 | | | $ | 8.7 | | | $ | 51.1 | | | $ | 59.8 | | | $ | 3.7 | | | $ | 56.1 | |
Amortization expense for intangible assets was $5.0 million and $2.7 million for the years ended December 31, 2024 and December 31, 2023, respectively.
Estimated future amortization expense related to intangible assets is as follows:
| | | | | | | | |
| (in millions) | | December 31, 2024 |
| 2025 | | $ | 5.0 | |
| 2026 | | 5.0 | |
| 2027 | | 5.0 | |
| 2028 | | 4.6 | |
| 2029 | | 4.0 | |
| 2030 and thereafter | | 27.5 | |
| Total | | $ | 51.1 | |
7. DEBT AND CREDIT FACILITIES
As of December 31, 2024 and 2023, debt included the following:
| | | | | | | | | | | | | | |
| (in millions) | | December 31, 2024 | | December 31, 2023 |
| Unsecured senior notes: principal payable at maturities ranging from 2025 through 2028; interest payable in semiannual installments through the same timeframe; weighted-average interest rate of 4.36% and 3.68% for 2024 and 2023, respectively | | $ | 145.0 | | | $ | 185.0 | |
| Revolving credit agreement: matures November 2027; variable rate interest payments due monthly based on the Term SOFR; weighted-average interest rate of 6.43% for 2024 and 2023 | | — | | | 45.0 | |
| Receivables purchase agreement: matures May 2027; variable rate interest payments due monthly based on the Term SOFR; weighted-average interest rate of 6.12% for 2024 and 6.28% in 2023 | | 70.0 | | | 60.0 | |
| Delayed-draw term loan facility: matures November 2029; variable rate interest payments due monthly based on the Term SOFR; weighted-average interest rate of 5.61% for 2024 | | 300.0 | | | — | |
| Total debt and credit facilities | | 515.0 | | | 290.0 | |
| Current maturities | | (98.7) | | | (100.0) | |
| | | | |
| Long-term debt and credit facilities | | $ | 416.3 | | | $ | 190.0 | |
Scheduled future debt principal payments are as follows:
| | | | | | | | |
| (in millions) | | December 31, 2024 |
| 2025 | | $ | 98.7 | |
| 2026 | | 7.3 | |
| 2027 | | 77.2 | |
| 2028 | | 57.0 | |
| 2029 | | 274.8 | |
| | |
| Total | | $ | 515.0 | |
Our Revolving Credit Agreement (the “2022 Credit Facility”) provides borrowing capacity of $250.0 million and allows us to request an additional increase in total commitment by up to $150.0 million, for a total potential commitment of $400.0 million through November 2027. The 2022 Credit Facility also provides a sublimit of $100.0 million to be used for the issuance of letters of credit. Standby letters of credit under these agreements amounted to $0.4 million as of December 31, 2024 and 2023 and were primarily related to the requirements of certain of our real estate leases.
During the second quarter of 2024, we renewed our Receivables Purchase Agreement (the “2024 Receivables Purchase Agreement”), which allows us to borrow funds against qualifying trade receivables up to $200.0 million through May 2027, inclusive of a $100.0 million sublimit to be used for the issuance of letters of credit. Our previous agreement, the “2021 Receivables Purchase Agreement,” allowed us to borrow up to $150.0 million against qualifying trade receivables at rates based on the one-month Term SOFR and had a maturity date of July 2024. Borrowings under the 2024 Receivables Purchase Agreement were included within long-term debt and finance lease obligations as of December 31, 2024. As of December 31, 2023, borrowings under the 2021 Receivables Purchase Agreement were included within our current maturities of debt and
finance lease obligations due to the pending maturity date. As of December 31, 2024 and December 31, 2023, standby letters of credit under these agreements amounted to $97.8 million and $81.4 million, respectively, and were primarily related to the requirements of certain of our insurance obligations.
On August 30, 2023, SNL issued and sold $50.0 million in notes pursuant to the Private Shelf Agreement to certain affiliates of PGIM, Inc. (“Prudential”). The notes represent senior promissory notes of SNL, bear interest of 5.63% per year, are payable semiannually, and mature in August 2028.
On November 22, 2024, SNL entered into a new credit agreement with Bank of America as administrative agent, which is a delayed-draw term loan facility providing capacity up to $400.0 million. The borrowings are unsecured, are subject to interest over their term based on the either the Term SOFR rate or the ABR (Alternate Base Rate) at the election of the Company for each borrowing, and mature in November 2029. The amount outstanding under this agreement amounted to $300.0 million as of December 31, 2024. The Company has the option to draw an additional $100.0 million during the availability period which ends in August 2025. Quarterly principal payments of .625% of the outstanding balance will be due beginning September 2025 until the agreement matures in November 2029.
The credit agreements and the guaranty agreements related to the unsecured senior notes contain various financial and other covenants, including required minimum consolidated net worth, consolidated net debt, limitations on indebtedness, transactions with affiliates, shareholder debt, and restricted payments. The credit agreements and senior notes contain change of control provisions pursuant to which a change of control is defined to mean the Schneider family no longer owns more than 50% of the combined voting power of our capital shares. A change of control event causes an immediate termination of unused commitments under the credit agreements and requires repayment of all outstanding borrowings plus accrued interest and fees. The senior notes require us to provide notice to the note holders offering prepayment of the outstanding principal along with interest accrued to the date of prepayment. The prepayment date is required to be within 20 to 60 days from the date of notice.
As of December 31, 2024, the Company was in compliance with all financial covenants.
8. LEASES
As Lessee
We lease real estate and equipment under operating and finance leases. Our real estate operating leases include operating centers, distribution warehouses, offices, and drop yards. Our non-real estate operating leases and finance leases include transportation, office, yard, and warehouse equipment, in addition to truck washes. Most leases include an option to extend the lease, and a small number include an option to terminate the lease early, which may include a termination payment. If we are reasonably certain to exercise an option to extend a lease, the extension period is included as part of the right-of-use asset and lease liability.
For our real estate leases, we have elected to apply the recognition requirement to leases of twelve months or less; therefore, a lease right-of-use asset and liability will be recognized for all of these leases. For our equipment leases, we have elected to not apply the recognition requirements to leases of twelve months or less. These leases will be expensed on a straight-line basis, and no operating lease right-of-use asset or liability will be recorded.
We have also elected to not separate the different components within the contract for our leases; therefore, all fixed costs associated with the lease are included in the right-of-use asset and lease liability. This often relates to the requirement for us to pay a proportionate share of real estate taxes, insurance, common area maintenance, and other operating costs in addition to a base or fixed rent. Some of our leases have variable payment amounts, and the variable portions of those payments are excluded from the right-of-use asset and lease liability.
At the inception of our contracts, we determine if the contract is or contains a lease. A contract is or contains a lease if it conveys the right to control the use of an identified asset for a period of time in exchange for consideration. None of our leases contain restrictions or covenants that restrict us from incurring other financial obligations.
Right-of-use lease assets and liabilities are recognized based on the present value of the future lease payments over the term. Our incremental borrowing rates are used as the discount rates for leases and are determined based on U.S. Treasury rates plus an applicable margin. Schneider uses multiple discount rates based on lease terms.
In conjunction with our acquisition of M&M, the Company entered into nine related party leases. The leases are for the use of shop, warehouse, office, and drop yard locations throughout the country. The leases run through 2026 and the related lease payments are not material.
The following table presents our net lease costs for the years ended December 31, 2024, 2023, and 2022.
| | | | | | | | | | | | | | | | | | | | | | | | | | |
| | Financial Statement Classification | | Year Ended December 31, |
| (in millions) | | | 2024 | | 2023 | | 2022 |
| Operating lease cost | | | | | | | | |
| Operating lease cost | | Operating supplies and expenses—net | | $ | 38.3 | | | $ | 36.7 | | | $ | 32.9 | |
Short-term lease cost (1) | | Operating supplies and expenses—net | | 5.4 | | | 7.7 | | | 6.3 | |
| Finance lease cost | | | | | | | | |
| Amortization of right-of-use assets | | Depreciation and amortization | | 4.5 | | | 3.9 | | | 2.2 | |
| Interest on lease liabilities | | Interest expense | | 0.5 | | | 0.5 | | | 0.2 | |
| Variable lease cost | | Operating supplies and expenses—net | | 2.5 | | | 2.7 | | | 2.9 | |
| Sublease income | | Operating supplies and expenses—net | | (2.4) | | | (2.3) | | | (3.0) | |
| Total net lease cost | | | | $ | 48.8 | | | $ | 49.2 | | | $ | 41.5 | |
(1)Includes short-term lease costs for leases twelve months or less, including those with a duration of one month or less.
As of December 31, 2024 and 2023, remaining lease terms and discount rates under operating and finance leases were as follows:
| | | | | | | | | | | | | | |
| | December 31, 2024 | | December 31, 2023 |
| Weighted-average remaining lease term | | | | |
| Operating leases | | 3.6 years | | 3.8 years |
| Finance leases | | 2.8 years | | 3.2 years |
| | | | |
Weighted-average discount rate (1) | | | | |
| Operating leases | | 5.2 | % | | 5.0 | % |
| Finance leases | | 5.1 | % | | 5.0 | % |
(1)Determined based on a portfolio approach.
Additional information related to our leases is as follows:
| | | | | | | | | | | | | | | | | | | | |
| | Year Ended December 31, |
| (in millions) | | 2024 | | 2023 | | 2022 |
| Cash paid for amounts included in the measurement of lease liabilities | | | | | | |
| Operating cash flows for operating leases | | $ | 39.0 | | | $ | 36.7 | | | $ | 33.3 | |
| Operating cash flows for finance leases | | 0.5 | | | 0.5 | | | 0.2 | |
| Financing cash flows for finance leases | | 4.5 | | | 3.9 | | | 2.0 | |
| | | | | | |
| Right-of-use assets obtained in exchange for new lease liabilities | | | | | | |
| Operating leases | | $ | 30.6 | | | $ | 52.6 | | | $ | 23.7 | |
| Finance leases | | 0.9 | | | 5.8 | | | 6.8 | |
Operating lease right-of-use assets, current operating lease liabilities, and noncurrent operating lease liabilities are included in internal use software and other noncurrent assets, other current liabilities, and other noncurrent liabilities, respectively, in the consolidated balance sheets. Operating lease right-of-use assets were $79.0 million and $82.9 million as of December 31, 2024 and 2023, respectively. Impairment amounts were not significant for the years ended December 31, 2024, 2023, and 2022.
As of December 31, 2024, future lease payments under operating and finance leases were as follows:
| | | | | | | | | | | | | | |
| (in millions) | | Operating Leases | | Finance Leases |
| 2025 | | $ | 35.2 | | | $ | 4.1 | |
| 2026 | | 22.6 | | | 2.5 | |
| 2027 | | 13.4 | | | 1.4 | |
| 2028 | | 10.1 | | | 0.8 | |
| 2029 | | 6.1 | | | 0.2 | |
| 2030 and thereafter | | 4.6 | | | — | |
| Total | | 92.0 | | | 9.0 | |
| Amount representing interest | | (8.0) | | | (0.6) | |
| Present value of lease payments | | 84.0 | | | 8.4 | |
| Current maturities | | (31.9) | | | (3.8) | |
| Long-term lease obligations | | $ | 52.1 | | | $ | 4.6 | |
For certain of our real estate leases, there are options contained within the lease agreement to extend beyond the initial lease term. The Company recognizes options as right-of-use assets and lease liabilities when deemed reasonably certain to be exercised. Future operating lease payments as of December 31, 2024 include $0.7 million related to options to extend lease terms that we are reasonably certain to exercise.
As of December 31, 2024, we had leases that were signed but had not yet commenced totaling $0.1 million over their lease terms. These leases will commence in 2025 and have lease terms of one to two years.
The consolidated balance sheets include right-of-use assets acquired under finance leases as components of property and equipment as of December 31, 2024 and 2023. Real and other property under finance leases are being amortized to a zero net book value over the initial lease term.
| | | | | | | | | | | | | | |
| (in millions) | | December 31, 2024 | | December 31, 2023 |
| Transportation equipment | | $ | 7.4 | | | $ | 7.9 | |
| Real property | | 1.3 | | | 1.1 | |
| Other property | | 8.9 | | | 10.4 | |
| Accumulated amortization | | (9.6) | | | (7.7) | |
| Total | | $ | 8.0 | | | $ | 11.7 | |
As Lessor
We finance various types of transportation-related equipment for independent third parties under lease contracts which are generally for one to three years and accounted for as sales-type leases with fully guaranteed residual values. At the inception of the contracts, we determine if the contract is or contains a lease. A contract is or contains a lease if it conveys the right to control the use of an identified asset for a period of time in exchange for consideration. Our leases contain an option for the lessee to return, extend, or purchase the equipment at the end of the lease term for the guaranteed contract residual amount. This contract residual amount is estimated to approximate the fair value of the equipment. Lease payments primarily include base rentals and guaranteed residual values.
In addition, we also collect one-time administrative fees and heavy vehicle use tax on our leases. We have elected to not separate the different components within the contract as the administrative fees were not material for the years ended December 31, 2024, 2023, and 2022. We have also elected to exclude all taxes assessed by a governmental authority from the consideration (e.g., heavy vehicle use tax). All of our leases require fixed payments, therefore we have no variable payment provisions.
As of December 31, 2024 and 2023, investments in lease receivables were as follows:
| | | | | | | | | | | | | | |
| (in millions) | | December 31, 2024 | | December 31, 2023 |
| Future minimum payments to be received on leases | | $ | 166.2 | | | $ | 161.8 | |
| Guaranteed residual lease values | | 96.7 | | | 103.9 | |
| Total minimum lease payments to be received | | 262.9 | | | 265.7 | |
| Unearned income | | (44.5) | | | (42.2) | |
| Net investment in leases | | $ | 218.4 | | | $ | 223.5 | |
The amounts to be received on lease receivables as of December 31, 2024 were as follows:
| | | | | | | | |
| (in millions) | | December 31, 2024 |
| 2025 | | $ | 110.9 | |
| 2026 | | 82.8 | |
| 2027 | | 68.9 | |
| 2028 | | 0.3 | |
| | |
| | |
| Total undiscounted lease cash flows | | 262.9 | |
| Amount representing interest | | (44.5) | |
| Present value of lease receivables | | 218.4 | |
| Current lease receivables—net of allowance | | (85.3) | |
| Long-term lease receivable | | $ | 133.1 | |
Prior to entering a lease contract, we assess the credit quality of the potential lessee using credit checks and other relevant factors, ensuring that the inherent credit risk is consistent with our existing lease portfolio. Given our leases have fully guaranteed residual values and we can take possession of the transportation-related equipment in the event of default, we do not categorize net investment in leases by different credit quality indicators upon origination. We monitor our lease portfolio weekly by tracking amounts past due, days past due, and outstanding maintenance account balances, including performing subsequent credit checks as needed. Our net investment in leases with any portion past due as of December 31, 2024 was $65.5 million, which includes both current and future lease payments.
Lease payments on our lease receivables are generally due on a weekly basis and are classified as past due when the weekly payment is not received by its due date. As of December 31, 2024, our lease payments past due were $2.7 million.
Leases are generally placed on nonaccrual status (nonaccrual of interest and other fees) when a payment becomes 90 days past due or upon notification of bankruptcy, death, or other instances management concludes collectability is not reasonably assured. The accrual of interest and other fees resumes when all payments are less than 60 days past due.
The table below provides additional information on our sales-type leases. Revenue and cost of goods sold are recorded in operating revenues and operating supplies and expenses—net in the consolidated statements of comprehensive income, respectively.
| | | | | | | | | | | | | | | | | | | | |
| | Year Ended December 31, |
| (in millions) | | 2024 | | 2023 | | 2022 |
| Revenue | | $ | 234.5 | | | $ | 206.1 | | | $ | 195.0 | |
| Cost of goods sold | | (210.5) | | | (174.9) | | | (161.8) | |
| Operating profit | | $ | 24.0 | | | $ | 31.2 | | | $ | 33.2 | |
| | | | | | |
| Interest income on lease receivable | | $ | 32.0 | | | $ | 36.1 | | | $ | 37.0 | |
| | | | | | |
9. INCOME TAXES
The components of the provision for income taxes for the years ended December 31, 2024, 2023, and 2022 were as follows:
| | | | | | | | | | | | | | | | | | | | |
| (in millions) | | 2024 | | 2023 | | 2022 |
| Current: | | | | | | |
| Federal | | $ | 27.3 | | | $ | 15.2 | | | $ | 28.1 | |
| Foreign | | 0.5 | | | (10.1) | | | 15.8 | |
| State | | 3.5 | | | 6.7 | | | 19.3 | |
| | 31.3 | | | 11.8 | | | 63.2 | |
| Deferred: | | | | | | |
| Federal | | 3.6 | | | 47.7 | | | 82.8 | |
| State and other | | 0.3 | | | 8.1 | | | 0.2 | |
| | 3.9 | | | 55.8 | | | 83.0 | |
| Total provision for income taxes | | $ | 35.2 | | | $ | 67.6 | | | $ | 146.2 | |
For the year ended December 31, 2024, the foreign provision for income taxes is insignificant to our overall position. For the years ended December 31, 2023, and 2022, the foreign provision (benefit) for income taxes is primarily related to the tax impact on the sale of our Canadian facility.
The provision for income taxes for the years ended December 31, 2024, 2023, and 2022 differed from the amounts computed using the federal statutory rate in effect as follows:
| | | | | | | | | | | | | | | | | | | | | | | | | | | | | | | | | | | | | | |
| | 2024 | | 2023 | | 2022 |
| (in millions, except percentages) | | Dollar Impact | | Rate | | Dollar Impact | | Rate | | Dollar Impact | | Rate |
| Income tax at federal statutory rate | | $ | 32.0 | | | 21.0 | % | | $ | 64.3 | | | 21.0 | % | | $ | 126.8 | | | 21.0 | % |
| State tax—net of federal effect | | 3.0 | | | 2.0 | | | 13.8 | | | 4.5 | | | 15.4 | | | 2.6 | |
| Change in valuation allowance | | — | | | — | | | (10.7) | | | (3.5) | | | 10.7 | | | 1.8 | |
| Other—net | | 0.2 | | | 0.1 | | | 0.2 | | | 0.1 | | | (6.7) | | | (1.2) | |
| Total provision for income taxes | | $ | 35.2 | | | 23.1 | % | | $ | 67.6 | | | 22.1 | % | | $ | 146.2 | | | 24.2 | % |
The components of the net deferred tax liability included in deferred income taxes in the consolidated balance sheets as of December 31, 2024 and 2023 were as follows:
| | | | | | | | | | | | | | |
| (in millions) | | 2024 | | 2023 |
| Deferred tax assets: | | | | |
| Compensation and employee benefits | | $ | 8.3 | | | $ | 8.1 | |
| Operating lease liabilities | | 20.5 | | | 21.4 | |
| Federal credit carryforward | | 34.8 | | | — | |
| State net operating losses and credit carryforwards | | 15.0 | | | 10.5 | |
| | | | |
| Other | | 12.4 | | | 14.2 | |
| Total gross deferred tax assets | | 91.0 | | | 54.2 | |
| Valuation allowance | | (1.0) | | | (0.9) | |
| Total deferred tax assets—net of valuation allowance | | 90.0 | | | 53.3 | |
| Deferred tax liabilities: | | | | |
| Property and equipment | | 595.9 | | | 596.3 | |
| Prepaid expenses | | 7.5 | | | 6.8 | |
| Intangible assets | | 14.8 | | | 8.1 | |
| Operating lease right-of-use assets | | 19.0 | | | 19.6 | |
| Other | | 18.4 | | | 18.2 | |
| Total gross deferred tax liabilities | | 655.6 | | | 649.0 | |
| Net deferred tax liability | | $ | 565.6 | | | $ | 595.7 | |
Unrecognized Tax Benefits
Our unrecognized tax benefits as of December 31, 2024 would reduce the provision for income taxes if subsequently recognized. Accrued interest and penalties for such unrecognized tax benefits as of December 31, 2024 and 2023 were $2.6 million and $2.7 million, respectively. We expect no significant increases or decreases for unrecognized tax benefits during the twelve months immediately following the December 31, 2024 reporting date.
As of December 31, 2024, 2023, and 2022, a reconciliation of the beginning and ending unrecognized tax benefits, which is recorded as other noncurrent liabilities in the consolidated balance sheets, is as follows:
| | | | | | | | | | | | | | | | | | | | |
| (in millions) | | 2024 | | 2023 | | 2022 |
| Gross unrecognized tax benefits—beginning of year | | $ | 4.4 | | | $ | 6.0 | | | $ | 5.2 | |
| Gross increases—tax positions related to current year | | — | | | — | | | 1.0 | |
| Gross decreases—tax positions taken in prior years | | (0.4) | | | (0.5) | | | (0.2) | |
| Settlements | | — | | | (1.1) | | | — | |
| | | | | | |
| Gross unrecognized tax benefits—end of year | | $ | 4.0 | | | $ | 4.4 | | | $ | 6.0 | |
Tax Examinations
We file a U.S. federal income tax return, as well as income tax returns in a majority of state tax jurisdictions. We also file returns in foreign jurisdictions. The years 2021, 2022, and 2023 are open for examination by the IRS, and various years are open for examination by state and foreign tax authorities. In October 2024, the statute for 2020 expired. State and foreign jurisdictional statutes of limitations generally range from three to four years.
Carryforwards
As of December 31, 2024, we had $248.7 million of state net operating loss carryforwards which are subject to expiration from 2025 to 2045. We also had federal credit carryforwards of $34.8 million which are subject to expiration in 2044, state credit carryforwards of $2.0 million, which are subject to expiration from 2027 to 2049, and no capital loss carryforwards. The deferred tax assets related to carryforwards as of December 31, 2024 were $34.8 million for federal credit carryforwards, $13.3 million for state net operating loss carryforwards, and $1.7 million for state credit carryforwards. Carryforwards are reviewed
for recoverability based on historical taxable income, the expected reversals of existing temporary differences, tax-planning strategies, and projections of future taxable income. As of December 31, 2024, we carried a total valuation allowance of $0.9 million, which was against state deferred tax assets.
10. COMMON EQUITY
Earnings Per Share
The following table sets forth the computation of basic and diluted earnings per share for the years ended December 31, 2024, 2023, and 2022.
| | | | | | | | | | | | | | | | | | | | |
| | Year Ended December 31, |
| (in millions, except per share data) | | 2024 | | 2023 | | 2022 |
| Numerator: | | | | | | |
| Net income available to common shareholders | | $ | 117.0 | | | $ | 238.5 | | | $ | 457.8 | |
| | | | | | |
| Denominator: | | | | | | |
| Weighted average common shares outstanding | | 175.5 | | | 177.3 | | | 177.9 | |
| Dilutive effect of share-based awards and options outstanding | | 0.6 | | | 0.8 | | | 0.9 | |
Weighted average diluted common shares outstanding (1) | | 176.1 | | | 178.2 | | | 178.8 | |
| | | | | | |
| Basic earnings per common share | | $ | 0.67 | | | $ | 1.35 | | | $ | 2.57 | |
| Diluted earnings per common share | | 0.66 | | | 1.34 | | | 2.56 | |
(1) Weighted average diluted common shares outstanding may not sum due to rounding.
The calculation of diluted earnings per share excluded no share-based awards and options that had anti-dilutive effect for the year ended December 31, 2024. The calculation excluded 0.2 million and 0.3 million share-based awards and options that had an anti-dilutive effect for the years ended 2023 and 2022, respectively.
Common Shares Outstanding
As of December 31, 2024, 2023, and 2022, we had 83,029,500 shares of Class A common stock outstanding. There were no changes to the number of shares of Class A common stock outstanding for the years ended December 31, 2024, 2023, and 2022.
The following table shows changes to our Class B common shares outstanding for the years ended December 31, 2024, 2023, and 2022.
| | | | | | | | | | | | | | | | | | | | |
| | Year Ended December 31, |
| | 2024 | | 2023 | | 2022 |
| Outstanding at beginning of period | | 92,931,242 | | | 94,993,144 | | | 94,626,740 | |
| Repurchases of common stock | | (1,289,769) | | | (2,505,267) | | | — | |
| Share issuances | | 698,133 | | | 681,642 | | | 306,071 | |
| Exercise of employee stock options | | 137,235 | | | 6,000 | | | 150,692 | |
| Shares withheld for employee taxes | | (255,458) | | | (244,277) | | | (90,359) | |
| Outstanding at end of period | | 92,221,383 | | | 92,931,242 | | | 94,993,144 | |
| | | | | | |
| | | | | | |
| | | | | | |
| | | | | | |
| | | | | | |
| | | | | | |
| | | | | | |
| | | | | | |
| | | | | | |
| | | | | | |
| | | | | | |
| | | | | | |
| | | | | | |
| | | | | | |
In January 2023, our Board approved a share repurchase program under which the Company is authorized to repurchase up to $150.0 million of its Class A and/or Class B common shares. The program does not obligate the Company to repurchase a minimum number of shares and is intended to help offset the dilutive effect of equity grants to employees over time. Under this program, the Company may repurchase shares in privately negotiated and/or open market transactions. As of December 31, 2024, the Company had repurchased $95.5 million of the $150.0 million authorized under the repurchase program.
Capital Stock and Rights
Our common equity consists of 750.0 million authorized shares of Class B common stock, entitled to one vote per share, and 250.0 million authorized shares of Class A common stock, entitled to 10 votes per share. Our Class B common stock has traded on the NYSE under the symbol “SNDR” since our IPO in April 2017. Our Class A common stock is held by the Voting Trust for the benefit of members of the Schneider family. Each share of Class A common stock is convertible into one share of Class B common stock. Our Class B common stock is not convertible into any other shares of our capital stock. There is no public trading market for our Class A common stock.
Our Amended and Restated Articles of Incorporation provide that holders of our Class A and Class B common stock will be treated equally and ratably on a per share basis with respect to dividends, unless disparate treatment is approved in advance by the vote of the holders of a majority of the outstanding shares of our Class A and Class B common stock, each voting as a separate group.
In the event of a dissolution, liquidation, or winding up of the company, the holders of Class A and Class B common stock are entitled to share ratably in all assets and funds remaining after payment of liabilities, subject to prior distribution rights of preferred stock, if any, then outstanding, unless disparate treatment is approved in advance by the vote of the holders of a majority of the outstanding shares of our Class A and Class B common stock, each voting as a separate group.
Additionally, a total of 50.0 million shares of preferred stock is authorized, none of which is currently outstanding. The Company has no present plans to issue any preferred stock.
Dividends Declared
During 2024, 2023, and 2022, the Company declared cash dividends totaling $0.38, $0.36, and $0.32 per share, respectively.
Subsequent Event - Dividends Declared
In January 2025, our Board declared a quarterly cash dividend for the first fiscal quarter of 2025 in the amount of $0.095 per share to holders of our Class A and Class B common stock. The dividend is payable to shareholders of record at the close of business on March 14, 2025 and is expected to be paid on April 9, 2025.
11. EMPLOYEE BENEFIT PLANS
We sponsor defined contribution plans for certain eligible employees. Under these plans, annual contribution levels, as defined in the plan agreements, are based upon years of service. Expense under these plans totaled $12.8 million, $13.5 million, and $12.1 million in 2024, 2023, and 2022, respectively, and is classified in salaries, wages, and benefits in the consolidated statements of comprehensive income.
We also have a savings plan, organized pursuant to Section 401(k) of the Internal Revenue Code, to provide employees with additional income upon retirement. Under the terms of the plan, substantially all employees may contribute a percentage of their annual compensation, as defined, to the plan. We make contributions to the plan, up to a maximum amount per employee, based on a percentage of employee contributions. Our net expense under this plan was $14.1 million, $15.4 million, and $14.2 million in 2024, 2023, and 2022, respectively.
12. SHARE-BASED COMPENSATION
We grant various equity-based awards relating to Class B common stock to employees under our 2017 Omnibus Incentive Plan (“the Plan”). These awards have historically consisted of restricted shares, RSUs, performance-based restricted shares (“performance shares”), PSUs, and non-qualified stock options. Performance shares and PSUs granted prior to 2021 were earned based on attainment of threshold performance of earnings and return on capital targets. Beginning with grants in 2021, in addition to achievement of earnings and return on capital targets, a multiplier is applied to performance share and PSU achievement based on rTSR against peers over the performance period.
We account for our restricted shares, RSUs, performance shares, PSUs, and non-qualified stock options granted as equity awards in accordance with the applicable accounting standards for these types of share-based payments. These standards require that the cost of the awards be recognized in our consolidated financial statements based on the grant date fair value of those awards. This cost is recognized over the period for which an employee is required to provide service in exchange for the award, subject to the attainment of performance metrics established for performance shares and PSUs. Share-based compensation
expense is recorded in salaries, wages, and benefits in our consolidated statements of comprehensive income, along with other compensation expenses to employees.
The following table summarizes the components of our employee share-based compensation expense.
| | | | | | | | | | | | | | | | | | | | |
| | Year Ended December 31, |
| (in millions) | | 2024 | | 2023 | | 2022 |
| Restricted shares and RSUs | | $ | 13.7 | | | $ | 9.7 | | | $ | 5.7 | |
| Performance shares and PSUs | | (1.6) | | | 3.9 | | | 8.7 | |
| Non-qualified stock options | | 0.3 | | | 2.0 | | | 1.4 | |
| Share-based compensation expense | | $ | 12.4 | | | $ | 15.6 | | | $ | 15.8 | |
| Related tax benefit | | $ | 2.9 | | | $ | 3.5 | | | $ | 3.8 | |
As of December 31, 2024, we had $16.4 million of pre-tax unrecognized compensation cost related to outstanding share-based compensation awards expected to be recognized over a weighted average period of 1.7 years.
Restricted Shares and RSUs
Under the Plan, RSUs granted after 2023 vest ratably over a period of three years while the majority of the restricted shares and RSUs granted prior to 2023 vest ratably over a period of four years beginning approximately one year after the date of grant and are subject to continued employment through the vesting date or retirement eligibility. Dividend equivalents, equal to dividends paid on our common shares during the vesting period, are tracked and accumulated for each restricted share and RSU. The dividend equivalents are forfeitable and are distributed to participants in cash consistent with the date the awards vest.
| | | | | | | | | | | | | | |
| Restricted Shares and RSUs | | Number of Awards | | Weighted Average Grant Date Fair Value |
| Unvested on December 31, 2021 | | 679,259 | | | $ | 22.84 | |
Granted (1) | | 322,316 | | | 25.85 | |
| Vested | | (256,779) | | | 23.49 | |
| Forfeited | | (49,329) | | | 23.91 | |
| Unvested on December 31, 2022 | | 695,467 | | | 23.92 | |
Granted (1) | | 378,453 | | | 28.45 | |
| Vested | | (272,678) | | | 23.41 | |
| Forfeited | | (53,685) | | | 26.21 | |
| Unvested on December 31, 2023 | | 747,557 | | | 26.24 | |
Granted (1) | | 657,251 | | | 24.35 | |
| Vested | | (299,013) | | | 25.56 | |
| Forfeited | | (7,965) | | | 25.41 | |
| Unvested on December 31, 2024 | | 1,097,830 | | | $ | 25.30 | |
(1)No restricted shares were granted.
The grant date fair value of restricted shares and RSUs is determined using the closing share price of the Company on the date of grant.
Performance Shares and PSUs
Performance shares and PSUs cliff-vest at the end of a performance period of three years with vesting based on attainment of threshold performance of earnings and return on capital targets. These awards are subject to continued employment through the vesting date or retirement eligibility, with payout ranging from 0% - 200% of the target number of shares for both PSUs and performance shares. Awards granted since 2021 include an additional rTSR component that allows for payout ranging from 0% - 250% of the target number of shares. Dividend equivalents equal to dividends paid on our common shares during the vesting period are tracked and accumulated for each award. The dividend equivalents are forfeitable consistent with the date the awards vest and are distributed to participants in cash at the same time as the underlying shares.
| | | | | | | | | | | | | | |
| Performance Shares and PSUs | | Number of Awards | | Weighted Average Grant Date Fair Value |
| Unvested on December 31, 2021 | | 781,280 | | | $ | 23.39 | |
Granted (1) | | 224,455 | | | 28.32 | |
| Vested | | (304,794) | | | 22.04 | |
| Forfeited | | (97,942) | | | 24.23 | |
| Unvested on December 31, 2022 | | 602,999 | | | 25.77 | |
Granted (1) | | 237,886 | | | 31.60 | |
| Vested | | (310,648) | | | 24.43 | |
| Forfeited | | (129,682) | | | 26.40 | |
| Unvested on December 31, 2023 | | 400,555 | | | 30.07 | |
Granted (1) | | 302,841 | | | 26.77 | |
| Vested | | — | | | — | |
| Forfeited | | (185,954) | | | 28.30 | |
| Unvested on December 31, 2024 | | 517,442 | | | $ | 28.77 | |
(1)No performance shares were granted.
We estimate the grant date fair value of performance shares and PSUs containing a rTSR component using a Monte Carlo simulation which requires assumptions for expected term, volatility, dividend yield, and risk-free interest rate. We use the historical volatility of peers to derive the expected volatility of the stock. The risk-free interest rate is based on the U.S. Treasury yield curve in effect at the time of grant taking into consideration the expected term of the awards. No expected dividend yield is used as the award agreement assumes dividends distributed during the performance period are reinvested.
Assumptions used in the Monte Carlo simulation for awards granted in 2024, 2023, and 2022 were as follows:
| | | | | | | | | | | | | | | | | | | | | | | | |
| | |
| | 2024 | | 2023 | | 2022 | | | | |
| Weighted-average Monte Carlo value | | $ | 26.77 | | | $ | 31.60 | | | $ | 28.32 | | | | | |
| Monte Carlo assumptions: | | | | | | | | | | |
| Expected term | | 2.87 years | | 2.87 years | | 2.87 years | | | | |
| Expected volatility | | 35.7 | % | | 39.3 | % | | 45.3 | % | | | | |
| | | | | | | | | | |
| Risk-free interest rate | | 4.3 | | | 4.3 | | | 1.8 | | | | | |
Non-qualified Stock Options
The options granted under the Plan have an exercise price equal to the fair market value of the underlying stock at the date of grant and vest ratably over a period of four years, with the first 25% of the grant becoming exercisable approximately one year after the date of grant. The options expire ten years from the date of grant.
| | | | | | | | | | | | | | | | | | | | | | | | | | |
| Non-qualified Stock Options Outstanding | | Number of Awards | | Weighted Average Exercise Price | | Weighted Average Remaining Contractual Term
(in years) | | Aggregate Intrinsic Value (1)
(in thousands) |
| Outstanding on December 31, 2021 | | 948,664 | | | $ | 21.42 | | | 7.3 | | $ | 5,208 | |
| Granted | | 311,501 | | | 25.58 | | | | | |
Exercised (2) | | (150,692) | | | 22.65 | | | | | 467 | |
| Forfeited | | (70,830) | | | 22.92 | | | | | |
| Outstanding on December 31, 2022 | | 1,038,643 | | | 22.39 | | | 7.6 | | 1,794 | |
Granted (3) | | — | | | — | | | | | |
Exercised (2) | | (6,000) | | | 18.99 | | | | | 64 | |
| Forfeited | | (61,946) | | | 23.71 | | | | | |
| Outstanding on December 31, 2023 | | 970,697 | | | 22.33 | | | 5.8 | | 3,140 | |
Granted (3) | | — | | | — | | | | | |
Exercised (2) | | (137,235) | | | 19.03 | | | | | 1,203 | |
| Forfeited | | (53,080) | | | 24.12 | | | | | |
| Outstanding on December 31, 2024 | | 780,382 | | | $ | 22.79 | | | 5.8 | | $ | 5,070 | |
| | | | | | | | |
| Exercisable as of: | | | | | | | | |
| December 31, 2022 | | 402,945 | | | $ | 20.89 | | | 6.4 | | $ | 1,098 | |
| December 31, 2023 | | 630,171 | | | 21.48 | | | 4.9 | | 2,531 | |
| December 31, 2024 | | 599,535 | | | 22.24 | | | 5.5 | | 4,224 | |
(1)The aggregate intrinsic value was computed using the closing share price on December 31, 2024 of $29.28, December 30, 2023 of $25.45, and December 31, 2022 of $23.40, as applicable.
(2)Cash received upon exercise of stock options was $2.6 million in 2024, $0.1 million in 2023, and $3.4 million in 2022.
(3)No NQSOs were granted in 2023 and 2024.
| | | | | | | | | | | | | | |
| Unvested Non-qualified Stock Options | | Number of Awards | | Weighted Average Grant Date Fair Value |
| Unvested on December 31, 2021 | | 618,953 | | | $ | 6.34 | |
| Granted | | 311,501 | | | 7.32 | |
| Vested | | (223,926) | | | 6.75 | |
| Forfeited | | (70,830) | | | 6.55 | |
| Unvested on December 31, 2022 | | 635,698 | | | 6.65 | |
Granted (1) | | — | | | — | |
| Vested | | (233,226) | | | 6.59 | |
| Forfeited | | (61,946) | | | 6.64 | |
| Unvested on December 31, 2023 | | 340,526 | | | 6.69 | |
Granted (1) | | — | | | — | |
| Vested | | (159,679) | | | 6.54 | |
| Forfeited | | — | | | — | |
| Unvested on December 31, 2024 | | 180,847 | | | $ | 6.82 | |
(1)No NQSOs were granted during 2023 and 2024.
We estimate the grant date fair value of option awards using the Black-Scholes option pricing model which uses assumptions over the expected term of the options. We use volatility analysis of comparable companies to determine the expected volatility of the stock and market data to estimate option exercise and employee termination within the valuation model. The expected term of options granted is based on the average of the contractual term and the weighted average of the vesting term, and it represents the average period of time that options granted are expected to be outstanding. The risk-free rate for periods within the contractual life of the option is based on the U.S. Treasury yield curve in effect at the time of grant.
Assumptions used in calculating the Black-Scholes value of options granted during 2022 were as follows:
| | | | | | | | | | | | | | |
| | | |
| | | | | | 2022 |
| Weighted-average Black-Scholes value | | | | | | $ | 7.32 | |
| Black-Scholes assumptions: | | | | | | |
| Expected term | | | | | | 6.25 years |
| Expected volatility | | | | | | 30.0 | % |
| Expected dividend yield | | | | | | 1.2 | |
| Risk-free interest rate | | | | | | 2.1 | |
Director Share Awards and Deferred Stock Units
Equity awards are granted to each director annually on the date of our annual shareholder meeting and accounted for as equity based in accordance with applicable accounting standards for these types of share-based payments. Expense related to our director equity-based awards was $1.5 million in 2024, $1.4 million in 2023, and $1.4 million in 2022.
We also grant equity retainer awards, or shares in lieu of cash, on a quarterly basis to our non-employee directors. These awards consist of fully vested shares of our Class B common stock or DSUs. We account for the quarterly director share awards and DSUs as liability based in accordance with the applicable accounting standards for these types of share-based payments and remeasure the DSUs at the end of each reporting period through settlement. Expense related to our director liability-based awards was $1.2 million in 2024, $1.1 million in 2023, and $0.9 million in 2022.
13. COMMITMENTS AND CONTINGENCIES
In the ordinary course of conducting our business, we become involved in certain legal matters and investigations including liability claims, taxes other than income taxes, contract disputes, employment, and other litigation matters. We accrue for anticipated costs to resolve matters that are probable and estimable. We believe the outcomes of these matters will not have a material impact on our business or our consolidated financial statements.
We record liabilities for claims against the Company based on our best estimate of expected losses. The primary claims arising for the Company through its trucking, intermodal, and logistics operations consist of accident-related claims for personal injury, collision, and comprehensive compensation, in addition to workers’ compensation, property damage, cargo, and wage and benefit claims. We maintain excess liability insurance with licensed insurance carriers for liability in excess of amounts we self-insure, which serves to largely offset the Company’s liability associated with these claims, with the exception of wage and benefit claims for which we self-insure. We review our accruals periodically to ensure that the aggregate amounts of our accruals are appropriate at any period after consideration of available insurance coverage. Although we expect that our claims accruals will continue to vary based on future developments, assuming that we are able to continue to obtain and maintain excess liability insurance coverage for such claims, we do not anticipate that such accruals will, in any period, materially impact our operating results.
As of December 31, 2024, our firm commitments to purchase transportation equipment totaled $140.7 million.
During 2022, the Company recorded a $5.2 million charge as a result of adverse audit assessments by a state tax authority over the applicability of sales tax for prior periods on rolling stock equipment used within that state. The Company filed a request for appeal of the audit assessment with the state jurisdiction, and during the second quarter of 2023, a ruling was made in favor of the state resulting in an additional $2.9 million in interest and penalties being recorded by the Company to cover all periods audited. The Company filed a petition request with the state Appellate Tax Board in January 2024 covering periods at appeals. During the third quarter of 2024, the Company received an assessment for additional periods audited and filed a request for appeal of the assessment with the state jurisdiction. The adjustment recorded as a result of the audit, including additional interest and penalties, was not material. All assessments and related interest and penalties were recorded within operating supplies and expenses—net on the consolidated statements of comprehensive income.
A representative of the former owners of WSL filed a lawsuit alleging that we did not fulfill certain obligations under the purchase and sale agreement and claiming that the former owners of WSL were entitled to damages including an additional payment of $40.0 million under an earn-out arrangement. On April 25, 2022, the Delaware Superior Court entered judgment in favor of the former owners of WSL, awarding $40.0 million in compensatory damages, plus prejudgment interest and the former owners’ attorneys’ fees. The Company settled with the former owners of WSL for a total of $57.0 million, which is included within other general expenses on the consolidated statements of comprehensive income for the year ended December 31, 2022.
14. SEGMENT REPORTING
We have three reportable segments – Truckload, Intermodal, and Logistics – which are based primarily on the services each segment provides.
As of December 31, 2022, our three operating segments within the Truckload reportable segment were: VTL, Bulk, and MLS. As a result of expanding our dedicated business through recent acquisitions, in the fourth quarter of 2023, we reorganized the operating segments within Truckload into Dedicated, which includes MLS and M&M; Van Network; and Bulk. With the acquisition of Cowan Systems in December 2024, its truckload operations were added to Dedicated. The three operating segments are aggregated because they have similar economic characteristics with our other Truckload operating segments and meet the other aggregation criteria described in ASC 280. Dedicated provides truckload services primarily focused on freight with consistent routes often based on long-term contracts, Van Network which consists of irregular routes, and Bulk which delivers key inputs for manufacturing processes, such as specialty chemicals.
The Intermodal reportable segment provides rail intermodal and drayage services to our customers. Company-owned containers, chassis, and dray tractors are used to provide these transportation services.
The Company has two operating segments within the Logistics reportable segment - Brokerage and SCDM - which are aggregated because they have similar economic characteristics and meet the other aggregation criteria described in the accounting guidance for segment reporting. In the Logistics segment, we provide additional sources of truck capacity, manage transportation-systems analysis requirements for individual customers, and provide transloading and warehousing services.
We generate other revenues from our leasing and captive insurance businesses which are operated by wholly owned subsidiaries. Through November of 2022 and prior to executing a management buyout agreement to sell that business, the Company had operations in Asia that met the definition of an operating segment. None of these operations meet the quantitative reporting thresholds, and a result, the revenue is presented as other revenues in the tables below. Corporate and other (loss) income from operations-net in the tables below reflect expenses incidental to our operations and not attributable to any of the reportable segments and other allocated corporate costs.
In 2024, we adopted the guidance in ASC 280-10 as updated by ASU 2023-07, Improvements to Reportable Segment Disclosures, which requires companies to disclose their significant segment expenses that are regularly provided to the CODM, details of the composition of other segment items, and the title and position of the CODM along with an explanation how the CODM uses the reported measures in assessing segment performance and have restated prior periods to comply with the updated guidance.
Our segment revenues, major expenses, and income from operations are provided to and regularly reviewed by the CODM, which is the Company’s CEO. The CODM uses income from operations in the annual budgeting process, forecasting, and capital allocation strategy. Income from operations is compared to budgeted, forecasted, and prior period amounts to assess segment performance.
Separate balance sheets are not prepared by segment, and as a result, assets are not separately identifiable by segment. All transactions between reportable segments are eliminated in consolidation.
Substantially all of our revenues and assets were generated or located within the U.S.
The following tables summarize our segment information. Inter-segment revenues include revenues from insurance premiums charged to other segments for workers’ compensation, auto, and other types of insurance and were $104.7 million, $77.5 million and $73.5 million for the years ended December 31, 2024, 2023, and 2022, respectively.
| | | | | | | | | | | | | | | | | | | | | | | | | | |
| Segment Revenues and Expenses | | Year Ended December 31, 2024 |
(in millions) | | Truckload | | Intermodal | | Logistics | | Total |
| Revenues (excluding fuel surcharge) | | $ | 2,170.7 | | | $ | 1,041.2 | | | $ | 1,281.3 | | | $ | 4,493.2 | |
| Fuel surcharge revenues | | 392.1 | | | 183.7 | | | 6.7 | | | 582.5 | |
| Segment operating revenues | | 2,562.8 | | | 1,224.9 | | | 1,288.0 | | | 5,075.7 | |
| Other revenues | | | | | | | | 383.9 | |
| Elimination of inter-segment revenues | | | | | | | | (162.8) | |
| Elimination of inter-segment fuel surcharge revenues | | | | | | | | (6.3) | |
| Operating revenues | | | | | | | | 5,290.5 | |
| | | | | | | | |
| Salaries, wages, and benefits | | 941.4 | | | 176.3 | | | 100.5 | | | |
| Purchased transportation, fuel, and fuel taxes | | 631.3 | | | 784.3 | | | 1,031.2 | | | |
| Depreciation and amortization | | 304.0 | | | 53.3 | | | 0.1 | | | |
| Operating supplies and expenses-net | | 264.5 | | | 65.6 | | | 45.2 | | | |
Other segment expenses(1) | | 332.5 | | | 90.9 | | | 78.3 | | | |
| | | | | | | | |
| Segment income from operations | | $ | 89.1 | | | $ | 54.5 | | | $ | 32.7 | | | 176.3 | |
| Corporate and other loss from operations—net | | | | | | | | (11.1) | |
| Income from operations | | | | | | | | 165.2 | |
| | | | | | | | |
| Total other expenses—net | | | | | | | | 13.0 | |
| | | | | | | | |
| Income before income taxes | | | | | | | | $ | 152.2 | |
| | | | | | | | | | | | | | | | | | | | | | | | | | |
| Segment Revenues and Expenses | | Year Ended December 31, 2023 |
(in millions) | | Truckload | | Intermodal | | Logistics | | Total |
| Revenues (excluding fuel surcharge) | | $ | 2,155.7 | | | $ | 1,050.7 | | | $ | 1,393.7 | | | $ | 4,600.1 | |
| Fuel surcharge revenues | | 461.2 | | | 224.0 | | | 6.9 | | | 692.1 | |
| Segment operating revenues | | 2,616.9 | | | 1,274.7 | | | 1,400.6 | | | 5,292.2 | |
| Other revenues | | | | | | | | 333.4 | |
| Elimination of inter-segment revenues | | | | | | | | (118.9) | |
| Elimination of inter-segment fuel surcharge revenues | | | | | | | | (7.8) | |
| Operating revenues | | | | | | | | 5,498.9 | |
| | | | | | | | |
| Salaries, wages, and benefits | | 853.2 | | | 173.7 | | | 102.7 | | | |
| Purchased transportation, fuel, and fuel taxes | | 749.5 | | | 805.0 | | | 1,113.9 | | | |
| Depreciation and amortization | | 278.7 | | | 53.4 | | | 0.1 | | | |
| Operating supplies and expenses-net | | 232.9 | | | 66.0 | | | 51.6 | | | |
Other segment expenses(1) | | 331.9 | | | 105.6 | | | 86.4 | | | |
| | | | | | | | |
| Segment income from operations | | $ | 170.7 | | | $ | 71.0 | | | $ | 45.9 | | | 287.6 | |
| Corporate and other income from operations—net | | | | | | | | 8.8 | |
| Income from operations | | | | | | | | 296.4 | |
| | | | | | | | |
| Total other income—net | | | | | | | | (9.7) | |
| | | | | | | | |
| Income before income taxes | | | | | | | | $ | 306.1 | |
| | | | | | | | | | | | | | | | | | | | | | | | | | |
| Segment Revenues and Expenses | | Year Ended December 31, 2022 |
(in millions) | | Truckload | | Intermodal | | Logistics | | Total |
| Revenues (excluding fuel surcharge) | | $ | 2,236.6 | | | $ | 1,287.4 | | | $ | 1,956.2 | | | $ | 5,480.2 | |
| Fuel surcharge revenues | | 549.8 | | | 302.4 | | | 16.3 | | | 868.5 | |
| Segment operating revenues | | 2,786.4 | | | 1,589.8 | | | 1,972.5 | | | 6,348.7 | |
| Other revenues | | | | | | | | 364.0 | |
| Elimination of inter-segment revenues | | | | | | | | (102.3) | |
| Elimination of inter-segment fuel surcharge revenues | | | | | | | | (6.0) | |
| Operating revenues | | | | | | | | 6,604.4 | |
| | | | | | | | |
| Salaries, wages, and benefits | | 771.6 | | | 174.4 | | | 114.2 | | | |
| Purchased transportation, fuel, and fuel taxes | | 884.4 | | | 1,001.5 | | | 1,526.3 | | | |
| Depreciation and amortization | | 249.3 | | | 57.2 | | | 0.1 | | | |
| Operating supplies and expenses-net | | 216.9 | | | 71.9 | | | 96.7 | | | |
Other segment expenses(1) | | 312.0 | | | 119.7 | | | 94.0 | | | |
| | | | | | | | |
| Segment income from operations | | $ | 352.2 | | | $ | 165.1 | | | $ | 141.2 | | | 658.5 | |
| Corporate and other loss from operations—net | | | | | | | | (58.1) | |
| Income from operations | | | | | | | | 600.4 | |
| | | | | | | | |
| Total other income—net | | | | | | | | (3.6) | |
| | | | | | | | |
| Income before income taxes | | | | | | | | $ | 604.0 | |
(1)For each reportable segment, other segment expenses include insurance and related expenses and other general expenses.
ITEM 9. CHANGES IN AND DISAGREEMENTS WITH ACCOUNTANTS ON ACCOUNTING AND FINANCIAL DISCLOSURE
There have been no disagreements with accountants on accounting or financial disclosure matters.
ITEM 9A. CONTROLS AND PROCEDURES
Evaluation of Disclosure Controls and Procedures
Our management, including our Chief Executive Officer and Chief Financial Officer, has evaluated the effectiveness of our disclosure controls and procedures (as defined in Rules 13a-15(e) and 15d-15(e) under the Securities Exchange Act of 1934, as amended), as of the end of the period covered by this report. The Company’s disclosure controls and procedures are designed to ensure that information required to be disclosed by the Company in the reports that it files or submits under the Exchange Act is recorded, processed, summarized, and reported within the time periods specified in the SEC’s rules and forms, and that such information is accumulated and communicated to the Company’s management, including the Company’s Chief Executive Officer and Chief Financial Officer, to allow timely decisions regarding required disclosure. Based upon their evaluation, our Chief Executive Officer and Chief Financial Officer have concluded that our disclosure controls and procedures were effective as of the end of the period covered by this report.
Changes in Internal Control
There were no changes in our internal control over financial reporting (as defined in Rules 13a-15(f) and 15d-15(f) under the Securities Exchange Act of 1934, as amended) during the fiscal quarter ended December 31, 2024 that have materially affected, or are reasonably likely to materially affect, our internal control over financial reporting.
Management’s Report on Internal Control Over Financial Reporting
Our management is responsible for establishing and maintaining adequate internal control over financial reporting as defined in Rules 13a-15(f) under the Securities Exchange Act of 1934. Our internal control over financial reporting is a process designed under the supervision of the Company’s Chief Executive Officer and Chief Financial Officer to provide reasonable assurance regarding the reliability of financial reporting and the preparation of the Company’s consolidated financial statements for external purposes in accordance with GAAP.
Because of its inherent limitation, internal control over financial reporting may not prevent or detect misstatements. Therefore, even those systems determined to be effective can provide only reasonable assurance with respect to financial statement preparation and presentation.
Management assessed the effectiveness of our internal control over financial reporting as of December 31, 2024. In making this assessment, management used the criteria set forth by the Committee of Sponsoring Organizations of the Treadway Commission (“COSO”) in Internal Control – Integrated Framework (2013 Framework). Based on this assessment, management believes that as of December 31, 2024, our internal control over financial reporting was effective.
On December 2, 2024, we completed our acquisition of Cowan Systems and in accordance with SEC Staff guidance, which allows companies to exclude an acquired business from management’s assessment of the effectiveness of internal control over financial reporting in the year of acquisition, we have excluded Cowan Systems from our assessment of the effectiveness of internal control over financial reporting as of December 31, 2024.
The total assets of Cowan Systems constitute approximately 9.4% of the Company’s consolidated total assets as of December 31, 2024, while operating revenues since the acquisition date constitute approximately 0.9% of the Company’s total revenues for the year ended December 31, 2024. See Note 2, Acquisition, for additional information.
The effectiveness of internal control over financial reporting as of December 31, 2024, has been audited by Deloitte & Touche LLP, an independent registered public accounting firm that also audited our consolidated financial statements. Deloitte & Touche LLP’s attestation report on internal control over financial reporting is included herein.
ITEM 9B. OTHER INFORMATION
Rule 10b5-1 Trading Plans
During the three months ended December 31, 2024, no director or officer of the Company adopted or terminated a “Rule 10b5-1 trading arrangement” or “non-Rule 10b5-1 trading arrangement,” as each term is defined in Item 408(a) of Regulation S-K.
ITEM 9C. DISCLOSURE REGARDING FOREIGN JURISDICTIONS THAT PREVENT INSPECTIONS
Not applicable.
PART III
ITEM 10. DIRECTORS, EXECUTIVE OFFICERS, AND CORPORATE GOVERNANCE
Except for the information concerning our executive officers and our Code of Conduct below, the information required by Item 10 is incorporated herein by reference to the information set forth under the captions “Election of Directors,” “Corporate Governance,” and “Delinquent Section 16(a) Reports” in our definitive proxy statement for our 2025 Annual Meeting of Shareholders (the “Proxy Statement”), which will be filed with the SEC no later than 120 days after the close of the fiscal year ended December 31, 2024.
Our Board has adopted a Code of Conduct applicable to all employees, and a Code of Ethics for CEO and Senior Financial Officers that applies to our Chief Executive Officer, Chief Financial Officer, Chief Accounting Officer, and other persons performing similar functions. We have posted a copy of our Code of Conduct and Code of Ethics for CEO and Senior Financial Officers on the “Investors - Governance” section of our website at www.schneider.com. We intend to satisfy the disclosure requirements under Item 5.05 of Form 8-K regarding amendments to, or waivers from, the Code of Conduct and Code of Ethics for CEO and Senior Financial Officers by posting such information on the “Investors” section of our website at www.schneider.com. We are not including the information contained on our website as part of, or incorporating it by reference into, this report.
Information About Our Executive Officers
Our executive officers as of February 21, 2025, together with their ages, positions, and business experience are below:
| | | | | | | | | | | | | | |
| Name | | Age | | Position |
| Mark B. Rourke | | 60 | | President, Chief Executive Officer and Director |
| Darrell G. Campbell | | 46 | | Executive Vice President, Chief Financial Officer |
| Shaleen Devgun | | 52 | | Executive Vice President, Chief Innovation & Technology Officer |
| James Filter | | 54 | | Executive Vice President, Group President of Transportation & Logistics |
| Angela Fish | | 53 | | Executive Vice President, Human Resources |
| Thomas G. Jackson | | 59 | | Executive Vice President, General Counsel & Corporate Secretary |
| Robert Reich | | 58 | | Executive Vice President, Chief Administrative Officer |
| | | | |
Mark B. Rourke has served as our President and Chief Executive Officer, and as a Director, since April 2019. Prior to serving as our Chief Executive Officer, Mr. Rourke served as Executive Vice President and Chief Operating Officer and held various other roles within Schneider including President of our Truckload Services Division and General Manager of Schneider Transportation Management, where he was responsible for the effective delivery to market of sole source, promotional, and brokerage service offerings. Mr. Rourke held a variety of other leadership roles at Schneider with increasing responsibility including Vice President of Customer Service, Director of Transportation Planning for Customer Service, Midwest Area Service Manager for Customer Service, and Director of Driver Training. Mr. Rourke joined our company in 1987, holds a bachelor’s degree in marketing from the University of Akron, Ohio, and has attended programs on corporate governance and strategic leadership at Harvard University. He currently serves on the Board for The Shyft Group, the Trucking Alliance, and the Green Bay Packers.
Darrell G. Campbell has served as our Executive Vice President and Chief Financial Officer since September 2023. Prior to joining Schneider, Mr. Campbell served as Group Vice President of Strategy and Finance for JM Family Enterprises, Inc. since 2022. Previously, he served as the Chief Financial Officer for Carnival Cruise Line from 2021 to 2022 and Corporate Treasurer of Carnival Corporation & plc from 2017 to 2021. Mr. Campbell also spent 14 years at PricewaterhouseCoopers LLP through 2017, including serving as an audit partner. Campbell is a licensed certified public accountant. He holds a bachelor’s degree in accounting and management from the University of the West Indies, as well as master’s degrees in international business from the University of Florida, and in accounting from Florida International University.
Shaleen Devgun has served as Executive Vice President, Chief Innovation and Technology Officer since 2022. Prior to serving
as our Chief Innovation and Technology Officer, Mr. Devgun served as our Chief Information Officer from 2015 through 2021, as well as Vice President for Strategy, Planning, and Solution Delivery. Before joining Schneider in 2009, he spent 12 years in management consulting roles with DiamondCluster International and Deloitte, specializing in corporate venturing, formulation and execution of business and technology strategy, program leadership, and operational design. Mr. Devgun holds bachelor’s degrees in economics and math from the University of Pune and a master’s degree in business administration from the
University of Detroit Mercy. He also serves as chief advisor to TitletownTech, a venture fund founded by the Green Bay Packers and Microsoft Corporation.
James Filter has served as our Executive Vice President, Group President of Transportation and Logistics since April 2022. Prior to assuming his current role, Mr. Filter served as Senior Vice President and General Manager of Intermodal from 2015 to 2021 when his responsibilities were expanded to include accountabilities as Chief Commercial Officer. Mr. Filter joined our company in 1998 having previously worked at United Parcel Service (UPS) and served in the U.S. Marine Corps. He holds a bachelor’s degree from the University of Wisconsin-Green Bay and a master’s degree in business administration from Wayne State University. He currently serves on the Board for Family Services of Northeast Wisconsin.
Angela Fish has served as Executive Vice President, Human Resources since March 2022. Prior to being promoted to that role, Ms. Fish served as Senior Vice President of Human Resources since 2019. Ms. Fish joined Schneider in 1996 and during her tenure has held senior leadership roles across the human resources, benefits, and compensation areas. Prior to joining Schneider, Ms. Fish worked at the University of Michigan. She holds a business degree from Northern Michigan University and locally serves on the Board of the Greater Green Bay YMCA.
Thomas G. Jackson has served as Executive Vice President, General Counsel and Corporate Secretary since July 2019. Prior to joining Schneider, Mr. Jackson served as Senior Vice President, Secretary, and General Counsel of Knowles Corporation from 2014 to 2019. Prior to joining Knowles, Mr. Jackson served as Vice President and Assistant General Counsel at Jabil Circuit, Inc. from March 2012 to December 2013. In addition, he served as Vice President, General Counsel, and Secretary at P.H. Glatfelter Company from June 2008 to November 2011, and as its Assistant General Counsel, Assistant Secretary, and Director of Compliance from September 2006 to June 2008. Mr. Jackson holds both a juris doctor and a master of business administration from Villanova University, and a bachelor of science degree in mechanical engineering from Drexel University.
Robert Reich has served as our Executive Vice President and Chief Administrative Office since April 2019. Prior to serving as our Chief Administrative Officer, Mr. Reich served as Senior Vice President, Equipment, Maintenance, and Driver Development from 2014 through 2019, as well as other senior leadership roles at Schneider across the maintenance, human resources, driver development and training, and safety areas. Before joining Schneider, Mr. Reich served as an officer in the U.S. Army and was a member of the 1st Cavalry Division at Fort Hood. He holds a bachelor’s degree in electrical engineering from Pennsylvania State University and a master’s degree in business administration from the University of Wisconsin-Oshkosh. He also serves as the Chair for the Board of the North American Council for Freight Efficiency.
ITEM 11. EXECUTIVE COMPENSATION
The information required by Item 11 is incorporated herein by reference to the information set forth under the captions “Corporate Governance - Compensation Committee Interlocks and Insider Participation,” “Compensation of Directors,” “Compensation Discussion and Analysis,” “Compensation Committee Report,” and “Executive Compensation Tables and Narrative” in the Proxy Statement, which will be filed with the SEC no later than 120 days after the close of the fiscal year ended December 31, 2024.
ITEM 12. SECURITY OWNERSHIP OF CERTAIN BENEFICIAL OWNERS AND MANAGEMENT AND RELATED STOCKHOLDER MATTERS
Equity Compensation Plan Information
The following table summarizes share and exercise price information about our equity compensation plans as of December 31, 2024. All of our equity compensation plans pursuant to which grants are currently being made have been approved by our shareholders.
| | | | | | | | | | | | | | | | | | | | |
| Plan Category | | Number of Securities to be Issued Upon Exercise of Outstanding Options, Warrants, and Rights | | Weighted Average Exercise Price of Outstanding Options, Warrants, and Rights (1) | | Number of Securities Remaining Available for Future Issuance Under Equity Compensation Plans (Excluding Securities Reflected in the First Column) |
| Equity compensation plans approved by security holders | | 2,212,996 | | | $ | 22.79 | | | 2,530,065 | |
| Equity compensation plans not approved by security holders | | — | | | — | | | — | |
| Total | | 2,212,996 | | | $ | 22.79 | | | 2,530,065 | |
(1)The calculation of the weighted average exercise price includes only stock options and does not include the outstanding deferred stock units, restricted stock units, and performance-based restricted stock units reflected in the first column.
The remaining information required by Item 12 is incorporated herein by reference to the information set forth under the caption “Information Regarding Beneficial Ownership of Principal Shareholders, the Board, and Management” in the Proxy Statement, which will be filed with the SEC no later than 120 days after the close of the fiscal year ended December 31, 2024.
ITEM 13. CERTAIN RELATIONSHIPS AND RELATED TRANSACTIONS AND DIRECTOR INDEPENDENCE
The information required by Item 13 is incorporated herein by reference to the information set forth under the caption “Corporate Governance” in the Proxy Statement, which will be filed with the SEC no later than 120 days after the close of the fiscal year ended December 31, 2024.
ITEM 14. PRINCIPAL ACCOUNTING FEES AND SERVICES
The information required by Item 14 is incorporated herein by reference to the information set forth under the caption “Ratification of Appointment of Independent Registered Public Accounting Firm” in the Proxy Statement, which will be filed with the SEC no later than 120 days after the close of the fiscal year ended December 31, 2024.
PART IV
ITEM 15. EXHIBITS AND FINANCIAL STATEMENT SCHEDULES
(1) Financial Statements
Our consolidated financial statements are included in Part II, Item 8, above.
(2) Financial Statement Schedules
Schedule II - Valuation and Qualifying Accounts (in millions)
| | | | | | | | | | | | | | | | | | | | | | | | | | |
| Allowance for Doubtful Accounts and Revenue Adjustments for the Year Ended | | Balance at Beginning of Year | | Charged (Credited) to Expense/Against Revenue | | Write-offs—Net of Recoveries | | Balance at
End of Year |
| December 31, 2022 | | $ | 5.2 | | | $ | 10.6 | | | $ | (2.1) | | | $ | 13.7 | |
| December 31, 2023 | | 13.7 | | | 7.9 | | | (6.6) | | | 15.0 | |
| December 31, 2024 | | 15.0 | | | (4.6) | | | (3.1) | | | 7.3 | |
All other schedules have been omitted either because they are not applicable or because the required information is included in our consolidated financial statements or the notes thereto.
(3) Exhibits
| | | | | | | | | | | | | | | | | | | | | | | | | | | | | | | | |
| | | | Incorporated by Reference Herein |
Exhibit
Number | | Exhibit Description | | Form | | Exhibit | | File No. | | Filing Date |
| 3.1 | | | | 8-K | | 3.1 | | 001-38054 | | 4/12/2017 |
| 3.2 | | | | 8-K/A | | 3.1 | | 001-38054 | | 1/16/2025 |
| 4.1 | | | | 10-K | | 4.1 | | 001-38054 | | 2/23/2024 |
| 9.1 | | | | S-1 | | 9.1 | | 333-215244 | | 12/22/2016 |
| 9.2 | | | | 10-K | | 9.2 | | 001-38054 | | 2/27/2018 |
| 10.2 | | | | S-1/A | | 10.3 | | 333-215244 | | 2/3/2017 |
| 10.3 | | | | S-1/A | | 10.4 | | 333-215244 | | 2/3/2017 |
| 10.4 | | Joinder and Amendment No. 2, dated as of September 5, 2018, to Amended and Restated Purchase Agreement dated as of March 31, 2011, as amended as of December 17, 2013, among Schneider Receivables Corporation, as seller, Schneider National, Inc., as the servicer, Wells Fargo Bank, N.A., as administrative agent, and the purchasers party thereto | | 8-K | | 10.1 | | 001-38054 | | 9/6/2018 |
| 10.5 | | | | S-1 | | 10.6 | | 333-215244 | | 12/22/2016 |
| 10.6 | | | | 10-K | | 10.6 | | 001-38054 | | 2/17/2023 |
| | | | | | | | | | | | | | | | | | | | | | | | | | | | | | | | |
| 10.7 | | Registration Rights Agreement, dated April 11, 2017, by and among Schneider National, Inc., Mary P. DePrey, Therese A. Koller, Paul J. Schneider, Thomas J. Schneider, Kathleen M. Zimmermann, the Donald J. Schneider Childrens Trust #1 f/b/o Mary P. DePrey, the Donald J. Schneider Childrens Trust #2 f/b/o Mary P. DePrey, the Donald J. Schneider Childrens Trust #1 f/b/o Paul J. Schneider, the Donald J. Schneider Childrens Trust #2 f/b/o Paul J. Schneider, the Donald J. Schneider Childrens Trust #1 f/b/o Therese A. Koller, the Donald J. Schneider Childrens Trust #2 f/b/o Therese A. Koller, the Donald J. Schneider Childrens Trust #1 f/b/o Thomas J. Schneider, the Donald J. Schneider Childrens Trust #2 f/b/o Thomas J. Schneider, the Donald J. Schneider Childrens Trust #1 f/b/o Kathleen M. Zimmermann, the Donald J. Schneider Childrens Trust #2 f/b/o Kathleen M. Zimmermann, the Donald J. Schneider 2000 Trust f/b/o Mary P. DePrey, the Donald J. Schneider 2000 Trust f/b/o Therese A. Koller, the Donald J. Schneider 2000 Trust f/b/o Paul J. Schneider, the Donald J. Schneider 2000 Trust f/b/o Thomas J. Schneider, the Donald J. Schneider 2000 Trust f/b/o Kathleen M. Zimmermann, the Paul J. Schneider 2011 Trust, the Mary P. DePrey 2011 Trust, the Therese A. Koller 2011 Trust and the Kathleen M. Zimmermann 2011 Trust | | 8-K | | 4.1 | | 001-38054 | | 4/12/2017 |
| 10.8+ | | | | S-1/A | | 10.9 | | 333-215244 | | 3/7/2017 |
| 10.9+ | | | | S-1/A | | 10.10 | | 333-215244 | | 3/7/2017 |
| 10.10+ | | | | S-1/A | | 10.13 | | 333-215244 | | 3/7/2017 |
| 10.11+ | | | | S-1/A | | 10.14 | | 333-215244 | | 3/7/2017 |
| 10.12+ | | | | S-1/A | | 10.18 | | 333-215244 | | 3/7/2017 |
| 10.14+ | | | | S-1/A | | 10.22 | | 333-215244 | | 3/7/2017 |
| 10.15+ | | | | S-1/A | | 10.23 | | 333-215244 | | 3/7/2017 |
| 10.16+ | | | | 10-K | | 10.16 | | 001-38054 | | 2/17/2023 |
| 10.17+ | | | | S-1/A | | 10.25 | | 333-215244 | | 3/7/2017 |
| 10.18+ | | | | S-1/A | | 10.26 | | 333-215244 | | 3/7/2017 |
| 10.19+ | | | | S-1/A | | 10.27 | | 333-215244 | | 3/7/2017 |
| 10.20+ | | | | S-1/A | | 10.28 | | 333-215244 | | 3/7/2017 |
| 10.21+ | | | | S-1/A | | 10.29 | | 333-215244 | | 3/7/2017 |
| 10.22+ | | | | S-1/A | | 10.30 | | 333-215244 | | 3/7/2017 |
| 10.24+ | | | | 10-Q | | 10.5 | | 001-38054 | | 4/30/2018 |
| 10.25+ | | | | 10-Q | | 10.6 | | 001-38054 | | 4/30/2018 |
| 10.26+ | | | | 10-Q | | 10.7 | | 001-38054 | | 4/30/2018 |
| 10.27+ | | | | 10-Q | | 10.1 | | 001-38054 | | 4/29/2021 |
| 10.28+ | | | | 10-Q | | 10.2 | | 001-38054 | | 4/29/2021 |
| 10.29+ | | | | 10-Q | | 10.3 | | 001-38054 | | 4/29/2021 |
| 10.30+ | | | | 10-Q | | 10.4 | | 001-38054 | | 4/29/2021 |
| | | | | | | | | | | | | | | | | | | | | | | | | | | | | | | | |
| 10.31+ | | | | 10-Q | | 10.5 | | 001-38054 | | 4/29/2021 |
| 10.32 | | Amendment No. 3 to Amended and Restated Receivables Purchase Agreement dated as of March 31, 2011, as amended as of December 17, 2013 and as further amended and restated as of September 5, 2018, among Schneider Receivables Corporation, as seller, Schneider National, Inc., as the servicer, Wells Fargo Bank, N.A., as administrative agent, and the purchasers party thereto | | 8-K | | 10.1 | | 001-38054 | | 8/2/2021 |
| 10.33+ | | | | 10-Q | | 10.1 | | 001-38054 | | 4/29/2022 |
| 10.34+ | | | | 10-Q | | 10.2 | | 001-38054 | | 4/29/2022 |
| 10.35+ | | | | 10-Q | | 10.3 | | 001-38054 | | 4/29/2022 |
| 10.36+ | | | | 10-Q | | 10.4 | | 001-38054 | | 4/29/2022 |
| 10.37+ | | | | 10-Q | | 10.1 | | 001-38054 | | 7/28/2022 |
| 10.38 | | | | 8-K | | 10.1 | | 001-38054 | | 11/7/2022 |
| 10.39+ | | | | 10-Q | | 10.1 | | 001-38054 | | 4/27/2023 |
| 10.40+ | | | | 10-Q | | 10.2 | | 001-38054 | | 4/27/2023 |
| 10.41+ | | | | 10-Q | | 10.3 | | 001-38054 | | 4/27/2023 |
| 10.42+ | | | | 10-Q | | 10.4 | | 001-38054 | | 4/27/2023 |
| 10.43 | | Amendment No. 4, dated as of June 1, 2023, to Amended and Restated Receivables Purchase Agreement, dated as of March 31, 2011, as amended as of December 17, 2013, as amended and restated as of September 5, 2018, and as further amended on July 30, 2021, among Schneider Receivables Corporation, as seller, Schneider National, Inc., as the servicer, Wells Fargo Bank, N.A., as administrative agent, and the purchasers party thereto | | 8-K | | 10.1 | | 001-38054 | | 6/7/2023 |
| 10.44+ | | | | 8-K | | 10.1 | | 001-38054 | | 7/18/2023 |
| 10.45 | | | | 8-K | | 10.1 | | 001-38054 | | 9/1/2023 |
| 10.46 | | | | 8-K | | 10.2 | | 001-38054 | | 9/1/2023 |
| 10.47 | | | | 8-K | | 10.3 | | 001-38054 | | 9/1/2023 |
| 10.48 | | Form of Parent Guaranty Agreement (included in Exhibit 10.45) | | 8-K | | 10.1 | | 001-38054 | | 9/1/2023 |
| 10.49 | | Form of Note (included in Exhibit 10.45) | | 8-K | | 10.1 | | 001-38054 | | 9/1/2023 |
| 10.50 | | Amendment No. 5, dated May 29, 2024, to Amended and Restated Receivables Purchase Agreement dated as of March 31, 2011, as amended and restated as of September 5, 2018, and as further amended on July 30, 2021 and June 1, 2023, among Schneider Receivables Corporation, as seller, Schneider National, Inc., as the servicer, Wells Fargo Bank, N.A., as administrative agent, and the purchasers party thereto. | | 8-K | | 10.1 | | 001-38054 | | 5/31/2024 |
| 10.51 | | | | 8-K | | 10.1 | | 001-38054 | | 11/25/2024 |
| | | | | | | | | | | | | | | | | | | | | | | | | | | | | | | | |
| 19.1 | | | | 10-K | | 19 | | 001-38054 | | 2/23/2024 |
| 19.2* | | | | | | | | | | |
| 21.1* | | | | | | | | | | |
| 23.1* | | | | | | | | | | |
| 31.1* | | | | | | | | | | |
| 31.2* | | | | | | | | | | |
| 32.1** | | | | | | | | | | |
| 32.2** | | | | | | | | | | |
| 97 | | | | 10-K | | 97 | | 001-38054 | | 2/23/2024 |
| 101.INS* | | XBRL Instance Document - The instance document does not appear in the interactive data file because its XBRL tags are embedded within the Inline XBRL document. | | | | | | | | |
| 101.SCH* | | XBRL Taxonomy Extension Schema Document | | | | | | | | |
| 101.CAL* | | XBRL Taxonomy Calculation Linkbase Document | | | | | | | | |
| 101.DEF* | | XBRL Taxonomy Extension Definition Linkbase Document | | | | | | | | |
| 101.LAB* | | XBRL Taxonomy Extension Labels Linkbase Document | | | | | | | | |
| 101.PRE* | | XBRL Taxonomy Extension Presentation Linkbase Document | | | | | | | | |
| 104* | | The cover page from the Company's Annual Report on Form 10-K for the year ended December 31, 2023, formatted in Inline XBRL. | | | | | | | | |
* Filed herewith.
** Furnished herewith.
+ Constitutes a management contract or compensatory plan or arrangement.
ITEM 16. FORM 10-K SUMMARY
Not applicable.
SIGNATURES
Pursuant to the requirements of Section 13 or 15(d) of the Securities Exchange Act of 1934, the registrant has duly caused this report to be signed on its behalf by the undersigned, thereunto duly authorized. | | | | | | | | |
| | |
| | SCHNEIDER NATIONAL, INC. |
| | |
| Date: | February 21, 2025 | /s/ Mark B. Rourke |
| | Mark B. Rourke |
| | President and Chief Executive Officer |
| | (Principal Executive Officer) |
Pursuant to the requirements of the Securities Exchange Act of 1934, this report has been signed below by the following persons on behalf of the registrant and in the capacities indicated on February 21, 2025. | | | | | | | | |
| | |
| Signature | | Title |
| | |
| /s/ James L. Welch | | |
| James L. Welch | | Chairman of the Board of Directors |
| /s/ Jyoti Chopra | | |
| Jyoti Chopra | | Director |
| /s/ Mary De Prey | | |
| Mary De Prey | | Director |
| /s/ James R. Giertz | | |
| James R. Giertz | | Director |
| /s/ Robert W. Grubbs | | |
| Robert W. Grubbs | | Director |
| /s/ Robert M. Knight, Jr. | | |
| Robert M. Knight, Jr. | | Director |
| /s/ Mark B. Rourke | | |
| Mark B. Rourke | | Director |
| /s/ Julie Streich | | |
| Julie Streich | | Director |
| /s/ John A. Swainson | | |
| John A. Swainson | | Director |
| /s/ Kathleen Zimmerman | | |
| Kathleen Zimmerman | | Director |
| | |
| | |
| /s/ Mark B. Rourke | | |
| Mark B. Rourke | | President and Chief Executive Officer (Principal Executive Officer) |
| | |
| /s/ Darrell G. Campbell | | |
| Darrell G. Campbell | | Executive Vice President and Chief Financial Officer (Principal Financial Officer) |
| | |
| /s/ Shelly A. Dumas-Magnin | | |
| Shelly A. Dumas-Magnin | | Vice President and Controller (Principal Accounting Officer) |