
Exhibit 99.3 rd 2021 3 Quarter Earnings Conference Call November 9, 2021

PARTICIPANTS JOHN HESTER KAREN HALLER GREG PETERSON JUSTIN BROWN KEN KENNY PRESIDENT AND CEO EVP/CHIEF LEGAL/ADMIN OFFICER SVP/CFO SVP/GENERAL COUNSEL VP/FINANCE/TREASURER SOUTHWEST GAS HOLDINGS SOUTHWEST GAS HOLDINGS SOUTHWEST GAS HOLDINGS SOUTHWEST GAS CORPORATION SOUTHWEST GAS HOLDINGS November 9, 2021 2

SAFE HARBOR STATEMENT This presentation includes “forward-looking statements” as defined by the Securities and Exchange Commission (“SEC”). We make these forward-looking statements in reliance on the safe harbor protections provided under the Private Securities Litigation Reform Act of 1995. All statements, other than statements of historical facts, included in this presentation that address activities, events or developments that we expect, believe or anticipate will or may occur in the future are forward-looking statements. These include, without limitation, our 2021 expectations for our utility infrastructure services and natural gas operations segments, estimated natural gas operations capital expenditures through 2025, projected rate base at December 31, 2025, our 2021 adjusted EPS guidance and expected long-term value drivers, as well as statements regarding our expansion projects and other investment opportunities. Our adjusted EPS guidance excludes any impacts of the planned acquisition of Questar Pipelines, activism response, and the partial-year results (and associated transaction and interest costs) in connection with the Riggs Distler acquisition. Forward-looking statements are based on assumptions which we believe are reasonable, based on current expectations and projections about future events and industry conditions and trends affecting our business. However, whether actual results and developments will conform to our expectations and predictions are subject to a number of risks and uncertainties that, among other things, could cause actual results to differ materially from those contained in the forward-looking statements, including without limitation, the risk factors described in Part I, Item 1A “Risk Factors,” and Part II, Item 7 and Item 7A “Management’s Discussion and Analysis of Financial Condition and Results of Operations,” and “Quantitative and Qualitative Disclosure about Market Risk” of our most recent Annual Report on Form 10-K and our quarterly report on Form 10-Q for the three months ended September 30, 2021 filed with the SEC, and other reports that we file with the SEC from time to time, and the following: ▪ The timing and amount of rate relief; ▪ Changes in operating expenses; ▪ Changes in rate design, infrastructure tracking mechanisms; ▪ Customer growth rates; ▪ Conditions in housing markets; ▪ The effects of regulation/deregulation; ▪ The impacts of construction activity at our utility infrastructure services segment; ▪ The impacts from acquisitions; ▪ The impacts of the ongoing COVID-19 pandemic and efforts to prevent its spread on our business; ▪ The impacts of stock market volatility; and ▪ Other factors discussed from time to time in our filings with the SEC. New factors that could cause actual results to differ materially from those described in forward-looking statements emerge from time to time, and it is not possible for us to predict all such factors, or the extent to which any such factor or combination of factors may cause actual results to differ from those contained in any forward-looking statement. The statements in this presentation are made as of the date hereof, even if subsequently made available on our Web site or otherwise. We do not assume any obligation to update the forward-looking statements provided to reflect events that occur or circumstances that exist after the date on which they were made. November 9, 2021 3
Highlights and Investment Thesis Financial Results – September 30, 2021 Regulation OUTLINE Customer Growth Liquidity and Capital Expenditures Dividend and Rate Base Growth 2021 Expectations November 9, 2021 4
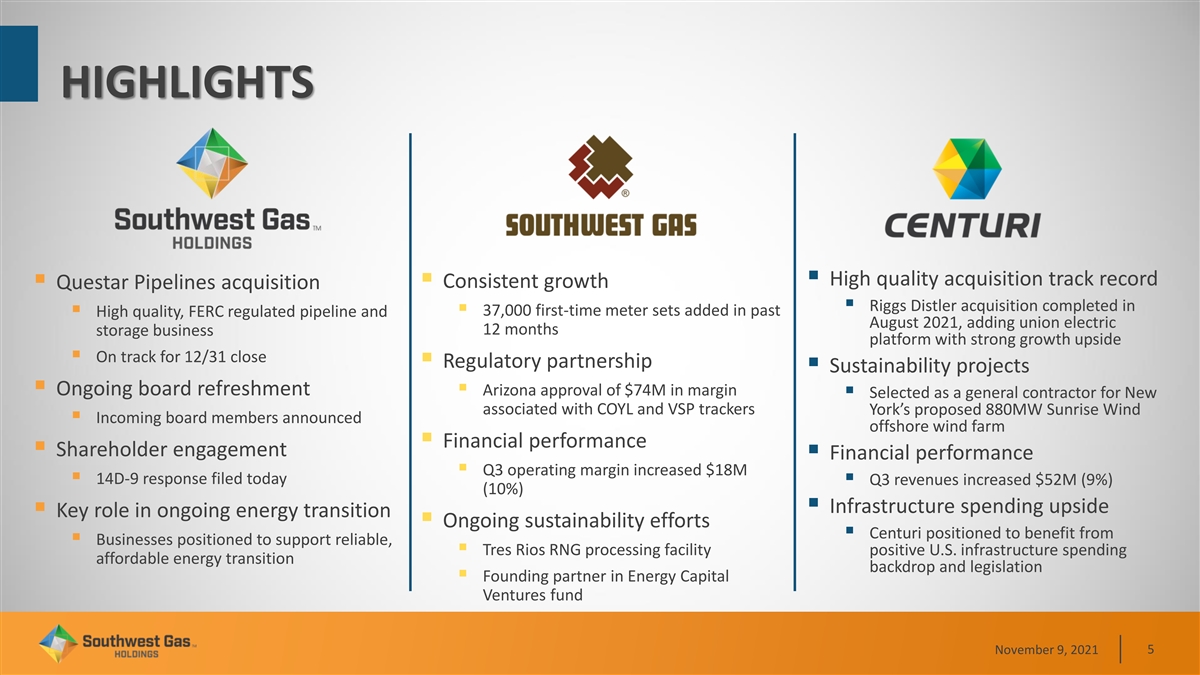
HIGHLIGHTS ▪ High quality acquisition track record ▪ Consistent growth ▪ Questar Pipelines acquisition ▪ Riggs Distler acquisition completed in ▪ 37,000 first-time meter sets added in past ▪ High quality, FERC regulated pipeline and August 2021, adding union electric 12 months storage business platform with strong growth upside ▪ On track for 12/31 close ▪ Regulatory partnership ▪ Sustainability projects ▪ Ongoing board refreshment ▪ Arizona approval of $74M in margin ▪ Selected as a general contractor for New associated with COYL and VSP trackers York’s proposed 880MW Sunrise Wind ▪ Incoming board members announced offshore wind farm ▪ Financial performance ▪ Shareholder engagement ▪ Financial performance ▪ Q3 operating margin increased $18M ▪ 14D-9 response filed today ▪ Q3 revenues increased $52M (9%) (10%) ▪ Infrastructure spending upside ▪ Key role in ongoing energy transition ▪ Ongoing sustainability efforts ▪ Centuri positioned to benefit from ▪ Businesses positioned to support reliable, ▪ Tres Rios RNG processing facility positive U.S. infrastructure spending affordable energy transition backdrop and legislation ▪ Founding partner in Energy Capital Ventures fund November 9, 2021 5

ONGOING BOARD REFRESHMENT INCOMING BOARD MEMBERS CURRENT BOARD MEMBERS E. Renae Conley ▪ 30+ years of energy and utility industry experience ▪ Chief Executive Officer of ER Solutions, LLC ▪ Former Chairman, CEO and President of Entergy Corp, previously serving as EVP, Human Resources and Michael J. Robert L. José A. Stephen C. John P. Administration and Chief Diversity Officer [1] [2] [1] ▪ Extensive public company board experience Melarkey Boughner Cárdenas Comer Hester Carlos A. Ruisanchez ▪ Co-founder of Sorelle Capital, Sorelle Entertainment and Sorelle Hospitality ▪ Former President/CFO of Pinnacle Entertainment, Inc. ▪ Former Senior Managing Director at Bear, Stearns & Co. Jane Lewis- Anne L. A. Randall Thomas A. Leslie T. ▪ Board member at Cedar Fair Entertainment Company Raymond Mariucci Thoman Thomas Thornton IMPROVING BOARD TENURE ATTRACTIVE BOARD PROFILE GENDER DIVERSITY INVESTMENT MGMT ✓✓ Announced Board refreshment lowers average ETHNIC DIVERSITY REGULATORY/LEGAL ✓✓ director tenure from 10.3 to 8.0 years year-on- INDUSTRY EXPERIENCE CYBERSECURITY year at Annual Meeting ✓✓ FINANCE/ACCOUNTING REFLECT COMMUNITY ✓✓ [1] Mssrs. Melarkey and Comer will retire from the Board effective at the 2022 Annual Meeting of Stockholders. [2] Mr. Boughner will become Chair of the Board effective at the 2022 Annual Meeting of Stockholders. November 9, 2021 6

QUESTAR PIPELINES: A COMPLEMENTARY PLATFORM Consistent, rate-regulated cash flow underpinned by FERC authorized ROEs and customer contracts… Pipelines Intrinsic Transaction Benefits Enterprise Transaction Benefits ▪ Highly contracted revenues anchored by high quality demand-pull ▪ Increases Southwest Gas Holdings’ regulated business mix, customers including Questar Gas and PacifiCorp while providing strong, incremental free cash flow ▪ Excellent re-contracting record: top 15 customers (80% of total ▪ Further regulatory diversification, incrementally reducing revenue) have an average relationship length of 49 years earnings volatility and business risk ▪ Strong, consistent cash flow production ▪ Earnings/cash flow accretion and financial stability provide ▪ Assets are difficult to replicate; uniquely positioned to serve incremental strategic optionality/flexibility location-specific transportation and storage demand ▪ Prudent equity content of permanent financing plan further ▪ Culture of safety, reliability, environmental compliance and strengthens SWX balance sheet operational excellence ▪ Potential adjacent energy transition opportunities in ▪ Customer growth/expansion opportunities through strong and RNG/RSG, hydrogen and CO2 transportation growing regional demand backdrop ▪ Tax step-up provides additional cash flow support via ▪ Constructive stakeholder environment with strong local support for incremental future tax-deductible amortization natural gas …delivers greater scale, diversity, financial benefits and strategic optionality November 9, 2021 7

RIGGS DISTLER- ACCELERATES EPS & DIVIDEND GROWTH Expands Electric Utility Services Platform and Offers Significant Growth Potential – Expected to Generate ~$600 Million in Revenue Growth Through 2024 ▪ Combines existing industry-leading utility services platform with a scaled, union electric utility distribution focused provider ▪ Provides compelling, multi-pronged growth avenues through core union electric utility distribution platform, with access to attractive service adjacencies ▪ Offers exposure to substantial growth prospects in electrification, 5G-telecom and renewables ▪ Augments SWX ESG profile with renewable project experience and access to offshore wind services ▪ Expected to be accretive to EPS in 2022 Leverages core competencies and expertise in utility infrastructure to create a unified platform with substantial prospects for accelerated growth November 9, 2021 8
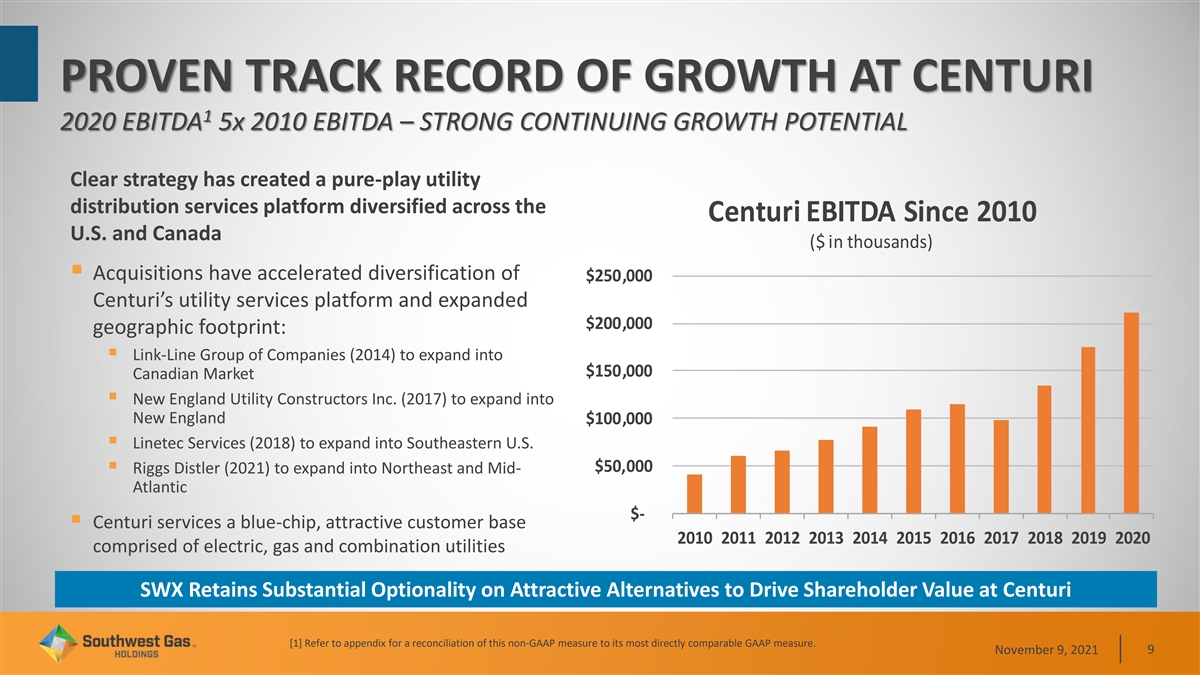
PROVEN TRACK RECORD OF GROWTH AT CENTURI 1 2020 EBITDA 5x 2010 EBITDA – STRONG CONTINUING GROWTH POTENTIAL Clear strategy has created a pure-play utility distribution services platform diversified across the Centuri EBITDA Since 2010 U.S. and Canada ($ in thousands) ▪ Acquisitions have accelerated diversification of $250,000 Centuri’s utility services platform and expanded $200,000 geographic footprint: ▪ Link-Line Group of Companies (2014) to expand into $150,000 Canadian Market ▪ New England Utility Constructors Inc. (2017) to expand into New England $100,000 ▪ Linetec Services (2018) to expand into Southeastern U.S. $50,000 ▪ Riggs Distler (2021) to expand into Northeast and Mid- Atlantic $- ▪ Centuri services a blue-chip, attractive customer base 2010 2011 2012 2013 2014 2015 2016 2017 2018 2019 2020 comprised of electric, gas and combination utilities SWX Retains Substantial Optionality on Attractive Alternatives to Drive Shareholder Value at Centuri [1] Refer to appendix for a reconciliation of this non-GAAP measure to its most directly comparable GAAP measure. November 9, 2021 9

SWX: A COMPELLING INVESTMENT THESIS Regulatory diversification across multiple jurisdictions (primarily state and FERC-regulated business mix) Strong LDC utility ratebase growth of 7.5% per annum expected over 2021 – 2025 Robust utility customer growth and demographic trends across jurisdictions Infrastructure services business is diversified across geographic ( U.S., Canada), customer (electric, gas, combo utility) and offering dimensions High-growth infrastructure services business that is poised for upside associated with infrastructure spending increases Strong EPS and dividend growth and investment grade credit Businesses positioned to play key long-term role in energy transition Strong ESG performance based upon sustainability, governance, diversity & inclusion and community commitments November 9, 2021 10

SUMMARY OF OPERATING RESULTS (IN THOUSANDS, EXCEPT PER SHARE AMOUNTS) Three months ended September 30, Twelve months ended September 30, 2021 2020 2021 2020 Results of Consolidated Operations Natural gas operations income (loss) $ (27,544) $ (15,973) $ 182,134 $ 155,993 Utility infrastructure services income 18,540 34,873 56,723 66,615 Corporate and administrative (2,572) (627) (4,477) (2,110) Net income (loss) $ (11,576) $ 18,273 $ 234,380 $ 220,498 Basic earnings (loss) per share $ (0.19) $ 0.32 $ 4.03 $ 3.97 Diluted earnings (loss) per share $ (0.19) $ 0 ..32 $ 4.02 $ 3.97 Weighted average common shares 5 9,688 5 6,271 58,209 55,508 Weighted average diluted shares 59,816 56,357 58,312 55,577 November 9, 2021 11

NET INCOME (LOSS) THREE MONTHS ENDED SEPTEMBER 30, 2021 Total NATURAL GAS OPERATIONS $ 10 Decrease Total Increase Decrease $11.5 million - $(16.0) (10) $13.5 $17.6 $(27.5) $5.0 (20) $9.7 $3.9 $6.0 (30) Customer Gas Plant Rate Service in Service Relief COLI $1.2 Arizona Customer Pension AFUDC (40) Property Growth (service) Taxes Pension Late Regulatory Regulatory (non- IT Fees Amort Amort service) (50) 2020 Net Legal Reserve Operating Other O&M Depreciation, Other Net Interest Income Tax 2021 Net Income (Loss) Margin Amortization Income Deductions Income (Loss) & Gen Taxes November 9, 2021 12 Millions of Dollars

NET INCOME THREE MONTHS ENDED SEPTEMBER 30, 2021 Total UTILITY INFRASTRUCTURE SERVICES Decrease Total Increase Decrease $ 35 $16.3 million $13.0 25 $1.2 $5.8 $34.9 $1.6 $4.3 $4.0 15 Riggs Riggs Reduced Life Distler Revenues $18.6 Distler Profitability Insurance Equipment $52.5M Acquisition Policies Equipment & Riggs Expenses Loan Outstanding Computer Distler $51.3M Fees Debt Systems Acquisition 5 2020 Net Riggs Distler Rev & Exp Depreciation, Other Net Interest Income Tax 2021 Net Income Deal Costs Amortization Deductions Income November 9, 2021 13 Millions of Dollars

NET INCOME TWELVE MONTHS ENDED SEPTEMBER 30, 2021 Total NATURAL GAS OPERATIONS 240 $ Increase Total Increase Decrease $26.1 million $20.7 210 $71.9 $31.9 180 $1.8 $7.1 $2.9 150 $5.0 Pension $182.1 Gas Plant Customer (service) 24% in Service COLI Growth $156.0 120 Pipeline Pension Property Rate 76% Programs (non- Taxes Relief service) Late Regulatory Regulatory AFUDC IT Fees Amort Amort 90 2020 Net Legal Reserve Operating Other O&M Depreciation, Other Net Interest Income Tax 2021 Net Income Margin Amortization Income Deductions Income & Gen Taxes November 9, 2021 14 Millions of Dollars
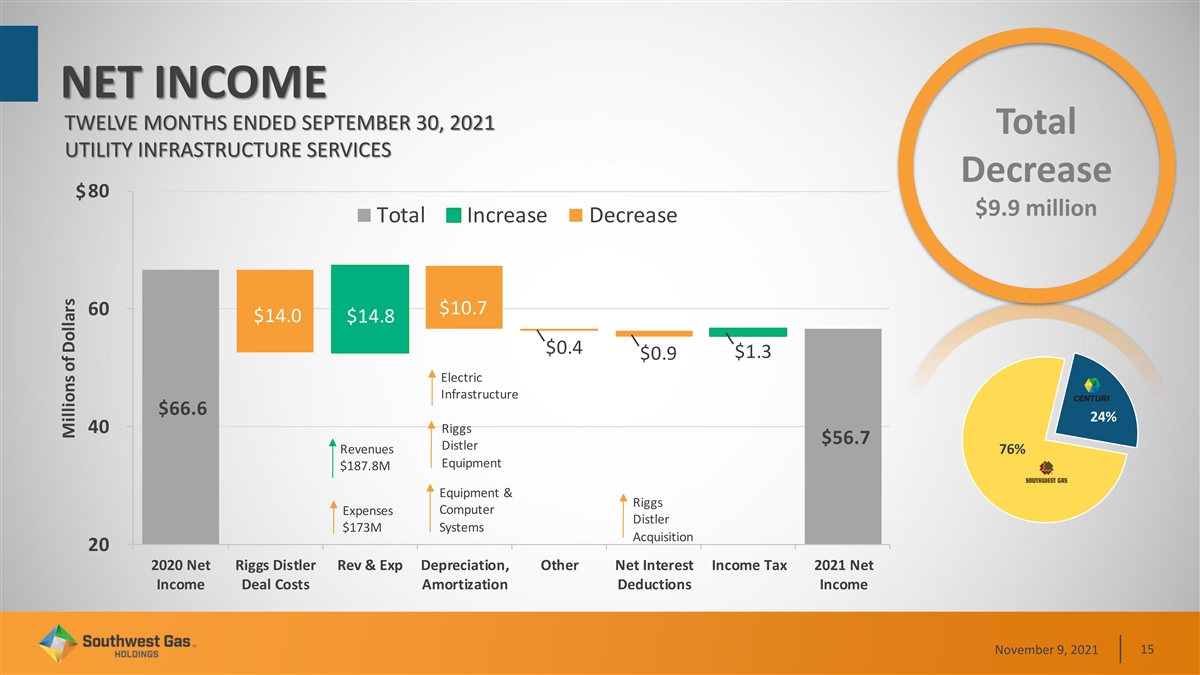
NET INCOME TWELVE MONTHS ENDED SEPTEMBER 30, 2021 Total UTILITY INFRASTRUCTURE SERVICES Decrease 80 $ $9.9 million Total Increase Decrease 60 $10.7 $14.0 $14.8 $0.4 $1.3 $0.9 Electric Infrastructure $66.6 24% Riggs 40 $56.7 Distler Revenues 76% Equipment $187.8M Equipment & Riggs Computer Expenses Distler Systems $173M Acquisition 20 2020 Net Riggs Distler Rev & Exp Depreciation, Other Net Interest Income Tax 2021 Net Income Deal Costs Amortization Deductions Income November 9, 2021 15 Millions of Dollars

CENTURI COMPLETES RIGGS DISTLER ACQUISITION Establishes Centuri’s Union electric platform, serving Utilities throughout the Northeast and Midwest Expansion into ESG and Energy Transition work ▪ Riggs Distler named a General Contractor for Orsted / Eversource Sunrise Wind Project in New York ▪ Responsible for building wind tower foundation parts Increases Centuri’s ability to respond to major outages ▪ Riggs Distler and Linetec crews offered essential storm response services for communities impacted by Hurricane Ida Natural Gas Electric Utility Renewables 5G / Telecom Industrial Distribution States Served Storm Response Area Offices November 9, 2021 16

RIGGS DISTLER ASSET ALLOCATION AND FINANCING UTILITY INFRASTRUCTURE SERVICES Weighted Summary of Key Terms - Centuri Acquisition Financing Amount average (millions) useful life Facility $400 Million Revolver $1,145 Million Term Loan B Tenor 5 years 7 years Current and other assets $ 118 Maturity 8/27/2026 8/27/2028 Property and equipment 118 5 years Pricing Pricing Grid: LIBOR + 250 bps Intangibles: Customer contracts backlog 5 1 year LIBOR/CDOR + 100 bps-225 bps 50 bps LIBOR Floor Customer relationships 270 19 years 99.0 OID Unused Fees: 15 bps-35bps Trade names 60 15 years Amortization 1.00% Per Year Goodwill 447 Optional Prepayments Prepayable at any time 101 Soft Call 6 months Total $ 1,018 November 9, 2021 17
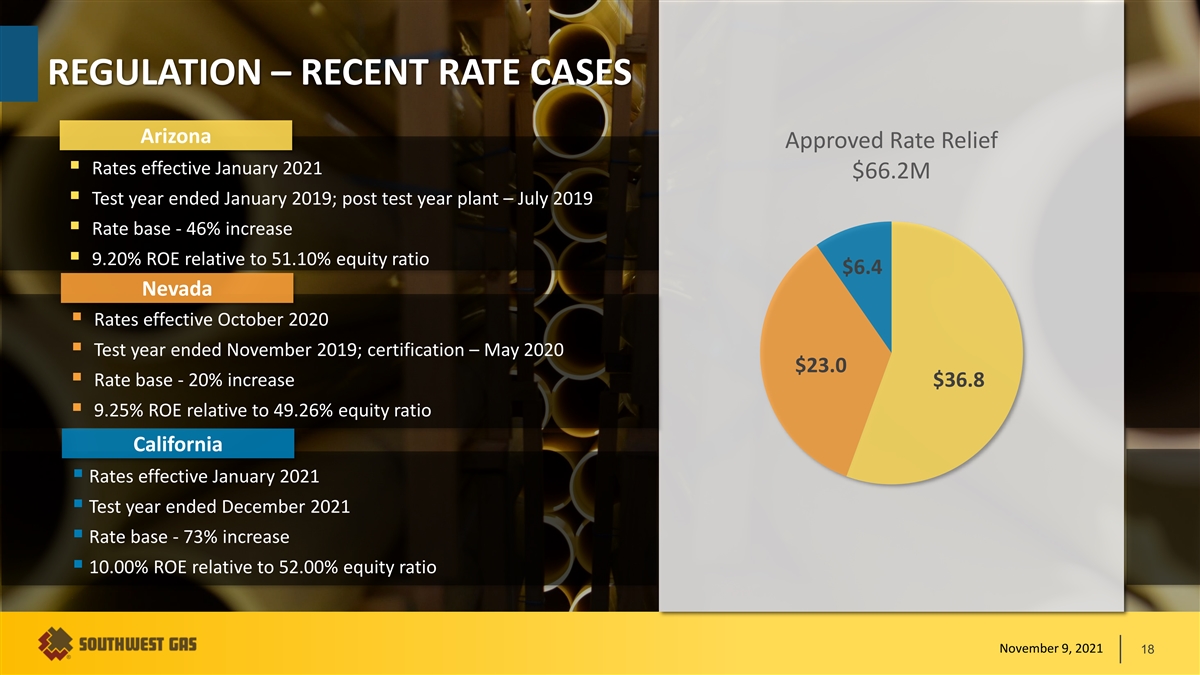
REGULATION – RECENT RATE CASES Arizona Approved Rate Relief ▪ Rates effective January 2021 $66.2M ▪ Test year ended January 2019; post test year plant – July 2019 ▪ Rate base - 46% increase ▪ 9.20% ROE relative to 51.10% equity ratio $6.4 Nevada ▪ Rates effective October 2020 ▪ Test year ended November 2019; certification – May 2020 $23.0 ▪ Rate base - 20% increase $36.8 ▪ 9.25% ROE relative to 49.26% equity ratio California ▪ Rates effective January 2021 ▪ Test year ended December 2021 ▪ Rate base - 73% increase ▪ 10.00% ROE relative to 52.00% equity ratio November 9, 2021 18

REGULATION – CURRENT RATE CASE ACTIVITY NATURAL GAS OPERATIONS NEVADA – FILED AUGUST 31, 2021 ARIZONA ▪ Proposal Includes: ▪ Estimate new general rate case filing in ▪ $30.5M Rate relief 4th quarter 2021 ▪ $1.73B Rate base ▪ Estimated test period August 2021 and ▪ 9.90% Return on equity propose 12 months post-test year adjustment ▪ 51% Target equity ratio ▪ Estimated increase in rate base of 35-40% ▪ Continuation of decoupling mechanism ▪ Proposed inclusion of G-4 Rate Schedule ▪ Recovery of $6.6M COVID-19 Regulatory Asset over two years ▪ Renewed request for recovery of 2020 wage increase ▪ Hearing February 2022 / Rates effective April 2022 November 9, 2021 19

REGULATORY PARTNERSHIPS ARIZONA NATURAL GAS OPERATIONS COYL & VSP Cost Recovery Proposal ($ in millions) Full Recovery of ~$74M Outstanding Revenue Requirement Approved ▪ COYL will be recovered over one year beginning November 2021 ▪ VSP will be recovered over three years beginning ~$14 March 2022 ~$60 November 9, 2021 20

REGULATORY PARTNERSHIPS NATURAL GAS OPERATIONS Safety/Reliability/Growth Partnerships * Rate Base ▪ Capital Tracker Programs: (Millions)▪ Post Test Year Plant Adjustments $4.0 ▪ COYL programs ▪ Expansion Programs: ▪ Pipe replacement programs ▪ Mesquite (NV) 69% $3.5 Increase ▪ Mobile Home Park ▪ Spring Creek (NV) replacement program $3.0 ▪ Graham County Utilities (AZ) ▪ Meter Protection program ▪ Southern AZ LNG Facility $2.5 Sustainability Initiative $2.0 2017 2018 2019 2020 2021 Partnerships ▪ RNG Purchase Authority Approval ▪ Move2Zero Stipulation Constructive rate case outcomes combined with supportive * regulatory mechanisms have supported rate base growth of ▪ RNG Development $1.6B, or 69%, since 2017 November 9, 2021 21

SERVING OUR CUSTOMERS WITH EXCELLENCE For 2 years in a row, ranked #1 among Customers prefer the choice of 91% 1 natural gas natural gas utilities in the West region #1 for business customer satisfaction in 4 2021 2 Customer satisfaction 95% Ranked #1 among large natural gas A Top 50 company recognition for utilities in the West region for residential #1 CSO50 security initiatives that demonstrate 5 customer satisfaction in 2020 outstanding business value and thought Award 3 leadership Ranked #1 among natural gas utilities in the West region for Utility Digital In May 2021, launched Project #1 6 Experience in 2021 2021 Horizon, the single largest digital transformation in Company history 1 - OH Predictive Insights. (2019, Dec). Natural Gas Customer Survey 2 – Monthly Customer Satisfaction Survey conducted by MDC Research 3 – IDG 2021 CSO50 Award 4 - 2021 Gas Utility Business Customer Satisfaction Study conducted by a global leader in consumer insights 5 - 2020 Gas Utility Residential Customer Study conducted by a global leader in consumer insights 6 - 2021 Utility Digital Experience Study conducted by a global leader in consumer insights November 9, 2021 22
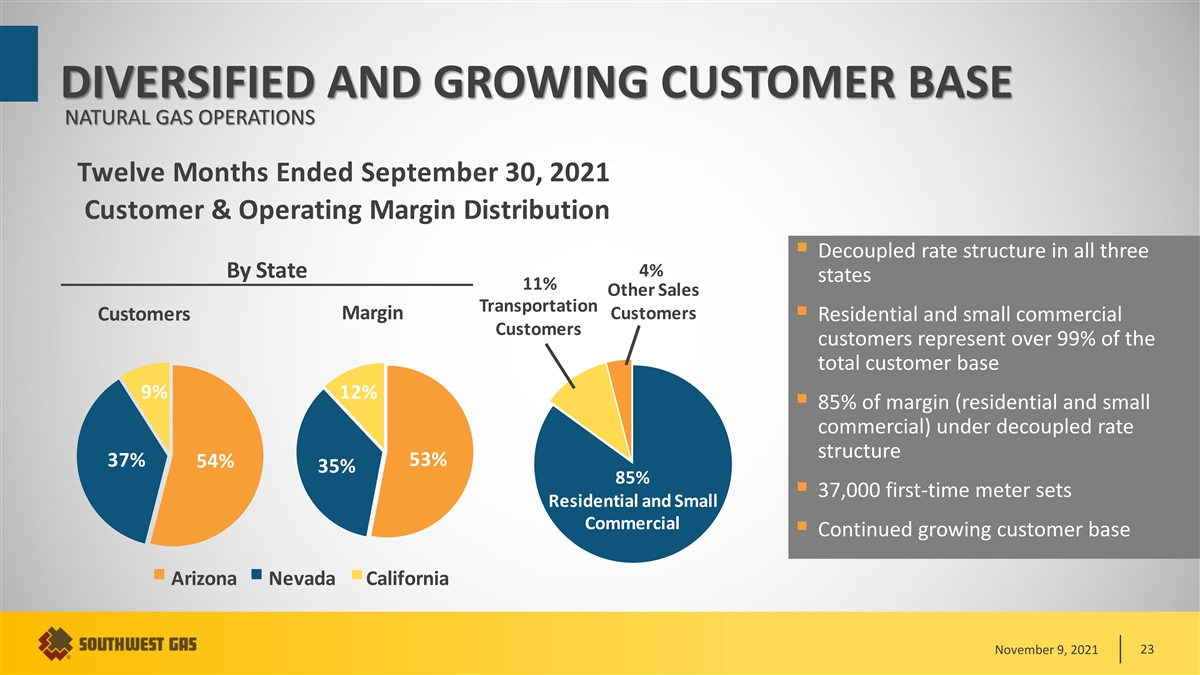
DIVERSIFIED AND GROWING CUSTOMER BASE NATURAL GAS OPERATIONS Twelve Months Ended September 30, 2021 Customer & Operating Margin Distribution ▪ Decoupled rate structure in all three 4% By State states 11% Other Sales Transportation Margin Customers Customers▪ Residential and small commercial Customers customers represent over 99% of the total customer base 9% 12% ▪ 85% of margin (residential and small commercial) under decoupled rate structure 37% 53% 54% 35% 85% ▪ 37,000 first-time meter sets Residential and Small Commercial ▪ Continued growing customer base Arizona Nevada California November 9, 2021 23
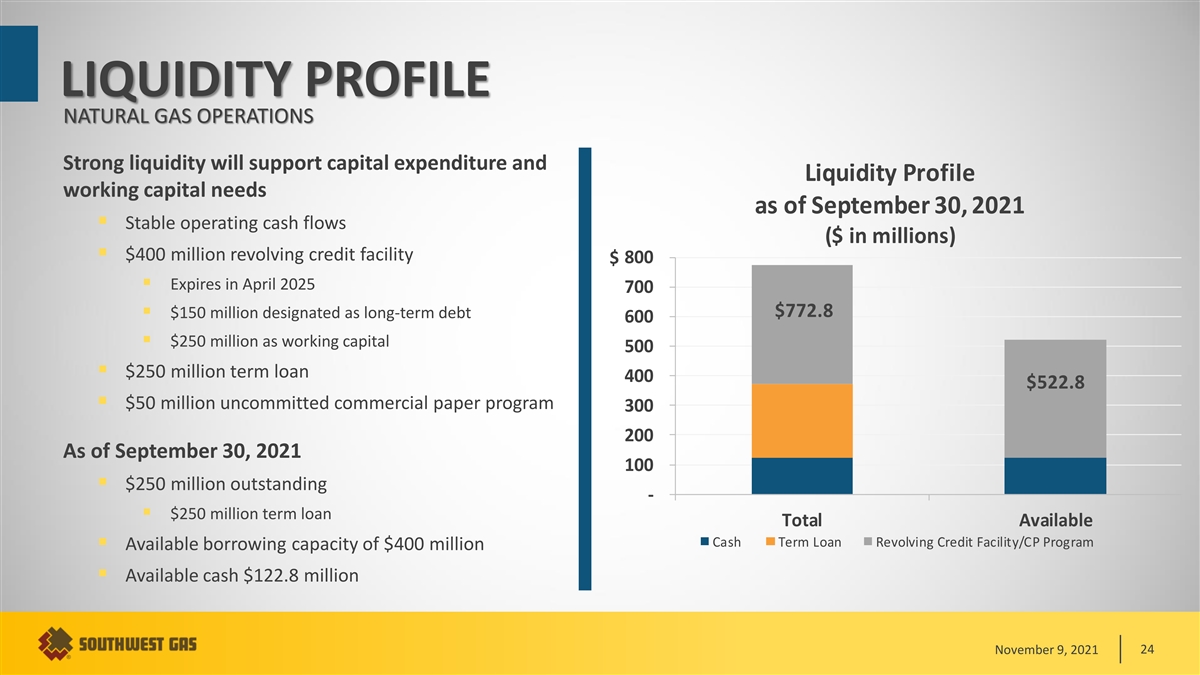
LIQUIDITY PROFILE NATURAL GAS OPERATIONS Strong liquidity will support capital expenditure and Liquidity Profile working capital needs as of September 30, 2021 ▪ Stable operating cash flows ($ in millions) ▪ $400 million revolving credit facility $ 800 ▪ Expires in April 2025 700 $772.8 ▪ $150 million designated as long-term debt 600 ▪ $250 million as working capital 500 ▪ $250 million term loan 400 $522.8 ▪ $50 million uncommitted commercial paper program 300 200 As of September 30, 2021 100 ▪ $250 million outstanding - ▪ $250 million term loan Total Available Cash Term Loan Revolving Credit Facility/CP Program ▪ Available borrowing capacity of $400 million ▪ Available cash $122.8 million November 9, 2021 24
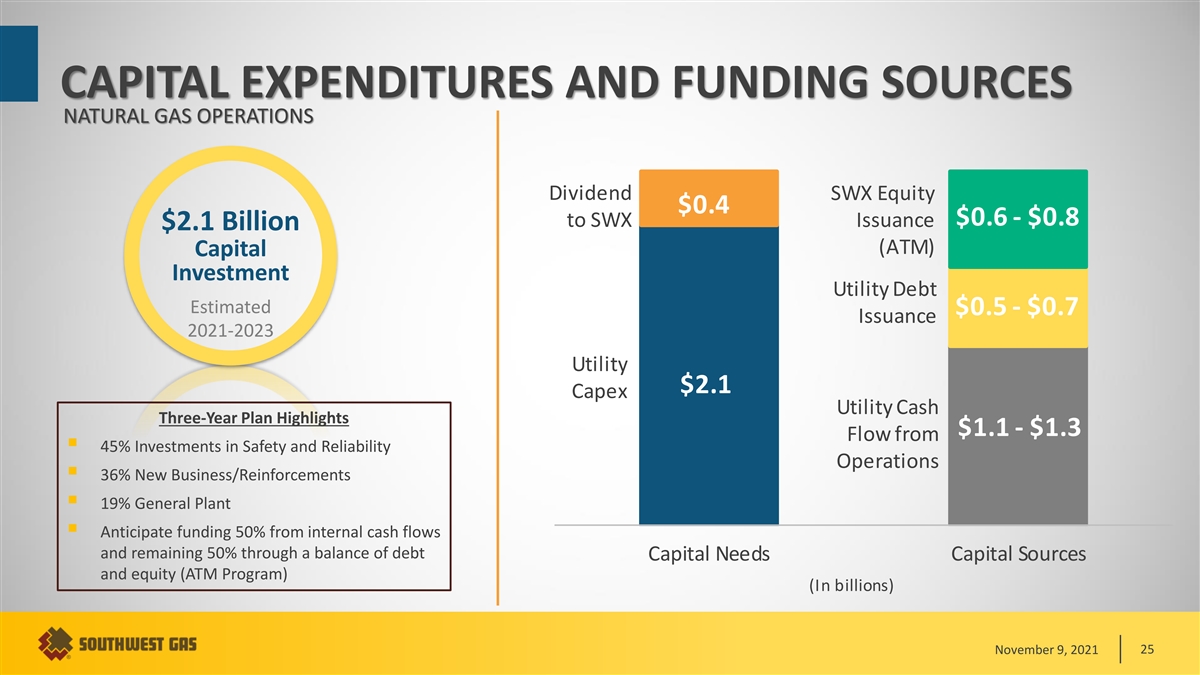
CAPITAL EXPENDITURES AND FUNDING SOURCES NATURAL GAS OPERATIONS Dividend SWX Equity $0.4 $0.6 - $0.8 to SWX Issuance $2.1 Billion (ATM) Capital Investment Utility Debt Estimated $0.5 - $0.7 Issuance 2021-2023 Utility $2.1 Capex Utility Cash Three-Year Plan Highlights $1.1 - $1.3 Flow from ▪ 45% Investments in Safety and Reliability Operations ▪ 36% New Business/Reinforcements ▪ 19% General Plant ▪ Anticipate funding 50% from internal cash flows and remaining 50% through a balance of debt Capital Needs Capital Sources and equity (ATM Program) (In billions) November 9, 2021 25

RATE BASE GROWTH CAGR calc Total Increase Decrease Rate base amounts reflect $ 8 estimated total investment in $1.5 7 facilities necessary to provide utility service. This is different $3.5 6 $0.03 than our authorized rate base, which is the rate base investment 5 that has been approved by our 4 regulatory bodies and that is $6.5 reflected in rates. 3 $4.5 2 Projecting 7.5% Compound Annual Growth Rate (CAGR) in 1 rate base (2021-2025). - Dec-20 Rate Base Net CapEx Depreciation, Deferred Taxes Dec-25 Rate Base Amortization November 9, 2021 26 Billions of Dollars

DIVIDEND GROWTH 5.8% 5-Year Dividend CAGR CAGR calc $ 2.50 $2.38 $2.28 $2.18 2.00 $2.08 $1.98 $1.80 1.50 1.00 0.50 - 2016 2017 2018 2019 2020 2021 CAGR = compound annual growth rate Maintain target payout ratio between 55% – 65% Expect future dividends to increase at the sustainable earnings growth rate November 9, 2021 27

(3) 2021 ADJUSTED EPS GUIDANCE Diluted Earnings Per Share $ 4.20 $4.14 $4.00 - $4.10 4.00 (2) $4.05 3.80 (1) $4.00 - $4.10 diluted EPS 3.60 3.40 3.20 3.00 2020 2021 Notes: (1) Changes in economic conditions, events, or other circumstances that the Company cannot currently anticipate could materially Actual Guidance Range impact earnings and, in turn, result in earnings for 2021 significantly above or below this EPS guidance. (2) Based on normalized COLI of $4 million (versus actual of $9.2 million). (3) Excludes the transaction-related costs for the planned Questar Pipelines acquisition, activism response, and the partial-year results (and associated costs) in connection with the Riggs Distler acquisition. November 9, 2021 28

2021 LINE ITEM GUIDANCE Natural Gas Operations ▪ Operating margin expected to increase 6% – 8% due to customer growth (1.7%), rate relief in all three states, expansion projects, and infrastructure tracker mechanisms ▪ Total pension costs are expected to be relatively flat compared to 2020 o Will be reflected as an increase in O&M costs of about $6M, with a comparable decrease to other expense ▪ Operating income expected to increase 4% – 6% (previously 3% to 5%) ▪ COLI earnings of $5M – $7M are projected (previously $3M to $5M) ▪ Capital expenditures estimated to be $650M – $675M (previously $700M) Utility Infrastructure Services ▪ Organic (pre-Riggs Distler) revenue for 2021 expected to be 1% – 3% (previously 1% – 4%) greater than record 2020 amount (included $82M of storm restoration services) o Organic operating income is expected to be approximately 5.0% – 5.4% of revenues (previously 5.3% – 5.8%) ▪ Riggs Distler expected to generate revenues of $150M – $170M and operating loss of $11M – $13M from date of acquisition through end of 2021 ▪ Total interest expense expected to be $19.5M – $20.5M (previously $7M – $8M for organic Centuri) following expansion/refinancing of term loan and credit facility in connection Riggs Distler acquisition ▪ Net income expectations reflect earnings attributable to Southwest Gas Holdings, net of estimated $6M – $7M (previously $5M – $6M) of noncontrolling interests o Changes in Canadian currency exchange rates could influence results Corporate and Administrative ▪ Transaction-related expenses (including advisor, legal, accounting, and initial financing commitment costs) associated with planned acquisition of Questar Pipelines and activism response are expected to approximate $25M – $30M November 9, 2021 29
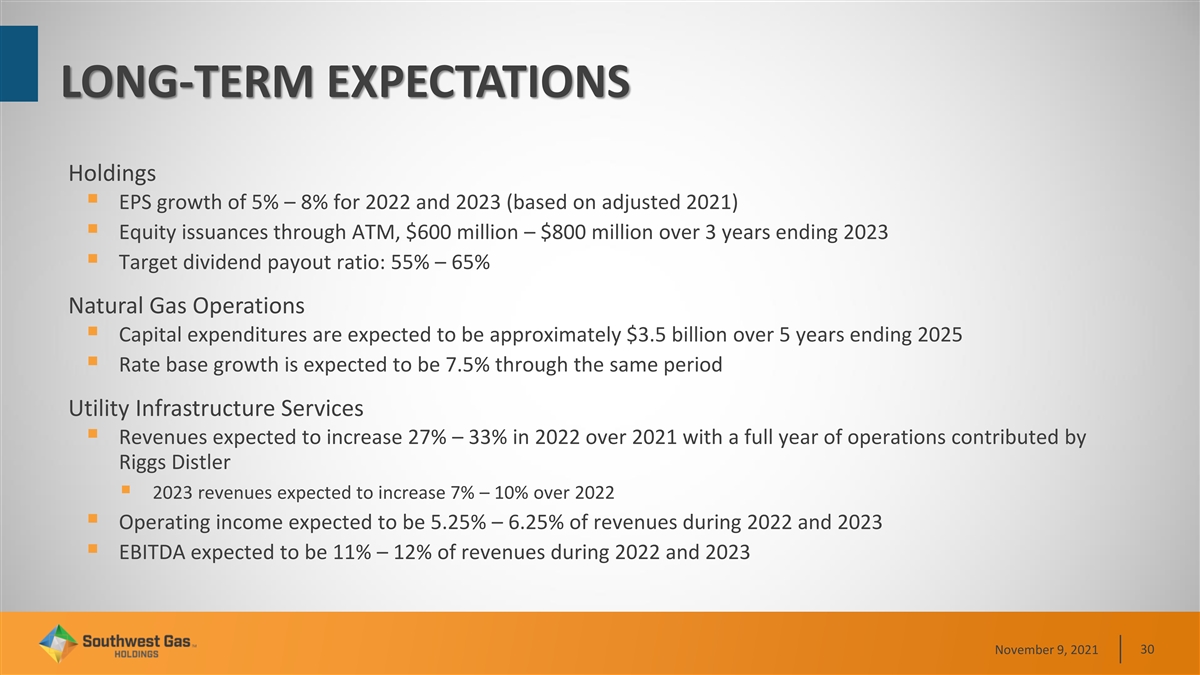
LONG-TERM EXPECTATIONS Holdings ▪ EPS growth of 5% – 8% for 2022 and 2023 (based on adjusted 2021) ▪ Equity issuances through ATM, $600 million – $800 million over 3 years ending 2023 ▪ Target dividend payout ratio: 55% – 65% Natural Gas Operations ▪ Capital expenditures are expected to be approximately $3.5 billion over 5 years ending 2025 ▪ Rate base growth is expected to be 7.5% through the same period Utility Infrastructure Services ▪ Revenues expected to increase 27% – 33% in 2022 over 2021 with a full year of operations contributed by Riggs Distler ▪ 2023 revenues expected to increase 7% – 10% over 2022 ▪ Operating income expected to be 5.25% – 6.25% of revenues during 2022 and 2023 ▪ EBITDA expected to be 11% – 12% of revenues during 2022 and 2023 November 9, 2021 30

STRONG AND GROWING, FUTURE FOCUSED Natural Gas Operations ▪ Continued capital and rate base growth ▪ Continued customer growth ▪ Focus on cost control and affordability to customers ▪ Ongoing decarbonization and efficiency ▪ Constructive regulatory results ▪ Continued earnings and dividend growth ▪ Sustainability focused Utility Infrastructure Services ▪ Very favorable electric and gas growth opportunities ▪ Operations execution focus ▪ Cost management and resource optimization ▪ Cross-selling services ▪ Increasing profitability and dividends ▪ Sustainability focused ▪ Cash source for SWX November 9, 2021 31

APPENDIX

CUSTOMERS BY STATE NATURAL GAS OPERATIONS (IN THOUSANDS) As of September 30, 1,200 1,146 1,101 1,126 900 799 786 768 600 300 202 197 200 - 2019 2020 2021 California Nevada Arizona November 9, 2021 33

SUMMARY OPERATING RESULTS NATURAL GAS OPERATIONS (IN THOUSANDS) Three months ended September 30, 2021 2020 Results of Natural Gas Operations Gas operating revenues $ 2 55,848 $ 2 10,834 Net cost of gas sold 6 3,710 3 6,321 Operating margin 1 92,138 1 74,513 Operations and maintenance expense 119,708 101,159 Depreciation and amortization 61,359 5 5,942 Taxes other than income taxes 20,109 15,787 Operating income (loss) (9,038) 1,625 Other income (deductions) (4,287) 1 ,751 Net interest deductions 2 4,922 26,103 Income (loss) before income taxes (38,247) (22,727) Income tax benefit (10,703) (6,754) Segment net income (loss) $ (27,544) $ (15,973) November 9, 2021 34

SUMMARY OPERATING RESULTS NATURAL GAS OPERATIONS (IN THOUSANDS) Twelve months ended September 30, 2021 2020 Results of Natural Gas Operations Gas operating revenues $ 1,445,066 $ 1,355,666 Net cost of gas sold 374,449 356,925 Operating margin 1,070,617 9 98,741 Operations and maintenance expense 431,795 406,169 Depreciation and amortization 249,118 2 30,158 Taxes other than income taxes 7 6,087 63,195 Operating income 313,617 2 99,219 Other income (deductions) (545) (7,615) Net interest deductions 9 7,259 100,115 Income before income taxes 215,813 191,489 Income tax expense 33,679 35,496 Segment net income $ 182,134 $ 1 55,993 November 9, 2021 35
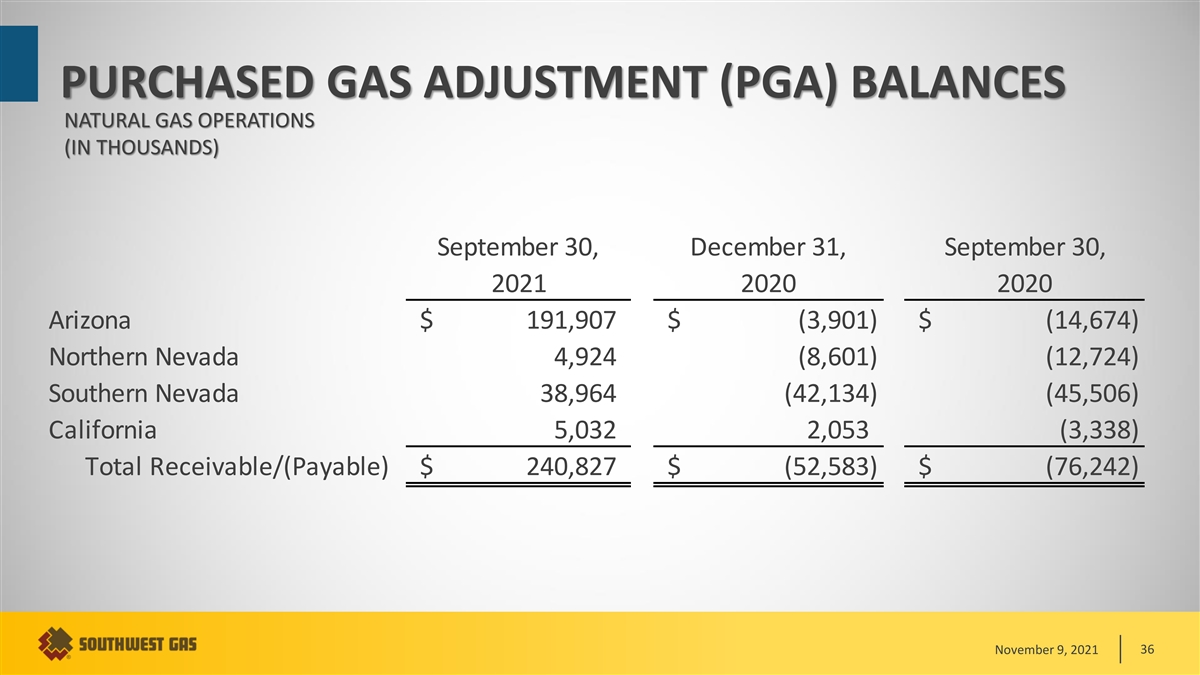
PURCHASED GAS ADJUSTMENT (PGA) BALANCES NATURAL GAS OPERATIONS (IN THOUSANDS) September 30, December 31, September 30, 2021 2020 2020 Arizona $ 191,907 $ (3,901) $ (14,674) Northern Nevada 4,924 (8,601) (12,724) Southern Nevada 38,964 (42,134) (45,506) California 5,032 2 ,053 (3,338) Total Receivable/(Payable) $ 240,827 $ (52,583) $ (76,242) November 9, 2021 36
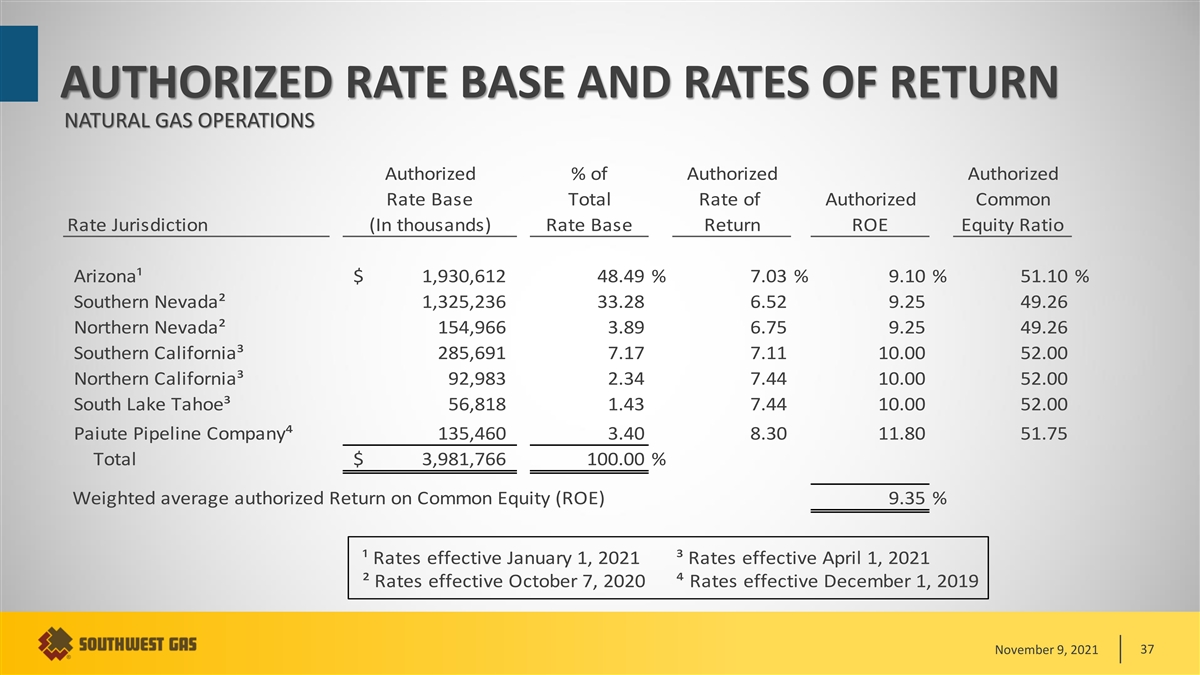
AUTHORIZED RATE BASE AND RATES OF RETURN NATURAL GAS OPERATIONS Authorized % of Authorized Authorized Rate Base Total Rate of Authorized Common Rate Jurisdiction (In thousands) Rate Base Return ROE Equity Ratio Arizona¹ $ 1,930,612 48.49 % 7.03 % 9.10 % 51.10 % Southern Nevada² 1,325,236 33.28 6.52 9.25 49.26 Northern Nevada² 154,966 3.89 6.75 9.25 49.26 Southern California³ 2 85,691 7.17 7.11 10.00 52.00 Northern California³ 9 2,983 2.34 7.44 10.00 52.00 South Lake Tahoe³ 56,818 1.43 7.44 10.00 52.00 Paiute Pipeline Company⁴ 135,460 3.40 8.30 11.80 51.75 Total $ 3 ,981,766 100.00 % Weighted average authorized Return on Common Equity (ROE) 9.35 % ¹ Rates effective January 1, 2021 ³ Rates effective April 1, 2021 ² Rates effective October 7, 2020 ⁴ Rates effective December 1, 2019 November 9, 2021 37

REGULATION NEVADA GENERAL RATE CASE NATURAL GAS OPERATIONS Procedural Schedule - Docket No. 21-09001 September 3, 2021 Application Filed December 15, 2021 Consumer Session Certification Filing December 17, 2021 SWG Certification Filing Testimonies January 14, 2022 Direct Testimony (Staff/Intervenor) January 31, 2022 Rebuttal Testimony (SWG) Hearings February 7, 2022 Hearing November 9, 2021 38

DIVERSIFIED INFRASTRUCTURE SERVICES MULTISERVICE PLATFORM REDUCES RISK Over GAS GROUP 10,500 employees supporting North American gas and electric utilities POWER GROUP CANADA GROUP November 9, 2021 39
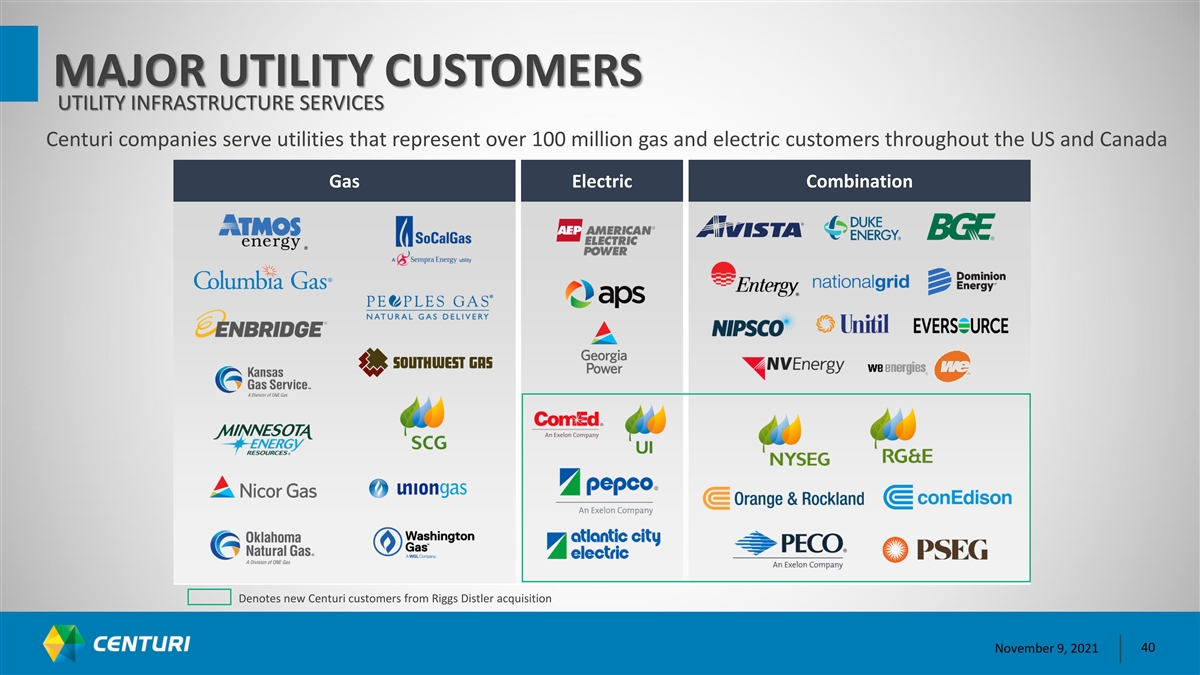
MAJOR UTILITY CUSTOMERS UTILITY INFRASTRUCTURE SERVICES Centuri companies serve utilities that represent over 100 million gas and electric customers throughout the US and Canada Gas Electric Combination Denotes new Centuri customers from Riggs Distler acquisition November 9, 2021 40

SUMMARY OPERATING RESULTS UTILITY INFRASTRUCTURE SERVICES (IN THOUSANDS) Three months ended September 30, 2021 2020 Revenues $ 632,848 $ 580,392 (1) Cost of sales 551,183 500,891 Gross profit 81,665 79,501 (2) General and administrative expenses 41,597 23,579 Amortization of intangible assets 4,511 2,678 Operating income 35,557 53,244 Other income (deductions) 1,175 48 Net interest deductions 6,257 2,000 Income before income taxes 30,475 51,292 Income tax expense 9,653 13,629 Net income 20,822 37,663 Net income attributable to noncontrolling interests 2,282 2,790 Contribution to consolidated net income attributable to Centuri $ 18,540 $ 34,873 (1) Included in Cost of sales during the three months ended September 30, 2021 and 2020 is depreciation expense of $24,454 and $20,826, respectively. (2) Included in General and administrative expenses during the three months ended September 30, 2021 and 2020 is depreciation expense of $1,056 and $693, respectively. November 9, 2021 41

SUMMARY OPERATING RESULTS UTILITY INFRASTRUCTURE SERVICES (IN THOUSANDS) Twelve months ended September 30, 2021 2020 Revenues $ 2,065,038 $ 1,877,264 (1) Cost of sales 1,847,453 1,683,392 Gross profit 217,585 193,872 (2) General and administrative expenses 103,901 72,171 Amortization of intangible assets 12,680 10,752 Operating income 101,004 110,949 Other income (deductions) 827 (210) Net interest deductions 11,642 10,710 Income before income taxes 90,189 100,029 Income tax expense 26,785 28,057 Net income 63,404 71,972 Net income attributable to noncontrolling interests 6,681 5,357 Contribution to consolidated net income attributable to Centuri $ 56,723 $ 66,615 (1) Included in Cost of sales during the twelve months ended September 30, 2021 and 2020 is depreciation expense of $88,771 and $81,205, respectively. (2) Included in General and administrative expenses during the twelve months ended September 30, 2021 and 2020 is depreciation expense of $4,119 and $2,880, respectively. November 9, 2021 42

REVENUES BY SERVICE TYPE Twelve Months Ended September 30, 2020 Twelve Months Ended September 30, 2021 13% 15% Gas Infrastructure Services 18% Electric Power Infrastucture Services 23% 62% 69% Other Infrastructure Services November 9, 2021 43

REVENUES BY CONTRACT PRICING TYPE UTILITY INFRASTRUCTURE SERVICES HIGHER 100% Fixed Price 8% Fixed Price 10% 75% Unit Price 66% Unit Price 72% 50% 25% Time and Materials 24% Time and Materials 20% LOWER 0% 12 Months Ended September 2021 12 Months Ended September 2020 November 9, 2021 44 RISK
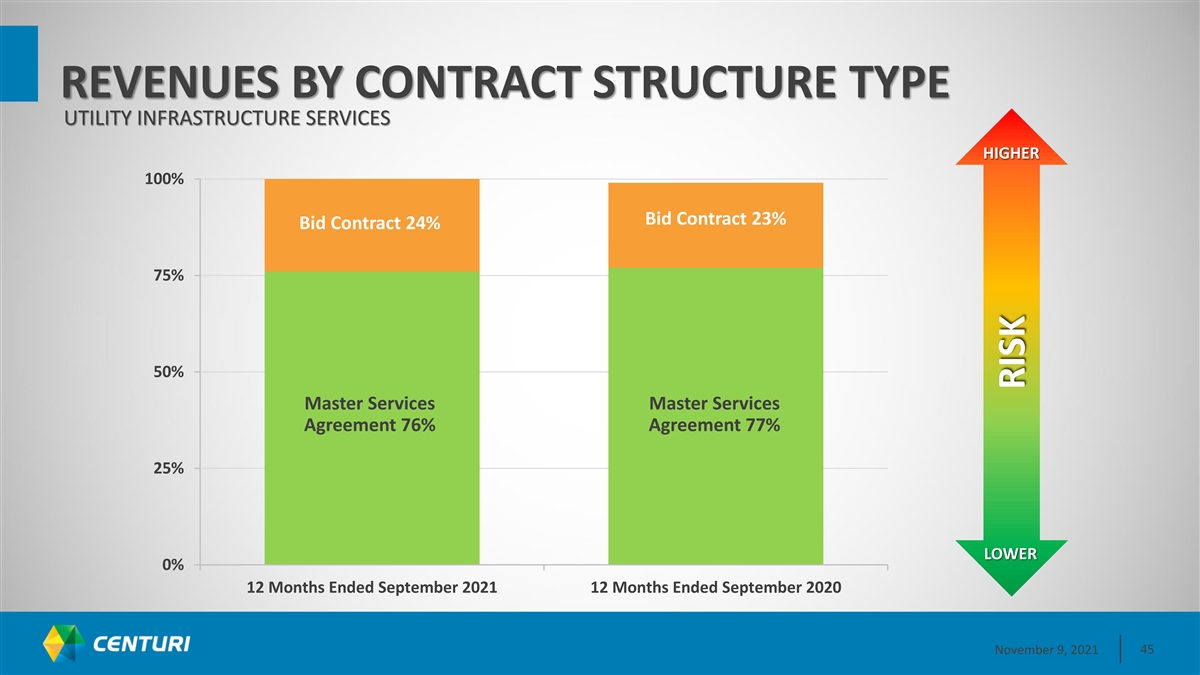
REVENUES BY CONTRACT STRUCTURE TYPE UTILITY INFRASTRUCTURE SERVICES HIGHER 100% Bid Contract 23% Bid Contract 24% 75% 50% Master Services Master Services Agreement 76% Agreement 77% 25% LOWER 0% 12 Months Ended September 2021 12 Months Ended September 2020 November 9, 2021 45 RISK
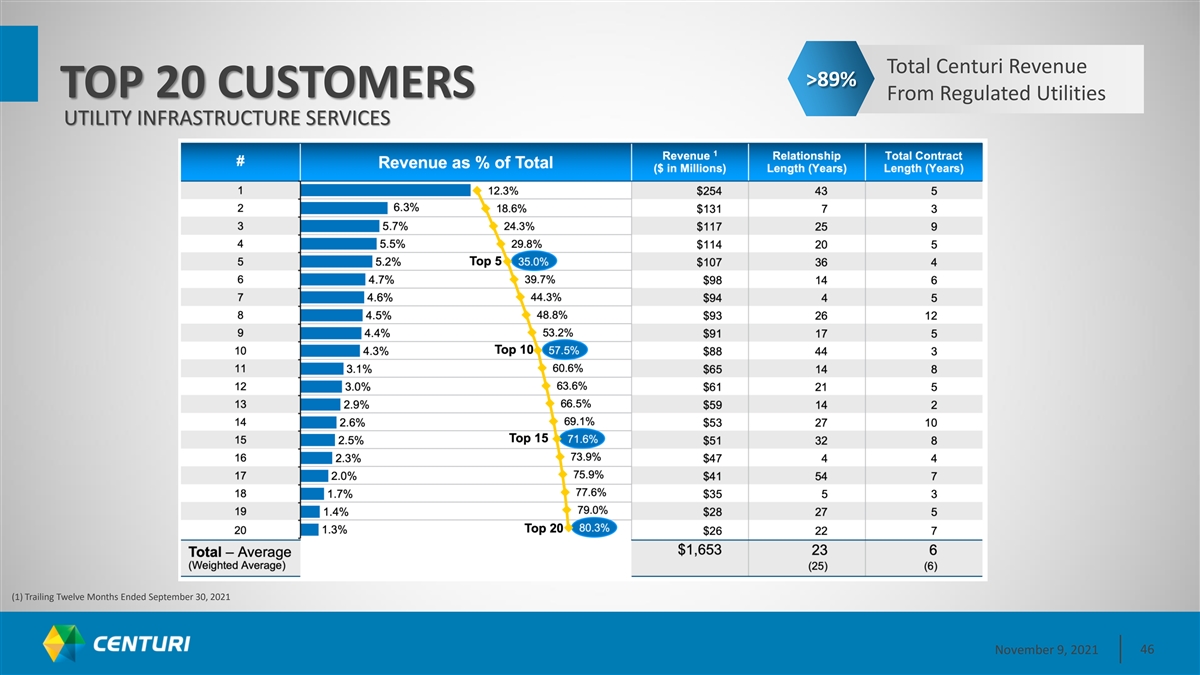
Total Centuri Revenue >89% TOP 20 CUSTOMERS From Regulated Utilities UTILITY INFRASTRUCTURE SERVICES (1) Trailing Twelve Months Ended September 30, 2021 November 9, 2021 46

CREDIT RATINGS Southwest Gas Holdings, Inc. Moody's S&P Fitch Issuer Rating Baa2 BBB- BBB+ Outlook Stable Negative Rating Watch Negative Southwest Gas Corporation Moody's S&P Fitch Senior Unsecured Baa1 BBB A Outlook Stable Negative Negative Centuri Group, Inc. Moody's S&P Senior Unsecured Ba2 BB- Outlook Stable Stable November 9, 2021 47

CONSOLIDATED CAPITAL STRUCTURE Capitalization at September 30, 2017 2018 2019 2020 2021 1 Equity $ 1 ,714 $ 1 ,946 $ 2 ,508 $ 2 ,727 $ 3,093 2 Long-Term Debt 1,760 2,157 2,500 2,730 3,871 Total Permanent Capital $ 3 ,474 $ 4 ,103 $ 5 ,008 $ 5 ,457 $ 6,964 Capitalization ratios 1 Equity 49.3% 47.4% 50.1% 50.0% 44.4% 2 Long-Term Debt 50.7% 52.6% 49.9% 50.0% 55.6% Total Permanent Capital 100.0% 100.0% 100.0% 100.0% 100.0% 1 Includes redeemable noncontrolling interest, if applicable. 2 Includes current maturities of long-term debt. November 9, 2021 48

DEMAND FOR NEW HOMES IS FUELING CUSTOMER GROWTH DEMAND FOR NEW HOMES IS FUELING CUSTOMER GROWTH New Home Permits Customer Growth Added Average of over + 33% + 27% + 17% 36,901 3,000 Southern Nevada Southern Arizona Central Arizona customers* meter sets a month *Year to date compared to same time frame in the previous year *Rolling 12-Month Meter Sets Sept 2021 November 9, 2021 49

DIVERSIFICATION DRIVES ARIZONA’S RECOVERY “During the next 30 years, Arizona “Looking at the largest 15 metros by “Arizona went into the pandemic with population is forecast to rise by total employment, Phoenix metro a rip-roaring economy. We were No. 1 2.81 million, hitting 10.1 million by ranked 12th for the most diversified in the country in the rate of job 2050. The state also adds 1.58 million metro in 2006. Skipping ahead to 2020, creation. We expect over 115,000 jobs jobs and $343 billion in real personal Phoenix metro jumped eight spots to to be added this year, which will income during the forecast period.” the fourth-most diversified metro.” replace all the jobs that were lost by the end of 2021.” - AZ Big Media, 9/9/2020 - Phoenix Business Journal, CBRE, 7/21/21 - Lee McPheters, Director, Arizona State University JP Morgan Chase Economic Outlook Center November 9, 2021 50

ARIZONA’S INCREDIBLE GROWTH “The state has welcomed “Phoenix grew at a faster “Phoenix grew 11.2%, the “Buckeye and Goodyear in about 760,000 new rate than any other major only one of the 10 largest the West Valley — were residents over the last 10 city in the last decade, U.S. cities to post double- among the 10 fastest- years, expanding digit population growth.” officially surpassing growing of all U.S. cities Arizona's total population Philadelphia as the during the decade. - Associated Press, 8/13/21 by nearly 12%.” nation's fifth largest city.” Growth across the Phoenix metro area drove - NBC 12 News, 8/12/21 - Arizona Republic, 8/12/21 up Maricopa County's population by 15.8%.” - Associated Press, 8/13/21 November 9, 2021 51

NEVADA IS GROWING MORE DIVERSE “Nevada has become more “The Silver State is the “Clark County, home to Las “Among Nevada’s major populous and more diverse nation’s third most ethnically Vegas and more than two- cities, Henderson grew the over the past decade, adding diverse, according to a new thirds of all Nevadans, gained fastest, up 23.2% to a 404,000 residents, with about diversity index introduced by more than 314,000 residents. population of 317,610. It was 4 out of 10 identifying as the federal agency. Officials It also had the largest relative followed by North Las Vegas, Hispanic or Latino according said only Hawaii and population growth, 16.1%, of 21% to 262,527; Reno, 17.3% to the U.S. Census Bureau.” California had a more racially any county. The county’s to 264,165; and Las Vegas, varied population in 2020.” population is now more than 9.9% to 641,903. Clark County Associated Press, 8/12/21 2.2 million.” grew 16.1% with a population - Reno Gazette Journal, 8/12/21 of 2,265,461.” - Las Vegas Review Journal, 8/12/21 - Las Vegas Sun, 8/12/21 November 9, 2021 52
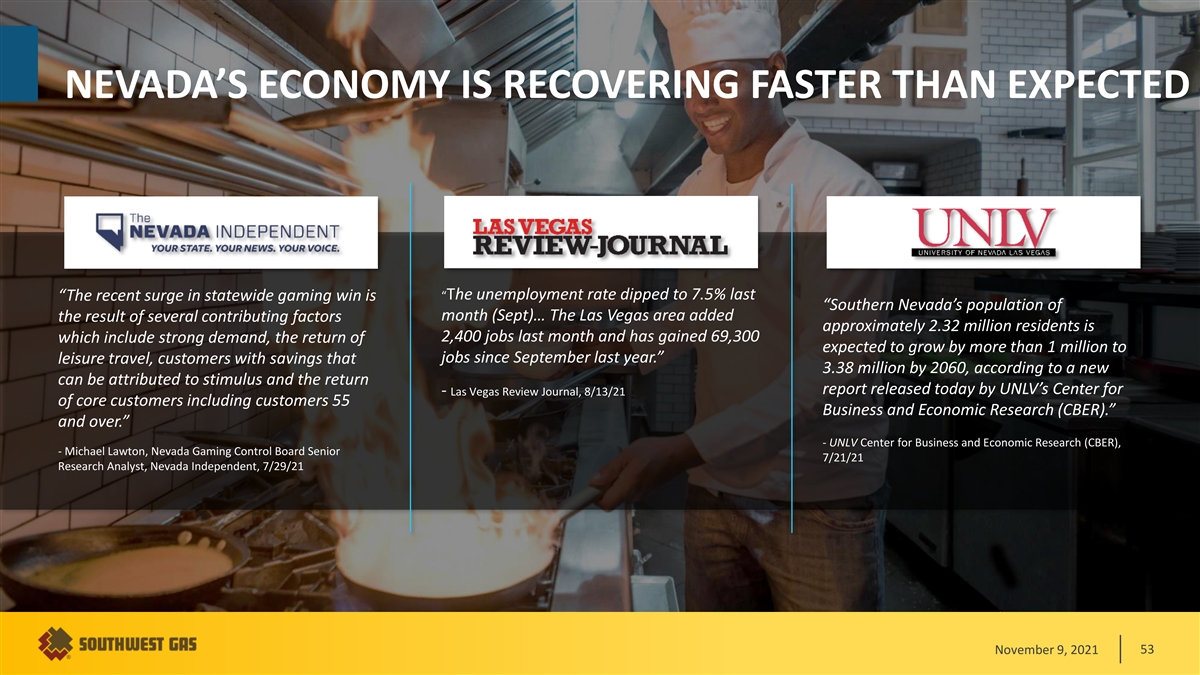
NEVADA’S ECONOMY IS RECOVERING FASTER THAN EXPECTED “The unemployment rate dipped to 7.5% last “The recent surge in statewide gaming win is “Southern Nevada’s population of month (Sept)… The Las Vegas area added the result of several contributing factors approximately 2.32 million residents is 2,400 jobs last month and has gained 69,300 which include strong demand, the return of expected to grow by more than 1 million to jobs since September last year.” leisure travel, customers with savings that 3.38 million by 2060, according to a new can be attributed to stimulus and the return report released today by UNLV’s Center for - Las Vegas Review Journal, 8/13/21 of core customers including customers 55 Business and Economic Research (CBER).” and over.” - UNLV Center for Business and Economic Research (CBER), - Michael Lawton, Nevada Gaming Control Board Senior 7/21/21 Research Analyst, Nevada Independent, 7/29/21 November 9, 2021 53
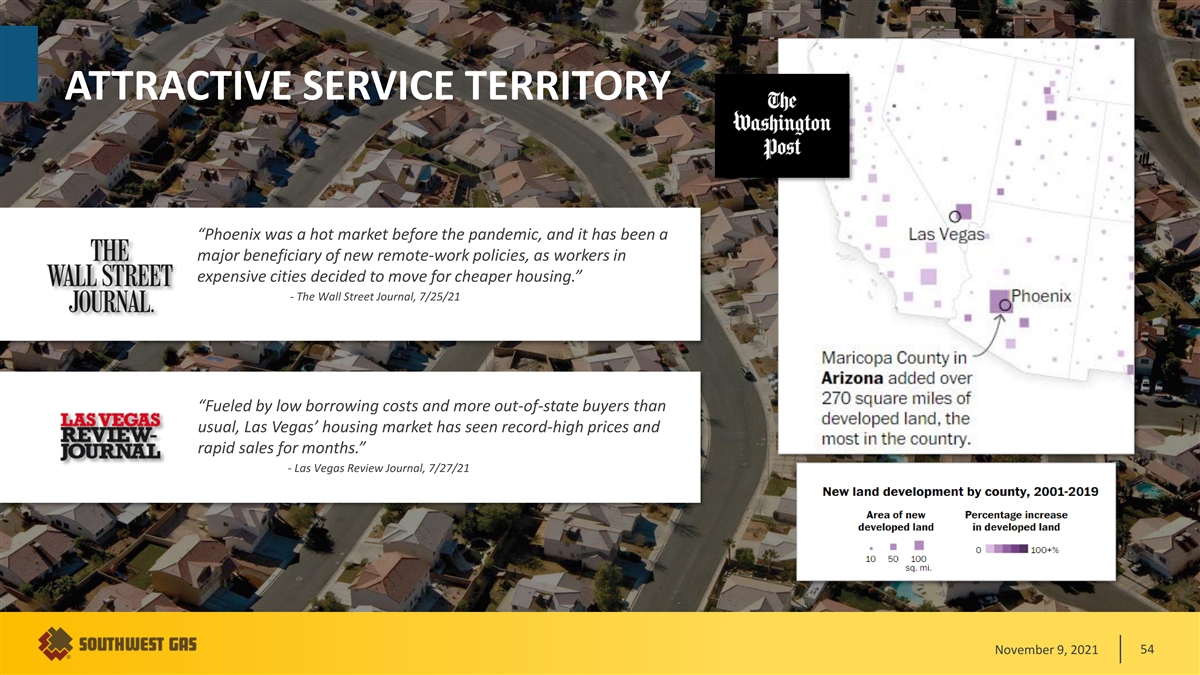
ATTRACTIVE SERVICE TERRITORY “Phoenix was a hot market before the pandemic, and it has been a major beneficiary of new remote-work policies, as workers in expensive cities decided to move for cheaper housing.” - The Wall Street Journal, 7/25/21 “Fueled by low borrowing costs and more out-of-state buyers than usual, Las Vegas’ housing market has seen record-high prices and rapid sales for months.” - Las Vegas Review Journal, 7/27/21 November 9, 2021 54

OUR SERVICE TERRITORY IS ATTRACTIVE TO BUSINESS INVESTMENT Featured Gas Users Access to clean, affordable natural gas is essential to these businesses November 9, 2021 55

ENVIRONMENT We are dedicated to our environment through practices that provide our customers and communities with energy solutions and technologies that are balanced and environmentally friendly. We are devoted to stewarding our natural resources for generations to come, through programs such as methane emissions abatement best practices, vehicle emissions reduction, pipeline integrity management and energy- efficiency initiatives. N No ov vem emb ber er 9 9, , 2 20 02 21 1 56 56
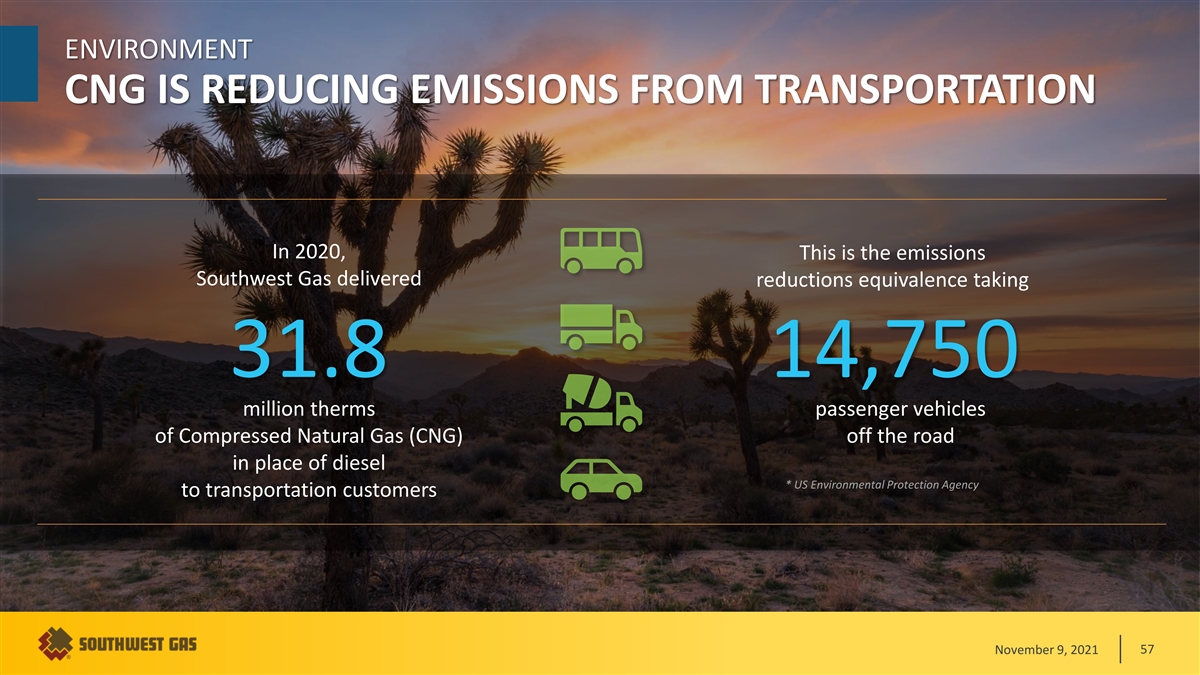
ENVIRONMENT CNG IS REDUCING EMISSIONS FROM TRANSPORTATION In 2020, This is the emissions Southwest Gas delivered reductions equivalence taking 31.8 14,750 million therms passenger vehicles of Compressed Natural Gas (CNG) off the road in place of diesel * US Environmental Protection Agency to transportation customers November 9, 2021 57

RENEWABLE NATURAL GAS (RNG) PROJECTS Pima County Wastewater Began flowing RNG to RTC Interconnect to receive RNG in 3 September 2021 to 5 weeks Victor Valley Wastewater Butterfield & Maricopa dairies Reclamation Authority interconnect groundbreaking took place June 29 expected online in Fall of 2021 Discussions with state, county and municipal entities coming to fruition November 9, 2021 58
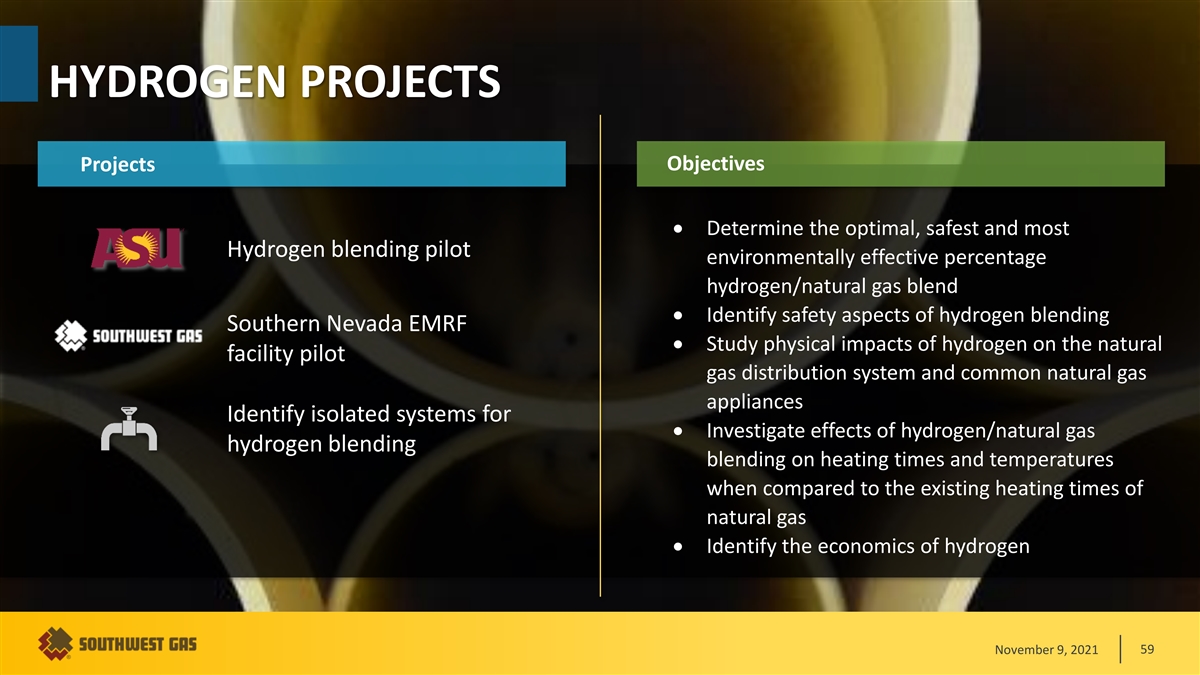
HYDROGEN PROJECTS Objectives Projects • Determine the optimal, safest and most Hydrogen blending pilot environmentally effective percentage hydrogen/natural gas blend • Identify safety aspects of hydrogen blending Southern Nevada EMRF • Study physical impacts of hydrogen on the natural facility pilot gas distribution system and common natural gas appliances Identify isolated systems for • Investigate effects of hydrogen/natural gas hydrogen blending blending on heating times and temperatures when compared to the existing heating times of natural gas • Identify the economics of hydrogen November 9, 2021 59

ENVIRONMENT INVESTING FOR COLLECTIVE IMPACT Energy Capital Ventures (ECV) is the only strategic venture capital fund purpose-built for driving environmental, social and governance innovation and digital transformation of the natural gas industry. Southwest Gas joined Renewable Natural Gas Focused on early-stage ESG with other founding partners Investments in decarbonization Hydrogen for collective impact Other Clean Energy Solutions Digital Transformations November 9, 2021 60

ENVIRONMENT KEEPING THE SYSTEM TIGHT As a result of our mitigation efforts, what they were 1/5 leaks today are 30 years ago November 9, 2021 61
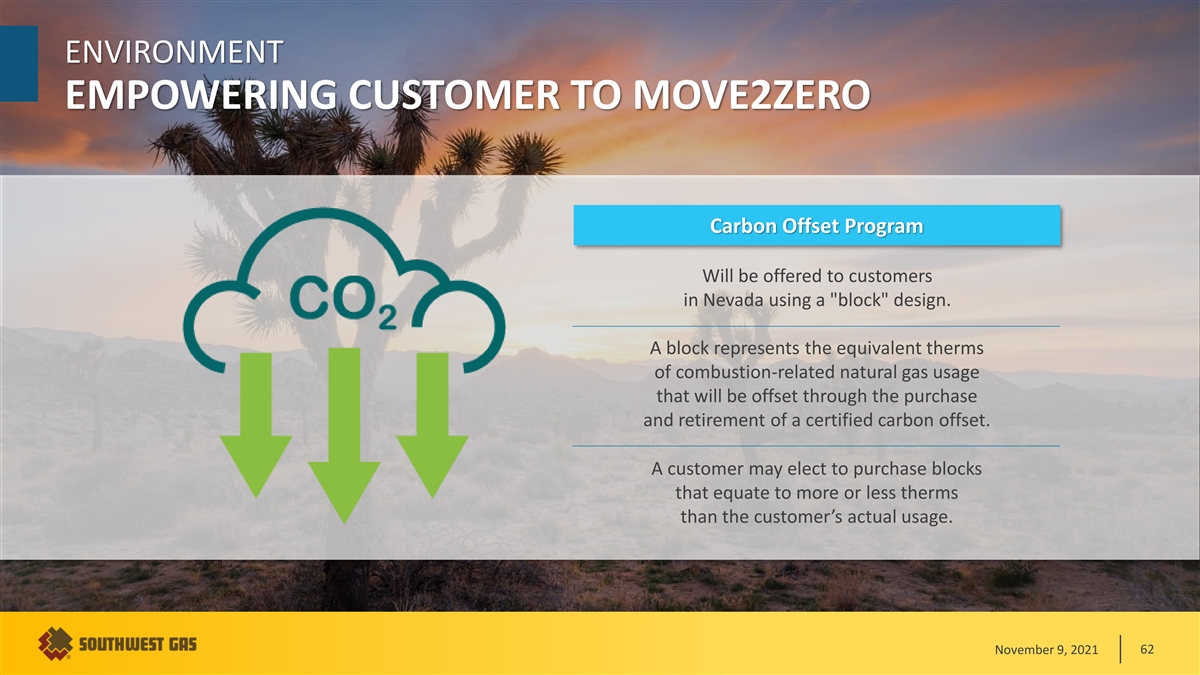
ENVIRONMENT EMPOWERING CUSTOMER TO MOVE2ZERO Carbon Offset Program Will be offered to customers in Nevada using a block design. A block represents the equivalent therms of combustion-related natural gas usage that will be offset through the purchase and retirement of a certified carbon offset. A customer may elect to purchase blocks that equate to more or less therms than the customer’s actual usage. November 9, 2021 62

2020 SUSTAINABILITY REPORT AVAILABLE Adopted the SASB Disclosure Framework “While no framework is perfect, BlackRock believes that the Sustainability Accounting Standards Board (SASB) provides a clear set of standards for reporting sustainability information across a wide range of issues, from labor practices to data privacy to business ethics.” - Larry Fink, CEO BlackRock Funds https://www.swgas.com/1409208370925/Southwest-Gas-Holdings-2020-Sustainability-Report.pdf November 9, 2021 63

NON-GAAP MEASURE Non-GAAP Measure Operating Margin – Southwest recognizes operating revenues from the distribution and transportation of natural gas (and related services) to customers. Gas cost is a tracked cost, which is passed through to customers without markup under purchased gas adjustment (“PGA”) mechanisms, impacting revenues and net cost of gas sold on a dollar-for-dollar basis, thereby having no impact on Southwest’s profitability. Therefore, management routinely uses operating margin, defined as operating revenues less the net cost of gas sold, in its analysis of Southwest’s financial performance. Operating margin also forms a basis for Southwest’s various regulatory decoupling mechanisms. Operating margin is not, however, specifically defined in accounting principles generally accepted in the United States (“U.S. GAAP”) and is considered a non-GAAP measure. Management believes supplying information regarding operating margin provides investors and other interested parties with useful and relevant information to analyze Southwest’s financial performance in a rate-regulated environment. Reconciliation of Gross Margin to Operating Margin (Non-GAAP measure) Three months ended September 30, Twelve months ended September 30, 2021 2020 2021 2020 (In thousands) Natural Gas Operations Utility Gross Margin $ 62,681 $ 57,188 $ 566,065 $ 524,010 Plus: Operations and maintenance (excluding Admin. & General) expense 68,098 61,383 255,434 244,573 Depreciation and amortization expense 61,359 55,942 249,118 230,158 Operating margin $ 1 92,138 $ 174,513 $ 1,070,617 $ 998,741 November 9, 2021 64
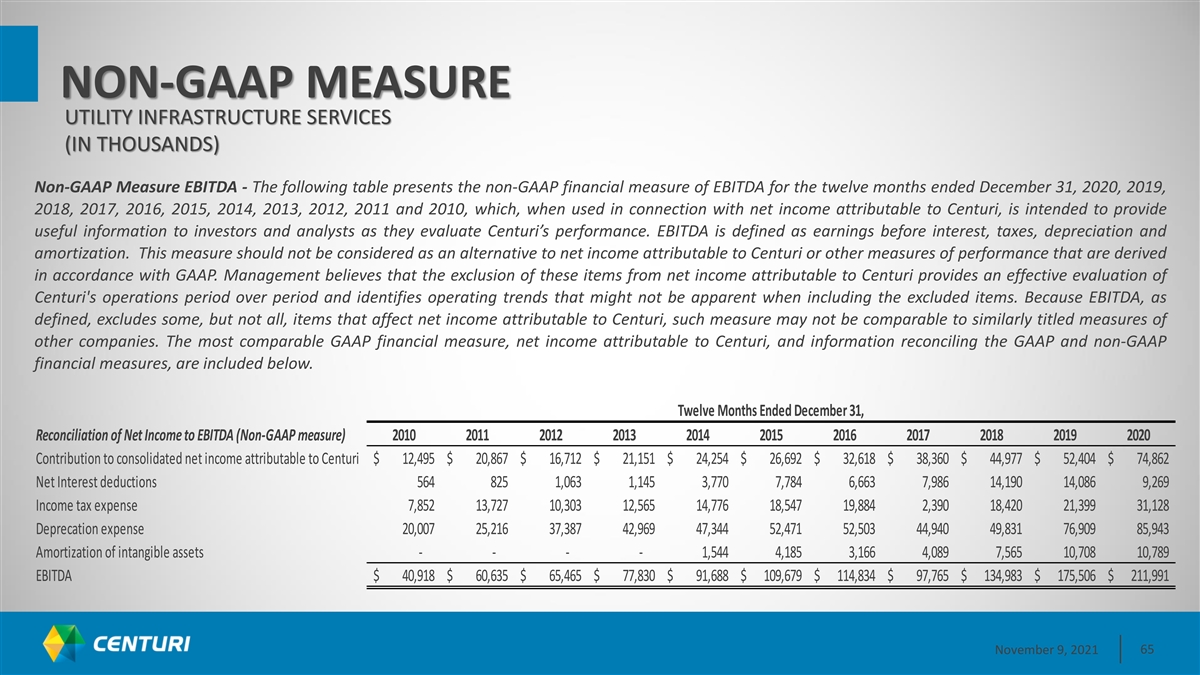
NON-GAAP MEASURE UTILITY INFRASTRUCTURE SERVICES (IN THOUSANDS) Non-GAAP Measure EBITDA - The following table presents the non-GAAP financial measure of EBITDA for the twelve months ended December 31, 2020, 2019, 2018, 2017, 2016, 2015, 2014, 2013, 2012, 2011 and 2010, which, when used in connection with net income attributable to Centuri, is intended to provide useful information to investors and analysts as they evaluate Centuri’s performance. EBITDA is defined as earnings before interest, taxes, depreciation and amortization. This measure should not be considered as an alternative to net income attributable to Centuri or other measures of performance that are derived in accordance with GAAP. Management believes that the exclusion of these items from net income attributable to Centuri provides an effective evaluation of Centuri's operations period over period and identifies operating trends that might not be apparent when including the excluded items. Because EBITDA, as defined, excludes some, but not all, items that affect net income attributable to Centuri, such measure may not be comparable to similarly titled measures of other companies. The most comparable GAAP financial measure, net income attributable to Centuri, and information reconciling the GAAP and non-GAAP financial measures, are included below. Twelve Months Ended December 31, Reconciliation of Net Income to EBITDA (Non-GAAP measure) 2010 2011 2012 2013 2014 2015 2016 2017 2018 2019 2020 Contribution to consolidated net income attributable to Centuri $ 12,495 $ 20,867 $ 16,712 $ 21,151 $ 24,254 $ 26,692 $ 32,618 $ 38,360 $ 44,977 $ 52,404 $ 74,862 Net Interest deductions 564 825 1 ,063 1 ,145 3 ,770 7,784 6,663 7 ,986 14,190 14,086 9,269 Income tax expense 7,852 13,727 10,303 12,565 14,776 18,547 19,884 2,390 18,420 21,399 31,128 Deprecation expense 20,007 25,216 37,387 42,969 47,344 52,471 52,503 44,940 49,831 76,909 85,943 Amortization of intangible assets - - - - 1 ,544 4,185 3,166 4 ,089 7,565 10,708 10,789 EBITDA $ 40,918 $ 60,635 $ 65,465 $ 77,830 $ 91,688 $ 1 09,679 $ 1 14,834 $ 97,765 $ 134,983 $ 1 75,506 $ 2 11,991 November 9, 2021 65