
4Q20 Earnings Presentation March 16, 2021 Exhibit 99
Forward-looking statements Some of the statements contained in this presentation may constitute forward-looking statements within the meaning of the federal securities laws. Forward-looking statements relate to expectations, projections, plans and strategies, anticipated events or trends, and similar expressions concerning matters that are not historical facts. In some cases, you can identify forward-looking statements by the use of forward-looking terminology such as "may," "will," "should," "expects," "intends," "plans," "anticipates," "believes," "estimates," "predicts," or "potential" or the negative of these words and phrases. You can also identify forward-looking statements by discussions of strategy, plans, or intentions. The forward-looking statements contained in this presentation reflect our current views about future events and are subject to numerous known and unknown risks, uncertainties, assumptions and changes in circumstances that may cause actual results to differ significantly from those expressed or contemplated in any forward-looking statement. While forward-looking statements reflect our good faith projections, assumptions and expectations, they are not guarantees of future results. Furthermore, we disclaim any obligation to publicly update or revise any forward-looking statement to reflect changes in underlying assumptions or factors, new information, data or methods, future events or other changes, except as required by applicable law. Factors that could cause our results to differ materially include but are not limited to: (1) the continued course and severity of the COVID-19 pandemic, and its direct and indirect impacts (2) general economic conditions and real estate market conditions, (3) regulatory and/or legislative changes, (4) our customers' continued interest in loans and doing business with us, (5) market conditions and investor interest in our contemplated securitization and (6) changes in federal government fiscal and monetary policies. For a further discussion of these and other factors that could cause future results to differ materially from those expressed or contemplated in any forward-looking statements, see the section titled ''Risk Factors" previously disclosed in our Form 10-Q filed with the SEC on May 14, 2020, as well as other cautionary statements we make in our current and periodic filings with the SEC. Such filings are available publicly on our Investor Relations web page at www.velfinance.com.
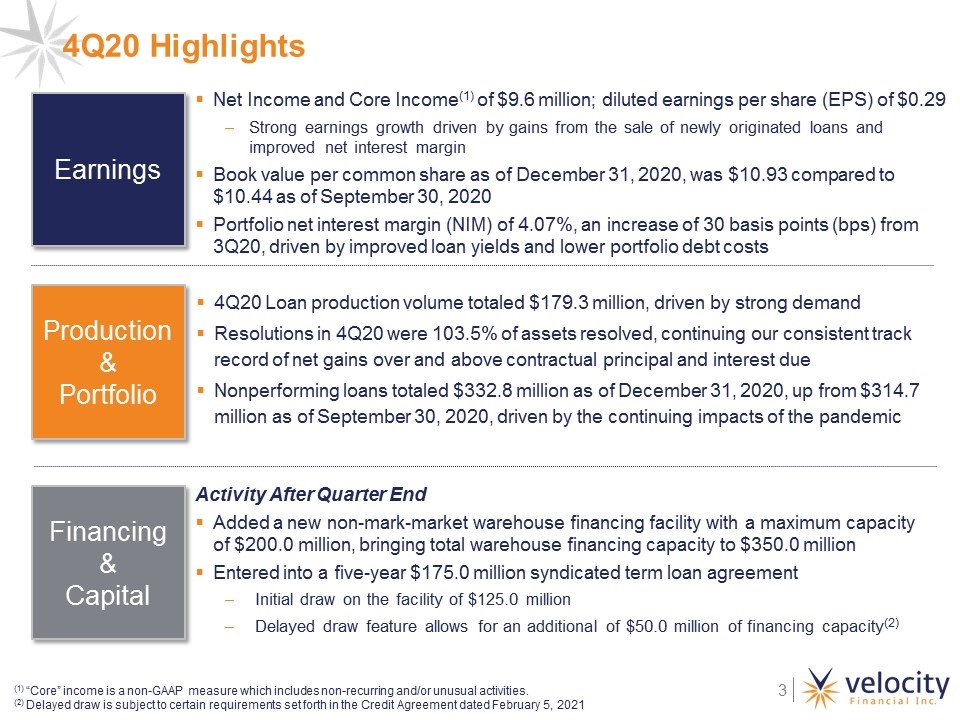
4Q20 Highlights Production& Portfolio Earnings Financing & Capital Net Income and Core Income(1) of $9.6 million; diluted earnings per share (EPS) of $0.29 Strong earnings growth driven by gains from the sale of newly originated loans and improved net interest margin Book value per common share as of December 31, 2020, was $10.93 compared to $10.44 as of September 30, 2020 Portfolio net interest margin (NIM) of 4.07%, an increase of 30 basis points (bps) from 3Q20, driven by improved loan yields and lower portfolio debt costs 4Q20 Loan production volume totaled $179.3 million, driven by strong demand Resolutions in 4Q20 were 103.5% of assets resolved, continuing our consistent track record of net gains over and above contractual principal and interest due Nonperforming loans totaled $332.8 million as of December 31, 2020, up from $314.7 million as of September 30, 2020, driven by the continuing impacts of the pandemic Activity After Quarter End Added a new non-mark-market warehouse financing facility with a maximum capacity of $200.0 million, bringing total warehouse financing capacity to $350.0 million Entered into a five-year $175.0 million syndicated term loan agreement Initial draw on the facility of $125.0 million Delayed draw feature allows for an additional of $50.0 million of financing capacity(2) (1) “Core” income is a non-GAAP measure which includes non-recurring and/or unusual activities. (2) Delayed draw is subject to certain requirements set forth in the Credit Agreement dated February 5, 2021
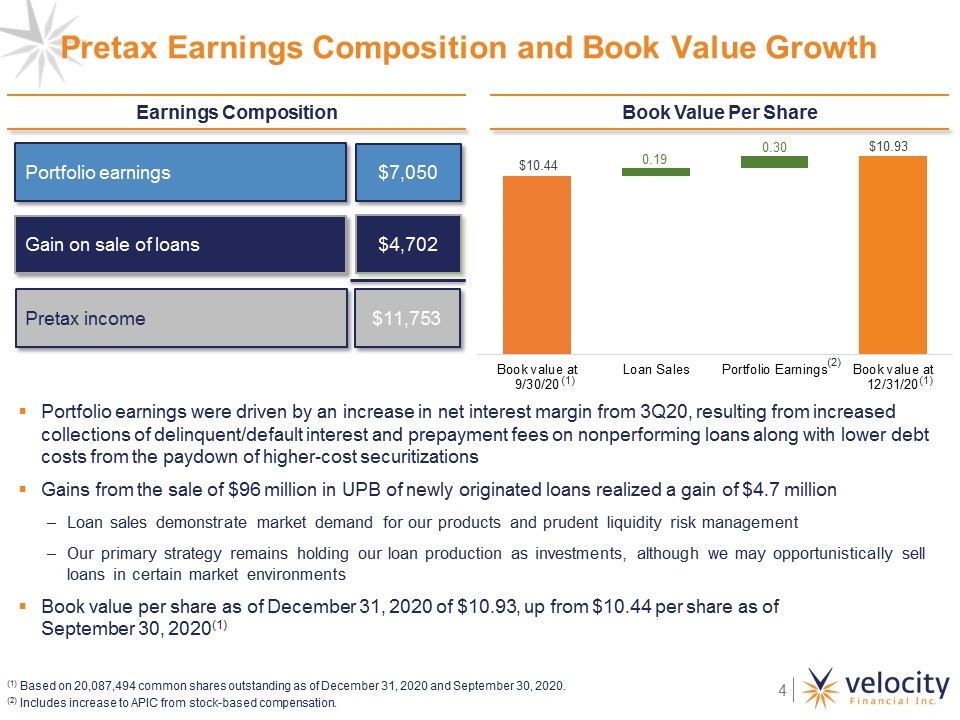
Pretax Earnings Composition and Book Value Growth Earnings Composition Book Value Per Share Portfolio earnings were driven by an increase in net interest margin from 3Q20, resulting from increased collections of delinquent/default interest and prepayment fees on nonperforming loans along with lower debt costs from the paydown of higher-cost securitizations Gains from the sale of $96 million in UPB of newly originated loans realized a gain of $4.7 million Loan sales demonstrate market demand for our products and prudent liquidity risk management Our primary strategy remains holding our loan production as investments, although we may opportunistically sell loans in certain market environments Book value per share as of December 31, 2020 of $10.93, up from $10.44 per share as of September 30, 2020(1) Pretax income $11,753 (1) Based on 20,087,494 common shares outstanding as of December 31, 2020 and September 30, 2020. (2) Includes increase to APIC from stock-based compensation. Gain on sale of loans $4,702 Portfolio earnings $7,050 (1) (1) (2)
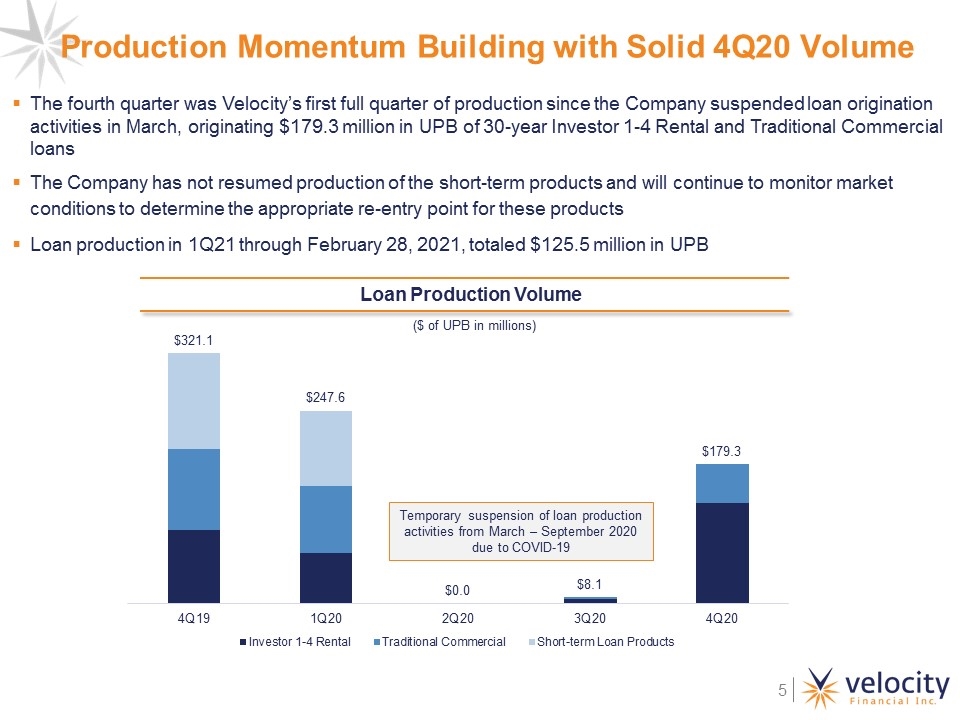
Production Momentum Building with Solid 4Q20 Volume The fourth quarter was Velocity’s first full quarter of production since the Company suspended loan origination activities in March, originating $179.3 million in UPB of 30-year Investor 1-4 Rental and Traditional Commercial loans The Company has not resumed production of the short-term products and will continue to monitor market conditions to determine the appropriate re-entry point for these products Loan production in 1Q21 through February 28, 2021, totaled $125.5 million in UPB Loan Production Volume ($ of UPB in millions) Temporary suspension of loan production activities from March – September 2020 due to COVID-19
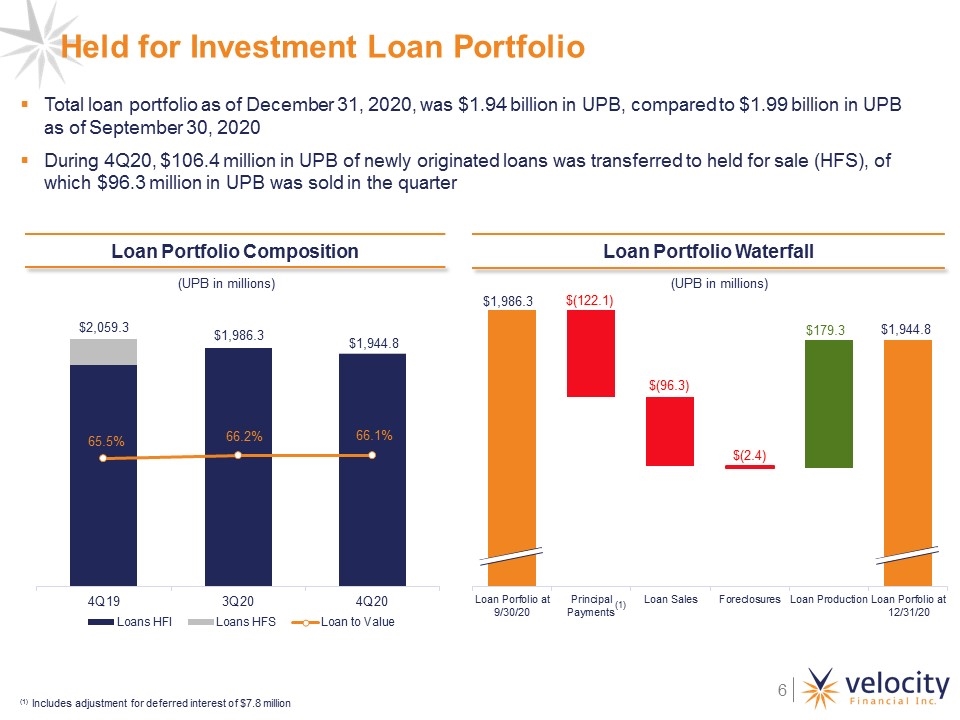
Total loan portfolio as of December 31, 2020, was $1.94 billion in UPB, compared to $1.99 billion in UPB as of September 30, 2020 During 4Q20, $106.4 million in UPB of newly originated loans was transferred to held for sale (HFS), of which $96.3 million in UPB was sold in the quarter Held for Investment Loan Portfolio $(122.1) $(96.3) Loan Portfolio Waterfall Loan Portfolio Composition (UPB in millions) (UPB in millions) (1) $179.3 $(2.4) (1) Includes adjustment for deferred interest of $7.8 million
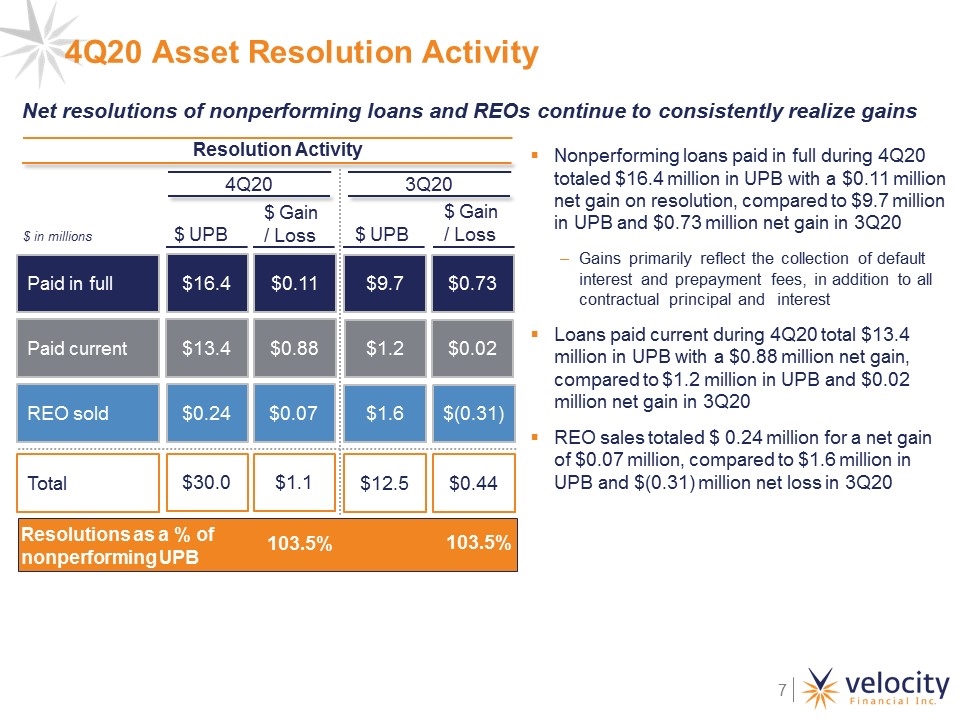
4Q20 Asset Resolution Activity $ in millions Resolutions as a % of nonperforming UPB Paid in full $9.7 Paid current REO sold $1.2 $1.6 $ UPB $ Gain / Loss $0.73 $0.02 $(0.31) Resolution Activity Nonperforming loans paid in full during 4Q20 totaled $16.4 million in UPB with a $0.11 million net gain on resolution, compared to $9.7 million in UPB and $0.73 million net gain in 3Q20 Gains primarily reflect the collection of default interest and prepayment fees, in addition to all contractual principal and interest Loans paid current during 4Q20 total $13.4 million in UPB with a $0.88 million net gain, compared to $1.2 million in UPB and $0.02 million net gain in 3Q20 REO sales totaled $ 0.24 million for a net gain of $0.07 million, compared to $1.6 million in UPB and $(0.31) million net loss in 3Q20 Net resolutions of nonperforming loans and REOs continue to consistently realize gains $16.4 $13.4 $0.24 $0.11 $0.88 $0.07 $ UPB $ Gain / Loss 4Q20 3Q20 Total $12.5 $0.44 $30.0 $1.1 103.5% 103.5%
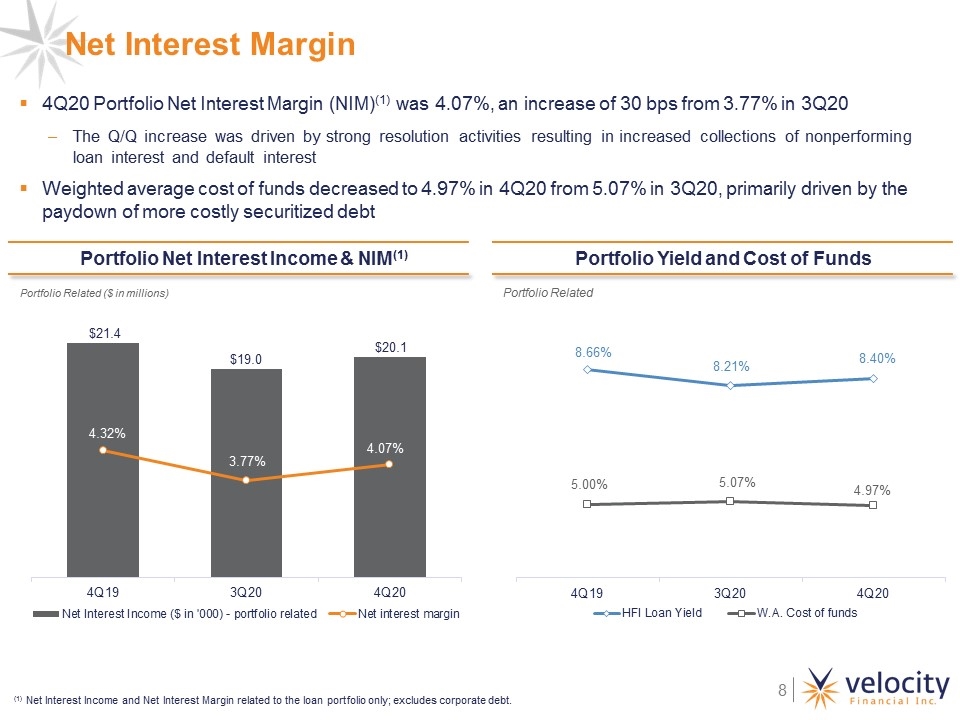
Portfolio Net Interest Income & NIM(1) Net Interest Margin 4Q20 Portfolio Net Interest Margin (NIM)(1) was 4.07%, an increase of 30 bps from 3.77% in 3Q20 The Q/Q increase was driven by strong resolution activities resulting in increased collections of nonperforming loan interest and default interest Weighted average cost of funds decreased to 4.97% in 4Q20 from 5.07% in 3Q20, primarily driven by the paydown of more costly securitized debt Portfolio Yield and Cost of Funds Portfolio Related Portfolio Related ($ in Millions) (1) Net Interest Income and Net Interest Margin related to the loan portfolio only; excludes corporate debt. Portfolio Related ($ in millions)
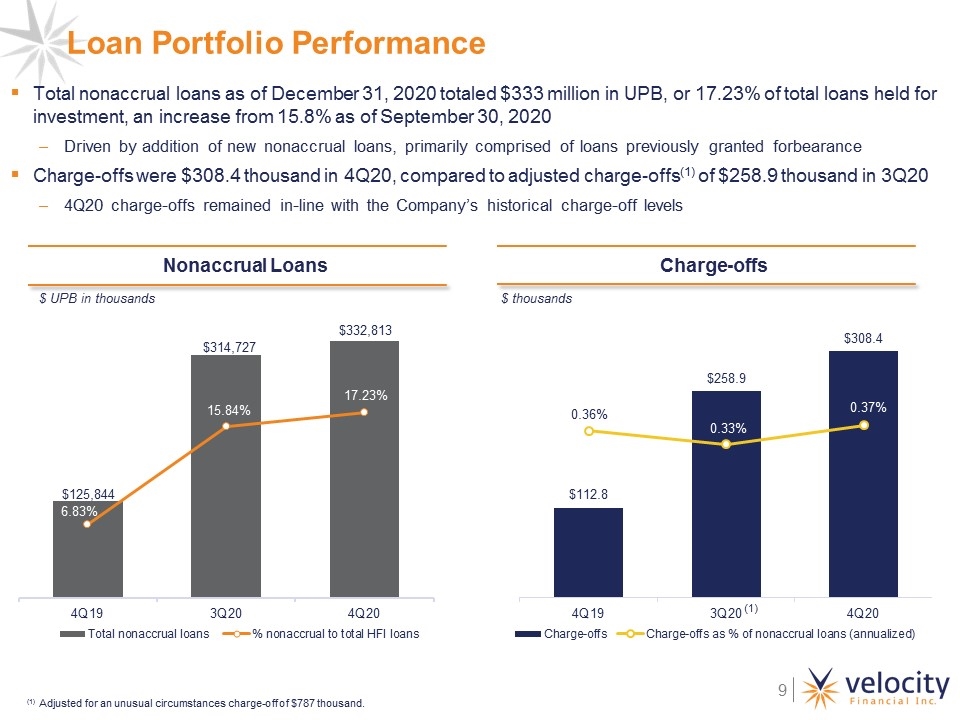
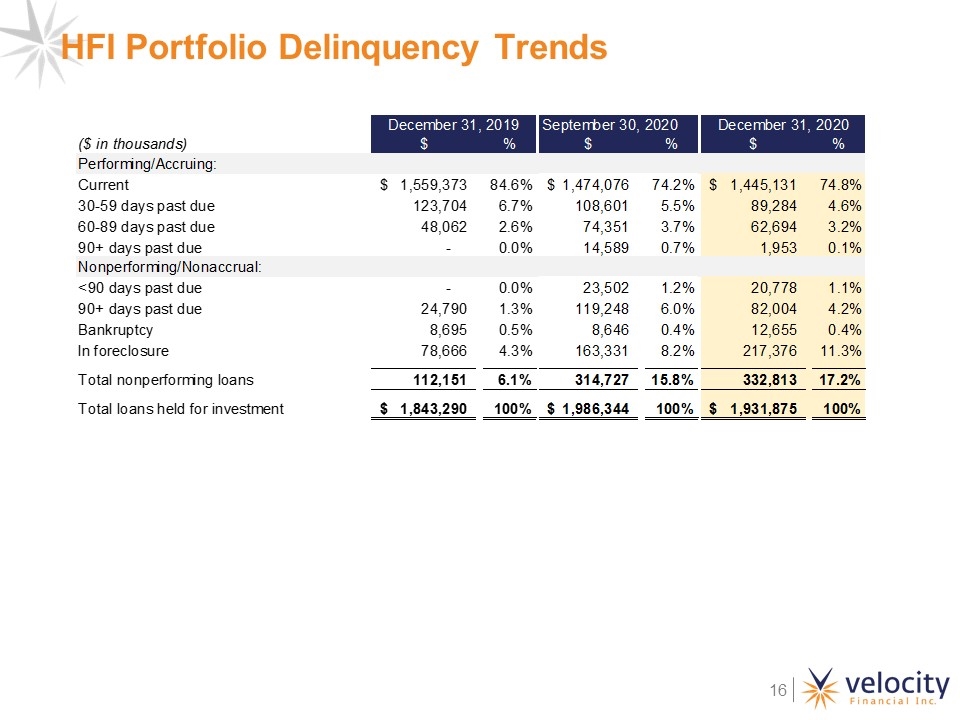
Nonaccrual Loans Total nonaccrual loans as of December 31, 2020 totaled $333 million in UPB, or 17.23% of total loans held for investment, an increase from 15.8% as of September 30, 2020 Driven by addition of new nonaccrual loans, primarily comprised of loans previously granted forbearance Charge-offs were $308.4 thousand in 4Q20, compared to adjusted charge-offs(1) of $258.9 thousand in 3Q20 4Q20 charge-offs remained in-line with the Company’s historical charge-off levels Charge-offs $ UPB in thousands Loan Portfolio Performance $ thousands 0.33% (1) Adjusted for an unusual circumstances charge-off of $787 thousand. (1)
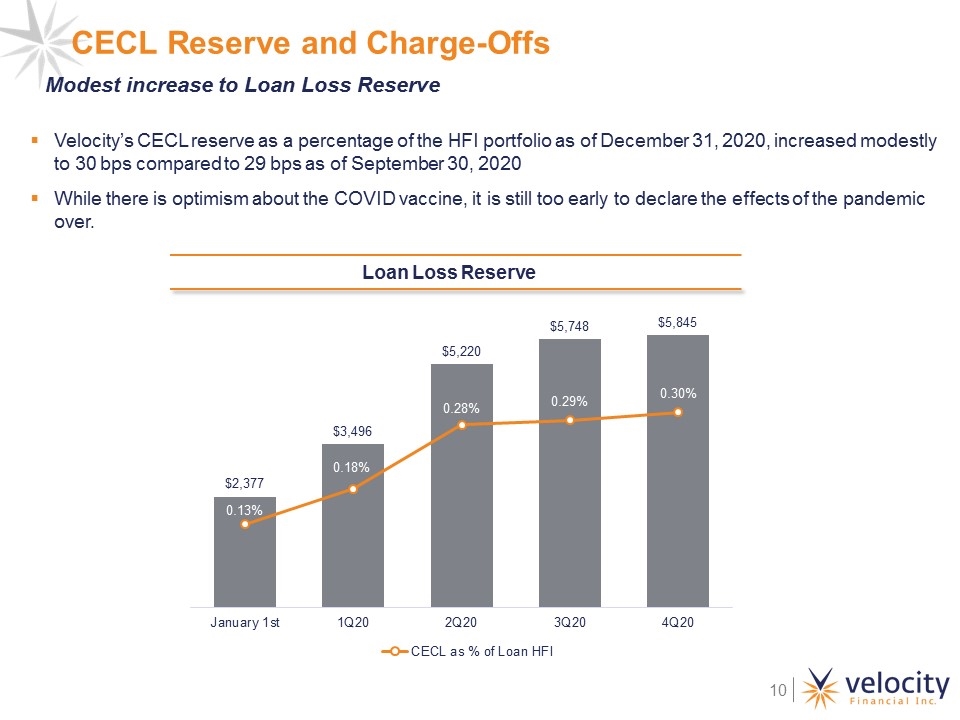
CECL Reserve and Charge-Offs Loan Loss Reserve Velocity’s CECL reserve as a percentage of the HFI portfolio as of December 31, 2020, increased modestly to 30 bps compared to 29 bps as of September 30, 2020 While there is optimism about the COVID vaccine, it is still too early to declare the effects of the pandemic over. Modest increase to Loan Loss Reserve
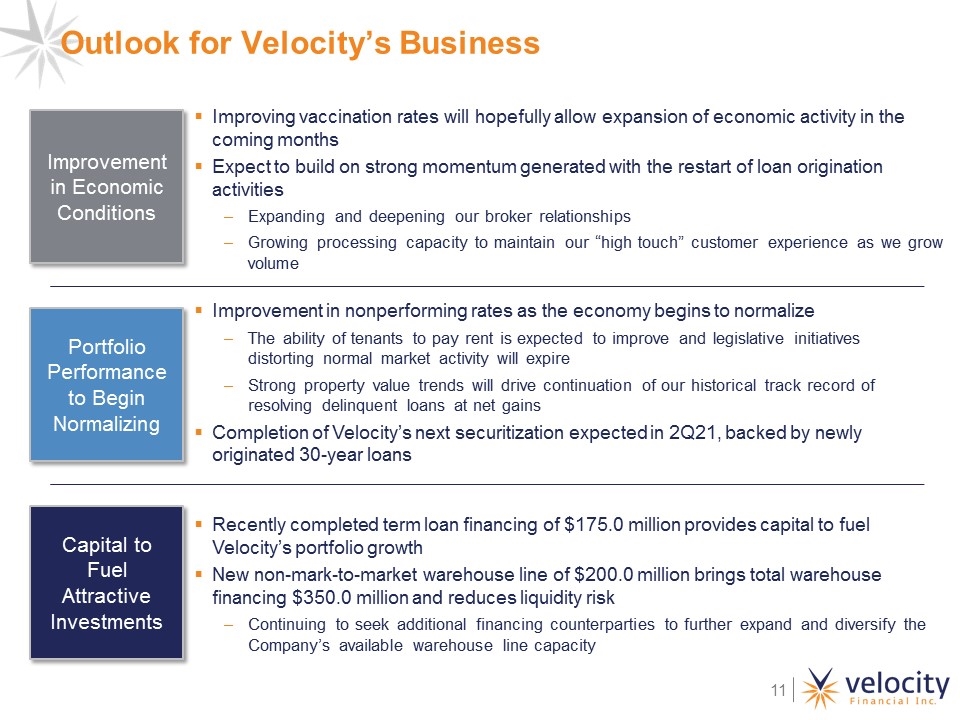
Portfolio Performance to Begin Normalizing Capital to Fuel Attractive Investments Improvement in Economic Conditions Improving vaccination rates will hopefully allow expansion of economic activity in the coming months Expect to build on strong momentum generated with the restart of loan origination activities Expanding and deepening our broker relationships Growing processing capacity to maintain our “high touch” customer experience as we grow volume Recently completed term loan financing of $175.0 million provides capital to fuel Velocity’s portfolio growth New non-mark-to-market warehouse line of $200.0 million brings total warehouse financing $350.0 million and reduces liquidity risk Continuing to seek additional financing counterparties to further expand and diversify the Company’s available warehouse line capacity Improvement in nonperforming rates as the economy begins to normalize The ability of tenants to pay rent is expected to improve and legislative initiatives distorting normal market activity will expire Strong property value trends will drive continuation of our historical track record of resolving delinquent loans at net gains Completion of Velocity’s next securitization expected in 2Q21, backed by newly originated 30-year loans Outlook for Velocity’s Business

Appendix
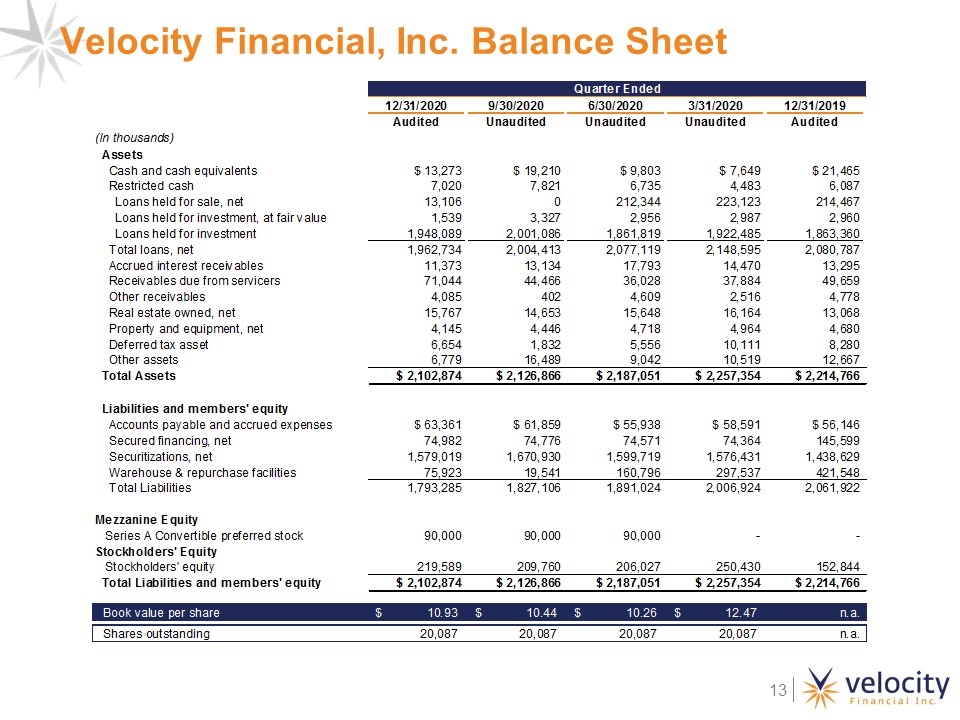
Velocity Financial, Inc. Balance Sheet
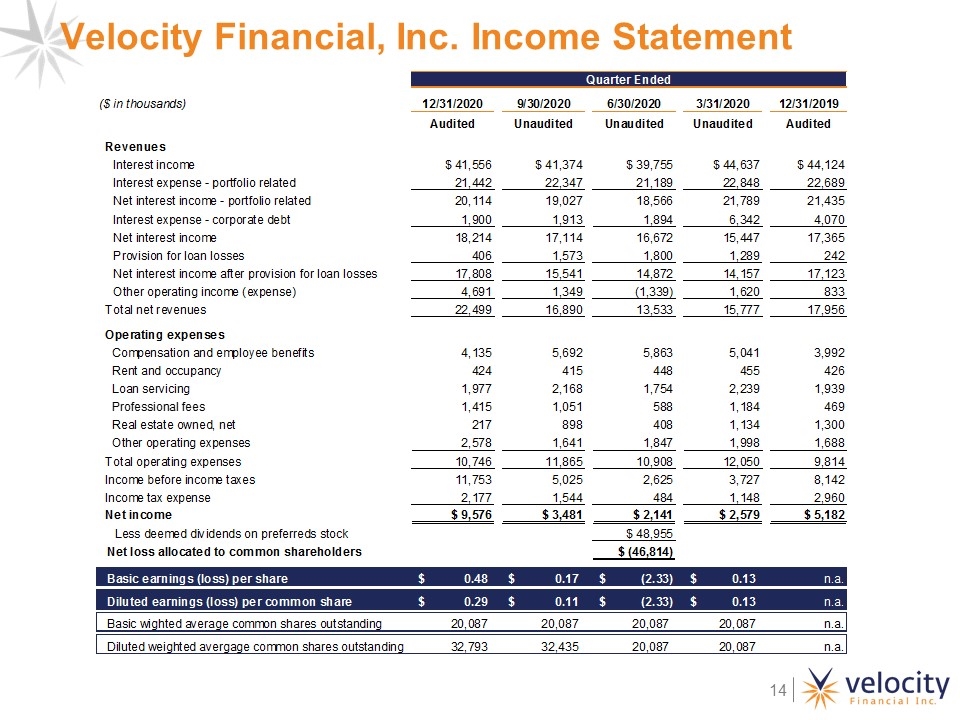
Velocity Financial, Inc. Income Statement
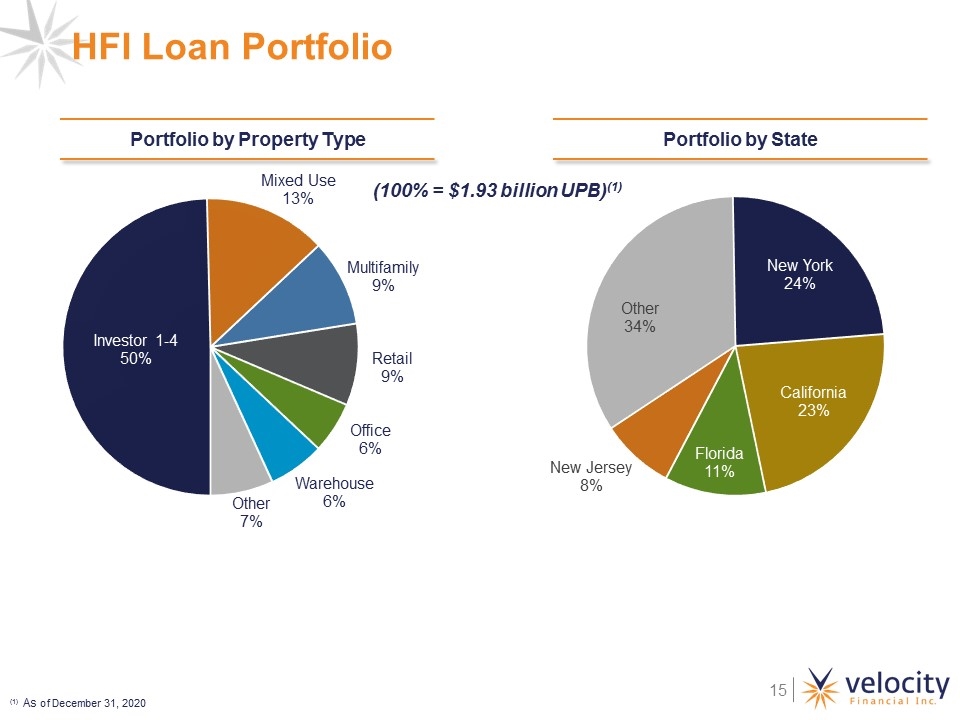
HFI Loan Portfolio Portfolio by Property Type (100% = $1.93 billion UPB)(1) (1) As of December 31, 2020 Portfolio by State
HFI Portfolio Delinquency Trends


