
1Q21 Earnings Presentation May 6, 2021 Exhibit 99
Forward-looking statements Some of the statements contained in this presentation may constitute forward-looking statements within the meaning of the federal securities laws. Forward-looking statements relate to expectations, projections, plans and strategies, anticipated events or trends, and similar expressions concerning matters that are not historical facts. In some cases, you can identify forward-looking statements by the use of forward-looking terminology such as "may," "will," "should," "expects," "intends," "plans," "anticipates," "believes," "estimates," "predicts," or "potential" or the negative of these words and phrases. You can also identify forward-looking statements by discussions of strategy, plans, or intentions. The forward-looking statements contained in this presentation reflect our current views about future events and are subject to numerous known and unknown risks, uncertainties, assumptions and changes in circumstances that may cause actual results to differ significantly from those expressed or contemplated in any forward-looking statement. While forward-looking statements reflect our good faith projections, assumptions and expectations, they are not guarantees of future results. Furthermore, we disclaim any obligation to publicly update or revise any forward-looking statement to reflect changes in underlying assumptions or factors, new information, data or methods, future events or other changes, except as required by applicable law. Factors that could cause our results to differ materially include but are not limited to: (1) the continued course and severity of the COVID-19 pandemic, and its direct and indirect impacts (2) general economic conditions and real estate market conditions, (3) regulatory and/or legislative changes, (4) our customers' continued interest in loans and doing business with us, (5) market conditions and investor interest in our contemplated securitization and (6) changes in federal government fiscal and monetary policies. For a further discussion of these and other factors that could cause future results to differ materially from those expressed or contemplated in any forward-looking statements, see the section titled ''Risk Factors" previously disclosed in our Form 10-Q filed with the SEC on May 14, 2020, as well as other cautionary statements we make in our current and periodic filings with the SEC. Such filings are available publicly on our Investor Relations web page at www.velfinance.com.
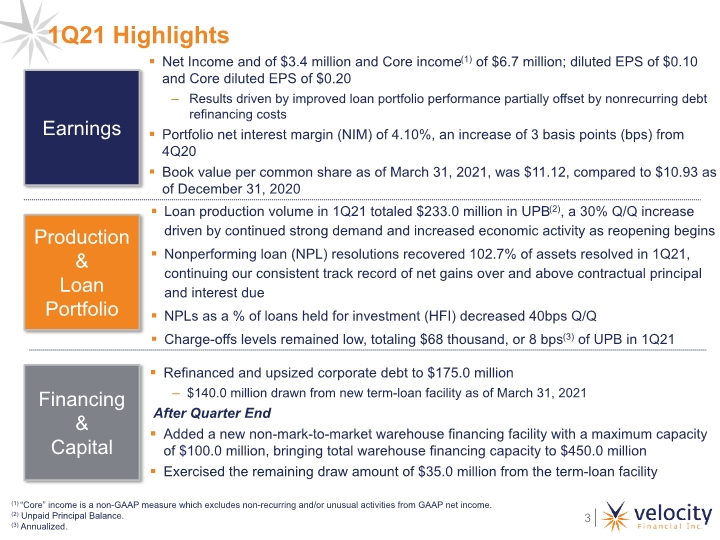
1Q21 Highlights Production& Loan Portfolio Earnings Financing & Capital Net Income and of $3.4 million and Core income(1) of $6.7 million; diluted EPS of $0.10 and Core diluted EPS of $0.20 Results driven by improved loan portfolio performance partially offset by nonrecurring debt refinancing costs Portfolio net interest margin (NIM) of 4.10%, an increase of 3 basis points (bps) from 4Q20 Book value per common share as of March 31, 2021, was $11.12, compared to $10.93 as of December 31, 2020 Loan production volume in 1Q21 totaled $233.0 million in UPB(2), a 30% Q/Q increase driven by continued strong demand and increased economic activity as reopening begins Nonperforming loan (NPL) resolutions recovered 102.7% of assets resolved in 1Q21, continuing our consistent track record of net gains over and above contractual principal and interest due NPLs as a % of loans held for investment (HFI) decreased 40bps Q/Q Charge-offs levels remained low, totaling $68 thousand, or 8 bps(3) of UPB in 1Q21 Refinanced and upsized corporate debt to $175.0 million $140.0 million drawn from new term-loan facility as of March 31, 2021 After Quarter End Added a new non-mark-to-market warehouse financing facility with a maximum capacity of $100.0 million, bringing total warehouse financing capacity to $450.0 million Exercised the remaining draw amount of $35.0 million from the term-loan facility (1) “Core” income is a non-GAAP measure which excludes non-recurring and/or unusual activities from GAAP net income. (2) Unpaid Principal Balance. (3) Annualized.
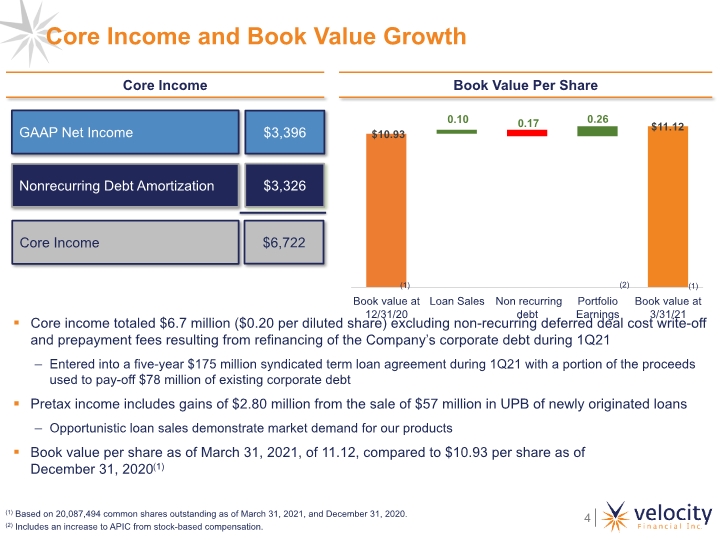
Core Income and Book Value Growth Core income totaled $6.7 million ($0.20 per diluted share) excluding non-recurring deferred deal cost write-off and prepayment fees resulting from refinancing of the Company’s corporate debt during 1Q21 Entered into a five-year $175 million syndicated term loan agreement during 1Q21 with a portion of the proceeds used to pay-off $78 million of existing corporate debt Pretax income includes gains of $2.80 million from the sale of $57 million in UPB of newly originated loans Opportunistic loan sales demonstrate market demand for our products Book value per share as of March 31, 2021, of 11.12, compared to $10.93 per share as of December 31, 2020(1) Core Income $6,722 (1) Based on 20,087,494 common shares outstanding as of March 31, 2021, and December 31, 2020. (2) Includes an increase to APIC from stock-based compensation. Nonrecurring Debt Amortization $3,326 GAAP Net Income $3,396 (1) (1) (2)
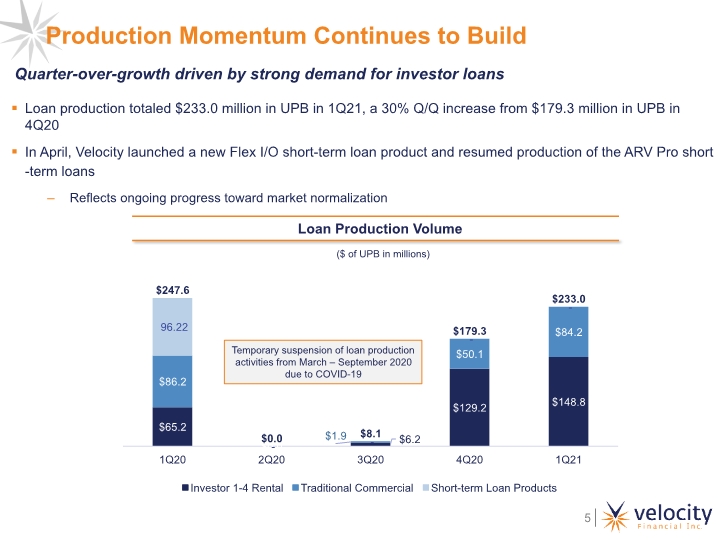
Production Momentum Continues to Build Loan production totaled $233.0 million in UPB in 1Q21, a 30% Q/Q increase from $179.3 million in UPB in 4Q20 In April, Velocity launched a new Flex I/O short-term loan product and resumed production of the ARV Pro short-term loans Reflects ongoing progress toward market normalization ($ of UPB in millions) Temporary suspension of loan production activities from March – September 2020 due to COVID-19 Quarter-over-growth driven by strong demand for investor loans
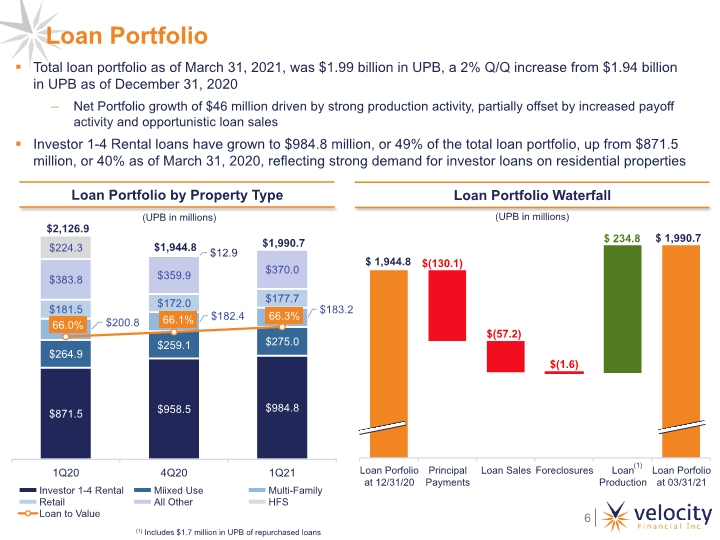
Total loan portfolio as of March 31, 2021, was $1.99 billion in UPB, a 2% Q/Q increase from $1.94 billion in UPB as of December 31, 2020 Net Portfolio growth of $46 million driven by strong production activity, partially offset by increased payoff activity and opportunistic loan sales Investor 1-4 Rental loans have grown to $984.8 million, or 49% of the total loan portfolio, up from $871.5 million, or 40% as of March 31, 2020, reflecting strong demand for investor loans on residential properties Loan Portfolio $(130.1) $(57.2) (UPB in millions) (UPB in millions) (1) $179.3 $(1.6) (1) Includes $1.7 million in UPB of repurchased loans
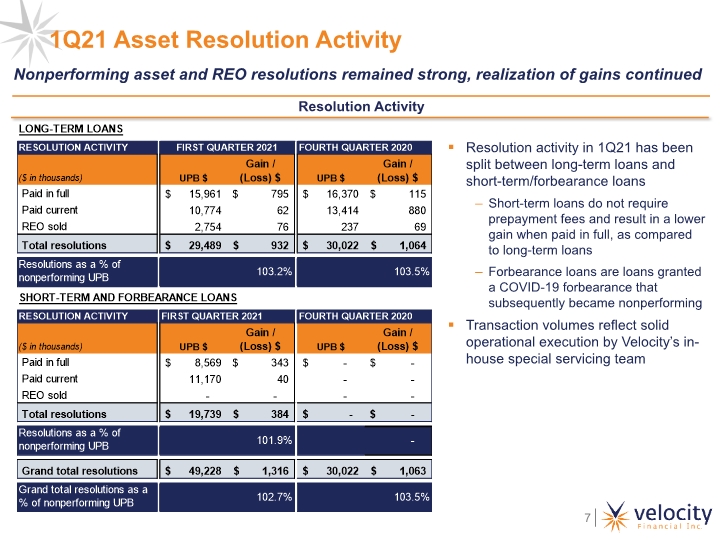
1Q21 Asset Resolution Activity Resolution activity in 1Q21 has been split between long-term loans and short-term/forbearance loans Short-term loans do not require prepayment fees and result in a lower gain when paid in full, as compared to long-term loans Forbearance loans are loans granted a COVID-19 forbearance that subsequently became nonperforming Transaction volumes reflect solid operational execution by Velocity’s in-house special servicing team Nonperforming asset and REO resolutions remained strong, realization of gains continued
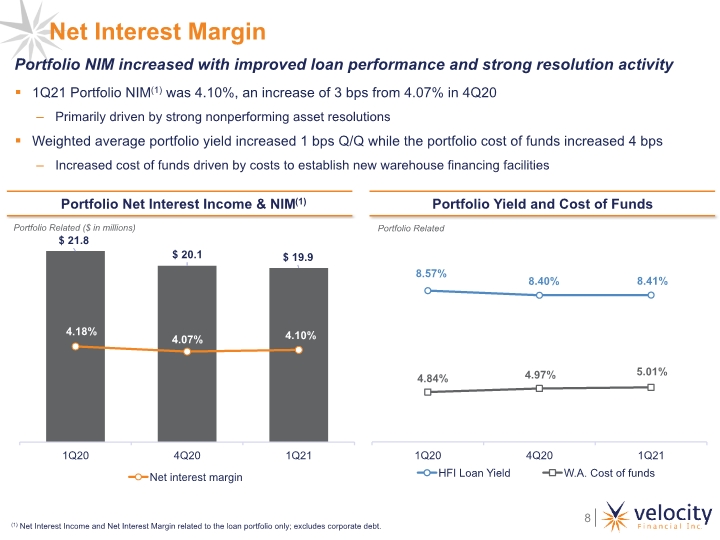
Net Interest Margin 1Q21 Portfolio NIM(1) was 4.10%, an increase of 3 bps from 4.07% in 4Q20 Primarily driven by strong nonperforming asset resolutions Weighted average portfolio yield increased 1 bps Q/Q while the portfolio cost of funds increased 4 bps Increased cost of funds driven by costs to establish new warehouse financing facilities Portfolio Related (1) Net Interest Income and Net Interest Margin related to the loan portfolio only; excludes corporate debt. Portfolio Related ($ in millions) Portfolio NIM increased with improved loan performance and strong resolution activity
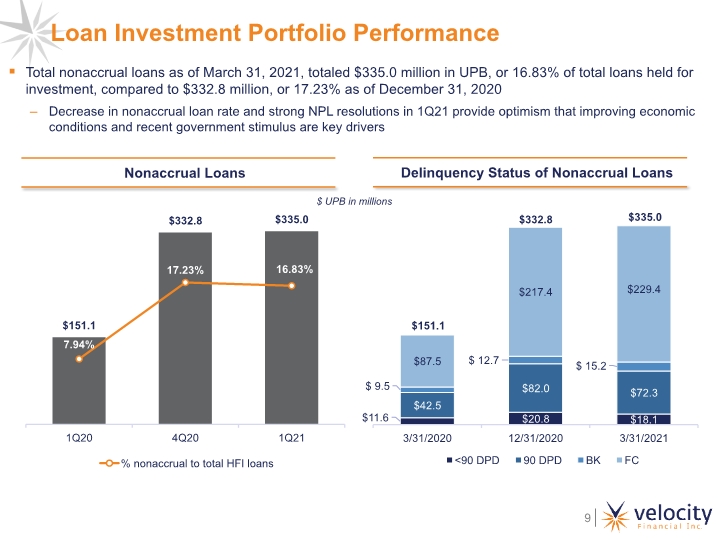
Total nonaccrual loans as of March 31, 2021, totaled $335.0 million in UPB, or 16.83% of total loans held for investment, compared to $332.8 million, or 17.23% as of December 31, 2020 Decrease in nonaccrual loan rate and strong NPL resolutions in 1Q21 provide optimism that improving economic conditions and recent government stimulus are key drivers $ UPB in millions Loan Investment Portfolio Performance
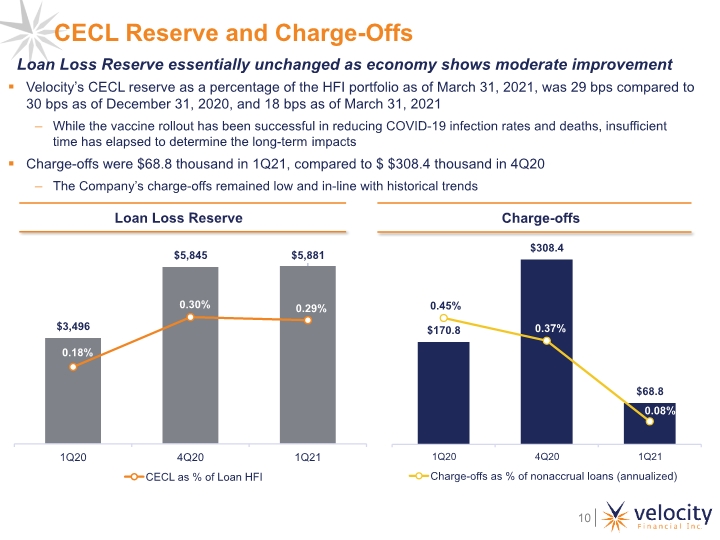
Velocity’s CECL reserve as a percentage of the HFI portfolio as of March 31, 2021, was 29 bps compared to 30 bps as of December 31, 2020, and 18 bps as of March 31, 2021 While the vaccine rollout has been successful in reducing COVID-19 infection rates and deaths, insufficient time has elapsed to determine the long-term impacts Charge-offs were $68.8 thousand in 1Q21, compared to $ $308.4 thousand in 4Q20 The Company’s charge-offs remained low and in-line with historical trends CECL Reserve and Charge-Offs Loan Loss Reserve essentially unchanged as economy shows moderate improvement
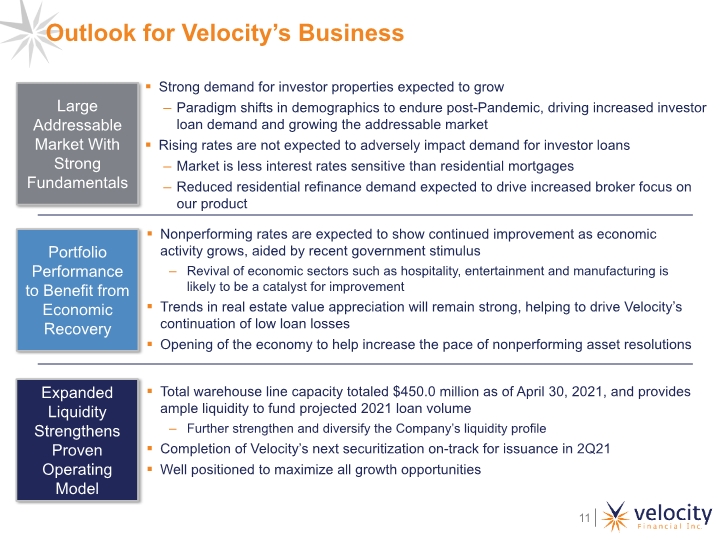
Portfolio Performance to Benefit from Economic Recovery Expanded Liquidity Strengthens Proven Operating Model Large Addressable Market With Strong Fundamentals Strong demand for investor properties expected to grow Paradigm shifts in demographics to endure post-Pandemic, driving increased investor loan demand and growing the addressable market Rising rates are not expected to adversely impact demand for investor loans Market is less interest rates sensitive than residential mortgages Reduced residential refinance demand expected to drive increased broker focus on our product Total warehouse line capacity totaled $450.0 million as of April 30, 2021, and provides ample liquidity to fund projected 2021 loan volume Further strengthen and diversify the Company’s liquidity profile Completion of Velocity’s next securitization on-track for issuance in 2Q21 Well positioned to maximize all growth opportunities Nonperforming rates are expected to show continued improvement as economic activity grows, aided by recent government stimulus Revival of economic sectors such as hospitality, entertainment and manufacturing is likely to be a catalyst for improvement Trends in real estate value appreciation will remain strong, helping to drive Velocity’s continuation of low loan losses Opening of the economy to help increase the pace of nonperforming asset resolutions Outlook for Velocity’s Business
Appendix
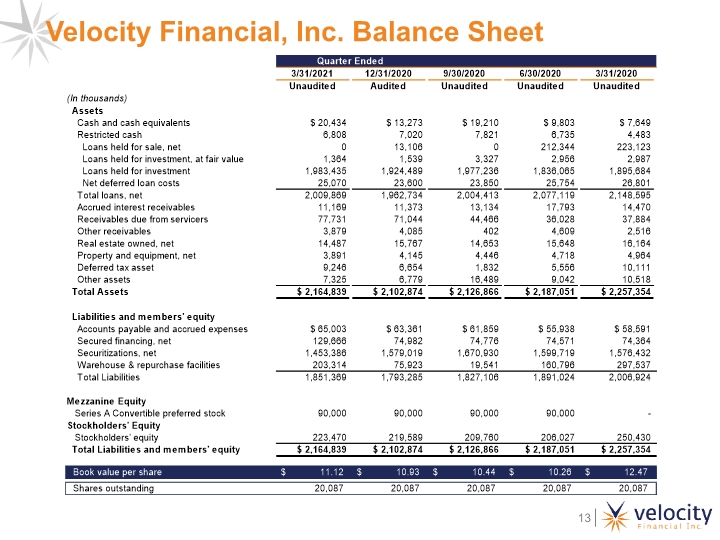
Velocity Financial, Inc. Balance Sheet
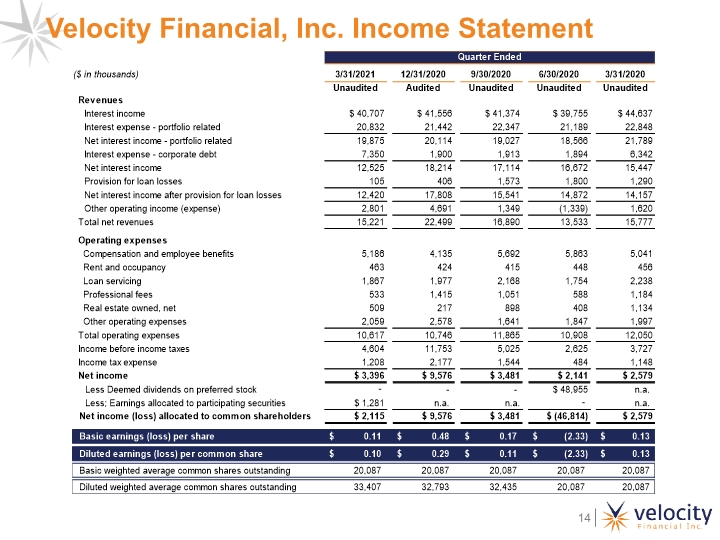
Velocity Financial, Inc. Income Statement
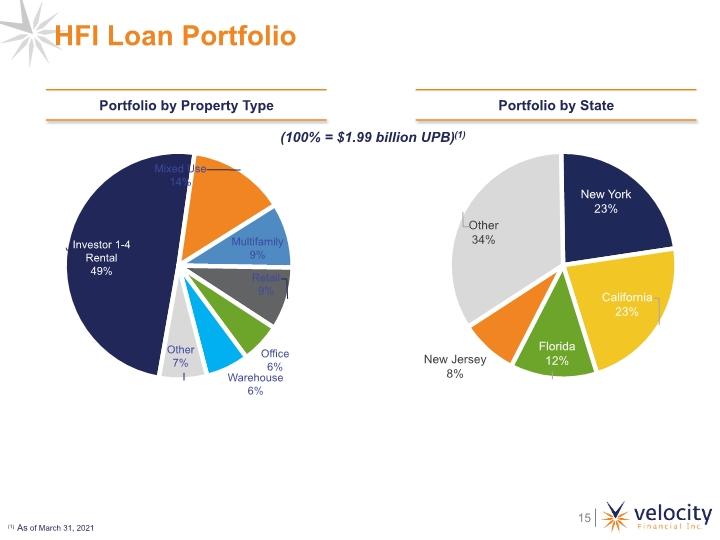
HFI Loan Portfolio (100% = $1.99 billion UPB)(1) (1) As of March 31, 2021
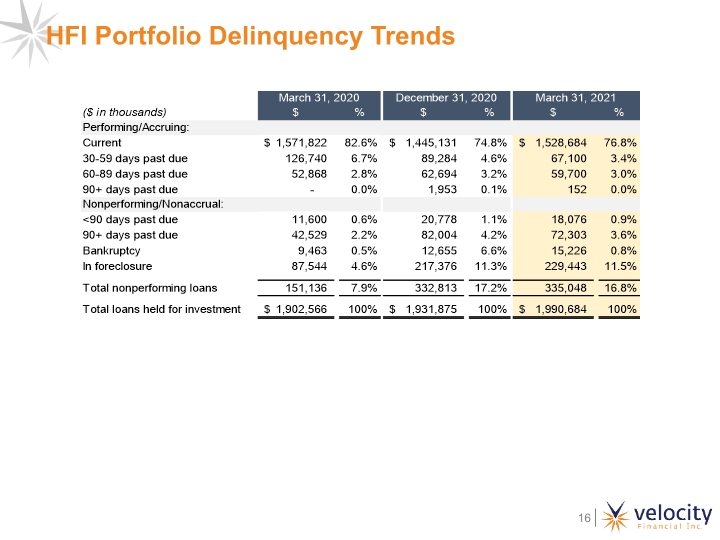
HFI Portfolio Delinquency Trends


