UNITED STATES
SECURITIES AND EXCHANGE COMMISSION
Washington, D.C. 20549
FORM 10-K
(Mark One)
| | | | | |
| ☒ | ANNUAL REPORT PURSUANT TO SECTION 13 OR 15(d) OF THE SECURITIES EXCHANGE ACT OF 1934 |
For the fiscal year ended December 31, 2024
or
| | | | | |
| ☐ | TRANSITION REPORT PURSUANT TO SECTION 13 OR 15(d) OF THE SECURITIES EXCHANGE ACT OF 1934 |
For the transition period from ________ to ________
Commission file number 001-38048
KINETIK HOLDINGS INC.
(Exact name of registrant as specified in its charter)
| | | | | | | | | | | | | | |
| Delaware | | | | 81-4675947 |
(State or other jurisdiction of incorporation or organization) | | | | (I.R.S. Employer Identification No.) |
2700 Post Oak Boulevard, Suite 300
Houston, Texas 77056-4400
(Address of principal executive offices) (Zip Code)
Registrant’s telephone number, including area code (713) 621-7330
Securities registered pursuant to Section 12(b) of the Act:
| | | | | | | | | | | | | | |
| Title of each class | | Trading Symbol(s) | | Name of each exchange on which registered |
| Class A common stock, $0.0001 par value | | KNTK | | New York Stock Exchange |
Securities registered pursuant to section 12(g) of the Act: None
Indicate by check mark if the registrant is a well-known seasoned issuer, as defined in Rule 405 of the Securities Act. Yes ☒ No ☐
Indicate by check mark if the registrant is not required to file reports pursuant to Section 13 or Section 15(d) of the Act. Yes ☐ No ☒
Indicate by check mark whether the registrant (1) has filed all reports required to be filed by Section 13 or 15(d) of the Securities Exchange Act of 1934 during the preceding 12 months (or for such shorter period that the registrant was required to file such reports), and (2) has been subject to such filing requirements for the past 90 days. Yes ☒ No ☐
Indicate by check mark whether the registrant has submitted electronically every Interactive Data File required to be submitted pursuant to Rule 405 of Regulation S-T (§ 232.405 of this chapter) during the preceding 12 months (or for such shorter period that the registrant was required to submit such files). Yes ☒ No ☐
Indicate by check mark whether the registrant is a large accelerated filer, an accelerated filer, a non-accelerated filer, a smaller reporting company, or an emerging growth company. See the definitions of “large accelerated filer,” “accelerated filer,” “smaller reporting company,” and “emerging growth company” in Rule 12b-2 of the Exchange Act.
| | | | | | | | | | | | | | | | | | | | | | | | | | | | | | | | |
| Large accelerated filer | | ☒ | | Accelerated filer | | ☐ | | Emerging growth company | | ☐ |
| Non-accelerated filer | | ☐ | | Smaller reporting company | | ☐ | | | | |
If an emerging growth company, indicate by check mark if the registrant has elected not to use the extended transition period for complying with any new or revised financial accounting standards provided pursuant to Section 13(a) of the Exchange Act. ☐
Indicate by check mark whether the registrant has filed a report on and attestation to its management’s assessment of the effectiveness of its internal control over financial reporting under Section 404(b) of the Sarbanes-Oxley Act (15 U.S.C. 7262(b)) by the registered public accounting firm that prepared or issued its audit report. ☒
If securities are registered pursuant to Section 12(b) of the Act, indicate by check mark whether the financial statements of the registrant included in the filing reflect the correction of an error to previously issued financial statements. ☐
Indicate by check mark whether any of those error corrections are restatements that required a recovery analysis of incentive-based compensation received by any of the registrant’s executive officers during the relevant recovery period pursuant to §240.10D-1(b). ☐
Indicate by check mark whether the registrant is a shell company (as defined in Rule 12b-2 of the Act): Yes ☐ No ☒
| | | | | | | | | | | | | | |
| Aggregate market value of the voting and non-voting common equity held by non-affiliates of registrant as of June 30, 2024 | $1,563,008,393 |
| Number of shares of registrant’s Class A common stock, $0.0001 issued and outstanding as of February 21, 2025 | 60,078,190 | |
| Number of shares of registrant’s Class C common stock, $0.0001 issued and outstanding as of February 21, 2025 | 97,696,784 | |
Documents Incorporated By Reference
Portions of registrant’s proxy statement relating to registrant’s 2024 annual meeting of stockholders to be filed hereafter are incorporated by reference in Part III of this Annual Report on Form 10-K.
TABLE OF CONTENTS
| | | | | | | | |
| Item | | Page |
| | |
| | |
| | |
| PART I | |
| | |
| 1 and 2. | | |
| 1A. | | |
| 1B. | | |
| 1C. | | |
| 3. | | |
| | |
| | |
| PART II | |
| | |
| 5. | | |
| 6. | | |
| 7. | | |
| 7A. | | |
| 8. | | |
| 9. | | |
| 9A. | | |
| 9B. | | |
| 9C. | | |
| | |
| PART III | |
| | |
| 10. | | |
| 11. | | |
| 12. | | |
| 13. | | |
| 14. | | |
| | |
| PART IV | |
| | |
| 15. | | |
| 16. | | |
| | |
GLOSSARY
The following are abbreviations and definitions of certain terms used in this Annual Report on Form 10-K (“Annual Report”) and certain terms which are commonly used in the exploration, production, and midstream sectors of the oil and natural gas industry:
•ASC. Accounting Standards Codification
•ASU. Accounting Standards Update
•Bbl. One stock tank barrel of 42 United States (“U.S.”) gallons liquid volume used herein in reference to crude oil, condensate or natural gas liquids
•Bcf. One billion cubic feet
•Bcf/d. One Bcf per day
•Btu. One British thermal unit, which is the quantity of heat required to raise the temperature of a one-pound mass of water by one degree Fahrenheit
•CODM. Chief Operating Decision Maker
•Delaware Basin. Located on the western section of the Permian Basin. The Delaware Basin covers a 6.4M acre area
•EBITDA. Earnings before interest, taxes, depreciation, and amortization
•FASB. Financial Accounting Standards Board
•Field. An area consisting of a single reservoir or multiple reservoirs, all grouped on, or related to, the same individual geological structural feature or stratigraphic condition. The field name refers to the surface area, although it may refer to both the surface and the underground productive formations
•Formation. A layer of rock which has distinct characteristics that differs from nearby rock
•GAAP. United States Generally Accepted Accounting Principles
•GHG. Greenhouse gas
•MBbl. One thousand barrels of crude oil, condensate or NGLs
•MBbl/d. One MBbl per day
•Mcf. One thousand cubic feet of natural gas
•Mcf/d. One Mcf per day
•MMBtu. One million British thermal units
•MMcf. One million cubic feet of natural gas
•MMcf/d. One MMcf per day
•MVC. Minimum volume commitments
•NGL or NGLs. Natural gas liquids. Hydrocarbons found in natural gas, which may be extracted as liquefied petroleum gas and natural gasoline
•Throughput. The volume of crude oil, natural gas, NGLs, water and refined petroleum products transported or passing through a pipeline, plant, terminal or other facility during a particular period
•SEC. United States Securities and Exchange Commission
•SOFR. Secured Overnight Financing Rate
FORWARD-LOOKING STATEMENTS AND RISK
This Annual Report on Form 10-K includes “forward-looking statements” within the meaning of Section 27A of the Securities Act of 1933, as amended (the “Securities Act”), and Section 21E of the Securities Exchange Act of 1934, as amended (the “Exchange Act”). All statements other than statements of historical facts included or incorporated by reference in this Annual Report, including, without limitation, statements regarding our future financial position, business strategy, budgets, projected revenues, projected costs and plans, and objectives of management for future operations, are forward-looking statements. In addition, forward-looking statements generally can be identified by the use of forward-looking terminology such as “may,” “will,” “could,” “expect,” “intend,” “project,” “estimate,” “anticipate,” “plan,” “believe,” “continue,” “seek,” “guidance,” “might,” “outlook,” “possibly,” “potential,” “prospect,” “should,” “would,” or similar terminology, but the absence of these words does not mean that a statement is not forward looking. Although we believe that the expectations reflected in such forward-looking statements are reasonable under the circumstances, we can give no assurance that such expectations will prove to have been correct. Important factors that could cause actual results to differ materially from our expectations include, but are not limited to, assumptions about:
•the market prices of oil, natural gas, NGLs, and other products or services;
•competition from other pipelines, terminals or other forms of transportation and competition from other service providers for gathering system capacity and availability;
•production rates, throughput volumes, reserve levels, and development success of dedicated oil and gas fields;
•our future financial condition, results of operations, liquidity, compliance with debt covenants and competitive position;
•our future revenues, cash flows and expenses;
•our access to capital and its anticipated liquidity;
•our future business strategy and other plans and objectives for future operations;
•the amount, nature and timing of our future capital expenditures, including future development costs;
•the risks associated with potential acquisitions, divestitures, new joint ventures or other strategic opportunities;
•the recruitment and retention of our officers and personnel;
•the likelihood of success of and impact of litigation and other proceedings, including regulatory proceedings;
•our assessment of our counterparty risk and the ability of our counterparties to perform their future obligations;
•the impact of federal, state, and local political, regulatory and environmental developments where we conduct our business operations;
•the occurrence of an extreme weather event, terrorist attack or other event that materially impacts project construction and our operations, including cyber or other operational electronic systems;
•our ability to successfully implement, execute and achieve our sustainability goals and initiatives;
•our ability to successfully implement our stock repurchase program;
•our ability to integrate operations or realize any anticipated benefits, savings or growth of business combinations. See Note 3 — Business Combination in the Notes to our Consolidated Financial Statements set forth in this Annual Report; •general economic and political conditions, epidemics or pandemics and actions taken by third parties in response to such epidemics or pandemics, the impact of continued inflation, central bank policy actions, bank failures and associated liquidity risks; and
Other factors or events that could cause the Company’s actual results to differ materially from the Company’s expectations may emerge from time to time, and it is not possible for the Company to predict all such factors or events. All subsequent written and oral forward-looking statements attributable to the Company, or persons acting on its behalf, are expressly qualified in their entirety by the cautionary statements. All forward-looking statements speak only as of the date of this Annual Report. Except as required by law, the Company disclaims any obligation to update or revise its forward-looking statements, whether based on changes in internal estimates or expectations, new information, future developments, or otherwise.
Risk Factors Summary
The following is a summary of the principal risks that could adversely affect our business, operations and financial results. Please refer to Part I—Item 1A—Risk Factors in this Annual Report below for additional discussion of the risks summarized in this Risk Factors Summary.
Business and Operational Risks
•The majority of the Company’s operating assets are currently located in the Permian Basin, making it vulnerable to risks associated with operating in a single geographic area.
•Because of the natural decline in hydrocarbon production from existing wells, the Company’s success depends, in part, on its ability to maintain or increase hydrocarbon throughput volumes on its midstream systems, which depends on its customers’ levels of development and completion activity on its dedicated acreage.
•We may experience difficulties completing acquisitions or divestitures or integrating new businesses and properties, and we may be unable to achieve the benefits we expect from any future acquisitions or divestitures.
•The Company owns interests in certain pipeline projects and other joint ventures, and the Company’s control of such entities is limited.
•If the third-party pipelines interconnected to the Company’s pipelines become unavailable to transport or store crude oil, NGLs or natural gas, or if our cost of transporting on such third-party pipelines changes, the Company’s revenue and available cash could be adversely affected.
•The third parties on whom the Company relies for transportation services from its processing facilities are subject to complex federal, state, and other laws that could adversely affect our financial condition and results of operations.
•The Company’s customers may suspend, reduce or terminate their obligations under the Company’s commercial agreements with them.
•Increased competition from other companies that provide midstream services, or from alternative fuel sources, could have a negative impact on the demand for the Company’s services.
•The Company’s exposure to commodity price risk may change over time and the Company cannot guarantee the terms of any existing or future agreements for its midstream services with its customers.
•The use of derivative financial instruments could result in material financial losses by us.
•The Company’s construction of new midstream assets may be subject to new or additional regulatory, environmental, political, contractual, legal and economic risks.
•The Company’s business involves many hazards and operational risks, some of which may not be fully covered by insurance.
•A shortage of equipment and skilled labor could reduce equipment availability and labor productivity and increase labor and equipment costs.
Environmental and Regulatory Risk Factors Related to the Company
•The Company operates in a highly regulated environment and its business and profitability could be adversely affected by actions by governmental entities, changes to current laws or regulations, or a failure to comply with laws or regulations.
•Changes to applicable tax laws and regulations or exposure to additional income tax liabilities could adversely affect our operating results and cash flows.
•Rate regulation, challenges by shippers to the rates the Company charges on its pipelines or changes in the jurisdictional characterization of some of the Company’s assets by federal, state or local regulatory agencies or a change in policy by those agencies may result in increased regulation of its assets, which may cause its operating expenses to increase, limit the rates it charges for certain services and decrease the amount of cash flows.
•Federal and state legislative and regulatory initiatives relating to pipeline safety, which are often subject to change, may result in more stringent regulations or enforcement and could subject the Company to increased operational costs, increased capital costs and potential operational delays.
•Increased regulation of hydraulic fracturing could result in reductions or delays in crude oil and natural gas production by the Company’s customers, which could reduce the throughput on its gathering and other midstream systems.
•Adoption of new or more stringent legal standards relating to induced seismic activity associated with produced-water disposal could affect the Company’s operations.
•The Company may incur significant liability under, or costs and expenditures to comply with, health, safety and environmental laws and regulations, which are complex and subject to frequent change.
•Legislation, executive orders and regulatory initiatives relating to climate change could have a material adverse effect on our business, demand for our services, financial condition, results of operations and cash flows, while potential physical effects of climate change could disrupt the Company’s operations, cause damage to its pipelines and other facilities and cause it to incur significant costs in preparing for or responding to those effects.
•Increasing attention to sustainability-related matters and conservation measures may adversely impact the Company’s business.
Risks Related to Ownership of Our Common Stock
•Entities controlled by Blackstone Inc. (“Blackstone”) and ISQ Global Fund II GP, LLC (“I Squared Capital”) are parties to the amended and restated stockholders agreement granting certain director designation rights and own a majority of the Company’s outstanding voting shares and thus could strongly influence all of the Company’s corporate actions.
•Potential future sales pursuant to registration rights granted by the Company and under Rule 144 may depress the market price for our shares of Class A Common Stock
•The Company’s ability to return capital to stockholders through dividends and stock repurchases depends on its ability to generate sufficient cash flows, which it may not be able to accomplish.
•The Company’s charter designates the Court of Chancery of the State of Delaware (the “Court of Chancery”) as the sole and exclusive forum for certain types of actions and proceedings that may be initiated by its stockholders, which could limit its stockholders’ ability to obtain a favorable judicial forum for disputes with the Company or its directors, officers, employees or agents.
•If the Company fails to maintain an effective system of internal controls, it may not be able to report accurately its financial results or prevent fraud. As a result, current and potential holders of the Company’s equity could lose confidence in its financial reporting, which would harm its business and cost of capital.
•If the performance of the Company does not meet the expectations of investors, stockholders or financial analysts, the market price of the Company’s securities may decline.
•We cannot guarantee that our stock repurchase program will enhance long-term stockholder value.
General Risks
•Continuing or worsening inflationary issues and associated changes in monetary policy have resulted in and may result in additional increases to the cost of the Company’s services and personnel.
•The Company’s operations could be disrupted by natural or human causes beyond its control.
•Cybersecurity breaches of our IT systems could result in information theft, data corruption, operational disruption and/or financial loss.
•Changes in management’s estimates and assumptions may have a material impact on the Company’s Consolidated Financial Statements and financial or operational performance in any given period.
PART I
ITEMS 1 and 2. BUSINESS AND PROPERTIES
Overview
We are an integrated midstream energy company in the Permian Basin providing comprehensive gathering, transportation, compression, processing and treating services. Our core capabilities include a variety of service offerings including natural gas gathering, transportation, compression, treating and processing; NGLs stabilization and transportation; produced water gathering and disposal; and crude oil gathering, stabilization, storage and transportation. We have approximately 2.2 Bcf/d cryogenic natural gas processing capacity strategically located across Texas and New Mexico. Such capacity will increase to 2.4 Bcf/d once the Kings Landing Project is completed in mid-2025. As measured by processing capacity, we are the fourth largest natural gas processor in the Delaware Basin and fourth largest across the entire Permian Basin. In addition, we have equity interests in three long-term contracted pipelines transporting natural gas, NGLs, and crude oil from the Permian Basin to the U.S. Gulf Coast.
Significant Transactions and Recent Developments
Permian Resources Midstream Assets Acquisition
On December 10, 2024, the Company announced it has entered into a definitive agreement with Permian Resources Corporation (“Permian Resources”) to acquire certain natural gas and crude oil gathering systems assets, primarily located in Reeves County, Texas, for $178.4 million of cash consideration (“Permian Resources Midstream Acquisition”). The Permian Resources Midstream Acquisition provides a multi-stream opportunity for natural gas gathering, compression and processing, as well as crude gathering services for the Company. The transaction closed in early January 2025 following satisfaction of customary closing conditions.
Epic Crude Holdings, LP (“EPIC”) Equity Interest
During the third quarter 2024, the Company consummated the Equity Sale and Purchase Agreement with Dos Rios Crude Intermediate LLC to purchase a 12.5% equity interest in EPIC. The acquisition of additional interest is accounted for as a business acquisition pursuant to ASC 805, Business Combination (“ASC 805”). After completion of the transaction, the Company owned a 27.5% equity interest in EPIC. EPIC has over 800 miles of pipeline connecting the Delaware and Midland Basins to the U.S. Gulf Coast and has a capacity of 625 MBbl/d. The Company’s original 15% investment in EPIC had no assigned value through the acquisition of Altus Midstream Company during 2022, so the company resumed accounting for the EPIC investment using the equity method of accounting upon the closing of the additional 12.5% interest. Refer to Note 7—Equity Method Investments in the Notes to our Consolidated Financial Statements in this Annual Report Form 10-K for further information. Durango Acquisition
On June 24, 2024, the Company completed the acquisition of all of the membership interests of Durango Permian LLC and its wholly owned subsidiaries for an adjusted purchase price of approximately $785.7 million (“Durango Acquisition”). Refer to Note 3—Business Combinations in the Notes to our Consolidated Financial Statements in this Annual Report Form 10-K for further information. The Durango Acquisition significantly expands our footprint into New Mexico and the Northern Delaware Basin, expanding our processing capacity by over 200 MMcf/d and doubling our existing gathering pipeline mileage. An additional 200 MMcf/d of processing capacity will be added upon completion of the Kings Landing Project.
Gulf Coast Express Pipeline (“GCX”) Divestiture
On June 4, 2024, the Company sold its 16% equity interest in GCX pursuant to the GCX Purchase Agreement for an adjusted purchase price of $524.4 million (the "GCX Sale"), including a $30.0 million earn out in cash upon the approval by the GCX Board of Directors of one or more capital projects that achieve certain capacity expansion criteria. Refer to Note 7—Equity Method Investments in the Notes to our Consolidated Financial Statements in this Annual Report Form 10-K for further information.
Accounts Receivable Securitization Facility
On April 2, 2024, Kinetik Receivables LLC (“Kinetik Receivables”), a bankruptcy remote special purpose entity formed as a direct subsidiary of Kinetik Holdings, LP, a Delaware limited partnership (the “Partnership”), which is a subsidiary of the Company, entered into an accounts receivable securitization facility with an initial facility limit of $150.0 million (the “A/R Facility”) with PNC Bank, as the administrative agent, and certain purchasers party thereto from time to time, which has a scheduled termination date of April 1, 2025. Refer to Note 8—Debt and Financing Costs in the Notes to our Consolidated Financial Statements in this Annual Report Form 10-K for further information. Organizational Structure
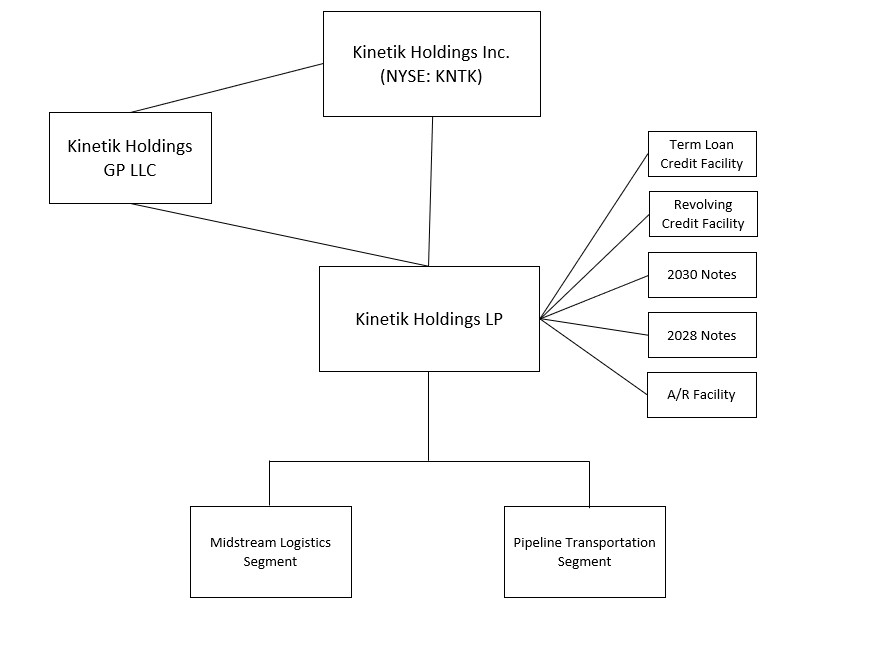
The Company is a holding company, whose only significant assets are ownership of the non-economic general partner interest and an approximate 38% limited partner interest in the Partnership. As the owner of the non-economic general partner interest in the Partnership, the Company is responsible for all operational, management and administrative decisions related to and consolidates the results of the Partnership and its subsidiaries. The Company also owns equity interests in three Permian Basin pipelines that have access to various points along the U.S. Gulf Coast. The Company’s operations are strategically located in the heart of the Delaware Basin in the Permian and the Company’s operational headquarters is located at 303 Veterans Airpark Lane in Midland, Texas 79705. The Company’s corporate office is located at 2700 Post Oak Boulevard, Suite 300, Houston, Texas 77056. The following chart summarizes our organizational structure as of December 31, 2024. For simplicity, certain entities and ownership interests have not been depicted.
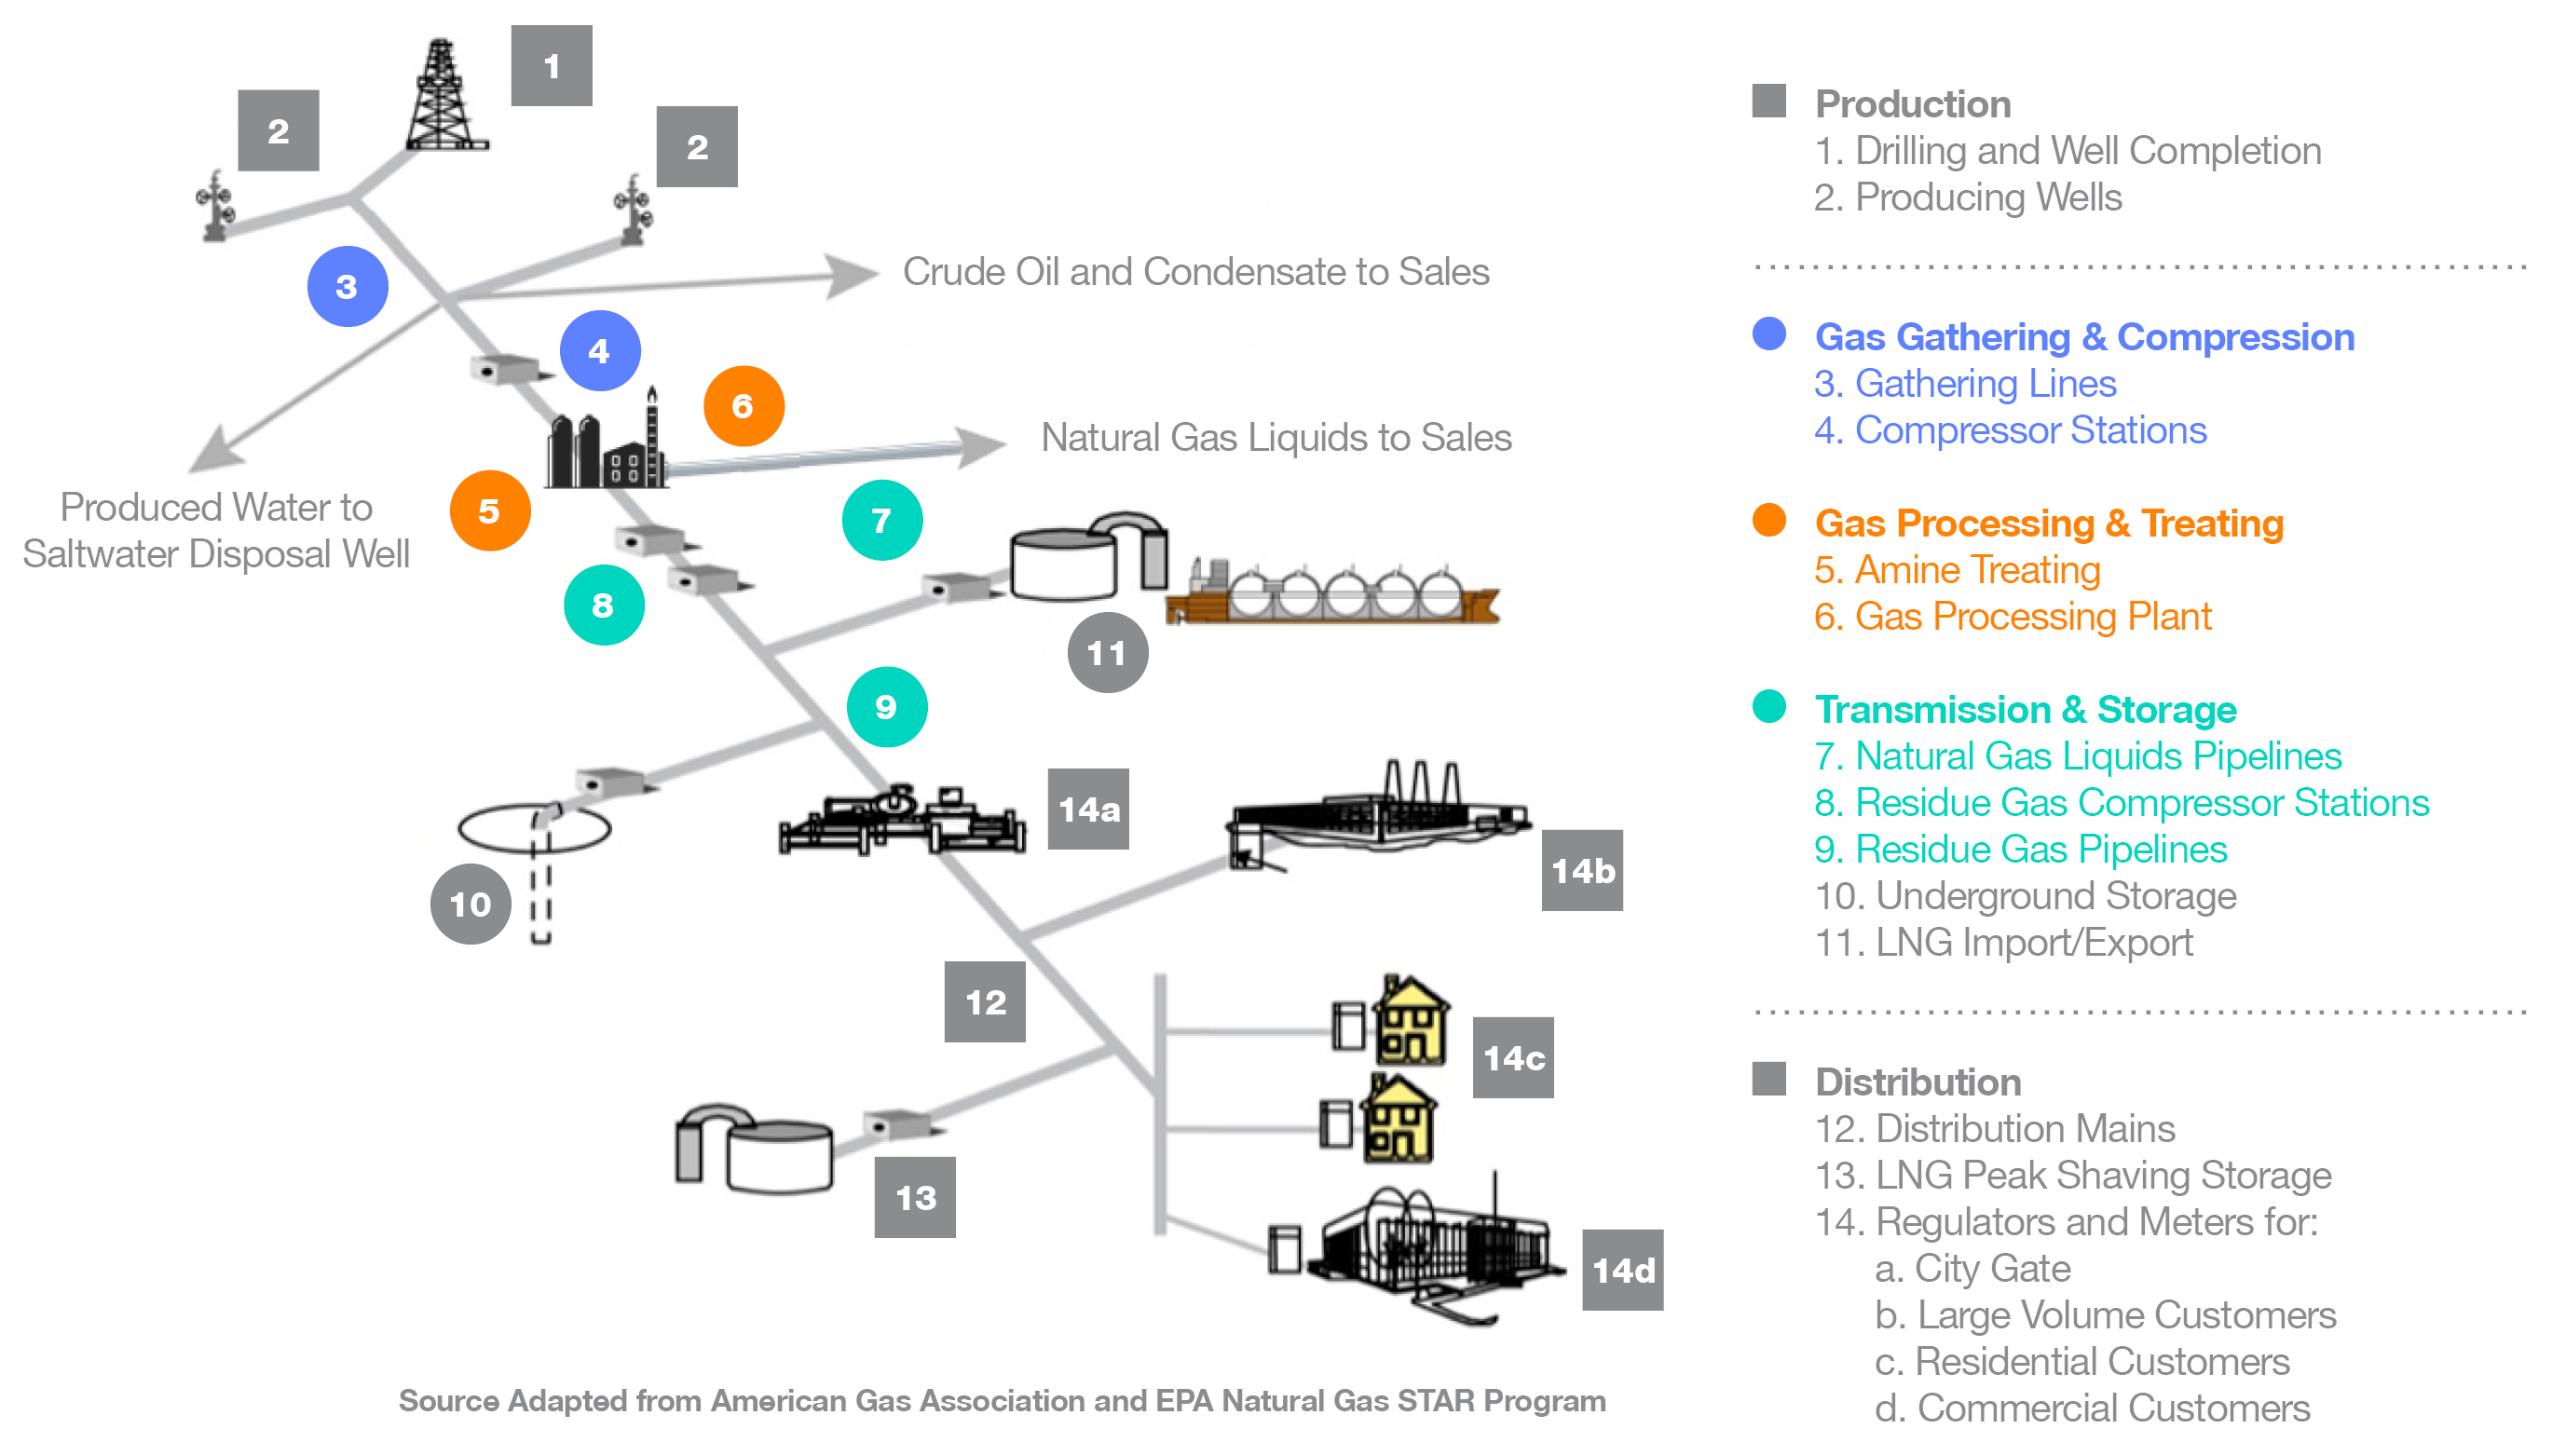
Industry Overview
The following diagram illustrates the Company’s primary operations along the midstream value chain:
The midstream industry is the link between the exploration and production of natural gas and crude oil and condensate and the delivery of its salable commodity components to end-user markets. The midstream industry is generally characterized by regional competition based on the proximity of gathering systems and processing plants to natural gas and crude oil and condensate producing wells.
Our Operating Segments and Properties
We have two operating segments which are strategic business units with differing products and services. The activities of each of our reportable segments from which the Company earns revenues, records equity income or losses and incurs expenses are described below:
Midstream Logistics
The Midstream Logistics segment provides three service offerings: 1) gas gathering and processing, 2) crude oil gathering, stabilization and storage services and 3) water gathering and disposal.
Gas Gathering and Processing
The Midstream Logistics segment provides gas gathering and processing services with over 3,900 miles of low and high-pressure steel pipeline located throughout the Delaware Basin, including over 2,300 miles of gas pipeline acquired through the Durango Acquisition. An additional 214 miles of gathering pipeline was added to our system through the Permian Resources Midstream Acquisition closed during January 2025. Gas processing assets are centralized at seven processing complexes with total cryogenic processing capacity of approximately 2.2 Bcf/d: Diamond Cryogenic complex (720 MMcf/d), the Pecos Bend complex (540 MMcf/d), the East Toyah complex (460 MMcf/d), the Pecos complex (260 MMcf/d), Maljamar ( 150 MMcf/d), Dagger Draw (75 MMcf/d) and the Sierra Grande complex (60 MMcf/d). Current residue gas outlets are the El Paso Natural Gas Pipeline, Energy Transfer Comanche Trail Pipeline and Transwestern Pipeline, ONEOK Roadrunner Pipeline, Whitewater Aqua Blanca Pipeline, Permian Highway Pipeline LLC (“PHP”), New Mexico Gas Company and the Company’s wholly owned and operated Delaware Link Pipeline. NGL outlets are Energy Transfer’s Lone Star NGL Pipeline, Targa’s Grand Prix
NGL Pipeline and Enterprise’s Shin Oak NGL Pipeline (“Shin Oak”), which are accessed through Kinetik NGL, our wholly owned and operated intrabasin NGL pipelines.
Crude Oil Gathering, Stabilization, and Storage Services
The Midstream Logistics segment provides crude oil gathering, stabilization and storage services throughout the Texas Delaware Basin. Crude gathering assets are centralized at the Caprock Stampede Terminal and the Pinnacle Sierra Grande Terminal. The system includes approximately 220 miles of gathering pipeline and 90,000 barrels of crude storage. The crude facilities have connections for takeaway transportation into Plains’s Central 285, North 285 and Wolfbone Ranch, and Plains Oryx’s Orla & Central Mentone and Energy Transfer’s Judith facilities. An additional 75 miles of gathering pipeline was added to our crude gathering assets through the Permian Resources Midstream Acquisition closed during January 2025.
Water Gathering and Disposal
In addition, the Midstream Logistics segment provides water gathering and disposal services through assets located in northern Reeves County, Texas. The system includes over 360 miles of gathering pipeline and approximately 580,000 barrels per day of permitted disposal capacity.
Pipeline Transportation
As of December 31, 2024, the Pipeline Transportation segment consists of three equity method investment (“EMI”) pipelines originating in the Permian Basin with various access points to the U.S. Gulf Coast, and our wholly owned and operated pipelines, Kinetik NGL and Delaware Link Pipelines. The pipelines transport crude oil, natural gas and NGLs within the Permian Basin and to the U.S. Gulf Coast. For a more in-depth discussion of the estimated capital resources, liquidity and timing associated with each EMI pipeline, please see Part IV, Item 15, Note 7—Equity Method Investments, set forth in this Annual Report. Permian Highway Pipeline
The Company owns an approximately 55.5% equity interest in PHP, which is also owned and operated by Kinder Morgan Texas Pipeline, LLC (“Kinder Morgan”). PHP transports natural gas from the Waha area in northern Pecos County, Texas to the Katy, Texas area with connections to the U.S. Gulf Coast and Mexico markets. PHP was placed in service in January 2021, with the total capacity of 2.1 Bcf/d fully subscribed under long-term contracts. In December 2023, PHP’s expansion project was put into service and its total capacity was increased to 2.65 Bcf/d.
Breviloba, LLC
The Company owns a 33.0% equity interest in Shin Oak, which is owned by Breviloba, LLC (“Breviloba”), and operated by Enterprise Products Operating LLC. Shin Oak transports NGLs from the Permian Basin to Mont Belvieu, Texas. Shin Oak was placed in service during 2019, with total capacity of over 600 MBbl/d.
EPIC Crude Oil Pipeline
The Company owns a 27.5% equity interest in EPIC, which is operated by EPIC Consolidated Operations, LLC. EPIC transports crude oil from Orla, Texas in Northern Reeves County to the Port of Corpus Christi, Texas. EPIC has over 800 miles of pipeline connecting the Delaware and Midland Basins and has a capacity of 625 MBbl/d.
Kinetik NGL Pipelines
The Kinetik NGL Pipelines consist of approximately 96 miles of NGL pipelines connecting our East Toyah and Pecos complexes to Waha, including our 20-inch Dewpoint pipeline that spans 40 miles, and our 30 mile, 20-inch Brandywine Pipeline connecting to our Diamond Cryogenic complex. The Kinetik NGL pipeline system has a capacity that approximate 580 MBbl/d.
Delaware Link Pipeline
The Delaware Link Pipeline consists of approximately 40 miles of 30-inch diameter pipeline with a capacity of approximately 1.0 Bcf/d that provides additional transportation capacity to Waha. The project reached commercial in-service in October 2023.
The following table summarizes our ownership and capacity of properties in our Pipeline Transportation segment as of December 31, 2024:
| | | | | | | | | | | |
| Asset | Ownership Interest | Approximate Pipeline System Miles | Capacity |
| Pipeline Transportation | | | |
| | | |
| PHP | 55.5% | 435 | 2.65 Bcf/d |
| Breviloba | 33.0% | 668 | 600 MBbl/d |
| EPIC | 27.5% | 800 | 625 MBbl/d |
| Kinetik NGL Pipelines | 100.0% | 126 | 580 MBbl/d |
| | | |
| Delaware Link Pipeline | 100.0% | 40 | 1.0 Bcf/d |
| | |
Title to Properties and Permits
Certain pipelines connecting our facilities are constructed on rights-of-way granted by the apparent record owners of the property and in some instances these rights-of-way are revocable at the election of the grantor. In several instances, lands over which rights-of-way have been obtained could be subject to prior liens that have not been subordinated to the right-of-way grants. We have obtained permits from public authorities to cross over or under, or to lay pipelines in or along, watercourses, county roads, municipal streets and state highways and, in some instances, these permits are revocable at the election of the grantor. These permits may also be subject to renewal from time to time and we will generally seek renewal or arrange alternative means of transport through additional investment or commercial agreements. We have also obtained permits from railroad companies to cross over or under lands or rights-of-way, many of which are also revocable at the grantor’s election.
We believe we have satisfactory permits and/or title to all our material rights-of-way. We also believe that we have satisfactory title to all our material assets.
Competition
The business of providing gathering, compression, processing and transmission services for natural gas and NGLs is highly competitive. The Company faces intense competition in obtaining natural gas and NGL volumes, including from major integrated and independent exploration and production companies, interstate and intrastate pipelines, and other companies that gather, compress, treat, process, transmit or market natural gas and NGLs. Competition for supplies is primarily based on geographic location of facilities in relation to production or markets, the reputation, efficiency and reliability of the midstream company, and the pricing arrangements offered by the midstream company. For areas where acreage is not dedicated to the Company, the Company will compete with similar enterprises in providing additional gathering, compression, processing and transmission services in the same area of operation.
Human Capital
At Kinetik, we recognize that our employees are our greatest asset, and their success is our success, and as such, we strive to prioritize their well-being, engagement and professional growth. We also strive to retain top talent by fostering a culture that emphasizes health and safety, respect for employees and continuous development. As of December 31, 2024, we had approximately 460 employees. None of these employees are covered by collective bargaining agreements.
Health and Safety. The Company’s Environmental, Health and Safety (“EHS”) Management System lays out our requirements, processes, and guidelines for process safety and occupational health and safety. We dedicate a safety team, led by the Director of Health and Safety and supported by our VP of Operations Risk Management and Reliability, to oversee our health and safety program. Our focus on achieving zero incidents has led us to establish a robust health and safety program that transcends mere compliance, fostering a culture where safety is driven by intrinsic motivation. We utilize computer-based tools for tracking environmental impacts, managing safety and risks and monitoring key performance metrics. We set ambitious and measurable safety targets to support our commitment to the safety and well-being of our employees and those around us. In 2024, our Total Recordable Incident Rate was 0.75 and our Motor Vehicle Incident Rate was 1.36.
Through effective engagement, recognition and incentive programs, we aim to cultivate a culture of excellence that results in a more engaged and productive workforce. The Kinetik Employee Engagement Program (“KEEP”) gives employees a straightforward line of communication to report hazards, suggest improvements, or recognize coworkers. This initiative, rooted in the “See Something, Say Something” philosophy, promotes shared learning and operational excellence. In 2024, employees
submitted 365 KEEP Cards, leading to 229 proactive risk mitigation actions.
In addition, we believe that a strong safety culture begins with a well-trained workforce. In 2024, our employees collectively completed over 18,000 hours of EHS-related training. Field-based employees averaged 45 hours of EHS training each, covering a variety of topics such as environmental compliance, Company EHS policies, OSHA regulations, driver safety and emergency response.
Cultivating an Empowered Workforce We are committed to cultivating an empowered workforce and believe that fostering a culture of appreciation empowers our workforce and inspires them to consistently deliver outstanding performance. We employ a mix of formal and informal recognition strategies, including monetary and non-monetary incentives that celebrate employee performance, service milestones and exceptional contributions in safety, compliance, innovation and teamwork. In October 2024, we contracted third-party providers to conduct our 2024 Engagement Survey in order to maximize our culture and leadership effectiveness. The results of the survey are to be discussed among the leadership team to reflect upon what we are doing right and where there may be gaps and opportunities for improvement. In 2024, we also conducted focus group interviews across key locations to gain deeper insights from our employees. These sessions provide more detailed feedback and guide our efforts to make Kinetik a world-class organization and employer of choice.
At Kinetik, we strive to ensure our employees are actively involved and embody Kinetik’s values every day. We involve our employees in a variety of initiatives, from volunteering at community events to participating in donation drives and celebrating special occasions together. We also believe that fostering an environment where all individuals feel valued, respected and included helps to ensure everyone can contribute to their fullest potential, leading to enhanced decision making, increased innovation, improved retention and overall success. Along with annually acknowledging our Code of Business Conduct (the “Code of Conduct”), as part of our ongoing commitment to equal employment opportunity, all employees are required to complete various training regarding our workplace policies.
Regulation of Operations
Natural Gas Pipeline Regulation
Under the Natural Gas Act (“NGA”), the Federal Energy Regulatory Commission (“FERC”) regulates the transportation of natural gas in interstate commerce. Intrastate transportation of natural gas is largely regulated by the state in which such transportation takes place. To the extent that the Company’s intrastate natural gas transportation systems transport natural gas in interstate commerce, the rates, terms and conditions of such services are subject to FERC jurisdiction under Section 311 of the Natural Gas Policy Act of 1978 (“NGPA”). The NGPA regulates, among other things, the provision of transportation services by an intrastate natural gas pipeline on behalf of a local distribution company or an interstate natural gas pipeline. Under Section 311 of the NGPA, rates charged for interstate transportation must be fair and equitable, and amounts collected in excess of fair and equitable rates are subject to refund with interest. The terms and conditions of service set forth in the Company’s statement of operating conditions for transportation service under Section 311 of the NGPA are also subject to FERC review and approval. Failure to observe the service limitations applicable to transportation services under Section 311, failure to comply with the rates approved by the FERC for Section 311 service, or failure to comply with the terms and conditions of service established in the pipeline’s FERC-approved statement of operating conditions could result in a change of jurisdictional status and/or the imposition of administrative, civil and criminal remedies.
The Company’s Intrastate natural gas operations are also subject to regulation by various agencies in Texas, principally the Railroad Commission of Texas (“TRRC”). The Company’s intrastate pipeline operations are also subject to the Texas Utilities Code and the Texas Natural Resources Code, as implemented by the TRRC. Generally, the TRRC is vested with authority to ensure that rates, operations and services of gas utilities, including intrastate pipelines, are just and reasonable and not discriminatory. The rates the Company charges for transportation services are deemed just and reasonable under Texas law unless challenged in a customer or TRRC complaint. Failure to comply with the Texas Utilities Code or the Texas Natural Resources Code can result in the imposition of administrative, civil and criminal remedies.
Natural Gas Gathering Regulation
Section 1(b) of the NGA exempts natural gas gathering facilities from the jurisdiction of the FERC. The Company believes that its natural gas gathering pipelines meet the traditional tests the FERC has used to establish whether a pipeline is a gathering pipeline that is not subject to FERC jurisdiction. However, the distinction between FERC-regulated transmission services and federally unregulated gathering services has been the subject of substantial litigation and varying interpretations. In addition, the FERC’s determinations as to whether a pipeline is a gathering pipeline are made on a case-by-case basis, so the classification and regulation of the Company’s natural gas pipeline system could be subject to change based on future determinations by the FERC and the courts. State regulation of gathering facilities generally includes various safety, environmental and, in some circumstances, nondiscriminatory take requirements and complaint-based rate regulation.
The Company’s natural gas gathering facilities in Texas are subject to regulation by the TRRC under the Texas Utilities Code and the Texas Natural Resources Code in the same manner as described above for intrastate pipeline transportation facilities. The Company’s natural gas gathering pipeline system is also subject to ratable take and common purchaser statutes in Texas. The ratable take statute generally requires gatherers to take, without undue discrimination, natural gas production that may be tendered to the gatherer for handling. Similarly, the common purchaser statute generally requires gatherers to purchase without undue discrimination as to source of supply or producer. These statutes are designed to prohibit discrimination in favor of one producer over another producer or one source of supply over another source of supply. In New Mexico, the Company’s natural gas gathering facilities are subject to regulation by numerous governmental agencies, including the New Mexico Public Regulation Commission (“NMPRC”).
Crude Oil and Natural Gas Liquids Pipeline Regulation
Transmission services rendered by the Company are subject to the regulation of the TRRC. The TRRC has the authority to regulate rates, though it generally has not investigated the rates or practices of intrastate pipelines in the absence of shipper complaints.
Pipeline Safety Regulations
Some of the Company’s pipelines are subject to regulation by the U.S. Department of Transportation’s (“DOT”) Pipeline and Hazardous Materials Safety Administration (“PHMSA”) pursuant to the Natural Gas Pipeline Safety Act of 1968 (“NGPSA”), with respect to natural gas, and the Hazardous Liquids Pipeline Safety Act of 1979 (“HLPSA”), with respect to NGLs. The NGPSA and HLPSA regulate safety requirements in the design, construction, operation, and maintenance of natural gas, crude oil, and NGL pipeline facilities, while the Pipeline Safety Improvement Act of 2002 (“PSIA”) establishes mandatory inspections for all U.S. crude oil, NGL, and natural gas transmission pipelines in high consequence areas (“HCAs”), the violation of which can result in administrative, civil and criminal penalties, including civil fines, injunctions, or both.
PHMSA regularly revises its pipeline safety regulations. States are largely preempted by federal law from regulating pipeline safety for interstate lines but most are certified by the DOT to assume responsibility for enforcing federal intrastate pipeline regulations and inspection of intrastate pipelines. States may adopt stricter standards for intrastate pipelines than those imposed by the federal government for interstate lines; however, states vary considerably in their authority and capacity to address pipeline safety. State standards may include requirements for facility design and management in addition to requirements for pipelines. For example, the TRRC and NMPRC have adopted rules that require operators of natural gas and hazardous liquid gathering lines in rural areas to report accidents, conduct investigations and perform necessary corrective action. Due to the possibility of new or amended laws and regulations or reinterpretation of existing laws and regulations, there can be no assurance that future compliance with PHMSA or state requirements will not have a material adverse effect on the Company’s financial condition, results of operations, or cash flows.
Environmental and Occupational Health and Safety
The Company complies with the requirements of the Occupational Safety and Health Administration (“OSHA”) and comparable state laws that regulate the protection of the health and safety of workers. The Company believes that its operations are in substantial compliance with OSHA requirements, including general industry standards, hazard communication, record keeping requirements and monitoring of occupational exposure to regulated substances.
Our business operations are also subject to numerous environmental and occupational health and safety laws and regulations imposed at the federal, regional, state and local levels. The activities the Company conducts in connection with the gathering, compression, dehydration, treatment, processing and transportation of natural gas and gathering, stabilization, transportation and storage of crude oil are subject to, or may become subject to, stringent environmental regulation and we
could incur costs related to the cleanup of third-party sites to which we have sent regulated substances for disposal or equipment for cleaning, and for damages to natural resources or other claims relating to releases of regulated substances at or from such third-party sites. The Company has implemented a number of programs and policies designed to monitor and pursue continued operation of our activities in a manner consistent with environmental and occupational health and safety laws and regulations. To that end, the Company has incurred and will continue to incur operating and capital expenditures to comply with these laws and regulations. Some of these environmental compliance costs may be material and have an adverse effect on our business, financial condition and results of operations.
Certain existing environmental and occupational health and safety laws and regulations include the following U.S. legal standards, which may be amended from time to time:
•the Clean Air Act, which restricts the emission of air pollutants from many sources and imposes various pre-construction, operational, monitoring and reporting requirements, and which the EPA has relied upon as authority for adopting climate change regulatory initiatives relating to GHG emissions;
•the Clean Water Act, which regulates discharges of pollutants to state and federal waters as well as establishing the extent to which waterways are subject to federal jurisdiction and rulemaking as protected waters of the United States;
•the Comprehensive Environmental Response, Compensation and Liability Act of 1980, which imposes liability on generators, transporters and arrangers of hazardous substances at sites where releases, or threatened releases, of such hazardous substances has occurred;
•the Resource Conservation and Recovery Act (“RCRA”), which governs the generation, treatment, storage, transport and disposal of solid wastes, including hazardous wastes;
•the Oil Pollution Act, which imposes liability for removal costs and damages arising from an oil spill in waters of the United States on owners and operators of onshore facilities, pipelines and other facilities;
•the National Environmental Policy Act, which requires federal agencies to evaluate major agency actions that have the potential to significantly impact the environment, to include the preparation of an Environmental Assessment to assess potential direct, indirect, and cumulative impacts of the proposed project, and, if necessary, prepare a more detailed Environmental Impact Statement that may be made available to the public for comment;
•the Safe Drinking Water Act, which ensures the quality of the nation’s public drinking through adoption of drinking water standards and controlling the injection of waste fluids into below-ground formations that may adversely affect drinking water sources;
•the Endangered Species Act, which imposes restrictions on activities that may adversely affect federally identified endangered and threatened species or their habitats, to include the implementation of operating restrictions or a temporary, seasonal or permanent ban in affected areas;
•the Emergency Planning and Community Right-to-Know Act, which requires the implementation of a safety hazard communication program and the dissemination of information to employees, local emergency planning committees, and response departments on toxic chemicals use and inventories;
•the Occupational Safety and Health Act, which establishes workplace standards for the protection of both the health and safety of employees, to include the implementation of hazard communications programs to inform employees about hazardous substances in the workplace, the potential harmful effects of those substances and appropriate control measures; and
•the DOT regulations relating to the advancement of safe transportation of energy and hazardous materials and emergency response preparedness.
On March 15, 2023, the EPA announced finalization of its Good Neighbor Plan (the “Plan”) to reduce nitrogen oxide pollution from power plants and other industrial facilities from 23 upwind states which the EPA determined are significantly contributing to National Ambient Air Quality Standards (NAAQS) nonattainment and interfering with maintenance of the 2015 ozone NAAQS in downwind states. As part of the Plan, the EPA announced that it would be issuing further emissions controls from industrial sectors, including new and existing reciprocating internal combustion engines of a certain size used in pipeline transportation of natural gas. Beginning in 2026, the Plan will apply to all impacted engines unless compliance schedule extensions are granted by the EPA, determined on an engine-by-engine basis. The Plan, however, has been challenged in multiple federal courts, and the Supreme Court held oral arguments on the challenges to the rule in February 2024 (specifically, whether to freeze the Plan while litigation continues in the courts). In June 2024, the Supreme Court halted enforcement of the Plan while it is contested in the lower courts. Although a decision remains pending at this time and we cannot predict how the Court may ultimately rule. The Plan could have material financial impacts on our natural gas business in relation to the costs necessary to comply with the Plan, the timing of compliance, equipment shortages, potential operational disruptions, and the availability of and costs associated with the purchase of offsets.
There are also state and local jurisdictions where we operate in the U.S. that have, are developing, or are considering developing, similar environmental and occupational health and safety laws. Any failure by the Company to comply with these laws and regulations could result in adverse effects upon our business to include the (i) assessment of sanctions, including administrative, civil, and criminal penalties; (ii) imposition of investigatory, remedial, and corrective action obligations or the incurrence of capital expenditures; (iii) occurrence of delays or cancellations in the permitting, development or expansion of projects; and (iv) issuance of injunctions restricting or prohibiting some or all of our activities in a particular area. Some environmental laws provide for citizen suits which allow for environmental organizations to act in place of the government and sue operators for alleged violations of environmental law. The ultimate financial impact arising from environmental laws and regulations is not clearly known nor determinable as existing standards are subject to change and new standards continue to evolve.
Environmental laws and regulations are frequently subject to change. More stringent environmental laws that apply to our operations and the operations of our customers may result in increased operating costs and capital expenditures for compliance, including, but not limited to, those related to the emission of GHGs and climate change. Given the long-term trend toward increasing regulation, future federal and/or state GHG regulations of the oil and gas industry remain a significant possibility.
Trends in environmental and worker health and safety regulation over time has been to typically place increasing restrictions and limitations on activities that could result in adverse effects to the environment or expose workers to injury. These changes in environmental and worker safety laws and regulations, or reinterpretations or enforcement policies that may arise in the future and result in increasingly stringent or costly waste management or disposal, pollution control, remediation or worker health and safety-related requirements, may have a material adverse effect on our business, operations and financial condition. We may not have insurance or be fully covered by insurance against all risks relating to environmental or occupational health and safety, and we may be unable to pass on the increased cost of compliance arising from such risks to our customers. We regularly review regulatory and environmental issues as they pertain to the Company and we consider these as part of our general risk management approach.
Insurance
Our business has operating risks normally associated with the gathering, stabilization, transportation and storage of crude oil and gathering, compression, dehydration, treatment, processing and transportation of natural gas, which could cause damage to life or property. In accordance with industry practice, we maintain insurance against some, but not all, potential operating losses. For some operating risks, the Company may not obtain insurance if the cost of available insurance is excessive relative to the risks presented; in such a case, if a significant operating accident or other event occurs which is not fully covered by the insurance the Company has, this could adversely affect our operations and business. As we continue to grow, we will continue to evaluate our policy limits and deductibles as they relate to the overall cost and scope of our insurance program.
Sustainability
Overview
The Company is committed to advancing a safer, cleaner, and more reliable energy future and believes that integrating environmental, safety, governance, and community considerations into our business decisions is essential to creating value for its stakeholders. In August 2024, the Company published its fiscal year 2023 Sustainability Report (“Report”). The Report focused on four key areas: Governance, Environment, People and Community Engagement.
Governance
The Kinetik Board consists of 11 Directors and is led by the Chairman of the Board and the Lead Independent Director. The Board exercises general supervision over the Company’s business, operations, strategy and risk management programs. To assist the Board in its oversight role, the Board’s committees consist of the Audit Committee, Compensation Committee and Governance and Sustainability Committee.
We firmly believe that commitment to an actionable sustainability strategy makes for a stronger, more resilient company and drives better performance. As such, we embed sustainability responsibilities throughout our organization by ensuring we have ownership and accountability at all levels. In both 2024 and 2023, our compensation program tied 20% of all salaried employees’ at-risk pay, including executives, to the achievement of specific sustainability goals, including those related to methane emissions and health and safety. The Governance and Sustainability Committee supported the Compensation Committee in establishing the specific parameters of the metrics.
In addition, the Company has developed an Enterprise Risk Management (“ERM”) program across all functional areas and mechanisms for identifying, prioritizing, and mitigating risks. We evaluate risks across the enterprise on a regular basis, examining the potential impact to our operating flexibility, along with the financial and reputational impact of such risks. Our Audit Committee of the Board has ultimate oversight over the ERM process, reviewing ongoing assessments of the company’s risk management processes and system of internal control. Our Executive Vice President, Chief Administrative Officer and Chief Accounting Officer has functional oversight over the Enterprise Risk function.
Furthermore, we are committed to conducting business in accordance with the highest ethical standards. Our Code of Conduct is designed to deter wrong-doing and promote honest and ethical conduct in every aspect of our business dealings. Our Code of Conduct details our policy regarding corruption, antitrust violations, insider dealings, gifts and entertainment, conflicts of interest, validity of financial information, amongst others. The Audit Committee is responsible for overseeing business ethics issues, and our General Counsel and Chief Compliance Officer oversees the day-to-day responsibilities for ethics and compliance. The Company also recognizes the importance of receiving, retaining and addressing concerns from our directors, officers, employees and other stakeholders seriously and expeditiously. We use a confidential third-party Ethics Hotline to enable anyone to report concerns. The Ethics Hotline is monitored by our Human Resources and Legal departments, as well as the Chair of the Audit Committee. Any critical concerns are communicated to the Audit Committee Chair immediately, and any other concerns are reported to the Audit Committee during quarterly meetings or as otherwise appropriate. In addition, all employees were required to complete Insider Trading and Anti-Bribery and Corruption training. In 2024, no critical concerns were reported.
Environmental Responsibility
The Company is committed to being a good steward of the environment and prioritizes climate change as a key issue. We are committed to contributing to global solutions by responsibly reducing the adverse environmental impact of our operations while pursuing economic growth and energy security. 100% of our debt capital structure is linked to sustainability performance, including performance targets related to GHG and methane emission intensity. The Company is in the process of gathering 2024 GHG emission data at the time this Annual Report on Form 10-K is filed with the SEC.
In line with our commitment, the Company not only complies with applicable federal, state, and local regulations but also actively engages in voluntary initiatives aimed at reducing GHG and criteria air emissions. Initiatives started in 2022 included:
•pneumatics upgrades;
•installation of electric compression;
•leak detection and repair (“LDAR”);
•advanced monitoring technologies;
•New Energy Ventures; and
•renewable energy and energy efficiency.
In 2023, we significantly advanced our efforts to reduce methane emissions by converting 3,742 natural gas-driven pneumatics and pumps to instrument air at seven compressor stations. These conversions reduced annual methane emissions from natural gas-driven pneumatics by approximately 50%. At the end of 2024, 68% of our gas plants and compressor stations were operating on instrument air. In 2024, we continued to expand our electric compression fleet, supported by a grant from the Texas Commission on Environmental Quality (“TCEQ”) and the Texas Emissions Reduction Plan (“TERP”) program's New Technology Implementation Grant (“NTIG”). We perform leak detection surveys through an independent third party to maintain thorough, unbiased inspections. We created an internal LDAR SWAT team to focus on improving the leak repair time, further minimizing emissions. We continue to leverage cutting-edge methane monitoring and detection technologies. Our operations and support teams are equipped with and trained to operate handheld leak detection devices. We also operate fixed continuous emissions monitoring cameras and sensor-based continuous emission technologies at strategic locations. In addition, we conduct regular aerial surveys of our facilities using Optical Gas Imaging (“OGI”) technology to provide high-resolution images of methane and volatile organic compounds. We elevated our decarbonization efforts by establishing the New Energy Ventures (“NEV”) team, who focuses on advancing emissions reduction through innovative technologies and other clean energy opportunities. In 2024, NEV partnered with Infinium in Project Roadrunner, which features a long-term agreement to supply CO2 from our Permian Basin operations for reuse in the production of ultra-low carbon eFuels. In addition, we received approval from the US Environmental Protection Agency (“EPA”) for the Monitoring, Reporting and Verification (“MRV”) Plan for three Class II Acid Gas Injection (“AGI”) wells at our Maljamar and Dagger Draw processing facilities, which were acquired through the Durango Acquisition. The MRV Plan enables the Company to economically benefit from sequestered carbon dioxide (“CO2”) through 45Q tax credits. We focus on reducing our Scope 2 GHG emissions through implementing energy efficiency measures and sourcing renewable energy.
While we use relatively insignificant amounts of water in our direct operations compared to upstream operations and other industries, we recognize the importance of conserving water in a water-scarce region and remain committed to minimizing our water consumption and strive to only use what is necessary. Through our partnership with the Oilfield Water Stewardship Council, we work with a community of peers to establish and standardize relevant performance metrics that support responsible water management and stewardship. We had no violations or penalties related to our Water Management program in 2024 and 2023.
Our Waste Management program, tailored for both of our gathering and processing operations and our produced water management operations, address the identification, characterization, disposition, reporting, and recordkeeping requirements of various waste streams generated during routine operations, general office/administrative tasks, facility maintenance, onsite corrective remediation actions, and excavation and construction activities. All wastes are evaluated to determine their characteristics and regulatory status as hazardous/non-hazardous, industrial, RCRA-exempt, or universal, and each category requires specific handling and disposal processes. We are committed to meeting our regulatory requirements. We had no violations or penalties related to our Waste Management program in 2024 and 2023.
At Kinetik, we are committed to responsibly constructing, maintaining and operating our facilities. Our Process Safety and Risk Management program and Pipeline Integrity Management program are designed to ensure the effective implementation of process safety and asset integrity practices. As part of our regulatory obligations, we subject ourselves to periodic process safety management audits required by OSHA. Furthermore, we undergo routine audits and inspections conducted by TRRC, NM PRC, and PHMSA, ensuring adherence to stringent safety and operational standards. In 2024, we underwent 13 pipeline integrity and safety audits and three process safety inspections by regulators, resulting in one immaterial regulatory penalty.
Our pipeline network spans over 4,500 miles. To ensure safe and efficient operations, we employ both risk-based and prescriptive inspection schedules for our pipeline systems. This schedule takes into account factors such as the potential for internal or external corrosion, soil erosion, adverse weather conditions, or the likelihood of damage from nearby construction activities. Spill prevention and control are fundamental to our operations and the community at large as we work to ensure the integrity of our pipelines and facilities and prevent any contamination of waterways or land. During the operation of our pipelines and facilities, we strictly adhere to spill prevention controls and have robust Spill Prevention, Control, and Countermeasure plans and Emergency Response Plans in place.
The Company believes that its operations are in substantial compliance with applicable environmental regulations and attempts to anticipate future regulatory requirements that might be imposed and plan accordingly. While any new or amended laws and regulations or reinterpretation of existing laws and regulations would not be expected to be any more burdensome to the Company than to other, similarly situated operators, there can be no assurance that future compliance with any new environmental requirements will not have an adverse effect on the Company’s financial condition, results of operations or cash flows.
Social Responsibility
We recognize that people are our greatest asset and that their success is our success. We prioritize a safe working environment and offer a comprehensive suite of benefits to all our employees to ensure the well-being and development of our people. See additional information regarding employee initiatives in Part I—Item 1. and 2. Business and Properties—Human Capital in this Annual Report. We take pride in being a responsible neighbor and a positive influence in the communities where we live and operate; as such, we continue to encourage our team to give back to the communities where they live and work, providing employees with eight hours of paid volunteer time each year. Volunteer hours totaled 421 and 533 hours in 2024 and 2023, respectively. We also made donations to various causes identified by our employees and our communities. We contributed over $1.9 million and $1.2 million to various initiatives in 2024 and 2023, respectively. To further show our commitment to communities where we live and operate, we made a significant commitment to support the Permian Strategic Partnership, joining forces to foster a better quality of life for Permian Basin residents. We also partner with Be A Resource (“BEAR”), a charitable organization dedicated to improving lives by offering hope and help for at-risk and CPS-involved children in the greater Houston area and are a sponsor of Texas’ Sponsor a Highway program, helping keep our interstates safe and beautiful.
We recognize that building strong relationships with our local communities and landowners is essential for the sustainable growth and success of our operations in West Texas, as they provide us with the right-of-way to place pipelines and other facilities on their properties. We aim to provide them with accurate and timely information about activities that may affect their properties, and we work hard to mitigate any negative impacts on their properties, the environment, and surrounding communities by implementing best practices for construction and maintenance of facilities.
We aim to develop a supply chain that aligns with our core values and sustainability and business objectives. Our Supplier Code of Conduct (“Supplier Code”) promotes responsible practices across our value chain, outlining expectations for ethics, compliance, safety, environmental stewardship, human rights and setting a benchmark for our suppliers to adhere to our high standards. To measure our suppliers against our standards, we utilize ISNetworld, a resource for connecting with safe, qualified contractors and suppliers. We also implemented sustainability focused measures into our Contractor Management program to gain valuable insights into our suppliers’ sustainability performance, which enable us to understand their sustainability practices and identify opportunities for improvement.
Available Information
The Company’s website is www.kinetik.com. The Company’s Annual Reports on Form 10-K, Quarterly Reports on Form 10-Q, Proxy Statements, Current Reports on Form 8-K, amendments to those reports filed or furnished pursuant to Section 13(a) or 15(d) of the Exchange Act, and other filings with the SEC are available at https://ir.kinetik.com/overview/default.aspx under the heading “Financials”—“SEC Filings”, as soon as reasonably practicable after the Company electronically files such material with, or furnishes it to, the SEC. These reports are also available on the SEC’s website at www.sec.gov. In addition to reports filed or furnished with the SEC, we publicly disclose material information from time to time in press releases, at annual meetings of shareholders, in publicly accessible conferences and investor presentations, and through our website. In addition, the Company’s Code of Conduct, Corporate Governance Guidelines, charters of the Audit Committee, Compensation Committee, Governance and Sustainability Committee, and other corporate governance materials are available on the Investor Relations section of the Company’s website. The information contained on the Company’s website as referenced in this report is not, and should not be deemed to be, part of or incorporated by reference into this report. Requests for a copy of any of the above-referenced reports and corporate governance documents may be directed in writing to: Investor Relations, Kinetik Holdings Inc., 2700 Post Oak Blvd, Suite 300 Houston, TX 77056 or by calling (713) 621-7330.
ITEM 1A. RISK FACTORS
We operate in rapidly changing economic and technological environments that present numerous risks, many of which are driven by factors that we cannot control or predict. The following discussion, as well as our discussion in Part II—Item 7—Management’s Discussion and Analysis of Financial Condition and Results of Operations and Item 7A—Quantitative and Qualitative Disclosures About Market Risk, highlights some of these risks. The risks described below are not exhaustive and you should carefully consider these risks and uncertainties before investing in our securities.
Business and Operational Risks
The majority of the Company’s operating assets are currently located in the Permian Basin, making it vulnerable to risks associated with operating in a single geographic area.
The majority of the Company’s wholly owned midstream assets are currently located in the Delaware Basin which is part of the broader Permian Basin. As a result of this concentration, the Company will be disproportionately exposed to the impact of regional supply and demand factors, delays or interruptions of production from wells in this area caused by governmental regulation, obtaining rights-of-way, market limitations, water shortages or restrictions, drought related conditions, or other weather-related conditions or interruption of the processing or transportation of crude oil, natural gas and water. If any of these factors were to impact the Permian Basin more than other producing regions, the Company’s business, financial condition and results of operations could be adversely affected relative to other midstream companies that have a more geographically diversified asset portfolio.
Because of the natural decline in production from existing wells, the Company’s success depends, in part, on its ability to maintain or increase throughput volumes on its midstream systems, which depends on its customers’ levels of development and completion activity on its dedicated acreage.
The level of crude oil and natural gas volumes handled by the Company’s midstream systems depends on the level of production from crude oil and natural gas wells dedicated to its midstream systems, which may be less than expected and which will naturally decline over time. To maintain or increase throughput levels on its midstream systems, the Company must obtain production from wells completed by customers on acreage dedicated to its midstream systems or execute agreements with other third parties in its areas of operation.
The Company has no control over producers’ levels of development and completion activity in its areas of operation, the amount of reserves associated with wells connected to its systems, or the rate at which production from a well declines. In addition, the Company has no control over producers or their exploration and development decisions, which may be affected by, among other things:
•the availability and cost of capital;
•the prevailing and projected prices of crude oil, natural gas and NGLs; fewer project opportunities or assumption of risk that results in weaker or more volatile financial performance than expected;
•assets that vary in age and were constructed over many decades which may cause our inspection, maintenance or repair costs to increase in the future;
•political and economic conditions and events in foreign oil, natural gas and NGL producing countries, including embargoes, disrupted global supply chains, continued hostilities in the Middle East and other sustained military campaigns, the armed conflict in Ukraine and associated economic sanctions on Russia;
•increase in interest rates and rising or sustained inflation;
•levels of crude oil and natural gas reserves;
•contractor or supplier non-performance, weather, geological or other factors;
•Consolidation in the upstream and midstream sector and the resulting changes in the strategic importance customers assign to development in certain acreage or locations in the Delaware Basin as opposed to other areas, which could adversely affect the financial and operational resources devoted to development of their acreage dedicated to the Company;
•increased levels of taxation related to the exploration and production of crude oil, natural gas and NGLs;
•environmental or other governmental regulations, including those related to the prorationing of oil and gas production, the availability of permits, the regulation of hydraulic fracturing, and a governmental determination that multiple facilities are to be treated as a single source for air permitting purposes;
•the costs of producing and ability to produce crude oil, natural gas and NGLs and the availability and costs of drilling rigs, pipeline transportation facilities and other equipment; and
•potential tariff to be imposed by the Trump Administration on crude oil, natural gas and NGLs and other imported supplies and equipment.
Due to these and other factors, even if reserves are known to exist in areas served by the Company’s midstream assets, producers may choose not to develop those reserves. If producers choose not to develop their reserves or they choose to slow their development rate in the Company’s areas of operation, utilization of its midstream systems will be below anticipated levels. Reductions in development activity, coupled with the natural decline in production from its current dedicated acreage, could materially reduce our revenue and affect adversely our business, financial condition, results of operations, and cash flows.
The acquisition or divestiture of businesses and assets is part of our strategy. We may experience difficulties completing acquisitions or divestitures or integrating new businesses and properties, and we may be unable to achieve the benefits we expect from the completed and any future acquisitions or divestitures.
Part of the Company’s business strategy includes acquiring additional businesses and assets and/or divesting certain assets or portions of our business. We cannot provide any assurance that we will be able to find complementary acquisition targets or complete such acquisitions or achieve the desired results from any acquisitions we do complete. Any acquired businesses or assets will be subject to many of the same risks as our existing businesses and may not achieve the levels of performance that we anticipate. We may evaluate potential divestiture opportunities with respect to portions of our business from time to time that support our growth initiatives and may determine to proceed with a divestiture opportunity if and when we believe such opportunity is consistent with our business strategy.
We may not realize the anticipated operating advantages and cost savings associated with any acquisition. Integration of acquired businesses or assets involves a number of risks, including (i) the loss of key customers of the acquired business; (ii) demands on management related to the increase in our size; (iii) the diversion of management’s attention from the management of daily operations; (iv) difficulties in implementing or unanticipated costs of accounting, budgeting, reporting, internal controls and other systems; and (v) difficulties in the retention and assimilation of necessary employees.
Difficulties in integration may be magnified if we make multiple acquisitions over a relatively short period of time. Because of difficulties in combining and expanding operations, we may not be able to achieve the cost savings and other size-related benefits that we hoped to achieve after these acquisitions, which could materially and adversely affect our financial condition and results of operations.
We also may not recognize the anticipated benefits of dispositions or other divestitures we may pursue in the future. If we do not realize the expected strategic, economic or other benefits of any divestiture transaction, it could materially and adversely affect our financial condition and results of operations.
The Company owns interests in certain pipeline projects and other joint ventures, and it may in the future enter into additional joint ventures, and the Company’s control of such entities is limited by provisions of the limited partnership and limited liability company agreements of such entities and by the Company’s percentage ownership in such entities.
The Company has ownership interests in several joint ventures, including the PHP, Breviloba and EPIC joint ventures, which were accounted for using the equity interest method, and it may enter into other joint venture arrangements in the future. While the Company owns equity interests and has certain voting rights with respect to its joint ventures and can exercise significant influence over the operating and financial policies of the entity, it does not act as operator of or control the joint ventures, each of which is operated by another joint venture partner. It may therefore be difficult or impossible for the Company to cause the joint venture to take actions that the Company believes would be in its or the relevant joint venture’s best interests. Moreover, joint venture arrangements involve various risks and uncertainties, such as committing the Company to fund operating and/or capital expenditures, the timing and amount of which the Company may not control, and which could materially and adversely affect its cash flows.
The Company also may be unable to control the amount of cash it will receive from the operation of these entities, which could further adversely affect its cash flows. Joint venture arrangements may also restrict the Company’s operational and organizational flexibility and its ability to manage risk, which could materially and adversely affect the Company’s financial condition, results of operations and cash flows.
If the third-party pipelines interconnected, or at some future point expected to be interconnected, to the Company’s pipelines become unavailable to transport or store crude oil, NGLs or natural gas, or if our cost of transporting on such third-party pipelines changes, the Company’s revenue and available cash could be adversely affected.
The Company depends upon third-party downstream pipelines and associated operations to provide delivery options from its processing system. Because the Company does not control these pipelines and associated operations, their continuing operation is not within its control. If any downstream pipeline were to become unavailable for current or future volumes due to repairs, damage to the facility, force majeure, lack of capacity, shut in by regulators, failure to meet quality requirements or any other reason, the Company’s ability to operate efficiently and continue shipping crude oil, natural gas and refined products to major demand centers could be restricted, thereby reducing revenue. Any temporary or permanent interruption at these pipelines could materially and adversely affect the Company’s business, results of operations, financial condition or cash flows. In addition, if our cost of transporting on such third-party pipelines changes, the Company’s revenue and available cash could be adversely affected.
The third parties on whom the Company relies for transportation services from its processing facilities are subject to complex federal, state, and other laws that could adversely affect our financial condition and results of operations.
The operations of the third parties on whom the Company relies on to provide downstream transportation and delivery options from its processing system are subject to complex and stringent laws and regulations that require obtaining and maintaining numerous permits, approvals and certifications from various federal, state and local government authorities. These third parties may incur substantial costs in order to comply with existing laws and regulations. If existing laws and regulations governing such third-party services are revised or reinterpreted, or if new laws and regulations become applicable to their operations, these changes may affect the costs that the Company pays for services. Similarly, a failure to comply with such laws and regulations by the third parties could materially and adversely affect the Company’s business, results of operations, and financial condition.
The Company’s customers may suspend, reduce or terminate their obligations under the Company’s commercial agreements with them in certain circumstances, which could have a material adverse effect on the Company’s financial condition, results of operations and cash flows.
The Company has entered into gas gathering, compression and processing agreements, crude oil gathering agreements, and produced water gathering and disposal agreements with its customers, which include provisions that permit the customer to suspend, reduce or terminate its obligations under each agreement if certain events occur. These events include non-performance by the Company and force majeure events which are out of the Company’s control. The customers have the discretion to make such decisions notwithstanding the fact that they may significantly and adversely affect the Company. Any such reduction, suspension or termination of these customers’ obligations under their commercial agreements could materially and adversely affect the Company’s financial condition, results of operations and cash flows.
Increased competition from other companies that provide midstream services, or from alternative fuel sources, could have a negative impact on the demand for the Company’s services, which could materially and adversely affect its financial results.
The Company will compete for third-party customers primarily with other crude oil and natural gas gathering and transportation systems and produced water service providers. Some of its competitors may now, or in the future, have access to greater supplies of crude oil, natural gas and produced water than the Company does. Some of these competitors may expand or construct gathering systems or other pipeline transportation facilities that would create additional competition for the services the Company would provide to third party customers. In addition, potential third-party customers may develop their own gathering systems or pipeline transportation facilities instead of using the Company’s systems.
Further, hydrocarbon fuels compete with other forms of energy available to end-users, including renewable electricity and coal. Increased demand for such other forms of energy at the expense of hydrocarbons could lead to a reduction in demand for the Company’s services.
All these competitive pressures could make it more difficult for the Company to attract new customers as it seeks to expand its business, which could materially and adversely affect its business, financial condition and results of operations. In addition, competition could intensify the negative impact of factors that decrease demand for crude oil, natural gas and produced water services in the markets served by its systems, such as adverse economic conditions, weather, higher fuel costs and taxes or other governmental or regulatory actions that directly or indirectly increase the cost or reduce demand for its services.
The Company’s exposure to commodity price risk may change over time and the Company cannot guarantee the terms of any existing or future agreements for its midstream services with its customers.
The Company currently generates revenues pursuant to a variety of different contractual arrangements, including fee-based agreements based on volumetric fees and percent-of-proceeds arrangements based on a percent of the proceeds from the sale of gathering and processing outputs on behalf of a producer and percent-of-products arrangements in which the Company is assigned a portion of the natural gas it gathers and processes as partial compensation. Consequently, the Company’s existing operations and cash flows have limited direct exposure to commodity price risk. However, the Company’s customers are exposed to commodity price risk, and extended reduction in commodity prices could reduce the production volumes available for the Company’s midstream services in the future below expected levels.
The use of derivative financial instruments could result in material financial losses by us.
The Company engages in commodity and interest rate hedging activities to reduce its exposure to fluctuations in commodity prices and interest rates by using derivative instruments. Hedging activities can result in losses that might be material to our financial condition, results of operations and cash flows. Such losses could occur under various circumstances, including those situations where a counterparty does not perform its obligations under a hedge arrangement, the hedge is not effective in mitigating the underlying risk, or our risk management policies and procedures are not followed. Adverse economic conditions (e.g., a significant decline in energy commodity prices that negatively impacts the cash flows of oil and gas producers) increase the risk of nonpayment or performance by our hedging counterparties.
The Company’s construction of new midstream assets may be subject to new or additional regulatory, environmental, political, contractual, legal and economic risks, which could materially and adversely affect its cash flows, results of operations and financial condition.
The construction of additions or modifications to the Company’s existing systems and the expansion into new production areas to service its customers involve numerous regulatory, environmental, political and legal uncertainties beyond the Company’s control and may require the expenditure of significant amounts of capital, and the Company may not be able to construct in certain locations due to setback requirements or expand certain facilities that are deemed to be part of a single source. Regulations clarifying how crude oil and natural gas production facility emissions must be aggregated under the federal Clean Air Act permitting program were finalized in June 2016. This action clarified certain permitting requirements yet could still impact permitting and compliance costs. As the Company builds infrastructure to meet its customers’ needs, it may not be able to complete such projects on schedule, at the budgeted cost, or at all.
The Company’s revenues may not increase immediately (or at all) upon the expenditure of funds on a particular project. For instance, if the Company builds additional gathering assets, the construction may occur over an extended period of time and it may not receive any material increases in revenues until the project is completed or at all. The Company may construct facilities to capture anticipated future production growth from its customers in an area where such growth does not materialize. As a result, new midstream assets may not be able to attract enough throughput to achieve their expected investment return, which could materially and adversely affect the Company’s business, financial condition, results of operations and cash flows.
The construction of additions to the Company’s existing assets may require it to obtain new rights-of-way, surface use agreements or other real estate agreements prior to constructing new pipelines or facilities. The Company may be unable to timely obtain such rights-of-way to connect new crude oil, natural gas and water sources to its existing infrastructure or capitalize on other attractive expansion opportunities. Additionally, it may become more expensive for the Company to obtain new rights-of-way or to expand or renew existing rights-of-way, leases or other agreements. If the cost of renewing or obtaining new agreements increases, the Company’s cash flows could be materially and adversely affected.
The Company’s business involves many hazards and operational risks, some of which may not be fully covered by insurance. The occurrence of a significant accident or other event that is not fully insured could curtail its operations and materially and adversely affect its cash flows.
The Company’s operations are subject to all the hazards inherent in the gathering and transportation of crude oil, natural gas and produced water, including:
•damage to pipelines, compressor stations, centralized gathering facilities, pump stations, storage terminals, related equipment, and surrounding properties caused by design, installation, construction materials or operational flaws, natural disasters, acts of terrorism, acts of third parties or other unforeseen circumstances.
•leaks of crude oil, natural gas or NGLs or losses of crude oil, natural gas or NGLs as a result of the malfunction of, or other disruptions associated with, equipment, facilities or pipelines;
•fires, ruptures and explosions; and
•other hazards that could also result in personal injury and loss of life, pollution and suspension of operations.
The Company may elect to not obtain insurance, maintain a self-insured retention or increase deductibles for any or all of these risks if it believes that the cost of available insurance is excessive relative to the risks presented. In addition, pollution and environmental risks generally are not fully insurable. The occurrence of an event that is not fully covered by insurance could materially and adversely affect the Company’s business, financial condition, results of operations and cash flows.
A shortage of equipment and skilled labor could reduce equipment availability and labor productivity and increase labor and equipment costs, which could materially and adversely affect the Company’s business and results of operations.
The Company’s gathering and other midstream services require special equipment and laborers who are skilled in multiple disciplines, such as equipment operators, mechanics and engineers, among others. If the Company experiences shortages of necessary equipment or skilled labor in the future, its labor and equipment costs and overall productivity could be materially and adversely affected. If the Company’s equipment or labor prices increase or if the Company experiences materially increased health and benefit costs for employees, its business and results of operations could be materially and adversely affected.
Environmental and Regulatory Risk Related to the Company
The Company operates in a highly regulated environment and its business and profitability could be adversely affected by actions by governmental entities, changes to current laws or regulations, or a failure to comply with laws or regulations.
The Company’s business is highly regulated and subject to numerous governmental laws, rules and regulations and requires permits, authorizations and various governmental and agency approvals, in the various jurisdictions in which the Company operates, that impose various restrictions and obligations that may have material effects on the Company’s business and results of operations. Each of the applicable laws or regulatory requirements and limitations is subject to change, either through new laws or regulations enacted on the federal, state or local level, or by new or modified regulations that may be implemented under existing law. The nature and extent of any changes in these laws, rules, regulations and permits may be unpredictable, have retroactive effects and may have material effects on the Company’s financial condition, results of operations and cash flows. Future legislation and regulations or changes in existing legislation and regulations, or interpretations thereof, could cause additional expenditures, liabilities, restrictions and delays in connection with the Company’s current business as well as future projects, the extent of which cannot be predicted and which may require the Company to limit substantially, delay or cease operations in some circumstances.
The Company’s sales of natural gas are subject to market manipulation requirements promulgated by FERC pursuant to the authority delegated to it by the Energy Policy Act of 2005 (“EPAct 2005”). The EPAct 2005 amended the NGA and NGPA to give FERC authority to impose civil penalties for violations of these statutes and regulations. The Commodity Futures Trading Commission (“CFTC”) also holds authority to monitor certain segments of the physical and futures energy commodities market pursuant to the Commodity Exchange Act. In addition, the Federal Trade Commission (“FTC”) has the authority under the Federal Trade Commission Act and the Energy Independence and Security Act of 2007 to regulate wholesale petroleum markets. The Company believes, however, that neither the EPAct 2005, nor the regulations promulgated by FERC as a result of the EPAct 2005, nor the regulations promulgated by the CFTC or FTC will affect it in a way that materially differs from the way they affect other sellers of oil, natural gas, or NGLs with which the Company competes.
For a general overview of federal, state and local regulations applicable to the Company’s assets, see the “Regulation” section included within Part I, Items 1 and 2.—Business and Properties of this annual report. This regulatory oversight can affect certain aspects of the Company’s business and the market for its products and could materially and adversely affect the Company’s financial position, results of operations and cash flows. Changes to applicable tax laws and regulations or exposure to additional income tax liabilities could adversely affect our operating results and cash flows.
We are subject to various complex and evolving U.S. federal, state and local tax laws. U.S. federal, state and local tax laws, policies, statutes, rules, regulations or ordinances could be interpreted, changed, modified or applied adversely to us, in each case, possibly with retroactive effect. Any significant variance in our interpretation of current tax laws or a successful
challenge of one or more of our tax positions by the IRS or other tax authorities could increase our future tax liabilities and adversely affect our operating results and cash flows.
Rate regulation, challenges by shippers to the rates the Company charges on its pipelines or changes in the jurisdictional characterization of some of the Company’s assets by federal, state or local regulatory agencies or a change in policy by those agencies may result in increased regulation of its assets, which may cause its operating expenses to increase, limit the rates it charges for certain services and decrease the amount of cash flows.
Natural gas and crude oil gathering may receive greater regulatory scrutiny at the federal and state level. Therefore, the Company’s natural gas and crude oil gathering operations could be adversely affected should they become subject to the application of federal or state regulation of rates and services. The Company’s gathering operations could also be subject to safety and operational regulations relating to the design, construction, testing, operation, replacement and maintenance of gathering facilities. Intrastate transportation of NGLs and crude oil may also receive greater regulatory scrutiny at the federal and state level. The Company’s intrastate NGL transportation services are subject to the TRRC regulations and must be provided in a manner that is just, reasonable and non-discriminatory. Such operations could be subject to additional regulation if the NGLs and crude oil are transported in interstate or through foreign commerce, whether by the Company’s pipelines or other means of transportation. The Company cannot predict what effect, if any, such changes might have on its operations, but it could be required to incur additional capital expenditures and increased operating costs depending on future legislative and regulatory changes.
The Company’s midstream and intrastate transportation and storage services that are regulated are generally subject to rate regulation and the regulation of the terms and conditions of service. If we do not comply with this regulation, we may be subject to claims for refunds of amounts charged, the modification, cancellation or suspension of a permit or other authorization, civil penalties and other relief. Additional rules and legislation pertaining to these matters are considered or adopted from time to time. The Company cannot predict what effect, if any, such changes might have on its operations, but the industry could be required to incur additional capital expenditures and increased costs depending on future legislative and regulatory changes.
Federal and state legislative and regulatory initiatives relating to pipeline safety, which are often subject to change, may result in more stringent regulations or enforcement and could subject the Company to increased operational costs, increased capital costs and potential operational delays.
Some of the Company’s pipelines are subject to regulation by the PHMSA pursuant to the Natural Gas Pipeline Safety Act of 1968 (“NGPSA”), with respect to natural gas, and the HLPSA, with respect to crude oil and NGLs. Both the NGPSA and the HLPSA were amended by the Pipeline Safety Act of 1992, the Accountable Pipeline Safety and Partnership Act of 1996, the PSIA, as reauthorized and amended by the Pipeline Inspection, Protection, Enforcement and Safety Act of 2006, and the Pipeline Safety, Regulatory Certainty and Job Creation Act of 2011. The NGPSA and HLPSA regulate safety requirements in the design, construction, operation, and maintenance of natural gas, crude oil and NGL pipeline facilities, while the PSIA establishes mandatory inspections for all U.S. crude oil, NGL and natural gas transmission pipelines in HCAs.
PHMSA has developed regulations that require pipeline operators to implement integrity management programs, including more frequent inspections and other measures to ensure pipeline safety in HCAs. The regulations require operators, including the Company, to:
•perform ongoing assessments of pipeline integrity;
•identify and characterize applicable threats to pipeline segments that could impact an HCA;
•improve data collection, integration and analysis;
•repair and remediate pipelines as necessary; and
•implement preventive and mitigating actions.
PHMSA may revise these standards from time-to-time and additional future regulatory action expanding PHMSA’s jurisdiction and imposing stricter integrity management requirements is possible. The adoption of laws or regulations that apply more comprehensive or stringent safety standards could require the Company to install new or modified safety controls, pursue new capital projects or conduct maintenance programs on an accelerated basis, all of which could require the Company to incur increasing operating costs that may be significant. Further, should the Company fail to comply with PHMSA or comparable state regulations, it could be subject to substantial fines and penalties.
Increased regulation of hydraulic fracturing could result in reductions or delays in crude oil and natural gas production by the Company’s customers, which could reduce the throughput on its gathering and other midstream systems, which could adversely impact its revenues.
The Company does not conduct hydraulic fracturing operations, but substantially all the saltwater, crude oil and natural gas production of its customers is developed from unconventional sources that require hydraulic fracturing as part of the completion process. Hydraulic fracturing is a well stimulation process that utilizes large volumes of water and sand combined with fracturing chemical additives that are pumped at high pressure to crack open previously impenetrable rock to release hydrocarbons. There has been increasing public controversy regarding hydraulic fracturing with regard to the use of fracturing fluids, induced seismic activity, impacts on drinking water supplies, use of water and the potential for impacts to surface water, groundwater and the environment generally.
Hydraulic fracturing is typically regulated by state oil and gas commissions and similar agencies. Some states and local governments, including those in which the Company operates, have adopted, and other states are considering adopting, regulations that could impose more stringent disclosure or well construction requirements on hydraulic fracturing operations. In addition, several states and local governments have banned or significantly restricted hydraulic fracturing and, over the past several years, federal agencies such as the U.S. Environmental Protection Agency (“EPA”) have sought to assert jurisdiction over the process. While the EPA has previously sought to relax environmental regulation and reduce enforcement efforts, including with respect to energy developed from unconventional sources, environmental groups and states have filed lawsuits challenging the EPA’s recent actions. The Company cannot predict the results of these or future lawsuits, or how such lawsuits will affect the regulation of hydraulic fracturing operations. Certain environmental groups have also suggested that additional laws at the federal, state and local levels of government may be needed to more closely and uniformly regulate the hydraulic fracturing process. The Company cannot predict whether any such legislation will be enacted and if so, what its provisions will be. Governmental actions such as these could impact the oil and gas industry and the Company’s future potential growth in such areas. Additional levels of regulation and permits required through the adoption of new laws and regulations at the federal, state or local level could lead to delays, increased operating costs and process prohibitions that could reduce the volumes of crude oil and natural gas that move through the Company’s gathering systems and decrease demand for its water services, which in turn could materially and adversely impact its revenues.
In recent history, public concern surrounding increased seismicity has heightened focus on the oil and gas industry’s use of water in operations, which may cause increased costs, regulations or environmental initiatives impacting the use or disposal of water. The adoption of federal, state and local legislation and regulations intended to address induced seismicity in the areas in which the Company operates could restrict drilling and production activities and could result in increased costs and additional operating restrictions or delays, that could, in turn, materially and adversely impact the Company's business and results of operations.
Adoption of new or more stringent legal standards relating to induced seismic activity associated with produced-water disposal could affect the Company’s operations.
The Company disposes of produced water generated from oil and natural-gas production operations. The legal requirements related to the disposal of produced water into a non-producing geologic formation by means of underground injection wells are subject to change based on concerns of the public or governmental authorities, including concerns relating to recent seismic events near injection wells used for the disposal of produced water. In response to such concerns, regulators in some states (including Texas, where the Company’s produced water gathering and disposal assets are) have imposed, or are considering imposing, additional requirements in the permitting and operating of produced-water disposal wells or are otherwise investigating the existence of a relationship between seismicity and the use of such wells. These developments could result in additional regulation and restrictions on the Company’s use of injection wells to dispose of produced water, including a possible shut down of wells, which could materially and adversely affect its business, financial condition, and results of operations. The Company currently operates produced water injection wells injecting into shallow formations in Texas, where the Texas Railroad Commission has addressed seismic activity by establishing Seismic Response Areas, curtailing injected volumes and/or suspending certain permits for disposal wells injecting into deep strata. Furthermore, additional regulations and restrictions on the use of injection wells could indirectly result in reduced gas gathering and processing volumes and / or crude gathering volumes from the Company’s customers, which could materially and adversely affect its business, financial condition, and results of operations.
The Company may incur significant liability under, or costs and expenditures to comply with, health, safety and environmental laws and regulations, which are complex and subject to frequent change.
The Company is subject to various stringent and complex federal, state and local laws and regulations governing health and safety aspects of its operations, the discharge of materials into the environment and the protection of the environment and natural resources (including endangered or threatened species). These laws and regulations may impose on the Company’s operations numerous requirements, including the acquisition of permits, approvals and certificates before conducting regulated activities; restrictions on the types, quantities and concentration of materials that may be released into the environment; the application of specific health and safety criteria to protect the public or workers; and the responsibility for cleaning up pollution resulting from operations. Moreover, many of the permits required for the construction and operation of the Company’s assets may be subject to challenge by third parties, resulting in project delays or the imposition of stringent environmental controls as a precondition to issuing such permits. The Company may incur substantial costs to maintain compliance with these existing laws and regulations and the permits and other approvals thereunder. Additionally, the Company’s costs of compliance may increase or operational delays may occur if existing laws and regulations are revised or reinterpreted, or if new laws and regulations apply to its operations. Numerous governmental authorities, such as the EPA and analogous state agencies, have the power to enforce compliance with these laws and regulations and the permits issued thereunder, oftentimes requiring difficult and costly response actions. Failure to comply with these laws and regulations may result in the assessment of sanctions, including administrative, civil and criminal penalties; the imposition of investigatory, remedial or corrective action obligations; the incurrence of capital expenditures, the occurrence of delays in the permitting, development or expansion of projects, and enjoining some or all of the Company’s future operations in a particular area. Compliance with more stringent standards and other environmental regulations could prohibit the Company’s ability to obtain permits for operations or require it to install additional equipment, the costs of which could be significant.
The risk of incurring environmental costs and liabilities in connection with the Company’s operations is significant because of its handling of natural gas, crude and other petroleum products, its air emissions and product-related discharges arising out of its operations and as a result of historical industry practices and waste disposal practices. For example, an accidental release from one of the Company’s facilities could subject it to substantial liabilities arising from environmental cleanup and restoration costs, claims made by neighboring landowners and other third parties for personal injury, natural resources and property damages and fines and penalties for related violations of environmental laws or regulations.
Changes in environmental laws and regulations occur frequently, and any changes that result in more stringent or costly requirements could require the Company to make significant expenditures to attain and maintain compliance or may otherwise have a material adverse effect on its operations, competitive position or financial condition.
Public interest in the protection of the environment has increased dramatically in recent years. The trend of more expansive and stringent environmental legislation and regulations applied to the oil and natural gas industry could continue, resulting in increased costs of doing business and, consequently, affecting profitability. Additionally, fuel conservation measures, alternative fuel requirements, increasing consumer demand for alternatives to oil and natural gas and technological advances in fuel economy and energy generation devices, could all reduce demand for oil and natural gas and consequently reduce demand for the midstream services the Company provides. The impact of this changing demand could materially and adversely affect the Company’s business, operations and cash flows.
Legislation, executive orders and regulatory initiatives relating to climate change could have a material adverse effect on our business, demand for our services, financial condition, results of operations and cash flows, while potential physical effects of climate change could disrupt the Company’s operations, cause damage to its pipelines and other facilities and cause it to incur significant costs in preparing for or responding to those effects.
The adoption and implementation of any federal, regional or state legislation, executive actions, regulations or other regulatory and policy initiatives that impose more stringent standards for GHG emissions, restrict the areas in which the oil and gas industry may produce crude oil and natural gas or generate GHG emissions, increase scrutiny of environmental permitting or delay such permitting reviews, or require enhanced disclosure of such GHG emission and other climate-related information, could result in reduced demand for crude oil and natural gas, and thus our services, as well as increase our compliance costs. Although it is not possible at this time to predict how legislation or new regulations that may be adopted to address GHG emissions and climate change could impact our business, any such future laws and regulations could have a material adverse effect on our business, demand for our services, financial condition, results of operations and cash flows.
In addition, it should be noted that there are increasing risks to the Company’s operations resulting from the potential physical impacts of climate change, such as drought, wildfires, damage to infrastructure and resources from flooding, storms and other natural disasters, chronic shifts in temperature and precipitation patterns and other physical disruptions. One or more
of these developments could materially and adversely affect the Company’s business, financial condition and results of operation.
Increasing attention to sustainability-related matters and conservation measures may adversely impact the Company’s business.
Increasing attention to climate change, societal expectations on companies to address climate change, investor and societal expectations regarding voluntary sustainability disclosures and consumer demand for alternative forms of energy may result in increased costs, reduced demand for the Company’s products, reduced profits, increased investigations and litigation and negative impacts on the Company’s access to capital markets. Increasing attention to climate change and environmental conservation, for example, may result in demand shifts for oil and natural gas products and additional governmental investigations and private litigation against the Company or its customers. To the extent that societal pressures or political or other factors are involved, it is possible that such liability could be imposed without regard to the Company’s causation of or contribution to the asserted damage, or to other mitigating factors. While the Company may participate in various voluntary frameworks and certification programs to improve the sustainability profile of its operations and services, the Company cannot guarantee that such participation or certification will have the intended results on its sustainability profile.
While the Company may create and publish voluntary disclosures regarding goals, sustainability targets and other sustainability-related matters from time to time, many of the statements will be aspirational, based on hypothetical expectations and assumptions that may or may not be representative of current or actual risks or events or forecasts of expected risks or events, including the costs associated therewith, and there is no guarantee that these goals or targets will be met within anticipated timelines. Such expectations and assumptions are necessarily uncertain and may be prone to error or subject to misinterpretation given the long timelines involved and the lack of an established single, uniformed approach to identifying, measuring, and reporting on many sustainability-related matters. The standards for tracking and reporting on sustainability-related matters are continuously evolving. Our choice of disclosure frameworks, designed to align with various voluntary reporting standards, may change from time to time, potentially resulting in a lack of comparative data from period to period. Furthermore, our interpretation of reporting standards may differ from that of others.
In addition, sustainability efforts related to employment practices and social initiatives are the subject of scrutiny by stakeholders, regulators and other third parties. In light of the sustainability-linked features governing certain of our debt agreements, among other factors, we cannot be certain of the impact of such regulatory, legal and other developments on our business. Further, recent executive orders by the Trump Administration have indicated that the U.S. government intends to encourage the private sector to terminate previously adopted diversity, equity and inclusion ("DEI") initiatives. In light of the sustainability-linked features governing certain of our indebtedness, among other factors, we cannot be certain of the impact of such orders on our business.
Risks Related to Ownership of Our Common Stock
Entities controlled by Blackstone and I Squared Capital are parties to the amended and restated stockholders agreement granting certain director designation rights and owning a majority of the Company’s outstanding voting shares and thus strongly influence all of the Company’s corporate actions.
We and each of Blackstone and I Squared Capital are party to the amended and restated stockholders agreement, dated October 21, 2021 and effective as of February 22, 2022, which entitles each of Blackstone and I Squared Capital to, among other things, certain director designation rights for so long as each holder continues beneficially own at least 10% of our Common Stock.
As long as Blackstone and I Squared Capital and their respective affiliates own or control a significant percentage of the Company’s outstanding voting power, they will have the ability to strongly influence all corporate actions, including stockholder approval of the election of and removal of directors. The interests of Blackstone or I Squared Capital may not align with the interests of the Company’s other stockholders.
Potential future sales pursuant to registration rights granted by the Company and under Rule 144 may depress the market price for our shares of Class A Common Stock.
The Company has granted a number of its stockholders, including Blackstone and I Squared Capital, registration rights with respect to their shares of Class A Common Stock, including shares of Class A Common Stock issuable upon redemption of Common Units. In addition, under Rule 144 under the Securities Act, a person who has satisfied a minimum holding period of between six months and one year and any other applicable requirements of Rule 144, may thereafter sell such shares in
transactions exempt from registration. A significant number of our currently issued and outstanding shares of Class A Common Stock held by existing stockholders, including officers and directors and other principal stockholders are currently eligible for resale pursuant to and in accordance with the provisions of Rule 144. The potential future sale of our shares by our existing stockholders, pursuant to and in accordance with the provisions of Rule 144, may have a depressive effect on the price of our shares of Class A Common Stock in the applicable trading marketplace.
The Company’s ability to return capital to stockholders through dividends and stock repurchases depends on its ability to generate sufficient cash flows, which it may not be able to accomplish.
The Company’s ability to return capital to stockholders through dividends and stock repurchases principally depends upon the amount of cash it generates from its operations, which will fluctuate from quarter to quarter based on, among other things, income from the Pipeline Transportation JVs, which are accounted for using equity method, the volumes of natural gas and NGLs it gathers and processes, commodity prices, and other factors impacting the Company’s financial condition, some of which are beyond its control. In addition, under Delaware law, dividends on the Company’s capital stock may only be paid from “surplus,” which is the amount by which the fair value of the Company’s total assets exceeds the sum of its total liabilities, including contingent liabilities, and the amount of its capital; if there is no surplus, cash dividends on capital stock may only be paid from the Company’s net profits for the then-current and/or the preceding fiscal year.
The Company’s charter designates the “Court of Chancery” as the sole and exclusive forum for certain types of actions and proceedings that may be initiated by its stockholders, which could limit its stockholders’ ability to obtain a favorable judicial forum for disputes with the Company or its directors, officers, employees or agents.
The charter provides that, unless the Company consents in writing to the selection of an alternative forum, the Court of Chancery will, to the fullest extent permitted by applicable law, be the sole and exclusive forum for any derivative action or proceeding brought on the Company’s behalf; any action asserting a claim of breach of a fiduciary duty owed by any of the Company’s directors, officers or other employees to it or its stockholders; any action asserting a claim against the Company or any of its directors, officers or employees arising pursuant to any provision of the Delaware General Corporation Law (“DGCL”), the charter or the Company’s bylaws; or any action asserting a claim against the Company or any of its directors, officers or other employees that is governed by the internal affairs doctrine.
The above does not apply for such claims as to which the Court of Chancery determines that it does not have personal jurisdiction over an indispensable party, exclusive jurisdiction is vested in a court or forum other than the Court of Chancery or the Court of Chancery does not have subject matter jurisdiction. Any person or entity purchasing or otherwise acquiring any interest in shares of the Company’s capital stock will be deemed to have notice of, and consented to, the provisions of the Company’s charter described in the preceding sentence. This exclusive forum provision may limit a stockholder’s ability to bring a claim in a judicial forum that the stockholder finds favorable for disputes with the Company or its directors, officers or other employees, which may discourage such lawsuits against the Company and such persons. Alternatively, if a court were to find these provisions of the Company’s charter inapplicable to, or unenforceable in respect of, one or more of the specified types of actions or proceedings, the Company may incur additional costs associated with resolving such matters in other jurisdictions, which could materially and adversely affect its business, financial condition or results of operations.
The Company’s charter provides that the exclusive forum provision will be applicable to the fullest extent permitted by applicable law. Section 27 of the Exchange Act creates exclusive federal jurisdiction over all suits brought to enforce any duty or liability created by the Exchange Act or the rules and regulations thereunder. Accordingly, the charter provides that the exclusive forum provision will not apply to suits brought to enforce any liability or duty created by the Exchange Act, the Securities Act or any other claim for which the federal courts have exclusive jurisdiction.
If the Company fails to maintain an effective system of internal controls, it may not be able to report accurately its financial results or prevent fraud. As a result, current and potential holders of the Company’s equity could lose confidence in its financial reporting, which would harm its business and cost of capital.
Effective internal controls are necessary for the Company to provide reliable financial reports, prevent fraud, and operate successfully as a public company. The Company cannot be certain that it will be able to maintain adequate controls over its financial processes and reporting in the future, or that it will be able to continue to comply with its obligations under Section 404 of the Sarbanes-Oxley Act of 2002. Any failure to maintain effective internal controls or to implement or improve the Company’s internal controls could harm its operating results or cause it to fail to meet its reporting obligations. Ineffective internal controls could also cause investors to lose confidence in the Company’s reported financial information, which would likely have a negative effect on the trading price of its equity interests.
If the performance of the Company does not meet the expectations of investors, stockholders or financial analysts, the market price of the Company’s securities may decline.
The price of the Company’s securities could be volatile and subject to wide fluctuations in response to various factors, some of which are beyond the Company’s control, and such fluctuations could contribute to the loss of all or part of a stockholder’s investment. Fluctuations or changes in the Company’s quarterly financial results, changes in or failure to meet market or financial analysts’ expectations about the Company, changes in laws and regulations, commencement of or involvement in litigation, changes in the Company’s capital structure and general economic and political conditions could materially and adversely affect a stockholder’s investment in the Company’s securities, and its securities may trade at prices significantly below the price paid for them. In such circumstances, the trading price of the Company’s securities may not recover and may experience a further decline.
Broad market and industry factors may materially harm the market price of the Company’s securities irrespective of the Company’s operating performance. The stock market in general has experienced price and volume fluctuations that have often been unrelated or disproportionate to the operating performance of the particular companies affected. The trading prices and valuations of these stocks and of the Company’s securities may not be predictable. A loss of investor confidence in the market for retail stocks or the stocks of other companies which investors perceive to be similar to the Company could depress the Company’s stock price regardless of its business, prospects, financial conditions or results of operations.
We cannot guarantee that our stock repurchase program will enhance long-term stockholder value.
Our stock repurchase program does not have an expiration date and we are not obligated to repurchase a specified number or dollar value of shares. Further, our stock repurchase program may be accelerated, suspended, delayed or discontinued at any time. However, we do not expect to significantly increase the amount of stock repurchases until our gross debt is reduced below certain thresholds. Although the Company repurchased Class A Common Stock during 2023 and will continue to repurchase Class A Common Stock in accordance with the stock repurchase program, such program may not enhance long-term stockholder value. Furthermore, the IRA provides for the imposition of a 1% non-deductible U.S. federal excise tax (the “Stock Buyback Tax”) on certain repurchases of stock by publicly traded U.S. corporations such as us after December 31, 2022. Accordingly, the Stock Buyback Tax will apply to our stock repurchase program, provided, that the amount of stock repurchases in the relevant taxable year subject to the Stock Buyback Tax is reduced by the fair market value of any stock issued by us during such taxable year, including the fair market value of any stock issued or provided to our employees or specified affiliates.
General Risks
Continuing or worsening inflationary issues and associated changes in monetary policy have resulted in and may result in additional increases to the cost of the Company’s services and personnel, which in turn cause the Company’s capital expenditures and operating costs to rise.
Although inflation has moderated in 2024 with an annual average consumer price index (“CPI”) of 2.9% compared to that of 4.1% in 2023, the inflation rate has risen slightly during the fourth quarter in 2024. In addition, potential policy shifts in tariff, immigration, and fiscal policy with the Trump Administration might cause additional inflationary pressures to the economy. Moderated inflation has led to multiple interest rates cut by the U.S. Federal Reserve starting in September 2024; however, the slight rise in inflation during fourth quarter of 2024, consumer perception of potential tariffs to be imposed on imports and potential policy shifts by the Trump Administration continue to cast uncertainty to monetary policy. The U.S Federal Reserve decided to hold interest rates steady during its January 2025 Federal Open Market Committee (“FOMC”) meeting and gave little indication of what will come next for interest rates. Inflation pressure has resulted in and may result in additional increases to the costs of the Company’s services and personnel, which in turn cause the Company’s capital expenditures and operating costs to rise and impact the Company’s financial and operating results adversely.
The Company’s operations could be disrupted by natural or human causes beyond its control.
Kinetik operates in both urban areas and remote areas. The Company’s operations are therefore subject to disruption from natural or human causes beyond its control, including risks from hurricanes, severe storms, floods, heat waves, other forms of severe weather, wildfires, sea level rise, ambient temperature increases, war or other military conflicts such as the ongoing conflicts in Ukraine, Israel and the Gaza Strip, accidents, civil unrest, global political events, fires, earthquakes, and epidemic or
pandemic diseases such as the COVID-19 pandemic, some of which may be impacted by climate change and any of which could result in suspension of operations or harm to people or the natural environment.
Crude oil and natural gas related facilities could be direct targets of terrorist attacks, and the Company’s operations could be adversely impacted if infrastructure integral to its operations is destroyed or damaged. Additionally, destructive forms of protest or opposition by activists, including acts of sabotage or eco-terrorism could cause significant damage or injury to people, property, or the environment or lead to extended interruptions of our operations. Costs for insurance and other security may increase as a result of these threats, and some insurance coverage may become more difficult to obtain, if available at all. Furthermore, any regional or domestic political turmoil and the related potential impact on the U.S. stability remain factors that contribute to an environment of economic and political uncertainty that could adversely affect our results of operations and financial condition, including our revenue growth and profitability. The Company’s risk management systems are designed to assess potential physical and other risks to its operations and assets and to plan for their resiliency. While capital investment reviews and decisions incorporate potential ranges of physical risks such as winter storm severity and frequency, air and water temperature, precipitation, among other factors, it is difficult to predict with certainty the timing, frequency or severity of such events, any of which could have a material adverse effect on the company's results of operations or financial condition.
Cybersecurity breaches of our IT systems could result in information theft, data corruption, operational disruption and/or financial loss.
The oil and gas industry has become increasingly dependent on digital technologies to conduct day-to-day operations including certain midstream activities. For example, software programs are used to manage gathering and transportation systems and for compliance reporting. The use of mobile communication devices has increased rapidly. Industrial control systems such as SCADA (supervisory control and data acquisition) now control large scale processes that can include multiple sites and long distances, such as crude oil and natural gas pipelines.
The Company depends on digital technology, including information systems and related infrastructure as well as cloud applications and services, to process and record financial and operating data and to communicate with its employees and business service providers. The Company’s business service providers, including vendors and financial institutions, are also dependent on digital technology. The technologies needed to conduct midstream activities make certain information the target of theft or misappropriation.
The Company’s technologies, systems, networks, and those of its business partners may become the target of cyber-attacks or information security breaches that could result in the unauthorized release, gathering, monitoring, misuse, loss or destruction of proprietary and other information, or other disruption of its business operations. In addition, certain cyber incidents, such as surveillance, may remain undetected for an extended period. A cyber incident involving the Company’s information systems and related infrastructure, or that of its business service providers, could disrupt its business plans and negatively impact its operations.
The Company’s implementation of various controls and processes, including globally incorporating a risk-based cyber security framework, to monitor and mitigate security threats and to increase security for its information, facilities and infrastructure is costly and labor intensive. Moreover, there can be no assurance that such measures will be sufficient to prevent security breaches from occurring. As cyber threats continue to evolve, the Company may be required to expend significant additional resources to continue to modify or enhance its protective measures or to investigate and remediate any information security vulnerabilities. Any such breakdowns or breaches, or resulting access, disclosure or other loss of information, could significantly disrupt the Company’s business and result in legal claims or proceedings, liability under laws that protect the privacy of personal information and damage to its reputation, any of which could materially and adversely affect its business, financial position, results of operations or cash flows. See additional information related to cybersecurity risks and how the Company manages such risk in Part I—Item 1C. Cybersecurity of this Annual Report. Changes in management’s estimates and assumptions may have a material impact on the Company’s Consolidated Financial Statements and financial or operational performance in any given period.
In preparing the Company’s periodic reports under the Exchange Act, including its financial statements, Kinetik’s management is required under applicable rules and regulations to make estimates and assumptions as of a specified date. These estimates and assumptions are based on management’s best estimates and experience as of that date and are subject to substantial risk and uncertainty. Materially different results may occur as circumstances change and additional information becomes known. Areas requiring significant estimates and assumptions by management include revenue recognition, impairments to property, plant and equipment, accruals for estimated liabilities, including litigation reserves. Changes in estimates or assumptions or the information underlying the assumptions, such as changes in the Company’s business plans,
general market conditions, or changes in the Company’s outlook on commodity prices, could affect reported amounts of assets, liabilities or expenses.
ITEM 1B. UNRESOLVED STAFF COMMENTS
None.
ITEM 1C. CYBERSECURITY
Description of Processes for Assessing, Identifying, and Managing Cybersecurity Risks
As a Company that manages midstream infrastructure for the energy sector, cybersecurity is of great concern to our organization, and we aim to protect our systems, networks and programs from digital attacks. We have endeavored to implement policies, standards, and technical controls based on external cybersecurity standards, such as National Institute of Standards and Technology (“NIST”) and ISO frameworks. Like others in our industry, we are reliant on the continuous and uninterrupted operation of our various technology systems. User access to our sites and information technology systems are important elements of our operations, as is protection against cybersecurity incidents. In the ordinary course of our business, we collect and store data in our data centers and on our networks, including proprietary business information, critical operating information, among other types of sensitive information. In addition, the information and operational technology infrastructure we use is important to the operation of our business and to our ability to perform day-to-day operations. We use various processes and tools, including third-party cybersecurity tools and technologies, to aid us in seeking to secure and protect our network perimeter and internal systems from unauthorized access, intrusion, or disruption, including those processes described below.
Kinetik has an established risk management policy supported by underlying processes to execute and meet the Company’s risk management objectives. This Policy is based on the NIST requirements.
Risk Assessment:
We conduct assessments across our systems, networks, and data infrastructure to identify, assess and manage potential and material cybersecurity threats and vulnerabilities. These assessments include penetration testing, vulnerability scans, cybersecurity audits, incident response planning, vendor risk assessments, and regulatory compliance assessments. Feedback from these assessments is incorporated into our systems and procedures through upgrades intended to further improve our cybersecurity posture.
Incident Identification and Response:
The Company has established a cybersecurity incident management policy to facilitate the Company’s management of cybersecurity incidents. Monitoring and detection systems have been implemented to help identify and remediate cybersecurity threats. All potential security events and/or confirmed security incidents, as appropriate, are reported and logged in to the Company’s authorized incident management systems. The Company’s incident response team (“IRT”), along with the third-party security system providers, aims to review, analyze, categorize and take action on reported security events. We also have an Incident Response Plan that is designed to be triggered if a security event is identified as a security incident. Consideration shall also be given to individually immaterial incidents that occur as part of a series of related unauthorized occurrences and are material when considered in the aggregate.
Furthermore, the Company has established processes for communicating an incident that is determined material, based on the Company’s materiality assessment, to the Audit Committee. This process is designed to help implement a containment strategy and to comply with applicable regulations. The Company’s Incident Response Plan focuses on the following goals: reduction of damage due to a security incident; identifying potential opportunities for eradication; identifying potential recovery strategies; establishing lesson learned analyses; and identifying mitigation strategies designed to decrease the likelihood of security incident reoccurrence.
Cybersecurity Training and Awareness:
At Kinetik, we believe that the recognition and reporting of cybersecurity threats by every employee and contractor plays a key role in protecting and securing our network. We have mandatory annual training for our employees and contractors on
security awareness annually, using a library of cybersecurity training modules. We deploy quarterly simulated phishing emails to all system users in an effort to gauge their cybersecurity awareness.
Access Controls:
Users are provided with access consistent with the principle of least privilege, which requires that users be given no more access than necessary to complete their job functions. To keep our network secure, we have multifactor authentication (MFA) for all users, a password change policy, separation of duties in accounting systems, controlled access to network drives, endpoint protection, email security, mobile device management, device encryption, and ongoing active monitoring of threats. We have implemented devices designed to control third-party access to our plant systems and also provide 24/7 monitoring of our infrastructure.
As part of our strategy, we continue to work with industry leading vendors to conduct our internal network, cloud environment, and external pen testing, all of which are critical as we work to protect our hybrid environment. We recognize that third-party service providers may introduce cybersecurity risks. In an effort to mitigate these risks, we have established a third-party risk management policy that requires third-party service providers to maintain security requirements and levels of services as part of their service delivery. Before engaging with any third-party service provider, we aim to conduct due diligence to evaluate their cybersecurity capabilities. Additionally, we endeavor to include cybersecurity requirements in our contracts with these providers and endeavor to require them to adhere to specific security standards and protocols.
The Board’s Oversight and Management’s Role
Our Board has delegated the responsibility for overseeing cybersecurity risk. Our Audit Committee oversees management’s assessment and management of cybersecurity risk. Our Senior IT Director, who reports to our Executive Vice President, Chief Administrative and Accounting Officer, leads the Information Technology team, is a member of our management-level Cybersecurity Governance Committee and management-level Cybersecurity Risk Committee and manages our information technology and cybersecurity function.
Through the Company’s ERM program, our Cybersecurity Governance Committee and Cybersecurity Risk Committee oversee the Company’s cybersecurity initiatives. The Cybersecurity Governance Committee is responsible for monitoring, reviewing and reporting to the Audit Committee on cyber incident response. The Cybersecurity Risk Committee is responsible for communication of security incidents to organizational stakeholders.
As part of our efforts to facilitate effective oversight, the Cybersecurity Governance Committee and the Cybersecurity Risk Committee hold discussions on cybersecurity risks, incident trends, and the effectiveness of cybersecurity measures at least quarterly and more frequently as necessitated by emerging material cyber risks or incidents.
Further, to communicate our system health, performance, metrics, and roadmap, the Information Technology team delivers a quarterly update to the Audit Committee, as well as the Cybersecurity Governance Committee and Cybersecurity Risk Committee, to discuss cybersecurity matters such as the effectiveness of our cybersecurity strategy and ensuring alignment with our business objectives. A Cybersecurity Dashboard is used to share metrics and matters needing Board attention in Audit Committee meetings. The Cybersecurity Dashboard also includes commentaries on risk exposure and materiality, if any, as they relate to cybersecurity.
Our executive team, in particular, our Senior IT Director and members of our IRT, have relevant degrees in computer information systems and extensive experience and background in network design and configuration, endpoint protection, privileged identity management, device encryption, cloud network and infrastructure, cloud email security, security information and event management (SIEM), and vulnerability assessments. This combined expertise is important to our cybersecurity risk management processes.
Disclosures
As of the date of this report, though the Company and our service providers have experienced certain cybersecurity incidents, we are not aware of any cybersecurity threats, including those resulting from any previous cybersecurity incidents, that have materially affected or are reasonably likely to materially affect the Company, including our business strategy, results of operations, or financial condition. However, we acknowledge that cybersecurity threats are continually evolving, and the possibility of future cybersecurity incidents remain. Despite the implementation of our cybersecurity processes, our security measures cannot guarantee that a significant cyberattack will not occur. See “Risk Factors” in Part I—Item 1A of this Annual
Report for additional information about the risks to our business associated with a breach or other compromise to our information and operational technology systems.
ITEM 3. LEGAL PROCEEDINGS
For further information regarding legal proceedings, see Note 17—Commitments and Contingencies in the Notes to Consolidated Financial Statements set forth in Part IV, Item 15 of this Annual Report.
PART II
ITEM 5. MARKET FOR THE REGISTRANT’S COMMON EQUITY, RELATED STOCKHOLDER MATTERS, AND ISSUER PURCHASES OF EQUITY SECURITIES
Market Information
The Company’s Class A Common Stock is traded on the NYSE under the symbol “KNTK”.
On February 21, 2025, the Class A Common Stock had a closing price of $59.03.
Holders
On February 21, 2025, there were 191 holders of record of the Company’s Class A Common Stock and eight holders of record of the Company’s Class C Common Stock, par value $0.0001 per share (“Class C Common Stock”).
Dividends
Holders of the Company’s Class A Common Stock are entitled to receive cash dividends when declared by the Company’s Board out of legally available funds. The Board intends to continue the policy of paying quarterly cash dividends, however, future dividend payments will depend upon our level of earnings, capital expenditure requirements, debt obligations, financial condition and other relevant factors.
Recent Sales of Unregistered Securities
None.
Purchase of Equity Securities by the Issuer and Affiliated Purchasers
In February 2023, the Board approved a stock repurchase program (“Repurchase Program”), authorizing discretionary purchases of the Company’s Class A Common Stock up to $100.0 million in the aggregate. The Repurchase Program allowed us to reduce dilution and potentially acquire shares at levels that we believe do not reflect the fundamental earnings power of the Company. Repurchases may be made at management’s discretion from time-to-time throughout the year, in accordance with applicable securities laws on the open market, a trading plan, or through privately negotiated transactions.
Except as already disclosed in the Company’s Current Report on From 8-K dated May 13, 2024, there were no repurchase activities during the three and twelve months ended December 31, 2024.
For more information regarding the non-deductible 1% U.S. federal excise tax imposed on certain repurchases of stock by publicly traded U.S. corporations, please refer to Part I—Item 1A Risk Factors—Risks Related to Ownership of our Common Stock.
Performance Graph
The graph and table below compares the Company’s cumulative return to holders of its common stock, the NASDAQ Composite Index, the NYSE Composite Index and the Alerian U.S. Midstream Energy Index during the period beginning on December 31, 2019 and ending on December 31, 2024. The NASDAQ Composite Index was included here as the Company’s Class A Common Stock was traded on NASDAQ prior to switching to NYSE in October 2022. In accordance with SEC rules, the performance graph presents both the indices used in the previous year and the newly selected index. The performance graph was prepared based on the following assumptions: (i) $100 was invested in our Class A Common Stock and in each of the indices at the beginning of the period, and (ii) dividends were reinvested on the relevant payment dates. The stock price performance included in this graph is historical and not necessarily indicative of future stock price performance.
COMPARISON CUMULATIVE TOTAL RETURN(1)(2)
Among Kinetik Holdings Inc., the NYSE Composite Index, the Nasdaq Composite Index and the Alerian US Midstream Energy Index
(1)The performance graph shall not be deemed “soliciting material” or to be “filed” with the SEC for purposes of Section 18 of the Exchange Act, or otherwise subject to the liabilities under that Section, and shall not be deemed to be incorporated by reference into any filing of the Company under the Securities Act of 1933, as amended (the “Securities Act”) or the Exchange Act except to the extent that we specifically request it be treated as soliciting material or specifically incorporate it by reference.
(2)$100 invested on 12/31/2019 in index, including reinvestment of dividends.
| | | | | | | | | | | | | | | | | | | | | | | | | | | | | | | | | | | |
| December 31, |
| 2019 | | 2020 | | 2021 | | 2022 | | 2023 | | 2024 |
| | | | | | | | | | | |
| Kinetik Holdings Inc | $ | 100.00 | | | $ | 82.95 | | | $ | 118.28 | | | $ | 135.91 | | | $ | 137.22 | | | $ | 251.27 | |
| NYSE Composite Index | 100.00 | | | 144.92 | | | 177.06 | | | 119.45 | | | 172.77 | | | 223.87 | |
| Nasdaq Composite Index | 100.00 | | | 106.99 | | | 129.11 | | | 117.04 | | | 133.16 | | | 154.19 | |
| Alerian US Midstream Energy Index | 100.00 | | | 75.04 | | | 108.82 | | | 140.99 | | | 168.00 | | | 253.24 | |
ITEM 6. [RESERVED]
ITEM 7. MANAGEMENT’S DISCUSSION AND ANALYSIS OF FINANCIAL CONDITION AND RESULTS OF OPERATIONS
The following discussion and analysis should be read together with the Consolidated Financial Statements and the Notes to Consolidated Financial Statements set forth in Part IV, Item 15 of this Annual Report, and the risk factors and related information set forth in Part I, Item 1A and Part II, Item 7A of this Annual Report. This section of this Annual Report generally discusses 2024 and 2023 items and year-to-year comparisons between 2024 and 2023. Discussions of 2022 items and year-to-year comparisons between 2023 and 2022 that are omitted in this Annual Report are incorporated by reference to “Management’s Discussion and Analysis of Financial Condition and Results of Operations” of the Company’s Annual Report on Form 10-K for the year ended December 31, 2023, filed on March 5, 2024.
Unless otherwise noted or the context requires otherwise, references herein to Kinetik Holdings Inc.,“the Company”, “us”, “our”, “we” or similar terms, with respect to time periods prior to February 22, 2022, include BCP and its consolidated subsidiaries and do not include ALTM and its consolidated subsidiaries, while references herein to Kinetik Holdings Inc.,“the Company”, “us”, “our”, “we” or similar terms, with respect to time periods from and after February 22, 2022, include ALTM and its consolidated subsidiaries.
Significant Business Combinations
On February 22, 2022, (“the Altus Closing Date”), Kinetik Holdings Inc., a Delaware corporation (formerly known as Altus Midstream Company), consummated the business combination transactions contemplated by the Contribution Agreement, dated as of October 21, 2021 (the “Contribution Agreement”), by and among the Company, Altus Midstream LP (now known as Kinetik Holdings LP, the “Partnership”), a Delaware limited partnership and subsidiary of Altus Midstream Company. New BCP Raptor Holdco, LLC, a Delaware limited liability company, and BCP. The transactions contemplated by the Contribution Agreement are referred to herein as the “Altus Acquisition.” In connection with the closing of the transaction, the Company changed its name from “Altus Midstream Company” to “Kinetik Holdings Inc.” Upon closing of the business combination, BCP and its subsidiaries became wholly owned subsidiaries of the Partnership. The Altus Acquisition was accounted for as a reverse merger pursuant to ASC 805.
On June 24, 2024 (the “Durango Closing Date”), the Company consummated the previously announced transaction contemplated by the Membership Interest Purchase Agreement (the “Durango MIPA”), dated May 9, 2024, by and between the Company, the Partnership, and Durango Midstream LLC, an affiliate of Morgan Stanley Equity Partners (the “Durango Seller”), pursuant to which the Partnership purchased all of the membership interests of Durango Permian LLC and its wholly owned subsidiaries (“Durango”) from Durango Seller (“Durango Acquisition”). The Durango Acquisition was accounted for as a business combination in accordance with ASC 805. Refer to Note 3—Business Combination in the Notes to the Consolidated Financial Statements in this Annual Report for further information regarding the Durango Acquisition. Overview
We are an integrated midstream energy company in the Permian Basin providing comprehensive gathering, transportation, compression, processing and treating services. Our core capabilities include a variety of service offerings including natural gas gathering, transportation, compression, treating and processing; NGLs stabilization and transportation; produced water gathering and disposal; and crude oil gathering, stabilization, storage and transportation. The Company’s corporate office is located in Houston, Texas and our operations are strategically located in the heart of the Delaware Basin.
Our Operations and Segments
We have two reportable segments which are strategic business units with various products and services. The Midstream Logistics segment operates under three service offerings, 1) gas gathering and processing, 2) crude oil gathering, stabilization and storage services and 3) produced water gathering and disposal. The Pipeline Transportation segment consists of three EMI pipelines originating in the Permian Basin with various access points to the U.S. Gulf Coast, Kinetik NGL Pipelines and Delaware Link Pipeline. The pipelines transport crude oil, natural gas and NGLs within the Permian Basin and to the U.S. Gulf Coast.
Midstream Logistics
Gas Gathering and Processing. The Midstream Logistics segment provides gas gathering and processing services with over 3,900 miles of low and high-pressure steel pipeline located throughout the Delaware Basin, including over 2,300 miles of gas
pipeline acquired through the Durango Acquisition, and over 570,000 horsepower of compression capacity. An additional 214 miles of gathering pipeline was added to our system through the Permian Resources Midstream Acquisition closed during January 2025. Gas processing assets are centralized at seven processing complexes with system-wide front-end amine treating capability, 6.5 MMcf/d AGI capacity and total cryogenic processing capacity of approximately 2.2 Bcf/d as of today and over 2.4 BCF/d once the Kings Landing Project is complete in mid-2025.
Crude Oil Gathering, Stabilization and Storage Services. Crude gathering assets are centralized at the Caprock Stampede Terminal and the Pinnacle Sierra Grande Terminal. The system includes approximately 220 miles of gathering pipeline and 90,000 barrels of crude storage. An additional 75 miles of gathering pipeline was added to our crude gathering assets through the Permian Resources Midstream Acquisition closed during January 2025.
Water Gathering and Disposal. The system includes over 360 miles of gathering pipeline and approximately 580,000 barrels per day of permitted disposal capacity.
Pipeline Transportation
EMI pipelines. The Company owns the following equity interests in three EMI pipelines in the Permian Basin with access to various points along the U.S. Gulf Coast: 1) an approximate 55.5% equity interest in Permian Highway Pipeline LLC (“PHP”), which is also owned and operated by Kinder Morgan; 2) 33.0% equity interest in Shin Oak, which is owned by Breviloba, LLC, and operated by Enterprise Products Operating LLC; and 3) 27.5% equity interest in Epic Crude Holdings, LP (“EPIC”), which is operated by EPIC Consolidated Operations, LLC. The increase of equity interest in EPIC was related to the purchase of an additional 12.5% equity interest from a third party in July 2024.
Kinetik NGL Pipelines. The Kinetik NGL Pipelines consist of approximately 96 miles of NGL pipelines connecting our East Toyah and Pecos complexes to Waha, including our 20-inch Dewpoint pipeline that spans 40 miles, and our 30 mile, 20-inch Brandywine Pipeline connecting to our Diamond Cryogenic complex. The Kinetik NGL pipeline system has a capacity approximate 580 MBbl/d.
Delaware Link Pipeline. The Delaware Link Pipeline consists of approximately 40 miles of 30-inch diameter pipeline with a capacity of approximately 1.0 Bcf/d that provides additional transportation capacity to Waha. The project reached commercial in-service in October 2023.
Recent Developments
Permian Resources Midstream Assets Acquisition
On December 10, 2024, the Company announced it has entered into a definitive agreement with Permian Resources to acquire certain natural gas and crude oil gathering systems assets, primarily located in Reeves County, Texas, for $178.4 million of cash consideration. The Permian Resources Midstream Acquisition provides a multi-stream opportunity for natural gas gathering, compression and processing, as well as crude gathering services for the Company. The transaction closed in early January 2025 following satisfaction of customary closing conditions.
EPIC Equity Interest
During the third quarter of 2024, the Company consummated the Equity Sale and Purchase Agreement with Dos Rios Crude Intermediate LLC to purchase a 12.5% of equity interest in EPIC. The acquisition of additional interest is accounted for as a business acquisition pursuant to ASC 805. After completion of the transaction, the Company owned a 27.5% equity interest in EPIC. EPIC has over 800 miles of pipeline connecting the Delaware and Midland Basins to the U.S. Gulf Coast and has a capacity of 625 MBbl/d.
Durango Acquisition
On June 24, 2024, the Company consummated the previously announced Durango Acquisition for an adjusted purchase price of approximately $785.7 million, consisting of (i) $358.0 million of cash consideration paid at closing, (ii) approximately 3.8 million shares of Class C Common Stock and an equivalent number of common units in the Partnership (“OpCo Units”), issued at closing and (iii) approximately 7.7 million shares of Class C Common Stock and an equivalent number of OpCo Units to be issued on July 1, 2025. Durango Seller is also entitled to an earn out of up to $75.0 million in cash contingent upon the completion and placing into service of the Kings Landing Project in Eddy County, New Mexico, which is currently under construction. This earn out is subject to reduction based on actual capital costs associated with the Kings Landing Project. This transaction was accounted for as a business combination pursuant to ASC 805. Refer to Note 3—Business Combinations in the Notes to our Consolidated Financial Statements in this Annual Report for further information. The Durango Acquisition significantly expands Kinetik’s footprint into New Mexico and the Northern Delaware Basin, expanding Kinetik’s processing capacity by over 200 MMcf/d and doubling its existing gathering pipeline mileage. An additional 200 MMcf/d of processing capacity will be added upon completion of the Kings Landing Project.
GCX Divestiture
On June 4, 2024, the Company consummated the previously announced transaction contemplated by the GCX Purchase Agreement to sell its 16% equity interest in GCX for an adjusted purchase price of $524.4 million (the "GCX Sale"), including an additional $30.0 million earn out in cash upon the approval by the GCX Board of Directors of one or more capital projects that achieve certain capacity expansion criteria. Net cash proceeds of $494.4 million were received from the GCX Buyer on June 4, 2024 and the cash earn out was received in September 2024. The Company recognized a gain of $89.8 million upon closing of the GCX Sale.
A/R Facility
On April 2, 2024, Kinetik Receivables, a bankruptcy remote special purpose entity formed as a direct subsidiary of the Partnership, which is a subsidiary of the Company entered into an A/R Facility with an initial facility limit of $150.0 million with PNC Bank, as the administrative agent, and certain purchasers party thereto from time to time, which has a scheduled termination date of April 1, 2025. Pursuant to the A/R Facility, the Company and certain of its subsidiaries continuously transfer receivables to Kinetik Receivables and Kinetik Receivables transfers receivables that meet certain qualifying conditions to third-party purchasers in exchange for cash. These receivables are held by Kinetik Receivables and are pledged to secure the collectability of the sold receivables. The amount available for borrowings at any one time under the A/R Facility is limited to an amount calculated based on the outstanding balance of eligible receivables sold to the purchasers, subject to certain reserves, concentration limits, and other limitations. As of December 31, 2024, eligible accounts receivable of $140.2 million was pledged to the A/R Facility as collateral and $9.8 million was available to be invested by the purchasers. The net proceeds of the A/R Facility were used, together with cash on hand, to repay a portion of the outstanding borrowings under the existing term loan credit facility (the “Term Loan Credit Facility”), lowering the remaining balance to $1.0 billion. As a result, the maturity of the Term Loan Credit Facility extended to December 8, 2026.
Secondary Offering of Common Stock
On March 13, 2024, the Company and Apache (the “Selling Stockholder”) entered into an Underwriting Agreement with Goldman Sachs & Co. LLC, as representative of the several underwriters named therein (collectively, the “Underwriters”), pursuant to which the Selling Stockholder agreed to sell to the Underwriters, and the Underwriters agreed to purchase from the Selling Stockholder, subject to and upon the terms and conditions set forth therein, 13,079,871 shares of Class A Common Stock. The Company did not receive any proceeds from the sale of shares of Common Stock in the offering.
Factors Affecting Our Business
Commodity Price Volatility
There has been, and we believe there will continue to be, volatility in commodity prices and in the relationships among NGLs, crude oil and natural gas prices. As a result of uncertainty around global commodity supply and demand, global geopolitical conflicts, foreign and trade policies with the new U.S. presidential administration, as well as the ongoing armed conflict in Ukraine, global oil and natural gas commodity prices continue to remain volatile. The volatility and uncertainty of natural gas, crude oil and NGL prices impact drilling, completion and other investment decisions by producers and ultimately supply to our systems. Although ongoing armed conflicts might generate commodity price upward pressure, and our operations
could benefit in an environment of higher natural gas, NGLs and condensate prices, the instability of the international political environment and human and economic hardship resulting from the conflicts would have a highly uncertain impact on the U.S. economy, which in turn, might affect our business and operations adversely. Our product sales revenue is exposed to commodity price fluctuations. Therefore, commodity price decline and sustained periods of low natural gas and NGL prices could have an adverse effect on our product revenue stream. The Company continues to monitor commodity prices closely and may enter into commodity price hedges from time to time as necessary to mitigate the volatility risk. In addition, the Company, when economically appropriate, enters into fee-based arrangements that insulate the Company from commodity price volatility.
Inflation and Interest Rates
The annual rate of inflation in the U.S. was 3.00% in January 2025 as measured by the Consumer Price Index. In light of the recent economic activity, unemployment level and uncertainty in policy making with the Trump Administration, the FOMC decided to maintain the target range for the federal funds rate at 4.25 % - 4.50% during its meeting in January 2025. During the meeting, the FOMC noted that the economic outlook is uncertain and the Committee is attentive to the risks to both sides of its dual mandate and is strongly committed to supporting maximum employment and returning inflation to its 2.00% objective. If interest rates elevated beyond the term of our hedges, our financing cost will increase and could have a negative impact on the Company’s ability to meet its contractual debt obligations and to fund its operating expenses and capital expenditures. The Company will continue to monitor the FOMC’s monetary policy and interest rate movement. Refer to Note 13—Derivatives and Hedging Activities in the Notes to Consolidated Financial Statements in this Annual Report for additional discussion regarding our hedging strategies and objectives for interest rate risk.
Results of Operations
The following table presents the Company’s results of operations for the periods presented:
| | | | | | | | | | | | | | | | | | | | |
| | Year Ended December 31, |
| | 2024 | | 2023 | | % Change |
| | | | | | |
| | (In thousands, except percentages) |
| Operating revenues: | | | | | | |
| Service revenue | | $ | 408,000 | | | $ | 417,751 | | | (2) | % |
| Product revenue | | 1,062,986 | | | 822,410 | | | 29 | % |
| Other revenue | | 11,943 | | | 16,251 | | | (27) | % |
| Total operating revenues | | 1,482,929 | | | 1,256,412 | | | 18 | % |
| Operating costs and expenses: | | | | | | |
Cost of sales (exclusive of depreciation and amortization expenses)* | | 620,618 | | | 515,721 | | | 20 | % |
| Operating expenses | | 195,970 | | | 161,520 | | | 21 | % |
| Ad valorem taxes | | 24,714 | | | 21,622 | | | 14 | % |
| General and administrative expenses | | 134,157 | | | 97,906 | | | 37 | % |
| Depreciation and amortization expenses | | 324,197 | | | 280,986 | | | 15 | % |
| Loss on disposal of assets, net | | 4,040 | | | 19,402 | | | (79) | % |
| Total operating costs and expenses | | 1,303,696 | | | 1,097,157 | | | 19 | % |
| Operating income | | 179,233 | | | 159,255 | | | 13 | % |
| Other income (expense): | | | | | | |
| Interest and other income | | 2,802 | | | 2,004 | | | 40 | % |
| Loss on debt extinguishment | | (525) | | | (1,876) | | | (72) | % |
| Gain on sale of equity method investment | | 89,802 | | | — | | | 100 | % |
| Interest expense | | (217,235) | | | (205,854) | | | 6 | % |
| Equity in earnings of unconsolidated affiliates | | 213,191 | | | 200,015 | | | 7 | % |
| Total other income (expense), net | | 88,035 | | | (5,711) | | | NM |
| Income before income taxes | | 267,268 | | | 153,544 | | | 74 | % |
| Income tax expense (benefit) | | 23,035 | | | (232,908) | | | (110) | % |
| Net income including noncontrolling interests | | $ | 244,233 | | | $ | 386,452 | | | (37) | % |
| | | | | | |
*Cost of sales (exclusive of depreciation and amortization) is net of gas service revenues totaling $219.7 million and $148.3 million for the years ended December 31, 2024 and 2023, respectively, for certain volumes where we act as principal.
NM - Not meaningful
Year Ended December 31, 2024 Compared to Year Ended December 31, 2023
Revenues
For the year ended December 31, 2024, revenue increased $226.5 million, or 18%, to $1,482.9 million, compared to $1,256.4 million for the same period in 2023. The increase was primarily driven by higher period-over-period product revenue due to increased natural gas residue volumes sold and increased gathered and processed gas volumes.
Service revenue
Service revenue consists of service fees paid to the Company by its customers for providing comprehensive gathering, treating, processing and water disposal services necessary to bring natural gas, NGLs and crude oil to market. Service revenue for the year ended December 31, 2024, decreased by $9.8 million, or 2%, to $408.0 million, compared to $417.8 million for the same period in 2023. The decrease was primarily driven by lower period-over-period gas gathering fees of $9.5 million. Total gathered and processed gas volumes increased 227.4 Mcf per day, or 13% and 189.9 Mcf per day, or 13%, respectively. Of the increase, Durango’s operations, on a six months basis, accounted for 105.8 Mcf per day and 98.2 Mcf per day of gathered and processed gas volumes, respectively. However, the total gathered and processed gas volumes where we function as the agent decreased period-over-period causing the change in net gas gathering fees presented as revenues to be down 3%. Over 98% of service revenues are included in the Midstream Logistics segment.
Product revenue
Product revenue consists of commodity sales (including condensate, natural gas residue and NGLs). Product revenue for the year ended December 31, 2024, increased by $240.6 million, or 29%, to $1,063.0 million, compared to $822.4 million for the same period in 2023, primarily due to period-over-period increases in natural gas residue sales volumes of 51.7 million MMBtu, or over 200% and NGL and condensate volumes sold of 2.0 million barrels, or 6%. The increase was also driven by a period-over-period increase in NGL prices of $0.62 per barrel, or 3% and condensate prices of $2.10 per barrel, or 3%. The overall increase was partially offset by a decrease in natural gas prices of $0.42 per MMBtu, or 24%. Product revenues are included entirely in the Midstream Logistics segment.
Operating Costs and Expenses
Costs of sales (exclusive of depreciation and amortization)
Cost of sales (exclusive of depreciation and amortization) primarily consists of purchases of NGLs and natural gas from our producers at contracted market prices to support product sales to other third parties. For the year ended December 31, 2024, cost of sales increased $104.9 million, or 20%, to $620.6 million, compared to $515.7 million for the same period in 2023. As discussed above, the increase was primarily driven by period-over-period increases in natural gas residue and NGL and condensate volumes sold, slightly offset by lower natural gas prices. More than 99% of the cost of sales (exclusive of depreciation and amortization) are included in the Midstream Logistics segment.
Operating expenses
Operating expenses increased by $34.5 million, or 21%, to $196.0 million for the year ended December 31, 2024, compared to $161.5 million for the same period in 2023. Of the total increase, $23.6 million was driven by Durango’s operations that were acquired during late June 2024. The remaining increase was primarily driven by increases in internal labor and repairs and maintenance totaling $10.7 million, which was related to the increased gathered and processed volumes during 2024. Over 98% of operating expenses are included in the Midstream Logistics segment.
General and administrative expenses
General and administrative expenses increased by $36.3 million, or 37% to $134.2 million for the year ended December 31, 2024, compared to $97.9 million for the same period in 2023. The increase was mainly driven by higher share-based compensation of $20.6 million primarily due to the 2024 STI bonus being paid via stock during December versus March for prior years and $9.1 million of integration and transaction costs associated with the 2024 Durango and EPIC transactions. The remaining increase primarily relates to higher internal labor expenses of $3.3 million related to the overall growth of the organization and payroll taxes on the aforementioned 2024 STI bonus, and higher insurance costs of $1.5 million primarily related to the Durango Acquisition as well as an incremental increase in insurance rates related to the legacy business.
Depreciation and amortization expenses
Depreciation and amortization expense increased by $43.2 million, or 15% to $324.2 million for the year ended December 31, 2024, compared to $281.0 million for the same period in 2023. Of the total increase, $25.5 million was driven by the Durango Acquisition that was completed during late June 2024. The remaining increase was driven by assets placed in service since the second half of 2023, including the Delaware Link Pipeline that was placed in service in October 2023 and the rich gas lateral into Lea County, New Mexico.
Loss on disposal of assets, net
Loss on disposal of asset, net decreased by $15.4 million, or 79% to $4.0 million for the year ended December 31, 2024, compared to $19.4 million for the same period in 2023. The decrease was mainly due to $14.9 million less asset write-offs of obsolete gathering and processing systems and facilities in 2024 compared to 2023.
Other Income (Expense)
Gain on sale of equity method investment
For the year ended December 31, 2024, we had gain on sale of equity method investment of $89.8 million compared to the same period in 2023 related to the GCX Sale consummated in the second quarter of 2024. There was no such gain in 2023.
Income taxes (benefit) expense
The Company recorded income tax expense of $23.0 million for the year ended December 31, 2024, compared to income tax benefit of $232.9 million for the same period in 2023. The increase was primarily due to the release of the valuation allowance on federal deferred tax assets during the fourth quarter of 2023 compared to the recognition of deferred federal income tax of $19.5 million for year ended December 31, 2024. As the Company achieved a three-year cumulative level of profitability as of December 31, 2024 and 2023, the Company concluded that it is more likely than not that its deferred tax assets will be realized and as such, no valuation allowance was recorded.
Key Performance Metrics
Adjusted EBITDA
Adjusted EBITDA is defined as net income including noncontrolling interests adjusted for interest, taxes, depreciation and amortization, gain or loss on disposal of assets and debt extinguishment, the proportionate EBITDA from our EMI pipelines, equity income and gain from sale of investments recorded using the equity method, share-based compensation expense, noncash increases and decreases related to hedging activities, fair value adjustments for contingent liabilities, integration and transaction costs and extraordinary losses and unusual or non-recurring charges. Adjusted EBITDA provides a basis for comparison of our business operations between current, past and future periods by excluding items that we do not believe are indicative of our core operating performance.
We believe that Adjusted EBITDA provides a meaningful understanding of certain aspects of earnings before the impact of investing and financing charges and income taxes. Adjusted EBITDA is useful to an investor in evaluating our performance because this measure:
•Is widely used by analysts, investors and competitors to measure a company’s operating performance;
•Is a financial measurement that is used by rating agencies, lenders, and other parties to evaluate our credit worthiness; and
•Is used by our management for various purposes, including as a measure of performance and as a basis for strategic planning and forecasting.
Adjusted EBITDA is not defined in GAAP
The GAAP measure used by the Company that is most directly comparable to Adjusted EBITDA is net income including noncontrolling interests. Adjusted EBITDA should not be considered as an alternative to the GAAP measure of net income including noncontrolling interests or any other measure of financial performance presented in accordance with GAAP. Adjusted EBITDA has important limitations as an analytical tool because it excludes some, but not all, items that affect net income including noncontrolling interests. Adjusted EBITDA should not be considered in isolation or as a substitute for analysis of the Company’s results as reported under GAAP. The Company’s definition of Adjusted EBITDA may not be comparable to similarly titled measures of other companies in the industry, thereby diminishing its utility.
Reconciliation of non-GAAP financial measure
Company management compensates for the limitations of Adjusted EBITDA as an analytical tool by reviewing the comparable GAAP measure, understanding the differences between Adjusted EBITDA as compared to net income including noncontrolling interests, and incorporating this knowledge into its decision-making processes. Management believes that investors benefit from having access to the same financial measure that the Company uses in evaluating operating results.
The following table presents a reconciliation of the GAAP financial measure of net income including noncontrolling interests to the non-GAAP financial measure of Adjusted EBITDA.
| | | | | | | | | | | | | | | | | | | | |
| | For The Year Ended December 31, | | |
| | 2024 | | 2023 | | % Change |
| | | | | | |
| | (In thousands, except percentage) |
| Reconciliation of net income including noncontrolling interests to Adjusted EBITDA | | | | | | |
| Net income including noncontrolling interests | | $ | 244,233 | | | $ | 386,452 | | | (37) | % |
| Add back: | | | | | | |
| Interest expense | | 217,235 | | | 205,854 | | | 6 | % |
| Income tax (benefit) expense | | 23,035 | | | (232,908) | | | (110) | % |
| Depreciation and amortization expenses | | 324,197 | | | 280,986 | | | 15 | % |
| Amortization of contract costs | | 6,621 | | | 6,620 | | | — | % |
| Proportionate EMI EBITDA | | 346,666 | | | 306,072 | | | 13 | % |
| Share-based compensation | | 76,536 | | | 55,983 | | | 37 | % |
| Loss on disposal of assets, net | | 4,040 | | | 19,402 | | | (79) | % |
| Loss on debt extinguishment | | 525 | | | 1,876 | | | (72) | % |
| Commodity hedging unrealized loss | | 10,788 | | | — | | | 100 | % |
| Contingent liabilities fair value adjustment | | 200 | | | — | | | 100 | % |
| Integration costs | | 5,826 | | | 1,015 | | | NM |
| Acquisition transaction costs | | 4,096 | | | 648 | | | NM |
| Other one-time cost and amortization | | 12,101 | | | 11,901 | | | 2 | % |
| Deduct: | | | | | | |
| Interest income | | 1,988 | | | 677 | | | 194 | % |
| Warrant valuation adjustment | | — | | | 88 | | | (100) | % |
| Commodity hedging unrealized gain | | — | | | 4,291 | | | (100) | % |
| Gain on sale of equity method investment | | 89,802 | | | — | | | 100 | % |
| Equity income from unconsolidated affiliates | | 213,191 | | | 200,015 | | | 7 | % |
| Adjusted EBITDA | | $ | 971,118 | | | $ | 838,830 | | | 16 | % |
NM - Not meaningful
Adjusted EBITDA increased by $132.3 million, or 16% to $971.1 million for the year ended December 31, 2024, compared to $838.8 million for the same period in 2023. As discussed in the Item 7. Management’s Discussion and Analysis of Financial Condition and Results of Operations—Results of Operations to this Annual Report, $226.5 million of the increase was due to increased total operating revenues, partially offset by increased cost of sales (exclusive of depreciation and amortization) of $104.9 million and an increase in operating expenses, ad valorem taxes and general and administrative expenses totaling of $73.8 million. The increase was also driven by (i) higher proportionate EMI EBITDA of $40.6 million due to increased profitability at PHP related to expanded capacity that was placed into service starting in December 2023; (ii) an increase in the add back related to share-based compensation of $20.6 million primarily due to new RSUs and PSUs granted during 2024; (iii) an increase in the add back related to unrealized commodity hedging activities of $15.1 million; and (iv) an increase in the add back of integration and acquisition transaction costs of $8.3 million primarily due to the Durango Acquisition in 2024. Segment Adjusted EBITDA
Segment Adjusted EBITDA is defined as segment net income including noncontrolling interests adjusted for taxes, depreciation and amortization, gain or loss on disposal of assets, the proportionate EBITDA from our EMI pipelines, equity income and gain from sale of investments recorded using the equity method, noncash increases and decreases related to hedging activities, fair value adjustments for contingent liabilities, integration and transaction costs and extraordinary losses and unusual or non-recurring charges The following table presents Segment Adjusted EBITDA. Also refer to Note 19—Segments in the Notes to our Consolidated Financial Statements in this Annual Report for reconciliation of segment adjusted EBITDA to Income before income taxes.
| | | | | | | | | | | | | | | | | | | | |
| | For The Year Ended December 31, | | |
| | 2024 | | 2023 | | % Change |
| | | | | | |
| | (In thousands, except percentage) |
| Midstream Logistics | | $ | 614,883 | | | $ | 543,190 | | | 13 | % |
| Pipeline Transportation | | 377,550 | | | 311,106 | | | 21 | % |
| Corporate and Other* | | (21,315) | | | (15,466) | | | 38 | % |
| Total segment adjusted EBITDA | | $ | 971,118 | | | $ | 838,830 | | | 16 | % |
* Corporate and Other represents those results that: (i) are not specifically attributable to a reportable segment; (ii) are not individually reportable or (iii) have not been allocated to a reportable segment for the purpose of evaluating their performance, including certain general and administrative expense.
Midstream Logistics segment adjusted EBITDA increased by $71.7 million, or 13%, to $614.9 million for the year ended December 31, 2024, compared to $543.2 million for the same period in 2023. The increase was primarily due to the increased total operating revenue of $223.9 million, or 18%, partially offset by increases in cost of sales (exclusive of depreciation and amortization) of $106.6 million, or 21%, and operating expense and ad valorem taxes of $35.1 million or 19%. The reasons for the fluctuations are discussed in the Item 7. Management’s Discussion and Analysis of Financial Condition and Results of Operations—Results of Operations to this Annual Report. Pipeline Transportation segment adjusted EBITDA increased by $66.4 million, or 21%, to $377.6 million for the year ended December 31, 2024, compared to $311.1 million for the same period in 2023. The increase was primarily driven by higher proportionate EMI EBITDA of $40.6 million, or 13%, due to increased profitability at PHP related to expanded capacity that was placed into service starting in December 2023. The increase was also related to an increase in total operating revenue of $27.0 million, primarily related to the Delaware Link Pipeline that was placed in service in October 2023.
Contractual Obligations
We have contractual obligations for principal and interest payments on our 2028 Notes, 2030 Notes, the Term Loan Credit Facility, Revolving Credit Facility and A/R Facility. See Note 8—Debt and Financing Costs in the Notes to our Consolidated Financial Statements in this Annual Report. Under certain clauses of our transportation services agreements with third party pipelines to transport natural gas and NGLs, if we fail to ship a minimum throughput volume, then we will pay certain deficiency payments for transportation based on the volume shortfall up to the MVC amount.
Liquidity and Capital Resources
The Company’s primary use of capital since inception has been for the initial construction of gathering and processing assets, as well as the acquisitions of businesses and EMI pipelines and associated subsequent construction costs. For 2024, the Company’s primary spending requirements were related to the business acquisitions and other budgeted capital expenditures for construction and maintenance of gathering and processing assets, the Company’s contractual debt obligations and quarterly cash dividends. In addition, the Company may repurchase its Class A Common Stock pursuant to the Share Repurchase Program from time to time.
During the year ended December 31, 2024, the Company’s primary sources of cash were distributions from the EMI pipelines, borrowings under the Revolving Credit Facility and the A/R Facility, proceeds from the GCX Sale and cash generated from operations. Based on the Company’s current financial plan, the Company believes that cash from operations and distributions from the EMI pipelines, and remaining borrowing capacity on our credit facilities will generate cash flows in excess of capital expenditures and the amount required to fund the Company’s planned quarterly dividend over the next 12 months.
Long-term Financing
From time to time, we issue long-term debt. Our senior unsecured notes are fixed rate borrowings; however, we have some exposure to the risk of changes in interest rates, primarily as a result of the variable rate borrowings under the Revolving Credit Facility, the Term Loan Credit Facility and the A/R Facility. We use interest rate swaps to mitigate the impact of changes in interest rates on cash flows. See Note 13—Derivatives and Hedging Activities in the Notes to the Consolidated Financial Statements in this Annual Report for detailed discussion. As of December 31, 2024, we had $800.0 million of our 6.625% senior unsecured notes due 2028 and $1.0 billion of our 5.875% senior unsecured notes due 2030 outstanding. The Term Loan Credit Facility and the Revolving Credit Facility, both with variable rates and maturing in 2026 and 2027, had outstanding borrowings of $1.00 billion and $590.0 million as of December 31,2024, respectively.
A/R Facility
On April 2, 2024, Kinetik Receivables, a bankruptcy remote special purpose entity formed as a direct subsidiary of the Partnership, which is a subsidiary of the Company, entered into an accounts receivable securitization facility with an initial facility limit of $150.0 million with PNC Bank, as the administrative agent, and certain purchasers party thereto from time to time, which has a scheduled termination date of April 1, 2025. As of December 31, 2024, we had outstanding borrowing under the A/R Facility of $140.2 million.
Our operations can be capital intensive, requiring investments to expand, upgrade, maintain or enhance existing operations and to meet environmental and operational regulations. During the year ended December 31, 2024 and 2023, capital spending for property, plant and equipment totaled $263.5 million and $312.9 million, respectively, intangible asset purchases of $12.3 million and $16.7 million, respectively, contributions to EMI totaled $3.3 million and $238.8 million, respectively, and paid net cash of $85.4 million to acquire additional equity interests in EPIC in second quarter 2024. In addition, the Company paid net cash of $341.2 million associated with the Durango Acquisition and net cash of $125.0 million to acquire midstream infrastructure assets through a business combination that closed in the first quarter 2023, see additional information in Note—3. Business Combinations in the Notes to the Consolidated Financial Statements in this Annual Report. Management believes its existing gathering, processing, and transmission infrastructure capacity is capable of fulfilling its contracts to service its customers. See Note 19—Segments in the Notes to the Consolidated Financial Statements in this Annual Report for capital expenditure for each operating segment. The Company estimates 2025 capital expenditures of approximately $450.0 million to $540.0 million, which is slightly higher than 2024. This estimate reflects capital to complete the Kings Landing Project, including contingent liabilities due to Durango’s former owner, to continue the build out of the low- and high-pressure gathering system in Eddy County, New Mexico, to integrate the new gathering assets acquired through the Permian Resources Midstream Acquisition in Reeves County, and growth and maintenance capital across the existing Texas and New Mexico systems.
The Company anticipates its existing capital resources will be sufficient to fund the future capital expenditures for EMI pipelines and the Company’s existing infrastructure assets over the next 12 months. For further information on EMIs, refer to Note 7—Equity Method Investments in the Notes to our Consolidated Financial Statements in this Annual Report. Cash Flows
The following tables present cash flows from operating, investing, and financing activities:
| | | | | | | | | | | | | | | | | | |
| | For The Year Ended December 31, | | |
| | 2024 | | 2023 | | | | |
| | | | | | | | |
| | (In thousands) |
| Cash provided by operating activities | $ | 637,346 | | | $ | 584,480 | | | | | |
| Cash used in investing activities | $ | (176,887) | | | $ | (686,320) | | | | | |
| Cash (used in) provided by financing activities | $ | (461,363) | | | $ | 99,956 | | | | | |
Operating Activities. Net cash provided by operating activities increased by $52.9 million for the year ended December 31, 2024 compared with the same period in 2023. The change in the operating cash flows reflected a decrease in net income including noncontrolling interests of $142.2 million, an increase in adjustments related to non-cash items of $234.4 million and a decrease in cash provided by changes in working capital of $39.3 million. Period-over-period increase in non-cash adjustments was primarily driven by a $252.9 million increase in deferred tax expense due to recognition of income tax expense from deferred tax assets in 2024 compared to the release of valuation allowance for deferred tax assets made in 2023, an increase in depreciation and amortization expense of $43.2 million compared with the same period in 2023 due to increase in property, plant and equipment acquired and put into service since second half of 2023, an increase in share-based compensation expense of $20.6 million compared with the same period in 2023 due to the 2024 STI bonus being paid in December for 2024 versus March in prior years, and an increase in distribution from unconsolidated affiliates of $17.5 million compared with the same period in 2023 driven by PHP’s expansion project. The increase was partially offset by gain from sale of all equity interest in GCX of $89.8 million, and a decrease in loss on disposal of assets of $15.4 million. Period-over-period changes in working capital were related to fluctuations in trade receivable and payable balances due to timing of collection and payments and fluctuations in accrued revenue and accrued purchases.
Investing Activities. Net cash used in investing activities decreased by $509.4 million for the year ended December 31, 2024 compared with the same period in 2023. The decrease was primarily driven by cash consideration received as a result of the GCX Sale of $524.4 million and a decrease of $235.5 million in contributions made to unconsolidated affiliates as PHP’s expansion project was completed and put into service in December 2023. The decrease was partially offset by the payment of net cash consideration of $341.2 million related to Durango Acquisition.
Financing Activities. Net cash used in financing activities totaled $461.4 million for the year ended December 31, 2024 compared with net cash provided by financing activities totaling $100.0 million in the same period in 2023. The $561.3 million change was primarily due to a net repayment of outstanding debt of $65.4 million made in 2024 compared to net proceeds of $187.8 million from the long-term debt and Revolving Credit Facility in 2023. Increase in cash outflow was also due to an increase of $313.9 million in cash dividends paid to Class A Common Stock shareholders and Class C Common Unit holders as the Reinvestment Agreement (as defined below) terminated in March 2024.
Dividend and Distribution Reinvestment Agreement
On February 22, 2022, the Company entered into a Dividend and Distribution Reinvestment Agreement (the “Reinvestment Agreement”) with certain stockholders including BCP Raptor Aggregator, LP, BX Permian Pipeline Aggregator, LP, Buzzard Midstream LLC, APA Corporation, Apache Midstream LLC and certain individuals (each, a “Reinvestment Holder”). Under the Reinvestment Agreement, each Reinvestment Holder was obligated to reinvest at least 20% of all distributions on common units representing limited partner interests in the Partnership (“Common Units”) or dividends on shares of Class A Common Stock in the Company’s Class A Common Stock. For the calendar year 2023, the Audit Committee resolved 100% of all distributions or dividends received by each Reinvestment Holder would be reinvested in shares of Class A Common Stock. The Reinvestment Agreement terminated automatically on March 8, 2024.
During 2024, the Company made cash dividend payments of $396.0 million to holders of Class A Common Stock and Common Units and $75.6 million was reinvested in shares of Class A Common Stock by the Reinvestment Holders.
Stock Repurchase Program
In February 2023, the Board approved the Repurchase Program, authorizing discretionary purchases of the Company’s Class A Common Stock up to $100.0 million in the aggregate. Repurchases may be made at management’s discretion from time to time, in accordance with applicable securities laws, on the open market or through privately negotiated transactions and may be made pursuant to a trading plan meeting the requirements of Rule 10b5-1 under the Exchange Act. Privately negotiated repurchases from affiliates are also authorized under the Repurchase Program, subject to such affiliates’ interest and other limitations. The repurchases will depend on market conditions and may be discontinued at any time without prior notice.
During the year ended December 31, 2024, the Company did not repurchase any of its outstanding shares.
For more information regarding the non-deductible 1% U.S. federal excise tax imposed on certain repurchases of stock by publicly traded U.S. corporations, please refer to Part I—Item 1A Risk Factors—Risks Related to Ownership of our Common Stock.
Dividend
On January 22, 2025, the Company declared a cash dividend of $0.78 per share on the Company’s Class A Common Stock and a distribution of $0.78 per Common Unit from the Partnership to the holders of Common Units. Dividends are payable on February 12, 2025 to holders of record as of market close on February 3, 2025. As the context requires, dividends paid to holders of Class A Common Stock and distributions paid to holders of Common Units may be referred to collectively as “dividends.”
Liquidity
The following table presents a summary of the Company’s key financial indicators:
| | | | | | | | | | | | | | |
| | December 31, |
| | 2024 | | 2023 |
| | | | |
| | | (In thousands) |
| Cash and cash equivalents | | $ | 3,606 | | | $ | 4,510 | |
| Total debt, net of unamortized deferred financing cost | | $ | 3,504,196 | | | $ | 3,562,809 | |
| Available committed borrowing capacity | | $ | 657,200 | | | $ | 643,400 | |
Off-Balance Sheet Arrangements
As of December 31, 2024, there were no off-balance sheet arrangements.
Critical Accounting Policies and Estimates
The Company prepares its financial statements and the accompanying notes in conformity with U.S. GAAP, which require management to make estimates and assumptions about future events that affect the reported amounts in the financial statements and the accompanying notes. We consider our critical accounting estimates to be those that require difficult, complex, or subjective judgment necessary in accounting for inherently uncertain matters and those that could significantly influence our financial results based on changes in those judgments. Critical accounting estimates cover accounting matters that are inherently uncertain because the future resolution of such matters is unknown. Management routinely discusses the development, selection, and disclosure of the following critical accounting estimates.
Business Combination
For acquired businesses, we recognize the identifiable assets acquired, the liabilities assumed and any noncontrolling interest in the acquiree at their estimated fair values on the date of acquisition with any excess purchase price over the fair value of net assets acquired recorded to goodwill. Determining the fair value of these items requires management’s judgment and/or the utilization of independent valuation specialists and involves the use of significant estimates and assumptions. The judgments made in the determination of the estimated fair value assigned to the assets acquired, the liabilities assumed and any noncontrolling interest in the investee, as well as the estimated useful life of each asset and the duration of each liability, can materially impact the financial statements in periods after acquisition, such as through depreciation and amortization expense. See Note 3—Business Combination in our Notes to the Consolidated Financial Statements in this Annual Report for more information regarding our valuation approach. Impairment of Long-lived Assets
Long-lived assets used in operations are evaluated for potential impairment when events or changes in circumstances indicate a possible significant deterioration in future cash flows expected to be generated by an asset group. Individual assets are grouped for impairment purposes based on a judgmental assessment of the lowest level for which there are identifiable cash flows that are largely independent of the cash flows of other groups of assets. If there is an indication that the carrying amount of an asset may not be recovered, the asset is assessed for impairment through an established process in which changes to significant assumptions such as service prices, throughput volumes, future development plans and fluctuation of commodity prices are reviewed. If, upon review, the sum of the undiscounted pre-tax cash flows is less than the carrying value of the asset
group, the carrying value is written down to an estimated fair value. Such fair value is generally determined by discounting anticipated future net cash flows, an income valuation approach, or by a market-based valuation approach, which are Level 3 fair value measurements. Estimates and assumptions can be affected by a variety of factors, including external factors such as industry and economic trends, and internal factors such as changes in our business strategy and our internal forecasts. An estimate of the sensitivity to changes in underlying assumptions of a fair value calculation is not practicable, given the numerous assumptions that can materially affect our estimates.
Equity Method Investment
We evaluate our EMIs for impairment when events or circumstances indicate that the carrying value of the EMI may be impaired and that impairment is other than temporary. If an event occurs, we evaluate the recoverability of our carrying value based on the fair value of the investment. If an impairment is indicated, we adjust the carrying values of the investment downward, if necessary, to their estimated fair values.
We estimate the fair value of our EMIs based on a number of factors, including discount rates, projected cash flows, and enterprise value. Estimating projected cash flows requires us to make certain assumptions as it relates to the future operating performance of each of our EMIs (which includes assumptions, among others, about estimating future operating margins and related future growth in those margins, contracting efforts and the cost and timing of facility expansions) and assumptions related to our EMIs, such as their future capital and operating plans and their financial condition.
Derivatives Instruments and Hedging Activities
All our derivative contracts are recorded at estimated fair value. We utilize published prices, broker quotes, and estimates of market prices to estimate the fair value of these contracts; however, actual amounts could vary materially from estimated fair values as a result of changes in market prices. In addition, changes in the methods used to determine the fair value of these contracts could have a material effect on our results of operations. We do not anticipate future changes in the methods used to determine the fair value of these derivative contracts.
Income Taxes
We make significant judgments and estimates in determining our provision for income taxes, including our assessment of our income tax positions, interpretation and application of complex tax laws and regulations and determining a valuation allowance, if necessary. In particular, there are numerous and complex judgments and assumptions inherent in determining a valuation allowance, including factors such as future operating conditions and profitability. For more information, see Note 15—Income Taxes in our Notes to the Consolidated Financial Statements in this Annual Report.
ITEM 7A. QUANTITATIVE AND QUALITATIVE DISCLOSURES ABOUT MARKET RISK
Quantitative and Qualitative Disclosure About Market Risk
The Company is exposed to various market risks, including the effects of adverse changes in commodity prices and credit risk as described below. The Company continually monitors its market risk exposure, including the impact of regional and international political instability, new U.S. presidential administration policies on various foreign and domestic issues and monetary policy addressing the interest rate and inflation trend, which continued to have significant impact on volatility and uncertainties in the financial markets.
Commodity Price Risk
The results of the Company’s operations may be affected by the market prices of oil, natural gas and NGLs. A portion of the Company’s revenue is directly tied to local crude, natural gas, NGLs and condensate prices in the Permian Basin and the U.S. Gulf Coast. Fluctuations in commodity prices also impact operating cost elements both directly and indirectly. For example, commodity prices directly impact costs such as power and fuel, which are expenses that increase or decrease in line with changes in commodity prices. Commodity prices also affect industry activity and demand, thus indirectly impacting the cost of items such as labor and equipment rentals. Management regularly reviews the Company’s potential exposure to commodity price risk and uses financial or physical arrangements to mitigate potential volatility. Refer to Note 13—Derivative and Hedging Activities in the Notes to our Consolidated Financial Statements in this Annual Report for additional discussion regarding our hedging strategies and objectives. Interest Rate Risk
The market risk inherent in our financial instruments and our financial position represents the potential loss arising from adverse changes in interest rates. As of December 31, 2024, the Company had interest bearing debt, net of deferred financing costs, with a principal amount of $3.50 billion. We are not exposed to changes in interest rates with respect to our senior unsecured notes due in 2028 and 2030 as these are fixed-rate obligations. The interest rates for the Revolving Credit Facility, the Term Loan Credit Facility and the A/R Facility are variable, which exposes the Company to the risk of increased interest expense in the event of increases to interest rates. Accordingly, results of operations, cash flows, financial condition and the ability to make cash distributions could be adversely affected by significant increases in interest rates. A 1.0% increase or decrease in interest rates would change our annualized interest expense by approximately $17.0 million for the Revolving Credit Facility, the Term Loan Credit Facility and the A/R Facility, based on our outstanding borrowings at December 31, 2024.
To mitigate interest rate risk exposure, the Company primarily uses interest rate swaps as part of its interest rate risk management strategy. As of December 31, 2024, the Company had two interest rate swap contracts with total notional amounts of $1.70 billion maturing on May 31, 2025 that pay a fixed rate ranging from 4.38% to 4.48% and four interest rate swap contracts with total notional amount of $0.30 billion maturing on December 31, 2025 that pays a fixed rate ranging from 3.02% to 4.06%. Refer to Note 13—Derivative and Hedging Activities in the Notes to our Consolidated Financial Statements in this Annual Report for additional discussion regarding our hedging strategies and objectives. Credit Risk
The Company is subject to credit risk resulting from nonpayment or nonperformance by, or the insolvency or liquidation of, third-party customers. Any increase in nonpayment and nonperformance by, or the insolvency or liquidation of, the Company’s customers could adversely affect the Company’s results of operations.
ITEM 8. FINANCIAL STATEMENTS AND SUPPLEMENTARY DATA
The financial statements and supplementary financial information required to be filed under this Item 8 are presented in Part IV, Item 15 of this Annual Report are incorporated herein by reference.
ITEM 9. CHANGES IN AND DISAGREEMENTS WITH ACCOUNTANTS ON ACCOUNTING AND FINANCIAL DISCLOSURE
Not applicable.
ITEM 9A. CONTROLS AND PROCEDURES
Disclosure Controls and Procedures
The Company’s Chief Executive Officer, President and Director, in his capacity as principal executive officer, and the Company’s Executive Vice President, Chief Accounting and Chief Administrative Officer, in his capacity as principal financial officer, evaluated the effectiveness of the Company’s disclosure controls and procedures (as defined in Exchange Act Rule 13a-15(e) or 15d-15(e)) as of December 31, 2024, the end of the period covered by this Annual Report. Based on that evaluation and as of the date of that evaluation, these officers concluded that the Company’s disclosure controls and procedures were effective, providing effective means to ensure that the information the Company is required to disclose under applicable laws and regulations is recorded, processed, summarized, and reported within the time periods specified in the Commission’s rules and forms and accumulated and communicated to the Company’s management, including its principal executive officer and principal financial officer, to allow timely decisions regarding required disclosure.
The Company periodically reviews the design and effectiveness of its disclosure controls, including compliance with various laws and regulations that apply to operations. The Company makes modifications to improve the design and effectiveness of its disclosure controls.
As disclosed in Note—3 Business Combinations in the Notes to Consolidated Financial Statements, we completed Durango Acquisition on June 24, 2024. Durango’s total revenues since its acquisition date constituted approximately 5% of total revenues as shown on our Consolidated Statements of Operations for the year ended December 31, 2024 and Durango’s total assets constituted approximately 13% of total assets as shown on our Consolidated Balance Sheet as of December 31, 2024. We excluded Durango’s internal control over financial reporting from the scope of management's assessment of the effectiveness of our disclosure controls and procedures for one year following the acquisition. As part of the Company’s ongoing integration activities, the Company’s financial reporting controls and procedures are in the process of incorporating the financial information of Durango. The Consolidated Financial Statements presented in this Annual Report on Form 10-K were prepared using certain information obtained from Durango’s separate, legacy systems. Management’s Annual Report on Internal Control Over Financial Reporting
Our management is responsible for establishing and maintaining adequate internal control over financial reporting for the Company. Internal control over financial reporting is a process to provide reasonable assurance regarding the reliability of our financial reporting and the preparation of financial statements for external purposes in accordance with accounting principles generally accepted in the United States. The Management’s Report on Internal Control Over Financial Reporting is included on page F-1 in Part IV, Item 15 of this Annual Report and is incorporated herein by reference. Management concluded that our internal control over financial reporting was effective as of December 31, 2024. The effectiveness of our internal control over financial reporting as of December 31, 2024 has been audited by KPMG LLP, an independent registered public accounting firm. See Attestation Report of Independent Registered Public Accounting Firm under Part IV, Item 15 of this Annual Report.
Changes in Internal Control Over Financial Reporting
There were no changes in the Company’s internal controls over financial reporting (as defined in Rules 13a-15(f) and 15d-15(f) of the Exchange Act) during the quarter ended December 31, 2024 that have materially affected, or are reasonably likely to materially affect, the Company’s internal controls over financial reporting.
ITEM 9B. OTHER INFORMATION
Departure of General Counsel
As previously announced, Todd Carpenter, General Counsel, Assistant Secretary and Chief Compliance Officer, retired from his position effective February 28, 2025. In connection with Mr. Carpenter’s departure, Lindsay Ellis, the Company’s Deputy General Counsel and Corporate Secretary, was appointed General Counsel and Chief Compliance Officer, effective February 26, 2025.
On February 28, 2025, the Company entered into a separation agreement and release agreement with Mr. Carpenter (the “Separation Agreement”). The Separation Agreement includes a one-time lump sum payment in the amount of $946,946, to be paid on the first payroll date that occurs on or after 45 days following his termination date. The Separation Agreement further provides that Mr. Carpenter’s outstanding and unvested equity awards previously granted under the Company’s long-term
incentive plan shall continue to be eligible to vest (according to their terms), including in accordance with the terms of the Consulting Agreement (as defined below).
On February 28, 2025, Mr. Carpenter also entered into a consulting agreement with the Company (the “Consulting Agreement”) and will serve as a consultant to the Company through March 1, 2027 (the “Consulting Period”). During the Consulting Period, Mr. Carpenter will provide consulting services at a rate of $200,000 annually, payable in monthly installments, plus reimbursement of reasonable out-of-pocket business-related expenses. Mr. Carpenter shall continue to be eligible to vest in his unvested equity awards, with his service through the Consulting Period counting towards the vesting and payment of such awards. The Consulting Agreement can be terminated by either party on and after March 1, 2026. Upon termination by the Company without “cause” any unpaid consulting fees will be paid to Mr. Carpenter and all unvested awards will be accelerated in full. Mr. Carpenter has also agreed to customary confidentiality restrictions and restrictive covenants within the Consulting Agreement.
Trading Arrangements
During the three months ended December 31, 2024, none of our directors or officers (as defined in Rule 16a-1(f) of the Exchange Act) adopted, terminated or modified a “Rule 10b5-1 trading arrangement” or non-Rule 10b5-1 trading arrangement (as each term is defined in Item 408 of Regulation S-K).
Disclosure pursuant to Section 13(r) of the Exchange Act
Pursuant to Section 13(r) of the Exchange Act, we may be required to disclose in our annual and quarterly reports to the SEC whether we or any of our “affiliates” knowingly engaged in certain activities, transactions or dealings relating to Iran or with certain individuals or entities targeted by U.S. economic sanctions. Disclosure is generally required even where the activities, transactions or dealings were conducted in compliance with applicable law. Because the SEC defines the term “affiliate” broadly, it includes any entity under common “control” with us (and the term “control” is also construed broadly by the SEC).
The description of the activities below has been provided to us by Blackstone, affiliates of which: (i) beneficially own more than 10% of our outstanding common stock and are members of our Board, and (ii) hold a minority non-controlling interest in Mundys S.p.A. (formerly Atlantia S.p.A). Mundys S.p.A may therefore be deemed to be under common “control” with us; however, this statement is not meant to be an admission that common control exists.
The disclosure below relates solely to activities conducted by Mundys S.p.A. The disclosure does not relate to any activities conducted by us or by Blackstone and does not involve our or Blackstone’s management. Neither we nor Blackstone has had any involvement in or control over the disclosed activities, and neither we nor Blackstone has independently verified or participated in the preparation of the disclosure. Neither we nor Blackstone is representing as to the accuracy or completeness of the disclosure nor do we or Blackstone undertake any obligation to correct or update it.
We understand that Blackstone disclosed the following in its Annual Report, filed with the SEC on February 28, 2025:
Disclosure pursuant to Section 13(r) of the Securities Exchange Act of 1934. Funds affiliated with Blackstone first invested in Mundys S.p.A. on November 18, 2022 in connection with the voluntary public tender offer by Schema Alfa S.p.A. for all of the shares of Mundys S.p.A., pursuant to which such funds obtained a minority non-controlling interest in Mundys S.p.A. Mundys S.p.A. owns and controls Aeroporti di Roma S.p.A. (“ADR”), an operator of airports in Italy including Leonardo da Vinci-Fiumicino Airport. Iran Air has historically operated periodic flights to and from Leonardo da Vinci-Fiumicino Airport as authorized, from time to time, by an aviation-related bilateral agreement between Italy and Iran, scheduled in compliance with European Regulation 95/93, and approved by the Italian Civil Aviation Authority. ADR, as airport operator, is under a mandatory obligation to provide airport services to all air carriers (including Iran Air) authorized by the applicable Italian authority. The relevant turnover attributable to these activities (whose consideration is calculated on the basis of general tariffs determined by such independent Italian authority) in the fiscal year ended December 31, 2024 was less than €210,000. Mundys S.p.A. does not track profits specifically attributable to these activities.
ITEM 9C. DISCLOSURE REGARDING FOREIGN JURISDICTIONS THAT PREVENT INSPECTIONS
Not applicable.
PART III
ITEM 10. DIRECTORS, EXECUTIVE OFFICERS AND CORPORATE GOVERNANCE
The information set forth under the captions “Election of Directors” and “Information About Our Executive Officers” in the proxy statement relating to the Company’s 2024 Annual Meeting of Stockholders (the “Proxy Statement”), which will be filed no later than 120 days after December 31, 2024, is incorporated herein by reference.
Code of Ethics
The Company is required to adopt a code of conduct for its directors, officers, and employees. The Board has adopted the Code of Business Conduct (the “Code of Conduct”), which was revised in August 2023. One can access the Company’s Code of Conduct the Investor - Governance page of the Company’s website at www.kinetik.com. Any stockholder who so requests may obtain a printed copy of the Code of Conduct without charge by submitting a request to the Company’s corporate secretary at the address on the cover of this Annual Report. Changes in and waivers to the Code of Conduct for the Company’s directors, chief executive officer, and certain senior financial officers will be posted on the Company’s website within four business days and maintained for at least 12 months. Information on the Company’s website or any other website is not incorporated by reference into, and does not constitute a part of, this Annual Report.
ITEM 11. EXECUTIVE COMPENSATION
The information set forth under the caption “Executive Compensation” in the Proxy Statement is incorporated herein by reference.
ITEM 12. SECURITY OWNERSHIP OF CERTAIN BENEFICIAL OWNERS AND MANAGEMENT AND RELATED STOCKHOLDER MATTERS
The information set forth under the captions “Securities Ownership and Principal Holders,” “Securities Authorized for Issuance Under Equity Compensation Plans,” and “Delinquent Section 16(a) Reports” (if such a caption is included) in the Proxy Statement is incorporated herein by reference.
ITEM 13. CERTAIN RELATIONSHIPS AND RELATED TRANSACTIONS, AND DIRECTOR INDEPENDENCE
ITEM 14. PRINCIPAL ACCOUNTING FEES AND SERVICES
The information set forth under the caption “Ratification of the Appointment of Independent Auditor” in the Proxy Statement is incorporated herein by reference.
PART IV
ITEM 15. EXHIBITS, FINANCIAL STATEMENT SCHEDULES
(a)Documents included in this Annual Report:
| | | | | |
| 2. | Financial Statement Schedules |
| |
| |
Financial statement schedules have been omitted because they are either not required, not applicable or the information required to be presented is included in the Company’s consolidated financial statements and related notes.
Pursuant to Rule 3-09 of Regulation S-X, the audited financial statements of Permian Highway Pipeline LLC, which is an equity method investment of the Company, is included in this Annual Report as Exhibit 99.1
| | | | | | | | |
| EXHIBIT NO. | | DESCRIPTION |
| 2.1*** | – | |
| 3.1 | – | |
| 3.2 | | |
| 3.3 | – | |
| 4.1 | | |
| 4.2 | – | Amended and Restated Stockholders Agreement, dated October 21, 2021, by and among APA Corporation, Apache Midstream LLC, Altus Midstream Company, New BCP Raptor Holdco, LLC, Raptor Aggregator, LP, BX Permian Pipeline Aggregator, LP, Buzzard Midstream LLC, and BCP Raptor Holdco, LP. (incorporated by reference to Exhibit 4.1 to the Registrant’s Current Report on Form 8-K filed on February 28, 2022). |
| 4.3 | – | Second Amended and Restated Registration Rights Agreement, dated February 22, 2022, by and among Altus Midstream Company, Apache Midstream LLC, Raptor Aggregator, LP, BX Permian Pipeline Aggregator, LP, Buzzard Midstream LLC and the other holders party thereto. (incorporated by reference to Exhibit 4.2 to the Registrant’s Current Report on Form 8-K filed on February 28, 2022). |
| 4.4 | – | |
| 4.5 | – | |
| 4.6 | – | |
| 4.7 | | |
| 4.8 | | |
| | |
| 10.1† | – | |
| 10.2† | – | |
| 10.3† | – | |
| 10.4† | – | |
| 10.5† | – | |
| 10.6† | – | |
| 10.7† | – | |
| 10.8† | – | |
| 10.9† | – | |
| 10.10† | – | |
| 10.11† | – | Dividend and Distribution Reinvestment Agreement, dated February 22, 2022, by and among Altus Midstream Company, Altus Midstream LP, APA Corporation, Apache Midstream LLC, Buzzard Midstream LLC, Raptor Aggregator, LP, BX Permian Pipeline Aggregator, LP and each of the other parties set forth on the signature pages thereto. (incorporated by reference to Exhibit 10.2 to the Registrant’s Current Report on Form 8-K filed on February 22, 2022). |
| 10.12† | – | |
| 10.13† | – | |
| 10.14† | – | |
| 10.15† | – | |
| 10.16† | – | |
| | | | | | | | |
| 10.17† | – | |
| 10.18† | – | |
| 10.19† | – | |
| 10.20† | – | |
| 10.21*** | – | Receivables Purchase Agreement, dated April 2, 2024, by and among Kinetik Receivables LLC, as the seller, Kinetik Holdings LP, a subsidiary of Kinetik Holdings Inc., as the servicer, PNC Bank, National Association, as administrative agent, PNC Capital Markets LLC, as structuring agent, and the purchasers party thereto (incorporated by reference to Exhibit 10.1 to the Registrant’s Current Report on Form 8-K filed on April 2, 2024). |
| 10.22*** | – | |
| 10.23*** | – | Purchase and Sale Agreement, dated as of May 9, 2024, by and among Kinetik GCX Pipe LLC, GCX Pipeline, LLC, solely for purposes of Section 6.7, Article X and Article XI, AL GCX Holdings, LLC and solely for purposes of Section 6.8, Article X and Article XI, Kinetik Holdings LP (incorporated by reference to Exhibit 10.2 to the Registrant’s Current Report on Form 8-K filed on May 13, 2024). |
| 10.24*** | – | |
| 10.25 | – | |
| 10.26 | – | |
| 10.27 | – | |
| 10.28 | – | First Amendment to Loan Credit Agreement, dated December 6, 2023, by and among Kinetik Holdings LP, Kinetik Holdings Inc., PNC Bank, National Association, as administrative agent, and the banks and other financial institutions party thereto, as lenders (incorporated by reference to Exhibit 10.2 of the Company's Current Report on Form 8-K filed with the Commission on December 6, 2023). |
| 19.1* | – | |
| 21.1* | – | |
| 23.1* | – | |
| 23.2* | – | |
| | |
| | |
| 31.1* | – | |
| 31.2* | – | |
| 32.1** | – | |
| 32.2** | – | |
| 97.1 | | |
| 99.1* | – | |
| 99.2* | – | |
| 101* | – | The following financial statements from the Registrant’s Annual Report on Form 10-K for the year ended December 31, 2024, formatted in Inline XBRL: (i) Consolidated Statements of Operations, (ii) Consolidated Balance Sheets, (iii) Consolidated Statements of Cash Flows, (iv) Consolidated Statements of Changes in Equity and Noncontrolling Interests and (v) Notes to Consolidated Financial Statements, tagged as blocks of text and including detailed tags. |
| 101.SCH* | – | Inline XBRL Taxonomy Schema Document. |
| 101.CAL* | – | Inline XBRL Calculation Linkbase Document. |
| 101.DEF* | – | Inline XBRL Definition Linkbase Document. |
| 101.LAB* | – | Inline XBRL Label Linkbase Document. |
| 101.PRE* | – | Inline XBRL Presentation Linkbase Document. |
| 104* | | Cover Page Interactive Data File (formatted as Inline XBRL and contained in Exhibit 101). |
| | |
| * Filed herewith. |
| ** Furnished herewith |
| *** Schedules and exhibits to this Exhibit have been omitted pursuant to Regulation S-K Item 601(b)(2). The Company agrees to furnish supplemental a copy of any omitted schedule or exhibit to the SEC upon request. |
| † Management contracts or compensatory plans or arrangements required pursuant to Item 15 hereof. |
|
ITEM 16. ANNUAL REPORT ON FORM 10-K SUMMARY
Not Applicable.
SIGNATURES
Pursuant to the requirements of Section 13 or 15(d) of the Securities Exchange Act of 1934, the registrant has duly caused this report to be signed on its behalf by the undersigned, thereunto duly authorized.
| | | | | | | | |
| | KINETIK HOLDINGS INC. |
| | |
| Dated: | March 3, 2025 | /s/ Jamie Welch |
| | Jamie Welch |
| | Chief Executive Officer, President and Director |
| | (Principal Executive Officer) |
| | |
| Dated: | March 3, 2025 | /s/ Steven Stellato |
| | Steven Stellato |
| | Executive Vice President, Chief Accounting and Chief Administrative Officer |
| | (Principal Financial Officer and Principal Accounting Officer) |
POWER OF ATTORNEY
The officers and directors of Kinetik Holdings Inc., whose signatures appear below, hereby constitute and appoint each of them (with full power to each of them to act alone), the true and lawful attorney-in-fact to sign and execute, on behalf of the undersigned, any amendment(s) to this report and each of the undersigned does hereby ratify and confirm all that said attorneys shall do or cause to be done by virtue thereof.
Pursuant to the requirements of the Securities Exchange Act of 1934, this report has been signed below by the following persons on behalf of the registrant and in the capacities and on the dates indicated.
| | | | | | | | | | | | | | |
| Name | | Title | | Date |
| /s/ Jamie Welch | | Chief Executive Officer, President and Director | | March 3, 2025 |
/s/ Steven Stellato
| | Executive Vice President, Chief Accounting and Chief Administrative Officer | | March 3, 2025 |
| /s/ David Foley | | Chair | | March 3, 2025 |
| /s/ John Paul Munfa | | Director | | March 3, 2025 |
| /s/ Karen Putterman | | Director | | March 3, 2025 |
| /s/ Michael A. Kumar | | Director | | March 3, 2025 |
| /s/ Jesse Krynak | | Director | | March 3, 2025 |
| /s/ William Ordemann | | Director | | March 3, 2025 |
| /s/ Laura Sugg | | Director | | March 3, 2025 |
| /s/ Kevin McCarthy | | Director | | March 3, 2025 |
| /s/ Mark Leland | | Director | | March 3, 2025 |
| /s/ Deborah Byers | | Director | | March 3, 2025 |
REPORT OF MANAGEMENT ON INTERNAL CONTROL OVER FINANCIAL REPORTING
Management of Kinetik Holdings Inc. (the “Company”) is responsible for the preparation and integrity of the consolidated financial statements appearing in this Annual Report. The financial statements were prepared in conformity with accounting principles generally accepted in the United States and include amounts that are based on management’s best estimates and judgments.
Management of the Company is responsible for establishing and maintaining effective internal control over financial reporting as such term is defined in Rule 13a-15(f) under the Securities Exchange Act of 1934. The Company’s internal control over financial reporting is designed to provide reasonable assurance regarding the reliability of financial reporting and the preparation of the consolidated financial statements. Our internal control over financial reporting is supported by a program of internal audits and appropriate reviews by management, written policies and guidelines, careful selection and training of qualified personnel and a written code of business conduct adopted by our Company’s Board, applicable to all Company directors and all officers of our Company.
Because of its inherent limitations, internal control over financial reporting may not prevent or detect misstatements and even when determined to be effective, can only provide reasonable assurance with respect to financial statement preparation and presentation. Also, projections of any evaluation of effectiveness to future periods are subject to the risk that controls may become inadequate because of changes in conditions or that the degree of compliance with the policies or procedures may deteriorate.
On June 24, 2024, we completed the acquisition of Durango Permian LLC and its wholly owned subsidiaries (“Durango”). Durango’s total revenues since its acquisition date constituted approximately 5% of total revenues as shown on our Consolidated Statements of Operations for the year ended December 31, 2024 and Durango’s total assets constituted approximately 13% of total assets as shown on our Consolidated Balance Sheet as of December 31, 2024. As part of the Company’s ongoing integration activities, the Company’s financial reporting controls and procedures are in the process of incorporating the financial information of Durango. As permitted under the SEC rules, we have elected to exclude Durango’s internal control over financial reporting from management’s assessment of effectiveness of internal controls as of December 31, 2024.
Management assessed the effectiveness of the Company’s internal control over financial reporting as of December 31, 2024. In making this assessment, management used the criteria set forth by the Committee of Sponsoring Organizations of the Treadway Commission in Internal Control – Integrated Framework (2013). Based on our assessment, management believes that the Company maintained effective internal control over financial reporting as of December 31, 2024.
The Company’s independent auditors, KPMG, a registered public accounting firm, are appointed by the Audit Committee of the Company’s Board. KPMG has audited and reported on the consolidated financial statements of Kinetik Holdings Inc. and its subsidiaries.
| | |
| /s/ Jamie Welch |
| Jamie Welch |
| Chief Executive Officer, President and Director |
| (Principal Executive Officer) |
|
| /s/ Steven Stellato |
| Steven Stellato |
| Executive Vice President, Chief Accounting and Chief Administrative Officer |
| (Principal Financial Officer and Principal Accounting Officer) |
|
| /s/ Jake Loden |
| Jake Loden |
| Vice President Controller |
|
Houston, Texas
March 3, 2025
Report of Independent Registered Public Accounting Firm
To the Stockholders and the Board of Directors
Kinetik Holdings Inc.:
Opinion on the Consolidated Financial Statements
We have audited the accompanying consolidated balance sheets of Kinetik Holdings Inc. and subsidiaries (the Company) as of December 31, 2024 and 2023, the related consolidated statements of operations, changes in equity and noncontrolling interests, and cash flows for each of the years in the three-year period ended December 31, 2024, and the related notes (collectively, the consolidated financial statements). In our opinion, the consolidated financial statements present fairly, in all material respects, the financial position of the Company as of December 31, 2024 and 2023, and the results of its operations and its cash flows for each of the years in the three-year period ended December 31, 2024, in conformity with U.S. generally accepted accounting principles.
We also have audited, in accordance with the standards of the Public Company Accounting Oversight Board (United States) (PCAOB), the Company’s internal control over financial reporting as of December 31, 2024, based on criteria established in Internal Control – Integrated Framework (2013) issued by the Committee of Sponsoring Organizations of the Treadway Commission, and our report dated March 3, 2025 expressed an unqualified opinion on the effectiveness of the Company’s internal control over financial reporting.
Basis for Opinion
These consolidated financial statements are the responsibility of the Company’s management. Our responsibility is to express an opinion on these consolidated financial statements based on our audits. We are a public accounting firm registered with the PCAOB and are required to be independent with respect to the Company in accordance with the U.S. federal securities laws and the applicable rules and regulations of the Securities and Exchange Commission and the PCAOB.
We conducted our audits in accordance with the standards of the PCAOB. Those standards require that we plan and perform the audit to obtain reasonable assurance about whether the consolidated financial statements are free of material misstatement, whether due to error or fraud. Our audits included performing procedures to assess the risks of material misstatement of the consolidated financial statements, whether due to error or fraud, and performing procedures that respond to those risks. Such procedures included examining, on a test basis, evidence regarding the amounts and disclosures in the consolidated financial statements. Our audits also included evaluating the accounting principles used and significant estimates made by management, as well as evaluating the overall presentation of the consolidated financial statements. We believe that our audits provide a reasonable basis for our opinion.
Critical Audit Matter
The critical audit matter communicated below is a matter arising from the current period audit of the consolidated financial statements that was communicated or required to be communicated to the audit committee and that: (1) relates to accounts or disclosures that are material to the consolidated financial statements and (2) involved our especially challenging, subjective, or complex judgments. The communication of a critical audit matter does not alter in any way our opinion on the consolidated financial statements, taken as a whole, and we are not, by communicating the critical audit matter below, providing a separate opinion on the critical audit matter or on the accounts or disclosures to which it relates.
Evaluation of impairment indicators for long-lived assets
As discussed in Note 2 to the consolidated financial statements, the Company assesses property, plant, and equipment, net and intangible assets, net (collectively, long-lived assets) for impairment when events or changes in circumstances indicate that the carrying amount of the asset may not be recoverable. Impairments exist when the carrying value of a long-lived asset exceeds the total estimated undiscounted net cash flows from the future use and eventual disposition of the asset. The carrying value of property, plant, and equipment, net and intangible assets, net as of December 31, 2024, was $3.4 billion and $652.5 million, respectively.
We identified the evaluation of impairment indicators for long-lived assets as a critical audit matter. Evaluating the Company’s judgments in determining whether events or changes in circumstances indicate carrying values may not be recoverable required a higher degree of subjective auditor judgment. Sustained decreases in pricing or throughput volumes and significant increases in competition or operating costs could significantly affect the recoverability of the long-lived assets, and the evaluation of these factors required a higher degree of auditor judgment.
The following are the primary procedures we performed to address this critical audit matter. We evaluated the design and tested the operating effectiveness of certain internal controls related to the Company’s process to evaluate triggering events related to the impairment of long-lived assets. We assessed the Company’s identification of potential impairment indicators by evaluating the Company’s assessment of the factors identified.
Specifically, we:
•read publicly available information to evaluate the performance of industry peers, commodity price trends, and overall macro-economic conditions
•analyzed the financial results for the current period compared to historical results for long-lived assets to determine if there were significant degradations in the related cash flows
•compared the remaining useful lives of the long-lived assets to the period of time required to recover the carrying value of the assets based on historical cash flows
•read publicly available information for the industry, peers, and customers to determine whether a potential impairment indicator was not considered in management’s analysis.
We have served as the Company’s auditor since 2017.
Houston, Texas
March 3, 2025
Report of Independent Registered Public Accounting Firm
To the Stockholders and the Board of Directors
Kinetik Holdings Inc.:
Opinion on Internal Control Over Financial Reporting
We have audited Kinetik Holdings Inc. and subsidiaries' (the Company) internal control over financial reporting as of December 31, 2024, based on criteria established in Internal Control – Integrated Framework (2013) issued by the Committee of Sponsoring Organizations of the Treadway Commission. In our opinion, the Company maintained, in all material respects, effective internal control over financial reporting as of December 31, 2024, based on criteria established in Internal Control – Integrated Framework (2013) issued by the Committee of Sponsoring Organizations of the Treadway Commission.
We also have audited, in accordance with the standards of the Public Company Accounting Oversight Board (United States) (PCAOB), the consolidated balance sheets of the Company as of December 31, 2024 and 2023, the related consolidated statements of operations, changes in equity and noncontrolling interests, and cash flows for each of the years in the three-year period ended December 31, 2024, and the related notes (collectively, the consolidated financial statements), and our report dated March 3, 2025 expressed an unqualified opinion on those consolidated financial statements.
The Company acquired Durango Permian, LLC during 2024, and management excluded from its assessment of the effectiveness of the Company’s internal control over financial reporting as of December 31, 2024, Durango Permian, LLC’s internal control over financial reporting associated with approximately 13% of total assets and approximately 5% of total revenues is included in the consolidated financial statements of the Company as of and for the year ended December 31, 2024. Our audit of internal control over financial reporting of the Company also excluded an evaluation of the internal control over financial reporting of Durango Permian, LLC.
Basis for Opinion
The Company’s management is responsible for maintaining effective internal control over financial reporting and for its assessment of the effectiveness of internal control over financial reporting, included in the accompanying Management's Annual Report on Internal Control over Financial Reporting. Our responsibility is to express an opinion on the Company’s internal control over financial reporting based on our audit. We are a public accounting firm registered with the PCAOB and are required to be independent with respect to the Company in accordance with the U.S. federal securities laws and the applicable rules and regulations of the Securities and Exchange Commission and the PCAOB.
We conducted our audit in accordance with the standards of the PCAOB. Those standards require that we plan and perform the audit to obtain reasonable assurance about whether effective internal control over financial reporting was maintained in all material respects. Our audit of internal control over financial reporting included obtaining an understanding of internal control over financial reporting, assessing the risk that a material weakness exists, and testing and evaluating the design and operating effectiveness of internal control based on the assessed risk. Our audit also included performing such other procedures as we considered necessary in the circumstances. We believe that our audit provides a reasonable basis for our opinion.
Definition and Limitations of Internal Control Over Financial Reporting
A company’s internal control over financial reporting is a process designed to provide reasonable assurance regarding the reliability of financial reporting and the preparation of financial statements for external purposes in accordance with generally accepted accounting principles. A company’s internal control over financial reporting includes those policies and procedures that (1) pertain to the maintenance of records that, in reasonable detail, accurately and fairly reflect the transactions and dispositions of the assets of the company; (2) provide reasonable assurance that transactions are recorded as necessary to permit preparation of financial statements in accordance with generally accepted accounting principles, and that receipts and expenditures of the company are being made only in accordance with authorizations of management and directors of the company; and (3) provide reasonable assurance regarding prevention or timely detection of unauthorized acquisition, use, or disposition of the company’s assets that could have a material effect on the financial statements.
Because of its inherent limitations, internal control over financial reporting may not prevent or detect misstatements. Also, projections of any evaluation of effectiveness to future periods are subject to the risk that controls may become inadequate because of changes in conditions, or that the degree of compliance with the policies or procedures may deteriorate.
Houston, Texas
March 3, 2025
KINETIK HOLDINGS INC.
CONSOLIDATED STATEMENTS OF OPERATIONS
| | | | | | | | | | | | | | | | | | | | |
| | | For the Year Ended December 31, |
| | | 2024 | | 2023 | | 2022(1) |
| | | | | | |
| | (In thousands, except per share data) |
| Operating revenues: | | | | | | |
| Service revenue | | $ | 408,000 | | | $ | 417,751 | | | $ | 393,954 | |
| Product revenue | | 1,062,986 | | | 822,410 | | | 806,353 | |
| Other revenue | | 11,943 | | | 16,251 | | | 13,183 | |
Total operating revenues(2) | | 1,482,929 | | | 1,256,412 | | | 1,213,490 | |
| Operating costs and expenses: | | | | | | |
Costs of sales (exclusive of depreciation and amortization expenses)(3)(4) | | 620,618 | | | 515,721 | | | 541,518 | |
| Operating expenses | | 195,970 | | | 161,520 | | | 137,289 | |
| Ad valorem taxes | | 24,714 | | | 21,622 | | | 16,970 | |
| General and administrative expenses | | 134,157 | | | 97,906 | | | 94,268 | |
| Depreciation and amortization expenses | | 324,197 | | | 280,986 | | | 260,345 | |
| Loss on disposal of assets, net | | 4,040 | | | 19,402 | | | 12,611 | |
| | | | | | |
| Total operating costs and expenses | | 1,303,696 | | | 1,097,157 | | | 1,063,001 | |
| Operating income | | 179,233 | | | 159,255 | | | 150,489 | |
| Other income (expense): | | | | | | |
| Interest and other income | | 2,802 | | | 2,004 | | | 489 | |
| Gain on redemption of mandatorily redeemable Preferred Units | | — | | | — | | | 9,580 | |
| Loss on debt extinguishment | | (525) | | | (1,876) | | | (27,975) | |
| Gain on sale of equity method investment | | 89,802 | | | — | | | — | |
| Gain on embedded derivative | | — | | | — | | | 89,050 | |
| Interest expense | | (217,235) | | | (205,854) | | | (149,252) | |
| Equity in earnings of unconsolidated affiliates | | 213,191 | | | 200,015 | | | 180,956 | |
| | | | | | |
| Total other income (expense), net | | 88,035 | | | (5,711) | | | 102,848 | |
| Income before income taxes | | 267,268 | | | 153,544 | | | 253,337 | |
| Income tax expense (benefit) | | 23,035 | | | (232,908) | | | 2,616 | |
| Net income including noncontrolling interests | | 244,233 | | | 386,452 | | | 250,721 | |
| Net income attributable to Preferred Unit limited partners | | — | | | — | | | 115,203 | |
| Net income attributable to common shareholders | | 244,233 | | | 386,452 | | | 135,518 | |
| Net income attributable to Common Unit limited partners | | 164,219 | | | 97,010 | | | 94,783 | |
| Net income attributable to Class A Common Stock Shareholders | | $ | 80,014 | | | $ | 289,442 | | | $ | 40,735 | |
| | | | | | |
| Net income attributable to Class A Common Shareholders per share | | | | | | |
| Basic | | $ | 1.03 | | | $ | 5.25 | | | $ | 1.47 | |
| Diluted | | $ | 1.02 | | | $ | 2.52 | | | $ | 1.47 | |
| | | | | | |
Weighted-average shares(5) | | | | | | |
| Basic | | 59,284 | | 51,823 | | 41,630 |
| Diluted | | 60,115 | | 146,197 | | 41,665 |
(1)The results of the legacy ALTM business are not included in the Company’s consolidated financials prior to February 22, 2022. Refer to Note 1—Description of Business and Basis of Presentation in the Notes to our Consolidated Financial Statements in this Annual Report for further information. (2)Includes amounts of $17.2 million, $104.1 million, and $107.7 million associated with related parties for the years ended December 31, 2024, 2023, and 2022, respectively. Refer to Note 18—Related Party Transactions in the Notes to our Consolidated Financial Statements in this Annual Report for further information. (3)Cost of sales (exclusive of depreciation and amortization) is net of gas service revenues totaling $219.7 million, $148.3 million and $70.4 million for the years ended December 31, 2024, 2023 and 2022, respectively, for certain volumes where we act as principal.
(4)Includes related party amounts of $58.5 million, $59.1 million, and $39.3 million for the years ended December 31, 2024, 2023, and 2022, respectively. Refer to Note 18—Related Party Transactions in the Notes to our Consolidated Financial Statements in this Annual Report for further information. (5)Share and per share amounts have been retrospectively restated to reflect the Company’s reverse stock split, which was effected June 8, 2022. Refer to Note 11—Equity and Warrants in the Notes to our Consolidated Financial Statements in this Annual Report for further information.
The accompanying notes are an integral part of the Consolidated Financial Statements.
KINETIK HOLDINGS INC.
CONSOLIDATED BALANCE SHEETS
| | | | | | | | | | | | | | |
| | December 31, |
| | | 2024 | | 2023 |
| | | | |
| | (In thousands, except share data) |
| ASSETS | | | | |
| CURRENT ASSETS: | | | | |
| Cash and cash equivalents | | $ | 3,606 | | | $ | 4,510 | |
Accounts receivable, net of allowance for credit losses of $1,000 in 2024 and 2023(1) | | 111,940 | | | 215,721 | |
| Accounts receivable pledged | | 140,200 | | | — | |
| Derivative assets | | 2,308 | | | 7,812 | |
| Prepaid and other current assets | | 36,705 | | | 29,256 | |
| | 294,759 | | | 257,299 | |
| NONCURRENT ASSETS: | | | | |
| Property, plant and equipment, net | | 3,433,864 | | | 2,743,227 | |
| Intangible assets, net | | 652,490 | | | 591,670 | |
| Derivative asset, non-current | | 65 | | | 165 | |
| Operating lease right-of-use assets | | 29,814 | | | 37,569 | |
| Deferred tax asset | | 203,996 | | | 235,627 | |
| Deferred charges and other assets | | 76,994 | | | 85,250 | |
| Investments in unconsolidated affiliates | | 2,117,878 | | | 2,540,989 | |
| Goodwill | | 5,077 | | | 5,077 | |
| | 6,520,178 | | | 6,239,574 | |
| Total assets | | $ | 6,814,937 | | | $ | 6,496,873 | |
| LIABILITIES, NONCONTROLLING INTEREST, AND EQUITY | | | | |
| CURRENT LIABILITIES: | | | | |
| Accounts payable | | $ | 27,239 | | | $ | 34,000 | |
| | | | |
| Accrued expenses | | 186,714 | | | 177,421 | |
| | | | |
| Derivative liabilities | | 10,011 | | | 1,734 | |
| | | | |
| Current portion of operating lease liabilities | | 18,701 | | | 29,203 | |
| Current debt obligations | | 140,200 | | | — | |
| Other current liabilities | | 35,689 | | | 7,786 | |
| | 418,554 | | | 250,144 | |
| NONCURRENT LIABILITIES | | | | |
| Long term debt, net | | 3,363,996 | | | 3,562,809 | |
| Contract liabilities | | 20,985 | | | 25,761 | |
| Operating lease liabilities | | 11,490 | | | 9,349 | |
| | | | |
| Derivative liabilities | | 1,937 | | | 5,363 | |
| Other liabilities | | 2,148 | | | 3,219 | |
| | | | |
| Deferred tax liabilities | | 16,761 | | | 13,244 | |
| | | | |
| | 3,417,317 | | | 3,619,745 | |
| Total liabilities | | 3,835,871 | | | 3,869,889 | |
COMMITMENTS AND CONTINGENCIES (NOTE 17) | | | | |
| Redeemable noncontrolling interest — Common Unit limited partners | | 5,955,662 | | | 3,157,807 | |
| | | | |
| EQUITY: | | | | |
| Class A Common Stock: $0.0001 par, 1,500,000,000 shares authorized, 59,929,611 and 57,096,538 shares issued and outstanding at December 31, 2024 and 2023, respectively | | 6 | | | 6 | |
| Class C Common Stock: $0.0001 par, 1,500,000,000 shares authorized, 97,783,034 and 94,089,038 shares issued and outstanding at December 31, 2024 and 2023, respectively | | 9 | | | 9 | |
| Deferred consideration | | 1 | | | — | |
| Additional paid-in capital | | — | | | 192,678 | |
| Accumulated deficit | | (2,976,612) | | | (723,516) | |
| | | | |
| Total equity | | (2,976,596) | | | (530,823) | |
| Total liabilities, noncontrolling interest, and equity | | $ | 6,814,937 | | | $ | 6,496,873 | |
(1)Includes amounts of nil and $15.8 million associated with related parties as of December 31, 2024 and 2023, respectively. Refer to Note 18—Related Party Transactions in the Notes to our Consolidated Financial Statements in this Annual Report for further information. The accompanying notes are an integral part of the Consolidated Financial Statements.
| | | | | | | | | | | | | | | | | | | | |
KINETIK HOLDINGS INC. CONSOLIDATED STATEMENTS OF CASH FLOWS |
| | | | | | |
| | | For the Year Ended December 31, |
| | | 2024 | | 2023 | | 2022 |
| | | | | | |
| | (In thousands) |
| CASH FLOWS FROM OPERATING ACTIVITIES: | | | | | | |
| Net income including noncontrolling interests | | $ | 244,233 | | | $ | 386,452 | | | $ | 250,721 | |
| Adjustments to reconcile net income to net cash provided by operating activities: | | | | | | |
| Depreciation and amortization expense | | 324,197 | | | 280,986 | | | 260,345 | |
| Amortization of deferred financing costs | | 7,438 | | | 6,194 | | | 9,569 | |
| Amortization of contract costs | | 6,621 | | | 6,620 | | | 1,807 | |
| Contingent liabilities fair value adjustment | | 200 | | | — | | | (839) | |
| Distributions from unconsolidated affiliate | | 289,992 | | | 272,490 | | | 256,764 | |
| Derivatives settlement | | (7,258) | | | 25,708 | | | 10,667 | |
| Derivative fair value adjustment | | 17,713 | | | (33,671) | | | (95,501) | |
| Warrants fair value adjustment | | — | | | (88) | | | (133) | |
| Gain on sale of equity method investment | | (89,802) | | | — | | | — | |
| Gain on redemption of mandatorily redeemable Preferred Units | | — | | | — | | | (9,580) | |
| Loss on disposal of assets, net | | 4,040 | | | 19,402 | | | 12,611 | |
| Equity in earnings from unconsolidated affiliates | | (213,191) | | | (200,015) | | | (180,956) | |
| Loss on debt extinguishment | | 525 | | | 1,876 | | | 27,975 | |
| Share-based compensation | | 76,536 | | | 55,983 | | | 42,780 | |
| Deferred income tax expense (benefit) | | 19,503 | | | (233,400) | | | 2,094 | |
| | | | | | |
| Changes in operating assets and liabilities: | | | | | | |
| Accounts receivable and pledged receivable | | (7,033) | | | (12,131) | | | (8,329) | |
| Other assets | | 8,000 | | | (5,910) | | | (4,242) | |
| | | | | | |
| Accounts payable | | (40,849) | | | 19,804 | | | (1,598) | |
| Accrued liabilities | | (2,913) | | | (6,521) | | | 38,672 | |
| | | | | | |
| Operating leases | | (606) | | | 701 | | | 179 | |
| Net cash provided by operating activities | | 637,346 | | | 584,480 | | | 613,006 | |
| | | | | | |
| CASH FLOWS FROM INVESTING ACTIVITIES: | | | | | | |
| Property, plant and equipment expenditures | | (263,544) | | | (312,860) | | | (206,160) | |
| Intangible assets expenditures | | (12,329) | | | (16,694) | | | (15,419) | |
| Investments in unconsolidated affiliate | | (3,273) | | | (238,803) | | | (78,171) | |
| Net cash paid for acquisition of interest in unconsolidated affiliates | | (85,417) | | | — | | | — | |
| Distributions from unconsolidated affiliate | | 4,059 | | | 6,679 | | | — | |
| Cash proceeds from sale of equity method investment | | 524,390 | | | — | | | — | |
| Cash proceeds from disposals of assets | | 409 | | | 358 | | | 219 | |
| Net cash (paid for) acquired in acquisition | | (341,182) | | | (125,000) | | | 13,401 | |
| Net cash used in investing activities | | (176,887) | | | (686,320) | | | (286,130) | |
| | | | | | |
| CASH FLOWS FROM FINANCING ACTIVITIES: | | | | | | |
| Proceeds from borrowings under A/R Facility | | 156,000 | | | — | | | — | |
| Payments on A/R Facility | | (15,800) | | | — | | | — | |
| Proceeds from borrowings from long-term debt | | — | | | 800,000 | | | 3,000,000 | |
| Principal payments on long-term debt | | (200,000) | | | (800,000) | | | (2,294,130) | |
| Payments of debt issuance costs | | (1,086) | | | (11,238) | | | (37,009) | |
| Payments on debt discount, net | | (500) | | | — | | | — | |
| Proceeds from revolver | | 1,060,000 | | | 752,500 | | | 565,000 | |
| Payments on revolver | | (1,064,000) | | | (553,500) | | | (879,000) | |
| Redemption of mandatorily redeemable Preferred Units | | — | | | — | | | (183,297) | |
| Redemption of redeemable noncontrolling interest Preferred Units | | — | | | — | | | (461,460) | |
| Distributions paid to mandatorily redeemable Preferred Unit holders | | — | | | — | | | (1,850) | |
| Distributions paid to redeemable noncontrolling interest Preferred Unit limited partners | | — | | | — | | | (6,937) | |
| | | | | | | | | | | | | | | | | | | | |
KINETIK HOLDINGS INC. CONSOLIDATED STATEMENTS OF CASH FLOWS (CONTINUED) |
| | | | | | |
| | | For the Year Ended December 31, |
| | | 2024 | | 2023 | | 2022 |
| | | | | | |
| | (In thousands) |
| Cash dividends paid to Class A Common Stock shareholders | | (175,208) | | | (81,352) | | | (39,298) | |
| Distributions paid to Class C Common Unit limited partners | | (220,769) | | | (697) | | | (1,230) | |
| | | | | | |
| Repurchase of Class A Common Stock | | — | | | (5,757) | | | — | |
| Net cash (used in) provided by financing activities | | (461,363) | | | 99,956 | | | (339,211) | |
| Net change in cash | | $ | (904) | | | $ | (1,884) | | | $ | (12,335) | |
| | | | | | |
| CASH, BEGINNING OF PERIOD | | $ | 4,510 | | | $ | 6,394 | | | $ | 18,729 | |
| CASH, END OF PERIOD | | $ | 3,606 | | | $ | 4,510 | | | $ | 6,394 | |
| | | | | | |
| SUPPLEMENTAL SCHEDULE OF INVESTING AND FINANCING ACTIVITIES | | | | | | |
| Cash paid for interest, net of amounts capitalized | | $ | 244,603 | | | $ | 207,700 | | | $ | 120,270 | |
| Cash paid for income taxes, net | | $ | 560 | | | $ | 480 | | | $ | — | |
| Property and equipment and intangible accruals in accounts payable and accrued liabilities | | $ | 21,094 | | | $ | 27,316 | | | $ | 17,274 | |
| Right-of-use obtained in exchange for lease liabilities | | $ | 43,682 | | | $ | 5,189 | | | $ | 7,059 | |
| Class A Common Stock issued through dividend and distribution reinvestment plan | | $ | 75,633 | | | $ | 352,060 | | | $ | 263,285 | |
| | | | | | |
Fair value of assets acquired in Durango and ALTM Acquisition(1) | | $ | 875,244 | | | $ | — | | | $ | 2,444,450 | |
| Cash consideration paid | | 357,967 | | | — | | | — | |
| Class C Common Units issued in exchange | | 148,200 | | | — | | | — | |
| Class A Common Stock issued in exchange | | — | | | — | | | 1,013,745 | |
| Deferred consideration | | 275,000 | | | — | | | — | |
| Contingent consideration | | 4,500 | | | — | | | — | |
| Liabilities and mezzanine equity assumed | | $ | 89,577 | | | $ | — | | | $ | 1,430,705 | |
| | | | | | |
| | | | | | |
(1)See Note 3—Business Combinations in the Notes to Consolidated Financial Statements for additional information regarding the Durango and ALTM Acquisition (as defined herein).
The accompanying notes are an integral part of the Consolidated Financial Statements.
| | | | | | | | | | | | | | | | | | | | | | | | | | | | | | | | | | | | | | | | | | | | | | | | | | | | | | | | | | | | | | | | | | | | | | | | | | | |
KINETIK HOLDINGS INC. STATEMENTS OF CONSOLIDATED CHANGES IN EQUITY AND NONCONTROLLING INTERESTS |
| | | | | | | | | | | | | | | | | | | | | | | | | |
| Redeemable Noncontrolling Interest — Preferred Unit Limited Partners | | Redeemable Noncontrolling Interest — Common Unit Limited Partner | | | | Class A Common Stock | | Class C Common Stock | | Class C Common Stock Deferred Consideration | | Additional Paid-in Capital | | Accumulated Deficit | | Treasury
Stock | | Total Equity |
| | | | | Shares(1) | | Amount | | Shares(1) | | Amount | | Shares(2) | | Amount | | | | |
| | | | | | | | | | | | | | | | | | | | | | | | | |
| (In thousands) | | | | (In thousands) |
| | | | | | | | | | | | | | | | | | | | | | | | | |
| Balance at December 31, 2021 | $ | — | | | $ | 1,006,838 | | | | | — | | | $ | — | | | 100,000 | | | $ | 10 | | | — | | | $ | — | | | $ | — | | | $ | — | | | $ | — | | | $ | 10 | |
| ALTM acquisition | 462,717 | | | — | | | | | 32,493 | | | 3 | | | — | | | — | | | — | | | — | | | 1,013,742 | | | — | | | — | | | 1,013,745 | |
| Distributions paid to Preferred Unit limited partners | (6,937) | | | — | | | | | — | | | — | | | — | | | — | | | — | | | — | | | — | | | — | | | — | | | — | |
| Redemption of Preferred Units | (461,460) | | | — | | | | | — | | | — | | | — | | | — | | | — | | | — | | | — | | | — | | | — | | | — | |
| Redemption of Common Units | — | | | (179,323) | | | | | 5,730 | | | 1 | | | (5,730) | | | (1) | | | — | | | — | | | 179,323 | | | — | | | — | | | 179,323 | |
| Excess of carrying amount over Preferred Units redemption price | (109,523) | | | 76,623 | | | | | — | | | — | | | — | | | — | | | — | | | — | | | — | | | 32,900 | | | — | | | 32,900 | |
| Issuance of common stock through dividend and distribution reinvestment plan | — | | | — | | | | | 7,452 | | | 1 | | | — | | | — | | | — | | | — | | | 263,284 | | | — | | | — | | | 263,285 | |
| Share-based compensation | — | | | — | | | | | 4 | | | — | | | — | | | — | | | — | | | — | | | 42,780 | | | — | | | — | | | 42,780 | |
| Step up in tax basis for Common Unit conversion | — | | | — | | | | | — | | | — | | | — | | | — | | | — | | | — | | | 297 | | | — | | | — | | | 297 | |
| Remeasurement of contingent consideration | — | | | — | | | | | — | | | — | | | — | | | — | | | — | | | — | | | 4,451 | | | — | | | — | | | 4,451 | |
| Net income | 115,203 | | | 94,783 | | | | | — | | | — | | | — | | | — | | | — | | | — | | | — | | | 40,735 | | | — | | | 40,735 | |
| Change in redemption value of noncontrolling interests | — | | | 2,325,918 | | | | | — | | | — | | | — | | | — | | | — | | | — | | | (1,385,037) | | | (940,881) | | | — | | | (2,325,918) | |
| Distributions paid to Common Units limited partners | — | | | (212,430) | | | | | — | | | — | | | — | | | — | | | — | | | — | | | — | | | — | | | — | | | — | |
| Dividends on Class A Common Stock $2.25 per share) | — | | | — | | | | | — | | | — | | | — | | | — | | | — | | | — | | | — | | | (91,383) | | | — | | | (91,383) | |
| Balance at December 31, 2022 | $ | — | | | $ | 3,112,409 | | | | | 45,679 | | | $ | 5 | | | 94,270 | | | $ | 9 | | | — | | | $ | — | | | $ | 118,840 | | | $ | (958,629) | | | $ | — | | | $ | (839,775) | |
| | | | | | | | | | | | | | | | | | | | | | | | | |
| | | | | | | | | | | | | | | | | | | | | | | | | | | | | | | | | | | | | | | | | | | | | | | | | | | | | | | | | | | | | | | | | | | | | | | | | | | |
KINETIK HOLDINGS INC. STATEMENTS OF CONSOLIDATED CHANGES IN EQUITY AND NONCONTROLLING INTERESTS (CONTINUED) |
| | | | | | | | | | | | | | | | | | | | | | | | | |
| Redeemable Noncontrolling Interest — Preferred Unit Limited Partners | | Redeemable Noncontrolling Interest — Common Unit Limited Partner | | | | Class A Common Stock | | Class C Common Stock | | Class C Common Stock Deferred Consideration | | Additional Paid-in Capital | | Accumulated Deficit | | Treasury
Stock | | Total Equity |
| | | | | Shares(1) | | Amount | | Shares(1) | | Amount | | Shares(2) | | Amount | | | | |
| | | | | | | | | | | | | | | | | | | | | | | | | |
| (In thousands) | | | | (In thousands) |
| Balance at December 31, 2022 | $ | — | | | $ | 3,112,409 | | | | | 45,679 | | | $ | 5 | | | 94,270 | | | $ | 9 | | | — | | | $ | — | | | $ | 118,840 | | | $ | (958,629) | | | $ | — | | | $ | (839,775) | |
| Redemption of Common Units | — | | | (5,634) | | | | | 181 | | | — | | | (181) | | | — | | | — | | | — | | | 5,634 | | | — | | | — | | | 5,634 | |
| Issuance of common stock through dividend and distribution reinvestment plan | — | | | — | | | | | 11,215 | | | 1 | | | — | | | — | | | — | | | — | | | 352,059 | | | — | | | — | | | 352,060 | |
| Retirement of treasury stock | — | | | — | | | | | — | | | — | | | — | | | — | | | — | | | — | | | — | | | (5,757) | | | 5,757 | | | — | |
| Repurchase of Class A Common Stock | — | | | — | | | | | (194) | | | — | | | — | | | — | | | — | | | — | | | — | | | — | | | (5,757) | | | (5,757) | |
| Share-based compensation | — | | | — | | | | | 216 | | | — | | | — | | | — | | | — | | | — | | | 55,983 | | | — | | | — | | | 55,983 | |
| Net income | — | | | 97,010 | | | | | — | | | — | | | — | | | — | | | — | | | — | | | — | | | 289,442 | | | — | | | 289,442 | |
| Change in redemption value of noncontrolling interests | — | | | 236,288 | | | | | — | | | — | | | — | | | — | | | — | | | — | | | (339,838) | | | 103,550 | | | — | | | (236,288) | |
| Distribution paid to Common Units limited partners | — | | | (282,266) | | | | | — | | | — | | | — | | | — | | | — | | | — | | | — | | | — | | | — | | | — | |
| Dividends on Class A Common Stock ($3.00 per share) | — | | | — | | | | | — | | | — | | | — | | | — | | | — | | | — | | | — | | | (152,122) | | | — | | | (152,122) | |
| Balance at December 31, 2023 | $ | — | | | $ | 3,157,807 | | | | | 57,097 | | | $ | 6 | | | 94,089 | | | $ | 9 | | | — | | | $ | — | | | $ | 192,678 | | | $ | (723,516) | | | $ | — | | | $ | (530,823) | |
| | | | | | | | | | | | | | | | | | | | | | | | | |
| | | | | | | | | | | | | | | | | | | | | | | | | | | | | | | | | | | | | | | | | | | | | | | | | | | | | | | | | | | | | | | | | | | | | | | | | | | |
KINETIK HOLDINGS INC. STATEMENTS OF CONSOLIDATED CHANGES IN EQUITY AND NONCONTROLLING INTERESTS (CONTINUED) |
| | | | | | | | | | | | | | | | | | | | | | | | | |
| Redeemable Noncontrolling Interest — Preferred Unit Limited Partners | | Redeemable Noncontrolling Interest — Common Unit Limited Partner | | | | Class A Common Stock | | Class C Common Stock | | Class C Common Stock Deferred Consideration | | Additional Paid-in Capital | | Accumulated Deficit | | Treasury
Stock | | Total Equity |
| | | | | Shares(1) | | Amount | | Shares(1) | | Amount | | Shares(2) | | Amount | | | | |
| | | | | | | | | | | | | | | | | | | | | | | | | |
| (In thousands) | | | | (In thousands) |
| Balance at December 31, 2023 | $ | — | | | $ | 3,157,807 | | | | | 57,097 | | | $ | 6 | | | 94,089 | | | $ | 9 | | | — | | | $ | — | | | $ | 192,678 | | | $ | (723,516) | | | $ | — | | | $ | (530,823) | |
| Durango Acquisition | — | | | 423,200 | | | | | — | | | — | | | 3,840 | | | — | | | 7,680 | | | 1 | | | — | | | — | | | — | | | 1 | |
| Redemption of Common Units | — | | | (5,060) | | | | | 146 | | | — | | | (146) | | | — | | | — | | | — | | | 5,060 | | | — | | | — | | | 5,060 | |
| Issuance of common stock through dividend and distribution reinvestment plan | — | | | — | | | | | 2,213 | | | — | | | — | | | — | | | — | | | — | | | 75,633 | | | — | | | — | | | 75,633 | |
| Share-based compensation | — | | | — | | | | | 474 | | | — | | | — | | | — | | | — | | | — | | | 76,536 | | | — | | | — | | | 76,536 | |
| Net income | — | | | 164,219 | | | | | — | | | — | | | — | | | — | | | — | | | — | | | — | | | 80,014 | | | — | | | 80,014 | |
| Change in redemption value of noncontrolling interests | — | | | 2,506,075 | | | | | — | | | — | | | — | | | — | | | — | | | — | | | (353,997) | | | (2,152,078) | | | — | | | (2,506,075) | |
| Recognition of deferred tax asset | — | | | — | | | | | — | | | — | | | — | | | — | | | — | | | — | | | 4,090 | | | — | | | — | | | 4,090 | |
| Distribution paid to Common Unit limited partners | — | | | (290,579) | | | | | — | | | — | | | — | | | — | | | — | | | — | | | — | | | — | | | — | | | — | |
| Dividends on Class A Common Stock ($3.03 per share) | — | | | — | | | | | — | | | — | | | — | | | — | | | — | | | — | | | — | | | (181,032) | | | — | | | (181,032) | |
| Balance at December 31, 2024 | $ | — | | | $ | 5,955,662 | | | | | 59,930 | | | $ | 6 | | | 97,783 | | | $ | 9 | | | 7,680 | | | $ | 1 | | | $ | — | | | $ | (2,976,612) | | | $ | — | | | $ | (2,976,596) | |
| | | | | | | | | | | | | | | | | | | | | | | | | |
|
(1)Share amounts have been retrospectively restated to reflect the Company’s reverse stock split, which was effected June 8, 2022. Refer to Note 11—Equity and Warrants in the Notes to our Consolidated Financial Statements in this Annual Report for further information. (2)Pursuant to the Durango MIPA (as defined herein), deferred consideration of 7.7 million shares of Class C Common Stock is to be issued on July 1, 2025. Fair value of the deferred consideration was included in the “Redeemable noncontrolling interest—Common Units limited partners” of the Consolidated Balance Sheets as of December 31, 2024.
The accompanying notes are an integral part of the Consolidated Financial Statements.
KINETIK HOLDINGS INC.
NOTES TO CONSOLIDATED FINANCIAL STATEMENTS
1. DESCRIPTION OF BUSINESS AND BASIS OF PRESENTATION
Organization
Kinetik Holdings Inc, (the “Company”) is a holding company, whose only significant assets are ownership of the non-economic general partner interest and an approximate 38% limited partner interest in Kinetik Holdings LP, a Delaware limited partnership (the “Partnership”). As the owner of the non-economic general partner interest in the Partnership, the Company is responsible for all operational, management and administrative decisions related to, and consolidates the results of, the Partnership and its subsidiaries.
BCP Raptor Holdco, LP (“BCP”), the predecessor for accounting purposes of the Company, formerly known as Altus Midstream Company), was formed on April 25, 2017 as a Delaware limited partnership to acquire and develop midstream oil and gas assets.
On February 22, 2022 (the “Altus Closing Date”), the Company consummated the business combination transaction (the “Altus Acquisition”) contemplated by that certain Contribution Agreement, dated as of October 21, 2021 (the “Contribution Agreement”), by and among the Company, Altus Midstream LP (now known as Kinetik Holdings LP) (the “Partnership”), New BCP Raptor Holdco, LLC, a Delaware limited liability company (“Contributor”) and BCP. In connection with the closing of Altus Acquisition, the Company changed its name from “Altus Midstream Company” to “Kinetik Holdings Inc.”
On June 24, 2024, the Company consummated the previously announced transaction contemplated by the Membership Interest Purchase Agreement (the “Durango MIPA”), dated May 9, 2024, by and between the Company, the Partnership, and Durango Midstream LLC, an affiliate of Morgan Stanley Equity Partners (the “Durango Seller”), pursuant to which the Partnership purchased all of the membership interests of Durango Permian LLC and its wholly owned subsidiaries (“Durango”) from Durango Seller (“Durango Acquisition”). The Durango Acquisition allows the Company to further expand its footprint into New Mexico and across the Northern Delaware Basin.
Nature of Operations
Through its consolidated subsidiaries, the Company provides comprehensive gathering, produced water disposal, transportation, compression, processing and treating services necessary to bring natural gas, NGL and crude oil to market. Additionally, the Company owns two NGL pipelines and equity interests in three separate Permian Basin pipeline entities that have access to various markets along the U.S. Gulf Coast.
Basis of Presentation
The accompanying consolidated financial statements have been prepared in accordance with GAAP. All adjustments that, in the opinion of management, are necessary for a fair presentation of the results of operations have been made and are of a recurring nature unless otherwise disclosed herein. All intercompany balances and transactions have been eliminated in consolidation.
During the year ended December 31, 2024, the Company adopted ASU 2023-07, Segment Reporting (Topic 280): Improvements to Reportable Segment Disclosures (“ASU 2023-07”) which has required prior periods to reflect the change in presentation. See Note 2—Summary of Significant Accounting Policies, Recent Accounting Pronouncements for further discussion.
In addition, the Company completed a two-for-one stock split on June 8, 2022 (the “Stock-Split”). All corresponding per-share and share amounts for periods prior to June 8, 2022 have been retrospectively restated in this Annual Report to reflect the two-for-one stock split, except for the number of common units representing limited partner interests in the Partnership (“Common Units”) and shares of the Company’s Class C Common Stock, par value $0.0001 per share (“Class C Common Stock”) described in relation to the Altus Acquisition in this Annual Report, which are presented at pre-Stock Split amounts. This presentation election is consistent with our previous public filings and the terms of the Contribution Agreement.
2. SUMMARY OF SIGNIFICANT ACCOUNTING POLICIES
Use of Estimates
Preparation of financial statements in conformity with GAAP and disclosure of contingent assets and liabilities requires management to make estimates and assumptions that affect reported amounts of assets and liabilities at the date of the consolidated financial statements and the reported amounts of revenues and expenses during the reporting period. The Company bases its estimates on historical experience and various other assumptions that are believed to be reasonable under the circumstances, the results of which form the basis for making judgments about carrying values of assets and liabilities that are not readily apparent from other sources. The Company evaluates its estimates and assumptions on a regular basis. Actual results may differ from these estimates and assumptions used in preparation of its Consolidated Financial Statements, and changes in these estimates are recorded when known. Significant items subject to such estimates and assumptions include the valuation of enterprise value, assets acquired and liabilities assumed in a business combination, derivatives, tangible and intangible assets and impairment of long-lived assets and equity method investments (“EMI” or “EMIs”).
Segment Information
The Company applies FASB ASC 280, Segment Reporting, in determining reportable segments for its financial statement disclosure. Operating segments are defined as components of an enterprise about which separate financial information is available that is evaluated regularly by the CODM in deciding how to allocate resources and in assessing performance. Our Chief Executive Officer is the CODM. The Company has determined it has two operating segments: (1) Midstream Logistics and (2) Pipeline Transportation. During the year ended December 31, 2024, the Company adopted ASU 2023-07 and identified significant segment expenses that are provided to CODM on a regular basis. See Note 19—Segments in the Notes to our Consolidated Financial Statements in this Annual Report for further information. Revenue Recognition
We provide gathering, processing, transportation, and disposal services and we sell commodities (including condensate, natural gas, and NGLs) under various contracts.
The Company recognizes revenue in accordance with the provisions of FASB ASC 606, Revenue from Contracts with Customers (“Topic 606”). We recognize revenues for services and products under revenue contracts as our obligations to perform services or deliver/sell products under the contracts are satisfied. A contract’s transaction price is allocated to each performance obligation in the contract and recognized as revenue when, or as, the performance obligation is satisfied. These contracts include:
a.Fee-based arrangements – Under fee-based contract arrangements, the Company provides gathering, processing and disposal services to producers and earns a net margin based on volumes. While transactions vary in form, the essential element of each transaction is the use of the Company’s assets to transport a product or provide a processed product to an end-user at the tailgate of the plant or pipeline. This revenue stream is generally directly related to the volume of water, natural gas, crude oil, NGLs, and condensate that flows through the Company’s systems and facilities and is not normally dependent on commodity prices. The Company primarily acts as an agent under these contracts selling the underlying commodities on behalf of the producer and remitting back to the producer the net proceeds. These such sales and remitted proceeds are presented net within revenue. However, in certain instances, the Company acts as the principal for processed residue gas and NGLs by purchasing them from the associated producer at the tailgate of the plant at index prices. This purchase and the associated third-party sale are presented gross within revenues and cost of sales.
b.Percent-of-proceeds arrangements – Under percentage-of-proceeds based contract arrangements, the Company will gather and process natural gas on behalf of producers and sell the outputs, including residue gas, NGLs and condensate, at market prices. The Company remits an agreed-upon percentage of proceeds to the producer based on the market price received from third parties or the index price defined in the contract. Under these arrangements, revenue is recognized net of the agreed-upon proceeds remitted to producers when the Company acts as an agent of the producer for the associated third-party sale. However, in certain instances the Company acts as the principal for processed residue gas and NGLs by purchasing these volumes from the associated producer at the tailgate of the plant at index prices. This purchase and the associated third-party sale are presented gross within revenues and cost of sales.
c.Percent-of-products arrangements – Under percent-of-products based contract arrangements, the Company will gather and process natural gas on behalf of producers. As partial compensation for services, the producer assigns to the
Company, for no additional consideration, all right, title and interest to a set percentage, as defined in the contract, of the processed residue volumes. The Company recognizes the fair value of these products as revenue when the associated performance obligation has been met.
d.Product sales contracts – Under these contracts, we sell natural gas, NGLs or condensate to third parties. These sales are presented gross within revenues and cost of sales or net within revenues depending on whether the Company acts as the principal or the agent in the sale transaction as discussed above.
Our fee-based service contracts primarily have a single performance obligation to deliver a series of distinct goods or services that are substantially the same and have the same pattern of transfer to our producers. For performance obligations associated with these contracts, we recognize revenues over time utilizing the output method based on the actual volumes of products delivered/sold or services performed, because the single performance obligation is satisfied over time using the same performance measure of progress toward satisfaction of the performance obligation. The transaction price under our fee-based service contracts includes variable consideration that varies primarily based on actual volumes that are delivered under the contracts. Because the variable consideration specifically relates to our efforts to transfer the services and/or products under the contracts, we allocate the variable consideration entirely to the distinct service utilizing the allocation exception guidance under Topic 606, and accordingly recognize the variable consideration as revenues at the time the good or service is transferred to the producer.
We recognize revenues at a point in time for performance obligations associated with percent-of-proceeds contract elements, percent-of-products contract elements and product sale contracts, and these revenues are recognized because control of the underlying product is transferred to the customer or producer.
The evaluation of when performance obligations have been satisfied and the transaction price that is allocated to our performance obligations requires judgments and assumptions, including our evaluation of the timing of when control of the underlying good or service has transferred to our producers or customers. Actual results can vary from those judgments and assumptions.
Minimum Volume Commitments
The Company has certain agreements that provide for quarterly or annual MVCs. Under these MVCs, our producers agree to ship and/or process a minimum volume of production on our gathering and processing systems or to pay a minimum monetary amount over certain periods during the term of the MVC. A producer must make a shortfall payment to us at the end of the contracted measurement period if its actual throughput volumes are less than its contractual MVC for that period. None of the Company’s MVC provisions allow for producers to make up past deficient volumes in a future period. However, certain MVC provisions allow producers to carryforward volumes delivered in excess of a current period MVC to future periods. The Company recognizes revenue associated with MVCs when a counterparty has not met the contractual MVC at the completion of the measurement period for the specific commitment or we determine that the counterparty cannot meet the contractual MVC by the end of the contracted measurement period.
Disaggregation of Revenue
The Company disaggregates revenue into categories that depict the nature, amount, and timing of revenue and cash flows based on differing economic risk profiles for each category. In concluding such disaggregation, the Company evaluated the nature of the products and services, consumer markets, sales terms, and sales channels which have similar characteristics such that the level of disaggregation provides an understanding of the Company’s business activities and historical performance. The level of disaggregation is evaluated annually and as appropriate for changes to the Company or its business, either from internal growth, acquisitions, divestitures, or otherwise. See Note 4—Revenue Recognition in the Notes to our Consolidated Financial Statements in this Annual Report for further information. Concentration Risk
All operations and efforts of the Company are focused in the oil and gas industry and are subject to the related risks of the industry. The Company’s assets are located in the Permian Basin, across Texas and New Mexico. Demand for the Company’s products and services may be influenced by various regional and global factors and may impact the value of the projects the Company is developing.
The Company’s concentration of customers may impact its overall business risk, either positively or negatively, in that these entities may be similarly affected by changes in the economy or other conditions. The Company’s operations involve a
variety of counterparties, both investment grade and non-investment grade. The Company analyzes the counterparties’ financial condition prior to entering into an agreement, establishes credit limits and monitors the appropriateness of these limits on an ongoing basis within approved tolerances, with the primary focus on published credit ratings when available and inherent liquidity metrics to mitigate credit risk. Typically, through our customer contracts, the Company takes title to the rich gas and associated plant products (NGLs and residue gas). As such, the inherent risk with these types of contracts is mitigated as the Company receives funds for the disposition and sale of such products from downstream counterparties that are large investment grade entities and is able to deduct all fees owed to it by its customers and associated costs before remitting the balance of any funds back to the relevant customer. For those few counterparties’ that retain ownership of their plant products, the Company attempts to minimize credit risk exposure through its credit policies and monitoring procedures as well as through customer deposits, and letters of credit. The Company manages credit risk to mitigate credit losses and exposure to uncollectible trade receivables and generally receivables are collected within 30 days. Below is a summary of operating revenue by major customer that individually exceeded 10% of consolidated operating revenue:
| | | | | | | | | | | | | | | | | | | | |
| | For the Year Ended December 31, |
| | 2024 | | 2023 | | 2022 |
| | | | | | |
| | (In thousands) |
| Customer 1 | | $ | 372,949 | | | $ | 205,079 | | | $ | 71,055 | |
| Customer 2 | | 335,107 | | | 278,408 | | | 211,093 | |
| Customer 3 | | 190,318 | | | 223,714 | | | 326,899 | |
| Customer 4 | | 158,451 | | | 9,395 | | | — | |
| | | | | | |
| | | | | | |
| Others | | 426,104 | | | 539,816 | | | 604,443 | |
| Consolidated Operating Revenue | | $ | 1,482,929 | | | $ | 1,256,412 | | | $ | 1,213,490 | |
| | | | | | |
As of December 31, 2024 and 2023, approximately 48% and 40%, respectively, of accounts receivable and accounts receivable pledged were derived from the above customers. All operating revenue derived from above customers are included in the Midstream Logistics segment.
Major Producers are defined as our producers who we gather natural gas, crude and/or produced water and process gas and dispose of produced water from and account for 10% or more of our cost of sales as presented in the consolidated financial statements. For the year ended December 31, 2024, approximately 59% of the Company’s cost of sales were derived from two producers. For the year ended December 31, 2023, approximately 60% of the Company’s cost of sales were derived from three producers. For the year ended December 31, 2022, approximately 87% of the Company’s cost of sales were derived from five producers. This concentration of producers may impact the Company's overall business risk, either positively or negatively, in that these entities may be similarly affected by changes in the economy or other conditions. We do not believe that a loss of revenues from any single customer would have a material adverse effect on our business, financial position, results of operations or cash flows.
The Company regularly maintains its cash in bank deposit accounts, which, at times, may exceed federally insured limits. The Company has not experienced any losses with respect to the related risks to cash and does not believe its exposure to such risk is more than nominal.
Fair Value Measurements
FASB ASC Topic 820, Fair Value Measurement (“Topic 820”), establishes a framework for measuring fair value in U.S. GAAP, clarifies the definition of fair value within that framework, and requires disclosures about the use of fair value measurements. Topic 820 defines fair value as the price that would be received to sell an asset, or paid to transfer a liability, in an orderly transaction between market participants at the measurement date. Topic 820 provides a framework for measuring fair value, establishes a three-level hierarchy for fair value measurements based upon the transparency of inputs to the valuation of an asset or liability as of the measurement date and requires consideration of the counterparty’s creditworthiness when valuing certain assets.
Topic 820 establishes a fair value hierarchy that prioritizes the inputs to valuation techniques used to measure fair value. The hierarchy gives the highest priority to unadjusted quoted prices in active markets (Level 1 inputs). The three levels of the fair value hierarchy under Topic 820 are described below:
Level 1 inputs: Unadjusted, quoted prices in active markets that are accessible at the measurement date for identical, unrestricted assets or liabilities. An active market is defined as a market where transactions for a financial instrument occur with sufficient frequency and volume to provide pricing information on an ongoing basis.
Level 2 inputs: Inputs, other than quoted prices in active markets, that are either directly or indirectly observable for the asset or liability through correlation with market data at the measurement date and for the duration of the instrument’s anticipated life.
Level 3 inputs: Prices or valuations that require unobservable inputs that are both significant to the fair value measurement and unobservable. Valuation under Level 3 generally involves a significant degree of judgment from management.
A financial instrument’s level within the fair value hierarchy is based on the lowest level of any input that is significant to the fair value measurement. Where available, fair value is based on observable market prices or inventory parameters or derived from such prices or parameters. Where observable prices or inputs are not available, valuation models are applied. These valuation techniques involve some level of management estimation and judgment, the degree of which is dependent on the price transparency for the instruments or market and the instrument’s complexity.
The Company’s Consolidated Balance Sheets reflect a mixture of measurement methods for financial assets and liabilities. Public and private warrants and derivative financial instruments are reported at fair value. See Note 12—Fair Value Measurements and Note 13—Derivatives and Hedging Activities in the Notes to our Consolidated Financial Statements in this Annual Report for further information. Other financial instruments are reported at historical cost or amortized cost on our Consolidated Balance Sheets. Long-term debt is primarily the other financial instrument for which carrying value could vary significantly from fair value. See Note 8—Debt and Financing Costs in the Notes to our Consolidated Financial Statements in this Annual Report for further information. Derivative Instruments and Hedging Activities
FASB ASC Topic 815, Derivatives and Hedging (“Topic 815”), provides the disclosure requirements for derivatives and hedging activities with the intent to provide users of financial statements with an enhanced understanding of: (a) how and why an entity uses derivative instruments, (b) how the entity accounts for derivative instruments and related hedged items, and (c) how derivative instruments and related hedged items affect an entity’s financial position, financial performance, and cash flows. Further, qualitative disclosures are required that explain the Company’s objectives and strategies for using derivatives, as well as quantitative disclosures about the fair value of and gains and losses on derivative instruments, and disclosures about credit-risk-related contingent features in derivative instruments.
As required by Topic 815, the Company records all derivatives on the balance sheet at fair value. The accounting for changes in the fair value of derivatives depends on the intended use of the derivative, whether the Company has elected to designate a derivative in a hedging relationship and apply hedge accounting and whether the hedging relationship has satisfied the criteria necessary to apply hedge accounting. Derivatives designated and qualifying as a hedge of the exposure to variability in expected future cash flows, or other types of forecasted transactions, are considered cash flow hedges. Hedge accounting generally provides for the matching of the timing of gain or loss recognition on the hedging instrument with the recognition of the changes in the fair value of the hedged asset or liability that are attributable to the hedged risk in a fair value hedge or the earnings effect of the hedged forecasted transactions in a cash flow hedge. The Company has not elected to apply hedge accounting to any of its current or recent derivative transactions.
When the Company does not elect to apply hedge accounting, the instruments are marked-to-market each period end and changes in fair value, realized or unrealized, are recognized in earnings.
Cash and Cash Equivalents
The Company considers all highly liquid short-term investments with a maturity of three months or less at the time of purchase to be cash equivalents. These investments are carried at cost, which approximate fair value. As of December 31, 2024 and 2023, the Company had $3.6 million and $4.5 million, respectively, of cash and cash equivalents.
Accounts Receivable and Current Expected Credit Losses
Accounts receivable include billed and unbilled amounts due from customers for gas, NGLs and condensate sales, pipeline transportation, and gathering, processing and disposal fees, under normal trade terms, generally requiring payment within 30 days. The Company’s current expected credit losses are determined based upon reviews of individual accounts, existing economics, and other pertinent factors. The Company had an allowance for credit losses of $1.0 million as of December 31, 2024 and 2023.
Accounts Receivable Securitization Facility
Pursuant to ASC 860, Transfers and Servicing, accounts receivable that are sold or contributed by the Partnership to the special purpose vehicle are treated as collateral for borrowings under the third party A/R Facility (as defined below) and are included as “Accounts receivable pledged” within the Consolidated Balance Sheets. Proceeds from the transfer of the eligible accounts receivable under the third party A/R Facility are secured borrowings included as “Current debt obligations” within our Consolidated Balance Sheets. Proceeds and repayments under such facility are reflected as cash flows from financing activities in our Consolidated Statements of Cash Flows. See Note 8—Debt and Financing Costs for further discussion. Gas Imbalance
Quantities of natural gas over-delivered or under-delivered related to imbalance agreements are recorded monthly as receivables or payables using weighted-average prices at the time of the imbalance. These imbalances are typically settled with deliveries of natural gas. We had imbalance receivables of $5.0 million and $1.3 million at December 31, 2024 and 2023, respectively, which are carried at the lower of cost or market value. We had no imbalance payables at December 31, 2024 and 2023. Imbalance receivables and imbalance payables are included in “Accounts Receivable” and “Accounts Payable”, respectively, on the Consolidated Balance Sheets.
Inventory
Other current assets include condensate, residue gas and NGL inventories that are valued at the lower of cost or net realizable value. At the end of each reporting period, the Company assesses the carrying value of inventory and makes any adjustments necessary to reduce the carrying value to the applicable net realizable value. Inventory was valued at $3.6 million and $3.1 million as of December 31, 2024 and 2023, respectively.
Property, Plant, and Equipment
Property, plant and equipment are carried at cost or fair market value at the date of acquisition less accumulated depreciation. The cost basis of constructed assets includes materials, labor, and other direct costs. Major improvements or betterment are capitalized, while repairs that do not improve the life of the respective assets are expensed as incurred. Depreciation and amortization are computed using the straight-line method over the estimated useful lives of the assets as follows:
| | | | | |
| Estimated Useful Life |
| Buildings | 30 years |
| Gathering and processing systems and facilities | 20 years |
| Furniture and fixtures | 5 years |
| Vehicles | 5 years |
| Computer hardware and software | 3 years |
Leases
The Company's lease portfolio includes certain real estate and equipment. The determination of whether an arrangement is, or contains, a lease is performed at the inception of the arrangement. Operating leases are recorded on the balance sheet with operating lease assets representing the right to use the underlying asset for the lease term and lease liabilities representing the obligation to make lease payments arising from the lease. The Company has elected to account for the lease and non-lease components together as a single component for all classes of underlying assets. The Company excludes variable lease payments in measuring right-of-use (“ROU”) assets and lease liabilities, other than those that depend on an index, a rate or are in-substance fixed payments.
ROU assets and lease liabilities are recognized at the commencement date based on the present value of lease payments over the lease term. In addition, ROU assets include initial direct costs incurred by the lessee as well as any lease payments made at or before the commencement date are reduced by lease incentives. As most of the Company's leases do not provide an implicit rate, the Company uses its incremental borrowing rate based on the information available at the commencement date in determining the present value of lease payments. The incremental borrowing rate is determined by using the rate of interest that the Company would pay to borrow on a collateralized basis an amount equal to the lease payments for a similar term and in a
similar economic environment. Lease terms include options to extend or terminate the lease when it is reasonably certain that the Company will exercise that option. Leases with a term of one year or less are excluded from ROU assets and liabilities.
Capitalized Interest
The Company’s policy is to capitalize interest cost incurred on debt during the construction of major projects.
Deferred Financing Costs
Deferred financing costs consist of fees incurred to secure debt financing and are amortized over the life of the related debt using the effective interest rate method. Deferred financing costs associated with the Company’s unsecured term loans and senior notes are presented with the related debt on the Consolidated Balance Sheets, as a reduction to the carrying amounts. Deferred financing costs associated with the Company's revolving credit facilities are presented within “Other Current Assets” and “Deferred Charges and Other Assets” on the Consolidated Balance Sheets.
Asset Retirement Obligation
The Company follows the provisions of FASB ASC Topic 410, Asset Retirement and Environmental Obligations, which require the fair value of a liability related to the retirement of long-lived assets to be recorded at the time a legal obligation is incurred if the liability can be reasonably estimated. The liability is based on future retirement cost estimates and incorporates many assumptions, such as time to permanent removal, future inflation rates and the credit-adjusted risk-free rate of interest. The retirement obligation is recorded at its estimated present value with an offsetting increase to the related asset on the balance sheet. Over time, the liability is accreted to its future value, with the accretion recorded to expense.
The Company’s assets generally consist of gas processing plants, crude storage terminals, saltwater disposal wells, and underground gathering and transportation pipelines installed along rights-of-way acquired from landowners and related above-ground facilities. The majority of the rights-of-way agreements do not require the dismantling and removal of the pipelines and reclamation of the rights-of-way upon permanent removal of the pipelines from service. Further, we have in place a rigorous repair and maintenance program that keeps our gathering and processing systems in good working order. As a result, the ultimate dismantlement and removal dates of the Company’s assets are not determinable. As such, the fair value of the liability is not estimable and, therefore, no asset retirement obligation has been recognized in the Consolidated Financial Statements as of December 31, 2024 and 2023.
Environmental Costs
The Company is subject to extensive federal, state, and local environmental laws and regulations. These laws, which are constantly changing, regulate the discharge of materials into the environment and may require the Company to remove or mitigate the environmental effects of the disposal or release of petroleum or chemical substances at various sites, if applicable.
Environmental costs that relate to current operations are expensed or capitalized as appropriate. Costs are expensed when they relate to an existing condition caused by past operations and will not contribute to current or future revenue generation. Liabilities related to environmental assessments and/or remedial efforts are accrued when property or services are probable or can reasonably be estimated. See Note 17—Commitments and Contingencies for additional discussion of environmental matter-related assessment. Intangible Assets
Intangible assets consist of rights of way agreements, primarily relate to underground pipeline easements and are generally for an initial term of ten years with an option to renew for an additional ten years at agreed upon renewal rates based on certain indices or up to 130% of the original consideration paid, and customer contracts, which are capitalized as a result of acquiring favorable customer contracts from business combinations with remaining contract terms that range from five to twenty years on acquisition dates. Intangible assets are amortized on a straight-line basis over their estimated economic life or remaining term of the contract and are assessed for impairment with the associated long-lived asset group whenever impairment indicators are present.
Goodwill
Goodwill represents the excess of cost over the fair value of assets of businesses acquired. Goodwill is not amortized, but instead is tested for impairment in accordance with FASB ASC 350, Intangibles – Goodwill and Other (“Topic 350”) at the reporting unit level at least annually. The Company’s reporting unit is subject to impairment testing annually, on November 30,
or more frequently if events and circumstances change that would more likely than not reduce the fair value of a reporting unit below its carrying amount.
Topic 350 provides the option to assess qualitative factors to determine whether it is more likely than not that the fair value of a reporting unit is less than its carrying amount, including goodwill. The Company has the unconditional option to bypass the qualitative assessment for any reporting unit in any period and proceed directly to performing a quantitative goodwill impairment test. If the assessment of all relevant qualitative factors indicates that it is more likely than not that the fair value of a reporting unit is more than its carrying amount, a quantitative goodwill impairment test is not necessary. If the assessment of all relevant qualitative factors indicates that it is more likely than not that the fair value of a reporting unit is less than its carrying amount, the Company will perform a quantitative goodwill impairment test. The quantitative impairment test for goodwill consists of a comparison of the fair value of a reporting unit with its carrying value, including the goodwill allocated to that reporting unit. If the carrying value of a reporting unit exceeds its fair value, the Company will recognize an impairment loss equal to the amount of the excess, limited to the amount of goodwill allocated to that reporting unit.
The Company assessed relevant qualitative factors, such as the Company’s operations, actual versus budgeted results of operations, forecast, macroeconomics conditions, etc. The Company concluded there is no indication that it is more likely than not that the fair value of the reporting unit is less than its carrying amount. As such, no quantitative impairment test is necessary and the Company’s goodwill was not impaired as of December 31, 2024 and 2023.
Impairment of Long-Lived Assets
In accordance with FASB ASC 360, Property, Plant and Equipment, long-lived assets, excluding goodwill, to be held and used by the Company are reviewed for impairment if events or circumstances indicate that the fair value of the assets have decreased below their carrying value. For long-lived assets to be held and used, the Company bases their evaluation on impairment indicators such as the nature of the assets, the future economic benefit of the assets, any historical or future profitability measurements and other external market conditions or factors that may be present.
The Company’s management assesses whether there has been an impairment trigger, and if a trigger is identified, then the Company would perform an undiscounted cash flow test at the lowest level for which identifiable cash flows are independent of cash flows from other assets. If the sum of the undiscounted future net cash flows is less than the net book value of the property, an impairment loss is recognized for any excess of the property’s net book value over its estimated fair value. There was no impairment trigger event observed in 2024 and 2023. The Company did not recognize impairment losses for long-lived assets during the years ended December 31, 2024 and 2023.
Variable Interest Entity
The Company uses a qualitative approach in assessing the consolidation requirement for variable interest entities. The approach focuses on identifying which enterprise has the power to direct the activities that most significantly impact the variable interest entity’s economic performance and which enterprise has the obligation to absorb losses or the right to receive benefits from the variable interest entity. In the event that the Company is the primary beneficiary of a variable interest entity, the assets, liabilities, and results of operations of the variable interest entity would be consolidated in our financial statements. The Company has determined that it has significant influence over the operating and financial policies of the three pipeline entities in which it is invested, but does not exercise control over them; and hence, it accounts for these investments using the equity method. Refer to Note 7—Equity Method Investments in the Notes to our Consolidated Financial Statements in this Annual Report. Equity Method Investments
The Company follows the equity method of accounting when it does not exercise control over its equity interests but can exercise significant influence over the operating and financial policies of the entity. Under this method, the equity investments are carried originally at acquisition cost, increased by the Company’s proportionate share of the equity interest’s net income and contributions made, and decreased by the Company’s proportionate share of the equity interest’s net losses and distributions received. The Company determines whether distributions are a return on or a return of the investment based on the nature of the distribution approach, under which the Company classifies distributions from an investee by evaluating the facts, circumstances and nature of each distribution. For distributions from the Company’s EMI pipeline entities that are generated from their respective normal course of business, the Company classifies the distributions as return on investments and as cash flows from operating activities. For distributions that are a return of the investment, the Company classifies the distribution as cash flows from investing activities. Please refer to Note 7—Equity Method Investments in the Notes to our Consolidated Financial Statements in this Annual Report, for further information of the Company’s EMIs.
Other Assets
The Company’s accounting policy is to classify its line fill as an other long-term asset to be consistent with industry practices and given line fill is required on certain third-party pipelines to properly flow the Company’s product. Additionally, this line fill is contractually required to be maintained through the life of the contract with our counterparty and therefore will not be settled within an operating period. Accordingly, the Company had NGL and gas line fill of $16.8 million and $16.4 million within other assets as of December 31, 2024 and 2023, respectively.
Redeemable Noncontrolling Interest — Common Units Limited Partners
Pursuant to the Contribution Agreement, in connection with the Closing, (i) Contributor contributed all the equity interests of the Contributed Entities to the Partnership; and (ii) in exchange for such contribution, the Partnership issued 50,000,000 common units representing limited partner interests in the Partnership and the Company issued 50,000,000 shares of the Company’s Class C Common Stock, par value $0.0001 per share, to Contributor. Please refer to Note 1—Description of Business and Basis of Presentation in the Notes to our Consolidated Financial Statements in this Annual Report. The Common Units are redeemable at the option of unit holders and accounted for in the Company’s Consolidated Balance Sheet as a redeemable noncontrolling interest classified as temporary equity. The Company records the redeemable noncontrolling interest at the higher of (i) its initial value plus accumulated earnings/losses associated with the noncontrolling interest or (ii) the maximum redemption value as of the balance sheet date. The redemption value was determined based on a 5-day volume weighted-average closing price of the Company’s Class A Common Stock, par value $0.0001 per share. See discussion and additional details in Note 11—Equity and Warrants in the Notes to our Consolidated Financial Statements in this Annual Report. Mandatorily Redeemable Preferred Units
The Partnership issued Series A Cumulative Redeemable Preferred Units (“Preferred Units”) on June 12, 2019. As the Transaction was accounted for as a reverse merger, the Company assumed certain Preferred Units that were issued and outstanding as of the Closing Date for accounting purposes.
At the Close of the Altus Acquisition, the Company effectuated the Third Amended and Restated Agreement of Limited Partnership of the Partnership, which among other things, provided for mandatory pro-rata redemptions by the Partnership. Given this mandatory redemption feature and pursuant to FASB ASC 480, liability classification was required for these Preferred Units and the pro rata PIK units. The Company valued the liability as of each reporting date and recorded the change in valuation in “Other income (expenses)” in the Consolidated Statements of Operations. During 2022, the Company redeemed all outstanding mandatorily redeemable preferred units and recorded a gain on the redemption of $9.6 million.
Redeemable Noncontrolling Interest — Preferred Unit Limited Partners
The remaining Preferred Units assumed on the Closing Date were accounted for on the Company’s Consolidated Balance Sheets as a redeemable noncontrolling interest classified as temporary equity in accordance with the terms of the Preferred Units. During 2022, the Company redeemed all outstanding redeemable noncontrolling Preferred Units and recorded a gain on the related embedded derivative of $89.1 million.
Deferred Consideration Shares
The adjusted purchase price of the Durango Acquisition included deferred consideration of approximately 7.7 million shares of Class C Common Stock (and an equivalent number of common units in the Partnership (“OpCo Units”)), valued at $275.0 million to be issued on July 1, 2025. Pursuant to ASC 260—Earnings Per Share, these shares are considered as deferred consideration and outstanding as of the Durango Closing Date for the purpose of earning per share (“EPS”) calculation as issuance of these shares is not subject to any conditions other than the passage of time. Fair value of the deferred consideration was included in the “Redeemable noncontrolling interest—Common Units limited partners” of the Consolidated Balance Sheets as of December 31, 2024. The outstanding number of deferred consideration shares is part of the “if-converted method” used by the Company to determine the potential dilutive effect of an assumed exchange of outstanding Common Units (and the cancellation of a corresponding number of shares of outstanding Class C Common Stock) for shares of Class A Common Stock.
Share-Based Compensation
On Altus Closing Date, all outstanding Class A-1 and Class A-2 units from BCP were cancelled and exchanged for shares of Class A Common Stock (“Class A Shares”). The Class A Shares are held in escrow and vest over three to four years. Similarly, the Class A-3 units from BCP were exchanged for shares of Class C Common Stock and a corresponding number of Common Units (“Class C Shares”) and vest over four years. In addition, the Company granted restricted stock units (“RSUs”) to its officers, directors and employees pursuant to the Company’s 2019 Omnibus Compensation Plan, as amended from time to time. The Class A and Class C Shares and RSUs are recorded at grant-date fair value and compensation expense is recognized on a straight‑line basis over the vesting period within “General and Administrative Expense” of the Consolidated Statements of Operations in accordance with FASB ASC 718, Compensation - Stock Compensation (“ASC 718”). Forfeitures are recognized as they occur.
In the first quarter of 2024, the Company granted performance stock units (“PSUs”) pursuant to the Kinetik Holdings Inc. Amended and Restated 2019 Omnibus Compensation Plan to certain of its employees and executives. These PSUs vest and become earned upon the achievement of certain performance goals based on the Company’s annualized absolute total stockholder return and the Company’s relative total stockholder return as compared to the performance peer group during a three-year performance period. Depending on the results achieved during the three-year performance period, the actual number of Class A Common Stock that a holder of the PSUs earns at the end of the performance period may range from 0% to 200% of the target number of PSUs granted. The fair value of the PSUs is determined using a Monte Carlo simulation at the grant date. The Company recognized compensation expense for PSUs on a straight-line basis over the performance period within “General and Administrative Expense” of the Consolidated Statements of Operations in accordance with FASB ASC 718. Any PSU not earned at the end of the performance period will be forfeited.
See further discussion of the Company’s assessment in Note 14—Share-Based Compensation in the Notes to our Consolidated Financial Statements in this Annual Report. Income Taxes
The Company is subject to federal income, state income, and Texas margin tax. The Texas margin tax is assessed on corporations, limited liability companies, and limited partnerships. As such, the Company accounts for state income taxes in accordance with the asset and liability method of accounting for income taxes. Deferred income taxes are recognized for the tax consequences of temporary differences, at enacted statutory rates, between the consolidated financial statement carrying amounts and the tax bases of existing assets and liabilities. Income tax or benefit represents the current tax payable or refundable for the period, as applicable, plus or minus the tax effect of the net change in the deferred tax assets and liabilities.
The Company routinely assesses its ability to realize its deferred tax assets. If the Company concludes that it is more likely than not that some or all of its deferred tax assets will not be realized, the tax asset is reduced by a valuation allowance. See further discussion of the Company’s assessment in Note 15—Income Taxes in the Notes to our Consolidated Financial Statements in this Annual Report. Net Income Per Share
Basic EPS is calculated by dividing net income attributable to Class A common shareholders by the weighted-average number of shares of Class A Common Stock outstanding during the period. Class C Common Stock is excluded from the weighted-average shares outstanding for the calculation of basic net income per share, as holders of Class C Common Stock are not entitled to any dividends or liquidating distributions.
The Company uses the “if-converted method” to determine the potential dilutive effect of an assumed exchange of outstanding Common Units (and the cancellation of a corresponding number of shares of outstanding Class C Common Stock) for shares of Class A Common Stock and includes the dilutive effect of unvested Class A common shares in the diluted weighted average outstanding shares calculation.
Recently Adopted Accounting Pronouncement
Effective January 1, 2024, the Company adopted ASU 2023-07, which was applied retrospectively to all prior periods presented in the financial statements. The amendment requires a public entity disclose, on an annual and interim basis (1) significant segment expenses that are regularly provided to the CODM and included within each reported measure of segment profit or loss (collectively referred to as the “significant expense principle”); (2) an amount for other segment items by reportable segment and a description of its composition. The other segment items category is the difference between segment revenue less the segment expenses disclosed under the significant expense principle and each reported measure of segment profit or loss; (3) clarification if the CODM uses more than one measure of a segment’s profit or loss in assessing segment performance and deciding how to allocate resources; (4) the title and position of the CODM and an explanation of how the CODM uses the reported measure(s) of segment profit or loss in assessing segment performance and deciding how to allocate resources. With adoption of ASU 2023-07, the Company has updated the segment disclosures in Note 19—Segments. Recent Accounting Pronouncement Not Yet Adopted
In December 2023, the FASB issued ASU 2023-09, Income Taxes (Topic 740) (“ASU 2023-09”). The amendments in this update require that public business entities on an annual basis (1) disclose specific categories in the rate reconciliation and (2) provide additional information for reconciling items that meet a quantitative threshold (if the effect of those reconciling items is equal to or greater than 5 percent of the amount computed by multiplying pretax income or loss by the applicable statutory income tax rate). A public business entity is required to provide an explanation, if not otherwise evident, of the individual reconciling items disclosed, such as the nature, effect, and underlying causes of the reconciling items and the judgment used in categorizing the reconciling items. The amendments in this update require that all entities disclose on an annual basis (1) the amount of income taxes paid (net of refunds received) disaggregated by federal (national), state, and foreign taxes and (2) the amount of income taxes paid (net of refunds received) disaggregated by individual jurisdictions in which income taxes paid (net of refunds received) is equal to or greater than 5 percent of total income taxes paid (net of refunds received). The amendments in this update eliminate the requirement for all entities to (1) disclose the nature and estimate of the range of the reasonably possible change in the unrecognized tax benefits balance in the next 12 months or (2) make a statement that an estimate of the range cannot be made. For public business entities, the amendments in this update are effective for annual periods beginning after December 15, 2024. The amendments in this Update should be applied on a prospective basis. Retrospective application is permitted. We are evaluating the effect of the amendments on our consolidated financial statements and expect to disclose the required information beginning in the Annual Report on Form 10-K for the year ended December 31, 2025.
In November 2024, the FASB issued ASU 2024-03, Income Statement—Reporting Comprehensive Income—Expense Disaggregation Disclosures (“ASU 2024-03”). The new standard requires that at each interim and annual reporting period an entity: (1) Disclose the amounts of (a) purchases of inventory, (b) employee compensation, (c) depreciation, (d) intangible asset amortization, and (e) depreciation, depletion, and amortization recognized as part of oil- and gas-producing activities (DD&A) (or other amounts of depletion expense) included in each relevant expense caption. A relevant expense caption is an expense caption presented on the face of the income statement within continuing operations that contains any of the expense categories listed in (a)–(e). (2) Include certain amounts that are already required to be disclosed under current GAAP in the same disclosure as the other disaggregation requirements. (3) Disclose a qualitative description of the amounts remaining in relevant expense captions that are not separately disaggregated quantitatively. (4) Disclose the total amount of selling expenses and, in annual reporting periods, an entity’s definition of selling expenses. In January 2025, the FASB issued ASU 2025-01, Income Statement—Reporting Comprehensive Income—Expense Disaggregation Disclosures - Clarifying the Effective Date (“ASU 2025-01”). ASU 2024-03 and ASU 2025-01 apply to all public business entities and are effective for annual reporting periods beginning after December 15, 2026 and interim reporting periods within annual reporting periods beginning after December 15, 2027. The requirements will be applied prospectively with the option for retrospective application. Early adoption is permitted. The Company is currently evaluating the effect that ASU 2024-03 and 2025-01 will have on the disclosures within its Consolidated Financial Statements.
3. BUSINESS COMBINATIONS
Durango Permian LLC Acquisition
On June 24, 2024 (the “Durango Closing Date”), the Company consummated the previously announced transaction contemplated by the Durango MIPA, dated May 9, 2024, by and between the Company, the Partnership, and the Durango Seller, pursuant to which the Partnership purchased all of the membership interests of Durango from Durango Seller for an adjusted purchase price of approximately $785.7 million, consisting of (i) $358.0 million of cash consideration paid at closing, (ii) approximately 3.8 million shares of Class C Common Stock, par value $0.0001 per share, of the Company (“Class C
Common Stock”) (and an equivalent number of OpCo Units), valued at $148.2 million, issued at closing and (iii) approximately 7.7 million shares of Class C Common Stock (and an equivalent number of OpCo Units), valued at $275.0 million, to be issued on July 1, 2025. Durango Seller is also entitled to an earn out of up to $75.0 million in cash contingent upon the Kings Landing gas processing complex in Eddy County, New Mexico (the “Kings Landing Project”), which is currently under construction, being placed into service (the “Kings Landing Earnout”). The Kings Landing Earnout is subject to reduction based on actual capital costs associated with the Kings Landing Project. The Durango Acquisition allows the Company to further expand its footprint into New Mexico and across the Northern Delaware Basin.
The Durango Acquisition was accounted for as a business combination in accordance with ASC 805 Business Combination (“ASC 805”). Starting on the Durango Closing Date, our Consolidated Financial Statements reflected Durango as a consolidated subsidiary. The accompanying Consolidated Financial Statements in this Annual Report herein include (i) the combined net assets of the Company carried at historical costs and net assets of Durango carried at fair value as of the Durango Closing Date and (ii) the combined results of operations of the Company with Durango’s results presented within the Consolidated Financial Statements in this Annual Report from the Durango Closing Date going forward.
Both observable and non-observable market data, thus Level 2 and Level 3 inputs, are used in the assessment of the fair value of the assets acquired and liabilities assumed listed in the table below. The fair value of the processing plants, gathering system and related facilities and equipment is based on market and cost approaches and will be depreciated over an estimated useful life ranging from one to thirty years, which is consistent with the Company’s policy over similar facilities and equipment. The fair value of the intangible assets is based on the market and cost approaches for the right-of-way and discounted cash flow approach for customer contracts, which will be amortized over estimated useful lives ranging from eight to nine years. The assumed liabilities are approximate to fair value as of the Durango Closing Date. Acquired net assets from this business combination were included in the Midstream Logistic segment. In addition, the Company recorded a contingent liability related to the Kings Landing Earnout based on project completion probability, see additional information in Note 17—Commitments and Contingencies in the Notes to our Consolidated Financial Statements set forth in this Annual Report. Since the Durango Closing Date, the Company has made necessary adjustments to the purchase price allocation as information about facts and circumstances that existed at the Durango Closing Date have become available. This included certain working capital adjustments as a result of obtaining Durango’s closing balance sheet as of June 30, 2024. During the year ended December 31, 2024, the Company identified working capital adjustments of $26.1 million and a reduction of other long-term assets of $0.2 million resulting from the final closing balance sheet, identification and assessment of environmental liabilities totaling $24.0 million, valuation adjustments related to the long-lived assets and intangible assets of $50.6 million, valuation of deferred tax liabilities of $0.4 million and valuation of contingent liabilities related to the Kings Landing Earnout of $59.5 million, resulting in a decrease in goodwill of $10.4 million.
The following table summarizes the estimated fair value of assets acquired and liabilities assumed in the Durango Acquisition as of June 24, 2024, in accordance with ASC 805:
| | | | | | | | | | | | | | |
| (In thousands) | | Amount |
| Cash and cash equivalents | | $ | 16,785 | |
| Accounts receivable | | 29,386 | |
| Prepaid and other current assets | | 15,000 | |
| Property, plant, and equipment, net | | 627,452 | |
| Intangible assets, net | | 183,000 | |
| Deferred charges and other assets | | 4 | |
| Operating lease ROU assets | | 3,617 | |
| | |
| Total assets acquired | | 875,244 | |
| | |
| Accounts payable | | 34,443 | |
| Accrued expenses | | 7,140 | |
| Environmental liabilities | | 24,000 | |
| Contract liabilities | | 642 | |
| Operating lease liabilities | | 3,617 | |
| Deferred tax liabilities | | 19,735 | |
| Total liabilities assumed | | 89,577 | |
| | |
Contingent consideration(1) | | 4,500 | |
| Consideration transferred | | $ | 781,167 | |
(1)Pursuant to ASC 805, the Company evaluated the earn-out consideration classification in accordance with ASC 480, Distinguishing Liabilities from Equity (“ASC 480”). The Company determined the earn-out consideration to be classified as a liability based on the settlement provision. Therefore, the Company records the contingent consideration at fair value as of December 31, 2024. Additional discussion in Note 17—Commitments and Contingencies in the Notes to our Consolidated Financial Statements set forth in this Annual Report. The Company incurred acquisition-related costs of $3.2 million for the year ended December 31, 2024, which were included in the “General and administrative expenses” of the Consolidated Statements of Operations.
The Company’s Consolidated Statement of Operations included results of operations from Durango starting from the Durango Closing Date through December 31, 2024, which included revenues of $75.9 million and net income of $4.1 million for the year ended December 31, 2024.
Supplemental Pro Forma Information
The unaudited supplemental pro forma financial data is for informational purposes only and is not indicative of future results. The results below for the years ended December 31, 2024 and 2023, respectively, combine the results of the Company and Durango, giving effect to the Durango Acquisition as if it had been completed on January 1, 2023.
| | | | | | | | | | | | | | | | | | | | |
| | Pro Forma Financials For the Year Ended December 31, | | | | |
| | 2024 | | 2023 | | | | | | |
| | | | | | | | |
| | (In thousands) | | | | | | |
| Revenues | | $ | 1,595,973 | | | $ | 1,560,541 | | | | | | | |
| Net income including noncontrolling interest | | $ | 246,022 | | | $ | 378,997 | | | | | | | |
Given the assumed pro forma transaction date of January 1, 2023, we removed $3.5 million of acquisition-related expenses for the year ended December 31, 2024 and recognized $3.5 million of acquisition-related expenses for the year ended December 31, 2023. We also removed $24.0 million of interest expense on Durango’s debt for the year ended December 31, 2024, and $16.1 million for the year ended December 31, 2023, as if the business combination had occurred and the debt had been paid off on January 1, 2023.
Midstream Infrastructure Assets
In the first quarter of 2023, the Partnership closed on a purchase and sale agreement for certain midstream assets for $65.0 million together with a new 20-year midstream service agreement. Midstream assets acquired consisted of water gathering and disposal assets and intangible right-of-way assets. As the net book value of the acquired assets were approximate to their fair market value, consideration was allocated to property plant and equipment and intangible based on the historical long-lived assets and intangible assets ratio acquired. In addition, the Partnership entered into an incentive and acceleration agreement related to near term supplemental development activities on acreage dedicated for midstream services to affiliates of the Partnership. Such development activities began in October 2023 and are subject to semi-annual performance milestones and subject to refund with consequential monetary penalty if not satisfied. Consideration for the incentive and acceleration agreement of $60.0 million was capitalized as a contract asset in accordance with ASC 606, of which $4.7 million was included in “Prepaid and Other Current Assets” and $55.3 million was included in “Deferred Charges and Other Assets” in the Consolidated Balance Sheet as of the date of acquisition. Acquisition-related costs were immaterial for this transaction. Acquired net assets from this business combination were included in the Midstream Logistic segment.
4. REVENUE RECOGNITION
The following table presents a disaggregation of the Company’s revenue:
| | | | | | | | | | | | | | | | | | | | |
| | For the Year Ended December 31, |
| | 2024 | | 2023 | | 2022 |
| | | | | | |
| | (In thousands) |
| Gathering and processing services | | $ | 408,000 | | | $ | 417,751 | | | $ | 393,954 | |
| Natural gas, NGLs and condensate sales | | 1,062,986 | | | 822,410 | | | 806,353 | |
| Other revenue | | 11,943 | | | 16,251 | | | 13,183 | |
| Total revenues | | $ | 1,482,929 | | | $ | 1,256,412 | | | $ | 1,213,490 | |
There have been no significant changes to the Company’s contracts with customers during the years ended December 31, 2024, 2023, and 2022 aside from the addition of certain gas gathering and processing agreements associated with the Durango Acquisition in 2024. Contracts with customers acquired through the Transaction had similar structures as the Company’s existing contracts with customers. For the years ended December 31, 2024, 2023, and 2022 the Company recognized revenues from producer MVC short falls of $0.1 million, $1.6 million and $4.0 million, respectively.
Remaining Performance Obligations
The following table presents our estimated revenue from contracts with customers for remaining performance obligations that has not yet been recognized, representing our contractually committed revenues as of December 31, 2024:
| | | | | |
| Fiscal Year | Amount |
| (In thousands) |
| 2025 | $ | 58,710 | |
| 2026 | 73,265 | |
| 2027 | 73,981 | |
| 2028 | 72,873 | |
| 2029 | 70,674 | |
| Thereafter | 160,076 | |
| $ | 509,579 | |
Our contractually committed revenue, for purposes of the tabular presentation above, is limited to customer contracts that have fixed pricing and fixed volume terms and conditions, generally including contracts with payment obligations associated with MVCs.
Contract Liabilities
The following provides information about contract liabilities from contracts with customers:
| | | | | | | | | | | |
| (In thousands) | 2024 | | 2023 |
| Balance as of January 1 | $ | 32,238 | | | $ | 29,300 | |
| Reclassification of beginning contract liabilities to revenue as a result of performance obligations being satisfied | (7,003) | | | (9,292) | |
| Cash received in advance and not recognized as revenue | 1,430 | | | 12,230 | |
| Balance as of December 31 | 26,665 | | | 32,238 | |
| Less: Current portion | 5,680 | | | 6,477 | |
| Non-current portion | $ | 20,985 | | | $ | 25,761 | |
Contract liabilities relate to payments received in advance of satisfying performance obligations under a contract, which result from contribution in aid of construction payments. Current and noncurrent contract liabilities are included in “Other Current Liabilities” and “Contract Liabilities”, respectively, of the Consolidated Balance Sheets.
Contract liabilities balance as of December 31, 2024 decreased $5.6 million compared to that as of December 31, 2023. Lower contract liabilities balance is primarily due to the reclassification of beginning contract liabilities to revenue as a result of performance obligations being satisfied during the year slightly offset by additional provisions for customer capital reimbursements.
Contract Cost Assets
The Company has capitalized certain costs incurred to obtain a contract or additional contract dedicated acreage or volumes that would not have been incurred if the contract or associated acreage and volumes had not been obtained. These costs are recovered through the net cash flows of the associated contract. As of December 31, 2024 and 2023, the Company had contract cost assets of $64.6 million and $71.2 million, respectively. Current and noncurrent contract cost assets are included in “Prepaid and Other Current Assets” and “Deferred Charges and Other Assets”, respectively, of the Consolidated Balance Sheets. The Company amortizes these assets as cost of sales on a straight-line basis over the life of the associated long-term customer contract. For the years ended December 31, 2024, 2023, and 2022, the Company recognized cost of sales associated with these assets of $6.6 million, $6.6 million and $1.8 million, respectively.
Contract cost assets balance as of December 31, 2024, decreased $6.6 million compared to that as of December 31, 2023 related to the amortization of these assets during 2024.
5. PROPERTY, PLANT AND EQUIPMENT, NET
Property, plant, and equipment, net at carrying value, is as follows:
| | | | | | | | | | | | | | |
| | December 31, |
| | 2024 | | 2023 |
| | | | |
| | (In thousands) |
| Gathering, processing, and transmission systems and facilities | | $ | 3,977,825 | | | $ | 3,253,539 | |
| Vehicles | | 15,659 | | | 11,447 |
| Computers and equipment | | 7,872 | | | 6,242 |
| Less: accumulated depreciation | | (813,371) | | | (626,223) | |
| Total depreciable assets, net | | 3,187,985 | | | 2,645,005 | |
| Construction in progress | | 215,168 | | | 74,369 | |
| Land | | 30,711 | | | 23,853 | |
| Total property, plant, and equipment, net | | $ | 3,433,864 | | | $ | 2,743,227 | |
The cost of property classified as “Construction in progress” is excluded from capitalized costs being depreciated. These amounts represent property that is not yet available to be placed into productive service as of the respective reporting date. The Company recorded $184.1 million, $158.6 million and $139.6 million of depreciation expense for the years ended December 31, 2024, 2023, and 2022, respectively.
Capitalized interest included in property, plant and equipment amounted to $8.3 million, $6.4 million and $1.4 million for the years ended December 31, 2024, 2023, and 2022, respectively.
6. INTANGIBLE ASSETS, NET
Intangible assets, net are comprised of the following:
| | | | | | | | | | | | | | |
| | December 31, |
| | 2024 | | 2023 |
| | | | |
| | (In thousands) |
| Customer contracts | | $ | 1,270,106 | | | $ | 1,139,665 | |
| Right of way assets | | 196,979 | | | 141,711 | |
| Less accumulated amortization | | (814,595) | | | (689,706) | |
| Total amortizable intangible assets, net | | $ | 652,490 | | | $ | 591,670 | |
At December 31, 2024, the remaining customer contract amortization terms range from one to seventeen years with weighted average amortization periods of approximately 7.87 years, and the right-of-way assets remaining amortization terms range from one to fifteen years with weighted average amortization periods of approximately 6.53 years. The overall remaining weighted average amortization period for the intangible assets as of December 31, 2024 was approximately 7.63 years.
The Company recorded $140.1 million, $122.3 million and $120.7 million of amortization expense for the years ended December 31, 2024, 2023, and 2022, respectively. There was no impairment recognized on intangible assets for the years ended December 31, 2024, 2023, and 2022, respectively.
Estimated aggregate amortization expense for the remaining unamortized balance in future years is as follows:
| | | | | |
| Fiscal Year | Amount |
| (In thousands) |
| 2025 | $ | 138,419 | |
| 2026 | 131,482 | |
| 2027 | 96,706 | |
| 2028 | 50,752 | |
| 2029 | 46,215 | |
| Thereafter | 188,916 | |
| Total | $ | 652,490 | |
7. EQUITY METHOD INVESTMENTS
As of December 31, 2024, the Company owned investments in the following long-haul pipeline entities in the Permian Basin. These investments were accounted for using the equity method of accounting. For each EMI pipeline entity, the Company has the ability to exercise significant influence based on certain governance provisions and its participation in the significant activities and decisions that impact the management and economic performance of the EMI pipeline.
The table below presents the ownership percentages and investment balances held by the Company for each entity:
| | | | | | | | | | | | | | | | | | | | | | | | | | |
| | December 31, |
| 2024 | | 2023 |
| | | | | | | | |
| | (In thousands, except for ownership percentages) |
| | Ownership | | Amount | | Ownership | | Amount |
| Permian Highway Pipeline LLC (“PHP”) | 55.5 | % | | $ | 1,607,323 | | | 55.5 | % | | $ | 1,666,254 | |
| Breviloba LLC (“Breviloba”) | 33.0 | % | | 428,383 | | | 33.0 | % | | 443,684 | |
Epic Crude Holdings, LP (“EPIC”)(1) | | 27.5 | % | | 82,172 | | | 15.0 | % | | — | |
Gulf Coast Express Pipeline LLC (“GCX”)(2) | — | % | | — | | | 16.0 | % | | 431,051 | |
| | | $ | 2,117,878 | | | | | $ | 2,540,989 | |
(1)As of December 31, 2023 and until the purchase of the 12.5% equity interest in EPIC in July 2024, the Company owned 15.0% of EPIC. However, no dollar value was assigned through the Altus Acquisition purchase price allocation as an adjustment was made to eliminate equity in losses of EPIC.
(2)The Company owned 16% of GCX as of December 31, 2023 and divested its entire ownership in June 2024.
During the third quarter 2024, the Company entered into an Equity Sale and Purchase Agreement with third parties to purchase a 12.5% equity interest in EPIC, increasing our total equity interest in EPIC to 27.5%. As the increase in ownership did not result in a controlling interest, and did not represent the funding of prior losses, the Company resumed accounting for its investment in EPIC using the equity method of accounting upon the closing of the acquisition of the additional interests during July 2024.
On June 4, 2024, the Company consummated the previously announced transaction contemplated by the Purchase and Sale Agreement dated as of May 9, 2024, to sell its 16% equity interest in GCX to GCX Pipeline, LLC (the "GCX Buyer") for an adjusted price of $524.4 million (the "GCX Sale"), including a $30.0 million earn out in cash upon the approval by the GCX Board of Directors of one or more capital projects that achieve certain capacity expansion criteria. The Company recognized a net gain of $89.8 million for the year ended December 31, 2024 in relation to this transaction.
As of December 31, 2024 and 2023, the unamortized net basis differences included in the EMI pipelines’ investment balances were $40.3 million and $349.3 million, respectively. These amounts represent differences in the Company’s contributions to date and the Company’s underlying equity in the separate net assets within the financial statements of the respective entities. Unamortized basis differences will be amortized or accreted into equity income over the useful lives of the underlying pipeline assets. There was capitalized interest of $23.9 million and $24.7 million as of December 31, 2024 and 2023, respectively. Capitalized interest is amortized on a straight-line basis into equity income.
The following table presents the activities in the Company’s EMIs:
| | | | | | | | | | | | | | | | | | | | | | | | | | | | | | | | |
| PHP | | Breviloba | | GCX | | EPIC | | Total |
| | | | | | | | | | |
| (In thousands) |
| Balance at December 31, 2022 | $ | 1,474,800 | | | $ | 455,057 | | | $ | 451,483 | | | $ | — | | | $ | 2,381,340 | |
| | | | | | | | | |
| Contributions | 226,948 | | | — | | | — | | | — | | | 226,948 | |
| Distributions | (178,542) | | | (42,711) | | | (57,916) | | | — | | | (279,169) | |
| Capitalized interest | 11,855 | | | — | | | — | | | — | | | 11,855 | |
Equity income, net(1) | 131,193 | | | 31,338 | | | 37,484 | | | — | | | 200,015 | |
| | | | | | | | | |
| | | | | | | | | |
| Balance at December 31, 2023 | $ | 1,666,254 | | | $ | 443,684 | | | $ | 431,051 | | | $ | — | | | $ | 2,540,989 | |
| | | | | | | | | |
| Acquisitions | | — | | | — | | | — | | | 85,417 | | | 85,417 | |
| Contributions | 3,273 | | | — | | | — | | | — | | | 3,273 | |
| Distributions | (236,285) | | | (42,156) | | | (15,610) | | | — | | | (294,051) | |
| | | | | | | | | | |
| | | | | | | | | |
| Disposition | — | | | — | | | (430,941) | | | — | | | (430,941) | |
Equity income, net(1) | 174,081 | | | 26,855 | | | 15,500 | | | (3,245) | | | 213,191 | |
| | | | | | | | | |
| | | | | | | | | |
| Balance at December 31, 2024 | $ | 1,607,323 | | | $ | 428,383 | | | $ | — | | | $ | 82,172 | | | $ | 2,117,878 | |
(1)For the year ended December 31, 2024, net of amortization and accretion of basis differences and capitalized interests, which represents undistributed earnings, the amortization (accretion) was $7.9 million from PHP, $0.7 million from Breviloba, $2.7 million from GCX, and $(3.2) million from EPIC. For the year ended December 31, 2023, net of amortization of basis differences and capitalized interests, which represents undistributed earnings, the amortization was $7.5 million from PHP, $0.7 million from Breviloba and $6.2 million from GCX.
Summarized Financial Information
The following represented selected income statement and balance sheet data for the Company’s EMI pipeline entities (on a 100 percent balance):
| | | | | | | | | | | | | | | | | | | | | | | | | | |
| | For the Year Ended December 31, 2024 |
| | PHP | | Breviloba | | GCX(1) | | EPIC |
| | | | | | | | |
| Statements of Operations | | (In thousands) |
| Revenues | | $ | 508,137 | | | $ | 193,118 | | | $ | 151,486 | | | $ | 382,958 | |
| Operating income | | 326,338 | | 87,301 | | 110,679 | | | 92,566 | |
| Net income (loss) | | 327,335 | | 87,886 | | 110,458 | | | (46,986) | |
| | | | | | | | |
| | For the Year Ended December 31, 2023 |
| | PHP | | Breviloba | | GCX | | EPIC |
| | | | | | | | |
| Statements of Operations | | (In thousands) |
| Revenues | | $ | 401,668 | | | $ | 188,921 | | | $ | 364,223 | | | $ | 347,436 | |
| Operating income | | 259,872 | | 93,763 | | 267,019 | | 55,830 | |
| Net income (loss) | | 261,332 | | 94,378 | | 273,194 | | (77,825) | |
| | | | | | | | |
| | For the Year Ended December 31, 2022 |
| | PHP | | Breviloba | | GCX | | EPIC |
| | | | | | | | |
| Statements of Operations | | (In thousands) |
| Revenues | | $ | 396,846 | | | $ | 183,328 | | | $ | 364,223 | | | $ | 244,250 | |
| Operating income | | 261,040 | | 98,119 | | 269,150 | | 12,174 | |
| Net income (loss) | | 261,028 | | 97,834 | | 268,493 | | (71,821) | |
| | | | | | | | |
|
| | | | | | | | |
| | | | | | | | |
| | | | | | | | | | | | | | | | | | | | | | | | | | | | | | | | | | | | | | | | | | | | | | | | | | |
| | December 31, |
| | 2024 | | 2023 |
| | PHP | | Breviloba | | GCX(1) | | EPIC | | PHP | | Breviloba | | GCX | | EPIC |
| | | | | | | | | | | | | | | | |
| Balance Sheets | | (In thousands) |
| Current assets | | $ | 84,566 | | | $ | 28,302 | | | $ | 47,649 | | | $ | 181,867 | | | $ | 101,900 | | | $ | 30,108 | | | $ | 49,884 | | | $ | 111,799 | |
| Noncurrent assets | | 2,474,121 | | | 1,237,862 | | | 1,524,798 | | | 1,937,058 | | | 2,575,843 | | | 1,277,648 | | | 1,509,632 | | | 2,041,496 | |
| Total assets | | $ | 2,558,687 | | | $ | 1,266,164 | | | $ | 1,572,447 | | | $ | 2,118,925 | | | $ | 2,677,743 | | | $ | 1,307,756 | | | $ | 1,559,516 | | | $ | 2,153,295 | |
| | | | | | | | | | | | | | | | |
| Current liabilities | | $ | 42,636 | | | $ | 14,639 | | | $ | 21,973 | | | $ | 80,994 | | | $ | 67,597 | | | $ | 17,131 | | | $ | 21,908 | | | $ | 80,353 | |
| Noncurrent liabilities | | — | | | 9,187 | | | 302 | | | 1,197,849 | | | — | | | 8,427 | | | 329 | | | 1,185,874 | |
| Equity | | 2,516,051 | | | 1,242,338 | | | 1,550,172 | | | 840,082 | | | 2,610,146 | | | 1,282,198 | | | 1,537,279 | | | 887,068 | |
| Total liabilities and equity | | $ | 2,558,687 | | | $ | 1,266,164 | | | $ | 1,572,447 | | | $ | 2,118,925 | | | $ | 2,677,743 | | | $ | 1,307,756 | | | $ | 1,559,516 | | | $ | 2,153,295 | |
(1)Represented summarized financial information from GCX for the five months period ended and as of May 31, 2024 as the Company sold all its equity interest in GCX on June 4, 2024.
8. DEBT AND FINANCING COSTS
Comprehensive Refinancing 2022
On June 8, 2022, the Partnership completed the private placement of $1.00 billion aggregate principal amount of 5.875% Senior Notes due 2030 (the “2030 Notes”), which are fully and unconditionally guaranteed by the Company. The 2030 Notes were issued under our Sustainability-Linked Financing Framework and include certain Sustainability Performance Targets (“SPT”) that the Company needs to meet from and including June 15, 2027.
In addition, the Partnership entered into the revolving credit agreement with Bank of America, N.A. as administrative agent, which provides for a $1.25 billion revolving credit facility (the “Revolving Credit Facility”) maturing on June 8, 2027, and the Term Loan with PNC Bank as administrative agent, which provided for a $2.00 billion senior unsecured term loan credit facility (“Term Loan”) maturing on June 8, 2025, which was amended on December 6, 2023 to extend the maturity date from June 8, 2025 to June 8, 2026, with an additional automatic six-month extension of the amended maturity date to December 8, 2026, at such time as no more than $1.00 billion of an aggregate principal amount of loans under the Term Loan remain outstanding, subject to customary conditions. Both the Revolving Credit Facility and Term Loan include certain “Sustainability Adjustment” features that could result in an interest rate adjustment that depends on the Company meeting the sustainability targets defined in the respective agreement.
Proceeds from the Notes and the Term Loan were used to repay all outstanding borrowings under previous credit facilities and to pay fees and expenses related to the offering. The Company recorded a loss on debt extinguishment of $28.0 million for the year ended December 31, 2022.
December 2028 Sustainability-Linked Senior Notes
On December 6, 2023, the Partnership completed a private placement of $500.0 million aggregate principal amount of 6.625% Sustainability-Linked Senior Notes due 2028 (the “Original 2028 Notes”) at par. Further, on December 19, 2023, the Company completed an additional private placement of $300.0 million aggregate principal amount of 6.625% Sustainability-Linked Senior Notes due 2028 (the “Additional 2028 Notes”) at 100.50% of face amount (collectively, the “2028 Notes”). The Original 2028 Notes and the Additional 2028 Notes are treated as a single series of securities under the indenture governing the 2028 Notes, vote together as a single class, and have substantially identical terms, other than the issue date and issue price. The 2028 Notes are fully and unconditionally guaranteed by the Company and include certain Sustainability Performance Targets (“SPT”) that the Company needs to meet from and including June 15, 2027.
Interest on the 2028 Notes is payable semi-annually in arrears on June 15 and December 15 of each year, commencing June 15, 2024. The aggregate fees and expenses paid to obtain the 2028 Notes totaled $11.2 million and were capitalized as debt issuance cost and included in the Consolidated Balance Sheets as a direct deduction to the 2028 Notes. The $1.5 million premium was added to the 2028 Notes. The debt issuance cost is amortized and debt premium was accreted to interest expense over the term of the 2028 Notes using the effective interest method.
The Partnership may redeem in whole or in part, at a redemption price equal to the Make-Whole-Redemption Price, which is the greater of (1) 100% of the principal amount of the 2028 notes to be redeemed or (2) the present value of the 2028 Notes to be redeemed at such redemption date, prior to December 15, 2025. On or after December 15, 2025, the Partnership may redeem in whole or in part at the redemption price set forth in the indenture agreement governing the 2028 Notes.
Term Loan Amendment 2023
On December 6, 2023, the Partnership, the Company, PNC Bank, and the banks and other financial institutions party thereto, as lenders, entered into a First amendment to Credit Agreement (the “First Amendment”), concurrently with the closing of its 2028 Notes discussed above.
The First Amendment (1) extended the maturity of the Term Loan to June 8, 2026 upon the prepayment of a principal amount of loans under the Term Loan of no less than $500.0 million; and (2) provided for an additional automatic six-month extension of the amended maturity date to December 8, 2026, at such time as no more than $1.00 billion of an aggregate principal amount of loans under the Term Loan remain outstanding, subject to customary conditions. Pursuant to FASB ASC 470-50, Modifications and Extinguishments, the Company determined that the amendment of the maturity date is a modification of the original Term Loan. Fees paid directly to lenders in arranging the modification totaled $1.5 million and were recorded as an original debt discount and included in the Consolidated Balance Sheets as a direct deduction of the Term Loan and was amortized over the modified remaining life of the Term Loan using the effective interest method. Cost incurred with third parties directly related to the modification totaled $0.6 million and were expensed as incurred. Furthermore, the partial paydown of the principal under the Term Loan totaled $800.0 million, using proceeds from the 2028 Notes, resulting in the write off (loss extinguishment) of a proportional amount of the remaining unamortized debt issuance cost and original discount from the Term Loan immediately prior to the paydown. The Company recorded a $1.9 million loss on extinguishment from these write offs in the Consolidated Statements of Operations for the year ended December 31, 2023.
Accounts Receivable Securitization Facility
On April 2, 2024, Kinetik Receivables LLC (“Kinetik Receivables”), a bankruptcy remote special purpose entity formed as a direct subsidiary of the Partnership, which is a subsidiary of the Company, entered into an accounts receivable securitization facility with an initial facility limit of $150.0 million (“A/R Facility”) with PNC Bank, as the administrative agent, and certain purchasers party thereto from time to time, which has a scheduled termination date of April 1, 2025. The aggregate fees and expenses paid directly to third parties in obtaining the A/R Facility totaled $1.1 million and were capitalized as debt issuance costs and included in the Consolidated Balance Sheets as a current asset within “Prepaid and other current assets”, amortized over the term of the A/R Facility to interest expense using the effective-interest method. There were unamortized debt issuance costs related to the A/R Facility of $0.3 million as of December 31, 2024.
Pursuant to the A/R Facility, the Company and certain of its subsidiaries continuously transfer receivables to Kinetik Receivables and Kinetik Receivables transfers receivables that meet certain qualifying conditions to third-party purchasers in exchange for cash. These receivables are held by Kinetik Receivables and are pledged to secure the collectability of the sold receivables and are accounted for as secured borrowings. The amount available for borrowing at any one time under the A/R Facility is limited to an amount calculated based on the outstanding balance of eligible receivables sold to the purchasers, subject to certain reserves, concentration limits, and other limitations. Under the A/R Facility, the Company is subject to pay a yield to the purchasers equal to SOFR plus a spread adjustment of 0.10% and a drawn fee of 0.90%. The Company also pays a fee of 0.40% on the undrawn committed amount of the A/R Facility. Yield and fees payable by the Company under the AR Facility are due monthly. The effective interest rate on the A/R Facility was 5.55% as of December 31, 2024. As of December 31, 2024, eligible accounts receivable of $140.2 million were pledged to the A/R Facility as collateral.
The Partnership has continuing involvement with the receivables transferred by Kinetik Receivables to the third-party purchasers by providing collection services.
The net proceeds of the A/R Facility were used, together with cash on hand, to repay a portion of the outstanding borrowings under the existing Term Loan Credit Facility, lowering the remaining balance to $1.0 billion. As a result, the maturity of the Term Loan Credit Facility extended to December 8, 2026. The Company recognized a loss on debt extinguishment of $0.5 million for the partial payment made on the Term Loan Credit Facility.
Sustainability Performance Targets
The Partnership’s outstanding debts were 100% linked to sustainability performance targets as of December 31, 2024 and 2023, among which, the Partnership’s 2030 Notes and the 2028 Notes have SPTs that would result in interest rate adjustments starting on June 15, 2027, and the Partnership’s Term Loan, Revolving Credit Facility and A/R Facility have SPTs to be met for each calendar year starting in 2022 and onward.
In 2023, the Company met both SPTs under the Term Loan and Revolving Credit Facility. As a result of meeting both SPTs under the Term Loan and Revolving Credit Facility, the Company maintained the favorable rate adjustment for these facilities during 2024. The 2024 SPTs will be verified in 2025 for rate adjustment.
Compliance with our Covenants
Each of the revolving credit agreements with Bank of America, N.A. as administrative agent and the Term Loan Credit Facility, contain customary covenants and restrictive provisions which may, among other things, limit the Partnership’s ability to create liens, incur additional indebtedness and make restricted payments and the Partnership’s ability to liquidate, dissolve, consolidate with or merge into or with any other person. The 2030 Notes and the 2028 Notes also contain covenants and restrictive provisions, which may, among other things, limit the Partnership’s and its subsidiaries’ ability to create liens to secure indebtedness.
The A/R Facility contains covenants and restrictive provisions with respect to the Partnership and Kinetik Receivables that are customary for accounts receivable securitization facilities.
As of December 31, 2024, the Partnership is in compliance with all customary and financial covenants.
Fair Value of Financial Instruments
The fair value of the Company and its subsidiaries’ consolidated debt as of December 31, 2024 and 2023 was $3.52 billion and $3.57 billion, respectively. At December 31, 2024, the 2030 Notes and the 2028 Notes’ fair value was based on Level 1 inputs and the Term Loan and Revolving Credit Facility’s fair value was based on Level 3 inputs and the A/R Facility’s fair value approximates its carrying value due to its short term nature.
The following table summarizes the Company’s debt obligations:
| | | | | | | | | | | | | | |
| | December 31, |
| | 2024 | | 2023 |
| | | | |
| | (In thousands) |
| A/R Facility | | $ | 140,200 | | | $ | — | |
| Total current debt obligations | | $ | 140,200 | | | $ | — | |
| | | | |
Unsecured term loan(1) | | $ | 1,000,000 | | | $ | 1,200,000 | |
| $1.00 billion 2030 senior unsecured notes | | 1,000,000 | | | 1,000,000 | |
| $0.80 billion 2028 senior unsecured notes | | 800,000 | | | 800,000 | |
$1.25 billion revolving line of credit(2) | | 590,000 | | | 594,000 | |
| Total Long-term debt | | 3,390,000 | | | 3,594,000 | |
Deferred debt issuance costs, net(3) | | (26,174) | | | (31,510) | |
| Unamortized debt premium and discount, net | | 170 | | | 319 | |
| Long-term portion of debt, net | | $ | 3,363,996 | | | $ | 3,562,809 | |
| | | | |
(1)The effective interest rate was 6.25% and 7.06% as of December 31, 2024 and 2023, respectively.
(2)The weighted average effective interest rate was 6.43% and 7.06% as of December 31, 2024 and 2023, respectively.
(3)Excludes unamortized debt issuance cost related to the Revolving Credit Facility. Unamortized debt issuance cost associated with the Revolving Credit Facility was $3.8 million and $5.4 million as of December 31, 2024 and 2023, respectively. As of December 31, 2024 and 2023, the current and non-current portion of the unamortized debt issuance costs related to the revolving credit facilities were included in the “Prepaid and other current assets” and “Deferred charges and other assets” of the Consolidated Balance Sheets, respectively.
Interest Income and Financing Costs, Net of Capitalized Interest
The table below presents the components of the Company’s financing costs, net of capitalized interest:
| | | | | | | | | | | | | | | | | | | | |
| | For the Year Ended December 31, |
| | 2024 | | 2023 | | 2022 |
| | | | | | |
| | (In thousands) |
| Capitalized interest | | $ | (8,321) | | | $ | (18,270) | | | $ | (2,747) | |
| Debt issuance costs | | 7,438 | | | 6,194 | | | 9,569 | |
| Interest expense | | 218,118 | | | 217,930 | | | 142,430 | |
| Total financing costs, net of capitalized interest | | $ | 217,235 | | | $ | 205,854 | | | $ | 149,252 | |
As of December 31, 2024 and 2023, unamortized debt issuance costs associated with the 2030 Notes, the 2028 Notes and the Term Loan Credit Facility were $26.2 million and $31.5 million, respectively, and unamortized debt premium and discount, net, associated with the 2028 Notes and Term Loan Credit Facility were $0.2 million and $0.3 million, respectively.
The following table reflects future maturities of our outstanding debt for each of the next five years and thereafter. These amounts exclude approximately $26.0 million in unamortized deferred financing costs, debt premium and discount, net:
| | | | | |
| Fiscal Year | Amount |
| (In thousands) |
| 2025 | $ | 140,200 | |
| 2026 | 1,000,000 | |
| 2027 | 590,000 | |
| 2028 | 800,000 | |
| 2029 | — | |
| Thereafter | 1,000,000 | |
| Total | $ | 3,530,200 | |
9. ACCRUED EXPENSES
The following table provides detail of the Company’s other current liabilities:
| | | | | | | | | | | | | | |
| | December 31, |
| | | 2024 | | 2023 |
| | | | |
| | (In thousands) |
| Accrued product purchases | | $ | 132,439 | | | $ | 109,172 | |
| Accrued taxes | | 15,538 | | | 632 | |
| Accrued salaries, vacation, and related benefits | | 3,111 | | | 1,872 | |
| Accrued capital expenditures | | 13,484 | | | 18,534 | |
| Accrued interest | | 6,127 | | | 33,760 | |
| Accrued other expenses | | 16,015 | | | 13,451 | |
| Total accrued expenses | | $ | 186,714 | | | $ | 177,421 | |
Accrued product purchases mainly accrue the liabilities related to producer payments and any additional business-related miscellaneous fees we owe to third parties, such as transport or capacity fees as of December 31, 2024 and 2023.
10. LEASES
Components of lease costs are presented on the Consolidated Statements of Operations as “General and administrative expense” for real-estate leases and operating expense for non-real estate leases. Total operating lease cost for the years ended December 31, 2024, 2023 and 2022 were $38.7 million, $45.6 million, and $37.7 million, respectively. Short-term lease cost for the years ended December 31, 2024, 2023 and 2022 were $7.7 million, $3.4 million, and $6.2 million, respectively.
The following table presents other supplemental lease information:
| | | | | | | | | | | | | | |
| | Year Ended December 31, |
| | 2024 | | 2023 |
| | | | |
| | (In thousands) |
| Operating cash flows from operating leases | | $ | 39,247 | | | $ | 45,366 | |
| Right-of-use assets obtained in exchange for new operating lease liabilities | | $ | 43,682 | | | $ | 5,189 | |
| Weighted-average remaining lease term — operating leases (in years) | | 1.85 | | 1.51 |
| Weighted-average discount rate — operating leases | | 6.82 | % | | 8.76 | % |
The following table presents future minimum lease payments under operating leases:
| | | | | | | | | | | | | | | | | | | | | | | |
| Fiscal Year | | | | | | | | | | | | | | | | | Amount |
| | | | | | | | | | | | | | | | | (In thousands) |
| 2025 | | | | | | | | | | | | | | | | | $ | 19,702 | |
| 2026 | | | | | | | | | | | | | | | | | 7,978 | |
| 2027 | | | | | | | | | | | | | | | | | 2,691 | |
| 2028 | | | | | | | | | | | | | | | | | 812 | |
| 2029 | | | | | | | | | | | | | | | | | 695 | |
| Thereafter | | | | | | | | | | | | | | | | | 48 | |
| Total lease payments | | | | | | | | | | | | | | | | | 31,926 | |
| Less: interest | | | | | | | | | | | | | | | | | (1,735) | |
| Present value of lease liabilities | | | | | | | | | | | | | | | | | $ | 30,191 | |
11. EQUITY AND WARRANTS
Redeemable Noncontrolling Interest - Common Unit Limited Partners
On February 22, 2022, the Company consummated the previously announced business combination transactions contemplated by the Contribution Agreement, dated as of October 21, 2021. Pursuant to the Contribution Agreement, in connection with the Closing, (i) Contributor contributed all the equity interests of the Contributed Entities to the Partnership; and (ii) in exchange for such contribution, the Partnership transferred to Contributor 50,000,000 common units representing limited partner interests in the Partnership and 50,000,000 shares of the Company’s Class C Common Stock, par value $0.0001 per share. Please refer to Note 1—Description of Business and Basis of Presentation in the Notes to our Consolidated Financial Statements in this Annual Report. The redemption option of the Common Unit is not legally detachable or separately exercisable from the instrument and is non-transferable, and the Common Unit is redeemable at the option of the holder. Therefore, the Common Unit is accounted for as redeemable noncontrolling interest and classified as temporary equity on the Company’s Consolidated Balance Sheets. During 2024, 146,250 common units were redeemed on a one-for-one basis for shares of Class A Common Stock and a corresponding number of shares of Class C Common Stock were cancelled. There were 97,783,034 Common Units and an equal number of Class C Common Stock issued and outstanding as of December 31, 2024. The Common Units fair value was approximately $5.96 billion and $3.16 billion as of December 31, 2024 and 2023, respectively. The fair value of the Common Units is estimated based on a quoted market price.
Preferred Units
Upon Closing, the Company assumed certain Preferred Units that were issued and outstanding as of the Closing Date. At the Closing, the Company assumed liabilities of $200.7 million related to mandatorily redeemable Preferred Units and temporary equity of $462.7 million related to redeemable noncontrolling interest - Preferred Units Limited Partners. During 2022, the Company redeemed all assumed Preferred Units from the Closing and recorded a gain on the redemption of mandatorily redeemable Preferred Units of $9.6 million and a gain on embedded derivative related to the redeemable noncontrolling interest - Preferred Units Limited Partners of $89.1 million.
Warrants
Upon Closing, the Company assumed certain warrants that were outstanding on the Closing Date. At the Closing, the Company recorded liabilities related to the warrants of $0.2 million. There were 12,577,350 Public Warrants, valued based on Level 1 inputs, and 6,364,281 Private Placement Warrants, valued based on Level 3 inputs. All Public Warrants and Private Placement Warrants expired on November 9, 2023.
Common Stock
As of December 31, 2024, there were 59.9 million and 97.8 million shares, respectively, of Class A Common Stock and Class C Common Stock issued and outstanding (collectively, “Common Stock”). In addition, 7.7 million shares of Class C Common Stock will be issued as deferred consideration for the Durango Acquisition on July 1, 2025.
Stock Repurchase Program
In February 2023, the Board of Directors (the “Board”) approved a stock repurchase program (“Repurchase Program”), authorizing discretionary purchases of the Company’s Class A Common Stock up to $100.0 million in the aggregate. Repurchases may be made at management’s discretion from time to time, in accordance with applicable securities laws, on the open market or through privately negotiated transactions and may be made pursuant to a trading plan meeting the requirements of Rule 10b5-1 under the Exchange Act. Privately negotiated repurchases from affiliates are also authorized under the Repurchase Program, subject to such affiliates’ interest and other limitations. The repurchases will depend on market conditions and may be discontinued at any time without prior notice.
During the year ended December 31, 2024, the Company did not repurchase any of its Class A Common Stock under the Repurchase Program. During the year ended December 31, 2023, the Company repurchased 194,174 shares at a total cost of $5.8 million. The Company retired all treasury stock as of December 31, 2023.
For more information regarding the non-deductible 1% U.S. federal excise tax imposed on certain repurchases of stock by publicly traded U.S. corporations, please refer to Part I—Item 1A Risk Factors—Risks Related to Ownership of our Common Stock.
Dividend
On February 22, 2022, the Company entered into a Dividend and Distribution Reinvestment Agreement (the “Reinvestment Agreement”) with certain stockholders including BCP Raptor Aggregator, LP, BX Permian Pipeline Aggregator, LP, Buzzard Midstream LLC, APA Corporation Apache Midstream LLC, and certain individuals (each, a “Reinvestment Holder”). Under the Reinvestment Agreement, each Reinvestment Holder is obligated to reinvest at least 20% of all distributions on Common Units or dividends on shares of Class A Common Stock in the Company’s Class A Common Stock. Additionally, the Audit Committee resolved that for the calendar year 2023, 100% of all distributions or dividends received by each Reinvestment Holder would be reinvested in newly issued shares of Class A Common Stock. The Reinvestment Agreement automatically terminated on March 8, 2024. As described in these Consolidated Financial Statements, as the context requires, dividends paid to holders of Class A Common Stock and distributions paid to holders of Common Units may be referred to collectively as “dividends.”
During 2024 and 2023, the Company made cash dividend payments of $396.0 million and $82.0 million, respectively, to holders of Class A Common Stock and Common Units and $75.6 million and $352.1 million, respectively, was reinvested in shares of Class A Common Stock by each Reinvestment Holder.
Stock Split
On May 19, 2022, the Company announced that its Board approved and declared a two-for-one stock split with respect to its Class A Common Stock and Class C Common Stock, in the form of a stock dividend. The Stock Split was accomplished by distributing one additional share of Class A Common Stock for each share of Class A Common Stock outstanding and one additional share of Class C Common Stock for each share of Class C Common Stock outstanding. The additional shares of Common Stock were issued on June 8, 2022 to holders of record at the close of business on May 31, 2022.
All corresponding per-share and share amounts, excluding the Altus Acquisition, for periods prior to June 8, 2022 have been retrospectively restated in this Annual Report to reflect the Stock Split.
12. FAIR VALUE MEASUREMENTS
The following tables present financial assets and liabilities that are measured at fair value on a recurring basis:
| | | | | | | | | | | | | | | | | | | | | | | | | | |
| | December 31, 2024 |
| | Level 1 | | Level 2 | | Level 3 | | Total |
| | | | | | | | |
| | (In thousands) |
| Commodity swap | | $ | — | | | $ | 1,869 | | | $ | — | | | $ | 1,869 | |
| Interest rate derivatives | | — | | | 504 | | | — | | | 504 | |
| Total assets | | $ | — | | | $ | 2,373 | | | $ | — | | | $ | 2,373 | |
| | | | | | | | |
| Commodity swaps | | $ | — | | | $ | 10,742 | | | $ | — | | | $ | 10,742 | |
| Interest rate derivatives | | — | | | 1,206 | | | — | | | 1,206 | |
| Contingent liabilities | | — | | | — | | | 4,700 | | | 4,700 | |
| Total liabilities | | $ | — | | | $ | 11,948 | | | $ | 4,700 | | | $ | 16,648 | |
| | | | | | | | |
| | | | | | | | | | | | | | | | | | | | | | | | | | |
| | December 31, 2023 |
| | Level 1 | | Level 2 | | Level 3 | | Total |
| | | | | | | | |
| | (In thousands) |
| Commodity swap | | $ | — | | | $ | 3,663 | | | $ | — | | | $ | 3,663 | |
| Interest rate derivatives | | — | | | 4,314 | | | — | | | 4,314 | |
| Total assets | | $ | — | | | $ | 7,977 | | | $ | — | | | $ | 7,977 | |
| | | | | | | | |
| Commodity swaps | | $ | — | | | $ | 1,749 | | | $ | — | | | $ | 1,749 | |
| Interest rate derivatives | | — | | | 5,348 | | | — | | | 5,348 | |
| Total liabilities | | $ | — | | | $ | 7,097 | | | $ | — | | | $ | 7,097 | |
| | | | | | | | |
Our derivative contracts consist of interest rate swaps and commodity swaps. The valuation of these derivative contracts involved both observable publicly quoted prices and certain credit valuation inputs that may not be readily observable in the marketplace. As such derivative contracts are classified as Level 2 in the hierarchy. Refer to Note 13—Derivatives and Hedging Activities in the Notes to our Consolidated Financial Statements in this Annual Report for further discussion related to commodity swaps and interest rate swaps. The Company recorded a contingent liability related to the Kings Landing Earnout using Level 3 inputs, including projected spending and completion probability of the project. Refer to Note 17—Commitments and Contingencies in the Notes to our Consolidated Financial Statements in this Annual Report for further discussion related to Kings Landing Earnout contingent liability. Long-term debt’s carrying value can vary from fair value. See Note 8—Debt and Financing Costs in the Notes to Consolidated Financial Statements in this Annual Report for further information. The carrying amounts reported on the Consolidated Balance Sheets for the Company’s remaining financial assets and liabilities approximate fair value due to their short-term nature. There were no transfers between Level 1, Level 2 or Level 3 of the fair value hierarchy during the year ended December 31, 2024.
13. DERIVATIVES AND HEDGING ACTIVITIES
The Company is exposed to certain risks arising from both its business operations and economic conditions, and it enters into certain derivative contracts to manage exposure to these risks. To minimize counterparty credit risk in derivative instruments, the Company enters into transactions with high credit-rating counterparties. The Company did not elect to apply hedge accounting to these derivative contracts and recorded the fair value of the derivatives on the Consolidated Balance Sheets as of December 31, 2024 and 2023.
Interest Rate Risk
The Company manages market risks, including interest rate, liquidity, and credit risk primarily by managing the amount, sources, and duration of its debt funding and by using derivative financial instruments. Specifically, the Company enters into derivative financial instruments to manage exposures that arise from activities that result in the payment of future known and uncertain cash amounts, the value of which are determined by interest rates.
The Company’s objectives in using interest rate derivatives is to add stability to interest expense and to manage its exposure to interest rate movements. To accomplish this objective, the Company primarily uses interest rate swaps as part of its interest rate risk management strategy. Interest rate swaps designated as interest rate derivatives involve the receipt of variable amounts from a counterparty if interest rates rise above the strike rate on the contract.
As of December 31, 2024, the Company had two interest rate swap contracts with total notional amounts of $1,700.0 million effective on May 1, 2023 and maturing on May 31, 2025 that pay a fixed rate ranging from 4.38% to 4.48% and four interest rate swap with a total notional amount of $300.0 million effective May 30, 2025 and maturing on December 31, 2025 that pays a fixed rate ranging from 3.02% to 4.06%.
The fair value or settlement value of the consolidated interest rate swaps outstanding are presented on a gross basis on the Consolidated Balance Sheets. The following table presents the fair value of derivative assets and liabilities related to the interest rate swap contracts:
| | | | | | | | | | | | | | |
| | December 31 | | December 31 |
| | 2024 | | 2023 |
| | | | |
| | (In thousands) |
| Derivatives assets - current | | $ | 504 | | | $ | 4,314 | |
| | | | |
| Total derivative assets | | $ | 504 | | | $ | 4,314 | |
| | | | |
| Derivative liabilities - current | | 1,206 | | | — | |
| Derivatives liabilities - noncurrent | | — | | | 5,348 | |
| Total derivative liabilities | | $ | 1,206 | | | $ | 5,348 | |
The Company recorded cash settlements and changes in fair value of the interest rate swap contracts in “Interest expense” of the Consolidated Statements of Operations. The following table presents interest rate swap derivatives activities for the years ended December 31, 2024, 2023 and 2022:
| | | | | | | | | | | | | | | | | | | | |
| | For the Year Ended December 31, |
| | 2024 | | 2023 | | 2022 |
| | | | | | |
| | |
| Realized gain on interest rate swaps | | $ | 13,149 | | | $ | 12,651 | | | $ | 10,872 | |
| Favorable fair value adjustment | | $ | 13,482 | | | $ | 17,270 | | | $ | 7,880 | |
| | | | | | |
Commodity Price Risk
The results of the Company’s operations may be affected by the market prices of oil, natural gas and NGLs. A portion of the Company’s revenue is directly tied to local natural gas, natural gas liquids and condensate prices in the Permian Basin and the U.S. Gulf Coast. Fluctuations in commodity prices also impact operating cost both directly and indirectly. Management regularly reviews the Company’s potential exposure to commodity price risk and manages exposure of such risk through commodity hedge contracts.
During the past twelve months, the Company entered into multiple commodity swap contracts based on the OPIS NGL Mont Belvieu prices for ethane, propane and butane, the Waha Basis index, the HSC index and the NYMEX West Texas Intermediate Control index. These contracts are for various notional quantities of NGLs, natural gas and crude. Similarly, the Company has entered into various natural gas and crude basis spread swaps. These contracts are effective over the next 1 to 17 months and are used to hedge against location price risk of the respective commodity resulting from supply and demand volatility and protect cash flows against price fluctuations.
The table below presents detail information of commodity swaps outstanding as of December 31, 2024 (in thousands, except volumes):
| | | | | | | | | | | | | | | | | | | | | | | | | | | | | | |
| | | | | | December 31, 2024 | | | | |
| Commodity | | Instruments | | Unit | | Volume | | Net Fair Value | | | | |
| | | | | | | | | | | | |
| | | | | | | | (In thousands) | | | | |
| Natural Gas | | Commodity Swap | | MMBtus | | 900,000 | | | $ | (79) | | | | | |
| NGL | | Commodity Swap | | Gallons | | 350,834,400 | | | (8,523) | | | | | |
| Crude | | Commodity Swap | | Bbl | | 622,000 | | | 908 | | | | | |
| Crude Collars | | Commodity Swap | | Bbl | | 145,400 | | | 468 | | | | | |
| | | | | | | | | | | | |
| Natural Gas Basis Spread Swaps | | Commodity Swap | | MMBtus | | 5,440,000 | | | (1,647) | | | | | |
| | | | | | | | $ | (8,873) | | | | | |
The fair value or settlement value of the outstanding swaps are presented on a gross basis on the Consolidated Balance Sheets. The following table presents the fair value of derivative assets and liabilities related to commodity swaps:
| | | | | | | | | | | | | | |
| | December 31 | | December 31 |
| | 2024 | | 2023 |
| | | | |
| | (In thousands) |
| Derivatives assets - current | | $ | 1,804 | | | $ | 3,498 | |
| Derivative assets - noncurrent | | 65 | | | 165 | |
| Total derivative assets | | $ | 1,869 | | | $ | 3,663 | |
| | | | |
| Derivative liabilities - current | | $ | 8,805 | | | $ | 1,734 | |
| Derivatives liabilities - noncurrent | | 1,937 | | | 15 | |
| Total derivative liabilities | | $ | 10,742 | | | $ | 1,749 | |
The Company recorded cash settlements and fair value adjustments on commodity swap derivatives in “Product revenue” of the Consolidated Statements of Operations. The following table presents commodity swap derivatives activities for the years ended December 31, 2024, 2023 and 2022:
| | | | | | | | | | | | | | | | | | | | |
| | For the Year Ended December 31, |
| | 2024 | | 2023 | | 2022 |
| | | | | | |
| | (In thousands) |
| Realized (loss) gain on commodity swaps | | $ | (20,407) | | | $ | 13,056 | | | $ | (205) | |
| (Unfavorable) favorable fair value adjustment | | $ | (31,195) | | | $ | 16,400 | | | $ | (1,429) | |
14. SHARE-BASED COMPENSATION
Class A Shares and Class C Shares
The table below summarizes Class A Shares and Class C Shares activity for the year ended December 31, 2024:
| | | | | | | | | | | | | | |
| | Number of Shares | | Weighted Avg Grant-Date Fair Market Value Per Unit |
| Outstanding and unvested units as of December 31, 2023 | | 5,444,488 | | | $ | 28.91 | |
| | | | |
| Vested | | 43,166 | | | 31.18 | |
| Forfeited | | 1,592 | | | 31.18 | |
| Outstanding and unvested units as of December 31, 2024 | | 5,399,730 | | | $ | 28.89 | |
The table below summarizes aggregate intrinsic value (market value at vesting date) and grant-date fair value of vested Class A Shares for the years ended December 31, 2024 and 2023. No vesting or forfeitures occurred for Class C Shares during 2024 or 2023.
| | | | | | | | | | | | | | |
| | Year Ended December 31, |
| | 2024 | | 2023 |
| | | | |
| | (In thousands) |
| Aggregate intrinsic value of vested Class A Shares | | $ | 1,756 | | | $ | 28 | |
| Grant-date fair value of vested Class A Shares | | $ | 1,346 | | | $ | 25 | |
As of December 31, 2024, there were $27.5 million of unrecognized compensation costs related to unvested Class A Shares and Class C Shares. These costs are expected to be recognized over a weighted average period of 1.03 years.
Restricted Stock Units
RSUs were granted to certain executives and employees under the Kinetik Holdings Inc. Amended and Restated 2019 Omnibus Compensation Plan (the “2019 Plan”) with various service vesting requirements. Such RSUs may be settled only for shares of Class A Common Stock on a one-for-one basis, contingent upon continued employment.
The table below summarizes RSUs activity for the year ended December 31, 2024:
| | | | | | | | | | | | | | |
| | Number of Shares(1) | | Weighted Avg Grant-Date Fair Market Value Per Unit(1) |
| Outstanding and unvested units as of December 31, 2023 | | 435,220 | | | $ | 31.15 | |
| Granted | | 770,227 | | | 39.83 | |
| Vested | | 493,402 | | | 41.89 | |
| Forfeited | | 13,450 | | | 32.40 | |
| Outstanding and unvested units as of December 31, 2024 | | 698,595 | | | $ | 33.11 | |
(1)The number of shares and weighted average fair market value per share here includes restricted share awards issued to new employees transitioned from ALTM as part of the merger.
The table below summarizes aggregate intrinsic value (market value at vesting date) and grant-date fair value of vested RSUs for the years ended December 31, 2024 and 2023.
| | | | | | | | | | | | | | |
| | Year Ended December 31, |
| | 2024 | | 2023 |
| | | | |
| | (In thousands) |
| Aggregate intrinsic value of vested RSUs | | $ | 21,104 | | | $ | 7,446 | |
| Grant-date fair value of vested RSUs | | $ | 20,667 | | | $ | 6,931 | |
As of December 31, 2024, there were $10.4 million of unrecognized compensation costs related to unvested RSUs. These costs are expected to be recognized over a weighted average period of 1.49 years.
Performance Stock Units
The Company granted PSUs pursuant to the 2019 Plan to certain of its employees and executives during 2024. These PSUs vest and become earned upon the achievement of certain performance goals based on the Company’s annualized absolute total stockholder return and the Company’s relative total stockholder return as compared to the performance peer group during a three-year performance period. Depending on the results achieved during the three-year performance period, the actual number of Class A Common Stock that a holder of the PSUs earns at the end of the performance period may range from 0% to 200% of the target number of PSUs granted. The fair value of the PSUs is determined using a Monte Carlo simulation at the grant date. The Company recognized compensation expense for PSUs on a straight-line basis over the performance period. Any PSU not earned at the end of the performance period will be forfeited.
The table below summarizes PSU activities for the year ended December 31, 2024:
| | | | | | | | | | | | | | |
| | Number of Shares | | Weighted Avg Grant-Date Fair Market Value Per Unit |
| | | | |
| Granted in 2024 | | 198,703 | | | $ | 36.76 | |
| | | | |
| | | | |
| Outstanding and unvested units as of December 31, 2024 | | 198,703 | | | $ | 36.76 | |
No vesting or forfeiture occurred for PSUs for the year ended December 31, 2024.
The table below presents a summary of the grant-date fair value assumptions used to value the PSUs on the grant date:
| | | | | | | | |
| | March 2024 |
| Grant-date fair value per unit | | $36.76 |
| Beginning average price | | $32.84 |
| Risk-free interest rate | | 4.21% |
| Volatility factor | | 37% |
| Expected term | | 2.82 years |
As of December 31, 2024, there were $5.2 million of unrecognized compensation costs related to the PSUs. These costs are expected to be recognized over a weighted average period of 2.00 years.
With respect to above Class A Shares, Class C Shares, RSUs and PSUs, the Company recorded compensation expenses of $76.5 million, $56.0 million and $42.8 million in “General and administrative expenses” of the Consolidated Statements of Operations, for the years ended December 31, 2024, 2023 and 2022, respectively, based on a straight-line amortization of the associated awards’ fair value over the respective vesting life of the shares.
15. INCOME TAXES
The total income tax provision consists of the following:
| | | | | | | | | | | | | | | | | | | | |
| | Year Ended December 31, |
| | 2024 | | 2023 | | 2022 |
| | | | | | |
| | (In thousands) |
| Current income tax expense: | | | | | | |
| Federal | | $ | 1,329 | | | $ | — | | | $ | — | |
| State | | 2,203 | | | 492 | | | 522 | |
| | 3,532 | | | 492 | | | 522 | |
| Deferred tax (benefit) expense: | | | | | | |
| Federal | | 19,535 | | | (235,627) | | | — | |
| State | | (32) | | | 2,227 | | | 2,094 | |
| | 19,503 | | | (233,400) | | | 2,094 | |
| Total | | $ | 23,035 | | | $ | (232,908) | | | $ | 2,616 | |
The difference between the effective income tax rate and the U.S. statutory rate is reconciled below:
| | | | | | | | | | | | | | |
| | Year Ended December 31, |
| | 2024 | | 2023 |
| | | | |
| U.S. statutory rate | | 21.00 | % | | 21.00 | % |
| Tax attributable to noncontrolling interest | | (13.11) | % | | (13.51) | % |
| | | | |
| State tax rate | | 2.03 | % | | 1.64 | % |
| Other | | (1.30) | % | | 0.02 | % |
| Valuation allowance | | — | % | | (160.84) | % |
| Effective rate | | 8.62 | % | | (151.69) | % |
The net deferred tax assets reflect the tax impact of temporary differences between the asset and liability amounts carried on the balance sheet under U.S. GAAP and amounts utilized for income tax purposes. The net deferred tax assets consist of the following:
| | | | | | | | | | | | | | |
| | December 31, |
| | 2024 | | 2023 |
| | | | |
| | (In thousands) |
| Deferred tax assets: | | | | |
| Investment in partnership | | $ | 110,856 | | | $ | 145,990 | |
| Net operating losses | | 90,435 | | | 88,788 | |
| Other | | 2,705 | | | 849 | |
| | | | |
| Total deferred tax assets | | 203,996 | | | 235,627 | |
| | | | |
| | | | |
| Deferred tax liabilities: | | | | |
| Property, plant, and equipment | | 16,761 | | | 13,244 | |
| Net deferred tax assets | | $ | 187,235 | | | $ | 222,383 | |
For state purposes, the Company records deferred tax assets and liabilities based on the differences between the carrying value and tax basis of assets and liabilities recorded on the Consolidated Balance Sheets.
For federal purposes, the Company has deferred tax assets related to (i) its investment in the Partnership and (ii) net operating losses (“NOLs”) with no expiration date. As of December 31, 2024, embedded in the investment in partnership deferred tax asset is approximately $21.3 million related to the carryover of interest expense limitation under IRC 163(j). The carryover for the interest expense limitation has no expiration. The Company has evaluated all positive and negative evidence to conclude that it is more likely than not that such deferred tax assets will be realized. This determination was based, in part, on the fact that the Company achieved a three-year cumulative position of profitability as of December 31, 2024. It is also based on our projections of future taxable income at current commodity prices and our current cost structure. This positive evidence outweighs negative evidence regarding the realization of the Company’s deferred tax assets. As a result, no valuation allowance was recorded with respect to such deferred tax assets as of December 31, 2024.
Internal Revenue Code (“IRC”) Section 382 addresses company ownership changes and specifically limits the utilization of certain deductions and other tax attributes on an annual basis following an ownership change. The Company experienced ownership changes within the meaning of IRC Section 382 that subjected certain of the Company's tax attributes, including NOLs, to an IRC Section 382 limitation. Subsequent ownership changes could further impact the limitation in future years. However, notwithstanding such limitation, we expect to use substantially all of our NOLs to offset our future federal tax liabilities. The timing of such usage will depend upon our future earnings and future tax circumstances.
The Company accounts for income taxes in accordance with FASB ASC 740, Income Taxes, which prescribes a minimum recognition threshold a tax position must meet before being recognized in the financial statements. Tax positions generally refer to a position taken in a previously filed income tax return or expected to be included in a tax return to be filed in the future that is reflected in the measurement of current and deferred income tax assets and liabilities.
The Company had no uncertain tax position as of December 31, 2024 and 2023.
The Company records interest and penalties related to unrecognized tax benefits as a component of income tax expense. The Company has recorded no interest or penalties associated with unrecognized tax benefits. As of December 31, 2024, tax years 2020 through 2024 remain subject to examination by various taxing authorities.
16. NET INCOME PER SHARE
EPS is computed by dividing net income attributable to common shareholders by the weighted average number of shares of common stock outstanding during the period. Diluted EPS is computed by dividing net income attributable to the Company by the weighted average number of shares of common stock outstanding and the assumed issuance of all potentially dilutive securities. Each issue of potential common shares is evaluated separately in sequence from the most dilutive to the least dilutive. The dilutive effect of share-based payment awards and stock options is calculated using the treasury stock method, which assumes share purchases are calculated using the average share price of the Company’s common stock during the applicable period. The Company uses the if-converted method to compute potential common shares exchanged from potentially dilutive Common Units. Under the if-converted method, dilutive Common Units are assumed to be exchanged from the date of the issuance and the resulting shares of Class A Common Stock are included in the denominator of the diluted EPS calculation for the period being presented.
The following table sets forth a reconciliation of net income and weighted average shares outstanding used in computing basic and diluted net income per common share:
| | | | | | | | | | | | | | | | | | | | |
| | Year Ended December 31, |
| | 2024 | | 2023 | | 2022 |
| | | | | | |
| | (In thousands, except per share amounts) |
| Net income attributable to Class A common shareholders | | $ | 80,014 | | | $ | 289,442 | | | $ | 40,735 | |
Less: Net income available to participating unvested restricted Class A common shareholders(1) | | (18,829) | | | (17,406) | | | (12,530) | |
Excess preferred carrying amount over consideration paid(2) | | — | | | — | | | 32,900 | |
| Total net income attributable to Class A common shareholders - basic | | $ | 61,185 | | | $ | 272,036 | | | $ | 61,105 | |
| | | | | | |
| Net income attributable to Class A Common shareholders - basic | | $ | 61,185 | | | $ | 272,036 | | | $ | 61,105 | |
Net income attributable to Common Units limited partners(3) | | — | | | 97,010 | | | — | |
| Total net income attributable to Class A common shareholders - diluted | | $ | 61,185 | | | $ | 369,046 | | | $ | 61,105 | |
| | | | | | |
Weighted average shares outstanding - basic(4) | | 59,284 | | | 51,823 | | | 41,630 | |
Dilutive effect of unvested Class A common shares(5) | | 831 | | | 269 | | | 35 | |
Dilutive effect of exchange of outstanding Common Units(3) | | — | | | 94,105 | | | — | |
| Weighted average shares outstanding - diluted | | 60,115 | | | 146,197 | | | 41,665 | |
| | | | | | |
| Net income available per common share - basic | | $ | 1.03 | | | $ | 5.25 | | | $ | 1.47 | |
| Net income available per common share - diluted | | $ | 1.02 | | | $ | 2.52 | | | $ | 1.47 | |
(1)Represents dividends paid to unvested Class A and Class C Shares, RSUs and PSUs.
(2)Represented excess of carrying value of redeemable noncontrolling interest Preferred Units over redemption price at redemption.
(3)The effect of an assumed exchange of outstanding Common Units (and the cancellation of a corresponding number of shares of outstanding Class C Common Stock) would have been anti-dilutive for the years ended December 31, 2024 and 2022.
(4)Share amounts have been retrospectively restated to reflect the Company’s two-for-one Stock Split. Refer to Note 11—Equity and Warrants in the Notes to our Consolidated Financial Statements in this Annual Report for further information. (5)Includes dilutive effect from both RSUs and PSUs on unvested Class A common shares.
17. COMMITMENTS AND CONTINGENCIES
Accruals for loss contingencies arising from claims, assessments, litigation, environmental, and other sources are recorded when it is probable that a liability has been incurred and the amount can be reasonably estimated. These accruals are adjusted as additional information becomes available or circumstances change. As of December 31, 2024 and 2023, there were no accruals for loss contingencies.
Litigation
The Company is a party to various legal actions arising in the ordinary course of its business. In accordance with ASC 450, Contingencies, the Company accrues reserves for outstanding lawsuits, claims, and proceedings when a loss contingency is probable and can be reasonably estimated. The Company estimates the amount of loss contingencies using current available information from legal proceedings, advice from legal counsel and available insurance coverage. Due to the inherent subjectivity of the assessments and unpredictability of the outcomes of the legal proceedings, any amounts accrued or included in this aggregate amount may not represent the ultimate loss to the Company from the legal proceedings in question. Thus, the Company’s exposure and ultimate losses may be higher, and possibly significantly more, than the amounts accrued.
The Company has entered into litigation with a third party to collect receivables totaling $11.6 million and is waiting on settlement of $8.0 million in outstanding vendor credits from another counterparty related to prior litigation the Company had previously entered into and subsequently dropped. These amounts remain outstanding from the Winter Storm Uri during February of 2021. Given the counterparties’ sufficient creditworthiness and the valid claims that we hold, no allowance has currently been established for these items as we have legally enforceable agreements with these parties.
Environmental Matters
The Company is subject to various local, state, and federal laws and regulations relating to various environmental matters during the ordinary course of business. Although we believe our operations are in substantial compliance with applicable environmental laws and relations, risks of additional costs and liabilities are inherent in our operations. Moreover, changes in environmental laws and regulations occur frequently, and any changes that result in more stringent or costly requirements could require the Company to make significant expenditures to attain and maintain compliance or may otherwise have a material adverse effect on its operations, competitive position, or financial condition.
As of the Durango Closing Date, the Company became a potential responsible party to certain potential civil penalties related to excess emission violations of certain gas plants and compressor stations acquired. The Company estimated a liability of $24.0 million based on information related to the alleged violations available as of the Durango Closing Date and December 31, 2024.
Contingent Liabilities
Durango Acquisition
On June 24, 2024, the Company consummated the previously announced Durango Acquisition. Pursuant to the Durango MIPA, Durango Seller is entitled to an earn out of up to $75.0 million in cash contingent upon the completion of the Kings Landing Project and placing it into service in Eddy County, New Mexico. This earn out is subject to reduction based on actual capital costs associated with the Kings Landing Project.
Upon Closing, the Company evaluated the earn-out consideration classification in accordance with ASC 480. The Company determined the earn-out consideration to be classified as a liability based on the settlement provision. As of Closing, the Company recorded an initial contingent liability of $64.0 million and further reduced such contingent liability through a measurement period adjustment of $59.5 million, based on information available as of the Durango Acquisition Date, but obtained subsequent thereto. The earn-out liability is a function of the present value of projected spend as evaluated using a weighted probability model. Pursuant to ASC 805, the Company also recorded a fair value adjustment of $0.2 million within “Costs of sales (exclusive of depreciation and amortization)” of the Consolidated Statement of Operations for the year ended December 31, 2024. The contingent liability associated with the Kings Landing Project of $4.7 million was included in “Other current liabilities” of the Consolidated Balance Sheet as of December 31, 2024.
2019 PDC Acquisition
As part of the acquisition of Permian Gas on June 11, 2019, consideration included a contingent liability arrangement with PDC Permian, Inc. (“PDC”). The arrangement requires additional monies to be paid by the Company to PDC on a per Mcf basis if the actual annual Mcf volume amounts exceed forecasted annual Mcf volume amounts starting in 2020 and continuing through 2029. The total monies paid under this arrangement are capped at $60.5 million and are payable on an annual basis over the earn-out period. PDC’s actual annual Mcf volume did not exceed the incentive forecast volume during the past five years and is not expected to over the next five years; therefore, the estimated fair value of the contingent consideration liability was nil as of December 31, 2024 and 2023.
Letters of Credit
Our Revolving Credit Facility maturing on June 8, 2027, can be used for letters of credit. Our obligations with respect to related letters of credit totaled $12.6 million and $12.6 million as of December 31, 2024 and 2023, respectively.
18. RELATED PARTY TRANSACTIONS
Transactions between related parties are considered to be related party transactions even though they may not be given accounting recognition. FASB ASC 850, Related Party Transactions (“Topic 850”), requires that transactions with related parties that would make a difference in decision making shall be disclosed so that users of the financial statements can evaluate their significance.
Upon closing of the Altus Acquisition, the Company had the following shareholders that owned more than 10% of the Company’s issued and outstanding Common Stock: BCP Raptor Aggregator, LP, Blackstone Management Partners, LLC, BX Permian Pipeline Aggregator LP, Buzzard Midstream LLC and Apache Midstream LLC (“Apache”). Out of these affiliates, the Company has product and service revenue contracts and operating expense contracts with Apache Midstream. In addition, Apache acquired Titus Oil and Gas, LLC (“Titus”) in October 2022, at which time Titus became a related party. Through secondary offerings completed in December 2023 and March 2024, Apache sold all of the Company’s Class A Common Stock it owned. Pursuant to ASC 850, Apache was no longer a related party after the completion of its secondary offering in December 2023 as it owned less than 10% of the Company’s common stock. Pursuant to Regulation S-K, Item 404(a), Apache ceased to be a related party as of March 18, 2024 as it no longer owned any of the Company’s common stock.
The Company also has equity interests in PHP, Breviloba and EPIC as of December 31, 2024. Investments in these EMIs are accounted for using the equity investment method and are considered unconsolidated affiliates. The Company makes contributions, receives distributions and records equity in earnings or losses from these EMIs. See Note 7—Equity Method Investments in the Notes to our Consolidated Financial Statements in this Annual Report for further information. In addition to equity investment activities, the Company pays a demand fee to PHP and a capacity fee to Breviloba for certain volumes transported on the Shin Oak pipeline. The following table summarizes transactions with the above unconsolidated affiliates. Investment contributions, distributions and equity in earnings from EMIs are detailed in Note 7—Equity Method Investments in the Notes to our Consolidated Financial Statements in this Annual Report, thus, not included in the table below. | | | | | | | | | | | | | | | | | | | | |
| | For the Year Ended December 31, |
| | 2024(1) | | 2023 | | 2022 |
| | | | | | |
| | (In thousands) |
| Operating revenue | | $ | 17,211 | | | $ | 104,138 | | | $ | 107,662 | |
| Operating expense | | $ | 179 | | | $ | 759 | | | $ | 632 | |
| Cost of sales | | $ | 58,496 | | | $ | 59,118 | | | $ | 39,304 | |
(1)Included activities from Apache for the period ended March 18, 2024, on which date Apache ceased to be a related party.
As of December 31, 2024, the Company had no accounts receivable or accounts payable due from or to related parties. As of December 31, 2023, accounts receivable from Apache Midstream and Titus totaled $15.8 million and immaterial accounts payable were due to Apache Midstream and Titus.
19. SEGMENTS
Our two operating segments represent the Company’s segments for which discrete financial information is available and is utilized on a regular basis by our CODM to make key operating decisions, assess performance and allocate resources. These segments represent strategic business units with differing products and services. No operating segments have been aggregated to form the reportable segments. Therefore, our two operating segments represent our reportable segments. The activities of each of our reportable segments from which the Company earns revenues and incurs expenses are described below:
•Midstream Logistics: The Midstream Logistics segment operates under three streams, 1) gas gathering and processing, 2) crude oil gathering, stabilization and storage services and 3) produced water gathering and disposal.
•Pipeline Transportation: The Pipeline Transportation segment consists of equity investment interests in three Permian Basin pipelines that access various points along the U.S. Gulf Coast, Kinetik NGL Pipeline and Delaware Link Pipeline. The current operating pipelines transport crude oil, natural gas and NGLs.
Our Chief Executive Officer, who is the CODM, uses segment net income or loss including noncontrolling interests adjusted for taxes, depreciation and amortization, gain or loss on disposal of assets, the proportionate EBITDA from our EMI pipelines, equity income and gain from sale of investments recorded using the equity method, noncash increases and decreases related to hedging activities, fair value adjustments for contingent liabilities, integration and transaction costs and extraordinary losses and unusual or non-recurring charges (“Segment Adjusted EBITDA”) to access performance of each operating segment. For both segments, the CODM uses Segment Adjusted EBITDA to allocate resources. The CODM considers budget-to-actual and forecast-to-actual variances on a monthly basis for both measures when making decisions about allocating capital and personnel to the segments.
The Midstream Logistics segment accounts for more than 98% of the Company’s operating revenues, cost of sales (excluding depreciation and amortization), operating expenses and ad valorem expenses. The Pipeline Transportation segment contains all of the Company’s equity method investments, which contribute more than 91% of the Segment’s Adjusted EBITDA. Corporate and Other contains the Company’s executive and administrative functions, including 84% of the Company’s general and administrative expenses and all of the Company’s stock compensation and debt service costs.
The Company regularly provides management reports to the CODM that include cost of sales, operating expenses, and general and administrative expenses related to the segments, which are all considered to be significant.
The following tables present the Segment Adjusted EBITDA of the Company’s reportable segments and reconciliations of the segment profits to consolidated income before income tax expenses for the years ended December 31, 2024, 2023 and 2022:
| | | | | | | | | | | | | | | | | | | | | | | | | | | | | | | | |
| | Midstream Logistics | | Pipeline Transportation | | Corporate and Other(1) | | Elimination | | Consolidated |
| | | | | | | | | | |
| For the year ended December 31, 2024 | | (In thousands) |
| Revenue | | $ | 1,461,898 | | | $ | 9,088 | | | $ | — | | | $ | — | | | $ | 1,470,986 | |
| Other revenue | | 11,652 | | | 291 | | | — | | | — | | | 11,943 | |
Intersegment revenue(2) | | — | | | 26,099 | | | — | | | (26,099) | | | — | |
| Total segment operating revenue | | 1,473,550 | | | 35,478 | | | — | | | (26,099) | | | 1,482,929 | |
| Costs of sales (excluding depreciation and amortization expense) | | (620,617) | | | (1) | | | — | | | — | | | (620,618) | |
| Intersegment cost of sales | | (26,099) | | | — | | | — | | | 26,099 | | | — | |
Operating expenses(3) | | (217,780) | | | (2,904) | | | — | | | — | | | (220,684) | |
| General and administrative expenses | | (19,623) | | | (1,689) | | | (112,845) | | | — | | | (134,157) | |
| Proportionate EMI EBITDA | | — | | | 346,666 | | | — | | | — | | | 346,666 | |
Other segment items(4) | | 25,452 | | | — | | | 91,530 | | | | | 116,982 | |
Segment Adjusted EBITDA(5) | | $ | 614,883 | | | $ | 377,550 | | | $ | (21,315) | | | $ | — | | | $ | 971,118 | |
| | | | | | | | | | |
| Reconciliation of Segment Adjusted EBITDA to income before income taxes | | | | | | | | | | |
Segment Adjusted EBITDA(5) | | $ | 614,883 | | | $ | 377,550 | | | $ | (21,315) | | | $ | — | | | $ | 971,118 | |
| Add back: | | | | | | | | | | |
| Other interest income | | — | | | — | | | 1,988 | | | — | | | 1,988 | |
| Gain on sale of equity method investment | | — | | | 89,802 | | | — | | | — | | | 89,802 | |
| Equity in earnings of unconsolidated affiliates | | — | | | 213,191 | | | — | | | — | | | 213,191 | |
| Deduct: | | | | | | | | | | |
| Interest expense | | 81 | | | — | | | 217,154 | | | — | | | 217,235 | |
| Depreciation and amortization expenses | | 314,970 | | | 9,204 | | | 23 | | | — | | | 324,197 | |
| Contract assets amortization | | 6,621 | | | — | | | — | | | — | | | 6,621 | |
| Proportionate EMI EBITDA | | — | | | 346,666 | | | — | | | — | | | 346,666 | |
| Share-based compensation | | — | | | — | | | 76,536 | | | — | | | 76,536 | |
| Loss on disposal of assets, net | | 4,040 | | | — | | | — | | | — | | | 4,040 | |
| Commodity hedging unrealized loss | | 10,788 | | | — | | | — | | | — | | | 10,788 | |
| Loss on debt extinguishment | | — | | | — | | | 525 | | | — | | | 525 | |
| Contingent liabilities fair value adjustment | | 200 | | | — | | | — | | | — | | | 200 | |
| Integration costs | | 2,110 | | | — | | | 3,716 | | | — | | | 5,826 | |
| Acquisition transaction costs | | — | | | — | | | 4,096 | | | — | | | 4,096 | |
| Other one-time costs and amortization | | 4,919 | | | — | | | 7,182 | | | — | | | 12,101 | |
| Income (loss) before income taxes | | $ | 271,154 | | | $ | 324,673 | | | $ | (328,559) | | | $ | — | | | $ | 267,268 | |
| | | | | | | | | | | | | | | | | | | | | | | | | | | | | | | | |
| | Midstream Logistics | | Pipeline Transportation | | Corporate and Other(1) | | Elimination | | Consolidated |
| | | | | | | | | | |
| For the year ended December 31, 2023 | | (In thousands) |
| Revenue | | $ | 1,236,304 | | | $ | 3,857 | | | $ | — | | | $ | — | | | $ | 1,240,161 | |
| Other revenue | | 13,343 | | | 2,908 | | | — | | | — | | | 16,251 | |
Intersegment revenue(2) | | — | | | 1,678 | | | — | | | (1,678) | | | — | |
| Total segment operating revenue | | 1,249,647 | | | 8,443 | | | — | | | (1,678) | | | 1,256,412 | |
| Costs of sales (excluding depreciation and amortization expense) | | (514,035) | | | (1,686) | | | — | | | | | (515,721) | |
| Intersegment cost of sales | | (1,678) | | | — | | | — | | | 1,678 | | | — | |
Operating expenses(3) | | (182,684) | | | (458) | | | — | | | — | | | (183,142) | |
| General and administrative expenses | | (17,216) | | | (1,265) | | | (79,425) | | | — | | | (97,906) | |
| Proportionate EMI EBITDA | | — | | | 306,072 | | | — | | | — | | | 306,072 | |
Other segment items(4) | | 9,156 | | | — | | | 63,959 | | | — | | | 73,115 | |
Segment Adjusted EBITDA(5) | | $ | 543,190 | | | $ | 311,106 | | | $ | (15,466) | | | $ | — | | | $ | 838,830 | |
| | | | | | | | | | |
| Reconciliation of Segment Adjusted EBITDA to income before income taxes | | | | | | | | | | |
Segment Adjusted EBITDA(5) | | $ | 543,190 | | | $ | 311,106 | | | $ | (15,466) | | | $ | — | | | $ | 838,830 | |
| Add back: | | | | | | | | | | |
| Other interest income | | — | | | — | | | 677 | | | — | | | 677 | |
| Warrant valuation adjustment | | — | | | — | | | 88 | | | — | | | 88 | |
| Commodity hedging unrealized gain | | 4,291 | | | — | | | — | | | — | | | 4,291 | |
| Equity in earnings of unconsolidated affiliates | | — | | | 200,015 | | | — | | | — | | | 200,015 | |
| Deduct: | | | | | | | | | | |
| Interest expense | | 47 | | | — | | | 205,807 | | | — | | | 205,854 | |
| Depreciation and amortization expenses | | 275,568 | | | 5,395 | | | 23 | | | — | | | 280,986 | |
| Contract assets amortization | | 6,620 | | | — | | | — | | | — | | | 6,620 | |
| Proportionate EMI EBITDA | | — | | | 306,072 | | | — | | | — | | | 306,072 | |
| Share-based compensation | | — | | | — | | | 55,983 | | | — | | | 55,983 | |
| Loss on disposal of assets, net | | 19,402 | | | — | | | — | | | — | | | 19,402 | |
| Loss on debt extinguishment | | — | | | — | | | 1,876 | | | — | | | 1,876 | |
| Integration costs | | 59 | | | — | | | 956 | | | — | | | 1,015 | |
| Acquisition transaction costs | | 33 | | | — | | | 615 | | | — | | | 648 | |
| Other one-time costs and amortization | | 5,996 | | | — | | | 5,905 | | | — | | | 11,901 | |
| Income (loss) before income taxes | | $ | 239,756 | | | $ | 199,654 | | | $ | (285,866) | | | $ | — | | | $ | 153,544 | |
| | | | | | | | | | | | | | | | | | | | | | | | | | |
| | Midstream Logistics | | Pipeline Transportation | | Corporate and Other(1) | | Consolidated(6) |
| | | | | | | | |
| For the year ended December 31, 2022 | | (In thousands) |
| Revenue | | $ | 1,198,474 | | | $ | 1,833 | | | $ | — | | | $ | 1,200,307 | |
| Other revenue | | 13,175 | | | 8 | | | — | | | 13,183 | |
| Total segment operating revenue | | 1,211,649 | | | 1,841 | | | — | | | 1,213,490 | |
| Costs of sales (excluding depreciation and amortization expense) | | (541,518) | | | — | | | — | | | (541,518) | |
Operating expenses(3) | | (153,456) | | | (239) | | | (564) | | | (154,259) | |
| General and administrative expenses | | (18,155) | | | (1,288) | | | (74,825) | | | (94,268) | |
| Proportionate EMI EBITDA | | — | | | 268,826 | | | — | | | 268,826 | |
Other segment items(4) | | 17,525 | | | 97 | | | 62,296 | | | 79,918 | |
Segment Adjusted EBITDA(5) | | $ | 516,045 | | | $ | 269,237 | | | $ | (13,093) | | | $ | 772,189 | |
| | | | | | | | |
| Reconciliation of segment adjusted EBITDA to income before income taxes | | | | | | | | |
Segment Adjusted EBITDA(5) | | $ | 516,045 | | | $ | 269,237 | | | $ | (13,093) | | | $ | 772,189 | |
| Add back: | | | | | | | | |
| Warrant valuation adjustment | | — | | | — | | | 133 | | | 133 | |
| Gain on redemption of mandatorily redeemable Preferred Units | | — | | | — | | | 9,580 | | | 9,580 | |
| Gain on embedded derivative | | — | | | — | | | 89,050 | | | 89,050 | |
| Equity in earnings of unconsolidated affiliates | | — | | | 180,956 | | | — | | | 180,956 | |
| Deduct: | | | | | | | | |
| Interest expense | | 47,419 | | | (664) | | | 102,497 | | | 149,252 | |
| Depreciation and amortization expenses | | 259,318 | | | 1,016 | | | 11 | | | 260,345 | |
| Contract assets amortization | | 1,807 | | | — | | | — | | | 1,807 | |
| Proportionate EMI EBITDA | | — | | | 268,826 | | | — | | | 268,826 | |
| Share-based compensation | | — | | | — | | | 42,780 | | | 42,780 | |
| Loss (gain) on disposal of assets | | 12,645 | | | — | | | (34) | | | 12,611 | |
| Loss (gain) on debt extinguishment | | 27,983 | | | (8) | | | — | | | 27,975 | |
| Integration costs | | 1,314 | | | 93 | | | 10,801 | | | 12,208 | |
| Acquisition transaction costs | | 9 | | | — | | | 6,403 | | | 6,412 | |
| Other one-time costs and amortization | | 14,137 | | | 4 | | | 2,214 | | | 16,355 | |
| Income (loss) before income taxes | | $ | 151,413 | | | $ | 180,926 | | | $ | (79,002) | | | $ | 253,337 | |
(1)Corporate and Other represents those results that: (i) are not specifically attributable to an operating segment; (ii) are not individually reportable or (iii) have not been allocated to a reportable segment for the purpose of evaluating their performance, including certain general and administrative expense items. Items included here to reconcile operating segments profit and loss with the Company’s consolidated profit and loss.
(2)The Company accounts for intersegment sales at market prices, while it accounts for asset transfers at book value. Intersegment revenue is eliminated at consolidation.
(3)Operating expenses includes ad valorem taxes.
(4)Other segment items include other income related to sales tax refund, proceeds from insurance claims and legal settlements, and warrants fair value adjustments, share-based compensation, and one-time or nonrecurring cost adjustments related to amortization of contract costs, commodity hedging unrealized (gain)/loss, contingent liabilities fair value adjustment, integration costs, acquisition transaction costs and other one-time cost or amortization.
(5)Segment adjusted EBITDA is a non-GAAP measure; please see Key Performance Metrics in Item 7. Management’s Discussion and Analysis of Financial Condition and Results of Operations of this Annual Report, for a definition and reconciliation to the GAAP measure.
The following tables present supplemental segment information that are not included in the segment profit measurements above for the years ended December 31, 2024, 2023 and 2022:
| | | | | | | | | | | | | | | | | | | | | | | | | | |
| | Midstream Logistics | | Pipeline Transportation | | Corporate and Other(1) | | Consolidated |
| | | | | | | | |
| For the year ended December 31, 2024 | | (In thousands) |
| Income tax expenses | | $ | — | | | $ | — | | | $ | 23,035 | | | $ | 23,035 | |
Segment assets (2) | | 4,326,954 | | | 2,270,403 | | | 217,580 | | | 6,814,937 | |
Total capital expenditures (3) | | 273,783 | | | 2,080 | | | 10 | | | 275,873 | |
| | | | | | | | | | | | | | | | | | | | | | | | | | |
| | Midstream Logistics | | Pipeline Transportation | | Corporate and Other(1) | | Consolidated |
| | | | | | | | |
| For the year ended December 31, 2023 | | (In thousands) |
| Income tax benefit | | $ | — | | | $ | — | | | $ | (232,908) | | | $ | (232,908) | |
Segment assets (2) | | 3,772,764 | | | 2,703,588 | | | 20,521 | | | 6,496,873 | |
Total capital expenditures (3) | | 234,879 | | | 94,675 | | | — | | | 329,554 | |
| | | | | | | | | | | | | | | | | | | | | | | | | | |
| | Midstream Logistics | | Pipeline Transportation | | Corporate and Other(1) | | Consolidated |
| | | | | | | | |
| For the year ended December 31, 2022 | | (In thousands) |
| Income tax expenses | | $ | — | | | $ | — | | | $ | 2,616 | | | $ | 2,616 | |
Segment assets (2) | | 3,486,948 | | | 2,414,829 | | | 17,934 | | | 5,919,711 | |
Total capital expenditures (3) | | 195,346 | | | 26,233 | | | — | | | 221,579 | |
(1)Corporate and Other represents those results that: (i) are not specifically attributable to an operating segment; (ii) are not individually reportable or (iii) have not been allocated to a reportable segment for the purpose of evaluating their performance, including certain general and administrative expense items.
(2)Pipeline Transportation includes investment in unconsolidated affiliates of $2.12 billion, $2.54 billion and $2.38 billion as of December 31, 2024, 2023 and 2022, respectively.
(3)Excludes contributions, acquisition and divestiture of equity interest in the Company’s EMIs included in Pipeline Transportation segment assets. See Note 7—Equity Method Investments in the Notes to our Consolidated Financial Statements in this Annual Report for additional information.
20. SUBSEQUENT EVENTS
On January 14, 2025, the Company consummated the previously announced transaction contemplated by the definitive agreement with Permian Resources Corporation (“Permian Resources”) to acquire certain natural gas and crude oil gathering systems assets, primarily located in Reeves County, Texas, for approximately $178.4 million of cash consideration (“Permian Resources Midstream Acquisition”). We are currently evaluating the Permian Resources Midstream Acquisition and have not completed the purchase accounting.
On January 22, 2025, the Board declared a cash dividend of $0.78 per share on the Company’s Class A Common Stock which was paid to stockholders of record as of February 3, 2025, on February 12, 2025. The Company, through its ownership of the general partner of the Partnership, declared a distribution of $0.78 per Common Unit from the Partnership to the holders of Common Units, which was paid on February 12, 2025.