Filed Pursuant to Rule 424(b)(3)
Registration No. 333-252697
NOTICE OF ACTION BY WRITTEN CONSENT AND INFORMATION STATEMENT
To the Stockholders of Cottonwood Residential II, Inc.:
This notice of action by written consent and the accompanying information statement/prospectus are being furnished to the holders of non-voting common stock and preferred stock of Cottonwood Residential II, Inc. (“CRII”).
On January 26, 2021, CRII, Cottonwood Residential O.P., LP (“CROP”), CRII’s operating partnership, Cottonwood Communities, Inc. (“CCI”), Cottonwood Communities O.P., LP (“CCOP”), CCI’s operating partnership, and Cottonwood Communities GP Subsidiary, LLC, a wholly owned subsidiary of CCI (“Merger Sub”), entered into an Agreement and Plan of Merger (the “CRII Merger Agreement”) pursuant to which (i) CRII will merge with and into Merger Sub (the “CRII Merger”), with Merger Sub surviving the CRII Merger, such that following the CRII Merger, the surviving entity will continue as a wholly owned subsidiary of CCI, and (ii) CCOP will merge with and into CROP (the “CROP Merger”), with CROP surviving the CROP Merger. At such time, the separate existence of CRII and CCOP will cease.
The CRII Merger Agreement was entered into after a thorough due diligence and negotiation process conducted by a special committee of CRII’s board of directors (the “CRII Transaction Committee”), with the assistance of its advisors, and a special committee of CCI’s board of directors (the “CCI Special Committee”), with the assistance of its advisors. Both the CRII Transaction Committee and the CCI Special Committee are comprised solely of directors independent of management. The board of directors of each of CRII and CCI, based on the unanimous recommendation of the CRII Transaction Committee and CCI Special Committee, respectively, each unanimously approved the CRII Merger. The obligations of CRII and CCI to effect the CRII Merger and of CROP and CCOP to effect the CROP Merger are subject to the satisfaction or waiver of several conditions set forth in the CRII Merger Agreement and described in this information statement/prospectus.
On January 26, 2021, CCI, CCOP and Merger Sub also entered into an Agreement and Plan of Merger with Cottonwood Multifamily REIT I, Inc. (“CMRI”) and Cottonwood Multifamily REIT I O.P., LP (“CMRI OP”), CMRI’s operating partnership, whereby CMRI will merge with and into Merger Sub, with Merger Sub surviving the merger, and CMRI OP will merge with and into CCOP or its successor, with CCOP or its successor surviving the merger. CCI’s proposed merger with CMRI and CCOP’s proposed merger with CMRI OP are referred to herein as the “CMRI Merger.” The consummation of the CRII Merger is not contingent upon the completion of the CMRI Merger, and the consummation of the CMRI Merger is not contingent upon the completion of the CRII Merger; however, under certain circumstances, CMRI may opt not to close if the CRII Merger does not occur.
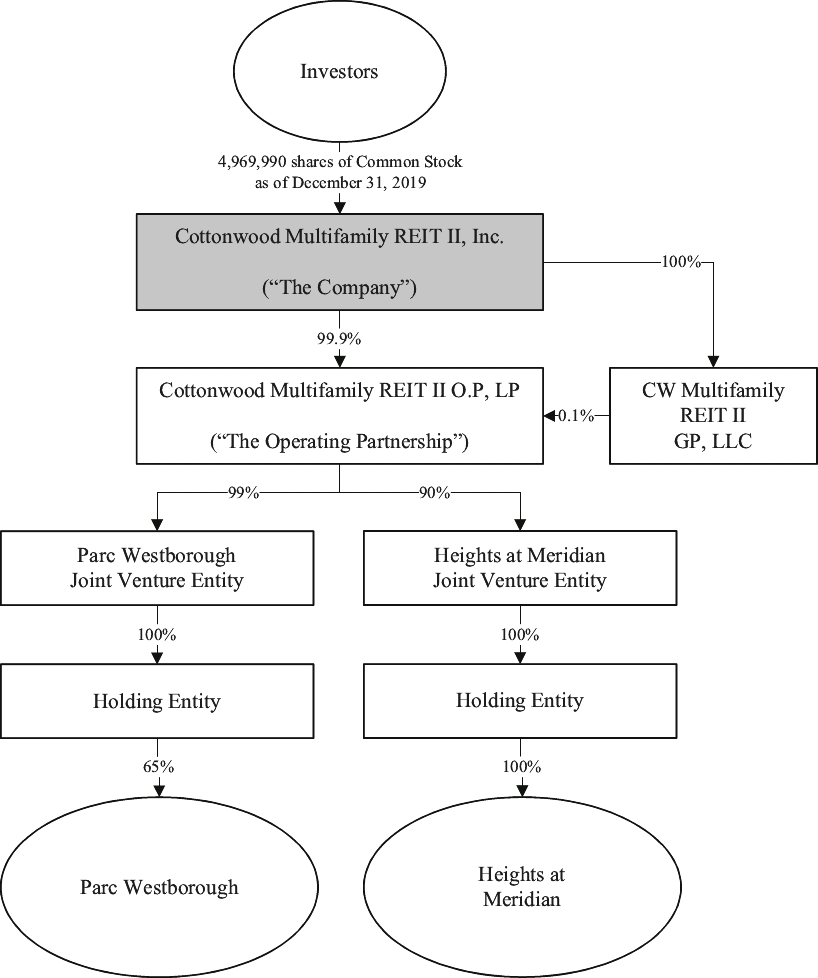
On January 26, 2021, CCI, CCOP and Merger Sub also entered into an Agreement and Plan of Merger with Cottonwood Multifamily REIT II, Inc. (“CMRII”) and Cottonwood Multifamily REIT II O.P., LP (“CMRII OP”), CMRII’s operating partnership, whereby CMRII will merge with and into Merger Sub, with Merger Sub surviving the merger, and CMRII OP will merge with and into CCOP or its successor, with CCOP or its successor surviving the merger. CCI’s proposed merger with CMRII and CCOP’s proposed merger with CMRII OP are referred to herein as the “CMRII Merger” and collectively with the CRII Merger and the CMRI Merger as the “Mergers.” The consummation of the CRII Merger is not contingent upon the completion of the CMRII Merger, and the consummation of the CMRII Merger is not contingent upon the completion of the CRII Merger; however, under certain circumstances, CMRII may opt not to close if the CRII Merger does not occur.
Pursuant to the CRII Merger Agreement, at the effective time of the CRII Merger (the “Effective Time”), (i) each share of common stock of CRII (the “CRII Common Stock”) issued and outstanding immediately prior to the Effective Time will convert into the right to receive 2.015 shares of common stock of CCI, (ii) each share of Series 2016 preferred stock of CRII issued and outstanding immediately prior to the Effective Time will convert into the right to receive one share of Series 2016 preferred stock of CCI and (iii) each share of Series 2017 preferred stock of CRII issued and outstanding immediately prior to the Effective Time will convert into the right to receive one share of Series 2017 preferred stock of CCI. The CRII Merger consideration described above was determined based on a thorough review of the relative valuation of each company by the CCI Special Committee, the CRII Transaction Committee and their respective financial advisors. See “The CRII Merger” beginning on page 105 of this information statement/prospectus for more information about the determination of the merger consideration.
The board of directors of CRII thoroughly reviewed and considered the terms and conditions of the CRII Merger Agreement, the CRII Merger and the other transactions contemplated by the CRII Merger Agreement and, based on the recommendation of the CRII Transaction Committee, unanimously (i) determined that the CRII Merger Agreement, the CRII Merger and the other transactions contemplated by the CRII Merger Agreement are advisable and in the best interests of CRII and its stockholders (other than CRII’s management and certain of its affiliates), (ii) authorized and approved the CRII Merger Agreement, the CRII Merger and the other transactions contemplated by the CRII Merger Agreement on the terms and subject to the conditions set forth in the CRII Merger Agreement, (iii) directed the approval of the CRII Merger be submitted to the holders of the voting common stock of CRII (the “CRII Voting Common Stock”) for consideration and (iv) recommended the approval of the CRII Merger by the holders of the CRII Voting Common Stock.
Pursuant to Section 3-105 of the Maryland General Corporation Law (the “MGCL”) and CRII’s articles of incorporation, as amended, the approval of the CRII Merger by CRII’s stockholders requires the affirmative vote of the holders of a majority of outstanding shares of CRII Voting Common Stock. All shares of the CRII Voting Common Stock are held by Cottonwood Residential Holdings, LLC. Under the terms of a voting agreement dated January 26, 2021 with CCI (the “Voting Agreement”), Cottonwood Residential Holdings, LLC and the beneficial holders of the CRII Voting Common Stock have delivered an irrevocable proxy to CCI with respect to their CRII Voting Common Stock to vote in favor of or act by written consent to approve the CRII Merger. Accordingly, the approval of the CRII Merger by CRII’s stockholders will be effected in accordance with Section 3-105 of the MGCL. No further approval of CRII’s stockholders will be required to approve the CRII Merger. As a result, CRII has not solicited and will not be soliciting your vote for approving the CRII Merger and does not intend to call a meeting of stockholders for purposes of voting on the approval of the CRII Merger.
This notice of action by written consent and the accompanying information statement/prospectus constitutes CRII’s notice to you that the CRII Merger will be approved by the holders of the CRII Voting Common Stock by unanimous written consent in lieu of a meeting in accordance with Section 2-505 of the MGCL. No dissenter’s or appraisal rights will be available with respect to the CRII Merger and the other transactions contemplated by the CRII Merger Agreement, including any remedy under Section 3-201 et seq. of the MGCL.
The information statement/prospectus accompanying this letter provides you with more specific information regarding the CRII Merger, the CRII Merger Agreement and the other transactions contemplated by the CRII Merger Agreement. We encourage you to carefully read the information statement/prospectus, including “Risk Factors” beginning on page 28 and the CRII Merger Agreement attached as Annex A to the information statement/prospectus.
Sincerely, |
 |
Daniel Shaeffer Chief Executive Officer |
Neither the Securities and Exchange Commission nor any state securities regulatory authority has approved or disapproved of the CRII Merger or the securities to be issued under this information statement/prospectus or has passed upon the adequacy or accuracy of the disclosure in this information statement/prospectus. Any representation to the contrary is a criminal offense.
This document and the accompanying information statement/prospectus is dated February 16, 2021 and it is first being mailed to the CRII stockholders on or about February 16, 2021.