UNITED STATES
SECURITIES AND EXCHANGE COMMISSION
WASHINGTON, D.C. 20549
FORM 10-K
(Mark One)
☒ ANNUAL REPORT PURSUANT TO SECTION 13 OR 15(d) OF THE SECURITIES EXCHANGE ACT OF 1934
For the Fiscal Year Ended December 31, 2024
OR
☐ TRANSITION REPORT PURSUANT TO SECTION 13 OR 15(d) OF THE SECURITIES EXCHANGE ACT OF 1934
Commission File No. 001-38081

| | | | | | | | | | | | | | |
| Liberty Energy Inc. |
| (Exact Name of Registrant as Specified in its Charter) |
| Delaware | | | | 81-4891595 |
| (State or Other Jurisdiction of Incorporation or Organization) | | | | (I.R.S. Employer Identification No.) |
950 17th Street, Suite 2400 Denver, Colorado | | | | 80202 |
| (Address of Principal Executive Offices) | | | | (Zip Code) |
| | (303) 515-2800 | | |
| (Registrant’s Telephone Number, Including Area Code) |
| Securities registered pursuant to Section 12(b) of the Act: |
| | | | |
| Title of each class | | Trading symbol(s) | | Name of each exchange on which registered |
| | | | |
| Class A Common Stock, par value $0.01 | | LBRT | | New York Stock Exchange |
Securities registered pursuant to Section 12(g) of the Act: None
Indicate by check mark if the registrant is a well-known seasoned issuer, as defined in Rule 405 of the Securities Act. ☒ Yes ☐ No
Indicate by check mark if the registrant is not required to file reports pursuant to Section 13 or Section 15(d) of the Act. ☐ Yes ☒ No
Indicate by check mark whether the registrant (1) has filed all reports to be filed by Section 13 or 15(d) of the Securities Exchange Act of 1934 during the preceding 12 months (or for such shorter period that the registrant was required to file such reports), and (2) has been subject to such filing requirements for the past 90 days. ☒ Yes ☐ No
Indicate by check mark whether the registrant has submitted electronically every Interactive Data File required to be submitted pursuant to Rule 405 of Regulation S-T (§232.405 of this Chapter) during the presiding 12 months (or for such shorter period that the registrant was required to submit and post such files). ☒ Yes ☐ No
Indicate by check mark whether the registrant is a large accelerated filer, an accelerated filer, a non-accelerated filer, a smaller reporting company, or an emerging growth company. See the definitions of “large accelerated filer,” “accelerated filer,” “smaller reporting company” and “emerging growth company” in Rule 12b-2 of the Exchange Act. | | | | | | | | | | | |
| Large Accelerated Filer ☒ | Accelerated Filer ☐ | Non-accelerated filer ☐ | Smaller reporting company ☐ |
Emerging growth company ☐
If an emerging growth company, indicate by check mark if the registrant has elected not to use the extended transition period for complying with any new or revised financial accounting standards provided pursuant to Section 13(a) of the Exchange Act. ☐
Indicate by check mark whether the registrant has filed a report on an attestation to its management’s assessment of the effectiveness of its internal control over financial reporting under Section 404(b) of the Sarbanes-Oxley (15 U.S.C. 7262(b)) by the registered public accounting firm that prepared or issued its audit report. ☒
If securities are registered pursuant to Section 12(b) of the Act, indicate by check mark whether the financial statements of the registrant included in the filing reflect the correction of an error to previously issued financial statements. ☐
Indicate by check mark whether any of those error corrections are restatements that required a recovery analysis of incentive-based compensation received by any of the registrant’s executive officers during the relevant recovery period pursuant to §240.10D-1(b). ☐
Indicate by check mark whether the registrant is a shell company (as defined in Rule 12b-2 of the Act): ☐ Yes ☒ No
As of June 28, 2024, the last business day of the registrant’s most recently completed second fiscal quarter, the aggregate market value of voting and non-voting common stock held by non-affiliates of the registrant was approximately $3.3 billion, determined using the per share closing price on the New York Stock Exchange on that date of $20.89. Shares of common stock held by each director and executive officer (and their respective affiliates) and each person who owns 10 percent or more of the outstanding common stock or who is otherwise believed by the registrant to be in a control position have been excluded. This determination of affiliate status is not necessarily a conclusive determination for other purposes.
As of January 31, 2025, the Registrant had 161,923,807 shares of Class A Common Stock and 0 shares of Class B Common Stock outstanding.
Documents Incorporated by Reference: Part III of this Annual Report on Form 10-K incorporates certain information by reference from the registrant’s proxy statement for the 2025 annual meeting of stockholders to be filed no later than 120 days after the end of the registrant’s fiscal year.
TABLE OF CONTENTS | | | | | | | | |
| | Page No. |
| | |
| Item 1. | | |
| Item 1A. | | |
| Item 1B. | | |
| Item 1C. | | |
| Item 2. | | |
| Item 3. | | |
| Item 4. | | |
| | |
| Item 5. | | |
| Item 6. | | |
| Item 7. | | |
| Item 7A. | | |
| Item 8. | | |
| Item 9. | | |
| Item 9A. | | |
| Item 9B. | | |
| | |
| Item 10. | | |
| Item 11. | | |
| Item 12. | | |
| Item 13. | | |
| Item 14. | | |
| | |
| Item 15. | | |
| Item 16. | | |
| | |
CAUTIONARY NOTE REGARDING FORWARD-LOOKING STATEMENTS
This Annual Report on Form 10-K (“Annual Report”) and certain other communications made by us contain forward-looking statements within the meaning of Section 27A of the Securities Act of 1933, as amended (the “Securities Act”), and Section 21E of the Securities Exchange of 1934, as amended (the “Exchange Act”), including, among others, expected performance, future operating results, oil and natural gas demand and prices and the outlook for the oil and gas industry, future global economic conditions, the impact of worldwide political, military and armed conflict, the impact of announcements and changes in oil production quotas by oil exporting countries, improvements in operating procedures and technology, our business strategy and the business strategies of our customers, in addition to other estimates, and beliefs. For this purpose, any statement that is not a statement of historical fact should be considered a forward-looking statement. We may use the words “estimate,” “outlook,” “project,” “forecast,” “position,” “potential,” “likely,” “believe,” “anticipate,” “assume,” “plan,” “expect,” “intend,” “achievable,” “may,” “will,” “continue,” “should,” “could” and similar expressions to help identify forward-looking statements. However, the absence of these words does not mean that the statements are not forward-looking. We cannot assure you that our assumptions and expectations will prove to be correct. Important factors, many of which are beyond our control, could cause our actual results to differ materially from those indicated or implied by forward-looking statements, including but not limited to the risks and uncertainties described in this Annual Report and other filings that we make with the U.S. Securities Exchange Commission (the “SEC”). We undertake no intention or obligation to update or revise any forward-looking statements, except as required by law, whether as a result of new information, future events or otherwise and readers should not rely on the forward-looking statements as representing the Company’s views as of any date subsequent to the date of the filing of this Annual Report. These forward-looking statements are based on management’s current belief, based on currently available information, as to the outcome and timing of future events.
All forward-looking statements, expressed or implied, included in this Annual Report are expressly qualified in their entirety by this cautionary statement. This cautionary statement should also be considered in connection with any subsequent written or oral forward-looking statements that we or persons acting on our behalf may issue.
MARKET AND INDUSTRY DATA
This Annual Report includes market and industry data and certain other statistical information based on third-party sources including independent industry publications, government publications and other published independent sources, such as content and estimates provided by Lium, LLC (“Lium Research”) as of December 31, 2024, and industry content and figures provided by Baker Hughes Co. (“Baker Hughes”) as of December 31, 2024. Neither Lium Research nor Baker Hughes is a member of the Financial Industry Regulatory Authority or the Securities Investor Protection Corporation and neither is a registered broker dealer or investment advisor. Although we believe these third-party sources are reliable as of their respective dates, we have not independently verified the accuracy or completeness of this information. Some data is also based on our own good faith estimates, which are supported by our management's knowledge of and experience in the markets and business in which we operate.
TRADEMARKS, SERVICE MARKS AND TRADENAMES
This Annual Report contains trademarks, tradenames, and service marks that are owned by us or other companies, which are our property. Solely for convenience, the trademarks, tradenames, and service marks referred to in this Annual Report may appear without the ®, TM, and SM symbols, but such references are not intended to indicate, in any way, that we will not assert, to the fullest extent under applicable law, our rights or the rights of the applicable licensors to these trademarks, tradenames, and service marks. We do not intend our use or display of other parties’ trademarks, tradenames, or service marks to imply, and such use or display should not be construed to imply a relationship with, or endorsement or sponsorship of us by, these other parties.
PART I
As used in this Annual Report, except as otherwise indicated or required by the context, all references in this Annual Report to (i) the “Company,” “Liberty,” “we,” “us” and “our” refer to Liberty Energy Inc. and its consolidated subsidiaries; and (ii) “Liberty LLC” refer to Liberty Oilfield Services New HoldCo LLC.
Item 1. Business
Our Company
The Company, together with its subsidiaries, is a leading integrated energy services and technology company focused on providing innovative hydraulic fracturing services and related technologies to onshore oil and natural gas exploration and production (“E&P”) companies. We offer customers hydraulic fracturing services, together with complementary services including wireline services, proppant delivery solutions, field gas processing and treating, compressed natural gas (“CNG”) delivery, data analytics, related goods (including our sand mine operations), and technologies to facilitate lower emission completions, thereby helping our customers reduce their emissions profile.
Our areas of operations are in all of the most active shale basins in North America, including the Permian Basin, the Williston Basin, the Haynesville Shale, the Eagle Ford Shale, the Denver-Julesburg Basin (the “DJ Basin”), the Western Canadian Sedimentary Basin, the Powder River Basin, and the Appalachian Basin (Marcellus Shale and Utica Shale). Our operations also extend to a few smaller shale basins, including the Anadarko Basin, the Uinta Basin, the San Juan Basin, as well as the Beetaloo Basin in Northern Territory, Australia. The breadth of our operational footprint provides us an opportunity to leverage our fixed costs and to efficiently reposition our equipment in response to customer requirements.
Areas of North American Operations
The process of hydraulic fracturing involves pumping a pressurized stream of fracturing fluid (typically a mixture of water, chemicals and proppant) into a well casing or tubing to cause the underground formation to fracture or crack. These fractures release trapped hydrocarbon particles and provide a conductive channel for the oil or natural gas to flow freely to the wellbore for collection. The propping agent, or proppant, typically sand, becomes lodged in the cracks created by the hydraulic
fracturing process, “propping” them open to facilitate the flow of hydrocarbons from the reservoir to the well. The fracturing fluid is engineered to lose viscosity, or “break,” and is subsequently flowed back from the formation, leaving the proppant suspended in the formation fractures. Once our customer has flushed the fracturing fluids from the well using a controlled flow-back process, the customer manages fluid and water recycling or disposal.
Our hydraulic fracturing fleets consist of mobile hydraulic fracturing units and other auxiliary heavy equipment to perform fracturing services. Our hydraulic fracturing units consist primarily of high-pressure hydraulic pumps, engines, transmissions, radiators and other supporting equipment (including power generation units for electric fleets) that are typically mounted on trailers. We refer to the group of units and other equipment, such as blenders, data vans, sand storage, tractors, manifolds and high-pressure fracturing iron, which are necessary to perform a typical hydraulic fracturing job, as a “fleet,” and the personnel assigned to each fleet as a “crew.” The size of each fleet and crew can vary depending on the requirements of each job design.
Wireline operations supplement our hydraulic fracturing fleets, which consist of a truck equipped with a spool of wireline that is lowered into wells to convey specialized tools or equipment, such as perforating guns and charges, which are necessary to connect the wellbore with the target formation. This operation is performed between each hydraulic fracturing stage. Our wireline service is primarily offered alongside our hydraulic fracturing services, which allows us to maximize efficiency for our customers through optimized coordination of the wireline and hydraulic fracturing services. In addition, we also offer our wireline service on a stand-alone basis.
We also operate two sand mines that allows us to vertically integrate our supply-chain in the Permian Basin. The mines provide sand to Liberty hydraulic fracturing fleets as well as to third parties. With a secured supply of regional sand in the basin, we reduce our dependency on other providers and any downtime that could result from sand supply issues.
We are a leading provider of last-mile proppant delivery solutions, including proppant handling equipment and logistics software across North America. We offer innovative environmentally friendly technology with optimized dry and wet sand containers and wellsite proppant handling equipment that drive logistics efficiency and reduce noise and emissions. We believe that our wet sand handling technology is a key enabler of the next step of cost and emissions reductions in the proppant industry. We also offer customers the latest real-time logistics software, PropConnect™, as a hosted software as a service.
We also own and operate Liberty Power Innovations LLC (“LPI”), an integrated alternative fuel and power solutions provider for remote applications. On April 6, 2023, LPI expanded its footprint with the acquisition of Siren Energy & Logistics, LLC (“Siren” and such acquisition, the “Siren Acquisition”), a Permian focused integrated natural gas compression and CNG delivery business that we have since expanded to other basins. LPI provides CNG supply, field gas processing and treating, and well site fueling and logistics. LPI was formed with the initial focus on supporting Liberty’s transition towards our next generation digiFleets℠ and dual fuel fleets, by providing consistent and reliable CNG fueling services, which are critical to maintaining highly efficient well site operations. Through 2024, LPI was primarily focused on supporting an industry transition to natural gas fueled technologies, serving as a key enabler of the next step of cost and emissions reductions in the oilfield. In January 2025, we announced LPI’s expansion into the distributed power business, where we expect to leverage our experience in providing electric power for our digiFrac pumps into other areas inside and outside of the oilfield.
Our operations are organized into a single business segment, which consists of hydraulic fracturing services, including wireline, proppant delivery and goods, including our Permian Basin sand mines, and natural gas compression and delivery, and we have one reportable geographical segment, North America. We have grown from one active hydraulic fracturing fleet as of December 2011 to approximately 40 active fleets as of December 31, 2024. We are focused on providing “next-generation” frac fleets and technologies to assist our customers with completing their wells in an efficient and responsible manner.
Our founders and management are pioneers in the development of data-driven hydraulic fracturing technologies for application in shale plays. Prior to founding the Company, several members of the senior executive management team founded and built Pinnacle Technologies, Inc. (“Pinnacle Technologies”) into a leading fracturing technology company. In 1992, Pinnacle Technologies developed the first commercial hydraulic fracture mapping technologies, analytical tools that played a major role in launching the shale revolution. Our extensive experience with fracture technologies and customized fracture design has enabled us to develop new technologies and processes that provide our customers with real-time solutions that significantly enhance their completions. These technologies include hydraulic fracture propagation models, reservoir engineering tools, large, proprietary shale production databases and multi-variable statistical analysis techniques. Taken together, these technologies have enabled us to be a leader in hydraulic fracture design innovation and application. Our management team has an average of over 20 years of energy services experience.
We believe technical innovation and strong relationships with our customers and suppliers distinguish us from our competitors and are the foundations of our business. We expect that E&P companies will continue to focus on technological innovation as completion complexity and fracture intensity of horizontal wells increases, particularly as customers are increasingly focused on reducing emissions from their completions operations. We remain proactive in developing innovative solutions to industry challenges, including developing: (i) our databases of U.S. unconventional wells to which we apply our
proprietary multi-variable statistical analysis technologies to provide differential insight into fracture design optimization; (ii) our Liberty Quiet Fleet® design which significantly reduces noise levels compared to conventional hydraulic fracturing fleets; (iii) hydraulic fracturing fluid systems tailored to the specific reservoir properties in the basins in which we operate; (iv) our dual fuel dynamic gas blending (“DGB”) fleets that allow our engines to run diesel or a combination of diesel and natural gas, to optimize fuel use, reduce emissions and lower costs; (v) our digiFleets℠, comprising of digiFrac℠ and digiPrime℠ pumps and other complementary equipment, including power generation units (together “digiTechnologies℠”), our innovative, purpose-built electric and hybrid frac pumps that have approximately 25% lower CO2e emission profile than the Tier IV DGB; (vi) our wet sand handling technology which eliminates the need to dry sand, enabling the deployment of mobile mines nearer to wellsites; and (vii) the launch of LPI to support the transition to our digiFleets as well as the transition to lower costs and emissions in the oilfield. In addition, our integrated supply chain includes proppant, chemicals, equipment, natural gas fueling services, logistics and integrated software which we believe promotes wellsite efficiency and leads to more pumping hours and higher productivity throughout the year to better service our customers. In order to achieve our technological objectives, we carefully manage our liquidity and debt position to promote operational flexibility and invest in the business throughout the full commodity cycle in the regions we operate.
Recent Leadership Updates
On February 3, 2025, Christopher A. Wright, our Chief Executive Officer and Chairman of the Board, was confirmed to the position of Secretary of Energy of the United States and resigned from his positions as Chairman of the Board, Director, and Chief Executive Officer of the Company. Also, on February 3, 2025, in accordance with the Company’s succession plan, the Board appointed William Kimble as the non-executive Chairman of the Board and Ron Gusek as the Company’s Chief Executive Officer and Director. Lastly, on January 22, 2025, the Board approved an increase to the size of the Board from nine to 10 directors and appointed Arjun Murti to fill the newly created vacancy.
Focused on Continuous Improvement
We support all energy sources that improve our energy system and better lives. We passionately work to better the process of bringing hydrocarbons to the surface in a clean, safe and efficient fashion and view these principles as foundational to our business. We focus on developing and adding technologies to our operations that assist our customers in implementing their goals. The list below sets forth specific examples of our efforts in this regard:
•In 2013, we introduced Tier II dual-fuel technology to our fleets which allows our frac pumps to use natural gas in place of some diesel fuel to lower particulate emissions.
•In 2014, we began the use of containerized sand delivery at frac locations, which reduces dust, noise and truck traffic.
•In 2016, we introduced Quiet Fleet® technology, which significantly reduces noise levels associated with frac operations.
•In 2018, we partnered with an equipment supplier to introduce Tier IV dynamic gas blending, or DGB, engines to our frac fleet that can substitute up to 80% of the diesel typically used by a frac pump with natural gas and significantly lower emission levels in frac operations. Tier IV DGB engines were added to our fleet in 2020.
•In 2018, we began the design and development of digiFracSM, our innovative, purpose-built electric frac pump that has approximately a 25% lower CO2e emission profile than the Tier IV DGB.
•In 2021, we announced the successful test of digiFrac and in 2022 commenced delivery of commercial pumps.
•In October 2021, we became a leading provider of last-mile proppant delivery solutions including proppant handling equipment and logistics software. We offer innovative, environmentally friendly technology with optimized dry and wet sand containers and wellsite proppant handling equipment that drive logistics efficiency and reduce noise and emissions.
•In 2022, we began the design and development of digiPrimeSM, the first hybrid pump technology, utilizing direct mechanical drive for the pumps while simultaneously generating power capable of electrifying supporting equipment at the well site. These pumps have a lower CO2e emissions profile than digiFrac.
•In 2023, we launched LPI and closed the acquisition of Siren. We believe that the shift in fuel consumption from diesel to cleaner natural gas has the potential to promote emissions reductions in the industry.
•In 2023, we commenced deployment of digiFleetsSM, comprised of digiFrac and digiPrime pump technology along with other complementary equipment from our digiTechnologiesSM suite. This deployment also included mobile generation units to provide the needed electricity to power our digiFrac pumps in remote locations.
•In 2024, the Bettering Human Lives Foundation, a non-profit organization dedicated to improving the well-being of communities worldwide with an early focus on promoting clean cooking solutions, supported two companies in Kenya
and Ghana to convert schools from burning firewood to liquid petroleum gas. During 2024, we made charitable contributions of $0.9 million to the Bettering Human Lives Foundation.
•The third edition of Liberty’s Bettering Human Lives report, emphasizing energy’s central role in human lives, was released in February 2024. Over 30,000 copies of the report have been distributed worldwide to date.
•In January 2025, we announced LPI’s expansion into the distributed power business, where we expect to leverage our experience in providing electric power for our digiFrac pumps into other areas inside and outside of the oilfield.
Furthermore, we are continuously committed to engagement in our communities. We provide K-12 scholarships to low-income children through Alliance for Choice in Education, and we proudly fund a Liberty Scholars program at Montana Technological University to enable lower-income students to obtain a college education. In total, over 100 students received Liberty scholarships across the U.S. and Canada in 2024. In addition to our educational initiatives, we have targeted outreach to organizations focused on veterans, poverty abatement, low-income housing, criminal justice reform, and job opportunities for those who had a disadvantaged start in life.
In 2024, we created a charitable giving committee to facilitate communication across all areas of Liberty operations and direct support to organizations where our employees live and work. In 2021, we launched Love, Liberty, our corporate matching program, to double our impact and encourage our employees to get involved in their communities. In 2024, Liberty processed over 200 match requests to nearly 50 different organizations, totaling nearly $40,000 in matching contributions.
Cyclical Nature of Industry
We operate in a cyclical industry reflecting global oil and gas supply and demand dynamics, current and expected future oil and gas commodity prices, and the perceived stability and sustainability of those prices. Global oil and gas supply and demand can be impacted by general domestic and international economic conditions, inflationary pressures, geopolitical developments, government regulations, and other factors. Such factors also impact capital expenditures and drilling and completions activities of E&P companies, which in turn can impact demand for our services. For these reasons, the results of our operations may fluctuate from quarter to quarter and from year to year, and these fluctuations may distort comparisons of results across periods.
Seasonality
Our results of operations have historically reflected seasonal tendencies relating to holiday seasons, inclement weather and the conclusion of our customers’ annual drilling and completion capital expenditure budgets. Our most notable declines typically occur in the fourth quarter of the year for the reasons described above. Additionally, some of the areas in which we have operations, including Canada, the DJ Basin, Powder River Basin and Williston Basin, are adversely affected by seasonal weather conditions, primarily in the winter and spring. During periods of heavy snow, ice, rain, or frost, and related road restrictions, we may be unable to move our equipment between locations, thereby reducing our ability to provide services and generate revenues. The exploration activities of our customers may also be affected during such periods of adverse weather conditions. Additionally, extended drought conditions in our operating regions could impact our ability or our customers’ ability to source sufficient water or increase the cost for such water.
Intellectual Property
Over the last several years and in connection with the acquisition of Siren, and others in prior periods, we have significantly invested in our research and technology capabilities. Our efforts to date have been focused on developing innovative, fit-for-purpose solutions designed to enhance our core service offerings, increase completion efficiencies, provide cost savings to our operations and add value for our customers. A cornerstone of our technological advantage is a series of proprietary databases of U.S. unconventional wells that include production data, completion designs and reservoir characteristics. We utilize these databases to perform multi-variable statistical analysis that generates differential insight into fracture design optimization to enhance our customers’ production economics. Our emphasis on data analytics is also deployed during job execution through the use of real-time feedback on variables that maximizes customer returns by improving cost-effective hydraulic fracturing operations.
Today, we hold approximately 500 patents and patent licenses relating to our engineering and technology solutions. We seek patent and trademark protections for our technology when we deem it prudent, and we aggressively pursue protection of these rights when warranted. We believe our patents, trademarks, and other protections for our proprietary technologies are adequate for the conduct of our business and that no single patent or trademark is critical to our business. In addition, we rely, to a great extent, on the technical expertise and know-how of our personnel to maintain our competitive position, and we take commercially reasonable measures to protect trade secrets and other confidential and/or proprietary information relating to the technologies we develop.
Human Capital Management
As of December 31, 2024, we had approximately 5,700 employees and no unionized labor. We believe we have good relations with our employees and that one of our key competitive advantages is our people. Our highly trained, experienced and motivated employees are critical to delivering our hydraulic fracturing services. Taking care of our employees is one of our top priorities, and we continually invest in hiring, training and retaining the employees we believe to be the best in our field. We consistently assess the current business environment and labor market to refine our compensation and benefits programs in order to attract and retain top talent in our industry. We strive to promote from within our existing employee base to manage new hydraulic fracturing fleets and organically grow our operating expertise. This organic growth is essential in achieving the expertise and level of customer service we strive to provide each of our customers. As a result, we plan to continue to invest in our employees through both personal and professional training to attract and retain the best individuals in our areas of operation. Overall, we focus on individual contributions and team success to foster a culture built around operational excellence and superior safety.
Health and Safety
Our people are our most important asset and ensuring their safety and the safety of those around them is the most important thing we do. Making certain that the Liberty team is well trained to handle the complexities of daily field operations, and that their training and competency remains current with the latest technology and standards is a key component. In order to facilitate this training, we have developed the Liberty Frac Academy, a thorough program where employees are trained on various aspects of the Company, from safety in equipment operation to leadership skills. The Liberty Frac Academy not only ensures dissemination of high-quality training material, but also provides a forum for sharing best practices and lessons learned across the Company. As a result, we are among the safest service providers in the industry with a constant focus on Health, Safety and Environmental performance and service quality, as evidenced by an average incident rate that was consistently lower than the industry average from 2022 to 2024. Our employee-centered focus and reputation for safety has enabled us to obtain projects from industry leaders with some of the most demanding safety and operational requirements.
Programs and Benefits
One way we have demonstrated a history of investing in our workforce is by offering competitive salaries and wages. To foster a strong sense of ownership, restricted stock units are provided to eligible employees under our long-term incentive plan. Furthermore, we offer innovative benefits to all eligible employees, including, among others, comprehensive health insurance coverage, parental leave to all new parents, for birth or adoption, financial support for child adoption, leave to care for partners with serious health conditions, 401(k) savings plan and educational tuition assistance for both bachelor’s degree and master’s degree programs. We are also passionate about community investment and are a part of the Ban the Box initiative which provides work opportunities for formerly incarcerated individuals.
Governmental Regulation and Climate Change
As a company with operations primarily in the United States and Canada, we are subject to the laws of both jurisdictions in which we operate and the rules and regulations of various governing bodies, which may differ among those jurisdictions. Compliance with these laws, rules and regulations has not had, and is not expected to have, a material effect on our capital expenditures, results of operations and competitive position as compared to prior periods. We are also subject to numerous environmental and regulatory requirements related to our operations. For further information related to such regulation, see the risks described under the heading “Risk Factors” in this Annual Report.
Our operations are subject to numerous stringent and complex laws and regulations at the federal, state, and local levels governing the discharge of materials into the environment, environmental protection, and health and safety aspects of our operations. Failure to comply with these laws and regulations or to obtain or comply with permits may result in the assessment of administrative, civil, and criminal penalties, imposition of remedial or corrective action requirements, and the imposition of injunctions or other orders to prohibit certain activities, restrict certain operations, or force future compliance with environmental requirements.
There is inherent risk of incurring significant environmental costs and liabilities in the performance of our operations due to our handling of petroleum hydrocarbons, other hazardous substances, and wastes, as a result of air emissions and wastewater discharges related to our operations, and because of historical operations and waste disposal practices. Spills or other releases of regulated substances, including such spills and releases that occur in the future, could expose us to material losses, expenditures, and liabilities under applicable environmental laws and regulations. Under certain of such laws and regulations, we could be held strictly liable for the removal or remediation of previously released materials or property contamination, regardless of whether we were responsible for the release or contamination and even if our operations met previous standards in the industry at the time they were conducted. The following is a summary of some of the existing laws, rules, and regulations to which we are subject.
U.S. Laws and Regulations
Hazardous Substances and Waste Handling
The Resource Conservation and Recovery Act (“RCRA”) and comparable state statutes regulate the generation, transportation, treatment, storage, disposal, and cleanup of hazardous and non-hazardous wastes. Under guidance issued by the U.S. Environmental Protection Agency (the “EPA”), the individual states administer some or all of the provisions of RCRA, sometimes in conjunction with their own, more stringent requirements. RCRA currently exempts many E&P wastes from classification as hazardous waste. Specifically, RCRA excludes produced waters and other wastes intrinsically associated with the exploration, development, or production of crude oil and natural gas from the definition of hazardous waste. However, these E&P wastes may still be regulated under state solid waste laws and regulations, and it is possible that certain oil and natural gas E&P wastes now classified as non-hazardous could be classified as hazardous waste in the future. Stricter regulation of wastes generated during our or our customers’ operations could result in increased costs for our operations or the operations of our customers, which could in turn reduce demand for our services and adversely affect our business. We cannot guarantee that the EPA will not revisit the exemption of E&P waste or that waste will not become more heavily regulated at the federal or state level.
Comprehensive Environmental Response, Compensation, and Liability Act
The Comprehensive Environmental Response, Compensation, and Liability Act (“CERCLA”), also known as the Superfund law, imposes joint and several liability, without regard to fault or legality of conduct, on classes of persons who are considered to be responsible for the release of a hazardous substance into the environment. These persons include the current and former owner or operator of the site where the release occurred and anyone who transported or disposed or arranged for the transport or disposal of a hazardous substance released at the site. Persons who are or were responsible for releases of hazardous substances under CERCLA and any state analogs may be subject to joint and several strict liability for the costs of cleaning up the hazardous substances that have been released into the environment and for damages to natural resources and for the costs of certain health studies. We currently own, lease, or operate, and previously owned, leased, or operated numerous properties that have been used for manufacturing and other operations for many years. These properties and the substances disposed or released on them may be subject to CERCLA and analogous state laws. Under such laws, we could be required to remove previously disposed substances and wastes, remediate contaminated property, or perform remedial operations to prevent future contamination. In addition, it is not uncommon for neighboring landowners and other third parties to file claims for personal injury and property damage allegedly caused by the hazardous substances released into the environment.
Worker Health and Safety
We are subject to a number of federal and state laws and regulations, including the OSHA regulatory standards, which establish requirements to protect the health and safety of workers. Among others, we may be subject to OSHA regulations for safe operation of cranes, power industrial trucks and similar equipment at our worksites, safe practices for working in hazardous locations and permit-required confined spaces, and proper use of required personal protective equipment by workers. OSHA’s hazard communication standard requires tracking of hazardous chemicals present at the worksite, sharing of such information with the workers, and training the workers to handle the chemicals appropriately. The EPA’s community right-to-know regulations under Title III of the federal Superfund Amendment and Reauthorization Act, and comparable state statutes also require maintenance of information about hazardous materials used or produced in operations and provision of this information to employees, state and local government authorities, and citizens. We are also subject to OSHA’s regulatory standard for respirable crystalline silica, which provides measures to protect workers in hydraulic fracturing operations from exposure to this chemical including limiting exposure to airborne respirable crystalline silica in excess of a specified limit. Additionally, the Federal Motor Carrier Safety Administration (the “FMCSA”) regulates and provides safety oversight of commercial motor vehicles, the EPA establishes requirements to protect human health and the environment, the federal Bureau of Alcohol, Tobacco, Firearms and Explosives establishes requirements for the safe use and storage of explosives, and the federal Nuclear Regulatory Commission establishes requirements for the protection against ionizing radiation. We are subject to Mine Safety & Health Administration regulations related to operation of sand mines including regulations for training and retraining of workers engaged in sand mine operations. Substantial fines and penalties can be imposed, and orders or injunctions limiting or prohibiting certain operations may be issued, in connection with any failure to comply with these laws and regulations.
Water Discharges
The federal Water Pollution Control Act (the “Clean Water Act”) and analogous state laws impose restrictions and strict controls with respect to the discharge of pollutants, including spills and leaks of oil and other substances, into waters of the U.S. The discharge of pollutants into regulated waters, including jurisdictional wetlands, is prohibited, except in accordance with the terms of a permit issued by the EPA or an analogous state agency. To the extent the agencies expanding the range of properties subject to the Clean Water Act’s jurisdiction or impose more stringent requirements on discharges of wastewater, certain energy companies could face increased costs and delays with respect to obtaining permits, including for the discharge of dredge and fill activities in waters of the U.S. or wetland areas, which in turn could reduce demand for our services. Furthermore, the process for obtaining permits has the potential to delay our operations and those of our customers. Spill prevention, control, and countermeasure requirements of federal laws require appropriate containment berms and similar structures to help prevent the contamination of navigable waters by a petroleum hydrocarbon tank spill, rupture, or leak. In addition, the Clean Water Act and analogous state laws require individual permits or coverage under general permits for discharges of wastewater and storm water runoff from certain types of facilities. The Clean Water Act and analogous state laws provide for administrative, civil, and criminal penalties for unauthorized discharges and, together with the Oil Pollution Act of 1990, impose rigorous requirements for spill prevention and response planning, as well as substantial potential liability for the costs of removal, remediation, and damages in connection with any unauthorized discharges.
Air Emissions
The federal Clean Air Act (the “CAA”) and comparable state laws regulate emissions of various air pollutants through air emissions permitting programs and the imposition of other requirements. In addition, the EPA has developed, and continues to develop, stringent regulations governing emissions of toxic air pollutants and other air emissions at specified sources. These regulations change frequently. These laws and regulations may require us to obtain pre-approval for the construction or modification of certain projects or facilities expected to produce or significantly increase air emissions, obtain and strictly comply with stringent air permit requirements, utilize specific equipment or technologies to control emissions of certain pollutants or prohibit certain types of emissions management practices. In recent years, the CAA has been used to impose additional stringent requirements upon oil and gas production operations. While many of these rules may not be directly applicable to our business, they are applicable to the business of our customers. Promulgation of stricter permitting or emission control requirements could delay or impair our or our customers’ ability to obtain air emission permits, to develop new wells and to continue to operate existing wells, and result in fewer wells being drilled or redeveloped, causing a decrease in demand for our services. Federal and state regulatory agencies can impose administrative, civil, and criminal penalties, as well as injunctive relief, for non-compliance with air permits or other requirements of the CAA and associated state laws and regulations.
Climate Change
The EPA has determined that emissions of greenhouse gases, including carbon dioxide and methane, present a danger to public health and the environment because emissions of such gases are, according to the EPA, contributing to warming of the Earth’s atmosphere and other climatic changes. The EPA has established greenhouse gas emissions reporting requirements for sources in the oil and gas sector and has also promulgated rules requiring certain large stationary sources of greenhouse gases to obtain preconstruction permits under the CAA and follow “best available control technology” requirements. Although we are not likely to become subject to greenhouse gas emissions permitting and best available control technology requirements because none of our facilities are presently major sources of greenhouse gas emissions, such requirements could become applicable to our customers. In addition, the EPA has used the CAA to impose additional greenhouse gas emissions control requirements upon our customers. Furthermore, the Inflation Reduction Act (“IRA 2022”) imposes a methane emissions charge on certain emissions from specific classes of sources that are required to report their greenhouse gas emissions, which began in calendar year 2024. This fee as well as additional requirements on greenhouse gas emissions from our customers could have an adverse effect on their costs of operations or financial performance, thereby adversely affecting our business, financial condition, and results of operations. Also, the U.S. Congress has from time to time considered adopting legislation to reduce emissions of greenhouse gases, and many states have already established regional greenhouse gas “cap-and-trade” programs. The adoption of any legislation or regulation that restricts emissions of greenhouse gases from the equipment and operations of our customers or with respect to the oil and natural gas they produce could adversely affect demand for our products and services.
Hydraulic Fracturing
Our business is clearly dependent on hydraulic fracturing and horizontal drilling activities. As further described herein, hydraulic fracturing is an important and common practice that is used to stimulate production of hydrocarbons, particularly natural gas, from tight formations, including shale. The process, which involves the injection of water, sand, and chemicals under pressure into formations to fracture the surrounding rock and stimulate production, is typically regulated by state oil and natural gas commissions. However, federal agencies have asserted regulatory authority over certain aspects of the process. There is considerable legislative and regulatory focus on the emissions of methane, which may be released during hydraulic fracturing, chemicals used in the hydraulic fracturing process, the discharge of wastewater from hydraulic fracturing operations and concerns about the triggering of seismic activity by the injection of produced waters into underground wells. The adoption of new or revised legislation or regulation could make it significantly more difficult and/or costly to drill and operate oil and gas wells. If adopted, such legislation or regulation could result in a decline in the completion of new oil and gas wells or the recompletion of existing wells, which could negatively impact the drilling programs of our customers and, consequently, delay, limit or reduce the demand for our services. Given the long-term trend towards increasing regulation, future regulation in the industry remains a possibility.
Some states, counties, and municipalities have enacted or are considering moratoria on hydraulic fracturing. For example, New York, Vermont, Maryland, and Washington have banned the use of high-volume hydraulic fracturing. Alternatively, some municipalities are, or have considered, zoning and other ordinances, the conditions of which could impose a de facto ban on drilling and/or hydraulic fracturing operations. Further, some states, counties, and municipalities are closely examining water use issues, such as permit and disposal options for processed water, which could have a material adverse impact on our financial condition, prospects, and results of operations if such additional permitting requirements are imposed upon our industry. If new laws or regulations that significantly restrict hydraulic fracturing are adopted, such laws could reduce demand for our business by making it more difficult or costly for certain customers to perform fracturing to stimulate production from tight formations.
National Environmental Policy Act
Businesses and operations of our customers that are carried out on federal lands may be subject to the National Environmental Policy Act (“NEPA”), which requires federal agencies, including the U.S. Department of the Interior, to evaluate major agency actions having the potential to significantly impact the human environment. In the course of such evaluations, an agency will evaluate the potential direct, indirect, and cumulative impacts of a proposed project and, if necessary, will prepare a detailed Environmental Impact Statement that must be made available for public review and comment. To the extent that our customers’ current activities, as well as proposed plans, on federal lands require governmental permits that are subject to the requirements of NEPA, this process has the potential to delay or impose additional conditions upon the development of oil and natural gas projects which in turn could reduce demand for our services.
Endangered Species Act and Migratory Bird Treaty Act
The federal Endangered Species Act (“ESA”) was established to protect endangered and threatened species. Pursuant to that act, if a species is listed as threatened or endangered, restrictions may be imposed on activities adversely affecting that species or its habitat. The U.S. Fish and Wildlife Service (the “FWS”) must also designate the species’ critical habitat and suitable habitat as part of the effort to ensure survival of the species. A critical habitat or suitable habitat designation could result in further material restrictions to land use and may materially delay or prohibit land access for oil and natural gas development and development of sand mines used for hydraulic fracturing. Similar protections are offered to migratory birds under the Migratory Bird Treaty Act (the “MBTA”), which makes it illegal to, among other things, hunt, capture, kill, possess, sell, or purchase migratory birds, nests, or eggs without a permit. This prohibition covers most bird species in the U.S. Future implementation of the rules implementing the ESA and the MBTA are uncertain. If we or our customers were to have areas within our respective operations designated as critical or suitable habitat for a protected species, it could decrease demand for our services and have a material adverse effect on our business.
Canadian Laws and Regulations
Companies such as us offering energy services that include hydraulic fracturing, engineering, and wireline services in the Provinces of Alberta and British Columbia in Canada are regulated by both the provincial governments of Alberta and British Columbia (“Province”) and the federal government of Canada (“Canada”). This includes, but is not limited to, regulation related to environmental protection legislation, climate change legislation, fracking legislation, and legislation related to wildlife. In addition to being regulated by the Province and Canada, energy services companies may also be subject to other international, national, and subnational laws, regulations, and policies.
Provincial Legislation
Energy services companies are primarily regulated by provincial governments in Canada. For example, in Alberta, provincial legislation potentially applicable to our Canadian operations includes the Environmental Protection and
Enhancement Act, RSA 2000, e E-12. This Act promotes the protection, enhancement and wise use of the environment, and deals with matters such as air emissions, water discharges, and the handling of hazardous substances and waste control (for example, under the Waste Control Regulation, Alta Reg 192/1996). Other environmental legislation in the Province that applies to energy service companies includes: the Water Act, RSA 2000, c W-3 and associated regulations, under which companies must apply for a license for any water use; and the Wildlife Act, RSA 2000, c W-10 which provides for the protection and conservation of wild animals and endangered species in Alberta.
Other potentially applicable provincial legislation in Alberta includes legislation directed at the transportation of dangerous goods, including oil (the Dangerous Goods Transportation and Handling Act, RSA 2000, c D-4 and associated regulations), legislation intended to provide for the responsible management of oil wells and associated sites, including remediation responsibilities (the Oil and Gas Conservation Act, RSA 2000, c O-6 and associated regulations), legislation establishing regulatory bodies overseeing oil and gas and electricity in Alberta (the Responsible Energy Development Act, SA 2012, c R-17.3 and the Alberta Utilities Commission Act, SA 2007, c A-37.2), legislation governing the removal of gas or propane from Alberta (the Gas Resources Preservation Act, RSA 2000, c G-4), legislation to effect conservation and prevent waste of the oil sands resource in Alberta (the Oil Sands Conservation Act, RSA 2000, c O-7), and legislation governing worker safety (the Occupational Health and Safety Act, SA 2017, c O-2.1).
The Alberta Energy Regulator has a number of directives that are applicable to energy services companies, such as Directive 050, updated in November 2024, which addresses salinity ranges for soils that can receive drilling wastes, Directive 058, updated in October 2022, which sets out regulatory requirements for the handling, treatment, and disposal of upstream oilfield waste, and Directive 083, updated in November 2024, which sets out the requirements for managing subsurface integrity associated with hydraulic fracturing, including seismic monitoring in certain areas of Alberta. Other provinces in Canada have their own statutory regime applicable to oilfield service companies.
Federal Legislation
The Federal government in Canada shares certain jurisdiction with the provinces over certain environmental matters. Federal legislation potentially applicable to our Canadian operations includes legislation focused on regulating greenhouse gases (the Greenhouse Gas Pollution Pricing Act, SC 2018, c 12, s 186), legislation aimed at protecting wildlife (the Species at Risk Act, SC 2002, c 29, Fisheries Act, RSC 1985, c F-14, and Migratory Birds Convention Act, 1994, SC 1994, c 22), and legislation governing the transportation of potentially dangerous substances and prevention of pollution (the Transportation of Dangerous Goods Act, 1992, SC 1992, c 34 and Canadian Environmental Protection Act, 1999, SC 1999, c 33).
Environmental assessment of major projects in Canada is shared between the federal and provincial governments. The federal environmental assessment legislation, the Impact Assessment Act, SC 2019, c 28, s1, governs approvals for federally regulated projects and was amended in June 2024.
Properties
Properties
Our corporate headquarters are located at 950 17th Street, Suite 2400, Denver, Colorado 80202. We lease our general office space at our corporate headquarters. The lease expires in December 2027. We currently own or lease the following additional principal properties: | | | | | | | | | | | | | | |
| District Facility Location | | Size | | Leased or Owned |
| Midland, TX | | 90,000 sq. ft on 35 acres | | Owned |
| Midland, TX | | 70,000 sq. ft on 12 acres | | Owned |
| Midland, TX | | 14,000 sq. ft on 22 acres | | Owned |
| Odessa, TX | | 77,500 sq. ft on 48 acres | | Owned |
| Cibolo, TX | | 90,000 sq. ft on 34 acres | | Owned |
| Kermit, TX | | 5,000 acres | | Owned |
| Monahans, TX | | 3,200 acres | | Owned |
| Magnolia, TX | | 63,350 sq. ft | | Leased (through May 31, 2031) |
| | | | |
| Magnolia, TX | | 29,402 sq. ft | | Leased (through December 31, 2026) |
| Orla, TX | | 4 acres | | Leased |
| Shreveport, LA | | 215,000 sq ft. on 45 acres | | Owned |
| Cheyenne, WY | | 115,000 sq. ft on 60 acres | | Owned |
| | | | |
| Henderson, CO | | 50,000 sq. ft on 13 acres | | Leased (through December 31, 2034) |
| Henderson, CO | | 96,582 sq. ft on 12 acres | | Owned |
| Briggsdale, CO | | 7 acres | | Leased |
| Williston, ND | | 55,000 sq. ft on 50 acres | | Owned |
| Vernal, UT | | 30,901 sq. ft on 10 acres | | Leased (through September 30, 2025) |
| El Reno, OK | | 80,000 sq. ft on 33 acres | | Owned |
| Red Deer, AB | | 170,000 sq. ft on 42 acres | | Owned |
| Grand Prairie, AB | | 135,000 sq. ft on 40 acres | | Owned |
| | | | |
| | | | |
We also lease several smaller facilities, which leases generally have terms of one to six years. We believe that our existing facilities are adequate for our operations and their locations allow us to efficiently serve our customers. We do not believe that any single facility is material to our operations and, if necessary, we could readily obtain a replacement facility.
Marketing and Customers
We have developed long-term partnerships with our customers through a continuous dialogue focused on their production economics. Further, we have a proven track record of executing our customers’ plans and delivering on time and in line with expected costs. Our customer base includes a broad range of integrated and independent E&P companies, including some of the largest E&P companies in our areas of operation. Our technological innovations, customer-tailored approach and track record of consistently providing high-quality, safe and reliable service has allowed us to develop long-term customer partnerships, which we believe makes us the service provider of choice for many of our customers.
Our sales and marketing activities typically are performed through our local sales representatives in each geographic region and are supported by our corporate headquarters. For the years ended December 31, 2024, 2023 and 2022, our top five customers collectively accounted for approximately 43%, 34%, and 30% of our revenues, respectively. For the year ended December 31, 2024, Occidental Petroleum Corporation accounted for more than 10% of consolidated revenues. For the years ended December 31, 2023, and 2022, no customers accounted for more than 10% of consolidated revenues.
Suppliers and Raw Materials
We have a dedicated supply chain team that manages sourcing and logistics to ensure flexibility and continuity of supply in a cost-effective manner across our areas of operation. We have built long-term relationships with multiple industry leading suppliers of proppant, chemicals and hydraulic fracturing equipment and have started to internally design and assemble key pump and maintenance parts. In addition, we have built a strong relationship with the assemblers of our custom-designed hydraulic fracturing fleets and believe we will continue to have timely access to new, high capability fleets as we continue to grow. In 2018, we vertically integrated a supplier of certain major components through the acquisition of ST9 Gas and Oil LLC, which subsequently changed its name to Liberty Advanced Equipment Technologies LLC, and now provides engineering design and packaging for certain equipment used in our operations. In October 2021, we vertically integrated a supplier of our containerized sand and last mile proppant logistics solutions with the acquisition of Proppant Express Solutions LLC. This, along with our two state-of-the-art sand mines in the Permian Basin, help us alleviate the risk of proppant supply shortages.
We purchase a wide variety of raw materials, parts and components that are manufactured and supplied for our operations. We are not dependent on any single source of supply for those parts, supplies or materials. To date, we have generally been able to obtain the equipment, parts and supplies necessary to support our operations, although we have experienced delivery delays and shortages on some items. While we believe that we will be able to make satisfactory alternative arrangements in the event of any interruption in the supply of these materials and/or products by one of our suppliers, we may not always be able to do so. In addition, certain materials for which we do not currently have long-term supply agreements could experience shortages and significant price increases in the future. As a result, we may be unable to mitigate any future supply shortages and our results of operations, prospects and financial condition could be adversely affected.
Competition
The markets in which we operate are highly competitive. We provide services in various geographic regions across the United States and Canada, and our competitors include many large and small oilfield service providers, including some of the largest integrated service companies. Our hydraulic fracturing services compete with large, integrated companies such as Halliburton Company as well as other companies including Patterson-UTI Energy Inc. and ProFrac Holding Corp. In addition, we compete regionally with ProPetro Services, Inc. and other smaller service providers.
We believe that the principal competitive factors in the markets we serve are technical expertise, equipment capacity, work force competency, efficiency, safety record, reputation, experience and price. Additionally, projects are often awarded on a bid basis, which tends to create a highly competitive environment. We seek to differentiate ourselves from our competitors by delivering the highest-quality services and equipment possible, coupled with superior execution and operating efficiency in a safe working environment.
Available Information
We file or furnish annual, quarterly and current reports, proxy statements and other documents with the SEC under the Exchange Act. The SEC also maintains an internet website at www.sec.gov that contains reports, proxy and information statements and other information regarding issuers, including us, that file electronically with the SEC.
We also make available free of charge through our website, www.libertyenergy.com, electronic copies of certain documents that we file with the SEC, including our annual reports on Form 10-K, quarterly reports on Form 10-Q, current reports on Form 8-K and amendments to those reports filed or furnished pursuant to Section 13(a) or 15(d) of the Exchange Act as soon as reasonably practicable after we electronically file such material with, or furnish it to, the SEC.
Item 1A. Risk Factors
Described below are certain risks that we believe apply to our business and the industry in which we operate. You should carefully consider each of the risks described below in conjunction with other information including the financial statements and related notes provided in this Annual Report and in our other public disclosures. The risks described below highlight potential events, trends or other circumstances that could adversely affect our business, financial condition, results of operations, cash flows, liquidity or access to sources of financing, and consequently, the market value of our Class A common stock, par value $0.01 per share (“Class A Common Stock”). These risks could cause our future results to differ materially from historical results and from guidance we may provide regarding our expectations of future financial performance. The risks described below are those that we have identified as material and is not an exhaustive list of all the risks we face. There may be other risks and uncertainties not currently known to us or that we currently deem to be immaterial which may also materially and adversely affect our business operations in the future. Please refer to the explanation of the qualifications and limitation on forward-looking statements set forth on page ii hereof.
Risks Related to the Oil and Natural Gas Industry
Federal, state, local and other applicable legislative and regulatory initiatives relating to hydraulic fracturing may serve to limit future oil and natural gas E&P activities and could have a material adverse effect on our results of operations and business.
Various federal, state, local and other applicable legislative and regulatory initiatives have been, or could be undertaken which could result in additional requirements or restrictions being imposed on hydraulic fracturing operations. Currently, hydraulic fracturing is generally exempt from federal regulation under the Safe Drinking Water Act Underground Injection Control (the “SDWA UIC”) program and is typically regulated by state oil and gas commissions or similar agencies but increased scrutiny and regulation by federal agencies does occur. For example, in late 2016, the EPA released a final report on the potential impacts of hydraulic fracturing on drinking water resources, concluding that “water cycle” activities associated with hydraulic fracturing may impact drinking water resources. Additionally, the EPA has asserted regulatory authority pursuant to the SDWA UIC program over hydraulic fracturing activities involving the use of diesel fuel in the fracturing fluid and issued guidance regarding the permitting of such activities. Furthermore, the U.S. Bureau of Land Management has previously published rules that established stringent standards relating to hydraulic fracturing on federal and Native American lands. Similarly, the EPA has adopted rules on the capture of methane and other emissions released during hydraulic fracturing. These rules have been the subject of ongoing legal challenges. In recent years, the EPA has enacted additional methane rules for new and existing petroleum operations. The EPA rules could make it more difficult and/or costly to drill and operate oil and gas wells. These rules may result in a decline in the completion of new oil and gas wells or the recompletion of existing wells, which could negatively impact the drilling programs of our customers and, consequently, delay, limit or reduce the demand for our services. In addition to federal regulatory actions, legislation has been introduced, but not enacted, in Congress to provide for further federal regulation of hydraulic fracturing and to require disclosure of the chemicals used in the hydraulic fracturing process.
Moreover, many states and local governments have adopted, or are considering, regulations that impose new or more stringent permitting, disclosure, disposal and well-construction requirements on hydraulic fracturing operations, including states where we or our customers operate, such as Texas, Colorado and North Dakota. States could also elect to place prohibitions on hydraulic fracturing, as several states have already done. In addition, some states have adopted broader sets of requirements related to oil and gas development more generally that could impact hydraulic fracturing activities. For example, the Colorado legislature adopted SB 19-181, which gave greater regulatory authority to local jurisdictions and reoriented the mandate of the Colorado Oil and Gas Conservation Commission to place more emphasis on the protection of human health and the environment. In response, a reconstituted Colorado Oil and Gas Conservation Commission modified its rules to address the requirements of the legislation, adopting increased setback requirements, provisions for assessing alternative sites for well pads to minimize environmental impacts, and consideration to cumulative impacts, among other provisions. The Colorado Department of Public Health and the Environment also finalized rules related to the control of emissions from certain pre-production activities. In Texas, there has been increased pressure on the Railroad Commission (“RRC”) to impose more stringent limitations on the flaring of gas from wells to prevent waste and because of increased concerns related to the environmental effects of flaring. The RRC continues to approve flaring permits, but at least one lawsuit was filed by a pipeline operator challenging the RRC’s flaring approval practices, but the suit was subsequently dismissed without any substantive opinion on the issue of flaring. Environmental groups, local citizens groups and others continue to seek to use a variety of means to force action on additional restrictions on hydraulic fracturing and oil and gas development generally.
Additionally, some states have enacted legislation limiting PFAS usage in certain products or limiting PFAS usage generally. For example, Colorado has banned the use of PFAS in oil and gas products including hydraulic fracturing fluids, drilling fluids and proppants. Should PFAS be in hydraulic fracturing chemicals, this could open up a new front for the regulation of hydraulic fracturing and result in additional exposure to liability for contamination resulting from the use or release of hydraulic fracturing chemicals. Additionally, various regulatory actions have been taken with respect to PFAS, including listing of certain PFAS as hazardous substances under CERCLA, that may result in additional exposure to liability for contamination resulting from the use or release of these chemicals.
Some states in which we operate require the disclosure of some or all of the chemicals used in our hydraulic fracturing operations. Certain aspects of one or more of these chemicals may be considered proprietary by us or our chemical suppliers. Disclosure of our proprietary chemical information to third parties or to the public, even if inadvertent, could diminish the value of our trade secrets or those of the chemicals suppliers and could result in competitive harm to us, which could have an adverse impact on our business, financial condition, prospects and results of operations.
In recent years, there have been allegations that hydraulic fracturing may result in seismic activities. Although the extent of any correlation between hydraulic fracturing and seismic activity has been and remains the subject of studies and debate, some parties believe that there is a causal relationship. As a result, federal and state legislatures and agencies may seek to further regulate, restrict or prohibit hydraulic fracturing. Such actions could result in a decline in the completion of new oil and
gas wells, which could negatively impact the drilling programs of our customers and, consequently, delay, limit or reduce the demand for our services.
Increased regulation and attention given to the hydraulic fracturing process could lead to greater opposition to, and litigation concerning, oil and natural gas production activities using hydraulic fracturing techniques. Additional legislation or regulation could also lead to operational delays for our customers or increased operating costs in the production of oil and natural gas, including from the developing shale plays, or could make it more difficult for (or could result in a prohibition for) us and our customers to perform hydraulic fracturing. The adoption of any additional laws or regulations regarding hydraulic fracturing or limitation in hydraulic fracturing could potentially cause a decrease in the completion of new oil and natural gas wells and an associated decrease in demand for our services and increased compliance costs and time. Such events could have a material adverse effect on our liquidity, consolidated results of operations, and consolidated financial condition.
Additional legislation, executive actions, regulations or other regulatory initiatives to limit, delay or prohibit hydraulic fracturing or other aspects of oil and gas development may be pursued. In the event that these or other new federal restrictions, delays or prohibitions relating to the hydraulic fracturing process are adopted in areas where we or our customers conduct business, we or our customers may incur additional costs or permitting requirements to comply with such federal requirements that may be significant and, in the case of our customers, also could result in added restrictions or delays in the pursuit of exploration, development, or production activities, which would in turn reduce the demand for our services and have a material adverse effect on our results of operations.
Federal legislation and regulatory initiatives relating to drilling on federal lands could harm our business and negatively impact the oil and natural gas industry.
Businesses and operations of our customers may be carried out on federal lands. As an example, in January 2021, based on a directive from President Biden, the U.S. Department of the Interior issued an order that effectively suspended new oil and gas leases and drilling permits on non-Indian federal lands and waters for a period of 60 days. However, the suspension did not limit existing operations under valid leases.
President Biden followed with an executive order directing the Secretary of the Interior to pause the issuance of new oil and gas leases on federal public lands and offshore waters pending completion of a comprehensive review of federal oil and gas permitting and leasing practices that take into consideration potential climate and other impacts associated with oil and gas activities. The leasing suspension was the subject of several lawsuits, resulting in conflicting decisions on the legality of the lease suspension. While the various lawsuits were pending, in August 2022, Congress passed the IRA 2022 which, among other things, made changes to the federal oil and gas leasing program (including increasing royalty rates and implementing policies to discourage venting and flaring) and require several oil and gas lease auctions, including some that had been suspended or cancelled.
Additionally, in November 2021, the U.S. Department of the Interior released a report on the federal oil and gas leasing program, which found that the then current program failed to serve the public interest. The report made several recommendations, including increasing royalty rates and adding new restrictions on what lands are made available for oil and gas development to minimize leasing of lands with low potential for development. The U.S. Department of the Interior promulgated rules in 2024 based on the recommendations. In April 2022, the U.S. Department of the Interior also announced that the U.S. Bureau of Land Management would post notices for significantly reformed onshore lease sales that would promote the public interest in public lands while addressing deficiencies in the current federal oil and gas leasing program. The new lease sales will incorporate many of the recommendations in the U.S. Department of the Interior report on the federal leasing program. Such scheduled sales began in June 2022.
Furthermore, a group of oil and gas related interests has also sued alleging that lease sales are not occurring as required under the Mineral Leasing Act. In addition, where lease sales have occurred, environmental groups have sued to block the sales. On June 1, 2022, the U.S. District Court for the District of Columbia granted a motion to voluntarily dismiss three cases after the U.S. Bureau of Land Management and other defendants agreed to conduct more robust environmental reviews of certain oil and gas leases and reconsider the cumulative climate effects of these leases. The settlement agreements apply to nearly four million acres of land in Colorado, Wyoming, Utah, Montana, and New Mexico. If the U.S. Bureau of Land Management fails to complete its obligations under the settlement agreements, the plaintiffs can reinstate the litigation.
To the extent our customers operate on leased federal land, these and other regulatory actions could have a material adverse effect on the Company and our industry.
Our business depends on domestic capital spending by the oil and natural gas industry, and reductions in capital spending could have a material adverse effect on our liquidity, results of operations and financial condition.
Our business is directly affected by our customers’ capital spending to explore for, develop and produce oil and natural gas in the United States and Canada. In addition, certain of our customers could become unable to pay their vendors and service
providers, including us, as a result of a decline in commodity prices. Reduced discovery rates of new oil and natural gas reserves in our areas of operation as a result of decreased capital spending may also have a negative long-term impact on our business, even in an environment of stronger oil and natural gas prices. Any of these conditions or events could adversely affect our operating results. If current activity levels decrease or our customers further reduce their capital spending, it could have a material adverse effect on our liquidity, results of operations and financial condition.
Industry conditions are influenced by numerous factors over which we have no control, including:
•expected economic returns to E&P companies of new well completions;
•domestic and foreign economic conditions and supply of and demand for oil and natural gas;
•the level of prices, and expectations about future prices, of oil and natural gas;
•the level of global oil and natural gas exploration and production;
•the level of domestic and global oil and natural gas inventories;
•the supply of and demand for hydraulic fracturing services and equipment in the United States and Canada;
•federal, tribal, state and local laws, regulations and taxes, including the policies of governments regarding hydraulic fracturing, oil and natural gas exploration, development and production activities and the transportation of oil and gas by pipeline, as well as non-U.S. governmental regulations and taxes;
•governmental regulations, including the policies of governments regarding the exploration for and production and development of their oil and natural gas reserves;
•political and economic conditions in oil and natural gas producing countries;
•actions by the members of the Organization of Petroleum Exporting Countries and other oil exporting nations (“OPEC+”) with respect to oil production levels and potential changes in such levels;
•global weather conditions and natural disasters;
•worldwide political, military and armed conflict, and economic conditions;
•the cost of producing and delivering oil and natural gas;
•lead times associated with acquiring equipment and products and availability of qualified personnel;
•the discovery rates of new oil and natural gas reserves;
•the production decline rate of existing oil and gas wells;
•stockholder activism or activities by non-governmental organizations to limit certain sources of funding for the energy sector or to restrict the exploration, development, production and transportation of oil and natural gas;
•the availability of water resources, suitable proppant and chemical additives in sufficient quantities for use in hydraulic fracturing fluids;
•advances in exploration, development and production technologies or in technologies affecting energy consumption;
•the availability, proximity and capacity of oil and natural gas pipelines and other transportation facilities;
•merger and divestiture activity among oil and natural gas producers;
•the price and availability of alternative fuels and energy sources; and
•uncertainty in capital and commodities markets and the ability of oil and natural gas companies to raise equity capital and debt financing.
The volatility of oil and natural gas prices may adversely affect the demand for our hydraulic fracturing services and negatively impact our results of operations.
The demand for our hydraulic fracturing services is primarily determined by current and anticipated oil and natural gas prices and the related levels of capital spending and drilling activity in the areas in which we have operations. Volatility or weakness in oil prices or natural gas prices (or the perception that oil prices or natural gas prices will decrease) affects the spending patterns of our customers and may result in the drilling of fewer new wells. This, in turn, could lead to lower demand for our services and may cause lower utilization of our assets. We have experienced, and may in the future experience significant fluctuations in operating results as a result of the reactions of our customers to changes in oil and natural gas prices.
Prices for oil and natural gas historically have been volatile and are expected to continue to be volatile. During the year 2024, the posted WTI price traded at an average of $76.63 per barrel (“Bbl”), as compared to the 2023 average of $77.58 per
Bbl and the 2022 average of $94.90 per Bbl. During this three-year period, the WTI price fluctuated between a high of $123.64 per Bbl and a low of $66.61 per Bbl. If the prices of oil and natural gas remain or become more volatile, our operations, financial condition, cash flows and level of expenditures may be materially and adversely affected.
Delays or restrictions in obtaining permits by us for our operations or by our customers for their operations could impair our business.
In most states, our hydraulic fracturing services, our natural gas compression and CNG delivery operations, and the operations of our oil and natural gas producing customers require permits from one or more governmental agencies in order to perform drilling and completion activities, secure water rights, or other regulated activities. Such permits are typically issued by state agencies, but federal and local governmental permits may also be required. The requirements for such permits vary depending on the location where such regulated activities will be conducted. As with all governmental permitting processes, there is a degree of uncertainty as to whether a permit will be granted, the time it will take for a permit to be issued, and the conditions that may be imposed in connection with the granting of the permit. In addition, some of our customers’ drilling and completion activities may take place on federal land or Native American lands, requiring leases and other approvals from the federal government or Native American tribes to conduct such drilling and completion activities or other regulated activities. Under certain circumstances, federal agencies may cancel proposed leases for federal lands and refuse to grant or delay required approvals. Therefore, our customers’ operations in certain areas may be interrupted or suspended for varying lengths of time, causing a loss of revenue to us and adversely affecting our results of operations in support of those customers.
Oil and natural gas companies’ operations using hydraulic fracturing are substantially dependent on the availability of water. Restrictions on the ability to obtain water for E&P activities and the disposal of flowback and produced water may impact their operations and have a corresponding adverse effect on our business, results of operations and financial condition.
Water is an essential component of shale oil and natural gas production during both the drilling and hydraulic fracturing processes. Our oil and natural gas producing customers’ access to water to be used in these processes may be adversely affected due to reasons such as periods of extended drought, privatization, third party competition for water in localized areas or the implementation of local or state governmental programs to monitor or restrict the beneficial use of water subject to their jurisdiction for hydraulic fracturing to assure adequate local water supplies. The occurrence of these or similar developments may result in limitations being placed on allocations of water due to needs by third party businesses with more senior contractual or permitting rights to the water. Our customers’ inability to locate or contractually acquire and sustain the receipt of sufficient amounts of water could adversely impact their E&P operations and have a corresponding adverse effect on our business, results of operations and financial condition.
Moreover, the imposition of new environmental regulations and other regulatory initiatives could include increased restrictions on our producing customers’ ability to dispose of flowback and produced water generated in hydraulic fracturing or other fluids resulting from E&P activities. Applicable laws impose restrictions and strict controls regarding the discharge of pollutants into waters of the United States and require that permits or other approvals be obtained to discharge pollutants to such waters. Additionally, in 2016, the EPA adopted a pretreatment standard that prohibits the discharge of wastewater pollutants from onshore unconventional oil and gas extraction facilities to publicly owned treatment works. Further, regulations implemented under both federal and state laws prohibit the discharge of produced water and sand, drilling fluids, drill cuttings and certain other substances related to the natural gas and oil industry into coastal waters. These laws provide for civil, criminal and administrative penalties for any unauthorized discharges of pollutants and unauthorized discharges of reportable quantities of oil and hazardous substances. Compliance with current and future environmental regulations and permit requirements governing the withdrawal, storage and use of surface water or groundwater necessary for hydraulic fracturing of wells and any inability to secure transportation and access to disposal wells with sufficient capacity to accept all of our flowback and produced water on economic terms may increase our customers’ operating costs and could result in restrictions, delays, or cancellations of our customers’ operations, the extent of which cannot be predicted.
Our operations are subject to risks associated with climate change and potential regulatory programs meant to address climate change; these programs may impact or limit our business plans, result in significant expenditures or reduce demand for our services and reduce our revenues.
Climate change continues to be the focus of political and societal attention. Numerous proposals have been made and are likely to be forthcoming on the international, national, regional, state and local levels to reduce GHG emissions. These efforts have included or may include cap-and-trade programs, carbon taxes, GHG reporting obligations and other regulatory programs that limit or require control of GHG’s from certain sources. Programs addressing climate change may limit the ability to produce crude oil and natural gas, require stricter limits on the release of methane or other GHGs, increase reporting and/or other compliance obligations associated with GHG emissions, limit the ability to explore in new areas, limit the construction of pipelines and related equipment or may make it more expensive to produce, any of which may decrease the demand for our services and our revenues.
Incentives to conserve energy or use alternative energy sources, which can be part of climate change programs, may increase the competitiveness of alternative energy sources (such as wind, solar, geothermal, tidal and biofuels) or increase the focus on reducing the use of combustion engines in transportation (such as governmental mandates that ban the sale of new gasoline-powered automobiles). At various Conferences of the Parties of the United Nations Framework Convention on Climate Change, the parties adopted a statement calling for “transitioning away from fossil fuels” and an increased focus on renewable energy capacity and energy efficiency. These actions could, in turn, reduce demand for hydrocarbons and therefore for our services, which would lead to a reduction in our revenues.
An increased societal and governmental focus on ESG and climate change issues may adversely impact our business, impact our access to investors and financing, and decrease demand for our services.
An increased expectation that companies address ESG matters (including climate change) may have a myriad of impacts on our business. Some investors and lenders are factoring these issues into investment and financing decisions. They may rely upon companies that assign ratings to a company’s ESG performance. Unfavorable ESG ratings, as well as recent activism around fossil fuels, may dissuade investors or lenders from us and toward other industries, which could negatively impact our stock price or our access to capital. Additionally, some potential sources of investment or financing have announced an intention to avoid or limit investment in companies that engage in hydraulic fracturing. While a substantial number of major banks and financing sources remain active in investments related to hydraulic fracturing, it is possible that the investment avoidance or limitation theme could expand in the future and restrict access to capital for companies like us.
Moreover, while we have and may continue to create and publish voluntary disclosures regarding ESG matters from time to time, many of the statements in those voluntary disclosures are based on hypothetical expectations and assumptions that may or may not be representative of current or actual risks or events or forecasts of expected risks or events, including the costs associated therewith. Such expectations and assumptions are necessarily uncertain and may be prone to error or subject to misinterpretation given the long timelines involved and the lack of an established single approach to identifying, measuring and reporting on many ESG matters. Additionally, to the extent that we report GHG emissions data, the methodologies that we use to calculate our emissions may change over time based upon changing industry standards. We note that standards and expectations regarding the processes for measuring and counting GHG emissions and GHG emission reductions are evolving, and it is possible that our approach to measuring our emissions maybe considered inconsistent with common or best practices with respect to measuring and accounting for such matters. If our approaches to such matters fall out of step with common or best practice, we may be subject to additional scrutiny, criticism, regulatory and investor engagement or litigation, any of which may adversely impact our business, financial condition or results of operation.
In 2023, the State of California enacted legislation that will require large U.S. companies doing business in California to make broad-based climate-related disclosures starting as early as 2026, and other jurisdictions, domestically and internationally, are also considering various climate change disclosure requirements.
In addition, ESG and climate change issues may cause consumer preference to shift toward other alternative sources of energy, lowering demand for oil and natural gas and consequently lowering demand for our services. In some areas these concerns have caused governments to adopt or consider adopting regulations to transition to a lower-carbon economy. These measures may include adoption of cap-and-trade programs, carbon taxes, increased efficiency standards, prohibitions on the manufacture of certain types of equipment (such as new automobiles with internal combustion engines), and requirements for the use of alternate energy sources such as wind or solar. These types of programs may reduce the demand for oil and natural gas and consequently the demand for our services.
Approaches to climate change and a transition to a lower-carbon economy, including government regulation, company policies, and consumer behavior, are continuously evolving. At this time, we cannot predict how such approaches may develop or otherwise reasonably or reliably estimate their impact on our financial condition, results of operations and ability to compete. However, any long-term material adverse effect on the oil and gas industry may adversely affect our financial condition, results of operations and cash flows.
Our operations are subject to significant risks, some of which are beyond our control. These risks may be self-insured, or may not be fully covered under our insurance policies.
Our operations are subject to significant hazards often found in the oil and natural gas industry, such as, but not limited to, accidents, including accidents related to trucking operations provided in connection with our services, blowouts, explosions, craterings, fires, natural gas leaks, oil and produced water spills and releases of hydraulic fracturing fluids or other well fluids into the environment. These conditions can cause:
•disruption in operations;
•substantial repair or remediation costs;
•personal injury or loss of human life;
•significant damage to or destruction of property, and equipment;
•environmental pollution, including groundwater contamination;
•unusual or unexpected geological formations or pressures and industrial accidents;
•impairment or suspension of operations; and
•substantial revenue loss.
In addition, our operations are subject to, and exposed to, employee/employer liabilities and risks such as wrongful termination, discrimination, labor organizing, retaliation claims and general human resource related matters.
The occurrence of a significant event or adverse claim in excess of the insurance coverage that we maintain or that is not covered by insurance could have a material adverse effect on our liquidity, consolidated results of operations and financial condition. Claims for loss of oil and natural gas production and damage to formations can occur in the well services industry. Litigation arising from a catastrophic occurrence at a location where our equipment and services are being used or trucking services provided in connection therewith may result in our being named as a defendant in lawsuits asserting large claims.
We do not have insurance against all foreseeable risks, either because insurance is not available or because of the high premium costs. The occurrence of an event not fully insured against or the failure of an insurer to meet its insurance obligations could result in substantial losses. In addition, we may not be able to maintain adequate insurance in the future at rates we consider reasonable. Insurance may not be available to cover any or all of the risks to which we are subject, or, even if available, it may be inadequate, or insurance premiums or other costs could rise significantly in the future so as to make such insurance prohibitively expensive.
We could experience continued or increased severity of trucking related issues or trucking accidents, which could materially affect our results of operations.
Trucking services can be adversely impacted by traffic congestion, shortage of drivers and weather delays which could hinder our service levels. We have experienced in the past, and we may experience in the future, a shortage of available trucking services in the United States due to the industry not having enough qualified drivers, which impacted our field operations at times. In addition, our field employees are generally required to have a commercial driver’s license (“CDL”) so they can drive trucks and move our frac pumps and other equipment from location to location. Obtaining employees with CDLs can be challenging during times when the trucking industry has driver shortages, as competition for qualified employees is often more intense. If we are unable to obtain trucking services on a timely basis or the services of a sufficient number of field employees with CDLs, it could have a material adverse impact on our financial condition, results of operations and cash flows.
In addition, potential liability and unfavorable publicity associated with accidents in the trucking industry can be severe and occurrences are unpredictable. The number and severity of litigation claims may be worsened by distracted driving by both truck drivers and other motorists. Our transportation operations often involve traveling on unpaved roads located in rural areas, increasing the risk of accidents. If we are involved in an accident involving hazardous substances, if there are releases of hazardous substances we transport, if soil or groundwater contamination is found at our facilities or results from our operations, or if we are found to be in violation of applicable environmental laws or regulations, we could owe cleanup costs and incur related liabilities, including substantial fines or penalties or civil and criminal liability. A material increase in the frequency or severity of accidents or workers’ compensation claims or the unfavorable development of existing claims could materially adversely affect our results of operations. In the event that accidents occur, we may be unable to obtain desired contractual indemnities, and our insurance may be inadequate in certain cases which could result in substantial losses. Any such lawsuits in the future may result in the payment of substantial settlements or damages and increases to our insurance costs.
We may be subject to claims for personal injury and property damage, which could materially adversely affect our financial condition, prospects and results of operations.
Our services are subject to inherent risks that can cause personal injury or loss of life, damage to or destruction of property, equipment or the environment or the suspension of our operations. Litigation arising from operations where our services are provided, may cause us to be named as a defendant in lawsuits asserting potentially large claims including claims for exemplary damages. We maintain what we believe is customary and reasonable insurance to protect our business against these potential losses, but such insurance may not be adequate to cover our liabilities, and we are not fully insured against all risks.
In addition, our customers usually assume responsibility for, including control and removal of, all other pollution or contamination which may occur during operations, including that which may result from seepage or any other uncontrolled flow of drilling and completion fluids. We may have liability in such cases if we are grossly negligent or commit willful acts. Our customers generally agree to indemnify us against claims arising from their employees’ personal injury or death to the extent that, in the case of our hydraulic fracturing operations, their employees are injured by such operations, unless resulting from our gross negligence or willful misconduct. Our customers also generally agree to indemnify us for loss or destruction of
customer-owned property or equipment. In turn, we agree to indemnify our customers for loss or destruction of property or equipment we own and for liabilities arising from personal injury to or death of any of our employees, unless resulting from gross negligence or willful misconduct of the customer. However, we might not succeed in enforcing such contractual liability allocation or might incur an unforeseen liability falling outside the scope of such allocation. As a result, we may incur substantial losses which could materially and adversely affect our financial condition and results of operation.
We are subject to environmental and occupational health and safety laws and regulations that may expose us to significant costs and liabilities.
Our operations and the operations of our customers are subject to numerous federal, tribal, regional, state and local laws and regulations relating to protection of the environment including natural resources, health and safety aspects of our operations and waste management, including the transportation and disposal of waste and other materials. These laws and regulations may impose numerous obligations on our operations and the operations of our customers, including the acquisition of permits or other approvals to conduct regulated activities, the imposition of restrictions on the types, quantities and concentrations of various substances that may be released into the environment or injected in non-productive formations below ground in connection with oil and natural gas drilling and production activities, the incurrence of capital expenditures to mitigate or prevent releases of materials from our equipment, facilities or from customer locations where we are providing services, the imposition of substantial liabilities for pollution resulting from our operations, and the application of specific health and safety criteria addressing worker protection. Any failure on our part or the part of our customers to comply with these laws and regulations could result in assessment of sanctions including administrative, civil and criminal penalties; imposition of investigatory, remedial or corrective action obligations or the incurrence of capital expenditures; the occurrence of restrictions, delays or cancellations in the permitting, performance or development of projects or operations; and the issuance of orders enjoining performance of some or all of our operations in a particular area. In addition to civil and other penalties associated with enforcement activities regarding compliance with occupational health and safety laws, our operations may be subject to abatement obligations that could require significant modifications to existing operations to achieve compliance.
Our business activities present risks of incurring significant environmental costs and liabilities, including costs and liabilities resulting from our handling of oilfield and other wastes, because of air emissions and wastewater discharges related to our operations, and due to historical oilfield industry operations and waste disposal practices. Moreover, accidental releases or spills may occur in the course of our operations or at facilities where our wastes are taken for reclamation or disposal, and we cannot assure you that we will not incur significant costs and liabilities as a result of such releases or spills, including any third-party claims for injuries to persons or damages to properties or natural resources. Some environmental laws and regulations may impose strict liability, which means that in some situations we could be exposed to liability as a result of our conduct that was lawful at the time it occurred or the conduct of, or conditions caused by, prior operators or other third parties. Remedial and abatement costs and other damages arising as a result of environmental and occupational health and safety laws and costs associated with changes in these laws and regulations could be significant and have a material adverse effect on our liquidity, consolidated results of operations and financial condition.
Laws and regulations protecting the environment generally have become more stringent in recent years and are expected to continue to do so, which could lead to material increases in costs for future environmental compliance and remediation. In particular, the ESA restricts activities that may result in a “take” of endangered or threatened species and provides for substantial penalties in cases where listed species are taken by being harmed. The dunes sagebrush lizard is one example of a species that was recently listed as an endangered species. The State of Texas has filed suit challenging the listing. The dunes sagebrush lizard is found in the active and semi-stable shinnery oak dunes of southeastern New Mexico and adjacent portions of Texas, including areas where our customers operate and our frac sand facilities are located. The listing of the dunes sagebrush lizard as an endangered species, may impact our operations and the operations of our customers in any area that is designated as the dunes sagebrush lizard’s habitat. Depending on the locations of our operations, we and our customers may be required to comply with expensive mitigation measures intended to protect the dunes sagebrush lizard and its habitat. If the U.S. Department of the Interior and Fish and Wildlife Service lists additional species as endangered or protected, it could negatively impact our business activities or the business activities of our customers which could subsequently impact demand for our services and thereafter our revenue. Furthermore, new laws and regulations, amendment of existing laws and regulations, reinterpretation of legal requirements or increased governmental enforcement with respect to environmental matters could restrict, delay or curtail exploratory or developmental drilling for oil and natural gas by our customers and could limit our well servicing opportunities.
Oilfield anti-indemnity provisions enacted by many states may restrict or prohibit a party’s indemnification of us.
We typically enter into agreements with our customers governing the provision of our services, which usually include certain indemnification provisions for losses resulting from operations. Such agreements may require each party to indemnify the other against certain claims regardless of the negligence or other fault of the indemnified party; however, many states place limitations on contractual indemnity agreements, particularly agreements that indemnify a party against the consequences of its own negligence. Furthermore, certain states, including Texas, New Mexico and Wyoming, have enacted statutes generally
referred to as “oilfield anti-indemnity acts” expressly prohibiting certain indemnity agreements contained in or related to oilfield services agreements. Such anti-indemnity acts may restrict or void a party’s indemnification of us, which could have a material adverse effect on our business, financial condition, prospects and results of operations.
Technology advancements in well service technologies, including those involving hydraulic fracturing, could have a material adverse effect on our business, financial condition and results of operations.
The hydraulic fracturing industry is characterized by rapid and significant technological advancements and introductions of new products and services using new technologies. As competitors and others use or develop new technologies or technologies comparable to ours in the future, we may lose market share or be placed at a competitive disadvantage. Further, we may face competitive pressure to implement or acquire certain new technologies at a substantial cost. Some of our competitors may have greater financial, technical and personnel resources than we do, which may allow them to gain technological advantages or implement new technologies before we can. Additionally, we may be unable to implement new technologies or services at all, on a timely basis or at an acceptable cost. New technology could also make it easier for our customers to vertically integrate their operations, thereby reducing or eliminating the need for our services. Limits on our ability to effectively use or implement new technologies may have a material adverse effect on our business, financial condition and results of operations.
The ability or willingness of OPEC+ and other oil exporting nations to set and maintain production levels and/or the impact of sanctions and global conflicts may have a significant impact on natural gas commodity prices.
OPEC+ is an intergovernmental organization that seeks to manage the price and supply of oil on the global energy market. Actions taken by OPEC+ members, including those taken alongside other oil exporting nations, have a significant impact on global oil supply and pricing. For example, OPEC+ and certain other oil exporting nations have previously agreed to take measures, including production cuts, to support crude oil prices. In 2020, largely as a result of the COVID-19 pandemic, oil prices decreased dramatically, and OPEC+ agreed to historic production cuts in an effort to support prices. Conversely, sanctions imposed on Russia as a result of the Russia-Ukraine conflict in 2022 increased prices. In October 2022, OPEC+ again determined to reduce production of oil, by approximately 2 million barrels per day. At its meeting on December 4, 2022, OPEC+ agreed to keep its current policy unchanged as the oil markets struggle to assess the impact of a slowing Chinese economy on demand, and the Group of Seven Nations agreed on a price cap on Russian oil supply. In June 2023, OPEC+ members announced they would extend crude oil production cuts through 2024, limiting global crude oil supplies. In November 2023, OPEC+ agreed to cut production by an additional 1 million barrels per day beginning in January 2024. In December 2024, OPEC+ agreed to delay the beginning of output rises and extended the full unwinding of previous production cuts until the end of 2026.
There can be no assurance that OPEC+ members and other oil exporting nations will agree to future production cuts or other actions to support and stabilize oil prices, nor can there be any assurance that sanctions or other global conflicts, including the Russia-Ukraine conflict and various conflicts in the broader Middle East, will not further impact oil prices. Uncertainty regarding future sanctions or actions to be taken by OPEC+ members or other oil exporting countries could lead to increased volatility in the price of oil and natural gas, which could adversely affect our business, future financial condition and results of operations.
Risks Related to the TRAs
The Company is required to make payments under the TRAs for certain tax benefits that it may claim, and the amounts of such payments could be significant.
In connection with the Company’s initial public offering (the “IPO”), on January 17, 2018, the Company entered into two Tax Receivable Agreements (the “TRAs”) with R/C Energy IV Direct Partnership, L.P. and the then-existing owners of Liberty Oilfield Services Holdings LLC (“Liberty Holdings”) that continued to own Liberty LLC Units (each such person and any permitted transferee, a “TRA Holder”). The TRAs generally provide for the payment by the Company to each TRA Holder of 85% of the net cash savings, if any, in U.S. federal, state, and local income tax and franchise tax (computed using simplifying assumptions to address the impact of state and local taxes) that the Company actually recognizes (or is deemed to recognize in certain circumstances) as a result of certain increases in tax basis, net operating losses available to the Company as a result of the corporate reorganization performed in connection with the IPO (the “Corporate Reorganization”), and certain benefits attributable to imputed interest. The Company will retain the benefit of the remaining 15% of these cash savings.
The Company is a holding company and has no material assets other than its direct and indirect equity interests in its subsidiaries. Because the Company has no independent means of generating revenue, its ability to make payments under the TRAs is dependent on the ability of its subsidiaries to make distributions to the Company in an amount sufficient to cover its obligations under the TRAs. To the extent that the Company is unable to make payments under the TRAs for any reason, such payments will be deferred and will accrue interest until paid.
The term of each of the TRAs continues until all tax benefits that are subject to such TRAs have been utilized or expired, unless the Company experiences a change of control (as defined in the TRAs, which includes certain mergers, asset sales and other forms of business combinations) or the TRAs are terminated early (at the Company’s election or as a result of its breach), and the Company makes the termination payments specified in such TRAs. In addition, payments the Company makes under the TRAs will be increased by any interest earned from the due date (without extensions) of the corresponding tax return. Payments under the TRAs commenced in 2020 and so long as the tax savings are recognized and the TRAs are not terminated, payments are anticipated to continue for 15 years after the date of the last redemption of the Liberty LLC Units, which occurred on January 31, 2023. Accordingly, if the applicable U.S. federal corporate tax rate is increased, then the amount of TRA payments paid in the future may also increase.
In certain cases, if the Company experiences a change of control (as defined under the TRAs, which includes certain mergers, asset sales and other forms of business combinations) or the TRAs terminate early (at the Company’s election or as a result of its breach), the Company would be required to make an immediate lump-sum payment, and such payment may be significantly in advance of, and may materially exceed, the actual realization, if any, of the future tax benefits to which the payment relates. As a result, the Company’s obligations under the TRAs could have a substantial negative impact on its liquidity and could have the effect of delaying, deferring or preventing certain mergers, asset sales, or other forms of business combinations or changes of control. There can be no assurance we will be able to finance our obligations under the TRAs. Furthermore, as a result of this payment obligation, holders of our Class A Common Stock could receive substantially less consideration in connection with a change in control transaction than they would receive in the absence of such obligation. Because our payment obligations under the TRAs will not be conditioned upon the TRA Holders’ having continued interest in the Company or Liberty LLC, the TRA Holders’ interests may conflict with those of the holders of our Class A Common Stock.
Payments under the TRAs are based on the tax reporting positions that we will determine. The TRA Holders will not reimburse us for any payments previously made under the TRAs if any tax benefits that have given rise to payments under the TRAs are subsequently disallowed in an audit, except that excess payments made to any TRA Holder will be netted against payments that would otherwise be made to such TRA Holder, if any, after our determination of such excess. As a result, in such circumstances the Company could make payments that are greater than its actual cash tax savings, if any, and may not be able to recoup those payments, which could adversely affect the Company’s liquidity. Furthermore, the payments under the TRAs will not be conditioned upon a holder of rights under each of the TRAs having a continued ownership interest in the Company or Liberty LLC. For further details of the TRAs, see Note 12—Income Taxes to the consolidated financial statements included in Part II, Item 8 of this Annual Report.
General Risks Related to our Business
We may be adversely affected by uncertainty in the global financial markets and the deterioration of the financial condition of our customers.
Our future results may be impacted by the uncertainty caused by an economic downturn, volatility or deterioration in the debt and equity capital markets, inflation, deflation or other adverse economic conditions that may negatively affect us or parties with whom we do business resulting in a reduction in our customers’ spending and their non-payment or inability to perform obligations owed to us, such as the failure of customers to honor their commitments or the failure of major suppliers to complete orders. Additionally, during times when the oil or natural gas markets weaken, our customers are more likely to experience financial difficulties, including being unable to access debt or equity financing, which could result in a reduction in our customers’ spending for our services. In addition, in the course of our business we hold accounts receivable from our customers. In the event of the financial distress or bankruptcy of a customer, we could lose all or a portion of such outstanding accounts receivable associated with that customer. Further, if a customer was to enter into bankruptcy, it could also result in the cancellation of all or a portion of our service contracts with such customer at significant expense or loss of expected revenues to us.
Our business, financial condition and results of operations may be adversely impacted by the effects of inflation.
Inflation has the potential to adversely affect our business, financial condition and results of operations by increasing our overall cost structure, particularly if we are unable to achieve commensurate increases in the prices we charge our customers. Other inflationary pressures could affect wages, the cost and availability of components, materials and other inputs and our ability to meet customer demand. Inflation may further exacerbate other risk factors, including supply chain disruptions, risks related to international operations and the recruitment and retention of qualified employees.
Reliance upon a few large customers may adversely affect our revenue and operating results.
Our top five customers represented approximately 43%, 34%, and 30%, of our consolidated revenue for the years ended December 31, 2024, 2023, and 2022, respectively. It is possible that we will derive a significant portion of our revenue from a concentrated group of customers in the future. If a major customer fails to pay us, revenue would be impacted, and our operating results and financial condition could be materially harmed. Additionally, if we were to lose any material customer or our customers were to consolidate or merge with other operators, we may not be able to redeploy our equipment at similar
utilization or pricing levels or within a short period of time and such loss could have a material adverse effect on our business until the equipment is redeployed at similar utilization or pricing levels.
We are subject to cyber security risks. A cyber incident could occur and result in information theft, data corruption, operational disruption and/or financial loss.
The oil and natural gas industry has become increasingly dependent on digital technologies to conduct certain processing activities. For example, we depend on digital technologies to perform many of our services and to process and record financial and operating data. At the same time, cyber incidents, including deliberate attacks, have increased. The U.S. government has issued public warnings that indicate that energy assets might be specific targets of cyber security threats. In early 2020, we experienced a denial of service cyberattack that targeted a portion of our non-financial data. We immediately shutdown critical systems, diagnosed the root cause of the attack and then methodically returned systems online. This cyberattack disrupted certain non-financial aspects of our internal system for a period of less than one day, while limited and non-critical portions of our systems were kept offline for up to one week in order to properly evaluate the breach. We determined that this cyberattack did not materially affect us or any of our operations. We engaged in extensive data evaluation for potential damage and concluded that minimal to no data loss had occurred as a result of this cyberattack. Our technologies, systems and networks, and those of our vendors, suppliers and other business partners, may become the target of cyberattacks or information security breaches in the future that could result in the unauthorized release, gathering, monitoring, misuse, loss or destruction of proprietary and other information, or other disruption of business operations. In addition, certain cyber incidents, such as surveillance, may remain undetected for an extended period. Our systems and insurance coverage for protecting against cyber security risks may not be sufficient. As cyber incidents continue to evolve, we will likely be required to expend additional resources to continue to modify or enhance our protective measures or to investigate and remediate any vulnerability to cyber incidents. Our insurance coverage for cyberattacks may not be sufficient to cover all the losses we may experience as a result of such cyberattacks.
Our assets require significant amounts of capital for maintenance, upgrades and refurbishment and may require significant capital expenditures for new equipment.
Our hydraulic fracturing fleets and other completion service-related equipment require significant capital investment in maintenance, upgrades and refurbishment to maintain their competitiveness. The costs of components and labor have increased in the past and may increase in the future with increases in demand, which will require us to incur additional costs for any fleets we may acquire in the future. Our fleets and other equipment typically do not generate revenue while they are undergoing maintenance, upgrades or refurbishment. Any maintenance, upgrade or refurbishment project for our assets could increase our indebtedness or reduce cash available for other opportunities. Furthermore, such projects may require proportionally greater capital investments as a percentage of total asset value, which may make such projects difficult to finance on acceptable terms. To the extent we are unable to fund such projects, we may have less equipment available for service or our equipment may not be attractive to potential or current customers. Additionally, competition or advances in technology within our industry may require us to update or replace existing fleets or build or acquire new fleets. Such demands on our capital or reductions in demand for our hydraulic fracturing fleets and the increase in cost of labor necessary for such maintenance and improvement, in each case, could have a material adverse effect on our business, liquidity position, financial condition, prospects and results of operations and may increase our costs.
We rely on certain third parties for materials, and delays in deliveries of such materials, increases in the cost of such materials or our contractual obligations to pay for materials that we ultimately do not require could harm our business, results of operations and financial condition.
We have established relationships with certain suppliers of our materials (such as, but not limited to, proppant and chemical additives) and other parts, supplies and items needed for our operations. Delays or shortages in materials can result from a variety of reasons, including those caused by weather and natural disasters. Historically, the United States has undergone supply chain disruptions due to backlogged ports and trucking shortages, and our business is not immune from these effects. Even once the root cause of the supply chain disruption or any future shortage or delay has passed, it can take time for our supply chain to recover and run in a regular fashion. Should the nationwide supply chain disruption continue, or should any of our current suppliers be unable to provide the necessary materials or otherwise fail to deliver the materials in a timely manner and in the quantities required, any resulting delays in the provision of services could have a material adverse effect on our business, results of operations and financial condition. Additionally, increasing costs of such materials may negatively impact demand for our services or the profitability of our business operations. In the past, our industry faced sporadic proppant shortages associated with hydraulic fracturing operations requiring work stoppages, which are believed to have adversely impacted the operating results of several competitors. We may not be able to mitigate any future shortages of materials, including proppant, or the impact of supply chain disruptions. Furthermore, to the extent our contracts require us to purchase more materials, including proppant, than we ultimately require, we may be forced to pay for the excess amount under “take or pay” contract provisions.
We currently utilize a limited number of assemblers and suppliers for major equipment to both build new fleets and upgrade any fleets we acquire to our preferred specifications, and our reliance on these vendors exposes us to risks including price and timing of delivery.
We currently utilize a limited number of assemblers and suppliers for major equipment to both build our new fleets and upgrade any fleets we may acquire to our custom design. If demand for hydraulic fracturing fleets or the components necessary to build such fleets increases or these vendors face financial distress or bankruptcy, these vendors may not be able to provide the new or upgraded fleets on schedule or at the current price. If this were to occur, we could be required to seek another assembler or other suppliers for major equipment to build or upgrade our fleets, which may adversely affect our revenues or increase our costs.
Interruptions of service on the rail lines by which we receive proppant could adversely affect our results of operations.
We receive a portion of the proppant used in our hydraulic fracturing services by rail. Rail operations are subject to various risks that may result in a delay or lack of service, including lack of available capacity, mechanical problems, extreme weather conditions, work stoppages, labor strikes, terrorist attacks and operating hazards. Additionally, if we increase the amount of proppant we require for delivery of our services, we may face difficulty in securing rail transportation for such additional amount of proppant. Any delay or failure in the rail services on which we rely could have a material adverse effect on our financial condition and results of operations.
Changes in transportation regulations may increase our costs and negatively impact our results of operations.
We are subject to various transportation regulations including as a motor carrier by the Department of Transportation and by various federal, state, provincial and tribal agencies, whose regulations include certain permit requirements of highway and safety authorities. These regulatory authorities exercise broad powers over our equipment transportation operations, generally governing such matters as the authorization to engage in motor carrier operations, safety, equipment testing, driver requirements and specifications and insurance requirements. The trucking industry is subject to possible regulatory and legislative changes that may impact our operations, such as changes in fuel emissions limits, hours of service regulations that govern the amount of time a driver may drive or work in any specific period and requiring onboard electronic logging devices or limits on vehicle weight and size. As the federal government continues to develop and propose regulations relating to fuel quality, engine efficiency and greenhouse gasses emissions, we may experience an increase in costs related to truck purchases and maintenance, impairment of equipment productivity, a decrease in the residual value of vehicles, unpredictable fluctuations in fuel prices and an increase in operating expenses. Additionally, we rely on third parties to provide trucking services, including hauling proppant to our customer work sites, and these third parties may fail to comply with various transportation regulations, resulting in our inability to use such third-party providers. Increased truck traffic may contribute to deteriorating road conditions in some areas where our operations are performed. Our operations, including routing and weight restrictions, could be affected by road construction, road repairs, detours and state and local regulations and ordinances restricting access to certain roads. Proposals to increase federal, state, provincial or local taxes, including taxes on motor fuels, are also made from time to time, and any such increase would increase our operating costs. Also, state and local regulation of permitted routes and times on specific roadways could adversely affect our operations. We cannot predict whether, or in what form, any legislative or regulatory changes or municipal ordinances applicable to our logistics operations will be enacted and to what extent any such legislation or regulations could increase our costs or otherwise adversely affect our business or operations.
We face a variety of risks related to our diversification and entry into a new line of business.
The proposed diversification of our business as a scaled distributed power and energy storage solutions provider carries a number of risks. We will become subject to laws and regulations previously inapplicable to our existing business and this could lead to additional litigation and regulatory risk. Our expansion into the distributed power solutions business will create the need for additional capital and other resources, the cost and availability of which may depend on market conditions, regulatory landscape, financial and operating results, interest rates, inflationary considerations, compliance with covenants under our credit facility, and other considerations. Furthermore, while our management team has a track record of successfully executing on the growth of our existing business, the team has not directly engaged in the distributed power solutions business before and this lack of experience could have adverse impacts and complications such as on cost and timing to execute on the new business and the overall success of the program. If we are unable to successfully execute on this new line of business, our revenue and profitability may not grow as expected, our competitiveness may be materially and adversely affected, and our reputation and business may be harmed.
As we continue our diversification into a new line of business, the market price for our common stock will become subject to factors different from those that have historically and currently impacted our common stock.
Our financial performance and results of operations with respect to the proposed new line of business will be subject to certain factors that may differ or be inapplicable to our existing business. Accordingly, the market price and performance of our common stock may be impacted differently in connection with our expansion into the distributed power systems line of business.
Our current and future indebtedness could adversely affect our financial condition.
Effective January 23, 2023, using proceeds from borrowings on our ABL Facility (as defined herein), we repaid all amounts outstanding under the Term Loan Facility (as defined herein). As of February 3, 2025, the Company had $261.0 million outstanding under our ABL Facility, in addition to letters of credit in the amount of $14.0 million, with $93.0 million of remaining availability. Please see “Management’s Discussion and Analysis of Financial Condition and Results of Operations—Liquidity and Capital Resources.”
Moreover, subject to the limits contained in our ABL Facility, we may incur substantial additional debt from time to time. Any borrowings we may incur in the future would have several important consequences for our future operations, including that:
•covenants contained in the documents governing such indebtedness may require us to meet or maintain certain financial tests, which may affect our flexibility in planning for, and reacting to, changes in our industry, such as being able to take advantage of acquisition opportunities when they arise;
•our ability to obtain additional financing for working capital, capital expenditures, acquisitions, general corporate and other purposes may be limited;
•our ability to use operating cash flow in other areas of our business may be limited because we must dedicate a substantial portion of these funds to make principal and interest payments on our indebtedness;
•we may be more vulnerable to interest rate increases to the extent that we incur variable rate indebtedness;
•we may be competitively disadvantaged to our competitors that are less leveraged or have greater access to capital resources; and
•we may be more vulnerable to adverse economic and industry conditions.
If we incur indebtedness in the future, we may have significant principal payments due at specified future dates under the documents governing such indebtedness. Our ability to meet such principal obligations will be dependent upon future performance, which in turn will be subject to general economic conditions, industry cycles and financial, business and other factors affecting our operations, many of which are beyond our control. Our business may not continue to generate sufficient cash flow from operations to repay any incurred indebtedness. If we are unable to generate sufficient cash flow from operations, we may be required to sell assets, to refinance all or a portion of such indebtedness or to obtain additional financing.
Unsatisfactory safety performance may negatively affect our customer relationships and, to the extent we fail to retain existing customers or attract new customers, adversely impact our revenues.
Our ability to retain existing customers and attract new business is dependent on many factors, including our ability to demonstrate that we can reliably and safely operate our business in a manner that is consistent with applicable laws, rules and permits, which legal requirements are subject to change. Existing and potential customers consider the safety record of their third-party service providers to be of high importance in their decision to engage such providers. If one or more accidents were to occur at one of our operating sites, the affected customer may seek to terminate or cancel its use of our equipment or services and may be less likely to continue to use our services, which could cause us to lose substantial revenues. Furthermore, our ability to attract new customers may be impaired if they elect not to engage us because they view our safety record as unacceptable. In addition, it is possible that we will experience multiple or particularly severe accidents in the future, causing our safety record to deteriorate. This may be more likely as we continue to grow, if we experience high employee turnover or labor shortage, or hire inexperienced personnel to bolster our staffing needs.
If we are unable to fully protect our intellectual property rights, we may suffer a loss in our competitive advantage or market share.
We do not have patents or patent applications relating to many of our key processes and technology. If we are not able to maintain the confidentiality of our trade secrets, or if our competitors are able to replicate our technology or services, our competitive advantage would be diminished. We also cannot ensure that any patents we may obtain in the future would provide us with any significant commercial benefit or would allow us to prevent our competitors from employing comparable technologies or processes.
We may be adversely affected by disputes regarding intellectual property rights of third parties.
Third parties from time to time may initiate litigation against us by asserting that the conduct of our business infringes, misappropriates or otherwise violates intellectual property rights. We may not prevail in any such legal proceedings related to such claims, and our products and services may be found to infringe, impair, misappropriate, dilute or otherwise violate the intellectual property rights of others. If we are sued for infringement and lose, we could be required to pay substantial damages and/or be enjoined from using or selling the infringing products or technology. Any legal proceeding concerning intellectual
property could be protracted and costly regardless of the merits of any claim and is inherently unpredictable and could have a material adverse effect on our financial condition, regardless of its outcome.
If we were to discover that our technologies or products infringe valid intellectual property rights of third parties, we may need to obtain licenses from these parties or substantially re-engineer our products in order to avoid infringement. We may not be able to obtain the necessary licenses on acceptable terms, or at all, or be able to re-engineer our products successfully. If our inability to obtain required licenses for our technologies or products prevents us from selling our products, that could adversely impact our financial condition and results of operations.
Additionally, we currently license certain third-party intellectual property in connection with our business, and the loss of any such license could adversely impact our financial condition and results of operations.
Seasonal weather conditions, natural disasters, public health crises, and other catastrophic events outside of our control could severely disrupt normal operations and harm our business.
Our operations are located in different regions of the United States and Canada. Some of these areas, including the DJ Basin, Powder River Basin, Williston Basin and our Canadian operations, are adversely affected by seasonal weather conditions, primarily in the winter and spring. Weather-related hazards exist in almost all the areas where we operate. During periods of heavy snow, ice or rain, we may be unable to move our equipment between locations or obtain adequate supplies of raw material or fuel, thereby reducing our ability to provide services and generate revenues. The exploration activities of our customers may also be affected during such periods of adverse weather conditions. Additionally, extended drought conditions in our operating regions could impact our ability or our customers’ ability to source sufficient water or increase the cost for such water. As a result, a natural disaster or inclement weather conditions could severely disrupt the normal operation of our business and adversely impact our financial condition and results of operations. Furthermore, if the area in which we operate or the market demand for oil and natural gas is affected by a public health crisis, such as the COVID-19 pandemic, or other similar catastrophic event outside of our control, our business and results of operations could be adversely impacted.
The sand mining operations are subject to a number of risks relating to the proppant industry.
We operate two sand mines in the Permian Basin. Sand mining operations are subject to risks normally encountered in the proppant industry. These risks include, among others: unanticipated ground, grade or water conditions; inability to acquire or maintain, or public or nongovernmental organization opposition to, necessary permits for mining, access or water rights; our ability to timely obtain necessary authorizations, approvals and permits from regulatory agencies (including environmental agencies, such as the FWS, where our operations in West Texas may be slowed, limited or halted due to conservation efforts targeted at the habitat of the dunes sagebrush lizard); pit wall or pond failures, and sluffing events; costs associated with environmental compliance or as a result of unauthorized releases into the environment; restrictions imposed on our operations related to the protection of natural resources, including plant and animal species; and reduction in the amount of water available for processing. Any of these risks could result in delays, limitations or cancellations in mining or processing activities, losses or possible legal liability.
Silica-related legislation, health issues and litigation could have a material adverse effect on our business, reputation or results of operations.
We are subject to laws and regulations relating to human exposure to crystalline silica. Historically, our environmental compliance costs with respect to existing crystalline silica requirements have not had a material adverse effect on our results of operations; however, federal regulatory authorities and analogous state agencies may continue to propose changes in their regulations regarding workplace exposure to crystalline silica, such as permissible exposure limits, required controls and personal protective equipment. We may not be able to comply with any new laws and regulations that are adopted, and any new laws and regulations could have a material adverse effect on our operating results by requiring us to modify or cease our operations.
In addition, the inhalation of respirable crystalline silica is associated with the lung disease silicosis. There is evidence of an association between crystalline silica exposure or silicosis and lung cancer and a possible association with other diseases, including immune system disorders such as scleroderma. The actual or perceived health risks of handling hydraulic fracture sand could materially and adversely affect hydraulic fracturing service providers, including us, through reduced use of hydraulic fracture sand, the threat of product liability or employee lawsuits, increased scrutiny by federal, state and local regulatory authorities of us and our customers or reduced financing sources available to the industry. Furthermore, we may incur additional costs with respect to purchasing specialized equipment designed to reduce exposure to crystalline silica in connection with our operations or invest capital in new equipment.
We are subject to the Federal Mine Safety and Health Act of 1977, which imposes stringent health and safety standards on certain aspects of our operations.
Our operations are subject to the Federal Mine Safety and Health Act of 1977, as amended by the Mine Improvement and New Emergency Response Act of 2006, which imposes stringent health and safety standards on numerous aspects of mineral
extraction and processing operations, including the training of personnel, operating procedures, operating equipment, and other matters. Our failure to comply with such standards, or changes in such standards or the re-interpretation or more stringent enforcement thereof, could have a material adverse effect on our business and financial condition or otherwise impose significant restrictions on its ability to conduct mineral extraction and processing operations.
Distributed power systems involve long sales cycles.
The sales cycle for distributed power systems, from initial contact with potential customers to the commencement of operations, may be lengthy. Customers generally consider a wide range of solutions before deciding to rent or to purchase power systems. Before a customer commits to rent or purchase power systems, they often require a significant technical review, assessment of competitive offerings and approval at a number of management levels within their organization. During the time customers are evaluating our power solutions offerings, we may incur substantial sales and marketing, engineering, and research and development expenses.
The occurrence of explosive incidents could disrupt our operations and could adversely affect our business, financial condition and results of operations.
The wireline service we provide to oil and natural gas E&P customers involves the storage and handling of explosive materials. Despite the use of specialized facilities to store explosive materials and intensive employee training programs, the handling of explosive materials could result in incidents that temporarily shut down or otherwise disrupt our or E&P customers’ operations or could cause restrictions, delays or cancellations in the delivery of services. It is possible that an explosion could result in death or significant injuries to employees and other persons. Material property damage to us, E&P customers and third parties could also occur. Any explosive incident could expose us to adverse publicity or liability for damages or cause production restrictions, delays or cancellations, any of which developments could have a material adverse effect on our ability to compete, business, financial condition and results of operations.
Geopolitical conditions, including political turmoil and volatility, regional conflicts, terrorism and war could result in market instability, which could adversely affect our business, financial condition and results of operations.
The global economy has been negatively impacted by geopolitical conflicts, such as the continuing military conflict between Russia and Ukraine and the conflict between Israel and Hamas, which has resulted in instability in the Middle East. Such conflicts have led and may continue to lead to significant market and other disruptions, including significant volatility in commodity prices and supply of energy resources, instability in financial markets, higher inflation, supply chain interruptions, political and social instability, changes in consumer or purchaser preferences as well as increase in cyberattacks and espionage. As a result of the invasion and ongoing military conflict in Ukraine, governments in the European Union, the United States, the United Kingdom, Switzerland and other countries have implemented and may implement additional sanctions, export controls or other measures against Russia, Belarus and other countries, regions, officials, individuals or industries in the respective territories. Such sanctions, and other measures, as well as the existing and potential further responses from Russia or other countries to such sanctions, supply chain disruptions, tensions and military actions, could adversely affect the global economy and financial markets and could adversely affect our business, financial condition and results of operations, and could also aggravate the other risk factors that we identify herein.
The choice of forum provisions in our charter and bylaws could limit our stockholders’ ability to obtain a favorable judicial forum for disputes with us.
Our Amended and Restated Certificate of Incorporation (as amended, the “Charter”) provides that unless the Company consents in writing to the selection of an alternative forum, the Court of Chancery of the State of Delaware will, to the fullest extent permitted by applicable law, be the sole and exclusive forum for (i) any derivative action or proceeding brought on behalf of the Company, (ii) any action asserting a claim of breach of a fiduciary duty owed by any director, officer, employee or agent of the Company to the Company or the Company’s stockholders, (iii) any action asserting a claim against the Company or any director or officer or other employee of the Company arising pursuant to any provision of the General Corporation Law of the State of Delaware, the Charter or the Company’s bylaws, or (iv) any action asserting a claim against the Company or any director or officer or other employee of the Company governed by the internal affairs doctrine, in each such case subject to Court of Chancery having personal jurisdiction over the indispensable parties named as defendants therein. Our Second Amended and Restated Bylaws (the “Bylaws”) further provide that unless the Company consents in writing to the selection of an alternative forum, the federal district courts of the United States of America will be the sole and exclusive forum for the resolution of any complaint asserting a cause of action arising under the Securities Act. Under the Securities Act, federal and state courts have concurrent jurisdiction over all suits brought to enforce any duty or liability created by the Securities Act, and stockholders cannot waive compliance with the federal securities laws and the rules and regulations thereunder. Accordingly, there is uncertainty as to whether a court would enforce such a forum selection provision as written in connection with claims arising under the Securities Act. Any person or entity purchasing or otherwise acquiring any interest in shares of common stock of the Company will be deemed to have notice of and have consented to the provisions of our Charter and Bylaws related to choice of forum. The choice of forum provisions in our Charter and Bylaws may limit our stockholders’ ability to obtain a
favorable judicial forum for disputes with us. Additionally, the enforceability of choice of forum provisions in other companies’ governing documents has been challenged in legal proceedings, and it is possible that, in connection with any applicable action brought against us, a court could find the choice of forum provisions contained in our Charter and Bylaws to be inapplicable or unenforceable in such action. If so, we may incur additional costs associated with resolving such action in other jurisdictions, which could harm our business, results of operations, and financial condition.
There can be no assurance we will repurchase shares of our Class A Common Stock in any particular amounts.
The stock markets in general have experienced substantial price and trading fluctuations, which have resulted in volatility in the market prices of securities that often are unrelated or disproportionate to changes in operating performance. These broad market fluctuations may adversely affect the trading price of our Class A Common Stock. Price volatility over a given period may also cause the average price at which we repurchase our own Class A Common Stock to exceed the stock’s price at a given point in time. In addition, significant changes in the trading price of our Class A Common Stock and our ability to access capital on terms favorable to us could impact our ability to repurchase shares of our Class A Common Stock. The timing and amount of any repurchases will be determined by the Company’s management based on its evaluation of market conditions, capital allocation alternatives and other factors beyond our control. Our share repurchase program may be modified, suspended, extended or terminated by the Company at any time and without notice.
Item 1B. Unresolved Staff Comments
None.
Item 1C. Cybersecurity
Risk Management and Strategy
We recognize the critical importance of developing, implementing, and maintaining robust cybersecurity measures to safeguard our information systems and protect the confidentiality, integrity, and availability of our information systems and the data residing therein.
We have integrated cybersecurity risk management into our broader risk management framework to promote a company-wide practice of cybersecurity risk management. This integration ensures that cybersecurity considerations are part of our decision-making processes. Our cybersecurity risk management processes include technical security controls, policy enforcement mechanisms, monitoring systems, employee training, contractual arrangements, tools and related services from third-party providers, and management oversight to identify, assess, and manage material risks from cybersecurity threats. As part of our cybersecurity risk management process, we have conducted simulated cybersecurity incidents to ensure that we are prepared to respond to such an incident and to highlight any areas for potential improvement in our cyber incident preparedness.
Engagement of Third-Parties
Recognizing the complexity and evolving nature of cybersecurity threats, we may periodically engage a range of external experts, including cybersecurity assessors, consultants, and auditors to evaluate and test our information systems. These partnerships enable us to leverage specialized knowledge and insights, ensuring our cybersecurity strategies and processes generally follow industry-recognized standards and frameworks, and are compliant with applicable laws.
Oversight of Third-Party Risk
Because we are aware of the risks associated with third-party service providers, we implement processes to oversee and manage these risks. We conduct security assessments of critical third-party providers before engagement and maintain ongoing monitoring to ensure compliance with our cybersecurity standards. The monitoring includes regular assessments by our Chief Information Officer (“CIO”) and cybersecurity staff and advisors. This approach is designed to mitigate risks related to data breaches or other security incidents involving third-parties.
Risks from Cybersecurity Threats
We have experienced, and may in the future experience, directly or indirectly through our third-party service providers, cybersecurity incidents. While prior cybersecurity incidents have not had a material impact on us, future incidents could have a material impact on our business strategy, results of operations, and financial condition. For more information about the cybersecurity risks we face, see “We are subject to cyber security risks. A cyber incident could occur and result in information theft, data corruption, operational disruption and/or financial loss” in “Risk Factors” in Part I, Item 1A of this Annual Report on Form 10-K.
Cybersecurity Governance
Board of Directors Oversight
Our Board of Directors (the “Board”) has designated the Audit Committee to oversee risk management associated with cybersecurity threats. The Audit Committee is comprised of board members with diverse expertise including risk management, technology, and finance, which we believe enables them to oversee cybersecurity risks.
Management’s Role
We have a cybersecurity risk management committee comprised of senior leadership, including our CIO. The committee evaluates and addresses cybersecurity risks in alignment with our business objectives and operational needs. The Company’s cybersecurity risk management committee is also responsible for informing the Audit Committee on cybersecurity risks. The committee provides briefings to the Audit Committee on at least a quarterly basis, performs a comprehensive annual review of cybersecurity risks and threats, and assesses and adjusts the Company’s processes to prevent, detect, mitigate, and remediate any such risks and threats.
Primary responsibility for assessing, monitoring and managing our cybersecurity risks rests with our CIO. With over 30 years of experience in the field of information systems and cybersecurity, our CIO brings a wealth of expertise to this role. His background includes extensive experience as an enterprise CIO and his in-depth knowledge and experience are instrumental in developing and executing our cybersecurity strategies. Our CIO oversees our governance programs, tests our compliance with standards, remediates known risks, and leads our employee training program as such items relate to cybersecurity. Our CIO
manages our cybersecurity risks with the help of key personnel overseeing cybersecurity, information technology networks and infrastructure, operational technology, and critical software applications.
Our CIO and information technology team are continually informed about the latest developments in cybersecurity, including potential threats and innovative risk management techniques. The CIO and information technology team implements and oversees processes for the regular monitoring of our information systems. This includes the deployment of advanced security measures and regular system audits to identify potential vulnerabilities. In the event of a cybersecurity incident, the CIO and information technology team are equipped with a well-defined incident response plan, which includes escalation to the cybersecurity risk management committee and the Audit Committee, and relevant public disclosure, as appropriate.
Item 2. Properties
Information regarding our properties is contained in “Item 1. Business” and is incorporated by reference herein.
Item 3. Legal Proceedings
The information with respect to this Item 3. Legal Proceedings is set forth in Note 15—Commitments & Contingencies in Part II, Item 8 of this Annual Report.
Item 4. Mine Safety Disclosures
Our mining operations are subject to regulation by the federal Mine Safety and Health Administration under the Federal Mine Safety and Health Act of 1977. Information concerning mine safety violations or other regulatory matters required by section 1503(a) of the Dodd-Frank Wall Street Reform and Consumer Protection Act and Item 104 of Regulation S-K is included in Exhibit 95 to this Annual Report.
PART II
Item 5. Market for Registrant’s Common Equity, Related Stockholder Matters and Issuer Purchases of Equity Securities
Market Information
On January 17, 2018, we consummated an initial public offering of our Class A Common Stock at a price of $17.00 per share. Our Class A Common Stock is traded on the NYSE under the symbol “LBRT.” Prior to that time, there was no public market for our Class A Common Stock. There is no public market for our Class B Common Stock.
Holders of our Common Stock
As of February 3, 2025, there were 14 stockholders of record of our Class A Common Stock and no stockholders of record of our Class B Common Stock. The number of record holders is based upon the actual number of holders registered on the books of the Company at such date and does not include holders of shares in “street names” or persons, partnerships, associations, corporations or other entities identified in security position listings maintained by depositories.
Dividend Policy
The Company has paid consecutive quarterly cash dividends since December 2022. Dividends are usually declared in January, April, July, and October, paid on the 20th of March, June, September, and December to stockholders of record as of the 6th of each respective payment month. If the record or payment date falls on a weekend or holiday, it is moved to the preceding or following business day.
The declaration of dividends is subject to approval by the Board and to the Board’s continuing determination that such declaration of dividends is in the best interests of the Company and its stockholders. Future dividends may be adjusted at the Board’s discretion based on market conditions and capital availability. We are not required to pay dividends, and our stockholders will not be guaranteed, or have contractual or other rights to receive, dividends.
See Note 10—Equity to the consolidated financial statements included in Part II, Item 8 of this Annual Report for further details.
Recent Sales of Unregistered Equity Securities
We had no sales of unregistered equity securities during the period covered by this Annual Report that were not previously reported in a Current Report on Form 8-K (or on Form 10-Q in lieu of Form 8-K).
Purchase of Equity Securities by the Issuer and Affiliated Purchasers
On July 25, 2022, the Board authorized and the Company announced a share repurchase program that allowed the Company to repurchase up to $250.0 million of the Company’s Class A Common Stock beginning immediately and continuing through July 31, 2024. Additionally, on January 24, 2023, the Board authorized and the Company announced an increase of the cumulative repurchase authorization to $500.0 million. Furthermore, on January 23, 2024, the Board authorized and the Company announced an increase of the cumulative repurchase authorization to $750.0 million and extended the authorization through July 31, 2026 (collectively “the Share Repurchase Plan”). Shares may be repurchased from time to time for cash in open market transactions, through block trades, in privately negotiated transactions, through derivative transactions, or by other means in accordance with applicable federal securities laws. The timing and the amount of repurchases will be determined by the Company at its discretion based on an evaluation of market conditions, capital allocation alternatives and other factors. The share repurchase program does not require us to purchase any dollar amount or number of shares of our Class A Common Stock and may be modified, suspended, extended or terminated at any time without prior notice. The Company expects to fund any repurchases by using cash on hand, borrowings under the ABL Facility, and expected free cash flow to be generated through the duration of the share repurchase program.
As of December 31, 2024, $294.2 million remained authorized for future repurchases of Class A Common Stock under the share repurchase program.
The following sets forth information with respect to our repurchases of shares of Class A Common Stock during the three months ended December 31, 2024:
| | | | | | | | | | | | | | | | | | | | | | | | | | |
| Period | | Total number of shares purchased | | Average price paid per share (2) | | Total number of shares purchased as part of publicly announced plans or programs (1) | | Approximate dollar value of shares that may yet be purchased under the plans or programs (1) |
| October 1, 2024 - October 31, 2024 | | 539,005 | | | 17.60 | | | 539,005 | | | 313,005,770 | |
| November 1, 2024 - November 30, 2024 | | 700,687 | | | 17.92 | | | 700,687 | | | 300,451,128 | |
| December 1, 2024 - December 31, 2024 | | 341,803 | | | 18.31 | | | 341,803 | | | 294,191,766 | |
| Total | | 1,581,495 | | | 17.90 | | | 1,581,495 | | | 294,191,766 | |
(1) All share repurchases are executed under the Share Repurchase Plan, as defined above. The shares may be repurchased from time to time in open market transactions, through block trades, in privately negotiated transactions, through derivative transactions, or by other means in accordance with applicable state and federal securities laws.
(2) The average price paid per share of $17.90 was calculated including commissions.
Stock Performance Graph
The following graph and table compares the cumulative total return on our Class A Common Stock with the cumulative total return on the Standard & Poor’s 500 ® Index and the Philadelphia Oil Service Index, since December 31, 2019 and each annual period thereafter through December 31, 2024. The graph assumes that $100 was invested in our Class A Common Stock in each index on December 31, 2019 and that any dividends were reinvested on the last day of the month in which they were paid. The cumulative total return set forth is not necessarily indicative of future performance.
The following graph and related information shall not be deemed “soliciting material” or to be “filed” with the SEC, nor shall such information be incorporated by reference into any future filing under the Securities Act or the Exchange Act, except to the extent that we specifically incorporate it by reference into such filing.
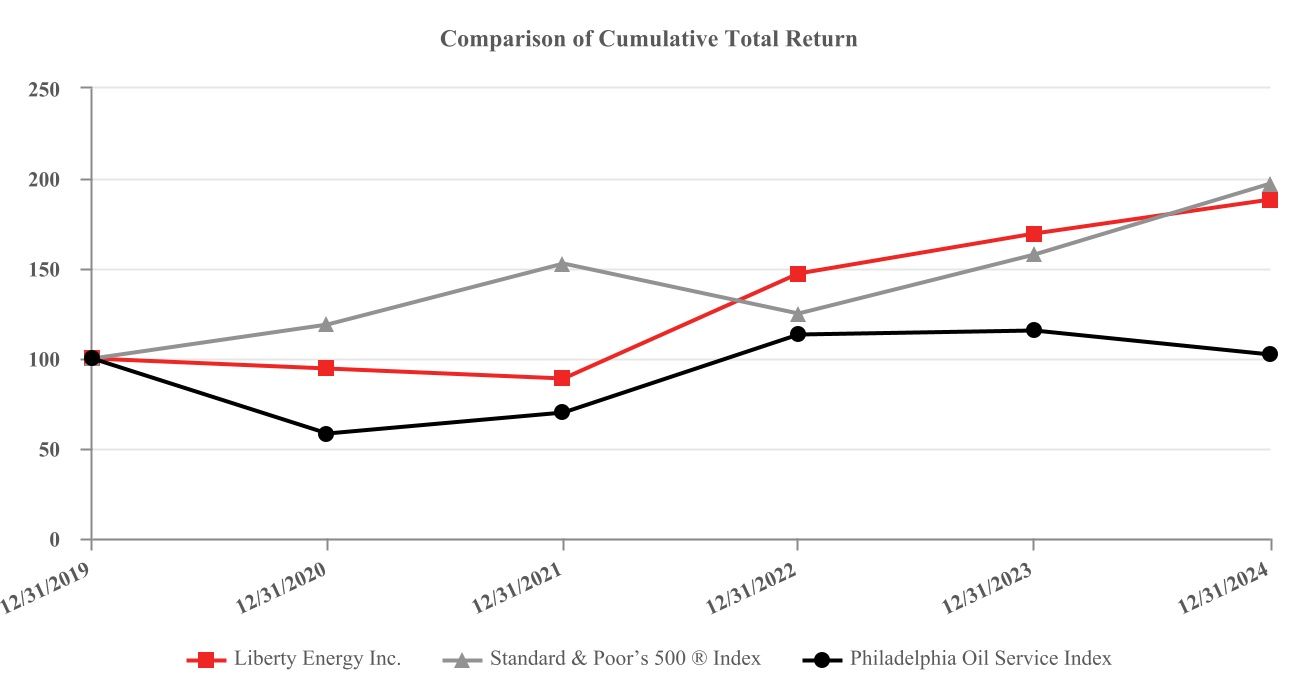
| | | | | | | | | | | | | | | | | | | | | | | | | | | | | | | | | | | | | | | | | | |
| | | For the Years Ended December 31 |
| | | 2019 | | | 2020 | | | 2021 | | | 2022 | | | 2023 | | | 2024 |
| Liberty Energy Inc. | | | $ | 100.00 | | | | $ | 94.44 | | | | $ | 88.85 | | | | $ | 147.11 | | | | $ | 169.06 | | | | $ | 188.06 | |
| Standard & Poor’s 500 ® Index | | | 100.00 | | | | 118.40 | | | | 152.39 | | | | 124.79 | | | | 157.59 | | | | 197.02 | |
| Philadelphia Oil Service Index | | | 100.00 | | | | 57.92 | | | | 69.93 | | | | 112.94 | | | | 115.11 | | | | 101.68 | |
Item 6. [Reserved]
Item 7. Management’s Discussion and Analysis of Financial Condition and Results of Operations
The following discussion and analysis of our financial condition and results of operations should be read in conjunction with our audited consolidated financial statements and related notes appearing elsewhere in this Annual Report. The following discussion contains “forward-looking statements” that reflect our future plans, estimates, beliefs and expected performance. Our actual results may differ materially from those anticipated in these forward-looking statements as a result of a variety of risks and uncertainties, including those described in this Annual Report under “Cautionary Note Regarding Forward-Looking Statements” and “Item 1A. Risk Factors.” Except as required by law, we assume no obligation to update any of these forward-looking statements. This section of this Annual Report generally discusses 2024 and 2023 items and year-to-year comparisons between 2024 and 2023. For discussion of year ended December 31, 2022, as well as the year ended 2023 compared to the year ended December 31, 2022, refer to Part II, Item 7— Management’s Discussion and Analysis of Financial Condition and Results of Operations of our 2023 Annual Report.
Overview
The Company, together with its subsidiaries, is a leading integrated energy services and technology company focused on providing innovative hydraulic fracturing services and related technologies to onshore oil and natural gas E&P companies. We offer customers hydraulic fracturing services, together with complementary services including wireline services, proppant delivery solutions, field gas processing and treating, CNG delivery, data analytics, related goods (including our sand mine operations), and technologies to facilitate lower emission completions, thereby helping our customers reduce their emissions profile. We have grown from one active hydraulic fracturing fleet in December 2011 to approximately 40 active fleets as of December 31, 2024. We provide our services primarily in the Permian Basin, the Williston Basin, the Haynesville Shale, the Eagle Ford Shale, the Denver-Julesburg Basin (the “DJ Basin”), the Western Canadian Sedimentary Basin, the Powder River Basin, and the Appalachian Basin (Marcellus Shale and Utica Shale). Our operations also extend to a few smaller shale basins, including the Anadarko Basin, the Uinta Basin, the San Juan Basin, and the Beetaloo Basin in Northern Territory, Australia, as well as to two sand mines in the Permian Basin.
In early 2023, the Company launched Liberty Power Innovations LLC (“LPI”), an integrated alternative fuel and power solutions provider for remote applications. LPI provides CNG supply, field gas processing and treating, and well site fueling and logistics. LPI was formed with the initial focus on supporting the Company’s transition towards our next generation digiFleets℠ and dual fuel fleets, as CNG fueling services can be limited in the market, yet critical to maintaining highly efficient well site operations. Through 2024, LPI was primarily focused on supporting an industry transition to natural gas fueled technologies, serving as a key enabler of the next step of cost and emissions reductions in the oilfield. In January 2025, we announced LPI’s expansion into the distributed power business, where we expect to leverage our experience in providing electric power for our digiFrac pumps into other areas inside and outside of the oilfield.
We believe technical innovation and strong relationships with our customer and supplier bases distinguish us from our competitors and are the foundations of our business. We expect that E&P companies will continue to focus on technological innovation as completion complexity and fracture intensity of horizontal wells increases, particularly as customers are increasingly focused on reducing emissions from their completions operations. We remain proactive in developing innovative solutions to industry challenges, including developing: (i) our databases of U.S. unconventional wells to which we apply our proprietary multi-variable statistical analysis technologies to provide differential insight into fracture design optimization; (ii) our Liberty Quiet Fleet® design which significantly reduces noise levels compared to conventional hydraulic fracturing fleets; (iii) hydraulic fracturing fluid systems tailored to the specific reservoir properties in the basins in which we operate; (iv) our dual fuel dynamic gas blending (“DGB”) fleets that allow our engines to run diesel or a combination of diesel and natural gas, to optimize fuel use, reduce emissions and lower costs; (v) our digiFleets℠, comprising of digiFrac℠ and digiPrime℠ pumps and other complementary equipment, including power generation units (together “digiTechnologies℠”), our innovative, purpose-built electric and hybrid frac pumps that have approximately 25% lower CO2e emission profile than the Tier IV DGB; (vi) our wet sand handling technology which eliminates the need to dry sand, enabling the deployment of mobile mines nearer to wellsites; and (vii) the launch of LPI to support the transition to our digiFleets as well as the transition to lower costs and emissions in the oilfield. In addition, our integrated supply chain includes proppant, chemicals, equipment, natural gas fueling services, logistics and integrated software which we believe promotes wellsite efficiency and leads to more pumping hours and higher productivity throughout the year to better service our customers. In order to achieve our technological objectives, we carefully manage our liquidity and debt position to promote operational flexibility and invest in the business throughout the full commodity cycle in the regions we operate.
Recent Trends and Outlook
Moderate declines in frac activity, that started in 2023, continued throughout 2024. However, the market appears to have reached an inflection point in early 2025 as completions activity emerges from 2024 lows. In 2025, E&P operators, especially those with an oil exploration focus, are working to maintain production levels from 2024. Improving natural gas fundamentals are encouraging as well. For the full year, industry-wide lateral footage completed is expected to be approximately flat with 2024.
The slowing pace of activity in late 2024 resulted in near term price pressure to start 2025, most notably impacting conventional fleets. The fundamental outlook for next generation, higher quality fleets remains strong, as operators continue to demand technologies that provide significant emissions reductions, fuel savings, and operational efficiency advantages. The growing complexities of E&P demands and the continued drive for efficiency gains promote continued investment in technology and partnering with high quality service companies.
Global oil markets reflect ongoing uncertainties in geopolitics, Chinese economic growth, OPEC+ production plans, and a change in the domestic political climate, but the resulting commodity price fluctuation has not led to a meaningful change in E&P activity plans. Natural gas demand is supported by LNG export capacity expansion and a large projected multi-year increase in North American power consumption.
During the year 2024, the posted WTI price traded at an average of $76.63 per barrel (“Bbl”), as compared to the 2023 average of $77.58 per Bbl, and the 2022 average of $94.90 per Bbl. In addition, the average domestic onshore rig count for the United States and Canada was 765 rigs reported in the fourth quarter of 2024, down from the average in the fourth quarter of 2023 of 781, according to a report from Baker Hughes.
Acquisitions
On April 6, 2023, LPI accelerated its expansion by acquiring Siren, a Permian focused integrated natural gas compression and CNG delivery business with 16 MMcf per day of natural gas compression capacity at two expandable Permian sites and transportation, logistics, and pressure reduction services, for cash consideration of $75.7 million, after post-closing adjustments and net of cash received. LPI currently delivers fuel to customers in both the drilling and completions markets, and its logistics system is designed to deliver CNG, renewable natural gas, or hydrogen to remote locations. We believe that the added natural gas compression capability is a key enabler of the next step of cost and emissions reductions in the industry.
Increase in Drilling Efficiency and Service Intensity of Completions
Over the past decade, E&P companies have focused on exploiting the vast resource potential available across many of North America’s unconventional resource plays through the application of horizontal drilling and completion technologies, including the use of multi-stage hydraulic fracturing, in order to increase recovery of oil and natural gas. As E&P companies have improved drilling and completion techniques to maximize return and efficiency, we believe that well economics have improved, and unconventional oil and gas production is globally competitive. Liberty has been a significant partner with our customers in driving these continued improvements.
Improved drilling economics from horizontal drilling and greater rig efficiencies. According to Baker Hughes, as reported on January 24, 2025, horizontal rigs accounted for approximately 90% of all rigs drilling in the United States and Canada, up from 77% as of December 26, 2014. Over the past several years, North American E&P companies have benefited from improved drilling economics driven by technologies that reduce the number of days, and the cost, of drilling wells. North American drilling rigs have incorporated newer technologies, which allow them to drill rock more effectively and quickly, meaning each rig can drill more wells in a given period. These include improved drilling technologies and the incorporation of geosteering techniques which allow better placement of the wellbore. Drilling rigs have also incorporated new technology which allows fully assembled rigs to automatically “walk” from one location to the next without disassembling and reassembling the rig, greatly reducing the time it takes to move from one drilling location to the next. Today the majority of E&P drilling is on multi-well pad development, allowing efficient drilling of multiple horizontal wellbores from the same pad or location. The aggregate effect of these improved techniques and technologies have reduced the average days required to drill a well, which according to Lium Research, has dropped from 28 days in 2014 to 16 days in 2024.
Increased complexity and service intensity of horizontal well completions. In addition to improved rig efficiencies discussed above, E&P companies are also improving the subsurface techniques and technologies used to exploit unconventional resources. These improvements have targeted increasing the exposure of each wellbore to the reservoir by drilling longer horizontal lateral sections of the wellbore. To complete the well, hydraulic fracturing is applied in stages along the wellbore to break-up the resource so that oil and gas can be produced. As wellbores have increased in length, the number of frac stages and/or the number of perforation clusters (frac initiation points) has also increased. Further, E&P companies have improved production from each stage by applying increasing amounts of proppant in each stage, which better connects the well to the resource. The aggregate effect of increased number of stages and the increasing amount of proppant in each stage has greatly increased the total amount of proppant used in each well, according to Liberty’s FracTrends database, from six million pounds
per well in 2014 to roughly 22 million pounds per well in 2024. Further efficiency gains are being sought via the “simul-frac,” “trimul-frac,” and other techniques. When compared to typical zipper-frac operations, these methods allow operators to complete a pad of wells quicker, thereby shortening the time from spud to first production.
These industry trends continue to keep our customers as important suppliers to the global oil and natural gas markets, which directly benefit hydraulic fracturing companies like us that have the expertise and innovative technology to effectively service today’s more efficient oilfield drilling activity and the increasing complexity and intensity of well completions. Given the expected returns that E&P companies have reported for new well development activities due to improved rig efficiencies and increasing well completion complexity and intensity, we expect these industry trends to continue.
Recent Leadership Updates
On February 3, 2025, Christopher A. Wright, our Chief Executive Officer and Chairman of the Board, was confirmed to the position of Secretary of Energy of the United States and resigned from his positions as Chairman of the Board, Director, and Chief Executive Officer of the Company. Also, on February 3, 2025, in accordance with the Company’s succession plan, the Board appointed William Kimble as the non-executive Chairman of the Board and Ron Gusek as the Company’s Chief Executive Officer and Director. Lastly, on January 22, 2025, the Board approved an increase to the size of the Board from nine to 10 directors and appointed Arjun Murti to fill the newly created vacancy.
How We Generate Revenue
We currently generate revenue through the provision of hydraulic fracturing, wireline services and goods, including sand from our Permian Basin sand mines, proppant delivery and logistics, and natural gas compression and delivery. These services and goods are provided under a variety of contract structures, primarily master service agreements (“MSAs”) as supplemented by statements of work, pricing agreements and specific quotes. A portion of our statements of work, under MSAs, include provisions that establish pricing arrangements for a period of up to approximately one year in length. However, the majority of those agreements provide for pricing adjustments based on market conditions. The majority of our services are priced based on prevailing market conditions and changing input costs at the time the services are provided, giving consideration to the specific requirements of the customer.
Our hydraulic fracturing and wireline services are performed in sections, which we refer to as fracturing stages. The estimated number of fracturing stages to be completed for a particular horizontal well is determined by the customer’s well completion design. We primarily recognize revenue based on pump hours, fracturing stages, or days on location, although total revenue depends on the actual volumes and types of proppants, chemicals, and fluid utilized on each pad. The number of fracturing stages that we are able to complete in a period is directly related to the number and utilization of our deployed fleets and size of stages.
Costs of Conducting Our Business
The principal expenses involved in conducting our business are direct cost of personnel, services, and materials used in the provision of services, general and administrative expenses, and depreciation, depletion, and amortization. A large portion of the costs we incur in our business are variable based on the number of hydraulic fracturing jobs and the requirements of services provided to our customers. We manage the level of our fixed costs, except depreciation, depletion, and amortization, based on several factors, including industry conditions and expected demand for our services.
How We Evaluate Our Operations
We use a variety of qualitative, operational and financial metrics to assess our performance. First and foremost, of these is a qualitative assessment of customer satisfaction because ensuring we are a valuable partner to our customers is the key to achieving our quantitative business metrics. Among other measures, management considers each of the following:
•Revenue;
•Operating Income;
•Net Income;
•EBITDA; and
•Adjusted EBITDA;
Revenue
We analyze our revenue by comparing actual revenue to our internal projections for a given period and to prior periods to assess our performance.
Operating Income
We analyze our operating income, which we define as revenues less direct operating expenses, depreciation, depletion, and amortization and general and administrative expenses, to measure our financial performance. We believe operating income is a meaningful metric because it provides insight on profitability and true operating performance based on the historical cost basis of our assets. We also compare operating income to our internal projections for a given period and to prior periods.
Net Income
We analyze our net income, which we define as operating income adjusted for other income or expense, net, including interest expense, net, and income tax expense. We analyze net income by comparing actual net income to our internal projections for a given period and to prior periods to assess our performance.
EBITDA and Adjusted EBITDA
We view EBITDA and Adjusted EBITDA as important indicators of performance. We define EBITDA as net income before interest, income taxes, and depreciation, depletion, and amortization. We define Adjusted EBITDA as EBITDA adjusted to eliminate the effects of items such as non-cash stock-based compensation, new fleet or new basin start-up costs, fleet lay-down costs, costs of asset acquisitions, gain or loss on the disposal of assets, provision for credit losses, transaction, severance, and other costs, the gain or loss on remeasurement of liability under our tax receivable agreements, the gain or loss on investments, and other non-recurring expenses that management does not consider in assessing ongoing performance. See “Comparison of Non-GAAP Financial Measures” for more information and a reconciliation of EBITDA and Adjusted EBITDA to net income, the most comparable financial measures calculated and presented in accordance with GAAP.
Results of Operations
Year Ended December 31, 2024, Compared to Year Ended December 31, 2023 | | | | | | | | | | | | | | | | | |
| Years Ended December 31, |
| Description | 2024 | | 2023 | | Change |
| (in thousands) |
| Revenue | $ | 4,315,161 | | | $ | 4,747,928 | | | $ | (432,767) | |
| Cost of services, excluding depreciation, depletion, and amortization shown separately | 3,200,506 | | | 3,349,370 | | | (148,864) | |
| General and administrative | 225,474 | | | 221,406 | | | 4,068 | |
| Transaction and other costs | — | | | 2,053 | | | (2,053) | |
| Depreciation, depletion, and amortization | 505,050 | | | 421,514 | | | 83,536 | |
| Gain on disposal of assets, net | (5,337) | | | (6,994) | | | 1,657 | |
| Operating income | 389,468 | | | 760,579 | | | (371,111) | |
| Other (income) expense, net | (13,803) | | | 25,689 | | | (39,492) | |
| Net income before income taxes | 403,271 | | | 734,890 | | | (331,619) | |
| Income tax expense | 87,261 | | | 178,482 | | | (91,221) | |
| Net income | 316,010 | | | 556,408 | | | (240,398) | |
| Less: Net income attributable to non-controlling interests | — | | | 91 | | | (91) | |
| Net income attributable to Liberty Energy Inc. stockholders | $ | 316,010 | | | $ | 556,317 | | | $ | (240,307) | |
Revenue
Our revenue decreased $432.8 million, or 9%, to $4.3 billion for the year ended December 31, 2024 compared to $4.7 billion for the year ended December 31, 2023. The decrease in revenue was primarily attributable to a decrease in service and materials pricing, partially offset by higher activity levels primarily from increased fleet efficiency.
Cost of Services
Cost of services (excluding depreciation, depletion, and amortization) decreased $148.9 million, or 4%, to $3.2 billion for the year ended December 31, 2024 compared to $3.3 billion for the year ended December 31, 2023. The decrease in expense was primarily related to decreases in materials costs and lower repairs and maintenance costs, partially offset by increased personnel costs related to higher activity levels discussed above, during the year ended December 31, 2024.
General and Administrative
General and administrative expenses increased $4.1 million, or 2%, to $225.5 million for the year ended December 31, 2024 compared to $221.4 million for the year ended December 31, 2023 primarily related to increased corporate costs to
support our additional service offerings, partially offset by a decrease in cash incentive and stock-based compensation expense due to lower operating results compared to the prior year period.
Transaction and Other Costs
Transaction and other costs decreased $2.1 million, or 100%, as the Company did not incur such costs for the year ended December 31, 2024 compared to $2.1 million for the year ended December 31, 2023. The costs incurred during the year ended December 31, 2023 primarily consisted of due diligence and integration costs for the Siren Acquisition. See Note 3—Acquisitions to the consolidated financial statements included in Part II, Item 8 of this Annual Report for further details.
Depreciation, Depletion, and Amortization
Depreciation, depletion, and amortization expense increased $83.5 million, or 20%, to $505.1 million for the year ended December 31, 2024 compared to $421.5 million for the year ended December 31, 2023. The increase in 2024 was due to additional equipment placed in service since the prior year period, including equipment related to the deployment of our digiTechnologiesSM.
Gain on Disposal of Assets, net
The Company recorded a gain on disposal of assets, net of $5.3 million for the year ended December 31, 2024 compared to $7.0 million for the year ended December 31, 2023. The gain recognized in the year ended December 31, 2024 was primarily related to the disposal of used older technology field equipment that was no longer operational. The gain recognized in the year ended December 31, 2023 was a result of the Company selling used field equipment and light duty trucks in a strong used vehicle and equipment market.
Other (Income) Expense, net
Other (income) expense, net changed by $39.5 million to $13.8 million income for the year ended December 31, 2024 compared to $25.7 million expense during the year ended December 31, 2023. Other (income) expense, net is comprised of loss on remeasurement of liability under the TRAs of $3.2 million during the year ended December 31, 2024, compared to a gain of $1.8 million for the year ended December 31, 2023. It also includes an unrealized gain on investments, net of $49.2 million related to investments in equity securities measured at fair value during the year ended December 31, 2024, compared to $0 for the year ended December 31, 2023. Interest expense, net increased $3.2 million primarily as a result of the addition of finance lease liabilities, refer to “Liquidity and Capital Resources” below for further discussion of the Company’s finance leases. Additionally, interest income—related party decreased $1.5 million related to a note receivable agreement executed in December 2022, amended in August 2023, and fully collected in March 2024.
Income Tax Expense
The Company recognized income tax expense of $87.3 million for the year ended December 31, 2024, an effective rate of 21.6%, compared to $178.5 million, for the year ended December 31, 2023, an effective rate of 24.3%. The decrease in income tax expense was primarily attributable to the decrease in net income before income taxes and increased U.S. federal tax credits.
Comparison of Non-GAAP Financial Measures
We view EBITDA and Adjusted EBITDA as important indicators of performance. We define EBITDA as net income before interest, income taxes, and depreciation, depletion, and amortization. We define Adjusted EBITDA as EBITDA adjusted to eliminate the effects of items such as non-cash stock-based compensation, new fleet or new basin start-up costs, fleet lay-down costs, gain or loss on the disposal of assets, net, bad debt reserves, transaction and other costs, the gain or loss on remeasurement of liability under our tax receivable agreements, the unrealized gain or loss on investments, net, and other non-recurring expenses that management does not consider in assessing ongoing performance.
Our Board, management, investors, and lenders use EBITDA and Adjusted EBITDA to assess our financial performance because it allows them to compare our operating performance on a consistent basis across periods by removing the effects of our capital structure (such as varying levels of interest expense), asset base (such as depreciation, depletion, and amortization) and other items that impact the comparability of financial results from period to period. We present EBITDA and Adjusted EBITDA because we believe they provide useful information regarding the factors and trends affecting our business in addition to measures calculated under GAAP.
Note Regarding Non-GAAP Financial Measures
EBITDA and Adjusted EBITDA are not financial measures presented in accordance with GAAP. We believe that the presentation of these non-GAAP financial measures will provide useful information to investors in assessing our financial performance and results of operations. Net income is the GAAP financial measure most directly comparable to EBITDA and Adjusted EBITDA. Our non-GAAP financial measures should not be considered as alternatives to the most directly comparable GAAP financial measure. Each of these non-GAAP financial measures has important limitations as an analytical tool due to exclusion of some but not all items that affect the most directly comparable GAAP financial measures. You should not consider EBITDA or Adjusted EBITDA in isolation or as substitutes for an analysis of our results as reported under GAAP. Because EBITDA and Adjusted EBITDA may be defined differently by other companies in our industry, our definitions of these non-GAAP financial measures may not be comparable to similarly titled measures of other companies, thereby diminishing their utility.
The following tables present a reconciliation of EBITDA and Adjusted EBITDA to our net income, which is the most directly comparable GAAP financial measure for the periods presented:
Year Ended December 31, 2024, Compared to Year Ended December 31, 2023: EBITDA and Adjusted EBITDA | | | | | | | | | | | | | | | | | |
| Years Ended December 31, |
| Description | 2024 | | 2023 | | Change |
| (in thousands) |
| Net income | $ | 316,010 | | | $ | 556,408 | | | $ | (240,398) | |
| Depreciation, depletion, and amortization | 505,050 | | | 421,514 | | | 83,536 | |
| Interest expense, net | 32,214 | | | 27,506 | | | 4,708 | |
| Income tax expense | 87,261 | | | 178,482 | | | (91,221) | |
| EBITDA | $ | 940,535 | | | $ | 1,183,910 | | | $ | (243,375) | |
| Stock-based compensation expense | 32,412 | | | 33,026 | | | (614) | |
| Gain on disposal of assets, net | (5,337) | | | (6,994) | | | 1,657 | |
| Unrealized gain on investments, net | (49,227) | | | — | | | (49,227) | |
| Loss (gain) on remeasurement of liability under tax receivable agreements | 3,210 | | | (1,817) | | | 5,027 | |
| Provision for credit losses | — | | | 808 | | | (808) | |
| Transaction and other costs | — | | | 2,053 | | | (2,053) | |
| Fleet start-up and lay-down costs | — | | | 2,082 | | | (2,082) | |
| Adjusted EBITDA | $ | 921,593 | | | $ | 1,213,068 | | | $ | (291,475) | |
EBITDA was $940.5 million for the year ended December 31, 2024 compared to $1.2 billion for the year ended December 31, 2023. Adjusted EBITDA was $921.6 million for the year ended December 31, 2024 compared to $1.2 billion for the year ended December 31, 2023. The decreases in EBITDA and Adjusted EBITDA primarily resulted from lower pricing and partially offset by changes in activity levels in 2024 as described above under the captions Revenue, Cost of Services, and General and Administrative Expenses for the Year Ended December 31, 2024, Compared to Year Ended December 31, 2023.
Liquidity and Capital Resources
Overview
Our primary sources of liquidity consist of cash flows from operations and borrowings under our ABL Facility (as defined below). We believe that we can fund operations and current organic growth plans with these sources. We monitor the availability and cost of capital resources such as equity, debt, and lease financings that could be leveraged for current or future financial obligations including those related to acquisitions, capital expenditures, working capital, and other liquidity requirements. We may incur additional indebtedness or issue equity in order to meet our capital expenditure activities and liquidity requirements, as well as to fund organic and other growth opportunities that we pursue, including via acquisition. Our primary uses of capital have been capital expenditures to support organic growth and funding ongoing operations, including maintenance and fleet upgrades, as well as the repurchases of, and dividends on, shares of our Class A Common Stock.
Cash and cash equivalents decreased by $16.8 million to $20.0 million as of December 31, 2024 compared to $36.8 million as of December 31, 2023, while working capital excluding cash and current liabilities under debt and lease arrangements decreased $88.2 million.
On September 19, 2017, the Company entered into two credit agreements, (i) a revolving line of credit up to $250.0 million, subsequently increased to $525.0 million, see below, (the “ABL Facility”) and (ii) a $175.0 million term loan (the “Term Loan Facility”, and together with the ABL Facility the “Credit Facilities”).
As of December 31, 2024, the Company had $525.0 million committed under the ABL Facility, subject to certain borrowing base limitations based on a percentage of eligible accounts receivable and inventory available to finance working capital needs. As of December 31, 2024, the borrowing base was calculated to be $319.8 million, and the Company had $190.5 million outstanding, in addition to letters of credit totaling $14.0 million, with $115.3 million of remaining availability.
On January 23, 2023, the Company entered into an Eighth Amendment to the ABL Facility (the “Eighth ABL Amendment”). The Eighth ABL Amendment amends certain terms, provisions and covenants of the ABL Facility, including, among other things: (i) increasing the maximum revolver amount from $425.0 million to $525.0 million (the “Upsized Revolver”); (ii) increasing the amount of the accordion feature from $75.0 million to $100.0 million; (iii) extending the maturity date from October 22, 2026 to January 23, 2028; (iv) modifying the dollar amounts of various credit facility triggers and tests proportionally to the Upsized Revolver; (v) permitting repayment under the Term Loan Facility prior to February 10, 2023; and (vi) increasing certain indebtedness, intercompany advance, and investment baskets. The Eighth ABL Amendment also includes an agreement from Wells Fargo Bank, National Association, as administrative agent, to release its second priority liens and security interests on all collateral that served as first priority collateral under the Term Loan Facility. This release was completed during the three months ended June 30, 2023.
Additionally, on January 23, 2023, the Company borrowed $106.7 million on the ABL Facility and used the proceeds to pay off and terminate the Term Loan Facility. The amount paid included the balance of the Term Loan Facility upon payoff of $104.7 million, $0.9 million of accrued interest, and a $1.1 million prepayment premium. Additionally, there were $0.2 million in administrative agent and lender legal fees included in the pay off.
The ABL Facility contains covenants that restrict our ability to take certain actions. At December 31, 2024, we were in compliance with all debt covenants.
See Note 8—Debt to the consolidated financial statements included in Part II, Item 8 of this Annual Report for further details.
We have no material off balance sheet arrangements as of December 31, 2024, except for purchase commitments under supply agreements as disclosed below under Note 15—Commitments & Contingencies in Part II, Item 8 of this Annual Report. As such, we are not materially exposed to any other financing, liquidity, market, or credit risk that could arise if we had engaged in such financing arrangements.
Share Repurchase Program
Under our share repurchase program, the Company is authorized to repurchase up to $750.0 million of outstanding Class A Common Stock through and including July 31, 2026. Shares may be repurchased from time to time for cash in open market transactions, through block trades, in privately negotiated transactions, through derivative transactions, or by other means in accordance with applicable federal securities laws. The timing and the amount of repurchases will be determined by the Company at its discretion based on an evaluation of market conditions, capital allocation alternatives and other factors. The share repurchase program does not require us to purchase any dollar amount or number of shares of our Class A Common Stock and may be modified, suspended, extended or terminated at any time without prior notice. The Company expects to fund any repurchases by using cash on hand, borrowings under the ABL Facility, and expected free cash flow to be generated through the duration of the share repurchase program. During the year ended December 31, 2024, the Company repurchased and retired shares of Class A Common Stock for $127.4 million, under the share repurchase program.
Cash Flows
The following table summarizes our cash flows for the periods indicated: | | | | | | | | | | | | | | | | | |
| Years Ended December 31, |
| Description | 2024 | | 2023 | | Change |
| (in thousands) |
| Net cash provided by operating activities | $ | 829,374 | | | $ | 1,014,583 | | | $ | (185,209) | |
| Net cash used in investing activities | (643,113) | | | (672,328) | | | 29,215 | |
| Net cash used in financing activities | (202,705) | | | (349,315) | | | 146,610 | |
Analysis of Cash Flow Changes Between the Years Ended December 31, 2024 and December 31, 2023
Operating Activities. Net cash provided by operating activities was $829.4 million for the year ended December 31, 2024, compared to $1.0 billion for the year ended December 31, 2023. The $185.2 million decrease in cash from operating activities is primarily attributable to a $432.8 million decrease in revenues, offset by a $145.3 million decrease in cash operating expenses, interest expense, net, and income tax expense, and a $9.4 million decrease in cash from changes in working capital for the year ended December 31, 2024, compared to a $111.7 million decrease in cash from changes in working capital for the year ended December 31, 2023.
Investing Activities. Net cash used in investing activities was $643.1 million for the year ended December 31, 2024, compared to $672.3 million for the year ended December 31, 2023. Cash used in investing activities was lower during the year ended December 31, 2024, compared to the year ended December 31, 2023 primarily due to the Siren Acquisition and higher equity investments in the prior year period, offset by higher capital spending in the current year period, and lower proceeds from asset sales. The Company purchased Siren Energy for $75.7 million in cash, net of cash received, during the year ended December 31, 2023. Refer to Note 3—Acquisitions to the consolidated financial statements in Part II, Item 8 of this Annual Report for additional information related to the Siren Acquisition. Investments in equipment, including the new digiTechnologiesSM suite and capitalized maintenance of existing equipment increased $47.7 million, from $603.3 million for the year ended December 31, 2023 to $651.0 million for the year ended December 31, 2024. Proceeds from asset sales decreased $2.9 million, from $26.9 million to $24.0 million as the Company benefited from strong used vehicle and equipment markets in the prior period. Finally, during the year ended December 31, 2024, the Company invested $16.1 million for equity investments in Tamboran Resources Corporation, Empire Energy Group Ltd., and Falcon Oil & Gas Ltd, compared to $20.3 million for equity investments in Tamboran Resources Corporation and Oklo Inc. during the year ended December 31, 2023.
Financing Activities. Net cash used in financing activities was $202.7 million for the year ended December 31, 2024, compared to $349.3 million for the year ended December 31, 2023. The $146.6 million decrease in cash used in financing activities was primarily due to net borrowings of $50.5 million during the current year period compared to $79.7 million in net repayment of borrowings during the prior year as well as a $73.9 million decrease in share repurchases for the year ended December 31, 2024, compared to the year ended December 31, 2023. These decreases in cash used in financing activities were offset by a $32.9 million increase in cash paid for finance leases, a $10.5 million increase in cash tax withholding on restricted stock unit vestings, and a $10.6 million increase in dividends paid.
Cash Requirements
Our material cash commitments consist primarily of obligations under long-term debt on the ABL Facility, TRAs, finance and operating leases for property and equipment, cash used to pay for repurchases of, and dividends on, shares of our Class A Common Stock, and purchase obligations as part of normal operations. Certain amounts included in our contractual obligations as of December 31, 2024 are based on our estimates and assumptions about these obligations, including pricing, volumes, and duration. We have no material off balance sheet arrangements as of December 31, 2024, except for purchase commitments under supply agreements disclosed below.
See Note 8—Debt to the consolidated financial statements included in Part II, Item 8 of this Annual Report for information regarding scheduled maturities of our long-term debt. See Note 6—Leases to the consolidated financial statements included in Part II, Item 8 of this Annual Report for information regarding scheduled maturities of finance and operating leases.
During the year ended December 31, 2024, the Company expanded its equipment lease facilities resulting in the addition of $149.0 million in new finance lease obligations. The term on these new leases range from three to five years. As of December 31, 2024, the Company had finance lease obligations of $87.5 million payable within the next twelve months and $222.5 million payable thereafter. Included in those liabilities, the Company had expected cash payments for estimated interest on our finance lease obligations of $17.1 million payable within the next twelve months and $22.4 million payable thereafter.
On January 23, 2023, the Company borrowed $106.7 million on the ABL Facility and used the proceeds to pay off and terminate the Term Loan Facility. The balance of the Term Loan Facility at pay off was $104.7 million and included $0.9 million of accrued interest, and a $1.1 million prepayment premium. As such, the only outstanding debt facility as of December 31, 2024 and 2023 was the ABL Facility.
As of December 31, 2024, the Company has purchase obligations of $26.3 million payable within the next twelve months. See Note 15—Commitments & Contingencies to the consolidated financial statements in Part II, Item 8 of this Annual Report for information regarding scheduled contractual obligations.
As of December 31, 2024, the Company expects to make a $40.8 million payment under the TRAs within the next twelve months. Future amounts payable under the TRAs are dependent upon future events. See Note 12—Income Taxes to the consolidated financial statements included in Part II, Item 8 of this Annual Report for information regarding the TRAs.
There have been no other material changes to cash requirements during the year ended December 31, 2024.
Other Factors Affecting Liquidity
Customer receivables: In line with industry practice, we typically bill our customers for services provided in arrears dependent upon contractual terms. In weak economic environments, we may experience delays in collection from our customers. In the past, we have experienced delays in customer payments and periodically agreed to extended payment terms, however, we have not experienced any material non-payment events.
Tax Receivable Agreements
In connection with the IPO, on January 17, 2018, the Company entered into two TRAs with the TRA Holders. The TRAs generally provide for the payment by the Company of 85% of the net cash savings, if any, in U.S. federal, state, and local income tax and franchise tax (computed using simplifying assumptions to address the impact of state and local taxes) that the Company actually recognizes (or is deemed to recognize in certain circumstances) in periods after the IPO as a result, as applicable to each of the TRA Holders, of (i) certain increases in tax basis that occur as a result of the Company’s acquisition (or deemed acquisition for U.S. federal income tax purposes) of all or a portion of such TRA Holders’ Liberty LLC Units in connection with the IPO or pursuant to the exercise of the right of each Liberty Unit Holder (the “Redemption Right”), subject to certain limitations, to cause Liberty LLC to acquire all or a portion of its Liberty LLC Units for, at Liberty LLC’s election, (A) shares of our Class A Common Stock at the specific redemption ratio or (B) an equivalent amount of cash, or, upon the exercise of the Redemption Right, the right of the Company (instead of Liberty LLC) to, for administrative convenience, acquire each tendered Liberty LLC Unit directly from the redeeming Liberty Unit Holder (the “Call Right”) for, at its election, (1) one share of Class A Common Stock or (2) an equivalent amount of cash, (ii) any net operating losses available to the Company as a result of the Corporate Reorganization, and (iii) imputed interest deemed to be paid by the Company as a result of, and additional tax basis arising from, any payments the Company makes under the TRAs. On January 31, 2023, the last redemption of the Liberty LLC Units occurred.
With respect to obligations the Company expects to incur under the TRAs (except in cases where the Company elects to terminate the TRAs early, the TRAs are terminated early due to certain mergers, asset sales, or other changes of control or the Company has available cash but fails to make payments when due), generally the Company may elect to defer payments due under the TRAs if the Company does not have available cash to satisfy its payment obligations under the TRAs or if its contractual obligations limit its ability to make such payments. Any such deferred payments under the TRAs generally will accrue interest. In certain cases, payments under the TRAs may be accelerated and/or significantly exceed the actual benefits, if any, the Company realizes in respect of the tax attributes subject to the TRAs. The Company accounts for amounts payable under the TRAs in accordance with Accounting Standard Codification (“ASC”) Topic 450, Contingencies (“ASC Topic 450”).
If the Company experiences a change of control (as defined under the TRAs) or the TRAs otherwise terminate early, the Company’s obligations under the TRAs could have a substantial negative impact on its liquidity and could have the effect of delaying, deferring or preventing certain mergers, asset sales, or other forms of business combinations or changes of control. There can be no assurance that we will be able to finance our obligations under the TRAs.
Income Taxes
The Company is a corporation and is subject to U.S. federal, state, and local income tax. The Company is also subject to Canada and Australia federal and provincial income tax on its foreign operations.
The effective global income tax rate applicable to the Company for the year ended December 31, 2024 was 21.6% compared to 24.3% for the year ended December 31, 2023. The Company’s effective tax rate for both years is greater than the statutory federal income tax rate of 21.0% due to the Company’s Canadian operations, state income taxes in the states the Company operates, as well as nondeductible executive compensation, partially offset by U.S. federal income tax credits.
The Company recognized income tax expense of $87.3 million and $178.5 million for the years ended December 31, 2024 and 2023, respectively. The Company’s effective tax rate can be volatile and may change with, among other things, the amount of jurisdiction pre-tax income or loss, ability to utilize foreign tax credits, excess tax benefits or deficiencies from share-based compensation and changes in tax laws in the jurisdictions that we operate.
Deferred income tax assets and liabilities are recognized for the estimated future tax consequences attributable to differences between the financial reporting and tax bases of assets and liabilities, and are measured using enacted tax rates in effect for the year in which those temporary differences are expected to be recovered or settled. In the year ended December 31, 2024, the Company’s U.S. net deferred tax liabilities were $137.7 million and Canada net deferred tax assets were $1.5 million. The Company has no valuation allowances recorded against the deferred tax assets for the year ended December 31, 2024 and 2023.
Refer to Note 12— Income Taxes to the consolidated financial statements in Part II, Item 8 of this Annual Report for additional information related to income tax expense.
Critical Accounting Policies and Estimates
The preparation of financial statements requires the use of judgments and estimates. Our critical accounting policies are described below to provide a better understanding of how we develop our assumptions and judgments about future events and related estimates and how they can impact our financial statements. A critical accounting estimate is one that requires our most difficult, subjective or complex estimates and assessments and is fundamental to our results of operations.
We base our estimates on historical experience and on various other assumptions we believe to be reasonable according to the current facts and circumstances, the results of which form the basis for making judgments about the carrying values of assets and liabilities that are not readily apparent from other sources. We believe the following are the critical accounting policies used in the preparation of our consolidated financial statements, as well as the significant estimates and judgments affecting the application of these policies. This discussion and analysis should be read in conjunction with our consolidated financial statements and related notes included in Part II, Item 8 of this Annual Report.
Revenue Recognition: Revenue from hydraulic fracturing services is recognized as specific services are provided in accordance with contractual arrangements. If our assessment of performance under a particular contract change, our revenue and / or costs under that contract may change. In connection with ASC Topic 842 - Leases (“Topic 842”), the Company determined that certain of its service revenue contracts contain a lease component. The Company elected to adopt a practical expedient available to lessors, which allows the Company to combine the lease and service component for certain of the Company’s service contracts when the service component is the predominant component and continues to account for the combined component under ASC Topic 606 - Revenue from Contracts with Customers.
Inventory: Inventory consists of raw materials used in the hydraulic fracturing process, such as proppants, chemicals and field service equipment maintenance parts, and is stated at the lower of cost or net realizable value, determined using the weighted average cost method. Net realizable value is determined based on our estimates of selling prices in the ordinary course
of business, less reasonably predictable cost of completion, disposal, and transportation, each of which require us to apply judgment.
Property and Equipment: We calculate depreciation and amortization on our assets based on the estimated useful lives and estimated salvage values that we believe are reasonable. The estimated useful lives and salvage values are subject to key assumptions such as maintenance, utilization and job variation. These estimates may change due to a number of factors such as changes in operating conditions or advances in technology.
We incur maintenance costs on our major equipment. The determination of whether an expenditure should be capitalized or expensed requires management judgment in the application of how the costs benefit future periods, relative to our capitalization policy. Costs that either establish or increase the efficiency, productivity, functionality or life of a fixed asset are capitalized and depreciated over the remaining useful life of the asset.
Impairment of long-lived assets: Long-lived assets, such as property and equipment, right-of-use lease assets and intangible assets, are evaluated for impairment whenever events or changes in circumstances indicate that their carrying value may not be recoverable. Possible indicators of impairment may include events or changes in circumstances affecting the manner in which the assets are being used, historical and estimated future profitability measures, and other adverse events or changes that could affect the value of the assets. If a triggering event is identified, recoverability is assessed using undiscounted future net cash flows of assets grouped at the lowest level for which there are identifiable cash flows independent of the cash flows of other groups of assets. When alternative courses of action to recover the carrying amount of the asset group are under consideration, estimates of future undiscounted cash flows take into account possible outcomes and probabilities of their occurrence, which require us to apply judgment. If the carrying amount of the asset is not recoverable based on its estimated undiscounted cash flows expected to result from the use and eventual disposition, an impairment loss is recognized in an amount by which its carrying amount exceeds its estimated fair value. The inputs used to determine such fair value are primarily based upon internally developed cash flow models. Our cash flow models are based on a number of estimates regarding future operations that may be subject to significant variability, are sensitive to changes in market conditions, and are reasonably likely to change in the future.
Leases: In accordance with ASC Topic 842, Leases, the Company determines if an arrangement is a lease at inception and evaluates identified leases for operating or finance lease treatment. Operating or finance lease right-of-use assets and liabilities are recognized at the commencement date based on the present value of lease payments over the lease term. We use our incremental borrowing rate based on the information available at the commencement date in determining the present value of lease payments. Lease terms may include options to renew; however, we typically cannot determine our intent to renew a lease with reasonable certainty at inception.
Tax Receivable Agreements: In connection with the IPO, on January 17, 2018, the Company entered into two TRAs with the TRA Holders. The TRAs generally provide for the payment by the Company of 85% of the net cash savings, if any, in U.S. federal, state, and local income tax and franchise tax that the Company actually realizes in periods after the IPO as a result of certain tax attributes applicable to each TRA Holder. The Company accounts for amounts payable under the TRAs in accordance with ASC Topic 450, Contingencies.
Share Repurchases: The Company accounts for the purchase price of repurchased Class A Common Stock in excess of par value ($0.01 per share of Class A Common Stock) as a reduction of additional paid-in capital, and will continue to do so until additional paid-in capital is reduced to zero. Thereafter, any excess purchase price will be recorded as a reduction to retained earnings. All Class A Common Stock shares repurchased to date have been retired upon repurchase.
Item 7A. Quantitative and Qualitative Disclosure about Market Risk
Industry Risk
The demand, pricing and terms for hydraulic fracturing services and related goods provided by us are largely dependent upon the level of drilling and completions activity in the U.S. oil and natural gas industry, as well as the available supply of hydraulic fracturing equipment. These activity levels are influenced by numerous factors over which we have no control, including, but not limited to: the supply of and demand for oil and natural gas; the level of prices, and expectations about future prices of oil and natural gas; the cost of exploring for, developing, producing and delivering oil and natural gas; the expected rates of declining current production; the discovery rates of new oil and natural gas reserves; supply of actively marketed and staffed fracturing fleets; available rail and other transportation capacity; weather conditions; domestic and worldwide economic conditions; political instability in oil-producing countries; environmental regulations; technical advances affecting energy consumption; the price and availability of alternative fuels; the ability of E&P companies to raise equity capital and debt financing; and merger and divestiture activity among E&P companies.
The level of U.S. oil and natural gas drilling can be volatile. Expected trends in oil and natural gas production activities may not materialize and demand for our services may not reflect the level of activity in the industry. Any prolonged and substantial reduction in oil and natural gas prices would likely affect oil and natural gas production levels and therefore affect demand for our services. A material decline in oil and natural gas prices or U.S. activity levels could have a material adverse effect on our business, financial condition, results of operations and cash flows.
Interest Rate Risk
As of December 31, 2024, the Company had $190.5 million of debt outstanding, with a weighted average interest rate of 6.8%. Interest is calculated under the terms of our ABL Facility based on our selection, from time to time, of one of the index rates available to us plus an applicable margin that varies based on certain factors. See Item 7. Management’s Discussion and Analysis of Financial Condition and Results of Operations—Liquidity and Capital Resources. Assuming no change in the amount outstanding, the impact on interest expense of a 1% increase or decrease in the weighted average interest rate would be approximately $1.9 million per year. We do not currently have or intend to enter into any derivative arrangements to protect against fluctuations in interest rates applicable to our outstanding indebtedness.
Commodity Price Risk
Our material and fuel purchases expose us to commodity price risk. Material costs primarily include inventory consumed while performing hydraulic fracturing services. Fuel costs consist of diesel fuel and natural gas used by trucks and other motorized equipment used for hydraulic fracturing services. At times, we have been able to pass along price increases for material costs and fuel costs to customers and conversely have been required to pass along price decreases for material costs to our customers, depending on market conditions. Further, we have purchase commitments with certain vendors to supply proppant inventory used in our operations at a fixed purchase price, including certain commitments which include minimum purchase obligations. Refer to Note 15—Commitments & Contingencies included in Part II, Item 8. of this Annual Report for further discussion regarding purchase commitments.
Foreign Translation Risk
Our consolidated financial statements are expressed in U.S. dollars but a portion of our operations is conducted in a currency other than U.S. dollars. The Canadian dollar and the Australian dollar are the functional currencies of the Company’s foreign subsidiaries as it is the primary currency within the economic environment in which the subsidiaries operate. Changes in the exchange rate can affect our revenues, earnings, and the carrying value of our assets and liabilities in our consolidated balance sheet, either positively or negatively. Adjustments resulting from the translation of the subsidiary’s financial statements are reported in other comprehensive (loss) income. During the years ended December 31, 2024 and 2023, the Company recorded a foreign currency translation loss of $13.7 million and a foreign currency translation gain of $1.3 million to comprehensive income, respectively.
Item 8. Financial Statements and Supplementary Data
Our financial statements and supplementary data are included in this Annual Report beginning on page F-1 and incorporated by reference herein.
Item 9. Changes in and Disagreements with Accountants on Accounting and Financial Disclosure
None.
Item 9A. Controls and Procedures
Evaluation of Disclosure Controls and Procedures
In accordance with the Securities Exchange Act of 1934 Rules 13a-15 and 15d-15, we carried out an evaluation, under the supervision and with the participation of management, including our principal executive officer and principal financial officer, of the effectiveness of our disclosure controls and procedures (as defined in Rules 13a-15(e) and 15d-15(e) of the Exchange Act) as of the end of the period covered by this report. Based on that evaluation, our principal executive officer and principal financial officer concluded that our disclosure controls and procedures were effective as of December 31, 2024 to provide reasonable assurance that information required to be disclosed in our reports filed or submitted under the Exchange Act is recorded, processed, summarized and reported within the time periods specified in the rules and forms of the SEC. Our disclosure controls and procedures include controls and procedures designed to ensure that information required to be disclosed in reports filed or submitted under the Exchange Act is accumulated and communicated to our management, including our principal executive officer and principal financial officer, as appropriate, to allow timely decisions regarding required disclosures.
There were no changes to our internal control over financial reporting (as defined in Rules 13a-15(f) and 15d-15(f) under the Exchange Act) that occurred during our last fiscal quarter that have materially affected, or are reasonably likely to materially affect, our internal control over financial reporting.
See page F-1 for Management’s Report on Internal Control Over Financial Reporting and page F-4 for Report of Independent Registered Public Accounting Firm on its assessment of our internal control over financial reporting.
Item 9B. Other Information
During the quarter ended December 31, 2024, none of our directors or Section 16 officers informed us of the adoption, modification, or termination of any “Rule 10b5-1 trading arrangement” or “non-Rule 10b5-1 trading arrangement” (in each case, as defined in Item 408(a) of Regulation S-K).
PART III
Item 10. Directors, Executive Officers and Corporate Governance
The information required by this item concerning our executive officers, directors and corporate governance is incorporated herein by reference to our definitive proxy statement for our 2025 annual meeting of stockholders, which will be filed with the SEC no later than 120 days after December 31, 2024, under the captions “Proposal 1 — Election of Directors,” “The Board and its Committees,” “Executive Officers” and “Delinquent Section 16(a) Reports.”
Item 11. Executive Compensation
The information required by this item concerning executive compensation is incorporated herein by reference to our definitive proxy statement for our 2025 annual meeting of stockholders, which will be filed with the SEC no later than 120 days after December 31, 2024, under the captions “The Board and its Committees,” “Compensation Discussion & Analysis,” “Compensation Committee Report,” “Executive Compensation Tables,” “Director Compensation,” and “CEO Pay Ratio,” except for the information required by Item 402(v) of Regulation S-K, which is specifically not incorporated by reference.
Item 12. Security Ownership of Certain Beneficial Owners and Management and Related Stockholder Matters
The information required by this item concerning the security ownership of certain beneficial owners and management and related stockholder matters are incorporated herein by reference to our definitive proxy statement for our 2025 annual meeting of stockholders, which will be filed with the SEC no later than 120 days after December 31, 2024, under the captions “Security Ownership of Certain Beneficial Owners and Management” and “Equity Compensation Plan Information.”
Item 13. Certain Relationships and Related Transactions, and Director Independence
The information required by this item concerning certain relationships and related person transactions and director independence is incorporated herein by reference to our definitive proxy statement for our 2025 annual meeting of stockholders, which will be filed with the SEC no later than 120 days after December 31, 2024, under the captions “Certain Relationships and Related Party Transactions” and “the Board and its Committees.”
Item 14. Principal Accountant Fees and Services
The information required by this item concerning principal accounting fees and services is incorporated herein by reference to our definitive proxy statement for our 2025 annual meeting of stockholders, which will be filed with the SEC no later than 120 days after December 31, 2024, under the caption “Proposal 3 — Ratification of Appointment of the Company’s Independent Registered Public Accounting Firm.”
PART IV
Item 15. Exhibits and Financial Statement Schedules
(a) Financial Statements and Financial Statement Schedules
Refer to Index to Financial Statements on page 53.
All schedules are omitted as information required is inapplicable or the information is presented in the consolidated financial statements and the related notes.
(b) Exhibits
The documents listed in the Index to Exhibits are filed, furnished or incorporated by reference as part of this Annual Report, and such Index to Exhibits are incorporated herein by reference.
Item 16. Form 10-K Summary
None.
INDEX TO EXHIBITS | | | | | | | | |
Exhibit Number | | Description |
| | |
| 2.1 | | |
| | |
| 2.2 | | |
| | |
| 3.1 | | |
| | |
| 3.2 | | |
| | |
| 3.3 | | |
| | |
| 4.1 | | |
| | |
| 10.1 | | |
| | |
| 10.2 | | |
| | |
| 10.3 | | |
| | |
| 10.4 | | |
| | |
| 10.5 | | |
| | |
| 10.6 | | Credit Agreement, dated September 19, 2017, by and among Wells Fargo Bank, National Association, as Administrative Agent, Wells Fargo Bank, National Association, JPMorgan Chase Bank, N.A. and Citibank, N.A., as Joint Lead Arrangers, Wells Fargo Bank, National Association, as Book Runner, JPMorgan Chase Bank, N.A. and Citibank, N.A., as Syndication Agents, the lender parties thereto, Liberty Oilfield Services Holdings LLC, as Parent and Liberty Oilfield Services LLC and LOS Acquisition Co I LLC, each as a Borrower (1) |
| | |
| 10.7 | | Amendment and Parent Joinder to Credit Agreement, dated January 17, 2018, by and among Liberty Oilfield Services Holdings LLC, Liberty Oilfield Services LLC, LOS Acquisition Co I LLC, Liberty Oilfield Services Inc., Liberty Oilfield Services New Holdco LLC, Wells Fargo Bank, National Association, as Administrative Agent, and the lenders signatory thereto (3) |
| | |
| 10.8 | | Second Amendment and Parent Joinder to Credit Agreement, dated March 21, 2018, by and among Liberty Oilfield Services LLC, LOS Acquisition Co I LLC, Liberty Oilfield Services Inc., Liberty Oilfield Services New Holdco LLC, R/C IV Non-U.S. LOS Corp, Wells Fargo Bank, National Association, as Administrative Agent, and the lenders signatory thereto (3) |
| | |
| 10.9 | | |
| | |
| 10.10 | | Fourth Amendment to Credit Agreement, dated August 12, 2020, by and among Liberty Oilfield Services LLC, Liberty Oilfield Services Inc., Liberty Oilfield Services New Holdco LLC, R/C IV Non-U.S. LOS Corp, Wells Fargo Bank, National Association, as Administrative Agent, and the lenders signatory thereto (9) |
| | |
| 10.11 | | Consent and Fifth Amendment to Credit Agreement, dated December 29, 2020, by and among Liberty Oilfield Services LLC, Liberty Oilfield Services Inc., Liberty Oilfield Services New Holdco LLC, R/C IV Non-U.S. LOS Corp, LOS Cibolo RE Investments, LLC, LOS Odessa RE Investments, LLC, ST9 Gas and Oil LLC, Wells Fargo Bank, National Association, as Administrative Agent, and the lenders signatory thereto (11) |
| | |
| | | | | | | | |
| 10.12 | | Sixth Amendment to Credit Agreement and Second Amendment to Guaranty and Security Agreement, dated October 22, 2021, by and among Liberty Oilfield Services LLC, Liberty Oilfield Services Inc., Liberty Oilfield Services New HoldCo LLC, R/C IV Non-U.S. LOS Corp, LOS Solar Acquisition LLC, Freedom Proppant LLC, LOS Kermit LLC, LOS Cibolo RE Investments, LLC, LOS Odessa RE Investments, LLC, ST9 Gas and Oil LLC, Wells Fargo Bank, National Association, as Administrative Agent, and the lenders signatory thereto (12) |
| | |
| 10.13 | | Increase Joinder and Seventh Amendment to Credit Agreement, dated July 18, 2022, by and among Liberty Oilfield Services LLC, Liberty Energy Inc., Liberty Oilfield Services New Holdco LLC, R/C IV Non-U.S. LOS Corp, Freedom Proppant LLC, LOS Kermit LLC, LOS Leasing Company LLC, LOS Cibolo RE Investments, LLC, LOS Odessa RE Investments, LLC, Proppant Express Solutions, LLC, ST9 Gas and Oil LLC, Well Fargo Bank, National Association, as Administrative Agent, and the lenders signatory thereto. (14) |
| | |
| 10.14 | | Eighth Amendment to Credit Agreement, dated January 23, 2023, by and among Liberty Oilfield Services LLC, Liberty Energy Inc., Liberty Oilfield Services New Holdco LLC, R/C IV Non-U.S. LOS Corp, Freedom Proppant LLC, LOS Kermit LLC, LOS Leasing Company LLC, LOS Cibolo RE Investments, LLC, LOS Odessa RE Investments, LLC, Proppant Express Solutions, LLC, ST9 Gas and Oil LLC, Well Fargo Bank, National Association, as Administrative Agent, and the lenders signatory thereto. (17) |
| | |
| 10.15 | | |
| | |
| 10.16 | | |
| | |
| 10.17 | | |
| | |
| 10.18 | | |
| | |
| 10.19 | | |
| | |
| 10.20 | | |
| | |
| 10.21 | | |
| | |
| 10.22 | | |
| | |
| 10.23 | | |
| | |
| 10.24 | | |
| | |
| 10.25 | | |
| | |
| 10.26 | | |
| | |
| 19.1 | | |
| | |
| 21.1 | | |
| | |
| 23.1 | | |
| | |
| 31.1 | | |
| | |
| 31.2 | | |
| | |
| 32.1 | | |
| | |
| 32.2 | | |
| | |
| 95 | | |
| | |
| 97 | | |
| | |
| 101.INS | | XBRL Instance Document * |
| | |
| 101.SCH | | XBRL Taxonomy Extension Schema Document * |
| | |
| | | | | | | | |
| 101.CAL | | XBRL Taxonomy Extension Calculation Linkbase Document * |
| | |
| 101.DEF | | XBRL Taxonomy Extension Definition Linkbase Document * |
| | |
| 101.LAB | | XBRL Taxonomy Extension Label Linkbase Document * |
| | |
| 101.PRE | | XBRL Taxonomy Extension Presentation Linkbase Document * |
| | |
| 104 | | Cover Page Interactive Data File (formatted as Inline XBRL and contained in Exhibit 101)* |
| | |
| (1) | Incorporated by reference to the exhibits to the registrant’s Registration Statement on Form S-1, as amended (SEC File 333-216050). |
| | |
| (2) | Incorporated by reference to the exhibits to the registrant’s Current Report on Form 8-K, filed on January 18, 2018. |
| |
| (3) | Incorporated by reference to the exhibits to the registrant’s Annual Report on Form 10-K, filed on March 23, 2018. |
| |
| (4) | Incorporated by reference to the exhibits to the registrant’s Quarterly Report on Form 10-Q, filed on May 10, 2018. |
| | |
| (5) | Incorporated by reference to the exhibits to the registrant’s Quarterly Report on Form 10-Q, filed on May 3, 2019. |
| | |
| (6) | Incorporated by reference to the exhibits to the registrant’s Current Report on Form 8-K, filed on August 30, 2019. |
| | |
| (7) | Incorporated by reference to the exhibits to the registrant’s Annual Report on Form 10-K, filed on February 27, 2020. |
| | |
| (8) | Incorporated by reference to the exhibits to the registrant’s Current Report on Form 8-K, filed on June 3, 2020. |
| |
| (9) | Incorporated by reference to the exhibits to the registrant’s Quarterly Report on Form 10-Q, filed on October 30, 2020. |
| | |
| (10) | Incorporated by reference to the exhibits to the registrant’s Current Report on Form 8-K, filed on September 1, 2020. |
| | |
| (11) | Incorporated by reference to the exhibits to the registrant’s Annual Report on Form 10-K, filed on February 24, 2021. |
| | |
| (12) | Incorporated by reference to the exhibits to the registrant’s Quarterly Report on Form 10-Q, filed on October 28, 2021. |
| | |
| (13) | Incorporated by reference to the registrant’s Current Report on Form 8-K, filed on April 21, 2022. |
| | |
| (14) | Incorporated by reference to the registrant’s Current Report on Form 8-K, filed on July 22, 2022. |
| | |
| (15) | Incorporated by reference to the exhibits to the registrant’s Quarterly Report on Form 10-Q, filed on April 25, 2022. |
| | |
| (16) | Incorporated by reference to the exhibits to the registrant’s Annual Report on Form 10-K, filed on February 22, 2022. |
| | |
| (17) | Incorporated by reference to the exhibits to the registrant’s Current Report on Form 8-K, filed on January 26, 2023. |
| | |
| (18) | Incorporated by reference to Annex A of the registrant’s Definitive Proxy Statement on Schedule 14A, filed on March 7, 2024. |
| | |
| (19) | Incorporated by reference to the registrant’s Registration Statement on Form S-8, filed on May 17, 2024. |
| | |
| (20) | Incorporated by reference to the registrant’s Annual Report on Form 10-K, filed on February 9, 2024. |
| | |
| * | Filed herewith. |
| | |
| ** | Furnished herewith. |
| | |
| † | Denotes a management contract or compensatory plan or arrangement. |
SIGNATURES
Pursuant to the requirements of Section 13 or 15(d) of the Securities Exchange Act of 1934, the registrant has duly caused this report to be signed on its behalf by the undersigned, thereunto duly authorized. | | | | | | | | | | | | | | |
| | | | | LIBERTY ENERGY INC.
/s/ Ron Gusek |
| Date: | February 6, 2025 | By: | | Ron Gusek Chief Executive Officer |
Pursuant to the requirements of the Securities Exchange Act of 1934, this report has been signed below by the following persons on behalf of the registrant and in the capacities and on the dates indicated.
| | | | | | | | | | | | | | |
| Signature | | Title | | Date |
| /s/ Ron Gusek | | Chief Executive Officer and Director (Principal Executive Officer) | | February 6, 2025 |
| Ron Gusek | | | | |
| | | | | |
| /s/ Michael Stock | | Chief Financial Officer (Principal Financial Officer) | | February 6, 2025 |
| Michael Stock | | | | |
| | | | | |
| /s/ Ryan T. Gosney | | Chief Accounting Officer and Vice President of Finance | | February 6, 2025 |
| Ryan T. Gosney | | (Principal Accounting Officer) | | |
| | | | |
| /s/ Simon Ayat | | Director | | February 6, 2025 |
| Simon Ayat | | | | |
| | | | | |
| /s/ Ken Babcock | | Director | | February 6, 2025 |
| Ken Babcock | | | | |
| | | | | |
| /s/ Peter A. Dea | | Director | | February 6, 2025 |
| Peter A. Dea | | | | |
| | | | | |
| /s/ William F. Kimble | | Director | | February 6, 2025 |
| William F. Kimble | | | | |
| | | | | |
| /s/ James R. McDonald | | Director | | February 6, 2025 |
| James R. McDonald | | | | |
| | | | | |
| /s/ Gale A. Norton | | Director | | February 6, 2025 |
| Gale A. Norton | | | | |
| | | | | |
| /s/ Audrey Robertson | | Director | | February 6, 2025 |
| Audrey Robertson | | | | |
| | | | |
| /s/ Cary D. Steinbeck | | Director | | February 6, 2025 |
| Cary D. Steinbeck | | | | |
| | | | |
| /s/ Arjun Murti | | Director | | February 6, 2025 |
| Arjun Murti | | | | |
Index to Financial Statements
MANAGEMENT’S REPORT ON INTERNAL CONTROL OVER FINANCIAL REPORTING
The management of Liberty Energy Inc. is responsible for establishing and maintaining adequate internal control over financial reporting as defined in Rules 13a-15(f) and 15d-15(f) of the Securities Exchange Act.
Internal control over financial reporting, no matter how well designed, has inherent limitations. Therefore, a system of internal control over financial reporting can provide only reasonable assurance and may not prevent or detect misstatements. Further, because of changes in conditions, effectiveness of internal controls over financial reporting may vary over time.
Under the supervision of, and with the participation of our management, including our principal executive officer and principal financial officer, we conducted an evaluation of the effectiveness of our internal control over financial reporting as of December 31, 2024 based on the framework and criteria established in Internal Control-Integrated Framework (2013), issued by the Committee of Sponsoring Organizations of the Treadway Commission.
Based on this evaluation, management concluded that, as of December 31, 2024, our internal control over financial reporting was effective.
The effectiveness of Liberty Energy Inc.’s internal control over financial reporting as of December 31, 2024 has been audited by Deloitte & Touche LLP, an independent registered public accounting firm, as stated in their report that is included herein.
REPORT OF INDEPENDENT REGISTERED PUBLIC ACCOUNTING FIRM
To the stockholders and the Board of Directors of Liberty Energy Inc.
Opinion on the Financial Statements
We have audited the accompanying consolidated balance sheets of Liberty Energy Inc. and subsidiaries (the "Company") as of December 31, 2024 and 2023, the related consolidated statements of operations, comprehensive income, changes in equity, and cash flows, for each of the three years in the period ended December 31, 2024, and the related notes (collectively referred to as the "financial statements"). In our opinion, the financial statements present fairly, in all material respects, the financial position of the Company as of December 31, 2024 and 2023, and the results of its operations and its cash flows for each of the three years in the period ended December 31, 2024, in conformity with accounting principles generally accepted in the United States of America.
We have also audited, in accordance with the standards of the Public Company Accounting Oversight Board (United States) (PCAOB), the Company’s internal control over financial reporting as of December 31, 2024, based on criteria established in Internal Control — Integrated Framework (2013) issued by the Committee of Sponsoring Organizations of the Treadway Commission and our report dated February 6, 2025, expressed an unqualified opinion on the Company’s internal control over financial reporting.
Basis for Opinion
These financial statements are the responsibility of the Company’s management. Our responsibility is to express an opinion on the Company’s financial statements based on our audits. We are a public accounting firm registered with the PCAOB and are required to be independent with respect to the Company in accordance with the U.S. federal securities laws and the applicable rules and regulations of the Securities and Exchange Commission and the PCAOB.
We conducted our audits in accordance with the standards of the PCAOB. Those standards require that we plan and perform the audit to obtain reasonable assurance about whether the financial statements are free of material misstatement, whether due to error or fraud. Our audits included performing procedures to assess the risks of material misstatement of the financial statements, whether due to error or fraud, and performing procedures that respond to those risks. Such procedures included examining, on a test basis, evidence regarding the amounts and disclosures in the financial statements. Our audits also included evaluating the accounting principles used and significant estimates made by management, as well as evaluating the overall presentation of the financial statements. We believe that our audits provide a reasonable basis for our opinion.
Critical Audit Matters
The critical audit matter communicated below is a matter arising from the current-period audit of the financial statements that was communicated or required to be communicated to the audit committee and that (1) relates to accounts or disclosures that are material to the financial statements and (2) involved our especially challenging, subjective, or complex judgments. The communication of critical audit matters does not alter in any way our opinion on the financial statements, taken as a whole, and we are not, by communicating the critical audit matter below, providing separate opinions on the critical audit matter or on the accounts or disclosures to which it relates.
Property and equipment — Determination of Impairment Indicators — Refer to Note 2 to the financial statements
Critical Audit Matter Description
As described in Note 2 to the consolidated financial statements, the Company assesses its property and equipment for impairment whenever events or changes in circumstances indicate that the carrying value of an asset may not be recoverable, referred to as triggering events. Possible indications of impairment may include events or changes in circumstances affecting the manner in which the assets are being used, historical and estimated future profitability measures, and other adverse events or changes that could affect the value of the assets. If a triggering event is identified, the Company evaluates its property and equipment for impairment by comparing undiscounted future cash flows expected to be generated over the life of the assets to the respective carrying amount. If the carrying amount of the assets exceeds the undiscounted future cash flows, an analysis is performed to determine the fair value of the assets.
We identified the evaluation of property and equipment for impairment triggering events as a critical audit matter. The Company makes assumptions to evaluate property and equipment for possible indications of impairment. Changes in these assumptions could have a significant impact on the assets identified for further analysis. For the year ended December 31, 2024, the Company concluded that no triggering events had occurred, and no impairment was recognized.
Given the Company’s evaluation of possible indications of impairment of property and equipment requires management to make assumptions, performing audit procedures to evaluate whether management appropriately identified events or
changes in circumstances indicating that the carrying amounts of property and equipment may not be recoverable required a high degree of auditor judgment.
How the Critical Audit Matter Was Addressed in the Audit
Our audit procedures related to the evaluation of property and equipment for possible indications of impairment included the following, among others:
•We tested the effectiveness of internal controls over financial reporting related to management’s evaluation of impairment. This included controls related to the Company’s process to identify and evaluate triggering events, including the consideration of forecasted to actual results and market conditions in determining whether a triggering event exists.
•We considered the completeness of management’s identification of impairment indicators by:
◦Considering industry and analysts reports and the impact of macroeconomic factors, such as adverse changes in the regulatory environment, legislation or other factors that may represent impairment indicators not previously contemplated in management’s analysis.
◦Inspecting minutes of the board of directors and committees to understand if there were factors that would represent potential impairment indicators for property and equipment.
◦Developing an independent expectation of impairment indicators and compared such expectation to management’s analysis.
•We evaluated management’s determination of the property and equipment’s estimated useful life as well as any factors impacting the useful life, such as plans to sell and any relevant purchase and sales agreements for assets sold.
/s/ DELOITTE & TOUCHE LLP
Denver, Colorado
February 6, 2025
We have served as the Company’s auditor since 2016.
REPORT OF INDEPENDENT REGISTERED PUBLIC ACCOUNTING FIRM
To the stockholders and the Board of Directors of Liberty Energy Inc.
Opinion on Internal Control over Financial Reporting
We have audited the internal control over financial reporting of Liberty Energy Inc. (the “Company”) as of December 31, 2024, based on criteria established in Internal Control — Integrated Framework (2013) issued by the Committee of Sponsoring Organizations of the Treadway Commission (COSO). In our opinion, the Company maintained, in all material respects, effective internal control over financial reporting as of December 31, 2024, based on criteria established in Internal Control — Integrated Framework (2013) issued by COSO.
We have also audited, in accordance with the standards of the Public Company Accounting Oversight Board (United States) (PCAOB), the consolidated financial statements as of and for the year ended December 31, 2024, of the Company and our report dated February 6, 2025, expressed an unqualified opinion on those financial statements.
Basis for Opinion
The Company’s management is responsible for maintaining effective internal control over financial reporting and for its assessment of the effectiveness of internal control over financial reporting, included in the accompanying Management's Report on Internal Control Over Financial Reporting. Our responsibility is to express an opinion on the Company’s internal control over financial reporting based on our audit. We are a public accounting firm registered with the PCAOB and are required to be independent with respect to the Company in accordance with the U.S. federal securities laws and the applicable rules and regulations of the Securities and Exchange Commission and the PCAOB.
We conducted our audit in accordance with the standards of the PCAOB. Those standards require that we plan and perform the audit to obtain reasonable assurance about whether effective internal control over financial reporting was maintained in all material respects. Our audit included obtaining an understanding of internal control over financial reporting, assessing the risk that a material weakness exists, testing and evaluating the design and operating effectiveness of internal control based on the assessed risk, and performing such other procedures as we considered necessary in the circumstances. We believe that our audit provides a reasonable basis for our opinion.
Definition and Limitations of Internal Control over Financial Reporting
A company’s internal control over financial reporting is a process designed to provide reasonable assurance regarding the reliability of financial reporting and the preparation of financial statements for external purposes in accordance with generally accepted accounting principles. A company’s internal control over financial reporting includes those policies and procedures that (1) pertain to the maintenance of records that, in reasonable detail, accurately and fairly reflect the transactions and dispositions of the assets of the company; (2) provide reasonable assurance that transactions are recorded as necessary to permit preparation of financial statements in accordance with generally accepted accounting principles, and that receipts and expenditures of the company are being made only in accordance with authorizations of management and directors of the company; and (3) provide reasonable assurance regarding prevention or timely detection of unauthorized acquisition, use, or disposition of the company’s assets that could have a material effect on the financial statements.
Because of its inherent limitations, internal control over financial reporting may not prevent or detect misstatements. Also, projections of any evaluation of effectiveness to future periods are subject to the risk that controls may become inadequate because of changes in conditions, or that the degree of compliance with the policies or procedures may deteriorate.
/s/ DELOITTE & TOUCHE LLP
Denver, Colorado
February 6, 2025
LIBERTY ENERGY INC.
Consolidated Balance Sheets
As of December 31, 2024 and 2023
(Dollars in thousands, except share data) | | | | | | | | | | | |
| 2024 | | 2023 |
| Assets | |
| Current assets: | | | |
| Cash and cash equivalents | $ | 19,984 | | | $ | 36,784 | |
| Accounts receivable—trade, net of allowances for credit losses of $848 and $939, respectively | 350,412 | | | 381,185 | |
| Accounts receivable—related party | 4,234 | | | 17,345 | |
| Unbilled revenue (including amounts from related parties of $0 and $13,379, respectively) | 185,210 | | | 188,940 | |
| Inventories | 203,469 | | | 205,865 | |
| Prepaid and other current assets | 85,214 | | | 124,135 | |
| Total current assets | 848,523 | | | 954,254 | |
| Property and equipment, net | 1,890,998 | | | 1,645,368 | |
| Finance lease right-of-use assets | 283,113 | | | 182,319 | |
| Operating lease right-of-use assets | 73,322 | | | 92,640 | |
| Other assets (including amounts from related parties of $0 and $14,785, respectively) | 119,402 | | | 127,330 | |
| | | |
| Investment in Nomad Proppant Services LLC | 10,674 | | | 11,363 | |
| Investment in Oklo Inc. | 51,611 | | | 10,000 | |
| Investment in Tamboran Resources Corporation | 18,751 | | | 10,283 | |
| Total assets | $ | 3,296,394 | | | $ | 3,033,557 | |
| Liabilities and Equity | | | |
| Current liabilities: | | | |
| Accounts payable (including amounts due to related parties of $582 and $0, respectively) | $ | 314,123 | | | $ | 293,733 | |
| Accrued liabilities | 206,713 | | | 261,066 | |
| Income taxes payable | 9,693 | | | 12,060 | |
| Current portion of payable pursuant to tax receivable agreements | 40,776 | | | 5,170 | |
| | | |
| Current portion of finance lease liabilities | 66,648 | | | 39,867 | |
| Current portion of operating lease liabilities | 28,570 | | | 27,528 | |
| Total current liabilities | 666,523 | | | 639,424 | |
| Long-term debt | 190,500 | | | 140,000 | |
| Deferred tax liability | 137,728 | | | 102,340 | |
| Payable pursuant to tax receivable agreements | 74,886 | | | 112,471 | |
| Noncurrent portion of finance lease liabilities | 203,511 | | | 133,654 | |
| Noncurrent portion of operating lease liabilities | 44,377 | | | 64,260 | |
| Total liabilities | 1,317,525 | | | 1,192,149 | |
| Commitments & contingencies (Note 15) | | | |
| | | |
| | | |
| | | |
| Stockholders’ equity: | | | |
| Preferred Stock, $0.01 par value, 10,000 shares authorized and none issued and outstanding | — | | | — | |
| Common Stock: | | | |
| Class A, $0.01 par value, 400,000,000 shares authorized and 161,858,784 issued and outstanding as of December 31, 2024 and 166,610,199 issued and outstanding as of December 31, 2023 | 1,619 | | | 1,666 | |
| Class B, $0.01 par value, 400,000,000 shares authorized and none issued and outstanding | — | | | — | |
| Additional paid in capital | 977,484 | | | 1,093,498 | |
| Retained earnings | 1,019,517 | | | 752,328 | |
| Accumulated other comprehensive loss | (19,751) | | | (6,084) | |
| Total stockholders’ equity | 1,978,869 | | | 1,841,408 | |
| | | |
| | | |
| Total liabilities and equity | $ | 3,296,394 | | | $ | 3,033,557 | |
See Notes to Consolidated Financial Statements.
LIBERTY ENERGY INC.
Consolidated Statements of Operations
For the Years Ended December 31, 2024, 2023, and 2022
(In thousands, except per share data) | | | | | | | | | | | | | | | | | |
| 2024 | | 2023 | | 2022 |
| Revenue: | | | | | |
| Revenue | $ | 4,183,821 | | | $ | 4,533,048 | | | $ | 4,000,780 | |
| Revenue—related parties | 131,340 | | | 214,880 | | | 148,448 | |
| Total revenue | 4,315,161 | | | 4,747,928 | | | 4,149,228 | |
| Operating costs and expenses: | | | | | |
| Cost of services (exclusive of depreciation, depletion, and amortization shown separately below) | 3,200,506 | | | 3,349,370 | | | 3,149,036 | |
| General and administrative | 225,474 | | | 221,406 | | | 180,040 | |
| Transaction and other costs | — | | | 2,053 | | | 5,837 | |
| Depreciation, depletion, and amortization | 505,050 | | | 421,514 | | | 323,028 | |
| Gain on disposal of assets, net | (5,337) | | | (6,994) | | | (4,603) | |
| Total operating costs and expenses | 3,925,693 | | | 3,987,349 | | | 3,653,338 | |
| Operating income | 389,468 | | | 760,579 | | | 495,890 | |
| Other (income) expense: | | | | | |
| Loss (gain) on remeasurement of liability under tax receivable agreements | 3,210 | | | (1,817) | | | 76,191 | |
| Unrealized gain on investments, net | (49,227) | | | — | | | (2,525) | |
| | | | | |
| Interest income—related party | (478) | | | (1,987) | | | — | |
| Interest expense, net | 32,692 | | | 29,493 | | | 22,715 | |
| Total other (income) expense, net | (13,803) | | | 25,689 | | | 96,381 | |
| Net income before income taxes | 403,271 | | | 734,890 | | | 399,509 | |
| Income tax expense (benefit) | 87,261 | | | 178,482 | | | (793) | |
| Net income | 316,010 | | | 556,408 | | | 400,302 | |
| | | | | |
| Less: Net income attributable to non-controlling interests | — | | | 91 | | | 700 | |
| Net income attributable to Liberty Energy Inc. stockholders | $ | 316,010 | | | $ | 556,317 | | | $ | 399,602 | |
| | | | | |
| Net income attributable to Liberty Energy Inc. stockholders per common share: | | | | | |
| Basic | $ | 1.91 | | | $ | 3.24 | | | $ | 2.17 | |
| Diluted | $ | 1.87 | | | $ | 3.15 | | | $ | 2.11 | |
| Weighted average common shares outstanding: | | | | | |
| Basic | 165,026 | | | 171,845 | | 184,334 |
| Diluted | 169,398 | | | 176,360 | | 189,349 |
| | | | | |
| | | | | |
| | | | | |
| | | | | |
| | | | | |
| | | | | |
| | | | | |
| | | | | |
See Notes to Consolidated Financial Statements.
LIBERTY ENERGY INC.
Consolidated Statements of Comprehensive Income
For the Years Ended December 31, 2024, 2023, and 2022
(In thousands)
| | | | | | | | | | | | | | | | | |
| 2024 | | 2023 | | 2022 |
| Net income | $ | 316,010 | | | $ | 556,408 | | | $ | 400,302 | |
| Other comprehensive (loss) income | | | | | |
| Foreign currency translation adjustments | (13,667) | | | 1,313 | | | (7,097) | |
| Comprehensive income | $ | 302,343 | | | $ | 557,721 | | | $ | 393,205 | |
| Comprehensive income attributable to non-controlling interest | — | | | 92 | | | 693 | |
| Comprehensive income attributable to Liberty Energy Inc. | $ | 302,343 | | | $ | 557,629 | | | $ | 392,512 | |
See Notes to Consolidated Financial Statements.
LIBERTY ENERGY INC.
Consolidated Statements of Changes in Equity
For the Years Ended December 31, 2024 and 2023
(In thousands, except per share and per unit data) | | | | | | | | | | | | | | | | | | | | | | | | | | | | | | | | | | | | | | | | | | | | | | | |
| Shares of Class A Common Stock | | Shares of Class B Common Stock | | Class A Common Stock, Par Value | | Class B Common Stock, Par Value | | Additional Paid in Capital | | Retained Earnings | | Accumulated Other Comprehensive Loss | | Total Equity |
| Balance—December 31, 2023 | 166,610 | | | — | | | $ | 1,666 | | | $ | — | | | $ | 1,093,498 | | | $ | 752,328 | | | $ | (6,084) | | | $ | 1,841,408 | |
| | | | | | | | | | | | | | | |
| | | | | | | | | | | | | | | |
| | | | | | | | | | | | | | | |
| | | | | | | | | | | | | | | |
| | | | | | | | | | | | | | | |
| | | | | | | | | | | | | | | |
| $0.29/share of Class A Common Stock dividend | — | | | — | | | — | | | — | | | — | | | (48,821) | | | — | | | (48,821) | |
| | | | | | | | | | | | | | | |
| Share repurchases | (6,321) | | | — | | | (63) | | | — | | | (127,332) | | | — | | | — | | | (127,395) | |
| Excise tax on share repurchases | — | | | — | | | — | | | — | | | (924) | | | — | | | — | | | (924) | |
| Stock-based compensation expense | — | | | — | | | — | | | — | | | 32,412 | | | — | | | — | | | 32,412 | |
| Vesting of restricted stock units, net | 1,570 | | | — | | | 16 | | | — | | | (20,170) | | | — | | | — | | | (20,154) | |
| | | | | | | | | | | | | | | |
| Currency translation adjustment | — | | | — | | | — | | | — | | | — | | | — | | | (13,667) | | | (13,667) | |
| Net income | — | | | — | | | — | | | — | | | — | | | 316,010 | | | — | | | 316,010 | |
| Balance—December 31, 2024 | 161,859 | | | — | | | $ | 1,619 | | | $ | — | | | $ | 977,484 | | | $ | 1,019,517 | | | $ | (19,751) | | | $ | 1,978,869 | |
| | | | | | | | | | | | | | | |
| | | | | | | | | | | | | | | | | | | | | | | | | | | | | | | | | | | | | | | | | | | | | | | | | | | | | | | | | | | |
| Shares of Class A Common Stock | | Shares of Class B Common Stock | | Class A Common Stock, Par Value | | Class B Common Stock, Par Value | | Additional Paid in Capital | | (Accumulated Deficit) Retained Earnings | | Accumulated Other Comprehensive Loss | | Total Stockholders’ equity | | Non-controlling Interest | | Total Equity |
| Balance - December 31, 2022 | 178,753 | | | 250 | | | $ | 1,788 | | | $ | 3 | | | $ | 1,266,097 | | | $ | 234,525 | | | $ | (7,396) | | | $ | 1,495,017 | | | $ | 2,289 | | | $ | 1,497,306 | |
| Exchange of Class B Common Stock for Class A Common Stock | 250 | | | (250) | | | 3 | | | (3) | | | 2,360 | | | — | | | — | | | 2,360 | | | (2,360) | | | — | |
| Offering Costs | — | | | — | | | — | | | — | | | (223) | | | — | | | — | | | (223) | | | — | | | (223) | |
| | | | | | | | | | | | | | | | | | | |
| | | | | | | | | | | | | | | | | | | |
| | | | | | | | | | | | | | | | | | | |
| Deferred tax and tax receivable agreements impact of Liberty LLC merger into the Company | — | | | — | | | — | | | — | | | 6,681 | | | — | | | — | | | 6,681 | | | — | | | 6,681 | |
| $0.22/share of Class A Common Stock dividend | — | | | — | | | — | | | — | | | — | | | (38,514) | | | — | | | (38,514) | | | — | | | (38,514) | |
| | | | | | | | | | | | | | | | | | | |
| | | | | | | | | | | | | | | | | | | |
| Share repurchases | (13,706) | | | — | | | (137) | | | — | | | (202,940) | | | — | | | — | | | (203,077) | | | (23) | | | (203,100) | |
| Excise tax on share repurchases | — | | | — | | | — | | | — | | | (1,855) | | | — | | | — | | | (1,855) | | | — | | | (1,855) | |
| Stock-based compensation expense | — | | | — | | | — | | | — | | | 33,023 | | | — | | | — | | | 33,023 | | | 3 | | | 33,026 | |
| Vesting of restricted stock units, net | 1,313 | | | — | | | 12 | | | — | | | (9,645) | | | — | | | — | | | (9,633) | | | (1) | | | (9,634) | |
| | | | | | | | | | | | | | | | | | | |
| | | | | | | | | | | | | | | | | | | |
| Currency translation adjustment | — | | | — | | | — | | | — | | | — | | | — | | | 1,312 | | | 1,312 | | | 1 | | | 1,313 | |
| Net income | — | | | — | | | — | | | — | | | — | | | 556,317 | | | — | | | 556,317 | | | 91 | | | 556,408 | |
| Balance - December 31, 2023 | 166,610 | | | — | | | $ | 1,666 | | | $ | — | | | $ | 1,093,498 | | | $ | 752,328 | | | $ | (6,084) | | | $ | 1,841,408 | | | $ | — | | | $ | 1,841,408 | |
See Notes to Consolidated Financial Statements.
LIBERTY ENERGY INC.
Consolidated Statements of Cash Flows
For the Years Ended December 31, 2024, 2023, and 2022
(Dollars in thousands) | | | | | | | | | | | | | | | | | |
| 2024 | | 2023 | | 2022 |
| Cash flows from operating activities: | | | | | |
| Net income | $ | 316,010 | | | $ | 556,408 | | | $ | 400,302 | |
| Adjustments to reconcile net income to net cash provided by operating activities: | | | | | |
| Depreciation, depletion, and amortization | 505,050 | | | 421,514 | | | 323,028 | |
| Gain on disposal of assets, net | (5,337) | | | (6,994) | | | (4,603) | |
| Stock-based compensation expense | 32,412 | | | 33,026 | | | 23,108 | |
| Deferred income tax expense (benefit) | 33,844 | | | 120,312 | | | (12,472) | |
| Unrealized gain on investments, net | (49,227) | | | — | | | (2,525) | |
| Cash return on equity method investment | 3,967 | | | — | | | — | |
| Loss (gain) on remeasurement of liability under tax receivable agreements | 3,210 | | | (1,817) | | | 76,191 | |
| Other non-cash items, net | 178 | | | 7,111 | | | 7,986 | |
| Changes in operating assets and liabilities: | | | | | |
| Accounts receivable and unbilled revenue | 18,187 | | | 19,612 | | | (166,605) | |
| Accounts receivable and unbilled revenue—related party | 41,275 | | | (19,855) | | | (25,522) | |
| Inventories | 66 | | | (114) | | | (84,989) | |
| Prepaid and other assets | (28,196) | | | (66,182) | | | (56,161) | |
| | | | | |
| Accounts payable and accrued liabilities | (41,319) | | | (45,133) | | | 57,203 | |
| Accounts payable and accrued liabilities—related party | 582 | | | — | | | (1,864) | |
| Initial payment of operating lease liability | (1,328) | | | (3,305) | | | (2,713) | |
| Net cash provided by operating activities | 829,374 | | | 1,014,583 | | | 530,364 | |
| Cash flows from investing activities: | | | | | |
| Purchases of property and equipment and construction in-progress | (651,034) | | | (603,298) | | | (451,905) | |
| Investment in sand logistics | — | | | — | | | (7,415) | |
| Investment in equity securities | (16,056) | | | (20,283) | | | (15,000) | |
| Acquisition of Siren Energy, net of cash received | — | | | (75,656) | | | — | |
| Proceeds from sales of assets | 23,977 | | | 26,909 | | | 23,664 | |
| Net cash used in investing activities | (643,113) | | | (672,328) | | | (450,656) | |
| Cash flows from financing activities: | | | | | |
| | | | | |
| | | | | |
| | | | | |
| Proceeds from borrowings on line-of-credit | 2,238,000 | | | 1,153,000 | | | 713,000 | |
| Repayments of borrowings on line-of-credit | (2,187,500) | | | (1,128,000) | | | (616,000) | |
| Repayments of borrowings on term loan | — | | | (104,716) | | | (1,750) | |
| Payments on finance lease obligations | (50,302) | | | (17,392) | | | (6,947) | |
| Class A Common Stock dividends and dividend equivalents upon restricted stock vesting | (48,310) | | | (37,684) | | | (9,164) | |
| Per unit distributions to non-controlling interest unitholders | — | | | — | | | (13) | |
| Other distributions and advance payments to non-controlling interest unitholders | — | | | — | | | 920 | |
| Share repurchases, including related excise tax | (129,250) | | | (203,100) | | | (125,313) | |
| Tax withholding on restricted stock units | (20,154) | | | (9,634) | | | (9,716) | |
| Payments under TRA liability | (5,189) | | | — | | | — | |
| Payment of equity issuance costs | — | | | (223) | | | (79) | |
| Payments of debt issuance costs | — | | | (1,566) | | | (708) | |
| Net cash used in financing activities | (202,705) | | | (349,315) | | | (55,770) | |
| Net (decrease) increase in cash and cash equivalents | (16,444) | | | (7,060) | | | 23,938 | |
| Translation effect on cash | (356) | | | 168 | | | (260) | |
| Cash and cash equivalents—beginning of period | 36,784 | | | 43,676 | | | 19,998 | |
| Cash and cash equivalents—end of period | $ | 19,984 | | | $ | 36,784 | | | $ | 43,676 | |
LIBERTY ENERGY INC.
Consolidated Statements of Cash Flows (cont.)
For the Years Ended December 31, 2024, 2023, and 2022
(Dollars in thousands) | | | | | | | | | | | | | | | | | |
| 2024 | | 2023 | | 2022 |
| Supplemental disclosure of cash flow information: | | | | | |
| Net cash paid for income taxes | $ | 35,857 | | | $ | 66,685 | | | $ | 10,744 | |
| Cash paid for interest | $ | 33,077 | | | $ | 26,651 | | | $ | 20,310 | |
| Non-cash investing and financing activities: | | | | | |
| Capital expenditures included in accounts payable and accrued liabilities | $ | 102,203 | | | $ | 99,165 | | | $ | 107,514 | |
| Capital expenditures reclassified from prepaid and other current assets | $ | 58,288 | | | $ | 50,313 | | | $ | 14,922 | |
| Capital expenditures reclassified from finance lease right-of-use assets | $ | 6,894 | | | $ | — | | | $ | — | |
| | | | | |
See Notes to Consolidated Financial Statements.
LIBERTY ENERGY INC.
Notes to Consolidated Financial Statements
Note 1—Organization and Basis of Presentation
Organization
Liberty Energy Inc., formerly known as Liberty Oilfield Services Inc. (the “Company”), was incorporated as a Delaware corporation on December 21, 2016, to become a holding corporation for Liberty Oilfield Services New HoldCo LLC (“Liberty LLC”) and its subsidiaries upon completion of a corporate reorganization (the “Corporate Reorganization”) and planned initial public offering of the Company (“IPO”). On April 19, 2022, the stockholders of the Company approved an amendment to the Company’s Amended and Restated Certificate of Incorporation for the purpose of changing the Company’s name from “Liberty Oilfield Services Inc.” to “Liberty Energy Inc.” and thereafter, the Company filed with the Secretary of State of the State of Delaware a Certificate of Amendment to the Company’s Amended and Restated Certificate of Incorporation to reflect the new name, effective April 25, 2022.
Effective January 31, 2023, Liberty LLC was merged into the Company, with the Company surviving the merger (the “Merger”). In connection with the Merger, all outstanding shares of the Company’s Class B Common Stock, par value $0.01 per share (the “Class B Common Stock”), were redeemed and exchanged for an equal number of shares of the Company’s Class A Common Stock, par value $0.01 per share (the “Class A Common Stock”). The Company did not make any distributions or receive any proceeds in connection with this exchange. The Merger did not have a significant impact on the Company’s consolidated financial statements.
The Company, together with its subsidiaries, is a leading integrated energy services and technology company focused on providing innovative hydraulic fracturing services and related technologies to onshore oil and natural gas exploration and production (“E&P”) companies. We offer customers hydraulic fracturing services, together with complementary services including wireline services, proppant delivery solutions, field gas processing, compressed natural gas (“CNG”) delivery, data analytics, related goods (including our sand mine operations), and technologies to facilitate lower emission completions, thereby helping our customers reduce their emissions profile.
Basis of Presentation
The accompanying consolidated financial statements were prepared using generally accepted accounting principles in the United States of America (“GAAP”) and the instructions to Form 10-K, Regulation S-X and the rules and regulations of the Securities and Exchange Commission.
The accompanying consolidated financial statements and related notes present the consolidated financial position of the Company and equity of the Company as of and for the years ended December 31, 2024 and 2023, and the results of operations and cash flows of the Company for the years ended December 31, 2024, 2023, and 2022.
The consolidated financial statements include the amounts of the Company and all majority owned subsidiaries where the Company has the ability to exercise control. All intercompany amounts have been eliminated in the presentation of the consolidated financial statements of the Company.
Our chief operating decision maker (“CODM”), the Chief Executive Officer, manages the Company’s business activities as a single operating and reportable segment at the consolidated level. Accordingly, our CODM uses consolidated net income to measure segment profit or loss, allocate resources, and assess performance. Further, the CODM is regularly provided with and utilizes consolidated functional expenses, as presented in the accompanying consolidated statements of operations, and total assets at the consolidated level, as included in the consolidated balance sheets herein, to manage the Company’s operations.
Note 2—Significant Accounting Policies
Business Combinations
Business combinations are accounted for using the acquisition method of accounting in accordance with the Accounting Standard Codification (“ASC”) Topic 805 - Business Combinations, as amended by Accounting Standards Update (“ASU”) 2017-01, Business Combinations (Topic 805), Clarifying the Definition of a Business, and ASU No. 2021-08, Business Combinations: Accounting for Contract Assets and Contract Liabilities from Contracts with Customers. The purchase price is allocated to the assets acquired and liabilities assumed based on their estimated fair values. Fair value of the acquired assets and liabilities is measured in accordance with the guidance of ASC 850, Fair Value Measurements, using discounted cash flows and other applicable valuation techniques. Any acquisition related costs incurred by the Company are expensed as incurred. Any excess purchase price over the fair value of the net identifiable assets acquired is recorded as goodwill if the definition of a
LIBERTY ENERGY INC.
Notes to Consolidated Financial Statements
business is met. Operating results of an acquired business are included in our results of operations from the date of acquisition. Refer to Note 3—Acquisitions.
Use of Estimates
The preparation of consolidated financial statements in conformity with GAAP requires management to make estimates and assumptions that affect the reported amounts of assets and liabilities and disclosures of contingent assets and liabilities at the date of the consolidated financial statements and the reported amounts of revenues and expenses during the reporting period. Actual results could differ from those estimates.
The consolidated financial statements include certain amounts that are based on management’s best estimates and judgments. The most significant estimates relate to the fair value of assets acquired and liabilities assumed, collectability of accounts receivable and estimates of allowance for doubtful accounts, the useful lives and salvage values of long-lived assets, future cash flows associated with long-lived assets, net realizable value of inventory, equity unit valuation, deferred taxes, and the tax receivable agreements value. These estimates may be adjusted as more current information becomes available.
Cash and Cash Equivalents
The Company considers all highly liquid instruments purchased with an original maturity of three months or less to be cash equivalents. The Company continually monitors its positions with, and the credit quality of, the financial institutions with which it has banking relationships. As of the balance sheet date, and periodically throughout the year, the Company has maintained balances in various operating accounts in excess of federally insured limits.
Accounts Receivable
In accordance with Accounting Standards Updates ASU 2016-13, Financial Instruments-Credit Losses (Topic 326): Measurement of Credit Losses on Financial Instruments (“ASU 2016-13”), the Company applies historic loss factors to its receivable portfolio segments that were not expected to be further impacted by current economic developments, and additional economic conditions factor to portfolio segments anticipated to experience greater losses in the current economic environment. Additionally, the Company continuously evaluates customers based on risk characteristics, such as historical losses and current economic conditions. Due to the cyclical nature of the oil and gas industry, the Company often evaluates its customers’ estimated losses on a case-by-case basis. The Company did not record an additional provision for credit losses during the year ended December 31, 2024 and 2022. During the year ended December 31, 2023, the Company recorded a provision for credit losses of $0.8 million, related to certain customers’ inability to pay. Provisions for credit losses are included in general and administrative expenses in the accompanying consolidated statements of operations. Refer to “Credit Risk” within Note 9—Fair Value Measurements and Financial Instruments for additional disclosures required under ASU 2016-13.
Inventories
Inventories consist of raw materials used in the hydraulic fracturing process, such as proppants, chemicals, and field service equipment maintenance parts and other and are stated at the lower of cost, determined using the weighted average cost method, or net realizable value. Inventories are charged to cost of services as used when providing hydraulic fracturing services. Net realizable value is the estimated selling prices in the ordinary course of business, less reasonably predictable cost of completion, disposal, and transportation.
Property and Equipment
Property and equipment are stated at cost. Depreciation expense is recognized on property and equipment, excluding land, utilizing the straight-line method over the estimated useful lives, ranging from two to 30 years. The Company estimates salvage values that it does not depreciate.
Construction in-progress, a component of property and equipment, represents long-lived assets not yet in service or being developed by the Company. These assets are not subject to depreciation until they are completed and ready for their intended use, at which point the Company reclassifies them to field services equipment, vehicles, or buildings and facilities, as appropriate.
The Company incurs maintenance costs on its major equipment. The determination of whether an expenditure should be capitalized or expensed requires management judgment in the application of how the costs incurred benefit future periods, relative to the Company’s capitalization policy. Costs that either establish or increase the efficiency, productivity, functionality or life of a fixed asset are capitalized and depreciated over the remaining useful life of the asset.
Impairment of long-lived assets
Long-lived assets, such as property and equipment, right-of-use lease assets and intangible assets, are evaluated for impairment whenever events or changes in circumstances indicate that their carrying value may not be recoverable. Possible
LIBERTY ENERGY INC.
Notes to Consolidated Financial Statements
indicators of impairment may include events or changes in circumstances affecting the manner in which the assets are being used, historical and estimated future profitability measures, and other adverse events or changes that could affect the value of the assets. If a triggering event is identified, recoverability is assessed using undiscounted future net cash flows of assets grouped at the lowest level for which there are identifiable cash flows independent of the cash flows of other groups of assets. The Company determined the lowest level of identifiable cash flows to be at the asset group, which is the aggregate of the Company’s hydraulic fracturing fleets that are in service. A long-lived asset is not recoverable if its carrying amount exceeds the sum of estimated undiscounted cash flows expected to result from the use and eventual disposition. When alternative courses of action to recover the carrying amount of the asset group are under consideration, estimates of future undiscounted cash flows take into account possible outcomes and probabilities of their occurrence. If the carrying amount of the asset is not recoverable, an impairment loss is recognized in an amount by which its carrying amount exceeds its estimated fair value, such that its carrying amount is adjusted to its estimated fair value, with an offsetting charge to impairment expense.
The Company measures the fair value of its long-lived assets using the discounted cash flow method. The expected future cash flows used for impairment reviews and related fair value calculations are based on judgmental assessments of projected revenue growth, fleet count, utilization, gross margin rates, selling, general and administrative rates, working capital fluctuations, capital expenditures, discount rates and terminal growth rates.
Goodwill
Goodwill represents the excess of the acquisition purchase price over the estimated fair value of net tangible and intangible assets required. Goodwill is not amortized, but instead tested for impairment at least annually, June 30, or more frequently if events and circumstances indicate that the asset might be impaired. In testing goodwill for impairment, the Company performs a qualitative assessment to determine whether the existence of events or circumstances indicate that it is more likely than not that the fair value of a reporting unit is less than its carrying amount. If the qualitative assessment determines that an impairment is more likely than not, then the Company performs the one-step quantitative impairment test by determining the fair value of the reporting unit. The fair value of the reporting unit is determined using either the income approach by utilizing estimated discounted future cash flows or the market approach utilizing recent transaction activity for comparable properties. These approaches are considered Level 3 fair value measurements. If the carrying amount of a reporting unit exceeds the fair value, an impairment loss is recognized in the current period in an amount equal to the excess.
For purposes of assessing goodwill, the Company has one reporting unit. No goodwill impairment was identified during the years ended December 31, 2024 and 2023.
Leases
In accordance with ASC Topic 842, the Company determines if an arrangement is a lease at inception and evaluates identified leases for operating or finance lease treatment. Operating or finance lease right-of-use assets and liabilities are recognized at the commencement date based on the present value of lease payments over the lease term. The Company uses the rate implicit in the lease, when available, or an estimated fully collateralized incremental borrowing rate corresponding with the lease term and the information available at the commencement date in determining the present value of lease payments. Lease terms may include options to renew, however, the Company typically cannot determine its intent to renew a lease with reasonable certainty at inception.
Additionally, the Company is a lessor in several operating leases in which the lease equipment is carried at amortized cost. Depreciation expense is recorded on a straight-line basis over its useful life to the estimated residual value. The lessee may not purchase the leased equipment and must return such equipment by the lease’s scheduled maturity date.
Equity Investments
The Company may from time to time invest in equity securities of public and private companies. Equity investments are measured and recorded as follows:
Marketable equity investments are equity investments with a readily determinable fair value and are recorded at fair value on a recurring basis with changes in fair value, whether realized or unrealized, recorded through the income statement. Unrealized gains and losses resulting from changes in fair value are recorded in unrealized gain on investments, net.
Equity method investments are equity securities in investees we do not control, but over which we have the ability to exercise significant influence. Equity method investments are measured at cost minus impairment, if any, plus or minus the Company’s share of equity method investee income or loss, less distributions received as return on investment.
The Company’s share of equity method investee income or loss is recorded as a component of cost of services as the investee is a supplier of the Company, refer to Note 14—Related Party Transactions Nomad Proppant Services LLC for further discussion of the Company’s equity method investment. Equity method investments are monitored for other-than-temporary
LIBERTY ENERGY INC.
Notes to Consolidated Financial Statements
decreases in investment value, which considers the severity and duration of a potential decline in fair value below cost and our ability and intent to hold the investment for a sufficient period of time to allow for recovery.
Income Taxes
Deferred income taxes are computed using the asset and liability method, which requires the recognition of deferred tax assets and liabilities for the expected future tax consequences of events that have been included in the consolidated financial statements. Deferred tax assets and liabilities are measured using the enacted tax rates in effect for the year in which the deferred tax asset or liability are expected to reverse. The Company classifies all deferred tax assets and liabilities as non-current. The Company records Global Intangible Low-Tax Income inclusion as a current period expense.
The Company evaluates its deferred tax assets quarterly and considers both positive and negative evidence in applying the guidance of ASC 740 Income Taxes (“ASC 740”) related to the realizability of its deferred tax assets. As of December 31, 2024 and 2023 there were no valuation allowances recorded against the Company’s deferred tax assets.
The Company recognizes the financial statement effects of a tax position when it is more-likely-than-not, based on the technical merits, that the position will be sustained upon examination. A tax position that meets the more-likely-than-not recognition threshold is measured as the largest amount of tax benefit that is greater than 50% likely of being realized upon ultimate settlement with a taxing authority. Previously recognized tax positions are reversed in the first period in which it is no longer more-likely-than-not that the tax position would be sustained upon examination. Income tax related interest and penalties, if applicable, are recorded as a component of the provision for income tax expense.
Tax Receivable Agreements
In connection with the IPO, on January 17, 2018, the Company entered into two Tax Receivable Agreements (the “TRAs”) with the R/C Energy IV Direct Partnership, L.P. and certain legacy owners that continued to own Liberty LLC Units (each such person and any permitted transferee, a “Tax Receivable Agreement Holder” and together, the “Tax Receivable Agreement Holders”). The TRAs generally provide for the payment by the Company of 85% of the net cash savings, if any, in U.S. federal, state, and local income tax and franchise tax (computed using simplifying assumptions to address the impact of state and local taxes) that the Company actually realizes (or is deemed to realize in certain circumstances) in periods after the IPO as a result, as applicable to each Tax Receivable Agreement Holder, of (i) certain increases in tax basis that occur as a result of the Company’s acquisition (or deemed acquisition for U.S. federal income tax purposes) of all or a portion of such Tax Receivable Agreement Holder’s Liberty LLC Units in connection with the IPO or pursuant to the exercise of the right (the “Redemption Right”) or the Company’s right (the “Call Right”), (ii) any net operating losses available to the Company as a result of the Corporate Reorganization, and (iii) imputed interest deemed to be paid by the Company as a result of, and additional tax basis arising from, any payments the Company makes under the TRAs.
With respect to obligations the Company expects to incur under the TRAs (except in cases where the Company elects to terminate the TRAs early, the TRAs are terminated early due to certain mergers, asset sales, or other changes of control or the Company has available cash but fails to make payments when due), generally the Company may elect to defer payments due under the TRAs if the Company does not have available cash to satisfy its payment obligations under the TRAs or if its contractual obligations limit its ability to make such payments. Any such deferred payments under the TRAs generally will accrue interest. In certain cases, payments under the TRAs may be accelerated and/or significantly exceed the actual benefits, if any, the Company realizes in respect of the tax attributes subject to the TRAs. The Company accounts for amounts payable under the TRAs in accordance with ASC Topic 450, Contingencies.
If the Company experiences a change of control (as defined under the TRAs) or the TRAs otherwise terminate early, the Company’s obligations under the TRAs could have a substantial negative impact on its liquidity and could have the effect of delaying, deferring or preventing certain mergers, asset sales, or other forms of business combinations or changes of control.
Share Repurchases
The Company accounts for the purchase price of repurchased Class A Common Stock in excess of par value ($0.01 per share of Class A Common Stock) as a reduction of additional paid-in capital, and will continue to do so until additional paid-in capital is reduced to zero. Thereafter, any excess purchase price will be recorded as a reduction to retained earnings. All Class A Common Stock shares repurchased to date have been retired upon repurchase.
Revenue Recognition
Under ASC Topic 606-Revenue from Contracts with Customers, revenue recognition is based on the transfer of control, or the customer’s ability to benefit from the services and products in an amount that reflects the consideration expected to be received in exchange for those services and products. In recognizing revenue for services and products, the transaction price is determined from sales orders or contracts with customers. Revenue is recognized at the completion of each fracturing stage, and
LIBERTY ENERGY INC.
Notes to Consolidated Financial Statements
in most cases the price at the end of each stage is fixed, however, in limited circumstances contracts may contain variable consideration.
Variable consideration typically may relate to discounts, price concessions and incentives. The Company estimates variable consideration based on the amount of consideration we expect to receive. The Company accrues revenue on an ongoing basis to reflect updated information for variable consideration as performance obligations are met.
The Company also assesses customers’ ability and intention to pay, which is based on a variety of factors including historical payment experience and financial condition. Payment terms and conditions vary by contract type, although terms generally include a requirement of payment within 30 to 45 days.
In connection with the adoption of ASC Topic 842, the Company determined that certain of its service revenue contracts contain a lease component. The Company elected to adopt a practical expedient available to lessors, which allows the Company to combine the lease and non-lease components and account for the combined component in accordance with the accounting treatment for the predominant component. Therefore, the Company combines the lease and service component for certain of the Company’s service contracts and continues to account for the combined component under ASC Topic 606, Revenue from Contracts with Customers.
Transaction and Other Costs
During 2024, the Company did not incur transaction and integration related costs.
During 2023, the Company incurred transaction and integration related costs in connection with the Siren Acquisition (as defined in Note 3—Acquisitions). Such costs include investment banking, legal, accounting and other professional services provided in connection with closing the transaction and are expensed as incurred.
During 2022, the Company incurred transaction and integration related costs in connection with a prior period acquisition. Such costs include investment banking, legal, accounting and other professional services provided in connection with closing the transaction and are expensed as incurred.
Foreign Currency Translation
The Company records foreign currency translation adjustments from the process of translating the functional currency of the financial statements of its foreign subsidiaries into the U.S. dollar reporting currency. The Canadian dollar and the Australian dollar are the functional currencies of the Company’s foreign subsidiaries as they are the primary currencies within the economic environment in which the subsidiaries operates. Assets and liabilities of the subsidiary’s operations are translated into U.S. dollars at the rate of exchange in effect on the balance sheet date and income and expenses are translated at the average exchange rate in effect during the reporting period. Adjustments resulting from the translation of the subsidiary’s financial statements are reported in other comprehensive income.
Recently Adopted Accounting Standards
Segment Reporting: Improvements to Reportable Segment Disclosures
In November 2023, the Financial Accounting Standards Board (“FASB”) issued Accounting Standards Update (“ASU”) No. 2023-07, Segment Reporting: Improvements to Reportable Segment Disclosures, which requires more detailed disclosures, on an annual and interim basis, related to the Company’s reportable segment. The guidance is effective for annual periods beginning after December 15, 2023, and interim periods within fiscal years beginning after December 15, 2024. The Company adopted this guidance during the most recent quarter. See Note 1—Organization and Basis of Presentation for further detail.
Recently Issued Accounting Standards
Income Taxes: Improvements to Income Tax Disclosures
In December 2023, the FASB issued ASU No. 2023-09, Income Taxes: Improvements to Income Tax Disclosures, which requires disaggregation of certain components included in the Company’s effective tax rate and income taxes paid disclosures. The guidance is effective for annual periods beginning after December 15, 2024. The Company is currently assessing the impact of this ASU on the Company’s financial statements but does not expect it will have a material impact.
LIBERTY ENERGY INC.
Notes to Consolidated Financial Statements
Income Statement - Reporting Comprehensive Income - Expense Disaggregation Disclosures: Disaggregation of Income Statement Expenses
In November 2024, the FASB issued ASU No. 2024-03, Income Statement - Reporting Comprehensive Income - Expense Disaggregation Disclosures: Disaggregation of Income Statement Expenses, which requires disclosure of specified information about certain costs and expenses. The guidance is effective for annual periods beginning after December 15, 2026 and interim periods beginning after December 15, 2027. The Company is currently assessing the impact of this ASU on the Company’s financial statements.
Reclassifications
Certain amounts in the prior period financial statements have been reclassified to conform to current period financial statement presentation. Amounts in the prior period financial statements have been reclassified from “Tax withheld on vesting of restricted stock units” into “Vesting of restricted stock units, net” in the accompanying consolidated statements of changes in equity.
In the accompanying consolidated balance sheets, amounts in the prior period financial statements have been reclassified from “Other assets” into “Investment in Nomad Proppant Services LLC,” “Investment in Oklo Inc.,” and “Investment in Tamboran Resources Corporation”.
Additionally, in the accompanying consolidated statement of cash flows, amounts in the prior period financial statements have been reclassified from “Other non-cash items, net” into “Unrealized gain on investments, net”.
These reclassifications had no effect on the previously reported net income.
Note 3—Acquisitions
Siren Acquisition
On April 6, 2023, the Company completed the acquisition of a Permian focused integrated natural gas compression and compressed natural gas delivery business, Siren Energy & Logistics, LLC, for cash consideration of $75.7 million, after post closing adjustments and net of cash received (the “Siren Acquisition”). The Siren Acquisition was accounted for under the acquisition method of accounting for business combinations. Accordingly, the Company conducted assessments of the net assets acquired and recognized amounts for identifiable assets acquired and liabilities assumed at their estimated acquisition date fair values, while transaction and integration costs associated with the acquisition were expensed as incurred. In connection with the Siren Acquisition, the Company recorded goodwill of $42.0 million, property and equipment of $34.9 million, net working capital of $2.5 million, deferred revenue of $5.2 million, and other assets of $1.8 million. Goodwill is recorded in other assets in the accompanying consolidated balance sheets. Due to the immateriality of the Siren Acquisition, the related revenue and earnings, supplemental pro forma financial information, and detailed purchase price allocation are not disclosed.
In accordance with ASC Topic 805, an acquirer is allowed a period, referred to as the measurement period, in which to complete its accounting for the transaction. Such measurement period ends at the earliest date that the acquirer a) receives the information necessary or b) determines that it cannot obtain further information, and such period may not exceed one year. As the Siren Acquisition closed on April 6, 2023, the Company completed the purchase price allocation during the year ended December 31, 2023.
Note 4—Inventories
Inventories consist of the following: | | | | | | | | | | | |
| December 31, |
| ($ in thousands) | 2024 | | 2023 |
| Proppants | $ | 9,341 | | | $ | 17,124 | |
| Chemicals | 18,629 | | | 16,896 | |
| Maintenance parts and other | 175,499 | | | 171,845 | |
| $ | 203,469 | | | $ | 205,865 | |
During the years ended December 31, 2024, 2023, and 2022, the lower of cost or net realizable value analysis resulted in the Company recording write-downs to the inventory carrying value of $1.0 million, $5.8 million, and $1.7 million, respectively. All are included as a component in cost of services in the consolidated statements of operations.
LIBERTY ENERGY INC.
Notes to Consolidated Financial Statements
Note 5—Property and Equipment
Property and equipment consist of the following: | | | | | | | | | | | | | | | | | |
| Estimated
useful lives
(in years) | | December 31, |
| | 2024 | | 2023 |
| ($ in thousands) | | | | | |
| Land | N/A | | $ | 30,041 | | | $ | 29,384 | |
| Field services equipment | 2-10 | | 3,068,681 | | | 2,520,336 | |
| Vehicles | 4-7 | | 61,433 | | | 63,423 | |
| Lease equipment | 10 | | 163,889 | | | 138,781 | |
| Buildings and facilities | 5-30 | | 180,010 | | | 149,876 | |
| Mineral reserves | >25 | | 80,070 | | | 76,823 | |
| Office equipment and furniture | 2-7 | | 12,532 | | | 11,836 | |
| | | 3,596,656 | | | 2,990,459 | |
| Less accumulated depreciation and depletion | | | (1,917,551) | | | (1,501,685) | |
| | | 1,679,105 | | | 1,488,774 | |
| Construction in-progress | N/A | | 211,893 | | | 156,594 | |
| Property and equipment, net | | | $ | 1,890,998 | | | $ | 1,645,368 | |
Depreciation expense for the years ended December 31, 2024, 2023, and 2022 was $448.1 million, $387.8 million, and $302.3 million, respectively. Depletion expense for the years ended December 31, 2024, 2023, and 2022 was $1.2 million, $1.1 million, and $1.2 million, respectively.
As of December 31, 2024 and December 31, 2023, the Company concluded that no triggering events that could indicate possible impairment of property and equipment had occurred, other than related to the assets held for sale discussed below.
As of December 31, 2024, the Company had no property that met the assets held for sale criteria.
However, as of December 31, 2023, the Company classified $0.7 million of land and $0.8 million of buildings, net of accumulated depreciation, of one property as held for sale.
During the year ended December 31, 2024, the Company sold two properties, including the property that was classified as held for sale as of December 31, 2023, resulting in a nominal gain included as a component of gain on disposal of assets, net in the accompanying consolidated statements of operations.
Note 6—Leases
Lessee Arrangements
The Company has operating and finance leases primarily for vehicles, equipment, railcars, office space, and facilities. The terms and conditions for these leases vary by the type of underlying asset.
Certain leases include variable lease payments for items such as property taxes, insurance, maintenance, and other operating expenses associated with leased assets. Payments that vary based on an index or rate are included in the measurement of lease assets and liabilities at the rate as of the commencement date. All other variable lease payments are excluded from the measurement of lease assets and liabilities, and are recognized in the period in which the obligation for those payments is incurred.
The components of lease expense for the years ended as of December 31, 2024, and 2023 were as follows: | | | | | | | | | | | | | | |
| ($ in thousands) | | 2024 | | 2023 |
| Finance lease cost: | | | | |
| Amortization of right-of-use assets | | $ | 43,364 | | | $ | 19,040 | |
| Interest on lease liabilities | | 16,972 | | | 6,060 | |
| Operating lease cost | | 35,861 | | | 40,275 | |
| Variable lease cost | | 6,392 | | | 5,116 | |
| Short-term lease cost | | 3,422 | | | 7,717 | |
| Total lease cost, net | | $ | 106,011 | | | $ | 78,208 | |
LIBERTY ENERGY INC.
Notes to Consolidated Financial Statements
Supplemental cash flow and other information related to leases for the years ended December 31, 2024 and 2023 were as follows: | | | | | | | | | | | |
| ($ in thousands) | 2024 | | 2023 |
| Cash paid for amounts included in measurement of liabilities: | | | |
| Operating leases | $ | 35,653 | | $ | 41,143 | |
| Finance leases | 67,181 | | 23,463 | |
| Right-of-use assets obtained in exchange for new lease liabilities: | | | |
| Operating leases | 14,581 | | 31,449 | |
| Finance leases | 149,005 | | 160,546 | |
During the year ended December 31, 2024, the Company amended certain operating leases, the change in terms of which caused the leases to be reclassified as finance leases. Additionally, the Company recognized finance lease right-of-use assets of $4.4 million and liabilities of $4.3 million. There was no gain or loss recognized as a result of these amendments. During the year ended December 31, 2023, the Company did not amend any operating or finance leases.
Lease terms and discount rates as of December 31, 2024 and 2023 were as follows: | | | | | | | | | | | | | | |
| | December 31, 2024 | | December 31, 2023 |
| Weighted-average remaining lease term: | | | | |
| Operating leases | | 3.8 years | | 4.3 years |
| Finance leases | | 3.2 years | | 3.3 years |
| Weighted-average discount rate: | | | | |
| Operating leases | | 6.7 | % | | 6.0 | % |
| Finance leases | | 7.4 | % | | 8.0 | % |
Future minimum lease commitments as of December 31, 2024 are as follows: | | | | | | | | | | | | | | |
| ($ in thousands) | | Finance | | Operating |
| 2025 | | $ | 87,476 | | | $ | 31,771 | |
| 2026 | | 85,503 | | | 21,496 | |
| 2027 | | 55,016 | | | 11,932 | |
| 2028 | | 60,381 | | | 3,935 | |
| 2029 | | 21,625 | | | 2,795 | |
| Thereafter | | — | | | 9,874 | |
| Total lease payments | | 310,001 | | | 81,803 | |
| Less imputed interest | | 39,842 | | | 8,856 | |
| Total | | $ | 270,159 | | | $ | 72,947 | |
The Company’s vehicle leases typically include a residual value guarantee. For the Company’s vehicle leases classified as operating leases, the total residual value guaranteed as of December 31, 2024 is $11.6 million; the payment is not probable and therefore has not been included in the measurement of the lease liability and right-of-use asset. For vehicle leases that are classified as finance leases, the Company includes the residual value guarantee, estimated in the lease agreement, in the financing lease liability.
Lessor Arrangements
The Company leases dry and wet sand containers, conveyor belts, and other equipment to customers through operating leases, where the lessor for tax purposes is considered to be the owner of the equipment during the term of the lease. The lease agreements do not include options for the lessee to purchase the underlying asset at the end of the lease term for either a stated fixed price or fair market value. However, some of the leases contain a termination clause in which the customer can cancel the contract. The leases can be subject to variable lease payments if the customer requests more units than what is agreed upon in the lease. The Company does not record any lease assets or liabilities related to these variable items.
LIBERTY ENERGY INC.
Notes to Consolidated Financial Statements
The carrying amount of equipment leased to others, included in property, plant and equipment, under operating leases as of December 31, 2024 and 2023 were as follows:
| | | | | | | | | | | | | | |
| ($ in thousands) | | December 31, 2024 | | December 31, 2023 |
| Equipment leased to others - at original cost | | $ | 163,889 | | | $ | 138,781 | |
| Less: Accumulated depreciation | | (41,223) | | | (25,819) | |
| Equipment leased to others - net | | $ | 122,666 | | | $ | 112,962 | |
Future payments receivable for operating leases as of December 31, 2024 are as follows:
| | | | | | | | |
| ($ in thousands) | | |
| 2025 | | $ | 5,412 | |
| 2026 | | 2,239 | |
| 2027 | | — | |
| 2028 | | — | |
| 2029 | | — | |
| Thereafter | | — | |
| Total | | $ | 7,651 | |
Revenues from operating leases for the years ended December 31, 2024 and 2023 were $39.0 million and $36.6 million, respectively.
Note 7—Accrued Liabilities
Accrued liabilities consist of the following: | | | | | | | | | | | | | | |
| ($ in thousands) | | December 31, 2024 | | December 31, 2023 |
| Accrued vendor invoices | | $ | 73,591 | | | $ | 99,620 | |
| Operations accruals | | 56,375 | | | 61,150 | |
| Accrued benefits and other | | 76,747 | | | 100,296 | |
| | $ | 206,713 | | | $ | 261,066 | |
Note 8—Debt
Debt consists of the following: | | | | | | | | | | | |
| | | |
| ($ in thousands) | December 31, 2024 | | December 31, 2023 |
| | | |
| Revolving Line of Credit | $ | 190,500 | | | $ | 140,000 | |
| | | |
| | | |
| | | |
| | | |
| | | |
On September 19, 2017, the Company entered into two credit agreements, (i) a revolving line of credit up to $250.0 million, subsequently increased to $525.0 million, see below, (the “ABL Facility”) and (ii) a $175.0 million term loan (the “Term Loan Facility”).
Effective January 23, 2023, the Company entered into an Eighth Amendment to the ABL Facility (the “Eighth ABL Amendment”). The Eighth ABL Amendment amends certain terms, provisions and covenants of the ABL Facility, including, among other things: (i) increasing the maximum revolver amount from $425.0 million to $525.0 million (the “Upsized Revolver”); (ii) increasing the amount of the accordion feature from $75.0 million to $100.0 million; (iii) extending the maturity date from October 22, 2026 to January 23, 2028; (iv) modifying the dollar amounts of various credit facility triggers and tests proportionally to the Upsized Revolver; (v) permitting repayment under the Term Loan Facility prior to February 10, 2023; and (vi) increasing certain indebtedness, intercompany advance, and investment baskets. The Eighth ABL Amendment included an agreement from the Wells Fargo Bank, National Association, as administrative agent, to release its second priority liens and security interests on all collateral that served as first priority collateral under the Term Loan Facility, which was completed during the three months ended June 30, 2023.
Additionally, on January 23, 2023, the Company borrowed $106.7 million on the ABL Facility and used the proceeds to pay off and terminate the Term Loan Facility. The amount paid included the balance of the Term Loan Facility at pay off of $104.7 million, $0.9 million of accrued interest, and a $1.1 million prepayment premium. Additionally, there were $0.2 million in administrative and lender legal fees incurred in connection with the pay off.
LIBERTY ENERGY INC.
Notes to Consolidated Financial Statements
The weighted average interest rate on all borrowings outstanding as of December 31, 2024 and December 31, 2023 was 6.8% and 7.6%, respectively.
Term Loan Facility
The Term Loan Facility provided for a $175.0 million term loan. In connection with the Eighth ABL Amendment and payoff of the Term Loan Facility, on January 23, 2023, the Company terminated the Term Loan Facility. See above for further discussion.
ABL Facility
Under the terms of the ABL Facility, up to $525.0 million may be borrowed, subject to certain borrowing base limitations based on a percentage of eligible accounts receivable and inventory. As of December 31, 2024, the borrowing base was calculated to be $319.8 million, and the Company had $190.5 million outstanding in addition to letters of credit totaling $14.0 million, with $115.3 million of remaining availability. Borrowings under the ABL Facility bear interest at Secured Overnight Financing Rate (“SOFR”) or a base rate, plus an applicable SOFR margin of 1.5% to 2.0% or base rate margin of 0.5% to 1.0%, as described in the ABL Facility credit agreement (the “ABL Facility credit agreement”). Additionally, borrowings as of December 31, 2024 incurred interest at a weighted average rate of 6.8%. The average monthly unused commitment is subject to an unused commitment fee of 0.25% to 0.375%. Interest and fees are payable in arrears at the end of each month, or, in the case of SOFR loans, at the end of each interest period. The ABL Facility matures on January 23, 2028. Borrowings under the ABL Facility are collateralized by accounts receivable and inventory, and further secured by the Company, as parent guarantor.
The ABL Facility includes certain non-financial covenants, including but not limited to restrictions on incurring additional debt and certain distributions. Moreover, the ability of the Company to incur additional debt and to make distributions is dependent on maintaining a maximum leverage ratio.
The ABL Facility is not subject to financial covenants unless liquidity, as defined in the ABL Facility credit agreement, drops below a specific level. The Company is required to maintain a minimum fixed charge coverage ratio, as defined in the ABL Facility credit agreement, of 1.0 to 1.0 for each period if excess availability is less than 10% of the borrowing base or $52.5 million, whichever is greater.
The Company was in compliance with these covenants as of December 31, 2024.
Maturities of debt are as follows: | | | | | |
| ($ in thousands) | |
| Years Ending December 31, | |
| 2025 | $ | — | |
| 2026 | — | |
| 2027 | — | |
| 2028 | 190,500 | |
| Thereafter | — | |
| $ | 190,500 | |
Note 9—Fair Value Measurements and Financial Instruments
The fair values of the Company’s assets and liabilities represent the amounts that would be received to sell those assets or that would be paid to transfer those liabilities in an orderly transaction on the reporting date. These fair value measurements maximize the use of observable inputs. However, in situations where there is little, if any, market activity for the asset or liability on the measurement date, the fair value measurement reflects the Company’s own judgments about the assumptions that market participants would use in pricing the asset or liability. The Company discloses the fair values of its assets and liabilities according to the quality of valuation inputs under the following hierarchy:
•Level 1 Inputs: Quoted prices (unadjusted) in an active market for identical assets or liabilities.
•Level 2 Inputs: Inputs other than quoted prices that are directly or indirectly observable.
•Level 3 Inputs: Unobservable inputs that are significant to the fair value of assets or liabilities.
The classification of an asset or liability is based on the lowest level of input significant to its fair value. Those that are initially classified as Level 3 are subsequently reported as Level 2 when the fair value derived from unobservable inputs is inconsequential to the overall fair value, or if corroborating market data becomes available. Assets and liabilities that are initially reported as Level 2 are subsequently reported as Level 3 if corroborating market data is no longer available. Transfers
LIBERTY ENERGY INC.
Notes to Consolidated Financial Statements
occur at the end of the reporting period. There were no transfers into or out of Levels 1, 2, and 3 during the years ended December 31, 2024 and 2023.
The Company’s financial instruments consist of cash and cash equivalents, accounts receivable, notes receivable, investments in equity securities, accounts payable, accrued liabilities, long-term debt, and finance and operating lease obligations. The carrying values of all of the Company’s financial instruments included in the accompanying consolidated balance sheets approximated or equaled their fair values on December 31, 2024 and 2023.
•The carrying values of cash and cash equivalents, accounts receivable, and accounts payable (including accrued liabilities) approximated fair value on December 31, 2024 and 2023, due to their short-term nature.
•The carrying value of investments in equity securities were measured at fair value on December 31, 2024 based on quoted prices in active markets.
•The carrying value of amounts outstanding under long-term debt agreements with variable rates approximated fair value on December 31, 2024 and 2023, as the effective interest rates approximated market rates.
•The carrying values of amounts outstanding under finance and operating lease obligations approximated fair value on December 31, 2024 and 2023, as the effective borrowing rates approximated market rates.
Nonrecurring Measurements
Certain assets and liabilities are measured at fair value on a nonrecurring basis. These items are not measured at fair value on an ongoing basis but may be subject to fair value adjustments in certain circumstances. These assets and liabilities include those acquired through the Siren Acquisition, which are required to be measured at fair value on the acquisition date in accordance with ASC Topic 805. See Note 3—Acquisitions.
During the year ended December 31, 2024, the Company sold two properties classified as held for sale resulting in a nominal gain included as a component of gain on disposal of assets, net in the accompanying consolidated statements of operations. Therefore, as of December 31, 2024, the Company had no property that met the assets held for sale criteria.
As of December 31, 2023, the Company recorded $0.7 million of land and $0.8 million of buildings of one property that met the held for sale criteria, to assets held for sale at a total fair value of $0.8 million, which are included in prepaid and other current assets in the accompanying consolidated balance sheets. The Company estimated the fair value of the property based on a communicated selling price for one property, which is a Level 3 input. The Company estimated that the carrying value of the assets is equal to the fair value less the estimated costs to sell, net of write-downs taken in the prior period, and therefore no gain or loss was recorded during the year ended December 31, 2023.
Other assets measured at fair value on a nonrecurring basis consisted of notes receivable—related party, which was recorded for trade receivables, created in the normal course of business, due from the Affiliate as of the Agreement Date, as defined and described in Note 14—Related Party Transactions. These notes were classified as Level 3 in the fair value hierarchy as the inputs to the determination of fair value were based upon unobservable inputs. During the year ended December 31, 2024, the notes were paid in full and therefore none was outstanding as of December 31, 2024. As of December 31, 2023, notes receivable—related party from the Affiliate was $14.8 million.
Recurring Measurements
The fair values of the Company’s cash equivalents measured on a recurring basis pursuant to ASC 820-10 Fair Value Measurements and Disclosures are carried at estimated fair value. Cash equivalents consist of money market accounts which the Company has classified as Level 1 given the active market for these accounts. As of December 31, 2024 and 2023, the Company had cash equivalents, measured at fair value, of $0.3 million and $0.3 million, respectively.
The Company holds an investment in Oklo Inc. (“Oklo”) made during the three months ended September 30, 2023. In May 2024, Oklo was acquired by a publicly traded special purpose acquisition company which resulted in the conversion of the Company’s investment into common shares of Oklo, which are traded on the New York Stock Exchange. The Company measures this investment in equity securities at fair value using Level 1 inputs based on quoted prices in an active market. As of December 31, 2024, the fair value of the investment was estimated at $51.6 million. The change in Oklo’s fair value resulted in an unrealized gain of $41.6 million during the year ended December 31, 2024, included in unrealized gain on investments, net in the accompanying consolidated statements of operations.
LIBERTY ENERGY INC.
Notes to Consolidated Financial Statements
Additionally, during the three months ended December 31, 2023, the Company purchased depository interests representing shares of common stock in Tamboran Resources Corporation (“Tamboran”). In June 2024, Tamboran completed an initial public offering and listed its common stock on the New York Stock Exchange. In addition to the prior purchase of depository interests, the Company participated in Tamboran’s initial public offering by purchasing an additional $10.0 million of Tamboran’s common stock. The Company measures this investment in equity securities at fair value using Level 1 inputs based on quoted prices in an active market. As of December 31, 2024, the fair value of the investment was estimated at $18.8 million. The change in Tamboran’s fair value resulted in an unrealized loss of $1.5 million during the year ended December 31, 2024, included in unrealized gain on investments, net in the accompanying consolidated statements of operations.
Nonfinancial assets
The Company estimates fair value to perform impairment tests as required on long-lived assets. The inputs used to determine such fair value are primarily based upon internally developed cash flow models and would generally be classified within Level 3 in the event that such assets were required to be measured and recorded at fair value within the consolidated financial statements. No such measurements were required as of December 31, 2024 and 2023 as no triggering event was identified.
Credit Risk
The Company’s financial instruments exposed to concentrations of credit risk consist primarily of cash and cash equivalents, and trade receivables.
The Company’s cash and cash equivalents balance on deposit with financial institutions total $20.0 million and $36.8 million as of December 31, 2024 and 2023, respectively, which exceeded Federal Deposit Insurance Corporation insured limits. The Company regularly monitors these institutions’ financial condition.
The majority of the Company’s customers have payment terms of 45 days or less.
As of December 31, 2024, Customer A and Customer B accounted for 13.7% and 10.4%, respectively, of total consolidated accounts receivable and unbilled revenue. As of December 31, 2023, no customers accounted for 10% of total consolidated accounts receivable and unbilled revenue. During the year ended December 31, 2024, Customer C accounted for 11.8% of consolidated revenues. During the years ended December 31, 2023, and 2022, no customers accounted for 10% of consolidated revenues.
The Company mitigates the associated credit risk by performing credit evaluations and monitoring the payment patterns of its customers.
As of December 31, 2024, the Company had $0.8 million in allowance for credit losses. As of December 31, 2023 and 2022, the Company had $0.9 million in allowance for credit losses and recorded a provision in 2023 related to certain customers’ expected inability to pay.
The Company applies historic loss factors to its receivable portfolio segments that are not expected to be further impacted by current economic developments, and an additional economic conditions factor to portfolio segments anticipated to experience greater losses in the current economic environment. While the Company has not experienced significant credit losses in the past and has not seen material changes to the payment patterns of its customers, the Company cannot predict with any certainty the degree to which unforeseen events may affect the ability of its customers to timely pay receivables when due. Accordingly, in future periods, the Company may revise its estimates of expected credit losses. | | | | | | | | | | | | | | | | | |
| ($ in thousands) | 2024 | | 2023 | | 2022 |
| Allowance for credit losses, beginning of year | $ | 939 | | | $ | 884 | | | $ | 884 | |
| Credit losses: | | | | | |
| Current period provision | — | | | 808 | | | — | |
| Amounts written off, net of recoveries | (91) | | | (753) | | | — | |
| Allowance for credit losses, end of year | $ | 848 | | | $ | 939 | | | $ | 884 | |
LIBERTY ENERGY INC.
Notes to Consolidated Financial Statements
Note 10—Equity
Preferred Stock
As of December 31, 2024 and 2023, the Company had 10,000 shares of preferred stock authorized, par value $0.01, with none issued and outstanding. If issued, each class or series of preferred stock will cover the number of shares and will have the powers, preferences, rights, qualifications, limitations and restrictions determined by the Company’s board of directors, which may include, among others, dividend rights, liquidation preferences, voting rights, conversion rights, preemptive rights and redemption rights. Except as provided by law or in a preferred stock designation, the holders of preferred stock will not be entitled to vote at or receive notice of any meeting of shareholders.
Class A Common Stock
The Company had a total of 161,858,784 and 166,610,199 shares of Class A Common Stock outstanding as of December 31, 2024 and 2023, respectively, none of which were restricted. Holders of Class A Common Stock are entitled to one vote per share on all matters to be voted upon by the stockholders and are entitled to ratably receive dividends when and if declared by the Company’s board of directors.
Class B Common Stock
The Company had no shares of Class B Common Stock outstanding as of December 31, 2024 and 2023, respectively. Effective January 31, 2023, in connection with the Merger, all outstanding shares of the Class B Common Stock were redeemed and exchanged, with no shares remaining outstanding as of December 31, 2024.
Long Term Incentive Plan
On January 11, 2018, the Company adopted the Long Term Incentive Plan (“LTIP”) to incentivize employees, officers, directors and other service providers of the Company and its affiliates. The LTIP provides for the grant, from time to time, at the discretion of the Company’s board of directors or a committee thereof, of stock options, stock appreciation rights, restricted stock, restricted stock units, stock awards, dividend equivalents, other stock-based awards, cash awards, substitute awards and performance awards. Subject to adjustment in the event of certain transaction or changes of capitalization in accordance with the LTIP, 12,908,734 shares of Class A Common Stock were initially reserved for issuance pursuant to awards under the LTIP. Effective April 16, 2024, following receipt of stockholder approval, the Company adopted the amended and restated the LTIP, which, among other things, increased the total number of shares authorized for issuance under the amended and restated LTIP, including shares already issued, to 21,239,244 shares of Class A Common Stock. Class A Common Stock subject to an award that expires or is canceled, forfeited, exchanged, settled in cash or otherwise terminated without delivery of shares will again be available for delivery pursuant to other awards under the LTIP.
Restricted Stock Units
Restricted stock units (“RSUs”) granted pursuant to the LTIP, if they vest, will be settled in shares of the Company’s Class A Common Stock. RSUs were granted with vesting terms up to three years. Changes in non-vested RSUs outstanding under the LTIP during the year ended December 31, 2024 were as follows: | | | | | | | | | | | |
| Number of Units | | Weighted Average Grant Date Fair Value per Unit |
| Non-vested as of December 31, 2023 | 2,985,218 | | | $ | 13.90 | |
| Granted | 1,519,597 | | | 19.46 | |
| Vested | (1,491,085) | | | 13.53 | |
| Forfeited | (75,322) | | | 15.18 | |
| Outstanding at December 31, 2024 | 2,938,408 | | | $ | 16.93 | |
LIBERTY ENERGY INC.
Notes to Consolidated Financial Statements
Performance Restricted Stock Units
Performance restricted stock units (“PSUs”) granted pursuant to the LTIP, if they vest, will be settled in shares of the Company’s Class A Common Stock. PSUs were granted with a three-year cliff vesting and performance period, with the vesting percentage of the target award dependent on the satisfaction of the performance goals set forth in the applicable award agreement. The Company records compensation expense based on the Company’s best estimate of the number of PSUs that will vest at the end of the performance period. If such performance targets are not met, or are not expected to be met, no compensation expense is recognized and any recognized compensation expense is reversed. Changes in non-vested PSUs outstanding under the LTIP during the year ended December 31, 2024 were as follows: | | | | | | | | | | | |
| Number of Units | | Weighted Average Grant Date Fair Value per Unit |
| Non-vested as of December 31, 2023 | 1,339,568 | | | $ | 13.49 | |
| Granted | 352,091 | | | 17.65 | |
| Vested | (584,720) | | | 12.95 | |
| Forfeited | — | | | — | |
| Outstanding at December 31, 2024 | 1,106,939 | | | $ | 15.10 | |
Stock-based compensation is included in cost of services and general and administrative expenses in the Company’s consolidated statements of operations. The Company recognized stock-based compensation expense of $32.4 million, $33.0 million, and $23.1 million for the years ended December 31, 2024, 2023, and 2022, respectively. There was approximately $39.3 million of unrecognized compensation expense relating to outstanding RSUs and PSUs as of December 31, 2024. The unrecognized compensation expense will be recognized on a straight-line basis over the weighted average remaining vesting period of two years.
Dividends
On October 18, 2022, the Company’s Board of Directors (the “Board”) reinstated quarterly dividends after they were suspended on April 2, 2020.
The Company paid cash dividends of $0.07 per share of Class A Common Stock on March 20, 2024, June 20, 2024, and September 20, 2024 to stockholders of record as of March 6, 2024, June 6, 2024, and September 6, 2024, respectively. Additionally, the Company paid cash dividends of $0.08 per share of Class A Common Stock on December 20, 2024 to stockholders of record as of December 6, 2024. During the year ended December 31, 2024, dividend payments totaled $47.7 million.
The Company paid cash dividends of $0.05 per share of Class A Common Stock on March 20, 2023, June 20, 2023, and September 20, 2023 to stockholders of record as of March 6, 2023, June 6, 2023, and September 6, 2023, respectively. Additionally, the Company paid cash dividends of $0.07 per share of Class A Common Stock on December 20, 2023 to stockholders of record as of December 6, 2023. During the year ended December 31, 2023, dividend payments totaled $37.5 million.
The Company paid cash dividends of $0.05 per share of Class A Common Stock on December 20, 2022 to stockholders of record as of December 6, 2022. Liberty LLC paid a distribution of $9.0 million, or $0.05 per Liberty LLC Unit, to all Liberty LLC unit holders as of December 6, 2022, $9.0 million of which was paid to the Company. The Company used the proceeds of the distribution to pay the dividend to all holders of shares of Class A Common Stock as of December 6, 2022, which totaled $9.0 million.
Additionally, the Company paid an accrued dividend equivalent upon vesting for the RSUs and PSUs with a 2024 vesting date, which totaled $0.7 million and $0.2 million for the years ended December 31, 2024 and 2023, respectively. As of December 31, 2024 and 2023, the Company had $1.5 million and $1.0 million of dividend equivalents payable related to RSUs and PSUs to be paid upon vesting, respectively. Dividend equivalents related to forfeited RSUs or PSUs will be forfeited.
LIBERTY ENERGY INC.
Notes to Consolidated Financial Statements
Share Repurchase Program
On July 25, 2022, the Company’s board of directors authorized and the Company announced a share repurchase program that allowed the Company to repurchase up to $250.0 million of the Company’s Class A Common Stock beginning immediately and continuing through July 31, 2024. On January 24, 2023, the Board authorized and the Company announced an increase of the cumulative repurchase authorization to $500.0 million. Furthermore, on January 23, 2024 the Board authorized and the Company announced an increase of the cumulative repurchase authorization to $750.0 million and extended the authorization through July 31, 2026. The shares may be repurchased from time to time in open market transactions, through block trades, in privately negotiated transactions, through derivative transactions, or by other means in accordance with applicable state and federal securities laws. The timing, as well as the number and value of shares repurchased under the program, will be determined by the Company at its discretion and will depend on a variety of factors, including management’s assessment of the intrinsic value of the Company’s Class A Common Stock, the market price of the Company’s Class A Common Stock, general market and economic conditions, available liquidity, compliance with the Company’s debt and other agreements, applicable legal requirements, and other considerations. The exact number of shares to be repurchased by the Company is not guaranteed, and the program may be suspended, modified, or discontinued at any time without prior notice. The Company expects to fund any repurchases by using cash on hand, borrowings under the ABL Facility and expected free cash flow to be generated through the duration of the share repurchase program.
| | | | | | | | | | | | | | |
| | Year Ended December 31, | Year Ended December 31, | Year Ended December 31, |
| ($ in thousands, except share count and per share data) | | 2024 | 2023 | 2022 |
| Shares of Class A Common Stock | | 6,320,536 | | 13,705,622 | | 8,185,890 | |
| Cost of shares repurchased | | $ | 127,395 | | $ | 203,100 | | $ | 125,313 | |
| Average price per share including commissions | | $ | 20.16 | | $ | 14.82 | | $ | 15.31 | |
As of December 31, 2024, $294.2 million remained authorized for future repurchases of Class A Common Stock under the share repurchase program.
The Company accounts for the purchase price of repurchased common shares in excess of par value ($0.01 per share of Class A Common Stock) as a reduction of additional paid-in capital, and will continue to do so until additional paid-in capital is reduced to zero. Thereafter, any excess purchase price will be recorded as a reduction to retained earnings.
As enacted by the Inflation Reduction Act of 2022 (the “Inflation Reduction Act”), the Company accrued stock repurchase excise tax of $0.9 million and $1.9 million for the years ended December 31, 2024 and 2023, respectively. As of December 31, 2024 and 2023, the Company had excise tax payables of $0.9 million and $1.9 million, respectively, in accrued liabilities in the accompanying consolidated balance sheets.
Note 11—Net Income per Share
Basic net income per share measures the performance of an entity over the reporting period. Diluted net income per share measures the performance of an entity over the reporting period while giving effect to all potentially dilutive common shares that were outstanding during the period. The Company uses the “if-converted” method to determine the potential dilutive effect of its Class B Common Stock and the treasury stock method to determine the potential dilutive effect of outstanding RSUs and PSUs.
LIBERTY ENERGY INC.
Notes to Consolidated Financial Statements
The following table reflects the allocation of net income to common stockholders and net income per share computations for the periods indicated based on a weighted average number of shares of Class A Common Stock and Class B Common Stock outstanding: | | | | | | | | | | | | | | |
| (In thousands, except per share data) | | Year Ended December 31, 2024 | | Year Ended December 31, 2023 |
| Basic Net Income Per Share | | | | |
| Numerator: | | | | |
| Net income attributable to Liberty Energy Inc. stockholders | | $ | 316,010 | | | $ | 556,317 | |
| Denominator: | | | | |
| Basic weighted average common shares outstanding | | 165,026 | | | 171,845 | |
| Basic net income per share attributable to Liberty Energy Inc. stockholders | | $ | 1.91 | | | $ | 3.24 | |
| Diluted Net Income Per Share | | | | |
| Numerator: | | | | |
| Net income attributable to Liberty Energy Inc. stockholders | | $ | 316,010 | | | $ | 556,317 | |
| Effect of exchange of the shares of Class B Common Stock for shares of Class A Common Stock | | — | | | 73 | |
| Diluted net income attributable to Liberty Energy Inc. stockholders | | $ | 316,010 | | | $ | 556,390 | |
| Denominator: | | | | |
| Basic weighted average shares outstanding | | 165,026 | | | 171,845 | |
| Effect of dilutive securities: | | | | |
| Restricted stock units | | 4,372 | | | 4,494 | |
| Class B Common Stock | | — | | | 21 | |
| Diluted weighted average shares outstanding | | 169,398 | | | 176,360 | |
| Diluted net income per share attributable to Liberty Energy Inc. stockholders | | $ | 1.87 | | | $ | 3.15 | |
Note 12—Income Taxes
The Company is a corporation and is subject to taxation in the United States, Canada, Australia and various state, local and provincial jurisdictions. Historically, Liberty LLC was treated as a partnership, and its income was passed through to its owners for income tax purposes. Liberty LLC’s members, including the Company, were liable for federal, state and local income taxes based on their share of Liberty LLC’s pass-through taxable income.
Effective January 31, 2023, the Company adopted a plan of merger, pursuant to which Liberty LLC merged into the Company, ceasing the existence of Liberty LLC with the Company remaining as the surviving entity. Liberty LLC filed a final tax return during the 2023 calendar year. The Company is still party to the TRAs; the associated liabilities are discussed below.
As of December 31, 2024, tax reporting by the Company for the years ended December 31, 2021, 2022, 2023, and the short period ended January 31, 2023 are subject to examination by the tax authorities. With few exceptions, as of December 31, 2024, the Company is no longer subject to U.S. federal, state or local examinations by tax authorities for tax years ended on or before December 31, 2020.
The components of the Company’s income from continuing operations before income taxes on which the provision for income taxes was computed consisted of the following:
| | | | | | | | | | | | | | | | | | | | |
| | Year Ended December 31, |
| ($ in thousands) | | 2024 | | 2023 | | 2022 |
| United States | | $ | 356,340 | | | $ | 668,338 | | | $ | 375,758 | |
| Foreign | | 46,931 | | | 66,552 | | | 23,751 | |
| Total | | $ | 403,271 | | | $ | 734,890 | | | $ | 399,509 | |
LIBERTY ENERGY INC.
Notes to Consolidated Financial Statements
The components of the provision for incomes taxes from continuing operations are summarized as follows: | | | | | | | | | | | | | | | | | | | | |
| | Year Ended December 31, |
| ($ in thousands) | | 2024 | | 2023 | | 2022 |
| Current: | | | | | | |
| Federal | | $ | 33,474 | | | $ | 36,319 | | | $ | 4,679 | |
| State | | 6,637 | | | 4,662 | | | 2,579 | |
| Foreign | | 13,306 | | | 17,189 | | | 4,421 | |
| Total Current | | $ | 53,417 | | | $ | 58,170 | | | $ | 11,679 | |
| | | | | | |
| Deferred: | | | | | | |
| Federal | | $ | 32,087 | | | $ | 109,399 | | | $ | (12,967) | |
| State | | 3,289 | | | 11,913 | | | (1,182) | |
| Foreign | | (1,532) | | | (1,000) | | | 1,677 | |
| Total Deferred | | $ | 33,844 | | | $ | 120,312 | | | $ | (12,472) | |
| Income tax expense (benefit) | | $ | 87,261 | | | $ | 178,482 | | | $ | (793) | |
Income tax expense (benefit) attributable to net income (loss) before income taxes differed from the amounts computed by applying the statutory U.S. federal income tax rate of 21.0% to pre-tax income as a result of the following: | | | | | | | | | | | | | | | | | | | | |
| | Year Ended December 31, |
| ($ in thousands) | | 2024 | | 2023 | | 2022 |
| Computed tax expense at the statutory rate | | $ | 84,687 | | | $ | 154,327 | | | $ | 83,897 | |
| Increase (decrease) in tax expense resulting from: | | | | | | |
| State and local income tax expense, net | | 9,340 | | | 15,745 | | | 10,224 | |
| Non-controlling interest | | — | | | (19) | | | (151) | |
| | | | | | |
| | | | | | |
| | | | | | |
| | | | | | |
| | | | | | |
| | | | | | |
| | | | | | |
| Effect of foreign tax rates | | 1,231 | | | 1,818 | | | 697 | |
| Stock-based compensation | | (1,771) | | | (239) | | | (2,724) | |
| Change in valuation allowance | | — | | | — | | | (91,336) | |
| Other TRA adjustment | | 181 | | | (248) | | | (2,763) | |
| U.S. Federal tax credits | | (6,743) | | | — | | | — | |
| | | | | | |
| Nondeductible executive compensation | | 2,920 | | | 6,514 | | | — | |
| U.S. impact of foreign earnings | | — | | | — | | | 315 | |
| Other, net | | (2,584) | | | 584 | | | 1,048 | |
| Total income tax expense (benefit) | | $ | 87,261 | | | $ | 178,482 | | | $ | (793) | |
The effective tax rate for the years ended December 31, 2024, 2023, and 2022 was 21.6%, 24.3%, and (0.2)%, respectively.
The Company’s effective tax rate is greater than the statutory federal income tax rate of 21.0% due to the Company’s Canadian operations, state income taxes in the states the Company operates, as well as nondeductible executive compensation, partially offset by U.S. federal income tax credits.
LIBERTY ENERGY INC.
Notes to Consolidated Financial Statements
The tax effects of temporary differences that give rise to significant portions of the deferred tax assets and deferred tax liabilities are presented below: | | | | | | | | | | | | | | |
| ($ in thousands) | | December 31, 2024 | | December 31, 2023 |
| Deferred tax assets: | | | | |
| Federal tax credit | | $ | 9,615 | | | $ | — | |
| State net operating losses | | 859 | | | 1,286 | |
| Foreign net operating losses | | 920 | | | — | |
| Realized tax benefit - TRAs | | 79,175 | | | 87,260 | |
| Intangibles | | 22,440 | | | 22,825 | |
| Lease liabilities | | 67,603 | | | 51,504 | |
| Stock-based compensation | | 4,494 | | | 4,279 | |
| Inventory | | 2,604 | | | 3,361 | |
| Other | | 10,674 | | | 5,133 | |
| Total deferred tax assets | | 198,384 | | | 175,648 | |
| | | | |
| | | | |
| | | | |
| Deferred tax liabilities: | | | | |
| | | | |
| Property and equipment | | (233,649) | | | (221,337) | |
| Lease assets | | (83,137) | | | (55,801) | |
| Other | | (17,782) | | | (850) | |
| Total deferred tax liabilities | | (334,568) | | | (277,988) | |
| | | | |
| Net deferred tax (liability) | | $ | (136,184) | | | $ | (102,340) | |
During the year ended December 31, 2023, the Company adopted a plan of merger, pursuant to which Liberty LLC merged into the Company, ceasing the existence of Liberty LLC with the Company remaining as the surviving entity. As a result of this change, the Company no longer has a deferred tax liability for the difference between the book value and the tax value of the Company’s investment in Liberty LLC and the associated net deferred tax liability balances have been allocated to the deferred tax asset and liability line items above. Significant deferred tax assets include the step up in basis of depreciable assets under Section 754 (“Section 754”) of the Internal Revenue Code of 1986, as amended and deferred tax liabilities related to property and equipment.
As of December 31, 2024, the Company has utilized all U.S. federal net operating loss carryforwards and has $0.9 million state net operating loss carryforwards that will not expire in the foreseeable future. The Company also has $9.6 million U.S. federal income tax credits that will not expire for twenty years.
On October 8, 2021, the Organization for Economic Co-operation and Development (“OECD”) released a statement on the OECD/G20 Inclusive Framework on Base Erosion and Profit Shifting, which agreed to a two-pillar solution to address tax challenges of the digital economy. On December 20, 2021, the OECD released Pillar Two model rules defining a 15% global minimum tax rate for large multinational corporations (the “Pillar Two Framework”). On June 20, 2024 and December 23, 2024, Canada and Australia, respectively, enacted the Pillar Two global minimum tax regime, which is not expected to have a material impact on the Company’s financial statements for the fiscal year ended December 31, 2024. The OECD continues to release additional guidance and countries are implementing legislation, with widespread adoption of the Pillar Two Framework expected by 2025. The Company is continuing to evaluate the Pillar Two Framework and its potential impact on future periods, including any legislation enacted in the jurisdictions in which the Company operates.
The Company may distribute cash from foreign subsidiaries to its U.S. parent as business needs arise. The Company has not provided for deferred income taxes on the undistributed earnings from certain foreign subsidiaries earnings as such earnings are considered to be indefinitely reinvested. If such earnings were to be distributed, any income and/or withholding tax would not be significant.
During the year ended December 31, 2024, the Company entered into a Tax Credit Transfer Agreement (“TCTA”) with a third-party seller, pursuant to which the Company agreed to purchase up to $33.5 million of transferable tax credits under the Inflation Reduction Act. The benefit for the federal income tax credits purchased has been recognized as a reduction to the Company’s income tax expense in the current period.
LIBERTY ENERGY INC.
Notes to Consolidated Financial Statements
Uncertain Tax Positions
The Company records uncertain tax positions on the basis of a two-step process in which (1) the Company determines whether it is more likely than not the tax positions will be sustained on the basis of the technical merits of the position and (2) for those tax positions meeting the more likely than not recognition threshold, the Company recognizes the largest amount of tax benefit that is more than 50% likely to be realized upon ultimate settlement with the related tax authority.
The Company determined that no liability for unrecognized tax benefits for uncertain tax positions was required at December 31, 2024. In addition, the Company does not believe that it has any tax positions for which it is reasonably possible that it will be required to record a significant liability for unrecognized tax benefits within the next twelve months. If the Company were to record an unrecognized tax benefit, the Company will recognize applicable interest and penalties related to income tax matters in income tax expense.
Tax Receivable Agreements
The term of each TRA commenced on January 17, 2018, and will continue until all such tax benefits that are subject to such TRA have been utilized or expired, unless the Company experiences a change of control (as defined in the TRAs, which includes certain mergers, asset sales and other forms of business combinations) or the TRAs are terminated early (at the Company’s election or as a result of its breach), and the Company makes the termination payments specified in such TRA.
The amounts payable, as well as the timing of any payments, under the TRAs are dependent upon significant future events and assumptions, including the timing of the redemptions of Liberty LLC Units, the price of our Class A Common Stock at the time of each redemption, the extent to which such redemptions are taxable transactions, the amount of the redeeming unit holder’s tax basis in its Liberty LLC Units at the time of the relevant redemption, the characterization of the tax basis step-up, the depreciation and amortization periods that apply to the increase in tax basis, the amount of net operating losses available to the Company as a result of the Corporate Reorganization, the amount and timing of taxable income the Company generates in the future, the U.S. federal income tax rate then applicable, and the portion of the Company’s payments under the TRAs that constitute imputed interest or give rise to depreciable or amortizable tax basis.
At December 31, 2024, the Company’s liability under the TRAs was $115.7 million of which $40.8 million is recorded as a current liability and $74.9 million is recorded as a component of long-term liabilities. The Company recorded a loss on remeasurement of the liabilities subject to the TRA of $3.2 million recorded as part of continuing operations in the current year.
At December 31, 2023, the Company’s liability under the TRAs was $117.7 million, of which $5.2 million was presented as a current liability, and $112.5 million was presented as a long-term liability. The Company recorded a gain on remeasurement of the liabilities subject to the TRA of $1.8 million recorded as part of continuing operations in the prior year.
The Company made $5.2 million of TRA payments during the year ended December 31, 2024.
During the year ended December 31, 2023, exchanges of Liberty LLC Units and shares of Class B Common Stock resulted in an increase of $0.6 million in amounts payable under the TRAs, and a net increase of $0.7 million in deferred tax assets, all of which were recorded through equity. The Company did not make any TRA payments during the year ended December 31, 2023. On January 31, 2023, the Company recorded an increase of $6.6 million of deferred tax assets for the impact of the adopted plan of merger for Liberty LLC into the Company, all of which was recorded through equity.
LIBERTY ENERGY INC.
Notes to Consolidated Financial Statements
Note 13—Defined Contribution Plan
The Company sponsors a 401(k) defined contribution retirement plan covering eligible employees. The Company makes matching contribution at a rate of $1.00 for each $1.00 of employee contribution, subject to a cap of 6% of the employee’s salary and federal limits. Contributions made by the Company were $36.9 million, $32.9 million, and $25.8 million for the years ended December 31, 2024, 2023 and 2022, respectively.
Note 14—Related Party Transactions
Schlumberger Limited
During 2020, the Company acquired certain assets and liabilities of Schlumberger Technology Corporation (“Schlumberger”) in exchange for the issuance of shares of the Company’s Class A Common Stock amongst other consideration. During the year ended December 31, 2023, the Company repurchased and retired 3,000,000 shares of Class A Common Stock for $45.0 million or $15.00 average price per share from Schlumberger, under the share repurchase program. Effective January 31, 2023, after the repurchase and retirement, Schlumberger owns no shares of Class A Common Stock of the Company and no longer qualified as a related party.
During the year ended December 31, 2022, the Company repurchased and retired 1,700,000 shares of Class A Common Stock for $27.8 million or $16.35 average price per share from Schlumberger, under the share repurchase program.
On April 29, 2022, the Company, Liberty LLC, Schlumberger, and BofA Securities, Inc. and J.P. Morgan Securities LLC (together, the “Underwriters”), entered into an underwriting agreement, dated as of April 29, 2022, pursuant to which Schlumberger sold 14,500,000 shares of Class A Common Stock at a price of $15.50 per share to the Underwriters (the “Sale”). The Sale closed on May 3, 2022. Following the Sale, Schlumberger held 35,101,961 shares of Class A Common Stock. The Company did not receive any proceeds from the Sale.
Within the normal course of business, the Company purchased chemicals, proppant, other equipment, and maintenance parts from Schlumberger and its subsidiaries. During the period from January 1, 2023 until January 31, 2023, total purchases from Schlumberger were approximately $1.7 million. Although the Company continues to do business with Schlumberger, the Company no longer presents cash flows with Schlumberger as related party in the accompanying consolidated statements of cash flows. During the year ended December 31, 2022, total purchases from Schlumberger were approximately $21.7 million.
Additionally, the Company sold equipment to Schlumberger including $0.1 million during the year ended December 31, 2022. The Company recognized a minimal gain on the sale of equipment.
Franklin Mountain Energy, LLC
A member of the board of directors of the Company, Audrey Robertson, serves as Executive Vice President of Finance of Franklin Mountain Energy, LLC (“Franklin Mountain”). During the years ended December 31, 2024, 2023 and 2022, the Company performed hydraulic fracturing services for Franklin Mountain in the amount of $120.3 million, $176.1 million, and $131.8 million, respectively.
Amounts included in unbilled revenue from Franklin Mountain as of December 31, 2024 and 2023, were $0.0 million and $13.4 million, respectively. Receivables from Franklin Mountain as of December 31, 2024 and 2023, were $4.2 million and $12.1 million, respectively.
Liberty Resources LLC
Liberty Resources LLC, an oil and gas exploration and production company, and its successor entity (collectively, the “Affiliate”) had certain common ownership and management with the Company. Effective March 14, 2024, the Affiliate was no longer a related party, following its acquisition by an unaffiliated party. The amounts of the Company’s revenue related to hydraulic fracturing services provided to the Affiliate for the period January 1, 2024 through March 13, 2024, and the years ended December 31, 2023 and 2022, were $11.1 million, $38.8 million and $16.7 million, respectively.
On December 28, 2022 (the “Agreement Date”), the Company entered into an agreement with the Affiliate to amend payment terms for outstanding invoices due as of the Agreement Date to extend the due dates to April 1, 2024. Additionally, on August 15, 2023, the agreement was further amended in order to extend the due dates for certain invoices to January 1, 2025. Amounts outstanding from the Affiliate as of December 31, 2023 were $14.8 million, included in other assets in the consolidated balance sheets. All amounts outstanding with the Affiliate under the agreement were collected in full during the three months ended March 31, 2024.
Receivables from the Affiliate as of December 31, 2023 were $5.2 million, included in accounts receivable—related party.
During the period January 1, 2024 through March 13, 2024, and the years ended December 31, 2023 and 2022, interest income from the Affiliate was $0.5 million, $2.0 million, and $0.0 million, respectively.
LIBERTY ENERGY INC.
Notes to Consolidated Financial Statements
Oklo Inc.
During the three months ended September 30, 2023, the Company invested $10.0 million in a fission power and nuclear fuel recycling company, Oklo. Effective May 10, 2024, through an acquisition by a special purpose acquisition company, the Company’s investment converted into shares traded on the New York Stock Exchange. Additionally, Chris Wright, the Company’s Chief Executive Officer and Chairman of the Board during fiscal year 2024, was appointed to the Oklo board of directors. During the year ended December 31, 2024, the Company recorded an unrealized gain of $41.6 million, included in unrealized gain on investments, net in the accompanying consolidated statements of operations. As of December 31, 2024, the fair value of the Company’s investment using Level 1 inputs was $51.6 million. The Company was not party to any other transactions with Oklo during the years ended December 31, 2024, and 2023.
Nomad Proppant Services LLC
During the year ended December 31, 2021, the Company committed to investing $10.0 million in Nomad Proppant Services LLC (“Nomad”), a mobile sand mine company. Upon the commitment, the Company had a significant but non-controlling financial interest in Nomad. Within the normal course of business, the Company purchased proppant from Nomad for $5.5 million during the year ended December 31, 2024. Payables to Nomad as of December 31, 2024, were $0.6 million. Prior to the year ended December 31, 2024 the Company did not purchase any goods from Nomad.
As of December 31, 2024 and 2023, the value of the Company’s investment using the equity method accounting was $10.7 million and $11.4 million, respectively. During the years ended December 31, 2024 and 2023, the Company received cash distributions from Nomad in the amounts of $4.0 million and $0.8 million, respectively.
Bettering Human Lives Foundation
In December 2023, the Company established the Bettering Human Lives Foundation (the “Foundation”), a nonprofit organization dedicated to promoting clean cooking solutions and improving the well-being of communities worldwide. Mr. Wright, the Company’s CEO during fiscal year 2024, serves as the Chairman of the Foundation, and Anne Hyre serves as its executive director. Ms. Hyre is the sister-in-law of Mr. Wright. In December 2023, the Company made an initial commitment to make a charitable contribution of $1.0 million to the Foundation. In addition, effective January 1, 2024 Ms. Hyre is employed by a subsidiary of the Company and seconded to the Foundation, and Company and the Foundation entered into a professional services agreement (the “Professional Services Agreement”), whereby the Company provides certain administrative services for the Foundation. During the year ended December 31, 2024, the Company made charitable contributions of $0.9 million to the Foundation, and received $0.5 million in other service revenue under the Professional Services Agreement.
Note 15—Commitments & Contingencies
Purchase Commitments (tons are not in thousands)
The Company enters into purchase and supply agreements to secure supply and pricing of proppant and equipment. As of December 31, 2024 and 2023, the agreements provide pricing and committed supply sources for the Company to purchase 360,000 tons and 1,854,000 tons, respectively, of proppant through December 31, 2025. Amounts below also include commitments to pay for transport fees on minimum amounts of proppants.
Future proppant and equipment commitments are as follows: | | | | | |
| ($ in thousands) | |
| 2025 | $ | 26,348 | |
| 2026 | — | |
| 2027 | — | |
| 2028 | — | |
| 2029 | — | |
| Thereafter | — | |
| $ | 26,348 | |
Certain supply agreements contain a clause whereby in the event that the Company fails to purchase minimum volumes, as defined in the agreement, during a specific time period, a shortfall fee may apply. In circumstances where the Company does not make the minimum purchase required under the contract, the Company and its suppliers have a history of amending such minimum purchase contractual terms and in rare cases does the Company incur shortfall fees. If the Company were unable to make any of the minimum purchases and the Company and its suppliers cannot come to an agreement to avoid such fees, the
LIBERTY ENERGY INC.
Notes to Consolidated Financial Statements
Company could incur shortfall fees in the amounts of $5.4 million for the year ended December 31, 2025. Based on forecasted levels of activity, the Company does not currently expect to incur significant shortfall fees.
Included in the commitments for the year ending December 31, 2024 are $2.5 million of payments expected to be made in the first quarter of 2025 for the use of certain light duty trucks, heavy tractors, and field equipment used to various degrees in frac and wireline operations. The Company is in negotiations with the third-party owner of such equipment to lease or purchase some or all of such aforementioned vehicles and equipment, subject to agreement on terms and conditions. No gain or loss is expected upon consummation of any such agreement.
Litigation
From time to time, the Company is subject to legal and administrative proceedings, settlements, investigations, claims and actions. The Company’s assessment of the likely outcome of litigation matters is based on its judgment of a number of factors including experience with similar matters, past history, precedents, relevant financial and other evidence and facts specific to the matter. Notwithstanding the uncertainty as to the final outcome, based upon the information currently available, management does not believe any matters, individually or in aggregate, will have a material adverse effect on the Company’s financial position or results of operations.
Note 16—Subsequent Events
On January 22, 2025, the Company’s Board of Directors (the “Board”) approved a quarterly dividend of $0.08 per share of Class A Common Stock to be paid on March 20, 2025 to holders of record as of March 6, 2025.
On February 3, 2025, Christopher A. Wright, the Company’s CEO was confirmed to the position of Secretary of Energy of the United States and resigned from his positions as Chairman of the Board, Director and Chief Executive Officer of the Company. In connection with Mr. Wright’s resignation, the Company modified certain terms and conditions of Mr. Wright’s stock awards granted under the LTIP. Unvested RSUs and PSUs granted to Mr. Wright in 2022, 2023, and 2024 vested effective February 3, 2025. In total 412,292 shares of Class A Common Stock were issued, net of tax withholding. As a result of the modification the Company expects to recognize $10.3 million of incremental non-cash stock-based compensation expense during the three months ended March 31, 2025.
No other significant subsequent events have occurred that would require recognition or disclosure in the consolidated financial statements and notes thereto.