November 20, 2017 Delek US Holdings, Inc. Delek CEO Interview: Outlook for Brent-WTI and a Buyer’s View on the Permian Hosted by Neil Mehta with Goldman Sachs
Disclaimers 2 Forward Looking Statements: Delek US Holdings, Inc. (“Delek US”) and Delek Logistics Partners, LP (“Delek Logistics”; collectively with Delek US, defined as “we”, “our”) and Alon USA Partners, LP (“ALDW”) are traded on the New York Stock Exchange in the United States under the symbols “DK”, ”DKL” and “ALDW” respectively, and, as such, are governed by the rules and regulations of the United States Securities and Exchange Commission. These slides and any accompanying oral and written presentations contain forward-looking statements that are based upon current expectations and involve a number of risks and uncertainties. Statements concerning current estimates, expectations and projections about future results, performance, prospects, opportunities, plans, actions and events and other statements, concerns, or matters that are not historical facts are “forward-looking statements,” as that term is defined under the federal securities laws. These forward-looking statements include, but are not limited to, statements regarding the post-merger integration and transition plan with Alon USA Energy Inc. (“ALJ”), including the timing, closing and success thereof; crude oil pricing, production, quality, imports, exports and location differentials; improvements in global markets; pipeline utilization, expansions and rates; Permian Basin production and takeaway balance; refinery configurations, utilization, crude oil slate flexibility, capacities, equipment limits, margins, bottlenecks and capital investments; crack spreads; future crude oil supply at the Company's refineries including link to WTI, differentials, cash flow, EBITDA; integration of assets and operations; light product pricing including the relationship of such pricing to the Gulf Coast; future initiatives, valuations, balance sheet, cash, drop down inventory, cash flow and self help projects including the profitability thereof; synergies relating to the ALJ acquisition; future ability to return value to shareholders, future dropdowns and the success thereof; continued safe and reliable operations; opportunities, anticipated future performance and financial position, and other factors. Investors are cautioned that the following important factors, among others, may affect these forward-looking statements. These factors include, but are not limited to: risks and uncertainties related to the ability to successfully integrate the businesses of Delek US and Alon; the risk that the combined company may be unable to achieve cost-cutting synergies, or it may take longer than expected to achieve those synergies; uncertainty related to timing and amount of value returned to shareholders; risks and uncertainties with respect to the quantities and costs of crude oil we are able to obtain and the price of the refined petroleum products we ultimately sell; gains and losses from derivative instruments; management's ability to execute its strategy of growth through acquisitions and the transactional risks associated with acquisitions and dispositions; acquired assets may suffer a diminishment in fair value as a result of which we may need to record a write-down or impairment in carrying value of the asset; changes in the scope, costs, and/or timing of capital and maintenance projects; operating hazards inherent in transporting, storing and processing crude oil and intermediate and finished petroleum products; our competitive position and the effects of competition; the projected growth of the industries in which we operate; general economic and business conditions affecting the geographic areas in which we operate; and other risks contained in Delek US’, Delek Logistics’ and ALDW’s filings with the United States Securities and Exchange Commission. Forward-looking statements should not be read as a guarantee of future performance or results, and will not be accurate indications of the times at, or by which such performance or results will be achieved. Forward-looking information is based on information available at the time and/or management’s good faith belief with respect to future events, and is subject to risks and uncertainties that could cause actual performance or results to differ materially from those expressed in the statements. Neither Delek US, Delek Logistics Partners nor ALDW undertakes any obligation to update or revise any such forward-looking statements. Non-GAAP Disclosures: Delek US and Delek Logistics believe that the presentation of EBITDA, distributable cash flow and distribution coverage ratio provides useful information to investors in assessing their financial condition, results of operations and cash flow their business is generating. EBITDA, distributable cash flow and distribution coverage ratio should not be considered as alternatives to net income, operating income, cash from operations or any other measure of financial performance or liquidity presented in accordance with U.S. GAAP. EBITDA, distributable cash flow and distribution coverage ratio have important limitations as analytical tools because they exclude some, but not all, items that affect net income. Additionally, because EBITDA, distributable cash flow and distribution coverage ratio may be defined differently by other companies in its industry, Delek US' and Delek Logistics’ definitions may not be comparable to similarly titled measures of other companies, thereby diminishing their utility. Please see reconciliations of EBITDA and distributable cash flow to their most directly comparable financial measures calculated and presented in accordance with U.S. GAAP in the appendix.

How did we get here? Cushing-Brent Crude Oil Price Differential Trends Improving 3 WTI-Cushing versus Brent began to widen in August 2017 Global market improvement - OPEC cuts Current WTI price supports production in U.S. Increased light production from Shale plays Source: Bloomberg 11/17/17
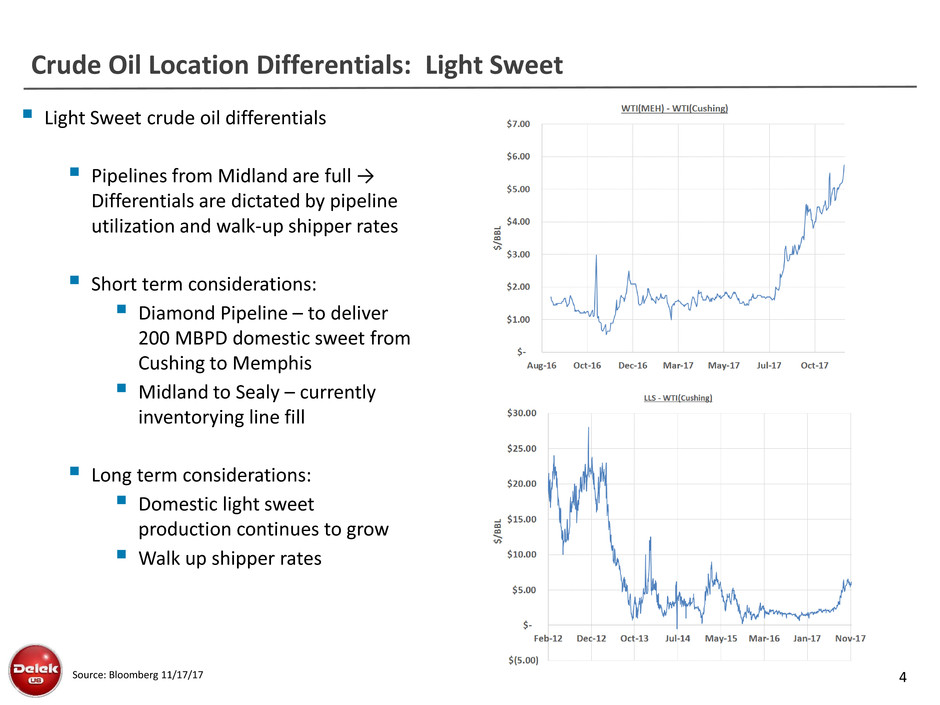
Crude Oil Location Differentials: Light Sweet 4 Light Sweet crude oil differentials Pipelines from Midland are full → Differentials are dictated by pipeline utilization and walk-up shipper rates Short term considerations: Diamond Pipeline – to deliver 200 MBPD domestic sweet from Cushing to Memphis Midland to Sealy – currently inventorying line fill Long term considerations: Domestic light sweet production continues to grow Walk up shipper rates Source: Bloomberg 11/17/17
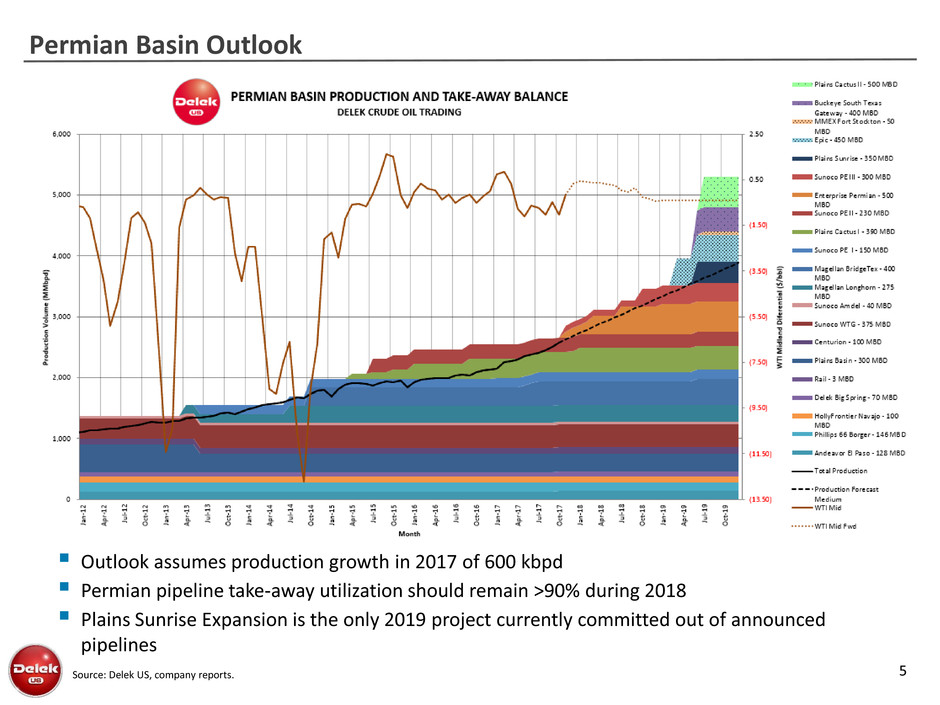
Permian Basin Outlook 5 Outlook assumes production growth in 2017 of 600 kbpd Permian pipeline take-away utilization should remain >90% during 2018 Plains Sunrise Expansion is the only 2019 project currently committed out of announced pipelines Source: Delek US, company reports.
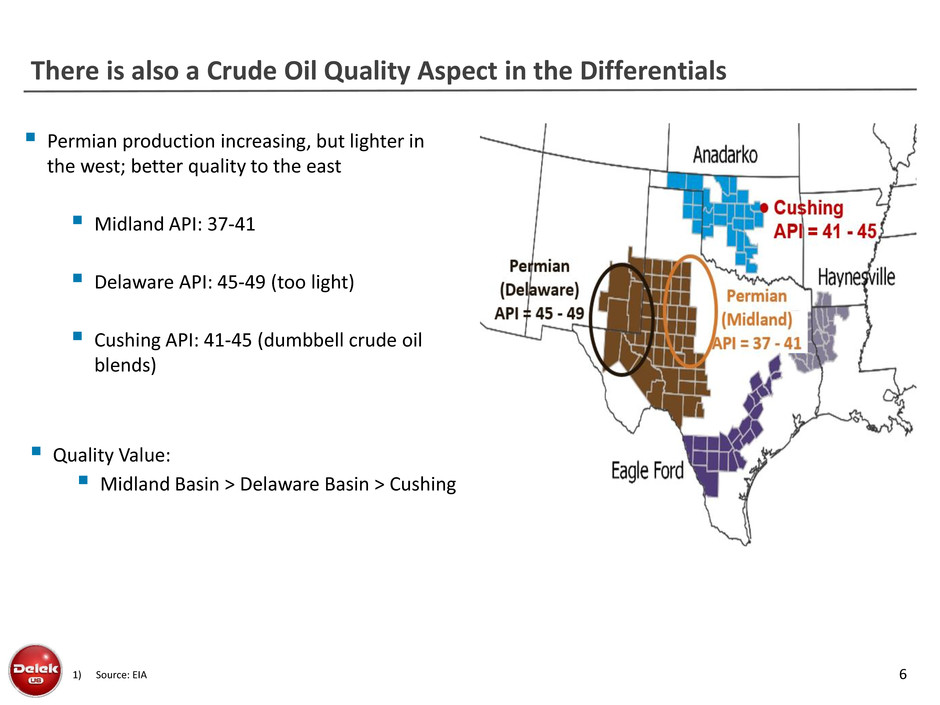
There is also a Crude Oil Quality Aspect in the Differentials 6 1) Source: EIA Permian production increasing, but lighter in the west; better quality to the east Midland API: 37-41 Delaware API: 45-49 (too light) Cushing API: 41-45 (dumbbell crude oil blends) Quality Value: Midland Basin > Delaware Basin > Cushing

Crude Oil Differentials: Light/Heavy 7 Light/Heavy crude oil differential has narrowed during 2017 OPEC cuts have primarily been medium sour barrels Heavy sour production declines in Mexico and Venezuela Most US Gulf Coast refineries are configured to run medium/heavy Majority of barrels from the U.S. Shale Revolution are light sweet Gulf Coast is import market for heavy crude oil and export market for light sweet crude oil 1) Source: Bloomberg Data 11/17/17 $(20.00) $(15.00) $(10.00) $(5.00) $- $5.00 $10.00 $15.00 Jan-12 Oct-12 Aug-13 Jun-14 Apr-15 Feb-16 Dec-16 Oct-17 $/ BB L Maya - WTI(Cushing)
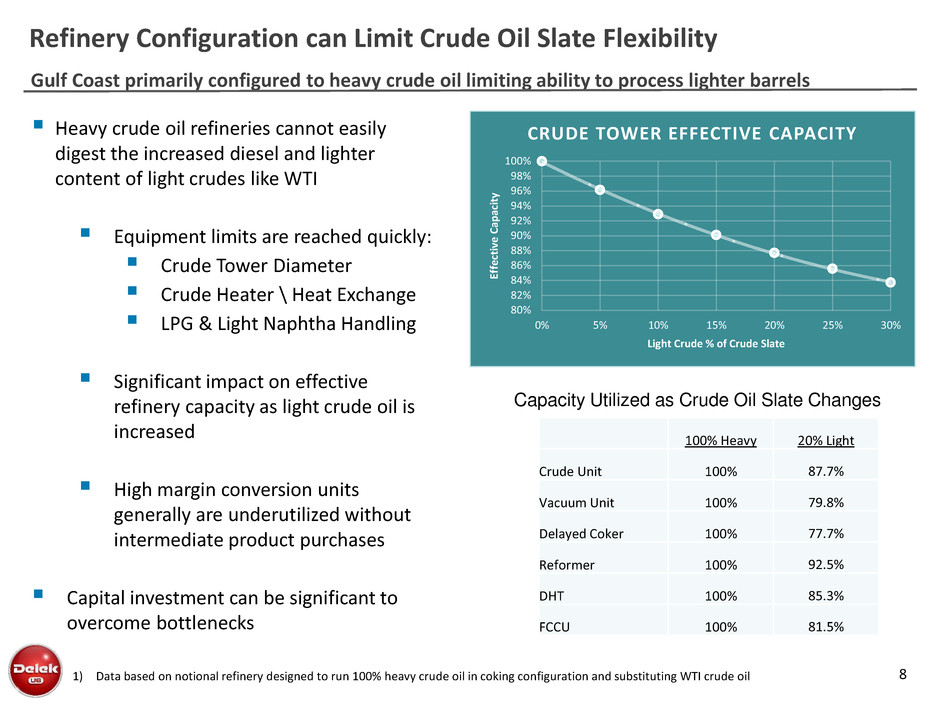
Gulf Coast primarily configured to heavy crude oil limiting ability to process lighter barrels Refinery Configuration can Limit Crude Oil Slate Flexibility 8 Heavy crude oil refineries cannot easily digest the increased diesel and lighter content of light crudes like WTI Equipment limits are reached quickly: Crude Tower Diameter Crude Heater \ Heat Exchange LPG & Light Naphtha Handling Significant impact on effective refinery capacity as light crude oil is increased High margin conversion units generally are underutilized without intermediate product purchases Capital investment can be significant to overcome bottlenecks Capacity Utilized as Crude Oil Slate Changes 1) Data based on notional refinery designed to run 100% heavy crude oil in coking configuration and substituting WTI crude oil 80% 82% 84% 86% 88% 90% 92% 94% 96% 98% 100% 0% 5% 10% 15% 20% 25% 30% Ef fe ct iv e C ap ac it y Light Crude % of Crude Slate CRUDE TOWER EFFECTIVE CAPACITY 100% Heavy 20% Light Crude Unit 100% 87.7% Vacuum Unit 100% 79.8% Delayed Coker 100% 77.7% Reformer 100% 92.5% DHT 100% 85.3% FCCU 100% 81.5%
Factors Driving Brent-WTI Spread May be Sustainable 9 Location differential Increased light production in U.S. Pipeline utilization increasing which effects transport tariffs and ability to clear the market Quality Differential Neat Midland barrel preferred compared to a blended barrel by refiners Production is getting lighter from the Delaware Basin Heavy/Light spreads have narrowed or flipped in the current market Most Gulf Coast configured to run heavy crude oil versus light crude oil Rising U.S. production is light; while heavy crude oil production in Mexico and Venezuela has declined Domestic light crude oil barrels must clear to the export market as there is limited Gulf Coast ability to process this crude oil type
How is this Market Environment for Delek US?
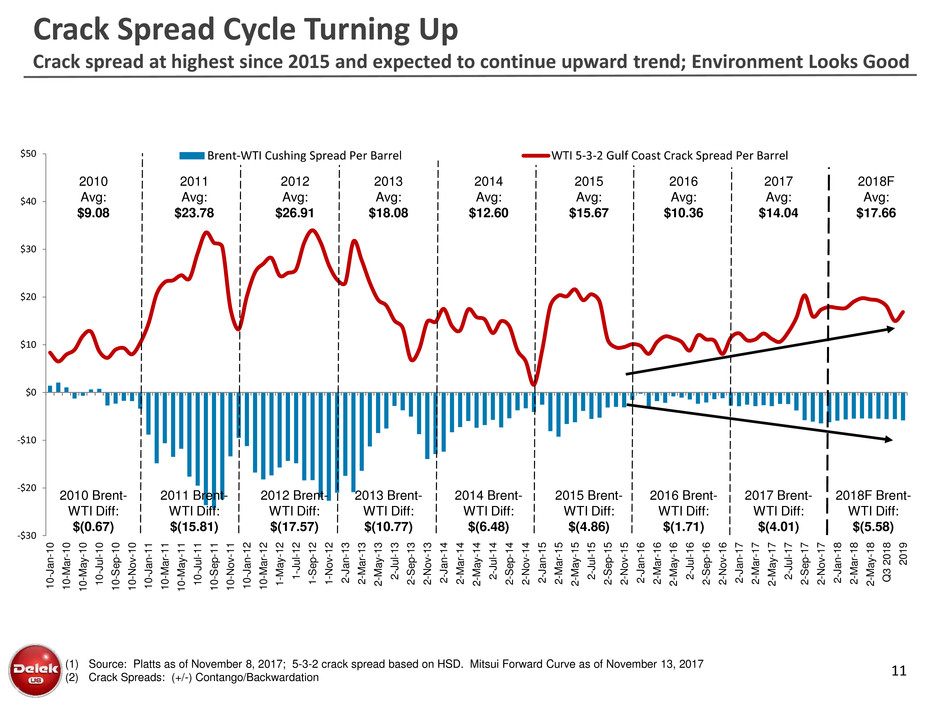
Crack Spread Cycle Turning Up Crack spread at highest since 2015 and expected to continue upward trend; Environment Looks Good 11 -$30 -$20 -$10 $0 $10 $20 $30 $40 $50 1 0 -J a n -1 0 1 0 -Ma r- 1 0 1 0 -Ma y -1 0 1 0 -J u l- 1 0 1 0 -S e p -1 0 1 0 -N o v -1 0 1 0 -J a n -1 1 1 0 -Ma r- 1 1 1 0 -Ma y -1 1 1 0 -J u l- 1 1 1 0 -S e p -1 1 1 0 -N o v -1 1 1 0 -J a n -1 2 1 0 -Ma r- 1 2 1 -Ma y -1 2 1 -J u l- 1 2 1 -S e p -1 2 1 -N o v -1 2 2 -J a n -1 3 2 -Ma r- 1 3 2 -Ma y -1 3 2 -J u l- 1 3 2 -S e p -1 3 2 -N o v -1 3 2 -J a n -1 4 2 -Ma r- 1 4 2 -Ma y -1 4 2 -J u l- 1 4 2 -S e p -1 4 2 -N o v -1 4 2 -J a n -1 5 2 -Ma r- 1 5 2 -Ma y -1 5 2 -J u l- 1 5 2 -S e p -1 5 2 -N o v -1 5 2 -J a n -1 6 2 -Ma r- 1 6 2 -Ma y -1 6 2 -J u l- 1 6 2 -S e p -1 6 2 -N o v -1 6 2 -J a n -1 7 2 -Ma r- 1 7 2 -Ma y -1 7 2 -J u l- 1 7 2 -S e p -1 7 2 -N o v -1 7 2 -J a n -1 8 2 -Ma r- 1 8 2 -Ma y -1 8 Q 3 2 0 1 8 2 0 1 9 Brent-WTI Cushing Spread Per Barrel WTI 5-3-2 Gulf Coast Crack Spread Per Barrel (1) Source: Platts as of November 8, 2017; 5-3-2 crack spread based on HSD. Mitsui Forward Curve as of November 13, 2017 (2) Crack Spreads: (+/-) Contango/Backwardation 2010 Avg: $9.08 2011 Avg: $23.78 2012 Avg: $26.91 2013 Avg: $18.08 2014 Avg: $12.60 2015 Avg: $15.67 2016 Avg: $10.36 2017 Avg: $14.04 2018F Avg: $17.66 2010 Brent- WTI Diff: $(0.67) 2011 Brent- WTI Diff: $(15.81) 2012 Brent- WTI Diff: $(17.57) 2013 Brent- WTI Diff: $(10.77) 2014 Brent- WTI Diff: $(6.48) 2015 Brent- WTI Diff: $(4.86) 2016 Brent- WTI Diff: $(1.71) 2017 Brent- WTI Diff: $(4.01) 2018F Brent- WTI Diff: $(5.58)
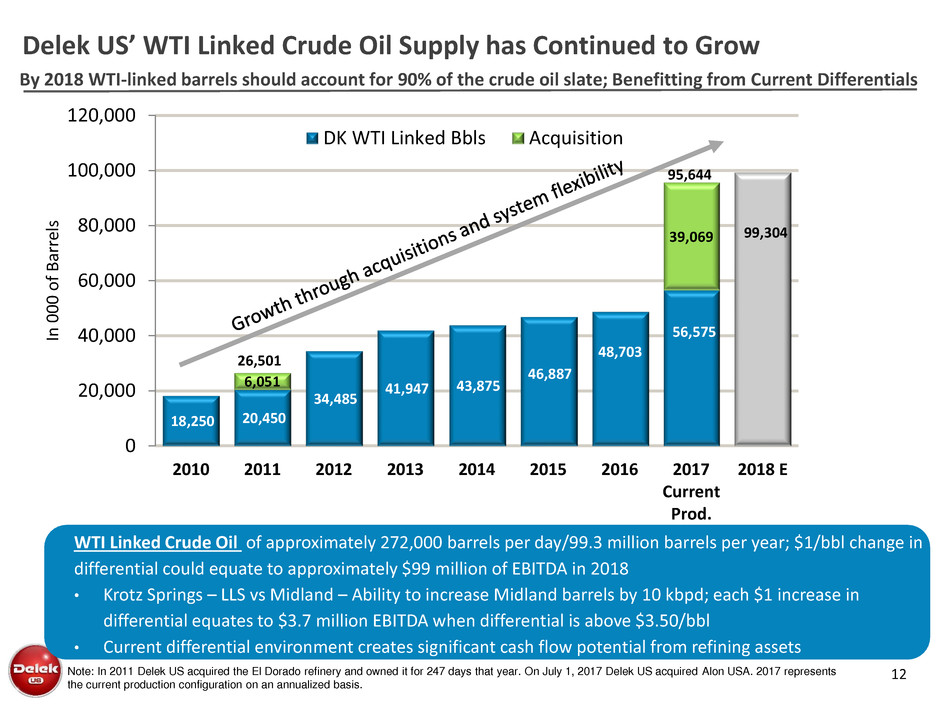
By 2018 WTI-linked barrels should account for 90% of the crude oil slate; Benefitting from Current Differentials Delek US’ WTI Linked Crude Oil Supply has Continued to Grow 12 18,250 20,450 34,485 41,947 43,875 46,887 48,703 56,575 99,304 6,051 39,069 0 20,000 40,000 60,000 80,000 100,000 120,000 2010 2011 2012 2013 2014 2015 2016 2017 Current Prod. 2018 E In 0 0 0 o f B ar rel s DK WTI Linked Bbls Acquisition WTI Linked Crude Oil of approximately 272,000 barrels per day/99.3 million barrels per year; $1/bbl change in differential could equate to approximately $99 million of EBITDA in 2018 • Krotz Springs – LLS vs Midland – Ability to increase Midland barrels by 10 kbpd; each $1 increase in differential equates to $3.7 million EBITDA when differential is above $3.50/bbl • Current differential environment creates significant cash flow potential from refining assets 26,501 95,644 Note: In 2011 Delek US acquired the El Dorado refinery and owned it for 247 days that year. On July 1, 2017 Delek US acquired Alon USA. 2017 represents the current production configuration on an annualized basis.
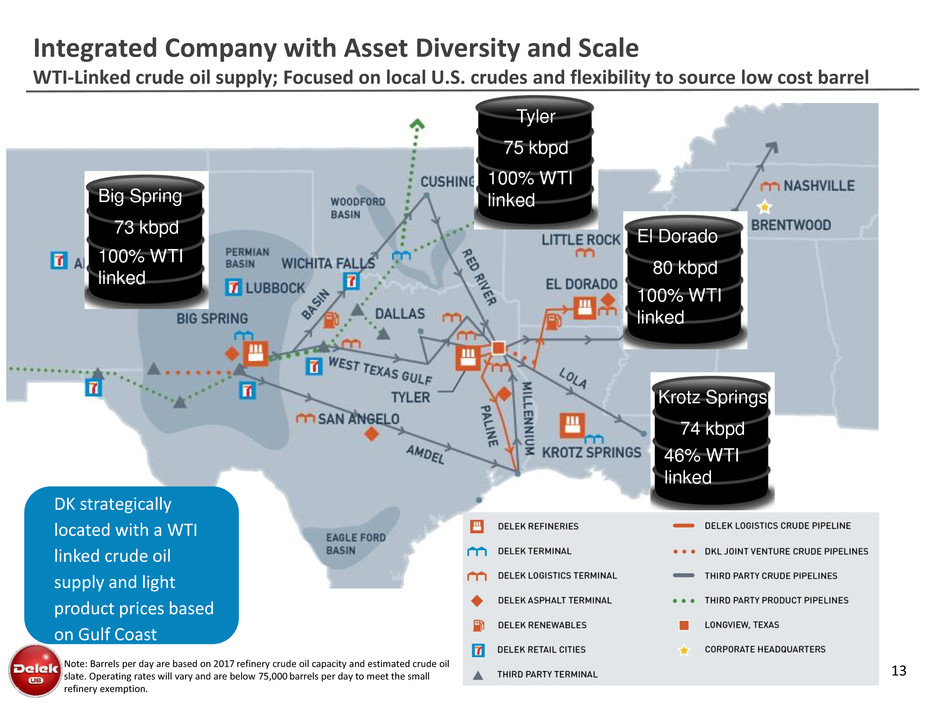
Integrated Company with Asset Diversity and Scale WTI-Linked crude oil supply; Focused on local U.S. crudes and flexibility to source low cost barrel 13 Big Spring 73 kbpd 100% WTI linked El Dorado 80 kbpd 100% WTI linked Tyler 75 kbpd 100% WTI linked Krotz Springs 74 kbpd 46% WTI linked DK strategically located with a WTI linked crude oil supply and light product prices based on Gulf Coast Note: Barrels per day are based on 2017 refinery crude oil capacity and estimated crude oil slate. Operating rates will vary and are below 75,000 barrels per day to meet the small refinery exemption.
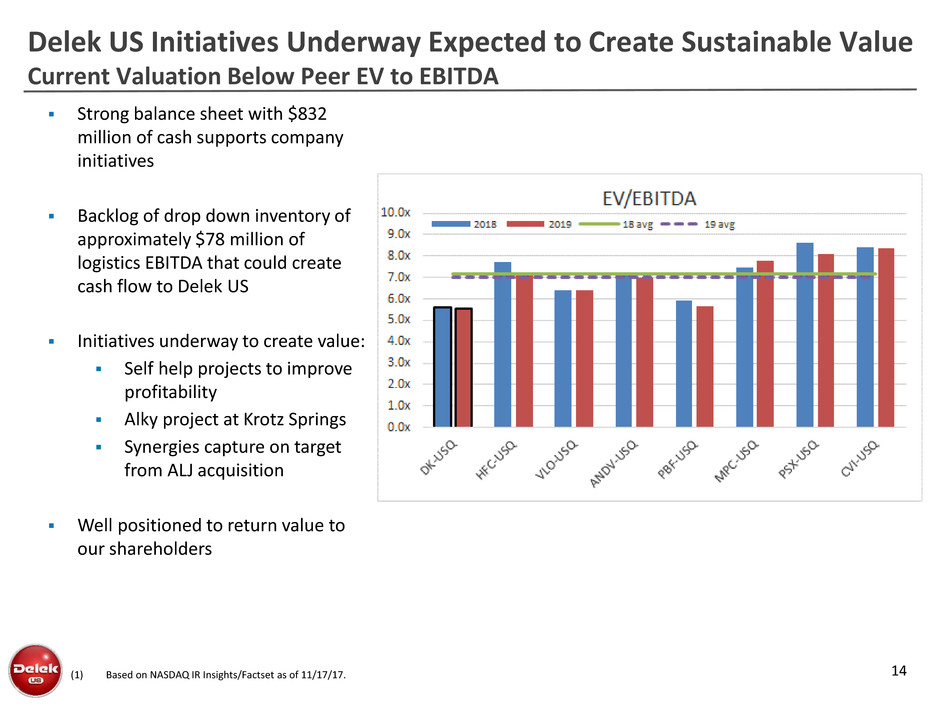
Delek US Initiatives Underway Expected to Create Sustainable Value Current Valuation Below Peer EV to EBITDA 14 (1) Based on NASDAQ IR Insights/Factset as of 11/17/17. Strong balance sheet with $832 million of cash supports company initiatives Backlog of drop down inventory of approximately $78 million of logistics EBITDA that could create cash flow to Delek US Initiatives underway to create value: Self help projects to improve profitability Alky project at Krotz Springs Synergies capture on target from ALJ acquisition Well positioned to return value to our shareholders
Investor Relations Contact: Kevin Kremke Keith Johnson Executive Vice President, CFO Vice President of Investor Relations 615-224-1323 615-435-1366


