EX 99.1 Delek US Holdings, Inc. Delek CEO Fireside Chat: Outlook for Crude Differentials, the Permian and IMO 2020, hosted by Neil Mehta October 2018
Disclaimers Forward Looking Statements: Delek US Holdings, Inc. (“Delek US”) and Delek Logistics Partners, LP (“Delek Logistics”; and collectively with Delek US, “we” or “our”) are traded on the New York Stock Exchange in the United States under the symbols “DK” and ”DKL”, respectively. These slides and any accompanying oral and written presentations contain forward-looking statements that are based upon current expectations and involve a number of risks and uncertainties. Statements concerning current estimates, expectations and projections about future results, performance, prospects, opportunities, plans, actions and events and other statements, concerns, or matters that are not historical facts are “forward-looking statements,” as that term is defined under the federal securities laws. These forward-looking statements include, but are not limited to, the statements regarding the following: future crude slates; financial strength and flexibility; potential for and projections of growth; return of cash to shareholders, stock repurchases and the payment of dividends, including the amount and timing thereof; crude oil throughput; crude oil market trends, including production, quality, pricing, imports, exports and transportation costs; light production from shale plays and Permian growth; risks related to Delek US’ exposure to Permian Basin crude oil, such as supply, pricing, production and transportation capacity; differentials including increases, trends and the impact thereof on crack spreads and refineries; pipeline takeaway capacity and projects related thereto; refinery complexity, configurations, utilization, crude oil slate flexibility, capacities, equipment limits and margins; the ability to unlock value, and the estimated savings from the Alon USA Energy, Inc. (“ALJ”) and Alon USA Partners LP (“ALDW”) transactions; the ability to add flexibility and increase margin potential at the Krotz Springs refinery; improved product netbacks; our ability to complete the alkylation project at Krotz Springs successfully or at all and the benefits, flexibility, returns and EBITDA therefrom; the potential for, and estimates of cost savings and other benefits from, acquisitions, divestitures, dropdowns and financing activities; divestiture of non-core assets and matters pertaining thereto; increased capacity on the Paline Pipeline and the impacts and benefits therefrom; retail growth and the opportunities and value derived therefrom; long-term value creation from capital allocation; execution of strategic initiatives and the benefits therefrom; and access to crude oil and the benefits therefrom. Words such as "may," "will," "should," "could," "would," "predicts," "potential," "continue," "expects," "anticipates," "future," "intends," "plans," "believes," "estimates," "appears," "projects" and similar expressions, as well as statements in future tense, identify forward-looking statements. Investors are cautioned that the following important factors, among others, may affect these forward-looking statements: risks and uncertainties related to the ability to successfully integrate the businesses of Delek US, ALJ and ALDW; the risks that the combined company may be unable to achieve cost-cutting synergies, or it may take longer than expected to achieve those synergies; uncertainty related to timing and amount of value returned to shareholders; risks and uncertainties with respect to the quantities and costs of crude oil we are able to obtain and the price of the refined petroleum products we ultimately sell; gains and losses from derivative instruments; management's ability to execute its strategy of growth through acquisitions and the transactional risks associated with acquisitions and dispositions; acquired assets may suffer a diminishment in fair value as a result of which we may need to record a write-down or impairment in carrying value of the asset; changes in the scope, costs, and/or timing of capital and maintenance projects; the ability to close the pipeline joint venture, obtain commitments and construct the pipeline; operating hazards inherent in transporting, storing and processing crude oil and intermediate and finished petroleum products; our competitive position and the effects of competition; the projected growth of the industries in which we operate; general economic and business conditions affecting the geographic areas in which we operate; and other risks contained in Delek US’ and Delek Logistics’ filings with the United States Securities and Exchange Commission. Forward-looking statements should not be read as a guarantee of future performance or results, and will not be accurate indications of the times at, or by which such performance or results will be achieved. Forward-looking information is based on information available at the time and/or management’s good faith belief with respect to future events, and is subject to risks and uncertainties that could cause actual performance or results to differ materially from those expressed in the statements. Neither Delek US nor Delek Logistics undertakes any obligation to update or revise any such forward-looking statements. Non-GAAP Disclosures: Delek US and Delek Logistics believe that the presentation of earnings before interest, taxes, depreciation and amortization ("EBITDA") provides useful information to investors in assessing their financial condition, results of operations and cash flow their business is generating. EBITDA should not be considered as an alternative to net income, operating income, cash from operations or any other measure of financial performance or liquidity presented in accordance with U.S. GAAP. EBITDA has important limitations as analytical tools because it excludes some, but not all, items that affect net income. Additionally, because EBITDA may be defined differently by other companies in its industry, Delek US' and Delek Logistics’ definitions may not be comparable to similarly titled measures of other companies, thereby diminishing their utility. Please see reconciliations of EBITDA to its most directly comparable financial measure calculated and presented in accordance with U.S. GAAP in the appendix. 2

Permian Basin Outlook Production has grown despite volatility of crude oil prices (1) • Steady growth has continued in production- Average Annual Crude Oil Production (Mbpd) and WTI-Midland Price (2) • Drilling supported by improved technology 7.00 $64.76 $65.98 70.00 $61.57 $60.72 and low costs $57.91 6.00 60.00 • Midland prices still support production $49.88 5.00 50.00 Current production • Production forecast to grow by 600,000 bpd per 4.00 Aug 2018: 3.5m bpd 40.00 year in 2019-2022 3.00 5.8 30.00 5.2 4.6 • In 2017 and 2018 Permian production 2.00 4.0 20.00 outpaced initial forecasts 3.4 1.00 2.5 10.00 - - • Production may outpace incremental expansion in 2017 2018E 2019E 2020E 2021E 2022E 2019 Drilled but Uncompleted Wells (1) • DUCs have grown at a rapid rate to 3,630 4,000 30% • Short time to finish well with low 3,500 25% capex costs 3,000 2,500 20% • Any shortfall in the system can create volatility in 2,000 15% 1,500 10% differentials 1,000 500 5% 0 0% 3/14 6/14 9/14 3/15 6/15 9/15 3/16 6/16 9/16 3/17 6/17 9/17 3/18 6/18 12/13 12/14 12/15 12/16 12/17 DUCs Incremental DUCs of New Drills % (Rolling 12-Month) 1) Source: Company estimates; current production based on EIA for August 2018, August Drilling Productivity Report, 2018 Drilling Productivity Report. 2) WTI Midland price source: Argus – September 27, 2018; futures based on ICE/NYMEX curve. 3
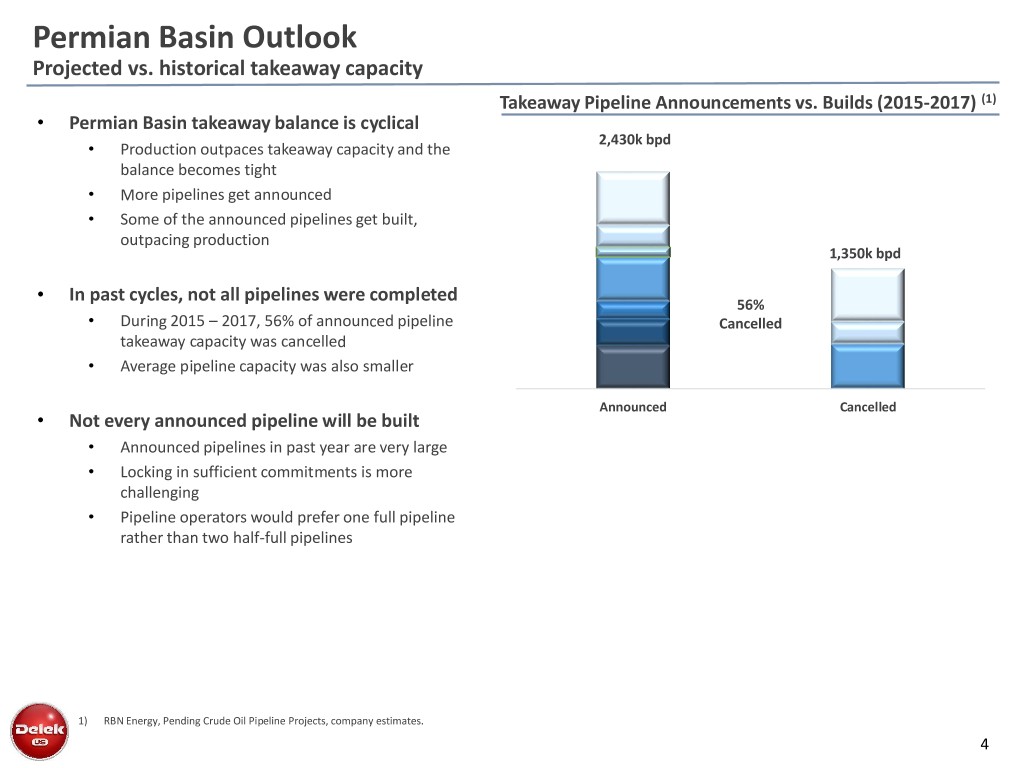
Permian Basin Outlook Projected vs. historical takeaway capacity Takeaway Pipeline Announcements vs. Builds (2015-2017) (1) • Permian Basin takeaway balance is cyclical 2,430k bpd • Production outpaces takeaway capacity and the balance becomes tight • More pipelines get announced • Some of the announced pipelines get built, outpacing production 1,350k bpd • In past cycles, not all pipelines were completed 56% • During 2015 – 2017, 56% of announced pipeline Cancelled takeaway capacity was cancelled • Average pipeline capacity was also smaller Announced Cancelled • Not every announced pipeline will be built • Announced pipelines in past year are very large • Locking in sufficient commitments is more challenging • Pipeline operators would prefer one full pipeline rather than two half-full pipelines 1) RBN Energy, Pending Crude Oil Pipeline Projects, company estimates. 4
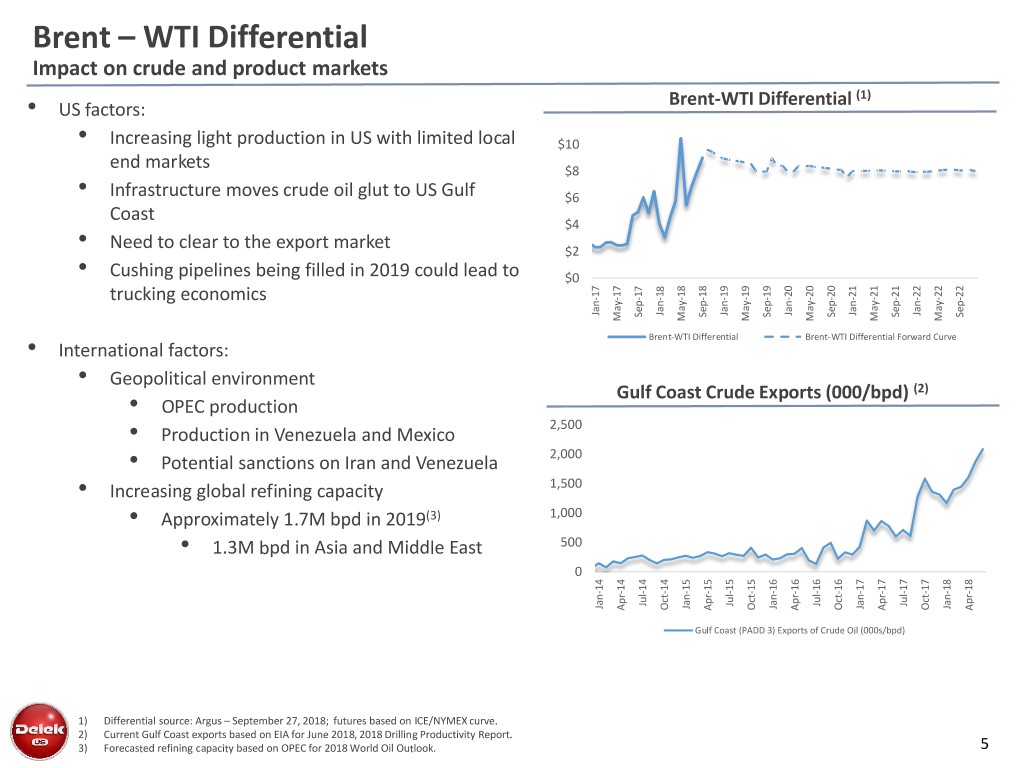
Brent – WTI Differential Impact on crude and product markets Brent-WTI Differential (1) • US factors: • Increasing light production in US with limited local $10 end markets $8 • Infrastructure moves crude oil glut to US Gulf $6 Coast $4 • Need to clear to the export market $2 • Cushing pipelines being filled in 2019 could lead to $0 trucking economics Jan-17 Jan-18 Jan-19 Jan-20 Jan-21 Jan-22 Sep-17 Sep-18 Sep-19 Sep-20 Sep-21 Sep-22 May-17 May-18 May-19 May-20 May-21 May-22 Brent-WTI Differential Brent-WTI Differential Forward Curve • International factors: • Geopolitical environment Gulf Coast Crude Exports (000/bpd) (2) • OPEC production 2,500 • Production in Venezuela and Mexico • Potential sanctions on Iran and Venezuela 2,000 • Increasing global refining capacity 1,500 • Approximately 1.7M bpd in 2019(3) 1,000 • 1.3M bpd in Asia and Middle East 500 0 Jul-14 Jul-15 Jul-16 Jul-17 Jan-14 Jan-15 Jan-16 Jan-17 Jan-18 Oct-14 Oct-15 Oct-16 Oct-17 Apr-14 Apr-15 Apr-16 Apr-17 Apr-18 Gulf Coast (PADD 3) Exports of Crude Oil (000s/bpd) 1) Differential source: Argus – September 27, 2018; futures based on ICE/NYMEX curve. 2) Current Gulf Coast exports based on EIA for June 2018, 2018 Drilling Productivity Report. 3) Forecasted refining capacity based on OPEC for 2018 World Oil Outlook. 5
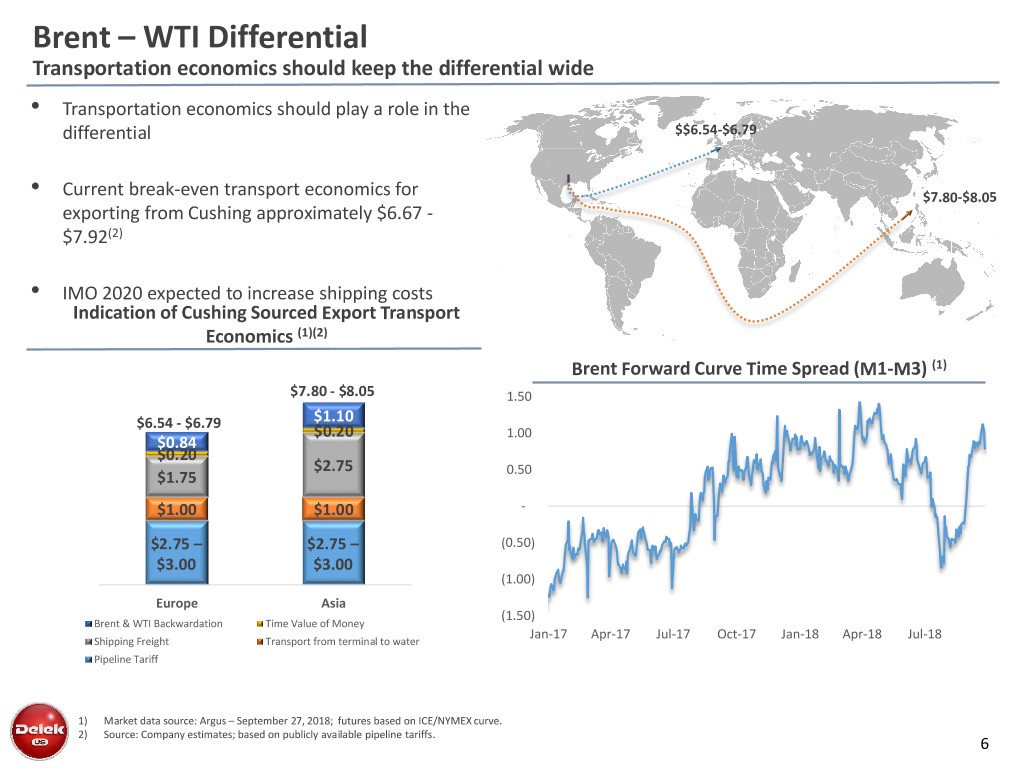
Brent – WTI Differential Transportation economics should keep the differential wide • Transportation economics should play a role in the differential $$6.54-$6.79 • Current break-even transport economics for $7.80-$8.05 exporting from Cushing approximately $6.67 - $7.92(2) • IMO 2020 expected to increase shipping costs Indication of Cushing Sourced Export Transport Economics (1)(2) Brent Forward Curve Time Spread (M1-M3) (1) $7.80 - $8.05 1.50 $6.54 - $6.79 $1.10 $0.20 1.00 $0.84 $0.20 $2.75 $1.75 0.50 $1.00 $1.00 - $2.75 – $2.75 – (0.50) $3.00 $3.00 (1.00) Europe Asia (1.50) Brent & WTI Backwardation Time Value of Money Jan-17 Apr-17 Jul-17 Oct-17 Jan-18 Apr-18 Jul-18 Shipping Freight Transport from terminal to water Pipeline Tariff 1) Market data source: Argus – September 27, 2018; futures based on ICE/NYMEX curve. 2) Source: Company estimates; based on publicly available pipeline tariffs. 6
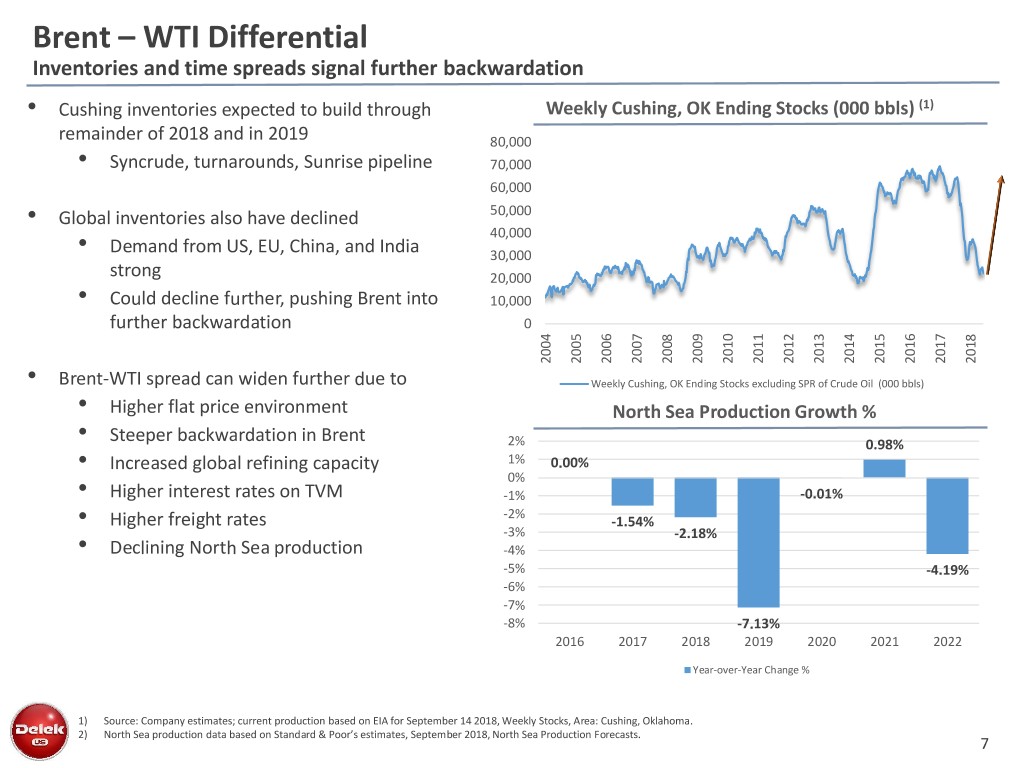
Brent – WTI Differential Inventories and time spreads signal further backwardation • Cushing inventories expected to build through Weekly Cushing, OK Ending Stocks (000 bbls) (1) remainder of 2018 and in 2019 80,000 • Syncrude, turnarounds, Sunrise pipeline 70,000 60,000 • Global inventories also have declined 50,000 40,000 • Demand from US, EU, China, and India 30,000 strong 20,000 • Could decline further, pushing Brent into 10,000 further backwardation 0 2011 2004 2005 2006 2007 2008 2009 2010 2012 2013 2014 2015 2016 2017 2018 • Brent-WTI spread can widen further due to Weekly Cushing, OK Ending Stocks excluding SPR of Crude Oil (000 bbls) • Higher flat price environment North Sea Production Growth % • Steeper backwardation in Brent 2% 0.98% • Increased global refining capacity 1% 0.00% 0% • Higher interest rates on TVM -1% -0.01% -2% • Higher freight rates -1.54% -3% -2.18% • Declining North Sea production -4% -5% -4.19% -6% -7% -8% -7.13% 2016 2017 2018 2019 2020 2021 2022 Year-over-Year Change % 1) Source: Company estimates; current production based on EIA for September 14 2018, Weekly Stocks, Area: Cushing, Oklahoma. 2) North Sea production data based on Standard & Poor’s estimates, September 2018, North Sea Production Forecasts. 7
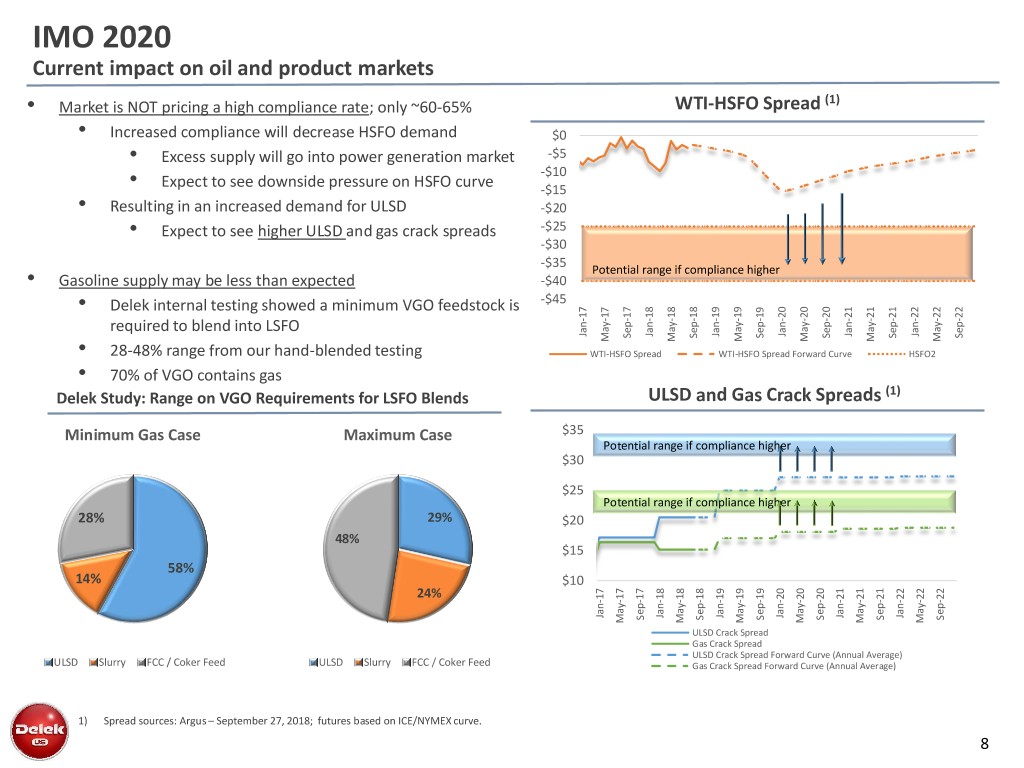
IMO 2020 Current impact on oil and product markets • Market is NOT pricing a high compliance rate; only ~60-65% WTI-HSFO Spread (1) • Increased compliance will decrease HSFO demand $0 • Excess supply will go into power generation market -$5 -$10 • Expect to see downside pressure on HSFO curve -$15 • Resulting in an increased demand for ULSD -$20 • Expect to see higher ULSD and gas crack spreads -$25 -$30 -$35 Potential range if compliance higher • Gasoline supply may be less than expected -$40 • Delek internal testing showed a minimum VGO feedstock is -$45 required to blend into LSFO Jan-17 Jan-18 Jan-19 Jan-20 Jan-21 Jan-22 Sep-17 Sep-18 Sep-19 Sep-20 Sep-21 Sep-22 May-17 May-18 May-19 May-20 May-21 May-22 • 28-48% range from our hand-blended testing WTI-HSFO Spread WTI-HSFO Spread Forward Curve HSFO2 • 70% of VGO contains gas Delek Study: Range on VGO Requirements for LSFO Blends ULSD and Gas Crack Spreads (1) Minimum Gas Case Maximum Case $35 Potential range if compliance higher $30 $25 Potential range if compliance higher 28% 29% $20 48% $15 58% 14% $10 24% Jan-17 Jan-18 Jan-19 Jan-20 Jan-21 Jan-22 Sep-17 Sep-18 Sep-19 Sep-20 Sep-21 Sep-22 May-17 May-18 May-19 May-20 May-21 May-22 ULSD Crack Spread Gas Crack Spread ULSD Crack Spread Forward Curve (Annual Average) ULSD Slurry FCC / Coker Feed ULSD Slurry FCC / Coker Feed Gas Crack Spread Forward Curve (Annual Average) 1) Spread sources: Argus – September 27, 2018; futures based on ICE/NYMEX curve. 8
Delek US Well Positioned for 2018-2022 Trends
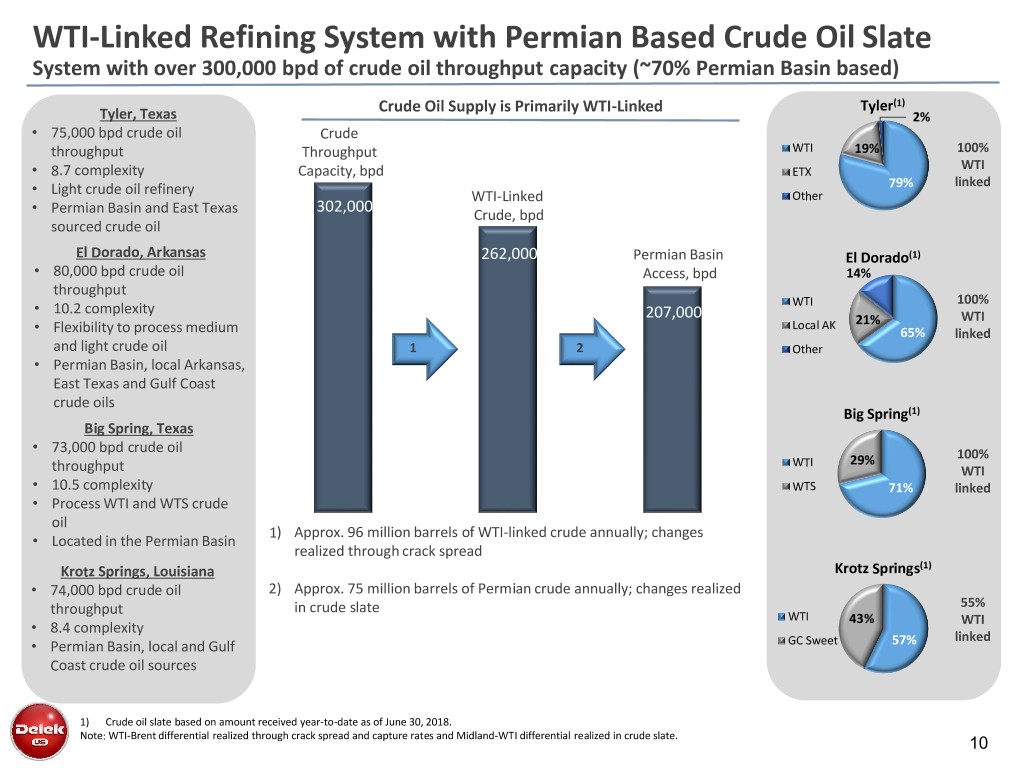
WTI-Linked Refining System with Permian Based Crude Oil Slate System with over 300,000 bpd of crude oil throughput capacity (~70% Permian Basin based) Crude Oil Supply is Primarily WTI-Linked Tyler(1) Tyler, Texas 2% • 75,000 bpd crude oil Crude throughput Throughput WTI 19% 100% WTI • 8.7 complexity Capacity, bpd ETX • 79% linked Light crude oil refinery WTI-Linked Other • 302,000 Permian Basin and East Texas Crude, bpd sourced crude oil El Dorado, Arkansas 262,000 Permian Basin El Dorado(1) • 80,000 bpd crude oil Access, bpd 14% throughput 100% • WTI 10.2 complexity 207,000 WTI Local AK 21% • Flexibility to process medium 65% linked and light crude oil 1 2 Other • Permian Basin, local Arkansas, East Texas and Gulf Coast crude oils Big Spring(1) Big Spring, Texas • 73,000 bpd crude oil 100% WTI 29% throughput WTI • 10.5 complexity WTS 71% linked • Process WTI and WTS crude oil 1) Approx. 96 million barrels of WTI-linked crude annually; changes • Located in the Permian Basin realized through crack spread Krotz Springs, Louisiana Krotz Springs(1) • 74,000 bpd crude oil 2) Approx. 75 million barrels of Permian crude annually; changes realized throughput in crude slate 55% WTI 43% WTI • 8.4 complexity linked • Permian Basin, local and Gulf GC Sweet 57% Coast crude oil sources 1) Crude oil slate based on amount received year-to-date as of June 30, 2018. Note: WTI-Brent differential realized through crack spread and capture rates and Midland-WTI differential realized in crude slate. 10
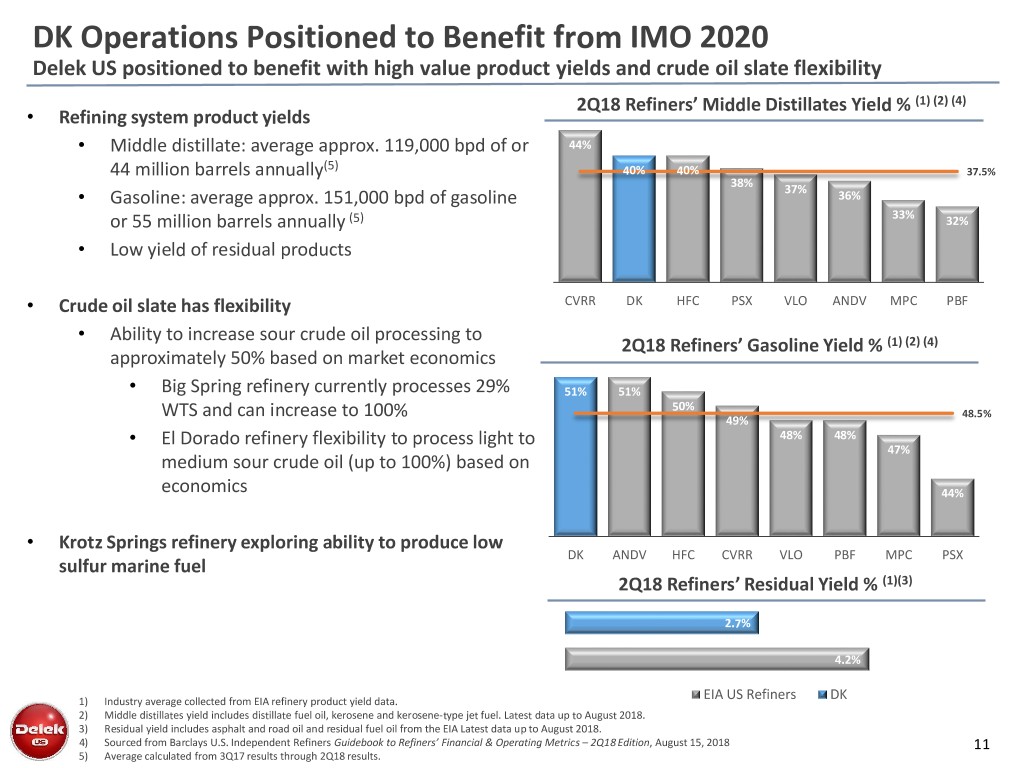
DK Operations Positioned to Benefit from IMO 2020 Delek US positioned to benefit with high value product yields and crude oil slate flexibility 2Q18 Refiners’ Middle Distillates Yield % (1) (2) (4) • Refining system product yields • Middle distillate: average approx. 119,000 bpd of or 44% (5) 44 million barrels annually 40% 40% 37.5% 38% • Gasoline: average approx. 151,000 bpd of gasoline 37% 36% or 55 million barrels annually (5) 33% 32% • Low yield of residual products • Crude oil slate has flexibility CVRR DK HFC PSX VLO ANDV MPC PBF • Ability to increase sour crude oil processing to 2Q18 Refiners’ Gasoline Yield % (1) (2) (4) approximately 50% based on market economics • Big Spring refinery currently processes 29% 51% 51% 50% WTS and can increase to 100% 48.5% 49% • El Dorado refinery flexibility to process light to 48% 48% 47% medium sour crude oil (up to 100%) based on economics 44% • Krotz Springs refinery exploring ability to produce low DK ANDV HFC CVRR VLO PBF MPC PSX sulfur marine fuel 2Q18 Refiners’ Residual Yield % (1)(3) 2.7% 4.2% 1) Industry average collected from EIA refinery product yield data. EIA US Refiners DK 2) Middle distillates yield includes distillate fuel oil, kerosene and kerosene-type jet fuel. Latest data up to August 2018. 3) Residual yield includes asphalt and road oil and residual fuel oil from the EIA Latest data up to August 2018. 4) Sourced from Barclays U.S. Independent Refiners Guidebook to Refiners’ Financial & Operating Metrics – 2Q18 Edition, August 15, 2018 11 5) Average calculated from 3Q17 results through 2Q18 results.
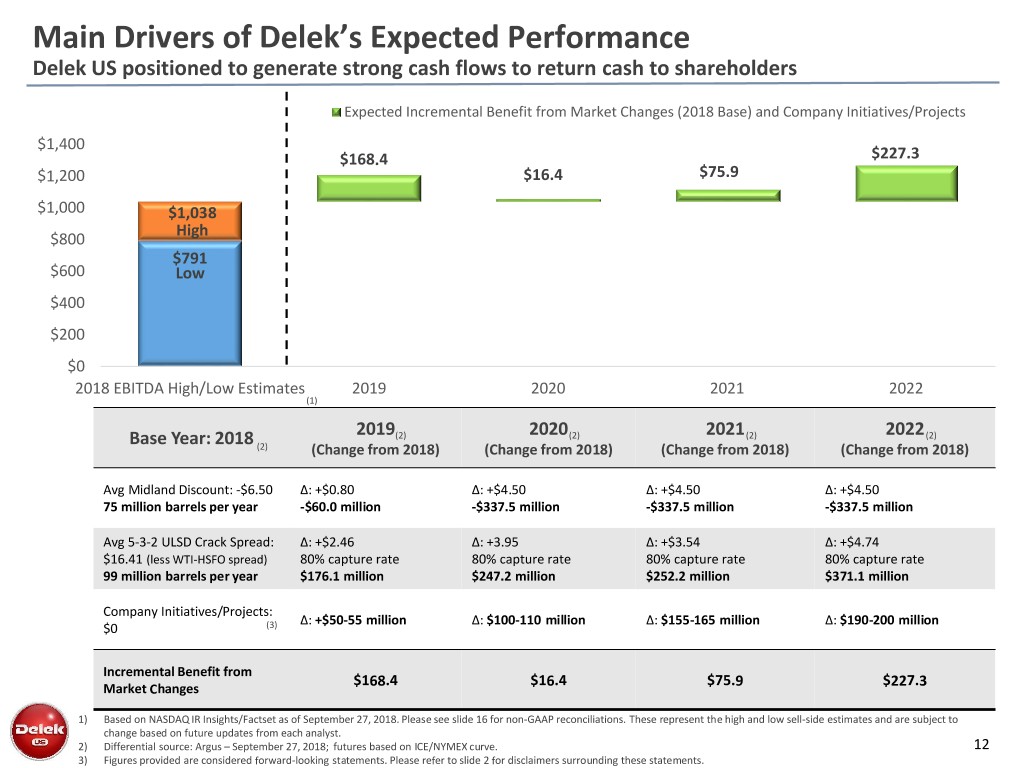
Main Drivers of Delek’s Expected Performance Delek US positioned to generate strong cash flows to return cash to shareholders Expected Incremental Benefit from Market Changes (2018 Base) and Company Initiatives/Projects $1,400 $168.4 $227.3 $1,200 $16.4 $75.9 $1,000 $1,038 High $800 $791 $600 Low $400 $200 $0 2018 EBITDA High/Low Estimates 2019 2020 2021 2022 (1) 2019 2020 2021 2022 Base Year: 2018 (2) (2) (2) (2) (2) (Change from 2018) (Change from 2018) (Change from 2018) (Change from 2018) Avg Midland Discount: -$6.50 Δ: +$0.80 Δ: +$4.50 Δ: +$4.50 Δ: +$4.50 75 million barrels per year -$60.0 million -$337.5 million -$337.5 million -$337.5 million Avg 5-3-2 ULSD Crack Spread: Δ: +$2.46 Δ: +3.95 Δ: +$3.54 Δ: +$4.74 $16.41 (less WTI-HSFO spread) 80% capture rate 80% capture rate 80% capture rate 80% capture rate 99 million barrels per year $176.1 million $247.2 million $252.2 million $371.1 million Company Initiatives/Projects: Δ: +$50-55 million Δ: $100-110 million Δ: $155-165 million Δ: $190-200 million $0 (3) Incremental Benefit from $168.4 $16.4 $75.9 $227.3 Market Changes 1) Based on NASDAQ IR Insights/Factset as of September 27, 2018. Please see slide 16 for non-GAAP reconciliations. These represent the high and low sell-side estimates and are subject to change based on future updates from each analyst. 2) Differential source: Argus – September 27, 2018; futures based on ICE/NYMEX curve. 12 3) Figures provided are considered forward-looking statements. Please refer to slide 2 for disclaimers surrounding these statements.

Current Valuation Below Peer EV-to-EBITDA DK positioned to benefit from Midland to Brent crude diffs and IMO; low valuation to peer group • Strong balance sheet with $1.1 billion of cash; net debt of $909.7 million; net debt excl. DKL of $177.8 million(1) • Operations positioned to generate strong cash flow based on current differential and crack spread outlook • Returning cash to shareholders through repurchases/dividends; Investing in business to create long term value EV/EBITDA(2) 12.0x 10.0x 8.0x 6.0x 4.0x 2.0x 0.0x DK-USQ HFC-USQ VLO-USQ ANDV-USQ PBF-USQ MPC-USQ PSX-USQ CVI-USQ 2018 2019 2018 Avg 2019 Avg (1) Based on company filing 10-Q on 8/9/2018 for Q2 2018. Data presented ending June 30, 2018. (2) Based on NASDAQ IR Insights/Factset as of September 27, 2018. 13
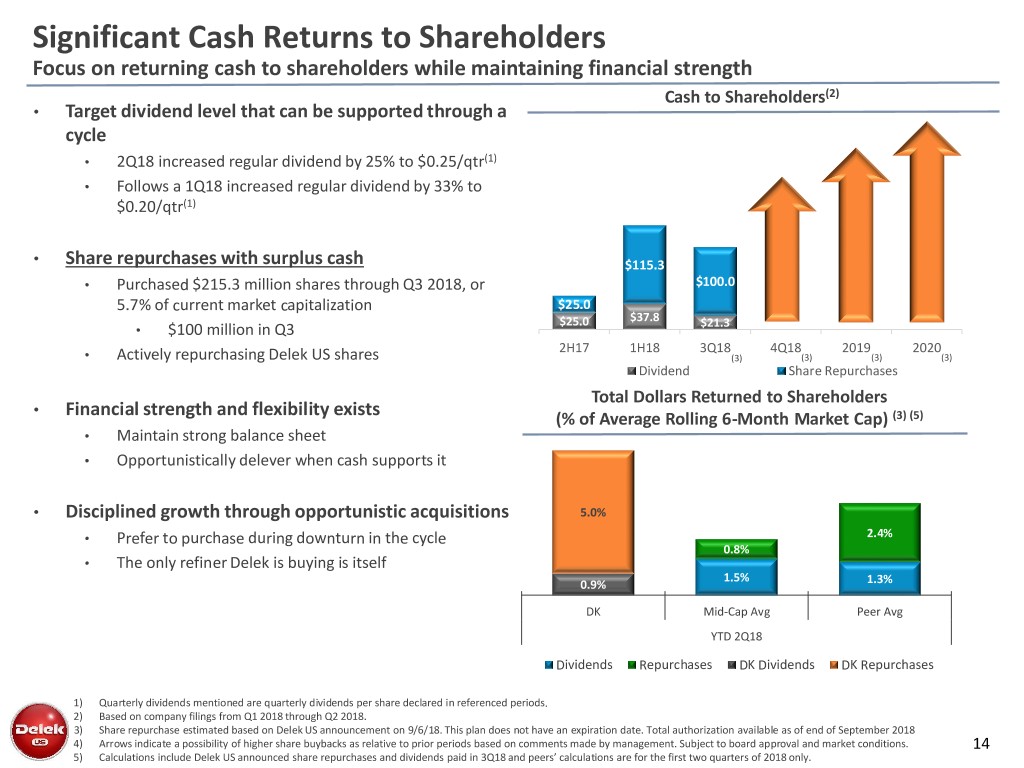
Significant Cash Returns to Shareholders Focus on returning cash to shareholders while maintaining financial strength Cash to Shareholders(2) • Target dividend level that can be supported through a cycle • 2Q18 increased regular dividend by 25% to $0.25/qtr(1) • Follows a 1Q18 increased regular dividend by 33% to $0.20/qtr(1) • Share repurchases with surplus cash $115.3 • Purchased $215.3 million shares through Q3 2018, or $100.0 5.7% of current market capitalization $25.0 $25.0 $37.8 $21.3 • $100 million in Q3 2H17 1H18 3Q18 4Q18 2019 2020 • Actively repurchasing Delek US shares (3) (3) (3) (3) Dividend Share Repurchases Total Dollars Returned to Shareholders • Financial strength and flexibility exists (% of Average Rolling 6-Month Market Cap) (3) (5) • Maintain strong balance sheet • Opportunistically delever when cash supports it • Disciplined growth through opportunistic acquisitions 5.0% • Prefer to purchase during downturn in the cycle 2.4% 0.8% • The only refiner Delek is buying is itself 1.5% 0.9% 1.3% DK Mid-Cap Avg Peer Avg YTD 2Q18 Dividends Repurchases DK Dividends DK Repurchases 1) Quarterly dividends mentioned are quarterly dividends per share declared in referenced periods. 2) Based on company filings from Q1 2018 through Q2 2018. 3) Share repurchase estimated based on Delek US announcement on 9/6/18. This plan does not have an expiration date. Total authorization available as of end of September 2018 4) Arrows indicate a possibility of higher share buybacks as relative to prior periods based on comments made by management. Subject to board approval and market conditions. 14 5) Calculations include Delek US announced share repurchases and dividends paid in 3Q18 and peers’ calculations are for the first two quarters of 2018 only.
Investor Relations Contact: Kevin Kremke Keith Johnson Executive Vice President, CFO Vice President of Investor Relations 615-224-1323 615-435-1366
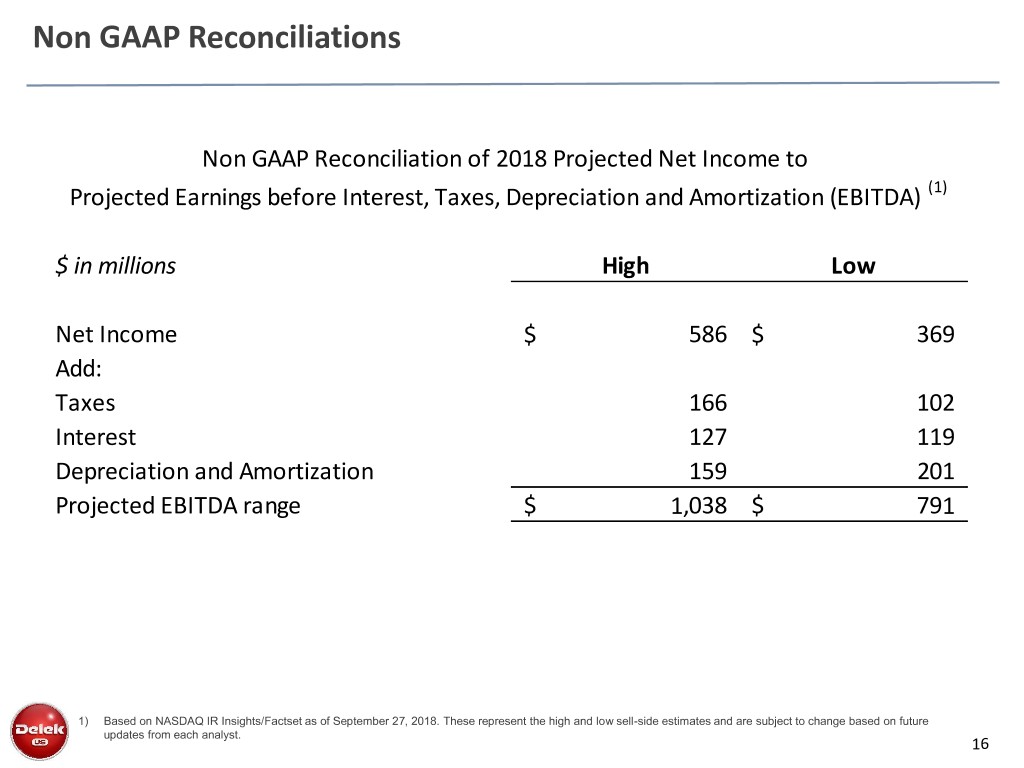
Non GAAP Reconciliations Non GAAP Reconciliation of 2018 Projected Net Income to Projected Earnings before Interest, Taxes, Depreciation and Amortization (EBITDA) (1) $ in millions High Low Net Income $ 586 $ 369 Add: Taxes 166 102 Interest 127 119 Depreciation and Amortization 159 201 Projected EBITDA range $ 1,038 $ 791 1) Based on NASDAQ IR Insights/Factset as of September 27, 2018. These represent the high and low sell-side estimates and are subject to change based on future updates from each analyst. 16


