EX 99.2 Delek US Holdings, Inc. Fourth Quarter 2018 Earnings Call February 20, 2019

Disclaimers Forward Looking Statements: Delek US Holdings, Inc. (“Delek US”) and Delek Logistics Partners, LP (“Delek Logistics”; and collectively with Delek US, “we” or “our”) are traded on the New York Stock Exchange in the United States under the symbols “DK” and ”DKL”, respectively. These slides and any accompanying oral and written presentations contain forward-looking statements within the meaning of federal securities laws that are based upon current expectations and involve a number of risks and uncertainties. Statements concerning current estimates, expectations and projections about future results, performance, prospects, opportunities, plans, actions and events and other statements, concerns, or matters that are not historical facts are “forward-looking statements,” as that term is defined under the federal securities laws. These forward-looking statements include, but are not limited to, the statements regarding the following: financial and operating guidance for future and uncompleted financial periods; future crude slates; financial strength and flexibility; potential for and projections of growth; return of cash to shareholders, stock repurchases and the payment of dividends, including the amount and timing thereof; crude oil throughput; crude oil market trends, including production, quality, pricing, demand, imports, exports and transportation costs; light production from shale plays and Permian growth; differentials including increases, trends and the impact thereof on crack spreads and refineries; pipeline takeaway capacity and projects related thereto; refinery complexity, configurations, utilization, crude oil slate flexibility, capacities, equipment limits and margins; the ability to add flexibility and increase margin potential at the Krotz Springs refinery; improved product netbacks; our ability to complete the alkylation project at Krotz Springs, the Big Spring Gathering System or the Permian Gulf Coast long-haul pipeline successfully or at all and the benefits, flexibility, returns and EBITDA therefrom; the potential for, and estimates of cost savings and other benefits from, acquisitions, divestitures, dropdowns and financing activities; divestiture of non-core assets and matters pertaining thereto; retail growth and the opportunities and value derived therefrom; long-term value creation from capital allocation; execution of strategic initiatives and the benefits therefrom; and access to crude oil and the benefits therefrom. Words such as "may," "will," "should," "could," "would," "predicts," "potential," "continue," "expects," "anticipates," "future," "intends," "plans," "believes," "estimates," "appears," "projects" and similar expressions, as well as statements in future tense, identify forward-looking statements. Investors are cautioned that the following important factors, among others, may affect these forward-looking statements: uncertainty related to timing and amount of value returned to shareholders; risks and uncertainties with respect to the quantities and costs of crude oil we are able to obtain and the price of the refined petroleum products we ultimately sell; risks related to Delek US’ exposure to Permian Basin crude oil, such as supply, pricing, production and transportation capacity; gains and losses from derivative instruments; management's ability to execute its strategy of growth through acquisitions and the transactional risks associated with acquisitions and dispositions; acquired assets may suffer a diminishment in fair value as a result of which we may need to record a write-down or impairment in carrying value of the asset; changes in the scope, costs, and/or timing of capital and maintenance projects; the ability to close the pipeline joint venture, obtain commitments and construct the pipeline; operating hazards inherent in transporting, storing and processing crude oil and intermediate and finished petroleum products; our competitive position and the effects of competition; the projected growth of the industries in which we operate; general economic and business conditions affecting the geographic areas in which we operate; and other risks contained in Delek US’ and Delek Logistics’ filings with the United States Securities and Exchange Commission. Forward-looking statements should not be read as a guarantee of future performance or results, and will not be accurate indications of the times at, or by which such performance or results will be achieved. Forward-looking information is based on information available at the time and/or management’s good faith belief with respect to future events, and is subject to risks and uncertainties that could cause actual performance or results to differ materially from those expressed in the statements. Neither Delek US nor Delek Logistics undertakes any obligation to update or revise any such forward-looking statements. Non-GAAP Disclosures: Delek US and Delek Logistics believe that the presentation of adjusted earnings per share (“adjusted EPS”), earnings before interest, taxes, depreciation and amortization ("EBITDA"), adjusted EBITDA and free cash flow provide useful information to investors in assessing their financial condition, results of operations and cash flow their business is generating. Adjusted EPS, EBITDA, adjusted EBITDA and free cash flow should not be considered as alternatives to net income, operating income, cash from operations or any other measure of financial performance or liquidity presented in accordance with U.S. GAAP. Adjusted EPS, EBITDA, adjusted EBITDA and free cash flow have important limitations as analytical tools because they exclude some, but not all, items that affect net income. Additionally, because adjusted EPS, EBITDA, adjusted EBITDA and free cash flow may be defined differently by other companies in its industry, Delek US' and Delek Logistics’ definitions may not be comparable to similarly titled measures of other companies, thereby diminishing their utility. Please see reconciliations of adjusted EPS, EBITDA, adjusted EBITDA and free cash flow to their most directly comparable financial measures calculated and presented in accordance with U.S. GAAP in the appendix. 2
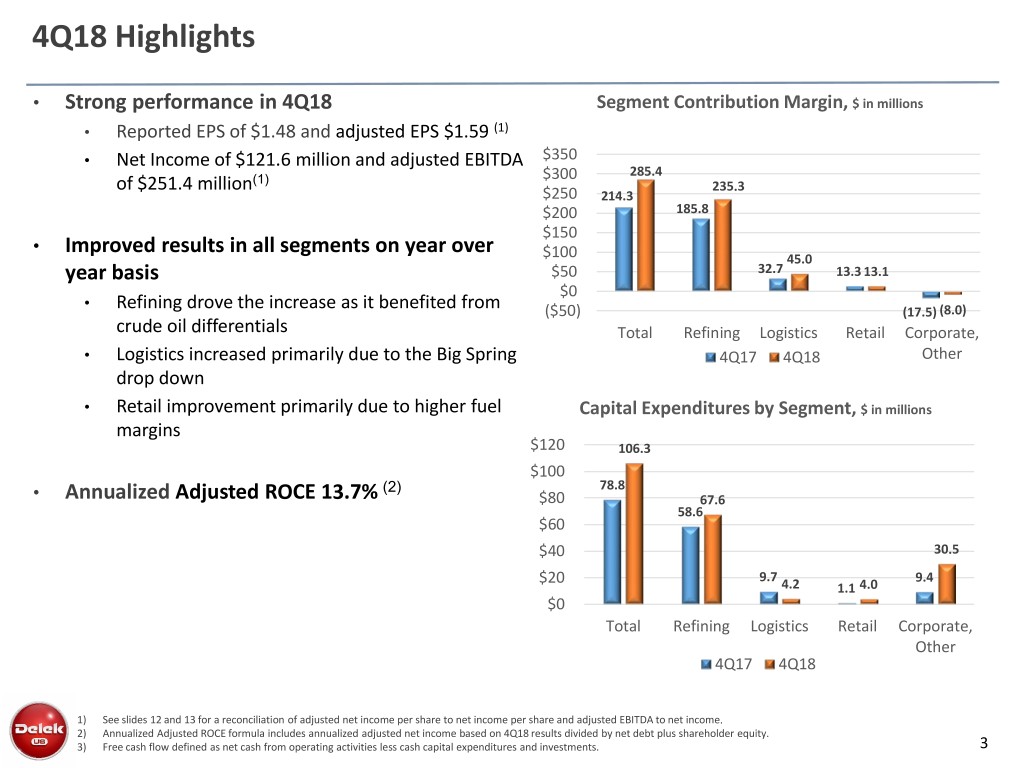
4Q18 Highlights • Strong performance in 4Q18 Segment Contribution Margin, $ in millions • Reported EPS of $1.48 and adjusted EPS $1.59 (1) • Net Income of $121.6 million and adjusted EBITDA $350 $300 285.4 of $251.4 million(1) 235.3 $250 214.3 $200 185.8 $150 • Improved results in all segments on year over $100 45.0 year basis $50 32.7 13.3 13.1 $0 • Refining drove the increase as it benefited from ($50) (17.5) (8.0) crude oil differentials Total Refining Logistics Retail Corporate, • Logistics increased primarily due to the Big Spring 4Q17 4Q18 Other drop down • Retail improvement primarily due to higher fuel Capital Expenditures by Segment, $ in millions margins $120 106.3 $100 (2) 78.8 • Annualized Adjusted ROCE 13.7% $80 67.6 58.6 $60 $40 30.5 $20 9.7 9.4 4.2 1.1 4.0 $0 Total Refining Logistics Retail Corporate, Other 4Q17 4Q18 1) See slides 12 and 13 for a reconciliation of adjusted net income per share to net income per share and adjusted EBITDA to net income. 2) Annualized Adjusted ROCE formula includes annualized adjusted net income based on 4Q18 results divided by net debt plus shareholder equity. 3) Free cash flow defined as net cash from operating activities less cash capital expenditures and investments. 3
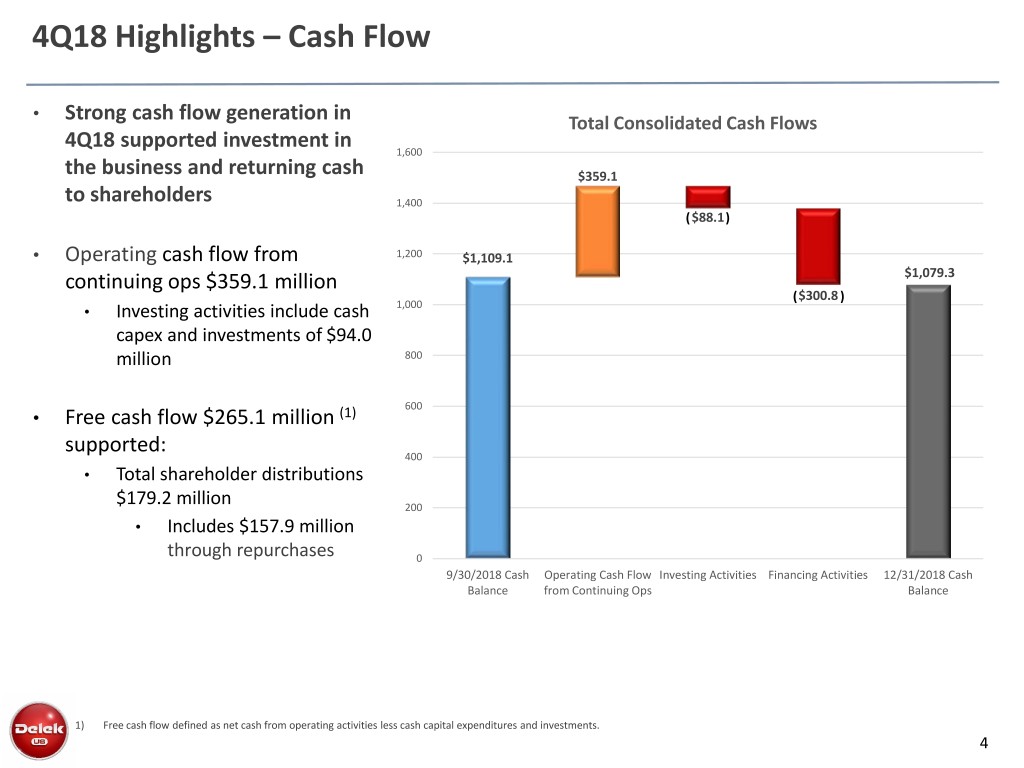
4Q18 Highlights – Cash Flow • Strong cash flow generation in Total Consolidated Cash Flows 4Q18 supported investment in 1,600 the business and returning cash $359.1 to shareholders 1,400 ($88.1) • Operating cash flow from 1,200 $1,109.1 continuing ops $359.1 million $1,079.3 ($300.8 ) 1,000 • Investing activities include cash capex and investments of $94.0 million 800 600 • Free cash flow $265.1 million (1) supported: 400 • Total shareholder distributions $179.2 million 200 • Includes $157.9 million through repurchases 0 9/30/2018 Cash Operating Cash Flow Investing Activities Financing Activities 12/31/2018 Cash Balance from Continuing Ops Balance 1) Free cash flow defined as net cash from operating activities less cash capital expenditures and investments. 4
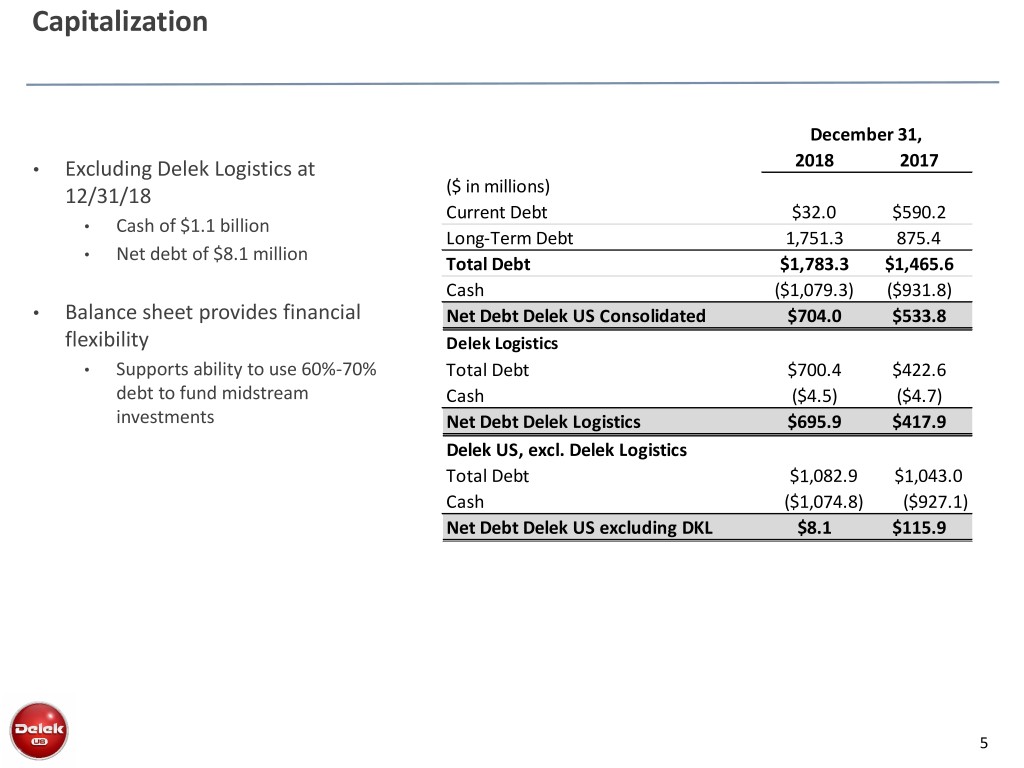
Capitalization December 31, 2018 2017 • Excluding Delek Logistics at 12/31/18 ($ in millions) Current Debt $32.0 $590.2 • Cash of $1.1 billion Long-Term Debt 1,751.3 875.4 • Net debt of $8.1 million Total Debt $1,783.3 $1,465.6 Cash ($1,079.3) ($931.8) • Balance sheet provides financial Net Debt Delek US Consolidated $704.0 $533.8 flexibility Delek Logistics • Supports ability to use 60%-70% Total Debt $700.4 $422.6 debt to fund midstream Cash ($4.5) ($4.7) investments Net Debt Delek Logistics $695.9 $417.9 Delek US, excl. Delek Logistics Total Debt $1,082.9 $1,043.0 Cash ($1,074.8) ($927.1) Net Debt Delek US excluding DKL $8.1 $115.9 5
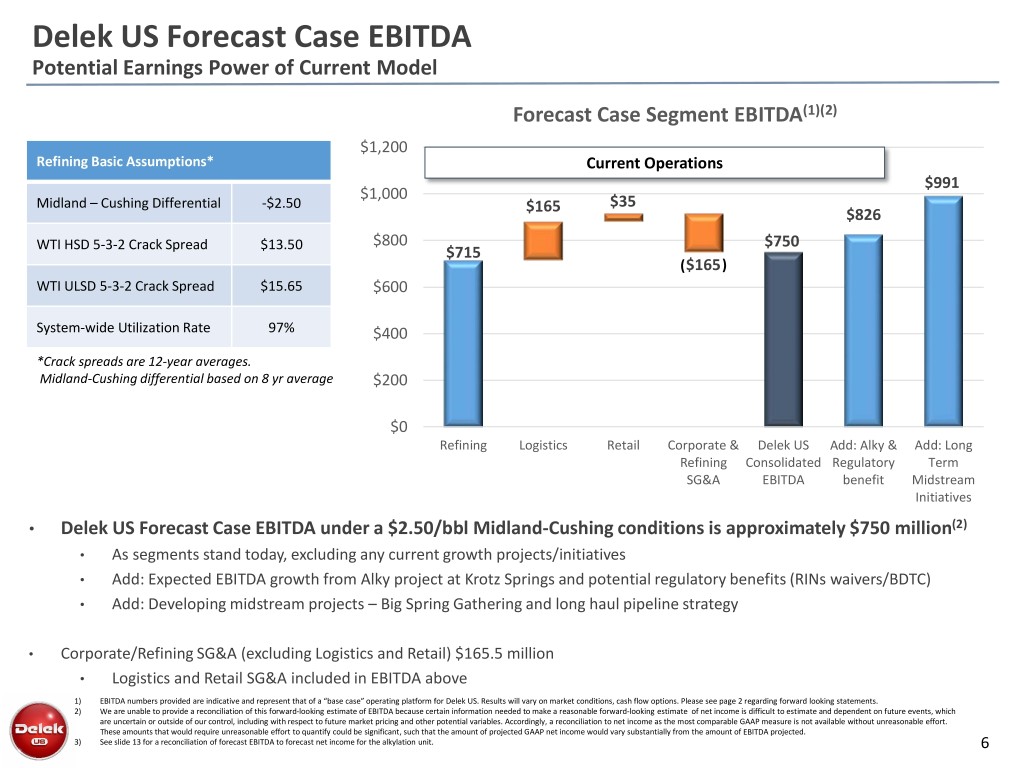
Delek US Forecast Case EBITDA Potential Earnings Power of Current Model Forecast Case Segment EBITDA(1)(2) $1,200 Refining Basic Assumptions* Current Operations $991 $1,000 Midland – Cushing Differential -$2.50 $165 $35 $826 $800 $750 WTI HSD 5-3-2 Crack Spread $13.50 $715 ($165) WTI ULSD 5-3-2 Crack Spread $15.65 $600 System-wide Utilization Rate 97% $400 *Crack spreads are 12-year averages. Midland-Cushing differential based on 8 yr average $200 Sustaining Capex $0 Refining Logistics Retail Corporate & Delek US Add: Alky & Add: Long Refining Consolidated Regulatory Term SG&A EBITDA benefit Midstream Initiatives • Delek US Forecast Case EBITDA under a $2.50/bbl Midland-Cushing conditions is approximately $750 million(2) • As segments stand today, excluding any current growth projects/initiatives • Add: Expected EBITDA growth from Alky project at Krotz Springs and potential regulatory benefits (RINs waivers/BDTC) • Add: Developing midstream projects – Big Spring Gathering and long haul pipeline strategy • Corporate/Refining SG&A (excluding Logistics and Retail) $165.5 million • Logistics and Retail SG&A included in EBITDA above 1) EBITDA numbers provided are indicative and represent that of a “base case” operating platform for Delek US. Results will vary on market conditions, cash flow options. Please see page 2 regarding forward looking statements. 2) We are unable to provide a reconciliation of this forward-looking estimate of EBITDA because certain information needed to make a reasonable forward-looking estimate of net income is difficult to estimate and dependent on future events, which are uncertain or outside of our control, including with respect to future market pricing and other potential variables. Accordingly, a reconciliation to net income as the most comparable GAAP measure is not available without unreasonable effort. These amounts that would require unreasonable effort to quantify could be significant, such that the amount of projected GAAP net income would vary substantially from the amount of EBITDA projected. 3) See slide 13 for a reconciliation of forecast EBITDA to forecast net income for the alkylation unit. 6
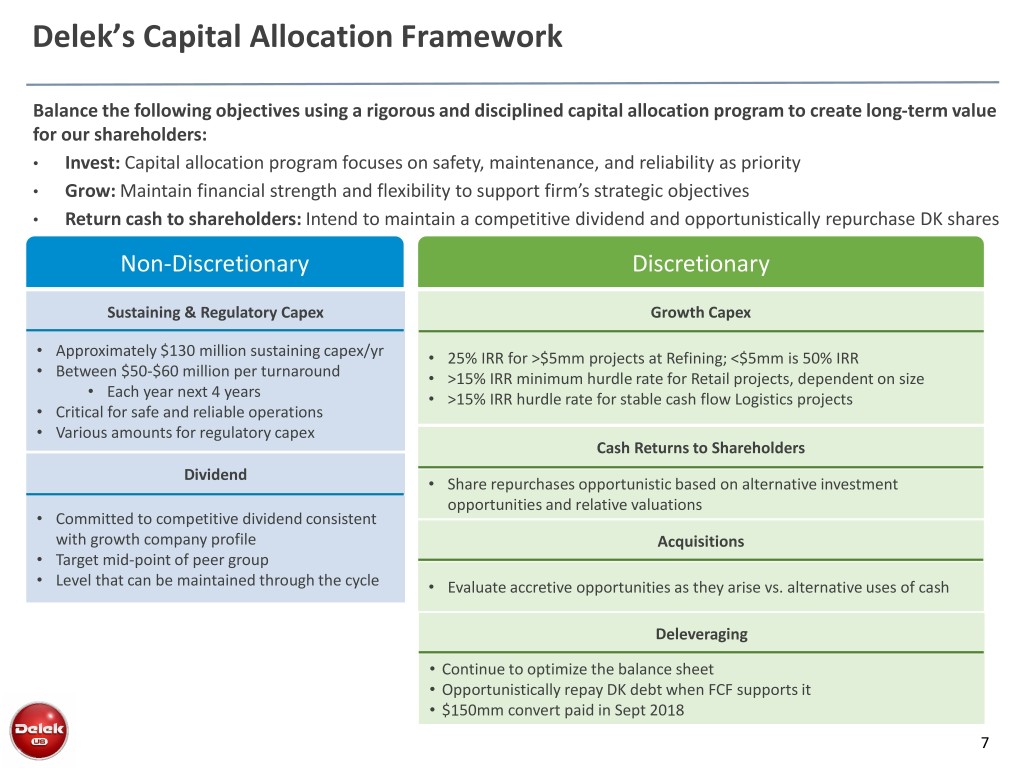
Delek’s Capital Allocation Framework Balance the following objectives using a rigorous and disciplined capital allocation program to create long-term value for our shareholders: • Invest: Capital allocation program focuses on safety, maintenance, and reliability as priority • Grow: Maintain financial strength and flexibility to support firm’s strategic objectives • Return cash to shareholders: Intend to maintain a competitive dividend and opportunistically repurchase DK shares Non-Discretionary Discretionary Sustaining & Regulatory Capex Growth Capex • Approximately $130 million sustaining capex/yr • 25% IRR for >$5mm projects at Refining; <$5mm is 50% IRR • Between $50-$60 million per turnaround • >15% IRR minimum hurdle rate for Retail projects, dependent on size • Each year next 4 years • >15% IRR hurdle rate for stable cash flow Logistics projects • CriticalSustaining for safe and Capex reliable operations • Various amounts for regulatory capex Cash Returns to Shareholders Dividend • Share repurchases opportunistic based on alternative investment opportunities and relative valuations • Committed to competitive dividend consistent with growth company profile Acquisitions • Target mid-point of peer group • Level that can be maintained through the cycle • Evaluate accretive opportunities as they arise vs. alternative uses of cash Deleveraging • Continue to optimize the balance sheet • Opportunistically repay DK debt when FCF supports it • $150mm convert paid in Sept 2018 7
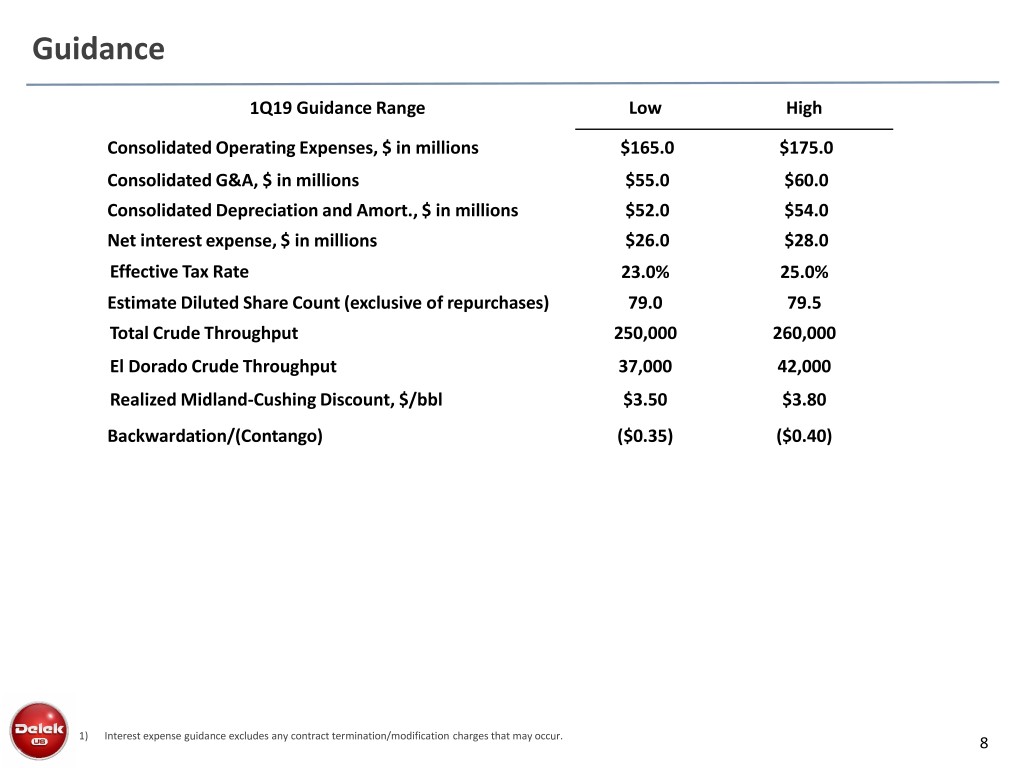
Guidance 1Q19 Guidance Range Low High Consolidated Operating Expenses, $ in millions $165.0 $175.0 Consolidated G&A, $ in millions $55.0 $60.0 Consolidated Depreciation and Amort., $ in millions $52.0 $54.0 Net interest expense, $ in millions $26.0 $28.0 Effective Tax Rate 23.0% 25.0% Estimate Diluted Share Count (exclusive of repurchases) 79.0 79.5 Total Crude Throughput 250,000 260,000 El Dorado Crude Throughput 37,000 42,000 Realized Midland-Cushing Discount, $/bbl $3.50 $3.80 Backwardation/(Contango) ($0.35) ($0.40) 1) Interest expense guidance excludes any contract termination/modification charges that may occur. 8
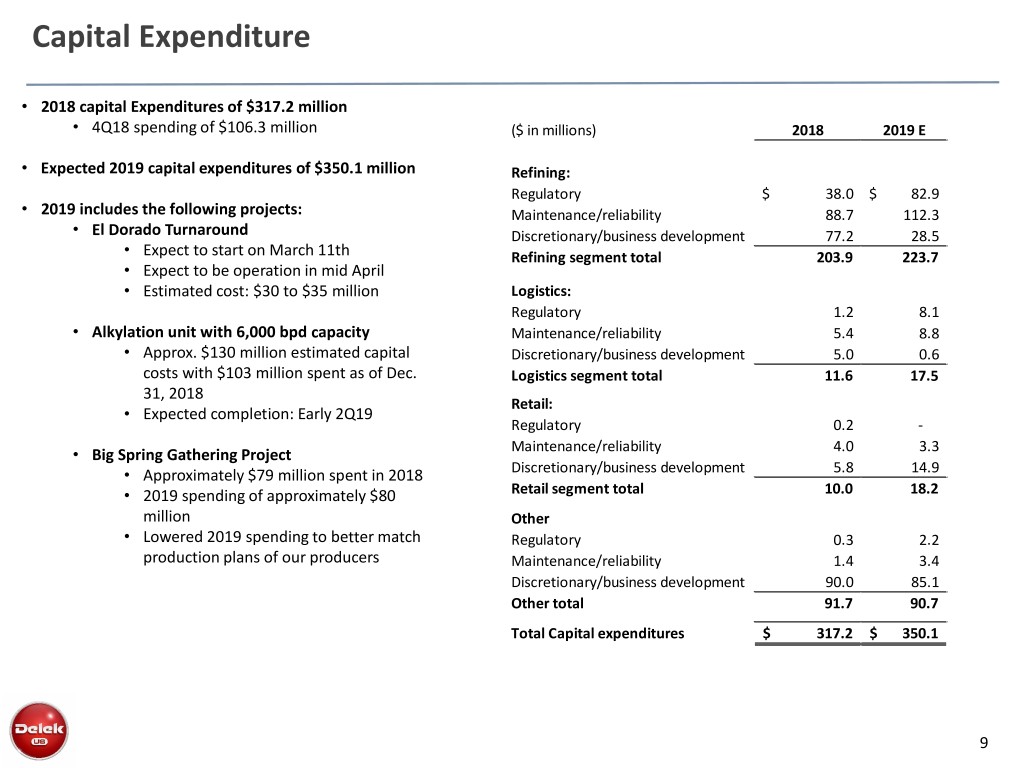
Capital Expenditure • 2018 capital Expenditures of $317.2 million • 4Q18 spending of $106.3 million ($ in millions) 2018 2019 E • Expected 2019 capital expenditures of $350.1 million Refining: Regulatory $ 38.0 $ 82.9 • 2019 includes the following projects: Maintenance/reliability 88.7 112.3 • El Dorado Turnaround Discretionary/business development 77.2 28.5 • Expect to start on March 11th Refining segment total 203.9 223.7 • Expect to be operation in mid April • Estimated cost: $30 to $35 million Logistics: Regulatory 1.2 8.1 • Alkylation unit with 6,000 bpd capacity Maintenance/reliability 5.4 8.8 • Approx. $130 million estimated capital Discretionary/business development 5.0 0.6 costs with $103 million spent as of Dec. Logistics segment total 11.6 17.5 31, 2018 Retail: • Expected completion: Early 2Q19 Regulatory 0.2 - Maintenance/reliability 4.0 3.3 • Big Spring Gathering Project • Approximately $79 million spent in 2018 Discretionary/business development 5.8 14.9 • 2019 spending of approximately $80 Retail segment total 10.0 18.2 million Other • Lowered 2019 spending to better match Regulatory 0.3 2.2 production plans of our producers Maintenance/reliability 1.4 3.4 Discretionary/business development 90.0 85.1 Other total 91.7 90.7 Total Capital expenditures $ 317.2 $ 350.1 9
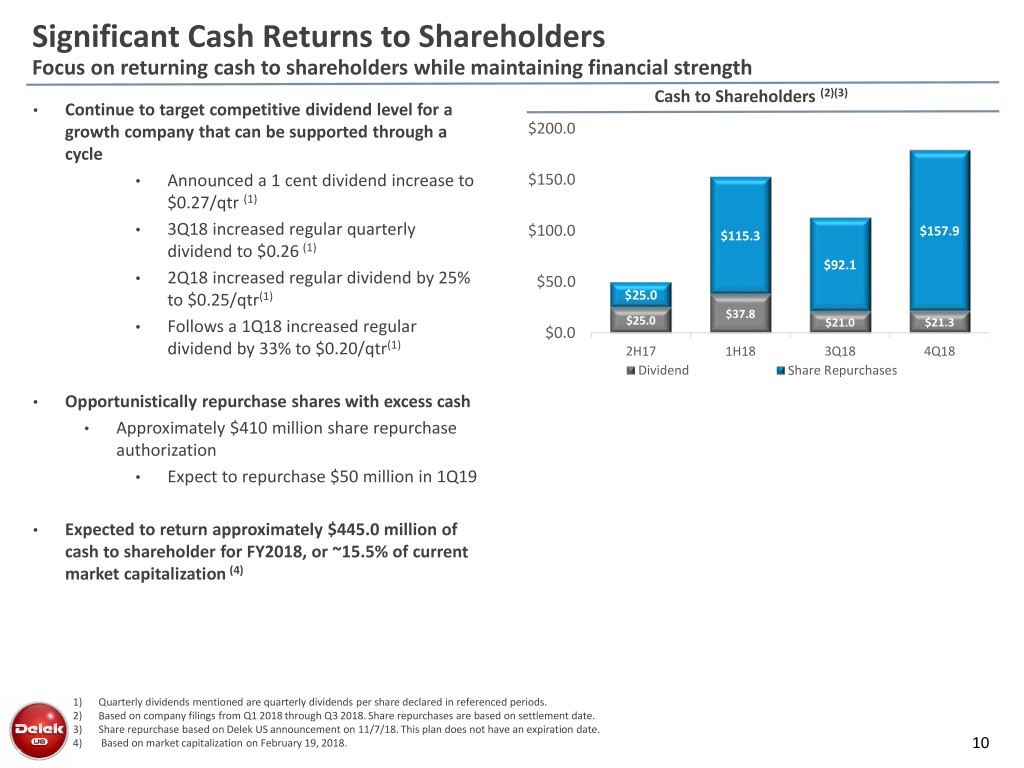
Significant Cash Returns to Shareholders Focus on returning cash to shareholders while maintaining financial strength Cash to Shareholders (2)(3) • Continue to target competitive dividend level for a growth company that can be supported through a $200.0 cycle • Announced a 1 cent dividend increase to $150.0 $0.27/qtr (1) • 3Q18 increased regular quarterly $100.0 $115.3 $157.9 dividend to $0.26 (1) $92.1 • 2Q18 increased regular dividend by 25% $50.0 to $0.25/qtr(1) $25.0 $37.8 $25.0 $21.0 $21.3 • Follows a 1Q18 increased regular $0.0 dividend by 33% to $0.20/qtr(1) 2H17 1H18 3Q18 4Q18 Dividend Share Repurchases • Opportunistically repurchase shares with excess cash • Approximately $410 million share repurchase authorization • Expect to repurchase $50 million in 1Q19 • Expected to return approximately $445.0 million of cash to shareholder for FY2018, or ~15.5% of current market capitalization (4) 1) Quarterly dividends mentioned are quarterly dividends per share declared in referenced periods. 2) Based on company filings from Q1 2018 through Q3 2018. Share repurchases are based on settlement date. 3) Share repurchase based on Delek US announcement on 11/7/18. This plan does not have an expiration date. 4) Based on market capitalization on February 19, 2018. 10
Questions and Answers Significant Organic Focus on Long-Term Growth / Margin Shareholder Returns Improvement Opportunities An Integrated and Permian Focused Diversified Refining, Financial Flexibility Refining System Logistics and Marketing Company Complementary Logistics Systems

Non-GAAP Reconciliations of Adjusted Net Income Delek US Holdings, Inc. Reconciliation of Amounts Reported Under U.S. GAAP per share data Three Months Ended Year Ended December 31, December 31, Reconciliation of U.S. GAAP Income per share to Adjusted Net Income per share 2018 2017 2018 2017 (Unaudited) (Unaudited) Reported diluted income per share $1.48 $2.56 $4.02 $4.00 Adjustments, after tax (per share) Net inventory valuation loss (gain) 0.51 (0.11) 0.47 (0.12) Environmental Indemnification Proceeds (0.19) - (0.18) - Contract termination charges 0.06 - 0.06 - Asset write offs - - - 0.01 Adjusted unrealized hedging (gain) loss (0.25) 0.10 (0.25) 0.19 Inventory fair value adjustment - - - 0.26 Transaction related expenses 0.01 0.03 0.15 0.24 Gain on remeasurement of equity method investment in Alon - - - (1.67) Deferred tax write-off - - - 0.65 Tax Cuts and Jobs Act adjustment (benefit) expense (0.03) (2.02) (0.01) (2.31) Impairment loss on assets held for sale - - 0.31 - Gain on sale of the asphalt business - - (0.12) - (Gain) loss on extinguishment of debt - - 0.08 - Discontinued operations loss - 0.02 0.10 0.08 Net loss attributable to non-controlling interest of discontinued operations - - 0.09 - Total adjustments 0.11 (1.98) 0.70 (2.67) Adjustment for economic benefit of note hedge related to Senior Convertible Notes - - 0.08 - Adjusted net income per share $1.59 $0.58 $4.80 $1.33 Shares used in computing Non-GAAP dilutive effect of convertible debt: Diluted 82,528,339 82,645,060 86,768,401 72,303,083 Less: Adjustment for economic benefit of note hedge related to Senior Convertible Notes - 526,464 1,525,846 - Non-GAAP Adjusted Diluted Share Count 82,528,339 82,118,596 85,242,555 72,303,083 12
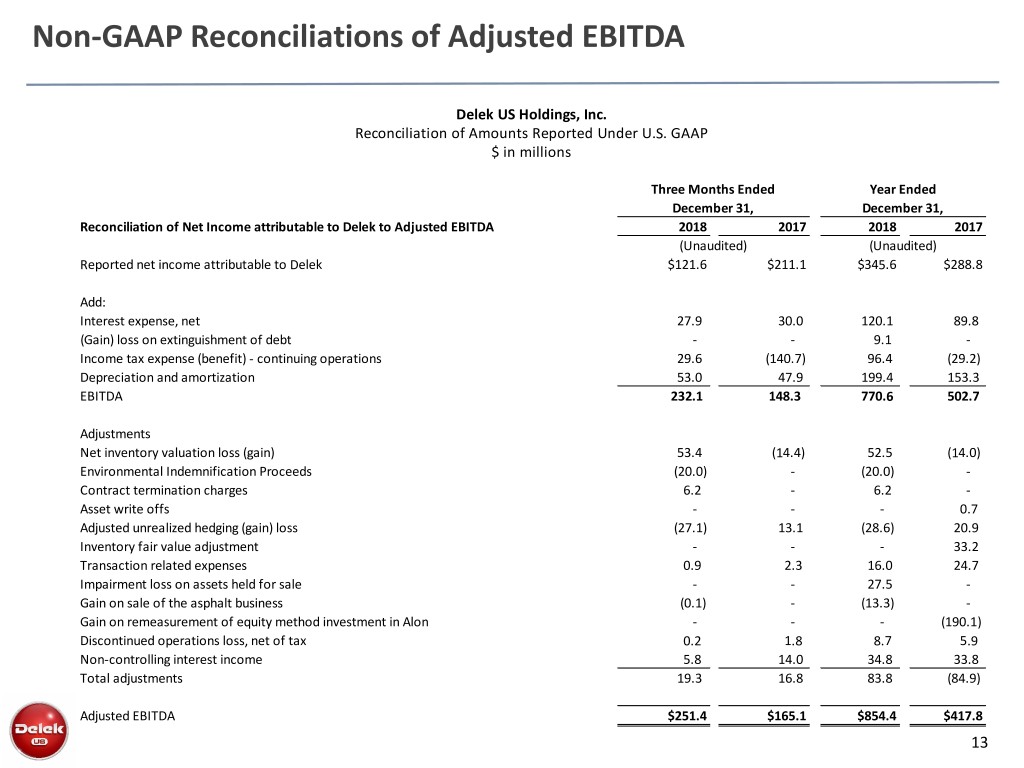
Non-GAAP Reconciliations of Adjusted EBITDA Delek US Holdings, Inc. Reconciliation of Amounts Reported Under U.S. GAAP $ in millions Three Months Ended Year Ended December 31, December 31, Reconciliation of Net Income attributable to Delek to Adjusted EBITDA 2018 2017 2018 2017 (Unaudited) (Unaudited) Reported net income attributable to Delek $121.6 $211.1 $345.6 $288.8 Add: Interest expense, net 27.9 30.0 120.1 89.8 (Gain) loss on extinguishment of debt - - 9.1 - Income tax expense (benefit) - continuing operations 29.6 (140.7) 96.4 (29.2) Depreciation and amortization 53.0 47.9 199.4 153.3 EBITDA 232.1 148.3 770.6 502.7 Adjustments Net inventory valuation loss (gain) 53.4 (14.4) 52.5 (14.0) Environmental Indemnification Proceeds (20.0) - (20.0) - Contract termination charges 6.2 - 6.2 - Asset write offs - - - 0.7 Adjusted unrealized hedging (gain) loss (27.1) 13.1 (28.6) 20.9 Inventory fair value adjustment - - - 33.2 Transaction related expenses 0.9 2.3 16.0 24.7 Impairment loss on assets held for sale - - 27.5 - Gain on sale of the asphalt business (0.1) - (13.3) - Gain on remeasurement of equity method investment in Alon - - - (190.1) Discontinued operations loss, net of tax 0.2 1.8 8.7 5.9 Non-controlling interest income 5.8 14.0 34.8 33.8 Total adjustments 19.3 16.8 83.8 (84.9) Adjusted EBITDA $251.4 $165.1 $854.4 $417.8 13


