September 2022 Delek US Holdings, Inc. Investor Presentation Exhibit 99.1
Disclaimers 2 Forward Looking Statements: Delek US Holdings, Inc. (“Delek US”) and Delek Logistics Partners, LP (“Delek Logistics”; and collectively with Delek US, “we” or “our”) are traded on the New York Stock Exchange in the United States under the symbols “DK” and ”DKL”, respectively. These slides and any accompanying oral and written presentations contain forward-looking statements within the meaning of federal securities laws that are based upon current expectations and involve a number of risks and uncertainties. Statements concerning current estimates, expectations and projections about future results, performance, prospects, opportunities, plans, actions and events and other statements, concerns, or matters that are not historical facts are “forward-looking statements,” as that term is defined under the federal securities laws. Words such as "may," "will," "should," "could," "would," "predicts," "potential," "continue," "expects," "anticipates," "future," "intends," "plans," "believes," "estimates," "appears," "projects" and similar expressions, as well as statements in future tense, identify forward-looking statements. These forward-looking statements include, but are not limited to, the statements regarding the following: financial and operating guidance for future and uncompleted financial periods; financial strength and flexibility; potential for and projections of growth; return of cash to shareholders, stock repurchases and the payment of dividends, including the amount and timing thereof; cost reductions; crude oil throughput; crude oil market trends, including production, quality, pricing, demand, imports, exports and transportation costs; competitive conditions in the markets where our refineries are located; the performance of our joint venture investments, including Red River and Wink to Webster, and the benefits, flexibility, returns and EBITDA therefrom; the potential for, and estimates of cost savings and other benefits from, acquisitions, divestitures, dropdowns and financing activities; the attainment of certain regulatory benefits; long-term value creation from capital allocation; targeted internal rates of return on capital expenditures; execution of strategic initiatives and the benefits therefrom, including cash flow stability from business model transition and approach to renewable diesel; and access to crude oil and the benefits therefrom. Investors are cautioned that the following important factors, among others, may affect these forward-looking statements: uncertainty related to timing and amount of value returned to shareholders; risks and uncertainties with respect to the quantities and costs of crude oil we are able to obtain and the price of the refined petroleum products we ultimately sell, including uncertainties regarding future decisions by OPEC regarding production and pricing disputes between OPEC members and Russia; uncertainty relating to the impact of the COVID-19 outbreak on the demand for crude oil, refined products and transportation and storage services; Delek US’ ability to realize cost reductions; risks related to Delek US’ exposure to Permian Basin crude oil, such as supply, pricing, production and transportation capacity; gains and losses from derivative instruments; management's ability to execute its strategy of growth through acquisitions and the transactional risks associated with acquisitions and dispositions; acquired assets may suffer a diminishment in fair value as a result of which we may need to record a write-down or impairment in carrying value of the asset; changes in the scope, costs, and/or timing of capital and maintenance projects; the ability of the Wink to Webster joint venture to construct the long-haul pipeline; the ability of the Red River joint venture to expand the Red River pipeline; the possibility of litigation challenging renewable fuel standard waivers; the ability to grow the Big Spring Gathering System; operating hazards inherent in transporting, storing and processing crude oil and intermediate and finished petroleum products; our competitive position and the effects of competition; the projected growth of the industries in which we operate; general economic and business conditions affecting the geographic areas in which we operate; and other risks contained in Delek US’ and Delek Logistics’ filings with the United States Securities and Exchange Commission. Forward-looking statements should not be read as a guarantee of future performance or results, and will not be accurate indications of the times at, or by which such performance or results will be achieved. Forward-looking information is based on information available at the time and/or management’s good faith belief with respect to future events, and is subject to risks and uncertainties that could cause actual performance or results to differ materially from those expressed in the statements. Neither Delek US nor Delek Logistics undertakes any obligation to update or revise any such forward-looking statements. Non-GAAP Disclosures: Our management uses certain “non-GAAP” operational measures to evaluate our operating segment performance and non-GAAP financial measures to evaluate past performance and prospects for the future to supplement our GAAP financial information presented in accordance with U.S. GAAP. These financial and operational non-GAAP measures are important factors in assessing our operating results and profitability and include: Adjusting items - certain identified infrequently occurring items, non-cash items, and items that are not attributable to or indicative of our on-going operations or that may obscure our underlying results and trends; Earnings before interest, taxes, depreciation and amortization ("EBITDA") - calculated as net income attributable to Delek US or Delek Logistics, as applicable, adjusted to add back interest expense, income tax expense, depreciation and amortization; Net debt- calculated as long-term debt (the most comparable GAAP measure) including both current and non-current portions, less cash and cash equivalents as of a specific balance sheet date. This is an important measure to monitor leverage and evaluate the balance sheet. Adjusted Segment Earnings - calculated as reported GAAP contribution margin (or revenue less cost of materials and other and operating expenses) less estimated general and administrative expenses specific to the segment (and excluding allocations of corporate general and administrative expenses), adjusted to include gain (loss) from disposal of property and equipment, and adjusted to reflect the relevant Adjusting items (defined above). While this measure does not exactly represent EBITDA, it may be considered a reasonably comparable measure to EBITDA, in that it includes all identified material cash income and expense items, and excludes depreciation, amortization, interest and income taxes. This definition of Adjusted Segment Earnings (or, individually, Adjusted Refining Segment Earnings, Adjusted [Logistics] Midstream Segment Earnings or Adjusted Retail Segment Earnings) is specific to this communication only and the exhibits referenced herein, and may not correlate to the use of the term ‘Adjusted Contribution Margin’ or ‘Adjusted Segment Contribution Margin’ as a non-GAAP measure in other of our filings with the SEC. Accordingly, always refer to the respective Non-GAAP Disclosures section, included in each of our filings that contain non-GAAP measures, for more information regarding the use of and definition of non-GAAP measures and terms, as they relate to that specific SEC filing. We believe these non-GAAP measures are useful to investors, lenders, ratings agencies and analysts to assess our financial results and ongoing performance in certain segments because, when reconciled to their most comparable GAAP financial measure, they provide important information regarding trends that may aid in evaluating our performance as well improved relevant comparability between periods, to peers or to market metrics. Non-GAAP measures have important limitations as analytical tools, because they exclude some, but not all, items that affect contribution margin, operating income (loss), and net income (loss). These measures should not be considered substitutes for their most directly comparable U.S. GAAP financial measures. Additionally, because the non-GAAP measures referenced above may be defined differently by other companies in its industry, Delek US’s definition may not be comparable to similarly titled measures of other companies. See the accompanying tables in the appendix for a reconciliation of these non-GAAP measures to the most directly comparable GAAP measures. We are unable to provide a reconciliation of forward-looking estimates of EBITDA or other forward-looking non-GAAP measures because certain information needed to make a reasonable forward-looking estimate of net income or other forward-looking GAAP measures is difficult to estimate and dependent on future events, which are uncertain or outside of our control. Accordingly, a reconciliation to the most comparable GAAP measure is not available without unreasonable effort. These amounts that would require unreasonable effort to quantify could be significant, such that the amount of the projected GAAP measure could vary substantially from projected non-GAAP measure.
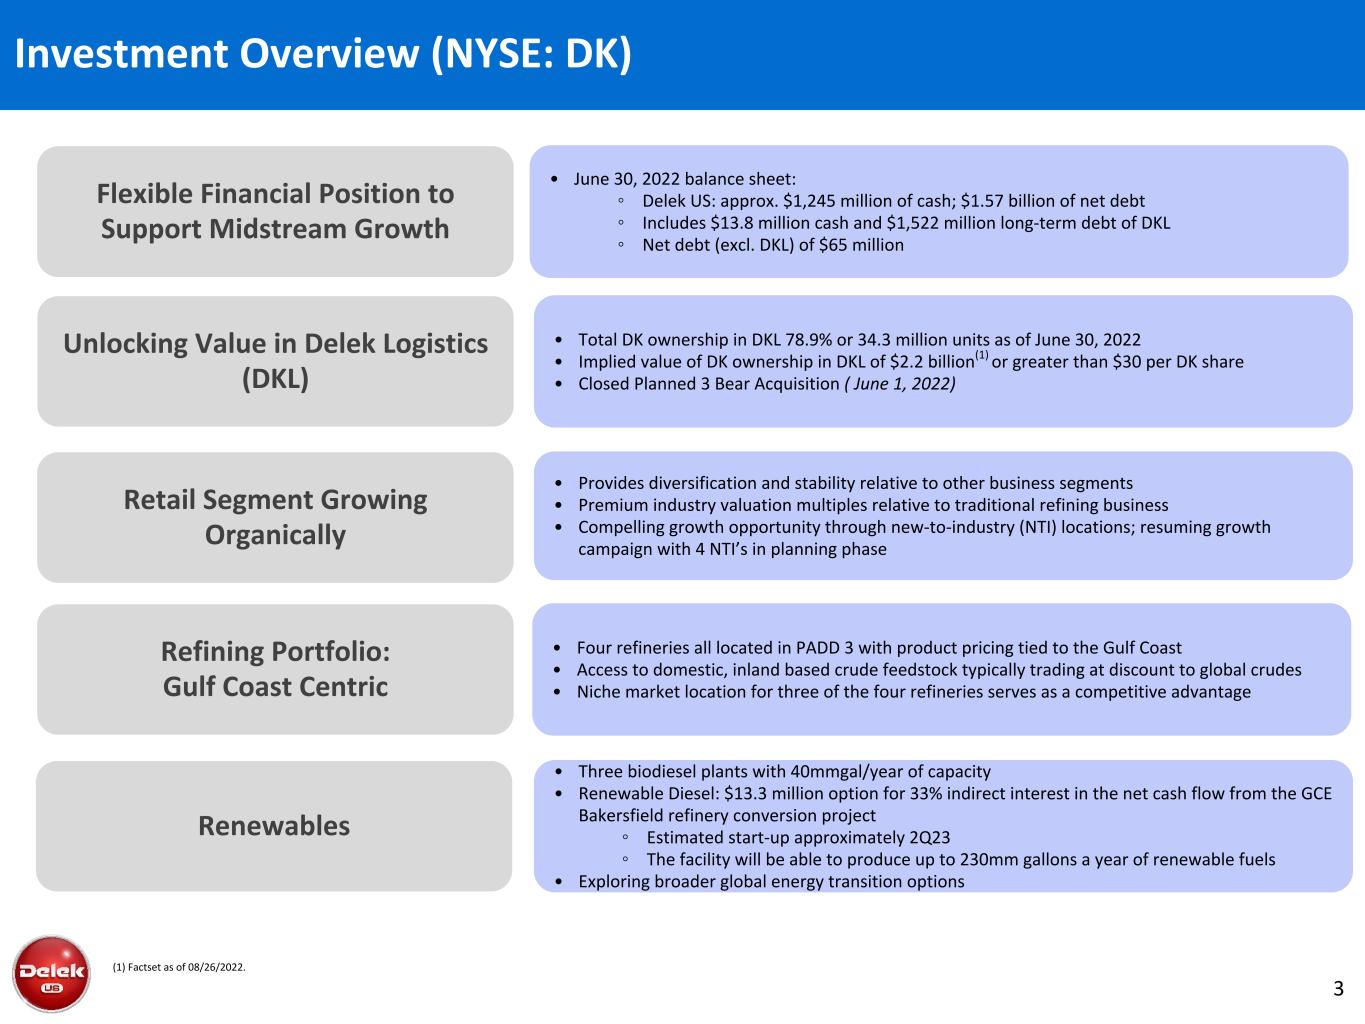
3 (1) Factset as of 08/26/2022. • June 30, 2022 balance sheet: ◦ Delek US: approx. $1,245 million of cash; $1.57 billion of net debt ◦ Includes $13.8 million cash and $1,522 million long-term debt of DKL ◦ Net debt (excl. DKL) of $65 million • Three biodiesel plants with 40mmgal/year of capacity • Renewable Diesel: $13.3 million option for 33% indirect interest in the net cash flow from the GCE Bakersfield refinery conversion project ◦ Estimated start-up approximately 2Q23 ◦ The facility will be able to produce up to 230mm gallons a year of renewable fuels • Exploring broader global energy transition options • Provides diversification and stability relative to other business segments • Premium industry valuation multiples relative to traditional refining business • Compelling growth opportunity through new-to-industry (NTI) locations; resuming growth campaign with 4 NTI’s in planning phase • Four refineries all located in PADD 3 with product pricing tied to the Gulf Coast • Access to domestic, inland based crude feedstock typically trading at discount to global crudes • Niche market location for three of the four refineries serves as a competitive advantage Unlocking Value in Delek Logistics (DKL) Renewables Retail Segment Growing Organically Refining Portfolio: Gulf Coast Centric Flexible Financial Position to Support Midstream Growth Investment Overview (NYSE: DK) • Total DK ownership in DKL 78.9% or 34.3 million units as of June 30, 2022 • Implied value of DK ownership in DKL of $2.2 billion(1) or greater than $30 per DK share • Closed Planned 3 Bear Acquisition ( June 1, 2022)
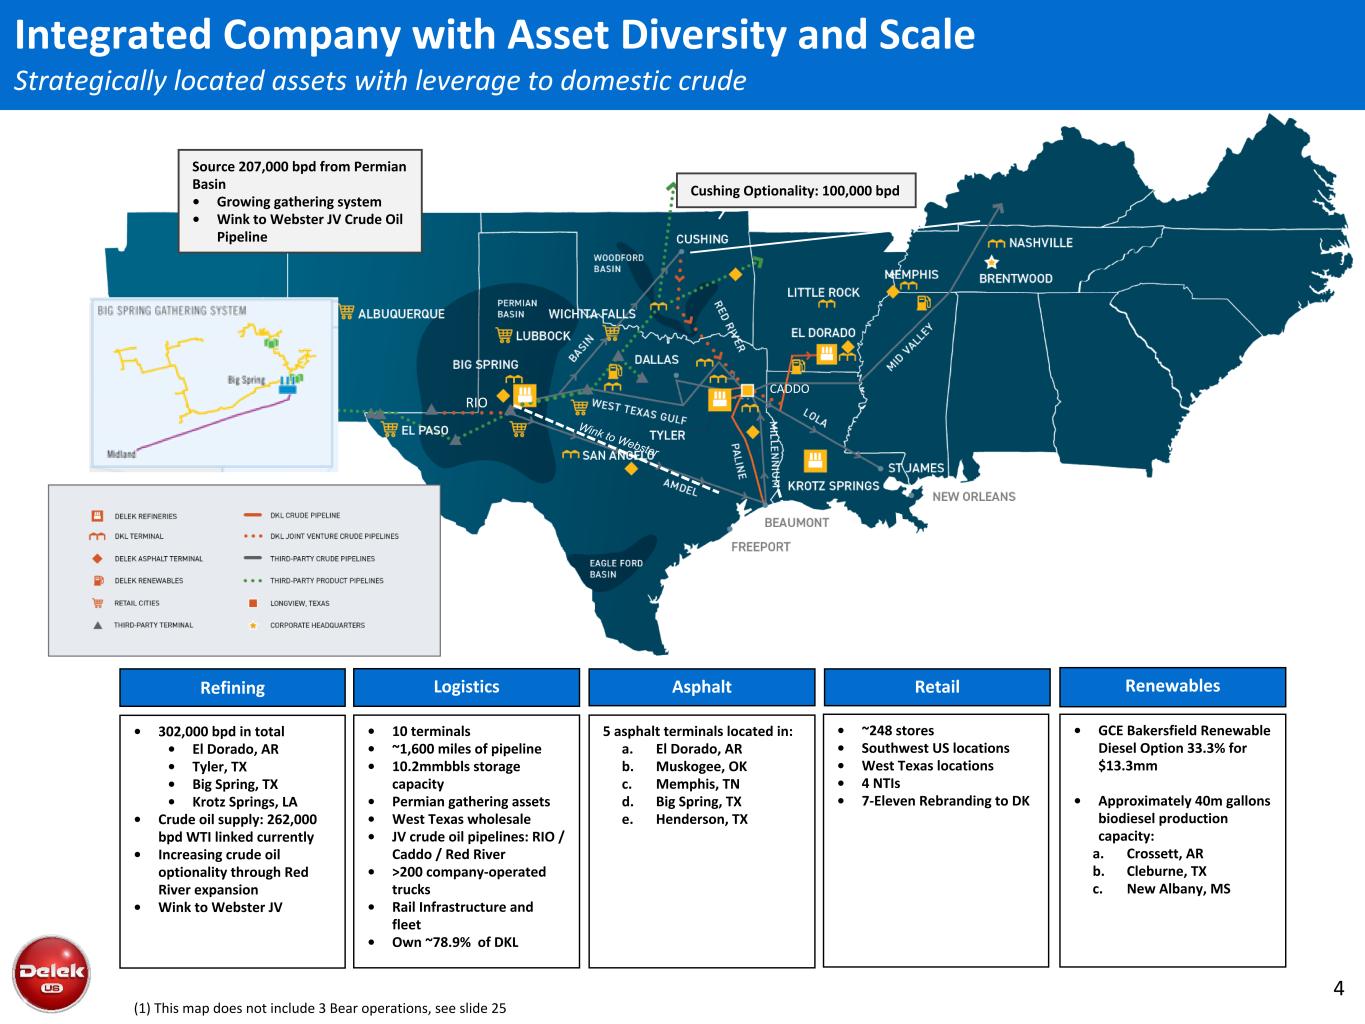
4 Asphalt 5 asphalt terminals located in: a. El Dorado, AR b. Muskogee, OK c. Memphis, TN d. Big Spring, TX e. Henderson, TX Refining • 302,000 bpd in total • El Dorado, AR • Tyler, TX • Big Spring, TX • Krotz Springs, LA • Crude oil supply: 262,000 bpd WTI linked currently • Increasing crude oil optionality through Red River expansion • Wink to Webster JV Logistics • 10 terminals • ~1,600 miles of pipeline • 10.2mmbbls storage capacity • Permian gathering assets • West Texas wholesale • JV crude oil pipelines: RIO / Caddo / Red River • >200 company-operated trucks • Rail Infrastructure and fleet • Own ~78.9% of DKL Source 207,000 bpd from Permian Basin • Growing gathering system • Wink to Webster JV Crude Oil Pipeline Wink to Webster Cushing Optionality: 100,000 bpd RIO CADDO Renewables • GCE Bakersfield Renewable Diesel Option 33.3% for $13.3mm • Approximately 40m gallons biodiesel production capacity: a. Crossett, AR b. Cleburne, TX c. New Albany, MS Integrated Company with Asset Diversity and Scale Strategically located assets with leverage to domestic crude Retail • ~248 stores • Southwest US locations • West Texas locations • 4 NTIs • 7-Eleven Rebranding to DK (1) This map does not include 3 Bear operations, see slide 25
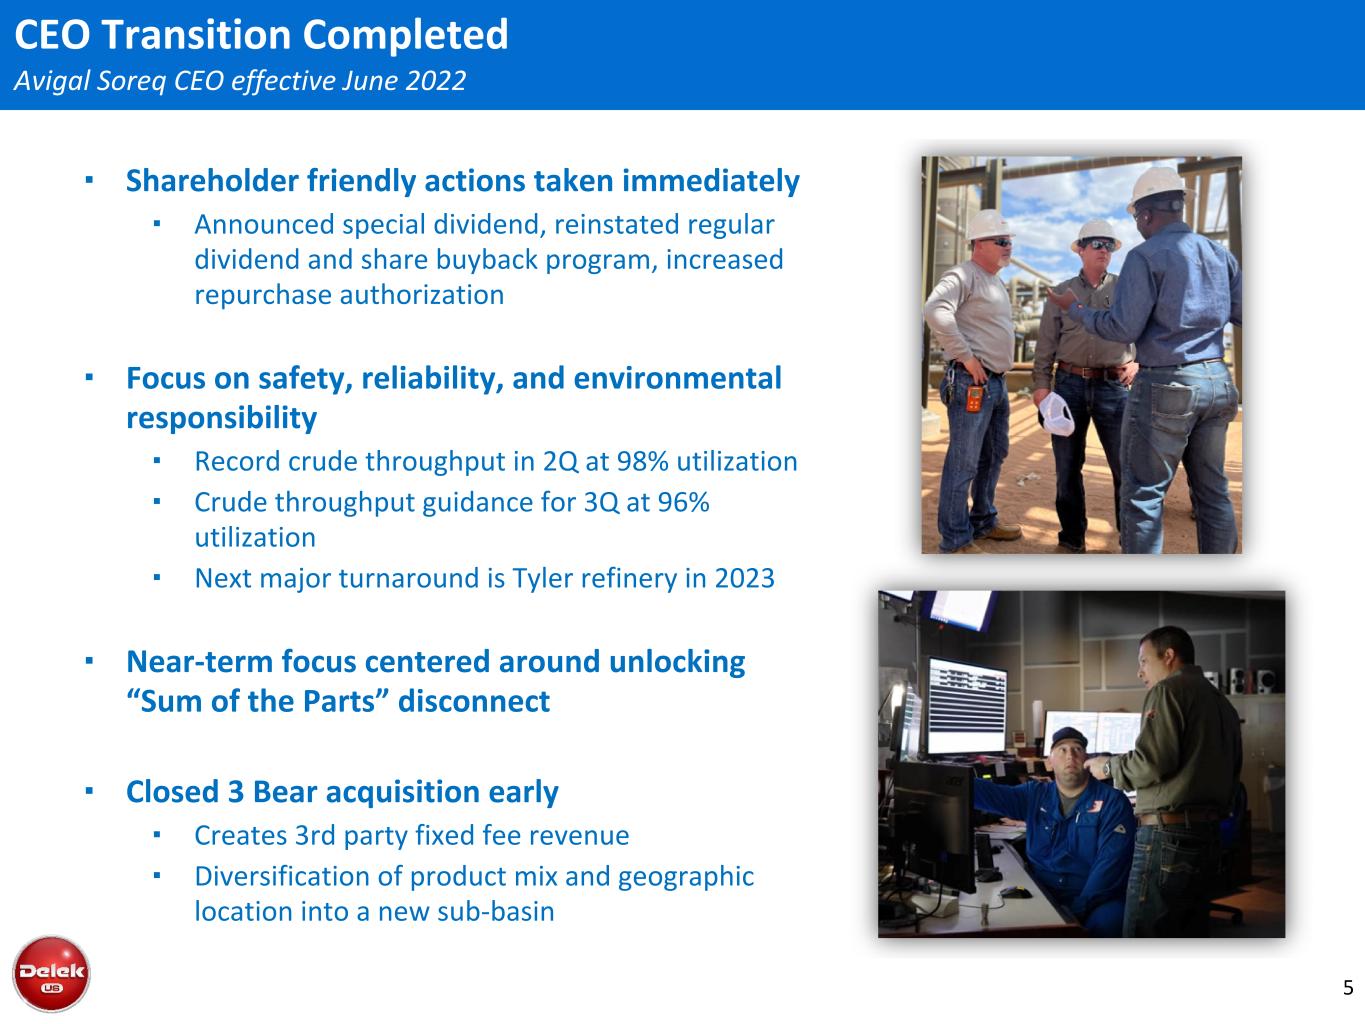
5 ▪ Shareholder friendly actions taken immediately ▪ Announced special dividend, reinstated regular dividend and share buyback program, increased repurchase authorization ▪ Focus on safety, reliability, and environmental responsibility ▪ Record crude throughput in 2Q at 98% utilization ▪ Crude throughput guidance for 3Q at 96% utilization ▪ Next major turnaround is Tyler refinery in 2023 ▪ Near-term focus centered around unlocking “Sum of the Parts” disconnect ▪ Closed 3 Bear acquisition early ▪ Creates 3rd party fixed fee revenue ▪ Diversification of product mix and geographic location into a new sub-basin CEO Transition Completed Avigal Soreq CEO effective June 2022
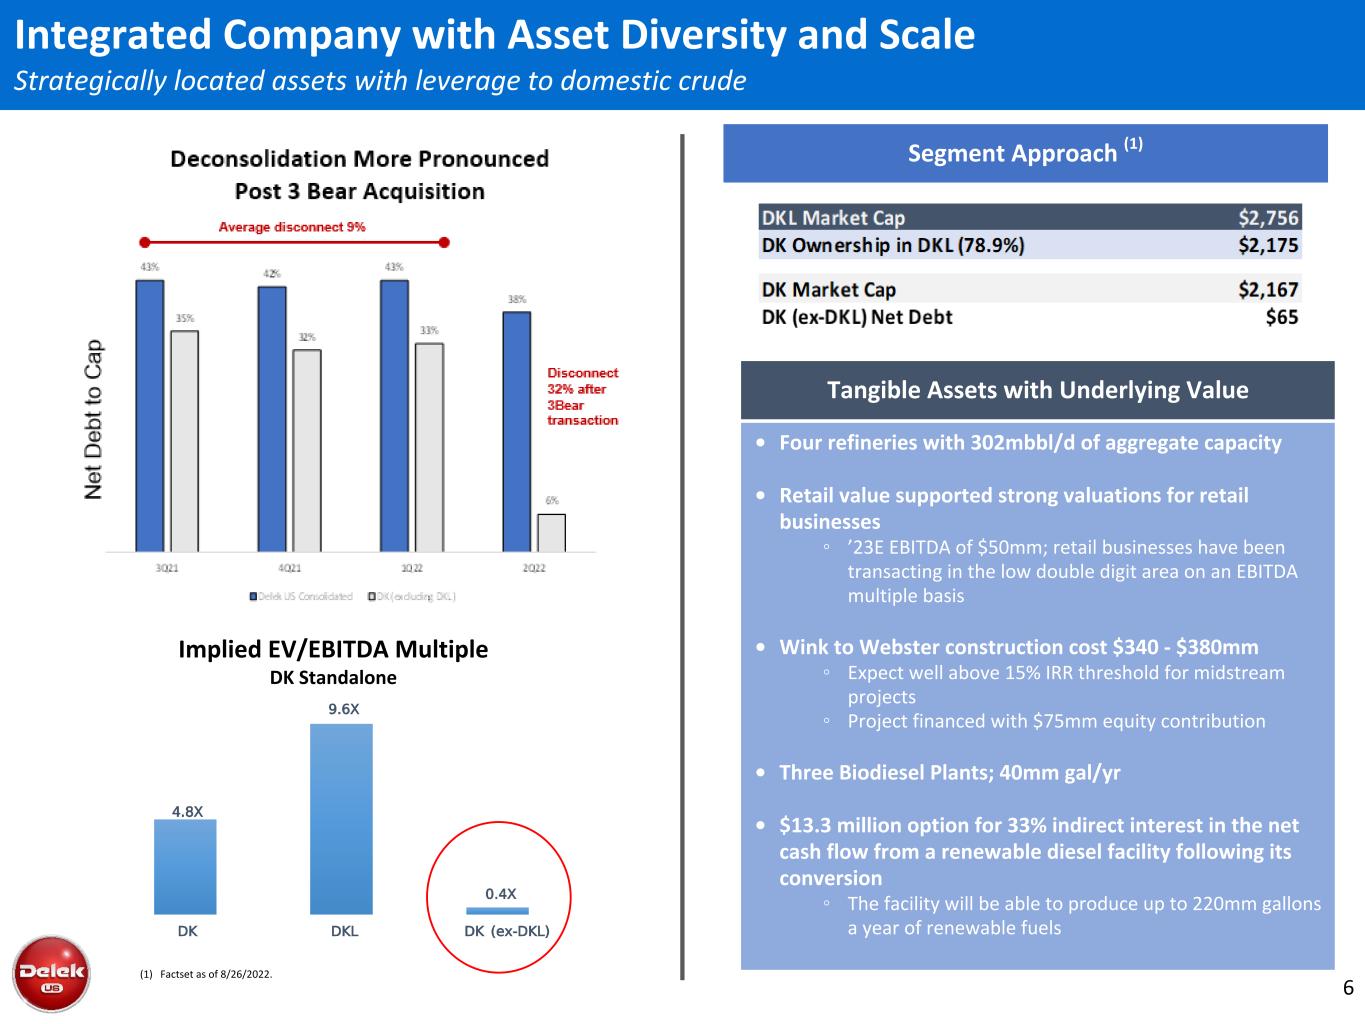
6 Segment Approach (1) Implied EV/EBITDA Multiple DK Standalone • Four refineries with 302mbbl/d of aggregate capacity • Retail value supported strong valuations for retail businesses ◦ ’23E EBITDA of $50mm; retail businesses have been transacting in the low double digit area on an EBITDA multiple basis • Wink to Webster construction cost $340 - $380mm ◦ Expect well above 15% IRR threshold for midstream projects ◦ Project financed with $75mm equity contribution • Three Biodiesel Plants; 40mm gal/yr • $13.3 million option for 33% indirect interest in the net cash flow from a renewable diesel facility following its conversion ◦ The facility will be able to produce up to 220mm gallons a year of renewable fuels Tangible Assets with Underlying Value (1) Factset as of 8/26/2022. Integrated Company with Asset Diversity and Scale Strategically located assets with leverage to domestic crude
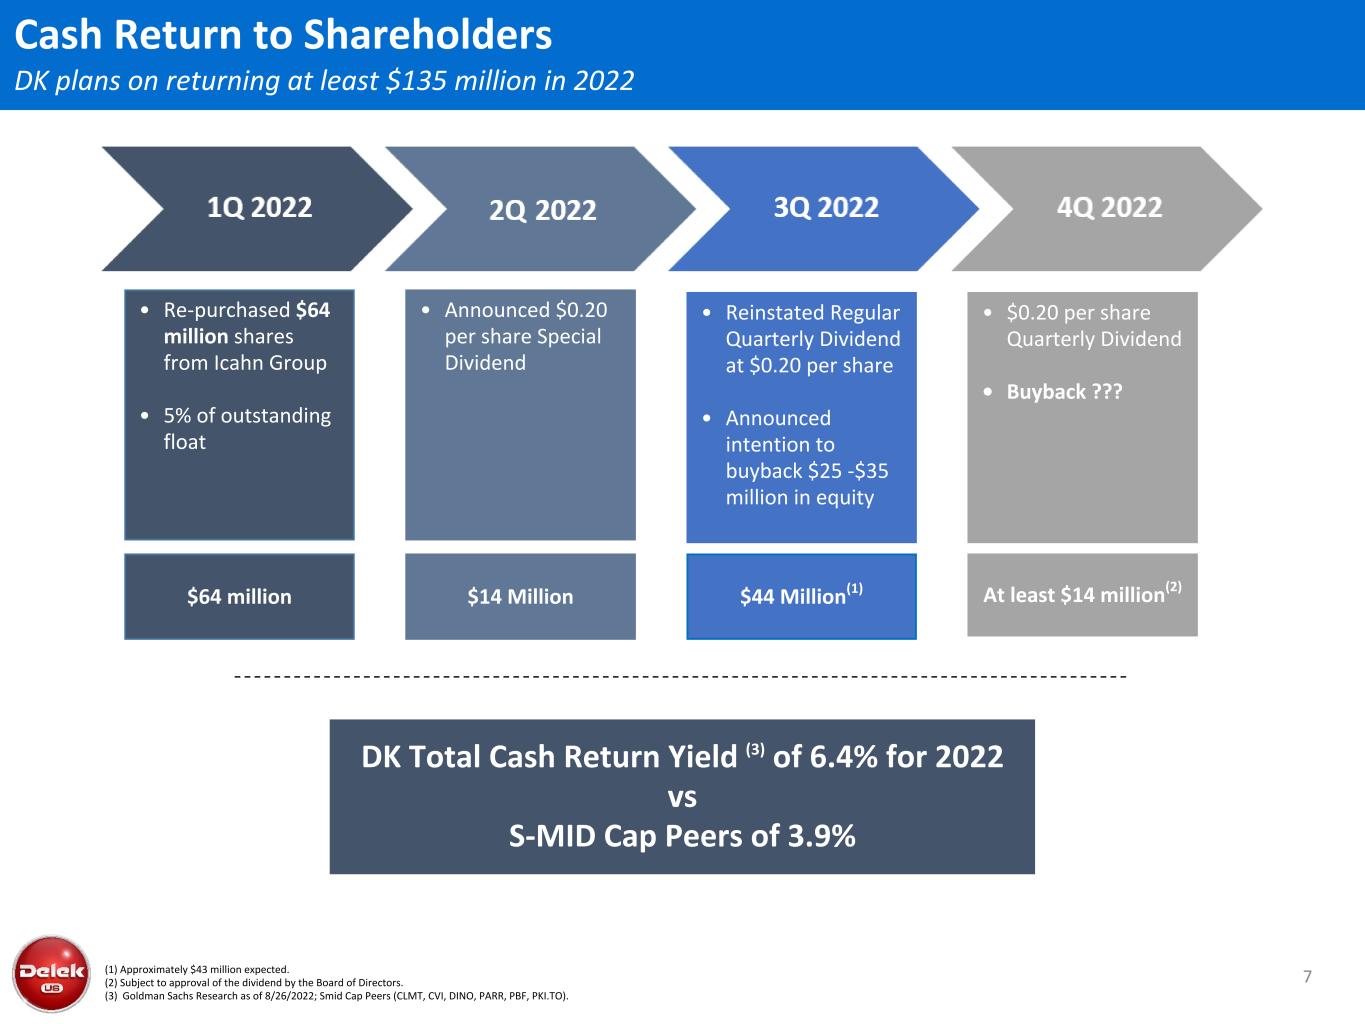
7 • Re-purchased $64 million shares from Icahn Group • 5% of outstanding float • $0.20 per share Quarterly Dividend • Buyback ??? • Reinstated Regular Quarterly Dividend at $0.20 per share • Announced intention to buyback $25 -$35 million in equity • Announced $0.20 per share Special Dividend $64 million $14 Million $44 Million(1) At least $14 million(2) (1) Approximately $43 million expected. (2) Subject to approval of the dividend by the Board of Directors. (3) Goldman Sachs Research as of 8/26/2022; Smid Cap Peers (CLMT, CVI, DINO, PARR, PBF, PKI.TO). DK Total Cash Return Yield (3) of 6.4% for 2022 vs S-MID Cap Peers of 3.9% Cash Return to Shareholders DK plans on returning at least $135 million in 2022
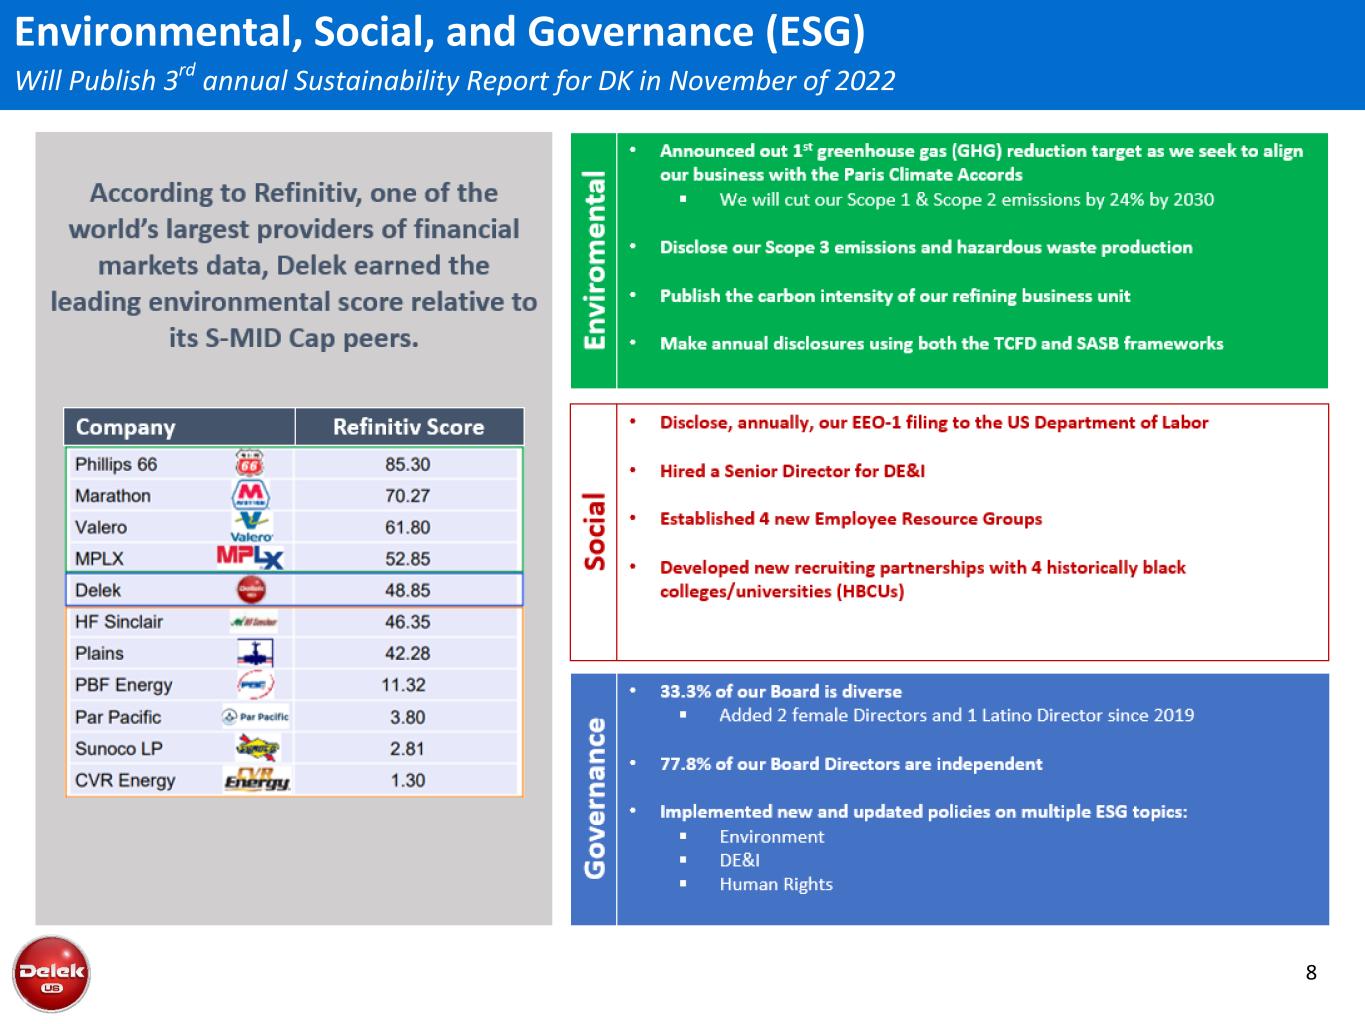
Environmental, Social, and Governance (ESG) Will Publish 3rd annual Sustainability Report for DK in November of 2022 • We measure our environmental performance daily, review our progress with the EHS Committee quarterly, and publicly report annually Recently announced our 1st greenhouse gas (GHG) emissions reductions target as we seek to align our business with the Paris Climate Accords: • We will cut our Scope 1 and 2 emissions 34% by 2030 • 1st disclosure of our Scope 3 emissions • 1st disclosure of our hazardous waste production • Implemented a sustainability screening process for capital projects • Published new public policies on ESG-related topics 2018 Delek US Refining 27 2019 Delek US Refining 28 2020 Delek US Refining 26 Carbon Intensity of Refining Business Unit(1) • Enhanced Transparency in 2021 Sustainability Report 8
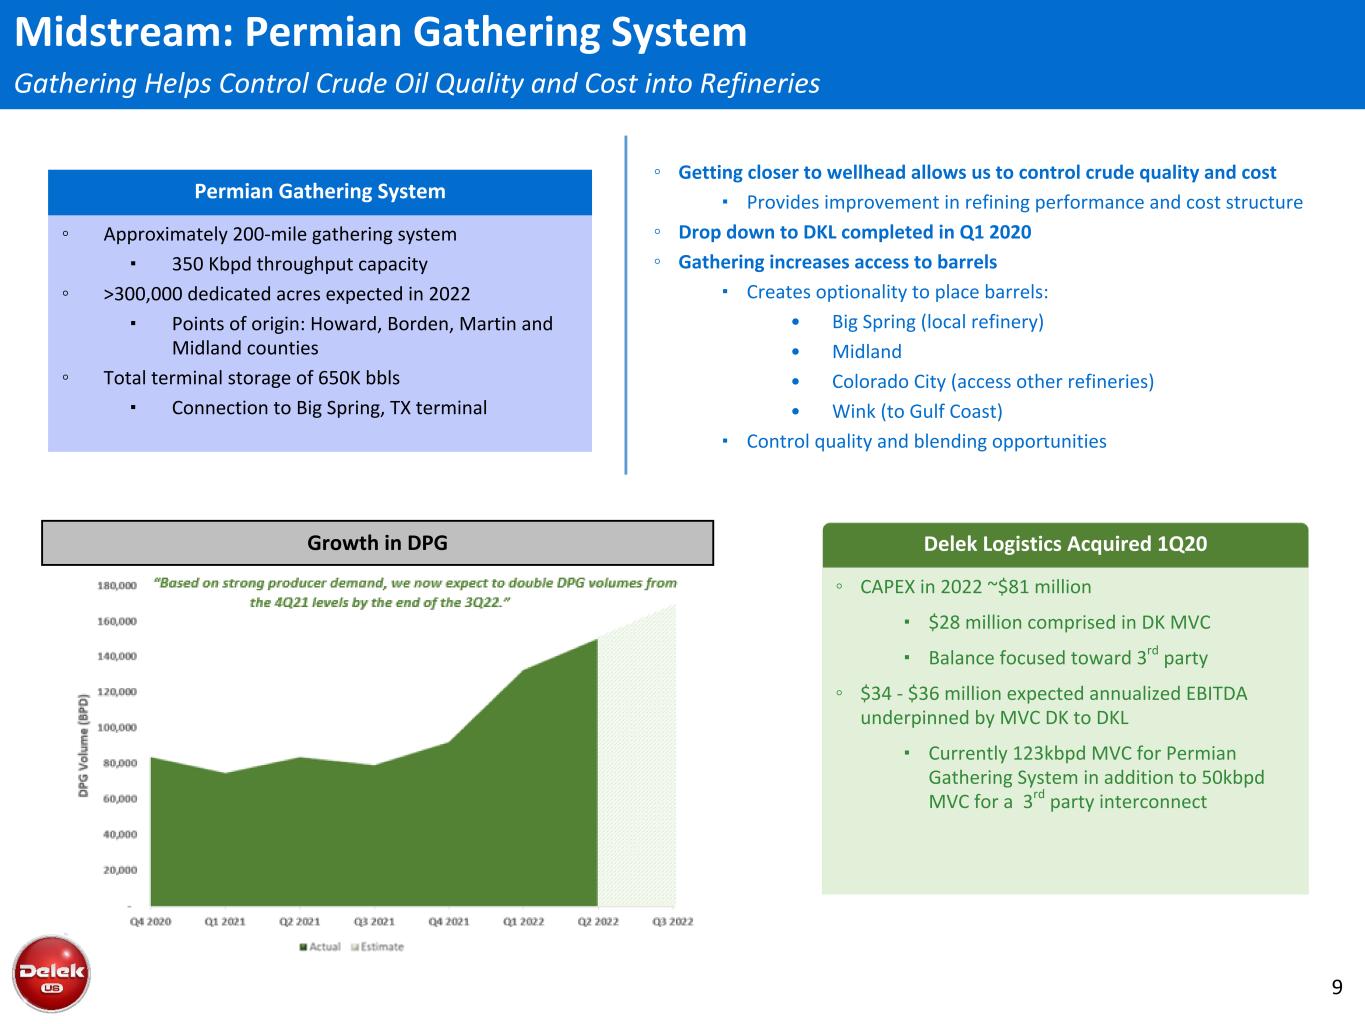
9 Midstream: Permian Gathering System Gathering Helps Control Crude Oil Quality and Cost into Refineries Permian Gathering System ◦ Approximately 200-mile gathering system ▪ 350 Kbpd throughput capacity ◦ >300,000 dedicated acres expected in 2022 ▪ Points of origin: Howard, Borden, Martin and Midland counties ◦ Total terminal storage of 650K bbls ▪ Connection to Big Spring, TX terminal ◦ Getting closer to wellhead allows us to control crude quality and cost ▪ Provides improvement in refining performance and cost structure ◦ Drop down to DKL completed in Q1 2020 ◦ Gathering increases access to barrels ▪ Creates optionality to place barrels: • Big Spring (local refinery) • Midland • Colorado City (access other refineries) • Wink (to Gulf Coast) ▪ Control quality and blending opportunities Delek Logistics Acquired 1Q20 ◦ CAPEX in 2022 ~$81 million ▪ $28 million comprised in DK MVC ▪ Balance focused toward 3rd party ◦ $34 - $36 million expected annualized EBITDA underpinned by MVC DK to DKL ▪ Currently 123kbpd MVC for Permian Gathering System in addition to 50kbpd MVC for a 3rd party interconnect Growth in DPG
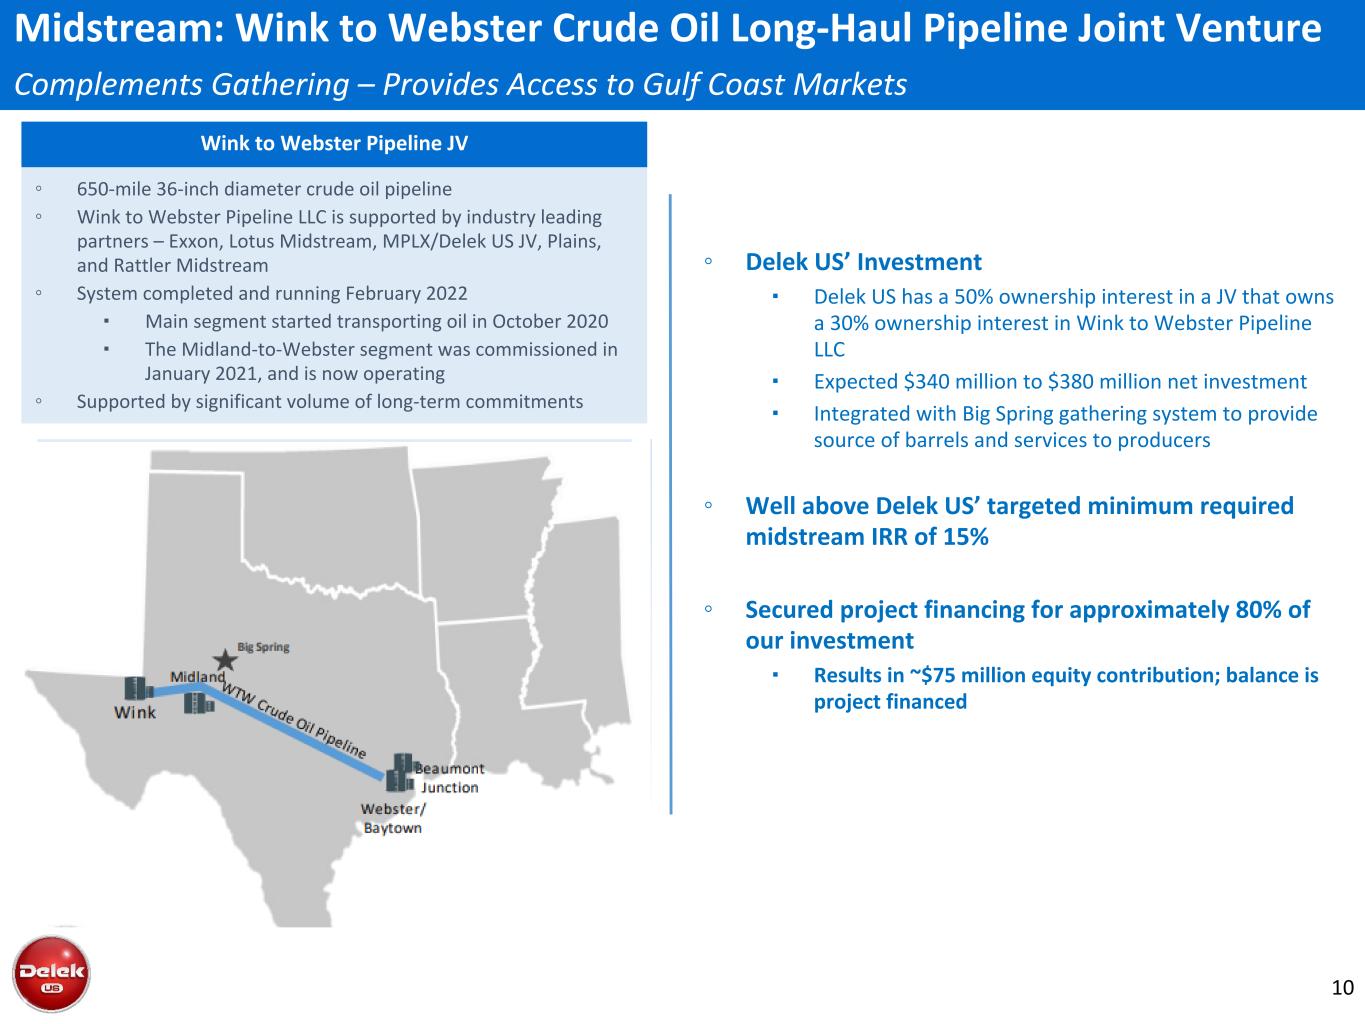
10 ◦ Delek US’ Investment ▪ Delek US has a 50% ownership interest in a JV that owns a 30% ownership interest in Wink to Webster Pipeline LLC ▪ Expected $340 million to $380 million net investment ▪ Integrated with Big Spring gathering system to provide source of barrels and services to producers ◦ Well above Delek US’ targeted minimum required midstream IRR of 15% ◦ Secured project financing for approximately 80% of our investment ▪ Results in ~$75 million equity contribution; balance is project financed Midstream: Wink to Webster Crude Oil Long-Haul Pipeline Joint Venture Complements Gathering – Provides Access to Gulf Coast Markets ◦ 650-mile 36-inch diameter crude oil pipeline ◦ Wink to Webster Pipeline LLC is supported by industry leading partners – Exxon, Lotus Midstream, MPLX/Delek US JV, Plains, and Rattler Midstream ◦ System completed and running February 2022 ▪ Main segment started transporting oil in October 2020 ▪ The Midland-to-Webster segment was commissioned in January 2021, and is now operating ◦ Supported by significant volume of long-term commitments Wink to Webster Pipeline JV
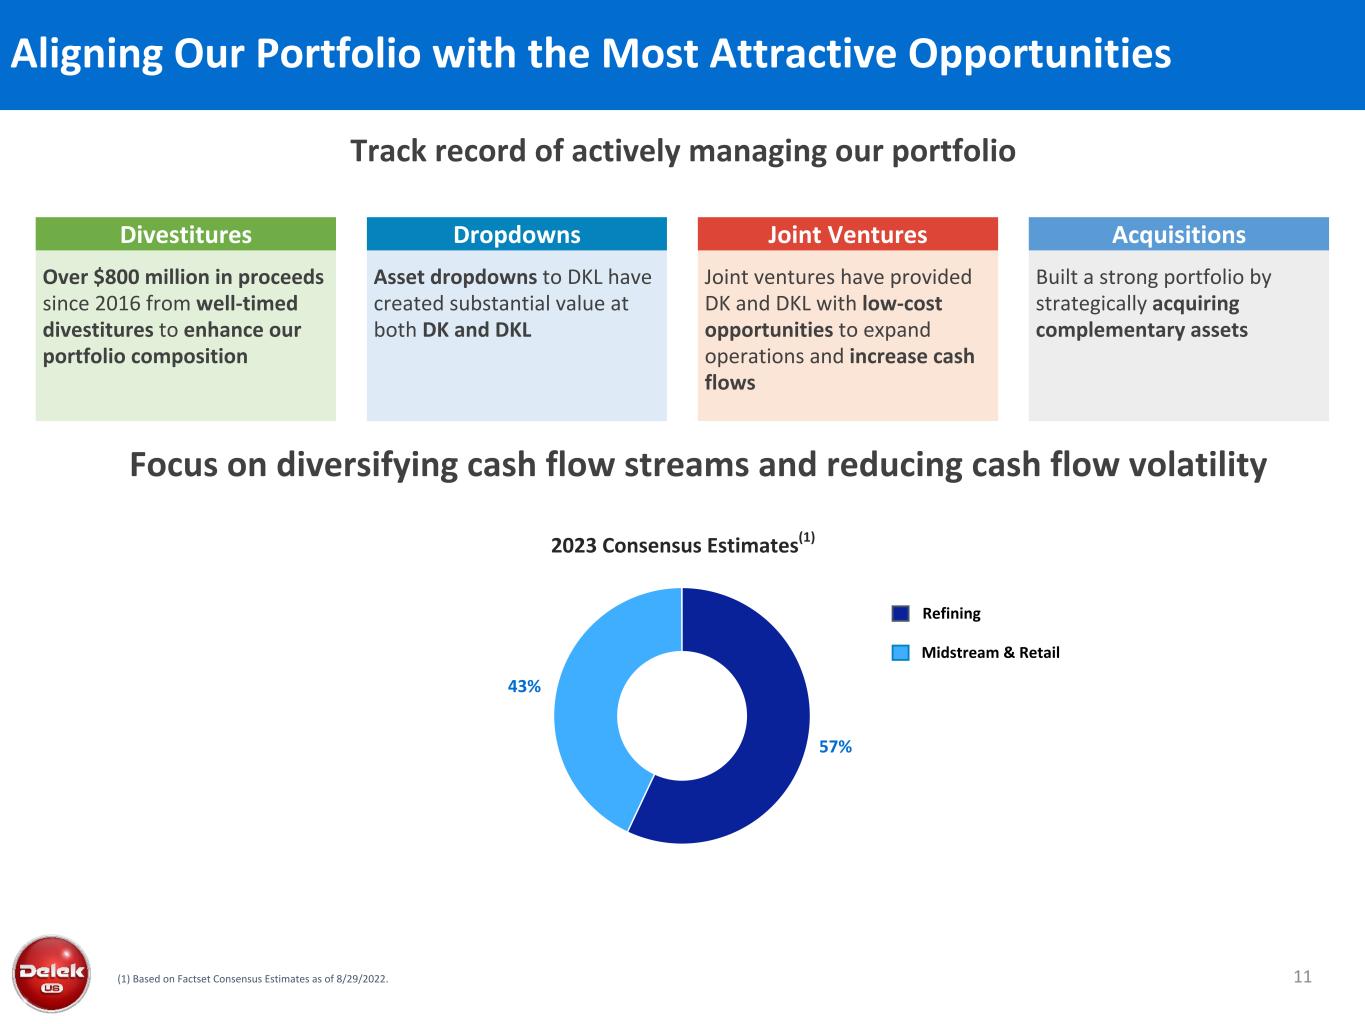
57% 43% 11 Aligning Our Portfolio with the Most Attractive Opportunities Divestitures Over $800 million in proceeds since 2016 from well-timed divestitures to enhance our portfolio composition Dropdowns Asset dropdowns to DKL have created substantial value at both DK and DKL Joint Ventures Joint ventures have provided DK and DKL with low-cost opportunities to expand operations and increase cash flows Acquisitions Built a strong portfolio by strategically acquiring complementary assets (1) Based on Factset Consensus Estimates as of 8/29/2022. Refining Midstream & Retail Focus on diversifying cash flow streams and reducing cash flow volatility Track record of actively managing our portfolio 2023 Consensus Estimates(1)
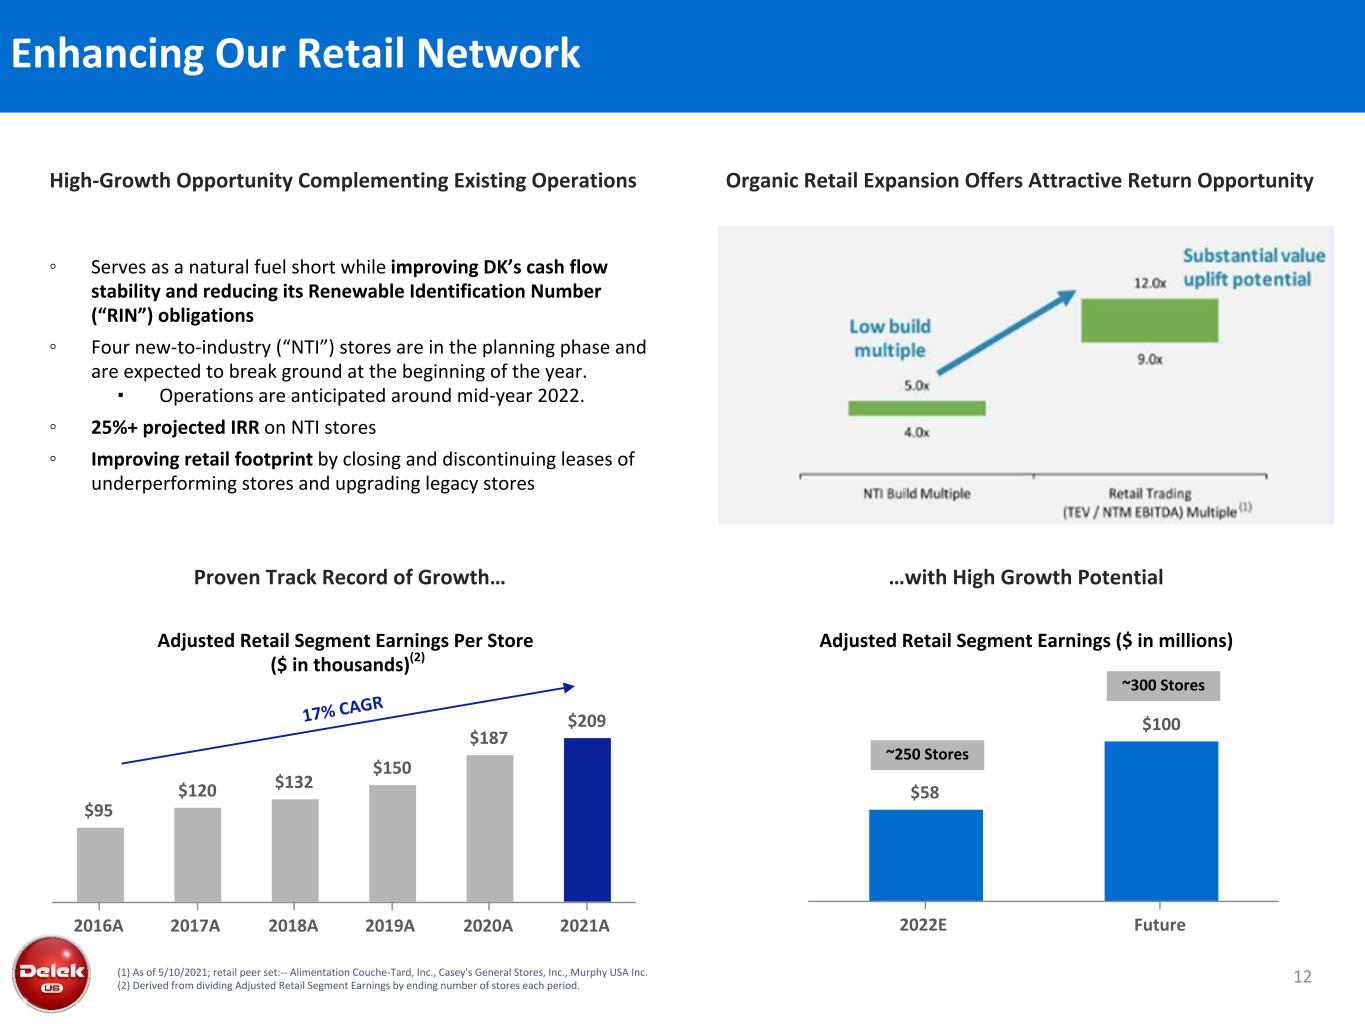
12 Enhancing Our Retail Network ◦ Serves as a natural fuel short while improving DK’s cash flow stability and reducing its Renewable Identification Number (“RIN”) obligations ◦ Four new-to-industry (“NTI”) stores are in the planning phase and are expected to break ground at the beginning of the year. ▪ Operations are anticipated around mid-year 2022. ◦ 25%+ projected IRR on NTI stores ◦ Improving retail footprint by closing and discontinuing leases of underperforming stores and upgrading legacy stores High-Growth Opportunity Complementing Existing Operations (1) As of 5/10/2021; retail peer set:-- Alimentation Couche-Tard, Inc., Casey's General Stores, Inc., Murphy USA Inc. (2) Derived from dividing Adjusted Retail Segment Earnings by ending number of stores each period. (1) Organic Retail Expansion Offers Attractive Return Opportunity Proven Track Record of Growth… …with High Growth Potential Adjusted Retail Segment Earnings ($ in millions) $95 $120 $132 $150 $187 $209 2016A 2017A 2018A 2019A 2020A 2021A Adjusted Retail Segment Earnings Per Store ($ in thousands)(2) 17% CAG R $58 $100 2022E Future ~250 Stores ~300 Stores
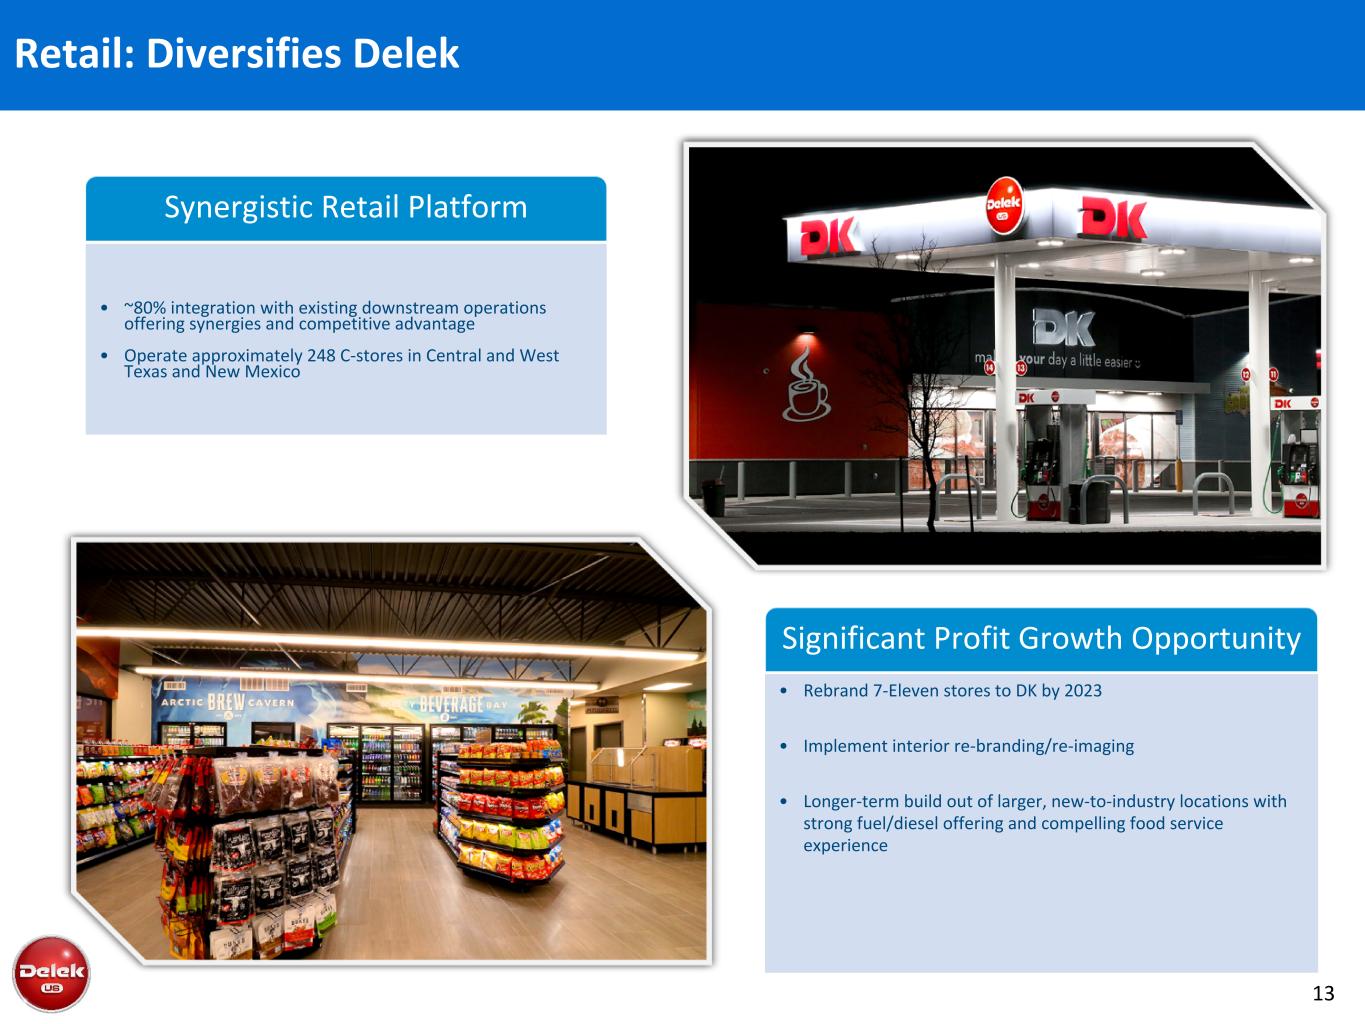
Retail: Diversifies Delek 13 • ~80% integration with existing downstream operations offering synergies and competitive advantage • Operate approximately 248 C-stores in Central and West Texas and New Mexico Synergistic Retail Platform Significant Profit Growth Opportunity • Rebrand 7-Eleven stores to DK by 2023 • Implement interior re-branding/re-imaging • Longer-term build out of larger, new-to-industry locations with strong fuel/diesel offering and compelling food service experience
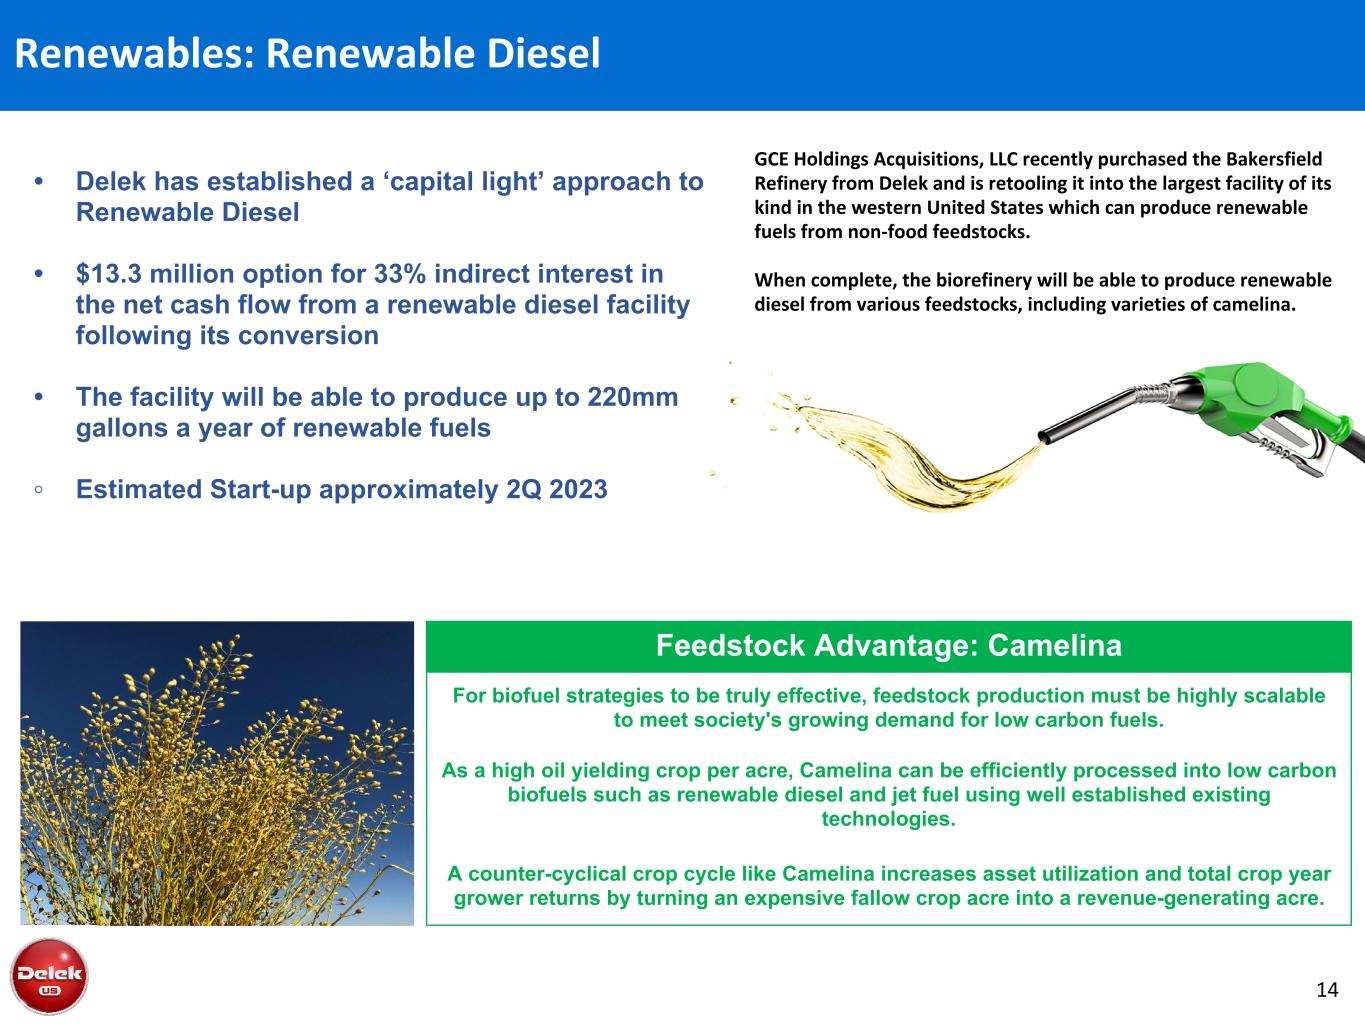
Renewables: Renewable Diesel 14 • Delek has established a ‘capital light’ approach to Renewable Diesel • $13.3 million option for 33% indirect interest in the net cash flow from a renewable diesel facility following its conversion • The facility will be able to produce up to 220mm gallons a year of renewable fuels ◦ Estimated Start-up approximately 2Q 2023 For biofuel strategies to be truly effective, feedstock production must be highly scalable to meet society's growing demand for low carbon fuels. As a high oil yielding crop per acre, Camelina can be efficiently processed into low carbon biofuels such as renewable diesel and jet fuel using well established existing technologies. A counter-cyclical crop cycle like Camelina increases asset utilization and total crop year grower returns by turning an expensive fallow crop acre into a revenue-generating acre. Feedstock Advantage: Camelina GCE Holdings Acquisitions, LLC recently purchased the Bakersfield Refinery from Delek and is retooling it into the largest facility of its kind in the western United States which can produce renewable fuels from non-food feedstocks. When complete, the biorefinery will be able to produce renewable diesel from various feedstocks, including varieties of camelina.
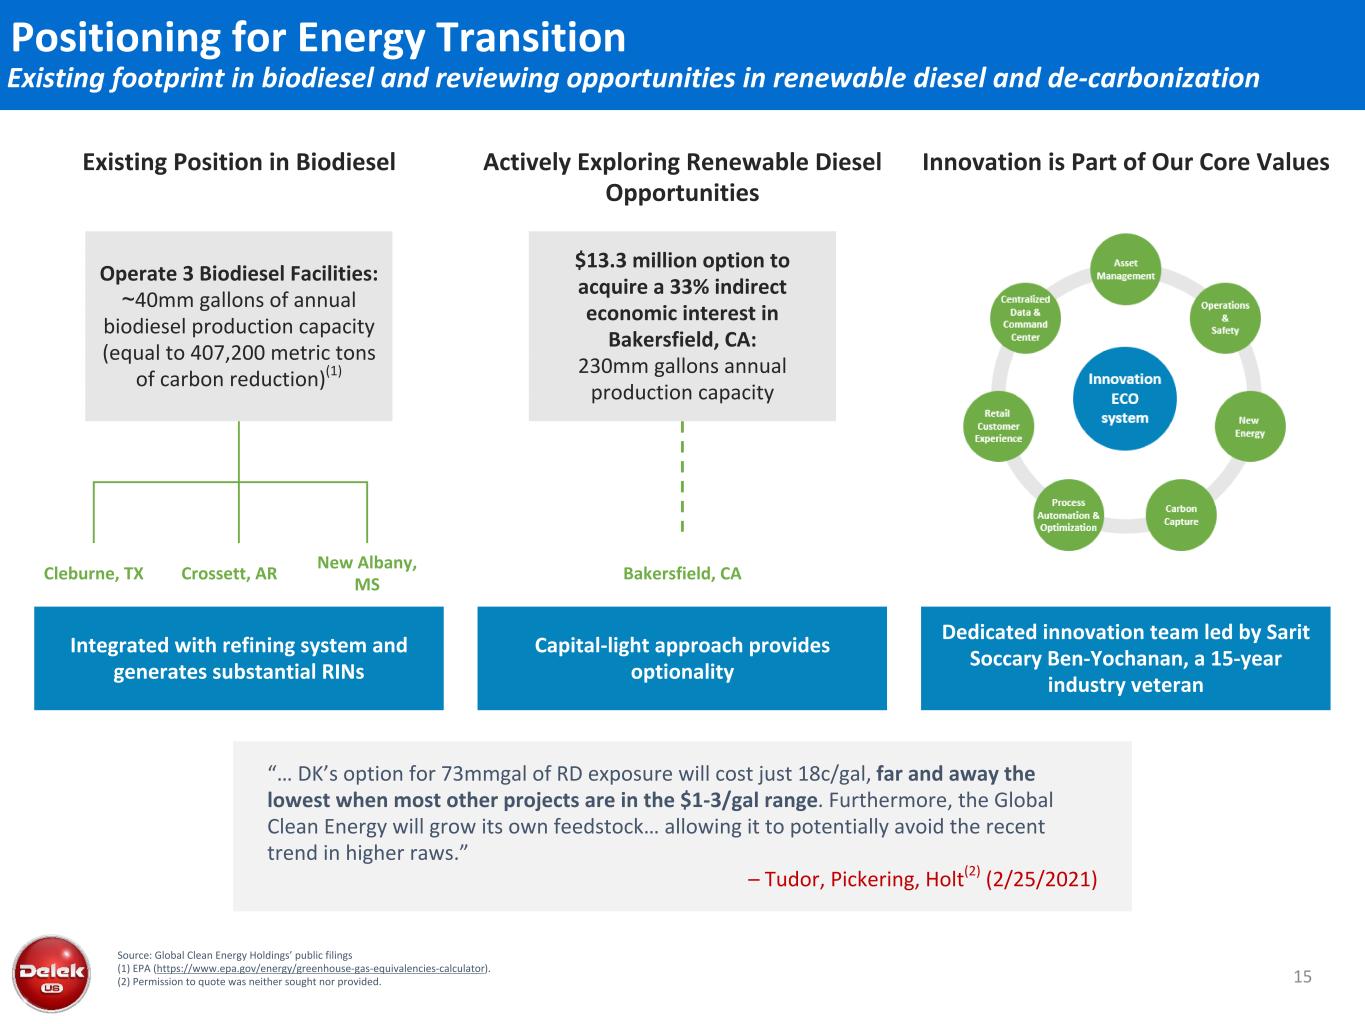
15 Positioning for Energy Transition Existing footprint in biodiesel and reviewing opportunities in renewable diesel and de-carbonization Operate 3 Biodiesel Facilities: ~40mm gallons of annual biodiesel production capacity (equal to 407,200 metric tons of carbon reduction)(1) Crossett, AR New Albany, MS Cleburne, TX Source: Global Clean Energy Holdings’ public filings (1) EPA (https://www.epa.gov/energy/greenhouse-gas-equivalencies-calculator). (2) Permission to quote was neither sought nor provided. Existing Position in Biodiesel Actively Exploring Renewable Diesel Opportunities $13.3 million option to acquire a 33% indirect economic interest in Bakersfield, CA: 230mm gallons annual production capacity Bakersfield, CA Capital-light approach provides optionality Integrated with refining system and generates substantial RINs Dedicated innovation team led by Sarit Soccary Ben-Yochanan, a 15-year industry veteran Innovation is Part of Our Core Values “… DK’s option for 73mmgal of RD exposure will cost just 18c/gal, far and away the lowest when most other projects are in the $1-3/gal range. Furthermore, the Global Clean Energy will grow its own feedstock… allowing it to potentially avoid the recent trend in higher raws.” – Tudor, Pickering, Holt(2) (2/25/2021)
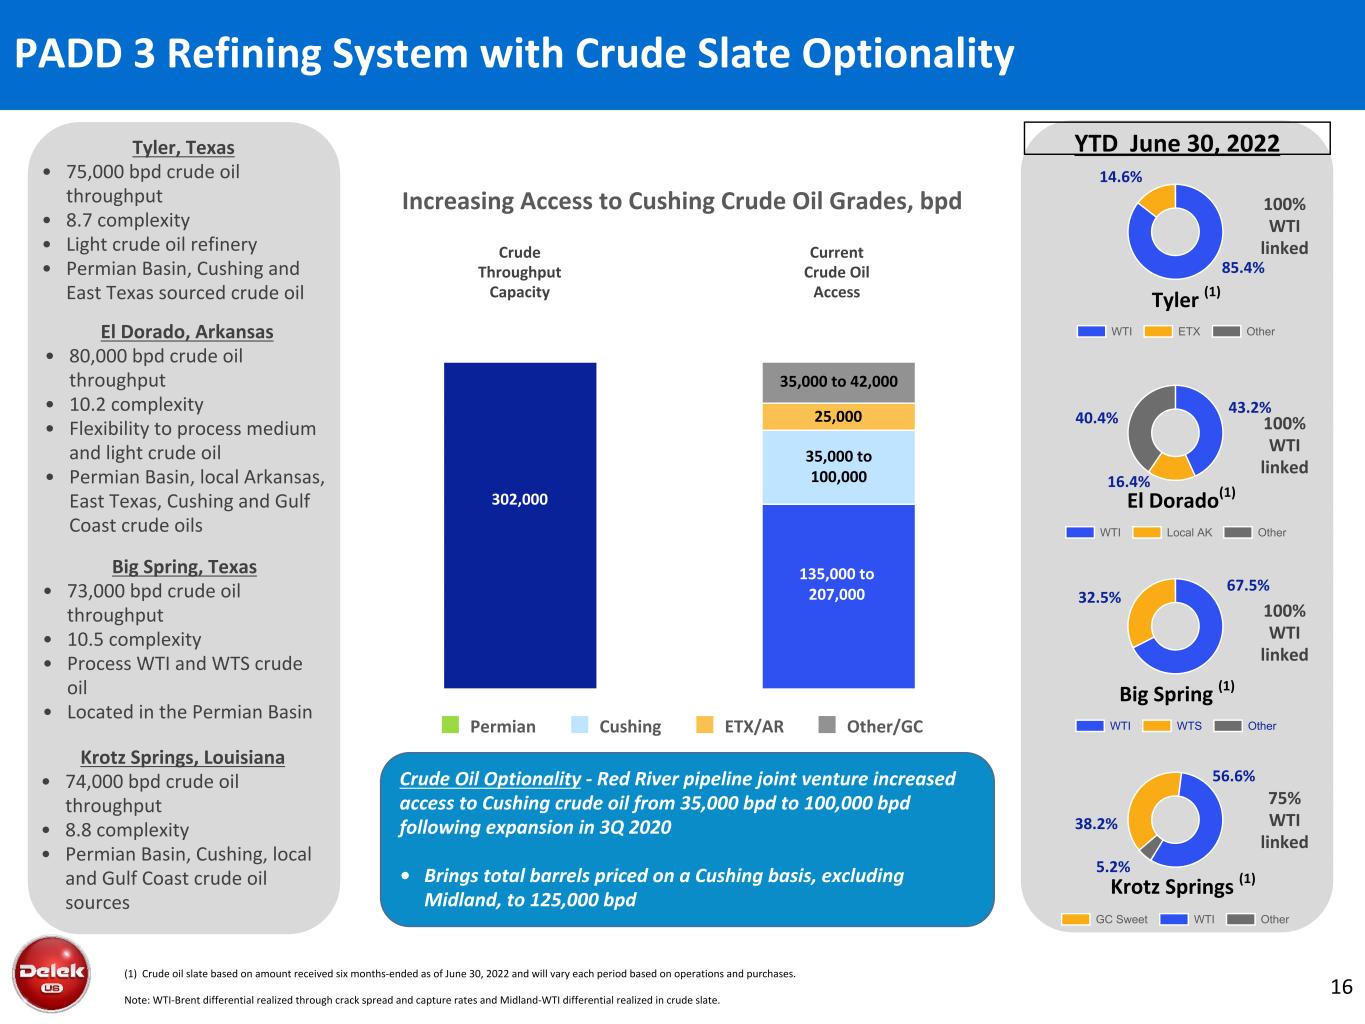
Permian Cushing ETX/AR Other/GC (1) Crude oil slate based on amount received six months-ended as of June 30, 2022 and will vary each period based on operations and purchases. Note: WTI-Brent differential realized through crack spread and capture rates and Midland-WTI differential realized in crude slate. 16 Tyler, Texas • 75,000 bpd crude oil throughput • 8.7 complexity • Light crude oil refinery • Permian Basin, Cushing and East Texas sourced crude oil El Dorado, Arkansas • 80,000 bpd crude oil throughput • 10.2 complexity • Flexibility to process medium and light crude oil • Permian Basin, local Arkansas, East Texas, Cushing and Gulf Coast crude oils Big Spring, Texas • 73,000 bpd crude oil throughput • 10.5 complexity • Process WTI and WTS crude oil • Located in the Permian Basin Krotz Springs, Louisiana • 74,000 bpd crude oil throughput • 8.8 complexity • Permian Basin, Cushing, local and Gulf Coast crude oil sources 100% WTI linked PADD 3 Refining System with Crude Slate Optionality 100% WTI linked 100% WTI linked 75% WTI linked Crude Oil Optionality - Red River pipeline joint venture increased access to Cushing crude oil from 35,000 bpd to 100,000 bpd following expansion in 3Q 2020 • Brings total barrels priced on a Cushing basis, excluding Midland, to 125,000 bpd YTD June 30, 2022 Crude Throughput Capacity Increasing Access to Cushing Crude Oil Grades, bpd Current Crude Oil Access 85.4% 14.6% WTI ETX Other 43.2% 16.4% 40.4% WTI Local AK Other 67.5% 32.5% WTI WTS Other 38.2% 56.6% 5.2% GC Sweet WTI Other Tyler (1) El Dorado(1) Big Spring (1) Krotz Springs (1) 302,000 35,000 to 42,000 25,000 35,000 to 100,000 135,000 to 207,000 35,000 to 42,000
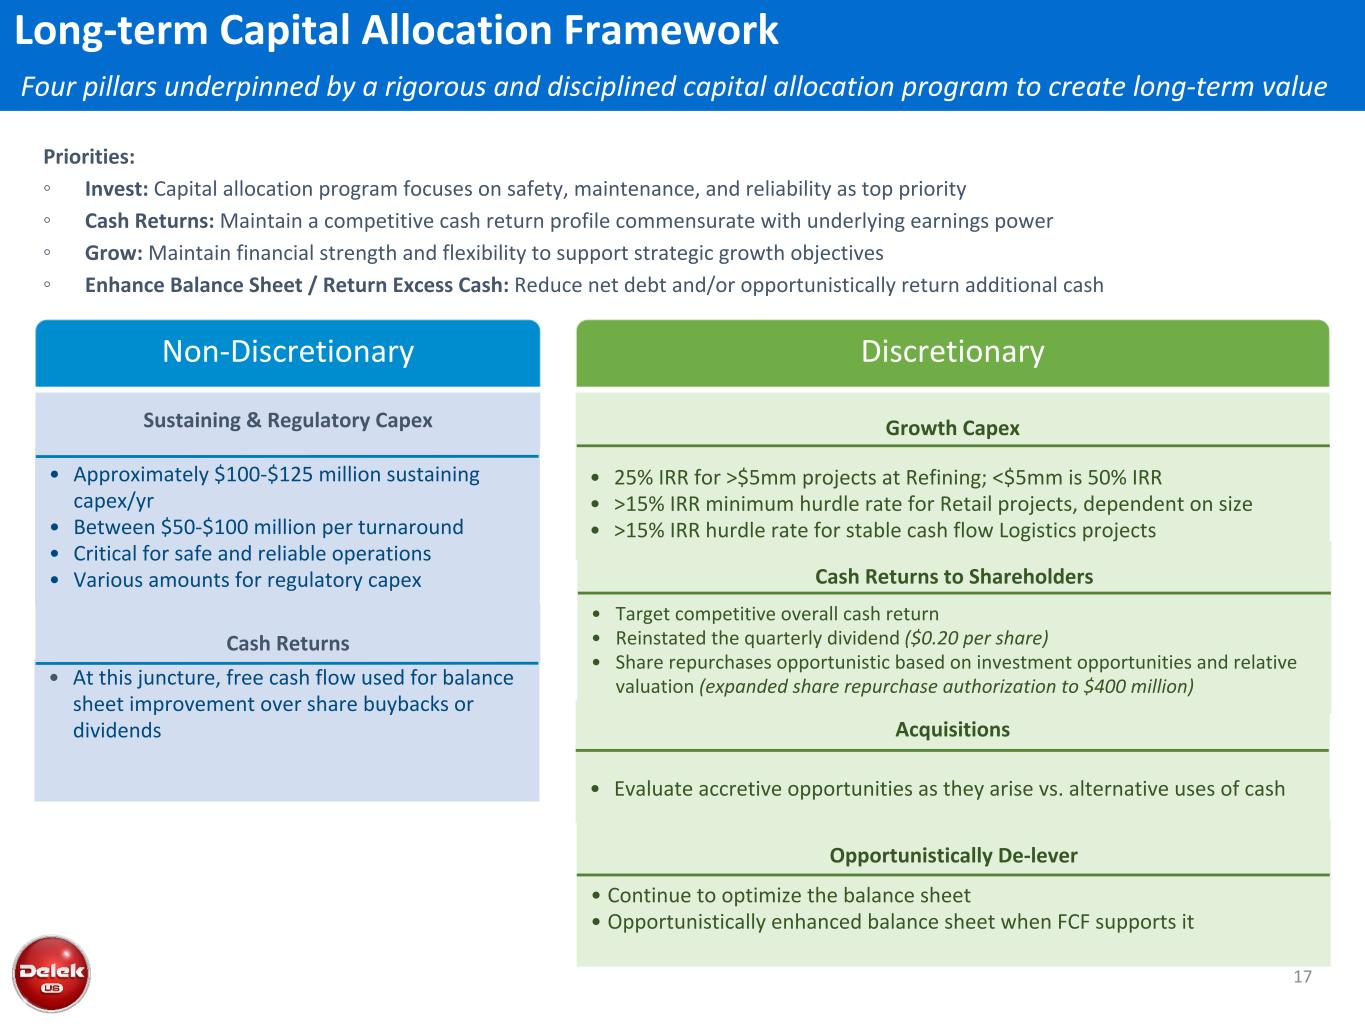
Long-term Capital Allocation Framework Four pillars underpinned by a rigorous and disciplined capital allocation program to create long-term value Priorities: ◦ Invest: Capital allocation program focuses on safety, maintenance, and reliability as top priority ◦ Cash Returns: Maintain a competitive cash return profile commensurate with underlying earnings power ◦ Grow: Maintain financial strength and flexibility to support strategic growth objectives ◦ Enhance Balance Sheet / Return Excess Cash: Reduce net debt and/or opportunistically return additional cash Sustaining Capex • Approximately $100-$125 million sustaining capex/yr • Between $50-$100 million per turnaround • Critical for safe and reliable operations • Various amounts for regulatory capex Sustaining & Regulatory Capex Non-Discretionary • At this juncture, free cash flow used for balance sheet improvement over share buybacks or dividends Cash Returns Discretionary Growth Capex • 25% IRR for >$5mm projects at Refining; <$5mm is 50% IRR • >15% IRR minimum hurdle rate for Retail projects, dependent on size • >15% IRR hurdle rate for stable cash flow Logistics projects Cash Returns to Shareholders • Target competitive overall cash return • Reinstated the quarterly dividend ($0.20 per share) • Share repurchases opportunistic based on investment opportunities and relative valuation (expanded share repurchase authorization to $400 million) Acquisitions • Evaluate accretive opportunities as they arise vs. alternative uses of cash Opportunistically De-lever • Continue to optimize the balance sheet • Opportunistically enhanced balance sheet when FCF supports it 17
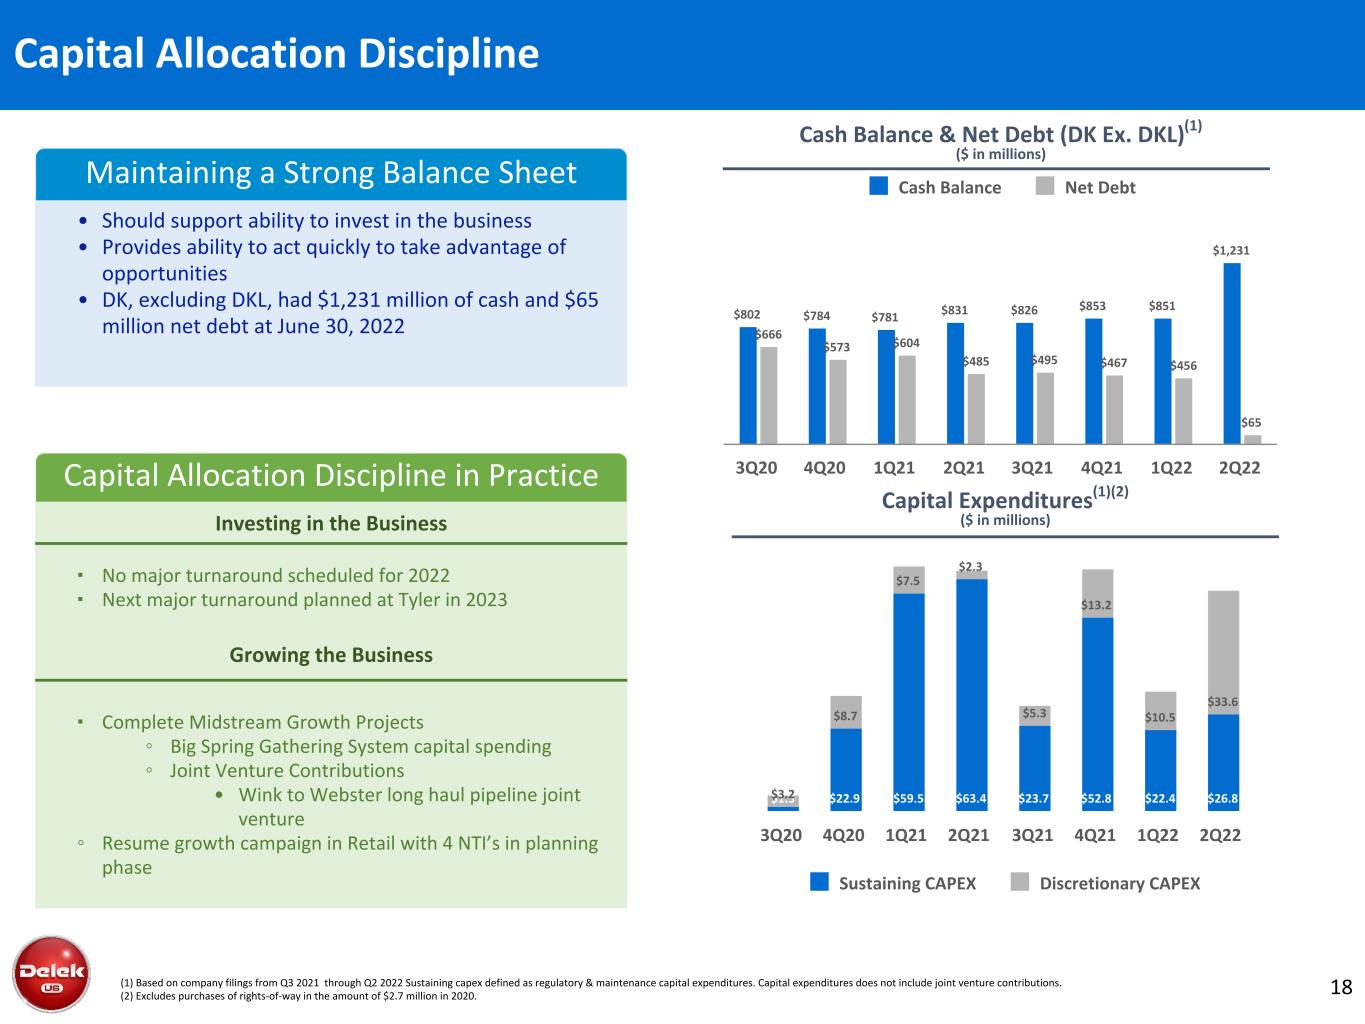
18 Capital Allocation Discipline Cash Balance & Net Debt (DK Ex. DKL)(1) ($ in millions) Capital Expenditures(1)(2) ($ in millions) (1) Based on company filings from Q3 2021 through Q2 2022 Sustaining capex defined as regulatory & maintenance capital expenditures. Capital expenditures does not include joint venture contributions. (2) Excludes purchases of rights-of-way in the amount of $2.7 million in 2020. Maintaining a Strong Balance Sheet • Should support ability to invest in the business • Provides ability to act quickly to take advantage of opportunities • DK, excluding DKL, had $1,231 million of cash and $65 million net debt at June 30, 2022 Capital Allocation Discipline in Practice Investing in the Business ▪ No major turnaround scheduled for 2022 ▪ Next major turnaround planned at Tyler in 2023 Growing the Business ▪ Complete Midstream Growth Projects ◦ Big Spring Gathering System capital spending ◦ Joint Venture Contributions • Wink to Webster long haul pipeline joint venture ◦ Resume growth campaign in Retail with 4 NTI’s in planning phase $802 $784 $781 $831 $826 $853 $851 $1,231 $666 $573 $604 $485 $495 $467 $456 $65 Cash Balance Net Debt 3Q20 4Q20 1Q21 2Q21 3Q21 4Q21 1Q22 2Q22 $1.5 $22.9 $59.5 $63.4 $23.7 $52.8 $22.4 $26.8$3.2 $8.7 $7.5 $2.3 $5.3 $13.2 $10.5 $33.6 Sustaining CAPEX Discretionary CAPEX 3Q20 4Q20 1Q21 2Q21 3Q21 4Q21 1Q22 2Q22

Market Opportunities & Valuation
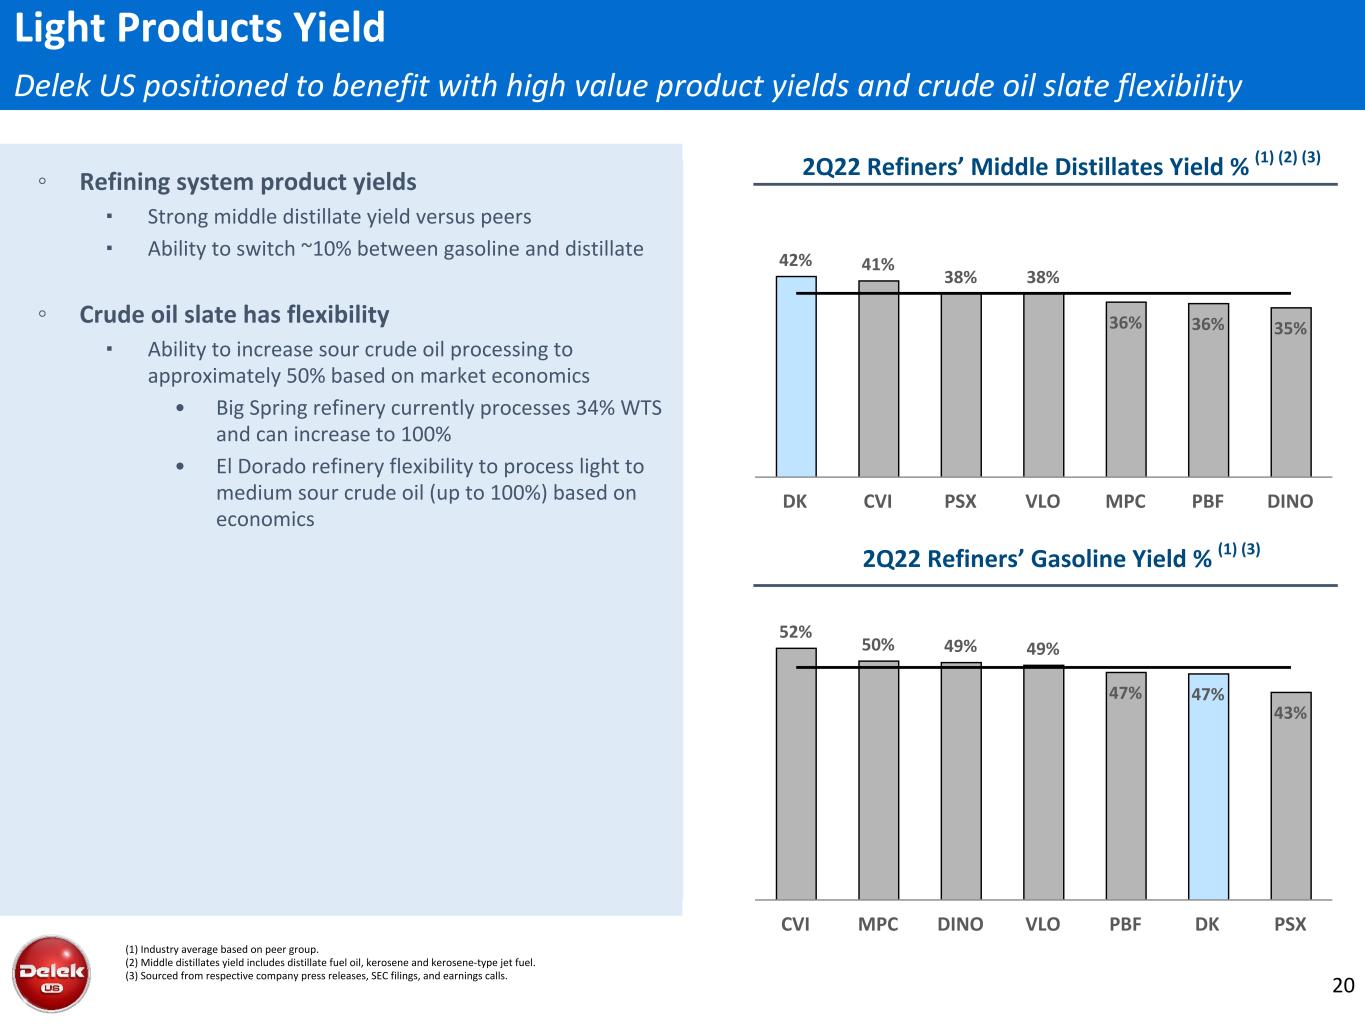
2Q22 Refiners’ Middle Distillates Yield % (1) (2) (3) 2Q22 Refiners’ Gasoline Yield % (1) (3) 20 ◦ Refining system product yields ▪ Strong middle distillate yield versus peers ▪ Ability to switch ~10% between gasoline and distillate ◦ Crude oil slate has flexibility ▪ Ability to increase sour crude oil processing to approximately 50% based on market economics • Big Spring refinery currently processes 34% WTS and can increase to 100% • El Dorado refinery flexibility to process light to medium sour crude oil (up to 100%) based on economics (1) Industry average based on peer group. (2) Middle distillates yield includes distillate fuel oil, kerosene and kerosene-type jet fuel. (3) Sourced from respective company press releases, SEC filings, and earnings calls. Light Products Yield Delek US positioned to benefit with high value product yields and crude oil slate flexibility 42% 41% 38% 38% 36% 36% 35% DK CVI PSX VLO MPC PBF DINO 52% 50% 49% 49% 47% 47% 43% CVI MPC DINO VLO PBF DK PSX
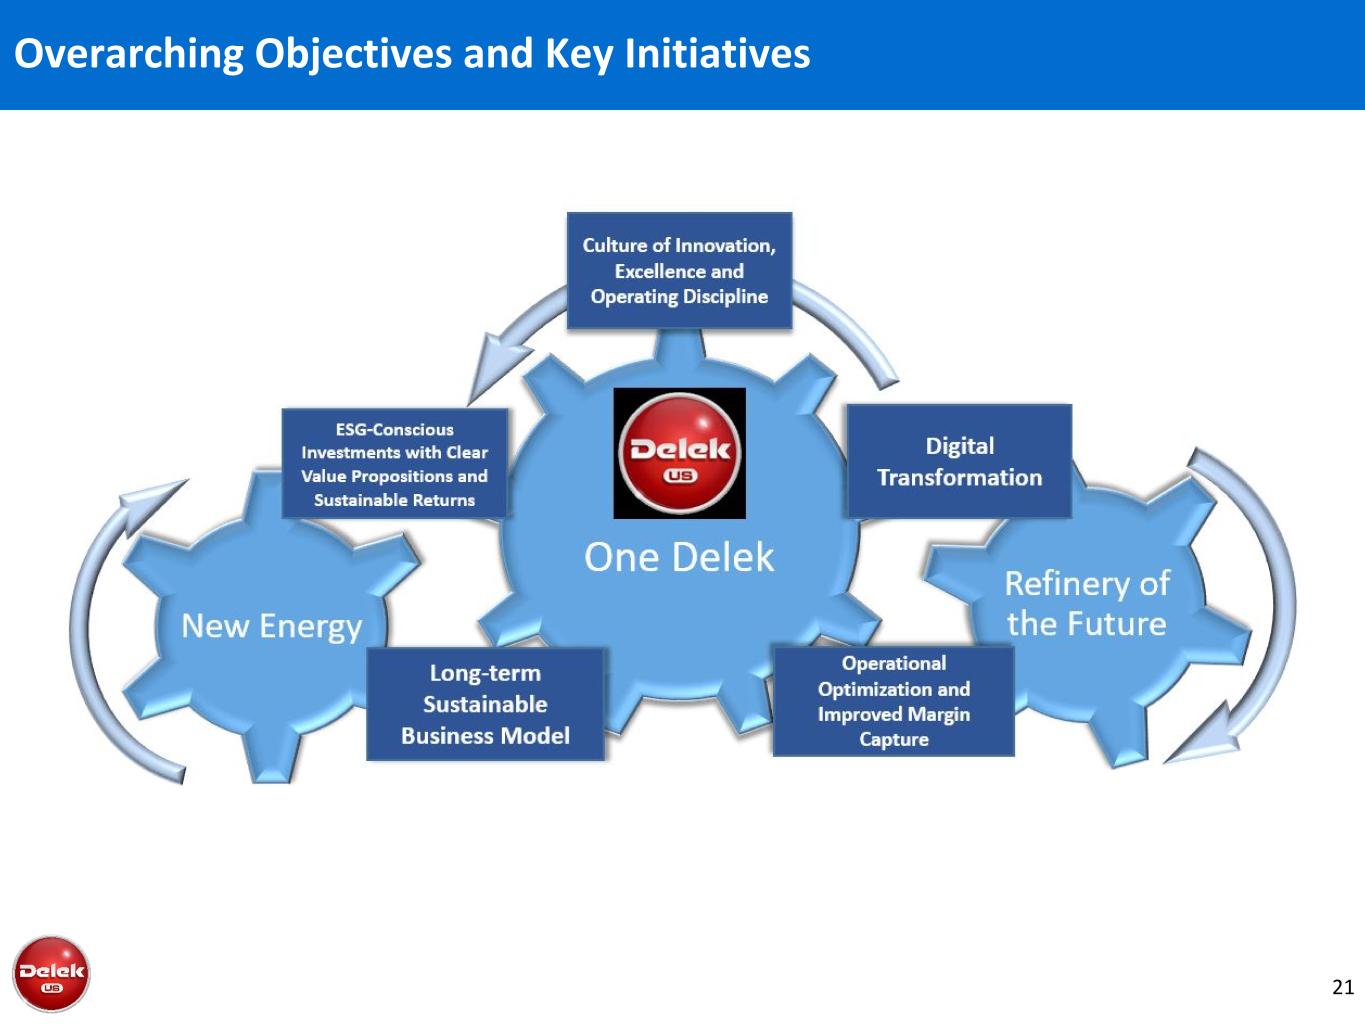
Overarching Objectives and Key Initiatives 21
3 Bear Acquisition

• Recently constructed asset in the most active area of the Delaware Basin (Lea and Eddy County, NM) • ~485 miles of in-ground pipeline currently • 88 MMcf/d of gas processing capacity; 140kbpd of crude gathering capacity supported by 120k bbls of storage; 200kbpd salt water disposal; offers producers one-stop-shop • Substantial upside optionality through expansion of existing facilities and infrastructure High Quality 3-Stream Revenue Investment Considerations for 3 Bear Increased Exposure to Highly Economic Delaware Basin, Third-Party Revenue; Expands Geographic and Commodity Diversification • Entry into the Delaware Basin which supports Delek’s long-term growth and integration strategies • Footprint anchored by long-term, fixed fee contracts (avg. remaining contract tenor of ~10 yrs.(1)) supported by a diverse group of Permian focused producers with 13 active rigs on dedicated acreage (2) • >3,000 remaining drilling locations(3) on dedicated acres provides visibility for long-term cash flow Attractive Footprint in the Heart of the Delaware • Significantly increases third party revenue and diversifies customer mix • Expands Permian presence from the Midland Basin to the Delaware Basin • Broadens product mix with increased exposure to natural gas and water • Long-term fixed fee contracts mitigates commodity exposure Enhances Diversification and Stability • Immediately accretive to Distributable Cash Flow and Coverage Ratios supporting 5% annual distribution growth • Strong Free Cash Flow generation enables a deleveraging profile near-term • Capital needs increase FY 2022 guidance by ~$10mm to approximately $80 million Accretive Transaction • Significant carbon capture optionality reinforces Delek’s commitment to ESG initiatives • Water recycling operations reduce total freshwater consumption and use in the Permian • Multiple GHG reduction projects underway providing CO2 reduction in the near term • Additional options offer potential to improve clean energy initiatives ESG Initiatives (1) Weighted-average by acreage. (2) Per Enverus as of Q4 2021. (3) Per third-party consultants. 23
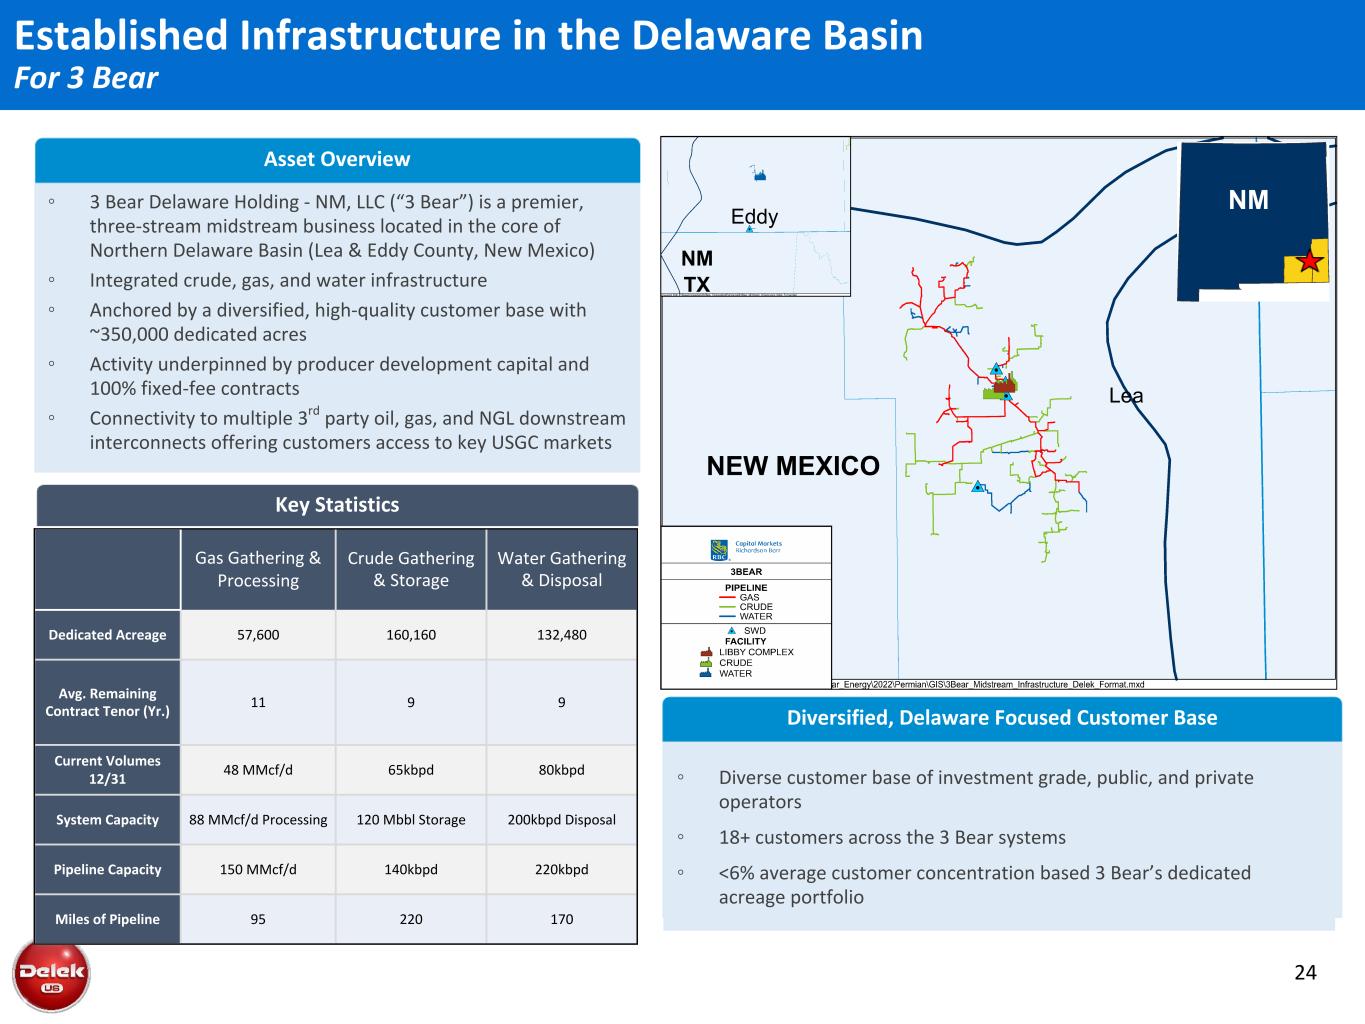
Established Infrastructure in the Delaware Basin For 3 Bear Asset Overview ◦ 3 Bear Delaware Holding - NM, LLC (“3 Bear”) is a premier, three-stream midstream business located in the core of Northern Delaware Basin (Lea & Eddy County, New Mexico) ◦ Integrated crude, gas, and water infrastructure ◦ Anchored by a diversified, high-quality customer base with ~350,000 dedicated acres ◦ Activity underpinned by producer development capital and 100% fixed-fee contracts ◦ Connectivity to multiple 3rd party oil, gas, and NGL downstream interconnects offering customers access to key USGC markets Gas Gathering & Processing Crude Gathering & Storage Water Gathering & Disposal Dedicated Acreage 57,600 160,160 132,480 Avg. Remaining Contract Tenor (Yr.) 11 9 9 Current Volumes 12/31 48 MMcf/d 65kbpd 80kbpd System Capacity 88 MMcf/d Processing 120 Mbbl Storage 200kbpd Disposal Pipeline Capacity 150 MMcf/d 140kbpd 220kbpd Miles of Pipeline 95 220 170 Key Statistics Diversified, Delaware Focused Customer Base Lea NEW MEXICO Eddy TX NM NM ◦ Diverse customer base of investment grade, public, and private operators ◦ 18+ customers across the 3 Bear systems ◦ <6% average customer concentration based 3 Bear’s dedicated acreage portfolio 24
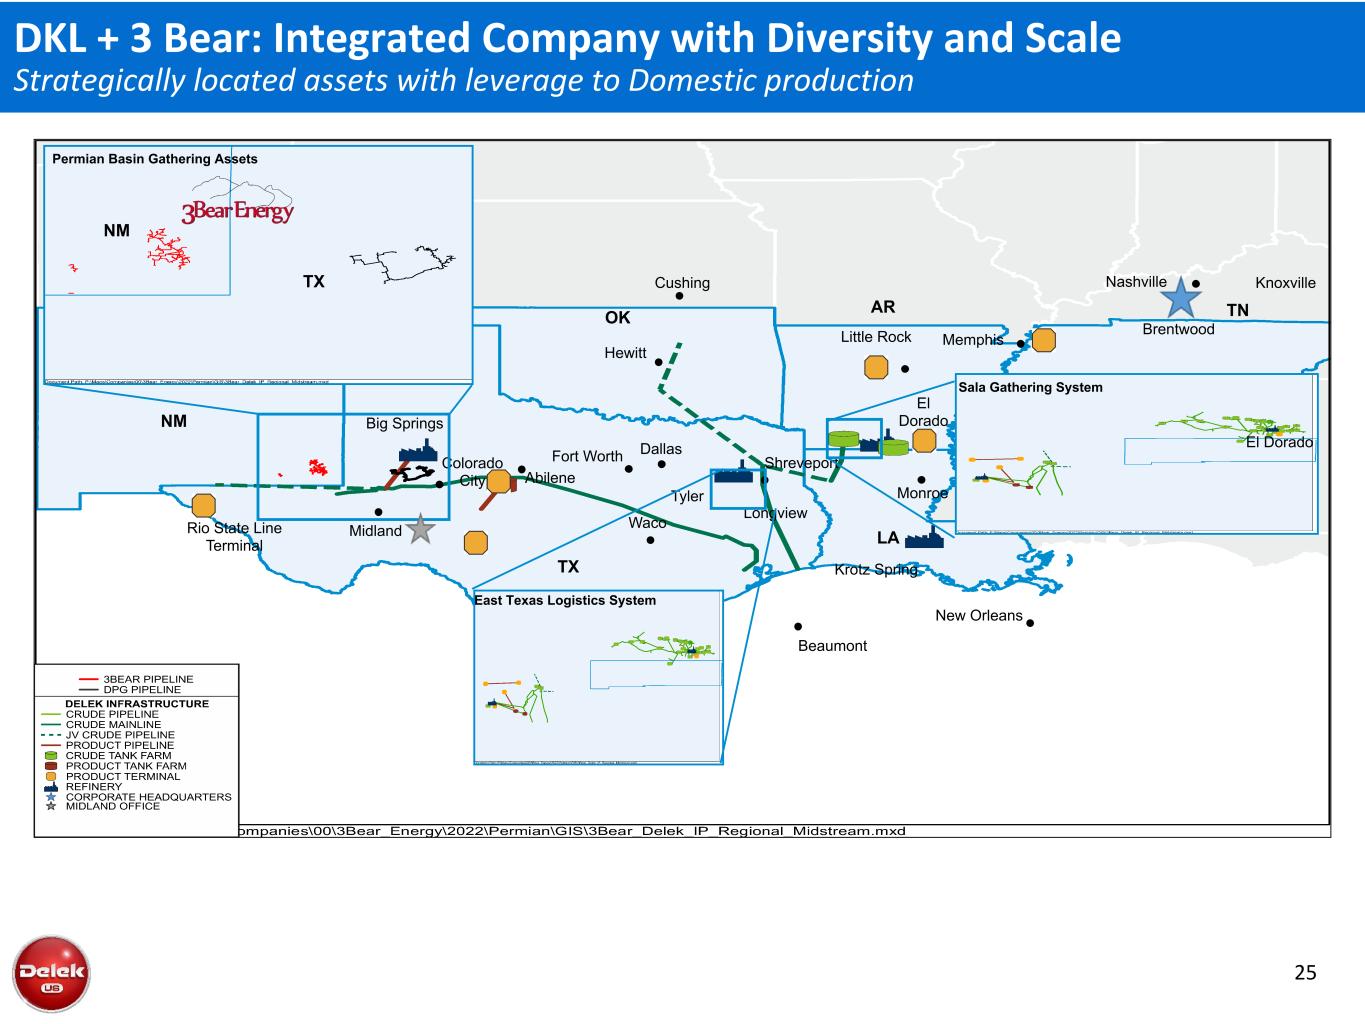
Rio State Line Terminal Midland Big Springs Colorado City Abilene Fort Worth Dallas Waco Hewitt Cushing Little Rock Memphis El Dorado Shreveport Longview Tyler Beaumont Monroe Krotz Spring New Orleans Nashville Knoxville Brentwood OK AR TN LA NM NM TX Permian Basin Gathering Assets East Texas Logistics System TX Sala Gathering System El Dorado DKL + 3 Bear: Integrated Company with Diversity and Scale Strategically located assets with leverage to Domestic production 25
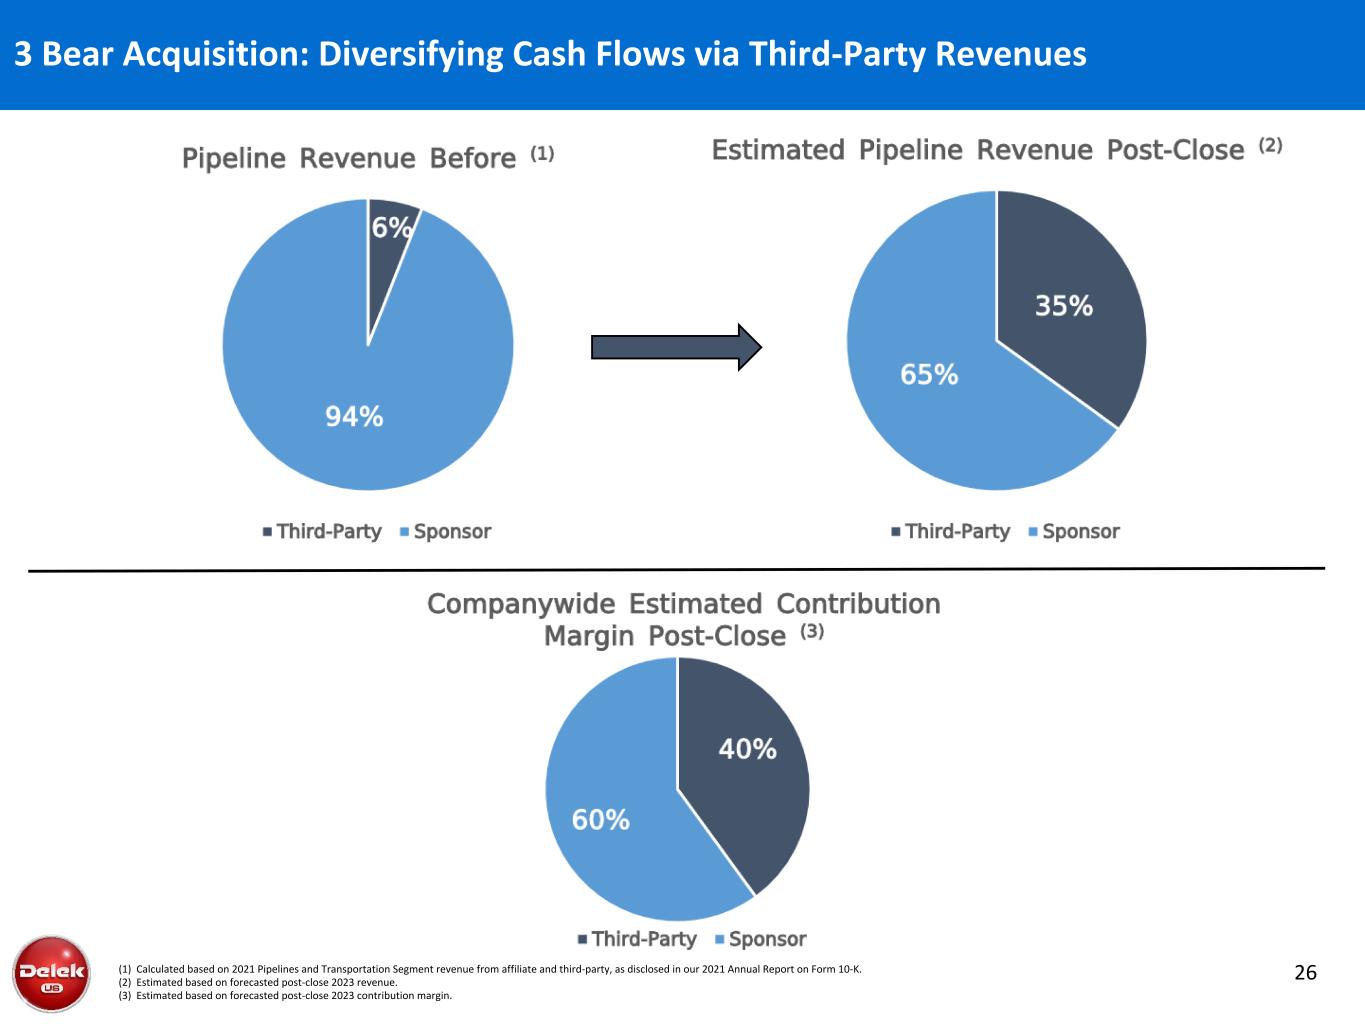
3 Bear Acquisition: Diversifying Cash Flows via Third-Party Revenues (1) Calculated based on 2021 Pipelines and Transportation Segment revenue from affiliate and third-party, as disclosed in our 2021 Annual Report on Form 10-K. (2) Estimated based on forecasted post-close 2023 revenue. (3) Estimated based on forecasted post-close 2023 contribution margin. 26
Appendix
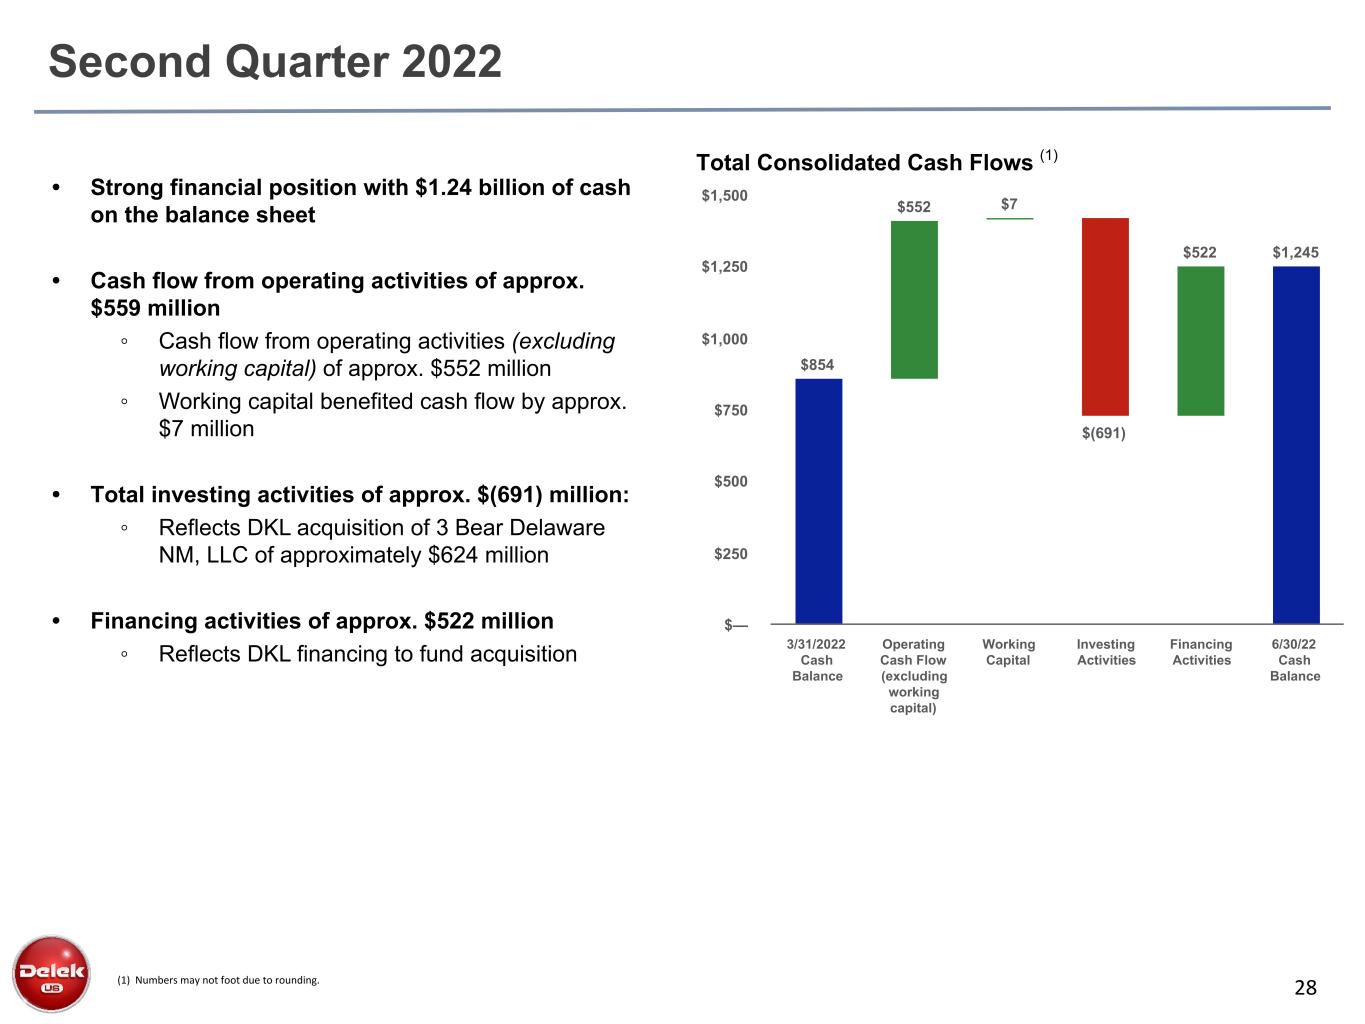
28 Second Quarter 2022 • Strong financial position with $1.24 billion of cash on the balance sheet • Cash flow from operating activities of approx. $559 million ◦ Cash flow from operating activities (excluding working capital) of approx. $552 million ◦ Working capital benefited cash flow by approx. $7 million • Total investing activities of approx. $(691) million: ◦ Reflects DKL acquisition of 3 Bear Delaware NM, LLC of approximately $624 million • Financing activities of approx. $522 million ◦ Reflects DKL financing to fund acquisition (1) Numbers may not foot due to rounding. $854 $552 $7 $(691) $522 $1,245 3/31/2022 Cash Balance Operating Cash Flow (excluding working capital) Working Capital Investing Activities Financing Activities 6/30/22 Cash Balance $— $250 $500 $750 $1,000 $1,250 $1,500 Total Consolidated Cash Flows (1)
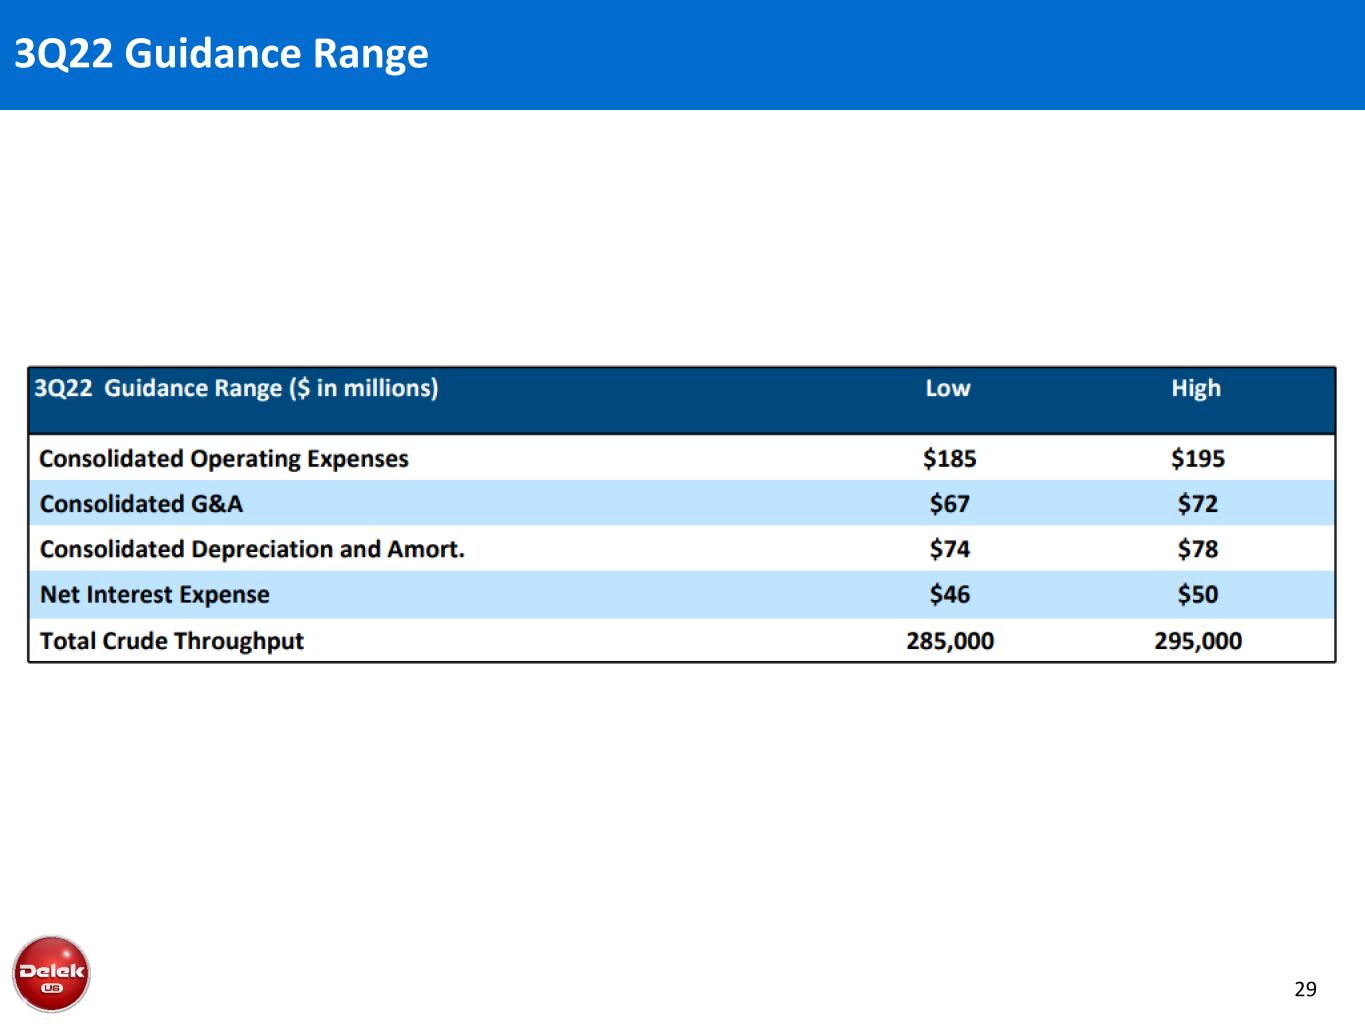
29 3Q22 Guidance Range
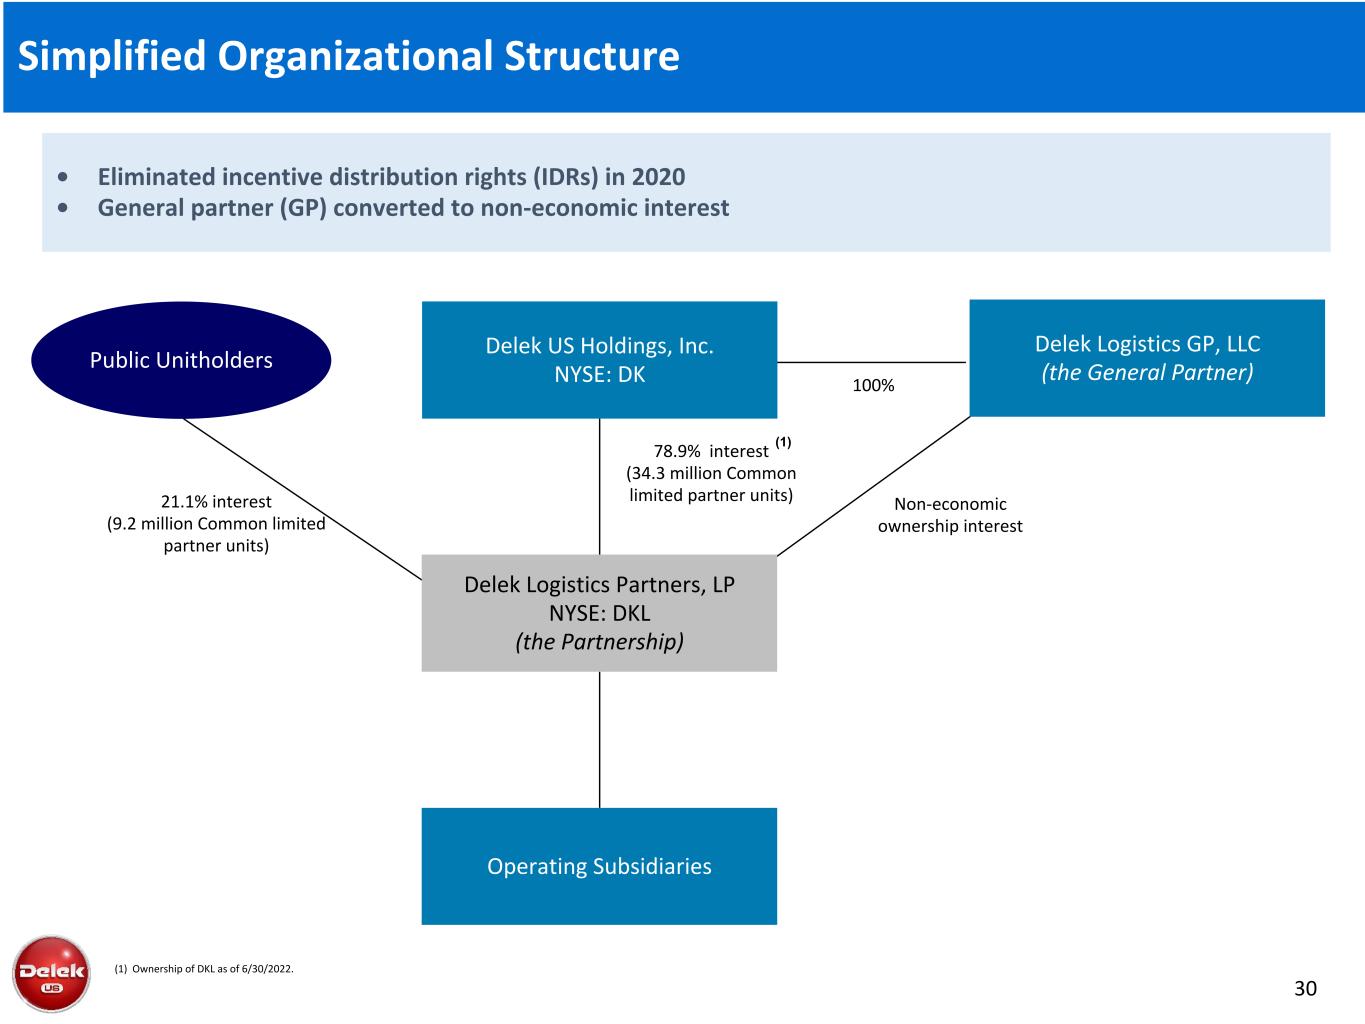
30 Simplified Organizational Structure 21.1% interest (9.2 million Common limited partner units) 100% Delek Logistics Partners, LP NYSE: DKL (the Partnership) Public Unitholders Operating Subsidiaries 78.9% interest (34.3 million Common limited partner units) Delek Logistics GP, LLC (the General Partner) Delek US Holdings, Inc. NYSE: DK • Eliminated incentive distribution rights (IDRs) in 2020 • General partner (GP) converted to non-economic interest Non-economic ownership interest (1) Ownership of DKL as of 6/30/2022. (1)
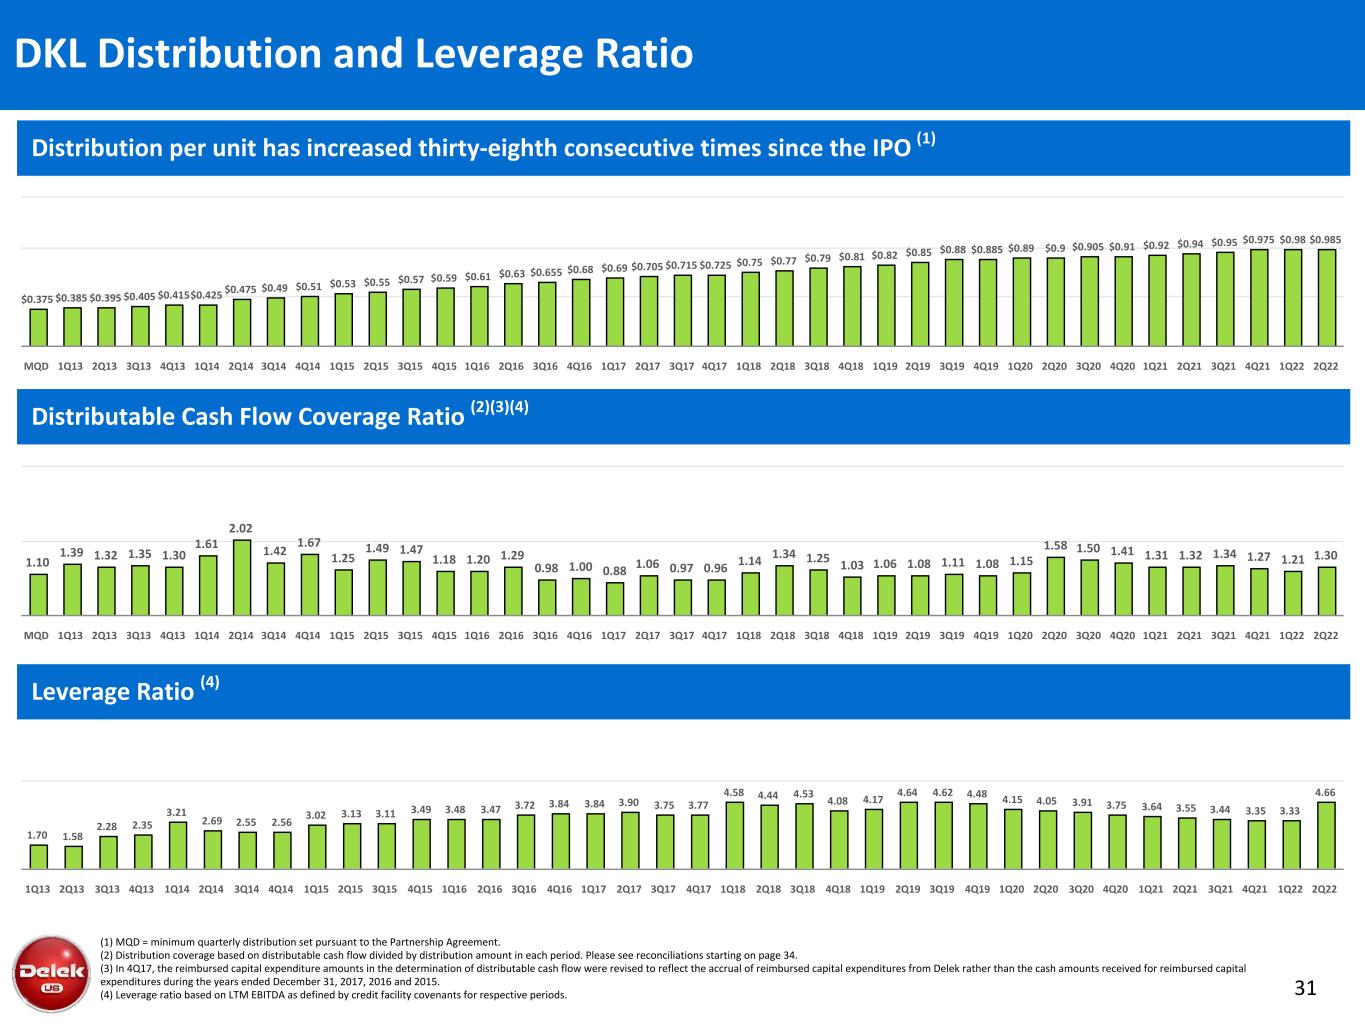
31 (1) MQD = minimum quarterly distribution set pursuant to the Partnership Agreement. (2) Distribution coverage based on distributable cash flow divided by distribution amount in each period. Please see reconciliations starting on page 34. (3) In 4Q17, the reimbursed capital expenditure amounts in the determination of distributable cash flow were revised to reflect the accrual of reimbursed capital expenditures from Delek rather than the cash amounts received for reimbursed capital expenditures during the years ended December 31, 2017, 2016 and 2015. (4) Leverage ratio based on LTM EBITDA as defined by credit facility covenants for respective periods. Distribution per unit has increased thirty-eighth consecutive times since the IPO (1) Distributable Cash Flow Coverage Ratio (2)(3)(4) Leverage Ratio (4) DKL Distribution and Leverage Ratio $0.375 $0.385 $0.395 $0.405 $0.415$0.425 $0.475 $0.49 $0.51 $0.53 $0.55 $0.57 $0.59 $0.61 $0.63 $0.655 $0.68 $0.69 $0.705 $0.715 $0.725 $0.75 $0.77 $0.79 $0.81 $0.82 $0.85 $0.88 $0.885 $0.89 $0.9 $0.905 $0.91 $0.92 $0.94 $0.95 $0.975 $0.98 $0.985 MQD 1Q13 2Q13 3Q13 4Q13 1Q14 2Q14 3Q14 4Q14 1Q15 2Q15 3Q15 4Q15 1Q16 2Q16 3Q16 4Q16 1Q17 2Q17 3Q17 4Q17 1Q18 2Q18 3Q18 4Q18 1Q19 2Q19 3Q19 4Q19 1Q20 2Q20 3Q20 4Q20 1Q21 2Q21 3Q21 4Q21 1Q22 2Q22 1.10 1.39 1.32 1.35 1.30 1.61 2.02 1.42 1.67 1.25 1.49 1.47 1.18 1.20 1.29 0.98 1.00 0.88 1.06 0.97 0.96 1.14 1.34 1.25 1.03 1.06 1.08 1.11 1.08 1.15 1.58 1.50 1.41 1.31 1.32 1.34 1.27 1.21 1.30 MQD 1Q13 2Q13 3Q13 4Q13 1Q14 2Q14 3Q14 4Q14 1Q15 2Q15 3Q15 4Q15 1Q16 2Q16 3Q16 4Q16 1Q17 2Q17 3Q17 4Q17 1Q18 2Q18 3Q18 4Q18 1Q19 2Q19 3Q19 4Q19 1Q20 2Q20 3Q20 4Q20 1Q21 2Q21 3Q21 4Q21 1Q22 2Q22 1.70 1.58 2.28 2.35 3.21 2.69 2.55 2.56 3.02 3.13 3.11 3.49 3.48 3.47 3.72 3.84 3.84 3.90 3.75 3.77 4.58 4.44 4.53 4.08 4.17 4.64 4.62 4.48 4.15 4.05 3.91 3.75 3.64 3.55 3.44 3.35 3.33 4.66 1Q13 2Q13 3Q13 4Q13 1Q14 2Q14 3Q14 4Q14 1Q15 2Q15 3Q15 4Q15 1Q16 2Q16 3Q16 4Q16 1Q17 2Q17 3Q17 4Q17 1Q18 2Q18 3Q18 4Q18 1Q19 2Q19 3Q19 4Q19 1Q20 2Q20 3Q20 4Q20 1Q21 2Q21 3Q21 4Q21 1Q22 2Q22

32 June 30, 2022 – Debt Maturity Profile DK and DKL Debt Profile Credit Ratings (S&P/Moody’s/Fitch) Cash Interest Obligations (3) (1) Delek prepaid down $10M of the Hapoalim Term Loan for each period on 7/30/21, 1/31/22, and 6/30/21. (2) Delek Logistic Partners entered into an Indenture with US Bank, as Trustee, on May 24, 2021 with a due date of June 1, 2028 and a aggregate principal amount of $400M. (3) Cash obligations are based on interest rates as of June 30, 2022. Delek US BB-/Ba3/BB- Delek Logistics B+/B1/BB- Net Debt Year Amount 2022 $94.2 2023 $90.6 2024 $85.7 2025 $48.3 2026 $30.5 2027 $30.5 2028 $16.3 (2) (1) Total Debt $2,818 (-) Cash $1,245 Total Debt Debt $1,573
Reconciliations
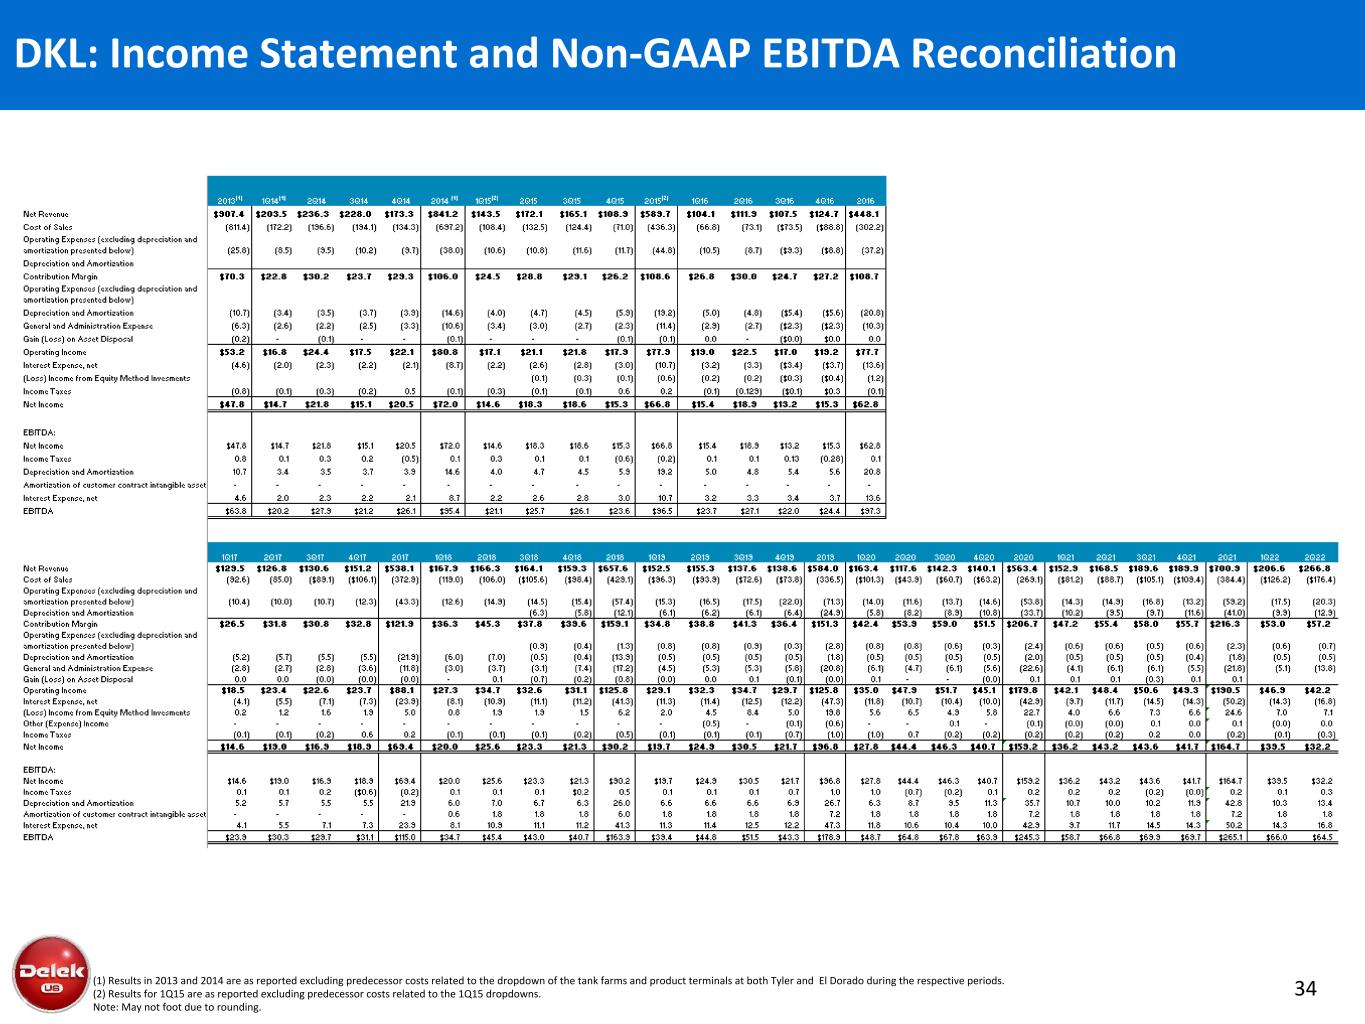
34(1) Results in 2013 and 2014 are as reported excluding predecessor costs related to the dropdown of the tank farms and product terminals at both Tyler and El Dorado during the respective periods. (2) Results for 1Q15 are as reported excluding predecessor costs related to the 1Q15 dropdowns. Note: May not foot due to rounding. DKL: Income Statement and Non-GAAP EBITDA Reconciliation
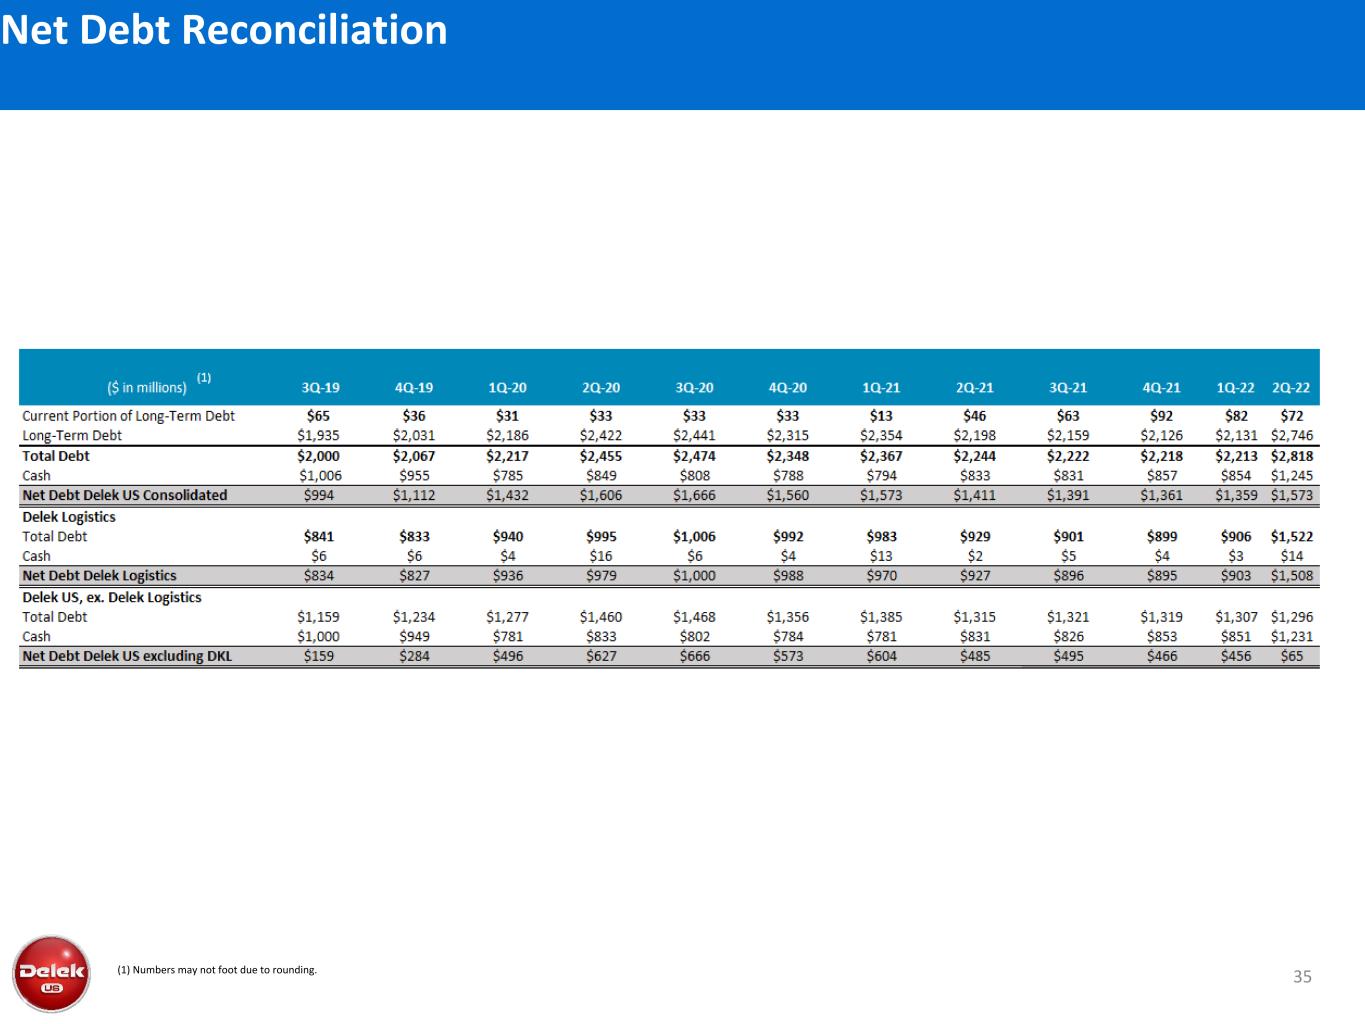
35 Net Debt Reconciliation (1) Numbers may not foot due to rounding.
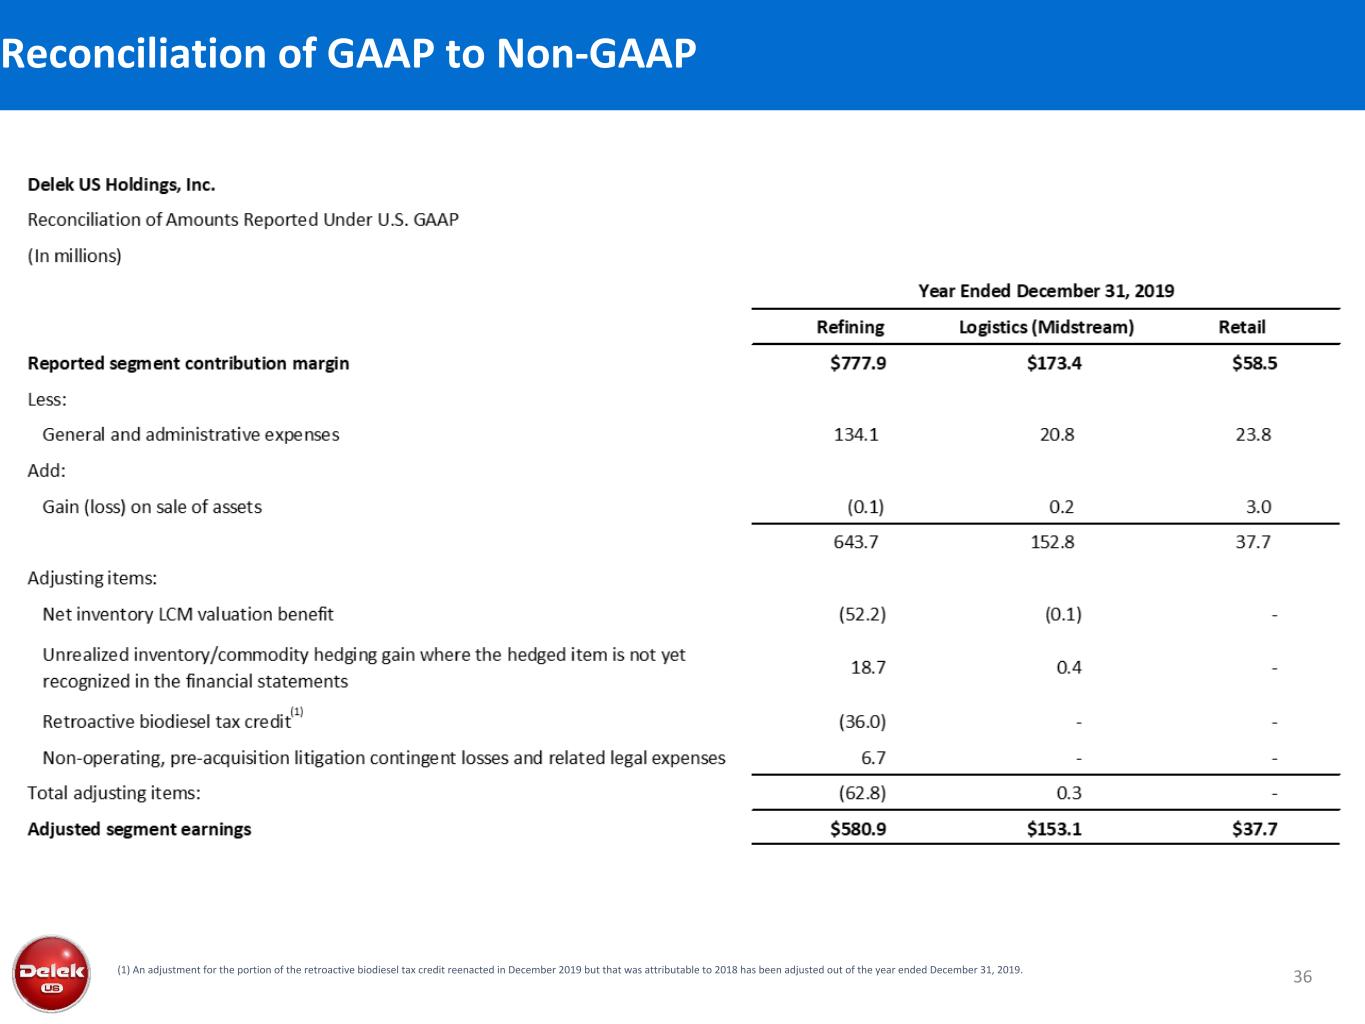
36 Reconciliation of GAAP to Non-GAAP (1) An adjustment for the portion of the retroactive biodiesel tax credit reenacted in December 2019 but that was attributable to 2018 has been adjusted out of the year ended December 31, 2019. (1)
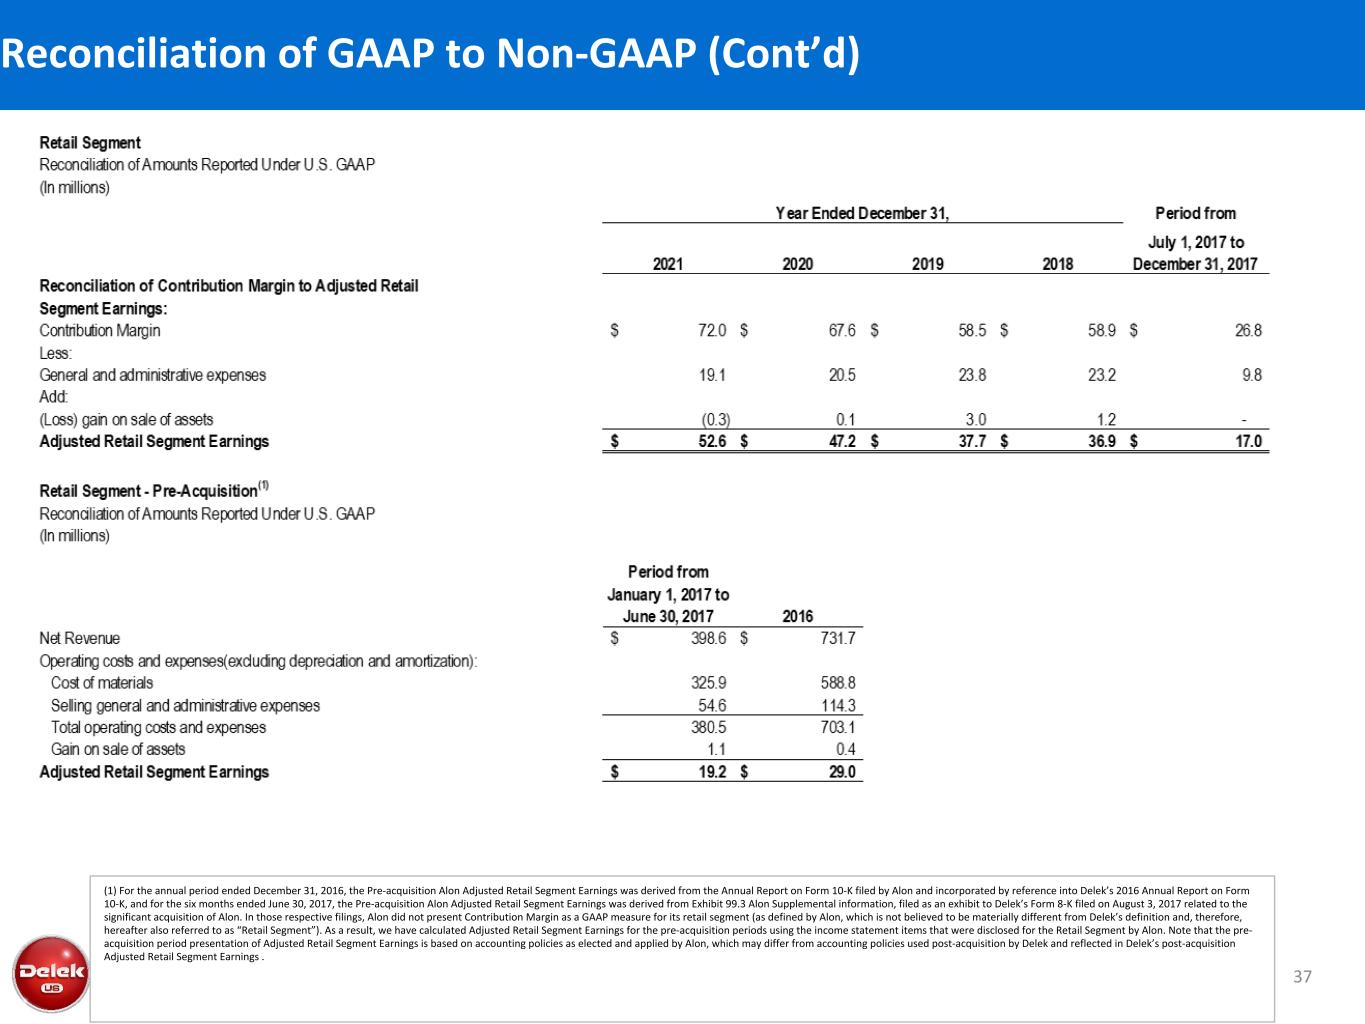
37 Reconciliation of GAAP to Non-GAAP (Cont’d) (1) For the annual period ended December 31, 2016, the Pre-acquisition Alon Adjusted Retail Segment Earnings was derived from the Annual Report on Form 10-K filed by Alon and incorporated by reference into Delek’s 2016 Annual Report on Form 10-K, and for the six months ended June 30, 2017, the Pre-acquisition Alon Adjusted Retail Segment Earnings was derived from Exhibit 99.3 Alon Supplemental information, filed as an exhibit to Delek’s Form 8-K filed on August 3, 2017 related to the significant acquisition of Alon. In those respective filings, Alon did not present Contribution Margin as a GAAP measure for its retail segment (as defined by Alon, which is not believed to be materially different from Delek’s definition and, therefore, hereafter also referred to as “Retail Segment”). As a result, we have calculated Adjusted Retail Segment Earnings for the pre-acquisition periods using the income statement items that were disclosed for the Retail Segment by Alon. Note that the pre- acquisition period presentation of Adjusted Retail Segment Earnings is based on accounting policies as elected and applied by Alon, which may differ from accounting policies used post-acquisition by Delek and reflected in Delek’s post-acquisition Adjusted Retail Segment Earnings .
Investor Relations Contacts: Blake Fernandez, SVP IR/Market Intelligence 615-224-1312


