Exhibit 4.3
MANAGEMENT’S DISCUSSION AND ANALYSIS
The Management’s Discussion and Analysis (MD&A) of operations is provided to enable readers to assess the results of operations, liquidity and capital resources of AltaGas Ltd. (AltaGas or the Corporation) as at and for the year ended December 31, 2017. This MD&A, dated February 28, 2018, should be read in conjunction with the accompanying audited Consolidated Financial Statements and notes thereto of AltaGas as at, and for the year ended, December 31, 2017.
The Consolidated Financial Statements and comparative information have been prepared in accordance with United States (U.S.) generally accepted accounting principles (U.S. GAAP) and in Canadian dollars, unless otherwise indicated. Throughout this MD&A, references to GAAP refer to U.S. GAAP.
Abbreviations, acronyms and capitalized terms used in this MD&A that are not otherwise defined herein are used consistently with the definitions in the Annual Information Form.
This MD&A contains forward looking information (forward looking statements). Words such as “may”, “can”, “would”, “could”, “should”, “will”, “intend”, “plan”, “anticipate”, “believe”, “aim”, “seek”, “propose”, “contemplate”, “estimate”, “forecast”, “expect”, “project”, “target”, “potential”, “objective”, “continue”, “outlook”, “vision”, “opportunity” and similar expressions suggesting future events or future performance, as they relate to the Corporation or any affiliate of the Corporation, are intended to identify forward looking statements. In particular, this MD&A contains forward looking statements with respect to, among other things, business objectives, the anticipated benefits of acquisitions and other major projects, the anticipated timing of commercial operations, investment decisions, expenditures and licensing and permitting, expected growth and drivers of growth, capital expenditures (including in respect of the 2018 capital program, expected allocation per business segment and project and anticipated sources of financing thereof), results of operations, operational and financial performance, business projects, opportunities and financial results.
Specifically, such forward looking statements are set forth under the headings: “Overview of the Business”, “AltaGas’ Vision and Objective”, “Strategy”, “Strategy Execution”, “Developments Relating to the Pending WGL Acquisition”, “2018 Outlook”, “Growth Capital”, “Gas”, “Power”, “Utilities” and “Future Changes in Accounting Principles” and under those headings specifically include AltaGas’ expectations of growth in natural gas supply and demand for clean energy, prospects for growth, the potential for growth through acquisition and development of energy infrastructure and the expectation that such growth in infrastructure will enable AltaGas to establish a western energy hub in northeast British Columbia providing access to export markets off the west coast and access to new markets and higher netbacks to producers in the WCSB; AltaGas’ ability to maximize profitability of its assets and to add complementary services to its existing business segments; AltaGas’ belief that investing in low-risk, long-life energy assets will generate superior economic returns; AltaGas’ expectations regarding sources of utility like returns and long life cash flows; AltaGas’ expectations regarding diversification including impact on earnings and cash flow and reduction in exposure to commodity market volatility; expectations that expansion of business through acquisitions and organic growth will support dividend and capital growth; AltaGas’ belief that in recent years natural gas supply and demand fundamentals have been changing, and consequently there is renewed interest in natural gas an economically priced, clean-burning fuel; expectations that AltaGas will acquire or build gas gathering and processing infrastructure from, or on behalf of, producers wishing to redeploy capital to exploration and production activities rather than to non-core activities such as midstream services; AltaGas’ potential to move natural gas and NGLs to key markets including Asia; AltaGas’ ability to provide a fully integrated midstream service offering to its customers across the energy value chain; AltaGas’ ability to focus on developing and operating larger gas infrastructure projects and AltaGas’ cost of doing so; expectations regarding the decommissioning of nuclear and coal-fired generation and expected timeline for decommissioning; expectations that renewable power and natural gas-fired power generation will replace nuclear and coal-fired power generation and that AltaGas is in a position to take advantage of such replacement opportunities; expectations for rate base growth in the utilities segment including through the execution of strategic utility acquisitions and addition of customers; expectations as to AltaGas’ ability to maintain financial strength and flexibility, sufficient liquidity, an investment grade credit rating and ready access to capital markets; AltaGas’ belief that proactively hedging foreign exchange rates and commodity price exposure mitigates earnings volatility from commodity price risk and volume risk; AltaGas’ belief that it can help meet the growing demand for clean energy, while continuing to deliver sustainable benefits for its
AltaGas Ltd. – 2017
shareholders; expectations with respect to in-house construction expertise and competitive advantages of such expertise, including the ability to safely deliver capital projects on time and on budget; AltaGas’ belief that it delivers an effective balance between yield and growth; AltaGas’ belief that the growth prospects in each of WGL’s regulated utility, midstream energy services and commercial energy system business lines are complementary to AltaGas’ long-term vision; expectations for the increased use of natural gas, providing opportunities for AltaGas to invest in and optimize assets; expectations regarding the decrease in U.S. demand for import of gas, NGLs and crude oil and impact that has on netbacks for Canadian energy sector; AltaGas’ belief that energy market diversification is critical for Canadian producers; expectations regarding the supply of NGL and natural gas reserves, demands from Asia for such products and opportunities such supply and demand presents for investing in infrastructure outside of North America; expectations that AltaGas is uniquely positioned to provide a competitive service to producers; AltaGas’ ability to provide multiple outlets for producers to access the highest value markets; expectations that access to Asian markets provides diversity to producers; expectations relating to AltaGas’ access to Asian markets, including through AltaGas’ relationship with Idemitsu; expectations for opportunities arising from increased demand in North America for clean sources of power and that AltaGas is in a position to take advantage of such opportunities; expectations regarding expansion and re-contracting opportunities and that AltaGas is in a position to take advantage of such opportunities; AltaGas’ expectation that its greenfield and brownfield development sites throughout California could attract multi-year power purchase agreements; expectations that continued improvements to assets will enhance value by positioning the assets to operate under a wider variety of environmental conditions; expectations with respect to the expansion of Blythe Energy Center; expectations of further development and expansion of power assets; expectations of continued investment in high growth jurisdictions; AltaGas’ ability to achieve a balanced mix of energy infrastructure assets and expected time frame to reach such balance; expectations regarding the locational benefits of the Blythe facility; expectations for growth in the utilities segment as a result of expansion of and investment in existing distribution systems, acquisition of new franchises, fuel switching and development of natural gas storage opportunities; expectations that advancing energy export opportunities will provide higher netbacks to producers; expectations regarding 2018 normalized EBITDA (including expected contributions per business segment and sources of generation); projected growth in normalized EBITDA and normalized funds from operations (including per business segment and on a combined basis with WGL); expectations with respect to the WGL Acquisition including the expected closing date, ability to obtain, and timeline for obtaining, regulatory and other approvals, the aggregate cash consideration including the anticipated sources of financing thereof and anticipated indebtedness under the bridge facility, planned asset divestitures, anticipated benefits of the WGL Acquisition including the portfolio of assets of the combined entity, nature, number, value and timing of growth and investment opportunities available to AltaGas, the quality and growth potential of the assets, the strategic focus of the business, the combined rate base and rate base growth, expectations to accelerate AltaGas’ growth, the ability of the combined entity to target higher growth markets, high growth franchise areas, and other growth markets; expectations for the Cove Point LNG Terminal including anticipated completion timing, the stability of cash flows and of AltaGas’ business, the growth potential available to AltaGas in the midstream business, capabilities for connections to marine-based energy export opportunities, clean energy, natural gas generation and retail energy services, the significance and growth potential and expectations for growth in the Montney and Marcellus/Utica formations; expectations with respect to net capital expenditures; expectations with respect to AltaGas’ capital program and funding thereof; AltaGas’ belief that the WCSB has changed from a maturing basin to one capable of sustainable long-term growth via new low cost gas formations; AltaGas’ belief that market demand, including the demand generated from the LPG and potential LNG export projects on the west coast of North America provides significant long-term growth opportunities, and that AltaGas expects to capitalize on these opportunities; expectations with respect to opportunities to increase volumes by tying-in new wells and building or purchasing adjoining facilities to create larger processing infrastructure; expectations with respect to the North Pine Facility, Townsend Facility and Townsend 2A including, expected earnings and impact on earnings; expectations with respect to the proposed Ridley Island Propane Export Terminal including costs, propane transport capability, locational benefits, initial shipment capacity, connection capability, quality of transport options, sources of propane supply, AltaGas’ ability to construct new plants and develop new projects, expectations regarding tolling arrangements, expectations of being the first propane export terminal off the west coast of British Columbia, sale and purchase of liquefied petroleum gas from the terminal, relations with Aboriginal peoples and Astomos, offtake opportunities, expectations of serving growing demand in Asia and offering new markets to producers and timing of construction and commercial operations; expectations that new AltaGas infrastructure is expected to be larger scale facilities; expectations with respect to the Alton Natural Gas Storage Project including expected natural gas storage capacity, ability to increase reliability of gas supply to AltaGas’ distribution customers in the area, ability to continue working in a constructive manner with stakeholders, construction and brining timeline and storage in service date; expectations with respect
to access to the CN rail network and transport of propane to the Ridley Island Propane Export Terminal; expectations regarding AltaGas’ ability to underpin and nature of contract commitments including with respect to term and dedication, AltaGas’ ability to negotiate and execute definitive agreements and receive regulatory approvals, expected timeline for executing definitive agreements and being on-line, AltaGas’ expectation that development of these facilities will broaden AltaGas’ customer base and drive continued growth for AltaGas’ midstream and energy export strategies; AltaGas’ belief that the value of existing gas-fired facilities can be optimized through active management, origination and additional technological and operational enhancements; expectations relating to the MCP including cost, construction and in-service date; cost, location, connection capability to existing pipelines and gas supply opportunities; expectations that AltaGas is well-positioned to fund its growth capital and to take advantage of growth opportunities as they arise; expectations relating to AltaGas’ ability to fund its projects and business; expectations relating to the energy needs of California, including an increasing demand for non-gas resource adequacy; the potential for, and timing of, RFPs from western U.S. states; expectations relating to the Pomona Energy Storage Facility including AltaGas’ ability to operate the facility, potential expansion opportunities, potential size of expansion, expected energy storage capacity and available resource adequacy, battery run time, expectations regarding resource adequacy payments and AltaGas’ ability to earn additional revenue from energy from batteries and impact successful commercial operations has on AltaGas and on earnings; expectations relating to the Northwest Hydro Facilities including expected generation and contributions to earnings and seasonality impacts; expectations regarding gas processing volumes and disposition of smaller non-core assets; expectations regarding the U.S. dollar exchange rate, foreign exchange forward contracts, commodity hedge gains, and frac spread exposure; impact of facility turnarounds on earnings and timing of turnarounds; expected earnings from the utilities segment; AltaGas’ ability to focus on enhancing productivity and streamlining businesses; and expectations regarding the adoption of changes in accounting principles and impact on financial statements.
These statements involve known and unknown risks, uncertainties and other factors that may cause actual results, events and achievements to differ materially from those expressed or implied by such statements. Such statements reflect AltaGas’ current expectations, estimates and projections at the time the statement was made. Material assumptions include: expected commodity supply, demand and pricing; volumes and rates; exchange rates; inflation; interest rates; credit rating; regulatory approvals and policies; future operating and capital costs; project completion dates; capacity expectations; implications of recent U.S. tax legislation changes; the outcomes of significant commercial contract negotiations; financing of the WGL Acquisition; and timing and completion of the WGL Acquisition.
AltaGas’ forward looking statements are subject to certain risks and uncertainties which could cause results or events to differ from current expectations, including without limitation: access to and use of capital markets; market value of AltaGas’ securities; AltaGas’ ability to pay dividends; AltaGas’ ability to service or refinance its debt and manage its credit rating and risk; prevailing economic conditions; potential litigation; AltaGas’ relationships with external stakeholders, including Aboriginal stakeholders; volume throughput and the impacts of commodity pricing, supply, composition and other market risks; available electricity prices; interest rate, exchange rate and counterparty risks; the Harmattan Rep agreements; legislative and regulatory environment; underinsured losses; weather, hydrology and climate changes; the potential for service interruptions; availability of supply from Cook Inlet; availability of biomass fuel; AltaGas’ ability to economically and safely develop, contract and operate assets; AltaGas’ ability to update infrastructure on a timely basis; AltaGas’ dependence on certain partners; impacts of climate change and carbon taxing; effects of decommissioning, abandonment and reclamation costs; impact of labour relations and reliance on key personnel; cybersecurity risks; risks associated with the acquisition of WGL, the financing of the WGL Acquisition and the underlying business of WGL; and other factors set out in AltaGas’ continuous disclosure documents.
Many factors could cause AltaGas’ or any of its business segments’ actual results, performance or achievements to vary from those described in this MD&A including, without limitation, those listed above as well as the assumptions upon which they are based proving incorrect. These factors should not be construed as exhaustive. Should one or more of these risks or uncertainties materialize, or should assumptions underlying forward-looking statements prove incorrect, actual results may vary materially from those described in this MD&A as intended, planned, anticipated, believed, sought, proposed, estimated, forecasted, expected, projected or targeted and such forward-looking statements included in this MD&A should not be unduly relied upon. The impact of any one assumption, risk, uncertainty or other factor on a particular forward-looking statement cannot be determined with certainty because they are interdependent and AltaGas’ future decisions and actions will depend on management’s assessment of all information at the relevant time. These statements speak only as of the date of this MD&A.
AltaGas does not intend, and does not assume any obligation, to update these forward-looking statements except as required by law. The forward-looking statements contained in this MD&A are expressly qualified by these cautionary statements.
Financial outlook information contained in this MD&A about prospective financial performance, financial position or cash flows is based on assumptions about future events, including economic conditions and proposed courses of action, based on AltaGas management’s (Management) assessment of the relevant information currently available. Readers are cautioned that such financial outlook information contained in this MD&A should not be used for purposes other than for which it is disclosed herein.
Additional information relating to AltaGas, including its quarterly and annual MD&A and Consolidated Financial Statements, Annual Information Form, and press releases are available through AltaGas’ website at www.altagas.ca or through SEDAR at www.sedar.com.
ALTAGAS ORGANIZATION
The businesses of AltaGas are operated by AltaGas and a number of its subsidiaries including, without limitation, AltaGas Services (U.S.) Inc.; in regards to the gas business, AltaGas Extraction and Transmission Limited Partnership, AltaGas Pipeline Partnership, AltaGas Processing Partnership, AltaGas Northwest Processing Limited Partnership and Harmattan Gas Processing Limited Partnership; in regards to the power business, Coast Mountain Hydro Limited Partnership, Blythe Energy Inc. (Blythe), and AltaGas San Joaquin Energy Inc.; and, in regards to the utility business, AltaGas Utilities Inc. (AUI), Heritage Gas Limited (Heritage Gas), Pacific Northern Gas Ltd. (PNG), and SEMCO Energy, Inc. (SEMCO). SEMCO conducts its Michigan natural gas distribution business under the name SEMCO Energy Gas Company (SEMCO Gas) and its Alaska natural gas distribution business under the name ENSTAR Natural Gas Company (ENSTAR).
OVERVIEW OF THE BUSINESS
AltaGas, a Canadian corporation, is a North American diversified energy infrastructure company with a focus on owning and operating assets to provide clean and affordable energy to its customers. AltaGas has three business segments:
· Gas, which transacts more than 2 Bcf/d of natural gas and includes natural gas gathering and processing, natural gas liquids (NGL) extraction and fractionation, transmission, storage, natural gas and NGL marketing, and the Corporation’s indirectly held one-third interest in Petrogas Energy Corp. (Petrogas), through which AltaGas’ interest in the Ferndale Terminal is held;
· Power, which includes 1,708 MW of gross capacity from natural gas-fired, hydro, wind, and biomass generation facilities, and energy storage assets located across North America; and
· Utilities, serving over 580,000 customers through ownership of regulated natural gas distribution utilities across North America and a regulated natural gas storage utility in the United States, delivering clean and affordable natural gas to homes and businesses.
As at December 31, 2017, AltaGas’ enterprise value exceeded $10 billion. With physical and economic links along the energy value chain, together with its experienced and talented workforce of more than 1,600 people, and its efficient, reliable and profitable assets, market knowledge and financial discipline, AltaGas has provided strong, stable and predictable returns to its investors. AltaGas focuses on maximizing the profitability of its assets, adding services that are complementary to its existing business segments, and growing through the acquisition and development of energy infrastructure.
2017 GROWTH HIGHLIGHTS
· On January 3, 2017, AltaGas announced a positive Final Investment Decision (FID) on the Ridley Island Propane Export Terminal (RIPET), having received approval from federal regulators. On May 5, 2017, AltaGas LPG Limited Partnership (AltaGas LPG), a wholly-owned subsidiary of AltaGas, and Vopak Development Canada Inc. (Vopak), a wholly-owned subsidiary of Koninklijke Vopak N.V. (Royal Vopak), a public company incorporated under the laws of the Netherlands,
formed the Ridley Island LPG Export Limited Partnership (RILE LP) for the development of RIPET. AltaGas’ subsidiaries hold a 70 percent interest in RILE LP, with Vopak holding the remaining 30 percent interest;
· On January 25, 2017, AltaGas entered into a definitive agreement (the Merger Agreement) to indirectly acquire WGL Holdings, Inc. (the WGL Acquisition). Pursuant to the Merger Agreement, following the consummation of the WGL Acquisition, WGL Holdings, Inc. (WGL) common shareholders will receive US$88.25 per common share in cash, which represents a total enterprise value of approximately US$7.2 billion, including the assumption of approximately US$2.7 billion of debt as at December 31, 2017;
· On June 29, 2017, AltaGas modified its existing take-or-pay agreement with Birchcliff Energy Ltd. (Birchcliff) to incent increased utilization of the Gordondale facility until late 2020. The modifications made apply solely to volumes above the existing take-or-pay volume commitments;
· In August 2017, the Michigan Public Service Commission (MPSC) approved SEMCO Gas’ application to construct, own, and operate the Marquette Connector Pipeline (MCP);
· In September 2017, the Regulatory Commission of Alaska (RCA) issued a decision on ENSTAR’s 2016 rate case. As a result, the rate increase implemented in the third quarter of 2016 was made permanent and a further permanent rate increase was implemented effective November 1, 2017;
· On October 1, 2017, commercial operations commenced at Townsend 2A, a 99 Mmcf/d shallow-cut gas processing facility located on the existing Townsend site, adjacent to the currently operating Townsend Facility;
· On December 1, 2017, commercial operations commenced with the first 10,000 Bbls/d train at the North Pine NGL Facility (the North Pine Facility), located approximately 40 km northwest of Fort St. John, British Columbia; and
· In December 2017, the power purchase agreement (PPA) at the Craven biomass facility was extended to December 31, 2027.
2017 FINANCIAL HIGHLIGHTS
(Normalized EBITDA, normalized funds from operations, normalized net income, net debt, and net debt to total capitalization ratio are non-GAAP financial measures. Please see Non-GAAP Financial Measures section of this MD&A.)
· Normalized EBITDA was $797 million, an increase of 14 percent compared to $701 million in 2016;
· Normalized funds from operations were $615 million ($3.60 per share), an 11 percent increase compared to $554 million ($3.52 per share) in 2016;
· Net income applicable to common shares was $30 million ($0.18 per share) compared to $155 million ($0.99 per share) in 2016;
· Normalized net income was $204 million ($1.19 per share), an increase of 33 percent compared to $153 million ($0.98 per share) in 2016;
· Net debt was $3.6 billion as at December 31, 2017, compared to $3.9 billion as at December 31, 2016;
· Net debt to total capitalization ratio was 44 percent as at December 31, 2017, compared to 46 percent as at December 31, 2016;
· In the first quarter of 2017, AltaGas completed the sale of 84.5 million subscription receipts at an issue price of $31 per subscription receipt for total gross proceeds of approximately $2.6 billion including the over-allotment option that was partially exercised;
· On February 22, 2017, AltaGas closed a public offering of 12.0 million cumulative 5-year minimum rate reset redeemable preferred shares, Series K, at a price of $25 per share for aggregate gross proceeds of $300 million;
· On March 15, 2017, AltaGas completed the sale of the Ethylene Delivery Systems (EDS) and the Joffre Feedstock Pipeline (JFP) transmission assets to Nova Chemicals Corporation (Nova Chemicals) for net proceeds of approximately $67 million;
· On October 4, 2017, AltaGas issued an aggregate of $450 million senior unsecured medium-term notes (MTNs) consisting of $200 million of MTNs with a coupon rate of 3.98 percent maturing on October 4, 2027, and $250 million of MTNs with a coupon rate of 4.99 percent maturing on October 4, 2047; and
· On October 18, 2017, the Board of Directors approved an increase in the monthly dividend by $0.0075 per common share to $0.1825 ($2.19 per common share annualized) effective for the November 2017 dividend, a 4.3 percent increase.
ALTAGAS’ VISION AND OBJECTIVE
AltaGas’ vision is to be a leading North American diversified energy infrastructure company. The Corporation’s overall objective is to generate superior economic returns by investing in low-risk, long-life energy assets. The Corporation focuses on assets underpinned by contracts with strong counterparties and regulated assets, both of which provide stable utility-like returns and long-life cash flows. Diversification increases the stability of earnings and cash flows and reduces AltaGas’ exposure to commodity market volatility. AltaGas’ earnings are underpinned by three business segments, and within each segment there is further diversification: by customer and service type in the Gas segment; by fuel source, customer, and geography within the Power segment; and by regulatory jurisdiction in the Utilities segment. The Corporation also focuses on expanding its business through acquisitions and organic growth to further support dividend and capital growth. AltaGas believes that in the long-term, the abundant supply of natural gas in North America and the increasing global demand for clean energy will continue to provide opportunities for sustained growth across all of its business segments. Superior service, safety, and reliability are also integral to AltaGas’ customer value proposition.
STRATEGY
Consistent with its mandate of overseeing and directing the Corporation’s strategic direction, AltaGas’ Board of Directors (Board of Directors) is actively engaged in regular review of the Corporation’s strategy. The Corporation continually assesses the macro and micro-economic trends impacting its business and seeks opportunities to generate value for shareholders, including through acquisitions, dispositions or other strategic transactions. Opportunities pursued by AltaGas must meet strategic, operating and financial criteria.
The Corporation’s long-term strategy is to grow in attractive areas and maintain a long-term, balanced mix of energy infrastructure assets across its Gas, Power and Utilities business segments. AltaGas’ business strategy is underpinned by the growing demand for clean energy with natural gas as a key fuel source.
Owning and Operating Energy Infrastructure
Natural gas supply and demand fundamentals and the demand for clean energy have consistently underpinned the Corporation’s strategy. In recent years, the supply and demand fundamentals have been changing. Abundant supply of natural gas in North America, driven by new technology that has improved the economics of unconventional gas plays, has been positive news for North American energy consumers and has led to renewed interest in natural gas as an economically priced, clean-burning fuel. As a result, the use of natural gas for power generation, household, and commercial and industrial uses has increased substantially, providing significant opportunities across AltaGas’ Gas, Power and Utilities segments to invest in and optimize its assets.
In the Gas segment, AltaGas’ strategy is to provide a fully-integrated midstream service offering to its customers across the energy value chain. As part of this strategy, the Corporation builds and acquires gas gathering and processing infrastructure on behalf of, or from, producers wishing to redeploy capital to exploration and production activities, rather than to non-core activities such as midstream services. Canada produces a surplus of gas, NGL and crude oil. The U.S. has traditionally been the sole export market for this surplus, but with the U.S. now having a surplus as well, its demand for import of these products has decreased. As a result, netbacks have been less attractive for Canadian producers. AltaGas believes that energy market diversification is critical for the Canadian energy sector. Investing in infrastructure for export outside of North America provides an opportunity for Canadian producers to align the vast supply of NGL and natural gas reserves with the growing demand from Asia. AltaGas is uniquely positioned to provide producers with a competitive service offering across the integrated value chain, from wellhead to end markets by way of export terminals. Access to Asian markets provides market diversity to producers, especially those in the Montney, Deep Basin, and Duvernay regions under development in northeastern British Columbia and western Alberta. AltaGas is uniquely positioned to deliver higher netbacks to producers for their NGL by establishing a western
energy hub in northeast British Columbia, through RIPET, which is currently under construction, and through its ownership interest in Petrogas and the Ferndale Terminal. AltaGas also has access to Asian markets through its relationship with Idemitsu Kosan Co.,Ltd. (Idemitsu), which owns 51 percent of Astomos Energy Corporation (Astomos), the largest liquefied petroleum gas (LPG) importer in Japan (Mitsubishi Corporation owns the remaining 49 percent of Astomos). On January 25, 2017, the Corporation announced its pending acquisition of WGL. WGL has a growing midstream business with investments in gas gathering infrastructure and regulated gas pipelines in the Marcellus/Utica gas formation located in the northeast United States with capabilities for connections to marine-based energy export opportunities via the North American Atlantic coast through the Cove Point LNG Terminal in Maryland being developed by a third party, which is currently in the final stages of commissioning. The combined enterprise will be uniquely positioned with key gas midstream assets in both the Marcellus/Utica and Montney gas formations, which are two of North America’s most prolific gas basins. Further information on the pending acquisition of WGL can be found in the Developments Relating to the Pending WGL Acquisition section of this MD&A.
There has been an increase in the demand in North America for clean sources of highly flexible power to complement the significant growth in renewable power, while also helping to fill the void as coal and nuclear power declines. The Power segment is focused on developing, building, owning, and operating a diversified portfolio of clean energy assets that reduce the Corporation’s carbon footprint and on meeting North America’s demand for clean energy. AltaGas is positioned to take advantage of this opportunity. In California, the California Independent System Operator (CAISO) has stated that up to 15,000 MW of fast ramping flexible capacity is required to meet the needs of the current 50 percent Renewable Portfolio Standard of California by 2030 given planned retirements of once-through cooling gas facilities, as well as the planned retirement of the Diablo Canyon nuclear plant. With the retirements of traditional generating assets and the increased variability of a growing renewable asset base, the demand for highly-responsive generation and energy storage assets is increasing. In northern California, the Corporation is focused on owning generation assets in locally constrained areas near load pockets as local resource adequacy needs result in more opportunities for expansion, re-contracting and energy storage. AltaGas is well positioned in northern California with the acquisition of the San Joaquin Facilities and Ripon in 2015. In southern California, there has been an increasing demand for non-gas resource adequacy as evidenced by the Aliso Canyon storage request for proposals (RFPs), which has resulted in the successful bidding, construction and operation of the Pomona Energy Storage Facility, located in the east Los Angeles load pocket. This site is well suited for future development of additional battery storage. The Corporation expects further development and expansion opportunities to arise from existing sites, including Ripon, as well as third party sites similar to the recently completed Pomona Energy Storage Facility. The Corporation’s pending acquisition of WGL fits synergistically with this strategy. WGL owns a growing non-regulated contracted power business, with a focus on distributed generation and energy efficiency assets throughout the United States. WGL also owns a retail gas and power marketing business serving approximately 222,000 customers across five states in the U.S. Further information on the pending acquisition of WGL can be found in the Developments Relating to the Pending WGL Acquisition section of this MD&A.
In the Utilities segment, the Corporation is focused on finding innovative ways to continue to safely and reliably deliver clean and affordable natural gas to more customers. AltaGas focuses on growing rate base through adding customers, including serving power plants within service jurisdictions, and through consumers fuel switching as abundant natural gas supply provides a clean low-cost energy alternative. In addition, the Utilities segment continues to invest in existing distribution systems through pipeline replacement and system betterment programs to ensure safe, reliable service for AltaGas’ customers as well as to meet increased residential and commercial demand. The Marquette Connector Pipeline that will be constructed in Marquette, Michigan by SEMCO Gas will provide approximately 35,000 customers in its service territory with needed redundancy and additional supply options. The Alton Natural Gas Storage Project currently under construction in Nova Scotia will help increase reliability of supply and lower costs for AltaGas’ natural gas distribution customers in that area. The Corporation also seeks to execute strategic utility acquisitions and dispositions when opportunities arise as demonstrated by the Corporation’s pending acquisition of WGL, which is the sole common shareholder of Washington Gas Light Company (Washington Gas), a regulated natural gas utility headquartered in Washington, D.C., serving more than 1.2 million customers in Maryland, Virginia, and the District of Columbia. Further information on the pending acquisition of WGL can be found in the Developments Relating to the Pending WGL Acquisition section of this MD&A.
Maintain Financial Strength and Flexibility
Integral to AltaGas’ strategy is maintaining financial strength and flexibility, an investment grade credit rating, and ready access to capital markets. Financial discipline and effective risk management are fundamental cornerstones of the Corporation’s strategy. AltaGas seeks to optimize risk and reward, ensuring that returns are commensurate with the level of risk assumed. AltaGas’ financing strategy is to ensure the Corporation has sufficient liquidity to meet its capital requirements and to do so at the lowest cost possible. As a growth-oriented energy infrastructure company, AltaGas creates value for its investors through minimizing its cost of capital and maximizing its return on invested capital, which ensures operating cash flows are maintained and growing. The Corporation develops and executes financing plans and strategies to ensure investment grade credit ratings, diversity in its funding sources, and ready access to capital markets.
A key element of the Corporation’s stable business model is mitigating its exposure to certain market price risks as well as volume risk. In addition to its diversification strategy, the Corporation has developed risk management processes that mitigate earnings volatility from commodity price risk and volume risk. AltaGas proactively hedges foreign exchange rates and commodity price exposures when it is prudent to do so. As well, the continued management of counterparty credit risk remains an ongoing priority. AltaGas partially mitigates the foreign exchange exposure on its U.S. investments by incorporating U.S. dollar (US$) denominated capital, both debt and preferred shares, into its financing strategy.
Continue to Develop Organizational Capability to Support the Strategy
AltaGas recognizes that to be successful in operating and constructing energy infrastructure, specific core competencies are required. To that end, the Corporation continues to focus on hiring and training the required competencies to execute its strategy, and ensuring that the performance management processes support the long-term objective of creating shareholder value.
Sustainability
AltaGas adheres to a strong set of core values, which reinforce its commitment to integrating sustainability fundamentals into every aspect of the business. AltaGas recognizes the broad range of stakeholders that are reached through its operations, and is focused on owning and operating assets that provide clean and affordable energy to its customers. As the Corporation continues to evolve and expand its diversified energy assets, AltaGas will continue to operate in a safe, reliable manner, while working closely with governments, regulatory agencies and stakeholders to maintain positive relationships. By balancing economic priorities with AltaGas’ social and environmental values, AltaGas believes it can help meet the growing global demand for clean energy, while continuing to deliver sustainable benefits to its shareholders.
Focus on Project Delivery
AltaGas has the internal capabilities and resources to safely deliver capital projects on time and on budget, in close partnership with Aboriginal peoples and community stakeholders. AltaGas has significant in-house construction expertise, demonstrated by the successful completion of more than $2.2 billion in projects since 2012, which provides a significant competitive advantage. Cost efficiency and strong operating performance are the drivers for increasing value as the Corporation continues to build out its portfolio of assets. Key initiatives continue to increase proficiency in managing costs and include upgrades to cost tracking systems and implementing best practice procurement strategies.
STRATEGY EXECUTION
AltaGas has successfully executed its strategy to create shareholder value and to maintain financial strength and flexibility, growing from under $6 billion in assets five years ago to total assets of over $10 billion at the end of 2017. In the last five years, the Corporation has reported a 19 percent compound annual growth rate in normalized EBITDA and a 9 percent compound annual growth rate in dividends per share. AltaGas delivers an effective balance between yield and growth. The pending acquisition of WGL supports AltaGas’ long-term vision by reinforcing AltaGas’ strategy of focusing on high quality, low risk and long-lived assets to achieve a diversified long-term growing business mix in three key energy infrastructure segments. The pending acquisition is expected to accelerate the Corporation’s growth, resulting in combined total assets of over $22 billion. AltaGas expects to continue investing in attractive high growth jurisdictions and is focused on achieving a balanced mix of energy infrastructure assets over the medium to long-term. The attractive growth prospects in each of WGL’s regulated utility, midstream energy services and commercial energy system business lines, of which the large majority are regulated and/or under
long-term contracts, is complementary to AltaGas’ long-term vision. Please refer to the Developments Relating to the Pending WGL Acquisition section of this MD&A for further information.
AltaGas continues to progress its integrated northeast British Columbia strategy. Construction was completed ahead of schedule and approximately $5 million under budget at Townsend 2A and this asset entered service on October 1, 2017. NGL produced from Townsend 2A is transported to the North Pine Facility via pipelines owned by AltaGas. On December 1, 2017, commercial operations commenced with the first 10,000 Bbls/d NGL separation train at the North Pine Facility, which was completed ahead of schedule and approximately $15 million under budget. The North Pine Facility is connected to existing AltaGas infrastructure in the region and has access to the CN rail network, allowing for the transportation of propane from the North Pine Facility to RIPET. AltaGas strives to meet producer needs for new markets and higher netbacks by advancing energy export projects. On January 3, 2017, AltaGas announced a positive FID for the construction of RIPET, a propane export terminal on Ridley Island near Prince Rupert, British Columbia. This propane export facility is expected to be the first LPG export terminal off the west coast of Canada, and is being designed to ship up to 1.2 million tonnes per annum. Please refer to the Growth Capital section in this MD&A for further details regarding RIPET.
AltaGas continues to drive its strategy to grow its highly contracted, clean power generation portfolio. The Power segment consists entirely of clean energy assets with approximately 74 percent and 26 percent of generation capacity from gas-fired and renewables sources, respectively. In the fourth quarter of 2016, AltaGas safely commissioned the Pomona Energy Storage Facility, located at the existing Pomona facility in the east Los Angeles Basin of Southern California. AltaGas continues to evaluate a future expansion of the facility based on Southern California Edison’s (SCE) potential procurement of additional energy storage in the Los Angeles Basin to further improve system reliability, including in relation to the ongoing concerns over the Aliso Canyon gas storage facility. As Publicly Owned Utilities (POUs), Investor Owned Utilities (IOUs), and Community Choice Aggregators (CCAs) add renewable resources to meet California’s renewable portfolio standard obligations as well as the California Public Utilities Commission’s (CPUC) energy storage procurement target of 1,325 MW, sites with strong solar and wind characteristics as well as cost effective transmission interconnections are in high demand. AltaGas expects that its greenfield and brownfield development sites throughout California, which are well suited for renewable, energy storage or both renewable and energy storage projects, could attract multi-year power purchase agreements through the standard RFP process. In addition, AltaGas is actively engaged in a strategy to optimize the value of its gas-fired facilities once they come off of their respective PPAs (between 2020 and 2022). This includes evaluating further enhancements to the facilities to improve the value of energy and ancillary services, selling resource adequacy (RA) to IOUs, POUs and CCAs, and the near term monetization of specific surplus assets and associated offsite infrastructure. For example, AltaGas’ Ripon facility has been awarded an RA contract for June through September 2018. Similar to the Pomona Energy Storage project, the market and operation knowledge gained from winning an RA contract will further advance AltaGas’ California strategy.
Continued enhancements have been made to AltaGas’ $1 billion investment in the Northwest Hydro Facilities, including numerous operational and mechanical facility improvements focused on increased efficiency and reliability. The continued improvements, particularly at Forrest Kerr, enhance value by positioning the assets to operate under a wider variety of environmental conditions. In 2017 the facilities showed incremental productivity growth of greater than 6 percent, and though seasonally lower fall volumes limited total output, the facilities entered 2018 better positioned to deliver incremental generation.
Across the five separate utility franchises throughout North America, AltaGas continues to focus on safely and reliably delivering customers clean, affordable energy. In 2017, AltaGas achieved customer growth across all utilities, and grew rate base by expanding its existing infrastructure through system upgrade programs and organic growth opportunities. In August 2017, SEMCO Gas received approval of its application to construct, own and operate the Marquette Connector Pipeline, allowing SEMCO Gas to provide needed redundancy and additional supply options to its existing customers as well as additional natural gas capacity to Michigan’s Upper Peninsula to allow for growth. Please refer to the Growth Capital section in this MD&A for further details regarding the MCP.
In 2017, the Corporation enhanced its financial strength and flexibility through a combination of internally-generated cash flows, the Premium DividendTM, Dividend Reinvestment and Optional Cash Purchase Plan (DRIP), and the issuance of approximately $750 million of preferred shares and MTNs. In addition, AltaGas also completed the sale of 84.5 million subscription receipts at an issue price of $31 per subscription receipt for total gross proceeds of approximately $2.6 billion (see Subscription Receipts section in this MD&A for further details). AltaGas maintained sufficient liquidity and a strong balance sheet throughout the year and exited 2017 with approximately $2.0 billion of available credit facilities and debt-to-total capitalization of 44 percent. AltaGas entered 2018 well positioned to fund its growth capital and to take advantage of growth opportunities such as the pending acquisition of WGL. Please refer to the Developments Relating to the Pending WGL Acquisition section of this MD&A.
During 2017, the Board of Directors approved a dividend increase of approximately 4 percent from $2.10 per share to $2.19 per share on an annualized basis. The dividend increase reflects the success of AltaGas’ strong operational and financial performance across its three business segments, as well as the stability and sustainability of its cash flows.
2018 OUTLOOK
AltaGas expects the WGL Acquisition to close in mid-2018. As a combined entity, AltaGas expects normalized EBITDA to increase by approximately 25 to 30 percent and normalized funds from operations to increase by approximately 15 to 20 percent.
Included in the above forecast are AltaGas’ expectations of normalized EBITDA and normalized FFO being reduced by approximately 5 percent as a result of the U.S. tax reform. The impact to normalized net income is expected to be neutral. The lower tax rates at the combined regulated Utilities will provide customers with decreased rates while providing the opportunity to drive rate base growth. The U.S. non-regulated Gas and Power segments are expected to record higher normalized net income as a result of the lower U.S. federal tax rate, partially offset by limitations on the deductibility of interest expense for U.S. tax purposes.
The WGL Acquisition is expected to drive growth in all three business segments. The combined Utilities segment is expected to have the largest contribution to EBITDA, followed by the Gas segment. Specifically for Utilities, the combined segment is expected to have an overall rate base of approximately $5 billion and is expected to grow through planned capital investments in 2018. The number of customers is also expected to increase by approximately 1.2 million. The Gas segment is expected to benefit from the addition of WGL’s pipeline investments in the prolific Marcellus/Utica gas resource regions as well as a gas supply agreement associated with the Cove Point LNG Terminal which is in the final stages of commissioning. WGL’s investment in the Stonewall Gas Gathering System is currently in-service and WGL expects the Central Penn and Mountain Valley pipelines to be operational by the end of 2018. The Gas segment will also benefit from a full year of contributions from AltaGas’ Townsend 2A and the first train of the North Pine Facility. Finally, the Power segment is expected to benefit from the addition of WGL’s distributed generation assets to its portfolio. For further information on the WGL Acquisition see Developments Relating to the Pending WGL Acquisition section of this MD&A.
The overall forecasted normalized EBITDA and funds from operations for the combined business include assumptions around the timing of closing of the WGL Acquisition, the U.S./Canadian dollar exchange rate, the impact of certain contemplated asset monetizations and other financing initiatives as part of the WGL financing plan, and the impact of U.S. tax reform. Any variance from AltaGas’ current assumptions could impact the forecasted increase to normalized EBITDA and funds from operations.
On a standalone basis, excluding the WGL Acquisition and potential asset monetizations, AltaGas expects a moderate increase to both normalized EBITDA and funds from operations in 2018 compared to 2017 related to its base business, mainly as a result of growth in the Gas segment. The moderate increase to normalized EBITDA and funds from operations for AltaGas’ standalone base business is primarily due to full year contributions from Townsend 2A and the first train of the North Pine Facility, higher realized frac spread mainly due to higher hedged prices, higher expected earnings from the Northwest Hydro Facilities due to contractual price increases and continued efficiency improvements, and rate base growth at certain of the Utilities. These increases may be partially offset by the impact of a weaker U.S. dollar on reported results of the U.S. assets, the impact of
TM Denotes trademark of Canaccord Genuity Corp.
planned turnarounds at the Harmattan and JEEP facilities, and the expiry of the PPA at the Ripon facility in the second quarter of 2018. The U.S. tax reform is expected to be immaterially negative to normalized EBITDA and funds from operations for AltaGas’ U.S. businesses while, on a net income basis, the impact of the U.S. tax reform is expected to be immaterially positive. This 2018 outlook does not include any potential upside associated with new developments in either the Gas or Power segments.
AltaGas estimates an average of approximately 10,000 Bbls/d will be exposed to frac spreads prior to hedging activities. For 2018, AltaGas has frac hedges in place for approximately 7,500 Bbls/d at an average price of approximately $33/Bbl excluding basis differentials.
SENSITIVITY ANALYSIS
AltaGas’ financial performance is affected by factors such as changes in commodity prices, exchange rates and weather. The following table illustrates the approximate effect of these key variables on AltaGas’ expected normalized EBITDA for 2018 (excluding WGL).
Factor |
| Increase or |
| Approximate impact |
|
Natural gas liquids fractionation spread(1) |
| $1/Bbl |
| 1 |
|
Degree day variance from normal - Canadian utilities(2) |
| 5 percent |
| 2 |
|
Degree day variance from normal - U.S. utilities(3) |
| 5 percent |
| 4 |
|
Change in CAD per US$ exchange rate |
| $0.05 |
| 14 |
|
(1) Based on approximately 75 percent of frac spread exposed NGL volumes being hedged.
(2) Degree days - Canadian utilities relate to AUI and Heritage Gas service areas. A degree day is the cumulative extent to which the daily mean temperature falls below 15 degrees Celsius at AUI and 18 degrees Celsius at Heritage Gas. Normal degree days are based on a 20-year rolling average. Positive variances from normal lead to increased delivery volumes from normal expectations. Degree day variances do not materially affect the results of PNG as the British Columbia Utilities Commission (BCUC) has approved a rate stabilization mechanism for its residential and small commercial customers.
(3) Degree days - U.S. utilities relate to SEMCO Gas and ENSTAR service areas. For U.S. utilities degree days are a measure of coldness determined daily as the number of degrees the average temperature during the day in question is below 65 degrees Fahrenheit. Degree days for a particular period are determined by adding the degree days incurred during each day of the period. Normal degree days for a particular period are the average of degree days during the prior 15 years for SEMCO Gas and during the prior 10 years for ENSTAR.
DEVELOPMENTS RELATING TO THE PENDING WGL ACQUISITION
On January 25, 2017, the Corporation entered into the Merger Agreement to indirectly acquire WGL. Pursuant to the Merger Agreement, following the consummation of the WGL Acquisition, WGL common shareholders will receive US$88.25 per common share in cash, which represents a total enterprise value of approximately US$7.2 billion, including the assumption of approximately US$2.7 billion of debt as at December 31, 2017.
WGL is a diversified energy infrastructure company and the sole common shareholder of Washington Gas, a regulated natural gas utility headquartered in Washington, D.C., serving approximately 1.2 million customers in Maryland, Virginia, and the District of Columbia. WGL has a growing midstream business with investments in natural gas gathering infrastructure and regulated gas pipelines in the Marcellus/Utica gas formation located in the northeast United States, with capabilities for connections to marine-based energy export opportunities via the North American Atlantic coast through the Cove Point LNG Terminal in Maryland being developed by a third party, which is currently in the final stages of commissioning. WGL also owns contracted clean power assets, with a focus on distributed generation and energy efficiency assets throughout the United States. In addition, WGL has a retail gas and power marketing business with approximately 222,000 customers in Maryland, Virginia, Delaware, Pennsylvania and the District of Columbia. Upon completion of the WGL Acquisition, AltaGas expects that it will have over $22 billion of assets and approximately 1.8 million rate regulated gas customers.
Consummation of the WGL Acquisition is subject to certain closing conditions, including certain regulatory and government approvals, including approval by the Public Service Commission of the District of Columbia (PSC of DC), the Maryland Public Service Commission (PSC of MD), the Commonwealth of Virginia State Corporation Commission (SCC of VA), the United States
Federal Energy Regulatory Commission (FERC), and the Committee on Foreign Investment in the United States (CFIUS), as well as expiration or termination of any applicable waiting period under the Hart-Scott-Rodino Antitrust Improvements Act of 1976, as amended (HSR Act).
Regulatory applications were filed with the PSC of DC, the PSC of MD, and the SCC of VA on April 24, 2017. On the same date, AltaGas and WGL also filed their voluntary Joint Notice to the CFIUS, and an application with FERC. On May 10, 2017, WGL common shareholders voted in favor of the Merger Agreement governing the proposed WGL Acquisition. On July 6, 2017, FERC approved the transaction, finding it to be consistent with the public interest. Also as of July 17, 2017, when the waiting period required by Section 7A(b)(1) of the HSR Act expired, the merger was deemed approved by the Federal Trade Commission and the Department of Justice, such approval being valid for one year. On July 28, 2017, CFIUS provided its approval for the WGL Acquisition. On October 20, 2017, the SCC of VA approved the WGL Acquisition. In Maryland, the hearing before the PSC of MD concluded on October 16, 2017, and on December 4, 2017 AltaGas and WGL announced that they had reached a settlement agreement with several of the intervenors in the Maryland proceeding. As a result, AltaGas and WGL filed a stipulation with the PSC of MD to extend the deadline for issuing its decision. The PSC of MD approved this request moving the date for a decision to on or before April 4, 2018. The hearing before the PSC of DC concluded on December 13, 2017, and a decision is expected to follow in the first half of 2018. On January 11, 2018, pursuant to the terms of the Merger Agreement, AltaGas elected to extend the Outside Date (as defined in the Merger Agreement) to July 23, 2018.
AltaGas believes that closing of the WGL Acquisition will occur in mid-2018. AltaGas plans to fund the WGL Acquisition with the proceeds from its aggregate $2.6 billion bought deal and private placement of subscription receipts, which closed in the first quarter of 2017 (see Subscription Receipts section below). In addition, AltaGas has US$3 billion available under its fully committed bridge facility, which can be drawn at the time of closing. With all funding required for the closing of the WGL Acquisition in place, AltaGas can evaluate and pursue its asset sale process in a prudent and timely fashion in step with the regulatory process and consistent with AltaGas’ long term strategic vision. Management has presently identified a total of over $4.0 billion of assets from AltaGas’ Gas, Power and Utilities business segments in respect of which it is evaluating various options for monetization that could include the sale of either minority and/or controlling interests. Management expects to realize over $2 billion from its asset sale process in 2018. With the present optionality available to AltaGas and in light of a number of factors including recent developments in the California Resource Adequacy markets, AltaGas has discontinued the previously announced sale process of its California power assets. AltaGas will instead continue to pursue other structuring and commercial opportunities to unlock the value of the California assets. Additional financing steps could include offerings of senior debt, hybrid securities, and equity-linked securities (including preferred shares), subject to prevailing market conditions.
Subscription Receipts
On February 3, 2017, the Corporation issued approximately 80.7 million subscription receipts pursuant to a private placement and public offering to partially fund the WGL Acquisition at a price of $31 each for total gross proceeds of approximately $2.5 billion. On March 3, 2017, the over-allotment option was partially exercised for an additional 3.8 million subscription receipts for gross proceeds of approximately $118 million. The sale of the additional subscription receipts pursuant to the over-allotment option brings the aggregate gross proceeds to approximately $2.6 billion. Each subscription receipt entitles the holder to automatically receive one common share upon closing of the WGL Acquisition. While the subscription receipts remain outstanding, holders will be entitled to receive cash payments (Dividend Equivalent Payments) per subscription receipt that are equal to dividends declared on each common share. Such Dividend Equivalent Payments will have the same record date as the related common share dividend and will be paid to holders of the subscription receipts concurrently with the payment date of each such common share dividend. The Dividend Equivalent Payments will be paid first out of any interest on the escrowed funds and then out of the escrowed funds. If the Merger Agreement is terminated after the common share dividend declaration date, but before the common share dividend record date, subscription receipt holders of record on the termination date shall receive a pro-rata payment of the dividend as the Dividend Equivalent Payment. If the Merger Agreement is terminated on a record date or following a record date but on or prior to the dividend payment date, holders will be entitled to receive the full Dividend Equivalent Payment.
The net proceeds from the sale of the subscription receipts are held by an escrow agent pending, among other things, receipt of all regulatory and government approvals required to finalize the WGL Acquisition and confirmation that the parties to the Merger
Agreement are able to complete the WGL Acquisition in all material respects in accordance with the terms of the Merger Agreement, but for the payment of the purchase price, and AltaGas has available to it all other funds required to complete the WGL Acquisition. If the escrow release notice and direction is not delivered on or prior to 5:00 pm (Calgary time) on September 4, 2018, the Corporation will be required to make a termination payment equal to the aggregate issue price of such holder’s subscription receipts plus any unpaid Dividend Equivalent Payments owing to such holders of subscription receipts.
GROWTH CAPITAL
Based on projects currently under review, development or construction, AltaGas expects net capital expenditures in the range of $500 to $600 million (excluding WGL) for 2018. AltaGas’ Gas segment will account for approximately 55 to 60 percent of the total capital expenditures, while AltaGas’ Utilities segment will account for approximately 25 to 30 percent and the Power segment will account for the remainder. Gas and Power maintenance capital is expected to be approximately $25 to $35 million of the total capital expenditures in 2018. The majority of AltaGas’ capital expenditures is focused on the continued construction at RIPET as well as maintaining and growing rate base at its existing utilities. The Corporation continues to focus on enhancing productivity and streamlining businesses, including the disposition of smaller non-core assets.
AltaGas’ 2018 committed capital program is expected to be funded through internally-generated cash flow and the DRIP. If required, the Corporation also has sufficient borrowing capacity available under its credit facilities, as well as access to capital markets.
Following the close of the WGL Acquisition (expected close date in mid-2018), the consolidated 2018 capital program on a combined basis including capital for WGL, is expected to be in the range of approximately $1.0 to $1.3 billion. Close to half of this total will be allocated to the Gas segment, with the majority of the remaining expected capital for the Utilities segment, followed by the Power segment. AltaGas expects that the largest portion of WGL’s 2018 capital program subsequent to close will be allocated to investments in the Central Penn and Mountain Valley gas pipeline developments in the Marcellus region. Capital allocated to WGL’s utilities business will represent most of the remaining 2018 capital subsequent to close, with spending consistent with recent levels.
Ridley Island Propane Export Terminal
On January 3, 2017, AltaGas reached a positive FID on RIPET, having received approval from federal regulators. AltaGas has executed long-term agreements securing land tenure along with rail and marine infrastructure on Ridley Island.
RIPET is expected to be the first propane export facility off the west coast of Canada. The site is near Prince Rupert, British Columbia, and is subleased from Ridley Terminals Inc. (RTI), which has a headlease with the Prince Rupert Port Authority (PRPA). The site has a locational advantage given very short shipping distances to markets in Asia, notably a 10-day shipping time compared to 25 days from the U.S. Gulf Coast. The brownfield site also benefits from excellent railway access and ample deep water access to the Pacific Ocean. AltaGas’ arrangements with RTI give AltaGas access to extensive land and water rights and a world class marine jetty, which allows for the efficient loading of Very Large Gas Carriers that can access key global markets. Propane from British Columbia and Alberta will be transported to the facility using 50-60 rail cars per day through the existing CN rail network. The construction cost of RIPET is estimated to be approximately $450 to $500 million and RIPET is expected to ship 1.2 million tonnes of propane per annum (which is equivalent to approximately 40,000 Bbls/d of export capacity).
On May 5, 2017, AltaGas LPG, a wholly-owned subsidiary of AltaGas, and Vopak, a wholly-owned subsidiary of Royal Vopak, a public company incorporated under the laws of the Netherlands, formed RILE LP to develop, own, and operate RIPET. AltaGas’ subsidiaries hold a 70 percent interest while Vopak holds a 30 percent interest in RILE LP. The construction cost of RIPET will be funded by AltaGas LPG and Vopak in proportion to their respective interests in RILE LP. As part of the arrangements, AltaGas entered into a long-term agreement for the capacity of RIPET with RILE LP, and AltaGas and certain of its subsidiaries will provide construction and operating services to RILE LP. RILE LP will be consolidated by AltaGas.
Based on production from its existing facilities and forecasts from new plants under construction and in active development, AltaGas anticipates having physical volumes equal to approximately 50 percent of the expected capacity of 1.2 million tonnes per annum. The remaining 50 percent is expected to be supplied by producers and other suppliers. AltaGas has entered into negotiations with a number of producers and other suppliers and expects to underpin approximately 40 percent of RIPET’s annual expected capacity under tolling arrangements with producers and other suppliers.
AltaGas LPG and Astomos have entered into a multi-year agreement for the purchase of at least 50 percent of the 1.2 million tonnes per annum of propane expected to be available to be shipped from RIPET each year. Commercial discussions with Astomos and several third party off-takers for further capacity commitments are proceeding.
Construction of RIPET commenced during the second quarter of 2017 and is proceeding pursuant to an agreement with RILE LP. AltaGas is using its self-perform model that has been successfully used to execute its other projects on time and on budget. Crews have completed work on the concrete outer wall for the propane tank and the inner steel tank roof was installed at the end of January 2018. The balance of plant fabrication and civil work is on track and the first modules are scheduled to be installed in the first quarter of 2018. All long-lead equipment has been ordered with delivery schedules aligned with the construction schedule. RIPET is expected to be in-service in the first quarter of 2019.
Alton Natural Gas Storage Project
Solution mining for cavern development of the Alton Natural Gas Storage Project, located near Truro, Nova Scotia is considered feasible to begin in 2018. The Nova Scotia Minister of Environment is expected to make a decision on the Industrial Approval (IA) appeal by Sipekne’katik First Nation (SFN) in the first half of 2018. In the meantime, the IA remains in effect for the project. AltaGas continues to work constructively with governments, regulators, and SFN. The Alton Natural Gas Storage Project is expected to provide up to 10 Bcf of natural gas storage capacity. The first phase of storage service is now expected to commence in 2021.
Marquette Connector Pipeline
On August 23, 2017, the MPSC approved SEMCO Gas’ application to construct, own, and operate the MCP. The MCP is a proposed new pipeline that will connect the Great Lakes Gas Transmission Pipeline to the Northern Natural Gas Pipeline in Marquette, Michigan, which will provide system redundancy and increase deliverability, reliability and diversity of supply to SEMCO Gas’ approximately 35,000 customers in Michigan’s Western Upper Peninsula. The MCP is estimated to cost between US$135 to $140 million. Engineering and property acquisitions are expected to begin in 2018 and construction is expected to be completed in 2019, with an anticipated in-service date by the end of the fourth quarter of 2019, which is earlier than the initial estimate of mid-2020.
GAS
Description of Assets
AltaGas’ Gas segment serves customers primarily in the Western Canada Sedimentary Basin (WCSB) and transacts more than 2 Bcf/d of natural gas including natural gas gathering and processing, NGL extraction and fractionation, transmission, storage, and natural gas and NGL marketing. Gas gathering systems move natural gas from producing wells to processing facilities where impurities and certain hydrocarbon components are removed. The gas is then compressed to meet downstream pipelines’ operating specifications for transportation. Extraction and fractionation facilities reprocess natural gas to extract and recover ethane and NGL. As at December 31, 2017, AltaGas owned approximately 1.7 Bcf/d of extraction processing capacity and approximately 1.1 Bcf/d of raw field gas processing capacity. The Gas segment also includes an equity investment in Petrogas through AltaGas Idemitsu Joint Venture Limited Partnership (AIJVLP).
Transmission pipelines deliver natural gas and NGL to distribution systems, end-users or other downstream pipelines. AltaGas uses its market knowledge and expertise to create value by buying and reselling natural gas; providing gas transportation, storage, and gas and NGL marketing for producers; and sourcing gas supply for some of the Corporation’s processing assets. The Gas segment also includes expansion and greenfield projects under development or construction, including RIPET and the Alton Natural Gas Storage Project discussed under the Growth Capital section of this MD&A.
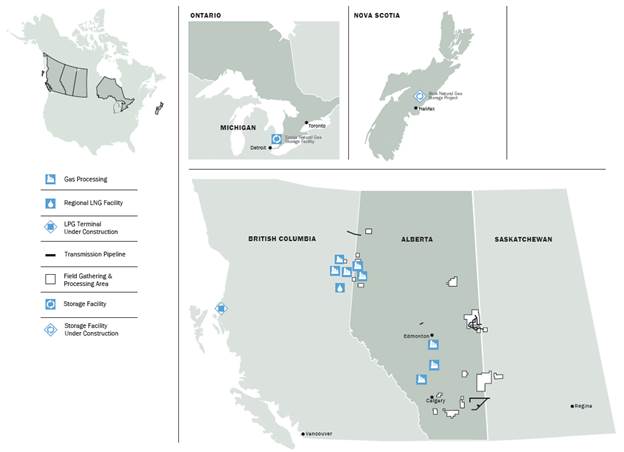
Specifically, the Gas segment includes:
· Interests in five NGL extraction plants with net licensed inlet capacity of 1.7 Bcf/d. The extraction assets provide stable fixed-fee or cost-of-service type revenues and margin based revenues. The natural gas supply to AltaGas’ extraction plants, with the exception of Harmattan and Younger extraction plants, depends on natural gas demand pull from residential, commercial and industrial usage inside and outside of Western Canada, and gas liquids demand pull from the Alberta petrochemical market and propane heating. Natural gas supply to Younger extraction plant (Younger) is dependent on the amount of raw natural gas processed at the McMahon gas plant, which is based on the robust natural gas producing region of northeastern British Columbia. Harmattan’s raw natural gas supply is based on producer activity in the west-central region of Alberta. Harmattan is the only deep-cut and full fractionation plant in the area;
· Four natural gas transmission systems with combined transportation capacity of approximately 0.6 Bcf/d. The transmission assets provide stable take-or-pay based revenues;
· Approximately 30 gathering and processing facilities in Western Canada and a network of approximately 5,000 km of gathering and sales lines that gather natural gas upstream of processing facilities and deliver natural gas into downstream pipeline systems that feed North American natural gas markets. The field facilities provide fee-for-service revenues based on volumes processed as well as revenues based on take-or-pay contracts. A significant portion of contracts flow through operating costs to the producers;
· �� 50 percent ownership of the 5.3 Bcf Sarnia natural gas storage facility connected to the Dawn Hub in Eastern Canada;
· The Alton Natural Gas Storage Project under construction;
· Natural gas and NGL marketing and gas transportation services to optimize the value of the infrastructure assets and meet customer needs;
· 50 percent ownership in AIJVLP, with the remaining 50 percent owned by Idemitsu;
· AIJVLP holds a two-thirds ownership interest in Petrogas, a leading North American integrated midstream company, with an extensive logistics network consisting of over 1,800 rail cars and 24 rail and truck terminals providing key infrastructure, supply logistics and marketing expertise. Petrogas also owns and operates the Ferndale Terminal;
· A 15-year strategic alliance between AltaGas and Painted Pony Energy Ltd. (Painted Pony) for the development of processing infrastructure and marketing services for natural gas and NGL. Since the formation of the strategic alliance in 2014, AltaGas completed the 198 Mmcf/d shallow-cut gas processing facility (the Townsend Facility) including the related egress pipelines and truck terminal, and the 99 Mmcf/d Townsend 2A (collectively the Townsend facilities). AltaGas is the operator of these facilities and is also the marketer for Painted Pony’s gas and NGL;
· The first train of the North Pine Facility near Fort St. John, British Columbia with capacity to fractionate 10,000 Bbls/d of propane plus NGL mix, and 6,000 Bbls/d of condensate terminaling capacity and two eight inch diameter NGL supply pipelines (the North Pine Pipelines), each approximately 40 km in length;
· The Ridley Island Propane Export Terminal in British Columbia under construction; and
· A regional liquefied natural gas (RLNG) facility in Dawson Creek, British Columbia, which came into service in February 2018.
Capitalize on Opportunities
AltaGas plans to grow its gas business by expanding and optimizing strategically-located assets and by adding new assets to serve customers by providing access to new markets, including Asia. New infrastructure is expected to be larger scale facilities supporting the vast reserves in North America. While providing safe and reliable service, AltaGas pursues opportunities in the Gas segment to deliver value to its customers and enhance long-term shareholder value. The Corporation’s objectives are to:
· Capitalize on the infrastructure growth opportunities associated with growing natural gas and liquids supply in North America;
· Provide a fully-integrated midstream service offering including gas and NGL gathering and processing, fractionation, and transportation facilities, and logistics and marketing services to its customers across the energy value chain, with higher producer netbacks resulting from export access to higher value markets, including Asia;
· Maintain strong relationships with local communities, Aboriginal peoples, governments, and regulatory bodies;
· Maximize profitability of existing facilities by increasing capacity, utilization and efficiency;
· Mitigate volume risk through contractual structures, redeployment of equipment and expansion of geographic reach;
· Coordinate between facilities, business segments and product lines to improve efficiencies and maximize profits; and
· Expand into new natural gas infrastructure markets such as RLNG.
In recent years, the WCSB has changed from a maturing basin to one capable of sustainable long-term growth via new low cost gas formations such as the Montney. The emergence of unconventional gas plays in the WCSB such as the Montney, as well as increased focus on horizontal multi-fracturing and completions technology, have resulted in abundant natural gas supply and associated liquids. Market demand, including the demand generated from the LPG and potential LNG export projects on the west coast of North America, provides significant long-term growth opportunities for the Corporation’s Gas segment. AltaGas expects to capitalize on these opportunities by increasing throughput at facilities, by increasing working interests in existing plants, and by acquiring and constructing new facilities such as liquefaction, refrigeration, natural gas processing, extraction, fractionation, storage and transmission pipelines. AltaGas’ 15-year strategic alliance with Painted Pony is an example of the Corporation’s ability to partner with producers to provide a fully-integrated service offering.
The Corporation also expects there to be opportunities to increase volumes by tying-in new wells and building or purchasing adjoining facilities and systems to create larger processing infrastructure to capture operating synergies and enhance its competitive advantage. The strategic location of some of its existing gas processing infrastructure is expected to benefit from growing natural gas production in northeastern British Columbia and western Alberta, in response to the development of unconventional sources of gas, such as the Montney and Duvernay shale plays. The Townsend facilities and the related infrastructure are examples of AltaGas’ ability to capitalize on energy infrastructure growth opportunities. In December 2017, AltaGas entered commercial operations at the first train of the North Pine Facility, which provides NGL processing capacity to producers in the area and is connected to the Townsend facilities through pipelines. The North Pine Facility is well connected by rail to Canada’s west coast including RIPET. Through the Townsend facilities, the North Pine Facility and RIPET currently under construction, AltaGas is well positioned to provide a fully integrated midstream service offering while also providing access to higher netback markets for producer NGL. The Gordondale facility and the Blair Creek facility are also meeting liquids extraction
needs in the Montney area as producers seek to increase netbacks by capitalizing on liquids-rich gas in this prolific area. Overall, the diverse nature of AltaGas’ natural gas and NGL infrastructure is expected to provide ongoing opportunities for AltaGas to increase throughput, utilization and profitability.
Due to the integrated nature of AltaGas’ gas gathering and processing assets, transmission services are often offered in combination with gathering and processing, natural gas marketing and extraction services. AltaGas is uniquely positioned to work with producers providing services across the integrated value chain, from wellhead to the coast and on to export markets. This is particularly the case with producers in the vast Montney, Deep Basin, and Duvernay resource plays under development in northeastern British Columbia and western Alberta. With RIPET near Prince Rupert, British Columbia currently under construction and the Petrogas Ferndale Terminal in the State of Washington, AltaGas can provide multiple outlets for producers to deliver their products to the highest value markets, including Asia. AltaGas also pursues additional opportunities to enhance the value of its infrastructure through services ancillary to its infrastructure based businesses. These include maintaining the cost effective flow of gas through extraction plants and increasing services provided to producers. AltaGas is also reviewing plant optimization opportunities which will generate another source of cash flow and improve customer netbacks. AltaGas has significant gas market knowledge, which it employs across all its assets to enhance returns along the energy value chain and more effectively serve customers’ needs.
POWER
Description of Assets
AltaGas’ Power segment is engaged in the generation and sale of capacity, electricity, and ancillary services and related products in Alberta, British Columbia, California, Colorado, Michigan, and North Carolina, all of which are under contracts with the exception of the Alberta assets. AltaGas continues to expand its geographic footprint to capitalize on the demand for clean energy sources, while increasing earnings, cash flow stability, and predictability.
As at December 31, 2017, the Power segment included 1,688 MW of gross power generation capacity from hydro, gas-fired, wind and biomass, 20 MW of energy storage capacity, along with an additional 450 MW of assets under development.
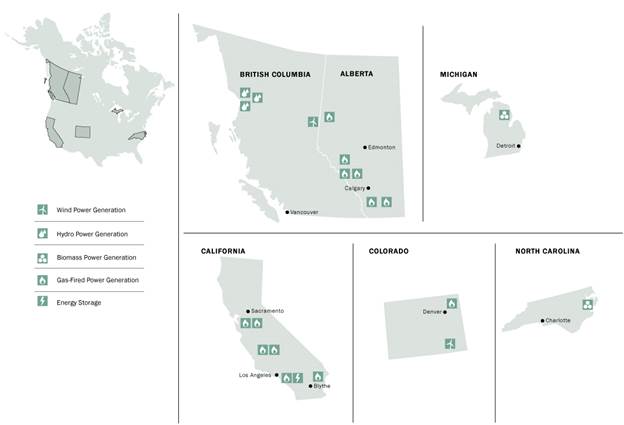
Specifically, the Power segment includes:
· Six natural gas-fired plants with 1,150 MW of generating capacity in the United States, including the 523 MW San Joaquin Facilities (Tracy, Hanford and Henrietta), the 507 MW Blythe Energy Center, and the 50 MW Ripon facility, all of which are located in California, and the 70 MW Brush II facility in Colorado. All facilities are under PPAs with creditworthy utilities;
· 277 MW of operating run-of-river generation in British Columbia (the Northwest Hydro Facilities), contracted under 60-year Electricity Purchase Agreements (EPA) to 2074 for Forrest Kerr and Volcano, and to 2075 for McLymont, fully indexed to the Consumer Price Index (CPI) with BC Hydro;
· 117 MW of wind generation, of which 102 MW is in British Columbia and 15 MW is in Colorado. All operating wind generation is sold via long-term EPAs;
· 45 MW of cogeneration and 20 MW of gas-fired peaking plant capacity in Alberta;
· 35 MW of biomass generation in the United States. The Grayling facility is under a long-term PPA with CMS Energy through 2027 while the Craven facility is contracted through 2027 with Duke Energy; and
· 20 MW of lithium ion battery storage in Pomona, California, with a 10 year agreement for capacity under contract with SCE, and a 44 MW gas-fired facility also in Pomona, California which is under an extended outage as AltaGas evaluates repowering opportunities.
On November 30, 2015, AltaGas acquired three northern California natural gas-fired power assets (Tracy, Hanford and Henrietta) with total generating capacity of 523 MW, located in the San Joaquin Valley. All three assets are fully contracted through 2022 with Pacific Gas & Electric Company (PG&E) under PPAs which are structured as tolling arrangements for 100 percent of facility energy, capacity and ancillary services. This is in addition to Ripon acquired in early 2015, which is also contracted with PG&E until May 31, 2018. Following the expiry of the PPA at Ripon, AltaGas has been awarded an RA contract for June through September 2018. Concurrently, AltaGas is also continuing to pursue battery storage opportunities at this site.
In southern California, the existing 507 MW Blythe Energy Center is currently operating under a long-term PPA with SCE until July 31, 2020, serving the CAISO market. The facility is directly connected to a Southern California Gas Company natural gas pipeline for its supply and has reactivated an El Paso Gas Company connection as a second supply source, and interconnects to SCE and CAISO via its 67-mile transmission line. Development activities are ongoing that could potentially result in a significant expansion in AltaGas’ generation capacity in the vicinity of the Blythe Energy Center. The Blythe Energy Center also successfully implemented a Low Load Turn Down (LLTD) package in 2017, which reduced the minimum operating level from 173 MW to 125 MW and increased the level of ancillary services certified by the CAISO by over 60 percent. The implementation of the LLTD coupled with the ability to draw gas from two gas pipeline systems has provided for increased reliability through a redundant gas source and led to a significant increase in capacity factor that is expected to continue into the future.
In early 2015, AltaGas acquired Pomona, which is strategically located in the east Los Angeles basin load pocket. AltaGas constructed, owns and operates a 20 MW (80 MWh) lithium-ion battery storage facility at the Pomona site (the Pomona Energy Storage Facility) which entered service in December of 2016 and is under contract for 20 MW of resource adequacy capacity with SCE under a 10-year ESA. AltaGas retains the rights to the energy and ancillary service attributes of the facility, which are sold on a merchant basis into the CAISO. AltaGas is continuing to work on incremental development of additional energy storage at the existing Pomona site.
AltaGas owns and operates the Northwest Hydro Facilities in northwest British Columbia with total generation capacity of 277 MW. The three facilities include Forrest Kerr, Volcano, and McLymont. These facilities are each underpinned by 60-year EPAs, fully indexed to CPI. The EPA for Forrest Kerr and Volcano expires in 2074 and the EPA for McLymont expires in 2075. Impact Benefit Agreements are in place for all three facilities, ensuring a cooperative and mutually beneficial relationship between the Tahltan Nation and AltaGas.
AltaGas also owns the 102 MW Bear Mountain Wind Park (Bear Mountain) in British Columbia, which came into service in October 2009 and has a 25-year EPA with BC Hydro, and a 50 percent interest in the Busch Ranch wind farm (Busch Ranch), a
29 MW wind farm in Colorado with a 25-year EPA with the local utility, which came into service in October 2012. AltaGas’ biomass assets include a 30 percent working interest in a 37 MW wood biomass power facility in Grayling, Michigan and a 50 percent working interest in a 48 MW wood biomass power facility in Craven County, North Carolina. The Grayling facility is contracted under a long term PPA through 2027 with CMS Energy and the Craven facility is contracted through 2027 with Duke Energy.
AltaGas also sells power to Commercial and Industrial (C&I) end-users in Alberta. Counterparties are subject to credit reviews and credit thresholds in the normal course of business. AltaGas actively markets electricity and gas directly to end-users, enabling the Corporation to secure fixed-price sales at competitive market prices while earning fees associated with the administration of the metered data and billing. These C&I sales are typically for three to five year terms. A portion of the electricity sales are used to secure long-term power sales for AltaGas’ Alberta generation portfolio, offering AltaGas price certainty.
Capitalize on Opportunities
While providing safe and reliable service, AltaGas pursues opportunities in the Power segment to deliver value to its customers and enhance long-term shareholder value. The Corporation’s objectives are to:
· Capitalize on North American demand for clean energy;
· Further grow and diversify the power generation portfolio by geography and fuel source;
· Optimize the value of the existing gas-fired facilities in California through active management, origination, and additional technological and operational enhancements;
· Leverage the success from the Pomona Energy Storage Facility to secure contracts to build new energy storage projects both within California and outside of the existing AltaGas footprint;
· Assess and pursue new technology offerings with solar and energy storage projects in California and the Desert Southwest markets;
· Maintain strong relationships with local communities, Aboriginal peoples, governments, and regulatory bodies;
· Acquire and develop power infrastructure backstopped by long-term PPAs or supported by strong power supply and demand fundamentals; and
· Explore opportunities for new natural gas-fired and renewable power generation in Alberta.
AltaGas’ strategy is to develop, build, own and operate long-life, low-risk power infrastructure assets to deliver strong, stable returns for investors. Growth is focused on renewable sources of clean energy as the Corporation seeks to capitalize on the increasing demand for clean power while reducing its carbon footprint.
The demand for clean energy continues to be strong across North America as the industry addresses climate change legislation and utilities are faced with the renewable portfolio standards. Utilities’ reliance on coal is lessening as its market share continues to decrease for environmental and economic reasons, with low cost natural gas and increasing renewables providing a cost competitive option to coal as a source of fuel on a marginal cost basis in many parts of North America.
Opportunities to develop and own additional power generation are likely to arise with the growing North American demand for cleaner energy sources such as natural gas, solar, wind, and hydro. AltaGas has significant opportunities to expand its generating assets in California and across the United States. Specifically in California, the CPUC mandated the state’s three largest utilities to procure 1,325 MW of energy storage by 2020. In addition, the three utilities are to explore up to a combined 500 MW of additional distributed energy storage systems. AltaGas expects to continue to leverage its existing sites as well as identify greenfield development opportunities to capitalize on these opportunities in California. In Alberta, the Government of Alberta (GOA) is moving forward with phasing out coal-fired electricity generation by 2030, creating the potential opportunity for AltaGas to develop new gas-fired and renewable generation assets in the province.
UTILITIES
Description of Assets
AltaGas owns and operates utility assets that store and deliver natural gas to end-users in Alberta, British Columbia, Nova Scotia, Michigan and Alaska. AltaGas also owns a one-third equity interest in the utility that delivers natural gas to end-users in Inuvik, Northwest Territories. AltaGas’ utility businesses serve over 580,000 customers and have a rate base of approximately $1.9 billion.
The utilities are underpinned by regulated returns and regulatory regimes that generally provide stable earnings and cash flows. The Utilities segment enhances the diversification of AltaGas’ portfolio of energy infrastructure assets and strengthens the Corporation’s business profile, thus allowing the Corporation to meet its objective of generating economic returns by investing in regulated, long-life assets with stable earnings.
The Utilities segment includes:
· SEMCO Gas in Michigan;
· ENSTAR in Alaska;
· 65 percent interest in Cook Inlet Natural Gas Storage Alaska LLC (CINGSA) in Alaska;
· AUI in Alberta;
· PNG in British Columbia;
· Heritage Gas in Nova Scotia; and
· One-third interest in Inuvik Gas Ltd. (Inuvik Gas) and the Ikhil Joint Venture in the Northwest Territories.
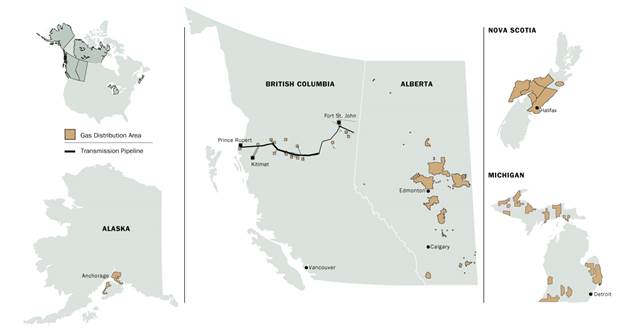
All of the utilities are allowed the opportunity to earn regulated returns. This return on rate base is composed of regulator-allowed financing costs and return on equity (ROE). Whether or not the utility is under a cost-of-service regulation or Performance Based Regulation (PBR) regulation, if actual costs are different from those recoverable through approved rates, the utility bears the risk of this difference other than for certain costs that are subject to deferral treatment. Inuvik Gas operates a natural gas distribution franchise in a regulatory environment where delivery service and natural gas pricing are market-based.
Earnings in the Utilities segment are seasonal, as revenues are primarily based on the demand for space heating in the winter months, mainly from November to March. Costs, on the other hand, are generally incurred more uniformly over the year. This typically results in stronger first and fourth quarters and weaker second and third quarters. In Alberta, Nova Scotia, Michigan and
Alaska, earnings can be impacted by variations from normal weather resulting in delivered volumes being different than anticipated. Increases in the number of customers or changes in customer usage are other factors that might typically affect delivered volumes, and hence actual earned returns for the Utilities segment. PNG is authorized by the BCUC to maintain a Revenue Stabilization Adjustment Mechanism regulatory account primarily to mitigate the effect of weather on earnings.
SEMCO Gas
SEMCO owns and operates a regulated natural gas distribution utility in Michigan under the name SEMCO Gas and has an interest in a regulated natural gas storage facility in Michigan. At the end of 2017, SEMCO Gas had approximately 309,000 customers. Of these customers, approximately 91 percent are residential. In 2017, SEMCO Gas experienced customer growth of approximately 1 percent reflecting growth in the franchise areas and customer conversions with the favorable price of natural gas. The rate base at year end was approximately US$497 million. In 2017, the approved regulated ROE for SEMCO Gas was 10.35 percent with an approved capital structure based on 49 percent equity.
SEMCO Gas is regulated by the MPSC. It operates under cost-of-service regulation and utilizes actual results from the most recently completed fiscal year along with known and measurable changes in its application for new rates.
SEMCO Gas has a Main Replacement Program (MRP) surcharge to recover a stated amount of accelerated main replacement capital expenditures in excess of what is authorized in its current base rates. The MRP began in 2011, was expanded in 2013 and renewed for an additional five years in 2015. The anticipated annual average capital spending over the final five year period is approximately US$10 million.
SEMCO Gas is required by Michigan law to establish an Energy Optimization Program (an EO plan) for their customers and to implement and fund various energy efficiency and conservation matters. The costs of the measures offered through the EO program are recovered through surcharges imposed on all customers of SEMCO Gas. EO plans and reconciliations are subject to review and approval by the MPSC. SEMCO Gas also has the ability to earn a performance incentive if certain EO goals and objectives are met annually. During 2017, the MPSC issued an order for SEMCO Gas to collect US$1 million for the 2016 EO plan year performance incentive. During 2016, the MPSC issued an order for SEMCO Gas to collect US$1 million for the 2015 EO plan year performance incentive.
In December 2016, SEMCO Gas filed an application with the MPSC seeking approval to construct, own, and operate the Marquette Connector Pipeline. In August 2017, the MPSC approved SEMCO’s application. Engineering and property acquisitions are expected to begin in 2018 and construction is expected to be completed in 2019, with an in-service date during the fourth quarter of 2019. Please refer to the Growth Capital section of this MD&A for further information.
As required by an order issued by the MPSC in September 2012, SEMCO Gas filed a depreciation study with the MPSC in September 2017, using 2016 data. A MPSC order is expected in mid-2018. SEMCO Gas is also expected to file its next rate case in 2019.
On December 27, 2017, the MPSC issued an order instructing all regulated utilities in Michigan to track the impact of the Tax Cuts and Jobs Act effective January 1, 2018 and sought comments from the utilities by January 19, 2018 on how any resulting benefit should flow back to customers. The Michigan utilities separately filed comments on January 19, 2018 and interested parties will have until February 2, 2018 to respond to the comments. The MPSC will then determine the appropriate process to establish how and when the savings will flow back to ratepayers. On February 22, 2018, the MPSC ordered the Michigan utilities to file an application no later than March 30, 2018 to determine the going forward tax credit to customers, with a goal for final commission determination no later than June 30, 2018 so that new rates can take effect on July 1, 2018. Within sixty days of the commission determination of the go-forward tax credit, the Michigan utilities are to submit a second application to determine the tax credit to customers for the prior period commencing January 1, 2018. Finally, no later than October 1, 2018, the utilities have to submit a third application to determine the deferred tax impact resulting from the tax law change and the method to flow the benefits to customers.
ENSTAR and CINGSA
SEMCO owns and operates a regulated natural gas distribution utility in Alaska under the name ENSTAR. SEMCO, through a subsidiary, holds a 65 percent interest in CINGSA, a regulated natural gas storage utility in Alaska. At the end of 2017, ENSTAR had approximately 144,000 customers including residential, commercial and transportation and of these customers, approximately 91 percent are residential. In 2017, ENSTAR experienced customer growth of approximately 1 percent reflecting growth in the franchise areas and customer conversions with the favorable price of natural gas. The rate base at year end was approximately US$277 million for ENSTAR and US$74 million for CINGSA (SEMCO’s 65 percent share).
ENSTAR and CINGSA are regulated by the RCA and operate under cost-of-service regulation utilizing actual results from the most recently completed fiscal year along with known and measureable changes in their application for new rates.
On June 1, 2016, ENSTAR filed the 2016 rate case requesting an overall annual base rate increase of approximately US$12 million, or 3.9 percent on total revenues. On July 18, 2016, the RCA approved ENSTAR’s request for an additional 1.6 percent interim and refundable rate increase on total revenues, effective August 1, 2016. On September 22, 2017, the RCA issued a final order (Rate Order) deciding matters in ENSTAR’s 2016 rate case, including granting ENSTAR a return on equity of 11.875 percent and return on total capital of 8.59 percent. The Rate Order also requires ENSTAR to file another rate case based upon calendar year 2020 by June 1, 2021. ENSTAR was further directed to file revised revenue requirement schedules, cost of service study, and tariff sheets reflecting the RCA’s decisions in its Rate Order, which ENSTAR filed on October 3, 2017. The net result of the changes showed an overall rate deficiency which was approximately US$1 million higher than provided for by the interim rates or an additional increase of approximately 0.3 percent on total test year revenues. On October 25, 2017, the RCA issued an order accepting ENSTAR’s filing, approving the revised rates effective November 1, 2017.
CINGSA is required to file a rate case by April 30, 2018 using the 2017 historical test year.
In 2013, CINGSA detected higher than expected pressure during its biannual shut-in. CINGSA determined that it had encountered a pocket of gas that was at or near the initial reservoir pressure. Following extensive analysis, CINGSA has determined that the pocket of found gas it discovered totalled approximately 14.5 Bcf. In August 2015, CINGSA entered into a stipulation with most of its customers regarding the disposition of the found gas. Hearings before the RCA were held in September 2015. On December 4, 2015, the RCA issued an order that denied the stipulation, allowed CINGSA to sell up to 2 Bcf of the gas and required that approximately 87 percent of the net proceeds of any such sale be allocated to CINGSA’s firm customers. On January 4, 2016, CINGSA appealed the RCA decision to the Superior Court of Alaska. On August 17, 2017, the Alaska superior court issued a decision upholding each facet of the RCA’s decision. CINGSA did not exercise its right to appeal the superior court’s decision to the Alaska Supreme Court; the RCA’s decision and allocation of proceeds stands.
AltaGas Utilities Inc.
AUI owns and operates a regulated natural gas distribution utility in Alberta. At the end of 2017, AUI served approximately 80,000 customers. AUI’s customers are primarily residential and small commercial consumers located in smaller population centers or rural areas of Alberta. Customer growth in 2017 was 1 percent and AUI’s rate base at year end was approximately $329 million. For 2017, the Alberta Utilities Commission (AUC) approved an ROE of 8.5 percent on 41 percent equity. For 2016, the AUC approved an ROE of 8.3 percent on 41 percent equity.
AUI is currently operating under a revenue cap per customer formula under PBR. The first generation PBR plan was implemented for all Alberta electric and natural gas distribution companies, and was effective for AUI as of January 1, 2013. The first generation PBR term was from 2013 to 2017. The PBR framework is intended to incentivize utilities to be more efficient. Rates are adjusted annually based on a customer growth factor and inflation factor less expected productivity. Although formulaic, the first generation PBR mechanism allowed for recovery of costs determined to flow through directly to customers and related to material exogenous events. In addition, incremental capital funding was available for specific applied-for capital projects and programs meeting certain criteria.
Effective January 1, 2018, the AUC approved a second PBR term from 2018 to 2022. Under the second generation PBR plan, rates continue to be set under a revenue cap per customer formula with annual adjustments for customer growth and inflation less expected productivity. In addition, the PBR mechanism continues to allow for recovery of costs determined to flow through directly to customers and related to material exogenous events. Incremental capital funding continues to be available, however, it is now largely established under a formula based on historical capital additions rather than for specific applied-for projects and programs.
On July 5, 2017, the AUC confirmed the final issues list for the Generic Cost of Capital (GCOC) proceeding to establish ROE and deemed equity ratios for 2018 to 2020. The scope of the proceeding will also include income tax methods used in revenue requirement calculations, relevant issues regarding long-term debt and effect of ROE and deemed equity ratios on municipally owned utilities. The AUC intends to issue a GCOC decision before the end of 2018.
Pacific Northern Gas Ltd.
PNG operates a transmission and distribution system in the west central portion of northern British Columbia (PNG West) and in the areas of Fort St. John and Dawson Creek (FSJ/DC) and Tumbler Ridge (TR) in northeastern British Columbia (PNG(N.E.)). At the end of 2017, PNG served approximately 42,000 customers. Approximately 87 percent of PNG’s total customers are residential. PNG’s rate base at year end was approximately $205 million. The allowed ROE for PNG West and PNG(N.E.) TR is 9.50 percent and for PNG(N.E.) FSJ/DC is 9.25 percent. The approved common equity ratio for PNG West and PNG(N.E.) TR is 46.5 percent and for PNG(N.E.) FSJ/DC is 41 percent.
PNG operates under a cost of service regulatory model whereby customer rates are set based on revenues that allow for the recovery of forecast costs plus an established rate of return on deemed common equity of PNG.
During 2016, the BCUC approved PNG’s 2016 to 2017 Revenue Requirements Application and determined final customer delivery rates for 2016 and 2017. On November 30, 2017, PNG also submitted Revenue Requirements Applications for 2018 and 2019 and received approvals for interim and refundable delivery rate increases effective January 1, 2018. Coupled with forecast changes in the Revenue Stabilization Adjustment Mechanism (RSAM) rate riders and decreases in the natural gas commodity costs, core customers will see net decreases in annualized bundled rates of 9 percent in the PNG West service area, a 1 percent decrease in the Northeast Fort St. John and Dawson Creek service area and no rate changes in the Northeast Tumbler Ridge service area.
Heritage Gas Limited
Heritage Gas has the exclusive rights to distribute natural gas through its distribution system to all or part of seven counties in Nova Scotia, including the Halifax Regional Municipality. In 2017, Heritage Gas’ customer base grew by 6 percent and ended the year at approximately 6,900 customers. Heritage Gas has a mix of residential, small commercial and large commercial customers. Heritage Gas’ rate base at year end was approximately $300 million. For 2017 and 2016, Heritage Gas’ approved regulated ROE was 11 percent with a prescribed capital structure of 45 percent equity and 55 percent debt.
Heritage Gas operates under cost-of-service regulation and is regulated by the NSUARB. In order to maintain competitive pricing and customer retention, Heritage Gas filed a Customer Retention Program application with the NSUARB on March 2, 2016 requesting a decrease in distribution rates for commercial customers with consumption between 500 and 4,999 GJ per year and allowing for flexible rate increases from time to time for these customers up to their previously approved distribution rates while the Customer Retention Program is in place. Heritage Gas also requested a suspension of depreciation and a 50 percent capitalization rate for operating, maintenance and administrative expenses while the Customer Retention Program is in place. In September 2016, the NSUARB approved Heritage Gas’ Customer Retention Program application. The approval included all of the items requested by Heritage Gas as well as a reduction to residential customer rates of $0.50 per GJ during the 2016 to 2017 and 2017 to 2018 winter seasons and a return on the deferred depreciation and operating expense balances arising from the Customer Retention Program of 4 percent.
The competitive position of natural gas pricing relative to propane improved in the Atlantic region throughout 2017 and into early 2018. Through enhanced gas procurement strategies and changes in market fundamentals, the average price of natural gas for
Heritage Gas customers declined by over 20 percent in 2017 compared to 2016 and 2015, while the 2017 Sarnia benchmark price for propane increased by over 30 percent compared to 2016 and 40 percent compared to 2015. Accordingly, in November 2017, Heritage Gas exercised the flexibility provided for in the Customer Retention Program to increase the rates that were previously reduced as part of the Customer Retention Program, which has partially restored the rates to previously approved cost of service levels. Heritage Gas estimates that the Customer Retention Program will be in place through to 2021.
Inuvik Gas Ltd. & Ikhil Joint Venture
AltaGas has a one-third equity interest in Inuvik Gas and the Ikhil Joint Venture (Ikhil) natural gas reserves, which have historically supplied Inuvik Gas with natural gas for the Town of Inuvik. The Ikhil natural gas reserves have depleted more rapidly than expected. As such, a propane air mixture system producing synthetic natural gas is currently the main source of energy supply for Inuvik Gas with Ikhil serving as a back-up. On December 7, 2016, Inuvik Gas notified the Town of Inuvik of its intention to terminate the gas distribution franchise agreement effective December 2018. Inuvik Gas is working with the Town of Inuvik over the course of the remaining term to transition ownership to the Town of Inuvik.
Capitalize on Opportunities
While providing safe and reliable service, AltaGas pursues opportunities in the Utilities segment to deliver value to its customers and enhance long-term shareholder value. The Corporation’s objectives are to:
· Maximize use of existing infrastructure and increase market penetration in order to maintain cost-effective rates;
· Invest in the safety and reliability of existing infrastructure, including delivery system upgrade programs;
· Expand infrastructure to new markets to bring the economic and environmental benefits of gas to new customers, without unduly burdening existing customers;
· Maintain strong relationships with local communities, Aboriginal peoples, governments, and regulatory bodies;
· Maintain strong community and regulatory relationships while ensuring fair returns to shareholders; and
· Acquire new franchises when the opportunities arise.
AltaGas expects to grow its existing utility infrastructure through continued investment and capital improvements in franchise areas, which will result in rate base growth and continued customer growth including the conversion of users of alternative energy sources to natural gas. AltaGas’ utilities have averaged 3 percent rate base growth over the past three years after adjusting for the impact of foreign exchange translation. The average rate base growth was approximately 6 percent over the past three years prior to adjusting for the impact of foreign exchange translation. The growth in rate base is a direct result of prudent investments in current areas of operations, as well as the addition of new customers. The growth rate of new customers varies amongst the Corporation’s utilities with mature utilities seeing more moderate growth rates, which are generally tied closely to the economic growth of the respective franchise regions, while less mature utilities are experiencing higher average growth rates as market penetration rates increase.
CONSOLIDATED FINANCIAL REVIEW
|
| Three Months Ended |
| Year Ended |
| ||||
($ millions) |
| 2017 |
| 2016 |
| 2017 |
| 2016 |
|
Revenue |
| 745 |
| 661 |
| 2,556 |
| 2,190 |
|
Normalized EBITDA(1) |
| 213 |
| 194 |
| 797 |
| 701 |
|
Net income (loss) applicable to common shares |
| (11 | ) | 38 |
| 30 |
| 155 |
|
Normalized net income(1) |
| 63 |
| 48 |
| 204 |
| 153 |
|
Total assets |
| 10,032 |
| 10,201 |
| 10,032 |
| 10,201 |
|
Total long-term liabilities |
| 4,578 |
| 4,589 |
| 4,578 |
| 4,589 |
|
Net additions to property, plant and equipment |
| 114 |
| 121 |
| 388 |
| 405 |
|
Dividends declared(2) |
| 94 |
| 87 |
| 362 |
| 320 |
|
Normalized funds from operations(1) |
| 179 |
| 172 |
| 615 |
| 554 |
|
|
| Three Months Ended |
| Year Ended |
| ||||
($ per share, except shares outstanding) |
| 2017 |
| 2016 |
| 2017 |
| 2016 |
|
Net income (loss) per common share - basic |
| (0.06 | ) | 0.23 |
| 0.18 |
| 0.99 |
|
Net income (loss) per common share - diluted |
| (0.06 | ) | 0.23 |
| 0.18 |
| 0.99 |
|
Normalized net income - basic(1) |
| 0.36 |
| 0.29 |
| 1.19 |
| 0.98 |
|
Dividends declared(2) |
| 0.54 |
| 0.53 |
| 2.12 |
| 2.03 |
|
Normalized funds from operations(1) |
| 1.03 |
| 1.04 |
| 3.60 |
| 3.52 |
|
Shares outstanding - basic (millions) |
|
|
|
|
|
|
|
|
|
During the period(3) |
| 174 |
| 166 |
| 171 |
| 157 |
|
End of period |
| 175 |
| 167 |
| 175 |
| 167 |
|
(1) Non-GAAP financial measure; see discussion in Non-GAAP Financial Measures section of this MD&A.
(2) Dividends declared per common share per month: $0.165 beginning on October 26, 2015, $0.175 beginning on August 25, 2016, and $0.1825 beginning on November 27, 2017.
(3) Weighted average.
Three Months Ended December 31
Normalized EBITDA for the fourth quarter of 2017 was $213 million, compared to $194 million for the same quarter in 2016. The increase was mainly due to higher realized frac spread and frac exposed volumes, higher river flows and prices at the Northwest Hydro Facilities, commencement of commercial operations at Townsend 2A, contributions from the Pomona Energy Storage Facility, shorter planned outages at the Craven facility, higher NGL marketing revenue, colder weather in Michigan and Alberta, and higher rates at ENSTAR. These increases were partially offset by the impact from the weaker U.S. dollar on reported results from U.S. assets, higher operating and administrative expenses, the impact of the sale of the EDS and the JFP transmission assets, and lower ethane revenue. For the three months ended December 31, 2017, the average Canadian/U.S. dollar exchange rate decreased to 1.27 from an average of 1.33 in the same quarter of 2016, resulting in a decrease in normalized EBITDA of approximately $5 million.
Normalized funds from operations for the fourth quarter of 2017 were $179 million ($1.03 per share), compared to $172 million ($1.04 per share) for the same quarter in 2016, reflecting the same drivers as normalized EBITDA, partially offset by lower distributions from Petrogas and higher current income tax expense. In the fourth quarter of 2017, AltaGas received $3 million of dividend income from the Petrogas Preferred Shares (2016 - $3 million) and $1 million of common share dividends from Petrogas (2016 - $6 million).
Operating and administrative expenses for the fourth quarter of 2017 were $152 million, compared to $131 million for the same quarter in 2016. The increase was mainly due to transaction costs incurred on the pending WGL Acquisition of approximately $15 million and new assets placed into service, partially offset by the absence of the costs incurred in the fourth quarter of 2016 related to the termination of the Sundance B Power Purchase Arrangements (Sundance B PPAs) of approximately $16 million. Depreciation and amortization expense for the fourth quarter of 2017 was $71 million, compared to $70 million for the same quarter in 2016. The increase was mainly due to new assets placed into service. Interest expense for the fourth quarter of 2017 was $44 million, compared to $40 million for the same quarter in 2016. The increase was mainly due to financing costs of approximately $4 million (pre-tax) associated with the bridge facility for the pending WGL Acquisition, and higher average interest rates, partially offset by lower average debt outstanding and higher capitalized interest. For further information on the bridge facility please see Developments Relating to the Pending WGL Acquisition section of this MD&A.
In the fourth quarter of 2017, AltaGas recorded pre-tax provisions on assets of approximately $138 million (after-tax $84 million) related to the Hanford and Henrietta gas-fired peaking facilities in California, a non-core gas processing facility in Alberta that has been classified as held for sale, and a non-core development stage peaking project in California.
AltaGas recorded an income tax recovery of $76 million for the fourth quarter of 2017 compared to income tax expense of $6 million in the same quarter of 2016. The decrease in income tax expense was mainly due to the tax recovery recognized on provisions on assets taken during the quarter of approximately $54 million, and the impact of the Tax Cuts and Jobs Act (the U.S. tax reform), which was enacted on December 22, 2017, and required the Corporation to revalue its U.S. deferred tax assets and liabilities using the lower federal corporate tax rate of 21 percent. The revaluation resulted in a decrease in income tax expense of approximately $34 million for AltaGas’ non-regulated U.S. businesses. As AltaGas’ U.S. utilities are subject to rate regulation, $102 million of deferred tax remeasurement was recorded as a deferred regulatory liability on the consolidated balance sheet. The decreases to income tax expense were partially offset by the absence of the $8 million tax recovery recorded on the dissolution of ASTC Power Partnership (ASTC) in the fourth quarter of 2016 and a portion of transaction costs incurred on the pending WGL Acquisition not being tax deductible.
Net loss applicable to common shares for the fourth quarter of 2017 was $11 million ($0.06 per share) compared to net income applicable to common shares of $38 million ($0.23 per share) for the same quarter in 2016. The decrease was mainly due to the provisions on assets recognized during the quarter as discussed above, transaction costs incurred on the pending WGL Acquisition of approximately $14 million after-tax, and higher interest expense, preferred share dividends and unrealized losses on risk management contracts. These decreases were partially offset by the impact of the U.S. tax reform, higher gains on long-term investments, and the same previously referenced factors resulting in the increase in normalized EBITDA.
Normalized net income was $63 million ($0.36 per share) for the fourth quarter of 2017, compared to $48 million ($0.29 per share) reported for the same quarter in 2016. The increase was mainly due to the same previously referenced factors resulting in the increase in normalized EBITDA, partially offset by higher interest expense and preferred share dividends. Normalizing items in the fourth quarter of 2017 included after-tax amounts related to transaction costs on acquisitions, unrealized losses on risk management contracts, gains on long-term investments, provisions on assets, development costs, financing costs associated with the bridge facility for the pending WGL Acquisition, and the impact of the U.S. tax reform. In the fourth quarter of 2016, normalizing items included after-tax amounts related to transaction costs on acquisitions, unrealized losses on risk management contracts, losses on long-term investments, the Sundance B PPAs termination costs, and the tax recovery on the dissolution of ASTC.
Year Ended December 31
Normalized EBITDA for the year ended December 31, 2017 was $797 million, compared to $701 million in 2016. The increase was primarily due to a full year of EBITDA generated from the Townsend Facility and the commencement of commercial operations at Townsend 2A in October 2017, higher realized frac spread and frac exposed volumes, higher earnings from Petrogas including a full year of dividend income from the Petrogas Preferred Shares, colder weather experienced at Alaska, Alberta, and Michigan, rate and customer growth at the Utilities, contributions from the Pomona Energy Storage Facility, higher contractual prices at the Northwest Hydro Facilities, higher NGL marketing revenue and storage margins, one-time income from
SEMCO’s non-regulated business related to a customer contract and insurance proceeds, and shorter planned outages at Craven. These increases were partially offset by the impact of the sale of the EDS and JFP transmission assets of approximately $11 million, the impact from the weaker U.S. dollar on reported results from U.S. assets, lower ethane revenue due to lower volumes, and lower rates at the Blair Creek facility. For the year ended December 31, 2017, the average Canadian/U.S. dollar exchange rate decreased to 1.29 from an average of 1.33 in the same period of 2016, resulting in a decrease in normalized EBITDA of approximately $10 million.
Normalized funds from operations for the year ended December 31, 2017 were $615 million ($3.60 per share), compared to $554 million ($3.52 per share) in 2016, reflecting the same drivers as normalized EBITDA, partially offset by lower distributions from Petrogas and higher current income tax expense. For the year ended December 31, 2017, AltaGas received $13 million of dividend income from Petrogas Preferred Shares (2016 - $6 million) and $5 million in common share dividends from Petrogas (2016 - $24 million). Petrogas retained cash to fund its growth capital program and for general corporate purposes.
Operating and administrative expenses for the year ended December 31, 2017 were $574 million, compared to $509 million in 2016. The increase was primarily due to transaction costs incurred on the pending WGL Acquisition of approximately $66 million, and new assets placed into service. This was partially offset by the absence of the Sundance B PPAs termination costs in the fourth quarter of 2016 of approximately $16 million and the non-utility workforce restructuring costs of approximately $7 million incurred in the second quarter of 2016. Depreciation and amortization expense for the year ended December 31, 2017 increased to $282 million, compared to $272 million in 2016 mainly due to new assets placed into service. Interest expense for the year ended December 31, 2017 was $170 million, compared to $151 million in 2016. The increase was mainly due to financing costs of approximately $19 million (pre-tax) associated with the bridge facility for the pending WGL Acquisition, and higher average interest rates, partially offset by lower average debt outstanding. For further information on the bridge facility please see Developments Relating to the Pending WGL Acquisition section of this MD&A.
In March 2017, AltaGas completed the sale of the EDS and the JFP transmission assets to Nova Chemicals for net proceeds of approximately $67 million, resulting in a pre-tax loss on disposition of $3 million. In the second quarter of 2017, the Power segment disposed of certain non-core development stage wind assets in Alberta for proceeds of approximately $1 million, resulting in a pre-tax gain on disposition of approximately $1 million.
At the end of May 2017, AltaGas concluded that it no longer exercised significant influence over Tidewater Midstream and Infrastructure Ltd. (Tidewater). Consequently, AltaGas ceased accounting for the investment under the equity method and now accounts for the Tidewater common shares at fair value. For the year ended December 31, 2017, AltaGas recorded an unrealized pre-tax gain of approximately $1 million representing the change in fair value of the investment in Tidewater.
In 2017, AltaGas recorded pre-tax provisions on assets of $133 million (after-tax $80 million) related to the Hanford and Henrietta gas-fired peaking facilities in California and certain non-core development stage projects in the Power segment. In addition, AltaGas recorded a pre-tax provision on asset of $7 million (after-tax $5 million) related to a non-core gas processing facility that has been classified as held for sale in the Gas segment.
AltaGas recorded an income tax recovery of $34 million for the year ended December 31, 2017 compared to income tax expense of $33 million in 2016. Income tax expense decreased primarily due to the tax recovery recognized on provisions on assets taken during 2017 and the impact of the U.S. tax reform as discussed earlier. These decreases were partially offset by higher income tax expense due to a portion of transaction costs incurred on the pending WGL Acquisition and the unrealized losses on certain risk management contracts not being tax deductible, the absence of a $10 million tax recovery related to the disposition of certain non-core natural gas gathering and processing assets in Alberta to Tidewater (the Tidewater Gas Asset Disposition) in the first quarter of 2016, and the absence of a $8 million tax recovery related to the dissolution of ASTC in the fourth quarter of 2016.
Net income applicable to common shares for the year ended December 31, 2017 was $30 million ($0.18 per share) compared to $155 million ($0.99 per share) in 2016. The decrease in net income applicable to common shares for the year ended December 31, 2017 was mainly due to the transaction costs incurred on the pending WGL Acquisition of approximately $53 million after-tax, higher unrealized losses on risk management contracts, higher interest and depreciation and amortization
expense, higher losses on sale of assets, higher preferred share dividends, and provisions on assets, partially offset by the lower income tax expense and the same previously referenced factors resulting in the increase in normalized EBITDA. In addition, net income per common share decreased for the year ended December 31, 2017 compared to the same period in 2016 as a result of the same factors impacting net income, as well as the increase in common shares outstanding in 2017.
Normalized net income for the year ended December 31, 2017 was $204 million ($1.19 per share), compared to $153 million ($0.98 per share) in 2016. The increase was driven by the same factors impacting normalized EBITDA, partially offset by higher preferred share dividends, interest and depreciation and amortization expense. For the year ended December 31, 2017, normalizing items included after-tax amounts related to unrealized losses on risk management contracts, the impact of the U.S. tax reform, transaction costs on acquisitions, financing costs associated with the bridge facility for the pending WGL Acquisition, losses on sale of assets, provisions on assets, gains on long-term investments, and development costs. For the year ended December 31, 2016, normalizing items included after-tax amounts related to unrealized losses on risk management contracts, transaction costs related to acquisitions, gains on sale of assets and related tax recovery, a dilution loss recognized on an investment accounted for by the equity method, provision on investment accounted for by the equity method, restructuring costs, development costs, the Sundance B PPAs termination costs, the tax recovery on the dissolution of ASTC, and the recovery of development costs for the PNG Pipeline Looping Project.
NON-GAAP FINANCIAL MEASURES
This MD&A contains references to certain financial measures used by AltaGas that do not have a standardized meaning prescribed by GAAP and may not be comparable to similar measures presented by other entities. Readers are cautioned that these non-GAAP measures should not be construed as alternatives to other measures of financial performance calculated in accordance with GAAP. The non-GAAP measures and their reconciliation to GAAP financial measures are shown below. These non-GAAP measures provide additional information that Management believes is meaningful in describing AltaGas’ operational performance, liquidity and capacity to fund dividends, capital expenditures, and other investing activities. The specific rationale for, and incremental information associated with, each non-GAAP measure is discussed below.
References to normalized EBITDA, normalized net income, normalized funds from operations, net debt, and net debt to total capitalization throughout this MD&A have the meanings as set out in this section.
Normalized EBITDA |
| Three Months Ended |
| Year Ended |
| ||||||||
($ millions) |
| 2017 |
| 2016 |
| 2017 |
| 2016 |
| ||||
Normalized EBITDA |
| $ | 213 |
| $ | 194 |
| $ | 797 |
| $ | 701 |
|
Add (deduct): |
|
|
|
|
|
|
|
|
| ||||
Transaction costs related to acquisitions |
| (15 | ) | (2 | ) | (66 | ) | (3 | ) | ||||
Unrealized losses on risk management contracts |
| (16 | ) | (12 | ) | (63 | ) | (11 | ) | ||||
Gains (losses) on long-term investments |
| 7 |
| (1 | ) | 4 |
| — |
| ||||
Gains (losses) on sale of assets |
| — |
| — |
| (3 | ) | 4 |
| ||||
Provisions on assets |
| (138 | ) | — |
| (140 | ) | — |
| ||||
Dilution loss on investment accounted for by the equity method |
| — |
| — |
| — |
| (1 | ) | ||||
Provision on investment accounted for by the equity method |
| — |
| — |
| — |
| (5 | ) | ||||
Development costs |
| (1 | ) | — |
| (2 | ) | (1 | ) | ||||
Restructuring costs |
| — |
| — |
| — |
| (7 | ) | ||||
Accretion expenses |
| (3 | ) | (3 | ) | (11 | ) | (11 | ) | ||||
Sundance B PPAs termination costs |
| — |
| (8 | ) | — |
| (8 | ) | ||||
Foreign exchange gains |
| — |
| — |
| 2 |
| 4 |
| ||||
Recovery of pipeline looping project development costs at PNG |
| — |
| — |
| — |
| 7 |
| ||||
EBITDA |
| $ | 47 |
| $ | 168 |
| $ | 518 |
| $ | 669 |
|
Add (deduct): |
|
|
|
|
|
|
|
|
| ||||
Depreciation and amortization |
| (71 | ) | (70 | ) | (282 | ) | (272 | ) | ||||
Interest expense |
| (44 | ) | (40 | ) | (170 | ) | (151 | ) | ||||
Income tax recovery (expense) |
| 76 |
| (6 | ) | 34 |
| (33 | ) | ||||
Net income after taxes (GAAP financial measure) |
| $ | 8 |
| $ | 52 |
| $ | 100 |
| $ | 213 |
|
EBITDA is a measure of AltaGas’ operating profitability prior to how business activities are financed, assets are amortized, or earnings are taxed. EBITDA is calculated from the Consolidated Statement of Income using net income adjusted for pre-tax depreciation and amortization, interest expense, and income tax expense.
Normalized EBITDA includes additional adjustments for unrealized gains (losses) on risk management contracts, gains (losses) on long-term investments, transaction costs related to acquisitions, gains (losses) on the sale of assets, accretion expenses, foreign exchange gains (losses), provision on investment accounted for by the equity method, provisions on assets, restructuring costs, dilution loss on an investment accounted for by the equity method, the Sundance B PPAs termination costs, the recovery of development costs for the PNG Pipeline Looping Project, and certain non-capitalizable project development costs. AltaGas presents normalized EBITDA as a supplemental measure. Normalized EBITDA is frequently used by analysts and investors in the evaluation of entities within the industry as it excludes items that can vary substantially between entities depending on the accounting policies chosen, the book value of assets and the capital structure.
Normalized Net Income |
| Three Months Ended |
| Year Ended |
| ||||||||
($ millions) |
| 2017 |
| 2016 |
| 2017 |
| 2016 |
| ||||
Normalized net income |
| $ | 63 |
| $ | 48 |
| $ | 204 |
| $ | 153 |
|
Add (deduct) after-tax: |
|
|
|
|
|
|
|
|
| ||||
Transaction costs related to acquisitions |
| (14 | ) | (1 | ) | (53 | ) | (2 | ) | ||||
Unrealized losses on risk management contracts |
| (12 | ) | (9 | ) | (55 | ) | (8 | ) | ||||
Gains (losses) on long-term investments |
| 6 |
| (1 | ) | 3 |
| — |
| ||||
Gains (losses) on sale of assets |
| — |
| — |
| (3 | ) | 15 |
| ||||
Provisions on assets |
| (84 | ) | — |
| (85 | ) | — |
| ||||
Dilution loss on investment accounted for by the equity method |
| — |
| — |
| — |
| (1 | ) | ||||
Provision on investment accounted for by the equity method |
| — |
| — |
| — |
| (2 | ) | ||||
Development costs |
| (1 | ) | — |
| (1 | ) | (1 | ) | ||||
Restructuring costs |
| — |
| — |
| — |
| (5 | ) | ||||
Sundance B PPAs termination costs |
| — |
| (7 | ) | — |
| (7 | ) | ||||
Tax recovery on dissolution of ASTC |
| — |
| 8 |
| — |
| 8 |
| ||||
Financing costs associated with the bridge facility |
| (3 | ) | — |
| (14 | ) | — |
| ||||
Impact of U.S. tax reform |
| 34 |
| — |
| 34 |
| — |
| ||||
Recovery of pipeline looping project development costs at PNG |
| — |
| — |
| — |
| 5 |
| ||||
Net income (loss) applicable to common shares (GAAP financial measure) |
| $ | (11 | ) | $ | 38 |
| $ | 30 |
| $ | 155 |
|
Normalized net income represents net income (loss) applicable to common shares adjusted for the after-tax impact of unrealized gains (losses) on risk management contracts, gains (losses) on long-term investments, transaction costs related to acquisitions, gains (losses) on the sale of assets, provisions on investments accounted for by the equity method, provisions on assets, restructuring costs, dilution loss on investment accounted for by the equity method, the Sundance B PPAs termination costs, the tax recovery on the dissolution of ASTC, the recovery of development costs for the PNG Pipeline Looping Project, certain non-capitalizable project development costs, financing costs associated with the bridge facility for the pending WGL Acquisition, and the impact of the U.S. tax reform. This measure is presented in order to enhance the comparability of AltaGas’ earnings, as it reflects the underlying performance of AltaGas’ business activities.
Normalized Funds from Operations |
| Three Months Ended |
| Year Ended |
| ||||||||
($ millions) |
| 2017 |
| 2016 |
| 2017 |
| 2016 |
| ||||
Normalized funds from operations |
| $ | 179 |
| $ | 172 |
| $ | 615 |
| $ | 554 |
|
Add (deduct): |
|
|
|
|
|
|
|
|
| ||||
Development costs |
| (1 | ) | — |
| (1 | ) | — |
| ||||
Transaction and financing costs related to acquisitions |
| (17 | ) | (2 | ) | (71 | ) | (3 | ) | ||||
Restructuring costs |
| — |
| — |
| — |
| (7 | ) | ||||
Sundance B PPAs termination costs |
| — |
| (11 | ) | — |
| (11 | ) | ||||
Recovery of pipeline looping project development costs at PNG |
| — |
| — |
| — |
| 5 |
| ||||
Funds from operations |
| 161 |
| 159 |
| 543 |
| 538 |
| ||||
Add (deduct): |
|
|
|
|
|
|
|
|
| ||||
Net change in operating assets and liabilities |
| (9 | ) | (21 | ) | 6 |
| (78 | ) | ||||
Asset retirement obligations settled |
| (1 | ) | (2 | ) | (4 | ) | (4 | ) | ||||
Cash from operations (GAAP financial measure) |
| $ | 151 |
| $ | 136 |
| $ | 545 |
| $ | 456 |
|
Normalized funds from operations is used to assist Management and investors in analyzing the liquidity of the Corporation without regard to changes in operating assets and liabilities in the period and non-operating related expenses (net of current taxes) such as transaction costs related to acquisitions, the Sundance B PPAs termination costs, the recovery of development costs for the PNG Pipeline Looping Project, certain non-capitalizable development costs, and restructuring costs.
Funds from operations are calculated from the Consolidated Statement of Cash Flows and are defined as cash from operations before net changes in operating assets and liabilities and expenditures incurred to settle asset retirement obligations.
Management uses this measure to understand the ability to generate funds for capital investments, debt repayment, dividend payments and other investing activities.
Funds from operations and normalized funds from operations as presented should not be viewed as an alternative to cash from operations or other cash flow measures calculated in accordance with GAAP.
Net Debt and Net Debt to Total Capitalization
Net debt and net debt to total capitalization are used by the Corporation to monitor its capital structure and financing requirements. It is also used as a measure of the Corporation’s overall financial strength. Net debt is defined as short-term debt, plus current and long-term portions of long-term debt, less cash and cash equivalents. Total capitalization is defined as net debt plus shareholders’ equity and non-controlling interests. Additional information regarding these non-GAAP measures can be found under the section Capital Resources of this MD&A.
RESULTS OF OPERATIONS BY REPORTING SEGMENT
Normalized EBITDA (1) |
| Three Months Ended |
| Year Ended |
| ||||||||
($ millions) |
| 2017 |
| 2016 |
| 2017 |
| 2016 |
| ||||
Gas |
| $ | 61 |
| $ | 49 |
| $ | 221 |
| $ | 163 |
|
Power |
| 72 |
| 63 |
| 303 |
| 285 |
| ||||
Utilities |
| 90 |
| 90 |
| 298 |
| 277 |
| ||||
Sub-total: Operating Segments |
| 223 |
| 202 |
| 822 |
| 725 |
| ||||
Corporate |
| (10 | ) | (8 | ) | (25 | ) | (24 | ) | ||||
|
| $ | 213 |
| $ | 194 |
| $ | 797 |
| $ | 701 |
|
(1) Non-GAAP financial measure; See discussion in Non-GAAP Financial Measures section of this MD&A.
GAS
OPERATING STATISTICS
|
| Three Months Ended |
| Year Ended |
| ||||
|
| 2017 |
| 2016 |
| 2017 |
| 2016 |
|
Extraction inlet gas processed (Mmcf/d)(1) |
| 983 |
| 972 |
| 970 |
| 918 |
|
FG&P inlet gas processed (Mmcf/d)(1) |
| 441 |
| 365 |
| 392 |
| 312 |
|
Total inlet gas processed (Mmcf/d)(1) |
| 1,424 |
| 1,337 |
| 1,362 |
| 1,230 |
|
Extraction ethane volumes (Bbls/d)(1) |
| 26,125 |
| 32,233 |
| 27,493 |
| 30,211 |
|
Extraction NGL volumes (Bbls/d)(1) (2) |
| 42,181 |
| 37,454 |
| 37,850 |
| 34,224 |
|
Total extraction volumes (Bbls/d)(1) (3) |
| 68,306 |
| 69,687 |
| 65,343 |
| 64,435 |
|
Frac spread - realized ($/Bbl)(1) (4) |
| 18.02 |
| 6.11 |
| 13.40 |
| 7.41 |
|
Frac spread - average spot price ($/Bbl)(1) (5) |
| 30.66 |
| 8.40 |
| 20.50 |
| 8.27 |
|
(1) Average for the period.
(2) NGL volumes refer to propane, butane and condensate.
(3) Includes Harmattan NGL processed on behalf of customers.
(4) Realized frac spread or NGL margin, expressed in dollars per barrel of NGL, is derived from sales recorded by the segment during the period for frac exposed volumes plus the settlement value of frac hedges settled in the period less extraction premiums, divided by the total frac exposed volumes produced during the period.
(5) Average spot frac spread or NGL margin, expressed in dollars per barrel of NGL, is indicative of the average sales price that AltaGas receives for propane, butane and condensate less extraction premiums, before accounting for hedges, divided by the respective frac exposed volumes for the period.
Inlet gas volumes processed at the extraction facilities for the three months ended December 31, 2017 increased by 11 Mmcf/d, compared to the same period in 2016. The increase was due to higher processed volumes at EEEP late in the fourth quarter of 2017 due to higher available gas flows. Inlet gas volumes processed at the field gathering and processing (FG&P) facilities for
the three months ended December 31, 2017 increased by 76 Mmcf/d primarily due to volumes at the newly constructed Townsend 2A, higher take-or-pay volumes at the Townsend Facility, and higher incentive volumes at the Gordondale facility.
Inlet gas volumes processed at the extraction facilities for the year ended December 31, 2017 increased by 52 Mmcf/d, compared to the same period in 2016. The increase was primarily due to higher processed volumes at EEEP and JEEP, due to reinjections and temporary shut-ins driven by low commodity prices in 2016. Inlet gas volumes processed at the FG&P facilities for the year ended December 31, 2017 increased by 80 Mmcf/d primarily due to volumes received at the Townsend facilities, partially offset by the impact from the Tidewater Gas Asset Disposition on February 29, 2016.
Average ethane volumes for the three months ended December 31, 2017 decreased by 6,108 Bbls/d, while average NGL volumes increased by 4,727 Bbls/d compared to the same period in 2016. Lower ethane volumes were as a result of rejecting production at the Pembina Empress Extraction Plant (PEEP) and EEEP due to uneconomic pricing. Higher NGL volumes were primarily due to increased volumes produced at the Townsend facilities, and at the Gordondale facility.
Average ethane volumes for the year ended December 31, 2017 decreased by 2,718 Bbls/d compared to the same period in 2016. Lower ethane volumes were as a result of rejecting production at PEEP and EEEP due to uneconomic pricing, partially offset by normal operations at JEEP compared to temporary plant shut-ins and reinjections driven by lower commodity prices in the first half of 2016. Average NGL volumes for the year ended December 31, 2017 increased by 3,626 Bbls/d compared to the same period in 2016. Higher NGL volumes were primarily due volumes produced at the Townsend facilities, and normal operations at EEEP compared to temporary plant shut-ins and reinjections driven by lower commodity prices in the same period in 2016.
Three Months Ended December 31
The Gas segment reported normalized EBITDA of $61 million in the fourth quarter of 2017, compared to $49 million for the same quarter in 2016. In the fourth quarter of 2017, normalized EBITDA increased due to higher realized frac spread and frac exposed volumes, commencement of commercial operations at Townsend 2A, higher NGL marketing revenues, and higher revenues from the Gordondale facility due to higher incentive volumes, partially offset by the sale of the EDS and JFP transmission assets in the first quarter of 2017, lower ethane revenue in the fourth quarter of 2017 due to lower volumes and pricing, and lower rates at the Blair Creek facility.
AltaGas recorded equity earnings of $6 million from Petrogas, compared to $5 million in the same quarter of 2016. The increase in equity earnings from Petrogas was mainly due to higher volumes exported from the Ferndale Terminal and strengthening of Petrogas’ business lines supporting the upstream sector.
During the fourth quarter of 2017, AltaGas hedged 6,500 Bbls/d of NGL at an average frac spread of $24/Bbl, excluding basis differentials. During the fourth quarter of 2016, AltaGas hedged approximately 3,100 Bbls/d of NGL at an average frac spread of $21/Bbl, excluding basis differentials. The average indicative spot NGL frac spread for the fourth quarter of 2017 was approximately $31/Bbl compared to $8/Bbl in the same quarter of 2016 inclusive of basis differentials. The realized frac spread (based on average spot price and realized hedging losses inclusive of basis differential) of $18/Bbl (2016 - $6/Bbl) in the fourth quarter of 2017 was higher than the same quarter in 2016 due to improved commodity prices.
During the fourth quarter of 2017, AltaGas recognized a pre-tax provision on assets of $7 million related to a non-core gas processing facility in Alberta, which has been classified as held for sale. No provisions were recorded during the fourth quarter of 2016.
Year Ended December 31
The Gas segment reported normalized EBITDA of $221 million for the year ended December 31, 2017, compared to $163 million in 2016. The increase in normalized EBITDA was due a full year of contributions from the Townsend Facility and the commencement of commercial operations at Townsend 2A in October 2017, higher realized frac spread and frac exposed volumes, higher equity earnings from Petrogas, higher NGL marketing revenue, and higher natural gas storage margins, partially offset by the impact of the sale of the EDS and JFP transmission assets, lower ethane revenue due to lower volumes, and lower
rates at the Blair Creek facility. Operating expenses related to the planned turnarounds at EEEP and the Turin facility in the second quarter of 2017 were fully offset by lower operating expenses at the Harmattan facility throughout the year.
For the year ended December 31, 2017, AltaGas recorded equity earnings of $25 million from Petrogas as compared to $12 million in 2016. The increase in Petrogas earnings was due to dividend income earned by AltaGas from the investment in Petrogas Preferred Shares in June 2016 and solid contributions from all of Petrogas’ business segments.
For the year ended December 31, 2017, AltaGas hedged 5,800 Bbls/d of NGL at an average frac spread of $23/Bbl, excluding basis differentials. For the year ended year ended December 31, 2016, AltaGas hedged approximately 1,100 Bbls/d of NGL volumes at an average frac spread of $24/Bbl, excluding basis differentials. The average indicative spot NGL frac spread for the year ended December 31, 2017 was approximately $21/Bbl compared to $8/Bbl in 2016 inclusive of basis differentials. Realized frac spread (based on average spot price and realized hedging losses inclusive of basis differentials) of $13/Bbl in 2017 (2016 - $7/Bbl) was higher than 2016 due to improved commodity prices.
At the end of May 2017, AltaGas concluded that it no longer exercised significant influence over Tidewater. Consequently, AltaGas ceased accounting for the investment under the equity method and now accounts for the Tidewater common shares at fair value. For the year ended December 31, 2017, AltaGas recorded an unrealized pre-tax gain of approximately $1 million representing the change in fair value of the investment in Tidewater.
For the year ended December 31, 2017, AltaGas recognized a pre-tax provision on assets of $7 million related to a non-core gas processing facility that has been classified as held for sale. No provisions were recorded for the year ended December 31, 2016.
In addition, for the year ended December 31, 2017, AltaGas recognized a pre-tax loss of $3 million on the sale of the EDS and JFP transmission assets while during the year ended December 31, 2016, AltaGas recognized a pre-tax gain of $5 million on the Tidewater Gas Asset Disposition.
POWER
OPERATING STATISTICS
|
| Three Months Ended |
| Year Ended |
| ||||
|
| 2017 |
| 2016 |
| 2017 |
| 2016 |
|
Renewable power sold (GWh) |
| 301 |
| 196 |
| 1,629 |
| 1,551 |
|
Conventional power sold (GWh) |
| 1,059 |
| 374 |
| 2,844 |
| 1,950 |
|
Renewable capacity factor (%) |
| 27.5 |
| 18.8 |
| 39.6 |
| 39.1 |
|
Contracted conventional equivalent availability factor (%) (1) |
| 96.3 |
| 99.8 |
| 98.1 |
| 97.3 |
|
(1) Calculated as the availability factor contracted under long-term tolling arrangements adjusted for occasions where partial or excess capacity payments have been added or deducted.
During the fourth quarter of 2017, the volume of renewable power sold increased by 105 GWh and the volume of conventional power sold increased by 685 GWh, compared to the same quarter in 2016. The increase in renewable volumes was due to a later end to seasonally higher river flows at the Northwest Hydro Facilities, increased generation at the Craven facility due to shorter planned outages, and stronger wind conditions at the Bear Mountain wind facility. The increase in conventional volumes sold was due to continued increased run time at the San Joaquin Facilities and Blythe as a result of increased dispatch under the respective power purchase agreements and greater operational and fuel flexibility at Blythe.
For the year ended December 31, 2017, the volume of renewable power sold increased by 78 GWh and the volume of conventional power sold increased by 894 GWh compared to 2016. The increase in renewable volumes sold was due to stronger wind conditions at the Bear Mountain wind facility, increased generation at the Craven facility due to shorter planned outages, and the addition of the Pomona Energy Storage Facility. The increase in conventional volumes sold was due to volume contributions from the San Joaquin Facilities, and higher dispatch at Blythe as the facility increased its cost effectiveness by
adding a second source of gas supply and expanding its operating limits, partially offset by the impact of the termination of the Sundance B PPAs effective March 8, 2016.
The contracted conventional equivalent availability factor was lower for the three months ended December 31, 2017 as a result of Blythe requiring maintenance in the fourth quarter of 2017 due to increased dispatch. The contracted conventional equivalent availability factor was higher for the year ended December 31, 2017 as Blythe increased its overall availability.
The renewable capacity factor during the fourth quarter of 2017 was higher due to strong wind conditions at the Bear Mountain wind facility. The renewable capacity factor for the year ended December 31, 2017 was comparable to 2016.
Three Months Ended December 31
The Power segment reported normalized EBITDA of $72 million in the fourth quarter of 2017, compared to $63 million in the same quarter of 2016. Normalized EBITDA increased as a result of higher river flows and higher prices at the Northwest Hydro Facilities, shorter planned outages at the Craven facility, and the addition of Pomona Energy Storage Facility. These increases were partially offset by the outage at Blythe in the fourth quarter of 2017, and the weaker U.S. dollar.
During the fourth quarter of 2017, the Power segment recorded pre-tax provisions on assets of $131 million related to the Hanford and Henrietta gas-fired peaking facilities and a non-core development stage peaking project in California. No provisions were recorded in the fourth quarter of 2016.
Year Ended December 31
The Power segment reported normalized EBITDA of $303 million for the year ended December 31, 2017, compared to $285 million in 2016. Normalized EBITDA increased as compared to the same period in 2016 as a result of the impact of the absence of equity losses from the Sundance B PPAs, contribution from the Pomona Energy Storage Facility, higher prices at the Northwest Hydro Facilities, and increased contribution from the Craven facility due shorter planned outages. These increases were partially offset by lower realized gains on hedges, the weaker U.S. dollar, and a one-time credit received by AltaGas San Joaquin Energy Inc. in the second quarter of 2016 from PG&E related to the San Bruno pipeline explosion on PG&E’s natural gas pipeline in 2010.
During the year ended December 31, 2017, the Power segment recorded pre-tax provisions on assets of approximately $133 million related to the Hanford and Henrietta gas-fired peaking facilities and certain non-core development stage gas-fired peaking assets in California and Alberta. During the year ended December 31, 2016, ASTC exercised its right to terminate the Sundance B PPAs effective March 8, 2016, and as a result, AltaGas recognized a pre-tax provision of $4 million on its investment in ASTC to settle the working capital deficiency.
In addition, during the year ended December 31, 2017, the Power segment disposed of certain non-core development stage wind assets for a pre-tax gain of $1 million.
UTILITIES
OPERATING STATISTICS
|
| Three Months Ended |
| Year Ended |
| ||||
|
| 2017 |
| 2016 |
| 2017 |
| 2016 |
|
Canadian utilities |
|
|
|
|
|
|
|
|
|
Natural gas deliveries - end-use (PJ)(1) |
| 11.2 |
| 10.8 |
| 33.2 |
| 30.0 |
|
Natural gas deliveries - transportation (PJ)(1) |
| 1.6 |
| 1.5 |
| 6.3 |
| 5.9 |
|
U.S. utilities |
|
|
|
|
|
|
|
|
|
Natural gas deliveries - end-use (Bcf)(1) |
| 24.3 |
| 22.8 |
| 70.8 |
| 65.3 |
|
Natural gas deliveries - transportation (Bcf)(1) |
| 14.2 |
| 14.2 |
| 52.0 |
| 51.5 |
|
Service sites (2) |
| 581,518 |
| 574,875 |
| 581,518 |
| 574,875 |
|
Degree day variance from normal - AUI (%) (3) |
| 4.0 |
| (0.6 | ) | (1.1 | ) | (12.6 | ) |
Degree day variance from normal - Heritage Gas (%) (3) |
| (4.6 | ) | (1.0 | ) | (3.7 | ) | (3.2 | ) |
Degree day variance from normal - SEMCO Gas (%) (4) |
| 4.8 |
| (6.1 | ) | (5.3 | ) | (6.9 | ) |
Degree day variance from normal - ENSTAR (%) (4) |
| (8.3 | ) | (1.4 | ) | (1.6 | ) | (16.3 | ) |
(1) Petajoule (PJ) is one million gigajoules. Bcf is one billion cubic feet.
(2) Service sites reflect all of the service sites of AUI, PNG, Heritage Gas and U.S. utilities, including transportation and non-regulated business lines.
(3) A degree day for AUI and Heritage Gas is the cumulative extent to which the daily mean temperature falls below 15 degrees Celsius at AUI and 18 degrees Celsius at Heritage Gas. Normal degree days are based on a 20-year rolling average. Positive variances from normal lead to increased delivery volumes from normal expectations. Degree day variances do not materially affect the results of PNG, as the BCUC has approved a rate stabilization mechanism for its residential and small commercial customers.
(4) A degree day for U.S. utilities is a measure of coldness determined daily as the number of degrees the average temperature during the day in question is below 65 degrees Fahrenheit. Degree days for a particular period are determined by adding the degree days incurred during each day of the period. Normal degree days for a particular period are the average of degree days during the prior 15 years for SEMCO Gas and during the prior 10 years for ENSTAR.
REGULATORY METRICS
Year Ended December 31 |
| 2017 |
| 2016 |
|
Approved ROE (%) |
|
|
|
|
|
Canadian utilities (average) |
| 9.7 |
| 9.7 |
|
U.S. utilities (average) |
| 11.6 |
| 11.8 |
|
Approved return on debt (%) |
|
|
|
|
|
Canadian utilities (average) |
| 5.0 |
| 5.0 |
|
U.S. utilities (average) |
| 6.0 |
| 6.0 |
|
Rate base ($ millions)(1) |
|
|
|
|
|
Canadian utilities |
| 833 |
| 790 |
|
U.S. utilities(2)(3) |
| 847 |
| 840 |
|
(1) Rate base is indicative of the earning potential of each utility over time. Approved revenue requirement for each utility is typically based on the rate base as approved by the regulator for the respective rate application, but may differ from the rate base indicated above.
(2) In U.S. dollars.
(3) Reflects AltaGas’ 65 percent interest in Cook Inlet Natural Gas Storage Alaska LLC.
Three Months Ended December 31
The Utilities segment reported normalized EBITDA of $90 million in the fourth quarter of 2017, consistent with the same quarter in 2016. Colder weather in Michigan and Alberta, the impact of the rate case increases at ENSTAR, customer growth, and higher customer usage were offset by the weaker U.S. dollar, higher operating and administrative expenses, and warmer weather in Alaska and Nova Scotia.
Year Ended December 31
The Utilities segment reported normalized EBITDA of $298 million for the year ended December 31, 2017, compared to $277 million in 2016. The increase was mainly due to the impact of rate and customer growth, insurance proceeds received by SEMCO’s non-regulated operations, an early termination payment of $2 million from one of SEMCO’s non-regulated customers
moving from a fixed fee to a volumetric based contract, and colder weather in Alaska, Alberta and Michigan. These variances were partially offset by the weaker U.S. dollar and higher operating and administrative expenses.
CORPORATE
Three Months Ended December 31
In the Corporate segment, normalized EBITDA for the fourth quarter of 2017 was a loss of $10 million, compared to $8 million in 2016. The increase was mainly due to higher employee-related costs incurred in the fourth quarter of 2017.
Year Ended December 31
In the Corporate segment, normalized EBITDA for the year ended December 31, 2017 was a loss of $25 million, compared to $24 million for the year ended December 31, 2016. The increase was mainly due to higher employee, software, and information technology related costs, partially offset by lower professional and consulting fees.
INVESTED CAPITAL
|
| Three Months Ended |
| |||||||||||||
($ millions) |
| Gas |
| Power |
| Utilities |
| Corporate |
| Total |
| |||||
Invested capital: |
|
|
|
|
|
|
|
|
|
|
| |||||
Property, plant and equipment |
| $ | 65 |
| $ | 3 |
| $ | 46 |
| $ | — |
| $ | 114 |
|
Intangible assets |
| 2 |
| — |
| 1 |
| 1 |
| 4 |
| |||||
Contributions from non-controlling interest |
| (5 | ) | — |
| — |
| — |
| (5 | ) | |||||
Invested capital |
| 62 |
| 3 |
| 47 |
| 1 |
| 113 |
| |||||
Disposals: |
|
|
|
|
|
|
|
|
|
|
| |||||
Property, plant and equipment |
| — |
| — |
| — |
| — |
| — |
| |||||
Net invested capital |
| $ | 62 |
| $ | 3 |
| $ | 47 |
| $ | 1 |
| $ | 113 |
|
|
| Three Months Ended |
| |||||||||||||
($ millions) |
| Gas |
| Power |
| Utilities |
| Corporate |
| Total |
| |||||
Invested capital: |
|
|
|
|
|
|
|
|
|
|
| |||||
Property, plant and equipment |
| $ | 25 |
| $ | 51 |
| $ | 45 |
| $ | 1 |
| $ | 122 |
|
Intangible assets |
| 1 |
| 1 |
| 1 |
| 3 |
| 6 |
| |||||
Invested capital |
| 26 |
| 52 |
| 46 |
| 4 |
| 128 |
| |||||
Disposals: |
|
|
|
|
|
|
|
|
|
|
| |||||
Property, plant and equipment |
| — |
| (1 | ) | — |
| — |
| (1 | ) | |||||
Net invested capital |
| $ | 26 |
| $ | 51 |
| $ | 46 |
| $ | 4 |
| $ | 127 |
|
During the fourth quarter of 2017, AltaGas increased invested capital by $113 million, compared to $128 million in the same quarter of 2016. The decrease in expenditures for property, plant and equipment in the fourth quarter of 2017 was mainly due to the timing of capital spending on certain growth projects. Contributions from non-controlling interest represents Vopak’s share of construction costs related to RIPET.
The invested capital in the fourth quarter of 2017 included maintenance capital of $2 million (2016 - $4 million) in the Gas segment and $2 million (2016 - $4 million) in the Power segment.
|
| Year Ended |
| |||||||||||||
($ millions) |
| Gas |
| Power |
| Utilities |
| Corporate |
| Total |
| |||||
Invested capital: |
|
|
|
|
|
|
|
|
|
|
| |||||
Property, plant and equipment |
| $ | 312 |
| $ | 19 |
| $ | 125 |
| $ | 2 |
| $ | 458 |
|
Intangible assets |
| 3 |
| 13 |
| 2 |
| 2 |
| 20 |
| |||||
Long-term investments |
| 17 |
| — |
| — |
| — |
| 17 |
| |||||
Contributions from non-controlling interest |
| (17 | ) | — |
| — |
| — |
| (17 | ) | |||||
Invested capital |
| 315 |
| 32 |
| 127 |
| 4 |
| 478 |
| |||||
Disposals: |
|
|
|
|
|
|
|
|
|
|
| |||||
Property, plant and equipment |
| (67 | ) | (2 | ) | (1 | ) | — |
| (70 | ) | |||||
Net invested capital |
| $ | 248 |
| $ | 30 |
| $ | 126 |
| $ | 4 |
| $ | 408 |
|
|
| Year Ended |
| |||||||||||||
($ millions) |
| Gas |
| Power |
| Utilities |
| Corporate |
| Total |
| |||||
Invested capital: |
|
|
|
|
|
|
|
|
|
|
| |||||
Property, plant and equipment |
| $ | 287 |
| $ | 96 |
| $ | 114 |
| $ | 4 |
| $ | 501 |
|
Intangible assets |
| 3 |
| 15 |
| 2 |
| 6 |
| 26 |
| |||||
Long-term investments |
| 235 |
| — |
| — |
| — |
| 235 |
| |||||
Invested capital |
| 525 |
| 111 |
| 116 |
| 10 |
| 762 |
| |||||
Disposals: |
|
|
|
|
|
|
|
|
|
|
| |||||
Property, plant and equipment |
| (94 | ) | (1 | ) | (1 | ) | — |
| (96 | ) | |||||
Net invested capital |
| $ | 431 |
| $ | 110 |
| $ | 115 |
| $ | 10 |
| $ | 666 |
|
For the year ended December 31, 2017, AltaGas increased invested capital by $478 million, compared to $762 million in 2016. The actual net capital expenditures incurred in 2017 for property, plant and equipment and intangible assets, including contributions from Vopak, were $461 million as compared to AltaGas’ previous guidance of $500 million to $550 million. The lower actual net capital expenditures as compared to guidance was mainly due to timing of spending on certain growth projects and the completion of the first train of the North Pine Facility below budget.
The decrease in expenditures for property, plant, and equipment for the year ended December 31, 2017 was mainly due to costs incurred in 2016 to complete the construction of the Townsend Facility as well as the purchase of the remaining 51 percent interest in EEEP, partially offset by the costs incurred during 2017 for the construction of Townsend 2A, RIPET, and the first train of the North Pine Facility, as well as the costs incurred on the Gordondale facility turnaround. The decrease in long-term investments during the year ended December 31, 2017 was mainly due to the investment made in Tidewater in the first quarter of 2016 as well as the investment made in Petrogas Preferred Shares in the second quarter of 2016, partially offset by the contribution of $17 million to AIJVLP in 2017 to fund the scheduled principal and interest repayments of a note payable related to AIJVLP’s acquisition of its interest in Petrogas in 2014. The disposals of property, plant and equipment during the year ended December 31, 2017 primarily related to the sale of the EDS and JFP transmission assets, while during the year ended December 31, 2016 the disposals of property, plant and equipment related to the Tidewater Gas Asset Disposition.
The invested capital for the year ended December 31, 2017 included maintenance capital of $10 million (2016 - $5 million) in the Gas segment and $9 million (2016 - $15 million) in the Power segment. The maintenance capital for the Gas segment was mainly related to the costs incurred on the Gordondale facility turnaround in the third quarter of 2017 while the maintenance capital for the Power segment mainly related to the U.S assets.
RISK MANAGEMENT
AltaGas is exposed to various market risks in the normal course of operations that could impact earnings and cash flows. At times, AltaGas will enter into financial derivative contracts to manage exposure to fluctuations in commodity prices and foreign exchange rates. The Board of Directors of AltaGas has established a risk management policy for the Corporation establishing AltaGas’ risk management control framework. Financial derivative instruments are governed under, and subject to, this policy. As at December 31, 2017 and December 31, 2016, the fair values of the Corporation’s derivatives were as follows:
($ millions) |
| December 31, |
| December 31, |
| ||
Natural gas |
| $ | 6 |
| $ | 4 |
|
Storage optimization |
| — |
| (3 | ) | ||
NGL frac spread |
| (24 | ) | (12 | ) | ||
Power |
| (1 | ) | 30 |
| ||
Foreign exchange |
| 2 |
| — |
| ||
Net derivative asset (liability) |
| $ | (17 | ) | $ | 19 |
|
Commodity Price Contracts
From time to time, the Corporation executes gas, power, and other commodity contracts to manage its asset portfolio and lock in margins from back-to-back purchase and sale agreements. The fair value of power, natural gas, and NGL derivatives was calculated using estimated forward prices from published sources for the relevant period. AltaGas has not elected hedge accounting for any of its commodity derivative contracts currently in place. Changes in the fair value of these derivative contracts are recorded in the Consolidated Statements of Income in the period in which the change occurs.
The Power segment has various fixed price power purchase and sale contracts in the Alberta market, which are expected to be settled over the next five years.
The Corporation also executes fixed-for-floating NGL frac spread swaps to manage its exposure to frac spreads as the financial results of several extraction plants are affected by fluctuations in NGL frac spreads. The average indicative spot NGL frac spread for the year ended December 31, 2017 was approximately $21/Bbl (2016 - $8/bbl), inclusive of basis differentials. The average NGL frac spread realized by AltaGas (based on average spot price and realized hedging losses inclusive of basis differentials) for the year ended December 31, 2017 was approximately $13/Bbl (2016 - $7/Bbl). For 2018, AltaGas currently has frac hedges in place to hedge approximately 7,500 Bbls/d at an average price of $33/Bbl, excluding basis differentials.
Foreign Exchange
AltaGas has foreign operations whereby the functional currency is the U.S. dollar. As a result, the Corporation’s earnings, cash flows, and other comprehensive income are exposed to fluctuations resulting from changes in foreign exchange rates. This risk is partially mitigated to the extent that AltaGas has U.S. dollar-denominated debt and/or preferred shares outstanding. AltaGas may also enter into foreign exchange forward derivatives to manage the risk of fluctuating cash flows due to variations in foreign exchange rates.
As at December 31, 2017, Management designated $nil of outstanding U.S. denominated long-term debt to hedge against the currency translation effect of its foreign investments (December 31, 2016 - US$301 million). Designation of U.S. dollar denominated long-term debt has the effect of mitigating volatility on net income by offsetting foreign exchange gains and losses on U.S. dollar denominated long-term debt and foreign net investment. For the year ended December 31, 2017, AltaGas incurred an after-tax unrealized gain of $7 million arising from the translation of debt in other comprehensive income (2016 — after-tax unrealized gain of $34 million).
To mitigate the foreign exchange risks associated with the cash purchase price of WGL, AltaGas has entered into foreign currency option contracts with an aggregate notional value of approximately US$1.2 billion. These foreign currency option
contracts do not qualify for hedge accounting. Therefore, all changes in fair value are recognized in net income. For the year ended December 31, 2017, an unrealized loss of $34 million was recognized under “unrealized gains and losses from risk management contracts” in relation to these contracts (2016 - $nil).
The Effects of Derivative Instruments on the Consolidated Statements of Income
The following table presents the unrealized gains (losses) on derivative instruments as recorded in the Corporation’s Consolidated Statements of Income:
|
| Three Months Ended |
| Year Ended |
| ||||||||
($ millions) |
| 2017 |
| 2016 |
| 2017 |
| 2016 |
| ||||
Natural gas |
| $ | 6 |
| $ | 2 |
| $ | 2 |
| $ | — |
|
Storage optimization |
| — |
| (2 | ) | 3 |
| (5 | ) | ||||
NGL frac spread |
| (11 | ) | (9 | ) | (12 | ) | (12 | ) | ||||
Power |
| (9 | ) | (3 | ) | (21 | ) | 5 |
| ||||
Heat rate |
| — |
| — |
| — |
| — |
| ||||
Foreign exchange |
| (2 | ) | — |
| (35 | ) | 1 |
| ||||
|
| $ | (16 | ) | $ | (12 | ) | $ | (63 | ) | $ | (11 | ) |
Please refer to Note 20 of the 2017 Annual Consolidated Financial Statements for further details regarding AltaGas’ risk management activities.
Corporation Risks
AltaGas manages its exposure to risks using the strategies outlined in the following table:
Risks |
| Strategies and Organizational Capability to Mitigate Risks | |
Operational |
| · | Maintain diversification across Gas, Power and Utilities |
| · | Acquire large working interests to control and optimize operations and maximize efficiencies | |
| · | Contractual provisions often provide for recovery of operating costs | |
| · | Centralized procurement strategy to reduce costs | |
| · | Maintain control over operational decisions, operating costs and capital expenditures by operating certain jointly-owned facilities | |
| · | Maintain standard operating practices, assess and document employee competency, and maintain formal inspection, maintenance, safety and environmental programs | |
| · | Purchase business interruption insurance | |
| · | Fixed price operating and maintenance contracts with equipment manufacturers | |
| · | Hedging strategy used to balance price and operating risk | |
Construction |
| · | Major projects group manages and monitors significant construction projects |
| · | Strong in-house project control and management framework | |
| · | Appropriate internal management structure and processes | |
| · | Engage specialists in designing and building major projects | |
| · | Contractual arrangements to mitigate cost and schedule risks | |
Liquidity |
| · | Forecast cash flow on a continuous basis to maintain adequate cash balances to fund financial obligations as they come due and to support business operations |
| · | Maintain financial flexibility and liquidity needs through a variety of sources including internally-generated cash flows, DRIP, access to credit facilities, and long-term debt and equity issuances | |
| · | Execute financing plans and strategies to maintain and improve credit ratings to minimize financing costs and support ready access to capital markets | |
Foreign exchange |
| · | Issue long term debt and preferred shares in U.S. dollars which hedge the Corporation’s net investment in U.S. subsidiaries |
| · | Employ hedging practices such as entering foreign exchange forward contracts | |
Interest rates |
| · | Optimize financing plans to maintain and improve credit ratings to minimize interest costs |
| · | Monitor and proactively manage the Corporation’s debt maturity profile | |
| · | Employ hedging practices such as entering into interest rate swaps | |
| · | Maintain financial flexibility and access to multiple credit facilities and continually monitor covenant compliance | |
Risks |
| Strategies and Organizational Capability to Mitigate Risks | |
Long-term natural gas volume declines |
| · | Long-term contracts such as take-or-pay, area of mutual interest, geographic franchise with economic out |
| · | Increase market share by expanding existing facilities or acquiring or constructing new facilities | |
| · | Increase geographic and customer diversity to reduce exposure to any one individual customer or area of the WCSB | |
| · | Strategically locate facilities to provide secure access to gas supply | |
| · | Capitalize on integrated aspects of AltaGas’ business to increase volumes through its processing facilities | |
Volume of power generated |
| · | PPAs for the Blythe, San Joaquin, Ripon, and Brush facilities include specified target availability levels and pay fixed capacity payments upon achieving target availability, and as a result, volumes of power sold have a minimal impact on the Corporation |
| · | Diversification of fuel sources and geography | |
| · | Hedging strategy to balance price and operating risk | |
| · | Undertake extensive studies to support investment decisions | |
Commodity price |
| · | Contracting terms, processing, storage and transportation fees independent of commodity prices through fee-for-service, take-or-pay, fixed-fee or cost-of-service provisions |
| · | Hedging strategy with hedge targets approved by the Board of Directors | |
| · | Monitor hedge transactions through Risk Management Committee | |
| · | AltaGas’ Commodity Risk Policy prohibits transactions for speculative purposes | |
| · | Employ hedging practices to reduce exposure to commodity prices and volatility and lock in margins when the opportunity arises to increase profitability and reduce earnings volatility | |
| · | Employ strong systems and processes for monitoring and reporting compliance with the Commodity Risk Policy | |
| · | In-depth knowledge and experience of transportation systems, natural gas, NGL and power markets where AltaGas operates | |
| · | Hedge power costs | |
| · | Direct marketing to end-use commercial and industrial customers | |
| · | Execute long-term inflation adjusted electricity purchase arrangements with power buyers | |
Counterparty |
| · | Strong credit policies and procedures |
| · | Continuous review of counterparty creditworthiness | |
| · | Establish credit thresholds using appropriate credit metrics | |
| · | Closely monitor exposures and impact of price shocks on liquidity | |
| · | Build a diverse customer and supplier base | |
| · | Active accounts receivable monitoring and collections processes in place | |
| · | Credit terms included in contracts | |
Weather |
| · | Anticipated volumes are determined based on the 20-year rolling average for weather for the Canadian utilities and 15 years for SEMCO Gas and 10 years for ENSTAR |
| · | PNG has a weather normalization account for residential and small commercial customers | |
Regulatory and Stakeholder |
| · | Regulatory and commercial personnel monitor and manage regulatory issues |
| · | Proactive regulatory and government relations group, strong working relationships with Aboriginal peoples, stakeholders, and regulators | |
| · | Build risk mitigation into contracts where appropriate | |
| · | Skilled regulatory department retained | |
| · | Use of expert third parties when needed | |
Environment and safety |
| · | Strong safety and environmental management systems |
| · | Continuous process improvement strategy employed | |
| · | Focus on mitigating the impact of the climate change regulations | |
| · | Zero tolerance safety policies for staff and contractors and reviews of past safety practices for contractors | |
| · | Purchase and maintain general liability and business interruption insurance | |
| · | Pipeline and asset integrity programs are in place | |
Labour relations |
| · | Maintain access to strong labour markets to attract qualified talent |
| · | Positive employee relations to retain existing talent and maintain strong relations with unions | |
Cybersecurity |
| · | Continuous monitoring of the Corporations infrastructure, technologies and data |
| · | Ongoing cybersecurity communications and training to staff | |
| · | Conducting third-party vulnerability and cybersecurity tests | |
| · | Corporate threat detection and incident response protocols | |
Litigation |
| · | Proactive management of lawsuits and other claims |
| · | Continuous monitoring of defense and settlement costs of lawsuits and claims | |
| · | Strong in-house legal department | |
| · | Use of expert third parties when needed | |
Risks |
|
| Strategies and Organizational Capability to Mitigate Risks |
External Stakeholder Relations |
| · | Proactive stakeholder relations and communications groups, strong working relationships with Aboriginal peoples, stakeholders, and regulators |
| · | Strong commitment to creating social value | |
| · | Strong safety and environmental management systems | |
Risks related to the WGL Acquisition |
| · | WGL shareholder approval received on May 10, 2017 |
| · | FERC approval received on July 6, 2017 | |
| · | CFIUS approval received on July 28, 2017 | |
| · | Waiting period for HSR Act expired on July 17, 2017 | |
| · | Virginia regulatory approval received on October 20, 2017 | |
| · | Announced settlement agreement with key stakeholders in Maryland on December 4, 2017. PSC of MD regulatory outcome expected on or before April 4, 2018 | |
| · | PSC of DC regulatory outcome expected in first half of 2018 | |
| · | Optimize the WGL financing plan to maintain and improve credit ratings to minimize interest costs, which includes proceeds from the Subscription Receipts as well as up to US$3 billion available under fully committed bridge facility, which can be drawn at the time of closing | |
| · | Execution of foreign currency option contracts with an aggregate notional value of approximately US$1.2 billion to mitigate the foreign exchange risks associated with the cash purchase price of WGL | |
| · | AltaGas and WGL have worked constructively with regulators, community groups and local leaders | |
| · | AltaGas has established a cross-functional WGL regulatory team focused on achieving regulatory approvals | |
| · | AltaGas has established a cross-functional WGL integration team focused on effectively integrating WGL into AltaGas its current operations |
LIQUIDITY
|
| Year Ended |
| ||||
($ millions) |
| 2017 |
| 2016 |
| ||
Cash from operations |
| $ | 545 |
| $ | 456 |
|
Investing activities |
| (499 | ) | (752 | ) | ||
Financing activities |
| (38 | ) | 21 |
| ||
Increase (decrease) in cash and cash equivalents |
| $ | 8 |
| $ | (275 | ) |
Cash from Operations
Cash from operations increased by $89 million for the year ended December 31, 2017 compared to 2016 primarily due to favorable variance in net change in operating assets and liabilities. The favorable variance in net change in operating assets and liabilities was primarily due to higher cash inflow in 2017 relating to changes in inventory and accounts payable at the Utilities due to weather, changes in accounts payable due to the pending WGL Acquisition and the first train of the North Pine Facility being commissioned in December 2017, and reimbursement for refundable payments. These increases in cash flow were partially offset by changes in accounts receivable due to increased NGL marketing activities and higher revenues compared to 2016, and higher prepayments on long-term service agreements related to RIPET.
Working Capital
($ millions except current ratio) |
| December 31, |
| December 31, |
| ||
Current assets |
| $ | 702 |
| $ | 739 |
|
Current liabilities |
| 815 |
| 996 |
| ||
Working capital (deficiency) |
| $ | (113 | ) | $ | (257 | ) |
Working capital ratio |
| 0.86 |
| 0.74 |
| ||
The improvement in the working capital ratio was primarily due to a lower current portion of long-term debt outstanding, a decrease in short-term debt, and an increase in accounts receivable as compared to December 31, 2016, partially offset by a decrease in inventory, increase in accounts payable and accrued liabilities as well as the completion of the sale of the EDS and JFP transmission assets to Nova Chemicals, which were previously classified as assets held for sale. AltaGas’ working capital
will fluctuate in the normal course of business and the working capital deficiency will be funded using cash flow from operations, DRIP and available credit facilities as required.
Investing Activities
Cash used in investing activities for the year ended December 31, 2017 was $499 million, compared to $752 million in 2016. Investing activities for the year ended December 31, 2017 primarily included expenditures of approximately $473 million for property, plant, and equipment and $20 million for intangible assets, approximately $36 million for derivative contracts, approximately $17 million of contributions to AltaGas’ equity investments, and a $13 million loan to Petrogas under the $100 million interest bearing secured loan facility provided to Petrogas, partially offset by cash proceeds of approximately $71 million, net of transaction costs, primarily from the sale of the EDS and JFP transmission assets. Investing activities for the year ended December 31, 2016 primarily included approximately $507 million in additions to property, plant, and equipment, AltaGas’ $150 million investment in Petrogas Preferred Shares, a $63 million loan to Petrogas under the $100 million interest bearing secured loan facility provided to Petrogas, approximately $24 million in additions to intangible assets, approximately $21 million for the purchase of EEEP, approximately $20 million of contributions to AltaGas’ equity investments, partially offset by cash inflow of approximately $32 million, net of transaction costs, primarily from the Tidewater Gas Asset Disposition.
Financing Activities
Cash used in financing activities for the year ended December 31, 2017 was $38 million, compared to cash from financing activities of $21 million in 2016. Financing activities for the year ended December 31, 2017 were primarily comprised of repayments of long-term debt and short-term debt of $862 million and $74 million, respectively, partially offset by net proceeds from the issuance of preferred shares of $293 million and common shares of $242 million (mainly from common shares issued through DRIP), net proceeds from the issuance of MTNs of $447 million, borrowings under the credit facilities of $311 million, and proceeds from the sale of a non-controlling interest in RIPET to Vopak of $24 million. Financing activities for the year ended December 31, 2016 were primarily comprised of net proceeds from the issuance of common shares of $604 million (including common shares issued through the DRIP), net proceeds from the issuance of MTNs of $348 million, and borrowings from credit facilities of $327 million, partially offset by the repayment of $884 million of long-term debt. Total dividends paid to common and preferred shareholders of AltaGas for the year ended December 31, 2017 were $421 million (2016 - $365 million), of which $236 million was reinvested through DRIP (2016 - $174 million). The increase in dividends paid was due to more common shares and preferred shares outstanding and dividend increases on common shares declared in 2017 and 2016. The increase in the amounts reinvested through the DRIP for the year ended December 31, 2017 compared to 2016 was due to the implementation of the Premium DividendTM component of the plan effective May 17, 2016. Please refer to Note 21 of the 2017 Annual Consolidated Financial Statements for more information about the DRIP.
CAPITAL RESOURCES
AltaGas’ objective for managing capital is to maintain its investment grade credit ratings, ensure adequate liquidity, maximize the profitability of its existing assets and grow its energy infrastructure to create long-term value and enhance returns for its investors. AltaGas’ capital structure is comprised of shareholders’ equity (including non-controlling interests), short-term and long-term debt (including current portion) less cash and cash equivalents.
TM Denotes trademark of Canaccord Genuity Corp.
The use of debt or equity funding is based on AltaGas’ capital structure, which is determined by considering the norms and risks associated with operations and cash flow stability and sustainability.
($ millions) |
| December 31, |
| December 31, |
| ||
Short-term debt |
| $ | 47 |
| $ | 129 |
|
Current portion of long-term debt |
| 189 |
| 383 |
| ||
Long-term debt(1) |
| 3,437 |
| 3,367 |
| ||
Total debt |
| 3,673 |
| 3,879 |
| ||
Less: cash and cash equivalents |
| (27 | ) | (19 | ) | ||
Net debt |
| $ | 3,646 |
| $ | 3,860 |
|
Shareholders’ equity |
| 4,573 |
| 4,581 |
| ||
Non-controlling interests |
| 66 |
| 35 |
| ||
Total capitalization |
| $ | 8,285 |
| $ | 8,476 |
|
|
|
|
|
|
| ||
Net debt to total capitalization (%) |
| 44 |
| 46 |
| ||
(1) Net of debt issuance costs of $14 million as at December 31, 2017 (December 31, 2016 - $14 million).
On February 22, 2017, AltaGas closed a public offering of 12,000,000 cumulative 5-year minimum rate reset redeemable preferred shares, Series K, at a price of $25 per Series K preferred share for aggregate gross proceeds of $300 million. Net proceeds were used to reduce existing indebtedness and for general corporate purposes.
On October 4, 2017, AltaGas issued an aggregate of $450 million of MTNs consisting of $200 million of MTNs with a coupon rate of 3.98 percent maturing on October 4, 2027, and $250 million of MTNs with a coupon rate of 4.99 percent maturing on October 4, 2047. The net proceeds were used to pay down existing indebtedness including, without limitations, indebtedness under AltaGas’ credit facility and the repayment at maturity of other outstanding debt obligations, and for general corporate purposes.
As at December 31, 2017, AltaGas’ total debt primarily consisted of outstanding MTNs of $2.9 billion (December 31, 2016 - $2.8 billion), PNG debenture notes of $34 million (December 31, 2016 - $43 million), SEMCO long-term debt of $462 million (December 31, 2016 - $500 million) and $260 million drawn under the bank credit facilities (December 31, 2016 - $501 million). In addition, AltaGas had $120 million of letters of credit (December 31, 2016 - $161 million) outstanding.
As at December 31, 2017, AltaGas’ total market capitalization was approximately $5.0 billion based on approximately 175 million common shares outstanding and a closing trading price on December 31, 2017 of $28.62 per common share.
AltaGas’ earnings interest coverage for the rolling 12 months ended December 31, 2017 was 1.3 times (12 months ended December 31, 2016 — 2.4 times).
Credit Facilities
|
|
|
| Drawn at |
| Drawn at |
| |||
($ millions) |
| Borrowing |
| December 31, |
| December 31, |
| |||
Demand operating facilities |
| $ | 70 |
| $ | 4 |
| $ | 4 |
|
Extendible revolving letter of credit facility |
| 150 |
| 41 |
| 49 |
| |||
Letter of credit demand facility |
| 150 |
| 71 |
| 104 |
| |||
PNG operating facility |
| 25 |
| 13 |
| 10 |
| |||
AltaGas Ltd. revolving credit facility (1) |
| 1,400 |
| 219 |
| 378 |
| |||
AltaGas Ltd. revolving US$ credit facility (1) (2) |
| 376 |
| — |
| — |
| |||
SEMCO Energy US$ unsecured credit facility (1) (2) |
| 188 |
| 32 |
| 117 |
| |||
|
| $ | 2,359 |
| $ | 380 |
| $ | 662 |
|
(1) Amount drawn at December 31, 2017 converted at the month-end rate of 1 U.S. dollar = 1.2545 Canadian dollar (December 31, 2016 - 1 U.S. dollar = 1.3427 Canadian dollar).
(2) Borrowing capacity was converted at the December 31, 2017 U.S./Canadian dollar month-end exchange rate.
All of the borrowing facilities have covenants customary for these types of facilities, which must be met at each quarter end. AltaGas and its subsidiaries have been in compliance with all financial covenants each quarter since the establishment of the facilities.
The following table summarizes the Corporation’s primary financial covenants as defined by the credit facility agreements:
Ratios |
| Debt covenant |
| As at |
|
Bank debt-to-capitalization(1) |
| not greater than 65 percent |
| 43.8 | % |
Bank EBITDA-to-interest expense (1) (2) |
| not less than 2.5x |
| 3.9 |
|
Bank debt-to-capitalization (SEMCO)(3) |
| not greater than 60 percent |
| 39.7 | % |
Bank EBITDA-to-interest expense (SEMCO)(3) |
| not less than 2.25x |
| 7.6 |
|
(1) Calculated in accordance with the Corporation’s credit facility agreement, which is available on SEDAR at www.sedar.com.
(2) Estimated, subject to final adjustments.
(3) Bank EBITDA-to-interest expense (SEMCO) and Bank debt-to-capitalization (SEMCO) are calculated based on SEMCO’s consolidated financial statements and are calculated similar to Bank debt-to-capitalization and Bank EBITDA-to-interest expense.
On September 7, 2017, a $5 billion base shelf prospectus was filed. The purpose of the base shelf prospectus is to facilitate timely offerings of certain types of future public debt and/or equity issuances during the 25-month period that the base shelf prospectus remains effective. As at December 31, 2017, approximately $4.6 billion was available under the base shelf prospectus.
CONTRACTUAL OBLIGATIONS
|
| Payments Due by Period |
| |||||||||||||
December 31, 2017 ($ millions) |
| Total |
| Less than |
| 1 - 3 |
| 4 - 5 |
| After 5 |
| |||||
Short-term debt (1) |
| $ | 47 |
| $ | 47 |
| $ | — |
| $ | — |
| $ | — |
|
Long-term debt (1) |
| 3,640 |
| 189 |
| 1,009 |
| 364 |
| 2,078 |
| |||||
Operating leases |
| 55 |
| 9 |
| 24 |
| 10 |
| 12 |
| |||||
Purchase obligations |
| 2,190 |
| 377 |
| 742 |
| 638 |
| 433 |
| |||||
Capital project commitments |
| 105 |
| 105 |
| — |
| — |
| — |
| |||||
Pension plan and retiree benefits (2) |
| 18 |
| 18 |
| — |
| — |
| — |
| |||||
Other liabilities |
| 169 |
| 22 |
| 26 |
| 21 |
| 100 |
| |||||
Total contractual obligations (3) |
| $ | 6,224 |
| $ | 767 |
| $ | 1,801 |
| $ | 1,033 |
| $ | 2,623 |
|
(1) Excludes interest payments and deferred financing costs.
(2) Assumes only required payments will be made into the pension plans in 2018. Contributions are made in accordance with independent actuarial valuations.
(3) U.S. dollar commitments have been converted to Canadian dollar using the December 31, 2017 exchange rate.
RELATED PARTY TRANSACTIONS
In the normal course of business, AltaGas transacts with its subsidiaries, affiliates and joint ventures. Refer to Note 27 of the 2017 Annual Consolidated Financial Statements for the amounts due to or from related parties on the Consolidated Balance Sheets and the classification of revenue, income, and expenses in the Consolidated Statements of Income.
CREDIT RATINGS
On November 6, 2017, DBRS Limited (DBRS) maintained its status of Under Review with Developing Implications.
On February 15, 2017, Standard & Poor’s (S&P) commenced rating of the Series K Preferred Shares with a rating of P-3 (High).
On February 17, 2017, DBRS commenced rating of the Series K Preferred Shares with a rating of Pfd-3 Under Review with Developing Implications.
On January 26, 2017, S&P reaffirmed the BBB with a Negative Outlook and P-3 (High) ratings for AltaGas.
On January 26, 2017, DBRS revised the BBB and the Pfd-3 rating of AltaGas to Under Review with Developing Implications.
According to the DBRS rating system, debt securities rated BBB are of adequate credit quality. The capacity for the payment of financial obligations is considered acceptable, but the entity may be vulnerable to future events, which reduce the strength of the entity and its rated securities. “High” or “low” grades are used to indicate the relative standing within a particular rating category. A Pfd-3 rating by DBRS is the third highest of six categories granted by DBRS. According to the DBRS rating system, preferred shares rated Pfd-3 are of adequate credit quality. While protection of dividends and principal is still considered acceptable, the issuing entity is more susceptible to adverse changes in financial and economic conditions, and there may be other adversities present which detract from debt protection. Pfd-3 ratings normally correspond with companies whose bonds are rated in the higher end of the BBB category. “High” or “low” grades are used to indicate the relative standing within a rating category. The absence of either a “high” or “low” designation indicates the rating is in the middle of the category.
The ratings action “Under Review” is applied, among other things, when a significant event occurs that directly impacts the credit quality of a particular entity or group of entities and there is uncertainty regarding the outcome of the event such that DBRS is unable to provide an objective, forward-looking opinion in a timely fashion. A rating that is “Under Review” remains outstanding; however, this status acts as a warning signal indicating that the outstanding rating may no longer be appropriate. When a rating is placed “Under Review”, DBRS will generally provide initial guidance as to the opinion of DBRS by noting whether the Under Review action has positive (Under Review — Positive), negative (Under Review — Negative) or developing implications (Under Review — Developing). These qualifications indicate the preliminary evaluation of DBRS of the impact on the credit quality of the security or issuer; however as situations and potential rating implications may vary, its final rating conclusion may depart from the preliminary assessment. DBRS will further review the Corporation’s ratings as more information becomes available and aims to resolve the Under Review status of the ratings once financing details are known and the WGL Acquisition has closed.
According to the S&P rating system, an obligation rated BBB exhibits adequate protection parameters. However, adverse economic conditions or changing circumstances are more likely to lead to a weakened capacity of the obligor to meet its financial commitment on the obligation. The ratings from AA to CCC may be modified by the addition of a plus (+) or minus (-) sign to show relative standing within the major rating categories. A P-3 rating by S&P is the third highest of eight categories granted by S&P. According to the S&P rating system, while securities rated P-3 are regarded as having significant speculative characteristics, they are less vulnerable to non-payment than other speculative issues. However, it faces ongoing uncertainties or exposure to adverse business, financial, or economic conditions which could lead to the obligor’s inadequate capacity to meet its financial commitment on the obligation. The ratings from P-1 to P-5 may be modified by “high” and “low” grades which indicate relative standing within the major rating categories.
The credit ratings accorded to the securities by the rating agencies are not recommendations to purchase, hold or sell the securities in as much as such ratings do not comment as to market price or suitability for a particular investor. There is no assurance that any rating will remain in effect for any given period of time or that any rating will not be revised or withdrawn entirely by a rating agency in the future if, in its judgment, circumstances so warrant.
SHARE INFORMATION
|
| As at February 23, 2018 |
|
Issued and outstanding |
|
|
|
Common shares |
| 176,918,328 |
|
Preferred Shares |
|
|
|
Series A |
| 5,511,220 |
|
Series B |
| 2,488,780 |
|
Series C |
| 8,000,000 |
|
Series E |
| 8,000,000 |
|
Series G |
| 8,000,000 |
|
Series I |
| 8,000,000 |
|
Series K |
| 12,000,000 |
|
Subscription Receipts |
| 84,510,000 |
|
Issued |
|
|
|
Share options |
| 4,507,136 |
|
Share options exercisable |
| 3,304,697 |
|
DIVIDENDS
AltaGas declares and pays a monthly dividend to its common shareholders. Dividends on preferred shares are paid quarterly. Dividends are at the discretion of the Board of Directors and dividend levels are reviewed periodically, giving consideration to the ongoing sustainable cash flow from operating activities, maintenance and growth capital expenditures, and debt repayment requirements of AltaGas.
On February 22, 2017, AltaGas closed a public offering of the Series K preferred shares. Holders of the Series K preferred shares will be entitled to receive a cumulative quarterly fixed dividend for the initial period ending on but excluding March 31, 2022 at an annual rate of 5.0 percent, payable on the last day of March, June, September and December, as and when declared by the Board of Directors of AltaGas. The first quarterly dividend payment was paid on June 30, 2017 in the amount of $0.4384 per Series K preferred share. Unless otherwise redeemed or converted pursuant to the terms of the Series K preferred shares, the dividend rate will reset on March 31, 2022 and every five years thereafter at a rate equal to the sum of the then five-year Government of Canada bond yield plus 3.8 percent, provided that, in any event, such rate shall not be less than 5.0 percent per annum.
On September 30, 2017, the annual fixed dividend rate for the Series C preferred shares was reset to 5.29 percent. The dividend rate will reset on September 30, 2022 and every five years thereafter at a rate equal to the sum of the then five-year United States Government bond yield plus 3.58 percent.
On October 18, 2017, the Board of Directors approved an increase in the monthly dividend by $0.0075 per common share to $0.1825 ($2.19 per common share annualized) effective for the November 2017 dividend, a 4.3 percent increase.
The following table summarizes AltaGas’ dividend declaration history:
Dividends
Year ended December 31 |
|
|
|
|
| ||
($ per common share) |
| 2017 |
| 2016 |
| ||
First quarter |
| $ | 0.525000 |
| $ | 0.495000 |
|
Second quarter |
| 0.525000 |
| 0.495000 |
| ||
Third quarter |
| 0.525000 |
| 0.515000 |
| ||
Fourth quarter |
| 0.540000 |
| 0.525000 |
| ||
Total |
| $ | 2.115000 |
| $ | 2.030000 |
|
Series A Preferred Share Dividends
Year ended December 31 |
|
|
|
|
| ||
($ per preferred share) |
| 2017 |
| 2016 |
| ||
First quarter |
| $ | 0.211250 |
| $ | 0.211250 |
|
Second quarter |
| 0.211250 |
| 0.211250 |
| ||
Third quarter |
| 0.211250 |
| 0.211250 |
| ||
Fourth quarter |
| 0.211250 |
| 0.211250 |
| ||
Total |
| $ | 0.845000 |
| $ | 0.845000 |
|
Series B Preferred Share Dividends
Year ended December 31 |
|
|
|
|
| ||
($ per preferred share) |
| 2017 |
| 2016 |
| ||
First quarter |
| $ | 0.195410 |
| $ | 0.192690 |
|
Second quarter |
| 0.195710 |
| 0.193930 |
| ||
Third quarter |
| 0.201010 |
| 0.201090 |
| ||
Fourth quarter |
| 0.214250 |
| 0.199210 |
| ||
Total |
| $ | 0.806380 |
| $ | 0.786920 |
|
Series C Preferred Share Dividends
Year ended December 31 |
|
|
|
|
| ||
(US$ per preferred share) |
| 2017 |
| 2016 |
| ||
First quarter |
| $ | 0.275000 |
| $ | 0.275000 |
|
Second quarter |
| 0.275000 |
| 0.275000 |
| ||
Third quarter |
| 0.275000 |
| 0.275000 |
| ||
Fourth quarter |
| 0.330625 |
| 0.275000 |
| ||
Total |
| $ | 1.155625 |
| $ | 1.100000 |
|
Series E Preferred Share Dividends
Year ended December 31 |
|
|
|
|
| ||
($ per preferred share) |
| 2017 |
| 2016 |
| ||
First quarter |
| $ | 0.312500 |
| $ | 0.312500 |
|
Second quarter |
| 0.312500 |
| 0.312500 |
| ||
Third quarter |
| 0.312500 |
| 0.312500 |
| ||
Fourth quarter |
| 0.312500 |
| 0.312500 |
| ||
Total |
| $ | 1.250000 |
| $ | 1.250000 |
|
Series G Preferred Share Dividends
Year ended December 31 |
|
|
|
|
| ||
($ per preferred share) |
| 2017 |
| 2016 |
| ||
First quarter |
| $ | 0.296875 |
| $ | 0.296875 |
|
Second quarter |
| 0.296875 |
| 0.296875 |
| ||
Third quarter |
| 0.296875 |
| 0.296875 |
| ||
Fourth quarter |
| 0.296875 |
| 0.296875 |
| ||
Total |
| $ | 1.187500 |
| $ | 1.187500 |
|
Series I Preferred Share Dividends
Year ended December 31 |
|
|
|
|
| ||
($ per preferred share) |
| 2017 |
| 2016 |
| ||
First quarter |
| $ | 0.328125 |
| $ | 0.463870 |
|
Second quarter |
| 0.328125 |
| 0.328125 |
| ||
Third quarter |
| 0.328125 |
| 0.328125 |
| ||
Fourth quarter |
| 0.328125 |
| 0.328125 |
| ||
Total |
| $ | 1.312500 |
| $ | 1.448245 |
|
Series K Preferred Share Dividends
Year ended December 31 |
|
|
|
|
| ||
($ per preferred share) |
| 2017 |
| 2016 |
| ||
First quarter |
| $ | — |
| $ | — |
|
Second quarter |
| 0.438400 |
| — |
| ||
Third quarter |
| 0.312500 |
| — |
| ||
Fourth quarter |
| 0.312500 |
| — |
| ||
Total |
| $ | 1.063400 |
| $ | — |
|
CRITICAL ACCOUNTING ESTIMATES
Since a determination of the value of many assets, liabilities, revenues and expenses is dependent upon future events, the preparation of AltaGas’ Consolidated Financial Statements requires the use of estimates and assumptions that have been made using careful judgment. AltaGas’ significant accounting policies are contained in the notes to the 2017 Annual Consolidated Financial Statements. Certain of these policies involve critical accounting estimates as a result of the requirement to make particularly subjective or complex judgments about matters that are inherently uncertain, and because of the likelihood that materially different amounts could be reported under different conditions or using different assumptions.
Significant estimates and judgments made by Management in the preparation of the Consolidated Financial Statements are outlined below:
Regulatory Assets and Liabilities
SEMCO Gas, ENSTAR and CINGSA, AUI, Heritage Gas, and PNG engage in the delivery and sale of natural gas and are regulated by the following regulatory agencies: MPSC, RCA, AUC, NSUARB and BCUC, respectively.
The regulatory agencies exercise statutory authority over matters such as tariffs, rates, construction, operations, financing, returns and certain contracts with customers. In order to recognize the economic effects of the actions and decisions of the regulators, the timing of recognition of certain assets, liabilities, revenues and expenses as a result of regulation may differ from that otherwise expected using U.S. GAAP for entities not subject to rate regulation.
Regulatory assets represent future revenues associated with certain costs incurred in the current period or in prior periods that are expected to be recovered from customers in future periods through the rate-setting process. Regulatory liabilities represent future reductions or limitations of increases in revenue associated with amounts that are expected to be refunded to customers through the rate-setting process.
Asset Impairment
AltaGas reviews long-lived assets and intangible assets with finite lives whenever events or changes in circumstances indicate that the carrying value of such assets may not be recoverable. Recoverability is determined based on an estimate of undiscounted cash flows, and measurement of an impairment loss is determined based on the fair value of the assets. The determination of fair value requires Management to make assumptions about future cash inflows and outflows over the life of an asset. Any changes to the assumptions used for the future cash flow could result in revisions to the evaluation of the recoverability of the long-lived assets or intangible assets and the recognition of an impairment loss in the Consolidated Financial Statements.
AltaGas also tests goodwill for impairment annually or more frequently if events or changes in circumstances indicate that it is more likely than not that the fair value of a reporting unit is less than its carrying value. The Corporation has the option to first assess qualitative factors to determine whether it is necessary to perform the two-step goodwill impairment test. If the two-step goodwill impairment test is performed, the first step is to compare the fair value of the Corporation’s reporting units and to the carrying values. If the carrying value of a reporting unit, including allocated goodwill exceeds its fair value, goodwill impairment is measured as the excess of the carrying value amount of the reporting unit’s allocated goodwill over the implied fair value of the goodwill. The fair value used in the quantitative impairment test of goodwill requires estimating future cash flows as well as
appropriate discount rates. AltaGas has assessed goodwill for impairment as at December 31, 2017 and determined that no write-down was required.
Asset Retirement Obligations
AltaGas records liabilities relating to asset retirement obligations when there is a legal obligation. In estimating the obligations, Management is required to make assumptions regarding inflation and discount rates, ultimate amounts and timing of settlements, and expected changes in environmental laws and regulation. A change in any of these estimates could have a material impact on AltaGas’ Consolidated Financial Statements.
Income Taxes
The Corporation is subject to the provisions of the Income Tax Act (Canada) for purposes of determining the amount of income that will be subject to tax in Canada and the Internal Revenue Code (U.S.) for the purposes of determining the amount of income that will be subject to tax in the United States. The determination of AltaGas’ and its subsidiaries’ provision for income taxes requires the application of these complex rules.
Substantial deferred income tax assets and liabilities are recognized in the Consolidated Financial Statements. The recognition of deferred tax assets depends on the assumption that future earnings will be sufficient to realize the deferred benefit. A valuation allowance is recorded against deferred tax assets where all or a portion of that asset is not expected to be realized. The amount of the deferred tax asset or liability recorded is based on Management’s best estimate of the timing of the realization of the assets or liabilities.
If Management’s interpretation of tax legislation differs from that of tax authorities, or if timing of reversals is not as anticipated, the provision for income taxes could increase or decrease in future periods. See Note 17 to the 2017 Annual Consolidated Financial Statements.
Pension Plans and Post-Retirement Benefits
The determination of pension plan obligations and expense is based on a number of actuarial assumptions. Critical assumptions include the expected long-term rate-of-return on plan assets, the discount rate applied to pension plan obligations, and the expected rate of compensation increase. For post-retirement benefit plans, which provide for certain health care premiums and life insurance benefits for qualifying retired employees and which are not funded, critical assumptions in determining post-retirement obligations and expense are the discount rate and the assumed health care cost trend rates. Notes 2 and 25 to the 2017 Annual Consolidated Financial Statements include information on the assumptions used for the purposes of recording the funding status of the plans and the associated expenses.
Depreciation and Amortization
Depreciation and amortization of property, plant, and equipment and intangible assets are based on Management’s judgment of the estimated useful life of the assets. When it is determined that assigned asset lives do not reflect the estimated remaining period of benefit, prospective changes are made to the depreciable lives of those assets. For regulated entities, amortization rates are generally prescribed by the applicable regulatory authority. There are a number of uncertainties inherent in estimating the remaining useful life of certain assets and changes in assumptions could result in material adjustments to the amount of amortization that AltaGas recognizes from period to period.
Loss Contingencies
AltaGas and its subsidiaries are subject to various legal claims and actions arising in the normal course of business. Liabilities for loss contingencies are determined on a case-by-case basis and are accrued for when it is probable that a liability has been incurred and the amount can be reasonably estimated. Significant judgement is required to determine the probability of having incurred the liability and the estimated amount. Estimates are reviewed regularly and updated as new information is received. As at December 31, 2017, no provisions on loss contingencies have been recorded by the Corporation. However, due to the inherent uncertainty of the litigation process, the resolution of any particular contingencies could have a material adverse effect on the Corporation’s results of operations or financial position.
Fair Value of Financial Instruments
Fair value is defined as the amount of consideration that would be agreed upon in an arms-length transaction, other than a forced sale or liquidation, between knowledgeable, willing parties who are under no compulsion to act. The best evidence of fair value is a quoted bid or ask price, as appropriate, in an active market. Fair value based on unadjusted quoted prices in an active market requires minimal judgment by Management. Where bid or ask prices in an active market are not available, Management’s judgment on valuation inputs is necessary to determine fair value. AltaGas uses over-the-counter derivative instruments to manage fluctuations in commodity prices and foreign exchange rates. AltaGas estimates forward prices based on published sources adjusted for factors specific to the asset or liability, including basis and location differentials, discount rates, and currency exchange. The forward curves used to mark these derivative instruments to market are vetted against public sources. Where observable market data is not available, AltaGas uses valuation techniques which require significant judgment by Management. Changes in estimates and assumptions about these inputs could affect the reported fair value.
ADOPTION OF NEW ACCOUNTING STANDARDS
Effective January 1, 2017, AltaGas adopted the following Financial Accounting Standards Board (FASB) issued Accounting Standards Updates (ASU):
· ASU No. 2015-11 “Inventory: Simplifying the Measurement of Inventory”. The amendments in this ASU require an entity to measure inventory at the lower of cost and net realizable value. The adoption of this ASU did not have a material impact on AltaGas’ consolidated financial statements;
· ASU No. 2016-05 “Derivatives and Hedging: Effect of Derivative Contract Novations on Existing Hedge Accounting Relationships”. The amendments in this ASU clarify that a change in the counterparty to a derivative instrument that has been designated as the hedging instrument under Topic 815 does not, in and of itself, require de-designation of that hedging relationship provided that all other hedge accounting criteria continue to be met. The adoption of this ASU did not have a material impact on AltaGas’ consolidated financial statements;
· ASU No. 2016-06, “Derivatives and Hedging: Contingent Put and Call Options in Debt Instruments”. The amendments in this ASU clarify the requirements for assessing whether contingent call (put) options that can accelerate the payment of principal on debt instruments are clearly and closely related to their debt hosts. The adoption of this ASU did not have a material impact on AltaGas’ consolidated financial statements;
· ASU No. 2016-07 “Investments - Equity Method and Joint Ventures Investments: Simplifying the Transition to the Equity Method of Accounting”. The amendments in this ASU eliminate the requirement to retrospectively apply the equity method as a result of an increase in the level of ownership interest or degree of influence. The adoption of this ASU did not have a material impact on AltaGas’ consolidated financial statements; and
· ASU No. 2016-09 “Stock Compensation: Improvements to Employee Share-Based Payment Accounting”. The amendments in this ASU focus on simplifying several areas of the accounting for share-based payment transactions, including the accounting for income taxes, forfeitures, and statutory withholding requirements, as well as the classification on the statement of cash flow. Upon adoption of this ASU, AltaGas elected as an accounting policy to account for forfeitures when they occur instead of estimating the number of awards that are expected to vest. The ASU requires this change to be adopted using the modified retrospective approach and as a result, AltaGas recorded a decrease to accumulated retained earnings of approximately $1 million and an increase to contributed surplus of approximately $1 million. The deferred tax impact was immaterial. The remaining amendments to this ASU did not have a material impact on AltaGas’ consolidated financial statements.
FUTURE CHANGES IN ACCOUNTING PRINCIPLES
In May 2014, FASB issued ASU No. 2014-09 “Revenue from Contracts with Customers”, which will replace numerous requirements in U.S. GAAP, including industry-specific requirements, and provide companies with a single revenue recognition
model for recognizing revenue from contracts with customers. The core principle of the amendments in this ASU is that an entity should recognize revenue to depict the transfer of promised goods or services to customers in an amount that reflects the consideration to which the entity expects to be entitled in exchange for those goods or services. The amendments specify various disclosure requirements that would enable users of financial statements to understand the nature, amount, timing, and uncertainty of revenue and cash flows arising from contracts with customers. In March 2016, FASB issued ASU No. 2016-08 “Principal versus Agent Consideration”. The amendments in this ASU clarify the implementation guidance on the principal versus agent considerations in the new revenue recognition standard. In April 2016, FASB issued ASU No. 2016-10 “Identifying Performance Obligation and Licensing”, which reduces the complexity when applying the guidance for identifying performance obligations and improves the operability and understandability of the license implementation guidance. In May 2016, FASB issued ASU No. 2016-12 “Narrow Scope Improvements and Practical Expedients”, clarifying several implementation issues, including collectability, presentation of sales taxes, non-cash consideration, contract modification, completed contracts, and transition. In December 2016, FASB issued ASU No. 2016-20 “Technical Corrections and Improvements”, which makes minor technical corrections and improvements to the new revenue standard. The new revenue standard will be effective for annual and interim periods beginning on or after December 15, 2017. The ASU permits the use of either the full retrospective or modified retrospective transition method and AltaGas has elected the modified retrospective transition method. In 2016, AltaGas established a cross-functional implementation team consisting of representatives from across all the operating segments. A scoping exercise was completed for each of AltaGas’ operating segments and AltaGas selected all material contracts or contract groups for review to identify potential impacts under the new standard. AltaGas has completed the contracts review and have not identified any material changes in how revenues are recognized under the new standard. AltaGas has started a process to compile the information needed to meet the new disclosure requirements and noted that there will be changes to the revenue disclosures based on additional requirements under the new standard regarding the disaggregation of revenue as well as details about performance obligations, and contracts assets and liabilities.
In January 2016, FASB issued ASU No. 2016-01 “Recognition and Measurement of Financial Assets and Financial Liabilities” which revises an entity’s accounting related to (1) the classification and measurement of investments in equity securities and (2) the presentation of certain fair value changes for financial liabilities measured at fair value. It also amends certain disclosure requirements associated with the fair value of financial instruments. The amendments in this ASU are effective for fiscal years beginning after December 15, 2017, including interim periods within those fiscal years. Upon adoption, entities will be required to make a cumulative-effect adjustment to the statement of financial position as of the beginning of the first reporting period in which the guidance is effective. The guidance on equity securities without readily determinable fair value will be applied prospectively to all equity investments that exist as of the date of adoption of the standard. Upon adoption, AltaGas will no longer be able to classify equity securities with readily determinable fair values as available-for-sale and any changes in fair value will be reported through earnings instead of other comprehensive income. The remaining provisions of this ASU are not expected to have a material impact on AltaGas’ financial statements.
In February 2016, FASB issued ASU No. 2016-02 “Leases”, which requires lessees to recognize on the balance sheet a right-of-use asset and a lease liability for all leases with lease terms greater than 12 months. Lessor accounting remains substantially unchanged, however, the ASU modifies what qualifies as a sales-type and direct financing lease and eliminates the real estate-specific provisions included in ASC 840. The ASU also requires additional disclosures regarding leasing arrangements. In January 2018, FASB issued ASU No. 2018-01 “Land Easement Practical Expedient for Transition to Topic 842” providing entities with an optional election not to evaluate existing and expired land easements not previously accounted for as leases under ASC 840 using the provisions of ASC 842. The amendments to the new leases standard are effective for fiscal years beginning after December 15, 2018, including interim periods within those fiscal years. In transition, lessees and lessors are required to recognize and measure leases at the beginning of the earliest period presented using a modified retrospective approach. AltaGas is currently performing a scoping exercise by gathering a complete inventory of lease contracts in order to evaluate the impact of adopting ASC 842 on its consolidated financial statements, but expects that the new standard will have an impact on the Corporation’s balance sheet as all operating leases will need to be reflected on the balance sheet upon adoption. In addition, AltaGas currently expects to utilize the transition practical expedients which allow entities to not have to reassess whether an arrangement contains a lease under the provisions of ASC 842.
In June 2016, FASB issued ASU No. 2016-13 “Financial Instruments — Credit Losses: Measurement of Credit Losses on Financial Instruments”. The amendments in this ASU replace the current “incurred loss” impairment methodology with an “expected loss” model for financial assets measured at amortized cost. The amendments in this ASU are effective for fiscal periods beginning after December 15, 2020, and interim periods within those fiscal periods. Early adoption is permitted. AltaGas is currently assessing the impact of this ASU on its consolidated financial statements.
In August 2016, FASB issued ASU No. 2016-15 “Statement of Cash Flows: Classification of Certain Cash Receipts and Cash Payments”. The amendments in this ASU clarify the classification of certain cash flow transactions on the statement of cash flow. The amendments in this ASU are effective for fiscal periods beginning after December 15, 2017, and interim periods within those fiscal periods. Early adoption is permitted. The adoption of this ASU is not expected to have a material impact on AltaGas’ consolidated financial statements.
In October 2016, FASB issued ASU No. 2016-16 “Income Taxes: Intra-Entity Transfers of Assets Other Than Inventory”. The amendments in this ASU revise the accounting for income tax consequences on intra-entity transfers of assets by requiring an entity to recognize current and deferred tax on intra-entity transfers of assets other than inventory when the transfer occurs. The amendment in this ASU is effective for annual periods beginning after December 15, 2017, and interim periods within those annual periods. An entity should apply the amendments in this ASU on a modified retrospective basis through a cumulative-effect adjustment directly to retained earnings as of the beginning of the period of adoption. The adoption of this ASU is not expected to have a material impact on AltaGas’ consolidated financial statements.
In November 2016, FASB issued ASU No. 2016-18 “Statement of Cash Flows: Restricted Cash”. The amendments in this ASU require those amounts deemed to be restricted cash and restricted cash equivalents to be included in the cash and cash equivalents balance on the statement of cash flows. The amendments in this ASU are effective for annual periods beginning after December 15, 2017, and interim periods within those annual periods. An entity should apply the amendments in this ASU retrospectively to each period presented. Early adoption is also permitted. The adoption of this ASU is not expected to have a material impact on AltaGas’ consolidated cash flow statements.
In January 2017, FASB issued ASU No. 2017-01 “Business Combinations: Clarifying the Definition of a Business”. The amendments in this ASU change the definition of a business to assist entities with evaluating when a set of transferred assets and activities is a business. The amendments in this ASU are effective for annual periods beginning after December 15, 2017, and interim periods within those annual periods. An entity should apply the amendments in this ASU on a prospective basis on or after the effective date. AltaGas will apply the amendments prospectively.
In January 2017, FASB issued ASU No. 2017-04 “Intangibles — Goodwill and Other: Simplifying the Test for Goodwill Impairment”. The ASU removes Step 2 of the goodwill impairment test, eliminating the requirement to determine the fair value of individual assets and liabilities of a reporting unit to measure the goodwill impairment. An entity should adopt the amendments in this ASU for annual periods beginning after December 15, 2020, and interim periods within those annual periods. An entity should apply the amendments in this ASU on a prospective basis. Early adoption is permitted. AltaGas currently expects to apply the amendments prospectively.
In February 2017, FASB issued ASU No. 2017-05 “Other Income — Gains and Losses from the De-recognition of Nonfinancial Assets: Clarifying the Scope of Asset De-recognition Guidance and Accounting for Partial Sales of Nonfinancial Assets”. The amendments in this ASU clarify the scope of ASC 610-20 as well as the accounting for partial sales of nonfinancial assets. The effective date and transition requirements for the amendments in this ASU are the same as the effective date and transition requirements for ASU No. 2014-09, which is effective for fiscal years and interim periods beginning on or after December 15, 2017. The adoption of this ASU is not expected to have a material impact on AltaGas’ consolidated financial statements.
In March 2017, FASB issued ASU No. 2017-07 “Compensation — Retirement Benefits: Improving the Presentation of Net Periodic Pension Cost and Net Periodic Postretirement Benefit Cost”. The amendments in this ASU revise the presentation of net periodic pension cost and net periodic postretirement benefit cost on the income statement and limit the components that are eligible for capitalization in assets to only the service cost component. The amendments in this ASU are effective for annual
periods beginning after December 15, 2017, and interim periods within those annual periods. The amendments in this ASU should be applied retrospectively for the presentation of the service cost component and the other components of net benefit cost in the income statement and prospectively, on and after the effective date, for the capitalization of the service cost component. The adoption of this ASU is not expected to have a material impact on AltaGas’ consolidated financial statements.
In May 2017, FASB issued ASU No. 2017-09 “Compensation — Stock Compensation: Scope of Modifications Accounting”. The amendments in this ASU provide guidance on the types of changes to the terms or conditions of share-based payment arrangements to which an entity would be required to apply modification accounting. The amendments in this ASU are effective for annual periods beginning after December 15, 2017, and interim periods within those annual periods. An entity should apply the amendments in this ASU on a prospective basis on or after the effective date. Early adoption is permitted. AltaGas will apply the amendments prospectively.
In August 2017, FASB issued ASU No. 2017-12 “Derivatives and Hedging — Targeted Improvements to Accounting for Hedging Activities”. The amendments in this ASU improves the financial reporting of hedging relationships to better portray the economic results of an entity’s risk management activities in its financial statements and make certain targeted improvements to simplify the application of hedge accounting. The amendments in this ASU are effective for annual periods beginning after December 15, 2018, including interim periods within those fiscal years. Early adoption is permitted. The adoption of this ASU is not expected to have a material impact on AltaGas’ consolidated financial statements.
OFF-BALANCE SHEET ARRANGEMENTS
In the first quarter of 2017, AltaGas completed the sale of approximately 84.5 million subscription receipts, the net proceeds thereof are held in escrow as described under the Developments Relating to the Pending WGL Acquisition section of this MD&A.
In May 2009, the National Energy Board (NEB) issued a decision that set out guiding principles for a mechanism that would set aside funds for pipeline abandonment. It also established a five-year action plan for all NEB-regulated companies. In May 2014, the NEB issued a decision establishing that, by January 1, 2015, all NEB-regulated companies must have a mechanism in place for the accumulation of funds to pay for future pipeline abandonment. AltaGas Holdings Inc., a wholly-owned subsidiary of AltaGas, opted to comply with the NEB decision with a surety bond supplied by a surety company regulated by the Office of the Superintendent of Financial Institutions in the amount of $30 million.
In October 2014, AltaGas issued two guarantees with an aggregate maximum liability of approximately US$92 million, guaranteeing Heritage Gas’ payment obligations under a transportation agreement entered into by Heritage Gas with Enbridge Inc. (formerly Spectra Energy) for the use of the expansion of its Algonquin Gas Transmission and Maritimes & Northeast Pipeline systems.
AltaGas is not party to any contractual arrangements with unconsolidated entities that have, or are reasonably likely to have, a current or future material effect on the Corporation’s financial performance or financial condition including liquidity and capital resources.
DISCLOSURE CONTROLS AND PROCEDURES (DCP) AND INTERNAL CONTROL OVER FINANCIAL REPORTING (ICFR)
Management, including the Chief Executive Officer and Chief Financial Officer, is responsible for establishing and maintaining DCP and ICFR, as those terms are defined in National Instrument 52-109 “Certification of Disclosure in Issuers’ Annual and Interim Filings”. The objective of this instrument is to improve the quality, reliability, and transparency of information that is filed or submitted under securities legislation.
Management, including the Chief Executive Officer and the Chief Financial Officer, have designed, or caused to be designed under their supervision, DCP and ICFR to provide reasonable assurance that information required to be disclosed by AltaGas in its annual filings, interim filings or other reports to be filed or submitted by it under securities legislation is made known to them,
is reported on a timely basis, financial reporting is reliable, and financial statements prepared for external purposes are in accordance with U.S. GAAP.
The ICFR has been designed based on the framework established in the 2013 Internal Control - Integrated Framework issued by the Committee of Sponsoring Organizations of the Treadway Commission (COSO).
The Chief Executive Officer and the Chief Financial Officer have evaluated, with the assistance of AltaGas’ employees, the effectiveness of AltaGas’ DCP and ICFR as at December 31, 2017 and concluded that as at December 31, 2017, AltaGas’ DCP and ICFR were effective.
It should be noted that a control system, no matter how well conceived and operated, can provide only reasonable, not absolute, assurance that the objectives of the control system are met. Because of the inherent limitations in all control systems, no evaluation of controls can provide absolute assurance that all control issues, including instances of fraud, if any, have been detected. The design of any system of controls is also based in part on certain assumptions about the likelihood of future events, and there can be no assurances that any design will succeed in achieving its stated goals under all potential conditions.
SUMMARY OF CONSOLIDATED RESULTS FOR THE EIGHT MOST RECENT QUARTERS (1)
($ millions) |
| Q4-17 |
| Q3-17 |
| Q2-17 |
| Q1-17 |
| Q4-16 |
| Q3-16 |
| Q2-16 |
| Q1-16 |
|
Total revenue |
| 745 |
| 502 |
| 539 |
| 771 |
| 661 |
| 492 |
| 426 |
| 611 |
|
Normalized EBITDA(2) |
| 213 |
| 190 |
| 166 |
| 228 |
| 194 |
| 176 |
| 153 |
| 178 |
|
Net income (loss) applicable to common shares |
| (11 | ) | 18 |
| (8 | ) | 32 |
| 38 |
| 46 |
| 16 |
| 55 |
|
($ per share) |
| Q4-17 |
| Q3-17 |
| Q2-17 |
| Q1-17 |
| Q4-16 |
| Q3-16 |
| Q2-16 |
| Q1-16 |
|
Net income (loss) per common share |
|
|
|
|
|
|
|
|
|
|
|
|
|
|
|
|
|
Basic |
| (0.06 | ) | 0.10 |
| (0.05 | ) | 0.19 |
| 0.23 |
| 0.28 |
| 0.10 |
| 0.38 |
|
Diluted |
| (0.06 | ) | 0.10 |
| (0.05 | ) | 0.19 |
| 0.23 |
| 0.28 |
| 0.10 |
| 0.38 |
|
Dividends declared |
| 0.54 |
| 0.53 |
| 0.53 |
| 0.53 |
| 0.53 |
| 0.52 |
| 0.50 |
| 0.50 |
|
(1) Amounts may not add due to rounding.
(2) Non-GAAP financial measure. See discussion in the “Non-GAAP Financial Measures” section of this MD&A.
AltaGas’ quarter-over-quarter financial results are impacted by seasonality, fluctuations in commodity prices, weather, the U.S./Canadian dollar exchange rate, planned and unplanned plant outages, timing of in-service dates of new projects, and acquisition and divestiture activities.
Revenue for the Utilities is generally the highest in the first and fourth quarters of any given year as the majority of natural gas demand occurs during the winter heating season, which typically extends from November to March. The run-of-river hydroelectric facilities in British Columbia are also impacted by seasonal precipitation and snowpack melt, which create periods of high flow during the spring and summer months.
Other significant items that impacted quarter-over-quarter revenue during the periods noted include:
· The weak NGL commodity prices throughout 2016;
· The closing of the Tidewater Gas Asset Disposition on February 29, 2016;
· The weak Alberta power pool prices throughout 2016;
· The stronger U.S. dollar throughout 2016 and the weaker U.S. dollar in the second half of 2017 on translated results of the U.S. assets;
· The seasonally warmer weather experienced at all of the Utilities in the first quarter of 2016 and the colder weather in the fourth quarter of 2017;
· The commencement of commercial operations early in the third quarter of 2016 at the integrated midstream complex at Townsend in northeast British Columbia, including the Townsend Facility, gas gathering line, NGL egress pipelines and truck terminal;
· The recovery of $7 million of development costs related to the PNG Pipeline Looping Project in the third quarter of 2016.
· The commissioning of the Pomona Energy Storage Facility on December 31, 2016;
· The closing of the sale of the EDS and the JFP transmission assets to Nova Chemicals in March of 2017;
· The commencement of commercial operations on October 1, 2017 at Townsend 2A;
· The commencement of commercial operations at the first train of the North Pine Facility on December 1, 2017; and
· Unrealized losses on risk management contracts recorded in 2017 related to the foreign currency option contracts entered into to mitigate the foreign exchange risks associated with the cash purchase price of WGL.
Net income (loss) applicable to common shares is also affected by non-cash items such as deferred income tax, depreciation and amortization expense, accretion expense, provision on assets, gains or losses on long-term investments, and gains or losses on the sale of assets. In addition, net income (loss) applicable to common shares is also impacted by preferred share dividends. For these reasons, the net income (loss) may not necessarily reflect the same trends as revenue. Net income (loss) applicable to common shares during the periods noted was impacted by:
· Higher depreciation and amortization expense due to new assets placed into service;
· Higher interest expense throughout 2017 mainly due to higher financing costs associated with the bridge facility;
· An after-tax gain on sale of $14 million in the first quarter of 2016 related to the Tidewater Gas Asset Disposition;
· After-tax restructuring charges of $5 million related to the non-utility workforce restructuring in the second quarter of 2016;
· The termination of the Sundance B PPAs effective March 8, 2016 pursuant to the change in law provision of the Sundance B PPAs and as a result, AltaGas recognized an after-tax provision of $4 million on its investment in ASTC to settle the working capital deficiency in the first quarter of 2016. In addition, AltaGas recognized a pre-tax termination expense of $8 million (after-tax $7 million) upon reaching a definitive settlement agreement with the GOA regarding the termination of the Sundance B PPAs in the fourth quarter of 2016. Including the tax recovery on the dissolution of ASTC of $8 million, the after-tax impact on the termination of the Sundance B PPAs was approximately $3 million.
· The unrealized loss of approximately $8 million recognized upon ceasing to account for the Tidewater investment using the equity method in the second quarter of 2017;
· After-tax provisions totaling $84 million recognized in the fourth quarter of 2017 related to the Hanford and Henrietta gas-fired peaking facilities, a non-core gas processing facility in Alberta, and a non-core development stage peaking project in California;
· Impact of the U.S. tax reform resulting in a decrease in tax expense of approximately $34 million in the fourth quarter of 2017; and
· After-tax transaction costs incurred throughout 2017 related to the pending WGL Acquisition.
SELECTED ANNUAL FINANCIAL INFORMATION
($ millions, except where noted) |
| 2017 |
| 2016 |
| 2015 |
|
Revenue |
| 2,556 |
| 2,190 |
| 2,193 |
|
Net income applicable to common shares |
| 30 |
| 155 |
| 10 |
|
Basic ($ per share) |
| 0.18 |
| 0.99 |
| 0.07 |
|
Diluted ($ per share) |
| 0.18 |
| 0.99 |
| 0.07 |
|
Total assets |
| 10,032 |
| 10,201 |
| 10,100 |
|
Total long-term financial liabilities |
| 3,596 |
| 3,532 |
| 3,899 |
|
Weighted average number of common shares outstanding (millions) |
| 171 |
| 157 |
| 138 |
|
Dividends declared per common share ($ per share) |
| 2.115000 |
| 2.030000 |
| 1.885000 |
|
Preferred share dividends declared ($ per share) |
|
|
|
|
|
|
|
Series A |
| 0.845000 |
| 0.845000 |
| 1.148750 |
|
Series B |
| 0.806380 |
| 0.786920 |
| 0.191560 |
|
Series C |
| 1.155625 |
| 1.100000 |
| 1.100000 |
|
Series E |
| 1.250000 |
| 1.250000 |
| 1.250000 |
|
Series G |
| 1.187500 |
| 1.187500 |
| 1.187500 |
|
Series I |
| 1.312500 |
| 1.448245 |
| — |
|
Series K |
| 1.063400 |
| — |
| — |
|
Other Information
DEFINITIONS
Bbls/d | barrels per day |
Bcf | billion cubic feet |
GJ | gigajoule |
GWh | gigawatt-hour |
Mcf | thousand cubic feet |
Mmcf/d | million cubic feet per day |
MW | megawatt |
MWh | megawatt-hour |
MMBTU | million British thermal unit |
PJ | petajoule |
US$ | United States dollar |
ABOUT ALTAGAS
AltaGas is an energy infrastructure business with a focus on natural gas, power and regulated utilities. The Corporation creates value by acquiring, growing and optimizing its energy infrastructure, including a focus on clean energy sources. For more information visit: www.altagas.ca.
For further information contact:
Investment Community
1-877-691-7199
investor.relations@altagas.ca