UNITED STATES
SECURITIES AND EXCHANGE COMMISSION
Washington, D.C. 20549
FORM N-CSR
CERTIFIED SHAREHOLDER REPORT OF REGISTERED MANAGEMENT INVESTMENT COMPANIES
Investment Company Act file number 811-23230
AlphaCentric Prime Meridian Income Fund
(Exact name of registrant as specified in charter)
36 North New York Avenue
Huntington, New York 11743
(Address of principal executive offices) (Zip code)
George F. Amrhein, Jr.
36 North New York Ave
Huntington, New York 11743
(Name and address of agent for service)
(631) 629-4237
Registrant's telephone number, including area code
Date of fiscal year end: September 30
Date of reporting period: March 31, 2021
Item 1. Reports to Stockholders.
(a)

AlphaCentric Prime Meridian Income Fund
Semi-Annual Report
March 31, 2021
You may elect to receive shareholder reports in paper free of charge. You can request to receive paper copies of your shareholder reports by contacting your financial intermediary or, if you invest directly with the Fund, calling 1-888-910-0412 to let the Fund know of your request.
AlphaCentric Prime Meridian Income Fund
| Table of Contents |
| Expense Example | 1 |
| Portfolio Overview | 2 |
| Condensed Schedule of Investments | 3 |
| Statement of Assets and Liabilities | 5 |
| Statement of Operations | 6 |
| Statement of Changes in Net Assets | 7 |
| Statement of Cash Flows | 8 |
| Financial Highlights | 9 |
| Notes to Financial Statements | 10 |
AlphaCentric Prime Meridian Income Fund
EXPENSE EXAMPLE
March 31, 2021 (Unaudited)
As a shareholder of AlphaCentric Prime Meridian Income Fund (the “Fund”), you incur two types of costs: (1) transaction costs, and (2) ongoing costs, including management fees, service fees on marketplace loans and other Fund expenses. This example is intended to help you understand your ongoing costs (in dollars) of investing in the Fund and to compare these costs with the ongoing costs of investing in other mutual funds.
The example is based on an investment of $1,000 invested at the beginning of the period, October 1, 2020, and held through the period ended March 31, 2021.
Actual Expenses
The “Actual” expenses line in the table below provides information about actual account values and actual expenses. You may use the information below, together with the amount you invested, to estimate the expenses that you paid over the period. Simply divide your account value by $1,000 (for example, an $8,600 account value divided by $1,000 = 8.6), then multiply the result by the number in the table under the heading entitled “Expenses Paid During Period” to estimate the expenses you paid on your account during this period.
Hypothetical Example for Comparison Purposes
The “Hypothetical” expenses line in the table below provides information about hypothetical account values and hypothetical expenses based on the Fund’s actual expense ratio and an assumed rate of return of 5% per year before expenses, which is not the Fund’s actual return. The hypothetical account values and expenses may not be used to estimate the actual ending account balances or expenses you paid for the period. You may use this information to compare this 5% hypothetical example with the 5% hypothetical examples that appear in the shareholder reports of other funds.
Please note that the expenses shown in the table are meant to highlight your ongoing costs only and do not reflect any transactional costs. Therefore, the table is useful in comparing ongoing costs only, and will not help you determine the relative total costs of owning different funds. In addition, if these transactional costs were included, your costs would have been higher.
| | Beginning | Ending | Annualized | Expenses Paid |
| | Account Value | Account Value | Expense | During the |
| | 10/1/2020 | 3/31/2021 | Ratio(a) | Period(a) |
| AlphaCentric Prime Meridian Income Fund | | | | |
| Actual | $1,000.00 | $1,034.80 | 2.47% | $12.53 |
| Hypothetical (5% return before expenses) | $1,000.00 | $1,012.62 | 2.47% | $12.39 |
| (a) | Expenses are equal to the Fund’s annualized expense ratio of 2.47%, multiplied by the average account value over the period, multiplied by 182/365 to reflect the one-half year period. |
AlphaCentric Prime Meridian Income Fund
PORTFOLIO OVERVIEW
March 31, 2021 (Unaudited)
Portfolio Allocation by Year of Scheduled Maturity(a)
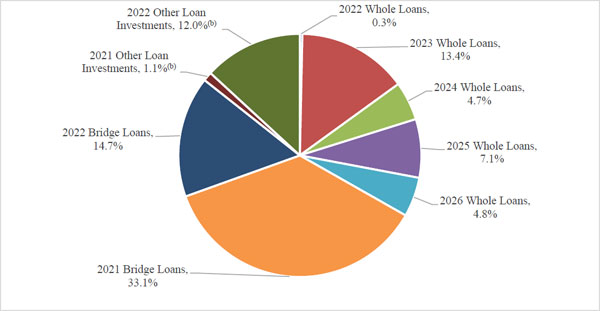
| (a) | Percentages are based on total net assets of the Fund. Please refer to the Condensed Schedule of Investments in this semi-annual report for a detailed analysis of the Fund’s holdings. |
| (b) | “Other Loan Investments” categories represent the Fund’s holdings in a special purpose vehicle which provides exposure to an underlying pool of consumer loans. The year represents the year in which the lock-up period expires for each respective investment. |
Fund Performance Data
The Fund’s performance figures for the periods ended March 31, 2021, as compared to its benchmarks(c):
| | Cumulative | | Annualized | |
| | | | | Since | |
| | Six Months | One Year | | Inception | |
| | (12/31/2019) | |
| AlphaCentric Prime Meridian Income Fund | 3.48% | 9.23% | | 8.14% | |
| Bloomberg Barclays U.S. High Yield Corporate Bond Index(d) | 7.36% | 23.72% | 6.37% | |
| Bloomberg Barclays U.S. Credit 1-3 Year Index(d) | 0.54% | 4.39% | 2.92% | |
| (c) | Returns shown include the reinvestment of all dividends. Returns shown do not reflect the deduction of taxes that a shareholder would pay on Fund distributions or the redemption of Fund shares. In the absence of fee waivers and reimbursements, returns for the Fund would be lower. Past performance is not predictive of future performance. Investment return and principal value will fluctuate, so that shares, when redeemed, may be worth more or less than the original cost. |
| (d) | The Bloomberg Barclays U.S. High Yield Corporate Bond Index measures the USD-denominated, high yield, fixed-rate corporate bond market. The Bloomberg Barclays U.S. Credit 1-3 Year Index measures the performance of investment grade, US dollar-denominated, fixed-rate, taxable corporate and government-related debt with 1 to 2.9999 years to maturity. It is composed of a corporate component and a non-corporate component that includes non-US agencies, sovereigns, supranationals and local authorities. Neither index reflects fees, taxes or expenses. A direct investment in an index is not possible. |
AlphaCentric Prime Meridian Income Fund CONDENSED SCHEDULE OF INVESTMENTS March 31, 2021 (Unaudited) |
| | | Platform | | | Original
Acquisition
Date | | Principal
Amount | | | Cost | | | Fair Value | |
| WHOLE LOANS - 30.3% | | | | | | | | | | | | | | | | | | |
| Consumer Loans - 30.3% (a) | | | | | | | | | | | | | | | | | | |
| Other Consumer Loans, 17.43%, 11/07/22 - 01/13/26 (b) | | | LendingClub | | | | | $ | 1,543,325 | | | $ | 1,449,231 | | | $ | 1,415,245 | |
| Total Whole Loans | | | | | | | | | | | | | 1,449,231 | | | | 1,415,245 | |
| | | | | | | | | | | | | | | | | | | |
| BRIDGE LOANS - 47.8% | | | | | | | | | | | | | | | | | | |
| Real Estate Loans - 47.8% (a)(c) | | | | | | | | | | | | | | | | | | |
| 41159, 8.50%, 03/10/22 | | | Fund That Flip | | | 03/29/21 | | | 58,000 | | | | 58,000 | | | | 57,979 | |
| 39301, 9.00%, 05/26/22 | | | Fund That Flip | | | 03/31/21 | | | 50,000 | | | | 50,000 | | | | 50,000 | |
| 40785, 8.25%, 08/25/21 | | | Fund That Flip | | | 03/29/21 | | | 50,000 | | | | 50,000 | | | | 49,989 | |
| 40671, 8.75%, 09/19/22 | | | Fund That Flip | | | 03/29/21 | | | 50,000 | | | | 50,000 | | | | 49,983 | |
| 41289, 8.50%, 03/22/22 | | | Fund That Flip | | | 03/29/21 | | | 50,000 | | | | 50,000 | | | | 49,982 | |
| 40949, 8.25%, 09/15/21 | | | Fund That Flip | | | 03/29/21 | | | 50,000 | | | | 50,000 | | | | 49,980 | |
| 39753, 9.00%, 01/15/22 | | | Fund That Flip | | | 03/24/21 | | | 50,000 | | | | 50,000 | | | | 49,959 | |
| 41131, 8.50%, 11/26/21 | | | Fund That Flip | | | 03/25/21 | | | 50,000 | | | | 50,000 | | | | 49,955 | |
| 40623, 8.25%, 12/02/21 | | | Fund That Flip | | | 03/25/21 | | | 50,000 | | | | 50,000 | | | | 49,953 | |
| 41154, 8.50%, 03/12/22 | | | Fund That Flip | | | 03/24/21 | | | 50,000 | | | | 50,000 | | | | 49,952 | |
| 41205, 8.50%, 12/12/21 | | | Fund That Flip | | | 03/25/21 | | | 50,000 | | | | 50,000 | | | | 49,951 | |
| 19690, 9.00%, 08/31/22 | | | Sharestates | | | 03/12/21 | | | 45,000 | | | | 45,000 | | | | 45,261 | |
| 19684, 10.50%, 08/31/21 | | | Sharestates | | | 03/12/21 | | | 45,000 | | | | 45,000 | | | | 45,124 | |
| 19683, 9.25%, 03/31/22 | | | Sharestates | | | 03/12/21 | | | 45,000 | | | | 45,000 | | | | 44,729 | |
| 19711, 11.00%, 06/30/21 | | | Sharestates | | | 03/17/21 | | | 40,000 | | | | 40,000 | | | | 39,902 | |
| 19682, 8.75%, 03/31/22 | | | Sharestates | | | 03/12/21 | | | 40,000 | | | | 40,000 | | | | 39,784 | |
| 184335088, 9.30%, 09/01/22 | | | Patch of Land | | | 01/29/21 | | | 34,225 | | | | 34,225 | | | | 34,356 | |
| 19675, 9.25%, 07/31/21 | | | Sharestates | | | 03/09/21 | | | 31,000 | | | | 31,000 | | | | 31,026 | |
| 19403, 8.75%, 06/30/22 | | | Sharestates | | | 01/07/21 | | | 30,000 | | | | 30,000 | | | | 30,129 | |
| 19476, 8.75%, 01/31/22 | | | Sharestates | | | 01/21/21 | | | 30,000 | | | | 30,000 | | | | 30,112 | |
| 184335066, 9.00%, 12/01/21 | | | Patch of Land | | | 01/19/21 | | | 30,000 | | | | 30,000 | | | | 30,110 | |
| 184335067, 9.10%, 12/01/21 | | | Patch of Land | | | 01/19/21 | | | 30,000 | | | | 30,000 | | | | 30,108 | |
| 184335022, 9.50%, 08/01/22 | | | Patch of Land | | | 01/04/21 | | | 30,000 | | | | 30,000 | | | | 30,104 | |
| 184334008, 7.50%, 08/01/21 | | | Patch of Land | | | 02/24/20 | | | 30,000 | | | | 30,000 | | | | 29,994 | |
| 19223, 10.00%, 11/30/21 | | | Sharestates | | | 11/18/20 | | | 30,000 | | | | 30,000 | | | | 29,994 | |
| 184334837, 10.50%, 08/01/21 | | | Patch of Land | | | 10/01/20 | | | 30,000 | | | | 30,000 | | | | 29,947 | |
| 19238, 10.00%, 05/31/21 | | | Sharestates | | | 11/24/20 | | | 30,000 | | | | 30,000 | | | | 29,884 | |
| 19234, 9.50%, 05/31/21 | | | Sharestates | | | 11/20/20 | | | 30,000 | | | | 30,000 | | | | 29,881 | |
| 19048, 9.25%, 10/31/21 | | | Sharestates | | | 09/28/20 | | | 30,000 | | | | 30,000 | | | | 29,805 | |
| 18070, 8.75%, 07/31/21 | | | Sharestates | | | 02/24/20 | | | 30,000 | | | | 30,000 | | | | 29,759 | |
| 184334317, 12.00%, 08/01/21 | | | Patch of Land | | | 05/07/20 | | | 30,000 | | | | 30,000 | | | | 29,685 | |
| 184335081, 8.75%, 02/01/22 | | | Patch of Land | | | 01/27/21 | | | 29,314 | | | | 29,314 | | | | 29,435 | |
| 17462, 10.50%, 04/30/21 | | | Sharestates | | | 01/16/20 | | | 30,000 | | | | 30,000 | | | | 29,141 | |
| 17463, 9.00%, 08/31/21 | | | Sharestates | | | 01/16/20 | | | 28,000 | | | | 28,000 | | | | 27,501 | |
| 19488, 8.75%, 12/31/21 | | | Sharestates | | | 01/28/21 | | | 26,000 | | | | 26,000 | | | | 26,279 | |
| 19585, 9.00%, 08/31/22 | | | Sharestates | | | 02/18/21 | | | 25,000 | | | | 25,000 | | | | 25,132 | |
| 19272, 9.00%, 11/30/21 | | | Sharestates | | | 12/02/20 | | | 25,000 | | | | 25,000 | | | | 25,029 | |
| 184333436, 9.00%, 08/01/21 | | | Patch of Land | | | 01/02/20 | | | 25,000 | | | | 25,000 | | | | 24,994 | |
| 184333602, 9.00%, 08/01/21 | | | Patch of Land | | | 01/16/20 | | | 25,000 | | | | 25,000 | | | | 24,994 | |
| 184333760, 9.00%, 06/01/21 | | | Patch of Land | | | 01/27/20 | | | 25,000 | | | | 25,000 | | | | 24,994 | |
| 184333924, 9.20%, 06/01/21 | | | Patch of Land | | | 02/11/20 | | | 25,000 | | | | 25,000 | | | | 24,994 | |
| 184333925, 9.00%, 06/01/21 | | | Patch of Land | | | 02/11/20 | | | 25,000 | | | | 25,000 | | | | 24,994 | |
| 184333926, 9.20%, 06/01/21 | | | Patch of Land | | | 02/11/20 | | | 25,000 | | | | 25,000 | | | | 24,994 | |
| 184333968, 9.20%, 06/01/21 | | | Patch of Land | | | 02/14/20 | | | 25,000 | | | | 25,000 | | | | 24,994 | |
The accompanying notes are an integral part of these financial statements.
AlphaCentric Prime Meridian Income Fund CONDENSED SCHEDULE OF INVESTMENTS (continued) March 31, 2021 (Unaudited) |
| | | Platform | | Original
Acquisition
Date | | | Principal
Amount | | | Cost | | | Fair Value | |
| 18773, 9.00%, 05/31/21 | | Sharestates | | | 07/01/20 | | | | 25,000 | | | | 25,000 | | | | 24,826 | |
| 17920, 8.00%, 06/30/21 | | Sharestates | | | 02/11/20 | | | | 25,000 | | | | 25,000 | | | | 24,807 | |
| 17923, 8.50%, 06/30/21 | | Sharestates | | | 02/11/20 | | | | 25,000 | | | | 25,000 | | | | 24,789 | |
| Other Real Estate Loans, 9.43%, 04/06/21 - 07/01/22 (b) | | Patch of Land,
Sharestates | | | | | | | 600,938 | | | | 600,938 | | | | 596,643 | |
| Total Bridge Loans | | | | | | | | | | | | | 2,242,477 | | | | 2,235,917 | |
| | | | | | | | | | | | | | | | | | | |
| OTHER LOAN INVESTMENTS - 13.1% | | | | | | | | | | | | | | |
| Private Investment Funds - 13.1% (a)(d) | | | | | | | | | | | | | | |
| Invest in America Credit Fund 1, LLC, Series PM Class B Member, 10.50% (e) | | MoneyLion | | | 03/12/21 | | | | 300,000 | | | | 300,000 | | | | 300,000 | |
| Invest in America Credit Fund 1, LLC, Series PM Class B Member, 11.50% (f) | | MoneyLion | | | 02/14/20 | | | | 250,000 | | | | 250,000 | | | | 260,825 | |
| Invest in America Credit Fund 1, LLC, Series PM Class B Member, 10.50% (g) | | MoneyLion | | | 09/30/20 | | | | 50,000 | | | | 50,000 | | | | 50,980 | |
| Total Other Loan Investments | | | | | | | | | | 600,000 | | | | 611,805 | |
| | | | | | | | | | | | | | | | |
| Total Investments - 91.2% | | | | | | | | | | 4,291,708 | | | | 4,262,967 | |
| | | | | | | | | | | | | | | | |
| Other Assets in Excess of Liabilities - 8.8% | | | | | | | | | | | | | 410,060 | |
| | | | | | | | | | | | | | | |
| TOTAL NET ASSETS - 100.0% | | | | | | | | | | | | | $ | 4,673,027 | |
The Condensed Schedule of Investments provides information regarding the 50 largest investments and summarized information regarding other investments at March 31, 2021. For individual investments disclosed, the description includes the unique loan identification number.
| (a) | Fair valued by a third party pricing service using unobservable inputs and subject to review by AlphaCentric Advisors LLC (the “Advisor”) pursuant to policies approved by the Board of Trustees of the Fund. |
| (b) | Rate presented is a weighted average interest rate for loans in this category. |
| (c) | Short-term loans backed by single-family, multi-family and commercial properties. |
| (d) | Underlying holdings are comprised of consumer loans. |
| (e) | The investment has a one-year lock-up period expiring on March 12, 2022, after which the Fund may redeem its investment by submitting a redemption request in accordance with Invest in America Credit Fund 1, LLC’s redemption request procedures. |
| (f) | The investment has a two-year lock-up period expiring on February 14, 2022, after which the Fund may redeem its investment by submitting a redemption request in accordance with Invest in America Credit Fund 1, LLC’s redemption request procedures. |
| (g) | The investment has a one-year lock-up period expiring on October 1, 2021, after which the Fund may redeem its investment by submitting a redemption request in accordance with Invest in America Credit Fund 1, LLC’s redemption request procedures. |
| Past-Due Loans Table |
| | | Principal Amount | | | Fair Value | |
| WHOLE LOANS - 0.51% | | | | | | | | |
| Consumer Loans - 0.51% (h) | | | | | | | | |
| LendingClub | | $ | 54,289 | | | $ | 24,065 | |
| Total Whole Loans | | $ | 54,289 | | | $ | 24,065 | |
| | | | | | | | | |
| BRIDGE LOANS - 3.13% | | | | | | | | |
| Real Estate Loans - 3.13% (h) | | | | | | | | |
| Sharestates | | $ | 150,000 | | | $ | 146,490 | |
| Total Bridge Loans | | $ | 150,000 | | | $ | 146,490 | |
| | | | | | | | | |
| (h) | Calculated as a percentage of net assets. |
The accompanying notes are an integral part of these financial statements.
AlphaCentric Prime Meridian Income Fund STATEMENT OF ASSETS AND LIABILITIES March 31, 2021 (Unaudited) |
| ASSETS: | | | |
| Investments at fair value (cost $4,291,708) | | $ | 4,262,967 | |
| Cash and cash equivalents | | | 411,842 | |
| Receivable from platforms | | | 10,208 | |
| Interest receivable | | | 35,489 | |
| Receivable from Advisor | | | 39,199 | |
| Prepaid expenses and other assets | | | 27,462 | |
| Total assets | | | 4,787,167 | |
| | | | | |
| LIABILITIES: | | | | |
| Accrued fund administration and accounting fees | | | 16,368 | |
| Accrued professional fees | | | 78,770 | |
| Other accrued expenses | | | 19,002 | |
| Total liabilities | | | 114,140 | |
| | | | | |
| Net Assets | | $ | 4,673,027 | |
| | | | | |
| NET ASSETS CONSIST OF: | | | | |
| Paid in capital | | $ | 4,695,260 | |
| Total accumulated losses | | | (22,233 | ) |
| Net Assets | | $ | 4,673,027 | |
| | | | | |
| NET ASSET VALUE PER SHARE: | | | | |
| 474,140 shares issued and outstanding, no par value, 25,000,000 authorized shares | | $ | 9.86 | |
The accompanying notes are an integral part of these financial statements.
AlphaCentric Prime Meridian Income Fund STATEMENT OF OPERATIONS |
| | | For the | |
| | | Six Months Ended | |
| | | March 31, 2021 | |
| | (Unaudited) | |
| INVESTMENT INCOME: | | | |
| Interest income | | $ | 220,743 | |
| Total investment income | | | 220,743 | |
| | | | | |
| EXPENSES: | | | | |
| Investment advisory fees | | | 24,271 | |
| Professional fees | | | 121,552 | |
| Fund administration and accounting fees | | | 49,827 | |
| Transfer agent fees | | | 27,535 | |
| Custody fees | | | 18,474 | |
| Directors’ fees and related expenses | | | 16,948 | |
| Offering costs | | | 9,942 | |
| Loan servicing fees | | | 8,403 | |
| Reports to shareholders | | | 8,291 | |
| Federal and state registration fees | | | 2,330 | |
| Tax expense | | | 32 | |
| Other expenses | | | 17,463 | |
| Total expenses before reimbursement | | | 305,068 | |
| Reimbursement of expenses by Advisor | | | (265,080 | ) |
| Net expenses | | | 39,988 | |
| | | | | |
| Net Investment Income | | | 180,755 | |
| | | | | |
| NET REALIZED AND UNREALIZED GAIN (LOSS) ON INVESTMENTS: | | | | |
| Net realized loss on investments | | | (80,551 | ) |
| Net change in unrealized appreciation on investments | | | 16,663 | |
| Net Realized and Unrealized Loss on Investments | | | (63,888 | ) |
| | | | | |
| Net Increase in Net Assets Resulting from Operations | | $ | 116,867 | |
The accompanying notes are an integral part of these financial statements.
AlphaCentric Prime Meridian Income Fund STATEMENTS OF CHANGES IN NET ASSETS |
| | | For the | | | For the Period | |
| | | Six Months Ended | | | December 31, 2019(1) | |
| | | March 31, 2021 | | | through | |
| | (Unaudited) | | | September 30, 2020 | |
| OPERATIONS: | | | |
| Net investment income | | $ | 180,755 | | | $ | 182,851 | |
| Net realized loss on investments | | | (80,551 | ) | | | — | |
| Net change in unrealized appreciation/depreciation on investments | | | 16,663 | | | | (45,404 | ) |
| Net increase in net assets resulting from operations | | | 116,867 | | | | 137,447 | |
| | | | | | | | | |
| DISTRIBUTIONS TO SHAREHOLDERS: | | | | | | | | |
| Distributions resulting from operations | | | (116,701 | ) | | | (160,166 | ) |
| Net decrease in net assets resulting from distributions paid | | | (116,701 | ) | | | (160,166 | ) |
| | | | | | | | | |
| CAPITAL SHARE TRANSACTIONS: | | | | | | | | |
| Shares sold | | | 1,928,058 | | | | 2,520,716 | |
| Reinvestment of distributions | | | 60,558 | | | | 86,263 | |
| Transaction fees | | | (15 | ) | | | — | |
| Net increase in net assets resulting from capital share transactions | | | 1,988,601 | | | | 2,606,979 | |
| | | | | | | | | |
| Total Increase in Net Assets | | | 1,988,767 | | | | 2,584,260 | |
| | | | | | | | | |
| NET ASSETS: | | | | | | | | |
| Beginning of Period | | | 2,684,260 | | | | 100,000 | |
| End of Period | | $ | 4,673,027 | | | $ | 2,684,260 | |
| | | | | | | | | |
| TRANSACTIONS IN SHARES: | | | | | | | | |
| Shares sold | | | 197,404 | | | | 261,729 | |
| Reinvestment of distributions | | | 6,260 | | | | 8,749 | |
| Transaction fees | | | (2 | ) | | | — | |
| Net increase in shares outstanding | | | 203,662 | | | | 270,478 | |
| (1) | Commencement of operations. |
The accompanying notes are an integral part of these financial statements.
AlphaCentric Prime Meridian Income Fund STATEMENT OF CASH FLOWS |
| | | For the | |
| | | Six Months Ended | |
| | | March 31, 2021 | |
| | (Unaudited) | |
| CASH FLOWS FROM OPERATING ACTIVITIES: | | | |
| Net increase in net assets resulting from operations | | $ | 116,867 | |
| Adjustments to reconcile the change in net assets resulting from operations to net cash provided by (used in) operating activities: | | | | |
| Purchases of long-term investments | | | (2,704,394 | ) |
| Proceeds from principal paydowns | | | 727,235 | |
| Proceeds from principal recovery | | | 5,314 | |
| Net accretion of discounts | | | (21,792 | ) |
| Amortization of deferred offering costs | | | 9,942 | |
| Net realized loss from investments | | | 80,551 | |
| Net change in unrealized appreciation on investments | | | (16,663 | ) |
| Changes in operating assets and liabilities: | | | | |
| Receivable from platforms | | | 22,768 | |
| Interest receivable | | | (5,920 | ) |
| Receivable from Advisor | | | 51,498 | |
| Prepaid expenses and other assets | | | (19,537 | ) |
| Due to affiliates | | | (9,942 | ) |
| Accrued fund administration and accounting fees | | | (319 | ) |
| Accrued professional fees | | | (62,738 | ) |
| Other accrued expenses | | | (3,310 | ) |
| Net cash used in operating activities | | | (1,830,440 | ) |
| | | | | |
| CASH FLOWS FROM FINANCING ACTIVITIES: | | | | |
| Subscriptions | | | 1,928,058 | |
| Distributions, net of reinvestments | | | (56,158 | ) |
| Net cash provided by financing activities | | | 1,871,900 | |
| | | | | |
| NET CHANGE IN CASH AND CASH EQUIVALENTS | | | 41,460 | |
| Cash and cash equivalents at beginning of period | | | 370,382 | |
| Cash and cash equivalents at end of period | | $ | 411,842 | |
The accompanying notes are an integral part of these financial statements.
AlphaCentric Prime Meridian Income Fund FINANCIAL HIGHLIGHTS |
| | | | | | For the Period | |
| | | Six Months Ended | | | December 31, 2019(1) | |
| | | March 31, 2021 | | | through | |
| | | (Unaudited) | | | September 30, 2020 | |
| Net Asset Value, Beginning of Period | | $ | 9.92 | | | $ | 10.00 | |
| | | | | | | | | |
| INCOME (LOSS) FROM INVESTMENT OPERATIONS: | | | | | | | | |
| Net investment income(2) | | | 0.55 | | | | 0.93 | |
| Net realized and unrealized gain (loss) on investments | | | (0.21 | ) | | | (0.29 | ) |
| Total Income from Investment Operations | | | 0.34 | | | | 0.64 | |
| | | | | | | | | |
| LESS DISTRIBUTIONS: | | | | | | | | |
| From net investment income | | | (0.40 | ) | | | (0.72 | ) |
| Total Distributions | | | (0.40 | ) | | | (0.72 | ) |
| | | | | | | | | |
| Net Asset Value, End of Period | | $ | 9.86 | | | $ | 9.92 | |
| | | | | | | | | |
| Total Return(3) | | | 3.48 | % (4) | | | 6.57 | % (4) |
| | | | | | | | | |
| SUPPLEMENTAL DATA AND RATIOS: | | | | | | | | |
| Net assets, end of period (in thousands) | | $ | 4,673 | | | $ | 2,684 | |
| Ratio of expenses to average net assets | | | | | | | | |
| Before waivers and reimbursements | | | 18.85 | % (5) | | | 32.36 | % (5) |
| Net of waivers and reimbursements | | | 2.47 | % (5)(6) | | | 2.41 | % (5)(7) |
| Ratio of net investment income (loss) to average net assets | | | | | | | | |
| Before waivers and reimbursements | | | (5.21) | % (5) | | | (17.50 | )% (5) |
| Net of waivers and reimbursements | | | 11.17 | % (5) | | | 12.45 | % (5) |
| Portfolio turnover rate | | | 24 | % (4) | | | 27 | % (4) |
| (1) | Commenced operations on December 31, 2019. |
| (2) | Per share net investment income has been calculated using the daily average share method. |
| (3) | Total return is calculated assuming an initial investment made at the net asset value at the beginning of the period, reinvestment of all distributions at net asset value during the period and repurchase on the last day of the period at net asset value. |
| (6) | Includes loan servicing fees of 0.52% and tax expense of less than 0.01% that are not subject to the Expense Limitation Agreement. See Note 4. |
| (7) | Includes loan servicing fees of 0.46% that are not subject to the Expense Limitation Agreement. See Note 4. |
The accompanying notes are an integral part of these financial statements.
AlphaCentric Prime Meridian Income Fund
NOTES TO FINANCIAL STATEMENTS
March 31, 2021 (Unaudited)
AlphaCentric Prime Meridian Income Fund (the “Fund”) was organized under the laws of the State of Delaware as a statutory trust on May 16, 2016. The Fund commenced operations on December 31, 2019, and operates pursuant to an Agreement and Declaration of Trust (the “Declaration of Trust”). The Fund is registered under the Investment Company Act of 1940, as amended (the “1940 Act”), as a closed-end, non-diversified management investment company. The Fund has no fixed termination date and will continue unless the Fund is otherwise terminated under the terms of the Declaration of Trust or unless and until required by law.
The Fund is operated as an interval fund in accordance with rule 23c-3 under the 1940 Act, pursuant to which the Fund, subject to applicable law, conducts quarterly repurchase offers of the Fund’s outstanding shares at net asset value (“NAV”) subject to approval by the Fund’s Board of Trustees (“Board”). In all cases, such repurchase offers will be for at least 5% and not more than 25% of the Fund’s outstanding shares. It is also possible that a repurchase offer may be oversubscribed, with the result that shareholders may only be able to have a portion of their shares repurchased. If the repurchase offer is oversubscribed, the Fund may, in its sole discretion, repurchase an additional number of shares not to exceed 2% of the shares outstanding on the repurchase request deadline.
The Fund’s investment objective is to seek current income. The Fund seeks to achieve its investment objective by investing, directly or indirectly, in loans to consumers, small- and mid-sized companies, and other borrowers (including loans backed by real estate) originated through online platforms that provide a marketplace for lending (“Marketplace Loans”). The Fund currently anticipates that its Marketplace Loan investments will originate predominantly from lending platforms based in the United States, a substantial portion of which will be through purchases of whole loans. The Fund may also invest in receivables or merchant cash advances that are originated from lending platforms (“Marketplace Receivables”).
AlphaCentric Advisors LLC (the “Advisor”), a Delaware limited liability company, serves as the Fund’s investment advisor. The Advisor oversees the day -to-day investment decisions for the Fund and continuously reviews, supervises and administers the Fund’s investment program. Prime Meridian Capital Management, LLC, a Nevada limited liability company, serves as sub-advisor (the “Sub-Advisor”) to the Fund. Under the general oversight by the Fund’s Board and supervision by the Advisor, the Sub-Advisor is responsible for the day- to-day management of the Fund’s investment portfolio. Both the Advisor and Sub-Advisor are registered as investment advisors under the Investment Advisers Act of 1940, as amended.
The Board is responsible for overseeing the management and operations of the Fund on behalf of the Fund’s shareholders. The Board is composed of three independent trustees. Among other things, the Board adopts the investment and other policies of the Fund, appoints officers to manage the Fund’s day-to-day operations, selects the Fund’s investment advisors and other service providers and approves their fees, provides ongoing oversight of the performance of the Fund and its service providers, and oversees conflicts of interest as well as the Fund’s compliance program.
| 2. | Significant Accounting Policies |
The following significant accounting policies are in conformity with accounting principles generally accepted in the United States (“U.S. GAAP”). Such policies are consistently followed by the Fund in preparation of its financial statements. Management has determined that the Fund is an investment company in accordance with the Financial Accounting Standards Board (“FASB”) Accounting Standards Codification (“ASC”) Topic 946, “Financial Services – Investment Companies,” for the purpose of financial reporting. The preparation of the financial statements in conformity with U.S. GAAP requires management to make estimates and assumptions that affect the reported amounts of assets and liabilities and disclosure of contingent assets and liabilities at the date of the financial statements. Actual results could differ from those estimates. The Fund’s financial statements are stated in U.S. dollars.
AlphaCentric Prime Meridian Income Fund
NOTES TO FINANCIAL STATEMENTS (continued)
March 31, 2021 (Unaudited)
a) Use of Estimates
The preparation of the financial statements in accordance with U.S. GAAP requires management to make estimates and assumptions that affect the reported amounts of assets and liabilities and disclosure of contingent assets and liabilities at the date of the financial statements, and the reported amounts of increases and decreases in net assets from operations during the reporting period. Actual results could differ from those estimates.
b) Cash and Cash Equivalents
Cash and cash equivalents consist of cash held on deposit and short-term highly liquid investments that are readily convertible to known amounts of cash and have maturities of three months or less. Cash equivalents are recorded at fair value and considered Level 1 securities in the fair value hierarchy. As of March 31, 2021, cash equivalents consisted of $411,842 held in the U.S. Bank Money Market Deposit Account (“MMDA”). The MMDA bears interest at a variable rate that is determined based on market conditions and may change daily and by any amount. At March 31, 2021, the interest rate for the MMDA was 0.01%.
c) Receivable from Platforms
Receivable from platforms represents cash held in collection accounts at lending platforms.
d) Distribution of Income and Gains
The Fund declares and makes distributions of investment company taxable income after payment of the Fund’s operating expenses at least quarterly and net capital gains annually. Distributions from net realized gains for book purposes may include short-term capital gains, which are included as ordinary income for tax purposes. Distributions are recorded on the ex-dividend date.
The tax character of distribution paid may differ from the character of distributions shown in the Statement of Changes in Net Assets due to short-term realized capital gains being treated as ordinary income for tax purposes.
e) Income Recognition and Expenses
The Fund recognizes income and records expenses on an accrual basis. Interest income is net of amortization/accretion of any premiums/discounts, if any, from loan purchases. The changes in fair value of the Marketplace Loans are included in net change in unrealized appreciation/depreciation on investments in the Statement of Operations. Realized gain (loss) from investments in Marketplace Loans is calculated using specific identification.
f) Investment Transactions
Investment transactions are recorded on the trade date.
| 3. | Portfolio Valuation and Fair Value Measurements |
The Board has adopted Valuation Procedures pursuant to which the Fund values its investments (the “Valuation Procedures”) to ensure investments are valued in a manner consistent with U.S. GAAP as required by the 1940 Act. The Board has delegated to the Fund’s Valuation Committee (the “Valuation Committee”) the responsibility for implementing the Valuation Procedures.
The vast majority of the Fund’s holdings are loans sourced through Marketplace Loans for which market quotations are not readily available. As of March 31, 2021, the Fund’s holdings were comprised of consumer and real estate loans and Private Investment Funds that provide exposure to underlying pools of consumer loans. The Fund has engaged a third party pricing service (“Valuation Service Provider”) to provide the fair value of the Fund’s Marketplace Loan holdings. The Valuation Service Provider’s proprietary pricing procedures utilize, among other inputs, a discounted cash flow approach that utilizes historical data received from the clients/platforms, as well as proprietary loan level models and roll rates and simulation-based FICO migration matrix and logistic regression models based on historical data of similar
AlphaCentric Prime Meridian Income Fund
NOTES TO FINANCIAL STATEMENTS (continued)
March 31, 2021 (Unaudited)
investments in loan/borrower (or receivable/account debtor) characteristics, which estimate forecasted contractual cash flows for each loan or receivable for its remaining life, and which incorporate adjustments for risk factors (such as default and prepayment, as applicable). The Valuation Service Provider has also been engaged by the Fund to provide the fair value of the Fund’s investments in Private Investment Funds, which are facility -style investments with underlying loan collateral. For the valuation of facility-style investments, the Valuation Service Provider also utilizes a discounted cash flow approach that utilizes collateral values to forecast losses at the facility-level based on whether the collateral values are expected to sufficiently cover the facility’s interest and principal payments. Management monitors the change in collateralization level of the facility since the origination date and the performance of the facility relative to initial expectations, as well as the change in rates of return required by investors in comparable debt instruments since the origination date. The forecasted cashflows as of the valuation date are discounted at a new risk-adjusted rate. The Advisor and Sub-Advisor monitor the application of the valuation methodology and consult with the Valuation Service Provider to ensure proper valuation of the Fund’s holdings. The NAV of shares of the Fund is determined daily. The Fund has adopted a valuation policy which states that the unit of account is at the individual loan level and fair valuation will be performed using inputs which incorporate borrower-level data that is updated as often as the NAV is calculated to reflect new information regarding the borrower and loan.
The Fund follows a fair value hierarchy that distinguishes between market data obtained from independent sources (observable inputs) and the Fund’s own market assumptions (unobservable inputs). These inputs are used in determining the value of the Fund’s investments and are summarized in the following fair value hierarchy:
Level 1 Inputs — Quoted prices in active markets for identical securities that the Fund has the ability to access
Level 2 Inputs — Inputs other than quoted prices included in Level 1 that are observable for the asset or liability, either directly or indirectly including inputs in markets that are not considered to be active or in active markets for similar assets or liabilities, observable inputs other than quoted prices and inputs that are not directly observable but are corroborated by observable market data
Level 3 Inputs — Significant unobservable inputs (including the Fund’s own assumptions in determining fair value of investments)
Transfers between levels are recognized at the end of the reporting period. There were no transfers between levels during the reporting period. The following is a summary of inputs used to value the Fund’s securities as of March 31, 2021:
| Investments at Fair Value | | Level 1 | | | Level 2 | | | Level 3 | | | Total | |
| Whole Loans | | | | | | | | | | | | | | | | |
| Consumer Loans | | $ | — | | | $ | — | | | $ | 1,415,245 | | | $ | 1,415,245 | |
| Bridge Loans | | | | | | | | | | | | | | | | |
| Real Estate Loans | | | — | | | | — | | | | 2,235,917 | | | | 2,235,917 | |
| Other Loan Investments | | | | | | | | | | | | | | | | |
| Private Investment Funds | | | — | | | | — | | | | 611,805 | | | | 611,805 | |
| Total | | $ | — | | | $ | — | | | $ | 4,262,967 | | | $ | 4,262,967 | |
AlphaCentric Prime Meridian Income Fund
NOTES TO FINANCIAL STATEMENTS (continued)
March 31, 2021 (Unaudited)
The following is a reconciliation of Level 3 investments for the period from October 1, 2020 to March 31, 2021:
| | | Consumer
Loans | | | Real Estate
Loans | | | Private
Investment Funds | |
| Beginning Balance – October 1, 2020 | | $ | 1,004,704 | | | $ | 1,023,514 | | | $ | 305,000 | |
| Acquisitions | | | 784,959 | | | | 1,619,435 | | | | 300,000 | |
| Paydowns | | | (316,301 | ) | | | (410,934 | ) | | | — | |
| Net realized losses | | | (85,865 | ) | | | — | | | | — | |
| Change in unrealized appreciation/depreciation | | | 5,956 | | | | 3,902 | | | | 6,805 | |
| Accretion of discounts | | | 21,792 | | | | — | | | | — | |
| Ending Balance – March 31, 2021 | | $ | 1,415,245 | | | $ | 2,235,917 | | | $ | 611,805 | |
| Change in unrealized appreciation/deprecation on investments still held at March 31, 2021 | | $ | (36,952 | ) | | $ | (406 | ) | | $ | 6,805 | |
The following is a summary of quantitative information about the significant unobservable valuation inputs for Level 3 investments held as of March 31, 2021:
| Type of Investment | | Fair Value as of
March 31, 2021 | | | Valuation
Techniques | | Unobservable Inputs | | Range | | | Weighted
Average | |
| Consumer Loans | | $ | 1,415,245 | | | Discounted | | Loss-Adjusted Discount Rate; | | | 3.70%-17.09% | | | | 12.76 | % |
| | | | | | | Cash Flow | | Projected Loss Rate | | | 3.05%-36.86% | | | | 14.66 | % |
| Real Estate Loans | | | 2,235,917 | | | Discounted | | Loss-Adjusted Discount Rate; | | | 3.60%-8.36% | | | | 6.44 | % |
| | | | | | | Cash Flow | | Projected Loss Rate | | | 0.26%-0.89% | | | | 0.56 | % |
| Private Investment Funds | | | 611,805 | | | Discounted
Cash Flow | | Loss-Adjusted Discount Rate | | | 6.25%-10.50% | | | | 8.38 | % |
| Total | | $ | 4,262,967 | | | | | | | | | | | | | |
The Fund will generally charge off and stop accruing interest on a loan if (i) the platform charges off the loan, or (ii) the Advisor has determined that the loan does not have a recoverable value. Charge offs of outstanding principal balances are included in net realized gain (loss) from investments in the Statement of Operations. During the six months ended March 31, 2021, the Fund had net charge offs of $80,551 of outstanding principal on the loans, of which $5,314 was recovered during the period.
The Fund’s policy is to place loans on non-accrual status when there is reasonable doubt that interest income will be collected. As of March 31, 2021, there were no loans placed on non-accrual status.
| 4. | Management Fee, Related Party Transactions and Other |
The Fund entered into a management agreement (the “Management Agreement”) with the Advisor. Under the terms of the Management Agreement, the Fund compensates the Advisor for its services at the annual rate of 1.50% of the Fund’s average daily net assets, payable on a monthly basis in arrears. The Sub-Advisor is paid by the Advisor, not the Fund. For the period ended March 31, 2021, the Fund incurred management fees of $24,271.
The Fund entered into an expense limitation agreement (the “Expense Limitation Agreement”) with the Advisor. Pursuant to the Expense Limitation Agreement, the Advisor has agreed to waive its fees and/or pay Fund expenses to the extent necessary to limit the annual Fund operating expenses (which includes the Fund’s organizational and offering expenses (other than related legal fees which are paid by the Advisor) and ordinary operating expenses such as advisory fees, but excluding acquired fund fees and expenses, distribution fees, loan servicing fees, brokerage commissions and trading costs, interest (including borrowing costs and overdraft charges), taxes, short sale dividends and interest expenses, as well as non-routine or extraordinary expenses, such as regulatory inquiry and litigation expenses or Fund organization costs), to the extent that such Fund annual operating expenses exceed 1.95% of the Fund’s average daily net assets. The Expense Limitation Agreement will remain in effect until at least January 31, 2022, unless and until the Board approves its modification or termination. During the initial or any renewal term, the agreement may be terminated only with the approval of the Board. In consideration of the Advisor’s agreement to limit the annual Fund operating expenses, the
AlphaCentric Prime Meridian Income Fund
NOTES TO FINANCIAL STATEMENTS (continued)
March 31, 2021 (Unaudited)
Expense Limitation Agreement also provides that the Advisor may recoup from the Fund: (1) any fees waived and/or expenses paid pursuant to the agreement for a period of up to three years from the date of the waiver and/or expense payment, and (2) any organizational and offering expenses of the Fund (excluding legal fees incurred in connection with the organization and initial offering of the Fund) paid by the Advisor prior to the commencement of operations of the Fund for a period of up to three years from the day the Fund commenced operations, provided such recoupment does not cause the annual Fund operating expenses to exceed the expense limit in effect when the fees were waived or expenses paid, or the expense limit in effect at the time of the recoupment.
Through commencement of the Fund’s operations on December 31, 2019, the Advisor incurred organizational and offering costs on behalf of the Fund of $72,843 and $39,548, respectively. The Advisor has agreed to permanently waive the right to recoup $50,850 of the organizational costs incurred, and the remainder of the organizational and offering costs are subject to the recoupment provisions of the Expense Limitation Agreement. Organizational expenses are recorded as they are incurred and offering costs are amortized over the twelve months from the later of the commencement of the Fund’s operations or when incurred. For the fiscal period December 31, 2019 through September 30, 2020, organizational and operating expenses of $4,450 and $435,466, respectively, were waived or reimbursed by the Advisor and are subject to recoupment.
The following table shows the waived or reimbursed expenses subject to potential recovery:
| Expiring | Expiring During the | Expiring During the | | |
| Fiscal Year Ending | Fiscal Year Ending | | |
| December 31, 2022 | September 30, 2023 | September 30, 2024 | Total | |
| $21,993 | $439,916 | $265,080 | $726,989 | |
As of March 31, 2021, the Advisor believes that the likelihood of recoupment of fees is not probable.
U.S. Bank Global Fund Services serves as Administrator, Accounting Agent, and Transfer Agent. Millennium Trust Company, LLC and U.S. Bank, N.A. serve as custodians for the securities and cash, respectively, of the Fund’s portfolio.
Foreside Fund Services, LLC (the “Distributor”) serves as the Fund’s principal underwriter, within the meaning of the 1940 Act, and acts as the distributor of the Fund’s shares on a best efforts basis, subject to various conditions. The Fund’s shares are offered for sale through the Distributor at NAV. The Distributor also may enter into selected dealer agreements with other broker dealers for the sale and distribution of the Fund’s shares. In reliance on Rule 415 under the Securities Act of 1933, the Fund intends to offer to sell its shares, on a continual basis, through the Distributor.
The beneficial ownership, either directly or indirectly, of more than 25% of the Fund’s voting securities creates a presumption of control. As of March 31, 2021, the Fund did not have any individual or omnibus shareholder account that owned more than 25% of the total shares outstanding of the Fund.
The Fund intends to comply with the requirements of Subchapter M of the Internal Revenue Code of 1986, as amended, necessary to qualify as a regulated investment company and to make the requisite distributions of income and capital gains to its shareholders sufficient to relieve it from all or substantially all federal income taxes. Therefore, no federal income tax provision has been provided.
The Fund has adopted financial reporting rules regarding recognition and measurement of tax positions taken or expected to be taken on a tax return. The Fund recognizes interest and penalties, if any, related to unrecognized tax benefits as income tax expense on the Statements of Operations. During the period, the Fund did not incur any interest or penalties. The Fund has reviewed all open tax years and concluded that there is no effect to the Fund’s financial position or results of operations and no tax liability resulting from unrecognized tax benefits relating to uncertain income tax positions taken or expected to be taken on a tax return. The Fund has no examinations in progress.
AlphaCentric Prime Meridian Income Fund
NOTES TO FINANCIAL STATEMENTS (continued)
March 31, 2021 (Unaudited)
At September 30, 2020, the Fund’s most recent fiscal year end, the components of accumulated earnings and cost of investments on a tax basis were as follows:
| Tax cost of investments | | $ | 2,360,611 | |
| Gross unrealized appreciation | | $ | 23,011 | |
| Gross unrealized depreciation | | | (50,404 | ) |
| Net unrealized appreciation/depreciation | | | (27,393 | ) |
| Undistributed ordinary income | | | 4,994 | |
| Undistributed long-term capital gain | | | — | |
| Total distributable earnings | | $ | 4,994 | |
The difference between book-basis and tax-basis unrealized appreciation (depreciation) is primarily attributable to the investments in private investment funds.
The character of distributions made during the period from net investment income or net realized gains may differ from its ultimate characterization for federal income tax purposes. Also, due to the timing of dividend distributions, the fiscal year in which amounts are distributed may differ from the fiscal year in which the income or realized gain were recorded by a Fund.
The tax character of the distributions paid during the six months ended March 31, 2021, and the fiscal period ended
September 30, 2020, were as follows:
| | | March 31, | | | September 30, | |
| | 2021 | | | 2020 | |
| Distributions paid from: | | | | | | | |
| Ordinary income | | $ | 116,701 | | | $ | 160,166 | |
| Total | | $ | 116,701 | | | $ | 160,166 | |
Net investment income and realized gains and losses for federal income tax purposes may differ from that reported on the financial statements because of permanent book-to-tax differences. GAAP requires that permanent differences in distributable earnings due to differences between financial reporting and tax reporting be reclassified to or from paid in capital. These reclassifications have no effect on NAV per share. For the fiscal period ended September 30, 2020, the following table shows the reclassifications made among tax components:
| Paid in capital | | $ | (320 | ) |
| Total distributable earnings | | $ | 320 | |
These differences primarily relate to recharacterization of non-recoupable organizational costs in the Fund.
| 6. | Investment Transactions |
Investment transactions for the six months ended March 31, 2021, excluding U.S. Government Obligations and short-term investments, were as follows:
| Purchases of Long-Term Investments | | $ | 2,704,394 | |
| Proceeds from Principal Paydowns | | $ | 727,235 | |
| 7. | Distribution and Shareholder Services Plans |
The Fund has adopted a distribution plan (the “Distribution Plan”). The Fund is authorized under the Distribution Plan to pay to the Distributor a distribution fee for certain activities relating to the distribution of shares to investors. These activities include marketing and other activities to support the distribution of shares. The Distribution Plan operates in a manner consistent with Rule 12b-1 under the 1940 Act, which regulates the manner in which an open-end investment company may directly or indirectly bear the expenses of distributing its shares. Although the Fund is not an open-end
AlphaCentric Prime Meridian Income Fund
NOTES TO FINANCIAL STATEMENTS (continued)
March 31, 2021 (Unaudited)
investment company, it undertakes to comply with the terms of Rule 12b-1. Under the Distribution Plan, the Fund would pay the Distributor a distribution fee at an annual rate of up to 0.75% of average daily net assets. As of March 31, 2021, the Fund has not implemented the Distribution Plan or imposed any distribution fees.
The Fund has adopted a “Shareholder Services Plan” under which the Fund may compensate financial industry professionals for providing ongoing services to shareholders. Such services may include electronic processing of client orders, electronic fund transfers between clients and the Fund, account reconciliations with the Fund’s transfer agent, facilitation of electronic delivery to clients of Fund documentation, monitoring client accounts for back-up withholding and any other special tax reporting obligations, maintenance of books and records with respect to the foregoing, and such other information and liaison services as the Fund, the Advisor, or Sub-Advisor may reasonably request. Under the Shareholder Services Plan, the Fund may incur expenses on an annual basis up to 0.25% of its average daily net assets. As of March 31, 2021, the Fund has not implemented the Shareholder Services Plan or imposed any shareholder servicing fees.
Investing in the Fund’s shares involves substantial risks, including the risks set forth in the “Risk Factors” section of the prospectus, which include, but are not limited to the following:
a) Marketplace Loan Risk
Marketplace Loans are generally not rated and constitute a highly risky and speculative investment. There can be no assurance that payments due on underlying Marketplace Loans will be made.
b) Default Risk
The ability of the Fund to generate income through its investment in Marketplace Loans is dependent upon payments being made by the borrower underlying such Marketplace Loans. If a borrower is unable to make its payments on a Marketplace Loan, the Fund may be greatly limited in its ability to recover any outstanding principal and interest under such loan.
c) Prepayment Risk
In the event of a prepayment of all or a portion of the remaining unpaid principal amount of a loan to which the Fund has investment exposure, the Fund will receive such prepayment but further interest will cease to accrue on the prepaid portion of the loan after the date of the prepayment.
d) Private Investment Risk
The Fund, as a holder of securities issued by private investment funds, will bear its pro rata portion of the private funds’ expenses. These indirect costs may include management fees and performance fees paid to the private investment fund’s advisor or its affiliates. These expenses are in addition to the direct expenses of the Fund’s own operations, thereby increasing costs and/or potentially reducing returns to shareholders.
e) Platform Concentration Risk
A substantial portion of the Fund’s Marketplace Loan investments have originated from a limited number of platforms. A concentration in select platforms may subject the Fund to increased dependency and risks associated with those platforms than it would otherwise be subject to if it were more broadly diversified across a greater number of platforms.
f) Servicer Risk
The Fund expects that all of its direct and indirect investments in loans originated by marketplace lending platforms will be serviced by a platform or a third-party servicer. However, the Fund’s investments could be adversely impacted if a platform that services the Fund’s investments becomes unable or unwilling to fulfill its obligations to do so. In the event that the servicer is unable to service the loans, there can be no guarantee that a backup servicer will be able to assume
AlphaCentric Prime Meridian Income Fund
NOTES TO FINANCIAL STATEMENTS (continued)
March 31, 2021 (Unaudited)
responsibility for servicing the loans in a timely or cost-effective manner; any resulting disruption or delay could jeopardize payments due to the Fund in respect of its investments or increase the costs associated with the Fund’s investments.
g) Impact of COVID-19
The global outbreak of COVID-19 has disrupted economic markets and the prolonged economic impact is uncertain. The operational and financial performance of the Funds’ investments depends on future developments, including the duration and spread of the outbreak, and such uncertainty may in turn impact the value of each of the Fund’s investments. In addition, the COVID-19 pandemic has produced a broad range of emergency legislation, orders, regulations and regulatory guidance that could adversely impact the value of the Fund’s investments.
h) Valuation Risk
Many of the Fund’s investments may be difficult to value. Valuation of illiquid investments may require more research than for more liquid investments. In addition, elements of judgment may play a greater role in valuation in such cases than for investments with a more active secondary market because there is less reliable objective data available. Amounts realized by the Fund on such investments may not equal the value at which the Fund carried the investment on its books, which would adversely affect the NAV of the Fund.
As noted above, the Fund operates as an interval fund pursuant to Rule 23c-3 under the 1940 Act and, as such, has adopted a fundamental policy that it will make quarterly repurchase offers for no less than for 5% of the Fund’s shares outstanding at net asset value (“NAV”) less any repurchase fee, unless suspended or postponed in accordance with regulatory requirements, and each repurchase pricing shall occur no later than the 14th day after the Repurchase Request Deadline (as defined below), or the next business day if the 14th is not a business day (each such pricing date, a “Repurchase Pricing Date”). There is no guarantee that shareholders will be able to sell all of the shares they desire to sell in a quarterly repurchase offer. Liquidity will be provided to shareholders only through the Fund’s quarterly repurchases. Shareholders will be notified in writing of each quarterly repurchase offer and the date the repurchase offer ends (the “Repurchase Request Deadline”).
During the six-month period ended March 31, 2021, the Fund completed two repurchase offers. In each offer, the Fund offered to repurchase up to 5% of the number of its outstanding shares as of the applicable Repurchase Pricing Date. The results of the repurchase offers are as follows:
| | | | Repurchase | | | | |
| Commencement | Repurchase | Repurchase | Offer | Shares | Amount | Shares | Amount |
| Date | Request Deadline | Pricing Date | Amount | Tendered | Tendered | Repurchased | Repurchased |
| December 1, 2020 | December 28, 2020 | January 11, 2021 | 5% | 0 | $0.00 | 0 | $0.00 |
| March 1, 2021 | March 26, 2021 | April 9, 2021 | 5% | 0 | $0.00 | 0 | $0.00 |
10. Commitments and Contingencies
Under the Fund’s organizational documents, its officers and trustees are indemnified against certain liabilities arising out of the performance of their duties to the Fund. In addition, in the normal course of business, the Fund enters into contracts that provide general indemnifications to other parties. The Fund’s maximum exposure under these arrangements is unknown as this would involve future claims that may be made against the Fund that has not yet occurred. However, the Fund has not had prior claims or losses pursuant to these contracts and expects the risk of loss to be remote.
Proxy Voting Policy
Information regarding how the Fund voted proxies relating to portfolio securities for the most recent period ended June 30 as well as a description of the policies and procedures that the Fund uses to determine how to vote proxies is available without charge, upon request, by calling 1-888-910-0412 or by referring to the Securities and Exchange Commission’s (“SEC”) website at http://www.sec.gov.
Portfolio Holdings
The Fund files a complete schedule of portfolio holdings for its first and third fiscal quarters with the SEC on Part F of Form N-PORT. Part F of Form N-PORT is available on the SEC’s website at http://www.sec.gov. The information on Part F of Form N-PORT is available without charge, upon request, by calling 1-888-910-0412, or on the Fund’s website at http://www.alphacentricfunds.com.
Investment Advisor
AlphaCentric Advisors LLC
53 Palmeras Street, Suite 601
San Juan, PR 00901
Investment Sub-Advisor
Prime Meridian Capital Management, LLC
2121 N. California Blvd, Suite 830
Walnut Creek, CA 94596
Independent Registered Public Accounting Firm
Deloitte & Touche LLP
555 Mission Street,
San Francisco, CA 94105
Legal Counsel
Stradley Ronon Stevens & Young, LLP
2005 Market Street, Suite 2600
Philadelphia, PA 19103
Custodians
Millennium Trust Company
2001 Spring Road, Suite 700
Oak Brook, IL 60523
U.S. Bank, National Association
1555 North RiverCenter Drive, Suite 302
Milwaukee, WI 53212
Distributor
Foreside Fund Services, LLC
3 Canal Plaza, Suite 100
Portland, ME 04101
Fund Administrator and Transfer Agent
U.S. Bank Global Fund Services
615 East Michigan Street
Milwaukee, WI 53202
(b) Not applicable.
Item 2. Code of Ethics.
Not applicable for semi-annual reports.
Item 3. Audit Committee Financial Expert.
Not applicable for semi-annual reports.
Item 4. Principal Accountant Fees and Services.
Not applicable for semi-annual reports.
Item 5. Audit Committee of Listed Registrants.
Not applicable to registrants who are not listed issuers (as defined in Rule 10A-3 under the Securities Exchange Act of 1934).
Item 6. Investments.
(a)
| AlphaCentric Prime Meridian Income Fund | | | |
| SCHEDULE OF INVESTMENTS | | | | | | | | | | |
| March 31, 2021 (Unaudited) | | | | | | | | | | |
| | | Platform | | Original Acquisition Date | | Principal Amount | | Cost | | Fair Value |
| WHOLE LOANS - 30.3% | | | | | | | | | | |
| Consumer Loans - 30.3% (a) | | | | | | | | | | |
| 171647609, 15.40%, 11/20/23 | | LendingClub | | 11/20/20 | | $ 2,913 | | $ 2,832 | | $ 2,802 |
| 171949148, 14.71%, 11/16/23 | | LendingClub | | 11/16/20 | | 6,274 | | 6,060 | | 6,000 |
| 171975587, 15.40%, 12/02/25 | | LendingClub | | 12/02/20 | | 17,508 | | 16,469 | | 16,389 |
| 172061073, 16.08%, 11/18/23 | | LendingClub | | 11/18/20 | | 9,110 | | 8,628 | | 8,564 |
| 172062950, 14.71%, 11/17/23 | | LendingClub | | 11/17/20 | | 6,864 | | 6,587 | | 6,556 |
| 172124627, 14.02%, 11/19/23 | | LendingClub | | 11/19/20 | | 5,451 | | 5,196 | | 5,169 |
| 172171302, 15.40%, 11/23/23 | | LendingClub | | 11/23/20 | | 10,922 | | 10,412 | | 10,331 |
| 172307554, 14.02%, 11/24/23 | | LendingClub | | 11/24/20 | | 5,607 | | 5,451 | | 5,412 |
| 172410090, 16.08%, 12/04/25 | | LendingClub | | 12/04/20 | | 9,667 | | 9,154 | | 9,080 |
| 172450861, 14.02%, 12/03/25 | | LendingClub | | 12/03/20 | | 19,416 | | 17,408 | | 17,369 |
| 172468574, 16.08%, 12/02/25 | | LendingClub | | 12/02/20 | | 25,134 | | 22,693 | | 22,586 |
| 172526594, 16.08%, 12/03/25 | | LendingClub | | 12/03/20 | | 9,667 | | 9,154 | | 9,079 |
| 172530961, 14.02%, 12/03/25 | | LendingClub | | 12/03/20 | | 9,696 | | 9,243 | | 9,195 |
| 172930301, 17.30%, 01/07/26 | | LendingClub | | 01/07/21 | | 9,787 | | 9,591 | | 9,447 |
| 172953769, 10.81%, 01/04/24 | | LendingClub | | 01/04/21 | | 8,586 | | 8,439 | | 8,424 |
| 173001562, 9.56%, 01/04/24 | | LendingClub | | 01/04/21 | | 11,419 | | 10,964 | | 10,957 |
| 173189961, 13.33%, 01/04/24 | | LendingClub | | 01/04/21 | | 9,543 | | 9,362 | | 9,272 |
| 173230532, 16.08%, 12/29/23 | | LendingClub | | 12/29/20 | | 11,205 | | 10,710 | | 10,637 |
| 173245923, 15.40%, 01/04/26 | | LendingClub | | 01/04/21 | | 14,663 | | 14,293 | | 14,169 |
| 173275380, 18.24%, 01/13/26 | | LendingClub | | 01/13/21 | | 9,694 | | 8,870 | | 8,772 |
| 173282489, 14.71%, 01/07/24 | | LendingClub | | 01/07/21 | | 5,731 | | 5,645 | | 5,591 |
| 173331051, 14.71%, 12/29/23 | | LendingClub | | 12/29/20 | | 5,744 | | 5,490 | | 5,470 |
| 173338471, 20.74%, 01/13/26 | | LendingClub | | 01/13/21 | | 17,714 | | 16,828 | | 16,702 |
| 173339982, 18.24%, 12/31/23 | | LendingClub | | 12/31/20 | | 9,596 | | 8,966 | | 8,901 |
| 173344582, 16.08%, 01/05/24 | | LendingClub | | 01/05/21 | | 11,473 | | 10,865 | | 10,797 |
| 173358800, 19.95%, 01/13/24 | | LendingClub | | 01/13/21 | | 19,173 | | 17,926 | | 17,714 |
| 173360905, 15.40%, 12/31/25 | | LendingClub | | 12/31/20 | | 11,592 | | 10,935 | | 10,855 |
| 173364691, 16.08%, 01/04/26 | | LendingClub | | 01/04/21 | | 5,000 | | 4,969 | | 4,961 |
| 173372260, 15.40%, 12/31/23 | | LendingClub | | 12/31/20 | | 5,598 | | 5,316 | | 5,274 |
| 173377823, 19.95%, 01/04/26 | | LendingClub | | 01/04/21 | | 14,114 | | 13,366 | | 13,173 |
| 173385054, 16.08%, 12/31/25 | | LendingClub | | 12/31/20 | | 9,666 | | 9,423 | | 9,343 |
| 173397739, 18.24%, 01/04/26 | | LendingClub | | 01/04/21 | | 11,824 | | 11,347 | | 11,254 |
| 173401158, 15.40%, 01/04/24 | | LendingClub | | 01/04/21 | | 2,891 | | 2,782 | | 2,760 |
| 173403097, 15.40%, 01/07/26 | | LendingClub | | 01/07/21 | | 9,384 | | 9,150 | | 9,075 |
| 173410101, 14.02%, 01/04/26 | | LendingClub | | 01/04/21 | | 14,650 | | 14,558 | | 14,418 |
| 173420765, 14.02%, 01/04/26 | | LendingClub | | 01/04/21 | | 9,767 | | 9,618 | | 9,531 |
| 173421109, 14.02%, 01/04/24 | | LendingClub | | 01/04/21 | | 9,547 | | 9,247 | | 9,169 |
| 173425721, 16.08%, 01/06/26 | | LendingClub | | 01/06/21 | | 11,735 | | 11,148 | | 11,069 |
| 173428112, 18.24%, 01/04/26 | | LendingClub | | 01/04/21 | | 9,849 | | 9,637 | | 9,551 |
| 173440757, 15.40%, 01/07/26 | | LendingClub | | 01/07/21 | | 19,550 | | 18,768 | | 18,631 |
| 173452322, 20.74%, 01/04/26 | | LendingClub | | 01/04/21 | | 11,767 | | 11,736 | | 11,531 |
| 173472479, 17.30%, 01/07/26 | | LendingClub | | 01/07/21 | | 19,573 | | 19,084 | | 18,802 |
| 173480973, 19.95%, 01/29/24 | | LendingClub | | 01/29/21 | | 9,581 | | 8,910 | | 8,831 |
| 173481448, 16.08%, 01/07/26 | | LendingClub | | 01/07/21 | | 11,148 | | 10,981 | | 10,884 |
| 173530627, 14.02%, 01/06/24 | | LendingClub | | 01/06/21 | | 4,801 | | 4,705 | | 4,684 |
| 173534074, 14.02%, 01/07/24 | | LendingClub | | 01/07/21 | | 9,468 | | 9,042 | | 8,981 |
| 173537826, 14.02%, 01/06/26 | | LendingClub | | 01/06/21 | | 9,767 | | 9,620 | | 9,535 |
| 173544115, 16.08%, 01/07/24 | | LendingClub | | 01/07/21 | | 2,892 | | 2,806 | | 2,782 |
| 173555296, 13.33%, 01/07/24 | | LendingClub | | 01/07/21 | | 9,543 | | 9,209 | | 9,139 |
| 173586675, 19.12%, 01/07/26 | | LendingClub | | 01/07/21 | | 9,797 | | 9,650 | | 9,500 |
| 173715688, 17.24%, 01/13/26 | | LendingClub | | 01/13/21 | | 11,743 | | 11,333 | | 11,211 |
| 173769503, 17.99%, 01/15/24 | | LendingClub | | 01/15/21 | | 9,574 | | 9,095 | | 9,013 |
| 173916043, 12.74%, 01/25/24 | | LendingClub | | 01/25/21 | | 4,769 | | 4,483 | | 4,462 |
| 174073400, 15.19%, 01/26/24 | | LendingClub | | 01/26/21 | | 7,644 | | 7,186 | | 7,134 |
| 174167788, 13.24%, 02/01/24 | | LendingClub | | 02/01/21 | | 9,381 | | 8,819 | | 8,793 |
| 174180131, 17.49%, 02/03/24 | | LendingClub | | 02/03/21 | | 9,796 | | 9,160 | | 9,152 |
| 163208217, 30.99%, 01/16/23 | | LendingClub | | 01/30/20 | | 3,002 | | 3,002 | | 2,943 |
| 163883960, 20.87%, 01/17/23 | | LendingClub | | 01/30/20 | | 13,108 | | 13,108 | | 12,474 |
| 164014273, 26.99%, 01/17/23 | | LendingClub | | 01/30/20 | | 8,217 | | 8,217 | | 7,808 |
| 164149433, 26.99%, 01/15/25 (b) | | LendingClub | | 01/30/20 | | 24,000 | | 24,000 | | 21,873 |
| 164176192, 29.96%, 01/17/23 | | LendingClub | | 01/30/20 | | 3,558 | | 3,558 | | 3,489 |
| 164233307, 30.99%, 01/13/23 | | LendingClub | | 01/30/20 | | 17,869 | | 17,869 | | 17,509 |
| 164330418, 18.17%, 01/17/25 | | LendingClub | | 01/30/20 | | 12,600 | | 12,600 | | 12,185 |
| 164363032, 29.41%, 01/16/23 | | LendingClub | | 01/30/20 | | 8,519 | | 8,519 | | 8,354 |
| 164446126, 30.99%, 01/13/23 | | LendingClub | | 01/30/20 | | 5,687 | | 5,687 | | 5,617 |
| 164453124, 21.59%, 01/15/23 | | LendingClub | | 01/30/20 | | 822 | | 822 | | 782 |
| 164454862, 23.31%, 01/14/23 | | LendingClub | | 01/30/20 | | 6,906 | | 6,906 | | 6,570 |
| 164549323, 25.21%, 01/14/23 | | LendingClub | | 01/30/20 | | 4,240 | | 4,240 | | 4,033 |
| 164570836, 23.31%, 01/13/25 | | LendingClub | | 01/30/20 | | 9,623 | | 9,623 | | 8,437 |
| 164606713, 22.33%, 01/14/23 | | LendingClub | | 01/30/20 | | 6,945 | | 6,945 | | 6,625 |
| 164614523, 30.99%, 01/16/23 (b) | | LendingClub | | 01/30/20 | | 1,569 | | 1,569 | | 201 |
| 164641464, 19.99%, 01/16/23 | | LendingClub | | 01/30/20 | | 2,379 | | 2,379 | | 2,265 |
| 164717993, 30.99%, 01/13/23 | | LendingClub | | 01/30/20 | | 4,369 | | 4,369 | | 4,398 |
| 164723963, 30.99%, 01/13/23 | | LendingClub | | 01/30/20 | | 2,770 | | 2,770 | | 2,714 |
| 164756845, 21.59%, 01/13/23 | | LendingClub | | 01/30/20 | | 6,850 | | 6,850 | | 6,517 |
| 164769043, 25.21%, 01/14/23 | | LendingClub | | 01/30/20 | | 1,785 | | 1,785 | | 1,694 |
| 164791937, 29.41%, 01/14/25 | | LendingClub | | 01/30/20 | | 24,209 | | 24,209 | | 22,768 |
| 164816754, 26.19%, 01/13/23 | | LendingClub | | 01/30/20 | | 2,379 | | 2,379 | | 2,259 |
| 164848741, 30.99%, 01/14/23 | | LendingClub | | 01/30/20 | | 4,289 | | 4,289 | | 4,203 |
| 164851627, 30.99%, 01/13/23 | | LendingClub | | 01/30/20 | | 6,908 | | 6,908 | | 6,764 |
| 164873178, 30.99%, 01/16/23 | | LendingClub | | 01/30/20 | | 2,288 | | 2,288 | | 2,232 |
| 164901199, 26.19%, 01/15/23 | | LendingClub | | 01/30/20 | | 11,183 | | 11,183 | | 10,584 |
| 164916212, 30.99%, 01/15/23 | | LendingClub | | 01/30/20 | | 5,074 | | 5,074 | | 4,953 |
| 164947338, 30.99%, 01/15/23 | | LendingClub | | 01/30/20 | | 2,394 | | 2,394 | | 2,347 |
| 164951573, 21.59%, 01/15/23 | | LendingClub | | 01/30/20 | | 1,370 | | 1,370 | | 1,304 |
| 164952374, 26.19%, 01/15/23 | | LendingClub | | 01/30/20 | | 6,998 | | 6,998 | | 6,633 |
| 164985845, 0.00%, 01/16/23 (b) | | LendingClub | | 01/30/20 | | 13,051 | | 13,051 | | 0 |
| 164973244, 26.99%, 01/17/23 (b) | | LendingClub | | 01/30/20 | | 15,669 | | 15,669 | | 1,991 |
| 164993830, 17.29%, 01/16/23 | | LendingClub | | 01/30/20 | | 2,012 | | 2,012 | | 1,948 |
| 165027782, 30.99%, 01/17/23 | | LendingClub | | 01/30/20 | | 3,574 | | 3,574 | | 3,505 |
| 165055308, 29.96%, 01/17/23 | | LendingClub | | 01/30/20 | | 3,598 | | 3,598 | | 3,529 |
| 165058585, 30.99%, 01/17/23 | | LendingClub | | 01/30/20 | | 12,349 | | 12,349 | | 12,386 |
| 165289957, 30.99%, 01/21/23 | | LendingClub | | 01/30/20 | | 5,030 | | 5,030 | | 4,929 |
| 165329681, 21.59%, 01/22/23 | | LendingClub | | 01/30/20 | | 10,279 | | 10,279 | | 9,787 |
| 165446373, 17.29%, 01/24/23 | | LendingClub | | 01/30/20 | | 5,052 | | 5,052 | | 4,860 |
| 160708165, 16.12%, 11/15/24 | | LendingClub | | 02/19/20 | | 12,094 | | 11,369 | | 11,270 |
| 161440596, 18.62%, 11/07/22 | | LendingClub | | 02/26/20 | | 3,163 | | 2,863 | | 2,994 |
| 161523634, 17.74%, 11/08/22 | | LendingClub | | 03/04/20 | | 8,677 | | 8,189 | | 8,252 |
| 161565701, 18.62%, 11/08/24 | | LendingClub | | 02/19/20 | | 8,977 | | 8,214 | | 8,234 |
| 161657418, 18.62%, 11/12/24 | | LendingClub | | 02/19/20 | | 12,241 | | 11,323 | | 11,242 |
| 161704640, 18.62%, 11/12/24 | | LendingClub | | 02/20/20 | | 16,322 | | 14,934 | | 14,989 |
| 161741565, 16.95%, 11/15/24 | | LendingClub | | 02/19/20 | | 16,188 | | 15,298 | | 15,095 |
| 161894133, 15.24%, 11/14/22 | | LendingClub | | 03/04/20 | | 281 | | 264 | | 278 |
| 161908462, 17.74%, 11/15/24 | | LendingClub | | 02/19/20 | | 12,189 | | 11,457 | | 11,366 |
| 163795041, 12.40%, 01/23/25 | | LendingClub | | 02/24/20 | | 5,586 | | 5,390 | | 5,285 |
| 163899498, 11.71%, 12/31/22 | | LendingClub | | 01/16/20 | | 3,126 | | 3,045 | | 2,988 |
| 164519373, 7.56%, 01/28/23 | | LendingClub | | 05/22/20 | | 7,653 | | 7,117 | | 7,470 |
| 164775194, 11.02%, 01/28/25 | | LendingClub | | 02/19/20 | | 16,263 | | 15,653 | | 15,314 |
| 164938162, 14.30%, 01/28/25 | | LendingClub | | 02/13/20 | | 10,157 | | 9,726 | | 9,462 |
| 164949038, 20.55%, 01/21/23 | | LendingClub | | 07/24/20 | | 12,258 | | 10,603 | | 11,312 |
| 165204262, 25.65%, 01/28/23 | | LendingClub | | 07/24/20 | | 4,198 | | 3,526 | | 3,906 |
| 165272177, 11.02%, 01/28/25 | | LendingClub | | 02/13/20 | | 8,466 | | 8,180 | | 7,953 |
| 165285975, 28.80%, 02/04/25 | | LendingClub | | 02/19/20 | | 13,301 | | 12,420 | | 12,395 |
| 165287847, 11.71%, 01/30/23 | | LendingClub | | 07/24/20 | | 8,703 | | 7,745 | | 8,296 |
| 165469407, 10.33%, 01/28/25 | | LendingClub | | 02/14/20 | | 11,406 | | 11,007 | | 10,740 |
| 165585249, 17.74%, 01/27/23 | | LendingClub | | 07/24/20 | | 2,023 | | 1,780 | | 1,921 |
| 165594779, 10.33%, 01/28/25 | | LendingClub | | 02/18/20 | | 10,837 | | 10,457 | | 8,063 |
| 165603303, 20.55%, 02/04/25 | | LendingClub | | 02/14/20 | | 2,655 | | 2,499 | | 2,489 |
| 165708112, 8.19%, 01/27/23 | | LendingClub | | 07/28/20 | | 7,398 | | 6,658 | | 7,212 |
| 165751196, 6.46%, 02/03/23 | | LendingClub | | 03/05/20 | | 4,013 | | 3,852 | | 3,927 |
| 165836606, 20.55%, 01/31/25 | | LendingClub | | 02/14/20 | | 8,482 | | 7,984 | | 7,707 |
| 165836621, 8.81%, 02/04/23 | | LendingClub | | 05/04/20 | | 12,068 | | 11,103 | | 11,774 |
| 165954224, 17.74%, 02/03/23 | | LendingClub | | 07/24/20 | | 3,279 | | 2,902 | | 3,101 |
| 166595031, 17.74%, 02/12/23 | | LendingClub | | 07/24/20 | | 1,396 | | 1,263 | | 1,321 |
| 166633377, 13.08%, 02/27/23 | | LendingClub | | 09/09/20 | | 7,347 | | 5,767 | | 7,021 |
| 166645557, 17.74%, 02/14/23 | | LendingClub | | 03/05/20 | | 10,470 | | 9,816 | | 9,911 |
| 166676755, 17.74%, 03/13/25 | | LendingClub | | 10/08/20 | | 18,136 | | 16,957 | | 16,950 |
| 166959518, 20.55%, 02/25/23 | | LendingClub | | 09/09/20 | | 6,297 | | 4,754 | | 5,859 |
| 166986377, 18.62%, 02/20/23 | | LendingClub | | 09/02/20 | | 3,132 | | 2,318 | | 2,917 |
| 167000582, 23.05%, 02/20/23 | | LendingClub | | 09/09/20 | | 6,385 | | 5,140 | | 5,957 |
| 167094451, 14.30%, 02/24/23 | | LendingClub | | 07/28/20 | | 6,725 | | 5,935 | | 6,362 |
| 167105159, 11.71%, 02/24/23 | | LendingClub | | 07/24/20 | | 4,769 | | 4,173 | | 4,028 |
| 167190347, 13.08%, 02/24/23 | | LendingClub | | 07/27/20 | | 2,716 | | 2,498 | | 2,593 |
| 167258723, 6.46%, 02/25/23 | | LendingClub | | 07/24/20 | | 2,887 | | 2,685 | | 2,822 |
| 167369199, 25.65%, 02/26/23 | | LendingClub | | 07/24/20 | | 5,349 | | 4,507 | | 4,971 |
| 167374459, 15.24%, 02/26/23 | | LendingClub | | 09/02/20 | | 1,035 | | 931 | | 982 |
| 167440004, 8.81%, 02/27/23 | | LendingClub | | 07/27/20 | | 1,672 | | 1,555 | | 1,632 |
| 167444034, 17.74%, 02/28/23 | | LendingClub | | 09/09/20 | | 8,784 | | 7,686 | | 8,406 |
| 167459197, 7.02%, 02/27/23 | | LendingClub | | 06/12/20 | | 4,640 | | 4,222 | | 4,528 |
| 167463481, 7.02%, 04/14/23 | | LendingClub | | 10/19/20 | | 15,331 | | 14,718 | | 14,776 |
| 167464521, 11.71%, 02/27/23 | | LendingClub | | 09/02/20 | | 10,177 | | 9,108 | | 9,740 |
| 167494291, 7.02%, 02/28/23 | | LendingClub | | 06/12/20 | | 3,977 | | 3,699 | | 3,881 |
| 167494635, 7.02%, 03/09/23 | | LendingClub | | 06/12/20 | | 8,332 | | 7,582 | | 8,143 |
| 167503134, 8.19%, 02/28/23 | | LendingClub | | 09/24/20 | | 5,139 | | 4,908 | | 4,929 |
| 167523901, 16.95%, 03/09/23 | | LendingClub | | 09/02/20 | | 4,326 | | 3,828 | | 4,082 |
| 167535249, 7.56%, 02/28/23 | | LendingClub | | 09/02/20 | | 4,470 | | 4,090 | | 4,362 |
| 167669367, 17.74%, 03/03/23 | | LendingClub | | 07/24/20 | | 13,637 | | 12,001 | | 12,885 |
| 167750772, 16.95%, 03/04/23 | | LendingClub | | 09/22/20 | | 2,004 | | 1,433 | | 1,488 |
| 167769472, 10.33%, 03/04/23 | | LendingClub | | 09/25/20 | | 7,003 | | 6,723 | | 6,719 |
| 167857537, 8.81%, 03/09/23 | | LendingClub | | 06/12/20 | | 1,597 | | 1,485 | | 1,585 |
| 167903543, 7.02%, 03/06/23 | | LendingClub | | 06/15/20 | | 3,448 | | 3,121 | | 3,361 |
| 167918460, 7.56%, 03/06/23 | | LendingClub | | 09/30/20 | | 13,627 | | 13,150 | | 10,915 |
| 167924944, 16.95%, 04/14/23 | | LendingClub | | 07/28/20 | | 5,148 | | 4,813 | | 4,973 |
| 167943866, 8.19%, 03/09/23 | | LendingClub | | 06/29/20 | | 1,662 | | 1,545 | | 1,620 |
| 168119696, 10.33%, 03/10/23 | | LendingClub | | 07/24/20 | | 560 | | 486 | | 552 |
| 168129697, 10.33%, 03/10/23 | | LendingClub | | 09/09/20 | | 4,619 | | 3,580 | | 4,404 |
| 168130519, 13.08%, 03/10/23 | | LendingClub | | 07/24/20 | | 2,500 | | 2,281 | | 2,389 |
| 168132569, 17.74%, 04/14/23 | | LendingClub | | 10/19/20 | | 5,242 | | 4,928 | | 4,909 |
| 168172636, 18.62%, 04/14/23 | | LendingClub | | 10/15/20 | | 6,382 | | 5,872 | | 5,878 |
| 168173979, 15.24%, 03/13/23 | | LendingClub | | 09/28/20 | | 12,437 | | 9,141 | | 9,344 |
| 168183156, 7.56%, 03/11/23 | | LendingClub | | 06/12/20 | | 4,356 | | 4,051 | | 4,246 |
| 168200504, 6.46%, 03/13/23 | | LendingClub | | 06/12/20 | | 6,549 | | 6,091 | | 6,388 |
| 168220915, 20.55%, 04/14/25 | | LendingClub | | 10/07/20 | | 18,806 | | 17,302 | | 17,300 |
| 168254213, 15.24%, 03/13/23 | | LendingClub | | 09/22/20 | | 12,009 | | 8,767 | | 9,033 |
| 168266031, 7.02%, 03/13/23 | | LendingClub | | 10/01/20 | | 8,658 | | 8,355 | | 8,374 |
| 168274051, 10.33%, 03/13/25 | | LendingClub | | 10/07/20 | | 8,398 | | 7,852 | | 7,871 |
| 168303877, 11.02%, 03/13/23 | | LendingClub | | 09/22/20 | | 2,980 | | 2,153 | | 2,249 |
| 168306633, 8.81%, 03/16/23 | | LendingClub | | 06/15/20 | | 6,817 | | 6,305 | | 6,648 |
| 168345597, 14.30%, 03/17/23 | | LendingClub | | 07/28/20 | | 2,846 | | 2,519 | | 2,691 |
| 168365641, 8.81%, 03/16/23 | | LendingClub | | 07/24/20 | | 6,955 | | 6,468 | | 6,780 |
| 168373608, 15.00%, 03/27/23 | | LendingClub | | 09/02/20 | | 7,834 | | 5,758 | | 7,380 |
| 168393982, 17.74%, 03/17/23 | | LendingClub | | 10/01/20 | | 3,703 | | 3,481 | | 3,479 |
| 168429535, 17.74%, 03/17/23 | | LendingClub | | 09/25/20 | | 21,624 | | 15,785 | | 13,504 |
| 168483788, 13.08%, 04/14/23 | | LendingClub | | 10/23/20 | | 11,804 | | 11,302 | | 11,287 |
| 168556628, 23.05%, 03/19/23 | | LendingClub | | 07/27/20 | | 2,227 | | 1,804 | | 2,083 |
| 168568136, 15.24%, 03/24/25 | | LendingClub | | 10/19/20 | | 18,823 | | 17,600 | | 17,638 |
| 168569235, 25.65%, 03/20/23 | | LendingClub | | 09/25/20 | | 16,716 | | 12,537 | | 12,767 |
| 168602126, 14.30%, 04/14/23 | | LendingClub | | 10/29/20 | | 7,844 | | 7,413 | | 7,410 |
| 168605278, 23.05%, 04/14/25 | | LendingClub | | 10/19/20 | | 16,034 | | 14,351 | | 14,320 |
| 168607697, 17.74%, 04/27/23 | | LendingClub | | 10/22/20 | | 4,490 | | 4,220 | | 4,235 |
| 168615219, 16.95%, 04/15/23 | | LendingClub | | 10/20/20 | | 6,341 | | 5,961 | | 5,952 |
| 168640072, 28.80%, 04/14/25 | | LendingClub | | 10/19/20 | | 9,619 | | 8,657 | | 8,622 |
| 168652487, 14.30%, 04/14/23 | | LendingClub | | 10/19/20 | | 8,860 | | 8,417 | | 8,391 |
| 168657591, 18.62%, 03/27/23 | | LendingClub | | 10/19/20 | | 2,178 | | 1,982 | | 2,014 |
| Total Whole Loans | | | | | | | | 1,449,231 | | 1,415,245 |
| | | | | | | | | | | |
| BRIDGE LOANS - 47.8% | | | | | | | | | | |
| Real Estate Loans - 47.8% (a)(c) | | | | | | | | | | |
| 39301, 9.00%, 05/26/22 | | Fund That Flip | | 03/31/21 | | 50,000 | | 50,000 | | 50,000 |
| 39753, 9.00%, 01/15/22 | | Fund That Flip | | 03/24/21 | | 50,000 | | 50,000 | | 49,959 |
| 40623, 8.25%, 12/02/21 | | Fund That Flip | | 03/25/21 | | 50,000 | | 50,000 | | 49,953 |
| 40671, 8.75%, 09/19/22 | | Fund That Flip | | 03/29/21 | | 50,000 | | 50,000 | | 49,983 |
| 40785, 8.25%, 08/25/21 | | Fund That Flip | | 03/29/21 | | 50,000 | | 50,000 | | 49,989 |
| 40949, 8.25%, 09/15/21 | | Fund That Flip | | 03/29/21 | | 50,000 | | 50,000 | | 49,980 |
| 41131, 8.50%, 11/26/21 | | Fund That Flip | | 03/25/21 | | 50,000 | | 50,000 | | 49,955 |
| 41154, 8.50%, 03/12/22 | | Fund That Flip | | 03/24/21 | | 50,000 | | 50,000 | | 49,952 |
| 41159, 8.50%, 03/10/22 | | Fund That Flip | | 03/29/21 | | 58,000 | | 58,000 | | 57,979 |
| 41205, 8.50%, 12/12/21 | | Fund That Flip | | 03/25/21 | | 50,000 | | 50,000 | | 49,951 |
| 41289, 8.50%, 03/22/22 | | Fund That Flip | | 03/29/21 | | 50,000 | | 50,000 | | 49,982 |
| 184333436, 9.00%, 08/01/21 | | Patch of Land | | 01/02/20 | | 25,000 | | 25,000 | | 24,994 |
| 184333601, 9.00%, 06/01/21 | | Patch of Land | | 01/16/20 | | 24,268 | | 24,268 | | 24,262 |
| 184333602, 9.00%, 08/01/21 | | Patch of Land | | 01/16/20 | | 25,000 | | 25,000 | | 24,994 |
| 184333760, 9.00%, 06/01/21 | | Patch of Land | | 01/27/20 | | 25,000 | | 25,000 | | 24,994 |
| 184333907, 8.75%, 06/01/21 | | Patch of Land | | 02/10/20 | | 20,000 | | 20,000 | | 19,996 |
| 184333908, 9.00%, 06/01/21 | | Patch of Land | | 02/10/20 | | 15,000 | | 15,000 | | 14,997 |
| 184333924, 9.20%, 06/01/21 | | Patch of Land | | 02/11/20 | | 25,000 | | 25,000 | | 24,994 |
| 184333925, 9.00%, 06/01/21 | | Patch of Land | | 02/11/20 | | 25,000 | | 25,000 | | 24,994 |
| 184333926, 9.20%, 06/01/21 | | Patch of Land | | 02/11/20 | | 25,000 | | 25,000 | | 24,994 |
| 184333968, 9.20%, 06/01/21 | | Patch of Land | | 02/14/20 | | 25,000 | | 25,000 | | 24,994 |
| 184334008, 7.50%, 08/01/21 | | Patch of Land | | 02/24/20 | | 30,000 | | 30,000 | | 29,994 |
| 184334313, 11.00%, 12/01/21 | | Patch of Land | | 05/05/20 | | 10,299 | | 10,299 | | 10,204 |
| 184334317, 12.00%, 08/01/21 | | Patch of Land | | 05/07/20 | | 30,000 | | 30,000 | | 29,685 |
| 184334431, 10.50%, 04/01/22 | | Patch of Land | | 05/26/20 | | 9,000 | | 9,000 | | 8,926 |
| 184334436, 10.50%, 12/01/21 | | Patch of Land | | 05/27/20 | | 9,000 | | 9,000 | | 8,926 |
| 184334463, 10.50%, 12/01/21 | | Patch of Land | | 06/03/20 | | 15,000 | | 15,000 | | 14,894 |
| 184334730, 9.50%, 09/01/21 | | Patch of Land | | 08/06/20 | | 18,612 | | 18,612 | | 18,553 |
| 184334731, 9.30%, 10/01/21 | | Patch of Land | | 08/06/20 | | 10,595 | | 10,595 | | 10,564 |
| 184334837, 10.50%, 08/01/21 | | Patch of Land | | 10/01/20 | | 30,000 | | 30,000 | | 29,947 |
| 184334838, 9.30%, 09/01/21 | | Patch of Land | | 10/01/20 | | 19,786 | | 19,786 | | 19,774 |
| 184334839, 9.30%, 10/01/21 | | Patch of Land | | 10/01/20 | | 10,510 | | 10,510 | | 10,504 |
| 184334947, 8.00%, 08/01/21 | | Patch of Land | | 11/27/20 | | 6,452 | | 6,452 | | 6,468 |
| 184334948, 9.70%, 07/01/22 | | Patch of Land | | 11/27/20 | | 8,436 | | 8,436 | | 8,444 |
| 184335020, 9.20%, 02/01/22 | | Patch of Land | | 01/04/21 | | 10,000 | | 10,000 | | 10,028 |
| 184335022, 9.50%, 08/01/22 | | Patch of Land | | 01/04/21 | | 30,000 | | 30,000 | | 30,104 |
| 184335040, 8.75%, 04/01/22 | | Patch of Land | | 01/12/21 | | 21,000 | | 21,000 | | 21,076 |
| 184335066, 9.00%, 12/01/21 | | Patch of Land | | 01/19/21 | | 30,000 | | 30,000 | | 30,110 |
| 184335067, 9.10%, 12/01/21 | | Patch of Land | | 01/19/21 | | 30,000 | | 30,000 | | 30,108 |
| 184335081, 8.75%, 02/01/22 | | Patch of Land | | 01/27/21 | | 29,314 | | 29,314 | | 29,435 |
| 184335088, 9.30%, 09/01/22 | | Patch of Land | | 01/29/21 | | 34,225 | | 34,225 | | 34,356 |
| 184335115, 8.00%, 03/01/22 | | Patch of Land | | 03/16/21 | | 7,768 | | 7,768 | | 7,817 |
| 17391, 10.00%, 04/06/21 | | Sharestates | | 01/02/20 | | 20,000 | | 20,000 | | 19,635 |
| 17405, 8.75%, 06/30/21 | | Sharestates | | 01/02/20 | | 25,000 | | 25,000 | | 24,771 |
| 17406, 11.00%, 06/30/21 (b) | | Sharestates | | 01/02/20 | | 25,000 | | 25,000 | | 24,027 |
| 17407, 10.00%, 05/31/21 | | Sharestates | | 01/02/20 | | 21,212 | | 21,212 | | 20,801 |
| 17409, 10.00%, 08/31/21 | | Sharestates | | 01/02/20 | | 25,000 | | 25,000 | | 24,775 |
| 17462, 10.50%, 04/30/21 (b) | | Sharestates | | 01/16/20 | | 30,000 | | 30,000 | | 29,141 |
| 17463, 9.00%, 08/31/21 | | Sharestates | | 01/16/20 | | 28,000 | | 28,000 | | 27,501 |
| 17539, 9.50%, 05/31/21 | | Sharestates | | 01/27/20 | | 24,000 | | 24,000 | | 23,763 |
| 17920, 8.00%, 06/30/21 | | Sharestates | | 02/11/20 | | 25,000 | | 25,000 | | 24,807 |
| 17921, 9.00%, 07/31/21 (b) | | Sharestates | | 02/11/20 | | 25,000 | | 25,000 | | 24,265 |
| 17922, 9.00%, 08/31/21 (b) | | Sharestates | | 02/11/20 | | 25,000 | | 25,000 | | 24,542 |
| 17923, 8.50%, 06/30/21 | | Sharestates | | 02/11/20 | | 25,000 | | 25,000 | | 24,789 |
| 18070, 8.75%, 07/31/21 | | Sharestates | | 02/24/20 | | 30,000 | | 30,000 | | 29,759 |
| 18773, 9.00%, 05/31/21 | | Sharestates | | 07/01/20 | | 25,000 | | 25,000 | | 24,826 |
| 18833, 8.75%, 08/31/21 (b) | | Sharestates | | 07/17/20 | | 25,000 | | 25,000 | | 24,668 |
| 19048, 9.25%, 10/31/21 | | Sharestates | | 09/28/20 | | 30,000 | | 30,000 | | 29,805 |
| 19084, 10.50%, 06/30/21 | | Sharestates | | 10/05/20 | | 20,000 | | 20,000 | | 19,900 |
| 19138, 9.00%, 07/31/21 | | Sharestates | | 10/23/20 | | 20,000 | | 20,000 | | 19,968 |
| 19171, 10.00%, 07/31/21 | | Sharestates | | 11/05/20 | | 22,000 | | 22,000 | | 21,938 |
| 19223, 10.00%, 11/30/21 | | Sharestates | | 11/18/20 | | 30,000 | | 30,000 | | 29,994 |
| 19234, 9.50%, 05/31/21 | | Sharestates | | 11/20/20 | | 30,000 | | 30,000 | | 29,881 |
| 19238, 10.00%, 05/31/21 | | Sharestates | | 11/24/20 | | 30,000 | | 30,000 | | 29,884 |
| 19272, 9.00%, 11/30/21 | | Sharestates | | 12/02/20 | | 25,000 | | 25,000 | | 25,029 |
| 19356, 9.00%, 12/31/21 | | Sharestates | | 12/29/20 | | 10,000 | | 10,000 | | 10,030 |
| 19403, 8.75%, 06/30/22 | | Sharestates | | 01/07/21 | | 30,000 | | 30,000 | | 30,129 |
| 19434, 9.00%, 09/30/21 (b) | | Sharestates | | 01/19/21 | | 20,000 | | 20,000 | | 19,847 |
| 19476, 8.75%, 01/31/22 | | Sharestates | | 01/21/21 | | 30,000 | | 30,000 | | 30,112 |
| 19479, 9.50%, 11/30/21 | | Sharestates | | 01/25/21 | | 23,000 | | 23,000 | | 23,112 |
| 19488, 8.75%, 12/31/21 | | Sharestates | | 01/28/21 | | 26,000 | | 26,000 | | 26,279 |
| 19585, 9.00%, 08/31/22 | | Sharestates | | 02/18/21 | | 25,000 | | 25,000 | | 25,132 |
| 19649, 9.50%, 05/31/21 | | Sharestates | | 03/04/21 | | 10,000 | | 10,000 | | 9,958 |
| 19675, 9.25%, 07/31/21 | | Sharestates | | 03/09/21 | | 31,000 | | 31,000 | | 31,026 |
| 19681, 8.75%, 12/31/21 | | Sharestates | | 03/12/21 | | 23,000 | | 23,000 | | 23,247 |
| 19682, 8.75%, 03/31/22 | | Sharestates | | 03/12/21 | | 40,000 | | 40,000 | | 39,784 |
| 19683, 9.25%, 03/31/22 | | Sharestates | | 03/12/21 | | 45,000 | | 45,000 | | 44,729 |
| 19684, 10.50%, 08/31/21 | | Sharestates | | 03/12/21 | | 45,000 | | 45,000 | | 45,124 |
| 19685, 9.25%, 03/31/22 | | Sharestates | | 03/12/21 | | 15,000 | | 15,000 | | 14,910 |
| 19690, 9.00%, 08/31/22 | | Sharestates | | 03/12/21 | | 45,000 | | 45,000 | | 45,261 |
| 19711, 11.00%, 06/30/21 | | Sharestates | | 03/17/21 | | 40,000 | | 40,000 | | 39,902 |
| 19728, 9.50%, 11/30/21 | | Sharestates | | 03/19/21 | | 7,000 | | 7,000 | | 7,053 |
| Total Bridge Loans | | | | | | | | 2,242,477 | | 2,235,917 |
| | | | | | | | | | | |
| OTHER LOAN INVESTMENTS - 13.1% | | | | | | | | | | |
| Private Investment Funds - 13.1% (a)(d) | | | | | | | | | | |
| Invest in America Credit Fund 1, LLC, | | | | | | | | | | |
| Series PM Class B Member, 10.50% (e) | | MoneyLion | | 09/30/20 | | 50,000 | | 50,000 | | 50,980 |
| Invest in America Credit Fund 1, LLC, | | | | | | | | | | |
| Series PM Class B Member, 11.50% (f) | | MoneyLion | | 02/14/20 | | 250,000 | | 250,000 | | 260,825 |
| Invest in America Credit Fund 1, LLC, | | | | | | | | | | |
| Series PM Class B Member, 10.50% (g) | | MoneyLion | | 03/12/21 | | 300,000 | | 300,000 | | 300,000 |
| Total Other Loan Investments | | | | | | | | 600,000 | | 611,805 |
| | | | | | | | | | | |
| Total Investments - 91.2% | | | | | | | | 4,291,708 | | 4,262,967 |
| | | | | | | | | | | |
| Other Assets in Excess of Liabilities - 8.8% | | | | | | | | | | 410,060 |
| | | | | | | | | | | |
| TOTAL NET ASSETS - 100.0% | | | | | | | | | | $4,673,027 |
| | | | | | | | | | | |
| | | | | | | | | | | |
| (a) Fair valued by a third party pricing service using unobservable inputs and subject to review by AlphaCentric Advisors LLC (the "Advisor") pursuant to policies approved by the Board of Trustees of the Fund. |
| (b) Past-due loan. | | | | | | | | | | |
| (c) Short-term loans backed by single-family, multi-family and commercial properties. | | | | | | |
| (d) Underlying holdings are comprised of consumer loans. | | | | | | | | |
| (e) The investment has a one-year lock-up period expiring on October 1, 2021, after which the Fund may redeem its investment by submitting a redemption request in accordance with Invest in America Credit Fund 1, LLC’s redemption request procedures. |
| (f) The investment has a two-year lock-up period expiring on February 14, 2022, after which the Fund may redeem its investment by submitting a redemption request in accordance with Invest in America Credit Fund 1, LLC’s redemption request procedures. |
| (g) The investment has a one-year lock-up period expiring on March 12, 2022, after which the Fund may redeem its investment by submitting a redemption request in accordance with Invest in America Credit Fund 1, LLC’s redemption request procedures. |
(b) Not Applicable.
Item 7. Disclosure of Proxy Voting Policies and Procedures for Closed-End Management Investment Companies.
Not applicable for semi-annual reports.
Item 8. Portfolio Managers of Closed-End Management Investment Companies.
Not applicable for semi-annual reports.
Item 9. Purchases of Equity Securities by Closed-End Management Investment Company and Affiliated Purchasers.
| Period | (a) Total Number of Shares (or Units) Purchased | (b) Average Price Paid per Share (or Unit) | (c) Total Number of Shares (or Units) Purchased as Part of Publicly Announced Plans or Programs | (d) Maximum Number (or Approximate Dollar Value) of Shares (or Units) that May Yet Be Purchased Under the Plans or Programs |
Month #1
10/01/20-10/31/20 | 0 | 0 | 0 | 0 |
Month #2
11/01/20-11/30/20 | 0 | 0 | 0 | 0 |
Month #3*
12/01/20-12/31/20 | 0 | 0 | 0 | 0 |
Month #4
01/01/21-01/31/21 | 0 | 0 | 0 | 0 |
Month #5
02/01/21-02/28/21 | 0 | 0 | 0 | 0 |
Month #6**
03/01/21-03/31/21 | 0 | 0 | 0 | 0 |
* The Fund issued a repurchase offer on December 1, 2020. The repurchase offer enabled up to 17,870 shares to be redeemed by shareholders. No shares were repurchased or paid out. The repurchase offer expired on December 28, 2020.
** The Fund issued a repurchase offer on March 1, 2021. The repurchase offer enabled up to 23,813 shares to be redeemed by shareholders. No shares were repurchased or paid out. The repurchase offer expired on March 26, 2021.
Item 10. Submission of Matters to a Vote of Security Holders.
Not applicable.
Item 11. Controls and Procedures.
| (a) | Based on an evaluation of the registrant’s disclosure controls and procedures (as defined in Rule 30a-3(c) under the Investment Company Act of 1940 (the “Act”)) as of a date within 90 days prior to the filing date of this Form N-CSR, the registrant’s principal executive officer and principal financial officer have concluded that the disclosure controls and procedures are effective. |
| (b) | There were no changes in the registrant's internal control over financial reporting (as defined in Rule 30a-3(d) under the Act) that occurred during the second fiscal quarter of the period covered by this report that has materially affected, or is reasonably likely to materially affect, the registrant's internal control over financial reporting. |
Item 12. Disclosure of Securities Lending Activities for Closed-End Management Investment Companies.
The registrant did not engage in securities lending activities during the fiscal period reported on this Form N-CSR.
Item 13. Exhibits.
| (a) | (1) Any code of ethics or amendment thereto, that is the subject of the disclosure required by Item 2, to the extent that the registrant intends to satisfy Item 2 requirements through filing an exhibit. Incorporated by reference to the registrant’s Form N-CSR filed December 10, 2020. |
(2) A separate certification for each principal executive officer and principal financial officer pursuant to Section 302 of the Sarbanes-Oxley Act of 2002. Filed herewith.
(3) Any written solicitation to purchase securities under Rule 23c-1 under the Act sent or given during the period covered by the report by or on behalf of the registrant to 10 or more persons. None.
(4) Change in the registrant’s independent public accountant. There was no change in the registrant’s independent public accountant for the period covered by this report.
SIGNATURES
Pursuant to the requirements of the Securities Exchange Act of 1934 and the Investment Company Act of 1940, the registrant has duly caused this report to be signed on its behalf by the undersigned, thereunto duly authorized.
AlphaCentric Prime Meridian Income Fund
By: /s/ George F. Amrhein, Jr.
George F. Amrhein, Jr., President
(Principal Executive Officer)
Date: 6/4/2021
Pursuant to the requirements of the Securities Exchange Act of 1934 and the Investment Company Act of 1940, this report has been signed below by the following persons on behalf of the registrant and in the capacities and on the dates indicated.
By: /s/ George F. Amrhein, Jr.
George F. Amrhein, Jr., President
(Principal Executive Officer)
Date: 6/4/2021
By: /s/ Peter Lowden
Peter Lowden, Treasurer
(Principal Financial Officer)
Date: 6/7/2021