UNITED STATES
SECURITIES AND EXCHANGE COMMISSION
Washington, D.C. 20549
FORM N-CSR
CERTIFIED SHAREHOLDER REPORT OF REGISTERED MANAGEMENT INVESTMENT COMPANIES
Investment Company Act file number 811-23230
AlphaCentric Prime Meridian Income Fund
(Exact name of registrant as specified in charter)
36 North New York Avenue
Huntington, New York 11743
(Address of principal executive offices) (Zip code)
George F. Amrhein, Jr.
36 North New York Ave
Huntington, New York 11743
(Name and address of agent for service)
(631) 629-4237
Registrant’s telephone number, including area code
Date of fiscal year end: September 30
Date of reporting period: September 30, 2022
Item 1. Reports to Stockholders.
(a)

AlphaCentric Prime Meridian Income Fund
Annual Report
September 30, 2022
You may elect to receive shareholder reports in paper free of charge. You can request to receive paper copies of your shareholder reports by contacting your financial intermediary or, if you invest directly with the Fund, calling 1-888-910-0412 to let the Fund know of your request.
AlphaCentric Prime Meridian Income Fund
Table of Contents
| |
| Shareholder Letter | 1 |
| | |
| Expense Example (Unaudited) | 3 |
| | |
| Investment Highlights (Unaudited) | 4 |
| | |
| Portfolio Overview (Unaudited) | 5 |
| | |
| Condensed Schedule of Investments | 6 |
| | |
| Statement of Assets and Liabilities | 8 |
| | |
| Statement of Operations | 9 |
| | |
| Statement of Changes in Net Assets | 10 |
| | |
| Statement of Cash Flows | 11 |
| | |
| Financial Highlights | 12 |
| | |
| Notes to Financial Statements | 13 |
| | |
| Report of Independent Registered Public Accounting Firm | 21 |
| | |
| Additional Information (Unaudited) | 22 |

September 30, 2022
Dear AlphaCentric Prime Meridian Income Fund (the “Fund”) Investor:
FUND OVERVIEW
The Fund invests, directly or indirectly, in loans originated through online platforms that provide a marketplace for lending to consumers, small businesses, and real estate developers. At the end of September 2022, the Fund did not hold any exposures to small business loans. A diversified pool of consumer and real estate bridge loans comprised the majority of the Fund’s assets, with the remainder held in cash and cash equivalents. The Fund’s portfolio duration remained short, with a Macaulay duration of 13 months.
All invested assets were sourced from four loan originators across the consumer and real estate lending verticals. The consumer vertical gave the Fund exposure to a highly diversified national pool of consumer loans. The Fund’s individual consumer loans had an average weighted FICO score of 694 across both traditional prime and near prime loan holdings (near prime being defined as loans with FICO scores between 600 and 659). The Fund’s real estate originators provided access to first lien residential, multi- family and commercial bridge loans across the country. The Fund’s real estate bridge loans were sourced from three originators in different geographies and had a weighted average loan to value of less than 60% across all positions.
The Fund was a strong performer for the year ended September 30, 2022, which is attributable to the Fund’s short-duration and quality loan underwriting and selection. Consumer loan performance specifically benefited from favorable saving trends and low levels of unemployment. Real estate bridge loans benefited from limited supply of housing and increasing rents. And while consumer and real estate loan delinquency was modestly higher recently as markets normalized, the fully collateralized nature of the real estate loans resulted in less performance impact to the Fund relative to uncollateralized consumer loans. As of this writing, the Fund’s 31+ day delinquency rate was 2.47%.
OUTLOOK
The Federal Reserve has increased interest rates significantly to combat rising inflation. Rising rates have contributed to increased market volatility, thus the need for increased diversification, especially within the fixed income asset class where the Fund has performed well relative to traditional fixed income benchmarks. Overall, we expect the Fund’s short-duration, high income portfolio to continue to be well positioned for the expected market environment. We plan to maintain and opportunistically add to existing exposures in both consumer and real estate loans through year-end, and we remain pleased with performance to date.
Sincerely,
AlphaCentric Prime Meridian Income Fund Team
This letter represents the opinions of the Fund’s management and are subject to change, are not guaranteed and should not be considered recommendations to buy or sell any security. The information provided is not intended to be, and is not, a forecast of future events, a guarantee of results, or investment advice.
This report is intended for the Fund’s shareholders. It may not be distributed to prospective investors unless it is preceded or accompanied by the current Fund prospectus. To obtain a prospectus or other information about the Fund, please visit www.AlphaCentricFunds.com or call 1-888-910-0412. Please read the prospectus carefully before investing.
The Fund’s total returns for the 2022 YTD period ended 9/30/22, fiscal year ended 9/30/22 and for the period since inception through 9/30/22, as compared to the benchmark indexes, were as follows:
| | | | Since |
| | 2022 YTD | Fiscal Year | Inception |
| | Ended | Ended | Annualized |
| | 9/30/2022 | 9/30/2022 | (12/31/2019)* |
| AlphaCentric Prime Meridian Income Fund | 2.15% | 4.05% | 6.40% |
| Bloomberg U.S. High Yield Corporate Bond Index | -14.74% | -14.14% | -1.42% |
| Bloomberg U.S. Credit 1-3 Year Index | -4.62% | -5.12% | -0.46% |
| * | The Fund commenced operations on December 31, 2019. |
Performance is historic and does not guarantee future results. Investment return and principal value will fluctuate with changing market conditions so that when redeemed, shares may be worth more or less than their original cost. Current performance may be lower or higher than the performance data quoted. To obtain the most recent month end performance information or the Fund’s prospectus, please call the Fund at 1-888-910-0412 or visit www.AlphaCentricFunds.com.
AlphaCentric Prime Meridian Income Fund
EXPENSE EXAMPLE
September 30, 2022 (Unaudited)
As a shareholder of AlphaCentric Prime Meridian Income Fund (the “Fund”), you incur two types of costs: (1) transaction costs, and (2) ongoing costs, including management fees, service fees on marketplace loans and other Fund expenses. This example is intended to help you understand your ongoing costs (in dollars) of investing in the Fund and to compare these costs with the ongoing costs of investing in other funds.
The example is based on an investment of $1,000 invested at the beginning of the period, April 1, 2022, and held through the period ended September 30, 2022.
Actual Expenses
The “Actual” expenses line in the table below provides information about actual account values and actual expenses. You may use the information below, together with the amount you invested, to estimate the expenses that you paid over the period. Simply divide your account value by $1,000 (for example, an $8,600 account value divided by $1,000 = 8.6), then multiply the result by the number in the table under the heading entitled “Expenses Paid During Period” to estimate the expenses you paid on your account during this period.
Hypothetical Example for Comparison Purposes
The “Hypothetical” expenses line in the table below provides information about hypothetical account values and hypothetical expenses based on the Fund’s actual expense ratio and an assumed rate of return of 5% per year before expenses, which is not the Fund’s actual return. The hypothetical account values and expenses may not be used to estimate the actual ending account balances or expenses you paid for the period. You may use this information to compare this 5% hypothetical example with the 5% hypothetical examples that appear in the shareholder reports of other funds.
Please note that the expenses shown in the table are meant to highlight your ongoing costs only and do not reflect any transactional costs. Therefore, the table is useful in comparing ongoing costs only, and will not help you determine the relative total costs of owning different funds. In addition, if these transactional costs were included, your costs would have been higher.
| | Beginning | Ending | Annualized | Expenses Paid |
| | Account Value | Account Value | Expense | During the |
| | 4/1/2022 | 9/30/2022 | Ratio(a) | Period(a) |
| AlphaCentric Prime Meridian Income Fund | | | | |
| Actual | $1,000.00 | $1,003.80 | 2.07% | $10.40 |
| Hypothetical (5% return before expenses) | $1,000.00 | $1,014.69 | 2.07% | $10.45 |
| (a) | Expenses are equal to the Fund’s annualized expense ratio of 2.07%, multiplied by the average account value over the period beginning April 1, 2022 and ending September 30, 2022, multiplied by 183/365 to reflect the one-half year period. |
AlphaCentric Prime Meridian Income Fund
INVESTMENT HIGHLIGHTS
September 30, 2022 (Unaudited)
Growth of a $10,000 Investment
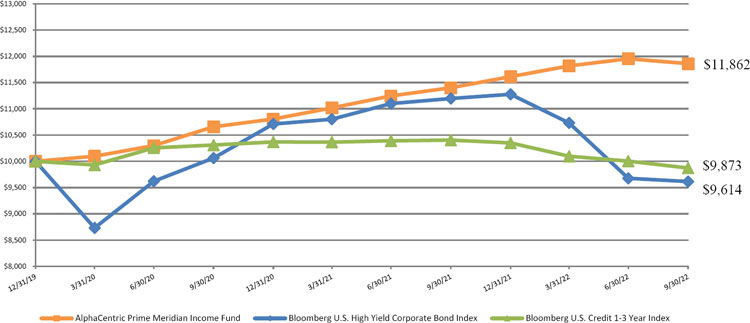
Fund Performance Data
The Fund’s performance figures for the periods ended September 30, 2022, as compared to its benchmarks(a):
| | | Cumulative | | Annualized |
| | | | | | | Since |
| | | | | | | Inception |
| | | Six Months | | One Year | | (12/31/2019) |
| AlphaCentric Prime Meridian Income Fund | | 0.38% | | 4.05% | | 6.40% |
| Bloomberg U.S. High Yield Corporate Bond Index(b) | | (10.41)% | | (14.14)% | | (1.42)% |
| Bloomberg U.S. Credit 1-3 Year Index(b) | | (2.21)% | | (5.12)% | | (0.46)% |
| (a) | Returns shown include the reinvestment of all dividends. Returns shown do not reflect the deduction of taxes that a shareholder would pay on Fund distributions or the redemption of Fund shares. In the absence of fee waivers and reimbursements, returns for the Fund would be lower. Past performance is not predictive of future performance. Investment return and principal value will fluctuate, so that shares, when redeemed, may be worth more or less than the original cost. |
| (b) | The Bloomberg U.S. High Yield Corporate Bond Index measures the USD-denominated, high yield, fixed-rate corporate bond market. The Bloomberg U.S. Credit 1-3 Year Index measures the performance of investment grade, US dollar-denominated, fixed-rate, taxable corporate and government-related debt with 1 to 2.9999 years to maturity. It is composed of a corporate component and a non-corporate component that includes non-US agencies, sovereigns, supranationals and local authorities. Neither index reflects fees, taxes or expenses. A direct investment in an index is not possible. |
AlphaCentric Prime Meridian Income Fund
PORTFOLIO OVERVIEW
September 30, 2022 (Unaudited)
Portfolio Allocation by Year of Scheduled Maturity(a)
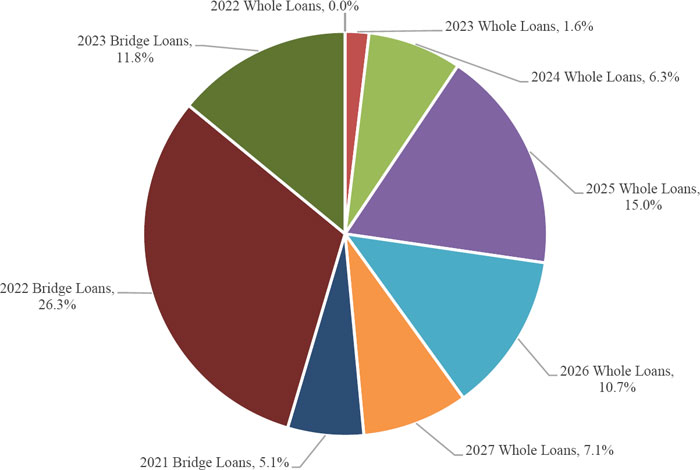
| Year of Scheduled Maturity | Percentage(a) |
| Whole Loans | |
| 2022 Whole Loans | 0.0% |
| 2023 Whole Loans | 1.6% |
| 2024 Whole Loans | 6.3% |
| 2025 Whole Loans | 15.0% |
| 2026 Whole Loans | 10.7% |
| 2027 Whole Loans | 7.1% |
| Total Whole Loans | 40.7% |
| Bridge Loans | |
| 2021 Bridge Loans | 5.1% |
| 2022 Bridge Loans | 26.3% |
| 2023 Bridge Loans | 11.8% |
| Total Bridge Loans | 43.2% |
| Other Assets in Excess of Liabilities | 16.1% |
| Total Net Assets | 100.0% |
| (a) | Percentages are based on total net assets of the Fund. Please refer to the Condensed Schedule of Investments in this annual report for a listing of the Fund’s holdings. |
| AlphaCentric Prime Meridian Income Fund |
| CONDENSED SCHEDULE OF INVESTMENTS |
| September 30, 2022 |
| | | | | Original | | | | | | | | | |
| | | | | Acquisition | | Principal | | | | | | | |
| | | Platform | | Date | | Amount | | | Cost | | | Fair Value | |
| WHOLE LOANS - 40.7% | | | | | | | | | | | | | | | | |
| Consumer Loans - 40.7% (a) | | | | | | | | | | | | | | | | |
| Other Consumer Loans, 22.29%, 11/08/22 - 11/26/27 (b)(c) | | LendingClub | | | | $ | 2,436,432 | | | $ | 2,406,482 | | | $ | 2,138,029 | |
| Total Whole Loans | | | | | | | | | | | 2,406,482 | | | | 2,138,029 | |
| | | | | | | | | | | | | | | | | |
| BRIDGE LOANS - 43.2% | | | | | | | | | | | | | | | | |
| Real Estate Loans - 43.2% (a)(d) | | | | | | | | | | | | | | | | |
| 41159, 8.50%, 12/11/22 | | Fund That Flip | | 03/29/21 | | | 58,000 | | | | 58,000 | | | | 57,726 | |
| 21998, 10.15%, 07/31/23 | | Sharestates | | 08/19/22 | | | 50,000 | | | | 50,000 | | | | 49,948 | |
| 22008, 11.00%, 08/31/23 | | Sharestates | | 08/22/22 | | | 50,000 | | | | 50,000 | | | | 49,941 | |
| 21603, 10.50%, 05/31/23 | | Sharestates | | 05/18/22 | | | 50,000 | | | | 50,000 | | | | 49,858 | |
| 21718, 11.00%, 06/30/23 | | Sharestates | | 06/06/22 | | | 50,000 | | | | 50,000 | | | | 49,850 | |
| 21723, 11.00%, 05/31/23 | | Sharestates | | 06/06/22 | | | 50,000 | | | | 50,000 | | | | 49,838 | |
| 62862, 10.25%, 05/02/23 | | Fund That Flip | | 08/19/22 | | | 50,000 | | | | 50,000 | | | | 49,792 | |
| 62634, 9.50%, 04/20/23 | | Fund That Flip | | 08/04/22 | | | 50,000 | | | | 50,000 | | | | 49,730 | |
| 57895, 9.50%, 04/07/23 | | Fund That Flip | | 07/12/22 | | | 50,000 | | | | 50,000 | | | | 49,684 | |
| 20890, 8.25%, 09/30/22 | | Sharestates | | 12/03/21 | | | 50,000 | | | | 50,000 | | | | 49,650 | |
| 58234, 9.00%, 12/16/22 | | Fund That Flip | | 08/04/22 | | | 50,000 | | | | 50,000 | | | | 49,618 | |
| 59261, 9.75%, 11/12/22 | | Fund That Flip | | 08/19/22 | | | 50,000 | | | | 50,000 | | | | 49,602 | |
| 62539, 9.25%, 12/24/22 | | Fund That Flip | | 08/04/22 | | | 50,000 | | | | 50,000 | | | | 49,588 | |
| 60352, 8.75%, 12/22/22 | | Fund That Flip | | 07/12/22 | | | 50,000 | | | | 50,000 | | | | 49,508 | |
| 60198, 9.50%, 10/15/22 | | Fund That Flip | | 08/04/22 | | | 50,000 | | | | 50,000 | | | | 49,406 | |
| 57920, 8.75%, 12/21/22 | | Fund That Flip | | 04/12/22 | | | 50,000 | | | | 50,000 | | | | 49,236 | |
| 41289, 8.50%, 12/22/22 | | Fund That Flip | | 03/29/21 | | | 50,000 | | | | 50,000 | | | | 48,913 | |
| 39301, 9.50%, 11/26/22 | | Fund That Flip | | 03/31/21 | | | 50,000 | | | | 50,000 | | | | 48,706 | |
| 40785, 8.25%, 05/25/22 | | Fund That Flip | | 03/29/21 | | | 50,000 | | | | 50,000 | | | | 46,637 | |
| 45227, 9.00%, 09/21/22 | | Fund That Flip | | 10/13/21 | | | 50,000 | | | | 50,000 | | | | 46,534 | |
| 40671, 8.75%, 09/19/22 | | Fund That Flip | | 03/29/21 | | | 50,000 | | | | 50,000 | | | | 46,272 | |
| 44866, 8.50%, 11/10/22 | | Fund That Flip | | 12/09/21 | | | 45,000 | | | | 45,000 | | | | 44,078 | |
| 20454, 9.50%, 08/31/22 | | Sharestates | | 09/07/21 | | | 50,000 | | | | 50,000 | | | | 43,856 | |
| 56260, 8.50%, 07/20/22 | | Fund That Flip | | 02/24/22 | | | 40,000 | | | | 40,000 | | | | 40,447 | |
| 19684, 10.50%, 05/31/22 | | Sharestates | | 03/12/21 | | | 45,000 | | | | 45,000 | | | | 40,130 | |
| 20909, 8.50%, 02/28/23 | | Sharestates | | 12/09/21 | | | 40,000 | | | | 40,000 | | | | 39,881 | |
| 56212, 9.00%, 01/21/23 | | Fund That Flip | | 02/24/22 | | | 40,000 | | | | 40,000 | | | | 39,365 | |
| 41250, 10.00%, 10/27/21 | | Fund That Flip | | 07/19/21 | | | 40,000 | | | | 40,000 | | | | 38,495 | |
| 41923, 10.00%, 12/10/21 | | Fund That Flip | | 07/19/21 | | | 40,000 | | | | 40,000 | | | | 37,823 | |
| 59145, 9.75%, 02/03/23 | | Fund That Flip | | 07/12/22 | | | 38,000 | | | | 38,000 | | | | 37,681 | |
| 19682, 8.75%, 04/30/22 | | Sharestates | | 03/12/21 | | | 40,000 | | | | 40,000 | | | | 36,133 | |
| 19711, 11.00%, 06/30/22 | | Sharestates | | 03/17/21 | | | 40,000 | | | | 40,000 | | | | 35,551 | |
| 20208, 10.00%, 04/30/23 | | Sharestates | | 06/29/21 | | | 35,000 | | | | 35,000 | | | | 34,960 | |
| 20347, 9.00%, 11/30/22 | | Sharestates | | 07/30/21 | | | 35,000 | | | | 35,000 | | | | 34,801 | |
| 20681, 9.00%, 10/31/22 | | Sharestates | | 10/14/21 | | | 35,000 | | | | 35,000 | | | | 34,775 | |
| 41710, 9.25%, 04/15/22 | | Fund That Flip | | 04/22/21 | | | 35,000 | | | | 35,000 | | | | 32,473 | |
| 18070, 8.75%, 10/31/22 | | Sharestates | | 02/24/20 | | | 30,000 | | | | 30,000 | | | | 29,820 | |
| 42127, 8.75%, 04/30/22 | | Fund That Flip | | 05/06/21 | | | 30,000 | | | | 30,000 | | | | 29,696 | |
| 20636, 9.50%, 09/30/22 | | Sharestates | | 10/01/21 | | | 30,000 | | | | 30,000 | | | | 29,692 | |
| 42375, 9.00%, 10/15/22 | | Fund That Flip | | 09/30/21 | | | 30,000 | | | | 30,000 | | | | 29,258 | |
| 20403, 9.00%, 02/28/23 | | Sharestates | | 08/20/21 | | | 29,000 | | | | 29,000 | | | | 28,891 | |
| 19675, 9.25%, 01/31/22 | | Sharestates | | 03/09/21 | | | 31,000 | | | | 31,000 | | | | 28,054 | |
| 43347, 8.75%, 08/03/22 | | Fund That Flip | | 08/16/21 | | | 30,000 | | | | 30,000 | | | | 27,927 | |
| 41663, 9.50%, 04/02/22 | | Fund That Flip | | 04/06/21 | | | 30,000 | | | | 30,000 | | | | 27,753 | |
| 41711, 9.50%, 04/02/22 | | Fund That Flip | | 04/06/21 | | | 30,000 | | | | 30,000 | | | | 27,752 | |
| 19234, 9.50%, 05/31/21 | | Sharestates | | 11/20/20 | | | 30,000 | | | | 30,000 | | | | 25,232 | |
| 19238, 10.00%, 05/31/21 | | Sharestates | | 11/24/20 | | | 30,000 | | | | 30,000 | | | | 25,173 | |
| 18833, 8.75%, 12/31/22 | | Sharestates | | 07/17/20 | | | 25,000 | | | | 25,000 | | | | 24,915 | |
The accompanying notes are an integral part of these financial statements.
| AlphaCentric Prime Meridian Income Fund |
| CONDENSED SCHEDULE OF INVESTMENTS (continued) |
| September 30, 2022 |
| | | | | Original | | | | | | | | | |
| | | | | Acquisition | | Principal | | | | | | | |
| | | Platform | | Date | | Amount | | | Cost | | | Fair Value | |
| BRIDGE LOANS - 43.2% (continued) | | | | | | | | | | | | | | | | |
| 61663, 9.00%, 07/08/23 | | Fund That Flip | | 08/04/22 | | $ | 25,000 | | | $ | 25,000 | | | $ | 24,903 | |
| 17920, 8.00%, 10/31/22 | | Sharestates | | 02/11/20 | | | 25,000 | | | | 25,000 | | | | 24,874 | |
| | | | | | | | | | | | | | | | | |
| | | Fund That Flip, | | | | | | | | | | | | | | |
| | | Patch of Land, | | | | | | | | | | | | | | |
| Other Real Estate Loans, 9.31%, 01/01/21 - 05/01/23 (b) | | Sharestates | | | | | 307,151 | | | | 307,151 | | | | 277,273 | |
| Total Bridge Loans | | | | | | | | | | | 2,368,151 | | | | 2,271,699 | |
| | | | | | | | | | | | | | | | | |
| Total Investments - 83.9% | | | | | | | | | | | 4,774,633 | | | | 4,409,728 | |
| | | | | | | | | | | | | | | | | |
| Other Assets in Excess of Liabilities - 16.1% | | | | | | | | | | | | | | | 844,659 | |
| | | | | | | | | | | | | | | | | |
| TOTAL NET ASSETS - 100.0% | | | | | | | | | | | | | | $ | 5,254,387 | |
The Condensed Schedule of Investments provides information regarding the 50 largest investments and summarized information regarding other investments at September 30, 2022. For individual investments disclosed, the description includes the unique loan identification number.
| (a) | Fair valued by a third-party pricing service using unobservable inputs and subject to review by AlphaCentric Advisors LLC (the “Advisor”) pursuant to policies approved by the Board of Trustees of the Fund. |
| (b) | Rate presented is a weighted average interest rate for loans in this category. |
| (c) | Includes investments that are non-income producing. |
| (d) | Short-term loans backed by single-family, multi-family and commercial properties. |
| Past-Due Loans Table |
| |
| | | Principal Amount | | | Fair Value | |
| WHOLE LOANS - 1.11% | | | | | | | | |
| Consumer Loans - 1.11% (e) | | | | | | | | |
| LendingClub | | $ | 290,331 | | | $ | 58,291 | |
| Total Whole Loans | | $ | 290,331 | | | $ | 58,291 | |
| | | | | | | | | |
| BRIDGE LOANS - 18.68% | | | | | | | | |
| Real Estate Loans - 18.68% (e) | | | | | | | | |
| Fund That Flip | | $ | 483,000 | | | $ | 459,535 | |
| Patch of Land | | | 170,000 | | | | 143,758 | |
| Sharestates | | | 414,000 | | | | 378,393 | |
| Total Bridge Loans | | $ | 1,067,000 | | | $ | 981,686 | |
| | | | | | | | | |
| (e) | Calculated as a percentage of net assets. |
The accompanying notes are an integral part of these financial statements.
| AlphaCentric Prime Meridian Income Fund |
| STATEMENT OF ASSETS AND LIABILITIES |
| September 30, 2022 |
| ASSETS: | | | |
| Investments, at fair value (cost $4,774,633) | | $ | 4,409,728 | |
| Cash and cash equivalents | | | 843,178 | |
| Receivable from platforms | | | 4,733 | |
| Interest receivable | | | 118,385 | |
| Receivable from Advisor | | | 45,734 | |
| Prepaid expenses and other assets | | | 7,527 | |
| Total assets | | | 5,429,285 | |
| | | | | |
| LIABILITIES: | | | | |
| Accrued fund administration and accounting fees | | | 17,895 | |
| Accrued custody fees | | | 14,456 | |
| Accrued professional fees | | | 121,899 | |
| Accrued transfer agent fees | | | 10,115 | |
| Accrued shareholder servicing fees | | | 4,866 | |
| Other accrued expenses | | | 5,667 | |
| Total liabilities | | | 174,898 | |
| | | | | |
| Net Assets | | $ | 5,254,387 | |
| | | | | |
| NET ASSETS CONSIST OF: | | | | |
| Paid in capital | | $ | 5,774,235 | |
| Total accumulated losses | | | (519,848 | ) |
| Net Assets | | $ | 5,254,387 | |
| | | | | |
| NET ASSET VALUE PER SHARE: | | | | |
| 588,528 shares issued and outstanding, no par value, 25,000,000 authorized shares | | $ | 8.93 | |
The accompanying notes are an integral part of these financial statements.
| AlphaCentric Prime Meridian Income Fund |
| STATEMENT OF OPERATIONS |
| | | For the | |
| | | Year Ended | |
| | | September 30, 2022 | |
| INVESTMENT INCOME: | | | | |
| Interest income | | $ | 697,550 | |
| Total investment income | | | 697,550 | |
| | | | | |
| EXPENSES: | | | | |
| Investment advisory fees | | | 79,003 | |
| Professional fees | | | 302,639 | |
| Fund administration and accounting fees | | | 105,883 | |
| Transfer agent fees | | | 58,594 | |
| Custody fees | | | 37,354 | |
| Trustees’ fees and related expenses | | | 34,001 | |
| Reports to shareholders | | | 16,582 | |
| Federal and state registration fees | | | 8,544 | |
| Loan servicing fees | | | 8,199 | |
| Shareholder servicing fees | | | 4,866 | |
| Tax expense | | | 32 | |
| Other expenses | | | 36,736 | |
| Total expenses before reimbursement | | | 692,433 | |
| Reimbursement of expenses by Advisor | | | (581,498 | ) |
| Net expenses | | | 110,935 | |
| | | | | |
| Net Investment Income | | | 586,615 | |
| | | | | |
| NET REALIZED AND UNREALIZED LOSS ON INVESTMENTS: | | | | |
| | | | | |
| Net realized loss on investments | | | (69,781 | ) |
| Net change in unrealized depreciation on investments | | | (307,873 | ) |
| Net Realized and Unrealized Loss on Investments | | | (377,654 | ) |
| | | | | |
| Net Increase in Net Assets Resulting from Operations | | $ | 208,961 | |
The accompanying notes are an integral part of these financial statements.
| AlphaCentric Prime Meridian Income Fund |
| STATEMENTS OF CHANGES IN NET ASSETS |
| | | For the Year | | | For the Year | |
| | | Ended | | | Ended | |
| | | September 30, 2022 | | | September 30, 2021 | |
| OPERATIONS: | | | | | | | | |
| Net investment income | | $ | 586,615 | | | $ | 415,074 | |
| Net realized loss on investments | | | (69,781 | ) | | | (122,359 | ) |
| Net change in unrealized depreciation on investments | | | (307,873 | ) | | | (11,628 | ) |
| Net increase in net assets resulting from operations | | | 208,961 | | | | 281,087 | |
| | | | | | | | | |
| DISTRIBUTIONS TO SHAREHOLDERS: | | | | | | | | |
| Distributions resulting from operations | | | (590,396 | ) | | | (408,132 | ) |
| Net decrease in net assets resulting from distributions paid | | | (590,396 | ) | | | (408,132 | ) |
| | | | | | | | | |
| CAPITAL SHARE TRANSACTIONS: | | | | | | | | |
| Shares sold | | | 573,853 | | | | 2,339,441 | |
| Reinvestment of distributions | | | 466,907 | | | | 284,467 | |
| Shares repurchased | | | (336,046 | ) | | | (250,015 | ) |
| Net increase in net assets resulting from capital share transactions | | | 704,714 | | | | 2,373,893 | |
| | | | | | | | | |
| Total Increase in Net Assets | | | 323,279 | | | | 2,246,848 | |
| | | | | | | | | |
| NET ASSETS: | | | | | | | | |
| Beginning of Year | | | 4,931,108 | | | | 2,684,260 | |
| End of Period | | $ | 5,254,387 | | | $ | 4,931,108 | |
| | | | | | | | | |
| TRANSACTIONS IN SHARES: | | | | | | | | |
| Shares sold | | | 59,820 | | | | 239,768 | |
| Reinvestment of distributions | | | 50,257 | | | | 29,433 | |
| Shares repurchased | | | (35,185 | ) | | | (26,043 | ) |
| Net increase in shares outstanding | | | 74,892 | | | | 243,158 | |
The accompanying notes are an integral part of these financial statements.
| AlphaCentric Prime Meridian Income Fund |
| STATEMENT OF CASH FLOWS |
| | | For the Year | |
| | | Ended | |
| | | September 30, 2022 | |
| CASH FLOWS FROM OPERATING ACTIVITIES: | | | | |
| Net increase in net assets resulting from operations | | $ | 208,961 | |
| Adjustments to reconcile the change in net assets resulting from operations to net cash provided by (used in) operating activities: | | | | |
| Purchases of investments | | | (3,949,121 | ) |
| Proceeds from principal paydowns | | | 3,496,558 | |
| Proceeds from principal recovery | | | 13,772 | |
| Net accretion of discounts | | | (28,877 | ) |
| Net realized loss from investments | | | 69,781 | |
| Net change in unrealized depreciation on investments | | | 307,873 | |
| Changes in operating assets and liabilities: | | | | |
| Receivable from platforms | | | (3,563 | ) |
| Interest receivable | | | (73,988 | ) |
| Receivable from Advisor | | | 12,468 | |
| Prepaid expenses and other assets | | | 2,631 | |
| Accrued fund administration and accounting fees | | | 1,004 | |
| Accrued custody fees | | | 6,199 | |
| Accrued professional fees | | | (21,376 | ) |
| Accrued transfer agent fees | | | 1,462 | |
| Accrued shareholder servicing fees | | | 4,866 | |
| Other accrued expenses | | | (1,242 | ) |
| Net cash provided from operating activities | | | 47,408 | |
| | | | | |
| CASH FLOWS FROM FINANCING ACTIVITIES: | | | | |
| Proceeds from shares sold | | | 623,814 | (1) |
| Distributions paid in cash | | | (123,489 | ) (1) |
| Payments on shares redeemed | | | (586,031 | ) (1) |
| Net cash used in financing activities | | | (85,706 | ) |
| | | | | |
| NET CHANGE IN CASH AND CASH EQUIVALENTS | | | (38,298 | ) |
| Cash and cash equivalents at beginning of period | | | 881,476 | |
| Cash and cash equivalents at end of period | | $ | 843,178 | |
| (1) | Noncash financing activities not included herein consist of reinvestment of distributions of $466,907, a decrease in receivable for Fund shares sold of $49,976 and an increase in payable for Fund shares repurchased of $250,000. |
The accompanying notes are an integral part of these financial statements.
| AlphaCentric Prime Meridian Income Fund |
| FINANCIAL HIGHLIGHTS |
| Selected Data and Ratios (for a share outstanding throughout each period) |
| | | | | | | | | For the Period | |
| | | For the Year | | | For the Year | | | December 31, 2019 (1) | |
| | | Ended | | | Ended | | | through | |
| | | September 30, 2022 | | | September 30, 2021 | | | September 30, 2020 | |
| Net Asset Value, Beginning of Period | | $ | 9.60 | | | $ | 9.92 | | | $ | 10.00 | |
| | | | | | | | | | | | | |
| INCOME (LOSS) FROM INVESTMENT OPERATIONS: | | | | | | | | | | | | |
| Net investment income(2) | | | 1.06 | | | | 1.00 | | | | 0.93 | |
| Net realized and unrealized loss on investments | | | (0.67 | ) | | | (0.34 | ) | | | (0.29 | ) |
| Total Income from Investment Operations | | | 0.39 | | | | 0.66 | | | | 0.64 | |
| | | | | | | | | | | | | |
| LESS DISTRIBUTIONS: | | | | | | | | | | | | |
| From net investment income | | | (1.06 | ) | | | (0.98 | ) | | | (0.72 | ) |
| Total Distributions | | | (1.06 | ) | | | (0.98 | ) | | | (0.72 | ) |
| | | | | | | | | | | | | |
| Net Asset Value, End of Period | | $ | 8.93 | | | $ | 9.60 | | | $ | 9.92 | |
| | | | | | | | | | | | | |
| Total Return(3) | | | 4.05 | % | | | 6.97 | % | | | 6.57 | % (4) |
| | | | | | | | | | | | | |
| SUPPLEMENTAL DATA AND RATIOS: | | | | | | | | | | | | |
| Net assets, end of period (in thousands) | | $ | 5,254 | | | $ | 4,931 | | | $ | 2,684 | |
| Ratio of expenses to average net assets | | | | | | | | | | | | |
| Before waivers and reimbursements | | | 13.15 | % | | | 15.84 | % | | | 32.36 | % (5) |
| Net of waivers and reimbursements | | | 2.11 | % (6) | | | 2.32 | % (6) | | | 2.41 | % (5)(7) |
| Ratio of net investment income (loss) to average net assets | | | | | | | | | | | | |
| Before waivers and reimbursements | | | 0.10 | % | | | (3.30 | )% | | | (17.50 | %) (5) |
| Net of waivers and reimbursements | | | 11.14 | % | | | 10.22 | % | | | 12.45 | % (5) |
| Portfolio turnover rate | | | 74 | % | | | 53 | % | | | 27 | % (4) |
| (1) | Commenced operations on December 31, 2019. |
| | |
| (2) | Per share net investment income has been calculated using the daily average share method. |
| | |
| (3) | Total return is calculated assuming an initial investment made at the net asset value at the beginning of the period, reinvestment of all distributions at net asset value during the period and repurchase on the last day of the period at net asset value. |
| | |
| (4) | Not annualized. |
| | |
| (5) | Annualized. |
| | |
| (6) | Includes loan servicing fees of 0.16% and 0.37% for the years ended September 30, 2022 and September 30, 2021, respectively, and tax expenses of less than 0.01% for each year, that are not subject to the Expense Limitation Agreement. See Note 4. |
| | |
| (7) | Includes loan servicing fees of 0.46% that are not subject to the Expense Limitation Agreement. See Note 4. |
The accompanying notes are an integral part of these financial statements.
AlphaCentric Prime Meridian Income Fund
NOTES TO FINANCIAL STATEMENTS
September 30, 2022
AlphaCentric Prime Meridian Income Fund (the “Fund”) was organized under the laws of the State of Delaware as a statutory trust on May 16, 2016. The Fund commenced operations on December 31, 2019, and operates pursuant to an Agreement and Declaration of Trust (the “Declaration of Trust”). The Fund is registered under the Investment Company Act of 1940, as amended (the “1940 Act”), as a closed-end, non-diversified management investment company. The Fund has no fixed termination date and will continue unless the Fund is otherwise terminated under the terms of the Declaration of Trust or unless and until required by law.
The Fund is operated as an interval fund in accordance with rule 23c-3 under the 1940 Act, pursuant to which the Fund, subject to applicable law, conducts quarterly repurchase offers of the Fund’s outstanding shares at net asset value (“NAV”) subject to approval by the Fund’s Board of Trustees (the “Board”). In all cases, such repurchase offers will be for at least 5% and not more than 25% of the Fund’s outstanding shares. It is also possible that a repurchase offer may be oversubscribed, with the result that shareholders may only be able to have a portion of their shares repurchased. If the repurchase offer is oversubscribed, the Fund may, in its sole discretion, repurchase an additional number of shares not to exceed 2% of the shares outstanding on the repurchase request deadline.
The Fund’s investment objective is to seek current income. The Fund seeks to achieve its investment objective by investing, directly or indirectly, in loans to consumers, small- and mid-sized companies, and other borrowers (including loans backed by real estate) originated through online platforms that provide a marketplace for lending (“Marketplace Loans”). The Fund’s Marketplace Loan investments originate predominantly from lending platforms based in the United States, a substantial portion of which having been made through purchases of whole loans and bridge loans. The Fund may also invest in receivables or merchant cash advances that are originated from lending platforms (“Marketplace Receivables”).
AlphaCentric Advisors LLC (the “Advisor”), a Delaware limited liability company, serves as the Fund’s investment advisor. The Advisor oversees the day-to-day investment decisions for the Fund and continuously reviews, supervises and administers the Fund’s investment program. Prime Meridian Capital Management, LLC, a Nevada limited liability company, serves as sub-advisor (the “Sub-Advisor”) to the Fund. Under the general oversight by the Fund’s Board and supervision by the Advisor, the Sub-Advisor is responsible for the day-to-day management of the Fund’s investment portfolio. Both the Advisor and Sub-Advisor are registered as investment advisors under the Investment Advisers Act of 1940, as amended.
The Board is responsible for overseeing the management and operations of the Fund on behalf of the Fund’s shareholders. The Board is composed of three independent trustees. Among other things, the Board adopts the investment and other policies of the Fund, appoints officers to manage the Fund’s day-to-day operations, selects the Fund’s investment advisors and other service providers and approves their fees, provides ongoing oversight of the performance of the Fund and its service providers, and oversees conflicts of interest as well as the Fund’s compliance program.
| 2. | Significant Accounting Policies |
The following significant accounting policies are in conformity with accounting principles generally accepted in the United States (“GAAP”). Such policies are consistently followed by the Fund in preparation of its financial statements. Management has determined that the Fund is an investment company in accordance with the Financial Accounting Standards Board (“FASB”) Accounting Standards Codification (“ASC”) Topic 946, Financial Services – Investment Companies, including Accounting Standards Update 2013-08, for the purpose of financial reporting. The Fund’s financial statements are stated in U.S. dollars.
a) Use of Estimates
The preparation of the financial statements in accordance with GAAP requires management to make estimates and assumptions that affect the reported amounts of assets and liabilities and disclosure of contingent assets and liabilities at
AlphaCentric Prime Meridian Income Fund
NOTES TO FINANCIAL STATEMENTS (continued)
September 30, 2022
the date of the financial statements, and the reported amounts of increases and decreases in net assets from operations during the reporting period. Actual results could differ from those estimates.
b) Cash and Cash Equivalents
Cash and cash equivalents consist of cash held on deposit and short-term highly liquid investments that are readily convertible to known amounts of cash and have maturities of three months or less. Cash equivalents are recorded at fair value and considered Level 1 securities in the fair value hierarchy. As of September 30, 2022, cash equivalents consisted of $843,178 held in the U.S. Bank Money Market Deposit Account (“MMDA”) . The MMDA bears interest at a variable rate that is determined based on market conditions and may change daily and by any amount. At September 30, 2022, the interest rate for the MMDA was 2.65%.
c) Receivable from Platforms
Receivable from platforms represents cash held in collection accounts at lending platforms.
d) Distribution of Income and Gains
The Fund declares and makes distributions of investment company taxable income after payment of the Fund’s operating expenses at least quarterly and net capital gains annually. Distributions from net realized gains for book purposes may include short-term capital gains, which are included as ordinary income for tax purposes. Distributions are recorded on the ex-dividend date.
The tax character of distribution paid may differ from the character of distributions shown in the Statements of Changes in Net Assets due to short-term realized capital gains being treated as ordinary income for tax purposes.
e) Income Recognition and Expenses
The Fund recognizes income and records expenses on an accrual basis. Interest income is net of amortization/accretion of any premiums/discounts, if any, from loan purchases. The changes in fair value of the Marketplace Loans are included in net change in unrealized appreciation/depreciation on investments in the Statement of Operations. Realized gain (loss) from investments in Marketplace Loans is calculated using specific identification. The Fund’s policy is to place loans on non-accrual status when there is reasonable doubt that interest income will be collected. The Fund will generally charge off a loan if (i) the platform charges off the loan, or (ii) the Advisor has determined that the loan does not have a recoverable value. Charge offs of outstanding principal balances are included in net realized gain (loss) from investments in the Statement of Operations.
f) Investment Transactions
Investment transactions are recorded on the trade date.
| 3. | Portfolio Valuation and Fair Value Measurements |
The Board has adopted Valuation Procedures (the “Valuation Procedures”) pursuant to which the Fund values its investments to ensure investments are valued in a manner consistent with GAAP as required by the 1940 Act. The Board has named the Advisor its valuation designee, and the Advisor is responsible for fair valuing securities and assets without readily available market quotations as determined in good faith.
The vast majority of the Fund’s holdings are loans sourced through Marketplace Loans for which market quotations are not readily available. As of September 30, 2022, the Fund’s holdings were comprised of consumer and real estate loans. The Fund has engaged a third-party pricing service (“Valuation Service Provider”) to provide the fair value of the Fund’s Marketplace Loan holdings. The Valuation Service Provider’s proprietary pricing procedures utilize, among other inputs, a discounted cash flow approach that utilizes historical data received from the clients/platforms, as well as proprietary loan level models and roll rates and simulation-based FICO migration matrix and logistic regression models based on historical data of similar investments in loan/borrower (or receivable/account debtor) characteristics, which estimate
AlphaCentric Prime Meridian Income Fund
NOTES TO FINANCIAL STATEMENTS (continued)
September 30, 2022
forecasted contractual cash flows for each loan or receivable for its remaining life, and which incorporate adjustments for risk factors (such as default and prepayment, as applicable). The forecasted cashflows as of the valuation date are discounted at a new risk-adjusted rate. The Advisor and Sub-Advisor monitor the application of the valuation methodology and consult with the Valuation Service Provider to ensure proper valuation of the Fund’s holdings. The NAV of shares of the Fund is determined daily. The Fund has adopted a valuation policy which states that the unit of account is at the individual loan level and fair valuation will be performed using inputs which incorporate borrower-level data that is updated as often as the NAV is calculated to reflect new information regarding the borrower and loan.
The Fund follows a fair value hierarchy that distinguishes between market data obtained from independent sources (observable inputs) and the Fund’s own market assumptions (unobservable inputs). These inputs are used in determining the value of the Fund’s investments and are summarized in the following fair value hierarchy:
Level 1 Inputs — Unadjusted quoted prices in active markets for identical securities that the Fund has the ability to access
Level 2 Inputs — Inputs other than quoted prices included in Level 1 that are observable for the asset or liability, either directly or indirectly including inputs in markets that are not considered to be active or in active markets for similar assets or liabilities, observable inputs other than quoted prices and inputs that are not directly observable but are corroborated by observable market data
Level 3 Inputs — Significant unobservable inputs (including the Fund’s own assumptions in determining fair value of investments)
The following is a summary of inputs used to value the Fund’s investments as of September 30, 2022:
| Investments at Fair Value | | Level 1 | | | Level 2 | | | Level 3 | | | Total | |
| Whole Loans | | | | | | | | | | | | | | | | |
| Consumer Loans | | $ | — | | | $ | — | | | $ | 2,138,029 | | | $ | 2,138,029 | |
| Bridge Loans | | | | | | | | | | | | | | | | |
| Real Estate Loans | | | — | | | | — | | | | 2,271,699 | | | | 2,271,699 | |
| Total | | $ | — | | | $ | — | | | $ | 4,409,728 | | | $ | 4,409,728 | |
The following is a reconciliation of Level 3 investments for the year ended September 30, 2022:
| | | Consumer | | | Real Estate | |
| | | Loans | | | Loans | |
| Beginning Balance – October 1, 2021 | | $ | 950,579 | | | $ | 2,753,396 | |
| Acquisitions | | | 2,480,121 | | | | 1,469,000 | |
| Paydowns | | | (997,949 | ) | | | (1,898,609 | ) |
| Net realized losses | | | (83,553 | ) | | | — | |
| Change in unrealized appreciation/depreciation | | | (239,011 | ) | | | (53,123 | ) |
| Accretion of discounts | | | 27,842 | | | | 1,035 | |
| Ending Balance – September 30, 2022 | | $ | 2,138,029 | | | $ | 2,271,699 | |
| Change in unrealized appreciation/depreciation on investments still held at September 30, 2022 | | $ | (268,471 | ) | | $ | (71,796 | ) |
AlphaCentric Prime Meridian Income Fund
NOTES TO FINANCIAL STATEMENTS (continued)
September 30, 2022
The following is a summary of quantitative information about the significant unobservable valuation inputs for Level 3 investments held as of September 30, 2022:
| Type of | | Fair Value as of | | | Valuation | | | | | | Weighted |
| Investment | | September 30, 2022 | | | Techniques | | Unobservable Inputs | | Range | | Average |
| Consumer Loans | | $ | 2,083,500 | | | Discounted | | Loss-Adjusted Discount Rate; | | 4.84%-41.44% | | 13.46% |
| | | | | | | Cash Flow | | Projected Loss Rate | | 0.26%-100.00% | | 21.97% |
| Consumer Loans | | | 54,529 | | | Cost on Investments | | Purchase Price | | $95.50-$99.00 | | N/A |
| Real Estate Loans | | | 2,271,699 | | | Discounted | | Loss-Adjusted Discount Rate; | | 0.07%-9.45% | | 5.40% |
| | | | | | | Cash Flow | | Projected Loss Rate | | 0.00%-0.89% | | 0.38% |
| Total | | $ | 4,409,728 | | | | | | | | | |
During the year ended September 30, 2022, the Fund had charge offs of $83,553 of outstanding principal on the loans and recoveries of $13,772, which resulted in a net charge off of $69,781. As of September 30, 2022, there were 12 loans placed on non-accrual status with a fair value of $7,158.
| 4. | Management Fee, Related Party Transactions and Other |
The Fund has entered into a management agreement (the “Management Agreement”) with the Advisor. Under the terms of the Management Agreement, the Fund compensates the Advisor for its services at the annual rate of 1.50% of the Fund’s average daily net assets, payable on a monthly basis in arrears. The Sub-Advisor is paid by the Advisor, not the Fund. For the year ended September 30, 2022, the Fund incurred management fees of $79,003.
The Fund has entered into an expense limitation agreement (the “Expense Limitation Agreement”) with the Advisor. Pursuant to the Expense Limitation Agreement, the Advisor has agreed to waive its fees and/or pay Fund expenses to the extent necessary to limit the annual Fund operating expenses (which includes the Fund’s organizational and offering expenses (other than related legal fees which are paid by the Advisor) and ordinary operating expenses such as advisory fees, but excluding acquired fund fees and expenses, distribution fees, loan servicing fees, brokerage commissions and trading costs, interest (including borrowing costs and overdraft charges), taxes, short sale dividends and interest expenses, as well as non-routine or extraordinary expenses, such as regulatory inquiry and litigation expenses or Fund organization costs), to the extent that such Fund annual operating expenses exceed 1.95% of the Fund’s average daily net assets. The Expense Limitation Agreement will remain in effect until at least January 31, 2023, unless and until the Board approves its modification or termination. During any renewal term, the agreement may be terminated only with the approval of the Board. In consideration of the Advisor’s agreement to limit the annual Fund operating expenses, the Expense Limitation Agreement also provides that the Advisor may recoup from the Fund any fees waived and/or expenses paid pursuant to the agreement for a period of up to three years from the date of the waiver and/or expense payment, provided such recoupment does not cause the annual Fund operating expenses to exceed the expense limit in effect when the fees were waived or expenses paid, or the expense limit in effect at the time of the recoupment.
Through commencement of the Fund’s operations on December 31, 2019, the Advisor incurred organizational and offering costs on behalf of the Fund of $72,843 and $39,548, respectively. The Advisor has agreed to permanently waive the right to recoup $50,850 of the organizational costs incurred, and the remainder of the organizational and offering costs are subject to the recoupment provisions of the Expense Limitation Agreement. Organizational expenses are recorded as they are incurred and offering costs are amortized over the twelve months from the later of the commencement of the Fund’s operations or when incurred. The recoupment period for the unwaived organizational expenses incurred through December 31, 2019 expires on December 31, 2022. Since inception of the Fund, $1,607,787 of organizational and operating expenses have been waived or reimbursed and are subject to potential recovery.
| | | | Expiring During | | | Expiring During | | | Expiring During | | | | |
| | | | the Fiscal Year | | | the Fiscal Year | | | the Fiscal Year | | | | |
| Expiring | | | Ending September | | | Ending September | | | Ending September | | | | |
| December 31, 2022 | | | 30, 2023 | | | 30, 2024 | | | 30, 2025 | | | Total | |
| $ | 37,215 | | | $ | 439,916 | | | $ | 549,158 | | | $ | 581,498 | | | $ | 1,607,787 | |
AlphaCentric Prime Meridian Income Fund
NOTES TO FINANCIAL STATEMENTS (continued)
September 30, 2022
As of September 30, 2022, the Advisor believes that the likelihood of recoupment of fees is not probable.
U.S. Bank Global Fund Services serves as Administrator, Accounting Agent, and Transfer Agent. Millennium Trust Company, LLC and U.S. Bank, N.A. serve as custodians for the securities and cash, respectively, of the Fund’s portfolio. Effective October 29, 2021, LendingClub Bank serves as custodian for the Fund’s cash maintained in transactional operating accounts on the LendingClub platform.
MFund Services LLC (“MFund”), an affiliate of the Advisor, provides the Fund with various management and legal administration services pursuant to a Management Services Agreement with the Fund. For these management and legal administration services, the Fund pays MFund an annual fixed fee and an asset- based fee. Pursuant to a separate Compliance Services Agreement, MFund also provides chief compliance officer services to the Fund. For these compliance services, the Fund pays MFund a monthly base fee plus an asset-based fee. In addition, the Fund reimburses MFund for any reasonable out-of-pocket expenses incurred in the performance of its duties under the Management Services Agreement and Compliance Services Agreement.
Foreside Fund Services, LLC (the “Distributor”) serves as the Fund’s principal underwriter, within the meaning of the 1940 Act, and acts as distributor of the Fund’s shares on a best effort basis, subject to various conditions. The Fund’s shares are offered for sale through the Distributor at NAV. The Distributor also may enter into selected dealer agreements with other broker dealers for the sale and distribution of the Fund’s shares. In reliance on Rule 415 under the Securities Act of 1933, the Fund intends to offer to sell its shares, on a continual basis, through the Distributor.
Certain officers of the Fund are also employees of U.S. Bank Global Fund Services, the Advisor, the Sub-Advisor and MFund.
The Fund intends to comply with the requirements of Subchapter M of the Internal Revenue Code of 1986, as amended, necessary to qualify as a regulated investment company and to make the requisite distributions of income and capital gains to its shareholders sufficient to relieve it from all or substantially all federal income taxes. Therefore, no federal income tax provision has been provided.
The Fund has adopted financial reporting rules regarding recognition and measurement of tax positions taken or expected to be taken on a tax return. The Fund recognizes interest and penalties, if any, related to unrecognized tax benefits as income tax expense on the Statement of Operations. During the year, the Fund did not incur any interest or penalties. The Fund has reviewed all open tax years and concluded that there is no effect to the Fund’s financial position or results of operations and no tax liability resulting from unrecognized tax benefits relating to uncertain income tax positions taken or expected to be taken on a tax return. The Fund has no examinations in progress.
At September 30, 2022, the Fund’s most recent fiscal year end, the components of accumulated earnings and cost of investments on a tax basis were as follows:
| Tax cost of investments | | $ | 4,778,121 | |
| Gross unrealized appreciation | | $ | 19,047 | |
| Gross unrealized depreciation | | | (387,440 | ) |
| Net unrealized depreciation | | | (368,393 | ) |
| Undistributed ordinary income | | | 45,571 | |
| Undistributed long-term capital gain | | | — | |
| Other accumulated losses | | | (197,026 | ) |
| Total accumulated losses | | $ | (519,848 | ) |
The difference between book-basis and tax-basis unrealized appreciation (depreciation) is primarily attributable to the debt with significant modification for tax.
AlphaCentric Prime Meridian Income Fund
NOTES TO FINANCIAL STATEMENTS (continued)
September 30, 2022
At September 30, 2022, the Fund had long-term capital loss carryforwards and short-term capital loss carryforwards that will not expire of $70,840 and $126,186, respectively.
The character of distributions made during the period from net investment income or net realized gains may differ from its ultimate characterization for federal income tax purposes. Also, due to the timing of dividend distributions, the fiscal year in which amounts are distributed may differ from the fiscal year in which the income or realized gain were recorded by the Fund.
The tax character of the distributions paid during the fiscal years ended September 30, 2022 and September 30, 2021 were as follows:
| | | September 30, | | | September 30, | |
| | | 2022 | | | 2021 | |
| Distributions paid from: | | | | | | | | |
| Ordinary income | | $ | 590,396 | | | $ | 397,124 | |
| Return of Capital | | | — | | | | 11,008 | |
| Total | | $ | 590,396 | | | $ | 408,132 | |
Net investment income and realized gains and losses for federal income tax purposes may differ from that reported on the financial statements because of permanent book-to-tax differences. GAAP requires that permanent differences in distributable earnings due to differences between financial reporting and tax reporting be reclassified to or from paid in capital. These reclassifications have no effect on NAV per share. For the fiscal year ended September 30, 2022, the following table shows the reclassifications made among tax components:
| Paid in capital | | $ | (23 | ) |
| Total accumulated deficit | | $ | 23 | |
These differences primarily relate to non-deductible excise tax paid from the Fund.
| 6. | Investment Transactions |
Investment transactions for the year ended September 30, 2022, excluding U.S. Government Obligations and short-term investments, were as follows:
| Purchases of Investments | | $ | 3,949,121 | |
| Proceeds from Principal Paydowns and Sales of Investments | | $ | 3,496,558 | |
| 7. | Distribution and Shareholder Services Plans |
The Fund has adopted a distribution plan (the “Distribution Plan”). The Fund is authorized under the Distribution Plan to pay to the Distributor a distribution fee for certain activities relating to the distribution of shares to investors. These activities include marketing and other activities to support the distribution of shares. The Distribution Plan operates in a manner consistent with Rule 12b-1 under the 1940 Act, which regulates the manner in which an open-end investment company may directly or indirectly bear the expenses of distributing its shares. Although the Fund is not an open-end investment company, it undertakes to comply with the terms of Rule 12b-1. Under the Distribution Plan, the Fund would pay the Distributor a distribution fee at an annual rate of up to 0.75% of average daily net assets. As of September 30, 2022, the Fund has not implemented the Distribution Plan or imposed any distribution fees.
The Fund has adopted a “Shareholder Services Plan” under which the Fund may compensate financial industry professionals for providing ongoing services to shareholders. Such services may include electronic processing of client orders, electronic fund transfers between clients and the Fund, account reconciliations with the Fund’s transfer agent, facilitation of electronic delivery to clients of Fund documentation, monitoring client accounts for back-up withholding and any other special tax reporting obligations, maintenance of books and records with respect to the foregoing, and such other information and liaison services as the Fund, the Advisor, or Sub-Advisor may reasonably request. Under the
AlphaCentric Prime Meridian Income Fund
NOTES TO FINANCIAL STATEMENTS (continued)
September 30, 2022
Shareholder Services Plan, the Fund may incur expenses on an annual basis up to 0.25% of its average daily net assets. Effective as of October 30, 2021, the Board has authorized implementation of such plan in an amount equal to 0.10% of the average daily net assets of the Fund. For the year ended September 30, 2022, the Fund incurred $4,866 in expenses under the Shareholder Services Plan.
Investing in the Fund’s shares involves substantial risks, including the risks set forth in the “Risk Factors” section of the prospectus, which include, but are not limited to the following:
a) Marketplace Loan Risk
Marketplace Loans are generally not rated and constitute a highly risky and speculative investment. There can be no assurance that payments due on underlying Marketplace Loans will be made.
b) Default Risk
The ability of the Fund to generate income through its investment in Marketplace Loans is dependent upon payments being made by the borrower underlying such Marketplace Loans. If a borrower is unable to make its payments on a Marketplace Loan, the Fund may be greatly limited in its ability to recover any outstanding principal and interest under such loan.
c) Prepayment Risk
In the event of a prepayment of all or a portion of the remaining unpaid principal amount of a loan to which the Fund has investment exposure, the Fund will receive such prepayment but further interest will cease to accrue on the prepaid portion of the loan after the date of the prepayment.
d) Platform Concentration Risk
A substantial portion of the Fund’s Marketplace Loan investments have originated from a limited number of platforms. A concentration in select platforms may subject the Fund to increased dependency and risks associated with those platforms than it would otherwise be subject to if it were more broadly diversified across a greater number of platforms.
e) Servicer Risk
The Fund expects that all of its direct and indirect investments in loans originated by marketplace lending platforms will be serviced by a platform or a third-party servicer. However, the Fund’s investments could be adversely impacted if a platform that services the Fund’s investments becomes unable or unwilling to fulfill its obligations to do so. In the event that the servicer is unable to service the loans, there can be no guarantee that a backup servicer will be able to assume responsibility for servicing the loans in a timely or cost-effective manner; any resulting disruption or delay could jeopardize payments due to the Fund in respect of its investments or increase the costs associated with the Fund’s investments.
f) Valuation Risk
Many of the Fund’s investments may be difficult to value. Valuation of illiquid investments may require more research than for more liquid investments. In addition, elements of judgment may play a greater role in valuation in such cases than for investments with a more active secondary market because there is less reliable objective data available. Amounts ultimately realized by the Fund on such investments may not equal the value at which the Fund carried the investment on its books, which would adversely affect the NAV of the Fund.
g) Non-Diversification Risk
The Fund is classified as a “non -diversified” fund under the 1940 Act. Accordingly, the Fund may invest a greater portion of its assets in the securities of a single issuer than if it were a “diversified” fund. To the extent that the Fund invests a
AlphaCentric Prime Meridian Income Fund
NOTES TO FINANCIAL STATEMENTS (continued)
September 30, 2022
higher percentage of its assets in the securities of a single issuer, the Fund is subject to a higher degree of risk associated with and developments affecting that issuer than a fund that invests more widely.
h) Liquidity Risk
The Fund is a closed-end investment company structured as an “interval fund” and designed for long-term investors. Unlike many closed-end investment companies, the Fund’s shares are not listed on any securities exchange and are not publicly traded. There is currently no secondary market for the shares and the Fund expects that no secondary market will develop. Limited liquidity is provided to shareholders only through the Fund’s quarterly repurchase offers for no less than 5% of the shares outstanding at NAV. There is no guarantee that shareholders will be able to sell all of the shares they desire in a quarterly repurchase offer. The Fund’s investments are also subject to liquidity risk. Liquidity risk exists when particular investments of the Fund would be difficult to purchase or sell, possibly preventing the Fund from selling such illiquid securities at an advantageous time or price, or possibly requiring the Fund to dispose of other investments at unfavorable times or prices in order to satisfy its obligations. Marketplace Loans may not have a secondary market and may be difficult to sell.
As noted above, the Fund operates as an interval fund pursuant to Rule 23c-3 under the 1940 Act and, as such, has adopted a fundamental policy that it will make quarterly repurchase offers for no less than for 5% of the Fund’s shares outstanding at NAV less any repurchase fee, unless suspended or postponed in accordance with regulatory requirements, and each repurchase pricing shall occur no later than the 14th day after the Repurchase Request Deadline (as defined below), or the next business day if the 14th is not a business day (each such pricing date, a “Repurchase Pricing Date”) . Repurchases are recorded on the Repurchase Request Deadline. There is no guarantee that shareholders will be able to sell all of the shares they desire to sell in a quarterly repurchase offer. Liquidity will be provided to shareholders only through the Fund’s quarterly repurchases. Shareholders will be notified in writing of each quarterly repurchase offer and the date the repurchase offer ends (the “Repurchase Request Deadline”).
During the year ended September 30, 2022, the Fund completed four repurchase offers. In each offer, the Fund offered to repurchase up to 5% of the number of its outstanding shares as of the applicable Repurchase Pricing Date. The results of the repurchase offers are as follows:
| | | | Repurchase | | | | Amount |
| Commencement | Repurchase | Repurchase | Offer | Shares | Amount | Shares | Paid for |
| Date | Request Deadline | Pricing Date | Amount | Tendered | Tendered | Repurchased | Repurchase |
| November 29, 2021 | December 27, 2021 | January 10, 2022 | 5% | 24,908 | $236,877 | 24,908 | $236,877 |
| February 7, 2022 | March 4, 2022 | March 18, 2022 | 5% | 10,275 | $99,154 | 10,275 | $99,154 |
| May 9, 2022 | June 3, 2022 | June 17, 2022 | 5% | 0 | $0 | 0 | $0 |
| August 8, 2022 | September 2, 2022 | September 16, 2022 | 5% | 0 | $0 | 0 | $0 |
| 10. | Commitments and Contingencies |
Under the Fund’s organizational documents, its officers and trustees are indemnified against certain liabilities arising out of the performance of their duties to the Fund. In addition, in the normal course of business, the Fund enters into contracts that provide general indemnifications to other parties. The Fund’s maximum exposure under these arrangements is unknown as this would involve future claims that may be made against the Fund that has not yet occurred. However, the Fund has not had prior claims or losses pursuant to these contracts and expects the risk of loss to be remote.
AlphaCentric Prime Meridian Income Fund
Report of Independent Registered Public Accounting Firm
September 30, 2022
To the Shareholders and Board of Trustees of AlphaCentric Prime Meridian Income Fund
Opinion on the Financial Statements
We have audited the accompanying statement of assets and liabilities, including the condensed schedule of investments, of AlphaCentric Prime Meridian Income Fund (the “Fund”) as of September 30, 2022, the related statements of operations, cash flows, and changes in net assets, the related notes, and the financial highlights for the year then ended (collectively referred to as the “financial statements”). In our opinion, the financial statements present fairly, in all material respects, the financial position of the Fund as of September 30, 2022, the results of its operations and its cash flows, the changes in net assets, and the financial highlights for the year then ended, in conformity with accounting principles generally accepted in the United States of America.
The Fund’s financial statements and financial highlights for the periods ended September 30, 2021, and prior, were audited by other auditors whose report dated November 23, 2021, expressed an unqualified opinion on those financial statements and financial highlights.
Basis for Opinion
These financial statements are the responsibility of the Fund’s management. Our responsibility is to express an opinion on the Fund’s financial statements based on our audit. We are a public accounting firm registered with the Public Company Accounting Oversight Board (United States) (“PCAOB”) and are required to be independent with respect to the Fund in accordance with the U.S. federal securities laws and the applicable rules and regulations of the Securities and Exchange Commission and the PCAOB.
We conducted our audit in accordance with the standards of the PCAOB. Those standards require that we plan and perform the audit to obtain reasonable assurance about whether the financial statements are free of material misstatement whether due to error or fraud.
Our audit included performing procedures to assess the risks of material misstatement of the financial statements, whether due to error or fraud, and performing procedures that respond to those risks. Such procedures included examining, on a test basis, evidence regarding the amounts and disclosures in the financial statements. Our procedures included confirmation of securities owned as of September 30, 2022, by correspondence with the custodians and lending platforms. Our audit also included evaluating the accounting principles used and significant estimates made by management, as well as evaluating the overall presentation of the financial statements. We believe that our audit provides a reasonable basis for our opinion.
We have served as the auditor of one or more investment companies advised by AlphaCentric Advisors LLC since 2015.
/s/ Cohen & Company, Ltd.
COHEN & COMPANY, LTD.
Cleveland, Ohio
December 9, 2022
AlphaCentric Prime Meridian Income Fund
ADDITIONAL INFORMATION (Unaudited)
Trustees and Officers as of September 30, 2022
The business and affairs of the Fund are managed under the direction of the Board. Each Trustee serves for an indefinite term. Information pertaining to the Trustees and officers of the Fund is set forth below. Unless otherwise noted, the business address of each person listed below is c/o AlphaCentric Prime Meridian Income Fund, 36 North New York Avenue, Huntington, NY 11743. Each officer is elected annually by the Board and does not receive compensation from the Fund. Each Trustee and several officers also serve in the same capacity for Mutual Fund and Variable Insurance Trust and Strategy Shares, each an open-end investment company many of whose series are managed by an affiliate of the Advisor. Collectively, the Fund, Mutual Fund and Variable Insurance Trust, Strategy Shares, Mutual Fund Series Trust, Variable Insurance Trust, and the TCG Financial Series Trusts I-X, constitute the “Fund Complex.” The SAI includes additional information about the Fund’s Trustees and officers and is available without charge, upon request by calling 1-888-910-0412.
Independent Trustees
Name, Address
and Age | Position(s)
with the
Fund | Term of
Office and
Length of
Time Served | Principal
Occupation(s)
During Past 5
Years | Number of
Portfolios
in Fund
Complex
Overseen
by Trustee | Other Directorships Held
by Trustee |
| Tobias Caldwell Year of Birth: 1967 | Chairman of the Board and Trustee | Since 2018 | Managing Member, Genovese Family Enterprises, LLC (real estate firm) since 1999; Managing member, Bear Properties, LLC (real estate firm) since 2006; Managing member, PTL Real Estate, LLC (real estate/investment firm), 2000-2019. | 54 | Chairman of the Board of Trustees, Mutual Fund and Variable Insurance Trust and Strategy Shares since 2016; Lead Independent Trustee and Chairman of Audit Committee, Mutual Fund Series Trust since 2006; Independent Trustee and Chair of Audit Committee, Variable Insurance Trust since 2010; Trustee, IDX Funds (formerly M3Sixty Funds Trust)since 2016. |
| Stephen P. Lachenauer Year of Birth: 1967 | Trustee and Chair of the Audit, Risk and Compliance, and Investment Committees | Trustee and Chair of Audit, Risk and Compliance Committees since 2018
Chair of Investment Committee since
November 2020 | Attorney, private practice since 2011. | 54 | Chair of the Audit and Risk and Compliance Committees and Trustee since 2016, and Chair of the Investment Committee since November 2020, Mutual Fund and Variable Insurance Trust and Strategy Shares; Trustee, TCG Financial Series Trusts I-X since 2015; Trustee, Mutual Fund Series Trust since 2022. |
| Donald McIntosh Year of Birth: 1967 | Trustee | Since 2018 | Business Control & Risk Management Advisor, Santander Bank, since 2019; Quality Control Advisor, Santander Bank, 2016-2019; Credit risk review analyst, Santander Holdings USA, 2015-2016. | 17 | Trustee, Mutual Fund and Variable Insurance Trust and Strategy Shares since 2016. |
AlphaCentric Prime Meridian Income Fund
ADDITIONAL INFORMATION (continued) (Unaudited)
Officers
| Name, Address and Age | Position(s)
Held with
the Fund | Term of
and Length
Served | Principal Occupation(s) During Past 5 Years |
George Amrhein
Year of Birth: 1951 | President | Since 2018 | AlphaCentric Advisors, LLC: Head of Business Development, 2014-2016; Director of Investment, 2017-2019; and NFA Liaison since 2019. Catalyst Capital Advisors LLC: Head of Business Development, 2013-2016; Director of Risk Management, 2015-2017; and Director of Investment, Risk and Compliance since 2017. Rational Advisors, Inc.: Head of Business Development, 2016; Director of Risk Management, 2016-2017; and Director of Investment, Risk and Compliance since 2017. Beacon Advisors LLC: President since 1996. |
Michael Schoonover 53 Palmeras St. Suite 601, San Juan, PR 00901
Year of Birth: 1983 | Vice President | Since 2021 | Chief Operating Officer (“COO”), Catalyst Capital Advisors LLC and Rational Advisors, Inc. since 2017; Portfolio Manager, Catalyst Capital Advisors LLC, 2013-May 2021; President, MFund Distributors LLC since January 2020; Catalyst International Advisors LLC, COO, 2019-2021, Chief Executive Officer since 2021; COO, Insights Media LLC since 2019; COO, MFund Management LLC since 2019; COO, AlphaCentric Advisors LLC since January 2021; Portfolio Manager, Rational Advisors, Inc., 2016-2018. |
Rocco DiBenedetto 2121 N. California Blvd. Suite 830, Walnut Creek, CA 94596
Year of Birth: 1987 | Treasurer | Since 2022 | Director of Accounting, Prime Meridian Capital Management, LLC since 2019; AVP – Fund Accounting, Opus Fund Services, LLC, 2015-2019; Designated Managing Broker, Realtysaber, LLC (real estate firm) since 2019. |
Shun Yin Ho 2020 E. Financial Way, Suite 100 Glendora, CA 91741
Year of Birth: 1980 | Assistant Treasurer | Since 2019 | Assistant Vice President since 2020 and Compliance Officer, 2015-2020, U.S. Bank Global Fund Services. |
Frederick J. Schmidt
Year of Birth: 1959 | Chief Compliance Officer | Since 2018 | Director of Compliance Services, MFund Services LLC since 2015. |
Jennifer A. Bailey
Year of Birth: 1968 | Secretary | Since 2018 | Director of Legal Services, MFund Services LLC since 2012. |
Proxy Voting Policy
Information regarding how the Fund voted proxies relating to portfolio securities for the most recent period ended June 30 as well as a description of the policies and procedures that the Fund uses to determine how to vote proxies is available without charge, upon request, by calling 1-888-910-0412 or by referring to the Securities and Exchange Commission’s (“SEC”) website at http://www.sec.gov.
Portfolio Holdings
The Fund files a complete schedule of portfolio holdings for its first and third fiscal quarters with the SEC on Part F of Form N-PORT. Part F of Form N-PORT is available on the SEC’s website at http://www.sec.gov. The information on Part F of Form N-PORT is available without charge, upon request, by calling 1-888-910-0412, or on the Fund’s website at http://www.alphacentricfunds.com.
Schedule of Investments
The Fund’s complete schedule of investments is available without charge, upon request, by calling 1-888-910-0412, or on the SEC’s website at https://www.sec.gov as part of the Form N-CSR.
| Investment Advisor | Legal Counsel |
| AlphaCentric Advisors LLC | Thompson Hine LLP |
| 53 Palmeras Street, Suite 601 | 41 S. High Street, Suite 1700 |
| San Juan, PR 00901 | Columbus, OH 43215 |
| | |
| Investment Sub-Advisor | Distributor |
| Prime Meridian Capital Management, LLC | Foreside Fund Services, LLC |
| 2121 N. California Blvd, Suite 830 | 3 Canal Plaza, Suite 100 |
| Walnut Creek, CA 94596 | Portland, ME 04101 |
| | |
| Independent Registered Public Accounting Firm | Fund Administrator and Transfer Agent |
| Cohen & Company, Ltd. | U.S. Bank Global Fund Services |
| 1350 Euclid Avenue, Suite 800 | 615 East Michigan Street |
| Cleveland, OH 44115 | Milwaukee, WI 53202 |
| | |
| Custodians | Management, Legal Administration and |
| LendingClub Bank | Compliance Services Provider |
| 595 Market Street, Suite 200 | MFund Services LLC |
| San Francisco, CA 94105 | 36 North New York Avenue |
| | Huntington, NY 11743 |
| Millennium Trust Company | |
| 2001 Spring Road, Suite 700 | |
| Oak Brook, IL 60523 | |
| | |
| U.S. Bank, National Association | |
| 1555 North RiverCenter Drive, Suite 302 | |
| Milwaukee, WI 53212 | |
(b) Not applicable.
Item 2. Code of Ethics.
The registrant has adopted a code of ethics that applies to the registrant’s principal executive officer and principal financial officer. The registrant has not made any substantive amendments to its code of ethics during the period covered by this report. The registrant has not granted any waivers from any provisions of the code of ethics during the period covered by this report.
A copy of the registrant’s Code of Ethics is incorporated by reference. See Item 13(a)(1).
Item 3. Audit Committee Financial Expert.
The registrant’s Board of Trustees (“Board”) has determined that the registrant does not have an audit committee financial expert. The Board has concluded that the audit committee members, as a group, are sufficiently experienced in matters related to financial reporting to perform the functions necessary under the Audit Committee Charter.
Item 4. Principal Accountant Fees and Services.
(a) Audit Fees. The aggregate fees billed for the fiscal years for professional services rendered by the registrant’s principal accountant for the audit of the registrant’s annual financial statements or services that are normally provided by the accountant in connection with statutory and regulatory filings or engagements are as follows:
Fiscal year from 10/1/2020 to 9/30/2021: $83,300
Fiscal year from 10/1/2021 to 9/30/2022: $85,000
(b) Audit-Related Fees. There were no fees billed in the fiscal years for assurances and related services by the principal accountant that are reasonably related to the performance of the audit of the registrant’s financial statements and are not reported under paragraph (a) of this item.
Fiscal year from 10/1/2020 to 9/30/2021: $0
Fiscal year from 10/1/2021 to 9/30/2022: $0
(c) Tax Fees. The aggregate fees billed or expected to be billed for the fiscal years for professional services rendered by the principal accountant for tax compliance are as follows:
Fiscal year from 10/1/2020 to 9/30/2021: $6,300
Fiscal year from 10/1/2021 to 9/30/2022: $6,000
(d) All Other Fees. The aggregate fees billed for the fiscal years for professional services rendered by the principal accountant related to the registrant’s semi-annual report and Form N-2/A filing and issuance of related consent letter are as follows:
Fiscal year from 10/1/2020 to 9/30/2021: $5,000
Fiscal year from 10/1/2021 to 9/30/2022: $700
(e)(1) The audit committee does not have pre-approval policies and procedures. Instead, the audit committee approves on a case-by-case basis each audit or non-audit service before the principal accountant is engaged by the registrant.
(e)(2) There were no services described in each of paragraphs (b) through (d) of this Item that were approved by the audit committee pursuant to paragraph (c)(7)(i)(C) of Rule 2-01 of Regulation S-X.
(f) Not applicable. The percentage of hours expended on the principal accountant’s engagement to audit the registrant’s financial statements for the most recent fiscal year that were attributed to work performed by persons other than the principal accountant’s full-time, permanent employees was zero percent (0%).
(g) All non-audit fees billed by the registrant’s principal accountant for services rendered to the registrant for each of the last two fiscal periods are disclosed in (b)-(d) above. There were no audit or non-audit services performed by the registrant’s principal accountant for the registrant’s advisor.
(h) The audit committee has considered whether the provision of non-audit services that were rendered to the registrant’s investment advisor is compatible with maintaining the principal accountant’s independence and has concluded that the provision of such non-audit services by the accountant has not compromised the accountant’s independence.
The registrant has not been identified by the U.S. Securities and Exchange Commission as having filed an annual report issued by a registered public accounting firm branch or office that is located in a foreign jurisdiction where the Public Company Accounting Oversight Board is unable to inspect or completely investigate because of a position taken by an authority in that jurisdiction.
The registrant is not a foreign issuer.
Item 5. Audit Committee of Listed Registrants.
(a) Not applicable to registrants who are not listed issuers (as defined in Rule 10A-3 under the Securities Exchange Act of 1934).
(b) Not Applicable.
Item 6. Investments.
(a)
| AlphaCentric Prime Meridian Income Fund |
| SCHEDULE OF INVESTMENTS |
| September 30, 2022 |
| | | Platform | | Original
Acquisition
Date | | Principal
Amount | | | Cost | | | Fair Value | |
| WHOLE LOANS - 40.7% | | | | | | | | | | | | | | | | |
| Consumer Loans - 40.7% (a) | | | | | | | | | | | | | | | | |
| 171647609, 15.40%, 11/20/23 | | LendingClub | | 11/20/20 | | $ | 1,421 | | | $ | 1,382 | | | $ | 1,387 | |
| 171949148, 14.71%, 11/16/23 | | LendingClub | | 11/16/20 | | | 3,047 | | | | 2,943 | | | | 2,965 | |
| 171975587, 15.40%, 12/17/25 (b)(c) | | LendingClub | | 12/02/20 | | | 14,102 | | | | 13,266 | | | | 1,323 | |
| 172124627, 14.02%, 11/19/23 | | LendingClub | | 11/19/20 | | | 2,808 | | | | 2,677 | | | | 2,715 | |
| 172410090, 16.08%, 12/04/25 | | LendingClub | | 12/04/20 | | | 7,362 | | | | 6,972 | | | | 6,971 | |
| 172526594, 16.08%, 05/03/26 (b) | | LendingClub | | 12/03/20 | | | 8,240 | | | | 7,804 | | | | 2,731 | |
| 172930301, 17.30%, 01/07/26 | | LendingClub | | 01/07/21 | | | 7,563 | | | | 7,412 | | | | 7,252 | |
| 172953769, 10.81%, 01/09/24 | | LendingClub | | 01/04/21 | | | 4,376 | | | | 4,301 | | | | 4,309 | |
| 173001562, 9.56%, 01/04/24 | | LendingClub | | 01/04/21 | | | 5,758 | | | | 5,528 | | | | 5,615 | |
| 173189961, 13.33%, 01/04/24 | | LendingClub | | 01/04/21 | | | 4,937 | | | | 4,844 | | | | 4,813 | |
| 173230532, 16.08%, 12/29/23 | | LendingClub | | 12/29/20 | | | 5,704 | | | | 5,453 | | | | 5,515 | |
| 173245923, 15.40%, 01/04/26 | | LendingClub | | 01/04/21 | | | 11,208 | | | | 10,926 | | | | 10,805 | |
| 173275380, 18.24%, 01/22/26 | | LendingClub | | 01/13/21 | | | 7,578 | | | | 6,934 | | | | 6,929 | |
| 173282489, 14.71%, 01/07/24 (b)(c) | | LendingClub | | 01/07/21 | | | 4,044 | | | | 3,983 | | | | 385 | |
| 173338471, 20.74%, 01/19/26 | | LendingClub | | 01/13/21 | | | 13,989 | | | | 13,289 | | | | 13,123 | |
| 173339982, 18.24%, 01/05/24 (b) | | LendingClub | | 12/31/20 | | | 5,412 | | | | 5,057 | | | | 1,982 | |
| 173344582, 16.08%, 01/05/24 | | LendingClub | | 01/05/21 | | | 6,046 | | | | 5,726 | | | | 5,800 | |
| 173358800, 19.95%, 01/13/24 | | LendingClub | | 01/13/21 | | | 10,360 | | | | 9,686 | | | | 9,835 | |
| 173377823, 19.95%, 01/04/26 | | LendingClub | | 01/04/21 | | | 11,070 | | | | 10,483 | | | | 10,353 | |
| 173397739, 18.24%, 01/04/26 | | LendingClub | | 01/04/21 | | | 9,227 | | | | 8,854 | | | | 8,718 | |
| 173401158, 15.40%, 01/04/24 | | LendingClub | | 01/04/21 | | | 1,517 | | | | 1,459 | | | | 1,465 | |
| 173421109, 14.02%, 01/04/24 | | LendingClub | | 01/04/21 | | | 4,963 | | | | 4,806 | | | | 4,810 | |
| 173425721, 16.08%, 01/06/26 | | LendingClub | | 01/06/21 | | | 9,006 | | | | 8,556 | | | | 8,534 | |
| 173428112, 18.24%, 01/15/26 | | LendingClub | | 01/04/21 | | | 7,686 | | | | 7,520 | | | | 7,362 | |
| 173440757, 15.40%, 01/20/26 | | LendingClub | | 01/07/21 | | | 14,836 | | | | 14,243 | | | | 14,180 | |
| 173452322, 20.74%, 01/04/26 | | LendingClub | | 01/04/21 | | | 9,269 | | | | 9,245 | | | | 8,980 | |
| 173472479, 17.30%, 01/07/26 | | LendingClub | | 01/07/21 | | | 15,127 | | | | 14,749 | | | | 14,454 | |
| 173480973, 19.95%, 01/29/24 | | LendingClub | | 01/29/21 | | | 5,172 | | | | 4,810 | | | | 4,906 | |
| 173481448, 16.08%, 01/07/26 | | LendingClub | | 01/07/21 | | | 8,556 | | | | 8,427 | | | | 8,308 | |
| 173537826, 14.02%, 01/13/26 | | LendingClub | | 01/06/21 | | | 7,437 | | | | 7,325 | | | | 7,226 | |
| 173555296, 13.33%, 01/07/24 | | LendingClub | | 01/07/21 | | | 4,599 | | | | 4,438 | | | | 4,457 | |
| 173715688, 17.24%, 01/13/26 | | LendingClub | | 01/13/21 | | | 9,073 | | | | 8,755 | | | | 8,663 | |
| 174073400, 15.19%, 01/26/24 | | LendingClub | | 01/26/21 | | | 4,005 | | | | 3,764 | | | | 3,836 | |
| 174167788, 13.24%, 02/01/24 | | LendingClub | | 02/01/21 | | | 5,006 | | | | 4,706 | | | | 4,784 | |
| 182645812, 23.99%, 11/08/26 (b) | | LendingClub | | 11/08/21 | | | 18,138 | | | | 17,956 | | | | 66 | |
| 182823625, 28.99%, 11/18/26 | | LendingClub | | 11/18/21 | | | 6,592 | | | | 6,460 | | | | 6,255 | |
| 182847100, 28.99%, 11/24/26 | | LendingClub | | 11/23/21 | | | 13,608 | | | | 13,200 | | | | 12,779 | |
| 182926009, 25.99%, 11/18/26 | | LendingClub | | 11/12/21 | | | 9,861 | | | | 9,565 | | | | 9,279 | |
| 183123528, 20.44%, 11/12/26 | | LendingClub | | 11/12/21 | | | 5,908 | | | | 5,908 | | | | 5,713 | |
| 183167221, 28.99%, 11/16/26 (b) | | LendingClub | | 11/16/21 | | | 9,052 | | | | 8,690 | | | | 1,057 | |
| 183196256, 28.99%, 11/17/26 | | LendingClub | | 11/17/21 | | | 11,098 | | | | 10,710 | | | | 8,832 | |
| 183289999, 28.99%, 11/19/26 | | LendingClub | | 11/19/21 | | | 5,493 | | | | 5,410 | | | | 5,235 | |
| 183337972, 23.99%, 11/22/26 | | LendingClub | | 11/22/21 | | | 7,593 | | | | 7,593 | | | | 7,341 | |
| 183380248, 16.99%, 11/24/26 | | LendingClub | | 11/23/21 | | | 1,595 | | | | 1,587 | | | | 1,551 | |
| 183394979, 23.99%, 11/27/26 (b) | | LendingClub | | 11/22/21 | | | 3,370 | | | | 3,370 | | | | 447 | |
| 183489173, 23.99%, 11/24/26 | | LendingClub | | 11/24/21 | | | 18,079 | | | | 18,079 | | | | 17,505 | |
| 183598008, 23.99%, 11/30/26 | | LendingClub | | 11/30/21 | | | 9,039 | | | | 8,994 | | | | 8,721 | |
| 183657208, 28.99%, 12/09/26 | | LendingClub | | 12/09/21 | | | 15,227 | | | | 14,770 | | | | 14,279 | |
| 183658618, 17.24%, 12/07/26 | | LendingClub | | 12/07/21 | | | 17,976 | | | | 17,257 | | | | 16,906 | |
| 183694841, 28.99%, 12/18/26 | | LendingClub | | 12/09/21 | | | 18,653 | | | | 18,093 | | | | 17,538 | |
| 183709052, 15.44%, 12/06/26 | | LendingClub | | 12/06/21 | | | 5,813 | | | | 5,726 | | | | 5,587 | |
| 183714114, 15.44%, 12/06/26 | | LendingClub | | 12/06/21 | | | 12,967 | | | | 12,773 | | | | 12,463 | |
| 183741816, 23.99%, 12/08/26 | | LendingClub | | 12/08/21 | | | 5,487 | | | | 5,432 | | | | 5,234 | |
| AlphaCentric Prime Meridian Income Fund |
| SCHEDULE OF INVESTMENTS |
| September 30, 2022 |
| | | Platform | | Original
Acquisition
Date | | Principal
Amount | | | Cost | | | Fair Value | |
| 183757303, 23.99%, 12/16/26 (b)(c) | | LendingClub | | 12/07/21 | | | 8,758 | | | | 8,539 | | | | 822 | |
| 183839826, 18.49%, 12/07/26 | | LendingClub | | 12/07/21 | | | 13,527 | | | | 13,325 | | | | 12,901 | |
| 183844896, 28.99%, 12/08/26 | | LendingClub | | 12/08/21 | | | 16,647 | | | | 16,064 | | | | 15,519 | |
| 183878363, 16.49%, 12/24/26 | | LendingClub | | 12/07/21 | | | 3,513 | | | | 3,513 | | | | 3,431 | |
| 183897668, 24.99%, 12/09/26 | | LendingClub | | 12/09/21 | | | 3,336 | | | | 3,319 | | | | 3,201 | |
| 183918274, 21.49%, 01/31/25 | | LendingClub | | 12/14/21 | | | 8,800 | | | | 8,712 | | | | 8,478 | |
| 183932613, 20.99%, 12/09/26 | | LendingClub | | 12/09/21 | | | 18,154 | | | | 18,064 | | | | 17,470 | |
| 183940931, 14.19%, 12/09/26 | | LendingClub | | 12/09/21 | | | 8,911 | | | | 8,911 | | | | 8,718 | |
| 183964825, 24.99%, 12/13/26 | | LendingClub | | 12/13/21 | | | 9,166 | | | | 8,937 | | | | 8,642 | |
| 183982510, 15.19%, 12/10/26 | | LendingClub | | 12/10/21 | | | 7,146 | | | | 7,110 | | | | 6,934 | |
| 184360530, 18.99%, 01/11/27 (b) | | LendingClub | | 01/06/22 | | | 6,798 | | | | 6,675 | | | | 2,458 | |
| 184568910, 18.99%, 01/01/27 | | LendingClub | | 12/31/21 | | | 18,290 | | | | 17,868 | | | | 17,281 | |
| 184582862, 17.44%, 12/31/26 | | LendingClub | | 12/31/21 | | | 13,931 | | | | 13,804 | | | | 13,498 | |
| 184595768, 18.49%, 12/30/26 | | LendingClub | | 12/30/21 | | | 9,018 | | | | 9,018 | | | | 8,762 | |
| 184715908, 21.99%, 01/04/27 | | LendingClub | | 01/04/22 | | | 9,207 | | | | 9,165 | | | | 8,817 | |
| 184719283, 14.19%, 01/15/27 | | LendingClub | | 01/04/22 | | | 4,905 | | | | 4,839 | | | | 4,749 | |
| 184722604, 16.49%, 01/15/27 | | LendingClub | | 01/04/22 | | | 9,179 | | | | 9,179 | | | | 8,983 | |
| 184755913, 21.99%, 08/06/27 (b)(c) | | LendingClub | | 01/06/22 | | | 9,716 | | | | 9,485 | | | | 0 | |
| 184921834, 20.49%, 01/11/27 | | LendingClub | | 01/11/22 | | | 9,177 | | | | 9,177 | | | | 8,877 | |
| 186432035, 7.09%, 02/25/25 | | LendingClub | | 03/01/22 | | | 3,873 | | | | 3,826 | | | | 3,802 | |
| 186491341, 8.79%, 03/01/25 | | LendingClub | | 03/03/22 | | | 6,915 | | | | 6,800 | | | | 6,757 | |
| 187375805, 28.99%, 04/11/27 | | LendingClub | | 04/13/22 | | | 12,483 | | | | 12,244 | | | | 11,873 | |
| 187522684, 7.09%, 04/16/25 | | LendingClub | | 04/05/22 | | | 3,138 | | | | 3,098 | | | | 3,084 | |
| 187683541, 30.99%, 04/12/27 | | LendingClub | | 04/14/22 | | | 11,549 | | | | 11,216 | | | | 10,883 | |
| 187697875, 12.49%, 03/29/25 | | LendingClub | | 03/31/22 | | | 6,426 | | | | 6,369 | | | | 6,272 | |
| 187726663, 11.49%, 03/30/25 | | LendingClub | | 04/01/22 | | | 4,281 | | | | 4,227 | | | | 4,181 | |
| 187789566, 8.79%, 03/31/25 | | LendingClub | | 04/04/22 | | | 2,127 | | | | 2,109 | | | | 2,095 | |
| 188007866, 20.49%, 04/08/25 | | LendingClub | | 04/12/22 | | | 17,895 | | | | 17,421 | | | | 16,965 | |
| 188138396, 30.99%, 04/12/27 (b) | | LendingClub | | 04/14/22 | | | 14,555 | | | | 14,066 | | | | 5,489 | |
| 188170710, 7.59%, 04/22/25 | | LendingClub | | 04/14/22 | | | 6,135 | | | | 6,003 | | | | 5,978 | |
| 188218952, 30.99%, 04/12/27 | | LendingClub | | 04/14/22 | | | 9,624 | | | | 9,532 | | | | 9,240 | |
| 191982264, 25.99%, 08/26/25 | | LendingClub | | 08/30/22 | | | 8,832 | | | | 8,399 | | | | 8,332 | |
| 192151885, 18.49%, 08/30/25 | | LendingClub | | 09/01/22 | | | 1,566 | | | | 1,551 | | | | 1,539 | |
| 192754897, 9.59%, 08/25/25 | | LendingClub | | 08/29/22 | | | 2,920 | | | | 2,834 | | | | 2,825 | |
| 192772719, 10.79%, 08/31/25 | | LendingClub | | 09/02/22 | | | 1,952 | | | | 1,914 | | | | 1,907 | |
| 192789429, 16.24%, 08/25/25 | | LendingClub | | 08/29/22 | | | 2,935 | | | | 2,892 | | | | 2,874 | |
| 192828837, 23.99%, 08/31/25 | | LendingClub | | 09/02/22 | | | 5,881 | | | | 5,562 | | | | 5,515 | |
| 192848472, 10.04%, 08/29/25 | | LendingClub | | 08/31/22 | | | 3,780 | | | | 3,650 | | | | 3,710 | |
| 192855771, 14.24%, 09/01/25 | | LendingClub | | 09/06/22 | | | 8,500 | | | | 8,250 | | | | 8,219 | |
| 192857598, 10.24%, 08/29/25 | | LendingClub | | 08/31/22 | | | 7,809 | | | | 7,578 | | | | 7,559 | |
| 192883953, 7.59%, 08/26/25 | | LendingClub | | 08/30/22 | | | 13,652 | | | | 13,253 | | | | 13,232 | |
| 192953015, 8.59%, 08/30/25 | | LendingClub | | 09/01/22 | | | 9,683 | | | | 9,399 | | | | 9,375 | |
| 192956227, 9.59%, 08/30/25 | | LendingClub | | 09/01/22 | | | 9,076 | | | | 8,765 | | | | 8,733 | |
| 192986022, 23.99%, 09/01/25 | | LendingClub | | 09/06/22 | | | 7,800 | | | | 7,416 | | | | 7,375 | |
| 193070792, 12.44%, 09/02/25 | | LendingClub | | 09/07/22 | | | 6,000 | | | | 5,853 | | | | 5,832 | |
| 193072701, 9.09%, 09/02/25 | | LendingClub | | 09/07/22 | | | 6,600 | | | | 6,406 | | | | 6,393 | |
| 193076996, 9.34%, 09/02/25 | | LendingClub | | 09/07/22 | | | 4,000 | | | | 3,882 | | | | 3,875 | |
| 193081080, 10.29%, 09/02/25 | | LendingClub | | 09/07/22 | | | 3,500 | | | | 3,414 | | | | 3,407 | |
| 193131738, 10.29%, 09/06/25 | | LendingClub | | 09/08/22 | | | 1,875 | | | | 1,857 | | | | 1,852 | |
| 193143602, 24.49%, 09/19/25 | | LendingClub | | 09/19/22 | | | 9,000 | | | | 8,598 | | | | 8,565 | |
| 193192106, 12.49%, 09/06/25 | | LendingClub | | 09/08/22 | | | 2,200 | | | | 2,168 | | | | 2,160 | |
| 193217338, 15.99%, 09/06/25 | | LendingClub | | 09/08/22 | | | 7,000 | | | | 6,897 | | | | 6,862 | |
| 193273414, 9.34%, 09/12/25 | | LendingClub | | 09/14/22 | | | 3,500 | | | | 3,448 | | | | 3,442 | |
| 193312242, 9.09%, 09/12/25 | | LendingClub | | 09/14/22 | | | 4,000 | | | | 3,941 | | | | 3,934 | |
| 193340586, 15.49%, 09/19/25 | | LendingClub | | 09/19/22 | | | 1,500 | | | | 1,485 | | | | 1,479 | |
| 193463279, 9.09%, 09/20/25 | | LendingClub | | 09/20/22 | | | 4,800 | | | | 4,610 | | | | 4,605 | |
| 193503662, 18.49%, 09/19/25 | | LendingClub | | 09/19/22 | | | 4,833 | | | | 4,618 | | | | 4,612 | |
| 193505022, 8.84%, 09/19/25 | | LendingClub | | 09/19/22 | | | 1,500 | | | | 1,478 | | | | 1,476 | |
| 193517179, 9.59%, 09/19/25 | | LendingClub | | 09/19/22 | | | 6,600 | | | | 6,338 | | | | 6,332 | |
| 193518701, 24.74%, 09/19/25 | | LendingClub | | 09/19/22 | | | 4,500 | | | | 4,366 | | | | 4,349 | |
| 193542225, 9.84%, 09/19/25 | | LendingClub | | 09/19/22 | | | 2,500 | | | | 2,426 | | | | 2,423 | |
| 193547190, 18.74%, 09/19/25 | | LendingClub | | 09/19/22 | | | 3,200 | | | | 3,152 | | | | 3,142 | |
| AlphaCentric Prime Meridian Income Fund |
| SCHEDULE OF INVESTMENTS |
| September 30, 2022 |
| | | Platform | | Original
Acquisition
Date | | Principal
Amount | | | Cost | | | Fair Value | |
| 193550455, 18.24%, 09/20/25 | | LendingClub | | 09/20/22 | | | 16,000 | | | | 15,762 | | | | 15,714 | |
| 193553167, 18.49%, 09/19/25 | | LendingClub | | 09/19/22 | | | 6,000 | | | | 5,911 | | | | 5,891 | |
| 193553595, 12.49%, 09/20/25 | | LendingClub | | 09/20/22 | | | 7,500 | | | | 7,165 | | | | 7,154 | |
| 193567947, 18.49%, 09/21/25 | | LendingClub | | 09/21/22 | | | 4,400 | | | | 4,356 | | | | 4,344 | |
| 193575581, 12.09%, 09/19/25 | | LendingClub | | 09/19/22 | | | 10,000 | | | | 9,901 | | | | 9,881 | |
| 193588330, 15.44%, 09/20/25 | | LendingClub | | 09/20/22 | | | 3,000 | | | | 2,911 | | | | 2,904 | |
| 193618065, 23.49%, 09/21/25 | | LendingClub | | 09/21/22 | | | 11,000 | | | | 10,727 | | | | 10,691 | |
| 193619319, 18.49%, 09/20/25 | | LendingClub | | 09/20/22 | | | 6,000 | | | | 5,911 | | | | 5,893 | |
| 193620005, 11.49%, 09/20/25 | | LendingClub | | 09/20/22 | | | 2,000 | | | | 1,970 | | | | 1,968 | |
| 193644144, 13.99%, 09/20/25 | | LendingClub | | 09/20/22 | | | 2,000 | | | | 1,980 | | | | 1,976 | |
| 193806872, 18.49%, 09/30/25 | | LendingClub | | 09/30/22 | | | 5,000 | | | | 4,800 | | | | 4,800 | |
| 193858687, 16.69%, 09/29/25 | | LendingClub | | 09/29/22 | | | 5,500 | | | | 5,390 | | | | 5,390 | |
| 193907286, 30.99%, 09/29/25 | | LendingClub | | 09/29/22 | | | 1,000 | | | | 955 | | | | 955 | |
| 193942727, 23.74%, 09/29/25 | | LendingClub | | 09/29/22 | | | 13,000 | | | | 12,610 | | | | 12,610 | |
| 193947452, 18.49%, 09/30/25 | | LendingClub | | 09/30/22 | | | 3,500 | | | | 3,465 | | | | 3,465 | |
| 193960159, 18.49%, 10/01/25 | | LendingClub | | 09/29/22 | | | 12,000 | | | | 11,700 | | | | 11,700 | |
| 193979516, 15.99%, 09/29/25 | | LendingClub | | 09/29/22 | | | 6,600 | | | | 6,501 | | | | 6,501 | |
| 193984683, 20.49%, 09/30/25 | | LendingClub | | 09/30/22 | | | 4,200 | | | | 4,158 | | | | 4,158 | |
| 193997500, 15.99%, 09/30/25 | | LendingClub | | 09/30/22 | | | 5,000 | | | | 4,950 | | | | 4,950 | |
| 163208217, 30.99%, 01/16/23 | | LendingClub | | 01/30/20 | | | 678 | | | | 678 | | | | 687 | |
| 164014273, 26.99%, 01/17/23 | | LendingClub | | 01/30/20 | | | 1,807 | | | | 1,807 | | | | 1,817 | |
| 164149433, 26.99%, 05/15/26 (b) | | LendingClub | | 01/30/20 | | | 16,804 | | | | 16,804 | | | | 14,169 | |
| 164176192, 29.96%, 01/27/23 | | LendingClub | | 01/30/20 | | | 822 | | | | 822 | | | | 836 | |
| 164233307, 30.99%, 01/13/23 | | LendingClub | | 01/30/20 | | | 4,035 | | | | 4,035 | | | | 4,087 | |
| 164363032, 29.41%, 01/16/23 | | LendingClub | | 01/30/20 | | | 1,904 | | | | 1,904 | | | | 1,932 | |
| 164453124, 21.59%, 01/15/23 | | LendingClub | | 01/30/20 | | | 174 | | | | 174 | | | | 174 | |
| 164549323, 25.21%, 01/25/23 | | LendingClub | | 01/30/20 | | | 994 | | | | 994 | | | | 1,001 | |
| 164570836, 23.31%, 04/03/25 | | LendingClub | | 01/30/20 | | | 7,736 | | | | 7,736 | | | | 7,528 | |
| 164606713, 22.33%, 01/23/23 | | LendingClub | | 01/30/20 | | | 1,244 | | | | 1,244 | | | | 1,244 | |
| 164717993, 30.99%, 03/18/23 | | LendingClub | | 01/30/20 | | | 2,087 | | | | 2,087 | | | | 2,117 | |
| 164756845, 21.59%, 01/13/23 | | LendingClub | | 01/30/20 | | | 1,453 | | | | 1,453 | | | | 1,451 | |
| 164816754, 26.19%, 01/13/23 | | LendingClub | | 01/30/20 | | | 520 | | | | 520 | | | | 522 | |
| 164848741, 30.99%, 01/14/23 | | LendingClub | | 01/30/20 | | | 968 | | | | 968 | | | | 981 | |
| 164916212, 30.99%, 01/27/23 | | LendingClub | | 01/30/20 | | | 1,217 | | | | 1,217 | | | | 1,240 | |
| 164951573, 21.59%, 01/15/23 | | LendingClub | | 01/30/20 | | | 291 | | | | 291 | | | | 290 | |
| 165055308, 29.96%, 05/24/23 (b) | | LendingClub | | 01/30/20 | | | 2,043 | | | | 2,043 | | | | 279 | |
| 165446373, 17.29%, 02/03/23 | | LendingClub | | 01/30/20 | | | 1,282 | | | | 1,282 | | | | 1,275 | |
| 183615887, 13.99%, 12/27/24 | | LendingClub | | 12/28/21 | | | 7,873 | | | | 7,935 | | | | 7,841 | |
| 183691129, 18.49%, 12/27/24 | | LendingClub | | 12/28/21 | | | 8,791 | | | | 8,859 | | | | 8,750 | |
| 183776530, 21.99%, 12/27/24 | | LendingClub | | 12/28/21 | | | 4,848 | | | | 4,884 | | | | 4,826 | |
| 183824964, 28.24%, 12/27/26 | | LendingClub | | 12/28/21 | | | 6,529 | | | | 6,583 | | | | 6,541 | |
| 183845635, 22.24%, 12/27/24 | | LendingClub | | 12/28/21 | | | 8,082 | | | | 8,147 | | | | 8,067 | |
| 184176809, 26.74%, 12/27/26 (b) | | LendingClub | | 12/28/21 | | | 11,273 | | | | 11,376 | | | | 2,305 | |
| 184197962, 23.99%, 12/27/24 | | LendingClub | | 12/28/21 | | | 9,748 | | | | 9,827 | | | | 9,728 | |
| 184199273, 30.99%, 12/30/26 | | LendingClub | | 12/28/21 | | | 17,700 | | | | 17,865 | | | | 17,492 | |
| 184237668, 25.49%, 12/27/26 | | LendingClub | | 12/28/21 | | | 8,219 | | | | 8,298 | | | | 8,078 | |
| 184303917, 13.99%, 12/27/24 | | LendingClub | | 12/28/21 | | | 4,244 | | | | 4,277 | | | | 4,223 | |
| 184341030, 30.99%, 12/27/24 | | LendingClub | | 12/28/21 | | | 7,456 | | | | 7,518 | | | | 7,441 | |
| 184361660, 28.49%, 12/27/24 | | LendingClub | | 12/28/21 | | | 2,469 | | | | 2,489 | | | | 2,457 | |
| 184362215, 15.99%, 12/27/24 | | LendingClub | | 12/28/21 | | | 15,855 | | | | 15,980 | | | | 15,789 | |
| 184370830, 17.99%, 12/27/24 | | LendingClub | | 12/28/21 | | | 4,263 | | | | 4,289 | | | | 4,242 | |
| 184388558, 26.99%, 12/31/24 | | LendingClub | | 12/28/21 | | | 5,190 | | | | 5,236 | | | | 5,131 | |
| 184397053, 30.99%, 12/27/26 | | LendingClub | | 12/28/21 | | | 13,930 | | | | 14,060 | | | | 13,847 | |
| 184398398, 30.99%, 12/28/26 (b)(c) | | LendingClub | | 12/28/21 | | | 7,831 | | | | 7,904 | | | | 730 | |
| 184403525, 17.99%, 12/27/24 | | LendingClub | | 12/28/21 | | | 3,191 | | | | 3,216 | | | | 3,177 | |
| 184406135, 30.99%, 12/27/26 | | LendingClub | | 12/28/21 | | | 8,695 | | | | 8,782 | | | | 8,555 | |
| 184414413, 15.74%, 12/27/24 | | LendingClub | | 12/28/21 | | | 3,802 | | | | 3,832 | | | | 3,786 | |
| 184416777, 24.99%, 12/27/24 | | LendingClub | | 12/28/21 | | | 2,342 | | | | 2,361 | | | | 2,329 | |
| 184417758, 30.49%, 12/27/24 | | LendingClub | | 12/28/21 | | | 2,482 | | | | 2,503 | | | | 2,477 | |
| AlphaCentric Prime Meridian Income Fund |
| SCHEDULE OF INVESTMENTS |
| September 30, 2022 |
| | | Platform | | Original
Acquisition
Date | | Principal
Amount | | | Cost | | | Fair Value | |
| 184429316, 28.49%, 12/27/24 | | LendingClub | | 12/28/21 | | | 1,267 | | | | 1,275 | | | | 1,256 | |
| 184430130, 30.99%, 12/27/26 | | LendingClub | | 12/28/21 | | | 9,288 | | | | 9,374 | | | | 9,205 | |
| 184447010, 28.99%, 12/27/26 | | LendingClub | | 12/28/21 | | | 6,659 | | | | 6,720 | | | | 6,670 | |
| 184450399, 30.99%, 12/31/24 | | LendingClub | | 12/28/21 | | | 4,991 | | | | 5,028 | | | | 4,938 | |
| 184455585, 17.99%, 12/27/24 | | LendingClub | | 12/28/21 | | | 1,595 | | | | 1,608 | | | | 1,588 | |
| 184459335, 19.99%, 12/27/24 | | LendingClub | | 12/28/21 | | | 19,265 | | | | 19,419 | | | | 19,143 | |
| 184460455, 30.99%, 12/27/26 (b) | | LendingClub | | 12/28/21 | | | 10,406 | | | | 10,502 | | | | 2,161 | |
| 184463310, 26.49%, 12/27/24 | | LendingClub | | 12/28/21 | | | 7,446 | | | | 7,507 | | | | 7,415 | |
| 184463486, 30.99%, 12/27/24 | | LendingClub | | 12/28/21 | | | 5,923 | | | | 5,968 | | | | 5,874 | |
| 184463650, 15.74%, 12/27/24 | | LendingClub | | 12/28/21 | | | 6,337 | | | | 6,387 | | | | 6,311 | |
| 184463700, 18.99%, 01/18/27 | | LendingClub | | 01/20/22 | | | 4,935 | | | | 4,935 | | | | 4,811 | |
| 184464380, 30.99%, 12/27/26 | | LendingClub | | 12/28/21 | | | 19,096 | | | | 19,284 | | | | 18,725 | |
| 184466611, 21.99%, 12/27/26 | | LendingClub | | 12/28/21 | | | 22,750 | | | | 22,957 | | | | 22,492 | |
| 184467082, 20.99%, 12/27/24 | | LendingClub | | 12/28/21 | | | 4,026 | | | | 4,058 | | | | 4,000 | |
| 184467823, 17.99%, 12/27/24 | | LendingClub | | 12/28/21 | | | 15,955 | | | | 16,082 | | | | 15,886 | |
| 184469051, 26.99%, 12/27/24 | | LendingClub | | 12/28/21 | | | 5,244 | | | | 5,287 | | | | 5,222 | |
| 184470793, 27.99%, 12/27/24 (b) | | LendingClub | | 12/28/21 | | | 10,544 | | | | 10,631 | | | | 1,303 | |
| 184471643, 30.99%, 12/27/26 | | LendingClub | | 12/28/21 | | | 14,314 | | | | 14,440 | | | | 14,146 | |
| 184472663, 27.49%, 12/27/26 | | LendingClub | | 12/28/21 | | | 1,349 | | | | 1,361 | | | | 1,336 | |
| 184473552, 17.49%, 12/27/24 | | LendingClub | | 12/28/21 | | | 9,558 | | | | 9,634 | | | | 9,517 | |
| 184474636, 24.99%, 12/30/24 | | LendingClub | | 12/28/21 | | | 3,144 | | | | 3,164 | | | | 3,114 | |
| 184475340, 30.99%, 12/27/24 | | LendingClub | | 12/28/21 | | | 2,055 | | | | 2,072 | | | | 2,013 | |
| 184476554, 30.99%, 12/27/24 | | LendingClub | | 12/28/21 | | | 3,729 | | | | 3,760 | | | | 3,702 | |
| 184477367, 30.99%, 12/27/26 | | LendingClub | | 12/28/21 | | | 4,643 | | | | 4,685 | | | | 4,616 | |
| 184477733, 30.99%, 12/27/24 (b) | | LendingClub | | 12/28/21 | | | 4,350 | | | | 4,386 | | | | 4,313 | |
| 184481397, 28.99%, 12/27/24 | | LendingClub | | 12/28/21 | | | 8,240 | | | | 8,307 | | | | 8,202 | |
| 184487239, 19.99%, 12/27/24 | | LendingClub | | 12/28/21 | | | 4,011 | | | | 4,041 | | | | 3,986 | |
| 184487535, 24.99%, 12/27/24 | | LendingClub | | 12/28/21 | | | 4,887 | | | | 4,927 | | | | 4,868 | |
| 184519976, 30.99%, 01/18/27 | | LendingClub | | 01/20/22 | | | 5,625 | | | | 5,625 | | | | 5,503 | |
| 184784913, 27.99%, 01/18/25 | | LendingClub | | 01/20/22 | | | 2,024 | | | | 2,024 | | | | 1,987 | |
| 185049440, 23.99%, 01/18/25 | | LendingClub | | 01/20/22 | | | 835 | | | | 835 | | | | 823 | |
| 185101413, 29.74%, 01/18/27 (b)(c) | | LendingClub | | 01/20/22 | | | 4,925 | | | | 4,925 | | | | 462 | |
| 185170623, 16.99%, 01/18/25 | | LendingClub | | 01/20/22 | | | 7,865 | | | | 7,865 | | | | 7,755 | |
| 185181915, 16.99%, 01/31/24 | | LendingClub | | 01/20/22 | | | 4,597 | | | | 4,597 | | | | 4,539 | |
| 185204609, 24.99%, 01/30/25 | | LendingClub | | 01/20/22 | | | 1,268 | | | | 1,268 | | | | 1,241 | |
| 185209914, 23.99%, 01/18/25 | | LendingClub | | 01/20/22 | | | 2,087 | | | | 2,087 | | | | 2,057 | |
| 185219366, 22.99%, 01/18/25 (b)(c) | | LendingClub | | 01/20/22 | | | 9,402 | | | | 9,402 | | | | 0 | |
| 185223458, 18.49%, 01/18/27 (b) | | LendingClub | | 01/20/22 | | | 9,359 | | | | 9,359 | | | | 1,703 | |
| 185224281, 19.99%, 01/31/25 | | LendingClub | | 01/20/22 | | | 10,568 | | | | 10,568 | | | | 3,973 | |
| 185231280, 17.99%, 01/18/25 (b)(c) | | LendingClub | | 01/20/22 | | | 4,678 | | | | 4,678 | | | | 59 | |
| 185338159, 29.49%, 02/11/25 | | LendingClub | | 02/15/22 | | | 13,010 | | | | 13,010 | | | | 12,726 | |
| 185347789, 30.49%, 02/11/26 | | LendingClub | | 02/15/22 | | | 4,589 | | | | 4,589 | | | | 4,467 | |
| 185399718, 30.99%, 02/11/25 | | LendingClub | | 02/15/22 | | | 8,295 | | | | 8,295 | | | | 8,108 | |
| 185439817, 26.99%, 02/11/25 | | LendingClub | | 02/15/22 | | | 3,106 | | | | 3,106 | | | | 3,042 | |
| 185468119, 22.99%, 02/11/25 | | LendingClub | | 02/15/22 | | | 3,420 | | | | 3,420 | | | | 3,365 | |
| 185509674, 29.74%, 02/26/25 | | LendingClub | | 02/15/22 | | | 13,232 | | | | 13,232 | | | | 13,005 | |
| 185561544, 30.99%, 02/11/27 | | LendingClub | | 02/15/22 | | | 18,867 | | | | 18,867 | | | | 18,388 | |
| 185689040, 30.99%, 02/11/25 | | LendingClub | | 02/15/22 | | | 1,914 | | | | 1,914 | | | | 1,872 | |
| 185735111, 21.49%, 02/11/27 | | LendingClub | | 02/15/22 | | | 22,330 | | | | 22,330 | | | | 21,849 | |
| 185809208, 30.99%, 02/11/26 | | LendingClub | | 02/15/22 | | | 4,145 | | | | 4,146 | | | | 4,032 | |
| 185921909, 30.99%, 02/11/25 | | LendingClub | | 02/15/22 | | | 11,311 | | | | 11,311 | | | | 11,061 | |
| 185927616, 28.99%, 02/14/25 | | LendingClub | | 02/16/22 | | | 866 | | | | 866 | | | | 849 | |
| 185998007, 22.74%, 02/25/25 | | LendingClub | | 02/15/22 | | | 863 | | | | 863 | | | | 852 | |
| 186023602, 21.99%, 02/11/27 | | LendingClub | | 02/15/22 | | | 23,282 | | | | 23,282 | | | | 22,746 | |
| 186064191, 15.99%, 02/26/24 | | LendingClub | | 02/15/22 | | | 3,727 | | | | 3,727 | | | | 3,690 | |
| 186066793, 30.99%, 02/11/25 | | LendingClub | | 02/15/22 | | | 4,350 | | | | 4,350 | | | | 4,254 | |
| 186071477, 28.99%, 02/11/25 | | LendingClub | | 02/15/22 | | | 2,599 | | | | 2,599 | | | | 2,545 | |
| 186090313, 30.99%, 02/12/25 | | LendingClub | | 02/15/22 | | | 4,880 | | | | 4,880 | | | | 4,759 | |
| AlphaCentric Prime Meridian Income Fund |
| SCHEDULE OF INVESTMENTS |
| September 30, 2022 |
| | | Platform | | Original
Acquisition
Date | | Principal
Amount | | | Cost | | | Fair Value | |
| 186105067, 20.49%, 02/11/25 | | LendingClub | | 02/15/22 | | | 2,210 | | | | 2,210 | | | | 2,172 | |
| 186112970, 30.99%, 02/11/27 | | LendingClub | | 02/15/22 | | | 11,352 | | | | 11,352 | | | | 11,080 | |
| 186112971, 17.99%, 02/11/25 (b) | | LendingClub | | 02/15/22 | | | 2,687 | | | | 2,687 | | | | 475 | |
| 186118303, 24.99%, 02/11/25 | | LendingClub | | 02/15/22 | | | 3,436 | | | | 3,436 | | | | 3,368 | |
| 186126706, 30.99%, 02/15/27 | | LendingClub | | 02/15/22 | | | 8,617 | | | | 8,617 | | | | 8,406 | |
| 186132867, 30.99%, 02/11/25 (b) | | LendingClub | | 02/15/22 | | | 2,841 | | | | 2,841 | | | | 0 | |
| 186132922, 12.54%, 02/15/25 | | LendingClub | | 02/15/22 | | | 8,352 | | | | 8,352 | | | | 8,246 | |
| 186134274, 17.99%, 02/20/25 | | LendingClub | | 02/15/22 | | | 6,075 | | | | 6,075 | | | | 6,001 | |
| 186136649, 30.99%, 02/11/25 (b) | | LendingClub | | 02/15/22 | | | 3,410 | | | | 3,410 | | | | 0 | |
| 186136774, 19.99%, 02/16/25 | | LendingClub | | 02/15/22 | | | 5,965 | | | | 5,965 | | | | 5,869 | |
| 186136784, 15.74%, 02/11/25 | | LendingClub | | 02/15/22 | | | 5,724 | | | | 5,724 | | | | 5,641 | |
| 186141899, 24.99%, 02/11/25 (b)(c) | | LendingClub | | 02/15/22 | | | 3,434 | | | | 3,434 | | | | 324 | |
| 186142053, 25.49%, 02/11/27 | | LendingClub | | 02/15/22 | | | 14,997 | | | | 14,997 | | | | 14,579 | |
| 186143344, 26.49%, 02/11/26 | | LendingClub | | 02/15/22 | | | 9,473 | | | | 9,473 | | | | 9,197 | |
| 186144954, 28.49%, 02/11/27 | | LendingClub | | 02/15/22 | | | 16,959 | | | | 16,959 | | | | 16,696 | |
| 186149058, 30.99%, 02/11/25 | | LendingClub | | 02/15/22 | | | 1,740 | | | | 1,740 | | | | 1,702 | |
| 186150988, 30.49%, 02/11/25 (b)(c) | | LendingClub | | 02/15/22 | | | 24,567 | | | | 24,567 | | | | 2,314 | |
| 186152115, 15.99%, 02/11/25 | | LendingClub | | 02/15/22 | | | 4,205 | | | | 4,205 | | | | 4,146 | |
| 186152464, 30.99%, 02/17/27 | | LendingClub | | 02/15/22 | | | 11,757 | | | | 11,757 | | | | 11,489 | |
| 186152678, 24.99%, 02/11/25 | | LendingClub | | 02/15/22 | | | 3,350 | | | | 3,350 | | | | 3,284 | |
| 186153496, 30.99%, 02/11/27 | | LendingClub | | 02/15/22 | | | 14,190 | | | | 14,190 | | | | 13,850 | |
| 186155024, 18.99%, 02/11/25 | | LendingClub | | 02/15/22 | | | 3,048 | | | | 3,048 | | | | 3,004 | |
| 186155205, 18.74%, 02/11/27 | | LendingClub | | 02/15/22 | | | 5,552 | | | | 5,552 | | | | 5,420 | |
| 186155341, 15.49%, 02/15/25 | | LendingClub | | 02/15/22 | | | 2,945 | | | | 2,945 | | | | 2,907 | |
| 186156211, 30.99%, 02/11/27 | | LendingClub | | 02/15/22 | | | 17,028 | | | | 17,028 | | | | 16,620 | |
| 186157752, 30.99%, 02/11/27 (b)(c) | | LendingClub | | 02/15/22 | | | 11,826 | | | | 11,826 | | | | 582 | |
| 186158108, 15.99%, 02/16/25 | | LendingClub | | 02/15/22 | | | 5,060 | | | | 5,060 | | | | 4,996 | |
| 186158605, 30.99%, 02/15/25 | | LendingClub | | 02/15/22 | | | 11,363 | | | | 11,363 | | | | 11,099 | |
| 186158727, 17.99%, 02/26/25 | | LendingClub | | 02/15/22 | | | 4,266 | | | | 4,266 | | | | 4,219 | |
| 186160312, 24.99%, 02/11/25 | | LendingClub | | 02/15/22 | | | 12,884 | | | | 12,884 | | | | 12,632 | |
| 186165090, 15.99%, 02/11/25 | | LendingClub | | 02/15/22 | | | 5,046 | | | | 5,046 | | | | 4,977 | |
| 186165112, 28.99%, 02/16/25 | | LendingClub | | 02/15/22 | | | 4,392 | | | | 4,392 | | | | 4,302 | |
| 186165332, 30.99%, 02/11/27 | | LendingClub | | 02/15/22 | | | 4,730 | | | | 4,730 | | | | 4,617 | |
| 186170176, 13.99%, 02/11/25 (b) | | LendingClub | | 02/15/22 | | | 9,301 | | | | 9,301 | | | | 1,131 | |
| 187766775, 30.99%, 04/11/25 | | LendingClub | | 04/13/22 | | | 5,003 | | | | 5,048 | | | | 4,909 | |
| 187784900, 15.54%, 04/11/27 | | LendingClub | | 04/13/22 | | | 7,543 | | | | 7,614 | | | | 7,456 | |
| 187860335, 28.49%, 04/11/25 | | LendingClub | | 04/13/22 | | | 8,508 | | | | 8,582 | | | | 8,336 | |
| 187887928, 22.49%, 04/20/25 | | LendingClub | | 04/22/22 | | | 3,421 | | | | 3,451 | | | | 3,391 | |
| 187887993, 30.99%, 04/11/25 | | LendingClub | | 04/13/22 | | | 5,458 | | | | 5,506 | | | | 5,355 | |
| 187899884, 27.99%, 04/11/25 | | LendingClub | | 04/13/22 | | | 13,583 | | | | 13,704 | | | | 13,376 | |
| 187944914, 19.99%, 04/11/25 | | LendingClub | | 04/13/22 | | | 398 | | | | 401 | | | | 396 | |
| 187989828, 30.99%, 04/20/27 | | LendingClub | | 04/13/22 | | | 14,902 | | | | 15,050 | | | | 12,795 | |
| 188051774, 22.99%, 04/11/25 | | LendingClub | | 04/13/22 | | | 898 | | | | 906 | | | | 889 | |
| 188053108, 15.49%, 04/26/24 | | LendingClub | | 04/13/22 | | | 6,055 | | | | 6,104 | | | | 6,062 | |
| 188078858, 17.99%, 04/11/25 | | LendingClub | | 04/13/22 | | | 5,348 | | | | 5,394 | | | | 5,325 | |
| 188081773, 16.49%, 04/11/25 | | LendingClub | | 04/13/22 | | | 1,777 | | | | 1,793 | | | | 1,768 | |
| 188082582, 30.99%, 04/25/25 (b) | | LendingClub | | 04/13/22 | | | 4,054 | | | | 4,091 | | | | 834 | |
| 188083049, 24.49%, 04/11/27 (b) | | LendingClub | | 04/13/22 | | | 6,943 | | | | 7,008 | | | | 2,791 | |
| 188083850, 23.49%, 04/15/25 | | LendingClub | | 04/13/22 | | | 9,922 | | | | 10,010 | | | | 9,835 | |
| 188085005, 15.99%, 04/16/25 | | LendingClub | | 04/13/22 | | | 22,252 | | | | 22,447 | | | | 22,181 | |
| 188085440, 23.49%, 04/11/25 | | LendingClub | | 04/13/22 | | | 7,779 | | | | 7,847 | | | | 7,687 | |
| 188086896, 30.99%, 04/11/25 | | LendingClub | | 04/13/22 | | | 2,706 | | | | 2,730 | | | | 2,643 | |
| 188087040, 29.74%, 04/16/25 | | LendingClub | | 04/13/22 | | | 1,761 | | | | 1,777 | | | | 1,730 | |
| 188087478, 23.24%, 04/11/25 | | LendingClub | | 04/13/22 | | | 5,393 | | | | 5,441 | | | | 5,338 | |
| 188087681, 30.49%, 04/11/25 (b) | | LendingClub | | 04/13/22 | | | 5,568 | | | | 5,618 | | | | 2,288 | |
| 188088747, 20.49%, 04/11/25 | | LendingClub | | 04/13/22 | | | 8,142 | | | | 8,214 | | | | 8,068 | |
| 188088983, 26.99%, 04/25/24 | | LendingClub | | 04/13/22 | | | 8,447 | | | | 8,517 | | | | 8,353 | |
| 188089525, 25.99%, 04/11/25 | | LendingClub | | 04/13/22 | | | 13,541 | | | | 13,661 | | | | 13,352 | |
| AlphaCentric Prime Meridian Income Fund |
| SCHEDULE OF INVESTMENTS |
| September 30, 2022 |
| | | Platform | | Original
Acquisition
Date | | Principal
Amount | | | Cost | | | Fair Value | |
| 188089558, 28.49%, 04/11/25 | | LendingClub | | 04/13/22 | | | 1,087 | | | | 1,097 | | | | 1,071 | |
| 188089781, 28.49%, 04/16/25 (b) | | LendingClub | | 04/13/22 | | | 4,839 | | | | 4,883 | | | | 591 | |
| 188090337, 23.49%, 04/26/27 | | LendingClub | | 04/13/22 | | | 7,226 | | | | 7,296 | | | | 7,197 | |
| 188090472, 24.99%, 04/11/25 | | LendingClub | | 04/13/22 | | | 1,622 | | | | 1,637 | | | | 1,600 | |
| 188090767, 30.99%, 04/20/27 | | LendingClub | | 04/13/22 | | | 5,826 | | | | 5,884 | | | | 5,741 | |
| 188091239, 30.99%, 04/11/27 | | LendingClub | | 04/13/22 | | | 14,436 | | | | 14,574 | | | | 14,164 | |
| 188091311, 20.49%, 05/28/25 | | LendingClub | | 04/13/22 | | | 3,458 | | | | 3,489 | | | | 3,440 | |
| 188092145, 28.99%, 04/11/25 | | LendingClub | | 04/13/22 | | | 4,530 | | | | 4,570 | | | | 4,460 | |
| 188092760, 17.99%, 04/11/25 | | LendingClub | | 04/13/22 | | | 3,564 | | | | 3,595 | | | | 3,544 | |
| 188094202, 26.24%, 04/11/25 | | LendingClub | | 04/13/22 | | | 1,803 | | | | 1,819 | | | | 1,778 | |
| 188094205, 19.99%, 04/11/25 | | LendingClub | | 04/13/22 | | | 3,397 | | | | 3,427 | | | | 3,363 | |
| 188094215, 27.99%, 04/15/25 | | LendingClub | | 04/13/22 | | | 6,361 | | | | 6,418 | | | | 6,274 | |
| 188096188, 30.99%, 04/12/27 | | LendingClub | | 04/14/22 | | | 9,153 | | | | 9,241 | | | | 8,978 | |
| 188096691, 30.99%, 04/25/25 | | LendingClub | | 04/13/22 | | | 1,809 | | | | 1,820 | | | | 1,785 | |
| 188097398, 17.49%, 04/11/25 | | LendingClub | | 04/13/22 | | | 1,786 | | | | 1,801 | | | | 1,779 | |
| 188097672, 15.99%, 04/11/24 | | LendingClub | | 04/13/22 | | | 2,043 | | | | 2,059 | | | | 2,032 | |
| 188099700, 15.74%, 04/17/25 | | LendingClub | | 04/13/22 | | | 5,339 | | | | 5,386 | | | | 5,323 | |
| 188100809, 20.99%, 04/11/27 | | LendingClub | | 04/13/22 | | | 4,943 | | | | 4,989 | | | | 4,885 | |
| 188101947, 22.99%, 04/11/25 | | LendingClub | | 04/13/22 | | | 1,348 | | | | 1,360 | | | | 1,334 | |
| 188103138, 30.99%, 04/19/25 | | LendingClub | | 04/13/22 | | | 10,721 | | | | 10,817 | | | | 10,555 | |
| 188103170, 30.99%, 04/22/25 | | LendingClub | | 04/13/22 | | | 12,857 | | | | 12,974 | | | | 12,680 | |
| 188103172, 25.49%, 04/20/25 | | LendingClub | | 04/13/22 | | | 4,541 | | | | 4,581 | | | | 4,492 | |
| 188103493, 24.99%, 04/11/25 | | LendingClub | | 04/13/22 | | | 4,507 | | | | 4,547 | | | | 4,444 | |
| 188108259, 21.49%, 04/11/27 | | LendingClub | | 04/13/22 | | | 7,134 | | | | 7,201 | | | | 7,051 | |
| 188108404, 19.49%, 04/11/25 | | LendingClub | | 04/13/22 | | | 5,360 | | | | 5,407 | | | | 5,311 | |
| 188112597, 17.74%, 04/22/25 | | LendingClub | | 04/13/22 | | | 6,275 | | | | 6,330 | | | | 6,261 | |
| 188112793, 20.49%, 04/13/25 | | LendingClub | | 04/13/22 | | | 17,920 | | | | 18,078 | | | | 17,786 | |
| 188114972, 30.99%, 04/11/25 | | LendingClub | | 04/13/22 | | | 3,184 | | | | 3,212 | | | | 3,124 | |
| 188116962, 30.99%, 04/11/27 | | LendingClub | | 04/13/22 | | | 11,549 | | | | 11,659 | | | | 11,331 | |
| 188117634, 25.49%, 04/20/27 | | LendingClub | | 04/13/22 | | | 6,743 | | | | 6,804 | | | | 6,667 | |
| 188119794, 23.99%, 04/11/25 | | LendingClub | | 04/13/22 | | | 13,498 | | | | 13,618 | | | | 13,361 | |
| 188121795, 28.99%, 04/11/25 (b) | | LendingClub | | 04/13/22 | | | 6,485 | | | | 6,543 | | | | 2,560 | |
| 188123133, 30.99%, 04/19/27 | | LendingClub | | 04/13/22 | | | 9,308 | | | | 9,397 | | | | 9,165 | |
| 188123577, 15.00%, 11/26/27 | | LendingClub | | 04/13/22 | | | 4,873 | | | | 4,918 | | | | 2,631 | |
| 188123711, 28.99%, 04/11/25 (b) | | LendingClub | | 04/13/22 | | | 7,269 | | | | 7,334 | | | | 0 | |
| 188124880, 30.99%, 04/11/25 | | LendingClub | | 04/13/22 | | | 2,270 | | | | 2,293 | | | | 2,228 | |
| 188125305, 19.99%, 04/11/25 | | LendingClub | | 04/13/22 | | | 2,682 | | | | 2,706 | | | | 2,658 | |
| 188125693, 15.99%, 04/11/25 | | LendingClub | | 04/13/22 | | | 3,108 | | | | 3,135 | | | | 3,091 | |
| 188129556, 30.99%, 04/11/27 | | LendingClub | | 04/13/22 | | | 4,812 | | | | 4,858 | | | | 4,721 | |
| 160708165, 16.12%, 11/15/24 | | LendingClub | | 02/19/20 | | | 7,963 | | | | 7,485 | | | | 7,685 | |
| 161523634, 17.74%, 11/08/22 | | LendingClub | | 03/04/20 | | | 987 | | | | 931 | | | | 986 | |
| 161657418, 18.62%, 11/12/24 | | LendingClub | | 02/19/20 | | | 8,206 | | | | 7,591 | | | | 7,958 | |
| 161704640, 18.62%, 11/12/24 | | LendingClub | | 02/20/20 | | | 10,938 | | | | 10,008 | | | | 10,607 | |
| 161741565, 16.95%, 11/15/24 | | LendingClub | | 02/19/20 | | | 10,741 | | | | 10,151 | | | | 10,365 | |
| 161908462, 17.74%, 11/15/24 | | LendingClub | | 02/19/20 | | | 8,127 | | | | 7,639 | | | | 7,842 | |
| 163899498, 11.71%, 12/31/22 | | LendingClub | | 01/16/20 | | | 485 | | | | 483 | | | | 482 | |
| 164519373, 7.56%, 01/28/23 | | LendingClub | | 05/22/20 | | | 1,471 | | | | 1,368 | | | | 1,467 | |
| 164938162, 14.30%, 01/28/25 | | LendingClub | | 02/13/20 | | | 7,072 | | | | 6,771 | | | | 6,757 | |
| 165603303, 20.55%, 02/04/25 | | LendingClub | | 02/14/20 | | | 247 | | | | 233 | | | | 244 | |
| 165836621, 8.81%, 02/10/23 | | LendingClub | | 05/04/20 | | | 2,825 | | | | 2,599 | | | | 2,809 | |
| 166595031, 17.74%, 02/18/23 | | LendingClub | | 07/24/20 | | | 346 | | | | 315 | | | | 343 | |
| 166633377, 13.08%, 04/27/23 | | LendingClub | | 09/09/20 | | | 2,269 | | | | 1,781 | | | | 2,241 | |
| 167094451, 14.30%, 04/24/23 | | LendingClub | | 07/28/20 | | | 2,299 | | | | 2,029 | | | | 2,267 | |
| 167190347, 13.08%, 02/24/23 | | LendingClub | | 07/27/20 | | | 634 | | | | 583 | | | | 630 | |
| 167369199, 25.65%, 04/15/23 (b)(c) | | LendingClub | | 07/24/20 | | | 3,307 | | | | 2,786 | | | | 157 | |
| 167374459, 15.24%, 02/26/23 | | LendingClub | | 09/02/20 | | | 250 | | | | 225 | | | | 249 | |
| 167464521, 11.71%, 02/27/23 | | LendingClub | | 09/02/20 | | | 2,410 | | | | 2,157 | | | | 2,397 | |
| 167523901, 16.95%, 03/09/23 | | LendingClub | | 09/02/20 | | | 1,221 | | | | 1,081 | | | | 1,211 | |
| AlphaCentric Prime Meridian Income Fund |
| SCHEDULE OF INVESTMENTS |
| September 30, 2022 |
| | | Platform | | Original
Acquisition
Date | | Principal
Amount | | | Cost | | | Fair Value | |
| 167669367, 17.74%, 03/29/23 | | LendingClub | | 07/24/20 | | | 1,384 | | | | 1,218 | | | | 1,378 | |
| 167903543, 7.02%, 03/06/23 | | LendingClub | | 06/15/20 | | | 908 | | | | 821 | | | | 902 | |
| 167918460, 7.56%, 08/06/23 | | LendingClub | | 09/30/20 | | | 5,410 | | | | 5,220 | | | | 5,327 | |
| 168129697, 10.33%, 06/10/23 | | LendingClub | | 09/09/20 | | | 1,619 | | | | 1,255 | | | | 1,593 | |
| 168130519, 13.08%, 03/23/23 | | LendingClub | | 07/24/20 | | | 704 | | | | 643 | | | | 697 | |
| 168132569, 17.74%, 04/15/23 | | LendingClub | | 10/19/20 | | | 1,564 | | | | 1,470 | | | | 1,543 | |
| 168172636, 18.62%, 04/14/23 | | LendingClub | | 10/15/20 | | | 2,041 | | | | 1,878 | | | | 2,021 | |
| 168173979, 15.24%, 08/13/23 | | LendingClub | | 09/28/20 | | | 5,131 | | | | 3,771 | | | | 4,542 | |
| 168183156, 7.56%, 03/11/23 | | LendingClub | | 06/12/20 | | | 1,151 | | | | 1,070 | | | | 1,144 | |
| 168200504, 6.46%, 03/21/23 | | LendingClub | | 06/12/20 | | | 1,729 | | | | 1,608 | | | | 1,718 | |
| 168220915, 20.55%, 04/14/25 | | LendingClub | | 10/07/20 | | | 13,626 | | | | 12,536 | | | | 13,151 | |
| 168306633, 8.81%, 03/16/23 | | LendingClub | | 06/15/20 | | | 1,640 | | | | 1,517 | | | | 1,631 | |
| 168345597, 14.30%, 03/17/23 | | LendingClub | | 07/28/20 | | | 789 | | | | 699 | | | | 784 | |
| 168365641, 8.81%, 03/16/23 | | LendingClub | | 07/24/20 | | | 1,855 | | | | 1,725 | | | | 1,844 | |
| 168556628, 23.05%, 03/23/23 | | LendingClub | | 07/27/20 | | | 666 | | | | 540 | | | | 663 | |
| 168602126, 14.30%, 04/14/23 | | LendingClub | | 10/29/20 | | | 2,435 | | | | 2,301 | | | | 2,411 | |
| 168607697, 17.74%, 04/27/23 | | LendingClub | | 10/22/20 | | | 1,430 | | | | 1,344 | | | | 1,412 | |
| 168615219, 16.95%, 04/15/23 | | LendingClub | | 10/20/20 | | | 2,005 | | | | 1,885 | | | | 1,981 | |
| 168652487, 14.30%, 04/14/23 | | LendingClub | | 10/19/20 | | | 2,750 | | | | 2,613 | | | | 2,726 | |
| 168657591, 18.62%, 03/27/23 | | LendingClub | | 10/19/20 | | | 622 | | | | 566 | | | | 619 | |
| Total Whole Loans | | | | | | | | | | | 2,406,482 | | | | 2,138,029 | |
| | | | | | | | | | | | | | | | | |
| BRIDGE LOANS - 43.2% | | | | | | | | | | | | | | | | |
| Real Estate Loans - 43.2% (a)(d) | | | | | | | | | | | | | | | | |
| 39301, 9.50%, 11/26/22 | | Fund That Flip | | 03/31/21 | | | 50,000 | | | | 50,000 | | | | 48,706 | |
| 39333, 8.50%, 05/01/23 | | Fund That Flip | | 08/31/21 | | | 17,801 | | | | 17,801 | | | | 17,552 | |
| 40671, 8.75%, 09/19/22 (b) | | Fund That Flip | | 03/29/21 | | | 50,000 | | | | 50,000 | | | | 46,272 | |
| 40785, 8.25%, 05/25/22 (b) | | Fund That Flip | | 03/29/21 | | | 50,000 | | | | 50,000 | | | | 46,637 | |
| 41159, 8.50%, 12/11/22 (b) | | Fund That Flip | | 03/29/21 | | | 58,000 | | | | 58,000 | | | | 57,726 | |
| 41250, 10.00%, 10/27/21 (b) | | Fund That Flip | | 07/19/21 | | | 40,000 | | | | 40,000 | | | | 38,495 | |
| 41289, 8.50%, 12/22/22 | | Fund That Flip | | 03/29/21 | | | 50,000 | | | | 50,000 | | | | 48,913 | |
| 41515, 9.25%, 09/23/22 | | Fund That Flip | | 08/16/21 | | | 4,350 | | | | 4,350 | | | | 4,239 | |
| 41663, 9.50%, 04/02/22 (b) | | Fund That Flip | | 04/06/21 | | | 30,000 | | | | 30,000 | | | | 27,753 | |
| 41710, 9.25%, 04/15/22 (b) | | Fund That Flip | | 04/22/21 | | | 35,000 | | | | 35,000 | | | | 32,473 | |
| 41711, 9.50%, 04/02/22 (b) | | Fund That Flip | | 04/06/21 | | | 30,000 | | | | 30,000 | | | | 27,752 | |
| 41923, 10.00%, 12/10/21 (b) | | Fund That Flip | | 07/19/21 | | | 40,000 | | | | 40,000 | | | | 37,823 | |
| 42127, 8.75%, 04/30/22 (b) | | Fund That Flip | | 05/06/21 | | | 30,000 | | | | 30,000 | | | | 29,696 | |
| 42375, 9.00%, 10/15/22 | | Fund That Flip | | 09/30/21 | | | 30,000 | | | | 30,000 | | | | 29,258 | |
| 43347, 8.75%, 08/03/22 (b) | | Fund That Flip | | 08/16/21 | | | 30,000 | | | | 30,000 | | | | 27,927 | |
| 44866, 8.50%, 11/10/22 | | Fund That Flip | | 12/09/21 | | | 45,000 | | | | 45,000 | | | | 44,078 | |
| 45227, 9.00%, 09/21/22 (b) | | Fund That Flip | | 10/13/21 | | | 50,000 | | | | 50,000 | | | | 46,534 | |
| 56212, 9.00%, 01/21/23 | | Fund That Flip | | 02/24/22 | | | 40,000 | | | | 40,000 | | | | 39,365 | |
| 56260, 8.50%, 07/20/22 (b) | | Fund That Flip | | 02/24/22 | | | 40,000 | | | | 40,000 | | | | 40,447 | |
| 57895, 9.50%, 04/07/23 | | Fund That Flip | | 07/12/22 | | | 50,000 | | | | 50,000 | | | | 49,684 | |
| 57920, 8.75%, 12/21/22 | | Fund That Flip | | 04/12/22 | | | 50,000 | | | | 50,000 | | | | 49,236 | |
| 58234, 9.00%, 12/16/22 | | Fund That Flip | | 08/04/22 | | | 50,000 | | | | 50,000 | | | | 49,618 | |
| 59145, 9.75%, 02/03/23 | | Fund That Flip | | 07/12/22 | | | 38,000 | | | | 38,000 | | | | 37,681 | |
| 59261, 9.75%, 11/12/22 | | Fund That Flip | | 08/19/22 | | | 50,000 | | | | 50,000 | | | | 49,602 | |
| 60198, 9.50%, 10/15/22 | | Fund That Flip | | 08/04/22 | | | 50,000 | | | | 50,000 | | | | 49,406 | |
| 60352, 8.75%, 12/22/22 | | Fund That Flip | | 07/12/22 | | | 50,000 | | | | 50,000 | | | | 49,508 | |
| 61663, 9.00%, 07/08/23 | | Fund That Flip | | 08/04/22 | | | 25,000 | | | | 25,000 | | | | 24,903 | |
| 62539, 9.25%, 12/24/22 | | Fund That Flip | | 08/04/22 | | | 50,000 | | | | 50,000 | | | | 49,588 | |
| 62634, 9.50%, 04/20/23 | | Fund That Flip | | 08/04/22 | | | 50,000 | | | | 50,000 | | | | 49,730 | |
| 62862, 10.25%, 05/02/23 | | Fund That Flip | | 08/19/22 | | | 50,000 | | | | 50,000 | | | | 49,792 | |
| 184333436, 9.00%, 01/01/21 (b) | | Patch of Land | | 01/02/20 | | | 25,000 | | | | 25,000 | | | | 21,015 | |
| 184333602, 9.00%, 01/01/21 (b) | | Patch of Land | | 01/16/20 | | | 25,000 | | | | 25,000 | | | | 21,019 | |
| 184333907, 8.75%, 02/01/21 (b) | | Patch of Land | | 02/10/20 | | | 20,000 | | | | 20,000 | | | | 17,804 | |
| 184333908, 9.00%, 02/01/21 (b) | | Patch of Land | | 02/10/20 | | | 15,000 | | | | 15,000 | | | | 12,265 | |
| 184333924, 9.20%, 02/01/21 (b) | | Patch of Land | | 02/11/20 | | | 25,000 | | | | 25,000 | | | | 22,087 | |
| 184333926, 9.20%, 02/01/21 (b) | | Patch of Land | | 02/11/20 | | | 25,000 | | | | 25,000 | | | | 20,330 | |
| 184333968, 9.20%, 02/01/21 (b) | | Patch of Land | | 02/14/20 | | | 25,000 | | | | 25,000 | | | | 20,330 | |
| 184335020, 9.20%, 02/01/21 (b) | | Patch of Land | | 01/04/21 | | | 10,000 | | | | 10,000 | | | | 8,908 | |
| AlphaCentric Prime Meridian Income Fund |
| SCHEDULE OF INVESTMENTS |
| September 30, 2022 |
| | | Platform | | Original
Acquisition
Date | | Principal
Amount | | | Cost | | | Fair Value | |
| 17406, 11.00%, 12/31/22 (b) | | Sharestates | | 01/02/20 | | | 25,000 | | | | 25,000 | | | | 24,432 | |
| 17409, 10.00%, 12/31/22 | | Sharestates | | 01/02/20 | | | 25,000 | | | | 25,000 | | | | 24,862 | |
| 17920, 8.00%, 10/31/22 | | Sharestates | | 02/11/20 | | | 25,000 | | | | 25,000 | | | | 24,874 | |
| 18070, 8.75%, 10/31/22 | | Sharestates | | 02/24/20 | | | 30,000 | | | | 30,000 | | | | 29,820 | |
| 18833, 8.75%, 12/31/22 | | Sharestates | | 07/17/20 | | | 25,000 | | | | 25,000 | | | | 24,915 | |
| 19234, 9.50%, 05/31/21 (b) | | Sharestates | | 11/20/20 | | | 30,000 | | | | 30,000 | | | | 25,232 | |
| 19238, 10.00%, 05/31/21 (b) | | Sharestates | | 11/24/20 | | | 30,000 | | | | 30,000 | | | | 25,173 | |
| 19434, 9.00%, 07/31/22 (b) | | Sharestates | | 01/19/21 | | | 20,000 | | | | 20,000 | | | | 18,523 | |
| 19675, 9.25%, 01/31/22 (b) | | Sharestates | | 03/09/21 | | | 31,000 | | | | 31,000 | | | | 28,054 | |
| 19681, 8.75%, 06/30/22 (b) | | Sharestates | | 03/12/21 | | | 23,000 | | | | 23,000 | | | | 21,967 | |
| 19682, 8.75%, 04/30/22 (b) | | Sharestates | | 03/12/21 | | | 40,000 | | | | 40,000 | | | | 36,133 | |
| 19684, 10.50%, 05/31/22 (b) | | Sharestates | | 03/12/21 | | | 45,000 | | | | 45,000 | | | | 40,130 | |
| 19711, 11.00%, 06/30/22 (b) | | Sharestates | | 03/17/21 | | | 40,000 | | | | 40,000 | | | | 35,551 | |
| 20164, 10.00%, 11/30/22 | | Sharestates | | 06/24/21 | | | 15,000 | | | | 15,000 | | | | 14,908 | |
| 20208, 10.00%, 04/30/23 | | Sharestates | | 06/29/21 | | | 35,000 | | | | 35,000 | | | | 34,960 | |
| 20347, 9.00%, 11/30/22 | | Sharestates | | 07/30/21 | | | 35,000 | | | | 35,000 | | | | 34,801 | |
| 20403, 9.00%, 02/28/23 | | Sharestates | | 08/20/21 | | | 29,000 | | | | 29,000 | | | | 28,891 | |
| 20454, 9.50%, 08/31/22 (b) | | Sharestates | | 09/07/21 | | | 50,000 | | | | 50,000 | | | | 43,856 | |
| 20636, 9.50%, 09/30/22 (b) | | Sharestates | | 10/01/21 | | | 30,000 | | | | 30,000 | | | | 29,692 | |
| 20681, 9.00%, 10/31/22 | | Sharestates | | 10/14/21 | | | 35,000 | | | | 35,000 | | | | 34,775 | |
| 20890, 8.25%, 09/30/22 (b) | | Sharestates | | 12/03/21 | | | 50,000 | | | | 50,000 | | | | 49,650 | |
| 20909, 8.50%, 02/28/23 | | Sharestates | | 12/09/21 | | | 40,000 | | | | 40,000 | | | | 39,881 | |
| 21603, 10.50%, 05/31/23 | | Sharestates | | 05/18/22 | | | 50,000 | | | | 50,000 | | | | 49,858 | |
| 21718, 11.00%, 06/30/23 | | Sharestates | | 06/06/22 | | | 50,000 | | | | 50,000 | | | | 49,850 | |
| 21723, 11.00%, 05/31/23 | | Sharestates | | 06/06/22 | | | 50,000 | | | | 50,000 | | | | 49,838 | |
| 21998, 10.15%, 07/31/23 | | Sharestates | | 08/19/22 | | | 50,000 | | | | 50,000 | | | | 49,948 | |
| 22008, 11.00%, 08/31/23 | | Sharestates | | 08/22/22 | | | 50,000 | | | | 50,000 | | | | 49,941 | |
| 22090, 10.00%, 11/30/22 | | Sharestates | | 09/09/22 | | | 7,000 | | | | 7,000 | | | | 7,032 | |
| Total Bridge Loans | | | | | | | | | | | 2,368,151 | | | | 2,271,699 | |
| | | | | | | | | | | | | | | | | |
| Total Investments - 83.9% | | | | | | | | | | | 4,774,633 | | | | 4,409,728 | |
| | | | | | | | | | | | | | | | | |
| Other Assets in Excess of Liabilities - 16.1% | | | | | | | | | | | | | | | 844,659 | |
| | | | | | | | | | | | | | | | | |
| TOTAL NET ASSETS - 100.0% | | | | | | | | | | | | | | $ | 5,254,387 | |
| (a) | Fair valued by a third party pricing service using unobservable inputs and subject to review by AlphaCentric Advisors LLC (the “Advisor”) pursuant to policies approved by the Board of Trustees of the Fund. |
| (d) | Short-term loans backed by single-family, multi-family and commercial properties. |
REPORT OF INDEPENDENT REGISTERED PUBLIC ACCOUNTING FIRM
To the Shareholders and the Board of Trustees of AlphaCentric Prime Meridian Income Fund
Opinion on the Schedule of Investments
We have audited the accompanying statement of assets and liabilities, including the condensed schedule of investments, of AlphaCentric Prime Meridian Income Fund (the “Fund”) and the schedule of investments (included in Item 6 of Form N-CSR) as of September 30, 2022, the related statements of operations, cash flows, and changes in net assets, the related notes, and the financial highlights for the year then ended (included in Item 1 of Form N-CRS) (collectively referred to as the “financial statements”). In our opinion, the financial statements present fairly, in all material respects, the financial position of the Fund as of September 30, 2022, the results of its operations and its cash flows, the changes in net assets, and the financial highlights for the year then ended, in conformity with accounting principles generally accepted in the United States of America.
The Fund’s financial statements and financial highlights for the periods ended September 30, 2021, and prior, were audited by other auditors whose report dated November 23, 2021, expressed an unqualified opinion on those financial statements and financial highlights.
Basis for Opinion
These financial statements are the responsibility of the Fund’s management. Our responsibility is to express an opinion on the Fund’s financial statements based on our audit. We are a public accounting firm registered with the Public Company Accounting Oversight Board (United States) (“PCAOB”) and are required to be independent with respect to the Fund in accordance with the U.S. federal securities laws and the applicable rules and regulations of the Securities and Exchange Commission and the PCAOB.
We conducted our audit in accordance with the standards of the PCAOB. Those standards require that we plan and perform the audit to obtain reasonable assurance about whether the financial statements are free of material misstatement whether due to error or fraud.
Our audit included performing procedures to assess the risks of material misstatement of the financial statements, whether due to error or fraud, and performing procedures that respond to those risks. Such procedures included examining, on a test basis, evidence regarding the amounts and disclosures in the financial statements. Our procedures included confirmation of securities owned as of September 30, 2022, by correspondence with the custodians and lending platforms. Our audit also included evaluating the accounting principles used and significant estimates made by management, as well as evaluating the overall presentation of the financial statements. We believe that our audit provides a reasonable basis for our opinion.
We have served as the auditor of one or more investment companies advised by AlphaCentric Advisors LLC since 2015.
COHEN & COMPANY, LTD.
Cleveland, Ohio
December 9, 2022
(b) Not Applicable.
Item 7. Disclosure of Proxy Voting Policies and Procedures for Closed-End Management Investment Companies.
The Board has adopted Proxy Voting Policies and Procedures (“Policies”) on behalf of the AlphaCentric Prime Meridian Income Fund (“Fund”), which delegate the responsibility for voting proxies to the AlphaCentric Advisors LLC (“Advisor”) or its designee, subject to the Board’s continuing oversight. The Policies require that the Advisor or its designee vote proxies received in a manner consistent with the best interests of the Fund and shareholders. The Advisor has delegated proxy voting duties to the Prime Meridian Capital Management, LLC (“Prime Meridian” or “Sub-Advisor”).
AlphaCentric Prime Meridian Income Fund
Proxy Voting Policy
Policy: Pursuant to rules established by the SEC under the 1940 Act the Board of Trustees of the AlphaCentric Prime Meridian Income Fund (the “Trust” or the “Fund”) has adopted the following amended formal, written guidelines for proxy voting by the Trust. The Board of Trustees of the Trust oversees voting policies and decisions for the Trust.
The Fund exercises its proxy voting rights with regard to the companies in the Fund’s investment portfolio, with the goals of maximizing the value of the Fund’s investments, promoting accountability of a company’s management and board of trustees to its shareholders, aligning the interests of management with those of shareholders, and increasing transparency of a company’s business and operations.
In general, the Board of Trustees of the Trust believes that the Fund’s investment adviser, or sub-adviser, if applicable, which selects the individual companies that are part of the Fund’s portfolio, is the most knowledgeable and best suited to make decisions about proxy votes. Therefore, the Trust defers to and relies on the Fund’s investment advisers or sub-advisers, as appropriate, to make decisions on casting proxy votes or delegating this responsibility.
In some instances, an adviser (or sub-adviser) may be asked to cast a proxy vote that presents a conflict between the interests of a Fund’s shareholders, and those of the adviser (or sub-adviser) or an affiliated person of the adviser (or sub-adviser). In such a case, the adviser (or sub-adviser) is instructed to abstain from making a voting decision and to forward all necessary proxy voting materials to the Trust to enable the Board of Trustees to make a voting decision. The adviser (or sub-adviser) shall make a written recommendation of the voting decision to the Board of Trustees, which shall include: (i) an explanation of why it has a conflict of interest; (ii) the reasons for its recommendation; and (iii) an explanation of why the recommendation is consistent with the advisers (or sub-adviser’s) proxy voting policies. The Board of Trustees shall make the proxy voting decision that in its judgment, after reviewing the recommendation of the adviser (or sub-adviser), is most consistent with the adviser’s (or sub-adviser’s) proxy voting policies and in the best interests of Fund shareholders. When the Board of Trustees is required to make a proxy voting decision, only the Trustees without a conflict of interest with regard to the security in question or the matter to be voted upon, shall be permitted to participate in the decision of how the Fund’s vote will be cast.
A copy of these Proxy Voting Policies and Procedures are available, without charge, upon request, by calling the Trust’s toll-free telephone number at (888)910-0412 and on the SEC’s website at http://www.sec.gov. The Trust will send a copy of the Trust’s Proxy Voting Policies and Procedures within three business days of receipt of a request, by first-class mail or other means designed to ensure equally prompt delivery. In addition, information regarding the Fund’s proxy voting record during the most recent 12-month period ended June 30 is available at no charge, upon request, by calling (888)910-0412. The information is also available on the SEC’s website at http://www.sec.gov.
Responsible Party/Procedures: Chief Compliance Officer/Administrator
Approved: Frederick Schmidt
Date: 07-20-2018
09-14-2021
Item 8. Portfolio Managers of Closed-End Management Investment Companies.
Portfolio Manager
Mr. Davis has been a Principal and Portfolio Manager of Prime Meridian since 2012, and serves as the Fund’s portfolio manager and is primarily responsible for the day-to-day management of the Fund’s portfolio. As a seasoned industry veteran and skilled portfolio manager, Mr. Davis applies his knowledge, conservative management principles, and hands on expertise to the day-to-day management of private funds advised by Prime Meridian. Mr. Davis has also been a principal of Novus Investments, LLC, a boutique alternative investment management firm since 2004, and was previously the #1 ranked futures trader in the U.S. for performance over both a 5 and a 7 year period. Mr. Davis is also a recognized speaker in the marketplace lending institutional investing space featured at: Bloomberg, LendIt, Wall Street Journal, China Credit Conference, American Bankers Association, Forbes, IMN, and LendAcademy.
Compensation of Portfolio Manager
Prime Meridian is paid by the Advisor, not the Fund. The portfolio manager receives a salary plus a bonus based on the profits of Prime Meridian.
Portfolio Manager Ownership of Fund Shares
As of September 30, 2022, Mr. Davis owned Fund shares with a value of $500,001-$1,000,000.
Conflicts of Interest
Actual or apparent conflicts of interest may arise when a portfolio manager has day-to-day management responsibilities with respect to more than one fund or other accounts. The management of multiple accounts may result in a portfolio manager devoting unequal time and attention to the management of each account. The management of multiple funds and accounts also may give rise to potential conflicts of interest if the funds and accounts have different objectives, benchmarks, time horizons, and fees as the portfolio manager must allocate his time and investment ideas across multiple funds and accounts.
With respect to securities transactions for the Fund, the Advisor or Sub-Advisor determines which broker to use to execute each order, consistent with the duty to seek best execution of the transaction. The portfolio manager may execute transactions for another fund or account that may adversely impact the value of securities held by the Fund. Securities selected for funds or accounts other than the Fund may outperform the securities selected for the Fund.
The appearance of a conflict of interest may arise where the Advisor or Sub-Advisor has an incentive, such as a performance-based management fee. The management of personal accounts may give rise to potential conflicts of interest; there is no assurance that the Fund’s code of ethics will adequately address such conflicts. One of the portfolio manager’s numerous responsibilities is to assist in the sale of Fund shares. Because the portfolio manager’s compensation is indirectly linked to the sale of Fund shares, they may have an incentive to devote time to marketing efforts designed to increase sales of Fund shares.
The Fund has adopted a code of ethics that, among other things, permits personal trading by employees under conditions where it has been determined that such trades would not adversely impact client accounts. Nevertheless, the management of personal accounts may give rise to potential conflicts of interest, and there is no assurance that these codes of ethics will adequately address such conflicts.
The Fund may invest in affiliated funds advised by the Advisor. The Advisor is subject to conflicts of interest in allocating a Fund’s assets among the affiliated funds. The Advisor will receive more revenue when it selects an affiliated fund rather than an unaffiliated fund for inclusion in the Fund’s portfolio. This conflict may provide an incentive for the Advisor to invest Fund assets in affiliated funds that perform less well than unaffiliated funds. The Advisor may have an incentive to allocate the Fund’s assets to those
affiliated funds for which the net advisory fees payable to the Advisor are higher than the fees payable by other affiliated funds.
The Advisor, Sub-Advisor and the Fund have each adopted certain compliance procedures which are designed to address these types of conflicts. However, there is no guarantee that such procedures will detect each and every situation in which a conflict arises.
Other Accounts Managed
As of September 30, 2022, the portfolio manager of the Fund was responsible for the management of the following other accounts (in addition to the Fund):
Portfolio
Manager | Registered
Investment
Companies
(other than
the Fund) | Registered
Investment
Companies
Subject to
Performance-
Based
Advisory
Fees | Other
Pooled
Investment
Vehicles | Other Pooled
Investment Vehicles
Subject to
Performance-Based
Advisory Fees | Other
Accounts | Other
Accounts
Subject to
Performance-
Based
Advisory Fees |
| Don Davis | Number: 0
Assets: $0 | Number: 0
Assets: $0 | Number: 0
Assets: $0 | Number: 6
Assets: $227,523,066 | Number: 0
Assets: $0 | Number: 0
Assets: $0 |
Item 9. Purchases of Equity Securities by Closed-End Management Investment Company and Affiliated Purchasers.
| Period | (a) Total Number
of Shares (or
Units) Purchased | (b) Average Price
Paid per Share (or
Unit) | (c) Total Number
of Shares (or
Units) Purchased
as Part of Publicly
Announced Plans
or Programs | (d) Maximum
Number (or
Approximate
Dollar Value) of
Shares (or Units)
that May Yet Be
Purchased Under
the Plans or
Programs |
Month #1
04/01/22-04/30/22 | 0 | $0 | 0 | $0 |
Month #2*
05/01/22-05/31/22 | 0 | $0 | 0 | $266,377 |
Month #3
06/01/22-06/30/22 | 0 | $0 | 0 | $0 |
Month #4
07/01/22-07/31/22 | 0 | $0 | 0 | $0 |
Month #5**
08/01/22-08/31/22 | 0 | $0 | 0 | $0 |
Month #6
09/01/22-09/30/22 | 0 | $0 | 0 | $266,092 |
| Total | 0 | $0 | 0 | $532,469 |
| * | The Fund issued a repurchase offer on May 9, 2022. The repurchase offer enabled up to 27,690 shares to be redeemed by shareholders. No shares were repurchased or paid out. The repurchase offer expired on June 3, 2022. |
| ** | The Fund issued a repurchase offer on August 8, 2022. The repurchase offer enabled up to 28,798 shares to be redeemed by shareholders. No shares were repurchased or paid out. The repurchase offer expired on September 2, 2022. |
Item 10. Submission of Matters to a Vote of Security Holders.
Not applicable.
Item 11. Controls and Procedures.
| (a) | Based on an evaluation of the registrant’s disclosure controls and procedures (as defined in Rule 30a-3(c) under the Investment Company Act of 1940 (the “Act”)) as of a date within 90 days prior to the filing date of this Form N-CSR, the registrant’s principal executive officer and principal financial officer have concluded that the disclosure controls and procedures are effective. |
| (b) | There were no changes in the registrant’s internal control over financial reporting (as defined in Rule 30a-3(d) under the Act) that occurred during the second fiscal quarter of the period covered by this report that has materially affected, or is reasonably likely to materially affect, the registrant’s internal control over financial reporting. |
Item 12. Disclosure of Securities Lending Activities for Closed-End Management Investment Companies.
The registrant did not engage in securities lending activities during the fiscal period reported on this Form N-CSR.
Item 13. Exhibits.
(2) A separate certification for each principal executive officer and principal financial officer pursuant to Section 302 of the Sarbanes-Oxley Act of 2002. Filed herewith.
(3) Any written solicitation to purchase securities under Rule 23c-1 under the Act sent or given during the period covered by the report by or on behalf of the registrant to 10 or more persons. None.
(4) Change in the registrant’s independent public accountant. Filed herewith.
Deloitte & Touche LLP (“Deloitte”) served as the independent registered public accounting firm for the Fund to audit the financial statements for the fiscal year ended September 30, 2021.
The Board engaged Cohen & Company Ltd. (“Cohen”) on December 21, 2021 to audit the Fund’s financial statements for the fiscal year ended September 30, 2022.
The report of Deloitte on the financial statements for the fiscal year ended September 30, 2021 and for the period December 31, 2019 through September 30, 2020, contained no adverse opinion or disclaimer of opinion, and was not qualified or modified as to uncertainty, audit scope or accounting principle.
In connection with the audit for the fiscal year ended September 30, 2021, there have been no disagreements with Deloitte on any matter of accounting principles or practices, financial statement disclosure, or auditing scope or procedure, which disagreements, if not resolved to the satisfaction of Deloitte would have caused them to make reference thereto in their report on the financial statements.
| (b) | Certifications pursuant to Section 906 of the Sarbanes-Oxley Act of 2002. Furnished herewith. |
SIGNATURES
Pursuant to the requirements of the Securities Exchange Act of 1934 and the Investment Company Act of 1940, the registrant has duly caused this report to be signed on its behalf by the undersigned, thereunto duly authorized.
| AlphaCentric Prime Meridian Income Fund | |
| | | |
| By: | /s/ George F. Amrhein, Jr. | |
| | George F. Amrhein, Jr., President | |
| | (Principal Executive Officer) | |
| | | |
| Date: | 12/8/2022 | |
Pursuant to the requirements of the Securities Exchange Act of 1934 and the Investment Company Act of 1940, this report has been signed below by the following persons on behalf of the registrant and in the capacities and on the dates indicated.
| By: | /s/ George F. Amrhein, Jr. | |
| | George F. Amrhein, Jr., President | |
| | (Principal Executive Officer) | |
| | | |
| Date: | 12/8/2022 | |
| By: | /s/ Rocco DiBenedetto | |
| | Rocco DiBenedetto, Treasurer | |
| | (Principal Financial Officer) | |
| | | |
| Date: | 12/8/2022 | |