UNITED STATES SECURITIES AND EXCHANGE COMMISSION
Washington, D.C. 20549
FORM 20-F
ANNUAL REPORT OF FOREIGN PRIVATE ISSUER
PURSUANT TO SECTION 13 OR 15(d) of
THE SECURITIES EXCHANGE ACT OF 1934
For the Fiscal Year Ended December 31, 2018
Commission File Number: 333‑216725
ARD Finance S.A.
(Name of Registrant)
56, rue Charles Martel
L‑2134 Luxembourg, Luxembourg
+352 26 25 85 55
(Address of Principal Executive Offices)
David Matthews, Chief Financial Officer
56, rue Charles Martel, L-2134 Luxembourg, Luxembourg
+352 26 25 85 55
Securities registered or to be registered pursuant to Section 12(b) of the Act:
| |
Title of each class | Name of each exchange on which registered |
None | |
Securities registered or to be registered pursuant to Section 12(g) of the Act: None
Securities for which there is a reporting obligation pursuant to Section 15(d) of the Act:
7.125% / 7.875% Senior Secured Toggle Notes due 2023
6.625% / 7.375% Senior Secured Toggle Notes due 2023
Indicate the number of outstanding shares of each of the issuer’s classes of capital or common stock as of the close of the period covered by the annual report:None
Indicate by check mark if each registrant is a well-known seasoned issuer, as defined in Rule 405 of the Securities Act:
Yes ☐ No ☒
If this report is an annual or transition report, indicate by check mark if each registrant is not required to file reports pursuant to Section 13 or 15(d) of the Securities Exchange Act of 1934.
Yes ☐ No ☒
Indicate by check mark whether the Registrant (1) has filed all reports required to be filed by Section 13 or 15(d) of the Securities Exchange Act of 1934 during the preceding 12 months (or for such shorter period that the Registrant was required to file such reports) and (2) has been subject to such filing requirements for the past 90 days.
Yes ☒ No ☐
Indicate by check mark whether the registrant has submitted electronically every Interactive Data File required to be submitted pursuant to Rule 405 of Regulation S-T (§232.405 of this chapter) during the preceding 12 months (or for such shorter period that the registrant was required to submit such files).
Yes ☒ No ☐
Indicate by check mark whether each registrant is a large accelerated filer, an accelerated filer, a non-accelerated filer or an emerging growth company. See definition of “accelerated filer”, “large accelerated filer” and “emerging growth company” in Rule 12b-2 of the Exchange Act.
| | | | |
Large Accelerated Filer ☐ | Accelerated Filer | ☐ | Non-Accelerated Filer☒ | Emerging growth company☐ |
If an emerging growth company that prepares its financial statements in accordance with U.S. GAAP, indicate by check mark if the registrant has elected not to use the extended transition period for complying with any new or revised financial accounting standards† provided pursuant to Section 13(a) of the Exchange Act. ☐
†The term ‘‘new or revised financial accounting standard’’ refers to any update issued by the Financial Accounting Standards Board to its Accounting Standards Codification after April 5, 2012.
Indicate by check mark which basis of accounting the registrant has used to prepare the financial statements included in this filing:
| | |
U.S. GAAP ☐ | International Financial Reporting Standards as issued | Other ☐ |
| by the International Accounting Standards Board ☒ | |
If “Other” has been checked in response to the previous question, indicate by check mark which financial statement item the registrant has elected to follow. Item 17 __ Item 18 __
If this is an annual report, indicate by check mark whether the registrant is a shell company (as defined in Rule 12b-2 of the Exchange Act): Yes ☐ No ☒
Definitions and Terminology
Except where the context otherwise requires or where otherwise indicated, all references to “ARD Finance”, “Company”, the “Group”, “ARD Finance Group”, “we”, “us” and “our” refer to ARD Finance S.A. and its consolidated subsidiaries, and all references to “Ardagh” and “Ardagh Group” refer to Ardagh Group S.A. and its consolidated subsidiaries. When we describe herein our business or operations, such business and operations are the business and operations of our subsidiary, Ardagh Group S.A., and its consolidated subsidiaries, since ARD Finance S.A. has no independent operations of its own, and, in such contexts, references to the “Group”, “we”, “us”, and “our” may refer to Ardagh Group S.A. and its subsidiaries. Ardagh Group’s operations have the following divisions: Metal Packaging and Glass Packaging.
References to legislation are, except where otherwise stated, references to legislation of the United States of America.
In addition, unless indicated otherwise, or the context otherwise requires, references in this annual report to:
| · | | “Articles” are to the Company’s articles of association; |
| · | | “Beverage Can Acquisition” are to the Ardagh Group’s acquisition of certain beverage can manufacturing assets from Ball Corporation and Rexam PLC on June 30, 2016; |
| · | | “Brexit” are to the United Kingdom’s withdrawal from the European Union; |
| · | | “CCIRS” are to cross currency interest rate swaps; |
| · | | “CERCLA” are to the U.S. federal Resource Conservation and Recovery Act and the Comprehensive Environmental Response, Compensation and Liability Act of 1980; |
| · | | “CGUs” are to cash generating units; |
| · | | “Code” are to the U.S. Internal Revenue Code of 1986, as amended; |
| · | | “CPGs” are to Consumer Packaged Goods companies; |
| · | | “CSDs” are to carbonated soft drinks; |
| · | | “EPA” are to the U.S. Environmental Protection Agency; |
| · | | “EU ETS” are to the EU Emissions Trading Scheme; |
| · | | “EWC” are to the European Works Council of Ardagh Group S.A.; |
| · | | “Exchange Act” are to the U.S. Securities Exchange Act of 1934, as amended; |
| · | | “FATCA” are to the U.S. Foreign Account Tax Compliance Act; |
| · | | “IAS” are to the International Accounting Standards; |
| · | | “IASB” are to the International Accounting Standards Board; |
| · | | “IED” are to the EU Industrial Emissions Directive; |
| · | | “IFRS” are to International Financial Reporting Standards; |
| · | | “IPO” are to the initial public offering of Ardagh Group S.A., which closed on March 20, 2017; |
| · | | “IRS” are to the U.S. Internal Revenue Service; |
| · | | “Lean” are to Lean Manufacturing techniques; |
| · | | “Luxembourg Law” are to the provisions of the laws of Luxembourg; |
| · | | “NYSE” are to the New York Stock Exchange; |
| · | | “Parent Company” are to ARD Holdings S.A. (“ARD Holdings”) and/or, where relevant, one or more of its subsidiaries; |
| · | | “PFIC” are to a passive foreign investment company; |
| · | | “PIK Interest” are to interest on the Toggle Notes for any interest period, which can be paid by the Company by increasing the principal amount of the PIK Notes or by issuing Notes in a principal amount equal to such interest; |
| · | | “PIK Notes” are, collectively, to the Ardagh Group’s euro denominated 8.375% Senior PIK Notes due 2019 (in an original issue amount of $250 million) and dollar denominated 8.625% Senior PIK Notes due 2019 (in an original issue amount of $710 million). On September 16, 2016, Ardagh Group repaid these Notes in full; |
| · | | “Ppm” are to parts per million; |
| · | | “REACH” are to the European Union’s regulations concerning the Registration, Evaluation, Authorization and Restriction of Chemicals; |
| · | | “Sarbanes Oxley Act” are to the U.S. Sarbanes Oxley Act of 2002; |
| · | | “Shareholder Agreement” are to the shareholder agreement dated March 20, 2017, entered into between ARD Holdings and Ardagh Group S.A.; |
| · | | “Toggle Notes” are to the Company’s Dollar Toggle Notes and Euro Toggle Notes, the terms of which are classified in full in the Company’s Form F-4 Registration Statement (File No. 333-216725) filed on April 12, 2017; |
| · | | U.S. GAAP are to the Generally Accepted Accounting Principles in the U.S.; |
| · | | “VNA Acquisition” are to the acquisition in 2014 of Verallia North America; and |
| · | | “VNA” are to the Ardagh Group's U.S. glass business, formerly Verallia North America. |
General Information
ARD Finance S.A. (the “Company”) was incorporated under the laws of Luxembourg on May 6, 2011 and is a subsidiary of ARD Holdings S.A. The Company’s registered office is 56, rue Charles Martel, L-2134 Luxembourg, Luxembourg. The Company is registered with the R.C. S. Luxembourg under number B 160806.
The Company is a holding company whose only significant assets as of December 31, 2018 consist of its direct and indirect interest in the share capital of Ardagh Group S.A., a company incorporated and existing under the laws of Luxembourg, and certain related party receivables. Ardagh Group S.A. has Class A common shares listed on the New York Stock Exchange.
Group Consolidated Financial Statements – Basis of Preparation
The consolidated financial statements of the Group have been prepared in accordance with, and are in compliance with IFRS and related interpretations, as adopted by the IASB. IFRS is comprised of standards and interpretations approved by the IASB and IAS and interpretations approved by the predecessor International Accounting Standards Committee that have been subsequently approved by the IASB and remain in effect. References to IFRS hereafter should be construed as references to IFRS as adopted by the IASB.
The consolidated financial statements are presented in U.S. dollar, rounded to the nearest million, and have been prepared under the historical cost convention except, for the following:
| · | | derivative financial instruments are stated at fair value; and |
| · | | employee benefit obligations are measured at the present value of the future estimated cash flows related to benefits earned and pension assets valued at fair value. |
The preparation of consolidated financial information in conformity with IFRS requires the use of critical accounting estimates and assumptions that affect the reported amounts of assets and liabilities and income and expenses. It also requires management to exercise judgment in the process of applying Group accounting policies. These estimates, assumptions and judgments are based on historical experience and other factors, including expectations of future events that are believed to be reasonable under the circumstances and are subject to continual re-evaluation. However, actual outcomes may differ from these estimates. The areas involving a higher degree of judgment or complexity, or areas where assumptions and estimates are significant to the consolidated financial statements are discussed in the critical accounting estimates, assumptions and judgment.
The consolidated financial statements for the Group were authorized for issue by the board of directors of ARD Finance S.A. on February 20, 2019.
Currencies
In this annual report, unless otherwise specified or the context otherwise requires:
| · | | “$” and “U.S. dollar” each refer to the United States dollar; |
| · | | “€”, “EUR” and “euro” each refer to the euro, the single currency established for members of the European Economic and Monetary Union since January 1, 1999; and |
| · | | “£”, “pounds”, “sterling” and “GBP” refer to pounds sterling, the lawful currency of the United Kingdom. |
With effect from January 1, 2018, the Group changed the currency in which it presents its financial statements from euro to U.S. dollar. This was principally as a result of the board of directors’ assessment that this change in presentation currency will help provide a clearer understanding of the Group’s financial performance and improve comparability of our performance to our peers following the IPO of Ardagh Group S.A. on the NYSE.
The change in our accounting policy impacts all financial statement line items whereby amounts previously reported in euro have been re-presented in U.S. dollar. To illustrate the effect of the re-presentation the previously reported euro consolidated statements of financial position as at December 31, 2017, 2016, 2015 and 2014, consolidated income statements, consolidated statements of comprehensive income and consolidated statements of cash flows for the years ended December 31, 2017, 2016 and 2015 have been set out in Note 26 to the consolidated financial statements.
Safe Harbour Statement
This annual report does not constitute or form part of any offer for sale or subscription of or solicitation or invitation of any offer to buy or subscribe for any securities, including in the United States, nor shall it or any part of it form the basis of or be relied on in connection with any contract or commitment whatsoever. Specifically, this annual report does not constitute a “prospectus” within the meaning of the U.S. Securities Act of 1933.
The Company routinely posts important information on the Parent Company’s website – http://www.ardholdings-sa.com. This website and the information contained therein or connected thereto shall not be deemed to be incorporated into this annual report.
Forward-Looking Statements
This annual report may contain "forward-looking" statements within the meaning of Section 21E of the Exchange Act and Section 27A of the U.S. Securities Act of 1933. Forward-looking statements reflect the Company’s current expectations and projections about future events at the time, and thus involve uncertainty and risk. The words “believe,” “expect,” “anticipate,” “will,” “could,” “would,” “should,” “may,” “plan,” “estimate,” “intend,” “predict,” “potential,” “continue,” and the negatives of these words and other similar expressions generally identify forward-looking statements. It is possible the Company's future financial performance may differ from expectations due to a variety of factors including, but not limited to, the following:
(i) global and regional economic downturn; (ii) competition from other metal and glass packaging producers and manufacturers of alternative forms of packaging; (iii) increases in metal and glass container manufacturing capacity; (iv) the Company’s inability to maintain relationships with its largest customers or suppliers; (v) less than expected levels of demand; (vi) varied seasonal demands, climate and water conditions, and the availability and cost of raw materials; (vii) currency and interest rate fluctuations; (viii) various environmental requirements; (ix) the Company’s ability to integrate acquired businesses and achieve expected operating efficiencies, cost savings and other synergies; (x) costs associated with post-retirement and post-employment obligations; (xi) operating hazards or unanticipated interruptions at our manufacturing facilities, including labor strikes or work stoppages; (xii) retention of executive and senior management.
Any forward-looking statements in this document are based on certain assumptions and analyses made by the Company in light of its experience and perception of historical trends, current conditions, expected future developments, and other factors it believes are appropriate in the circumstances. Forward-looking statements are not a guarantee of future performance and actual results or developments may differ materially from expectations. While the Company continually reviews trends and uncertainties affecting the Company's results of operations and financial condition, the Company does not assume any obligation to update or supplement any particular forward-looking statements contained in this document.
Non-GAAP Financial Measures
This annual report may contain certain consolidated financial measures such as Adjusted EBITDA, working capital, operating cash flow, Adjusted free cash flow, net debt, Adjusted profit/(loss), and ratios relating thereto that are not calculated in accordance with IFRS or U.S. GAAP. Adjusted EBITDA consists of profit/(loss) for the year before income tax expense/(credit), net finance expense, depreciation and amortization and exceptional operating items.
Non-GAAP financial measures may be considered in addition to GAAP financial information, but should not be used as substitutes for the corresponding GAAP measures. The non-GAAP financial measures used by the Company may differ from, and not be comparable to, similarly titled measures used by other companies.
Part I
Item 1. Identity of Directors, Senior Management and Advisors
Not Applicable
Item 2. Offer Statistics and Expected Timetable
Not Applicable
Item 3. Key Information
| A. | | Selected financial data |
Summary Consolidated Financial and Other Data of ARD Finance S.A.
The financial data of ARD Finance S.A. as of and for the years ended December 31, 2018, 2017 and 2016 and as of December 31, 2015, are derived from the audited consolidated financial statements included in this annual report. The financial data for the year ended December 31, 2014 has been derived from our unaudited consolidated financial statements (which are unaudited as they were re-presented following the change in accounting policy as described in Note 2 to the consolidated financial statements included in this annual report). The summary historical financial data for the year ended December 31, 2014 has been translated from euro to U.S. dollar using the foreign exchange rate at the balance sheet date, or an average rate for the year, as appropriate.
The summary historical financial data set forth below should be read in conjunction with and is qualified in its entirety by reference to the audited consolidated financial statements included in this annual report and the related notes thereto. The following financial data should also be read in conjunction with “Management’s Discussion and Analysis of Financial Condition and Results of Operations” also included in this annual report. Our historical results are not necessarily indicative of results to be expected in any future period.
| | | | | | | | | | | |
| | Year ended | |
| | December 31, | |
| | 2018 | | 2017 | | 2016 | | 2015 | | 2014 | |
Income Statement Data (1) | | (in $ millions except margins and per share data) | |
Revenue | | 9,097 | | 8,596 | | 7,014 | | 5,795 | | 6,316 | |
Cost of sales | | (7,778) | | (7,210) | | (5,786) | | (4,817) | | (5,454) | |
Gross profit | | 1,319 | | 1,386 | | 1,228 | | 978 | | 862 | |
Sales, general and administration expenses | | (433) | | (450) | | (462) | | (353) | | (377) | |
Intangible amortization | | (451) | | (264) | | (191) | | (122) | | (160) | |
Loss on disposal of business | | — | | — | | — | | — | | (214) | |
Operating profit | | 435 | | 672 | | 575 | | 503 | | 111 | |
Net finance expense | | (654) | | (671) | | (681) | | (590) | | (880) | |
(Loss)/profit before tax | | (219) | | 1 | | (106) | | (87) | | (769) | |
Income tax (charge)/credit | | (44) | | 40 | | (66) | | (48) | | 10 | |
(Loss)/profit for the year | | (263) | | 41 | | (172) | | (135) | | (759) | |
| | | | | | | | | | | |
Balance Sheet Data (at year end) | | | | | | | | | | | |
Cash and cash equivalents (2) | | 565 | | 823 | | 818 | | 603 | | 526 | |
Working capital (3) | | 425 | | 566 | | 708 | | 599 | | 738 | |
Total assets | | 10,349 | | 11,191 | | 10,851 | | 6,902 | | 7,425 | |
Net liabilities | | (3,240) | | (3,142) | | (3,150) | | (2,582) | | (2,603) | |
Issued share capital | | — | | — | | — | | — | | — | |
Net borrowings (4) | | 9,605 | | 10,076 | | 10,232 | | 6,972 | | 7,331 | |
Net debt (5) | | 9,153 | | 9,554 | | 9,283 | | 6,369 | | 7,808 | |
| | | | | | | | | | | |
Other Data | | | | | | | | | | | |
Adjusted EBITDA (6) | | 1,478 | | 1,508 | | 1,281 | | 1,041 | | 1,060 | |
Adjusted EBITDA Margin (6) | | 16.2 | % | 17.5 | % | 18.3 | % | 18.0 | % | 16.8 | % |
Adjusted profit/(loss) for the year (7) | | 237 | | 401 | | 155 | | 15 | | (86) | |
Depreciation and amortization (8) | | 714 | | 687 | | 561 | | 449 | | 485 | |
Capital expenditure (9) | | 575 | | 492 | | 351 | | 339 | | 419 | |
Net cash from operating activities | | 734 | | 847 | | 515 | | 633 | | 467 | |
| (1) | | The income statement data presented above is on a reported basis and includes certain exceptional items which, by their incidence or nature, management considers should be adjusted for to enable a better understanding of the financial performance of the Company. A summary of these exceptional items included in the income statement data is as follows: |
| | | | | | | | | | |
| | Year ended |
| | December 31, |
| | 2018 | | 2017 | | 2016 | | 2015 | | 2014 |
Exceptional Items | | (in $ millions) |
Exceptional cost of sales | | 124 | | 100 | | 15 | | 41 | | 160 |
Exceptional sales, general and administrative expenses | | 19 | | 49 | | 130 | | 48 | | 49 |
Exceptional impairment - goodwill | | 186 | | — | | — | | — | | 41 |
Exceptional loss on disposal of business | | — | | — | | — | | — | | 214 |
Exceptional operating items | | 329 | | 149 | | 145 | | 89 | | 464 |
Exceptional net finance expense | | 28 | | 132 | | 97 | | 15 | | 234 |
Exceptional income tax credit | | (54) | | (138) | | (49) | | (36) | | (107) |
Total exceptional items net of tax | | 303 | | 143 | | 193 | | 68 | | 591 |
For further details on the exceptional items for the years ended December 31, 2018, 2017, and 2016, see Note 4 and Note 6 to the consolidated financial statements of ARD Finance included elsewhere in this annual report.
| (2) | | Cash and cash equivalents include restricted cash as per the note disclosures to the consolidated financial statements included in this annual report. |
| (3) | | Working capital is comprised of inventories, trade and other receivables, contract assets, trade and other payables and current provisions. Other companies may calculate working capital in a manner different to ours. |
| | | | | | | | | | |
| | Year ended |
| | December 31, |
| | 2018 | | 2017 | | 2016 | | 2015 | | 2014 |
| | (in $ millions) |
Inventories | | 1,284 | | 1,353 | | 1,186 | | 898 | | 935 |
Trade and other receivables | | 1,053 | | 1,274 | | 1,227 | | 709 | | 840 |
Contract asset | | 160 | | — | | — | | — | | — |
Trade and other payables | | (1,984) | | (1,991) | | (1,632) | | (956) | | (976) |
Current provisions | | (88) | | (70) | | (73) | | (52) | | (61) |
Working capital | | 425 | | 566 | | 708 | | 599 | | 738 |
| (4) | | Net borrowings comprises non‑current and current borrowings, net of deferred debt issue costs and bond premium/discount. |
| (5) | | Net debt is comprised of net borrowings and derivative financial instruments used to hedge foreign currency and interest rate risk, net of cash and cash equivalents. |
| (6) | | To supplement our financial information presented in accordance with IFRS, we use the following additional financial measures to clarify and enhance an understanding of past performance: Adjusted EBITDA, Adjusted EBITDA margin, and Adjusted profit. We believe that the presentation of these financial measures enhances an investor’s understanding of our financial performance. We further believe that these financial measures are useful financial metrics to assess our operating performance from period to period by excluding certain items that we believe are not representative of |
our core business. We use certain of these financial measures for business planning purposes and in measuring our performance relative to that of our competitors. |
Adjusted EBITDA consists of profit/(loss) for the year before income tax expense/(credit), net finance expense, depreciation and amortization and exceptional operating items. Adjusted EBITDA margin is calculated as Adjusted EBITDA divided by revenue. Adjusted EBITDA and Adjusted EBITDA margin are presented because we believe that they are frequently used by securities analysts, investors and other interested parties in evaluating companies in the packaging industry. However, other companies may calculate Adjusted EBITDA and Adjusted EBITDA margin in a manner different from ours. Adjusted EBITDA and Adjusted EBITDA margin are not measurements of financial performance under IFRS and should not be considered an alternative to profit/(loss) as indicators of operating performance or any other measures of performance derived in accordance with IFRS.
The reconciliation of (loss)/profit for the year to Adjusted EBITDA is as follows:
| | | | | | | | | | |
| | Year ended |
| | December 31, |
| | 2018 | | 2017 | | 2016 | | 2015 | | 2014 |
| | (in $ millions) |
(Loss)/profit for the year | | (263) | | 41 | | (172) | | (135) | | (759) |
Income tax expense/(credit) | | 44 | | (40) | | 66 | | 48 | | (10) |
Net finance expense | | 654 | | 671 | | 681 | | 590 | | 880 |
Depreciation and amortization | | 714 | | 687 | | 561 | | 449 | | 485 |
EBITDA | | 1,149 | | 1,359 | | 1,136 | | 952 | | 596 |
Exceptional operating items | | 329 | | 149 | | 145 | | 89 | | 464 |
Adjusted EBITDA | | 1,478 | | 1,508 | | 1,281 | | 1,041 | | 1,060 |
| (7) | | Adjusted profit/(loss) for the year is calculated as follows: |
| | | | | | | | | | |
| | Year ended |
| | December 31, |
| | 2018 | | 2017 | | 2016 | | 2015 | | 2014 |
| | (in $ millions) |
(Loss)/profit for the year | | (263) | | 41 | | (172) | | (135) | | (759) |
Total exceptional items | | 303 | | 143 | | 193 | | 68 | | 591 |
Intangible amortization | | 265 | | 264 | | 191 | | 122 | | 119 |
Tax credit associated with intangible amortization | | (58) | | (75) | | (57) | | (40) | | (37) |
(Gain)/loss on derivatives | | (10) | | 28 | | — | | — | | — |
Adjusted profit/(loss) for the year | | 237 | | 401 | | 155 | | 15 | | (86) |
Adjusted profit consists of profit/(loss) for the year before total exceptional items (net of tax), (gain)/loss on derivatives, intangible amortization and associated tax credits. Adjusted profit is presented because we believe that it accurately reflects the ongoing cost structure of the company. It excludes total exceptional items and (gain)/loss on derivatives which we consider not representative of ongoing operations because such items are not reflective of the normal earnings potential of the business. We have also adjusted for the amortization of intangible assets and associated tax credits, as this is driven by our acquisition activity which can vary in size, nature and timing compared to other companies within our industry and from period to period. Accordingly, due to the incomparability of acquisition activity among companies and from period to period, we believe exclusion of the amortization associated with intangible assets acquired through our acquisitions and total exceptional items allows investors to better compare and understand our results.
| (8) | | Depreciation, amortization, and gain/(loss) on disposal of property, plant and equipment. |
| (9) | | Capital expenditure is the sum of purchase of property, plant and equipment and software and other intangibles, net of proceeds from disposal of property, plant and equipment. |
| B. | | Capitalization and indebtedness |
Not Applicable
| C. | | Reasons for the offer and use of proceeds |
Not Applicable
When we describe our business or operations in this “Risk Factors” section, such business and operations are the business and operations of our subsidiary, Ardagh Group S.A., and its consolidated subsidiaries, since ARD Finance S.A. has no independent operations of its own. Our business, financial condition, or results of operations could be materially adversely affected by one or more of the risks and uncertainties described below:
Risks Relating to Our Business
Our customers sell to consumers of food & beverages, personal care, household products and pharmaceuticals. If economic conditions affect consumer demand, our customers may be affected and so reduce the demand for our products.
Demand for our packaging depends on demand for the products which use our packaging, which is primarily consumer driven. General economic conditions may adversely impact consumer confidence resulting in reduced spending on our customers’ products and, thereby, reduced or postponed demand for our products.
Adverse economic conditions may also lead to more limited availability of credit, which may have a negative impact on the financial condition, particularly on the purchasing ability, of some of our customers and distributors and may also result in requests for extended payment terms, and result in credit losses, insolvencies and diminished sales channels available to us. Our suppliers may have difficulties obtaining necessary credit, which could jeopardize their ability to provide timely deliveries of raw materials and other essentials to us. The adverse economic conditions may also lead to suppliers requesting credit support or otherwise reducing credit, which may have a negative effect on our cash flows and working capital.
Volatility in exchange rates may also increase the costs of our products that we may not be able to pass on to our customers; impair the purchasing power of our customers in different markets; result in significant competitive benefit to certain of our competitors who incur a material part of their costs in other currencies than we do; hamper our pricing; and increase our hedging costs and limit our ability to hedge our exchange rate exposure.
Changes in global economic conditions may reduce our ability to forecast developments in our industry and plan our operations and costs, resulting in operational inefficiencies. Negative developments in our business, results of operations and financial condition due to changes in global economic conditions or other factors could cause ratings agencies to lower the credit ratings, or ratings outlook, of our short‑ and long‑term debt and, consequently, impair our ability to raise new financing or refinance our current borrowings and increase our costs of issuing any new debt instruments.
Furthermore, the economic outlook could be adversely affected by the risk that one or more eurozone countries could leave the European Monetary Union, or the euro as the single currency of the eurozone could cease to exist. Any of these developments, or the perception that any of these developments are likely to occur, could have a material adverse effect on the economic development of the affected countries and could lead to severe economic recession or depression, and a general anticipation that such risks will materialize in the future could jeopardize the stability of financial markets or the overall financial and monetary system. This, in turn, would have a material adverse effect on our business, financial position, liquidity and results of operations.
In addition, some segments of our markets are more cyclical than others. Our sales in the paints and coatings markets depend mainly on the building and construction industries and the do‑it‑yourself home decorating market. Demand in these markets is cyclical, as to a lesser extent is demand for products such as aerosols. Variations in the demand for
packaging products in these market segments could have a material adverse effect on our business, financial condition and results of operations.
We face intense competition from other metal and glass packaging producers, as well as from manufacturers of alternative forms of packaging.
Metal Packaging
The metal packaging sectors in which Metal Packaging operates are mature, experiencing limited growth in demand in recent years, and competitive. The most competitive part of the metal packaging market is the sale of undifferentiated, standardized food cans. Prices for these products are primarily driven by raw material costs and seasonal capacity, and price competition is sometimes fierce. Competition in the market for customized, differentiated packaging is based on price and, increasingly, on innovation, design, quality and service. Our principal competitors include Ball Corporation, Crown Holdings, Silgan Holdings and Can Pack. To the extent that any one or more of our competitors become more successful with respect to any key competitive factor, our ability to attract and retain customers could be materially and adversely affected, which could have a material adverse effect on our business.
Metal Packaging is subject to substantial competition from producers of packaging made from plastic, carton and composites, particularly from producers of plastic packaging and flexible packaging. Changes in consumer preferences in terms of food processing (e.g., fresh or frozen food content and dry versus wet pet food) or in terms of packaging materials, style and product presentation can significantly influence sales. An increase in Metal Packaging’s costs of production or a decrease in the costs of, or a further increase in consumer demand for, alternative packaging could have a material adverse effect on our business, financial condition and results of operations.
Glass Packaging
Glass Packaging is subject to intense competition from other glass packaging producers, as well as from producers of other forms of rigid and non‑rigid packaging, against whom we compete on the basis of price, product characteristics, quality, customer service, reliability of delivery and the overall attractiveness of our offering. Advantages or disadvantages in any of these competitive factors may be sufficient to cause customers to consider changing suppliers or to use an alternative form of packaging. In some instances, we also face the threat of vertical integration by our customers into the manufacture of their own packaging materials.
Our principal competitors in glass packaging include Anchor Glass and Owens‑Illinois in North America and Owens‑Illinois, Verallia and Vidrala in Europe. Additionally, we face competition from firms that carry out specific export operations at low prices when their domestic markets are at overcapacity or when foreign exchange rates or economic conditions (particularly transport costs) allow this, such as has been seen with the importing of glass containers into the United States from lower cost countries. Despite the generally regional nature of the glass packaging markets, these export operations could have a material negative impact on our business, financial condition and results of operations.
In addition to competing with other large, well‑established manufacturers in the glass packaging industry, we also compete with manufacturers of other forms of rigid packaging, principally plastic packaging and aluminum cans, on the basis of quality, price, service and consumer preference. We also compete with manufacturers of non‑rigid packaging alternatives, including flexible pouches and aseptic cartons, particularly in serving the packaging needs of non‑alcoholic beverage customers, including juice customers and food customers. We believe that the use of glass packaging for alcoholic and non‑alcoholic beverages is subject to consumer taste. In addition, the association of glass packaging with premium items in certain product categories exposes glass packaging to economic variations. Therefore, if economic conditions are poor, we believe that consumers may be less likely to prefer glass packaging over other forms of packaging. We cannot ensure that our products will continue to be preferred by end consumers and that consumer preference will not shift from glass packaging to alternative packaging. A material shift in consumer preference away from glass packaging, or competitive pressures from our various competitors, could result in a decline in sales volume or pricing pressure that would have a material adverse effect on our business, financial condition and results of operations. Furthermore, new threats from container and production innovations in all forms of packaging could disadvantage our existing business. If we are unable to respond to competitive technological advances, our future performance could be materially adversely affected.
Some customers meet some of their metal and glass packaging requirements through self-manufacturing, reducing their external purchases of packaging. In metal packaging, for example, AB InBev manufactures metal packaging through its Metal Container Corporation subsidiary in the United States. In glass packaging, companies which satisfy some of their requirements through self-manufacture include AB InBev and Gallo, which manufacture glass packaging in the United States, and AB InBev and Constellation Brands, which produce glass packaging in Mexico. The potential vertical integration of our customers could introduce new production capacity in the market, which may create an imbalance between glass packaging supply and demand. The growth of vertically integrated operations could have a material negative impact on our future performance.
An increase in metal or glass container manufacturing capacity without a corresponding increase in demand for metal or glass packaging could cause prices to decline, which could have a material adverse effect on our business, financial condition and results of operations.
The profitability of metal or glass packaging companies is heavily influenced by the supply of, and demand for, metal or glass packaging.
We cannot assure you that metal or glass container manufacturing capacity in any of our markets will not increase further in the future, nor can we assure you that demand for metal or glass packaging will meet or exceed supply. If metal or glass container manufacturing capacity increases and there is no corresponding increase in demand, the prices we receive for our products could materially decline, which could have a material adverse effect on our business, financial condition and results of operations.
Because our customers are concentrated, our business could be adversely affected if we were unable to maintain relationships with our largest customers.
For the year ended December 31, 2018, Metal Packaging’s ten largest customers accounted for approximately 42% of its consolidated revenues. For the year ended December 31, 2018, Glass Packaging’s ten largest customers accounted for approximately 43% of its revenues.
We believe our relationships with these customers are good, but there can be no assurance that we will be able to maintain these relationships. For Metal Packaging, approximately two‑thirds of revenues for the year ended December 31, 2018, were under multi‑year supply agreements of varying terms between two and ten years, with the remaining revenues generally under one-year agreements. For Glass Packaging, we also typically sell most of our glass packaging directly to customers under one- to five‑year arrangements. Although these arrangements have provided, and we expect they will continue to provide, the basis for long‑term partnerships with our customers, there can be no assurance that our customers will not cease purchasing our products. If our customers unexpectedly reduce the amount of glass packaging and/or metal cans they purchase from us, or cease purchasing our glass packaging and/or metal cans altogether, our revenues could decrease and our inventory levels could increase, both of which could have an adverse effect on our business, financial condition and results of operations. In addition, while we believe that the arrangements that we have with our customers will be renewed, there can be no assurance that such arrangements will be renewed upon their expiration or that the terms of any renewal will be as favorable to us as the terms of the current arrangements. There is also the risk that our customers may shift their filling operations to locations in which we do not operate. The loss of one or more of these customers, a significant reduction in sales to these customers or a significant change in the commercial terms of our relationship with these customers could have a material adverse effect on our business.
The continuing consolidation of our customer base may intensify pricing pressures or result in the loss of customers, either of which could have a material adverse effect on our business, financial condition and results of operations.
Some of our largest customers have acquired companies with similar or complementary product lines. For example, in 2017 Reckitt Benckiser merged with Mead Johnson Nutrition Company, in 2016 AB InBev acquired SABMiller and in 2015 Kraft Foods Group merged with H.J. Heinz Holding Corporation. Such consolidation has increased the concentration of our net sales with our largest customers and may continue in the future. In many cases, such consolidation may be accompanied by pressure from customers for lower prices. Increased pricing pressures from our customers may have a material adverse effect on our business, financial condition and results of operations. In addition, this consolidation may lead manufacturers to rely on a reduced number of suppliers. If, following the consolidation of one
of our customers with another company, a competitor was to be the main supplier to the consolidated companies, this could have a material adverse effect on our business, financial condition or results of operations.
A significant write down of goodwill would have a material adverse effect on our financial condition and results of operations.
Goodwill at December 31, 2018 totaled $2.0 billion. The Company evaluates goodwill annually (or more frequently if impairment indicators arise) for impairment. The valuation methods used include those requiring the use of a weighted average cost of capital to calculate the present value of the expected future cash flows of the Company’s groups of cash generating units. Future changes in the cost of capital, expected cash flows, or other factors may cause the Company’s goodwill to be impaired, resulting in a non‑cash charge against results of operations to write down goodwill for the amount of the impairment. If a significant write down is required, the charge would have a material adverse effect on the Company’s financial condition and results of operations.
Our profitability could be affected by varied seasonal demands.
Demand for Metal Packaging and Glass Packaging products is seasonal. Metal Packaging’s sales are typically greater in the second and third quarters of the year, with generally lower sales in the first and fourth quarters. Unseasonably cool weather during the summer months can reduce demand for certain beverages packaged in its beverage cans. Weather conditions can reduce crop yields and adversely affect customer demand for fruit and vegetable cans. Metal Packaging’s worldwide seafood canning activities are also affected by variations in local fish catches. The variable nature of the food and seafood packaging businesses and Metal Packaging’s vulnerability to natural conditions could have a material adverse effect on our business, financial condition and results of operations.
Demand for our Glass Packaging products is typically strongest during the summer months and in the period prior to the holidays in December because of the seasonal nature of the consumption of beer and other beverages. Unseasonably cool weather during the summer months can reduce demand for certain beverages packaged in our glass packaging, which could have a material adverse effect on our business, financial condition and results of operations. In addition, we generally schedule shutdowns of our furnaces for rebuilding and repairs of machinery in the first quarter in Europe and around year‑end and the first quarter in North America. If demand for glass packaging should unexpectedly rise during such a shutdown, we would not have the ability to fulfill such demand and may lose potential revenues. These shutdowns and seasonal sales patterns could have a material adverse effect on profitability during the first quarter.
Our profitability could be affected by the availability and cost of raw materials including as a result of changes in tariffs and duties.
The raw materials that we use have historically been available in adequate supply from multiple sources. For certain raw materials, however, there may be temporary shortages due to weather, transportation, production delays or other factors. In such an event, no assurance can be given that we would be able to secure our raw materials from sources other than our current suppliers on terms as favorable as our current terms, or at all. Any such shortages, as well as material increases in the cost of any of the principal raw materials that we use, including the introduction of new tariffs, such as, in 2018, with the introduction of tariffs of 25% on steel and 10% on aluminum in the United States. Further tariffs, duties or other increases in the cost to transport materials to our production facilities, could have a material adverse effect on our business, financial condition and results of operations. Furthermore, the relative price of oil and its products may impact our business, by affecting transport, lacquer and ink costs.
The primary raw materials that we use for Metal Packaging are aluminum ingot and steel (both in tinplate and tin‑free forms). Aluminum ingot is traded daily as a commodity on the London Metal Exchange, which has historically been subject to significant price volatility. Because aluminum is priced in U.S. dollar, fluctuations in the U.S. dollar/euro rate also affect the euro cost of aluminum ingot.
Our business is exposed to both the availability of aluminum and the volatility of aluminum prices, including associated premia. While raw materials are generally available from independent suppliers, raw materials are subject to fluctuations in price and availability attributable to a number of factors, including general economic conditions, commodity price fluctuations (with respect to aluminum on the London Metal Exchange), the demand by other industries for the same
raw materials and the availability of complementary and substitute materials. Adverse economic or financial changes could impact our suppliers, thereby causing supply shortages or increasing costs for our business.
Steel is generally obtained under one‑year contracts with prices that are usually fixed in advance. When such contracts are renewed in the future, our steel costs under such contracts will be subject to prevailing global steel and/or tinplate prices at the time of renewal, which may be different from historical prices. In contrast to aluminum, the hedging market for steel, and in particular that for coking coal, is a relatively new market which does not have the depth of the aluminum market and as a consequence, there might be limitations to place hedges in the market.
We may not be able to pass on all or substantially all raw material price increases, now or in the future. In addition, we may not be able to hedge successfully against raw material cost increases. Furthermore, aluminum and steel prices are subject to considerable volatility in price and demand. While in the past sufficient quantities of aluminum and steel have been generally available for purchase, these quantities may not be available in the future, and, even if available, we may not be able to continue to purchase them at current prices. Further increases in the cost of these raw materials could adversely affect our operating margins and cash flows.
The supplier industries from which Metal Packaging receives its raw materials are relatively concentrated, and this concentration can impact raw material costs. Over the last ten years, the number of major aluminum and steel suppliers has decreased and there remains the possibility of further consolidation among steel suppliers. Further consolidation could hinder our ability to obtain adequate supplies of these raw materials and could lead to higher prices for aluminum and tinplate.
Glass Packaging also consumes significant amounts of raw materials in the manufacturing process, in particular, glass sand, limestone and soda ash (natural or synthetic). Crushed recycled glass (“cullet”) is also a key raw material that is used in variable percentages, depending on the type of glass manufactured and the availability of cullet in a particular market. The combination of higher energy prices and a tight supply market has resulted in a significant increase in price for soda ash. Increases in demand without corresponding increases in supply is putting pressure not only on soda ash, but also on some other raw materials. The price of cullet varies widely from one region to another and is dependent on a number of factors, including glass collection and its effectiveness and the distance of our production sites to population centres where the waste glass is generated. Changes in regulations related to glass collection and recycling can have a significant impact on the availability of cullet and on its price. Any significant increase in the price of the raw materials we use to manufacture glass could have a material negative impact on our business, financial condition and results of operations.
The failure to obtain adequate supplies of raw materials or future price increases could have a material adverse effect on our business, financial condition and results of operations.
Currency, interest rate fluctuations and commodity prices may have a material impact on our business.
Our functional currency is the euro and we present our financial information in U.S. dollar. Insofar as possible, we actively manage currency exposures through the deployment of assets and liabilities throughout the Group and, when necessary and economically justified, enter into currency hedging arrangements to manage our exposure to foreign currency fluctuations by hedging against rate changes with respect to our functional currency, the euro. However, we may not be successful in limiting such exposure, which could adversely affect our business, financial condition and results of operations. In addition, our presented results may be impacted as a result of fluctuations in the U.S. dollar exchange rate versus the euro.
Metal Packaging has production facilities in 21 different countries worldwide. It also sells products to, and obtains raw materials from, companies located in these and different regions and countries globally. As a consequence, a significant portion of consolidated revenue, costs, assets and liabilities of Metal Packaging are denominated in currencies other than the euro, particularly the U.S. dollar, the pound and Brazilian real. The exchange rates between the currencies which we are exposed to, such as the euro, the U.S. dollar, the pound and the Brazilian real, have fluctuated significantly in the past and may continue to do so in the future.
Metal Packaging incurs currency transaction risks primarily on metal purchases (or the hedging of those purchases), as metal prices are denominated in U.S. dollars, and on revenue denominated in currencies other than the euro fulfilled from euro‑participant territories (or the hedging of those sales).
A substantial portion of the assets, liabilities, revenues and expenses of Glass Packaging is denominated in U.S. dollars, pounds, Swedish krona, Danish krone and Polish zloty. Fluctuations in the value of these currencies with respect to the euro have had, and may continue to have, a significant impact on our financial condition and results of operations.
For the year ended December 31, 2018, 64% of our revenues were to countries with currencies other than the euro.
In addition to currency translation risk, we are subject to currency transaction risk. Our policy is, where practical, to match net investments in foreign currencies with borrowings in the same currency. The debt and interest payments relating to our Swedish, Danish and Polish operations are all denominated in euro. Fluctuations in the value of these currencies with respect to the euro may have a significant impact on our financial condition and results of operations.
Changes in exchange rates can affect our ability to purchase raw materials and sell products at profitable prices, reduce the value of our assets and revenues, and increase liabilities and costs.
We are also exposed to interest rate risk. Fluctuations in interest rates may affect our interest expense on existing debt and the cost of new financing. We occasionally use CCIRS to manage this risk, but sustained increases in interest rates could nevertheless materially adversely affect our business, financial condition and results of operations.
In addition, we are exposed to movements in the price of natural gas. We try to ensure that natural gas prices are fixed for future periods but do not always do so because the future prices can be far in excess of the spot price. We do not use commodity futures contracts to limit the fluctuations in prices paid and the potential volatility in earnings and cash flows from future market price movements.
For a further discussion of these matters and the measures we have taken to seek to protect our business against these risks, see “Item 5. Operating and Financial Review and Prospects” and “Item 11. Quantitative and Qualitative Disclosures About Market Risk”.
It is difficult to compare our results of operations from period to period.
It is difficult to make period‑to‑period comparisons of our results of operations. Our business has been created as a result of a series of acquisitions and other corporate transactions over many years. These acquisitions have had a positive effect on our results of operations in periods following their completion and integration. Furthermore, our sales and, therefore, our net operating income are variable within the fiscal year due to the seasonality described above. Thus, a period‑to‑period comparison of our results of operations may not be meaningful.
Interrupted energy supplies and higher energy costs may have a material adverse effect on our business.
We use natural gas, electrical power, oil, oxygen and, in limited circumstances, liquefied petroleum gas to manufacture our products. These energy sources are vital to our operations and we rely on a continuous power supply to conduct our business. Energy prices are subject to considerable volatility. We are not able to predict to what extent energy prices will vary in the future. If energy costs increase further in the future, we could experience a significant increase in operating costs, which could, if we are not able to recover these costs increases from our customers through selling price increases, have a material adverse effect on our business, financial condition and results of operations.
Our ability to fully pass-through input costs may have an adverse effect on our financial condition and results of operations
A significant number of our sales contracts with customers include provisions enabling us to pass-through increases in certain input costs, which help us deliver consistent margins. However, there is no assurance that the Group will be in a position to fully recover increased input costs from all of our customers, as has been the case with respect to the elevated freight and logistics costs incurred in our Metal Packaging and Glass Packaging businesses in North America during 2018.
Our manufacturing facilities are subject to operating hazards.
Our manufacturing processes include cutting, coating and shaping metal into containers, as well as heating raw materials to extremely high temperatures to make glass, which we then form into glass containers. These processes, which are conducted at high speeds and involve operating heavy machinery and equipment, entail risks and hazards, including industrial accidents, leaks and ruptures, explosions, fires, mechanical failures and environmental hazards, such as spills, storage tank leaks, discharges or releases of hot glass or toxic or hazardous substances and gases. These hazards may cause unplanned business interruptions, unscheduled downtime, transportation interruptions, personal injury and loss of life, severe damage to or the destruction of property and equipment, environmental contamination and other environmental damage, civil, criminal and administrative sanctions and liabilities, and third‑party claims, any of which may have a material adverse effect on our business, financial condition and results of operations.
We are involved in a continuous manufacturing process with a high degree of fixed costs. Any interruption in the operations of our manufacturing facilities may adversely affect our business, financial condition and results of operations.
All of our manufacturing activities take place at facilities that we own or that are leased by the Group. We conduct regular maintenance on all of our operating equipment. However, due to the extreme operating conditions inherent in some of our manufacturing processes, we cannot assure you that we will not incur unplanned business interruptions due to furnace breakdowns or similar manufacturing problems or that such interruptions will not have an adverse impact on our business, financial condition and results of operations. There can be no assurance that alternative production capacity would be available in the future if a major disruption were to occur or, if it were available, that it could be obtained on favorable terms. A disruption in such circumstances could have a material adverse effect on our business, financial condition and results of operations.
To the extent that we experience any furnace breakdowns or similar manufacturing problems, we will be required to make capital expenditures even though we may not have available resources at such time and we may not be able to meet customer demand, which would result in a loss of revenues. As a result, our liquidity may be impaired as a result of such expenditures and loss of revenues.
A mechanical failure or disruption affecting any major operating line may result in a disruption of our ability to supply customers, and standby capacity may not be available. The potential impact of any disruption would depend on the nature and extent of the damage caused to such facility. Further, our facilities in geographically vulnerable areas, including parts of the United States and Italy, may be disrupted by the occurrence of natural phenomena, such as earthquakes, hurricanes, floods, wildfires and tsunamis.
Our business requires relatively high levels of capital expenditures, which we may be unable to fund.
Our business requires relatively high levels of maintenance capital expenditures. We may not be able to make such capital expenditures if we do not generate sufficient cash flow from operations, have funds available for borrowing under our existing credit facilities to cover these capital expenditure requirements or if we were restricted from incurring additional debt to cover such expenditures or as a result of a combination of these factors. If we are unable to meet our capital expenditure plans, we may not be able to maintain our manufacturing capacity, which may negatively impact our competitive position and ultimately, our revenues and profitability. If we are unable to meet our maintenance capital expenditures, our manufacturing capacity may decrease, which may have a material adverse effect on our profitability.
Our expansion strategy may adversely affect our business.
We aim over the longer term to continue to capitalize on strategic opportunities to expand our packaging activities. We believe that such future expansion is likely to require the further acquisition of existing businesses. Because we believe that such businesses may be acquired with modest equity and relatively high levels of financial leverage given the cash‑generating capabilities of our business streams, our leverage may increase in the future in connection with any acquisitions. This could have an adverse effect on our business, financial condition and results of operations. In addition, any future expansion is subject to various risks and uncertainties, including the inability to integrate effectively the operations, personnel or products of acquired companies and the potential disruption of existing businesses and diversion of management’s attention from our existing businesses. Furthermore, there can be no assurance that any future expansions will achieve positive results.
We are subject to various environmental and other legal requirements and may be subject to new requirements of this kind in the future that could impose substantial costs upon us.
Our operations and properties are subject to extensive laws, ordinances, regulations and other legal requirements relating to environmental protection. Such laws and regulations which may affect our operations include, among others, requirements regarding remediation of contaminated soil, groundwater and buildings, water supply and use, natural resources, water discharges, air emissions, waste management, noise pollution, asbestos and other deleterious materials, the generation, storage, handling, transportation and disposal of regulated materials, product safety, and workplace health and safety. Such laws and regulations are also subject to constant review by lawmakers and regulators, which may result in further environmental legal requirements.
We have incurred, and expect to continue to incur, costs to comply with such legal requirements, and these costs are likely to increase in the future. The EPA and other regulators have targeted the glass packaging, flat glass, mineral wool and fiber sectors as part of an enforcement initiative involving high fuel combustion sources. Inquiries and enforcement by other regulators, including demands for more stringent pollution control devices could also result in the need for further capital upgrades to our furnaces and plant operations at substantial cost. We require a variety of permits to conduct our operations, including operating permits such as those required under various U.S. laws, including the federal Clean Air Act, and the EU Industrial Emissions Directive water and trade effluent discharge permits, water abstraction permits and waste permits. We are in the process of applying for, or renewing, permits at a number of our sites. Failure to obtain and maintain the relevant permits, as well as noncompliance with such permits, could have a material adverse effect on our business, financial condition and results of operations.
If we were to violate or fail to comply with these laws and regulations or our permits, we could be subject to criminal, civil and administrative sanctions and liabilities, including substantial fines and orders, or a partial or total shutdown of our operations. For example, in 2017 we settled alleged violations of hazardous waste regulations governing the reuse of electrostatic precipitator dust at our Madera plant in the United States, which occurred in the period prior to the acquisition in 2014 of VNA. As part of this settlement, we paid a civil penalty of $3.5 million and expect to incur increased dust disposal costs, which we estimate to be about $500,000 annually. We cannot assure you that our reuse of electrostatic precipitator dust at our other glass manufacturing plants will not result in regulatory inquiries or enforcement relating to compliance with hazardous waste regulations.
In order to comply with air emission restrictions, significant capital investments may be necessary at some sites. For example, to comply with U.S. environmental regulations and the demands of the EPA, VNA, which we acquired in 2014, agreed to make sizable investments to replace or install new electrostatic precipitators and other equipment in order to control the air emissions at certain sites located in the United States. In 2010, VNA and the EPA signed a global consent decree pursuant to which VNA has made and will continue to make investments estimated at up to an aggregate of $112 million over a ten‑year period, excluding operating costs of the systems installed. In addition, we paid a penalty amounting to $2.5 million excluding interest pursuant to this consent decree.
We have received notices of violation from the EPA for alleged violations under the Clean Air Act’s Prevention of Significant Deterioration, New Source Performance Standards and Title V provisions stemming from past furnace‑related projects at our other glass manufacturing facilities unrelated to our acquisition of VNA, including furnace‑related projects conducted by third parties who owned the facilities before us. The EPA has sent information requests to certain of our glass manufacturing facilities concerning furnace‑related projects, as well as our air pollutant emissions more generally, which could culminate in notices of violation or other enforcement.
In Europe, under the IED and its reference document for “Best Available Techniques” for glass manufacturing plants and metal manufacturing plants with surface treatment using solvents, permitted emissions levels from these plants including ours are reduced substantially periodically. In Germany, technical guidelines, TA Luft, set forth emission thresholds which could potentially result in stricter limits in the future. These types of changes could require additional investment in our affected operations. Our business is also affected by the EU ETS, which limits emissions of greenhouse gases. See “Item 4. Information on the Company–Environmental, Health and Safety and Product Safety Regulation”. This scheme, any future changes to it and any additional measures required to control the emission of greenhouse gases that may apply to our operations could have a material adverse effect on our business, financial condition and results of operations. California has implemented a similar program, which results in the need for us to incur potentially significant
compliance costs, including for the purchase of offsets against our greenhouse gas emissions. Other states where we have operations, such as Washington, are expected to implement similar programs.
Changes to the laws and regulations governing the materials that are used in our manufacturing operations may impact the price of such materials or result in such materials no longer being available, which could have a material adverse effect on our business, financial condition and results of operations. The European Union passed regulations concerning REACH, which place onerous obligations on the manufacturers and importers of substances, preparations and articles containing substances, and which may have a material adverse effect on our business. Furthermore, substances we use may have to be removed from the market (under REACH’s authorization and restriction provisions) or need to be substituted for alternative chemicals which may also adversely impact upon our operations.
Sites at which we operate often have a long history of industrial activities and may be, or have been in the past, engaged in activities involving the use of materials and processes that could give rise to contamination and result in potential liability to investigate or remediate, as well as claims for alleged damage to persons, property or natural resources. Liability may be imposed on us as owners, occupiers or operators of contaminated facilities. These legal requirements may apply to contamination at sites that we currently or formerly owned, occupied or operated, or that were formerly, owned, occupied or operated by companies we acquired or at sites where we have sent waste offsite for treatment or disposal. Regarding assets acquired by us, including the beverage can manufacturing assets, we cannot assure you that our due diligence investigations identified or accurately quantified all material environmental matters related to the acquired facilities. Our closure of a site may accelerate the need to investigate and remediate any contamination at the site.
In addition, we may be required to remediate contaminated third‑party sites where we have sent waste for disposal. Liability for remediation of these third‑party sites may be established without regard to whether the party disposing of the waste was at fault or the disposal activity was legal at the time it was conducted. For example, “Superfund” sites in the United States are the highest priority contaminated sites designated by the federal government as requiring remediation, and costs of their remediation tend to be high. We and a number of other companies have been named as potentially responsible parties to clean up the Lower Duwamish Waterway Superfund Site in Washington, because our Seattle plant is adjacent to the waterway and is alleged to have contributed to its contamination. Whether we will have any liability for investigation and remediation costs at this or any other Superfund site or for costs relating to claims for natural resource damages, and what portion of the costs we must bear, has not been determined.
Changes in product requirements and their enforcement may have a material impact on our operations.
Changes in laws and regulations relating to deposits on, and the recycling of, glass or metal packaging could adversely affect our business if implemented on a large scale in the major markets in which we operate. Changes in laws and regulations laying down restrictions on, and conditions for use of, food contact materials or on the use of materials and agents in the production of our products could likewise adversely affect our business. Changes to health and food safety regulations could increase costs and also might have a material adverse effect on revenues if, as a result, the public attitude toward end‑products, for which we provide packaging, were substantially affected.
Additionally, the effectiveness of new standards such as the ones related to recycling or deposits on different packaging materials could result in excess costs or logistical constraints for some of our customers who could choose to reduce their consumption and even terminate the use of glass or metal packaging for their products. We could thus be forced to reduce, suspend or even stop the production of certain types of products. The regulatory changes could also affect our prices, margins, investments and activities, particularly if these changes resulted in significant or structural changes in the market for food packaging that might affect the market shares for glass, the volumes produced or production costs.
Environmental concerns could lead U.S. or European Union bodies to implement other product regulations that are likely to be restrictive for us and have a material negative impact on our business, financial condition and results of operations. For example, in the European Union, each bottle cannot, in principle, contain more than the applicable heavy metals limit pursuant to Directive 94/62/CE on Packaging and Packaging Waste. There is significant variation, among countries where we sell our products, in the limitation on certain constituents in packaging, which can have the effect of restricting the types of raw materials or amount of recycled glass we use. In turn, these restrictions can increase our operating costs, such as increased energy consumption, and the environmental impacts of our operations.
Similarly, in the United States, some state regulations set the concentration of certain heavy metals in packaging at 100 ppm and provide for an exception to this rule in the event of additions of recycled packaging. Because this exemption has expired in certain states, the bottles manufactured from recycled glass that have a heavy metals concentration higher than 100 ppm could be noncompliant, which could have a negative impact on our earnings, financial condition, assets or image. We have had regulatory inquiries about our compliance and may in the future have additional inquiries or enforcement.
Other changes, such as restrictions on bisphenol A in coatings for some of our products, which have been proposed or adopted in the European Union under the REACH legislation and some of its Member States, have required us to develop substitute materials for our production.
We could incur significant costs in relation to claims of injury and illness resulting from materials present or used at our production sites, or from our use of these sites or other workplace injuries, or from our products.
As is the case in a number of other industrial processes that deal with high temperatures, asbestos was once present in the glass‑making industry, primarily in safety equipment, until measures were taken to substitute this material for other materials made possible through technological advances. Since the 1990s, items made of asbestos have gradually been removed at our sites in Western Europe and the United States. Because of the age of some of our sites, however, asbestos‑cement may have been used in construction and may still be present at these sites. When these buildings are modernized or repaired, the cost of upgrades is higher because of the restrictions associated with removing asbestos‑containing materials.
We are exposed to claims alleging injury or illness associated with asbestos and related compensation over and above the support that may be offered through various existing social security systems in countries where we operate.
Claims associated with our glass manufacturing operations exist and may arise for reasons associated with the work environment unrelated to the presence of asbestos. For example, claims have arisen associated with the acoustic environment generated by forming machines, the use of glass sand in making glass and products likely to contain heavy metals or solvents for decoration. We may also face the risk of work‑related health claims owing to materials present or used at our production sites such as silicosis, and, under certain conditions, Legionnaires’ disease. The U.S. Occupational Safety and Health Administration has implemented a requirement that reduced by 50% the permissible exposure limit to crystalline silica and requires engineering controls or personal protective equipment to safeguard employees from such exposure. The European Union has also set stricter exposure limit values for respirable crystalline silica in work processes under the Carcinogens and Mutagens Directive. This substance is a common mineral found in sand, which is a significant raw material component for glass manufacturing and is also contained in refractories, or bricks, used in glass manufacturing operations. Our costs to meet these reduced limits could be substantial, particularly if it becomes necessary for us to implement broad engineering controls across many of our glass manufacturing plants.
We are also exposed to claims alleging musculoskeletal disorders caused by performing certain repetitive operations or motions. We could also face claims alleging illness or injury from use of the products that we manufacture or sell or from workplace injuries more generally. If these claims succeed, they could have a material adverse impact on our business, financial condition and results of operations.
We may not be able to integrate any future acquisitions effectively.
Even though we have acquired businesses in the past, there is no certainty that any businesses we may acquire in the future will be effectively integrated. If we cannot successfully integrate acquired businesses within a reasonable time frame, we may not be able to realize the potential benefits anticipated from those acquisitions. Our failure to successfully integrate such businesses and the diversion of management attention and other resources from our existing operations could have a material adverse effect on our business, financial condition and results of operations.
Furthermore, even if we are able to integrate successfully the operations of acquired businesses, we may not be able to realize the cost savings, synergies and revenue enhancements that we anticipate either in the amount or within the time frame that we anticipate, and the costs of achieving these benefits may be higher than, and the timing may differ
from, what we expect. Our ability to realize anticipated cost savings and synergies may be affected by a number of factors, including the following:
| · | | the use of more cash or other financial resources on integration and implementation activities than we expect, including restructuring and other exit costs; and |
| · | | increases in other expenses related to acquisitions, which may offset the cost savings and other synergies from such acquisitions. |
We have potential indemnification obligations relating to divestments.
We have disposed of a number of businesses. Pursuant to these agreements, we may be required to provide indemnification to the acquirers for damages resulting from a breach of any representation, warranty or covenants contained therein. The indemnification obligations under these agreements are subject to certain monetary and other limitations. To the extent that we are required to make any significant payments under these indemnification provisions, these payments could adversely impact our business, financial condition and results of operations.
We may be subject to litigation, regulatory investigations, arbitration and other proceedings that could have an adverse effect on us.
We are currently involved in various litigation matters, and we anticipate that we will be involved in litigation matters from time to time in the future. The risks inherent in our business expose us to litigation, including personal injury, environmental litigation, contractual litigation with customers and suppliers, intellectual property litigation, tax or securities litigation, and product liability lawsuits. We cannot predict with certainty the outcome or effect of any claim, regulatory investigation, or other litigation matter, or a combination of these. If we are involved in any future litigation, or if our positions concerning current disputes are found to be incorrect, this may have an adverse effect on our business, financial condition and results of operations, because of potential negative outcomes, the costs associated with asserting our claims or defending such lawsuits, and the diversion of management’s attention to these matters.
We could incur significant costs due to the location of some of our industrial sites in urban areas.
Obtaining, renewing or maintaining permits and authorizations issued by administrative authorities necessary to operate our production plants could be made more difficult due to the increasing urbanization of the sites where some of our manufacturing plants are located. Some of our sites are located in urban areas. Urbanization could lead to more stringent operating conditions (by imposing traffic restrictions for example), conditions for obtaining or renewing the necessary authorizations, the refusal to grant or renew these authorizations, or expropriations of these sites in order to allow urban planning projects to proceed.
The occurrence of such events could result in us incurring significant costs and there can be no assurance that the occurrence of such events would entitle us to partial or full compensation.
Changes in consumer lifestyle, nutritional preferences, health‑related concerns and consumer taxation could adversely affect our business.
Changes in consumer preferences and tastes can have an impact on demand for our customers’ products, which in turn can lead to reduced demand for our products. In the United States, for example, the growth in consumption of imported beer has seen reduced demand for domestically-produced mass beer brands, resulting in reduced demand for glass packaging for this end-use category.
Certain end‑products represent a significant proportion of our packaging market. In the past, the occurrence of diseases such as bovine spongiform encephalopathy and swine fever have sometimes led to reduced demand for associated canned products, such as sauces, soups and ready meals, and publicity about the supposed carcinogenic effect of coatings used on some cans may have affected sales of canned products. Additionally, France and the United Kingdom have introduced taxes on drinks with added sugar and artificial sweeteners that companies produce or import. France has also imposed taxes on energy drinks using certain amounts of taurine and caffeine. As a result of such taxes, demand decreased
temporarily, and the imposition of such taxes in the future may decrease the demand for certain soft drinks and beverages that our customers produce, which may cause our customers to respond by decreasing their purchases of our metal and glass packaging products. Consumer tax legislation and future attempts to tax sugar or energy drinks by other jurisdictions could reduce the demand for our products and adversely affect our profitability.
Any decline in the popularity of these product types as a result of lifestyle, nutrition, health considerations or consumer taxation could have a significant impact on our customers and could have a material adverse impact on our business, financial condition and results of operations.
We face costs associated with our post‑retirement and post‑employment obligations to employees which could have an adverse effect on our financial condition.
As of December 31, 2018, our accumulated post‑retirement benefit obligation was approximately $957 million. The additional costs associated with these and other benefits to employees could have a material adverse effect on our financial condition.
We operate a number of pension and other post‑retirement benefit schemes funded by a range of assets which may include property, derivatives, equities and/or bonds. The value of these assets is heavily dependent on the performance of markets which are subject to volatility. The liability structure of the obligations to provide such benefits is also subject to market volatility in relation to its accounting valuation and management. Additional significant funding of our pension and other post‑retirement benefit obligations may be required if market underperformance is severe.
Organized strikes or work stoppages by unionized employees could have a material adverse effect on our business.
Many of our operating companies are party to collective bargaining agreements with trade unions. These agreements cover the majority of our employees. Upon the expiration of any collective bargaining agreement, our operating companies’ inability to negotiate acceptable contracts with trade unions could result in strikes by the affected workers and increased operating costs as a result of higher wages or benefits paid to union members. If the unionized workers were to engage in a strike or other work stoppage, we could experience a significant disruption of operations and/or higher ongoing labor costs, which may have a material adverse effect on our business, financial condition and results of operations.
Failure of control measures and systems resulting in faulty or contaminated product could have a material adverse effect on our business.
We have strict control measures and systems in place to ensure that the maximum safety and quality of our products is maintained. The consequences of a product not meeting these rigorous standards, due to, among other things, accidental or malicious raw materials contamination or due to supply chain contamination caused by human error or equipment fault, could be severe. Such consequences might include adverse effects on consumer health, litigation exposures, loss of market share, financial costs and loss of revenues.
In addition, if our products fail to meet rigorous standards, we may be required to incur substantial costs in taking appropriate corrective action (up to and including recalling products from consumers) and to reimburse customers and/or end‑consumers for losses that they suffer as a result of this failure. Customers and end‑consumers may seek to recover these losses through litigation and, under applicable legal rules, may succeed in any such claim despite there being no negligence or other fault on our part. Placing an unsafe product on the market, failing to notify the regulatory authorities of a safety issue, failing to take appropriate corrective action and failing to meet other regulatory requirements relating to product safety could lead to regulatory investigation, enforcement action and/or prosecution. Any product quality or safety issue may also result in adverse publicity, which may damage our reputation. This could in turn have a material adverse effect on our business, financial condition and results of operations. Although we have not had material claims for damages for defective products in the past, and have not conducted any substantial product recalls or other material corrective action, these events may occur in the future.
In certain contracts, we provide warranties in respect of the proper functioning of our products and the conformity of a product to the specific use defined by the customer.
In addition, if a product contained in packaging manufactured by us is faulty or contaminated, it is possible that the manufacturer of the product may allege that our packaging is the cause of the fault or contamination, even if the packaging complies with contractual specifications. Furthermore, in certain countries, certain participants in the distribution chain refill bottles even though they may not be designed for this purpose.
In case of the failure of packaging produced by us to open properly or to preserve the integrity of its contents, we could face liability to our customers and to third parties for bodily injury or other tangible or intangible damages suffered as a result. Such liability, if it were to be established in relation to a sufficient volume of claims or to claims for sufficiently large amounts, could have a material adverse effect on our business, financial condition and results of operations.
Our existing insurance coverage may be insufficient and future coverage may be difficult or expensive to obtain.
Although we believe that our insurance policies provide adequate coverage for the risks inherent in our business, these insurance policies typically exclude certain risks and are subject to certain thresholds and limits. We cannot assure you that our property, plant and equipment and inventories will not suffer damages due to unforeseen events or that the proceeds available from our insurance policies will be sufficient to protect us from all possible loss or damage resulting from such events. As a result, our insurance coverage may prove to be inadequate for events that may cause significant disruption to our operations, which may have a material adverse effect on our business, financial condition and results of operations.
We may suffer indirect losses, such as the disruption of our business or third‑party claims of damages, as a result of an insured risk event. While we carry business interruption insurance and general liability insurance, they are subject to certain limitations, thresholds and limits, and may not fully cover all indirect losses.
We renew our insurance policies on an annual basis. The cost of coverage may increase to an extent that we may choose to reduce our policy limits or agree to certain exclusions from our coverage. Among other factors, adverse political developments, security concerns and natural disasters in any country in which we operate may materially adversely affect available insurance coverage and result in increased premiums for available coverage and additional exclusions from coverage.
Our food packaging sales could be adversely affected by changes in EU agricultural subsidy rules.
Certain subsidies are provided to agricultural producers under EU rules governing the production of various fruit, vegetable and dairy products. The availability of these subsidies may affect levels of production for certain agricultural products. Any reduction in existing subsidy levels could lead to a reduction in harvest or canning operations and therefore could have a material adverse effect on our business, financial condition and results of operations.
Our business may suffer if we do not retain our executive and senior management.
We depend on our executive team, who are identified under “Item 6–Directors, Senior Management and Employees” of this annual report. The loss of services of any of the members of our executive team or other members of senior management could adversely affect our business until a suitable replacement can be found. There may be a limited number of persons with the requisite skills to serve in these positions and there is no assurance that we would be able to locate or employ such qualified personnel on terms acceptable to us or at all.
The results of the United Kingdom’s referendum on withdrawal from the European Union may have a negative effect on our financial condition and results of operations.
In June 2016, a majority of the United Kingdom’s electorate voted in a referendum that the United Kingdom should withdraw from the European Union. Currently, the United Kingdom is due to leave the European Union on March 29, 2019.
In November 2018, the United Kingdom and the European Union agreed upon a draft withdrawal agreement setting out the terms of the United Kingdom’s departure. This agreement included a two-year transition period, during which the European Union would treat the United Kingdom as if it were still a member of the European Union. This was included to facilitate the orderly withdrawal of the United Kingdom from the European Union and to provide additional
legal certainty once European Union law ceases to apply to the United Kingdom. However, this agreement was subsequently rejected by the U.K. Parliament. Discussions regarding the terms of the United Kingdom’s exit are therefore on-going. Nevertheless, if the U.K. Parliament does not approve a withdrawal deal before March 29, 2019, then (subject to an extension of the negotiation period being agreed to by the United Kingdom and a unanimous decision of the European Council or the United Kingdom revoking Brexit altogether), the United Kingdom will leave the European Union without a deal on that date. In such a scenario, the United Kingdom could, subject to any unilateral exemptions or bilateral topic-by-topic deals, lose the trade agreements it has in place with other countries as a member of the European Union and trade with both the European Union and the rest of the world could be subject to tariffs and duties based on World Trade Organization terms. Additionally, the movement of goods between the United Kingdom and the remaining member states of the European Union could be subject to additional inspections and documentation checks, leading to possible delays at ports of entry and departure. These changes to the trading relationship between the United Kingdom and European Union could result in increased cost of goods imported into and exported from the United Kingdom.
Approximately 10% of our total revenue for the year ended December 31, 2018 was derived from revenues generated in the United Kingdom and nine of our 109 Glass or Metal Packaging manufacturing facilities are located in the United Kingdom. Any changes to the trading relationship between the United Kingdom and the European Union may adversely affect the cost or timing of imports, including aluminum and coatings in our Metal Packaging operations and molds and machinery in our Glass Packaging operations. Further, while we predominantly sell to customers in the local U.K. market, some of our customers based in the U.K. who export outside the local U.K. market, may experience reduced demand and/or delays arising from Brexit and post-Brexit arrangements. These negative impacts could adversely affect our financial condition and results of operations. Additionally, because of the extent of our business in the United Kingdom, the precise impact of Brexit is difficult to predict and may include effects beyond those described herein, which could have a material adverse impact on our financial condition and results of operations.
Further, political instability as a result of Brexit may result in a material negative effect on credit markets and foreign direct investments in Europe and the United Kingdom. Uncertainty related to Brexit has also resulted in exchange rate volatility between the British pound and other currencies. See also our risk factor entitled “Currency, interest rate fluctuations and commodity prices may have a material impact on our business.” This deterioration in economic conditions could result in increased unemployment rates, increased short- and long-term interest rates, consumer and commercial bankruptcy filings, a decline in the strength of national and local economies, and other results that negatively impact household incomes.
The economic outlook could be further adversely affected by the risk that one or more European Union member states could leave the European Union as well, the risk of a greater push for independence by Scotland or Northern Ireland, or the risk that the Euro as the single currency of any or all of the Eurozone member states could cease to exist. These developments, or the perception that any of them could occur, may have a material adverse effect on the stability of global financial markets, and could significantly reduce global market liquidity and restrict the ability of key market participants to operate in certain financial markets. Asset valuations, currency exchange rates and credit ratings may be especially subject to increased market volatility. These negative impacts could adversely affect our financial condition and results of operations.
Increasing privacy and data security obligations or a significant data breach may adversely affect the Group’s business.
The Group will continue its efforts to meet data security obligations and must manage evolving cybersecurity threats. The loss, disclosure, misappropriation of or access to employees’ or business partners’ information or the Group’s failure to meet its obligations could result in lost revenue, increased costs, legal claims or proceedings, liability or regulatory penalties. A significant data breach or the Group’s failure to meet its obligations may adversely affect the Group’s reputation and financial condition.
The Groups’s heavy reliance on technology and automated systems to operate its business could mean any significant failure or disruption of the technology or these systems could materially harm its business.
The Group depends on automated systems and technology to operate its business, including accounting systems, manufacturing systems and telecommunication systems. The Group operates a cyber and information risk management program including operating a global information security function which partners with global leaders in the security industry to deliver an integrated information and cyber risk management service using state-of-the-art technologies in
areas including antivirus & anti-malware, email and web security platforms, firewalls, intrusion detection systems, cyber threat intelligence services and advanced persistent threat detection. The Group also partners with global leaders to deliver high availability, resilient systems and communication platforms. However, there is the possibility that these systems could suffer substantial or repeated disruptions due to various events, some of which are beyond the Group’s control, including natural disasters, power failures, terrorist attacks, equipment or software failures, computer viruses or cyber security attacks. Substantial or repeated systems failures or disruptions, could result in the unauthorized release of confidential or otherwise protected information, result in increased costs, lost revenue and the loss or compromise of important data, and may adversely affect the Group’s business, results of operations and financial condition.
Risks Relating to Our Debt
The Company’s ability to pay principal and interest on or refinance the Toggle Notes may be affected by our organizational structure. The Company is dependent upon payments from other members of our corporate group to fund payments to Note holders, and such other members might not be able to make such payments in some circumstances.
The Company does not itself conduct any business operations and does not have any assets or sources of income of its own, other than the shares in Ardagh Group and intercompany loans to one or more of the Company’s parent companies and to one of its direct subsidiaries. As a result, the Company’s ability to make payments on the Toggle Notes or refinance our debt is dependent directly upon payments it receives from its subsidiaries, including Ardagh Group. There can be no assurance that those assets or sources of income will be sufficient to enable the Company to pay interest or principal amount on the Toggle Notes, and there can be no assurance that Ardagh Group will be able to make distributions to its equity holders. In making decisions relating to the repayment of the intercompany loan(s), the Company’s subsidiary borrower(s) may take actions that conflict with the interests of the Company or the holders of the Toggle Notes.
Moreover, if we cannot generate sufficient cash to meet our scheduled debt service obligations or fund our other business needs, we may, among other things, need to refinance all or a portion of our debt, including the Toggle Notes, obtain additional financing, delay planned acquisitions or capital expenditures or sell assets. There can be no assurance that we will be able to generate sufficient cash through any of the foregoing. If we are not able to refinance any of our debt, obtain additional financing or sell assets on commercially reasonable terms or at all, we may not be able to satisfy our obligations with respect to our debt, including the Toggle Notes. See “Item 5. Management’s Discussion and Analysis of Financial Condition and Results of Operations—Liquidity and Capital Resources.”
We expect to be able to repay or refinance the principal amounts outstanding under our outstanding notes on or before maturity of each such series of notes between now and 2023. If we are unable to do so, we expect to refinance such principal amounts with new debt. We may, however, be unable to refinance such principal amounts on terms satisfactory to us or at all.
Holders of the Notes do not have any direct claim on the cash flows of the operating subsidiaries of the Company, and such subsidiaries have no obligation, contingent or otherwise, to make payments with respect to the Toggle Notes or to make funds available to the Company.
Our substantial debt could adversely affect our financial health.
The Company and its subsidiaries have a substantial amount of debt and significant debt service obligations. As of December 31, 2018, we had total borrowings and net debt of $9.7 billion and $9.2 billion, respectively. For more information, see the description of our debt facilities and the table outlining our principal financing arrangements in “Item 5. Operating and Financial Review and Prospects—Liquidity and Capital Resources”.
Our substantial debt could have negative consequences for us and for holders of the Toggle Notes. For example, our substantial debt could:
| · | | require us to dedicate a large portion of our cash flow from operations to service debt and fund repayments on our debt, thereby reducing the availability of our cash flow to fund working capital, capital expenditures and other general corporate purposes; |
| · | | increase our vulnerability to adverse general economic or industry conditions; |
| · | | limit our flexibility in planning for, or reacting to, changes in our business or the industry in which we operate; |
| · | | limit our ability to raise additional debt or equity capital in the future; |
| · | | restrict us from making strategic acquisitions or exploiting business opportunities; |
| · | | make it difficult for us to satisfy our obligations with respect to our debt; and |
| · | | place us at a competitive disadvantage compared to our competitors that have less debt. |
In addition, a portion of our debt at fixed rates has been swapped to interest at variable rates that are linked to changing market interest rates. As a result, an increase in market interest rates would increase our interest expense and our debt service obligations, which would exacerbate the risks associated with our leveraged capital structure.
Negative developments in our business, results of operations and financial condition due to the changes in the global economic conditions or other factors could cause ratings agencies to lower the credit ratings, or ratings outlook, of our short‑ and long‑term debt and, consequently, impair our ability to raise new financing or refinance our current borrowings and increase our costs of issuing any new debt instruments.
If certain conditions for the payment of interest on the Toggle Notes in cash are not met, interest may be paid in PIK Interest.
The Company is required to pay interest on the Toggle Notes entirely in cash unless the conditions under the terms of the Toggle Notes, as described in the Company’s Form F-4 Registration Statement (File No. 333-216725), are satisfied, in which case the Company will be entitled to pay, to the extent described therein, PIK Interest. The terms of the Toggle Notes do not restrict the ability of Ardagh Group S.A. or its subsidiaries to use their dividend payment capacity for alternative uses. For example, the Toggle Note indentures, the Global Asset Based Loan Facility, and certain of their other credit facilities allow Ardagh Group S.A. and its subsidiaries to utilize amounts that would otherwise be available to pay cash dividends to the Company for purposes such as making restricted investments and prepaying subordinated indebtedness. In addition, subject to certain limitations, the Toggle Notes indentures also permit the Company to make cash dividends to and other payments in respect of its equity holders, and all such uses would reduce the amounts available to pay interest on the Toggle Notes in cash or principal of the Toggle Notes. See “Item 5. Operating and Financial Review and Prospects—Liquidity and Capital Resources”. As a result, there can be no assurance that we will be required (or able) to make cash interest payments on the Toggle Notes.
U.S. Holders will be required to accrue interest on the Toggle Notes whether or not we pay interest on the Toggle Notes in cash and will recognize ordinary income upon a sale, exchange, redemption or other taxable disposition of the Toggle Notes at a gain.
As a result of the Company being required to redeem the Notes for a price above 100% under certain circumstances, while not free from doubt, the Notes should be treated as “contingent payment debt instruments” for U.S. federal income tax purposes. We and each holder agree to treat the Toggle Notes as “contingent payment debt instruments” for U.S. federal income tax purposes. Accordingly, a U.S. Holder (as defined in “Taxation—United States Federal Income Taxation”) will be required to accrue original issue discount, regardless of their regular method of accounting for U.S. federal income tax purposes, on the Toggle Notes on a constant yield to maturity basis at the “comparable yield” (the rate at which the Company could have issued comparable notes without such contingencies) and to include such accrued amounts in gross income (as ordinary income) in advance of the receipt of cash attributable to such original issue discount. In addition, a U.S. Holder will recognize ordinary income (rather than capital gain) upon a sale, exchange, redemption or other taxable disposition of the Toggle Notes at a gain. Holders are urged to consult their own tax advisers as to the U.S. federal, state and other tax consequences of acquiring, owning and disposing of the Toggle Notes. See “Taxation—United States Federal Income Taxation.”
Item 4. Information on the Company
| A. | | History and development of the Company |
Ardagh Group traces its origins back to 1932 in Dublin, Ireland, when the Irish Glass Bottle Company was founded and listed on the Irish Stock Exchange. The Company operated a single glass plant in Dublin, largely serving the domestic beverage and food customer base, until 1998, when Yeoman International, led by the current Chairman and Chief Executive Officer and major shareholder, Paul Coulson, took an initial stake in Ardagh. Paul Coulson became Chairman later that year.
Since 1999, we have played a major role in the consolidation of the global metal and glass packaging industries, completing 23 acquisitions and significantly increasing our scope, scale, and geographic presence. Acquisitions, divestments and investments in greenfield projects to strengthen our position in selected segments have included the following select transactions:
| · | | In 1999, we acquired Rockware PLC in the U.K., from Owens‑Illinois for approximately GBP 247 million, which established the Company as the leading glass packaging producer in the U.K. and Ireland; |
| · | | In 2007, we acquired Rexam PLC’s European glass packaging business for approximately €657 million, broadening our presence across Continental Europe; |
| · | | In 2010, we acquired Impress Group for approximately €1.7 billion, which diversified our presence into metal packaging; |
| · | | In 2012, we acquired Leone Industries Inc., a single plant glass packaging business in New Jersey, United States, for approximately $220 million, representing our first expansion into the U.S. glass packaging market. We also acquired Anchor Glass for $880 million, the third largest producer of glass packaging in the United States, operating eight glass packaging plants; |
| · | | In 2014, following an extensive regulatory review, we completed the VNA Acquisition, the second largest glass packaging producer in North America, with 13 manufacturing plants in the United States, for $1.5 billion. The VNA Acquisition expanded our glass packaging business in North America into new geographies and end‑use categories. We also divested six former Anchor Glass plants and ancillary assets as a condition of gaining approval for this acquisition; |
| · | | In 2015, we completed an investment of approximately $220 million in two new can‑making facilities in Roanoke, Virginia and Reno, Nevada, as well as a significant expansion of our Conklin, New York, ends plant; and |
| · | | In 2016, we acquired 22 plants required to be divested by Ball Corporation and Rexam PLC as a condition of Ball Corporation’s acquisition of Rexam PLC. This acquisition, for a total consideration of €2.7 billion, broadened our presence in metal packaging to include leading global beverage can market positions. |
For additional information on the Company, see also “General Information”.
The SEC maintains an internet site at www.sec.gov that contains reports and information statements and other information regarding regristrants like us that ile electronically with the SEC.
The Company routinely posts important information on the Parent Company’s website – http://www.ardholdings-sa.com. This website and the information contained therein or connected thereto shall not be deemed to be incorporated into this annual report.
We are a leading supplier of innovative, value‑added rigid packaging solutions. Our products include metal and glass containers primarily for food and beverage markets, which are characterized by stable, consumer‑driven demand. Our end‑use categories include beer, wine, spirits, CSD, energy drinks, juices and flavored waters, as well as food, seafood and nutrition. We also supply the paints & coatings, chemicals, personal care, pharmaceuticals and general household end‑use categories. Our customers include a wide variety of leading consumer product companies which value our packaging products for their features, convenience and quality, as well as the end‑user appeal they offer through design, innovation, functionality, premium association and brand promotion. With our significant invested capital base, extensive technological capabilities and manufacturing know‑how, we believe we are well‑positioned to continue to meet the dynamic needs of our global customers. We have mainly built our Company through strategic acquisitions and have established leadership positions in large, attractive markets in beverage cans, food and specialty cans and glass containers.
We serve over 2,000 customers across more than 100 countries, comprised of multi‑national companies, large national and regional companies and small local businesses. In our target regions of Europe, North America and Brazil, our customers include a wide variety of CPGs, which own some of the best known brands in the world. We have a stable customer base with long-standing relationships and approximately two‑thirds of our sales are generated under multi‑year contracts, with the remainder largely subject to annual arrangements. A significant portion of our sales volumes are supplied under contracts which include input cost pass‑through provisions, which help us deliver generally consistent margins.
We operate 109 production facilities in 22 countries and employ approximately 23,400 personnel. Our plant network includes 75 metal production facilities and 34 glass production facilities. Our plants are generally located in close proximity to our customers, with some located on‑site or near‑site to our customers’ filling locations. Certain facilities may also be dedicated to end‑use categories, enhancing product‑specific expertise and generating benefits of scale and production efficiency. Significant capital has been invested in our extensive network of long‑lived production facilities, which, together with our skilled workforce and related manufacturing process know‑how, supports our competitive positions.
We are committed to market‑leading innovation and product development and maintain dedicated innovation, development and engineering centers in France, Germany, and the U.S. to support these efforts. These facilities focus on three main areas: (i) innovations that provide enhanced product design, differentiation and user friendliness for our customers and end‑use consumers; (ii) innovations that reduce input costs to generate cost savings for both our customers and us (downgauging and lightweighting); and (iii) developments to meet evolving product safety standards and regulations. Further, our subsidiary, Heye International, is a leading provider of engineering solutions to the glass container industry globally, with significant proprietary know‑how and expertise.
Our leading global positions have been established through acquisitions, with 23 successful acquisitions completed over the past 20 years. Most recently, on June 30, 2016, we completed the Beverage Can Acquisition, comprising 22 beverage can production facilities in Europe, North America and Brazil which, on a combined basis, we believe is the third largest beverage can business globally.
In addition to organic and acquisitive growth initiatives, we have also expanded our footprint through strategic investments in new capacity including, in 2014, a glass furnace investment in the United Kingdom, supported by a long‑term contract with a large European customer, in 2015, an investment of approximately $220 million in can‑making facilities in Roanoke, Virginia and Reno, Nevada, as well as a significant expansion of our Conklin, New York, ends plant to meet substantially all of the U.S. food can requirements of a major U.S. customer pursuant to a long‑term contract and, in 2018, we completed construction of a beverage can ends plant in Manaus, Brazil, to supply our two can-making facilities in that market. These initiatives, as well as other acquisitions and investments over many years, in existing and adjacent end‑use categories, have increased our scale and diversification and provided opportunities to grow our business with both existing and new customers.
Our net loss, Adjusted EBITDA and net cash from operating activities for the year ended December 31, 2018 were $263 million, $1,478 million and $734 million, respectively.
The following chart illustrates the breakdown of our revenue by destination for the year ended December 31, 2018:
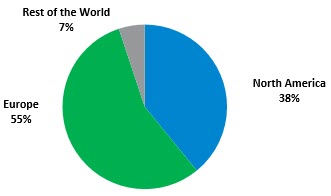
Our Industry
The global packaging industry is a large, consumer‑driven industry with stable growth characteristics. We operate in the metal and glass container sectors and our target regions are Europe, North America and Brazil. Metal and glass containers are attractive to brand owners, as their strength and rigidity allows them to be filled at high speeds and easily transported, while their shelf‑stable nature means that refrigeration is not required, thereby resulting in further energy savings in the supply chain. The ability to customize and differentiate products supplied in metal and glass containers, through innovative design, shaping and printing, also appeals to our customers. Both the metal and the glass container markets have been marked by progressive downgauging (metal cans) and lightweighting (glass containers), which have generated material savings in input costs and logistics, while enhancing the consumer experience. This reduction in raw material and energy usage in the manufacturing process has also increased the appeal to end‑users, who are increasingly focused on sustainability.
Our Competitive Strengths
| · | | Leader in Rigid Packaging. We believe we are one of the leading suppliers of metal and glass packaging solutions, capable of supplying multi‑national CPGs in our target markets. |
| · | | Based on management estimates, we believe that we are the #2 supplier of metal cans by value (meaning total revenue derived from supplying to specific end‑markets and end‑use categories) in the European beverage can and food can end‑use categories and a leading supplier of metal cans by value in the European specialty end‑use categories. In addition, we believe that we are a leading supplier of food and beverage cans by value in the United States and Brazil. |
| · | | Based on management estimates, we believe that we are the #2 supplier of glass packaging by value globally. In the United States, we believe we are the #2 supplier of glass packaging by value, serving the beer, food, wine, spirits and non‑alcoholic beverage sectors. In addition, we believe we are the #3 supplier of glass packaging by value in Europe and the #1 supplier by value in Northern Europe, Germany, the United Kingdom and the Nordic region, serving the beer, food, wine, spirits, non‑alcoholic beverage and pharmaceutical end‑use categories. |
We believe the combination of our extensive footprint, proximity to customers, efficient manufacturing and high level of customer service underpins our leading positions.
| · | | Long‑term relationships with diverse blue‑chip customer base. We supply some of the world’s best‑known brands with innovative packaging solutions, and have been recognized with numerous industry awards. We have longstanding relationships with many of our major customers, which include leading multinational consumer products companies, large national and regional food and beverage companies, as well as |
numerous local companies. Some of our major customers include AB InBev, Akzo Nobel, Bacardi, Britvic, Coca‑Cola, ConAgra Brands, Constellation Brands, Diageo, Heineken, The Kraft Heinz Company, Monster Beverage, Nestlé, Pernod Ricard, Procter & Gamble, JM Smucker and Unilever. Approximately two‑thirds of our revenues are derived from multi‑year contracts of between two and ten years, most of which include input cost pass‑through provisions. |
| · | | Focus on stable markets. We derive over 90% of our revenues in Europe and North America, mature markets characterized by predictable consumer spending, stable supply and demand and low cyclicality. Furthermore, over 90% of our revenues are generated from the stable food and beverage end‑use categories, including fruit, vegetables, soups, sauces, seafood, pet food, beer, wine, spirits and non‑alcoholic beverages. In addition, in some of our end‑use categories, we serve customers in high‑growth categories, such as premium spirits, where customers value premium glass packaging, or powdered infant formula, where demand is driven by emerging market growth. |
| · | | Well‑invested asset base with significant scale and operational excellence. We believe we have one of the most extensive plant networks in the rigid packaging industry. We operate 109 strategically‑located production facilities in 22 countries, enabling us to efficiently serve our customers with high quality and innovative products and services across multiple geographies. Our asset base is well‑invested, with approximately $2.2 billion invested in capital expenditure in the five years ended December 31, 2018. We pursue continuous improvement in our facilities by applying Lean. To supplement our Lean initiatives and promote a culture of consistently pursuing excellence, we formed our Operational Support Group in Metal Packaging, Operational Excellence Group and Central Technical Services group in Glass Packaging to standardize and share best practices across our network of plants. We believe the total value proposition we offer our customers, in the form of geographic reach, customer service, product quality, reliability, and innovation, will enable us to continue to drive growth and profitability. |
| · | | Technical leadership and innovation. We have advanced technical and manufacturing capabilities in both metal and glass packaging, including innovation, development and engineering centers in Europe and the United States. In addition, our subsidiary, Heye International, is a leading provider of engineering solutions to the glass container industry globally, with significant proprietary know‑how and expertise while we also have in‑house mold‑manufacturing expertise. We continually seek to improve the quality of our products and processes, through focused investment in new technology. These capabilities have enabled us to develop a pipeline of product and process innovations to meet the dynamic needs of our customers. Our innovations have also been recognized with numerous industry awards and accreditations. We have significant expertise in the production of value‑added metal packaging, both aluminum and tinplate, with features such as high‑quality graphic designs, a wide range of shapes and sizes and convenience features, such as easy‑open ends and Easy Peel® and Easip® peelable lids, and introduced lightweight aluminum cans. In Glass Packaging, our focus has been on product development, process improvement and cost reduction, which has resulted in progressive advances such as container lightweighting and the increased use of cullet in the production process. This has delivered significant environmental benefits by reducing the use of raw materials and energy. |
| · | | Highly contracted revenue base. Approximately two‑thirds of our sales are made pursuant to multi‑year contracts, with the remainder largely pursuant to annual arrangements. A significant proportion of our sales volumes are supplied under contracts which include mechanisms that help to protect us from earnings volatility related to input costs. Specifically, such arrangements include (i) multi‑year contracts that include input cost pass‑through and/or margin maintenance provisions and (ii) one‑year contracts that allow us to negotiate pricing levels for our products on an annual basis at the same time that we determine our input costs for the relevant year. |
| · | | Attractive proven track record of generating attractive growth through successful acquisitions and business optimization. We have grown our business through a combination of acquisitions and combined with organic growth and business optimization, has significantly increased the size and scope of our Company and the breadth of our product offering. We have successfully integrated these acquired businesses and realized or exceeded targeted cost synergies. We believe we can continue to create value for shareholders through acquisitions, business optimization and synergy realization. In 1998, under Irish GAAP, our revenue |
and Adjusted EBITDA were €51 million and €10 million, respectively. In 2018, under IFRS, our revenue and Adjusted EBITDA have grown to $9,097 million and $1,478 million, respectively. We also believe we maintain attractive margins and generate significant cash flow and returns on capital for our shareholders. For the year ended December 31, 2018, our Adjusted EBITDA margin was 16.2% and our net cash from operating activities was $734 million. We believe we can maintain attractive margins and grow cash flow through business mix optimization, growth with new and existing customers, efficiency gains, cost reduction, working capital optimization and disciplined capital allocation. |
| · | | Experienced management team with a proven track record and high degree of shareholder alignment. Members of our management team have extensive experience in the consumer packaging industry have demonstrated their ability to manage costs, adapt to changing market conditions, undertake strategic investments and acquire and integrate new businesses, thereby driving significant value creation. Our board of directors, led by our Chairman and Chief Executive, has a high degree of indirect ownership in our Company, which we believe promotes efficient capital allocation decisions and results in strong shareholder alignment and commitment to further shareholder value creation. |
Our Business Strategy
Our principal objective remains to increase shareholder value by achieving growth in Adjusted EBITDA and cash generation, but we will continue to opportunistically engage in strategic capital investments and selective acquisitions that enhance shareholder value. We pursue these objectives through the following strategies:
| · | | Grow Adjusted EBITDA and cash flow. We seek to leverage our extensive footprint, proximity to customers, efficient manufacturing and high level of customer service to grow revenue with new and existing customers, improve our productivity, and reduce our costs. To increase Adjusted EBITDA, we will continue to take decisive actions with respect to our assets and invest in our business, in line with our stringent investment criteria. To increase cash generation, we continue to actively manage our working capital and capital expenditures. |
| · | | Enhance product mix and profitability. We have enhanced our product mix over the years by replacing lower margin business with higher margin business. We will continue to develop long‑term partnerships with our global customers and selectively pursue opportunities with existing and new customers that will grow our business and enhance our overall profitability. |
| · | | Apply leading process technology and technical expertise. We intend to continue increasing productivity through the deployment of leading technology (including our internal engineering, innovation and design capabilities), and development and dissemination of best practices and know‑how across our operations. |
| · | | Emphasize operational excellence and optimize manufacturing base. In managing our businesses, we seek to improve our efficiency, control costs and preserve and expand our margins. We have consistently reduced total costs through implementing operational efficiencies, streamlining our manufacturing base and investing in advanced technology to enhance our production capacity. We continue to take actions to reduce costs by optimizing our manufacturing footprint, including through further investment in advanced technology. |
| · | | Carefully evaluate and pursue acquisitions and other strategic opportunities. We have achieved our current market positions by selectively pursuing acquisition and other strategic opportunities. Although our near‑term focus is primarily on de‑leveraging our Company, we will continue to evaluate opportunities in line with our objectives. We believe there are still significant opportunities for further growth by acquisition and we may selectively explore acquisition opportunities, in line with our stringent investment criteria and focus on enhancing shareholder value. Our acquisition criteria include (i) attractive bolt‑on acquisitions in existing markets, (ii) acquisitions that allow us access to critical technology, and (iii) new platform acquisitions that have scale positions and attractive financial profiles. |
Our Divisions
Today, we manage our business in two divisions, Metal Packaging and Glass Packaging. The following charts illustrate the breakdown of our revenue and Adjusted EBITDA for the year ended December 31, 2018:
[ | |
| |
| |
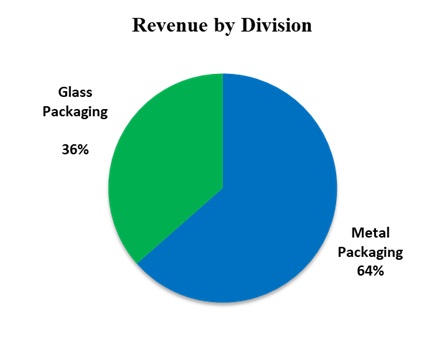
| 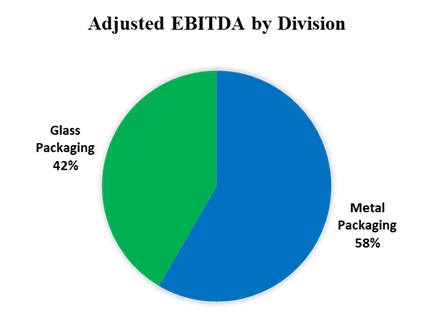
|
We are organized into four operating and reportable segments, Europe and Americas in Metal Packaging, and Europe and North America in Glass Packaging. Adjusted EBITDA is the performance measure used to manage and assess performance of our reportable segments.
Metal Packaging
We are a leading supplier of innovative, value‑added metal packaging for the consumer products industry. We currently supply a broad range of products, including aluminum and steel beverage cans, two‑piece aluminum, two‑piece tinplate and three‑piece tinplate food and specialty cans, and a wide range of can ends, including easy‑open and peelable ends. Many of our products feature high‑quality printed graphics, customized sizes and shapes or other innovative designs. Our products provide functionality and differentiation and enhance our customers’ brands on the shelf. In combination with efficient manufacturing and high service levels, this overall value proposition enables us to achieve margins in Metal Packaging that compare well with other large competitors in the sector.
Metal Packaging revenues represented 64% of our total revenues in 2018. For a discussion of the impact of seasonality on Metal Packaging, see “Item 5—Operating and Financial Review and Prospects”.
Based on management estimates, we believe that we are one of the leading suppliers of consumer metal packaging in the world, holding leading market positions in each of the end‑use categories that we serve. On June 30, 2016, we completed the Beverage Can Acquisition and we believe that we are now the #2 supplier of metal cans by value in the European beverage can and food can categories and a leading supplier of metal cans by value in the European specialty end‑use categories. In addition, we believe that we are a leading supplier of food and beverage cans by value in the United States and Brazil.
Manufacturing and Production
As of December 31, 2018, we operated 75 production facilities in 21 countries and had approximately 11,400 employees. Our plants are currently located in 15 European countries, as well as in Brazil, Canada, Morocco, the Seychelles, South Korea and the United States.
The following table summarizes Metal Packaging’s principal production facilities as of December 31, 2018.
| | |
Location | | Number of
Production
Facilities |
Germany | 10 |
France | 9 |
Italy | 8 |
Netherlands | 6 |
Other European countries(1) | 22 |
United States | 13 |
Brazil | 3 |
Rest of the world(2) | 4 |
| 75 |
(1)Austria, Czech Republic, Denmark, Hungary, Latvia, Poland, Romania, Russia, Spain, Ukraine and the United Kingdom.
(2)Canada, Morocco, the Seychelles and South Korea.
Industry Overview
We operate in the consumer metal packaging industry, which can be broadly divided into (i) the processed food and specialties segments and (ii) the beverage segment. We are currently focused on the processed food and specialties markets, as well as the beverage can market.
The food can sector, which includes cans for a variety of food, pet food and seafood end uses, is a stable market. In Europe, the market is characterized by lightweight three‑piece and two‑piece cans with easy open or peelable ends that are decorated with high quality printed graphics and other innovative designs. In contrast, in the United States, food cans are typically heavier, with more modest levels of decoration, creating a growth opportunity for our products and innovations, including lighter‑weight cans incorporating advanced coating solutions. The specialty can sector is characterized by a number of different products and applications, including paints & coatings, aerosol, nutrition and other cans. The beverage can sector is growing in Europe and Brazil, while North America is stable. Growth in unit volumes of specialty beverage cans has exceeded growth in standard beverage cans, thereby increasing specialty can penetration, a trend that is expected to continue.
We believe the purchasing decisions of retail consumers are significantly influenced by packaging. Consumer product manufacturers and marketers are increasingly using packaging as a means to position their products in the market and differentiate them on retailers’ shelves. The development and production of premium, specialized packaging products with a combination of value‑added features requires a higher level of design capabilities, manufacturing and process know‑how and quality control than for more standardized products.
Customers
We operate worldwide, selling metal packaging for a wide range of consumer products to national and international customers. We supply leading manufacturers in each of the markets we serve, including AB InBev, AkzoNobel, Britvic, Coca‑Cola, Conagra Brands, Danone, Heineken, J.M. Smucker, The Kraft Heinz Company, L’Oréal, Mars, Mead Johnson, Monster Beverage, Nestlé, PepsiCo, Petrópolis, Procter & Gamble, Reckitt Benckiser, Thai Union and Unilever, among others.
The top ten metal packaging customers represented approximately 42% of 2018 metal revenues, more than two‑thirds of which were backed by multi‑year supply agreements, typically ranging from two‑ to ten‑years in duration. These contracts generally provide for the pass through of metal price fluctuations and, in most cases, all or most of variable cost movements, while others have tolling arrangements whereby customers arrange for the procurement of metal themselves. In addition, within multi‑year relationships, both parties can work together to streamline the product, service and supply process, leading to significant cost reductions and improvements in product and service, with benefits arising
to both parties. Wherever possible, we seek to enter into multi‑year supply agreements with our customers. In other cases, sales are made under commercial supply agreements, typically of one‑year’s duration, with prices based on expected purchase volumes.
Competitors
Our principal competitors in metal packaging include Ball Corporation, Crown Holdings, Silgan Holdings and Can Pack.
Energy, Raw Materials and Suppliers
The principal raw materials used in Metal Packaging are aluminum, steel (in both tin‑plated and tin‑free forms), coatings and lining compounds. In 2018, approximately 60% of metal raw materials spend related to aluminum and approximately 30% of metal raw materials spend related to tin‑plated steel and tin‑free steel. Our major aluminum suppliers include Alcoa, Constellium, Elval, Hydro and Novellis. Our major steel suppliers include ArcelorMittal, Baosteel, Dongbu Steel, Tata Steel, ThyssenKrupp Rasselstein and U.S. Steel.
We continuously seek to minimize the price of raw materials and reduce exposure to price movements in a number of ways, including the following:
| · | | harnessing the scale of our global metal purchasing requirements, to achieve better raw materials pricing than smaller competitors; |
| · | | entering into variable‑priced pass‑through contracts with customers, whereby selling prices are indexed to the price of the underlying raw materials; |
| · | | maintaining the focus on downgauging; |
| · | | continuing the process of reducing spoilage and waste in manufacturing; |
| · | | rationalizing the number of both specifications and suppliers; and |
| · | | hedging the price of aluminum ingot and the related euro/U.S. dollar exposure. |
Aluminum is typically purchased under three-year contracts, with prices that are fixed in advance. Despite an increase in the level of aluminum production being targeted to new end‑use applications, including automotive and aerospace, we believe that adequate quantities of the relevant grades of packaging aluminum will continue to be available from various producers and that we are not overly dependent upon any single supplier. Some of our aluminum requirements are subject to tolling arrangements with our customers, whereby risk and responsibility for the procurement of aluminum is managed by the customer.
We typically purchase steel under one‑year contracts, with prices that are usually fixed in advance. Agreements are generally renegotiated late in the year for effect from the beginning of the following calendar year. Despite significant reductions in steel production capacity in Europe over the past few years, we believe that adequate quantities of the relevant grades of packaging steel will continue to be available from various producers and that we are not overly dependent upon any single supplier.
Distribution
We use various freight and haulage contractors to make deliveries to customer sites or warehousing facilities. In some cases, customers make their own delivery arrangements and therefore may purchase from us on an ex‑works basis. Warehousing facilities are primarily situated at our manufacturing facilities; however, in some regions, we use networks of externally‑rented warehouses at strategic third‑party locations, close to major customers’ filling operations.
Intellectual Property and Innovation, Development and Engineering
Metal Packaging currently holds and maintains a significant number of patent families, each filed in several countries and covering a range of different products in each jurisdiction.
The majority of Metal Packaging’s innovation and development activities are primarily concentrated at our designated engineering facilities in Europe and the United States, particularly at our Crosmieres, France, facility. These centers focus on serving the existing and potential needs of customers, including the achievement of cost reductions, particularly metal content reduction, new product innovation, meeting new and anticipated legislative requirements, including those related to food safety, as well as technology and support services.
New product innovations include shaping and printing effects which differentiate Metal Packaging’s customers’ brands, and new designs for easy‑open ring‑pull ends, Easy Peel® and Easip® lids, which enhance convenience for the final consumer.
Glass Packaging
We manufacture both proprietary and non‑proprietary glass containers for a variety of end‑use categories, mainly food and beverage. Our proprietary products are customized to the exact specifications of our customers and play an important role in their branding strategies. Our non‑proprietary products deliver consistent performance and product differentiation through value‑added decoration, including embossing, coating, printing and pressure‑sensitive labeling. Our product offerings and continuing focus on operational excellence have enabled us to meet and exceed our customers’ requirements and consistently generate margins in Glass Packaging that compare well with other large competitors in the sector.
Glass Packaging revenues represented 36% of our total revenues in 2018. For a discussion of the impact of seasonality on Glass Packaging, see “Item 5—Operating and Financial Review and Prospects”.
Based on management estimates, we believe we are the #1 supplier of glass packaging in Northern Europe by market share and the #3 supplier in Europe overall by market share, as well as the #2 supplier in the U.S. market by market share.
Products and Services
In addition to the manufacturing of proprietary and non-proprietary glass containers, Glass Packaging includes our glass engineering business, Heye International, and our mold manufacturing and repair operations. Through Heye International, we design and supply glass packaging machinery and spare parts for existing glass packaging machinery. We also provide technical assistance to third‑party users of our equipment and licensees of our technology. For the 2018 fiscal year, these activities represented approximately 2% of Glass Packaging’s revenues.
Manufacturing and Production
As of December 31, 2018, we operated 34 glass plants with 70 glass furnaces and had approximately 12,000 employees. We have glass manufacturing facilities in Denmark, Germany, Italy, the Netherlands, Poland, Sweden, the United Kingdom and the United States. We believe that our facilities are well maintained and that we generally have sufficient capacity to satisfy current and expected demand. We own all of our manufacturing facilities, some of which are subject to finance leases or similar financial arrangements. Certain of our warehousing facilities are leased from third parties.
The following table summarizes Glass Packaging’s principal production facilities as of December 31, 2018.
| | |
Location | | Number of
Production
Facilities |
Germany | 8 |
Netherlands | 2 |
Poland | 3 |
United Kingdom | 4 |
Other European countries(1) | 3 |
United States | 14 |
| 34 |
(1)Denmark, Italy and Sweden.
Industry Overview
Glass packaging is utilized in a wide range of end‑use categories in the food and beverage market, as well as in applications such as pharmaceuticals, cosmetics and personal care. We principally operate in the food and beverage end‑use categories and benefit from the premium appeal of glass packaging to spirits, craft beer, wine and other brand owners, as higher levels of design and differentiation support end‑user brand perception and loyalty.
We believe the purchasing decisions of retail consumers are significantly influenced by packaging. Consumer product manufacturers and marketers are increasingly using packaging as a means to position their products in the market and differentiate them on retailers’ shelves. The development and production of premium, specialized packaging products with a combination of value‑added features requires a higher level of design capabilities, manufacturing and process know‑how and quality control than for more standardized products. The glass packaging industry has continued to produce advances in light‑weighting technology and energy efficiency over many years, delivering supply chain benefits, as well as reducing raw material and energy usage in the manufacturing process, thereby increasing the appeal to end‑users, who are increasingly focused on sustainability.
Customers
In certain end‑use categories, such as beer, wine, spirits and non‑alcoholic beverages, revenues are relatively concentrated among key customers with whom we have strong, long‑term relationships, mirroring the recent consolidation in these end‑use categories. Our top ten customers in Glass Packaging accounted for 43% of total glass revenues in 2018. Some of our largest and longest‑standing customers include AB InBev, Bacardi, Carlsberg, Coca‑Cola, Constellation Brands, Diageo, Heineken, J.M. Smucker, The Kraft Heinz Company, Mizkan, PepsiCo, Pernod Ricard, Sazerac, and Treehouse Foods.
Approximately two‑thirds of our total glass packaging revenues are made pursuant to multi-year supply arrangements, a majority of which allow us to recover input cost inflation on some or all of our cost base. Our remaining revenues are subject to shorter arrangements, largely annual, which have provided, and which we expect will continue to provide, the basis for long‑term partnership with our customers. These customer arrangements are typically renegotiated annually (in terms of price and expected volume) and typically we have been able to recover the majority of input cost inflation which has impacted our cost base, as demonstrated by the generally consistent margins we have generated in the past, despite occasional volatility in certain input costs such as energy and freight and logistics costs.
Competitors
Our principal competitors in glass packaging include Anchor Glass and Owens‑Illinois in North America and Owens‑Illinois, Verallia and Vidrala in Europe.
Energy, Raw Materials and Suppliers
We use natural gas, electricity, oil and oxygen to fuel our furnaces. We have developed substantial backup systems, which protect our operations in the case of an interruption of our primary energy sources. We have multiple energy suppliers in both Europe and the United States, with contractual pricing arrangements typically linked to the relevant market index. We seek to mitigate the inherent risk in energy price fluctuations through a combination of contractual customer pass‑through agreements, fixed‑price procurement contracts, index tracking procurement contracts and hedging.
We have developed an active hedging strategy. In Europe, we typically hedge in small tranches and our policy is to hedge approximately 70% of our energy requirements before the beginning of the following year. In North America, customer contracts are almost exclusively multi‑year and provide for the pass‑through of movements in energy costs. Consequently, in North America our purchasing strategy for energy mirrors our customer contracts.
The primary raw materials used in our glass manufacturing operations are cullet, sand, soda ash and limestone. We have several country suppliers of cullet and a number of global and regional suppliers of soda ash. We seek to optimize the use of recycled glass in our production process as this enables the other raw materials to melt at lower temperatures, thereby lowering our energy costs and carbon emissions and prolonging furnace life.
Distribution
We use various freight and haulage contractors to make deliveries to customer sites or warehousing facilities. In some cases, customers make their own delivery arrangements and therefore may purchase from us on an ex‑works basis. Warehousing facilities are primarily situated at our manufacturing facilities; however, in some regions, we use networks of externally‑rented warehouses at strategic third‑party locations, close to major customers’ filling operations.
Intellectual Property and Innovation, Development and Engineering
Heye International has an extensive portfolio of patents covering the design of equipment for the manufacture of glass packaging. It also has substantial proprietary knowledge of the technology and processes involved in the production of glass packaging, based on its history of more than 40 years as a leading supplier of engineering solutions to the industry globally. It has entered into a large number of agreements to provide technical assistance and technology support to glass packaging manufacturers for which it receives annual fees.
We support a innovation, development and design effort, particularly at Heye International, which we believe is important to our ability to compete effectively. We are a member of glass research associations and other organizations that are engaged in initiatives aimed at improving the manufacturing processes and the quality and design of products, while continuing to meet our environmental responsibilities. In addition, we have three glass engineering facilities in Europe and the United States and we operate one of the largest in‑house decoration facilities in the European glass packaging industry.
Environmental, Health and Safety and Product Safety Regulation
Our operations and properties are regulated under a wide range of laws, ordinances and regulations and other legal requirements concerning the environment, health and safety and product safety in each jurisdiction in which we operate. We believe that our manufacturing facilities are in compliance, in all material respects, with these laws and regulations.
The principal environmental issues facing us include the impact on air quality through gas and particle emissions, including the emission of greenhouse gases, the environmental impact of the disposal of water used in our production processes, generation and disposal of waste, the receiving, use and storage of hazardous and non‑hazardous materials and the potential contamination and subsequent remediation of land, surface water and groundwater arising from our operations.
Our substantial operations in the EU are subject to, among additional requirements, the requirements of the IED, which requires that operators of industrial installations, including glass manufacturing installations, take into account the whole environmental performance of the installation and obtain and maintain compliance with a permit, which sets emission limit values that are based on best available techniques.
Our EU glass production facilities are also regulated under the EU ETS, now in its third phase which runs until 2020. Under this regime, the European Commission sets emission caps for greenhouse gases for all installations covered by the scheme, which are then implemented by Member States. Installations that emit less than their greenhouse gas emission cap can sell emission allowances on the open market and installations that exceed their emission cap are required to buy emission allowances and are penalized if they are unable to surrender the required amount of allowances at the end of each trading year. California has enacted a similar greenhouse gas reduction scheme that works on a cap and trade basis and that applies to our manufacturing operations in the state, requiring us to purchase offsets against our greenhouse gas emissions. Other states where we have operations, such as Washington, are expected to implement similar programs. In addition, the EPA has also begun to regulate certain greenhouse gas emissions under the Clean Air Act.
Furthermore, the EU Directive on environmental liability with regard to the prevention and remedying of environmental damage aims to make those who cause damage to the environment (specifically damage to habitats and species protected by EU law, damage to water resources and land contamination which presents a threat to human health) financially responsible for its remediation. It requires operators of industrial premises (including those which hold a permit governed by the IED) to take preventive measures to avoid environmental damage, inform the regulators when such damage has or may occur and to remediate contamination.
Our operations are also subject to stringent and complex U.S. federal, state and local laws and regulations relating to environmental protection, including the discharge of materials into the environment, health and safety and product safety including, but not limited to: the U.S. federal Clean Air Act, the U.S. federal Water Pollution Control Act of 1972, the U.S. federal Resource Conservation and Recovery Act and the Comprehensive Environmental Response, Compensation and Liability Act of 1980 (“CERCLA”). These laws and regulations may, among other things (i) require obtaining permits to conduct industrial operations; (ii) restrict the types and quantities and concentration of various substances that can be released into the environment; (iii) result in the suspension or revocation of necessary permits, licenses and authorizations; (iv) require that additional pollution controls be installed and (v) require remedial measures to mitigate pollution from former and ongoing operations, including related natural resource damages. Specifically, certain U.S. environmental laws, such as CERCLA, or Superfund, and analogous state laws, provide for strict, and under certain circumstances, joint and several liability for the investigation and remediation of releases or the disposal of regulated materials into the environment including soil and groundwater, as well as for damages to natural resources.
In North America, sales of beverage cans and bottles are affected by governmental regulation of packaging, including deposit return laws. As of January 1, 2019, there were ten U.S. states with container deposit laws in effect, requiring consumer deposits of between 5 and 15 cents (USD), depending on the size of the container or product. In Canada, there are 10 provinces and three territories. Deposit laws cover some form of beverage container in all provinces and territories except the territory of Nunavut, which does not have a deposit program. The range for deposits are between 5 and 40 cents (CND), depending on size of container and type of beverage.
Many beverages and containers, particularly new product innovations and unique alcohol beverage products, are not clearly defined in U.S. and Canadian deposit laws. The text of some U.S. and Canadian deposit laws expressly exempts certain beverages or containers from application of the deposit laws. In many states, certain common beverage categories are simply not found in the text of the deposit law. Local agencies provide final decisions on the application of deposit laws.
We are also committed to ensuring that safe operating practices are established, implemented and maintained throughout our organization. In addition, we have instituted active health and safety programs throughout our company. See “Item 3. Key Information—Risk Factors—Risks Relating to Our Business—We are subject to various environmental and other legal requirements and may be subject to new requirements of this kind in the future that could impose substantial costs upon us”.
| C. | | Organisational structure |
The following table provides information relating to the principal operating subsidiaries of the Ardagh Group, all of which are wholly owned, at December 31, 2018.
| | | | |
Company | | Country of
incorporation | | Activity |
Ardagh Metal Beverage Manufacturing Austria GmbH | | Austria | | Metal Packaging |
Ardagh Metal Beverage Trading Austria GmbH | | Austria | | Metal Packaging |
Latas Indústria de Embalagens de Alumínio do Brasil Ltda | | Brazil | | Metal Packaging |
Ardagh Indústria de Embalagens Metálicas do Brasil Ltda * | | Brazil | | Metal Packaging |
Ardagh Metal Packaging Czech Republic s.r.o. | | Czech Republic | | Metal Packaging |
Ardagh Glass Holmegaard A/S | | Denmark | | Glass Packaging |
Ardagh Aluminium Packaging France SAS | | France | | Metal Packaging |
Ardagh MP West France SAS | | France | | Metal Packaging |
Ardagh Metal Packaging France SAS | | France | | Metal Packaging |
Ardagh Metal Beverage Trading France SAS | | France | | Metal Packaging |
Ardagh Metal Beverage France SAS | | France | | Metal Packaging |
Ardagh Glass GmbH | | Germany | | Glass Packaging |
Heye International GmbH | | Germany | | Glass Engineering |
Ardagh Metal Packaging Germany GmbH | | Germany | | Metal Packaging |
Ardagh Germany MP GmbH | | Germany | | Metal Packaging |
Ardagh Metal Beverage Trading Germany GmbH | | Germany | | Metal Packaging |
Ardagh Metal Beverage Germany GmbH | | Germany | | Metal Packaging |
Ardagh Glass Sales Limited | | Ireland | | Glass Packaging |
Ardagh Packaging Holdings Limited | | Ireland | | Glass and Metal Packaging |
Ardagh Glass Italy S.r.l. (formerly Ardagh Group Italy S.r.l.)* | | Italy | | Glass Packaging |
Ardagh Metal Packaging Italy S.r.l.* | | Italy | | Metal Packaging |
Ardagh Aluminium Packaging Netherlands B.V. | | Netherlands | | Metal Packaging |
Ardagh Glass Dongen B.V. | | Netherlands | | Glass Packaging |
Ardagh Glass Moerdijk B.V. | | Netherlands | | Glass Packaging |
Ardagh Metal Packaging Netherlands B.V. | | Netherlands | | Metal Packaging |
Ardagh Metal Beverage Trading Netherlands B.V. | | Netherlands | | Metal Packaging |
Ardagh Metal Beverage Netherlands B.V. | | Netherlands | | Metal Packaging |
Ardagh Glass S.A. | | Poland | | Glass Packaging |
Ardagh Metal Packaging Poland Sp. z o.o. | | Poland | | Metal Packaging |
Ardagh Metal Beverage Trading Poland Sp. z o.o. | | Poland | | Metal Packaging |
Ardagh Metal Beverage Poland Sp. z o.o. | | Poland | | Metal Packaging |
Ardagh Metal Beverage Trading Spain SL | | Spain | | Metal Packaging |
Ardagh Metal Beverage Spain SL | | Spain | | Metal Packaging |
Ardagh Metal Packaging Iberica S.A. | | Spain | | Metal Packaging |
Ardagh Glass Limmared AB | | Sweden | | Glass Packaging |
Ardagh Metal Beverage Europe GmbH | | Switzerland | | Metal Packaging |
Ardagh Glass Limited | | United Kingdom | | Glass Packaging |
Ardagh Metal Beverage Trading UK Limited | | United Kingdom | | Metal Packaging |
Ardagh Metal Beverage UK Limited | | United Kingdom | | Metal Packaging |
Ardagh Metal Packaging UK Limited | | United Kingdom | | Metal Packaging |
Ardagh Metal Packaging USA Inc. | | United States | | Metal Packaging |
Ardagh Glass Inc. | | United States | | Glass Packaging |
Ardagh Metal Beverage USA Inc. | | United States | | Metal Packaging |
* Newly incorporated subsidiaries or name change effected in year ended December 31, 2018
| D. | | Property, plant and equipment |
See “Item 4—Information on the Company—B. Business Overview—Metal Packaging—Manufacturing and Production” and “Item 4—Information on the Company—B. Business Overview—Glass Packaging—Manufacturing and Production”.
Item 4A. Unresolved Staff Comments
Not Applicable
Item 5. Operating and Financial Review and Prospects
MANAGEMENT’S DISCUSSION AND ANALYSIS OF FINANCIAL CONDITION AND RESULTS OF OPERATIONS
The following discussion should be read together with, and is qualified in its entirety by reference to the audited consolidated financial statements of ARD Finance S.A. for the three‑year period ended December 31, 2018, including the related notes thereto, included elsewhere in this annual report. The following discussion should also be read in conjunction with “Selected Financial Information”. When we describe our business or operations in this discussion, such business and operations are the business and operations of our subsidiary, Ardagh Group S.A., and its consolidated subsidiaries, since ARD Finance S.A. has no independent operations of its own.
Some of the measures used in this annual report are not measurements of financial performance under IFRS and should not be considered an alternative to cash flow from operating activities as a measure of liquidity or an alternative to operating profit/(loss) or profit/(loss) for the year as indicators of our operating performance or any other measures of performance derived in accordance with IFRS.
Business Drivers
The main factors affecting our results of operations for both Metal Packaging and Glass Packaging are: (i) global economic trends and end‑consumer demand for our products; (ii) prices of energy and raw materials used in our business, primarily aluminum, tinplate, cullet, sand, soda ash and limestone, and our ability to pass‑through these and other cost increases to our customers, through contractual pass‑through mechanisms under multi‑year contracts, or through renegotiation in the case of short‑term contracts; (iii) investment in operating cost reductions; (iv) acquisitions; and (v) foreign exchange rate fluctuations and currency translation risks arising from various currency exposures, primarily with respect to the euro, the U.S. dollar, British pound, Swedish krona, Polish zloty, Danish krone and the Brazilian real.
In addition, certain other factors affect revenue and operating profit/(loss) for Metal Packaging and Glass Packaging.
Metal Packaging
Metal Packaging generates its revenue from supplying metal containers to a wide range of consumer‑driven end‑use categories. Revenue is primarily dependent on sales volumes and sales prices.
Sales volumes are influenced by a number of factors, including factors driving customer demand, seasonality and the capacity of our Metal Packaging plants. Demand for our metal containers may be influenced by vegetable and fruit harvests, seafood catches, trends in the consumption of food and beverages, trends in the use of consumer products, industry trends in packaging, including marketing decisions, and the impact of environmental regulations. The size and quality of harvests and catches vary from year to year, depending in large part upon the weather in the regions in which we operate. The food can industry is seasonal in nature, with strongest demand during the end of the summer, coinciding with the harvests. Accordingly, Metal Packaging’s volume of containers shipped is typically highest in the second and third quarters and lowest in the first and fourth quarters. Demand for our beverage containers is strongest during spells of warm weather and therefore typically peaks during the summer months, as well as in the period leading up to holidays in
December. Accordingly, we generally build inventories in the first quarter in anticipation of the seasonal demands in both our food and beverage businesses.
Metal Packaging generates the majority of its earnings from operations during the second and third quarters. Metal Packaging’s Adjusted EBITDA is based on revenue derived from selling our metal containers and is affected by a number of factors, primarily cost of sales. The elements of Metal Packaging’s cost of sales include (i) variable costs, such as electricity, raw materials (including the cost of aluminum and tinplate), packaging materials, decoration and freight and other distribution costs, and (ii) fixed costs, such as labor and other plant‑related costs including depreciation, maintenance and sales, marketing and administrative costs. Metal Packaging variable costs have typically constituted approximately 80% and fixed costs approximately 20% of the total cost of sales for our metal containers manufacturing business.
Glass Packaging
Glass Packaging generates its revenue principally from selling our glass containers. Glass Packaging revenue is primarily dependent on sales volumes and sales prices. Glass Packaging includes our glass engineering business, Heye International.
Sales volumes are affected by a number of factors, including factors impacting customer demand, seasonality and the capacity of Glass Packaging’s plants. Demand for glass containers may be influenced by trends in the consumption of beverages, industry trends in packaging, including marketing decisions, and the impact of environmental regulations. In the U.S., for example, the growth in consumption of imported beer has seen reduced demand for domestically-produced mass beer brands, resulting in reduced demand for glass packaging for this end-use category. In response, the Company has announced reductions of over 10% in production capacity in its Glass North America division, including the permanent closure of its Milford, Massachusetts, facility in 2018 and the announced permanent closure of its Lincoln, Illinois facility in 2019. The Company is pursuing growth opportunities in stronger performing end markets, including food, wines and spirits and, is converting production capacity from the mass beer sector to serve these alternative end markets. This will result in a reduction in overall production capacity and a greater reduction in our mass beer capacity. Investments in advanced inspection equipment and automation are also being undertaken to enhance quality and productivity.
Beverage sales within our Glass Packaging business are seasonal in nature, with strongest demand during the summer and during periods of warm weather, as well as the period leading up to holidays in December. Accordingly, Glass Packaging’s shipment volume of glass containers is typically lower in the first quarter. Glass Packaging builds inventory in the first quarter in anticipation of these seasonal demands. In addition, Glass Packaging generally schedules shutdowns of its plants for furnace rebuilding and repairs of machinery in the first quarter. These strategic shutdowns and seasonal sales patterns adversely affect profitability in Glass Packaging’s glass manufacturing operations during the first quarter of the year. Plant shutdowns may also affect the comparability of results from period to period. Glass Packaging’s working capital requirements are typically greatest at the end of the first quarter of the year .
Glass Packaging’s Adjusted EBITDA is based on revenue derived from selling our glass containers and glass engineering products and services and is affected by a number of factors, primarily cost of sales. The elements of Glass Packaging’s cost of sales for its glass container manufacturing business include (i) variable costs, such as natural gas and electricity, raw materials, packaging materials, decoration and freight and other distribution costs, and (ii) fixed costs, such as labor and other plant‑related costs including depreciation, maintenance, sales, marketing and administrative costs. Glass Packaging’s variable costs have typically constituted approximately 40% and fixed costs approximately 60% of the total cost of sales for our glass container manufacturing business.
Recent Acquisitions and Disposals
The Beverage Can Acquisition
On June 30, 2016, the Ardagh Group closed the Beverage Can Acquisition for total consideration of $3.0 billion.
The VNA Acquisition
On April 11, 2014, the Group completed the purchase of 100% of the equity of VNA from Compagnie de Saint‑Gobain for a consideration of $1.5 billion.
Disposal of Former Anchor Glass Plants
On June 30, 2014, the Group completed the sale of six former Anchor Glass plants and certain related assets, acquired from the purchase of Anchor Glass Container Corporation in 2012, for a consideration of $436 million.
Other disposals
During the year ended December 31, 2014, the Group disposed of a small business in the Metal Packaging division and also of its Metal Packaging operations in Australia and New Zealand for a total consideration of $104 million.
Critical Accounting Policies
We prepare our financial statements in accordance with IFRS as issued by the IASB. A summary of significant accounting policies is contained in Note 2 to our audited consolidated financial statements for the three years ended December 31, 2018. In applying accounting principles, we make assumptions, estimates and judgments which are often subjective and may be affected by changing circumstances or changes in our analysis. Material changes in these assumptions, estimates and judgments have the potential to materially alter our results of operations. The estimates and assumptions that have a significant risk of causing a material adjustment to the carrying amounts of assets and liabilities within the next financial year are discussed below .
Business combinations and goodwill
All business combinations are accounted for by applying the purchase method of accounting. This involves measuring the cost of the business combination and allocating, at the acquisition date, the cost of the business combination to the assets acquired and liabilities assumed. Identifiable assets acquired and liabilities assumed in a business combination are measured initially at their fair values at the acquisition date. The determination of the fair value of the assets and liabilities is based, to a considerable extent, on management’s judgment. Allocation of the purchase price affects the results of the Group as finite lived intangible assets are amortized, whereas indefinite lived intangible assets, including goodwill, are not amortized and could result in differing amortization charges based on the allocation to indefinite lived and finite lived intangible assets.
The cost of an acquisition is measured as the aggregate of the consideration transferred, which is measured at acquisition date fair value, and the amount of any non‑controlling interests in the acquiree. For each business combination, the Group elects whether to measure the non‑controlling interests in the acquiree at fair value or at the proportionate share of the acquiree’s identifiable net assets. Acquisition‑related costs are expensed as incurred and included in sales, general and administration expenses.
When the Group acquires a business, it assesses the financial assets and liabilities assumed for appropriate classification and designation in accordance with the contractual terms, economic circumstances and pertinent conditions as at the acquisition date.
Any contingent consideration to be transferred by the acquirer will be recognized at fair value at the acquisition date.
Goodwill represents the excess of the cost of an acquisition over the fair value of the net identifiable assets of the acquired subsidiary at the date of acquisition.
Goodwill is stated at cost less any accumulated impairment losses. Goodwill is allocated to those groups of CGUs that are expected to benefit from the business combination in which the goodwill arose for the purpose of assessing impairment. Goodwill is tested annually for impairment.
Where goodwill has been allocated to a CGU and part of the operation within that unit is disposed of, the goodwill associated with the disposed operation is included in the carrying amount of the operation when determining the gain or loss on disposal. Goodwill disposed in these circumstances is measured based on the relative values of the disposed operation and the portion of the cash‑generating unit retained.
Impairment of goodwill
Goodwill acquired through a business combination has been allocated to groups of CGUs for the purpose of impairment testing based on the segment into which the business combination is assimilated. The groupings represent the lowest level at which the related goodwill is monitored for internal management purposes. As at the reporting date, Metal Europe, Metal Americas, Beverage Europe, Beverage Americas, Glass Packaging Europe and Glass Packaging North America were the groups of CGUs to which goodwill was allocated and monitored.
The Group used the value in use (“VIU”) model for the purposes of the goodwill impairment testing as this reflects the Group’s intention to hold and operate the assets. However, if an impairment indicator exists for a CGU, the Group uses both the VIU model and the fair value less costs to sell (“FVLCTS”) model to establish the higher of the recoverable amount.
The VIU model used the 2019 budget approved by the board and a two-year forecast for 2020 to 2021. The budget and forecast results were then extended for a further two‑year period making certain assumptions including that long-term capital expenditure equals depreciation and that any increase in input cost will be passed through to customers, in line with historic practice and contractual terms.
The terminal value assumed long-term growth in line with long-term inflation.
Cash flows considered in the VIU model included the cash inflows and outflows related to the continuing use of the assets over their remaining useful lives, expected earnings, required maintenance capital expenditure, depreciation, amortization, tax paid, working capital and lease principal repayments.
The discount rate applied to cash flows in the VIU model was estimated using our weighted average cost of capital as determined by the Capital Asset Pricing Model with regard to the risks associated with the cash flows being considered (country, market and specific risks of the asset).
The modelled cash flows take into account the Group’s established history of earnings, cash flow generation and the nature of the markets in which we operate, where product obsolescence is low. The key assumptions employed in modelling estimates of future cash flows are subjective and include projected Adjusted EBITDA, discount rates and growth rates, replacement capital expenditure requirements, rates of customer retention and the ability to maintain margin through the pass through of input cost inflation.
Growth rates of 1.5% have been assumed beyond the five‑year period. The terminal value is estimated based on capitalizing the year 5 cash flows in perpetuity. The discount rates used ranged from 6.7% ‑ 9.7% (2017: 7.3% ‑ 9.6%). These rates are pre‑tax. These assumptions have been used for the analysis for each group of CGU. Management determined budgeted cash‑flows based on past performance and its expectations for the market development.
Under the VIU model, there was an indicator of impairment identified in the Glass Packaging North America CGU when the discounted future cash flows were compared to the carrying amount of the Glass Packaging North America CGU. Consequently, a FVLCTS calculation was performed to establish the higher of the recoverable amount when compared to the VIU model for Glass Packaging North America at December, 31 2018. See below for details of results of the FVLCTS calculation.
For all remaining CGUs, a sensitivity analysis was performed reflecting potential variations in terminal growth rate and discount rate assumptions. In all cases the recoverable values calculated were in excess of the carrying values of the CGUs. The variation applied to terminal value growth rates and discount rates was a 50 basis points decrease and increase, respectively, and represents a reasonably possible change to the key assumptions of the VIU model. Further, a
reasonably possible change to the operating cash flows would not reduce the recoverable amounts below the carrying value of the CGUs.
The FVLCTS calculation for the Glass Packaging North America CGU used the 2019 projected Adjusted EBITDA multiplied by an earnings multiple of 6.7x and adjusted for selling costs. The FVLCTS calculation resulted in a higher recoverable amount than the VIU model. The recoverable amount was then compared to the carrying value of the Glass Packaging North America CGU, resulting in the recognition of an impairment charge of $186 million (before the impact of deferred tax) on goodwill allocated to Glass Packaging North America in the year ended December 31, 2018.
A sensitivity analysis was performed on the FVLCTS calculation by increasing and decreasing the earnings multiple and the 2019 projected Adjusted EBITDA by 50 basis points respectively. The results of the sensitivitiy analysis does not have a material impact on the impairment charge recognized in the year end December 31, 2018.
Income taxes
We are subject to income taxes in numerous jurisdictions. Significant judgment is required in determining the worldwide provision for income taxes. There are many transactions and calculations for which the ultimate tax determination is uncertain during the ordinary course of business. The Group recognizes liabilities for anticipated tax audit issues based on estimates of whether additional taxes will be due. Where the final tax outcome of these matters is different from the amounts that were initially recorded, such differences will impact the income tax and deferred tax provisions in the period in which such determination is made.
Measurement of defined benefit obligations
We follow guidance of IAS 19 to determine the present value of our obligations to current and past employees in respect of defined benefit pension obligations, other long‑term employee benefits and other end of service employee benefits, which are subject to similar fluctuations in value in the long term. We, with the assistance of a network of professionals, value such liabilities designed to ensure consistency in the quality of the key assumptions underlying the valuations.
The principal pension assumptions used in the preparation of the financial statements take account of the different economic circumstances in the countries in which we operate and the different characteristics of the respective plans including the length of duration of liabilities.
The ranges of the principal assumptions applied in estimating defined benefit obligations were:
| | | | | | | | | | | | |
| | U.S. | | Germany | | U.K. |
| | 2018 | | 2017 | | 2018 | | 2017 | | 2018 | | 2017 |
| | % | | % | | % | | % | | % | | % |
Rates of inflation | | 2.50 | | 2.50 | | 1.50 | | 1.50 | | 3.15 | | 3.10 |
Rates of increase in salaries | | 1.50 - 3.00 | | 2.00 - 3.00 | | 2.50 | | 2.50 | | 2.15 | | 2.60 |
Discount rates | | 4.50 | | 3.80 | | 1.88 - 2.25 | | 1.68 - 2.24 | | 2.90 - 2.95 | | 2.70 |
Assumptions regarding future mortality experience are set based on actuarial advice in accordance with published statistics and experience.
These assumptions translate into the following average life expectancy in years for a pensioner retiring at age 65. The mortality assumptions for the countries with the most significant defined benefit plans are set out below:
| | | | | | | | | | | | |
| | U.S. | | Germany | | U.K. |
| | 2018 | | 2017 | | 2018 | | 2017 | | 2018 | | 2017 |
| | Years | | Years | | Years | | Years | | Years | | Years |
Life expectancy, current pensioners | | 22 | | 22 | | 22 | | 21 | | 20 | | 21 |
Life expectancy, future pensioners | | 23 | | 23 | | 24 | | 24 | | 21 | | 22 |
If the discount rate were to decrease by 50 basis points from management estimates, the carrying amount of the pension obligations would increase by an estimated $193 million million (2017: $216 million). If the discount rate were to increase by 50 basis points, the carrying amount of the pension obligations would decrease by an estimated $173 million (2017: $230 million).
If the inflation rate were to decrease by 50 basis points from management estimates, the carrying amount of the pension obligations would decrease by an estimated $85 million (2017: $96 million). If the inflation rate were to increase by 50 basis points, the carrying amount of the pension obligations would increase by an estimated $94 million (2017: $91 million).
If the salary increase rate were to decrease by 50 basis points from management estimates, the carrying amount of the pension obligations would decrease by an estimated $90 million (2017: $103 million). If the salary increase rate were to increase by 50 basis points, the carrying amount of the pension obligations would increase by an estimated $99 million (2017: $97 million).
The impact of increasing the life expectancy by one year would result in an increase in the Group’s liability of $66 million at December 31, 2018 (2017: $55 million), holding all other assumptions constant.
Establishing lives for the purposes of depreciation and amortization of property, plant and equipment and intangibles
Long‑lived assets, consisting primarily of property, plant and equipment, customer intangibles and technology intangibles, comprise a significant portion of the total assets. The annual depreciation and amortization charges depend primarily on the estimated lives of each type of asset and, in certain circumstances, estimates of fair values and residual values. The board of directors regularly review these asset lives and change them as necessary to reflect current thinking on remaining lives in light of technological change, prospective economic utilization and physical condition of the assets concerned. Changes in asset lives can have a significant impact on the depreciation and amortization charges for the period. It is not practical to quantify the impact of changes in asset lives on an overall basis, as asset lives are individually determined and there are a significant number of asset lives in use. Details of the useful lives are included in the accounting policy. The impact of any change would vary significantly depending on the individual changes in assets and the classes of assets impacted.
Impairment tests for items of property, plant and equipment are performed on a CGU level basis. The recoverable amounts in property, plant and equipment are determined based on the higher of value‑in‑use or fair value less costs to sell.
Exceptional items
The consolidated income statement and segment analysis separately identify results before exceptional items. Exceptional items are those that in our judgment need to be disclosed by virtue of their size, nature or incidence. Such items include, where significant, restructuring, redundancy and other costs relating to permanent capacity realignment or footprint reorganization, directly attributable acquisition costs and acquisition integration costs, profit or loss on disposal or termination of operations, start‑up costs incurred in relation and associated with plant builds, significant new line investments or furnaces, major litigation costs and settlements and impairment of non‑current assets.
The Group believes that this presentation provides additional analysis as it highlights exceptional items. The determination of ‘significant’ as included in our definition uses qualitative and quantitative factors which remain consistent from period to period. Management uses judgment in assessing the particular items, which by virtue of their scale and nature, are disclosed in the consolidated income statement and related notes as exceptional items. Management considers the columnar consolidated income statement presentation of exceptional items to be appropriate as it provides useful additional information and is consistent with the way that financial information is measured by management and presented to the board of directors. In that regard, management believes it to be consistent with paragraph 85 of IAS 1 ‘Presentation of financial statements’ (‘IAS 1’), which permits the inclusion of line items and subtotals that improve the understanding of performance.
Change in presentation currency
With effect from January 1, 2018, the Group changed the currency in which it presents its consolidated financial statements from euro to U.S. dollar. This was principally as a result of the board of directors’ assessment that this change in presentation currency will help provide a clearer understanding of the Group’s financial performance and improve comparability of our performance to our peers following the Ardagh Group’s IPO on the NYSE.
The change in accounting policy impacts all financial statement line items whereby amounts previously reported in euro have been re-presented in U.S. dollar. To illustrate the effect of the re-presentation, the previously reported euro consolidated statements of financial position as at December 31, 2017, 2016, 2015 and 2014, consolidated income statements, consolidated statements of comprehensive income and consolidated statements of cash flows for the years ended December 31, 2017, 2016 and 2015 have been set out in Note 26 to the consolidated financial statements included in this annual report.
Recent accounting pronouncements
The impact of new standards, amendments to existing standards and interpretations issued and effective for annual periods beginning on or after January 1, 2018, have been assessed by the board of directors and, with the exception of those identified above, no new standards or amendments to existing standards effective January 1, 2018, are currently relevant for the Group. The board of directors’ assessment of the impact of new standards, which are not yet effective and which have not been early adopted by the Group, on the consolidated interim financial statements and disclosures is on-going and is set out below.
IFRS 16, ‘Leases’ is effective for annual periods beginning on or after January 1, 2019, and sets out the principles for the recognition, measurement, presentation and disclosure of leases. The objective is to ensure that lessees and lessors provide relevant information in a manner that appropriately represents those transactions. This information provides a basis for users of financial statements to assess the effect that leases have on the financial position, financial performance and cash flows of the entity.
IFRS 16 replaces IAS 17, ‘Leases’, and later interpretations, and will result in the majority of the Group’s operating leases being recognized on the consolidated statement of financial position.
The Group has completed an assessment of the impact IFRS 16, involving the establishment of a cross-functional project team to implement the new standard from January 1, 2019. The Group has gathered and assessed the data relating to approximately 2,000 leases to which the Group is party and have designed and implemented a system solution and business process, with appropriate internal controls applied, in order to meet the new accounting and disclosure requirements post-adoption.
The Group will adopt IFRS 16 by applying the modified retrospective approach, with the right-of-use assets being calculated as if IFRS 16 had always been applied, and avail of the practical expedient to combine lease and non-lease components.
We expect that the adoption of IFRS 16 will have a significant impact on our consolidated statement of financial position and consolidated statement of cash flows as follows:
| · | | an increase in non-current assets due to the recognition of right-of-use assets in the range of $275 million to $300 million; |
| · | | an increase in financial liabilities as lease liabilities are recognized based on the new treatment in the range of $325 million to $350 million; and |
| · | | cash generated from operations is expected to increase due to certain lease expenses no longer being recognized as operating cash outflows, however this is expected to be offset by a corresponding increase in cash used in financing activities due to repayments of the principle on lease liabilities. |
In addition to the above impact, the adoption of IFRS 16 will also have an impact on the consolidated income statement and certain of the Group’s key financial metrics as a result of changes in the classification of charges recognized in the consolidated income statement. The application of the new standard will decrease both cost of sales and operating costs (excluding depreciation) in the income statement, giving rise to an increase in underlying EBITDA, but this will be largely offset by corresponding increases in depreciation and finance expenses, and hence the expected impact on the Group’s profit/(loss) for the year will not be material.
The operating lease cost for the year ended December 31, 2018 is set out in Note 9 to the consolidated financial statements of the Group included elsewhere in this annual report, and it is the Group’s expectation that a significant portion of those operating lease costs in the range of $70 million to $80 million will be reclassified in the consolidated income statement upon adoption of IFRS 16, subject to changes in exchange rates when compared to the euro functional currency.
The IFRS Interpretations Committee issued IFRIC 23 ‘Uncertainty over income tax treatments’, which clarifies how the recognition and measurement requirements of IAS 12 ‘Income taxes’, are applied where there is uncertainty over income tax treatments. IFRIC 23 is effective for annual periods beginning on or after January 1, 2019. It is not expected that the application of this interpretation will have a material impact on the consolidated financial statements of the Group.
Operating results
Year Ended December 31, 2018 compared to Year Ended December 31, 2017
| | | | |
| | Year ended |
| | December 31, |
| | 2018 | | 2017 |
| | (in $ millions) |
Revenue | | 9,097 | | 8,596 |
Cost of sales | | (7,778) | | (7,210) |
Gross profit | | 1,319 | | 1,386 |
Sales, general and administration expenses | | (433) | | (450) |
Intangible amortization and impairment | | (451) | | (264) |
Operating profit | | 435 | | 672 |
Net finance expense | | (654) | | (671) |
(Loss)/profit before tax | | (219) | | 1 |
Income tax (charge)/credit | | (44) | | 40 |
(Loss)/profit for the year | | (263) | | 41 |
Revenue
Revenue in the year ended December 31, 2018 increased by $501 million, or 6%, to $9,097 million, compared with $8,596 million in the year ended December 31, 2017. The increase in revenue principally reflected favorable foreign currency translation effects of $220 million, the pass through to customers of higher input costs in selling price and favorable volume/mix effects of $64 million.
Cost of sales
Cost of sales in the year ended December 31, 2018 increased by $568 million, or 8%, to $7,778 million, compared with $7,210 million in the year ended December 31, 2017. The increase in cost of sales is due mainly to unfavorable currency translation effects, higher input and other operating costs and higher exceptional cost of sales. Exceptional cost of sales increased by $24 million, reflecting higher restructuring, capacity realignment and start-up related charges. Further analysis of the movement in exceptional items is set out in the “Supplemental Management’s Discussion and Analysis” section.
Gross profit
Gross profit in the year ended December 31, 2018 decreased by $67 million, or 5%, to $1,319 million, compared with $1,386 million in the year ended December 31, 2017. Gross profit percentage in the year ended December 31, 2018
decreased by 160 basis points to 14.5%, compared with 16.1% in the year ended December 31, 2017. Excluding exceptional cost of sales, gross profit percentage in the year ended December 31, 2018 decreased by 140 basis points to 15.9%, compared with 17.3% in the year ended December 31, 2017 due mainly to higher operating costs and the dilutive effect of the pass through to customers of higher input costs outlined above.
Sales, general and administration expenses
Sales, general and administration expenses in the year ended December 31, 2018 decreased by $17 million, or 4%, to $433 million, compared with $450 million in the year ended December 31, 2017. The decrease primarily related to lower exceptional transaction-related costs. Excluding exceptional items, sales, general and administration expenses increased by $13 million, or 3%, mainly due to unfavorable foreign currency translation effects. Further analysis of the movement in exceptional items is set out in the “Supplemental Management’s Discussion and Analysis” section.
Intangible amortization and impairment
Intangible amortization and impairment in the year ended December 31, 2018 increased by $187 million, to $451 million, compared with $264 million in the year ended December 31, 2017. The increase was mainly due to a $186 million impairment charge to goodwill in Glass Packaging North America in 2018.
Operating profit
Operating profit in the year ended December 31, 2018 decreased by $237 million, or 35%, to $435 million compared with $672 million in the year ended December 31, 2017. The decrease in operating profit primarily reflected lower gross profit partly offset by lower sales, general and administration expenses, as described above.
Net finance expense
Net finance expense in the year ended December 31, 2018 decreased by $17 million, or 3%, to $654 million, compared with $671 million in the year ended December 31, 2017. Net finance expense for the year ended December 31, 2018 and 2017 comprised the following:
| | | | |
| | Year ended |
| | December 31, |
| | 2018 | | 2017 |
| | (in $ millions) |
Interest expense | | 570 | | 564 |
Net pension interest cost | | 21 | | 24 |
(Gain)/loss on derivative financial instruments | | (10) | | 28 |
Foreign currency translation losses/(gains) | | 45 | | (75) |
Exceptional net finance expense | | 28 | | 132 |
Other finance income | | — | | (2) |
Net finance expense | | 654 | | 671 |
Interest expense in the year ended December 31, 2018 increased by $6 million, or 1%, to $570 million, compared with $564 million in the year ended December 31, 2017. The increase was mainly due to adverse currency translation effects, partly offset by the favorable impact of refinancing activity in 2017 and debt redemptions in 2017 and 2018. Derivative financial instruments in the year ended December 31, 2018 was a gain of $10 million, compared to a loss of $28 million in the year ended December 31, 2017 which primarily related to the Group’s CCIRS.
Foreign currency translation losses in the year ended December 31, 2018 was a loss of $45 million compared to a gain of $75 million in the year ended December 31, 2017, principally relating to the appreciation of the U.S. dollar versus the euro functional currency in 2018, giving rise to foreign exchange losses on the Toggle Notes, compared to the depreciation of the U.S. dollar versus the euro in 2017.
Exceptional finance expense was $28 million for the year ended December 31, 2018 and mainly comprised $10 million in costs relating to the redemption in July 2018 of the Group’s $440 million 6.000% Senior Notes due 2021 and $6 million relating to the loss on the termination of the related $440 million U.S. dollar to euro CCIRS. Exceptional finance expense for the year ended December 31, 2017 of $132 million related to costs associated with the debt refinancing and redemption activity in 2017, principally comprising early redemption premiums, accelerated amortization of deferred financing costs and issue discounts, as well as a loss of $15 million on the termination of certain of the Group’s CCIRS.
Income tax (charge)/credit
Income tax expense in the year ended December 31, 2018 resulted in a tax charge of $44 million, compared with a tax credit of $40 million in the year ended December 31, 2017. The increase in income tax expense is primarily attributable to a decrease in the tax credit on the re-measurement of deferred taxes of $75 million (a tax credit of $78 million was recognized in the year ended December 31, 2017 on the enactment of the Tax Cuts and Jobs Act of 2017 (“TCJA”) in the United States), in addition to an increase of $25 million in the tax charge relating to income taxed at rates other than the standard rate of Luxembourg corporation tax (due to changes in the profitability mix during 2018), a reduction of $4 million in tax credits in respect of prior years, an increase of $1 million in the tax charge on tax losses for which no deferred income tax was recognized and an increase of $1 million in income subject to state and other local income taxes. These increases were partially offset by an increase in the loss before tax of $73 million (tax effect of $19 million at the standard rate of Luxembourg corporation tax), and a decrease of $4 million in other tax items.
The effective income tax rate for the year ended December 31, 2018 was (20%) compared to an effective income tax rate for the year ended December 31, 2017 of (4000%). The effective income tax rate is a function of the profit or loss before tax and the tax charge or credit for the year. The loss before tax for the year ended December 31, 2018 increased by $220 million to $219 million, compared with a profit before tax of $1 million in the year ended December 31, 2017, and, together with the tax credit arising on the enactment of the TCJA in the year ended December 31, 2017 and changes in the profitability mix during 2018 outlined above, are the primary drivers of the movement in the effective tax rate.
As a result of movements in profits and losses outlined above, in addition to non‑deductible interest expense, a comparison of historic effective income tax rates remains difficult.
(Loss)/profit for the year
As a result of the items described above, the Group realized a loss in the year ended December 31, 2018 of $263 million, compared with a profit of $41 million in the year ended December 31, 2017.
Year Ended December 31, 2017 compared to Year Ended December 31, 2016
| | | | |
| | Year ended |
| | December 31, |
| | 2017 | | 2016 |
| | (in $ millions) |
Revenue | | 8,596 | | 7,014 |
Cost of sales | | (7,210) | | (5,786) |
Gross profit | | 1,386 | | 1,228 |
Sales, general and administration expenses | | (450) | | (462) |
Intangible amortization | | (264) | | (191) |
Operating profit | | 672 | | 575 |
Net finance expense | | (671) | | (681) |
Profit/(loss) before tax | | 1 | | (106) |
Income tax credit/(charge) | | 40 | | (66) |
Profit/(loss) for the year | | 41 | | (172) |
Revenue
Revenue in the year ended December 31, 2017 increased by $1,582 million, or 23%, to $8,596 million, compared with $7,014 million in the year ended December 31, 2016. The full year effect of the Beverage Can Acquisition increased
revenue by $1,449 million. Excluding the impact of the Beverage Can Acquisition, revenue increased by 2%, principally reflecting the pass through of higher input costs and favorable foreign currency translation effects of $17 million, partly offset by an immaterial revision of charges for ancillary services from revenue to cost of goods sold in Glass Packaging North America of $17 million and unfavorable volume/mix effects of $8 million.
Cost of sales
Cost of sales in the year ended December 31, 2017, increased by $1,424 million, or 25%, to $7,210 million, compared with $5,786 million in the year ended December 31, 2016. The increase in cost of sales was largely the result of the Beverage Can Acquisition, the revision of charges for ancillary services described above of $17 million and higher exceptional cost of sales of $85 million due mainly to higher impairment and restructuring charges. Operating and other cost reductions were partly offset by higher input costs. Further analysis of the movement in exceptional items is set out in the “Supplemental Management’s Discussion and Analysis” section.
Gross profit
Gross profit in the year ended December 31, 2017 increased by $158 million, or 13%, to $1,386 million, compared with $1,228 million in the year ended December 31, 2016. Growth in gross profit was less than growth in revenue largely due to the mix effect of the Beverage Can Acquisition and higher exceptional cost of sales of $85 million. Gross profit percentage in the year ended December 31, 2017 decreased by 140 basis points to 16.1%, compared with 17.5% in the year ended December 31, 2016. Excluding exceptional cost of sales, gross profit percentage in the year ended December 31, 2017 decreased by 40 basis points to 17.3%, compared with 17.7% in the year ended December 31, 2016.
Sales, general and administration expenses
Sales, general and administration expenses in the year ended December 31, 2017 decreased by $12 million, or 3%, to $450 million, compared with $462 million in the year ended December 31, 2016. Exceptional sales, general and administration expenses decreased by $81 million in 2017 principally reflecting lower acquisition costs incurred relating to the Beverage Can Acquisition, partly offset by costs incurred in relation to the IPO. Excluding exceptional costs, sales, general and administration expenses increased by $69 million, or 21% due largely to the Beverage Can Acquisition, partly offset by operating cost reductions.
Intangible amortization
Intangible amortization in the year ended December 31, 2017 increased by $73 million, or 38%, to $264 million, compared with $191 million in the year ended December 31, 2016. The increase was attributable to twelve months amortization of the intangible assets in 2017, arising from the Beverage Can Acquisition.
Operating profit
Operating profit in the year ended December 31, 2017 increased by $97 million, or 17%, to $672 million compared with $575 million in the year ended December 31, 2016. The increase in operating profit reflected higher gross profit and lower sales, general and administration expenses, partly offset by higher intangible amortization as described above.
Net finance expense
Net finance expense in the year ended December 31, 2017 decreased by $10 million, or 1%, to $671 million, compared with $681 million in the year ended December 31, 2016. Net finance expense for the year ended December 31, 2017 and 2016, comprised the following:
| | | | |
| | Year ended |
| | December 31, |
| | 2017 | | 2016 |
| | (in $ millions) |
Interest expense | | 564 | | 531 |
Net pension interest cost | | 24 | | 28 |
Loss on derivative financial instruments | | 28 | | — |
Foreign currency translation (gains)/losses | | (75) | | 30 |
Exceptional net finance expense | | 132 | | 97 |
Other finance income | | (2) | | (5) |
Net finance expense | | 671 | | 681 |
Interest expense in the year ended December 31, 2017 increased by $33 million, or 6%, to $564 million, compared with $531 million in the year ended December 31, 2016. The increase in interest expense was primarily attributable to the full year effect of interest charged on debt raised to finance the Beverage Can Acquisition, the full year effect of the replacement of the PIK Notes with the Toggle Notes, where higher principal at lower rates increased the interest charge, partly offset by the refinancing and redemption of certain debt securities in January, March, April, June and August 2017.
Foreign currency translation gains in the year ended December 31, 2017 increased by $105 million to a gain of $75 million compared with a loss of $30 million in the year ended December 31, 2016. The increase was due primarily to the depreciation of the U.S. dollar versus the Group’s euro functional currency in 2017, giving rise to foreign exchange gains on the Toggle Notes, compared to the appreciation of the U.S. dollar versus the euro in 2016.
Loss on derivative financial instruments in the year ended December 31, 2017 was $28 million compared to $nil in the year ended December 31, 2016. These losses relate primarily to ineffectiveness on the CCIRS used to hedge the Group’s foreign currency and interest rate risk.
Exceptional net finance expense in the year ended December 31, 2017 increased by $35 million to $132 million compared with $97 million in the year ended December 31, 2016. Exceptional net finance expense in the year ended December 31, 2017 of $132 million related to costs associated with the debt refinancing and redemption in January, March, April, June and August 2017, principally comprising early redemption premiums, accelerated amortization of deferred financing costs and issue discounts of $117 million, as well as a loss of $15 million recognized on the termination of certain of the Group’s CCIRS. The $97 million net finance expense in 2016 comprised one-off expenses of $185 million net of a one-off credit of $88 million. Further analysis of the movement in exceptional items is set out in the “Supplemental Management’s Discussion and Analysis” section.
Income tax credit/(expense)
Income tax expense in the year ended December 31, 2017 reduced by $106 million, or 161%, to a tax credit of $40 million, compared with a tax charge of $66 million in the year ended December 31, 2016. The decrease in income tax expense is primarily attributable an increase in the tax credit on the re-measurement of deferred taxes of $73 million (mainly due to a tax credit of $78 million arising on the enactment of the TCJA in the United States), in addition to an increase of $40 million in the tax credit relating to income taxed at rates other than standard tax rates (due to changes in the profitability mix during 2017; in particular relating to decreased profitability in Glass Packaging North America), a reduction of $30 million in the tax effect of non-deductible items, an increase of $13 million in tax credits in respect of prior years and a reduction of $1 million in the tax charge on tax losses for which no deferred income tax was recognized. These decreases were partially offset by a decrease in the loss before tax of $105 million (tax effect of $31 million at the
standard rate of Luxembourg corporation tax), an increase of $7 million in income subject to state and other local income taxes, and an increase of $13 million in other tax items.
The effective income tax rate for the year ended December 31, 2017 was (4,000%) compared to an effective income tax rate for the year ended December 31, 2016 of (62%). The effective income tax rate is a function of the profit or loss before tax and the tax charge or credit for the year. The loss before tax for the year ended December 31, 2017 decreased by $105 million to a profit before tax of $1 million, compared with a loss before tax of $106 million in the year ended December 31, 2016, and, together with the tax credit arising on the enactment of the TCJA and changes in the profitability mix during 2017 outlined above, are the primary drivers of the movement in the effective tax rate.
As a result of movements in profits and losses outlined above, in addition to non‑deductible interest expense and the tax credit arising on the enactment of the TCJA, a comparison of historic effective income tax rates remains difficult.
Profit/(loss) for the year
As a result of the items described above, the profit in the year ended December 31, 2017 increased by $213 million to $41 million, compared with a loss of $172 million in the year ended December 31, 2016.
Supplemental Management’s Discussion and Analysis
Key Operating Measures
Adjusted EBITDA consists of profit/(loss) for the year before income tax charge/(credit), net finance expense, depreciation and amortization and exceptional operating items. We use Adjusted EBITDA to evaluate and assess our segment performance. Adjusted EBITDA is presented because we believe that it is frequently used by securities analysts, investors and other interested parties in evaluating companies in the packaging industry. However, other companies may calculate Adjusted EBITDA in a manner different from ours. Adjusted EBITDA is not a measure of financial performance under IFRS and should not be considered an alternative to profit/(loss) as indicators of operating performance or any other measures of performance derived in accordance with IFRS.
For a reconciliation of the (loss)/profit for the year to Adjusted EBITDA see footnote 6 to the Summary Consolidated Financial and Other Data of ARD Finance S.A..
Adjusted EBITDA in the year ended December 31, 2018 decreased by $30 million, or 2%, to $1,478 million compared with $1,508 million in the year ended December 31, 2017. The decline reflected the effects of higher input costs partly offset by other cost savings and favorable currency translation effects of $35 million.
Adjusted EBITDA in the year ended December 31, 2017 increased by $227 million, or 18%, to $1,508 million compared with $1,281 million in the year ended December 31, 2016. The impact of the Beverage Can Acquisition increased Adjusted EBITDA by $194 million compared with the prior year. Favorable foreign currency translation effects increased Adjusted EBITDA by $5 million compared with 2016. Excluding the Beverage Can Acquisition and foreign currency, Adjusted EBITDA grew by $28 million in the year largely reflecting the achievement of operating and other cost savings, partly offset by higher input costs.
Exceptional Items
The following table provides detail on exceptional items from continuing operations included in cost of sales, sales, general and administration expenses, finance expense and finance income:
| | | | | | |
| | Year ended |
| | December 31, |
| | 2018 | | 2017 | | 2016 |
| | (in $ millions) |
Impairment - property, plant and equipment | | 11 | | 54 | | 9 |
Restructuring and other costs | | 57 | | 38 | | 15 |
Start-up related costs | | 48 | | 8 | | 5 |
Non - cash inventory adjustment | | — | | — | | 10 |
Past service cost/(credit) | | 8 | | — | | (24) |
Exceptional items - cost of sales | | 124 | | 100 | | 15 |
Transaction-related costs - acquisition, integration and IPO | | 19 | | 49 | | 128 |
Restructuring and other costs | | — | | — | | 2 |
Exceptional items - SGA expenses | | 19 | | 49 | | 130 |
Impairment - goodwill | | 186 | | — | | — |
Exceptional items - impairment of intangible assets | | 186 | | — | | — |
Debt refinancing and settlement costs | | 22 | | 117 | | 157 |
Loss on derivative financial instruments | | 6 | | 15 | | 11 |
Interest payable on acquisition notes | | — | | — | | 17 |
Exceptional items - finance expense | | 28 | | 132 | | 185 |
Exceptional gain on derivative financial instruments | | — | | — | | (88) |
Exceptional items - finance income | | — | | — | | (88) |
Total exceptional items | | 357 | | 281 | | 242 |
2018
Exceptional items of $357 million have been recognized for the year ending December 31, 2018, primarily comprising:
| · | | $116 million related to the Group’s capacity realignment programs, including restructuring costs ($57 million), start-up related costs ($48 million) and property, plant and equipment impairment charges ($11 million). These costs were incurred in Glass Packaging North America ($78 million), Metal Packaging Europe ($27 million), Metal Packaging Americas ($6 million) and Glass Packaging Europe ($5 million). |
| · | | $8 million pension service cost recognized in Metal Packaging Europe and Glass Packaging Europe following a High Court ruling in the U.K. in October 2018 in respect of GMP equalization (Note 18 to the consolidated financial statements included elsewhere in this annual report). |
| · | | $19 million transaction related costs, primarily comprised of costs relating to acquisition, integration and other transactions. |
| · | | $186 million impairment of goodwill in Glass Packaging North America. |
| · | | $22 million debt refinancing and settlement costs primarily relating to the redemption of the Group’s $440 million 6.000% Senior Notes due 2021 in July 2018, principally comprising an early redemption premium and accelerated amortization of deferred finance costs. |
| · | | $6 million exceptional loss on the termination of the Group’s $440 million U.S. dollar to euro CCIRS in July 2018. |
2017
Exceptional items of $281 million have been recognized for the year ending December 31, 2017, primarily comprising:
| · | | $100 million related to the Group’s capacity realignment programs, including restructuring costs ($38 million), start-up related costs ($8 million) and property, plant and equipment impairment charges ($54 million). These |
costs were incurred in Glass Packaging North America ($43 million), Metal Packaging Europe ($54 million) and Metal Packaging Americas ($3 million). |
| · | | $49 million transaction related costs, primarily comprised of costs directly attributable to the Beverage Can Acquisition and the integration of this business, and other IPO and transaction related costs. |
| · | | $117 million debt refinancing and settlement costs relating to the notes and loans redeemed and repaid in January, March, April, June, and August 2017, principally comprising premiums payable on the early redemption of the notes and accelerated amortization of deferred finance costs and issue discounts. |
| · | | $15 million exceptional loss on the termination in June 2017, of $500 million of the Group’s U.S. dollar to British pound CCIRS, of which $12 million relates to cumulative losses recycled from other comprehensive income. |
2016
Exceptional items of $242 million have been recognized in the year ended December 31, 2016, primarily comprising:
| · | | $31 million related to the Group’s capacity realignment programs, including restructuring costs ($15 million), start-up related costs ($5 million) and property, plant and equipment impairment charges ($9 million). These costs were principally incurred in Glass Packaging North America ($5 million), Metal Packaging Europe ($15 million), and Metal Packaging Americas ($11 million). |
| · | | $24 million pension service credit in Glass Packaging North America, following the amendment of certain defined benefit pension schemes during the period. |
| · | | $128 million transaction related costs attributable primarily to the IPO and Beverage Can Acquisition. |
| · | | $157 million debt refinancing and settlement costs related to the notes repaid in May, September, and November 2016 including premiums payable on the early redemption of the notes, accelerated amortization of deferred finance costs, debt issuance premium and discounts and interest charges incurred in lieu of notice. |
| · | | The $11 million exceptional loss on derivative financial instruments relating to hedge ineffectiveness on the Group’s CCIRS. |
| · | | $17 million net interest charged in respect of notes held in escrow for the period between their issuance and the completion of the Beverage Can Acquisition. |
| · | | $88 million exceptional gain on derivative financial instruments relating to the gain on fair value of the CCIRS which were entered into during the second quarter and for which hedge accounting had not been applied until the third quarter. |
Segment Information
Year Ended December 31, 2018 compared to Year Ended December 31, 2017
| | | | |
| | Year ended |
| | December 31, |
| | 2018 | | 2017 |
| | (in $ millions) |
Revenue | | | | |
Metal Packaging Europe | | 3,592 | | 3,339 |
Metal Packaging Americas | | 2,187 | | 1,931 |
Glass Packaging Europe | | 1,623 | | 1,549 |
Glass Packaging North America | | 1,695 | | 1,777 |
Total Revenue | | 9,097 | | 8,596 |
Adjusted EBITDA | | | | |
Metal Packaging Europe | | 565 | | 554 |
Metal Packaging Americas | | 298 | | 265 |
Glass Packaging Europe | | 358 | | 340 |
Glass Packaging North America | | 257 | | 349 |
Adjusted EBITDA | | 1,478 | | 1,508 |
Revenue
Metal Packaging Europe. Revenue increased by $253 million, or 8%, to $3,592 million in the year ended December 31, 2018, compared with $3,339 million in the year ended December 31, 2017. Revenue growth principally reflected favorable foreign currency translation effects of $157 million, the pass through of higher input costs and favorable volume/mix effects of 1%.
Metal Packaging Americas. Revenue increased by $256 million, or 13% to $2,187 million in the year ended December 31, 2018, compared with $1,931 million in the year ended December 31, 2017. Revenue growth reflected favorable volume/mix effects of 8% and the pass through of higher input costs.
Glass Packaging Europe. Revenue increased by $74 million, or 5%, to $1,623 million in the year ended December 31, 2018, compared with $1,549 million in the year ended December 31, 2017. Revenue growth principally reflected favorable foreign currency translation effects of $63 million, the pass through of higher input costs and favorable volume/mix effects in Glass packaging of 2%, partly offset by lower activity in Glass Engineering.
Glass Packaging North America. Revenue decreased by $82 million or 5% to $1,695 million in the year ended December 31, 2018, compared with $1,777 million in the year ended December 31, 2017. The decrease in revenue was mainly attributed to unfavorable volume/mix effects of 6%, partly offset by the pass through of higher input costs (see “Item 5. Operating and Financial Review and Prospects—Business Drivers”).
Adjusted EBITDA
Metal Packaging Europe. Adjusted EBITDA increased by $11 million, or 2%, to $565 million in the year ended December 31, 2018, compared with $554 million in the year ended December 31, 2017. Adjusted EBITDA growth primarily reflected favorable foreign currency translation effects of $24 million and the achievement of operating and other cost savings, including $12 million relating to a lower pension-related expense, partly offset by higher input costs.
Metal Packaging Americas. Adjusted EBITDA increased by $33 million, or 12%, to $298 million in the year ended December 31, 2018, compared with $265 million in the year ended December 31, 2017. Adjusted EBITDA growth chiefly reflected favorable volume/mix effects and the achievement of production efficiencies and other cost savings, partly offset by higher input costs.
Glass Packaging Europe. Adjusted EBITDA increased by $18 million, or 5%, to $358 million in the year ended December 31, 2018, compared with $340 million in the year ended December 31, 2017. Adjusted EBITDA growth mainly reflected favorable foreign currency translation effects of $11 million, operating and other cost savings and favorable volume/mix effect in Glass packaging partly offset by lower activity in Glass Engineering.
Glass Packaging North America. Adjusted EBITDA decreased by $92 million or 26% to $257 million in the year ended December 31, 2018, compared with $349 million in the year ended December 31, 2017. The decline in Adjusted EBITDA principally reflected unfavorable volume/mix effects, higher freight and logistics costs and the costs of planned production downtime.
Year Ended December 31, 2017 compared to Year Ended December 31, 2016
| | | | |
| | Year ended |
| | December 31, |
| | 2017 | | 2016 |
| | (in $ millions) |
Revenue | | | | |
Metal Packaging Europe | | 3,339 | | 2,470 |
Metal Packaging Americas | | 1,931 | | 1,168 |
Glass Packaging Europe | | 1,549 | | 1,541 |
Glass Packaging North America | | 1,777 | | 1,835 |
Total Revenue | | 8,596 | | 7,014 |
Adjusted EBITDA | | | | |
Metal Packaging Europe | | 554 | | 404 |
Metal Packaging Americas | | 265 | | 154 |
Glass Packaging Europe | | 340 | | 328 |
Glass Packaging North America | | 349 | | 395 |
Total Adjusted EBITDA | | 1,508 | | 1,281 |
Revenue
Metal Packaging Europe. Revenue increased by $869 million, or 35%, to $3,339 million in the year ended December 31, 2017, compared with $2,470 million in the year ended December 31, 2016. Revenue growth principally reflected an additional six months contribution in 2017 from the Beverage Can Acquisition, completed in June 2016, which increased revenue by $758 million. Revenue growth also reflected the pass through of higher input costs, as well as favorable foreign currency translation effects of $21 million, largely attributable to favorable movements in the euro partly offset by adverse movements in the British pound, compared to the U.S. dollar. Volume/mix was in line with the prior year.
Metal Packaging Americas. Revenue increased by $763 million, or 65% to $1,931 million in the year ended December 31, 2017, compared with $1,168 million in the year ended December 31, 2016. Revenue growth primarily reflected an additional six months contribution in 2017 from Beverage Can Acquisition, completed in June 2016, which increased revenue by $691 million,. It also reflected the pass through of higher input costs and favorable volume/mix effects of 1% of prior year revenues, adjusted for the impact of the Beverage Can Acquisition.
Glass Packaging Europe. Revenue increased by $8 million, or 1%, to $1,549 million in the year ended December 31, 2017, compared with $1,541 million in the year ended December 31, 2016. The increase in revenue is due to favorable volume/mix effects of 2%, partly offset by the pass through of lower input costs and adverse foreign currency translation effects of $4 million, largely attributable to unfavorable movements in the British pound, partly offset by favorable movements in the euro, compared to the U.S. dollar.
Glass Packaging North America. Revenue declined by $58 million or 3% to $1,777 million in the year ended December 31, 2017, compared with $1,835 million in the year ended December 31, 2016. The decline in revenue principally reflects lower volume/mix effects of 3%, primarily in the beer end market and the reclassification of charges for ancillary services from revenue to cost of goods sold of $17 million, partly offset by the pass through of higher input costs.
Adjusted EBITDA
Metal Packaging Europe. Adjusted EBITDA increased by $150 million, or 37%, to $554 million in the year ended December 31, 2017, compared with $404 million in the year ended December 31, 2016. Adjusted EBITDA growth primarily reflected an additional six months contribution from the Beverage Can Acquisition, completed in June 2016, which increased Adjusted EBITDA by $116 million. Adjusted EBITDA growth also reflected stable volume/mix, the achievement of operating and other cost savings and favorable foreign currency translation effects of $5 million.
Metal Packaging Americas. Adjusted EBITDA increased by $111 million, or 72%, to $265 million in the year ended December 31, 2017, compared with $154 million in the year ended December 31, 2016. Adjusted EBITDA growth principally reflected the Beverage Can Acquisition in June 2016, increasing Adjusted EBITDA by $78 million and the achievement of operating and other cost savings of 10% and favorable volume/mix effects.
Glass Packaging Europe. Adjusted EBITDA increased by $12 million, or 4%, to $340 million in the year ended December 31, 2017, compared with $328 million in the year ended December 31, 2016. Adjusted EBITDA growth mainly reflected operating and other cost savings of 2% and favorable volume/mix effects.
Glass Packaging North America. Adjusted EBITDA decreased by $46 million or 12% to $349 million in the year ended December 31, 2017, compared with $395 million in the year ended December 31, 2016. The decline in Adjusted EBITDA is due mainly to lower volume/mix, as well as higher freight and operating and other costs of 7%.
| B. | | Liquidity and Capital Resources |
Cash Requirements Related to Operations
Our principal sources of cash are cash generated from operations and external financings, including borrowings and other credit facilities. Our principal funding arrangements include borrowings available under the Ardagh Group’s Global Asset Based Loan Facility. These and other sources of external financing are described further in the following table. Our principal credit agreements and indentures are also filed as exhibits to this annual report.
Both our metal and glass packaging divisions’ sales and cash flows are subject to seasonal fluctuations. The investment in working capital for Metal Packaging excluding beverage generally builds over the first three quarters of the year, in line with agricultural harvest periods, and then unwinds in the fourth quarter, with the calendar year‑end being the low point. Demand for our metal beverage and glass products is typically strongest during the summer months and in the period prior to December because of the seasonal nature of beverage consumption. The investment in working capital for metal beverage and Glass Packaging typically peaks in the first quarter. We manage the seasonality of our working capital by supplementing operating cash flows with drawings under our credit facilities.
The following table outlines our principal financing arrangements as of December 31, 2018.
| | | | | | | | | | | | | | |
| | | | Maximum | | | | | | | | | | |
| | | | Amount | | | | | | Amount Drawn as of | | Undrawn |
| | | | Drawable | | Final | | | | December 31, 2018 | | Amount |
| | | | Local | | Maturity | | Facility | | Local | | | | |
Facility | | Currency | | Currency | | Date | | Type | | Currency | | $ | | $ |
| | | | (millions) | | | | | | (millions) | | (millions) | | (millions) |
Liabilities guaranteed by the ARD Finance Group | | | | | | | | | | | | | | |
7.125%/7.875% Senior Secured Toggle Notes | | USD | | 770 | | 15-Sep-23 | | Bullet | | 770 | | 770 | | — |
6.625%/7.375% Senior Secured Toggle Notes | | EUR | | 845 | | 15-Sep-23 | | Bullet | | 845 | | 967 | | — |
Liabilities guaranteed by the Ardagh Group | | | | | | | | | | | | | | |
2.750% Senior Secured Notes | | EUR | | 750 | | 15-Mar-24 | | Bullet | | 750 | | 859 | | — |
4.625% Senior Secured Notes | | USD | | 1,000 | | 15-May-23 | | Bullet | | 1,000 | | 1,000 | | — |
4.125% Senior Secured Notes | | EUR | | 440 | | 15-May-23 | | Bullet | | 440 | | 504 | | — |
4.250% Senior Secured Notes | | USD | | 715 | | 15-Sep-22 | | Bullet | | 715 | | 715 | | — |
4.750% Senior Notes | | GBP | | 400 | | 15-Jul-27 | | Bullet | | 400 | | 512 | | — |
6.000% Senior Notes | | USD | | 1,700 | | 15-Feb-25 | | Bullet | | 1,700 | | 1,685 | | — |
7.250% Senior Notes | | USD | | 1,650 | | 15-May-24 | | Bullet | | 1,650 | | 1,650 | | — |
6.750% Senior Notes | | EUR | | 750 | | 15-May-24 | | Bullet | | 750 | | 859 | | — |
Global Asset Based Loan Facility | | USD | | 739 | | 07-Dec-22 | | Revolving | | — | | 100 | | 639 |
Finance lease obligations | | GBP/EUR | | — | | — | | Amortizing | | — | | 36 | | — |
Other borrowings/credit lines | | EUR | | — | | Rolling | | Amortizing | | — | | 15 | | 1 |
Total borrowings / undrawn facilities | | | | | | | | | | | | 9,672 | | 640 |
Deferred debt issue costs and bond premiums | | | | | | | | | | | | (67) | | — |
Net borrowings / undrawn facilities | | | | | | | | | | | | 9,605 | | 640 |
Cash, cash equivalents and restricted cash | | | | | | | | | | | | (565) | | 565 |
Derivative financial instruments used to hedge foreign currency and interest rate risk | | | | | | | | | | | | 113 | | — |
Net debt / available liquidity | | | | | | | | | | | | 9,153 | | 1,205 |
On July 31, 2018, the Group redeemed in full its $440 million 6.000% Senior Notes due 2021 and paid applicable redemption premium and accrued interest in accordance with their terms. The redemption was funded by a combination of cash-on-hand and available liquidity, drawing from the Group’s Global Asset Based Loan Facility.
As at December 31, 2018, the Group had $639 million available under the Global Asset Based Loan Facility.
The following table outlines the minimum repayments the Group is obliged to make in the twelve months ending December 31, 2019 assuming that the other credit lines will be renewed or replaced with similar facilities as they mature.
| | | | | | | | | | |
| | | | | | | | | | Minimum net |
| | | | | | | | | | repayment for |
| | | | | | | | | | the twelve |
| | | | | | Final | | | | months ending |
| | | | Local | | Maturity | | Facility | | December 31, |
Facility | | Currency | | Currency | | Date | | Type | | 2019 |
| | | | (in millions) | | | | | | (in $ millions) |
Global Asset Based Loan Facility | | USD | | 100 | | 07-Dec-22 | | Revolving | | 100 |
Finance lease obligations | | USD/GBP/EUR | | — | | | | Amortizing | | 4 |
Other borrowings/credit lines | | EUR/USD | | — | | Rolling | | Amortizing | | 14 |
The Group believes it has adequate liquidity to satisfy our cash needs for at least the next 12 months. In the year ended December 31, 2018, the Group reported operating profit of $435 million, cash generated from operations of $1,376 million and generated Adjusted EBITDA of $1,478 million.
The Group generates substantial cash flow from our operations and had $565 million in cash and cash equivalents and restricted cash as of December 31, 2018, as well as available but undrawn liquidity of $640 million under our credit facilities. We believe that our cash balances and future cash flow from operating activities, as well as our credit facilities, will provide sufficient liquidity to fund our purchases of property, plant and equipment, interest payments on our notes and other credit facilities and dividend payments for at least the next 12 months. In addition, we believe that we will be able to fund certain additional investments from our current cash balances, credit facilities and cash flow from operating activities.
Accordingly, the Group believes that our long‑term liquidity needs primarily relate to the service of our debt obligations. We expect to satisfy our future long‑term liquidity needs through a combination of cash flow generated from operations and, where appropriate, to refinance our debt obligations in advance of their respective maturity dates as we have successfully done in the past.
Cash Flows
The following table sets forth certain information reflecting a summary of our cash flow activity for the three years ended December 31, 2018:
| | | | | | |
| | Year ended December 31, |
| | 2018 | | 2017 | | 2016 |
| | (in $ millions) |
Operating profit | | 435 | | 672 | | 575 |
Depreciation and amortization | | 714 | | 687 | | 561 |
Exceptional operating items | | 329 | | 149 | | 145 |
Movement in working capital(1) | | 24 | | 99 | | 131 |
Acquisition-related, IPO, start-up and other exceptional costs paid | | (94) | | (74) | | (176) |
Exceptional restructuring paid | | (32) | | (10) | | (11) |
Cash generated from operations | | 1,376 | | 1,523 | | 1,225 |
Interest paid — excluding cumulative PIK interest paid(2) | | (537) | | (573) | | (412) |
Cumulative PIK interest paid | | — | | — | | (205) |
Income tax paid | | (105) | | (103) | | (93) |
Net cash from operating activities | | 734 | | 847 | | 515 |
Purchase of businesses | | — | | — | | (3,036) |
Capital expenditure(3) | | (575) | | (492) | | (351) |
Net cash used in investing activities | | (575) | | (492) | | (3,387) |
Repayment of borrowings | | (443) | | (4,385) | | (2,604) |
Proceeds from borrowings | | 114 | | 3,730 | | 6,169 |
Dividends paid by subsidiary to non-controlling interest | | (10) | | (8) | | — |
Consideration (paid)/received on termination of derivative financial instruments | | (44) | | 46 | | — |
Deferred debt issued costs paid | | (5) | | (43) | | (82) |
Finance lease payments | | (4) | | — | | — |
Early redemption premium costs paid | | (7) | | (91) | | (121) |
Proceeds from share issuance by subsidiary | | — | | 326 | | — |
Dividends paid to parent company | | — | | (4) | | (303) |
Net (outflow)/inflow from financing activities | | (399) | | (429) | | 3,059 |
Net (decrease)/increase in cash and cash equivalents | | (240) | | (74) | | 187 |
Exchange gains/(losses) on cash and cash equivalents | | (18) | | 79 | | 28 |
Net increase in cash and cash equivalents after exchange (losses)/gains | | (258) | | 5 | | 215 |
| (1) | | Working capital is made up of inventories, trade and other receivables, contract assets, trade and other payables and current provisions. |
| (2) | | Includes exceptional interest paid of $2 million during the years ended December 31, 2018 and 2017, respectively, and $28 million during the year ended December 31, 2016. |
| (3) | | Capital expenditure is the sum of purchase of property, plant and equipment and software and other intangibles, net of proceeds from disposal of property, plant and equipment. |
Net cash from operating activities
Net cash from operating activities decreased by $113 million from $847 million in the year ended December 31, 2017, to $734 million in the year ended December 31, 2018. The decrease was primarily due to a decrease of $237 million in operating profit, lower working capital inflows of $75 million, an increase in restructuring costs paid of $22 million and an increase of $20 million in transaction-related, start-up and other exceptional costs paid, partly offset by an increase in
exceptional operating items of $180 million and an increase in depreciation and amortization of $27 million. Net cash from operating activities was further impacted by interest paid and tax paid of $537 million and $105 million, respectively.
Net cash from operating activities increased by $332 million from $515 million in the year ended December 31, 2016, to $847 million in the year ended December 31, 2017. The year on year increase was primarily due an increase of $97 million in operating profit in the year ended December 31, 2017 compared with 2016, an increase of $126 million in depreciation and amortization, lower interest paid (including cumulative PIK interest) of $44 million and lower acquisition-related, IPO, start-up and other exceptional costs paid of $102 million, partly offset by a reduction in working capital inflow of $32 million and higher income tax paid of $10 million. The increase in operating profit and depreciation and amortization principally related to the Beverage Can Acquisition.
Net cash used in investing activities
Net cash used in investing activities increased by $83 million to $575 million in the year ended December 31, 2018, compared with the same period in 2017, due to increased capital expenditure in all operating segments, reflecting capital investment initiatives, the timing of projects and furnace rebuilds. Capital expenditure for the year ended December 31, 2018 includes $65 million related to the Group’s short payback projects.
Net cash used in investing activities decreased by $2,895 million to $492 million in the year ended December 31, 2017, compared with the same period in 2016. The decrease was mainly due to the cash consideration paid for the acquisition of the Beverage Can Business in June 2016, partly offset by increased capital expenditure principally in Metal Packaging Europe and Metal Packaging Americas.
Net (outflow)/inflow from financing activities
Net cash from financing activities represented an outflow of $399 million in the year ended December 31, 2018, compared with $429 million in the same period in 2017. Repayment of borrowings of $443 million mainly reflects the redemption in July 2018 of the Ardagh Group’s $440 million 6.000% Senior Notes due 2021. Total associated early redemption premium paid was $7 million. Proceeds from borrowings of $114 million principally reflect amounts drawn under the Group’s Global Asset Based Loan Facility.
Consideration paid on the termination of derivative financial instruments of $44 million reflects amounts paid in settlement of the Ardagh Group’s $440 million U.S. dollar to euro CCIRS in July 2018.
Debt issue costs paid and finance lease payments in the year ended December 31, 2018 were $7 million and $4 million, respectively.
Net cash from financing activities represented an outflow of $429 million in the year ended December 31, 2017, compared with a 3,059 million inflow in the same period in 2016. Proceeds from borrowings ($3,730 million) mainly reflects: (a) $1,000 million from the issuance of 6.000% Senior Notes due 2025 in January 2017, (b) the issuance of €750 million 2.750% Senior Secured Notes due 2024, $715 million 4.250% Senior Secured Notes due 2022 and $700 million 6.000% Senior Secured Notes due 2025 in March 2017 and (c) £400 million from the issuance of 4.750% Senior Notes due 2027 in June 2017. Repayment of borrowings ($4,385 million) mainly comprises: the redemption of $1,110 million First Priority Senior Secured Floating Rate Notes due 2019, the redemption of $415 million 6.250% Senior Notes due 2019, the redemption of €1,155 million 4.250% First Priority Senior Secured Notes due 2022, the repayment of $663 million Term Loan B Facility, the redemption of $415 million 6.750% Senior Notes due 2021 and the redemption of $500 million Senior Secured Floating Rate Notes due 2021. Total associated early redemption premium costs paid were $91 million and debt issue costs paid were $43 million.
In the year ended December 31, 2017, the company received net proceeds from share issuance by a subsidiary of $326 million following its IPO on the NYSE. The company also paid dividends to its parent of $4 million in the year ended December 31, 2017.
Working capital
For the year ended December 31, 2018, the movement in working capital during the period decreased by $75 million to an inflow of $24 million compared to an inflow of $99 million in December 31, 2017. The decrease in working capital was primarily due to less favorable cashflows generated from trade and other payables and inventories partly offset by lower trade and other receivables.
For the year ended December 31, 2017, the movement in working capital during the period decreased by $32 million to an inflow of $99 million compared to an inflow of $131 million in December 31, 2016. The decrease in working capital was primarily due to unfavorable cashflows generated from trade and other receivables and trade and other payables, partly offset by the impact of the Beverage Can Acquisition.
Exceptional operating costs paid
Transaction-related, start-up and other exceptional costs paid in the year ended December 31, 2018 increased by $20 million to $94 million compared with $74 million in the year ended December 31, 2017. In the year end ended December 31, 2018, amounts paid of $94 million primarily related to capacity realignment and start-up related costs paid in Glass Packaging North America, Metal Packaging Europe and Metal Packaging Americas and other transaction-related costs paid. In the year ended December 31, 2017, amounts paid of $74 million primarily related to the integration of the Beverage Can Business, start-up related costs in Metal Packaging Americas and other transaction-related costs paid.
Acquisition-related, IPO, start-up and other exceptional costs paid in the year ended December 31, 2017 decreased by $102 million to $74 million compared with $176 million in the year ended December 31, 2016. In 2017 the costs paid primarily relate to acquisition and integration costs associated with the Beverage Can Acquisition and costs associated with the Group’s initial public offering. In 2016 the costs paid primarily relate to professional fees and other costs associated with the Beverage Can Acquisition and to a lesser degree professional fees and other costs of the withdrawn Metal Packaging initial public offering which in total were $168 million. Exceptional restructuring costs paid in the year ended December 31, 2017 decreased by $1 million to $10 million compared to $11 million in the year ended December 31, 2016.
Income tax paid
Income tax paid during the year ended December 31, 2018 was $105 million, which represents an increase of $2 million when compared to the year ended December 31, 2017. The increase is primarily attributable to changes in the profitability mix during 2018, in addition to the timing of tax payments on a trailing year basis in certain jurisdictions.
Income tax paid during the year ended December 31, 2017 was $103 million, which represents an increase of $10 million when compared to the year ended December 31, 2016. The increase is attributable to the inclusion of full year results of the Beverage Can Acquisition and an increase in taxable profits in both the current period and the prior year.
Capital expenditure
| | | | | | |
| | Year ended |
| | December 31, |
| | 2018 | | 2017 | | 2016 |
| | (in $ millions) |
Metal Packaging Europe | | 202 | | 176 | | 80 |
Metal Packaging Americas | | 88 | | 80 | | 39 |
Glass Packaging Europe | | 151 | | 110 | | 99 |
Glass Packaging North America | | 134 | | 126 | | 133 |
Total capital expenditure | | 575 | | 492 | | 351 |
Capital expenditure for the year ended December 31, 2018 increased by $83 million to $575 million, compared to $492 million for the year ended December 31, 2017. The increase was primarily attributable to spending of $65 million on short payback projects across the Group during 2018. In Metal Packaging Europe, capital expenditure in the year ended December 31, 2018 was $202 million, compared to capital expenditure of $176 million in the same period in 2017 with
the increase primarily attributable to short payback project spending and the timing of projects. In Metal Packaging Americas capital expenditure in the year ended December 31, 2018 was $88 million compared to capital expenditure of $80 million in the same period in 2017, with the increase primarily attributable to the investment in a new plant in Manaus, Brazil. In Glass Packaging Europe, capital expenditure was $151 million in the year ended December 31, 2018, compared to capital expenditure of $110 million in the same period in 2017, reflecting short payback project spending and the timing of furnace rebuild activity. In Glass Packaging North America, capital expenditure was $134 million in the year ended December 31, 2018, compared to capital expenditure of $126 million in the same period in 2017, also due to the timing of furnace rebuild activity.
Capital expenditure for the year ended December 31, 2017 increased by $141 million to $492 million, compared to $351 million for the year ended December 31, 2016. In Metal Packaging Europe, capital expenditure in the year ended December 31, 2017 was $176 million compared to capital expenditure of $80 million in the same period in 2016 with the increase primarily attributable to the Beverage Can Acquisition. In Metal Packaging Americas capital expenditure in the year ended December 31, 2017 was $80 million compared to capital expenditure of $39 million in the same period in 2016 with the increase primarily attributable to the Beverage Can Acquisition. In Glass Packaging Europe, capital expenditure was $110 million in the year ended December 31, 2017, compared to capital expenditure of $99 million in the same period in 2016, reflecting higher furnace rebuild activity in 2017. In Glass Packaging North America, capital expenditure was $126 million in the year ended December 31, 2017 compared to capital expenditure of $133 million in the same period in 2016, due to lower furnace rebuild activity in 2017.
| C. | | Research and development, patents and licenses |
See “Item 4. Information on the Company—B. Business Overview—Metal Packaging—Intellectual Property and Innovation, Development and Engineering” and “Item 4. Information on the Company—B. Business Overview—Glass Packaging—Intellectual Property and Innovation, Development and Engineering”.
Other than as disclosed elsewhere in this annual report, we are not aware of any trends, uncertainties, demands, commitments or events since December 31, 2018 that are reasonably likely to have a material adverse effect on our revenues, income, profitability, liquidity or capital resources, or that would cause the reported financial information in this annual report to be not necessarily indicative of future operating results or financial conditions.
| E. | | Off-balance sheet arrangements |
The Group participates in several uncommitted accounts receivable factoring and related programs with various financial institutions for certain receivables, accounted for as true sales of receivables, without recourse to the Ardagh Group. Receivables of $525 million were sold under these programs at December 31, 2018 (December 31, 2017: $324 million).
| F. | | Contractual Obligations and Commitments |
The following table outlines our principal contractual obligations as of December 31, 2018:
| | | | | | | | | | |
| | | | Less than | | | | | | More than |
| | Total | | one year | | 1 – 3 years | | 3 – 5 years | | five years |
| | | | (in $ millions) |
Long term debt—capital repayment | | 9,521 | | — | | — | | 3,956 | | 5,565 |
Long term debt—interest | | 2,873 | | 543 | | 543 | | 1,514 | | 273 |
Finance leases and other borrowings | | 150 | | 117 | | 5 | | 21 | | 7 |
Operating leases | | 364 | | 67 | | 103 | | 47 | | 147 |
Purchase obligations | | 1,984 | | 1,984 | | — | | — | | — |
Derivatives | | 2,587 | | 552 | | 33 | | 2,002 | | — |
Contracted capital commitments | | 76 | | 76 | | — | | — | | — |
Total | | 17,556 | | 3,339 | | 684 | | 7,540 | | 5,992 |
Item 6. Directors, Senior Management and Employees
For the purposes of this item 6.A, references to the “Group” refer to Ardagh Group S.A. and related pre-IPO holding entities. Set forth below is information concerning our directors and officers as of the date of this annual report, including their names, ages, positions and current directorship terms (which expire on the date of the relevant year’s annual general meeting of shareholders). There are no family relationships between any director or executive officer. Our executive officers are appointed by the board of directors to serve in their roles. Each executive officer is appointed for such term as may be prescribed by the board of directors or until a successor has been chosen and qualified or until such officer’s death, resignation or removal. Unless otherwise indicated, the business address of all of our directors and executive officers is 56, rue Charles Martel, L‑2134 Luxembourg, Luxembourg.
| | | | | |
Name | | Age | | Position | | Expiration of current directorship term |
Paul Coulson | | 66 | | Chairman and Chief Executive Officer | | 2021 |
David Matthews | | 55 | | Chief Financial Officer and Director | | 2021 |
Wolfgang Baertz | | 78 | | Director | | 2021 |
Herman Troskie | | 48 | | Director | | 2021 |
Backgrounds of Our Officers and Directors
Paul Coulson
Paul Coulson graduated from Trinity College Dublin with a business degree in 1973. He spent five years with Price Waterhouse in London and Dublin and qualified as a Chartered Accountant in 1978. He then established his own accounting firm before setting up Yeoman International in 1980 and developing it into a significant leasing and structured finance business. In 1998 he became Chairman of the Group and initiated the transformation of Ardagh from a small, single plant operation into a leading global packaging company. Over the last 30 years he has been involved in the creation and development of a number of businesses apart from Yeoman and Ardagh. These include Fanad Fisheries, a leading Irish salmon farming company, and Sterile Technologies. Prior to its sale to Stericycle, Inc. in 2006, Sterile Technologies had been developed into the leading medical waste management company in the United Kingdom and Ireland.
David Matthews
David Matthews was appointed Chief Financial Officer and director of the Group in 2014. Prior to joining Ardagh, Mr. Matthews held various senior finance positions at DS Smith plc and Bunzl plc. Mr. Matthews qualified as a Chartered Accountant in 1989 with Price Waterhouse in London and holds an engineering degree from the University of Southampton.
Wolfgang Baertz
Wolfgang Baertz was President of the Executive Committee of Dresdner Bank Luxembourg from 1997 until his retirement in 2003, having been Managing Director from 1982 to 1997. Mr. Baertz previously served with Commerzbank AG Düsseldorf and has been a director of the Group since December 2002.
Herman Troskie
Herman Troskie has been a director of the Group since 2004. Mr. Troskie is Managing Director, Private Clients at Maitland, a global advisory and administration firm. He has extensive experience in the areas of international corporate structuring, cross‑border financing and capital markets, with a particular interest in integrated structuring for entrepreneurs and their businesses. Mr. Troskie is a director of companies within the Yeoman group of companies, and other private and public companies. He qualified as a South African attorney in 1997, and as a Solicitor of the Senior Courts of England and Wales in 2001. Mr. Troskie is based in Luxembourg.
Director Compensation
The aggregate amount of compensation of Ardagh Group’s key management (including directors) received from the Ardagh Group for service as key management for the year ended December 31, 2018 was $11 million. An aggregate of approximately $550,000 has been set aside or accrued for the year ended December 31, 2018 to provide pension, retirement or similar benefits to our key management (including directors). See Note 23 to the audited consolidated financial statements included elsewhere in this annual report.
Composition of Our Board of Directors
Our board of directors currently consists of 4 members. Our board of directors consists of such number of directors as the general meeting of shareholders may from time to time determine.
Number and Election of Directors
Pursuant to Luxembourg Law, the board of directors must be composed of at least three directors. The holders of the shares have the right to elect the board of directors at a general meeting of shareholders by a simple majority of the votes validly cast. The existing directors have the right to appoint persons to fill vacancies, which persons may hold office until the next following annual general meeting. For information on the date of expiration of each directors’ term and th length of time each director has served, see “Item 6. Directors, Senior Management and Employees—A. Directors and Officers” above.
Service Contracts of Directors
There are no service contracts between the Group and any of our current non-employee directors providing for benefits upon termination of their service. For a discussion of compensation, including post-termination benefits, of employee directors, see “Item 6. Directors, Senior Management and Employees—B. Compensation—Director Compensation” above.
Board of Directors Powers and Function
The board of directors has the power to take any action necessary or useful to realize the corporate objects of the Company, with the exception of the powers reserved by Luxembourg Law or by the Articles to the general meeting of shareholders. Directors must act with diligence and in good faith in performing their duties. The expected behavior of a director is that of a normally prudent person, in a like position, having the benefit, when making such a decision, of the same knowledge and information as the directors having made the decision.
Board of Directors Meetings and Decisions
We expect that all of the resolutions of the board of directors will be adopted by a simple majority of votes cast in a meeting at which a quorum is present or represented by proxy. A member of the board of directors may authorize another member of the board of directors to represent him/her at the board meeting and to vote on his/her behalf at the meeting.
Our board of directors meets as often as it deems necessary to conduct the business of the Company.
Code of Conduct
ARD Finance has not adopted a code of conduct as it is not required to do so. However, all of its directors, officers or employees are also directors, officers or employees of Ardagh Group S.A., and are subject to its code of conduct, which is publicly available at https://www.ardaghgroup.com/corporate/investors.
Corporate Governance Guidelines
The Company is not subject to the NYSE requirements to have corporate governance guidelines. The board of directors of the Company operates consistent with all applicable Luxembourg legal requirements.
As of December 31, 2018, the Ardagh Group had approximately 23,400 employees globally.
As of December 31, 2018, Metal Packaging had approximately 11,400 employees globally, of which approximately 1,400 were located in the Netherlands, approximately 1,300 were located in France, approximately 2,300 were located in Germany, approximately 600 were located in Italy and approximately 1,700 were located in the United States.
As of December 31, 2018, Glass Packaging had approximately 12,000 employees, of which approximately 5,300 employees were located in the United States, approximately 2,300 employees were located in Germany, approximately 600 employees were located in the Netherlands and approximately 1,500 employees were located in the United Kingdom.
We strive to maintain a safe working environment for all of our employees, with safety in the workplace being a key objective, measured through individual accident reports, detailed follow‑up programs and key performance indicator reporting. We believe that our safety record is among the best in the industry.
The majority of our employees are members of labor unions or are subject to centrally‑negotiated collective agreements. We generally negotiate national contracts with our unions, with variations agreed at the local plant level. Most such labor contracts have a duration of one to two years. Our management believes that, overall, our current relations with our employees are good. We have experienced temporary work stoppages in certain jurisdictions in which we operate; however, such stoppages have not had a material adverse impact on our business.
For the employees of our subsidiaries located in countries of the European Union, Ardagh Group has established a EWC in compliance with EU directives. The EWC acts as a communications conduit and consultative body between our EU subsidiaries and our employees. All the elected EWC country employee representatives meet once a year with senior management at an annual EWC Forum meeting.
The EWC has the right to be notified of any special circumstances that would have a major impact on the interests of employees. In order to facilitate this process in an efficient and effective way, the EWC has elected a Select Committee which meets at least 4 times a year with a senior management delegation to discuss any matters which are of interest for the EWC.
EWC delegates are elected for four-year terms on the basis of legal principles or practices in the relevant countries, while the allocation of EWC delegates between countries is governed by EU directives.
Not Applicable
Item 7. Major Shareholders and Related Party Transactions
ARD Finance S.A. is an indirect, fully-controlled subsidiary of the Parent Company.
| B. | | Related Party Information |
Shareholder Agreement
The Parent Company entered into the Shareholder Agreement with Ardagh Group S.A. in March 2017, which is filed as an exhibit to this annual report. The Shareholder Agreement addresses, among other things:
(i)Matters relating to the assumption, indemnification and allocation of benefits and responsibilities and mutual release of liabilities in connection with arrangements and other obligations with respect to Ardagh Group S.A.’s business that were entered into by the Parent Company prior to the IPO;
(ii)Ardagh Group S.A.’s obligation to cooperate in providing information to the Company and taking such other actions reasonably requested to facilitate the Parent Company’s ability to manage its investment in the Ardagh Group and comply with governmental or contractual obligations, including reporting obligations under the Toggle Notes, the defense of litigation, the preparation of tax returns, financial statements or documents required to be filed with the SEC or any regulatory authority (including any stock exchange), or the management of any tax audits;
(iii)Ardagh Group S.A.’s acknowledgement that there is anticipated at a future date a Reorganization Event (defined as an event in which the shareholders of the Parent Company and/or its subsidiaries will receive direct ownership in a number of Ardagh Group’s common shares (in proportion to their respective ownership interest in the Parent Company and/or its subsidiaries), whether by dividend, distribution, exchange offer or other means; provided that the aggregate number of Class B common shares received by such shareholders in such event shall be substantially the same as or fewer than (adjusting for fractional shares) the number of the Class B common shares owned by the Parent Company and/or its subsidiaries immediately prior to the date of such event) and Ardagh Group’s agreement to take such actions as are necessary to implement the Reorganization Event at the Group’s cost;
(iv)Ardagh Group S.A.’s intention to pay dividends to all shareholders in amounts that will, at a minimum, be sufficient to enable ARD Finance to satisfy the cash interest payment obligations under the Toggle Notes in accordance with applicable laws, contractual obligations and its Articles; and
(v)Ardagh Group S.A.’s agreement, so long as the Toggle Notes are outstanding, not to, and not to permit its subsidiaries to, agree to restrictions on the payment of dividends that are materially more restrictive than the restrictions in place under any contract or agreement existing on the closing date of Ardagh Group IPO, unless such restriction would not have a material adverse effect on Ardagh Group’s ability to pay dividends as described in the preceding clause (iv) (such determination to be made at the time such restrictions are entered into).
Registration Rights Agreement
The Parent Company entered into a Registration Rights Agreement with Ardagh Group S.A. in March 2017. The Registration Rights Agreement provides customary “demand,” “shelf,” and “piggyback” registration rights to eligible holders, which includes (i) the Parent Company and its subsidiaries who hold Ardagh Group S.A.’s Class B common shares; (ii) any Qualified Holder (as defined in the articles of association of Ardagh Group S.A.) of Class B or Class A common shares received in the Reorganization Event; and (iii) certain Registration Rights Transferees who acquire at least 5% of the registrable securities under the Registration Rights Agreement. The Registration Rights Agreement provides that Ardagh Group and the eligible holders will provide customary indemnities to one another for certain liabilities relating to such registrations.
Related Party Transactions
For additional information, see “Note 23 – Related Party Information” to the audited consolidated financial statements included elsewhere in this annual report.
There have been no materially significant related party transactions in the period since the date of approval of the financial statements included elsewhere in this annual report.
| C. | | Interests of experts and counsel |
Not Applicable
Item 8. Financial Information
| A. | | Consolidated Statements and Other Financial Information |
See “Item 18. Financial Statements” of this annual report for consolidated financial statements. See also Exhibit 99.10 of this annual report for the consolidated financial statements of Ardagh Group S.A. incorporated by reference in this annual report pursuant to the requirements of Regulation S-X 3-16 issued by the SEC.
Legal or arbitration proceedings
We become involved from time to time in various claims and lawsuits arising in the ordinary course of business, such as employee claims, disputes with our suppliers, environmental liability claims and intellectual property disputes.
In 2015, the German competition authority (the Federal Cartel Office) initiated an investigation of the practices in Germany of metal packaging manufacturers, including Ardagh. In 2018, the European Commission took over this investigation and the German investigation is, as a result, at an end. The European Commission’s investigation is ongoing, and there is at this stage no certainty as to the extent of any charge which may arise. Accordingly, no provision has been recognized.
On April 21, 2017, a jury in the United States awarded $50 million in damages against the Ardagh Group’s U.S. glass business, formerly VNA, in respect of one of two asserted patents alleged to have been infringed by VNA. On March 8, 2018, the trial judge confirmed the jury verdict. Ardagh notes the Court’s award of pre-judgement interest to the Plaintiffs, its refusal to enhance the damages award in favor of the Plaintiffs and its refusal to award legal costs to the Plaintiffs. Ardagh disagrees with the jury verdict, both as to liability and quantum of damages, and strongly believes that the case is without merit and accordingly, no provision has been recognized. Ardagh is vigorously appealing the verdict to the Federal Appeals Court. On March 23, 2018, the Company filed its appeal notice and posted a surety bond with the Court. Plaintiffs filed a notice of cross-appeal on April 4, 2018. The appeal proceedings are ongoing. The case was filed before Ardagh acquired VNA and customary indemnifications are in place between Ardagh and the seller of VNA.
With the exception of the above legal matters, the Group is involved in certain other legal proceedings arising in the normal course of its business. The Group believes that none of these proceedings, either individually or in aggregate, are expected to have a material adverse effect on its business, financial condition, results of operations or cash flows.
Dividend Policy
The Company does not pay regular dividends to its Parent Company, with any dividends paid being at the discretion of the board of directors of the Company.
Our subsidiary, Ardagh Group S.A currently pays a quarterly cash dividend of $0.14 per share on its Class A and Class B common shares.
Under the terms of the indenture governing the Toggle Notes, we are required to (i) pay the interest due on the Toggle Notes in cash, unless it is entitled to pay interest on up to a specified percentage of the then outstanding principal amount of the Toggle Notes as PIK Interest (defined herein), based on the amount of the Cash Available for Debt Service
(defined below) and, (ii) to the extent that cash interest is payable, cause our other restricted subsidiaries to take all such shareholder, corporate and other actions necessary or appropriate to permit the making of any such dividends or other distribution or other form of return on capital, provided that any such shareholder and corporate and other actions would not violate applicable law and such actions would otherwise be consistent with fiduciary and directors’ duties of the relevant companies.
We anticipate that the expected quarterly dividend will be sufficient to enable us to satisfy the cash interest obligations under the Toggle Notes; however, because the dividend will be declared in U.S. dollars and our interest obligations for the Toggle Notes are payable in a combination of U.S. dollars and euro, exchange rate fluctuations may affect the amount of our interest obligations, which may require a special dividend to be made by Ardagh Group S.A. to the extent of any shortfall.
There have been no significant changes since the approval date of the financial statements included elsewhere in this annual report. Please see Note 25 of the consolidated financial statements elsewhere in this annual report for details of events after the reporting period.
Item 9. The Offer and Listing
| A. | | Offer and listing details |
Not applicable
Not applicable
Not applicable
Not applicable
Not applicable
Not applicable
Item 10. Additional Information
Not Applicable
| B. | | Memorandum and articles of association |
The following is a summary of certain provisions of the articles of association (our "Articles"). Such summaries do not purport to be complete and are subject to, and are qualified in their entirety by reference to, all of the provisions of our Articles, the form of which has been filed as an exhibit to this annual report on Form 20-F and incorporated by reference herein. See also "Comparison of Luxembourg Corporate Law and Delaware Corporate Law".
General
We are a public limited liability company (société anonyme) incorporated under, and governed by, the laws of Luxembourg. We are registered with the Trade and Companies Register in Luxembourg under the number B 160806. We were incorporated on May 6, 2011. Our registered office is located at 56, rue Charles Martel, L-2134 Luxembourg, Luxembourg.
The Company has legal personality. The objects of our business, as set out in article 4 of our Articles, are the acquisition, holding and disposal of participations and related activities. They are to be interpreted in the broadest sense and any transaction or agreement which is entered into by the Company that is not inconsistent with the specified objects will be deemed to be within the scope of such objects or powers.
Shares
We have an issued share capital of EUR 102,564.10 divided into 10,256,410 ordinary shares of a par value of EUR 0.01 each.
Shares are issued in registered form only. The Company is entitled to treat the registered holder of any share as the absolute owner thereof and is not bound to recognize any equitable claim or other claim or interest in such share on the part of any other person.
Issuance of shares
The Company may issue additional shares, from time to time, either at par or at a premium and with such rights and restrictions (with respect to dividends, voting, return of capital, or otherwise) as we may direct by resolution passed at an extraordinary general meeting held in the manner required for an amendment to the Articles.
Preemptive Rights
Holders of our shares have a pro rata preemptive right to subscribe for newly issued shares, except for shares issued for consideration other than cash (i.e., in kind).
Meetings of shareholders
The Company will convene at least one general meeting of shareholders each calendar year (the "annual general meeting") for the purpose of, among other things, approving the annual accounts and electing directors. Under Luxembourg Law, the annual general meeting must be held within six months of the end of the fiscal year. The board of directors may convene any general meeting whenever in its judgment such a meeting is necessary. The board of directors may delegate its authority to call the general meeting to the Chairman or any committee of the board of directors or to one or more board members by resolution. The board of directors must convene a general meeting within a period of one month upon notice, to the Company from shareholders holding at least the 10% threshold on the date of such notice. In addition, one or more shareholders who together hold the 10% threshold on the date of the notice to the Company, may require that the Company include on the agenda of such general meeting one or more additional items. This request shall be sent to the registered office by registered mail at least five days prior to the holding of the meeting. At least eight days' notice to registered shareholders is required for a general meeting. No business may be transacted at a general meeting, other than business that is properly brought before the general meeting in accordance with our Articles and Luxembourg Law.
Voting rights
Holders of our shares are entitled to one vote per share on all matters submitted to a vote of shareholders. Luxembourg Law does not provide for cumulative voting in the election of directors. Voting of shareholders at a general
meeting may be in person, by proxy or by voting form. Our Articles and Luxembourg Law distinguish ordinary general meetings of shareholders and extraordinary general meetings of shareholders.
Ordinary general meetings of shareholders. No quorum is required for any ordinary resolutions to be considered at a general meeting, and such ordinary resolutions are adopted by a simple majority of votes validly cast on such resolution by shareholders entitled to vote. Abstentions and nil votes are not taken into account.
Extraordinary general meetings of shareholders. Our Articles require resolutions adopted at an extraordinary general meeting for any of the following matters, among other things: (a) an increase or decrease of the issued capital, (b) an amendment to our Articles and (c) dissolving the Company. Pursuant to our Articles and Luxembourg Law, for any resolutions to be considered at an extraordinary general meeting the quorum is at least one-half (1/2) of the share capital in issue present in person or by proxy. Any resolution may be adopted at an extraordinary general meeting at which a quorum is present by the affirmative vote of holders of at least two-thirds (2/3) of the votes validly cast on such resolution by shareholders entitled to vote.
Amendment of the Articles
Our Articles require a resolution approved at an extraordinary general meeting of shareholders to amend the Articles.
Dividend rights
Under Luxembourg Law, dividends may only be declared from the freely available distributable reserves of the Company. Interim dividends may be declared by the board of directors, subject to certain mandatory legal requirements. The general meeting of shareholders would in the normal course be asked to declare as final the interim dividends paid during the year. The shareholders may declare dividends at a general meeting.
Distributions on winding up of the Company
Any voluntary dissolution of the Company will take place in accordance with the provisions of Luxembourg Law. We may only be placed into voluntary dissolution if shareholders vote in favor of such dissolution by means of a resolution passed at an extraordinary general meeting.
In the event of our liquidation, dissolution or winding up, the holders of shares are entitled to share equally and ratably in our assets, if any, remaining after the payment of all of our debts and liabilities in proportion to the number of shares owned by them, without regard to the par value of the shares.
Because all shares of the Company, will be fully paid, shareholders will have no liability in the event of a winding up of the Company, unless they are deemed to be a de facto manager (gérant de fait) exercising effective and continuing control over the Company by positive actions.
Share repurchases
Pursuant to our Articles, our board of directors may purchase our own shares in accordance with Luxembourg Law.
Board of Directors
Our Articles provide that our business is to be managed and conducted by or under the direction of our board of directors. In managing the business of the Company, the board of directors may exercise all the powers of the Company that are not reserved by Luxembourg Law or by the Articles to the general meeting of shareholders. There is no requirement in our Articles or Luxembourg Law that directors hold any of our shares. There is also no requirement in our Articles or Luxembourg Law that directors must retire at a certain age.
Our Articles provide that our board of directors shall consist of at least three directors where the Company has more than one shareholder. Our Articles provide that any director may be removed at a shareholders meeting with or without cause by an ordinary resolution and any vacancy on the board of directors, may be filled by our board of directors (other than where a director is removed from office by the shareholders, in which case the shareholders shall elect a director to fill such vacancy by ordinary resolution in accordance with our Articles), acting by a simple majority, on a provisional basis until the provisional appointment of the director appointed by the board of directors is confirmed at the next general meeting of shareholders.
The compensation of our directors will be determined by the general meeting of shareholders. Our directors may also be paid all travel, hotel and other expenses properly incurred by them in connection with our business or their duties as directors.
COMPARISON OF LUXEMBOURG CORPORATE LAW AND DELAWARE CORPORATE LAW
The following comparison between Luxembourg corporate law, which applies to the Company, and Delaware corporate law, the law under which many corporations in the United States are incorporated, discusses additional matters not otherwise described in this annual report. In certain respects, the Articles may provide for provisions that vary the minimum requirements of Luxembourg Law.
Meetings of Shareholders
Luxembourg
Under Luxembourg Law, at least one general meeting of shareholders must be held each financial year in Luxembourg.
Luxembourg Law provides that any general meeting of shareholders may be called by the board of directors of a company or the supervisory auditor of a company and must be called so that it is held within a period of one month upon the written request of shareholders holding not less than the 10% voting rights threshold. One or more shareholders who together hold at least the 10% voting rights threshold may request that one or more additional items be put on the agenda of any general meeting.
Delaware
Shareholders generally do not have the right to call meetings of shareholders unless that right is granted in the certificate of incorporation or by-laws. However, if a corporation fails to hold its annual meeting within a period of 30 days after the date designated for the annual meeting, or if no date has been designated for a period of 13 months after its last annual meeting, the Delaware Court of Chancery may order a meeting to be held upon the application of a shareholder.
Amendments to the articles of association
Luxembourg
Luxembourg Law provides that amendments to the articles of association of a company generally require an extraordinary general meeting of shareholders held in front of a public notary at which at least one half of the share capital is represented. The shareholders may change the nationality of a Luxembourg company by a resolution of the general meeting of shareholders adopted in the manner required for an amendment of the articles of association of the company. An increase of the commitments of its shareholders requires, however, the unanimous consent of the shareholders.
In very limited circumstances the board of directors may be authorized by the shareholders to amend the articles of association, albeit always within the limits set forth by the shareholders. These include (i) where the board of directors is authorized to transfer the registered office within Luxembourg, (ii) where the board of directors is authorized to issue shares within the company's authorized unissued share capital and (iii) a cancellation of shares following a repurchase of
shares. The board of directors is then authorized to appoint a representative to appear in front of a Luxembourg notary to record the transfer of registered office out of the city of Luxembourg, the capital increase or decrease and to amend the share capital set forth in the articles of association.
Delaware
Amendments to the certificate of incorporation of a Delaware corporation require the affirmative vote of the holders of a majority of the outstanding shares entitled to vote thereon or such greater vote as is provided for in the certificate of incorporation. A provision in the certificate of incorporation requiring the vote of a greater number or proportion of the directors or of the holders of any class of shares than is required by Delaware corporate law may not be amended, altered or repealed except by such greater vote.
Duties of directors
Luxembourg
The board of directors must act as a collegiate body in the corporate interest of a company and has the power to take any action necessary or useful to realize the corporate objects of the company, with the exception of the powers reserved by Luxembourg Law or by the articles of association to the general meeting of shareholders. Luxembourg Law imposes a duty on directors of a Luxembourg company to: (i) act in good faith with a view to the best interests of the company; and (ii) exercise the care, diligence and skill that a reasonably prudent person would exercise in comparable circumstances. The standard of care required from directors in the execution of their mandate vis-à-vis the company is the standard that the ordinary or reasonable man would apply to his own affairs. The standard of care is more onerous where a director has special skills or where such director receives remuneration for his office.
In addition, Luxembourg Law imposes specific duties on directors and officers of a company to comply with Luxembourg Law and the articles of association of the company.
Delaware
Except as otherwise provided in its certificate of incorporation, the board of directors of a Delaware corporation bears the ultimate responsibility for managing the business and affairs of a corporation. In discharging this function, directors of a Delaware corporation owe fiduciary duties of care and loyalty to the corporation and its shareholders. Delaware courts have decided that the directors of a Delaware corporation are required to exercise an informed business judgment in the performance of their duties. An informed business judgment means that the directors have informed themselves of all material information reasonably available to them. Delaware courts have also subjected directors' actions to enhanced scrutiny in certain situations, including if directors take certain actions intended to prevent a threatened change in control of the corporation or in connection with transactions involving a conflicted controlling shareholder. In addition, under Delaware law, when the board of directors of a Delaware corporation determines to sell or break-up a corporation, the board of directors may, in certain circumstances, have a duty to obtain the highest value reasonably available to the shareholders at that time.
Director terms
Luxembourg
Under Luxembourg Law and except as specified differently in the Articles, directors may be re-elected but the term of their office may not exceed six years.
Delaware
The Delaware General Corporation Law generally provides for a one-year term for directors, but permits directors to be divided into up to three classes with up to three-year terms, with the terms for each class expiring in different years, if permitted by the certificate of incorporation, an initial bylaw or a bylaw adopted by the shareholders.
Director vacancies
Luxembourg
Under Luxembourg Law and our Articles, in case of vacancy of the office of a director appointed by the general meeting, unless the vacancy results from the removal of a director by the shareholders, the remaining directors so appointed may fill the vacancy on a provisional basis. In such circumstances, the next general meeting shall make the final appointment. The decision to fill a vacancy is taken by the remaining directors by simple majority vote.
Delaware
The Delaware General Corporation Law provides that vacancies and newly created directorships may be filled by a majority of the directors then in office (even though less than a quorum) unless (a) otherwise provided in the certificate of incorporation or by-laws of the corporation or (b) the certificate of incorporation directs that a particular class of stock is to elect such director, in which case any other directors elected by such class, or a sole remaining director elected by such class, will fill such vacancy.
Removal of directors
Luxembourg
Under Luxembourg Law a director may be removed from office by the shareholders at a general meeting of the shareholders, at any time and with or without cause, by ordinary resolution.
Delaware
Under the Delaware General Corporation Law, any director or the entire board of directors may be removed, with or without cause, by the holders of a majority of the shares then entitled to vote at an election of directors, except (a) unless the certificate of incorporation provides otherwise, in the case of a corporation whose board of directors is classified, shareholders may effect such removal only for cause, and (b) in the case of a corporation having cumulative voting, if less than the entire board of directors is to be removed, no director may be removed without cause if the votes cast against his/her removal would be sufficient to elect him if then cumulatively voted at an election of the entire board of directors, or, if there are classes of directors, at an election of the class of directors of which he/she is a part.
Interested director transactions
Luxembourg
There are no rules under Luxembourg Law preventing a director from entering into contracts or transactions with the company to the extent the contract or the transaction is in the corporate interest of the company.
Luxembourg Law prohibits a director from participating in deliberations and voting on a transaction which has to be considered by the board of directors if that director has a direct or indirect financial interest conflicting with that of the company. The concerned director must advise the board of directors thereof and cause a record of his statement to be included in the minutes of the meeting. Such director may not take part in these deliberations. At the next general meeting of shareholders, before any other resolution is put to the vote, a special report must be made on any transactions in which
the directors may have had an interest conflicting with that of the company. These restrictions will not apply where the decision of the board of directors relates to ordinary business entered into under normal conditions.
Delaware
Interested director transactions are permissible and may not be legally voided if:
| · | | either a majority of disinterested directors, or a majority in interest of holders of shares of the corporation's capital stock entitled to vote upon the matter, approves the transaction upon disclosure of all material facts; or |
| · | | the transaction is determined to have been fair as to the corporation as of the time it is authorized, approved or ratified by the board of directors, a committee thereof or the shareholders. |
Approval of corporate matters by written consent
Luxembourg
Pursuant to Luxembourg Law, shareholders of a public limited liability company may not take actions by written consent. A shareholder meeting must always be called if the matter to be considered requires a shareholder resolution under Luxembourg Law or our Articles. Shareholders may vote by proxy or by submission of a voting form.
Delaware
Unless otherwise specified in a corporation's certificate of incorporation, shareholders may take action permitted to be taken at an annual or special meeting, without a meeting, notice or a vote, if consents, in writing, setting forth the action, are signed by shareholders with not less than the minimum number of votes necessary to authorize such action at a meeting at which all shareholders entitled to vote were present and voted.
Declaration and payment of dividends
Luxembourg
Pursuant to Luxembourg Law, distributions may be made (i) by decision of the general meeting out of available profits (up to the prior year end and after approval of accounts as of the end of and for the prior year) and reserves and (ii) by the board of directors as interim dividends out of available profits and reserves if the articles of association authorize the board of directors to do so. Furthermore, up to 5% of any net profits generated by the company must be allocated to a legal reserve that is not available for distribution, until such legal reserve is equal to 10% of the company's issued share capital.
The amount of distributions declared by the annual general meeting of shareholders may include (i) the amount previously declared by the board of directors (i.e., the interim distributions for the year of which accounts are being approved), and if proposed (ii) the (new) distributions declared on the annual accounts. Where the payments made on account of interim dividends exceed the amount of the dividends subsequently approved by the shareholders at the annual general meeting, the excess amount shall be deemed to have been paid on account of the next dividend.
Delaware
Under the DGCL, subject to any restrictions contained in the certificate of incorporation, the directors of a corporation may declare and pay dividends upon the shares of its capital stock either (i) out of its surplus or (ii) if there is no surplus, out of its net profits for the fiscal year in which the dividend is declared and/or the preceding fiscal year, except when the capital of the corporation is diminished by depreciation in the value of its property, or by losses, or otherwise, to an amount less than the aggregate amount of capital represented by the issued and outstanding shares of all classes having a preference on the distribution of assets. "Surplus" is defined in the DGCL as the excess of the net assets of the corporation over capital, as such capital may be adjusted by the board of directors.
Not Applicable
None
United States Federal Income Taxation
General
The following summary describes certain U.S. federal income tax consequences that may be relevant with respect to the acquisition, ownership and disposition of Toggle Notes. This summary only applies to holders that hold the Toggle Notes as capital assets. It does not purport to be a comprehensive description of all the U.S. tax considerations that may be relevant to a decision to purchase the Toggle Notes. In particular, this summary does not address tax considerations applicable to holders that may be subject to special tax rules including, without limitation, the following: (i) financial institutions; (ii) insurance companies; (iii) dealers or traders in securities or currencies; (iv) tax‑exempt entities; (v) persons who hold Toggle Notes as part of a “hedging” or “conversion” transaction or as a position in a “straddle” or as part of a “synthetic security” or other integrated transaction for U.S. federal income tax purposes; (vi) persons who have a “functional currency” other than the U.S. dollar; (vii) regulated investment companies; (viii) real estate investment trusts; (ix) persons required to accelerate the recognition of any item of gross income with respect to the Toggle Notes as a result of such income being recognized on an “applicable financial statement” within the meaning of Section 451 of the Code; (x) partnerships or other pass‑through entities and investors therein; and (xi) persons who have ceased to be U.S. citizens or lawful permanent residents of the United States. Further, this summary does not address alternative minimum tax consequences, any U.S. federal tax consequences other than U.S. federal income tax consequences addressed herein (such as, U.S. federal estate and gift tax consequences or the Medicare tax on net investment income) or U.S. state and local or foreign tax consequences of acquiring, owning or disposing of Toggle Notes.
This summary is based on the Code and U.S. Treasury regulations and judicial and administrative interpretations thereof, as of the date of this annual report. All of the foregoing are subject to change, which change could apply retroactively and could affect the tax consequences described below.
For purposes of this summary, a “U.S. Holder” is a beneficial owner of a Toggle Note that is, for U.S. federal income tax purposes: (i) an individual who is a citizen or resident of the United States; (ii) a corporation, or other entity treated as a corporation, created or organized in or under the laws of the United States, any state thereof, or the District of Columbia; (iii) an estate, the income of which is subject to U.S. federal income taxation regardless of its source; or (iv) a trust if (1) a court within the United States is able to exercise primary supervision over the administration of the trust and one or more U.S. persons have the authority to control all substantial decisions of the trust or (2) the trust was in existence on August 20, 1996 and has properly elected to continue to be treated as a U.S. person.
A “non-U.S. Holder” is a beneficial owner of a Toggle Note other than an entity or arrangement treated as a partnership for U.S. tax purposes that is not a U.S. Holder.
If any entity or arrangement treated as a partnership or other pass‑through entity for U.S. federal income tax purposes holds Toggle Notes, the tax treatment of a partner in or owner of the partnership or other pass‑through entity will generally depend upon the status of the partner or owner and the activities of the entity. A person that is a partner in a partnership or other pass‑through entity that is considering investing in Toggle Notes should consult its own tax adviser.
Each prospective investor should consult its own tax adviser with respect to the U.S. federal (including income, estate and gift), state, local and foreign tax consequences of acquiring, owning and disposing of Toggle Notes. U.S. Holders should also review the discussion under “—Luxembourg Taxation” for the Luxembourg tax consequences to a holder of the ownership of Toggle Notes.
Taxation of U.S. Holders
Characterization of the Toggle Notes
As a result of the Company being required to redeem the Toggle Notes for a price above 100% under certain circumstances, while not free from doubt, the Toggle Notes should be treated as indebtedness that is subject to the Treasury regulations governing contingent payment debt instruments (the “Contingent Debt Regulations”) in the manner described below. We and each holder of the Notes agree, for U.S. federal income tax purposes, to treat the Notes as indebtedness that is subject to the Contingent Debt Regulations. The remainder of this discussion assumes that the Toggle Notes will be so treated and does not address any possible differing treatments of the Toggle Notes. However, the application of the Contingent Debt Regulations to instruments such as the Toggle Notes is uncertain in several respects, and no rulings have been sought from the U.S. Internal Revenue Service, or a court with respect to any of the tax consequences discussed below. Accordingly, no assurance can be given that the IRS or a court will agree with the treatment described herein. Any differing treatment could affect the amount, timing and character of income, gain or loss in respect of an investment in the Toggle Notes. U.S. Holders should consult their tax advisers concerning the application of the Contingent Debt Regulations to the Toggle Notes and the consequences thereof.
Accrual of Interest
Pursuant to the Contingent Debt Regulations, a U.S. Holder will be required to accrue interest income on a constant yield basis, based on a comparable yield, as described below, regardless of the holder’s regular method of accounting for U.S. federal income tax purposes. In addition, a U.S. Holder will be required to separately recognize currency exchange gain or loss with respect to payments on the Toggle Notes.
A U.S. Holder will be required to accrue an amount of original issue discount (“OID”), for U.S. federal income tax purposes, for each accrual period prior to and including the maturity date of a Toggle Note that equals:
| · | | the product of (i) the adjusted issue price (as defined below) of the Toggle Note as of the beginning of the accrual period; and (ii) the comparable yield (as defined below) of the Toggle Note, adjusted for the length of the accrual period; |
| · | | divided by the number of days in the accrual period; and |
| · | | multiplied by the number of days during the accrual period that the U.S. Holder held the Toggle Note. |
The “adjusted issue price” of a Toggle Note will be its issue price (denominated in euros for euro Toggle Notes), increased by any OID (denominated in euros for euro Toggle Notes) previously accrued, generally determined without regard to any adjustments to OID accruals described below, and decreased by the projected amount (denominated in euros for euro Toggle Notes) of any prior payments (in accordance with the projected payment schedule described below) made with respect to the Toggle Notes. However, the adjusted issue price may be adjusted with respect to the payment of PIK Interest where Cash Interest was projected, or adjusted in the case of a Pro Rata Prepayment, as described below under “—Adjustments to Interest Accruals on the Toggle Notes.” All such adjustments to the adjusted issue price are calculated in euros for the euro Toggle Notes, as further discussed below.
OID on the euro Toggle Notes for any accrual period will be determined in euros and then translated into U.S. dollars. A U.S. Holder may determine the U.S. dollar amount of income recognized with respect to such OID in accordance with either of two methods. Under the first method, a U.S. Holder will be required to include in income for each taxable year the U.S. dollar value of the OID that has accrued during such year, determined by translating such OID at the average spot rate of exchange for the period during which such OID accrued (or, in the case of an accrual period that spans two taxable years of a U.S. Holder, the part of the period within the taxable year). Under the second method, a U.S. Holder may elect to translate OID at the spot rate of exchange on:
| · | | the last day of the accrual period; |
| · | | the last day of the taxable year in the case of a partial accrual period ending on the last day of the U.S. Holder’s taxable year; or |
| · | | the date the cash payment attributable to such OID is received if such date is within five business days of the end of the accrual period. |
This election will apply to all debt obligations held by a U.S. Holder from year to year and cannot be changed without the consent of the IRS. U.S. Holders should consult their own tax advisers as to the advisability of making the above election.
A U.S. Holder will recognize exchange gain or loss on a euro Toggle Note when OID is paid in cash on a Toggle Note as described below under “—Exchange of Foreign Currencies.” Certain ordering rules apply to different payments received on the Toggle Notes, including payments received upon disposition of the Toggle Notes. U.S. Holders should consult their own tax advisers regarding the application of these rules.
Under the Contingent Debt Regulations, a U.S. Holder will be required to include OID in income each year, regardless of its regular method of tax accounting, based on the comparable yield of the Toggle Notes. We determined the comparable yield of the Toggle Notes based on the rate, as of the issue date, at which we would issue a fixed‑rate instrument with no contingent payments but with terms and conditions similar to the Toggle Notes. We are required to furnish to holders the comparable yield and, solely for U.S. federal income tax purposes, a projected payment schedule (which, in certain circumstances, is required to be updated) that estimates the amount and timing of each scheduled interest payment in Cash Interest or PIK Interest (denominated in euros for euro Toggle Notes), including future interest accretions with respect to payments of Interest, and the payment upon maturity of the Toggle Notes (denominated in euros for euro Toggle Notes). Holders may obtain the comparable yield and projected payment schedule (and any updated schedule) by submitting a written request for it to the directors of ARD Finance S.A. at 56, rue Charles Martel, L‑2134 Luxembourg, Luxembourg. A U.S. Holder will generally be bound by the comparable yield and the projected payment schedule determined by us, unless the U.S. Holder determines its own comparable yield and projected payment schedule and explicitly discloses such schedule to the IRS, and explains to the IRS the reason for preparing its own schedule. Our determination, however, is not binding on the IRS, and it is possible that the IRS could conclude that some other comparable yield or projected payment schedule should apply.
The comparable yield and the projected payment schedule are not used for any purpose other than to determine a U.S. Holder’s interest accruals and adjustments thereto in respect of the Toggle Notes for U.S. federal income tax purposes. They do not constitute a projection or representation by us regarding the actual amounts that will be paid on the Toggle Notes.
The projected payment schedule of the Toggle Notes must produce the Toggle Notes’ comparable yield. In determining the projected payment schedule, we made assumptions regarding the extent to which we will pay Cash Interest or PIK Interest under the relevant facts and applicable Treasury regulations. If we pay Cash Interest and PIK Interest as assumed in the projected payment schedule, a U.S. holder will accrue OID on the Toggle Notes in accordance with the projected payment schedule and will not be required to make any adjustments to its income inclusions or calculations as described below.
Adjustments to Interest Accruals on the Toggle Notes
If the actual payments (denominated in euros for euro Toggle Notes) made on the Toggle Notes in a taxable year differ from the projected contingent payments (denominated in euros for euro Toggle Notes), an adjustment will need to be made for the difference. In general, if, during any taxable year, a U.S. Holder receives actual payments with respect to the Toggle Notes for that taxable year that in the aggregate exceed the total amount of projected payments for the taxable year, the U.S. Holder will incur a positive adjustment equal to the amount of such excess. Such positive adjustment will be treated as additional interest in such taxable year. If a U.S. Holder receives in a taxable year actual payments with respect to the Toggle Notes for that taxable year that in the aggregate are less than the amount of projected payments for that taxable year, the U.S. Holder will generally incur a negative adjustment equal to the amount of such deficit. Such a negative adjustment will be calculated as follows:
| · | | first, a negative adjustment will reduce the amount of OID required to be accrued in the current year; |
| · | | second, any negative adjustments that exceed the amount of OID accrued in the current year will be treated as ordinary loss to the extent of a U.S. Holder’s total prior OID inclusions with respect to the Toggle Notes, reduced to the extent such prior OID was offset by prior negative adjustments; and |
| · | | third, any excess negative adjustments (i) will be treated as a regular negative adjustment in the succeeding taxable year; and (ii) if not used by the time the Toggle Notes are disposed of, will reduce the amount realized on the disposition. |
Positive or negative adjustments with respect to a future contingent payment may be taken into account before the payment is due (which would increase or decrease the adjusted issue price and adjusted tax basis of a Toggle Note) if the future contingent payment becomes fixed more than six months before the payment is due.
For these purposes, if we pay PIK Interest in lieu of a projected payment of Cash Interest, while not free from doubt, we intend to treat such payment as a payment subject to the special rules governing fixed but deferred contingent payments. Under these special rules, if one or more contingent payments on the Toggle Notes (denominated in euros for euro Toggle Notes) become fixed more than six months prior to the date each such payment is due, a U.S. Holder will be required to make a positive or negative adjustment, as appropriate, equal to the difference between the present value of the amounts that are fixed and the present value of the projected amounts of the contingent payments as provided in the projected payment schedule (determined in euros), using the comparable yield as the discount rate in each case. The application of these special rules to the Toggle Notes is complex. If we pay Cash Interest in lieu of a projected payment of PIK Interest, while not free from doubt, such cash payment may be treated as a pro rata prepayment in retirement of a portion of a Toggle Note (a “Pro Rata Prepayment”), rather than an event giving rise to positive and negative adjustments as described above, which Pro Rata Prepayment may result in a gain or loss to a U.S. holder as described below under “—Disposition of the Toggle Notes” and would be calculated by assuming that the Toggle Note consisted of two instruments, one that is retired and one that remains outstanding. The adjusted issue price, the adjusted basis and accrued but unpaid OID of the Toggle Note, determined immediately before a Pro Rata Prepayment, would be allocated between those two instruments based on the portion of the Toggle Note that would be treated as retired by the Pro Rata Prepayment. U.S. Holders should consult their tax advisers concerning the application of these special rules.
A positive adjustment will be determined in euros and then translated into U.S. dollars at the spot rate of exchange on the last day of the taxable year in which the adjustment is taken into account, or, if earlier, the date the euro Toggle Note is sold or otherwise disposed. Any negative adjustment that exceeds the OID required to be accrued in the current year will first be determined in euros on the euro Toggle Notes. To the extent that such negative adjustment is attributable to accrued but unpaid OID from prior taxable years, such negative adjustment will be translated into U.S. dollars at the same rate used to translate the accrued OID in such prior taxable years. To the extent that such negative adjustment is attributable to OID accrued and paid in prior taxable years, or results in a negative adjustment carryforward, such negative adjustment will be translated into U.S. dollars at the spot rate of exchange on the date the Toggle Notes were issued.
U.S. Holders that acquire the Toggle Notes on a secondary market generally must accrue interest and make the necessary adjustments based on the projected payment schedule (described above). Upon acquiring a Toggle Note, the U.S. Holder generally must reasonably allocate any difference between the adjusted issue price at the time of purchase or other acquisition and the U.S. Holder’s basis to the daily portions of interest and projected payments over the remaining term of the Toggle Note pursuant to Contingent Debt Regulations. U.S. Holders that acquired the Toggle Notes on a secondary market are urged to consult their tax advisers regarding the application of these rules in their particular circumstances.
Disposition of the Toggle Notes
Upon the sale, exchange or other taxable disposition (including retirement or redemption) of a Toggle Note (or a PIK Interest Toggle Note), a U.S. Holder generally will recognize gain or loss in an amount equal to the difference, if any, between the amount realized and the U.S. Holder’s adjusted tax basis in the Toggle Note (or PIK Interest Toggle Note). A U.S. Holder’s adjusted tax basis in a Toggle Note generally will equal the cost of the Toggle Note to the holder increased by any OID previously included in income with respect to the Toggle Note (including in the year of disposition) and decreased by any cash payments previously received with respect to the Toggle Note. Although not free from doubt, a U.S. Holder’s adjusted tax basis in a note should be allocated between the Toggle Note and any PIK Interest Toggle Notes received in respect of PIK Interest thereon in proportion to their relative principal amounts. A U.S. Holder’s holding period
in any PIK Interest Toggle Note would likely be identical to its holding period for the Toggle Note with respect to which the PIK Interest Toggle Note was received. Prospective holders should consult their tax advisers as to the U.S. federal income tax consequences of disposing, in separate transactions, of Toggle Notes and any PIK Interest Toggle Notes issued as PIK Interest with respect to such Toggle Notes.
With respect to a scheduled retirement of the Toggle Notes at maturity, the U.S. Holder is treated as receiving the projected amount of any contingent payment due at maturity, reduced by the amount of any negative adjustment carryforward, subject to any adjustment at that time.
The cost of a Toggle Note purchased with euro will be the U.S. dollar value of the euro purchase price on the date of purchase, calculated at the spot rate of exchange in effect on the date of purchase. The amount realized on the sale, exchange or other taxable disposition (including retirement or redemption) of a Toggle Note for an amount of foreign currency generally will be the U.S. dollar value of such foreign currency based on the spot rate on (i) the settlement date, if the Toggle Note is traded on an established securities market and the U.S. Holder is a cash basis taxpayer or an electing accrual basis taxpayer and (ii) the date of disposition, in any case not described in clause (i). If an accrual method taxpayer makes the election described in this paragraph, the election must be applied consistently to all debt instruments held by the U.S. Holder from year to year and cannot be changed without the consent of the IRS.
The portion of any gain or loss recognized by a U.S. Holder upon the sale, exchange or other taxable disposition (including retirement or redemption) of a Toggle Note that is attributable to changes in currency exchange rates will be U.S. source ordinary income or loss not treated as interest income or expense, and will be equal to the difference, if any, between (i) the U.S. dollar value of the U.S. Holder’s purchase price of the Toggle Note in foreign currency determined at the spot rate of exchange on the date the Toggle Note is disposed of, and (ii) the U.S. dollar value of the U.S. Holder’s purchase price of the Toggle Note in foreign currency determined at the spot rate of exchange on the date the U.S. holder acquired the Toggle Note (or, in each case, determined on the settlement date if the Toggle Notes are traded on an established securities market and the holder is either a cash basis or an electing accrual basis holder). In addition, as discussed above, a U.S. Holder may recognize foreign currency exchange gain or loss with respect to amounts of previously accrued OID based on the difference between the rate of exchange at which the OID was included in income in each accrual period while the Toggle Note is held by the holder and the applicable rate of exchange at which the holder is required to translate foreign currency at the time the Toggle Note matures or is otherwise disposed of. The aggregate amount of foreign currency gain or loss attributable to purchase price and OID will be recognized only to the extent of the total gain or loss realized by the U.S. Holder on the sale, exchange or other taxable disposition (including retirement or redemption) of the Toggle Note.
Any gain or loss recognized by a U.S. Holder in excess of foreign currency gain or loss recognized on the sale, exchange or other taxable disposition of a Toggle Note will generally be U.S. source capital gain or loss and will be long‑term capital gain or loss if the Toggle Note has been held for more than one‑year at the time of the sale or other disposition. In the case of a non‑corporate individual U.S. holder, any such gain is currently subject to preferential U.S. federal income tax rates if that U.S. holder satisfies certain prescribed minimum holding periods. The deductibility of capital losses is subject to limitations.
Exchange of Foreign Currencies
A U.S. Holder’s tax basis in any euro received on a Toggle Note will be the U.S. dollar value of such euro at the spot rate of exchange in effect on the date of receipt of the euro. Any gain or loss recognized by a U.S. Holder on a sale, exchange or other disposition of the euro will be ordinary income or loss and generally will be U.S. source income or expense for U.S. foreign tax credit purposes.
Tax Return Disclosure Requirements
U.S. Treasury regulations meant to require the reporting of certain tax shelter transactions cover certain transactions generally not regarded as tax shelters, including certain foreign currency transactions giving rise to losses in excess of a minimum amount (e.g., $50,000 in the case of an individual or trust), such as the receipt or accrual of interest or a sale, exchange, retirement or other taxable disposition of a foreign currency note or of foreign currency received in respect of a foreign currency note. Persons considering the purchase of the euro Toggle Notes should consult with their
own tax advisers to determine the tax return disclosure obligations, if any, with respect to an investment in the euro Toggle Notes or the disposition of euro, including any requirement to file IRS Form 8886 (Reportable Transaction Statement).
Information with Respect to Foreign Financial Assets
Certain U.S. Holders may be required to report information relating to an interest in the Toggle Notes, subject to certain exemptions (including an exemption for Toggle Notes held in accounts maintained by certain U.S. financial institutions), by attaching a complete IRS Form 8938, Statement of Specified Foreign Financial Assets, to their tax return for each year in which they hold an interest in the Toggle Notes. U.S. Holders are urged to consult their tax advisers regarding the application of this requirement to their ownership and disposition of the Toggle Notes and the significant penalties for noncompliance.
Taxation of non-U.S. Holders
Subject to the discussion of backup withholding below, a non-U.S. Holder generally will not be subject to U.S. Federal income or withholding tax on any payment on a Toggle Note and any gain realized on the sale, exchange or retirement of a Toggle Note unless:
| · | | that payment on the Toggle Note or gain realized on the sale, exchange or retirement of the Toggle Note is effectively connected with the conduct by a non-U.S. Holder of a trade or business in the United States, |
| · | | in the case of any gain realized by an individual non-U.S. Holder, that holder is present in the United States for 183 days or more in the taxable year of the sale or exchange and certain other conditions are met, or |
| · | | the non-U.S. Holder is subject to tax pursuant to provisions of the Code applicable to certain expatriates. |
Backup Withholding and Information Reporting
Backup withholding and information reporting requirements may apply to certain payments to U.S. Holders of interest on the Toggle Notes, accruals of OID and to the proceeds of a sale, exchange or other taxable disposition (including a retirement or redemption) of a Toggle Note. Backup withholding (currently at a rate of 24%) may be required if the U.S. Holder fails (i) to furnish the U.S. Holder’s taxpayer identification number, (ii) to certify that such U.S. Holder is not subject to backup withholding or (iii) to otherwise comply with the applicable requirements of the backup withholding rules. Certain U.S. Holders are not subject to the backup withholding and information reporting requirements. Non-U.S. Holders may be required to comply with applicable certification procedures to establish that they are not U.S. Holders in order to avoid the application of such information reporting requirements and backup withholding.
Backup withholding is not an additional tax. Any amounts withheld under the backup withholding rules from a payment to a U.S. Holder generally may be claimed as a credit against such U.S. Holder’s U.S. federal income tax liability (if any) and any excess may result in a refund, provided that the required information is timely furnished to the IRS.
Material Luxembourg Tax Considerations
The following summary is of a general nature and is included herein solely for information purposes. It is based on the laws presently in force in Luxembourg, though it is not intended to be, nor should it be construed to be, legal or tax advice. Investors in the Toggle Notes should therefore consult their own professional advisers as to the effects of state, local or foreign laws, including Luxembourg tax law, to which they may be subject. In particular the summary does not take account of the application of any double taxation treaty that may apply in any given situation and does not address gift tax and subscription tax implications. This is not a complete analysis or listing of all possible tax consequences in relation to the Toggle Notes and does not address all tax considerations that may be relevant for the Toggle Notes holder. Special rules that are not discussed in the general descriptions below may also apply to the Toggle Notes holder. There can be no assurance that the Luxembourg tax authorities will not challenge any of the Luxembourg tax consequences described thereafter; in particular, changes in law and/or administrative practice, as well as changes in relevant facts and circumstances, may alter the tax considerations described below.
Please be aware that the residence concept used under the respective headings below applies for Luxembourg income tax assessment purposes only. Any reference in this section to a tax, duty, levy, impost or other charge or
withholding of a similar nature refers to Luxembourg tax law and/or concepts only. Also, please note that a reference to Luxembourg income tax encompasses corporate income tax (impôt sur le revenu des collectivit´es), municipal business tax (impôt commercial communal), a solidarity surcharge (contribution au fonds pour l’emploi) as well as personal income tax (impôt sur le revenu, retenues d’ impôt sur intérêts, dividendes, etc) generally. Investors may further be subject to net wealth tax (impôt sur la fortune) as well as other duties, levies or taxes. Corporate income tax, municipal business tax, net wealth tax as well as the solidarity surcharge invariably apply to most corporate taxpayers’ resident in Luxembourg for tax purposes. Individual taxpayers are generally subject to personal income tax and the solidarity surcharge. Under certain circumstances, where an individual taxpayer acts in the course of the management of a professional or business undertaking, municipal business tax may apply as well.
Withholding Tax
Non-Luxembourg Tax Resident Holder and Luxembourg Tax Resident Holder
On the basis that the Toggle Notes qualify as debt from a Luxembourg income tax perspective, under Luxembourg general tax laws, there is in principle no withholding tax to be withheld by the Company on payments of principal, premium or arm’s length interest (including accrued but unpaid interest) made to non-Luxembourg tax resident holders and Luxembourg tax resident holders of Toggle Notes to the extent the Toggle Notes�� do not give entitlement to a share of the profits generated by the issuing company and the issuing company is not thinly capitalized (in case of thinly capitalized companies and interest payments which are not arm’s length, the ‘‘excessive’’ portion of interest is deemed to be a dividend potentially subject to dividend withholding tax). No Luxembourg withholding tax payable upon redemption or repurchase of the Toggle Notes held by Luxembourg tax resident holders and non-Luxembourg tax resident holders to the extent the Toggle Notes do not give entitlement to a share of the profits generated by the issuing company and the issuing company is not thinly capitalized.
According to the Law of December 23, 2005, interest payments arising from the Toggle Notes and paid by a paying agent established in Luxembourg would be subject to a compulsory withholding tax of 20% (as of January 1, 2017) if such payments are made for the immediate benefit of individuals resident in Luxembourg. The 20% withholding tax is levied by the aforementioned paying agent.
Income Taxation
Non-Luxembourg Tax Resident
A non-Luxembourg tax resident holder of the Toggle Notes, not having a permanent establishment or permanent representative in Luxembourg to which such Toggle Notes are attributable, is not subject to Luxembourg income tax on interest accrued or received, redemption premiums or issue discounts, under the Toggle Notes. A gain realized by such non-resident holder of Toggle Notes on the sale or disposal, in any form whatsoever, of the Toggle Notes is further not subject to Luxembourg income tax to the extent the Toggle Notes are not attributable to a permanent establishment or permanent representative in Luxembourg.
A non-Luxembourg tax resident corporate holder of Toggle Notes or an individual holder of Toggle Notes acting in the course of the management of a professional or business undertaking, who has a permanent establishment or permanent representative in Luxembourg to which such Toggle Notes are attributable, is subject to Luxembourg income tax on interest accrued or received, redemption premiums or issue discounts, under the Toggle Notes and on any gains realized upon the sale or disposal, in any form whatsoever, of the Toggle Notes.
Luxembourg Tax Resident
A corporate holder of Toggle Notes tax resident in Luxembourg must include any interest accrued or received, any redemption premium or issue discount, as well as any gain realized on the sale or disposal, in any form whatsoever, of the Toggle Notes, in its taxable income for Luxembourg income tax assessment purposes. The same inclusion applies to an individual holder of Toggle Notes, acting in the course of the management of a professional or business undertaking.
Net Wealth Taxation
A corporate holder of the Toggle Notes, if resident of Luxembourg for tax purposes or, if not, where it maintains a permanent establishment or a permanent representative in Luxembourg to which the Toggle Notes are attributable, is subject to Luxembourg net wealth tax on the fair value of such Toggle Notes, except if the holder of such Toggle Notes is for instance governed by the law of May 11, 2007 organizing private family asset holding companies (Société de Gestion de Patrimoine Familiale), or by the laws of December 20, 2002 (as amended), December 17, 2010 and February 13, 2007 (SIF), or by the law of July 14, 2016 (RAIF).
An individual holder of the Toggle Notes, whether or not he/she is tax resident of Luxembourg, is not subject to Luxembourg net wealth tax.
Other Taxes
No Luxembourg value added tax (VAT) should arise on a transfer of the Toggle Notes.
No capital duty, issuance tax and/or transfer tax should arise on a transfer of the Toggle Notes.
No registration duties are levied on the transfer of a bond or any other negotiable security
(excluding a transfer of interest in a partnership holding Luxembourg real estate property).
Automatic exchange of information
The following summary is of a general nature and is included herein solely for information purposes. It is based on the laws presently in force in Luxembourg, though it is not intended to be, nor should it be construed to be, legal or tax advice. Prospective investors in the Toggle Notes should therefore consult their own professional advisers as to the effects of state, local or foreign laws, including Luxembourg tax law, to which they may be subject.
Further, our Luxembourg comments are of general nature and do not result from an analysis of the Company’s activities and potential entity classification for exchange of information purposes, especially CRS and FATCA, as defined below.
The Organisation for Economic Cooperation and Development (‘‘OECD’’) has developed a global standard for automatic exchange of financial account information (‘‘Global Standard’’), composed of:
| A. | | the Common Reporting Standard (‘‘CRS’’) detailing the reporting and due diligence rules to be imposed on Financial Institutions, and |
| B. | | the Model Competent Authority Agreement (‘‘MCAA’’), pursuant to which governments would agree to exchange the information reported in order to achieve a comprehensive and multilateral automatic exchange of information (‘‘AEOI’’) on a global basis. |
On December 9, 2014, the Council of the European Union (‘‘EU Council’’) adopted Council Directive 2014/107/EU which amended Council Directive 2011/16/EU about the mandatory automatic exchange of information in the field of taxation (the ‘‘Euro-CRS Directive’’) to implement the CRS among the Member States.
The Euro-CRS Directive was implemented into Luxembourg law by the law of December 18, 2015 on the automatic exchange of financial account information in the field of taxation (‘‘CRS Law’’). Since its implementation, the CRS Law has been complemented by a ‘‘Frequently Asked Questions’’ document published by the Luxembourg tax authorities on April 20, 2016 (as subsequently amended), and grand-ducal decrees regarding the list of Participating and Reportable Jurisdictions, last updated July 18, 2018, and the administrative circular ECHA N°4 published by the Luxembourg tax authorities on February 6, 2017.
Aside from the CRS, there is also a mechanism for automatic exchange of information with respect to certain U.S. Persons called the Foreign Account Tax Compliance Act (“FATCA”). The term “U.S. Person” includes a U.S. citizen or resident individual, a partnership or corporation organized in the U.S. or under the laws of the U.S. or any State thereof,
and certain trusts and estates as defined in Section 7701(a)(30) of the U.S. Internal Revenue Code of 1986, as amended (the “Code”). Luxembourg signed a reciprocal Model 1 Intergovernmental Agreement with the U.S. on 28 March 2014 (“Luxembourg IGA”). The Luxembourg IGA has been ratified by the Luxembourg law of 24 July 2015 which was published on 29 July 2014 (the “FATCA Law”). To complement this, the Luxembourg tax authorities issued final versions of their administrative circulars, namely ECHA N°2 regarding the implementation of the automatic exchange of information between Luxembourg and the U.S. and ECHA N°3 defining the technical aspects of the automatic exchange of information between Luxembourg and the U.S.
The CRS Law and the FATCA Law require Luxembourg financial institutions to identify financial accounts held, directly or indirectly, by certain account holders that are (i) fiscally resident in another Member State or in a country with which Luxembourg has agreed to sharing information (‘‘CRS Reportable Accounts’’) or (ii) certain U.S. Persons (“FATCA Reportable Accounts”). Luxembourg financial institutions will then report information on such CRS and FATCA Reportable Accounts to the Luxembourg tax authorities, which will thereafter automatically exchange this information with the competent foreign tax authorities on an annual basis.
Accordingly, the Company may (i) require its investors to provide information or documentation in relation to the identity and fiscal residence of holders of Toggle Notes (including entities and their controlling persons, as the case may be) in order to ascertain their CRS and FATCA status (in the case of entities) and jurisdiction of residence for tax purposes and (ii) report information to the Luxembourg tax authorities and ultimately to the competent authorities of their jurisdiction(s) of residence for tax purposes in accordance with applicable rules and regulations, if such an account is deemed to be a Reportable Account under either the CRS or FATCA Laws.
As such, holders of Toggle Notes may be under the obligation to provide the Company with a self-certification.
If a holder of Toggle Notes is considered a ‘‘Passive Non-Financial Entity’’ under CRS Law or as ‘‘Passive Non-Financial Foreign Entity’’ under FATCA Law, each natural person controlling a holder of Toggle Notes could be considered as a controlling person which is a reportable person under the CRS or FATCA Laws and would therefore be required to submit a self-certification in addition to the self-certification of the ‘‘Passive Non-Financial Foreign Entity’’ itself.
As mentioned above, prospective investors should seek advice from their own professional tax advisors regarding the possible implications of CRS or FATCA to their particular circumstances i.e., the requirements they need to fulfil based on CRS and FATCA Laws and the effects these may have on their situation or regarding their residence for tax purposes.
| F. | | Dividends and paying agents |
Not applicable
Not applicable
We will provide our Note holders with annual reports on Form 20‑F containing financial statements audited by our independent auditors within 120 days after the end of each fiscal year. We also intend to provide quarterly reports containing interim unaudited financial statements within 60 days after the end of each fiscal quarter. We will furnish these quarterly reports to the SEC on Form 6‑K and these are publicly available on our Parent Company website at https://www.ardholdings-a.com/corporate/investors.
The SEC maintains a website at www.sec.gov that contains reports and information statements and other information regarding registrants like us that file electronically with the SEC. You can also inspect the Company’s registration statement and the reports and other information that we file or furnish with the SEC on this website. Our filings with the SEC are available through the electronic data gathering, analysis and retrieval (EDGAR) system of the SEC.
Not applicable
Item 11. Quantitative and Qualitative Disclosures About Market Risk
The statements about market risk below relate to our historical financial information included in this annual report.
Interest Rate Risk
The Board’s policy, in the management of interest rate risk, is to strike the right balance between the Group’s fixed and floating rate financial instruments. The balance struck by the Board is dependent on prevailing interest rate markets at any point in time.
At December 31, 2018, the Group’s external borrowings were 91.9% (2017: 93.2%) fixed with a weighted average interest rate of 5.7% (2017: 5.7%; 2016: 5.6%). The weighted average interest rate of the Group for the year ended December 31, 2018 was 5.3% (2017: 5.3%; 2016: 5.4%).
Holding all other variables constant, including levels of the Group’s external indebtedness, at December 31, 2017 a one percentage point increase in variable interest rates would increase interest payable by approximately $9 million (2017: $7 million).
Currency Exchange Risk
The Group presents its consolidated financial information in U.S. dollar. The functional currency of the Company will continue to be the euro.
The Group operates in 22 countries, across five continents and its main currency exposure in the year ended December 31, 2018, from the euro functional currency, was in relation to the U.S. dollar, British pound, Swedish krona, Polish zloty, Danish krone and Brazilian real. Currency exchange risk arises from future commercial transactions, recognized assets and liabilities, and net investments in foreign operations.
As a result of the consolidated financial statements being presented in U.S. dollar, the Group’s results are also impacted as a result of fluctuations in the U.S. dollar exchange rate versus the euro.
The Group has a limited level of transactional currency exposure arising from sales or purchases by operating units in currencies other than their functional currencies.
The Group has certain investments in foreign operations, whose net assets are exposed to foreign currency translation risk. Currency exposure arising from the net assets of the Group’s foreign operations is managed primarily through borrowings and swaps denominated in the Group’s principal foreign currencies.
Fluctuations in the value of these currencies with respect to the euro may have a significant impact on the Group’s financial condition and results of operations as reported in euro. When considering the Group’s position, the Group believes that a strengthening of the euro exchange rate by 1% against all other foreign currencies from the December 31, 2018 rate would increase shareholders’ equity by approximately $5 million (2017: $2 million increase).
Commodity Price Risk
The Group is exposed to changes in prices of our main raw materials, primarily energy, aluminum and steel. Production costs in our Metal Packaging division are exposed to changes in prices of our main raw materials, primarily aluminum and steel. Aluminum ingot is traded daily as a commodity on the London Metal Exchange, which has historically been subject to significant price volatility. Because aluminum is priced in U.S. dollars, fluctuations in the U.S. dollar/ euro rate also affect the euro cost of aluminum ingot. The price and foreign currency risk on the aluminum purchases in Metal
Packaging Europe and Metal Packaging Americas are hedged by entering into swaps under which we pay fixed euro and U.S. dollar prices, respectively. In contrast, the hedging market for steel, and in particular that for coking coal, is a relatively new market which does not have the depth of the aluminum market and as a consequence, there might be limitations to placing hedges in the market. The majority of our steel purchases are obtained under one‑year contracts with prices that are usually fixed in advance. When such contracts are renewed in the future, our steel costs under such contracts will be subject to prevailing global steel and/or tinplate prices at the time of renewal, which may be different from historical prices. Furthermore, the relative price of oil and its by‑products may materially impact our business, affecting our transport, lacquer and ink costs.
Where we do not have pass through contracts in relation to the underlying metal raw material cost the Group uses derivative agreements to manage this risk. The Group depends on an active liquid market and available credit lines with counterparty banks to cover this risk. The use of derivative contracts to manage our risk is dependent on robust hedging procedures. Increasing raw material costs over time has the potential, if we are unable to pass on price increases, to reduce sales volume and could therefore have a significant impact on our financial condition. The Group is also exposed to possible interruptions of supply of aluminum and steel or other raw materials and any inability to purchase raw materials could negatively impact our operations.
Production costs in our Glass Packaging division are sensitive to the price of energy. Our main energy exposure is to the cost of gas and electricity. These energy costs have experienced significant volatility in recent years with a corresponding effect on our production costs. In terms of gas, which represents 50% of our energy costs, there is a continuous de‑coupling between the cost of gas and oil, whereby now only significant changes in the price of oil have an impact on the price of gas. The volatility in gas pricing is driven by shale gas development (United States only), the availability of liquefied natural gas in Europe, as both Europe and Asia compete for shipments, and storage levels. Volatility in the price of electricity is caused by the German Renewable Energy policy, the phasing out of nuclear generating capacity, fluctuations in the price of gas and coal and the influence of carbon dioxide costs on electricity prices.
As a result of the volatility of gas and electricity prices, the Group has either included energy pass‑through clauses in our sales contracts or developed an active hedging strategy to fix a significant proportion of our energy costs through contractual arrangements directly with our suppliers, where there is no energy clause in the sales contract.
Where pass through contracts do not exist the Group policy is to purchase gas and electricity by entering into forward price‑fixing arrangements with suppliers for the bulk of our anticipated requirements for the year ahead. Such contracts are used exclusively to obtain delivery of our anticipated energy supplies. The Group does not net settle, nor do we sell within a short period of time after taking delivery. The Group avails of the own use exemption and, therefore, these contracts are treated as executory contracts.
The Group typically builds up these contractual positions in tranches of approximately 10% of the anticipated volumes. Any gas and electricity which is not purchased under forward price‑fixing arrangements is purchased under index tracking contracts or at spot prices. As at December 31, 2018, we have 60% and 55% of our energy risk covered for 2019 and 2020, respectively.
Credit Risk
Credit risk arises from derivative contracts, cash and deposits held with banks and financial institutions, as well as credit exposures to the Group’s customers, including outstanding receivables. Group policy is to place excess liquidity on deposit, only with recognized and reputable financial institutions. For banks and financial institutions, only independently rated parties with a minimum rating of ‘BBB+’ from at least two credit rating agencies are accepted, where possible. The credit ratings of banks and financial institutions are monitored to ensure compliance with Group policy. Risk of default is controlled within a policy framework of dealing with high quality institutions and by limiting the amount of credit exposure to any one bank or institution.
Group policy is to extend credit to customers of good credit standing. Credit risk is managed on an on‑going basis, by experienced people within the Group. The Group’s policy for the management of credit risk in relation to trade receivables involves periodically assessing the financial reliability of customers, taking into account their financial position, past experience and other factors. Provisions are made, where deemed necessary, and the utilization of credit limits is regularly monitored. Management does not expect any significant counterparty to fail to meets its obligations.
The maximum exposure to credit risk is represented by the carrying amount of each asset. For the year ended December 31, 2018, the Group’s ten largest customers accounted for approximately 37% of total revenues (2017: 36%; 2016: 33%). There is no recent history of default with these customers.
Surplus cash held by the operating entities over and above the balance required for working capital management is transferred to Group Treasury. Group Treasury invests surplus cash in interest‑bearing current accounts and time deposits with appropriate maturities to provide sufficient headroom as determined by the below‑mentioned forecasts.
Liquidity Risk
The Group is exposed to liquidity risk which arises primarily from the maturing of short term and long term debt obligations. The Group’s policy is to ensure that sufficient resources are available either from cash balances, cash flows or undrawn committed bank facilities, to ensure all obligations can be met as they fall due.
To effectively manage liquidity risk, the Group:
| · | | has committed borrowing facilities that it can access to meet liquidity needs; |
| · | | maintains cash balances and liquid investments with highly‑rated counterparties; |
| · | | limits the maturity of cash balances; |
| · | | borrows the bulk of its debt needs under long term fixed rate debt securities; and |
| · | | has internal control processes to manage liquidity risk. |
Cash flow forecasting is performed in the operating entities of the Group and is aggregated by Group Treasury. Group Treasury monitors rolling forecasts of the Group’s liquidity requirements to ensure it has sufficient cash to meet operational needs while maintaining sufficient headroom on its undrawn committed borrowing facilities at all times so that the Group does not breach borrowing limits or covenants on any of its borrowing facilities. Such forecasting takes into consideration the Group’s debt financing plans.
Item 12. Description of Securities Other than Equity Securities
Not Applicable
Part II
Item 13. Defaults, Dividend Arrearages and Delinquencies
None
Item 14. Material Modifications to the Rights of Security Holders and Use of Proceeds
On April 13, 2017, our registration statement on Form F-4 (File No. 333-216725) was declared effective by the Securities and Exchange Commission for an offer to exchange outstanding unregistered $770,000,000 7.125% / 7.875% Senior Secured Toggle Notes due 2023 (the “Old Dollar Notes”) and $845,000,000 6.625% / 7.375% Senior Secured Toggle Notes due 2023 (the “Old Euro Notes” and, together with the Old Dollar Notes, the “Old Notes”) previously issued in a private placement pursuant to Rule 144A and Regulation S under the Securities Act for new $770,000,000 7.125% / 7.875% Senior Secured Toggle Notes due 2023 and $845,000,000 6.625% / 7.375% Senior Secured Toggle Notes due 2023, respectively, registered under the Securities Act.
The exchange offer commenced April 13, 2017 and as of the expiration date for the Exchange Offers on May 11, 2017, tenders of $768,778,000 aggregate principal amount of Old Dollar Notes and $829,700,000 aggregate principal amount of Old Euro Notes had been received. The Company accepted all of the Old Notes tendered in exchange for the New Notes and settlement occurred on May 15, 2017. We did not receive any proceeds from the issuance of notes in the exchange offer.
Item 15. Controls and Procedures
| A. | | Disclosure Controls and Procedures |
Management maintains disclosure controls and procedures that are designed to ensure that information required to be disclosed in the Company’s reports under the Exchange Act is recorded, processed, summarized and reported within time periods specified in the SEC’s rules and forms, and that such information is accumulated and communicated to management, including the Chief Executive Officer and Chief Financial Officer, as appropriate, to allow timely decisions regarding required disclosures. Ardagh Group S.A.’s controls and procedures are designed to provide reasonable assurance of achieving their objectives.
Management carried out an evaluation, under the supervision and with the participation of its Chief Executive Officer and Chief Financial Officer, of the effectiveness of the design and operation of the Company’s disclosure controls and procedures (as defined in Exchange Act Rule 13a-15(e)) as of December 31, 2018. Based upon that evaluation, the Company’s Chief Executive Officer and Chief Financial Officer concluded that the Company’s disclosure controls and procedures were effective as of December 31, 2018 so as to provide reasonable assurance that (1) information required to be disclosed by the Company in the reports that the Company files under the Exchange Act is recorded, processed, summarized and reported within the time periods specified in the SEC’s rules and forms, and (2) that such information is accumulated and communicated to the Company’s management, including its Chief Executive Officer and its Chief Financial Officer, as appropriate, to allow timely decisions regarding required disclosures.
There are inherent limitations to the effectiveness of any system of disclosure controls and procedures, including the possibility of human error and the circumvention or overriding of the controls and procedures. Accordingly, even effective disclosure controls and procedures can only provide reasonable assurance of achieving their control objectives.
| B. | | Management’s annual report on internal control over financial reporting |
Management, under the supervision and with the participation of its Chief Executive Officer and Chief Financial Officer, is responsible for establishing and maintaining adequate internal control over the Company’s financial reporting. The Company’s internal control over financial reporting was designed to provide reasonable assurance to the Company’s management, including the Chief Executive Officer and Chief Financial Officer, regarding the reliability of financial reporting and the preparation of financial statements for external purposes in accordance with IFRS as adopted by IASB and includes policies and procedures that pertain to the maintenance of records that, in reasonable detail, accurately and fairly reflect the transactions and dispositions of the assets of the Company; provide reasonable assurance that transactions are recorded as necessary to permit preparation of financial statements in accordance with IFRS as adopted by IASB, and that receipts and expenditures of the Company are being made only in accordance with authorizations of management and directors of the Company; and provide reasonable assurance regarding prevention or timely detection of unauthorized acquisition, use or disposition of the Company’s assets that could have a material effect on the consolidated financial statements.
Management assessed the effectiveness of the Company’s internal control over financial reporting (as defined in Rules 13(a)-13(f) and 15(d)-15(f) under the U.S. Securities Exchange Act of 1934) as of December 31, 2018. In making this assessment, it used the criteria established in Internal Control—Integrated Framework (2013) issued by the Committee of Sponsoring Organizations of the Treadway Commission (COSO). Based on our assessment, management concluded that, as of December 31, 2018, the Company’s internal control over financial reporting is effective based on those criteria.
Based on its inherent limitations, internal control over financial reporting may not prevent or detect misstatements. Also, projections of any evaluation of effectiveness to future periods are subject to the risk that controls
may become inadequate because of changes in conditions, or that the degree of compliance with the policies or procedures may deteriorate.
| C. | | Attestation report of the registered public accounting firm |
Not Applicable
| D. | | Changes in internal control over financial reporting |
Throughout 2018, we continued to make the following changes to our system of internal control over financial reporting, that has materially affected, or is reasonably likely to materially affect, our internal control over financial reporting:
(i) We hired additional accounting and finance personnel with many of these additional personnel involved in the identification, documentation and design of key controls as prescribed in Section 404 of the Sarbanes-Oxley Act; and
(ii) Senior management across all functions were involved in the documentation and design of enhanced internal controls in accordance with the Company's timeline for end of 2018 compliance with Section 404 of the Sarbanes-Oxley Act.
Item 16. Reserved
Item 16A. Audit committee financial expert
Not Applicable
Item 16B. Code of Ethics
See “Item 6. C – Directors, Senior Management and Employees – Board Practices”
Item 16C. Principal Accountant Fees and Services
PricewaterhouseCoopers have acted as the Group’s principal accountants for the years ended December 31, 2018 and December 31, 2017.
The following table sumarises the total amounts charged for professional fees rendered in those periods:
| | | | |
| | Year ended |
| | December 31, |
| | 2018 | | 2017 |
| | (in $ millions) |
Audit services fees | | 8 | | 5 |
Audit-related services fees | | 1 | | 2 |
Tax services fees | | 1 | | 1 |
Total | | 10 | | 8 |
Audit Services fees
Audit services are defined as standard audit work that needs to be performed each year in order to issue opinions on our consolidated financial statements, to issue an attestation report on internal control required by Section 404 of the Sarbanes-Oxley Act of 2002 and to issue reports on our local financial statements.
Audit-Related Services fees
Audit-related fees include services such as auditing of non-recurring transactions, reviews of quarterly financial results, consents and comfort letters and any other audit services required for SEC or other regulatory filings.
Tax Services fees
Tax services relate to the aggregated fees for services on tax compliance.
The Ardagh Group S.A. Audit Committee approves all auditing services and permitted non-audit services performed for the Group by its independent auditor in advance of an engagement. All auditing services and permitted non-audit services (including the fees and terms thereof) to be performed for the Group by its independent auditor must be approved by the Ardagh Group S.A. Audit Committee in advance, subject to the de minimis exceptions for non-audit services described in Section 10A(i)(1)(B) of the Exchange Act which are approved by the Ardagh Group S.A. Audit Committee prior to the completion of the audit.
All audit-related service fees and tax services fees were approved by the Ardagh Group S.A. Audit Committee.
Item 16D. Exemptions from the Listing Standards for Audit Committees
Not applicable
Item 16E. Purchases of Equity Securities by the Issuer and Affiliated Purchasers
Not applicable
Item 16F. Changes in Registrant’s Certifying Accountant
Not applicable
Item 16G. Corporate Governance
Not Applicable
Item 16H. Mine Safety Disclosure
Not applicable
Part III
Item 17. Financial Statements
See “Item 18. Financial Statements”. See also Exhibit 99.10 of this annual report for the consolidated financial statements of Ardagh Group S.A. incorporated by reference in this annual report pursuant to the requirements of Regulation S-X 3-16 issued by the SEC.
Item 18. Financial Statements
Refer to the Consolidated Financial Statements from F-1 – F-64. See also Exhibit 99.10 of this annual report for the consolidated financial statements of Ardagh Group S.A. incorporated by reference in this annual report pursuant to the requirements of Regulation S-X 3-16 issued by the SEC.
Item 19. Exhibits
The following exhibits are filed as part of this annual report:
Exhibit Index
| |
1.1 | Memorandum and articles of association (incorporated by reference to Exhibit 3.1 of our Registration Statement on Form F-4 filed with the SEC on April 12, 2017 (File No. 333-216725)) |
| |
4.1+ | Equity and Asset Purchase Agreement dated April 22, 2016 by and among Ardagh Group S.A., Ball Corporation and Rexam PLC (incorporated by reference to Exhibit 2.1 of Amendment No. 3 to our Registration Statement on Form F-1 filed with the SEC on February 23, 2017) |
| |
4.2+ | Amendment No. 1 to the Equity and Asset Purchase Agreement dated June 9, 2016 by and among Ardagh Group S.A., Ball Corporation and Rexam PLC (incorporated by reference to Exhibit 2.2 of Amendment No. 3 to our Registration Statement on Form F-1 filed with the SEC on February 23, 2017) |
| |
4.3+ | Amendment No. 2 to the Equity and Asset Purchase Agreement dated June 30, 2016 by and among Ardagh Group S.A., Ball Corporation and Rexam PLC (incorporated by reference to Exhibit 2.3 of Amendment No. 3 to our Registration Statement on Form F-1 filed with the SEC on February 23, 2017) |
| |
4.4 | Registration Rights Agreement (incorporated by reference to Exhibit 10.1 of Amendment No. 4 to our Registration Statement on Form F-1 filed with the SEC on March 01, 2017) |
| |
4.5 | Shareholder Agreement (incorporated by reference to Exhibit 10.2 of Amendment No. 4 to our Registration Statement on Form F-1 filed with the SEC on March 01, 2017) |
| |
4.6 | Indemnification Agreement (incorporated by reference to Exhibit 10.3 of Amendment No. 3 to our Registration Statement on Form F-1 filed with the SEC on February 23, 2017) |
| |
8.1 | Subsidiaries of Ardagh Group S.A. |
| |
12.1 | Rule 13a-14(a)/15d-14(a) -– Section 302 - Certification of Chief Executive Officer |
| |
12.2 | Rule 13a-14(a)/15d-14(a) -– Section 302 - Certification of Chief Financial Officer |
| |
13.1 | 18 U.S.C. SECTION 1350 - Section 906 - Certification of Chief Executive Officer |
| |
13.2 | 18 U.S.C. SECTION 1350 - Section 906 - Certification of Chief Financial Officer |
| |
99.1 | Credit Agreement dated as of December 17, 2013 among: (i) Ardagh Holdings USA Inc. and Ardagh Packaging Finance S.A. (as Borrowers); (ii) Ardagh Packaging Holdings Limited (as Parent Guarantor); (iii) the Subsidiary Guarantors from time to time party thereto; (iv) the Lenders from time to time party thereto; (v) Citibank, N.A. (as Administrative Agent) and (vi) Citibank, N.A., London Branch (as Security Agent) (incorporated by reference to Exhibit 99.1 to the Registration Statement on Form F-1 of Ardagh Group S.A. filed with the SEC on Novemer 17, 2016) |
| |
99.2 | Indenture dated as of February 5, 2014 among: (i) Ardagh Packaging Finance plc and Ardagh Holdings USA Inc. (as Issuers); (ii) Citibank, N.A., London Branch (as Trustee, Principal Paying Agent and Transfer Agent); (iii) Ardagh Packaging Holdings Limited (as Parent Guarantor); (iv) the Subsidiary Guarantors listed therein and (v) Citigroup Global Markets Deutschland AG (as Registrar) (incorporated by reference to Exhibit 99.2 to the Registration Statement on Form F-1 of Ardagh Group S.A. filed with the SEC on November 17, 2016) |
| |
99.3 | Indenture (as supplemented to the date hereof) dated as of July 3, 2014 among: (i) Ardagh Packaging Finance plc and Ardagh Holdings USA Inc. (as Issuers); (ii) Citibank, N.A., London Branch (as Trustee, Principal Paying Agent, Transfer Agent and Security Agent); (iii) Citibank, N.A. (as U.S. Paying Agent); (iv) Ardagh Packaging Holdings Limited (as Parent Guarantor); (v) the Subsidiary Guarantors listed therein and (vi) Citigroup Global Markets Deutschland AG (as Registrar) (incorporated by reference to Exhibit 99.3 to the Registration Statement on Form F-1 of Ardagh Group S.A. filed with the SEC on November 17, 2016) |
| |
99.4 | Indenture dated as of July 3, 2014 among: (i) Ardagh Packaging Finance plc and Ardagh Holdings USA Inc. (as Issuers); (ii) Citibank, N.A., London Branch (as Trustee, Principal Paying Agent and Transfer Agent); (iii) Citibank, N.A. (as U.S. Paying Agent); (iv) Ardagh Packaging Holdings Limited (as Parent Guarantor); (v) the Subsidiary Guarantors listed therein and (vi) Citigroup Global Markets Deutschland AG (as Registrar) (incorporated by reference to Exhibit 99.4 to the Registration Statement on Form F-1 of Ardagh Group S.A. filed with the SEC on November 17, 2016) |
| |
99.5 | Indenture (as supplemented to the date hereof) dated as of May 16, 2016 among: (i) Ardagh Packaging Finance plc and Ardagh Holdings USA Inc. (as Issuers); (ii) Citibank, N.A., London Branch (as Trustee, Principal Paying Agent, Transfer Agent and Security Agent); (iii) Citibank, N.A. (as U.S. Paying Agent); (iv) Ardagh Packaging Holdings Limited (as Parent Guarantor); (v) the Subsidiary Guarantors listed therein and (vi) Citigroup Global Markets Deutschland AG (as Registrar) (incorporated by reference to Exhibit 99.5 to the Registration Statement on Form F-1 of Ardagh Group S.A. filed with the SEC on November 17, 2016) |
| |
99.6 | Indenture (as supplemented to the date hereof) dated as of May 16, 2016 among: (i) Ardagh Packaging Finance plc and Ardagh Holdings USA Inc. (as Issuers); (ii) Citibank, N.A., London Branch (as Trustee, Principal Paying Agent and Transfer Agent); (iii) Citibank, N.A. (as U.S. Paying Agent); (iv) Ardagh Packaging Holdings Limited (as Parent Guarantor); (v) the Subsidiary Guarantors listed therein and (vi) Citigroup Global Markets Deutschland AG (as Registrar) (incorporated by reference to Exhibit 99.6 to the Registration Statement on Form F-1 of Ardagh Group S.A. filed with the SEC on November 17, 2016) |
| |
99.7 | Indenture dated as of September 16, 2016 among: (i) ARD Finance S.A. (as Issuer); (ii) Citibank, N.A., London Branch (as Trustee, Principal Paying Agent, Transfer Agent and Security Agent); (iii) Citibank, N.A. (as U.S. Paying Agent) and (vi) Citigroup Global Markets Deutschland AG (as Registrar) (incorporated by reference to Exhibit 99.7 to the Registration Statement on Form F-1 of Ardagh Group S.A. filed with the SEC on November 17, 2016) |
| |
99.8 | Indenture dated as of January 30, 2017 among: (i) Ardagh Packaging Finance plc and Ardagh Holdings USA Inc. (as Issuers); (ii) Ardagh Packaging Holdings Limited (as Parent Guarantor); (iii) Citibank, N.A., London Branch (as Trustee, Principal Paying Agent and Transfer Agent); (iv) Citibank, N.A. (as U.S. Paying Agent); and (v) Citigroup Global Markets Deutschland AG (as Registrar) (incorporated by reference to Amendment No. 2 to the Registration Statement on Form F-1 of Ardagh Group S.A. filed with the SEC on February 10, 2017) |
| |
99.9 | Indenture dated as of March 8, 2017 among: (i) Ardagh Packaging Finance plc and Ardagh Holdings USA Inc. (as Issuers); (ii) Ardagh Packaging Holdings Limited (as Parent Guarantor); (iii) Citibank, N.A., London Branch (as Trustee, Principal Paying Agent, Transfer Agent and Security Agent); (iv) Citibank, N.A. (as U.S. Paying Agent); and (v) Citigroup Global Markets Deutschland AG (as Registrar) (incorporated by reference to Amendment No. 6 to the Registration Statement on Form F-1 of Ardagh Group S.A. filed with the SEC on March 10, 2017) |
| |
99.10 | Ardagh Group S.A. Audited Financial Statements as of December 31, 2018 and 2017 and for each of the three years ended December 31, 2018 (incorporated by reference to pages F-1 – F-68 of Ardagh Group S.A.’s 2018 annual report on Form 20-F filed on March 01, 2019) |
| |
101 | Interactive Data Files (XBRL – Related Documents) |
+Exhibits and schedules have been omitted pursuant to Item 601(b)(2) of Regulation S-K and will be supplementally provided to the SEC upon request.
SIGNATURES
The registrant hereby certifies that it meets all the requirements for filing on Form 20-F and that it has duly caused and authorized the undersigned to sign this annual report on its behalf.
Date: March 01, 2019
| | | |
| ARD Finance S.A. | |
| | | |
| | | |
| By: | /s/ DAVID MATTHEWS | |
| Name: | David Matthews | |
| Title: | Chief Financial Officer | |
INDEX TO THE FINANCIAL STATEMENTS
| | |
ARD Finance S.A. | | |
Audited Financial Statements | | |
Report of Independent Registered Public Accounting Firm | | F-2 |
Consolidated Income Statement for the years ended December 31, 2018, 2017 and 2016 | | F-3 |
Consolidated Statement of Comprehensive Income for the years ended December 31, 2018, 2017 and 2016 | | F-4 |
Consolidated Statement of Financial Position at December 31, 2018, 2017, 2016 and 2015 | | F-5 |
Consolidated Statement of Changes in Equity for the years ended December 31, 2018, 2017 and 2016 | | F-6 |
Consolidated Statement of Cash Flows for the years ended December 31, 2018, 2017 and 2016 | | F-7 |
Notes to the Consolidated Financial Statements | | F-8 |
| | |
Report of Independent Registered Public Accounting Firm
To the Board of Directors and Shareholders of ARD Finance S.A.
Opinion on the Financial Statements
We have audited the accompanying consolidated statement of financial position of ARD Finance S.A. and its subsidiaries (the “Company”) as of December 31, 2018 and 2017, and the related consolidated income statement, consolidated statement of comprehensive income, consolidated statement of changes in equity and consolidated statement of cashflows for each of the three years in the period ended December 31, 2018, including the related notes (collectively referred to as the ‘consolidated financial statement’). In our opinion, the consolidated financial statements present fairly, in all material respects, the financial position of the Company as of December 31, 2018 and 2017, and the results of its operations and its cash flows for each of the three years in the period ended December 31, 2018 in conformity with International Financial Reporting Standards as issued by the International Accounting Standards Board.
Change in Accounting Principles
As discussed in Note 2 to the consolidated financial statements, the Company changed the manner in which it accounts for revenues from contracts with customers and the manner in which it accounts for financial instruments in 2018.
As discussed in Notes 2 and 26 to the consolidated financial statements, the Company changed the currency in which it presents its financial statements in 2018 from Euro to U.S. Dollar.
Basis for Opinion
These consolidated financial statements are the responsibility of the Company’s management. Our responsibility is to express an opinion on the Company’s consolidated financial statements based on our audits. We are a public accounting firm registered with the Public Company Accounting Oversight Board (United States) (‘PCAOB’) and are required to be independent with respect to the Company in accordance with the U.S. federal securities laws and the applicable rules and regulations of the Securities and Exchange Commission and the PCAOB.
We conducted our audits of these consolidated financial statements in accordance with the standards of the PCAOB. Those standards require that we plan and perform the audit to obtain reasonable assurance about whether the consolidated financial statements are free of material misstatement, whether due to error or fraud. The Company is not required to have, nor were we engaged to perform, an audit of its internal control over financial reporting. As part of our audits we are required to obtain an understanding of internal control over financial reporting but not for the purpose of expressing an opinion on the effectiveness of the Company's internal control over financial reporting. Accordingly, we express no such opinion.
Our audits included performing procedures to assess the risks of material misstatement of the consolidated financial statements, whether due to error or fraud, and performing procedures that respond to those risks. Such procedures included examining, on a test basis, evidence regarding the amounts and disclosures in the consolidated financial statements. Our audits also included evaluating the accounting principles used and significant estimates made by management, as well as evaluating the overall presentation of the consolidated financial statements. We believe that our audits provide a reasonable basis for our opinion.
/s/ PricewaterhouseCoopers
Dublin, Ireland
February 21, 2019
We have served as the Company’s auditor since at least 1968, which includes periods before the Company became subject to SEC reporting in 2017. We have not determined the specific year we began serving as auditor of the Company or its predecessors.
ARD FINANCE S.A.
CONSOLIDATED INCOME STATEMENT
| | | | | | | | | | | | | | | | | | | | | | | |
| | | | | | Re-presented(i) | | Re-presented(i) |
| | | | Year ended December 31, 2018 | | Year ended December 31, 2017 | | Year ended December 31, 2016 |
| | | | Before | | | | | | Before | | | | | | Before | | | | |
| | | | exceptional | | Exceptional | | | | exceptional | | Exceptional | | | | exceptional | | Exceptional | | |
| | | | items | | items | | Total | | items | | items | | Total | | items | | items | | Total |
| | Note | | $'m | | $'m | | $'m | | $'m | | $'m | | $'m | | $'m | | $'m | | $'m |
| | | | | | Note 4 | | | | | | | Note 4 | | | | | | | Note 4 | | | |
Revenue | | 3 | | 9,097 | | — | | | 9,097 | | 8,596 | | — | | | 8,596 | | 7,014 | | — | | | 7,014 |
Cost of sales | | | | (7,654) | | (124) | | | (7,778) | | (7,110) | | (100) | | | (7,210) | | (5,771) | | (15) | | | (5,786) |
Gross profit/(loss) | | | | 1,443 | | (124) | | | 1,319 | | 1,486 | | (100) | | | 1,386 | | 1,243 | | (15) | | | 1,228 |
Sales, general and administration expenses | | | | (414) | | (19) | | | (433) | | (401) | | (49) | | | (450) | | (332) | | (130) | | | (462) |
Intangible amortization and impairment | | 8 | | (265) | | (186) | | | (451) | | (264) | | — | | | (264) | | (191) | | — | | | (191) |
Operating profit/(loss) | | | | 764 | | (329) | | | 435 | | 821 | | (149) | | | 672 | | 720 | | (145) | | | 575 |
Net finance expense | | 5 | | (626) | | (28) | | | (654) | | (539) | | (132) | | | (671) | | (584) | | (97) | | | (681) |
Profit/(loss) before tax | | | | 138 | | (357) | | | (219) | | 282 | | (281) | | | 1 | | 136 | | (242) | | | (106) |
Income tax (charge)/credit | | 6 | | (98) | | 54 | | | (44) | | (98) | | 138 | | | 40 | | (115) | | 49 | | | (66) |
Profit/(loss) for the year | | | | 40 | | (303) | | | (263) | | 184 | | (143) | | | 41 | | 21 | | (193) | | | (172) |
| | | | | | | | | | | | | | | | | | | | | | | |
(Loss)/profit attributable to: | | | | | | | | | | | | | | | | | | | | | | | |
Owners of the parent | | | | | | | | | (256) | | | | | | | 38 | | | | | | | (172) |
Non-controlling interests | | | | | | | | | (7) | | | | | | | 3 | | | | | | | — |
(Loss)/profit for the year | | | | | | | | | (263) | | | | | | | 41 | | | | | | | (172) |
The accompanying notes to the consolidated financial statements are an integral part of these consolidated financial statements.
| (i) | | The consolidated income statements for the years ended December 31, 2017 and 2016 have been re-presented to reflect the Group’s change in presentation currency from euro to U.S. dollar on January 1, 2018 as described in Notes 2 and 26 to these consolidated financial statements. |
ARD FINANCE S.A.
CONSOLIDATED STATEMENT OF COMPREHENSIVE INCOME
| | | | | | | | |
| | | | Year ended December 31, |
| | | | 2018 | | 2017 | | 2016 |
| | | | $'m | | $'m | | $'m |
| | Note | | | | Re-presented(ii) | | Re-presented(ii) |
(Loss)/profit for the year | | | | (263) | | 41 | | (172) |
Other comprehensive expense | | | | | | | | |
Items that may subsequently be reclassified to income statement | | | | | | | | |
Foreign currency translation adjustments: | | | | | | | | |
—Arising in the year | | | | 167 | | (390) | | 63 |
| | | | 167 | | (390) | | 63 |
Effective portion of changes in fair value of cash flow hedges: | | | | | | | | |
—New fair value adjustments into reserve | | | | 54 | | (254) | | 54 |
—Movement out of reserve | | | | (73) | | 258 | | (85) |
—Movement in deferred tax | | | | 5 | | 1 | | (4) |
| | | | (14) | | 5 | | (35) |
Gain recognized on cost of hedging | | | | | | | | |
—New fair value adjustments into reserve | | | | 15 | | — | | — |
—Movement out of reserve | | | | (2) | | — | | — |
| | | | 13 | | — | | — |
Items that will not be reclassified to income statement | | | | | | | | |
—Re-measurements of employee benefit obligations | | 18 | | 11 | | 49 | | (139) |
—Deferred tax movement on employee benefit obligations | | | | (1) | | (6) | | 18 |
| | | | 10 | | 43 | | (121) |
| | | | | | | | |
Total other comprehensive income/(expense) for the year | | | | 176 | | (342) | | (93) |
| | | | | | | | |
Total comprehensive expense for the year | | | | (87) | | (301) | | (265) |
Attributable to: | | | | | | | | |
Owners of the parent | | | | (86) | | (307) | | (265) |
Non-controlling interests | | | | (1) | | 6 | | — |
Total comprehensive expense for the year | | | | (87) | | (301) | | (265) |
The accompanying notes to the consolidated financial statements are an integral part of these consolidated financial statements
| (ii) | | The consolidated statements of comprehensive income for the years ended December 31, 2017 and 2016 have been re-presented to reflect the Group’s change in presentation currency from euro to U.S. dollar on January 1, 2018 as described in Notes 2 and 26 to these consolidated financial statements. |
ARD FINANCE S.A.
CONSOLIDATED STATEMENT OF FINANCIAL POSITION
| | | | | | | | | | |
| | | | At December 31, |
| | | | 2018 | | 2017 | | 2016 | | 2015 |
| | | | $'m | | $'m | | $'m | | $'m |
| | Note | | | | Re-presented(iii) | | Re-presented(iii) | | Re-presented(iii) |
Non-current assets | | | | | | | | | | |
Intangible assets | | 8 | | 3,601 | | 4,104 | | 4,115 | | 1,971 |
Property, plant and equipment | | 9 | | 3,388 | | 3,368 | | 3,068 | | 2,512 |
Derivative financial instruments | | 17 | | 11 | | 7 | | 131 | | — |
Deferred tax assets | | 11 | | 254 | | 221 | | 273 | | 194 |
Other non-current assets | | 10 | | 24 | | 25 | | 21 | | 15 |
| | | | 7,278 | | 7,725 | | 7,608 | | 4,692 |
Current assets | | | | | | | | | | |
Inventories | | 12 | | 1,284 | | 1,353 | | 1,186 | | 898 |
Trade and other receivables | | 13 | | 1,053 | | 1,274 | | 1,227 | | 709 |
Contract asset | | 2 | | 160 | | — | | — | | — |
Derivative financial instruments | | 17 | | 9 | | 16 | | 12 | | — |
Cash and cash equivalents | | 14 | | 565 | | 823 | | 818 | | 603 |
| | | | 3,071 | | 3,466 | | 3,243 | | 2,210 |
TOTAL ASSETS | | | | 10,349 | | 11,191 | | 10,851 | | 6,902 |
| | | | | | | | | | |
Equity attributable to owners of the parent | | | | | | | | | | |
Issued capital | | 15 | | — | | — | | — | | — |
Other reserves | | | | 82 | | (76) | | 309 | | 281 |
Retained earnings | | | | (3,206) | | (2,967) | | (3,462) | | (2,866) |
| | | | (3,124) | | (3,043) | | (3,153) | | (2,585) |
Non-controlling interests | | | | (116) | | (99) | | 3 | | 3 |
TOTAL EQUITY | | | | (3,240) | | (3,142) | | (3,150) | | (2,582) |
| | | | | | | | | | |
Non-current liabilities | | | | | | | | | | |
Borrowings | | 17 | | 9,487 | | 10,074 | | 10,224 | | 6,964 |
Employee benefit obligations | | 18 | | 957 | | 997 | | 954 | | 784 |
Derivative financial instruments | | 17 | | 107 | | 301 | | — | | — |
Deferred tax liabilities | | 11 | | 543 | | 583 | | 732 | | 491 |
Provisions | | 19 | | 38 | | 44 | | 60 | | 52 |
| | | | 11,132 | | 11,999 | | 11,970 | | 8,291 |
Current liabilities | | | | | | | | | | |
Borrowings | | 17 | | 118 | | 2 | | 8 | | 8 |
Interest payable | | | | 115 | | 107 | | 118 | | 86 |
Derivative financial instruments | | 17 | | 38 | | 2 | | 8 | | 8 |
Trade and other payables | | 20 | | 1,984 | | 1,991 | | 1,632 | | 956 |
Income tax payable | | | | 114 | | 162 | | 192 | | 83 |
Provisions | | 19 | | 88 | | 70 | | 73 | | 52 |
| | | | 2,457 | | 2,334 | | 2,031 | | 1,193 |
TOTAL LIABILITIES | | | | 13,589 | | 14,333 | | 14,001 | | 9,484 |
TOTAL EQUITY and LIABILITIES | | | | 10,349 | | 11,191 | | 10,851 | | 6,902 |
The accompanying notes to the consolidated financial statements are an integral part of these consolidated financial statements.
| (iii) | | The consolidated statements of financial position as at December 31, 2017, 2016 and 2015 have been re-presented to reflect the Group’s change in presentation currency from euro to U.S. dollar on January 1, 2018 as described in Notes 2 and 26 to these consolidated financial statements. |
ARD FINANCE S.A.
CONSOLIDATED STATEMENT OF CHANGES IN EQUITY
| | | | | | | | | | | | | | | | |
| | Attributable to the owner of the parent, re-presented(iv) | | | | |
| | | | Foreign | | | | | | | | | | | | |
| | | | currency | | Cash flow | | Cost of | | | | | | Non- | | |
| | Share | | translation | | hedge | | hedging | | Retained | | | | controlling | | |
| | capital | | reserve | | reserve | | reserve | | earnings | | Total | | interests | | Total equity |
| | $'m | | $'m | | $'m | | $'m | | $'m | | $'m | | $'m | | $'m |
| | Note 15 | | | | | | | | | | | | | | |
At January 1, 2016 | | — | | 283 | | (2) | | — | | (2,866) | | (2,585) | | 3 | | (2,582) |
Loss for the year | | — | | — | | — | | — | | (172) | | (172) | | — | | (172) |
Other comprehensive income/(expense) | | — | | 63 | | (35) | | — | | (121) | | (93) | | — | | (93) |
Return of capital to parent company | | — | | — | | — | | — | | (303) | | (303) | | — | | (303) |
At December 31, 2016 | | — | | 346 | | (37) | | — | | (3,462) | | (3,153) | | 3 | | (3,150) |
| | | | | | | | | | | | | | | | |
At January 1, 2017 | | — | | 346 | | (37) | | — | | (3,462) | | (3,153) | | 3 | | (3,150) |
Profit for the year | | — | | — | | — | | — | | 38 | | 38 | | 3 | | 41 |
Other comprehensive (expense)/income | | — | | (390) | | 5 | | — | | 40 | | (345) | | 3 | | (342) |
Share issuance by subsidiary (Note 1) | | — | | — | | — | | — | | 421 | | 421 | | (98) | | 323 |
Dividends paid (Note 15) | | — | | — | | — | | — | | (4) | | (4) | | (8) | | (12) |
Non-controlling interest in disposed business | | — | | — | | — | | — | | — | | — | | (2) | | (2) |
At December 31, 2017 | | — | | (44) | | (32) | | — | | (2,967) | | (3,043) | | (99) | | (3,142) |
| | | | | | | | | | | | | | | | |
At January 1, 2018(v) | | — | | (44) | | (48) | | 18 | | (2,954) | | (3,028) | | (99) | | (3,127) |
Loss for the year | | — | | — | | — | | — | | (256) | | (256) | | (7) | | (263) |
Other comprehensive income/(expense) | | — | | 167 | | (14) | | 13 | | 4 | | 170 | | — | | 170 |
Hedging gains transferred to cost of inventory | | — | | — | | (10) | | — | | — | | (10) | | — | | (10) |
Dividends paid by subsidiary to non-controlling interest | | — | | — | | — | | — | | — | | — | | (10) | | (10) |
At December 31, 2018 | | — | | 123 | | (72) | | 31 | | (3,206) | | (3,124) | | (116) | | (3,240) |
The accompanying notes to the consolidated financial statements are an integral part of these consolidated financial statements.
| (iv) | | The consolidated statements of changes in equity for the years ended December 31, 2017 and 2016 has been re-presented to reflect the Group’s change in presentation currency from euro to U.S. dollar on January 1, 2018 as described in Notes 2 and 26 to these consolidated financial statements. |
| (v) | | Retained earnings at January 1, 2018 have been re-presented by $13 million reflecting $20 million in respect of the impact of the adoption of IFRS 15 “Revenue from contracts with customers”, partly offset by $7 million in respect of the adoption of IFRS 9 “Financial instruments”. Further, following the adoption of IFRS 9 “Financial instruments”, the cash flow hedge reserve has been re-presented by $16 million, and a cost of hedging reserve has been re-presented to $18 million. Please refer to Note 2 for further details in respect of the impact of these recently adopted accounting standards. |
ARD FINANCE S.A.
CONSOLIDATED STATEMENT OF CASH FLOWS
| | | | | | | | |
| | | | Year ended December 31, |
| | | | 2018 | | 2017 | | 2016 |
| | | | $'m | | $'m | | $'m |
| | Note | | | | Re-presented(vi) | | Re-presented(vi) |
Cash flows from operating activities | | | | | | | | |
Cash generated from operations | | 21 | | 1,376 | | 1,523 | | 1,225 |
Interest paid — excluding cumulative PIK interest paid | | * | | (537) | | (573) | | (412) |
Cumulative PIK interest paid | | * | | — | | — | | (205) |
Income tax paid | | | | (105) | | (103) | | (93) |
Net cash from operating activities | | | | 734 | | 847 | | 515 |
Cash flows from investing activities | | | | | | | | |
Purchase of business net of cash acquired | | 22 | | — | | — | | (3,036) |
Purchase of property, plant and equipment | | | | (555) | | (476) | | (343) |
Purchase of software and other intangibles | | | | (32) | | (22) | | (12) |
Proceeds from disposal of property, plant and equipment | | | | 12 | | 6 | | 4 |
Net cash used in investing activities | | | | (575) | | (492) | | (3,387) |
Cash flows from financing activities | | | | | | | | |
Repayment of borrowings | | 17 | | (443) | | (4,385) | | (2,604) |
Proceeds from borrowings | | 17 | | 114 | | 3,730 | | 6,169 |
Consideration (paid)/received on termination of derivative financial instruments | | 17 | | (44) | | 46 | | — |
Dividends paid by subsidiary to non-controlling interest | | | | (10) | | (8) | | — |
Early redemption premium costs paid | | | | (7) | | (91) | | (121) |
Deferred debt issue costs paid | | | | (5) | | (43) | | (82) |
Finance lease payments | | | | (4) | | — | | — |
Net proceeds from share issuance by subsidiary | | | | — | | 326 | | — |
Dividends paid to parent company | | | | — | | (4) | | (303) |
Net cash (outflow)/inflow from financing activities | | | | (399) | | (429) | | 3,059 |
Net (decrease)/increase in cash and cash equivalents | | | | (240) | | (74) | | 187 |
Cash and cash equivalents at the beginning of the year | | 14 | | 823 | | 818 | | 603 |
Exchange (losses)/gains on cash and cash equivalents | | | | (18) | | 79 | | 28 |
Cash and cash equivalents at the end of the year | | 14 | | 565 | | 823 | | 818 |
* Total interest paid for the year ended December 31, 2018 is $537 million (2017: $573 million; 2016: $617 million).
The accompanying notes to the consolidated financial statements are an integral part of these consolidated financial statements.
| (vi) | | The consolidated statements of cash flows for the years ended December 31, 2017 and 2016 have been re-presented to reflect the Group’s change in presentation currency from euro to U.S. dollar on January 1, 2018 as described in Notes 2 and 26 to these consolidated financial statements. |
ARD FINANCE S.A.
NOTES TO THE CONSOLIDATED FINANCIAL STATEMENTS
1. General information
ARD Finance S.A. (the “Company”) was incorporated in Luxembourg on May 6, 2011. The Company’s registered office is 56, rue Charles Martel, L-2134, Luxembourg.
On March 20, 2017 a subsidiary of the Company, Ardagh Group S.A. (“Ardagh”), closed its initial public offering (“IPO”) of 18,630,000 Class A common shares on the New York Stock Exchange (“NYSE”). Following the IPO, the Company recognized a non-controlling interest of $98 million.
Ardagh Group S.A. and its subsidiaries (together the “Ardagh Group”) is a leading supplier of sustainable innovative, value‑added rigid packaging solutions. The Ardagh Group’s products include metal and glass containers primarily for food and beverage markets. End‑use categories include beer, wine, spirits, carbonated soft drinks, energy drinks, juices and water, as well as food, seafood and nutrition. The Ardagh Group also supplies the paints & coatings, chemicals, personal care, pharmaceuticals and general household end‑use categories. The Company and those of its subsidiaries who are above Ardagh Group S.A. in the corporate structure are referred to as the “ARD Finance Group”.
All of the business of the group of companies controlled by this company (the “Group”) is conducted by Ardagh and its subsidiaries. All of the financing of the Group other than the 7.125%/7.875% $770 million Senior Secured Toggle Notes due 2023, and the 6.625%/7.375% €845 million Senior Secured Toggle Notes due 2023 (the “Toggle Notes”, as described in Note 17) are liabilities of the Ardagh Group.
These consolidated financial statements reflect the consolidation of the legal entities forming the Group for the periods presented. These principal operating legal entities forming the Group are listed in Note. 23.
Any description of the business of the Group is a description of the business of the Ardagh Group.
The principal accounting policies that have been applied to the consolidated financial statements are described in Note 2.
2. Summary of significant accounting policies
Basis of preparation
The consolidated financial statements of the Group have been prepared in accordance with, and are in compliance with, International Financial Reporting Standards (“IFRS”) and related interpretations as adopted by the International Accounting Standards Board (“IASB”). IFRS is comprised of standards and interpretations approved by the IASB and IFRS and interpretations approved by the predecessor International Accounting Standards Committee that have been subsequently approved by the IASB and remain in effect. References to IFRS hereafter should be construed as references to IFRS as adopted by the IASB.
The consolidated financial statements are presented in U.S. dollar, rounded to the nearest million, and have been prepared under the historical cost convention except for the following:
| · | | derivative financial instruments are stated at fair value; and |
| · | | employee benefit obligations are measured at the present value of the future estimated cash flows related to benefits earned and pension assets valued at fair value. |
The preparation of consolidated financial information in conformity with IFRS requires the use of critical accounting estimates and assumptions that affect the reported amounts of assets and liabilities and income and expenses. It also requires management to exercise judgment in the process of applying Group accounting policies. These estimates, assumptions and judgments are based on historical experience and other factors, including expectations of future events that are believed to be reasonable under the circumstances and are subject to continual re‑evaluation. However, actual
outcomes may differ from these estimates. The areas involving a higher degree of judgment or complexity, or areas where assumptions and estimates are significant to the consolidated financial statements are discussed in the critical accounting estimates, assumptions and judgments.
The consolidated financial statements for the Group were authorized for issue by the board of directors of ARD Finance S.A. (the “Board”) on February 20, 2019.
Recently adopted accounting standards and changes in accounting policies
IFRS 9 “Financial Instruments”
The Group adopted IFRS 9 “Financial Instruments” (“IFRS 9”) with a date of initial adoption of January 1, 2018. The guidance in IFRS 9 replaces IAS 39 “Financial Instruments: Recognition and Measurement”. IFRS 9 includes requirements on the classification and measurement of financial instruments, impairment of financial instruments and hedge accounting.
Since adoption, the Group has applied the changes in accounting policy as discussed below:
| · | | differences in the carrying amount of financial assets and liabilities resulting from the adoption of IFRS 9 are recognized in retained earnings and reserves as at January 1, 2018. Accordingly, the information presented for 2017 does not generally reflect the requirements of IFRS 9 and therefore is not comparable to the information presented for 2018 under IFRS 9. |
| · | | the determination of the business model within which the Group’s financial assets are held has been made based on the facts and circumstances that existed at the date of initial adoption. |
| · | | all hedging relationships designated under IAS 39 at December 31, 2017 met the criteria for hedge accounting under IFRS 9 at January 1, 2018, and are therefore regarded as continuing hedging relationships. |
| · | | for non-financial assets recognized as of December 31, 2017 that are subject to hedge accounting, the Group continues to hold amounts in the hedging reserve and recycle to inventory and, subsequently, to the consolidated income statement, when the hedged non-financial asset affects the consolidated income statement. |
The total impact on the Group’s retained earnings due to classification and measurement of financial instruments as at January 1, 2018 primarily related to:
| 1) | | the application of the new expected credit loss model to trade and other receivables which resulted in a decrease in retained earnings of $4 million, net of tax. |
| 2) | | the recognition of changes in currency basis spread in the costs of hedging reserve within equity. This change has been applied for cross currency interest rate swaps (“CCIRS”) resulting in reclassifications of a gain of $4 million from retained earnings and a gain of $15 million from the cash flow hedge reserve to the cost of hedging reserve as of January 1, 2018, and a loss of $1 million from retained earnings to the cash flow hedge reserve. |
Upon adoption of IFRS 9, the Group recognizes trade and other receivables without a financing component initially at transaction price and measures them at amortized cost using the effective interest rate method less any provision for impairment. A provision for impairment against specific trade receivable balances will be recognized when there is evidence that the Group will not be able to collect all amounts due according to the original terms of the receivables. For all other trade receivables and contract assets, the Group will use an allowance matrix to measure the expected credit loss, based on historical actual credit loss experiences, adjusted for forward-looking information. On the date of initial application, January 1, 2018, the Group also assessed which business models apply to the financial assets held by the Group at that date. The Group participates in several uncommitted accounts receivable factoring and related programs with various financial institutions for certain receivables, accounted for as true sales of receivables, without recourse to the Group. At the date of initial adoption, the Group had a selling business model related to those receivables and, as such, any unsold receivables under such programs would need to be accounted for at fair value through profit or loss. There was no impact on the consolidated financial statements as of January 1, 2018, as the Group had utilized existing programs.
IFRS 15 “Revenue from contracts with customers”
The Group adopted IFRS 15, “Revenue from contracts with customers” (“IFRS 15”) effective January 1, 2018 on a modified retrospective basis, which resulted in the Group retaining prior period figures as reported under the previous standards and recognizing the cumulative effect of applying IFRS 15 as an adjustment to retained earnings as at the date of initial adoption.
The guidance in IFRS 15 replaced IAS 18, “Revenue” and IAS 11, “Construction contracts” and related interpretations. Under the guidance in IAS 18 and IAS 11, revenue from the sale of goods was recognized in the consolidated income statement when the significant risks and rewards of ownership had been transferred to the buyer, primarily on dispatch of the goods. Allowances for customer rebates were provided for in the same period as the related revenues were recorded. Revenue was presented net of such rebates as well as cash discounts and value added tax. Upon adoption of IFRS 15, revenue is recognized when control of a good or service has transferred to the customer. For certain contracts in the Metal Packaging Europe and Metal Packaging Americas reportable segments, the Group manufactures products for customers that have no alternative use and for which the Group has an enforceable right to payment for production completed to date, therefore the Group will recognize revenue earlier for these contracts, such that a portion of revenue, net of any related estimated rebates and cash discounts, excluding sales or value added tax, will be recognized prior to the dispatch of goods. For all other contracts, the Group will continue to recognize revenue, net of any related estimated rebates and cash discounts, excluding sales or value added tax, primarily at the point of dispatch of goods.
The following is a description of the main activities from which the Group generates its revenue. For more detailed information about the reportable segments, see Note 3.
We are a leading supplier of sustainable innovative, value-added rigid packaging solutions. The global packaging industry is a large, consumer‑driven industry with stable growth characteristics. We operate in the metal and glass container sectors and our target regions are Europe, North America and Brazil. We derive approximately 93% of our revenues in Europe and North America, mature markets characterized by predictable consumer spending, stable supply and demand and low cyclicality. Our products include metal and glass containers primarily for food and beverage markets, which are characterized by stable, consumer‑driven demand. We serve over 2,000 customers across more than 100 countries, comprised of multi‑national companies, large national and regional companies and small local businesses. In our target regions of Europe, North America and Brazil, our customers include a wide variety of consumer-packaged goods companies, which own some of the best-known brands in the world. We have a stable customer base with longstanding relationships and approximately two‑thirds of our sales are generated under multi‑year contracts, with the remainder largely subject to annual arrangements. A significant portion of our sales volumes are supplied under contracts which include input cost pass‑through provisions, which help us deliver generally consistent margins.
In addition to metal containers, within the Metal Packaging Europe and Metal Packaging Americas reportable segments, the Group manufactures and supplies a wide range of can ends. Containers and ends are usually distinct items and can be sold separately from each other. The Glass Packaging Europe reportable segment, includes Heye International, a glass engineering business, which represents 1% of the revenue of that reportable segment for the year ended December 31, 2018.
The Group usually enters into framework agreements with its customers, which establish the terms under which individual orders to purchase goods or services may be placed. As the framework agreements do not identify each party’s rights regarding the goods or services to be transferred, they do not create enforceable rights and obligations on a stand-alone basis. Therefore, the Group has concluded that only individual purchase orders create enforceable rights and obligations and meet the definition of a contract in IFRS 15. The individual purchase orders have, in general, a duration of one year or less and, as such, the Group does not disclose any information about remaining performance obligations under these contracts. The Group’s payment terms are in line with customary business practice, which can vary by customer and region. The Group has availed of the practical expedient from considering the existence of a significant financing component as, based on past experience, we expect that, at contract inception, the period between when a promised good is transferred to the customer and when the customer pays for that good will be one year or less.
Disaggregation of revenue
Within each reportable segment our packaging containers have similar production processes and classes of customer. Further, they have similar economic characteristics, as evidenced by similar profit margins, degrees of risk and opportunities for growth. We operate in mature markets aligned with our reportable segments. The following illustrates the disaggregation of revenue by destination for the year ended December 31, 2018:
| | | | | | | | |
| | Europe | | North America | | Rest of the World | | Total |
| | $'m | | $'m | | $'m | | $'m |
Metal Packaging Europe | | 3,393 | | 11 | | 188 | | 3,592 |
Metal Packaging Americas | | 4 | | 1,777 | | 406 | | 2,187 |
Glass Packaging Europe | | 1,572 | | 9 | | 42 | | 1,623 |
Glass Packaging North America | | — | | 1,687 | | 8 | | 1,695 |
Group | | 4,969 | | 3,484 | | 644 | | 9,097 |
Contract balances
Included in trade and other receivables is an amount of $823 million (January 1, 2018: $1,010 million) related to receivables from contracts with customers. The following table provides information about significant changes in contract assets during the year ended December 31, 2018:
| | |
| | Contract assets |
| | $'m |
Balance as at January 1, 2018 | | 168 |
Transfers from contract assets recognized at the beginning of the period to receivables | | (168) |
Increase as a result of new contract assets recognized during the period | | 157 |
Other | | 3 |
Balance as at December 31, 2018 | | 160 |
Impact of adoption of IFRS 15
The Group reported in its 2017 consolidated financial statements that, based on its IFRS 15 impact assessment, it had concluded that the new standard would not have a material impact on the amount of revenue recognized over the full year, when compared to the previous accounting guidance. The Group also reported that it would be required to recognize a contract asset, as opposed to inventory, as a result of the new standard with this contract asset representing revenue that would be required to be accelerated under the new guidance.
This arises due to the fact that within our Metal Packaging Europe and Metal Packaging Americas reportable segments, we manufacture certain products for customers that have no alternative use and for which the Group has an enforceable right to payment for production completed to date. Under the new standard, in these circumstances, the Group is required to recognize revenue earlier than under previous standards and prior to dispatch of the goods. As a result, revenue recognized on a quarterly basis can be impacted by the new standard due to the seasonality in inventory build, whilst revenue recognized over the full year is not expected to be materially impacted.
The principal impact on the consolidated statement of financial position as at the adoption date of January 1, 2018 was that a contract asset of $168 million was recognized and inventory of $145 million was derecognized. As a result of the aforementioned impact on the reported consolidated statement of financial position, deferred tax liabilities increased by $4 million. There was no impact on the reported consolidated statement of cash flows.
There is no material impact on revenue, operating profit or profit for the year in the reported consolidated income statement for the year ended December 31, 2018. The principal impact on the reported consolidated statement of financial position as at the reporting date is that a contract asset of $160 million has been recognized, whilst inventory of $138 million has been derecognized. As a result of the aforementioned impact on the reported consolidated statement of financial position, deferred tax liabilities increased by $3 million. There has been no impact on the reported consolidated statement of cash flows.
Change in presentation currency
With effect from January 1, 2018, the Group changed the currency in which it presents its consolidated financial statements from euro to U.S. dollar. This was principally as a result of the board of directors’ assessment that this change will help provide a clearer understanding of the Group’s financial performance and improve comparability of our performance to our peers following the Ardagh Group’s IPO on the NYSE.
The change in accounting policy impacts all financial statement line items, whereby amounts previously reported in euro have been re-presented in U.S. dollar. To illustrate the effect of the re-presentation on the previously reported euro consolidated statements of financial position as at December 31, 2017, 2016, 2015 and 2014, consolidated income statements, consolidated statements of comprehensive income and consolidated statements of cash flows for the years ended December 31, 2017, 2016 and 2015 have been set out in Note 26.
Recent accounting pronouncements
The impact of new standards, amendments to existing standards and interpretations issued and effective for annual periods beginning on or after January 1, 2018 have been assessed by the Directors and, with the exception of those identified above, no new standards or amendments to existing standards effective January 1, 2018 are currently relevant for the Group. The Directors’ assessment of the impact of new standards, which are not yet effective and which have not been early adopted by the Group, on the consolidated interim financial statements and disclosures is on-going and is set out below.
IFRS 16, ‘Leases’, is effective for annual periods beginning on, or after, January 1, 2019 and sets out the principles for the recognition, measurement, presentation and disclosure of leases. The objective is to ensure that lessees and lessors provide relevant information in a manner that appropriately represents those transactions. This information provides a basis for users of financial statements to assess the effect that leases have on the financial position, financial performance and cash flows of the entity.
IFRS 16 replaces IAS 17, ‘Leases’, and later interpretations and will result in the majority of the Group’s operating leases being recognized on the consolidated statement of financial position.
The Group has completed an assessment of the impact IFRS 16, involving the establishment of a cross-functional project team to implement the new standard from January 1, 2019. The Group has gathered and assessed the data relating to approximately 2,000 leases to which the Group is party and have designed and implemented a system solution and business process, with appropriate internal controls applied, in order to meet the new accounting and disclosure requirements post-adoption.
The Group will adopt IFRS 16 by applying the modified retrospective approach, with the right-of-use assets being calculated as if IFRS 16 had always been applied, and avail of the practical expedient to combine lease and non-lease components.
We expect that the adoption of IFRS 16 will have a significant impact on our consolidated statement of financial position and consolidated statement of cash flows as follows:
| · | | an increase in non-current assets due to the recognition of right-of-use assets in the range of $275 million to $300 million; |
| · | | an increase in financial liabilities as lease liabilities are recognized based on the new treatment in the range of $325 million to $350 million; and |
| · | | cash generated from operations is expected to increase due to certain lease expenses no longer being recognized as operating cash outflows, however this is expected to be offset by a corresponding increase in cash used in financing activities due to repayments of the principal on lease liabilities. |
In addition to the above impact, the adoption of IFRS 16 will also have an impact on the consolidated income statement and certain of the Group’s key financial metrics as a result of changes in the classification of charges recognized in the consolidated income statement. The application of the new standard will decrease both cost of sales and operating costs (excluding depreciation) in the income statement, giving rise to an increase in underlying Adjusted EBITDA, but this will be largely offset by corresponding increases in depreciation and finance expenses, and hence the expected impact on the Group’s profit/(loss) for the year will not be material.
The operating lease cost for the year ended December 31, 2018 is set out in Note 9 and it is the Group’s expectation that a significant portion of those operating lease costs, in the range of $70 million to $80 million, will be reclassified in the consolidated income statement upon adoption of IFRS 16, subject to changes in exchange rates when compared to the euro functional currency.
The IFRS Interpretations Committee issued IFRIC 23 ‘Uncertainty over income tax treatments’, which clarifies how the recognition and measurement requirements of IAS 12 ‘Income taxes’, are applied where there is uncertainty over income tax treatments. IFRIC 23 is effective for annual periods beginning on or after January 1, 2019. It is not expected that the application of this interpretation will have a material impact on the consolidated financial statements of the Group.
Basis of consolidation
Subsidiaries are fully consolidated from the date on which control is transferred to the Group and are de‑consolidated from the date on which control ceases. Subsidiaries are all entities (including structured entities) over which the Group has control. The Group controls an entity when it is exposed to, or has rights to, variable returns from its involvement with the entity and has the ability to affect those returns through its power to direct the activities of the entity.
The acquisition method of accounting is used to account for the acquisition of subsidiaries by the Group. The cost of an acquisition is the consideration given in exchange for control of the identifiable assets, liabilities and contingent liabilities of the acquired legal entities. Directly attributable transaction costs are expensed and included as exceptional items within sales, general and administration expenses. The acquired net assets are initially measured at fair value. The excess of the cost of acquisition over the fair value of the identifiable net assets acquired is recorded as goodwill. Any goodwill and fair value adjustments are recorded as assets and liabilities of the acquired legal entity in the currency of the primary economic environment in which the legal entity operates (the “functional currency”). If the cost of acquisition is less than the fair value of the Group’s share of the net assets of the legal entity acquired, the difference is recognized directly in the consolidated income statement. The Group considers obligations of the acquiree in a business combination that arise as a result of the change in control, to be cash flows arising from obtaining control of the controlled entity, and classifies these obligations as investing activities in the consolidated statement of cash flows.
| (ii) | | Non-controlling interests |
Non-controlling interests represent the portion of the equity of a subsidiary which is not attributable to the Group. Non-controlling interests are presented separately in the consolidated financial statements. Changes in ownership of a subsidiary which do not result in a change in control are treated as equity transactions.
| (iii) | | Transactions eliminated on consolidation |
Transactions, balances and unrealized gains or losses on transactions between Group companies are eliminated. Subsidiaries’ accounting policies have been changed where necessary to ensure consistency with the policies adopted by the Group.
Foreign currency
| (i) | | Functional and presentation currency |
The functional currency of the Company is euro. The consolidated financial statements are presented in U.S. dollar which is the Group’s presentation currency as set out above.
| (ii) | | Foreign currency transactions |
Items included in the financial statements of each of the Group’s entities are measured using the functional currency of that entity.
Transactions in foreign currencies are translated into the functional currency at the foreign exchange rate ruling at the date of the transaction. Monetary assets and liabilities denominated in foreign currencies at the reporting date are translated into the functional currency at the foreign exchange rate ruling at that date. Foreign exchange differences arising on translation are recognized in the consolidated income statement, except: (i) differences on foreign currency borrowings that provide an effective hedge against a net investment in a foreign entity (“net investment hedges”), which are taken to other comprehensive income until the disposal of the net investment, at which time they are recognized in the consolidated income statement; and (ii) differences on certain derivative financial instruments discussed under “Derivative financial instruments” below. Net investment hedges are accounted for in a similar manner to cash flow hedges. The gain or loss relating to the ineffective portion of a net investment hedge is recognized immediately in the consolidated income statement within finance income or expense.
| (iii) | | Financial statements of foreign operations |
The assets and liabilities of foreign operations are translated into euro at foreign exchange rates ruling at the reporting date. The revenues and expenses of foreign operations are translated to euro at average exchange rates for the year. Foreign exchange differences arising on retranslation and settlement of such transactions are recognized in other comprehensive income. Gains or losses accumulated in other comprehensive income are recycled to the consolidated income statement when the foreign operation is disposed of.
Non‑monetary items measured at fair value in foreign currency are translated using the exchange rates as at the date when the fair value is determined.
Business combinations and goodwill
All business combinations are accounted for by applying the acquisition method of accounting. This involves measuring the cost of the business combination and allocating, at the acquisition date, the cost of the business combination to the assets acquired and liabilities assumed. Identifiable assets acquired and liabilities assumed in a business combination are measured initially at their fair values at the acquisition date.
The cost of an acquisition is measured as the aggregate of the consideration transferred, which is measured at acquisition date fair value, and the amount of any non‑controlling interests in the acquiree. For each business combination, the Group elects whether to measure the non‑controlling interests in the acquiree at fair value or at the proportionate share of the acquiree’s identifiable net assets. Acquisition‑related costs are expensed as incurred and included in sales, general and administration expenses.
When the Group acquires a business, it assesses the financial assets and liabilities assumed for appropriate classification and designation in accordance with the contractual terms, economic circumstances and pertinent conditions as at the acquisition date.
Any contingent consideration is recognized at fair value at the acquisition date.
Goodwill represents the excess of the cost of an acquisition over the fair value of the net identifiable assets of the acquired subsidiary at the date of acquisition.
Goodwill is stated at cost less any accumulated impairment losses. Goodwill is allocated to those groups of cash‑generating units (“CGUs”) that are expected to benefit from the business combination in which the goodwill arose for the purpose of assessing impairment. Goodwill is tested annually for impairment.
Where goodwill has been allocated to a CGU and part of the operation within that unit is disposed of, the goodwill associated with the disposed operation is included in the carrying amount of the operation when determining the gain or loss on disposal. Goodwill disposed in these circumstances is measured based on the relative values of the disposed operation and the portion of the cash‑generating unit retained.
Intangible assets
Intangible assets are initially recognized at cost.
Intangible assets acquired as part of a business combination are capitalized separately from goodwill if the intangible asset is separable or arises from contractual or other legal rights. They are initially recognized at cost which, for intangible assets arising in a business combination, is their fair value at the date of acquisition.
Subsequent to initial recognition, intangible assets are carried at cost less any accumulated amortization and any accumulated impairment losses. The carrying values of intangible assets with finite useful lives are reviewed for indicators of impairment at each reporting date and are subject to impairment testing when events or changes in circumstances indicate that the carrying values may not be recoverable.
The amortization of intangible assets is calculated to write off the book value of finite lived intangible assets over their useful lives on a straight‑line basis on the assumption of zero residual value as follows:
| | | | | |
Computer software | | 2 | - | 7 | years |
Customer relationships | | 5 | - | 15 | years |
Technology | | 8 | - | 15 | years |
Computer software development costs are recognized as assets. Costs associated with maintaining computer software programs are recognized as an expense as incurred.
| (ii) | | Customer relationships |
Customer relationships acquired in a business combination are recognized at fair value at the acquisition date. Customer relationships have a finite useful economic life and are carried at cost less accumulated amortization.
Technology based intangibles acquired in a business combination are recognized at fair value at the acquisition date and reflect the Group’s ability to add value through accumulated technological expertise surrounding product and process development.
| (iv) | | Research and development costs |
Research costs are expensed as incurred. Development costs relating to new products are capitalized if the new product is technically and commercially feasible. All other development costs are expensed as incurred.
Property, plant and equipment
Items of property, plant and equipment are stated at cost less accumulated depreciation and impairment losses, except for land which is shown at cost less impairment. Spare parts which form an integral part of plant and machinery and which have an estimated useful economic life greater than one year are capitalized. Spare parts which do not form an integral part of plant and machinery and which have an estimated useful economic life less than one year are included as consumables within inventory and expensed when utilized.
Where components of property, plant and equipment have different useful lives, they are accounted for as separate items of property, plant and equipment.
The determination of whether an arrangement is, or contains a lease, is based on the substance of the arrangement and requires an assessment of whether the fulfillment of the arrangement is dependent on the use of a specific asset or assets, and the arrangement conveys a right to use the asset.
Leases of property, plant and equipment where the Group has substantially all the risks and rewards of ownership are classified as finance leases.
Leases where the lessor retains substantially all the risks and rewards of ownership are classified as operating leases. Payments made under operating leases (net of any incentives received from the lessor) are charged to the consolidated income statement on a straight‑line basis over the period of the lease.
The Group recognizes in the carrying amount of an item of property, plant and equipment, the cost of replacing the component of such an item when that cost is incurred, if it is probable that the future economic benefits embodied with the item will flow to the Group and the cost of the item can be measured reliably. When a component is replaced the old component is de‑recognized in the period. All other costs are recognized in the consolidated income statement as an expense as incurred. When a major overhaul is performed, its cost is recognized in the carrying amount of the plant and equipment as a replacement if the recognition criteria above are met.
Depreciation is charged to the consolidated income statement on a straight‑line basis over the estimated useful lives of each part of an item of property, plant and equipment. Land is not depreciated. The estimated useful lives are as follows:
| | | | | |
Buildings | | 30 | - | 40 | years |
Plant and machinery | | 3 | - | 40 | years |
Molds | | 2 | - | 3 | years |
Office equipment and vehicles | | 3 | - | 10 | years |
Assets’ useful lives and residual values are adjusted if appropriate, at each balance sheet date.
Impairment of non‑financial assets
Assets that have an indefinite useful economic life are not subject to amortization and are tested annually for impairment or whenever indicators suggest that impairment may have occurred. Assets that are subject to amortization are reviewed for impairment whenever events or changes in circumstances indicate that the carrying amount may not be
recoverable. An impairment loss is recognized for the amount by which the asset’s carrying amount exceeds its recoverable amount.
For the purposes of assessing impairment, assets excluding goodwill and long lived intangible assets, are grouped at the lowest levels at which cash flows are separately identifiable. Goodwill and long lived intangible assets are allocated to groups of CGUs. The groupings represent the lowest level at which the related assets are monitored for internal management purposes.
Non‑financial assets other than goodwill that suffered impairment are reviewed for possible reversal of the impairment at each reporting date.
The recoverable amount of other assets is the greater of their value in use and fair value less costs to sell. In assessing value in use, the estimated future cash flows are discounted to their present value, using a pre‑tax discount rate that reflects current market assessments of the time value of money and the risks specific to the asset. For an asset that does not generate largely independent cash inflows, the recoverable amount is determined for the CGU to which the asset belongs.
Inventories
Inventories are measured at the lower of cost and net realizable value. The cost of inventories is based on the first‑in, first‑out basis and includes expenditure incurred in acquiring the inventories and bringing them to their current location and condition. In the case of finished goods and work‑in‑progress, cost includes direct materials, direct labor and attributable overheads based on normal operating capacity.
Net realizable value is the estimated proceeds of sale less all further costs to completion, and less all costs to be incurred in marketing, selling and distribution.
Spare parts which are deemed to be of a consumable nature, are included within inventories and expensed when utilized.
Non‑derivative financial instruments
Non‑derivative financial instruments comprise trade and other receivables, cash and cash equivalents, borrowings and trade and other payables. Non‑derivative financial instruments are recognized initially at fair value plus any directly attributable transaction costs, except as described below. Subsequent to initial recognition, non‑derivative financial instruments are measured as described below.
| (i) | | Trade and other receivables |
Effective January 1, 2018 on adoption of IFRS 9
Trade and other receivables are recognized initially at fair value and are thereafter measured at amortized cost using the effective interest rate method less any provision for impairment, in accordance with the Group’s held to collect business model. A provision for impairment of specific trade receivables is recognized when there is evidence that the Group will not be able to collect all amounts due according to the original terms of the receivables. For all other trade receivables, the Group will use an allowance matrix to measure the expected credit loss, based on historical actual credit loss experiences, adjusted for forward-looking information.
Effective prior to adoption of IFRS 9 on January 1, 2018
Trade and other receivables are recognized initially at fair value and are thereafter measured at amortized cost using the effective interest rate method less any provision for impairment. A provision for impairment of trade receivables is recognized when there is objective evidence that the Group will not be able to collect all amounts due according to the original terms of the receivables.
The Group has entered into securitization transactions involving certain of its trade receivables. The securitized assets are recognized on the consolidated statement of financial position, until all of the rights to the cash flows from those assets have expired or have been fully transferred outside the Group, or until substantially all of the related risks, rewards and control of the related assets have been transferred to a third party.
The Group has also entered into a Global Asset Based Loan Facility (“ABL”) involving certain of its trade receivables and inventory. The lenders under the ABL have security over those receivables, inventory and the bank accounts where the associated cash flows are received. The risks, rewards and control of these assets are still retained by the Group and are, therefore, recognized on the statement of financial position.
| (iii) | | Contract assets – effective from January 1, 2018 on adoption of IFRS 15 |
Contract assets represent revenue required to be accelerated or recognized over time based on production completed in accordance with the Group’s revenue recognition policy (as set out below). A provision for impairment of a contract asset will be recognized when there is evidence that the revenue recognized will not be recoverable. The provision is measured based on an allowance matrix to measure the expected credit loss, based on historical actual credit loss experiences, adjusted for forward-looking information.
| (iv) | | Cash and cash equivalents |
Cash and cash equivalents include cash on hand and call deposits held with banks and restricted cash. Cash and cash equivalents are carried at amortized cost.
Short term bank deposits of greater than three months’ maturity which do not meet the definition of cash and cash equivalents are classified as financial assets within current assets and stated at amortized cost.
Restricted cash comprises cash held by the Group but which is ring‑fenced or used as security for specific financing arrangements, and to which the Group does not have unfettered access. Restricted cash is measured at amortized cost.
| (v) | | Borrowings (including related party debt) |
Borrowings are recognized initially at fair value, net of transaction costs incurred. Borrowings are subsequently stated at amortized cost; any difference between the proceeds (net of transaction costs) and the redemption value is recognized in the Group’s consolidated income statement over the period of the borrowings using the effective interest rate method.
Borrowings are classified as current liabilities unless the Group has an unconditional right to defer settlement of the liability for at least twelve months after the reporting date.
| (vi) | | Trade and other payables |
Trade and other payables are recognized initially at fair value and subsequently measured at amortized cost using the effective interest rate method.
Derivative financial instruments
Derivatives are initially recognized at fair value on the date a derivative contract is entered into and are subsequently re‑measured at their fair value. The method of recognizing the resulting gain or loss depends on whether the derivative is designated as a hedging instrument, and if so, the nature of the item being hedged.
The fair values of various derivative instruments used for hedging purposes are disclosed in Note 17. The full fair value of a hedging derivative is classified as a non‑current asset or liability when the remaining maturity of the hedged item is more than 12 months and as a current asset or liability when the remaining maturity of the hedged item is less than 12 months. Trading derivatives are classified as a current asset or liability.
The effective portion of changes in the fair value of derivatives that are designated and qualify as cash flow hedges are recognized in other comprehensive income, allocated between cash flow hedge gains or losses and cost of hedging gains or losses. For cash flow hedges which subsequently result in the recognition of a non-financial asset, the amounts accumulated in the cash flow hedge reserve are reclassified to the asset in order to adjust its carrying value. Amounts accumulated in the cash flow hedge reserve and cost of hedging reserve, or as adjustments to carrying value of non-financial assets, are recycled to the consolidated income statement in the periods when the hedged item will affect profit or loss.
The gain or loss relating to the ineffective portion is recognized immediately in the consolidated income statement. When a hedging instrument expires or is sold, or when a hedge no longer meets the criteria for hedge accounting, any cumulative gain or loss existing at that time remains in equity and is recognized in the consolidated income statement when the forecast cash flow arises. When a forecast transaction is no longer expected to occur, the cumulative gain or loss that was reported in equity is immediately transferred to the consolidated income statement.
| (ii) | | Net investment hedges |
Derivative financial instruments are classified as net investment hedges when they hedge changes in the Group’s net investments in its subsidiaries due to exposure to foreign currency. Net investment hedges are accounted for in a similar manner to cash flow hedges.
Derivative financial instruments are classified as fair value hedges when they hedge the Group’s exposure to changes in the fair value of a recognized asset or liability. Changes in the fair value of derivatives that are designated and qualify as fair value hedges are recorded in the Group’s consolidated income statement, together with any changes in the fair value of the hedged item that is attributable to the hedged risk. Changes in the fair value of dervatives relating to the cost of hedging are recognized in other comprehensive income.
The gain or loss relating to the effective portion of derivatives with fair value hedge accounting is recognized in the consolidated income statement within “net finance expense”. The gain or loss relating to the ineffective portion is also recognized in the consolidated income statement within “net finance expense”. If a hedge no longer meets the criteria for hedge accounting, the adjustment to the carrying amount of a hedged item for which the effective interest rate method is used is amortized to profit or loss over the period to maturity.
When a hedging instrument expires or is sold, or when a fair value hedge no longer meets the criteria for hedge accounting, any cumulative gain or loss existing at that time remains in equity and is recognized in the consolidated income statement when the forecast cash flow arises. When a forecast transaction is no longer expected to occur, the cumulative gain or loss that was reported in equity is immediately transferred to the consolidated income statement.
Fair value measurement
The Group measures financial instruments such as derivatives and pension assets at fair value at each balance sheet date. Fair value related disclosures for financial instruments and pension assets that are measured at fair value or where fair values are disclosed, are summarized in the following notes:
| · | | Disclosures for valuation methods, significant estimates and assumptions (Notes 17 and 18) |
| · | | Contingent consideration |
| · | | Quantitative disclosures of fair value measurement hierarchy (Note 17) |
| · | | Financial instruments (including those carried at amortized cost) (Note 17) |
Fair value is the price that would be received to sell an asset or paid to transfer a liability in an orderly transaction between market participants at the measurement date. The fair value measurement is based on the presumption that the transaction to sell the asset or transfer the liability takes place either:
| · | | in the principal market for the asset or liability; or |
| · | | in the absence of a principal market, in the most advantageous market for the asset or liability. |
The principal or the most advantageous market must be accessible by the Group.
The fair value of an asset or a liability is measured using the assumptions that market participants would use when pricing the asset or liability, assuming that market participants act in their economic best interest.
A fair value measurement of a non‑financial asset takes into account a market participant’s ability to generate economic benefits by using the asset in its highest and best use or by selling it to another market participant that would use the asset in its highest and best use.
The Group uses valuation techniques that are appropriate in the circumstances and for which sufficient data are available to measure fair value, maximizing the use of relevant observable inputs and minimizing the use of unobservable inputs.
Employee benefits
| (i) | | Defined benefit pension plans |
Typically, defined benefit plans define an amount of pension benefit that an employee will receive on retirement, usually dependent on one or more factors such as age, years of service and compensation.
The liability recognized in the consolidated statement of financial position in respect of defined benefit pension plans is the present value of the defined benefit obligation at the reporting date less the fair value of plan assets. The defined benefit obligation is calculated annually by independent actuaries using the projected unit credit method. The present value of the defined benefit obligation is determined by discounting the estimated future cash outflows using interest rates of high quality corporate bonds that are denominated in the currency in which the benefits will be paid, and that have terms to maturity approximating to the terms of the related pension liability.
Actuarial gains and losses arising from experience adjustments and changes in actuarial assumptions are charged or credited to equity in other comprehensive income in the period in which they arise. Past service costs are recognized immediately in the consolidated income statement.
| (ii) | | Multi‑employer pension plans |
Multi‑employer craft or industry based pension schemes (“multi‑employer schemes”) have arrangements similar to those of defined benefit schemes. In each case it is not possible to identify the Group’s share of the underlying assets and liabilities of the multi‑employer schemes and therefore in accordance with IAS 19(R), the Group has taken the exemption for multi‑employer pension schemes to account for them as defined contribution schemes recognizing the contributions payable in each period in the consolidated income statement.
| (iv) | | Other end of service employee benefits |
In a number of countries, the Group pays lump sums to employees leaving service. These arrangements are accounted for in the same manner as defined benefit pension plans.
| (v) | | Other long term employee benefits |
The Group’s obligation in respect of other long term employee benefit plans represents the amount of future benefit that employees have earned in return for service in the current and prior periods for post‑retirement medical schemes, partial retirement contracts and long service awards. These are included in the category of employee benefit obligations on the consolidated statement of financial position. The obligation is computed on the basis of the projected unit credit method and is discounted to present value using a discount rate equating to the market yield at the reporting date on high quality corporate bonds of a currency and term consistent with the currency and estimated term of the obligations. Actuarial gains and losses are recognized in full in the Group’s consolidated statement of comprehensive income in the period in which they arise.
| (vi) | | Defined contribution plans |
A defined contribution plan is a pension plan under which the Group pays fixed contributions into a separate entity. The contributions are recognized as employee benefit expense when they are due.
Provisions
Provisions are recognized when the Group has a present legal or constructive obligation as a result of a past event, it is probable that an outflow of economic benefits will be required to settle the obligation and the amount can be reliably estimated.
Provisions are measured at the present value of the expenditures expected to be required to settle the obligation using a pre‑tax rate that reflects current market assessments of the time value of money and the risks specific to the obligation.
Revenue recognition
Effective January 1, 2018 on adoption of IFRS 15
Revenue is recognized when control of a good or service has transferred to the customer. For certain contracts, the Group manufactures products for customers that have no alternative use and for which the Group has an enforceable right to payment for production completed to date. Therefore, the Group will recognize revenue over time as the Group satisfies the contractual performance obligations for those contracts. For all other contracts, the Group will continue to recognize revenue primarily on dispatch of the goods, net of any related customer rebates, cash discounts and value added taxes.
Effective prior to adoption of IFRS 15 on January 1, 2018
Revenue from the sale of goods is recognized in the consolidated income statement when the significant risks and rewards of ownership have been transferred to the buyer, primarily on dispatch of the goods. Allowances for customer rebates are provided for in the same period as the related revenues are recorded. Revenue is presented net of such rebates as well as cash discounts and value added tax.
Exceptional items
The Group’s consolidated income statement, cash flow and segmental analysis separately identify results before specific items. Specific items are those that in management’s judgment need to be disclosed by virtue of their size, nature or incidence to provide additional information. Such items include, where significant, restructuring, redundancy and other costs relating to permanent capacity realignment or footprint reorganization, directly attributable acquisition costs and acquisition integration costs, profit or loss on disposal or termination of operations, start‑up costs incurred in relation to and associated with plant builds, significant new line investments or furnaces, major litigation costs and settlements and impairment of non‑current assets. In this regard the determination of “significant”’ as included in our definition uses qualitative and quantitative factors. Judgment is used by the Group in assessing the particular items, which by virtue of their scale and nature, are disclosed in the Group’s consolidated income statement, and related notes as exceptional items. Management considers columnar presentation to be appropriate in the consolidated income statement as it provides useful additional information and is consistent with the way that financial performance is measured by management and presented to the Board. Exceptional restructuring costs are classified as restructuring provisions and all other exceptional costs when outstanding at the balance sheet date are classified as exceptional items payable.
Finance income and expense
Finance income comprises interest income on funds invested, gains on disposal of financial assets, ineffective portions of derivative instruments designated as hedging instruments and gains on derivative instruments that are not designated as hedging instruments and are recognized in profit or loss.
Finance expense comprises interest expense on borrowings (including amortization of deferred debt issuance costs), finance lease expenses, certain net foreign currency translation related to financing, net interest cost on net pension plan liabilities, losses on extinguishment of borrowings, ineffective portions of derivative instruments designated as hedging instruments, losses on derivative instruments that are not designated as hedging instruments and are recognized in profit or loss, and other finance expense.
The Group capitalizes borrowing costs directly attributable to the acquisition, construction or production of manufacturing plants that require a substantial period of time to build that would have been avoided if the expenditure on the qualifying asset had not been made.
Costs related to the issuance of new debt are deferred and amortized within finance expense over the expected terms of the related debt agreements by using the effective interest rate method.
Income tax
Income tax on the profit or loss for the year comprises current and deferred tax. Income tax is recognized in the consolidated income statement except to the extent that it relates to items recognized in other comprehensive income.
Current tax is the expected tax payable on the taxable income for the year, using tax rates enacted or substantively enacted at the reporting date and any adjustment to tax payable in respect of previous years.
Deferred income tax is recognized, using the liability method, on temporary differences arising between the tax bases of assets and liabilities and their carrying amounts in the consolidated financial statements. However, deferred tax liabilities are generally not recognized if they arise from the initial recognition of goodwill; deferred income tax is not accounted for if it arises from initial recognition of an asset or liability in a transaction other than a business combination that at the time of the transaction affects neither accounting nor taxable profit or loss. Deferred income tax is determined using tax rates (and laws) that have been enacted or substantively enacted by the balance sheet date and are expected to apply when the related deferred income tax asset is realized or the deferred income tax liability is settled.
Deferred income tax assets are recognized only to the extent that it is probable that future taxable profit will be available against which the temporary differences can be utilized. Deferred income tax is provided on temporary differences arising on investments in subsidiaries and associates, except for deferred income tax liability where the timing of the reversal of the temporary difference is controlled by the Group and it is probable that the temporary difference will not reverse in the foreseeable future.
Deferred income tax assets and liabilities are offset when there is a legally enforceable right to offset current tax assets against current tax liabilities and when the deferred income tax assets and liabilities relate to income taxes levied by the same taxation authority on either the same taxable entity or different taxable entities where there is an intention to settle the balances on a net basis.
Segment reporting
The board of directors in addition to certain members of the board of directors of Ardagh Group S.A. has been identified as the Chief Operating Decision Maker (“CODM”) for the Group.
Operating segments are identified on the basis of the internal reporting provided to the Board in order to allocate resources to the segment and assess its performance.
Critical accounting estimates, assumptions and judgments
Estimates and judgments are continually evaluated and are based on historical experience and other factors, including expectations of future events that are believed to be reasonable under the circumstances. The Group makes estimates and assumptions concerning the future. The resulting accounting estimates will, by definition, seldom equal the related actual results. The estimates and assumptions that have a significant risk of causing a material adjustment to the carrying amounts of assets and liabilities within the next financial year are discussed below.
| (i) | | Estimated impairment of goodwill and other long lived assets |
In accordance with IAS 36 “Impairment of assets” (“IAS 36”), the Group tests whether goodwill and other long lived assets have suffered any impairment in accordance with the accounting policies stated. The determination of recoverable amounts requires the use of estimates as outlined in Note 8. The Group’s judgments relating to the impairment of goodwill and other long lived assets are included in Notes 8 and 9.
| (ii) | | Establishing lives for the purposes of depreciation and amortization of property, plant and equipment and intangibles |
Long lived assets, consisting primarily of property, plant and equipment, customer intangibles and technology intangibles, comprise a significant portion of the Group’s total assets. The annual depreciation and amortization charges depend primarily on the estimated lives of each type of asset and, in certain circumstances, estimates of fair values and residual values. The Board regularly review these asset lives and change them as necessary to reflect current thinking on remaining lives in light of technological change, prospective economic utilization and physical condition of the assets concerned. Changes in asset lives can have a significant impact on the depreciation and amortization charges for the period. It is not practical to quantify the impact of changes in asset lives on an overall basis, as asset lives are individually determined and there are a significant number of asset lives in use.
The Group is subject to income taxes in numerous jurisdictions and judgment is therefore required in determining the worldwide provision for income taxes. There are many transactions and calculations for which the ultimate tax determination is uncertain during the ordinary course of business. The Group recognizes liabilities for anticipated tax audit matters based on estimates of whether additional taxes will be due. Where the final tax outcome of these matters is different from the amounts that were initially recorded, such differences will impact the income tax and deferred tax provisions in the period in which such determination is made.
| (iv) | | Measurement of employee benefit obligations |
The Group follows guidance of IAS 19(R) to determine the present value of its obligations to current and past employees in respect of defined benefit pension obligations, other long term employee benefits, and other end of service employee benefits which are subject to similar fluctuations in value in the long term. The Group with the assistance of professional actuaries, values such liabilities designed to ensure consistency in the quality of the key assumptions underlying the valuations. The critical assumptions and estimates applied are discussed in detail in Note 18.
The consolidated income statement and segment analysis separately identify results before exceptional items. Exceptional items are those that in our judgment need to be disclosed by virtue of their size, nature or incidence.
The Group believes that this presentation provides additional analysis as it highlights exceptional items. The determination of “significant” as included in our definition uses qualitative and quantitative factors which remain consistent from period to period. Management uses judgment in assessing the particular items, which by virtue of their scale and nature, are disclosed in the consolidated income statement and related notes as exceptional items. Management considers the consolidated income statement presentation of exceptional items to be appropriate as it provides useful additional information and is consistent with the way that financial information is measured by management and presented to the Board. In that regard, management believes it to be consistent with paragraph 85 of IAS 1 “Presentation of financial statements” (“IAS 1”), which permits the inclusion of line items and subtotals that improve the understanding of performance.
Revenue is recognized when control of a good or service has transferred to the customer. For certain contracts, the Group manufactures products for customers that have no alternative use and for which the Group has an enforceable right to payment for production completed to date. The determination of goods or contracts having no alternative use and the enforceable right to payment involves and relies upon management judgment, and can result in the Group accelerating the recognition of revenue over time as the Group satisfies the contractual performance obligations for those contracts.
| (vii) | | Business combinations and goodwill |
Goodwill only arises in business combinations. The amount of goodwill initially recognized is dependent on the allocation of the purchase price to the fair value of the identifiable assets acquired and the liabilities assumed. The determination of the fair value of the assets and liabilities is based, to a considerable extent, on management’s judgment. Allocation of the purchase price affects the results of the Group as finite lived intangible assets are amortized, whereas indefinite lived intangible assets, including goodwill, are not amortized and could result in differing amortization charges based on the allocation to indefinite lived and finite lived intangible assets.
3. Segment analysis
The Group’s four operating and reportable segments are Metal Packaging Europe, Metal Packaging Americas, Glass Packaging Europe and Glass Packaging North America. This reflects the basis on which the Group performance is reviewed by management and presented to the CODM.
Net finance expense is not allocated to segments as these are reviewed by the CODM on a Group‑wide basis. Performance of the segments is assessed based on Adjusted EBITDA. Adjusted EBITDA consists of profit/(loss) before income tax (credit)/charge, net finance expense, depreciation and amortization and exceptional operating items. Segment revenues are derived from sales to external customers. Inter‑segmental revenue is not material.
Segment assets consist of intangible assets, property, plant and equipment, derivative financial instrument assets, deferred tax assets, other non‑current assets, inventories, trade and other receivables and cash and cash equivalents. The accounting policies of the segments are the same as those in the consolidated financial statements of the Group as set out in Note 2.
Reconciliation of (loss)/profit for the year to Adjusted EBITDA
| | | | | | |
| | Year ended December 31, |
| | 2018 | | 2017 | | 2016 |
| | $'m | | $'m | | $'m |
(Loss)/profit for the year | | (263) | | 41 | | (172) |
Income tax charge/(credit) (Note 6) | | 44 | | (40) | | 66 |
Net finance expense (Note 5) | | 654 | | 671 | | 681 |
Depreciation and amortization (Notes 8, 9) | | 714 | | 687 | | 561 |
Exceptional operating items (Note 4) | | 329 | | 149 | | 145 |
Adjusted EBITDA | | 1,478 | | 1,508 | | 1,281 |
The segment results for the year ended December 31, 2018 are:
| | | | | | | | | | |
| | Metal | | Metal | | Glass | | Glass | | |
| | Packaging | | Packaging | | Packaging | | Packaging | | |
| | Europe | | Americas | | Europe | | North America | | Group |
| | $'m | | $'m | | $'m | | $'m | | $'m |
Revenue | | 3,592 | | 2,187 | | 1,623 | | 1,695 | | 9,097 |
Adjusted EBITDA | | 565 | | 298 | | 358 | | 257 | | 1,478 |
Capital expenditure | | 202 | | 88 | | 151 | | 134 | | 575 |
Segment assets | | 4,236 | | 1,965 | | 1,951 | | 2,197 | | 10,349 |
The segment results for the year ended December 31, 2017 are:
| | | | | | | | | | |
| | Metal | | Metal | | Glass | | Glass | | |
| | Packaging | | Packaging | | Packaging | | Packaging | | |
| | Europe | | Americas | | Europe | | North America | | Group |
| | $'m | | $'m | | $'m | | $'m | | $'m |
Revenue | | 3,339 | | 1,931 | | 1,549 | | 1,777 | | 8,596 |
Adjusted EBITDA | | 554 | | 265 | | 340 | | 349 | | 1,508 |
Capital expenditure | | 176 | | 80 | | 110 | | 126 | | 492 |
Segment assets | | 4,485 | | 1,858 | | 2,226 | | 2,622 | | 11,191 |
The segment results for the year ended December 31, 2016 are:
| | | | | | | | | | |
| | Metal | | Metal | | Glass | | Glass | | |
| | Packaging | | Packaging | | Packaging | | Packaging | | |
| | Europe | | Americas | | Europe | | North America | | Group |
| | $'m | | $'m | | $'m | | $'m | | $'m |
Revenue | | 2,470 | | 1,168 | | 1,541 | | 1,835 | | 7,014 |
Adjusted EBITDA | | 404 | | 154 | | 328 | | 395 | | 1,281 |
Capital expenditure | | 80 | | 39 | | 99 | | 133 | | 351 |
Segment assets | | 4,159 | | 1,934 | | 2,003 | | 2,755 | | 10,851 |
Capital expenditure is the sum of purchases of property, plant and equipment and software and other intangibles, net of proceeds from disposal of property, plant and equipment, as per the consolidated statement of cash flows.
No customer accounted for greater than 10% of total revenue in 2018 (2017: none; 2016: none).
Total revenue and non‑current assets, excluding derivative financial instruments, taxes, pensions and goodwill arising on acquisitions, in countries which account for more than 10% of total revenue or non‑current assets, in the current or prior years presented, are as follows:
| | | | | | |
| | Year ended December 31, |
| | 2018 | | 2017 | | 2016 |
Revenue | | $'m | | $'m | | $'m |
U.S. | | 3,358 | | 3,261 | | 2,695 |
United Kingdom | | 969 | | 879 | | 801 |
Germany | | 890 | | 801 | | 726 |
| | | | |
| | At December 31, |
| | 2018 | | 2017 |
Non-current assets | | $'m | | $'m |
U.S. | | 2,190 | | 2,218 |
Germany | | 847 | | 1,025 |
United Kingdom | | 659 | | 676 |
The revenue above is attributed to countries on a destination basis.
The Company is domiciled in Luxembourg. During the year the Group had revenues of $4 million (2017: $3 million, 2016: $2 million) with customers in Luxembourg. Non‑current assets located in Luxembourg were $nil (2017: $nil).
Within each reportable segment our packaging containers have similar production processes and classes of customers. Further, they have similar economic characteristics as evidenced by similar profit margins, similar degrees of risk and similar opportunities for growth. Based on the foregoing, we do not consider that they constitute separate product lines and therefore additional disclosures relating to product lines is not necessary.
4. Exceptional items
| | | | | | |
| | Year ended December 31, |
| | 2018 | | 2017 | | 2016 |
| | $'m | | $'m | | $'m |
Impairment - property, plant and equipment | | 11 | | 54 | | 9 |
Restructuring and other costs | | 57 | | 38 | | 15 |
Start-up related costs | | 48 | | 8 | | 5 |
Non-cash inventory adjustment | | — | | — | | 10 |
Past service cost/(credit) | | 8 | | — | | (24) |
Exceptional items - cost of sales | | 124 | | 100 | | 15 |
Transaction related costs - acquisition, integration and IPO | | 19 | | 49 | | 128 |
Restructuring and other costs | | — | | — | | 2 |
Exceptional items - SGA expenses | | 19 | | 49 | | 130 |
Impairment - goodwill | | 186 | | — | | — |
Exceptional items - impairment of intangible assets | | 186 | | — | | — |
Debt refinancing and settlement costs | | 22 | | 117 | | 157 |
Loss on derivative financial instruments | | 6 | | 15 | | 11 |
Interest payable on acquisition notes | | — | | — | | 17 |
Exceptional items - finance expense | | 28 | | 132 | | 185 |
Exceptional gain on derivative financial instruments | | — | | — | | (88) |
Exceptional items - finance income | | — | | — | | (88) |
Total exceptional items | | 357 | | 281 | | 242 |
Exceptional items are those that in management’s judgment need to be disclosed by virtue of their size, nature or incidence.
2018
Exceptional items of $357 million have been recognized for the year ending December 31, 2018, primarily comprising:
| · | | $116 million related to the Group’s capacity realignment programs, including start-up related costs ($48 million), restructuring costs ($57 million) and property, plant and equipment impairment charges ($11 million). These costs were incurred in Glass Packaging North America ($78 million), Metal Packaging Europe ($27 million), Metal Packaging Americas ($6 million) and Glass Packaging Europe ($5 million). |
| · | | $8 million pension service cost recognized in Metal Packaging Europe and Glass Packaging Europe following a High Court ruling in the UK in October 2018 in respect of GMP equalization (Note 18). |
| · | | $19 million transaction-related costs, primarily comprised of costs relating to acquisition, integration and other transactions. |
| · | | $186 million impairment of goodwill in Glass Packaging North America. |
| · | | $22 million debt refinancing and settlement costs primarily relating to the redemption of the Group’s $440 million 6.000% Senior Notes due 2021 in July 2018, principally comprising an early redemption premium and accelerated amortization of deferred finance costs. |
| · | | $6 million exceptional loss on the termination of the Group’s $440 million U.S. dollar to euro CCIRS in July 2018. |
2017
Exceptional items of $281 million have been recognized for the year ending December 31, 2017, primarily comprising:
| · | | $100 million related to the Group’s capacity realignment programs, including restructuring costs ($38 million), start-up related costs ($8 million) and property, plant and equipment impairment charges ($54 million). These costs were incurred in Glass Packaging North America ($43 million), Metal Packaging Europe ($54 million) and Metal Packaging Americas ($3 million). |
| · | | $49 million transaction-related costs, primarily comprised of costs directly attributable to the Beverage Can acquisition and the integration of this business and other IPO and transaction-related costs. |
| · | | $117 million debt refinancing and settlement costs relating to the notes and loans redeemed and repaid in January, March, April, June, and August 2017, principally comprising premiums payable on the early redemption of the notes and accelerated amortization of deferred finance costs and issue discounts. |
| · | | $15 million exceptional loss on the termination, in June 2017, of $500 million of the Group’s U.S. dollar to British pound CCIRS, of which $12 million relates to cumulative losses recycled from other comprehensive income. |
2016
Exceptional items of $242 million have been recognized in the year ended December 31, 2016, primarily comprising:
| · | | $31 million related to the Group’s capacity realignment programs, including restructuring costs ($15 million), start-up related costs ($5 million) and property, plant and equipment impairment charges ($9 million). These costs were principally incurred in Glass Packaging North America ($5 million), Metal Packaging Europe ($15 million) and Metal Packaging Americas ($11 million). |
| · | | $24 million pension service credit in Glass Packaging North America, following the amendment of certain defined benefit pension schemes during the period. |
| · | | $128 million transaction-related costs attributable primarily to the IPO and Beverage Can Acquisition. |
| · | | $157 million debt refinancing and settlement costs related to the notes repaid in May, September, and November 2016, including premiums payable on the early redemption of the notes, accelerated amortization of deferred finance costs, debt issuance premium and discounts and interest charges incurred in lieu of notice. |
| · | | The $11 million exceptional loss on derivative financial instruments relating to hedge ineffectiveness on the Group’s CCIRS. |
| · | | $17 million net interest charged in respect of notes held in escrow for the period between their issuance and the completion of the Beverage Can Acquisition. |
| · | | $88 million exceptional gain on derivative financial instruments relating to the gain on fair value of the CCIRS which were entered into during the second quarter and for which hedge accounting had not been applied until the third quarter. |
5. Finance income and expense
| | | | | | |
| | Year ended December 31, |
| | 2018 | | 2017 | | 2016 |
| | $'m | | $'m | | $'m |
Senior secured and senior notes | | 546 | | 553 | | 494 |
Other interest expense | | 24 | | 6 | | 7 |
Term loan | | — | | 5 | | 30 |
Interest expense | | 570 | | 564 | | 531 |
Foreign currency translation losses/(gains) | | 45 | | (75) | | 30 |
Net pension interest cost (Note 18) | | 21 | | 24 | | 28 |
(Gain)/loss on derivative financial instruments | | (10) | | 28 | | — |
Other finance income | | — | | (2) | | (5) |
Finance expense before exceptional items | | 626 | | 539 | | 584 |
Exceptional finance expense (Note 4) | | 28 | | 132 | | 185 |
Total finance expense | | 654 | | 671 | | 769 |
Exceptional finance income (Note 4) | | — | | — | | (88) |
Net finance expense | | 654 | | 671 | | 681 |
6. Income tax
| | | | | | |
| | Year ended December 31, |
| | 2018 | | 2017 | | 2016 |
| | $'m | | $'m | | $'m |
Current tax: | | | | | | |
Current tax for the year | | 103 | | 99 | | 69 |
Adjustments in respect of prior years | | 6 | | 1 | | (20) |
Total current tax | | 109 | | 100 | | 49 |
Deferred tax: | | | | | | |
Deferred tax for the year | | (58) | | (134) | | (11) |
Adjustments in respect of prior years | | (7) | | (6) | | 28 |
Total deferred tax | | (65) | | (140) | | 17 |
Income tax charge/(credit) | | 44 | | (40) | | 66 |
Reconciliation of income tax charge/(credit) and the (loss)/profit before tax multiplied by the Group’s domestic tax rate for 2018, 2017 and 2016 is as follows:
| | | | | | |
| | Year ended December 31, |
| | 2018 | | 2017 | | 2016 |
| | $'m | | $'m | | $'m |
Loss before tax | | (219) | | 1 | | (106) |
Loss before tax multiplied by the standard rate of Luxembourg corporation tax: 26.01% (2017: 27.08%; 2016: 29.22%) | | (57) | | — | | (31) |
Tax losses for which no deferred income tax asset was recognized | | 16 | | — | | 1 |
Re-measurement of deferred taxes | | (4) | | (79) | | (6) |
Adjustment in respect of prior years | | (1) | | (5) | | 8 |
Income subject to state and other local income taxes | | 18 | | 17 | | 10 |
Income taxed at rates other than standard tax rates | | 6 | | (19) | | 21 |
Non-deductible items | | 60 | | 36 | | 66 |
Other | | 6 | | 10 | | (3) |
Income tax charge/(credit) | | 44 | | (40) | | 66 |
The total income tax charge/(credit) outlined above for each year includes tax credits of $54 million in 2018 (2017: $138 million; 2016: $49 million) in respect of exceptional items, being the tax effect of the items set out in Note 4. The $138 million exceptional income tax credit recognized in the year ended December 31, 2017 includes a credit of $78 million on remeasurement of deferred tax positions following the enactment of the Tax Cuts and Jobs Act of 2017 (“TCJA”) in the United States of America.
7. Employee costs
| | | | | | |
| | Year ended December 31, |
| | 2018 | | 2017 | | 2016 |
| | $'m | | $'m | | $'m |
Wages and salaries | | 1,305 | | 1,345 | | 1,190 |
Social security costs | | 228 | | 209 | | 167 |
Defined benefit plan pension costs (Note 18) | | 46 | | 46 | | 46 |
Defined benefit past service credit (Note 18) | | (3) | | (10) | | (43) |
Defined contribution plan pension costs (Note 18) | | 44 | | 35 | | 34 |
| | 1,620 | | 1,625 | | 1,394 |
| | | | | | |
| | At December 31, |
Employees | | 2018 | | 2017 | | 2016 |
Production | | 20,619 | | 20,793 | | 20,823 |
Administration | | 2,809 | | 2,699 | | 2,712 |
| | 23,428 | | 23,492 | | 23,535 |
8. Intangible assets
| | | | | | | | | | |
| | | | Customer | | Technology | | | | |
| | Goodwill | | relationships | | and other | | Software | | Total |
| | $'m | | $'m | | $'m | | $'m | | $'m |
Cost | | | | | | | | | | |
At January 1, 2017 | | 2,088 | | 2,258 | | 234 | | 64 | | 4,644 |
Charge for the year | | — | | — | | 5 | | 16 | | 21 |
Derecognition of fully amortized assets | | — | | (42) | | — | | — | | (42) |
Exchange | | 113 | | 139 | | 12 | | 8 | | 272 |
At December 31, 2017 | | 2,201 | | 2,355 | | 251 | | 88 | | 4,895 |
Amortization | | | | | | | | | | |
At January 1, 2017 | | | | (399) | | (87) | | (43) | | (529) |
Additions | | | | (225) | | (31) | | (8) | | (264) |
Derecognition of fully amortized assets | | | | 42 | | — | | — | | 42 |
Exchange | | | | (25) | | (8) | | (7) | | (40) |
At December 31, 2017 | | | | (607) | | (126) | | (58) | | (791) |
Net book value | | | | | | | | | | |
At December 31, 2017 | | 2,201 | | 1,748 | | 125 | | 30 | | 4,104 |
Cost | | | | | | | | | | |
At January 1, 2018 | | 2,201 | | 2,355 | | 251 | | 88 | | 4,895 |
Additions | | — | | — | | 12 | | 25 | | 37 |
Impairment | | (186) | | — | | — | | — | | (186) |
Exchange | | (45) | | (55) | | (8) | | (3) | | (111) |
At December 31, 2018 | | 1,970 | | 2,300 | | 255 | | 110 | | 4,635 |
Amortization | | | | | | | | | | |
At January 1, 2018 | | | | (607) | | (126) | | (58) | | (791) |
Charge for the year | | | | (227) | | (30) | | (8) | | (265) |
Exchange | | | | 17 | | 3 | | 2 | | 22 |
At December 31, 2018 | | | | (817) | | (153) | | (64) | | (1,034) |
Net book value | | | | | | | | | | |
At December 31, 2018 | | 1,970 | | 1,483 | | 102 | | 46 | | 3,601 |
An impairment charge of $186 million, before the impact of deferred tax, was recognized in the year ended December 31, 2018 in respect of the goodwill in Glass Packaging North America as a result of the impairment testing performed. The impairment charge primarily arises as a result of a challenging market backdrop of continuing reductions in demand and volumes of glass packaging for domestically-produced mass beer brands as a result of the growth in consumption of imported beer. The decline in mass beer continues and the Group has undertaken a comprehensive review of our capacity, transportation, logistics and supply chain and implemented measures to improve future performance in order to ensure that the business once again performs in line with our expectations. These actions included the recalibration of our production capacity through addressing the overcapacity in beer and establishing additional capacity for wine and food.
In the year ended December 31, 2017 an intangible asset relating to an acquired customer relationship in Glass Packaging North America was derecognised. This asset had reached the end of its estimated useful life and had a net book value of $nil at the date of derecognition.
Goodwill
Allocation of goodwill
Goodwill has been allocated to groups of CGUs for the purpose of impairment testing. The groupings represent the lowest level at which the related goodwill is monitored for internal management purposes. Goodwill acquired through business combination activity is allocated to CGUs that are expected to benefit from synergies arising from that combination.
The lowest level within the Group at which the goodwill is monitored for internal management purposes and consequently the CGUs to which goodwill is allocated is set out below:
| | | | |
| | At December 31, |
| | 2018 | | 2017 |
| | $'m | | $'m |
Metal Packaging Europe - excluding the Beverage Can Business ('Metal Europe') | | 305 | | 320 |
Metal Packaging Americas - excluding the Beverage Can Business ('Metal Americas') | | 29 | | 29 |
Metal Packaging Europe - Beverage Can Business ('Beverage Europe') | | 577 | | 604 |
Metal Packaging Americas - Beverage Can Business ('Beverage Americas') | | 437 | | 437 |
Glass Packaging Europe | | 62 | | 65 |
Glass Packaging North America | | 560 | | 746 |
Total Goodwill | | 1,970 | | 2,201 |
Impairment tests for goodwill
The Group performs its impairment test of goodwill annually following approval of the annual budget.
Recoverable amount and carrying amount
The Group used the value in use (“VIU”) model for the purposes of the goodwill impairment testing as this reflects the Group’s intention to hold and operate the assets. However, if an impairment indicator exists for a CGU, the Group uses both the VIU model and the fair value less costs to sell (“FVLCTS”) model to establish the higher of the recoverable amount.
Value in use
The VIU model used the 2019 budget approved by the Board and a two year forecast for 2020 to 2021 (2017: one-year budget). The budget and forecast results were then extended for a further two-year period (2017: four-year period) making certain assumptions including that long-term capital expenditure equals depreciation and that any increase in input cost will be passed through to customers, in line with historic practice and contractual terms.
The terminal value assumed long-term growth in line with long-term inflation.
Cash flows considered in the VIU model included the cash inflows and outflows related to the continuing use of the assets over their remaining useful lives, expected earnings, required maintenance capital expenditure, depreciation and working capital.
The discount rate applied to cash flows in the VIU model was estimated using our weighted average cost of capital as determined by the Capital Asset Pricing Model with regard to the risks associated with the cash flows being considered (country, market and specific risks of the asset).
The modelled cash flows take into account the Group’s established history of earnings, cash flow generation and the nature of the markets in which we operate, where product obsolescence is low. The key assumptions employed in modelling estimates of future cash flows are subjective and include projected Adjusted EBITDA, discount rates and growth rates, replacement capital expenditure requirements, rates of customer retention and the ability to maintain margin through the pass through of input cost inflation.
Under the VIU model, there was an indicator of impairment identified in the Glass Packaging North America CGU when the discounted future cash flows were compared to the carrying amount of the Glass Packaging North America CGU. Consequently, a FVLCTS calculation was performed to establish the higher of the recoverable amount when compared to the VIU model for Glass Packaging North America at December, 31 2018. See below for details of results of the FVLCTS calculation.
For all remaining CGUs, a sensitivity analysis was performed reflecting potential variations in terminal growth rate and discount rate assumptions. In all cases the recoverable values calculated were in excess of the carrying values of
the CGUs. The variation applied to terminal value growth rates and discount rates was a 50 basis points decrease and increase respectively and represents a reasonably possible change to the key assumptions of the VIU model. Further, a reasonably possible change to the operating cash flows would not reduce the recoverable amounts below the carrying value of the CGUs.
Fair value less costs to sell
The FVLCTS calculation for the Glass Packaging North America CGU used the 2019 projected Adjusted EBITDA multiplied by an earnings multiple of 6.7x, based on comparable market transactions, and adjusted for selling costs. The fair value measurement was considered a Level 3 fair value based on certain unobservable pricing inputs. The FVLCTS calculation resulted in a higher recoverable amount than the VIU model. The recoverable amount was then compared to the carrying value of the Glass Packaging North America CGU, resulting in the recognition of an impairment charge of $186 million (before the impact of deferred tax) on goodwill allocated to Glass Packaging North America in the year ended December 31, 2018.
A sensitivity analysis was performed on the FVLCTS calculation by increasing and decreasing the earnings multiple and the 2019 projected Adjusted EBITDA by 50 basis points respectively. The results of the sensitivitiy analysis does not have a material impact on the impairment charge recognized in the year end December 31, 2018.
The additional disclosures required under IAS 36 in relation to significant goodwill amounts arising in the groups of CGUs are as follows:
| | | | | | | | | | | | | |
| | | | | | | | | | | | | |
| | | | | | | | | | | | Glass | |
| | | | | | | | | | Glass | | Packaging | |
| | Metal | | Metal | | Beverage | | Beverage | | Packaging | | North | |
| | Europe | | Americas | | Europe | | Americas | | Europe | | America | |
| | $'m/% | | $'m/% | | $'m/% | | $'m/% | | $'m/% | | $'m/% | |
2018 | | | | | | | | | | | | | |
Carrying amount of goodwill | | 305 | | 29 | | 577 | | 437 | | 62 | | 560 | |
Excess of recoverable amount | | 1,672 | | 299 | | 1,673 | | 1,085 | | 2,222 | | N/A | |
Pre-tax discount rate applied | | 7.6 | | 9.7 | | 6.7 | | 9.6 | | 8.5 | | N/A | |
Growth rate for terminal value | | 1.5 | | 1.5 | | 1.5 | | 1.5 | | 1.5 | | N/A | |
2017 | | | | | | | | | | | | | |
Carrying amount of goodwill | | 320 | | 29 | | 604 | | 437 | | 65 | | 746 | |
Excess of recoverable amount | | 3,104 | | 451 | | 1,650 | | 786 | | 2,907 | | 859 | |
Pre-tax discount rate applied | | 7.3 | | 8.3 | | 7.4 | | 9.6 | | 8.2 | | 9.1 | |
Growth rate for terminal value | | 1.5 | | 1.5 | | 1.5 | | 1.5 | | 1.5 | | 1.5 | |
9. Property, plant and equipment
| | | | | | | | |
| | | | Plant, | | Office | | |
| | Land and | | machinery | | equipment | | |
| | buildings | | and other | | and vehicles | | Total |
| | $'m | | $'m | | $'m | | $'m |
Cost | | | | | | | | |
At January 1, 2017 | | 983 | | 3,541 | | 64 | | 4,588 |
Additions | | 8 | | 508 | | 6 | | 522 |
Impairment (Note 4) | | — | | (54) | | — | | (54) |
Disposals | | (4) | | (160) | | (10) | | (174) |
Transfers | | 11 | | (9) | | 7 | | 9 |
Exchange | | 96 | | 316 | | 4 | | 416 |
At December 31, 2017 | | 1,094 | | 4,142 | | 71 | | 5,307 |
Depreciation | | | | | | | | |
At January 1, 2017 | | (200) | | (1,295) | | (25) | | (1,520) |
Charge for the year | | (35) | | (378) | | (10) | | (423) |
Disposals | | 2 | | 156 | | 10 | | 168 |
Transfers | | 1 | | (2) | | 1 | | — |
Exchange | | (26) | | (137) | | (1) | | (164) |
At December 31, 2017 | | (258) | | (1,656) | | (25) | | (1,939) |
Net book value | | | | | | | | |
At December 31, 2017 | | 836 | | 2,486 | | 46 | | 3,368 |
Cost | | | | | | | | |
At January 1, 2018 | | 1,094 | | 4,142 | | 71 | | 5,307 |
Additions | | 15 | | 539 | | 37 | | 591 |
Impairment (Note 4) | | — | | (11) | | — | | (11) |
Disposals | | (16) | | (190) | | (11) | | (217) |
Transfers | | — | | — | | 5 | | 5 |
Exchange | | (49) | | (182) | | (8) | | (239) |
At December 31, 2018 | | 1,044 | | 4,298 | | 94 | | 5,436 |
Depreciation | | | | | | | | |
At January 1, 2018 | | (258) | | (1,656) | | (25) | | (1,939) |
Charge for the year | | (37) | | (388) | | (24) | | (449) |
Disposals | | 10 | | 187 | | 9 | | 206 |
Exchange | | 21 | | 107 | | 6 | | 134 |
At December 31, 2018 | | (264) | | (1,750) | | (34) | | (2,048) |
Net book value | | | | | | | | |
At December 31, 2018 | | 780 | | 2,548 | | 60 | | 3,388 |
| | | | | | | | |
Depreciation expense of $440 million (2017: $415 million; 2016: $363 million) has been charged in cost of sales and $9 million (2017: $8 million; 2016: $6 million) in sales, general and administration expenses.
Transfers primarily relate to the reclassification of construction in progress to the applicable classification within property, plant and equipment and the reclassification of certain consumables with an estimated useful life of greater than one year, from inventory to property, plant and equipment. Construction in progress at December 31, 2018 was $254 million (2017: $241 million).
Included in property, plant and equipment is an amount for land of $213 million (2017: $225 million).
Substantially all of the Group’s property, plant and equipment is pledged as security under the terms and conditions of the Group’s financing arrangements. No interest was capitalized in the year (2017: $nil).
Impairment
The board of directors of Ardagh Group S.A. has considered the carrying value of the Group’s property, plant and equipment and assessed the indicators of impairment as at December 31, 2018 in accordance with IAS 36. In the year ended December 31, 2018 an impairment charge of $11 million (2017: $54 million) has been recognized, of which $4 million (2017: $38 million) relates to the impairment of plant and machinery in Glass Packaging North America, $5 million (2017: $nil) relates to the impairment of plant and machinery in Metal Packaging Americas, and $2 million (2017: $16 million) relates to the impairment of plant and machinery in Metal Packaging Europe, arising principally from capacity realignment programs.
Finance leases
The depreciation charge for capitalized leased assets was $5 million (2017: $1 million; 2016: $1 million) and the related finance charges were $2 million (2017: $nil; 2016: $nil). The net carrying amount is $36 million (2017: $12 million).
Operating lease commitments
During the year, the expense in respect of operating lease commitments was as follows:
| | | | | | |
| | Year ended December 31, |
| | 2018 | | 2017 | | 2016 |
| | $'m | | $'m | | $'m |
| | | | Re-presented | | Re-presented |
Plant and machinery | | 22 | | 21 | | 20 |
Land and buildings | | 51 | | 38 | | 34 |
Office equipment and vehicles | | 17 | | 9 | | 9 |
| | 90 | | 68 | | 63 |
At December 31, the Group had total commitments under non‑cancellable operating leases which expire:
| | | | | | |
| | At December 31, |
| | 2018 | | 2017 | | 2016 |
| | $'m | | $'m | | $'m |
| | | | Re-presented | | Re-presented |
Not later than one year | | 67 | | 64 | | 59 |
Later than one year and not later than five years | | 150 | | 132 | | 123 |
Later than five years | | 147 | | 106 | | 98 |
| | 364 | | 302 | | 280 |
Capital commitments
The following capital commitments in relation to property, plant and equipment were authorized by management, but have not been provided for in the consolidated financial statements:
| | | | | | |
| | At December 31, |
| | 2018 | | 2017 | | 2016 |
| | $'m | | $'m | | $'m |
Contracted for | | 118 | | 101 | | 116 |
Not contracted for | | 76 | | 14 | | 20 |
| | 194 | | 115 | | 136 |
10. Other non‑current assets
At December 31, 2018 other non‑current assets of $24 million (2017: $25 million) include $9 million (2017: $10 million) relating to the Group’s investment in its joint ventures.
11. Deferred income tax
The movement in deferred tax assets and liabilities during the year was as follows:
| | | | | | |
| | Assets | | Liabilities | | Total |
| | $'m | | $'m | | $'m |
At January 1, 2017 | | 469 | | (928) | | (459) |
(Charged)/credited to the income statement (Note 6) | | (67) | | 207 | | 140 |
(Charged)/credited to other comprehensive income | | (6) | | 1 | | (5) |
Reclassification | | 4 | | (4) | | — |
Exchange | | 28 | | (66) | | (38) |
At December 31, 2017 | | 428 | | (790) | | (362) |
Credited to the income statement (Note 6) | | 36 | | 29 | | 65 |
Credited/(charged) to other comprehensive income | | 7 | | (3) | | 4 |
Reclassification | | (36) | | 36 | | — |
Exchange | | (3) | | 7 | | 4 |
At December 31, 2018 | | 432 | | (721) | | (289) |
The components of deferred income tax assets and liabilities are as follows:
| | | | |
| | At December 31, |
| | 2018 | | 2017 |
| | $'m | | $'m |
Tax losses | | 49 | | 34 |
Employee benefit obligations | | 179 | | 187 |
Depreciation timing differences | | 83 | | 90 |
Provisions | | 69 | | 70 |
Other | | 52 | | 47 |
| | 432 | | 428 |
Available for offset | | (178) | | (207) |
Deferred tax assets | | 254 | | 221 |
Intangible assets | | (344) | | (395) |
Accelerated depreciation and other fair value adjustments | | (343) | | (369) |
Other | | (34) | | (26) |
| | (721) | | (790) |
Available for offset | | 178 | | 207 |
Deferred tax liabilities | | (543) | | (583) |
The tax credit/(charge) recognized in the consolidated income statement is analyzed as follows:
| | | | | | |
| | Year ended December 31, |
| | 2018 | | 2017 | | 2016 |
| | $'m | | $'m | | $'m |
Tax losses | | 18 | | (2) | | (3) |
Employee benefit obligations | | 3 | | (21) | | (13) |
Depreciation timing differences | | 4 | | (6) | | (13) |
Provisions | | (1) | | (26) | | — |
Other deferred tax assets | | 12 | | (12) | | (17) |
Intangible assets | | 52 | | 155 | | 42 |
Accelerated depreciation and other fair value adjustments | | (20) | | 29 | | (4) |
Other deferred tax liabilities | | (3) | | 23 | | (9) |
| | 65 | | 140 | | (17) |
Deferred tax assets are only recognized on tax loss carry‑forwards to the extent that the realization of the related tax benefit through future taxable profits is probable based on management’s forecasts. The Group did not recognize deferred tax assets of $111 million (2017: $131 million) in respect of tax losses amounting to $450 million (2017: $627 million) that can be carried forward against future taxable income due to uncertainty regarding their utilization. In addition, the Group did not recognize deferred tax assets of $51 million (2017: $50 million) in respect of capital losses amounting to $243 million (2017: $239 million) that can be carried forward against future taxable income due to uncertainty regarding their utilization.
No provision has been made for temporary differences applicable to investments in subsidiaries as the Group is in a position to control the timing of reversal of the temporary difference and it is probable that the temporary difference will not reverse in the foreseeable future. Given that exemptions and tax credits would be available in the context of the Group’s investments in subsidiaries in the majority of jurisdictions in which it operates, the aggregate amount of temporary differences in respect of which deferred tax liabilities have not been recognized would not be material.
12. Inventories
| | | | |
| | At December 31, |
| | 2018 | | 2017 |
| | $'m | | $'m |
Raw materials and consumables | | 389 | | 369 |
Mold parts | | 51 | | 52 |
Work-in-progress | | 114 | | 85 |
Finished goods | | 730 | | 847 |
| | 1,284 | | 1,353 |
Certain inventories held by the Ardagh Group have been pledged as security under the Group’s Global Asset Based Loan Facility (Note 17). The amount recognized as a write down in inventories or as a reversal of a write down in the year ended December 31, 2018 was not material.
At December 31, 2018, the hedging gain included in the carrying value of inventories, which will be recognized in the income statement when the related finished goods have been sold, is not material.
13. Trade and other receivables
| | | | |
| | At December 31, |
| | 2018 | | 2017 |
| | $'m | | $'m |
Trade receivables | | 823 | | 1,015 |
Other receivables and prepayments | | 230 | | 259 |
| | 1,053 | | 1,274 |
The fair values of trade and other receivables approximate the amounts shown above. Movements on the provision for impairment of trade receivables are as follows:
| | | | | | |
| | 2018 | | 2017 | | 2016 |
| | $'m | | $'m | | $'m |
At January 1, | | 23 | | 15 | | 15 |
Impact of adoption of IFRS 9 on January 1, 2018 | | (4) | | — | | — |
At January 1, | | 19 | | 15 | | 15 |
Provision for receivables impairment | | 2 | | 6 | | 1 |
Receivables written off during the year as uncollectible | | (3) | | — | | (1) |
Exchange | | (1) | | 2 | | — |
At December 31, | | 17 | | 23 | | 15 |
The majority of the provision above relates to balances which are more than six months past due. The maximum exposure to credit risk at the reporting date is the carrying value of each class of receivable set out above.
Provisions against specific balances
Significant balances are assessed for evidence of increased credit risk. Examples of factors considered are high probability of bankruptcy, breaches of contract or major concession being sought by the customer. Instances of significant single customer related bad debts are rare and there is no significant concentration of risk associated with particular customers.
Providing against the remaining population of customers
The Group monitors actual historical credit losses and adjusts for forward-looking information to measure the level of expected losses. Adverse changes in the payment status of customers of the Group, or national or local economic conditions that correlate with defaults on receivables owing to the Group, may also provide a basis for an increase in the level of provision above historic loss experience.
As of December 31, 2018, trade receivables of $68 million (2017: $62 million) were past due but not impaired. These relate to a number of independent customers for whom there is no recent history of default. The ageing analysis of these trade receivables is as follows:
| | | | |
| | At December 31, |
| | 2018 | | 2017 |
| | $'m | | $'m |
Up to three months past due | | 56 | | 46 |
Three to six months past due | | 5 | | 5 |
Over six months past due | | 7 | | 11 |
| | 68 | | 62 |
14. Cash and cash equivalents
| | | | |
| | At December 31, |
| | 2018 | | 2017 |
| | $'m | | $'m |
Cash at bank and in hand | | 529 | | 680 |
Short term bank deposits | | 26 | | 130 |
Restricted cash | | 10 | | 13 |
| | 565 | | 823 |
| | | | |
Within cash and cash equivalents, the Group had $10 million of restricted cash at December 31, 2018 (2017: $13 million), which includes bank guarantees in the United States and early retirement plans in Germany.
15. Issued capital and reserves
Issued and fully paid shares:
| | | | |
| | Number of | | |
| | shares | | |
| | (millions) | | $'m |
Ordinary shares (par value €0.01) | | 10.3 | | — |
At December 31, 2018 and at December 31, 2017 | | 10.3 | | — |
| | | | |
There were no transactions in shares of the Company during the year ended December 31, 2018. During the year ended December 31, 2018, the Group paid dividends of $10 million (2017: $8 million), to the non-controlling interest of a subsidiary of the Company.
During the year ended December 31, 2017 the Company issued 256,410 ordinary shares for consideration equal to the par value of €0.01 each.
16. Financial risk factors
The Group’s activities expose it to a variety of financial risks: capital risk, interest rate risk, currency exchange risk, commodity price risk, credit risk, and liquidity risk.
Capital structure and risk
The Group’s objectives when managing capital are to safeguard the Group’s ability to continue as a going concern and provide returns to its shareholders. The Group funds its operations primarily from the following sources of capital: borrowings, cash flow and shareholders’ capital. The Group aims to achieve a capital structure that results in an appropriate cost of capital to accommodate material investments or acquisitions, while providing flexibility in short and medium term funding. The Group also aims to maintain a strong balance sheet and to provide continuity of financing by having a range of maturities and borrowing from a variety of sources. The Group’s overall treasury objectives are to ensure sufficient funds are available for the Group to carry out its strategy and to manage certain financial risks to which the Group is exposed, details of which are provided below.
Financial risks are managed on the advice of Group Treasury and senior management. The Group does not permit the use of treasury instruments for speculative purposes, under any circumstances. Group Treasury regularly reviews the level of cash and debt facilities required to fund the Group’s activities, plans for repayments and refinancing of debt, and identifies an appropriate amount of headroom to provide a reserve against unexpected funding requirements.
Additionally, financial instruments, including derivative financial instruments, are used to hedge exposure to interest rate, currency exchange risk and commodity price risk.
One of the Group’s key metrics has been the ratio of consolidated external net debt as a multiple of Adjusted EBITDA. Adjusted EBITDA consists of profit/(loss) before income tax (credit)/charge, net finance expense, depreciation and amortization and exceptional operating items. As at December 31, 2018 the ratio for the Group was 6.2x (2017: 6.3x; 2016: 7.3x).
Interest rate risk
The Board’s policy, in the management of interest rate risk, is to strike the right balance between the Group’s fixed and floating rate financial instruments, which occasionally includes the use of CCIRS. The balance struck by the Board is dependent on prevailing interest rate markets at any point in time.
At December 31, 2018, the Group’s external borrowings were 91.9% (2017: 93.2%) fixed with a weighted average interest rate of 5.7% (2017: 5.7%; 2016: 5.6%). The weighted average interest rate of the Group for the year ended December 31, 2018 was 5.3% (2017: 5.3%; 2016: 5.4%).
Holding all other variables constant, including levels of the Group’s external indebtedness, at December 31, 2018 a one percentage point increase in variable interest rates would increase interest payable by approximately $9 million (2017: $7 million).
Currency exchange risk
The Group presents its consolidated financial information in U.S. dollar. The functional currency of the Company will continue to be the euro.
The Group operates in 22 countries, across five continents and its main currency exposure in the year to December 31, 2018, from the euro functional currency, was in relation to the U.S. dollar, British pound, Swedish krona, Polish zloty, Danish krone and Brazilian real. Currency exchange risk arises from future commercial transactions, recognized assets and liabilities, and net investments in foreign operations.
As a result of the consolidated financial statements being presented in U.S. dollar, the Group’s results are also impacted as a result of fluctuations in the U.S. dollar exchange rate versus the euro.
The Group has a limited level of transactional currency exposure arising from sales or purchases by operating units in currencies other than their functional currencies.
The Group has certain investments in foreign operations, whose net assets are exposed to foreign currency translation risk. Currency exposure arising from the net assets of the Group’s foreign operations is managed primarily through borrowings and swaps denominated in the Group’s principal foreign currencies.
Fluctuations in the value of these currencies with respect to the euro functional currency may have a significant impact on the Group’s financial condition and results of operations. When considering the Group’s position, the Group believes that a strengthening of the euro exchange rate (the functional currency) by 1% against all other foreign currencies from the December 31, 2018 rate would increase shareholders’ equity by approximately $5 million (2017: $2 million).
Commodity price risk
The Group is exposed to changes in prices of our main raw materials, primarily energy, aluminum and steel. Production costs in our Metal Packaging division are exposed to changes in prices of our main raw materials, primarily aluminum and steel. Aluminum ingot is traded daily as a commodity on the London Metal Exchange, which has historically been subject to significant price volatility. Because aluminum is priced in U.S. dollars, fluctuations in the U.S. dollar/ euro rate also affect the euro cost of aluminum ingot. The price and foreign currency risk on the aluminum purchases in Metal Packaging Europe and Metal Packaging Americas are hedged by entering into swaps under which we pay fixed euro and U.S. dollar prices, respectively. In contrast, the hedging market for steel, and in particular that for coking coal, is a relatively new market which does not have the depth of the aluminum market and as a consequence, there might be limitations to placing hedges in the market. The majority of our steel purchases are obtained under one‑year contracts with prices that are usually fixed in advance. When such contracts are renewed in the future, our steel costs under such contracts will be subject to prevailing global steel and/or tinplate prices at the time of renewal, which may be different from historical prices. Furthermore, the relative price of oil and its by‑products may materially impact our business, affecting our transport, lacquer and ink costs.
Where we do not have pass through contracts in relation to the underlying metal raw material cost the Group uses derivative agreements to manage this risk. The Group depends on an active liquid market and available credit lines with counterparty banks to cover this risk. The use of derivative contracts to manage our risk is dependent on robust hedging procedures. Increasing raw material costs over time has the potential, if we are unable to pass on price increases, to reduce sales volume and could therefore have a significant impact on our financial condition. The Group is also exposed to possible interruptions of supply of aluminum and steel or other raw materials and any inability to purchase raw materials could negatively impact our operations.
Production costs in our Glass Packaging division are sensitive to the price of energy. Our main energy exposure is to the cost of gas and electricity. These energy costs have experienced significant volatility in recent years with a corresponding effect on our production costs. In terms of gas, which represents 50% of our energy costs, there is a continuous de‑coupling between the cost of gas and oil, whereby now only significant changes in the price of oil have an impact on the price of gas. The volatility in gas pricing is driven by shale gas development (United States only), the availability of liquefied natural gas in Europe, as both Europe and Asia compete for shipments, and storage levels. Volatility in the price of electricity is caused by the German Renewable Energy policy, the phasing out of nuclear generating capacity, fluctuations in the price of gas and coal and the influence of carbon dioxide costs on electricity prices.
As a result of the volatility of gas and electricity prices, the Group has either included energy pass‑through clauses in our sales contracts or developed an active hedging strategy to fix a significant proportion of our energy costs through contractual arrangements directly with our suppliers, where there is no energy clause in the sales contract.
Where pass through contracts do not exist the Group policy is to purchase gas and electricity by entering into forward price‑fixing arrangements with suppliers for the bulk of our anticipated requirements for the year ahead. Such contracts are used exclusively to obtain delivery of our anticipated energy supplies. The Group does not net settle, nor do
we sell within a short period of time after taking delivery. The Group avails of the own use exemption and, therefore, these contracts are treated as executory contracts.
The Group typically builds up these contractual positions in tranches of approximately 10% of the anticipated volumes. Any gas and electricity which is not purchased under forward price‑fixing arrangements is purchased under index tracking contracts or at spot prices. As at December 31, 2018, we have 60% and 55% of our energy risk covered for 2019 and 2020, respectively.
Credit risk
Credit risk arises from derivative contracts, cash and deposits held with banks and financial institutions, as well as credit exposures to the Group’s customers, including outstanding receivables. Group policy is to place excess liquidity on deposit, only with recognized and reputable financial institutions. For banks and financial institutions, only independently rated parties with a minimum rating of ‘BBB+’ from at least two credit rating agencies are accepted, where possible. The credit ratings of banks and financial institutions are monitored to ensure compliance with Group policy. Risk of default is controlled within a policy framework of dealing with high quality institutions and by limiting the amount of credit exposure to any one bank or institution.
Group policy is to extend credit to customers of good credit standing. Credit risk is managed on an on‑going basis, by experienced people within the Group. The Group’s policy for the management of credit risk in relation to trade receivables involves periodically assessing the financial reliability of customers, taking into account their financial position, past experience and other factors. Provisions are made, where deemed necessary, and the utilization of credit limits is regularly monitored. Management does not expect any significant counterparty to fail to meets its obligations. The maximum exposure to credit risk is represented by the carrying amount of each asset. For the year ended December 31, 2018, the Group’s ten largest customers accounted for approximately 37% of total revenues (2017: 36%; 2016: 33%). There is no recent history of default with these customers.
Surplus cash held by the operating entities over and above the balance required for working capital management is transferred to Group Treasury. Group Treasury invests surplus cash in interest‑bearing current accounts and time deposits with appropriate maturities to provide sufficient headroom as determined by the below‑mentioned forecasts.
Liquidity risk
The Group is exposed to liquidity risk which arises primarily from the maturing of short term and long term debt obligations. The Group’s policy is to ensure that sufficient resources are available either from cash balances, cash flows or undrawn committed bank facilities, to ensure all obligations can be met as they fall due.
To effectively manage liquidity risk, the Group:
| · | | has committed borrowing facilities that it can access to meet liquidity needs; |
| · | | maintains cash balances and liquid investments with highly‑rated counterparties; |
| · | | limits the maturity of cash balances; |
| · | | borrows the bulk of its debt needs under long term fixed rate debt securities; and |
| · | | has internal control processes to manage liquidity risk. |
Cash flow forecasting is performed in the operating entities of the Group and is aggregated by Group Treasury. Group Treasury monitors rolling forecasts of the Group’s liquidity requirements to ensure it has sufficient cash to meet operational needs while maintaining sufficient headroom on its undrawn committed borrowing facilities at all times so that the Group does not breach borrowing limits or covenants on any of its borrowing facilities. Such forecasting takes into consideration the Group’s debt financing plans.
17. Financial assets and liabilities
The Group’s net external debt was as follows:
| | | | |
| | At December 31, |
| | 2018 | | 2017 |
| | $'m | | $'m |
Loan notes | | 9,463 | | 10,064 |
Other borrowings | | 142 | | 12 |
Total borrowings | | 9,605 | | 10,076 |
Cash and cash equivalents | | (565) | | (823) |
Derivative financial instruments used to hedge foreign currency and interest rate risk | | 113 | | 301 |
Net debt | | 9,153 | | 9,554 |
The Group’s net borrowings of $9,605 million (2017: $10,076 million) are are classified as non-current liabilities of $9,487 million (2017: $10,074 million) and current liabilities of $118 million (2017: $2 million) in the consolidated statement of financial position at December 31, 2018.
At December 31, 2018, the Group’s net debt and available liquidity was as follows:
| | | | | | | | | | | | | | |
| | | | Maximum | | Final | | | | | | | | |
| | | | amount | | maturity | | Facility | | | | | | Undrawn |
Facility | | Currency | | drawable | | date | | type | | Amount drawn | | amount |
| | | | Local | | | | | | Local | | $'m | | $'m |
| | | | currency | | | | | | currency | | | | |
| | | | m | | | | | | m | | | | |
Liabilities guaranteed by the ARD Finance Group | | | | | | | | | | | | | | |
7.125%/7.875% Senior Secured Toggle Notes | | USD | | 770 | | 15-Sep-23 | | Bullet | | 770 | | 770 | | — |
6.625%/7.375% Senior Secured Toggle Notes | | EUR | | 845 | | 15-Sep-23 | | Bullet | | 845 | | 967 | | — |
Liabilities guaranteed by the Ardagh Group | | | | | | | | | | | | | | |
2.750% Senior Secured Notes | | EUR | | 750 | | 15-Mar-24 | | Bullet | | 750 | | 859 | | — |
4.625% Senior Secured Notes | | USD | | 1,000 | | 15-May-23 | | Bullet | | 1,000 | | 1,000 | | — |
4.125% Senior Secured Notes | | EUR | | 440 | | 15-May-23 | | Bullet | | 440 | | 504 | | — |
4.250% Senior Secured Notes | | USD | | 715 | | 15-Sep-22 | | Bullet | | 715 | | 715 | | — |
4.750% Senior Notes | | GBP | | 400 | | 15-Jul-27 | | Bullet | | 400 | | 512 | | — |
6.000% Senior Notes | | USD | | 1,700 | | 15-Feb-25 | | Bullet | | 1,700 | | 1,685 | | — |
7.250% Senior Notes | | USD | | 1,650 | | 15-May-24 | | Bullet | | 1,650 | | 1,650 | | — |
6.750% Senior Notes | | EUR | | 750 | | 15-May-24 | | Bullet | | 750 | | 859 | | — |
Global Asset Based Loan Facility | | USD | | 739 | | 07-Dec-22 | | Revolving | | — | | 100 | | 639 |
Finance lease obligations | | USD/GBP/EUR | | — | | — | | Amortizing | | — | | 36 | | — |
Other borrowings / credit lines | | EUR/USD | | — | | Rolling | | Amortizing | | — | | 15 | | 1 |
Total borrowings / undrawn facilities | | | | | | | | | | | | 9,672 | | 640 |
Deferred debt issue costs and bond premiums | | | | | | | | | | | | (67) | | — |
Net borrowings / undrawn facilities | | | | | | | | | | | | 9,605 | | 640 |
Cash and cash equivalents | | | | | | | | | | | | (565) | | 565 |
Derivative financial instruments used to hedge foreign currency and interest rate risk | | | | | | | | | | | | 113 | | — |
Net debt / available liquidity | | | | | | | | | | | | 9,153 | | 1,205 |
Net debt includes the fair value of associated derivative financial instruments that are used to hedge foreign exchange and interest rate risks relating to finance debt.
Certain of the Group’s borrowing agreements contain certain covenants that restrict the Group’s flexibility in certain areas such as incurrence of additional indebtedness (primarily maximum borrowings to Adjusted EBITDA and a minimum Adjusted EBITDA to interest expense), payment of dividends and incurrence of liens. The Global Asset Based Loan Facility is subject to a number of financial covenants including a fixed charge coverage ratio. The facility also includes cash dominion, representations, warranties, events of default and other covenants that are generally of a nature customary for such facilities.
At December 31, 2017, the Group’s net debt and available liquidity was as follows:
| | | | | | | | | | | | | | |
| | | | Maximum | | Final | | | | | | | | |
| | | | amount | | maturity | | Facility | | | | | | Undrawn |
Facility | | Currency | | drawable | | date | | type | | Amount drawn | | amount |
| | | | Local | | | | | | Local | | $'m | | $'m |
| | | | currency | | | | | | currency | | | | |
| | | | m | | | | | | m | | | | |
Liabilities guaranteed by the ARD Finance Group | | | | | | | | | | | | | | |
7.125%/7.875% Senior Secured Toggle Notes | | USD | | 770 | | 15-Sep-23 | | Bullet | | 770 | | 770 | | — |
6.625%/7.375% Senior Secured Toggle Notes | | EUR | | 845 | | 15-Sep-23 | | Bullet | | 845 | | 1,013 | | — |
Liabilities guaranteed by the Ardagh Group | | | | | | | | | | | | | | |
2.750% Senior Secured Notes | | EUR | | 750 | | 15-Mar-24 | | Bullet | | 750 | | 899 | | — |
4.625% Senior Secured Notes | | USD | | 1,000 | | 15-May-23 | | Bullet | | 1,000 | | 1,000 | | — |
4.125% Senior Secured Notes | | EUR | | 440 | | 15-May-23 | | Bullet | | 440 | | 528 | | — |
4.250% Senior Secured Notes | | USD | | 715 | | 15-Sep-22 | | Bullet | | 715 | | 715 | | — |
4.750% Senior Notes | | GBP | | 400 | | 15-Jul-27 | | Bullet | | 400 | | 541 | | — |
6.000% Senior Notes | | USD | | 1,700 | | 15-Feb-25 | | Bullet | | 1,700 | | 1,696 | | — |
7.250% Senior Notes | | USD | | 1,650 | | 15-May-24 | | Bullet | | 1,650 | | 1,650 | | — |
6.750% Senior Notes | | EUR | | 750 | | 15-May-24 | | Bullet | | 750 | | 899 | | — |
6.000% Senior Notes | | USD | | 440 | | 30-Jun-21 | | Bullet | | 440 | | 440 | | — |
Global Asset Based Loan Facility | | USD | | 813 | | 07-Dec-22 | | Revolving | | — | | — | | 813 |
Finance lease obligations | | GBP/EUR | | — | | | | Amortizing | | — | | 8 | | — |
Other borrowings / credit lines | | EUR | | 4 | | | | Amortizing | | — | | 4 | | 1 |
Total borrowings / undrawn facilities | | | | | | | | | | | | 10,163 | | 814 |
Deferred debt issue costs and bond premiums | | | | | | | | | | | | (87) | | — |
Net borrowings / undrawn facilities | | | | | | | | | | | | 10,076 | | 814 |
Cash and cash equivalents | | | | | | | | | | | | (823) | | 823 |
Derivative financial instruments used to hedge foreign currency and interest rate risk | | | | | | | | | | | | 301 | | — |
Net debt / available liquidity | | | | | | | | | | | | 9,554 | | 1,637 |
The following table summarizes the Group’s movement in net debt:
| | | | |
| | 2018 | | 2017 |
| | $'m | | $'m |
Net decrease/(increase) in cash and cash equivalents per consolidated statement of cash flows | | 258 | | (5) |
(Decrease)/increase in net borrowings and derivative financial instruments | | (659) | | 276 |
(Decrease)/increase in net debt | | (401) | | 271 |
Net debt at January 1, | | 9,554 | | 9,283 |
Net debt at December 31, | | 9,153 | | 9,554 |
The decrease in net borrowings and derivative financial instruments includes proceeds from borrowings of $0.1 billion (2017: $3.7 billion), repayments of borrowings of $0.4 billion (2017: $4.4 billion), a fair value gain on derivative financial instruments used to hedge foreign currency and interest rate risk of $0.2 billion (2017: loss of $0.4 billion) which offsets foreign exchange loss on borrowings of $0.3 billion (2017: gain of $0.5 billion), resulting in a net foreign exchange loss on borrowings impacting net debt by approximately $0.5 billion (2017: gain of $0.9 billion).
The maturity profile of the Group’s borrowings is as follows:
| | | | |
| | At December 31, |
| | 2018 | | 2017 |
| | $'m | | $'m |
Within one year or on demand | | 118 | | 2 |
Between one and two years | | 4 | | 1 |
Between two and five years | | 3,939 | | 1,154 |
Greater than five years | | 5,544 | | 8,919 |
| | 9,605 | | 10,076 |
The table below analyzes the Group’s financial liabilities (including interest payable) into relevant maturity groupings based on the remaining period at the reporting date to the contractual maturity date. The amounts disclosed in the table are the contracted undiscounted cash flows.
| | | | | | |
| | | | Derivative | | Trade and |
| | | | financial | | other |
| | Borrowings | | instruments | | payables |
At December 31, 2018 | | $'m | | $'m | | $'m |
Within one year or on demand | | 660 | | 38 | | 1,984 |
Between one and two years | | 548 | | 2 | | — |
Between two and five years | | 5,492 | | 105 | | — |
Greater than five years | | 5,845 | | — | | — |
| | | | | | |
| | | | Derivative | | Trade and |
| | | | financial | | other |
| | Borrowings | | instruments | | payables |
At December 31, 2017 | | $'m | | $'m | | $'m |
Within one year or on demand | | 578 | | 2 | | 1,991 |
Between one and two years | | 578 | | 84 | | — |
Between two and five years | | 2,846 | | 66 | | — |
Greater than five years | | 9,748 | | 151 | | — |
The carrying amount and fair value of the Group’s borrowings are as follows:
| | | | | | | | |
| | Carrying value | | |
| | | | Deferred debt | | | | |
| | Amount | | issue costs and | | | | |
| | drawn | | bond premium | | Total | | Fair value |
At December 31, 2018 | | $'m | | $'m | | $'m | | $'m |
Loan notes | | 9,521 | | (57) | | 9,464 | | 9,176 |
Global Asset Based Loan Facility and other borrowings | | 115 | | (10) | | 105 | | 115 |
Finance leases | | 36 | | — | | 36 | | 36 |
| | 9,672 | | (67) | | 9,605 | | 9,327 |
| | | | | | | | |
| | Carrying value | | |
| | | | Deferred debt | | | | |
| | Amount | | issue costs and | | | | |
| | drawn | | bond discount | | Total | | Fair value |
At December 31, 2017 | | $'m | | $'m | | $'m | | $'m |
Loan notes | | 10,151 | | (87) | | 10,064 | | 10,686 |
Global Asset Based Loan Facility and other borrowings | | 4 | | — | | 4 | | 4 |
Finance leases | | 8 | | — | | 8 | | 8 |
| | 10,163 | | (87) | | 10,076 | | 10,698 |
Financing activity
2018 – Ardagh Group
On July 31, 2018, the Group redeemed in full its $440 million 6.000% Senior Notes due 2021 and paid applicable redemption premium and accrued interest in accordance with their terms. The redemption was funded by a combination of cash on hand and available liquidity, drawing from the Group’s Global Asset Based Loan Facility.
As at December 31, 2018, the Ardagh Group had $639 million available under the Global Asset Based Loan Facility.
2017 – Ardagh Group
On January 30, 2017, the Ardagh Group issued $1,000 million 6.000% Senior Notes due 2025. The proceeds, together with certain cash, were used to partially redeem, on the same day, $845 million First Priority Senior Secured Floating Rate Notes due 2019, to redeem in full on March 2, 2017, $415 million 6.250% Senior Notes due 2019 and to pay applicable redemption premiums and accrued interest.
On March 8, 2017, the Ardagh Group issued €750 million 2.750% Senior Secured Notes due 2024, $715 million 4.250% Senior Secured Notes due 2022 and $700 million 6.000% Senior Notes due 2025. On March 9, 2017, using the proceeds from the notes issued on March 8, 2017, the Ardagh Group redeemed €750 million 4.250% First Priority Senior Secured Notes due 2022, redeemed in full the $265 million First Priority Senior Secured Floating Rate Notes due 2019 and repaid in full the $663 million Term Loan B Facility, together with applicable redemption premiums and accrued interest.
On March 21, 2017, the Ardagh Group S.A. replaced its wholly-owned subsidiary, Ardagh Packaging Holdings Limited as the parent guarantor of the then outstanding notes issued by Ardagh Holdings USA Inc. and Ardagh Packaging Finance plc.
On April 10, 2017, using the proceeds of the notes issued on March 8, 2017, the Ardagh Group redeemed in full $415 million 6.750% Senior Notes due 2021 and paid applicable redemption premiums and accrued interest.
On June 12, 2017, the Ardagh Group issued £400 million 4.750% Senior Notes due 2027. The proceeds, together with certain cash, were used to redeem, on June 12, 2017, the Ardagh Group’s $500 million Senior Secured Floating Rate Notes due 2021, and to pay applicable redemption premiums and accrued interest.
On August 1, 2017, the Ardagh Group redeemed in full the 4.250% First Priority Senior Secured Notes due 2022, together with applicable redemption premiums and accrued interest.
On December 7, 2017, the Ardagh Group closed a committed five year $850 million Global Asset Based Loan facility. This facility, secured by trade receivables and inventories, replaced the HSBC Securitization Program and the Bank of America Facility. It provides funding for working capital and general corporate purposes. On December 31, 2017, the Ardagh Group had $813 million available under this facility.
Effective interest rates
The effective interest rates of borrowings at the reporting date are as follows:
| | | | | | | | | | | | | | |
| | 2018 | | | 2017 | |
| | USD | | EUR | | GBP | | | USD | | EUR | | GBP | |
7.125% / 7.875% Senior Secured Toggle Notes | | 7.49 | % | — | | — | | | 7.49 | % | — | | — | |
6.625% / 7.375% Senior Secured Toggle Notes | | — | | 7.03 | % | — | | | — | | 7.03 | % | — | |
2.750% Senior Secured Notes due 2024 | | — | | 2.92 | % | — | | | — | | 2.92 | % | — | |
4.625% Senior Secured Notes due 2023 | | 5.16 | % | — | | — | | | 5.16 | % | — | | — | |
4.125% Senior Secured Notes due 2023 | | — | | 4.63 | % | — | | | — | | 4.63 | % | — | |
4.250% Senior Secured Notes due 2022 | | 4.51 | % | — | | — | | | 4.51 | % | — | | — | |
4.750% Senior Notes due 2027 | | — | | — | | 4.99 | % | | — | | — | | 4.99 | % |
6.000% Senior Notes due 2025 | | 6.14 | % | — | | — | | | 6.14 | % | — | | — | |
7.250% Senior Notes due 2024 | | 7.72 | % | — | | — | | | 7.72 | % | — | | — | |
6.750% Senior Notes due 2024 | | — | | 7.00 | % | — | | | — | | 7.00 | % | — | |
6.000% Senior Notes due 2021 | | — | | — | | — | | | 6.38 | % | — | | — | |
Finance Lease Obligation | | 6.45 | % | — | | — | | | — | | — | | — | |
The carrying amounts of the Group’s net borrowings are denominated in the following currencies:
| | | | |
| | At December 31, |
| | 2018 | | 2017 |
| | $'m | | $'m |
Euro | | 3,182 | | 3,322 |
U.S. dollar | | 5,914 | | 6,216 |
British pound | | 509 | | 538 |
| | 9,605 | | 10,076 |
The Group has the following undrawn borrowing facilities:
| | | | |
| | At December 31, |
| | 2018 | | 2017 |
| | $'m | | $'m |
Expiring within one year | | 1 | | 1 |
Expiring beyond one year | | 639 | | 813 |
| | 640 | | 814 |
The Group uses the following hierarchy for determining and disclosing the fair value of financial instruments:
Level 1Quoted prices (unadjusted) in active markets for identical assets or liabilities;
Level 2Inputs other than quoted prices included within Level 1 that are observable for the asset or liability, either directly (as prices) or indirectly (derived from prices); and
Level 3Inputs for the asset or liability that are not based on observable market data (unobservable inputs).
There were no transfers between Level 1 and Level 2 during the year.
Fair values are calculated as follows:
| (i) | | Senior secured and senior notes - The fair value of debt securities in issue is based on quoted market prices and represent Level 1 inputs. |
| (ii) | | Global Asset Based Loan facility and other borrowings – The estimated value of fixed interest bearing deposits is based on discounted cash flows using prevailing money-market interest rates for debts with similar credit risk and remaining maturity. |
| (iii) | | Finance leases - The carrying amount of finance leases is assumed to be a reasonable approximation of fair value. |
| (iv) | | CCIRS - The fair values of the CCIRS are derived using Level 2 valuation inputs. |
| (v) | | Commodity and foreign exchange derivatives – The fair value of these derivatives are based on quoted market prices and represent Level 2 inputs. |
Derivative financial instruments
| | | | | | | | |
| | Assets | | Liabilities |
| | | | Contractual | | | | Contractual |
| | | | or notional | | | | or notional |
| | Fair values | | amounts | | Fair values | | amounts |
| | $'m | | $'m | | $'m | | $'m |
Fair Value Derivatives | | | | | | | | |
Metal forward contracts | | 9 | | 79 | | 22 | | 262 |
Cross currency interest rate swaps | | 9 | | 282 | | 122 | | 2,219 |
Forward foreign exchange contracts | | 2 | | 385 | | 1 | | 98 |
NYMEX gas swaps | | — | | 7 | | — | | 8 |
At December 31, 2018 | | 20 | | 753 | | 145 | | 2,587 |
| | | | | | | | |
| | Assets | | Liabilities |
| | | | Contractual | | | | Contractual |
| | | | or notional | | | | or notional |
| | Fair values | | amounts | | Fair values | | amounts |
| | $'m | | $'m | | $'m | | $'m |
Fair Value Derivatives | | | | | | | | |
Metal forward contracts | | 17 | | 197 | | — | | — |
Cross currency interest rate swap | | — | | — | | 301 | | 3,107 |
Forward foreign exchange contracts | | 4 | | 179 | | 1 | | 52 |
NYMEX gas swaps | | — | | — | | 1 | | 20 |
Carbon futures | | 2 | | 10 | | — | | — |
At December 31, 2017 | | 23 | | 386 | | 303 | | 3,179 |
Derivative instruments with a fair value of $11 million (2017: $7 million) are classified as non-current assets and $9 million (2017 $16 million) as current assets in the consolidated statement of financial position at December 31, 2018. Derivative instruments with a fair value of $107 million (2017: $301 million) are classified as non-current liabilities and $38 million (2017: $2 million) as current liabilities in the consolidated statement of financial position at December 31, 2018.
The majority of derivative assets and liabilities mature within one year, with the exception of certain of the Group’s CCIRS which mature at dates between May 2022 and February 2023 and certain metal forward contracts which mature at dates between January 2020 and October 2021.
With the exception of interest on the CCIRS, all cash payments in relation to derivative instruments are paid or received when they mature. Bi‑annual and quarterly interest cash payments and receipts are made and received in relation to the CCIRS.
The Ardagh Group mitigates the counterparty risk for derivatives by contracting with major financial institutions which have high credit ratings.
Cross currency interest rate swaps
2018
The Ardagh Group hedges certain portions of its external borrowings and interest payable thereon using CCIRS, with a net liability at December 31, 2018 of $113 million (December 31, 2017: $301 million).
On July 11, 2018, the Ardagh Group terminated its $440 million U.S. dollar to euro CCIRS, due for maturity in 2019. The Ardagh Group paid net consideration of $44 million on termination and recognized a related exceptional loss of $6 million (Note 4).
2017
The Ardagh Group hedged certain of its external borrowings and interest payable thereon using CCIRS, with a net liability at December 31, 2017 of $251 million (December 31, 2016: net asset of $124 million). In the year ended December 31, 2017 the Ardagh Group executed a number of CCIRS to swap (i) the U.S. dollar principal and interest repayments on $1,250 million of its U.S. dollar-denominated borrowings into euro, and (ii) the euro principal and interest repayments on $332 million of its euro denominated borrowings into British pounds.
In June 2017, as a result of the issuance of the £400 million 4.750% Senior Notes due 2027, the Ardagh Group terminated $500 million of its existing U.S. dollar to British pound CCIRS, due for maturity in 2022. The Ardagh Group received net proceeds of $46 million in consideration and recognized an exceptional loss of $15 million on the termination (see Note 4).
Net investment hedge in foreign operations
The Ardagh Group has certain investments in foreign operations, whose net assets are exposed to foreign currency translation risk. Currency exposure arising from the net assets of the Ardagh Group’s foreign operations is managed primarily through borrowings denominated in the relevant foreign currencies.
Hedges of net investments in foreign operations are accounted for whereby any gain or loss on the hedging instruments relating to the effective portion of the hedge is recognized in other comprehensive income. The gain or loss relating to an ineffective portion is recognized immediately in the consolidated income statement within finance income or expense respectively. Gains and losses accumulated in other comprehensive income are recycled to the consolidated income statement when the foreign operation is disposed of. The amount that has been recognized in the consolidated income statement due to ineffectiveness is $nil (2017: $nil; 2016: $nil).
Metal forward contracts
The Ardagh Group hedges a substantial portion of its anticipated metal purchases. Excluding conversion and freight costs, the physical metal deliveries are priced based on the applicable indices agreed with the suppliers for the relevant month.
Fair values have been based on quoted market prices and are valued using Level 2 valuation inputs. The fair value of these contracts when initiated is $nil; no premium is paid or received.
Forward foreign exchange contracts
The Group operates in a number of currencies and, accordingly, hedges a portion of its currency transaction risk. The fair values are based on Level 2 valuation techniques and observable inputs including the contract prices. The fair value of these contracts when initiated is $nil; no premium is paid or received.
NYMEX gas swaps
The Ardagh Group hedges a portion of its Glass Packaging North America anticipated energy purchases on the New York Mercantile Exchange (“NYMEX”).
Fair values have been based on NYMEX‑quoted market prices and Level 2 valuation inputs have been applied. The fair value of these contracts when initiated is $nil; no premium is paid or received.
18. Employee benefit obligations
The Ardagh Group operates defined benefit or defined contribution pension schemes in most of its countries of operation and the assets are held in separately administered funds. The principal funded defined benefit schemes, which are funded by contributions to separately administered funds, are in the U.S. and the United Kingdom.
Other defined benefit schemes are unfunded and the provision is recognized in the consolidated statement of financial position. The principal unfunded schemes are in Germany.
The contribution rates to the funded plans are agreed with the Trustee boards, plan actuaries and the local pension regulators periodically. The contributions paid in 2018 were those recommended by the actuaries.
In addition, the Ardagh Group has other employee benefit obligations in certain territories.
Total employee obligations recognized in the consolidated statement of financial position of $957 million (2017: $997 million) includes other employee benefit obligations of $127 million (2017: $132 million).
The employee obligations and assets of the defined benefit schemes included in the consolidated statement of financial position are analyzed below:
| | | | | | | | | | | | | | | | | | | | |
| | U.S. | | Germany | | UK | | Other | | Total |
| | 2018 | | 2017 | | 2018 | | 2017 | | 2018 | | 2017 | | 2018 | | 2017 | | 2018 | | 2017 |
| | $'m | | $'m | | $'m | | $'m | | $'m | | $'m | | $'m | | $'m | | $'m | | $'m |
Obligations | | (1,217) | | (1,313) | | (386) | | (405) | | (862) | | (1,000) | | (38) | | (44) | | (2,503) | | (2,762) |
Assets | | 1,040 | | 1,179 | | — | | — | | 624 | | 706 | �� | 9 | | 12 | | 1,673 | | 1,897 |
Net obligations | | (177) | | (134) | | (386) | | (405) | | (238) | | (294) | | (29) | | (32) | | (830) | | (865) |
Defined benefit pension schemes
The amounts recognized in the consolidated income statement are:
| | | | | | |
| | Year ended December 31, |
| | 2018 | | 2017 | | 2016 |
| | $'m | | $'m | | $'m |
Current service cost and administration costs: | | | | | | |
Cost of sales ‑ current service cost (Note 7) | | (42) | | (43) | | (40) |
Cost of sales ‑ past service credit (Note 7) | | 3 | | 8 | | 32 |
SGA ‑ current service cost (Note 7) | | (4) | | (3) | | (6) |
SGA ‑ past service credit (Note 7) | | — | | 2 | | 11 |
| | (43) | | (36) | | (3) |
Finance expense (Note 5) | | (21) | | (24) | | (28) |
| | (64) | | (60) | | (31) |
The amounts recognized in the consolidated statement of comprehensive income are:
| | | | | | |
| | Year ended December 31, |
| | 2018 | | 2017 | | 2016 |
| | $'m | | $'m | | $'m |
Re-measurement of defined benefit obligation: | | | | | | |
Actuarial gain/(loss) arising from changes in demographic assumptions | | 19 | | (6) | | 26 |
Actuarial gain/(loss) arising from changes in financial assumptions | | 119 | | (104) | | (280) |
Actuarial gain/(loss) arising from changes in experience | | 19 | | 2 | | (11) |
| | 157 | | (108) | | (265) |
Re-measurement of plan assets: | | | | | | |
Actual (loss)/return less expected return on plan assets | | (151) | | 158 | | 122 |
Actuarial gain/(loss) for the year on defined benefit pension schemes | | 6 | | 50 | | (143) |
Actuarial gain/(loss) on other long term and end of service employee benefits | | 5 | | (1) | | 4 |
| | 11 | | 49 | | (139) |
The actual return on plan assets was a loss of $96 million in 2018 (2017: $228 million gain; 2016: $206 million gain).
Movement in the defined benefit obligations and assets:
| | | | | | | | |
| | At December 31, |
| | Obligations | Assets |
| | 2018 | | 2017 | | 2018 | | 2017 |
| | $'m | | $'m | | $'m | | $'m |
At January 1, | | (2,762) | | (3,101) | | 1,897 | | 2,276 |
Interest income | | — | | — | | 55 | | 71 |
Current service cost | | (40) | | (46) | | — | | — |
Past service credit | | 3 | | 10 | | — | | — |
Interest cost | | (72) | | (92) | | — | | — |
Administration expenses paid from plan assets | | — | | — | | (1) | | (2) |
Re-measurements | | 157 | | (108) | | (151) | | 157 |
Obligations/(assets) extinguished on reclassification | | — | | 602 | | — | | (602) |
Employer contributions | | — | | — | | 52 | | 51 |
Employee contributions | | — | | (2) | | — | | 2 |
Benefits paid | | 140 | | 163 | | (140) | | (163) |
Exchange | | 71 | | (188) | | (39) | | 107 |
At December 31, | | (2,503) | | (2,762) | | 1,673 | | 1,897 |
The defined benefit obligations above include $403 million (2017: $455 million) of unfunded obligations. Employer contributions above include no contributions under schemes extinguished during the year (2017: $7 million).
Interest income and interest cost above does not include interest cost of $4 million (2017: $3 million; 2016: $3 million) relating to other employee benefit obligations. Current service costs above does not include current service costs of $6 million (2017: $4 million) relating to other employee benefit obligations.
During the year ended December 31, 2018 (2017: $10 million), the Group elected to re-design one of its pension schemes in Germany, moving from a defined benefit pension scheme to a contribution orientated system. This amendment resulted in the recognition of a past service gain of $12 million (2017: $nil) in the year within cost of sales. The past service gain was partly offset by a past service cost of $8 million (2017: $nil) following a high court judgement in the UK in October 2018 guaranteeing gender equality in UK pension schemes for accrued benefits (“GMP Equalization”) and a further $1 million past service cost arising from amendments to the defined benefit pension scheme in Metal Beverage UK during the year. The GMP equalization past service cost has been recognized as exceptional within the income statement for the year ended December 31, 2018.
During the year ended December 31, 2017 a defined benefit pension scheme in the Netherlands was transferred to a multi-employer scheme. Prior to the date of transfer, a past service credit of $10 million was recognized such that, on the date of transfer, the defined benefit obligation and asset were both $602 million (December 31, 2016: $552 million and $541 million respectively). The Ardagh Group has taken the exemption under IAS 19 (R) to account for multi-employer schemes as defined contribution schemes. As a result, the scheme is no longer accounted for as a defined benefit scheme at December 31, 2017.
Plan assets comprise:
| | | | | | | | |
| | At December 31, |
| | 2018 | | 2018 | | 2017 | | 2017 |
| | $'m | | % | | $'m | | % |
Equities | | 1,039 | | 62 | | 1,177 | | 62 |
Target return funds | | 267 | | 16 | | 297 | | 16 |
Bonds | | 184 | | 11 | | 249 | | 13 |
Cash/other | | 183 | | 11 | | 174 | | 9 |
| | 1,673 | | 100 | | 1,897 | | 100 |
The pension assets do not include any of the Company’s ordinary shares, other securities or other Ardagh Group assets.
Investment strategy
The choice of investments takes account of the expected maturity of the future benefit payments. The plans invest in diversified portfolios consisting of an array of asset classes that attempt to maximize returns while minimizing volatility. The asset classes include national and international equities, fixed income government and non‑government securities and real estate, as well as cash.
Characteristics and associated risks
Glass Packaging North America and Metal Packaging Americas each sponsor a defined benefit pension plan which is subject to Federal law (“ERISA”), reflecting regulations issued by the Internal Revenue Service (“IRS”) and the Department of Labor.
The Glass Packaging North America plan covers both hourly and salaried employees. The plan benefits are determined using a formula which reflects an employee’s years of service and either their final average salary or a dollar per month benefit level. The plan is governed by a Fiduciary Benefits Committee (“the Committee”) which is appointed by the Company and contains only employees of Ardagh Group. The Committee is responsible for the investment of the plan’s assets, which are held in a trust for the benefit of employees, retirees and their beneficiaries, and which can only be used to pay plan benefits and expenses.
The defined benefit pension plan is subject to IRS funding requirements, with actuaries calculating the minimum and maximum allowable contributions each year. The defined benefit pension plan currently has no cash contribution requirement due to the existence of a credit balance following a contribution of approximately $200 million in 2014 in connection with the VNA Acquisition. The Pension Benefit Guaranty Corporation (“PBGC”) protects the pension benefits of employees and retirees when a plan sponsor becomes insolvent and can no longer meet its obligation. All plan sponsors pay annual PBGC premiums that have two components: a fixed rate based on participant count and a variable rate which is determined based on the amount by which the plan is underfunded.
The Metal Packaging Americas plan covers hourly employees only. Plan benefits are determined using a formula which reflects the employees’ years of service and is based on a final average pay formula.
The UK pension plans are trust‑based UK funded final salary defined benefit schemes providing pensions and lump sum benefits to members and dependents. There are two pension plans in place relating to Metal Packaging Europe, one of which relates to the Beverage Can Business. One of the pension plans in the Metal Packaging Europe division has been closed to future accrual from July 1, 2014. For this plan, pensions are calculated based on service to the point of closure, but with members’ benefits retaining a final salary link while employed by the Company. The other Metal Packaging Europe pension plan, relating to the Beverage Can Business, is closed to new entrants and was closed to future accrual effective December 31, 2018. For this plan, pensions are calculated based on service to retirement with members’ benefits based on final career earnings. There are two pension plans in place in Glass Packaging Europe. The pension plans relating to Glass Packaging Europe have been closed to future accrual from March 31, 2013 and September 30, 2015 respectively.
The UK pension plans are each governed by a board of trustees, which includes members who are independent of the Company. The trustees are responsible for managing the operation, funding and investment strategy. The UK pension plans are subject to the UK regulatory framework, the requirements of the Pensions Regulator and are subject to a statutory funding objective.
The Ardagh Group operates a number of defined benefit pension schemes in Germany. The pension plans in Germany operate under the framework of German Company Pension Law (BetrAVG) and general regulations based on German Labor Law. The entitlements of the plan members depend on years of service and final salary. Furthermore, the plans provide lifelong pensions. No separate assets are held in trust, i.e. the plans are unfunded defined benefit plans. During the year ended December 31, 2018, the Group elected to re-design one of its pension schemes in Germany, moving to a contribution orientated system.
Assumptions and sensitivities
The principal pension assumptions used in the preparation of the financial statements take account of the different economic circumstances in the countries of operations and the different characteristics of the respective plans, including the duration of the obligations.
The ranges of the principal assumptions applied in estimating defined benefit obligations were:
| | | | | | | | | | | | |
| | U.S. | | Germany | | UK |
| | 2018 | | 2017 | | 2018 | | 2017 | | 2018 | | 2017 |
| | % | | % | | % | | % | | % | | % |
Rates of inflation | | 2.50 | | 2.50 | | 1.50 | | 1.50 | | 3.15 | | 3.10 |
Rates of increase in salaries | | 1.50 - 3.00 | | 2.00 - 3.00 | | 2.50 | | 2.50 | | 2.15 | | 2.60 |
Discount rates | | 4.50 | | 3.80 | | 1.88 - 2.25 | | 1.68 - 2.24 | | 2.90 - 2.95 | | 2.70 |
Assumptions regarding future mortality experience are based on actuarial advice in accordance with published statistics and experience.
These assumptions translate into the following average life expectancy in years for a pensioner retiring at age 65. The mortality assumptions for the countries with the most significant defined benefit plans are set out below:
| | | | | | | | | | | | |
| | U.S. | | Germany | | UK |
| | 2018 | | 2017 | | 2018 | | 2017 | | 2018 | | 2017 |
| | Years | | Years | | Years | | Years | | Years | | Years |
Life expectancy, current pensioners | | 22 | | 22 | | 22 | | 21 | | 20 | | 21 |
Life expectancy, future pensioners | | 23 | | 23 | | 24 | | 24 | | 21 | | 22 |
If the discount rate were to decrease by 50 basis points from management estimates, the carrying amount of the pension obligations would increase by an estimated $193 million (2017: $216 million). If the discount rate were to increase by 50 basis points, the carrying amount of the pension obligations would decrease by an estimated $173 million (2017: $230 million).
If the inflation rate were to decrease by 50 basis points from management estimates, the carrying amount of the pension obligations would decrease by an estimated $85 million (2017: $96 million). If the inflation rate were to increase by 50 basis points, the carrying amount of the pension obligations would increase by an estimated $94 million (2017: $91 million).
If the salary increase rate were to decrease by 50 basis points from management estimates, the carrying amount of the pension obligations would decrease by an estimated $90 million (2017: $103 million). If the salary increase rate were to increase by 50 basis points, the carrying amount of the pension obligations would increase by an estimated $99 million (2017: $97 million).
The impact of increasing the life expectancy by one year would result in an increase in the Ardagh Group’s liability of $66 million at December 31, 2018 (2017: $55 million), holding all other assumptions constant.
The Ardagh Group’s best estimate of contributions expected to be paid to defined benefit plans in 2019 is $28 million (2018: $36 million).
The principal defined benefit schemes are described briefly below:
| | | | | | | | | | | | |
| | Metal Packaging | | Glass Packaging |
| | Europe | | Europe | | North | | Europe | | Europe | | North |
| | UK | | Germany | | America | | UK | | Germany | | America |
Nature of the schemes | | Funded | | Unfunded | | Funded | | Funded | | Unfunded | | Funded |
2018 | | | | | | | | | | | | |
Active members | | 467 | | 1,553 | | 925 | | — | | 1,027 | | 4,193 |
Deferred members | | 886 | | 651 | | 142 | | 1,240 | | 747 | | 2,589 |
Pensioners including dependents | | 763 | | 1,101 | | 172 | | 815 | | 775 | | 6,455 |
Weighted average duration (years) | | 18 | | 18 | | 16 | | 20 | | 18 | | 12 |
2017 | | | | | | | | | | | | |
Active members | | 467 | | 1,694 | | 943 | | — | | 1,011 | | 4,137 |
Deferred members | | 954 | | 706 | | 139 | | 1,527 | | 759 | | 2,697 |
Pensioners including dependents | | 756 | | 1,081 | | 150 | | 744 | | 762 | | 6,379 |
Weighted average duration (years) | | 21 | | 17 | | 17 | | 23 | | 18 | | 13 |
The expected total benefit payments over the next five years are:
| | | | | | | | | | | | |
| | | | | | | | | | | | Subsequent |
| | 2019 | | 2020 | | 2021 | | 2022 | | 2023 | | five years |
| | $'m | | $'m | | $'m | | $'m | | $'m | | $'m |
Benefits | | 115 | | 112 | | 114 | | 117 | | 121 | | 640 |
The Ardagh Group also has defined contribution plans; the contribution expense associated with these plans for 2018 was $44 million (2017: $35 million; 2016: $34 million). The Ardagh Group’s best estimate of the contributions expected to be paid to these plans in 2019 is $41 million (2018: $36 million).
Other employee benefits
| | | | |
| | At December 31, |
| | 2018 | | 2017 |
| | $'m | | $'m |
End of service employee benefits | | 25 | | 25 |
Long term employee benefits | | 102 | | 107 |
| | 127 | | 132 |
End of service employee benefits principally comprise amounts due to be paid to employees leaving the Ardagh Group’s service in France and Italy.
Long term employee benefit obligations comprise amounts due to be paid under post‑retirement medical schemes in Glass Packaging North America and Metal Packaging Beverage Americas, partial retirement contracts in Germany and other obligations to pay benefits primarily related to long service awards.
19. Provisions
| | | | |
| | At December 31, |
| | 2018 | | 2017 |
| | $'m | | $'m |
Current | | 88 | | 70 |
Non-current | | 38 | | 44 |
| | 126 | | 114 |
| | | | | | |
| | | | Other | | Total |
| | Restructuring | | provisions | | provisions |
| | $'m | | $'m | | $'m |
At January 1, 2017 | | 23 | | 110 | | 133 |
Provided | | 12 | | 26 | | 38 |
Released | | (2) | | (31) | | (33) |
Paid | | (10) | | (21) | | (31) |
Exchange | | 2 | | 5 | | 7 |
At December 31, 2017 | | 25 | | 89 | | 114 |
Provided | | 39 | | 108 | | 147 |
Released | | (17) | | (24) | | (41) |
Paid | | (26) | | (67) | | (93) |
Exchange | | (1) | | — | | (1) |
At December 31, 2018 | | 20 | | 106 | | 126 |
The restructuring provision relates to redundancy and other restructuring costs. Other provisions relate to probable environmental claims, customer quality claims, onerous leases and specifically in Glass Packaging North America, workers’ compensation provisions.
The provisions classified as current are expected to be paid in the next twelve months. The majority of the restructuring provision is expected to be paid in 2019. The remaining balance represents longer term provisions for which the timing of the related payments is subject to uncertainty.
20. Trade and other payables
| | | | |
| | At December 31, |
| | 2018 | | 2017 |
| | $'m | | $'m |
Trade payables | | 1,517 | | 1,469 |
Other payables and accruals | | 340 | | 438 |
Other tax and social security payable | | 111 | | 49 |
Payables and accruals for exceptional items | | 16 | | 35 |
| | 1,984 | | 1,991 |
The fair values of trade and other payables approximate the amounts shown above.
Other payables and accruals mainly comprise accruals for operating expenses, deferred income and value added tax payable.
21. Cash generated from operating activities
| | | | | | |
| | Year ended December 31, |
| | 2018 | | 2017 | | 2016 |
| | $'m | | $'m | | $'m |
(Loss)/profit for the year | | (263) | | 41 | | (172) |
Income tax charge/(credit) (Note 6) | | 44 | | (40) | | 66 |
Net finance expense (Note 5) | | 654 | | 671 | | 681 |
Depreciation and amortization (Notes 8, 9) | | 714 | | 687 | | 561 |
Exceptional operating items (Note 4) | | 329 | | 149 | | 145 |
Movement in working capital | | 24 | | 99 | | 131 |
Transaction-related, IPO, start-up and other exceptional costs paid | | (94) | | (74) | | (176) |
Exceptional restructuring paid | | (32) | | (10) | | (11) |
Cash generated from operations | | 1,376 | | 1,523 | | 1,225 |
22. Business combinations and disposals
On April 22, 2016 the Ardagh Group entered into an agreement with Ball Corporation and Rexam PLC to acquire certain of their beverage can manufacturing assets. The acquisition was completed on June 30, 2016.
The acquired business comprised ten beverage can manufacturing plants and two end plants in Europe, seven beverage can manufacturing plants and one end plant in the United States, two beverage can manufacturing plants in Brazil and certain innovation and support functions in Germany, the U.K., Switzerland and the United States. The acquired business has annual revenue of approximately $3.0 billion.
This was a strategically important acquisition which was highly complementary to the Ardagh Group's existing metal and glass packaging businesses.
The following table summarizes the consideration paid for this acquisition and the fair value of assets acquired and liabilities assumed.
| | |
| | $'m |
Cash and cash equivalents | | 11 |
Property, plant and equipment | | 702 |
Intangible assets | | 1,431 |
Inventories | | 294 |
Trade and other receivables | | 367 |
Trade and other payables | | (484) |
Net deferred tax liability | | (162) |
Employee benefit obligations | | (129) |
Provisions | | (42) |
Total identifiable net assets | | 1,988 |
Goodwill | | 1,004 |
Total consideration | | 2,992 |
The allocations above are based on the fair values at the acquisition date. The purchase price allocation was completed on June 30, 2017.
Goodwill arising from the acquisition reflects the anticipated synergies from integrating the acquired business into the Group and the skills and the technical talent of the acquired workforce.
Goodwill of $298 million which relates to the North American Beverage Can Business is deductible for tax purposes.
23. Related party information
| (i) | | Interests of Paul Coulson |
As of February 20, 2019, the approval date of these financial statements, a company owned by Paul Coulson owns approximately 25% of the issued share capital of ARD Holdings S.A., the ultimate parent company of ARD Finance S.A.. Through its non-controlling interest in a number of companies in the Yeoman group of companies, this company has an interest in a further approximate 34% of the issued share capital of ARD Holdings S.A..
At December 31, 2018, Yeoman Capital S.A. owned approximately 34% of the ordinary shares of ARD Holdings S.A. During 2017, the Group incurred costs of $nil (2017: $nil; 2016: $nil) for fees charged by the Yeoman group of companies. The amount outstanding at year end was $nil (2017: $nil; 2016: $nil).
| (iii) | | Common directorships |
Four of the ARD Finance S.A. directors (Paul Coulson, Wolfgang Baertz, Brendan Dowling, and Herman Troskie) also serve as directors in the Yeoman group of companies. All of the existing directors of ARD Finance S.A. are members of the board of directors of ARD Holdings S.A..
At December 31, 2018, the Ardagh Group’s investment in joint ventures is $9 million (2017: $10 million). Transactions and balances outstanding with joint ventures are not material for the year ended and as at December 31, 2018 (2017 and 2016: not material).
| (v) | | Key management compensation |
Key management are those persons who have the authority and responsibility for planning, directing and controlling the activities of the Group. Key management is comprised of the members who served on the board of directors of Ardagh Group S.A. and the Ardagh Group’s executive leadership team during the reporting period. The amount outstanding at year end was $1 million (2017: $7 million, 2016: $4 million).
| | | | | | |
| | Year ended December 31, |
| | 2018 | | 2017 | | 2016 |
| | $'m | | $'m | | $'m |
Salaries and other short term employee benefits | | 10 | | 12 | | 12 |
Post-employment benefits | | 1 | | 1 | | 1 |
| | 11 | | 13 | | 13 |
Transaction related and other compensation | | — | | 7 | | 29 |
| | 11 | | 20 | | 42 |
The Ardagh Group’s pension schemes are related parties. For details of all transactions during the year, please read Note 18.
| (vii) | | Senior Secured Toggle Notes due 2023 |
Certain Directors of the Company acquired and hold the Toggle Notes, as issued by the Company in September 2016. There have been no materially significant transactions by the Directors relating to the Toggle Notes in the year ended December 31, 2018.
(viii) Subsidiaries
The following table provides information relating to the Ardagh Group’s principal operating subsidiaries, all of which are wholly owned, at December 31, 2018.
Company | | Country of
incorporation | | Activity |
Ardagh Metal Beverage Manufacturing Austria GmbH | | Austria | | Metal Packaging |
Ardagh Metal Beverage Trading Austria GmbH | | Austria | | Metal Packaging |
Latas Indústria de Embalagens de Alumínio do Brasil Ltda | | Brazil | | Metal Packaging |
Ardagh Indústria de Embalagens Metálicas do Brasil Ltda * | | Brazil | | Metal Packaging |
Ardagh Metal Packaging Czech Republic s.r.o. | | Czech Republic | | Metal Packaging |
Ardagh Glass Holmegaard A/S | | Denmark | | Glass Packaging |
Ardagh Aluminium Packaging France SAS | | France | | Metal Packaging |
Ardagh MP West France SAS | | France | | Metal Packaging |
Ardagh Metal Packaging France SAS | | France | | Metal Packaging |
Ardagh Metal Beverage Trading France SAS | | France | | Metal Packaging |
Ardagh Metal Beverage France SAS | | France | | Metal Packaging |
Ardagh Glass GmbH | | Germany | | Glass Packaging |
Heye International GmbH | | Germany | | Glass Engineering |
Ardagh Metal Packaging Germany GmbH | | Germany | | Metal Packaging |
Ardagh Germany MP GmbH | | Germany | | Metal Packaging |
Ardagh Metal Beverage Trading Germany GmbH | | Germany | | Metal Packaging |
Ardagh Metal Beverage Germany GmbH | | Germany | | Metal Packaging |
Ardagh Glass Sales Limited | | Ireland | | Glass Packaging |
Ardagh Packaging Holdings Limited | | Ireland | | Glass and Metal Packaging |
Ardagh Glass Italy S.r.l. (formerly Ardagh Group Italy S.r.l.)* | | Italy | | Glass Packaging |
Ardagh Metal Packaging Italy S.r.l.* | | Italy | | Metal Packaging |
Ardagh Aluminium Packaging Netherlands B.V. | | Netherlands | | Metal Packaging |
Ardagh Glass Dongen B.V. | | Netherlands | | Glass Packaging |
Ardagh Glass Moerdijk B.V. | | Netherlands | | Glass Packaging |
Ardagh Metal Packaging Netherlands B.V. | | Netherlands | | Metal Packaging |
Ardagh Metal Beverage Trading Netherlands B.V. | | Netherlands | | Metal Packaging |
Ardagh Metal Beverage Netherlands B.V. | | Netherlands | | Metal Packaging |
Ardagh Glass S.A. | | Poland | | Glass Packaging |
Ardagh Metal Packaging Poland Sp. z o.o. | | Poland | | Metal Packaging |
Ardagh Metal Beverage Trading Poland Sp. z o.o. | | Poland | | Metal Packaging |
Ardagh Metal Beverage Poland Sp. z o.o. | | Poland | | Metal Packaging |
Ardagh Metal Beverage Trading Spain SL | | Spain | | Metal Packaging |
Ardagh Metal Beverage Spain SL | | Spain | | Metal Packaging |
Ardagh Metal Packaging Iberica S.A. | | Spain | | Metal Packaging |
Ardagh Glass Limmared AB | | Sweden | | Glass Packaging |
Ardagh Metal Beverage Europe GmbH | | Switzerland | | Metal Packaging |
Ardagh Glass Limited | | United Kingdom | | Glass Packaging |
Ardagh Metal Beverage Trading U.K. Limited | | United Kingdom | | Metal Packaging |
Ardagh Metal Beverage U.K. Limited | | United Kingdom | | Metal Packaging |
Ardagh Metal Packaging U.K. Limited | | United Kingdom | | Metal Packaging |
Ardagh Metal Packaging USA Inc. | | United States | | Metal Packaging |
Ardagh Glass Inc. | | United States | | Glass Packaging |
Ardagh Metal Beverage USA Inc. | | United States | | Metal Packaging |
* Newly incorporated subsidiaries or name change effected in year ended December 31, 2018
24. Contingencies
Environmental issues
The Ardagh Group is regulated under various national and local environmental, occupational health and safety and other governmental laws and regulations relating to:
| · | | the operation of installations for manufacturing of metal packaging and surface treatment using solvents; |
| · | | the operation of installations for manufacturing of container glass; |
| · | | the generation, storage, handling, use and transportation of hazardous materials; |
| · | | the emission of substances and physical agents into the environment; |
| · | | the discharge of waste water and disposal of waste; |
| · | | the remediation of contamination; |
| · | | the design, characteristics, collection and recycling of its packaging products; and |
| · | | the manufacturing, sale and servicing of machinery and equipment for the container glass and metal packaging industry. |
The Ardagh Group believes, based on current information that it is in substantial compliance with applicable environmental laws and regulations and permit requirements. It does not believe it will be required, under existing or anticipated future environmental laws and regulations, to expend amounts, over and above the amounts accrued, which will have a material effect on its business, financial condition or results of operations or cash flows. In addition, no material proceedings against the Ardagh Group arising under environmental laws are pending.
Legal matters
In 2015, the German competition authority (the Federal Cartel Office) initiated an investigation of the practices in Germany of metal packaging manufacturers, including Ardagh. In 2018, the European Commission took over this investigation and the German investigation is as a result at an end. The European Commission’s investigation is ongoing, and there is at this stage no certainty as to the extent of any charge which may arise. Accordingly, no provision has been recognized.
On April 21, 2017, a jury in the United States awarded $50 million in damages against the Ardagh Group’s U.S. glass business, formerly Verallia North America (“VNA”), in respect of one of two asserted patents alleged to have been infringed by VNA. On March 8, 2018, the trial judge confirmed the jury verdict. Ardagh notes the Court’s award of pre-judgement interest to the Plaintiffs, its refusal to enhance the damages award in favor of the Plaintiffs and its refusal to award legal costs to the Plaintiffs. Ardagh disagrees with the jury verdict, both as to liability and quantum of damages, and strongly believes that the case is without merit and accordingly, no provision has been recognized. Ardagh is vigorously appealing the verdict to the Federal Appeals Court. On March 23, 2018, the Company filed its appeal notice and posted a surety bond with the Court. Plaintiffs filed a notice of cross-appeal on April 4, 2018. The appeal proceedings are ongoing. The case was filed before Ardagh acquired VNA and customary indemnifications are in place between Ardagh and the seller of VNA.
With the exception of the above legal matters, the Group is involved in certain other legal proceedings arising in the normal course of its business. The Group believes that none of these proceedings, either individually or in aggregate, are expected to have a material adverse effect on its business, financial condition, results of operations or cash flows.
25. Events after the reporting period
There have been no significant events after the balance sheet date which would require disclosure in or amendment to the financial statements.
26. Effect in change of presentation currency
As set out in Note 2, the Group has elected to change its presentation currency to U.S. dollar from January 1, 2018. This change in presentation currency constitutes a change in accounting policy with retrospective application in accordance with IAS 8 “Accounting Policies, Changes in Accounting Estimates and Errors” and is affected in these consolidated financial statements by applying the procedures outlined below, in accordance with the reqirements set out in IAS 21 “The Effects of Changes in Foreign Exchange Rates”.
| · | | the consolidated statements of financial position have been translated at the foreign exchange rate at the balance sheet dates; |
| · | | the consolidated income statements, consolidated statements of comprehensive income and consolidated statements of cash flows were translated at average exchange rates for the respective periods; |
| · | | historic equity transactions were translated at the foreign exchange rate on the date of the transactions and were subsequently carried at historical value; |
| · | | foreign exchange differences arising on translation to presentation currency are recognised in other comprehensive income; and |
| · | | all foreign exchange rates used were extracted from the Group’s underlying financial records. |
The exchange rates used in translation were as follows:
| | | | | | | | |
| | Year ended December 31, |
| | 2017 | | 2016 | | 2015 | | 2014 |
Closing rate | | 1.1993 | | 1.0541 | | 1.0887 | | 1.2141 |
Average rate | | 1.1249 | | 1.1061 | | 1.1150 | | 1.3348 |
The Group’s previously reported euro consolidated statements of financial position as at December 31, 2017, 2016, 2015 and 2014 consolidated income statements, consolidated statements of comprehensive income and consolidated statements of cash flows as at and for the years ended December 31, 2017, 2016 and 2015 are set out below to illustrate the effect of the change in accounting policy.
ARD FINANCE S.A.
CONSOLIDATED INCOME STATEMENT
| | | | | | | | | | | | | | | | | | | | | | |
| | Year ended December 31, 2017 | | Year ended December 31, 2016 | | Year ended December 31, 2015 | |
| | Before | | | | | | Before | | | | | | Before | | | | | |
| | exceptional | | Exceptional | | | | exceptional | | Exceptional | | | | exceptional | | Exceptional | | | |
| | items | | Items | | Total | | items | | Items | | Total | | items | | Items | | Total | |
| | €m | | €m | | €m | | €m | | €m | | €m | | €m | | €m | | €m | |
| | | | | | | | | | | | | | | | | | | | | | |
Revenue | | 7,644 | | — | | | 7,644 | | 6,345 | | — | | | 6,345 | | 5,199 | | — | | | 5,199 | |
Cost of sales | | (6,321) | | (85) | | | (6,406) | | (5,221) | | (15) | | | (5,236) | | (4,285) | | (37) | | | (4,322) | |
Gross profit/(loss) | | 1,323 | | (85) | | | 1,238 | | 1,124 | | (15) | | | 1,109 | | 914 | | (37) | | | 877 | |
Sales, general and administration expenses | | (359) | | (43) | | | (402) | | (300) | | (116) | | | (416) | | (274) | | (44) | | | (318) | |
Intangible amortization | | (235) | | — | | | (235) | | (173) | | — | | | (173) | | (109) | | — | | | (109) | |
Operating profit/(loss) | | 729 | | (128) | | | 601 | | 651 | | (131) | | | 520 | | 531 | | (81) | | | 450 | |
Finance expense | | (479) | | (123) | | | (602) | | (528) | | (165) | | | (693) | | (514) | | (13) | | | (527) | |
Finance income | | — | | — | | | — | | — | | 78 | | | 78 | | — | | — | | | — | |
Profit/(loss) before tax | | 250 | | (251) | | | (1) | | 123 | | (218) | | | (95) | | 17 | | (94) | | | (77) | |
Income tax (charge)/credit | | (87) | | 122 | | | 35 | | (103) | | 43 | | | (60) | | (75) | | 32 | | | (43) | |
Profit/(loss) for the year | | 163 | | (129) | | | 34 | | 20 | | (175) | | | (155) | | (58) | | (62) | | | (120) | |
| | | | | | | | | | | | | | | | | | | | | | |
Profit/(loss) attributable to: | | | | | | | | | | | | | | | | | | | | | | |
Owners of the parent | | | | | | | 31 | | | | | | | (155) | | | | | | | (120) | |
Non-controlling interests | | | | | | | 3 | | | | | | | — | | | | | | | — | |
Profit/(loss) for the year | | | | | | | 34 | | | | | | | (155) | | | | | | | (120) | |
CONSOLIDATED STATEMENT OF COMPREHENSIVE INCOME
| | | | | | | |
| | Year ended December 31, | |
| | 2017 | | 2016 | | 2015 | |
| | €m | | €m | | €m | |
Profit/(loss) for the year | | 34 | | (155) | | (120) | |
Other comprehensive income/(expense) | | | | | | | |
Items that may subsequently be reclassified to income statement | | | | | | | |
Foreign currency translation adjustments: | | | | | | | |
—Arising in the year | | (1) | | (55) | | (139) | |
| | (1) | | (55) | | (139) | |
Effective portion of changes in fair value of cash flow hedges: | | | | | | | |
—New fair value adjustments into reserve | | (226) | | 50 | | 44 | |
—Movement out of reserve | | 230 | | (77) | | (43) | |
—Movement in deferred tax | | 1 | | (4) | | — | |
| | 5 | | (31) | | 1 | |
Items that will not be reclassified to income statement | | | | | | | |
—Re-measurements of employee benefit obligations | | 43 | | (121) | | 72 | |
—Deferred tax movement on employee benefit obligations | | (6) | | 16 | | (27) | |
| | 37 | | (105) | | 45 | |
Total other comprehensive income/(expense) for the year | | 41 | | (191) | | (93) | |
Total comprehensive income/(expense) for the year | | 75 | | (346) | | (213) | |
Attributable to: | | | | | | | |
Owners of the parent | | 66 | | (346) | | (213) | |
Non-controlling interests | | 9 | | — | | — | |
Total comprehensive income/(expense) for the year | | 75 | | (346) | | (213) | |
CONSOLIDATED STATEMENT OF FINANCIAL POSITION
| | | | | | | | |
| | At December 31, |
| | 2017 | | 2016 | | 2015 | | 2014 |
| | €m | | €m | | €m | | €m |
Non-current assets | | | | | | | | |
Intangible assets | | 3,422 | | 3,904 | | 1,810 | | 1,762 |
Property, plant and equipment | | 2,808 | | 2,911 | | 2,307 | | 2,223 |
Derivative financial instruments | | 6 | | 124 | | — | | 40 |
Deferred tax assets | | 184 | | 259 | | 178 | | 184 |
Other non-current assets | | 21 | | 20 | | 14 | | 10 |
| | 6,441 | | 7,218 | | 4,309 | | 4,219 |
Current assets | | | | | | | | |
Inventories | | 1,128 | | 1,125 | | 825 | | 770 |
Trade and other receivables | | 1,062 | | 1,164 | | 651 | | 692 |
Derivative financial instruments | | 13 | | 11 | | — | | 2 |
Cash and cash equivalents | | 686 | | 776 | | 554 | | 433 |
| | 2,889 | | 3,076 | | 2,030 | | 1,897 |
TOTAL ASSETS | | 9,330 | | 10,294 | | 6,339 | | 6,116 |
Equity attributable to owners of the parent | | | | | | | | |
Issued capital | | — | | — | | — | | — |
Other reserves | | (325) | | (329) | | (114) | | 24 |
Retained earnings | | (2,204) | | (2,661) | | (2,260) | | (2,170) |
| | (2,529) | | (2,990) | | (2,374) | | (2,146) |
Non-controlling interests | | (92) | | 2 | | 2 | | 2 |
TOTAL EQUITY | | (2,621) | | (2,988) | | (2,372) | | (2,144) |
Non-current liabilities | | | | | | | | |
Borrowings | | 8,400 | | 9,699 | | 6,397 | | 6,034 |
Employee benefit obligations | | 831 | | 905 | | 720 | | 723 |
Derivative financial instruments | | 251 | | — | | — | | 455 |
Deferred tax liabilities | | 486 | | 694 | | 451 | | — |
Provisions | | 37 | | 57 | | 48 | | 33 |
| | 10,005 | | 11,355 | | 7,616 | | 7,245 |
Current liabilities | | | | | | | | |
Borrowings | | 2 | | 8 | | 7 | | 4 |
Interest payable | | 89 | | 112 | | 79 | | 83 |
Derivative financial instruments | | 2 | | 8 | | 7 | | 7 |
Trade and other payables | | 1,660 | | 1,548 | | 878 | | 804 |
Income tax payable | | 135 | | 182 | | 76 | | 67 |
Provisions | | 58 | | 69 | | 48 | | 50 |
| | 1,946 | | 1,927 | | 1,095 | | 1,015 |
TOTAL LIABILITIES | | 11,951 | | 13,282 | | 8,711 | | 8,260 |
TOTAL EQUITY and LIABILITIES | | 9,330 | | 10,294 | | 6,339 | | 6,116 |
CONSOLIDATED STATEMENT OF CASH FLOWS
| | | | | | | |
| | Year ended December 31, | |
| | 2017 | | 2016 | | 2015 | |
| | €m | | €m | | €m | |
Cash flows from operating activities | | | | | | | |
Cash generated from operations | | 1,330 | | 1,109 | | 950 | |
Interest paid — excluding cumulative PIK interest paid | | (510) | | (372) | | (323) | |
Cumulative PIK interest paid | | — | | (184) | | — | |
Income tax paid | | (90) | | (84) | | (59) | |
Net cash from operating activities | | 730 | | 469 | | 568 | |
Cash flows from investing activities | | | | | | | |
Purchase of business net of cash acquired | | — | | (2,685) | | — | |
Purchase of property, plant and equipment | | (422) | | (310) | | (304) | |
Purchase of software and other intangibles | | (19) | | (12) | | (8) | |
Proceeds from disposal of property, plant and equipment | | 5 | | 4 | | 8 | |
Net cash used in investing activities | | (436) | | (3,003) | | (304) | |
Cash flows from financing activities | | | | | | | |
Proceeds from borrowings | | 3,497 | | 5,479 | | — | |
Repayment of borrowings | | (4,061) | | (2,322) | | (198) | |
Return of capital to parent company | | — | | — | | (15) | |
Net proceeds from share issuance by subsidiary | | 306 | | — | | — | |
Dividends paid to parent company | | (3) | | (270) | | — | |
Dividends paid by subsidiary to non-controlling interest | | (7) | | — | | — | |
Early redemption premium costs paid | | (85) | | (108) | | (8) | |
Deferred debt issue costs paid | | (39) | | (72) | | (2) | |
Proceeds from the termination of derivative financial instruments | | 42 | | — | | 81 | |
Net cash (outflow)/inflow from financing activities | | (350) | | 2,707 | | (142) | |
Net (decrease)/increase in cash and cash equivalents | | (56) | | 173 | | 122 | |
Cash and cash equivalents at the beginning of the year | | 776 | | 554 | | 433 | |
Exchange (losses)/gains on cash and cash equivalents | | (34) | | 49 | | (1) | |
Cash and cash equivalents at the end of the year | | 686 | | 776 | | 554 | |
27. Company financial information
This note has been included in these financial statements in accordance with the requirements of Regulation S‑X rule 12.04 Condensed financial information of registrant. The financial information provided below relates to the individual company financial statements for ARD Finance S.A. as presented in accordance with IFRS as issued by the IASB.
Certain information and footnote disclosures normally included in financial statements prepared in accordance with International Financial Reporting Standards have been condensed or omitted. The footnote disclosures contain supplemental information only and, as such, these statements should be read in conjunction with the notes to the accompanying consolidated financial statements.
The condensed financial information has been prepared using the same accounting policies as set out in the consolidated financial statements, except that investments in subsidiaries are included at cost less any provision for impairment in value.
The functional currency of the Company is euro and accordingly, the Company financial information set out below is presented in euro.
| i) | | Statement of financial position |
| | | | |
| | At December 31, |
| | 2018 | | 2017 |
| | €'m | | €'m |
Non-current assets | | | | |
Investments in subsidiary undertakings | | 900 | | 882 |
Receivables from subsidiary undertaking | | 672 | | 642 |
| | 1,572 | | 1,524 |
Current assets | | | | |
Receivables from subsidiary undertaking | | 20 | | 8 |
Cash and cash equivalents | | 31 | | 32 |
| | 51 | | 40 |
Total assets | | 1,623 | | 1,564 |
Equity attributable to owners of the parent | | | | |
Issued capital | | — | | — |
Retained earnings | | 81 | | 54 |
Total equity | | 81 | | 54 |
Non-current liabilities | | | | |
Borrowings | | 1,512 | | 1,479 |
| | 1,512 | | 1,479 |
Current liabilities | | | | |
Interest payable | | 30 | | 31 |
| | 30 | | 31 |
Total liabilities | | 1,542 | | 1,510 |
Total equity and liabilities | | 1,623 | | 1,564 |
| ii) | | Statement of comprehensive income |
| | | | | | |
| | Year ended December 31, |
| | 2018 | | 2017 | | 2016 |
| | €'m | | €'m | | €'m |
Dividend income | | 86 | | 133 | | 270 |
Finance expense | | (106) | | (111) | | (31) |
Finance income | | 47 | | 50 | | 14 |
Profit before tax | | 27 | | 72 | | 253 |
Income tax | | — | | — | | — |
Profit and total comprehensive income for the year | | 27 | | 72 | | 253 |
| iii) | | Statement of cash flows |
| | | | | | |
| | Year ended December 31, |
| | 2018 | | 2017 | | 2016 |
| | €'m | | €'m | | €'m |
Cash flows from operating activities | | | | | | |
Cash generated from operations | | — | | — | | — |
Related party interest received | | 35 | | 54 | | — |
Interest paid | | (102) | | (105) | | — |
Net cash used in operating activities | | (67) | | (51) | | — |
Cash flows from investing activities | | | | | | |
Repayment of loans from subsidiary undertakings | | — | | (3) | | (404) |
Contribution to subsidiary undertaking | | (18) | | (45) | | (431) |
Dividends received | | 86 | | 133 | | 270 |
Loans granted to subsidiary undertakings | | — | | — | | (679) |
Net cash received from/(used in) investing activities | | 68 | | 85 | | (1,244) |
Cash flows from financing activities | | | | | | |
Net proceeds from borrowings | | — | | — | | 1,529 |
Dividends paid | | — | | (3) | | (270) |
Deferred debt issue costs paid | | — | | (3) | | (12) |
Net cash (outflow)/inflow from financing activities | | — | | (6) | | 1,247 |
Net increase in cash and cash equivalents | | 1 | | 28 | | 3 |
Cash and cash equivalents at the beginning of the year | | 32 | | 4 | | 1 |
Exchange losses on cash and cash equivalents | | (2) | | — | | — |
Cash and cash equivalents at the end of the year | | 31 | | 32 | | 4 |
| iv) | | Maturity analysis of the Company’s borrowings |
At December 31, 2018, the Company had €1,512 million of borrowings (2017: €1,479 million) which are due to mature in 2023.
| v) | | Distributions paid and received |
During the year ended December 31, 2018 the Company received a dividend of €86 million (2017: €133 million, 2016: €270 million) from a subsidiary company. The Company also paid a dividend to its parent company of €nil million (2017: €3 million, 2016: €270 million).
| vi) | | Commitments and contingencies |
The Company had no commitments and contingencies at December 31, 2018 (2017: €nil).
| vii) | | Additional information |
The following reconciliations are provided as additional information to satisfy the Schedule I SEC Requirements for parent‑only financial information, and are presented in both euro and U.S. dollars.
| | | | | | |
| | Year ended December 31, |
| | 2018 | | 2017 | | 2016 |
| | €'m | | €'m | | €'m |
IFRS profit/(loss) reconciliation: | | | | | | |
Parent only—IFRS profit for the year | | 27 | | 72 | | 253 |
Additional loss if subsidiaries had been accounted for using the equity method of accounting as opposed to cost | | (253) | | (41) | | (408) |
Consolidated IFRS (loss)/profit for the year | | (226) | | 31 | | (155) |
| | | | | | |
| | At December 31, |
| | 2018 | | 2017 | | 2016 |
| | €'m | | €'m | | €'m |
IFRS equity reconciliation: | | | | | | |
Parent only—IFRS equity | | 81 | | 54 | | (15) |
Additional loss if subsidiaries had been accounted for using the equity method of accounting as opposed to cost | | (2,911) | | (2,583) | | (2,975) |
Consolidated—IFRS equity | | (2,830) | | (2,529) | | (2,990) |
| | | | | | |
| | Year ended December 31, |
| | 2018 | | 2017 | | 2016 |
| | $'m | | $'m | | $'m |
IFRS profit/(loss) reconciliation: | | | | | | |
Parent only—IFRS profit for the year | | 32 | | 81 | | 280 |
Additional loss if subsidiaries had been accounted for using the equity method of accounting as opposed to cost | | (295) | | (40) | | (452) |
Consolidated IFRS (loss)/profit for the year | | (263) | | 41 | | (172) |
| | | | | | |
| | At December 31, |
| | 2018 | | 2017 | | 2016 |
| | $'m | | $'m | | $'m |
IFRS equity reconciliation: | | | | | | |
Parent only—IFRS equity | | 93 | | 65 | | (16) |
Additional loss if subsidiaries had been accounted for using the equity method of accounting as opposed to cost | | (3,333) | | (3,207) | | (3,134) |
Consolidated—IFRS equity | | (3,240) | | (3,142) | | (3,150) |