UNITED STATES
SECURITIES AND EXCHANGE COMMISSION
Washington, D.C. 20549
SCHEDULE 14A
Proxy Statement Pursuant to Section 14(a) of
the Securities Exchange Act of 1934 (Amendment No. )
Filed by the Registrant ☒
Filed by a Party other than the Registrant ☐
Check the appropriate box:
| ☐ | Preliminary Proxy Statement |
| ☐ | Confidential, for Use of the SEC Only (as permitted by Rule 14a-6(e)(2)) |
| ☐ | Definitive Proxy Statement |
| ☐ | Definitive Additional Materials |
| ☒ | Soliciting Material Pursuant to §240.14a-12 |
Legacy Acquisition Corp. |
(Name of Registrant as Specified In Its Charter) |
| N/A |
(Name of Person(s) Filing Proxy Statement, if other than the Registrant) |
| |
| |
Payment of Filing Fee (Check the appropriate box):
| ☐ | Fee computed on table below per Exchange Act Rules 14a-6(i)(4) and 0-11. |
| (1) | Title of each class of securities to which transaction applies: |
| | | |
| (2) | Aggregate number of securities to which transaction applies: |
| | | |
| (3) | Per unit price or other underlying value of transaction computed pursuant to Exchange Act Rule 0-11 (Set forth the amount on which the filing fee is calculated and state how it was determined): |
| | | |
| (4) | Proposed maximum aggregate value of transaction: |
| | | |
| (5) | Total fee paid: |
| | | |
| ☐ | Fee paid previously with preliminary materials. |
| ☐ | Check box if any part of the fee is offset as provided by Exchange Act Rule 0-11(a)(2) and identify the filing for which the offsetting fee was paid previously. Identify the previous filing by registration statement number, or the Form or Schedule and the date of its filing. |
| (1) | Amount Previously Paid: |
| | | |
| (2) | Form, Schedule or Registration Statement No.: |
| | | |
| (3) | Filing Party: |
| | | |
| (4) | Date Filed: |
| | | |
Included in this Schedule 14A filing is a copy of an investor presentation, dated January 21, 2020, that will be used in connection with the previously announced business combination (the “Business Combination”) of Legacy Acquisition Corp., a Delaware corporation (“Legacy”), with Blue Valor Limited, a company incorporated in Hong Kong (the “Seller”) and an indirect, wholly owned subsidiary of BlueFocus Intelligent Communications Group Co. Ltd. pursuant to the Amended and Restated Share Exchange Agreement, dated December 2, 2019 by and between Legacy and the Seller (the “Amended and Restated Share Exchange Agreement”), which amends and restates the Share Exchange Agreement dated as of August 23, 2019 by and between Legacy and the Seller (the “Original Share Exchange Agreement”), as amended by that First Amendment to Share Exchange Agreement dated as of September 27, 2019.
The communication listed above was first used or made available January 21, 2020.
For Discussion & General Information Purposes Only Analyst Presentation January 2020
2 This presentation (“Presentation”) is for informational purposes only. This Presentation has been prepared to assist parties in making their own evaluation with respect to a proposed Transaction as contemplated by the definitive share exchange agreement between Legacy Acquisition Corp. (“Legacy”) and Blue Valor Limited, the indirect, who lly - owned subsidiary of BlueFocus Intelligent Communications Group (“BFICG”), and for no other purpose. Additional information about the proposed business combination (the “Transaction”) and the definiti ve share exchange agreement has been provided in a preliminary proxy statement filed with the U.S. Securities and Exchange Commission (the “SEC”) on December 2, 2019 and will be provided in a definitive p rox y statement that Legacy intends to file with the SEC in connection with the proposed Transaction. Under the definitive agreement, Legacy will purchase all of the issued and outstanding shares of a new ly formed and wholly - owned subsidiary of BFICG that at closing will hold the Blue Impact group business -- a digital - first, integrated and intelligent, global advertising & marketing services group (“Blue Impac t” or the “Company”). This Presentation is not intended to form the basis of any investment or other decision with respect to the proposed Transaction or otherwise. Certain information contained herein has been derived from sources prepared by third parties. While such information is belie ved to be reliable for the purposes used herein, neither Legacy nor the Company makes any representation or warranty with respect to the accuracy of such information. The Blue Impact design logo and “Blue Imp act” are the property of the Company. Other trademarks and trade names referred to in this Presentation are the property of their respective owners. All references made to Blue Impact and the Comp any include predecessor organizations as well. This Presentation does not purport to contain all of the information that may be required to evaluate a possible voting or in ves tment decision with respect to Legacy. The recipient agrees and acknowledges that this Presentation is not intended to form the basis of any voting or investment decision by the recipient and does not consti tut e investment, tax or legal advice. No representation or warranty, express or implied, is or will be given by Legacy or the Company or any of their respective affiliates, directors, officers, employees or advisers o r a ny other person as to the accuracy or completeness of the information in this Presentation or any other written, oral or other communications transmitted or otherwise made available to any party in the c our se of its evaluation of a possible Transaction between Legacy and the Company (the “Transaction”), and no responsibility or liability whatsoever is accepted for the accuracy or sufficiency thereof or for an y errors, omissions or misstatements, negligent or otherwise, relating thereto. The recipient also acknowledges and agrees that the information contained in this Presentation is preliminary in nature and is su bje ct to change, and any such changes may be material. Legacy and the Company disclaim any duty to update the information contained in this Presentation, which information is given only as of the date of th is Presentation unless otherwise stated herein. This Presentation contains certain “forward - looking statements” within the meaning of the Private Securities Litigation Reform Act of 1995, Section 27A of the Securities Ac t of 1933, as amended (the “Securities Act”), and Section 21E of the Securities Exchange Act of 1934, as amended, including statements regarding Legacy and the Comp any and the potential Transaction between Legacy and the Company and their respective management teams’ expectations, hopes, beliefs, intentions or strategies regarding the future. In addition, any st ate ments that refer to projections, forecasts or other characterizations of future events or circumstances, including any underlying assumptions, are forward - looking statements. The words “anticipate,” “believe,” “cont inue,” “could,” “estimate,” “expect,” “intends,” “may,” “might,” “plan,” “possible,” “potential,” “predict,” “project,” “should,” “would” and similar expressions may identify forward - looking statements, but the ab sence of these words does not mean that a statement is not forward - looking. These forward - looking statements are based on Legacy’s and the Company’s current expectations and assumptions about future events and are based on currently available information as to the outcome and timing of future events. We caution you that these forward - looking statements are subject to all of the risks and uncertainties, most of w hich are difficult to predict and many of which are beyond Legacy’s and the Company’s control, that could cause the actual results to differ materially from the expected results. Factors that may cause su ch differences include, but are not limited to: (1) the occurrence of any event, change or other circumstances that could give rise to the termination of the share exchange agreement, (2) the outcome of any le gal proceedings that may be instituted against Legacy and other transaction parties following the announcement of the share exchange agreement and the transactions contemplated therein; (3) the inabili ty to complete the proposed Transaction, including due to failure to obtain approval of the stockholders of Legacy or other conditions to closing in the share exchange agreement; (4) the occurrence of any event , c hange or other circumstance that could otherwise cause the Transaction to fail to close; (5) the receipt of an unsolicited offer from another party for an alternative business transaction that could interfer e w ith the proposed Transaction; (6) the inability to obtain or maintain the listing of Blue Impact’s common stock on the New York Stock Exchange following the proposed Transaction; (7) the risk that the proposed Trans act ion disrupts current plans and operations as a result of the announcement and consummation of the proposed Transaction; (8) the ability to recognize the anticipated benefits of the proposed Transacti on, which may be affected by, among other things, competition, the ability to integrate the Blue Impact businesses, and the ability of the combined business to grow and manage growth profitably; (9) costs related to the proposed Transaction; (10) changes in applicable laws or regulations; (11) the possibility that the Blue Impact business or the combined company may be adversely affected by other economic business, and/o r c ompetitive factors; (12) the aggregate number of Legacy shares requested to be redeemed by Legacy’s stockholders in connection with the proposed Transaction; (13) the risk that current trends in digita l m edia and marketing decelerate or do not continue; (14) the ability of the Blue Impact business to ameliorate or otherwise mitigate its existing material weaknesses and any material weaknesses in internal control ov er financial reporting or significant deficiencies that may be identified in the future; (15) estimates for the financial performance of the Blue Impact business may prove to be incorrect or materially different fr om actual results; and (16) other risks and uncertainties indicated from time to time in the proxy statement relating to the proposed Transaction, including those under “Risk Factors” therein, and in Legacy’s other fil ing s with the SEC. The foregoing list of factors is not exclusive. You should not place undue reliance upon any forward - looking statements, which speak only as of the date made. Legacy and the Company do not undertak e or accept any obligation or undertaking to release publicly any updates or revisions to any forward - looking statements to reflect any change in its expectations or any change in events, conditions or cir cumstances on which any such statement is based. Financial Statements 2016 interim and pro forma financial information is not audited. There can be no assurance that the final results for 2016, a ny interim periods and the pro forma financial information, if it were to be audited will not differ from the results provided in this presentation, including as a result of review adjustments. As a result of the forego ing considerations and the other limitations described herein, investors are cautioned not to place undue reliance on this unaudited financial information. Disclaimer
3 Disclaimer (Continued) Use of Non - GAAP Information This Presentation contains numbers that are not required by, or presented in accordance with, GAAP, including Pro Forma Adjus ted Net Revenue, Pro Forma Adjusted EBITDA, Acquired EBITDA, Unadjusted EBITDA and Adjusted EBITDA (collectively, our “Non - GAAP Measures”). Our Non - GAAP Measures are not GAAP measures of our financial performance or liquidity and should not be considered as alternatives to net income (loss) as a measure of financial performance, cash flows from operating activities as a measure of liquidity, o r a ny other performance measure derived in accordance with GAAP. They should not be construed as an inference that our future results will be unaffected by unusual or non - recurring items. In addition, our Non - GAA P Measures exclude certain non - recurring and other charges and income items. You should be aware that in the future we may incur expenses that are the same as or similar to some of the adjustments in Ou r N on - GAAP Measures. Our presentation of Our Non - GAAP Measures should not be construed to imply that our future results will be unaffected by any such adjustments. Management compensates for these li mit ations by relying primarily on our GAAP results and by using our Non - GAAP Measures as supplemental information. Our Non - GAAP Measures are not necessarily comparable to other similarly titled captions of other companies due to different methods of calculation. A reconciliation of some of our Non - GAAP Measures to the nearest comparable GAAP measure can be found at slide 57 of this presentation. A reconcilia tion for our 2020E Non - GAAP Measures to the most directly comparable GAAP financial measures is not included, because, without unreasonable efforts, we are unable to predict with reasonable cert ain ty the amount or timing of non - GAAP adjustments that are used to calculate these Non - GAAP Measures, including, but not limited to, (a) expenses associated with the opening, closing or moving of offices, (b) the net loss or gains on the sale of assets or associated with certain past M&A and future financing and other transactions, (c) other expenses that we do not believe are indicative of our ongoing operatio ns, as well as (d) gains and losses related to foreign currency exchange rates. Projections and Historical Financial Information Any estimates, forecasts or projections set forth in the Presentation have been prepared by Legacy and the Company in good fa ith on a basis believed to be reasonable. Such estimates, forecasts and projections involve significant elements of subjective judgment and analysis and reflect numerous judgments, estimates and assumptions th at are inherently uncertain in prospective financial information of any kind. As such, no representation can be made as to the attainability of such estimates, forecasts and projections. The recipient is cautione d t hat such estimates, forecasts or projections have not been audited and have not been prepared in conformity with generally accepted accounting principles (“GAAP”). The risks and other factors that could impact the Company’s ability to attain projected results include, but are not limited to, those mentioned in the prior paragraphs. The recipient therefore should not rely on the estimates, forecasts or projections contain ed in the Presentation. Important Information About the Proposed Transaction and Where to Find It This Presentation may be deemed to be solicitation material in respect of the proposed Transaction. In connection with the pr opo sed Transaction, Legacy has filed a preliminary proxy statement with the SEC on December 2, 2019 and intends to file other relevant materials with the SEC, including a definitive proxy statement on Schedul e 1 4A. Legacy’s stockholders and other interested persons are advised to read the preliminary proxy statement and the amendments thereto and other relevant materials to be filed in connection with the propos ed Transaction with the SEC, including, when available, the definitive proxy statement and documents incorporated by reference therein, as these materials will contain important information about the Co mpa ny, Legacy and the proposed Transaction contemplated by the share exchange agreement. When available, the definitive proxy statement and other relevant materials for the proposed Transaction will be m ail ed to stockholders of Legacy as of January 27, 2020, the record date for voting on the proposed Transaction, or such other date as may be set and announced by Legacy. Stockholders are able to obtain copies of th e preliminary proxy statement, and will also be able to obtain once available the definitive proxy statement and other documents filed with the SEC that will be incorporated by reference therein, without cha rge at the SEC’s web site at www.sec.gov, or by directing a request to: Legacy Acquisition Corp., 1308 Race Street, Suite 200, Cincinnati, Ohio 45202, Attention: Secretary, (513) 618 - 7161. Participants in the Solicitation Legacy and its directors and executive officers may be deemed participants in the solicitation of proxies from Legacy’s stock hol ders with respect to the proposed Transaction. A list of the names of those directors and executive officers and a description of their interests in Legacy is set forth in its proxy statement for its 2019 annual me eting of stockholders, which was filed with the SEC on November 22, 2019 and is available free of charge at the SEC’s web site at www.sec.gov, or by directing a request Legacy Acquisition Corp., 1308 Race Str eet, Suite 200, Cincinnati, Ohio 45202, Attention: Secretary, (513) 618 - 7161. Additional information regarding the interests of such participants is contained in the preliminary proxy statement filed wit h t he SEC on December 2, 2019 and will be contained in the definitive proxy statement that Legacy intends to file with the SEC in connection with the proposed Transaction when available. Blue Valor Limited, BlueFocus Intelligent Communications Group and their respective affiliates and directors, officers and em plo yees may also be deemed to be participants in the solicitation of proxies from the stockholders of Legacy in connection with the proposed Transaction. A list of the names of such directors and officers and in for mation regarding their interests in the proposed Transaction is contained in the preliminary proxy statement filed with the SEC on December 2, 2019 and will be contained in the definitive proxy statement th at Legacy intends to file with the SEC in connection with the proposed Transaction when available. No Offer or Solicitation This presentation shall not constitute a solicitation of a proxy, consent or authorization with respect to any securities or in respect of the Transaction. This presentation shall also not constitute an offer to sell, or the solicitation of an offer to buy, any securities, nor shall there be any sale of securities in any states or jurisdictions in which such offer, solicitation or sale would be unlawful. No offer of securities shall be made except by means of a prospectus meeting the requirements of Section 10 of the Securities Act. Blue Impact’s Organization Prior to the consummation of the contemplated Transaction, Blue Valor Limited, an indirect wholly - owned subsidiary of BFICG orga nized in Hong Kong, will contribute its interests in the Vision 7 Group, We Are Social, Madhouse, Metta and Fuseproject into its newly formed wholly owned subsidiary, Blue Impact (Cayman) Limited organized in the Cayman Islands (the “Blue Impact T arget”). At closing of the contemplated Transaction, Legacy will acquire Blue Impact Target, thereby acquiring control of the Vision 7 Group, We Are Social, Madhouse , M etta and Fuseproject . Following closing of the proposed Transaction, Legacy will change its name to Blue Impact Inc.
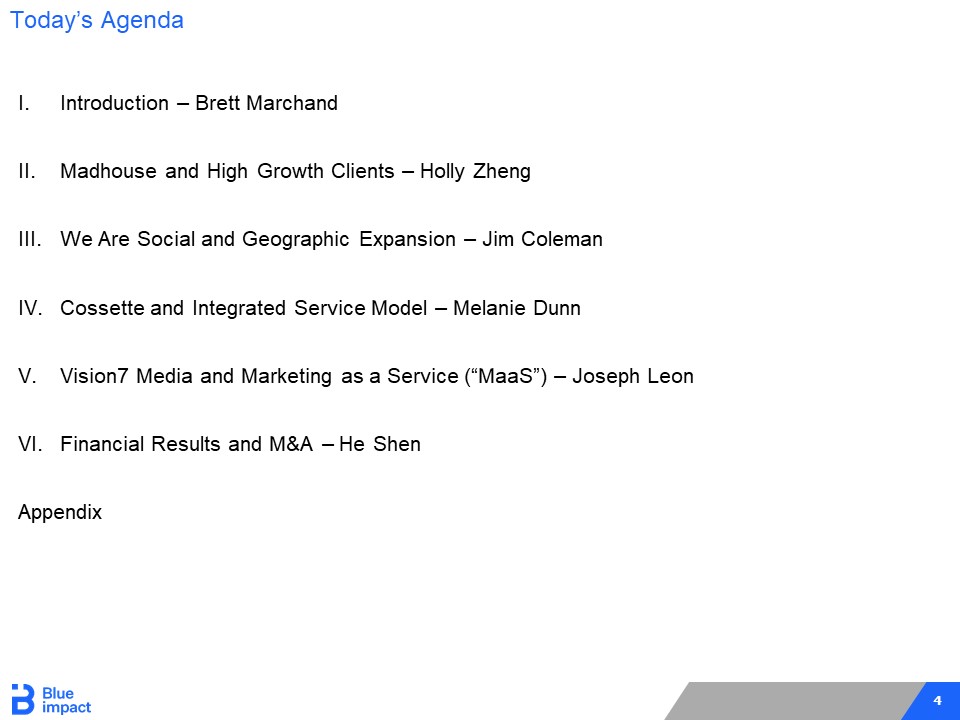
4 I. Introduction – Brett Marchand II. Madhouse and High Growth Clients – Holly Zheng III. We Are Social and Geographic Expansion – Jim Coleman IV. Cossette and Integrated Service Model – Melanie Dunn V. Vision7 Media and Marketing as a Service (“MaaS”) – Joseph Leon VI. Financial Results and M&A – He Shen Appendix Today’s Agenda

Introduction Brett Marchand

6 The Objective: Create management, client and shareholder value with a digital - first, integrated and intelligent, global advertising and marketing services company which is well funded to work towards achieving its goal Our Goal: $1.0 Billion + in Revenue

7 And While We’re at It, Change the Industry!

8 ` The History and Agencies of Blue Impact Blue Impact at a Glance Global marketing communications network headquartered in Canada Global social media specialist headquartered in the U.K. Product and digital design agency headquartered in the U.S. Full service marketing agency headquartered in Hong Kong, China Mobile performance marketing platform headquartered in China BFICG Highlighted Acquisitions 2014 2015 2016 2017 2018 Key Acquisition Timeline 2013
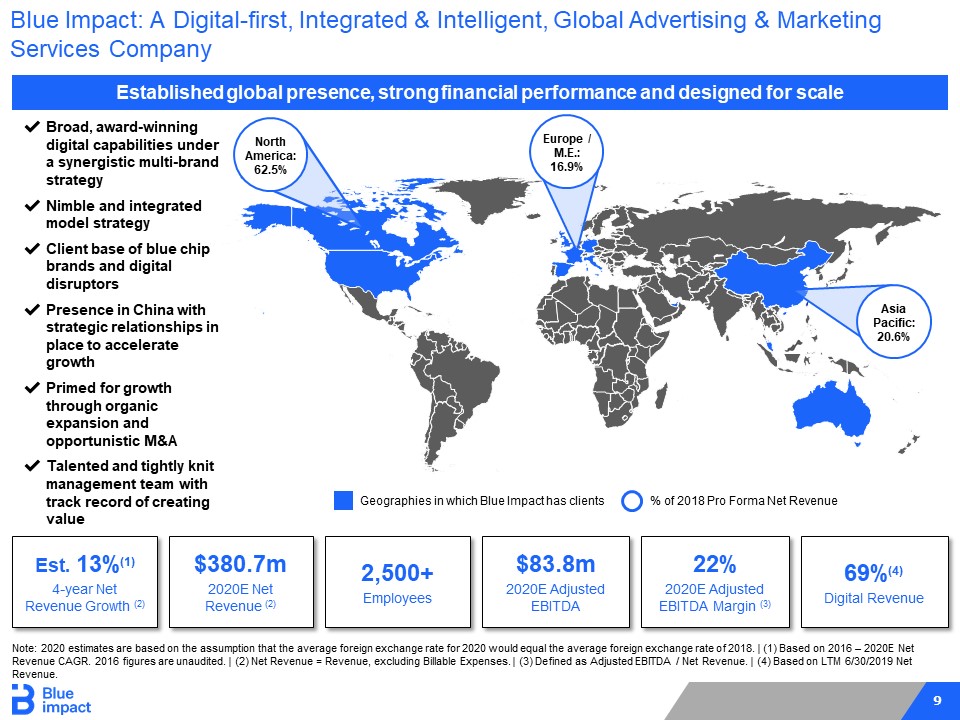
9 Blue Impact: A Digital - first, Integrated & Intelligent, Global Advertising & Marketing Services Company Note: 2020 estimates are based on the assumption that the average foreign exchange rate for 2020 would equal the average fore ign exchange rate of 2018. | (1) Based on 2016 – 2020E Net Revenue CAGR. 2016 figures are unaudited. | (2) Net Revenue = Revenue, excluding Billable Expenses. | (3) Defined as Adjusted EB ITDA / Net Revenue. | (4) Based on LTM 6/30/2019 Net Revenue. $83.8m 2020E Adjusted EBITDA Est. 13% (1) 4 - year Net Revenue Growth (2) 22% 2020E Adjusted EBITDA Margin (3) 2,500+ Employees 69% (4) Digital Revenue $380.7m 2020E Net Revenue (2) ✔ Broad, award - winning digital capabilities under a synergistic multi - brand strategy ✔ Nimble and integrated model strategy ✔ Client base of blue chip brands and digital disruptors ✔ Presence in China with strategic relationships in place to accelerate growth ✔ Primed for growth through organic expansion and opportunistic M&A ✔ Talented and tightly knit management team with track record of creating value Established global presence, strong financial performance and designed for scale Geographies in which Blue Impact has clients % of 2018 Pro Forma Net Revenue North America: 62.5% Europe / M.E.: 16.9% Asia Pacific: 20.6%

10 Talented and tightly knit management team with track record of creating value Blue chip clients across multiple verticals and serving leading digital disruptors with a platform for growth in China 3 Targeting double digit revenue growth and ~20% Adjusted EBITDA Margins (1) 4 Primed for growth – ability to scale with organic expansion and opportunistic M&A 5 A simple and nimble structure built around Owned, Paid, Earned and Shared media 2 An Advertising & Marketing Services Company of the Future: Digital - first, Integrated & Intelligent 1 Blue Impact Investment Highlights 6 (1) Based on 2020 estimates; Adjusted EBITDA Margin defined as Adjusted EBITDA / Net Revenue; Net Revenue = Revenue, excludin g B illable Expenses.
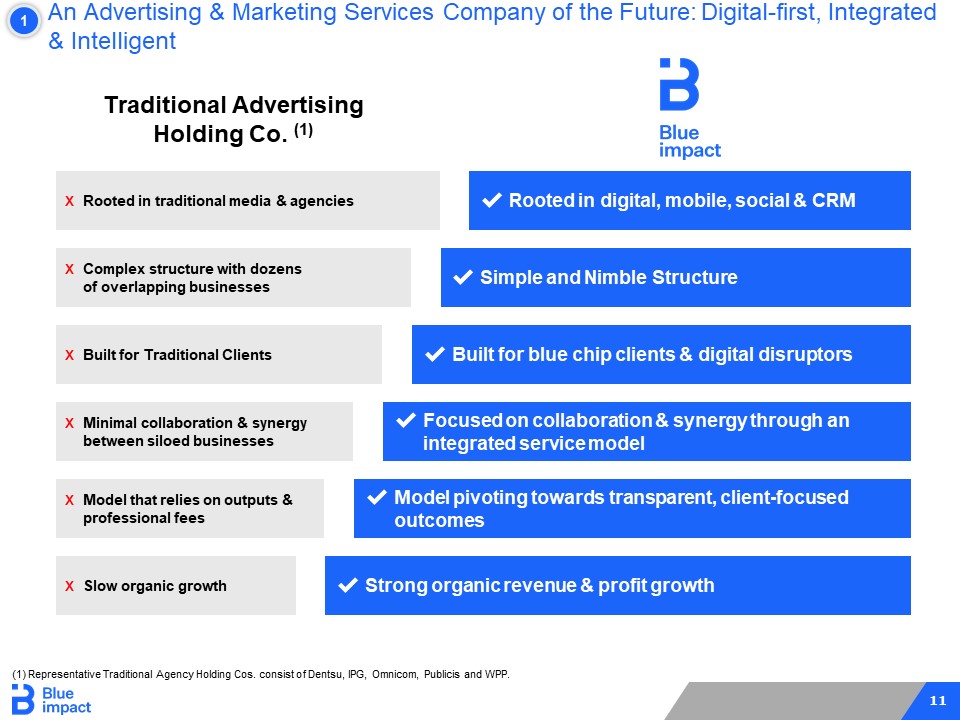
11 An Advertising & Marketing Services Company of the Future: Digital - first, Integrated & Intelligent x Complex structure with dozens of overlapping businesses x Built for Traditional Clients x Slow organic growth ✔ Rooted in digital, mobile, social & CRM ✔ Focused on collaboration & synergy through an integrated service model ✔ Strong organic revenue & profit growth x Minimal collaboration & synergy between siloed businesses x Rooted in traditional media & agencies ✔ Simple and Nimble Structure ✔ Built for blue chip clients & digital disruptors x Model that relies on outputs & professional fees ✔ Model pivoting towards transparent, client - focused outcomes Traditional Advertising Holding Co. (1) (1) Representative Traditional Agency Holding Cos. consist of Dentsu, IPG, Omnicom, Publicis and WPP. 1

12 A Simple and Nimble Structure Built around Owned, Paid, Earned and Shared Media 2 Owned media Paid media Shared media Earned media • Deliver marketing & brand campaigns • Strategy, creative & production services • Brand, content, product & user design • Media consulting planning & buying services • Digital, search, social & programmatic media • Channel optimization, performance & ROI • Deliver communication advice & campaigns • Experiential, influencer & media relations • Brand, Corporate, Healthcare & Tech PR • Socially - led strategy & creative • Design, content & production services • Social insights & analytics • Encompasses elements of Owned, Paid and Earned media, all focused on social media platforms
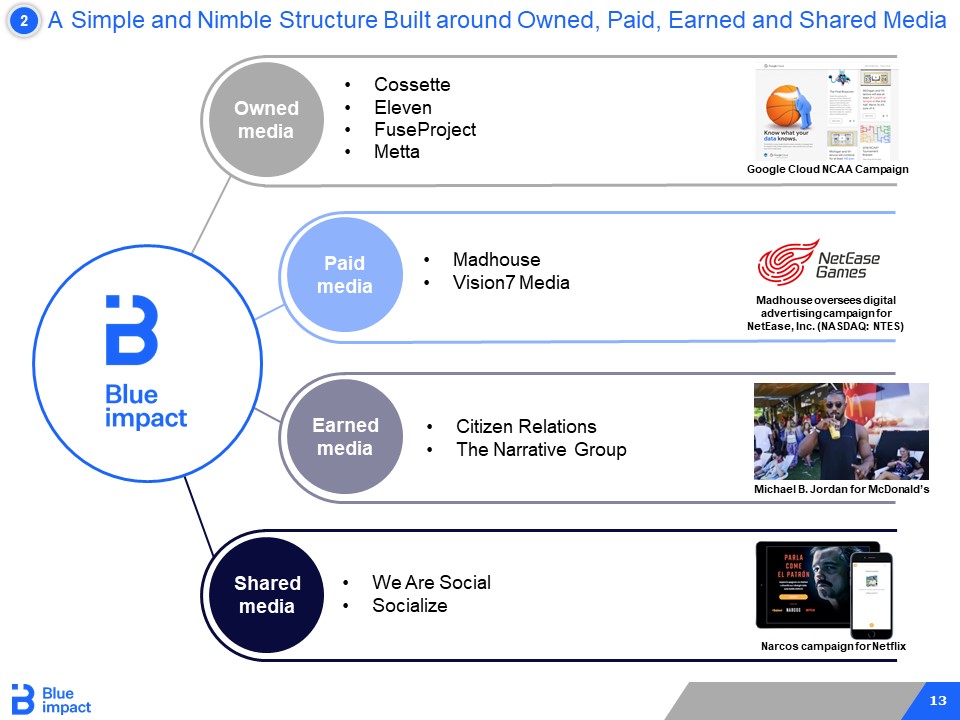
13 A Simple and Nimble Structure Built around Owned, Paid, Earned and Shared Media 2 Google Cloud NCAA Campaign Narcos campaign for Netflix Owned media Paid media Shared media Earned media Michael B. Jordan for McDonald’s Madhouse oversees digital advertising campaign for NetEase, Inc. (NASDAQ: NTES) • Cossette • Eleven • FuseProject • Metta • We Are Social • Socialize • Madhouse • Vision7 Media • Citizen Relations • The Narrative Group
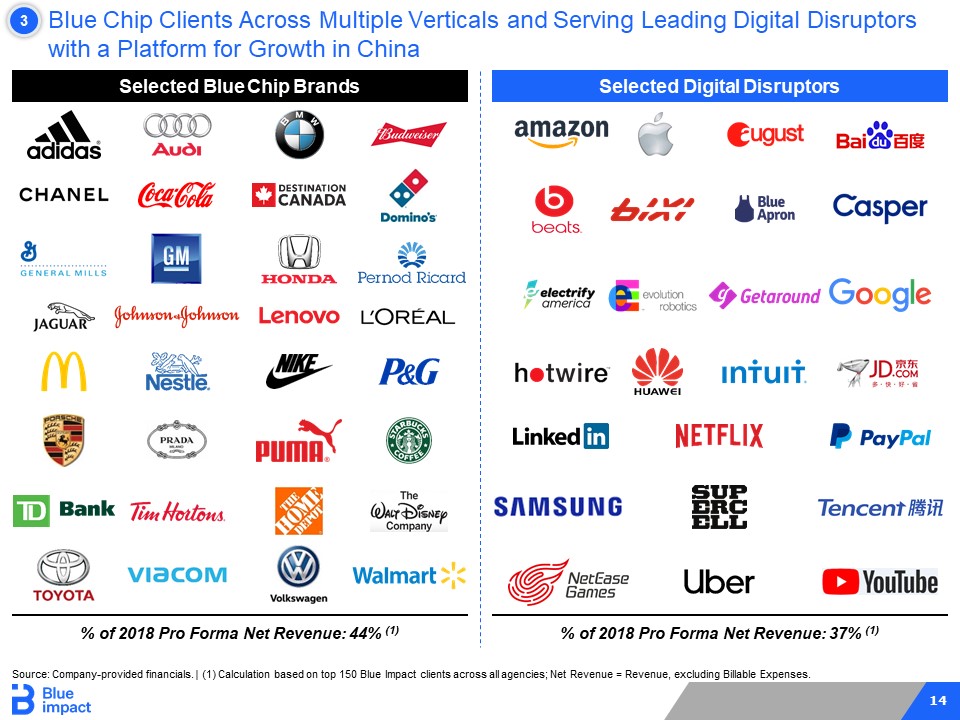
14 Blue Chip Clients Across Multiple Verticals and Serving Leading Digital Disruptors with a Platform for Growth in China 3 Selected Blue Chip Brands Selected Digital Disruptors % of 2018 Pro Forma Net Revenue: 44% (1) % of 2018 Pro Forma Net Revenue: 37% (1) Source: Company - provided financials. | (1) Calculation based on top 150 Blue Impact clients across all agencies; Net Revenue = R evenue, excluding Billable Expenses.
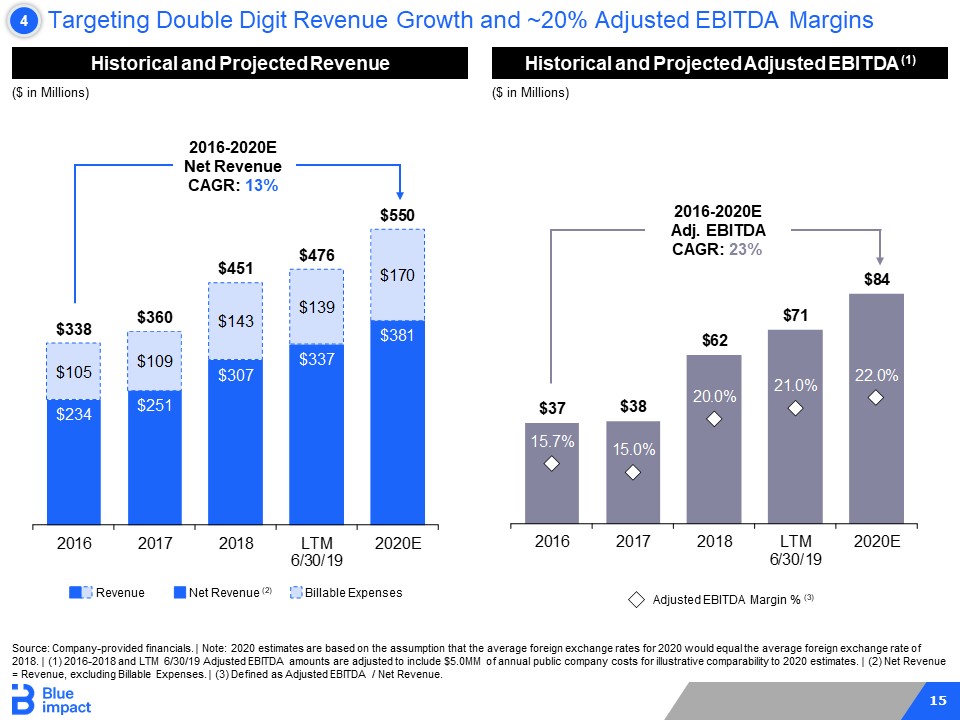
15 $234 $251 $307 $337 $381 $105 $109 $143 $139 $170 $338 $360 $451 $476 $550 2016 2017 2018 LTM 6/30/19 2020E $37 $38 $62 $71 $84 15.7% 15.0% 20.0% 21.0% 22.0% 2016 2017 2018 LTM 6/30/19 2020E Targeting Double Digit Revenue Growth and ~20% Adjusted EBITDA Margins 4 Source: Company - provided financials. | Note: 2020 estimates are based on the assumption that the average foreign exchange rates for 2020 would equal the average foreign exchange rate of 2018. | (1) 2016 - 2018 and LTM 6/30/19 Adjusted EBITDA amounts are adjusted to include $5.0MM of annual public company costs for illustrative comparability to 2020 estimates. | (2) Net Revenue = Revenue, excluding Billable Expenses. | (3) Defined as Adjusted EBITDA / Net Revenue. ($ in Millions) 2016 - 2020E Net Revenue CAGR: 13% Historical and Projected Revenue Historical and Projected Adjusted EBITDA (1) ($ in Millions) Adjusted EBITDA Margin % (3) 2016 - 2020E Adj. EBITDA CAGR: 23% Billable Expenses Net Revenue (2) Revenue

16 Talented and Tightly Knit Management Team with Track Record of Creating Value 5 Holly Zheng Executive Chairwoman ▪ 5 years with Blue Impact and predecessors as well as service on the Board of Directors for BlueFocus Intelligent Communications Group (BFICG); currently CEO and President of BlueFocus International ▪ 18 years experience of marketing and sales experience BFICG board member; oversees international business development He Shen Interim CFO and Chief Development Officer – M&A ▪ 3 years with Blue Impact; currently CFO of BlueFocus International ▪ 23 years experience in corporate finance and investment banking Financial reporting and strategic transactions including M&A and capital market financings Brett Marchand CEO ▪ 14 years with Blue Impact and predecessors including as CEO of BFICG’s largest acquisition outside China; currently CEO of Vision7 and Executive Chairman of Cossette ▪ 30 years experience of marketing / advertising Global operations & directing the growth plan Nick Cowling ▪ President of Citizen Relations, Global ▪ 9 years with Blue Impact and predecessors ▪ Led the design of Citizen’s new agency model that helped the company grow to the 4th largest communications firm in the country Earned Media, Global Blue Impact will be led by a highly experienced management team with a deep bench of category experts (1) Name Selected Prior Experience Primary Responsibility Mélanie Dunn ▪ President and CEO of Cossette ▪ 17 years with Blue Impact and predecessors ▪ Led integration of owned media / creative service model in Canada Owned Media, Canada Joseph Leon ▪ President and CEO of Vision7 Media ▪ 6 years with Blue Impact and predecessors ▪ Led digital strategy expansion and move to performance media Paid Media, North America & EMEA Nathan McDonald ▪ Co - Founder and CEO of We Are Social ▪ 11 years with Blue Impact and predecessors ▪ Led international expansion of We Are Social into 10 markets Shared Media, Global Yves Behar Owned Media, US & Europe ▪ Founder and CEO of Fuseproject ▪ 19 years with Blue Impact and predecessors ▪ Led brand and product design for many successful disruptors in Silicon Valley Charlie Ruan ▪ President of Madhouse ▪ 12 years with Blue Impact and predecessors ▪ Led Madhouse’s expansion to serve both brand advertisers as well as app developers in global markets Paid Media, Asia (1) This slide reflects the expected management team upon the consummation of the Transaction.

17 Primed for Growth – Ability to Scale With Organic Expansion and Opportunistic M&A 6 ▪ Grow disruptor clients with Blue Impact’s unique digital - first platform ▪ Grow with BFICG’s clients as they expand internationally ▪ Leverage Legacy’s network to grow Blue Impact’s blue chip client base Accelerate Growth with High Growth High Spend Clients A ▪ Grow scale through geographic expansion of capabilities and M&A in critical, markets to fill out Blue Impact’s suite of services in that geography ▪ Employ a disciplined approach in assessing potential strategic acquisitions Expand Capabilities Geographically B ▪ Drive revenue and increased efficiency and margin expansion through the scalable integrated service model Replicate the Proven Integrated Service Model C ▪ Expansion of “MaaS” offerings to drive margin accretion ▪ Blue Impact is well - positioned to grow its presence in MaaS Pursue Profitable Growth Through Marketing as a Service (“MaaS”) D Our Goal: $1.0 Billion + in Revenue

Madhouse and High Growth Clients Holly Zheng
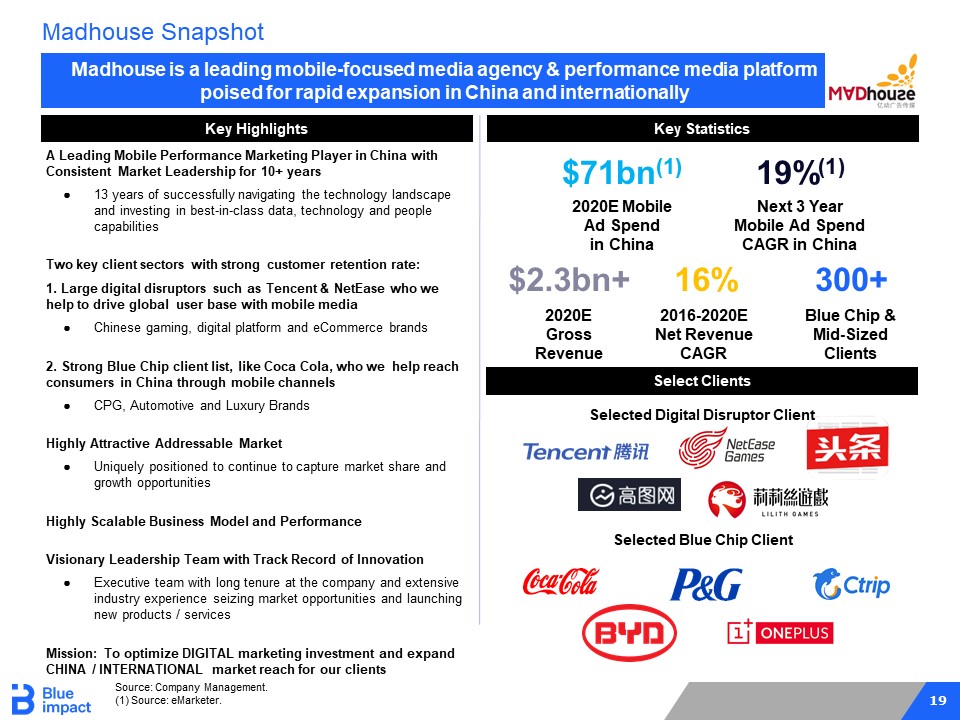
19 ▪ Madhouse is a leading mobile - focused media agency & performance media platform poised for rapid expansion in China and internationally A Leading Mobile Performance Marketing Player in China with Consistent Market Leadership for 10+ years ● 13 years of successfully navigating the technology landscape and investing in best - in - class data, technology and people capabilities Two key client sectors with strong customer retention rate: 1. Large digital disruptors such as Tencent & NetEase who we help to drive global user base with mobile media ● Chinese gaming, digital platform and eCommerce brands 2. Strong Blue Chip client list, like Coca Cola, who we help reach consumers in China through mobile channels ● CPG, Automotive and Luxury Brands Highly Attractive Addressable Market ● Uniquely positioned to continue to capture market share and growth opportunities Highly Scalable Business Model and Performance Visionary Leadership Team with Track Record of Innovation ● Executive team with long tenure at the company and extensive industry experience seizing market opportunities and launching new products / services Mission: To optimize DIGITAL marketing investment and expand CHINA / INTERNATIONAL market reach for our clients Select Clients Key Highlights Key Statistics 300+ Blue Chip & Mid - Sized Clients $2.3bn+ 2020E Gross Revenue 16% 2016 - 2020E Net Revenue CAGR $71bn (1) 2020E Mobile Ad Spend in China Selected Digital Disruptor Client 19% (1) Next 3 Year Mobile Ad Spend CAGR in China Madhouse Snapshot Source: Company Management. (1) Source: eMarketer. Selected Blue Chip Client
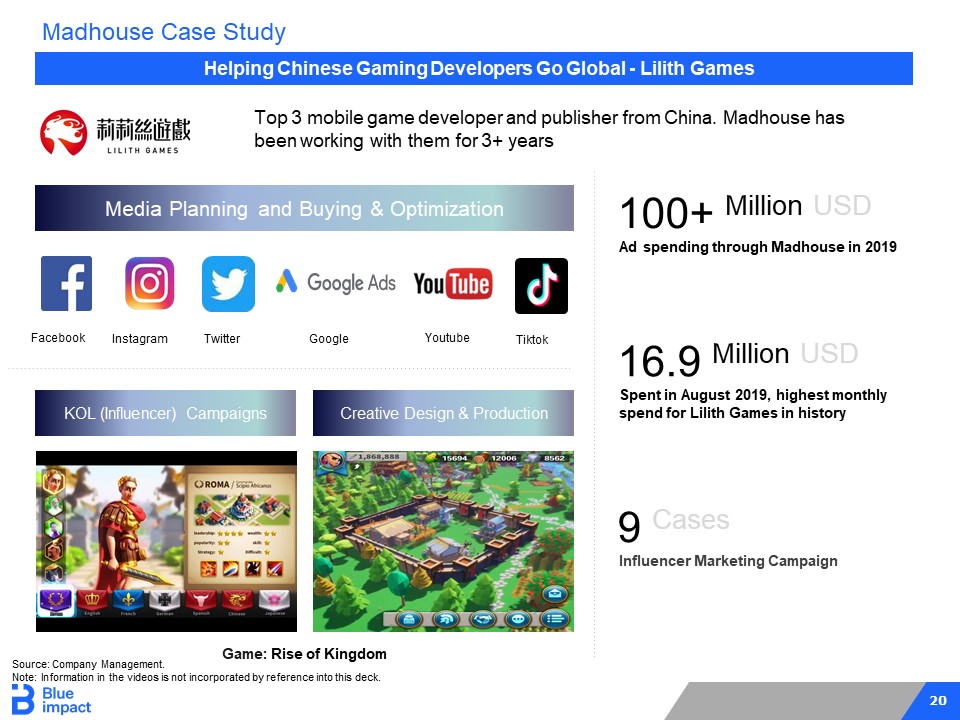
20 Helping Chinese Gaming Developers Go Global - Lilith Games Media Planning and Buying & Optimization KOL (Influencer) Campaigns Creative Design & Production Game: Rise of Kingdom Twitter Instagram Facebook Google Youtube Tiktok Top 3 mobile game developer and publisher from China. Madhouse has been working with them for 3+ years 100+ Million USD Ad spending through Madhouse in 2019 16.9 Million USD Spent in August 2019, highest monthly spend for Lilith Games in history 9 Cases Influencer Marketing Campaign Source: Company Management. Note: Information in the videos is not incorporated by reference into this deck. Madhouse Case Study
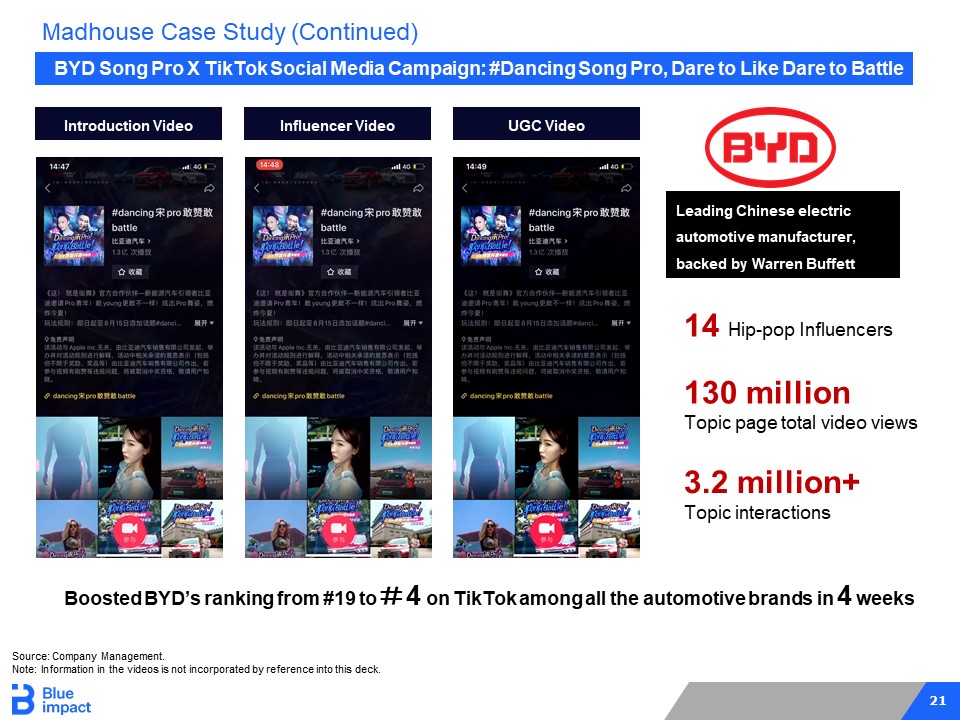
21 BYD Song Pro X TikTok Social Media Campaign: #Dancing Song Pro, Dare to Like Dare to Battle Introduction Video 130 million Topic page total video views 3.2 million+ Topic interactions 14 Hip - pop Influencers Leading Chinese electric automotive manufacturer, backed by Warren Buffett Boosted BYD’s ranking from #19 to # 4 on TikTok among all the automotive brands in 4 weeks Influencer Video UGC Video Source: Company Management. Note: Information in the videos is not incorporated by reference into this deck. Madhouse Case Study (Continued)
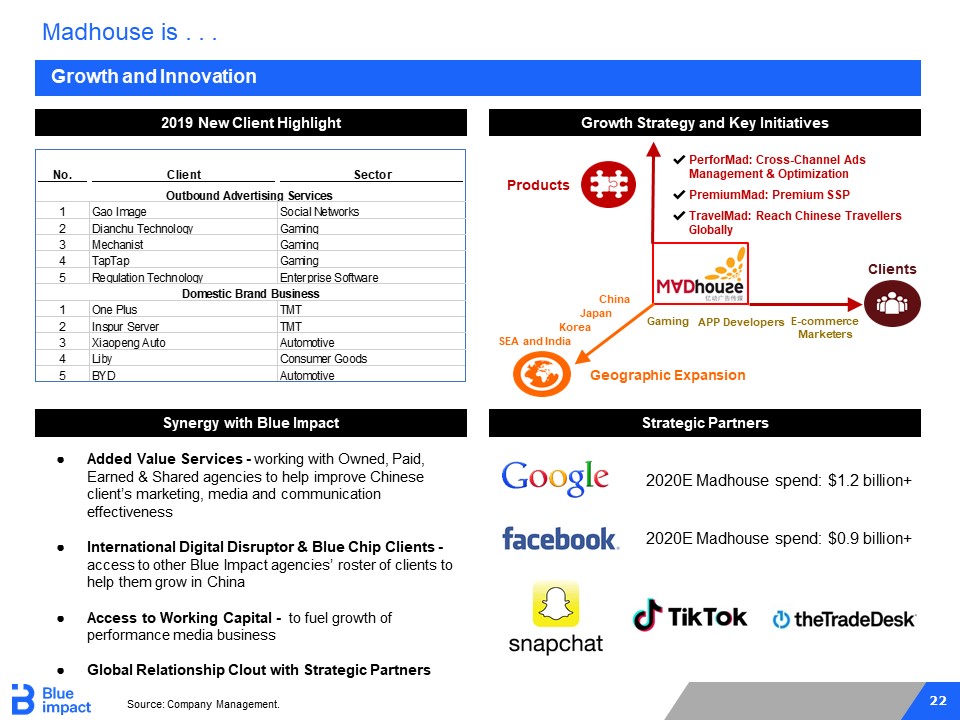
22 E - commerce Marketers APP Developers ✔ PerforMad: Cross - Channel Ads Management & Optimization ✔ PremiumMad: Premium SSP ✔ TravelMad: Reach Chinese Travellers Globally Growth and Innovation Madhouse is . . . 2019 New Client Highlight Growth Strategy and Key Initiatives Products Geographic Expansion Clients Gaming Korea China Japan SEA and India Strategic Partners 2020E Madhouse spend: $1.2 billion+ 2020E Madhouse spend: $0.9 billion+ ● Added Value Services - working with Owned, Paid, Earned & Shared agencies to help improve Chinese client’s marketing, media and communication effectiveness ● International Digital Disruptor & Blue Chip Clients - access to other Blue Impact agencies’ roster of clients to help them grow in China ● Access to Working Capital - to fuel growth of performance media business ● Global Relationship Clout with Strategic Partners Source: Company Management. Synergy with Blue Impact No. Client Sector Outbound Advertising Services 1 Gao Image Social Networks 2 Dianchu Technology Gaming 3 Mechanist Gaming 4 TapTap Gaming 5 Regulation Technology Enterprise Software Domestic Brand Business 1 One Plus TMT 2 Inspur Server TMT 3 Xiaopeng Auto Automotive 4 Liby Consumer Goods 5 BYD Automotive
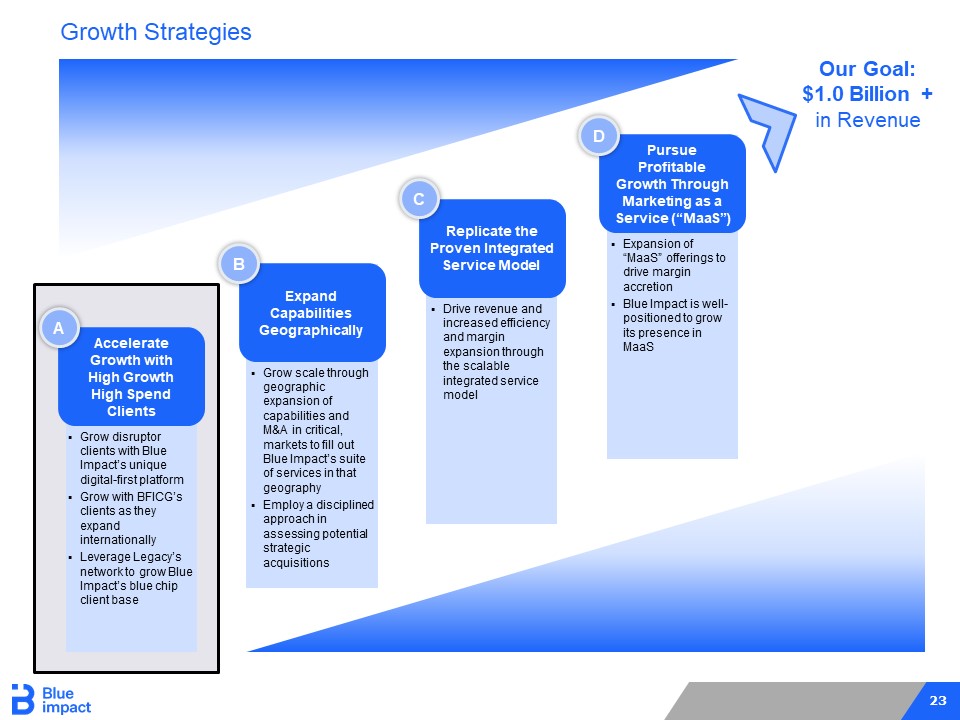
23 Growth Strategies ▪ Grow disruptor clients with Blue Impact’s unique digital - first platform ▪ Grow with BFICG’s clients as they expand internationally ▪ Leverage Legacy’s network to grow Blue Impact’s blue chip client base Accelerate Growth with High Growth High Spend Clients A ▪ Grow scale through geographic expansion of capabilities and M&A in critical, markets to fill out Blue Impact’s suite of services in that geography ▪ Employ a disciplined approach in assessing potential strategic acquisitions Expand Capabilities Geographically B ▪ Drive revenue and increased efficiency and margin expansion through the scalable integrated service model Replicate the Proven Integrated Service Model C ▪ Expansion of “MaaS” offerings to drive margin accretion ▪ Blue Impact is well - positioned to grow its presence in MaaS Pursue Profitable Growth Through Marketing as a Service (“MaaS”) D Our Goal: $1.0 Billion + in Revenue
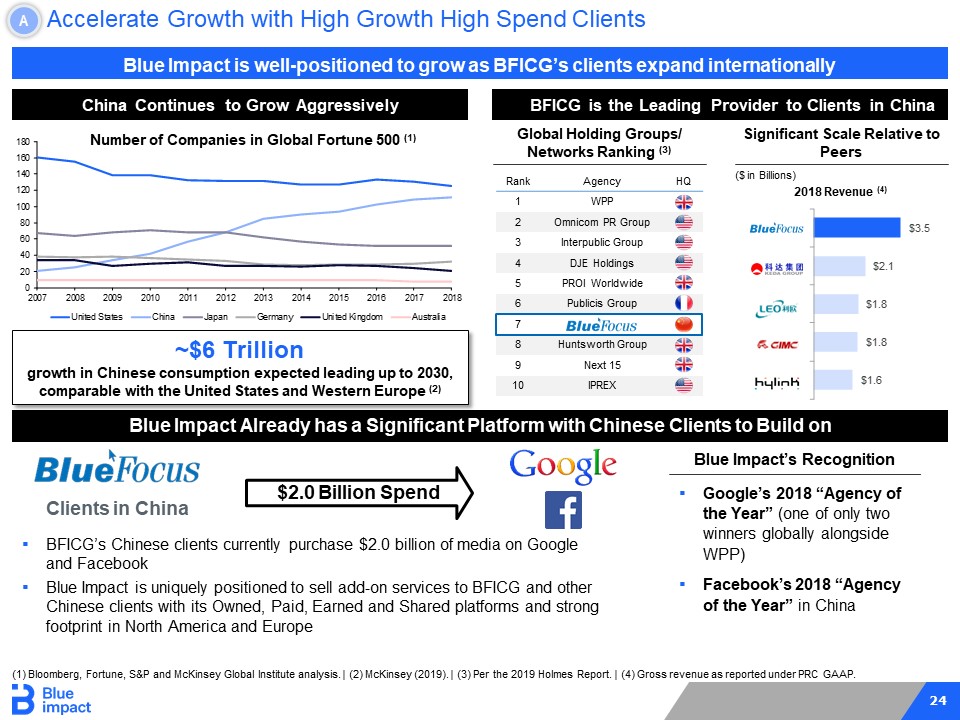
24 A ▪ BFICG’s Chinese clients currently purchase $2.0 billion of media on Google and Facebook ▪ Blue Impact is uniquely positioned to sell add - on services to BFICG and other Chinese clients with its Owned, Paid, Earned and Shared platforms and strong footprint in North America and Europe Clients in China $2.0 Billion Spend Blue Impact Already has a Significant Platform with Chinese Clients to Build on (1) Bloomberg, Fortune, S&P and McKinsey Global Institute analysis. | (2) McKinsey (2019). | (3) Per the 2019 Holmes Report. | ( 4) Gross revenue as reported under PRC GAAP . Blue Impact’s Recognition ▪ Google’s 2018 “Agency of the Year” (one of only two winners globally alongside WPP) ▪ Facebook’s 2018 “Agency of the Year” in China Accelerate Growth with High Growth High Spend Clients Blue Impact is well - positioned to grow as BFICG’s clients expand internationally China Continues to Grow Aggressively BFICG is the Leading Provider to Clients in China Global Holding Groups/ Networks Ranking (3) Rank Agency HQ 1 WPP 2 Omnicom PR Group 3 Interpublic Group 4 DJE Holdings 5 PROI Worldwide 6 Publicis Group 7 8 Huntsworth Group 9 Next 15 10 IPREX Significant Scale Relative to Peers ($ in Billions) 2018 Revenue (4) $1.6 $1.8 $1.8 $2.1 $3.5 ~$6 Trillion growth in Chinese consumption expected leading up to 2030, comparable with the United States and Western Europe (2) 0 20 40 60 80 100 120 140 160 180 2007 2008 2009 2010 2011 2012 2013 2014 2015 2016 2017 2018 United States China Japan Germany United Kingdom Australia Number of Companies in Global Fortune 500 (1)
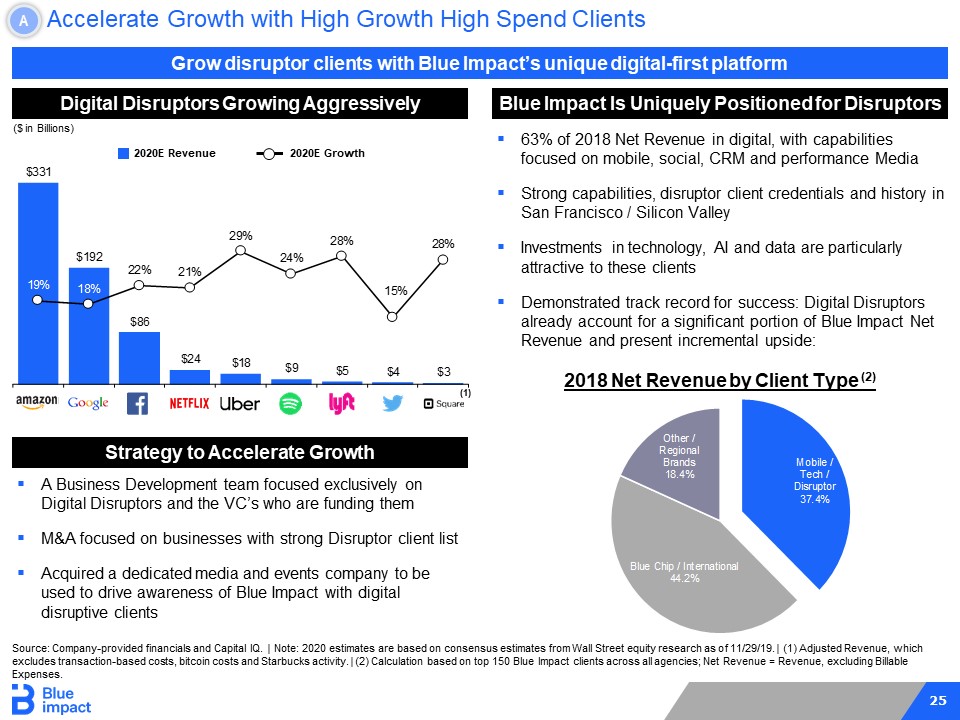
25 $331 $192 $86 $24 $18 $9 $5 $4 $3 19% 18% 22% 21% 29% 24% 28% 15% 28% A Accelerate Growth with High Growth High Spend Clients Digital Disruptors Growing Aggressively Blue Impact Is Uniquely Positioned for Disruptors ($ in Billions) ▪ A Business Development team focused exclusively on Digital Disruptors and the VC’s who are funding them ▪ M&A focused on businesses with strong Disruptor client list ▪ Acquired a dedicated media and events company to be used to drive awareness of Blue Impact with digital disruptive clients Grow disruptor clients with Blue Impact’s unique digital - first platform Strategy to Accelerate Growth ▪ 63% of 2018 Net Revenue in digital, with capabilities focused on mobile, social, CRM and performance Media ▪ Strong capabilities, disruptor client credentials and history in San Francisco / Silicon Valley ▪ Investments in technology, AI and data are particularly attractive to these clients ▪ Demonstrated track record for success: Digital Disruptors already account for a significant portion of Blue Impact Net Revenue and present incremental upside: 2020E Revenue 2020E Growth Source: Company - provided financials and Capital IQ. | Note: 2020 estimates are based on consensus estimates from Wall Street equity research as of 11/29/19. | (1) Adjusted Revenue, whic h excludes transaction - based costs, bitcoin costs and Starbucks activity. | (2) Calculation based on top 150 Blue Impact clients a cross all agencies; Net Revenue = Revenue, excluding Billable Expenses. (1) 2018 Net Revenue by Client Type (2) Mobile / Tech / Disruptor 37.4% Blue Chip / International 44.2% Other / Regional Brands 18.4%
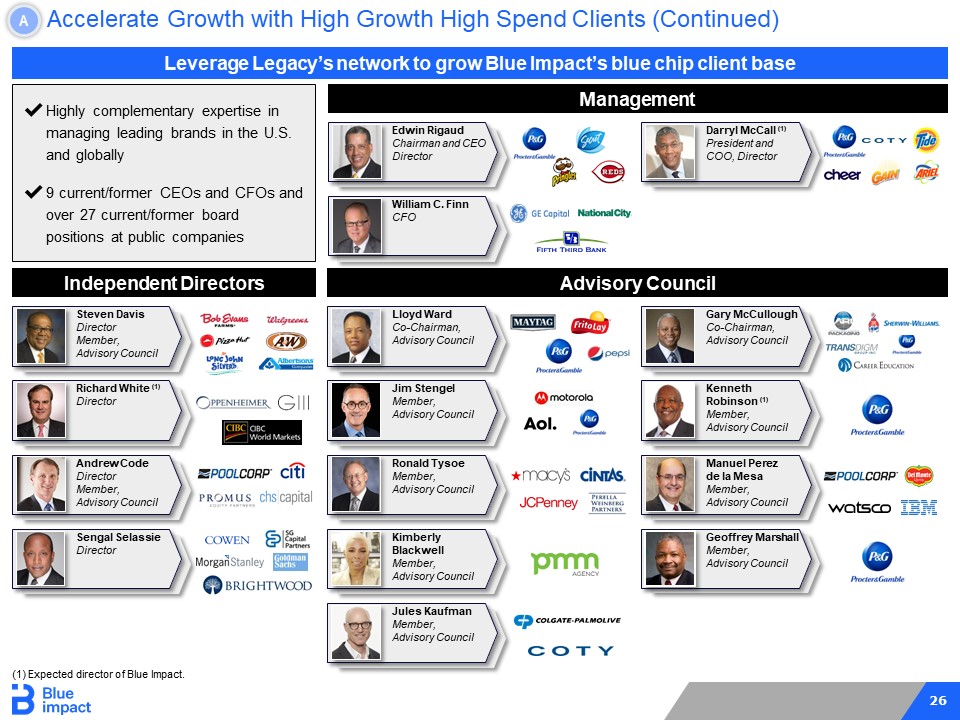
26 A Management Leverage Legacy’s network to grow Blue Impact’s blue chip client base Kenneth Robinson (1) Member, Advisory Council Manuel Perez de la Mesa Member, Advisory Council Jules Kaufman Member, Advisory Council Lloyd Ward Co - Chairman, Advisory Council Ronald Tysoe Member, Advisory Council Kimberly Blackwell Member, Advisory Council Jim Stengel Member, Advisory Council Gary McCullough Co - Chairman, Advisory Council Advisory Council ✔ Highly complementary expertise in managing leading brands in the U.S. and globally ✔ 9 current/former CEOs and CFOs and over 27 current/former board positions at public companies Steven Davis Director Member, Advisory Council Richard White (1) Director Andrew Code Director Member, Advisory Council Sengal Selassie Director Independent Directors Edwin Rigaud Chairman and CEO Director William C. Finn CFO Darryl McCall (1) President and COO, Director Geoffrey Marshall Member, Advisory Council (1) Expected director of Blue Impact. Accelerate Growth with High Growth High Spend Clients (Continued)
We Are Social & Geographic Expansion Jim Coleman
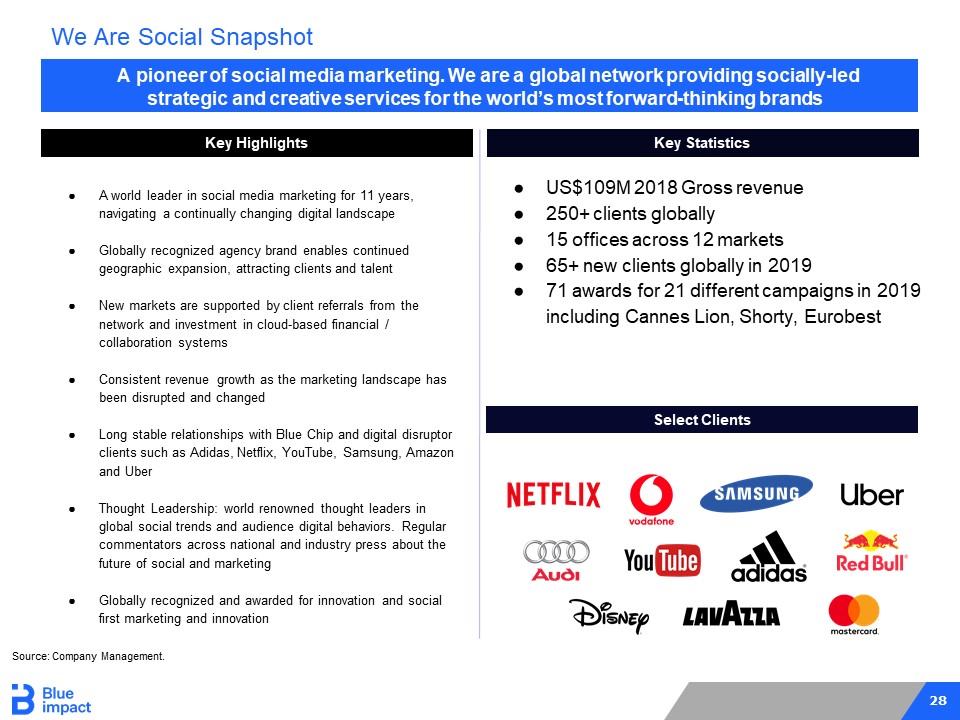
28 A pioneer of social media marketing. We are a global network providing socially - led strategic and creative services for the world’s most forward - thinking brands Select Clients Key Highlights Key Statistics We Are Social Snapshot ● A world leader in social media marketing for 11 years, navigating a continually changing digital landscape ● Globally recognized agency brand enables continued geographic expansion, attracting clients and talent ● New markets are supported by client referrals from the network and investment in cloud - based financial / collaboration systems ● Consistent revenue growth as the marketing landscape has been disrupted and changed ● Long stable relationships with Blue Chip and digital disruptor clients such as Adidas, Netflix, YouTube, Samsung, Amazon and Uber ● Thought Leadership: world renowned thought leaders in global social trends and audience digital behaviors. Regular commentators across national and industry press about the future of social and marketing ● Globally recognized and awarded for innovation and social first marketing and innovation ● US$109M 2018 Gross revenue ● 250+ clients globally ● 15 offices across 12 markets ● 65+ new clients globally in 2019 ● 71 awards for 21 different campaigns in 2019 including Cannes Lion, Shorty, Eurobest Source: Company Management.
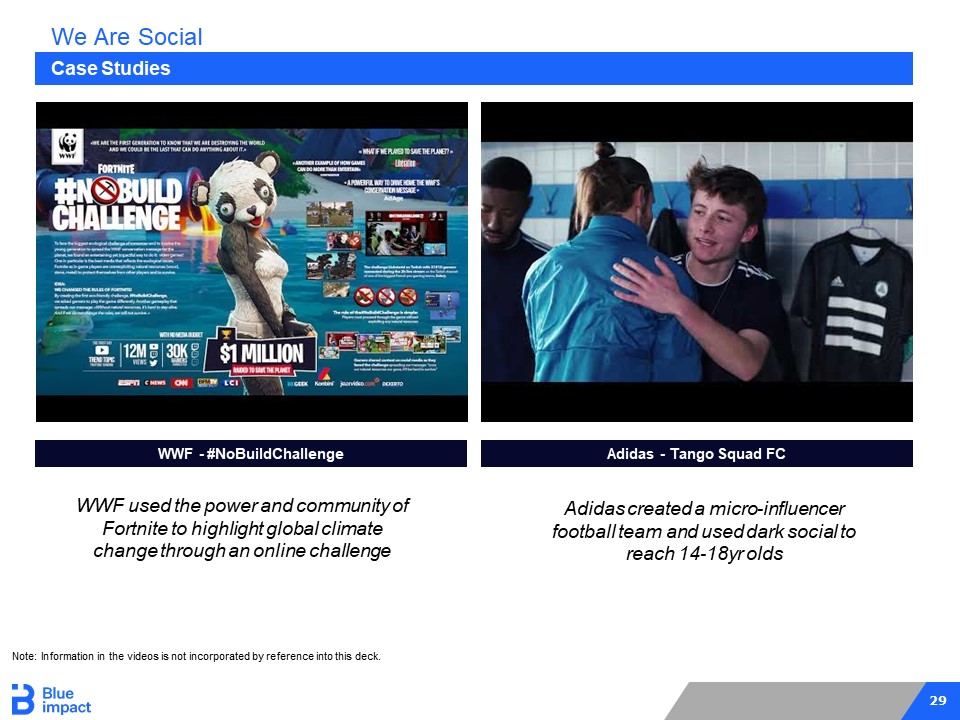
29 Case Studies We Are Social Adidas - Tango Squad FC WWF - #NoBuildChallenge Adidas - Tango Squad FC Adidas created a micro - influencer football team and used dark social to reach 14 - 18yr olds WWF used the power and community of Fortnite to highlight global climate change through an online challenge Note: Information in the videos is not incorporated by reference into this deck.
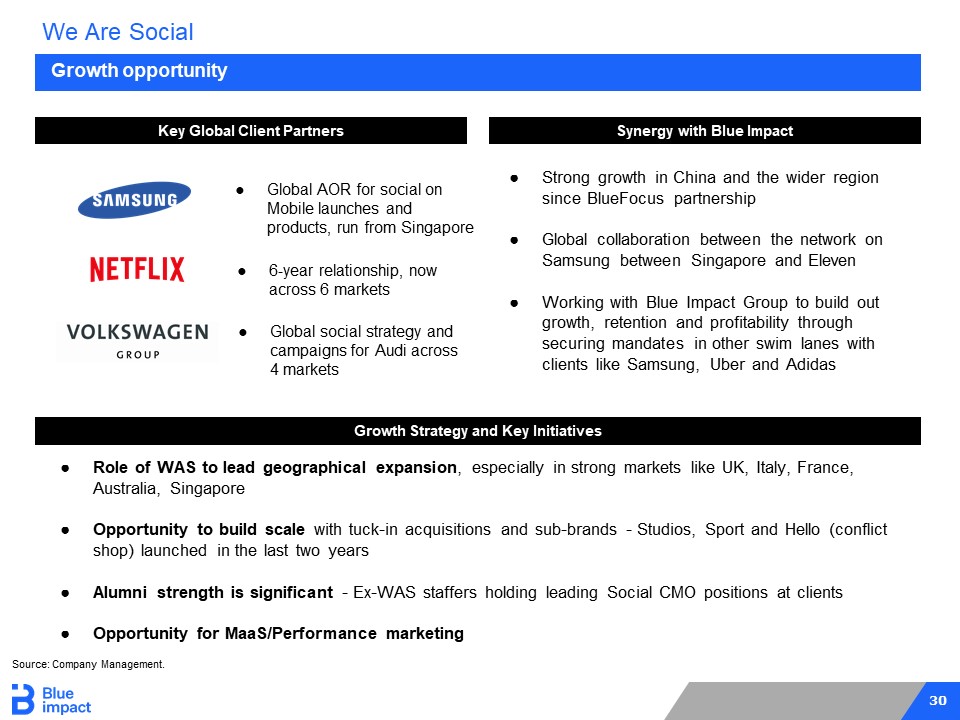
30 Growth opportunity We Are Social Key Global Client Partners Growth Strategy and Key Initiatives ● Strong growth in China and the wider region since BlueFocus partnership ● Global collaboration between the network on Samsung between Singapore and Eleven ● Working with Blue Impact Group to build out growth, retention and profitability through securing mandates in other swim lanes with clients like Samsung, Uber and Adidas ● Role of WAS to lead geographical expansion , especially in strong markets like UK, Italy, France, Australia, Singapore ● Opportunity to build scale with tuck - in acquisitions and sub - brands - Studios, Sport and Hello (conflict shop) launched in the last two years ● Alumni strength is significant - Ex - WAS staffers holding leading Social CMO positions at clients ● Opportunity for MaaS/Performance marketing Synergy with Blue Impact Source: Company Management. ● Global AOR for social on Mobile launches and products, run from Singapore ● 6 - year relationship, now across 6 markets ● Global social strategy and campaigns for Audi across 4 markets
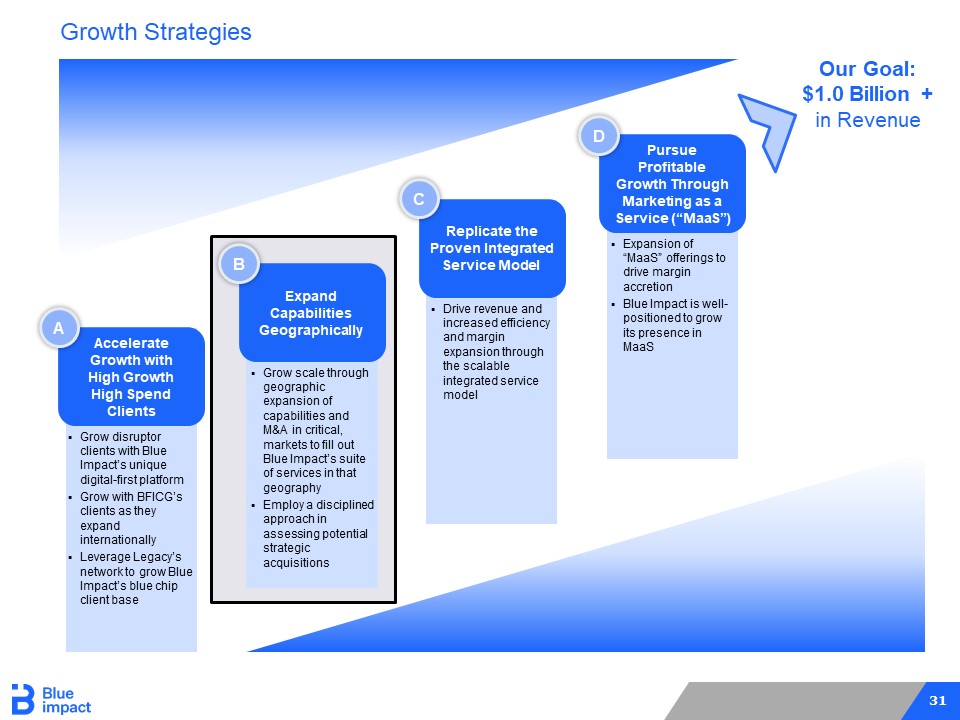
31 ▪ Grow disruptor clients with Blue Impact’s unique digital - first platform ▪ Grow with BFICG’s clients as they expand internationally ▪ Leverage Legacy’s network to grow Blue Impact’s blue chip client base Accelerate Growth with High Growth High Spend Clients A ▪ Grow scale through geographic expansion of capabilities and M&A in critical, markets to fill out Blue Impact’s suite of services in that geography ▪ Employ a disciplined approach in assessing potential strategic acquisitions Expand Capabilities Geographically B ▪ Drive revenue and increased efficiency and margin expansion through the scalable integrated service model Replicate the Proven Integrated Service Model C ▪ Expansion of “MaaS” offerings to drive margin accretion ▪ Blue Impact is well - positioned to grow its presence in MaaS Pursue Profitable Growth Through Marketing as a Service (“MaaS”) D Our Goal: $1.0 Billion + in Revenue Growth Strategies
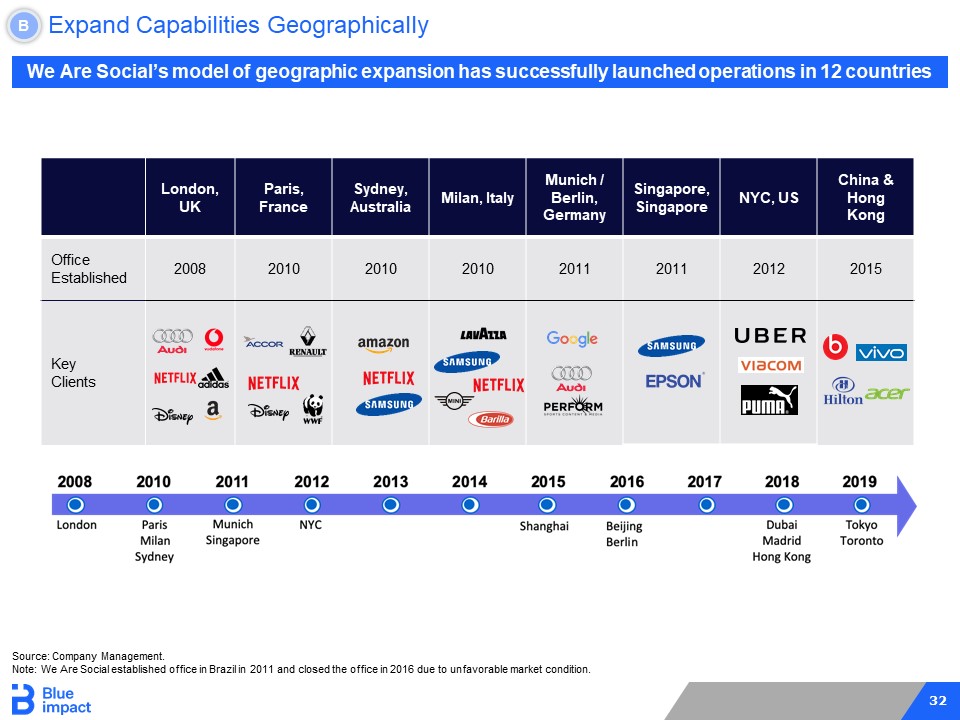
32 We Are Social’s model of geographic expansion has successfully launched operations in 12 countries London, UK Paris, France Sydney, Australia Milan, Italy Munich / Berlin, Germany Singapore, Singapore NYC, US China & Hong Kong Office Established 2008 2010 2010 2010 2011 2011 2012 2015 Key Clients Expand Capabilities Geographically B Source: Company Management. Note: We Are Social established office in Brazil in 2011 and closed the office in 2016 due to unfavorable market condition.

33 Expand Capabilities Geographically (Continued) B Capabilities North America Canada U.S. Europe Middle East China Rest of APAC EMEA Asia Owned ▪ Cossette & Camps Collective ▪ Eleven ▪ Fuseproject ▪ Select capabilities through We Are Social ▪ Select capabilities through We Are Social ▪ Metta ▪ Strategic relationship with BFICG ▪ Fuseproject ▪ Select capabilities through We Are Social Earned ▪ Citizen Relations ▪ PR platform with Citizen Relations ▪ Experiential and influencer marketing with The Narrative Group ▪ PR capability via Citizen UK & partner network ▪ Influencer capability via We Are Social ▪ PR capabilities through Citizen partnerships ▪ Influencer capability via Socialize ▪ Strategic relationship through BFICG (Blue Digital) ▪ Influencer capability via We Are Social ▪ PR capabilities through Citizen relationships ▪ Influencer capability via We Are Social Grow scale through geographic expansion of capabilities and M&A in critical, underpenetrated markets Market Leadership ▪ Proven, value - add capabilities ▪ Realizing synergies from scale ▪ No immediate M&A needs Poised for Scale ▪ Established capabilities ▪ Significant opportunity to scale through organic expansion and opportunistic M&A M&A Required ▪ Emerging capabilities ▪ Growth through M&A is required to achieve scale Paid ▪ Vision 7 Media ▪ Vision 7 through Horizon Media Partnership ▪ Select capabilities through Local Planet partnership ▪ Paid social via We Are Social ▪ Select capabilities through Local Planet partnership ▪ Paid social via We Are Social ▪ Madhouse ▪ Metta ▪ Strategic relationship with BFICG ▪ Select capabilities through BFICG and Local Planet ▪ Paid social via We Are Social Shared ▪ We Are Social NY ▪ Expected Expansion of We Are Social to California ▪ We Are Social in U.K., Germany, France, Italy ▪ Launched Spain in ‘18 ▪ Recent acquisition of Dubai - based Socialize ▪ We Are Social Shanghai, Beijing and Hong Kong ▪ Strategic relationship with BFICG ▪ We Are Social in Singapore and Australia ▪ Launched We Are Social Japan in ‘19 ▪ Serviced through Cossette & Camps Collective ▪ Launched We Are Social Canada JV with Citizens in 2019
Cossette and Integrated Service Model Melanie Dunn

35 We are a strategic partner, gathering experts across all disciplines to offer integrated brand experiences unlike any other. We play with powerful, high - potential brands, and act local, with global impact Select Clients Key Highlights Key Statistics Cossette Snapshot ● Fully integrated creative agency One brand + One P&L + One leadership ● A market leader in Canada ● Outpacing growth industry standards (1) ● History of digital & data innovation • Cossette Lab 2015 • Implemented Agile in 2016 • AI JV in 2018 ● 5 full - service locations in Canada 550 highly skilled professionals ● Engaged in global Growth Strategy • Serving clients in 13 countries • Goal of 7M$ in the US within 3 years • NYC operation in 2020 - Q2 expected ● Exceptional International Award Showing • Canadian Agency of the year 3X • 12 Cannes Lions (1) Based on Q3 2019 earnings release of Publicis Groupe & WPP, which reported organic revenue growth of negative 3.6% and 3.5% respectively in North America. score engagement 70% 2019 3X
36 Our Work SickKids Hospital McDonald’s Note: Information in the videos is not incorporated by reference into this deck.

37 Growth Initiatives Business Performance Growth Strategy and Key Initiatives Strategic Current Client Geo - Mapping Cossette is... New Client Wins (last 3 years) ● Walmart ● McDonald’s (Digital & Merchandising) ● CSX ● General Mills (US Market) ● Toyota Canada ● TD (CRM Insurance) ● Canopy Growth ● Investors Group ● Kabam ● DoorDash ● Destination Canada (US Market) ● The Globe and Mail ● Simons (US Market) ● Google ● Uber ● Flight Center Seize momentum in the U.S. ● Intensify communications and reputation initiatives ● Office space in the NYC campus expected (Q2 - 2020) Grow Global Clients ● McDonald’s, General Mills and Canopy Growth ● Leverage European and US deployment ● Strategic partnership in Europe and Asia Leverage MaaS Model in Canada Cossette Clients in more than 1 Agency (x) Existing Business in the Market .
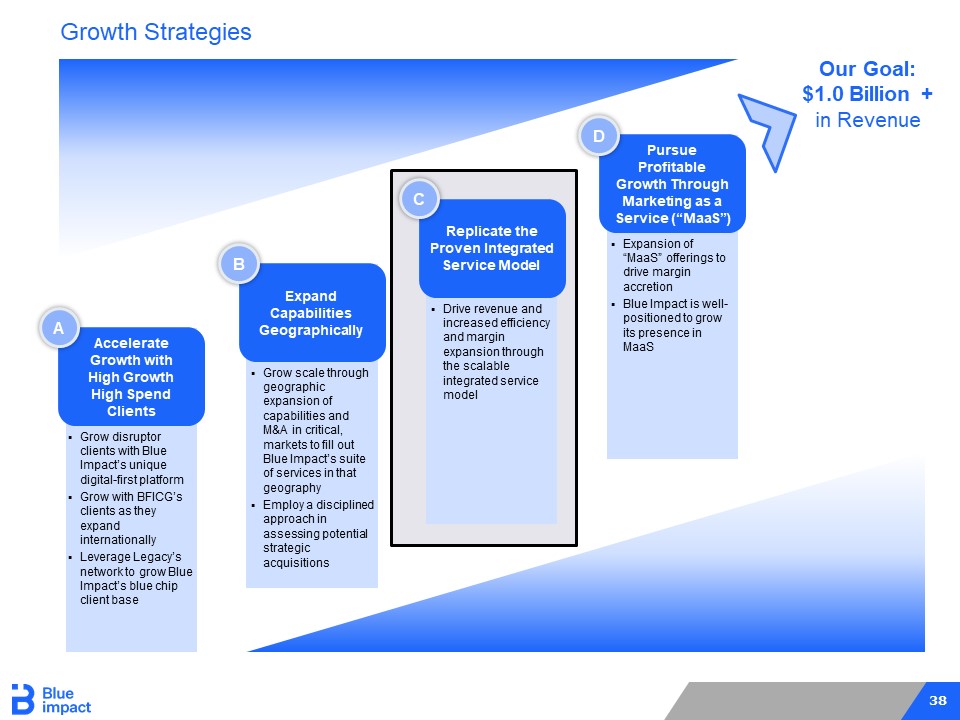
38 ▪ Grow disruptor clients with Blue Impact’s unique digital - first platform ▪ Grow with BFICG’s clients as they expand internationally ▪ Leverage Legacy’s network to grow Blue Impact’s blue chip client base Accelerate Growth with High Growth High Spend Clients A ▪ Grow scale through geographic expansion of capabilities and M&A in critical, markets to fill out Blue Impact’s suite of services in that geography ▪ Employ a disciplined approach in assessing potential strategic acquisitions Expand Capabilities Geographically B ▪ Drive revenue and increased efficiency and margin expansion through the scalable integrated service model Replicate the Proven Integrated Service Model C ▪ Expansion of “MaaS” offerings to drive margin accretion ▪ Blue Impact is well - positioned to grow its presence in MaaS Pursue Profitable Growth Through Marketing as a Service (“MaaS”) D Our Goal: $1.0 Billion + in Revenue Growth Strategies
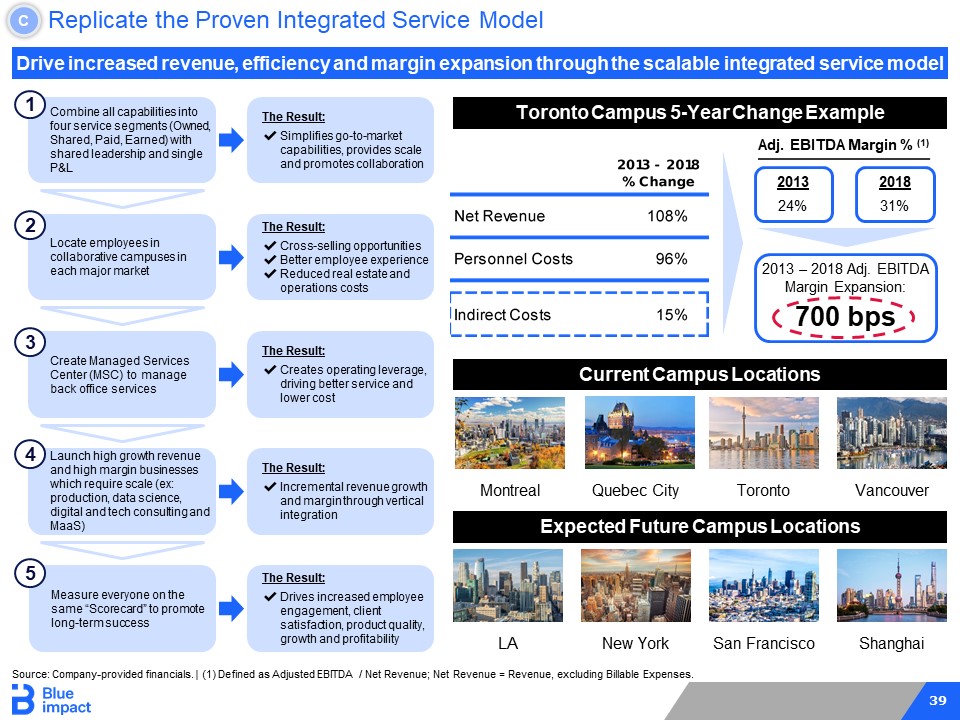
39 Replicate the Proven Integrated Service Model C Expected Future Campus Locations Toronto Current Campus Locations Toronto Campus 5 - Year Change Example New York LA San Francisco Shanghai Drive increased revenue, efficiency and margin expansion through the scalable integrated service model Combine all capabilities into four service segments (Owned, Shared, Paid, Earned) with shared leadership and single P&L Locate employees in collaborative campuses in each major market Create Managed Services Center (MSC) to manage back office services The Result: ✔ Simplifies go - to - market capabilities, provides scale and promotes collaboration Launch high growth revenue and high margin businesses which require scale (ex: production, data science, digital and tech consulting and MaaS) Measure everyone on the same “Scorecard” to promote long - term success 1 2 3 4 5 The Result: ✔ Cross - selling opportunities ✔ Better employee experience ✔ Reduced real estate and operations costs The Result: ✔ Creates operating leverage, driving better service and lower cost The Result: ✔ Incremental revenue growth and margin through vertical integration The Result: ✔ Drives increased employee engagement, client satisfaction, product quality, growth and profitability 2013 24% 2013 – 2018 Adj. EBITDA Margin Expansion: 700 bps 2018 31% Adj. EBITDA Margin % (1) Vancouver Source: Company - provided financials. | (1) Defined as Adjusted EBITDA / Net Revenue; Net Revenue = Revenue, excluding Billable E xpenses. Montreal Quebec City
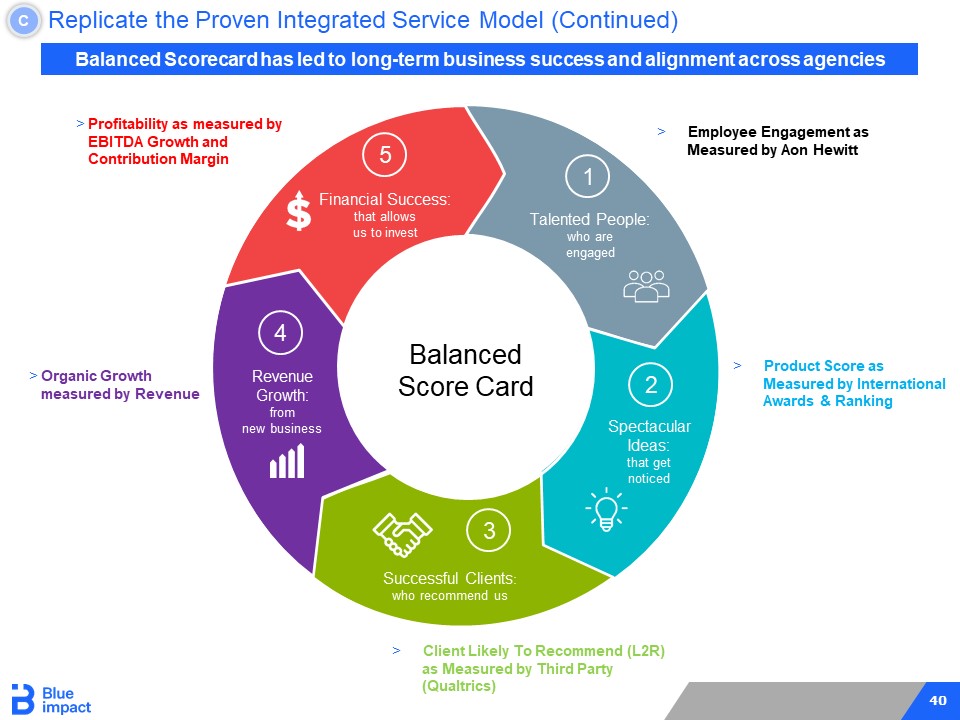
40 Balanced Scorecard has led to long - term business success and alignment across agencies Balanced Score Card Talented People: who are engaged Financial Success: that allows us to invest Spectacular Ideas: that get noticed Successful Clients : who recommend us Revenue Growth: from new business 1 2 3 4 5 > Employee Engagement as Measured by Aon Hewitt > Product Score as Measured by International Awards & Ranking > Client Likely To Recommend (L2R) as Measured by Third Party (Qualtrics) > Organic Growth measured by Revenue > Profitability as measured by EBITDA Growth and Contribution Margin Replicate the Proven Integrated Service Model (Continued) C
Vision7 Media and MaaS Joseph Leon
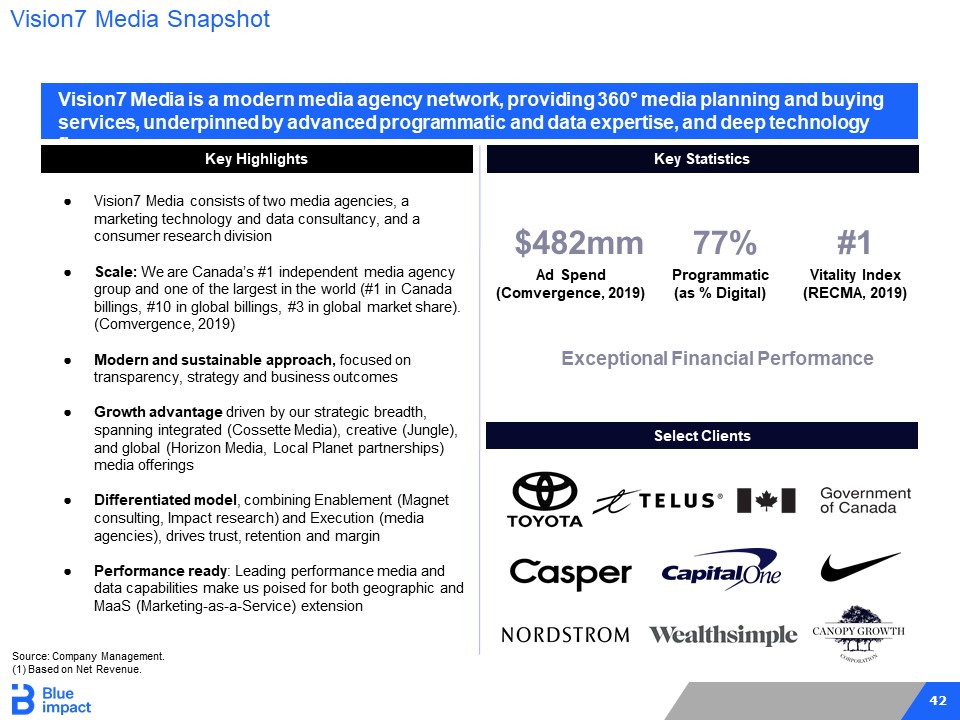
42 Vision7 Media is a modern media agency network, providing 360 ° media planning and buying services, underpinned by advanced programmatic and data expertise, and deep technology fluency Select Clients Key Highlights Key Statistics ● Vision7 Media consists of two media agencies, a marketing technology and data consultancy, and a consumer research division ● Scale: We are Canada’s #1 independent media agency group and one of the largest in the world (#1 in Canada billings, #10 in global billings, #3 in global market share). (Comvergence, 2019) ● Modern and sustainable approach, focused on transparency, strategy and business outcomes ● Growth advantage driven by our strategic breadth, spanning integrated (Cossette Media), creative (Jungle), and global (Horizon Media, Local Planet partnerships) media offerings ● Differentiated model , combining Enablement (Magnet consulting, Impact research) and Execution (media agencies), drives trust, retention and margin ● Performance ready : Leading performance media and data capabilities make us poised for both geographic and MaaS (Marketing - as - a - Service) extension Vision7 Media Snapshot 77% Programmatic (as % Digital) #1 Vitality Index (RECMA, 2019) Exceptional Financial Performance $482mm Ad Spend (Comvergence, 2019) Source: Company Management. (1) Based on Net Revenue.
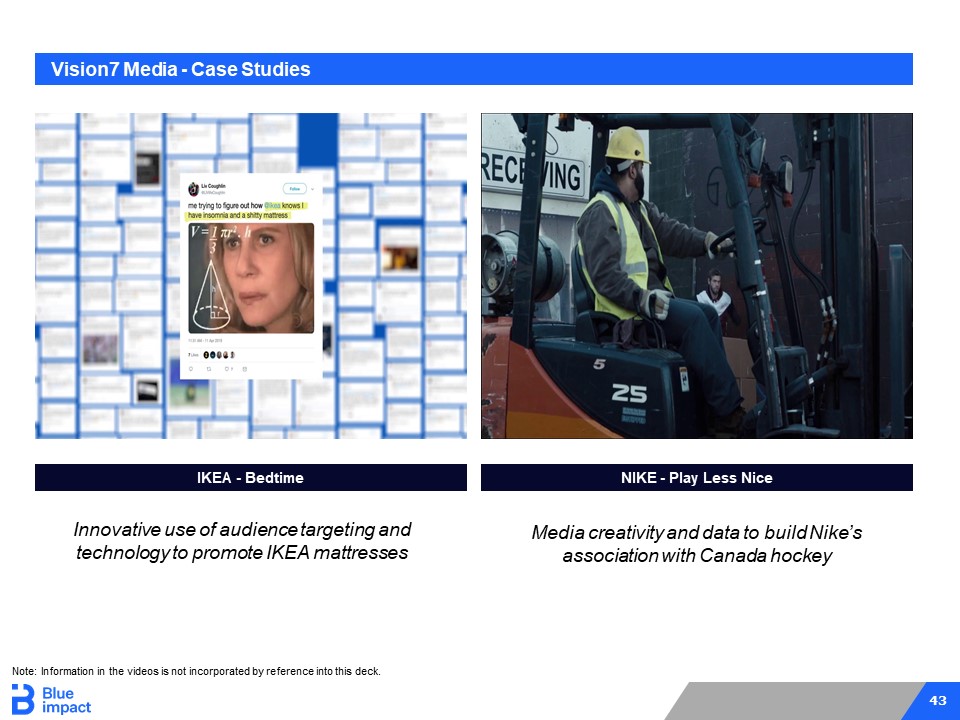
43 Vision7 Media - Case Studies IKEA - Bedtime Innovative use of audience targeting and technology to promote IKEA mattresses Media creativity and data to build Nike’s association with Canada hockey NIKE - Play Less Nice Note: Information in the videos is not incorporated by reference into this deck.
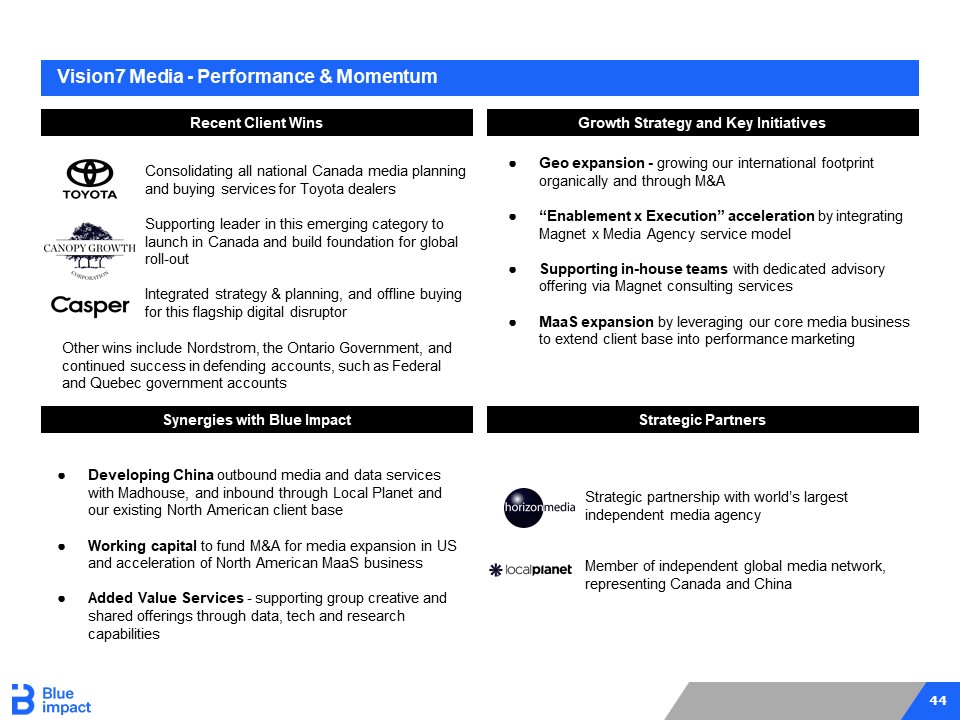
44 Consolidating all national Canada media planning and buying services for Toyota dealers Supporting leader in this emerging category to launch in Canada and build foundation for global roll - out Integrated strategy & planning, and offline buying for this flagship digital disruptor Vision7 Media - Performance & Momentum Recent Client Wins Growth Strategy and Key Initiatives Synergies with Blue Impact Strategic Partners ● Developing China outbound media and data services with Madhouse, and inbound through Local Planet and our existing North American client base ● Working capital to fund M&A for media expansion in US and acceleration of North American MaaS business ● Added Value Services - supporting group creative and shared offerings through data, tech and research capabilities ● Geo expansion - growing our international footprint organically and through M&A ● “Enablement x Execution” acceleration by integrating Magnet x Media Agency service model ● Supporting in - house teams with dedicated advisory offering via Magnet consulting services ● MaaS expansion by leveraging our core media business to extend client base into performance marketing Member of independent global media network, representing Canada and China Strategic partnership with world’s largest independent media agency Other wins include Nordstrom, the Ontario Government, and continued success in defending accounts, such as Federal and Quebec government accounts

45 ▪ Grow disruptor clients with Blue Impact’s unique digital - first platform ▪ Grow with BFICG’s clients as they expand internationally ▪ Leverage Legacy’s network to grow Blue Impact’s blue chip client base Accelerate Growth with High Growth High Spend Clients A ▪ Grow scale through geographic expansion of capabilities and M&A in critical, markets to fill out Blue Impact’s suite of services in that geography ▪ Employ a disciplined approach in assessing potential strategic acquisitions Expand Capabilities Geographically B ▪ Drive revenue and increased efficiency and margin expansion through the scalable integrated service model Replicate the Proven Integrated Service Model C ▪ Expansion of “MaaS” offerings to drive margin accretion ▪ Blue Impact is well - positioned to grow its presence in MaaS Pursue Profitable Growth Through Marketing as a Service (“MaaS”) D Our Goal: $1.0 Billion + in Revenue Growth Strategies
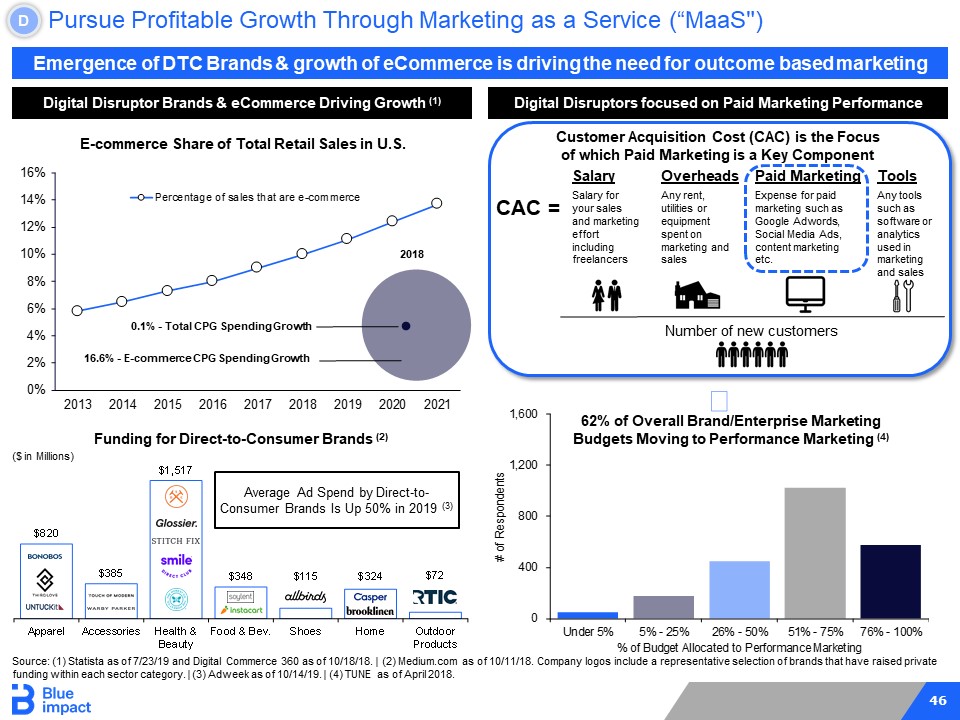
46 0% 2% 4% 6% 8% 10% 12% 14% 16% 2013 2014 2015 2016 2017 2018 2019 2020 2021 Percentage of sales that are e-commerce 0 400 800 1,200 1,600 Under 5% 5% - 25% 26% - 50% 51% - 75% 76% - 100% # of Respondents % of Budget Allocated to Performance Marketing Pursue Profitable Growth Through Marketing as a Service (“MaaS") D Digital Disruptor Brands & eCommerce Driving Growth (1) Emergence of DTC Brands & growth of eCommerce is driving the need for outcome based marketing Digital Disruptors focused on Paid Marketing Performance Customer Acquisition Cost (CAC) is the Focus of which Paid Marketing is a Key Component 0.1% - Total CPG Spending Growth 16.6% - E - commerce CPG Spending Growth 2018 Tools Any tools such as software or analytics used in marketing and sales CAC = Salary Salary for your sales and marketing effort including freelancers Overheads Any rent, utilities or equipment spent on marketing and sales Paid Marketing Expense for paid marketing such as Google Adwords , Social Media Ads, content marketing etc. Number of new customers $820 $385 $1,517 $348 $115 $324 $72 Apparel Accessories Health & Beauty Food & Bev. Shoes Home Outdoor Products Funding for Direct - to - Consumer Brands (2) Average Ad Spend by Direct - to - Consumer Brands Is Up 50% in 2019 (3) E - commerce Share of Total Retail Sales in U.S. 62% of Overall Brand/Enterprise Marketing Budgets Moving to Performance Marketing (4) ($ in Millions) Source: (1) Statista as of 7/23/19 and Digital Commerce 360 as of 10/18/18. | (2) Medium.com as of 10/11/18. Company logos in clu de a representative selection of brands that have raised private funding within each sector category. | (3) Adweek as of 10/14/19. | (4) TUNE as of April 2018.
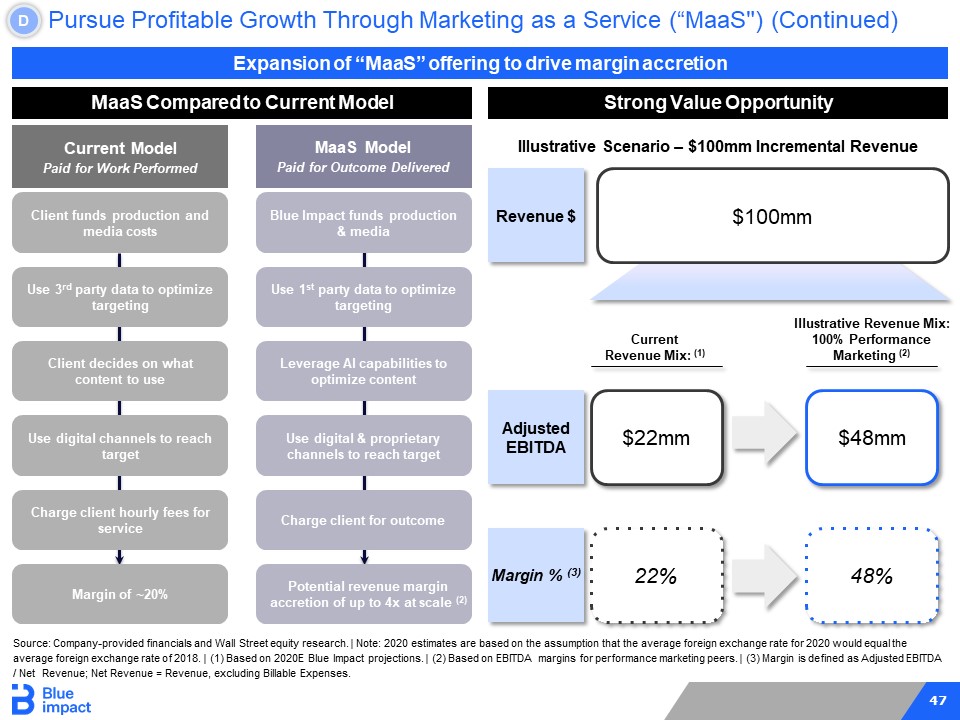
47 Pursue Profitable Growth Through Marketing as a Service (“MaaS") (Continued) D MaaS Compared to Current Model Charge client hourly fees for service Blue Impact funds production & media Charge client for outcome Potential revenue margin accretion of up to 4x at scale (2) Leverage AI capabilities to optimize content Expansion of “MaaS” offering to drive margin accretion Client funds production and media costs Use 3 rd party data to optimize targeting Use digital & proprietary channels to reach target Client decides on what content to use Use 1 st party data to optimize targeting Use digital channels to reach target Current Model Paid for Work Performed MaaS Model Paid for Outcome Delivered Strong Value Opportunity Illustrative Scenario – $100mm Incremental Revenue Current Revenue Mix: (1) Illustrative Revenue Mix: 100% Performance Marketing (2) $100mm Revenue $ Margin % (3) $22mm $48mm Adjusted EBITDA 22% 48% Source: Company - provided financials and Wall Street equity research. | Note: 2020 estimates are based on the assumption that the average foreign exchange rate for 2020 would equal the average foreign exchange rate of 2018. | (1) Based on 2020E Blue Impact projections. | (2) Based on EBITDA margins for perfor man ce marketing peers. | (3) Margin is defined as Adjusted EBITDA / Net Revenue; Net Revenue = Revenue, excluding Billable Expenses. Margin of ~20%
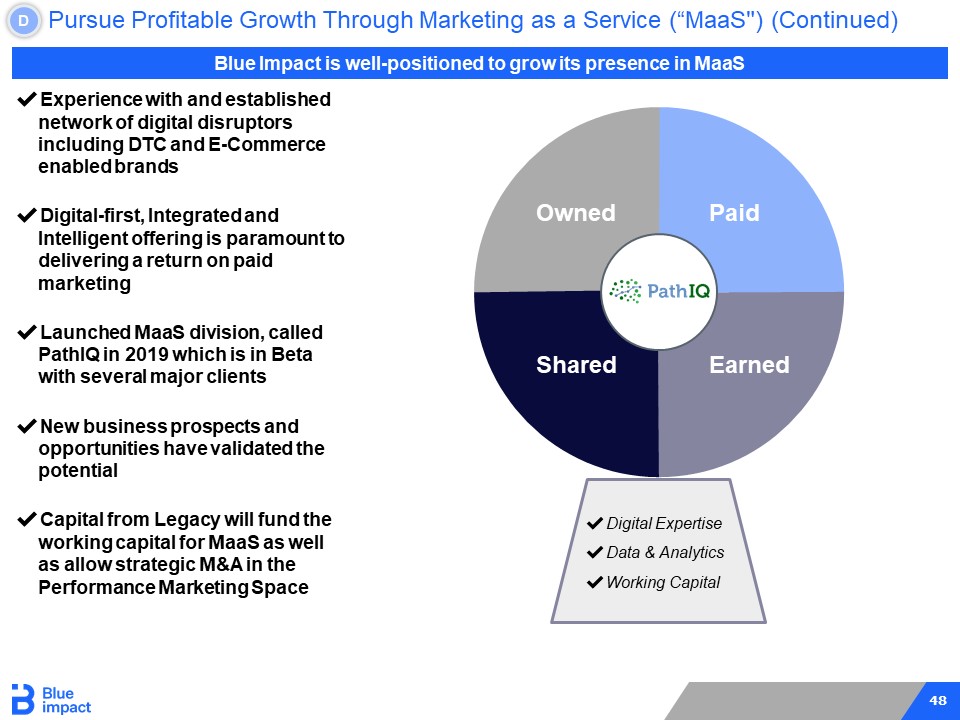
48 ✔ Digital Expertise ✔ Data & Analytics ✔ Working Capital Owned Paid Shared Earned Pursue Profitable Growth Through Marketing as a Service (“MaaS") (Continued) D Blue Impact is well - positioned to grow its presence in MaaS ✔ Experience with and established network of digital disruptors including DTC and E - Commerce enabled brands ✔ Digital - first, Integrated and Intelligent offering is paramount to delivering a return on paid marketing ✔ Launched MaaS division, called PathIQ in 2019 which is in Beta with several major clients ✔ New business prospects and opportunities have validated the potential ✔ Capital from Legacy will fund the working capital for MaaS as well as allow strategic M&A in the Performance Marketing Space

Financial Results and M&A He Shen
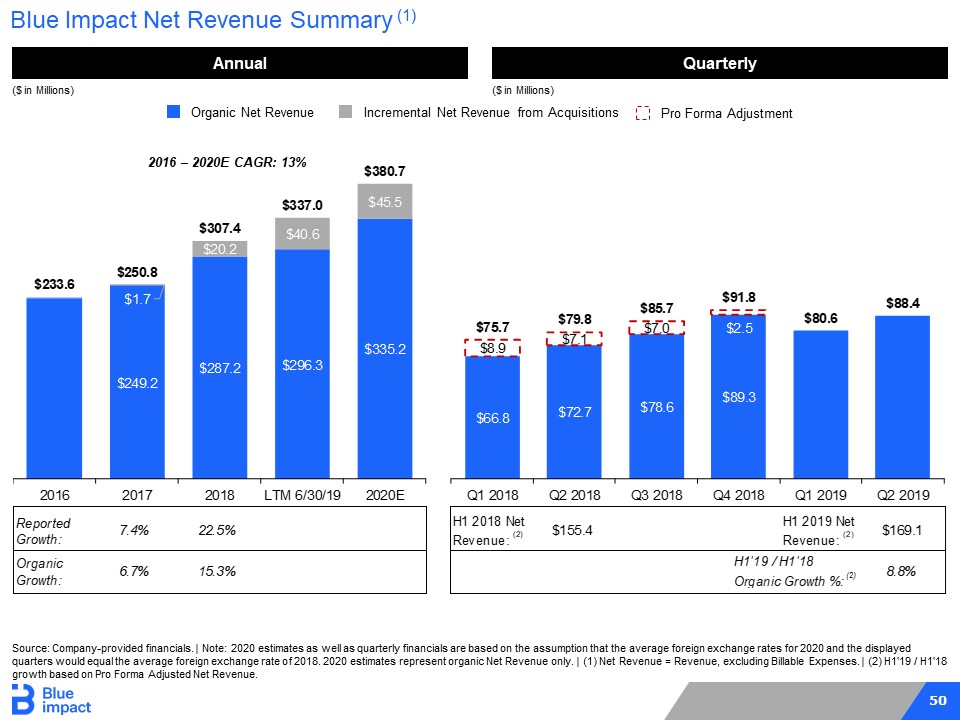
50 Reported Growth: 7.4% 22.5% H1 2018 Net Revenue: (2) $155.4 H1 2019 Net Revenue: (2) $169.1 Organic Growth: 6.7% 15.3% 8.8% H1'19 / H1'18 Organic Growth %: (2) $249.2 $287.2 $296.3 $335.2 $1.7 $20.2 $40.6 $45.5 $233.6 $250.8 $307.4 $337.0 $380.7 2016 2017 2018 LTM 6/30/19 2020E $66.8 $72.7 $78.6 $89.3 $8.9 $7.1 $7.0 $2.5 $75.7 $79.8 $85.7 $91.8 $80.6 $88.4 Q1 2018 Q2 2018 Q3 2018 Q4 2018 Q1 2019 Q2 2019 Blue Impact Net Revenue Summary (1) Annual ($ in Millions) Quarterly ($ in Millions) Source: Company - provided financials. | Note: 2020 estimates as well as quarterly financials are based on the assumption that the average foreign exchange rates for 202 0 and the displayed quarters would equal the average foreign exchange rate of 2018. 2020 estimates represent organic Net Revenue only. | (1) Net Revenue = Revenue, excluding Billable Expenses. | (2) H1'19 / H1 '18 growth based on Pro Forma Adjusted Net Revenue. Organic Net Revenue Incremental Net Revenue from Acquisitions Pro Forma Adjustment 2016 – 2020E CAGR: 13%
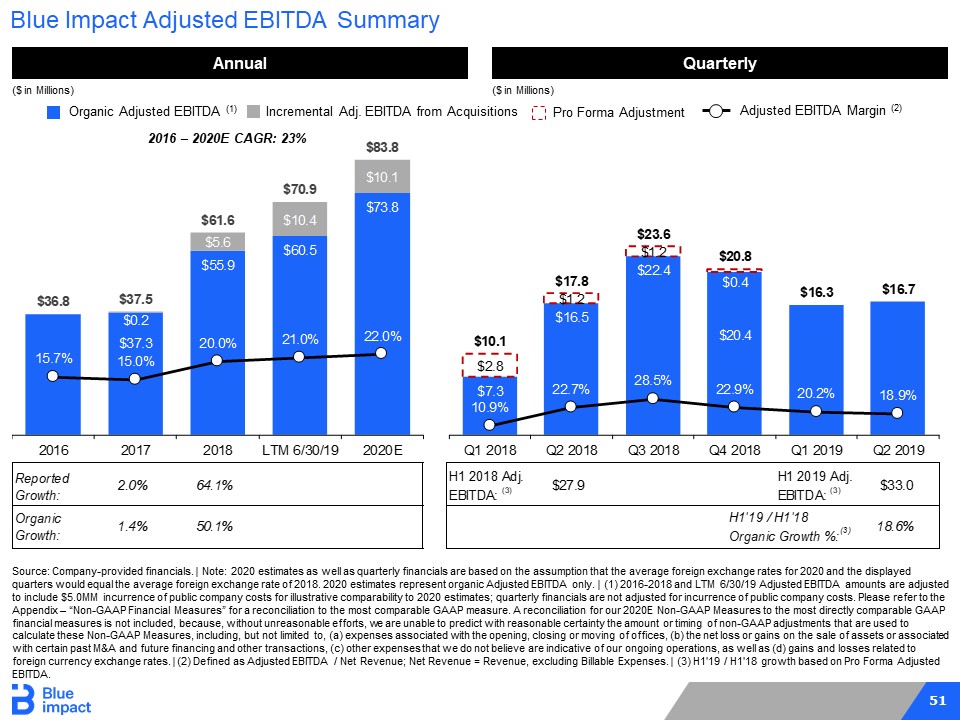
51 Blue Impact Adjusted EBITDA Summary Source: Company - provided financials. | Note: 2020 estimates as well as quarterly financials are based on the assumption that the average foreign exchange rates for 2020 a nd the displayed quarters would equal the average foreign exchange rate of 2018. 2020 estimates represent organic Adjusted EBITDA only. | (1) 201 6 - 2018 and LTM 6/30/19 Adjusted EBITDA amounts are adjusted to include $5.0MM incurrence of public company costs for illustrative comparability to 2020 estimates; quarterly financials a re not adjusted for incurrence of public company costs. Please refer to the Appendix – “Non - GAAP Financial Measures” for a reconciliation to the most comparable GAAP measure. A reconciliation for our 2020 E Non - GAAP Measures to the most directly comparable GAAP financial measures is not included, because, without unreasonable efforts, we are unable to predict with reasonable certainty th e amount or timing of non - GAAP adjustments that are used to calculate these Non - GAAP Measures, including, but not limited to, (a) expenses associated with the opening, closing or moving of offices, (b) the net loss or gains on the sale of assets or associated with certain past M&A and future financing and other transactions, (c) other expenses that we do not believe are indicative o f o ur ongoing operations, as well as (d) gains and losses related to foreign currency exchange rates. | (2) Defined as Adjusted EBITDA / Net Revenue; Net Revenue = Revenue, excluding Billable Ex pen ses. | (3) H1'19 / H1'18 growth based on Pro Forma Adjusted EBITDA. Adjusted EBITDA Margin (2) Incremental Adj. EBITDA from Acquisitions Organic Adjusted EBITDA (1) Pro Forma Adjustment Annual ($ in Millions) Quarterly ($ in Millions) 2016 – 2020E CAGR: 23% Reported Growth: 2.0% 64.1% H1 2018 Adj. EBITDA: (3) $27.9 H1 2019 Adj. EBITDA: (3) $33.0 Organic Growth: 1.4% 50.1% 18.6% H1'19 / H1'18 Organic Growth %: (3) $7.3 $16.5 $22.4 $20.4 $2.8 $1.2 $1.2 $0.4 $10.1 $17.8 $23.6 $20.8 $16.3 $16.7 10.9% 22.7% 28.5% 22.9% 20.2% 18.9% Q1 2018 Q2 2018 Q3 2018 Q4 2018 Q1 2019 Q2 2019 $37.3 $55.9 $60.5 $73.8 $0.2 $5.6 $10.4 $10.1 $36.8 $37.5 $61.6 $70.9 $83.8 15.7% 15.0% 20.0% 21.0% 22.0% 2016 2017 2018 LTM 6/30/19 2020E

52 Net Working Capital Summary 2016 2017 2018 Net Working Capital (2) ($5.6) $9.2 ($12.0) Change in Net Working Capital $14.8 ($21.2) $19.0 $13.8 $52.8 $85.1 2016 2017 2018 LTM 6/30/19 Blue Impact Supplemental Financial Data ($ in Millions) Source: Company - provided financials. | (1) Free cash flow defined as (Cash Flow from Operations – CapEx). | (2) Defined as (Non - cash Current Assets – Non - debt Current Liabilities). | (3) The information presented consists of estimates of the unadjusted EBITDA that could result from hypothetical acquisitions by the Com pany. Actual results could differ materially and adversely from the information presented and there are no assurances that any acquisitions may be completed at the prices or multiples reflected , i f at all. | (4) Assumes Purchase Price is calculated as a multiple of unadjusted EBITDA of the hypothetical target and no fees and expenses are incurred in conjunction with the transaction for il lus trative purposes only. Please refer to the Appendix – “Non - GAAP Financial Measures” for more information about Acquired EBITDA. | (5) Defined as TEV / Purchase Multiple. (3) Free Cash Flow (1) Estimated Incremental EBITDA through Acquisitions (3) Analysis at Various Prices (4) Purchase Price (TEV) $50.0 Purchase Multiple (5) 6.0x 7.0x 8.0x Acquired EBITDA $8.3 $7.1 $6.3 Purchase Price (TEV) $100.0 Purchase Multiple (5) 6.0x 7.0x 8.0x Acquired EBITDA $16.7 $14.3 $12.5 Purchase Price (TEV) $200.0 Purchase Multiple (5) 6.0x 7.0x 8.0x Acquired EBITDA $33.3 $28.6 $25.0 ($ in Millions) ▪ 2016 & 2017 reflect non - recurring working capital deployment for Madhouse business growth ▪ 2018 is representative of normalized net working capital levels
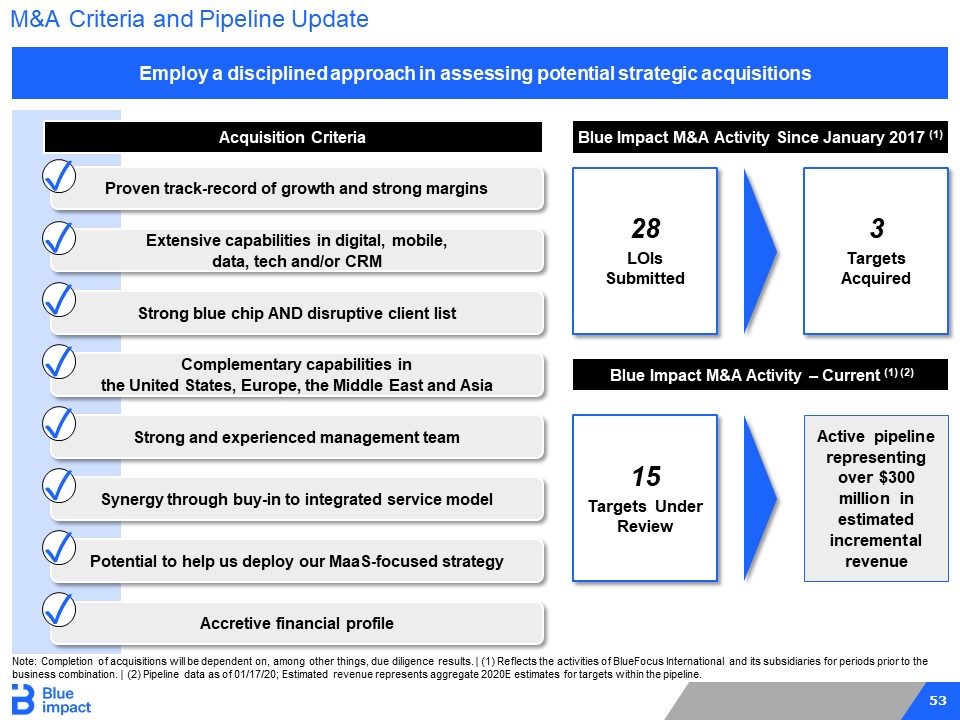
53 Employ a disciplined approach in assessing potential strategic acquisitions Note: Completion of acquisitions will be dependent on, among other things, due diligence results. | (1) Reflects the activiti es of BlueFocus International and its subsidiaries for periods prior to the business combination. | (2) Pipeline data as of 01/17/20; Estimated revenue represents aggregate 2020E estimates for targets wit hin the pipeline. Active pipeline representing over $300 million in estimated incremental revenue Blue Impact M&A Activity Since January 2017 (1) Acquisition Criteria Proven track - record of growth and strong margins Extensive capabilities in digital, mobile, data, tech and/or CRM Strong blue chip AND disruptive client list Complementary capabilities in the United States, Europe, the Middle East and Asia Strong and experienced management team Synergy through buy - in to integrated service model Potential to help us deploy our MaaS - focused strategy ✓ ✓ ✓ ✓ ✓ ✓ ✓ Accretive financial profile ✓ 28 LOIs Submitted Blue Impact M&A Activity – Current (1) (2) 3 Targets Acquired 15 Targets Under Review M&A Criteria and Pipeline Update

54 The Objective: Create management, client and shareholder value with a digital - first, integrated and intelligent, global advertising and marketing services company which is well funded to work towards achieving its goal Our Goal: $1.0 Billion + in Revenue

Appendix

56 ▪ The Company provides the non - GAAP measurement of Pro Forma Adjusted Revenue, Pro Forma Adjusted EBITDA, Acquired EBITDA, Unadjusted EBITDA and Adjusted EBITDA (including Organic and Incremental Adjusted EBITDA). The Company has included these non - GAAP measurements because they are a key measure used by the Company’s management and board of directors to understand and evaluate its core operating performance and trends. ▪ The Company’s Pro Forma Adjusted Revenue and Pro Forma Adjusted EBITDA reflect the adjustments shown on slides 50 and 51, respectively. Unadjusted EBITDA and Adjusted EBITDA (including Organic and Incremental Adjusted EBITDA) consists of income (loss), adjusted for the items included in the accompanying reconciliation. The exclusion of certain income and expens e items and accounting adjustments in calculating Unadjusted EBITDA and Adjusted EBITDA can provide a useful measure for comparison of our core business before and after the potential Transaction with Legacy. The Company’s Pro Forma Adjusted Revenue, Pro Forma Adjusted EBITDA, Unadjusted EBITDA and Adjusted EBITDA (including Organic and Incremental Adjusted EBITDA) are not necessarily comparable to calculations performed by other companies and reported as similarly titled measures. These non - GAAP measures should be considered in addition to results prepared in accordance with GAAP, but should not be considered a substitute for or superior to GAAP results. Unadjusted EBITDA and Adjusted EBITDA (including Organic and Incremental Adjusted EBITDA) are reconciled from the respective measures under GAAP in the attached table “Reconciliation of Non - GAAP Financial Measures.” ▪ The Company's Acquired EBITDA is an estimate of the Unadjusted EBITDA that could result from potential acquisitions by the Company and is calculated assuming that the purchase price for a potential acquisition is calculated as a multiple of unadjus ted EBITDA of the hypothetical target and there are no fees and expenses incurred by the Company in the acquisition. Actual results could differ materially and adversely from the information presented and there are no assurances that any acquisition s may be completed at the prices or multiples reflected, if at all. ▪ In addition, these Non - GAAP measures exclude certain non - recurring and other charges. The exclusion of these items should not be construed as an inference that our future results will be unaffected by unusual or non - recurring items. Non - GAAP Financial Measures
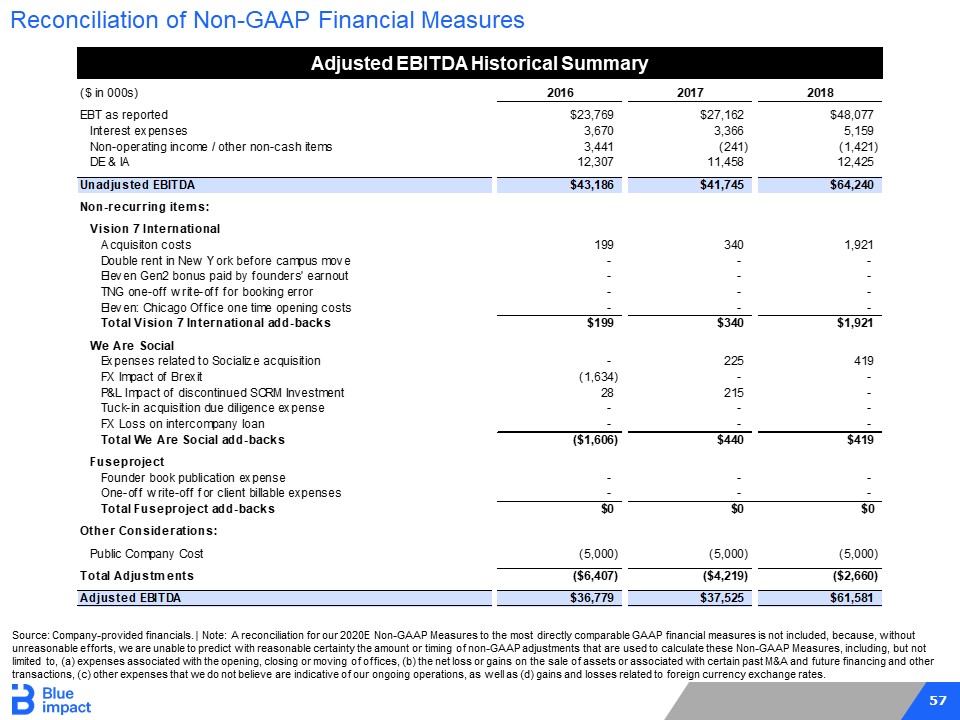
57 Reconciliation of Non - GAAP Financial Measures Adjusted EBITDA Historical Summary Source: Company - provided financials. | Note: A reconciliation for our 2020E Non - GAAP Measures to the most directly comparable GA AP financial measures is not included, because, without unreasonable efforts, we are unable to predict with reasonable certainty the amount or timing of non - GAAP adjustments that are u sed to calculate these Non - GAAP Measures, including, but not limited to, (a) expenses associated with the opening, closing or moving of offices, (b) the net loss or gains on the sale of ass ets or associated with certain past M
&A and future financing and other transactions, (c) other expenses that we do not believe are indicative of our ongoing operations, as well as (d) gains and lo sse s related to foreign currency exchange rates. ($ in 000s) 2016 2017 2018 EBT as reported $23,769 $27,162 $48,077 Interest expenses 3,670 3,366 5,159 Non-operating income / other non-cash items 3,441 (241) (1,421) DE & IA 12,307 11,458 12,425 Unadjusted EBITDA $43,186 $41,745 $64,240 Non-recurring items: Vision 7 International Acquisiton costs 199 340 1,921 Double rent in New York before campus move - - - Eleven Gen2 bonus paid by founders' earnout - - - TNG one-off write-off for booking error - - - Eleven: Chicago Office one time opening costs - - - Total Vision 7 International add-backs $199 $340 $1,921 We Are Social Expenses related to Socialize acquisition - 225 419 FX Impact of Brexit (1,634) - - P&L Impact of discontinued SCRM Investment 28 215 - Tuck-in acquisition due diligence expense - - - FX Loss on intercompany loan - - - Total We Are Social add-backs ($1,606) $440 $419 Fuseproject Founder book publication expense - - - One-off write-off for client billable expenses - - - Total Fuseproject add-backs $0 $0 $0 Other Considerations: Public Company Cost (5,000) (5,000) (5,000) Total Adjustments ($6,407) ($4,219) ($2,660) Adjusted EBITDA $36,779 $37,525 $61,581
Important Information About the Business Combination and Where to Find It
In connection with the proposed Business Combination, Legacy has filed a preliminary proxy statement with the U.S. Securities and Exchange Commission (the “SEC”) on December 2, 2019 and intends to file other relevant materials with the SEC, including a definitive proxy statement on Schedule 14A. Legacy’s stockholders and other interested persons are advised to read the preliminary statement and the amendments thereto and other relevant materials to be filed in connection with the Business Combination with the SEC, including, when available, the definitive proxy statement on Schedule 14A and documents incorporated by reference therein, as these materials will contain important information about the Business Combination. When available, the definitive proxy statement and other relevant materials for the Business Combination will be mailed to stockholders of Legacy as of January 27, 2020, the record date for voting on the Business Combination, or such other date as may be set and announced by Legacy. Stockholders are also able to obtain copies of the preliminary proxy statements and other documents filed with the SEC incorporated by reference therein, and will also be able to obtain, once available, the definitive proxy statement and other documents filed with the SEC that will be incorporated by reference therein, without charge, at the SEC’s web site at www.sec.gov, or by directing a request to: Legacy Acquisition Corp., 1308 Race Street, Suite 200, Cincinnati, Ohio 45202, Attention: Secretary, (513) 618-7161.
Participants in the Solicitation
Legacy and its directors and executive officers may be deemed participants in the solicitation of proxies from Legacy’s stockholders with respect to the Business Combination. A list of the names of those directors and executive officers and a description of their interests in Legacy is contained in the preliminary proxy statement filed with the SEC on December 2, 2019 and in Legacy’s proxy statement for its 2019 Annual Meeting that was filed with the SEC on November 22, 2019 and are available free of charge at the SEC’s web site at www.sec.gov, or by directing a request Legacy Acquisition Corp., 1308 Race Street, Suite 200, Cincinnati, Ohio 45202, Attention: Secretary, (513) 618-7161. Additional information regarding the interests of such participants will be contained in the definitive proxy statement that Legacy intends to file with the SEC in connection with the Business Combination when available.
The Seller, Blue Focus Intelligent Communications Group, and their respective affiliates and their directors, officers and employees may also be deemed to be participants in the solicitation of proxies from the stockholders of Legacy in connection with the Business Combination. A list of the names of such directors and officers and information regarding their interests in the Business Combination is contained in the preliminary proxy statement filed with the SEC on December 2, 2019 and will be contained in the definitive proxy statement that Legacy intends to file with the SEC in connection with the Business Combination when available.
Forward-Looking Statements:
This Schedule 14A filing includes “forward-looking statements” within the meaning of the “safe harbor” provisions of the Private Securities Litigation Reform Act of 1995. Legacy’s and the Blue Impact business’ actual results may differ from their expectations, estimates and projections and consequently, you should not rely on these forward looking statements as predictions of future events. Words such as “expect,” “estimate,” “project,” “budget,” “forecast,” “anticipate,” “intend,” “propose,” “plan,” “contemplate,” “may,” “will,” “shall,” “would,” “could,” “should,” “believes,” “predicts,” “potential,” “continue,” “positioned,” “goal,” “conditional” and similar expressions are intended to identify such forward-looking statements. These forward-looking statements include, without limitation, the anticipated portfolio of assets and agencies to comprise the Blue Impact business, Legacy’s anticipated name following the closing of the proposed transaction, projected cash available for acquisitions and working capital following the closing and the anticipated closing date of the proposed transaction.
These forward-looking statements involve significant risks and uncertainties that could cause the actual results to differ materially from the expected results. Most of these factors are outside Legacy’s and the Blue Impact business’ control and are difficult to predict. Factors that may cause such differences include, but are not limited to: (1) the occurrence of any event, change or other circumstances that could give rise to the termination of the Amended and Restated Share Exchange Agreement, (2) the outcome of any legal proceedings that may be instituted against Legacy and other transaction parties since the announcement of the Original Share Exchange Agreement and the transactions contemplated therein; (3) the inability to complete the proposed transaction, including due to failure to obtain approval of the stockholders of Legacy or other conditions to closing in the Amended and Restated Share Exchange Agreement; (4) the occurrence of any event, change or other circumstance that could otherwise cause the transaction to fail to close; (5) the receipt of an unsolicited offer from another party for an alternative business transaction that could interfere with the proposed transaction; (6) the inability to obtain or maintain the listing of the post-acquisition company’s common stock on the New York Stock Exchange following the proposed transaction; (7) the risk that the proposed transaction disrupts current plans and operations as a result of the announcement and consummation of the proposed transaction; (8) the ability to recognize the anticipated benefits of the proposed transaction, which may be affected by, among other things, competition, the ability of the combined company to operate cohesively as a standalone group, grow and manage growth profitably and retain its key employees; (9) costs related to the proposed transaction; (10) changes in applicable laws or regulations; (11) the possibility that the Blue Impact business or the combined company may be adversely affected by other economic business, and/or competitive factors; (12) the aggregate number of Legacy shares requested to be redeemed by Legacy’s stockholders in connection with the proposed transaction; (13) the risk that current trends in digital media and marketing decelerate or do not continue; (14) the ability of the Blue Impact business to ameliorate or otherwise mitigate its existing material weaknesses and any material weaknesses in internal control over financial reporting or significant deficiencies that may be identified in the future; (15) estimates for the financial performance of the Blue Impact business may prove to be incorrect or materially different from actual results; and (16) other risks and uncertainties indicated from time to time in the proxy statement relating to the proposed transaction, including those under “Risk Factors” therein, and in Legacy’s other filings with the SEC. Legacy cautions that the foregoing list of factors is not exclusive. Legacy cautions readers not to place undue reliance upon any forward-looking statements, which speak only as of the date made. Legacy does not undertake or accept any obligation or undertaking to release publicly any updates or revisions to any forward-looking statements to reflect any change in its expectations or any change in events, conditions or circumstances on which any such statement is based.
No Offer or Solicitation:
This Schedule 14A filing shall not constitute a solicitation of a proxy, consent or authorization with respect to any securities or in respect of the proposed transaction. This Schedule 14A filing shall also not constitute an offer to sell or the solicitation of an offer to buy any securities, nor shall there be any sale of securities in any states or jurisdictions in which such offer, solicitation or sale would be unlawful prior to registration or qualification under the securities laws of any such jurisdiction. No offering of securities shall be made except by means of a prospectus meeting the requirements of section 10 of the Securities Act of 1933, as amended.