UNITED STATES
SECURITIES AND EXCHANGE COMMISSION
Washington, D.C. 20549
FORM 6-K
REPORT OF FOREIGN PRIVATE ISSUER PURSUANT TO RULE 13a-16 OR
15d-16 UNDER THE SECURITIES EXCHANGE ACT OF 1934
For the month of November, 2019
Commission File Number: 000-55899
BANCO SANTANDER MÉXICO, S.A., INSTITUCIÓN DE BANCA MÚLTIPLE, GRUPO FINANCIERO SANTANDER MÉXICO
(Exact Name of Registrant as Specified in Its Charter)
Avenida Prolongación Paseo de la Reforma 500
Colonia Lomas de Santa Fe
Delegación Álvaro Obregón
01219, Ciudad de México
(Address of principal executive office)
Indicate by check mark whether the registrant files or will file annual reports under cover of Form 20-F or Form 40-F:
| Form 20-F | ☒ | Form 40-F | ☐ |
Indicate by check mark if the registrant is submitting the Form 6-K in paper as permitted by Regulation S-T Rule 101(b)(1):
| Yes | ☐ | No | ☒ |
Indicate by check mark if the registrant is submitting the Form 6-K in paper as permitted by Regulation S-T Rule 101(b)(7):
| Yes | ☐ | No | ☒ | |
BANCO SANTANDER MÉXICO, S.A., INSTITUCIÓN DE BANCA MÚLTIPLE, GRUPO FINANCIERO SANTANDER MÉXICO
TABLE OF CONTENTS
| ITEM | |
| 1. | Third quarter 2019 earnings release of Banco Santander México, S.A., Institución de Banca Múltiple, Grupo Financiero Santander México |
| 2. | Third quarter 2019 earnings presentation of Banco Santander México, S.A., Institución de Banca Múltiple, Grupo Financiero Santander México |
| 3. | Relevant information dated October 31, 2019 |
SIGNATURE
Pursuant to the requirements of the Securities Exchange Act of 1934, the registrant has duly caused this report to be signed on its behalf by the undersigned, thereunto duly authorized.
BANCO SANTANDER MÉXICO, S.A., INSTITUCIÓN DE BANCA MÚLTIPLE, GRUPO FINANCIERO SANTANDER MÉXICO | |||||
| By: | /s/ Hector Chávez Lopez | ||||
| Name: | Hector Chávez Lopez | ||||
| Title: | Executive Director of Investor Relations | ||||
Date: November 1, 2019
Item 1
| Earnings Release | 3Q.2019 |  |
| Banco Santander México |
TABLE OF CONTENTS
| I. | CEO Message / Key Highlights for the Quarter |
| II. | Summary of 3Q19 Consolidated Results |
| III. | Analysis of 3Q19 Consolidated Results |
| IV. | Relevant Events, Transactions and Activities |
| V. | Awards & Recognitions |
| VI. | Sustainability and Social Responsibility |
| VII. | Credit Ratings |
| VIII. | 3Q19 Earnings Call Dial-In Information |
| IX. | Analyst Coverage |
| X. | Definition of Ratios |
| XI. | Consolidated Financial Statements |
| XII. | Notes to Consolidated Financial Statements |
| Earnings Release | 3Q.2019 |
1 |
| Banco Santander México |
Banco Santander México Reports Third Quarter 2019 Net Income of Ps.5,517 Million
| - | Progress on strategy execution to transform the Bank operationally and digitally. |
| - | Loan growth mainly driven by mortgages, credit cards and payroll loans, along with middle-market. |
| - | Continue attracting lower-cost individual deposits, while further enhancing ability to cross-sell products. |
| - | Solid quarter with strong net interest income and healthy asset quality. |
Mexico City – October 31st, 2019, Banco Santander México, S.A., Institución de Banca Múltiple, Grupo Financiero Santander México(NYSE: BSMX; BMV: BSMX), (“Banco Santander México” or “the Bank”), today announced financial results for the three-month and nine-month periods ending September 30, 2019.
Banco Santander México reported net income of Ps.5,517 million in 3Q19, representing a YoY increase of 8.3% and a QoQ decrease of 1.6%. On a cumulative basis, net income for 9M19 reached Ps.16,416 million, representing a 9.5% YoY increase.
| HIGHLIGHTS | ||||||||||||
| Results(Million pesos) | 3Q19 | 2Q19 | 3Q18 | %QoQ | %YoY | 9M19 | 9M18 | %YoY | ||||
| Net interest income | 16,589 | 16,588 | 15,795 | 0.0 | 5.0 | 49,626 | 45,205 | 9.8 | ||||
| Fee and commission, net | 4,580 | 4,697 | 4,271 | (2.5) | 7.2 | 13,703 | 12,602 | 8.7 | ||||
| Core revenues | 21,169 | 21,285 | 20,066 | (0.5) | 5.5 | 63,329 | 57,807 | 9.6 | ||||
| Provisions for loan losses | 4,478 | 4,454 | 4,796 | 0.5 | (6.6) | 13,250 | 12,913 | 2.6 | ||||
| Administrative and promotional expenses | 9,783 | 9,482 | 9,003 | 3.2 | 8.7 | 28,521 | 26,066 | 9.4 | ||||
| Net income | 5,517 | 5,608 | 5,096 | (1.6) | 8.3 | 16,416 | 14,994 | 9.5 | ||||
| Net income per share1 | 0.81 | 0.83 | 0.75 | (1.6) | 8.3 | 2.42 | 2.21 | 9.4 | ||||
Balance Sheet Data (Million pesos) | Sep-19 | Jun-19 | Sep-18 | %QoQ | %YoY | Sep-19 | Sep-18 | %YoY | ||||
| Total assets | 1,460,741 | 1,368,187 | 1,375,294 | 6.8 | 6.2 | 1,460,741 | 1,375,294 | 6.2 | ||||
| Total loans | 697,326 | 700,329 | 680,120 | (0.4) | 2.5 | 697,326 | 680,120 | 2.5 | ||||
| Deposits | 683,590 | 721,288 | 680,143 | (5.2) | 0.5 | 683,590 | 680,143 | 0.5 | ||||
| Shareholders´ equity | 139,700 | 133,829 | 127,385 | 4.4 | 9.7 | 139,700 | 127,385 | 9.7 | ||||
| Key Ratios(%) | 3Q19 | 2Q19 | 3Q18 | bps QoQ | bps YoY | 9M19 | 9M18 | bps YoY | ||||
| Net interest margin | 5.74 | 5.76 | 5.66 | (2) | 8 | 5.69 | 5.48 | 21 | ||||
| Net loans to deposits ratio | 98.89 | 94.13 | 97.00 | 476 | 189 | 98.89 | 97.00 | 189 | ||||
| ROAE | 16.63 | 17.29 | 16.74 | (66) | (11) | 16.49 | 16.41 | 8 | ||||
| ROAA | 1.55 | 1.63 | 1.51 | (8) | 4 | 1.54 | 1.48 | 6 | ||||
| Efficiency ratio | 45.11 | 44.29 | 44.18 | 82 | 93 | 44.74 | 44.64 | 10 | ||||
| Capital ratio | 16.89 | 16.50 | 16.02 | 39 | 87 | 16.89 | 16.02 | 87 | ||||
| NPLs ratio | 2.33 | 2.23 | 2.35 | 10 | (2) | 2.33 | 2.35 | (2) | ||||
| Cost of Risk | 2.62 | 2.70 | 2.77 | (8) | (15) | 2.62 | 2.77 | (15) | ||||
| Coverage ratio | 130.82 | 136.56 | 127.60 | (574) | 322 | 130.82 | 127.60 | 322 | ||||
| Operating Data | Sep-19 | Jun-19 | Sep-18 | %QoQ | %YoY | Sep-19 | Sep-18 | %YoY | ||||
| Branches | 1,223 | 1,216 | 1,218 | 0.6 | 0.4 | 1,223 | 1,218 | 0.4 | ||||
| Branches and offices2 | 1,411 | 1,394 | 1,385 | 1.2 | 1.9 | 1,411 | 1,385 | 1.9 | ||||
| ATMs | 8,866 | 8,749 | 8,003 | 1.3 | 10.8 | 8,866 | 8,003 | 10.8 | ||||
| Customers | 17,739,373 | 17,220,259 | 16,482,009 | 3.0 | 7.6 | 17,739,373 | 16,482,009 | 7.6 | ||||
| Employees | 19,876 | 19,403 | 18,629 | 2.4 | 6.7 | 19,876 | 18,629 | 6.7 | ||||
1) Accumulated EPS, net of treasury shares (compensation plan) and discontinued operations. Calculated by using weighted number of shares. | ||||||||||||
| 2) Includes cash desks (espacios select, box select and corner select) and SMEs business centers. Excluding brokerage house offices. | ||||||||||||
| Earnings Release | 3Q.2019 |
2 |
| Banco Santander México |
Héctor Grisi, Banco Santander México’s Executive President and CEO, commented:“Our focus on profitable growth delivered another quarter of solid performance, with steady increases in high margin loans and fees. Net income grew over 8% year-on-year, as we attracted more retail deposits, expanded our base of loyal, digital and mobile customers, and cross sold more of our products. The increase came despite a substantially higher effective tax rate as well as additional strategic investments that are further strengthening our retail franchise and making Santander the primary bank of a growing number of Mexicans.
Our performance was particularly gratifying, given softer economic conditions in the third quarter and our ability to maintain asset quality at a healthy level with year-on-year improvements across risk metrics. Driving our loan book were mortgages, credit cards and payroll loans, as well as middle-market lending. Individuals are increasingly attracted to our more modern and user-friendly branch formats, with 180 branches being converted during this year. Our base of digital and mobile customers grew 51% and 69%, respectively, as we continued upgrading our online and mobile banking platforms. This quarter we also formed a strategic alliance with CONTPAQi, a leading supplier of accounting software to over 1 million SMEs in México. Through this partnership, we aim to grow our base of SME customers by 50% within the next four years.
Although both domestic and global macroeconomic environments remain complex and challenging, we are encouraged by more accommodative central bank policies, still moderate inflation, as well as healthy employment levels across almost all sectors in México. And as we near the completion of our three-year investment plan, we continue building a far stronger and more customer-centric bank to maintain our profitable growth momentum in the years ahead.”
| Earnings Release | 3Q.2019 |
3 |
| Banco Santander México |
SUMMARY OF THIRD QUARTER 2019 CONSOLIDATED RESULTS
Loan portfolio
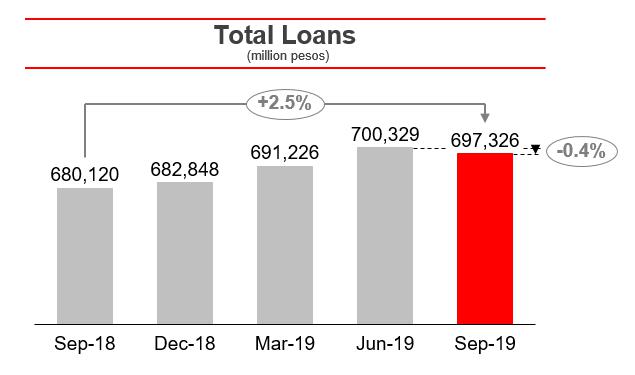
Banco Santander México’s total loan portfolio, as of Sep-19, increased 2.5% YoY, or Ps.17,206 million, to Ps.697,326 million, and decreased 0.4%, or Ps.3,003 million, on a sequential basis.
This slowdown was mainly related to softer growth in commercial and government loans, due to weaker demand and a strong competitive environment. By contrast, individual loan demand remained quite healthy. The Bank continues with a prudent approach to risk management and trading.
Deposits
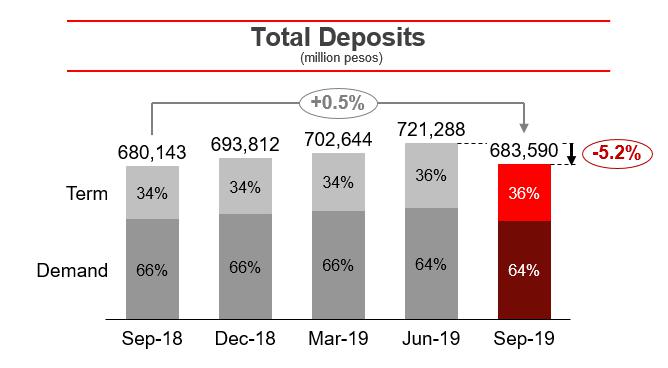
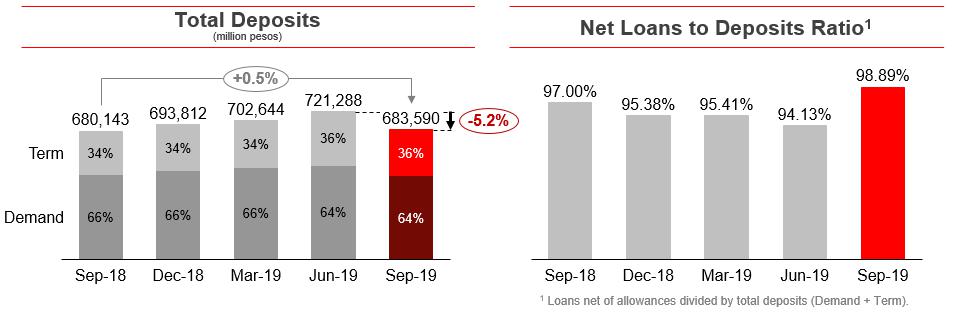
Deposits, which represent 82.8% of Banco Santander México’s total funding1, increased 0.5% YoY in Sep-19, and decreased 5.2% sequentially. In turn, term deposits increased by 5.3% YoY, still supported by the high interest rate environment, while demand deposits decreased by 2.0% YoY due to a contraction in demand deposits from corporates of 4.7% YoY. It is worth noting that demand deposits from individuals expanded by 5.0% YoY.
In Sep-19, term deposits from individuals represented 34.9% of total term deposits, compared with 31.8% in Sep-18, and 32.3% in Jun-19. Demand deposits from individuals represented 29.7% of total demand deposits, compared with 27.8% in Sep-18, and 29.8% in Jun-19. Total deposits from individuals expanded 8.9% YoY, supported by the Bank’s strategy focused on prioritizing individual deposits and foregoing certain expensive corporate deposits that resulted in a 2.9% YoY contraction.
The loans-to-deposits ratio stood at 98.89% in Sep-19, which compares with 97.00% in Sep-18, and 94.13% in Jun-19, maintaining a sound funding position.
______________________
1Total funding includes: deposits, credit instruments issued, bank and other loans and subordinated credit notes.
| Earnings Release | 3Q.2019 |
4 |
| Banco Santander México |
Net income
Banco Santander México reported 3Q19 net income of Ps.5,517 million, representing an increase of 8.3% YoY and a decrease of 1.6% QoQ. On a cumulative basis, net income for the first nine months of the year, reached Ps.16,416 million, representing a 9.5% YoY increase. Net interest income along with fee income drove solid growth, despite a higher effective tax rate.

| Net income statement | ||||||||||||
| Million pesos | % Variation | % Variation | ||||||||||
| 3Q19 | 2Q19 | 3Q18 | QoQ | YoY | 9M19 | 9M18 | 19/18 | |||||
| Net interest income | 16,589 | 16,588 | 15,795 | 0.0 | 5.0 | 49,626 | 45,205 | 9.8 | ||||
| Provisions for loan losses | (4,478) | (4,454) | (4,796) | 0.5 | (6.6) | (13,250) | (12,913) | 2.6 | ||||
| Net interest income after provisions for loan losses | 12,111 | 12,134 | 10,999 | (0.2) | 10.1 | 36,376 | 32,292 | 12.6 | ||||
| Commission and fee income, net | 4,580 | 4,697 | 4,271 | (2.5) | 7.2 | 13,703 | 12,602 | 8.7 | ||||
| Net gain (loss) on financial assets and liabilities | 1,101 | 564 | 843 | 95.2 | 30.6 | 1,997 | 2,180 | (8.4) | ||||
| Other operating income | (582) | (440) | (533) | 32.3 | 9.2 | (1,573) | (1,593) | (1.3) | ||||
| Administrative and promotional expenses | (9,783) | (9,482) | (9,003) | 3.2 | 8.7 | (28,521) | (26,066) | 9.4 | ||||
| Operating income | 7,427 | 7,473 | 6,577 | (0.6) | 12.9 | 21,982 | 19,415 | 13.2 | ||||
| Income taxes (net) | (1,910) | (1,865) | (1,481) | 2.4 | 29.0 | (5,566) | (4,421) | 25.9 | ||||
| Net income | 5,517 | 5,608 | 5,096 | (1.6) | 8.3 | 16,416 | 14,994 | 9.5 | ||||
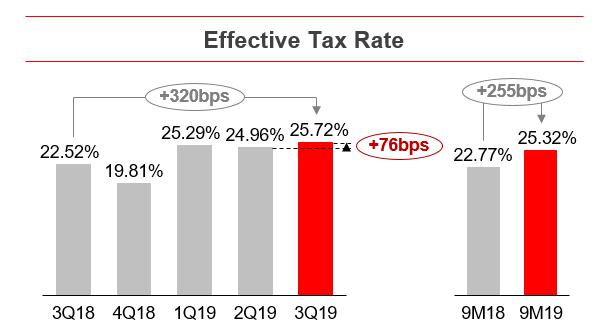
| Effective tax rate (%) | 25.72 | 24.96 | 22.52 | 25.32 | 22.77 | |||||||
| Earnings Release | 3Q.2019 |
5 |
| Banco Santander México |
3Q19 vs 3Q18
The 8.3% year-on-year increase in net income was principally driven by:
| i) | A 5.0%, or Ps.794 million, increase in net interest income, supported by steady growth in high-margin loans; |
| ii) | A 6.6%, or Ps.318 million, decrease in provisions for loan losses, particularly in commercial loans, given that in 3Q18 the Bank made additional provisions for a specific project finance corporate loan; |
| iii) | A 7.2%, or Ps.309 million, increase in net commissions and fees, mainly due to increases in debit and credit card usage and financial advisory services fees; and |
| iv) | A 30.6%, or Ps.258 million, increase in net gains on financial assets and liabilities, mainly resulting from improved market activity that drove higher client flows, supporting market-making activity. |
The increase in net income was partially offset by:
| i) | An 8.7%, or Ps.780 million, increase in administrative and promotional expenses, mainly due to higher technology services, other expenses, depreciation and amortization and taxes and duties; and |
| ii) | A 29.0%, or Ps.429 million, increase in income taxes, which resulted in a 25.72% effective tax rate in the quarter, compared to 22.52% in 3Q18. |
9M19 vs 9M18
Net income growth of 9.5% for 9M19 was mainly due to:
| i) | A 9.8%, or Ps.4,421 million, increase in net interest income, as the Bank focused on driving profitability across the balance sheet; and |
| ii) | An 8.7%, or Ps.1,101 million, increase in net commissions and fees, mainly due to increases in debit and credit card usage, insurance and account management fees. |
The increase in net income was partially offset by:
| i) | A 9.4%, or Ps.2,455 million, increase in administrative and promotional expenses, mainly due to higher other expenses, technology services, depreciation and amortization, personnel expenses and taxes and duties; |
| ii) | A 25.9%, or Ps.1,145 million, increase in income taxes, which resulted in a 25.32% effective tax rate in 9M19, compared to 22.77% in 9M18; |
| iii) | A 2.6%, or Ps.337 million, increase in provisions for loan losses; and |
| iv) | A 8.4%, or Ps.183 million, decrease in net gains on financial assets and liabilities. |
| Earnings Release | 3Q.2019 |
6 |
| Banco Santander México |
Gross operating income
Banco Santander México’s gross operating income for 3Q19 totaled Ps.22,270 million, representing increases of 6.5% YoY and 1.9% QoQ, driven by strong performance across the business. Core earnings accounted 95% of gross operating income, while market-related income rose above the Bank’s average historical levels of Ps.600 to Ps.800 million. Gross operating income for 9M19 amounted to Ps.65,326 million, increasing 8.9% from 9M18.
Gross operating income is broken down as follows:
| Breakdown gross operating Income (%) | |||||||||||
| Variation (bps) | Variation (bps) | ||||||||||
| 3Q19 | 2Q19 | 3Q18 | QoQ | YoY | 9M19 | 9M18 | YoY | ||||
| Net Interest Income | 74.49 | 75.92 | 75.54 | (143) | (105) | 75.97 | 75.36 | 61 | |||
| Net Commissions and Fees | 20.57 | 21.50 | 20.43 | (93) | 14 | 20.98 | 21.01 | (3) | |||
| Market related revenue | 4.94 | 2.58 | 4.03 | 236 | 91 | 3.06 | 3.63 | (57) | |||
| Gross Operating Income* | 100.00 | 100.00 | 100.00 | 100.00 | 100.00 | ||||||
*Does not include other income
Return on average equity (ROAE)
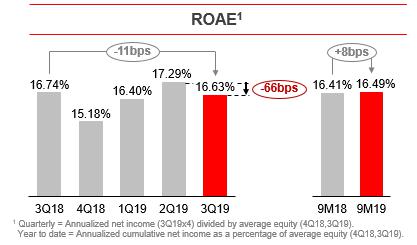
ROAE for 3Q19 decreased 11 basis points to 16.63%, from 16.74% reported in 3Q18 and by 66 basis points from 17.29% in 2Q19. This level reflects the Ps.4.8 billion cash dividend paid by the bank in May-19. For 9M19, ROAE stood at 16.49%, 8 basis points higher than the 16.41% reported in 9M18.
| Earnings Release | 3Q.2019 |
7 |
| Banco Santander México |
Strategic initiatives and commercial actions
On December 2016, Banco Santander México announced an investment plan for Ps.15 billion over three years with the aim to digitalize operations and to become the primary bank of our customers. The investment plan will end this year, but the Bank’s strategy will remain centered on attracting and retaining customers while increasing their loyalty, expanding cross selling, promoting adoption of our digital platforms, and broadening our value proposition with next generation products and services.
Main progress of our three main strategic pillars on which our investment plan is based:
| Ø | Digitalization of products and processes, transformation of the distribution network, and investment in infrastructure and cutting-edged technology. |
| § | In the digital factory, “Spotlight”, the Bank is working on digital solutions for its customers to be able to do any banking operation or transaction from their smartphones, without the need to go to a branch. The Bank is digitalizing products and processes for its clients and employees and has launched more than 100 functionalities, including new features for its mobile banking app “Súper Móvil”, such as Face ID access, cardless cash withdrawals, a personalized savings plan, “Mis Metas”, the programing of direct debits through “GoPay” for paying services, contactless payments through smart-watches like Garmin and Fitbit, and a new channel to manage credit card clarifications of unrecognized charges through “Súper Móvil” or “Súper Net” without the need for making a phone call or going to a branch. |
| § | This quarter the Bank also launched a new functionality through its App “Super Wallet”, which allows customers to generate the NIP for their credit cards on the App, without the need to call “Súper Línea” to perform this task. |
| § | Santander was the first bank in Mexico ready to use CoDi, incorporating this payment method into its “Súper Móvil” App. |
| § | Launch of “Santander TAP” last quarter, a free function through messaging services like WhatsApp, Facebook or Instagram, that allows Santander customers to make money transfers to Santander customers and non-customers without leaving the chat feature. If the intended recipient does not have a bank account, Santander offers the online opening of a “Super Digital” account to be able to receive the money. “Santander TAP” already has more than 150,000 active customers since its launch 4 months ago. |
| § | Teamed up with FUNO to provide customers a new service model featuring special attention points (Isla Financiera) in shopping centers along with next-generation ATMs, offering more personalized assistance to customers. The first of these modules was opened this quarter, with a total of 50 scheduled to be opened in 39 cities in the coming months. |
| § | Continue with the deployment of next-generation ATMs throughout the country and with constant enhancements to CRM. Added 60 full-function ATMs during the quarter, with 981 in operation at the end of September 2019 and a total of 1,000 by year-end, which would position the Bank to the natural market share in this type of infrastructure. |
| § | During the year, transformed 180 branches according to a new distribution model, which promotes the use of digital channels and self-service, reaching 494 branches under this format. The identification of 818 micro-markets within Mexico has allowed branches to be adapted according to each micro-market’s needs, which is expected to boost volume growth. The Bank also transformed its distribution network model, whereby branch managers are responsible for their branches’ own P&L and cost of risk. |
| Earnings Release | 3Q.2019 |
8 |
| Banco Santander México |
| § | “Super Digital”, a fully digital account which addresses non-banked clients or digital natives who prefer bypassing a branch, now has more than 289,300 accounts since its launch in October 2016. |
| § | Ongoing efforts to further digitalize the client base and build loyalty, led to a 51% increase in digital clients and 27% in loyal customers as of 3Q19. The number of mobile customers increased 69% in the last 12 months. Mobile monetary transactions accounted for 86% of digital monetary transactions, up from 67% in 3Q18. |
| Ø | On the retail front, investment initiatives are aimed at boosting customer acquisition, cross-selling and building loyalty. |
| § | Our App “Super Wallet” reached 835,500 customers, supporting the migration of our customers to digital banking. The App allows customer to manage their money, block or unblock cards, make contactless payments, check balances, transfer funds, and check their loyalty programs. |
| § | To continue attracting new customers and increase the loyalty of existing ones, Santander has launched several initiatives that are progressing well: |
| - | Santander Plus continues to perform well. As of September 2019, over 6.7 million customers have enrolled in this program, of which 52% are new to the bank. Additional benefits were added to the Santander Plus program this quarter, including an alliance with Repsol, which will give Santander Plus customers Ps.200 cash-back for every Ps.2,000 spent at Repsol gas stations every month. |
| - | The focus on attracting payroll accounts has resulted in 4.56 million customers, of which almost 600,000 are new to the bank in the last twelve months. |
| - | The Santander-Aeroméxico co-branded card has also been very successful, with more than one million cardholders, of which 34% are new. |
| - | The “Hipoteca Plus” mortgage program is helping attract and maintain loyal customers. This quarter, 73% of new mortgage loans were linked to “Hipoteca Plus”. |
| § | Additionally, in the commercial segment, the Bank continues consolidating a leading position in key segments in Mexico, such as SMEs and middle-market, while it aims to become one of the top three players in corporate and investment banking. |
| - | Launched “Comercio Plus”, a Santander Plus-like program, designed to attract SMEs and individuals with commercial activity, giving them up to Ps.10,000 cash-back per month for their POS’ interests for up to twelve months after their enrollment in the program, seeking to drive loyalty through POS, payroll and financing. |
| - | Announced this quarter a commercial alliance with CONTPAQi, a leading company in accounting software for SMEs, with 35% market share in this segment. Through this alliance, the Bank aims to boost the value offering by reaching more SMEs, while developing financial products that meet their needs and offering credit based on their transactional information. |
| Ø | In addition, the bank’s value proposition is complemented with new offerings, which address other client needs, such as auto financing and insurance. |
| § | In the auto loans business, “Super Auto”, the Bank is working with 657 dealers and more than 100 automotive groups nationwide. By September 2019, the loan portfolio totaled over Ps.1.6 billion. Established alliances with Peugeot, Suzuki and KTM are positioning Banco Santander México as their main financial partner for branded financing of cars and motorcycles and with personalized offers. |
| Earnings Release | 3Q.2019 |
9 |
| Banco Santander México |
| § | With regard to México’s the financial inclusion program, “TUIIO”, at the end of 3Q19, the Bank had 70 branches in 15 states, with more than 70,000 customers, reaching a loan portfolio of Ps.198 million. Since TUIIO began operations, more than half of these customers have used an ATM and/or had obtained a debit card for the first time in their lives. |
| Customers | ||||||
| (Thousands) | % Variation | |||||
| Sep-19 | Jun-19 | Sep-18 | QoQ | YoY | ||
| Loyal Customers1 | 2,980 | 2,844 | 2,353 | 4.8 | 26.6 | |
| Digital Customers2 | 3,815 | 3,512 | 2,533 | 8.6 | 50.6 | |
| Santander Plus | 6,686 | 5,737 | 4,296 | 16.5 | 55.6 | |
| Santander – Aeroméxico | 1,004 | 984 | 903 | 2.0 | 11.2 | |
1 Loyal customers = Clients with non-zero balance and depending on the segment should have between two and four products and between three and ten transactions in the last 90 days.
2 Digital customers = Clients with at least one digital transaction per month in SuperNet or SuperMóvil.
| Earnings Release | 3Q.2019 |
10 |
| Banco Santander México |
ANALYSIS OF THIRD QUARTER 2019 CONSOLIDATED RESULTS
(Amounts expressed in millions of pesos, except where otherwise stated)
Loan portfolio
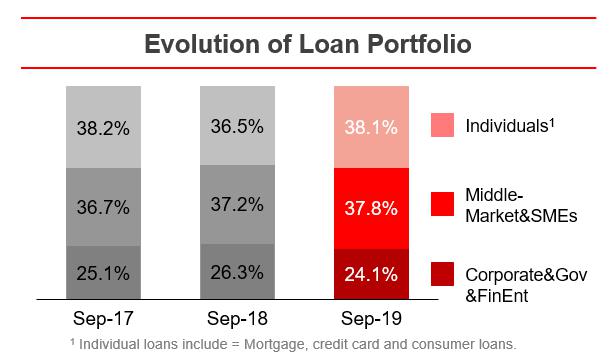
The evolution of the loan portfolio shows sustained growth in high-margin loan segments, reflecting a continued focus on profitability.
| Portfolio Breakdown | ||||||
| Million pesos | % Variation | |||||
| Sep-19 | Jun-19 | Sep-18 | QoQ | YoY | ||
| Commercial | 431,963 | 439,983 | 432,114 | (1.8) | (0.0) | |
| Middle-market | 185,567 | 188,053 | 175,567 | (1.3) | 5.7 | |
| Corporates | 93,838 | 98,270 | 97,031 | (4.5) | (3.3) | |
| SMEs | 78,075 | 79,491 | 77,519 | (1.8) | 0.7 | |
| Government & Financial Entities | 74,482 | 74,169 | 81,997 | 0.4 | (9.2) | |
| Individuals | 265,363 | 260,346 | 248,006 | 1.9 | 7.0 | |
| Consumer | 116,630 | 114,695 | 109,471 | 1.7 | 6.5 | |
| Credit cards | 58,960 | 57,476 | 54,997 | 2.6 | 7.2 | |
| Other consumer | 57,670 | 57,219 | 54,474 | 0.8 | 5.9 | |
| Mortgages | 148,733 | 145,651 | 138,535 | 2.1 | 7.4 | |
| Total | 697,326 | 700,329 | 680,120 | (0.4) | 2.5 | |
The total loan portfolio rose 2.5% YoY, or Ps.17,206 million, to Ps.697,326 million in Sep-19. On a sequential basis, the total loan portfolio decreased 0.4%, or Ps.3,003 million.
Thecommercial loan portfolio is comprised of loans to business and commercial entities, as well as loans to government entities and financial institutions, and represented 61.9% of the total loan portfolio. Excluding loans to government entities and financial institutions, the commercial loan portfolio accounted for 51.3% of the total. Middle-market, Corporate and SME loans represented 26.6%, 13.5% and 11.2% of the total loan portfolio, respectively.
Theindividuals loan portfolio, comprised of mortgages, consumer and credit card loans, represented 38.1% of the total loan portfolio. Mortgage, credit card and consumer loans, represented 21.3%, 8.5% and 8.3% of the total loan portfolio, respectively. The Bank continues with the strategy of prioritizing payroll loans over unsecured personal loans and taking advantage of our strong position in the middle market and SME segments. Since the Bank began focusing on driving payroll loans in 1Q17, it has expanded the share of payroll loans by 9 percentage points to 62.3% of total consumer loans as of 3Q19.
| Earnings Release | 3Q.2019 |
11 |
| Banco Santander México |
| Loan portfolio breakdown | ||||||||
| Million pesos | ||||||||
| Sep-19 | % | Jun-19 | % | Sep-18 | % | |||
| Performing loans | ||||||||
| Commercial | 426,180 | 61.1 | 434,438 | 62.0 | 426,351 | 62.7 | ||
| Individuals | 254,865 | 36.5 | 250,260 | 35.7 | 237,801 | 35.0 | ||
| Consumer | 112,099 | 16.1 | 110,226 | 15.7 | 105,232 | 15.5 | ||
| Credit cards | 56,452 | 8.1 | 54,950 | 7.8 | 52,642 | 7.7 | ||
| Other consumer | 55,647 | 8.0 | 55,276 | 7.9 | 52,590 | 7.7 | ||
| Mortgages | 142,766 | 20.5 | 140,034 | 20.0 | 132,569 | 19.5 | ||
| Total performing loans | 681,045 | 97.7 | 684,698 | 97.8 | 664,152 | 97.7 | ||
| Non-performing loans | ||||||||
| Commercial | 5,783 | 0.8 | 5,545 | 0.8 | 5,763 | 0.8 | ||
| Individuals | 10,498 | 1.5 | 10,086 | 1.4 | 10,205 | 1.5 | ||
| Consumer | 4,531 | 0.6 | 4,469 | 0.6 | 4,239 | 0.6 | ||
| Credit cards | 2,509 | 0.4 | 2,526 | 0.4 | 2,355 | 0.3 | ||
| Other consumer | 2,022 | 0.3 | 1,943 | 0.3 | 1,884 | 0.3 | ||
| Mortgages | 5,967 | 0.9 | 5,617 | 0.8 | 5,966 | 0.9 | ||
| Total non-performing loans | 16,281 | 2.3 | 15,631 | 2.2 | 15,968 | 2.3 | ||
| Total loan portfolio | ||||||||
| Commercial | 431,963 | 61.9 | 439,983 | 62.8 | 432,114 | 63.5 | ||
| Individuals | 265,363 | 38.1 | 260,346 | 37.2 | 248,006 | 36.5 | ||
| Consumer | 116,630 | 16.7 | 114,695 | 16.4 | 109,471 | 16.1 | ||
| Credit cards | 58,960 | 8.5 | 57,476 | 8.2 | 54,997 | 8.1 | ||
| Other consumer | 57,670 | 8.3 | 57,219 | 8.2 | 54,474 | 8.0 | ||
| Mortgages | 148,733 | 21.3 | 145,651 | 20.8 | 138,535 | 20.4 | ||
| Total loan portfolio | 697,326 | 100.0 | 700,329 | 100.0 | 680,120 | 100.0 |
As of Sep-19, commercial loans remained unchanged YoY, reflecting more difficult comps in corporate, government and financial entities loans, as well as the Bank’s prudent and disciplined approach to pricing. Corporate loans decreased 3.3%, with difficult comps and some prepayments, while government and financial entities loans decreased 6.1% and 20.6% YoY, respectively. The Bank has been reducing its exposure to state-owned companies while prioritizing loans to certain states that bring along their payrolls, providing future cross-selling opportunities. Finally, loans to middle-market companies, increased 5.7% YoY, also experiencing some prepayments during the quarter, while SME loans increased 0.7% YoY, reflecting weak loan demand.
Mortgage loans posted a good performance during the quarter, increasing 7.4% YoY and 2.1% sequentially, even after the sale of a Ps.1 billion non-performing loan portfolio in January of this year. The Hipoteca Plus product remains the main driver behind this strong performance, accounting for 73% of total mortgage origination in the quarter. However, mortgage loans were still affected by the run-off of acquired portfolios. Excluding this effect, the mortgage portfolio would have increased 12.0% YoY, higher than average market growth.
Credit card loans increased 7.2% YoY and 2.6% QoQ, while credit card usage continued to grow – up 11.0% this quarter, although a high percentage of customers continued to pay their balances in full. The Bank further expanded this product by cross-selling credit cards to its payroll and Hipoteca Plus customers, while also supporting healthy asset quality and good levels of profitability.
The strategy of prioritizing Banco Santander México’s payroll loans over unsecured personal loans and leveraging a strong position in the middle market and SME segments is driving robust growth in consumer loans. Payroll loans continued expanding at a solid rate during the quarter, increasing 12.1% YoY and 1.2% QoQ, which was above-market growth. However personal loans decreased 8.6% YoY and 1.7% QoQ, as the Bank focused on further strengthening its payroll franchise.
| Earnings Release | 3Q.2019 |
12 |
| Banco Santander México |
Total Deposits
Total deposits in Sep-19 were Ps.683,590 million, an increase of 0.5% YoY and a decrease of 5.2% sequentially. Term deposits increased 5.3% YoY and decreased 6.4% QoQ to Ps.244,745 million. Term deposits from individuals grew 15.4% YoY and 1.0% QoQ, still benefiting from a higher interest rate environment. Demand deposits reached Ps.438,845 million, decreasing 2.0% YoY and 4.5% sequentially. Demand deposits from individuals rose 5.0% YoY, while demand deposits from corporates decreased 4.7% YoY.
The focus on driving profitability across the deposit base, by prioritizing retail deposits and foregoing certain expensive corporate deposits, resulted in a 2.9% YoY contraction in corporate deposits. In turn, individual deposits grew 8.9% YoY, as the Bank continued making headway in attracting and retaining retail clients.
Net interest income
| Net interest income | |||||||||||
| Million pesos | % variation | % variation | |||||||||
| 3Q19 | 2Q19 | 3Q18 | QoQ | YoY | 9M19 | 9M18 | 19/18 | ||||
| Interest on funds available | 1,017 | 1,019 | 801 | (0.2) | 27.0 | 2,895 | 2,325 | 24.5 | |||
| Interest on margin accounts | 256 | 266 | 211 | (3.8) | 21.3 | 830 | 727 | 14.2 | |||
| Interest and yield on securities | 4,847 | 4,675 | 5,218 | 3.7 | (7.1) | 14,156 | 14,404 | (1.7) | |||
| Interest and yield on loan portfolio – excluding credit cards | 18,738 | 18,591 | 17,408 | 0.8 | 7.6 | 55,435 | 49,370 | 12.3 | |||
| Interest and yield on loan portfolio related to credit cards | 3,809 | 3,774 | 3,472 | 0.9 | 9.7 | 11,097 | 10,152 | 9.3 | |||
| Commissions collected on loan originations | 136 | 155 | 137 | (12.3) | (0.7) | 423 | 437 | (3.2) | |||
| Interest and premium on sale and repurchase agreements and securities loans | 1,662 | 2,076 | 1,581 | (19.9) | 5.1 | 6,958 | 4,918 | 41.5 | |||
| Interest income | 30,465 | 30,556 | 28,828 | (0.3) | 5.7 | 91,794 | 82,333 | 11.5 | |||
| Daily average interest- earnings assets | 1,156,479 | 1,151,592 | 1,116,683 | 0.4 | 3.6 | 1,162,217 | 1,099,598 | 5.7 | |||
| Interest from customer deposits – demand deposits | (3,299) | (3,188) | (2,715) | 3.5 | 21.5 | (9,500) | (7,673) | 23.8 | |||
| Interest from customer deposits – time deposits | (4,704) | (4,394) | (3,951) | 7.1 | 19.1 | (13,400) | (11,013) | 21.7 | |||
| Interest from credit instruments issued | (893) | (868) | (671) | 2.9 | 33.1 | (2,467) | (2,040) | 20.9 | |||
| Earnings Release | 3Q.2019 |
13 |
| Banco Santander México |
| Interest on bank and other loans | (1,098) | (1,209) | (1,187) | (9.2) | (7.5) | (3,319) | (3,033) | 9.4 | |||
| Interest on subordinated capital notes | (402) | (388) | (442) | 3.6 | (9.0) | (1,205) | (1,306) | (7.7) | |||
| Interest and premium on sale and repurchase agreements and securities loans | (3,480) | (3,921) | (4,067) | (11.2) | (14.4) | (12,277) | (12,063) | 1.8 | |||
| Interest expense | (13,876) | (13,968) | (13,033) | (0.7) | 6.5 | (42,168) | (37,128) | 13.6 | |||
| Daily average interest-bearing liabilities | 1,023,281 | 1,019,172 | 993,960 | 0.4 | 2.9 | 1,029,221 | 974,364 | 5.6 | |||
| Net interest income | 16,589 | 16,588 | 15,795 | 0.0 | 5.0 | 49,626 | 45,205 | 9.8 |
Net interest income in 3Q19 totaled Ps.16,589 million, increasing 5.0% YoY, or Ps.794 million, and remaining flat sequentially.
The 5.0% YoY increase in net interest income resulted from the combination of:
| i) | A 5.7%, or Ps.1,637 million, increase in interest income, to Ps.30,465 million, stemming from a 3.6%, or Ps.39,796 million, increase in average interest-earning assets and a 21 basis points increase in the average interest rate received; and |
| ii) | A 6.5%, or Ps.843 million, increase in interest expense, to Ps.13,876 million, resulting from a 2.9%, or Ps.29,321 million, increase in interest-bearing liabilities and an 18 basis points increase in the average interest rate paid. |
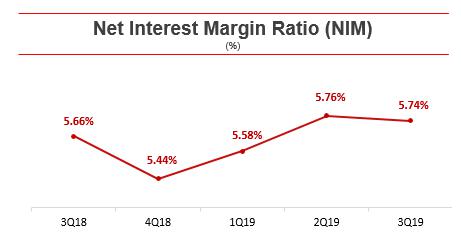
The net interest margin ratio (NIM), calculated using daily average interest-earning assets for 3Q19, stood at 5.74%, compared to 5.66% in 3Q18 and 5.76% in 2Q19. The YoY increase in NIM mainly reflects the Bank’s focus on profitability across the balance sheet, further supported by steady growth in high-margin loans, and despite softer economic conditions. On a cumulative basis, NIM for 9M19 reached 5.69%, an increase of 21 basis points vs. 9M18.
| Earnings Release | 3Q.2019 |
14 |
| Banco Santander México |
Interest Income
Total average interest earning assets in 3Q19 amounted to Ps.1,156,479 million, increasing 3.6%, or Ps.39,796 million, YoY, mainly driven by 5.5% growth, or Ps.35,824 million, in the average loan portfolio, and by 27.7% growth, or Ps.21,515 million, in funds available, partly offset by a 6.1% decrease, or Ps.17,025 million, in investment in securities, by a 0.5% decrease, or Ps.374 million, in repurchase agreements, and by a 0.6% decrease, or Ps.144 million, in margin accounts. Banco Santander México’s interest earning assets are broken down as follows:
| Average Assets (Interest-Earnings Assets) | |||||
| Breakdown (%) | |||||
| 3Q18 | 4Q18 | 1Q19 | 2Q19 | 3Q19 | |
| Loan portfolio | 58.9 | 57.0 | 57.6 | 59.9 | 59.9 |
| Investment in securities | 25.0 | 25.6 | 20.7 | 21.1 | 22.6 |
| Repurchase agreements | 7.0 | 8.5 | 13.4 | 8.6 | 6.8 |
| Funds available | 7.0 | 6.2 | 5.7 | 8.1 | 8.6 |
| Margin accounts | 2.1 | 2.7 | 2.6 | 2.3 | 2.1 |
| Total | 100.0 | 100.0 | 100.0 | 100.0 | 100.0 |
Banco Santander México’s interest income consists mainly of interest from the loan portfolio and commissions on loan originations, which in 3Q19 generated Ps.22,683 million and accounted for 74.5% of total interest income. The remaining interest income of Ps.7,782 million is broken down as follows: 15.9% from investment in securities, 5.5% from repurchase agreements, 3.3% from funds available, and 0.8% from margin accounts.
Interest income for 3Q19 increased 5.7%, or Ps.1,637 million YoY, to Ps.30,465 million, mainly reflecting higher interest income from the total loan portfolio, funds available and repurchase agreements, which increased 8.0%, or Ps.1,667 million, 27.0%, or Ps.216 million, and 5.1%, or Ps.81 million, respectively, partly offset by a 7.1%, or Ps.371 million, decrease in investment in securities.
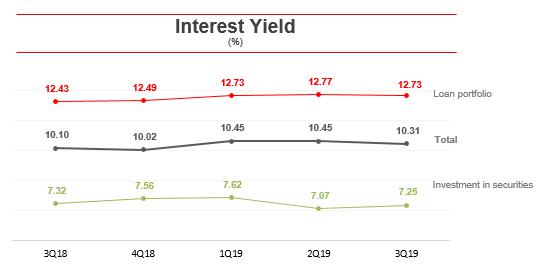
The average interest yield on interest-earning assets in 3Q19 stood at 10.31%, increasing 21 basis points from 10.10% in 3Q18, supported by steady growth in high-margin loans. Sequentially, the average interest yield on interest-earning assets decreased 19 basis points from 10.50% in 2Q19. During the quarter, the Mexican Central Bank (Banxico) made two interest rate cuts of 25 basis points each, totaling 50 basis points.
In 3Q19, the average interest rate on the total loan portfolio stood at 12.73%, increasing 30 basis points YoY, supported by the Bank’s focus on profitability across the balance sheet. The average interest rate on the consumer portfolio stood at 25.67%, increasing 107 basis points YoY, while the yield of credit card loans stood at 25.68%, increasing 84 basis points YoY, due to the Bank’s strategy of rebalancing its portfolio toward a more profitable product mix. The average interest rate on the investment in securities portfolio stood at 7.25%, decreasing 7 basis points YoY.
| Earnings Release | 3Q.2019 |
15 |
| Banco Santander México |
| Interest income | |||||||||||
| Million Pesos | 3Q19 | 3Q18 | Var YoY | ||||||||
| Average Balance | Interest | Yield (%) | Average Balance | Interest | Yield (%) | Average Balance | Interest (%) | Yield (bps) | |||
| Funds available | 99,263 | 1,017 | 4.01 | 77,748 | 801 | 4.03 | 27.7 | 27.0 | (2) | ||
| Margin accounts | 23,843 | 256 | 4.20 | 23,987 | 211 | 3.44 | (0.6) | 21.3 | 76 | ||
| Investment in securities | 261,740 | 4,847 | 7.25 | 278,765 | 5,218 | 7.32 | (6.1) | (7.1) | (7) | ||
| Loan portfolio | 692,999 | 22,547 | 12.73 | 657,175 | 20,880 | 12.43 | 5.5 | 8.0 | 30 | ||
| Commissions collected on loan originations | 0. | 136 | n.a. | 0 | 137 | n.a. | n.a. | (0.7) | n.a. | ||
| Sale and repurchase agreements and securities loans | 78,634 | 1,662 | 8.27 | 79,008 | 1,581 | 7.83 | (0.5) | 5.1 | 44 | ||
| Interest income | 1,156,479 | 30,465 | 10.31 | 1,116,683 | 28,828 | 10.10 | 3.6 | 5.7 | 21 | ||
As previously explained, the main contributor to interest income growth was the 8.0%, or Ps.1,667 million, increase in interest income from the total loan portfolio. This increase resulted from an 5.5%, or Ps.35,824 million, rise in average loan portfolio volume, and a 30 basis points increase in the average interest rate. Higher interest income from the loan portfolio resulted from the following YoY increases by product:
| § | Commercial: 4.5%, or Ps.18,793 million, with a 10.21% interest yield, which increased 19 bps; |
| § | Mortgages: 7.5%, or Ps.10,184 million, with a 9.99% interest yield, which increased 1 bps; |
| § | Consumer: 6.5%, or Ps.3,493 million, with a 25.67% interest yield, which increased 107 bps; and |
| § | Credit Cards: 6.1%, or Ps.3,354 million, with a 25.68% interest yield, which increased 84 bps. |
Interest income from investment in securities decreased 7.1%, or Ps.371 million, which resulted from the decrease of 6.1%, or Ps.17,025 million, in average volume, and a 7 basis points decrease in the average interest rate. Interest income from repurchase agreements grew 5.1%, or Ps.81 million, which resulted from the combined effect of a 0.5%, or Ps.374 million, decrease in average volume, and a 44 basis points increase in the average interest rate.
Interest expense
Total average interest-bearing liabilities amounted to Ps.1,023,281 million, increasing 2.9%, or Ps.29,321 million YoY, and were driven by increases of 10.8%, or Ps.42,201 million, in demand deposits, 15.0%, or Ps.7,113 million, in credit instruments issued, 2.6%, or Ps.6,882 million, in term deposits, and 2.5%, or Ps.618 million, in subordinated capital notes. These increases were partly offset by a 9.5%, or Ps.19,776 million, decrease, in repurchase agreements and a 12.7%, or Ps.7,717 million, decrease in bank and other loans.
Banco Santander México’s interest-bearing liabilities are broken down as follows:
| Average liabilities (interest-bearing liabilities) | |||||
| Breakdown (%) | |||||
| 3Q18 | 4Q18 | 1Q19 | 2Q19 | 3Q19 | |
| Demand deposits | 39.2 | 37.5 | 39.1 | 40.9 | 42.2 |
| Time deposits | 26.5 | 26.1 | 25.4 | 25.9 | 26.5 |
| Sale and repurchase agreements and securities loans | 20.9 | 23.8 | 23.3 | 19.4 | 18.3 |
| Bank and other loans | 6.1 | 5.5 | 5.4 | 6.1 | 5.2 |
| Credit instruments issued | 4.8 | 4.5 | 4.3 | 5.2 | 5.3 |
| Subordinated capital notes | 2.5 | 2.6 | 2.5 | 2.5 | 2.5 |
| Total | 100.0 | 100.0 | 100.0 | 100.0 | 100.0 |
| Earnings Release | 3Q.2019 |
16 |
| Banco Santander México |
Banco Santander México’s interest expense consists mainly of interest paid on customer deposits and repurchase agreements, which in 3Q19 amounted to Ps.8,003 million and Ps.3,480 million, respectively, and accounted for 57.7% and 25.1% of interest expense. The remaining interest expense of Ps.2,393 million was paid as follows: 7.9% on bank and other loans, 6.4% on credit instruments issued, and 2.9% on subordinated debentures.
Interest expense for 3Q19 increased 6.5%, or Ps.843 million, to Ps.13,876 million, mainly driven by higher interest expenses on term deposits and demand deposits.
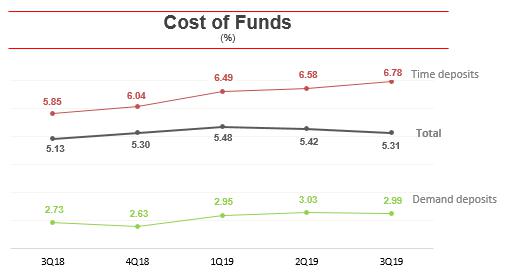
The average interest rate on interest-bearing liabilities increased 18 basis points to 5.31% in 3Q19. For 3Q19, the average interest rate on the main sources of funding increased YoY as follows:
| § | 93 basis points in term deposits, at an average interest rate paid of 6.78%; |
| § | 87 basis points in credit instruments issued, at an average interest rate paid of 6.40%; |
| § | 46 basis points in bank and other loans, at an average interest rate paid of 8.10%; and |
| § | 26 basis points in demand deposits, at an average interest rate paid of 2.99%. |
| Interest expense | |||||||||||
| Million pesos | 3Q19 | 3Q18 | Var YoY | ||||||||
| Average Balance | Interest | Yield (%) | Average Balance | Interest | Yield (%) | Average Balance | Interest (%) | Yield (bps) | |||
| Demand deposits | 431,526 | 3,299 | 2.99 | 389,325 | 2,715 | 2.73 | 10.8 | 21.5 | 26 | ||
| Time deposits | 271,368 | 4,704 | 6.78 | 264,486 | 3,951 | 5.85 | 2.6 | 19.1 | 93 | ||
| Credit instruments issued | 54,608 | 893 | 6.40 | 47,495 | 671 | 5.53 | 15.0 | 33.1 | 87 | ||
| Bank and other loans | 53,055 | 1,098 | 8.10 | 60,772 | 1,187 | 7.64 | (12.7) | (7.5) | 46 | ||
| Subordinated capital notes | 25,257 | 402 | 6.23 | 24,639 | 442 | 7.02 | 2.5 | (9.0) | (79) | ||
| Sale and repurchase agreements and securities loans | 187,467 | 3,480 | 7.26 | 207,243 | 4,067 | 7.68 | (9.5) | (14.4) | (42) | ||
| Interest expense | 1,023,281 | 13,876 | 5.31 | 993,960 | 13,033 | 5.13 | 2.9 | 6.5 | 18 | ||
| Earnings Release | 3Q.2019 |
17 |
| Banco Santander México |
Increases in retail deposits continue to reflect the Bank’s focus on driving profitability in its deposit base. The average balance of demand deposits expanded 10.8%, while the average balance of term deposits rose 2.6%. This volume growth, together with still high interest rates, resulted in increases of 21.5% and 19.1% in interest paid on demand and term deposits, respectively.
The 14.4%, or Ps.587 million, decrease in interest expenses on repurchase agreements resulted from a 9.5%, or Ps.19,776 million, decrease in the average balance and a 42 basis points decrease in the average interest rate paid.
Provisions for loan losses and asset quality
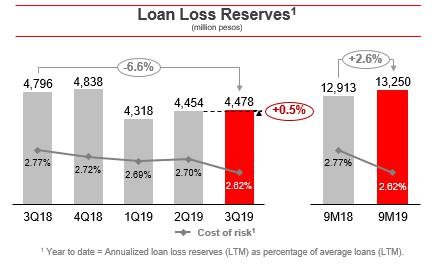
During 3Q19, provisions for loan losses amounted to Ps.4,478 million, which represented a decrease of 6.6%, or Ps.318 million, YoY, and an increase of 0.5%, or Ps.24 million, on a sequential basis. In 3Q18, the Bank made additional provisions for a specific project finance corporate loan, which contributed to easier YoY comps. At the same time, provisions for consumer loans tend to be higher in the second half of the year, due to back-to-school spending in August and September.
Please note that because of new accounting rules effective at the beginning of 2019, banks are required to record recoveries in the provision account. Previously, recoveries were booked in the other income line. For comparative purposes, provisions for 2018 are net of recoveries.
| Loan Loss Reserves | |||||||||||
| Million pesos | % Variation | % Variation | |||||||||
| 3Q19 | 2Q19 | 3Q18 | QoQ | YoY | 9M19 | 9M18 | YoY | ||||
| Commercial | 1,208 | 1,276 | 1,592 | (5.3) | (24.1) | 3,553 | 4,038 | (12.0) | |||
| Consumer | 2,994 | 2,985 | 2,924 | 0.3 | 2.4 | 9,069 | 8,254 | 9.9 | |||
| Mortgages | 276 | 193 | 280 | 43.1 | (1.3) | 628 | 621 | 1.2 | |||
| Total | 4,478 | 4,454 | 4,796 | 0.6 | (6.6) | 13,250 | 12,913 | 2.6 | |||
| Cost of Risk (%) | ||||||
| Variation (bps) | ||||||
| 3Q19 | 2Q19 | 3Q18 | QoQ | YoY | ||
| Commercial | 1.10 | 1.20 | 1.40 | (10) | (30) | |
| Consumer | 10.65 | 10.74 | 10.50 | (9) | 15 | |
| Mortgages | 0.90 | 0.92 | 0.62 | (2) | 28 | |
| Total | 2.62 | 2.70 | 2.77 | (8) | (15) | |
| Earnings Release | 3Q.2019 |
18 |
| Banco Santander México |
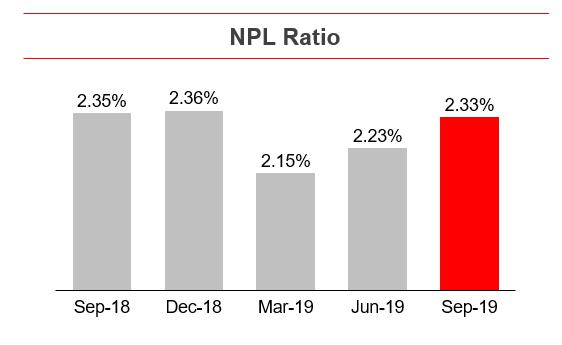
Non-performing loans at Sep-19 increased Ps.313 million YoY, or 2.0%, to Ps.16,281 million, and increased Ps.650 million, or 4.2%, on a sequential basis. The NPL ratio for Sep-19 stood at 2.33%, a 2 basis points decline from 2.35% in Sep-18. Sequentially, the NPL ratio, increased 10 basis points from 2.23% in Jun-19.
The YoY increase in non-performing loans was mainly due to an increase of 6.9%, or Ps.292 million, in consumer loans (including credit cards), together with a 0.3%, or Ps.20 million, increase in commercial loans. Mortgage loans remained stable.
On a sequential basis, Banco Santander México reported a 4.2%, or Ps.650 million, increase in non-performing loans, which resulted from increases in the non-performing loan portfolio of mortgages, commercial and consumer (including credit cards) loans of Ps.350 million, Ps.238 million and Ps.62 million, respectively.
NPLs for the mortgage loan portfolio decreased 30 basis points YoY and increased 15 basis points sequentially. Consumer loan NPLs (including credit cards) increased 1 basis point YoY and decreased 2 basis points QoQ. At the same time, commercial loan NPLs increased 1 basis point YoY and increased 8 basis points sequentially.
The breakdown of the non-performing loan portfolio is as follows: mortgage loans 36.7%, commercial loans 35.5% and consumer loans (including credit cards) 27.8%.
| Non-Performing loan ratio (%) | ||||||
| Variation (bps) | ||||||
| Sep-19 | Jun-19 | Sep-18 | QoQ | YoY | ||
| Commercial | 1.34 | 1.26 | 1.33 | 8 | 1 | |
| Individuals | ||||||
| Consumer | 3.88 | 3.90 | 3.87 | (2) | 1 | |
| Credit Card | 4.25 | 4.39 | 4.28 | (14) | (3) | |
| Other consumer | 3.51 | 3.40 | 3.46 | 11 | 5 | |
| Mortgages | 4.01 | 3.86 | 4.31 | 15 | (30) | |
| Total | 2.33 | 2.23 | 2.35 | 10 | (2) | |
The aforementioned variations in non-performing loans led to an NPL ratio of 2.33% in Sep-19, decreasing 2 basis points from 2.35% in Sep-18 and increasing 10 basis point compared to the 2.23% ratio reported in Jun-19. The current NPL ratio reflects Banco Santander México’s strong focus on prudent risk management and continual monitoring of loan portfolio quality.
Finally, the coverage ratio for Sep-19 stood at 130.82%, an increase from 127.60% in Sep-18 and a decrease from 136.56% in Sep-19.
| Earnings Release | 3Q.2019 |
19 |
| Banco Santander México |
Commission and fee income, net
| Commission and fee income, net | |||||||||||
| Million pesos | % Variation | % Variation | |||||||||
| 3Q19 | 2Q19 | 3Q18 | QoQ | YoY | 9M19 | 9M18 | 19/18 | ||||
| Commission and fee income | |||||||||||
| Debit and credit card | 2,447 | 2,361 | 1,979 | 3.6 | 23.6 | 7,070 | 5,920 | 19.4 | |||
| Account management | 374 | 352 | 307 | 6.3 | 21.8 | 1,059 | 907 | 16.8 | |||
| Collection services | 727 | 759 | 727 | (4.2) | 0.0 | 2,215 | 2,152 | 2.9 | |||
| Investment funds | 400 | 394 | 397 | 1.5 | 0.8 | 1,164 | 1,174 | (0.9) | |||
| Insurance | 1,217 | 1,383 | 1,152 | (12.0) | 5.6 | 3,760 | 3,475 | 8.2 | |||
| Purchase-sale of securities and money market transactions | 252 | 246 | 212 | 2.4 | 18.9 | 687 | 824 | (16.6) | |||
| Checks trading | 59 | 65 | 58 | (9.2) | 1.7 | 187 | 182 | 2.7 | |||
| Foreign trade | 308 | 352 | 308 | (12.5) | 0.0 | 978 | 937 | 4.4 | |||
| Financial advisory services | 485 | 340 | 281 | 42.6 | 72.6 | 1,181 | 992 | 19.1 | |||
| Other | 235 | 234 | 238 | 0.4 | (1.3) | 705 | 635 | 11.0 | |||
| Total | 6,504 | 6,486 | 5,659 | 0.3 | 14.9 | 19,006 | 17,198 | 10.5 | |||
| Commission and fee expense | |||||||||||
| Debit and credit card | (1,052) | (1,064) | (793) | (1.1) | 32.7 | (3,038) | (2,711) | 12.1 | |||
| Investment funds | (1) | 0 | 0 | 0.0 | 0.0 | (1) | (1) | 0.0 | |||
| Insurance | (39) | (25) | (29) | 56.0 | 34.5 | (87) | (88) | (1.1) | |||
| Purchase-sale of securities and money market transactions | (84) | (33) | (72) | 154.5 | 16.7 | (145) | (200) | (27.5) | |||
| Checks trading | (11) | (4) | (7) | 175.0 | 57.1 | (23) | (21) | 9.5 | |||
| Financial advisory services | (77) | (15) | (1) | 413.3 | — | (103) | (3) | — | |||
| Other | (660) | (648) | (486) | 1.9 | 35.8 | (1,906) | (1,572) | 21.2 | |||
| Total | (1,924) | (1,789) | (1,388) | 7.5 | 38.6 | (5,303) | (4,596) | 15.4 | |||
| Commission and fee income, net | |||||||||||
| Debit and credit card | 1,395 | 1,297 | 1,186 | 7.6 | 17.6 | 4,032 | 3,209 | 25.6 | |||
| Account management | 374 | 352 | 307 | 6.3 | 21.8 | 1,059 | 907 | 16.8 | |||
| Collection services | 727 | 759 | 727 | (4.2) | 0.0 | 2,215 | 2,152 | 2.9 | |||
| Investment funds | 399 | 394 | 397 | 1.3 | 0.5 | 1,163 | 1,173 | (0.9) | |||
| Insurance | 1,178 | 1,358 | 1,123 | (13.3) | 4.9 | 3,673 | 3,387 | 8.4 | |||
| Purchase-sale of securities and money market transactions | 168 | 213 | 140 | (21.1) | 20.0 | 542 | 624 | (13.1) | |||
| Checks trading | 48 | 61 | 51 | (21.3) | (5.9) | 164 | 161 | 1.9 | |||
| Foreign trade | 308 | 352 | 308 | (12.5) | 0.0 | 978 | 937 | 4.4 | |||
| Financial advisory services | 408 | 325 | 280 | 25.5 | 45.7 | 1,078 | 989 | 9.0 | |||
| Other | (425) | (414) | (248) | 2.7 | 71.4 | (1,201) | (937) | 28.2 | |||
| Total | 4,580 | 4,697 | 4,271 | (2.5) | 7.2 | 13,703 | 12,602 | 8.7 | |||
In 3Q19, net commission and fee income totaled Ps.4,580 million, increasing 7.2% YoY, or Ps.309 million, and decreasing 2.5%, or Ps.117 million, QoQ. Commission and fee income increased 14.9%, or Ps.845 million, YoY, while commission and fee expense increased 38.6%, or Ps.536 million.
| Earnings Release | 3Q.2019 |
20 |
| Banco Santander México |
The main contributors to net commissions and fees were credit and debit card fees, which accounted for 30.5% of the total, followed by insurance fees and collection services fees, which accounted for 25.7% and 15.9% of total commissions and fees, respectively.
| Commission and fee income, net | ||||||
| Breakdown (%) | ||||||
| 3Q19 | 2Q19 | 3Q18 | 9M19 | 9M18 | ||
| Credit cards | 30.5 | 27.6 | 27.8 | 29.4 | 25.5 | |
| Insurance | 25.7 | 28.9 | 26.3 | 26.8 | 26.9 | |
| Collection services | 15.9 | 16.2 | 17.0 | 16.2 | 17.1 | |
| Financial advisory services | 8.9 | 6.9 | 6.6 | 7.9 | 7.8 | |
| Investment funds | 8.7 | 8.4 | 9.3 | 8.5 | 9.3 | |
| Account management | 8.2 | 7.5 | 7.2 | 7.7 | 7.2 | |
| Foreign trade | 6.7 | 7.5 | 7.2 | 7.1 | 7.4 | |
| Purchase-sale of securities and money market transactions | 3.7
| 4.5
| 3.3
| 4.0
| 5.0
| |
| Checks trading | 1.0 | 1.3 | 1.2 | 1.2 | 1.3 | |
| Other | (9.3) | (8.8) | (5.9) | (8.8) | (7.5) | |
| Total | 100.0 | 100.0 | 100.0 | 100.0 | 100.0 |
Net commissions and fees rose 7.2% YoY in 3Q19, mostly as a result of the following increases:
| i) | 17.6%, or Ps.209 million, in debit and credit card fees. Fee income was up 23.6%, driven by sustained higher usage levels and lower origination costs; |
| ii) | 45.7%, or Ps.128 million, in financial advisory services; |
| iii) | 21.8%, or Ps.67 million, in account management, mainly a result of Banco Santander México’s continued focus on being an integral part of its clients’ liquidity management efforts, which led to increased transactional activity; and |
| iv) | 4.9%, or Ps.55 million, in insurance fees, driven by strong cross-selling opportunities among the Bank’s mortgage and payroll customers, along with the performance of the Bank’s digital car insurance platform; |
These positive contributions to net commissions and fees were partly offset by a 71.4%, or Ps.177 million, increase in other commissions and fees paid.
On a cumulative basis, net commissions and fees amounted Ps.13,703 million in 9M19, reflecting a YoY increase of 8.7%, or Ps.1,101 million. Commission and fee income increased 10.5%, while commission and fee expense increased 15.4%.
| Earnings Release | 3Q.2019 |
21 |
| Banco Santander México |
Net gain (loss) on financial assets and liabilities
| Net gain (loss) on financial assets and liabilities | |||||||||||
| Million pesos | % variation | % variation | |||||||||
| 3Q19 | 2Q19 | 3Q18 | QoQ | YoY | 9M19 | 9M18 | 19/18 | ||||
| Valuation | |||||||||||
| Foreign exchange | 59 | (129) | (246) | 145.7 | 124.0 | (47) | 329 | (114.3) | |||
| Derivatives | 1,163 | 312 | 1,753 | 272.8 | (33.7) | 4,020 | 7,855 | (48.8) | |||
| Equity securities | 13 | (57) | (278) | 122.8 | 104.7 | 36 | 328 | (89.0) | |||
| Debt instruments | 610 | 1,031 | (145) | (40.8) | 520.7 | 1,594 | (1,348) | 218.2 | |||
| Valuation result | 1,845 | 1,157 | 1,084 | 59.5 | 70.2 | 5,603 | 7,164 | (21.8) | |||
| Purchase / sale of securities | |||||||||||
| Foreign exchange | 156 | 232 | 388 | (32.8) | (59.8) | 586 | 447 | 31.1 | |||
| Derivatives | (1,261) | (1,065) | (1,197) | 18.4 | 5.3 | (5,329) | (6,346) | (16.0) | |||
| Equity securities | 491 | 450 | 355 | 9.1 | 38.3 | 988 | 872 | 13.3 | |||
| Debt instruments | (130) | (210) | 213 | (38.1) | (161.0) | 149 | 43 | 246.5 | |||
| Purchase -sale result | (744) | (593) | (241) | 25.5 | 208.7 | (3,606) | (4,984) | (27.6) | |||
| Total | 1,101 | 564 | 843 | 95.2 | 30.6 | 1,997 | 2,180 | (8.4) | |||
In 3Q19, Banco Santander México reported a Ps.1,101 million net gain from financial assets and liabilities, which compares to gains of Ps.843 million in 3Q18 and Ps.564 million in 2Q19.
The Ps.1,101 million net gain from financial assets and liabilities in the quarter is mostly a result of:
i) A Ps.1,845 million valuation gain, which resulted from gains of Ps.1,163 million, Ps.610 million, Ps.59 million and Ps.13 million in derivative instruments, debt instruments, foreign exchange and equity securities, respectively; and
ii) A Ps.744 million purchase-sale loss related to losses of Ps.1,261 million and Ps.130 million in derivative instruments and debt instruments, respectively. These losses were partly offset by gains of Ps.491 million and Ps.156 million in equity securities and foreign exchange, respectively.
On a cumulative basis, the net gain from financial assets and liabilities for 9M19 reached Ps.1,997 million, representing an 8.4% YoY decrease.
| Earnings Release | 3Q.2019 |
22 |
| Banco Santander México |
Other operating expense
| Other operating income | |||||||||||
| Million pesos | % variation | % variation | |||||||||
| 3Q19 | 2Q19 | 3Q18 | QoQ | YoY | 9M19 | 9M18 | 19/18 | ||||
| Cancellation of liabilities and reserves | 216 | 71 | 109 | 204.2 | 98.2 | 376 | 343 | 9.6 | |||
| Interest on personnel loans | 74 | 72 | 71 | 2.8 | 4.2 | 219 | 212 | 3.3 | |||
| Allowance for losses on foreclosed assets | (17) | (18) | (28) | (5.6) | (39.3) | (75) | (75) | 0.0 | |||
| Profit from sale of foreclosed assets | 26 | 43 | 27 | (39.5) | (3.7) | 100 | 70 | 42.9 | |||
| Technical advisory and technology services | 39 | 13 | 10 | 200.0 | 290.0 | 72 | 66 | 9.1 | |||
| Portfolio recovery legal expenses and costs | (268) | (248) | (231) | 8.1 | 16.0 | (769) | (693) | 11.0 | |||
| Premiums paid on guarantees for SMEs loans portfolio | (281) | (198) | (119) | 41.9 | 136.1 | (662) | (368) | 79.9 | |||
| Write-offs and bankruptcies | (379) | (216) | (335) | 75.5 | 13.1 | (905) | (910) | (0.5) | |||
| Income from sale of loan portfolio | 0 | 0 | 0 | 0.0 | 0.0 | 0 | (19) | (100.0) | |||
| Provision for legal and tax contingencies | (28) | (91) | (93) | (69.2) | (69.9) | (187) | (418) | (55.3) | |||
| Others | 36 | 132 | 56 | (72.7) | (35.7) | 258 | 199 | 29.6 | |||
| Total | (582) | (440) | (533) | 32.3 | 9.2 | (1,573) | (1,593) | (1.3) | |||
Other operating expenses in 3Q19 totaled Ps.582 million, up from Ps.533 million in 3Q18 and Ps.440 million reported in 2Q19.
The 9.2%, or Ps.49 million, YoY increase, in other operating expenses in 3Q19 was mainly driven by higher premiums paid on guarantees for SMEs loans portfolio. The increase was partly offset by an increase of 98.2%, or Ps.107 million, in cancellation of liabilities and reserves. On a sequential basis, the 32.3%, or Ps.142 million, increase in other operating expenses, was mainly driven by higher write-offs and bankruptcies of Ps.163 million.
On a cumulative basis, other operating expenses for 9M19 reached Ps.1,573 million, representing a 1.3%, or Ps.20 million, YoY decrease.
| Earnings Release | 3Q.2019 |
23 |
| Banco Santander México |
Administrative and promotional expenses
Administrative and promotional expenses consist of personnel costs, such as payroll and benefits, promotion and advertising expenses, and other general expenses. Personnel expenses consist mainly of salaries, social security contributions, bonuses and a long-term incentive plan for the Bank’s executives. Other general expenses are mainly related to technology and systems, administrative services - mainly outsourced in the areas of information technology - taxes and duties, professional fees, contributions to IPAB, rental of properties and hardware, advertising and communication, surveillance and cash courier services, and expenses related to maintenance, conservation and repair, among others.
| Administrative and promotional expenses | |||||||||||
| Million pesos | % variation | % variation | |||||||||
| 3Q19 | 2Q19 | 3Q18 | QoQ | YoY | 9M19 | 9M18 | 19/18 | ||||
| Salaries and employee benefits | 4,012 | 3,978 | 4,096 | 0.9 | (2.1) | 11,855 | 11,602 | 2.2 | |||
| Credit card operation | 72 | 89 | 80 | (19.1) | (10.0) | 239 | 232 | 3.0 | |||
| Professional fees | 279 | 81 | 414 | 244.4 | (32.6) | 449 | 893 | (49.7) | |||
| Leasehold | 585 | 620 | 536 | (5.6) | 9.1 | 1,802 | 1,706 | 5.6 | |||
| Promotional and advertising expenses | 215 | 216 | 141 | (0.5) | 52.5 | 682 | 607 | 12.4 | |||
| Taxes and duties | 501 | 504 | 365 | (0.6) | 37.3 | 1,489 | 1,263 | 17.9 | |||
| Technology services (IT) | 1,115 | 808 | 780 | 38.0 | 42.9 | 2,862 | 2,210 | 29.5 | |||
| Depreciation and amortization | 868 | 948 | 708 | (8.4) | 22.6 | 2,694 | 2,141 | 25.8 | |||
| Contributions to IPAB | 852 | 848 | 796 | 0.5 | 7.0 | 2,512 | 2,316 | 8.5 | |||
| Cash protection | 253 | 323 | 256 | (21.7) | (1.2) | 899 | 828 | 8.6 | |||
| Others | 1,031 | 1,067 | 831 | (3.4) | 24.1 | 3,038 | 2,268 | 34.0 | |||
| Total | 9,783 | 9,482 | 9,003 | 3.2 | 8.7 | 28,521 | 26,066 | 9.4 | |||
Banco Santander México’s administrative and promotional expenses are broken down as follows:
| Administrative and promotional expenses | ||||||
| Breakdown (%) | ||||||
| 3Q19 | 2Q19 | 3Q18 | 9M19 | 9M18 | ||
| Personnel | 41.0 | 42.0 | 45.5 | 41.6 | 44.5 | |
| Others | 10.5 | 11.3 | 9.1 | 10.7 | 8.8 | |
| Depreciation and amortization | 8.9 | 10.0 | 7.9 | 9.4 | 8.2 | |
| IPAB | 8.7 | 8.9 | 8.8 | 8.8 | 8.9 | |
| Professional fees | 2.9 | 0.9 | 4.6 | 1.6 | 3.4 | |
| Technology services (IT) | 11.4 | 8.5 | 8.7 | 10.0 | 8.5 | |
| Leasehold | 6.0 | 6.5 | 6.0 | 6.3 | 6.5 | |
| Taxes and duties | 5.1 | 5.3 | 4.1 | 5.2 | 4.8 | |
| Cash protection | 2.6 | 3.4 | 2.8 | 3.2 | 3.2 | |
| Promotional and advertising expenses | 2.2 | 2.3 | 1.6 | 2.4 | 2.3 | |
| Credit card operation | 0.7 | 0.9 | 0.9 | 0.8 | 0.9 | |
| Total | 100.0 | 100.0 | 100.00 | 100.0 | 100.0 | |
Administrative and promotional expenses in 3Q19 totaled Ps.9,783 million, compared to Ps.9,003 million in 3Q18 and Ps.9,482 million in 2Q19, increasing 8.7% YoY and 3.2% QoQ, respectively, reflecting the investment plan to enhance the Bank’s operating infrastructure and drive digitalization.
| Earnings Release | 3Q.2019 |
24 |
| Banco Santander México |
The 8.7%, or Ps.780 million, YoY rise in administrative and promotional expenses was mainly due to the following increases:
| i) | 42.9%, or Ps.335 million, in technology services; |
| ii) | 24.1%, or Ps.200 million, in other expenses; |
| iii) | 22.6%, or Ps.160 million, in depreciation and amortization; |
| iv) | 37.3%, or Ps.136 million, in taxes and duties; |
| v) | 52.5%, or Ps.74 million, in promotional and advertising expenses; |
| vi) | 7.0%, or Ps.56 million, in contributions to IPAB; and |
| vii) | 9.1%, or Ps.49 million, in rents. |
These increases were partly offset by the following decreases:
| i) | 32.6%, or Ps.135 million, in professional fees; and |
| ii) | 2.1%, or Ps.84 million, in salaries and employee benefits. |
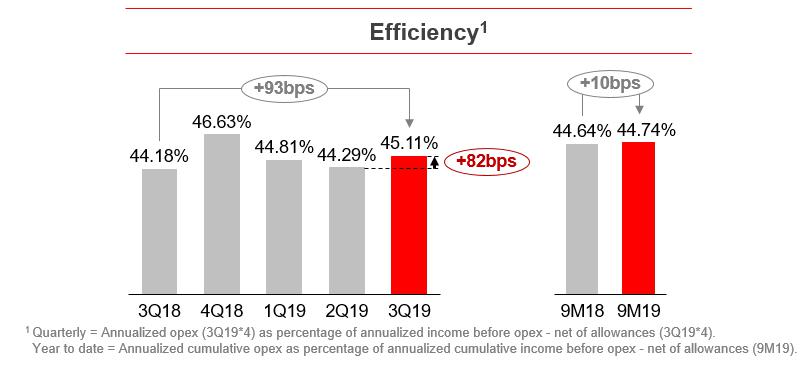
The efficiency ratio for the quarter increased 93 basis points YoY and 82 basis points QoQ to 45.11%. The execution of the Bank’s operational transformation program continues to impact the efficiency ratio.
The recurrence ratio for 3Q19 was 51.37%, down from 51.49% in 3Q18 and lower than the 55.04% reported in 2Q19.
On a cumulative basis, administrative and promotional expenses in 9M19 amounted to Ps.28,521 million, reflecting an increase of 9.4%, or Ps.2,455 million. The efficiency ratio for 9M19 increased 10 basis points YoY from 44.64% in 9M18.
Profit before taxes
Profit before taxes in 3Q19 was Ps.7,427 million, reflecting an increase of 12.9%, or Ps.850 million, YoY and a decrease of 0.6%, or Ps.46 million, QoQ.
On a cumulative basis, profit before taxes for 9M19 amounted to Ps.21,982 million, reflecting a YoY increase of 13.2%, or Ps.2,567 million.
| Earnings Release | 3Q.2019 |
25 |
| Banco Santander México |
Income taxes
In 3Q19, Banco Santander México reported a tax expense of Ps.1,910 million compared to Ps.1,481 million in 3Q18 and Ps.1,865 million in 2Q19. The effective tax rate for the quarter was 25.72%, compared to 22.52% reported in 3Q18 and 24.96% in 2Q19.
On a cumulative basis, the effective tax rate for 9M19 stood at 25.32%, 255 basis points higher than the 22.77% for 9M18.
Capitalization and liquidity
| Capitalization | ||||||
| Million pesos | Sep-19 | Jun-19 | Sep-18 | |||
| CET1 | 94,694 | 90,145 | 85,318 | |||
| Tier 1 | 104,548 | 99,735 | 94,661 | |||
| Tier 2 | 25,610 | 25,296 | 24,448 | |||
| Total Capital | 130,158 | 125,031 | 119,109 | |||
| Risk-weighted assets | ||||||
| Credit risk | 547,898 | 537,963 | 559,555 | |||
| Credit, market and operational risk | 770,793 | 757,894 | 743,422 | |||
| Credit risk ratios: | ||||||
| CET1 (%) | 17.28 | 16.76 | 15.25 | |||
| Tier 1 (%) | 19.08 | 18.54 | 16.92 | |||
| Tier 2 (%) | 4.67 | 4.70 | 4.37 | |||
| Capitalization ratio (%) | 23.76 | 23.24 | 21.29 | |||
| Total capital ratios: | ||||||
| CET1 (%) | 12.29 | 11.89 | 11.48 | |||
| Tier 1 (%) | 13.56 | 13.16 | 12.73 | |||
| Tier 2 (%) | 3.32 | 3.34 | 3.29 | |||
| Capitalization ratio (%) | 16.89 | 16.50 | 16.02 |
Banco Santander México’s capital ratio at Sep-19 was 16.89%, compared to 16.02% and 16.50% at Sep-18 and Jun-19, respectively. The 16.89% capital ratio was comprised of 12.29% of fundamental capital (CET1), 1.28% of additional capital (AT1), and 3.32% of complementary capital (Tier 2).
As of August 2019, Banco Santander México was classified in Category 1, in accordance with Article 134 Bis of the Mexican Banking Law, and the Bank remains in this category per the preliminary results dated September 30, 2019, which is the most recent available analysis.
| Earnings Release | 3Q.2019 |
26 |
| Banco Santander México |
Liquidity coverage ratio (LCR)
Pursuant to the regulatory requirements of Banxico and the Mexican National Banking and Securities Commission (Comisión Nacional Bancaria y de Valores, or “CNBV”), the average Liquidity Coverage Ratio (LCR or CCL by its Spanish acronym) for 3Q19 was 180.25%, which compares to 141.45% in 3Q18 and 177.56% in 2Q19. (Please refer to note 24 of this report).
Leverage ratio
In accordance with CNBV regulatory requirements, effective June 14, 2016, the leverage ratio was 7.64% for September 2019, 7.67% for June 2019, 7.92% for March 2019, 7.03% for December 2018, and 7.10% for September 2018.
This ratio is defined by regulators and is calculated by dividing core capital (according to Article 2 Bis 6 (CUB)) by adjusted assets (according to Article 1, II (CUB)).
RELEVANT EVENTS, TRANSACTIONS AND ACTIVITIES
Relevant Events
Banco Santander México informed that its Parent Company, issued a material fact announcement
On September 6, 2019, Banco Santander México announced that Banco Santander, S.A., its Parent Company, had published the results of its exchange offer for securities representing the share capital of the Bank. As a result of the exchange offer, the Parent Company’s shareholding in Banco Santander México increased from 74.96% to 91.65% of its share capital, with the remaining 8.35% held by minority shareholders.
Resolution of the Board of Directors of Banco Santander México, in connection with the exchange offers issued by its Parent Company
On August 20, 2019, the board of directors of Banco Santander México, after considering legal opinions as well as financial opinions in connection with the exchange offer delivered by Morgan Stanley & Co. LLC, determined as fair the exchange ratio proposed by Banco Santander, S.A., the Bank’s Parent Company, as part of the tender offer for its shares.
Banco Santander México informed that its Parent Company, issued a material fact announcement
On July 23, 2019, Banco Santander, S.A., the Parent Company of the Banco Santander México, announced that, at its Extraordinary General Meeting, shareholders had approved a capital increase required to acquire the shares in Banco Santander México that were held by minority shareholders.
Relevant Activities
Launch ofObjetivo Protegido Santander
Banco Santander México, in line with its strategy to expand its base of loyal customers and improve profitability, launchedObjetivo Protegido Santander, a savings product with broad benefits for Select segment customers. Using this product, these customers can reach a set financial goal, such as paying for their childrens’ college education. The financial goal is protected by life insurance that covers the customer’s savings plan by delivering the saved amount to beneficiaries, in the event of insured customer’s death.
| Earnings Release | 3Q.2019 |
27 |
| Banco Santander México |
Relevant Transactions
Mexico’s first bank financing with sustainability features
Banco Santander México participated as Administrative Agent and Joint Bookrunner, in Mexico’s first bank financing with sustainability features. With the participation of 11 other banks,Fibra Uno (FUNO) received a multi-currency Revolving Credit Facility for a total amount of Ps.21,350 million disbursed in two tranches, one in the amount of Ps.13,500 million and the other in the amount of $410 million dollars, with a term of five years. Banco Santander México contributed a total amount of Ps.4,000 million for the first tranche.
América Móvil financing
Banco Santander México participated, along with 18 other banks, as Administrative Agent and Joint Bookrunner, in a Revolving Credit Facility forAmérica Móvil, for a total amount of $2.5 billion dollars, with a five-year term. Banco Santander México contributed a total of $168 million dollars for the credit facility.
SUSTAINABILITY AND SOCIAL RESPONSIBILITY
705 homes delivered to victims of earthquakes in Mexico
Since the earthquakes of September 2017, Banco Santander México, along with the civil associationFideicomiso Provivah, has undertaken charitable actions as part of initiatives to help people who were affected by the earthquakes, with the rebuilding and construction of their homes. To date, 705 homes and nine restored classrooms have been delivered, benefiting approximately 5,800 earthquake victims in the six states most affected in the country.
Green Power supply agreement withAMMPER Energía
Banco Santander México entered into a Power Purchase Agreement withAMMPER Energía for the self-supply of green power for approximately 30% of the Bank's total electricity needs.
For more information about Banco Santander México as a sustainable and socially responsible company:https://servicios.santander.com.mx/comprometidos/
| Earnings Release | 3Q.2019 |
28 |
| Banco Santander México |
CREDIT RATINGS
On July 16, 2019, Fitch Ratings affirmed all Banco Santander México credit ratings (see table below). The outlook is ‘Stable’. On the same date, Fitch Ratings affirmed Santander Consumo ratings (see table below).
| Banco Santander México | Fitch Ratings | Moody’s | |
| Global scale | |||
| Foreign currency | |||
| Long term | BBB+ | A3 | |
| Short term | F2 | P-2 | |
| Local currency | |||
| Long term | BBB+ | A3 | |
| Short Term | F2 | P-2 | |
| National scale | |||
| Long term | AAA(mex) | Aaa.mx | |
| Short Term | F1+(mex) | Mx-1 | |
| Rating viability (VR) | bbb | N/A | |
| Support | 2 | N/A | |
| Counterparty risk Assessments (CR) | |||
| Long Term | N/A | A3 (cr) | |
| Short Term | N/A | P-2 (cr) | |
| Standalone BCA | N/A | baa2 | |
| Standalone Adjusted BCA | N/A | baa1 | |
| Outlook | Stable | Negative | |
| International Issuances | |||
| Tier 2 Subordinated Capital Notes due 2028 | BBB- | Baa3 (hyb) | |
| Long Term Senior Unsecured Global Notes due 2022 | BBB+ | A3 | |
| Perpetual Subordinated Non-Preferred Contingent Convertible Additional Tier 1 Capital Notes (AT1) | |||
| Global Scale | |||
| Foreign currency | |||
| Long term | BB | Ba1 (hyb) | |
| Local currency | |||
| Long term | N/A | Ba1(hyb) | |
| National scale | |||
| Long term | N/A | A1.mx (hyb) |
| Earnings Release | 3Q.2019 |
29 |
| Banco Santander México |
| Santander Consumo | Fitch Ratings | ||
| National Scale | |||
| Long term | AAA (mex) | ||
| Short Term | F1+ (mex) | ||
| Outlook | Stable | ||
| Santander Vivienda | HR | ||
| National Scale | |||
| Long term | HR AAA | ||
| Short Term | HR +1 | ||
| Outlook | Stable | ||
Notes:
| § | BCA = Baseline Credit Assessment |
| § | SR = Support Rating |
| § | VR = Viability Rating |
| § | SCP = Standalone Credit Profile |
| § | CR= Counterparty Risk Assessments |
N/A = Not applicable
| Earnings Release | 3Q.2019 |
30 |
| Banco Santander México |
3Q19 EARNINGS CALL DIAL-IN INFORMATION
| Date: | Friday, November, 1st, 2019 |
| Time: | 08:00 a.m. (MCT); 10:00 a.m. (US ET) |
| Dial-in Numbers: | 1-877-407-4018 US & Canada 1-201-689-8471 International & Mexico |
| Access Code: | Please ask for Santander México Earnings Call |
| Webcast: | http://public.viavid.com/index.php?id=136399 |
| Replay: | Starting: Friday, November 1st, 2019 at 1:00 p.m. (US ET) |
| Ending: Friday, November 8th, 2019 at 11:59 p.m. (US ET) | |
| ET Dial-in number: 1-844-512-2921 US & Canada; 1-412-317-6671 International & Mexico Access Code: 13695244 |
ANALYST COVERAGE
Bank of America Merrill Lynch, Barclays, BBVA, Bradesco, Brasil Plural, Banco BTG Pactual, Bx+, Citi, Credit Suisse, GBM, HSBC, Invex, Itaú, JP Morgan, Morgan Stanley, Nau Securities, Signum Research, Scotiabank, UBS and Intercam.
Santander México is covered by the above investment banks and research firms. Please note that any opinions, estimates or forecasts regarding the performance of Santander México issued by the research analysts of these firms reflect their own views, and therefore do not represent the opinions, estimates or forecasts of Santander México or its management. Although Santander México may refer to or distribute such statements, this does not imply that Santander México agrees with or endorses any information, conclusions or recommendations included therein.
DEFINITION OF RATIOS
ROAE:Annualized net income divided by average equity
Efficiency:Annualized administrative and promotional expenses divided by annualized gross operating income (before administrative and promotional expenses and allowances).
Recurrency:Annualized net fees divided by annualized administrative and promotional expenses (net of amortizations and depreciations).
NIM:Financial margin divided by daily average interest earnings assets.
Cost of risk:Annualized provisions for loan losses divided by average loan portfolio
| Note: |
Annualized figures consider
| · | Quarterly ratio = 3Q19x4 |
| · | Average figures are calculated using 3Q18 and 3Q19 |
| Earnings Release | 3Q.2019 |
31 |
| Banco Santander México |
ABOUT BANCO SANTANDER MÉXICO (NYSE: BSMX; BMV: BSMX)
Banco Santander México, S.A., Institución de Banca Múltiple, Grupo Financiero Santander México (Banco Santander México), one of Mexico’s leading banking institutions, provides a wide range of financial and related services, including retail and commercial banking, financial advisory and other related investment activities. Banco Santander México offers a multichannel financial services platform focused on mid- to high-income individuals and small- to medium-sized enterprises, while also providing integrated financial services to larger multinational companies in Mexico. As of September 30, 2019, Banco Santander México had total assets of Ps.1,461 billion under Mexican Banking GAAP and more than 17.7 million customers. Headquartered in Mexico City, the Company operates 1,411 branches and offices nationwide and has a total of 19,876 employees.
We, the undersigned under oath to tell the truth declare that, in the area of our corresponding functions, we prepared the information of Banco Santander México contained in this quarterly report, which to the best of our knowledge reasonably reflects its situation.
| HÉCTOR B. GRISI CHECA | DIDIER MENA CAMPOS | |
| Executive President and Chief Executive Officer | Chief Financial Officer | |
| EMILIO DE EUSEBIO SAIZ | JUAN CARLOS GARCÍA CONTRERAS | JUAN RAMÓN JIMÉNEZ LORENZO |
| Deputy General Director Financial Accounting and Control | Executive Director of Intervention | Chief Audit Executive |
The financial information presented in this report has been obtained from the non-audited financial statements prepared in accordance with accounting principles and regulations prescribed by the CNBV applicable to Credit Institution which are subject to the supervision of the CNBV on accounting procedures, published in the Federal Official Gazette on January 31st, 2011. The exchange rate used to convert foreign currency transactions US$ to Mexican pesos is Ps.19.7345.
INVESTOR RELATIONS CONTACT
Héctor Chávez Lopez – Managing Director - IRO
+ 52 (55) 5269-1925
hchavez@santander.com.mx
Investor Relations Team
investor@santander.com.mx
www.santander.com.mx
| Earnings Release | 3Q.2019 |
32 |
| Banco Santander México |
LEGAL DISCLAIMER
Banco Santander México cautions that this presentation may contain forward-looking statements within the meaning of the U.S. Private Securities Litigation Reform Act of 1995. These forward-looking statements could be found in various places throughout this presentation and include, without limitation, statements regarding our intent, belief, targets or current expectations in connection with: asset growth and sources of funding; growth of our fee-based business; expansion of our distribution network; financing plans; competition; impact of regulation and the interpretation thereof; action to modify or revoke our banking license; exposure to market risks including interest rate risk, foreign exchange risk and equity price risk; exposure to credit risks including credit default risk and settlement risk; projected capital expenditures; capitalization requirements and level of reserves; investment in our information technology platform; liquidity; trends affecting the economy generally; and trends affecting our financial condition and our results of operations. While these forward-looking statements represent our judgment and future expectations concerning the development of our business, many important factors could cause actual results to differ substantially from those anticipated in forward-looking statements. These factors include, among other things: changes in capital markets in general that may affect policies or attitudes towards lending to Mexico or Mexican companies; changes in economic conditions, in Mexico in particular, in the United States or globally; the monetary, foreign exchange and interest rate policies of the Mexican Central Bank (Banco de México); inflation; deflation; unemployment; unanticipated turbulence in interest rates; movements in foreign exchange rates; movements in equity prices or other rates or prices; changes in Mexican and foreign policies, legislation and regulations; changes in requirements to make contributions to, for the receipt of support from programs organized by or requiring deposits to be made or assessments observed or imposed by, the Mexican government; changes in taxes and tax laws; competition, changes in competition and pricing environments; our inability to hedge certain risks economically; economic conditions that affect consumer spending and the ability of customers to comply with obligations; the adequacy of allowance for impairment losses and other losses; increased default by borrowers; our inability to successfully and effectively integrate acquisitions or to evaluate risks arising from asset acquisitions; technological changes; changes in consumer spending and saving habits; increased costs; unanticipated increases in financing and other costs or the inability to obtain additional debt or equity financing on attractive terms; changes in, or failure to comply with, banking regulations or their interpretation; and certain other risk factors included in our annual report on Form 20-F. The risk factors and other key factors that we have indicated in our past and future filings and reports, including those with the U.S. Securities and Exchange Commission, could adversely affect our business and financial performance. The words “believe,” “may,” “will,” “aim,” “estimate,” “continue,” “anticipate,” “intend,” “expect,” “forecast” and similar words are intended to identify forward-looking statements. You should not place undue reliance on such statements, which speak only as of the date they were made. We undertake no obligation to update publicly or to revise any forward-looking statements after we distribute this presentation because of new information, future events or other factors. In light of the risks and uncertainties described above, the future events and circumstances discussed herein might not occur and are not guarantees of future performance.
Note: The information contained in this presentation is not audited. Nevertheless, the consolidated accounts are prepared on the basis of the accounting principles and regulations prescribed by the Mexican National Banking and Securities Commission (Comisión Nacional Bancaria y de Valores) for credit institutions, as amended (Mexican Banking GAAP). All figures presented are in millions of Mexican pesos, unless otherwise indicated. Historical figures are not adjusted by inflation.
| Earnings Release | 3Q.2019 |
33 |
| Banco Santander México |
CONSOLIDATED FINANCIAL STATEMENTS
Banco Santander México
| § | Consolidated balance sheet |
| § | Consolidated statement income |
| § | Consolidated statement of changes in stockholders’ equity |
| § | Consolidated statement of cash flows |
The information contained in this report and the financial statements of the Bank subsidiaries may be consulted on the Internet website: www.santander.com.mx or through the following direct access:
http://www.santander.com.mx/ir/english/financial/quarterly.html
There is also information on Santander México on the CNBV website:https://www.gob.mx/cnbv
| Earnings Release | 3Q.2019 |
34 |
| Banco Santander México |
| Consolidated balance sheet | |||||||||
| Million pesos | |||||||||
| 2019 | 2018 | ||||||||
| Sep | Jun | Mar | Dec | Sep | Jun | Mar | |||
| Assets | |||||||||
| Funds available | 66,997 | 73,192 | 73,680 | 70,151 | 71,557 | 114,978 | 89,137 | ||
| Margin accounts | 5,319 | 3,826 | 3,521 | 3,689 | 2,444 | 3,767 | 2,812 | ||
| Investment in securities | 365,999 | 282,178 | 241,293 | 317,781 | 338,954 | 288,369 | 275,640 | ||
| Trading securities | 146,864 | 94,763 | 77,513 | 111,891 | 142,546 | 142,468 | 102,458 | ||
| Securities available for sale | 208,074 | 176,435 | 152,878 | 195,063 | 185,609 | 135,176 | 162,526 | ||
| Securities held to maturity | 11,061 | 10,980 | 10,902 | 10,827 | 10,799 | 10,725 | 10,656 | ||
| Debtors under sale and repurchase agreements | 14,747 | 67,889 | 63,768 | 37,881 | 31,850 | 44,757 | 38,500 | ||
| Derivatives | 182,761 | 147,088 | 135,612 | 162,891 | 153,190 | 174,983 | 149,144 | ||
| Trading purposes | 174,093 | 139,902 | 128,162 | 155,299 | 142,445 | 158,658 | 137,593 | ||
| Hedging purposes | 8,668 | 7,186 | 7,450 | 7,592 | 10,745 | 16,325 | 11,551 | ||
| Valuation adjustment for hedged financial assets | 253 | 152 | 77 | 6 | (10) | (11) | (4) | ||
| Performing loan portfolio | |||||||||
| Commercial loans | 426,180 | 434,438 | 430,571 | 424,710 | 426,351 | 402,745 | 386,451 | ||
| Commercial or business activity | 351,698 | 360,269 | 351,907 | 344,942 | 344,354 | 332,930 | 323,025 | ||
| Financial entities loans | 13,713 | 12,430 | 15,911 | 20,221 | 17,274 | 13,567 | 13,437 | ||
| Government entities loans | 60,769 | 61,739 | 62,753 | 59,547 | 64,723 | 56,248 | 49,989 | ||
| Consumer loans | 112,099 | 110,226 | 107,959 | 106,576 | 105,232 | 104,354 | 102,715 | ||
| Mortgage loans | 142,766 | 140,034 | 137,820 | 135,475 | 132,569 | 129,103 | 126,484 | ||
| Medium and residential | 128,996 | 126,003 | 123,041 | 120,559 | 116,915 | 113,520 | 111,257 | ||
| Social interest | 37 | 42 | 49 | 55 | 63 | 72 | 83 | ||
| Credits acquired from INFONAVIT or FOVISSSTE | 13,733 | 13,989 | 14,730 | 14,861 | 15,591 | 15,511 | 15,144 | ||
| Total performing loan portfolio | 681,045 | 684,698 | 676,350 | 666,761 | 664,152 | 636,202 | 615,650 | ||
| Non-performing loan portfolio | |||||||||
| Commercial loans | 5,783 | 5,545 | 5,423 | 5,652 | 5,763 | 5,594 | 5,327 | ||
| Commercial or business activity | 5,783 | 5,545 | 5,423 | 5,645 | 5,763 | 5,594 | 5,327 | ||
| Financial entities loans | 0 | 0 | 0 | 7 | 0 | 0 | 0 | ||
| Consumer loans | 4,531 | 4,469 | 4,091 | 4,261 | 4,239 | 4,446 | 4,156 | ||
| Mortgage loans | 5,967 | 5,617 | 5,362 | 6,174 | 5,966 | 6,009 | 5,866 | ||
| Medium and residential | 4,431 | 4,094 | 3,978 | 4,917 | 4,797 | 4,922 | 4,897 | ||
| Social interest | 5 | 5 | 5 | 12 | 12 | 14 | 15 | ||
| Credits acquired from INFONAVIT or FOVISSSTE | 1,531 | 1,518 | 1,379 | 1,245 | 1,157 | 1,073 | 954 | ||
| Total non-performing portfolio | 16,281 | 15,631 | 14,876 | 16,087 | 15,968 | 16,049 | 15,349 | ||
| Total loan portfolio | 697,326 | 700,329 | 691,226 | 682,848 | 680,120 | 652,251 | 630,999 | ||
| Allowance for loan losses | (21,299) | (21,345) | (20,836) | (21,100) | (20,375) | (20,027) | (19,874) | ||
| Loan portfolio (net) | 676,027 | 678,984 | 670,390 | 661,748 | 659,745 | 632,224 | 611,125 | ||
| Accrued income receivable from securitization transactions | 80 | 84 | 113 | 127 | 125 | 123 | 123 | ||
| Other receivables (net) | 110,974 | 77,945 | 79,046 | 89,089 | 83,641 | 85,393 | 87,424 | ||
| Foreclosed assets (net) | 231 | 232 | 241 | 270 | 291 | 332 | 455 | ||
| Property, furniture and fixtures (net) | 9,715 | 9,054 | 8,841 | 8,714 | 6,709 | 6,426 | 6,360 | ||
| Long-term investment in shares | 90 | 90 | 90 | 91 | 90 | 90 | 91 | ||
| Deferred taxes and deferred profit sharing (net) | 18,702 | 18,901 | 18,986 | 20,418 | 18,672 | 19,187 | 19,561 | ||
| Deferred charges, advance payments and intangibles | 8,808 | 8,536 | 8,601 | 8,679 | 7,990 | 7,948 | 7,837 | ||
| Other | 38 | 36 | 35 | 35 | 46 | 45 | 44 | ||
| Total assets | 1,460,741 | 1,368,187 | 1,304,294 | 1,381,570 | 1,375,294 | 1,378,611 | 1,288,249 | ||
| Earnings Release | 3Q.2019 |
35 |
| Banco Santander México |
| Consolidated balance sheet | |||||||||
| Million pesos | |||||||||
| 2019 | 2018 | ||||||||
| Sep | Jun | Mar | Dec | Sep | Jun | Mar | |||
| Liabilities | |||||||||
| Deposits | 738,723 | 776,006 | 750,154 | 738,537 | 727,316 | 746,850 | 711,217 | ||
| Demand deposits | 437,202 | 458,126 | 462,441 | 455,045 | 446,484 | 467,485 | 444,728 | ||
| Time deposits – general public | 190,925 | 207,018 | 193,528 | 178,978 | 176,426 | 177,424 | 172,341 | ||
| Time deposits – money market | 53,820 | 54,543 | 45,175 | 58,288 | 55,999 | 52,043 | 46,832 | ||
| Credit instruments issued | 55,133 | 54,718 | 47,510 | 44,725 | 47,173 | 48,732 | 46,117 | ||
| Global Account uptake without movements | 1,643 | 1,601 | 1,500 | 1,501 | 1,234 | 1,166 | 1,199 | ||
| Bank and other loans | 51,640 | 68,089 | 57,574 | 57,083 | 43,171 | 40,674 | 39,259 | ||
| Demand loans | 9,546 | 22,305 | 6,792 | 9,990 | 2,035 | 590 | 656 | ||
| Short-term loans | 15,239 | 17,816 | 22,440 | 19,084 | 13,226 | 10,733 | 10,208 | ||
| Long-term loans | 26,855 | 27,968 | 28,342 | 28,009 | 27,910 | 29,351 | 28,395 | ||
| Creditors under sale and repurchase agreements | 162,216 | 84,668 | 65,455 | 100,689 | 157,528 | 94,087 | 101,085 | ||
| Securities Lending | 0 | 1 | 0 | 1 | 1 | 1 | 1 | ||
| Collateral sold or pledged as guarantee | 30,611 | 21,211 | 24,006 | 30,539 | 21,088 | 31,492 | 23,084 | ||
| Repurchase | 9 | 118 | 912 | 2,301 | 1,597 | 1,911 | 0 | ||
| Securities loans | 30,602 | 21,093 | 23,094 | 28,238 | 19,491 | 29,581 | 23,084 | ||
| Derivatives | 176,569 | 144,866 | 134,917 | 163,206 | 146,717 | 167,278 | 148,910 | ||
| Trading purposes | 168,014 | 136,778 | 127,854 | 154,830 | 140,136 | 157,948 | 140,586 | ||
| Hedging purposes | 8,555 | 8,088 | 7,063 | 8,376 | 6,581 | 9,330 | 8,324 | ||
| Valuation adjustment of financial liabilities hedging | 14 | (12) | (19) | (24) | 0 | 0 | 0 | ||
| Other payables | 125,472 | 104,255 | 104,521 | 128,318 | 117,943 | 139,354 | 109,159 | ||
| Income taxes payable | 111 | 22 | 29 | 42 | 28 | 9 | 5 | ||
| Employee profit sharing payable | 273 | 184 | 395 | 318 | 211 | 154 | 334 | ||
| Creditors from settlement of transactions | 65,724 | 41,499 | 41,122 | 48,620 | 45,251 | 50,195 | 38,803 | ||
| Payable for margin accounts | 1 | 532 | 69 | 411 | 0 | 0 | 0 | ||
| Payable for cash collateral received | 16,208 | 22,924 | 28,378 | 42,480 | 37,216 | 40,235 | 29,572 | ||
| Sundry creditors and other payables | 43,155 | 39,094 | 34,528 | 36,447 | 35,237 | 48,761 | 40,445 | ||
| Subordinated credit notes | 35,464 | 34,886 | 34,819 | 37,228 | 33,791 | 35,914 | 32,958 | ||
| Deferred revenues and other advances | 332 | 388 | 501 | 300 | 354 | 441 | 444 | ||
| Total liabilities | 1,321,041 | 1,234,358 | 1,171,928 | 1,255,877 | 1,247,909 | 1,256,091 | 1,166,117 | ||
| Paid-in capital | 34,859 | 34,961 | 34,908 | 34,762 | 34,824 | 35,291 | 35,311 | ||
| Capital stock | 29,799 | 29,799 | 29,799 | 29,799 | 29,799 | 29,799 | 29,799 | ||
| Share premium | 5,060 | 5,162 | 5,109 | 4,963 | 5,025 | 5,492 | 5,512 | ||
| Other capital | 104,841 | 98,868 | 97,458 | 90,931 | 92,561 | 87,229 | 86,821 | ||
| Capital reserves | 23,845 | 23,845 | 22,315 | 22,315 | 22,315 | 22,315 | 9,515 | ||
| Retained earnings | 63,217 | 63,365 | 69,885 | 50,451 | 55,864 | 56,014 | 73,238 | ||
| Result from valuation of available for sale securities, net | 1,311 | 667 | (145) | (1,440) | (774) | (1,174) | (689) | ||
| Result from valuation of cash flow hedge instruments, net | (261) | (221) | (155) | (261) | 40 | 41 | (73) | ||
| Cumulative effect of conversion | 9 | 9 | 9 | 9 | 9 | 9 | 9 | ||
| Adjustment employees’ pension fund | 261 | 272 | 226 | 241 | 84 | 91 | 43 | ||
| Net income | 16,416 | 10,899 | 5,291 | 19,584 | 14,994 | 9,898 | 4,727 | ||
| Non-controlling interest | 43 | 32 | 32 | 32 | 29 | 35 | 51 | ||
| Total stockholders´ equity | 139,700 | 133,829 | 132,366 | 125,693 | 127,385 | 122,520 | 122,132 | ||
| Total liabilities and stockholders´ equity | 1,460,741 | 1,368,187 | 1,304,294 | 1,381,570 | 1,375,294 | 1,378,611 | 1,288,249 | ||
| Earnings Release | 3Q.2019 |
36 |
| Banco Santander México |
| Consolidated balance sheet | |||||||||
| Million pesos | |||||||||
| 2019 | 2018 | ||||||||
| Sep | Jun | Mar | Dec | Sep | Jun | Mar | |||
| Memorandum accounts | |||||||||
| Contingent assets and liabilities | 50 | 46 | 46 | 69 | 61 | 65 | 68 | ||
| Credit commitments | 232,458 | 214,277 | 231,994 | 238,273 | 222,065 | 226,035 | 200,183 | ||
| Assets in trust or under mandate | 187,586 | 179,341 | 177,672 | 174,606 | 166,366 | 169,543 | 162,435 | ||
| Trusts | 186,678 | 177,240 | 175,516 | 173,443 | 165,123 | 168,089 | 161,095 | ||
| Mandates | 908 | 2,101 | 2,156 | 1,163 | 1,243 | 1,454 | 1,340 | ||
| Assets in custody or under administration | 2,147,758 | 2,058,218 | 2,124,474 | 2,197,358 | 2,381,418 | 3,209,606 | 3,280,074 | ||
| Collateral received | 97,706 | 141,731 | 208,248 | 141,168 | 122,316 | 133,931 | 129,060 | ||
| Collateral received and sold or pledged as guarantee | 46,861 | 49,536 | 118,896 | 74,274 | 68,652 | 57,487 | 64,647 | ||
| Investment banking transactions for third parties (net) | 170,777 | 111,475 | 66,018 | 10,149 | 29,028 | 58,533 | 86,567 | ||
| Uncollected interest earned on past due loan portfolio | 854 | 859 | 803 | 937 | 883 | 875 | 831 | ||
| Other record accounts | 1,730,053 | 1,686,189 | 1,696,042 | 1,647,744 | 1,608,264 | 1,602,318 | 1,528,317 | ||
| 4,614,103 | 4,441,672 | 4,624,193 | 4,484,578 | 4,599,053 | 5,458,393 | 5,452,182 | |||
These consolidated financial statements were approved by the Board of Directors and signed on its behalf by
| HÉCTOR B. GRISI CHECA | DIDIER MENA CAMPOS | |
| Executive President and Chief Executive Officer | Chief Financial Officer | |
| EMILIO DE EUSEBIO SAIZ | JUAN CARLOS GARCÍA CONTRERAS | JUAN RAMÓN JIMÉNEZ LORENZO |
| Deputy General Director Financial Accounting and Control | Executive Director of Intervention | Chief Audit Executive |
The accompanying notes are part of these consolidated financial statements
www.santander.com.mx
| Earnings Release | 3Q.2019 |
37 |
| Banco Santander México |
| Consolidated statement of income | ||||||||||
| Million pesos | ||||||||||
| 2019 | 2018 | |||||||||
| 9M | 3Q | 2Q | 1Q | 9M | 4Q | 3Q | 2Q | 1Q | ||
| Interest income | 91,794 | 30,465 | 30,556 | 30,773 | 82,333 | 30,489 | 28,828 | 27,517 | 25,988 | |
| Interest expense | (42,168) | (13,876) | (13,968) | (14,324) | (37,128) | (14,286) | (13,033) | (12,722) | (11,373) | |
| Net interest income | 49,626 | 16,589 | 16,588 | 16,449 | 45,205 | 16,203 | 15,795 | 14,795 | 14,615 | |
| Provisions for loan losses | (13,250) | (4,478) | (4,454) | (4,318) | (12,913) | (4,838) | (4,796) | (3,980) | (4,137) | |
| Net interest income after provisions for loan losses | 36,376 | 12,111 | 12,134 | 12,131 | 32,292 | 11,365 | 10,999 | 10,815 | 10,478 | |
| Commission and fee income | 19,006 | 6,504 | 6,486 | 6,016 | 17,198 | 5,885 | 5,659 | 6,049 | 5,490 | |
| Commission and fee expense | (5,303) | (1,924) | (1,789) | (1,590) | (4,596) | (1,655) | (1,388) | (1,787) | (1,421) | |
| Net gain (loss) on financial assets and liabilities | 1,997 | 1,101 | 564 | 332 | 2,180 | (188) | 843 | 1,049 | 288 | |
| Other operating income | (1,573) | (582) | (440) | (551) | (1,593) | (455) | (533) | (443) | (617) | |
| Administrative and promotional expenses | (28,521) | (9,783) | (9,482) | (9,256) | (26,066) | (9,228) | (9,003) | (8,845) | (8,218) | |
| Operating income | 21,982 | 7,427 | 7,473 | 7,082 | 19,415 | 5,724 | 6,577 | 6,838 | 6,000 | |
| Current income taxes | (4,991) | (1,958) | (1,782) | (1,251) | (3,581) | (2,034) | (1,258) | (1,332) | (991) | |
| Deferred income taxes (net) | (575) | 48 | (83) | (540) | (840) | 900 | (223) | (335) | (282) | |
| Net income | 16,416 | 5,517 | 5,608 | 5,291 | 14,994 | 4,590 | 5,096 | 5,171 | 4,727 | |
These consolidated financial statements were approved by the Board of Directors and signed on its behalf by
| HÉCTOR B. GRISI CHECA | DIDIER MENA CAMPOS | |
| Executive President and Chief Executive Officer | Chief Financial Officer | |
| EMILIO DE EUSEBIO SAIZ | JUAN CARLOS GARCÍA CONTRERAS | JUAN RAMÓN JIMÉNEZ LORENZO |
| Deputy General Director Financial Accounting and Control | Executive Director of Intervention | Chief Audit Executive |
The accompanying notes are part of these consolidated financial statements
www.santander.com.mx
| Earnings Release | 3Q.2019 |
38 |
| Banco Santander México |
| Consolidated statement of changes in stockholders’ equity | |||||||||||||||
| From January 1stto September 30th, 2019 | |||||||||||||||
| Million pesos | |||||||||||||||
| Paid-in capital | Other capital | ||||||||||||||
| CONCEPT | Capital stock | Additional paid-in capital | Capital reserves | Retained earnings | Result from valuation of securities available for sale, net | Result from the valuation of cash flow hedge instruments | Cumulative effect from conversion | Measurement defined benefit employees | Net income | Non-controlling interest | Total stockholders' equity | ||||
| BALANCE AS OF DECEMBER 31st, 2018 | 29,799 | 4,963 | 22,315 | 50,451 | (1,440) | (261) | 9 | 241 | 19,584 | 32 | 125,693 | ||||
| MOVEMENTS INHERENT TO THE SHAREHOLDERS' DECISIONS | |||||||||||||||
| Transfer of prior year's net income | 1,530 | 18,054 | (19,584) | 0 | |||||||||||
| Dividends declared | (4,843) | (4,843) | |||||||||||||
| TOTAL | 0 | 0 | 1,530 | 13,211 | 0 | 0 | 0 | 0 | (19,584) | 0 | (4,843) | ||||
| MOVEMENTS INHERENT TO THE RECOGNITION OF THE COMPREHENSIVE INCOME | |||||||||||||||
| Result from valuation of available for sale securities, net | 2,751 | 2,751 | |||||||||||||
| Recognition of share-based payments | (98) | (98) | |||||||||||||
| Shares held by treasury | 195 | 195 | |||||||||||||
| Interest on Subordinated debentures Perpetual Non-Preferred Contingent Convertible | (445) | (445) | |||||||||||||
| Employee defined benefit measures | 20 | 20 | |||||||||||||
| Net income | 16,416 | 11 | 16,427 | ||||||||||||
| TOTAL | 0 | 97 | 0 | (445) | 2,751 | 0 | 0 | 20 | 16,416 | 11 | 18,850 | ||||
| BALANCE AS OF SEPTEMBER 30th, 2019 | 29,799 | 5,060 | 23,845 | 63,217 | 1,311 | (261) | 9 | 261 | 16,416 | 43 | 139,700 | ||||
These consolidated financial statements were approved by the Board of Directors and signed on its behalf by.
| HÉCTOR B. GRISI CHECA | DIDIER MENA CAMPOS | |
| Executive President and Chief Executive Officer | Chief Financial Officer | |
| EMILIO DE EUSEBIO SAIZ | JUAN CARLOS GARCÍA CONTRERAS | JUAN RAMÓN JIMÉNEZ LORENZO |
| Deputy General Director Financial Accounting and Control | Executive Director of Intervention | Chief Audit Executive |
The accompanying notes are part of these consolidated financial statements
www.santander.com.mx
| Earnings Release | 3Q.2019 |
39 |
| Banco Santander México |
| Consolidated statement of cash flows | ||
| From January 1st to September 30th, 2019 | ||
| Million pesos | ||
| OPERATING ACTIVITIES | ||
| Net income | 16,416 | |
| Adjustment for line items that do not require cash flows | ||
| Result from valuation associated with operating activities | 3,511 | |
| Depreciation of property, furniture and fixtures | 982 | |
| Amortizations of intangible assets | 1,712 | |
| Recognition of share-based payments | (98) | |
| Current and deferred income taxes | 5,566 | |
| Deferred employee profit sharing | (1) | |
| Provisions | 234 | |
| Amortizations of debt issuance expenses | 9 | 11,915 |
| 28,331 | ||
| OPERATING ACTIVITIES | ||
| Margin accounts | (1,630) | |
| Investment in securities | (47,010) | |
| Debtors under sale and repurchase agreements | 23,134 | |
| Derivatives-asset | (20,400) | |
| Loan portfolio-net | (14,396) | |
| Accrued income receivable from securitization transactions | 47 | |
| Foreclosed assets | 39 | |
| Other operating assets | (22,141) | |
| Deposits | 140 | |
| Bank and other loans | (5,444) | |
| Creditors under sale and repurchase agreements | 61,527 | |
| Collateral sold or pledged as guarantee | 72 | |
| Derivatives-liability | 16,195 | |
| Issuance of subordinated debentures | (1,477) | |
| Other operating liabilities | (2,847) | |
| Payments of income taxes | (4,990) | |
| Net cash provided by (used in) operating activities | (19,181) | |
| INVESTING ACTIVITIES | ||
| Proceeds from disposal of property, furniture and fixtures | 5 | |
| Payments for acquisition of property, furniture and fixtures | (1,984) | |
| Payments for acquisition of intangible assets | (1,704) | |
| Net cash provided by (used in) investing activities | (3,683) | |
| FINANCING ACTIVITIES | ||
| Cash payment of dividends | (4,843) | |
| Payments associated with subordinated capital notes | (445) | |
| Payments from associated for purchase of treasury shares | 195 | |
| Net cash used in financing activities | (5,093) | |
| Net Increase in cash and cash equivalents | 374 | |
| Adjustment to cash flows for changes in exchange rate | (3,528) | |
| Funds available at the beginning of the year | 70,151 | |
| Funds available at the end of the year | 66,997 | |
| Earnings Release | 3Q.2019 |
40 |
| Banco Santander México |
These consolidated financial statements were approved by the Board of Directors and signed on its behalf by:
| HÉCTOR B. GRISI CHECA | DIDIER MENA CAMPOS | |
| Executive President and Chief Executive Officer | Chief Financial Officer | |
| EMILIO DE EUSEBIO SAIZ | JUAN CARLOS GARCÍA CONTRERAS | JUAN RAMÓN JIMÉNEZ LORENZO |
| Deputy General Director Financial Accounting and Control | Executive Director of Intervention | Chief Audit Executive |
The accompanying notes are part of these consolidated financial statements
www.santander.com.mx
| Earnings Release | 3Q.2019 |
41 |
| Banco Santander México |
NOTES TO CONSOLIDATED FINANCIAL STATEMENTS
| § | Significant accounting policies |
| § | Earnings per share |
| § | Consolidated balance sheet and consolidated income statement by segment |
| § | Annex 1. Loan portfolio rating |
| § | Annex 2. Financial ratios according to CNBV |
| § | Notes to consolidated financial statements |
The information contained in this report and the financial statements of the Bank subsidiaries may be consulted on the Internet website: www.santander.com.mx or through the following direct access:
http://www.santander.com.mx/ir/english/financial/quarterly.html
There is also information on Santander México on the CNBV website:https://www.gob.mx/cnbv
| Earnings Release | 3Q.2019 |
42 |
| Banco Santander México |
Significant accounting policies
Changes in Accounting Criteria issued by the CNBV
Accounting Criteria B-6,Loan portfolio and Accounting Criteria D-2,Income Statement
On December 27, 2017, several amendments were published in the Federal Official Gazette (DOF) by its Spanish acronym) to the Accounting Criteria issued by the CNBV. These Accounting Criteria applicable to credit institutions are adjusted so that they can cancel, in the period in which they occur, the surpluses of the allowance for loan losses in the income statement, as well as to recognize the recovery of credits previously written-off against the heading "Allowance for loan losses" of the income statement in order to be consistent with international accounting standards established in International Financial Reporting Standards (IFRS).
This amendment is mandatory on January 1, 2019.
Changes in the Mexican Financial Reporting Standards (MFRS) issued by the Mexican Financial Reporting Standards Board (CINIF by its Spanish acronym)
Improvements to MFRS 2019
Starting January 1, 2019, the Bank prospectively adopted the following Improvements to the MFRS which were issued by the CINIF and were effective on the aforementioned date. These Improvements to the MFRS did not have a significant impact on the financial information presented by the Bank.
MFRS C-6,Property, plant and equipment
MFRS C-6 establishes that the assets delivered or, if applicable, the assets received in an exchange of assets must be valued at their fair value. Entity must determine such valuation of fair value according to MFRS B-17,Determination of fair value.
MFRS D-3,Employee benefits
Clarifications are made about the recognition of benefits for personnel transfers between entities, so the following paragraphs are modified:
“A transfer of personnel between entities with recognition of seniority implies for the entity that receives the staff the recognition of a retroactive effect of a Modification to the Plan for the introduction of a new plan. For the entity that transfers implies an Early Settlement of Obligations. In the consolidated financial statements, the effects of the transfers between entities of the group are eliminated, unless the benefits are changed at the time of the transfer.”
“A transfer of personnel between entities under common control with recognition of seniority involves recognizing in the stand alone financial statements of the entity that receives the staff a retroactive effect of a Modification to the Plan equivalent to an introduction of a new plan and for the entity that transfer implies an Early Settlement of Obligations. In the consolidated financial statements, the transfer of personnel has no effect, unless the benefits are changed at the time of the transfer.”
In addition, the following paragraphs related to the discount interest rate and the Labor Cost of Past Services (LCPS) were modified:
“The interest rate used to discount post-employment benefit obligations (funded or not funded) must be an interest rate without or with very low credit risk, such as the interest rate of government bonds and the interest rate of high quality corporate bonds in absolute terms in a deep market, respectively. The chosen interest rate should be used consistently over time. The currency and term of the bonds utilized to obtain the discount rate must be consistent with the currency and the estimated term for the payment of the Defined Benefit Obligation. The entity must justify the use of a certain interest rate and, in the case of a change of the discount rate, must also justify this fact. Any effect on the present value of the labor liability from a change in the discount rate (from government bonds to corporate bonds or vice versa) should be considered as a change in accounting estimate and recognized prospectively, when this occurs, in the income statement of the period based on the
| Earnings Release | 3Q.2019 |
43 |
| Banco Santander México |
provisions of MFRS B-1,Accounting changes and error corrections.”
The LCPS is the increase or decrease in the Defined Benefit Obligation (OBD) for services rendered by employees in previous periods, from:
a) A Modification to the Plan that, in turn, includes the retroactive effect of benefits to employees by:
i. Introduction of a new benefit plan,
ii. Benefits assumed by the transfer of employees,
iii. Withdrawal of a benefit plan, or
iv. Subsequent changes in benefits payable in an established benefit plan; and
b) Personnel Reduction
A Modification to the Plan occurs when an entity introduces a previously non-existent plan, withdraws or changes the benefits of a defined benefit plan, and a Personnel Reduction occurs when an entity significantly reduces the obligation for a reduction in the number of employees covered by the plan (it may arise from an isolated event, such as the closure of a plant or the discontinuance of an operation); this generates a Labor Cost of Past Services that is equivalent to the difference between the current Defined Benefit Obligation and the previous Defined Benefit Obligation, including, in the case of Personnel Reduction, the payments made by the entity, which corresponds to the increase or decrease in the obligation due to the retroactive effect of previous services on the benefits to employees when performing a Modification to the Plan or Personnel Reduction.
Changes in Accounting Criteria issued by the CNBV applicable in 2020
Accounting Criteria A-2,Application of particular standards
On December 27, 2017, several amendments were published in the DOF to the Accounting Criteria issued by the CNBV with the purpose of incorporating certain MFRS issued by the CINIF.
Subsequently, on November 15th, 2018, an amending resolution was published with the purpose of extending the term of the application of the amendment mentioned in the previous paragraph to January 1st, 2020 so that the clearing houses and settlement partners are able to adjust their accounting information systems.
The MFRS that are now included in the Accounting Criteria are as follows:
MFRS B-17, Determination of fair value
It establishes the standards for the determination of fair value and related disclosure. It mentions that fair value must be determined by using assumptions that market participants would use when setting the price of an asset or a liability under current market conditions at certain date, including assumptions about the risk. It is established that should be considered the market in which it would take place for an asset or liability that is being valued, if it is monetary and if it is used in combination with other assets or on an independent basis; and the appropriate valuation technique(s) for determining their fair value, as well as maximizing the use of relevant observable inputs and minimizing unobservable inputs.
MFRS C-3, Accounts receivable
It establishes the valuation, presentation and disclosure standards for the initial and subsequent recognition of trade accounts receivable and other accounts receivable in the financial statements of an economic entity. It specifies that accounts receivable that are based on a contract represent a financial instrument.
| Earnings Release | 3Q.2019 |
44 |
| Banco Santander México |
MFRS C-9,Provisions, contingencies and commitments
It establishes the standards for valuation, presentation and disclosure of liabilities, provisions and commitments, reducing its scope by reallocating the item related to financial liabilities to the MFRS C-19,Financial instruments payable. The definition of liability was modified, eliminating the concept of "unconditional right to avoid" and including the term "probable".
MFRS C-16,Impairment of financial instruments receivable
It establishes the standards for valuation, recognition, presentation and disclosure of impairment losses on financial instruments receivable.
MFRS C-19,Financial instruments payable
It establishes the standards for valuation, presentation and disclosure for the initial and subsequent recognition of accounts payable, borrowings and other financial liabilities in the financial statements of an economic entity. The following concepts are introduced to value the financial liabilities: amortized cost and the effective interest method, which is determined based on the effective interest rate. Both the discounts and the costs of issuing a financial liability are deducted from the liability.
MFRS C-20,Financial instruments to collect principal and interest
It establishes the standards for valuation, presentation and disclosure for the initial and subsequent recognition of the financing instruments receivable in the financial statements of an economic entity that carries out financing activities. Discards the concept of intention when acquiring and holding the financial instruments (assets) to determine their classification. Adopts the concept of business model.
MFRS, D-1,Revenue from contracts with customers
It establishes the standards for valuation, presentation and disclosure of the income incurred to fulfill the contracts with clients. The most significant aspects are established for the revenue recognition through the transfer of control, identification of obligations to be fulfilled in a contract, assignment of the amount of the transaction and recognition of collection rights.
MFRS D-2,Costs associated with contracts with customers
It establishes the standards for valuation, presentation and disclosure of the costs that arise from contracts with clients. Additionally, it establishes the standards for the recognition of costs for contracts with customers, and incorporates the accounting treatment of the costs related to contracts for the construction and manufacture of capital goods, including costs related to customer contracts.
MFRS D-5,Leases
This MFRS introduces a unique model for the recognition of leases by the lessee and eliminates the classification of operatives and financial leases. As a result requires the lessee to recognize the assets and liabilities of all leases with a maturity of more than 12 months, unless the underlying asset is of low value. The lessee is required to recognize a right-of-use asset that represents its right to use the leased underlying asset and a lease liability that represents its obligation to make lease payments. Consequently, the most significant impact will be an increase in the assets under leasing and the financial liabilities of the lessee. The accounting recognition for the lessor has no change. There were added some additional disclosures for the lessor.
The Bank is analyzing the effect that this MFRS will have on the financial information.
| Earnings Release | 3Q.2019 |
45 |
| Banco Santander México |
Changes in Accounting Criteria issued by the CNBV applicable to the participants in the derivatives market
On January 4th, 2018, an amendment was published in the DOF that modifies the General Provisions that establishes the accounting criteria to which the participants of derivative contracts market will be subject. This amendment incorporates certain Mexican Financial Reporting Standards (MFRS) issued by the Mexican Financial Reporting Standards Board (CINIF by its acronym in Spanish) for the preparation of the accounting of the clearing houses and settlement partners that participate in the derivatives contracts market listed on stock exchanges. This amendment was effective starting January 1st, 2019.
Subsequently, on November 15th, 2018, an amending resolution was published with the purpose of extending the term of the application of the amendment mentioned in the previous paragraph to January 1st, 2020 so that the clearing houses and settlement partners are able to adjust their accounting information systems.
The MFRS that will be effective for clearing houses starting January 1st, 20120 are the following: MFRS B-17,Determination of fair value,MFRS C-3, Accounts receivable,MFRS C-9,Provisions, contingencies and commitments,MFRS C-16,Impairment of financial instruments receivable,MFRS C-19,Financial instruments payable,MFRS C-20,Financial instruments to collect principal and interest,MFRS, D-1,Revenue from contracts with customers,MFRS D-2,Costs associated with contracts with customersand MFRS D-5,Leases.
| Earnings Release | 3Q.2019 |
46 |
| Banco Santander México |
| Earnings per ordinary share and earnings per diluted share | |||||||||||||
| Million pesos, except shares and earnings per share | |||||||||||||
| September 2019 | September 2018 | September 2017 | |||||||||||
| Shares | Earnings | Shares | Earnings | Shares | Earnings | ||||||||
| Earnings | -weighted- | per share | Earnings | -weighted- | per share | Earnings | -weighted- | per share | |||||
| Earnings per share | 16,416 | 6,774,530,788 | 2.42 | 14,994 | 6,776,856,201 | 2.21 | 13,164 | 80,855,403,803 | 0.16 | ||||
| Treasury stock | 12,463,569 | 10,138,156 | |||||||||||
| Diluted earnings per share | 16,416 | 6,786,994,357 | 2.42 | 14,994 | 6,786,994,357 | 2.21 | 13,164 | 80,855,403,803 | 0.16 | ||||
| Plus loss / less (profit): | |||||||||||||
| Discontinued operations | |||||||||||||
| Continued fully diluted earnings per share | 16,416 | 6,786,994,357 | 2.42 | 14,994 | 6,786,994,357 | 2.21 | 13,164 | 80,855,403,803 | 0.16 | ||||
| Balance outstanding shares as of September 30th, 2019 | 6,778,200,136 | ||||||||||||
| Earnings Release | 3Q.2019 |
47 |
| Banco Santander México |
| Consolidated Balance Sheet by Segment | |||||||
| Million pesos | |||||||
| As of September 30th, 2019 | As of September 30th, 2018 | ||||||
| Retail Banking | Corporate & Investment Banking | Corporate Activities | Retail Banking | Corporate & Investment Banking | Corporate Activities | ||
| Assets | |||||||
| Funds available | 51,139 | 4,811 | 11,047 | 44,947 | 14,315 | 12,295 | |
| Margin accounts | 0 | 5,319 | 0 | 0 | 2,444 | 0 | |
| Investment in securities | 0 | 145,487 | 220,512 | 0 | 139,650 | 199,304 | |
| Debtors under sale and repurchase agreements | 0 | 14,747 | 0 | 0 | 31,850 | 0 | |
| Derivatives | 0 | 174,093 | 8,668 | 0 | 142,445 | 10,745 | |
| Valuation adjustment for hedged financial assets | 0 | 0 | 253 | 0 | 0 | (10) | |
| Total loan portfolio | 582,482 | 114,844 | 0 | 548,004 | 132,116 | 0 | |
| Allowance for loan losses | (18,858) | (2,441) | 0 | (17,996) | (2,379) | 0 | |
| Loan portfolio (net) | 563,624 | 112,403 | 0 | 530,008 | 129,737 | 0 | |
| Accrued income receivable from securitization transactions | 0 | 0 | 80 | 0 | 0 | 125 | |
| Other receivables (net) | 208 | 87,823 | 22,943 | 205 | 67,854 | 15,582 | |
| Foreclosed assets (net) | 231 | 0 | 0 | 265 | 26 | 0 | |
| Property, furniture and fixtures (net) | 8,209 | 1,384 | 122 | 5,669 | 956 | 84 | |
| Long-term investment in shares | 0 | 0 | 90 | 0 | 0 | 90 | |
| Deferred taxes and deferred profit sharing (net) | 0 | 0 | 18,702 | 0 | 0 | 18,672 | |
| Other assets | 1,700 | 1,333 | 5,813 | 1,687 | 1,217 | 5,132 | |
| Total assets | 625,111 | 547,400 | 288,230 | 582,781 | 530,494 | 262,019 | |
| Liabilities | |||||||
| Deposits | 553,360 | 87,370 | 42,860 | 514,223 | 104,374 | 61,546 | |
| Credit instruments issued | 0 | 4,979 | 50,154 | 0 | 5,866 | 41,307 | |
| Bank and other loans | 15,033 | 419 | 36,188 | 12,925 | 2,244 | 28,002 | |
| Creditors under sale and repurchase agreements | 8,407 | 153,809 | 0 | 8,221 | 149,307 | 0 | |
| Securities lending | 0 | 0 | 0 | 0 | 1 | 0 | |
| Collateral sold or pledged as guarantee | 0 | 30,611 | 0 | 0 | 21,088 | 0 | |
| Derivatives | 0 | 168,014 | 8,555 | 0 | 140,136 | 6,581 | |
| Valuation adjustment of financial liabilities hedging | 0 | 0 | 14 | 0 | 0 | 0 | |
| Other payables | 35,365 | 86,293 | 3,814 | 33,274 | 82,479 | 2,190 | |
| Subordinated credit notes | 0 | 0 | 35,464 | 0 | 0 | 33,791 | |
| Deferred revenues and other advances | 332 | 0 | 0 | 354 | 0 | 0 | |
| Total liabilities | 612,497 | 531,495 | 177,049 | 568,997 | 505,495 | 173,417 | |
| Total stockholders' equity | 69,862 | 26,141 | 43,697 | 62,056 | 22,221 | 43,108 | |
| Total liabilities and stockholders' equity | 682,359 | 557,636 | 220,746 | 631,053 | 527,716 | 216,525 | |
| Earnings Release | 3Q.2019 |
48 |
| Banco Santander México |
| Income Statement by Segment | |||||||
| Million pesos | |||||||
| 9M19 | 9M18 | ||||||
| Retail Banking | Corporate & Investment Banking | Corporate Activities | Retail Banking | Corporate & Investment Banking | Corporate Activities | ||
| Net interest income | 43,925 | 5,287 | 414 | 39,529 | 4,450 | 1,226 | |
| Provisions for loan losses | (13,250) | 0 | 0 | (11,954) | (959) | 0 | |
| Net interest income after provisions for loan losses | 30,675 | 5,287 | 414 | 27,575 | 3,491 | 1,226 | |
| Commission and fee income (net) | 12,359 | 1,345 | (1) | 11,347 | 1,390 | (135) | |
| Net gain (loss) on financial assets and liabilities | 915 | 944 | 138 | 879 | 1,238 | 63 | |
| Other operating income | (1,670) | 19 | 78 | (1,477) | 1 | (117) | |
| Administrative and promotional expenses | (24,481) | (3,500) | (540) | (22,274) | (3,139) | (653) | |
| Operating income | 17,798 | 4,095 | 89 | 16,050 | 2,981 | 384 | |
Segment information has been prepared according to the classifications used in Santander México at secondary level, based in the type of developed business:
Retail banking
The Retail Banking segment encompasses the entire commercial banking and asset management business. Our Retail Banking segment’s activities include products and services for individuals, private banking clients, SMEs, middle-market corporations and government institutions.
Corporate & Investment Banking
The Corporate & Investment Banking segment reflects the returns on the corporate banking business, including managed treasury departments and the equities business. Our Corporate & Investment Banking segment provides comprehensive products and services relating to finance, guarantees, mergers and acquisitions, equity and fixed income, structured finance, international trade finance, cash management services, collection services and e-banking, including structured loans, syndicated loans, acquisition financing and financing of investment plans, among others.
Corporate activities
The Corporate Activities segment is comprised of all operational and administrative activities that are not assigned to a specific segment or product mentioned above. The Corporate Activities segment includes the financial management division, which manages structural financial risks arising from our commercial activities, mainly liquidity risk and interest rate risk, provides short- and long-term funding for our lending activities and calculates and controls transfer prices for loans and deposits in local and foreign currencies. The financial management division also oversees the use of our resources in compliance with internal and regulatory limits regarding liquidity and regulatory capital requirements.
| Earnings Release | 3Q.2019 |
49 |
| Banco Santander México |
| Annex 1. Loan portfolio rating | |||||
| As of September 30th, 2019 | |||||
| Million pesos | |||||
| Allowance for loan losses | |||||
| Category | Loan Portfolio | Commercial | Consumer | Mortgages | Total |
| Risk "A" | 736,875 | 1,963 | 1,325 | 289 | 3,577 |
| Risk "A-1" | 663,399 | 1,446 | 413 | 254 | 2,113 |
| Risk "A-2" | 73,476 | 517 | 912 | 35 | 1,464 |
| Risk "B" | 82,026 | 346 | 2,773 | 182 | 3,301 |
| Risk "B-1" | 38,492 | 97 | 1,346 | 31 | 1,474 |
| Risk "B-2" | 25,493 | 66 | 770 | 109 | 945 |
| Risk "B-3" | 18,041 | 183 | 657 | 42 | 882 |
| Risk "C" | 29,448 | 237 | 2,129 | 520 | 2,886 |
| Risk "C-1" | 17,323 | 129 | 923 | 192 | 1,244 |
| Risk "C-2" | 12,125 | 108 | 1,206 | 328 | 1,642 |
| Risk "D" | 10,796 | 670 | 2,316 | 762 | 3,748 |
| Risk "E" | 10,094 | 3,394 | 3,306 | 440 | 7,140 |
| Total rated portfolio | 869,239 | 6,610 | 11,849 | 2,193 | 20,652 |
| Provisions created | 20,652 | ||||
| Complementary provisions | 647 | ||||
| Total | 21,299 | ||||
| Notes: | ||
| 1. | The figures used for rating and creation of allowance for loan losses, correspond to the ones as of the last day of the month of the balance sheet as of September 30th, 2019. | |
| 2. | Loan portfolio is rated according to the methodology issued by the CNBV in chapter V of Title II of the General Rules Applicable to Credit Institutions, can be rated by internal methodology approved by the CNBV.
We use the methodology established by the CNBV, which have been incorporated or modified according to the following schedule:
As of September 2011, the Bank apply the rules for rating the states and municipalities loan portfolio.
As of June 2013, the Bank apply the new rules for rating the commercial loan portfolio.
As of October 2016, the Bank updated the rules for rating the revolving consumer loan portfolio.
As of September 2017, the Bank updated the rules for rating the non-revolving consumer and mortgage loan portfolios.
As of November 2018, the Bank began to report the allowance for loans losses with our IRB methodology for middle-market and mortgages broker’s loans.
Credit Institutions use risk ratings: A-1; A-2; B-1; B-2; B-3; C-1; C-2; D and E, to classify allowance for impairment losses according to the portfolio segment and percentage of the provisions representing the outstanding balance of the loan, established in Section Fifth of “De la constitución de reservas y su clasificación por grado de riesgo”, contained in chapter 5 of Title II of such regulation.
| |
| Earnings Release | 3Q.2019 |
50 |
| Banco Santander México |
| Annex 2. Financial ratios according to CNBV | |||||||
| Percentages | 3Q19 | 2Q19 | 3Q18 | 9M19 | 9M18 | ||
| Past Due Loans Ratio | 2.33 | 2.23 | 2.35 | 2.33 | 2.35 | ||
| Past Due Loans Coverage | 130.82 | 136.56 | 127.60 | 130.82 | 127.60 | ||
| Operative Efficiency | 2.77 | 2.84 | 2.62 | 2.69 | 2.52 | ||
| ROE | 16.14 | 16.85 | 16.31 | 16.00 | 16.00 | ||
| ROA | 1.56 | 1.68 | 1.48 | 1.55 | 1.45 | ||
| Capitalization Ratio | |||||||
| Credit Risk | 23.76 | 23.24 | 21.29 | 23.76 | 21.29 | ||
| Credit, Market and operations risk | 16.89 | 16.50 | 16.02 | 16.89 | 16.02 | ||
| Liquidity | 91.33 | 69.12 | 86.57 | 91.33 | 86.57 | ||
| NIM (Net Interest Margin) | 3.90 | 4.19 | 3.60 | 3.91 | 3.53 | ||
Note: ratios are prepared according to the general rules applicable to financial information of credit institutions, issued by the CNBV, according to Annex 34.
NPL ratio = Balance of past due loans portfolio as of the end of the quarter / Balance of loans portfolio as of the end of the quarter.
Coverage ratio= Balance of provision for loan losses as of the end of the quarter / Balance of past due loans portfolio as of the end of the quarter.
Efficiency ratio = Administration and promotion expenses of the quarter, annualized / Total Average Assets.
ROAE = Annualized quarterly net earnings/ Average stockholders’ equity.
ROAA = Annualized quarterly net earnings /Total average assets.
Breakdown of capitalization ratio: (1)=Net Capital/ Assets subject to credit risk. (2)=Net Capital / Assets subject to credit, market and operation risk.
Liquidity = Current Assets/ Current Liabilities.
Where: Current Assets = Availabilities + securities for trade + securities available for sale.
Current liabilities= Demand deposits + bank loans and loans from other entities, payable on demand, + short term bank loans and loans from other entities.
NIM = Quarterly Net Interest Margin, adjusted by annualized credit risks / Average interest-earning assets.
Where: Average interest-earning assets = availabilities, investments in securities, transactions with securities and derivatives and loan portfolio.
Notes:
Average = ((Balance of the corresponding quarter + balance of the previous quarter) / 2).
Annualized figures = (Flow of the corresponding quarter * 4).
| Earnings Release | 3Q.2019 |
51 |
| Banco Santander México |
| Notes to financial statements as of September 30th 2019 | |
| Million pesos, except for number of shares |
| 1. Investment in securities | |
| Financial instruments are constituted as follows: | |
| Book Value | |
| Trading securities: | |
| Bank securities | 9,688 |
| Government securities | 135,202 |
| Shares | 1,974 |
| 146,864 | |
| Securities available for sale: | |
| Government securities | 204,991 |
| Private securities | 2,468 |
| Shares | 615 |
| 208,074 | |
| Securities held until maturity: | |
| Government securities | 7,821 |
| Government securities (special cetes) | 3,240 |
| 11,061 | |
| Total | 365,999 |
| 2. Sale and repurchase agreements | ||
| The sale and repurchase agreements transactions are constituted as follows: | ||
| Net balance | ||
| Debit balances | ||
| Bank securities | 3,225 | |
| Government securities | 11,234 | |
| Private securities | 288 | |
| Total | 14,747 | |
| Credit balances | ||
| Bank securities | 7,733 | |
| Government securities | 154,230 | |
| Private securities | 253 | |
| Total | 162,216 | |
| (147,469) | ||
| 3. Investment in securities different to government securities |
| At September 30th, 2019 the investments in debt securities with the same issuer (other than government), are less than 5% of the Institution’s net capital. |
| 4. Derivatives | |||||
| The nominal value of the different derivative financial instruments agreements for trading and hedging purposes, as of September 30th, 2019, are as follows: | |||||
| Trading | |||||
| Swaps | |||||
| Interest rate | 6,415,073 | ||||
| Cross currency | 832,251 | ||||
| Equity | 843 | ||||
| Earnings Release | 3Q.2019 |
52 |
| Banco Santander México |
| Futures | Buy | Sell | |
| Foreign currency | 27,765 | 0 | |
| Index | 34 | 194 | |
| Forward contracts | |||
| Foreign currency | 430,165 | 21,871 | |
| Equity | 13,212 | 13,519 | |
| Options | Long | Short | |
| Interest rate | 141,414 | 139,222 | |
| Foreign currency | 78,360 | 79,284 | |
| Indexes | 2,559 | 1,403 | |
| Equity | 57 | 34 | |
| Total trading derivatives | 7,941,733 | 255,527 | |
| Hedging | |||
| Cash flow | |||
| Interest rate swaps | 11,311 | ||
| Cross currency swaps | 22,693 | ||
| Foreign Exchange Forwards | 71,610 | ||
| Fair value | |||
| Interest rate swaps | 11,851 | ||
| Cross currency swaps | 32,930 | ||
| Total hedging derivatives | 150,395 | ||
| Total derivative financial instruments | 8,092,128 | 255,527 | |
| 5. Performing loan portfolio | ||||||||||||
| The loan portfolio, by type of loan and currency, as of September 30th, 2019, is constituted as follows: | ||||||||||||
| Amount | ||||||||||||
| Pesos | USA Dlls | UDIS | Euros | GBP | Total | |||||||
| Commercial or business activity | 290,611 | 57,677 | 0 | 2,579 | 831 | 351,698 | ||||||
| Financial entities | 12,375 | 1,338 | 0 | 0 | 0 | 13,713 | ||||||
| Government entities | 56,320 | 2,840 | 1,609 | 0 | 0 | 60,769 | ||||||
| Commercial loans | 359,306 | 61,855 | 1,609 | 2,579 | 831 | 426,180 | ||||||
| Consumer loans | 112,099 | 0 | 0 | 0 | 0 | 112,099 | ||||||
| Media and residential | 126,114 | 561 | 2,321 | 0 | 0 | 128,996 | ||||||
| Of social interest | 37 | 0 | 0 | 0 | 0 | 37 | ||||||
| Credits acquired from INFONAVIT or FOVISSSTE | 13,733 | 0 | 0 | 0 | 0 | 13,733 | ||||||
| Mortgage loans | 139,884 | 561 | 2,321 | 0 | 0 | 142,766 | ||||||
| Total performing loan portfolio | 611,289 | 62,416 | 3,930 | 2,579 | 831 | 681,045 | ||||||
| 6. Non-performing loan portfolio | ||||||
| Amount | ||||||
| Pesos | USA Dlls | UDIS | Total | |||
| Commercial or business activity | 4,063 | 1,720 | 0 | 5,783 | ||
| Financial entities | 0 | 0 | 0 | 0 | ||
| Commercial loans | 4,063 | 1,720 | 0 | 5,783 | ||
| Consumer loans | 4,531 | 0 | 0 | 4,531 | ||
| Media and residential | 4,086 | 101 | 244 | 4,431 | ||
| Of social interest | 5 | 0 | 0 | 5 | ||
| Credits acquired from INFONAVIT or FOVISSSTE | 1,531 | 0 | 0 | 1,531 | ||
| Earnings Release | 3Q.2019 |
53 |
| Banco Santander México |
| Mortgage loans | 5,622 | 101 | 244 | 5,967 | |||||
| Total non-performing loan portfolio | 14,216 | 1,821 | 244 | 16,281 | |||||
| The analysis of movements in non-performing loans from December 31st, 2018 to September 30th, 2019, is as follows: | |||||||||
| Balance as of December 31st, 2018 | 16,087 | ||||||||
| Plus: Transfer from performing loan portfolio to non-performing loan portfolio | 23,416 | ||||||||
| Collections | |||||||||
| Cash | (1,859) | ||||||||
| Transfer to performing loan portfolio | (5,422) | ||||||||
| Proceeds from foreclosure proceedings | (228) | ||||||||
| Write-offs | (15,717) | ||||||||
| Adjustment for exchange rate | 4 | ||||||||
| Balance as of September 30th, 2019 | 16,281 | ||||||||
| 7. Allowance for loan losses | |||||||
| The movement in the allowance for loan losses, from January 1st to September 30th, 2019, is as follows: | |||||||
| Balance as of January 1st, 2019 | 21,100 | ||||||
| Allowance for loan losses | 15,819 | ||||||
| Write-offs | (15,629) | ||||||
| Foreign exchange result | 9 | ||||||
| Balance as of September 30th, 2019 | 21,299 | ||||||
| The table below presents a summary of write-offs by type of product as of September 30th, 2019: | |||||||
| Product | Charge-offs | Debit Relieves | Total | % | |||
| First quarter | |||||||
| Commercial loans | 970 | 116 | 1,086 | 19.0 | |||
| Mortgage loans | 1,187 | 18 | 1,205 | 21.1 | |||
| Credit card loans | 1,843 | 60 | 1,903 | 33.4 | |||
| Consumer loans | 1,496 | 17 | 1,513 | 26.5 | |||
| Total | 5,496 | 211 | 5,707 | 100.0 | |||
| Second quarter | |||||||
| Commercial loans | 901 | 53 | 954 | 20.7 | |||
| Mortgage loans | 169 | 16 | 185 | 4.0 | |||
| Credit card loans | 1,790 | 56 | 1,846 | 40.0 | |||
| Consumer loans | 1,610 | 22 | 1,632 | 35.3 | |||
| Total | 4,470 | 147 | 4,617 | 100.0 | |||
| Third quarter | |||||||
| Commercial loans | 1,368 | 62 | 1,430 | 27.0 | |||
| Mortgage loans | 151 | 16 | 167 | 3.1 | |||
| Credit card loans | 1,864 | 15 | 1,879 | 35.4 | |||
| Consumer loans | 1,763 | 66 | 1,829 | 34.5 | |||
| Total | 5,146 | 159 | 5,305 | 100.0 | |||
| Accumulated 2019 | |||||||
| Commercial loans | 3,239 | 231 | 3,470 | 22.2 | |||
| Mortgage loans | 1,507 | 50 | 1,557 | 10.0 | |||
| Credit card loans | 5,497 | 131 | 5,628 | 36.0 | |||
| Consumer loans | 4,869 | 105 | 4,974 | 31.8 | |||
| Total | 15,112 | 517 | 15,629 | 100.0 | |||
| Earnings Release | 3Q.2019 |
54 |
| Banco Santander México |
| 8. Problematic loans |
| Loans portfolio was graded according to the general provisions issued by the National Banking and Securities Commission. The management considers that problematic loans are the ones graded as “D” and “E”, due to their low possibility for the collection of the full amount of principal. |
| 9. Programs of benefits to bank debtors with the support of the Federal Government | |||||||||||||
| Breakdown of special CETES, of which Ps.3,240 million correspond to the early extinction of debtor support programs: | |||||||||||||
| Amount | |||||||||||||
| Government Securities | |||||||||||||
| Special CETES for housing loan debtor support programs | 3,406 | ||||||||||||
| Total securities held to maturity (no reserve) | 3,406 | ||||||||||||
| Minus- | |||||||||||||
| Reserve for Special CETES | (166) | ||||||||||||
| Total securities held to maturity, net | 3,240 | ||||||||||||
| The remaining balance and expiration date Special Cetes that were not repurchased by the Federal Government and therefore the Bank holds in its balance sheet at September 30th, 2019, is as follows: | |||||||||||||
| Issue | Trust | Securities Number | Due date | Price (MXN) | Amount | ||||||||
| B4-220707 | 422-9 | 12,762,386 | 07-jul-22 | 119.58 | 1,526 | ||||||||
| B4-270701 | 423-2 | 15,292,752 | 01-jul-27 | 119.58 | 1,829 | ||||||||
| B4-220804 | 431-2 | 440,294 | 04-aug-22 | 109.48 | 48 | ||||||||
| BC-220804 | 431-2 | 71,442 | 04-aug-22 | 37.24 | 3 | ||||||||
| 3,406 | |||||||||||||
| 10. Average interest rates paid on deposits | |||||
| The average interest rates paid on deposits during September 2019, is as follow: | |||||
| Pesos | USD | ||||
| Average balance | 371,022 | 60,504 | |||
| Interest | 3,261 | 38 | |||
| Rate | 3.44% | 0.25% | |||
| 11. Bank and other loans | |||||
| As of September 30th, 2019, banks and other loans are constituted as follows: | |||||
| Amount | Average Rate (%) | Maturity | |||
| Liabilities | |||||
| Loans in pesos | |||||
| Call money | 9,209 | 7.60 | From 1 to 3 days | ||
| Local bank loans | 48 | 9.39 | To 8 years | ||
| Public fiduciary funds | 13,109 | 8.20 | From 1 day to 9 years | ||
| Development banking institutions | 21,350 | 8.07 | From 1 day to 20 years | ||
| Total | 43,716 | ||||
| Loans in foreign currency | |||||
| Earnings Release | 3Q.2019 |
55 |
| Banco Santander México |
| Foreign bank loans | 6,257 | 2.52 | From 1 day to 2 years | ||
| Call money | 158 | 1.60 | From 1 to 2 days | ||
| Public fiduciary funds | 1,377 | 2.96 | From 2 days to 5 years | ||
| Development banking institutions | 1 | 7.38 | From 1 to 3 months | ||
| Total | 7,793 | ||||
| Total loans | 51,510 | ||||
| Accrued interests | 130 | ||||
| Total bank and other loans | 51,640 | ||||
| 12. Current and deferred taxes | ||
| Current taxes are composed as follows at September 30th, 2019 | ||
| Income taxes | 3,938 | |
| Deferred taxes | 152 | (1) |
| Total Bank | 4,090 | |
| Current and-deferred taxes from other subsidiaries | 1,476 | |
| Total consolidated Bank | 5,566 | |
| (1) Deferred taxes are composed as follows: | ||
| Global provision | (292) | |
| Fixed assets and deferred charges | 67 | |
| Net effect from financial instruments | (45) | |
| Accrued liabilities | 303 | |
| Others | 120 | |
| Total Bank | 153 | (1) |
| Allowance for loan losses of subsidiaries, net | 490 | |
| Others, subsidiaries | (67) | |
| Total deferred tax, consolidated Bank | 576 | |
| As of September 30th, 2019, deferred assets and deferred liabilities are registered at 100% | ||
| Remainder of global provisions and allowances for loan losses | 9,367 | |
| Other | 9,335 | |
| Total deferred income tax (net) | 18,702 | |
| Deferred taxes registered in balance sheet accounts | 18,702 | |
| Deferred taxes registered in memorandum accounts | 0 | |
| 13. Employee profit sharing | |
| As of September 30th, 2019, the deferred Employee profit sharing “EPS” is compromised as follows: | |
| Asset per deferred EPS: | |
| Allowance for loan losses deducting outstanding | 1,605 |
| Fixed assets and deferred charges | 750 |
| Accrued liabilities | 504 |
| Capital losses carryforward | 901 |
| Commissions and interests early collected | 201 |
| Earnings Release | 3Q.2019 |
56 |
| Banco Santander México |
| Foreclosed assets | 101 |
| Labor obligations | 295 |
| Derivative financial transactions of exchange rate | 423 |
| Deferred EPS asset: | 4,780 |
| Deferred EPS liability: | |
| Net effect from financial instruments | (923) |
| Advance payments | (120) |
| Others | (84) |
| Deferred EPS liability | (1,127) |
| Less – Reserve | 0 |
| Deferred EPS asset (net) | 3,653 |
| 14. Capitalization Ratio |
Table I.1
Form of disclosure of the capital integration without considering the phase in in the application of regulatory adjustments
| Reference | Capital Description | Capital |
| Level 1 (CET 1) Ordinary capital: Instruments and reserves | ||
| 1 | Ordinary shares that qualify for level 1 Common Capital plus corresponding premium | 35,062 |
| 2 | Earnings from previous fiscal years | 62,949 |
| 3 | Other elements of other comprehensive income (and other reserves) | 41,521 |
| 4 | Capital subject to gradual elimination of level 1 ordinary capital (only applicable for companies that are not lined to shares) | |
| 5 | Ordinary shares issued by subsidiaries held by third parties (amount allowed in level 1 ordinary capital) | |
| 6 | Level 1 ordinary capital before adjustments to regulation | 139,532 |
| Level 1 Ordinary capital: adjustments to regulation | ||
| 7 | Adjustments due to prudential valuation | |
| 8 | Goodwill (net of its corresponding deferred profit taxes debited) | 1,735 |
| 9 | Other intangibles other than rights to mortgage rights (net of its corresponding deferred profit taxes debited) | 6,214 |
| 10 | Deferred taxes to profit credited relying on future income excluding those that derive from temporary differences (net of deferred profit taxes debited) | 0 |
| 11 | Results of valuation of cash flow hedging instruments | 0 |
| 12 | Reserves to be constituted | 0 |
| 13 | Benefits surplus of securitization transactions | 0 |
| 14 | Losses and gains caused for the changes in credit rating of liabilities assessed at a reasonable value | 0 |
| 15 | Pension plan for defined benefits | 0 |
| 16 | Investments in proprietary shares | 4 |
| 17 | Reciprocal investments in ordinary capital | 0 |
| 18 | Investments in capital of banks, financial institutions and insurance companies out of the reach of the regulation consolidation, net of short eligible positions, wherein the institution does not hold more than 10% of the issued capital (amount that exceeds the 10% threshold) | 71 |
| Earnings Release | 3Q.2019 |
57 |
| Banco Santander México |
| 19 | Significant investments in ordinary shares of banks, financial institutions and insurance companies out of the scope of the regulation consolidation, nets of eligible short positions, wherein the institutions holds more than 10% of the issued capital (amount that exceeds the 10% threshold) | 0 |
| 20 | Rights for mortgage services (amount exceeding the 10% threshold) | 0 |
| 21 | Deferred taxes assets resulting from temporary differences (amount exceeding the 10% threshold, net of deferred taxes debited) | 6,316 |
| 22 | Amount exceeding the 15% threshold. | |
| 23 | of which: significant investments wherein the institution holds more than 10% of ordinary shares of financial institutions | |
| 24 | of which: rights for mortgage services | |
| 25 | of which: Taxes to profit Deferred credited deriving from temporary differences | |
| 26 | National regulation adjustments | 30,498 |
| A | of which: Other elements of other comprehensive income (and other reserves) | 0 |
| B | of which: investments in subordinated debt | 0 |
| C | of which: profit or increase in the value of assets from the purchase of securitization positions (Originating Institutions) | 0 |
| D | of which: investments in multilateral entities | 0 |
| E | of which: investments in related corporations | 29,032 |
| F | of which: investments in risk capital | 0 |
| G | of which: Stakes on investments funds | 0 |
| H | of which: Funding for the purchase of proprietary shares | 0 |
| I | of which: Transactions in breach of provisions | 0 |
| J | of which: Deferred charges and installments | 1,046 |
| K | of which: Positions in First Losses Schemes | 0 |
| L | of which: Worker's Deferred Profit Sharing | 0 |
| M | of which: Relevant Related Persons | 0 |
| N | of which: Pension plan for defined benefits | 0 |
| O | of witch: Adjustment for capital acknowledgment | 0 |
| P | of which: investments in Clearing Houses | 420 |
| 27 | Regulation adjustments that apply to level 1 common stock due to level 1 capital shortage and level 2 capital to cover deductions | 0 |
| 28 | Total regulation adjustments to level 1 Common Capital | 44,838 |
| 29 | Level 1 Common Capital (CET1) | 94,694 |
| Level 1 additional capital: instruments | ||
| 30 | Instruments directly issued that qualify as level 1 additional capital, plus premium | 9,854 |
| 31 | of which: Qualify as capital under the applicable accounting criteria | 9,854 |
| 32 | of which: Qualify as liability under the applicable accounting criteria | |
| 33 | Capital instruments directly issued subject to gradual elimination of level 1 additional capital | 0 |
| 34 | Instruments issued of level 1 additional capital and level 1 Common Capital instruments that are not included in line 5 issued by subsidiaries held by third parties (amount allowed at additional level 1) | 0 |
| 35 | of which: instruments issued by subsidiaries subject to gradual elimination | |
| 36 | Level 1 additional capital before regulation adjustments | 9,854 |
| Level 1 additional capital: regulation adjustments | ||
| 37 | Investments in held instruments of level 1 additional capital | |
| 38 | Investments in reciprocal shares in level 1 additional capital instruments. |
| Earnings Release | 3Q.2019 |
58 |
| Banco Santander México |
| 39 | Investments in capital of banks, financial institutions and insurance companies out of the scope of the regulation consolidation, net of short eligible positions, wherein the institution holds more than 10% of the issued capital | |
| 40 | Significant investments in ordinary shares of banks, financial institutions and insurance companies out of the scope of the regulation consolidation, nets of eligible short positions, wherein the institutions holds more than 10% of the issued capital | |
| 41 | National regulation adjustments | 0 |
| 42 | Regulation adjustments that apply to level 1 common stock due to level 1 capital shortage and level 2 capital to cover deductions | |
| 43 | Total regulation adjustments to level 1 additional Common Capital | 0 |
| 44 | Level 1 additional capital (AT1) | 9,854 |
| 45 | Level 1 capital (T1 = CET1 + AT1) | 104,548 |
| Level 2 capital: instruments and reserves | ||
| 46 | Instruments directly issued that qualify as level 2 capital, plus premium | 25,610 |
| 47 | Capital instruments directly issued subject to gradual elimination of level 2 capital. | |
| 48 | Level 2 capital instruments and level 1 Common Capital instruments and level 1 additional capital that has not been included in lines 5 or 34, which have been issued by subsidiaries held by third parties (amount allowed in level 2 completer capital) | 0 |
| 49 | of which: instruments issued by subsidiaries subject to gradual elimination | 0 |
| 50 | Reserves | 0 |
| 51 | Level 2 capital before regulation adjustments | 25,610 |
| Level 2 capital : regulation adjustments | ||
| 52 | Investments in own instruments of level 2 capital | |
| 53 | Reciprocal investments in level 2 capital instruments | |
| 54 | Investments in capital of banks, financial institutions and insurance companies out of the scope of the regulation consolidation, net of short eligible positions, wherein the institution does not hold more than 10% of the issued capital (amount exceeding the 10% threshold) | |
| 55 | Significant investments in ordinary shares of banks, financial institutions and insurance companies out of the scope of the regulation consolidation, nets of eligible short positions, wherein the institutions holds more than 10% of the issued capital | |
| 56 | National regulation adjustments | 0 |
| 57 | Total regulation adjustments to level 2 capital | 0 |
| 58 | Level 2 capital (T2) | 25,610 |
| 59 | Total stock (TC = T1 + T2) | 130,158 |
| 60 | Total Risk Weighted Assets | 770,793 |
| Capital reasons and buffers | ||
| 61 | Level 1 Common Capital (as percentage of assets weighted by total risks) | 12.29% |
| 62 | Level 1 Stock (as percentage of assets weighted by total risks) | 13.56% |
| 63 | Total capital (as percentage of assets weighted by total risks) | 16.89% |
| 64 | Institutional specific buffer (must at least consist of: the level 1 Common Capital requirement plus the capital maintenance buffer, plus the countercyclical buffer, plus D-SIB buffer; expressed as percentage of the total risk weighted assets) | 15.99% |
| 65 | of which: Buffer of capital preservation | 2.50% |
| 66 | of which: Buffer of specific bank countercyclical | |
| 67 | of which: Buffer of systematically important local banks (D-SIB) | 1.20% |
| 68 | Level 1 Common Capital available for hedging the buffers (as percentage of total risk weighted assets) | 5.29% |
| National minimums (if other than those of Basel 3) | ||
| 69 | National minimum reason of CET1 (if different than the minimum established by Basilea 3) |
| Earnings Release | 3Q.2019 |
59 |
| Banco Santander México |
| 70 | National minimum reason of T1 (if different than the minimum established by Basel 3) | |
| 71 | National minimum reason of TC (if different than the minimum established by Basel 3) | |
| Amounts under the deduction thresholds (before weighting by risk) | ||
| 72 | Non-significant investment in the capital of other financial institutions | |
| 73 | Significant investment in the capital of other financial institutions | |
| 74 | Rights for mortgage services (net of Deferred profit taxes debited) | |
| 75 | Deferred profit taxes credited derived from temporary differences (net of Deferred profit taxes debited) | 7,003 |
| Applicable limits to the inclusion of reserves in level 2 capital | ||
| 76 | Eligible reserves to be included in level 2 capital with respect to expositions subject to standardized methodology (prior application of limit) | |
| 77 | Limit in the inclusion of level 2 capital provisions under standardized methodology | |
| 78 | Eligible reserves for its inclusion on level 2 capital regarding exposure subject to credit risks (before the limit application). | |
| 79 | Limit in the inclusion of reserves in level 2 capital under internal rating methodology | |
| Capital instruments subject to gradual elimination (applicable only between January 1, 2018 and January 1, 2022) | ||
| 80 | Current limit of CET1 instruments subject to gradual elimination | |
| 81 | Amount excluded from CET1 due to limit (excess over the limit after amortization and maturity periods) | |
| 82 | Current limit of AT1 instruments subject to gradual elimination | |
| 83 | Amount excluded from AT1 due to limit (excess over the limit after amortization and maturity periods) | |
| 84 | Current limit of T2 instruments subject to gradual elimination | |
| 85 | Amount excluded from T2 due to limit (excess over the limit after amortization and maturity periods) |
I.2
Notes to Table I.1 “Form of disclosure of the capital integration without considering the phase in in the application of regulatory adjustments”
| Reference | Description |
| 1 | Elements of capital contributed pursuant to fraction I item a) numbers 1) and 2) of Article 2 Bis 6 hereof |
| 2 | Results from previous fiscal years and their corresponding updates. |
| 3 | Capital reserves, net result, result per assessment of titles available for sale, accrued effect per conversion, result per assessment of cash flow, result from non-monetary assets holding, and the measuring balance from defined benefits to the employees considering on each concept its updates. |
| 4 | Does not apply. The capital stock of credit institutions in Mexico is represented by representative certificates or shares. This concept only applies for entities where such capital is represented by representative certificates or shares. |
| 5 | Does not apply for the capitalization scope in Mexico which is on a non-consolidated basis. This concept will only apply for entities with a consolidated scope. |
| 6 | Sum of concepts 1 through 5. |
| 7 | Does not apply. In Mexico the use of internal models for calculating capital requirements per market risk is not allowed. |
| 8 | Goodwill, net of owed differed profit taxes pursuant to the provisions of fraction I item n) of Article 2 Bis 6 hereof. |
| 9 | Intangibles, other than commercial credit, and if applicable to mortgage service rights, net of owed deferred profit taxes, pursuant to the provisions of fraction I item n) of Article 2 Bis 6 hereof. |
| 10* | Credited deferred profit taxes from losses and fiscal credits pursuant to the provisions of fraction I item p) of Article 2 Bis 6 hereof. |
| Earnings Release | 3Q.2019 |
60 |
| Banco Santander México |
| This is a more conservative approach than the one established by the Basel Committee on Banking Supervision in its document "Basel III: Global legal framework for the reinforcement of banks and banking systems" published on June 2011, given that it does not allow to set off with owed differed profit taxes. | |
| 11 | Result from assessment of cash flow hedging instruments corresponding to hedged entries that are not assessed at reasonable value. |
| 12* | Reserves pending constitution pursuant to the provisions of fraction I item k) of Article 2 Bis 6 hereof. |
| This is a more conservative approach than the one established by the Basel Committee on Banking Supervision in its document "Basel III: Global legal framework for the reinforcement of banks and banking systems" published on June 2011, given that deducts from level 1 common stock the preventive reserves pending constitution, according to the provisions of Chapter V of the Second Title hereof, as well as those constituted charged to accounting accounts that are part of the result entries or shareholders' equity and not only the positive difference between the Aggregate Expected Losses minus the Aggregate Admissible Reserves, in the event the Institutions use methods based in internal qualifications in the determination of their capital requirements. | |
| 13 | Benefits surplus of securitization transactions pursuant to the provisions of fraction I item c) of Article 2 Bis 6 hereof. |
| 14 | Does not apply |
| 15 | Investments made by the benefit pension fund defined corresponding to resources to which the Institution does not have unrestrictive or unlimited access. These investments are considered as net of the plan's liabilities and owed differed taxes to profit that correspond that have not been applied in any other regulatory adjustment. |
| 16* | The amount of investment in any own action the institution acquires : in accordance with the provisions of the Act in accordance with the provisions of section I subsection d) of Article 2 Bis 6 of these provisions ; through rates predicted values of section I subsection e ) of Section 2 Bis 6 of these provisions and through investment in funds established in section I point i) of article 2 bis 6. |
| This treatment is more conservative than the one established by the Committee on Banking Basel Supervision in its document " Basel III : A global regulatory framework for more resilient banks and banking systems " published in June 2011 because the deduction for this concept is made of common equity tier 1 capital , regardless of the level of capital which has been invested | |
| 17* | Investments, in capital of corporations, other than financial entities referred to by item f) of Article 2 Bis 6 hereof, that are in turn, directly or indirectly, shareholders of the institution itself, of the fund |
| This is a more conservative approach to the one established by the Basel Committee on Banking Supervision in its documents "Basel III: Global regulatory framework for the reinforcement of banks and banking systems" published on June 2011 given that the deduction for this concept is made in the level 1 common stock, irrespective of the capital level where it has been invested, and in addition because any type of entity is considered, not only financial entities. | |
| 18* | Investments in shares, where the Institution owns up to 10% of the capital stock of the financial entities referred to by Articles 89 of the Law and 31 of the Law Regulating Financial Groups pursuant to the provisions of fraction I item f) of Article 2 Bis 6 hereof, including those investments made through investment funds referred to by fraction I item i) of Article 2 Bis 6. The previous investments exclude those made in the capital of development and promotion multilateral organizations of an international nature that have a credit Qualification assigned by any of the issuer's Qualifying Institutions, equal or greater than long term Risk Degree 2. |
| Earnings Release | 3Q.2019 |
61 |
| Banco Santander México |
| This is a more conservative approach to the one established by the Basel Committee on Banking Supervision in its documents "Basel III: Global regulatory framework for the reinforcement of banks and banking systems" published on June 2011 given that the deduction for this concept is made in level 1 common stock, irrespective of the capital level in which it is invested, and additionally because it is deducted from the aggregate amount registered of the investments. | |
| 19* | Investments in shares, where the Institution owns up to 10% of the capital stock of the financial entities referred to by Articles 89 of the Law and 31 of the Law Regulating Financial Groups pursuant to the provisions of fraction I fraction f) of Article 2 Bis 6 hereof, including those investments made through investment funds referred to by fraction I item i) of Article 2 Bis 6. The previous investments exclude those made in development and promotion multilateral organizations of an international nature that have a credit Qualification assigned by any of the issuer's Qualifying institutions, equal or greater than long term Risk Degree 2. |
| This is a more conservative approach to the one established by the Basel Committee on Banking Supervision in its documents "Basel III: Global regulatory framework for the reinforcement of banks and banking systems" published on June 2011 given that the deduction for this concept is made from level 1 common stock, irrespective of the level of capital where it has been investment, and additionally because the aggregate amount registered of investments is deducted. | |
| 20* | Mortgage service s rights shall be deducted from the aggregate amount registered in the event these rights exist. |
| This is a more conservative approach to the one established by the Basel Committee on Banking Supervision in its documents "Basel III: Global regulatory framework for the reinforcement of banks and banking systems" published on June 2011 given that the aggregate amount registered of rights is deducted. | |
| 21 | Deferred taxes assets resulting from temporary differences minus the corresponding owed differed profit taxes not considered to set-off other adjustments, exceeding 10% of the difference between the reference 6 and the sum of references 7 through 20. |
| 22 | Does not apply. Concepts were deducted from the aggregate capital. See notes of references 19, 20 and 21. |
| 23 | Does not apply. Concepts were deducted from the aggregate capital. See note of references 19. |
| 24 | Does not apply. Concepts were deducted from the aggregate capital. See note of reference 20. |
| 25 | Does not apply. Concepts were deducted from the aggregate capital. See note of reference 21. |
| 26 | National adjustments considered as the sum of the following concepts. |
| A. | The sum of the accrued effect for conversion and result for ownership of non-monetary assets considering the amount of each of these concepts with a sign different than the one considered to include them in reference 3, namely, if positive in this concept shall be entered as negatives and vice versa. |
| B. | Investments in subordinated debt instruments, pursuant to the provisions of fraction I item b) of Article 2 Bis 6 hereof. |
| C. | The amount resulting if on account of the purchase of securitization positions, the originating Institutions register a profit or increase in the value of their assets with respect to the assets previously registered in its balance, pursuant to the provisions of fraction I item c) of Article 2 Bis 6 hereof. |
| D. | Investments in capital of development or promotion multilateral organizations of an international nature pursuant to the provisions of fraction I item f) of Article 2 Bis 6 hereof, that have a credit Qualification assigned by any of the issuer's Qualifying Institutions, equal or better to long term Risk Degree 2. |
| Earnings Release | 3Q.2019 |
62 |
| Banco Santander México |
| E. | Investments in shares or corporations related to the Institution under the terms of Articles 73, 73 Bis and 73 Bis 1 of the Law, including the amount corresponding to investments in investment funds and investments indices pursuant to the provisions of fraction I item g) of Article 2 Bis 6 hereof. |
| F. | Investments made by development banking institutions in risk capital, pursuant to the provisions of fraction I item h) of Article 2 Bis 6 hereof. |
| G. | Investments in shares, other than fix capital, in listed investment funds wherein the Institutions holds more than 15 per cent of shareholder's equity of the aforementioned investment funds, pursuant to fraction I item i) of Article 2 Bis 6, that have not been considered in the preceding references. |
| H. | Any type of contribution which resources are destined to the purchase of shares in the financial group's holding company, of the other financial entities that comprise the group to which the Institution belongs or of the financial affiliates of the latter pursuant to the provisions of fraction I item l) of Article 2 Bis 6 hereof. |
| I. | Transactions that infringe the provisions, pursuant to the provisions of fraction I item m) of Article 2 Bis 6 hereof. |
| J. | Differed charges and early payments, net of owed differed profit taxes, pursuant to the provisions of fraction I item n) of Article 2 Bis 6 hereof. |
| K. | Positions pertaining to the First Losses Scheme where the risk is preserved or credit protection is provided up to a certain limit of a position pursuant to fraction I item o) of Article 2 Bis 6. |
| L. | Worker's participation in credited differed profits pursuant to fraction I item p) of Article 2 Bis 6 hereof. |
| M. | The added amount of Transactions Subject to Credit Risk owed by Relevant Related Persons pursuant to fraction I item r) of Article 2 Bis 6 hereof. |
| N. | The difference between the investments made by the benefit pension funds defined pursuant to Article 2 Bis 8 minus reference 15. |
| O. | Adjustment for the acknowledgment of Net Capital. The amount shown corresponds to the amount registered in box C1 of the form included in section II hereof. |
| P. | The investments or contributions, directly or indirectly, in the corporation's capital or in the trust estate or other type of similar figures that have the purpose to set off and liquidate Transactions executed in the stock market, except for such corporation's or trust's share in the former pursuant to item f) fraction I of Article 2 Bis 6. |
| 27 | Does not apply. There are no regulatory adjustments for additional level 1 capital nor for ancillary capital. All regulatory adjustments are made from the level 1 common stock. |
| 28 | Sum of lines 7 through 22, plus lines 26 and 27. |
| 29 | Line 6 minus line 28. |
| 30 | The amount corresponding to titles representing the capital stock (including its share sale premium) that had not been considered in Fundamental Capital and Capital Instruments, that meet the conditions established in fraction II of Article 2 Bis 6 hereof. |
| 31 | Amount of line 30 qualified as capital under the applicable accounting standards. |
| 32 | Does not apply. Instruments directly issued that qualify as additional level 1 capital, plus its premium are registered for accounting purposes as capital. |
| 33 | Subordinated obligations computed as Non-Fundamental Capital, pursuant to the provisions of Article Third Transitory of Resolution 50th that amends the general provisions applicable to Credit Institutions, (Resolution 50th) |
| 34 | Does not apply. See note to reference 5. |
| 35 | Does not apply. See note to reference 5. |
| 36 | Sum of lines 30, 33 and 34. |
| 37* | Does not apply. Deduction is made in aggregate level 1 common capital. |
| 38* | Does not apply. Deduction is made in aggregate level 1 common capital. |
| 39* | Does not apply. Deduction is made in aggregate level 1 common capital. |
| Earnings Release | 3Q.2019 |
63 |
| Banco Santander México |
| 40* | Does not apply. Deduction is made in aggregate level 1 common capital. |
| 41 | National adjustments considered: |
| Adjustment for the acknowledgment of Net Capital. The amount shown corresponds to the amount registered in box C2 of the form included in section II hereof. | |
| 42 | Does not apply. There are no regulatory adjustments for ancillary capital. All regulatory adjustments are made from the level 1 common stock. |
| 43 | Sum of lines 37 through 42. |
| 44 | Line 36, minus line 43. |
| 45 | Line 29, plus line 44. |
| 46 | The amount corresponding to titles representing the capital stock (including its share sale premium) that had not been considered in Capital Fundamental nor in Non-Fundamental Capital and Capital Instruments, that comply with Exhibit 1-S hereof pursuant to the provisions of Article 2 Bis 7 hereof. |
| 47 | Subordinated obligations computed as ancillary capital, pursuant to the provisions of Article Third Transitory, of Resolution 50th |
| 48 | Does not apply. See note to reference 5. |
| 49 | Does not apply. See note to reference 5. |
| 50 | Preventive estimations for credit risk up to a sum of 1.25% of the assets weighed by credit risk corresponding to the Transactions that use the Standard Method to calculate the capital requirement per credit risk; and the positive difference of the Aggregate Admissible Reserves minus the Aggregate Expected Losses, up to an amount that does not exceed of 0.6 per cent of the assets weighed by credit risk, corresponding to the Transactions wherein the method based in internal qualifications to calculate the capital requirements by credit risk is used, pursuant to fraction III of Article 2 Bis 7. |
| 51 | Sun of lines 46 through 48, plus line 50. |
| 52* | Does not apply. The deduction is made in aggregate of level 1 common stock. |
| 53* | Does not apply. The deduction is made in aggregate of level 1 common stock. |
| 54* | Does not apply. The deduction is made in aggregate of level 1 common stock. |
| 55* | Does not apply. The deduction is made in aggregate of level 1 common stock. |
| 56 | National adjustments considered: |
| Adjustment for the acknowledgment of Net Capital. The amount shown corresponds to the amount registered in box C4 of the form included in section II hereof. | |
| 57 | Sum of lines 52 through 56. |
| 58 | Line 51, minus line 57. |
| 59 | Line 45, plus line 58. |
| 60 | Total Risk Weighted Assets. |
| 61 | Line 29 divided by line 60 (expressed as percentages) |
| 62 | Line 45, divided by line 60 (expressed as percentages) |
| 63 | Line 59 divided by line 60 (expressed as percentages) |
| 64 | To report the percentages amount expressed on lines 61, 65, 66 and 67. |
| 65 | Report 2.5% |
| 66 | Percentage corresponding to the Countercyclical Capital buffer referred to on section c), subsection III, article 2 Bis 5 |
| 67 | The SCCS amount on line 64 (expressed as a percentage of the total risk weighted assets) which is related to the banking institutions’ capital buffer for systemic character, in accordance with section b), subsection III, article 2 Bis 5. |
| 68 | Line 61 minus 7% |
| 69 | Does not apply. The minimum is the same as established by the Basel Committee on Banking Supervision in its document "Basel III: Global regulatory framework for the reinforcement of banks and banking systems" published in June 2011. |
| Earnings Release | 3Q.2019 |
64 |
| Banco Santander México |
| 70 | Does not apply. The minimum is the same as established by the Basel Committee on Banking Supervision in its document "Basel III: Global regulatory framework for the reinforcement of banks and banking systems" published in June 2011. |
| 71 | Does not apply. The minimum is the same as established by the Basel Committee on Banking Supervision in its document "Basel III: Global regulatory framework for the reinforcement of banks and banking systems" published in June 2011. |
| 72 | Does not apply. The concept was deducted from the aggregate capital. See note of reference 18. |
| 73 | Does not apply. The concept was deducted from the aggregate capital. See note of reference 19. |
| 74 | Does not apply. The concept was deducted from the aggregate capital. See note of reference 20. |
| 75 | The amount, that does not exceed 10% of the difference between reference 6 and the sum of references 7 through 20, of the credited differed taxes assets resulting from temporary differences minus those corresponding to owed profit taxes not considered to set off other adjustments. |
| 76 | Preventive estimations for credit risk corresponding to the Transactions that use the Standard Method to calculate the capital requirement per credit risk. |
| 77 | 1.25% of weighed assets per credit risk, corresponding to Transactions wherein the Standard Method to calculate the capital requirement by credit risk. |
| 78 | Positive difference of the Aggregate Admissible Reserves minus the Aggregate Expected Losses corresponding to Transactions wherein the method based in internal qualifications to calculate the capital requirement by credit risk is used. |
| 79 | 0.6 per cent of the weighted assets by credit risk, corresponding to Transactions wherein the method based in internal qualifications to calculate the capital requirement by credit risk is used. |
| 80 | Does not apply. There are no instruments subject to transience that compute in level 1 common stock |
| 81 | Does not apply. There are no instruments subject to transience that compute in level 1 common stock |
| 82 | Balance of instruments computed as capital in the basic portion by December 31, 2012 for the corresponding balance limit therein. |
| 83 | Balance of instruments computed as capital in the basic portion by December 31, 2012 minus line 33. |
| 84 | Balance of instruments computed as capital in the complementary portion by December 31, 2012 for the corresponding balance limit therein. |
| 85 | Balance of instruments computed as capital in the basic portion by December 31, 2012 minus line 47. |
Note: * The aforementioned approach is more conservative than the one established by the Basel Committee on Banking Supervision in its document "Basel III: Global regulatory framework for the reinforcement of banks and banking systems" published in June 2011.
Table II.1
Balance sheet figures
| Reference of the balance sheet items | Balance sheet items | Amount shown in the balance sheet |
| Assets | 1,437,437 | |
| BG1 | Funds Available | 66,958 |
| BG2 | Margin accounts | 3,962 |
| BG3 | Investment in securities | 365,912 |
| BG4 | Debtors under sale and repurchase agreements | 12,982 |
| BG5 | Securities loans) | - |
| BG6 | Derivatives | 182,762 |
| Earnings Release | 3Q.2019 |
65 |
| Banco Santander México |
| BG7 | Valuation adjustment for hedged financial assets | 253 |
| BG8 | Total loan portfolio | 629,219 |
| BG9 | Benefits to be received in securitization transactions | 0 |
| BG10 | Other receivables (net) | 112,284 |
| BG11 | Foreclosed assets (net | 143 |
| BG12 | Property, furniture and fixtures (net) | 9,115 |
| BG13 | Long-term investment in shares | 31,864 |
| BG14 | Non current assets held for sale | 0 |
| BG15 | Deferred income taxes (net) | 13,319 |
| BG16 | Other assets (net) | 8,665 |
| Liabilities | 1,297,896 | |
| BG17 | Deposits | 739,405 |
| BG18 | Bank and other loans | 31,474 |
| BG19 | Creditors under sale and repurchase agreements | 162,286 |
| BG20 | Securities loans | 0 |
| BG21 | Collateral sold or pledged as guarantee | 30,611 |
| BG22 | Derivatives | 176,569 |
| BG23 | Valuation adjustment for hedged financial liabilities | 13.899759 |
| BG24 | Creditors from settlement of transactions | 0 |
| BG25 | Other payables, deferred revenues and other advances | 121,772 |
| BG26 | Subordinated debentures outstanding | 35,464 |
| BG27 | Deferred income taxes (net) | 0 |
| BG28 | Deferred revenues and other advances | 301 |
| Shareholders' Equity | 139,541 | |
| BG29 | Paid-in capital | 35,062 |
| BG30 | Other capital | 104,479 |
| Memorandum accounts | 4,024,067 | |
| BG31 | Guarantees granted | 0 |
| BG32 | Contingent assets and liabilities | 48 |
| BG33 | Credit commitments | 143,652 |
| BG34 | Assets in trust or mandate | 186,097 |
| BG35 | Federal Government financial agent | |
| BG36 | Assets in custody or under administration | 2,147,527 |
| BG37 | Collateral received by the entity | 95,940 |
| BG38 | Collateral received and sold or pledged as guarantee | 46,861 |
| BG39 | Investment bank operations on behalf of third parties | 0 |
| BG40 | Uncollected interest earned on past due loan portfolio | 518 |
| BG41 | Other accounts | 1,403,423 |
| Earnings Release | 3Q.2019 |
66 |
| Banco Santander México |
Table II.2
Regulatory concepts considered in the calculation of Net Capital components
| Identifier | Regulatory concepts considered for the calculation of Net Capital components | Reference of the format for the disclosure of capital integration of section I hereof | Amount pursuant to the notes of the table Regulatory concepts considered for the calculation of Net Capital components | Reference(s) of balance sheet item and amount related with the regulatory concept considered for the calculation of Net Capital derived from the aforementioned reference |
| Asset | ||||
| 1 | Goodwill | 8 | 1,735 | BG16= 8,665 Minus: deferred charges and advance payments 1,046; intangibles 6,214; advance payments that are computed as risk assets 247; other assets are computed as risk assets 577 |
| 2 | Intangible assets | 9 | 6,214 | BG16= 8,665 Minus: deferred charges and advance payments 1,046; intangibles 1,735; advance payments that are computed as risk assets 247; other assets that are computed as risk assets 577 |
| 3 | Deferred income tax from tax losses carryforward and tax credits | 10 | 0 | |
| 4 | Benefits to be received in securitization transactions | 13 | 0 | |
| 5 | Defined benefit pension plan assets with no restriction and unlimited access | 15 | 0 | |
| 6 | Investment in own-equity securities | 16 | 4 | BG3= 365,912 Minus: Reciprocal investments in common capital of financial entities 71; Investments in securities computed as risk assets 365,838 |
| 7 | Reciprocal investments in common capital | 17 | 0 | |
| 8 | Direct investments in the capital of financial entities wherein the institution does not hold more than 10% of the issued capital stock | 18 | 0 |
| Earnings Release | 3Q.2019 |
67 |
| Banco Santander México |
| 9 | Indirect investment in capital of financial entities wherein the institution does not hold more than 10% of the issued capital stock | 18 | 71 | BG3= 365,912 Minus: Investment in own-equity securities 4; Investments in securities computed as risk assets 365,838 |
| 10 | Direct investments in the capital of financial entities wherein the institution holds more than 10% of the issued capital stock | 19 | 0 | |
| 11 | Indirect investment in capital of financial entities wherein the institution holds more than 10% of the issued capital stock | 19 | 0 | |
| 12 | Deferred income tax from temporary differences | 21 | 6,316 | BG15= 13,319 Minus: Amount computed as risk asset 7,003 |
| 13 | Reserves recognized as complementary capital | 50 | 0 | BG8= Total loan portfolio 629,219 |
| 14 | Investments in subordinated debt | 26 - B | 0 | |
| 15 | Investments in multilateral entities | 26 - D | 0 | BG13= 31,864 Minus: Investments in subsidiaries 29,032; Investments in clearing houses 420; Investments in associated companies 110; Other investments that are computed as risk assets 2,301 |
| 16 | Investments in associated companies | 26 - E | 29,032 | BG13= 31,864 Minus: Investments in clearing houses 420; Investments in associated companies 110; Other investments that are computed as risk assets 2,301 |
| 17 | Investments in risk capital | 26 - F | 0 | |
| 18 | Investments in investment corporations | 26 - G | 0 | |
| 19 | Financing for repurchase of own shares | 26 - H | 0 |
| Earnings Release | 3Q.2019 |
68 |
| Banco Santander México |
| 20 | Deferred charges and advance payments | 26 - J | 1,061 | BG16= 8,665 Minus: intangible assets 7,949; others assets that are computed as risk assets 247; other assets are computed as risk assets 592 |
| 21 | Deferred employee profit sharing (net) | 26 - L | 0 | |
| 22 | Defined benefit pension plan assets | 26 - N | 0 | |
| 23 | Investments in clearing houses | 26 - P | 420 | BG13= 31,864 Minus: Investments in subsidiaries 29,032; Investments in associated companies 110; other investments that are computed as risk assets 2,301 |
| Liabilities | ||||
| 24 | Deferred income tax related to goodwill | 8 | 0 | |
| 25 | Deferred income tax related to other intangible assets | 9 | 0 | |
| 26 | Provision for defined benefit pension plan with no restriction and unlimited access | 15 | 0 | |
| 27 | Deferred income tax related to defined benefit pension plan | 15 | 0 | |
| 28 | Deferred income tax related to other items | 21 | 0 | |
| 29 | Subordinated liabilities that meets with Exhibit 1-R | 31 | 0 | |
| 30 | Subordinated liabilities subject to transitoriness that compute as basic capital 2 | 33 | 0 | |
| 31 | Subordinated liabilities that meets with Exhibit 1-S | 46 | 0 | |
| 32 | Subordinated obligations subject to transitoriness that compute as complementary capital | 47 | 0 | |
| 33 | Deferred income tax related to deferred charges and advance payments | 26 - J | 0 | |
| Shareholders' Equity | ||||
| 34 | Paid-in capital that meets with Exhibit 1-Q | 1 | 35,062 | BG29 |
| 35 | Retained earnings | 2 | 62,949 | BG30= 104,479 Minus: other items of earned capital 41,521, cumulative effect of conversion 9 |
| 36 | Result from valuation of cash flow hedge instruments | 3 | 0 |
| Earnings Release | 3Q.2019 |
69 |
| Banco Santander México |
| 37 | Other items of earned capital | 3 | 41,521 | BG30= 104,479 Minus: Retained earnings 62,949,cumulative effect of conversion 9 |
| 38 | Paid-in capital that meets with Exhibit 1-R | 31 | 9,854 | BG26= 35,464 More: Subordinated debt instruments non-convertible 25,610 |
| 39 | Paid-in capital that meets with Exhibit 1-S | 46 | 25,610 | BG26= 35,464 More: Subordinated debt instruments convertible 9,854 |
| 40 | Result from valuation of cash flow hedge instruments | 03, 11 | 0 | |
| 41 | Cumulative effect from conversion | 3, 26 - A | 0 | |
| 42 | Result from ownership of non-monetary assets | 3, 26 - A | 0 | |
| Accounts in order | ||||
| 43 | Positions in First Losses Schemes | 26 - K | 0 | |
| Regulatory concepts not considered in the balance sheet | ||||
| 44 | Reserves pending constitution | 12 | 0 | |
| 45 | Profit or increase of the value of assets from the purchase of securitization positions (Originating Institutions) | 26 - C | 0 | |
| 46 | Transactions that breach the provisions | 26 - I | 0 | |
| 47 | Transactions with Relevant Related Persons | 26 - M | 0 | |
| 48 | Repealed | 0 |
Table II.3
Notes to table III.2 "Regulatory concepts considered for the calculation of Net Capital components"
| Identifier | Description |
| 1 | Commercial credit. |
| 2 | Intangibles, without including commercial credit. |
| 3 | Credited differed profit taxes originating from fiscal losses and credits. |
| 4 | Benefits regarding the remnant of securitization transactions. |
| 5 | Investments of pension plan for defined benefits without unrestrictive and unlimited access. |
| 6 | Any share that the Institution acquires pursuant to the provisions of the Law, that have not been subtracted; considering those amounts acquired through investments in securities indexes and the amount corresponding to investments in investment funds other than those provided by reference 18. |
| 7 | Investments in shares in corporations other than financial entities referred to by item f) of fraction I of Article 2 Bis 6 hereof, that are in turn, directly or indirectly shareholders of the Institution itself, of the financial group's holding company, of the remaining financial entities that comprise the group to which the Institution belongs or financial affiliates of the latter, considering those investments corresponding to investment funds other than those provided by reference 18. |
| 8 | Direct investments in financial entities capital referred to by Article 89 of the Law and 12 and 8 of the Law Regulating Financial Groups, where the Institution owns more than 10% of the capital thereof. |
| 9 | Direct investments in financial entities capital referred to by Article 89 of the Law and 12 and 8 of the Law Regulating Financial Groups, where the Institution owns more than 10% of the capital thereof. |
| 10 | Direct investments in financial entities capital referred to by Article 89 of the Law and 12 and 8 of the Law Regulating Financial Groups, where the Institution owns more than 10% of the capital thereof. |
| Earnings Release | 3Q.2019 |
70 |
| Banco Santander México |
| 11 | Indirect investments in financial entities capital referred to by Article 89 of the Law and 12 and 8 of the Law Regulating Financial Groups, where the Institution owns more than 10% of the capital thereof. |
| 12 | Credited differed profit taxes originating from temporary differences. |
| 13 | Preventive estimates for credit risk up to a sum of 1.25% of the weighted assets by credit risk, corresponding to Transactions wherein the Standard Method is used to calculate the capital requirement by credit risk; and the positive difference of the Aggregate Admissible Reserves minus the Aggregate the Expected Losses, up to an amount that does not exceed of 0.6 per cent of the weighted assets by credit risk, corresponding to Transactions where the method based in internal qualifications is used to calculate the capital requirement by credit risk. |
| 14 | Investments in subordinated debt instruments, pursuant to the provisions of fraction I item b) of Article 2 Bis 6 hereof. |
| 15 | Investments in development or promotion multilateral organizations of an international nature pursuant to the provisions of fraction I item f) of Article 2 Bis 6 hereof that have a credit Qualification assigned by any of the issuer's Qualifying Institutions, equal or greater than long term Risk Degree 2. |
| 16 | Investments in shares of corporations related with the Institution under the terms of Articles 73, 73 Bis and 73 Bis 1 of the Law, including the amount corresponding to investments in investment corporations and investments in indices pursuant to the provisions of fraction I item g) of Article 2 Bis 6 hereof. |
| 17 | Investments made in development banking institutions in risk capital, pursuant to the provisions of fraction I item h) of Article 2 Bis 6 hereof. |
| 18 | Investments in shares, other than fix capital, of listed investment corporations, wherein the Institution holds more than 15 per cent of shareholders' equity of the aforementioned investment corporation, pursuant to fraction I item i) of Article 2 Bis 6, that have not been considered in the previous references. |
| 19 | Any type of contributions which resources are destined to the purchase of shares of the financial group's holding company, of the other financial entities that comprise the group to which the Institution belongs or the latter's financial affiliates, pursuant to the provisions of fraction I item l) of Article 2 Bis 6 hereof. |
| 20 | Differed charges and early payments. |
| 21 | Workers' share in credited differed profits pursuant to fraction I item p) of Article 2 Bis 6 hereof. |
| 22 | Investments of the pension plan for benefits defined that have to be deducted according with Article 2 Bis 8 hereof. |
| 23 | Investments or contributions, directly or indirectly, in the corporation's capital or in trust estate or other type of similar figures that have the purpose of setting off and liquidating Transactions executed in the stock market, unless the share in such corporations or trusts in the former pursuant to item f) fraction I of Article 2 Bis 6. |
| 24 | Owed differed taxes to profit originating from temporary differences related to commercial credit. |
| 25 | Owed differed taxes to profit originated from temporary differences related to other intangibles (other than commercial credit). |
| 26 | Liabilities of the pension plan for benefits defined related to investments of the pension plan for defined benefits. |
| 27 | Owed differed taxes originated from temporary differences related to the pension plan for defined benefits. |
| 28 | Owed differed profit taxes originated from temporary differences other than those of references 24, 25, 27 and 33 |
| 29 | Amount of subordinated obligations that meet with Exhibit 1-R hereof. |
| 30 | Amount of subordinated obligations subject to transience that are computed as Non-Fundamental Capital. |
| 31 | Amount of subordinated obligations that meet with Exhibit 1-S hereof. |
| 32 | Amount of subordinated obligations subject to transience that compute as ancillary capital. |
| 33 | Owed differed profit taxes originated from temporary differences related to differed charges and early payments. |
| 34 | Amount of capital contributed that meets the provisions of Exhibit 1-Q hereof. |
| 35 | Result of the previous fiscal years. |
| 36 | Result for the assessment of cash flow hedging instruments from covered entries assessed at reasonable value. |
| 37 | Net result and result for the assessment of titles available for sale. |
| 38 | Amount of capital contributed that meets the provisions of Exhibit 1-R hereof. |
| 39 | Amount of capital contributed that meets the provisions of Exhibit 1-S hereof. |
| 40 | Result for the assessment of cash flow hedging instruments from covered entries assessed at capitalized cost. |
| 41 | Accrued effect by conversion. |
| 42 | Result for ownership of non-monetary assets. |
| Earnings Release | 3Q.2019 |
71 |
| Banco Santander México |
| 43 | Positions related with the First Losses Scheme wherein risk is preserved or credit protection provided until certain limit of a position pursuant to fraction I item o) of Article 2 Bis 6. |
| 44 | Reserves pending constitution pursuant to the provisions of fraction I item k) of Article 2 Bis 6 hereof. |
| 45 | The amount resulting if on account of the purchase of securitization positions, the originating Institutions register a profit or an increase in the value of their assets with respect to assets previously registered in its balance, pursuant to the provisions of fraction I item c) of Article 2 Bis 6 hereof. |
| 46 | Transactions that infringe the provisions, pursuant to the provisions of fraction I item m) of Article 2 Bis 6 hereof. |
| 47 | The aggregate amount of Transactions Subject to Credit Risk owed by Relevant Related Persons pursuant to fraction I item r) of Article 2 Bis 6 hereof. |
Table III.1
Positions exposed to market risks per risk factor
| Concept | Amount of equivalent positions | Capital Requirement |
| Transactions in national currency with nominal rate | 82,095 | 6,568 |
| Transactions with debt instruments in national currency with surtax and reviewable rate | 793 | 63 |
| Transactions in national currency with real rate or denominated in UDIs | 6,798 | 544 |
| Transactions in national currency with yield rate referred to the increase of the General Minimum Wage | 10,318 | 825 |
| Positions in UDIs or with yield referred to INPC | 24 | 2 |
| Positions in national currency with yield rate referred to the increase of the General Minimum Wage | 356 | 28 |
| Transactions in foreign currency with nominal rate | 53,841 | 4,307 |
| Positions in foreign currency or with yield indexed to the exchange rate | 10,442 | 835 |
| Positions in shares or with yield indexed to the price of one share or set of shares | 6,107 | 489 |
| Positions in commodities | 0 | 0 |
| Impact Capital requirement for Gamma and Vega | 0 | 0 |
Table III.2
Assets weighted subject to credit risk by risk group
| Concept | Risk weighted assets | Capital Requirement |
| Group I-A (weighted at 0%) | 0 | 0 |
| Group I-A (weighted at 10%) | 0 | 0 |
| Group I-A (weighted at 20%) | 0 | 0 |
| Group I-B (weighted at 2%) | 1,776 | 142 |
| Group I-B (weighted at 4.0%) | 0 | 0 |
| Group II (weighted at 0%) | 0 | 0 |
| Group II (weighted at 20%) | 5,589 | 447 |
| Group II (weighted at 50%) | 0 | 0 |
| Group II (weighted at 100%) | 31,996 | 2,560 |
| Group II (weighted at 120%) | 0 | 0 |
| Group II (weighted at 150%) | 0 | 0 |
| Group III (weighted at 2.5%) | 0 | 0 |
| Group III (weighted at 10%) | 0 | 0 |
| Group III (weighted at 11.5%) | 0 | 0 |
| Group III (weighted at 20%) | 38,475 | 3,078 |
| Group III (weighted at 23%) | 2,582 | 207 |
| Group III (weighted at 25%) | 0 | 0 |
| Group III (weighted at 28.75%) | 0 | 0 |
| Group III (weighted at 50%) | 38 | 3 |
| Earnings Release | 3Q.2019 |
72 |
| Banco Santander México |
| Group III (weighted at 57.5%) | 0 | 0 |
| Group III (weighted at 60%) | 0 | 0 |
| Group III (weighted at 75%) | 0 | 0 |
| Group III (weighted at 100%) | 50,882 | 4,071 |
| Group III (weighted at 115%) | 0 | 0 |
| Group III (weighted at 120%) | 474 | 38 |
| Group III (weighted at 138%) | 0 | 0 |
| Group III (weighted at 150%) | 0 | 0 |
| Group III (weighted at 172.5%) | 0 | 0 |
| Group IV (weighted at 0%) | 0 | 0 |
| Group IV (weighted at 20%) | 9,100 | 728 |
| Group V (weighted at 10%) | 0 | 0 |
| Group V (weighted at 20%) | 6,324 | 506 |
| Group V (weighted at 50%) | 0 | 0 |
| Group V (weighted at 115%) | 0 | 0 |
| Group V (weighted at 150%) | 0 | 0 |
| Group VI (weighted at 20%) | 0 | 0 |
| Group VI (weighted at 50%) | 31,731 | 2,538 |
| Group VI (weighted at 75%) | 12,447 | 996 |
| Group VI (weighted at 100%) | 42,177 | 3,374 |
| Group VI (weighted at 120%) | 0 | 0 |
| Group VI (weighted at 150%) | 0 | 0 |
| Group VI (weighted at 172.5%) | 0 | 0 |
| Group VII-A (weighted at 10%) | 0 | 0 |
| Group VII-A (weighted at 11.5%) | 0 | 0 |
| Group VII-A (weighted at 20%) | 15,386 | 1,231 |
| Group VII-A (weighted at 23%) | 0 | 0 |
| Group VII-A (weighted at 50%) | 4,103 | 328 |
| Group VII-A (weighted at 57.5%) | 0 | 0 |
| Group VII-A (weighted at 100%) | 99,441 | 7,955 |
| Group VII-A (weighted at 115%) | 0 | 0 |
| Group VII-A (weighted at 120%) | 0 | 0 |
| Group VII-A (weighted at 138%) | 0 | 0 |
| Group VII-A (weighted at 150%) | 3 | 0 |
| Group VII-A (weighted at 172.5%) | 0 | 0 |
| Group VII-B (weighted at 0%) | 0 | 0 |
| Group VII-B (weighted at 20%) | 0 | 0 |
| Group VII-B (weighted at 23%) | 0 | 0 |
| Group VII-B weighted at 50%) | 1,297 | 104 |
| Group VII-B weighted at 57.5%) | 8,758 | 701 |
| Group VII-B (weighted at 100%) | 46,346 | 3,708 |
| Group VII-B (weighted at 115%) | 0 | 0 |
| Group VII-B (weighted at 120%) | 0 | 0 |
| Group VII-B (weighted at 138%) | 0 | 0 |
| Group VII-B (weighted at 150%) | 0 | 0 |
| Group VII-B (weighted at 172.5%) | 0 | 0 |
| Group VIII (weighted at 115%) | 1,993 | 159 |
| Group VIII (weighted at 150%) | 4,158 | 333 |
| Earnings Release | 3Q.2019 |
73 |
| Banco Santander México |
| Group IX (weighted at 100%) | 67,785 | 5,423 |
| Group IX (weighted at 115%) | 0 | 0 |
| Group IX (weighted at 150%) | 0 | 0 |
| Group X (weighted at 1250%) | 1,339 | 107 |
| Other Assets (weighted at 0%) | 0 | 0 |
| Other Assets (weighted at 100%) | 18,771 | 1,502 |
| Credit Valuation Adjustment on Derivative Operations | 31,585 | 2,527 |
| Re-securitization with Risk Degree 1 (weighted at 20%) | 9,792 | 783 |
| Re-securitization with Risk Degree 2 (weighted at 50%) | 0 | 0 |
| Re-securitization with Risk Degree 3 (weighted at 100%) | 0 | 0 |
| Re-securitization with Risk Degree 4 (weighted at 350%) | 0 | 0 |
| Re-securitization with Risk Degree 4, o 5 or Not qualified (weighted at 1250%) | 3,553 | 284 |
| ReRe-securitization with Risk Degree 1 (weighted at 40%) | 0 | 0 |
| ReRe-securitization with Risk Degree 1 (weighted at 100%) | 0 | 0 |
| ReRe-securitization with Risk Degree 1 (weighted at 225%) | 0 | 0 |
| ReRe-securitization with Risk Degree 1 (weighted at 650%) | 0 | 0 |
| ReRe-securitization with Risk Degree 4, 5 or Not qualified (weighted at 1250%) | 0 | 0 |
Table III.3
Assets weighted subject to operational risk
| Method | Risk weighted Assets | Capital Requirement |
| STANDARD ALTERNATIVE METHOD | 52,120 | 4,170 |
| Average of requirement by market and credit risk of the last 36 months | Average of annual positive net income of the last 36 months | |
| 0 | 54,586 | |
Table IV.1
Main characteristics of titles that are part of the Net Capital
| Reference | Characteristic | Options |
| 1 | Issuer | Banco Santander México, S. A. |
| 2 | ISIN, CUSIP or Bloomberg Identifier | MX41BS060013 |
| 3 | Legal frame | Securities Market Law |
| Regulation treatment | ||
| 4 | Level of capital with transitory | N.A |
| 5 | Level of capital without transitory | Fundamental Capital |
| 6 | Instrument level | Credit Institution without consolidating |
| 7 | Instrument type | Series F Shares |
| 8 | Amount acknowledge of regulatory capital | $15,210,402,155.77 |
| 9 | Instrument's par value | $3.78 |
| 9A | Instrument's currency | Mexican Pesos |
| 10 | Accounting qualification | Capital |
| 11 | Date of issuance | N.A |
| 12 | Instrument´s term | Perpetual |
| 13 | Date of expiration | Without expiration |
| 14 | Early payment clause | No |
| 15 | First date of early payment | N.A |
| 15A | Regulatory or fiscal events | No |
| 15B | Liquidation price of the early payment clause | N.A |
| 16 | Subsequent early payment dates | N.A |
| Yields / Dividends | ||
| 17 | Type of yield/dividend | Variable |
| Earnings Release | 3Q.2019 |
74 |
| Banco Santander México |
| 18 | Interest rate/dividend | Variable |
| 19 | Cancellation of dividends clause | No |
| 20 | Payment discretion | Mandatory |
| 21 | Interest increase clause | No |
| 22 | Yields/Dividends | Not Accruable |
| 23 | Convertibility of the instrument | N.A |
| 24 | Convertibility conditions | N.A |
| 25 | Degree of convertibility | N.A |
| 26 | Conversion rate | N.A |
| 27 | Instrument convertibility rate | N.A |
| 28 | Type of convertibility financial instrument | N.A |
| 29 | Instrument issuer | N.A |
| 30 | Write-down clause | No |
| 31 | Conditions for write-down | N.A |
| 32 | Degree of write-down | N.A |
| 33 | Temporality of write-down | N.A |
| 34 | Mechanism for temporary write down | N.A |
| 35 | Subordination position in the event of liquidation | Creditors in general |
| 36 | Breach characteristics | No |
| 37 | Description of breach characteristics | N.A |
Table IV.1.2
Main characteristics of titles that are part of the Net Capital
| Reference | Characteristic | Options |
| 1 | Issuer | Banco Santander México, S. A. |
| 2 | ISIN, CUSIP or Bloomberg Identifier | MX41BS060005 |
| 3 | Legal frame | Securities Market Law |
| Regulation treatment | ||
| 4 | Level of capital with transitory | N.A |
| 5 | Level of capital without transitory | Fundamental Capital |
| 6 | Instrument level | Credit Institution without consolidating |
| 7 | Instrument type | Series B Shares |
| 8 | Amount acknowledge of regulatory capital | $14,588,587,852.93 |
| 9 | Instrument's par value | $3.78 |
| 9A | Instrument's currency | Mexican Pesos |
| 10 | Accounting qualification | Capital |
| 11 | Date of issuance | N.A |
| 12 | Instrument´s term | Perpetual |
| 13 | Date of expiration | Without expiration |
| 14 | Early payment clause | No |
| 15 | First date of early payment | N.A |
| 15A | Regulatory or fiscal events | No |
| 15B | Liquidation price of the early payment clause | N.A |
| 16 | Subsequent early payment dates | N.A |
| Yields / Dividends | ||
| 17 | Type of yield/dividend | Variable |
| 18 | Interest rate/dividend | Variable |
| 19 | Cancellation of dividends clause | No |
| 20 | Payment discretion | Mandatory |
| 21 | Interest increase clause | No |
| 22 | Yields/Dividends | Not Accruable |
| 23 | Convertibility of the instrument | N.A |
| 24 | Convertibility conditions | N.A |
| Earnings Release | 3Q.2019 |
75 |
| Banco Santander México |
| 25 | Degree of convertibility | N.A |
| 26 | Conversion rate | N.A |
| 27 | Instrument convertibility rate | N.A |
| 28 | Type of convertibility financial instrument | N.A |
| 29 | Instrument issuer | N.A |
| 30 | Write-down clause | No |
| 31 | Conditions for write-down | N.A |
| 32 | Degree of write-down | N.A |
| 33 | Temporality of write-down | N.A |
| 34 | Mechanism for temporary write down | N.A |
| 35 | Subordination position in the event of liquidation | Creditors in general |
| 36 | Breach characteristics | No |
| 37 | Description of breach characteristics | N.A |
Table IV.1.3
Main characteristics of titles that are part of the Net Capital
| Reference | Item | Characteristics | ||
| 1 | Issuer | Banco Santander México, S. A., Institución de Banca Múltiple, Grupo Financiero Santander México. | ||
| 2 | ISIN, CUSIP or Bloomberg Identifier | ISIN | CUSIP | |
| 144A | US05969BAC72 | 05969BAC7 | ||
| Reg S | USP1507SAG23 | P1507SAG2 | ||
| 3 | Governing Law | The Indenture and the Notes will be governed by, and construed in accordance with, the law of the State of New York. All additional dispositions related to the determination of Suspension Periods, a Trigger Event (leading to a Writedown), Interest Payment cancellation, Optional Redemption or, the ranking and subordination of the Notes, will be governed by, and construed in accordance with, Mexican Law, as established in the Indenture and the Notes. | ||
| Regulatory Treatment | ||||
| 4 | Capital category the Note qualifies as, based on Article 3, Transitory, Resolution 50th | N.A. | ||
| 5 | Capital category the Note qualifies as, based on Annexes 1-Q, 1-R and 1-S | “Tier 2” or Supplementary Capital (Capital Complementario). | ||
| 6 | Instrument seniority within the Group | Subordinated Debt issued by our Credit Institution. | ||
| 7 | Type of Instrument | Tier 2 Subordinated Preferred Capital Notes. | ||
| 8 | Amount acknowledged as regulatory capital | $25,145,225,839.39 | ||
| 9 | Instrument's Face Value | $25,654,850,000.00 (USD $1,300,000,000.00) | ||
| 9A | Currency | USD. | ||
| 10 | Accounting Classification | Subordinated Debt. | ||
| 11 | Issuance Date | October 1, 2018. | ||
| Earnings Release | 3Q.2019 |
76 |
| Banco Santander México |
| 12 | Type of Expiration | Expiration Date. |
| 13 | Expiration Date | October 1, 2028. |
| 14 | Optional Redemption | Subject to certain conditions, the Issuer may redeem the Notes at par plus accrued and unpaid interest due on, or with respect to, the Capital Notes, plus Additional Amounts, if any, (i) in whole or in part, only on the Optional Redemption Date or (ii) in whole, but not in part, at any date by means of the existence a Withholding Tax Redemption event or a Special Redemption event. |
| 15 | Optional Redemption Date | October 1, 2023. |
| 15A | Does the early redemption clause contemplates Regulatory or Fiscal Events? | Yes.
Withholding Tax Redemption: The Issuer may redeem the Capital Notes at par plus accrued and unpaid interest due on, or with respect to the Capital Notes, plus Additional Amounts, if any, in whole but not in part, prior to the Maturity Date as a result of certain changes in tax law affecting the Notes and resulting in a higher withholding tax applicable to interest payments under the Notes, subject to the satisfaction of certain conditions.
Special Event Redemption: The Issuer may redeem the Notes at par plus accrued and unpaid interest due on, or with respect to, the Capital Notes, plus Additional Amounts, if any, in whole but not in part, upon the occurrence of a Special Event (which event happens upon the occurrence of certain changes in capital treatment or tax deductibility of payments under the Notes and the satisfaction of certain conditions).
|
| 15B | Liquidation price for an early redemption | Upon an early redemption, the Notes would be repaid at par plus accrued and unpaid interest due on, or with respect to, the Notes, plus Additional Amounts, if any. |
| 16 | Subsequent early redemption dates | None, except for early redemptions caused by a Withholding Tax Redemption event or a Special Redemption event, which can be made at any date before Maturity Date. |
| Yields / Dividends | ||
| 17 | Type of Interest Rate | Fixed Rate with only one reset date at the Optional Redemption Date. |
| 18 | Interest Rate | 5.95%. |
| 19 | Dividend Stopper Clause: | Subject to certain exceptions, the Issuer will not be allowed to make certain distributions during a Suspension Period, including (i) dividends or distributions on capital stock, (ii) make any payment of the Issuer’s debt securities that rankpari passu with or junior in right of payment and in liquidation to the Notes; or (iii) make any guaranty payments with respect to any guaranty of the debt securities of its subsidiaries if such guaranty rankspari passu with or junior in right of payment and in liquidation to the Notes. |
| 20 | Are Interest Payments discretionary? | Interest Payments are Mandatory. |
| 21 | Interest increase / Step-Up clause | No. |
| 22 | Are coupon payments cumulative? | Cumulative.
The Issuer will have the right to and will defer, but not cancel (except pursuant to a Write-Down), payment of interest and principal due on the Notes, if the CNBV institutes certain corrective measures against the Issuer if the Issuer is classified as Class III (or equivalent classification under any successor provisions) or below under the Mexican Capitalization Requirements. Payments of interest due on the Notes will be cumulative. Subject to the occurrence of one or more Write-Downs, a Suspension Period shall terminate and the payment of interest due on the Notes and payment of principal thereof will resume when the related Mexican Regulatory Event has terminated.
|
| 23 | Convertibility of the instrument | N.A. |
| 24 | Convertibility conditions | N.A. |
| Earnings Release | 3Q.2019 |
77 |
| Banco Santander México |
| 25 | Degree of convertibility | N.A. |
| 26 | Conversion rate | N.A. |
| 27 | Type of Conversion | N.A. |
| 28 | Type of shares into which the title is converted | N.A. |
| 29 | Issuer of such capital instrument | N.A. |
| 30 | Write-Down Mechanism | Yes. |
| 31 | Write-Down Trigger Events | A “Trigger Event” will be deemed to have occurred if (i) the CNBV publishes a determination, in its official publication of capitalization levels for Mexican banks, that Banco Santander Mexico’s Fundamental Capital Ratio, as calculated pursuant to the applicable Mexican Capitalization Requirements, is equal to or below 4.5%, or (ii) both (A) the CNBV notifies the Issuer that it has made a determination, pursuant to Article 29 Bis of the Mexican Banking Law, that a cause for revocation of Banco Santander Mexico’s license has occurred resulting from (x) the Issuer’s non-compliance with corrective measures imposed by the CNBV pursuant to the Mexican Banking Law, or (y) the Issuer’s non-compliance with the capitalization requirements set forth in the Mexican Capitalization Requirements and (B) the Issuer has not cured such cause for revocation, by (a) complying with such corrective measures, or (b)(1) submitting a capital restoration plan to, and receiving approval of such plan by, the CNBV, (2) transferring at least seventy five percent (75%) of its shares to an irrevocable
trust and (3) not being classified in Class III, IV, or V, or (c) remedying any capital deficiency, , in each case, on or before the third (in the case of (A)(z)) or seventh (in the case of (A)(x) or (y)) business day in Mexico, as applicable, following the date on which the CNBV notifies the Issuer of such determination..
|
| 32 | Write-Down Amount | “Write-Down Amount” means an (i) amount that would be sufficient, together with any concurrent pro rata write down of any other loss-absorbing instruments issued by us and then outstanding, to return Banco Santander Mexico’s Fundamental Capital to the levels required under Section IX, b), 2 of Annex 1-S of the General Rules Applicable to Mexican Banks, or (ii) if any Write-Down of the Current Principal Amount, together with any concurrent pro rata write down of any other loss-absorbing instruments issued by us and then outstanding, would be insufficient to return Banco Santander Mexico’s Fundamental Capital to the levels required under Section IX, b), 2 of Annex 1-S of the General Rules Applicable to Mexican Banks, the amount necessary to reduce the Current Principal Amount of each outstanding Capital Note to zero. |
| 33 | Write-Up Mechanism | N.A., Write-Down, if applied, will be permanent. |
| 34 | Mechanism for temporary Write-Down | N.A. |
| 35 | Ranking of the Capital Notes in a liquidation event | The Notes constitute subordinated preferred indebtedness, and will rank (i) subordinate and junior in right of payment and in liquidation to all of the Issuer’s present and future senior indebtedness, (ii)pari passu without preference among themselves and with all of the Issuer’s present and future unsecured subordinated preferred indebtedness and (iii) senior only to all of the Issuer’s present and future subordinated non-preferred indebtedness and all classes of the Issuer’s equity or capital stock.. |
| 36 | Does any characteristic of the Notes breach conditions set forth in Annex 1-R, 1-S or 1-Q of the Mexican Banking Law | No. |
| 37 | Specify which characteristics of the Notes breach conditions set forth in Annex 1-R, 1-S or 1-Q of the Mexican Banking Law | N.A. |
| Earnings Release | 3Q.2019 |
78 |
| Banco Santander México |
Table IV.1.4
Main characteristics of titles that are part of the Net Capital
| Reference | Characteristic | Options |
| 1 | Issuer | Banco Santander México, S. A., Institución de Banca Múltiple, Grupo Financiero Santander México. |
| 2 | ISIN, CUSIP or Bloomberg Identifier | ISIN: US40053CAA36 CUSIP: 40053C AA3 BMV Ticker: BSMX 17 |
| 3 | Governing Law | The Capital Notes and the Indenture are governed by, and construed in accordance with the laws of New York, except that the ranking and subordination provisions, provisions related to mandatory cancellation of interest, provisions relating to conversion, provisions relating to a withholding tax redemption or a special redemption and the waiver of the right to set-off by the holders of the Capital Notes and by the Trustee acting on behalf of the holders with respect to the Capital Notes will be governed by and construed in accordance with the laws of Mexico. |
| Regulatory Treatment | ||
| 4 | Level of capital with transitory | N.A. |
| 5 | Level of capital without transitory | Tier 1 Capital (Capital Básico No Fundamental). |
| 6 | Instrument level within the Group | Subordinated Debt issued from our Credit Institution. |
| 7 | Type of Instrument | Perpetual Subordinated Non-Preferred Contingent Convertible Additional Tier 1 Capital Notes. |
| 8 | Amount acknowledged as regulatory capital | $9,018,160,682.00 |
| 9 | Instrument's Face Value | $9,867,250,000.00 (USD $500,000,000.00) |
| 9A | Currency | USD. |
| 10 | Accounting Classification | Principal is accounted as debt, coupon payments are accounted as capital. |
| 11 | Issuance Date | December 23, 2016. |
| 12 | Type of Expiration | Perpetuity. |
| 13 | Expiration Date | N.A. |
| 14 | Optional Redemption | Subject to certain conditions, the Issuer may redeem the Capital Notes at par plus accrued and unpaid interest due on, or with respect to, the Capital Notes, plus Additional Amounts, if any, (i) in whole or in part, only on the Optional Redemption Dates or (ii) in whole at any date by means of the existence a Withholding Tax Event or a Special Event.
|
| 15 | First Optional Redemption Date | January 20, 2022. |
| 15A | Does the early redemption clause contemplates Regulatory or Fiscal Events? | Yes.
Withholding Tax Redemption: The Issuer may redeem the Capital Notes at par plus accrued and unpaid interest due on, or with respect to the Capital Notes, plus Additional Amounts, if any, in whole but not in part, prior to the Maturity Date as a result of certain changes in tax law affecting the, and resulting in a higher, withholding tax applicable to interest payments under the Capital Notes, subject to the satisfaction of certain conditions.
|
| Earnings Release | 3Q.2019 |
79 |
| Banco Santander México |
| Special Event Redemption: The Issuer may redeem the Capital Notes at par plus accrued and unpaid interest due on, or with respect to, the Capital Notes, plus Additional Amounts, if any, in whole but not in part, upon the occurrence of a Special Event (which event happens upon the occurrence of certain changes in capital treatment or tax deductibility of payments under the Capital Notes and the satisfaction of certain conditions). | ||
| 15B | Liquidation price for an early redemption | Upon an early redemption, Capital Notes would be repaid at par plus accrued and unpaid interest due on, or with respect to, the Capital Notes, plus Additional Amounts, if any, |
| 16 | Subsequent early redemption dates | Every Interest Payment Date after the First Optional Redemption Date.
Early redemptions caused by a Withholding Event or a Special Event, which can be made at any date.
|
| Yields / Dividends | ||
| 17 | Type of Interest Rate | Fixed with reset dates on the First Redemption Date and every fifth anniversary thereafter. |
| 18 | Interest Rate | 8.50%. |
| 19 | Dividend Stopper Clause | Unless the most recent payable accrued interests and any Additional Interest on the Capital Notes have been paid, the Issuer shall not: (i) declare or pay any dividends or distributions on, or redeem, purchase, acquire, or make a liquidation payment with respect to, any of its capital stock; or (ii) make any payment of premium, if any, or interest on or repay, repurchase or redeem any of its Subordinated Non-Preferred Indebtedness. |
| 20 | Are Interest Payments discretionary | Completely Discretionary.
(a) Interest is payable solely at the Issuer’s discretion, and no amount of interest shall become due and payable in respect of the relevant interest period to the extent that it has been canceled by the Issuer (in whole or in part) at its sole discretion and/or has been canceled as a result of the occurrence and continuation of an Interest Cancellation Event; and (b) a cancellation of interest (in whole or in part) shall not constitute a default.
|
| 21 | Interest increase / Step-Up clause | No. |
| 22 | Are Coupon Payments Cumulative? | No. |
| 23 | Convertibility of the instrument | Yes. |
| 24 | Conversion Trigger Events | A Conversion Trigger Event shall occur:
(i) the Business Day in Mexico following the publication of a determination by the CNBV, in its official publication of capitalization levels for Mexican banks, that Banco Santander México’s Fundamental Capital Ratio, as calculated pursuant to the applicable Mexican Capitalization Requirements, is equal to or below 5.125%;
(ii) if both (A) the CNBV notifies Banco Santander México that it has made a determination, pursuant to Article 29 Bis of the Mexican Banking Law, that a cause for revocation of Banco Santander México’s license has occurred resulting from (x) Banco Santander México’s assets being insufficient to satisfy its liabilities, (y) Banco Santander México’s non-compliance with corrective measures imposed by the CNBV pursuant to the Mexican Banking Law, or (z) Banco Santander México’s non-compliance with the capitalization requirements set forth in the Mexican Capitalization Requirements and (B) Banco Santander México has not cured such cause for revocation, by (x) complying with such corrective measures, or (y)(1) submitting a capital restoration plan to, and receiving approval of such plan by, the CNBV, (2) not being classified in Class III, IV or V, and (3) transferring at least 75% of its shares to an irrevocable trust, or (z) remedying any capital deficiency, in each case, on or before the third or seventh calendar day in Mexico, as applicable, following the date on which the CNBV notifies Banco Santander México of such determination;
(iii) if the Banking Stability Committee, which is a committee formed by the CNBV, the Ministry of Finance and Public Credit (Secretaría de Hacienda y Crédito Público), Banco de México and the IPAB, determines pursuant to Article 29 Bis 6 of the Mexican Banking Law that, under Article 148, Section II, paragraphs (a) and (b) of the Mexican Banking Law, financial assistance is required by Banco Santander México to avoid revocation of its license because Banco Santander
|
| Earnings Release | 3Q.2019 |
80 |
| Banco Santander México |
| México’s assets are insufficient to satisfy Banco Santander México’s liabilities, or Banco Santander México’s failure to comply with corrective measures, to comply with capitalization requirements, or to satisfy certain liabilities when due, as a means to maintain the solvency of the Mexican financial system or to avoid risks affecting the Mexican payments system and such determination is either made public or notified to Banco Santander México (for the avoidance of doubt, pursuant to Annex 1-R of the general rules applicable to Mexican banks, a Conversion Trigger Event shall occur if financial assistance or other loans shall be granted to the Bank pursuant to Article 148, Section II, paragraphs (a) and (b) of the Mexican Banking Law) | ||
| 25 | Conversion Amount | “Conversion Amount” means: (i) a conversion of the then Current Principal Amount of Capital Notes in an amount that would be sufficient, and together with any concurrent pro rata write-down or conversion of any other Subordinated Non-Preferred Indebtedness issued by Banco Santander México and then outstanding, to return Banco Santander México’s Fundamental Capital Ratio to the then-applicable Fundamental Capital Ratio required by the CNBV in accordance with Section IV, c), 1 of Annex 1-R of the general rules applicable to Mexican banks or any successor regulation; or, if no such amount, together with any such concurrent pro rata write-down or conversion, would be sufficient to so restore Banco Santander México’s Fundamental Capital Ratio to the aforementioned amount, then (ii) conversion of the then Current Principal Amount of Notes in the amount necessary to reduce the principal amount of each outstanding Note to zero. |
| 26 | Conversion Price | The conversion price shall be, if the Ordinary Shares are:
(i) then admitted to trading on the Mexican Stock Exchange, the higher of: (x) the volume weighted average of the Ordinary Shares closing price on the Mexican Stock Exchange for the thirty (30) consecutive Business Days immediately preceding the Conversion Date, with each closing price for the thirty (30) consecutive Business Days being converted from Mexican pesos into U.S. dollars at the then-prevailing exchange rate; or (y) floor price of Ps.20.30 converted into U.S. dollars at the then-prevailing exchange rate;
(ii) not then admitted to trading on the Mexican Stock Exchange, the floor price of Ps.20.30 converted into U.S. dollars at the then-prevailing exchange rate.
The conversion price shall be subject to certain anti-dilution adjustments. |
| 27 | Type of Conversion | Mandatory. |
| 28 | Type of shares into which the title is converted | Banco Santander México’s Series F shares (common shares). |
| 29 | Issuer of such capital instrument | Banco Santander México, S. A., Institución de Banca Múltiple, Grupo Financiero Santander México. |
| 30 | Write-Down Mechanism | N.A. |
| 31 | Write-Down Trigger Events | N.A. |
| 32 | Write-Down Amount | N.A. |
| 33 | Write-Up Mechanism | N.A. |
| 34 | Mechanism for temporary Write-Down | N.A. |
| 35 | Ranking of the Capital Notes in a liquidation event | The Capital Notes will represent the Issuer’s general, unsecured and subordinated obligations. The Capital Notes constitute Subordinated Non-Preferred Indebtedness and will rank (i) subordinate and junior in right of payment and in liquidation to all of the Issuer’s present and future Senior Indebtedness and Subordinated Preferred Indebtedness, (ii)pari passu without preference among themselves and with all of the Issuer’s present and future other unsecured Subordinated Non-Preferred Indebtedness and (iii) senior only to all classes of the Issuer’s capital stock. |
| 36 | Does any characteristic of the Capital Notes breach conditions set forth in Annex 1-R, 1-S or 1-Q of the Mexican Banking Law | No. |
| Earnings Release | 3Q.2019 |
81 |
| Banco Santander México |
| 37 | Specify which characteristics of the Capital Notes breach conditions set forth in Annex 1-R, 1-S or 1-Q of the Mexican Banking Law | N.A. |
The information relating to Annex 1-O Capitalization Ratio Santander Consumo, Santander Hipotecario and Santander Inclusión Financiera is available on the website
www.santander.com.mx/ir
Leverage ratio
| Table I.1 | ||
| Integration of the main sources of leverage | ||
| Reference | Item | Sep-19 |
| 1 | On-balance sheet items (excluding derivatives and SFTs, but including collateral) | 1,241,693 |
| 2 | (Asset amounts deducted in determining Basel III Tier 1 capital) | (44,838) |
| 3 | Total on-balance sheet exposures (excluding derivatives and SFTs) (sum of lines 1 and 2) | 1,196,855 |
| Derivative exposures | ||
| 4 | Replacement cost associated with all derivatives transactions (ie net of eligible cash variation margin) | 24,541 |
| 5 | Add-on amounts for PFE associated with all derivatives transactions | 46,371 |
| 6 | Gross-up for derivatives collateral provided where deducted from the balance sheet assets pursuant to the operative accounting framework | 0 |
| 7 | (Deductions of receivables assets for cash variation margin provided in derivatives transactions) | 0 |
| 8 | (Exempted CCP leg of client-cleared trade exposures) | 0 |
| 9 | Adjusted effective notional amount of written credit derivatives | 0 |
| 10 | (Adjusted effective notional offsets and add-on deductions for written credit derivatives) | 0 |
| 11 | Total derivative exposures (sum of lines 4 to 10) | 70,912 |
| Securities financing transaction exposures | ||
| 12 | Gross SFT assets (with no recognition of netting), after adjusting for sale accounting transactions | 59,857 |
| 13 | (Netted amounts of cash payables and cash receivables of gross SFT assets) | (46,875) |
| 14 | CCR exposure for SFT assets | 640 |
| 15 | Agent transaction exposures | 0 |
| 16 | Total securities financing transaction exposures (sum of lines 12 to 15) | 13,622 |
| Other off-balance sheet exposures | ||
| 17 | Off-balance sheet exposure at gross notional amount | 143,652 |
| 18 | (Adjustments for conversion to credit equivalent amounts) | (56,261) |
| 19 | Off-balance sheet items (sum of lines 17 and 18) | 87,391 |
| Capital and total exposures | ||
| 20 | Tier 1 capital | 104,548 |
| Earnings Release | 3Q.2019 |
82 |
| Banco Santander México |
| 21 | Total exposures (sum of lines 3, 11, 16 and 19) | 1,368,781 |
| Leverage ratio | ||
| 22 | Basel III leverage ratio | 0 |
| Table II.1 | ||||
| Comparison total assets and assets adjusted | ||||
| Reference | Item | Sep-19 | ||
| 1 | Total consolidated assets as per published financial statements | 1,437,437 | ||
| 2 | Adjustment for investments in banking, financial, insurance or commercial entities that are consolidated for accounting purposes but outside the scope of regulatory consolidation | 0 | ||
| 3 | Adjustment for fiduciary assets recognised on the balance sheet pursuant to the operative accounting framework but excluded from the leverage ratio exposure measure | (44,838) | ||
| 4 | Adjustments for derivative financial instruments | (111,849) | ||
| 5 | Adjustment for securities financing transactions | 640 | ||
| 6 | Adjustment for off-balance sheet items | 87,391 | ||
| 7 | Other adjustments | 0 | ||
| 8 | Leverage ratio exposure | 1,368,781 | ||
Table III.1
| ||||
| Conciliation of total assets and exposure in the balance | ||||
| Reference | Item | Sep-19 | ||
| 1 | Total consolidated assets as per published financial statements | 1,437,437 | ||
| 2 | operative derivative financial instruments | (182,762) | ||
| 3 | operative securities financing transactions | (12,982) | ||
| 4 | Trust assets recognized in the balance sheet under the accounting framework, but excluded from the exposure measure of the leverage ratio | 0 | ||
| On-balance exposure | 1,241,693 | |||
| Table IV.1 | |||
| Variation of the elements | |||
| Jun-19 | Sep-19 | ||
| Concept/Quarter | T-1 | T | Variation (%) |
| Basic Capital | 99,735 | 104,548 | 5 |
| Adjusted assets | 1,300,225 | 1,368,781 | 5 |
| Leverage Ratio | 7.67% | 7.64% | |
The information relating to Annex 1-O Leverage Ratio is available on the website
www.santander.com.mx/ir
| Earnings Release | 3Q.2019 |
83 |
| Banco Santander México |
| 15. Risk Diversification |
Pursuant to the general rules for risk diversification in the performance of borrowing and lending transactions applicable to credit institutions, published in the Federal official Gazette on April 30, 2003, the following information with respect to credit risk transactions as of Sep 30, 2019, is provided:
- As of Sep 30, 2019 the Bank did not grant financing to debtors or groups of individuals representing single common risk greater than amount of core capital Bank.
- Loans granted to the three major debtors or groups of persons representing a common risk for a total amount of Ps.47,864 million representing the 45.78% of the basic capital of the Bank.
|
16. Internal and external Sources of Liquidity
Financial sources of liquidity in domestic and foreign currency come from the different savings products that Banco Santander México offers to its clients; mainly checking accounts and time deposits.
An additional internal source of liquidity is the collection of fees, interests and principal amounts of the loans that the Bank grants to its clients.
With respect to external sources of liquidity, the Bank has access to the local and foreign capital markets through different alternatives that range from the issuance of senior and subordinated debt as well as the issuance of other debt or equity instruments. Santander México also obtains funding from other institutions including the Mexican Central Bank, development banks, commercial banks, and other institutions.
Banco Santander México may also obtain liquidity via sale and repurchase agreements (short-term repos) over securities it holds in its investment portfolio. Additionally, the Bank could obtain liquidity through the sale of assets.
17. Dividends Policy
Banco Santander México performs the payment of dividends pursuant to the applicable legal, administrative, fiscal and accounting rules, based in the results obtained by Banco Santander México. The payment of dividendsis discussed in the Ordinary General Stockholders’ Meeting, which is the body that orders and approves the payment of dividends to the stockholders.
18. Treasury Policies
The activities of Banco Santander México’s treasury are performed pursuant to the following:
| a) | In compliance with the provisions issued by the different authorities of the financial system for bank institutions, such as guidelines for lending and borrowing transactions, accounting rules, liquidity ratios, regulatory matching, capacity of the payment systems, etc. |
| b) | Internal limits for market, liquidity and credit risks that are reviewed and approved by appropriate committees, i.e., there are limits established and independent for treasury activities for the management of the assets and liabilities of the bank with respect to the market and liquidity risk derived from such management, as well as the limits regarding counterparty risk derived from the daily transactions. The treasury is responsible for their activities within the limits allowed to manage their risk. |
| c) | Compliance with the guidelines stipulated by national and international standard agreements regarding transactions performed in markets. |
| d) | Sound market practices. |
| e) | Strategies proposed in the banks internal committees. |
| f) | Compliance with the operation procedures of the institution. |
| 19. Shareholding | ||
| Subsidiaries | % of interest | |
| Santander Consumo, S.A. de C.V., SOFOM, E.R. | 99.99 | |
| Santander Vivienda, S.A. de C.V., SOFOM, E.R. | 99.99 | |
| Santander Inclusion Financiera, S.A. de C.V., SOFOM, E.R. | 99.99 | |
| Centro de Capacitación Santander, A.C. | 99.99 | |
| Banco Santander, S.A. F-100740 | 99.99 | |
| Fideicomiso GFSSLPT Banco Santander, S.A. | 89.14 | |
| Santander Servicios Corporativos, S.A. de C.V. | 99.99 | |
| Santander Servicios Especializados, S.A. de C.V. | 99.99 | |
| Santander Tecnología México, S.A. de C.V. | 99.99 |
| Earnings Release | 3Q.2019 |
84 |
| Banco Santander México |
20. Internal Control
The activities of Banco Santander Mexico are governed by the current legislations of the local regulator and for a series of guidelines established by his holding company, Banco Santander, whose headquarters are located in Madrid.
For the compliance of the regulations in force, Santander México has developed and implemented an Internal Control Model (ICM) which includes the participation of the Board of Directors, the statutory advisor, the Audit Committee, the Internal Audit Department, the General Direction, the Executive Direction of Non-Financial Risks (Internal Control Unit), Financial Control Department and the Regulatory Control Department.
The ICM is based in the identification and documentation of the main risks and the annual assessment of the controls that are created to mitigate such risks. ICM guarantees, among other aspects, design and execution of controls, establishment and updating of measures and controls that promote the compliance with the internal and external regulations, such as the Committee of Sponsoring Organizations of the Tradeway Commission (COSO) guidelines and the proper operation of the financial data processing systems.
The internal control system includes:
The implementation of an organizational structure has allowed the development and growth of the bank. Such structure is constituted as follows:
CEO and General Direction
The following functions report to the President and CEO:
| § | Deputy General of intervention and Management Control |
| § | Deputy General Direction of Technology and Operations |
| § | Executive Direction of Human Resources |
| § | Deputy General Direction of Corporate Resources and Recoveries |
| § | Deputy General Direction of Legal Affairs and Compliance |
| § | Chief Financial Officer |
| § | Vice-president of Commercial Banking: |
| - | Deputy General Direction Network Commercial |
| - | Deputy General Direction of Specialized Business |
| - | Deputy General Direction of Strategy of Business |
| - | Executive Direction of Commercial Planning |
| - | Deputy General Direction of Transformation and Digital Banking |
| - | Executive Direction of Strategy Clients |
| § | Deputy General Direction of Corporate & Investment Banking |
| § | Deputy General Direction of Enterprises and Institutions |
| § | Deputy General Direction of Risk |
| § | Deputy General Direction of Public Affairs and Strategy |
| § | Chief Audit Executive |
The roles and responsibilities of each direction have been stipulated in order to optimize the performance of the activities of Santander México.
The Organization area, via manuals, circulars and bulletins, governs the activities of the bank; likewise, the Regulatory Control Department has established a general Code of Conduct that every employee of Santander México has to follow.
The structure of Santander México includes the constitution of a Board of Directors, which establishes the objectives, the policies and general procedures of Santander México, the appointment of directors and the constitution of committees that are to supervise the development of the activities of Santander México.
| Earnings Release | 3Q.2019 |
85 |
| Banco Santander México |
The committees that supervise the development of the entities that constitute Banco Santander México, created and reported to the Board of Directors, are:
| § | Audit Committee |
| § | Corporate Practices, Nominating and Compensation Committee |
| § | Risk Management Committee |
| § | Remuneration Committee |
| § | Communication and Control Committee |
The registration, control and storage of the daily activities of Santander México are carried out by systems mainly designed and focused on the banking and brokerage activity. The common platform for such purposes is known as ALTAIR and it is applied by all the entities in Latin America that are part of Banco Santander (España).
Loans portfolio and transactions of commercial banking of the bank are controlled and registered at ALTAIR. Treasury activities are controlled and registered in computer platforms and the operations are centralized for its accounting registration in ALTAIR. Such platforms comply with the parameters stipulated by the CNBV with respect to reliability and accuracy.
Santander México is regulated by the CNBV, and therefore, the financial statements are prepared according to the accounting practices stipulated by such Commission via the issue of accounting circulars, general official letters and particular official letters regarding the accounting registration of transactions. For such purposes, the accounting system of Santander México has been structured with an accounts catalog stipulated by the Commission, and all the reports come from such system and comply with the applicable provisions.
Within Santander México, there is an independent area of Internal Audit, whose mission is to oversee the compliance, efficacy and efficiency of the internal control systems of the Bank, as well as the reliability and quality of the accounting information.
To achieve so, Internal Audit verifies that the risks inherent to the activity of Santander México are properly covered and the policies stipulated by the Direction, the applicable internal and external regulations and the procedures are observed.
The results of the activities of Internal Audit are reported on regular basis to the General Direction, the Audit Committee and the Board of Directors. Among other issues, the results of the audits performed to the different business units of the companies that constitute Santander México and the follow up of the recommendations provided to the different areas and/ or entities are informed.
Internal Audit has a quality system oriented to the client satisfaction focus on continuous process improvement, which has been subject to a successful Quality Assurance Review (QAR) during 2014.
In summary, Internal Control of Santander México includes the continuous development, implementation and updating of an internal control model where all the areas of the bank have an active role.
During the quarter, there have been no changes to the internal controls and internal audit guidelines.
| 21. Transactions with related parties | |
| Receivable | |
| Funds available | 2,270 |
| Debtors under sale and repurchase agreements | 1,319 |
| Derivatives (asset) | 66,648 |
| Performing loan portfolio | 6,898 |
| Other receivables, (net) | 13,623 |
| Intangible assets (IT Development) | 1,045 |
| Payable | |
| Time deposits | 1,709 |
| Demand deposits | 1,517 |
| Credit instruments issued | 1,014 |
| Creditors under sale and repurchase agreements | 7,037 |
| Derivatives (liability) | 58,942 |
| Other payables | 8,862 |
| Creditors from settlement of transactions | 9,903 |
| Earnings Release | 3Q.2019 |
86 |
| Banco Santander México |
| Subordinated debentures | 27,946 |
| Revenues | |
| Interest | 213 |
| Premium on sale and repurchase agreements | 91 |
| Others | 166 |
| Net Commissions | 4,729 |
| Net gain (loss) on financial assets and liabilities | (21,705) |
| Expenses | |
| Interest | 1,829 |
| Administrative expenses | 713 |
| Technical assistance | 1,539 |
| 22. Interests on loan portfolio |
| As of September 30st, 2019, the consolidated income statement includes, in the item "Interest income", Ps.66,532 million that correspond to interests from the loan portfolio of Banco Santander México, S.A., Santander Consumo, S.A. de C.V. SOFOM E.R. and Santander Vivienda, S.A. de C.V. SOFOM E.R. |
| 23. Integral Risk Management (unaudited) |
Risk management is considered by Banco Santander as a competitive element of strategic nature with the purpose of maximizing the value for the stockholder. This management is defined, from a conceptual and organizational sense, as a comprehensive management of the different risks (market risk, liquidity risk, credit risk, counterparty risk, operative risk, legal risk and technological risk) assumed by Banco Santander for the development of its activities. The management of the risk inherent to transactions is essential for understanding and determining the behavior of the financial condition of Banco Santander and the creation of long-term value.
In order to comply with the provisions regarding the Comprehensive Risk management applicable to credit institutions, issued by the National Banking and Exchange Commission, the Board of Directors agreed to create the Comprehensive Risk Management Committee of Banco Santander, to work pursuant to the rules set by such regulations. This Committee gathers every month and verifies that the transactions are according to the objectives, policies and procedures approved by the Board of Directors for the Comprehensive Risk Management.
The Comprehensive Risk management Committee delegates in the Comprehensive Risk Management Unit the responsibility for the implementation of procedures for the measure, administration and control of risks according to the applicable policies; such Unit has the faculty to authorize amounts greater than the stipulated limits and in such cases, the Board of Directors shall be informed on such deviations.
Market Risk
The Market Risk Management department of the Comprehensive Risk management Unit is responsible for recommending the policies on market risk management of Banco Santander, and to establish the parameters for risk measuring, and to provide reports, analysis and assessments to the senior management, to the Comprehensive Risk management Committee and to the Board of Directors.
The market risk management is to identify measure, monitor and control risks arising from fluctuations in interest rates, exchange rates, prices and other market risk factors in currency, money, capital and derivative markets that are exposed the positions that belong to Banco Santander.
The market risk measurement quantifies the potential variation in the value of the positions as a consequence of changes in the market risk factors.
Depending on the nature of the activities of each business unit, debt and capital instruments are registered as securities for trade, securities available for sale and or securities held to maturity. The main characteristic that identifies securities available for sale is their permanent nature and they are managed as an structural part of the balance sheet. Banco Santander has established provisions that all securities available for sale must fulfill, as well as adequate controls for the compliance of such provisions.
Whenever significant risks are identified, they are measured and limits are allocated in order to assure an adequate control. Global measurement of risk is carried out via a combination of the methodology applied to Portfolios for Trade and to the management of Assets and Liabilities.
| Earnings Release | 3Q.2019 |
87 |
| Banco Santander México |
Trading Books
In order to measure the risk in a global approach, the methodology of Value at Risk (“VaR”) is used. VaR is defined as the statistical estimate of the potential loss of value of a given position, during certain period and at certain confidence level. VaR provides a universal measure of the level of exposure of the different risk portfolios; it allows the comparison of the risk level assumed in different securities and markets and expresses the level of each portfolio through a unique figure in economic units.
VaR is calculated via historical simulation, with a 521 working-days window (520 percentage changes) and a one-day horizon. The calculation is performed from a series of simulated gains and losses with 1% percentile at constant pesos and with pesos decreasing on an exponential basis, with a decrease factor that is reviewed on annual basis, the most conservative measure is the one to be reported. A confidence level of 99% is assumed.
Note that the historical simulation model is limiting to assume that the recent past represent the near future.
The Value at Risk as of the end of third quarter of 2019 (unaudited) amounted to:
| Bank | ||
| VaR (Thousands of pesos) | % | |
| Trading Desks | 75,977.48 | 0.06% |
| Market Making | 31,937.02 | 0.02% |
| Proprietary Trading | 11,151.46 | 0.01% |
| Risk factor | ||
| Interest rate | 40,087.50 | 0.03% |
| Foreign exchange | 60,232.91 | 0.05% |
| Equity | 4,055.99 | 0.00% |
| * % of VaR with respect to Net Capital | ||
The Value at Risk for the average the third quarter of 2019 (unaudited) amounted to:
| Bank | ||
| VaR (Thousands of pesos) | % | |
| Trading Desks | 70,172.32 | 0.05% |
| Market Making | 27,873.46 | 0.02% |
| Proprietary Trading | 13,538.26 | 0.01% |
| Risk factor | ||
| Interest rate | 42,036.19 | 0.03% |
| Foreign exchange | 51,357.46 | 0.04% |
| Equity | 5,068.04 | 0.00% |
| * % of VaR with respect to Net Capital | ||
Likewise, monthly simulations of gains or losses of portfolios are carried out by revaluating such portfolios under different scenarios (Stress Test). Such estimates are generated using two different methods:
| ▪ | Applying to risk factors the percentage changes observed in certain periods including relevant market turbulences. |
| ▪ | Applying to risk factors changes that depend on the volatility of each risk factor. |
On a monthly basis “back testing” is carried out to compare daily gains and losses that would have been observed is the same positions had been maintained, taking into account only the change in value at risk in order to be able to fine tune the models. Even though these reports are prepared on a monthly basis, they include daily tests.
| Earnings Release | 3Q.2019 |
88 |
| Banco Santander México |
Assets and Liabilities Management
Commercial banking activities of Banco Santander generate important balance sheet amounts. The Assets and Liabilities Committee (“ALCO”) is responsible for determining the guidelines for the management of financial margin risk, net worth value and liquidity that must be followed by the different commercial portfolios. Pursuant to this approach, the General Direction of Finances has the responsibility to execute the strategies defined by the Assets and Liabilities Committee in order to modify the risk profile of the commercial portfolio by following the corresponding policies. Compliance with information requirements for interest rate, Exchange rate and liquidity risks is fundamental.
As part of the financial management of Banco Santander, sensitivity to Net Interest Income (“NIM”) and Market Value of Equity (“MVE”) of the different balance sheet items is analyzed in comparison to variations in interest rates. This sensitivity is derived from the difference between maturity dates of assets and liabilities and the dates interest rates are modified. The analysis is performed from the classification of each item sensitive to interest rate throughout time, according to their repayment, maturity or contractual modification of the applicable interest rate.
| Sensitivity NIM | Sensitivity MVE | ||||||||
| Bank | Jul-19 | Aug-19 | Sep-19 | Average | Jul-19 | Aug-19 | Sep-19 | Average | |
| Balance MXN GAP | 54% | 51% | 64% | 56% | 47% | 29% | 31% | 36% | |
| Scenario | (100) bp | (100) bp | (100) bp | N/A | +100 bp | +100 bp | +100 bp | N/A | |
| Balance USD GAP | 65% | 74% | 68% | 69% | 59% | 82% | 68% | 70% | |
| Scenario | (100) bp | (100) bp | (100) bp | N/A | (100) bp | (100) bp | (100) bp | N/A | |
Using simulation techniques, the predictable change of the net interest income and the market value of equity are measured in different interest rate scenarios, and their sensitivity under extreme movement of such scenarios, as of the end of the third quarter of 2019:
| Sensitivity NIM | Sensitivity MVE | ||||||||
| Bank | Scenario | Total | Derivatives | Non Derivatives | Scenario | Total | Derivatives | Non Derivatives | |
| Balance MXN GAP | (100) bp | (954) | (534) | (420) | +100 bp | (1,300) | (199) | (1,101) | |
| Balance USD GAP | (100) bp | (445) | 71 | (516) | (100) bp | (1,350) | (989) | (361) | |
The Assets and Liabilities Committee adopts investment and hedging strategies in order to maintain such sensitivities within the target range.
Limits
Limits are used to control global risk of the financial group derived from each portfolio and books. The structure of limits is used to control exposures and to establish the total risk authorized to business units. These limits are established for VaR, Loss alert, maximum loss, equivalent volume of interest rate, delta equivalent in equity, open foreign currency positions, sensitivity of net interest income and sensitivity of market value of equity.
Liquidity Risk
Liquidity risk is related to the ability of Banco Santander to finance acquired commitments at reasonable market prices, as well as to fulfill business plans with stable financing sources. Risk factors may be external (liquidity crisis) and internal due to excessive concentration of maturities.
Banco Santander carries out a coordinated management of maturities of assets and liabilities, and oversees the maximum timing difference profiles. This monitoring is based in the analysis of maturities of assets and liabilities, both contractual and managerial. Banco Santander realizes a control for the maintenance of a sufficient quantity of liquid assets to guarantee a horizon of survival during a minimum of days facing a scene of stress of liquidity without resorting to additional financing sources. The risk of Liquidity is limited in terms of a minimal period of days established for local, foreign and consolidated currencies. It is necessary to indicate that in the current quarter incidents have not been had in the metrics.
| Million pesos | Total | 1D | 1W | 1M | 3M | 6M | 9M | 1Y | 5Y | >5Y | |
| Structural GAP | (128,239) | (82,797) | 96,823 | (37,975) | 89,779 | 24,985 | 25,620 | 27,129 | 243,887 | (515,690) | |
| Non Derivative | (150,581) | (82,797) | 96,763 | (38,151) | 89,596 | 22,524 | 24,987 | 26,341 | 230,569 | (520,413) | |
| Derivatives | 22,342 | 0 | 60 | 175 | 183 | 2,461 | 633 | 789 | 13,318 | 4,723 |
| Earnings Release | 3Q.2019 |
89 |
| Banco Santander México |
Credit Risk
Management of credit risk of Grupo Financiero Santander is developed differently for the different segments of clients along the three phases of the credit process: acceptance, follow-up and recovery.
From a global perspective, management of credit risk in Grupo Financiero Santander is responsible for the identification, measurement, integration and assessment of the aggregated risk and the profitability according to such risk; with the purpose of oversee the levels of risk concentration and to adapt them to the limits and objectives previously established.
Risks receiving an individual treatment (risks with companies, Grupo Financiero Santander and financial entities) are identified and taken apart from those other risk that are managed in standardized manner (consumer and mortgages credits to individuals, loans to businesses and small enterprises)
Risks managed on individual basis are subject to a solvency or rating system with a related probability of failure that allows the measuring of the risk for each client and for each transaction from the beginning. The assessment of the client, after analyzing other relevant risk factors in different areas, is adjusted according to the special characteristics of the transaction (guarantee, term, etc,)
Standardized risks require, due to their special characteristics (great number of transactions for relatively low amounts), a different management that allows an efficient process and effective use of resources, so automated decision tools are used (expert and credit scoring systems).
Management of loans to companies is complemented, during the follow-up phase, with the so called “system of special monitoring” that determines the policy to be followed in the management of the risks with companies or groups rated within such category. Different situations of levels of monitoring are identified and generate different actions. A special monitoring grade is given in the case of alert signals, systematic reviews, or specific initiatives promoted by the Risks Department or Internal Audit.
Recovery Units constitute a critical element in the management of irregular risk, in order to minimize the final loss for Grupo Financiero Santander. These units are responsible for a specialized management of the risk from the moment they are classified as irregular risk loans (defaulting payment).
Grupo Financiero Santander has carried out a policy for the selective growth of risk and a strict treatment of late payments and the creation of the corresponding provisions, based in the prudent criteria defined by the Group.
Probability of Default and Expected Losses
Pursuant to the provisions on Comprehensive Risk Management included in the general regulations applicable to credit institutions, as part of the credit risk management, credit institutions must determine the probability of default.
The system allows the calculation of the probability for the different loans portfolios.
| a. | The probability of failure is for “No Retail” portfolios. It is determined via the fine tune of the ratings of clients in a given moment, based in the Monthly Default Rates observed during a period of five years. Such Default Rates are adjusted to an economic cycle of ten years. For “Retail” portfolios, the standard default probabilities set by the Basilea Convention are used. |
| b. | Once the probability of default is determined, the parameters of “severity of Loss” (“LGD”) and “Exposure at Default” (“EAD”) stipulated in Basilea, are taken into consideration. |
Once the abovementioned factors are obtained, the Expected Loss (“PE”) is calculated as follows:
Expected Loss = Probability of Default x Severity of Loss x Exposure at Default
i.e.:PE = PD * LGD * EAD
Counterparty Risk
Included in the credit risk, there is a concept that, due to its characteristics, it requires a special management: the Counterparty Risk.
Counterparty Risk is the risk Banco Santander assumes with governmental entities, financial institutions, corporations, companies and individuals in their treasury activities and correspondent bank activities. The measurement and control of the Credit Risk in Financial Instruments, Counterparty Risk, is carried out by a special unit with an organizational structure independent from the business areas.
The control of Counterparty Risk is performed daily via theInteractive Risk Integrated System (“IRIS”), which informs the credit line available with any counterparty, in any product and any term.
| Earnings Release | 3Q.2019 |
90 |
| Banco Santander México |
For the control of the counterparty lines, the Equivalent Credit Risk (“REC”) is used. REC is an estimate of the amount Banco Santander may lose in current transactions with certain counterparty, if such counterparty commits a default in any moment until the maturity date of transactions. REC takes into account the Current Credit Exposure, which is defined as the cost to substitute the transaction at market value provided that this value is positive for Banco Santander, and it is measured as the market value of the transaction (“MtM”). In addition, REC includes the Potential Credit Exposure or Potential Additional Risk (“RPA”), which represents the possible evolution of the current credit exposure until maturity, given the characteristics of the transaction and the possible variations in the market factors. The REC Gross considers definitions described above, without considering mitigating by netting or by mitigating collateral.
For the calculation of REC, mitigating factors of the counterparty credit risk are taken into consideration, such as collaterals, netting agreements, among other. The methodology continues to be effective.
In addition to the Counterparty Risk, there is the Settlement Risk, which is present in every transaction at its maturity date, when the possibility that the counterparty does not comply with its payment obligations arises, once Banco Santander has complied with its obligations by issuing payment directions.
For the process of control for this risk, the Deputy General Direction of Financial Risks oversees on a daily basis the compliance with the limits on counterparty credit risks by product, term and other conditions stipulated in the authorization for financial markets. Likewise, it is the responsible for communicating on a daily bases, the limits, consumptions and any incurred deviation or excess.
On a monthly basis, a report is presented to the Comprehensive Risk Management Committee, with respect to the limits to Counterparty Risks, Issuer Risks and current consumptions. In addition, on a monthly basis, a report is presented to the Global Banking Credit Committee and Retail Credit Committee with respect to incurred excesses and transactions with non authorized customers. In addition, it informs to the Comprehensive Risk Management Committee the calculation of the Expected Loss for current transactions in financial markets at the closing of every month and different scenarios of stress of Expected Loss. All of the above according to the methodologies and assumptions approved by the Comprehensive Risk Management Committee.
Currently, we have approved lines of Counterparty Risks in Banco Santander for the following segments: Mexican Sovereign Risk and Domestic Development Banking, Foreign Financial Institutions, Mexican Financial Institutions, Corporations, Companies Banking-SGC, Institutional Banking, Large Enterprises Unit, Project Finance.
Equivalent Net Credit Risk of the lines of Counterparty Risk and Issuer Risk of Banco Santander for the third of 2019:
| Equivalent Net Credit Risk | ||||
| Millions of U.S. Dollars | ||||
| Segment | jul-19 | agu-19 | sep-19 | Average |
| Sovereign Risk, Development Banking and Financial Institutions | 16,555.82 | 16,622.44 | 17,316.17 | 16,831.47 |
| Corporates | 599.84 | 614.17 | 597.59 | 603.87 |
| Project Finance | 400.94 | 447.59 | 454.09 | 434.20 |
| Companies | 177.21 | 190.09 | 220.55 | 195.95 |
The equivalent credit risk lines maximum gross counterparty risk of Banco Santander as of the end of the third of 2019, which corresponds to derivative transactions, is distributed depending on the type of derivative:
| Equivalent Gross Credit | |
| Millions of U.S. Dollars | |
| Type of Derivative | End of the third quarter of 2019 |
| Interest Rate Derivatives | 17,588.76 |
| Exchange Rate Derivatives | 28,512.16 |
| Bonds Derivatives | 0.00 |
| Equity Derivatives | 609.47 |
| Total | 46,710.39 |
The Expected Loss of Banco Santander at the end of the third of 2019, and the quarterly average of the expected loss of the lines of Counterparty risk of Banco Santander, for the third of 2019 are:
| Expected Loss | ||||
| Millions of U.S. Dollars | ||||
| Segment | jul-19 | agu-19 | sep-19 | Average |
| Sovereign Risk, Development Banking and Financial Institutions | 1.93 | 1.95 | 1.93 | 1.93 |
| Corporates | 11.38 | 12.94 | 12.72 | 12.35 |
| Earnings Release | 3Q.2019 |
91 |
| Banco Santander México |
| Project Finance | 3.63 | 5.30 | 4.78 | 4.57 |
| Companies | 1.86 | 2.51 | 2.44 | 2.27 |
The segments of Mexican Financial Institutions and Foreign Financial Institutions are very active counterparties with whom Banco Santander has current positions of financial instruments with Counterparty Credit Risk. It is important to mention that Equivalent Credit Risk is mitigated by netting agreements (ISDA-CMOF) and, in some cases, by collateral agreements (CSA-CGAR) or revaluation agreements with counterparties.
Respect to total collateral received for derivatives transactions as of the end of the third of 2019.
| Cash collateral | 65.19% |
| Collateral refer to bonds issued by the Mexican Federal Government and others Sovereign | 34.81% |
In respect to collateral management in derivatives transactions, counterparty’s positions are valuated according to the frequency established at each collateral agreement. In addition, all credit risk parameters, established at each collateral agreement are considered to obtain the amount of collateral to be delivered or to be received from the counterparty. These amounts, margin calls, will be requested from the counterparty which has the right to receive the collateral, according to the frequency established at the collateral agreement.
The counterparty which receives the margin call, has the right to analyze the valuation and it could result on discrepancies to solve.
In respect to the correlation between the collateral and the counterparty in derivatives transactions, the Institution confirms that, at this time, the eligible collateral consists on government bonds and cash collateral, so as a result, there are no adverse effects due to correlation between the counterparty and the collateral.
In the hypothetical stressed scenario, assuming that the Institution’s credit rating decreases and the impact of this credit rating decrease on the collateral that the Institution would have to deliver, this stressed test confirms that there would not be significant impact; a few of the Thresholds established on the Institution’s collateral agreements are dependent on the Institution’s credit rating.
Legal Risk
Legal Risk is defined as the potential loss due to the failure to comply with the applicable legal and administrative regulations, the issue of administrative and judicial resolutions against Banco Santander and the application of fines, with respect to the transactions carried out by Banco Santander.
Pursuant to the provisions regarding the Comprehensive Risk Management, the following activities are performed: a) Establishment of policies and procedures for analyzing the legal validity and the proper execution of the legal acts. b) estimates of the amount of potential losses derived from judicial or administrative orders against Banco Santander and the possible application of fines c) Analysis of the legal acts governed by a legal system different to the Mexican laws, d) communication to directors and employees on the legal and administrative regulations applicable to transactions and e) the performance, at least on annual basis, of internal legal audits.
Operational Risk
Operational risk is defined as the risk of loss resulting from inadequate or failed internal processes, people and systems or from external events.
The main objective is to avoid or reduce the impact of Operational Risk, through the identification, monitoring and control of the factors that trigger the events of potential loss. Therefore it also requires to establish policies and procedures to operate under the risk exposure that the Bank is willing to accept.
The sound management of risk involves mainly the heads of each Business Unit on the management tools and results; as well as a continuous training to the staff. The pillars on which the operational risks are managed are:
a) Strategic planning and budget: Required activities to define the operational risk profile for Banco Santander México; this includes:
| - | Risk appetite, defined as the level of risk that the Bank is willing to accept |
| - | Loss annual budget; ensuring the overview of real losses according to the budget and the deviations, challenging the controls and extenuation measures. |
| Earnings Release | 3Q.2019 |
92 |
| Banco Santander México |
b) Identify, measure and evaluation of the Operational risk; identify risks and the factors that trigger them in the Bank, and estimate the qualitative or/and quantitative impact.
c) Monitoring; The Overview and monitoring of operational risk goal for periodic analysis of available information of risk (type and level) during the normal development of the activities.
d) Extenuation (Mitigation); once the Operational Risk has been assessed, it is required to establish actions to avoid the risk or to mitigate the impact for risk that materialize, develop a cost-benefit study and indicators should be implemented to help us evaluate the effectiveness of these actions.
e) Reporting; the Operational Risk profile and performance of the Operational Risk environment is presented on a regular basis in Bank Committees.
Banco Santander México had an average monthly loss of Ps.52 million for operational risk in general to the third quarter of 2019.
Since December 2016, Banco Santander México applies the Alternate Standard Approach (ASA) for operational risk capital requirements.
Technological Risk
Technological risk is defined as the potential loss due to damages, discontinuation, alterations or failures derived from the use or dependence on hardware, software, systems, applications, networks and any other data channel distribution for the provision of banking services to the clients of Banco Santander.
Banco Santander México has adopted a corporate model for the management of technological risk (which includes cyber risks), integrated into the service and support processes of the technological areas, to identify, evaluate, monitor, control, mitigate and report the technological risks to which the operation is exposed. This model allows the establishment of control measures to reduce the probability of risks materializing or, minimize the impact of those risks.
Processes and levels of authorization
Pursuant to internal regulations, all the products and services traded by Banco Santander are approved by the “Comité de Comercialización” and by the “Comité Corporativo de Comercialización”. Those products or services that are modified or extended with respect to their original approval must be approved by the “Comité de Comercialización” and, depending of their relevance, the “Comité Corporativo de Comercialización” must approve them too.
All areas taking part in the operation of the product or service, depending on the nature of such product or service, as well as the areas responsible for their accounting registration, legal formalization, fiscal treatment, risk assessment, etc. are present in the Committee. All approvals shall be unanimous as there are no authorizations approved by majority of votes. In addition to the Committee’s approval, there are products that require authorizations from local authorities, and therefore, the Committee’s approvals are subject to the authorizations issued by the competent authorities in each case.
Finally, all the approvals shall be authorized by the Comprehensive Risk Management Committee.
Independent Reviews
Banco Santander is subject to the monitoring and supervision of the National Bank and Exchange Commission, the Central Bank of Mexico and the Bank of Spain, and such monitoring and supervision is exercised via follow-up processes, inspection visits, information requests, delivery of documents and reports.
Likewise, periodic reviews are performed by Internal and External Auditors.
General description of the valuation techniques
Derivative financial securities are valued at reasonable value, according to the accounting rules established in the Circular Letter for Credit Institutions issued by the National Banking and Exchange Commission, in Principle B-5 “Derivative Financial Instruments and hedging Transactions” and the provisions in Principle A-2 “Application of specific rules”, and the provisions in the specific rule included in Bulletin C-10 of the Financial Information Rules.
| A. | Methodology of Valuation |
| 1) | Trading purposes |
| a) | Organized Markets |
Valuation is made at the corresponding closing market price. Prices are provided by the supplier of prices.
| Earnings Release | 3Q.2019 |
93 |
| Banco Santander México |
| b) | Over-the-Counter Markets |
| i) | Derivative financial instruments with optionality. |
In the majority of the cases, a general form of the Black & Scholes model is used. Such model assumes that the underlying product follows a lognormal distribution. For exotic products or when payment depends on the trajectory of any market variable, MonteCarlo simulations are used. In this case, it is assumed that logarithms of the different variables follow a multi-varied normal distribution.
| ii) | Derivative financial instruments with no optionality. |
The valuation technique is to obtain the present value of the estimated future flows.
In all cases, Banco Santander carries out the valuation of its positions and registers the corresponding value. In some cases, a different calculation agent is designated, and such calculation agent may be the counterparty or a third party.
| 2) | Hedging purposes |
In the performance of its commercial banking activities, Banco Santander has tried to cover the evolution of the financial margin of structured portfolios that are exposed to adverse movements in interest rates. The ALCO, the body responsible for the management of long-term assets and liabilities, has constituted the portfolio via which the Banco Santander achieves such hedge.
An accounting hedge is defined as a transaction that complies with the following conditions:
| a. | A hedge relationship is designated and documented from the beginning in an individual file, where its objective and strategy is established. |
| b. | The hedge is effective for the compensation of variations in the reasonable value or in the cash flows attributed to such risk, according to the risk management documented at the beginning. |
The Management of Banco Santander performs derivative transactions for hedging purposes with swaps.
Derivatives for hedging purposes are valued at market value, and the effect is recognized depending on the type of accounting hedge, pursuant to the following:
| a. | In the case of fair value hedges, they are valued at market value for the risk covered, the primary position and the hedging derivative instrument, and the net effect is registered in the statement of income of the corresponding period. |
| b. | In the case of cash flow hedges, the hedging derivative instrument is valued at market value. The effective portion of the hedge is registered in the comprehensive income account, within the stockholders’ equity, and the ineffective portion is registered in the statement of income. |
Banco Santander ceases the recording of hedges at the maturity date of the derivative, or when such derivative is sold, cancelled or exercised; when the derivative does not reach a high efficiency in compensating the changes in the reasonable value or the cash flows of the covered item, or when Banco Santander decides to cancel the hedge.
It shall be fully evidenced that the hedge fulfills the objective for which derivatives were contracted for. This effectiveness requirement assumes that the hedge must comply with a maximum range of deviation with respect to the initial objective of 80% to 125%.
In order to demonstrate the efficacy of hedges, two tests are to be carried out:
| a) | Forward-looking Test: it is demonstrated that, in the future, the hedge will be within the aforementioned range of deviation. |
| b) | Retrospective Test: This test reviews if, in the past, from its initial date to now, the hedge has been maintained within the allowed range of deviation. |
In the cases of Fair Value Hedges and the Cash Flow Hedges, they are retrospective and forward-looking efficient and within the allowed maximum range of deviation.
| B. | Reference Variables |
The most relevant reference variables are:
Exchange Rates
Interest Rates
Equity
Baskets of equities and stock indexes.
| Earnings Release | 3Q.2019 |
94 |
| Banco Santander México |
| C. | Frequency of valuation |
Derivative financial instruments for trading and hedging purposes are valued on a daily basis.
Management of internal and external sources of liquidity that may be used for the compliance of requirements related to derivative financial instruments.
Resources are obtained via the National and International Treasury departments.
Changes in exposure to identified risks, contingencies and events, known or expected, in derivative financial instruments.
At the end of the third quarter of 2019, Banco Santander has no situation or contingency such as changes in the value of the underlying asset or the reference variables, that may cause the use of the derivative financial instruments to be different to their original intended use, a significant change in their scheme or the total or partial loss of the hedge, requiring the Issuer to assume new obligations, commitments or variations in its cash flow or affecting its liquidity (day trade calls), nor contingencies or events known or expected by the Management that may affect future reports.
| Summary of Derivative Financial Instruments | ||||||
| Million Pesos as of September 30th, 2019 | ||||||
| Derivatives | Underlying Asset | Purposes trading or hedging | Notional | Fair Value
| ||
| Current Quarter | Previous Quarter | |||||
| Forwards | Foreign Currency | Trading | 452,036 | 1,422 | 1,670 | |
| Forwards | Equity | Trading | 26,732 | (3) | 2 | |
| Futures | Foreign Currency | Trading | 27,765 | 0 | 0 | |
| Futures | Market Index | Trading | 228 | 0 | 0 | |
| Options | Equity | Trading | 157 | (71) | (131) | |
| Options | Foreign Currency | Trading | 157,644 | (512) | (455) | |
| Options | Market Index | Trading | 3,898 | 75 | 18 | |
| Options | Interest Rate | Trading | 280,636 | 130 | 1 | |
| Swaps | Cross Currency | Trading | 832,251 | 446 | (1,154) | |
| Swaps | Interest Rate | Trading | 6,412,037 | 4,588 | 3,187 | |
| Swaps | Equity | Trading | 843 | 4 | (14) | |
| Forwards | Foreign Currency | Hedging | 71,610 | 3,597 | 1,807 | |
| Swaps | Cross Currency | Hedging | 55,623 | (3,402) | (2,984) | |
| Swaps | Interest Rate | Hedging | 26,199 | (81) | 275 | |
Santander México, at the execution of transactions of OTC derivative financial instruments, has Collateral formalized agreements with many of its counterparties, which function as market value guarantee of the derivative transactions, and it is determined based on the exposure of the net position on risk with each opposing party. The managed Collateral consists mainly in cash deposits, whereat there is not a deterioration situation.
During the third quarter of 2019, there have been no derivatives which underlying assets are investments in proprietary shares or stock certificates that represent them.
During the third quarter of 2019, the number or expired derivative financial instruments and closed positions was as follows (unaudited):
| Description | Maturities | Closed Positions | |
| CAPS AND FLOORS | 705 | 47 | |
| EQUITY FORWARD | 0 | 0 | |
| OTC EQ | 124 | 28 |
| Earnings Release | 3Q.2019 |
95 |
| Banco Santander México |
| OTC FX | 1951 | 271 | |
| SWAPTIONS | 0 | 0 | |
| FX FORWARD | 1356 | 127 | |
| IRS | 509 | 86 | |
| CCS | 44 | 5 |
The amount of day trade calls performed during the quarter was the necessary for covering contributions to organized markets and the requirements in collateral agreements.
During the third quarter of 2019, there were no defaults by counterparties.
Sensitivity Analysis
Identification of Risks
Sensitivity measures of market risk associated with securities and derivative financial instruments are those that measure the change (sensitivity) of the market value of the financial instrument concerned, when changes in each of the risk factors associated with same occur.
The sensitivity of the value of a financial instrument when changes in market factors occur and is determined by the full instrument revaluation.
The sensitivities are detailed below according to each risk factor and associated historical consumption of the trading book.
The management strategy of the organization is integrated with security positions and derivatives. The latter are used largely to mitigate the market risk of the second. In view of the above, the sensitivities or exposures as described below are both types of instruments considered as a whole.
1. Sensitivity to risk factor “Equity (“Delta EQ”)”
The EQ Delta shows the change in the portfolio's value in relation to changes in the prices of equities.
The EQ Delta calculated for the case of derivative financial instruments considered the relative change of 1% in the prices of the underlying assets in equities, in the case of equities, this considers the relative variation of 1% of market price title.
2. Sensitivity to risk factor “Foreign Exchange”, (“Delta FX”)
The FX Delta shows the change in the portfolio's value in relation to changes in asset prices exchange rate.
The FX Delta calculated for the case of derivative financial instruments considered the relative change of 1% in the prices of the underlying assets of the exchange rate, In the case of currency positions, this considers the relative variation of 1%of the corresponding exchange rate.
3. Sensitivity to risk factor “Volatility” (“Vega”)
Vega sensitivity is the measure resulting from changes in the volatility of the underlying asset (the reference asset). Vega risk is the risk that a change in the volatility of the underlying asset value, that results in a change in the market value of the derivative.
The calculation of Vega sensitivity, considers the absolute change of 1% in the volatility of the underlying asset value.
4. Sensitivity to risk factors “Interest Rate” (“Rho”)
This sensitivity quantifies the change in value of financial instruments for the trading portfolio in the face of a parallel increase in the interest rate curves of a basis point.
The table below presents the sensitivities described above corresponding to the position of the trading portfolio,as of the end of the third quarter of 2019:
| Earnings Release | 3Q.2019 |
96 |
| Banco Santander México |
| Sensitivity Analysis | ||||||
| Million pesos | ||||||
| Total Rate Sensitivity | ||||||
| Pesos | Other Currencies | |||||
| Sens. a 1 Bp | (0.71) | 6.57 | ||||
| Vega Risk factor | ||||||
| EQ | FX | IR | ||||
| Total | 0.62 | (0.52) | (2.67) | |||
| Delta Risk Factor (EQ and FX) | ||||||
| EQ | FX | |||||
| Total | (1.51) | (13.42) | ||||
It is considered that the above sensitivity table reflects prudent management of the trading portfolio of Banco Santander with respect to risk factors.
Stress Test for Derivative Financial Instruments
The following are various stress test scenarios considering various scenarios calculated for the trading portfolio of Banco Santander.
| · | Probable scenario |
This scenario was defined based in the movements derived from a standard deviation, with respect to risk factors that have an influence over the valuation of financial instruments. Specifically:
| o | Risk factors of Interest Rate (“IR”), volatility (“Vol”) and rate of Exchange (“FX”) were incremented in a standard deviation. |
| o | Risk factors with respect to stock market (“EQ”) were decreased in a standard deviation. |
| · | Possible scenario |
Under this scenario, as requested in the official letter, risk factors were modified in 25%. Specifically:
| o | Risk factors: IR, Vol and FX were multiplied by 1.25 that means, they were incremented in 25%. |
| o | Risk factor EQ was multiplied by 0.75 that means, it was decreased in 25%. |
| · | Remote scenario |
Under this scenario, as requested in the official letter, risk factors were modified in 50%. Specifically:
| o | Risk factors IR, Vol and FX are multiplied by 1.50, that is, they were incremented in 50%. |
| o | Risk factor EQ was multiplied by 0.5, that is, it was decreased a 50%. |
Effect in the Income Statement
The following table shows the possible income (loss) for the trading portfolio of Banco Santander, in millions of Mexican pesos for each stress scenario,as of the end of the third quarter of 2019:
| Summary of Stress Test |
| Earnings Release | 3Q.2019 |
97 |
| Banco Santander México |
| Million pesos | |
| Risk Profile | Stress all factors |
| Probable scenario | (7) |
| Remote scenario | 112 |
| Possible scenario | (176) |
24. Disclosure of the Liquidity Coverage Ratio
On December 31st, 2014, the Commission and the Central Bank of Mexico published in the Federal Official Gazette, the General Provisions on Liquidity Requirements for multiple banking institutions, which establish liquidity requirements that credit institutions must comply at all times in accordance with the guidelines established by the Committee on Regulation of Bank Liquidity at its meeting held on October 17th, 2014.
These regulations came into effect on January 1st, 2015.
During the third quarter of 2019, the weighted average CCL for the Bank is 180.25%, complying with the Bank´s desired Risk Profile and well above the regulatory minimum established in the regulations.
| Million pesos | Amount unweighted (average) | Weighted amount (average) | |||
| Liquidity Assets | |||||
| 1 | Total high-quality liquid assets | Not applicable | 169,965 | ||
| Cash Outflows | |||||
| 2 | Unsecured retail financing | 222,383 | 12,977 | ||
| 3 | Stable funding | 185,229 | 9,261 | ||
| 4 | Less stable funding | 37,154 | 3,715 | ||
| 5 | Unsecured wholesale funding | 410,465 | 155,398 | ||
| 6 | Operational deposits | 226,624 | 52,458 | ||
| 7 | Non-operational deposits | 158,585 | 77,684 | ||
| 8 | Unsecured debt | 25,256 | 25,256 | ||
| 9 | Secured wholesale funding | Not applicable | 437 | ||
| 10 | Additional requirements: | 186,200 | 39,738 | ||
| 11 | Outflows related to derivatives exposures and other collateral requirements | 50,722 | 31,395 | ||
| 12 | Outflows related to loss of funding on debt products | 0 | 0 | ||
| 13 | Credit and liquidity facilities | 135,479 | 8,343 | ||
| 14 | Other contractual funding obligations | 83,274 | 341 | ||
| 15 | Other contingent funding obligations | 5,841 | 5,841 | ||
| 16 | Total Cash Out | Not applicable | 214,731 | ||
| Cash Inflows | |||||
| 17 | Cash inflows secured transactions | 80,808 | 3,848 | ||
| 18 | Cash inflows from operations unsecured | 127,915 | 101,444 | ||
| 19 | Other cash inflows | 11,802 | 11,802 | ||
| 20 | Total Cash Inflows | 220,525 | 117,094 | ||
| Total adjusted value | |||||
| 21 | Total of Eligible Liquid Assets | Not applicable | 169,965 | ||
| 22 | Total Net Cash Out | Not applicable | 97,878 | ||
| 23 | Liquidity Coverage Ratio | Not applicable | 180.25% | ||
The presented numbers are subject to review and therefore they might suffer changes. It should be noted that the figures presented in the Liquidity Coverage Ratio’s note for the second quarter of 2019 were updated. Therefore, the Liquidity Coverage Ratio for 2Q19 is 177.56% instead of 175.43% published in July 2019.
Notes relating to the Liquidity Coverage Ratio
| a) | Natural days contemplated in the quarterly report. |
| · | 92 days. |
| b) | Main causes of the results of the Liquidity Coverage Ratio and the evolution of its main components; |
| Earnings Release | 3Q.2019 |
98 |
| Banco Santander México |
· During the quarter, there was an increase in CCL supported by an improvement in commercial gap, driven by greater deposits that increase the level of liquid assets.
c) Changes of major components within the quarter report.
· During the quarter, there was an increase in CCL supported by an improvement in commercial gap, driven by greater deposits that increase the level of liquid assets.
d) Evolution of the composition of the Eligible and Computable Liquid Assets.
· The Bank has a significant proportion of liquid assets comprised by government debt, deposits in Bank of Mexico and cash.
e) Concentration of funding sources.
· The main sources of funding are diversified by its own nature as: (i) demand deposits; (ii) term deposits, which include retail deposits and the money market (promissory notes with interest payable at maturity), and (iii) repurchase agreements.
· In addition, the Bank has registered programs for local market´s debt issuances and has experience issuing in international markets.
f) Exposures in financial derivative instruments and possible margin calls.
· Performed analyses don’t show any significant vulnerabilities coming from financial derivative instruments.
g) Currency mismatch.
· Performed analyses don’t show any significant vulnerability in Currency mismatch.
h) Description of the level of centralization of liquidity management and interaction between the units of the group.
· Banco Santander Mexico is autonomous in terms of liquidity and capital; it develops its financial plans, liquidity forecast, and analyzes funding requirements for all its subsidiaries. The Bank is responsible for its own "ratings", its issuance program, "road shows", any other activities to keep its ability to access capital markets. The issuance activity is performed without having the guarantee of the parent company.
· The liquidity management of all Bank subsidiaries is centralized.
i) Cash flows and Inflows, if any, that are not captured in this framework, but the institution considers relevant to the liquidity profile.
· The Liquidity Coverage Ratio considers only the inflows and outflows up to 30 days, however the flows that are not contained in the metric are well managed and controlled by the Group.
Additional notes for the previous quarter
I.Quantitative information:
a) The concentration limits for different groups of guarantees received and major sources of financing.
· The Bank has no concentration limits under guarantees received by market operations, as they are mainly composed of government securities and cash.
b) Exposure to liquidity risk and funding needs of the institution, taking into account the legal, regulatory and operational constraints on liquidity transfers.
· Liquidity risk is associated with our capacity to finance the commitments we undertake at reasonable prices, as well as maintaining our ability to carry out our business plans using stable financing sources. Factors that influence liquidity risk may be external, such as a liquidity crisis, or internal, such as an excessive concentration of maturities.
· The measures used to control liquidity risk in balance sheet management are the liquidity gap, liquidity ratios, stress scenarios and liquidity horizons.
· The liquidity horizons metric has been defined to ensure that the Group has sufficient liquid assets to comply with its requirements during a certain period of time, given different stress scenarios. The Group set a 90-day survival horizon for local currency and consolidated balance and a 30-day survival horizon for foreign currency. During the 2Q19, the balance remained above the established limits, and therefore we maintained a sufficient liquidity buffer.
| Earnings Release | 3Q.2019 |
99 |
| Banco Santander México |
| 28/06/2019 | Term | Amount | |
| Million pesos | |||
| Consolidated | 90 days | 173,404 | |
| Local Currency | 90 days | 50,016 | |
| Foreign Currency | 30 days | 126,485 | |
| c) | Balance sheet maturity liquidity gap including off balance sheet accounts. |
· The table below shows the liquidity gap of our assets and liabilities using maturity dates as of June 28, 2019. The reported amounts include cash flows from interest on fixed and variable rate instruments. The interest on variable rate instruments is determined using the forward interest rates for each period presented.
| Million pesos | Total | 0-1 months | 1-3 months | 3-6 months | 6-12 months | 1-3 years | 3-5 years | >5 years | Not Sensitive |
| Money Market | 144,997 | 37,254 | 0 | 0 | 0 | 40 | 0 | 0 | 107,702 |
| Loans | 901,006 | 55,152 | 147,228 | 83,052 | 82,842 | 243,885 | 123,070 | 166,272 | (495) |
| Trade Finance | 0 | 0 | 0 | 0 | 0 | 0 | 0 | 0 | 0 |
| Intragroup | 1,345 | 0 | 0 | 0 | 0 | 0 | 0 | 0 | 1,345 |
| Securities | 225,155 | 161,549 | 152 | 42,455 | 447 | 1,785 | 3,121 | 10,851 | 4,795 |
| Permanent | 14,426 | 0 | 0 | 0 | 0 | 0 | 0 | 0 | 14,426 |
| Other Balance Sheet Assets | 2,432,291 | 0 | 0 | 0 | 0 | 0 | 0 | 0 | 2,432,291 |
| Total Balance Sheet Assets | 3,719,219 | 253,956 | 147,380 | 125,507 | 83,290 | 245,710 | 126,191 | 177,123 | 2,560,064 |
| Money Market | (110,207) | (19,047) | 0 | 0 | 0 | 0 | 0 | 0 | (91,159) |
| Deposits | (906,604) | (278,656) | (29,495) | (23,610) | (21,874) | (38,171) | (28,919) | (485,878) | 0 |
| Trade Finance | 0 | 0 | 0 | 0 | 0 | 0 | 0 | 0 | 0 |
| Intragroup | 0 | 0 | 0 | 0 | 0 | 0 | 0 | 0 | 0 |
| Long-Term Funding | (218,861) | (4,902) | (16,362) | (19,276) | (39,738) | (51,015) | (55,225) | (10,534) | (21,810) |
| Equity | (133,623) | 0 | 0 | 0 | 0 | 0 | 0 | 0 | (133,623) |
| Other Balance Sheet Liabilities | (2,455,102) | 0 | 0 | 0 | 0 | 0 | 0 | 0 | (2,455,102) |
| Total Balance Sheet Liabilities | (3,824,396) | (302,605) | (45,857) | (42,887) | (61,612) | (89,186) | (84,144) | (496,412) | (2,701,693) |
| Total Balance Sheet Gap | (105,177) | (48,650) | 101,522 | 82,620 | 21,678 | 156,524 | 42,047 | (319,289) | (141,629) |
| Total Off-Balance Sheet Gap | 28,739 | (12,640) | 749 | 393 | 2,562 | 4,599 | 6,875 | 4,769 | 21,431 |
| Total Structural Gap | (30,100) | 100,831 | 81,186 | 23,049 | 158,169 | 48,922 | (314,520) | (143,991) | |
| Accumulated Gap | (74,579) | 70,731 | 151,917 | 336,627 | 333,135 | 382,058 | 67,538 | (76,454) | |
II.Qualitative information:
| a) | The way in which liquidity risk is managed within the institution, considering the risk tolerance, the structure and responsibilities for managing liquidity risk, internal liquidity reports, the liquidity risk strategy, policies and practices across business lines and with the board of directors. |
· Our general policy regarding liquidity management seeks to ensure that even under adverse conditions, we have enough liquidity to fulfill client needs, maturing liabilities and working capital requirements. The Bank ´s liquidity management is based on analyses of asset and liability maturities, using contractual and management models.
· The Financial Management Area is responsible for executing the strategies and policies established by ALCO in order to modify the risk profile of the Bank, within the limits established by the CAIR who reports to the Board.
| b) | Financing strategy, including diversification policies, and whether the funding strategy is centralized or decentralized. |
· Annually the Financial Plan for the Bank is prepared considering: the projected business growth, the debt maturity profile, risk appetite, expected market conditions, the implementation of diversification policies and regulatory metrics and
| Earnings Release | 3Q.2019 |
100 |
| Banco Santander México |
the analysis of the liquidity buffer. The Financial Plan is the guide used to issue debt or contract term liabilities and aims to maintain adequate liquidity profile.
· The funding strategy of all subsidiaries is centralized.
| c) | Mitigation techniques of liquidity risk used by the institution. |
· The risk mitigation techniques in the Group have a proactive nature. The Financial Plan in addition to the projection exercises and stress test scenarios allows us to anticipate risks and implement measures to ensure that the liquidity profile is adequate.
| d) | Explanation of how the stress tests are used. |
· The Liquidity Stress Test is a Risk Management tool designed to warn the governing committees and areas responsible for making decisions in this area about the potential adverse effects of the liquidity risk the Institution is exposed to.
· The results of these stress tests aim to identify the impacts prospectively in order to improve planning processes, and help align and calibrate Risk Appetite, Exposure Limits and Levels of Liquidity Risk tolerance.
| e) | Description of contingent financing plans. |
· The plan includes the following elements: type and business model as the starting point. Early Warning Indicators to identify in a timely manner the increase in liquidity risk and the elements that define the crisis scenarios used. Additionally we measure the liquidity shortages that stress scenarios could produce and the available actions considered by the plan to restore liquidity conditions. Actions are prioritized in order to preserve the value of the entity and the stability of the markets. A key aspect of the Plan is the governance process, stating the areas responsible for the different stages involved: activation, execution, communication and maintenance of the Plan.
| 25. Underlying Assets |
General data and stock market information
Each of the Series of this issue may be related, individually or jointly, pursuant to the provisions of the fourth paragraph of article 66 of the Mexican Exchange Law, to any of the following securities for which, during the last three years and up to date, no material suspensions have occurred in their trading.
The Issuer shall publish on a monthly basis at the Internet sitewww.santander.com.mx/conocealbanco/títulosopcionales the information regarding the behavior of the Underlying Assets of the Series in effect.
Indexes
| Index | Ticker Symbol |
| S&P 500 | SPX |
| Eurostoxx 50 | SX5E |
| i) | S&P 500 Index (SPX) |
Standard and Poor’s 500 Index is an index weighted by capitalization and it is constituted by 500 stocks. This Index is designed to measure the performance of the USA economy via the changes in the market value added of 500 stocks representing the main industrial sectors
Formula:
The formula used for determining the value of SPX measures the daily change of the capitalization value of a sample of securities. This formula assesses the market trends and eases its reproduction in portfolios, mutual funds and securities portfolios aiming to obtain the average yield offered by the market.
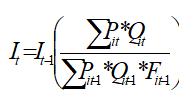
It: Index in time t
Pit: Price of issuer i in time t
| Earnings Release | 3Q.2019 |
101 |
| Banco Santander México |
Qit: Stocks of issuer i in time t
Fi: Factor of Adjustment due to input and output of securities in the sample, rights declared by issuers, repurchase of stocks and new issues, and disincorporations.
i= 1, 2, 3….n
Weighting:Weighting is determined according to the capitalization value.
Selection Criteria:
| · | Companies in USA. |
| · | Capitalization value greater than 5 billion dollars. |
| · | financial viability |
| · | Bursatility |
Operating companies
Size of sample:
S&P 500 Index includes the 500 most important companies within the most important industries in the economy of the United States of America. The table below shows the ticker symbols of the securities that constitute the sample:
| Ticker | Name | Ticker | Name | Ticker | Name |
| LYB UN Equity | LyondellBasell Industries NV | MU UW Equity | Micron Technology Inc | DVA UN Equity | DaVita Inc |
| AXP UN Equity | American Express Co | MSI UN Equity | Motorola Solutions Inc | HIG UN Equity | Hartford Financial Services Group Inc/Th |
| VZ UN Equity | Verizon Communications Inc | CBOE UF Equity | Cboe Global Markets Inc | IRM UN Equity | Iron Mountain Inc |
| AVGO UW Equity | Broadcom Inc | MYL UW Equity | Mylan NV | EL UN Equity | Estee Lauder Cos Inc/The |
| BA UN Equity | Boeing Co/The | LH UN Equity | Laboratory Corp of America Holdings | CDNS UW Equity | Cadence Design Systems Inc |
| CAT UN Equity | Caterpillar Inc | NEM UN Equity | Newmont Goldcorp Corp | UHS UN Equity | Universal Health Services Inc |
| JPM UN Equity | JPMorgan Chase & Co | NKE UN Equity | NIKE Inc | ETFC UW Equity | E*TRADE Financial Corp |
| CVX UN Equity | Chevron Corp | NI UN Equity | NiSource Inc | SWKS UW Equity | Skyworks Solutions Inc |
| KO UN Equity | Coca-Cola Co/The | NBL UN Equity | Noble Energy Inc | NOV UN Equity | National Oilwell Varco Inc |
| ABBV UN Equity | AbbVie Inc | NSC UN Equity | Norfolk Southern Corp | DGX UN Equity | Quest Diagnostics Inc |
| DIS UN Equity | Walt Disney Co/The | PFG UW Equity | Principal Financial Group Inc | ATVI UW Equity | Activision Blizzard Inc |
| FLT UN Equity | FleetCor Technologies Inc | ES UN Equity | Eversource Energy | ROK UN Equity | Rockwell Automation Inc |
| EXR UN Equity | Extra Space Storage Inc | NOC UN Equity | Northrop Grumman Corp | KHC UW Equity | Kraft Heinz Co/The |
| XOM UN Equity | Exxon Mobil Corp | WFC UN Equity | Wells Fargo & Co | AMT UN Equity | American Tower Corp |
| PSX UN Equity | Phillips 66 | NUE UN Equity | Nucor Corp | HFC UN Equity | HollyFrontier Corp |
| GE UN Equity | General Electric Co | PVH UN Equity | PVH Corp | REGN UW Equity | Regeneron Pharmaceuticals Inc |
| Earnings Release | 3Q.2019 |
102 |
| Banco Santander México |
| HPQ UN Equity | HP Inc | OXY UN Equity | Occidental Petroleum Corp | AMZN UW Equity | Amazon.com Inc |
| HD UN Equity | Home Depot Inc/The | OMC UN Equity | Omnicom Group Inc | JKHY UW Equity | Jack Henry & Associates Inc |
| IBM UN Equity | International Business Machines Corp | OKE UN Equity | ONEOK Inc | RL UN Equity | Ralph Lauren Corp |
| CXO UN Equity | Concho Resources Inc | RJF UN Equity | Raymond James Financial Inc | BXP UN Equity | Boston Properties Inc |
| JNJ UN Equity | Johnson & Johnson | PH UN Equity | Parker-Hannifin Corp | APH UN Equity | Amphenol Corp |
| MCD UN Equity | McDonald's Corp | ROL UN Equity | Rollins Inc | ARNC UN Equity | Arconic Inc |
| MRK UN Equity | Merck & Co Inc | PPL UN Equity | PPL Corp | PXD UN Equity | Pioneer Natural Resources Co |
| MMM UN Equity | 3M Co | EXC UN Equity | Exelon Corp | VLO UN Equity | Valero Energy Corp |
| AWK UN Equity | American Water Works Co Inc | COP UN Equity | ConocoPhillips | SNPS UW Equity | Synopsys Inc |
| BAC UN Equity | Bank of America Corp | PHM UN Equity | PulteGroup Inc | WU UN Equity | Western Union Co/The |
| BHGE UN Equity | Baker Hughes a GE Co | PNW UN Equity | Pinnacle West Capital Corp | CHRW UW Equity | CH Robinson Worldwide Inc |
| PFE UN Equity | Pfizer Inc | PNC UN Equity | PNC Financial Services Group Inc/The | ACN UN Equity | Accenture PLC |
| PG UN Equity | Procter & Gamble Co/The | PPG UN Equity | PPG Industries Inc | TDG UN Equity | TransDigm Group Inc |
| T UN Equity | AT&T Inc | PGR UN Equity | Progressive Corp/The | YUM UN Equity | Yum! Brands Inc |
| TRV UN Equity | Travelers Cos Inc/The | PEG UN Equity | Public Service Enterprise Group Inc | PLD UN Equity | Prologis Inc |
| UTX UN Equity | United Technologies Corp | RTN UN Equity | Raytheon Co | FE UN Equity | FirstEnergy Corp |
| ADI UW Equity | Analog Devices Inc | RHI UN Equity | Robert Half International Inc | VRSN UW Equity | VeriSign Inc |
| WMT UN Equity | Walmart Inc | EIX UN Equity | Edison International | PWR UN Equity | Quanta Services Inc |
| CSCO UW Equity | Cisco Systems Inc | SLB UN Equity | Schlumberger Ltd | HSIC UW Equity | Henry Schein Inc |
| INTC UW Equity | Intel Corp | SCHW UN Equity | Charles Schwab Corp/The | AEE UN Equity | Ameren Corp |
| GM UN Equity | General Motors Co | SHW UN Equity | Sherwin-Williams Co/The | ANSS UW Equity | ANSYS Inc |
| MSFT UW Equity | Microsoft Corp | SJM UN Equity | JM Smucker Co/The | NVDA UW Equity | NVIDIA Corp |
| DG UN Equity | Dollar General Corp | SNA UN Equity | Snap-on Inc | SEE UN Equity | Sealed Air Corp |
| CI UN Equity | Cigna Corp | AME UN Equity | AMETEK Inc | CTSH UW Equity | Cognizant Technology Solutions Corp |
| KMI UN Equity | Kinder Morgan Inc/DE | SO UN Equity | Southern Co/The | SIVB UW Equity | SVB Financial Group |
| Earnings Release | 3Q.2019 |
103 |
| Banco Santander México |
| C UN Equity | Citigroup Inc | BBT UN Equity | BB&T Corp | ISRG UW Equity | Intuitive Surgical Inc |
| AIG UN Equity | American International Group Inc | LUV UN Equity | Southwest Airlines Co | AMG UN Equity | Affiliated Managers Group Inc |
| HON UN Equity | Honeywell International Inc | SWK UN Equity | Stanley Black & Decker Inc | TTWO UW Equity | Take-Two Interactive Software Inc |
| MO UN Equity | Altria Group Inc | PSA UN Equity | Public Storage | RSG UN Equity | Republic Services Inc |
| HCA UN Equity | HCA Healthcare Inc | ANET UN Equity | Arista Networks Inc | EBAY UW Equity | eBay Inc |
| UAA UN Equity | Under Armour Inc | STI UN Equity | SunTrust Banks Inc | GS UN Equity | Goldman Sachs Group Inc/The |
| IP UN Equity | International Paper Co | SYY UN Equity | Sysco Corp | SRE UN Equity | Sempra Energy |
| HPE UN Equity | Hewlett Packard Enterprise Co | CTVA UN Equity | Corteva Inc | SBAC UW Equity | SBA Communications Corp |
| ABT UN Equity | Abbott Laboratories | TXN UW Equity | Texas Instruments Inc | MCO UN Equity | Moody's Corp |
| AFL UN Equity | Aflac Inc | TXT UN Equity | Textron Inc | BKNG UW Equity | Booking Holdings Inc |
| APD UN Equity | Air Products & Chemicals Inc | TMO UN Equity | Thermo Fisher Scientific Inc | FFIV UW Equity | F5 Networks Inc |
| RCL UN Equity | Royal Caribbean Cruises Ltd | TIF UN Equity | Tiffany & Co | AKAM UW Equity | Akamai Technologies Inc |
| AEP UN Equity | American Electric Power Co Inc | TJX UN Equity | TJX Cos Inc/The | MKTX UW Equity | MarketAxess Holdings Inc |
| HES UN Equity | Hess Corp | TMK UN Equity | Torchmark Corp | DVN UN Equity | Devon Energy Corp |
| APC UN Equity | Anadarko Petroleum Corp | TSS UN Equity | Total System Services Inc | GOOGL UW Equity | Alphabet Inc |
| AON UN Equity | Aon PLC | JCI UN Equity | Johnson Controls International plc | TFX UN Equity | Teleflex Inc |
| APA UN Equity | Apache Corp | ULTA UW Equity | Ulta Beauty Inc | RHT UN Equity | Red Hat Inc |
| ADM UN Equity | Archer-Daniels-Midland Co | UNP UN Equity | Union Pacific Corp | NFLX UW Equity | Netflix Inc |
| ADP UW Equity | Automatic Data Processing Inc | KEYS UN Equity | Keysight Technologies Inc | ALLE UN Equity | Allegion PLC |
| VRSK UW Equity | Verisk Analytics Inc | UNH UN Equity | UnitedHealth Group Inc | A UN Equity | Agilent Technologies Inc |
| AZO UN Equity | AutoZone Inc | UNM UN Equity | Unum Group | ANTM UN Equity | Anthem Inc |
| AVY UN Equity | Avery Dennison Corp | MRO UN Equity | Marathon Oil Corp | CME UW Equity | CME Group Inc |
| MSCI UN Equity | MSCI Inc | VAR UN Equity | Varian Medical Systems Inc | JNPR UN Equity | Juniper Networks Inc |
| BLL UN Equity | Ball Corp | VTR UN Equity | Ventas Inc | BLK UN Equity | BlackRock Inc |
| Earnings Release | 3Q.2019 |
104 |
| Banco Santander México |
| BK UN Equity | Bank of New York Mellon Corp/The | VFC UN Equity | VF Corp | DTE UN Equity | DTE Energy Co |
| BAX UN Equity | Baxter International Inc | VNO UN Equity | Vornado Realty Trust | NDAQ UW Equity | Nasdaq Inc |
| BDX UN Equity | Becton Dickinson and Co | VMC UN Equity | Vulcan Materials Co | CE UN Equity | Celanese Corp |
| BRK/B UN Equity | Berkshire Hathaway Inc | WY UN Equity | Weyerhaeuser Co | PM UN Equity | Philip Morris International Inc |
| BBY UN Equity | Best Buy Co Inc | WHR UN Equity | Whirlpool Corp | CRM UN Equity | salesforce.com Inc |
| HRB UN Equity | H&R Block Inc | WMB UN Equity | Williams Cos Inc/The | HII UN Equity | Huntington Ingalls Industries Inc |
| BSX UN Equity | Boston Scientific Corp | WEC UN Equity | WEC Energy Group Inc | MET UN Equity | MetLife Inc |
| BMY UN Equity | Bristol-Myers Squibb Co | XRX UN Equity | Xerox Corp | UA UN Equity | Under Armour Inc |
| FBHS UN Equity | Fortune Brands Home & Security Inc | ADBE UW Equity | Adobe Inc | TPR UN Equity | Tapestry Inc |
| BF/B UN Equity | Brown-Forman Corp | AES UN Equity | AES Corp/VA | CSX UW Equity | CSX Corp |
| COG UN Equity | Cabot Oil & Gas Corp | AMGN UW Equity | Amgen Inc | EW UN Equity | Edwards Lifesciences Corp |
| CPB UN Equity | Campbell Soup Co | AAPL UW Equity | Apple Inc | AMP UN Equity | Ameriprise Financial Inc |
| KSU UN Equity | Kansas City Southern | ADSK UW Equity | Autodesk Inc | FTI UN Equity | TechnipFMC PLC |
| HLT UN Equity | Hilton Worldwide Holdings Inc | CTAS UW Equity | Cintas Corp | ZBH UN Equity | Zimmer Biomet Holdings Inc |
| CCL UN Equity | Carnival Corp | CMCSA UW Equity | Comcast Corp | CBRE UN Equity | CBRE Group Inc |
| QRVO UW Equity | Qorvo Inc | TAP UN Equity | Molson Coors Brewing Co | MA UN Equity | Mastercard Inc |
| CTL UN Equity | CenturyLink Inc | KLAC UW Equity | KLA-Tencor Corp | KMX UN Equity | CarMax Inc |
| UDR UN Equity | UDR Inc | MAR UW Equity | Marriott International Inc/MD | ICE UN Equity | Intercontinental Exchange Inc |
| CLX UN Equity | Clorox Co/The | MKC UN Equity | McCormick & Co Inc/MD | FIS UN Equity | Fidelity National Information Services I |
| CMS UN Equity | CMS Energy Corp | JWN UN Equity | Nordstrom Inc | CMG UN Equity | Chipotle Mexican Grill Inc |
| NWL UW Equity | Newell Brands Inc | PCAR UW Equity | PACCAR Inc | WYNN UW Equity | Wynn Resorts Ltd |
| CL UN Equity | Colgate-Palmolive Co | COST UW Equity | Costco Wholesale Corp | AIZ UN Equity | Assurant Inc |
| CMA UN Equity | Comerica Inc | FRC UN Equity | First Republic Bank/CA | NRG UN Equity | NRG Energy Inc |
| IPGP UW Equity | IPG Photonics Corp | SYK UN Equity | Stryker Corp | RF UN Equity | Regions Financial Corp |
| Earnings Release | 3Q.2019 |
105 |
| Banco Santander México |
| CAG UN Equity | Conagra Brands Inc | TSN UN Equity | Tyson Foods Inc | MNST UW Equity | Monster Beverage Corp |
| ED UN Equity | Consolidated Edison Inc | LW UN Equity | Lamb Weston Holdings Inc | MOS UN Equity | Mosaic Co/The |
| SLG UN Equity | SL Green Realty Corp | AMAT UW Equity | Applied Materials Inc | EXPE UW Equity | Expedia Group Inc |
| GLW UN Equity | Corning Inc | AAL UW Equity | American Airlines Group Inc | EVRG UN Equity | Evergy Inc |
| CMI UN Equity | Cummins Inc | CAH UN Equity | Cardinal Health Inc | DISCA UW Equity | Discovery Inc |
| DHR UN Equity | Danaher Corp | CELG UW Equity | Celgene Corp | CF UN Equity | CF Industries Holdings Inc |
| TGT UN Equity | Target Corp | CERN UW Equity | Cerner Corp | VIAB UW Equity | Viacom Inc |
| DE UN Equity | Deere & Co | CINF UW Equity | Cincinnati Financial Corp | GOOG UW Equity | Alphabet Inc |
| D UN Equity | Dominion Energy Inc | DHI UN Equity | DR Horton Inc | COO UN Equity | Cooper Cos Inc/The |
| DOV UN Equity | Dover Corp | FLS UN Equity | Flowserve Corp | TEL UN Equity | TE Connectivity Ltd |
| LNT UW Equity | Alliant Energy Corp | EA UW Equity | Electronic Arts Inc | DFS UN Equity | Discover Financial Services |
| DUK UN Equity | Duke Energy Corp | EXPD UW Equity | Expeditors International of Washington I | TRIP UW Equity | TripAdvisor Inc |
| REG UW Equity | Regency Centers Corp | FAST UW Equity | Fastenal Co | V UN Equity | Visa Inc |
| ETN UN Equity | Eaton Corp PLC | MTB UN Equity | M&T Bank Corp | MAA UN Equity | Mid-America Apartment Communities Inc |
| ECL UN Equity | Ecolab Inc | XEL UW Equity | Xcel Energy Inc | XYL UN Equity | Xylem Inc/NY |
| PKI UN Equity | PerkinElmer Inc | FISV UW Equity | Fiserv Inc | MPC UN Equity | Marathon Petroleum Corp |
| EMR UN Equity | Emerson Electric Co | FITB UW Equity | Fifth Third Bancorp | TSCO UW Equity | Tractor Supply Co |
| EOG UN Equity | EOG Resources Inc | GILD UW Equity | Gilead Sciences Inc | AMD UW Equity | Advanced Micro Devices Inc |
| ETR UN Equity | Entergy Corp | HAS UW Equity | Hasbro Inc | RMD UN Equity | ResMed Inc |
| EFX UN Equity | Equifax Inc | HBAN UW Equity | Huntington Bancshares Inc/OH | MTD UN Equity | Mettler-Toledo International Inc |
| IQV UN Equity | IQVIA Holdings Inc | WELL UN Equity | Welltower Inc | CPRT UW Equity | Copart Inc |
| IT UN Equity | Gartner Inc | BIIB UW Equity | Biogen Inc | ALB UN Equity | Albemarle Corp |
| FDX UN Equity | FedEx Corp | NTRS UW Equity | Northern Trust Corp | FTNT UW Equity | Fortinet Inc |
| M UN Equity | Macy's Inc | PKG UN Equity | Packaging Corp of America | ESS UN Equity | Essex Property Trust Inc |
| FMC UN Equity | FMC Corp | PAYX UW Equity | Paychex Inc | O UN Equity | Realty Income Corp |
| F UN Equity | Ford Motor Co | PBCT UW Equity | People's United Financial Inc | STX UW Equity | Seagate Technology PLC |
| NEE UN Equity | NextEra Energy Inc | QCOM UW Equity | QUALCOMM Inc | WRK UN Equity | Westrock Co |
| Earnings Release | 3Q.2019 |
106 |
| Banco Santander México |
| BEN UN Equity | Franklin Resources Inc | ROP UN Equity | Roper Technologies Inc | INFO UW Equity | IHS Markit Ltd |
| FCX UN Equity | Freeport-McMoRan Inc | ROST UW Equity | Ross Stores Inc | WAB UN Equity | Wabtec Corp |
| GPS UN Equity | Gap Inc/The | IDXX UW Equity | IDEXX Laboratories Inc | WDC UW Equity | Western Digital Corp |
| GD UN Equity | General Dynamics Corp | SBUX UW Equity | Starbucks Corp | PEP UW Equity | PepsiCo Inc |
| GIS UN Equity | General Mills Inc | KEY UN Equity | KeyCorp | FANG UW Equity | Diamondback Energy Inc |
| GPC UN Equity | Genuine Parts Co | FOXA UW Equity | Fox Corp | NKTR UW Equity | Nektar Therapeutics |
| ATO UN Equity | Atmos Energy Corp | FOX UW Equity | Fox Corp | MXIM UW Equity | Maxim Integrated Products Inc |
| GWW UN Equity | WW Grainger Inc | STT UN Equity | State Street Corp | CHD UN Equity | Church & Dwight Co Inc |
| HAL UN Equity | Halliburton Co | NCLH UN Equity | Norwegian Cruise Line Holdings Ltd | DRE UN Equity | Duke Realty Corp |
| HOG UN Equity | Harley-Davidson Inc | USB UN Equity | US Bancorp | FRT UN Equity | Federal Realty Investment Trust |
| LHX UN Equity | L3Harris Technologies Inc | AOS UN Equity | AO Smith Corp | MGM UN Equity | MGM Resorts International |
| HCP UN Equity | HCP Inc | SYMC UW Equity | Symantec Corp | JBHT UW Equity | JB Hunt Transport Services Inc |
| HP UN Equity | Helmerich & Payne Inc | TROW UW Equity | T Rowe Price Group Inc | LRCX UW Equity | Lam Research Corp |
| FTV UN Equity | Fortive Corp | WM UN Equity | Waste Management Inc | MHK UN Equity | Mohawk Industries Inc |
| HSY UN Equity | Hershey Co/The | CBS UN Equity | CBS Corp | PNR UN Equity | Pentair PLC |
| SYF UN Equity | Synchrony Financial | AGN UN Equity | Allergan PLC | VRTX UW Equity | Vertex Pharmaceuticals Inc |
| HRL UN Equity | Hormel Foods Corp | STZ UN Equity | Constellation Brands Inc | AMCR UN Equity | Amcor PLC |
| AJG UN Equity | Arthur J Gallagher & Co | XLNX UW Equity | Xilinx Inc | FB UW Equity | Facebook Inc |
| MDLZ UW Equity | Mondelez International Inc | XRAY UW Equity | DENTSPLY SIRONA Inc | URI UN Equity | United Rentals Inc |
| CNP UN Equity | CenterPoint Energy Inc | ZION UW Equity | Zions Bancorp NA | ABMD UW Equity | ABIOMED Inc |
| HUM UN Equity | Humana Inc | ALK UN Equity | Alaska Air Group Inc | ARE UN Equity | Alexandria Real Estate Equities Inc |
| WLTW UW Equity | Willis Towers Watson PLC | IVZ UN Equity | Invesco Ltd | DAL UN Equity | Delta Air Lines Inc |
| ITW UN Equity | Illinois Tool Works Inc | LIN UN Equity | Linde PLC | UAL UW Equity | United Airlines Holdings Inc |
| IR UN Equity | Ingersoll-Rand PLC | INTU UW Equity | Intuit Inc | NWS UW Equity | News Corp |
| FL UN Equity | Foot Locker Inc | MS UN Equity | Morgan Stanley | CNC UN Equity | Centene Corp |
| Earnings Release | 3Q.2019 |
107 |
| Banco Santander México |
| IPG UN Equity | Interpublic Group of Cos Inc/The | MCHP UW Equity | Microchip Technology Inc | MAC UN Equity | Macerich Co/The |
| IFF UN Equity | International Flavors & Fragrances Inc | CB UN Equity | Chubb Ltd | MLM UN Equity | Martin Marietta Materials Inc |
| JEC UN Equity | Jacobs Engineering Group Inc | HOLX UW Equity | Hologic Inc | PYPL UW Equity | PayPal Holdings Inc |
| HBI UN Equity | Hanesbrands Inc | CFG UN Equity | Citizens Financial Group Inc | COTY UN Equity | Coty Inc |
| K UN Equity | Kellogg Co | ORLY UW Equity | O'Reilly Automotive Inc | DISH UW Equity | DISH Network Corp |
| BR UN Equity | Broadridge Financial Solutions Inc | ALL UN Equity | Allstate Corp/The | DOW UN Equity | Dow Inc |
| PRGO UN Equity | Perrigo Co PLC | FLIR UW Equity | FLIR Systems Inc | ALXN UW Equity | Alexion Pharmaceuticals Inc |
| KMB UN Equity | Kimberly-Clark Corp | EQR UN Equity | Equity Residential | RE UN Equity | Everest Re Group Ltd |
| KIM UN Equity | Kimco Realty Corp | BWA UN Equity | BorgWarner Inc | WCG UN Equity | WellCare Health Plans Inc |
| KSS UN Equity | Kohl's Corp | INCY UW Equity | Incyte Corp | NWSA UW Equity | News Corp |
| ORCL UN Equity | Oracle Corp | SPG UN Equity | Simon Property Group Inc | GPN UN Equity | Global Payments Inc |
| KR UN Equity | Kroger Co/The | EMN UN Equity | Eastman Chemical Co | CCI UN Equity | Crown Castle International Corp |
| LEG UN Equity | Leggett & Platt Inc | TWTR UN Equity | Twitter Inc | APTV UN Equity | Aptiv PLC |
| LEN UN Equity | Lennar Corp | AVB UN Equity | AvalonBay Communities Inc | AAP UN Equity | Advance Auto Parts Inc |
| JEF UN Equity | Jefferies Financial Group Inc | PRU UN Equity | Prudential Financial Inc | CPRI UN Equity | Capri Holdings Ltd |
| LLY UN Equity | Eli Lilly & Co | UPS UN Equity | United Parcel Service Inc | ALGN UW Equity | Align Technology Inc |
| LB UN Equity | L Brands Inc | AIV UN Equity | Apartment Investment & Management Co | ILMN UW Equity | Illumina Inc |
| CHTR UW Equity | Charter Communications Inc | WBA UW Equity | Walgreens Boots Alliance Inc | ADS UN Equity | Alliance Data Systems Corp |
| LNC UN Equity | Lincoln National Corp | MCK UN Equity | McKesson Corp | LKQ UW Equity | LKQ Corp |
| L UN Equity | Loews Corp | LMT UN Equity | Lockheed Martin Corp | NLSN UN Equity | Nielsen Holdings PLC |
| LOW UN Equity | Lowe's Cos Inc | ABC UN Equity | AmerisourceBergen Corp | GRMN UW Equity | Garmin Ltd |
| HST UN Equity | Host Hotels & Resorts Inc | COF UN Equity | Capital One Financial Corp | XEC UN Equity | Cimarex Energy Co |
| MMC UN Equity | Marsh & McLennan Cos Inc | WAT UN Equity | Waters Corp | ZTS UN Equity | Zoetis Inc |
| MAS UN Equity | Masco Corp | DLTR UW Equity | Dollar Tree Inc | EQIX UW Equity | Equinix Inc |
| Earnings Release | 3Q.2019 |
108 |
| Banco Santander México |
| SPGI UN Equity | S&P Global Inc | DRI UN Equity | Darden Restaurants Inc | DLR UN Equity | Digital Realty Trust Inc |
| MDT UN Equity | Medtronic PLC | NTAP UW Equity | NetApp Inc | DISCK UW Equity | Discovery Inc |
| CVS UN Equity | CVS Health Corp | CTXS UW Equity | Citrix Systems Inc | ||
| DD UN Equity | DuPont de Nemours Inc | DXC UN Equity | DXC Technology Co |
Frequency of Review of the sample:
Changes to sample are performed discretionally; there is no established periodicity.
For more information regarding this index, its background, main characteristics and selection criteria, please consult www.indices.standardandpoors.com
Historical Evolution:
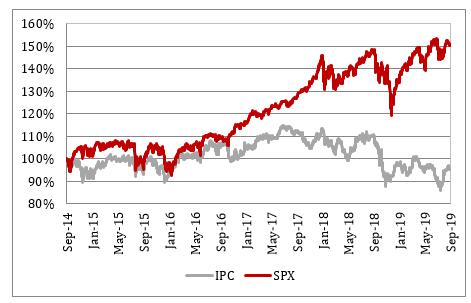
Comparison base: September 30, 2014
| Period | Minimum Price | Maximum Price | Average Securities |
| 2014 | 1,862.49 | 2,090.57 | 549,697,352.97 |
| 2015 | 1,867.61 | 2,130.82 | 633,844,598.65 |
| 2016 | 1,829.08 | 2,271.72 | 673,318,153.53 |
| 2017 | 2,238.83 | 2,690.16 | 567,284,554.67 |
| 2018 | 2,351.10 | 2,930.75 | 647,233,053.89 |
| 1° Sem. 2017 | 2,238.83 | 2,453.46 | 597,283,965.21 |
| 2° Sem. 2017 | 2,409.75 | 2,690.16 | 537,774,264.96 |
| 1° Sem. 2018 | 2,581.00 | 2,872.87 | 646,249,029.04 |
| 2° Sem. 2018 | 2,351.10 | 2,930.75 | 648,201,034.85 |
| Earnings Release | 3Q.2019 |
109 |
| Banco Santander México |
| April 2019 | 2,867.19 | 2,945.83 | 517,145,757.60 |
| May 2019 | 2,752.06 | 2,945.64 | 526,576,467.81 |
| June 2019 | 2,744.45 | 2,954.18 | 665,511,343.70 |
| July 2019 | 2,964,33 | 3,025.86 | 456,452,771.97 |
| August 2019 | 2,840.60 | 2,953.56 | 561,563,601.23 |
| September 2019 | 2,906.27 | 3,009.57 | 609,993,686.57 |
Historical Volatility:
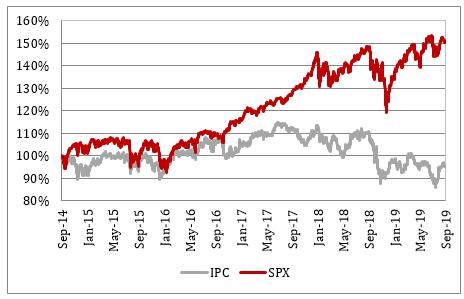
Source of Information on Historic Evolution and Volatility:www.bloomberg.com.mx
Historical:www.bloomberg.com.mx
Quantitative examples that illustrate possible gains or losses
SPX004R DV006
| Earnings Release | 3Q.2019 |
110 |
| Banco Santander México |
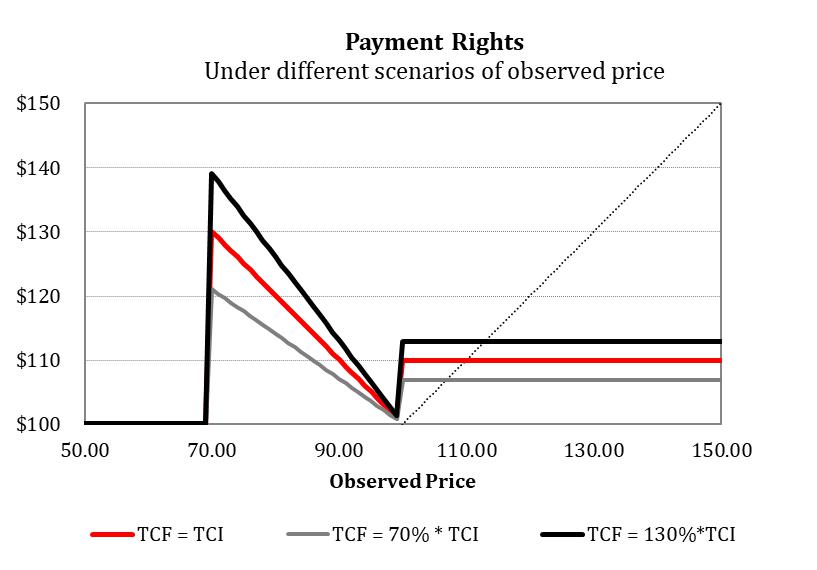
| Payment Rights (MXN) | ||||
| Market Price | Observed Price | Scenario 1 (TCF = 100%*TCI) | Scenario 2 (TCF = 70%*TCI) | Scenario 3 (TCF = 130%*TCI) |
| 1,936.99 | 70 | 130.00 | 121.00 | 139.00 |
| 1,992.33 | 72 | 128.00 | 119.60 | 136.40 |
| 2,047.68 | 74 | 126.00 | 118.20 | 133.80 |
| 2,103.02 | 76 | 124.00 | 116.80 | 131.20 |
| 2,158.36 | 78 | 122.00 | 115.40 | 128.60 |
| 2,213.70 | 80 | 120.00 | 114.00 | 126.00 |
| 2,269.05 | 82 | 118.00 | 112.60 | 123.40 |
| 2,324.39 | 84 | 116.00 | 111.20 | 120.80 |
| 2,379.73 | 86 | 114.00 | 109.80 | 118.20 |
| 2,435.07 | 88 | 112.00 | 108.40 | 115.60 |
| 2,490.42 | 90 | 110.00 | 107.00 | 113.00 |
| 2,545.76 | 92 | 108.00 | 105.60 | 110.40 |
| 2,601.10 | 94 | 106.00 | 104.20 | 107.80 |
| 2,656.44 | 96 | 104.00 | 102.80 | 105.20 |
| 2,711.79 | 98 | 102.00 | 101.40 | 102.60 |
| 2,767.13 | 100 | 109.84 | 106.89 | 112.79 |
| 2,822.47 | 102 | 109.84 | 106.89 | 112.79 |
| 2,877.82 | 104 | 109.84 | 106.89 | 112.79 |
| 2,933.16 | 106 | 109.84 | 106.89 | 112.79 |
| 2,988.50 | 108 | 109.84 | 106.89 | 112.79 |
| Earnings Release | 3Q.2019 |
111 |
| Banco Santander México |
| 3,043.84 | 110 | 109.84 | 106.89 | 112.79 |
| 3,099.19 | 112 | 109.84 | 106.89 | 112.79 |
| 3,154.53 | 114 | 109.84 | 106.89 | 112.79 |
| 3,209.87 | 116 | 109.84 | 106.89 | 112.79 |
| 3,265.21 | 118 | 109.84 | 106.89 | 112.79 |
| 3,320.56 | 120 | 109.84 | 106.89 | 112.79 |
| 3,375.90 | 122 | 109.84 | 106.89 | 112.79 |
| 3,431.24 | 124 | 109.84 | 106.89 | 112.79 |
| 3,486.58 | 126 | 109.84 | 106.89 | 112.79 |
| 3,541.93 | 128 | 109.84 | 106.89 | 112.79 |
| ii) | Eurostoxx 50 |
Eurostoxx 50 is a stock index of the European zone designed by Stoxx Ltd, an index supplier of Deutsche Böese and SIX Group. Its goal is to provide a “blue chip” representation of the leaders of the European zone.
Methodology
The index universe is defined as all the components of the 19 Euro Stoxx indexes of the supersector. The components stocks are ranked regarding the shares outstanding. The more floating shares are added to the selection list until the coverage is closed, but without not exceeding 60% of the free floatation from the Total Euro Stoxx Market Index (TMI). If the following ordered stocks have a coverage of nearly 60% in absolute terms, then they will be added to the selected list.
Any remaining stock that is an actual component of the index is added to the selection list.
The listed stocks are ordered from the highest to the lowest. The actions in the list are ordered from highest to lowest shares. In exceptional cases , the Oversight Committee may add or remove stocks to the list.
Selection of the shares:
• The 40 stocks with more outstanding shares in the selection list are chosen as components.
• Any remaining component of the Euro Stoxx 50 index place between 41 and 60 is added as index component
• If the number of components is still less than 50 , then the actions with the highest number of shares outstanding are added to make 50 shares.
Frequency of Review
The index composition is reviewed annually in September. The components are monitored monthly.
Weighting
The index is weighted by market capitalization of free float. The weight of each component is capped to 10% of the free float market. Free float weights are reviewed quarterly.
Here the list of values in the sample:
| Ticker | Name | Ticker | Name |
| OR FP Equity | L'Oreal SA | ISP IM Equity | Intesa Sanpaolo SpA |
| DG FP Equity | Vinci SA | ENI IM Equity | Eni SpA |
| BBVA SQ Equity | Banco Bilbao Vizcaya Argentaria SA | ENGI FP Equity | Engie SA |
| SAN SQ Equity | Banco Santander SA | ORA FP Equity | Orange SA |
| ASML NA Equity | ASML Holding NV | ABI BB Equity | Anheuser-Busch InBev SA/NV |
| URW NA Equity | Unibail-Rodamco-Westfield | SAN FP Equity | Sanofi |
| PHIA NA Equity | Koninklijke Philips NV | GLE FP Equity | Societe Generale SA |
| TEF SQ Equity | Telefonica SA | ENEL IM Equity | Enel SpA |
| FP FP Equity | TOTAL SA | NOKIA FH Equity | Nokia OYJ |
| Earnings Release | 3Q.2019 |
112 |
| Banco Santander México |
| AI FP Equity | Air Liquide SA | SU FP Equity | Schneider Electric SE |
| CS FP Equity | AXA SA | ALV GY Equity | Allianz SE |
| BNP FP Equity | BNP Paribas SA | AIR FP Equity | Airbus SE |
| BN FP Equity | Danone SA | BAYN GY Equity | Bayer AG |
| VIV FP Equity | Vivendi SA | BMW GY Equity | Bayerische Motoren Werke AG |
| EL FP Equity | EssilorLuxottica SA | CRH ID Equity | CRH PLC |
| MC FP Equity | LVMH Moet Hennessy Louis Vuitton SE | BAS GY Equity | BASF SE |
| KER FP Equity | Kering SA | SIE GY Equity | Siemens AG |
| AMS SQ Equity | Amadeus IT Group SA | VOW3 GY Equity | Volkswagen AG |
| SAF FP Equity | Safran SA | MUV2 GY Equity | Munich Re |
| AD NA Equity | Koninklijke Ahold Delhaize NV | FRE GY Equity | Fresenius SE & Co KGaA |
| UNA NA Equity | Unilever NV | SAP GY Equity | SAP SE |
| IBE SQ Equity | Iberdrola SA | ADS GY Equity | adidas AG |
| INGA NA Equity | ING Groep NV | DTE GY Equity | Deutsche Telekom AG |
| LIN GY Equity | Linde PLC | DPW GY Equity | Deutsche Post AG |
| ITX SQ Equity | Industria de Diseño Textil SA | DAI GY Equity | Daimler AG |
For more information on this index regarding its background, main characteristics and the criteria for the selection of issuers, please visitwww.stoxx.com
Historical Evolution:

Comparison base: September 30, 2014
| Period | Minimum Price | Maximum Price | Average (securities) |
| 2014 | 2,874.65 | 3,277.38 | 810,101,857.85 |
| Earnings Release | 3Q.2019 |
113 |
| Banco Santander México |
| 2015 | 3,007.91 | 3,828.78 | 664,475,833.08 |
| 2016 | 2,680.35 | 3,290.52 | 670,496,806.23 |
| 2017 | 3,230.68 | 3,697.40 | 480,238,812.63 |
| 2018 | 2,937.36 | 3,672.29 | 495,507,423.09 |
| 1° Sem. 2017 | 3,230.68 | 3,658.79 | 539,967,049.53 |
| 2° Sem. 2017 | 3,388.22 | 3,697.40 | 421,484,405.67 |
| 1° Sem. 2018 | 3,278.72 | 3,672.29 | 525,141,755.13 |
| 2° Sem. 2018 | 2,937.36 | 3,527.18 | 466,356,259.51 |
| April 2019 | 3,385.38 | 3,514.62 | 507,200,156.20 |
| May 2019 | 3,280.43 | 3,514.62 | 473,404,878.81 |
| June 2019 | 3,280.43 | 3,473.69 | 468,876,916.93 |
| July 2019 | 3,462.85 | 3,544.15 | 357,537,482.16 |
| August 2019 | 3,282.78 | 3,490.03 | 436,706,518.58 |
| September 2019 | 3,420.74 | 3,571.39 | 440,835,308.40 |
Historical Volatility:
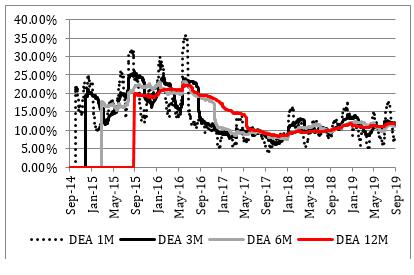
Quantitative examples that illustrate possible gains or losses
SXE009R DC058
| Earnings Release | 3Q.2019 |
114 |
| Banco Santander México |
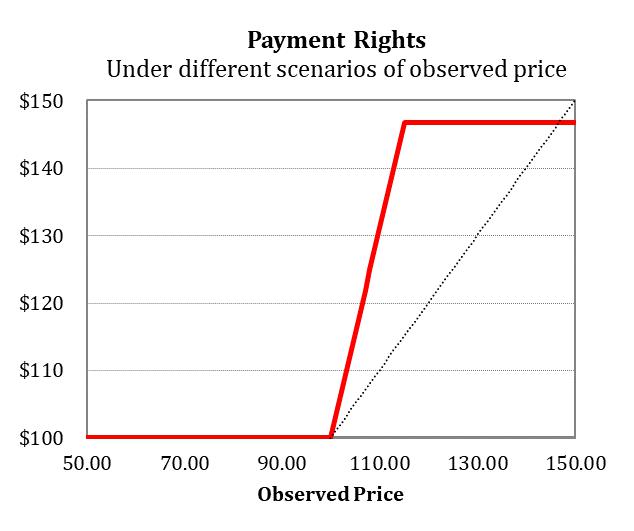
| Market Price | Observed Price | Payment Rights |
| 2,379.44 | 70 | 100.00 |
| 2,447.42 | 72 | 100.00 |
| 2,515.41 | 74 | 100.00 |
| 2,583.39 | 76 | 100.00 |
| 2,651.38 | 78 | 100.00 |
| 2,719.36 | 80 | 100.00 |
| 2,787.34 | 82 | 100.00 |
| 2,855.33 | 84 | 100.00 |
| 2,923.31 | 86 | 100.00 |
| 2,991.30 | 88 | 100.00 |
| 3,059.28 | 90 | 100.00 |
| 3,127.26 | 92 | 100.00 |
| 3,195.25 | 94 | 100.00 |
| 3,263.23 | 96 | 100.00 |
| 3,331.22 | 98 | 100.00 |
| 3,399.20 | 100 | 100.00 |
| 3,467.18 | 102 | 106.22 |
| 3,535.17 | 104 | 112.44 |
| 3,603.15 | 106 | 118.66 |
| 3,671.14 | 108 | 124.88 |
| 3,739.12 | 110 | 131.10 |
| 3,807.10 | 112 | 137.32 |
| 3,875.09 | 114 | 143.54 |
| 3,943.07 | 116 | 146.65 |
| 4,011.06 | 118 | 146.65 |
| Earnings Release | 3Q.2019 |
115 |
| Banco Santander México |
| 4,079.04 | 120 | 146.65 |
| 4,147.02 | 122 | 146.65 |
| 4,215.01 | 124 | 146.65 |
| 4,282.99 | 126 | 146.65 |
| 4,350.98 | 128 | 146.65 |
| Earnings Release | 3Q.2019 |
116 |
| Banco Santander México |
Hedged Position as of September 30th, 2019
HEDGED INSTRUMENTS
ISSUERS: SPX004R DV006, SXE009R DC058
| ASSET T YPE | ISSUER / SERIE | NUMBER OF SHARES | MARKET PRICE | BETA COEF. | PERIOD IN MONTHS USED FOR BETA | DELTA COEFIC. (FOR OPTIONS AND WARRANTS) | DELTA (SHARES) | DELTA (SECURITIES) |
| HEDGE | .STOXX50E | 464,000 | 0.00 | 1.0000 | 12 | 1.000000 | 464,000.00 | 43.5230 |
| HEDGE | MINI-SP FUT | 1 | 2,978.50 | 1.0000 | 12 | 1.000000 | 1.00 | 50.0000 |
| OBLIGATION | SXE009R DC058 | 464,000 | 0.00 | 1.0000 | 12 | 0.000094 | 43.5230 | (43.5230) |
| OBLIGATION | SPX004R DV006 | 190,000 | 103.31 | 1.0000 | 12 | 0.000112 | 21.3589 | (21.3589) |
| DELTA AS ISSUERS | ||
| ISSUER / SERIE | ASSET TYPE | TOTAL |
| MINI-SP FUT | HEDGE | 50.000000 |
| SPX004R DV006 | OBLIGATION | (21.358900) |
| .STOXX50E | HEDGE | 43.523040 |
| SXE009R DC058 | OBLIGATION | (43.523040) |
| Total | 28.641100 | |
| ISSUER | DELTA (SHARES) | ORIGINAL BETA | STANDARD ERROR | DELTA EN TERMINOS DE EMISORAS | DELTA HEDGE IN SECURITIES | DELTA OBLIGATIONS IN SECURITIES |
| SPX004R DV006 | 28.6411 | 1.0000 | 0.000000 | 28.6411 | 50.0000 | (21.3589) |
| SXE009R DC058 | 0.0000 | 1.0000 | 0.000000 | 0.0000 | 43.5230 | (43.5230) |
| Earnings Release | 3Q.2019 |
117 |
| Banco Santander México |
Item 2
3Q.19 Earnings Presentation Banco Santander México, S.A., Institución de Banca Múltiple, Grupo Financiero Santander México.
Safe Harbor Statement 2 Banco Santander México cautions that this presentation may contain forward - looking statements within the meaning of the U . S . Private Securities Litigation Reform Act of 1995 . These forward - looking statements could be found in various places throughout this presentation and include, without limitation, statements regarding our intent, belief, targets or current expectations in connection with : asset growth and sources of funding ; growth of our fee - based business ; expansion of our distribution network ; financing plans ; competition ; impact of regulation and the interpretation thereof ; action to modify or revoke our banking license ; exposure to market risks including interest rate risk, foreign exchange risk and equity price risk ; exposure to credit risks including credit default risk and settlement risk ; projected capital expenditures ; capitalization requirements and level of reserves ; investment in our formation technology platform ; liquidity ; trends affecting the economy generally ; and trends affecting our financial condition and our results of operations . While these forward - looking statements represent our judgment and future expectations concerning the development of our business, many important factors could cause actual results to differ substantially from those anticipated in forward - looking statements . These factors include, among other things : changes in capital markets in general that may affect policies or attitudes towards lending to Mexico or Mexican companies ; changes in economic conditions, in Mexico in particular, in the United States or globally ; the monetary, foreign exchange and interest rate policies of the Mexican Central Bank ( Banco de México ) ; inflation ; deflation ; unemployment ; unanticipated turbulence in interest rates ; movements in foreign exchange rates ; movements in equity prices or other rates or prices ; changes in Mexican and foreign policies, legislation and regulations ; changes in requirements to make contributions to, for the receipt of support from programs organized by or requiring deposits to be made or assessments observed or imposed by, the Mexican government ; changes in taxes and tax laws ; competition, changes in competition and pricing environments ; our inability to hedge certain risks economically ; economic conditions that affect consumer spending and the ability of customers to comply with obligations ; the adequacy of allowance for impairment losses and other losses ; increased default by borrowers ; our inability to successfully and effectively integrate acquisitions or to evaluate risks arising from asset acquisitions ; technological changes ; changes in consumer spending and saving habits ; increased costs ; unanticipated increases in financing and other costs or the inability to obtain additional debt or equity financing on attractive terms ; changes in, or failure to comply with, banking regulations or their interpretation ; and certain other risk factors included in our annual report on Form 20 - F . The risk factors and other key factors that we have indicated in our past and future filings and reports, including those with the U . S . Securities and Exchange Commission, could adversely affect our business and financial performance . The words “believe,” “may,” “will,” “aim,” “estimate,” “continue,” “anticipate,” “intend,” “expect,” “forecast” and similar words are intended to identify forward - looking statements . You should not place undue reliance on such statements, which speak only as of the date they were made . We undertake no obligation to update publicly or to revise any forward - looking statements after we distribute this presentation because of new information, future events or other factors . In light of the risks and uncertainties described above, the future events and circumstances discussed herein might not occur and are not guarantees of future performance . Note : The information contained in this presentation is not audited . Nevertheless, the consolidated accounts are prepared on the basis of the accounting principles and regulations prescribed by the Mexican National Banking and Securities Commission ( Comisión Nacional Bancaria y de Valores ) for credit institutions, as amended (Mexican Banking GAAP) . All figures presented are in millions of nominal Mexican pesos, unless otherwise indicated . Historical figures are not adjusted by inflation .
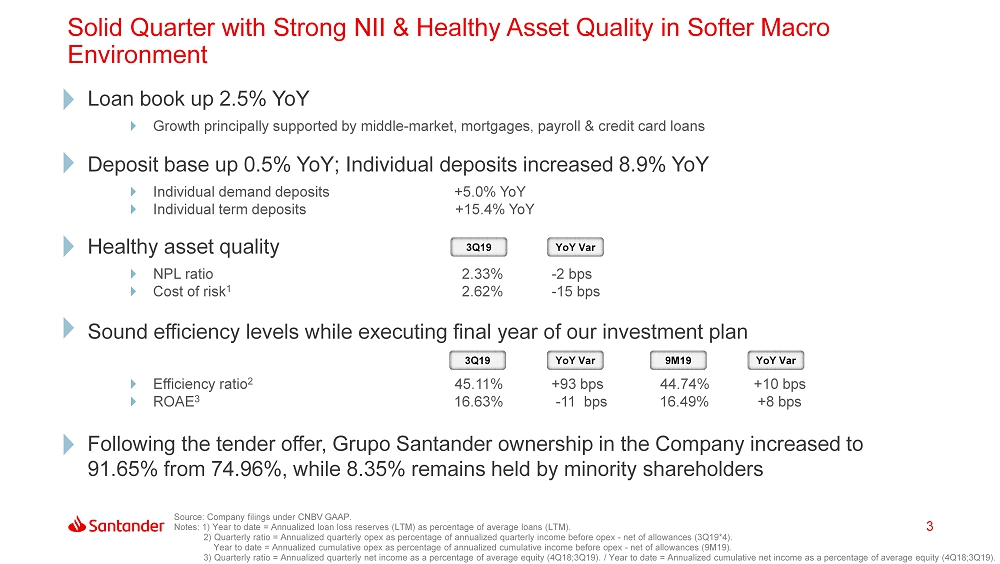
Solid Quarter with Strong NII & Healthy Asset Quality in Softer Macro Environment 3 Source: Company filings under CNBV GAAP. Notes: 1) Year to date = Annualized loan loss reserves (LTM) as percentage of average loans (LTM). 2) Quarterly ratio = Annualized quarterly opex as percentage of annualized quarterly income before opex - net of allowances (3Q19*4). Year to date = Annualized cumulative opex as percentage of annualized cumulative income before opex - net of allowances (9M19). 3) Quarterly ratio = Annualized quarterly net income as a percentage of average equity (4Q18;3Q19). / Year to date = Annualized cumulative net income as a percentage of average equity (4Q18;3Q19). Loan book up 2.5% YoY Growth principally supported by middle - market, mortgages, payroll & credit card loans Deposit base up 0.5% YoY; Individual deposits increased 8.9% YoY Individual demand deposits +5.0% YoY Individual term deposits +15.4% YoY Healthy asset quality NPL ratio 2.33% - 2 bps Cost of risk 1 2.62% - 15 bps Sound efficiency levels while executing final year of our investment plan Efficiency ratio 2 45.11% +93 bps 44.74% +10 bps ROAE 3 16.63% - 11 bps 16.49% +8 bps 3Q19 YoY Var 9M19 YoY Var 3Q19 YoY Var Following the tender offer, Grupo Santander ownership in the Company increased to 91.65% from 74.96%, while 8.35% remains held by minority shareholders
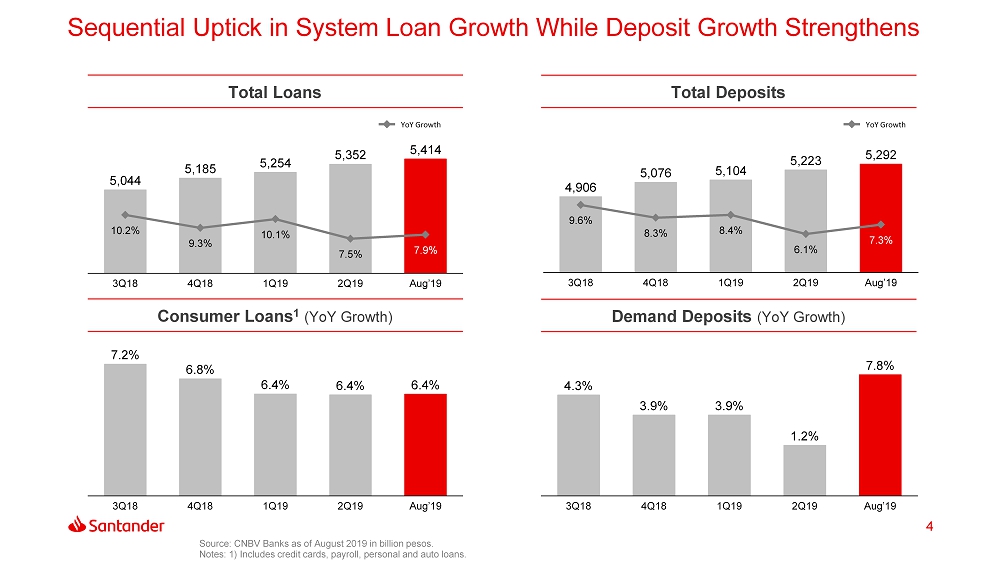
Sequential Uptick in System Loan Growth While Deposit Growth Strengthens 4 Source: CNBV Banks as of August 2019 in billion pesos. Notes: 1) Includes credit cards, payroll, personal and auto loans. Total Loans Total Deposits Consumer Loans 1 (YoY Growth) Demand Deposits (YoY Growth) 5,414 4Q18 7.9 % 10.2% 3Q18 10.1% 9.3% 1Q19 7.5% 2Q19 Aug’19 5,044 5,185 5,254 5,352 YoY Growth 1Q19 4Q18 7.3% 8.4% 9.6% 3Q18 8.3% 6.1% 2Q19 Aug’19 4,906 5,076 5,223 5,104 5,292 YoY Growth 6.4% 3Q18 1Q19 4Q18 2Q19 Aug’19 7.2% 6.8% 6.4% 6.4% 4Q18 3.9% 3.9% 3Q18 4.3% 1Q19 2Q19 Aug’19 1.2% 7.8%
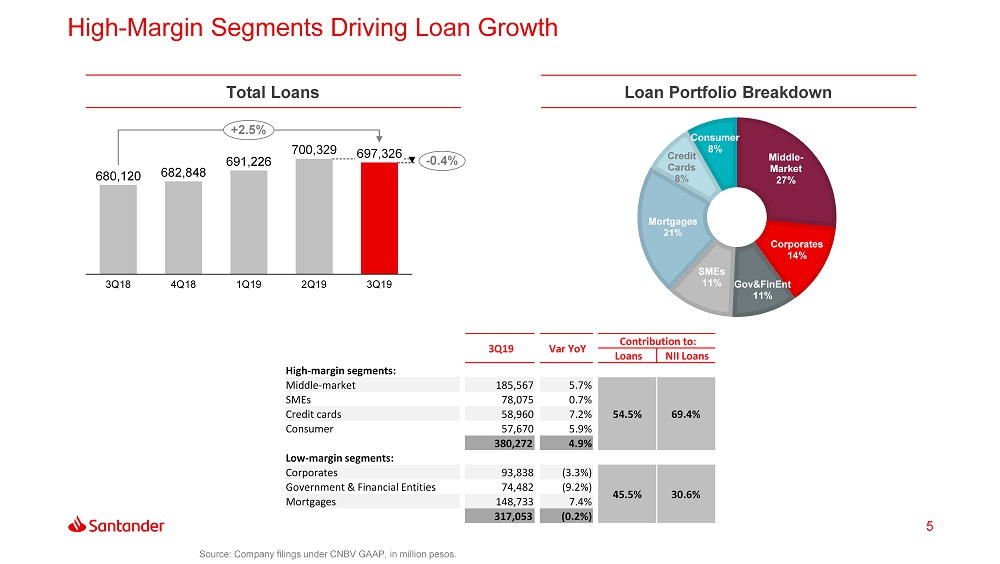
5 Source: Company filings under CNBV GAAP, in million pesos. Total Loans Loan Portfolio Breakdown 4Q18 3Q18 2Q19 1Q19 3Q19 700,329 680,120 682,848 691,226 697,326 - 0.4% +2.5% 3Q19 Var YoY Contribution to: Loans NII Loans High - margin s egments : Middle - market 185,567 5.7% 54.5% 69.4% SMEs 78,075 0.7% Credit cards 58,960 7.2% Consumer 57,670 5.9% 380,272 4.9% Low - margin segments: Corporates 93,838 (3.3%) 45.5% 30.6% Government & Financial Entities 74,482 (9.2%) Mortgages 148,733 7.4% 317,053 (0.2%) Middle - Market 27% Corporates 14% Gov&FinEnt 11% SMEs 11% Mortgages 21% Credit Cards 8% Consumer 8% High - Margin Segments Driving Loan Growth
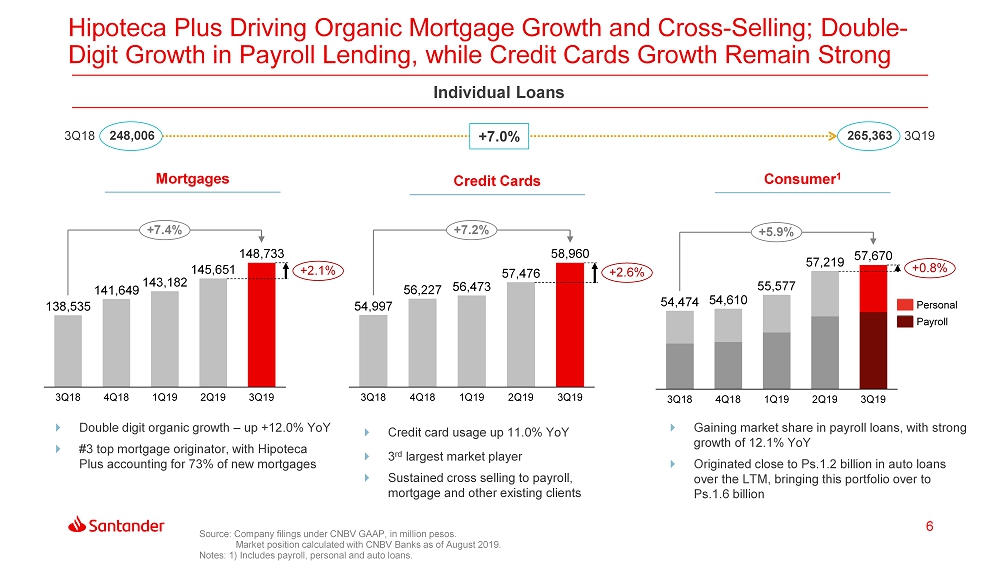
Hipoteca Plus Driving Organic Mortgage Growth and Cross - Selling; Double - Digit Growth in Payroll Lending, while Credit Cards Growth Remain Strong 6 Source: Company filings under CNBV GAAP, in million pesos. Market position calculated with CNBV Banks as of August 2019. Notes: 1) Includes payroll, personal and auto loans. Individual Loans 265,363 248,006 3Q18 3Q19 +7.0% 3Q18 145,651 4Q18 3Q19 1Q19 2Q19 148,733 138,535 141,649 143,182 +2.1% +7.4% 4Q18 3Q18 1Q19 2Q19 3Q19 54,997 56,227 56,473 57,476 58,960 +2.6% +7.2% 3Q18 4Q18 1Q19 2Q19 3Q19 54,610 54,474 55,577 57,670 57,219 +0.8% +5.9% Double digit organic growth – up +12.0% YoY #3 top mortgage originator, with Hipoteca Plus accounting for 73% of new mortgages Credit card usage up 11.0% YoY 3 rd largest market player Sustained cross selling to payroll, mortgage and other existing clients Gaining market share in payroll loans, with strong growth of 12.1% YoY Originated close to Ps.1.2 billion in auto loans over the LTM, bringing this portfolio over to Ps.1.6 billion Personal Payroll Mortgages Credit Cards Consumer 1
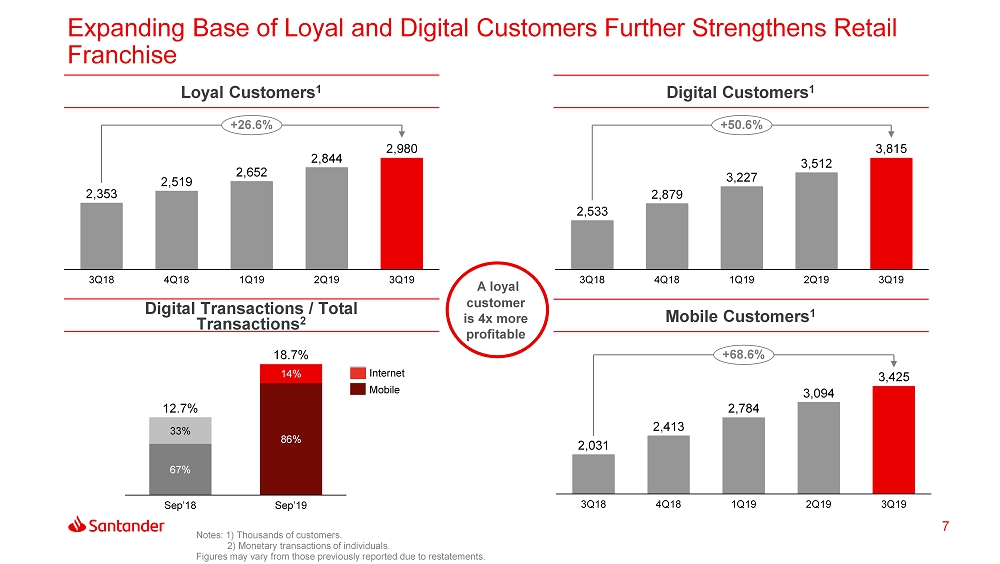
Expanding Base of Loyal and Digital Customers Further Strengthens Retail Franchise 7 Notes: 1) Thousands of customers. 2) Monetary transactions of individuals. Figures may vary from those previously reported due to restatements. Loyal Customers 1 Digital Customers 1 Digital Transactions / Total Transactions 2 Mobile Customers 1 3Q19 3Q18 2,353 4Q18 1Q19 2Q19 2,519 2,652 2,844 2,980 +26.6% 4Q18 1Q19 3Q18 2Q19 3Q19 2,533 2,879 3,227 3,512 3,815 +50.6% 3Q18 2Q19 4Q18 1Q19 3Q19 2,031 2,413 2,784 3,094 3,425 +68.6% A loyal customer is 4x more profitable Sep’19 33% 67% 14% Sep’18 18.7% 86% 12.7% Internet Mobile
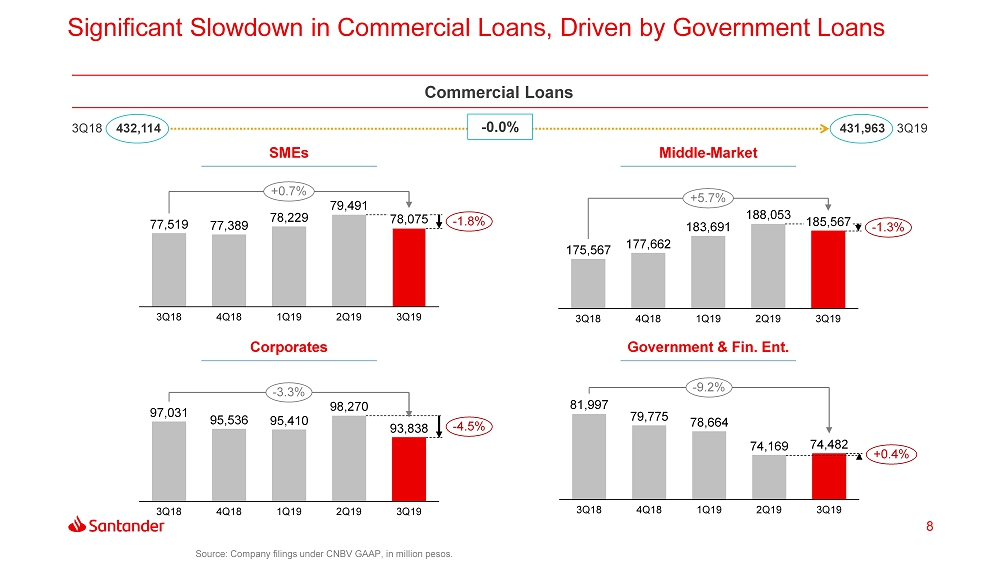
Significant Slowdown in Commercial Loans, Driven by Government Loans 8 Source: Company filings under CNBV GAAP, in million pesos. Commercial Loans 431,963 432,114 3Q18 3Q19 - 0.0% SMEs Middle - Market Corporates Government & Fin. Ent . 3Q18 3Q19 1Q19 4Q18 2Q19 77,519 77,389 78,229 79,491 78,075 - 1.8% +0.7% 3Q18 3Q19 1Q19 4Q18 93,838 98,270 2Q19 97,031 95,536 95,410 - 4.5% - 3.3% 1Q19 4Q18 3Q18 2Q19 185,567 3Q19 175,567 177,662 183,691 188,053 - 1.3% +5.7% 2Q19 3Q18 1Q19 4Q18 3Q19 79,775 81,997 78,664 74,169 74,482 +0.4% - 9.2%
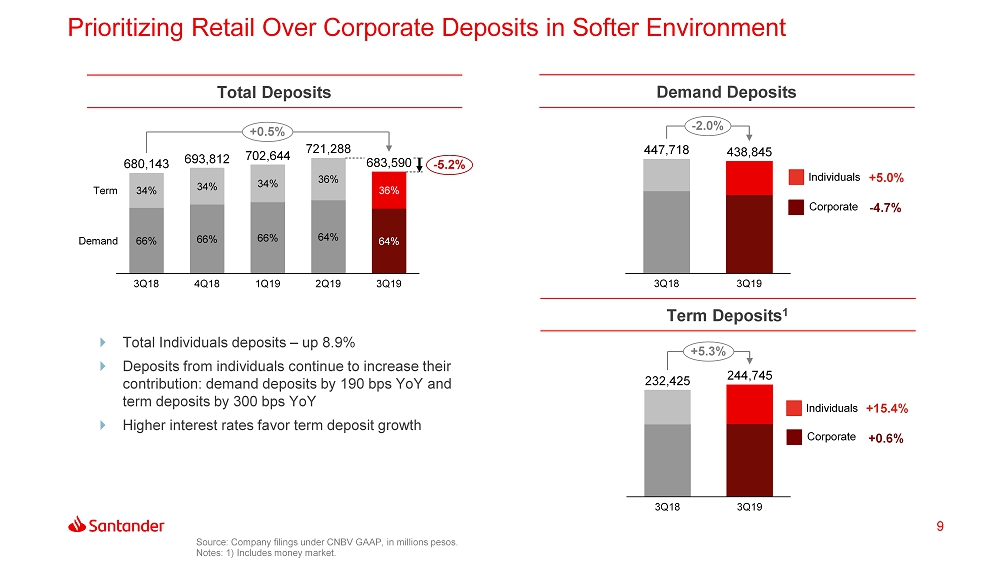
Prioritizing Retail Over Corporate Deposits in Softer Environment 9 Total Deposits 66% 66% 693,812 34% 66% 1Q19 3Q18 34% 36% 4Q18 34% 64% 2Q19 36% 64% 3Q19 Term 702,644 Demand 680,143 721,288 683,590 - 5.2% +0.5% Demand Deposits 438,845 3Q18 3Q19 447,718 - 2.0% +5.0% Individuals Corporate - 4.7% Term Deposits 1 3Q19 3Q18 244,745 232,425 +5.3% Total Individuals deposits – up 8.9% Deposits from individuals continue to increase their contribution: demand deposits by 190 bps YoY and term deposits by 300 bps YoY Higher interest rates favor term deposit growth Source: Company filings under CNBV GAAP, in millions pesos. Notes: 1) Includes money market. Individuals Corporate +15.4% +0.6%
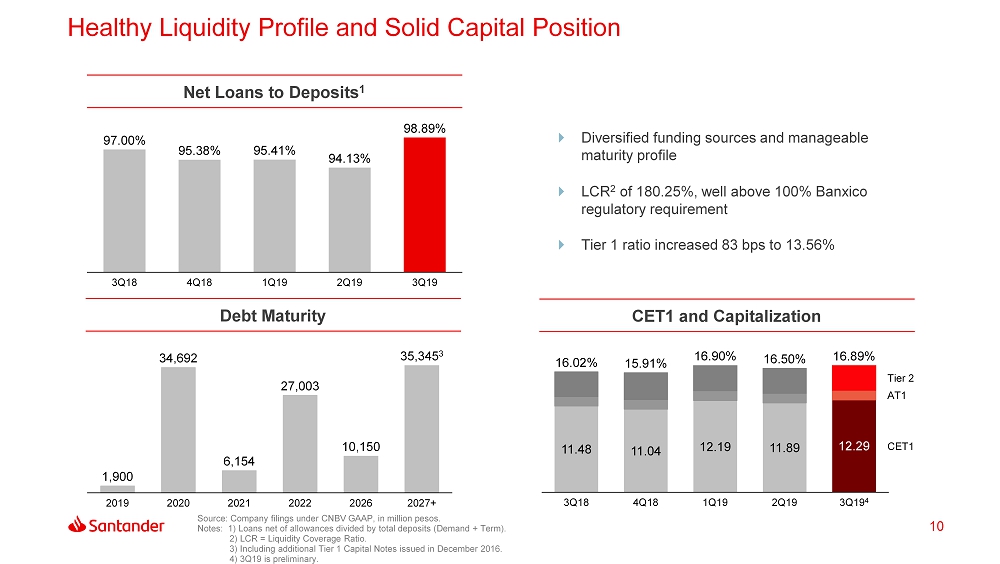
Healthy Liquidity Profile and Solid Capital Position 10 Net Loans to Deposits 1 Debt Maturity CET1 and Capitalization Diversified funding sources and manageable maturity profile LCR 2 of 180.25%, well above 100% Banxico regulatory requirement Tier 1 ratio increased 83 bps to 13.56% Source: Company filings under CNBV GAAP, in million pesos. Notes: 1) Loans net of allowances divided by total deposits (Demand + Term). 2) LCR = Liquidity Coverage Ratio. 3) Including additional Tier 1 Capital Notes issued in December 2016. 4) 3Q19 is preliminary. 3Q18 4Q18 98.89% 1Q19 95.41% 2Q19 97.00% 3Q19 95.38% 94.13% 1,900 34,692 6,154 27,003 10,150 2026 2021 2020 2019 2022 2027+ 35,345 3 11.48 11.04 12.19 11.89 12.29 2Q19 3Q18 CET1 4Q18 1Q19 3Q19 4 Tier 2 AT1 16.02% 15.91% 16.90% 16.50% 16.89%
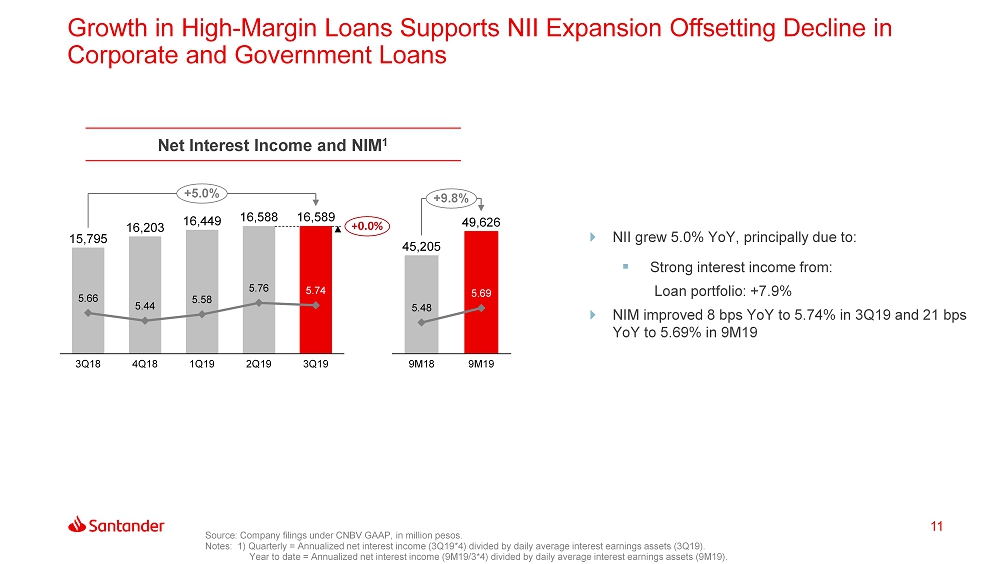
Growth in High - Margin Loans Supports NII Expansion Offsetting Decline in Corporate and Government Loans 11 Net Interest Income and NIM 1 NII grew 5.0% YoY, principally due to: ▪ Strong interest income from: Loan portfolio: +7.9% NIM improved 8 bps YoY to 5.74% in 3Q19 and 21 bps YoY to 5.69% in 9M19 Source: Company filings under CNBV GAAP, in million pesos. Notes: 1) Quarterly = Annualized net interest income (3Q19*4) divided by daily average interest earnings assets (3Q19). Year to date = Annualized net interest income (9M19/3*4) divided by daily average interest earnings assets (9M1 9). 45,205 9M19 5.48 9M18 5.69 49,626 +9.8% 5.76 16,203 5.44 3Q18 5.66 2Q19 4Q18 5.58 16,588 5.74 1Q19 3Q19 15,795 16,449 16,589 +0.0% +5.0%

Strong Credit Card Usage Coupled With Insurance and Advisory Drove Fees & Commissions 12 Net Commissions and Fees Source: Company filings under CNBV GAAP, in million pesos. Notes: 1) Includes fees from collections and payments, account management, checks, foreign trade and others. 3Q18 4Q18 3Q19 1Q19 2Q19 4,271 4,230 4,426 4,697 4,580 - 2.5% +7.2% Credit cards 30% Insurance 26% Cash management* 22% Financial advisory services 9% Investment funds 9% Purchase - sale of securities and money market transactions 4% 9M18 9M19 13,703 12,602 +8.7% Var YoY Var YoY 3Q18 2Q19 3Q19 $$ % 9M18 9M19 $$ % Credit cards 1,186 1,297 1,395 209 17.6% 3,209 4,032 823 25.6% Insurance 1,123 1,358 1,178 55 4.9% 3,387 3,673 286 8.4% Cash management* 1,145 1,110 1,032 (113) (9.9%) 3,220 3,215 (5) (0.2%) Financial advisory services 280 325 408 128 45.7% 989 1,078 89 9.0% Investment funds 397 394 399 2 0.5% 1,173 1,163 (10) (0.9%) Purchase - sale of securities and money market transactions 140 213 168 28 20.0% 624 542 (82) (13.1%) Net commisions and fees 4,271 4,697 4,580 309 7.2% 12,602 13,703 1,101 8.7%
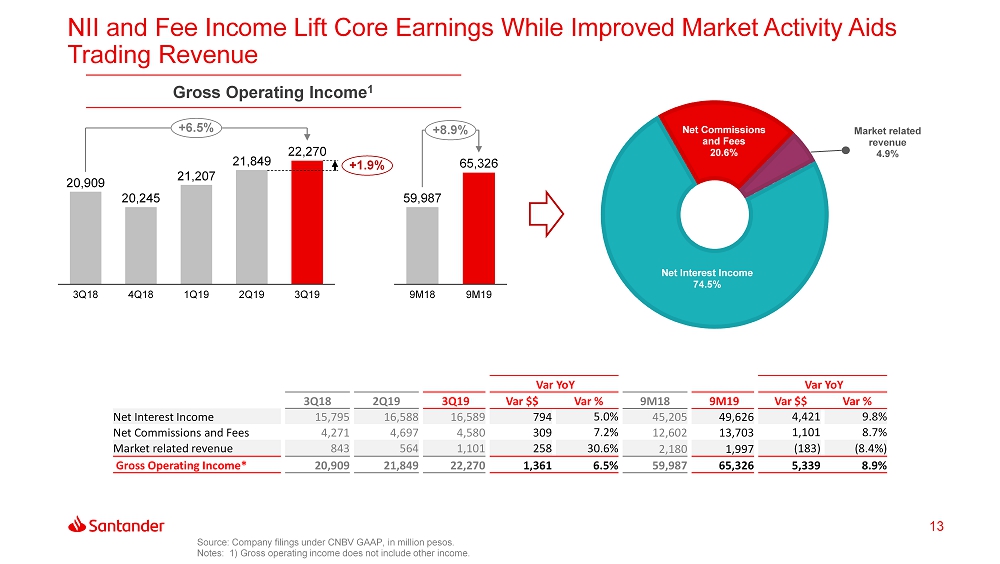
NII and Fee Income Lift Core Earnings While Improved Market Activity Aids Trading Revenue 13 Gross Operating Income 1 Source: Company filings under CNBV GAAP, in million pesos. Notes: 1) Gross operating income does not include other income. 3Q18 4Q18 2Q19 1Q19 3Q19 20,909 20,245 21,207 21,849 22,270 +1.9% +6.5% Net Interest Income 74.5% Net Commissions and Fees 20.6% Market related revenue 4.9% 59,987 65,326 9M18 9M19 +8.9% Var YoY Var YoY 3Q18 2Q19 3Q19 Var $$ Var % 9M18 9M19 Var $$ Var % Net Interest Income 15,795 16,588 16,589 794 5.0% 45,205 49,626 4,421 9.8% Net Commissions and Fees 4,271 4,697 4,580 309 7.2% 12,602 13,703 1,101 8.7% Market related revenue 843 564 1,101 258 30.6% 2,180 1,997 (183) (8.4%) Gross Operating Income* 20,909 21,849 22,270 1,361 6.5% 59,987 65,326 5,339 8.9%
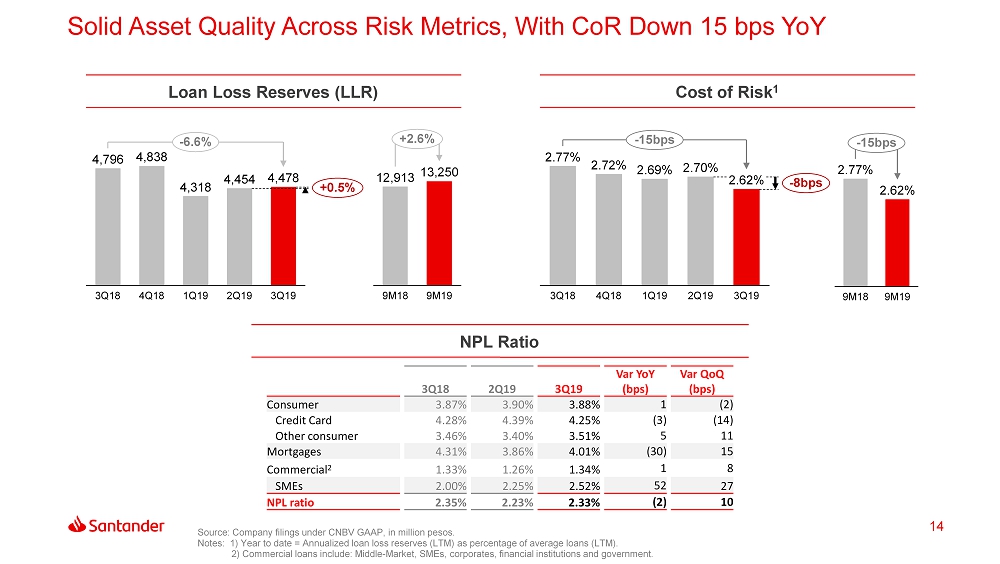
9M19 9M18 2.77% 2.62% - 15 bps Solid Asset Quality Across Risk Metrics, With CoR Down 15 bps YoY 14 Loan Loss Reserves (LLR) Source: Company filings under CNBV GAAP, in million pesos. Notes: 1) Year to date = Annualized loan loss reserves (LTM) as percentage of average loans (LTM). 2) Commercial loans include: Middle - Market, SMEs, corporates, financial institutions and government. 3Q19 4,838 3Q18 4Q18 4,478 1Q19 2Q19 4,454 4,796 4,318 +0.5% - 6.6% Cost of Risk 1 1Q19 3Q18 2Q19 4Q18 3Q19 2.69% 2.77% 2.72% 2.70% 2.62% - 8bps - 15 bps 9M18 9M19 12,913 13,250 +2.6% NPL Ratio 3Q18 2Q19 3Q19 Var YoY (bps) Var QoQ (bps) Consumer 3.87% 3.90% 3.88% 1 (2) Credit Card 4.28% 4.39% 4.25% (3) (14) Other consumer 3.46% 3.40% 3.51% 5 11 Mortgages 4.31% 3.86% 4.01% (30) 15 Commercial 2 1.33% 1.26% 1.34% 1 8 SMEs 2.00% 2.25% 2.52% 52 27 NPL ratio 2.35% 2.23% 2.33% (2) 10
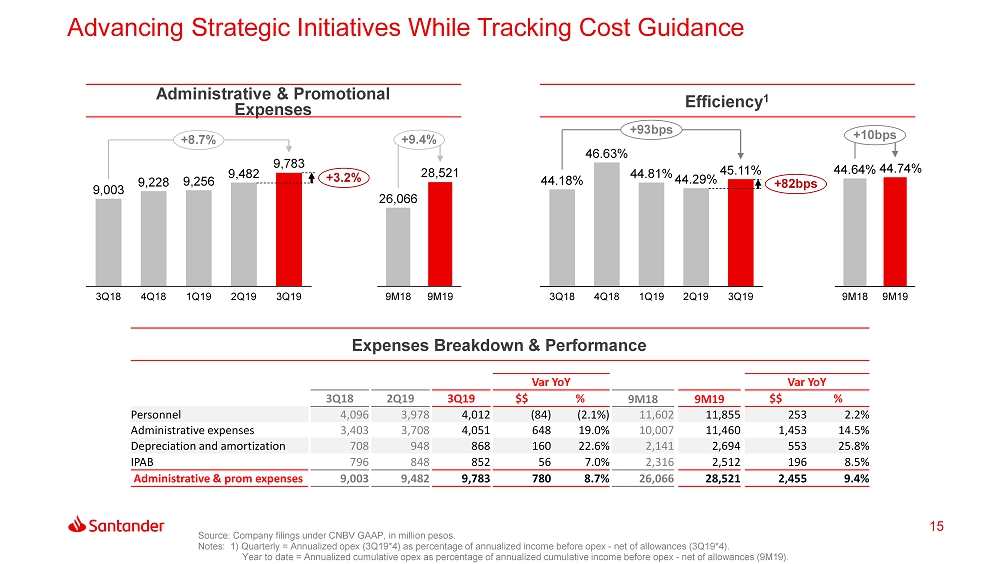
9M18 9M19 44.64% 44.74% +10 bps Advancing Strategic Initiatives While Tracking Cost Guidance 15 Administrative & Promotional Expenses Source: Company filings under CNBV GAAP, in million pesos. Notes: 1) Quarterly = Annualized opex (3Q19*4) as percentage of annualized income before opex - net of allowances (3Q19*4). Year to date = Annualized cumulative opex as percentage of annualized cumulative income before opex - net of allowances (9M19). Efficiency 1 3Q18 1Q19 9,256 4Q18 2Q19 3Q19 9,003 9,228 9,482 9,783 +3.2% +8.7% 4Q18 3Q18 1Q19 2Q19 3Q19 44.18% 46.63% 44.81% 44.29% 45.11% +82bps +93 bps Expenses Breakdown & Performance 26,066 9M18 9M19 28,521 +9.4% Var YoY Var YoY 3Q18 2Q19 3Q19 $$ % 9M18 9M19 $$ % Personnel 4,096 3,978 4,012 (84) (2.1%) 11,602 11,855 253 2.2% Administrative expenses 3,403 3,708 4,051 648 19.0% 10,007 11,460 1,453 14.5% Depreciation and amortization 708 948 868 160 22.6% 2,141 2,694 553 25.8% IPAB 796 848 852 56 7.0% 2,316 2,512 196 8.5% Administrative & prom expenses 9,003 9,482 9,783 780 8.7% 26,066 28,521 2,455 9.4%

14,994 9M18 9M19 16,416 +9.5% Net Income Up 8.3% YoY and Down 1.6% Sequentially Despite Substantially Higher Effective Tax Rate 16 Source: Company filings under CNBV GAAP, in million pesos. Notes: 1) Quarterly = Annualized net income (3Q19x4) as percentage of average equity (4Q18,3Q19). Year to date = Annualized cumulative net income as percentage of average equity (4Q18,3Q19). Net Income ROAE 1 Effective Tax Rate Profit Before Taxes 5,517 3Q18 5,096 4Q18 1Q19 5,291 2Q19 3Q19 4,590 5,608 - 1.6% +8.3% 4Q18 3Q18 2Q19 1Q19 3Q19 16.74% 15.18% 16.40% 17.29% 16.63% - 66bps - 11bps 3Q19 3Q18 4Q18 1Q19 2Q19 22.52% 19.81% 25.29% 25.72% 24.96% +76bps +320bps 3Q19 4Q18 3Q18 1Q19 2Q19 6,577 5,724 7,082 7,473 7,427 - 0.6% +12.9% 9M18 9M19 16.49% 16.41% +8bps 9M19 9M18 25.32% 22.77% +255bps 9M18 21,982 9M19 19,415 +13.2%
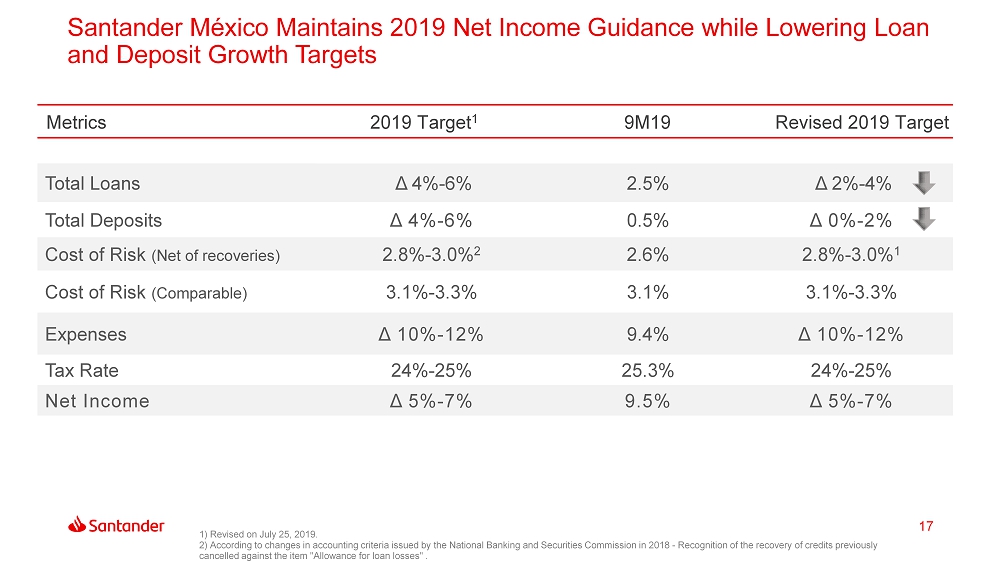
Santander México Maintains 2019 Net Income Guidance while Lowering Loan and Deposit Growth Targets 17 1) Revised on July 25, 2019. 2) According to changes in accounting criteria issued by the National Banking and Securities Commission in 2018 - Recognition of the recovery of credits previously cancelled against the item "Allowance for loan losses" . Total Loans Δ 4% - 6% 2.5% Δ 2% - 4% Total Deposits Δ 4% - 6% 0.5% Δ 0% - 2% Cost of Risk (Net of recoveries ) 2.8% - 3.0% 2 2.6% 2.8% - 3.0% 1 Cost of Risk (Comparable) 3.1% - 3.3% 3.1% 3.1% - 3.3% Expenses Δ 10% - 12% 9.4% Δ 10% - 12% Tax Rate 24% - 25% 25.3% 24% - 25% Net Income Δ 5% - 7% 9.5% Δ 5% - 7% Metrics 2019 Target 1 9M19 Revised 2019 Target

Questions and Answers
19 Annexes
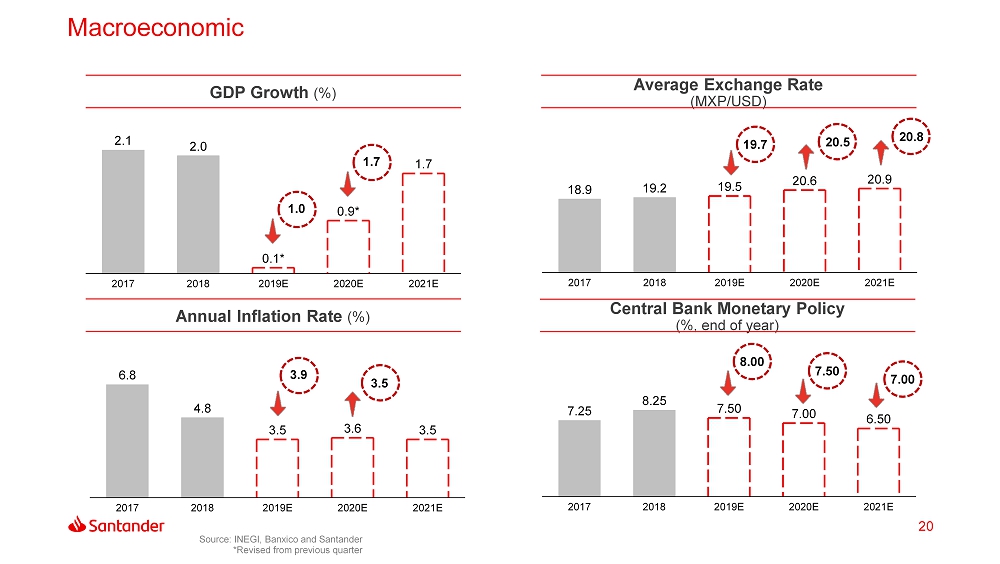
Macroeconomic 20 Source: INEGI, Banxico and Santander *Revised from previous quarter GDP Growth (%) Average Exchange Rate (MXP/USD) Annual Inflation Rate (%) Central Bank Monetary Policy (%, end of year) 2.1 2.0 1.7 2017 2018 2019E 2020E 2021E 0.1 * 0.9 * 18.9 19.2 19.5 20.6 20.9 2017 2019E 2018 2021E 2020E 6.8 4.8 3.5 3.6 3.5 2017 2018 2019E 2020E 2021E 7.25 8.25 7.50 7.00 6.50 2021E 2017 2020E 2018 2019E 20.5 1.0 1.7 19.7 20.8 3.9 3.5 8.00 7.50 7.00
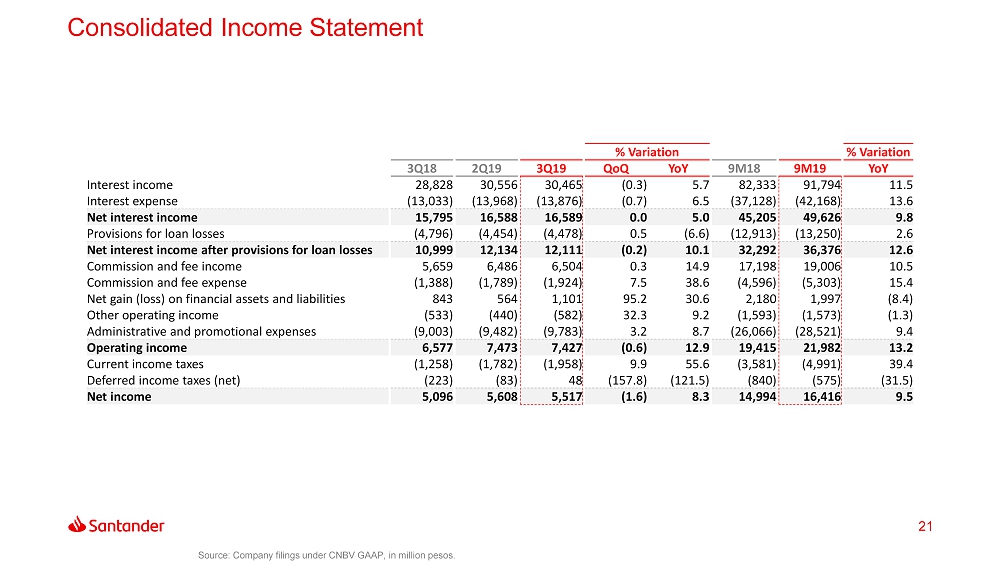
Consolidated Income Statement 21 Source: Company filings under CNBV GAAP, in million pesos. % Variation % Variation 3Q18 2Q19 3Q19 QoQ YoY 9M18 9M19 YoY Interest income 28,828 30,556 30,465 (0.3) 5.7 82,333 91,794 11.5 Interest expense (13,033) (13,968) (13,876) (0.7) 6.5 (37,128) (42,168) 13.6 Net interest income 15,795 16,588 16,589 0.0 5.0 45,205 49,626 9.8 Provisions for loan losses (4,796) (4,454) (4,478) 0.5 (6.6) (12,913) (13,250) 2.6 Net interest income after provisions for loan losses 10,999 12,134 12,111 (0.2) 10.1 32,292 36,376 12.6 Commission and fee income 5,659 6,486 6,504 0.3 14.9 17,198 19,006 10.5 Commission and fee expense (1,388) (1,789) (1,924) 7.5 38.6 (4,596) (5,303) 15.4 Net gain (loss) on financial assets and liabilities 843 564 1,101 95.2 30.6 2,180 1,997 (8.4) Other operating income (533) (440) (582) 32.3 9.2 (1,593) (1,573) (1.3) Administrative and promotional expenses (9,003) (9,482) (9,783) 3.2 8.7 (26,066) (28,521) 9.4 Operating income 6,577 7,473 7,427 (0.6) 12.9 19,415 21,982 13.2 Current income taxes (1,258) (1,782) (1,958) 9.9 55.6 (3,581) (4,991) 39.4 Deferred income taxes (net) (223) (83) 48 (157.8) (121.5) (840) (575) (31.5) Net income 5,096 5,608 5,517 (1.6) 8.3 14,994 16,416 9.5
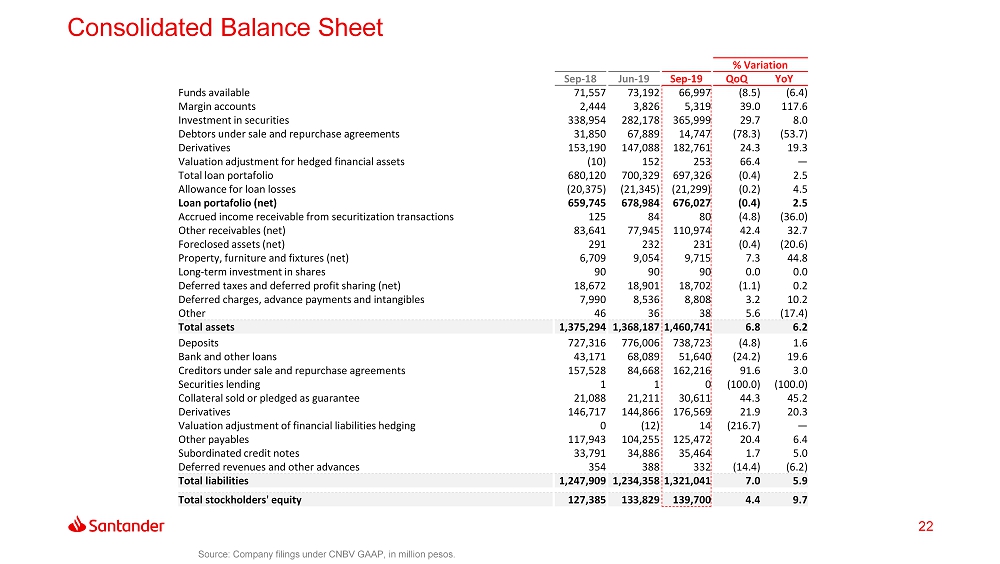
Consolidated Balance Sheet 22 Source: Company filings under CNBV GAAP, in million pesos. % Variation Sep - 18 Jun - 19 Sep - 19 QoQ YoY Funds available 71,557 73,192 66,997 (8.5) (6.4) Margin accounts 2,444 3,826 5,319 39.0 117.6 Investment in securities 338,954 282,178 365,999 29.7 8.0 Debtors under sale and repurchase agreements 31,850 67,889 14,747 (78.3) (53.7) Derivatives 153,190 147,088 182,761 24.3 19.3 Valuation adjustment for hedged financial assets (10) 152 253 66.4 — Total loan portafolio 680,120 700,329 697,326 (0.4) 2.5 Allowance for loan losses (20,375) (21,345) (21,299) (0.2) 4.5 Loan portafolio (net) 659,745 678,984 676,027 (0.4) 2.5 Accrued income receivable from securitization transactions 125 84 80 (4.8) (36.0) Other receivables (net) 83,641 77,945 110,974 42.4 32.7 Foreclosed assets (net) 291 232 231 (0.4) (20.6) Property, furniture and fixtures (net) 6,709 9,054 9,715 7.3 44.8 Long - term investment in shares 90 90 90 0.0 0.0 Deferred taxes and deferred profit sharing (net) 18,672 18,901 18,702 (1.1) 0.2 Deferred charges, advance payments and intangibles 7,990 8,536 8,808 3.2 10.2 Other 46 36 38 5.6 (17.4) Total assets 1,375,294 1,368,187 1,460,741 6.8 6.2 Deposits 727,316 776,006 738,723 (4.8) 1.6 Bank and other loans 43,171 68,089 51,640 (24.2) 19.6 Creditors under sale and repurchase agreements 157,528 84,668 162,216 91.6 3.0 Securities lending 1 1 0 (100.0) (100.0) Collateral sold or pledged as guarantee 21,088 21,211 30,611 44.3 45.2 Derivatives 146,717 144,866 176,569 21.9 20.3 Valuation adjustment of financial liabilities hedging 0 (12) 14 (216.7) — Other payables 117,943 104,255 125,472 20.4 6.4 Subordinated credit notes 33,791 34,886 35,464 1.7 5.0 Deferred revenues and other advances 354 388 332 (14.4) (6.2) Total liabilities 1,247,909 1,234,358 1,321,041 7.0 5.9 Total stockholders' equity 127,385 133,829 139,700 4.4 9.7

Thank you . Our purpose is to help people and business prosper. Our culture is based on believing that everything we do should be:
Item 3
| |
|
BANCO SANTANDER MÉXICO ANNOUNCES ITS BOARD OF DIRECTORS MEETING RESOLUTION
Mexico City, Mexico October 31, 2019 – Banco Santander México, S.A., Institución de Banca Multiple, Grupo Financiero Santander México (BMV: BSMX; NYSE: BSMX)(“Banco Santander Mexico” or the “Bank”), one of the leading banking institutions in Mexico, announced that its Board of Directors, on its meeting held today, determined among others, to call an Extraordinary Shareholders Meeting to be held in the near future, on which the merger between the Bank as surviving entity and Santander Vivienda, S.A. de C.V., SOFOM, E.R., Grupo Financiero Santander México, as the merged entity, will be submitted to the shareholders’ approval, amongst other items, subject to obtaining the corresponding corporate, regulatory and governmental authorizations.
ABOUT BANCO SANTANDER MÉXICO (NYSE: BSMX; BMV: BSMX)
Banco Santander México, S.A., Institución de Banca Múltiple, Grupo Financiero Santander México (Banco Santander México), one of Mexico’s leading banking institutions, provides a wide range of financial and related services, including retail and commercial banking, financial advisory and other related investment activities. Banco Santander México offers a multichannel financial services platform focused on mid- to high-income individuals and small- to medium-sized enterprises, while also providing integrated financial services to larger multinational companies in Mexico. As of September 30, 2019, Banco Santander México had total assets of Ps.1,461 billion under Mexican Banking GAAP and more than 17.7 million customers. Headquartered in Mexico City, the Company operates 1,411 branches and offices nationwide and has a total of 19,876 employees.
Investor Relations Contact
Héctor Chávez López – Managing Director - IRO
+52-55-52691925
hchavez@santander.com.mx
Investor Relations Team
investor@santander.com.mx
Material Fact | |
Banco Santander México |  |