UNITED STATES
SECURITIES AND EXCHANGE COMMISSION
Washington, D.C. 20549
FORM 20-F
(Mark One)
☐REGISTRATION STATEMENT PURSUANT TO SECTION 12(b) OR (g) OF THE SECURITIES EXCHANGE ACT OF 1934
OR
☒ANNUAL REPORT PURSUANT TO SECTION 13 OR 15(d) OF THE SECURITIES EXCHANGE ACT OF 1934
For the fiscal year ended December 31, 2018
OR
☐TRANSITION REPORT PURSUANT TO SECTION 13 OR 15(d) OF THE SECURITIES EXCHANGE ACT OF 1934
OR
☐SHELL COMPANY REPORT PURSUANT TO SECTION 13 OR 15(d) OF THE SECURITIES EXCHANGE ACT OF 1934
Date of event requiring this shell company report
For the transition period from to
Commission file number: 001-35658
BANCO SANTANDER MÉXICO, S.A., INSTITUCIÓN DE BANCA MÚLTIPLE,
GRUPO FINANCIERO SANTANDER MÉXICO
(Exact name of Registrant as specified in its charter)
United Mexican States
(Jurisdiction of incorporation or organization)
Avenida Prolongación Paseo de la Reforma 500
Colonia Lomas de Santa Fe
Delegación Álvaro Obregón
01219 Mexico City
(Address of principal executive offices)
Fernando Borja Mujica
Deputy General Legal and Compliance Director
BANCO SANTANDER MÉXICO, S.A., INSTITUCIÓN DE BANCA MÚLTIPLE,
GRUPO FINANCIERO SANTANDER MÉXICO
Avenida Prolongación Paseo de la Reforma 500
Colonia Lomas de Santa Fe
Delegación Álvaro Obregón
01219 Mexico City
Telephone: +(52) 55-5257-8000
Fax: +52 55-5269-2701
(Name, Telephone, E-mail and/or Facsimile number and Address of Company Contact Person)
Securities registered or to be registered pursuant to Section 12(b) of the Act:
| |
Title of each class | Name of each exchange on which registered |
American Depositary Shares, each representing five shares of the Series B common stock of Banco Santander México, S.A., Institución de Banca Múltiple, Grupo Financiero Santander México., par value of Ps.3.780782962 | New York Stock Exchange |
Series B shares, par value of Ps.3.780782962 | New York Stock Exchange* |
*Banco Santander México, S.A., Institución de Banca Múltiple, Grupo Financiero Santander México’s Series B shares are not listed for trading, but are only listed in connection with the registration of the American Depositary Shares, pursuant to the requirements of the New York Stock Exchange.
Securities registered or to be registered pursuant to Section 12(g) of the Act:
None
(Title of Class)
Securities for which there is a reporting obligation pursuant to Section 15(d) of the Act:
U.S.$500,000,000 8.500% Perpetual Subordinated Non-Preferred Contingent Convertible Additional Tier 1 Capital Notes
(Title of Class)
Indicate the number of outstanding shares of each of the issuer’s classes of capital stock or common stock as of the close of the period covered by the annual report.
Series B shares: 3,322,685,212
Series F shares: 3,464,309,145
Indicate by check mark if the registrant is a well-known seasoned issuer, as defined in Rule 405 of the Securities Act.
☒ Yes ☐ No
If this report is an annual or transition report, indicate by check mark if the registrant is not required to file reports pursuant to Section 13 or 15(d) of the Securities Exchange Act of 1934.
☐ Yes ☒ No
Note – Checking the box above will not relieve any registrant required to file reports pursuant to Section 13 or 15(d) of the Securities Exchange Act of 1934 from their obligations under those Sections.
Indicate by check mark whether the registrant (1) has filed all reports required to be filed by Section 13 or 15(d) of the Securities Exchange Act of 1934 during the preceding 12 months (or for such shorter period that the registrant was required to file such reports), and (2) has been subject to such filing requirements for the past 90 days.
☒ Yes ☐ No
Indicate by check mark whether the registrant has submitted electronically every Interactive Data File required to be submitted pursuant to Rule 405 of Regulation S-T (§232.405 of this chapter) during the preceding 12 months (or for such shorter period that the registrant was required to submit such files).
☒ Yes ☐ No
Indicate by check mark whether the registrant is a large accelerated filer, an accelerated filer, a non-accelerated filer, or an emerging growth company. See definition of “large accelerated filer," accelerated filer,” and "emerging growth company" in Rule 12b-2 of the Exchange Act. (Check one):
| | |
Large accelerated filer ☒ | Accelerated filer ☐ | Non-accelerated filer ☐ |
| | Emerging growth company ☐ |
If an emerging growth company that prepares its financial statements in accordance with U.S. GAAP, indicate by check mark if the registrant has elected not to use the extended transition period for complying with any new or revised financial accounting standards† provided pursuant to Section 13(a) of the Exchange Act. ☐
† The term “new or revised financial accounting standard” refers to any update issued by the Financial Accounting Standards Board to its Accounting Standards Codification after April 5, 2012.
Indicate by check mark which basis of accounting the registrant has used to prepare the financial statements included in this filing:
| | |
U.S. GAAP ☐ | International Financial Reporting Standards as issued by the International Accounting Standards Board ☒ | Other ☐ |
If “Other” has been checked in response to the previous question, indicate by check mark which financial statement item the registrant has elected to follow.
☐ Item 17 ☐ Item 18
If this is an annual report, indicate by check mark whether the registrant is a shell company (as defined in Rule 12b-2 of the Exchange Act).
☐ Yes ☒ No
BANCO SANTANDER MÉXICO, S.A., INSTITUCIÓN DE BANCA MÚLTIPLE, GRUPO FINANCIERO SANTANDER MÉXICO
TABLE OF CONTENTS
}
PRESENTATION OF FINANCIAL AND OTHER INFORMATION
Definitions
Unless otherwise indicated or the context otherwise requires, all references in this annual report on Form 20-F (hereinafter the “Report”) to “Banco Santander México,” the “Bank,” “we,” “our,” “ours,” “us” or similar terms, refer to Banco Santander México, S.A., Institución de Banca Múltiple, Grupo Financiero Santander México, together with its consolidated subsidiaries.
When we refer to “Banco Santander Parent” or the “Parent,” we refer to our controlling shareholder, Banco Santander, S.A., a Spanish bank.
When we refer to “Former Holding Company,” we refer to Grupo Financiero Santander México, S.A.B. de C.V., our former parent company.
When we refer to “Grupo Financiero Santander México” we refer to Grupo Financiero Santander México, S.A. de C.V. our new parent company as of January 1, 2018, which is not a public company and is a wholly-owned subsidiary of Banco Santander Parent.
When we refer to Casa de Bolsa Santander, S.A. de C.V., Grupo Financiero Santander México, a Mexican broker-dealer, we refer to the Former Holding Company’s brokerage subsidiary, which is now owned by Grupo Financiero Santander México.
When we refer to “Gestión Santander,” we refer to SAM Asset Management, S.A. de C.V., Sociedad Operadora de Sociedades de Inversión (formerly known as Gestión Santander, S.A. de C.V., Grupo Financiero Santander México) (entity sold in December 2013).
When we refer to “Seguros Santander”, we refer to Zurich Santander Seguros México, S.A. (formerly known as Seguros Santander, S.A., Grupo Financiero Santander) (entity sold in November 2011).
When we refer to the “Santander Group,” we refer to the worldwide Banco Santander Parent conglomerate and its consolidated subsidiaries.
References in this Report to certain financial terms have the following meanings:
| · | | References to “IFRS” are to the International Financial Reporting Standards as issued by the International Accounting Standards Board (“IASB”) and interpretations issued by the IFRS Interpretations Committee. |
| · | | References to “Mexican Banking GAAP” are to the accounting standards and regulations prescribed by the Mexican National Banking and Securities Commission (Comisión Nacional Bancaria y de Valores, or “CNBV”) for credit institutions, as amended. |
| · | | References to our “audited financial statements” are to the audited consolidated financial statements of Banco Santander México as of December 31, 2017 and 2018, and for each of the fiscal years ended December 31, 2016, 2017 and 2018, together with the notes thereto. The audited financial statements were prepared in accordance with IFRS and are contained in this Report. |
| · | | References herein to “UDIs” are to Unidades de Inversión, a peso-equivalent unit of account indexed for Mexican inflation. UDIs are units of account created by the Mexican Central Bank on April 4, 1995, the value of which in pesos is indexed to inflation on a daily basis, as measured by the change in the National Consumer Price Index (Índice Nacional de Precios al Consumidor). Under a UDI-based loan or financial instrument, the borrower’s nominal peso principal balance is converted either at origination or upon restructuring to a UDI principal balance and interest on the loan or financial instrument is calculated on the outstanding UDI balance of the loan or financial instrument. Principal and interest payments are made by the borrower in an amount of pesos equivalent to the amount due in UDIs at |
the stated value of UDIs on the day of payment. As of December 31, 2018, one UDI was equal to Ps.6.22663 (U.S.$0.3169). |
As used in this Report, the following terms relating to our capital adequacy have the meanings set forth below, unless otherwise indicated. See “Item 4. Information on the Company—B. Business Overview—Supervision and Regulation.”
| · | | “Capital Ratio” refers to the ratio of the total net capital (capital neto) to risk-weighted assets calculated in accordance with the methodology established or adopted from time to time by the CNBV pursuant to the Mexican Capitalization Requirements. |
| · | | “General Rules Applicable to Mexican Banks” means the General Provisions Applicable to Credit Institutions (Disposiciones de Carácter General Aplicables a las Instituciones de Crédito) issued by the CNBV. |
| · | | “Mexican Capitalization Requirements” refers to the capitalization requirements for commercial banks, including Banco Santander México, set forth in the Mexican Banking Law (Ley de Instituciones de Crédito) and in the General Rules Applicable to Mexican Banks, as such laws and regulations may be amended from time to time or superseded. |
| · | | “Tier 1 capital (capital básico)” means the basic capital (capital básico) of the Total Net Capital (capital neto), as such term is determined based on the Mexican Capitalization Requirements, as such determination may be amended from time to time, which is comprised of Fundamental Capital (capital fundamental) and Additional Tier 1 Capital (capital básico no fundamental). |
| · | | “Tier 2 capital (capital complementario)” means the additional capital (capital complementario) of the Total Net Capital (capital neto), as such term is determined based on the Mexican Capitalization Requirements, as such determination may be amended from time to time. |
As used in this Report, the term “billion” means one thousand million (1,000,000,000).
In this Report, the term “Mexico” refers to the United Mexican States, and the terms “Mexican government” or the “government” refer to the federal government of Mexico. References to “U.S.$,” “U.S. dollars” and “dollars” are to United States dollars, and references to “Mexican pesos,” “pesos,” or “Ps.” are to Mexican pesos. References to “euros” or “€” are to the common legal currency of the member states participating in the European Economic and Monetary Union.
Financial and Other Information
Market position. We make statements in this Report about our competitive position and market share in the Mexican financial services industry and the size of the Mexican financial services industry. We have made these statements on the basis of statistics and other information from third-party sources, primarily the CNBV, that we believe are reliable.
Currency and accounting standards. We maintain our financial books and records in pesos. Our consolidated income statement data for each of the years ended December 31, 2014, 2015, 2016, 2017 and 2018 and our consolidated balance sheet data as of December 31, 2014, 2015, 2016, 2017 and 2018, included in this Report, have been audited under the standards of the Public Company Accounting Oversight Board (“PCAOB”), and are prepared in accordance with IFRS. For regulatory purposes, including Mexican Central Bank regulations and the reporting requirements of the CNBV, we concurrently prepare and will continue to prepare and make available to our shareholders, statutory financial statements in accordance with Mexican Banking GAAP, which prescribes generally accepted accounting criteria for all financial institutions in Mexico.
IFRS differs in certain significant respects from Mexican Banking GAAP. We adopted IFRS in 2014. While we have prepared our consolidated financial data as of and for the years ended December 31, 2014, 2015,
2016, 2017 and 2018 in accordance with IFRS, data reported by the CNBV for the Mexican financial sector as a whole as well as individual financial institutions in Mexico, including our own, is prepared in accordance with Mexican Banking GAAP and, thus, may not be comparable to our results prepared in accordance with IFRS. All statements in this Report regarding our relative market position and financial performance vis-à-vis the financial services sector in Mexico, including financial information as to net income, return-on-average equity and non-performing loans, among others, are based, out of necessity, on information obtained from CNBV reports, and accordingly are presented in accordance with Mexican Banking GAAP. Unless otherwise indicated, all financial information provided in this Report has been prepared in accordance with IFRS.
Effect of rounding. Certain amounts and percentages included in this Report and in our audited financial statements have been rounded for ease of presentation. Percentage figures included in this Report have not in all cases been calculated on the basis of such rounded figures but on the basis of such amounts prior to rounding. For this reason, certain percentage amounts in this Report may vary from those obtained by performing the same calculations using the figures in our audited financial statements. Certain other amounts that appear in this Report may not sum due to rounding.
Exchange rates and translation into U.S. dollars. This Report contains translations of certain peso amounts into U.S. dollars at specified rates solely for your convenience. These translations should not be interpreted as representations by us that the peso amounts actually represent such U.S. dollar amounts or could, at this time, be converted into U.S. dollars at the rate indicated. Unless otherwise indicated, we have translated peso amounts into U.S. dollars at an exchange rate of Ps.19.65 per U.S.$1.00, the rate calculated on December 31, 2018 (the last business day in December) and published on January 2, 2019 in the Federal Official Gazette by the Mexican Central Bank, as the exchange rate for the payment of obligations denominated in currencies other than pesos and payable within Mexico (tipo de cambio para solventar obligaciones denominadas en moneda extranjera). The translation of income statement transactions expressed in pesos using such rates may result in presentation of dollar amounts that differ from the U.S. dollar amounts that would have been obtained by translating Mexican pesos into U.S. dollars at the exchange rate prevailing when such transactions were recorded. See “Item 3. Key Information—A. Selected Financial Data—Exchange Rates” for information regarding exchange rates between the peso and the U.S. dollar for the periods specified therein.
New impairment model. IFRS 9, Financial instruments establishes new recognition and measurement requirements for financial instruments and became mandatory for financial statement periods commencing January 1, 2018. As of January 1, 2018, the Bank now classifies its financial assets in the following measurement categories: (i) those to be measured subsequently at fair value (either through other comprehensive income or through profit or loss) and (ii) those to be measured at amortized cost. The Bank determines the applicable category of a financial asset based on the business model for managing that financial asset. We applied IFRS 9 in a retrospective manner, by adjusting the opening balance of affected financial instruments at January 1, 2018, without restating prior period amounts. Regarding the recognition of credit risk impairment, the most important change is that the new accounting standard introduces the concept of expected loss, whereas the previous model was based on incurred loss. As of January 1, 2018, the allowance for impairment losses and provisions for off-balance sheet risk increased from Ps.17,961 million to Ps.21,217 million as result of the application of IFRS 9. The Bank has applied these requirements in a retrospective manner, by adjusting the opening balance at January 1, 2018, without restating the comparative financial statements, and as a result, there was no income statement impact. The primary reasons for this increase are the requirements to recognize (i) an allowance for impairment losses for the expected life of the transaction for financial instruments where a significant risk increase has been identified after initial recognition and (ii) use of forward-looking information as the application of this impairment methodology looks to whether there has been a significant increase in credit risk in the allowance for impairment losses and in the provisions for off-balance sheet risk. See Note 2.h to our audited financial statements included elsewhere in this Report for more details on the new recognition and measurement requirements for financial instruments. Because the Bank did not restate prior period amounts upon adoption of IFRS 9, prior period financial information may not be comparable.
GLOSSARY OF SELECTED TERMS
The following is a glossary of selected terms used in this Report.
| |
Afore | An entity established pursuant to Mexican law that manages independent retirement accounts. The main functions of an Afore include, among others, (i) managing pension funds, (ii) creating and managing individual pension accounts for each worker, (iii) creating, managing and operating specialized pension funds known as Siefores, (iv) distributing and purchasing Siefores’ stock, (v) contracting pension insurance, and (vi) distributing, in certain cases, the individual funds directly to the pensioned worker |
| |
ALCO | Our Assets and Liabilities Committee (Comité de Activos y Pasivos), which is responsible for determining guidelines for managing risk with respect to financial margin, net worth and long-term liquidity |
| |
Basel III | An international framework of capital and liquidity standards for internationally active banking organizations that includes, among other things, the definition of capital, capital requirements, the treatment of counterparty credit risk, the leverage ratio and the global liquidity standard. The Basel III framework was designed by the Basel Committee in 2010 |
| |
Basel Committee | Basel Committee on Banking Supervision, which includes the supervisory authorities of twelve major industrial countries |
| |
BIVA | Bolsa Institucional de Valores, S.A. de C.V. |
| |
Bonding Companies Law | Ley Federal de Instituciones de Fianzas |
| |
BSC | Banking Stability Committee (Comité de Estabilidad Bancaria) |
| |
Cetes | Mexican Treasury Bills (Certificados de la Tesorería de la Federación) |
| |
CDI | Certificate of interbank deposit |
| |
CNBV | Mexican National Banking and Securities Commission (Comisión Nacional Bancaria y de Valores) |
| |
CNSF | Mexican National Insurance and Bonding Commission (Comisión Nacional de Seguros y Fianzas) |
| |
COFECE | Mexican Federal Antitrust Commission (Comisión Federal de Competencia Económica) |
| |
CONSAR | Mexican National Commission for the Mexican Pension Saving System (Comisión Nacional del Sistema de Ahorro para el Retiro) |
| |
CONDUSEF | Mexican National Commission for the Protection and Defense of Financial Service Users (Comisión Nacional para la Protección y Defensa de los Usuarios de Servicios Financieros) |
| |
CRM | Customer relationship management |
| |
Exchange Act | Securities Exchange Act of 1934, as amended |
| |
IASB | International Accounting Standards Board |
| |
IFRS | International Financial Reporting Standards, accounting standards issued by the International Accounting Standards Board and interpretations issued by the International Financial Reporting Standards Interpretations Committee |
| |
IMPI | Mexican Institute of Industrial Property (Instituto Mexicano de la Propiedad Industrial) |
| |
Infonavit | Mexican Institute of the National Housing Fund for Workers (Instituto Nacional para el Fomento de la Vivienda de los Trabajadores) |
| |
Insurance Companies Law | Ley General de Instituciones y Sociedades Mutualistas de Seguros |
| |
Investment Services Rules | Disposiciones de Carácter General Aplicables a las Entidades Financieras y otras Personas que Proporcionan Servicios de Inversión |
| |
IPAB | Mexican Institute for the Protection of Bank Savings (Instituto para la Protección al Ahorro Bancario) |
| |
IPC | Mexican Stock Exchange Prices and Quotations Index (Índice de Precios y Cotizaciones) |
| |
Law of the Mexican Central Bank | Ley del Banco de México |
| |
LCR | Liquidity coverage ratio |
| |
LGD | Loss given default |
| |
LIC | Mexican Banking Law (Ley de Instituciones de Crédito) |
| |
LMV | Mexican Securities Market Law (Ley del Mercado de Valores) |
| |
Mexican Banking GAAP | The financial accounting standards and regulations prescribed by the CNBV for financial institutions, as amended |
| |
Mexican Central Bank | Banco de México |
| |
Mexican Corporations Law | Ley General de Sociedades Mercantiles |
| |
Mexican Financial Groups Law | Ley para Regular las Agrupaciones Financieras |
| |
Mexican Stock Exchange | Bolsa Mexicana de Valores, S.A.B. de C.V. |
| |
MIEA | Internal Methodology with Advanced Approach (Metodología Interna con Enfoque Avanzado) |
| |
MIEB | Internal Methodology with Basic Approach (Metodología Interna con Enfoque Básico) |
| |
MORENA | Mexican Political Party “Movimiento de Regeneración Nacional” |
| |
MVE | Market value of equity |
| |
NAFIN | Nacional Financiera, Sociedad Nacional de Crédito, Institución de Banca de Desarrollo, a Mexican government bank that provides support for SMEs |
| |
NAFTA | North American Free Trade Agreement |
| |
National Consumer Price Index | Índice Nacional de Precios al Consumidor |
| |
NIM | Net interest margin |
| |
NIM Sensitivity | Net interest margin sensitivity is the difference between the return on assets and the financial cost of our financial liabilities based on a one-year time frame and a parallel movement of 100 basis points (1%) in market interest rates |
| |
NYSE | New York Stock Exchange |
| |
NSFR | Net Stable Funding Ratio |
| |
Federal Official Gazette | Diario Oficial de la Federación |
| |
PCAOB | Public Company Accounting Oversight Board (United States) |
| |
Public Registry of Commerce | Registro Público de Comercio |
| |
RNV | Mexican National Securities Registry (Registro Nacional de Valores) |
| |
RWA | Risk-weighted assets |
| |
SEC | U.S. Securities and Exchange Commission |
| |
SHCP | Mexican Ministry of Finance and Public Credit (Secretaría de Hacienda y Crédito Público) |
| |
Siefores | Specialized pension funds (Sociedades de Inversión Especializadas de Fondos para el Retiro) established pursuant to Mexican law |
| |
SME | Small and medium-sized enterprises, consisting of small companies with annual revenue of less than Ps.250,000,000 (U.S.$12,721,869). |
| |
Sofoles | Sociedades Financieras de Objeto Limitado, non-banking institutions in Mexico that focus primarily on offering credit or financing for specific purposes (housing, automobiles, personal loans, etc.) to middle- and low-income individuals. All existing Sofol authorizations automatically terminated on July 19, 2013. Existing Sofoles had the option of converting to Sofomes or otherwise extending their corporate purpose to include activities carried out by Sofomes |
| |
Sofomes | Sociedades Financieras de Objeto Múltiple, non-banking institutions in Mexico that engage in lending and/or financial leasing and/or factoring services and may be regulated or non-regulated |
| |
TIIE | Mexican benchmark interbank money market rate (Tasa de Interés Interbancaria de Equilibrio) |
| |
UDI | Unidades de inversión, a peso-equivalent unit of account indexed for Mexican inflation |
| |
VaR | Value at risk, an estimate of the expected maximum loss in the market value of a given portfolio over a one-day time horizon at a 99% confidence interval |
SPECIAL NOTE REGARDING FORWARD-LOOKING STATEMENTS
This Report includes forward-looking statements, principally under the captions “Item 3. Key Information—D. Risk Factors,” “Item 4. Information on the Company—B. Business Overview” and “Item 5. Operating and Financial Review and Prospects.” These statements appear throughout this Report and include statements regarding our intent, belief or current expectations in connection with :
asset growth and sources of funding;
growth of our fee-based business;
expansion of our distribution network;
financing plans;
competition;
impact of regulation and the interpretation thereof;
action to modify or revoke our banking license;
exposure to market risks including interest rate risk, foreign exchange risk and equity price risk;
exposure to credit risks including credit default risk and settlement risk;
projected capital expenditures;
capitalization requirements and level of reserves;
investment in its information technology platform;
liquidity;
trends affecting the economy generally; and
trends affecting our financial condition and our results of operations.
Many important factors, in addition to those discussed elsewhere in this Report, could cause our actual results to differ substantially from those anticipated in our forward-looking statements, including, among other things:
changes in capital markets in general that may affect policies or attitudes towards lending to Mexico or Mexican companies;
changes in economic conditions, in Mexico, in particular, in the United States, or globally;
the monetary, foreign exchange and interest rate policies of the Mexican Central Bank;
inflation;
deflation;
unemployment;
unanticipated turbulence in interest rates;
the entry into force of the USMCA or the deterioration of the terms of trade between Mexico and the United States;
the implementation of new economic policy by the new administration in Mexico;
movements in foreign exchange rates;
movements in equity prices or other rates or prices;
changes in Mexican and foreign policies, legislation and regulations;
changes in requirements to make contributions to, for the receipt of support from programs organized by or requiring deposits to be made or assessments observed or imposed by, the Mexican government;
changes in taxes and tax laws;
competition, changes in competition and pricing environments;
our inability to hedge certain risks economically;
economic conditions that affect consumer spending and the ability of customers to comply with obligations;
the adequacy of allowance for impairment losses and other losses;
increased default by borrowers;
our inability to successfully and effectively integrate acquisitions or to evaluate risks arising from asset acquisitions;
technological changes;
changes in consumer spending and saving habits;
increased costs;
unanticipated increases in financing and other costs or the inability to obtain additional debt or equity financing on attractive terms;
changes in, or failure to comply with, banking regulations or their interpretation; and
the other risk factors discussed under “Item 3. Key Information—D. Risk Factors” in this Report.
The words “believe,” “may,” “will,” “aim,” “estimate,” “continue,” “anticipate,” “intend,” “expect,” “forecast” and similar words are intended to identify forward-looking statements. You should not place undue reliance on such statements, which speak only as of the date they were made. We undertake no obligation to update publicly or to revise any forward-looking statements after we distribute this Report because of new information, future events or other factors. Our independent public accountants have neither examined nor
compiled the forward-looking statements and, accordingly, do not provide any assurance with respect to such statements. In light of the risks and uncertainties described above, the future events and circumstances discussed in this Report might not occur and are not guarantees of future performance. Because of these uncertainties, you should not make any investment decision based upon these estimates and forward-looking statements.
ENFORCEMENT OF JUDGMENTS
We are a corporation (sociedad anónima) incorporated in accordance with the laws of Mexico. All of our directors and officers and experts named herein are non-residents of the United States, and all or substantially all of the assets of such persons and substantially all of our assets are located outside the United States. As a result, it may not be possible for investors to effect service of process within the United States upon such persons or to enforce against them or us in United States courts judgments predicated upon the civil liability provisions of United States federal securities laws. We have been advised by our special counsel as to Mexican law, that there is doubt as to the enforceability, in original actions in Mexican courts, of liabilities predicated solely on U.S. federal securities laws and as to the enforceability in Mexican courts of judgments of United States courts obtained in actions predicated upon the civil liability provisions of U.S. federal securities laws. We have been advised by such special Mexican counsel, Ritch, Mueller, Heather y Nicolau, S.C., that no bilateral treaty is currently in effect between the United States and Mexico that covers the reciprocal enforcement of civil foreign judgments. In the past, Mexican courts have enforced judgments rendered in the United States by virtue of the legal principles of reciprocity and comity, consisting of the review in Mexico of the United States judgment, in order to ascertain, among other matters, whether Mexican legal principles of due process, public policy (orden público) and non-violation of Mexican law have been complied with, without reviewing the merits of the subject matter of the case.
PART I
ITEM 1. IDENTITY OF DIRECTORS, SENIOR MANAGEMENT AND ADVISERS
A. Directors and Senior Management
Not applicable.
B. Advisers
Not applicable.
C. Auditors
Not applicable.
ITEM 2. OFFER STATISTICS AND EXPECTED TIMETABLE
A. Offer Statistics
Not applicable.
B. Method and Expected Timetable
Not applicable.
ITEM 3. KEY INFORMATION
A.Selected Financial Data
The following tables present our selected consolidated financial data for each of the periods indicated. You should read this information in conjunction with our audited financial statements and related notes and the information under “Item 5. Operating and Financial Review and Prospects” included elsewhere in this Report.
We have derived our selected consolidated income statement data for the years ended December 31, 2014, 2015, 2016, 2017 and 2018 and our selected consolidated balance sheet data as of December 31, 2014, 2015, 2016, 2017 and 2018 from our audited financial statements, which have been prepared in accordance with IFRS. We have included in Item 18 hereto our audited financial statements as of December 31, 2017 and 2018 and for each of the three years in the three-year period ended December 31, 2018.
CONSOLIDATED INCOME STATEMENT DATA IN ACCORDANCE WITH IFRS
| | | | | | | | | | | | | | | | | | | | | | | | |
| For the year ended December 31, |
| | 2014 | | | 2015 | | | 2016 | | | 2017 | | | 2018 | | | 2018 | |
| | | | | | | | | | | | | | | | | | | | | | (Millions of U.S. | |
| | (Millions of pesos)(1) | | | dollars) (1)(2) | |
Interest income | | Ps. | 57,956 | | | Ps. | 64,230 | | | Ps. | 77,453 | | | Ps. | 98,002 | | | Ps. | 99,537 | | | U.S. | 5,065 | |
Interest income from financial assets at fair value through profit or loss | | | — | | | | — | | | | — | | | | — | | | | 14,049 | | | | 715 | |
Interest expenses and similar charges | | | (20,386) | | | | (21,242) | | | | (28,323) | | | | (42,158) | | | | (51,589) | | | | (2,625) | |
Net interest income | | | 37,570 | | | | 42,988 | | | | 49,130 | | | | 55,844 | | | | 61,997 | | | | 3,155 | |
Dividend income | | | 137 | | | | 104 | | | | 94 | | | | 150 | | | | 210 | | | | 11 | |
Fee and commission income (net) | | | 12,858 | | | | 13,632 | | | | 13,940 | | | | 14,813 | | | | 15,722 | | | | 800 | |
Gains/(losses) on financial assets and liabilities (net) | | | 2,610 | | | | 2,504 | | | | 3,760 | | | | 3,458 | | | | 1,484 | | | | 76 | |
Exchange differences (net) | | | (11) | | | | 6 | | | | 2 | | | | 6 | | | | — | | | | — | |
Other operating income | | | 509 | | | | 472 | | | | 486 | | | | 669 | | | | 748 | | | | 38 | |
Other operating expenses | | | (2,472) | | | | (3,010) | | | | (3,361) | | | | (3,614) | | | | (4,393) | | | | (223) | |
Total income | | | 51,201 | | | | 56,696 | | | | 64,051 | | | | 71,326 | | | | 75,768 | | | | 3,857 | |
Administrative expenses | | | (19,290) | | | | (20,780) | | | | (22,655) | | | | (25,437) | | | | (28,649) | | | | (1,457) | |
Personnel expenses | | | (9,557) | | | | (10,625) | | | | (11,472) | | | | (12,748) | | | | (14,354) | | | | (730) | |
Other general administrative expenses | | | (9,733) | | | | (10,155) | | | | (11,183) | | | | (12,689) | | | | (14,295) | | | | (727) | |
Depreciation and amortization | | | (1,682) | | | | (1,863) | | | | (2,058) | | | | (2,533) | | | | (2,973) | | | | (151) | |
Impairment losses on financial assets (net) | | | (13,132) | | | | (16,041) | | | | (16,661) | | | | (18,820) | | | | (18,810) | | | | (956) | |
Loans and receivables(3) | | | (13,132) | | | | (16,041) | | | | (16,661) | | | | (18,820) | | | | — | | | | — | |
Financial assets at amortized cost(3) | | | — | | | | — | | | | — | | | | — | | | | (18,806) | | | | (956) | |
Financial assets at fair value through other comprehensive income | | | — | | | | — | | | | — | | | | — | | | | (4) | | | | — | |
Impairment losses on other assets (net) | | | (48) | | | | — | | | | — | | | | — | | | | (5) | | | | — | |
Other intangible assets | | | — | | | | — | | | | — | | | | — | | | | — | | | | — | |
Non-current assets held for sale | | | (48) | | | | — | | | | — | | | | — | | | | (5) | | | | — | |
Provisions (net)(4) | | | (137) | | | | 258 | | | | (881) | | | | (437) | | | | (562) | | | | (28) | |
Gains/(losses) on disposal of assets not classified as non-current assets held for sale | | | 2 | | | | 7 | | | | 20 | | | | 6 | | | | 7 | | | | — | |
Gains/(losses) on disposal of non-current assets held for sale not
classified as discontinued operations | | | (15) | | | | 91 | | | | 71 | | | | 69 | | | | 38 | | | | 2 | |
Operating profit before tax | | | 16,899 | | | | 18,368 | | | | 21,887 | | | | 24,174 | | | | 24,814 | | | | 1,267 | |
Income tax | | | (3,539) | | | | (4,304) | | | | (5,351) | | | | (5,496) | | | | (5,458) | | | | (278) | |
Profit from continuing operations | | | 13,360 | | | | 14,064 | | | | 16,536 | | | | 18,678 | | | | 19,356 | | | | 989 | |
Profit from discontinued operations (net) | | | — | | | | — | | | | — | | | | — | | | | — | | | | — | |
Consolidated profit for the year | | Ps. | 13,360 | | | Ps. | 14,064 | | | Ps. | 16,536 | | | Ps. | 18,678 | | | Ps. | 19,356 | | | U.S. | 989 | |
Profit attributable to the Parent | | | 13,359 | | | | 14,051 | | | | 16,536 | | | | 18,678 | | | | 19,353 | | | | 989 | |
Profit attributable to non-controlling interests | | | 1 | | | | 13 | | | | — | | | | — | | | | 3 | | | | — | |
| | | | | | | | | | | | | | | | | | | | | | | | |
Earnings per share from continuing and discontinued operations: | | | | | | | | | | | | | | | | | | | | | | | | |
Basic earnings per share | | | 1.97 | | | | 2.07 | | | | 2.44 | | | | 2.76 | | | | 2.86 | | | | 0.15 | |
Diluted earnings per share(5) | | | 1.97 | | | | 2.07 | | | | 2.44 | | | | 2.75 | | | | 2.85 | | | | 0.15 | |
Earnings per share from continuing operations: | | | | | | | | | | | | | | | | | | | | | | | | |
Basic earnings per share | | | 1.97 | | | | 2.08 | | | | 2.44 | | | | 2.76 | | | | 2.86 | | | | 0.15 | |
Diluted earnings per share(5) | | | 1.97 | | | | 2.07 | | | | 2.44 | | | | 2.75 | | | | 2.85 | | | | 0.15 | |
Cash dividend per share(6) | | | 0.51 | | | | 1.00 | | | | 2.58 | | | | 1.31 | | | | 1.36 | | | | 0.07 | |
Weighted average shares outstanding | | | 6,777,381,551 | | | | 6,777,381,551 | | | | 6,777,381,551 | | | | 6,777,381,551 | | | | 6,776,220,369 | | | | 6,776,220,369 | |
Dilutive effect of rights on shares(5) | | | 9,612,806 | | | | 9,612,806 | | | | 9,612,806 | | | | 9,612,806 | | | | 10,773,988 | | | | 10,773,988 | |
Adjusted number of shares | | | 6,786,994,357 | | | | 6,786,994,357 | | | | 6,786,994,357 | | | | 6,786,994,357 | | | | 6,786,994,357 | | | | 6,786,994,357 | |
Dividend paid | | | 3,473 | | | | 6,760 | | | | 17,468 | | | | 8,910 | | | | 9,228 | | | | 470 | |
Basic earnings per share | | | 1.97 | | | | 2.07 | | | | 2.44 | | | | 2.76 | | | | 2.86 | | | | 0.15 | |
Diluted earnings per share | | | 1.97 | | | | 2.07 | | | | 2.44 | | | | 2.75 | | | | 2.85 | | | | 0.15 | |
Dividend pay-out ratio | | | 26.03% | | | | 48.18% | | | | 105.64% | | | | 47.77% | | | | 47.76% | | | | 47.60% | |
| (1) | | Except share and per share amounts. |
| (2) | | Results for the year ended December 31, 2018 have been translated into U.S. dollars, for convenience purposes only, using the exchange rate of Ps.19.65 per U.S.$1.00 as calculated on December 31, 2018 and reported by the Mexican Central Bank in the Federal Official Gazette on January 2, 2019 as the exchange rate for the payment of obligations denominated in currencies other than pesos and payable within Mexico. These translations should not be construed as representations that the pesos amounts represent, have been or could have been converted into, U.S. dollars at such or at any other exchange rate. |
| (3) | | Impairment losses less recoveries of previously written-off loans (net of legal expenses). |
| (4) | | Principally includes provisions for off-balance sheet risk and provisions for tax and legal matters. See “Item 5. Operating and Financial Review and Prospects.” |
| (5) | | To calculate diluted earnings per share, the amount of profit attributable to the Parent and the weighted average number of shares issued, excluding the average number of treasury shares, are adjusted to |
consider all the dilutive effects inherent to potential shares. For additional information on earnings per share, see Note 4.2.ii to our audited financial statements included elsewhere in this Report. |
| (6) | | On December 29, 2014, we paid a dividend of Ps.3,473 million, equal to Ps.0.0430 per share. On May 29, 2015, we paid a dividend of Ps.3,534 million, equal to Ps.0.0437 per share. On December 22, 2015, we paid a dividend of Ps.3,226 million, equal to Ps.0.0399 per share. On May 26, 2016, we paid a dividend of Ps.3,844 million, equal to Ps.0.0475 per share. On December 30, 2016, we paid a dividend of Ps.13,624 million, equal to Ps.0.1685 per share. On May 30, 2017 we paid a dividend of Ps.4,234 million, equal to Ps.0.0524 per share. On December 27, 2017, we paid a dividend of Ps.4,676 million, equal to Ps.0.0578 per share. On June 29, 2018, we paid a dividend of Ps.4,279 million, equal to Ps.0.6304 per share.On December 28, 2018, we paid a dividend of Ps.4,949 million, equal to Ps.0.7292 per share. |
CONSOLIDATED BALANCE SHEET DATA IN ACCORDANCE WITH IFRS
| | | | | | | | | | | | | | | | | | | | | | | | |
| As of December 31, |
| | 2014 | | | 2015 | | | 2016 | | | 2017 | | | 2018(1) | | | 2018(1) | |
| | | | | | | | | | | | | | | | | | | | | | (Millions of U.S. | |
| | (Millions of pesos) | | | dollars)(2) | |
Assets | | | | | | | | | | | | | | | | | | | | | | | | |
Cash and balances with Mexican Central Bank | | Ps. | 51,823 | | | Ps. | 59,788 | | | Ps. | 78,663 | | | Ps. | 57,687 | | | Ps. | 55,310 | | | U.S. | 2,815 | |
Financial assets at fair value through profit or loss | | | — | | | | — | | | | — | | | | — | | | | 267,524 | | | | 13,614 | |
Financial assets held for trading | | | 207,651 | | | | 326,872 | | | | 342,582 | | | | 315,570 | | | | — | | | | — | |
Other financial assets at fair value through profit or loss | | | 32,501 | | | | 28,437 | | | | 42,340 | | | | 51,705 | | | | 107,425 | | | | 5,467 | |
Financial assets at fair value through other comprehensive income | | | — | | | | — | | | | — | | | | — | | | | 155,789 | | | | 7,928 | |
Available-for-sale financial assets | | | 83,340 | | | | 113,873 | | | | 154,644 | | | | 165,742 | | | | — | | | | — | |
Financial assets at amortized cost | | | — | | | | — | | | | — | | | | — | | | | 766,225 | | | | 38,991 | |
Loans and receivables | | | 530,225 | | | | 598,712 | | | | 675,498 | | | | 679,300 | | | | — | | | | — | |
Hedging derivatives | | | 4,740 | | | | 12,121 | | | | 15,003 | | | | 15,116 | | | | 9,285 | | | | 472 | |
Non-current assets held for sale | | | 844 | | | | 1,101 | | | | 1,107 | | | | 1,295 | | | | 1,277 | | | | 65 | |
Tangible assets | | | 5,259 | | | | 5,547 | | | | 5,692 | | | | 6,498 | | | | 8,714 | | | | 443 | |
Intangible assets | | | 4,079 | | | | 4,877 | | | | 5,772 | | | | 6,960 | | | | 8,044 | | | | 409 | |
Tax assets | | | 22,923 | | | | 18,659 | | | | 23,301 | | | | 20,209 | | | | 21,968 | | | | 1,118 | |
Other assets | | | 6,209 | | | | 5,847 | | | | 6,335 | | | | 9,109 | | | | 7,163 | | | | 366 | |
Total assets | | Ps. | 949,594 | | | Ps. | 1,175,834 | | | Ps. | 1,350,937 | | | Ps. | 1,329,191 | | | Ps. | 1,408,724 | | | U.S. | 71,688 | |
| | | | | | | | | | | | | | | | | | | | | | | | |
Liabilities | | | | | | | | | | | | | | | | | | | | | | | | |
Financial liabilities at fair value through profit or loss | | Ps. | — | | | Ps. | — | | | Ps. | — | | | Ps. | — | | | Ps. | 255,481 | | | U.S. | 13,001 | |
Financial liabilities held for trading | | | 136,805 | | | | 172,573 | | | | 266,828 | | | | 239,725 | | | | — | | | | — | |
Other financial liabilities at fair value through profit or loss | | | 110,520 | | | | 208,341 | | | | 136,860 | | | | 120,653 | | | | 105,430 | | | | 5,365 | |
Financial liabilities at amortized cost | | | 579,056 | | | | 659,209 | | | | 806,091 | | | | 820,431 | | | | 890,284 | | | | 45,304 | |
Hedging derivatives | | | 4,403 | | | | 9,568 | | | | 14,287 | | | | 11,091 | | | | 8,393 | | | | 427 | |
Provisions (3) | | | 5,988 | | | | 6,580 | | | | 7,202 | | | | 6,730 | | | | 6,800 | | | | 345 | |
Tax liabilities | | | 26 | | | | 643 | | | | 44 | | | | 71 | | | | 194 | | | | 9 | |
Other liabilities | | | 12,300 | | | | 11,162 | | | | 14,398 | | | | 15,080 | | | | 18,855 | | | | 958 | |
Total liabilities | | Ps. | 849,098 | | | Ps. | 1,068,076 | | | Ps. | 1,245,710 | | | Ps. | 1,213,781 | | | Ps. | 1,285,437 | | | U.S. | 65,409 | |
| | | | | | | | | | | | | | | | | | | | | | | | |
Shareholders’ equity | | Ps. | 100,704 | | | | 107,328 | | | Ps. | 106,768 | | | Ps. | 116,558 | | | Ps. | 124,240 | | | U.S. | 6,327 | |
Share capital | | | 8,086 | | | Ps. | 8,086 | | | | 8,086 | | | | 8,086 | | | | 25,660 | | | | 1,306 | |
Share premium | | | 16,956 | | | | 16,956 | | | | 16,956 | | | | 16,956 | | | | — | | | | — | |
Accumulated reserves | | | 62,303 | | | | 68,235 | | | | 65,190 | | | | 72,838 | | | | 79,227 | | | | 4,032 | |
Profit for the year attributable to the Parent | | | 13,359 | | | | 14,051 | | | | 16,536 | | | | 18,678 | | | | 19,353 | | | | 989 | |
Valuation adjustments | | | (253) | | | | 372 | | | | (1,596) | | | | (1,177) | | | | (985) | | | | (50) | |
Non-controlling interests | | | 45 | | | | 58 | | | | 55 | | | | 29 | | | | 32 | | | | 2 | |
Total equity | | | 100,496 | | | | 107,758 | | | | 105,227 | | | | 115,410 | | | | 123,287 | | | | 6,279 | |
Total liabilities and equity | | Ps. | 949,594 | | | Ps. | 1,175,834 | | | Ps. | 1,350,937 | | | Ps. | 1,329,191 | | | Ps. | 1,408,724 | | | U.S. | 71,688 | |
| (1) | | Amounts prepared in accordance with IFRS 9. Prior periods have not been restated. See Note 2.h to our audited financial statements included elsewhere in this Report for more details on our change in accounting estimates in connection with the initial adoption of IFRS 9. |
| (2) | | The balance as of December 31, 2018 has been translated into U.S. dollars, for convenience purposes only, using the exchange rate of Ps.19.65 per U.S.$1.00 as calculated on December 31, 2018 and reported by the Mexican Central Bank in the Federal Official Gazette on January 2, 2019 as the exchange rate for the payment of obligations denominated in currencies other than pesos and payable within Mexico. These translations should not be interpreted as representations that the pesos amounts represent, have been or could have been converted into, U.S. dollars at such or at any other exchange rate. |
| (3) | | Includes provisions for pensions and similar obligations, provisions for off-balance sheet risk and provisions for tax and legal matters. See “Item 5. Operating and Financial Review and Prospects.” |
SELECTED RATIOS AND OTHER DATA
All of the selected ratios and other data below (except for number of shares, offices and employee data) are presented in accordance with IFRS unless otherwise noted.
| | | | | | | | | | | | | | | |
| | | | | | | | | | | | | | | |
| | 2014 | | | 2015 | | | 2016 | | | 2017 | | | 2018 | |
| | | | | | | | | | | | | | | |
Profitability and performance | | | | | | | | | | | | | | | |
Net interest margin(1) | | 4.80% | | | 4.88% | | | 4.97% | | | 5.34% | | | 5.55% | |
Total margin(2) | | 6.44% | | | 6.42% | | | 6.38% | | | 6.76% | | | 6.96% | |
Return on average total assets (ROAA)(3) | | 1.44% | | | 1.36% | | | 1.50% | | | 1.57% | | | 1.49% | |
Return on average equity (ROAE)(4) | | 14.17% | | | 13.71% | | | 14.89% | | | 16.93% | | | 16.27% | |
Efficiency ratio(5) | | 40.96% | | | 39.94% | | | 38.58% | | | 39.21% | | | 41.74% | |
Net fee and commission income as a percentage of operating expenses(6) | | 61.31% | | | 60.20% | | | 56.41% | | | 52.96% | | | 49.72% | |
Gross yield on average interest earning-assets | | 7.38% | | | 7.27% | | | 7.82% | | | 9.35% | | | 10.14% | |
Average cost of interest bearing liabilities | | 2.85% | | | 2.60% | | | 3.17% | | | 4.52% | | | 5.20% | |
Net interest spread | | 4.53% | | | 4.67% | | | 4.65% | | | 4.83% | | | 4.94% | |
Common stock dividend payout ratio (annual)(7) | | 26.00% | | | 48.11% | | | 105.64% | | | 47.70% | | | 47.76% | |
Average interest-earning assets(8) | | 785,345 | | | 883,735 | | | 989,857 | | | 1,047,976 | | | 1,120,323 | |
Average interest-bearing liabilities(8) | | 716,302 | | | 815,902 | | | 893,128 | | | 932,380 | | | 991,805 | |
Capital adequacy | | | | | | | | | | | | | | | |
Net tangible book value | | 96,417 | | | 102,881 | | | 99,455 | | | 108,450 | | | 115,243 | |
Net tangible book value per share | | 14.23 | | | 15.18 | | | 14.67 | | | 16.00 | | | 17.01 | |
Average equity as a percentage of average total assets | | 10.18% | | | 9.94% | | | 10.10% | | | 9.28% | | | 9.17% | |
Total capital (Mexican Banking GAAP)(9) | | 96,517 | | | 103,639 | | | 109,238 | | | 115,321 | | | 121,454 | |
Tier 1 capital (Mexican Banking GAAP)(9) | | 76,697 | | | 80,328 | | | 81,785 | | | 89,267 | | | 94,035 | |
Tier 1 capital to risk-weighted assets (Mexican Banking GAAP) | | 12.85% | | | 12.10% | | | 11.79% | | | 12.18% | | | 12.32% | |
Total capital to risk-weighted assets (Mexican Banking GAAP)(10) | | 16.17% | | | 15.61% | | | 15.74% | | | 15.73% | | | 15.91% | |
Asset quality | | | | | | | | | | | | | | | |
Non-performing loans as a percentage of total loans(11) | | 3.90% | | | 3.56% | | | 2.93% | | | 2.89% | | | 2.67% | |
Non-performing loans as a percentage of computable credit risk(11)(12) | | 3.66% | | | 3.32% | | | 2.66% | | | 2.57% | | | 2.35% | |
Written-off loans as a percentage of average total loans | | 3.10% | | | 2.85% | | | 3.48% | | | 3.63% | | | 3.00% | |
Written-off loans as a percentage of computable credit risk(12) | | 2.68% | | | 2.42% | | | 3.03% | | | 3.08% | | | 2.51% | |
Allowance for impairment losses as a percentage of average total loans(13) | | 3.49% | | | 3.70% | | | 3.10% | | | 2.83% | | | 3.28% | |
Allowance for impairment losses as a percentage of non-performing loans(11)(13) | | 82.46% | | | 94.97% | | | 101.64% | | | 93.36% | | | 116.75% | |
Allowance for impairment losses as a percentage of written-off loans(13) | | 112.49% | | | 129.98% | | | 89.21% | | | 77.89% | | | 109.34% | |
Allowance for impairment losses as a percentage of total loans(13) | | 3.22% | | | 3.38% | | | 2.98% | | | 2.70% | | | 3.12% | |
Liquidity | | | | | | | | | | | | | | | |
Liquid assets as a percentage of deposits(14) | | 47.32% | | | 46.05% | | | 38.72% | | | 35.41% | | | 36.70% | |
Total Loans, net of allowances, as a percentage of deposits(15) | | 102.15% | | | 71.98% | | | 73.08% | | | 76.61% | | | 79.32% | |
Total loans as a percentage of total funding(16) | | 60.97% | | | 64.88% | | | 64.92% | | | 67.52% | | | 70.18% | |
Deposits as a percentage of total funding(15)(16) | | 69.76% | | | 87.09% | | | 86.18% | | | 85.75% | | | 85.71% | |
Operations | | | | | | | | | | | | | | | |
Offices(17) | | 1,322 | | | 1,354 | | | 1,364 | | | 1,375 | | | 1,393 | |
Employees (full-time equivalent) | | 14,038 | | | 14,674 | | | 14,643 | | | 15,116 | | | 16,016 | |
| (1) | | Net interest margin is defined as net interest income (including dividend income) divided by average interest-earning assets, which are loans, receivables, debt instruments and other financial assets which, yield interest or similar income. |
| (2) | | Total margin is defined as net interest income (including dividend income) plus fee and commission income (net) divided by average interest-earning assets. |
| (3) | | Calculated based upon the average daily balance of total assets. |
| (4) | | Calculated based upon the average daily balance of equity. |
| (5) | | Efficiency ratio is defined as administrative expenses plus depreciation and amortization, divided by total income. |
| (6) | | Net fee and commission income divided by administrative expenses plus depreciation and amortization. |
| (7) | | Dividends paid per share divided by net income per share. |
| (8) | | Average balance sheet data has been calculated based upon the sum of the daily average for each month in the applicable period. |
| (9) | | “Total capital” and “Tier 1 capital” are calculated in accordance with the methodology established or adopted from time to time by the CNBV pursuant to the Mexican Capitalization Requirements. |
| (10) | | Tier 1 capital plus Tier 2 capital divided by total risk-weighted assets, calculated according to the Mexican Capitalization Requirements. |
| (11) | | See Note 2.g to our audited financial statements included elsewhere in this Report for more details on the classification of credit-impaired or non-performing loans. |
| (12) | | Computable credit risk is the sum of the face amounts of loans (including non-performing loans) plus guarantees and documentary credits. At December 31, 2018, total loans were Ps.689,059 million and total guarantees and documentary credits were Ps.94,267 million. When guarantees or documentary credits are contracted, we record them as off-balance sheet accounts. We present the off-balance sheet information to better demonstrate our total managed credit risk. |
| (13) | | Allowance for impairment losses were Ps.15,198 million, Ps.18,749 million, Ps.17,883 million, Ps.16,929 million and Ps.21,516 million as of December 31, 2014, 2015, 2016, 2017 and 2018, respectively. Allowance for impairment losses as of December 31, 2018 have been prepared in accordance with IFRS 9. Prior periods have not been restated. See Note 2.h to our audited financial statements included elsewhere in this Report for more details on our change in accounting estimates in connection with the initial adoption of IFRS 9. |
| (14) | | For the purpose of calculating this ratio, the amount of deposits includes the sum of demand deposits and time deposits. See “Item 5. Operating and Financial Review and Prospects—B. Liquidity and Capital Resources—Composition of Deposits.” |
Liquid assets include cash due from banks and government securities recorded at market prices. We believe we could obtain cash for our liquid assets immediately, although under systemic stress scenarios, we would likely be subject to a discount to the face value of these assets. As of December 31, 2014, 2015, 2016, 2017 and 2018, we had a total amount of liquid assets of Ps.211,751 million, Ps.342,408 million, Ps.308,177 million, Ps.281,690 million and Ps.308,857 million respectively. For the years ended December 31, 2014, 2015, 2016, 2017 and 2018, the average amounts outstanding were Ps.203,061 million, Ps.291,828 million, Ps.315,660 million, Ps.343,395 million and Ps.281,882 million respectively.
As of December 31, 2014, liquid assets were composed of the following: 24.5% cash and balances with the Mexican Central Bank (cash at our branches and automated teller machines (ATM) and the Depósito de Regulación Monetaria (Compulsory Deposits)); 31.6% debt instruments issued by the Mexican Government; and 43.9% debt instruments issued by the Mexican Central Bank.
As of December 31, 2015, liquid assets were composed of the following: 17.5% cash and balances with the Mexican Central Bank (cash at our branches and ATMs and the Depósito de Regulación Monetaria (Compulsory Deposits)); 35.2% debt instruments issued by the Mexican Government; and 47.4% debt instruments issued by the Mexican Central Bank.
As of December 31, 2016, liquid assets were composed of the following: 25.5% cash and balances with the Mexican Central Bank (cash at our branches and ATMs and the Depósito de Regulación Monetaria
(Compulsory Deposits)); 41.7% debt instruments issued by the Mexican Government; and 32.8% debt instruments issued by the Mexican Central Bank.
As of December 31, 2017, liquid assets were composed of the following: 20.5% cash and balances with the Mexican Central Bank (cash at our branches and ATMs and the Depósito de Regulación Monetaria (Compulsory Deposits)); 51.2% debt instruments issued by the Mexican Government; and 28.3% debt instruments issued by the Mexican Central Bank.
As of December 31, 2018, liquid assets were composed of the following: 17.9% cash and balances with the Mexican Central Bank (cash at our branches and ATMs and the Depósito de Regulación Monetaria (Compulsory Deposits)); 59.6% debt instruments issued by the Mexican Government; and 22.5% debt instruments issued by the Mexican Central Bank.
| (15) | | For the purpose of calculating this ratio, the amount of deposits includes the sum of demand deposits and time deposits. See “Item 5. Operating and Financial Review and Prospects—B. Liquidity and Capital Resources—Composition of Deposits.” |
| (16) | | For the purpose of calculating this ratio, the amount of total funding comprises the total of our deposits and repurchase agreements, our total marketable debt securities and the amount of our subordinated liabilities. |
For December 31, 2014, 2015, 2016, 2017, and 2018 our deposits and repurchase agreements amounted to Ps.598,721 million, Ps.743,632 million, Ps.795,852 million, Ps.795,440 million and Ps.841,618 million respectively, and our marketable debt securities amounted to Ps.59,077 million, Ps.87,449 million, Ps.90,003 million, Ps.96,296 million and Ps.103,062 million, respectively. For December 31, 2014, 2015, 2016, 2017 and 2018, our subordinated liabilities amounted to Ps.19,446 million, Ps.22,788 million, Ps.37,576 million, Ps.35,885 million and Ps.37,228 million, respectively.
| (17) | | Includes traditional branches (including those offering Santander Select service), offices and branches that serve SMEs, traditional bank tellers (ventanillas – including those offering Santander Select service), Santander Select offices (including centers (Centros Select), spaces (Espacios Select), box offices and corners) as well as Santander Select units (módulos). |
Exchange Rates
Mexico has had a free market for foreign exchange since 1994 and the Mexican government allows the peso to float against the U.S. dollar. Although the incoming Mexican government has announced that it will adhere to the flexible exchange rate regime, there can be no assurance that the Mexican government will maintain its current policies with regard to the peso or that the peso will not depreciate or appreciate significantly in the future.
External macroeconomic factors such as the normalization of U.S. monetary policy and the volatility in the global financial markets generated by the results of the 2016 U.S. presidential election negatively affected the year-end 2016 peso to U.S. dollar exchange rate, resulting in a 19.54% depreciation of the peso against the U.S. dollar, from Ps.17.25 as of December 31, 2015 to Ps.20.62 as of December 31, 2016. The peso recovered in 2017, appreciating 4.6% to Ps.19.66 as of December 31, 2017. In the second half of 2018, the peso to U.S. dollar exchange rate experienced substantial volatility as a result of external factors, including turbulence in international markets and monetary policy in the U.S., as well as domestic factors, including uncertainty about the economic policy of the incoming Mexican government, and closed at Ps.19.65 as of December 31, 2018, which implied an appreciation of 0.05%.
The following tables set forth, for the periods indicated, the low, high, average and end-of-period exchange rates expressed in pesos per U.S. dollar published by the Mexican Central Bank in the Federal Official Gazette as the exchange rate for the payment of obligations denominated in currencies other than pesos and payable within Mexico. The rates shown below are in nominal pesos and have not been restated in
constant currency units. No representation is made that the peso amounts referred to in this Report could have been or could be converted into U.S. dollars at any particular rate or at all. As of April 29, 2019, the exchange rate for U.S. dollars was Ps.19.01 per U.S. dollar.
| | | | | | | | | | | | | | | |
Year | | Low | | | High | | | Average(1) | | | Period End |
2014 | | Ps. | 12.85 | | | | 14.79 | | | | 13.30 | | | | 14.74 |
2015 | | | 14.56 | | | | 17.38 | | | | 15.88 | | | | 17.25 |
2016 | | | 17.18 | | | | 21.05 | | | | 18.69 | | | | 20.62 |
2017 | | | 17.49 | | | | 21.91 | | | | 18.91 | | | | 19.66 |
2018 | | | 17.98 | | | | 20.72 | | | | 19.24 | | | | 19.65 |
| (1) | | Average of end-of-month exchange rates for 2014, 2015, 2016, 2017 and 2018, respectively. |
| | | | | | | | | | | | | | | |
Month | | Low | | | High | | | Average(1) | | | Period End |
October 2018 | | Ps. | 18.65 | | | Ps. | 20.32 | | | Ps. | 19.19 | | | Ps. | 20.23 |
November 2018 | | | 19.82 | | | | 20.53 | | | | 20.26 | | | | 20.35 |
December 2018 | | | 19.65 | | | | 20.57 | | | | 20.11 | | | | 19.65 |
January 2019 | | | 18.93 | | | | 19.61 | | | | 19.17 | | | | 19.04 |
February 2019 | | | 19.08 | | | | 19.41 | | | | 19.20 | | | | 19.26 |
March 2019 | | | 18.87 | | | | 19.52 | | | | 19.25 | | | | 19.38 |
April 2019 (through April 29) | | | 18.77 | | | | 19.23 | | | | 18.99 | | | | 19.01 |
| (1) | | Average daily exchange rates for October, November and December 2018 and January, February, March and April (through April 29) 2019. |
Unless otherwise indicated, U.S. dollar amounts that have been translated from pesos have been so translated at an exchange rate of Ps.19.65 per U.S.$1.00, the exchange rate as calculated on December 31, 2018 and reported by the Mexican Central Bank in the Federal Official Gazette on January 2, 2019 as the exchange rate for the payment of obligations denominated in currencies other than pesos and payable within Mexico. These translations should not be interpreted as representations that the pesos amounts represent, have been or could have been converted into, U.S. dollars at such or at any other exchange rate.
The Mexican economy has suffered balance-of-payment deficits and shortages in foreign exchange reserves in the past. While the Mexican government, for more than ten years, has not restricted the ability of both Mexican and foreign individuals or entities to convert pesos into U.S. dollars, we cannot assure you that the Mexican government will not institute restrictive exchange control policies in the future. To the extent that the Mexican government institutes restrictive exchange control policies in the future, our ability to transfer or convert pesos into U.S. dollars and other currencies would be adversely affected.
B. Capitalization and Indebtedness
Not applicable.
C. Reasons for the Offer and Use of Proceeds
Not applicable.
D. Risk Factors
Our business, financial condition and results of operations could be materially and adversely affected if any of the risks described below occur. As a result, the market price of our American Depositary Shares, or ADSs, or our Series B shares could decline, and you could lose all or part of your investment. This annual report also contains forward-looking statements that involve risks and uncertainties. See “Special Note Regarding Forward-Looking Statements.” The risks described below are those known to us or that we currently believe may materially and adversely affect us; other risks not currently known to us may arise
in the future or may reach a greater level of materiality, which may materially and adversely affect us and our business.
Risks Associated with Our Business
We are vulnerable to disruptions and volatility in the global financial markets.
Global economic conditions deteriorated significantly between 2007 and 2009, and many countries, including the United States, fell into recession. Although most countries have recovered, the recovery was uneven among different regions and is vulnerable to the materialization of existing risks. Many major financial institutions, including some of the world’s largest global commercial banks, investment banks, mortgage lenders, mortgage guarantors and insurance companies, experienced, and some continue to experience, significant difficulties. Around the world, there were runs on deposits at several financial institutions, numerous institutions sought additional capital or were assisted by governments, and many lenders and institutional investors reduced or ceased providing funding to borrowers (including to other financial institutions).
Within this context, volatile oil prices and a continuous reduction in Mexico’s oil production, together with any future downturn in manufacturing activity in the U.S., the U.S. administration’s policies on trade and immigration, and volatility in global financial markets, could have an adverse effect on the Mexican economy and its growth prospects, which could have an unfavorable impact on our business. While at the end of 2018, the governments of the three members of NAFTA reached a new trade deal, the United States-Mexico-Canada Agreement (USMCA), in order to come into force it must be ratified by each country’s Congress, a process that faces particular uncertainty in the U.S. after the results of the 2018 midterm elections. In this setting, any setback during the legislative ratification process could have a material adverse effect on the Mexican economy, which could adversely affect credit quality and dampen business volumes. The normalization of U.S. monetary policy, and divergent monetary policies around the world, including in Mexico, might also have a negative impact on the Mexican economy and adversely affect our business.
In particular, we face, among others, the following risks related to the economic downturn:
Reduced demand for our products and services.
Increased regulation of our industry. Compliance with such regulation will continue to increase our costs and may affect the pricing for our products and services, increase our conduct and regulatory risks related to non-compliance and limit our ability to pursue business opportunities.
Inability of our borrowers to timely or fully comply with their existing obligations. Macroeconomic shocks may negatively impact the household income of our retail customers and may adversely affect the recoverability of our retail loans, resulting in increased loan losses.
The process we use to estimate losses inherent in our credit exposure requires complex judgments, including forecasts of economic conditions and how these economic conditions might impair the ability of our borrowers to repay their loans. The degree of uncertainty concerning economic conditions may adversely affect the accuracy of our estimates, which may, in turn, impact the reliability of the process and the sufficiency of our loan loss allowances.
The value and liquidity of the portfolio of investment securities that we hold may be adversely affected.
Any worsening of global economic conditions may delay the recovery of the international financial industry and impact our financial condition and results of operations.
Despite recent improvements in certain segments of the global economy, and in particular the strength of domestic demand in Mexico and the manufacturing sector in the U.S. in 2018, uncertainty remains concerning the future economic environment. Such economic uncertainty could have a negative impact on our business and results of operations. A slowing of economic activity in the U.S. and Mexico, unexpected impacts from U.S. monetary policy or unexpected changes to economic policy in Mexico would likely aggravate the adverse effects of these difficult economic and market conditions on us and on others in the financial services industry.
A return to volatile conditions in the global financial markets could have a material adverse effect on us, including on our ability to access capital and liquidity on financial terms acceptable to us, if at all. If capital markets financing ceases to become available, or becomes excessively expensive, we may be forced to raise the rates we pay on deposits to attract more customers and/or become unable to maintain certain liability maturities. Any such increase in capital markets funding availability or costs or in deposit rates could have a material adverse effect on our interest margins and liquidity.
If all or some of the foregoing risks were to materialize, this could have a material adverse effect on our financing availability and terms and, more generally, on our results, financial condition and prospects.
Our financial results are constantly exposed to market risk. We are subject to fluctuations in interest rates and other market risks, which may materially and adversely affect us and our profitability.
Market risk refers to the probability of variations in our net interest income or in the market value of our assets and liabilities due to volatility of interest rates, inflation, exchange rates or equity prices. Changes in interest rates affect the following areas, among others, of our business:
net interest income;
the volume of loans originated;
credit spreads;
the market value of our securities holdings;
the value of our loans and deposits; and
the value of our derivatives transactions.
Interest rates are sensitive to many factors beyond our control, including increased regulation of the financial sector, monetary policies and domestic and international economic and political conditions. Variations in interest rates could affect the interest earned on our assets and the interest paid on our borrowings, thereby affecting our net interest income, which comprises the majority of our revenue, reducing our growth rate and potentially resulting in losses. In addition, costs we incur as we implement strategies to reduce interest rate exposure could increase in the future (which, in turn, will impact our results). We monitor our interest rate risk using the Net Interest Margin, or NIM, sensitivity, which is the difference between the return on assets and the financial cost of our financial liabilities based on a one-year period and a parallel movement of 100 basis points (1%) in market interest rates. As of December 31, 2018, the 1% NIM sensitivity was Ps.222 million.
Increases in interest rates may reduce the volume of loans we originate. Sustained high interest rates have historically discouraged customers from borrowing and have resulted in increased delinquencies in outstanding loans and deterioration in the quality of assets. Increases in interest rates may also reduce the propensity of our customers to prepay or refinance fixed-rate loans. Increases in interest rates may reduce the value of our financial assets and may reduce gains or require us to record losses on sales of our
securities or loans. We hold a substantial portfolio of debt securities and loans that have both fixed and floating interest rates.
In addition, we may experience increased delinquencies in a low-interest-rate environment when such an environment is accompanied by high unemployment and recessionary conditions.
We are also exposed to foreign exchange rate risk as a result of mismatches between assets and liabilities denominated in different currencies. Fluctuations in the exchange rate between currencies may negatively affect our earnings and the value of our assets and liabilities.
We are also exposed to equity price risk in our investments in equity securities in the banking book and in the trading portfolio. The performance of financial markets may cause adverse changes in the value of our investment and trading portfolios. The volatility of world equity markets due to the continued economic uncertainty has had a particularly strong impact on the financial sector. Continued volatility may affect the value of our investments in equity securities and, depending on their fair value and future recovery expectations, could become a permanent impairment which would be subject to write-offs against our results. To the extent any of these risks materialize, our net interest income or the market value of our assets and liabilities could be materially adversely affected, which would in turn adversely impact our business.
Market conditions have resulted, and could result, in material changes to the estimated fair values of our financial assets. Negative fair value adjustments could have a material adverse effect on our operating results, financial condition and prospects.
In the past ten years, financial markets have been subject to significant stress resulting in steep falls in perceived or actual financial asset values, particularly due to volatility in global financial markets and the resulting widening of credit spreads. We have material exposures to securities, loans and other investments that are recorded at fair value and are therefore exposed to potential negative fair value adjustments. Asset valuations in future periods, reflecting then-prevailing market conditions, may result in negative changes in the fair values of our financial assets and these may also translate into increased impairments. In addition, the value ultimately realized by us on disposal may be lower than the current fair market value. Any of these factors could require us to record negative fair value adjustments, which may have a material adverse effect on our operating results, financial condition or prospects.
In addition, to the extent that fair values are determined using financial valuation models, such values may be inaccurate or subject to change, as the data used by such models may not be available or may become unavailable due to changes in market conditions, particularly for illiquid assets, and particularly in times of economic instability. In such circumstances, our valuation methodologies require us to make assumptions, judgments and estimates in order to establish fair value, and reliable assumptions are difficult to make and are inherently uncertain and valuation models are complex, making them inherently imperfect predictors of actual results. Any consequential impairments or write-downs could have a material adverse effect on our operating results, financial condition and prospects.
The credit quality of our loan portfolio may deteriorate and our allowance for impairment losses could be insufficient to cover our actual losses, which could have a material adverse effect on us.
Risks arising from changes in credit quality and the recoverability of loans and amounts due from counterparties are inherent in a wide range of our businesses. Non-performing or low credit quality loans have in the past negatively impacted our results of operations and could do so in the future. In particular, the amount of our reported non-performing loans may increase in the future as a result of growth in our total loan portfolio, including as a result of loan portfolios that we may acquire in the future (the credit quality of which may turn out to be worse than we had anticipated), or factors beyond our control, such as adverse changes in the credit quality of our borrowers and counterparties or a general deterioration in economic
conditions. If we were unable to control the level of our non-performing or poor credit quality loans, this could have a material adverse effect on us.
Our allowance for impairment of losses is based on our current assessment of and expectations concerning various factors affecting the quality of our loan portfolio. These factors include, among other things, our borrowers’ financial condition, repayment abilities and repayment intentions, the realizable value of any collateral, the prospects for support from any guarantor, government macroeconomic policies, interest rates and the legal and regulatory environment. Because many of these factors are beyond our control and there is no precise method for predicting loan and credit losses, we cannot assure that our current or future allowance for impairment losses will be sufficient to cover actual losses. If our assessment of and expectations concerning the above-mentioned factors differ from actual developments, if the quality of our total loan portfolio deteriorates for any reason, including the increase in lending to individuals and SMEs and the introduction of new products, or if the future actual losses exceed our estimates of expected losses, we may be required to increase our allowance for impairment losses, which may adversely affect our business. Additionally, in calculating our allowance for impairment losses, we employ qualitative tools and statistical models which may not be reliable in all circumstances and which are dependent upon data that may not be complete.
We believe that recoveries of non-performing loans as a percentage of our total non-performing loan portfolio are likely to decline over time because of the aging of our non-performing loan portfolio. In addition, because the mortgage foreclosure process relating to collateral in Mexico takes three years on average to be fully completed due to procedural requirements under Mexican law, other factors such as third-party claims, mechanic’s liens and deterioration of the relevant property may impair the value of the collateral during the foreclosure process.
Our exposure to individuals and small and medium-sized businesses could lead to higher levels of non-performing loans, allowances for impairment losses and write-offs.
A substantial number of our customers consist of individuals, approximately 37.4% of our total loans and advances to customers as of December 31, 2018, and, to a lesser extent, SMEs (those companies with annual revenues of less than Ps.250 million (U.S.$12.7 million), which accounted for approximately 11.3% of our total loans and advances to customers as of December 31, 2018. As part of our business strategy, we are seeking to further increase lending and other services to individuals and SMEs, which are more likely to be adversely affected by downturns in the Mexican economy than large corporations and high-income individuals who have greater economic resources. Consequently, in the future we may experience higher levels of non-performing loans, which could result in increases in our allowance for impairment losses, which in turn will affect our financial condition and results of operations. For the year ended December 31, 2018, non-performing loans were Ps.18,429 million and total written-off loans against our allowance for impairment losses were Ps.19,679 million. Non-performing loans related to individuals and SMEs represented 64.5% and 8.0%, respectively, of our total non-performing loans for the year ended December 31, 2018, as compared to 66.9% and 10.6%, respectively, of our total non-performing loans for the year ended December 31, 2017. Written-off loans related to individual and SME loans represented 70.5% and 15.0%, respectively, of our total written-off loans for the year ended December 31, 2018, as compared to 67.1% and 19.0%, respectively, for the year ended December 31, 2017. There can be no assurance that the levels of non-performing loans and subsequent write-offs will not be materially higher in the future and that this activity will not have an adverse effect on us.
Part of our current growth strategy is also to increase volume in the credit card portfolio, at the same rate or a slightly higher rate than the market, which may increase the level of non-performing loans in our total loan portfolio. As of December 31, 2018, our mortgage loan portfolio totaled Ps.145,749 million, representing 21.2% of our total loans and advances to customers. If the economy and real estate market in Mexico experience a significant downturn due to any global financial and economic crisis, this could materially adversely affect the liquidity, businesses and financial conditions of our customers, which may in turn cause us to experience higher levels of past due loans, thereby resulting in higher allowance for
impairment losses and subsequent write-offs. This may materially and adversely affect our asset quality, results of operations and financial condition.
The volatility in peso exchange rates and interest rates in Mexico could have a material adverse effect on our business.
We are exposed to currency risk any time we hold an open position in a currency other than pesos and to interest rate risk when we have an interest rate repricing gap or carry interest-earning securities having fixed real or nominal interest rates. Peso exchange rates and interest rates in Mexico have been subject to significant fluctuations in recent years. Because of the historical volatility in peso exchange rates and interest rates in Mexico, the risks associated with such positions may be greater than in certain other countries. Our foreign currency liabilities are subject to regulation by the Mexican Central Bank, which imposes liquidity requirements in matching currencies, depending upon the maturities of such liabilities. As of December 31, 2018, the value at risk, or VaR, associated with our financial instruments sensitive to interest rates and foreign currency exchange rates was U.S.$2.8 million (Ps.54.6 million) and U.S.$3.3 million (Ps.65.2 million), respectively. Although we follow various risk management procedures in connection with our trading and treasury activities and are subject to regulations that seek to avoid important mismatches, there can be no assurance that we will not experience losses with respect to these positions in the future, any of which could have a material adverse effect on our business, including our results of operations.
Severe devaluation or depreciation of the peso may have an adverse effect on us by, for example, increasing in peso terms the amount of our foreign currency-denominated liabilities and the rate of default among our borrowers or affecting our results of operations when measured in U.S. dollar terms. In addition, severe depreciations may result, as in the past, in the implementation of exchange controls that may impact our ability to convert pesos into U.S. dollars or to transfer currencies outside of Mexico, which may have an impact on us.
Negative economic conditions and volatility in global financial markets, mainly due to fluctuations in oil and commodity prices, slow economic activity in emerging markets, the prospect for higher interest rates in the United States and a “flight to quality” seen in global financial markets have translated into high volatility in international and domestic markets.
As a result, the Mexican peso has suffered significant fluctuations in the past years. For instance, at the end of 2014, the peso had depreciated to Ps.14.74 per U.S. dollar, and in 2015, the peso further depreciated to Ps.17.21 per U.S. dollar. At the end of 2016, the peso had again sharply depreciated to Ps.20.62 pesos per U.S. dollar. However, by December 2017, the peso had appreciated to Ps.19.66 per U.S. dollar. As of December 31, 2018, the peso again appreciated to Ps.19.65 per U.S. dollar.
The peso continues to be affected by uncertainty and volatility in the global markets. The Mexican government has occasionally implemented a series of measures to limit the volatility of the peso, including auctions of U.S. dollars in the foreign exchange market and regulating hedges of foreign currency-denominated liabilities of Mexican banks. However, we cannot assure you that such measures will be effective or maintained or how such measures will impact the Mexican economy.
Severe devaluation or depreciation of the peso may also result in government intervention, as has occurred in other countries, or disruption of international foreign exchange markets. While the Mexican government does not currently restrict, and for many years has not restricted, the right or ability of Mexican or foreign persons or entities to convert pesos into U.S. dollars or to transfer other currencies outside of Mexico, the Mexican government has taken such measures in the past and could institute restrictive exchange control policies in the future. Accordingly, fluctuations in the value of the peso against the U.S. dollar could have a material adverse effect on us.
Fluctuations in the exchange rate between the peso and the U.S. dollar, particularly depreciations in the value of the peso, may adversely affect the U.S. dollar equivalent of the peso price of the Series B shares on the Mexican Stock Exchange. Such peso depreciations also will likely affect our revenues and earnings when measured in U.S. dollar terms and the market price of the ADSs. Exchange rate fluctuations would also affect the U.S. dollar equivalent value of any cash dividends paid in pesos and other distributions that we pay in pesos in respect of the Series B shares.
Mexican government banking laws and regulations may have a material adverse effect on us.
We are subject to extensive laws and regulations regarding our organization, operations, lending and funding activities, capitalization, transactions with related parties, and taxation and other matters. These laws and regulations impose numerous requirements on us, including the maintenance of minimum credit risk-based, market risk-based and operating-risk capital levels and allowance for impairment losses, prohibited activities, regulation of our business practices and practices relating to risk-profile and sales of securities, regulation on money laundering, regulation on derivatives, rates charged, application of required accounting regulations and tax obligations. Many of the applicable laws and regulations have changed extensively in recent years, some with a negative impact on us. There may be future changes in the legal or regulatory system or in the interpretation and enforcement of the laws and regulations, which may have a material adverse effect on us.
On November 1, 2013, the Mexican Congress approved several tax reforms that have become effective. These reforms include changes to the Income Tax Law (Ley del Impuesto sobre la Renta), the Value Added Tax Law (Ley del Impuesto al Valor Agregado) and the Mexican Federal Tax Code (Código Fiscal de la Federación). The tax reforms also repeal the Single Rate Corporate Tax Law (Ley del Impuesto Empresarial a Tasa Única) and the Tax Law on Cash Deposits (Ley del Impuesto a los Depósitos en Efectivo). On November 26, 2013, the Mexican Congress approved a financial reform package that granted broader authority to financial authorities and ordered the Mexican competition authorities to initiate an investigation into the fairness of trade practices in the Mexican financial system. See “Item 4. Information on the Company—B. Business Overview—The Mexican Financial System.”
The Mexican Congress also approved a number of changes to the Mexican Banking Law in recent years. One of the main changes to the Mexican Banking Law was the grant of authority to the SHCP to conduct evaluations of Mexican banks. The SHCP conducts evaluations of Mexican banks through the Guidelines for the Assessment on the Performance of Credit Institutions (the “Guidelines”), which were published in the Federal Official Gazette on December 31, 2014 and the “Strategic Questionnaire”. The SHCP first delivered the Strategic Questionnaire to Banco Santander México on October 26, 2015. The Bank filed its response on January 20, 2016.
By means of the official note UBVA/DGAAF/011/2016, the SHCP notified the Bank of the preliminary result of such assessment, in 2015, granting the Bank an approbatory grade on the “Banking Assessment Index”, and an outstanding rating on the Strategic Questionnaire. The final preliminary result was therefore satisfactory.
On January 11, 2017, the Guidelines were amended, setting forth that the Strategic Questionnaire corresponding to the 2016 performance assessment had to be filed within the first fifteen calendar days of February 2017. On February 15, 2017, we submitted the Strategic Questionnaire.
On May 31, 2017, by means of official note number UBVA/DGAAF/008/2017, the SHCP notified the Bank of the preliminary result of the 2016 performance assessment, which was “Satisfactory”. The final result of the 2016 performance assessment, was “Satisfactory”, the Bank being notified of such result on July 31, 2017, by means of the official note number UBVA/DGAAF/171/2017.
By means of the official note number UBVA/DGFAAF/232/2017, dated October 31, 2017, the SHCP provided the Bank with the Strategic Questionnaire to be duly completed between February 1 and February
15, 2018. We submitted the Strategic Questionnaire on February 15, 2018. On July 31, 2018, by means of official note number UBVA/DGAAF/174/2018, the SHCP notified the Bank that the final result of the 2017 performance assessment was “Satisfactory.”
On June 29, 2018, by means of the official note number UBVA/DGAAF/122/2018, the SHCP notified Banco Santander México of the indexes from which its 2018 performance assessment of the Bank would be computed. On October 29, 2018, the SHCP, by means of official note number UBVA/152/2018 provided us the Strategic Questionnaire to be duly completed between February 1 and February 15th, 2019. We submitted the Strategic Questionnaire on February 14, 2019 and the results are pending.
Results of evaluations are required to be made publicly available by the SHCP. Negative or deficient results of evaluations may result in corrective measures being ordered, including a requirement to present a plan to correct such deficiencies. It is uncertain what such measures may be and whether the imposition of such measures on us may have a material adverse effect on our business.
We cannot predict the terms that will be included in the evaluation report prepared by the SHCP, particularly in relation to lending to certain sectors of the economy. However, if the SHCP determines, after an evaluation, that we have not complied with applicable requirements, we may be forced to lend to certain sectors of the economy or to certain persons that may not meet our credit quality or other standards specified in our policies, that we may not be familiar with or that are not acceptable credit risks, which in turn may impact our financial condition and results of operations. Furthermore, if we were to fail any evaluation, publicity surrounding such failure may impact our reputation, which in turn may adversely impact our ability to conduct business in Mexico and our financial condition and results of operations.
Given the current environment affecting the financial services sector, and due to the new administration that came to power as a result of the Mexican general elections held on July 1, 2018, there may be future changes in the regulatory system or in the interpretation and enforcement of the laws and regulations that could adversely affect us. See “Item 4. Information on the Company—B. Business Overview—Supervision and Regulation” for a discussion of the governmental authorities that regulate us.
The Federal Law for Protection of Personal Data Held by Private Persons (Ley Federal de Protección de Datos Personales en Posesión de los Particulares) protects personal data collected and requires that we ensure the confidentiality of information received from clients. We have modified our processes, procedures and systems as required in order to facilitate the implementation of this law and the supervision of our activities thereunder and as a means to obtain the consent of our customers prior to using any personal information provided by them. Violations of this law could have a material adverse effect on us, including increasing our operating costs and subjecting us to fines and penalties in the event of violations of the provisions of such law.
In June 2014, the Mexican Supreme Court (Suprema Corte de Justicia de la Nación) of Justice issued a thesis, of mandatory application, allowing federal judges to determine ex officio if an interest rate agreed in a promissory note is evidently excessive, violating an individual’s human rights, and consequently establishing a reduced interest rate. The elements the judge should take into account to determine if an interest rate is evidently excessive are: (i) the type of relationship between the parties; (ii) the qualification of the persons intervening in the issuance of the promissory note and if the activity of the creditor is regulated; (iii) the purpose of the credit; (iv) the amount of the loan; (v) the term of the loan; (vi) the existence of guarantees or collateral for the payment of the loan; (vii) the interest rates applied by financial institutions in transactions similar to the one under analysis, as a mere reference; (viii) the variation of the national inflation index during the term of the loan; (ix) market conditions; and (x) other issues that may be relevant for the judge. The mandatory and partly discretionary application of such criteria in the lawsuits affecting our loan portfolio could have a material adverse effect on the interest rates we charge and on our operating results.
To date, the Mexican Courts have not issued any judgment reducing the interest rates on loans charged by the Bank. In addition, in November 2016, the Mexican Supreme Court of Justice published a separate thesis setting forth a rebuttable presumption that the interest rates charged on loans made by Mexican banking institutions are not excessive. The thesis was based on the fact that the loans offered to the public by credit institutions are supervised by the Mexican Central Bank, which supervision has the objective of ensuring that their conditions are accessible and reasonable for the public.
We are subject to potential intervention by any of our regulators or supervisors, particularly in response to customer complaints.
As noted above, our business and operations are subject to increasingly significant rules and regulations that are required to conduct banking and financial services business. These apply to business operations, affect financial returns, include allowance for impairment losses and reporting requirements, and prudential and conduct of business regulations. These requirements are set by the Mexican Central Bank and regulatory authorities that authorize, regulate and supervise us.
In their supervisory roles, the regulators seek to maintain the safety and soundness of financial institutions with the aim of strengthening the protection of customers and the financial system. The supervisors’ continuing supervision of financial institutions is conducted through a variety of regulatory tools, including the collection of information by way of prudential returns, reports obtained from skilled persons, visits to firms and regular meetings with management to discuss issues such as performance, risk management and strategy. In general, these regulators have a more outcome-focused regulatory approach that involves more proactive enforcement and more punitive penalties for infringement, including intervening institutions, and restricting dividends or bonuses to employees in case of a decrease of capital. As a result, we face increased supervisory scrutiny (resulting in increasing internal compliance costs and supervision fees), and in the event of a breach of our regulatory obligations we are likely to face more stringent regulatory fines. Some of the regulators are focusing intently on consumer protection and on conduct risk, including profiling clients considering role, and will continue to do so. This has included a focus on the design and operation of products, the behavior of customers and the operation of markets. Such a focus could result in usury regulation that could restrict our ability to charge certain levels of interest in credit transactions or in regulation that would prevent us from bundling products that we offer to our customers.
The regulators could conclude that our products cause significant detriment to consumers because of certain product features or governance flaws or distribution strategies. Such rules may prevent institutions from entering into product agreements with customers until such problems have been solved. Regulations require us to be in compliance across all aspects of our business, including the training, authorization and supervision of personnel, systems, processes and documentation. If we fail to comply with the relevant regulations, there would be a risk of an adverse impact on our business from sanctions, fines or other actions imposed by the regulatory authorities, including the revocation of our authorization and the intervention in our operations. Customers of financial services institutions, including our customers, may seek redress if they consider that they have suffered loss as a result of the mis-selling of a particular product, or through incorrect application of the terms and conditions of a particular product. Given the inherent unpredictability of litigation and the evolution of judgments by the relevant authorities, it is possible that an adverse outcome in some matters could harm our reputation or have a material adverse effect on our operating results, financial condition and prospects arising from any penalties imposed or compensation awarded, together with the costs of defending such an action, thereby reducing our profitability.
Claims by COFECE
On April 26, 2017, in connection with the ongoing investigation about possible Absolute Monopoly Practices (PMA) in the markets in which the Bank participates, the Mexican Federal Antitrust Commission (“COFECE”) requested information from the Bank regarding its activity as market maker and intermediary in such markets of the following instruments issued by the Mexican government: Cetes, Bonos M, Udibonos and Bondes D. The investigation period covers from 2006 to 2017. The Bank is not being investigated
separately but rather as one participant in the markets in question and is cooperating in the investigation by providing information to COFECE. On June 1, 2017, Banco Santander México responded timely, providing the requested information.
At present, we are waiting for COFECE to issue its official communication regarding the outcome of the investigation. On May 30, 2018, the investigation period was extended for a third time for an additional 120 business days. This extension concluded on December 4, 2018. A fourth extension is possible. Because the contingencies related to these sort of practices are high, we have fully cooperated with COFECE, including by monitoring our internal communications and transmitted all relevant communications to COFECE.
On November 3, 2017, COFECE notified Banco Santander México of a claim that the Bank is potentially responsible for facilitating the establishment of different conditions for the taking out of loans for certain clients in similar positions by the Credit Information Company, of which Banco Santander México is a shareholder. We submitted our response to COFECE on January 24, 2018. On February 19, 2018, COFECE acknowledged that our response was timely. On February 7, 2019 COFECE issued its final ruling, which was notified to Banco Santander México on February 22, 2019. COFECE resolved that there was no evidence of the liability of Banco Santander México for facilitating the commission of the abuse of dominance aforementioned.
Antitrust Class Action Filed in NY
A putative class action filed in New York federal court by two U.S. pension funds on March 30, 2018, alleges that the Bank, along with other members of the Santander Group including Santander España, violated U.S. antitrust laws by conspiring with other major financial institutions, including Banco Bilbao Vizcaya Argentaria (BBVA), J.P. Morgan, HSBC, Barclays, Deutsche Bank, Bank of America and Citi, to rig auctions and fix prices of Mexican Government Bonds (Cetes, Bonos M, Udibonos, Bondes D) (“MGBs”), allegedly inflating prices.
In particular, the complaint alleges that the defendants: (1) rigged MGB auctions through collusive bidding and information sharing; (2) sold MGBs purchased at auction at artificially higher prices; and (3) agreed to fix the "bid-ask spread" artificially wider, overcharging and underpaying customers in every MGB transaction by suppressing the "bid price" at which the defendants offered to buy MGBs and increasing the "ask price" at which they offered to sell. The complaint further alleges that these activities resulted in MGB prices being between 20% and 50% higher than they otherwise would have been in a competitive market.
According to the complaint, the alleged conspiracy came to light following an April 2017 announcement that the COFECE had uncovered evidence of anticompetitive behavior in the MGB marketplace. In addition, the Manhattan and Bronx Surface Transit Operating Authority Pension Plan and the Metropolitan Transportation Authority Defined Benefit Pension Plan Master Trust, filed a second putative antitrust class action in New York federal court alleging the Bank along with other members of the Santander Group conspired with other financial institutions to fix MGB auctions and purchase prices. These actions were consolidated into one case. At this time, we are also aware of a third, similar complaint, which may be consolidated with the existing cases in the future. We are in the process of preparing our defenses.
The investigation is in preliminary stages. While the Bank does not currently anticipate incurring any liability in connection with this investigation, it is not possible to predict their outcome and any adverse finding or penalty imposed could have a material adverse effect on our reputation, financial condition or results of operations.
Future Mexican government restrictions on interest rates or commissions could have a material adverse effect on us.
In Mexico, the Law for the Protection and Defense of Financial Services Users (Ley de Protección y Defensa al Usuario de Servicios Financieros) does not impose any specific limit on interest rates or commissions. However, under the Law for the Transparency and Ordering of Financial Services (Ley para la Transparencia y Ordenamiento de los Servicios Financieros), the Mexican Central Bank may issue regulations in respect of interest rates or commissions, if it determines that economic conditions are not conducive to competition (after hearing the opinion of the COFECE). Although the Mexican government could impose limitations or additional informational requirements regarding such interest rates or commissions in the future, as of the date of this Report, the Mexican Congress and Mexican regulators (including the Mexican Central Bank) have not proposed any specific limit to the interest rates or commissions we may charge. A large portion of our revenues and operating cash flow is generated by interest rates or commissions we charge to our customers, and any such limitations or additional information requirements could have a material adverse effect on us.
We may be required to make significant contributions to the IPAB.
IPAB manages the bank savings protection system and the financial support granted to banks in Mexico. Under Mexican law, banks are required to make monthly contributions to IPAB to support its operations that are equal to 1/12 of 0.004% (the annual rate) multiplied by the average of certain liabilities minus the average of certain assets. Mexican authorities impose regular assessments on banking institutions covered by IPAB for funding. We contributed to IPAB Ps.2,238 million in 2015, Ps.2,631 million in 2016, Ps.2,894 million in 2017 and Ps.3,134 million in 2018. In the event that IPAB’s reserves are insufficient to manage the Mexican bank savings protection system and provide the necessary financial support required by troubled banking institutions, IPAB maintains the right to require extraordinary contributions to all banking institution participants in the system, which we may be required to make and may be significant. Although we have not been required to make extraordinary contributions to the IPAB in the past, we may be required to make extraordinary contributions in the future. Such extraordinary contributions would increase our expenses and could have a material adverse effect on us.
We are subject to Mexican regulatory inspections, examinations, inquiries or audits, and future sanctions, fines and other penalties resulting from such inspections and audits, including the revocation of Banco Santander México’s banking license, could have a material adverse effect on us.
We are subject to comprehensive regulation and supervision by Mexican regulatory authorities, such as the Mexican Central Bank, the CNBV and the SHCP. See “Item 4. Information on the Company—B. Business Overview—The Mexican Financial System.” These regulatory authorities have broad powers to adopt regulations and other requirements affecting or restricting virtually all aspects of our capitalization, organization and operations, including changes to capital adequacy and allowance for impairment losses requirements, the activities we may and may not conduct (including limitations on derivative transactions), supervision of compliance with rules relating to secrecy, the imposition of anti-money laundering measures and the authority to regulate the terms of products, including the interest rates we charge and the fees we collect in exchange for services. Moreover, Mexican financial regulatory authorities possess significant powers to enforce applicable regulatory requirements, including the imposition of fines, requiring that new capital be contributed, inhibiting us from paying dividends to shareholders or paying bonuses to employees, or the revocation of licenses to operate our business (including our banking or broker-dealer licenses). In the event that we encounter significant financial problems or become insolvent or in danger of becoming insolvent, Mexican banking authorities would have the power to take over our management and operations. Pursuant to the Law for the Protection and Defense of Financial Services Users, the CONDUSEF is entitled to, among other things, initiate class actions against Mexican financial institutions in connection with events of any nature that affect groups of users of financial services. Likewise, COFECE is entitled to initiate investigations on the commercial practices relating to equity markets within the Mexican Financial System,
as well as to impose certain penalties provided for by law. See ”Item 4. Information on the Company—B. Business Overview—Supervision and Regulation.”
Failure to successfully implement and continue to improve our risk management policies, procedures and methods, including our credit risk management system, which is affected by the quality and scope of information available in Mexico, could materially and adversely affect us and we may be exposed to unidentified or unanticipated risks.
The management of risk is an integral part of our activities. We seek to monitor and manage our risk exposure through a variety of separate but complementary financial, credit, market, operational, compliance and legal reporting systems. While we employ a broad and diversified set of risk monitoring and risk mitigation techniques, such techniques and strategies may not be fully effective in mitigating our risk exposure in all economic market environments or against all types of risk, including risks that we fail to identify or anticipate.
Some of our qualitative tools and metrics for managing risk are based upon our use of observed historical market behavior. We apply statistical and other tools to these observations to arrive at quantifications of our risk exposures. These qualitative tools and metrics may fail to predict future risk exposures. These risk exposures could, for example, arise from factors we did not anticipate or correctly evaluate in our statistical models. This would limit our ability to manage our risks. Our losses, thus, could be significantly greater than the historical measures indicate. In addition, our quantified modeling does not take all risks into account. Our more qualitative approach to managing those risks could prove insufficient, exposing us to material unanticipated losses. We could face adverse consequences as a result of decisions, which may lead to actions by management, based on models that are poorly developed, implemented or used, or as a result of the modeled outcome being misunderstood or the use of such information for purposes for which it was not designed. In addition, if existing or potential customers or counterparties believe our risk management is inadequate, they could take their business elsewhere or seek to limit their transactions with us. This could have a material adverse effect on our reputation, operating results, financial condition and prospects.
As a commercial bank, one of the main types of risks inherent in our business is credit risk. For example, an important feature of our credit risk management system is to employ an internal credit rating system to assess the particular risk profile of a customer. As this process involves detailed analyses of the customer, taking into account both quantitative and qualitative factors, it is subject to human or IT systems errors. In exercising their judgment on current or future credit risk behavior of our customers, our employees may not always be able to assign an accurate credit rating, which may result in our exposure to higher credit risks than indicated by our risk rating system. In addition, we seek to continuously refine our credit policies and guidelines to address potential risks associated with particular industries or types of customers. However, we may not be able to timely detect all possible risks before they occur, or due to limited tools available to us, our employees may not be able to effectively implement them, which may increase our credit risk. Failure to effectively implement, consistently monitor or continuously refine our credit risk management system may result in an increase in the level of non-performing loans and a higher risk exposure for us, which could have a material adverse effect on us.
In addition, the effectiveness of our credit risk management is affected by the quality and scope of information available in Mexico. In assessing customers’ creditworthiness, we rely largely on the credit information available from our own internal databases, the Mexican credit information companies and other sources. Due to limitations in the availability of information and the developing information infrastructure in Mexico, our assessment of credit risk associated with a particular customer may not be based on complete, accurate or reliable information. In addition, although we have been improving our credit scoring systems to better assess borrowers’ credit risk profiles, we cannot assure you that our credit scoring systems collect complete or accurate information reflecting the actual behavior of customers or that their credit risk can be assessed correctly. Without complete, accurate and reliable information, we have to rely on other publicly available resources and our internal resources, which may not be effective. As a result, our ability to
effectively manage our credit risk and subsequently our impairment losses and allowance for impairment losses may be materially adversely affected.
Our loan and investment portfolios are subject to risk of prepayment, which could have a material adverse effect on us.
Our fixed rate loan and investment portfolios are subject to prepayment risk, which results from the ability of a borrower or issuer to pay a debt obligation prior to maturity. Generally, in a low interest rate environment, prepayment activity increases, which reduces the weighted average lives of our earning assets and could have a material adverse effect on us. We would also be required to recognize net premiums or commissions as income over a shorter period of time, thereby reducing the corresponding asset yield and net interest income. Prepayment risk also has a significant adverse impact on credit card and collateralized mortgage loans, since prepayments could shorten the weighted average life of these assets, which may result in a mismatch in our funding obligations and reinvestment at lower yields. Prepayment risk is inherent to our commercial activity and an increase in prepayments could have a material adverse effect on us.
We may generate lower revenues from commission-based businesses.
The revenues from commissions that we earn from the different banking and other financial services that we provide represent a significant source of our profitability. Market downturns have led, and are likely to continue to lead, to a decline in the volume of transactions that we execute for our customers and, therefore, to a decline in our non-interest revenues. In addition, because the fees that we charge for managing our clients’ portfolios are in many cases based on the value or performance of those portfolios, a market downturn that reduces the value of our clients’ portfolios or increases the amount of withdrawals would reduce the revenues we receive from our private banking and custody businesses and adversely affect our results of operations. Moreover, our customers may further significantly decrease their risk tolerance to non-deposit investments such as stocks, bonds and mutual funds, which would adversely affect us, including our revenues from commissions.
Even in the absence of a market downturn, our revenues from commissions may also be reduced by legislative changes affecting the financial system.
The financial problems faced by our customers could adversely affect us.
Market turmoil and economic recession could materially and adversely affect the liquidity, credit ratings, businesses and/or financial conditions of our borrowers, which could in turn increase our non-performing loan ratios, impair our loan and other financial assets and result in decreased demand for borrowings in general. In addition, our customers may further significantly decrease their risk tolerance to non-deposit investments that we offer such as stocks, bonds and mutual funds, which would adversely affect our fee and commission income. We may also be adversely affected by the negative effects of the heightened regulatory environment on our customers due to the high costs associated with regulatory compliance and proceedings. Any of the conditions described above could have a material adverse effect on our business, financial condition and results of operations.
Changes in our pension liabilities and obligations could have a material adverse effect on us.
We provide retirement benefits for many of our former and current employees through a number of defined benefit pension plans. We calculate the amount of our defined benefit obligations using actuarial techniques and assumptions, including mortality rates, the rate of increase of salaries, discount rates, inflation, the expected rate of return on plan assets, or others. The accounting and disclosures are based on IFRS and on those other requirements defined by the local supervisors. Given the nature of these obligations, changes in the assumptions that support valuations, including market conditions, can result in actuarial losses which would in turn impact the financial condition of our pension funds. Because pension obligations
are generally long term obligations, fluctuations in interest rates have a material impact on the projected costs of our defined benefit obligations and therefore on the amount of pension expense that we accrue.
Any increase in the current size of the deficit in our defined benefit pension plans could result in our having to make increased contributions to reduce or satisfy the deficits, which would divert resources from use in other areas of our business. Any such increase may be due to certain factors over which we have no or limited control. Increases in our pension liabilities and obligations could have a material adverse effect on our business, financial condition and results of operations.
Our financial statements are based in part on assumptions and estimates which, if inaccurate, could cause material misstatement of the results of our operations and financial position.
The preparation of financial statements requires management to make judgments, estimates and assumptions that affect the reported amounts of assets, liabilities, income and expenses. Due to the inherent uncertainty in making estimates, actual results reported in future periods may be based upon amounts, which differ from those estimates. Estimates, judgments and assumptions are continually evaluated and are based on historical experience and other factors, including expectations of future events that are believed to be reasonable under the circumstances. Revisions to accounting estimates are recognized in the period in which the estimate is revised and in any future periods affected. The accounting policies deemed critical to our results and financial position, based upon materiality and significant judgments and estimates, include fair value measurements and disclosures of financial instruments, deferred tax assets, impairment of financial assets at fair value through other comprehensive income, allowance for impairment losses and provisions for off-balance sheet risk, defined benefit plans, goodwill and business combinations, impairment of goodwill and provisions and contingent liabilities.
The valuation of financial instruments measured at fair value can be subjective, in particular where models use significant inputs not observable in market data. Given the uncertainty and subjectivity associated with valuing such instruments, it is possible that the results of our operations and financial position could be materially misstated if the estimates and assumptions used prove to be inaccurate.
If the judgment, estimates and assumptions we use in preparing our audited financial statements are subsequently found to be incorrect, there could be a material effect on our results of operations and a corresponding effect on our funding requirements and capital ratios.
Disclosure controls and procedures over financial reporting may not prevent or detect all errors or acts of fraud.
Disclosure controls and procedures over financial reporting are designed to provide reasonable assurance that information required to be disclosed by the company in reports filed or submitted under the Exchange Act is accumulated and communicated to management, and recorded, processed, summarized and reported within the time periods specified in the SEC’s rules and forms.
These disclosure controls and procedures have inherent limitations which include the possibility that judgments in decision-making can be faulty and that breakdowns occur because of errors or mistakes. Additionally, controls can be circumvented by any unauthorized override of the controls. Consequently, our business is exposed to risk from potential non-compliance with policies, employee misconduct or negligence and fraud, which could result in regulatory sanctions, civil claims and serious reputational or financial harm. In recent years, a number of multinational financial institutions have suffered material losses due to the actions of ‘rogue traders’ or other employees. It is not always possible to deter employee misconduct and the precautions we take to prevent and detect this activity may not always be effective. Accordingly, because of the inherent limitations in the control system, misstatements due to error or fraud may occur and not be detected.
Goodwill impairments may be required in relation to acquired businesses.
We have made business acquisitions in past years and may make further acquisitions in the future. It is possible that the goodwill, which has been attributed, or may be attributed, to these businesses may have to be written-down if our valuation assumptions are required to be reassessed as a result of any deterioration in their underlying profitability, asset quality and other relevant matters. Impairment testing in respect of goodwill is performed annually or more frequently if there are impairment indicators present, and comprises a comparison of the carrying amount of the cash-generating unit with its recoverable amount. Goodwill impairment does not, however, affect our regulatory capital. While no material impairment of goodwill was recognized in 2017 or 2018, there can be no assurances that we will not have to recognize any impairment or write down the value attributed to goodwill in the future, which would adversely affect our results and net assets.
Increased competition, including from non-traditional providers of banking services such as financial technology providers, and industry consolidation may adversely affect our results of operations.
We face substantial competition in all parts of our business, including in originating loans and in attracting deposits. The competition in originating loans comes principally from other Mexican and foreign banks, mortgage banking companies, consumer finance companies, insurance companies and other lenders and purchasers of loans. We anticipate that we will encounter greater competition as we expand our operations. In addition, certain of our competitors, such as “non-regulated Sofomes,” are financial companies which are not regulated and thus, not subject to the same extensive banking regulation, including capitalization and allowance for impairment losses requirements. As a result, certain of our competitors may have advantages in conducting certain businesses and providing certain services and, particularly, may be more aggressive in their loan origination strategies. However, non-regulated Sofomes, are subject to the supervision and oversight of the CNBV, but only with respect to compliance with anti-money laundering and anti-terrorism preemptive regulations.
Our main competitors are BBVA Bancomer, S.A., Institución de Banca Múltiple, Grupo Financiero BBVA Bancomer; Banco Nacional de México, S.A., Institución de Banca Múltiple, Grupo Financiero Citibanamex; Banco Mercantil del Norte, S.A., Institución de Banca Múltiple, Grupo Financiero Banorte; HSBC México, S.A., Institución de Banca Múltiple, Grupo Financiero HSBC; Banco Inbursa, S.A., Institución de Banca Múltiple, Grupo Financiero Inbursa; and Scotiabank Inverlat, S.A., Institución de Banca Múltiple, Grupo Financiero Scotiabank Inverlat.
For a number of years, foreign financial institutions have been permitted to establish subsidiary financial groups, banks, broker-dealers and other financial entities in Mexico. According to the CNBV, as of December 31, 2018, Mexico’s ten largest domestic banks, measured in terms of assets, held 85.0% of the total assets in the Mexican banking system; five of these ten banks are foreign-owned. These foreign financial institutions are generally well capitalized, and have substantial resources (such as personnel, technology and product development, and organization); if any of them pursue the Mexican market aggressively by establishing or expanding operations, we may be unable to compete with them.
The CNBV continues, from time to time, to grant banking licenses, including licenses to niche banks that are solely permitted to engage in limited activities. Newly licensed banks are likely to aggressively pursue market expansion, which may adversely affect our activities and results of operations.
Additionally, legal and regulatory reforms in the Mexican banking industry have also increased competition among banks and among other financial institutions. In particular, recent rules applicable to all banks permit the substitution of loans by banks (and the resulting acquisition of clients) by complying with minimum requirements, which are likely to result in banks losing clients to their competitor institutions that embark in aggressive pricing strategies. We believe that the Mexican government’s policies of adopting market-oriented reforms in the financial industry have brought greater competition. Some foreign financial institutions, having greater resources than we do, have entered and may continue to enter the Mexican
market either by themselves or in partnership with existing Mexican financial institutions and compete with us. There can be no assurance that we will be able to compete successfully with such domestic or foreign financial institutions.
Additionally, there has been a trend towards consolidation in the banking industry, which has created larger and stronger banks with which we must now compete. For example, in 2018, Banco Mercantil del Norte, S.A. merged with Banco Interacciones, S.A., creating one of the largest banking institution in Mexico. There can be no assurance that this increased competition will not adversely affect our growth prospects and therefore our operations. We also face competition from non-bank competitors, such as brokerage companies, department stores (for some credit products), leasing and factoring companies, mutual fund and pension fund management companies, insurance companies and recently Finance Technology, or FinTech, institutions focused on digital business models. The Mexican government has prepared a law to further regulate FinTech platforms (Ley para Regular para Regular las Instituciones de Tecnología Financiera or “FinTech Law”), which was approved by the Mexican Congress and published in the Federal Official Gazette on March 9, 2018. Although the law allows Mexican banks to operate Finance Technology platforms, it still requires them to use a different corporate name and branding for such platforms, which may provide FinTech platforms not connected to a bank with a competitive advantage over us.
Non-traditional providers of banking services, such as internet based e-commerce providers, mobile telephone companies and internet search engines may offer and/or increase their offerings of financial products and services directly to customers. These non-traditional providers of banking services currently have an advantage over traditional providers because they are not subject to banking regulation. Several of these competitors may have long operating histories, large customer bases, strong brand recognition and significant financial, marketing and other resources. They may adopt more aggressive pricing and rates and devote more resources to technology, infrastructure and marketing. New competitors may enter the market or existing competitors may adjust their services with unique product or service offerings or approaches to providing banking services. If we are unable to successfully compete with current and new competitors, or if we are unable to anticipate and adapt our offerings to changing banking industry trends, including technological changes, our business may be adversely affected. In addition, our failure to effectively anticipate or adapt to emerging technologies or changes in customer behavior, including among younger customers, could delay or prevent our access to new digital-based markets, which would in turn have an adverse effect on our competitive position and business.
Furthermore, the widespread adoption of new technologies, including cryptocurrencies and payment systems, could require substantial expenditures to modify or adapt our existing products and services as we continue to grow our internet and mobile banking capabilities. Our customers may choose to conduct business or offer products in areas that may be considered speculative or risky. Such new technologies and mobile banking platforms in recent years could negatively impact our investments in bank premises, equipment and personnel for our branch network. The persistence or acceleration of this shift in demand towards internet and mobile banking may necessitate changes to our retail distribution strategy, which may include closing and/or selling certain branches and restructuring our remaining branches and work force. These actions could lead to losses on these assets and may lead to increased expenditures to renovate, reconfigure or close a number of our remaining branches or to otherwise reform our retail distribution channel. Furthermore, our failure to swiftly and effectively implement such changes to our distribution strategy could have an adverse effect on our competitive position.
Increasing competition could also require that we increase our rates offered on deposits or lower the rates we charge on loans, which could also have a material adverse effect on us, including our profitability. It may also negatively affect our business results and prospects by, among other things, limiting our ability to increase our customer base and expand our operations and increasing competition for investment opportunities.
If our customer service levels were perceived by the market to be materially below those of our competitor financial institutions, we could lose existing and potential business. If we are not successful in retaining and
strengthening customer relationships, we may lose market share, incur losses on some or all of our activities or fail to attract new deposits or retain existing deposits, which could have a material adverse effect on our operating results, financial condition and prospects.
In addition, the Mexican Congress passed the FinTech Law in 2018, whose main purpose is to regulate the financial services provided by the Collective Financing (Crowdfunding) Institutions and Electronic Payment Institutions. The CNBV is the authority responsible for granting authorizations and supervising their organization, operation and functioning. Collective Financing (Crowdfunding) Institutions are intended to put members of the public in contact with one another so that any member of the public can provide financing to any other member of the public. Electronic Payment Institutions are intended to provide the public with applications, digital interfaces, internet pages and other means of electronic or digital communications that they can use to make electronic payments in their day-to-day personal and professional lives. In addition, the FinTech Law also regulates transactions carried out with digital assets. A digital asset is an asset that represents value registered electronically that can be used by the public as a means of payment for any kind of legal activity and whose transfer can only be carried out through electronic media. The law limits digital assets, noting that the FinTech institutions can only operate with digital assets approved by the Mexican Central Bank. It also provides for the creation of the Inter-institutional Committee, which will be responsible for making decisions, such as the granting of authorizations and impositions of penalties, among others, in connection with activities pursuant to the FinTech Law. The Committee will also serve as the examining body of the CNBV and will be composed of public servants of the SHCP, Banco de México and the CNBV.
In accordance with the FinTech Law, we will be able to establish our own Financial Technology institution, although we will not be able to use our name or our corporate brand. As a result, we may not be able to realize our full competitive advantage over other companies. In addition, Financial Technology institutions that obtain authorization from the CNBV could represent a source of new and strong competition for us, which could have an adverse effect on our operations and results, and require additional capital expenditures for further investments in technology.
We are subject to counterparty risk in our banking business.
We are exposed to counterparty risk in addition to credit risks associated with lending activities. Counterparty risk may arise from, for example, investing in securities of third parties, entering into derivative contracts under which counterparties have obligations to make payments to us or executing securities, futures, currency or commodity trades from proprietary trading activities that fail to settle at the required time due to non-delivery by the counterparty or systems failure by clearing agents, clearing houses or other financial intermediaries.
We routinely transact with counterparties in the financial services industry, including brokers and dealers, commercial banks, investment banks, mutual funds, hedge funds and other institutional clients. Defaults by, and even rumors or questions about the solvency of, certain financial institutions and the financial services industry generally have led to market-wide liquidity problems and could lead to losses or defaults by other institutions. Many of the routine transactions we enter into expose us to significant credit risk in the event of default by one of our significant counterparties.
Liquidity and funding risks are inherent in our business and could have a material adverse effect on us.
Liquidity risk is the risk that we do not have sufficient available financial resources to meet our obligations as they become due or that we can secure them only at an excessive cost. This risk is inherent in any retail and commercial banking business and can be heightened by a number of enterprise-specific factors, including over-reliance on a particular source of funding, changes in credit ratings or market-wide phenomena such as market dislocation. While we implement liquidity management processes to seek to mitigate and control these risks, unforeseen systemic market factors make it difficult to eliminate them
completely. Continued constraints in the supply of liquidity, including in inter-bank lending, has affected and may materially and adversely affect the cost of funding our business, and extreme liquidity constraints may affect our current operations and our ability to fulfill regulatory liquidity requirements, as well as limit growth possibilities.
Disruption and volatility in the global financial markets could also have a material adverse effect on our ability to access capital and liquidity on financial terms acceptable to us.
Our cost of obtaining funding is directly related to the prevailing level of interest rates, general liquidity conditions in the financial system, and to our credit spreads. Increases in interest rates and our credit spreads, or deterioration of general liquidity conditions, can significantly increase the cost of our funding. Changes in our credit spreads are market-driven and may be influenced by market perceptions of our creditworthiness. Changes to interest rates and our credit spreads occur continuously and may be unpredictable and highly volatile.
We rely, and will continue to rely, primarily on commercial deposits to fund lending activities. The ongoing availability of this type of funding is sensitive to a variety of factors outside of our control, such as general economic conditions and the confidence of commercial depositors in the economy and in the financial services industry, and the availability and extent of deposit guarantees, as well as competition between banks or with other products, such as mutual funds, for deposits. Any of these factors could significantly increase the amount of commercial deposit withdrawals in a short period of time, thereby reducing our ability to access commercial deposit funding on appropriate terms, or at all, in the future. If these circumstances were to arise, this could have a material adverse effect on our operating results, financial condition and growth prospects.
If wholesale debt financing and related markets cease to be available, or become excessively expensive to us, we may be forced to raise the interest rates we pay on deposits, in order to attract more customers, and/or to sell assets, potentially at discounted prices. The persistence or worsening of these adverse market conditions or an increase in base interest rates could have a material adverse effect on our ability to access liquidity and the cost of funding.
We anticipate that our customers will continue, in the near future, to make deposits (particularly demand deposits and short-term time deposits), and we intend to maintain our emphasis on the use of banking deposits as a source of funds. The short-term nature of some deposits could cause liquidity problems for us in the future, if deposits are not made in the volumes we expect or are not renewed. If a substantial number of our depositors withdraw their demand deposits or do not roll over their time deposits upon maturity, we may be materially and adversely affected.
Central banks worldwide have taken extraordinary measures to increase liquidity in the financial markets as a response to the 2008 financial crisis. If current facilities were rapidly removed or significantly reduced, this could have an adverse effect on our ability to access liquidity and on our funding costs.
We cannot assure that in the event of a sudden or unexpected shortage of funds in the banking system, we will be able to maintain levels of funding without incurring higher costs, a reduction in average funding maturities or the liquidation of certain assets. If this were to happen, we could be materially adversely affected.
Many Mexican banks have suffered severe liquidity problems from time to time. We have not suffered material liquidity problems since the 1995 to 1996 period, when we experienced a significant increase in the cost of funding as a result of the financial crisis in Mexico. During that period, we were able to obtain the required funding, but at a higher cost. While we have not suffered material liquidity problems in recent years, we cannot assure that liquidity problems will not affect the Mexican banking system in the future or that liquidity constraints will not affect us in the future. While we expect to be able to refinance our
liabilities, we cannot assure that we will be able to repay our liabilities or refinance our liabilities on favorable terms or at all.
Finally, the implementation of internationally accepted liquidity ratios might require changes in business practices that affect our profitability. The liquidity coverage ratio (LCR) is a liquidity standard that measures if banks have sufficient high-quality liquid assets to cover expected net cash outflows over a 30-day liquidity stress period. At December 31, 2018, our LCR ratio was 174%, above the 100% minimum requirement. The net stable funding ratio (NSFR) provides a sustainable maturity structure of assets and liabilities such that banks maintain a stable funding profile in relation to their activities. The final definition of the NSFR approved by the Basel Committee in October 2014, has not yet come into effect. The Basel requirement still needs to be written into the CRR, which is expected to be published in 2019. At the end of 2018 this ratio stands at 130% for the Bank.
The credit card industry is highly competitive and entails significant risks, including the possibility of over-indebtedness of customers, which could have a material adverse effect on us.
The credit card industry in Mexico is dominated by institutions that may possess greater financial resources and broader coverage in this market than we do. There is no assurance that we will be able to effectively compete for and retain customers in this competitive industry or that we will be able to implement our experience in the Mexican market successfully.
Our credit card business is subject to a number of risks and uncertainties, including the possibility of over-indebtedness of our customers, despite our focus on low-risk and medium- and high-income customers. We currently segment our credit card portfolio into seven groups based on a composite score comprised of a behavior score based on internal and external data and a credit capacity score based primarily on external data. We perform monthly validations of our scores to test their predictive capacity so that the methodologies can be adjusted, if necessary. During 2018, we rearranged our risk groups, aligning our limits strategy. We measure the loss rates for each of the seven groups over a one-year period and compare the average loss rate to our risk appetite within the credit card portfolio. As of December 31, 2018, approximately 73% of our credit card portfolio was included in the top six groups, which together had an average loss rate of 5.3%, which we consider to be low risk.
Credit card products are characterized by higher consumer default than other consumer credit products, and defaults are highly correlated with macroeconomic indicators that are beyond our control. Part of our current growth strategy is to increase volume in the credit card portfolio, at the same or a slightly higher rate than the market, which may increase our exposure to risk in our loan portfolio. During 2018, our credit card portfolio grew 3.4%. If Mexican economic growth slows or declines, or if we fail to effectively analyze the creditworthiness of our customers (including by targeting certain sectors), we may be faced with unexpected losses that could have a material adverse effect on us.
If we cannot efficiently manage the growth of our operations, this could have an adverse effect on our profitability.
We allocate management and planning resources to develop strategic plans for organic growth, and to identify possible acquisitions and disposals and areas for restructuring our businesses. From time to time, we evaluate acquisition and partnership opportunities that we believe offer additional value to our shareholders and are consistent with our business strategy. However, we may not be able to identify suitable acquisition or partnership candidates, and our ability to benefit from any such acquisitions and partnerships will depend in part on our successful integration of those businesses. Any such integration entails significant risks such as unforeseen difficulties in integrating operations and systems and unexpected liabilities or contingencies relating to the acquired businesses, including legal claims. We can give no assurances that our expectations with regards to integration and synergies will materialize. We also cannot provide assurance that we will, in all cases, be able to manage our growth effectively or deliver our
strategic growth objectives. Challenges that may result from our strategic growth decisions include our ability to:
manage efficiently the operations and employees of expanding businesses;
maintain or grow our existing customer base;
assess the value, strengths and weaknesses of investment or acquisition candidates, including local regulation that can reduce or eliminate expected synergies;
finance strategic investments or acquisitions;
align our current information technology systems adequately with those of an enlarged group;
apply our risk management policy effectively to an enlarged group; and
manage a growing number of branch offices without over-committing management or losing key personnel.
Any failure to manage growth effectively could have a material adverse effect on our operating results, financial condition and prospects.
In addition, any acquisition or venture could result in the loss of key employees and inconsistencies in standards, controls, procedures and policies.
Moreover, the success of the acquisition or venture will at least in part be subject to a number of political, economic and other factors that are beyond our control. Any of these factors, individually or collectively, could have a material adverse effect on us.
The value of the collateral securing our loans may not be sufficient, and we may be unable to realize the full value of the collateral securing our loan portfolio.
The value of the collateral securing our loan portfolio may fluctuate or decline due to factors beyond our control, including macroeconomic factors affecting Mexico’s economy. The value of the collateral securing our loan portfolio may be adversely affected by force majeure events, such as natural disasters, particularly in locations where a significant portion of our loan portfolio is composed of real estate loans. The performance of the real estate market may affect us, as real estate represents a significant portion of the collateral securing our residential mortgage loan portfolio. As of December 31, 2018, the loan-to-value ratio of our mortgage portfolio and the loan-to-value ratio for originations were 52.7% and 67.6% on average, respectively. We may also not have sufficiently recent information on the value of collateral, which may result in an inaccurate assessment for impairment losses of our loans secured by such collateral. If any of the above were to occur, we may need to make additional allowance for impairment losses to cover actual impairment losses of our loans, which may materially and adversely affect our results of operations and financial condition. The value of the guarantees of a portion of the delinquent portfolio has been updated to minimize additional credit losses.
Credit, market and liquidity risk may have an adverse effect on our credit ratings and our cost of funds. Any downgrade in our credit rating would likely increase our cost of funding, require us to post additional collateral or take other actions under some of our derivative contracts and adversely affect our interest margins and results of operations.
Credit ratings affect the cost and other terms upon which we are able to obtain funding. Rating agencies regularly evaluate us, and their ratings of our debt are based on a number of factors, including our financial strength and conditions affecting the financial services industry generally.
Any downgrade in our debt credit ratings would likely increase our borrowing costs and require us to post additional collateral or take other actions under some of our derivative contracts, and could limit our access to capital markets and adversely affect our commercial business. For example, a ratings downgrade could adversely affect our ability to sell or market certain of our products, engage in certain longer-term and derivatives transactions and retain our customers, particularly customers who require a minimum rating level in order to invest. In addition, under the terms of certain of our derivative contracts and other financial commitments, we may be required to maintain a minimum credit rating or terminate such contracts or require the posting of collateral. Any of these results of a ratings downgrade, could reduce our liquidity and have an adverse effect on us, including our operating results and financial condition.
On January 29, 2018, following the Merger (as defined herein), Fitch Ratings affirmed its ratings of our Tier 1 Capital Notes (as defined herein), the obligations of which we assumed in connection with the Merger. On July 23, 2018, Fitch Ratings affirmed our ratings, including our Viability Rating (VR) at 'bbb+' and our Long-Term Foreign and Local Currency Issuer Default Ratings (IDRs) at 'BBB+', with a Stable Outlook. In addition, Fitch affirmed our Short-Term Foreign and Local Currency IDRs at 'F2'. On November 6, 2018, Fitch Ratings conducted a portfolio review of selected Mexican financial institutions, including us, following the revision of Mexico's sovereign rating Outlook to Negative from Stable on October 31, 2018 and reaffirmed our Long-Term Foreign and Local Currency Issuer Default Ratings (IDRs) with a Stable Outlook. In addition, on September 28, 2018 Fitch Ratings assigned a final rating of BBB- to our Tier 2 notes.
On April 13, 2018, Moody’s affirmed our ratings and changed its outlook to stable from negative following a similar action on Mexico's A3 bond rating, which Moody’s incorporates into its assumptions of government support for the Bank. On May 30, 2018, Moody’s affirmed all of our ratings and assessments and the outlook remained stable. On September 20, 2018 Moody’s assigned a Baa3 (hyb) foreign currency subordinated debt rating to our Tier 2 notes. On February 11, 2019, Moody’s downgraded counterparty risk assessments (CRA’s) for four Mexican banks, including us. Our CRA’s were downgraded as follows: Long-term CRA of A2(cr), to A3(cr); Short-term CRA of Prime-1(cr), to Prime-2(cr). This rating action did not affect any other ratings or assessments of us.
For debt financing, we rely in part on local, peso-denominated issuances, and we continue to be rated Aaa.mx and AAA(mex) by Moody’s and Fitch Ratings, respectively, with respect to our local peso-denominated long-term debt, with equivalent ratings for our local peso-denominated short-term debt. Nor have we been required to post additional collateral or take other actions under any of our derivative contracts.
Banco Santander Parent’s long-term debt is currently rated investment grade by the major rating agencies: A2 stable outlook by Moody’s Investors Service España, S.A., A- stable outlook by Standard & Poor’s Ratings Services and A- stable outlook by Fitch Ratings Ltd (long term bank deposit rating). In April 2018, Standard & Poor’s Ratings and Moody’s upgraded Banco Santander Parent’s rating to A1, after the upgrade of the sovereign rating for Spain. In July 2018, Fitch upgraded the long term bank deposit rating of Banco Santander Parent to A, reflecting the funding plans and the loss absorbing capacity of the bank.
However, any downgrades of Spain’s sovereign debt, Banco Santander Parent’s debt and our related downgrades could adversely affect our cost of funding related to any further issuances of debt in the international capital markets. We estimate that if the rating agencies were to downgrade our long-term senior debt ratings by one or two notches, it would increase our borrowing costs for debt issued in the international capital markets by approximately 15 to 25 basis points for our short-term debt. The effect on our long-term debt is much more uncertain due to the factors described above; however, we estimate that there would be an increase of approximately 40 to 60 basis points in our borrowing costs for long-term debt issued in the international capital markets in the event of a downgrade by one or two notches. In addition, we estimate that we would be required to post up to U.S.$15 million in additional collateral in respect of our derivative arrangements in the event of such a downgrade, based on our derivatives portfolio as of December 31, 2018.
While certain potential impacts of these downgrades are contractual and quantifiable, the full consequences of a credit rating downgrade are inherently uncertain, as they depend upon numerous dynamic, complex and inter-related factors and assumptions, including market conditions at the time of any downgrade, whether any downgrade of our long-term credit rating precipitates downgrades to our short-term credit rating, and assumptions about the potential behaviors of various customers, investors and counterparties. Actual outflows could be higher or lower than the preceding hypothetical examples, depending upon certain factors including which credit rating agency downgrades our credit rating, any management or restructuring actions that could be taken to reduce cash outflows and the potential liquidity impact from loss of unsecured funding (such as from money market funds) or loss of secured funding capacity. Although unsecured and secured funding stresses are included in our stress testing scenarios and a portion of our total liquid assets is held against these risks, a credit rating downgrade could still have a material adverse effect on us.
In addition, if we were required to cancel our derivatives contracts with certain counterparties and were unable to replace such contracts, our market risk profile could be altered.
There can be no assurance that the rating agencies will maintain the current ratings or outlooks. Failure to maintain favorable ratings and outlooks could increase our cost of funding and adversely affect interest margins, which could have a material adverse effect on us.
We are subject to market, operational and other related risks associated with our derivative transactions that could have a material adverse effect on us.
We enter into derivative transactions for trading purposes as well as for hedging purposes. We are subject to market, credit and operational risks associated with these transactions, including basis risk (the risk of loss associated with variations in the spread between the asset yield and the funding and/or hedge cost) and credit or default risk (the risk of insolvency or other inability of the counterparty to a particular transaction to perform its obligations thereunder, including providing sufficient collateral).
In addition, in connection with Mexican domestic derivative transactions, Mexican courts have had limited experience in dealing with issues related to derivative transactions, as most disputes have typically been resolved through negotiations among Mexican financial institutions. As a result, the outcomes of disputes regarding derivatives reaching the Mexican judicial system are not fully predictable.
Market practices and documentation for derivative transactions in Mexico may differ from those in other countries. In addition, the execution and performance of these transactions depends on our ability to maintain adequate control and administration systems. Moreover, our ability to adequately monitor, analyze and report derivative transactions continues to depend, largely, on our information technology systems. These factors further increase the risks associated with these transactions and could have a material adverse effect on us.
Broad regulatory authority granted to CONDUSEF and COFECE may result in measures being taken that affect our operations and financial condition.
CONDUSEF has broad powers to regulate our activities and activities of other Mexican banks, which may have an adverse impact on us. Under recent changes approved by the Mexican Congress to the Law for the Protection and Defense of Financial Services Users, CONDUSEF is entitled to (i) order amendments to our standard form commercial banking documentation (such as loan and account agreements), if CONDUSEF deems that provisions included in such agreements are detrimental to users, (ii) order the attachment of our assets for the benefit of our customers, and (iii) initiate class actions for the benefit of groups of customers. CONDUSEF has broad and discretionary authority to take this and other similar actions, including the imposition of fines and the publication of information that may be detrimental to our business and reputation. Actions taken by CONDUSEF against us, whether on an isolated or recurrent basis, may have a material adverse impact on us.
In addition, on November 26, 2013, the Mexican Congress approved a financial reforms package through which they broadened the regulatory authority granted to financial authorities, including COFECE.
As a result of such expansion, COFECE has the ability to initiate investigations on the equality of commercial practices within the Mexican Financial System, as well as to impose fines and penalties established in the laws applicable to COFECE. The time spent responding to investigations initiated by COFECE and any fines and penalties imposed by COFECE in connection with any investigations of us could have an adverse effect our business and financial condition.
Portions of our loan portfolio are subject to risks relating to force majeure events and any such event could materially adversely affect our operating results.
Our financial and operating performance may be adversely affected by force majeure events, such as natural disasters, particularly in locations where a significant portion of our loan portfolio is composed of real estate loans. Natural disasters such as earthquakes and floods may cause widespread damage, which could impair the asset quality of our loan portfolio and could have an adverse impact on the economy of the affected region.
The retail banking market is exposed to macroeconomic shocks that may negatively impact household income, and a downturn in the economy could result in increased loan losses.
One of our main strategies is to focus on the retail banking sector with customer centricity and to grow our retail loan portfolio. The recoverability of retail loans in particular and our ability to increase the amount of loans outstanding, and our results of operations and financial condition in general, may become increasingly vulnerable to macroeconomic shocks that could negatively impact the household income of our retail customers and result in increased loan losses that could have a material adverse effect on us. Mexican gross domestic product (GDP) growth in 2013 posted a sharp decline, but improved over the subsequent years and was equal to 2.0% in 2018, consistent with the Mexican cyclical economic history. We can provide no assurance that GDP growth rates will increase in the future, or that they will not regress.
Furthermore, because the penetration of bank lending products in the Mexican retail sector historically has been low, there is little basis on which to evaluate how the retail sector will perform in the event of an economic crisis, such as a recession or a significant depreciation, among others. Consequently, our historical loan loss experience may not be indicative of the performance of our loan portfolio in the future.
Our ability to maintain our competitive position depends, in part, on the success of new products and services that we offer to our clients and on the ability of these products and services to satisfy needs of our customers throughout their life cycle, and we may not be able to manage various risks we face as we expand our range of products and services that could have a material adverse effect on us.
The success of our operations and our profitability depends, in part, on the success of new products and services we offer to our clients and our ability to offer products and services that meet the customers’ needs throughout their life cycle. In addition, success also depends, to a certain extent, on our ability to continue offering products and services from third parties. However, we cannot ensure that our new products, services and promotional campaigns will be responsive to the needs of our customers or will be successful once offered to our customers, or that they will be successful in the future.
Our clients’ needs or desires may change over time, and such changes may render our products and services obsolete, outdated or unattractive and we may not be able to develop new products that meet our clients’ changing needs. Our success is also dependent on our ability to anticipate and leverage new and existing technologies that may have an impact on products and services in the banking industry. Technological changes may further intensify and complicate the competitive landscape and influence client behavior. If we cannot respond in a timely fashion to the changing needs of our clients, we may lose clients, which could in turn materially and adversely affect us.
As we expand the range of our products and services, some of which may be at an early stage of development in the Mexican market, we will be exposed to new and potentially increasingly complex risks, such as conduct and reputational risk in the relationship with customers, and development expenses.
Our employees and risk management systems, as well as our experience and that of our partners may not be sufficient to enable us to properly manage such risks. In addition, the cost of developing products that are not launched is likely to affect our results of operations. Any or all of these factors, individually or collectively, could have a material adverse effect on us.
Further, our customers may issue complaints and seek redress if they consider that they have suffered loss from our products and services, for example, as a result of any alleged mis-selling or incorrect application of the terms and conditions of a particular product. This could in turn subject us to risks of potential legal action by our customers and intervention by our regulators. We have in the past experienced losses due to claims of mis-selling in and may do so again in the future.
While we have successfully increased our customer service levels in recent years, should these levels ever be perceived by the market to be materially below those of our competitor financial institutions, we could lose existing and potential business. If we are not successful in retaining and strengthening customer relationships, we may lose market share, incur losses on some or all of our activities or fail to attract new deposits or retain existing deposits, which could have a material adverse effect on our operating results, financial condition and prospects.
Any failure to effectively improve or upgrade our information technology infrastructure and management information systems in a timely manner or any failure to successfully implement new IT regulations could have a material adverse effect on us.
Our ability to remain competitive depends in part on our ability to upgrade our information technology infrastructure on a timely and cost-effective basis. We must continually make significant investments and improvements in our information technology infrastructure in order to remain competitive and improve the way we provide financial services to our customers. For 2019, 66.7% of our capital expenditures budget for information technology is designated for replacing obsolete hardware and software in order to minimize technological risk and the implementation of new digital technologies. We cannot assure you that in the future we will be able to maintain the level of capital expenditures necessary to support the improvement or upgrading of our information technology infrastructure. Any failure to effectively improve or upgrade our information technology infrastructure and management information systems in a timely manner could have a material adverse effect on us.
In addition, the Mexican government is increasingly focused on data breaches and other information technology risks and may implement new regulations in the future. A failure to successfully implement all or some of these new global and local regulations, that in some cases have severe sanctions regimes, could have a material adverse effect on us.
We may not be able to detect or prevent money laundering and other illicit activities fully or on a timely basis, which could expose us to additional liabilities and could have a material adverse effect on us.
We are required to comply with applicable anti-money laundering (“AML”), anti-terrorism, anti-bribery and corruption, sanctions and other laws and regulations applicable to us. These laws and regulations require us, among other things, to conduct full customer due diligence (including sanctions and politically-exposed person screening), keep our customer, account and transaction information up to date and have implemented effective financial crime policies and procedures detailing what is required from those responsible. We are also required to conduct AML training for our employees and to report suspicious transactions and activity to appropriate law enforcement following full investigation by our AML team.
Financial crime has become the subject of enhanced regulatory scrutiny and supervision by regulators globally. AML, anti-bribery and corruption and sanctions laws and regulations are increasingly complex and detailed and have become the subject of enhanced regulatory supervision, requiring improved systems, sophisticated monitoring and skilled compliance personnel.
We have developed policies and procedures aimed at detecting and preventing the use of our banking network for money laundering and other financial crime-related activities. However, emerging technologies, such as cryptocurrencies and blockchain, could limit our ability to track the movement of funds. Our ability to comply with the legal requirements depends on our ability to improve detection and reporting capabilities and reduce variation in control processes and oversight accountability. These require implementation and embedding within our business effective controls and monitoring, which in turn requires on-going changes to systems and operational activities. Financial crime is continually evolving and, as noted, is subject to increasingly stringent regulatory oversight and focus. This requires proactive and adaptable responses from us so that we are able to deter threats and criminality effectively. As one of the largest Mexican banks and a member of a global banking group through Banco Santander Parent, we are particularly exposed to this risk. Even known threats can never be fully eliminated, and there will be instances in which we may be used by other parties to engage in money laundering and other illegal or improper activities. In addition, we rely heavily on our employees to assist us by spotting such activities and reporting them, and our employees have varying degrees of experience in recognizing criminal tactics and understanding the level of sophistication of criminal organizations. When we outsource any of our customer due diligence, customer screening or anti-financial crime operations, we remain responsible and accountable for full compliance and any breaches. If we are unable to apply the necessary scrutiny and oversight of third parties to whom we outsource certain tasks and processes, there remains a risk of regulatory breach.
If we are unable to fully comply with applicable laws, regulations and expectations, our regulators and relevant law enforcement agencies have the ability and authority to impose significant fines and other penalties on us, including requiring a complete review of our business systems, day-to-day supervision by external consultants and ultimately the revocation of our banking license.
The reputational damage to our business and brand would be severe if we were found to have breached AML, anti-bribery and corruption or sanctions requirements. Our reputation could also suffer if we are unable to protect our customers’ bank products and services from being used by criminals for illegal or improper purposes.
In addition, while we review our relevant counterparties’ internal policies and procedures with respect to such matters, we, to a large degree, rely upon our relevant counterparties to maintain and properly apply their own appropriate compliance procedures and internal policies. Such measures, procedures and internal policies may not be completely effective in preventing third parties from using our (and our relevant counterparties’) services as a conduit for illicit purposes (including illegal cash operations) without our (and our relevant counterparties’) knowledge. If we are associated with, or even accused of having breached or being associated with breaches of AML, anti-terrorism, or sanctions requirements our reputation could suffer and/or we could become subject to fines, sanctions and/or legal enforcement (including being added to any “black lists” that would prohibit certain parties from engaging in transactions with us), any one of which could have a material adverse effect on our operating results, financial condition and prospects.
Any such risks could have a material adverse effect on our operating results, financial condition and prospects.
See also “Item 4. Information on the Company—B. Business Overview—Supervision and Regulation—Banking Regulation—Money Laundering Regulations.”
Risks relating to data collection, processing and storage systems and security are inherent in our business.
Like other financial institutions, we manage and hold confidential personal information of customers in the conduct of our banking operations, as well as a large number of assets. Accordingly, our business depends on the ability to process a large number of transactions efficiently and accurately, and on our ability to rely on our digital technologies, computer and email services, software and networks, as well as on the secure processing, storage and transmission of confidential sensitive personal data and other information using our computer systems and networks. The proper functioning of financial control, accounting or other data collection and processing systems is critical to our businesses and to our ability to compete effectively. Losses can result from inadequate personnel, inadequate or failed internal control processes and systems, or from external events that interrupt normal business operations. We also face the risk that the design of our controls and procedures prove to be inadequate or are circumvented such that our data and/or client records are incomplete, not recoverable or not securely stored. Although we work with our clients, vendors, service providers, counterparties and other third parties to develop secure data and information processing, storage and transmission capabilities to prevent against information security risk, we routinely manage personal, confidential and proprietary information by electronic means, and we may be the target of attempted cyber-attack. If we cannot maintain an effective and secure electronic data and information, management and processing system or we fail to maintain complete physical and electronic records, this could result in regulatory sanctions and serious reputational or financial harm to us.
We are required to report every event related to information security issues, such as hacking or hacking attempts, events where customer information may be compromised, unauthorized access and other security breaches to the CNBV. Aware of the current risks in terms of cybersecurity threats, Banco Santander Parent globally and locally has established strategies to reinforce the protection against detection and response to these threats in its technological infrastructure. As a result of such strategies, data breach incidents in 2018 were detected timely in both the Electronic Banking and ATM platforms. These incidents were contained and actions were taken to prevent recurrences, including the development of continuous monitoring schemes to detect threats. According to local regulations, these incidents have been reported to the local regulator, although they are not expected to have a material adverse effect on our business. As of the date of this Report, we have not experienced information security problems and we have not had to report any such events to the CNBV. Any material disruption or slowdown of our systems could cause information, including data related to customer requests, to be lost or to be delivered to our clients with delays or errors, which could reduce demand for our services and products and could materially and adversely affect us. Internet banking, ATMs and branches are the main distribution channels that are subject to this risk in Mexico. Internet banking, ATMs and branches are the main distribution channels that are subject to this risk in Mexico.
We take protective measures and continuously monitor and develop our systems to protect our technology infrastructure, data and information from misappropriation or corruption, but our systems, software and networks nevertheless may be vulnerable to unauthorized access, misuse, computer viruses or other malicious code and other events that could have a security impact. An interception, misuse or mishandling of personal, confidential or proprietary information sent to or received from a client, vendor, service provider, counterparty or third party could result in legal liability, regulatory action, reputational harm and financial loss. There can be no absolute assurance that we will not suffer material losses from operational risk in the future, including those relating to any security breaches.
We have seen in recent years computer systems of companies and organizations being targeted, not only by cyber criminals, but also by activists and rogue states. We have been and continue to be subject to a range of cyber-attacks, such as denial of service, malware and phishing. Cyber-attacks could give rise to the loss of significant amounts of customer data and other sensitive information, as well as significant levels of liquid assets (including cash). In addition, cyber-attacks could disrupt our electronic systems used to service our customers. As attempted attacks continue to evolve in scope and sophistication, we may incur significant costs in order to modify or enhance our protective measures against such attacks, or to investigate or remediate any vulnerability or resulting breach, or in communicating cyber-attacks to our
customers. If we fail to effectively manage our cyber security risk, e.g. by failing to update our systems and processes in response to new threats, this could harm our reputation and adversely affect our operating results, financial condition and prospects through the payment of customer compensation, regulatory penalties and fines and/or through the loss of assets. In addition, we may also be impacted by cyber-attacks against national critical infrastructures in Mexico, such as the telecommunications network. Our information technology systems are dependent on such national critical infrastructure and any cyber-attack against such critical infrastructure could negatively affect our ability to service our customers. As we do not operate such national critical infrastructure, we have limited ability to protect our information technology systems from the adverse effects of such a cyber-attack.
Although we have procedures and controls to safeguard personal information in our possession, unauthorized disclosures could subject us to legal actions and administrative sanctions as well as damages and reputational harm that could materially and adversely affect our operating results, financial condition and prospects. Further, our business is exposed to risk from potential non-compliance with policies, employee misconduct or negligence and fraud, which could result in regulatory sanctions and serious reputational or financial harm. It is not always possible to deter or prevent employee misconduct, and the precautions we take to detect and prevent this activity may not always be effective. In addition, we may be required to report events related to information security issues (including any cyber security issues), events where customer information may be compromised, unauthorized access and other security breaches, to the relevant regulatory authorities. Any material disruption or slowdown of our systems could cause information, including data related to customer requests, to be lost or to be delivered to our clients with delays or errors, which could reduce demand for our services and products, could produce customer claims and could materially and adversely affect us.
Taking into account the increase, in recent years, in the cyber-attacks suffered by banking institutions active in Mexico and internationally, we have established security controls to prevent cyber-attacks and/or other breaches to the security of our networks and information technology systems. We periodically update our equipment, networks and software as a security measure, following market standards and allocating a percentage of our annual budget to such measures. If we are not able to maintain adequate security systems, we could be subject to regulatory sanctions and reputational and/or financial damage.
Notwithstanding the foregoing, if there are cyber-attacks and/or other security breaches of our networks and information technology systems that our security controls are unable to prevent for any reason (including because of advancements in such attacks that enable them to circumvent our controls), these attacks could cause us damage (including reputational damage), which could in turn have an adverse effect on our operations and results and require further capital expenditures to protect our systems. Other credit institutions have been affected by cyber-attacks, which have caused significant and adverse damage to their operations and financial situation. Most of the cybersecurity incidents to which we are subject are related to transactions on our digital banking platform and would lead to capital expenditure costs and additional investments, as well as the loss of customer data and other confidential information. Any cybersecurity incidents that we experience could also result in claims by our clients, which could further affect our reputation and financial situation.
We rely on recruiting, retaining and developing appropriate senior management and skilled personnel.
Our continued success depends in part on the continued service of key members of our senior executive team and other key employees. The ability to continue to attract, train, motivate and retain highly qualified and talented professionals is a key element of our strategy. The successful implementation of our strategy and culture depends on the availability of skilled and appropriate management, both at our head office and in each of our business units. If we or one of our business units or other functions fails to staff its operations appropriately, or loses one or more of its key senior executives or other key employees and fails to replace them in a satisfactory and timely manner, our business, financial condition and results of operations, including control and operational risks, may be adversely affected.
In addition, the financial industry has and may continue to experience more stringent regulation of employee compensation, which could have an adverse effect on our ability to hire or retain the most qualified employees. If we fail or are unable to attract and appropriately train, motivate and retain qualified professionals, our business may also be adversely affected.
Damage to our reputation could cause harm to our business prospects.
Maintaining a positive reputation is critical to protect our brand, attract and retain customers, investors and employees and conduct business transactions with counterparties. Damage to our reputation can therefore cause significant harm to our business and prospects. Harm to our reputation can arise from numerous sources, including, among others, employee misconduct, including the possibility of fraud perpetrated by our employees, litigation or regulatory enforcement, failure to deliver minimum standards of service and quality, dealing with sectors that are not well perceived by the public (weapons industries or embargoed countries, for example), dealing with customers on sanctions lists, rating downgrades, significant variations in our share price throughout the year, compliance failures, unethical behavior, and the activities of customers and counterparties. Further, negative publicity regarding us may result in harm to our prospects.
Actions by the financial services industry generally or by certain members of, or individuals in, the industry can also affect our reputation. For example, the role played by financial services firms in the financial crisis and the seeming shift toward increasing regulatory supervision and enforcement has caused public perception of us and others in the financial services industry to decline.
We could suffer significant reputational harm if we fail to identify and manage potential conflicts of interest properly. The failure, or perceived failure, to adequately address conflicts of interest could affect the willingness of clients to deal with us, or give rise to litigation or enforcement actions against us. Therefore, there can be no assurance that conflicts of interest will not arise in the future that could cause material harm to us.
We may be the subject of misinformation and misrepresentations deliberately propagated to harm our reputation or for other deceitful purposes, or by profiteering short sellers seeking to gain an illegal market advantage by spreading false information about us. There can be no assurance that we will effectively neutralize and contain a false information that may be propagated regarding the Bank, which could have an adverse effect on our operating results, financial condition and prospects.
Changes in accounting standards could impact reported earnings.
The accounting standard setters and other regulatory bodies periodically change the financial accounting and reporting standards that govern the preparation of our audited financial statements included elsewhere in this Report. For example, IFRS 9 was adopted as of January 1, 2018, establishing a new impairment model of expected loss and making changes to the classification and measurement requirements for financial assets and financial liabilities. Changes in accounting standards can materially impact how we record and report our financial condition and results of operations, as well as affect the calculation of our capital ratios. In some cases, we could be required to apply a new or revised standard retroactively, resulting in the restatement of prior period financial statements.
We rely on third parties and affiliates for important products and services.
Third party vendors and certain affiliated companies provide key components of our business infrastructure such as loan and deposit servicing systems, back office and business process support, information technology production and support, internet connections and network access. Relying on these third parties and affiliated companies can be a source of operational and regulatory risk to us, including with respect to security breaches affecting such parties. We are also subject to risk with respect to security breaches affecting the vendors and other parties that interact with these service providers. As our interconnectivity with these third parties and affiliated companies increases, we increasingly face the risk of operational
failure with respect to their systems. We may be required to take steps to protect the integrity of our operational systems, thereby increasing our operational costs and potentially decreasing customer satisfaction. In addition, any problems caused by these third parties or affiliated companies, including as a result of them not providing us their services for any reason, or performing their services poorly, could adversely affect our ability to deliver products and services to customers and otherwise conduct our business, which could lead to reputational damage and regulatory investigations and intervention. Replacing these third party vendors could also entail significant delays and expense. Further, the operational and regulatory risk we face as a result of these arrangements may be increased to the extent that we restructure such arrangements. Any restructuring could involve significant expense to us and entail significant delivery and execution risk which could have a material adverse effect on our business, operations and financial condition.
We engage in transactions with our subsidiaries or affiliates that others may not consider to be on an arm’s-length basis.
We and our affiliates have entered into a number of services agreements, pursuant to which we render services such as administrative, accounting, finance, treasury, legal and other services agreements with our subsidiaries and affiliates. In 2018, the aggregate amount of our expenses related to the service agreements we have with our subsidiaries and affiliates was Ps.3,708 million, or 11.7% of our administrative expenses, and we had an insignificant amount of income related to such agreements. In addition, we have entered into services agreements with certain affiliates to allow these companies to offer their products and services within our branch network or that assist with our activities in consideration for certain fees.
Mexican law applicable to public companies and financial institutions, as well as our bylaws, provide for several procedures designed to ensure that the transactions entered into with or among our financial subsidiaries and/or affiliates do not deviate from prevailing market conditions for those types of transactions, including the requirement that our Board of Directors approve such transactions.
We are likely to continue to engage in transactions with our subsidiaries or affiliates (including our indirect controlling shareholder Banco Santander Parent). While the CNBV has not disagreed with our determinations that the terms of these transactions are “substantially on market conditions” in the past, we can provide no assurances that the CNBV will agree with any of our future determinations. Future conflicts of interests between us and any of our subsidiaries or affiliates, or among our subsidiaries and affiliates, may arise, which conflicts are not required to be and may not be resolved in our favor. See “Item 7. Major Shareholders and Related Party Transactions—B. Related Party Transactions.”
The growth of our loan portfolio may expose us to increased loan losses.
From December 31, 2016 to December 31, 2017, total loans and advances to customers increased by 4.5% to Ps.626,349 million (U.S.$31,873 million), while our consumer loans to individuals grew by 6.8% to Ps.107,754 million (U.S.$5,483 million). From December 31, 2017 to December 31, 2018, total loans and advances to customers increased by 10.0% to Ps.689,059 million (U.S.$35,064 million), while our consumer loans to individuals grew by 3.7% to Ps.111,787 million (U.S.$5,689 million).
The expansion of our loan portfolio (particularly in the consumer, SME and real estate segments) can be expected to expose us to a higher level of loan losses and require us to establish higher levels of allowance for impairment losses.
Our loan portfolio may not continue to grow at the same rate. Economic turmoil may lead to a contraction in our loan portfolio.
There can be no assurance that our loan portfolio will continue to grow at similar rates to the historical growth rate described elsewhere in this Report. A reversal of the rate of growth of the Mexican economy, a slowdown in the growth of customer demand, an increase in market competition, changes in
governmental regulations or changes in our credit risk appetite could adversely affect the rate of growth of our loan portfolio and our risk index and, accordingly, increase our required allowance for impairment losses. Economic turmoil could materially adversely affect the liquidity, businesses and financial condition of our customers as well as lead to a general decline in consumer spending and a rise in unemployment. All this could in turn lead to decreased demand for borrowings in general, adversely affecting us.
Credit facilities granted to the Mexican home builder sector may cause an adverse effect on our credit portfolio.
During recent years, the historic shortage of housing in Mexico drove the Mexican government to actively incentivize its development. These incentives led to increased construction of subsidized housing and to the acquisition of large land inventories. The lack of infrastructure, large distances to workplaces and transportation costs, as well as announced changes to the government’s policies relating to housing infrastructure, led to increased abandonment and mortgage default of these homes. The foregoing caused a strong decrease in home building and sales of the principal Mexican home builders and an adjustment in their growth plans and business models in order to compensate for the impacts of these changes.
In April and June 2014, two of the three major Mexican real estate companies were declared bankrupt since they were in breach of their payment obligations and thus fulfilled the requirements provided by the Mexican Commercial Bankruptcy Law (Ley de Concursos Mercantiles). In June and November 2015, these two Mexican real estate companies emerged from bankruptcy.
In early December 2014, the third major Mexican real estate company sent, a request to the applicable court to initiate a pre-arranged bankruptcy. In January 2015, this real estate company was declared bankrupt under the Mexican Commercial Bankruptcy Law. Bankruptcy proceedings were declared concluded by the Mexican authorities in February 2016.
As of December 31, 2017, our loan portfolio with the three principal Mexican companies in the home builder sector stood at Ps.43.8 million, which represents 0.01% of our total loans and advances to customers (excluding reverse repurchase agreements) and 0.0% of our total assets, of which the full amount was composed of non-performing loans.
As of December 31, 2018, we had closed these loan portfolios and no longer had exposure to these companies.
Our controlling shareholder has a great deal of influence over our business and its interests could conflict with yours.
We operate as a stand-alone subsidiary within the Santander Group. Our principal shareholders have no liability for our banking operations, except for the amount of their respective holdings of our capital stock. Banco Santander Parent, our indirect controlling shareholder, currently beneficially owns, indirectly 74.96% of our common stock (including Series B and Series F shares) through its 100% ownership of Grupo Financiero Santander México. Due to its share ownership, our indirect controlling shareholder has the ability to control us, including the ability to:
elect the majority of the directors and exercise control over our company and subsidiaries;
cause the appointment of our principal officers;
declare the payment of any dividends;
agree to sell or otherwise transfer its controlling stake in us; and
determine the outcome of substantially all actions requiring shareholder approval, including amendments of our bylaws, transactions with related parties, corporate reorganizations, acquisitions and disposals of assets and issuance of additional equity securities, if any.
In December 2012, primarily in response to the requirements of the European Banking Authority, the Bank of Spain and regulators in various jurisdictions, Banco Santander Parent adopted a corporate governance framework (Marco de Gobierno Interno del Grupo Santander). The purpose of the framework is to organize and standardize the corporate governance practices of Banco Santander Parent and its most significant subsidiaries, including us. Our Former Holding Company’s Board of Directors, approved the adoption of this corporate governance framework in July 2013, subject to certain overarching principles, such as the precedence of applicable laws and regulations over the framework to the extent they are in conflict. See “Item 16G. Corporate Governance.”
On July 27, 2015, as a result of the new requirements of the European Central Bank, the Bank of Spain and the regulators in different jurisdictions, Banco Santander Parent established a new corporate governance model for its subsidiaries, with the purpose of setting forth a clear and transparent conceptual framework to govern their relationship. The model reinforces Banco Santander Parent’s corporate governance and provides greater faculties and powers to the boards of directors of the subsidiaries. Our Former Holding Company’s Board of Directors approved the new corporate governance model in January 2016 and January 2018, respectively, in compliance with local regulations. This corporate framework also applies to us and may enhance Banco Santander Parent’s control over us.
On July 26, 2018, the Group-Subsidiary Governance Model and Guidelines for Subsidiaries were approved by the Board of Directors of Banco Santander México.
Regarding the new guidelines of the Governance Model, the Government Policy (local) was updated in order to include these guidelines. Both documents were approved by the Board of Directors Meeting held on January 24, 2019.
The interests of Banco Santander Parent may differ from our interests or those of our other shareholders, and the concentration of control in Banco Santander Parent will limit other shareholders’ ability to influence corporate matters. As a result, we may take actions that our other shareholders do not view as beneficial.
Our recent and future acquisitions may not be successful and may be disruptive to our business.
We have acquired controlling interests in various companies and have engaged in other strategic partnerships. From time to time, we evaluate acquisition opportunities that we believe offer additional value to our shareholders and are consistent with our business strategy. These acquisitions may be acquisitions of assets or of existing operations, such as our acquisition of a non-revolving consumer loan portfolio from Scotiabank Inverlat in April 2015. However, we may not be able to identify suitable acquisition candidates, and we may not be able to acquire promising targets on favorable terms or at all. We base our assessment of potential acquisitions on limited and potentially imprecise information and on assumptions with respect to operations, profitability and other matters that may prove to be incorrect. For example, we face the risk of undisclosed liabilities. Our ability to benefit from any such acquisitions will depend in part on our successful integration of those businesses. We can give no assurances that our expectations with regards to integration and synergies will materialize. The integration of acquired businesses entails significant risks, including:
unforeseen difficulties in integrating operations and systems;
inability to modify accounting standards rapidly;
problems assimilating or retaining the employees of acquired businesses;
challenges retaining customers of acquired businesses;
unexpected liabilities or contingencies relating to the acquired businesses, including legal claims;
the possibility that management may be distracted from day-to-day business concerns by integration activities and related problem-solving; and
the possibility of regulatory restrictions that prevent us from achieving the expected benefits of the acquisition.
In addition, an acquisition could result in the loss of key employees and inconsistencies in standards, controls, procedures and policies. Moreover, the success of the acquisition will at least in part be subject to a number of political, economic and other factors that are beyond our control. Any or all of these factors, individually or collectively, could have a material adverse effect on us.
We prepare our financial statements in accordance with IFRS, and these financial statements are not directly comparable to the financial statements that we have historically prepared and that we will continue to prepare in accordance with Mexican Banking GAAP. In addition, some of the financial data presented in this annual report are not easily comparable from period to period.
We prepare our financial statements in accordance with IFRS. As a result, our financial data as of and for the years ended December 31, 2014, 2015, 2016, 2017 and 2018 presented in this Report has been derived from our audited financial statements prepared in accordance with IFRS. However, as per Mexican Central Bank regulations and CNBV reporting requirements, we also prepare our financial statements in accordance with Mexican Banking GAAP. Because IFRS differs in certain significant respects from Mexican Banking GAAP, any Mexican Banking GAAP financial information related to our business for any period is not directly comparable to our IFRS financial data. The lack of comparability of our IFRS and Mexican Banking GAAP financial data from period to period may make it difficult to gain a full and accurate understanding of our operations and financial condition.
We are exposed to risk of loss from legal and regulatory proceedings.
We face risk of loss from legal and regulatory proceedings, including tax proceedings, that could subject us to monetary judgments, regulatory enforcement actions, fines and penalties. The current regulatory and tax enforcement environment, which suggests an increased supervisory focus on enforcement, combined with uncertainty about the evolution of the regulatory regime, may lead to material operational and compliance costs.
We are from time to time subject to regulatory investigations and civil and tax claims, and party to certain legal proceedings incidental to the normal course of our business, including in connection with conflicts of interest, lending securities and derivatives activities, relationships with our employees and other commercial or tax matters. In view of the inherent difficulty of predicting the outcome of legal matters, particularly where the claimants seek very large or indeterminate damages, or where the cases present novel legal theories, involve a large number of parties or are in the early stages of investigation or discovery, we cannot state with confidence what the eventual outcome of these pending matters will be or what the eventual loss, fines or penalties related to each pending matter may be. We believe that we have made adequate provisions related to the costs anticipated to be incurred in connection with these various claims and legal proceedings. As of December 31, 2018, we have set aside Ps.1,516 million (U.S.$77 million) as provisions for these legal actions (including tax-related litigation). For more details on provisions for tax and legal matters, see Note 23.e to our audited financial statements included elsewhere in this Report. However, the amount of these provisions is substantially less than the total amount of the claims asserted against us, and in light of the uncertainties involved in such claims and proceedings, there is no assurance that the ultimate resolution of these matters will not significantly exceed the provisions currently accrued by
us. As a result, the outcome of a particular matter may be material to our operating results for a particular period.
We identified material weaknesses in our internal control over financial reporting as part of management’s assessment. If we are unable to remediate these material weaknesses, or if we identify additional material weaknesses in the future or otherwise fail to maintain an effective system of internal controls, investor confidence in our company and the market price of our shares may be adversely affected.
As part of our assessment of the effectiveness of our internal control over financial reporting as of December 31, 2018, based on the criteria established in Internal Control—Integrated Framework (2013) issued by the Committee of Sponsoring Organizations of the Treadway Commission, we identified material weaknesses as defined under the Exchange Act and by the U.S. Public Company Accounting Oversight Board, or PCAOB, in our internal control over financial reporting. A material weakness is a deficiency, or a combination of deficiencies, in internal control over financial reporting, such that there is a reasonable possibility that a material misstatement of the company’s annual financial statements will not be prevented or detected on a timely basis. The material weaknesses identified relate specifically to ineffective risk assessment over information technology general controls and information technology user access controls. The material weaknesses did not result in a restatement of our prior year financial statements. See “Item 15. Controls and Procedures – B. Management’s Annual Report on Internal Control Over Financial Reporting.”
We have initiated remedial measures and are taking additional measures to remediate these material weaknesses. These measures include developing strategies to enhance our risk assessment processes and related control procedures over information technology change management. As part of our plan, we anticipate remediating our control deficiencies in information technology user access controls with respect to significant applications during 2019, which includes the implementation of a comprehensive automated monitoring system. See “Item 15. Controls and Procedures – B. Management’s Annual Report on Internal Control Over Financial Reporting.”
However, the implementation of the remedial measures described above and other measures we may take may not fully address these material weaknesses in our internal control over financial reporting, and therefore we might not be able to conclude that it has been fully remedied. If we fail to correct these material weaknesses or if we experience additional material weaknesses in the future or otherwise fail to maintain an effective system of internal controls, we may not be able to accurately or timely report our financial information and such failure could result in a negative reaction in the financial markets due to a loss of confidence in the reliability of our financial information, which could negatively affect the market price of our shares. In addition, we may be required to incur additional costs in connection with improving our internal control system and hiring additional personnel. Any such action could negatively affect our results of operation and cash flows.
Risks Relating to Mexico
Adverse economic conditions in Mexico could have a negative effect on us.
We are a banking institution, and substantially all of our operations and assets are in Mexico and are dependent upon the performance of the Mexican economy. As a result, our business, financial condition and results of operations may be affected by the general condition of the Mexican economy, the devaluation of the peso as compared to the U.S. dollar, price instability, inflation or deflation, interest rates, regulation, taxation, social instability and other political, social and economic developments in or affecting Mexico, over which we have no control. The economy of Mexico has experienced significant volatility in recent decades, characterized, in some cases, by slow or regressive growth and contraction, declining investment and hyperinflation. This volatility has resulted in fluctuations in the levels of deposits and in the relative economic strength of various segments of the economy to which we lend.
A substantial amount of our loans is to borrowers doing business in Mexico. Accordingly, the recoverability of these loans in particular, and our ability to increase the amount of loans outstanding and our results of operations and financial condition in general, are dependent to a significant extent on the level of economic activity in Mexico. Our results of operations and financial condition could be affected by changes in economic or other policies of the Mexican government, which has exercised and continues to exercise substantial influence over many aspects of the private sector, or other political or economic developments in Mexico.
Negative and fluctuating economic conditions, such as a changing interest rate environment, affect our profitability by causing lending margins to decrease and leading to decreased demand for higher-margin products and services. Negative and fluctuating economic conditions in Mexico could also result in government defaults on public debt. This could affect us in two ways: directly, through portfolio losses, and indirectly, through instabilities that a default in public debt could cause to the banking system as a whole, particularly since commercial banks’ exposure to government debt is high in Mexico. No assurance can be given that our growth, asset quality and profitability will not be affected by volatile macroeconomic conditions.
According to the Mexican National Institute of Statistics and Geography (Instituto Nacional de Estadística y Geografía), and the Mexican Central Bank, in 2014, GDP increased 2.8% and inflation reached 4.1%. In 2015, GDP increased 3.3% and inflation reached 2.1%. In 2016, GDP increased 2.9% and inflation reached 3.4%. In 2017, GDP increased 2.1% and inflation reached 6.8%. In 2018, GDP increased 2.0% and inflation reached 4.8%.
Mexico also has, and is expected to continue to have, volatility in exchange and interest rates. The annualized interest rates on 28‑day Mexican Treasury Bills (Certificados de la Tesorería de la Federación, or Cetes) averaged approximately 3.0%, 3.0%, 4.2%, 6.7% and 7.6% for 2014, 2015, 2016, 2017 and 2018, respectively. Relative to the U.S. dollar, the peso depreciated by 12.7% in 2014, depreciated by 16.7% in 2015, depreciated by 19.5% in 2016, appreciated by 4.6% in 2017 and appreciated by 0.05% in 2018, closing at Ps.19.65 per dollar on December 31, 2018, all in nominal terms. The peso continues to be affected by uncertainty and volatility in the global markets.
Our business may be significantly affected by the general condition of the Mexican economy, by the rate of inflation or deflation in Mexico, interest rates in Mexico and exchange rates for the Mexican peso or by changes in oil prices. Decreases in the growth rate of the Mexican economy, periods of negative growth and/or increases in inflation or interest rates may result in lower demand for our services and products, lower real pricing of our services and products or a shift to lower-margin services and products. Because a significant percentage of our costs and expenses are fixed, we may not be able to reduce costs and expenses upon the occurrence of any of these events, and our profit margins may suffer as a result.
Political decisions in Mexico could have a material adverse effect on us.
The Mexican government exercises considerable influence over many aspects of the Mexican economy. Our revenues are subject to risk of loss from unfavorable political and diplomatic developments, social instability, and changes in governmental policies, changes in the financial, governance and operating structure of Petroleos Mexicanos and Comision Federal de Electricidad, including expropriation, nationalization, international ownership legislation, interest-rate and fee caps, as well as tax policies. As a result, the actions of the Mexican government concerning the economy and regulation of certain industries, including the financial services sector, could have a significant effect on Mexican private sector entities, including us, and on market conditions, prices and returns on Mexican securities, including our securities.
Mexico held general elections on July 1, 2018. At the federal level, Mexican citizens elected a new president, 500 members of the Chamber of Deputies and 128 members to the Senate, in addition to thousands of state and municipal positions. In total, more than 3,400 elected positions were voted on, making the 2018 election unprecedented in its scope and impact on Mexico’s political landscape. Andrés
Manuel Lopez Obrador of the Morena-Partido Encuentro Social-Partido del Trabajo coalition received over 53% of the vote in the presidential election, more than double the total of his closest rival, and became the 58th president for a period of almost six years (due to a constitutional amendment Presidential terms will now end on October 30) starting on December 1, 2018. The Morena party also gained an absolute majority in congress and is close to having the legislative seats required to pass constitutional changes. As a result of its landslide victory in both the presidential and congressional elections, the Morena party has a strong mandate in both the executive and legislative branches, both at federal and state levels.
The social and economic policies of the new administration are different from the ones implemented until recently, there is no certainty on the continuance or the modifications to the structural reforms approved by the past administration, and we may see a change of direction. Nevertheless, subsequent to its election and since taking office, the new government messaging regarding economic plans has been mostly pro-market and conciliatory, with an explicit emphasis on the importance of Mexican Central Bank autonomy and balanced public finances, leading to a favorable reaction of financial markets to the election results. Some controversial measures have been announced, including the halt of the construction of Mexico new international airport, leading to drops in financial markets, a depreciation of the peso and an increase of interest rates. In November 2018, the Morena division in the Senate presented an initiative to amend several laws in order to reduce or prohibit some banking fees and commissions, alleging that foreign banks operating in Mexico post significantly higher fee income locally than in its headquarters. This proposal caused major market downturns and a confrontation between the President and the Morena division in the Senate. A working group, including authorities, regulators and banks (through the Mexican Banks Association), was established in order to discuss the initiative. As of December 31, 2018, the working group continued to meet regularly and its output was still unknown. The new administration took office on December 1, 2018 and sent its proposal of 2019 budget to Congress on December 15, 2018. The proposal, as well as the approved version, is based on realistic macroeconomic assumptions and adheres to the public finances strategy followed by the previous administration, setting a stable public debt to GDP ratio as a short term goal. While the reaction of financial markets to the 2019 budget was favorable, key details regarding the administration’s plans and next actions for economic policy are still developing and have led to increased economic uncertainty.
We cannot provide any assurance that future political events in Mexico, over which we have no control, will not have an unfavorable impact on our financial position or results of operations. In particular, the current government may implement significant changes in laws, public policies and/or regulations that could affect Mexico’s political and economic situation, which could have a material adverse effect on us.
Developments in other countries may affect us, including the prices for our securities.
Financial and securities markets in Mexico are, to varying degrees, influenced by economic and market conditions in other countries in Latin America and beyond. Negative developments in the economy or securities markets in one country, particularly in an emerging market, may have a negative impact on other emerging market economies. These developments may adversely affect our business, financial condition and operating results. Although economic conditions in other countries may differ significantly from economic conditions in Mexico, investors’ reactions to adverse developments in other countries may have an adverse effect on the market value of securities of Mexican issuers, including us. For example, during 2007 and 2008, prices of both Mexican debt and equity securities decreased substantially as a result of the global financial crisis.
In addition, in recent years, economic conditions in Mexico have become increasingly correlated to economic conditions in the United States. Accordingly, any adverse change in U.S. trade or other policy with respect to Mexico or change in the U.S. economy, such as higher interest rates or changes in fiscal and monetary policies in the U.S. may have an adverse impact on the Mexican Economy. In particular, the normalization of monetary policy in the United States and the U.S. administration’s policies on trade and immigration, particularly towards Mexico, have caused an increase in the volatility of the peso/dollar exchange rate. While at the end of 2018, the governments of the three members of NAFTA reached a new
trade deal, the United States-Mexico-Canada Agreement (USMCA), in order to come into force the agreement must be ratified by each country’s Congress, a process that faces particular uncertainty in the United States after the results of the 2018 midterm elections. Any setback during the legislative ratification process could have a material adverse effect on the Mexican economy, which could adversely affect credit quality and dampen business volumes. The relative strength of the U.S. dollar against other currencies, including the Mexican peso, may also impact manufacturing’s contribution to growth, thus affecting economic activity in Mexico. Thus, we cannot assure you that any developments in the United States or elsewhere will not materially and adversely affect us in the future.
In 2013, the uncertainties regarding the recovery of the U.S. economy and the changes made to its monetary policy resulted in increased volatility in the debt and foreign exchange markets, affecting all emerging economies, including Mexico. In 2014 and 2015, the U.S. economy showed signs of improvement with an annual GDP growth rate of 2.4% during each year, which caused the U.S. Federal Reserve System to begin normalizing its monetary policy by ending its quantitative monetary stimulus and increasing the U.S. Federal Reserve’s reference rate by 25 basis points in December 2015. The U.S. Federal Reserve further raised rates in 2016 and 2017 by 100 basis points and by an additional 100 basis points in 2018. Such monetary policy normalization, together with a sharp decline in oil prices and the results of the 2016 U.S. presidential election, resulted in increased volatility in financial markets and increased uncertainty regarding the recovery of certain regions in Europe, China and most emerging markets. We cannot assure you that events in Europe, the United States or elsewhere will not materially and adversely affect us in the future.
As a majority subsidiary of our indirect controlling shareholder, Banco Santander Parent, significant aspects of our strategy, infrastructure and capital funding are dependent on our controlling shareholder. Although our controlling shareholder has a significant presence in various markets around the world, its results of operations are materially affected by conditions in the capital markets and the economy generally in Europe, Latin America and the United States. Accordingly, a significant decline in general economic conditions in Europe, Latin America or the United States, whether caused by recession, inflation, unemployment, changes in securities markets, acts of terrorism or other occurrences, could impact our controlling shareholder, and, in turn, have a material adverse effect on our financial condition and results of operations.
Violence in Mexico has adversely impacted, and may continue to adversely impact, the Mexican economy and could have a material adverse effect on us.
Mexico has experienced a significant increase over the past few years in violence relating to illegal drug trafficking, particularly in Mexico’s northern states near the U.S. border as well as in the states on the Pacific coast. This increase in violence has had an adverse impact on economic activity throughout Mexico. Also, social instability in Mexico or adverse social or political developments in the country could adversely affect our ability to conduct our business and offer our services and our ability to obtain financing. We cannot assure you that the levels of violent crime in Mexico, over which we have no control, will not increase or decrease and will have no further adverse effects on Mexico’s economy or on us.
Furthermore, illegal activities have resulted in more detailed and comprehensive anti-money laundering rules and an increased supervision of such activities by Mexican regulators, which have affected the way in which we conduct our foreign-currency cash business and have resulted in a requirement to enhance our systems and the reinforcement of our compliance measures. Our failure to detect and report anti-money laundering activities may result in fines and penalties and may have an adverse impact on our business and results of operations.
Our status as a controlled company and a foreign private issuer exempts us from certain of the corporate governance standards of the NYSE, limiting the protections afforded to investors.
We are a “controlled company” and a “foreign private issuer” within the meaning of the NYSE corporate governance standards. Under the NYSE rules, a controlled company is exempt from certain NYSE
corporate governance requirements. In addition, a foreign private issuer may elect to comply with the practice of its home country and not to comply with certain NYSE corporate governance requirements, including the requirements that (1) a majority of the Board of Directors consist of independent directors, (2) a nominating and corporate governance committee be established that is composed entirely of independent directors and has a written charter addressing the committee’s purpose and responsibilities, (3) a compensation committee be established that is composed entirely of independent directors and has a written charter addressing the committee’s purpose and responsibilities and (4) an annual performance evaluation of the nominating and corporate governance and compensation committees be undertaken.
Although we have similar practices, they do not entirely conform to the NYSE requirements for U.S. issuers; therefore, we currently use these exemptions available to foreign private issuers and intend to continue using them. Accordingly, you will not have the same protections afforded to shareholders of companies that are subject to all NYSE corporate governance requirements.
For example, under our bylaws and in accordance with the Mexican Banking Law and the Mexican Securities Market Law, at least 25% of the members of our Board of Directors must be independent, but independence is determined in accordance with Article 22 of the Mexican Banking Law and our bylaws, rather than NYSE standards. The independence standards in Article 22 of the Mexican Banking Law and our bylaws may not necessarily be consistent with, or as stringent as, the director independence standards established by the NYSE. In addition, like U.S. companies, we are required to have an audit committee that satisfies the requirements of Rule 10A‑3 under the Exchange Act, including basic independence standards. However, as a foreign private issuer, we are exempt from additional requirements relating to independence and the audit committee charter. As a result, the oversight of our Audit Committee may be different from, or more limited than, the oversight provided by audit committees of U.S. companies listed on the NYSE.
Our corporate disclosure may differ from disclosure regularly published by issuers of securities in other countries, including the United States.
Issuers of securities in Mexico are required to make public disclosures that are different from, and that may be reported under presentations that are not consistent with, disclosures required in countries with more developed capital markets, including the United States. In particular, for regulatory purposes, we currently prepare and will continue to prepare and make available to our shareholders statutory financial statements in accordance with Mexican Banking GAAP, which differs from IFRS in a number of respects. In addition, as a foreign private issuer, we are not subject to the same disclosure requirements in the United States as a domestic U.S. registrant under the Exchange Act, including the requirements to prepare and issue quarterly reports, or the proxy rules applicable to domestic U.S. registrants under Section 14 of the Exchange Act or the insider reporting and short-swing profit rules under Section 16 of the Exchange Act. Accordingly, the information about us available to you will not be the same as the information available to shareholders of a U.S. company and may be reported in a manner that you are not familiar with.
We are subject to substantial regulation and regulatory and governmental oversight, which could adversely affect our business, operations and financial condition. In addition, we are subject to regulatory capital and liquidity requirements that could limit our operations, and changes to these requirements may further limit and adversely affect our operating results, financial condition and prospects.
The effective management of our capital position is important to our ability to operate our business, to continue to grow organically and to implement our business strategy. However, as these changes to the regulatory capital framework and other changes are implemented, or as future changes are considered or adopted that limit our ability to manage our balance sheet and capital resources effectively or to access funding on commercially acceptable terms, we may experience a material adverse effect on our financial condition and regulatory capital position.
As a financial institution, we are subject to extensive regulation, including regulation by the Mexican Central Bank, the CNBV and the SHCP, which materially affects our businesses. The statutes, regulations and policies to which we are subject, in particular those relating to the banking sector and financial institutions, may be changed at any time, and the interpretation and application of those laws and regulations by regulators is also subject to change. The wide range of regulations, actions and proposals which most significantly affect us, or which could most significantly affect us in the future, relate to capital requirements, funding and liquidity. These and other regulatory reforms adopted or proposed in the wake of the previous financial crisis or resulting from subsequent events in Mexico, the United States or worldwide have increased and may continue to materially increase our operating costs and negatively affect our business model. Furthermore, regulatory authorities have substantial discretion in how to regulate banks, and this discretion, and the means available to the regulators, have been increasing during recent years. Regulation may be imposed on an ad hoc basis by governments and regulators in response to a crisis, and these may especially affect financial institutions such as us that are deemed to be systemically important. In addition, the volume, granularity, frequency and scale of regulatory and other reporting requirements require a clear data strategy to enable consistent data aggregation, reporting and management. Inadequate management information systems or processes, including those relating to risk data aggregation and risk reporting, could lead to a failure to meet regulatory reporting requirements or other internal or external information demands, and we may face supervisory measures as a result.
Any legislative or regulatory actions and any required changes to our business operations resulting from such legislation and regulations, as well as any deficiencies in our compliance with such legislation and regulation, could result in significant loss of revenue, limit our ability to pursue business opportunities in which we might otherwise consider engaging and provide certain products or services, affect the value of assets that we hold, require us to increase our prices and therefore reduce demand for our products, impose additional compliance and other costs on us or otherwise adversely affect our businesses. In particular, legislative or regulatory actions resulting in enhanced prudential standards, in particular with respect to capital and liquidity, could impose a significant regulatory burden on us and could limit our ability to distribute capital and liquidity. Future liquidity standards could require us to maintain a greater proportion of our assets in highly-liquid but lower-yielding financial instruments, which would negatively affect our net interest margin. Moreover, our regulators, as part of their supervisory function, periodically review our allowance for loan losses under Mexican Banking GAAP. Such regulators may require us to increase our allowance for loan losses or to recognize further losses for Mexican Banking GAAP purposes. Any such additional provisions for loan losses, as required by these regulatory agencies, whose views may differ from those of our management, could have an adverse effect on our earnings and financial condition for Mexican Banking GAAP. Accordingly, there can be no assurance that future changes in regulations or in their interpretation or application will not adversely affect us.
The Bank is subject to capital adequacy requirements adopted by the CNBV which provide for a minimum ratio for operations of risk-weighted assets for credit, market and operational risk of 8%, along with back-up capital of 2.5% which gives a total of 10.5% minimum requirement (including the capital conservation buffer), plus, within a four year period starting December 31, 2016, a domestic systemically important bank supplement of 1.20% imposed on the Bank due to its classification as Grade III and a countercyclical capital supplement. Any failure by us to maintain this minimum will result in administrative actions or sanctions which may affect our ability to fulfill our obligations, including losing our banking license.
In response to the financial crisis, the Basel Committee issued comprehensive changes to its regulatory capital standards as part of a comprehensive capital and liquidity framework, known as Basel III. The Basel III framework includes heightened capital standards reflecting increases in both the quality and quantity of the regulatory capital base and enhancements to the risk coverage of the capital framework. The Basel III minimum risk-based capital ratio standards require a minimum ratio of 8% over total risk-weighted assets from which a minimum of 4.5% concerns Ordinary Level 1 Capital risk-weighted assets and a minimum of 6% over risk-weighted assets Total Capital Level 1 (Ordinary Level 1 Capital plus Additional Level 1). In addition to these minimum capital requirements, the Basel III capital standards also include capital buffers that must be maintained above the minimum capital requirements in order to avoid corrective measures from CNBV. These capital buffers include, on a fully phased-in basis, a 2.5% capital conservation buffer, a
variable surcharge of up to 2.5% for certain global systemically important banks and a countercyclical buffer of up to 2.5% (during excessive credit growth periods) and a systemic entities buffer up to 3.5%, to be deployed at the discretion of national regulators. Basel III also introduces a leverage ratio for institutions as a backstop measure, to be applied alongside the risk-based regulatory capital requirements. The Basel III capital standards are intended to be implemented at the national level subject to transitional arrangements, with the principal requirements being phased in from January 2013 to January 2019 and the remaining requirements fully effective in 2022. Since being first finalized in 2010, the Basel III capital standards have continued to evolve, with the Basel Committee issuing new standards on, among other things, the measurement of risk-weighted assets for counterparty credit risk, exposures to central counterparties and market risk.
The CNBV issued amendments to the capital requirements, which became effective on January 1, 2013 and implemented the Basel III capital standards in all material respects.
In addition to the changes to the capital standards described above, the Basel III framework also introduces the Basel Committee’s global quantitative liquidity standards, which include the Liquidity Coverage Ratio, or LCR, and the Net Stable Funding Ratio, or NSFR. The objectives of the LCR and NSFR, respectively, are to (1) promote the short-term resilience of banks’ liquidity risk profiles by ensuring they have sufficient high-quality liquid assets to meet 30‑day cash outflows during a significant stress scenario; and (2) promote resilience over a longer time horizon by creating incentives for banks to fund their activities with more stable sources of funding on an ongoing basis. The LCR was subsequently revised by the Basel Committee in January 2013, which amended the definition of high-quality liquid assets and agreed to a revised timetable for phase-in of the standard from 2015 to 2019, as well as making some technical changes to some of the stress scenario assumptions. In October 2014, the Basel Committee published the final NSFR standard, which established a standard for banks to maintain a stable funding profile in relation to the composition of their assets and off-balance sheet activities. The first effective date of the NSFR under the Basel Committee standard was January 1, 2018. A proposed disclosure standard related to the NSFR was published in December 2014.
As part of its liquidity management model, in recent years we have been managing the implementation, monitoring and early compliance with the new liquidity requirements set by international financial legislation.
In 2014, following the approval by the Basel Committee of the final definition of the short-term liquidity coverage ratio (LCR), the delegated act of the European Commission was adopted, which, within the scope of the CRD IV, defines the criteria for calculating and implementing this metric in the European Union. The implementation was delayed until October 2015, although the level of initial compliance reached 60% in 2015, and should gradually increase to 100% by 2019.
Our LCR levels exceeded 100% throughout 2018, thereby surpassing regulatory requirements.
On December 31, 2014, the CNBV and the Mexican Central Bank published in the Federal Official Gazette the “General Liquidity Requirements for Banking Institutions” as per the guidelines established by the Banking Liquidity Regulation Committee on October 17, 2014 (the “General Liquidity Requirements”). The effective date of the General Liquidity Requirements was January 1, 2015.
On December 31, 2015, the CNBV published in the Federal Official Gazette, a resolution modifying the General Liquidity Requirements for Banking Institutions. Such resolution entered into effect on January 1, 2016.
In 2012, the Basel Committee established a Regulatory Consistency Assessment Program through which it monitors, assesses and evaluates national regulators’ implementation of regulations and the Basel Committee’s standards. The Basel Committee issues reports on individual countries, presenting findings on each country’s adoption of the risk-based capital standards. In response to these findings, some national
authorities have developed modifications to their regulations to more closely align their regulations with the Basel Committee’s standards.
In consideration of the Basel Committee’s assessment of Mexico’s implementation of the Basel III framework, the CNBV modified the risk-based capital rules in six specific areas.
During 2015, the CNBV and the Mexican Central Bank modified general regulatory dispositions related to operational risk, counterparty risk, market risk and credit risk, including the following modifications:
| · | | Operational risk: on December 16, 2016 the CNBV approved our request to use the Alternative Standardized Approach (ASA) to estimate and report, from November 2016 onwards, the capital requirement for operational risk. |
| · | | Counterparty risk: a risk exposure was incorporated to account for the future potential increase of transactions with derivatives and departure from their actual value. The focus on capital requirements was modified and directed to the counterparty, considering the benefits of compensation contracts that allow the counterparty assumption of the exposition risk in favor of the banks. Additionally, capital requirements were increased for standard derivative transactions or transactions liquidated through clearinghouses from 0% to 2% (minimum), and, furthermore, additional capital requirements for institutions with direct exposure to clearinghouses were established. |
| · | | Market risk: a new capital requirement was established for short trading positions, along with a capital requirement for transactions with options which consider changes on value (gamma) and market volatility (vega). A capital requirement was also set for merchandise, and gold was included in the currencies capital requirements. On the other hand, capital requirements for liquidation on stock positions were eliminated, and specific market capital requirements were adjusted to 8% considering the correlation of the portfolio with the market. |
| · | | Credit risk: criteria to determine the credit risk applicable to various levels of exposure to financial entities, corporations and stocks were modified. For internal ratings-based (IRB) approach models, the following requirements were modified: a loss severity of 10% for mortgage loans, changes in the default definition for restructured credits and additional requirements to the interim models certification test. |
| · | | There is a risk that implementing and maintaining enhanced liquidity risk management systems may incur significant costs, and more stringent requirements to hold liquid assets and stable funding sources may materially affect our lending business as we may be required to maintain a larger liquidity buffer or more stable funding sources, thereby reducing future profitability. |
On June 22, 2016, the CNBV published in the Federal Official Gazette a resolution establishing the methodology to calculate the leverage ratio for banking institutions. Such resolution entered into effect on September 1, 2016. We are currently in compliance with these requirements. This ratio is calculated as Tier 1 capital divided by leverage exposure. Exposure is calculated as the sum of the following items:
| · | | Accounting assets, excluding derivatives and items treated as deductions from Tier 1 capital (for example, the balance of loans is included, but not that of goodwill). |
| · | | Off-balance-sheet items (mainly guarantees, unused credit limits granted and documentary credits) weighted using credit conversion factors. |
| · | | The net value of derivatives (gains and losses vis-à-vis the same counterparty are netted, less the collateral if certain conditions are met) plus an add-on for potential future exposure. |
| · | | An add-on for the potential exposure of securities financing transactions. |
In accordance with the aforementioned regulatory requirements set forth by the CNBV, banking institutions must publish their leverage ratio beginning on September 2016 (and include quarters beginning on December 2015) in the case of systemically important banks. Our leverage ratio as of December 31, 2018 was 7.03%, as of November 30, 2018 was 6.79%, as of October 31, 2018, was 6.52%, as of September 30, 2018 was 7.10%, as of June 30, 2018 was 6.89%, as of March 31, 2018 was 7.37%, and as of December 31, 2017 was 7.03%.
The Mexican government has exercised, and continues to exercise, considerable influence over the Mexican economy, including to control inflation. This involvement, together with Mexico’s political and economic conditions, could adversely affect our financial condition and the market price of our securities.
The Mexican government frequently intervenes in the Mexican economy and occasionally makes significant changes in policies and regulations. The Mexican government’s actions to control inflation and other policies and regulations historically have involved, among other measures, increases in interest rates, changes in tax policies, price controls, currency fluctuations, taxation on investment flows, capital controls and limits on imports. Our business, financial condition and results of operations, as well as the market price of our securities, may be adversely affected by changes in policies or regulations involving, among others:
| · | | exchange rates and controls and restrictions on the movement of capital out of Mexico; |
| · | | liquidity of the domestic capital and lending markets; and |
| · | | tax and regulatory policies. |
Mexico has experienced high rates of inflation in the past and has therefore implemented monetary policies that have resulted in high nominal interest rates. The Mexican government’s measures to fight inflation, principally through the Mexican Central Bank, have had and may in the future have significant effects on the Mexican economy and our business. Tight monetary policies with high interest rates and high compulsory deposit requirements may restrict Mexico’s growth and the availability of credit, reduce our loan volumes and increase our impairment losses. Conversely, more lenient government and Mexican Central Bank policies and interest rate decreases may trigger increases in inflation, and, consequently, growth volatility and the need for sudden and significant interest rate increases, which could negatively affect our interest rate spreads.
Although the Mexican government has implemented what we believe to be sound economic policies over the past few years, uncertainty over whether the Mexican government will implement changes in policy or regulation in the future may contribute to economic uncertainty in Mexico and to heightened volatility in the Mexican securities markets and in the securities issued abroad by Mexican issuers. These uncertainties and other developments in the Mexican economy may adversely affect us and the market value of our securities.
Changes in taxes and other fiscal assessments may adversely affect us.
The Mexican government regularly enacts reforms to tax and other assessment regimes to which we and our customers are subject. Such reforms include changes in the rate of assessments and, occasionally, enactment of temporary taxes, the proceeds of which are earmarked for designated governmental purposes. The effects of these changes and any other changes that result from enactment of additional tax reforms cannot be quantified and there can be no assurance that these reforms will not, once implemented, have an adverse effect upon our business. Furthermore, such changes may produce uncertainty in the financial system, increasing the cost of borrowing and contributing to the increase in our non-performing loan portfolio.
We may not effectively manage risks associated with the replacement of benchmark indices.
A significant portion of our assets and liabilities are tied to variable interests rates, and as of December 31, 2018 aproximately 27% of our assets and 13% of our liabilities at fair value were tied to the the London interbank offered rate (“LIBOR”). Interest rate, equity, foreign exchange rate and other types of indices which are deemed to be “benchmarks” are the subject of increased regulatory scrutiny. For example, in 2017, the FCA announced that it will no longer persuade or compel banks to submit rates for the calculation of LIBOR benchmark after 2021. This announcement indicates that the continuation of LIBOR on the current basis cannot and will not be guaranteed after 2021, and it appears likely that LIBOR will be discontinued or modified by 2021. This and other reforms may cause benchmarks to reform differently than in the past, or to disappear entirely, or have other consequences which cannot be fully anticipated which introduces a number of risks for the Bank. These risks include (i) legal risks arising from potential changes required to documentation for new and existing transactions; (ii) financial risks arising from any changes in the valuation of financial instruments linked to benchmark rates; (iii) pricing risks arising from how changes to benchmark indices could impact pricing mechanisms on some instruments; (iv) operational risks arising from the potential requirement to adapt IT systems, trade reporting infrastructure and operational processes; and (v) conduct risks arising from the potential impact of communication with customers and engagement during the transition period. The replacement benchmarks, and the timing of and mechanisms for implementation have not yet been confirmed by central banks. Accordingly, it is not currently possible to determine whether, or to what extent, any such changes would affect us. However, the implementation of alternative benchmark rates may have a material adverse effect on our business, results of operations, financial condition and prospects.
Exposure to Mexican government debt could have a material adverse effect on us.
Like many other Mexican banks, we invest in debt securities of the Mexican government (including those issued by the Mexican Central Bank). As of December 31, 2018, approximately 18% of our total assets and 80% of our debt securities portfolio was comprised of debt securities issued by the Mexican government (including those issued by the Mexican Central Bank). Any failure by the Mexican government to make timely payments under the terms of these securities, or a significant decrease in their market value, will have a material adverse effect on us.
Investors may find it difficult to enforce civil liabilities against us or our directors, officers and controlling persons.
We and all of our subsidiaries are organized under the laws of Mexico. Our directors, officers and controlling persons reside outside of the United States. In addition, all or a substantial portion of our assets and the assets of our directors and officers are located outside of the United States. Although we have appointed an agent for service of process in any action against us in the United States with respect to our ADSs, none of our directors, officers or controlling persons has consented to service of process in the United States or to the jurisdiction of any United States court. As a result, it may be difficult for investors to effect service of process within the United States on such persons.
Additionally, investors may experience difficulty in Mexico enforcing foreign judgments obtained against us and our executive officers, directors and controlling persons, including in any action based on civil liabilities under the U.S. federal securities laws. Based on the opinion of our Mexican counsel, there is doubt as to the enforceability against such persons in Mexico, whether in original actions or in actions to enforce judgments of U.S. courts, of liabilities based solely on the U.S. federal securities laws. See “Enforcement of Judgments.”
Risks Relating to the ADSs and Our Series B Shares
Preemptive rights may be unavailable to non-Mexican holders of our Series B shares and ADSs and, as a result, they may suffer dilution.
Except in certain circumstances (including a follow-on public offering), under Mexican law, if we issue new shares of common stock as part of a capital increase, we generally grant our shareholders the right to subscribe and pay for enough shares to maintain their existing ownership percentage. Rights to subscribe and pay for shares in these circumstances are known as preemptive rights. We may not legally be permitted to allow holders of our Series B shares or ADSs in the United States to exercise any preemptive rights in any future capital increase, unless we file a registration statement with the SEC with respect to that future issuance of shares or the offering qualifies for an exemption from the registration requirements of the Securities Act. Similar restrictions may apply to holders of our Series B shares or ADSs in other jurisdictions. We cannot assure you that we will file a registration statement with the SEC or any other regulatory authority, or that an exemption from registration will be available to allow holders of our Series B shares or ADSs in the United States or any other jurisdiction, to participate in a preemptive rights offering. At the time of any future capital increase, we will evaluate the costs and potential liabilities associated with filing a registration statement with the SEC, and any other factors, that we consider important to determine whether we will file such a registration statement. Under Mexican law, sales or other transfers by the depositary of preemptive rights and distribution of the proceeds from such sales to ADS holders is not possible. See “Item 10. Additional Information—B. Memorandum and Articles of Association—Preemptive Rights.”
Holders of ADSs may be unable to exercise voting rights with respect to the Series B shares underlying their ADSs at our shareholders’ meetings.
We will not treat holders of ADSs as our shareholders and they may not be able to exercise shareholder rights. The depositary is the holder of the Series B shares underlying the ADSs and holders may exercise voting rights with respect to the Series B shares represented by the ADSs only in accordance with the deposit agreement relating to the ADSs. There are no provisions under Mexican law or under our bylaws that limit the exercise by ADS holders of their voting rights through the depositary with respect to the underlying Series B shares. However, there are practical limitations on the ability of ADS holders to exercise their voting rights due to the additional procedural steps involved in communicating with these holders. For example, holders of our Series B shares will receive notice of shareholders’ meetings generally through publications in newspapers of wide distribution in Mexico and will be able to exercise their voting rights by either attending the meeting in person or voting by proxy. ADS holders, by comparison, will not receive notice directly from us. Instead, in accordance with the deposit agreement, we will provide the notice to the depositary. If we ask it to do so, the depositary will mail to holders of ADSs the notice of the meeting and a statement as to the way in which voting instructions may be given by holders. To exercise their voting rights, ADS holders must then instruct the depositary as to voting the Series B shares represented by their ADSs. Due to these procedural steps involving the depositary, the process for exercising voting rights may take longer for ADS holders than for holders of Series B shares. The Series B shares represented by ADSs for which the depositary fails to receive timely voting instructions may, if requested by us, be voted as we instruct at the corresponding meeting.
ADS holders may be subject to additional risks related to holding ADSs rather than shares.
Because ADS holders do not hold their shares directly, they are subject to the following additional risks, among others:
| · | | as an ADS holder, you may not be able to exercise the same shareholder rights as a direct holder of ordinary shares; |
| · | | distributions on the Series B shares represented by your ADSs will be paid to the depositary, and before the depositary makes a distribution to you on behalf of your ADSs, withholding taxes, if any, that must be paid will be deducted and the depositary will be required to convert the Mexican pesos received into U.S. dollars. Additionally, if the exchange rate fluctuates significantly during a time when the depositary cannot convert the Mexican pesos received into U.S. dollars, or while it holds the Mexican pesos, you may lose some or all of the U.S. dollar value of the distribution; |
| · | | we and the depositary may amend or terminate the deposit agreement without the ADS holders’ consent in a manner that could prejudice ADS holders or that could affect the ability of ADS holders to transfer ADSs; and |
| · | | the depositary may take or be required to take actions under the deposit agreement that may have adverse consequences for some ADS holders in their particular circumstances. |
As a holder of ADSs you will have different shareholders’ rights than do shareholders of companies incorporated in the United States and certain other jurisdictions.
Our corporate affairs are governed by our bylaws and Mexican Corporations Law (including specific laws that regulate us as a bank) which may differ from the legal principles that would apply if we were incorporated in a jurisdiction in the United States or in certain other jurisdictions outside Mexico. Under Mexican Corporations Law, you may have fewer and less well-defined rights to protect your interests than under the laws of other jurisdictions outside Mexico. For example, under Mexican law, the protections afforded to minority shareholders and the fiduciary duties of officers and directors are, in some respects, less than, or different from, those existing in the United States and certain other jurisdictions.
Actions against officers and directors may only be initiated by holders of blocks of 5% of our outstanding Series B shares (including Series B shares underlying ADSs), as opposed to a single shareholder or group of affected shareholders, and are shareholders’ derivative suits, which benefit us (as the affected company) rather than affected shareholders directly. Rules and policies against self-dealing and regarding conflicts of interest may also be less well-defined and enforced in Mexico than in the United States, putting holders of our Series B shares and ADSs at a potential disadvantage. In particular, the Mexican legal regime concerning fiduciary duties of directors is not as comprehensive or developed as in the United States. The duties of care and loyalty of directors and officers are solely defined by the Mexican Securities Market Law and have not been interpreted or defined by courts and, as a result, the judicial interpretation of the meaning and extent of such duties is uncertain. Although Mexico recently passed laws that permit the initiation of class actions, rules implementing applicable law have not fully developed procedural requirements for class action lawsuits. There has not been a considerable number of claims relating to breach of duties, whether as class actions or as derivative suits, to encourage litigation based upon breaches of fiduciary duties or to assist in the predictability of the outcome of any potential action. As a result, it may be more difficult in practice for our minority shareholders to decide to exercise or enforce their rights against us and our directors, officers or controlling shareholders than it would be for shareholders of a U.S. company.
Although Mexican Corporations Law imposes restrictions on insider trading and price manipulation, the form of these regulations and the manner of their enforcement may differ from that in the U.S. securities markets or markets in certain other jurisdictions. In addition, in Mexico, self-dealing and the preservation of
shareholder interests may be regulated differently, which could potentially disadvantage you as a holder of the shares underlying ADSs.
Certain provisions of Mexican law and our bylaws impose limitations on the trading of our securities and may delay or limit a change of control of Banco Santander México.
In accordance with the LIC, LMV and our by-laws, any person or entity, or group of persons or entities, may directly or indirectly, in one or a series of related transactions, acquire our Series B shares, in terms of article 17 of the LIC. In case any person(s) or entity(ies) intend to acquire directly or indirectly more than 5% (five percent) of our Series B shares or grant a guarantee on the shares representing such percentage, the prior authorization of the CNBV is required. In case a person or a group of persons (shareholders or not) intend to purchase 20% (twenty percent) or more of our Series B shares or to obtain the Bank’s control, the prior authorization of the CNBV is required.
Additionally, the persons who acquire or transfer Series B shares for more than 2% (two percent) shall give notice to CNBV within 3 (three) business days following the purchase or the transfer.
Foreign governments shall not participate, directly or indirectly, in the Bank’s capital stock, save in cases provided for by article 13 of the LIC.
The aforementioned provisions may delay or limit a change of control of Banco Santander México or a change in our management.
There may be a lack of liquidity and market for our shares and ADSs.
Prior to our merger with our Former Holding Company, there was no public market for our ADSs and substantially no liquidity of our Series B shares. Our ADSs are listed and traded on the NYSE under the symbol “BSMX.” Our Series B shares are listed and traded on the Mexican Stock Exchange under the symbol “BSMX.” At December 31, 2018, we had 6,786,994,357 shares of common stock outstanding, including 3,322,685,212 Series B shares and 3,464,309,145 Series F shares. The Mexican securities markets are substantially smaller, less liquid and more volatile than major securities markets in the United States.
Although our Series B shares are traded on the Mexican Stock Exchange, there can be no assurance that a liquid trading market for our Series B shares will continue to exist. As of December 31, 2018, approximately 25.04% of our outstanding Series B shares were held by the public (i.e., shareholders other than Banco Santander Parent and its affiliates), including our Series B shares that are represented by ADSs trading on the NYSE. A limited trading market in general and our concentrated ownership in particular may impair the ability of an ADS holder to sell in the Mexican market Series B shares obtained upon withdrawal of such shares from the ADR facility in the amount and at the price and time such holder desires, and could increase the volatility of the price of the ADSs.
In addition, if the trading volume of our ADSs on the NYSE or our Series B shares on the Mexican Stock Exchange were to decline below certain levels, the ADSs or the Series B shares could be delisted or deregistered, further reducing liquidity of our ADSs and Series B shares.
The relative volatility and illiquidity of the Mexican securities markets may substantially limit ADS holders’ ability to sell the Series B shares underlying the ADSs at the price and time they desire.
Investing in securities that trade in emerging markets, such as Mexico, often involves greater risk than investing in securities of issuers in the United States, and such investments are considered to be more speculative in nature. The Mexican securities market is substantially smaller, less liquid, more concentrated in a limited number of broker-dealers and institutional participants, and can be more volatile than securities markets in the United States. There is also significantly greater concentration in the Mexican securities
market than in major securities markets in the United States. Accordingly, although ADS holders are entitled to withdraw the Series B shares underlying the ADSs from the depositary at any time, their ability to sell such shares in the Mexican securities market at a price and time they desire may be limited.
Our shareholders may be subject to liability for certain votes of their securities.
Shareholders who have a conflict of interest with us and do not abstain from voting on a resolution that ultimately causes damages and losses to us, may be held liable for such damages and losses, but only if the transaction would not have been approved without the favorable vote of such shareholders. See “Item 10. Additional Information—B. Memorandum and Articles of Association—Conflicts of Interest.”
ITEM 4. INFORMATION ON THE COMPANY
A. History and Development of the Company
General
We are the second-largest bank in Mexico based on total assets, the third-largest based on total loans and net income and the fourth-largest based on deposits, as of December 31, 2018, in each case as determined in accordance with Mexican Banking GAAP, according to information published by the CNBV. As a bank and through our subsidiaries, we provide a wide range of financial and related services, principally in Mexico, including retail and commercial banking, and securities underwriting. Our main subsidiaries are Santander Consumo, S.A. de C.V., Sociedad Financiera de Objeto Múltiple, Entidad Regulada, Santander Vivienda, S.A de C.V., Sociedad Financiera de Objeto Múltiple, Entidad Regulada and Santander Inclusión Financiera, S.A. de C.V., Sociedad Financiera de Objeto Múltiple, Entidad Regulada.
Our principal executive offices are located at Avenida Prolongación Paseo de la Reforma 500, Colonia Lomas de Santa Fe, Delegación Álvaro Obregón, 01219, Mexico City, Mexico. Our telephone number at that address is +52 55 5257‑8000 and our website is www.santander.com.mx. None of the information contained on our website is incorporated by reference into, or forms part of, this Report.
Our agent for service of process is Banco Santander, S.A., New York Branch, Attn.: James H. Bathon, Chief Legal Officer, 45 E. 53rd Street New York, New York 10022.
History
Banco Santander México was incorporated on November 16, 1932, under the name Banco Mexicano. In 1955, Sociedad Mexicana de Crédito Industrial (subsequently Banco Somex), which was incorporated in 1941, purchased a controlling portion of the shares of Banco Mexicano. In 1958, Banco Mexicano merged with Banco Español, with Banco Mexicano as the surviving entity.
In 1970, Banco de Londres y México merged with Compañía General de Aceptaciones (formerly a shareholder of Banco de Londres), with Banco de Londres y México under its new name, Banca Serfin, as the surviving entity.
In 1979, Banco Mexicano changed its corporate name to Banco Mexicano Somex, S.A., operating as a multiple-purpose banking institution.
In 1982, Mexican commercial banks were nationalized by the Mexican government.
In 1990, the Mexican Constitution was amended to permit the total reprivatization of Mexican commercial banks, and the Mexican government enacted the Mexican Banking Law, which led to the reprivatization of such banks starting in 1991. As part of this banking privatization process, in 1992, Grupo Financiero
InverMéxico acquired Banco Mexicano Somex, which then took the corporate name of Banco Mexicano, S.A., Institución de Banca Múltiple, Grupo Financiero InverMéxico.
In 1992, Grupo Financiero Serfin was incorporated following the acquisition of Banca Serfin by Operadora de Bolsa.
In 1997, Banco Santander Parent acquired Grupo Financiero InverMéxico, which became Grupo Financiero Santander Mexicano. Banco Mexicano later became Banco Santander Mexicano. In May 2000, Banco Santander Parent acquired Grupo Financiero Serfin, which was merged into Grupo Financiero Santander Mexicano and changed its corporate name to Grupo Financiero Santander Serfin. In 2001, Banco Santander Mexicano adopted the corporate name of Banco Santander Mexicano, S.A., Institución de Banca Múltiple, Grupo Financiero Santander Serfin.
Banco Santander Mexicano and Banca Serfin initially operated independently. In 2004, Banca Serfin was merged into Banco Santander Mexicano, with the surviving entity being Banco Santander Serfin, S.A., Institución de Banca Múltiple, Grupo Financiero Santander Serfin. Subsequently, in 2006, the Bank was renamed Banco Santander, S.A., Institución de Banca Múltiple, Grupo Financiero Santander.
On February 21, 2008, the corporate name of the Bank was changed to Banco Santander (México), S.A., Institución de Banca Múltiple, Grupo Financiero Santander.
On December 23, 2010, Banco Santander México entered into a stock and assets purchase agreement to acquire the residential mortgage business of General Electric Capital Corporation and its subsidiaries, or GE Capital, in Mexico, or the GE Capital mortgage business. The transaction closed on April 29, 2011. The acquisition made us the second-largest provider of residential mortgages in Mexico in terms of residential mortgages outstanding in 2011, as determined in accordance with Mexican Banking GAAP, according to information published by the CNBV.
Banco Santander México obtained shareholder approval on September 12, 2012 to change its name to Banco Santander (México), S.A., Institución de Banca Múltiple, Grupo Financiero Santander México, and such name change was subsequently authorized by the CNBV.
In November 2012, Banco Santander México completed a debt offering of U.S.$1.0 billion in senior notes in the domestic and international markets in accordance with the Rule 144A of the Securities Act, under an indenture dated as of November 9, 2012. The notes mature on November 9, 2022, and bear interest at a rate per annum equal to 4.125%. Interest is paid semi-annually in arrears on May 9 and November 9 of each year.
In November 2013, Banco Santander México completed the acquisition of the equity stock of ING Hipotecaria, S.A. de C.V., Sociedad Financiera de Objeto Múltiple, Entidad No Regulada, or ING Hipotecaria, a subsidiary of ING Group. Prior to the acquisition, ING Hipotecaria provided mortgage-related products and services to more than 28,000 clients and operated 20 branches throughout Mexico. Since the acquisition, all of the branches operated by ING Hipotecaria have been closed, in an effort to consolidate the distribution network and increase operational efficiency.
On December 13, 2013, ING Hipotecaria obtained shareholder approval to change its name to Santander Vivienda, S.A. de C.V., Sociedad Financiera de Objeto Múltiple, Entidad Regulada, or Santander Vivienda. In February 2014, Santander Vivienda obtained the permits required to change its legal name.
In December 2013, Banco Santander México completed a debt offering of U.S.$1.3 billion aggregate principal amount of Basel III compliant Tier 2 Subordinated Capital Notes due 2024 (the “2024 Notes”) in the domestic and international capital markets.
On November 26, 2014, we entered into an agreement to acquire a non-revolving consumer loan portfolio from Scotiabank Inverlat. The acquisition was completed in April 2015 after obtaining the applicable regulatory approvals. The acquired portfolio consists of 39,252 loans with a face value of Ps.3,179 million and a fair value of Ps.3,002 million.
On July 24, 2015, Banco Santander Parent made us an offer to purchase our custody business, which we accepted.
In August 2016, Banco Santander Parent received the authorization of the Mexican authorities for the incorporation and operation of Banco S3 México, S.A., Institución de Banca Múltiple (“Banco S3 México”), an entity to be focused on the specialized business of deposit, custody and management of securities and cash in Mexico. For additional information on the sale of the custody business, see Note 3.1 to our audited financial statements included elsewhere in this Report. On January 2, 2018 we sold our custodial business to Banco S3 Mexico.
On December 21, 2016, by means of note UBVA/093/2016, the SHCP approved the merger of our subsidiaries Santander Hipotecario, S.A. de C.V., Sociedad Financiera de Objeto Múltiple, Entidad Regulada, Grupo Financiero Santander México and Santander Holding Vivienda, S.A. de C.V., both as merged entities and Santander Vivienda, S.A. de C.V., Sociedad Financiera de Objeto Múltiple, Entidad Regulada, Grupo Financiero Santander México as merging company. The merger was effective January 1, 2017. For additional information on the merger of Santander Vivienda, S.A. de C.V., see Note 3.8 to our audited financial statements included elsewhere in this Report.
On December 29, 2016, the Bank issued perpetual subordinated non-preferred contingent convertible additional Tier 1 capital notes (the “Back-to-Back notes”) in an aggregate principal amount of U.S.$500,000,000, under an indenture dated as of December 27, 2016, as supplemented by a first supplemental indenture dated as of December 27, 2016, with the same terms as the perpetual subordinated non-preferred contingent convertible additional Tier 1 capital notes (the “Tier 1 notes”) issued by the Former Holding Company on the same date. The Former Holding Company purchased 100% of the aggregate principal amount of the Back-to-Back notes. In connection with the Merger (as defined below), the Bank assumed all of the obligations of the Former Holding Company under the Tier 1 notes and the Back-to-Back notes were cancelled. See “Item 5. Operating and Financial Review and Prospects—B. Liquidity and Capital Resources—Debt Securities Outstanding—The Additional Tier 1 Capital Notes”. For additional information on the issuance of subordinated liabilities, see Note 3.2 to our audited financial statements included elsewhere in this Report.
On October 5, 2017, the SHCP authorized the incorporation of a new company called Santander Inclusión Financiera, S.A. de C.V., Sociedad Financiera de Objeto Múltiple, Entidad Regulada, Grupo Financiero Santander México (Inclusión Financiera) as a subsidiary of the Bank, the main activity of which is granting credits to low income creditors. The aim of this subsidiary is to achieve a social impact through a competitive offer in the sector of microcredits. For additional information on the authorization to incorporate Santander Inclusión Financiera, S.A. de C.V., see Note 3.5 to our audited financial statements included elsewhere in this Report.
On December 8, 2017, the shareholders of the Bank approved the merger of the Former Holding Company with and into the Bank, with the Bank as the surviving company (the “Merger”) and by official letter UBVA/077/2017 dated December 13, 2017, the SHCP authorized the Merger. On December 8, 2017, the Bank and the Former Holding Company entered into a merger agreement, which became effective exclusively between the parties and for accounting purposes as of January 1, 2018 pursuant to Mexican law. On January 26, 2018, upon the filing of the resolutions of the shareholders of the Bank and the Former Holding Company approving the Merger and the filing of the merger agreement with the Public Registry of Commerce in Mexico, the Merger became effective before third parties. For additional information on the corporate restructuring, see Note 3.6 to our audited financial statements included elsewhere in this Report.
Immediately following the effectiveness of the Merger before third parties, (i) Banco Santander Parent contributed all of the shares of the Bank held by it as a result of the Merger to a new holding company, Grupo Financiero Santander México, S.A. de C.V., and (ii) the Bank sold all of the shares of Casa de Bolsa held by it as a result of the Merger to its new holding company, Grupo Financiero Santander México, S.A. de C.V. As a result of the Merger, the Former Holding Company’s Series B shares were delisted from the Mexican Stock Exchange and their registration with the RNV was cancelled; the Bank’s Series B shares were listed on the Mexican Stock Exchange and registered with the RNV; and the shares underlying the Former Holding Company’s ADSs were substituted for shares of the Bank and the ADSs were listed on the NYSE in the Bank’s name. For additional information on the corporate restructuring, see Note 3.6 to our audited financial statements included elsewhere in this Report.
As aforementioned, on January 2, 2018, the Bank sold its custody business to Banco S3 Mexico, a wholly owned subsidiary of Banco Santander Parent and entered into a contract with Banco S3 Mexico pursuant to which Banco S3 Mexico will provide exclusive custody services to the Bank for a term of 20 years, pursuant to a purchase and sale agreement, which is an exhibit to this Report. See “Item 10—C, Material Contracts” for more information. Banco S3 Mexico began operating as an independent subsidiary of Banco Santander Parent on February 2, 2018 upon authorization by the CNBV. For additional information on the sale of the custody business, see Note 3.1 to our audited financial statements included elsewhere in this Report.
On October 1, 2018, Banco Santander México completed a debt offering of U.S.$1,300,000,000 aggregate principal amount of Tier 2 Subordinated Preferred Capital Notes due 2028 in the international capital markets. The funds of this offering were used for the acquisition by Banco Santander México of 94.07% of the outstanding 2024 Notes pursuant to a concurrent cash tender offer for any and all outstanding 2024 Notes. For additional information on the issuance of subordinated liabilities, early settlement of Tier II Subordinated Capital Notes - Expiration of cash tender offer and issue of Tier II Subordinated Capital Notes due 2028, see Notes 3.2, 3.9 and 3.10 to our audited financial statements included elsewhere in this Report.
On October 10, 2018, the corporate name of the Bank was changed to Banco Santander México, S.A., Institución de Banca Múltiple, Grupo Financiero Santander México. For additional information on the change of corporate name, see Note 3.11 to our audited financial statements included elsewhere in this Report.
On October 11, 2018, the Bank acquired from Banco Santander Parent, all the shares representing the capital stock of Isban México, S.A. de C.V. with the objective of creating a new technology operating model for the Bank. On October 15, 2018, the Board of Directors of Isban México, S.A. de C.V. approved the change of its corporate name from Isban México, S.A. de C.V. to Santander Tecnología México, S.A. de C.V. For additional information on the acquisition of Isban México, S.A. de C.V., see Note 3.7 to our audited financial statements included elsewhere in this Report.
By means of official note #OFI003-26050 dated December 27, 2018, the Central Bank authorized the early redemption by the Bank on January 30, 2019 of the remaining 5.93% of the 2024 Notes that were not acquired. For additional information on the issuance of subordinated liabilities, early settlement of Tier II Subordinated Capital Notes - Expiration of cash tender offer and issue of Tier II Subordinated Capital Notes due 2028, see Notes 3.2, 3.9 and 3.10 to our audited financial statements included elsewhere in this Report.
Capital Expenditures and Divestitures
In 2016, our capital expenditures were Ps.2,946 million (U.S.$142.9 million), 77.4% (Ps.2,280 million) of which was spent on information technology and the remainder Ps.666 million which was spent on furniture, fixtures and equipment. In 2017, our capital expenditures were Ps.4,322 million, 78.0% (Ps.3,372 million) of which was spent on information technology and the remainder Ps.950 million which was spent on furniture, fixtures and equipment. In 2018, our capital expenditures were Ps.5,651 million, 66.3% (Ps.3,745
million) of which was spent on information technology and the remainder Ps.1,905 million which was spent on furniture, fixtures and equipment.
For 2019, we have a capital expenditures budget of Ps.6,310 million (U.S.$321 million), 66.7% of which (Ps.4,211 million) will be spent on information technology and the rest of which will be spent on furniture, fixtures and equipment (Ps.2,099 million). Our management expects that cash flows from operations will be sufficient to meet our liquidity requirements over the next 12 months, including our expected 2019 capital expenditures.
Public Takeover Offers
Banco Santander Parent announced its intention of making a public acquisition offer to acquire approximately 25% of the shares of the Bank, which are owned by investors other than Banco Santander Parent. Investors that accept the offer are expected to receive 0.337 of shares of Banco Santander (Spain) for each share of the Bank and 1.685 American Depositary Shares of Banco Santander Parent for each ADS of the Bank. The offering and the exchange of shares are expected to take place during the second half of 2019.
B. Business Overview
Overview
We are the second-largest bank in Mexico based on total assets, the third-largest banks based on total loans and net income and fourth-largest based on deposits as of December 31, 2018, in each case as determined in accordance with Mexican Banking GAAP, according to information published by the CNBV. As a bank and through our subsidiaries, we provide a wide range of financial and related services, principally in Mexico, including retail and commercial banking and securities underwriting. Our principal subsidiaries are Santander Consumo, S.A. de C.V. Sociedad Financiera de Objeto Múltiple, Entidad Regulada, Santander Vivienda, S.A. de C.V. Sociedad Financiera de Objeto Múltiple, Entidad Regulada and Santander Inclusión Financiera, S.A. de C.V. Sociedad Financiera de Objeto Múltiple, Entidad Regulada. As of December 31, 2018, we had total assets of Ps.1,408,724 million (U.S.$71,686 million), total equity of Ps.123,287 million (U.S.$6,274 million), and a market capitalization of Ps.201,845 million (U.S.$10,271 million), and for the year ended December 31, 2018, we had net income of Ps.19,356 million (U.S.$985 million), which represented a return-on-average equity, or ROAE, of 16.27% for that period. As of December 31, 2018, we had total loans, net of allowance for impairment losses, of Ps.667,541 million (U.S.$33,969 million), total deposits of Ps.841,618 million (U.S.$42,828 million) and 1,393 offices located throughout Mexico.
We offer a differentiated financial services platform in Mexico focused on the client segments that we believe are most profitable, such as high- and mid-income individuals, SMEs and middle-market and large corporations in Mexico, while also providing integrated financial services to low-income individuals. We developed our client segmentation strategy in 2008 with clearly defined client segments: high- and mid-income individuals, SMEs and middle-market corporations. Since then, we have focused our efforts on further refining our client segmentation, developing our product offerings, information technology systems and internal practices, as well as enhancing our distribution channels in order to maximize service in our key client segments.
The following chart sets forth the Retail Banking and Corporate and Investment Banking operating segments of the Bank and their main focus.
Retail Banking | | Corporate and Investment Banking |
Focusing on the following categories of clients: Individuals, for individuals with net worth of less than Ps.8 million, categorized as classic, preferred, premier or select Private banking, for individuals with net worth in excess of Ps.15 million Individuals, with a net worth between Ps.8 million and Ps.15 million are attended to by either the Individuals segment or the Private Banking segment described above, depending on the product offering that suits them best SMEs, with annual gross revenues of less than Ps.250 million Middle-market corporations, with annual gross revenues of more than Ps.250 million that are not clients of Corporate and Investment Banking Government institutions, comprised of Mexican government agencies, state agencies and municipalities, as well as Mexican universities | | Offering our largest clients (mainly Mexican and multinational corporations, financial groups and large institutional clients) financial services and products such as: Global Transaction Banking (GTB), which includes cash management, working capital solutions and trade finance solutions Global Debt Finance (GDF), which includes origination, structuring and distribution of structured loan products, project finance and asset based finance Banking and Corporate Finance, which includes Mergers and Acquisitions, and Equity Capital Markets Markets, which includes “plain vanilla” and tailored fixed income, foreign exchange and hedging solutions Corporate and Investment Banking products and solutions for retail customers, which offers retail segment clients tailor-made corporate banking products and solutions in order to meet specific needs |
In addition, we have a Corporate Activities operating segment comprised of all other operational and administrative activities that are not assigned to a specific segment or product listed above. These activities include the centralized management of our financial investments, the financial management of our structural interest rate risk and foreign exchange position and the management of our liquidity and equity through securities offerings and the management of assets and liabilities.
Our insurance activities are included in the Retail Banking segment.
The following table sets forth the breakdown of our net interest income and operating profit before tax by operating segment.
| | | | | | | | | | | | | | | | | | | | | | | |
| | IFRS |
| | Net interest income | | | Operating profit before tax |
| | For the year ended December 31, | | | For the year ended December 31, |
| | 2016 | | | 2017 | | | 2018 | | | 2016 | | | 2017 | | | 2018 |
| | (Millions of pesos) |
Retail Banking | | Ps. | 42,277 | | | Ps. | 47,969 | | | Ps. | 54,005 | | | Ps. | 15,230 | | | Ps. | 17,111 | | | Ps. | 21,733 |
Corporate and Investment Banking | | | 4,899 | | | | 5,295 | | | | 6,121 | | | | 5,348 | | | | 5,085 | | | | 3,155 |
Corporate Activities | | | 1,954 | | | | 2,580 | | | | 1,871 | | | | 1,309 | | | | 1,978 | | | | (74) |
Total | | Ps. | 49,130 | | | Ps. | 55,844 | | | Ps. | 61,997 | | | Ps. | 21,887 | | | Ps. | 24,174 | | | Ps. | 24,814 |
The following table shows certain of our financial and operational data.
| | | | | | | | | | | | |
| | IFRS | |
| | As of and for the year ended | |
| | December 31, | |
| | 2016 | | | 2017 | | | 2018 | |
| | (Millions of pesos, except percentages, | |
| | offices and customer data) | |
Offices(1) | | | 1,364 | | | | 1,375 | | | | 1,393 | |
Customers | | | 13,553,067 | | | | 15,450,216 | | | | 16,690,063 | |
Total assets | | Ps. | 1,350,937 | | | Ps. | 1,329,191 | | | Ps. | 1,408,724 | |
Loans | | Ps. | 581,638 | | | Ps. | 609,420 | | | Ps. | 667,543 | |
Deposits(2) | | Ps. | 795,852 | | | Ps. | 795,440 | | | Ps. | 841,618 | |
Total equity | | Ps. | 105,227 | | | Ps. | 115,410 | | | Ps. | 123,287 | |
Non-performing loans as a percentage of total loans(3) | | | 2.93% | | | | 2.89% | | | | 2.67% | |
Efficiency(4) | | | 38.58% | | | | 39.21% | | | | 41.74% | |
ROAE(5) | | | 14.89% | | | | 16.93% | | | | 16.27% | |
| (1) | | Includes traditional branches (including those offering Santander Select service), offices and branches that serve SMEs, traditional bank tellers (ventanillas – including those offering Santander Select service), Santander Select offices (including centers (Centros Select), spaces (Espacios Select), box offices and corners) as well as Santander Select units (módulos). |
| (2) | | Includes demand, time deposits, repurchase agreements and deposits from the Mexican Central Bank and credit institutions. |
| (3) | | See Note 2.g to our audited financial statements included elsewhere in this Report for more details on the classification of credit-impaired or non-performing loans. |
| (4) | | Efficiency ratios are equal to administrative expenses plus depreciation and amortization, divided by total income. |
| (5) | | Calculated based upon the average daily balance of equity. |
As a result of the Merger, Grupo Financiero Santander México, our new holding company, directly owns 74.96% of our capital stock. Banco Santander, S.A., or Banco Santander Parent, owns 100% of the capital stock of Grupo Financiero Santander México and is our indirect controlling shareholder. We believe that our relationship with Banco Santander Parent and the Santander Group as a whole offers us significant competitive advantages over other banks in Mexico. As of December 31, 2018, the Santander Group had total assets of €1,459 billion (U.S.$1,668 billion), equity of €107,361 million (U.S.$122,730 million) and a market capitalization of €64,508 million (U.S.$73,742 million). It also generated an attributable profit of €7,810 million (U.S.$8,928 million) in the year ended December 31, 2018. We represented approximately 8% of the Santander Group’s attributable profit in the year ended December 31, 2018, making us the fifth largest contributor of attributable profits to the Santander Group. We also represented approximately 5% of the Santander Group’s assets in the year ended December 31, 2018, according to the annual report of the Santander Group for 2018.
Our Competitive Strengths
Leading market position in select categories
We are ranked second in terms of total assets, third in terms of total loans and net income and fourth in terms of deposits among private-sector banks in Mexico, with market shares of 14.3%, 13.2%, 12.3% and
13.7%, respectively, as of December 31, 2018, in each case as determined in accordance with Mexican Banking GAAP, according to information published by the CNBV. Among the seven largest private-sector banks in Mexico, we believe we hold leading market positions in most of our key product lines, such as mortgage and commercial loans (including loans to SMEs and middle-market corporations).
The following table shows rankings and market shares as of December 31, 2018, according to information published by the CNBV. All statements in this Report regarding our market position and relative financial performance vis-à-vis the financial services sector in Mexico are based, out of necessity, on information obtained from CNBV reports, and accordingly are presented in accordance with Mexican Banking GAAP. For a more detailed description of our performance relative to the Mexican banking industry, see “—Competition.”
| | | | | | |
| | Mexican Banking GAAP | |
| | As of December 31, 2018 | |
| | | | | | |
| | | | | | |
| | | | | Market Share | |
| | Position of Banco | | | of Banco | |
| | Santander | | | Santander | |
| | México among | | | México among | |
Rankings and Market Share | | banks(1) | | | banks(2) | |
Total loans | | 3 | | | 13.2 | % |
Deposits | | 4 | | | 13.7 | % |
Total assets | | 2 | | | 14.3 | % |
Asset quality(3) | | 7 | | | — | |
Total equity | | 3 | | | 12.3 | % |
Net income | | 3 | | | 12.3 | % |
Efficiency(4) | | 4 | | | — | |
ROAE(5) | | 3 | | | — | |
Source: CNBV.
| (1) | | Among the largest private banks in Mexico in terms of total assets, which are Banco Santander México; BBVA Bancomer, S.A., Institución de Banca Múltiple, Grupo Financiero BBVA Bancomer; Banco Nacional de México, S.A., integrante del Grupo Financiero Citibanamex; Banco Mercantil del Norte, S.A., Institución de Banca Múltiple, Grupo Financiero Banorte; HSBC México, S.A., Institución de Banca Múltiple, Grupo Financiero HSBC; Banco Inbursa, S.A., Institución de Banca Múltiple, Grupo Financiero Inbursa; and Scotiabank Inverlat, S.A., Institución de Banca Múltiple, Grupo Financiero Scotiabank. |
| (2) | | We calculate market share data based on information published by the CNBV. |
| (3) | | Defined as total non-performing loans as a percentage of total loans. |
| (4) | | We calculate the efficiency ratio as administrative and promotional expenses, which include depreciation and amortization, divided by total income, using information published by the CNBV. |
| (5) | | Calculated based on the average balance of equity. |
We believe that our scale and market leadership provide us with exceptional competitive opportunities, including the ability to gather market intelligence to support decision-making in determining business opportunities and in meeting our customers’ needs.
Focus on well-defined profitable client segments resulting in superior track record
We believe our market share in our key client segments (high- and mid-income individuals and SMEs) will continue to contribute to our profitability. We have posted ROAE levels of 14.4%, 15.8% and 16.0% in 2016, 2017 and 2018, respectively, making us the third most profitable bank among the seven largest
private-sector banks in Mexico under that metric in 2018, as determined in accordance with Mexican Banking GAAP, according to information published by the CNBV.
We developed our client segmentation strategy in 2008 with clearly defined client segments: high- and mid-income individuals, SMEs and middle-market corporations. Since then, we have focused our efforts on further refining our client segmentation, developing our product offerings, developing our information technology systems and our internal practices, as well as enhancing our distribution channels in order to better service our key client segments.
We believe our targeted efforts have helped us organically increase our market share in key business lines such as retail services to middle-market corporations and SMEs. We maintained our strategy of generating greater profitability through the high margin segments that continue to grow at a good pace, such as middle-market corporations, SMEs, consumer and credit card loans. From December 31, 2017 to December 31, 2018, our payroll loans market share increased 60 basis points, from 12.9% to 13.5%, as determinated in accordance with Mexican Banking GAAP, according to information published by the CNBV. We are the third-largest provider of residential mortgages in Mexico in terms of residential mortgages outstanding in 2018, as determined in accordance with Mexican Banking GAAP, according to information published by the CNBV. Through this strategy, we continue attracting deposits and maintaining a healthy quality of assets. See “—Our Core Products—Retail Lending—Mortgages.”
Efficient and business-oriented operational platform
Our operations are supported by our modern business-oriented information technology systems and our multichannel distribution strategy, resulting in innovative ways to serve our clients. Our multichannel distribution strategy consists of using both traditional and alternative distribution channels such as branches, Internet banking, mobile banking and contact centers tailored to each of our client segments and designed to reach a broad spectrum of customers in a cost-efficient manner.
We have well-developed customer relationship management, or CRM, tools that allow us to monitor our clients’ behavior and provide them with targeted product offerings through diverse channels. As a consequence, we are able to efficiently leverage alternative distribution channels, such as ATMs, Internet banking and our contact centers, which are complementary to our traditional proprietary branch network, which enables us to deliver better service to our clients and increases our sales ratios. As of December 31, 2018, we had approximately 1.8 million customers with pre-authorized credit offers.
We believe our efficient operations allow us to realize synergies and more profitable growth. As of December 31, 2018, we were the fourth most efficient bank among the seven largest private-sector banks in Mexico, as calculated in accordance with Mexican Banking GAAP, according to information published by the CNBV. For this purpose, we calculate the efficiency ratio as administrative expenses divided by total income, using information published by the CNBV.
We believe this is a result of many factors, including our focus on cost-control and best practices that we can leverage from Banco Santander Parent, among others. We believe our efficiency ratio provides us with operating flexibility and enables us to be competitive in pricing versus our peers.
Synergies from our affiliation with the Santander Group
We believe that being an affiliate of the Santander Group offers us significant competitive advantages. The Santander Group is one of the largest banking groups in Latin America in terms of assets, the largest financial group in Spain and a significant financial system participant in various European countries, including the United Kingdom, through its Santander U.K. subsidiary, Poland and Portugal, among others. Through Santander Consumer, Santander Group also operates a leading consumer finance franchise in
the United States as well as in Germany, Italy, Spain and several other European countries. Our relationship with the Santander Group allows us, among other things, to:
| · | | benefit from the Santander Group’s operational expertise in areas such as internal control and risk management, with practices that have been developed in response to a wide range of market conditions around the world and that we believe will enhance our ability to grow our business within desired risk limits; |
| · | | strengthen our internal auditing function and, as a result of the addition of an internal auditing department that reports concurrently and directly to our Audit Committee and the audit committee of Santander Group, making it more independent from management; |
| · | | enhance our ability to manage credit and market risks through the adoption of policies and know-how developed by Santander Group; |
| · | | leverage the Santander Group’s latest-generation, customer-centered, global information technology platform, which reduces our technology development costs, provides operational synergies with the Santander Group, enhances our ability to support our customers and enables us to deliver products and services targeted to the needs of our customers; |
| · | | utilize the Santander Group’s management training and development, which is composed of a combination of in-house training and development with access to managerial expertise and best practices in other Santander Group units outside Mexico. Santander Group also participates in monitoring key supervisory areas, including risk, auditing, accounting and financial control; |
| · | | access the Santander Group’s multinational client base and benefit from the Santander Group’s global presence, particularly in Latin America; |
| · | | support our large Mexican corporate customers in the internationalization of their businesses, through trade financing, international capital markets access, structured finance and syndicated loans, as well as transactional banking services; |
| · | | benefit from selectively borrowing from Santander Group’s product offerings in other countries as well as from their know-how in systems management; |
| · | | replicate or adapt to the Mexican market successful product offerings and best practices from the Santander Group and its subsidiaries in other countries; and |
| · | | benefit from Santander Group’s overall market presence and market campaigns such as its Formula 1 sponsorship. |
Although we benefit from our affiliation with the Santander Group, our executive officers are responsible for the management of our business and are independent from Banco Santander Parent.
Strong and sustainable funding and capitalization profile
Our principal source of funding is customer deposits, including repurchase agreements, which represented Ps.711,458 million, or 55.35%, of our total liabilities as of December 31, 2018. As of December 31, 2018, customer deposits represented 84.5% of our total deposits. Since we are primarily a commercial bank, customer deposits, a comparatively less expensive source of funding, constitute the main source of liquidity in our financing structure. This has allowed us to manage (i) our reliance on, and exposure to, riskier sources of funding and (ii) our liquidity requirements. We believe we have attractive capitalization levels based on our Tier 1 capital ratio, which has been near the median of the seven largest banks in Mexico over the past five years. As of December 31, 2018, our total capitalization ratio was 15.91%, comprised of
Tier 1 capital ratio of 12.32% and Tier 2 capital ratio of 3.59%, in each case as calculated in accordance with Mexican Banking GAAP.
Experienced management team and skilled workforce
We benefit from a highly-experienced management team. Our senior management has an average of 23 years of experience in the financial industry and 16 years in the Santander Group. Our management team has guided us through economic cycles and, by anticipating recent macroeconomic developments, has allowed us to achieve ROAE levels of 14.4%, 15.8% and 16.0% in 2016, 2017 and 2018, respectively, making us the third most profitable bank among the seven largest private-sector banks in Mexico under that metric in 2018, as determined in accordance with Mexican Banking GAAP, according to information published by the CNBV. Our management has concentrated its efforts on establishing a successful working environment and employee culture, and has invested in rigorous personnel selection processes, training programs and evaluation processes to maintain a strong talent base and foster retention. We have promoted the development and strengthening of abilities and skills in managing people and teams. The experience and commitment of our senior management team has been a critical component in the growth of our franchise, as well as in the continuing enhancement of our operations and financial performance.
Our Strategy
During 2018, we enhanced our commercial strategy focusing towards two main objectives: (i) becoming our clients’ primary bank and (ii) being leaders in profitable growth.
Based on our strong profitability and growth in key business lines, we will continue to focus on improving the experience of our customers and becoming their main bank. To achieve this, we continue to transform our distribution network and infrastructure, while we have launched new products and services through digital channels. We are working to strengthen our retail banking business by targeting high- and middle-income individuals, SMEs and companies, the most dynamic and profitable segments of the Mexican economy.
We intend to achieve these objectives through the following strategies:
Establish a client centric model that places the customer at the core of our business while we continue to expand and develop our customer base and further enhance customer loyalty
Customers are our main focus and our priority with respect to all of our commercial efforts. We seek to differentiate Banco Santander Mexico by providing exceptional service and an attractive value proposition, allowing us to increase customer loyalty. We believe this model will allow us to strengthen our position in the retail segment by attracting new high-potential customers, retaining existing customers through transactional products and ultimately becoming their primary bank.
We intend to continue to use our extensive distribution network to proactively pursue and strengthen our relationships with (i) high- and middle-income customers through the offering of key products and (ii) SMEs and middle-market corporations through innovative business solutions. An important part of our strategy is the segmentation of our customer base. We classify our individual customers in four main categories: “select,” “premier,” “preferred” and “classic” customers. We believe that our clear customer classification allows us to offer our customers a portfolio of targeted products that fit their specific needs.
In May 2016, we launched a new program, “Santander Plus”, an innovative and comprehensive program focused on client attraction, loyalty and digitalization that provides benefits customers transacting in the Bank. To join the program, customers must have their payroll account at the Bank or receive deposits of Ps.20,000 per month in their bank account with the Bank and become a digital customer through the use of Internet or mobile banking services. The benefits of the program for customers include cash reimbursements for using the Bank’s services or for spending money at Alsea Group restaurants and
establishments. Clients also have access to preferential rates in savings accounts. In addition, as we continue to work towards our goal of adapting to the needs and lifestyles of our customers, we added additional benefits to Santander Plus in September 2016, including the refunding of the opening fee when contracting payroll, cash credit, Express Line credit or a Personal Mortgage through the program and "Santander Event Protection," which grants our clients who have at least two assets insured with us (home, auto, health and life) a certificate to celebrate the occurrence of certain important events in their lives.
Since November 2017, in alliance with Grupo Soriana, we also grant refunds in cash to customers who spend money at Grupo Soriana stores. This alliance has helped us to promote the convenience of making payments through the Bank. We believe this initiative is one of our principal engines to attract high potential clients and a valuable tool to foster its loyalty and become their primary bank.
In April 2018, we announced the launch of “Hipoteca Plus”, a mortgage product with an interest rate of 8.59%, the lowest rate available in the market. By December 2018, more than 4.7 million clients have signed up to the program, 55% or more of which represented new clients.
Furthermore, to take advantage of the new payroll portability regulations, we are seeking to leverage our unique position in the corporate, middle-market and SMEs segments to attract new payroll customers and grow our individual demand deposit base.
Our different stakeholders – employees, clients, shareholders and our broader community – nowadays expect more from us than providing an excellent service at a good price; they expect that we take advantage of our role and positioning in the Mexican market to address the significant challenges facing our society.
We are facing two main challenges. First, our business environment has changed. Government regulators and society at large are more critical of the way we manage our business, going beyond the compliance with local rules and regulations. Therefore, it is essential that we have the right culture, capabilities, corporate governance and business practices. The second challenge is that we achieve inclusive and sustainable growth.
We have addressed these challenges through our financial inclusion and financial empowerment initiative Tuiio, through our scholarship program (due to the impact that education has in the economic development), and through our efforts to reduce our environmental impact.
We have been part of the IPC Sustainability Index since 2013 and have been recognized by Unicef for donating more than Ps.100 million over the past 13 years. We have also obtained the Corporate Social Responsibility recognition from the Mexican Center for Philanthropy (Cemefi) and the Alliance for Corporate Social Responsibility (AliaRSE) every year since 2004, and have been named the Most Socially Responsible Bank in Mexico by International Finance for two years in a row.
This is what responsible banking means to us: helping people make their dreams come true, supporting the creation of new jobs and new opportunities, and in this way, sharing the benefits of economic growth.
On October 16, 2017, we announced the launch of “Tuiio”, a financial inclusion program for low income individuals. Tuiio, which has its own operating model, infrastructure and brand, is a robust financial inclusion program that leverages technology to support the needs of Mexico’s low-income segment. It generates measurable social impact through productive micro-lending, a digital savings account, its own branch network, staff, ATMs, point-of-sale terminals and electronic banking. The initiative also includes a financial education program for clients, with the purpose of maximizing their skills and developing their employment potential.
As of December 31st, 2018, Tuiio had 39 dedicated branches in ten states across Mexico, more than 19,000 clients with an average of eight clients per group, and a loan portfolio of Ps.70 million.
Upgrade and enhance our technological platforms and infrastructure and expand our product offering in order to offer our customers innovative and quality services that satisfy their changing needs
We are upgrading and enhancing our technological platforms and infrastructure in order to meet our clients’ changing needs by providing them with high-quality and innovative products and services. In order to be able to achieve this goal, our strategy requires the digitalization of our businesses.
In order to secure our offerings with a client centric vision, we will continue to improve our CRM tool to drive strategies based on market intelligence; we plan to offer new products and services to existing customers based on our customer segmentation and the development of value-added offerings. Our goal in managing customer relationships is to position our customers at the heart of our business strategy. By improving our information technology systems and our processes, we believe we will be able to produce business intelligence by acquiring detailed information about current and future needs and the behavior of our customers. We believe that this business intelligence will enable us to define our customer segments in greater detail according to the life cycle and income levels, as well as improving the way we serve our customers through various distribution channels.
We will also continue to invest in creating and maintaining strong business support and commercial processes to make our products and services more accessible and improve our relationships with our clients. For example, we have developed a fully integrated commercial network, which manages customer product offerings through an internally designed CRM tool that makes it easier for branch executives to know their portfolios and to approach customers with specific and tailored product offerings. In addition, we also defined a differentiated on-boarding model to optimize the opening of accounts and the digital contracting of loans for our clients and non-clients.
We seek to increase our market share in retail banking by offering innovative banking products and intend to focus on profitable or high-potential products such as insurance, mortgages, credit cards, personal loans, and loans to SMEs and middle-market corporations, where we believe there is an opportunity to increase our market share. For our non-retail clients, we will continue to offer through our Corporate and Investment Banking segment an array of comprehensive products and services relating to finance, guarantees, mergers and acquisitions, equity and fixed income, structured finance, international trade finance, cash management services, collection services and e-banking, including structured loans, syndicated loans, acquisition financing and financing of investment plans, among others. We intend to improve the ways we serve our clients by expanding the multichannel distribution strategy related to each of our client segments and we will continue to seek to maximize the synergies and leverage the cross-selling opportunities between our corporate and retail businesses. In addition, we have established a division that is focused on enhancing the quality of our products and processes.
During 2017 we focused on the development of new products and digital channels to provide our customers with a modern technological experience, launching products such as "Super Digital” and “Super Cuenta". We also launched an innovative new remote service model "Santander Connect", the platform "Santander Cash Nexus" and the "Super Wallet" application. In addition, in October 2017, the digital "Spotlight" factory was inaugurated with a team dedicated to the development of solutions, improvements in processes, products and new banking schemes, based on technologies that seek to add next-generation services for our customers.
As part of our goal of adapting to our clients’ needs and providing them with better services, during 2018, we launched “Nómina digital” which makes the process of adding a client’s payroll easier through the implementation of a ChatBot. In November 2018, we launched a payment method using the NFC (Near Field Communication) technology with Mastercard and the Android operating system, which allows clients to pay at different businesses using their mobile phones. Moreover, we entered the car financing market with a traditional loan product for cars and motorbikes at competitive interest rates that includes a system of quotation and fully digital credit.
Leverage our leading market position to benefit from the significant growth potential of the Mexican banking sector
We seek to continue to increase our market penetration, focusing on our well-defined client segments and high-margin or high-potential products (such as mortgages, consumer lending, and lending to SMEs and middle-market corporations). At the same time, we intend to continue developing our profitable and client-centered global Corporate and Investment banking. To achieve these objectives, we will continue to leverage our strong brand name, distribution network and products with customer centricity, as well as seek to capture the benefits of growth in the banking sector as the Mexican economy grows and the level of penetration of financial services in Mexico approaches those of other countries in Latin America. Furthermore, we will continue to focus our marketing efforts to grow our customer base and promote loyalty through the transactional use of our electronic channels, as well as the cross-selling of products and tailored services to increase the number of products used by each of our clients. We intend to achieve this objective through ongoing technological innovation, development of lasting relationships with our customers and by cross-selling credit products, such as mortgage loans, credit card loans, payroll loans, personal loans and insurance products, such as life, automobile, home, health, accident, fraud and unemployment insurance, to our clients. We aim to improve our competitiveness by further strengthening our brand awareness, particularly through the marketing of our products and the use of our multichannel distribution platform and by continuing to focus on the development of innovative products aimed at satisfying the changing needs of each of our different client segments.
In addition, we aim to increase our exposure to demand deposits from individuals in order to reduce our cost of funding and thus increase our profitability in the medium term. We plan to achieve this goal by attracting more payroll accounts through cross-selling to our strong base of corporate clients.
Capitalize on our risk management practices, cost-efficient culture and efficient capital allocation to promote profitable and sustainable growth
As we pursue our growth and profitability objectives, we will sharpen our focus on profitability and efficiency, by seeking to be a more balanced bank with a higher share of consumer loans and lower cost deposits. We aim to underpin this strategy through efficient capital allocation, strong risk management, an efficient overhead structure and productive investments. We will continue applying risk policies aimed at generating an appropriate return on our risk-weighted assets. We intend to continue to carefully monitor the credit quality of our asset portfolio and adapt our risk policies accordingly, particularly assets in high growth segments such as individuals and SMEs, while diversifying our balance sheet. We plan to maintain a balanced growth profile with a strong emphasis on (i) liquidity, (ii) a stable and low-cost funding base and (iii) strong capital ratios.
We plan to make efficient use of technology and digitalization through alternative channels, such as mobile banking, internet banking, full-function ATMs and our telephone contact centers, in order to control the expenses associated with the continued expansion of our multichannel distribution strategy. As of December 31, 2018, we were the fourth most efficient bank among the seven largest private-sector banks in terms of assets in the Mexican banking system, as determined in accordance with Mexican Banking GAAP, according to data from the CNBV. For this purpose, we calculate the efficiency ratio as administrative expenses divided by total income, using information published by the CNBV. We will continue to monitor our administrative and promotional expenses in order to seek to maintain a low efficiency ratio.
Operations Through Subsidiaries
As of December 31, 2018, we have three principal subsidiaries: Santander Consumo, S.A. de C.V. Sociedad Financiera de Objeto Múltiple, Entidad Regulada, Santander Vivienda, S.A. de C.V. Sociedad Financiera de Objeto Múltiple, Entidad Regulada and Santander Inclusión Financiera, S.A. de C.V. Sociedad Financiera de Objeto Múltiple, Entidad Regulada.
On December 21, 2016, the SHCP authorized the merger of our subsidiary Santander Vivienda, S.A. de C.V., Sociedad Financiera de Objeto Múltiple, Entidad Regulada, Grupo Financiero Santander México as merging entity with two of our other subsidiaries, Santander Hipotecario, S.A. de C.V., Sociedad Financiera de Objeto Múltiple, Entidad Regulada, Grupo Financiero Santander México and Santander Holding Vivienda, S.A. de C.V. both as merged entities. The merger was effective on January 1, 2017.
On October 5, 2017, the SHCP authorized the incorporation of Inclusión Financiera as a subsidiary of the Bank, the main activity of which is granting credits to low income creditors. The aim of this subsidiary is to achieve a social impact through a competitive offer in the sector of microcredits. For additional information on the authorization to incorporate Santander Inclusión Financiera, S.A. de C.V., see Note 3.5 to our audited financial statements included elsewhere in this Report.
The following table shows total assets, net income and total equity of each of our principal subsidiaries as of and for the year ended December 31, 2018.
| | | | | | | | | | | |
| | IFRS |
| | As of and for the year ended |
| | December 31, 2018 |
| | Total assets | | | Net income | | | Total equity |
| | (Millions of pesos) |
Santander Consumo | | Ps. | 77,886 | | | Ps. | 3,495 | | | Ps. | 11,023 |
Santander Vivienda | | | 49,189 | | | | 504 | | | | 7,412 |
Inclusión Financiera | | | 197 | | | | (115) | | | | 270 |
Our principal sources of funding are customer deposits. Customer deposits typically represent a substantial portion of our funding base because of our ability to attract deposits from customers through our extensive retail, wholesale and corporate network. Since we are primarily a commercial bank, customer deposits constitute the main source of liquidity in our financing structure. These deposits currently cover most of our liquidity requirements. Our control and management functions involve planning our funding requirements, structuring the sources of financing to achieve optimal diversification in terms of maturities, instruments and markets and setting forth contingency plans. In order to increase liquidity, we rely in part on local peso-denominated issuances. We also have access to international funding through U.S. dollar-denominated issuances with longer maturities. For a further discussion of our funding, see “Item 5. Operating and Financial Review and Prospects—B. Liquidity and Capital Resources.”
Retail Banking
General
Our Retail Banking segment’s activities include products and services for individuals, private banking clients, SMEs, middle-market corporations and government institutions. As of December 31, 2018, our Retail Banking segment accounted for approximately 83.1% of our total loans and advances to customers (excluding reverse repurchase agreements) based on the aggregate principal amount of loans in this segment, approximately 82.2% of our total demand and time deposits, 87.1% of our net interest income, 90.2% of our fee and commissions income (net) and 87.6% of our operating profit before tax. Our retail banking operations served 16,676,741 customers as of December 31, 2018, an increase of 1,239,039 customers since December 31, 2017.
In 2018, our branch network and alternative channels originated more than 528,257 credit cards, 497,383 consumer loans and 16,071 mortgage loans.
Individuals
We classify individual high-income customers as “select,” if they have a monthly income in excess of Ps.70,000 (U.S.$3,562) and “premier,” if they have a monthly income between Ps.50,000 (U.S.$2,544) and
Ps.70,000 (U.S.$3,562); mid-income, or “preferred,” if they have a monthly income between Ps.10,000 (U.S.$509) and Ps.50,000 (U.S.$2,544); and low-income, or “classic,” if they have a monthly income below Ps.10,000 (U.S.$509). We believe that our clear customer classification allows us to offer our customers a portfolio of targeted products that fit their specific needs. Our focus is on select, premier and preferred customers, areas in which we have experienced growth as a result of our efforts to provide innovative products and services. We began to classify eligible customers as premier or preferred in April 2010 and soon thereafter began to sell them packaged products and services known as Membresía Premier (Premier Membership), Círculo Preferente (Preferred Circle) and Cuenta Total (Total Account) accounts. Since 2014, we also have offered Mundo Select (Select World) services to our select customers. As of December 31, 2018, individuals accounted for 37.4% of our total loans and advances to customers (excluding reverse repurchase agreements) and 36.4% of our deposits. As of December 31, 2018, individuals (including individuals served by our private banking business described below under “—Private Banking”) accounted for 56.2% of our fee income and 30.2% of our operating profit before tax in the year ended December 31, 2018.
New individual customers are classified according to their socioeconomic status as classic, preferred, premier, select or as private banking customers (as described below in “Private Banking”). Individual customers are then further classified into sub-segments according to their age, and each customer sub-segment is offered products tailored to their socioeconomic status and age. Through this strategy, we aim to build customer loyalty by developing products that meet our customers’ financial needs throughout their entire financial life cycle.
We follow different service models for each customer class:
| · | | Select customers: We offer a commercial model tailored to provide exclusive products and services through unique and differentiated branches. The customers in this segment have significant assets giving them access to specialized channels and an exclusive menu of products and services. To best serve our select customers, we offer different investment products (both short- and long-term), asset protection, personal credit, mortgage loans and credit cards. The select model offers the opportunity to be part of a network of both financial and non-financial benefits called Mundo Select, which is the key access point for the select commercial model. As of December 31, 2018, our select customers class included 568,184 customers, 362,520 of whom were attended to by 722 select managers that specialize in investment services. About 63.8% of our select customers were attended to in 166 exclusive Santander Select offices, which provide services in a private, distinguished and comfortable environment. |
| · | | Premier customers: We have a commercial model that tracks our premier customers’ financial growth and addresses their credit, protection and savings needs. These customers are attended to with a value-added approach focused on providing quality service with the flexibility of accessing banking services through any of our channels. All of our branches have a dedicated area to serve these customers, as well as a premier executive to focus exclusively on their specific needs. As of December 31, 2018, our premier customer class included 617,298 customers that were served by approximately 690 representatives throughout our 1,393 offices across Mexico. |
| · | | Preferred customers: We use a multichannel service model, supported by our account managers as well as our contact center operators. We provide differentiated services with preferential benefits such as insurance, additional credit cards, consumer loans and automatic payments to these customers, whom we view as upwardly mobile. As of December 31, 2018, we had 5,006,207 preferred customers. |
| · | | Classic customers: Our emphasis is on serving our classic customers through alternative channels to support self-service and maintain a profitable business model. In our branches, classic customers are served under a standardized model through pools of account executives, with a sales-oriented approach. We offer differentiated services such as preferred bundled offers and payroll benefits to |
customers we view as upwardly mobile. As of December 31, 2018, we had 10,081,682 classic customers. |
Within the Retail Banking segment, customers classified as individuals, together with private banking customers, collectively accounted for 62.4% of our fee income and 34.5% of our operating profit before tax in 2018.
Private Banking
The goal for our Private Banking division is to grow as a market leader in the private banking business in the countries where we operate, offering our customers solutions for their financial needs, through a transparent and innovative approach, based on a long-term, respectful and trustful relationship.
Private Banking has 2,000 professionals across more than 100 offices worldwide, and is within the top twenty five private banking operations in terms of asset volume. In Mexico, we have 19 offices and 95 specialized bankers located throughout the country, which provide financial advice and financial services to more than 14,261 customers with Ps.252,595 million (U.S.$12,854 million) in assets and 22,460 accounts.
In 2017 and 2018, Euromoney recognized us as the “Best Private Bank” in Mexico.
We provide customized financial and investment services by offering innovative products developed via a rigorous risk management process adapted to each client’s specific needs and investment profile. These customers are assigned to a specialized banker who monitors their investment portfolio and remains in frequent contact with the client.
We offer different services to each customer, depending on the degree of involvement that such customer wishes to have with the bank, including custody/execution services, advisory services, centralized management, real estate planning advice and financing and real estate services.
In order to provide a differentiated business model, we have two divisions:
| · | | Private banking customers, with net wealth in excess of Ps.15 million (U.S.$0.8); and |
| · | | Ultra-High Net-Worth customers, with net wealth in excess of Ps.300 million (U.S.$15 million). |
SMEs
As of December 31, 2018, our SME line of business represented 11.3% of our total loans and advances to customers (excluding reverse purchase agreements) and 9.5% of our deposits. SMEs accounted for 14.4% of our fee and commission income (net) and 23.5% of our operating profit before tax in the year ended December 31, 2018. We offer our customers in this business line a range of products and services, including revolving lines of credit, commercial loans, leasing, factoring, foreign trade loans and guarantees, credit cards, mortgage loans, current accounts, savings products, mutual funds and insurance brokerage and an acquiring business, among others.
Our Retail Banking segment provides banking services and originates loans for SMEs. In 2015 we strengthened our service model for “Medium-Sized Enterprises,” where through a specialized risk analysis channel we can work with SMEs of bigger size. We introduced sales forces for SMEs Agro business and sales force for SMEs International Commerce business as well as specialists in the derivatives business for clients seeking derivatives for exchange rates and credit rates, two important sectors for Medium-Sized Enterprises. The maximum level of credit extended to such companies is generally limited to approximately Ps.20 million (U.S.$1 million), although there are faculties for larger loans in our risk committees. Approximately 49% of the SMEs loan portfolio has a certain type of guarantee granted by Nacional
Financiera, Sociedad Nacional de Crédito, Institución de Banca de Desarrollo, or NAFIN, a Mexican government bank that provides support for SMEs.
Our SME business represented Ps.77,706 million of our total loan portfolio as of December 31, 2018, an increase of 7.5% from December 31, 2017. This increase reflects the positive results obtained from the improvement in client services via the “SME Santander Model,” through which we strive to be the preferred bank for SMEs by providing quality customer service, straightforward and targeted commercial and risk processes and a customer development program featuring financial educational courses offered both live and online that focus on issues relevant to SMEs in Mexico. We also continue to expand our specialized network of SME executives dedicated exclusively to attending SME customers. The specialized SME network included 895 dedicated SME specialists as well as 28 dedicated specialized offices (Centros Pyme, or SME Centers) as of December 31, 2018, an increase in 3 specialized offices compared to last year.
As of the end of 2018, we have two digital credit schemes for SMEs, especially focused on small and medium young digital native entrepreneurs, one that grants digital credit, thereby accelerating the approval response and one for digital onboarding for the opening of current account in line. Both schemes make the processes simpler and more efficient.
In addition, we improved the value proposition of the SME packages for a customer segment that requires tailor-made solutions with the entrepreneurial package for SAS (Sociedad por Acciones Simplificadas) thanks to an agreement with the SHCP that allows us to be the first bank to have the process for opening accounts online for this type of customer supported by on-boarding and digital credit that improve the experience of our customers.
Together with the digital alliance with “Cívico”, we made an innovative partnership to bring banking and promotion services to small businesses in Mexico City through a geo-location model of economic activities. We also launch the “Agro Contract Application for marketers”, through which we encourage the placement of agricultural loans in the segment.
Middle-Market Corporations
This business line is comprised of companies that generally have annual revenues of more than Ps.250 million (U.S.$13 million), are not clients of Corporate and Investment Banking and meet certain other qualifying criteria. We offer middle-market corporations a wide range of products, including commercial loans, credit lines, leasing, factoring, foreign trade loans and guarantees, current accounts, savings products, mutual funds, payroll administration (a potential source for new individual customers), cash management, treasury services, financial advisory services, credit cards and insurance brokerage. We also offer our middle-market corporations customers with higher income the same products that we offer to our global corporate banking customers. As of December 31, 2018, we had 8,398 middle-market corporations customers, and 33 specialized offices, 203 senior executives, 19 agro-executives, 21 account directors, 18 deputy directors and 162 management officers (back office executives that support the sales force) located throughout Mexico dedicated to attending these middle-market corporations customers.
Our middle-market corporations portfolio represented Ps.178,109 million (U.S.$9,064 million) of our total loans and advances to customers (excluding reverse repurchase agreements) as of December 31, 2018, an increase of 6.8% from December 31, 2017. The quality of this portfolio has not been affected by its growth; the non-performance rate was 1.0% as of December 31, 2017 and 1.1% as of December 31, 2018. As of December 31, 2018, our middle-market corporations customers represented 25.8% of our total loans and advances to customers (excluding reverse repurchase agreements) and 18.2% of our deposits. In savings account balances, we increased our market share by 1.7 times with a 10.9% increase as compared to 2017. Middle-market corporations accounted for 16.8% of our fee and commission income (net) and 26.4% of our operating profit before tax in 2018.
The middle-market business is an important source of deposits and most of its revenues come from credit products. This business line has consistently increased its array of products designed to meet our customers’ needs in terms of cash management and collection solutions. Due to the low penetration in this market by Mexican banks, we believe we have an opportunity to further provide loans and cash management and collections solutions to middle-market corporations.
In addition, we have significantly increased cross-selling within this business unit. We have established a model to serve customers that actively use at least three products, including investment, credit, payroll administration and cash management, among others. We refer to these clients as Vinculados Transaccionales (Loyal Clients). Our sales team has focused on increasing the volume of transactions of our middle-market corporations customers and, as a result, we had 3,497 Vinculados Transaccionales customers as of December 31, 2018, an increase of 8.7% from December 31, 2017.
We have a specialized area in our contact center to provide a more personalized service to corporations (SMEs and middle-market corporations), driven by efficient and high-quality services while keeping our executives current on the corporations’ specific needs and requests.
In 2018, we contributed 170,866 payrolls accounts to the Retail Banking segment. We strengthened our Investment Banking model, through internal integration and the addition of a new working team, generating more than Ps.874.2 million income.
Institutions
This business unit caters to Mexican government agencies, states agencies and municipalities as well as Mexican universities. As of December 31, 2018, these customers represented 8.6% of our total loans and advances to customers (excluding reverse repurchase agreements) and 18.1% of our deposits. Institutions accounted for 2.8% of our fee income and 7.5% of our operating profit before tax in the year ended December 31, 2018. We had 1,809 institutional customers as of December 31, 2018.
We have 11 specialized representative zones in Mexico that offer tailor-made products to meet our institutional customers’ needs. Among the products we offer to our governmental clients are current accounts, loans, payroll processing, cash management, collection services and payment processing services. Serving these institutions allows us to cross-sell current accounts, credit card services, loan products, insurance products and collection services to their employees.
We have a global business model called “Red Salud” that brings specialized service to health care institutions in Mexico, through our nine branches. In addition, we have implemented a model to attend to several religious institutions, such as Parishes, Archdiocese and Diocese in Mexico.
Corporate and Investment Banking
General
The Corporate and Investment Banking segment serves customers such as large Mexican companies and local and foreign multinational companies, which are served globally by the Santander Group which, due to their size, complexity or sophistication require customized services and value-added corporate products. This segment also includes domestic and international financial groups, as well as large institutional customers.
This segment provides comprehensive products and services relating to finance, guarantees, mergers and acquisitions, equity and fixed income, structured finance, international trade finance, cash management services and e-banking, structured loans, syndicated loans, acquisition financing and asset, among others, through two branch offices located in Mexico City and Monterrey. The Corporate and Investment Banking
segment uses its range of products, knowledge of the local market and efficient execution in order to customize the financial solutions it offers to our customers.
As of December 31, 2018, the Corporate and Investment Banking segment served 465 customers and accounted for 16.9% of our total loans and advances to customers (excluding reverse repurchase agreements), 13.9% of our total demand and time deposits, 10.8% of our fee and commission income (net) and 12.7% of our operating profit before tax.
The main products and services that our Corporate and Investment Banking segment provides are:
| · | | Global Transaction Banking, which includes cash management, working capital solutions and trade finance; |
| · | | Global Debt Finance (GDF), which includes origination, structuring and distribution for structured credit and debt products, project finance and asset based finance; |
| · | | Banking and Corporate Finance, which provides advisory, origination and execution services in financial and strategic advisory services on mergers and acquisitions processes; |
| · | | Markets, which includes solutions and services for investing and hedging using both plain vanilla and structured products such as rates, equity and foreign exchange, as well as the intermediation in organized markets; and |
| · | | Corporate and Investment Banking products and solutions for retail customers, which offers retail segment clients’ tailor-made corporate banking products and solutions in order to meet specific needs. |
Global Transaction Banking
Our Global Transaction Banking segment focuses on facilitating and optimizing the most common banking transactions of corporate and institutional clients in the Corporate and Investment Banking segment by offering products and services such as:
| · | | Cash Management. We offer our clients our electronic banking platforms, enabling them to manage payments, collections and liquidity efficiently. |
| · | | Working Capital Solutions. We offer solutions to allow our clients to operate efficiently by optimizing cash cycles through: |
| o | | Commercial Financing: Structured and non-structured products for payments and collections chains (Confirming, Factoring, Receivables Purchase Program) and monetization of commercial contracts. |
| o | | Basic Financing: Credit lines and short-and medium-term bilateral loans to finance working capital needs. |
| o | | Structured Trade: Structured financing products for the acquisition of machinery and equipment. |
| · | | Trade finance. Products to finance everything related to international trade, including: |
| o | | Documentary Trade: Plain vanilla management through letters of credit and guaranties administration. |
| o | | Trade: Management of everything related to structured financing through guaranties to acquire foreign machinery and equipment covered by Export Credit Agency and specific projects. |
Global Debt Finance
The credit markets operations of Corporate and Investment Banking are in the scope of our GDF area, which includes project finance, syndicated loans and acquisition finance, and asset based finance:
| · | | Project Finance. We originate, structure and finance projects generally sponsored by a private institution, with public sponsorship and/or productive state enterprises. We have participated in transactions in almost all economic sectors, most notably in energy, oil and gas, logistics, infrastructure and water, among others. |
| · | | Syndicated Loans and Acquisition Finance. Medium-and long-term financing to attend our clients’ investment or corporate needs. Due to the size and importance of the operations, we usually act as Structuring Agent and look for other banks to join the financing. We aim to lead syndicated loan operations and look to reduce our risk exposure through the syndication. |
| · | | Asset Based Finance. This team supports Capital for Infrastructure and Energy Projects through financing alternatives such as subordinate or mezzanine debt, convertible debt, or capital for projects; as well as long term financing based on assets such as long term leasing for the transport sector where we assume the capital risk in that framework. |
| · | | Debt Capital Market: Includes the design, advisory, and execution of issuance of fixed income securities in all modalities (fixed and floating obligations, structured bonds) from issuers from the private sector as well as from the public sector. |
Banking and Corporate Finance
Our Banking and Corporate Finance sub-division of our Corporate and Investment Banking segment is engaged in the following activities.
Mergers and Acquisitions
We offer a wide range of investment banking services relating to mergers and acquisitions, including sell-side advisory, buy-side advisory, fairness opinions and capital raising services. As part of our universal banking model, we can offer financing to the parties we advise.
Equity Capital Markets
We take care of the processes related to the placement of equity securities issued by Mexican companies, mostly stocks in the market (Mexican Stock Exchange). Types of transactions we facilitate include initial public offerings, follow-ons and public acquisition offers, among others. We evaluate, each issuer through different methodologies, analyze the market situation, elaborate proposals that best fit each issuer’s profile considering its balance, size and dilution, among others, as well as review all documentation necessary to complete each placement.
Markets
Our Markets area offers a variety of treasury products to customers, including institutional investors, corporate clients and individuals. We provide sophisticated and innovative derivative products to help our customers manage market risk exposure to foreign exchange rates and interest rates. We believe we have an effective client coverage model based on dedicated sales teams for each client segment that allows us to maintain specialists committed to providing for the specific needs of our individual clients. In addition, we
have structuring and product development teams that work to maintain a cutting-edge portfolio of innovative client solutions. The global network of Santander Group, with its strong presence in Europe and Latin America, gives us the ability to offer a wide range of international products as an integrated service for our local customers. Furthermore, we offer treasury products as a standardized solution, providing hedge and yield enhancement, to middle and retail market companies. We have implemented extensive suitability processes designed to ensure customers understand and accept the risks involved in the derivatives market.
We also have a team responsible for the management of the Bank’s relative value investment. In the management of the Bank’s books, we seek to maintain recurrent results for each single individual book with the main objective of preserving capital. The decision-making process is based on fundamental aspects of each market, supported by technical views. The relative value trading desks must comply with risk control policies established by our senior management and with those applied worldwide by Banco Santander Parent. All positions and processes are strictly monitored and controlled by specialized market and operational risk teams and finance and compliance departments.
Asset Credit Portfolio Management
The goal of this area is to mobilize the balance of the corporate wallet by hedging exposures through credit derivatives, buy and sell of proprietary credit positions, and diversifying credit risk in order to obtain the appropriate risk profile.
Corporate and Investment Banking Products and Solutions for Retail Customers
We have specialized teams dedicated to bringing retail segment clients tailor-made corporate banking products and solutions in order to cover these clients’ needs in investment banking and markets.
Our retail markets team designs and provides adapted derivative and cash flow products (mainly interest rates and foreign exchange) for retail clients, distributing them through our branch network. They also provide tailor-made derivative products for those retail clients with specific and complex requirements.
Our Banking and Corporate Finance team is involved in structuring a variety of transactions, such as project and acquisition finance, mergers and acquisitions, and asset and capital structuring, bringing our retail clients products that address specific needs.
Our Core Products
Deposit-Taking and Repurchase Agreements Transactions
We offer our retail banking customers a variety of deposit products, such as:
| · | | current accounts (also referred to as demand deposits), which do not bear interest; |
| · | | traditional savings accounts, which bear interest; and |
| · | | time deposits, which are represented mainly by notes with interest payable at maturity and which normally have a maturity of less than 36 months and bear interest at a fixed or floating rate. |
In addition, we accept deposits from financial institutions as part of our treasury operations, which are represented by certificates of interbank deposit, or CDIs, and which earn the interbank deposit rate. Besides representing a significant source of stable funding for us, we regard each account holder as a potential customer for the full range of products and services we offer.
We also enter into repurchase agreement transactions. Repurchase agreements are Mexican-law governed sale and repurchase agreements (reportos), also known as repos, pursuant to which a party agrees to a temporary purchase or sale of securities in exchange for (i) a specified premium to be paid or received and (ii) the obligation to resell or repurchase the underlying security. Under a circular issued by the Mexican Central Bank, Mexican banks may enter into repurchase transactions with Mexican and foreign counterparties. Repurchase transactions may be entered into in respect of bank securities, Mexican government securities, debt securities registered with the CNBV and certain foreign securities. Repurchase transactions must be entered into under master agreements, such as the master agreements of the International Securities Market Association and the Public Securities Association. Collateral may be provided in connection with repurchase transactions.
Repurchase agreements totaled Ps.100,680 million at December 31, 2018, a 8.60% decrease compared to the amount at December 31, 2017. We expect to continue using this funding source in the future due to its broad availability and low cost.
The table below presents a breakdown of our total deposits by product type including repurchase agreements at the dates indicated.
| | | | | | | | | | | |
| | At December 31, |
| | 2016 | | | 2017 | | | 2018 |
| | (Millions of pesos) |
Demand deposits: | | | | | | | | | | | |
Interest-bearing deposits | | Ps. | 246,101 | | | Ps. | 256,635 | | | Ps. | 237,948 |
Non-interest-bearing deposits | | | 157,222 | | | | 165,393 | | | | 205,275 |
Subtotal | | Ps. | 403,323 | | | Ps. | 422,028 | | | Ps. | 443,223 |
Time deposits: | | | | | | | | | | | |
Notes with interest payable at maturity | | Ps. | 124,375 | | | Ps. | 141,883 | | | Ps. | 154,838 |
Fixed-term deposits | | | 5,454 | | | | 5,598 | | | | 3,778 |
Foreign currency time deposits | | | 10,579 | | | | 11,983 | | | | 17,026 |
Subtotal | | Ps. | 140,408 | | | Ps. | 159,464 | | | Ps. | 175,642 |
Repurchase agreements | | Ps. | 83,891 | | | Ps. | 81,790 | | | Ps. | 65,369 |
Accrued interest(1) | | | 578 | | | | 1,054 | | | | 1,320 |
Other deposits | | | 27,696 | | | | 26,230 | | | | 25,904 |
Total customer deposits | | Ps. | 655,896 | | | Ps. | 690,566 | | | Ps. | 711,458 |
Deposits from the Mexican Central Bank and credit institutions(2) | | | 139,956 | | | | 104,874 | | | | 130,160 |
Total deposits | | Ps. | 795,852 | | | Ps. | 795,440 | | | Ps. | 841,618 |
| (1) | | Mainly from time deposits. |
| (2) | | Includes Ps.40,634 million, Ps.28,359 million and Ps.35,311 million of repurchase agreements with the Mexican Central Bank and with credit institutions as of December 31, 2016, 2017 and 2018, respectively. |
Lending
The following table shows a breakdown of our total loans and advances to customers (excluding reverse repurchase agreements) by customer category at the dates indicated.
| | | | | | | | | | | | | | | |
| | | | | | | | | | Change, December 31, 2018 vs. | |
| | At December 31, | | | December 31, 2017 | |
| | 2017 | | | 2018 | | | (Millions of pesos) | | | (%) | |
| | (Millions of pesos) | |
Individuals | | Ps. | 241,950 | | | Ps. | 257,536 | | | Ps. | 15,586 | | | 6.4% | |
SMEs | | | 72,279 | | | | 77,706 | | | | 5,427 | | | 7.5% | |
Middle-market corporations(1) | | | 166,783 | | | | 178,109 | | | | 11,326 | | | 6.8% | |
Institutions | | | 34,766 | | | | 59,542 | | | | 24,776 | | | 71.3% | |
Subtotal | | | 515,778 | | | | 572,893 | | | | 57,115 | | | 11.1% | |
Global corporate clients | | | 110,571 | | | | 116,166 | | | | 5,595 | | | 5.1% | |
Total(2) | | Ps. | 626,349 | | | Ps. | 689,059 | | | Ps. | 62,710 | | | 10.0% | |
| (1) | | Includes private banking. |
| (2) | | These amounts do not include reverse repurchase agreements. |
Retail Lending
General
We offer retail lending products to customers through our extensive branch network and on-site service units. See “—Distribution Network.” We divide our customers into separate categories based principally on their monthly income (for individuals) and annual gross revenues (for businesses). We tailor our products and services to the needs of each customer classification. Our loans are generally originated and serviced internally. We believe our underwriting system has the capability to process large application volumes (greater than the expected volume for the upcoming years), maintaining the tight controls and information requirements to improve the decision models.
We make credit available to our customers through the various loan products listed in the table below. The table sets forth the composition of our individual and SME customer total loan portfolio at the dates indicated.
| | | | | | | | | | | | | | | |
| | | | | | | | | | Change, December 31, 2018 vs. | |
| | At December 31, | | | December 31, 2017 | |
| | 2017 | | | 2018 | | | (Millions of pesos) | | | (%) | |
| | (Millions of pesos) | |
Mortgages | | Ps. | 134,196 | | | Ps. | 145,749 | | | Ps. | 11,553 | | | 8.6% | |
Credit cards | | | 54,372 | | | | 56,298 | | | | 1,926 | | | 3.5% | |
SMEs | | | 72,279 | | | | 77,705 | | | | 5,426 | | | 7.5% | |
Payroll loans | | | 29,844 | | | | 33,380 | | | | 3,536 | | | 11.8% | |
Personal loans | | | 23,291 | | | | 21,364 | | | | (1,927) | | | (8.3)% | |
Other | | | 247 | | | | 745 | | | | 498 | | | 201.6% | |
Total | | Ps. | 314,229 | | | Ps. | 335,241 | | | Ps. | 21,012 | | | 6.7% | |
The Santander Vivienda residential mortgage portfolio amounted to Ps.25,739 million and Ps.46,342 million as of December 31, 2017 and December 31, 2018, respectively.
The following table shows the annual interest rate applicable to the main categories of retail lending products at December 31, 2018.
| | |
| | Annual |
| | interest rate |
| | (%) |
Credit cards | | 26.56 |
Personal loans (includes payroll loans, personal loans and others) | | 25.11 |
Mortgages | | 10.11 |
Payroll Loans
Payroll loans are a typical consumer lending product with a differentiated method of payment. We grant loans (after conducting a risk assessment) to customers that receive their salaries through a current account at the Bank. The loan payments are made through automatic charges to the current account and are scheduled according to the payroll frequency of each employee (weekly, biweekly, monthly).
Our clients include employees from the public and private sectors. At December 31, 2018, payroll loans amounted to Ps.33,380 million (U.S.$1,699 million), representing approximately 4.8% of our total loans and advances to customers (excluding reverse repurchase agreements). We held approximately 13.5% of the market share in Mexico in payroll loans at December 31, 2018, as determined in accordance with Mexican Banking GAAP, according to information published by the CNBV.
Personal Loans
Personal loans are loans granted to individuals with maturities of up to 48 months and the monthly installments to be paid by the customer may not exceed 65% of such customer’s net monthly salary. Personal loans are not secured by collateral. At December 31, 2018, personal loans amounted to Ps.21,409 million (U.S.$1,089 million), representing approximately 3.1% of our total loans and advances to customers (excluding reverse repurchase agreements).
Credit Cards
We are the third-largest market player with respect to credit card loans in the Mexican market according to information published by the CNBV, and we had 3.5 million outstanding credit cards across 3.5 million accounts as of December 31, 2018. At December 31, 2018, we held a 13.8% of the market share in Mexico, with a delinquency rate of 4.3%, below the average in the Mexican market, in each case as determined in accordance with Mexican Banking GAAP, according to information published by the CNBV. At December 31, 2018, credit card loans amounted to Ps.56,227 million (U.S.$2,861 million), representing approximately 8.2% of our total loans and advances to customers (excluding reverse repurchase agreements).
We issue 23 different MasterCard, Visa and American Express credit cards designed for our different business segments. We mainly issue credit cards to our existing customers, such as deposit account holders and non-deposit account holders. Our income from credit cards includes interchange merchant fees, interest on credit card balances, annual cardholder fees and fees charged for cash advances. We market our credit cards through our branch network and offer preselected credit cards to our customer base across all socioeconomic customer segments. Our growth strategy is based on gaining market share while growing profits, by focusing on product innovation and aggressive customer acquisition efforts through commercial campaigns and managing risk according to different segments and channels. Since 2001, we have launched credit card products designed to serve customer preferences and financial needs and aimed at encouraging demand for our products. The main customer preferences and needs that have been addressed are low rates, no commissions, total protection and miles/rewards programs.
We offer many benefits for our credit card customers, including: (i) the Fiesta Rewards Platinum card, through which customers (a) receive points on the first purchase within 100 days of card authorization, points for every dollar consumed in any establishment and for every dollar in participating hotels, (b) can exchange points for hotel nights, plane tickets, car rental and catalog products and (c) can access our Concierge service and more than 900 VIP lounges with Priority Pass membership; (ii) the Delta Platino card, through which customers receive a welcome bonus, priority in the boarding of certain flights and access to the SkyMiles Program in which one mile is accumulated for every dollar spent in any establishment and two miles for every dollar spent in Delta, with no expiration of points and can access Concierge service and Elite Valet; (iii) the American Express card, which grants differentiated points: for each dollar in purchases in department stores, supermarkets and in any other trade, plus an extra bonus of triple points for purchases without interest during the first six months after activation.
In February 2016, we launched a new travel credit card "TDC Santander-Aeromexico", in conjunction with the most important airline in Mexico, with exclusive benefits for 10 years. This card offers differentiated benefits to different client segments: Santander Aeroméxico Infinite and Santander Aeroméxico Platinum for high income clients and Santander Aeroméxico Blanca for mid income and massive clients. Benefits to our “TDC Santander-Aeromexico” credit card customers include “premier points” per trips and for each U.S.$1.00 spent, benefits when traveling including preferential boarding, airport transportation and access to airport and premium lounges, free use of Santander ATMs abroad, replacement and cash advance with emergency card abroad, shopping protection and international emergency medical services, among others.
The Santander-Aeroméxico co-branded card has reached more than 919,000 cardholders at the end of 2018 since its launch in 2016 and we increased the number of cardholders by 12% since December 2017.
As of December 31, 2018, our credit card portfolio has the second-best performance in terms of asset quality (defined as total non-performing loans as a percentage of total loans) among the seven largest private banks in Mexico, as determined in accordance with Mexican Banking GAAP, according to information published by the CNBV.
In 2017, we sought to strengthen our credit card portfolio through a strategic product relaunch of our FlexCard, Fiesta Rewards and Black Unlimited cards through a “Credit Card Profiler”, a card profiling tool, that matches clients with the right product in order to achieve efficiency in costs and commissions. Portfolio management was mainly based on promotions, including promotions providing interest-free months for spending at businesses with the highest turnover recurrence. We also engaged in campaigns to encourage leveraged use of credit cards through global and local sponsorships, with an important focus on the entertainment and sport industries, as well as temporary promotions at key times during the year (Easter, summer, Good Friday, year-end). These campaigns are in addition to initiatives with commercial partners such as Aeroméxico and Club Premier, including joint campaigns and special promotions, such as “Día Más Santander” and “Venta Azul Aeroméxico”.
During 2018, we improved the offer of value for our customers by adjusting the tariff plan for credit card products and launching the digital signature on debit and credit cards to reinforce the level of protection of card data. We have a new profiler for contracting a credit card according to the customer’s segment and preference and we relaunched the offer of additional credit cards with a simpler process, without charging an annual fee and immediate delivery. We also launched several campaigns to increase the use of credit cards with focus on entertainment and sports companies, such as: UEFA Champions League, La Liga Santander and Showcase Entertainment, as well as cash back campaigns with optimization and improvement of ecommerce processes.
Additionally, we improved the customer experience through a digital transformation by improving the SuperWallet functionalities, such as point consulting and payment with points rewards in the app, launch of cellular payments through NFC technology, activation of debit or credit card and consultation of movements in real time. We also launched contactless payments with third-party wallets, such as: Samsung
Pay, Fitbit Pay and Garmin Pay; launched Go Pay for payment of services and Balance Transfer in Supermóvil, and increased the line of credit available to customers through Supermóvil and Superwallet.
The following table shows the non-performing loans in our credit card portfolio as a percentage of the total loans in our credit card portfolio for the periods indicated.
| | | | | | | | | | | | | | | |
| | IFRS | |
| | As of December 31, | |
| | 2014 | | | 2015 | | | 2016 | | | 2017 | | | 2018 | |
Total credit card non-performing loans as a percentage of total credit card loans | | 4.70 | % | | 3.86 | % | | 3.79 | % | | 4.29 | % | | 3.30 | % |
A special risk management unit for the credit card business continuously monitors portfolio performance. New application scores, behavior scores and capacity score models were implemented to manage new growth strategies. In addition, the credit card portfolio is segmented for risk according to behavior models. Depending on risk stratification, different offers are designed to increase, maintain or reduce exposure and profitability.
Our credit card business follows the Santander Group’s corporate model, which provides the following benefits:
| · | | Standardization throughout the Santander Group’s markets through standardized management of certain “business levers”: acquisition, activation, billing, receivables, retention, loyalty and products. |
| · | | Knowledge transfer across geographies and business levers. Campaign definitions, design and results are shared by the Santander Group’s card units globally by means of an electronic campaign library. |
| · | | Decision-making process based on commercial and business facts and information, supported by strong analytic capabilities and robust infrastructure that enable us to design and execute focused, aggressive strategies and tactics, directed by a group of experts who collectively identify portfolio-relevant trends, patterns and opportunities in order to grow the business. |
| · | | Campaign management. All marketing initiatives and campaigns are run through a proven statistical model that allows the managers of the business levers to measure and analyze each campaign. |
| · | | New product development is subject to a very strict methodology that provides deep opportunity analysis and filtering. |
We have invested in simplifying support and commercial processes. Due to our new issuing process, customers can leave the branch with their credit card in less than fifteen minutes. Our contact centers provide segmented customer service and retention activities, utilizing analytical tools as well as predictive retention models.
In addition to issuing credit and debit cards, we also manage ATMs and point-of-sale terminals. The point-of-sale terminals business is a joint venture with Elavon Merchant Services México, or Elavon, which is a subsidiary of U.S. Bancorp, a company that provides end-to-end payment processing services to more than one million merchants in the United States, Europe, Canada and Puerto Rico and other countries. The main contributions of Elavon are its know-how, its portfolio of products and services, its multinational customers with operations in Mexico and its access to the investments that this business requires. Our alliance with Elavon has resulted in what we believe is a more diligent management of our credit card business, focusing on providing new payment solutions and innovative business services for merchants.
Mortgage Loans
We offer loans to our customers for the purchase of real estate secured by mortgages with a maturity of up to 20 years. We have a leading position in this business among non-government-owned banks and, at December 31, 2018, held a 17.3% market share in Mexico in terms of amounts of loans outstanding, as determined in accordance with Mexican Banking GAAP, according to information published by the CNBV. As of December 31, 2018, we had a total mortgage loan portfolio of Ps.145,749 million (U.S.$7,417 million), representing approximately 21.2% of our total lending portfolio (excluding reverse repurchase agreements).
On December 23, 2010, we entered into a stock and assets purchase agreement to acquire the U.S.$2 billion residential mortgage business of General Electric Capital Corporation and its subsidiaries, or GE Capital, in Mexico, or the GE Capital mortgage business. The transaction was closed on April 29, 2011. In addition, we repaid at closing to GE Capital the Ps.21,009 million (U.S.$1,218 million) intercompany debt at that date relating to the GE Capital mortgage business, which GE Capital historically had financed through intercompany debt. We did not purchase any loans to developers as part of the GE Capital acquisition or otherwise. The total volume of assets at the time of closing was Ps.23,904 million (U.S.$1,386 million), including a total loan portfolio of Ps.21,926 million (U.S.$1,271 million), while the total volume of liabilities was Ps.21,494 million (U.S.$1,246 million).
On November 29, 2013, we completed the acquisition of the equity stock of ING Hipotecaria, S.A. de C.V., Sociedad Financiera de Objeto Múltiple, Entidad No Regulada, or ING Hipotecaria, a subsidiary of ING Group. In February 2014, ING Hipotecaria was renamed Santander Vivienda. Santander Vivienda provides mortgage-related products and services to more than 28,000 clients and operates two branches throughout Mexico. The net assets acquired amounted to Ps.395 million, which included a loan portfolio with an unpaid principal balance of Ps.11,237 million and an estimated fair value of Ps.10,772 million. As part of the transaction, we made a cash payment of Ps.541 million (approximately U.S.$31.4 million) for ING Hipotecaria’s equity. Since the acquisition, all of the branches operated by ING Hipotecaria have been closed, in an effort to consolidate the distribution network and increase operational efficiency.
We currently have the third largest mortgage loan portfolio in the financial system, as determined in accordance with Mexican Banking GAAP, according to information published by the CNBV, in terms of the size of the mortgage portfolio.
On average, the loan-to-value ratio of our mortgage loans was 67.4% as of December 31, 2018. We generally do not make any loans for more than 80% of the value of the property to be purchased (if the property value is greater than Ps.5 million) or up to 90% (if the property value is less than or equal to Ps.5 million). Borrowers must meet certain minimum monthly income levels as evidenced by recent payroll information and tax returns. Borrowers must provide satisfactory documentary evidence to confirm their employment or other types of revenue and to otherwise evaluate their ability to pay.
On November 16, 2016, the Santander Personal Mortgage product was launched, aligned to the profile and needs of each client at a personalized rate, being the only mortgage loan with this modality in Mexico. The new mortgage subsidizes the opening fee equivalent to 1% of the amount of credit requested by the client.
During 2017, efforts were made to mitigate the impact of the increases in the interest rates on mortgage loans. Our mortgage offerings were simplified to facilitate the placement processes for clients and the sales force and recurring promotions were launched, such as appraisal bonus, acceptances of other banks’ appraisals and interest free months.
At the beginning of 2018, we launched “Hipoteca Preventa”, a unique product in Mexico, which allows the client to anticipate the approval of their mortgage loan during the pre-sale stage of their new home. With this product, customers can ensure the interest rate and the amount of credit of their mortgage up to 24
months before the delivery of their new home, in addition to having a personal credit of up to 10% of the mortgage.
In April 2018, we launched the “Hipoteca Plus” program, which recognizes the level of relationship and punctual payment that the client has with the Bank through the interest rate of their mortgage, allowing customers with positive payment histories to access the best market rate and improving the processes of approval of its credit card together with the mortgage. Together with this product, we renewed our offer of insurance with the new damage insurance that covers the commercial value of the property at the time of the loss, discounting the value of the land.
In addition to the new products and attributes, we maintained our benefits as the bonus of the opening fee with the Santander Plus program and the acceptance of the appraisal made by other banks.
Insurance Brokerage
We currently distribute insurance products from Zurich Santander Insurance America, S.L. as well as third-party providers. The joint venture we have with Zurich Financial Services Group issues products that we sell and, together with products sold by its predecessor, Seguros Santander, represented approximately 29.3% and 29.1% of the net commissions we earned in 2017 and 2018, respectively.
Total outstanding insurance premiums distributed by us increased 5.6%, or Ps.655 million in 2018, as compared to 2017, and total insurance commissions collected by us increased 5.4% in 2018 as compared to 2017.
The products we offer as part of our insurance brokerage services include life, car, home, health, accident, fraud, unemployment and life-savings insurance. We focus on simple standardized banking product-related insurance products primarily directed to the retail business. We cross-sell these insurance products with other banking products, offering an all-round assessment service to our clients. Insurance products are sold through our distribution networks and contact center in addition to our website and our ATM network. We earn a service fee from insurers according to the number of the insurance sales.
We do not bear any underwriting risk in connection with our insurance brokerage services. All underwriting risk is assumed by, and all premiums are payable to, the relevant third-party insurance underwriters.
In 2011, we launched our “Autocompara program”, which allows potential clients to compare car insurance quotes from the ten largest insurance companies in Mexico. Clients can access this program at our branches, on our website or by telephone. This program has been advertised throughout a national marketing campaign, which has positioned us among the top companies in the car insurance industry. By December 31, 2018, car insurances products had generated commissions of Ps.1,000 million (U.S.$50.9 million) based on a portfolio of approximately 1.4 million outstanding car insurance policies.
In 2016, we launched the "Protección Eventos Santander" affiliation program as an additional benefit of “Santander Plus” program, which awards our clients that have at least two insured assets with us (home, car, health or life) with a certificate of Ps.7,200 to celebrate the following five mayor life events: the birth or adoption of a child, getting married, getting a college diploma or moving to a new home. This program promotes the integral protection of our clients, it increases the profitability and strengthens our client’s portfolio using the reward scheme. In 2016, we also made improvements in our insurance marketing campaign through ATMs, through which notifications were sent via text messages and email to clients who acquired a new insurance through an ATM.
During 2017, we began the digital transformation of our business that included investing in the development of digital services to improve the client’s experience and giving them the ability to access information on the insurance products they’ve purchased from us directly from our website. Our website was optimized so that it now provides a three-step insurance buying process. In addition, after the earthquakes in southern and central Mexico, assistance was given immediately to more than 2,500 clients whose homes were
affected and who owned a home insurance or a damages insurance plan linked to their mortgages. We also offer insurance products that provide for multiple client needs and apply to various client segments, such as our “Amplia elite”, which has been well accepted.
Our strategic plan in 2018 was focused on increasing the number of products with a broad segmentation and in covering any of the needs that clients may have in their daily lives. In the healthcare sector, we launched "Gastos Medicos Santander" through our branch network, offering specialized executives to make sure clients get the best assessment possible. Moreover, we launched the “Gadgets” product, through our insurance website which aims for the inclusion of specialized segments, such as universities.
Corporate Lending
We offer a wide range of credit products to our corporate customers, including general corporate and working capital financing and foreign trade financing complemented by deposit-taking and cash management services. As of December 31, 2018, we had approximately 340,499 SME customers, 8,398 middle-market corporation customers and 1,809 government institutional customers. Our middle-market corporation customers include companies across all industry sectors. Our SME and middle-market corporation clients’ coverage is handled by our officers who are appointed according to the customer’s geographic location in the case of middle-market clients, and according to the location of our corporate headquarters in Monterrey and Mexico City in the case of our large domestic companies customers.
Distribution Network
General
We refer to our strategy of using multiple distribution channels, such as branches, Internet banking, mobile banking, contact centers and third-party branches, tailored to each of our client segments and designed to reach a broad spectrum of customers in a cost-efficient manner as our multichannel distribution strategy. Our distribution network provides integrated financial services and products to our customers through a variety of channels, including our traditional proprietary branch network and on-site service units and complementary distribution channels such as ATMs, our contact centers and other direct sales distribution channels like Internet banking, which we refer to as alternative distribution channels. The principal aims of the complete multichannel distribution strategy are to benefit from the synergy of the various channels and to direct customers to the most effective channel for the purposes of their transactions.
As of December 31, 2018, our distribution channels included:
| · | | Office network. We have 1,393 offices throughout Mexico. |
| · | | ATMs. We have 8,294 ATMs with coverage throughout Mexico, with more than 47 million transactions per month in average. |
| · | | Contact centers. We have 2,794 contact center positions with approximately 5,533 employees. We receive more than 4.2 million in-bound calls on average per month and generate 6.2 million transactions. |
| · | | Internet banking. We had, on average, more than 33 million banking transactions per month in 2018, with more than 1,012,318 active customers. |
| · | | Mobile banking. Our newly launched channel, which enables customers to complete transactions from their mobile phones and tablets. As of December 31, 2018, we had more than 2,423,551 active customers and 106 million transactions per month on average. |
| · | | Specialized sales force. We have 593 agents in our Asesores Super Nómina network. See “—Alternative Distribution Channels—Specialized Sales Force.” |
| · | | Third-party branches (corresponsalía). We have 25,376 complementary branches provided by our agents, Telecomm, Oxxo, 7‑Eleven, Circle K, Tiendas Extra, K, Farmacias Guadalajara and Super 7/24. See “—Alternative Distribution Channels—Third-Party Branches.” |
| · | | Third-party mortgage brokers. In the year ended December 31, 2018, approximately 50% of our mortgages were originated through third-party mortgage brokers. The rest of the mortgages were originated through our office network. |
During 2017, we promoted digital channels to improve electronic banking in three highly relevant applications: Public Portal, SuperNet and SuperMóvil (commercial banners, receipt of notifications and new image). All the enhancements were made to improve the experience of our customers.
For 2018, we improved our Mobile Banking offerings through which the client can request an increase of credit lines, balance transfer and pre-approved consumer products, all this to continuously add value to the business and improve the customer experience.
We continue to promote our multi-channel platform, our distribution strategy and strategic alliances with our correspondents. With the help of our correspondents we are able to expand our basic banking services for commercial clients, such as credit card payments, deposits, low commission transactions and cash withdrawals with debit and credit cards in a wider territory. The promotion of multichannel services allows us to keep our clients updated on new options to make their transactions easier and faster.
Office Network
Our office network offers our products and services to our customers. The table below shows the number of offices in our branch network, which includes our branches (sucursales; traditional, traditional + select, smart, smart + select, centro select, Agile, universities, salud, salud + select, express, express + select), cash tellers (ventanillas; traditional, business, business + select, espacio select, box select, corner select, universities and customs) and SME business centers, across Mexico’s regions at the dates indicated. Information is provided with respect to the offices of Banco Santander México only. Cash desks are service areas that do not have a branch director and which are located in enclosed areas, for example, inside courthouses, corporations, universities, municipalities and airports. Santander Select offices include (i) Centros Select, which operate like individual branches and have a director and between four and five executives, (ii) Espacios Select, which are smaller and are inside or adjacent to a branch but function like an individual branch, with a director and approximately three executives, and (iii) box offices, which are inside of branches and have two executives but no cash tellers. Santander Select units are service areas that do not have a branch director and that are in enclosed areas, but are larger than cash desks. For example, Santander Select units may be located in universities or hospitals.
| | | | | | | | | | | | | | | |
| | | | | | | | | | | Change, December 31, 2018 vs. | |
| | At December 31, | | | December 31, 2017 | |
| | 2016 | | | 2017 | | | 2018 | | | # | | | % | |
Central | | 156 | | | 159 | | | 163 | | | 4 | | | 2.5% | |
Metro North | | 187 | | | 185 | | | 179 | | | (6) | | | (3.2)% | |
Metro South | | 184 | | | 187 | | | 193 | | | 6 | | | 3.2% | |
Northeast | | 165 | | | 169 | | | 173 | | | 4 | | | 2.4% | |
Northwest | | 123 | | | 124 | | | 125 | | | 1 | | | 0.8% | |
North | | 113 | | | 113 | | | 113 | | | — | | | — | |
West | | 138 | | | 139 | | | 139 | | | — | | | — | |
South | | 117 | | | 119 | | | 122 | | | 3 | | | 2.5% | |
Southeast | | 181 | | | 180 | | | 186 | | | 6 | | | 3.3% | |
Total(1) | | 1,364 | | | 1,375 | | | 1,393 | | | 18 | | | 1.3% | |
| (1) | | Includes 28 SME business centers. |
Alternative Distribution Channels
General
We also distribute our products and services through alternative distribution channels, which have experienced consistent growth in terms of sales, services, provision of product information and customer preference. These alternative distribution channels consist of ATMs, our contact centers, Internet banking, mobile banking, Asesores Super Nómina and third-party branches.
Because of their low cost and large attendance capacity, these channels are becoming one of the most efficient ways to interact with our customers at any time. We believe that alternative distribution channels are an important way to reach certain customers, in particular those in the low-income segment where we are able to have a more effective relationship with a broader customer base.
ATMs
We operate an extensive network of 8,294 ATMs throughout Mexico, including those located in our branches and on-site service units. Our customers may use these ATMs to access their accounts and conduct banking transactions.
The following table shows the number of our ATM machines across Mexico’s regions at the dates indicated.
| | | | | | | | | | | | | | | |
| | | | | | | | | | | Change, December 31, 2018 vs. | |
| | At December 31, | | | December 31, 2017 | |
| | 2016 | | | 2017 | | | 2018 | | | # | | | % | |
Central | | 741 | | | 817 | | | 944 | | | 127 | | | 15.5% | |
Metro North | | 837 | | | 878 | | | 990 | | | 112 | | | 12.8% | |
Metro South | | 724 | | | 770 | | | 902 | | | 132 | | | 17.1% | |
Northeast | | 738 | | | 781 | | | 848 | | | 67 | | | 8.6% | |
Northwest | | 624 | | | 651 | | | 764 | | | 113 | | | 17.4% | |
North | | 630 | | | 671 | | | 730 | | | 59 | | | 8.8% | |
West | | 568 | | | 615 | | | 702 | | | 87 | | | 14.1% | |
South | | 772 | | | 810 | | | 937 | | | 127 | | | 15.7% | |
Southeast | | 1,191 | | | 1,330 | | | 1,477 | | | 147 | | | 11.1% | |
Total | | 6,825 | | | 7,323 | | | 8,294 | | | 971 | | | 13.3% | |
We designed a comprehensive strategy that includes installing additional ATMs to transfer operations currently performed by cashiers to ATMs, reducing the workload of cashiers and thus improving the quality of their services, by increasing the functions of ATMs to encourage self-servicing and replacing machines that were becoming obsolete. We have also devised an expansion plan to amplify the ATMs’ functions, including receiving credit card payments, payment services and deposit accounts.
Contact Centers
Our contact centers in Queretaro and Crisol in Mexico City can be used by customers to make inquiries, execute payment transactions or apply for products and services, such as personal loans. A portion of our contact center personnel is dedicated to contacting current account holders to offer them additional products and services, in particular insurance, credit cards and consumer loans. Those products are offered to preauthorized customers who are selected by our Risk and Commercial Intelligence departments in our central offices. Our contact centers also have a retention unit that handles customer requests for the cancellation of products or services.
Our contact centers serve three basic functions:
| · | | Customer service. We receive more than 4.2 million in-bound calls per month from our customers. |
| · | | Sales. Through our contact centers, we grant approximately 29.7% of the consumer loans and approximately 40.4% of the credit cards that we issue. |
| · | | Collecting receivables. With more than 46 million outbound and in-bound calls, we collect more than Ps.1,641 million (U.S.$84 million) of receivables per month. |
Internet Banking
We view the Internet banking channel as the most efficient and convenient way to access bank services and as a key instrument for offering additional products. Our strategy includes three main components that seek to ensure the success of our Internet banking channel:
| · | | Customer acquisition. This includes a complete strategy regarding how to easily enroll new customers and make product alliances to promote Internet banking as “easy, fast and secure”. We seek to provide great service to our Internet banking customers through an intuitive operating platform that we are developing throughout the site. |
| · | | Customer transactions. We are constantly improving the ways our customers access information, creating synergies within all our channels in order to promote the use of Internet banking and optimize transaction costs. |
| · | | Selling products and services. We offer products according to a customer’s profile and design easy and efficient product acquisition processes. |
As of December 31, 2018, we had approximately 1,012,318 active Internet banking clients. We had, on average, 33 million Internet banking transactions, either monetary or non-monetary, per month in the year ended December 31, 2018. The following table presents summarized operating statistics for our Internet banking channel:
| | | | | | | | | | | | |
| | | | | | | | Change, Year Ended | |
| | Monthly Average | | | December 31, 2018 vs. | |
| | Year ended December 31, | | | year ended December 31, 2017 | |
| | 2017 | | | 2018 | | | # | | | % | |
Monetary transactions | | 17,512,582 | | | 18,746,466 | | | 1,233,884 | | | 7% | |
Non-monetary transactions | | 42,605,390 | | | 50,258,192 | | | 7,652,802 | | | 18% | |
Total transactions | | 60,117,972 | | | 69,004,658 | | | 8,886,686 | | | 15% | |
Mobile Banking
In March 2012, we launched our mobile banking (Banca Móvil or SúperMóvil) channel, which enables customers to effect transactions on mobile phones. The application comes with a “geo-reference” function, which allows our customers to locate the nearest branch or ATM. The application is compatible with most of the mobile phones available in the Mexican market, including smart phones. There is also a customized version for tablets.
Mobile banking lowers the cost of bringing services to our customers and makes our services more convenient, which we believe helps to increase customer transactions.
In December 2018, we had approximately 2,454,551 Mobile banking active customers, with approximately 106 million monetary and non-monetary mobile banking transactions. The following table presents the statistical results of the mobile banking channel:
| | | | | | | | | | | | |
| | | | | | | | Change, year ended | |
| | Month average | | | December 31, 2018 vs. | |
| | Year ended December 31, | | | year ended December 31, 2017 | |
| | 2017 | | | 2018 | | | # | | | % | |
Monetary transactions | | 2,006,126 | | | 3,837,133 | | | 1,831,007 | | | 91% | |
Non-monetary transactions | | 61,762,254 | | | 101,977,105 | | | 40,214,851 | | | 65% | |
Total transactions | | 63,768,380 | | | 105,814,238 | | | 42,045,858 | | | 66% | |
At the end of 2016, SúperMóvil launched the new functionality "Mis finanzas" to help customers to identify and keep track of their spending habits by providing details of purchases, average expenses and comparisons.
To date, SúperMóvil has functions for making clarifications to unrecognized charges, activation of credit card, renewal of Super Token, registration to Santander Plus, provision of consumer credit, portability of payroll, request for an increase in the line of credit and transfer of debts of other banks with preferential rates.
Specialized Sales Force
Our Asesores Super Nómina network is a specialized sales force responsible for delivering the payroll kits to the employees of the companies that have payroll services with the Bank. Payroll kits are welcome kits that describe all the benefits of the payroll deposit services to the client. Upon the signature of a contract contained in this kit, the employee allows us to offer him pre-approved financial products (such as credit cards, consumer loans, insurance policies and investments) through all of our banking channels. This process is part of our 360‑degree cross-selling strategy.
When the payroll kits are delivered, the Asesores Super Nómina also explain the different benefits of being a customer of the Bank and assist with the activation process of debit cards.
As of December 31, 2018, 593 agents belonged to our Asesores Super Nómina network. These agents are located throughout Mexico, primarily at our branches but also at some of our corporate offices.
We delivered a monthly average of 118,441 total payroll kits in 2018, an increase of 7.0% from a monthly average of 110,692 payroll kits delivered in 2017.
Third-Party Branches
We provide banking services to our customers through 18,514 Grupo Oxxo stores, 1,798 7‑Eleven stores and 1,753 complementary branches provided through our below-described relationship with Telecomm, 2,018 Farmacias Guadalajara stores, 1,170 Tiendas Extra stores and 123 of our new 7/24 Mix, which are third- party branches, as of December 31, 2018. At these third-party branches, we process more than 3.4 million transactions per month, offering basic banking services, such as debit and credit deposits, withdrawals and balance inquiries. These branches strengthen our national coverage and fortify our payroll service to companies with local coverage.
In April 2010, we signed an agreement with Telecomunicaciones de Mexico (Telecomm), a public entity created and operated by the SCT (Secretaria de Comunicaciones y Transportes), with locations primarily in rural areas where we have no branch network presence. We serve our customers in more than 1,700 Telecomm offices, where they can (i) execute cash withdrawals and payments (up to $5,000 per account per day), (ii) make checking account deposits (up to $15,000 per account per day), (iii) check account balances, (iv) obtain information, and (v) perform other transactions. The agreement is renewable on an
annual basis and we pay Telecomm a commission that varies depending on the service and value of the transaction.
In the first quarter of 2013, we entered into an agreement with Grupo Oxxo, which operates convenience stores throughout Mexico, allowing us to offer our services through more than 18,500 Grupo Oxxo stores. At these locations, our clients make deposits through debit cards and payments through credit cards any day of the week. Transaction amounts are limited to Ps.10,000 per account per day. The agreement is renewable on an annual basis and we pay Grupo Oxxo a fixed amount per transaction.
In November 2014, we signed an agreement with 7‑Eleven, setting up a complementary network that enables us to serve our customers in more than 1,700 convenience stores nationwide. In such convenience stores, our customers can perform payments, credit and debit card deposits (up to $5,000 per account per day), 365 days a year, from 8:00 a.m. to 8:00 p.m. The agreement is renewable on an annual basis and we pay 7‑Eleven a fixed amount per transaction.
In April 2018, we signed an agreement with the convenience chain Circle K, Tiendas Extra and K to enable its more than 1,170 stores to be banking hubs that provide services for the deposit and/or payment to a credit card for a maximum of Ps.5,000 per account per day and with no a minimum amount at any time between of 8 a.m. and 8 p.m. any day of the dear.
In addition, in the last quarter of 2018, for the convenience of our customers and users we signed an agreement with 7/24 Mix, a fast food chain, where customers can make deposits and payments to debit cards of up to Ps.5,000 per day.
We are evaluating other joint strategies with third parties that might be interested in offering our services, which would increase the number of customers visiting their facilities and their revenues from commission received per transaction. We are also considering providing other services, such as “Referenced Deposits” and “Cellphone Deposits.”
Third-Party Mortgage Brokers
Approximately 50% of our mortgage loans were originated through third-party mortgage brokers in 2018. We have a direct relationship with the largest mortgage brokers in Mexico and an indirect relationship with approximately 33 smaller brokers, which sometimes originate mortgage loans on behalf of the larger brokers.
Funding
Our principal source of funding is customer deposits, including repurchase agreements, which represented Ps.711 billion (U.S.$36 billion), or 55.3%, of our total liabilities as of December 31, 2018. Customer deposits typically represent a large portion of our funding base because of our ability to attract deposits from customers through our extensive retail, wholesale and corporate network. Since we are primarily a commercial bank, customer deposits constitute the main source of liquidity in our financing structure. These deposits currently cover most of our liquidity requirements. Our control and management functions involve planning our funding requirements, structuring the sources of financing to achieve optimal diversification in terms of maturities, instruments and markets and setting forth contingency plans.
In order to increase liquidity and extend our maturity profile, we rely in part on domestic peso-denominated issuances. We also have access to international funding through U.S. dollar-denominated issuances with longer maturities. For a further discussion of our funding, see “Item 5. Operating and Financial Review and Prospects—B. Liquidity and Capital Resources.”
The following table sets forth Banco Santander México’s funding and market share with respect to funding for the periods indicated.
| | | | | | | | | | | | | | | | | | | | | | | | | | | | | | | | | | | |
| | Mexican Banking GAAP | |
| | As of December 31, | |
| | 2014 | | | 2015 | | | 2016 | | | 2017 | | | 2018 | |
| | (Millions
of pesos) | | | (Market
share (%))(1) | | | (Millions
of pesos) | | | (Market
share (%))(1) | | | (Millions
of pesos) | | | (Market
share (%))(1) | | | (Millions
of pesos) | | | (Market
share (%)) (1) | | | (Millions
of pesos) | | | (Market
share (%)) (1) | |
Santander | | Ps. | 524,047 | | | 13.7 | % | | Ps. | 600,436 | | | 14.0 | % | | Ps. | 693,804 | | | 14.4 | % | | Ps. | 711,996 | | | 13.5 | % | | Ps. | 775,840 | | | 13.6 | % |
BBVA Bancomer | | | 847,427 | | | 22.2 | | | | 973,984 | | | 22.7 | | | | 1,054,695 | | | 21.9 | | | | 1,179,911 | | | 22.4 | | | | 1,218,560 | | | 21.3 | |
Banorte | | | 492,754 | | | 12.9 | | | | 556,608 | | | 13.0 | | | | 597,009 | | | 12.4 | | | | 660,937 | | | 12.5 | | | | 792,391 | | | 13.9 | |
Banamex | | | 589,990 | | | 15.5 | | | | 650,546 | | | 15.2 | | | | 709,443 | | | 14.7 | | | | 715,820 | | | 13.6 | | | | 768,574 | | | 13.4 | |
HSBC | | | 341,279 | | | 8.9 | | | | 318,064 | | | 7.4 | | | | 339,300 | | | 7.0 | | | | 406,361 | | | 7.7 | | | | 464,208 | | | 8.1 | |
Scotiabank | | | 186,873 | | | 4.9 | | | | 230,081 | | | 5.4 | | | | 276,787 | | | 5.7 | | | | 333,916 | | | 6.3 | | | | 385,791 | | | 6.7 | |
Inbursa | | | 180,948 | | | 4.7 | | | | 183,225 | | | 4.3 | | | | 232,926 | | | 4.8 | | | | 234,372 | | | 4.4 | | | | 236,756 | | | 4.1 | |
Santander + Top 6 | | Ps. | 3,163,318 | | | 82.8 | % | | Ps. | 3,512,944 | | | 82.0 | % | | Ps. | 3,903,965 | | | 80.9 | % | | Ps. | 4,243,313 | | | 80.4 | % | | Ps. | 4,642,120 | | | 81.1 | % |
Total System | | Ps. | 3,816,826 | | | 100.0 | % | | Ps. | 4,290,853 | | | 100.0 | % | | Ps. | 4,825,783 | | | 100.0 | % | | Ps. | 5,273,627 | | | 100.0 | % | | Ps. | 5,722,176 | | | 100.0 | % |
Source: (1) Funding and market share data are calculated by us, using information published by the CNBV.
The following table sets forth Banco Santander México’s total demand deposits and market share with respect to demand deposits for the periods indicated.
| | | | | | | | | | | | | | | | | | | | | | | | | | | | | | | | | | | |
| | Mexican Banking GAAP | |
| | As of December 31, | |
| | 2014 | | | 2015 | | | 2016 | | | 2017 | | | 2018 | |
| | (Millions
of pesos) | | | (Market
share (%))(1) | | | (Millions
of pesos) | | | (Market
share (%))(1) | | | (Millions
of pesos) | | | (Market
share (%))(1) | | | (Millions
of pesos) | | | (Market
share (%))(1) | | | (Millions
of pesos) | | | (Market
share (%))(1) | |
Santander | | Ps. | 294,269 | | | 13.2 | % | | Ps. | 347,827 | | | 13.6 | % | | Ps. | 405,768 | | | 13.8 | % | | Ps. | 433,231 | | | 13.4 | % | | Ps. | 455,110 | | | 13.6 | % |
BBVA Bancomer | | | 578,467 | | | 25.9 | | | | 682,242 | | | 26.7 | | | | 754,935 | | | 25.8 | | | | 835,500 | | | 25.9 | | | | 864,707 | | | 25.8 | |
Banamex | | | 470,042 | | | 21.0 | | | | 483,429 | | | 18.9 | | | | 545,495 | | | 18.6 | | | | 563,571 | | | 17.5 | | | | 608,527 | | | 18.1 | |
Banorte | | | 287,838 | | | 12.9 | | | | 337,019 | | | 13.2 | | | | 382,459 | | | 13.0 | | | | 395,135 | | | 12.2 | | | | 412,547 | | | 12.3 | |
HSBC | | | 177,870 | | | 8.0 | | | | 187,259 | | | 7.3 | | | | 210,608 | | | 7.2 | | | | 256,121 | | | 7.9 | | | | 267,707 | | | 8.0 | |
Scotiabank | | | 99,268 | | | 4.4 | | | | 119,847 | | | 4.7 | | | | 147,174 | | | 5.0 | | | | 176,461 | | | 5.5 | | | | 163,028 | | | 4.8 | |
Inbursa | | | 69,473 | | | 3.1 | | | | 77,028 | | | 3.0 | | | | 82,200 | | | 2.8 | | | | 106,729 | | | 3.3 | | | | 124,533 | | | 3.7 | |
Santander + Top 6(2) | | Ps. | 1,977,227 | | | 88.5 | % | | Ps. | 2,234,651 | | | 87.4 | % | | Ps. | 2,528,639 | | | 86.2 | % | | Ps. | 2,766,749 | | | 85.7 | % | | Ps. | 2,896,159 | | | 86.3 | % |
Total System | | Ps. | 2,237,273 | | | 100.0 | % | | Ps. | 2,551,118 | | | 100.0 | % | | Ps. | 2,931,012 | | | 100.0 | % | | Ps. | 3,229,371 | | | 100.0 | % | | Ps. | 3,354,975 | | | 100.0 | % |
Source: CNBV.
| (1) | | Market share data are calculated by us, using information published by the CNBV. |
| (2) | | Total demand deposits and market share data for “Santander + Top 6” are calculated by us, using information published by the CNBV. |
The following table sets forth Banco Santander México’s total fixed-term deposits and market share with respect to fixed-term deposits for the periods indicated.
| | | | | | | | | | | | | | | | | | | | | | | | | | | | | | | | | | | |
| | Mexican Banking GAAP | |
| | As of December 31, | |
| | 2014 | | | 2015 | | | 2016 | | | 2017 | | | 2018 | |
| | (Millions
of pesos) | | | (Market
share (%))(1) | | | (Millions
of pesos) | | | (Market
share (%))(1) | | | (Millions
of pesos) | | | (Market
share (%))(1) | | | (Millions
of pesos) | | | (Market
share (%))(1) | | | (Millions
of pesos) | | | (Market
share (%))(1) | |
Santander | | Ps. | 192,547 | | | 14.9 | % | | Ps. | 208,693 | | | 14.5 | % | | Ps. | 235,122 | | | 15.1 | % | | Ps. | 259,081 | | | 14.8 | % | | Ps. | 283,357 | | | 14.2 | % |
Banorte | | | 190,211 | | | 14.7 | | | | 204,704 | | | 14.2 | | | | 192,043 | | | 12.3 | | | | 249,012 | | | 14.3 | | | | 342,267 | | | 17.1 | |
BBVA Bancomer | | | 219,339 | | | 16.9 | | | | 270,904 | | | 18.8 | | | | 277,385 | | | 17.8 | | | | 323,707 | | | 18.5 | | | | 332,427 | | | 16.6 | |
Scotiabank | | | 79,155 | | | 6.1 | | | | 95,531 | | | 6.6 | | | | 107,945 | | | 6.9 | | | | 143,323 | | | 8.2 | | | | 191,834 | | | 9.6 | |
HSBC | | | 121,387 | | | 9.4 | | | | 93,322 | | | 6.5 | | | | 92,236 | | | 5.9 | | | | 118,041 | | | 6.8 | | | | 160,875 | | | 8.0 | |
Banamex | | | 111,989 | | | 8.6 | | | | 142,330 | | | 9.9 | | | | 156,747 | | | 10.1 | | | | 133,657 | | | 7.7 | | | | 150,650 | | | 7.5 | |
Inbursa | | | 107,022 | | | 8.3 | | | | 102,432 | | | 7.1 | | | | 136,044 | | | 8.7 | | | | 108,809 | | | 6.2 | | | | 90,976 | | | 4.6 | |
Santander + Top 6 | | Ps. | 1,021,650 | | | 78.9 | % | | Ps. | 1,117,916 | | | 77.6 | % | | Ps. | 1,197,522 | | | 76.8 | % | | Ps. | 1,335,629 | | | 76.5 | % | | Ps. | 1,552,386 | | | 77.6 | % |
Total System | | Ps. | 1,295,564 | | | 100.0 | % | | Ps. | 1,439,870 | | | 100.0 | % | | Ps. | 1,556,016 | | | 100.0 | % | | Ps. | 1,746,385 | | | 100.0 | % | | Ps. | 2,001,700 | | | 100.0 | % |
Source: (1) Total fixed-term deposits and market share data are calculated by us, using information published by the CNBV.
The following table sets forth Banco Santander México’s total interbank lending and market share with respect to interbank lending for the periods indicated.
| | | | | | | | | | | | | | | | | | | | | | | | | | | | | | | | | | | |
| | Mexican Banking GAAP | |
| | As of December 31, | |
| | 2014 | | | 2015 | | | 2016 | | | 2017 | | | 2018 | |
| | (Millions
of pesos) | | | (Market
share (%))(1) | | | (Millions
of pesos) | | | (Market
share (%))(1) | | | (Millions
of pesos) | | | (Market
share (%))(1) | | | (Millions
of pesos) | | | (Market
share (%))(1) | | | (Millions
of pesos) | | | (Market
share (%))(1) | |
Santander | | Ps. | 37,231 | | | 13.1 | % | | Ps. | 43,916 | | | 14.6 | % | | Ps. | 51,784 | | | 15.8 | % | | Ps. | 18,467 | | | 6.5 | % | | Ps. | 35,872 | | | 10.2 | % |
Banorte | | | 14,705 | | | 5.2 | | | | 14,885 | | | 5.0 | | | | 21,155 | | | 6.4 | | | | 15,134 | | | 5.3 | | | | 35,686 | | | 10.1 | |
HSBC | | | 42,021 | | | 14.8 | | | | 37,482 | | | 12.5 | | | | 35,780 | | | 10.9 | | | | 31,541 | | | 11.0 | | | | 34,935 | | | 9.9 | |
Scotiabank | | | 8,450 | | | 3.0 | | | | 14,704 | | | 4.9 | | | | 21,323 | | | 6.5 | | | | 13,622 | | | 4.8 | | | | 30,334 | | | 8.6 | |
Inbursa | | | 4,454 | | | 1.6 | | | | 3,765 | | | 1.3 | | | | 14,618 | | | 4.4 | | | | 18,745 | | | 6.6 | | | | 21,142 | | | 6.0 | |
BBVA Bancomer | | | 49,621 | | | 17.5 | | | | 20,838 | | | 6.9 | | | | 19,204 | | | 5.8 | | | | 17,380 | | | 6.1 | | | | 17,861 | | | 5.1 | |
Banamex | | | 7,959 | | | 2.8 | | | | 24,787 | | | 8.3 | | | | 3,952 | | | 1.2 | | | | 14,548 | | | 5.1 | | | | 5,013 | | | 1.4 | |
Santander + Top 6(2) | | Ps. | 164,441 | | | 58.0 | % | | Ps. | 160,377 | | | 53.5 | % | | Ps. | 167,816 | | | 51.0 | % | | Ps. | 129,437 | | | 45.4 | % | | Ps. | 180,843 | | | 51.3 | % |
Total System | | Ps. | 283,989 | | | 100.0 | % | | Ps. | 299,866 | | | 100.0 | % | | Ps. | 328,533 | | | 100.0 | % | | Ps. | 286,011 | | | 100.0 | % | | Ps. | 352,313 | | | 100.0 | % |
Source: CNBV.
| (1) | | Market share data are calculated by us, using information published by the CNBV. |
| (2) | | Total interbank lending and market share data for “Santander + Top 6” are calculated by us, using information published by the CNBV. |
Marketing
The Bank’s marketing priorities are attracting new clients and connecting with current customers. We created a strategic plan that places the customer at the center of our strategy and whose motto is "to improve a little day by day in what matters to our customers," which we use as our basis of communications and marketing strategy. We took a new approach in marketing this year and integrated consumer insights into our marketing of services and products so that we can talk about what is really important to our customers: being the bank that commits to help them fulfill their dreams.
In order to achieve this, during the first half of 2018, we launched three main campaigns. Two campaigns were sponsorships to reward the loyalty of our clients, offering them the possibility of getting tickets for the UEFA Champions League and the F1 Grand Prix of Mexico; and one was a mortgage campaign that aimed to attract new customers by providing them the lowest fixed rate of the market, 8.59%, if they have a series of products with us.
During the second half of the year, we launched a campaign that establishes a communication platform that further integrates into our communications the message that what is important for our customers is taken seriously by us and further positions Banco Santander México as a serious bank, which puts itself in the shoes of its clients, understands them and helps them, regardless of their dreams, desires, needs and unforeseen circumstances. From this platform, different initiatives have been developed for offers and launches of products and services, with their own and differentiated visual communication code, with messages aligned to the umbrella strategy of "What is important for you is serious to us".
Banco Santander México has generated a differentiation with respect to advertising spending within its category. Despite occupying 6th place among the Banks according to the IBOPE AGB information as of December 2018, the efficiency of the management of the communication channels is evident in the main brand image key performance indicators. For example, during 2018, we went from the 4th to 3rd position in brand awareness. In addition, we went from the 3rd to 2nd position as the bank most recommended by clients. Among "non-customers", we are the least rejected bank and we hold the 4th position in the “Consideration” indicator (data obtained from the Corporate Brand report tracker, Kantar Millboard Brown). We believe this shows the success of our communications strategy. Furthermore, we maintained the 3rd position in overall satisfaction. The number of branches with satisfaction greater than 60% was 57% at the end of the third quarter of 2018.
To optimize our communication in 2018, we created an internal strategic digital team with a focus on SMART Planning for the execution of our campaigns in the digital environment. Additionally, we eliminated all agencies FEEs Media (3%) and RRSS (15%), generating strategic alliances directly with key platforms such as Google, Facebook, Collective Culture and IMS (including Linkedin, Spotify, Snapchat, etc.), among others.
We defined metrics that have helped us to understand our overall campaigns performance: MCR (marketing created consumer rate) and DER (digital engagement rate), while working conjunction with the Data HUB to ensure the tracking and tagging of digital channels to measurement of results.
We coordinated the implementation of Santander's new image by updating our portals and digital apps, the image in our corporate headquarters in Santa Fe and Monterrey and the marquees of more than 80 branches. In the last quarter of the year, we leveraged our spaces to communicate concepts and values in our ATM areas of some branches connecting with our clients in three relevant moments, social awareness with pink October (breast cancer), traditions in November with Day of the Dead and December with the end of the year celebrations.
Lastly, we began to communicate to our clients our new global sponsorship as Official Bank of the UEFA Champions League, through experiences such as trips to matches and events with our global ambassador Ronaldo Nazario.
Correspondingly, we continue to invite our clients through promotions to the best events such as the F1 Grand Prix of Mexico, Gastronomic Festivals and great concerts in the main venues such as Arena Monterrey.
In Mexico, part of our marketing efforts is dedicated to social responsibility. Our ATMs receive voluntary donations from our customers five times a year. With these contributions, we have supported the valuable work of UNICEF in Mexico, helping children attend school and receive a quality education. This program has raised more than Ps.136.7 million in the past sixteen years. We have also supported environmental projects led by Reforestamos México, and also the building of homes through Fundación Vivienda (Fideicomiso Provivah), raising more than Ps.32.2 million and Ps.58.1 million, respectively, over the past eleven years. Additionally, together with other organizations, we actively support the Mexican Banking Association “Bécalos” program, raising more than Ps.158.5 million over the past thirteen years. We also support Casa de la Amistad para Niños con Cancer in early detection and early childhood cancer care. In the last two years we have raised more than Ps.8.1 million.
Information Technology
Our main data center is located in Mexico and our disaster recovery site is located in Spain. We continuously invest in new technologies and the maintenance of our existing equipment and infrastructure in order to improve our value proposition to our customers, increase our effectiveness and support business growth. We believe that proper management of technology is key to the proper management of our business. Our modern technology platform is interconnected with the platform of the Santander Group, which enables us to provide seamless coverage to our customers. Additionally, we are incorporating new digital technologies that we strongly believe will allow us to implement modern systems in an agile and flexible way with better offers of value for our clients, who can access to a broad variety of our services both by the traditional channels as well as by the new digital channels.
Through our Information Technology Governance Model, we identify those information technology investments aligned with our strategy and business plan. In this model, we strongly encourage Robotic Process Automation, in order to increase efficiency in business operations.
In order to achieve our business plan, we have acquired all of the shares of Santander Tecnología México, S.A. de C.V. (formerly Isban México, S.A. de C.V.) from our Parent in 2018, and to date it is fully integrated into our operations, helping us to manage our technical infrastructure, execute information technology projects and support and manage our suppliers.
This strategy enables us to leverage our global scale and capture the benefits of outsourcing, including consolidation, shared capability, scale, diversified expertise from our collaborators, exchange of best practices and simplified governance, without the risk of losing control of the core activities.
Our information technology architecture is the central pillar of our banking operations. Our focus is to serve our customers on a global scale, under an architecture that is uniquely customer-centered, provides business support and increases the efficiency of our processes, all within a framework of enhanced security and regulatory compliance.
Our operational platform efficiently combines our modern digital business-oriented information technology systems with our multichannel distribution strategy, resulting in innovative ways to reach, support and serve our clients and attract potential new ones. We continue to incorporate new digital technologies and agile methodologies and to increase cloud adoption for the development of systems and tools as well as new biometric recognition technologies for authentication, which will allow us to efficiently implement digital and secure solutions that improve the experience of our customers. In order to enhance the banking experience of our customers, we are also growing our nationwide installed ATM infrastructure and strategically replacing the old infrastructure, adding new features to the existing machines, and also updating the CRM
tools and strategies that allow us to monitor our clients’ behavior and provide them with targeted and real-time product offerings through diverse channels.
As a result, we are able to efficiently leverage alternative distribution channels, such as ATMs, digital banking, Application Programming Interfaces (“APIs”) and our contact centers, which are complementary to our traditional proprietary branch network, which enables us to provide better service and support to our clients and to increase our digital customer satisfaction, and therefore, our sales ratios. This has allowed us to adequately support the huge increase of digital customer and activity.
Intellectual Property
In Mexico, ownership of trademarks can be acquired only through a validly approved registration with the IMPI, the agency responsible for registering trademarks and patents in Mexico. After registration, the owner has exclusive use of the trademark in Mexico for ten years. Trademarks registrations can be renewed indefinitely for additional ten-year periods, if the registrant proves that it has used such trademark within the last three years.
We have several trademarks, most of which are brand names of our products or services. All our material trademarks are registered or have been submitted to IMPI for registration by the Santander Group or us.
We own the principal domain names used in our business, which include www.santander.com.mx, www.llamasantander.com.mx and www.supernetempresas.com.mx. None of the information contained on our websites is incorporated by reference into, or forms part of, this Report.
Competition
General
We face strong domestic competition in all aspects of our business from other Mexican financial groups, commercial banks and insurance companies, as well as from non-Mexican banks and international financial institutions. We compete for both commercial and retail customers with other large Mexican banks, including subsidiaries of foreign banks. In some parts of Mexico, Banco Santander México also competes with regional banks. Banco Santander México also competes with certain non-Mexican banks (principally those based in the United States and Spain) for the business of the largest Mexican industrial groups and government entities, as well as high net worth individuals.
Our principal competitors are BBVA Bancomer, S.A., Institución de Banca Múltiple, Grupo Financiero BBVA Bancomer; Banco Nacional de México, S.A., integrante del Grupo Financiero Citibanamex, which is part of Citigroup; Banco Mercantil del Norte, S.A., Institución de Banca Múltiple, Grupo Financiero Banorte; HSBC México, S.A., Institución de Banca Múltiple, Grupo Financiero HSBC; Banco Inbursa, S.A., Institución de Banca Múltiple, Grupo Financiero Inbursa; and Scotiabank Inverlat, S.A., Institución de Banca Múltiple, Grupo Financiero Scotiabank Inverlat. Some of the banks with which Banco Santander México competes are significantly larger and have more financial resources than Banco Santander México, including a larger asset size and capital base.
The following table shows the rankings and market share of Banco Santander México as of December 31, 2018, according to information published by the CNBV.
| | | | | | |
| | Mexican Banking GAAP |
| | As of December 31, 2018 |
| | | | | | |
| | | | | | |
| | | | | Market Share | |
| | Position of Banco | | | of Banco | |
| | Santander | | | Santander | |
| | México among | | | México among | |
Rankings and Market Share | | banks(1) | | | banks(2) | |
Total loans | | 3 | | | 13.2 | % |
Deposits | | 4 | | | 13.7 | % |
Total assets | | 2 | | | 14.3 | % |
Asset quality(3) | | 7 | | | — | |
Total equity | | 3 | | | 12.3 | % |
Net income | | 3 | | | 12.3 | % |
Efficiency(4) | | 4 | | | — | |
ROAE(5) | | 3 | | | — | |
Source: CNBV.
| (1) | | Among the largest private banks in Mexico in terms of total assets: Banco Santander México, BBVA Bancomer, S.A., Institución de Banca Múltiple, Grupo Financiero BBVA Bancomer; Banco Nacional de México, S.A., integrante del Grupo Financiero CitiBanamex; Banco Mercantil del Norte, S.A., Institución de Banca Múltiple, Grupo Financiero Banorte; HSBC México, S.A., Institución de Banca Múltiple, Grupo Financiero HSBC; Banco Inbursa, S.A., Institución de Banca Múltiple, Grupo Financiero Inbursa; and Scotiabank Inverlat, S.A., Institución de Banca Múltiple, Grupo Financiero Scotiabank. |
| (2) | | We calculate market share based on information published by the CNBV. |
| (3) | | Defined as total non-performing loans as a percentage of total loans. |
| (4) | | We calculate the efficiency ratio as administrative expenses divided by total income, using information published by the CNBV. |
| (5) | | Calculated based upon the average balance of equity. |
Our prominence in Mexico’s financial system has been recognized in the Mexican business community. In 2018, Euromoney Magazine named Santander Private Banking as “Best Private Banking Overall” for the first time in Mexico. Furthermore, Banco Santander México received the “Deal of the Year 2018" award from Global Trade Review magazine for financing the two concession companies of Line 7 of the Metrobus in March 2017, and was named “Most Socially Responsible Bank 2018” by the International Finance Magazine in December 2018.
In addition, Banco Santander Mexico ranked first in the financial industry and second in a group of 80 companies listed in the Sustainability Index of the Mexican Stock Exchange. The Bank was also named “Leader Enterprise in Sustainability” by this index in 2018. Great Place to Work Mexico 2018 ranked us in the top fifteen best companies to work for in the banking, insurance and finances sector with more than 1,000 workers. The Mexican Center for Philanthropy (CEMEFI) and the Alliance for Corporate Social Responsibility (AliarRSE) awarded Grupo Financiero Santander México, our holding company, with the prestigious Socially Responsible Company (ESR) Distinctive, for the fourteenth time. Banco Santander México was also awarded by Reforestamos Mexico for its Promotion of Sustainable Forest Management. Finally, in 2018, the Bank became part of the FTSE4Good Index.
The banking sector in Mexico can be classified into two groups: the mature, established “large banks” and the recently created “new banks.” As of December 31, 2018, the four largest banks, BBVA Bancomer, Banamex, Banorte and Banco Santander México, held in the aggregate 62.1% of the total deposits in Mexico, followed by a total of 19.0% held in the aggregate by HSBC, Scotiabank and Inbursa, all of which are established large banks. The remaining 18.9% was distributed among 43 other banks.
We also compete with credit unions in Mexico. Credit unions are financial institutions that are formed for the purpose of providing access to funding and favorable conditions for savings and receipt of loans and financial services. Credit unions do not provide services to the public in general, since they are only authorized to carry out transactions with their members. The operation of a credit union is carried out by its own members. In order to be a member of a credit union, one must comply with the eligibility requirements established for that organization and acquire a certain number of shares of the credit union.
The deposits of members with a credit union are not subject to any form of deposit insurance. There are credit unions for many different economic groups, ranging from fishermen to industrialists, but there are also “mixed” credit unions that accept members who perform different economic activities and “social sector” credit unions that serve economic sectors that are unable to access traditional financial institutions due to social, economic and geographic conditions.
Commercial banks in Mexico also compete in the retail market with non-banking institutions known as Sofomes, which focus primarily on offering consumer, commercial and mortgage loans to middle- and low-income individuals. Until recently, the commercial credit market for middle- and low-income individual customers has been serviced almost exclusively by non-banking institutions. Currently, more than 50 non-banking institutions are licensed to operate in Mexico. Mexican non-banking institutions may engage in certain specific lending activities, but are prohibited from engaging in many banking operations, including receiving deposits, foreign trade financing, offering current accounts and engaging in foreign currency operations. Traditional banks have begun to extend their credit services to the markets previously dominated by Sofoles (now abolished) and Sofomes.
At the beginning of 2008, the Mexican Banking Law was modified to, among other things, grant authority to the CNBV (with the assistance of other regulators, but having primary responsibility) to authorize the creation of banks solely to engage in certain activities (which is intended to incentivize competition, reduce required capital considering their risk exposure and improve the attention to certain industries and regions) as compared to so-called “universal” banks, such as Banco Santander México. As a result of the reduced capital requirements and potential reduced operational costs that are likely to apply to this type of bank, competition has increased as a result of the creation of more banks to target specific market niches.
Commercial banks also face increasing competition from securities firms and other financial intermediaries that can provide larger companies with access to domestic and international capital markets as an alternative to bank loans.
Market Position of Banco Santander México
Net income
The following table sets forth net income and market share in terms of net income for the seven largest commercial banks in Mexico for the periods indicated.
| | | | | | | | | | | | | | | | | | | | | |
| | Mexican Banking GAAP | |
| | As of December 31, | |
| | 2016 | | | 2017 | | | 2018 | |
| | (Millions of pesos) | | | (Market
share (%))(1) | | | (Millions of pesos) | | | (Market
share (%))(1) | | | (Millions of pesos) | | | (Market
share (%))(1) | |
Santander | | Ps. | 15,750 | | | 14.7 | % | | Ps. | 17,644 | | | 12.8 | % | | Ps. | 19,316 | | | 12.3 | % |
BBVA Bancomer | | | 33,311 | | | 31.1 | | | | 39,143 | | | 28.4 | | | | 46,059 | | | 29.3 | |
Banorte | | | 15,044 | | | 14.1 | | | | 18,339 | | | 13.3 | | | | 24,834 | | | 15.8 | |
Banamex | | | 10,571 | | | 9.9 | | | | 16,630 | | | 12.1 | | | | 17,735 | | | 11.3 | |
Inbursa | | | 7,805 | | | 7.3 | | | | 12,944 | | | 9.4 | | | | 11,922 | | | 7.6 | |
Scotiabank | | | 4,373 | | | 4.1 | | | | 6,550 | | | 4.8 | | | | 7,176 | | | 4.6 | |
HSBC | | | 1,174 | | | 1.1 | | | | 3,006 | | | 2.2 | | | | 5,836 | | | 3.7 | |
Others(2) | | | 18,978 | | | 17.7 | | | | 23,479 | | | 17.0 | | | | 24,195 | | | 15.4 | |
Mexican financial system | | Ps. | 107,006 | | | 100.0 | % | | Ps. | 137,735 | | | 100.0 | % | | Ps. | 157,073 | | | 100.0 | % |
Source: CNBV.
| (1) | | Market share data is calculated by us, using information published by the CNBV. |
| (2) | | Net income and market share data for “Others” are calculated by us, using information published by the CNBV. |
Total equity
The following table sets forth shareholders’ equity and market share in terms of total equity (as a percentage of the total equity of 50 private banks in Mexico) for the seven private-sector banks with the largest market shares for the periods indicated.
| | | | | | | | | | | | | | | | | | | | | |
| | Mexican Banking GAAP | |
| | As of December 31, | |
| | 2016 | | | 2017 | | | 2018 | |
| | (Millions of pesos) | | | (Market
share (%))(1) | | | (Millions of pesos) | | | (Market share (%))(1) | | | (Millions of pesos) | | | (Market
share (%))(1) | |
Santander | | Ps. | 107,196 | | | 12.5 | % | | Ps. | 116,135 | | | 12.4 | % | | Ps. | 125,630 | | | 12.3 | % |
BBVA Bancomer | | | 158,946 | | | 18.6 | | | | 175,737 | | | 18.8 | | | | 194,185 | | | 19.1 | |
Banamex | | | 151,829 | | | 17.8 | | | | 163,706 | | | 17.5 | | | | 159,925 | | | 15.7 | |
Inbursa | | | 88,012 | | | 10.3 | | | | 98,910 | | | 10.6 | | | | 111,509 | | | 11.0 | |
Banorte | | | 92,844 | | | 10.9 | | | | 86,062 | | | 9.2 | | | | 108,400 | | | 10.6 | |
HSBC | | | 51,426 | | | 6.0 | | | | 55,783 | | | 6.0 | | | | 59,715 | | | 5.9 | |
Scotiabank | | | 41,215 | | | 4.8 | | | | 48,347 | | | 5.2 | | | | 49,777 | | | 4.9 | |
Total for seven banks(2) | | Ps. | 691,468 | | | 80.9 | % | | Ps. | 744,680 | | | 79.7 | % | | Ps. | 809,141 | | | 79.5 | % |
Source: CNBV.
| (1) | | Market share data are calculated by us, using information published by the CNBV. |
| (2) | | Total equity and market share data for the seven banks are calculated by us, using information published by the CNBV. |
Return-on-average equity and equity to total assets ratio
The following table sets forth the return-on-average equity and equity to total assets ratio for the seven largest commercial banks in Mexico for the periods indicated.
| | | | | | | | | | | | | | | | | | |
| | Mexican Banking GAAP | |
| | As of December 31, | |
| | 2016 | | | 2017 | | | 2018 | |
| | Return-on-average | | | Equity to total | | | Return-on-average | | | Equity to total | | | Return-on-average | | | Equity to total | |
| | equity (%)(1) | | | assets ratio (%) | | | equity (%)(1) | | | assets ratio (%) | | | equity (%)(1) | | | assets ratio (%) | |
Santander | | 14.4 | % | | 7.9 | % | | 15.8 | % | | 8.9 | % | | 16.0 | % | | 9.2 | % |
Banorte | | 15.4 | | | 9.0 | | | 20.5 | | | 8.2 | | | 25.5 | | | 9.2 | |
BBVA Bancomer | | 21.9 | | | 8.3 | | | 23.4 | | | 8.8 | | | 24.9 | | | 9.4 | |
Scotiabank | | 11.4 | | | 10.8 | | | 14.6 | | | 10.7 | | | 14.6 | | | 9.5 | |
Inbursa | | 9.3 | | | 24.2 | | | 13.8 | | | 26.8 | | | 11.3 | | | 28.3 | |
Banamex | | 7.1 | | | 13.5 | | | 10.5 | | | 14.3 | | | 11.0 | | | 12.8 | |
HSBC | | 2.4 | | | 7.9 | | | 5.5 | | | 7.9 | | | 10.1 | | | 7.7 | |
Mexican financial system | | 12.9 | % | | 9.9 | % | | 15.4 | % | | 10.5 | % | | 16.1 | % | | 10.7 | % |
Source: Return-on-average equity and equity to total assets ratio data are calculated by us, using information published by the CNBV.
| (1) | | Calculated based upon the average balance of equity. |
Core capital ratio
The following table sets forth Banco Santander México’s and its peers’ core capital ratios for the periods presented. Core capital ratio is defined as Tier 1 Capital (total equity) divided by risk-weighted assets.
| | | | | | | | | | | | | | | |
| | Mexican Banking GAAP | |
| | As of December 31, | |
| | 2014 | | | 2015 | | | 2016 | | | 2017 | | | 2018 | |
| | (%) | |
Santander | | 12.8 | % | | 12.1 | % | | 10.3 | % | | 10.8 | % | | 11.0 | % |
Inbursa | | 20.3 | | | 18.5 | | | 18.5 | | | 18.3 | | | 22.2 | |
Banamex | | 15.5 | | | 14.0 | | | 14.4 | | | 13.9 | | | 13.7 | |
Banorte | | 12.7 | | | 12.4 | | | 12.1 | | | 12.0 | | | 12.7 | |
BBVA Bancomer | | 10.5 | | | 11.0 | | | 10.7 | | | 11.7 | | | 12.0 | |
Scotiabank | | 12.2 | | | 11.5 | | | 13.0 | | | 13.8 | | | 11.6 | |
HSBC | | 10.8 | | | 10.0 | | | 10.7 | | | 11.6 | | | 10.4 | |
Median of seven banks | | 12.7 | % | | 12.1 | % | | 12.1 | % | | 12.0 | % | | 12.0 | % |
Source: CNBV.
Efficiency
As of December 31, 2018, Banco Santander México was the fourth most efficient bank among the seven largest commercial banks in Mexico, according to each bank’s efficiency ratio. For this purpose, we calculate the efficiency ratio as administrative expenses divided by total income, using information
published by the CNBV. The following table sets forth Banco Santander México’s and its peers’ efficiency ratios for the periods indicated.
| | | | | | | | | |
| | Mexican Banking GAAP | |
| | As of December 31, | |
| | 2016 | | | 2017 | | | 2018 | |
| | (%) | |
Santander | | 41.2 | % | | 41.8 | % | | 43.5 | % |
Inbursa | | 32.8 | | | 22.8 | | | 26.9 | |
BBVA Bancomer | | 43.6 | | | 39.8 | | | 38.2 | |
Banorte | | 47.5 | | | 43.8 | | | 41.4 | |
Banamex | | 58.6 | | | 56.0 | | | 59.5 | |
Scotiabank | | 61.1 | | | 55.9 | | | 60.1 | |
HSBC | | 69.6 | | | 61.9 | | | 60.1 | |
Median of seven banks | | 47.5 | % | | 43.8 | % | | 43.5 | % |
Source: Efficiency ratios are calculated by us, using information published by the CNBV.
Total loans
The following table sets forth total loans and market share (as a percentage of the total loans of 50 private banks in Mexico) for the seven private-sector banks with the largest market shares for the periods indicated.
| | | | | | | | | | | | | | | | | | | | | | | | | | | | | | | | | | | |
| | Mexican Banking GAAP | |
| | As of December 31, | |
| | 2014 | | | 2015 | | | 2016 | | | 2017 | | | 2018 | |
| | (Millions
of pesos) | | | (Market
share (%))(1) | | | (Millions
of pesos) | | | (Market
share (%))(1) | | | (Millions
of pesos) | | | (Market
share (%))(1) | | | (Millions
of pesos) | | | (Market
share (%))(1) | | | (Millions
of pesos) | | | (Market
share (%))(1) | |
Santander | | Ps. | 465,541 | | | 13.9 | % | | Ps. | 547,744 | | | 14.3 | % | | Ps. | 591,428 | | | 13.6 | % | | Ps. | 617,870 | | | 13.0 | % | | Ps. | 682,848 | | | 13.2 | % |
BBVA Bancomer | | | 802,468 | | | 24.0 | | | | 898,811 | | | 23.4 | | | | 1,017,682 | | | 23.5 | | | | 1,075,080 | | | 22.7 | | | | 1,160,308 | | | 22.4 | |
Banorte | | | 464,201 | | | 13.9 | | | | 504,926 | | | 13.1 | | | | 567,083 | | | 13.1 | | | | 615,744 | | | 13.0 | | | | 769,433 | | | 14.8 | |
Banamex | | | 478,899 | | | 14.3 | | | | 566,448 | | | 14.7 | | | | 599,229 | | | 13.8 | | | | 667,931 | | | 14.1 | | | | 671,735 | | | 13.0 | |
HSBC | | | 231,460 | | | 6.9 | | | | 247,725 | | | 6.4 | | | | 278,102 | | | 6.4 | | | | 317,914 | | | 6.7 | | | | 379,026 | | | 7.3 | |
Scotiabank | | | 178,553 | | | 5.3 | | | | 214,883 | | | 5.6 | | | | 251,937 | | | 5.8 | | | | 316,054 | | | 6.7 | | | | 370,365 | | | 7.1 | |
Inbursa | | | 199,844 | | | 6.0 | | | | 238,043 | | | 6.2 | | | | 283,662 | | | 6.5 | | | | 289,347 | | | 6.1 | | | | 250,048 | | | 4.8 | |
Total for seven banks(2) | | Ps. | 2,820,966 | | | 84.3 | % | | Ps. | 3,218,580 | | | 83.7 | % | | Ps. | 3,589,123 | | | 82.7 | % | | Ps. | 3,899,940 | | | 82.2 | % | | Ps. | 4,283,763 | | | 82.6 | % |
Source: CNBV.
| (1) | | Market share data are calculated by us, using information published by the CNBV. |
| (2) | | Total loans and market share data for the seven banks are calculated by us, using information published by the CNBV. |
The following table sets forth Banco Santander México’s total mortgage loans and market share based on total mortgage loans for the periods indicated.
| | | | | | | | | | | | | | | | | | | | | | | | | | | | | | | | | | | |
| | Mexican Banking GAAP | |
| | As of December 31, | |
| | 2014 | | | 2015 | | | 2016 | | | 2017 | | | 2018 | |
| | (Millions
of pesos) | | | (Market
share (%))(1) | | | (Millions
of pesos) | | | (Market
share (%))(1) | | | (Millions
of pesos) | | | (Market
share (%))(1) | | | (Millions
of pesos) | | | (Market
share (%))(1) | | | (Millions
of pesos) | | | (Market
share (%))(1) | |
Santander | | Ps. | 106,588 | | | 18.9 | % | | Ps. | 120,476 | | | 19.3 | % | | Ps. | 128,836 | | | 18.7 | % | | Ps. | 130,492 | | | 17.5 | % | | Ps. | 141,649 | | | 17.3 | % |
BBVA Bancomer | | | 161,697 | | | 28.7 | | | | 170,398 | | | 27.3 | | | | 184,418 | | | 26.8 | | | | 196,510 | | | 26.4 | | | | 211,517 | | | 25.8 | |
Banorte | | | 89,767 | | | 16.0 | | | | 99,511 | | | 16.0 | | | | 115,856 | | | 16.8 | | | | 136,728 | | | 18.3 | | | | 157,262 | | | 19.2 | |
Scotiabank | | | 67,580 | | | 12.0 | | | | 80,302 | | | 12.9 | | | | 92,616 | | | 13.5 | | | | 107,248 | | | 14.4 | | | | 123,327 | | | 15.0 | |
Banamex | | | 77,407 | | | 13.8 | | | | 79,165 | | | 12.7 | | | | 81,838 | | | 11.9 | | | | 84,174 | | | 11.3 | | | | 82,326 | | | 10.0 | |
HSBC | | | 26,426 | | | 4.7 | | | | 29,830 | | | 4.8 | | | | 34,506 | | | 5.0 | | | | 38,762 | | | 5.2 | | | | 48,038 | | | 5.9 | |
Inbursa | | | 1,501 | | | 0.3 | | | | 4,208 | | | 0.7 | | | | 6,900 | | | 1.0 | | | | 6,853 | | | 0.9 | | | | 6,371 | | | 0.8 | |
Santander + Top 6(2) | | Ps. | 530,966 | | | 94.4 | % | | Ps. | 583,890 | | | 93.7 | % | | Ps. | 644,970 | | | 93.7 | % | | Ps. | 700,767 | | | 94.0 | % | | Ps. | 770,490 | | | 94.0 | % |
Total System | | Ps. | 562,608 | | | 100.0 | % | | Ps. | 623,205 | | | 100.0 | % | | Ps. | 687,600 | | | 100.0 | % | | Ps. | 745,683 | | | 100.0 | % | | Ps. | 819,607 | | | 100.0 | % |
Source: CNBV.
| (1) | | Market share data are calculated by us, using information published by the CNBV. |
| (2) | | Total mortgage loans and market share data for “Santander + Top 6” are calculated by us, using information published by the CNBV. |
The following table sets forth Banco Santander México’s total consumer loans and market share based on total consumer loans for the periods indicated.
| | | | | | | | | | | | | | | | | | | | | | | | | | | | | | | | | | | |
| | Mexican Banking GAAP | |
| | As of December 31, | |
| | 2014 | | | 2015 | | | 2016 | | | 2017 | | | 2018 | |
| | (Millions
of pesos) | | | (Market
share (%))(1) | | | (Millions
of pesos) | | | (Market
share (%))(1) | | | (Millions
of pesos) | | | (Market
share (%))(1) | | | (Millions
of pesos) | | | (Market
share (%))(1) | | | (Millions
of pesos) | | | (Market
share (%))(1) | |
Santander | | Ps. | 75,624 | | | 10.6 | % | | Ps. | 91,693 | | | 11.5 | % | | Ps. | 100,065 | | | 11.2 | % | | Ps. | 106,864 | | | 11.0 | % | | Ps. | 110,837 | | | 10.7 | % |
BBVA Bancomer | | | 200,618 | | | 28.1 | | | | 225,415 | | | 28.3 | | | | 254,720 | | | 28.4 | | | | 267,373 | | | 27.5 | | | | 282,268 | | | 27.2 | |
Banamex | | | 174,234 | | | 24.4 | | | | 177,886 | | | 22.3 | | | | 190,209 | | | 21.2 | | | | 202,111 | | | 20.8 | | | | 212,194 | | | 20.4 | |
Banorte | | | 66,856 | | | 9.4 | | | | 76,943 | | | 9.6 | | | | 89,832 | | | 10.0 | | | | 106,324 | | | 10.9 | | | | 115,569 | | | 11.1 | |
HSBC | | | 37,940 | | | 5.3 | | | | 48,233 | | | 6.0 | | | | 58,327 | | | 6.5 | | | | 59,245 | | | 6.1 | | | | 60,828 | | | 5.9 | |
Inbursa | | | 18,843 | | | 2.6 | | | | 41,107 | | | 5.2 | | | | 48,346 | | | 5.4 | | | | 50,802 | | | 5.2 | | | | 48,931 | | | 4.7 | |
Scotiabank | | | 26,020 | | | 3.6 | | | | 23,753 | | | 3.0 | | | | 27,456 | | | 3.1 | | | | 34,726 | | | 3.6 | | | | 43,473 | | | 4.2 | |
Santander + Top 6(2) | | Ps. | 600,135 | | | 84.0 | % | | Ps. | 685,030 | | | 85.9 | % | | Ps. | 768,955 | | | 85.8 | % | | Ps. | 827,445 | | | 85.1 | % | | Ps. | 874,100 | | | 84.2 | % |
Total System | | Ps. | 713,200 | | | 100.0 | % | | Ps. | 797,391 | | | 100.0 | % | | Ps. | 895,930 | | | 100.0 | % | | Ps. | 972,417 | | | 100.0 | % | | Ps. | 1,038,608 | | | 100.0 | % |
Source: CNBV.
| (1) | | Market share data are calculated by us, using information published by the CNBV. |
| (2) | | Total consumer loans and market share data for “Santander + Top 6” are calculated by us, using information published by the CNBV. |
The following table sets forth Banco Santander México’s total commercial loans and market share based on total commercial loans for the periods indicated.
| | | | | | | | | | | | | | | | | | | | | | | | | | | | | | | | | | | |
| | Mexican Banking GAAP | |
| | As of December 31, | |
| | 2014 | | | 2015 | | | 2016 | | | 2017 | | | 2018 | |
| | (Millions
of pesos) | | | (Market
share (%))(1) | | | (Millions
of pesos) | | | (Market
share (%))(1) | | | (Millions
of pesos) | | | (Market
share (%))(1) | | | (Millions
of pesos) | | | (Market
share (%))(1) | | | (Millions
of pesos) | | | (Market
share (%))(1) | |
Santander | | Ps. | 221,822 | | | 15.4 | % | | Ps. | 265,861 | | | 15.7 | % | | Ps. | 292,718 | | | 14.8 | % | | Ps. | 314,679 | | | 13.8 | % | | Ps. | 350,586 | | | 13.7 | % |
BBVA Bancomer | | | 301,845 | | | 20.9 | | | | 349,114 | | | 20.6 | | | | 415,975 | | | 21.0 | | | | 459,035 | | | 20.2 | | | | 506,446 | | | 19.8 | |
Banamex | | | 167,115 | | | 11.6 | | | | 209,478 | | | 12.3 | | | | 238,495 | | | 12.0 | | | | 295,896 | | | 13.0 | | | | 301,874 | | | 11.8 | |
Banorte | | | 172,219 | | | 11.9 | | | | 182,589 | | | 10.8 | | | | 207,272 | | | 10.5 | | | | 217,000 | | | 9.5 | | | | 283,280 | | | 11.1 | |
HSBC | | | 124,591 | | | 8.6 | | | | 126,159 | | | 7.4 | | | | 140,227 | | | 7.1 | | | | 185,613 | | | 8.2 | | | | 213,652 | | | 8.3 | |
Inbursa | | | 146,056 | | | 10.1 | | | | 168,870 | | | 9.9 | | | | 192,803 | | | 9.7 | | | | 198,936 | | | 8.7 | | | | 173,662 | | | 6.8 | |
Scotiabank | | | 60,921 | | | 4.2 | | | | 78,813 | | | 4.6 | | | | 95,369 | | | 4.8 | | | | 127,258 | | | 5.6 | | | | 155,686 | | | 6.1 | |
Santander + Top 6(2) | | Ps. | 1,194,569 | | | 82.7 | % | | Ps. | 1,380,884 | | | 81.3 | % | | Ps. | 1,582,859 | | | 79.9 | % | | Ps. | 1,798,417 | | | 79.0 | % | | Ps. | 1,985,186 | | | 77.6 | % |
Total System | | Ps. | 1,441,251 | | | 100.0 | % | | Ps. | 1,698,183 | | | 100.0 | % | | Ps. | 1,980,829 | | | 100.0 | % | | Ps. | 2,274,115 | | | 100.0 | % | | Ps. | 2,559,401 | | | 100.0 | % |
Source: CNBV.
| (1) | | Market share data are calculated by us, using information published by the CNBV. |
| (2) | | Total commercial loans and market share data for “Santander + Top 6” are calculated by us, using information published by the CNBV. |
The following table sets forth Banco Santander México’s total government and financial entities loans and market share based on total government and financial entities loans for the periods indicated.
| | | | | | | | | | | | | | | | | | | | | | | | | | | | | | | | | | | |
| | Mexican Banking GAAP | |
| | As of December 31, | |
| | 2014 | | | 2015 | | | 2016 | | | 2017 | | | 2018 | |
| | (Millions
of pesos) | | | (Market
share (%))(1) | | | (Millions
of pesos) | | | (Market
share (%))(1) | | | (Millions
of pesos) | | | (Market
share (%))(1) | | | (Millions
of pesos) | | | (Market
share (%))(1) | | | (Millions
of pesos) | | | (Market
share (%))(1) | |
Santander | | Ps. | 61,507 | | | 9.8 | % | | Ps. | 69,714 | | | 9.6 | % | | Ps. | 69,808 | | | 9.0 | % | | Ps. | 65,836 | | | 8.7 | % | | Ps. | 79,776 | | | 10.4 | % |
Banorte | | | 135,360 | | | 21.5 | | | | 145,884 | | | 20.1 | | | | 154,123 | | | 19.9 | | | | 155,691 | | | 20.7 | | | | 213,322 | | | 27.8 | |
BBVA Bancomer | | | 138,308 | | | 22.0 | | | | 153,885 | | | 21.2 | | | | 162,569 | | | 21.0 | | | | 152,163 | | | 20.2 | | | | 160,076 | | | 20.9 | |
Banamex | | | 60,143 | | | 9.5 | | | | 99,919 | | | 13.8 | | | | 88,688 | | | 11.4 | | | | 85,750 | | | 11.4 | | | | 75,340 | | | 9.8 | |
Scotiabank | | | 24,032 | | | 3.8 | | | | 32,015 | | | 4.4 | | | | 36,496 | | | 4.7 | | | | 46,822 | | | 6.2 | | | | 47,879 | | | 6.2 | |
HSBC | | | 42,504 | | | 6.7 | | | | 43,504 | | | 6.0 | | | | 45,042 | | | 5.8 | | | | 34,294 | | | 4.6 | | | | 56,508 | | | 7.4 | |
Inbursa | | | 33,445 | | | 5.3 | | | | 23,857 | | | 3.3 | | | | 35,614 | | | 4.6 | | | | 32,756 | | | 4.3 | | | | 21,085 | | | 2.7 | |
Santander + Top 6(2) | | Ps. | 495,299 | | | 78.6 | % | | Ps. | 568,778 | | | 78.4 | % | | Ps. | 592,340 | | | 76.4 | % | | Ps. | 573,312 | | | 76.1 | % | | Ps. | 653,986 | | | 85.2 | % |
Total System | | Ps. | 629,867 | | | 100.0 | % | | Ps. | 724,194 | | | 100.0 | % | | Ps. | 774,737 | | | 100.0 | % | | Ps. | 753,713 | | | 100.0 | % | | Ps. | 767,536 | | | 100.0 | % |
Source: CNBV.
| (1) | | Market share data are calculated by us, using information published by the CNBV. |
| (2) | | Total government and financial entities loans and market share data for “Santander + Top 6” are calculated by us, using information published by the CNBV. |
Deposits
The following table sets forth deposits and market share in terms of deposits (as a percentage of the total deposits of 50 private banks in Mexico) for the seven private-sector banks with the largest market shares for the periods indicated.
| | | | | | | | | | | | | | | | | | | | | |
| | Mexican Banking GAAP | |
| | As of December 31, | |
| | 2016 | | | 2017 | | | 2018 | |
| | (Millions
of pesos) | | | (Market
share (%)) | | | (Millions
of pesos) | | | (Market
share (%)) | | | (Millions
of pesos) | | | (Market
share (%)) | |
Santander | | Ps. | 593,087 | | | 14.1 | % | | Ps. | 647,199 | | | 13.8 | % | | Ps. | 693,742 | | | 13.7 | % |
BBVA Bancomer | | | 952,549 | | | 22.7 | | | | 1,073,108 | | | 22.9 | | | | 1,109,223 | | | 21.9 | |
Banamex | | | 693,723 | | | 16.5 | | | | 693,911 | | | 14.8 | | | | 751,280 | | | 14.8 | |
Banorte | | | 574,502 | | | 13.7 | | | | 644,147 | | | 13.7 | | | | 745,731 | | | 14.7 | |
HSBC | | | 297,818 | | | 7.1 | | | | 364,040 | | | 7.8 | | | | 408,819 | | | 8.0 | |
Scotiabank | | | 241,591 | | | 5.7 | | | | 293,530 | | | 6.3 | | | | 329,085 | | | 6.5 | |
Inbursa | | | 130,179 | | | 3.1 | | | | 138,465 | | | 3.0 | | | | 152,603 | | | 3.0 | |
Total for seven banks | | Ps. | 3,483,449 | | | 82.9 | % | | Ps. | 3,854,400 | | | 82.3 | % | | Ps. | 4,190,483 | | | 82.6 | % |
Source: Deposits and market share data are calculated by us, using information published by the CNBV.
Asset quality
The following table sets forth the asset quality, defined as total non-performing loans as a percentage of total loans by the CNBV, for the seven largest commercial banks in Mexico for the periods indicated.
| | | | | | | | | |
| | Mexican Banking GAAP | |
| | As of December 31, | |
| | 2016 | | | 2017 | | | 2018 | |
| | (Asset quality (%)) | | | (Asset quality (%)) | | | (Asset quality (%)) | |
Santander | | 2.5 | % | | 2.5 | % | | 2.4 | % |
Banorte | | 1.8 | | | 2.0 | | | 1.7 | |
HSBC | | 3.0 | | | 2.4 | | | 1.9 | |
BBVA Bancomer | | 2.2 | | | 2.1 | | | 2.0 | |
Scotiabank | | 2.4 | | | 2.2 | | | 2.2 | |
Banamex | | 1.5 | | | 1.5 | | | 2.2 | |
Inbursa | | 2.7 | | | 3.0 | | | 2.3 | |
Mexican financial system | | 2.1 | % | | 2.1 | % | | 2.1 | % |
Source: CNBV.
Branches and ATMs
The following table sets forth Banco Santander México’s total bank branches and market share based on number of bank branches for the periods indicated.
| | | | | | | | | | | | | | | | | | | | | | | | | | | | | | |
| | | | | | | | | | | | | | | | | | | | | | | | | | | | | | |
| | As of December 31, | |
| 2014 | | | 2015 | | | 2016 | | | 2017 | | | 2018 | |
| | | | | (Market | | | | | | (Market | | | | | | (Market | | | | | | (Market | | | | | | (Market | |
| | | | | share | | | | | | share | | | | | | share | | | | | | share | | | | | | share | |
| | (Branches) | | | (%))(1) | | | (Branches) | | | (%))(1) | | | (Branches) | | | (%))(1) | | | (Branches) | | | (%))(1) | | | (Branches) | | | (%))(1) | |
Santander | | 1,209 | | | 9.5 | % | | 1,216 | | | 9.9 | % | | 1,226 | | | 9.8 | % | | 1,220 | | | 9.6 | % | | 1,222 | | | 9.6 | % |
BBVA Bancomer | | 1,830 | | | 14.4 | | | 1,817 | | | 14.9 | | | 1,835 | | | 14.7 | | | 1,839 | | | 14.4 | | | 1,832 | | | 14.3 | |
Banamex | | 1,539 | | | 12.1 | | | 1,492 | | | 12.2 | | | 1,493 | | | 11.9 | | | 1,479 | | | 11.6 | | | 1,463 | | | 11.4 | |
Banorte | | 1,269 | | | 10.0 | | | 1,191 | | | 9.7 | | | 1,175 | | | 9.4 | | | 1,148 | | | 9.0 | | | 1,150 | | | 9.0 | |
HSBC | | 984 | | | 7.7 | | | 974 | | | 8.0 | | | 974 | | | 7.8 | | | 971 | | | 7.6 | | | 960 | | | 7.5 | |
Inbursa | | 341 | | | 2.7 | | | 539 | | | 4.4 | | | 676 | | | 5.4 | | | 696 | | | 5.5 | | | 703 | | | 5.5 | |
Scotiabank | | 586 | | | 4.6 | | | 579 | | | 4.7 | | | 572 | | | 4.6 | | | 551 | | | 4.3 | | | 551 | | | 4.3 | |
Santander + Top 6(2) | | 7,758 | | | 61.0 | % | | 7,808 | | | 63.8 | % | | 7,951 | | | 63.6 | % | | 7,904 | | | 62.0 | % | | 7,881 | | | 61.6 | % |
Total System | | 12,715 | | | 100.0 | % | | 12,234 | | | 100.0 | % | | 12,522 | | | 100.0 | % | | 12,744 | | | 100.0 | % | | 12,792 | | | 100.0 | % |
Source: CNBV (R1 regulatory report on branches, ATMs and credit cards).
| (1) | | Market share data are calculated by us, using information published by the CNBV. |
| (2) | | Total bank branches and market share data for “Santander + Top 6” are calculated by us, using information published by the CNBV. |
The following table sets forth Banco Santander México’s total number of ATMs and market share in terms of ATMs for the periods indicated.
| | | | | | | | | | | | | | | | | | | | | | | | | | | | | | |
| | As of December 31, | |
| 2014 | | | 2015 | | | 2016 | | | 2017 | | | 2018 | |
| | (ATMs) | | | (Market
share (%))(1) | | | (ATMs) | | | (Market
share (%))(1) | | | (ATMs) | | | (Market
share (%))(1) | | | (ATMs) | | | (Market
share (%))(1) | | | (ATMs) | | | (Market
share (%))(1) | |
Santander | | 5,517 | | | 12.9 | % | | 5,989 | | | 13.1 | % | | 6,722 | | | 14.0 | % | | 7,323 | | | 14.8 | % | | 8,295 | | | 15.6 | % |
BBVA Bancomer | | 8,996 | | | 21.0 | | | 10,772 | | | 23.5 | | | 11,434 | | | 23.8 | | | 11,724 | | | 23.7 | | | 12,477 | | | 23.4 | |
Banamex | | 7,142 | | | 16.6 | | | 7,526 | | | 16.4 | | | 8,133 | | | 17.0 | | | 8,765 | | | 17.7 | | | 9,319 | | | 17.5 | |
Banorte | | 7,297 | | | 17.0 | | | 7,425 | | | 16.2 | | | 7,756 | | | 16.2 | | | 7,911 | | | 16.0 | | | 8,423 | | | 15.8 | |
HSBC | | 5,780 | | | 13.5 | | | 5,625 | | | 12.3 | | | 5,472 | | | 11.4 | | | 5,470 | | | 11.0 | | | 5,851 | | | 11.0 | |
Scotiabank | | 2,148 | | | 5.0 | | | 1,975 | | | 4.3 | | | 1,797 | | | 3.7 | | | 1,511 | | | 3.0 | | | 1,564 | | | 2.9 | |
Inbursa | | 752 | | | 1.8 | | | 808 | | | 1.8 | | | 845 | | | 1.8 | | | 807 | | | 1.6 | | | 810 | | | 1.5 | |
Santander + Top 6(2) | | 37,632 | | | 87.8 | % | | 40,120 | | | 87.6 | % | | 42,159 | | | 87.9 | % | | 43,511 | | | 87.8 | % | | 46,739 | | | 87.7 | % |
Total System | | 42,931 | | | 100.0 | % | | 45,781 | | | 100.0 | % | | 47,945 | | | 100.0 | % | | 49,508 | | | 100.0 | % | | 53,270 | | | 100.0 | % |
Source: CNBV (R1 regulatory report on branches, ATMs and credit cards).
| (1) | | Market share data are calculated by us, using information published by the CNBV. |
| (2) | | Total ATMs and market share data are calculated by us, using information published by the CNBV. |
Environmental Matters
We follow a strategic program of Corporate Social Responsibility, which promotes a continuous commitment to act responsibly, thus contributing to economic development and improving the quality of life of employees, their families and the community in general.
In this context, we have reaffirmed our respect and commitment to the environment by renewing our environmental policies and maintaining an Environmental Management System (EMS) for our corporate building in Santa Fe, Mexico City.
During 2018, we achieved the recertification with the new version of the ISO 14001 2015 standard. Throughout the year, internal monitoring audits and environmental legal compliance reviews were carried out, confirming that the EMS continues operating and that significant improvement activities have been carried out.
In accordance with the above, in August 2018 the recertification audit was carried out by AENOR, now under the ISO 14001 2015 guidelines. We obtained favorable results and zero non-conformities, which places us at the forefront in terms of environmental commitment.
The environmental policy seeks to integrate sustainability into our daily management, carried out by senior management. This environmental policy commits us to the following:
| · | | Adopt practices focused on the efficient and responsible use of natural and material resources, minimize the generation of waste, pollutant emissions and wastewater resulting from our production processes. |
| · | | Comply with the requirements of environmental legislation, applicable to the environmental aspects of our production, administrative and support services and processes, as well as other requirements to which we subscribe. |
| · | | Maintain a commitment to continuous improvement of our EMS, which impacts in the environmental performance of the organization. |
This environmental policy is communicated to all employees through one or more of the following means: communication announcements, posters located within the workspace, intranet website and / or training courses for contractors and new employees.
In compliance with the regulations at the federal level, annual information is sent to SEMARNAT (Secretaría de Medio Ambiente y Recursos Naturales) through the Annual Operating Certificate (COA), relating to the consumption information that generates pollutant emissions into the atmosphere, facilitating the classification and monitoring of these by the environmental authority through the National Emissions Register (RENE).
Below is a list of the recognitions and certifications we have obtained:
Corporate Center Santa Fe, Mexico City, Mexico
| · | | 14 years of continuous certification of the Santa Fe Corporate Building under the international standard ISO 14001, including recertification under the 2015 standard in 2018. |
Technological Operations Center Santander (Centro Tecnologico de Operaciones Santander) (CTOS), Queretaro, Mexico
| · | | The International Computer Room Experts Association (ICREA) again awarded the TITANIO Level V Certification for 14 consecutive years, which is the highest level Certification under the international standard ISO 14001 2015 Environmental Management System. |
| · | | Certification of Environmental Quality Level I –National granted by the Federal Procurator for Environmental Protection (PROFEPA) and which certifies compliance with environmental regulations required by law at the municipal, state and federal levels. |
Contact Center Santander (CCS), Queretaro, Mexico
| · | | The International Computer Room Experts Association (ICREA) awarded for the eighth year in a row to the IT Room with the CCS PLATINO Level V Certification. |
| · | | Certification under the international standard ISO 14001 2015 Environmental Management System. |
| · | | Certification of Environmental Quality Level I –National granted by the Federal Procurator for Environmental Protection (PROFEPA) and which certifies compliance with environmental regulations required by law at the municipal, state and federal levels. |
Data Processing Center (Centro de Procesamiento de Datos) (CPD Q), Queretaro, Mexico
| · | | The International Computer Room Experts Association (ICREA) awarded for the fifth year in a row CTOS II “Project Q” Plata Certification Level V. |
| · | | Certification under the international standard ISO 14001 2015 Environmental Management System. |
| · | | Certification of Environmental Quality Level I-National granted by the Federal Procurator for Environmental Protection (PROFEPA) and which certifies compliance with environmental regulations required by law at the municipal, state and federal levels. |
To the best of our knowledge and understanding, there are currently no international, federal, state or local environmental laws, rules or regulations that will materially adversely affect our results of operations or our position with respect to our competitors. However, in the future there may be.
Selected Statistical Information
The following information is included for analytical purposes and is derived from, and should be read in conjunction with, the audited financial statements contained elsewhere herein as well as “Item 5. Operating and Financial Review and Prospects.”
Average balance sheet data has been calculated based upon the sum of daily average for each month in the applicable period. Average income statement and balance sheet data and other related statistical information have been prepared on a consolidated basis. We believe that the average data set forth herein accurately reflect in all material aspects our financial condition and results of operations at the date and for the periods specified.
Average Balance Sheet and Interest Rates
The following tables show our average balance sheet and interest rates for each of the periods presented. With respect to the tables below and the tables under “—Changes in Net Interest Income—Volume and Rate Analysis” and “—Assets—Earning Assets—Yield Spread,” we have stated average balances on a gross basis, before netting our allowance for impairment losses, except for the total average asset figures, which include such netting. All average data have been calculated using daily averages.
Average Balance Sheets, Income from Interest-Earning Assets and Interest on Interest-Bearing Liabilities
| | | | | | | | | | | | | | | | | | | | | | | | | | | | | | | | | |
| | IFRS for the year ended December 31, | |
| | 2016 | | | 2017 | | | 2018 | |
| | | | | | | | Average | | | | | | | | | Average | | | | | | | | | Average | |
| | Average | | | | | | nominal | | | Average | | | | | | nominal | | | Average | | | | | | nominal | |
| | balance | | | Interest | | | rate | | | balance | | | Interest | | | rate | | | balance | | | Interest | | | rate | |
| | (Millions of pesos, except percentages) | |
Cash and balances with the Mexican Central Bank | | | | | | | | | | | | | | | | | | | | | | | | | | | | | | | | | |
Pesos | | Ps. | 33,817 | | | Ps. | 1,418 | | | 4.19% | | | Ps. | 30,472 | | | Ps. | 2,081 | | | 6.83% | | | Ps. | 30,215 | | | Ps. | 2,361 | | | 7.81% | |
Total | | Ps. | 33,817 | | | Ps. | 1,418 | | | 4.19% | | | Ps. | 30,472 | | | Ps. | 2,081 | | | 6.83% | | | Ps. | 30,215 | | | Ps. | 2,361 | | | 7.81% | |
Loans and advances to credit institutions | | | | | | | | | | | | | | | | | | | | | | | | | | | | | | | | | |
Pesos | | Ps. | 59,361 | | | Ps. | 2,605 | | | 4.39% | | | Ps. | 60,959 | | | Ps. | 4,012 | | | 6.58% | | | Ps. | 95,424 | | | Ps. | 7,085 | | | 7.42% | |
Foreign currency(1) | | | 30,059 | | | | 227 | | | 0.76% | | | | 80,056 | | | | 792 | | | 0.99% | | | | 61,427 | | | | 1,075 | | | 1.75% | |
Total | | Ps. | 89,420 | | | Ps. | 2,832 | | | 3.17% | | | Ps. | 141,015 | | | Ps. | 4,804 | | | 3.41% | | | Ps. | 156,851 | | | Ps. | 8,160 | | | 5.20% | |
Loans and advances to customers—excluding credit cards | | | | | | | | | | | | | | | | | | | | | | | | | | | | | | | | | |
Pesos | | Ps. | 437,480 | | | Ps. | 44,655 | | | 10.21% | | | Ps. | 469,722 | | | Ps. | 56,254 | | | 11.98% | | | Ps. | 528,922 | | | Ps. | 64,846 | | | 12.26% | |
Foreign currency(1) | | | 90,102 | | | | 2,885 | | | 3.20% | | | | 76,314 | | | | 2,760 | | | 3.62% | | | | 72,260 | | | | 3,125 | | | 4.32% | |
Total | | Ps. | 527,582 | | | Ps. | 47,540 | | | 9.01% | | | Ps. | 546,036 | | | Ps. | 59,014 | | | 10.81% | | | Ps. | 601,182 | | | Ps. | 67,971 | | | 11.31% | |
Loans and advances to customers—credit cards | | | | | | | | | | | | | | | | | | | | | | | | | | | | | | | | | |
Pesos | | Ps. | 49,096 | | | Ps. | 11,724 | | | 23.88% | | | Ps. | 52,167 | | | Ps. | 13,249 | | | 25.40% | | | Ps. | 54,690 | | | Ps. | 14,523 | | | 26.56% | |
Total | | Ps. | 49,096 | | | Ps. | 11,724 | | | 23.88% | | | Ps. | 52,167 | | | Ps. | 13,249 | | | 25.40% | | | Ps. | 54,690 | | | Ps. | 14,523 | | | 26.56% | |
Debt instruments | | | | | | | | | | | | | | | | | | | | | | | | | | | | | | | | | |
Pesos | | Ps. | 249,278 | | | Ps. | 11,692 | | | 4.69% | | | Ps. | 218,415 | | | Ps. | 14,016 | | | 6.42% | | | Ps. | 201,125 | | | Ps. | 14,294 | | | 7.11% | |
Foreign currency(1) | | | 40,664 | | | | 1,457 | | | 3.58% | | | | 59,871 | | | | 2,775 | | | 4.63% | | | | 76,260 | | | | 3,296 | | | 4.32% | |
Total | | Ps. | 289,942 | | | Ps. | 13,149 | | | 4.54% | | | Ps. | 278,286 | | | Ps. | 16,791 | | | 6.03% | | | Ps. | 277,385 | | | Ps. | 17,590 | | | 6.34% | |
Income from hedging operations | | | | | | | | | | | | | | | | | | | | | | | | | | | | | | | | | |
Pesos | | | | | | Ps. | 703 | | | | | | | | | | Ps. | 1,895 | | | | | | | | | | Ps. | 2,858 | | | | |
Foreign currency(1) | | | | | | | — | | | | | | | | | | | — | | | | | | | | | | | — | | | | |
Total | | | | | | Ps. | 703 | | | | | | | | | | Ps. | 1,895 | | | | | | | | | | Ps. | 2,858 | | | | |
Other interest-earning assets | | | | | | | | | | | | | | | | | | | | | | | | | | | | | | | | | |
Pesos | | | | | | Ps. | 70 | | | | | | | | | | Ps. | 114 | | | | | | | | | | Ps. | 62 | | | | |
Foreign currency(1) | | | | | | | 17 | | | | | | | | | | | 54 | | | | | | | | | | | 61 | | | | |
Total | | | | | | Ps. | 87 | | | | | | | | | | Ps. | 168 | | | | | | | | | | Ps. | 123 | | | | |
Total interest-earning assets | | | | | | | | | | | | | | | | | | | | | | | | | | | | | | | | | |
Pesos | | Ps. | 829,032 | | | Ps. | 72,867 | | | 8.79% | | | Ps. | 831,735 | | | Ps. | 91,621 | | | 11.02% | | | Ps. | 910,376 | | | Ps. | 106,029 | | | 11.65% | |
Foreign currency(1) | | | 160,825 | | | | 4,586 | | | 2.85% | | | | 216,241 | | | | 6,381 | | | 2.95% | | | | 209,947 | | | | 7,557 | | | 3.60% | |
Total | | Ps. | 989,857 | | | Ps. | 77,453 | | | 7.82% | | | Ps. | 1,047,976 | | | Ps. | 98,002 | | | 9.35% | | | Ps. | 1,120,323 | | | Ps. | 113,586 | | | 10.14% | |
| (1) | | Represents assets or liabilities denominated in foreign currencies. Values are presented in pesos. |
| | | | | | | | | | | | | | | | | | | | | | | | | | | | | | | | | |
| | IFRS for the year ended December 31, | |
| | 2016 | | | 2017 | | | 2018 | |
| | | | | | | | | Average | | | | | | | | | Average | | | | | | | | | Average | |
| | Average | | | | | | nominal | | | Average | | | | | | nominal | | | Average | | | | | | nominal | |
| | balance | | | Interest | | | rate | | | balance | | | Interest | | | rate | | | balance | | | Interest | | | rate | |
| | (Millions of pesos, except percentages) | |
Cash and loans and advances to credit institutions | | | | | | | | | | | | | | | | | | | | | | | | | | | | | | | | | |
Pesos | | Ps. | 20,972 | | | | | | | | | | Ps. | 21,224 | | | | | | | | | | Ps. | 19,564 | | | | | | | | |
Foreign currency(1) | | | 1,829 | | | | | | | | | | | 2,843 | | | | | | | | | | | 3,974 | | | | | | | | |
Total | | Ps. | 22,801 | | | | | | | | | | Ps. | 24,067 | | | | | | | | | | Ps. | 23,538 | | | | | | | | |
Allowance for impairment losses | | | | | | | | | | | | | | | | | | | | | | | | | | | | | | | | | |
Pesos | | Ps. | (16,793) | | | | | | | | | | Ps. | (16,024) | | | | | | | | | | Ps. | (18,002) | | | | | | | | |
Foreign currency(1) | | | (1,157) | | | | | | | | | | | (1,435) | | | | | | | | | | | (1,969) | | | | | | | | |
Total | | Ps. | (17,950) | | | | | | | | | | Ps. | (17,459) | | | | | | | | | | Ps. | (19,971) | | | | | | | | |
Tangible assets | | | | | | | | | | | | | | | | | | | | | | | | | | | | | | | | | |
Pesos | | Ps. | 8,876 | | | | | | | | | | Ps. | 9,795 | | | | | | | | | | Ps. | 11,401 | | | | | | | | |
Total | | Ps. | 8,876 | | | | | | | | | | Ps. | 9,795 | | | | | | | | | | Ps. | 11,401 | | | | | | | | |
Intangible assets | | | | | | | | | | | | | | | | | | | | | | | | | | | | | | | | | |
Pesos | | Ps. | 1,942 | | | | | | | | | | Ps. | 2,038 | | | | | | | | | | Ps. | 2,654 | | | | | | | | |
Total | | Ps. | 1,942 | | | | | | | | | | Ps. | 2,038 | | | | | | | | | | Ps. | 2,654 | | | | | | | | |
Other non-interest-earning assets | | | | | | | | | | | | | | | | | | | | | | | | | | | | | | | | | |
Pesos | | Ps. | 90,366 | | | | | | | | | | Ps. | 121,852 | | | | | | | | | | Ps. | 141,723 | | | | | | | | |
Foreign currency(1) | | | 4,182 | | | | | | | | | | | 871 | | | | | | | | | | | 17,637 | | | | | | | | |
Total | | Ps. | 94,548 | | | | | | | | | | Ps. | 122,723 | | | | | | | | | | Ps. | 159,360 | | | | | | | | |
Total non-interest-earning assets | | | | | | | | | | | | | | | | | | | | | | | | | | | | | | | | | |
Pesos | | Ps. | 105,363 | | | | | | | | | | Ps. | 138,885 | | | | | | | | | | Ps. | 157,340 | | | | | | | | |
Foreign currency(1) | | | 4,854 | | | | | | | | | | | 2,279 | | | | | | | | | | | 19,642 | | | | | | | | |
Total | | Ps. | 110,217 | | | | | | | | | | Ps. | 141,164 | | | | | | | | | | Ps. | 176,982 | | | | | | | | |
Total average assets | | | | | | | | | | | | | | | | | | | | | | | | | | | | | | | | | |
Pesos | | Ps. | 934,395 | | | Ps. | 72,867 | | | 7.80% | | | Ps. | 970,620 | | | Ps. | 91,621 | | | 9.44% | | | Ps. | 1,067,716 | | | Ps. | 106,029 | | | 9.93% | |
Foreign currency(1) | | | 165,679 | | | | 4,586 | | | 2.77% | | | | 218,520 | | | | 6,381 | | | 2.92% | | | | 229,589 | | | | 7,557 | | | 3.29% | |
Total | | Ps. | 1,100,074 | | | Ps. | 77,453 | | | 7.04% | | | Ps. | 1,189,140 | | | Ps. | 98,002 | | | 8.24% | | | Ps. | 1,297,305 | | | Ps. | 113,586 | | | 8.76% | |
| (1) | | Represents assets or liabilities denominated in foreign currencies. Values are presented in pesos. |
| | | | | | | | | | | | | | | | | | | | | | | | | | | | | | | | | |
| | IFRS for the year ended December 31, | |
| | 2016 | | 2017 | | 2018 | |
| | | | | | | | | | Average | | | | | | | | | | | Average | | | | | | | | | | | Average | |
| | Average | | | | | | | nominal | | | Average | | | | | | | nominal | | | Average | | | | | | | nominal | |
| | balance | | | Interest | | | rate | | | balance | | | Interest | | | rate | | | balance | | | Interest | | | rate | |
| | (Millions of pesos, except percentages) | |
Deposits from the Mexican Central Bank and credit institutions | | | | | | | | | | | | | | | | | | | | | | | | | | | | | | | | | |
Pesos | | Ps. | 135,218 | | | Ps. | 5,869 | | | 4.34% | | | Ps. | 103,921 | | | Ps. | 7,290 | | | 7.01% | | | Ps. | 91,520 | | | Ps. | 7,304 | | | 7.98% | |
Foreign currency(1) | | | 27,664 | | | | 277 | | | 1.00% | | | | 19,152 | | | | 274 | | | 1.43% | | | | 6,733 | | | | 116 | | | 1.72% | |
Total | | Ps. | 162,882 | | | Ps. | 6,146 | | | 3.77% | | | Ps. | 123,073 | | | Ps. | 7,564 | | | 6.15% | | | Ps. | 98,253 | | | Ps. | 7,420 | | | 7.55% | |
Customer deposits— Demand accounts | | | | | | | | | | | | | | | | | | | | | | | | | | | | | | | | | |
Pesos | | Ps. | 267,813 | | | Ps. | 5,007 | | | 1.87% | | | Ps. | 305,826 | | | Ps. | 8,837 | | | 2.89% | | | Ps. | 331,574 | | | Ps. | 10,315 | | | 3.11% | |
Foreign currency(1) | | | 54,586 | | | | 51 | | | 0.09% | | | | 60,543 | | | | 52 | | | 0.09% | | | | 52,043 | | | | 15 | | | 0.03% | |
Total | | Ps. | 322,399 | | | Ps. | 5,058 | | | 1.57% | | | Ps. | 366,369 | | | Ps. | 8,889 | | | 2.43% | | | Ps. | 383,617 | | | Ps. | 10,330 | | | 2.69% | |
Customer deposits—Savings accounts | | | | | | | | | | | | | | | | | | | | | | | | | | | | | | | | 0.27% | |
Pesos | | Ps. | 12 | | | | | | | | | | Ps. | 11 | | | | | | | | | | Ps. | 10 | | | | | | | | |
Total | | Ps. | 12 | | | | | | | | | | Ps. | 11 | | | | | | | | | | Ps. | 10 | | | | | | | | |
Customer deposits— Time deposits | | | | | | | | | | | | | | | | | | | | | | | | | | | | | | | | | |
Pesos | | Ps. | 140,045 | | | Ps. | 5,617 | | | 4.01% | | | Ps. | 158,639 | | | Ps. | 9,580 | | | 6.04% | | | Ps. | 194,579 | | | Ps. | 13,933 | | | 7.16% | |
Foreign currency(1) | | | 31,200 | | | | 114 | | | 0.37% | | | | 49,820 | | | | 420 | | | 0.84% | | | | 61,742 | | | | 1,010 | | | 1.64% | |
Total | | Ps. | 171,245 | | | Ps. | 5,731 | | | 3.35% | | | Ps. | 208,459 | | | Ps. | 10,000 | | | 4.80% | | | Ps. | 256,321 | | | Ps. | 14,943 | | | 5.83% | |
Customer deposits— Repurchase agreements | | | | | | | | | | | | | | | | | | | | | | | | | | | | | | | | | |
Pesos | | Ps. | 90,619 | | | Ps. | 3,820 | | | 4.22% | | | Ps. | 86,170 | | | Ps. | 5,671 | | | 6.58% | | | Ps. | 87,540 | | | Ps. | 6,640 | | | 7.59% | |
Total | | Ps. | 90,619 | | | Ps. | 3,820 | | | 4.22% | | | Ps. | 86,170 | | | Ps. | 5,671 | | | 6.58% | | | Ps. | 87,540 | | | Ps. | 6,640 | | | 7.59% | |
Subordinated debentures | | | | | | | | | | | | | | | | | | | | | | | | | | | | | | | | | |
Foreign currency(1) | | Ps. | 24,101 | | | Ps. | 1,473 | | | 6.11% | | | Ps. | 24,427 | | | Ps. | 1,600 | | | 6.55% | | | Ps. | 25,262 | | | Ps. | 1,610 | | | 6.37% | |
Total | | Ps. | 24,101 | | | Ps. | 1,473 | | | 6.11% | | | Ps. | 24,427 | | | Ps. | 1,600 | | | 6.55% | | | Ps. | 25,262 | | | Ps. | 1,610 | | | 6.37% | |
Marketable debt securities and other financial liabilities | | | | | | | | | | | | | | | | | | | | | | | | | | | | | | | | | |
Pesos | | Ps. | 38,927 | | | Ps. | 1,800 | | | 4.62% | | | Ps. | 39,573 | | | Ps. | 2,816 | | | 7.12% | | | Ps. | 40,054 | | | Ps. | 3,247 | | | 8.11% | |
Foreign currency(1) | | | 18,771 | | | | 825 | | | 4.40% | | | | 19,088 | | | | 880 | | | 4.61% | | | | 23,447 | | | | 997 | | | 4.25% | |
Total | | Ps. | 57,698 | | | Ps. | 2,625 | | | 4.55% | | | Ps. | 58,661 | | | Ps. | 3,696 | | | 6.30% | | | Ps. | 63,501 | | | Ps. | 4,244 | | | 6.68% | |
Other liabilities | | | | | | | | | | | | | | | | | | | | | | | | | | | | | | | | | |
Pesos | | Ps. | 64,172 | | | Ps. | 2,997 | | | 4.67% | | | Ps. | 65,210 | | | Ps. | 4,277 | | | 6.56% | | | Ps. | 77,301 | | | Ps. | 5,931 | | | 7.67% | |
Foreign currency(1) | | | — | | | | — | | | — | | | | — | | | | — | | | 0.00% | | | | — | | | | — | | | | |
Total | | Ps. | 64,172 | | | Ps. | 2,997 | | | 4.67% | | | Ps. | 65,210 | | | Ps. | 4,277 | | | 6.56% | | | Ps. | 77,301 | | | Ps. | 5,931 | | | 7.67% | |
Expense from hedging operation | | | | | | | | | | | | | | | | | | | | | | | | | | | | | | | | | |
Pesos | | Ps. | | | | Ps. | 167 | | | | | | Ps. | | | | Ps. | 129 | | | | | | Ps. | | | | Ps. | 108 | | | | |
Foreign currency (1) | | | | | | | — | | | | | | | | | | | — | | | | | | | | | | | — | | | | |
Total | | Ps. | — | | | Ps. | 167 | | | | | | Ps. | — | | | Ps. | 129 | | | | | | Ps. | — | | | Ps. | 108 | | | | |
Other interest expense | | | | | | | | | | | | | | | | | | | | | | | | | | | | | | | | | |
Pesos | | Ps. | | | | Ps. | 306 | | | | | | Ps. | | | | Ps. | 332 | | | | | | Ps. | | | | Ps. | 363 | | | | |
Foreign currency(1) | | | | | | | — | | | | | | | | | | | — | | | | | | | | | | | — | | | | |
Total | | Ps. | — | | | Ps. | 306 | | | | | | Ps. | — | | | Ps. | 332 | | | | | | Ps. | — | | | Ps. | 363 | | | | |
Total interest-bearing liabilities | | | | | | | | | | | | | | | | | | | | | | | | | | | | | | | | | |
Pesos | | Ps. | 736,806 | | | Ps. | 25,583 | | | 3.47% | | | Ps. | 759,350 | | | Ps. | 38,932 | | | 5.13% | | | Ps. | 822,578 | | | Ps. | 47,841 | | | 5.82% | |
Foreign currency(1) | | | 156,322 | | | | 2,740 | | | 1.75% | | | | 173,030 | | | | 3,226 | | | 1.86% | | | | 169,227 | | | | 3,748 | | | 2.21% | |
Total | | Ps. | 893,128 | | | Ps. | 28,323 | | | 3.17% | | | Ps. | 932,380 | | | Ps. | 42,158 | | | 4.52% | | | Ps. | 991,805 | | | Ps. | 51,589 | | | 5.20% | |
| (1) | | Represents assets or liabilities denominated in foreign currencies. Values are presented in pesos. |
| | | | | | | | | | | | | | | | | | | | | | | | | | | | | | | | | |
| | IFRS for the year ended December 31, | |
| | 2016 | | | 2017 | | | 2018 | |
| | | | | | | | | | Average | | | | | | | | | | | Average | | | | | | | | | | | Average | |
| | Average | | | | | | | nominal | | | Average | | | | | | | nominal | | | Average | | | | | | | nominal | |
| | balance | | | Interest | | | rate | | | balance | | | Interest | | | rate | | | balance | | | Interest | | | rate | |
| | (Millions of pesos, except percentages) | |
Customer deposits— Demand deposits | | | | | | | | | | | | | | | | | | | | | | | | | | | | | | | | | |
Pesos | | Ps. | 30,806 | | | | | | | | | | Ps. | 21,031 | | | | | | | | | | Ps. | 23,459 | | | | | | | | |
Foreign currency(1) | | | 15 | | | | | | | | | | | 38 | | | | | | | | | | | 53 | | | | | | | | |
Total | | Ps. | 30,821 | | | | | | | | | | Ps. | 21,069 | | | | | | | | | | Ps. | 23,512 | | | | | | | | |
Other liabilities— non-interest-bearing | | | | | | | | | | | | | | | | | | | | | | | | | | | | | | | | | |
Pesos | | Ps. | 61,247 | | | | | | | | | | Ps. | 85,546 | | | | | | | | | | Ps. | 92,491 | | | | | | | | |
Foreign currency(1) | | | 3,795 | | | | | | | | | | | 39,817 | | | | | | | | | | | 70,517 | | | | | | | | |
Total | | Ps. | 65,042 | | | | | | | | | | Ps. | 125,363 | | | | | | | | | | Ps. | 163,008 | | | | | | | | |
Total equity | | | | | | | | | | | | | | | | | | | | | | | | | | | | | | | | | |
Pesos | | Ps. | 111,083 | | | | | | | | | | | 110,328 | | | | | | | | | | Ps. | 118,980 | | | | | | | | |
Total | | Ps. | 111,083 | | | | | | | | | | | 110,328 | | | | | | | | | | Ps. | 118,980 | | | | | | | | |
Total non-interest-bearing liabilities and equity | | | | | | | | | | | | | | | | | | | | | | | | | | | | | | | | | |
Pesos | | Ps. | 203,136 | | | | | | | | | | | 216,905 | | | | | | | | | | Ps. | 234,930 | | | | | | | | |
Foreign currency(1) | | | 3,810 | | | | | | | | | | | 39,855 | | | | | | | | | | | 70,570 | | | | | | | | |
Total | | Ps. | 206,946 | | | | | | | | | | Ps. | 256,760 | | | | | | | | | | Ps. | 305,500 | | | | | | | | |
Total liabilities and equity | | | | | | | | | | | | | | | | | | | | | | | | | | | | | | | | | |
Pesos | | Ps. | 939,942 | | | Ps. | 25,583 | | | 2.72% | | | | 976,255 | | | Ps. | 38,932 | | | 3.99% | | | Ps. | 1,057,508 | | | Ps. | 47,841 | | | 4.52% | |
Foreign currency(1) | | | 160,132 | | | | 2,740 | | | 1.71% | | | | 212,885 | | | | 3,226 | | | 1.52% | | | | 239,797 | | | | 3,748 | | | 1.56% | |
Total | | Ps. | 1,100,074 | | | Ps. | 28,323 | | | 2.57% | | | Ps. | 1,189,140 | | | Ps. | 42,158 | | | 3.55% | | | Ps. | 1,297,305 | | | Ps. | 51,589 | | | 3.98% | |
| (1) | | Represents assets or liabilities denominated in foreign currencies. Values are presented in pesos. |
Changes in our Net Interest Income—Volume and Rate Analysis
The following tables allocate the changes in our net interest income between changes in average volume and changes in average rate for the year ended December 31, 2018 compared to the year ended December 31, 2017 and changes for the year ended December 31, 2017 compared to the year ended December 31, 2016. We have calculated volume variations based on movements in average balances over the period and rate variance based on changes in interest rates on average interest-earning assets and average interest-bearing liabilities. We have allocated variations caused by changes in both volume and rate to volume. You should read the following tables and the footnotes thereto in light of our observations noted in “—Average Balance Sheet and Interest Rates.”
Change in Financial Income and Expense
| | | | | | | | | | | | |
| | IFRS for the year ended December 31, 2018 and 2017 | |
| | Volume | | | Rate | | | Net Change | |
| | (Millions of pesos) | |
INTEREST-EARNING ASSETS | | | | | | | | | | | | |
Cash and balances with the Mexican Central Bank | | | | | | | | | | | | |
Pesos | | Ps. | (20) | | | Ps. | 300 | | | Ps. | 280 | |
Total | | Ps. | (20) | | | Ps. | 300 | | | Ps. | 280 | |
Loans and advances to credit institutions | | | | | | | | | | | | |
Pesos | | Ps. | 2,559 | | | Ps. | 514 | | | Ps. | 3,073 | |
Foreign currency(1) | | | (326) | | | | 609 | | | | 283 | |
Total | | Ps. | 2,233 | | | Ps. | 1,123 | | | Ps. | 3,356 | |
Loans and advances to customers—excluding credit cards | | | | | | | | | | | | |
Pesos | | Ps. | 7,258 | | | Ps. | 1,334 | | | Ps. | 8,592 | |
Foreign currency(1) | | | (175) | | | | 540 | | | | 365 | |
Total | | Ps. | 7,083 | | | Ps. | 1,874 | | | Ps. | 8,957 | |
Loans and advances to customers—credit cards | | | | | | | | | | | | |
Pesos | | Ps. | 670 | | | Ps. | 604 | | | Ps. | 1,274 | |
Total | | Ps. | 670 | | | Ps. | 604 | | | Ps. | 1,274 | |
Debt instruments | | | | | | | | | | | | |
Pesos | | Ps. | (1,229) | | | Ps. | 1,507 | | | Ps. | 278 | |
Foreign currency(1) | | | 708 | | | | (188) | | | | 520 | |
Total | | Ps. | (521) | | | Ps. | 1,319 | | | Ps. | 798 | |
Income from hedging operations | | | | | | | | | | | | |
Pesos | | Ps. | — | | | Ps. | 963 | | | Ps. | 963 | |
Foreign currency(1) | | | — | | | | — | | | | — | |
Total | | Ps. | — | | | Ps. | 963 | | | Ps. | 963 | |
Other interest-earning assets | | | | | | | | | | | | |
Pesos | | Ps. | — | | | Ps. | (52) | | | Ps. | (52) | |
Foreign currency(1) | | | — | | | | 7 | | | | 7 | |
Total | | Ps. | — | | | Ps. | (45) | | | Ps. | (45) | |
Total interest-earning assets | | | | | | | | | | | | |
Pesos | | Ps. | 9,159 | | | Ps. | 5,248 | | | Ps. | 14,407 | |
Foreign currency(1) | | | (227) | | | | 1,402 | | | | 1,175 | |
Total | | Ps. | 8,932 | | | Ps. | 6,650 | | | Ps. | 15,582 | |
| (1) | | Represents assets or liabilities denominated in foreign currencies. Values are presented in pesos. |
| | | | | | | | | | | | |
| | IFRS for the year ended December 31, 2018 and 2017 | |
| | Volume | | | Rate | | | Net Change | |
| | (Millions of pesos) | |
INTEREST-BEARING LIABILITIES | | | | | | | | | | | | |
Deposits from the Mexican Central Bank and credit institutions | | | | | | | | | | | | |
Pesos | | Ps. | (990) | | | Ps. | 1,004 | | | Ps. | 14 | |
Foreign currency(1) | | | (214) | | | | 56 | | | | (158) | |
Total | | Ps. | (1,204) | | | Ps. | 1,060 | | | Ps. | (144) | |
Customer deposits—Demand accounts | | | | | | | | | | | | |
Pesos | | Ps. | 801 | | | Ps. | 677 | | | Ps. | 1,478 | |
Foreign currency(1) | | | (2) | | | | (35) | | | | (37) | |
Total | | Ps. | 799 | | | Ps. | 642 | | | Ps. | 1,441 | |
Customer deposits—Savings accounts | | | | | | | | | | | | |
Pesos | | Ps. | — | | | Ps. | — | | | Ps. | — | |
Total | | Ps. | — | | | Ps. | — | | | Ps. | — | |
Customer deposits—Time deposits | | | | | | | | | | | | |
Pesos | | Ps. | 2,574 | | | Ps. | 1,779 | | | Ps. | 4,353 | |
Foreign currency(1) | | | 195 | | | | 395 | | | | 590 | |
Total | | Ps. | 2,769 | | | Ps. | 2,174 | | | Ps. | 4,943 | |
Customer deposits—Repurchase agreements | | | | | | | | | | | | |
Pesos | | Ps. | 104 | | | Ps. | 865 | | | Ps. | 969 | |
Total | | Ps. | 104 | | | Ps. | 865 | | | Ps. | 969 | |
Subordinated debentures | | | | | | | | | | | | |
Foreign currency(1) | | Ps. | 53 | | | Ps. | (43) | | | Ps. | 10 | |
Total | | Ps. | 53 | | | Ps. | (43) | | | Ps. | 10 | |
Marketable debt securities and other financial liabilities | | | | | | | | | | | | |
Pesos | | Ps. | 39 | | | Ps. | 392 | | | Ps. | 431 | |
Foreign currency(1) | | | 185 | | | | (68) | | | | 117 | |
Total | | Ps. | 224 | | | Ps. | 324 | | | Ps. | 548 | |
Other liabilities | | | | | | | | | | | | |
Pesos | | Ps. | 928 | | | Ps. | 726 | | | Ps. | 1,654 | |
Foreign currency(1) | | | — | | | | — | | | | — | |
Total | | Ps. | 928 | | | Ps. | 726 | | | Ps. | 1,654 | |
Expense from hedging operations | | | | | | | | | | | | |
Pesos | | Ps. | — | | | Ps. | (21) | | | Ps. | (21) | |
Foreign currency(1) | | | — | | | | — | | | | — | |
Total | | Ps. | — | | | Ps. | (21) | | | Ps. | (21) | |
Other interest expense | | | | | | | | | | | | |
Pesos | | Ps. | — | | | Ps. | 31 | | | Ps. | 31 | |
Foreign currency(1) | | | — | | | | — | | | | — | |
Total | | Ps. | — | | | Ps. | 31 | | | Ps. | 31 | |
Total interest-bearing liabilities | | | | | | | | | | | | |
Pesos | | Ps. | 3,455 | | | Ps. | 5,454 | | | Ps. | 8,909 | |
Foreign currency(1) | | | 217 | | | | 305 | | | | 522 | |
Total | | Ps. | 3,673 | | | Ps. | 5,758 | | | Ps. | 9,431 | |
| (1) | | Represents assets or liabilities denominated in foreign currencies. Values are presented in pesos. |
| | | | | | | | | | | | |
| | IFRS for the year ended December 31, 2017 and 2016 | |
| | Volume | | | Rate | | | Net Change | |
| | (Millions of pesos) | |
INTEREST-EARNING ASSETS | | | | | | | | | | | | |
Cash and balances with the Mexican Central Bank | | | | | | | | | | | | |
Pesos | | Ps. | (228) | | | Ps. | 891 | | | Ps. | 663 | |
Total | | Ps. | (228) | | | Ps. | 891 | | | Ps. | 663 | |
Loans and advances to credit institutions | | | | | | | | | | | | |
Pesos | | Ps. | 105 | | | Ps. | 1,302 | | | Ps. | 1,407 | |
Foreign currency(1) | | | 495 | | | | 70 | | | | 565 | |
Total | | Ps. | 600 | | | Ps. | 1,372 | | | Ps. | 1,972 | |
Loans and advances to customers—excluding credit cards | | | | | | | | | | | | |
Pesos | | Ps. | 3,861 | | | Ps. | 7,738 | | | Ps. | 11,599 | |
Foreign currency(1) | | | (499) | | | | 374 | | | | (125) | |
Total | | Ps. | 3,363 | | | Ps. | 8,111 | | | Ps. | 11,474 | |
Loans and advances to customers—credit cards | | | | | | | | | | | | |
Pesos | | Ps. | 780 | | | Ps. | 745 | | | Ps. | 1,525 | |
Total | | Ps. | 780 | | | Ps. | 745 | | | Ps. | 1,525 | |
Debt instruments | | | | | | | | | | | | |
Pesos | | Ps. | (1,981) | | | Ps. | 4,305 | | | Ps. | 2,324 | |
Foreign currency(1) | | | 890 | | | | 428 | | | | 1,318 | |
Total | | Ps. | (1,090) | | | Ps. | 4,732 | | | Ps. | 3,642 | |
Income from hedging operations | | | | | | | | | | | | |
Pesos | | Ps. | — | | | Ps. | 1,192 | | | Ps. | 1,192 | |
Foreign currency(1) | | | — | | | | — | | | | — | |
Total | | Ps. | — | | | Ps. | 1,192 | | | Ps. | 1,192 | |
Other interest-earning assets | | | | | | | | | | | | |
Pesos | | Ps. | — | | | Ps. | 44 | | | Ps. | 44 | |
Foreign currency(1) | | | — | | | | 37 | | | | 37 | |
Total | | Ps. | — | | | Ps. | 81 | | | Ps. | 81 | |
Total interest-earning assets | | | | | | | | | | | | |
Pesos | | Ps. | 298 | | | Ps. | 18,456 | | | Ps. | 18,754 | |
Foreign currency(1) | | | 1,635 | | | | 160 | | | | 1,795 | |
Total | | Ps. | 1,933 | | | Ps. | 18,616 | | | Ps. | 20,549 | |
| (1) | | Represents assets or liabilities denominated in foreign currencies. Values are presented in pesos. |
| | | | | | | | | | | | |
| | IFRS for the year ended December 31, 2017 and 2016 | |
| | Volume | | | Rate | | | Net Change | |
| | (Millions of pesos) | |
INTEREST-BEARING LIABILITIES | | | | | | | | | | | | |
Deposits from the Mexican Central Bank and credit institutions | | | | | | | | | | | | |
Pesos | | Ps. | (2,195) | | | Ps. | 3,616 | | | Ps. | 1,421 | |
Foreign currency(1) | | | (122) | | | | 119 | | | | (3) | |
Total | | Ps. | (2,317) | | | Ps. | 3,735 | | | Ps. | 1,418 | |
Customer deposits—Demand accounts | | | | | | | | | | | | |
Pesos | | Ps. | 1,098 | | | Ps. | 2,732 | | | Ps. | 3,830 | |
Foreign currency(1) | | | 5 | | | | (4) | | | | 1 | |
Total | | Ps. | 1,104 | | | Ps. | 2,727 | | | Ps. | 3,831 | |
Customer deposits—Savings accounts | | | | | | | | | | | | |
Pesos | | Ps. | — | | | Ps. | — | | | Ps. | — | |
Total | | Ps. | — | | | Ps. | — | | | Ps. | — | |
Customer deposits—Time deposits | | | | | | | | | | | | |
Pesos | | Ps. | 1,123 | | | Ps. | 2,840 | | | Ps. | 3,963 | |
Foreign currency(1) | | | 157 | | | | 149 | | | | 306 | |
Total | | Ps. | 1,280 | | | Ps. | 2,989 | | | Ps. | 4,269 | |
Customer deposits—Repurchase agreements | | | | | | | | | | | | |
Pesos | | Ps. | (293) | | | Ps. | 2,144 | | | Ps. | 1,851 | |
Total | | Ps. | (293) | | | Ps. | 2,144 | | | Ps. | 1,851 | |
Subordinated debentures | | | | | | | | | | | | |
Foreign currency(1) | | Ps. | 21 | | | Ps. | 106 | | | Ps. | 127 | |
Total | | Ps. | 21 | | | Ps. | 106 | | | Ps. | 127 | |
Marketable debt securities and other financial liabilities | | | | | | | | | | | | |
Pesos | | Ps. | 46 | | | Ps. | 970 | | | Ps. | 1,016 | |
Foreign currency(1) | | | 15 | | | | 40 | | | | 55 | |
Total | | Ps. | 61 | | | Ps. | 1,010 | | | Ps. | 1,071 | |
Other liabilities | | | | | | | | | | | | |
Pesos | | Ps. | 68 | | | Ps. | 1,212 | | | Ps. | 1,280 | |
Foreign currency(1) | | | — | | | | — | | | | — | |
Total | | Ps. | 68 | | | Ps. | 1,212 | | | Ps. | 1,280 | |
Expense from hedging operations | | | | | | | | | | | | |
Pesos | | Ps. | — | | | Ps. | (38) | | | Ps. | (38) | |
Foreign currency(1) | | | — | | | | — | | | | — | |
Total | | Ps. | — | | | Ps. | (38) | | | Ps. | (38) | |
Other interest expense | | | | | | | | | | | | |
Pesos | | Ps. | — | | | Ps. | 26 | | | Ps. | 26 | |
Foreign currency(1) | | | — | | | | — | | | | — | |
Total | | Ps. | — | | | Ps. | 26 | | | Ps. | 26 | |
Total interest-bearing liabilities | | | | | | | | | | | | |
Pesos | | Ps. | (153) | | | Ps. | 13,502 | | | Ps. | 13,349 | |
Foreign currency(1) | | | 76 | | | | 410 | | | | 486 | |
Total | | Ps. | (77) | | | Ps. | 13,912 | | | Ps. | 13,835 | |
| (1) | | Represents assets or liabilities denominated in foreign currencies. Values are presented in pesos. |
Assets
Earning Assets—Yield Spread
The following tables analyze our average earning assets, interest income and dividends on equity securities and net interest income and shows gross yields, net yields and yield spread for each of the periods
indicated. You should read this table and the footnotes thereto in light of our observations noted in “—Average Balance Sheet and Interest Rates.”
| | | | | | | | | | | | |
| | IFRS for the year ended December 31, | |
| | 2016 | | | 2017 | | | 2018 | |
| | (Millions of pesos, except percentages) | |
Net Interest Margin and Spread | | | | | | | | | | | | |
Average earning assets | | | | | | | | | | | | |
Pesos | | Ps. | 829,032 | | | Ps. | 831,735 | | | Ps. | 910,376 | |
Foreign currency(1) | | | 160,825 | | | | 216,241 | | | | 209,947 | |
Total | | Ps. | 989,857 | | | Ps. | 1,047,976 | | | Ps. | 1,120,323 | |
Net interest income | | | | | | | | | | | | |
Pesos | | Ps. | 47,284 | | | Ps. | 52,689 | | | Ps. | 58,187 | |
Foreign currency(1) | | | 1,846 | | | | 3,155 | | | | 3,809 | |
Total | | Ps. | 49,130 | | | Ps. | 55,844 | | | Ps. | 61,995 | |
Gross yield(2) | | | | | | | | | | | | |
Pesos | | | 8.79% | | | | 11.02% | | | | 11.65% | |
Foreign currency(1) | | | 2.85% | | | | 2.95% | | | | 3.60% | |
Total | | | 7.82% | | | | 9.35% | | | | 10.14% | |
Net yield(3) | | | | | | | | | | | | |
Pesos | | | 5.70% | | | | 6.33% | | | | 6.39% | |
Foreign currency(1) | | | 1.15% | | | | 1.46% | | | | 1.81% | |
Total | | | 4.96% | | | | 5.33% | | | | 5.53% | |
Yield spread(4) | | | | | | | | | | | | |
Pesos | | | 5.32% | | | | 5.89% | | | | 5.83% | |
Foreign currency(1) | | | 1.10% | | | | 1.09% | | | | 1.39% | |
Total | | | 4.65% | | | | 4.83% | | | | 4.94% | |
| (1) | | Represents assets or liabilities denominated in foreign currencies. Values are presented in pesos. |
| (2) | | Gross yield is the quotient of interest divided by average interest-earning assets, which are loans, receivables, debt instruments and other financial assets that yield interest or similar income. |
| (3) | | Net yield is the quotient of net interest income divided by average earning assets. |
| (4) | | Yield spread is the difference between gross yield on earning assets and the average cost rate of interest-bearing liabilities. |
Return-on-average Equity and Assets
The following table presents our selected financial ratios for the periods indicated.
| | | | | | | | | |
| | IFRS | |
| | For the year ended December 31, | |
| | 2016 | | | 2017 | | | 2018 | |
| | (Percentages) | |
Return-on-average Equity and Assets | | | | | | | | | |
ROAA: Return-on-average total assets | | 1.50% | | | 1.57% | | | 1.49% | |
ROAE: Return-on-average equity | | 14.89% | | | 16.93% | | | 16.27% | |
Dividend pay-out ratio(1) | | 105.64% | | | 47.70% | | | 47.66% | |
Average equity as a percentage of average total assets | | 10.10% | | | 9.28% | | | 9.17% | |
| (1) | | Dividends declared per share divided by net income per share. On May 26, 2016, we paid a dividend of Ps.3,844 million, equal to Ps.0.0475 per share. On December 30, 2016, we paid a dividend of Ps.13,624 million, equal to Ps.0.1685 per share. On May 30, 2017 we paid a dividend of Ps.4,234 million, equal to |
Ps.0.0524 per share. On December 27, 2017 we paid a dividend of Ps.4,676 million equal to Ps.0.0578 per share. On June 29, 2018 we paid a dividend of Ps.4,279 million, equal to Ps.0.6314 per share. On December 28, 2018, we paid a dividend of Ps.4,949 million, equal to Ps.0.7292 per share. |
Interest-Earning Assets
The following table shows the percentage mix of our average interest-earning assets for the years indicated. You should read this table in light of our observations noted in “—Average Balance Sheet and Interest Rates.”
| | | | | | | | | |
| | IFRS | |
| | For the year ended December 31, | |
| | 2016 | | | 2017 | | | 2018 | |
| | (Percentages) | |
Average Interest-Earning Assets | | | | | | | | | |
Cash and balances with the Mexican Central Bank | | 3.42% | | | 2.91% | | | 2.70% | |
Loans and advances to credit institutions | | 9.03% | | | 13.46% | | | 14.00% | |
Loans and advances to customers–excluding credit cards | | 53.31% | | | 52.10% | | | 53.66% | |
Loans and advances to customers–credit cards | | 4.96% | | | 4.98% | | | 4.88% | |
Debt instruments | | 29.28% | | | 26.55% | | | 24.76% | |
Total interest-earning assets | | 100.00% | | | 100.00% | | | 100.00% | |
Investment Securities
At December 31, 2016, 2017 and 2018, the book value of our investment securities was Ps.308.7 billion, Ps.326.8 billion and Ps.320.0 billion, respectively (representing 22.9%, 24.6% and 22.7% of our total assets at such dates). Mexican government securities and instruments issued by the Mexican Central Bank represented Ps.229.5 billion, or 74.3%, of our investment securities at December 31, 2016, Ps.224.0 billion, or 68.5%, of our investment securities at December 31, 2017 and Ps.253.5 billion, or 79.2%, of our investment securities at December 31, 2018. For a discussion of how we value our investment securities, see Note 2.d to our audited financial statements included elsewhere in this Report.
The following table shows the book value of our investment securities by type of counterparty at each of the dates indicated. As of December 31, 2016 and 2017, Ps.113.9 billion and Ps.124.7 billion of our available for sale debt instruments, respectively, were issued by the Mexican government and by the Mexican Central Bank. As of December 31, 2018, Ps.98.4 billion of our debt instruments at fair value through other comprehensive income were issued by the Mexican government and by the Mexican Central Bank. As of December 31, 2016, 2017 and 2018, the aggregate book value of our debt instruments issued by the Mexican government, excluding instruments issued by the Mexican Central Bank, was equal to 122.2%, 125.0% and 149.4% of our total equity, respectively, and the aggregate book value of our debt
instruments issued by the Mexican Central Bank was equal to 95.9%, 69.1% and 56.3% of our total equity, respectively.
| | | | | | | | | | | |
| | IFRS |
| | As of December 31, |
| | 2016 | | | 2017 | | | 2018 |
| | (Millions of pesos) |
Investment Securities | | | | | | | | | | | |
Debt instruments issued by the Mexican government (excluding Mexican Central Bank) | | Ps. | 128,577 | | | Ps. | 144,251 | | | Ps. | 183,454 |
Debt instruments issued by the Mexican Central Bank | | | 100,937 | | | | 79,752 | | | | 69,413 |
Foreign government debt securities | | | 65,286 | | | | 89,585 | | | | 54,297 |
Debt instruments issued by private sector | | | 11,843 | | | | 9,864 | | | | 9,280 |
Total debt instruments | | | 306,643 | | | | 323,452 | | | | 317,124 |
Total equity securities | | | 2,148 | | | | 3,357 | | | | 2,883 |
Total investment securities | | Ps. | 308,791 | | | Ps. | 326,809 | | | Ps. | 320,007 |
The following table analyzes the expected maturities of our debt investment securities (before allowance for impairment losses) and the weighted average yield at December 31, 2018.
| | | | | | | | | | | | | | | | | | | | | | | | | | | | | | | | |
| | Maturity as of December 31, 2018 | |
| | Less than | | | Average | | | | | | Average | | | | | | Average | | | More than | | | Average | | | | | |
| | 1 year | | | yield | | | 1 to 5 years | | | yield | | | 5 to 10 years | | | yield | | | 10 years | | | yield | | | Total |
| | (Millions of pesos, except percentages) | |
Investment Securities | | | | | | | | | | | | | | | | | | | | | | | | | | | | | | | | |
Debt instruments issued by the Mexican government (excluding Mexican Central Bank) | | Ps. | 78,366 | | | 7.58% | | | Ps. | 56,812 | | | 6.20% | | | Ps. | 31,665 | | | 7.55% | | | Ps. | 17,291 | | | 6.06% | | | Ps. | 184,134 | |
Debt instruments issued by the Mexican Central Bank | | | 22,426 | | | 8.22% | | | | 39,201 | | | 8.26% | | | | 7,786 | | | 8.25% | | | | — | | | 0.00% | | | | 69,413 | |
Foreign government debt securities | | | 36,503 | | | 3.33% | | | | 17,794 | | | 8.16% | | | | — | | | 0.00% | | | | — | | | 0.00% | | | | 54,297 | |
Debt instruments issued by the private sector | | | 5,628 | | | 8.22% | | | | 3,406 | | | 7.16% | | | | 246 | | | 8.95% | | | | — | | | 0.00% | | | | 9,280 | |
Total debt instruments | | Ps. | 142,922 | | | 6.84% | | | Ps. | 117,213 | | | 7.44% | | | Ps. | 39,697 | | | 6.19% | | | Ps. | 17,291 | | | 6.06% | | | Ps. | 317,124 | |
Loans and Advances to Credit Institutions
The following table shows our short-term funds deposited with other banks at each of the dates indicated.
| | | | | | | | | | | |
| | IFRS |
| | As of December 31, |
| | 2016 | | | 2017 | | | 2018 |
| | (Millions of pesos) |
Loans and Advances to Credit Institutions | | | | | | | | | | | |
Time deposits | | Ps. | 96 | | | Ps. | 71 | | | Ps. | 51 |
Call money transactions granted | | | 1,062 | | | | — | | | | — |
Reverse repurchase agreements | | | 37,831 | | | | 46,087 | | | | 98,332 |
Guarantee deposits—collateral delivered | | | 51,414 | | | | 34,542 | | | | 29,508 |
Other demand accounts | | | 3,799 | | | | 5,940 | | | | 2,165 |
Reciprocal accounts | | | 26,017 | | | | 18,569 | | | | 15,310 |
Total | | Ps. | 120,219 | | | Ps. | 105,209 | | | Ps. | 145,366 |
Loan Portfolio
At December 31, 2016, 2017 and 2018 our total loans and advances to customers (excluding reverse repurchase agreements) equaled Ps.599,521 million, Ps.626,349 million and Ps.689,059 million respectively, representing 44.4%, 47.1% and 48.9% of our total assets at such dates, respectively. Loans and advances to customers (excluding reverse repurchase agreements), net of allowance for impairment losses equaled Ps.581,638 million, Ps.609,420 million and Ps.667,541 million at December 31, 2016, 2017 and 2018, respectively, representing 43.1%, 45.9% and 47.4% of our total assets at such dates. We also have loan commitments drawable by third parties, which amounted to Ps.140,658 million, Ps.136,649 million and Ps.144,006 million at December 31, 2016, 2017 and 2018, respectively. Loan commitments
drawable by third parties include mostly credit card lines and commercial commitments. While credit cards lines are unconditionally cancelable by the issuer, commercial commitments are generally one-year facilities, subject to an evaluation of the customer’s projected cash flows and financial history. The loans guaranteed by governmental entities are reported in non-performing loans without impact on or adjustment relating to the amount guaranteed, and therefore the guarantees have no impact on our non-performing loan ratios.
Types of Loans by Type of Customer
The following tables analyze our loans and advances to customers (excluding reverse repurchase agreements), by type of customer loan, at each of the dates indicated. For each category of loan, we maintain specific risk management policies in line with the standards of the Santander Group, and as managed and monitored by our board of directors through the Comprehensive Risk Management Committee. Our credit approval processes for each category of loan are structured primarily around our business segments. See “Item 11. Quantitative and Qualitative Disclosures About Market Risk—Credit Risk” for details on our credit approval policies.
| | | | | | | | | | | | | | | | | | | | |
| | IFRS | |
| | As of December 31, | |
| | 2014 | | | 2015 | | | 2016 | | | 2017 | | | 2018 | |
| | (Millions of pesos) | |
Loans by Type of Customer | | | | | | | | | | | | | | | | | | | | |
Public sector | | Ps. | 55,865 | | | Ps. | 59,925 | | | Ps. | 57,022 | | | Ps. | 49,294 | | | Ps. | 59,547 | |
Commercial, financial and industrial | | | 231,802 | | | | 278,624 | | | | 309,207 | | | | 335,105 | | | | 371,976 | |
Mortgage | | | 108,184 | | | | 122,919 | | | | 132,414 | | | | 134,196 | | | | 145,749 | |
Installment loans to individuals | | | 76,586 | | | | 92,541 | | | | 100,878 | | | | 107,754 | | | | 111,787 | |
Revolving consumer credit card loans | | | 42,104 | | | | 47,776 | | | | 51,536 | | | | 54,372 | | | | 56,227 | |
Non-revolving consumer loans | | | 34,482 | | | | 44,765 | | | | 49,342 | | | | 53,382 | | | | 55,560 | |
Total loans | | | 472,437 | | | | 554,009 | | | | 599,521 | | | | 626,349 | | | | 689,059 | |
Allowance for impairment losses | | | (15,198) | | | | (18,749) | | | | (17,883) | | | | (16,929) | | | | (21,516) | |
Loans net of allowance for impairment losses | | Ps. | 457,239 | | | Ps. | 535,260 | | | Ps. | 581,638 | | | Ps. | 609,420 | | | Ps. | 667,543 | |
The following table shows the percentage of our non-performing loans by type of customer, for the periods indicated.
| | | | | | | | | | | | | | | |
| | IFRS | |
| | As of December 31, | |
| | 2014 | | | 2015 | | | 2016 | | | 2017 | | | 2018 | |
| | (Percentages) | |
Non-performing Loans as a Percentage of Total Loans by Type of Customer | | | | | | | | | | | | | | | |
Public sector | | 0.0% | | | 0.0% | | | 0.0% | | | 0.0% | | | 0.0% | |
Commercial, financial and industrial | | 4.1% | | | 3.5% | | | 2.2% | | | 1.8% | | | 1.8% | |
Mortgage | | 4.9% | | | 5.3% | | | 5.1% | | | 5.5% | | | 5.7% | |
Installment loans to individuals | | 4.7% | | | 3.8% | | | 3.9% | | | 4.4% | | | 3.2% | |
Revolving consumer credit card loans | | 4.7% | | | 3.9% | | | 3.8% | | | 4.3% | | | 3.1% | |
Non-revolving consumer loans | | 4.7% | | | 3.8% | | | 4.1% | | | 4.5% | | | 3.3% | |
Total | | 3.9% | | | 3.6% | | | 2.9% | | | 2.9% | | | 2.7% | |
See Note 2.g to our audited financial statements included elsewhere in this Report for more details on the classification of credit-impaired or non-performing loans.
Maturity
The following tables set forth an analysis by maturity of our loans and advances to customers (excluding reverse repurchase agreements) by type of loan as of December 31, 2018.
| | | | | | | | | | | | | | | | | | | | | | | | | | | | |
| | IFRS as of December 31, 2018 | |
| | Less than 1 year | | 1 to 5 Years | | Over 5 years | | Total | |
| | Balance | | | % of total | | | Balance | | | % of total | | | Balance | | | % of total | | | Balance | | | % of total | |
| | (Millions of pesos, except percentages) | |
Public sector | | Ps. | 16,736 | | | 5.96% | | | Ps. | 19,481 | | | 7.22% | | | Ps. | 23,330 | | | 16.87% | | | Ps. | 59,547 | | | 9.51% | |
Commercial, financial and industrial | | | 209,830 | | | 74.69% | | | | 144,813 | | | 53.67% | | | | 17,333 | | | 12.53% | | | | 371,976 | | | 59.39% | |
Mortgages | | | 19,140 | | | 6.81% | | | | 42,756 | | | 15.85% | | | | 83,853 | | | 60.63% | | | | 145,749 | | | 23.27% | |
Installment loans to individuals | | | 35,247 | | | 12.54% | | | | 62,748 | | | 23.26% | | | | 13,791 | | | 9.97% | | | | 111,787 | | | 17.85% | |
Revolving consumer credit card loans | | | 13,416 | | | 4.77% | | | | 29,041 | | | 10.77% | | | | 13,770 | | | 9.95% | | | | 56,227 | | | 8.98% | |
Non-revolving consumer loans | | | 21,831 | | | 7.77% | | | | 33,707 | | | 12.49% | | | | 22 | | | 0.02% | | | | 55,560 | | | 8.87% | |
Total loans | | | 280,953 | | | 100.00% | | | | 269,798 | | | 100.00% | | | | 138,307 | | | 100.00% | | | | 689,059 | | | 100.00% | |
Allowance for impairment losses | | | — | | | | | | | — | | | | | | | — | | | | | | | (21,516) | | | | |
Loans net of allowance for impairment losses | | Ps. | 280,953 | | | | | | Ps. | 269,798 | | | | | | Ps. | 138,307 | | | | | | Ps. | 667,543 | | | | |
Fixed and Variable Rate Loans
The following table sets forth a breakdown of our fixed and floating rate loans having a maturity of more than one year as of December 31, 2018.
| | | |
| | IFRS as of December 31, |
| | 2018 |
| | (Millions of pesos) |
Interest Rate Formula | | | |
Fixed interest rate | | Ps. | 255,910 |
Floating interest rate | | | 433,149 |
Total | | Ps. | 689,059 |
Non-Accrual of Interest
The following table shows (i) the amount of gross interest income that would have been recognized on our non-accrual and restructured loans if such loans had been current in accordance with their original terms and had been outstanding throughout the reported periods or since origination if outstanding for less than the entire period and (ii) the amount of interest income that was recorded for such loans in the periods presented. In general, the total interest that we received on our restructured loans in 2014 through 2018 was greater than the amount of non-accrued interest based on the original contractual terms because the restructurings resulted in interest rates that were higher on average than the contractual interest rates that preceded such restructurings.
| | | | | | | | | | | | | | | | | | | |
| IFRS |
| For the year ended December 31, |
| | 2014 | | | 2015 | | | 2016 | | | 2017 | | | 2018 |
Non-accrued interest on the basis of contractual terms owed: | | | | | | | | | | | | | | | | | | | |
Non-accrual loans(1) | | Ps. | 916 | | | Ps. | 1,103 | | | Ps. | 1,109 | | | Ps. | 1,305 | | | Ps. | 1,459 |
Restructured loans(1) | | | 412 | | | | 375 | | | | 461 | | | | 352 | | | | 206 |
Interest received: | | | | | | | | | | | | | | | | | | | |
Non-accrual loans(1) | | Ps. | 250 | | | Ps. | 349 | | | Ps. | 345 | | | Ps. | 317 | | | Ps. | 368 |
Restructured loans(1) | | | 490 | | | | 419 | | | | 496 | | | | 350 | | | | 210 |
| (1) | | These amounts do not include non-accrued interest on the basis of contractual terms owed and interest received from revolving consumer credit card loans due to the revolving nature of these types of loans. |
The restructured loans referred to in the tables above comprise non-performing loans that have been renegotiated. However, our renegotiated loans include both renegotiations of performing loans and renegotiations of loans in non-performing status, as contractual terms of a loan may be modified not only
due to concerns about the customer’s ability to meet contractual payments but also for customer retention purposes and other factors not related to current or potential credit deterioration of the customer. See Note 12.e to our audited financial statements included elsewhere in this Report for additional information about our renegotiated loans.
The following table shows the cumulative balance of renegotiated loans as of the dates presented.
| | | | | | | | | | | | | | | | | | | |
| As of December 31, |
| | 2014 | | | 2015 | | | 2016 | | | 2017 | | | 2018 |
| | (Millions of pesos) |
Commercial | | Ps. | 12,440 | | | Ps. | 9,674 | | | Ps. | 12,144 | | | Ps. | 4,197 | | | Ps. | 4,329 |
Consumer | | | 638 | | | | 641 | | | | 623 | | | | 587 | | | | 471 |
Mortgage | | | 4,174 | | | | 3,628 | | | | 2,614 | | | | 1,046 | | | | 1,133 |
Credit card | | | 1,442 | | | | 1,331 | | | | 1,238 | | | | 1,162 | | | | 881 |
Total | | Ps. | 18,694 | | | Ps. | 15,274 | | | Ps. | 16,619 | | | Ps. | 6,992 | | | Ps. | 6,814 |
Movements in Allowance for Impairment Losses
The following tables analyze the movements in our allowance for impairment losses for each of the periods indicated below, not including recoveries. For further discussion of movements in the allowance for impairment losses, see “Item 5. Operating and Financial Review and Prospects—A. Operating Results—Results of Operations for the Year Ended December 31, 2018 Compared to the Year Ended December 31, 2017—Impairment Losses on Financial Assets (Net)” and “Item 5. Operating and Financial Review and Prospects—A. Operating Results—Results of Operations for the Year Ended December 31, 2017 Compared to the Year Ended December 31, 2016—Impairment Losses on Financial Assets (Net).”
| | | | | | | | | | | | | | | | | | | | |
| | IFRS | |
| | For the year ended December 31, | |
| | 2014 | | | 2015 | | | 2016 | | | 2017 | | | 2018(1) | |
| | (Millions of pesos) | |
Movements in Allowance for Impairment Losses | | | | | | | | | | | | | | | | | | | | |
Allowance for impairment losses at beginning of year | | Ps. | 13,764 | | | Ps. | 15,198 | | | Ps. | 18,749 | | | Ps. | 17,883 | | | Ps. | 16,929 | |
Initial adoption of IFRS 9 | | | — | | | | — | | | | — | | | | — | | | | 3,270 | |
Impairment losses on loans and receivables(2) | | | 14,831 | | | | 17,766 | | | | 19,022 | | | | 20,771 | | | | 20,949 | |
Others | | | 113 | | | | 209 | | | | 157 | | | | 8 | | | | 46 | |
Written-off loans against allowance for impairment losses | | | (13,510) | | | | (14,424) | | | | (20,045) | | | | (21,733) | | | | (19,678) | |
Allowance for impairment losses at end of year | | Ps. | 15,198 | | | Ps. | 18,749 | | | Ps. | 17,883 | | | Ps. | 16,929 | | | Ps. | 21,516 | |
| (1) | | Amounts prepared in accordance with IFRS 9. Prior periods have not been restated. See Note 2.h to our audited financial statements included elsewhere in this Report for more details on our change in accounting estimates in connection with the initial adoption of IFRS 9. |
| (2) | | The amount of impairment losses on financial assets—Loans and receivables presented in the consolidated income statement is net of recoveries of previously written-off loans and expenses paid to recovery agencies for an amount of Ps.1,725 million in 2015, Ps.2,361 million in 2016, Ps.1,951 million in 2017 and Ps.2,141 million in 2018 and is recorded under Impairment losses on financial assets (net)—Loans and receivables in the consolidated income statement. |
The tables below show a breakdown of recoveries, impairment losses on loans and receivables and written-off loans against allowance for impairment losses by type of borrower for the periods indicated.
| | | | | | | | | | | | | | | | | | | | |
| | IFRS | |
| | For the year ended December 31, | |
| | 2014 | | | 2015 | | | 2016 | | | 2017 | | | 2018 | |
| | (Millions of pesos) | |
Recoveries of Loans Previously Written-Off – by type | | | | | | | | | | | | | | | | | | | | |
Commercial, financial and industrial | | Ps. | (534) | | | Ps. | (735) | | | Ps. | (961) | | | Ps. | (1,189) | | | Ps. | (1,301) | |
Mortgage | | | (888) | | | | (740) | | | | (1,096) | | | | (413) | | | | (440) | |
Installment loans to individuals | | | (1,046) | | | | (1,075) | | | | (1,104) | | | | (1,188) | | | | (1,316) | |
Revolving consumer credit card loans | | | (696) | | | | (698) | | | | (717) | | | | (794) | | | | (856) | |
Non-revolving consumer loans | | | (350) | | | | (377) | | | | (387) | | | | (394) | | | | (460) | |
Expenses paid to recovery agencies | | | 769 | | | | 825 | | | | 800 | | | | 839 | | | | 916 | |
Total recoveries of loans previously written-off | | Ps. | (1,699) | | | Ps. | (1,725) | | | Ps. | (2,361) | | | Ps. | (1,951) | | | Ps. | (2,141) | |
| | | | | | | | | | | | | | | | | | | | |
| | IFRS | |
| | For the year ended December 31, | |
| | 2014 | | | 2015 | | | 2016 | | | 2017 | | | 2018 | |
| | (Millions of pesos) | |
Impairment Losses on Loans and Receivables | | | | | | | | | | | | | | | | | | | | |
Commercial, financial and industrial | | Ps. | 3,925 | | | Ps. | 6,173 | | | Ps. | 5,802 | | | Ps. | 6,265 | | | Ps. | 5,888 | |
Mortgage | | | 1,203 | | | | 1,039 | | | | 1,388 | | | | 1,105 | | | | 1,744 | |
Installment loans to individuals | | | 9,703 | | | | 10,554 | | | | 11,832 | | | | 13,401 | | | | 13,317 | |
Revolving consumer credit card loans | | | 5,837 | | | | 6,044 | | | | 6,683 | | | | 7,763 | | | | 7,636 | |
Non-revolving consumer loans | | | 3,866 | | | | 4,510 | | | | 5,149 | | | | 5,638 | | | | 5,681 | |
Total impairment losses on loans and receivables(1) | | Ps. | 14,831 | | | Ps. | 17,766 | | | Ps. | 19,022 | | | Ps. | 20,771 | | | Ps. | 20,949 | |
| (1) | | The amount of impairment losses on financial assets—Loans and receivables net of recoveries of previously written-off loans and expenses paid to recovery agencies for an amount of Ps.1,699 million in 2014, Ps.1,725 million in 2015, Ps.2,361 million in 2016, Ps.1,951 million in 2017 and Ps.2,141 million in 2018, is recorded under Impairment losses on financial assets (net)—Loans and receivables in the consolidated income statement. |
| | | | | | | | | | | | | | | | | | | | |
| | IFRS | |
| | For the year ended December 31, | |
| | 2014 | | | 2015 | | | 2016 | | | 2017 | | | 2018 | |
| | (Millions of pesos) | |
Written-off loans against Allowance for Impairment Losses(1) | | | | | | | | | | | | | | | | | | | | |
Commercial, financial and industrial | | Ps. | 3,139 | | | Ps. | 4,443 | | | Ps. | 7,282 | | | Ps. | 7,140 | | | Ps. | 5,809 | |
Mortgage | | | 642 | | | | 542 | | | | 1,657 | | | | 1,568 | | | | 860 | |
Installment loans to individuals | | | 9,729 | | | | 9,439 | | | | 11,106 | | | | 13,025 | | | | 13,009 | |
Revolving consumer credit card loans | | | 5,631 | | | | 5,449 | | | | 6,229 | | | | 7,445 | | | | 7,482 | |
Non-revolving consumer loans | | | 4,098 | | | | 3,990 | | | | 4,877 | | | | 5,580 | | | | 5,527 | |
Total written-off loans against allowance for impairment losses | | Ps. | 13,510 | | | Ps. | 14,424 | | | Ps. | 20,045 | | | Ps. | 21,733 | | | Ps. | 19,678 | |
| (1) | | See Note 11.d to our audited financial statements included elsewhere in this Report for more details on the written-off financials assets. |
The tables below show a breakdown of recoveries, impairment losses on loans and receivables and written-off loans against allowance for impairment losses by type of borrower for the periods indicated.
| | | | | | | | | | | | | | | | | | | | | | | | | | | | | | | | | | | |
| | IFRS | |
| | As of December 31, | |
| | | | | | % of total | | | | | | | % of total | | | | | | | % of total | | | | | | | % of total | | | | | | | % of total | |
| | 2014 | | | allowance | | | 2015 | | | allowance | | | 2016 | | | allowance | | | 2017 | | | allowance | | | 2018 | | | allowance | |
| | (Millions of pesos, except percentages) | |
Allowance for Impairment Losses | | | | | | | | | | | | | | | | | | | | | | | | | | | | | | | | | | | |
Commercial, financial and industrial | | Ps. | 6,031 | | | 39.68% | | | Ps. | 7,943 | | | 42.36% | | | Ps. | 6,463 | | | 36.14% | | | Ps. | 5,588 | | | 33.01% | | | Ps. | 7,457 | | | 34.66% | |
Mortgage | | | 2,054 | | | 13.51% | | | | 2,558 | | | 13.64% | | | | 2,445 | | | 13.67% | | | | 1,990 | | | 11.76% | | | | 3,578 | | | 16.63% | |
Installment loans to individuals | | | 7,113 | | | 46.81% | | | | 8,248 | | | 44.00% | | | | 8,975 | | | 50.19% | | | | 9,351 | | | 55.23% | | | | 10,481 | | | 48.70% | |
Revolving consumer credit card loans | | | 3,893 | | | 25.62% | | | | 4,488 | | | 23.94% | | | | 4,942 | | | 27.64% | | | | 5,259 | | | 31.06% | | | | 5,354 | | | 24.87% | |
Non-revolving consumer loans | | | 3,220 | | | 21.19% | | | | 3,760 | | | 20.06% | | | | 4,033 | | | 22.55% | | | | 4,092 | | | 24.17% | | | | 5,127 | | | 23.83% | |
Total | | Ps. | 15,198 | | | 100.00% | | | Ps. | 18,749 | | | 100.00% | | | Ps. | 17,883 | | | 100.00% | | | Ps. | 16,929 | | | 100.00% | | | Ps. | 21,516 | | | 100.00% | |
Impaired Loans
The following tables show our impaired loans.
| | | | | | | | | | | | | | | | | | | | |
| | IFRS | |
| | As of December 31, | |
| | 2014 | | | 2015 | | | 2016 | | | 2017 | | | 2018(2) | |
| | (Millions of pesos, except percentages) | |
Impaired Loans(1) | | | | | | | | | | | | | | | | | | | | |
Non-performing loans | | Ps. | 18,430 | | | Ps. | 19,742 | | | Ps. | 17,595 | | | Ps. | 18,132 | | | Ps. | 18,429 | |
Non-performing loans as a percentage of total loans | | | 3.90% | | | | 3.56% | | | | 2.93% | | | | 2.89% | | | | 2.67% | |
Written-off loans as a percentage of average total loans | | | 3.10% | | | | 2.85% | | | | 3.48% | | | | 3.63% | | | | 3.00% | |
| (1) | | See Note 2.g to our audited financial statements included elsewhere in this Report for more details on the classification of credit-impaired or non-performing loans. |
| (2) | | Amounts prepared in accordance with IFRS 9. Prior periods have not been restated. See Note 2.h to our audited financial statements included elsewhere in this Report for more details on our change in accounting estimates in connection with the initial adoption of IFRS 9. |
Movement of Impaired Loans
The following tables show the movement in our impaired loans.
| | | | | | | | | | | | | | | | | | | | |
| | IFRS | |
| | For the year ended December 31, | |
| | 2014 | | | 2015 | | | 2016 | | | 2017 | | | 2018 | |
| | (Millions of pesos) | |
Movement of impaired loans | | | | | | | | | | | | | | | | | | | | |
Beginning balance | | Ps. | 15,175 | | | Ps. | 18,430 | | | Ps. | 19,742 | | | Ps. | 17,595 | | | Ps. | 18,132 | |
Additions | | | 24,848 | | | | 30,006 | | | | 30,431 | | | | 34,180 | | | | 32,461 | |
Transfers to performing loans | | | (8,083) | | | | (14,270) | | | | (12,533) | | | | (11,910) | | | | (12,486) | |
Written-off loans | | | (13,510) | | | | (14,424) | | | | (20,045) | | | | (21,733) | | | | (19,678) | |
Balance at year-end | | Ps. | 18,430 | | | Ps. | 19,742 | | | Ps. | 17,595 | | | Ps. | 18,132 | | | Ps. | 18,429 | |
See Note 2.g to our audited financial statements included elsewhere in this Report for more details on the classification of credit-impaired or non-performing loans.
Impaired Asset Ratios
The following tables show the ratio of our impaired assets to total computable credit risk and our coverage ratio at the dates indicated.
| | | | | | | | | | | | | | | | | | | | |
| | IFRS | |
| | As of December 31, | |
| | 2014 | | | 2015 | | | 2016 | | | 2017 | | | 2018 | |
| | (Millions of pesos, except percentages) | |
Impaired assets and ratios | | | | | | | | | | | | | | | | | | | | |
Computable credit risk(1) | | Ps. | 503,216 | | | Ps. | 594,883 | | | Ps. | 661,586 | | | Ps. | 705,160 | | | Ps. | 783,326 | |
Non-performing loans(2) | | | 18,430 | | | | 19,742 | | | | 17,595 | | | | 18,132 | | | | 18,429 | |
Commercial, financial and industrial | | | 9,575 | | | | 9,673 | | | | 6,842 | | | | 6,007 | | | | 6,538 | |
Mortgage | | | 5,249 | | | | 6,514 | | | | 6,778 | | | | 7,362 | | | | 8,345 | |
Installment loans to individuals | | | 3,606 | | | | 3,555 | | | | 3,975 | | | | 4,763 | | | | 3,546 | |
Revolving consumer credit card loans | | | 1,980 | | | | 1,846 | | | | 1,952 | | | | 2,335 | | | | 1,716 | |
Non-revolving consumer loans | | | 1,626 | | | | 1,709 | | | | 2,023 | | | | 2,428 | | | | 1,830 | |
Allowance for impairment losses | | | 15,198 | | | | 18,749 | | | | 17,883 | | | | 16,929 | | | | 21,516 | |
Ratios | | | | | | | | | | | | | | | | | | | | |
Non-performing loans to computable credit risk(1) | | | 3.66% | | | | 3.32% | | | | 2.66% | | | | 2.57% | | | | 2.35% | |
Coverage ratio(3) | | | 82.46% | | | | 94.97% | | | | 101.64% | | | | 93.37% | | | | 116.75% | |
Written-off loans coverage ratio (4) | | | 2.68% | | | | 2.42% | | | | 3.03% | | | | 3.08% | | | | 2.51% | |
| (1) | | Computable credit risk as of December 31, 2018 is the sum of the face amounts of loans (including non-performing loans) amounting to Ps.689,059 million and guarantees and documentary credits amounting to Ps.94,267 million. When guarantees or documentary credits are contracted, we record as off-balance sheet accounts. We present the off-balance sheet information to better demonstrate our total managed credit risk. |
| (2) | | See Note 2.g to our audited financial statements included elsewhere in this Report for more details on the classification of credit-impaired or non-performing loans. |
| (3) | | Allowance for impairment losses as a percentage of non-performing loans. |
| (4) | | Written-off loans as percentage of computable credit risk. |
Liabilities
Deposits
The principal components of our deposits are demand and time deposits. Our retail customers are the principal source of our demand and time deposits.
| | | | | | | | | | | | |
| | 2016 | | | 2017 | | | 2018 | |
| | | | | | | | | | | | |
Deposits from Mexican Central Bank and credit institutions | | | | | | | | | | | | |
Reciprocal accounts and overnight deposits | | Ps. | 10,310 | | | Ps. | 16,004 | | | Ps. | 27,358 | |
Repurchase agreements | | | 40,634 | | | | 28,359 | | | | 35,311 | |
Time deposits | | | 31,545 | | | | 4,506 | | | | 10,125 | |
Other accounts | | | 57,397 | | | | 55,848 | | | | 57,315 | |
Accrued interest | | | 70 | | | | 157 | | | | 51 | |
Total deposits from Mexican Central Bank and credit institutions | | Ps. | 139,956 | | | Ps. | 104,874 | | | Ps. | 130,160 | |
Customer deposits | | | | | | | | | | | | |
Current accounts | | | 403,323 | | | | 422,028 | | | | 443,223 | |
Other deposits | | | 27,696 | | | | 26,230 | | | | 25,904 | |
Time deposits | | | 140,408 | | | | 159,464 | | | | 175,642 | |
Repurchase agreements | | | 83,891 | | | | 81,790 | | | | 65,369 | |
Accrued interest | | | 578 | | | | 1,054 | | | | 1,320 | |
Total customer deposits | | Ps. | 655,896 | | | Ps. | 690,566 | | | Ps. | 711,458 | |
Total deposits | | Ps. | 795,852 | | | Ps. | 795,440 | | | Ps. | 841,618 | |
Short-Term Borrowings
The following table shows our short-term borrowings including securities that we sold under repurchase agreements for the purpose of funding our operations as well as short positions from financial liabilities arising out of the outright sale of financial assets acquired under reverse repurchase agreements.
| | | | | | | | | | | | | | | | | | | | | |
| | IFRS | |
| | For the year ended December 31, | |
| | 2016 | | | 2017 | | | 2018 | |
| | Amount | | | Average rate | | | Amount | | | Average rate | | | Amount | | | Average rate | |
| | (Millions of pesos, except percentages) | |
Short-Term Borrowings | | | | | | | | | | | | | | | | | | | | | |
Repurchase agreements: | | | | | | | | | | | | | | | | | | | | | |
At December 31 | | Ps. | 124,525 | | | 5.45% | | | Ps. | 110,149 | | | 6.79% | | | Ps. | 100,680 | | | 7.99% | |
Average during year | | | 190,943 | | | 4.11% | | | | 157,984 | | | 6.61% | | | | 143,993 | | | 7.56% | |
Maximum month-end balance | | | 249,866 | | | 5.45% | | | | 199,054 | | | 7.10% | | | | 186,732 | | | 7.99% | |
Short positions: | | | | | | | | | | | | | | | | | | | | | |
At December 31(1) | | Ps. | 40,613 | | | 5.32% | | | Ps. | 68,443 | | | 6.84% | | | Ps. | 101,754 | | | 8.25% | |
Average during year | | | 49,259 | | | 3.92% | | | | 64,615 | | | 6.50% | | | | 77,898 | | | 7.63% | |
Maximum month-end balance | | | 78,075 | | | 5.32% | | | | 99,320 | | | 7.15% | | | | 98,730 | | | 8.25% | |
Total short-term borrowings at year end | | Ps. | 165,138 | | | 5.39% | | | Ps. | 178,592 | | | 6.81% | | | Ps. | 202,434 | | | 8.12% | |
| (1) | | This amount forms part of the outstanding balance of “Short positions” in our consolidated balance sheet. For more details on short positions, see Note 11.b to our audited financial statements included elsewhere in this Report. |
The Mexican Financial System
General
Mexico’s financial system is currently comprised of commercial banks, national development banks, brokerage firms, development trust funds and other non-bank institutions, such as insurance and reinsurance companies, bonding companies, credit unions, savings and loans companies, foreign exchange houses, factoring companies, bonded warehouses, financial leasing companies, mutual fund companies, pension fund management companies, limited purpose financial institutions, multiple purpose financial institutions and limited purpose banks. In 1990, the Mexican government adopted the Mexican Financial Groups Law aimed at achieving the benefits of universal banking, which permits a number of financial services companies to operate as a single financial services holding company. Most major Mexican financial institutions, including Banco Santander México, are members of financial groups.
The principal financial authorities that regulate financial institutions, including commercial banks, are the SHCP, the Mexican Central Bank, the CNBV, the CONSAR, the CNSF, the IPAB and CONDUSEF.
Authorities of the Mexican Financial System
The principal authorities that regulate and supervise financial institutions related to the activities of Banco Santander México in Mexico are the Mexican Central Bank, the SHCP, the CNBV, the IPAB and the CONDUSEF. These authorities are subject to several organic laws and other administrative regulations that govern their regulatory, supervisory and other powers. Also, these entities continually enact administrative regulations within the scope of their respective authority for the regulation of the corresponding financial entities, as further mentioned below. Banco Santander México, as a banking institution, is subject to the supervision and regulation of the CNBV. In addition, our financial subsidiaries are subject to the supervision and regulation of the corresponding financial authority, and are in constant interaction with such authorities during their normal course of business.
Banco de México
Banco de México is the Mexican Central Bank. It is an autonomous entity that is not subordinated to any other body in the Mexican government. Its primary purpose is to issue the Mexican currency, as well as to maintain the acquisition power of such currency, to establish reference interest rates and to ensure that the banking and payments systems perform under safe and sound principles.
Monetary policy decisions are taken by the members of the Governing Board of the Mexican Central Bank. The Governing Board is composed of a Governor and four Deputy Governors, all of which are appointed by the President and ratified by the Senate or the Permanent Commission of Congress, as applicable.
Among the decisions that only the Governing Board may take are the authorization of the issuance of currency and the minting of coins, the decision to extend credit to the Mexican government, the determination of policies and criteria that the Mexican Central Bank uses in its operations and in the regulations that it issues, and the approval of its rules of procedure, budget, working conditions and similar internal matters.
SHCP
The SHCP is the regulator in charge of proposing, conducting and controlling the economic policy of the Mexican government in matters of economics, tax, finance, public budget, public debt and income. Together with the CNBV and the Mexican Central Bank, it is the primary regulator of commercial banks and national development banks. The SHCP participates in the process of incorporation, revocation, operation, merger, control and stock purchase of financial institutions.
CNBV
The CNBV is a governmental body subordinate to the SHCP, having independent technical and executive powers. The CNBV is in charge of the supervision and regulation of financial entities, with the purpose of ensuring their stability and sound performance, as well as the maintenance of a safe and sound financial system. The scope of the CNBV’s authority includes inspection, supervision, prevention and correction powers. The primary financial entities regulated by the CNBV are commercial banks, national development banks, regulated multiple purpose financial institutions, brokerage firms, as well as publicly traded companies and other entities that have issued debt securities to the public. The CNBV is also in charge of granting and revoking banking and securities brokerage licenses in Mexico.
IPAB
After the 1994 financial crisis, the Mexican government created the IPAB, an independent, decentralized governmental institution with its own legal standing and assets. The IPAB’s primary purpose is the protection and insurance of bank deposits, also having powers to provide solvency to banking institutions, contributing to the safe and sound development of the banking sector and the national payments system. The IPAB is also entitled to acquire assets from distressed banking institutions.
CONDUSEF
The CONDUSEF is a governmental body under the SHCP. The CONDUSEF is in charge of the provision of financial orientation, guidance and information to customers of financial services, as well as implementation of corrective measures through the processing of claims by such customers, with the primary purpose of protecting customer’s interests. The CONDUSEF may also act as arbitrator in disputes between financial institutions and their customers and establish regulations and impose sanctions to financial institutions in order to protect their clients.
Reforms to Mexican Banking Law
In November 2013, the Mexican Congress approved reforms to the Mexican financial system which, among other measures, seek to promote lending activities to small and medium-sized companies, improve banking supervision and regulations, improve regulatory powers of, and the ability to impose sanctions by, CONDUSEF, improve the banks’ ability to foreclose on collateral and correct deficiencies of the Mexican Commercial Bankruptcy Law, in respect of related policy sanctions and certain other activities.
In July 2014, the investigation regarding competitive conditions in the Mexican financial system performed by the COFECE, arising from the approved financial reforms, resulted in a series of recommendations in connection with new regulations to promote competition in the Mexican financial system. The recommendations issued by the COFECE may be summarized as requiring (i) avoidance of a displacement or any access limitations to competitors in the financial markets, (ii) reducing the risks of coordinated anticompetitive effects among competitors, (iii) reducing barriers to competition, and (iv) increasing the COFECE’s authority over anticompetitive action.
Mexican Commercial Bankruptcy Law
The Mexican Commercial Bankruptcy Law provides for a single insolvency proceeding encompassing two successive phases: a conciliatory phase of mediation between creditors and debtor, and bankruptcy. Recent amendments permit parties to move directly to the bankruptcy stage.
In connection with banks, there is a special procedure under which only IPAB or the CNBV may demand the declaration of insolvency of banking institutions, including Banco Santander México. In the case of banking institutions, such as Banco Santander México, with the declaration of bankruptcy the judicial procedure is initiated in the bankruptcy phase (quiebra) and not, as in common procedures, in the
conciliatory phase. The bankruptcy of a Mexican bank is viewed as an extreme measure (because it results in a liquidation and dissolution), which has not been resorted to in practice, and is preceded by several measures that seek to avoid it, such as corrective measures taken by the CNBV, facilities made available by IPAB and an intervention led by the CNBV. Upon filing of the application for the declaration of insolvency, banking institutions must cease operations and suspend payment of all obligations.
The Mexican Commercial Bankruptcy Law establishes precise rules that determine when a debtor is in general default in its payment obligations. The principal indications are failure by a debtor to comply with its payment obligations in respect of two or more creditors, and the existence of any of the following two conditions: (i) 35% or more of a debtor’s outstanding liabilities are 30 days past due; or (ii) the debtor fails to have certain specifically defined liquid assets and receivables to cover at least 80% of its obligations which are due and payable.
Applicable law provides for the use and training of experts in the field of insolvency and the creation of an entity to coordinate their efforts. Such experts include the intervener (interventor), conciliator (conciliador) and receiver (síndico). The IPAB acts as the liquidator and receiver and the CONDUSEF may appoint up to three interveners.
On the date the insolvency judgment is entered, all peso-denominated obligations are converted into UDIs, and foreign currency-denominated obligations are converted into pesos at the rate of exchange for that date and then converted into UDIs. Only creditors with a perfected security interest (i.e., mortgage, pledge or security trust) continue to accrue interest on their loans. The Mexican Commercial Bankruptcy Law mandates the netting of derivative transactions upon the declaration of insolvency.
The Mexican Commercial Bankruptcy Law provides for a general rule as to the period when transactions may be scrutinized by the judge to determine if they were entered into for fraudulent purposes, which is 270 calendar days prior to the judgment declaring insolvency (recently modified as set forth below). This period is referred to as the retroactivity period. Nevertheless, upon the reasoned request of the conciliator, the controller, who may be appointed by the creditors to oversee the process, or any creditor, the judge may set a longer period.
The Mexican Congress has approved changes to the Mexican Commercial Bankruptcy Law, intended to improve the application of such law. Relevant changes include (i) the consolidation of bankruptcy proceedings affecting parent and subsidiary companies, (ii) the immediate application of liquid assets provided as collateral (without judicial intervention), in connection with the netting and close out of derivative and similar contracts, (iii) setting forth an outside limit to bankruptcy restructuring (three years), (iv) permitting trustees and other creditor representatives to submit claims on behalf of groups of creditors, (v) expressly recognizing subordinated creditors, and deeming related party creditors as subordinated creditors, and (vi) making members of the Board of Directors liable to the bankrupt debtor if such member acted when affected by a conflict of interest, self-dealing and otherwise against the interests of the bankrupt debtor.
Deregulation of Lending Entities and Activities
In July 2006, the Mexican Congress enacted reforms to the General Law of Auxiliary Credit Organizations and Activities (Ley General de Organizaciones y Actividades Auxiliares de Crédito), the Mexican Banking Law and the Foreign Investment Law (Ley de Inversión Extranjera), with the objective of creating a new type of financial entity called multiple purpose financial entities (sociedad financiera de objeto múltiple, or Sofom) (the “Sofom Amendments”). The Sofom Amendments were published in the Federal Official Gazette on July 18, 2006.
The main purpose of the Sofom Amendments was to deregulate lending activities, including financial leasing and factoring activities. Sofomes are Mexican corporations (sociedades anónimas) that expressly include as their main corporate purpose in their bylaws, engaging in lending and/or financial leasing and/or
factoring services. Pursuant to the Sofom Amendments, the SHCP ceased to authorize the creation of new Sofoles, and all existing Sofol authorizations automatically terminated on July 19, 2013.
Among others, Sofomes that are affiliates of Mexican credit institutions (i.e., private or public banks) or the holding companies of financial groups that hold a credit institution are regulated and supervised by the CNBV, and required to comply with a number of provisions and requirements applicable to credit institutions such as capital adequacy requirements, risk allocation requirements, related party transactions rules, write-offs and assignment provisions, as well as reporting obligations. Regulated Sofomes are required to include in their denomination the words “Entidad Regulada” (regulated entity) or the abbreviation thereof, “E.R.” All other entities whose main purpose is engaging in lending, financial leasing and factoring activities are non-regulated Sofomes and must so indicate in their corporate denomination by including the words “Entidad No Regulada” (non-regulated entity) or the abbreviation thereof, “E.N.R.”. Non-regulated Sofomes are not subject to the supervision of the CNBV.
Sofomes (regulated or non-regulated) are subject to the supervision of the CONDUSEF as is the case with any other financial entity.
The Sofom Amendments also eliminated the restrictions on foreign equity investment applicable to Sofomes, financial leasing and factoring companies, which until the Sofom Amendments became effective, was limited to 49%. Accordingly, the Sofom Amendments resulted in an increase in competition in the financial services industry, from foreign financial institutions.
The Mexican Securities Market Law
The Mexican Securities Market Law sets standards for authorizing companies to operate as brokerage firms, which authorization is granted by the CNBV with the approval of its Governing Board. In addition to setting standards for brokerage firms, the Mexican Securities Market Law authorizes the CNBV, among other things, to regulate the public offering and trading of securities, corporate governance, disclosure and reporting standards and to impose sanctions for the illegal use of insider information and other violations of the Mexican Securities Market Law. See “Item 9. The Offer and Listing—C. Markets—The Mexican Securities Market.”
Insurance System
The Mexican insurance system is governed by the Insurance Companies Law, the Bonding Companies Law, the Insurance Contract Law (Ley Sobre el Contrato de Seguro) and other regulatory provisions issued by the SHCP and the CNSF. Insurance companies require the authorization of the SHCP for their incorporation. The authorization shall include the specific sector in which the insurance company will conduct business, including life, health care, property and casualty, civil and professional liability, among others. The SHCP may also grant authorization to perform reinsurance and co-insurance activities. Insurance companies are subject to stringent capital adequacy and investment rules, compliance with which is verified by the CNSF. These rules determine the type of assets into which insurance companies may invest, as well as the minimum amount of capital required to be maintained by such entities. Also, insurance companies are required to maintain technical reserves as protection against risks, which help such entities to maintain adequate liquidity levels.
The regulation and surveillance powers of the CNSF grant this entity the authority to verify compliance with the various financial and technical actuarial regulations, as well as with other corporate governance principles.
Retirement Savings System
The Retirement Savings Systems Law (Ley de los Sistemas de Ahorro para el Retiro) established the Afore pension system. Among other economic benefits and other services to be provided to participants in the
retirement savings system, the Retirement Savings Systems Law provides that each employee may establish an independent retirement account, which is to be managed by an approved Afore. Under this system, employees, employers and the government are required to make contributions to the independent retirement accounts maintained by each employee. In addition to the mandatory contributions, employees can make voluntary contributions to their independent retirement accounts. Pursuant to the Retirement Savings Systems Law, the main functions of an Afore include, among others, (i) managing pension funds, (ii) creating and managing individual pension accounts for each worker, (iii) creating, managing and operating specialized pension funds (Siefores), (iv) distributing and purchasing Siefores’ stock, (v) contracting pension insurance, and (vi) distributing, in certain cases, the individual funds directly to the pensioned worker.
Afores and Siefores are subject to the supervision of the CONSAR, which is in charge of the coordination and regulation of the pension system.
Amendments to Financial Regulations Impacting Banks
The Mexican financial system has continued to advance in recent years, consistent with demands from regulators and market participants, developments in other jurisdictions and to address systemic issues resulting from the global financial crisis.
Even though the recent global financial crisis did not affect Mexican banks directly, many Mexican corporations were affected, primarily by having engaged in foreign currency-linked derivative transactions, which increased exposures substantially as a result of the devaluation of the peso, triggering a new regulation issued by the CNBV that seeks to improve disclosure standards as they relate to derivative transactions.
The Federal Law for Protection of Personal Data Held by Private Persons (Ley Federal de Protección de Datos Personales en Posesión de Particulares) requires us to ensure the confidentiality of information received from clients. We have modified our processes, procedures and systems as required to implement this law and the supervision of our activities thereunder and as a means to obtain the consent of our customers prior to using any personal information provided by them. We could be subject to fines and penalties in the event of violations of the provisions of such law.
On January 9, 2015, the General Rules Applicable to Financial Entities and other Persons that Provide Investment Services (Disposiciones de Carácter General Aplicables a las Entidades Financieras y otras Personas que Proporcionan Servicios de Inversión, or the “Investment Services Rules”) were published. The purpose of the Investment Services Rules includes having a sole regulation that contains the rules applicable to brokerage firms, credit institutions and investment advisors, companies that operate mutual funds and companies or entities that distribute shares of mutual funds.
In accordance with the Investment Services Rules, financial entities and investment advisors rendering advisory services in connection with investments shall ensure that any advice, recommendation or suggestion given to the client is reasonable for such client, and consistent with the client’s investment profile and the financial product profile.
The Investment Services Rules set forth obligations applicable to financial entities and investment advisors to create either a committee which shall be responsible for the analysis of financial products offered by such entities, and whose members shall be independent from the structuring area of the relevant entity, or an equivalent institution or responsible person.
The Investment Services Rules also require the creation of an Analysis Committee. Such Analysis Committee shall maintain minutes for each committee meeting held together with the relevant presentations, which documentation shall be kept by the entity and made available to the CNBV for at least five years.
The Analysis Committee shall approve each financial product offered, compensation applicable to investment portfolios and, prior to its delivery, all information given to any client regarding any investment recommendation, which information shall include at least the prospectus or memorandum describing the relevant securities or offering.
The Investment Services Rules also provide that the board of directors of the financial entity shall approve the policies and guidelines required for each entity to:
| · | | perform the necessary evaluation to determine the profile of its clients; |
| · | | carry out the analysis of the financial products to be offered to the clients; and |
| · | | comply with the evaluation of the “reasonableness” of recommendations, required to render advisory investment services. |
Such policies and guidelines must be submitted to the CNBV within 10 days from its approval by the Board of Directors, and the CNBV may order the relevant entity to incorporate corrections in order to make them consistent with the Investment Services Rules.
The Investment Services Rules provide that the Board of Directors must appoint an officer to verify compliance of each firm with the Investment Services Rules.
Pursuant to the changes to the Mexican Securities Market Law, (i) all offerings conducted outside of Mexico by Mexican issuers, regardless of whether the offering is public or not, are required to be notified to the CNBV, (ii) clarifications were made in respect of the governance regime applicable to vehicles issuing asset-backed securities, (iii) required capitalization requirements and corrective measures in the absence of compliance with capitalization requirements applicable to broker-dealers were defined, (iv) rules implementing profiling of investors and provisions dealing with parties relating to the sale of securities have been incorporated into the Mexican Securities Market Law (as opposed to being left to implementing regulations), and (v) investment advisors are required to be registered with the CNBV, and are more strictly regulated.
Supervision and Regulation
Introduction
Our operation is primarily regulated by the Mexican Banking Law and the rules and regulations issued by the SHCP, the CNBV and the Mexican Central Bank. Our operations are primarily regulated by the Mexican Banking Law, the Mexican Securities Market Law and the rules issued thereunder by the SHCP and the CNBV, as well as rules issued by the Mexican Central Bank and the IPAB. The authorities that supervise our financial subsidiaries’ operations are the SHCP, the Mexican Central Bank, CONDUSEF and the CNBV.
Banking Regulation
The SHCP, either directly or through the CNBV, possesses broad regulatory powers over the banking system. Banks are required to report regularly to the financial regulatory authorities. Reports to bank regulators are often supplemented by periodic meetings, formal or informal, between senior management of the banks and senior officials of the CNBV. Banks must submit their unaudited monthly and quarterly and audited annual financial statements to the CNBV for review, and must publish on their website and in a national newspaper their unaudited quarterly balance sheets and audited annual balance sheets. The CNBV may order a bank to modify and republish such balance sheets.
Additionally, banks must publish on their website, among other information:
| · | | the bank’s basic consolidated and audited annual financial statements, together with a report containing the management’s discussion and analysis of the financial statements and the bank’s financial position, including any important changes thereto and a description of the bank’s internal control systems; |
| · | | a description of the bank’s Board of Directors, identifying independent and non-independent directors and their background, education and experience; |
| · | | a description and the total sum of compensation and benefits paid to the members of the Board of Directors and senior officers during the past year; |
| · | | unaudited quarterly financial statements for the periods ending March, June and September of each year, together with any comments thereon; |
| · | | any information requested by the CNBV to approve the accounting criteria and special accounting registries; |
| · | | a detailed explanation regarding the main differences in the accounting used to prepare the financial statements; |
| · | | the credit rating of their portfolio; |
| · | | the capitalization level of the bank, its classification (as determined by the CNBV) and any modifications thereto; |
| · | | a brief summary of the resolutions adopted by any shareholders’ meeting, debenture holders’ meeting, or by holders of other securities or instruments; and |
The CNBV has authority to impose fines for failing to comply with the provisions of the Mexican Banking Law, or regulations promulgated thereunder. In addition, the Mexican Central Bank has authority to impose certain fines and administrative sanctions for failure to comply with the provisions of the Law of the Mexican Central Bank and regulations adopted by it and the Law for the Transparency and Ordering of Financial Services, particularly as violations relate to interest rates, fees and the terms of disclosure of fees charged by banks to clients. Violations of specified provisions of the Mexican Banking Law are subject to administrative sanctions and criminal penalties.
The Mexican Baking Law permits foreign governments to acquire equity securities of Mexican banks on a temporary basis in connection with rescue or similar packages, and to acquire control of Mexican banks with the prior approval of the CNBV.
Mexican banks are required to obtain the express approval, through their Boards of directors, of compensation payable to officers and, for that purpose, will be required to observe general rules to be issued by the CNBV and to establish and maintain a compensation committee.
The Mexican Banking Law includes a provision for self-correcting irregularities detected by Mexican banks, arising from non-compliance with applicable law. Programs for self-correction are required to be approved by the board of directors of the applicable Mexican bank and must be supervised by the bank’s audit committee. General rules implementing the provisions are expected to be issued by the CNBV.
A Mexican bank may only be dissolved and liquidated, if the CNBV has issued a determination to that effect. Prior to such dissolution and liquidation, IPAB may provide temporary financial assistance to Mexican banks having liquidity problems.
Non-viable Mexican banks will be liquidated pursuant to a procedure set forth in the Mexican Banking Law, under which IPAB will act as liquidator, will conduct the procedures necessary to collect fees and pay creditors (respective parties specified under the Mexican Banking Law) and will take all measures conducive to the bank’s liquidations. The Mexican Banking Law reflects provisions related to the dissolution and liquidation of Mexican banks. Liquidation proceedings may be conducted in-court or out of court, depending upon the circumstances affecting the relevant Mexican bank. In addition to liquidation proceedings, Mexican banks may be declared in bankruptcy pursuant to a specialized proceeding set forth in the Mexican Commercial Bankruptcy Law.
The SHCP is authorized to conduct evaluations of Mexican banks. Although guidelines for such evaluations have already been issued, additional rules will be issued in the future. Such evaluations will be based upon the size of the banks and their participation in the relevant markets, and will determine whether or not a particular bank is lending to all sectors of the economy (primarily to small and medium-sized businesses). Results of evaluations are required to be made publicly available by the Ministry. Negative results from evaluations may result in corrective measures being ordered, however, it is uncertain what such measures may be.
We cannot predict the terms that will be included in implementing regulations in connection with requirements to be satisfied in respect of lending activities to certain sectors of the economy. However, if the SHCP determines, after an evaluation, that Banco Santander México has not complied with applicable requirements, it may be forced to lend to certain sectors of the economy or to certain persons that may not meet its credit quality standards, or other standards specified in its policies, that it may not know or that are not acceptable credit risks, which in turn may impact its financial condition and results of operations. Furthermore, if the Bank were to fail any evaluation, publicity surrounding such failure may impact its reputation, which in turn may adversely impact its ability to conduct business in Mexico and its financial condition and results of operations.
Licensing of Banks
Authorization of the Mexican government is required to conduct banking activities. The CNBV, with the approval of its Governing Board and subject to the prior favorable opinion of the Mexican Central Bank, has the power to authorize the establishment of new banks, subject to minimum capital standards, among other things. Approval of the CNBV is also required prior to opening, closing or relocating offices, including branches, of any kind outside of Mexico or transfer of assets or liabilities between branches.
Intervention
The CNBV, with the approval of its Governing Board, may declare the managerial intervention (intervención) of a banking institution pursuant to Articles 129 through 146 of the Mexican Banking Law (a “CNBV Intervention”). In addition, the Governing Board of IPAB may also appoint a peremptory manager (administrador cautelar) if IPAB provides liquidity, in accordance with applicable law, to a banking institution.
A CNBV Intervention pursuant to Articles 129 through 146 of the Mexican Banking Law will only occur when (i) during a calendar month, the Capital Ratio of a bank is reduced from a level equal to or below the minimum Capital Ratio required under Article 50 of the Mexican Banking Law, to 50% or less than such minimum Capital Ratio, (ii) the bank does not maintain the minimum Capital Ratio required in accordance with the Mexican Banking Law, and such bank does not operate under the conditional regime referred to in article 29 Bis 2 of the law, or (iii) the bank (a) for an amount in pesos exceeding the equivalent of twenty million UDIs (1) does not pay loans granted by another bank, foreign financial entity or the Mexican Central
Bank, or (2) does not pay the principal and interest amounts of securities issued by it and deposited in a securities deposit institution, (b) within two or more business days and for an amount in pesos exceeding the equivalent of two million UDIs (1) does not pay one or more participants the amounts due under any compensation process carried out through a clearinghouse or central counterparty, or does not pay three or more checks for a total amount of two million UDIs, that have been excluded from a clearinghouse for causes attributable to the drawee institution in terms of the applicable provisions, or (2) does not pay in the bank windows of two or more branches the banking deposits and cash withdrawals carried out by 100 or more of their customers and that total said amount.
The peremptory manager will be appointed by IPAB, if IPAB has granted extraordinary financial support to a bank in accordance with the Mexican Banking Law. The peremptory manager appointed by IPAB will assume the authority of the Board of Directors and the shareholders. The peremptory manager will have the authority to represent and manage the bank with the broadest powers under Mexican law, will prepare and submit to IPAB the bank’s budget (for approval), will be authorized to contract liabilities, make investments, undertake acquisitions or dispositions and incur expenses, is authorized to hire and fire personnel and may suspend operations. The appointment of the peremptory manager must be registered in the Public Registry of Commerce of the corresponding domicile.
Revocation of a License; Payment of Guaranteed Obligations
Revocation of Banking License. In the case that the CNBV revokes a license to be organized and operate as a banking institution, IPAB’s Governing Board will determine the manner under which the corresponding banking institution shall be dissolved and liquidated in accordance with Articles 166 through 187 of the Mexican Banking Law. In such a case, IPAB’s Governing Board may determine to carry out the liquidation through any or a combination of the following transactions: (i) transfer the liabilities and assets of the banking institution in liquidation to another banking institution directly or indirectly through a trust set up for such purposes; (ii) constitute, organize and manage a new banking institution owned and operated directly by IPAB with the exclusive purpose of transferring the liabilities and assets of the banking institution in liquidation; or (iii) any other alternative that may be determined within the limits and conditions provided by the Mexican Banking Law that IPAB considers as the best and least expensive option to protect the interests of bank depositors. As described above, amendments to the Mexican Banking Law approved by the Mexican Congress will substitute these provisions.
Causes to Revoke a Banking License. The following are the events upon which the CNBV may revoke a banking license:
| (i) | | if a shareholder decision is made to request the revocation; |
| (ii) | | if the banking institution is dissolved or initiates liquidation procedures; |
| (iii) | | if the banking institution (a) does not comply with any minimum corrective measures ordered by the CNBV pursuant to Article 122 of the Mexican Banking Law, (b) does not comply with more than one special corrective measure ordered by the CNBV pursuant to such Article 134 Bis 1, or (c) repeatedly does not comply with an additional special corrective measure ordered by the CNBV; |
| (iv) | | if the banking institution does not comply with the minimum Capital Ratio required under the Mexican Capitalization Requirements; |
| (v) | | if the banking institution (a) does not timely repay loans or debt securities issued or (b) does not timely pay deposits or clear checks; or |
| (vi) | | if the institution repeatedly undertakes prohibited or sanctioned transactions in accordance with the Mexican Banking Law or if it continues not complying with preventive or corrective actions imposed by the CNBV. |
Upon publication of the resolution of the CNBV revoking a banking license in the Federal Official Gazette and in two newspapers of wide distribution in Mexico and registration of such resolution with the corresponding Public Registry of Commerce, the relevant banking institution will be dissolved and liquidation will be initiated. Upon liquidation or the declaration of bankruptcy of a banking institution, IPAB is required to proceed to make payment of all “guaranteed obligations” of the relevant banking institution in accordance with the terms and conditions set forth in the Mexican Banking Law and the IPAB law.
Liabilities owed by the banking institution in liquidation will be paid in the following order of preference: (i) secured claims, (ii) labor claims and tax claims, (iii) claims entitled to special privileges under applicable law, (iv) claims guaranteed by IPAB, up to the amount guaranteed by IPAB, (v) claims in excess of the amount guaranteed by IPAB, (vi) other senior claims, (vii) subordinated preferred debentures, and (viii) subordinated non-preferred debentures. The remainder, if any, shall be paid to the shareholders.
Financial Support
Determination by the Banking Stability Committee. The BSC includes representatives of the SHCP, the Mexican Central Bank, the CNBV and IPAB. In the case that the BSC determines that if a bank were to default on its payment obligations and such default may (i) generate severe negative effects in one or more commercial banks or other financial entities, endangering their financial stability or solvency, and such circumstance may affect the stability or solvency of the financial system, or (ii) result in the operation of the payments’ system to be put at risk, then the BSC may determine, on a case-by-case basis, that a general percentage of all of the outstanding obligations of the troubled bank that are not considered “guaranteed obligations” under the IPAB Law and guaranteed obligations in amounts equal to or higher than the amount set forth under Article 11 of the IPAB Law (400,000 UDIs per person per entity), be paid as a means to avoid the occurrence of any of such circumstances. Notwithstanding the foregoing, under no circumstance may transactions such as liabilities or deposits in favor of shareholders, members of the Board of Directors and certain senior officers, and certain illegal transactions or the liabilities resulting from the issuance of subordinated debentures, be covered or paid by IPAB or any other Mexican governmental agency.
Types of Financial Support. In the case that the BSC makes the determination referred to in the prior paragraph, then IPAB’s Governing Board will determine the manner according to which the troubled commercial bank will receive financial support, which may be through either of the following options:
| (a) | | If the BSC determines that the full amount of all of the outstanding liabilities of the relevant troubled bank (guaranteed and non-guaranteed) must be paid, then the financial support may be implemented through (i) capital contributions granted by IPAB in accordance with the Mexican Banking Law, or (ii) credit support granted by IPAB also in accordance the Mexican Banking Law, and in either case the CNBV shall refrain from revoking the banking license granted to such commercial bank. |
| (b) | | If the BSC determines that less than the full amount of all of the outstanding liabilities of the troubled commercial bank (guaranteed and non-guaranteed) must be paid, then the support will consist of transferring the assets and liabilities of such bank to any third party, as set forth in Articles 188 through 197 of the Mexican Banking Law. |
Conditional Management Regime. As an alternative to revoking the banking license, a new conditional management regime was created, which can be established in respect of commercial banks with a Capital Ratio below the minimum required pursuant to the Mexican Capitalization Requirements. To adopt this regime, the relevant bank, with prior approval of its shareholders, must voluntarily request from the CNBV the application of the conditional management regime. To qualify for such regime, the relevant commercial bank should (i) deliver to the CNBV a plan for the reconstitution of its capital, and (ii) transfer at least 75% of its shares to an irrevocable trust.
Banking institutions with a Capital Ratio equal to or below 50% of the minimum Capital Ratio required by the Mexican Capitalization Requirements may not adopt the conditional management regime.
Capitalization
The minimum subscribed and paid-in capital for banks is set in accordance with three different components: credit risk, market risk and operational risk. Pursuant to the Mexican Banking Law and the General Rules Applicable to Mexican Banks, banks may participate in any of the activities and render the services as provided under Article 46 of the Mexican Banking Law, as well as those permitted under other laws.
In accordance with the capitalization rules currently in effect, the minimum equity capital required for banks that engage in all banking activities under the Mexican Banking Law (such as Banco Santander México) is 90,000,000 UDIs.
The Mexican Capitalization Requirements set forth the methodology to determine the net capital (capital neto) relative to market risk, credit risk and operational risk. Under the relevant regulations, the CNBV may impose additional capital requirements. The Mexican Capitalization Requirements provide capitalization standards for Mexican banks similar to international capitalization standards, particularly with respect to the recommendations of the Basel Committee on Banking Regulations and Supervisory Practices, or the Basel Committee, which includes the supervisory authorities of twelve major industrial countries.
The General Rules Applicable to Mexican Banks, currently specify that Mexican banks may be classified in several categories based on their Capital Ratio, Tier 1 capital and Fundamental Tier 1 Capital. The relevant corrective measures applicable to the Bank are determined based on the following classifications:
| | | | | | | | | |
Class | | | Capital Ratio | | | Tier 1 Capital | | | Fundamental Tier 1 Capital |
Class I | | | Equal to or greater than 10.5% | | | Equal to or greater than 8.5% | | | Equal to or greater than 7% |
Class II | | | Equal to or greater than 10.5% | | | Equal to or greater than 6% | | | Equal to or greater than 4.5% |
Class II | | | Equal to or greater than 8% and less than 10.5% | | | Equal to or greater than 6% | | | Equal to or greater than 4.5% |
Class III | | | Equal to or greater than 8% | | | Less than 6.0% | | | Equal to or greater than 4.5% |
Class III | | | Equal to or greater than 7% and less than 8% | | | Equal to or greater than 6% | | | Equal to or greater than 4.5% |
Class IV | | | Equal to or greater than 7% and less than 8% | | | Less than 6% | | | Equal to or greater than 4.5% |
Class IV | | | Equal to or Greater than 4.5% and less than 7% | | | Equal to or greater than 4.5% | | | Equal to or greater than 4.5% |
Class V | | | Less than 4.5% | | | Not Applicable | | | Less than 4.5% |
In cases in which the CNBV determines a Multiple Banking Institution as being of Local Systemic Importance, such institution is required to have a capital conservation supplement of the percentage determined by the CNBV, within a four year period ending in 2019. In April 29, 2016, the Bank was appointed by the CNBV as a systemic important bank, assigning a Grade III of systemic importance. As a result, the Bank should progressively constitute in four years a capital preservation supplement of 1.20%, starting 2016.
As of December 31, 2018, the Bank has constituted 75% of the capital preservation supplement required.
This table is based upon the table set forth in Article 220 of the General Rules Applicable to Mexican Banks, which should be consulted for a complete understanding of the applicable requirements.
Furthermore, the General Rules Applicable to Mexican Banks provide that none of Capital Ratio, Tier 1 capital or Fundamental Tier 1 Capital shall be subject to a maximum limit if (a) the Capital Ratio is equal to
or exceeds 10.5%, (b) Tier 1 capital is equal to or exceeds 8.5%, and (c) Fundamental Tier 1 Capital is equal to or exceeds 7.0%
For clarification purposes, Tier 1 capital means the two components of Tier 1 capital (Fundamental Tier 1 Capital and Non-fundamental Tier 1 Capital) as such terms are defined in the Rules for Capitalization. Fundamental Tier 1 Capital means only the basic or fundamental amount of Tier 1 capital (excluding Non-fundamental Tier 1 Capital) as such term is defined in the Rules for Capitalization, as further described below. Tier 2 capital refers to the additional portion (parte complementaria) of total net capital; as such term is defined in the Rules for Capitalization. Tier 1 capital refers to the basic portion (parte básica) of total net capital, as such term is defined in the Rules for Capitalization.
Aggregate net capital consists of Tier 1 capital and Tier 2 capital. The Mexican Capitalization Requirements include among the Fundamental Tier 1 Capital, mainly, paid-in capital, which represents the most subordinated right to collect in case of liquidation of a credit institution, which are not due and do not grant reimbursement rights, profits (mainly including retained profits), and capital reserves, and subtract from such Fundamental Tier 1 Capital, among other things, certain subordinated debt instruments, issued by financial and non-financial entities, securities representing residual parts of portfolio securitization, investments in the equity of venture-capital funds and investments in or credits to related companies (only in instances where they exceed certain thresholds), reserves pending creation, loans and other transactions that contravene applicable law, and intangibles (including goodwill). Non-fundamental Tier 1 capital is comprised of preferential shares, regarding which the issuer has the right to cancel the dividend payments, and subordinated debt instruments, which are not subject to a due date or forced conversion, regarding which it is possible to cancel the interest payments and which may become shares of a credit institution or a controlling entity or are subject to cancellation (when capitalization problems arise).
The supplementary part of basic capital (Tier 2) comprises capitalization instruments, which are subordinated to deposits and any other debt of the credit institution, do not have any specific guarantee, have a term of at least five years and are convertible into shares at their maturity date or are subject of write-down procedures, and the difference between total admissible reserves and total expected losses up to an amount that does not exceed 0.6% of weighted assets by credit risk. These instruments shall be included as capital based on their maturity date: 100% if the due date exceeds five years, 80% if the due date exceeds four years but is less than five years, 60% if the due date exceeds three years but is less than four years, 40% if the due date exceeds two years but is less than three years, 20% if the due date exceeds one year but is less than two years, and 0% if the due date is less than one year.
The General Rules Applicable to Mexican Banks require Mexican banks to maintain a mandatory capital conservation buffer of 2.5% of risk-weighted assets, or RWA, resulting in a 10.5% minimum total capital (including the capital conservation buffer), plus a systemically important bank supplement of the percentage determined by the CNBV, within a four year period ending in 2019, and a countercyclical capital supplement.
Every Mexican bank must create certain legal reserves (fondo de reserva) that are considered to be part of Tier 1 capital. Banks must separate and allocate 10.0% of their net income to such reserve each year until the legal reserve equals 100.0% of their paid-in capital (without adjustment for inflation). The remainder of net income, to the extent not distributed to shareholders as dividends, is added to the retained earnings account. Under Mexican law, dividends may not be paid out against the legal reserve.
Corrective Measures
The Mexican Banking Law and the General Rules Applicable to Mexican Banks establish the minimum corrective and special additional measures that banks must fulfill according to the category in which they were classified based on their capital. These corrective measures are designed to prevent and, when necessary, correct the operations of the banks that could negatively affect their solvency or financial stability. The CNBV is required to notify the relevant bank in writing of the corrective measures that it must
observe, within five business days after the Mexican Central Bank has notified the CNBV the capitalization ratio of the bank, as well as verify its compliance with the corrective measures imposed. Class I is exempted from any corrective measure, but for the remainder of the categories such corrective measures include:
For Class II:
| (a) | | requiring the bank to (i) inform the Board of Directors about the bank’s classification, as well as the causes that caused the CNBV to make such classification, and submit a detailed report containing a comprehensive evaluation of the bank’s financial situation, its level of compliance with the regulatory framework and the main indicators that reflect the degree of stability and solvency of the bank, within 20 business days after the bank has received the CNBV notification of the corrective measure, (ii) include in such report any observations mandated, in accordance with their respective scope of authority, by each of the CNBV and the Mexican Central Bank, (iii) report in writing the financial situation to the chief executive officer and chairman of the board of directors of the bank or the board of directors of the bank’s holding company, in the event the bank is part of a financial group, (iv) abstain from entering transactions that will cause its Capital Ratio to be lower than required under the Capitalization Requirements, (v) abstain from increasing the current amounts of the financings granted to relevant related parties, and (vi) submit for approval to the CNBV, a plan for capital restoration which has as a result an increase of its Capital Ratio in order for the institution to be placed in Class I. Such plan shall be presented to the CNBV no later than 20 business days after the date the bank receives the CNBV notification of the corrective measure; |
For Class III and above:
| (b) | | requiring the bank’s Board of Directors to (i) within 15 business days as of the notice of its classification, submit to the CNBV, for its approval, a plan for capital restoration that will result in an increase in its Capital Ratio, which may contemplate a program for improvement in operational efficiency, streamlining costs and increasing profitability, the carrying out of contributions to the capital and limits to the operations that the banks may carry out in compliance with their bylaws, or to the risks derived from such operations. The capital restoration plan shall be approved by such bank’s Board of Directors before being presented to the CNBV. The bank shall determine in the capital restoration plan that, in accordance with this subsection, it must submit, periodic targets, as well as the date in which the capital of such bank will get the capitalization level required in accordance with the applicable provisions. The CNBV, through its governing Board, must resolve all that corresponds to the capital restoration plan that has been presented to them, in a maximum of 60 calendar days from the date the plan was submitted; and (ii) comply with the plan within the period specified by the CNBV, which in no case may exceed 270 calendar days starting the day after the bank was notified of the respective approval. To determine the period for the completion of the restoration plan, the CNBV shall take into consideration the bank’s category, its financial situation, as well as the general conditions prevailing in the financial market. The CNBV, by agreement of its governing Board, may extend the deadline once by a period that will not exceed 90 calendar days. The CNBV will monitor and verify compliance with the capital restoration plan, without prejudice of the provenance of other corrective measures depending on the category in which the corresponding bank is classified; |
| (c) | | requiring the bank to suspend any payment of dividends to its shareholders, as well as any mechanism or act that involves the transfer of any economic benefits to the shareholders. If the bank belongs to the holding company, the measure provided in this subsection will apply to the holding company to which the bank belongs, as well as the financial entities or companies that are part of such holding company. This restriction on the payment of dividends for entities that are part of the same financial group will not apply in the event the dividend is being applied to the capitalization of the bank; |
| (d) | | requiring the bank to suspend any capital stock repurchase programs of the bank and, in the event that the bank belongs to a financial group, also the programs of the holding company of such group; |
| (e) | | requiring the bank to defer or cancel the interest payments on outstanding subordinated debt and, when applicable, defer the payment of the principal or exchange the debt into shares of the bank in the amount necessary to cover the capital deficiency, in advance and proportionately, according to the nature of such obligations. This corrective measure will be applicable to those obligations that are identified as subordinated debt in their indenture or issuance document; |
| (f) | | requiring the bank to suspend payment of any extraordinary benefits and bonuses that are not a component of the ordinary salary of the chief executive officer or any officer within the next two levels, as well as not granting any new benefits in the future for the chief executive officer and the officers until the bank complies with the minimum levels of capitalization required by the CNBV in accordance with the provisions referred to in Article 50 of the Mexican Banking Law; |
| (g) | | requiring the bank to refrain from increasing outstanding amounts of any credit granted to any individual who is a related party. |
For Class IV and above:
| (h) | | requiring the bank to request authorization from the CNBV to undertake new investments on non-financial assets, open branches or perform activities other than those made in the ordinary course of business, provided those investments or activities do not require authorization from SHCP or the Mexican Central Bank; and |
| (i) | | requiring the bank to undertake other corrective measures provided for in the general rules of Articles 225 I and IV and 226, 227 and 228 of the General Rules Applicable to Mexican Banks and Article 134 Bis 1 of the Mexican Banking Law (which are the General Rules Applicable to Mexican Banks), from time to time. |
Regardless of the Capital Ratio of the banks, the CNBV may order the implementation of additional and special corrective measures. The additional and special corrective measures that, if applicable, the banks must comply with are: (a) define the concrete actions that it will carry out in order not to deteriorate its Capital Ratio; (b) hire the services of external auditors or any other specialized third party for special audits on specific issues; (c) refrain from agreeing to increases in the salaries and benefits of the officers and employees in general, except for agreed salary revisions and in compliance with labor rights; (d) substitute officers, members of the Board or external auditors with appointed persons occupying the respective positions; or (e) undergo other actions or be subject to other limitations as determined by the CNBV, based on the result of its functions of monitoring and inspection, as well as with sound banking and financial practices.
On July 26, 2010, the Group of Governors and Heads of Supervision, the oversight body of the Basel Committee, reached broad agreement on the overall design of a capital and liquidity reform package for internationally active banking organizations around the world, known as Basel III, which includes, among other things, the definition of capital, the treatment of counterparty credit risk, the leverage ratio and the global liquidity standard. On September 12, 2010, the Basel Committee announced a substantial strengthening of existing capital requirements in connection with Basel III. The full text of the Basel III rules and the results of a quantitative impact study to determine the effects of the reforms on banking organizations were published on December 16, 2010.
The Basel III rules for capitalization were implemented in Mexico through an amendment to the General Rules Applicable to Mexican Banks published in the Federal Official Gazette on November 28, 2012, effective as of January 1, 2013. Banco Santander México currently complies with the minimum capital requirement.
Compliance with regulatory ratios
As part of its liquidity management model, in recent years the Bank has been managing the implementation, monitoring and early compliance with the new liquidity requirements set by international financial legislation.
In 2014, following the approval by the Basel Committee of the final definition of the short-term liquidity coverage ratio (LCR), the delegated act of the European Commission was adopted, which, within the scope of the CRD IV, defines the criteria for calculating and implementing this metric in the European Union. The implementation was delayed until October 2015, although the level of initial compliance was at 60% in 2015, which should gradually increase to 100% by 2019. Our LCR levels exceeded 100% throughout 2018, thereby surpassing regulatory requirements.
On December 31, 2014, the CNBV and the Mexican Central Bank published in the Federal Official Gazette, the “General Liquidity Requirements for Banking Institutions”, in accordance with those provided by the Banking Liquidity Regulation Committee on October 17, 2014. Such requirements entered into effect on January 1, 2015.
On December 31, 2015, the CNBV published in the Federal Official Gazette, a resolution modifying the General Liquidity Requirements for Banking Institutions. Such resolution entered into effect on January 1, 2016.
On June 22, 2016, the CNBV published in the Federal Official Gazette a resolution establishing the methodology to calculate the leverage ratio for banking institutions. Such resolution entered into effect on September 1, 2016. During the fourth quarter of 2018, the weighted average LCR for the Bank is 143.31%, complying with the Bank’s desired risk profile and well above the regulatory minimum established. This ratio is calculated as Tier 1 capital divided by leverage exposure. Exposure is calculated as the sum of the following items:
| · | | Accounting assets, excluding derivatives and items treated as deductions from Tier 1 capital (for example, the balance of loans is included, but not that of goodwill). |
| · | | Off-balance-sheet items (mainly guarantees, unused credit limits granted and documentary credits) weighted using credit conversion factors. |
| · | | The net value of derivatives (gains and losses vis-à-vis the same counterparty are netted, less the collateral if certain conditions are met) plus an add-on for potential future exposure. |
| · | | An add-on for the potential exposure of securities financing transactions. |
Reserve and Compulsory Deposit Requirements
The compulsory reserve requirement is one of the monetary policy instruments used as a mechanism to control the liquidity of the Mexican economy to reduce inflation. The objective of the Mexican Central Bank’s monetary policy is to maintain the stability of the purchasing power of the Mexican peso and in this context, to maintain a low inflation level. Given the historic inflation levels in Mexico, the efforts of the Mexican Central Bank have been directed towards a restrictive monetary policy.
Under the Law of the Mexican Central Bank, the Mexican Central Bank has the authority to determine the percentage of the liabilities of financial institutions that must be deposited in interest or non-interest-bearing deposits with the Mexican Central Bank (Depósitos de Regulación Monetaria). These deposits may not exceed 20% of the aggregate liabilities of the relevant financial institution. The Mexican Central Bank also has the authority to order that 100% of the liabilities of Mexican banks resulting from specific funding purposes, or pursuant to special legal regimes, be invested in specific assets created in respect of any such purpose or regime.
The Mexican Central Bank imposes reserve and compulsory deposit requirements on Mexican commercial banks. Bulletin 09/2014 published on June 17, 2014, stated that the total compulsory reserve deposit required of Mexican commercial banks was Ps.278.5 billion, which had to be deposited by June 19, 2014. The amount of the deposit that each bank had to make was equal to the amount of the compulsory deposits allocated as of June 18, 2014. Additionally, according to Bulletin 11/2014 published on June 25, 2014, an additional deposit of Ps.41.5 billion was required which had to be deposited in four installments, on August 14, September 11, October 9 and November 6, 2014. The amount of the deposit that each bank had to make was determined based on the total amount of the traditional customer deposits in Mexican pesos of each Mexican bank as of May 31, 2014.
The compulsory deposit reserves required under the terms of Bulletins 09/2014 and 11/2014 have an indefinite term. During the time these reserves are maintained on deposit with the Mexican Central Bank, each banking institution receives interest on such deposits every 27, 28, 29 or 30 days so that each last day of the period falls on a Thursday. The Mexican Central Bank will provide advance notice of the date and the procedure to withdraw the balance of these compulsory deposits at such time, if any, that the compulsory deposit reserves are suspended or terminated.
In order to promote the development of the Mexican monetary policy, on May 12, 2016, the Mexican Central Bank published in the Federal Official Gazette the rules for the auction by the Mexican Central Bank of Bonos de Regulación Monetaria Reportables (BREMS R) as an alternative for credit institutions to comply with their compulsory deposit requirements. The BREMS R can only be acquired by Mexican credit institutions through auctions made by the Mexican Central Bank and by means of repurchase transactions (reportos) between the Mexican Central Bank and the financial entities, or among financial entities, in accordance with the regulations set forth by the Mexican Central Bank. The BREMS R held by financial institutions shall be sold to the Mexican Central Bank at the date and in accordance with the terms included in general resolutions to be issued by the Mexican Central Bank.
As of December 31, 2018, the Group held a BREMS R position amounting to Ps.7,785 million, which were purchased with funds arising from the cancelation of the compulsory deposits by the Mexican Central Bank.
Classification of Loans and Allowance for Impairment Losses
Non-performing loan portfolio
We apply the following criteria to classify loans and advances as impaired loans:
| · | | Commercial, financial and industrial loans |
| - | | Loans with a single payment of principal and interest (non-amortizing loans), generally commercial loans for a short period of time, are considered impaired after 90 days of the maturity date. |
| - | | Loans with a single payment of principal at maturity and with periodic interest payments (interest-only loans) are considered impaired 90 days after principal or interest become due. |
| - | | Loans whose principal and interest payments have been agreed in periodic installments (amortizing loans) are considered impaired 90 days after an installment becomes due. |
| - | | Mortgage loans are considered impaired when a payment is past due more than 90 days. |
| · | | Installment loans to individuals |
| - | | Revolving consumer credit cards loans are considered impaired when payment is not received 90 days after they become due. |
| - | | Non-revolving consumer loans whose principal and interest payments have been agreed in periodic installments are considered impaired 90 days after an installment becomes due. |
| · | | If the borrower is declared bankrupt in accordance with the Mexican Commercial Bankruptcy Law. |
We also consider as impaired loans, the sum of all transactions of a customer when the loan balances of the same customer classified as impaired are equivalent to more than 20% of the total outstanding amounts of that customer.
Loans and advances which are not impaired due to default but for which there are reasonable doubts about their full repayment (principal and interest) according to their contractual terms are considered impaired loans. This analysis includes, among others, customers in situations involving deterioration in their creditworthiness, such as negative equity, continued losses, general delay in payments, inadequate economic or financial structure and insufficient cash flows to settle debt or inability to obtain additional financing, etc.
Impaired loans, which are renegotiated, will remain impaired until there exists evidence of sustained payment. Sustained payment is considered as the payment by the borrower without payment delay for the total amount due and payable in terms of principal and interest during certain period of time.
A loan is considered to be no longer in default (i.e., to have been cured) when all the contractual payments have been settled, except for those cases in which the borrower is in long-term forbearance and the financial asset does not fulfill the criteria to be considered as impaired. For these particular cases, a twelve month probation period is necessary in order to be considered as not impaired.
The entire loan balance relating to impaired assets continue to be recognized on the consolidated balance sheet, for their full amounts, until the recovery of any recognized amount is considered to be unlikely. The recovery of a loan is considered to be unlikely when there is a significant and irreversible deterioration of the borrower’s overall financial condition, resources, value of any guarantees and payment record which would lead a borrower to bankruptcy.
When the recovery of a loan is considered to be unlikely, it is written-off together with the corresponding allowance for impairment losses from the consolidated balance sheet without prejudice to any actions that the Bank may initiate to seek collection until their contractual rights are extinguished due to the expiration of the statute-of-limitations period, forgiveness or any other cause.
Loans and the related allowance for impairment losses are written-off considering the following:
| · | | Commercial, financial and industrial loans are evaluated on a case-by-case basis; as such, write-off will only take place after considering all relevant information such as the occurrence of a significant change in the borrower’s financial position, guarantees and collateral and payment records. Within this portfolio, SME loans and revolving SME loans are written-off when the loans become 181 and 151 days past due, respectively. |
| · | | Mortgage loans are written-off when they have been past due for 36 months. |
| · | | For installment loans to individuals, any portion of the balance that the Bank does not expect to collect is written-off at 151 days past due for revolving consumer credit card loans and 181 days past due for other non-revolving consumer loans. |
In the event of bankruptcy or similar proceedings, write-off may occur earlier than at the periods stated above. Collections procedures may continue after write-off.
In accordance with Mexican Banking GAAP, we apply the following criteria to classify past-due loans as non-performing:
| · | | Loans with a single payment of principal and interest at maturity are considered non-performing 30 calendar days after the date of maturity. |
| · | | Loans with a single payment of principal at maturity and with scheduled interest payments are considered non-performing 30 calendar days after principal becomes past due and 90 calendar days after interest becomes past due. |
| · | | Loans with a payment of principal and interest had been agreed to in scheduled payments are considered non-performing 90 days after the first installment is due. |
| · | | In the case of revolving credit, loans are considered non-performing when payment has not been received for two normal successive billing periods, or 60 days after they become due. |
| · | | Mortgage loans with periodic payments of principal and interest are considered non-performing when a payment is 90 days or more past due. |
| · | | Customer bank accounts showing overdrafts are reported as non-performing loans at the time the overdraft occurs. |
| · | | If the debtor files for bankruptcy protection, except for those loans: |
| · | | That continue to receive payments in terms of the provisions of section VIII of Article 43 of the Mexican Commercial Bankruptcy Law, or |
| · | | That have been granted under Article 75, Sections II and III of Article 224 of the Mexican Commercial Bankruptcy Law, applying different adjustment factors or deductions with respect to each type of guarantee. |
For Mexican Banking GAAP purposes, restructured or renewed non-performing loans are not considered as performing until there is evidence of sustained payment; i.e., evidence of payment by the borrower without arrears for the total amount due and payable in terms of principal and interest, for at least three consecutive installments under the credit payment scheme, or in the case of credits with installments that cover periods in excess of 60 calendar days, the payment of one installment as established in Mexican Banking GAAP.
Loans with a single payment of principal upon maturity and periodic payments of interest, which were restructured or renewed during the loan term, are considered as non-performing until there is evidence of sustained payment, as well as those in which at least 80% of the original term of the loan has not elapsed, which did not cover the total amount of the accrued interest or cover the principal of the original amount of the loan, and which should have been settled as of the date of renewal or restructuring in question. Sustained payment is evidenced when the borrower has paid at least 20% of the capital of the loan at the time of the restructuring or renewal, or when the borrower has paid the amount of accrued interest related to a period of 90 days under the restructuring or renewal scheduled payment.
Interest is recognized in income when it is accrued. However, the accrual of interest is suspended when loans become non-performing.
For accrued but uncollected regular interest on non-performing loans, the Bank creates an allowance for an equal amount when the loan is transferred to the non-performing portfolio.
Classification of loans and allowance for impairment losses under Mexican Banking GAAP
The loan classification and rating rules set forth under the General Rules Applicable to Mexican Banks, provide a General Methodology to classify (i) consumer loans (i.e., each of credit card exposure and loans to individuals, divided as separate groups), considering as principal elements (a) for credit card exposure, the possibility of non-payment and potential losses, and (b) for loans to individuals, the possibility of non-payment, potential losses (taking into account collateral and guarantees received), and credit exposure (net of allowance for impairment losses); (ii) mortgage loans (i.e., residential, including loans for construction, remodeling or improvements), considering as principal elements delinquency periods, possibility of non-payment and potential losses (taking into account collateral and guarantees received); and (iii) commercial loans, based principally on an evaluation of the borrower’s ability to repay its loan (including country risk, financial risk, industry risk and payment history) and an evaluation of the related collateral and guarantees. The loan classification and rating rules also permit banks, subject to prior approval by the CNBV, to develop and adopt specific internal methodologies within certain parameters to grade the loans in their loan portfolio. Generally, our subsidiaries follow the methodology set forth in the loan classification and rating rules. However, with respect to our commercial, corporate and financial institutions portfolios, we received approval from the CNBV, effective as of October 1, 2015, to use our internal models to determine our allowance for impairment losses under Mexican Banking GAAP as an alternative to the standard generic models developed by the CNBV. Our approach is based on the Advanced Internal Ratings-Based Approach as defined in the Basel II accords and is based on the evaluation of four main factors: country risk, financial risk, industry risk and payment performance. This results in an overall determination of debtor risk, which is then applied to each loan operation and mitigated by any collateral to obtain a risk grade which is associated to a provision factor. We have a mapping between this risk grade and the internal customer rating that has been approved by the CNBV. Our internal methodology predicts expected losses more accurately than the standard methodology because it is based on the particular characteristics of our loan portfolio, whereas the standard methodology approved by the CNBV is based on the Mexican banking sector as a whole, which has a higher risk profile than us. While our internal methodology has resulted in the calculation of probabilities of default that are lower than the probabilities of default calculated and established by the CNBV in its standard methodology, the use of an internal methodology does not necessarily result in a reduction of capital requirements or in the allowance for impairment losses.
Through different notes, the CNBV authorized the use of the Internal Methodology with Basic Approach (Metodología Interna con Enfoque Básico), or MIEB, and the Internal Methodology with Advanced Approach (Metodología Interna con Enfoque Avanzado) or MIEA, set forth in the Regulations, in order for us to determine the preliminary estimation of credit risk in the commercial credit portfolio. We use the MIEB for the following segments: companies, Corporate and Investment Banking and financial institutions and the MIEA for Corporates and real estate companies.
The MIEB consists of determining the probability of breach through a rating procedure that contemplates a quantitative or statistic module based on financial information of the client and a qualitative or expert module, based on the analyst opinion, who grades the variables of the model based on his experience and on the financial and expert analysis performed by the entity.
The MIEA consists of determining the probability of breach through a rating procedure based on an automatic module that uses a first intervention of the expert analyst, which may or may not be supplemented afterwards. The automatic module determines the rating in two phases, a quantitative and a qualitative based on a questionnaire that allows the expert analyst to modify the automatic scoring in a limited number of rating items.
The automatic valuation is obtained from a linear regression model, in which variables are comprised by financial and credit information of the company in addition to the responses to a closed questionnaire to be
analyzed by the expert analyst. The variables used have been previously identified as the ones which can more accurately predict the breach potential of an entity.
As a part of the MIEA, the loss given default is determined, considering:
| · | | The internal experience of the recovery flows of the contracts in breach. It is obtained as an average of historical losses in order to be considered a “long-run” loss. |
| · | | Coherence with the definition of “default” proposed by Basilea and the CNBV. |
| · | | Complies with the requirements of the CNBV set forth in the resolutions, by reflecting the loss given default considering unfavorable economic conditions. |
Since November 30, 2018, the Bank has completed the parallel calculation period of the General Methodology and the Internal Methodologies (MIEB and MIEA) as set forth in the Regulations. From this date, allowances of credit risk calculation for large corporates and real estate companies has been recognized for Mexican Banking GAAP purposes under the MIEA. As for December 31, 2018 for Corporate and Investment Banking and financial institutions segments, the Bank maintains the parallel calculation equivalent to 80% of the General Methodology for those loans which have an allowance using the MIEB lower than 98% with respect to the preliminary estimation of credit risk obtained by using the General Methodology. This effect represents 15% less allowance for Corporate and Investment Banking and financial institutions loans.
The loan classification and rating rules require that consumer loans to individuals be stratified on a loan‑by‑loan basis, considering the type of loan, amounts due, the number of unpaid billing periods applicable to the relevant loans, collateral received and other factors that may influence delinquency, on an expected loss basis; and that a statutory percentage be applied to loans that are past due for each level, as a means to create an allowance for impairment losses under Mexican Banking GAAP.
The allowance for impairment losses created in accordance with Mexican Banking GAAP may be decreased as the maturity of the applicable loan approaches and past due payments are made. Credit card loans must be reserved, on a loan-by-loan basis, considering amounts due, amounts paid to the relevant date, credit limits, and minimum payments required. Our total loans portfolio may be classified as A, B, C, D or E, depending upon the percentage of allowance required (from 0% to 100%); credit card consumer loans may be classified as A, B‑1, B‑2, C, D or E also depending upon the percentage of allowance required.
Since September 2011, the grading of loans to government entities, such as states and municipalities, is also based on an expected loss model that is calculated on a loan-by-loan basis. In this model, the expected loss is based on both qualitative and quantitative characteristics of the debtor, as well as other factors established by the CNBV. The qualitative characteristics include socioeconomic risk and financial strength. The quantitative characteristics include payment experience, coverage of the debtor by rating agencies and financial statement ratios that capture the financial risk of the debtor.
The loan classification and rating rules establish the following categories corresponding to levels of risk and applicable allowance for impairment losses and set forth procedures for the grading of commercial loans: A‑1, A‑2, B‑1, B‑2, B‑3, C‑1, C‑2, D and E.
Since June 2013, the grading of commercial loan portfolios is also based on an expected loss model that is calculated on a loan-by-loan basis under Mexican Banking GAAP. In this model, the expected loss is based on both qualitative and quantitative characteristics of the debtor, as well on the type and coverage of the collateral and guarantees that cover the loans. The qualitative characteristics include country and industry risk, market position, corporate governance and quality of the management. The quantitative
characteristics include payment experience in the credit bureau, payment experience with Infonavit and financial statement ratios that capture the financial risk of the debtor.
The loan classification and rating rules require that Mexican banks grade their commercial loan portfolio (except loans made to or guaranteed by the Mexican government) as of the end of each quarter and the classification must be reported to the CNBV. The classification of mortgage and consumer loans is required to be made monthly and reported to the CNBV.
All write-offs of uncollectible loans are recorded against the allowance for impairment losses. Mexican banks are required to obtain authorization from their Board of Directors to write-off loans.
The allowance for impairment losses under IFRS 9 requirements differs in some significant respects from the allowance for impairment losses requirements under Mexican Banking GAAP. Both under IFRS and under Mexican Banking GAAP, we estimate the impairment of loans and receivables using an expected loss model. However, under IFRS9 models are developed based on our historical experience of impairment and other circumstances known at the time of assessment, while under Mexican Banking GAAP, impairment losses are determined using prescribed formulas that are based primarily on an expected losses model developed by the CNBV using losses information compiled from the Mexican lending market as a whole, which may differ significantly from our credit loss experience. Furthermore, the risk weighting of assets under IFRS is determined using the most important factors that contribute to explaining the situation of the portfolio whereas risk weighting of assets under Mexican Banking GAAP is determined by the CNBV based on market experience during an observation period. In addition, to these differences, IFRS 9 also requires the use of the whole life of expected losses for credits that have experienced a significant increase in credit risk (referred to as Life Time Expected Loss) as well as the use of macroeconomic forward-looking information in determining expected losses.
Liquidity Requirements for Foreign Currency-Denominated Liabilities
Pursuant to regulations of the Mexican Central Bank, the total amount of maturity-adjusted (by applying a factor, depending upon the maturity of the relevant liability) net liabilities denominated or indexed to foreign currencies that Mexican banks, their subsidiaries or their foreign agencies or branches may maintain (calculated daily), is limited to 1.83 times the amount of their Tier 1 capital. To calculate such limit, maturity-adjusted foreign currency-denominated or indexed assets (including liquid assets, assets with a maturity of less than one year, short-term derivatives and spot foreign exchange transactions) are subtracted from maturity-adjusted foreign currency-denominated or indexed liabilities, and the aforementioned factor is applied to the resulting amount.
The maturity-adjusted net liabilities of Mexican banks denominated or indexed to foreign currencies (including dollars) are subject to a liquidity coefficient (i.e., to maintaining sufficient foreign currency-denominated or indexed liquid assets). These permitted liquid assets include, among others:
| · | | U.S. dollar-denominated cash or cash denominated in any other currency freely convertible; |
| · | | deposits with the Mexican Central Bank; |
| · | | treasury bills, treasury bonds and treasury notes issued by the U.S. government or debt certificates issued by agencies of the U.S. government, which have the unconditional guarantee of the United States government; |
| · | | demand deposits or one- to seven-day deposits in foreign financial institutions rated at least P‑2 by Moody’s Investors Service, Inc., or Moody’s, or A‑2 by Standard & Poor’s Rating Services, or S&P; |
| · | | investments in mutual or similar funds or companies approved by the Mexican Central Bank, that satisfy certain requirements; and |
| · | | unused lines of credit granted by foreign financial institutions rated at least P‑2 by Moody’s or A‑2 by S&P, subject to certain requirements. |
Such liquid assets may not be posted as collateral, lent or be subject to repurchase transactions or any other similar transactions that may limit their transferability.
Banco Santander México is in compliance with the applicable reserve requirement and liquidity coefficients in all material aspects.
Lending Limits
In accordance with the General Rules Applicable to Mexican Banks, limits relating to the diversification of a bank’s lending transactions are determined in accordance with the bank’s compliance with Mexican Capitalization Requirements. For a bank with:
| · | | a Capital Ratio greater than 8.0% and up to 9.0%, the maximum financing exposure to a person or a group of persons representing common risk to the bank, is limited to 12.0% of the bank’s Tier 1 capital; |
| · | | a Capital Ratio greater than 9.0% and up to 10.0%, the maximum financing exposure to a person or a group of persons representing common risk to the bank is limited to 15.0% of the bank’s Tier 1 capital; |
| · | | a Capital Ratio greater than 10.0% and up to 12.0%, the maximum financing exposure to a person or a group of persons representing common risk to the bank is limited to 25.0% of the bank’s Tier 1 capital; |
| · | | a Capital Ratio greater than 12.0% and up to 15.0%, the maximum financing exposure to a person or a group of persons representing common risk to the bank is limited to 30.0% of the bank’s Tier 1 capital; and |
| · | | a Capital Ratio greater than 15.0%, the maximum financing exposure to a person or a group of persons representing common risk to the bank is limited to 40.0% of the bank’s Tier 1 capital. |
These lending limits are required to be measured on a quarterly basis. The CNBV has discretion to reduce the aforementioned limits, if internal control systems or the risk management of the bank is inadequate.
The following financings are exempt from these lending limits: (i) financings guaranteed by unconditional and irrevocable security interests or guarantees, that may be enforced immediately and without judicial action, granted by foreign financial institutions with investment grade ratings and established in a country member of the European Union or the Organization for Economic Cooperation and Development (which guarantees must be accompanied with a legal opinion as to their enforceability), (ii) securities issued by the Mexican government and financings made to the Mexican government, Mexican local governments (subject to such financings being guaranteed by the right to receive certain Federal taxes), the Mexican Central Bank, the IPAB and development banks guaranteed by the Mexican government, and (iii) cash (transferred to the bank lender under a deposit that may be freely disposed of by the lender). However, such financings may not exceed 100% of a bank’s Tier 1 capital.
Likewise, financings granted to Sofomes for which the bank owns at least 99% of its capital stock, are exempted from the aforementioned limits, but such financings may not exceed 100% of a bank’s Tier 1 capital. In turn, the regulated Sofomes maintain or grant financing (regardless of the origin of the resources) to a person or a group of persons representing common risk, such financing shall comply with the aforementioned limits.
The aggregate amount of financings granted to the three largest borrowers of a bank may not exceed 100% of the bank’s Tier 1 capital.
Banks are not obligated to comply with the aforementioned limits with respect to financings granted to the Mexican government, local governments (subject to such financings being guaranteed by the right to receive certain Federal taxes), the Mexican Central Bank, IPAB and development banks guaranteed by the Mexican government.
Banks are required to disclose, in the notes to their financial statements for Mexican Banking GAAP purposes, (i) the number and amount of financings that exceed 10% of Tier 1 capital and (ii) the aggregate amount of financings made to their three largest borrowers.
Funding Limits
In accordance with the General Rules Applicable to Mexican Banks, Mexican banks are required to diversify their funding risks. In particular, a Mexican bank is required to notify the CNBV, on the business day following the occurrence of the event, in the event it receives funds from a person or a group of persons acting in concert that represent in one or more funding transactions more than 100% of such bank’s Tier 1 capital. None of the liabilities of Banco Santander México to a person or group of persons exceeds the 100% threshold.
Related Party Loans
Pursuant to the Mexican Banking Law, the total amount of the transactions with related parties may not exceed 35% of the bank’s Tier 1 capital. For the case of loans and revocable credits, only the disposed amount will be counted. See “Item 7. Major Shareholders and Related Party Transactions—B. Related Party Transactions—Loans to Related Parties.”
Tier 1 capital is calculated by taking into account the balance as of the last day of each month. When calculating Tier 1 capital, the General Rules Applicable to Mexican Banks establish that if the aggregate amount of operations subject to credit risk relating to relevant related parties exceeds 25% of the bank’s Tier 1 capital then the excess must be subtracted in order to determine Tier 1 capital.
On a monthly basis, we monitor and implement controls relating to the consumption of both the 35% and 25% limits in order to ensure strict compliance with the abovementioned regulations.
Foreign Currency Transactions
Mexican Central Bank regulations govern transactions by banks denominated in foreign currencies. Mexican banks may, without any specific additional approval, engage in spot, foreign exchange transactions (i.e., transactions having a maturity not exceeding four business days). Other foreign currency transactions are deemed derivative transactions and require approvals as discussed below. At the end of each trading day, banks are generally obligated to maintain a balanced foreign currency position (both in the aggregate and by currency). However, short and long positions are permitted in the aggregate, so long as such positions do not exceed 15% of a bank’s Tier 1 capital. In addition, Mexican banks must maintain liquid assets, prescribed by regulations issued by the Mexican Central Bank, in connection with maturities of obligations denominated in foreign currencies (as discussed under “—Liquidity Requirements for Foreign Currency-Denominated Liabilities” above).
Derivative Transactions
Certain Mexican Central Bank rules apply to derivative transactions entered into by Mexican banks. Mexican banks are permitted to enter into swaps, credit derivatives, forwards and options with respect to the following underlying assets:
| · | | specific shares, groups of shares or securities referenced to shares; that are listed in a securities exchange, |
| · | | Mexican currency, foreign currencies and UDIs (a peso-equivalent unit of account indexed for Mexican inflation), |
| · | | swine meat, pork and cattle, |
| · | | natural gas, diesel, gasoline and crude oil, |
| · | | aluminum, copper, nickel, platinum, lead and zinc, |
| · | | wheat, corn, soybean and sugar, |
| · | | rice, sorghum, cotton, oats, coffee, orange juice, cocoa, barley, cattle, swine, milk, canola, soybean oil and soybean paste, |
| · | | nominal or real interest rates with respect to any debt instrument, |
| · | | loans or other advances, and |
| · | | futures, options and swaps with respect to the underlying assets mentioned above. |
Mexican banks require an express general approval, issued in writing by the Mexican Central Bank, to enter into, as so-called intermediaries, derivative transactions, with respect to each class or type of derivative. Mexican banks that have not received the relevant general approval would require a specific approval from the Mexican Central Bank to enter into such derivative transactions (or even if in possession of such general approval, to enter into derivative transactions with underlying assets different from the assets specified above). Mexican banks may, however, enter into derivative transactions without the authorization of the Mexican Central Bank, if the exclusive purpose of such derivative transactions is to hedge the relevant bank’s existing risks. Authorizations may be revoked if, among other things, the applicable Mexican bank fails to comply with Mexican Capitalization Requirements, does not timely comply with reporting requirements, or enters into derivative transactions that contravene applicable law or sound market practices.
Banks that execute derivative transactions with related parties or with respect to underlying assets of which the issuer or debtor are related parties, shall comply with the corresponding limits set forth in the Mexican Banking Law in respect of related party transactions.
Institutions may collateralize derivative transactions through cash deposits, receivables and/or securities of its portfolio. Derivative transactions that are entered into in over-the-counter (OTC) markets, may be collateralized only when the counterparties are credit institutions, brokerage firms, foreign financial institutions, mutual funds, pension fund managers, Sofomes, and any other counterpart authorized by the Mexican Central Bank. Mexican banks are required to periodically inform their Board of Directors with respect to the derivative transactions entered into, and whether or not the Mexican bank is in compliance with limits imposed by the Board of Directors and any applicable committee. Mexican banks must also inform the Mexican Central Bank periodically of derivative transactions entered into and whether any such transaction was entered into with a related party. The counterparties in respect of hedging derivatives transactions entered into by Mexican banks must be other Mexican banks, Mexican financial entities authorized to enter into such derivatives by the Mexican Central Bank or foreign financial institutions or
recognized markets. Derivative transactions must be entered into pursuant to master agreements that must include terms and guidelines, similar to international standards such as International Swap and Derivatives Association (ISDA) master agreements and master agreements approved for the domestic market. As an exception to applicable rules, Mexican banks may pledge cash, receivables and securities to secure obligations resulting from their derivative transactions.
The Bank has received approval from the Mexican Central Bank to engage in swaps, forwards and options related to stocks, indices, currencies and interest rates.
The Bank carries out derivative financial transactions, with financial counterparties in order to cover the Bank’s own position, as well with clients who request so, in our ordinary course of business.
Restrictions on Liens and Guarantees
Under the Mexican Banking Law, banks are specifically prohibited from (i) pledging their securities or other assets as collateral, except (a) if the Mexican Central Bank or the CNBV so authorizes, including as described above with respect to derivative transactions, or (b) for obligations in favor of the Mexican Central Bank, IPAB, Mexican development banks or governmental trusts, (ii) guaranteeing the obligations of third parties, except, generally, in connection with letters of credit and bankers’ acceptances and (iii) make loans secured by subordinated debt or rights of trusts funded by subordinated debt.
Bank Secrecy Provisions; Credit Bureaus
Pursuant to the Mexican Banking Law, a Mexican bank may not provide any information relating to the identity of its customers or specific deposits, services or any other banking transactions (including loans) to any third parties (including any purchaser, underwriter or broker, or holder of any of the bank’s securities), other than (i) the depositor, debtor, accountholder or beneficiary and their legal representatives or attorneys-in-fact, (ii) judicial authorities in trial proceedings in which the accountholder is a party or defendant, (iii) the Mexican federal tax authorities for tax purposes, (iv) the SHCP for purposes of the implementation of measures and procedures to prevent terrorism and money laundering, (v) the Federal Auditor (Auditoría Superior de la Federación) to exercise its supervisory authority (including information on accounts or agreements involving federal public resources), (vi) the supervisory unit of the Federal Electoral Agency (Instituto Nacional Electoral), (vii) the federal attorney general’s office (Procuraduría General de la República) for purposes of criminal proceedings, (viii) the Treasurer of the Federation (Tesorería de la Federación), as applicable, to request account statements and any other information regarding the personal accounts of public officers, assistants and, as the case may be, individuals related to the corresponding investigation, and (ix) the Secretary and undersecretaries of the Ministry of Public Function (Secretaría de la Función Pública) when investigating or auditing the estates and assets of federal public officers, among others. In most cases, the information needs to be requested through the CNBV.
The CNBV is authorized to furnish foreign financial authorities with certain protected information under the Mexican bank secrecy laws, provided that an agreement must be in effect between the CNBV and such authority for the reciprocal exchange of information. The CNBV must abstain from furnishing information to foreign financial authorities if, in its sole discretion, such information may be used for purposes other than financial supervision, or by reason of public order, national security or any other cause set forth in the relevant agreement.
Banks and other financial entities are allowed to provide credit-related information to duly authorized Mexican credit bureaus.
Money Laundering Regulations
Mexico has a local framework in effect for the prevention of money laundering and terrorist financing (General Provisions on Money Laundering and Terrorist Financing); which has been in force since April 21,
2009 and has been subsequently amended through certain publications on the Federal Official Gazette in 2010, 2011, 2013, 2014, 2015 and 2017.
These General Provisions on Money Laundering and Terrorist Financing require the Bank to comply with various obligations, including:
| · | | The establishment and implementation of procedures and policies regarding customer identification and know-you-customer (KYC) policies in order to prevent and detect those transactions that may be connected to terrorism or money laundering activities as defined in the Mexican Federal Criminal Code (Código Penal Federal); |
| · | | The implementation of procedures for detecting and reporting relevant, unusual and suspicious transactions (as defined in the General Provisions on Money Laundering and Terrorist Financing); and |
| · | | The establishment of a Committee (Communication and Control Committee), which in turn must designate a Compliance Officer who is in charge of among other matters, supervising compliance with anti-money laundering provisions and the institution’s anti-money laundering and terrorism financing program. |
Our institution is also required to maintain a file (an “ID file”) before establishing any business relationship or entering into any kind of transaction with a costumer for the identification of such customer. This ID file shall include, among other information:
(i) full name,
(ii) gender,
(iii) date of birth,
(iv) nationality and country of birth,
(v) tax identification number,
(vi) occupation, profession, main activity or line of business,
(vii) domicile (including telephone number),
(viii) e-mail address, if any, and
(ix) advanced electronic signature series number, when applicable.
ID Files shall be maintained for the complete duration of the account or contract, and for a minimum term of ten years from the date of the termination of the business relationship with the applicable client.
Also the General Provisions on Money Laundering and Terrorist Financing require the Bank to have an anti-money laundering manual, which should be approved by the Audit Committee and include our anti-money laundering policies and procedures.
According to the General Provisions on Money Laundering and Terrorist Financing published on April 21, 2009, our subsidiaries operating in the financial sector must provide to the SHCP, through the CNBV:
(i) Quarterly reports (within ten business days from the end of each quarter) with respect to transactions equal to, or exceeding, U.S.$10,000,
(ii) Monthly reports with respect to international funds transfers, received or sent by a customer, equal to, or exceeding, U.S.$10,000,
(iii) Reports of unusual transactions, within 60 calendar days from the date an unusual transaction is detected by our automated systems; and
(iv) Quarterly reports of cashier checks equal to, or exceeding, U.S.$10,000.
In June 2010, new regulations were issued by the SHCP, which were amended in September and December 2010 and August 2011 and, which restrict cash transactions denominated in U.S. dollars that may be entered into by Mexican banks. Pursuant to such regulations, Mexican banks are prohibited from receiving physical cash amounts, from individuals in excess of U.S.$4,000 per month for deposits. Mexican banks are also prohibited from receiving physical cash amounts, in U.S. dollars, from their corporate clients, except in very limited circumstances.
Also, Mexican banks are prohibited from receiving physical cash amounts from individuals, in excess of U.S.$300 per day for individual foreign exchange transactions. In each case, the monthly amount per individual for such transactions cannot exceed U.S.$1,500.
On October 17, 2012, the Federal Law to Prevent and Identify Transactions with Illegal Proceeds, or the New Money Laundering Law (Ley Federal para la Prevención e Identificación de Operaciones con Recursos de Procedencia Ilícita), was published in the Federal Official Gazette, and is applicable to non-financial entities and service providers. The law punishes “Vulnerable Activities,” which are defined as all acts that have a high tendency to result in a crime through the use of illegal proceeds. In addition, under such law, the SHCP has broad authority to obtain information about unlawful activities, coordinate activities with foreign authorities and present claims related to them. This law also grants authority to the Federal Attorney General (Procuraduría General de la República) to investigate and prosecute illegal activities, in coordination with the SHCP.
Additionally, pursuant to the Mexican Banking Law reforms published in the Federal Official Gazette on January 10, 2014, the following sanctions were included, with the purpose of preventing and detecting operations that might encourage acts of terrorism:
| · | | A fine of 10% to 100% of the amount of the activity, transaction or service performed by an entity for a customer or user whom the entity knows to be on the blocked persons list prepared by the SHCP. |
| · | | A fine of 10% to 100% of the amount of any unreported unusual transaction and, if applicable, any additional transactions related to same customer or user involved in the unreported transaction. |
| · | | A fine of 30,000 to 100,000 days’ worth of the minimum wage applicable in Mexico for significant transactions or, if applicable, a series of related transactions involving international transfers and unreported transactions in cash undertaken in a foreign currency. |
| · | | A fine of 5,000 to 50,000 days’ worth of the minimum wage applicable in Mexico for other failures to comply with applicable law. |
The amendments to the General Provisions on Money Laundering and Terrorist Financing published in the Federal Official Gazette on April 25, 2014, September 12, 2014 and December 31, 2014, added the following obligations to the prevention of money laundering and terrorist financing:
| · | | Provide the CNBV, through the Financial Intelligence Unit (Unidad de Inteligencia Financiera), within the first ten business days of January, April, July and October of each year, a report for each issuance or payment of cashier’s checks carried out with its customer or users in the previous three months in an amount equal to or exceeding U.S.$10,000. |
| · | | Inform the CNBV prior to, or simultaneously with, the sharing of information regarding money laundering and terrorist financing activities, |
| · | | Immediate cancellation of any transaction or service related to a customer or user identified to be on the SHCP’s blocked persons’ list and notification to the client that it has been included on such list. |
| · | | Inform the CNBV, within the first 15 business days of January of each year, through electronic media and on the official form, a report containing the annual program of training courses for the current year. |
The amendments to the General Provisions on Money Laundering and Terrorist Financing published in the Federal Official Gazette on September 10, 2015, added the following to the prevention of money laundering and terrorist financing:
| · | | An additional 30‑day period was granted to submit unusual transactions reports, according to the guidelines to be published by the SHCP. |
| · | | Additional time, up to and including September 2016, to update the customer identification file for Trust Customers. |
On February 24, 2017, amendments to the General Provisions on Money Laundering and Terrorist Financing referred to in Article 115 of the Mexican Banking Law were published in the Federal Official Gazette, establishing:
| · | | The reduction of the threshold at which the Bank must report cash transactions from U.S.$10,000 to U.S.$7,500. |
| · | | New obligations to provide to the Mexican Central Bank information on international transfers to be integrated into a central database. |
| · | | Obligations to update records of customers regardless of their risk levels. |
The amendments to the General Provisions on Money Laundering and Terrorist Financing, published in the Federal Official Gazette on December 27, 2017, added obligations in order to consult and obtain information regarding international transfers and domestic transfers in foreign currencies performed by our customers in the Mexican financial system contained in the Mexican Central Bank’s database. Among others obligations, a customer’s consent must be obtained prior to providing it’s information to the central database.
Rules on Interest Rates
Mexican Central Bank regulations limit the number of reference rates that may be used by Mexican banks as a basis for determining interest rates on loans. For peso-denominated loans, banks may choose any of a fixed rate, the Mexican benchmark interbank money market rate (Tasa de Interés Interbancaria de Equilibrio, or TIIE), Mexican Treasury bills (Certificados de la Tesorería de la Federación, or Cetes) rate, CCP (costo de captación promedio a plazo), the rate determined by the Mexican Central Bank as applied to loans funded by or discounted with NAFIN, the rate agreed upon with development banks in loans funded or discounted with them, the weighted bank funding rate (tasa ponderada de fondeo bancario) and the weighted governmental funding rate (tasa ponderada de fondeo gubernamental). For UDI-denominated loans, the reference rate is the UDIBONOS. For foreign currency-denominated loans, banks may choose any of a fixed rate or floating market reference rates that are not unilaterally determined by a financial institution, including the London Interbank Offered Rate, or LIBOR, or the rate agreed upon with international or national development banks or funds, for loans funded by or discounted with such banks or funds. For dollar-denominated loans, banks may choose either a fixed rate or any of the rates referred
to in the prior sentence or the CCP-Dollars, as calculated and published in the Federal Official Gazette by the Mexican Central Bank.
The rules also provide that only one reference rate can be used for each transaction and that no alternative reference rate is permitted, unless the selected reference rate is discontinued, in which event a substitute reference rate may be established. A rate, or the mechanism to determine a rate, may not be modified unilaterally by a bank. Rates must be calculated annually, based upon 360‑day periods.
On November 11, 2010, the Mexican Central Bank published new rules that regulate the issuance and use of credit cards. Such rules standardize the regulations and forms that enable cardholders to authorize charges for recurrent payments relating to goods and services and standardize the procedures for objecting to improper charges and cancelling such services quickly and securely. The rules also establish the way in which credit card issuers shall determine the amount of the minimum payment in each period by means of a formula that favors payment of a part of the principal at the time of each minimum payment, with the aim of achieving payment of debts within a reasonable time period. Such rules also include certain protection provisions for card users in case of theft or loss of their credit cards, the creation of incentives to credit card issuers to adopt additional measures to reduce risks derived from use of credit cards in Internet transactions and the wrongful use of information contained in credit cards. These rules did not have a material impact on our operations or financial condition.
In June 2014, the Mexican Supreme Court of Justice issued a thesis, of mandatory application, allowing federal judges to determine ex officio if an interest rate agreed in a promissory note is evidently excessive, violating an individual’s human rights, and consequently establishing a reduced interest rate. The elements the judge should take into account to determine if an interest rate is evidently excessive are: (i) the type of relationship between the parties; (ii) the qualification of the persons intervening in the issuance of the promissory note and if the activity of the creditor is regulated; (iii) the purpose of the credit; (iv) the amount of the loan; (v) the term of the loan; (vi) the existence of guarantees or collateral for the payment of the loan; (vii) the interest rates applied by financial institutions in transactions similar to the one under analysis, as a mere reference; (viii) the variation of the national inflation index during the term of the loan; (ix) market conditions; and (x) other issues that may be relevant for the judge.
To date, the Mexican Courts have not issued any judgment reducing the interest rates on loans charged by the Bank. In addition, in November 2016, the Mexican Supreme Court of Justice published a separate thesis setting forth a rebuttable presumption that the interest rates charged on loans made by Mexican banking institutions are not excessive. The thesis was based on the fact that the loans offered to the public by credit institutions are supervised by the Mexican Central Bank, which supervision has the objective of ensuring that their conditions are accessible and reasonable for the public.
Fees
Under Mexican Central Bank regulations, Mexican banks and Sofomes may not, in respect of loans, deposits or other forms of funding and services with their respective clients, among others, (i) charge fees that are not included in their respective, publicly disclosed, aggregate annual cost (costo anual total), (ii) charge alternative fees, except if the fee charged is the lower fee, and (iii) charge fees for the cancellation of credit cards issued. In addition, among other things, Mexican banks may not (i) charge simultaneous fees, in respect of demand deposits, for account management and relating to not maintaining minimum amounts, (ii) charge fees for returned checks received for deposit in a deposit account or as payment for loans granted, (iii) charge fees for cancellation of deposit accounts, debit or teller cards, or the use of electronic banking services, or (iv) charge different fees depending upon the amount of a money transfer. Under the regulations, fees arising from the use of ATMs must be disclosed to users.
Mexican banks and Sofomes operating or permitting customers to use ATMs must choose between two options for charging fees to clients withdrawing cash or requesting balances: (i) specifying a fee for the relevant transactions, in which case, Mexican banks and Sofomes issuing credit or debit cards may not
charge cardholders any additional fee (credit or debit card issuers are entitled to charge operators the respective fee), or (ii) permit credit card or debit card issuers to charge a fee to clients, in which case, banks and Sofomes may not charge additional fees to clients.
The Mexican Central Bank, on its own initiative or as per request from the CONDUSEF, banks or Sofomes, may assess whether reasonable competitive conditions exist in connection with fees charged by banks or Sofomes in performing financial operations. The Mexican Central Bank must obtain the opinion of the COFECE in carrying out this assessment. The Mexican Central Bank may take measures to address these issues.
The Mexican Central Bank published rules that modified the rules on ATM user fees which limited the Bank’s ability to charge fees for the use of ATMs by customers and the amount of such fees for services including: (i) cash withdrawals, (ii) checking account balances, (iii) deposits and (iv) payments, both in bank windows and ATMs operated by the clients’ bank. The rules also specify that ATMs shall show a clear legend on their screens regarding costs of the transaction so the client may decide whether to proceed with the transaction.
IPAB
The IPAB Law, which became effective January 20, 1999, provides for the creation, organization and functions of IPAB, the Mexican bank savings protection agency. IPAB is a decentralized public entity that regulates the financial support granted to banks for the protection of bank deposits and other bank credits.
Only in exceptional cases may IPAB grant financial support to banking institutions.
According to the IPAB Law, banks must provide the information required by IPAB for the assessment of their financial situation and notify IPAB about any event that could affect their financial stability. The IPAB Law expressly excludes the release of such data from bank secrecy provisions contained in the Mexican Banking Law and expressly provides that IPAB and the CNBV can share information databases of banks.
IPAB will manage and sell the loans, rights, shares and any other assets that it acquires to perform its activity according to the IPAB Law, to maximize their recovery value. IPAB must ensure that the sale of such assets is made through open and public procedures. The President of Mexico is required to present annually a report to Congress prepared by IPAB with a detailed account of the transactions conducted by IPAB in the prior year.
IPAB has a governing Board of seven members: (i) the Minister of the SHCP, (ii) the Governor of the Mexican Central Bank, (iii) the President of the CNBV, and (iv) four other members appointed by the President of Mexico, with the approval of two-thirds of the Senate.
The deposit insurance to be provided by IPAB to bank depositors will be paid upon determination of the dissolution and liquidation, or bankruptcy of a bank. IPAB will act as liquidator or receiver in the dissolution and liquidation, or bankruptcy of banks, either directly or through designation of a representative. IPAB will guarantee obligations of banks to certain depositors and creditors only up to the amount of 400,000 UDIs (or approximately U.S.$126,743 as of December 31, 2018), per person per bank.
Banks have the obligation to pay IPAB ordinary and extraordinary contributions as determined from time to time by the Governing Board of IPAB. For such purposes, banks must promptly deliver to the IPAB information regarding their liabilities for the determination of their ordinary quotas. Under the IPAB Law, banks are required to make monthly ordinary contributions to IPAB, equal to one-twelfth of 0.004% multiplied by the average of the daily outstanding liabilities of the respective bank in a specific month, less (i) holdings of term bonds issued by other commercial banks; (ii) financing granted to other commercial banks; (iii) financing granted by IPAB; (iv) subordinated debentures that are mandatorily convertible in shares representing the capital stock of the banking institution; and (v) restricted assets and liabilities
resulting from the repurchase transactions (reportos) and lending of securities with the same counterparty, pursuant to the provisions issued by IPAB.
IPAB’s Governing Board also has the authority to impose extraordinary contributions in the case that, given the conditions of the Mexican financial system, IPAB does not have available sufficient funds to comply with its obligations. The determination of the extraordinary contributions is subject to the following limitations: (i) may not exceed, on an annual basis, the amount equivalent to 0.003% multiplied by the total amount of the liabilities outstanding of the banking institutions that are subject to IPAB ordinary contributions; and (ii) the aggregate amount of the ordinary and extraordinary contributions may not exceed, in any event, on an annual basis, an amount equivalent to 0.008% multiplied by the total amount of a bank’s liabilities subject to IPAB contributions.
The Mexican Congress allocates funds to IPAB on a yearly basis to manage and service IPAB’s liabilities. In emergency situations, IPAB is authorized to incur additional financing every three years in an amount not to exceed 6% of the total liabilities of certain Mexican banks as determined by the CNBV.
Under the IPAB law, in the event the quotas are not timely paid, between 30% and 100% of the value of the omitted quota may be imposed as a fine.
Law for the Protection and Defense of Financial Services Users
A Law for the Protection and Defense of Financial Services Users is in effect in Mexico. The purpose of this law is to protect and defend the rights and interests of users of financial services. To this end, the law provides for the creation of CONDUSEF, an autonomous entity that protects the interests of users of financial services and that has very wide authority to protect users of financial services (including imposing fines). CONDUSEF acts as mediator and arbitrator in disputes submitted to its jurisdiction and seeks to promote better relationships among users of financial institutions and the financial institutions. Banco Santander México and its subsidiaries must submit to CONDUSEF’s jurisdiction in all conciliation proceedings (initial stages of a dispute) and may choose to submit to CONDUSEF’s jurisdiction in all arbitration proceedings that may be brought before it. The law requires banks to maintain an internal unit designated to resolve any and all controversies submitted by clients. The Bank maintains such internal unit.
CONDUSEF maintains a Registry of Financial Service Providers (Registro de Prestadores de Servicios Financieros), in which all financial services providers must be registered, that assists CONDUSEF in the performance of its activities. This Registry will be replaced as explained below. CONDUSEF is required to publicly disclose the products and services offered by financial service providers, including interest rates. To satisfy this duty, CONDUSEF has wide authority to request all necessary information from financial institutions. Furthermore, CONDUSEF may scrutinize banking services provided by approving and supervising the use of standard accession agreements.
CONDUSEF, (i) is entitled to initiate class actions against Mexican financial institutions, in connection with events affecting groups of users of financial services, (ii) shall maintain a new Bureau of Financial Entities (Buró de Entidades Financeras), which is to set forth any and all information deemed material for users of financial services, (iii) is empowered to order amendments to any of the standard form commercial banking documentation (such as account and loan agreements) used by financial institutions, if it considers provisions thereof as detrimental to users, (iv) is permitted to issue resolutions as part of arbitration proceedings, for the benefit of issuers, that would permit users to attach assets of a financial institution prior to the completion of arbitration proceedings, and (v) is given broader authority to fine financial institutions, if any such financial institution does not comply with an order issued by CONDUSEF.
Banco Santander México and its subsidiaries may be required to provide reserves against contingencies which could arise from proceedings pending before CONDUSEF. The Bank may also be subject to recommendations by CONDUSEF regarding our standard agreements or information used to provide our
services. Our financial subsidiaries may be subject to coercive measures or sanctions imposed by CONDUSEF. The Bank is not the subject of any material proceedings before CONDUSEF.
Law for the Transparency and Ordering of Financial Services
The Law for the Transparency and Ordering of Financial Services regulates (i) the fees charged to clients of financial institutions for the use and/or acceptance of means of payment, as with debit cards, credit cards, checks and orders for the transfer of funds, (ii) the fees that financial institutions charge to each other for the use of any payment system, (iii) interest rates that may be charged to clients, and (iv) other aspects related to financial services, all in an effort to make financial services more transparent and protect the interests of the users of such services. This law grants the Mexican Central Bank the authority to regulate interest rates and fees and establish general guidelines and requirements relating to payment devices and credit card account statements (see “—Rules on Interest Rates” and “—Fees” above). The Mexican Central Bank has the authority to specify the basis upon which each bank must calculate its aggregate annual cost (costo anual total), which comprises interest rates and fees, on an aggregate basis, charged in respect of loans and other services. The aggregate annual cost must be publicly disclosed by each bank. The law also regulates the terms that banks must include in standard accession agreements and the terms of any publicity and of information provided in account statements. Our subsidiaries operating in the financial sector must inform the Mexican Central Bank of any changes in fees at least 30 calendar days before they become effective.
As part of the financial reform made in 2013, the Mexican Congress approved changes to the Law for the Transparency and Ordering of Financial Services pursuant to which the Mexican Central Bank may issue temporary regulations applicable to interest rates and fees, if it or the COFECE determines that no reasonable competitive conditions exist among financial institutions. Also, the Mexican Central Bank and the CNBV are given authority to issue rules regulating the means to obtain funds (i.e., credit cards, debit cards, checks and funds transfers), as a means to ensure competition, free access, no discrimination and protecting the interests of users.
Law on Transparency and Development of Competition for Secured Credit
The Law on Transparency and Development of Competition for Secured Credit (Ley de Transparencia y de Fomento a la Competencia en el Crédito Garantizado, or the “Secured Credit Law”) provides a legal framework for financial activities and certain other services performed by private credit institutions (as opposed to governmental entities) in connection with secured loans relating to real property in general and housing in particular (i.e., purchase, construction, restoration or refinancing). In particular, the Secured Credit Law established specific rules requiring the following: (i) the disclosure of certain information by credit institutions to their clients prior to the execution of the relevant loan agreement, including the disclosure of certain terms relating to interest rates, aggregate costs and expenses payable; (ii) the compliance by credit institutions and borrowers with certain requirements in the application process; (iii) the binding effect of offers made by credit institutions granting secured loans; (iv) the inclusion of mandatory provisions in loan agreements; and (v) the assumption of certain obligations by public officers (or notaries) before whom secured loans are granted.
In addition, the Secured Credit Law seeks to foster competition among credit institutions by permitting security interests underlying a secured loan to survive any refinancing thereof, even if such loans were granted by different credit institutions. This provision of the Secured Credit Law is designed to reduce expenditures made by borrowers.
Law on the Regulation of Financial Technology Institutions
On March 9, 2018, the FinTech Law was published in the Federal Official Gazette. Its main purpose is to regulate financial services provided by Collective Financing (Crowdfunding) Institutions and Electronic Payment Institutions (jointly the "Financial Technology Institutions"), two types of entities which were
created by the law. The CNBV is the authority responsible for granting authorizations and supervising their organization and operation. Collective Financing (Crowdfunding) Institutions are intended to put members of the public in contact with one another so that any member of the public can provide financing to any other member of the public. Electronic Payment Institutions are intended to provide the public with applications, digital interfaces, internet pages and other means of electronic or digital communications that they can use to make electronic payments in their day-to-day personal and professional lives. In addition, the FinTech Law also regulates transactions carried out with digital assets. A digital asset is an asset that represents value registered electronically that can be used by the public as a means of payment for any kind of legal activity and whose transfer can only be carried out through electronic media. The law limits digital assets, noting that the FinTech institutions can only operate with digital assets approved by the Mexican Central Bank. It also provides for the creation of the Inter-institutional Committee, which will be responsible for making decisions, such as the granting of authorizations and impositions of penalties, among others, in connection with activities pursuant to the FinTech Law. The Committee will also serve as the examining body of the CNBV and will be composed of public servants of the SHCP, Banco de México and the CNBV.
United States Supervision and Regulation
Financial Regulatory Reform
Banking statutes and regulations are continually under review by the United States Congress. In addition to laws and regulations, the U.S. bank regulatory agencies may issue policy statements, interpretive letters and similar written guidance. Many changes have occurred as a result of the Dodd-Frank Act and its implementing regulations, most of which are now in place. More recently, President Trump issued an executive order in 2017 that sets forth principles for financial regulatory and legislative reform. In May 2018, the United States Congress passed, and President Trump signed into law, the Economic Growth, Regulatory Relief and Consumer Protection Act (EGRRCPA), which exempts bank holding companies with less than U.S.$100 billion in total consolidated assets from certain enhanced prudential standards, and may exempt bank holding companies with between U.S.$100 billion and U.S.$250 billion in total consolidated assets from certain enhanced prudential standards in 2019 at the U.S. Federal Reserve’s discretion. EGRRCPA made clear that the U.S. Federal Reserve retained the right to apply enhanced prudential standards to Foreign Banking Organizations (FBOs) with greater than U.S.$100 billion in global total consolidated assets, such as Banco Santander Parent but the U.S. Federal Reserve has not yet proposed regulations to implement EGRRCPA for FBOs. While the final form of regulations implementing EGRRCPA for FBOs is unclear, it is possible that EGRRCPA and its implementing regulations will leave in place most enhanced prudential standards applicable to Banco Santander Parent, and will have little direct impact on Banco Santander México.
Volcker Rule
The Volcker Rule prohibits “banking entities” from engaging in certain forms of proprietary trading or from sponsoring or investing in “covered funds,” in each case subject to certain exceptions. The Volcker Rule also limits the ability of banking entities and their affiliates to enter into certain transactions with covered funds with which they or their affiliates have certain relationships. Banking entities such as Banco Santander México and Banco Santander Parent were required to bring their activities and investments into compliance with the requirements of the Volcker Rule by the end of the conformance period applicable to each requirement. Banco Santander Parent has assessed how the Volcker Rule affects its businesses and subsidiaries, including Banco Santander México, and has brought its activities into compliance. Santander Group has adopted processes to establish, maintain, enforce, review and test the compliance program designed to achieve and maintain compliance with the Volcker Rule. The Volcker Rule contains exclusions and certain exemptions for market-making, hedging, underwriting, trading in U.S. government and agency obligations, as well as certain foreign government obligations, and trading solely outside the United States, and also permits certain ownership interests in certain types of funds to be retained. Banco Santander Parent and its non-U.S. banking organization subsidiaries, including Banco Santander México, are largely able to continue their activities outside the United States in reliance on the “solely outside the U.S.”
exemptions from the Volcker Rule. Those exemptions generally exempt proprietary trading, and sponsoring or investing in covered funds if, among other restrictions, the essential actions take place outside the United States and any transactions are not with U.S. persons.
On July 21, 2017 the five regulatory agencies charged with implementing the Volcker Rule announced the coordination of reviews of the treatment of certain foreign funds that are investment funds organized and offered outside of the United States and that are excluded from the definition of covered fund under the agencies' implementing regulations. Also in July 2017, the U.S. Federal Reserve issued guidelines for banking entities seeking an extension to conform certain “seeding” investments in covered funds to the requirements of the Volcker Rule.
In May 2018, the five regulatory agencies charged with implementing the Volcker Rule released proposed amendments to the current Volcker Rule regulations. The proposal would tailor the Volcker Rule’s compliance requirements to the amount of a firm’s trading activity, revise the definition of a trading account, clarify certain key provisions in the Volcker Rule, and simplify the information that covered entities are required to provide to regulatory agencies. If adopted, the proposed changes regarding the definition of trading account would likely expand the scope of investing and trading activities subject to the Volcker Rule’s restrictions, although Banco Santander México would still largely rely on the “solely outside the U.S. exemption” to conduct its trading activities. Banco Santander Parent will continue to monitor Volcker Rule-related developments and assess their impact on its operations, including those of Banco Santander México, as necessary.
Disclosure pursuant to Section 219 of the Iran Threat Reduction and Syria Human Rights Act
Pursuant to Section 219 of the Iran Threat Reduction and Syria Human Rights Act of 2012, which added Section 13(r) to the Exchange Act, an issuer is required to disclose in its annual or quarterly reports, as applicable, whether it or any of its affiliates knowingly engaged in certain activities, transactions or dealings relating to Iran or with individuals or entities designated pursuant to certain Executive Orders. Disclosure is generally required even where the activities, transactions or dealings were conducted in compliance with applicable law.
The following activities are disclosed in response to Section 13(r) with respect to the Santander Group and its affiliates. During the period covered by this annual report:
| (a) | | Santander UK holds two savings accounts and one current account for two customers. Both of the customers, who are resident in the UK, are currently designated by the US under the Specially Designated Global Terrorist (SDGT) sanctions program. Revenues and profits generated by Santander UK on these accounts in the year ended 31 December 2018 were negligible relative to the overall profits of Banco Santander SA. |
| (b) | | During the period covered by this annual report, Santander UK held one savings account with a balance of £1.24, and one current account with a balance of £1,884.53 for another customer resident in the UK who is currently designated by the US under the SDGT sanctions program. The customer relationship pre-dates the designations of the customer under these sanctions. The United Nations and European Union removed this customer from their equivalent sanctions lists in 2008. Santander UK determined to put a block on these accounts and the accounts were subsequently closed on 14 January 2019. Revenues and profits generated by Santander UK on these accounts in the year ended 31 December 2018 were negligible relative to the overall profits of Banco Santander SA. |
| (c) | | Santander UK holds two frozen current accounts for two UK nationals who are designated by the US under the SDGT sanctions program. The accounts held by each customer have been frozen since their designation and have remained frozen through 2018. The accounts are in arrears (£1,844.73 in debit combined) and are currently being managed by Santander UK Collections and Recoveries department. No revenues or profits were generated by Santander UK on these accounts in the year ended 31 December 2018. |
| (d) | | The Santander Group also has certain legacy performance guarantees for the benefit of Bank Sepah and Bank Mellat (stand-by letters of credit to guarantee the obligations – either under tender documents or under contracting agreements – of contractors who participated in public bids in Iran) that were in place prior to 27 April 2007. |
In the aggregate, all of the transactions described above resulted in gross revenues and net profits in the year ended 31 December 2018, which were negligible relative to the overall revenues and profits of Banco Santander, S.A. The Santander Group has undertaken significant steps to withdraw from the Iranian market such as closing its representative office in Iran and ceasing all banking activities therein, including correspondent relationships, deposit taking from Iranian entities and issuing export letters of credit, except for the legacy transactions described above. The Santander Group is not contractually permitted to cancel these arrangements without either (i) paying the guaranteed amount (in the case of the performance guarantees), or (ii) forfeiting the outstanding amounts due to it (in the case of the export credits). As such, the Santander Group intends to continue to provide the guarantees and hold these assets in accordance with company policy and applicable laws.
C. Organizational Structure
On December 8, 2017, the shareholders of the Bank approved the merger of the Former Holding Company with and into the Bank, with the Bank as the surviving company. On December 8, 2017, the Bank and the Former Holding Company entered into a merger agreement, which became effective exclusively between the parties and for accounting purposes as of January 1, 2018 pursuant to Mexican law. On January 26, 2018, upon the filing of the resolutions of the shareholders of the Bank and the Former Holding Company approving the Merger and the filing of the Merger agreement with the Public Registry of Commerce in Mexico, the Merger became effective before third parties.
Immediately following the effectiveness of the Merger before third parties, (i) Banco Santander Parent contributed all of the shares of the Bank held by it as a result of the Merger to a new holding company, Grupo Financiero Santander México, S.A. de C.V., and (ii) the Bank sold all of the shares of Casa de Bolsa held by it as a result of the Merger to its new holding company, Grupo Financiero Santander México, S.A. de C.V. due to the prohibition under Mexican law of a commercial bank maintaining a direct investment in a brokerage entity. We no longer hold any interests in Casa de Bolsa.
As a result of the Merger, Grupo Financiero Santander México, S.A. de C.V., our new holding company, directly owns 74.96% of our capital stock. Banco Santander, S.A., or Banco Santander Parent, owns 100% of the capital stock of Grupo Financiero Santander México S.A. de C.V. and is our indirect controlling shareholder.
The Santander Group, through its stand-alone subsidiaries, was one of the largest foreign bank groups in Latin America in terms of assets as of December 31, 2018, based on publicly available annual reports. As of December 31, 2018, the Santander Group had 13,217 branches and a presence in 10 core markets. As a result of its voting control over us, the Santander Group is in a position to cause the election of a majority of the members of our management and to determine substantially all matters to be decided by a vote of shareholders. For more information on Banco Santander Parent, please see “Item 4. Information on the Company—B. Business Overview.”
The following chart presents our corporate structure as of December 31, 2018.
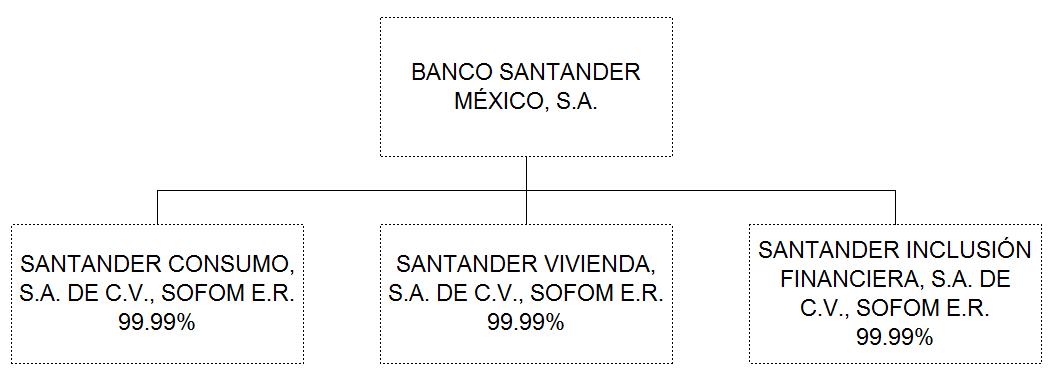
| | |
| | |
* IFRS at December 31, 2018 | * IFRS at December 31, 2018 | * IFRS at December 31, 2018 |
Total assets: Ps.77,786 million (5.5% of total) Net income: Ps.3,495 million (18.1% of total) Total equity: Ps.11,023 million (8.9% of total) | Total assets: Ps.49,189 million (3.5% of total) Net income: Ps.504 million (2.6% of total) Total equity: Ps.7,412 million (6.0% of total) | Total assets: Ps.197 million (0.01% of total) Net loss: Ps.115 million (0.06% of total) Total equity: Ps.270 million (0.2% of total) |
* These figures include our principal subsidiaries. All of our subsidiaries are incorporated in Mexico.
D. Property, Plants and Equipment
We are domiciled in Mexico City and own our principal executive offices, which are located at Avenida Prolongación Paseo de la Reforma 500, Colonia Lomas de Santa Fe, Delegación Álvaro Obregón, 01219, Mexico City, Mexico.
We also own two other buildings in Queretaro and rent 137 other buildings for central offices. We also own four branches’ buildings, Martinica located in León in Guanajuato, Interna Santa Fe located in Mexico City and Interna Contact Center and Interna Cetos, both located in Queretaro. The branches operated at rented locations have lease terms varying from 1 to 10 years.
The following table sets forth our main properties as of the date indicated.
| | | |
Main properties as of December 31, 2018 | | | Number |
Central Offices | | | |
Owned | | | 3 |
Rented | | | 137 |
Total | | | 140 |
Branches | | | |
Owned | | | 4 |
Rented(1) | | | 1,389 |
Total | | | 1,393 |
SME Center | | | |
Owned | | | — |
Rented | | | 28 |
Total | | | 28 |
Other Property(2) | | | |
Owned | | | — |
Rented | | | 1,287 |
Total | | | 1,287 |
| (1) | | Includes 71 branches under bailment (comodato). |
| (2) | | Consists mainly of back offices, storage, parking lots and ATMs. |
For additional information about our property, plants and equipment, see Note 2.k to our audited financial statements included elsewhere in this Report.
On April 27, 2012, we entered into an agreement to sell 220 properties (branches, offices and parking lots) to Fibra Uno, a Mexican publicly traded real estate investment trust. The sale of the properties was completed in May 2012 for Ps.3,334 million, which resulted in the recognition of net gains in the amount of Ps.1,730 million. Under the agreement, the properties were immediately leased back to us for a period of 20 years with an annual rent of Ps.276 million. For additional information on tangible assets, see Note 14.a to our audited financial statements included elsewhere in this Report.
ITEM 4A. UNRESOLVED STAFF COMMENTS
Not applicable.
ITEM 5. OPERATING AND FINANCIAL REVIEW AND PROSPECTS
Principal Factors Affecting Our Financial Condition and Results of Operations
All of our operations are located in Mexico. Consequently, our results of operations and our financial condition are strongly affected by the general economic environment and political conditions existing in Mexico and the applicable regulations. For more detail on the applicable regulations, please see “Item 4. Information on the Company—B. Business Overview—The Mexican Financial System,” “Item 4. Information on the Company—B. Business Overview—Supervision and Regulation,” and “Item 4. Information on the Company—B. Business Overview—Supervision and Regulation—Banking Regulation.”
Economic Environment��
In 2016, the Mexican economy grew at an annual GDP growth rate of 2.9%, supported mainly by domestic demand. The peso depreciated 18.82% against the U.S. dollar and inflation reached 3.4%, during the year. The sharp drop in global oil prices and the significant reduction of oil production in Mexico, together with
the increase of interest rates in the U.S., contributed to the depreciation and caused volatility in the foreign exchange market. Additionally, uncertainty following the U.S. presidential election with regard to the administration’s approach to trade and immigration policy with respect to Mexico caused further volatility in the foreign exchange market during the end of 2016 and beginning of 2017.
In 2017, the Mexican economy grew at an annual GDP growth rate of 2.1%, supported by resilient domestic consumption and a strengthening of external demand. During this period, the peso appreciated 4.6% against the U.S. dollar, as the depreciation that followed the presidential election in the United States was partially reversed. Inflation reached 6.8%, due to the delayed effect of exchange rate depreciation and a hike in domestic fuel prices at the start of the year. Monetary policy responded promptly, with a 150 basis points increase in the target rate. The increase in inflation was temporary, given the monetary policy response, the one-off nature of fuel price increases and the fact that the exchange rate decreased relative to its maximum levels.
In 2018, the Mexican economy grew at an annual GDP growth rate of 2.0%, supported by resilient domestic consumption, a strong labor market, a dynamic exporting sector, and manufacturing growth in the U.S. During this period, the peso showed significant volatility but appreciated 0.05% against the U.S. dollar, in a context of highly volatile financial markets around the world and uncertainties about the economic policies to be followed by the incoming Mexican government. Inflation decreased to 4.8%, but remained above the 3% +/- 1% Mexican Central Bank range due to continued increases in fuel prices and the volatility of the peso. In response, monetary policy increased the target rate by 100 basis points. Inflation is expected to decrease gradually and to approach the Mexican Central Bank range over the medium term, but this will depend largely on the evolution of the exchange rate and on the fiscal policy plans of the incoming Mexican government. The future of the USMCA, the new trade deal to replace NAFTA, and the policies of the new administration could also have a material adverse effect on the Mexican economy.
Effects of Changes in Interest Rates
Short-term interest rates, as measured by the Mexican Central Bank’s target rate, began 2011 at 4.50% and remained unchanged until March 2013, when such rate was cut to 4.0%. In the second half of 2013, the Mexican Central Bank further reduced the interest rate by 25 basis points, both in September 2013 and October 2013, leaving the target rate at 3.50%. In June 2014, following a weaker-than-expected performance of the economy, an additional 50 basis points reduction left the target rate at 3.0%.
Late in 2015, after a long period of loose monetary policy, the U.S. Federal Reserve increased the fed funds rate by 25 bps. In response, the Mexican Central Bank increased the target rate by 25 basis points (leaving the rate at 3.25%) . During 2016, the Mexican Central Bank increased the target rate by 250 basis points closing the year at a level of 5.75%. During 2017, the Mexican Central Bank increased the target rate by 150 basis points closing at a level of 7.25%. In 2018, there were four additional rate hikes in February, June, November and December, each of 25 basis points, closing at a level of 8.25%, as inflation decreased but remained above the Mexican Central Bank range of 3% +/- 1%.
Interest rates affect both our cost of funding and our interest income in diverse ways depending on the portfolio or activity conducted. The Assets and Liabilities Committee (Comité de Activos y Pasivos, or ALCO) portfolio strategies (which are comprised mainly by Mexican sovereign bonds, in addition to interest rate swaps) are designed to protect our Net Interest Margin sensitivity against changes in the interest rates. Our sensitivity to a parallel shift of 100 basis points in the interest rate curve over the course of the last five years has been around 2% of the net interest margin for each year. Therefore, impacts on margin from movements in interest rates have not been material over the last five years. Our balance sheet is currently positioned such that increases in interest rates would result in increases in the net interest margin. This is reflected in the current levels of NIM consumption, which show that a 100 basis point parallel shift in the interest rate curve would result in an increase in the net interest margin, and a 100 basis point parallel decrease in the interest rate curve would result in a decrease in the net interest margin. For further detail, see “Item 11. Quantitative and Qualitative Disclosures About Market Risk—Market Risk—Stress Tests—Assets and Liabilities Management (Banking Books).”
Critical Accounting Policies
The following is a description of certain key accounting policies on which our financial condition and results of operations are dependent. The key accounting policies generally involve complex quantitative analyses or are based on subjective judgments or assumptions. Management bases its estimates and judgments on historical experience and on various other factors that are believed to be reasonable under current circumstances. Actual results may differ from these estimates if assumptions and conditions change. For a full description of our accounting policies, see Notes 1.c and 2 to our audited financial statements included elsewhere in this Report.
Fair value measurements and disclosures of financial instruments
Fair value is the price that would be received to sell an asset or paid to transfer a liability in an orderly transaction in the principal (or most advantageous) market at the measurement date under current market conditions (i.e., an exit price) regardless of whether that price is directly observable or estimated using another valuation technique. In estimating the fair value of an asset or a liability, we consider the characteristics of the asset or liability if market participants would take those characteristics into account when pricing the asset or liability at the measurement date.
When there is no market price available for an identical instrument, we measure fair value on the basis of other valuation techniques that are commonly used by the financial markets that maximize the use of relevant observable inputs and minimize the use of unobservable inputs as explained in Note 2.d to our audited financial statements included elsewhere in this Report.
The availability of observable prices or inputs varies by product and market, and may change over time. The level of management judgment required in establishing fair value of financial instruments for which there is a quoted price in an active market is minimal. Similarly, there is little subjectivity or judgment required for instruments valued using valuation models that are standard across the industry and where all parameter inputs are quoted in active markets. The level of subjectivity and degree of management judgment required are more significant for those instruments valued using specialized and sophisticated models and those where some or all of the parameter inputs are not observable.
In making appropriate valuation adjustments, we follow methodologies that consider factors such as liquidity and credit risk (both counterparty credit risk in relation to financial assets and our own credit risk in relation to financial liabilities, which are at fair value through profit or loss).
We are required to disclose the valuation methods used to determine fair value measurements. Specifically, segmentation is required between those valued using quoted market prices in an active market (Level 1), valuation techniques based on observable inputs (Level 2) and valuation techniques using significant unobservable inputs (Level 3). Significant unobservable inputs are defined as inputs for which observable market data are not available and that are significant to the fair value measurement. Such inputs are developed using the best information available about assumptions that market participants would use when pricing the asset or liability. Such disclosure is provided in Note 2.d.iii (for financial assets and liabilities at fair value) and Note 44.d (for financial assets at amortized cost) to our audited financial statements included elsewhere in this Report.
Allowance for impairment losses and provisions for off-balance sheet risk
From January 1, 2018, the Bank assesses on a forward-looking basis the expected credit losses associated with its financial assets carried at amortized cost and at fair value through other comprehensive income. The impairment methodology applied depends on whether there has been a significant increase in credit risk. The Bank considers whether a financial asset has experienced a significant increase in credit risk, since initial recognition, by taking into account different quantitative, qualitative and backstop criteria.
The Bank uses the concept of expected credit loss methodology according to IFRS 9 to quantify the credit losses as further described in Note 2.g to our audited financial statements included elsewhere in this Report.
The accounting estimates and judgments related to the allowance for impairment losses and provisions for off-balance sheet risk are a critical accounting estimate for the Bank because the underlying assumptions used to assess the impairment can change from period to period and may significantly affect the Bank’s operating results, particularly in circumstances of economic and financial uncertainty. Further, the statistical models incorporate numerous estimates and judgments (for example, probability of default, loss given default and segmentation of loans in groups with similar credit risk characteristics, etc.). As such, the actual amount of the future cash flows and their timing may differ from the estimates used by the Bank’s management and consequently may cause actual credit losses to differ from the recognized allowance for impairment losses or provisions for off-balance sheet risk.
Deferred tax assets
As further described in Note 2.t to our audited financial statements included elsewhere in this Report, deferred tax assets and liabilities include temporary differences, which are identified as the amounts expected to be payable or recoverable on differences between the carrying amounts of assets and liabilities and their related tax bases, and tax loss and tax credit carryforwards. These amounts are measured at the tax rates that are expected to apply in the period when the asset is recovered or the liability is settled.
In determining the amount of deferred tax assets, we use current expectations and estimates on projections of future events and trends which may affect our audited financial statements, including a review of the eligible carryforward periods, available tax planning opportunities and other relevant considerations.
We believe that the accounting estimate related to the deferred tax assets is a critical accounting estimate because it requires significant management judgment and the underlying assumptions used in the estimate can change from period to period (for example, future projected operating performance).
Goodwill and business combinations
Goodwill and intangible assets include the cost of acquired subsidiaries in excess of the fair value of the tangible net assets recorded in connection with acquisitions as well as acquired intangible assets. Accounting for goodwill and acquired intangible assets requires management’s estimates regarding: (1) the fair value of the acquired intangible assets and the initial amount of goodwill to be recorded, (2) the amortization period (for identified intangible assets other than those with indefinite lives or goodwill) and (3) the recoverability of the carrying value of acquired intangible assets.
To determine the initial amount of goodwill to be recognized on an acquisition, we determine the fair value of the consideration and the fair value of the net assets acquired. We use internal analysis, generally based on discounted cash flow techniques, to determine the fair value of the net assets acquired and non-cash components of the consideration paid. The actual fair value of net assets acquired could differ from the fair value determined, resulting in an under- or over-statement of goodwill.
The useful lives of acquired intangible assets are estimated based on the period over which the assets are expected to contribute directly or indirectly to our future cash flows.
Impairment of goodwill
Determining whether goodwill is impaired requires an estimation of the value in use of the cash generating unit (CGU) to which goodwill has been allocated. A cash generating unit is the smallest identifiable group of assets that, as a result of continuing operation, generates cash inflows that are largely independent of the cash inflows from other assets or groups of assets. The value in use calculation requires that we
estimate the future cash flows expected to arise from the CGU and a suitable discount rate to calculate present value. Where the actual future cash flows are less than expected, an impairment loss may arise affecting our results of operations.
Defined benefit plans
The net cost of our defined benefit pension plan and other post-employment medical benefits and the present value of our pension obligations are determined using actuarial valuations. An actuarial valuation involves making various assumptions, including the determination of the discount rate, which may differ from actual developments in the future. Any changes in these assumptions will impact the carrying value of our pension obligations which may affect our results of operations. Further details about our pension obligations are included in Note 24.c. to our audited financial statements included elsewhere in this Report.
Provisions and contingent liabilities
We conduct our business in many different legal, regulatory and tax environments, and, accordingly, legal claims, regulatory proceedings or uncertain income tax matters may arise.
The use of estimates is important in determining provisions for potential losses that may arise from litigation, regulatory proceedings and uncertain income tax matters. We estimate and provide for potential losses that may arise out of litigation, regulatory proceedings and uncertain income tax matters to the extent that a current obligation exists, such losses are probable and can be reasonably estimated. Significant judgment is required in making these estimates and our final liabilities may ultimately be materially different.
Our actual losses may differ materially from recognized amounts.
Application of New and Revised IFRS
In 2018, we applied new and revised IFRS standards issued by the IASB that are mandatory for an accounting period beginning on or after January 1, 2018. These revised standards have had no material impact on the disclosures or on the amounts recognized in our audited financial statements. On January 1, 2018, we adopted, among others, IFRS 15, Revenue from contracts with customers and IFRS 9, Financial instruments. The effects of adopting these standards are discussed in Note 1.b to our audited financial statements included elsewhere in this Report. On January 1, 2019, we adopted IFRS 16, Leases. The effects of adopting these standards are discussed in Note 1.b to our audited financial statements included elsewhere in this Report.
A. Operating Results
The following discussion of our financial condition and results of operations should be read in conjunction with our audited financial statements as of December 31, 2017 and 2018 and for the years ended December 31, 2016, 2017 and 2018, and the notes thereto, included elsewhere in this annual report, as well as the information presented under “Presentation of Financial and Other Information” and “Item 3. Key Information—A. Selected Financial Data.”
The following discussion contains forward-looking statements that involve risks and uncertainties. Our actual results may differ materially from those discussed in the forward-looking statements as a result of various factors, including those set forth in “Special Note Regarding Forward-Looking Statements” and “Item 3. Key Information—D. Risk Factors.”
Results of Operations for the Year Ended December 31, 2018 Compared to the Year Ended December 31, 2017
The following table presents our consolidated results of operations for the year ended December 31, 2018 as compared to the year ended December 31, 2017.
| | | | | | | | | | | | | | | |
| | For the year ended December 31, | |
| | 2017 | | | 2018 | | | 2018 | | | 2018/2017 | |
| | | | | | | | | | (Millions of U.S. | | | | |
| | (Millions of pesos) | | | dollars)(1) | | | (% Change) | |
Interest income | | Ps. | 98,002 | | | Ps. | 99,537 | | | U.S.$ | 5,065 | | | 1.57% | |
Interest income from financial assets at fair value through profit or loss | | | — | | | | 14,049 | | | | 715 | | | 100.00% | |
Interest expenses and similar charges | | | (42,158) | | | | (51,589) | | | | (2,625) | | | 22.37% | |
Net Interest Income | | | 55,844 | | | | 61,997 | | | | 3,155 | | | 11.02% | |
Dividend income | | | 150 | | | | 210 | | | | 11 | | | 40.00% | |
Fee and commission income (net) | | | 14,813 | | | | 15,722 | | | | 800 | | | 6.14% | |
Gains/(losses) on financial assets and liabilities (net) | | | 3,458 | | | | 1,484 | | | | 76 | | | (57.09)% | |
Exchange differences (net) | | | 6 | | | | — | | | | — | | | (100.00)% | |
Other operating income | | | 669 | | | | 748 | | | | 38 | | | 11.81% | |
Other operating expenses | | | (3,614) | | | | (4,393) | | | | (223) | | | 21.56% | |
Total Income | | | 71,326 | | | | 75,768 | | | | 3,857 | | | 6.23% | |
Administrative expenses | | | (25,437) | | | | (28,649) | | | | (1,457) | | | 12.63% | |
Personnel expenses | | | (12,748) | | | | (14,354) | | | | (730) | | | 12.60% | |
Other general administrative expenses | | | (12,689) | | | | (14,295) | | | | (727) | | | 12.66% | |
Depreciation and amortization | | | (2,533) | | | | (2,973) | | | | (151) | | | 17.37% | |
Impairment losses on financial assets not at fair value through profit or loss (net): | | | (18,820) | | | | (18,810) | | | | (956) | | | (0.05)% | |
Loans and receivables | | | (18,820) | | | | — | | | | — | | | (100.00)% | |
Financial assets at amortized cost | | | — | | | | (18,806) | | | | (956) | | | 100.00% | |
Financial assets at fair value through other comprehensive income | | | — | | | | (4) | | | | — | | | (100.00)% | |
Provisions (net)(2) | | | (437) | | | | (562) | | | | (28) | | | 28.60% | |
Gains/(losses) on disposal of assets not classified as non-current assets held for sale (net) | | | 6 | | | | 7 | | | | — | | | 16.67% | |
Gains/(losses) on disposal of non-current assets held for sale not classified as discontinued operations (net) | | | 69 | | | | 33 | | | | 2 | | | (52.17)% | |
Operating Profit Before Tax | | | 24,174 | | | | 24,814 | | | | 1,267 | | | 2.65% | |
Income tax | | | (5,496) | | | | (5,458) | | | | (278) | | | (0.69)% | |
Profit for the year | | Ps. | 18,678 | | | Ps. | 19,356 | | | U.S.$ | 989 | | | 3.63% | |
Profit attributable to the Parent | | | 18,678 | | | | 19,353 | | | | 989 | | | 3.61% | |
Profit attributable to non-controlling interests | | | — | | | | 3 | | | | — | | | — | |
| (1) | | Results for the year ended December 31, 2018 have been translated into U.S. dollars, for convenience purposes only, using the exchange rate of Ps.19.65 per U.S.$1.00 as calculated on December 31, 2018 and reported by the Mexican Central Bank in the Federal Official Gazette on January 2, 2019 as the exchange rate for the payment of obligations denominated in currencies other than pesos and payable within Mexico. These translations should not be construed as representations that the peso amounts represent, have been or could have been converted into, U.S. dollars at such or at any other exchange rate. |
| (2) | | Mainly provisions for off-balance sheet risk and tax and legal matters. |
Summary
In 2018 net profit amounted to Ps.19,356 million, representing a 3.63% or Ps.678 million increase over the Ps.18,678 million generated in 2017.
This result reflects mainly:
| · | | a Ps.6,153 million, or 11.02%, increase in net interest income mainly due to higher interest income from the loan portfolio driven by loan growth and higher interest rates, and partially offset by higher interest paid on customers deposits; |
| · | | a Ps.909 million, or 6.14%, increase in income from fees and commissions (net) mainly resulting from: growth in credit and debit card fees, which accounted for 23.6% of the total; and |
| · | | a Ps.38 million, or 0.69%, decrease in income tax that resulted in an effective tax rate of 22.00% in the year as compared to that of 22.74% in 2017. |
These positive results were partially offset by:
| · | | a Ps.3,212 million, or 12.63%, increase in administrative expenses, due primarily to an increase in information technology and system expenses, as well as to increases in wages and salaries, other expenses, taxes other than income tax, surveillance and cash courier services, travel costs, credit card and stationery and supplies expenses, which were partly offset by decreases rents, maintenance, conservation and repair, administrative services expenses, advertising and communication and operating costs; |
| · | | a Ps.1,974 million, or 57.09%, decrease in gains on financial assets and liabilities (net), mainly resulting from losses on interest rate products and exchange rate products, mainly driven by market volatility; |
| · | | a Ps.700 million, or 23.77%, increase in other operating expenses (net), mainly due to increases in IPAB’s contributions as well as write-offs and bankruptcies, in particular as a result of higher fraud-related losses; |
| · | | a Ps.440 million, or 17.37%, increase in depreciation and amortization due to an increase in investments in information technology, reflecting the execution of our investment plan; and |
| · | | a Ps.125 million, or 28.60%, increase in provisions (net) due to increased provisions for tax and legal contingencies as a result of an increase in claims by certain clients and higher provisions for pensions and similar obligations, which were partly offset by a decrease in requirements for provisions for off-balance sheet risk. |
Net Interest Income
Our interest income consists mainly of interest from lending activities to customers and credit institutions, which generated Ps.90,654 million, or 79.81%, of our total interest in 2018, with the remaining interest income of Ps.22,933 million consisting of interest from investments in debt instruments, cash and balances with the Mexican Central Bank, income from hedging operations and other interest income. Interest income increased by Ps.15,584 million, or 15.90%, in 2018 compared to that of 2017.
Our interest expenses and similar charges consist mainly of interest paid on customer deposits. In 2018, interest expense on customer deposits was Ps.31,913 million, representing 61.86% of our total interest expenses and similar charges for that period. Interest expenses from time deposits, demand accounts and repurchase agreements related to Mexican government securities with non-financial institution customers amounted to Ps.14,943 million, Ps.10,330 million and Ps.6,640 million, respectively, in 2018, representing 28.97%, 20.02% and 12.87% of our total interest expenses and similar charges for the period, respectively. In addition, interest expense on deposits from the Mexican Central Bank and credit institutions (which includes repurchase agreements with financial institutions) was Ps.7,420 million, representing 14.38% of our total interest expense in 2018, while interest expense on subordinated debentures was Ps.1,610 million, representing 3.12% of our total interest expense in 2018. Finally, interest expense on other liabilities, marketable debt securities and other financial liabilities, and other interest expenses on hedging operations were Ps.5,931 million, Ps.4,244 million, Ps.363 million and Ps.108 million, respectively and represented
11.50%, 8.23%, 0.70% and 0.21%, of our total interest expense, respectively, in 2018. Interest expenses and similar charges increased by Ps.9,431 million, or 22.37%, in 2018 compared to that of 2017.
Our net interest income in 2018 was Ps.61,997 million, a Ps.6,153 million or 11.02% increase from Ps.55,844 million in 2017. This growth was mainly due to a higher average interest rate of 10.14% in 2018 as compared to 9.35% in 2017, combined with an increase of 6.90% in average total interest-earning assets. This increase was partly offset by an increase in our interest expenses, mainly due to higher interest paid on customer deposits which in turn was due to an increase in retail deposits during the year. Increase in retail deposits reflects our focus on offering innovative products and a client-centric approach for individuals and SMEs, while the high interest rate environment continued to fuel demand for low-risk term instruments.
The following table sets forth the components of our interest income and interest expenses and similar charges, for 2017 and 2018.
| | | | | | | | | | | |
| | For the year ended December 31, | | | | |
| | 2017 | | | 2018 | | | 2017/2018 | |
| | (Millions of pesos) | | | (% Change) | |
Interest income | | | | | | | | | | | |
Cash and balances with the Mexican Central Bank | | Ps. | 2,081 | | | Ps. | 2,361 | | | 13.46% | |
Loans and advances to credit institutions | | | 4,804 | | | | 8,160 | | | 69.86% | |
Loans and advances to customers—excluding credit cards | | | 59,014 | | | | 67,971 | | | 15.18% | |
Loans and advances to customers—credit cards | | | 13,249 | | | | 14,523 | | | 9.62% | |
Debt instruments | | | 16,791 | | | | 17,590 | | | 4.76% | |
Income from hedging operations | | | 1,895 | | | | 2,858 | | | 50.82% | |
Other interest income | | | 168 | | | | 123 | | | (26.79%) | |
Total | | Ps. | 98,002 | | | Ps. | 113,586 | | | 15.90% | |
| | | | | | | | | | | |
Interest expense and similar charges | | | | | | | | | | | |
Deposits from the Mexican Central Bank and credit institutions | | Ps. | (7,564) | | | Ps. | (7,420) | | | (1.90%) | |
Customer deposits—Demand accounts | | | (8,889) | | | | (10,330) | | | 16.21% | |
Customer deposits—Time deposits | | | (10,000) | | | | (14,943) | | | 49.43% | |
Customer deposits—Repurchase agreements | | | (5,671) | | | | (6,640) | | | 17.09% | |
Subordinated debentures | | | (1,600) | | | | (1,610) | | | 0.63% | |
Marketable debt securities and other financial liabilities | | | (3,696) | | | | (4,244) | | | 14.83% | |
Other liabilities | | | (4,277) | | | | (5,931) | | | 38.67% | |
Expenses from hedging operations | | | (129) | | | | (108) | | | (16.28%) | |
Other interest expenses | | | (332) | | | | (363) | | | 9.34% | |
Total | | Ps. | (42,158) | | | Ps. | (51,589) | | | 22.37% | |
Net interest income | | Ps. | 55,844 | | | Ps. | 61,997 | | | 11.02% | |
The following table sets forth the components of our average loans and advances to customers for 2017 and 2018.
| | | | | | | | | | | |
| | As of December 31, | |
| | 2017 | | | 2018 | | | 2017/2018 | |
| | (Millions of pesos) | | | (% Change) | |
Average loans and advances to customers | | | | | | | | | | | |
Commercial, financial and industrial | | Ps. | 368,408 | | | Ps. | 413,776 | | | 12.31% | |
Mortgage | | | 127,332 | | | | 134,320 | | | 5.49% | |
Installment loans to individuals | | | 102,463 | | | | 107,776 | | | 5.19% | |
Revolving consumer credit card loans | | | 52,167 | | | | 54,690 | | | 4.84% | |
Non-revolving consumer loans | | | 50,296 | | | | 53,086 | | | 5.55% | |
Total | | Ps. | 598,203 | | | Ps. | 655,872 | | | 9.64% | |
In 2018, average total interest-earning assets amounted to Ps.1,120,323 million, representing a 6.90% or Ps.72,347 million increase from Ps.1,047,976 million in 2017. This growth was mainly due to: (i) an increase in the average volume of loans and advances to customers excluding credit cards of 10.10% or Ps.55,146 million, which went from Ps.546,036 million in 2017 to Ps.601,182 million in 2018; (ii) an increase in the
average volume of loans and advances to credit institutions of 11.23% or Ps.15,836 million, which went from Ps.141,015 million in 2017 to Ps.156,851 million in 2018; and (iii) an increase in the average volume of loans and advances to credit card customers of 4.84% or Ps.2,523 million, which went from Ps.52,167 million in 2017 to Ps.54,690 million in 2018. These increases were partially offset by a decrease in the average balance of debt instruments of 0.32% or Ps.901 million, which went from Ps.278,286 million in 2017 to Ps.277,385 million in 2018, and a decrease in the average volume of cash and balances with the Mexican Central Bank of 0.84% or Ps.257 million, which went from Ps.30,472 million in 2017 to Ps.30,215 million in 2018.
Interest income from interest-earning assets improved by Ps.15,584 million or 15.90%, from Ps.98,002 million in 2017 to Ps.113,586 million in 2018, due primarily to an expansion in the average interest rate, which increased 79 basis points from 9.35% in 2017 to 10.14% in 2018, driven by increasing market interest rates and a shift in asset mix towards higher-yielding products (SMEs, mid-market companies, credit card loans and consumer loans). The increase in interest income on loans and advances to customers excluding credit card loans was driven primarily by a Ps.55,146 million or 10.10% increase in average volume in 2018 compared to 2017 combined with an expansion of 50 basis points in the average interest rate, which resulted from higher interest rates and our focus on high-margin segments and which was comprised of: (i) a Ps.45,368 million or 12.31% increase in average volume of our commercial, financial and industrial loans and an increase in the average interest rate of 88 basis points, (ii) a Ps.24,329 million or 15.57% increase in average middle-market loans and an increase in the average interest rate of 83 basis points, (iii) a Ps.9,704 million or 8.93% increase in the average volume of our loans to Corporate and Investment Banking clients with an increase in the average interest rate of 97 basis points, (iv) an Ps.8,127 million or 28.62% increase in the average volume of our loans and advances to institutions coupled with an increase in the average interest rate of 59 basis points, (v) a Ps.6,988 million or 5.49% increase in the average volume of our mortgage loan portfolio, (vi) a Ps.5,476 million or 8.01% increase in the average volume of our SMEs loan portfolio coupled with an increase in the average interest rate of 82 basis points, and (vii) a Ps.2,790 million or 5.55% increase in the average volume of our non-revolving consumer loan portfolio and an increase in the average interest rate of 23 basis points. Our mortgage loan portfolio continues to be affected by the run-off of the ING and GE portfolios acquired in 2011 and 2013, respectively, but is gaining traction supported by the continued positive performance of our “Hipoteca Plus” product. Additionally, the increase in the interest income on our revolving consumer credit card loan portfolio was mainly driven by a Ps.2,523 million increase in the average volume of the credit card loan portfolio and an expansion in the average interest rate of 116 basis points. We registered strong loan growth in 2018, supported by a solid performance in our high-margin segments, particularly middle-market, SME and payroll loans as well as selective loans to corporates and government entities, prioritizing profitability.
We continue executing our transformation plan to support our goal of becoming our clients’ primary bank and Mexico’s market leader in sustainable and profitable growth. At the center of this strategy are the following priorities: commercial transformation of our distribution network, digitalization, attraction and loyalty of new customers, as well as the expansion of our product and service offerings. In the commercial segment, we continue to consolidate our leading positions in key markets, such as SMEs and middle-market companies. In Corporate and Investment Banking, our objective is to continue as one of the top three players in the market by improving the quality of our services as we execute our transformation plan. We also continue our efforts to attract new payroll accounts, leveraging our strong franchise in corporate and middle-market and the Santander Plus program. Finally, the increase in our revolving consumer credit card loan portfolio was mainly due to our strong focus on incentivizing the use of our full suite of credit cards and attracting new clients outside of our existing customer pool, targeting the mid and high-income segments while maintaining strict origination standards through increased commercial activity, effective promotions and reward programs.
Average interest rates on interest-earning assets increased by 79 basis points, from 9.35% in 2017 to 10.14% in 2018, which was mainly due to: (i) 180 basis points increase in the average interest rate on loans and advances to credit institutions, (ii) 116 basis points increase in the average interest rate on credit card loans from 25.40% in 2017 to 26.56% in 2018, supported by more frequent usage of our full suite of credit cards where we continue to see a change in the mix of our credit card loan portfolio composition as more
customers pay their outstanding balances in full and do not, as a result, contribute to our interest income; and (iii) a 50 basis points increase in the average interest rate on loans and advances to customers excluding credit card loans. Results for 2018, continued to show the benefits of a higher interest rate environment as well as the results of our increased focus in the most profitable segments (SMEs, middle-market companies, credit card and consumer loans).
Average volume of commercial, financial and industrial loans increased by Ps.45,368 million, from Ps.368,408 million in 2017 to Ps.413,776 million in 2018. This increase was mainly driven by: (i) a Ps.24,329 million increase in the average volume of loans to middle-market corporations, (ii) a Ps.9,704 million increase in the average volume of loans to Corporate and Investment Banking clients, (iii) a Ps.8,127 million increase in the average volume of loans and advances to credit institutions, and (iv) a Ps.5,476 million increase in the average volume of loans to SMEs.
The increase in the average volume of loans to middle-market corporations resulted from our continued strong focus on client attraction and transactionality.
The increase in the average volume of loans to Mexican governmental institutions was mainly due to loans to the Mexican government, and certain states and financial entities where we seek to maintain reciprocity in transactional business and payroll, given that governmental institutions are one of the main sources of payroll accounts for the Bank.
Finally, the increase in SME average loan volume resulted from increased commercial activity together with more streamlined approval processes and tailored product offerings distributed by our dedicated executives at our specialized branches. In late 2018, we launched an innovative partnership with Civico to bring banking and promotional services to small businesses in Mexico City through a geo-location model of economic activities. Also, in August 2018, we launched our Agro Contract Application to promote the placement of agricultural loans. We now have two digital credit schemes for SMEs that offer attractive terms, and that are available through two products. With this, we accelerated the approval process for SME customers to 60 minutes from 48 hours, and have plans to grant loans of up to Ps.2,800 million. In May 2018, we launched a campaign with one of the leading Mexican retailers with the aim of attracting and engaging their suppliers. Also, we opened the first digital account for SMEs with the “SAS” corporate structure created by the Ministry of Economy, becoming the first Mexican bank to do so. In addition, we continued developing effective commercial initiatives targeted to expand our SME client base towards larger SMEs as we take advantage of guarantees granted by NAFIN, a Mexican government bank. As of December end 2018, over 50% of our SME loan portfolio was backed by a NAFIN guarantee.
As mentioned above, the combination of a higher interest rate environment, along with a stronger focus in the most profitable segments (SMEs, mid-market companies, credit cards and consumer loans) resulted in an 88 basis points increase in the average interest rate from loans to commercial, financial and industrial clients, from 9.05% in 2017 to 9.93% in 2018 and is broken down as follows: (i) average interest rate from loans to the Corporate and Investment Banking segment increased by 97 basis points from 6.50% in 2017 to 7.47% in 2018, (ii) average interest rate from loans to middle-market corporations increased by 83 basis points, from 8.82% in 2017 to 9.65% in 2018, (iii) average interest rate from loans to SMEs increased by 82 basis points, from 14.27% in 2017 to 15.08% in 2018, and (iv) average interest rate from loans to institutions increased by 59 basis points, from 8.37% in 2017 to 8.96% in 2018.
Interest income from our trading portfolio increased by Ps.59 million, from Ps.459 million in 2017 to Ps.518 million in 2018, due to the combined effect of an increase of 458 basis points in the average interest rate, and a decrease of Ps.2,075 million in the average balance of our trading portfolio, from Ps.6,540 million in 2017 to Ps.4,465 million in 2018 due to soft deal flow in the market.
Interest income from debt instruments increased by Ps.799 million, from Ps.16,791 million in 2017 to Ps.17,590 million in 2018, or 4.76%, mainly explained by the combined effect of: (i) a 31 basis points
increase in the average interest rate, and (ii) a Ps.901 million or 0.32%, decrease in the average balance of the portfolio, from Ps.278,286 million in 2017 to Ps.277,385 million in 2018.
Average total interest-bearing liabilities in 2018 were Ps.991,805 million, a 6.37% or Ps.59,425 million increase from Ps.932,380 million in 2017. Interest expenses and similar charges increased by Ps.9,431 million, or 22.37%, from Ps.42,158 million in 2017 to Ps.51,589 million in 2018. The main drivers of this increase were: (i) an increase of Ps.4,943 million in interest expense on time deposits, due mainly to an increase in the average balance of Ps.47,862 million, together with an increase of 103 basis points in the average interest rate, from 4.80% in 2017 to 5.83% in 2018, due to the higher interest rate environment, which continued to fuel demand for low-risk term instruments, (ii) an increase of Ps.1,654 million in interest expense on other liabilities, due primarily to an increase of 111 basis points in the average interest rate, from 6.56% in 2017 to 7.67% in 2018, and an increase in the average balance of Ps.12,091 million, (iii) an increase of Ps.1,441 million in interest expense on demand deposits, due primarily to an increase in the average balance of Ps.17,248 million, from Ps.366,369 million in 2017 to Ps.383,617 million in 2018, together with an increase of 27 basis points in the average interest rate, (iv) an increase of Ps.969 million in interest expense on repurchase agreements, due primarily to an increase in the average interest rate of 100 basis points, (v) an increase of Ps.548 million in interest expense on marketable debt securities and other financial liabilities, due primarily to an increase in the average interest rate of 38 basis point from 6.30% in 2017 to 6.68% in 2018, and an increase in the average balance of Ps.4,840 million, and (vi) an increase of Ps.10 million in interest expense on subordinated debentures, due to an increase of Ps.835 million in the average balance of subordinated debentures. These increases were partially offset by a decrease of Ps.144 million in interest expense on deposits from Mexican Central Bank and credit institutions, due primarily to a decrease of Ps.24,820 million in the average balance, from Ps.123,073 million in 2017 to Ps.98,253 million in 2018, which was offset by a 141 basis points increase in the average interest rate paid. Increases in retail deposits continue to reflect the execution of our strategy to become our customers’ primary bank, expand our product and service offering for individuals and SMEs, increase exposure to individual deposits to lower our funding costs, and become a market leader in sustainable, profitable growth.
The positive effect of the increases in our average balance and interest income on interest-earning assets was partially offset by an increase in the average balance of our interest-bearing liabilities and an increase in the average interest rate on interest-bearing liabilities in 2018 compared to 2017. The combined effect of an increase of 79 basis points in the average yield on our interest earning-assets together with an increase of 68 basis points in the cost of our interest bearing liabilities resulted in an increase in the net interest spread of 11 basis points. Net interest income increased by Ps.6,153 million, due mainly to the increase in the average volume of interest-earning assets of Ps.72,347 million with an average interest rate of 10.14%, whereas interest bearing liabilities increased by Ps.59,425 million with an average cost of 5.20%. The average cost of interest bearing-liabilities increased from 4.52% to 5.20%, mainly reflecting a higher interest rate environment, which resulted in higher interest paid on customer deposits and repurchase agreements, and which offset the shift in the deposit base mix towards retail deposits. During 2018, we saw a slight decrease in demand accounts at the Bank as well as throughout the entire banking system in Mexico as a result of the availability of products with higher profitability, such as time deposits, which have been growing at double digit. The interest rate paid on time deposits, which accounted for 28.97% of interest expense and similar charges, increased from 4.80% in 2017 to 5.83% in 2018, while the interest rate paid on demand deposits, which accounted for 20.02% of interest expense and similar charges, increased from 2.43% in 2017 to 2.69% in 2018. Additionally, the interest rate on customer deposits and repurchase agreements, which accounted for 12.87% of interest expense and similar charges, increased from 6.58% in 2017 to 7.59% in 2018.
For additional information on interest income and interest expenses and similar charges, see Notes 32 and 34 to our audited financial statements included elsewhere in this Report.
Net Fee and Commission Income
Our net fee and commission income consists mainly of commissions charged to customers for credit and debit card purchases, sales of insurance products, investment fund management fees, fees from collection and payment services and fees from financial advisory services.
Net fee and commission income in 2018 amounted to Ps.15,722 million, which represented a 6.13% or Ps.909 million increase from Ps.14,813 million in 2017. The following table presents a breakdown, by product, of our fee and commission income and expense for 2017 and 2018.
| | | | | | | | | | | |
| | For the Year Ended December 31, | |
| | 2017 | | | 2018 | | | 2017/2018 | |
| | (Millions of pesos) | | | (% Change) | |
Fee and commission income | | | | | | | | | | | |
Service charges on deposits accounts | | Ps. | 1,046 | | | Ps. | 1,217 | | | 16.35% | |
Credit and debit cards | | | 6,268 | | | | 7,398 | | | 18.02% | |
Insurance | | | 4,341 | | | | 4,575 | | | 5.39% | |
Collection and payment services | | | 2,568 | | | | 2,832 | | | 10.28% | |
Investment funds management | | | 1,457 | | | | 1,569 | | | 7.69% | |
Foreign currency transactions | | | 1,111 | | | | 1,255 | | | 12.96% | |
Checks and others | | | 252 | | | | 240 | | | (4.76%) | |
Capital markets and securities activities | | | 513 | | | | 738 | | | 43.86% | |
Administration and custody | | | 524 | | | | 368 | | | (29.77%) | |
Financial advisory services | | | 1,341 | | | | 1,212 | | | (9.62%) | |
Other fees and commissions | | | 895 | | | | 892 | | | (0.34%) | |
Total | | Ps. | 20,316 | | | Ps. | 22,296 | | | 9.75% | |
Fee and commission expense | | | | | | | | | | | |
Credit and debit cards | | Ps. | (3,250) | | | Ps. | (3,680) | | | 13.25% | |
Fund management | | | (2) | | | | (1) | | | (50.00%) | |
Checks and others | | | (25) | | | | (26) | | | 4.00% | |
Capital markets and securities activities | | | (199) | | | | (189) | | | (5.03%) | |
Collections and transactional services | | | (226) | | | | (287) | | | 26.99% | |
Other fees and commissions | | | (1,795) | | | | (2,378) | | | 32.52% | |
Financial advisory services | | | (6) | | | | (13) | | | 116.67% | |
Total | | Ps. | (5,503) | | | Ps. | (6,574) | | | 19.49% | |
Net fee and commission income | | Ps. | 14,813 | | | Ps. | 15,722 | | | 6.13% | |
Fee and commission income amounted to Ps.22,296 million in 2018, representing a 9.75% or Ps.1,980 million increase from Ps.20,316 million in 2017, mainly due to an increase in fees and commissions from: (i) credit and debit cards of Ps.1,130 million or 18.02%, from Ps.6,268 million in 2017 to Ps.7,398 million in 2018, (ii) collection and payment services of Ps.264 million or 10.28%, from Ps.2,568 million in 2017 to Ps.2,832 million in 2018, (iii) the sale of insurance products of Ps.234 million or 5.39%, from Ps.4,341 million in 2017 to Ps.4,575 million in 2018, (iv) capital markets and securities activities of Ps.225 million or 43.86%, from Ps.513 million in 2017 to Ps.738 million in 2018, (v) service charges on deposit accounts of Ps.171 million or 16.35%, from Ps.1,046 million in 2017 to Ps.1,217 million in 2018, (vi) foreign currency transactions of Ps.144 million or 12.96%, from Ps.1,111 million in 2017 to Ps.1,255 million in 2018, and (vii) investment funds management of Ps.112 million or 7.69%, from Ps.1,457 million in 2017 to Ps.1,569 million in 2018. These increases were partly offset by a Ps.156 million or 29.77% decrease in fees and commissions from administration and custody services and a Ps.129 million or 9.62% decrease in fees and commissiones from financial advisory services.
Fee and commission expense amounted to Ps.6,574 million in 2018, representing a Ps.1,071 or 19.49% million increase from Ps.5,503 million in 2017, mainly due to an increase in other fees and commissions paid of Ps.583 million or 32.52%, compared with 2017 and an increase in fees and commissions paid on credit and debit cards of Ps.430 million or 13.25%. This increase was mainly due to higher costs related to selling credit cards outside of our existing customer pool, including telemarketing, as well as higher rewards and issuance costs from the successful performance of the Santander-Aeromexico co-branded credit card.
Net fee and commission income amounted to Ps.15,722 million, representing a 6.13% or Ps.909 million increase from Ps.14,813 million in 2017. The increase in net fees and commissions from credit and debit cards was mainly due to strong credit and debit card usage while origination and rewards granted remained stable, leading to an increase of Ps.10,359 million, or 16.90% in the average of outstanding credit and debit cards balances as of December 31, 2018. The increase in net fees and commissions from collection and payment services and foreign currency transactions, resulted from our continued focus on being an integral part of our client’s liquidity management efforts, which led to increased transactional activity. Finally, net fees and commissions from the sale of insurance products reflected our focus on simple-standardized banking product-related insurance products primarily directed to the retail business. We cross-sell these insurance products with other banking products, offering an all-round assessment service to our clients.
For additional information on fee and commission income and fee and commission expenses, see Notes 36 and 37 to our audited financial statements included elsewhere in this Report.
Gains /(Losses) on Financial Assets and Liabilities (Net)
Our gains/(losses) on financial assets and liabilities consist mainly of gains and losses on financial instruments and derivatives. The following table shows a breakdown of our net gains/(losses) on financial assets and liabilities for 2017 and 2018.
| | | | | | | | | | | |
| | For the Year Ended December 31, | |
| | 2017 | | | 2018 | | | 2017/2018 | |
| | (Millions of pesos) | | | (% Change) | |
Interest rate products | | Ps. | (72) | | | Ps. | (1,157) | | | 1,506.94% | |
Debt instruments | | | 846 | | | | (511) | | | (160.40%) | |
Interest rate derivatives | | | (918) | | | | (646) | | | (29.63%) | |
Equity products | | | 182 | | | | (72) | | | (139.34%) | |
Equity securities | | | 41 | | | | 35 | | | (14.63%) | |
Equity derivatives | | | 142 | | | | (107) | | | (175.35%) | |
Exchange rate products | | | 3,431 | | | | 2,790 | | | (18.68%) | |
Foreign exchange securities | | | 1,159 | | | | 1,140 | | | (1.64%) | |
Foreign exchange derivatives | | | 2,272 | | | | 1,650 | | | (27.38%) | |
Commissions paid to brokers | | | (84) | | | | (77) | | | (8.33%) | |
Total | | Ps. | 3,458 | | | Ps. | 1,484 | | | (57.09%) | |
Gains on financial assets and liabilities (net) in 2018 amounted to Ps.1,484 million, a decrease of Ps.1,974 million or 57.08%, from a gain of Ps.3,458 million in 2017, mainly due to the market making and sale activities of our Corporate and Investment Banking segment with clients, where gains decreased by Ps.1,107 million or 59.52% in 2018 compared to 2017 and proprietary trading activities, where gains decreased by Ps.713 million, or 117.66% in 2018 compared to 2017, mainly driven by highly volatile global financial markets and increased policy uncertainty in Mexico under the new administration. During 2018, the Mexican Central Bank made several increases to the interest rate benchmark funding to maintain inflation rates near objective levels. The interest rate benchmark was increased by 100 basis points by the end of 2018.
The result in gains on financial assets and liabilities (net) was mainly due to the following:
(i) A loss on interest rate products of Ps.1,085 million, from Ps.72 million in 2017 to Ps.1,157 million in 2018. This loss was mainly caused by a decrease of Ps.1,357 million in debt instruments, from a gain of Ps.846 million in 2017 to a loss of Ps.511 million in 2018, mainly due to increases to the interest rate benchmark. Losses from interest rate derivatives decreased by Ps.272 million, from a loss of Ps.918 million in 2017 to a loss of Ps.646 million in 2018, mainly resulting from losses on cross-currency swaps;
(ii) A decrease in gains on exchange rate products of Ps.641 million or 18.68%, from a gain of Ps.3,431 million in 2017 to a gain of Ps.2,790 million in 2018. Gains from foreign exchange derivatives decreased by Ps.622 million or 27.38%, from Ps.2,272 million in 2017 to Ps.1,650 million in 2018 mainly due to decreases of: (i) Ps.955 million in foreign exchange forwards, (ii) Ps.43 million in foreign exchange futures which offset an increase of Ps.327 million in foreign exchange options. Gains in foreign exchange positions decreased by Ps.20 million or 1.71%, from Ps.1,160 million in 2017 to Ps.1,140 million in 2018; and
(iii) A decrease in equity products of Ps.254 million, from a gain of Ps.182 million in 2017 to a loss of Ps.72 million in 2018, mainly explained by a loss of Ps.107 million on equity derivatives, against a gain of Ps.142 million in 2017, which was partly offset by a Ps.35 million gain in equity securities in 2018, which compared to a Ps.41 million gain in 2017. As a reference, the Mexican Stock Exchange Prices and Quotations Index (IPC Futures) quote was 49,354.43 at the end of December 2017 and 41,640.27 at the end of December 2018, representing a decrease of 15.63%. None of our transactions in equity derivatives in 2017 or 2018 are related to proprietary trading.
For additional information on gains/(losses) on financial assets and liabilities (net), see Note 38 to our audited financial statements included elsewhere in this Report.
Exchange Differences (Net)
Exchange differences (net) shows the gains or losses arising from the translation of monetary items in foreign currency to our functional currency, and result from changes in foreign exchange rates. Exchange differences (net) increased Ps.4 million in 2017 compared to a Ps.6 million decrease in 2018.
For additional information on exchange differences (net), see Note 39 to our audited financial statements included elsewhere in this Report.
Other Operating Income (Net)
Other operating income increased by Ps.79 million or 11.81%, from Ps.669 million in 2017 to Ps.748 million in 2018.
Other operating expenses increased by Ps.779 million or 21.56%, from Ps.3,614 million in 2017 to Ps.4,393 million in 2018, mainly due to the increase of Ps.240 million, or 8.29%, in IPAB contributions, from Ps.2,894 million in 2017 to Ps.3,134 million in 2018, and write-offs and bankruptcies, in particular as a result of higher fraud-related losses in connection with increased cyber attacks.
Other operating expense (net) increased by Ps.700 million or 23.77%, from Ps.2,945 million in 2017 to Ps.3,645 million in 2018 as a result of the foregoing.
For additional information on other operating income and other operating expenses, see Note 40 to our audited financial statements included elsewhere in this Report.
Administrative Expenses
Our administrative expenses consist of personnel and other general expenses. Our personnel expenses consist mainly of salaries, social security contributions, bonuses and our long-term incentive plan for our executives. Our other general expenses mainly consist of: expenses related to information technology and systems, administrative services, which are mainly services outsourced in the areas of information technology, taxes other than income tax, rental of properties and hardware, advertising and communication, surveillance and cash courier services and expenses related to maintenance, conservation and repair, among others.
Administrative expenses increased by Ps.3,212 million or 12.63%, from Ps.25,437 million in 2017 to Ps.28,649 million in 2018, due primarily to an increase in information technology and system expenses, as well as to increases in wages and salaries, other expenses, taxes other than income tax, surveillance and cash courier services, travel costs, credit card and stationery and supplies expenses, which were partly offset by decreases rents, maintenance, conservation and repair, administrative services expenses, advertising and communication and operating costs.
The following table sets forth administrative expenses for 2017 and 2018, by type.
| | | | | | | | | | | |
| | For the Year Ended December 31, | |
| | 2017 | | | 2018 | | | 2017/2018 | |
| | (Millions of pesos) | | | (% Change) | |
Personnel expenses | | Ps. | (12,748) | | | Ps. | (14,354) | | | 12.60% | |
Other general expenses | | | (12,689) | | | | (14,295) | | | 12.66% | |
Administrative services | | | (936) | | | | (503) | | | (46.26%) | |
Taxes other than income tax | | | (1,454) | | | | (1,820) | | | 25.17% | |
Surveillance and cash courier services | | | (894) | | | | (979) | | | 9.51% | |
Advertising and communication | | | (968) | | | | (890) | | | (8.06%) | |
Maintenance, conservation and repair | | | (1,227) | | | | (646) | | | (47.35%) | |
Rents | | | (1,963) | | | | (1,120) | | | (42.94%) | |
Information technology and systems | | | (2,790) | | | | (4,820) | | | 72.76% | |
Stationery and supplies | | | (215) | | | | (227) | | | 5.58% | |
Insurance premiums | | | (78) | | | | (75) | | | (3.85%) | |
Credit cards | | | (241) | | | | (267) | | | 10.79% | |
Travel costs | | | (293) | | | | (364) | | | 24.23% | |
Operating costs | | | (609) | | | | (535) | | | (12.15%) | |
Other | | | (1,021) | | | | (2,049) | | | 100.69% | |
Total administrative expenses | | Ps. | (25,437) | | | Ps. | (28,649) | | | 12.63% | |
Our personnel expenses increased by Ps.1,606 million or 12.60%, from Ps.12,748 million in 2017 to Ps.14,354 million in 2018, primarily because of a 6.13% period-over-period average headcount increase, together with an overall increase of 15.5% in salaries, 12.0% in bonuses and 7.5% in other personnel expenses, which include personnel benefits such as medical expenses, social security and pension plans. The increase in average headcount was mainly in our Retail Banking segment and is related to the hiring of additional employees to accompany business growth and support our investment plan.
The increase in personnel expenses resulted from an increase of Ps.1,390 million or 12.77%, in Retail Banking, from Ps.10,881 million in 2017 to Ps.12,271 million in 2018; an increase of Ps.210 million, or 12.37%, in wholesale banking, from Ps.1,698 million in 2017 to Ps.1,908 million in 2018; and an increase of Ps.7 million or 4.14%, in our corporate activities. The increase in Retail Banking was due to an increase of Ps.877 million or 16.29%, in salaries, from Ps.5,385 million in 2017 to Ps.6,262 million in 2018, an increase of Ps.336 million or 12.43% in bonuses, from Ps.2,704 million in 2017 to Ps.3,040 million in 2018, and an increase of Ps.177 million or 6.34% in other personnel expenses, from Ps.2,792 million in 2017 to Ps.2,969 million in 2018. Additionally, personnel expenses in wholesale banking, increased due to an increase of Ps.93 million or 11.16% in salaries, an increase of Ps.61 million or 10.97%, in bonuses paid and an increase of Ps.56 million or 18.12% in other personnel expenses.
Other general expenses increased by Ps.1,606 million or 12.66%, from Ps.12,689 million in 2017 to Ps.14,295 million in 2018, mainly due to an increase of Ps.2,030 million or 72.76% in information technology and system expenses. In addition, other expenses increased by Ps.1,028 million, taxes other than income tax increased by Ps.366 million or 25.17%, expenses for surveillance and cash courier services increased by Ps.85 million or 9.51%, expenses of travel costs increased by Ps.71 million or 24.23%, credit card expenses increased by Ps.26 million or 10.79% and expenses related to stationery supplies increased by Ps.12 million or 5.58%. These increases were partly offset by decreases of Ps.843 million or 42.94% in rents, Ps.581 million or 47.35% in maintenance, conservation and repair expenses, Ps.433 million or
46.26% in administrative services, Ps.78 million or 8.06% in advertising and communication expenses and Ps.74 million or 12.15% in operating costs.
For additional information on personnel expenses and other general administrative expenses, see Notes 41 and 42 to our audited financial statements included elsewhere in this Report.
Impairment Losses on Financial Assets (Net)
On January 1, 2018, we adopted IFRS 9 and applied IFRS 9 in a retrospective manner, by adjusting the opening balance of affected financial assets and financial liabilities at January 1, 2018, without restating prior period amounts. As of January 1, 2018, the allowance for impairment losses and provisions for off-balance sheet risk increased from Ps.17,961 million to Ps.21,217 million as result of the application of IFRS 9. See “Presentation of Financial and Other Information—Financial and Other Information—New Impairment Model” and Note 1.b, Note 1.c and Note 2.b to our audited financial statements included elsewhere in this Report for more information. Because we did not restate prior period amounts, impairment losses on financial assets (net) as of December 31, 2018 and as of December 31 2017 are not directly comparable.
Our impairment losses on financial assets (not classified at fair value through profit or loss) were Ps.18,812 million in 2018 and Ps.18,820 million in 2017. Because we did not restate prior period amounts upon the adoption of IFRS 9, these amounts are not directly comparable. Our impairment losses on financial assets (not classified at fair value through profit or loss) in 2018 mainly consist of impairment losses of: (i) Ps.6,780 million in our revolving consumer credit card loan portfolio, (ii) Ps.5,221 million in our non-revolving consumer loan portfolio, (iii) Ps.4,587 million in our commercial, financial and industrial loan portfolio, (iv) Ps.1,304 million in our mortgage portfolio and (v) Ps.916 million on expenses paid to recovery agencies. Our impairment losses in our installment loans to individuals’ in our non-revolving consumer loan and credit card portfolios in 2018 benefitted from the closure of certain external channels for credit card placement, such as Face to Face (“F2F”), Internet and Telemarketing, combined with better performance of our customers, despite the shift to higher margin segments. Impairment losses in our commercial, financial and industrial loan portfolio benefited from the clean-up of legacy positions relating to homebuilders and certain corporates in the last twelve months. Impairment losses in our mortgage portfolio were mainly related to provisions made for non-performing loans (run-off and floating-rate loans) which were sold in the first quarter of 2019.
For additional information on impairment losses on financial assets, see Note 11 to our audited financial statements included elsewhere in this Report.
Non-performing loans totaled Ps.18,429 million as of December 31, 2018, an increase of Ps.297 million or 1.64%, as compared to Ps.18,132 million as of December 31, 2017, due to the increase of non-performing loans in our mortgage loan portfolio and our commercial, financial and industrial loan portfolio of Ps.983 million and Ps.531 million, respectively, which were partly offset by decreases in non-performing loans in our revolving consumer credit card loan portfolio and our non-revolving consumer loan portfolio of Ps.619 million and Ps.598 million, respectively. The ratio of our non-performing loans as a percentage of total loans, or NPL ratio, decreased from 2.89% as of December 31, 2017 to 2.67% as of December 31, 2018.
The non-performing loan ratio in our mortgage loan portfolio for 2018 stood at 5.73% up from 5.49% in 2017, caused mainly by a 13.35% increase in non-performing-loans, which remained impacted by the deterioration of a portion of our variable interest rate mortgage loans that occurred during 2018 and due to legacy positions of acquired portfolios in the past, which offset an 8.61% increase in total mortgage loans.
The increase in non-performing loans in our commercial, financial and industrial loan portfolio was mainly due to a lower base effect during 2017 as a result of our clean-up of our homebuilder loan portfolio in 2017, which consisted of write-offs made in connection with our exposure to the three leading Mexican homebuilders and the sale of a portion of our homebuilder portfolio in 2017, each of which impacted the
non-performing loans in the commercial portfolio during that period. These variations in non-performing loans in combination with significant loan portfolio growth resulted in a NPL ratio for our commercial, financial and industrial loan portfolio of 1.76% as of December 31, 2018, that decreased slightly from the 1.79% reported as of December 31, 2017.
Finally, the decrease in non-performing loans in our consumer loan portfolio together with a significant growth of this loan portfolio resulted in a non-performing loan ratio of 3.17% as of December 31, 2018, which compares with the 4.42% reported as of December 31, 2017, mainly due to the aforementioned closing of some external channels for credit card loans placements and prudent risk management across all segments.
The following table shows the ratio of our credit-impaired loans to total computable credit risk and our coverage ratio as of December 31, 2017 and 2018.
| | | | | | | | |
| | As of December 31, | |
| | 2017 | | | 2018 | |
| | (Millions of pesos, except percentages) | |
Computable credit risk(1) | | Ps. | 705,160 | | | Ps. | 783,326 | |
Non-performing loans(4) | | | 18,132 | | | | 18,429 | |
Written-off loans | | | 21,733 | | | | 19,678 | |
Allowance for impairment losses(5) | | | 16,929 | | | | 21,516 | |
Ratios | | | | | | | | |
Non-performing loans to computable credit risk | | | 2.57% | | | | 2.35% | |
Non-performing loans coverage ratio(2) | | | 93.36% | | | | 116.75% | |
Written-off loans coverage ratio(3) | | | 3.08% | | | | 2.51% | |
| (1) | | Computable credit risk is the sum of the face amounts of loans (including non-performing loans) amounting to Ps.689,059 million and guarantees and documentary credits amounting to Ps.94,267 million. When guarantees or documentary credits are contracted, we recognized them as off-balance sheet accounts. We present the off-balance sheet information to better demonstrate our total managed credit risk. |
| (2) | | Allowance for impairment losses as a percentage of non-performing loans. |
| (3) | | Written-off loans as percentage of computable credit risk. |
| (4) | | See Note 2.g to our audited financial statements included elsewhere in this Report for more details on the classification of credit-impaired or non-performing loans. |
| (5) | | Amounts prepared in accordance with IFRS 9. Prior periods have not been restated. See Note 2.h to our audited financial statements included elsewhere in this Report for more details on our change in accounting estimates in connection with the initial adoption of IFRS 9. |
The following table shows our non-performing loans by type of loan as of December 31, 2017 and 2018:
| | | | | | | | | | | |
| | As of December 31, | | | | |
| | 2017 | | | 2018(1) | | | 2017/2018 | |
| | (Millions of pesos) | | (% Change) | |
Commercial, financial and industrial | | Ps. | 6,007 | | | Ps. | 6,538 | | | 8.84% | |
Mortgage | | | 7,362 | | | | 8,345 | | | 13.35% | |
Installment loans to individuals | | | 4,763 | | | | 3,546 | | | (25.55%) | |
Revolving consumer credit card loans | | | 2,335 | | | | 1,716 | | | (26.51%) | |
Non-revolving consumer loans | | | 2,428 | | | | 1,830 | | | (24.63%) | |
Total | | Ps. | 18,132 | | | Ps. | 18,429 | | | 1.64% | |
| (1) | | See Note 2.g to our audited financial statements included elsewhere in this Report for more details on the classification of credit-impaired or non-performing loans. |
Commercial, financial and industrial
Our impairment losses in our commercial, financial and industrial loans portfolio were Ps.4,587 million in 2018 and Ps.5,076 million in 2017. Because we did not restate prior period amounts upon the adoption of IFRS 9, these amounts are not directly comparable. The decrease in impairment losses in this portfolio in 2018 is mainly the result of higher impairment losses during 2017 related to two corporate clients in the energy and petrochemical industries, respectively, as well as higher impairment losses in connection with the homebuilders, as we wrote-off the loans related to these clients in 2017.
Non-performing loans in our commercial, financial and industrial loan portfolio, which as of December 31, 2018 represented 35.5% of our total non-performing loans, increased by Ps.531 million or 8.84%, from December 31, 2017 to December 31, 2018, primarily reflecting the result of a lower base in 2017, due to write-offs of loans given to Mexico’s three leading Mexican homebuilders. Our NPL ratio with respect to commercial, financial and industrial loans decreased slightly from 1.79% as of December 31, 2017 to 1.76% as of December 31, 2018.
Mortgage loans
Our impairment losses in our mortgage loan portfolio were Ps.1,304 million in 2018 and Ps.692 million in 2017. Because we did not restate prior period amounts upon the adoption of IFRS 9, these amounts are not directly comparable. The increase in impairment losses in our mortgage portfolio in 2018 was mainly due to provisions made for non-performing loans (run-off and floating-rate loans) which were sold in the first quarter of 2019.
Meanwhile, non-performing loans in our mortgage loan portfolio, which as of December 31, 2018 represented 45.3% of our total non-performing loans, increased by Ps.983 million or 13.35% from December 31, 2017 to December 31, 2018, resulting in a non-performing loan ratio of 5.73%, as compared to 5.49% in 2017.
Installment loans to individuals
Our impairment losses in our installment loans to individuals portfolio were Ps.12,001 million in 2018 and Ps.12,213 million in 2017. Because we did not restate prior period amounts upon the adoption of IFRS 9, these amounts are not directly comparable.
Impairment losses in our revolving consumer credit card portfolio and in our non-revolving consumer loan portfolio were Ps.6,780 million and Ps.5,221 million, respectively, in 2018 and Ps.6,969 million and Ps.5,244 million, respectively, in 2017. Because we did not restate prior period amounts upon the adoption of IFRS 9, these amounts are not directly comparable. The decrease in both portfolios was mainly driven by better performance of our customers in these segments.
Non-performing loans in our installment loans to individuals portfolio, which as of December 31, 2018 represented 19.2% of our total non-performing loans, decreased Ps.1,217 million or 25.55%, from December 31, 2017 to December 31, 2018. This lower volume was related to decreases of non-performing loans in our revolving credit card loan portfolio of Ps.619 million and non-performing loans in our non-revolving consumer loan portfolio of Ps.598 million.
Our NPL ratio with respect to our installment loans to individuals portfolio in the revolving credit card loan portfolio decreased from 4.29% as of December 31, 2017 to 3.05% as of December 31, 2018, as a result of an increase in NPLs in 2017 in the banking sector as a whole due to high inflation levels that have subsided in 2018 and, in the case of Banco Santander México, a slight deterioration of credit card loans in
2017 mainly due to the performance of certain external channels, such as F2F, Internet and Telemarketing, that we closed in the fourth quarter of 2017.
Our NPL ratio with respect to our installment loans to individuals portfolio in the non-revolving consumer loan portfolio decreased from 4.55% as of December 31, 2017 to 3.29% as of December 31, 2018, driven by the same factors affecting the revolving credit card loan portfolio.
Non-performing loan coverage ratio
The following table shows our non-performing loan coverage ratio by type of loan as of December 31, 2017 and 2018:
| | | | | | | |
| | | As of December 31, | |
| | | 2017 | | | 2018 | |
| | | (Percentages) | |
Commercial, financial and industrial | | | 93.02% | | | 114.06% | |
Mortgage | | | 27.03% | | | 42.88% | |
Installment loans to individuals | | | 196.33% | | | 295.57% | |
Revolving consumer credit card loans | | | 225.22% | | | 312.00% | |
Non-revolving consumer loans | | | 168.53% | | | 280.16% | |
Total | | | 93.37% | | | 116.75% | |
The non-performing loan coverage ratio increased from 93.37% to 116.75%, mainly reflecting improvements in the non-performing loans in installment loans to individuals and the clean-up of legacy positions relating to homebuilders, mortgage loans and some corporate loans in 2017.
The non-performing loan coverage ratio of our commercial loan portfolio increased from 93.02% in 2017 to 114.06% in 2018, mainly due to the combined effect of higher impairment losses during 2017 related to two corporate clients in the energy and petrochemical industries that we had to provision for according to our expected loss methodology and higher impairment losses in connection with homebuilders, as we wrote-off those loans related to projects with no continued value.
With respect to our installment loans to individuals portfolio, the non-performing loan coverage ratio for the non-revolving consumer loans increased from 168.53% in 2017 to 280.16% in 2018, reflecting a 24.63% decrease in impaired assets.
Meanwhile, the non-performing loan coverage ratio for the revolving consumer credit card loans increased from 225.22% to 312.00%, reflecting a 26.51% decrease in impaired assets.
Finally, regarding our mortgage loan portfolio, the non-performing loan coverage ratio stood at 42.88%, increase from 27.03% in 2017, reflecting an 13.35% increase in impaired assets. As discussed above, the increase in impairment losses was mainly related to provisions made for non-performing loans (run-off and floating-rate loans) which were sold in the first quarter of 2019, as well as greater provisioning as a result of the adoption of IFRS 9.
Provisions (Net)
Our provisions consist mainly of provisions for pensions and other retirement obligations, provisions for off-balance sheet risk and provisions for legal and tax matters. Off-balance sheet risks include undrawn lines of credit cards, guarantees and loan commitments of commercial and public sector loans and guarantees and loan commitments of commercial loans to SMEs.
Provisions in 2018 registered a net loss of Ps.562 million, which compares to a net loss of Ps.437 million in 2017 reflecting a Ps.125 million increase. This variation to provisions mainly resulted from increased provisions for tax and legal contingencies and higher provisions for pensions and similar obligations, as
well as greater provisioning as a result of the adoption of IFRS 9, which were partly offset by a decrease in requirements for provisions for off-balance sheet risk.
For additional information on provisions, see Note 23 to our audited financial statements included elsewhere in this Report.
Income Tax
Income tax in 2018 was Ps.5,458 million, a Ps.38 million or 0.69% decrease from Ps.5,496 million in 2017.
Our effective tax rates in 2017 and 2018 were 22.74% and 22.00%, respectively. The variation remained relatively flat despite the fact that inflation decreased 200 basis points in 2018 as compared to 2017, a negative effect that was offset by an overall reduction in credit forgiveness in 2018. Our effective tax rate, thus, decreased 74 basis points in 2018 compared to 2017.
For additional information on tax matters, see Notes 25 to our audited financial statements included elsewhere in this Report.
Results of Operations by Segment for the Year Ended December 31, 2018 Compared to the Year Ended December 31, 2017
The following table presents an overview of certain consolidated income statement data for each of our segments for 2017 and 2018.
| | | | | | | | | | | | | | | | | | | | | | | | |
| | Retail Banking(1) | | | Corporate and Investment Banking(2) | | | Corporate Activities(3) | |
| | For the Year Ended December 31, | |
| | 2017 | | | 2018 | | | 2017 | | | 2018 | | | 2017 | | | 2018 | |
| | (Millions of pesos) | |
Net interest income | | Ps. | 47,969 | | | Ps. | 54,005 | | | Ps. | 5,295 | | | Ps. | 6,121 | | | Ps. | 2,580 | | | Ps. | 1,871 | |
Dividend income | | | — | | | | — | | | | 5 | | | | 34 | | | | 145 | | | | 176 | |
Fee and commission income (expense) (net) | | | 13,047 | | | | 14,181 | | | | 1,758 | | | | 1,700 | | | | 8 | | | | (159) | |
Gains/(losses) on financial assets and liabilities and exchange differences (net) | | | 786 | | | | 1,086 | | | | 2,532 | | | | 689 | | | | 146 | | | | (291) | |
Other operating income (expenses) (net) | | | (2,136) | | | | (2,561) | | | | (505) | | | | (672) | | | | (304) | | | | (412) | |
Total income | | Ps. | 59,666 | | | Ps. | 66,711 | | | Ps. | 9,085 | | | Ps. | 7,872 | | | Ps. | 2,575 | | | Ps. | 1,185 | |
Administrative expenses | | | (22,377) | | | | (24,574) | | | | (2,759) | | | | (3,530) | | | | (301) | | | | (545) | |
Depreciation and amortization | | | (2,317) | | | | (2,769) | | | | (204) | | | | (200) | | | | (12) | | | | (4) | |
Impairment losses on financial assets not at fair value through profit or loss (net) | | | (17,763) | | | | (17,813) | | | | (1,057) | | | | (997) | | | | — | | | | — | |
Impairment losses on other assets (net) | | | — | | | | — | | | | — | | | | — | | | | — | | | | — | |
Provisions (net) | | | (98) | | | | 178 | | | | 20 | | | | 10 | | | | (359) | | | | (750) | |
Gain/(losses) on disposal of assets not classified as non-current assets held for sale | | | — | | | | — | | | | — | | | | — | | | | 6 | | | | 7 | |
Gain/(losses) on disposal of non-current assets held for sale not classified as discontinued operations | | | — | | | | — | | | | — | | | | — | | | | 69 | | | | 33 | |
Operating profit before tax | | Ps. | 17,111 | | | Ps. | 21,733 | | | Ps. | 5,085 | | | Ps. | 3,155 | | | Ps. | 1,978 | | | Ps. | (74) | |
| (1) | | The Retail Banking segment encompasses the entire commercial banking and asset management business. Our Retail Banking segment’s activities include products and services for individuals, private banking clients, SMEs, middle-market corporations and government institutions. |
| (2) | | The Corporate and Investment Banking segment reflects the returns on the corporate banking business, including managed treasury departments and the equities business. Our Corporate and Investment Banking segment provides comprehensive products and services relating to finance, guarantees, mergers and acquisitions, equity and fixed income, structured finance, international trade finance, cash management services, collection services and e-banking, including structured loans, syndicated loans, acquisition financing and financing of investment plans, among others. |
| (3) | | The Corporate Activities segment is comprised of all operational and administrative activities that are not assigned to a specific segment or product mentioned above. The Corporate Activities segment includes the financial management area, which manages structural financial risks arising from our commercial activities, mainly liquidity risk and interest rate risk, provides short- and long-term funding for our lending activities and calculates and controls transfer prices for loans and deposits in local and foreign currencies. |
The financial management area also oversees the use of our resources in compliance with internal and regulatory limits regarding liquidity and regulatory capital requirements. |
The following table presents an overview of certain consolidated balance sheet data for each of our segments as of December 31, 2017 and 2018.
| | | | | | | | | | | | | | | | | | | | | | | |
| | Retail Banking | | | Corporate and Investment Banking | | | Corporate Activities |
| | As of December 31, |
| | 2017 | | | 2018(1) | | | 2017 | | | 2018(1) | | | 2017 | | | 2018(1) |
| | (Millions of pesos) |
Cash and balances with the Mexican Central Bank | | Ps. | 43,693 | | | Ps. | 47,915 | | | Ps. | 11,533 | | | Ps. | 4,871 | | | Ps. | 2,461 | | | Ps. | 2,524 |
Financial assets at fair value through profit or loss | | | — | | | | — | | | | — | | | | 267,524 | | | | — | | | | — |
Financial assets held for trading | | | — | | | | — | | | | 315,570 | | | | — | | | | — | | | | — |
Other financial assets at fair value through profit or loss | | | — | | | | — | | | | 51,705 | | | | 107,425 | | | | — | | | | — |
Financial assets at fair value through other comprehensive income | | | — | | | | — | | | | — | | | | — | | | | — | | | | 155,789 |
Available-for-sale financial assets | | | — | | | | — | | | | — | | | | — | | | | 165,742 | | | | — |
Financial assets at amortized cost | | | — | | | | 535,681 | | | | — | | | | 165,222 | | | | — | | | | 65,322 |
Loans and receivables | | | 494,391 | | | | — | | | | 150,855 | | | | — | | | | 34,054 | | | | — |
Hedging derivatives | | | — | | | | — | | | | — | | | | — | | | | 15,116 | | | | 9,285 |
Non-current assets held for sale | | | 1,187 | | | | 1,229 | | | | 108 | | | | 48 | | | | — | | | | — |
Tangible assets | | | 5,466 | | | | 7,330 | | | | 922 | | | | 1,237 | | | | 110 | | | | 147 |
Intangible assets | | | 4,666 | | | | 5,662 | | | | 559 | | | | 646 | | | | 1,735 | | | | 1,736 |
Tax assets | | | — | | | | — | | | | — | | | | — | | | | 20,209 | | | | 21,968 |
Other assets | | | 1,847 | | | | 1,453 | | | | 43 | | | | 33 | | | | 7,219 | | | | 5,677 |
Total assets | | Ps. | 551,250 | | | Ps. | 599,270 | | | Ps. | 531,295 | | | Ps. | 547,006 | | | Ps. | 246,646 | | | Ps. | 262,448 |
Financial liabilities at fair value through profit or loss | | Ps. | — | | | Ps. | — | | | Ps. | — | | | Ps. | 255,481 | | | Ps. | — | | | Ps. | — |
Financial liabilities held for trading | | | — | | | | — | | | | 239,725 | | | | — | | | | — | | | | — |
Other financial liabilities at fair value through profit or loss | | | 10,288 | | | | 9,538 | | | | 110,365 | | | | 95,892 | | | | — | | | | — |
Financial liabilities at amortized cost | | | 508,049 | | | | 553,205 | | | | 170,379 | | | | 134,044 | | | | 142,003 | | | | 203,035 |
Hedging derivatives | | | — | | | | — | | | | — | | | | — | | | | 11,091 | | | | 8,393 |
Provisions | | | 64 | | | | 852 | | | | 262 | | | | 264 | | | | 6,404 | | | | 5,684 |
Tax liabilities | | | — | | | | — | | | | — | | | | — | | | | 71 | | | | 194 |
Other liabilities | | | 3,386 | | | | 4,234 | | | | 553 | | | | 691 | | | | 11,141 | | | | 13,930 |
Total liabilities | | Ps. | 521,787 | | | Ps. | 567,829 | | | Ps. | 521,284 | | | Ps. | 486,372 | | | Ps. | 170,710 | | | Ps. | 231,236 |
Total equity | | Ps. | 59,545 | | | Ps. | 67,301 | | | Ps. | 23,020 | | | Ps. | 22,860 | | | Ps. | 32,845 | | | Ps. | 33,126 |
Total liabilities and equity | | Ps. | 581,332 | | | Ps. | 635,130 | | | Ps. | 544,304 | | | Ps. | 509,232 | | | Ps. | 203,555 | | | Ps. | 264,362 |
(1) Amounts prepared in accordance with IFRS 9. Prior periods have not been restated and are not directly comparable. See Note 2.h to our audited financial statements included elsewhere in this Report for more details on our change in accounting estimates in connection with the initial adoption of IFRS 9.
Retail Banking Segment
Our Retail Banking segment’s activities include the provision of products and services for individuals, private banking clients, SMEs, middle-market corporations and government institutions. We provide commercial banking services to individual customers of all income levels, and offer a wide range of products and services to our individual customers, including demand and term deposits, credit and debit cards, mortgage loans, payroll and personal loans. Our Retail Banking segment also serves the middle market and local corporates that are not within the global corporate customers served by our Corporate and
Investment Banking segment. We offer SMEs a variety of services and products including commercial loans, transactional collections and payment services, insurance, hedging and foreign trade services.
Operating profit before taxes attributable to the Retail Banking segment in 2018 was Ps.21,733 million, a 27.01% or Ps.4,622 million increase from Ps.17,111 million in 2017. This increase was mainly due to:
| · | | a 12.58% or Ps.6,036 million increase in net interest income, mainly due to an increase of Ps.47,710 million or 11.08% in the average balance of the loan portfolio excluding credit card loans and an increase of Ps.2,523 million or 4.84%, in the average balance of the credit card loan portfolio, which was further supported by increases of 34 basis points and 116 basis points, respectively, in the average interest rate of these loan portfolios. These results reflect the continued benefits of a higher interest rate environment and our increased focus on the most profitable segments (SMEs, mid-market companies, credit cards and consumer loans); |
| · | | a 8.69% or Ps.1,134 million increase in net fees and commissions income, from Ps.13,047 million in 2017 to Ps.14,181 million in 2018, due mainly to an increase in fees and commissions from credit and debit card, collection and payment services, sale of insurance products, service charges on deposit accounts, fund management, capital markets and securities activities and fees related to foreign trade, partially offset by an increase in other commissions and fees payable; and |
| · | | a 38.17% or Ps.300 million increase in gains/(losses) on financial assets and liabilities and exchange differences, from a gain of Ps.786 million in 2017 to a gain of Ps.1,086 million in 2018 due to an increase of purchase-sale of foreign exchange instruments by our retail customers, supported by high exchange volatility in 2018 compared to 2017. |
These positive effects were partially offset by:
| · | | a 9.82% or Ps.2,197 million increase in administrative expenses, from Ps.22,377 million in 2017 to Ps.24,574 million in 2018, mainly due to increases in personnel expenses, as well as higher information technology and systems expenses, other administrative expenses and taxes other than income tax, partly offset by a decrease in rents and administrative expenses. Personnel expenses increased Ps.1,390 million or 12.77%, resulting from an increase of Ps.877 million or 16.29% in salaries, an increase of Ps.336 million or 12.43% in bonuses and an increase of Ps.177 million or 6.34% in other personal expenses, while technology and systems expenses, other administrative expenses and taxes other than income tax increased Ps.1,836 million or 73.97%, Ps.328 million or 19.91% and Ps.243 million or 18.69% respectively. The increase in personnel expenses is related to the hiring of additional employees to accompany business growth and support our investment plan; and |
| · | | a 19.90% or Ps.425 million increase in other expenses (net), mainly due to a growth in write-offs and bankruptcies and higher contributions to the IPAB, resulting from an increase in customer deposits. |
Corporate and Investment Banking Segment
Our Corporate and Investment Banking segment provides comprehensive products and services, including corporate banking, global transactional banking and investment banking services, relating to finance, guarantees, mergers and acquisitions, equity and fixed income, structured finance, international trade finance, cash management services, collection services and e-banking, including structured loans, syndicated loans, acquisition financing and financing of investment plans, among others, to our Corporate
and Investment Banking segment customers. This segment also includes our proprietary trading operations.
Operating profit before taxes attributable to the Corporate and Investment Banking segment in 2018 was Ps.3,155 million, representing a Ps.1,930 million or 37.95% decrease from Ps.5,085 million in 2017. This decrease was mainly due to:
| · | | a 72.79% or Ps.1,843 million decrease in gains/(losses) on financial assets and liabilities and exchange differences, from a gain of Ps.2,532 million in 2017 to a gain of Ps.689 million in 2018, primarily due to a reduction of Ps.1,107 million in market making and sale activities and Ps.713 million in proprietary trading; |
| · | | a 27.94% or Ps.771 million increase in administrative expenses, from Ps.2,759 million in 2017 to Ps.3,530 million in 2018, mainly due to increases in salaries, bonuses and other personnel expenses, as well as higher administrative expenses, information technology services and taxes other than income tax. Personnel expenses increased Ps.210 million or 12.37%, resulting from an increase of Ps.93 million or 11.16%, in salaries, an increase of Ps.61 million or 10.97% in bonuses and an increase of Ps.56 million or 18.12% in other personnel expenses, while administrative expenses, technology services and taxes other than income increased by Ps.278 million, Ps.160 million and Ps.88 million, respectively; and |
| · | | a 33.07% or Ps.167 million increase in other operating expense which mainly resulted from higher reserves related to the cancelation of liabilities and higher contributions to the IPAB. |
These negative results were partially offset by:
| · | | a 15.60% or Ps.826 million increase in net interest income, mainly due to a decrease of Ps.698 million in interest expenses, due to a decrease of 95 basis points in the cost of other non-interest liabilities, and an increase of Ps.128 million in interest income. |
Corporate Activities Segment
Our Corporate Activities segment is comprised of those operational and administrative activities that are not assigned to a specific segment or product mentioned above. The Corporate Activities segment includes the financial management area, which manages structural financial risks that arise from our commercial activities, mainly liquidity risk and interest rate risk, provides short- and long-term funding for our lending activities and calculates and controls transfer prices for loans and deposits in local and foreign currencies. The financial management area also oversees the use of our resources in compliance with internal and regulatory limits regarding liquidity and regulatory capital requirements.
Through the assignment of a transfer price to each loan or deposit, interest income is divided between our operating segments (Retail Banking and Corporate and Investment Banking) and the Corporate Activities segment as follows:
| · | | the difference between the interest rate charged to customers for the loans granted by our operating segments and the transfer price assigned to these loans is assigned as interest income to the respective operating segment; |
| · | | the difference between the interest rate paid to customers for the deposits received by our operating segments and the transfer price assigned to these deposits is assigned as interest income to the respective operating segment; and |
| · | | finally, the difference between the transfer price charged to the loans and the transfer price paid for the deposits is assigned to Corporate Activities as net interest income. |
The financial management area determines transfer prices based on interest rates currently prevailing in the market for different durations, which are estimated from the yield of the most representative and liquid short and medium term corporate, government and Mexican Central Bank debt securities, and from the Mexican Central Bank’s reference interest rates for long term securities.
The ALCO manages the risks associated with financial margin and net worth of the banking book, as well as liquidity risk for the entire balance sheet. We hedge the interest rate risk of the balance sheet using strategies that can address specific operations or modify the risk profile as a whole. In recent years, the ALCO portfolio was comprised of fixed interest rate positions, mainly Mexican sovereign bonds, in addition to fixed rate swaps, to protect the interest rate margin against a lower interest rate environment. As the scenario changed to short-term interest rates increases, we have reduced the volume of activity in the ALCO portfolio, leaving existing positions to mature at their stated maturity.
Operating profit before taxes attributed to Corporate Activities in 2018 was a loss of Ps.74 million, a Ps.2,052 million decrease from a gain of Ps.1,978 million in 2017. This decrease in operating profit before taxes was mainly due to a Ps.709 million decrease in net interest income, from a gain of Ps.2,580 million in 2017 to a gain of Ps.1,871 million in 2018, a Ps.437 million decrease in gain/(losses) on financial assets and liabilities and exchange differences, a Ps.391 million increase in provisions (net), a Ps.244 million increase in administrative expenses, an Ps.167 million decrease in net fees and commissions expense and a Ps.108 million increase in other operating expenses, partly offset by a Ps.31 million increase in income from equity instruments.
Results of Operations for the Year Ended December 31, 2017 Compared to the Year Ended December 31, 2016
The following table presents our consolidated results of operations for the year ended December 31, 2017 as compared to the year ended December 31, 2016.
| | | | | | | | | | | | | | | |
| | For the year ended December 31, | |
| | 2016 | | | 2017 | | | 2017 | | | 2017/2016 | |
| | | | | | | | | | (Millions of U.S. | | | | |
| | (Millions of pesos) | | | dollars)(1) | | | (% Change) | |
Interest income | | Ps. | 77,453 | | | Ps. | 98,002 | | | U.S.$ | 4,984 | | | 26.53% | |
Interest expenses and similar charges | | | (28,323) | | | | (42,158) | | | | (2,144) | | | 48.85% | |
Net Interest Income | | Ps. | 49,130 | | | | 55,844 | | | | 2,840 | | | 13.67% | |
Dividend income | | | 94 | | | | 150 | | | | 8 | | | 59.57% | |
Fee and commission income (net) | | | 13,940 | | | | 14,813 | | | | 753 | | | 6.26% | |
Gains/(losses) on financial assets and liabilities (net) | | | 3,760 | | | | 3,458 | | | | 176 | | | (8.03)% | |
Exchange differences (net) | | | 2 | | | | 6 | | | | — | | | 200.00% | |
Other operating income | | | 486 | | | | 669 | | | | 34 | | | 37.65% | |
Other operating expenses | | | (3,361) | | | | (3,614) | | | | (184) | | | 7.53% | |
Total Income | | Ps. | 64,051 | | | | 71,326 | | | | 3,627 | | | 11.36% | |
Administrative expenses | | | (22,655) | | | | (25,437) | | | | (1,293) | | | 12.28% | |
Personnel expenses | | | (11,472) | | | | (12,748) | | | | (648) | | | 11.12% | |
Other general administrative expenses | | | (11,183) | | | | (12,689) | | | | (645) | | | 13.47% | |
Depreciation and amortization | | | (2,058) | | | | (2,533) | | | | (129) | | | 23.08% | |
Impairment losses on financial assets (net) | | | (16,661) | | | | (18,820) | | | | (957) | | | 12.96% | |
Loans and receivables | | | (16,661) | | | | (18,820) | | | | (957) | | | 12.96% | |
Impairment losses on other assets (net): | | | — | | | | — | | | | — | | | 0.00% | |
Other intangible assets | | | — | | | | — | | | | — | | | 0.00% | |
Non-current assets held for sale | | | — | | | | — | | | | — | | | 0.00% | |
Provisions (net)(2) | | | (881) | | | | (437) | | | | (22) | | | (50.40)% | |
Gains/(losses) on disposal of assets not classified as non-current assets held for sale | | | 20 | | | | 6 | | | | — | | | (70.00)% | |
Gains/(losses) on disposal of non-current assets held for sale not classified as discontinued operations | | | 71 | | | | 69 | | | | 4 | | | (2.82)% | |
Operating Profit Before Tax | | Ps. | 21,887 | | | | 24,174 | | | | 1,230 | | | 10.45% | |
Income tax | | | (5,351) | | | | (5,496) | | | | (280) | | | 2.71% | |
Profit from Continuing Operations | | | 16,536 | | | | 18,678 | | | | 950 | | | 12.95% | |
Profit from Discontinued Operations (net) | | | — | | | | — | | | | — | | | 0.00% | |
Profit for the Year | | Ps. | 16,536 | | | Ps. | 18,678 | | | U.S.$ | 950 | | | 12.95% | |
Profit attributable to the Parent | | | 16,536 | | | | 18,678 | | | | 950 | | | 12.95% | |
Profit attributable to non-controlling interests | | | — | | | | — | | | | — | | | — | |
| (1) | | Results for the year ended December 31, 2017 have been translated into U.S. dollars, for convenience purposes only, using the exchange rate of Ps.19.6629 per U.S.$1.00 as calculated on December 29, 2017 and reported by the Mexican Central Bank in the Federal Official Gazette on January 2, 2018 as the exchange rate for the payment of obligations denominated in currencies other than pesos and payable within Mexico. These translations should not be construed as representations that the peso amounts represent, have been or could have been converted into, U.S. dollars at such or at any other exchange rate. |
| (2) | | Mainly provisions for off-balance sheet risk and tax and legal matters. |
Summary
Profit in 2017 was Ps.18,678 million, a 12.95% or Ps.2,142 million increase from Ps.16,536 million in 2016. These results reflect mainly:
| · | | a Ps.6,714 million, or 13.67%, increase in net interest income due primarily to higher average interest rate of 9.35% in 2017 as compared to 7.82% in 2016, combined with an increase of 5.87% in average total interest earnings assets income from the loan portfolio and from debt instruments; |
| · | | a Ps.873 million, or 6.26%, increase in income from fees and commissions (net) mainly resulting from: (i) growth in credit and debit cards, (ii) collection and payment services, (iii) service charges on deposits accounts and (iv) financial advisory services. |
These positive results were partially offset by:
| · | | a Ps.2,782 million, or 12.28%, increase in administrative expenses, due primarily to increases in wages and salaries, as well as increases in technology and systems, surveillance and cash courier services, rents, taxes other than income tax and advertising and communication; |
| · | | a Ps.2,159 million, or 12.96%, increase in impairment losses on loans and receivables (net), principally because of business volume growth, particularly in the most profitable segments (SMEs, mid-market companies, credit cards and consumer loans), as well as the clean-up of our total exposure to homebuilders; |
| · | | a Ps.475 million, or 23.08%, increase in depreciation and amortization due to an increase in investments in technology; and |
| · | | a Ps.145 million, or 2.71%, increase in tax expense. The effective tax rate for the year was 22.74% lower than the 24.45% in 2016; as a reflection of a higher inflation in relation to the previous period, which represented a greater tax deduction for inflation. |
Net Interest Income
Our interest income consists mainly of interest from lending activities to customers and credit institutions, which generated Ps.77,067 million, or 78.64%, of our total interest and similar income in 2017, with the remaining interest income of Ps.20,935 million consisting of interest from investments in debt instruments, cash and balances with the Mexican Central Bank, income from hedging operations and other interest income. Interest income increased by Ps.20,549 million, or 26.53%, in 2017 compared to 2016.
Our interest expenses and similar charges consist mainly of interest paid on customer deposits. In 2017, interest expense on customer deposits was Ps.24,560 million, representing 58.26% of our total interest expenses and similar charges for that period. Interest expenses from time deposits, demand accounts and repurchase agreements relating to Mexican government securities with non-financial institution customers amounted to Ps.10,000 million, Ps.8,889 million and Ps.5,671 million, respectively, in 2017, representing 23.72%, 21.08% and 13.45% of our total interest expenses and similar charges for the period, respectively. In addition, interest expense on deposits from the Mexican Central Bank and credit institutions (which includes repurchase agreements with financial institutions) was Ps.7,564 million, representing 17.94% of our total interest expense in 2017, while interest expense on subordinated debentures was Ps.1,600 million, representing 3.80% of our total interest expense in 2017. Finally, interest expense on other liabilities, marketable debt securities and other financial liabilities, expenses on hedging operations and other interest expenses were Ps.4,277 million, Ps.3,696 million, Ps.332 million and Ps.129 million, respectively and represented 10.15%, 8.77%, 0.79% and 0.31%, of our total interest expense in 2017, respectively. Interest expenses and similar charges increased by Ps.13,835 million, or 48.85%, in 2017 compared to 2016.
Our net interest income in 2017 was Ps.55,844 million, a Ps.6,714 million or 13.67% increase from Ps.49,130 million in 2016. This growth was mainly due to a higher average interest rate of 9.35% in 2017 as compared to 7.82% in 2016, combined with an increase of 5.87% in average total interest-earning assets, partly affected by an expansion in our interest expenses, mainly due to higher interest we paid on
customer deposits and deposits from the Mexican Central Bank and credit institutions which include repurchase agreements of governmental bonds with financial institutions.
The following table sets forth the components of our interest income and interest expenses and similar charges, for 2016 and 2017.
| | | | | | | | | | | |
| | For the year ended December 31, | | | | |
| | 2016 | | | 2017 | | | 2016/2017 | |
| | (Millions of pesos) | | | (% Change) | |
Interest income | | | | | | | | | | | |
Cash and balances with the Mexican Central Bank | | Ps. | 1,418 | | | Ps. | 2,081 | | | 46.76% | |
Loans and advances to credit institutions | | | 2,832 | | | | 4,804 | | | 69.63% | |
Loans and advances to customers—excluding credit cards | | | 47,540 | | | | 59,014 | | | 24.14% | |
Loans and advances to customers—credit cards | | | 11,724 | | | | 13,249 | | | 13.01% | |
Debt instruments | | | 13,149 | | | | 16,791 | | | 27.70% | |
Income from hedging operations | | | 703 | | | | 1,895 | | | 169.56% | |
Other interest income | | | 87 | | | | 168 | | | 93.10% | |
Total | | Ps. | 77,453 | | | Ps. | 98,002 | | | 26.53% | |
| | | | | | | | | | | |
Interest expense and similar charges | | | | | | | | | | | |
Deposits from the Mexican Central Bank and credit institutions | | Ps. | (6,146) | | | Ps. | (7,564) | | | 23.07% | |
Customer deposits—Demand accounts | | | (5,058) | | | | (8,889) | | | 75.74% | |
Customer deposits—Time deposits | | | (5,731) | | | | (10,000) | | | 74.49% | |
Customer deposits—Repurchase agreements | | | (3,820) | | | | (5,671) | | | 48.46% | |
Subordinated debentures | | | (1,473) | | | | (1,600) | | | 8.62% | |
Marketable debt securities and other financial liabilities | | | (2,625) | | | | (3,696) | | | 40.80% | |
Other liabilities | | | (2,997) | | | | (4,277) | | | 42.71% | |
Expenses from hedging operations | | | (167) | | | | (129) | | | (22.75%) | |
Other interest expenses | | | (306) | | | | (332) | | | 8.50% | |
Total | | Ps. | (28,323) | | | Ps. | (42,158) | | | 48.85% | |
Net interest income | | Ps. | 49,130 | | | Ps. | 55,844 | | | 13.67% | |
The following table sets forth the components of our average loans and advances to customers for 2016 and 2017.
| | | | | | | | | | | |
| | As of December 31, | |
| | 2016 | | | 2017 | | | 2016/2017 | |
| | (Millions of pesos) | | | (% Change) | |
Average loans and advances to customers | | | | | | | | | | | |
Commercial, financial and industrial | | Ps. | 357,374 | | | Ps. | 368,408 | | | 3.09% | |
Mortgage | | | 124,014 | | | | 127,332 | | | 2.68% | |
Installment loans to individuals | | | 95,290 | | | | 102,463 | | | 7.53% | |
Revolving consumer credit card loans | | | 49,096 | | | | 52,167 | | | 6.26% | |
Non-revolving consumer loans | | | 46,194 | | | | 50,296 | | | 8.88% | |
Total | | Ps. | 576,678 | | | Ps. | 598,203 | | | 3.73% | |
Average total interest-earning assets were Ps.1,047,976 million in 2017, a 5.87% or Ps.58,119 million increase from Ps.989,857 million in 2016. This growth was mainly due to: (i) an increase in the average balance of loans and advances to credit institutions of 57.70% or Ps.51,595 million, from 89,420 in 2016 to Ps.141,015 million in 2017; (ii) an increase in the average balance of loans and advances to customers excluding credit cards of 3.50% or Ps.18,454 million, from Ps.527,582 million in 2016 to Ps.546,036 million in 2017; and (iii) an increase in the average volume of loans and advances to credit card customers of 6.26% or Ps.3,071 million, from Ps.49,096 million in 2016 to Ps.52,167 million in 2017. These increases were partially offset by a decrease in the average balance of debt instruments of 4.02% or Ps.11,656 million from Ps.289,942 million in 2016 to Ps.278,286 million in 2017, and a decrease in the average volume of
cash and balances with the Mexican Central Bank of 9.89% or Ps.3,345 million, from Ps.33,817 million in 2016 to Ps.30,472 million in 2017.
Interest income from interest-earning assets increased by Ps.20,549 million or 26.53%, from Ps.77,453 million in 2016 to Ps.98,002 million in 2017, due primarily to an expansion in the average interest rate, which increased 153 basis points from 7.82% in 2016 to 9.35% in 2017. The increase in interest income on loans and advances to customers excluding credit cards was driven primarily by a Ps.18,454 million or 3.50% increase in average volume in 2017 compared to 2016 combined with an expansion of 180 basis points in the average interest rate, which was comprised of: (i) a Ps.20,204 million or 14.85% increase in average middle-market loans and an increase in the average interest rate of 197 basis points, (ii) a Ps.11,034 million or 3.09% increase in the average volume of our commercial, financial and industrial portfolio with an expansion in the average interest rate of 234 basis points, (iii) an increase of Ps.5,474 million or 8.71% in the average volume of our SMEs loan portfolio coupled with a hike in the average interest rate of 209 basis points, (iv) an increase of Ps.4,102 million or 8.88% in the average volume of our non-revolving consumer loan portfolio, and (v) an increase of Ps.3,318 million or 2.68% in the average volume of our mortgage loan portfolio. This slow loan growth is partially attributed to the run-off of the ING and GE portfolios acquired in 2011 and 2013, respectively. Additionally, the increase in the interest income on our revolving consumer credit card portfolio was mainly driven by a Ps.3,071 million increase in the average volume of the credit card loan portfolio and an expansion in the average interest rate of 152 basis points.
In the commercial segment, we believe our targeted efforts have helped us organically increase our market share in key business lines such as retail services to middle-market corporations and SMEs. As to our non-revolving consumer loan portfolio, growth was mainly driven by payroll loans as a result of our focus on risk-weighted assets, advertising campaigns and the launching of new channels such as Supermóvil, where clients can obtain a payroll loan from a mobile device. In 2017, we continued our efforts to attract new payroll accounts, leveraging our strong franchise in corporate and middle-market and the Santander Plus program. Finally, the increase in our revolving consumer credit card loan portfolio was mainly due to our strong focus on incentivizing our full suite of credit cards and attracting new clients outside of our existing customer pool, targeting the mid and high-income segments while maintaining origination standards through increased commercial activity, effective promotions, reward programs and the value proposition offered through the co-branded Santander-Aeroméxico credit card, a product that has enjoyed great success, and as of December 2017 registered over 822,000 cardholders, of which around 39% were new customers. These efforts resulted in higher credit card usage of our full suite of credit cards though it is not fully reflected in loan growth as a high number of customers continued to pay their balances in full and not contribute to our interest income.
In addition to the combination of increases to the reference rate enacted by Mexican Central Bank during 2017 and a stronger focus on returns on risk-weighted assets and risk-based pricing, the 153 basis points increase in the average interest rate on interest-earning assets was further supported by (i) a 24 basis points increase in the average interest rate on loans and advances to credit institutions, (ii) a 152 basis points increase in the average interest rate on credit card loans from 23.88% in 2016 to 25.40%, where we continue to see a change in mix in the composition of our credit card loan portfolio, as we are seeing more customers who pay their outstanding balances in full therefore not contributing to interest income; and (iii) a 149 basis points increase in the average interest rate on debt instruments, from 4.54% in 2016 to 6.03% in 2017.
Average volume of commercial, financial and industrial loans increased by Ps.11,034 million, from Ps.357,374 million in 2016 to Ps.368,408 million in 2017. This increase was mainly comprised of an increase of (i) Ps.20,204 million in the average volume of loans to middle-market corporations, and (ii) a Ps.5,474 million increase in the average volume of loans to SMEs. These increases in average volumes were partly affected by (i) a Ps.13,245 million decrease in the average volume of the Corporate and Investment Banking, and (ii) a Ps.2,344 million decrease in the average trading portfolio. The increase in SME average loan volume resulted from increased commercial activity together with more streamlined approval processes, tailored product offerings distributed through specialized branches attended by
specialized executives, and increased volume of substitution loans to SMEs. Through these type of loans, we continued to offer our existing SME clients with a good credit history the opportunity to substitute an existing loan that is close to maturity for a new loan (which may be for an increased amount) to retain these SME clients with good credit histories. We also offered fixed rates loans to these clients to support their cash flow. During 2017, our substitution of loans to SMEs accounted for approximately 12.0% of SME loans. In addition, we continued developing effective commercial initiatives targeted to expand our SME client base towards larger SMEs. The increase in the average volume of loans to middle-market corporations resulted from our continued strong focus on client attraction and transactionality. Besides, we continued promoting the agricultural and international businesses. Regarding the agricultural business, we have maintained strategic alliances with major brands in the segment that have allowed us to increase loan origination and attract new customers, while developing tailored products for each sector, considering their production cycles. In the international business, we have maintained a solid performance and a continued positive trend by advising companies in their foreign trade transactions and foreign direct investments. Additionally, the decrease in average Corporate and Investment Banking segment loans is mainly a result of our focus on profitability. Finally, the increase in the average volume of loans to Mexican governmental institutions was mainly due to loans to the Mexican government, and certain states and financial entities where we seek to maintain reciprocity in transactional business and payroll, given that governmental institutions are one of the main sources of payroll accounts for the Bank and maintaining our focus on profitability.
As mentioned before, the combination of increases to the reference rate enacted by Mexican Central Bank during 2017, stronger focus on returns on risk-weighted assets and risk-based pricing resulted in a 234 basis points increase in the average interest rate from loans to commercial, financial and industrial clients, from 6.71% in 2016 to 9.05% in 2017 and is broken down as follows: (i) average interest rate from loans to middle-market corporations increased by 197 basis points, from 6.85% in 2016 to 8.82% in 2017, (ii) average interest rate from loans to SMEs increased by 209 basis points, from 12.18% in 2016 to 14.27% in 2017, (iii) average interest rate from loans to the Corporate and Investment Banking segment increased by 230 basis points from 4.20% in 2016 to 6.50% in 2017, and (iv) average interest rate from loans to institutions increased by 261 basis points, from 5.76% in 2016 to 8.37% in 2017.
Interest income from our trading portfolio increased by Ps.108 million, from Ps.351 million in 2016 to Ps.459 million in 2017, due to the combined effect of a decrease of Ps.2,344 million in the average balance of our trading portfolio, from Ps.8,883 million in 2016 to Ps.6,540 million in 2017, and an increase of 307 basis points in the average interest rate. The decrease in the average balance of this portfolio was due to a lower customer demand of repurchase agreements.
Interest income from debt instruments increased by Ps.3,642 million, from Ps.13,149 million in 2016 to Ps.16,791 million in 2017, or 27.70%, reflecting an increase of 150 basis point in the average interest rate, which more than offset the decrease of Ps.11,656 million or 4.02% in the average balance of the portfolio, from Ps.289,942 million in 2016 to Ps.278,286 million in 2017.
Average total interest-bearing liabilities in 2017 were Ps.932,380 million, a 4.39% or Ps.39,252 million increase from Ps.893,128 million in 2016. Interest expenses and similar charges increased by Ps.13,835 million, or 48.85%, from Ps.28,323 million in 2016 to Ps.42,158 million in 2017. The principal drivers of this increase were (i) an increase of Ps.1,851 million in interest expense on repurchase agreements, due primarily to an increase in the average interest rate of 236 basis points, (ii) an increase of Ps.3,831 million in interest expense on demand deposits, due primarily to an increase in the average balance of Ps.43,970 million, from Ps.322,399 million in 2016 to Ps.366,369 million in 2017, mainly as a result of our initiatives focused on offering innovative products and a client centric approach for Individuals and SMEs, (iii) an increase of Ps.4,269 million in interest expense on time deposits, due mainly to an increase in the average balance of Ps.37,214 million, (iv) an increase of Ps.1,071 million in interest expense on marketable debt securities and other financial liabilities, due primarily to an increase in the average interest rate of 175 basis point from 4.55% in 2016 to 6.30% in 2017, (v) an increase of Ps.1,280 million in interest expense on other liabilities, due primarily to an increase of 189 basis points in the average interest rate paid, from 4.67% in 2016 to 6.56% in 2017, (vi) an increase of Ps.127 million in interest expense on subordinated debentures,
from Ps.1,473 million in 2016 to Ps.1,600 million in 2017, due to an increase of Ps.326 million in the average balance of subordinated debentures, and (vii) an increase of Ps.1,418 million in interest expense on deposits from Mexican Central Bank and credit institutions, due primarily to a decrease of Ps.39,809 million in the average balance, from Ps.162,882 million in 2016 to Ps.123,073 million in 2017 which was offset by a 238 basis points increase in the average interest rate paid.
The positive effect of the increases in our average balance and interest income earned on interest-earning assets was partially offset by an increase in the average balance of our interest-bearing liabilities and an increase in the average interest rate on interest-bearing liabilities in 2017 compared to 2016. The combined effect of an increase of 153 basis points in the average yield on our interest-earning assets together with an increase of 135 basis points in the cost of our interest-bearing liabilities resulted in an increase in the net interest spread of 18 basis points. Net interest income increased by Ps.6,714 million, due mainly to the increase in the average volume of interest-earning assets of Ps.58,119 million with an average interest rate of 9.35%, whereas interest-bearing liabilities increased by Ps.39,252 million with an average cost of 4.52%. The average cost of interest-bearing liabilities increased from 3.17% to 4.52%, mainly because of the increases in reference rates enacted by the Mexican Central Bank during 2017 which resulted in higher interest paid on customer deposits and repurchase agreements, which offset the shift in the deposit base mix towards demand deposits. The interest rate on time deposits, which accounted for 23.72% of interest expense and similar charges, increased from 3.35% in 2016 to 4.80% in 2017, while the interest rate on demand deposits, which accounted for 21.08% of interest expense and similar charges, increased from 1.57% in 2016 to 2.43% in 2017. Additionally, the interest rate paid on customer deposits repurchase agreements, which accounted for 13.45% of interest expense and similar charges, increased from 4.22% in 2016 to 6.58% in 2017.
For additional information on interest income and interest expenses and similar charges, see Notes 32 and 34 to our audited financial statements included elsewhere in this Report.
Net Fee and Commission Income
Our net fee and commission income consists mainly of commissions charged to customers for credit and debit cards purchases, sales of insurance products, investment fund management fees, fees from collection and payment services and fees from financial advisory services.
Net fee and commission income in 2017 was Ps.14,813 million, a 6.26% or Ps.873 million increase from Ps.13,940 million in 2016. The following table presents a breakdown, by product, of our fee and commission income and expense for 2016 and 2017.
| | | | | | | | | | | |
| | For the Year Ended December 31, | |
| | 2016 | | | 2017 | | | 2016/2017 | |
| | (Millions of pesos) | | | (% Change) | |
Fee and commission income | | | | | | | | | | | |
Service charges on deposits accounts | | Ps. | 951 | | | Ps. | 1,046 | | | 9.99% | |
Credit and debit cards | | | 5,369 | | | | 6,268 | | | 16.74% | |
Insurance | | | 4,272 | | | | 4,341 | | | 1.62% | |
Collection and payment services | | | 2,334 | | | | 2,568 | | | 10.03% | |
Investment funds management | | | 1,486 | | | | 1,457 | | | (1.95%) | |
Foreign currency transactions | | | 1,080 | | | | 1,111 | | | 2.87% | |
Checks and others | | | 253 | | | | 252 | | | (0.40%) | |
Capital markets and securities activities | | | 439 | | | | 513 | | | 16.86% | |
Administration and custody | | | 528 | | | | 524 | | | (0.76%) | |
Financial advisory services | | | 1,222 | | | | 1,341 | | | 9.74% | |
Other fees and commissions | | | 836 | | | | 895 | | | 7.06% | |
Total | | Ps. | 18,770 | | | Ps. | 20,316 | | | 8.24% | |
Fee and commission expense | | | | | | | | | | | |
Credit and debit cards | | Ps. | (2,894) | | | Ps. | (3,250) | | | 12.30% | |
Fund management | | | (4) | | | | (2) | | | (50.00%) | |
Checks and others | | | (26) | | | | (25) | | | (3.85%) | |
Capital markets and securities activities | | | (135) | | | | (199) | | | 47.41% | |
Collections and transactional services | | | (158) | | | | (226) | | | 43.04% | |
Other fees and commissions | | | (1,597) | | | | (1,795) | | | 12.40% | |
Financial advisory services | | | (16) | | | | (6) | | | (62.50%) | |
Total | | Ps. | (4,830) | | | Ps. | (5,503) | | | 13.93% | |
Net fee and commission income | | Ps. | 13,940 | | | Ps. | 14,813 | | | 6.26% | |
Fee and commission income was Ps.20,316 million in 2017, a 8.24% or Ps.1,546 million increase from Ps.18,770 million in 2016, mainly due to an increase in fees and commissions earned from: (i) credit and debit cards of Ps.899 million or 16.74%, from Ps.5,369 million in 2016 to Ps.6,268 million in 2017, (ii) collection and payment services of Ps.234 million or 10.03%, from Ps.2,334 million in 2016 to Ps.2,568 million in 2017, (iii) financial advisory services of Ps.119 million or 9.74%, from Ps.1,222 million in 2016 to Ps.1,341 million in 2017, (iv) service charges on deposit accounts of Ps.95 million or 9.99%, from 951 million in 2016 to Ps.1,046 million in 2017, (v) capital markets and securities activities of Ps.74 million or 16.86%, from Ps.439 million in 2016 to Ps.513 million in 2017, (vi) the sale of insurance products of Ps.69 million or 1.62%, from Ps.4,272 million in 2016 to Ps.4,341 million in 2017, and (vii) foreign currency transactions of Ps.31 million or 2.87%, from Ps.1,080 million in 2016 to Ps.1,111 million in 2017. These increases were partly offset by a Ps.29 million or 1.95% decrease in investment funds management.
The increase in fees and commissions earned from credit and debit cards was mainly due to higher usage of our full suite of credit cards and the well performance of our Santander-Aeromexico co-branded card that led to an increase of Ps.899 million or 16.74% in the average of outstanding credit and debit cards balances as of December 31, 2017. Finally, the increase in fees and commissions earned from the sale of insurance mainly resulted from a 6.0% increase in insurance distribution premiums. This result was supported by the strengthening of our focus on pre-sale and post-sale service quality, a solid performance of car insurance sales through our online platform for car insurance Autocompara and by our commercial strategy on insurance product sales by our branch network and our contact center personnel together with other services such as consumer loans.
Fee and commission expense was Ps.5,503 million in 2017, a 13.93% or Ps.673 million increase from Ps.4,830 million in 2016, mainly due to an increase in fees and commissions paid on credit and debit cards of Ps.356 million or 12.30% and an increase in other fees and commissions paid of Ps.198 million or 12.40%, compared with 2016.
Net fees and commissions generated from credit and debit cards increased by Ps.543 million or 21.94%, from Ps.2,475 million in 2016 to Ps.3,018 million in 2017. The increase in net fees and commissions in 2017 resulted from the combined effect of an increase in the volume of credit and debit cards together with an increase in credit card reward programs and issuance costs.
For additional information on fee and commission income and fee and commission expenses, see Notes 36 and 37 to our audited financial statements included elsewhere in this Report.
Gains /(Losses) on Financial Assets and Liabilities (Net)
Our gains/(losses) on financial assets and liabilities consist mainly of gains and losses on financial instruments and derivatives. The following table shows a breakdown of our net gains/(losses) on financial assets and liabilities for 2016 and 2017.
| | | | | | | | | | | |
| | For the Year Ended December 31, | |
| | 2016 | | | 2017 | | | 2016/2017 | |
| | (Millions of pesos) | | | (% Change) | |
Interest rate products | | Ps. | (901) | | | Ps. | (72) | | | (92.05%) | |
Debt instruments | | | 1,208 | | | | 846 | | | (30.00%) | |
Interest rate derivatives | | | (2,109) | | | | (917) | | | (56.51%) | |
Equity securities | | | (190) | | | | 182 | | | (195.92%) | |
Equity positions | | | 109 | | | | 41 | | | (62.76%) | |
Equity derivatives | | | (299) | | | | 142 | | | (147.38%) | |
Exchange rate products | | | 4,961 | | | | 3,431 | | | (30.83%) | |
Foreign exchange positions | | | 683 | | | | 1,160 | | | 69.82% | |
Foreign exchange derivatives | | | 4,278 | | | | 2,272 | | | (46.90%) | |
Commissions paid to brokers | | | (110) | | | | (84) | | | (23.64%) | |
Total | | Ps. | 3,760 | | | Ps. | 3,458 | | | (8.03%) | |
Gains on financial assets and liabilities (net) in 2017 were Ps.3,458 million, a decrease of Ps.302 million from a gain of Ps.3,760 million in 2016, mainly due to the activities of our Corporate and Investment Banking segment, where gains decreased by Ps.150 million or 5.59% in 2017 compared to 2016.
During 2017, the Mexican Central Bank made several increases to the interest rate benchmark funding to maintain inflation rates near objective levels. The interest rate benchmark was increased by 150 basis points by the end of 2017. The country risk decreased to 188 basis points in 2017 from 232 basis points in 2016.
The peso appreciated 4.6% in 2017. As of December 31, 2016, the exchange rate for U.S. dollars was Ps.20.62 per U.S. dollar, and as of December 31, 2017, the exchange rate for U.S. dollars was Ps.19.66.
In this context, the result in gains on financial assets and liabilities (net) was mainly due to the following:
(i) A decrease in gains on exchange rate products of Ps.1,530 million, from a gain of Ps.4,961 million in 2016 to a gain of Ps.3,431 million in 2017. Results from foreign exchange derivatives decreased by Ps.2,006 million, from a gain of Ps.4,278 million in 2016 to a gain of Ps.2,272 million in 2017 mainly due to decreases of: (i) Ps.1,503 million in foreign exchange forwards, (ii) Ps.523 million in foreign exchange futures which offset an increase of Ps.35 million in foreign exchange options. Gains in foreign exchange positions increased by Ps.477 million, from a gain of Ps.683 million in 2016 to a gain of Ps.1,160 million in 2017. These gains offset the Ps.1,171 million decrease in cross currency swaps registered in interest rate derivatives;
(ii) An increase in gains on interest rate products of Ps.829 million, from a loss of Ps.901 million in 2016 to a loss of Ps.72 million in 2017. Gains from debt instruments decreased by Ps.362 million, from a gain of Ps.1,208 million in 2016 to a gain of Ps.846 million in 2017 mainly due to increases to the interest rate
benchmark. Loss in interest rate derivatives decreased by Ps.1,192 million, from a loss of Ps.2,109 million in 2016 to a loss of Ps.917 million in 2017 mainly resulting from cross currency swaps; and
(iii) An increase in equity products of Ps.372 million, from a loss of Ps.190 million in 2016 to a gain of Ps.182 million in 2017, was mainly explained by a gain of Ps.142 million on equity derivatives, against a loss of Ps.299 million in 2016, which was partly offset by a Ps.41 million gain in equity securities in 2017, which compared to a Ps.109 gain in 2016. As a reference, the Mexican Stock Exchange Prices and Quotations Index (IPC Futures) quote was 45,642.90 at the end of December 2016 and 49,354.43 at the end of December 2017, representing an increase of 8.13%. None of our transactions in equity derivatives in 2016 or 2017 are related to proprietary trading.
For additional information on gains/(losses) on financial assets and liabilities (net), see Note 38 to our audited financial statements included elsewhere in this Report.
Exchange Differences (Net)
Our expense from exchange differences arises from the effect that fluctuations in the value of the peso against other currencies have on our net foreign currency positions, which are mainly in U.S. dollars. Exchange differences (net) decreased Ps.4 million in 2016 compared to the Ps.4 million increase in 2017.
For additional information on exchange differences (net), see Note 39 to our audited financial statements included elsewhere in this Report.
Other Operating Income (Net)
Other operating expense (net) increased by Ps.70 million, or 2.43%, from an expense of Ps.2,875 million in 2016 to Ps.2,945 million in 2017.
Other operating income increased by Ps.183 million, or 37.65%, from Ps.486 million in 2016 to Ps.669 million in 2017.
Other operating expenses increased by Ps.253 million or 7.53%, from Ps.3,361 million in 2016 to Ps.3,614 million in 2017, mainly due to the increase of Ps.263 million, or 10.00%, in IPAB’s contributions, from Ps.2,631 million in 2016 to Ps.2,894 million in 2017, due to the general increase in our funding sources, especially total customer deposits, which grew 5.29%.
For additional information on other operating income and other operating expenses, see Note 40 to our audited financial statements included elsewhere in this Report.
Administrative Expenses
Our administrative expenses consist of personnel and other general expenses. Our personnel expenses consist mainly of salaries, social security contributions, bonuses and our long-term incentive plan for our executives. Our other general expenses mainly consist of: expenses related to information technology and systems, administrative services, which are mainly services outsourced in the areas of information technology, taxes other than income tax, rental of properties and hardware, advertising and communication, surveillance and cash courier services and expenses related to maintenance, conservation and repair, among others.
Administrative expenses increased by Ps.2,782 million or 12.28%, from Ps.22,655 million in 2016 to Ps.25,437 million in 2017, due primarily to increases in wages and salaries, as well as increases in information technology and systems, surveillance and cash courier services, rents, taxes other than income tax and advertising and communication.
The following table sets forth administrative expenses for 2016 and 2017, by type.
| | | | | | | | | | | |
| | For the Year Ended December 31, | |
| | 2016 | | | 2017 | | | 2016/2017 | |
| | (Millions of pesos) | | | (% Change) | |
Personnel expenses | | Ps. | (11,472) | | | Ps. | (12,748) | | | 11.12% | |
Other general expenses | | | (11,183) | | | | (12,689) | | | 13.47% | |
Administrative services | | | (926) | | | | (936) | | | 1.08% | |
Taxes other than income tax | | | (1,360) | | | | (1,454) | | | 6.91% | |
Surveillance and cash courier services | | | (699) | | | | (894) | | | 27.90% | |
Advertising and communication | | | (901) | | | | (968) | | | 7.44% | |
Maintenance, conservation and repair | | | (1,073) | | | | (1,227) | | | 14.35% | |
Rents | | | (1,839) | | | | (1,963) | | | 6.74% | |
Information technology and systems | | | (2,555) | | | | (2,790) | | | 9.20% | |
Stationery and supplies | | | (197) | | | | (215) | | | 9.14% | |
Insurance premiums | | | (82) | | | | (78) | | | (4.88%) | |
Credit cards | | | (272) | | | | (241) | | | (11.40%) | |
Travel costs | | | (215) | | | | (293) | | | 12.09% | |
Operating costs | | | (490) | | | | (609) | | | 24.29% | |
Other | | | (574) | | | | (1,021) | | | 77.87% | |
Total administrative expenses | | Ps. | (22,655) | | | Ps. | (25,437) | | | 12.28% | |
Our personnel expenses increased by Ps.1,276 million or 11.12%, from Ps.11,472 million in 2016 to Ps.12,748 million in 2017, primarily because of a 1.7% period-over-period average headcount increase, together with an overall increase of 18.23% in bonuses, 13.68% in salaries and 0.32% in other personnel expenses. Other personnel expenses include personnel benefits such as medical expenses, social security and pension plans. The increase in average headcount was mainly in our Retail Banking segment and is related to the hiring of additional employees to accompany business growth and support our investment plan.
The increase in personnel expenses resulted from an increase of Ps.1,008 million or 10.21%, in Retail Banking, from Ps.9,873 million in 2016 to Ps.10,881 million in 2017, an increase of Ps.240 million, or 16.40%, in wholesale banking, from Ps.1,458 million in 2016 to Ps.1,698 million in 2017, and an increase of Ps.28 million or 19.86%, in corporate activities. The increase in Retail Banking was due to an increase of Ps.292 million or 12.11% in bonuses, from Ps.2,412 million in 2016 to Ps.2,704 million in 2017, an increase of Ps.317 million or 6.25%, in salaries, from Ps.5,068 million in 2016 to Ps.5,385 million in 2017 and an increase of Ps.399 million or 16.67% in other personnel expenses, from Ps.2,393 million in 2016 to Ps.2,792 million in 2017. Additionally, personnel expenses in wholesale banking, increased due to an increase of Ps.194 million or 53.59%, in bonuses paid and an increase of Ps.384 million or 6.25% in salaries, which were partially offset by a decrease of Ps.338 million or 52.24% in other personnel expenses.
Other general expenses increased by Ps.1,506 million or 13.47%, from Ps.11,183 million in 2016 to Ps.12,689 million in 2017, mainly due to an increase of Ps.235 million or 9.20%, in expenses related to information technology and services, mainly reflecting the investment to strengthen our business and drive innovation to better serve clients. In addition, expenses related to surveillance and cash courier services increased by Ps.195 million or 27.90%, maintenance, conservation and repair expenses increased by Ps.154 million or 14.35%, rents increased by Ps.124 million or 6.74% and taxes other than income tax increased by Ps.94 million or 6.91%. Finally, advertising and communication increased by Ps.67 million or 7.44% reflecting the increased investments to market the “Santander” brand and launching new products.
For additional information on personnel expenses and other general administrative expenses, see Notes 41 and 42 to our audited financial statements included elsewhere in this Report.
Impairment Losses on Financial Assets (Net)
Our impairment losses on loans and receivables increased by Ps.2,159 million or 12.96%, from Ps.16,661 million in 2016 to Ps.18,820 million in 2017, mainly reflecting an increase in impairment losses of (i) Ps.1,003 million in our revolving consumer credit card loan portfolio, (ii) Ps.482 million in our non-revolving consumer loan portfolio, (iii) Ps.400 million in our mortgage loan portfolio, and (iv) Ps.235 million in our commercial, financial and industrial loan portfolio, as well as an increase of Ps.40 million on expenses paid to recovery agencies. The increase in impairment losses in our installment loans to individuals portfolio was mainly due to the growth of the portfolio, as well as an increase in NPLs and write-offs; while impairment losses in our mortgage loan portfolio increased as a result of lower recoveries of previously written-off loans related to the portfolio we acquired from ING in 2011.
For additional information on impairment losses on financial assets, see Note 11 to our audited financial statements included elsewhere in this Report.
Non-performing loans totaled Ps.18,132 million as of December 31, 2017, an increase of Ps.537 million or 3.05%, as compared to Ps.17,595 million as of December 31, 2016, due to the increase of non-performing loans in our mortgage loan portfolio, our non-revolving consumer loan portfolio and our revolving consumer credit card loan portfolio of Ps.583 million, Ps.406 million and Ps.383 million, respectively, which was partly offset by a decrease in non-performing loans in our commercial, financial and industrial loan portfolio of Ps.835 million. The ratio of our non-performing loans as a percentage of total loans, or NPL ratio, decreased from 2.93% as of December 31, 2016 to 2.89% as of December 31, 2017.
The non-performing loan ratio in our mortgage loan portfolio for 2017 stood at 5.49% up from 5.12% in 2016, caused mainly by an 8.60% increase in non-performing loans, which more than offset a 1.3% increase in total loans. Higher interest rates resulted in the deterioration of a portion of our variable rate mortgage loans during 2017. As a result, we no longer offer this product to our customers and we made certain campaigns to offer a change of scheme from variable interest rate to fixed interest rate for certain customers. So far, the mortgage loans that changed to fixed interest rate have been performing well.
The decrease in non-performing loans in our commercial, financial and industrial loan portfolio was mainly due to write-offs made in connection with our exposure to the three principal Mexican companies in the home builder sector. A portion of our home builder loan portfolio was sold in June 2017 and another portion was written-off during the third quarter of 2017, benefiting the NPL of the commercial portfolio. This year we completed these changes to our home builder loan portfolio. These variations in non-performing loans in combination with significant loan growth resulted in a NPL ratio for our commercial, financial and industrial loan portfolio of 1.79% as of December 31, 2017, improving from the 2.21% reported as of December 31, 2016.
Finally, the increase in non-performing loans in our consumer loan portfolio together with significant growth of this portfolio resulted in a non-performing loan ratio of 4.42% as of December 31, 2017, which compares with the 3.94% reported as of December 31, 2016.
The following table shows the ratio of our impaired assets to total computable credit risk and our coverage ratio as of December 31, 2016 and 2017.
| | | | | | | | |
| | As of December 31, | |
| | 2016 | | | 2017 | |
| | (Millions of pesos, except percentages) | |
Computable credit risk(1) | | Ps. | 661,586 | | | Ps. | 705,160 | |
Non-performing loans(4) | | | 17,595 | | | | 18,132 | |
Written-off loans | | | 20,045 | | | | 21,733 | |
Allowance for impairment losses(4) | | | 17,883 | | | | 16,929 | |
Ratios | | | | | | | | |
Non-performing loans to computable credit risk | | | 2.66% | | | | 2.57% | |
Non-performing loans coverage ratio(2) | | | 101.64% | | | | 93.36% | |
Written-off loans coverage ratio(3) | | | 3.03% | | | | 3.08% | |
| (1) | | Computable credit risk is the sum of the face amounts of loans (including non-performing loans) amounting to Ps.626,348 million and guarantees and documentary credits amounting to Ps.78,811 million. When guarantees or documentary credits are contracted, we record them as off-balance sheet accounts. We present the off-balance sheet information to better demonstrate our total managed credit risk. |
| (2) | | Allowance for impairment losses as a percentage of non-performing loans. |
| (3) | | Written-off loans as percentage of computable credit risk. |
| (4) | | See Note 2.g to our audited financial statements included elsewhere in this Report for more details on the classification of credit-impaired or non-performing loans. |
The following table shows our non-performing loans by type of loan as of December 31, 2016 and 2017:
| | | | | | | | | | | |
| | As of December 31, | | | | |
| | 2016 | | | 2017 | | | 2016/2017 | |
| | (Millions of pesos) | | | (% Change) | |
Commercial, financial and industrial | | Ps. | 6,842 | | | Ps. | 6,007 | | | (12.20)% | |
Mortgage | | | 6,778 | | | | 7,362 | | | 8.62% | |
Installment loans to individuals | | | 3,975 | | | | 4,763 | | | 19.82% | |
Revolving consumer credit card loans | | | 1,952 | | | | 2,335 | | | 19.62% | |
Non-revolving consumer loans | | | 2,023 | | | | 2,428 | | | 20.02% | |
Total | | Ps. | 17,595 | | | Ps. | 18,132 | | | 3.05% | |
Commercial, financial and industrial
Our impairment losses in our commercial, financial and industrial loans portfolio increased by 4.85% to Ps.5,076 million in 2017 from Ps.4,841 million in 2016. The increase is mainly the result of higher impairment losses related to two corporate clients in the energy and petrochemical industries, as well as higher impairment losses in connection with the home builders, as we have written-off those loans related to projects with no value to be continued.
Non-performing loans in our commercial, financial and industrial loan portfolio, which as of December 31, 2017 represented 33.13% of our total non-performing loans, decreased by Ps.835 million or 12.20%, from December 31, 2016 to December 31, 2017, primarily due to write-offs made during 2017 in connection with the three principal Mexican companies in the home builder sector. Additionally, non-performing loans in the middle-market and SME segments have remained stable and in line with portfolio growth. Our NPL ratio with respect to commercial, financial and industrial loans improved from 2.21% as of December 31, 2016 to 1.79% as of December 31, 2017.
Mortgage
Our impairment losses in our mortgage loan portfolio increased by 136.99% or Ps.400 million in 2017, from Ps.292 million in 2016 to Ps.692 million in 2017. The increase is mainly the result of lower recoveries of previously written-off loans related to the portfolio we acquired from ING in 2011.
Before write-off recoveries, the impairment losses in our mortgage loan portfolio decreased from Ps.1,388 million in 2016 to Ps.1,105 million in 2017.
Meanwhile, non-performing loans in our mortgage loan portfolio, which as of December 31, 2017 represented 40.60% of our total non-performing loans, increased by Ps.583 million or 8.60%, from December 31, 2016 to December 31, 2017, resulting in a non-performing loan ratio of 5.49%, as compared to 5.12% in 2016.
Installment loans to individuals
Our impairment losses in our installment loans to individuals portfolio increased by Ps.1,485 million or 13.84% to Ps.12,213 million in 2017 from Ps.10,728 million in 2016.
Impairment losses in our revolving consumer credit card loan portfolio increased by Ps.1,003 million or 16.81% to Ps.6,969 million in 2017 from Ps.5,966 million in 2016. This increase is explained by the growth of the portfolio, as well as an increase in NPLs and write-offs.
Impairment losses in our non-revolving consumer loan portfolio increased by Ps.482 million or 10.12% to Ps.5,244 million in 2017 from Ps.4,762 million in 2016. This increase is also explained by the growth of the portfolio, as well as a slight increase in NPLs.
Non-performing loans in our installment loans to individuals portfolio, which as of December 31, 2017 represented 26.27% of our total non-performing loans, increased Ps.789 million or 19.85%, from December 31, 2016 to December 31, 2017. This increase was due to an increase of non-performing loans in our revolving consumer credit card loan portfolio of Ps.383 million and an increase in the non-performing loans in our non-revolving consumer loan portfolio of Ps.406 million.
Our NPL ratio with respect to our installment loans to individuals portfolio in the revolving credit card loan portfolio increased from 3.79% as of December 31, 2016 to 4.29% as of December 31, 2017, as a result of a general increase in NPLs in the banking sector as a whole, and, in the case of Banco Santander México, a slight deterioration of credit cards mainly due to the performance of certain external channels such as F2F, Internet and Telemarketing.
Our NPL ratio with respect to our installment loans to individuals portfolio in the non-revolving consumer loan portfolio increased from 4.10% as of December 31, 2016 to 4.55% as of December 31, 2017, also as a result of a general increase in NPLs in the banking sector as a whole, and, in the case of Banco Santander México, a slight deterioration of personal loans mainly due to the performance of certain external channels such as F2F, Internet and Telemarketing.
Non-performing loan coverage ratio
The following table shows our non-performing loan coverage ratio by type of loan as of December 31, 2016 and 2017:
| | | | | | | |
| | | As of December 31, | |
| | | 2016 | | | 2017 | |
| | | (Percentages) | |
Commercial, financial and industrial | | | 94.46% | | | 93.02% | |
Mortgage | | | 36.07% | | | 27.03% | |
Installment loans to individuals | | | 225.79% | | | 196.33% | |
Revolving consumer credit card loans | | | 253.18% | | | 225.22% | |
Non-revolving consumer loans | | | 199.36% | | | 168.53% | |
Total | | | 101.64% | | | 93.37% | |
The non-performing loan coverage ratio decreased from 101.64% to 93.37%, mainly reflecting increases in non-performing loans in our mortgage and installment loans to individual portfolios.
The non-performing loan coverage ratio of our commercial loan portfolio decreased slightly from 94.46% in 2016 to 93.02% in 2017, due to the combined effect of higher impairment losses related to two corporate clients in the energy and petrochemical industries and higher impairment losses in connection with the home builders, as we have written-off those loans related to projects with no continued value.
With respect to our installment loans to individuals portfolio, the non-performing loan coverage ratio for the non-revolving consumer loans declined from 199.36% in 2016 to 168.53% in 2017, reflecting a 20.07% increase in impaired assets.
Meanwhile, the non-performing loan coverage ratio for the revolving consumer credit card loans decreased from 253.18% to 225.22%, reflecting a 19.62% increase in impaired assets.
Finally, regarding our mortgage loan portfolio, the non-performing loan coverage ratio stood at 27.03%, down from 36.07% in 2016, reflecting an 8.60% increase in impaired assets.
Provisions (Net)
Our provisions (net) consist mainly of provisions for pensions and other retirement obligations, provisions for off-balance sheet risk and provisions for legal and tax matters. Off-balance sheet risks include undrawn lines of credit of credit cards, guarantees and loan commitments of commercial and public sector loans and guarantees and loan commitments of commercial loans to SMEs.
Provisions (net) decreased by Ps.444 million, from a loss of Ps.881 million in 2016 to a loss of Ps.437 million in 2017. This variation to provisions mainly resulted from lower provisions for legal and tax contingencies and lower requirements for provisions for other matters.
For additional information on provisions, see Note 23 to our audited financial statements included elsewhere in this Report.
Income Tax
Income tax in 2017 was Ps.5,496 million, a Ps.145 million or 2.71% increase from Ps.5,351 million in 2016. Our effective tax rates in 2016 and 2017 were 24.45% and 22.74%, respectively. The variation in income tax paid is primarily explained by the increase in income before taxes in 2017 as compared to 2016, and by a higher inflation in relation to the previous period, which represented a greater tax deduction for inflation. Our effective tax rate decreased 171 basis points in 2017 compared to 2016.
For additional information on tax matters, see Note 25 to our audited financial statements included elsewhere in this Report.
Results of Operations by Segment for the Year Ended December 31, 2017 Compared to the Year Ended December 31, 2016
The following table presents an overview of certain consolidated income statement data for each of our segments for 2016 and 2017.
| | | | | | | | | | | | | | | | | | | | | | | | |
| | Retail Banking(1) | | | Corporate and Investment Banking(2) | | | Corporate Activities(3) | |
| | For the Year Ended December 31, | |
| | 2016 | | | 2017 | | | 2016 | | | 2017 | | | 2016 | | | 2017 | |
| | (Millions of pesos) | |
Net interest income | | Ps. | 42,277 | | | Ps. | 47,969 | | | Ps. | 4,899 | | | Ps. | 5,295 | | | Ps. | 1,954 | | | Ps. | 2,580 | |
Dividend income | | | — | | | | — | | | | — | | | | 5 | | | | 94 | | | | 145 | |
Fee and commission income (expense) (net) | | | 12,211 | | | | 13,047 | | | | 1,749 | | | | 1,758 | | | | (20) | | | | 8 | |
Gains/(losses) on financial assets and liabilities and exchange differences (net) | | | 721 | | | | 786 | | | | 2,682 | | | | 2,532 | | | | 359 | | | | 146 | |
Other operating income (expenses) (net) | | | (2,104) | | | | (2,136) | | | | (649) | | | | (505) | | | | (122) | | | | (304) | |
Total income | | Ps. | 53,105 | | | Ps. | 59,666 | | | Ps. | 8,681 | | | Ps. | 9,085 | | | Ps. | 2,265 | | | Ps. | 2,575 | |
Administrative expenses | | | (19,955) | | | | (22,377) | | | | (2,440) | | | | (2,759) | | | | (260) | | | | (301) | |
Depreciation and amortization | | | (1,890) | | | | (2,317) | | | | (158) | | | | (204) | | | | (10) | | | | (12) | |
Impairment losses on loans and receivables (net) | | | (15,955) | | | | (17,763) | | | | (706) | | | | (1,057) | | | | — | | | | — | |
Impairment losses on other assets (net) | | | — | | | | — | | | | — | | | | — | | | | — | | | | — | |
Provisions (net) | | | (75) | | | | (98) | | | | (29) | | | | 20 | | | | (777) | | | | (359) | |
Gain/(losses) on disposal of assets not classified as non-current assets held for sale | | | — | | | | — | | | | — | | | | — | | | | 20 | | | | 6 | |
Gain/(losses) on disposal of non-current assets held for sale not classified as discontinued operations | | | — | | | | — | | | | — | | | | — | | | | 71 | | | | 69 | |
Operating profit before tax | | Ps. | 15,230 | | | Ps. | 17,111 | | | Ps. | 5,348 | | | Ps. | 5,085 | | | Ps. | 1,309 | | | Ps. | 1,978 | |
| (1) | | The Retail Banking segment encompasses the entire commercial banking and asset management business. Our Retail Banking segment’s activities include products and services for individuals, private banking clients, SMEs, middle-market corporations and government institutions. |
| (2) | | The Corporate and Investment Banking segment reflects the returns on the corporate banking business, including managed treasury departments and the equities business. Our Corporate and Investment Banking segment provides comprehensive products and services relating to finance, guarantees, mergers and acquisitions, equity and fixed income, structured finance, international trade finance, cash management services, collection services and e-banking, including structured loans, syndicated loans, acquisition financing and financing of investment plans, among others. |
| (3) | | The Corporate Activities segment is comprised of all operational and administrative activities that are not assigned to a specific segment or product mentioned above. The Corporate Activities segment includes the financial management area, which manages structural financial risks arising from our commercial activities, mainly liquidity risk and interest rate risk, provides short- and long-term funding for our lending activities and calculates and controls transfer prices for loans and deposits in local and foreign currencies. The financial management area also oversees the use of our resources in compliance with internal and regulatory limits regarding liquidity and regulatory capital requirements. |
The following table presents an overview of certain consolidated balance sheet data for each of our segments as of December 31, 2016 and 2017.
| | | | | | | | | | | | | | | | | | | | | | | |
| | Retail Banking | | | Corporate and Investment Banking | | | Corporate Activities |
| | As of December 31, |
| | 2016 | | | 2017 | | | 2016 | | | 2017 | | | 2016 | | | 2017 |
| | (Millions of pesos) |
Cash and balances with the Mexican Central Bank | | Ps. | 48,049 | | | Ps. | 43,693 | | | Ps. | 29,891 | | | Ps. | 11,533 | | | Ps. | 723 | | | Ps. | 2,461 |
Financial assets held for trading | | | — | | | | — | | | | 342,195 | | | | 315,570 | | | | 387 | | | | — |
Other financial assets at fair value through profit or loss | | | — | | | | — | | | | 42,340 | | | | 51,705 | | | | — | | | | — |
Available-for-sale financial assets | | | — | | | | — | | | | — | | | | — | | | | 154,644 | | | | 165,742 |
Loans and receivables | | | 460,891 | | | | 494,391 | | | | 172,751 | | | | 150,855 | | | | 41,856 | | | | 34,054 |
Hedging derivatives | | | — | | | | — | | | | — | | | | — | | | | 15,003 | | | | 15,116 |
Non-current assets held for sale | | | 990 | | | | 1,187 | | | | 117 | | | | 108 | | | | — | | | | — |
Tangible assets | | | 4,789 | | | | 5,466 | | | | 808 | | | | 922 | | | | 95 | | | | 110 |
Intangible assets | | | 3,573 | | | | 4,666 | | | | 464 | | | | 559 | | | | 1,735 | | | | 1,735 |
Tax assets | | | — | | | | — | | | | — | | | | — | | | | 23,301 | | | | 20,209 |
Other assets | | | 1,297 | | | | 1,847 | | | | 30 | | | | 43 | | | | 5,008 | | | | 7,219 |
Total assets | | Ps. | 519,589 | | | Ps. | 551,250 | | | Ps. | 588,596 | | | Ps. | 531,295 | | | Ps. | 242,752 | | | Ps. | 246,646 |
Financial liabilities held for trading | | Ps. | — | | | Ps. | — | | | Ps. | 266,829 | | | Ps. | 239,725 | | | Ps. | — | | | Ps. | — |
Other financial liabilities at fair value through profit or loss | | | 7,603 | | | | 10,288 | | | | 128,186 | | | | 110,365 | | | | 1,071 | | | | — |
Financial liabilities at amortized cost | | | 463,861 | | | | 508,049 | | | | 168,297 | | | | 170,379 | | | | 173,933 | | | | 142,003 |
Hedging derivatives | | | — | | | | — | | | | — | | | | — | | | | 14,287 | | | | 11,091 |
Provisions | | | 874 | | | | 64 | | | | 282 | | | | 262 | | | | 6,046 | | | | 6,404 |
Tax liabilities | | | — | | | | — | | | | — | | | | — | | | | 44 | | | | 71 |
Other liabilities | | | 3,287 | | | | 3,386 | | | | 537 | | | | 553 | | | | 10,572 | | | | 11,141 |
Total liabilities | | Ps. | 475,625 | | | Ps. | 521,787 | | | Ps. | 564,131 | | | Ps. | 521,284 | | | Ps. | 205,953 | | | Ps. | 170,710 |
Total equity | | Ps. | 60,238 | | | Ps. | 59,545 | | | Ps. | 27,208 | | | Ps. | 23,020 | | | Ps. | 17,782 | | | Ps. | 32,845 |
Total liabilities and equity | | Ps. | 535,863 | | | Ps. | 581,332 | | | Ps. | 591,339 | | | Ps. | 544,304 | | | Ps. | 223,735 | | | Ps. | 203,555 |
Retail Banking Segment
Our Retail Banking segment’s activities include products and services for individuals, private banking clients, SMEs, middle-market corporations and government institutions. We provide commercial banking services to individual customers of all income levels, and offer a wide range of products and services to our individual customers, including demand and term deposits, credit and debit cards, mortgages, and payroll and personal loans. Our Retail Banking segment also serves the middle market and local corporates that are not within the global corporate customers served by our Corporate and Investment Banking segment. We offer SMEs a variety of services and products including commercial loans, transactional collections and payment services, insurance, hedging and foreign trade services.
Operating profit before taxes attributable to the Retail Banking segment in 2017 was Ps.17,111 million, a 12.35% or Ps.1,881 million increase from Ps.15,230 million in 2016. This increase was mainly due to:
| · | | a 13.46% or Ps.5,692 million increase in net interest income, mainly due to an increase of Ps.34,046 million or 8.58% in the average balance of the loan portfolio excluding credit card loans and an increase of Ps.3,071 million or 6.26%, in the average balance of the credit card loan portfolio, both resulting from the organic growth of the portfolio, which was further supported by increases of 143 basis points and 150 basis points, respectively, in the average interest rate of these portfolios, resulting mainly from the increases in reference rates enacted by the Mexican Central Bank during 2017 and our strong focus on returns on risk weighted assets; |
| · | | a 6.85% or Ps.836 million increase in net fees and commissions income, from Ps.12,211 million in 2016 to Ps.13,047 million in 2017, due mainly to an increase in fees and commissions earned from credit and debit card, collection and payment services, financial advisory services, partially offset by a |
decrease in commissions and fees from capital market and securities activities and other commissions and fees; and |
| · | | a 9.02% or Ps.65 million increase in gains/(losses) on financial assets and liabilities and exchange differences, from a gain of Ps.721 million in 2016 to a gain of Ps.786 million in 2017, primarily due to gains on exchange rate derivatives that were benefited by higher volatility in global financial markets. |
These positive effects were partially offset by:
| · | | a 12.14% or Ps.2,422 million increase in administrative expenses, from Ps.19,955 million in 2016 to Ps.22,377 million in 2017, mainly due to increases in personnel expenses, as well as higher information technology and systems and other administrative expenses. Personnel expenses increased Ps.1,008 million or 10.21%, resulting from an increase of Ps.399 million or 16.67%, in other personal expenses, an increase of Ps.317 million or 6.25% in salaries, and an increase of Ps.292 million or 12.11%, in bonuses, while other administrative expenses and information technology and systems expenses increased Ps.1,105 million or 203.87%, and Ps.218 million or 9.63%, respectively mainly reflecting the execution of our strategic initiatives to continue supporting business growth, client service and innovation; and |
| · | | an 11.3% or Ps.1,808 million increase in impairment losses on loans and receivables, reflecting mainly increases in impairment losses of Ps.1,002 million, Ps.482 million and Ps.400 million in our credit card, consumer and mortgage loan portfolios, respectively, as well as an increase of Ps.40 million in loan collection and recovery expenses. These increases were partially offset by a decrease of Ps.116 million in our commercial loan portfolio. |
Corporate and Investment Banking Segment
Our Corporate and Investment Banking segment provides comprehensive products and services, including corporate banking, global transactional banking and investment banking services, relating to finance, guarantees, mergers and acquisitions, equity and fixed income, structured finance, international trade finance, cash management services, collection services and e-banking, including structured loans, syndicated loans, acquisition financing and financing of investment plans, among others, to our Corporate and Investment Banking segment customers. This segment also includes our proprietary trading operations.
Operating profit before taxes attributable to the Corporate and Investment Banking segment in 2017 was Ps.5,085 million, representing a Ps.263 million or 4.92% decrease from Ps.5,348 million in 2016. This decrease was mainly due to:
| · | | a 49.72% or Ps.351 million increase in impairment losses on loans and receivables, from Ps.706 million in 2016 to Ps.1,057 million in 2017. This increase mainly resulted from higher impairment losses related to two corporates, as well as higher impairment losses related to our homebuilders loan portfolio, as we made write-offs to finalize the clean-up process of that portfolio; |
| · | | a 13.07% or Ps.319 million increase in administrative expenses, from Ps.2,440 million in 2016 to Ps.2,759 million in 2017, mainly due to increases in bonuses and salaries, partially offset by a decrease in other personnel expenses. Personnel expenses increased Ps.240 million or 16.46%, resulting from an increase of Ps.384 million or 85.52%, in salaries and an increase of Ps.194 million or 53.59% in bonuses, while other personnel expenses decreased Ps.338 million or 52.24% in other personnel expenses; |
| · | | a 5.59% or Ps.150 million decrease in gains/(losses) on financial assets and liabilities and exchange differences, from a gain of Ps.2,682 million in 2016 to a gain of Ps.2,532 million in 2017, primarily due to a decrease of Ps.749 million in market making, resulting from lower client activity; and |
| · | | a 22.19% or Ps.144 million decrease in other operating expense which mainly resulted from a release of reserves related to the cancelation of liabilities, partially compensated by higher contributions to the IPAB, resulting from an increase in customer deposits. |
These negative results were partially offset by:
| · | | an 8.08% or Ps.396 million increase in net interest income, mainly due to an increase of Ps.1,946 million in interest income from loans and advances to customers. The increase in interest income from loans and advances to customers resulted from a 230 basis point increase in the average interest rate, despite a Ps.13,245 million or 10.86% decrease in the average portfolio of loans and advances to customers. The 230 basis point increase in the average interest rate earned from loans and advances to corporate customers, mainly resulted from the combination of increases to the reference rate enacted by Mexican Central Bank during 2017 and stronger focus on returns on risk weighted assets; and |
| · | | a 0.51% or Ps.9 million increase in net fees and commissions income, from Ps.1,749 million in 2016 to Ps.1,758 million in 2017, mainly due to an increase in net fees and commissions from capital markets and securities activities, as well as higher fees related to foreign trade and higher other net fees and commissions, partially offset by a decrease in net fees and commissions from financial advisory services, transportation of cash behalf customers and administration and custody. |
Corporate Activities Segment
Our Corporate Activities segment is comprised of all operational and administrative activities that are not assigned to a specific segment or product mentioned above. The Corporate Activities segment includes the financial management area, which manages structural financial risks that arise from our commercial activities, mainly liquidity risk and interest rate risk, provides short- and long-term funding for our lending activities and calculates and controls transfer prices for loans and deposits in local and foreign currencies. The financial management area also oversees the use of our resources in compliance with internal and regulatory limits regarding liquidity and regulatory capital requirements.
Through the assignment of a transfer price to each loan or deposit, interest income is divided between our operating segments (Retail Banking and Corporate and Investment Banking) and the Corporate Activities segment as follows:
| · | | the difference between the interest rate charged to customers for the loans granted by our operating segments and the transfer price assigned to these loans is assigned as interest income to the respective operating segment; |
| · | | the difference between the interest rate paid to customers for the deposits received by our operating segments and the transfer price assigned to these deposits is assigned as interest income to the respective operating segment; and |
| · | | finally, the difference between the transfer price charged to the loans and the transfer price paid for the deposits is assigned to Corporate Activities as net interest income. |
The financial management area determines transfer prices based on interest rates currently prevailing in the market for different durations, which are estimated from the yield of the most representative and liquid short-and medium-term corporate, government and Mexican Central Bank debt securities, and from the Mexican Central Bank’s reference interest rates for long-term securities.
The ALCO manages the risks associated with financial margin and net worth of the banking book, as well as liquidity risk for the entire balance sheet. We hedge the interest rate risk of the balance sheet using strategies that can address specific operations or modify the risk profile as a whole. In recent years, the
ALCO portfolio was comprised of fixed rate positions, mainly Mexican sovereign bonds, in addition to fixed rate swaps, to protect the interest rate margin against a lower interest rate environment. As the scenario changed to short-term interest rates increases, we have reduced the volume of activity in the ALCO portfolio, leaving existing positions to mature at their stated maturity.
Operating profit before taxes attributed to Corporate Activities in 2017 was a gain of Ps.1,978, a Ps.669 million or 51.11%, increase from a gain of Ps.1,309 million in 2016. This increase in operating profit before taxes was mainly due to a Ps.626 million increase in net interest income, from a gain of Ps.1,954 million in 2016 to a gain of Ps.2,580 million in 2017, mainly due to interest rate hikes in the short-term. This positive result was partially offset by a Ps.213 million or 59.33% decrease in gains on financial assets and liabilities and exchange differences from Ps.359 million in 2016 to Ps.146 million in 2017.
B.Liquidity and Capital Resources
Our control and management functions involve planning our funding requirements, structuring the sources of financing to achieve optimal diversification in terms of maturities, instruments and markets and setting forth contingency plans.
Overall, we have a strong liquidity position with total loans, net of allowance for impairment losses, as a percentage of our deposits, representing approximately 79.32% of our total deposits, 99.83% of our customer deposits and 107.87% of our demand and time deposits as of December 31, 2018. We constantly review our liquidity position and the forecasted growth of our business lines relative to our loan/deposit ratio.
Banco Santander Parent and its subsidiaries follow a global model in which each unit is responsible for its own capital and funding. We are autonomous in the management of our liquidity and capital needs, with no structural support from Grupo Financiero Santander México or any other unit of the Santander Group.
Pursuant to the Mexican Capitalization Requirements, we may be restricted from paying dividends to Grupo Financiero Santander México, if we do not meet our required regulatory capital ratios, do not have sufficient retained earnings or do not maintain legal reserves at required levels. Payment of dividends, distributions and advances will be contingent upon our earnings and business considerations and is or may be limited by legal, regulatory and contractual restrictions. Additionally, our right to receive any assets of any of our subsidiaries as an equity holder of such subsidiaries, upon their liquidation or reorganization, will be effectively subordinated to the claims of our subsidiaries’ creditors, including trade creditors.
For information about our use of financial instruments for hedging purposes, see Note 13 to our audited financial statements included elsewhere in this Report and “Item 11. Quantitative and Qualitative Disclosures About Market Risk—Market Risk.”
Risk-Weighted Assets and Regulatory Capital
Pursuant to Mexican Capitalization Requirements, we are required to maintain specified levels of net capital on an unconsolidated basis as a percentage of risk-weighted assets, including credit, market and operational risks. The minimum Capital Ratio currently required by the Mexican Capitalization Requirements in order not to be required to cancel interest payments or principal payments (including the
forced conversion of certain securities into shares) is 11.40%. As of December 31, 2018, our Capital Ratio was 15.91%.
The table below presents our risk-weighted assets and Capital Ratios as of December 31, 2016, 2017 and 2018, calculated in accordance with Mexican Banking GAAP:
| | | | | | | | | | | | |
| | Mexican Banking GAAP | |
| | As of December 31, | |
| | 2016 | | | 2017 | | | 2018 | |
| | (Thousands of pesos, except percentages) | |
Capital: | | | | | | | | | | | | |
Perpetual subordinated non-preferred contingent convertible additional Tier 1 capital notes (AT1 Notes) | | Ps. | 71,487,285 | | | Ps. | 79,455,469 | | | Ps. | 84,225,628 | |
Tier 1 | | | 81,784,659 | | | | 89,267,141 | | | | 94,034,729 | |
Tier 2 | | | 27,453,243 | | | | 26,053,739 | | | | 27,418,932 | |
Total capital | | | 109,237,902 | | | | 115,320,880 | | | | 121,453,661 | |
Risk-Weighted Assets: | | | | | | | | | | | | |
Credit risk | | | 546,227,285 | | | | 553,910,680 | | | | 534,153,701 | |
Market risk | | | 108,027,290 | | | | 137,991,688 | | | | 178,497,016 | |
Operational risk | | | 39,609,492 | | | | 41,443,619 | | | | 50,519,756 | |
Total risk-weighted assets | | | 693,864,067 | | | | 733,345,986 | | | | 763,170,474 | |
Required Regulatory Capital: | | | | | | | | | | | | |
Credit risk | | | 43,698,183 | | | | 44,312,854 | | | | 42,732,296 | |
Market risk | | | 8,642,183 | | | | 11,039,335 | | | | 14,279,761 | |
Operational risk | | | 3,168,759 | | | | 3,315,490 | | | | 4,041,581 | |
Total risk-weighted assets | | Ps. | 55,509,125 | | | Ps. | 58,667,679 | | | Ps. | 61,053,638 | |
Capital Ratios (credit, market and operational risk)(*): | | | | | | | | | | | | |
CET 1 capital to risk-weighted assets | | | 10.30% | | | | 10.83% | | | | 11.04% | |
Tier 1 capital to risk-weighted assets | | | 11.79% | | | | 12.17% | | | | 12.32% | |
Tier 2 capital to risk-weighted assets | | | 3.95% | | | | 3.55% | | | | 3.59% | |
Total capital to risk-weighted assets(1)(2) | | | 15.74% | | | | 15.73% | | | | 15.91% | |
(*)The capital ratios included in this table are in accordance to the data published by the CNBV.
| (1) | | Our Capitalization Index as of December 31, 2018 increased by 18 basis points from 15.73% as of December 31, 2017 to 15.91% on December 31, 2018, mainly due to increases of 29.4% (Ps.3,240.4 million) in regulatory capital required for market risk, 21.9% (Ps.726.1 million) in regulatory capital required for operational risk, and a decrease of 3.6% (Ps.1,580.6 million) in regulatory capital required for credit risk and an increase of 5.3% (Ps.6,132.7 million) in total capital. |
The Mexican government has stated that the country will be an early adopter of the Basel III international rules, which will require full implementation by 2019. Basel III is a capital and liquidity reform package for internationally active banking organizations around the world that includes, among other things, the definition of capital, capital requirements, the treatment of counterparty risk, the leverage ratio and the global liquidity standard. On November 28, 2012, the CNBV published changes to the regulations under Basel III standards in Mexico, which resulted in changes to Mexican regulations that affected regulatory capital requirements. The new regulations are applicable to Mexican banks as of January 1, 2013, and require banks to hold a minimum of 4.5% of Common Equity Tier 1 (CET1), and 6% of Tier 1 capital of RWA. In addition, a mandatory capital conservation buffer of 2.5% of RWA is also required, resulting in a 10.5% minimum total capital (including the capital conservation buffer), plus a systemically important bank supplement of the percentage determined by the CNBV, within a four year period ending in 2019, and a countercyclical capital supplement. Due to its classification as Grade III on April 29, 2016, a supplementary
capital conservation percentage of 1.20% applicable as of December 2016 at a rate of 0.30% per year was imposed on us. We remained in compliance as of December 31, 2018 with the regulations in the third year of their application, demonstrating that we have been fully in compliance since such regulations’ establishment.
In addition, and in accordance with the regulatory requirement by the CNBV published on June 22, 2016, banking institutions must publish their leverage ratios beginning in September 2016 (and include quarters beginning on December 2015) in the case of systemically important banks. Our leverage ratio as of December 31, 2018 was 7.03%, as of November 30, 2018, was 6.79%, as of October 31, 2018 was 6.52%, as of September 30, 2018 was 7.10%, as of June 30, 2018 was 6.89%, as of March 31, 2018 was 7.37%, and as of December 31, 2017 was 7.03%.
This ratio is calculated as Tier 1 capital divided by leverage exposure.
Liquidity Management
Liquidity management seeks to ensure that, even under adverse conditions, we have access to funds necessary to cover client needs, maturing liabilities and working capital requirements. Liquidity risk arises in the general funding of our financing, trading and investment activities. It includes the risk of unexpected increases in the cost of funding the portfolio of assets at appropriate maturities and rates, the risk of being unable to liquidate a position in a timely manner at a reasonable price and the risk that we are required to repay liabilities earlier than anticipated.
Our general policy is to maintain adequate liquidity to ensure our ability to honor withdrawals of deposits in amounts and at times consistent with historical data, make repayment of other liabilities at maturity, extend loans and meet our own working capital needs in compliance with the applicable internal and regulatory reserve requirements and liquidity coefficients in all material respects. See “Item 4. Information on the Company—B. Business Overview—Supervision and Regulation—Classification of Loans and Allowance for Impairment Losses—Liquidity Requirements for Foreign Currency—Denominated Liabilities” and “Item 11. Quantitative and Qualitative Disclosures About Market Risk—Liquidity Risk.”
Additionally, the Basel III framework has implemented a liquidity coverage ratio, or LCR, and is considering the definition of a Net Stable Funding Ratio, or NSFR. The LCR requires banks to maintain sufficient high-quality liquid assets to cover the net cash outflows that could be encountered under a stress scenario during a one-month period. The NSFR establishes a minimum amount of stable funding a bank will be required to maintain based on the liquidity of our assets and activities over a one-year period.
As part of our liquidity management model, in recent years we have been managing the implementation, monitoring and early compliance with the new liquidity requirements set by international financial legislation.
On December 31, 2014, the CNBV and the Mexican Central Bank published in the Federal Official Gazette the General Liquidity Requirements, which entered into effect on January 1, 2015.
On June 22, 2016, the CNBV published in the Federal Official Gazette a resolution amending the methodology to calculate the leverage percentage of financial institutions. Such resolution entered into effect on September 1, 2016. We are currently in compliance with these requirements.
We have three principal sources of short-term peso funding: (i) demand deposits, comprised by interest-bearing and non-interest-bearing demand deposits, (ii) time deposits, which include short-term promissory notes with interest payable at maturity (pagarés bancarios), fixed-term deposits and foreign currency time deposits and (iii) repurchase agreements.
The following table shows the composition of our short-term funding described above:
| | | | | | | | | | | |
| | As of December 31, |
| | 2016 | | | 2017 | | | 2018 |
| | (Millions of pesos) |
Demand deposits: | | | | | | | | | | | |
Interest-bearing deposits | | Ps. | 246,101 | | | Ps. | 256,635 | | | Ps. | 237,948 |
Non-interest-bearing deposits | | | 157,222 | | | | 165,393 | | | | 205,275 |
Subtotal | | Ps. | 403,323 | | | Ps. | 422,028 | | | Ps. | 443,223 |
Time deposits: | | | | | | | | | | | |
Notes with interest payable at maturity | | Ps. | 124,375 | | | Ps. | 141,883 | | | Ps. | 154,838 |
Fixed-term deposits | | | 5,454 | | | | 5,598 | | | | 3,778 |
Foreign currency time deposits | | | 10,579 | | | | 11,983 | | | | 17,026 |
Subtotal | | Ps. | 140,408 | | | Ps. | 159,464 | | | Ps. | 175,642 |
Repurchase agreements | | | 83,891 | | | | 81,790 | | | | 65,369 |
Accrued interest(1) | | | 578 | | | | 1,054 | | | | 1,320 |
Other deposits | | | 27,696 | | | | 26,230 | | | | 25,904 |
Total customer deposits | | Ps. | 655,896 | | | Ps. | 690,566 | | | Ps. | 711,458 |
Deposits from the Mexican Central Bank and credit institutions (2) | | | 139,956 | | | | 104,874 | | | | 130,160 |
Total deposits(3) | | Ps. | 795,852 | | | Ps. | 795,440 | | | Ps. | 841,618 |
| (1) | | Mainly from time deposits. |
| (2) | | Includes Ps.40,634 million, Ps.28,359 million and Ps.35,311 million of repurchase agreements with the Mexican Central Bank and with credit institutions as of December 31, 2016, 2017 and 2018, respectively. |
| (3) | | As of December 31, 2016, we had deposits of Ps.655,896 million from customers, Ps.124,477 million from credit institutions and Ps.15,479 million from the Mexican Central Bank. As of December 31, 2017, we had deposits of Ps.690,566 million from customers, Ps.82,457 million from credit institutions and Ps.22,417 million from the Mexican Central Bank. As of December 31, 2018, we had deposits of Ps.711,458 million from customers, Ps.99,165 million from credit institutions and Ps.30,995 million from the Mexican Central Bank. See “Item 4. Information on the Company—B. Business Overview—Selected Statistical Information—Liabilities—Deposits.” |
Demand deposits are our most important funding source and are also less expensive relative to other sources of funding. Our funding strategy focuses on increasing the source of low-cost funding through new banking products and commercial campaigns oriented to grow the volume of demand deposits from our existing customers and expand our customer base. Consistent with our funding strategy, we were able to increase our non-interest-bearing demand deposits by approximately 24.1%, from Ps.165,393 million at December 31, 2017 to Ps.205,275 million at December 31, 2018 as a result of tailored marketing efforts based on the extensive knowledge of our customers that we have developed using information technology and leveraged using CRM strategies.
Short-term promissory notes with interest payable at maturity (pagarés bancarios) are generally issued to meet short-term funding needs and are generally issued with maturities ranging from one to 364 days.
Repurchase agreements are another important instrument in Mexico’s money market as they provide short-term investments to banking customers, mainly with Mexican government-issued paper and to a lesser extent securities issued by other Mexican banks and corporations. We have used repurchase agreements to achieve cost efficiencies and as an additional source of short-term funding.
The following tables show our short-term borrowings that we sold under repurchase agreements for funding our operations as well as short positions from financial liabilities arising from the outright sale or from pledging of financial assets acquired under reverse repurchase agreements. Short-term borrowings
at year-end from 2017 to 2018 remain stable. See “Item 4. Information on the Company—B. Business Overview—Liabilities—Short-term Borrowings.”
| | | | | | | | | | | | | | | | | | | | | |
| | IFRS for the year ended December 31, | |
| | 2016 | | | 2017 | | | 2018 | |
| | Amount | | | Average rate | | | Amount | | | Average rate | | | Amount | | | Average rate | |
| | (Millions of pesos, except percentages) | |
Short-Term Borrowings | | | | | | | | | | | | | | | | | | | | | |
Repurchase agreements: | | | | | | | | | | | | | | | | | | | | | |
At December 31 | | Ps. | 124,525 | | | 5.45% | | | Ps. | 110,149 | | | 6.79% | | | Ps. | 100,680 | | | 7.99% | |
Average during year | | | 190,943 | | | 4.11% | | | | 157,984 | | | 6.61% | | | | 143,993 | | | 7.56% | |
Maximum month-end balance | | | 249,866 | | | 5.45% | | | | 199,054 | | | 7.10% | | | | 186,732 | | | 7.99% | |
Short positions: | | | | | | | | | | | | | | | | | | | | | |
At December 31(1) | | Ps. | 40,613 | | | 5.32% | | | Ps. | 68,443 | | | 6.84% | | | Ps. | 101,754 | | | 8.25% | |
Average during year | | | 49,259 | | | 3.92% | | | | 64,615 | | | 6.50% | | | | 77,898 | | | 7.63% | |
Maximum month-end balance | | | 78,075 | | | 5.32% | | | | 99,320 | | | 7.15% | | | | 98,730 | | | 8.25% | |
Total short-term borrowings at year end | | Ps. | 165,138 | | | 5.39% | | | Ps. | 178,592 | | | 6.81% | | | Ps. | 202,434 | | | 8.12% | |
| (1) | | This amount forms part of the outstanding balance of “Short positions” in our consolidated balance sheet. For more information on short positions, see Note 11.b to our audited financial statements included elsewhere in this Report. |
In the future, we expect to continue using the funding sources described above in accordance with their availability, their cost, and our asset and liability management needs. The short-term nature of these funding sources, however, increases our liquidity risk and could cause liquidity problems for us in the future if deposits are not made in the volumes we expect or are not renewed. For example, we are aware of the risk that a substantial number of our depositors may withdraw their demand deposits or not roll over their time deposits upon maturity; however, we believe we can respond to a liquidity problem by increasing the interest rates we pay on time deposits, altering our mix of funding sources and by liquidating our short-term assets. We review our pricing policy daily and we believe we can reflect our cost of funding in the pricing of loans effectively, reducing the impact on net income.
We also have access to short- and long-term funding through the issuance of unsecured bonds (certificados bursátiles bancarios), time deposits (certificados de depósito bancario de dinero a plazo), promissory notes with interest payable at maturity (pagarés con rendimiento liquidable al vencimiento) and international funding through U.S. dollar-denominated issuances with longer maturities. As of December 31, 2018, the balance of our debt securities outstanding totaled Ps.140,290 million. See “—Debt Securities Outstanding.”
For debt financing, we rely in part on local, peso-denominated issuances, and we continue to be rated Aaa.mx and AAA(mex) by Moody’s and Fitch Ratings, respectively, with respect to our local peso-denominated long-term debt, with equivalent ratings for our local peso-denominated short-term debt. However, a downgrade in the sovereign debt ratings of Spain or Mexico, the global rating of Santander Spain, and/or our related ratings could adversely affect our financing costs in the international capital markets.
We do not rely in any material respect on funding from Banco Santander Parent, and Banco Santander Parent does not rely in any material respect on funding from us. As such, the elimination of funding to us from Banco Santander Parent or any deterioration of Banco Santander Parent’s financial condition or increase in its funding costs would not have an impact on us except to the limited extent disclosed under “Item 3. Key Information—D. Risk Factors—Risks Associated with Our Business—Credit, market and liquidity risk may have an adverse effect on our credit ratings and our cost of funds. Any downgrade in our credit rating would likely increase our cost of funding, require us to post additional collateral or take other
actions under some of our derivative contracts and adversely affect our interest margins and results of operations.”
Our management expects that our cash flows from operations will be sufficient to meet our liquidity requirements over the next 12 months, including our expected 2019 capital expenditures. For 2019, we have a capital expenditures budget of Ps.6,310 million (U.S.$321 million), 66.7% of which (Ps.4,211 million) will be spent on information technology and the rest of which will be spent on furniture, fixtures and equipment (Ps.2,099 million). In 2018, our capital expenditures were Ps.5,651 million (U.S.$288 million), 66.3% of which (Ps.3,745 million) was spent in information technology and the rest was spent on furniture, fixtures and equipment (Ps.1,905 million).
As of December 31, 2018, total interest-bearing liabilities denominated in dollars amounted to Ps.126,015 million, or U.S.$6,412 million, representing 15.0% of our total deposits and 17.7% of our customer deposits. The sources of such funding as of December 31, 2016, 2017 and 2018 were as follows:
| | | | | | | | | | | | | | | |
| | IFRS |
| | As of December 31, |
| | 2016 | | | 2017 | | | 2018 | | | 2018 |
| | (Millions of pesos) | | | (Millions of U.S.$)(1) |
| | | | | | | | | | | | | | | |
Demand deposits | | Ps. | 58,815 | | | Ps. | 49,716 | | | Ps. | 48,661 | | | U.S.$ | 2,476 |
Time deposits | | | 40,427 | | | | 15,119 | | | | 27,044 | | | | 1,376 |
Bank and other loans | | | 55,577 | | | | 45,646 | | | | 50,310 | | | | 2,560 |
Total | | Ps. | 154,819 | | | Ps. | 110,481 | | | Ps. | 126,015 | | | U.S.$ | 6,412 |
| (1) | | Translated at the rate of Ps.19.65 per U.S.$1.00 as calculated on December 31, 2018 and reported by the Mexican Central Bank in the Federal Official Gazette on January 2, 2019, as the exchange rate for the payment of obligations denominated in currencies other than pesos and payable within Mexico. These translations should not be interpreted as representations that the peso amounts represent, have been or could have been converted into, U.S. dollars at such or at any other exchange rate. See “Item 3. Key Information—A. Selected Financial Data—Exchange Rates.” |
Foreign Currency Position
Our foreign currency-denominated assets, most of which are U.S. dollar denominated, are funded from a number of sources, including: (i) savings accounts and time deposits from private banking customers and medium and large Mexican companies, primarily in the export sector; (ii) issuance of U.S. dollar-denominated certificates of deposit in the Mexican market; (iii) interbank deposits; (iv) trade and working capital financing facilities from Mexican development banks and from foreign export-import banks; and (v) issuance of securities in the international capital markets. We also obtain funding in foreign currency by swapping funding in Mexican pesos into U.S. dollars or euros through foreign currency derivatives (foreign currency swaps and cross-currency swaps) with certain local and foreign counterparties. Foreign currency funding rates are generally referenced to the London Interbank Offered Rate, or LIBOR.
Mexican Central Bank regulations require that a bank maintain open positions in foreign currencies no higher than a specified level with respect to its total Tier 1 capital. As of December 31, 2018, our foreign currency-denominated assets, including derivative transactions, totaled U.S.$63,045 million (Ps.1,240,884 million) and our foreign currency-denominated liabilities, including derivative transactions, totaled U.S.$63,514 million (Ps.1,248,122 million). As part of our asset and liability management strategy, we monitor closely our exposure to foreign currencies, with a view to minimizing the effect of exchange rate movements on our income.
As of December 31, 2018, we are also in compliance with the limits established for us by the Mexican Central Bank for foreign currency-denominated liabilities, which was U.S.$9,252 million (Ps.181,817 million). As of such date, our foreign currency-denominated liabilities were U.S.$6,536 million (Ps.128,435
million). For a discussion of the components of Tier 1 and Tier 2 capital, see “Item 4. Information on the Company—B. Business Overview—Supervision and Regulation.”
For the years ended December 31, 2016, 2017 and 2018, we were in compliance with all regulatory requirements relating to the ratio of U.S. dollar-denominated liabilities to total liabilities.
Deposits and Other Borrowings
The following tables set forth our average daily balance of liabilities for each of the periods presented, in each case together with the related average nominal interest rates paid thereon.
| | | | | | | | | | | | | | | | | | | | | | | | | | | | | | |
| | IFRS | |
| | For the year ended December 31, | |
| | 2016 | | | 2017 | | | 2018 | |
| | | | | | % of | | | | | | | | | | % of | | | | | | | | | | % of | | | | |
| | | | | | Total Average | | | Average | | | | | | | Total Average | | | Average | | | | | | | Total Average | | | Average | |
| | Average | | | Liabilities and | | | Nominal | | | Average | | | Liabilities and | | | Nominal | | | Average | | | Liabilities and | | | Nominal | |
| | Balance | | | Equity | | | Rate | | | Balance | | | Equity | | | Rate | | | Balance | | | Equity | | | Rate | |
| | (Millions of pesos, except percentages) | |
Demand accounts | | Ps. | 322,411 | | | 29.31% | | | 1.57% | | | Ps. | 366,380 | | | 30.81% | | | 2.43% | | | Ps. | 383,627 | | | 29.57% | | | 2.69% | |
Time deposits | | | 171,245 | | | 15.57% | | | 3.35% | | | | 208,459 | | | 17.53% | | | 4.80% | | | | 256,321 | | | 19.76% | | | 5.83% | |
Deposits from the Mexican Central Bank and credit institutions | | | 162,882 | | | 14.81% | | | 3.77% | | | | 123,073 | | | 10.35% | | | 6.15% | | | | 98,253 | | | 7.57% | | | 7.55% | |
Repurchase agreements | | | 90,619 | | | 8.24% | | | 4.22% | | | | 86,170 | | | 7.25% | | | 6.58% | | | | 87,540 | | | 6.75% | | | 7.59% | |
Marketable debt securities and other financial liabilities | | | 57,698 | | | 5.24% | | | 4.55% | | | | 58,661 | | | 4.93% | | | 6.30% | | | | 63,501 | | | 4.89% | | | 6.68% | |
Other liabilities(1) | | | 64,172 | | | 5.83% | | | 4.67% | | | | 65,210 | | | 5.48% | | | 6.56% | | | | 77,301 | | | 5.96% | | | 7.67% | |
Subordinated liabilities | | | 24,101 | | | 2.19% | | | 6.11% | | | | 24,427 | | | 2.05% | | | 6.55% | | | | 25,262 | | | 1.94% | | | 6.37% | |
Subtotal interest-bearing liabilities | | | 893,128 | | | 81.19% | | | 3.17% | | | | 932,380 | | | 78.40% | | | 4.52% | | | | 991,805 | | | 76.44% | | | 5.20% | |
Non-interest-bearing liabilities | | | 95,863 | | | 8.71% | | | | | | | 146,432 | | | 12.32% | | | | | | | 186,520 | | | 14.39% | | | | |
Total equity | | | 111,083 | | | 10.10% | | | | | | | 110,328 | | | 9.28% | | | | | | | 118,980 | | | 9.17% | | | | |
Subtotal non-interest-bearing liabilities and equity | | | 206,946 | | | 18.81% | | | | | | | 256,760 | | | 21.60% | | | | | | | 305,500 | | | 23.56% | | | | |
Total liabilities and equity | | Ps. | 1,100,074 | | | 100.00% | | | | | | Ps. | 1,189,140 | | | 100.00% | | | | | | Ps. | 1,297,305 | | | 100.00% | | | | |
| (1) | | This line includes the amount of financial liabilities arising from the outright sale or from pledging of financial assets acquired under reverse repurchase agreements, securities loans and sales of borrowed securities. |
Average time deposits as a share of average total liabilities and equity increased from 17.53% as of December 31, 2017 to 19.76% as of December 31, 2018, while the ratio of average demand accounts to average total liabilities and equity decreased from 30.81% to 29.57% over the same period.
Average non-interest-bearing liabilities as a share of average total liabilities and equity increased from 12.32% as of December 31, 2017 to 14.39% as of December 31, 2018.
Composition of Deposits
The following table sets forth the composition of our demand and time deposits as of December 31, 2016, 2017 and 2018.
| | | | | | | | | | | |
| | IFRS |
| | As of December 31, |
| | 2016 | | | 2017 | | | 2018 |
| | (Millions of pesos) |
Demand deposits | | | | | | | | | | | |
Interest-bearing deposits | | Ps. | 246,101 | | | Ps. | 256,635 | | | Ps. | 237,948 |
Non-interest-bearing deposits | | | 157,222 | | | | 165,393 | | | | 205,275 |
Subtotal | | Ps. | 403,323 | | | Ps. | 422,028 | | | Ps. | 443,223 |
Time deposits | | | | | | | | | | | |
Notes with interest payable at maturity | | Ps. | 124,375 | | | Ps. | 141,883 | | | Ps. | 154,838 |
Fixed-term deposits(1) | | | 5,454 | | | | 5,598 | | | | 3,778 |
Foreign currency time deposits(2) | | | 40,427 | | | | 15,119 | | | | 27,044 |
Subtotal | | Ps. | 170,256 | | | Ps. | 162,600 | | | Ps. | 185,660 |
Total | | Ps. | 573,579 | | | Ps. | 584,628 | | | Ps. | 628,883 |
| (1) | | As of December 31, 2016, 2017 and 2018 we had not received any fixed-term deposits from the Mexican Central Bank nor other credit institutions. |
| (2) | | As of December 31, 2016, includes Ps.29,848 million of foreign currency time deposits from other credit institutions. As of December 31, 2017, includes Ps.3,136 million of foreign currency time deposits from other credit institutions. As of December 31, 2018, includes Ps.10,018 million of foreign currency time deposits from other credit institutions. |
Debt Securities Outstanding
The following table sets forth the composition, term and rate of our outstanding debt securities as of December 31, 2018.
| | | | | | | | | |
Instrument | | Amount | | | Maturity Date | | | Rate | |
| | (Millions of pesos) | | | | | | | |
| | | | | | | | | |
Certificates of deposit (unsecured) | | 8 | | | 02/01/2019 | | | 8.14% | |
Certificates of deposit (unsecured) | | 15 | | | 03/01/2019 | | | 8.14% | |
Certificates of deposit (unsecured) | | 28 | | | 04/01/2019 | | | 8.14% | |
Certificates of deposit (unsecured) | | 28 | | | 07/01/2019 | | | 8.15% | |
Certificates of deposit (unsecured) | | 23 | | | 08/01/2019 | | | 8.14% | |
Certificates of deposit (unsecured) | | 26 | | | 09/01/2019 | | | 8.16% | |
Certificates of deposit (unsecured) | | 21 | | | 10/01/2019 | | | 8.16% | |
Certificates of deposit (unsecured) | | 16 | | | 11/01/2019 | | | 8.15% | |
Certificates of deposit (unsecured) | | 22 | | | 14/01/2019 | | | 8.15% | |
Certificates of deposit (unsecured) | | 19 | | | 15/01/2019 | | | 8.15% | |
Certificates of deposit (unsecured) | | 12 | | | 16/01/2019 | | | 8.17% | |
Certificates of deposit (unsecured) | | 20 | | | 17/01/2019 | | | 8.17% | |
Certificates of deposit (unsecured) | | 1,050 | | | 17/01/2019 | | | 8.12% | |
Certificates of deposit (unsecured) | | 20 | | | 18/01/2019 | | | 8.18% | |
Certificates of deposit (unsecured) | | 23 | | | 21/01/2019 | | | 8.36% | |
Certificates of deposit (unsecured) | | 21 | | | 22/01/2019 | | | 8.38% | |
Certificates of deposit (unsecured) | | 16 | | | 23/01/2019 | | | 8.38% | |
Certificates of deposit (unsecured) | | 28 | | | 24/01/2019 | | | 8.38% | |
Certificates of deposit (unsecured) | | 19 | | | 25/01/2019 | | | 8.39% | |
Certificates of deposit (unsecured) | | 34 | | | 28/01/2019 | | | 8.40% | |
Certificates of deposit (unsecured) | | 24 | | | 29/01/2019 | | | 8.13% | |
Certificates of deposit (unsecured) | | 39 | | | 30/01/2019 | | | 8.14% | |
Certificates of deposit (unsecured) | | 65 | | | 31/01/2019 | | | 8.14% | |
Certificates of deposit (unsecured) | | 1,000 | | | 08/02/2019 | | | 8.12% | |
Certificates of deposit (unsecured) | | 60 | | | 11/02/2019 | | | 8.38% | |
Certificates of deposit (unsecured) | | 900 | | | 15/02/2019 | | | 8.12% | |
Certificates of deposit (unsecured) | | 1,000 | | | 08/02/2019 | | | 8.38% | |
Certificates of deposit (unsecured) | | 700 | | | 25/02/2019 | | | 8.12% | |
Certificates of deposit (unsecured) | | 1,500 | | | 15/03/2019 | | | 8.12% | |
Certificates of deposit (unsecured) | | 1,500 | | | 26/03/2019 | | | 8.44% | |
Certificates of deposit (unsecured) | | 550 | | | 01/02/2019 | | | 8.34% | |
Certificates of deposit (unsecured) | | 1,000 | | | 16/05/2019 | | | 8.12% | |
Certificates of deposit (unsecured) | | 800 | | | 13/06/2019 | | | 8.12% | |
Certificates of deposit (unsecured) | | 9 | | | 20/06/2019 | | | 8.89% | |
Certificates of deposit (unsecured) | | 12 | | | 21/06/2019 | | | 8.89% | |
Certificates of deposit (unsecured) | | 26 | | | 24/06/2019 | | | 8.90% | |
Certificates of deposit (unsecured) | | 8 | | | 25/06/2019 | | | 8.89% | |
Certificates of deposit (unsecured) | | 23 | | | 26/06/2019 | | | 8.91% | |
Certificates of deposit (unsecured) | | 40 | | | 27/06/2019 | | | 8.91% | |
Certificates of deposit (unsecured) | | 40 | | | 28/06/2019 | | | 8.90% | |
Certificates of deposit (unsecured) | | 80 | | | 01/07/2019 | | | 8.90% | |
Certificates of deposit (unsecured) | | 23 | | | 02/07/2019 | | | 8.90% | |
Certificates of deposit (unsecured) | | 36 | | | 03/07/2019 | | | 8.92% | |
Certificates of deposit (unsecured) | | 43 | | | 04/07/2019 | | | 8.92% | |
Certificates of deposit (unsecured) | | 1,200 | | | 04/07/2019 | | | 8.12% | |
Certificates of deposit (unsecured) | | 43 | | | 05/07/2019 | | | 8.93% | |
Certificates of deposit (unsecured) | | 51 | | | 08/07/2019 | | | 9.11% | |
Certificates of deposit (unsecured) | | 57 | | | 09/07/2019 | | | 9.13% | |
Certificates of deposit (unsecured) | | 66 | | | 10/07/2019 | | | 9.13% | |
Certificates of deposit (unsecured) | | 48 | | | 11/07/2019 | | | 9.13% | |
Certificates of deposit (unsecured) | | 36 | | | 12/07/2019 | | | 9.14% | |
Certificates of deposit (unsecured) | | 52 | | | 15/07/2019 | | | 9.15% | |
Certificates of deposit (unsecured) | | 41 | | | 16/07/2019 | | | 8.88% | |
Certificates of deposit (unsecured) | | 33 | | | 17/07/2019 | | | 8.88% | |
Certificates of deposit (unsecured) | | 43 | | | 18/07/2019 | | | 8.89% | |
Certificates of deposit (unsecured) | | 46 | | | 19/07/2019 | | | 8.89% | |
Certificates of deposit (unsecured) | | 1,000 | | | 19/07/2019 | | | 8.12% | |
Certificates of deposit (unsecured) | | 39 | | | 22/07/2019 | | | 8.90% | |
Certificates of deposit (unsecured) | | 28 | | | 23/07/2019 | | | 8.89% | |
| | | | | | | | | |
Instrument | | Amount | | | Maturity Date | | | Rate | |
| | (Millions of pesos) | | | | | | | |
| | | | | | | | | |
Certificates of deposit (unsecured) | | 41 | | | 24/07/2019 | | | 8.91% | |
Certificates of deposit (unsecured) | | 500 | | | 24/07/2019 | | | 8.12% | |
Certificates of deposit (unsecured) | | 40 | | | 25/07/2019 | | | 8.91% | |
Certificates of deposit (unsecured) | | 34 | | | 26/07/2019 | | | 8.90% | |
Certificates of deposit (unsecured) | | 43 | | | 29/07/2019 | | | 8.90% | |
Certificates of deposit (unsecured) | | 50 | | | 25/07/2019 | | | 8.36% | |
Certificates of deposit (unsecured) | | 66 | | | 30/07/2019 | | | 8.90% | |
Certificates of deposit (unsecured) | | 92 | | | 31/07/2019 | | | 8.92% | |
Certificates of deposit (unsecured) | | 32 | | | 01/08/2019 | | | 8.92% | |
Certificates of deposit (unsecured) | | 200 | | | 01/08/2019 | | | 8.40% | |
Certificates of deposit (unsecured) | | 18 | | | 02/08/2019 | | | 8.93% | |
Certificates of deposit (unsecured) | | 32 | | | 05/08/2019 | | | 9.11% | |
Certificates of deposit (unsecured) | | 20 | | | 06/08/2019 | | | 9.13% | |
Certificates of deposit (unsecured) | | 52 | | | 07/08/2019 | | | 9.13% | |
Certificates of deposit (unsecured) | | 71 | | | 08/08/2019 | | | 9.13% | |
Certificates of deposit (unsecured) | | 2,000 | | | 06/13/2019 | | | 8.12% | |
Certificates of deposit (unsecured) | | 1 | | | 13/08/2019 | | | 8.88% | |
Certificates of deposit (unsecured) | | 350 | | | 22/08/2019 | | | 8.39% | |
Certificates of deposit (unsecured) | | 600 | | | 28/08/2019 | | | 8.12% | |
Certificates of deposit (unsecured) | | 1,700 | | | 02/09/2019 | | | 8.12% | |
Certificates of deposit (unsecured) | | 500 | | | 25/09/2019 | | | 8.40% | |
Certificates of deposit (unsecured) | | 600 | | | 27/09/2019 | | | 8.41% | |
Certificates of deposit (unsecured) - USD | | 1 | | | 04/01/2019 | | | 0.98% | |
Certificates of deposit (unsecured) - USD | | 2 | | | 03/05/2019 | | | 0.98% | |
Certificates of deposit (unsecured) - USD | | 1,100 | | | 08/11/2019 | | | 8.12% | |
Certificates of deposit (unsecured) - USD | | 112 | | | 04/01/2019 | | | 2.00% | |
Certificates of deposit (unsecured) - USD | | 13 | | | 04/03/2019 | | | 1.50% | |
Certificates of deposit (unsecured) - USD | | 13 | | | 16/05/2019 | | | 1.51% | |
Certificates of deposit (unsecured) - USD | | 22 | | | 30/09/2019 | | | 1.70% | |
Certificates of deposit (unsecured) - USD | | 33 | | | 20/11/2019 | | | 1.75% | |
Certificates of deposit (unsecured) - USD | | 1 | | | 20/11/2019 | | | 1.75% | |
Certificates of deposit (unsecured) - USD | | 12 | | | 20/11/2019 | | | 1.75% | |
Certificates of deposit (unsecured) - USD | | 12 | | | 20/11/2019 | | | 1.75% | |
Certificates of deposit (unsecured) - USD | | 12 | | | 29/11/2019 | | | 1.75% | |
Certificates of deposit (unsecured) - USD | | 22 | | | 17/12/2019 | | | 1.75% | |
Certificates of deposit (unsecured) - USD | | 105 | | | 24/12/2019 | | | 1.75% | |
Certificates of deposit (unsecured) - USD | | 4 | | | 16/05/2019 | | | 1.65% | |
Certificates of deposit (unsecured) - USD | | 4 | | | 16/05/2019 | | | 1.65% | |
Certificates of deposit (unsecured) - USD | | 4 | | | 16/05/2019 | | | 1.65% | |
Certificates of deposit (unsecured) - USD | | 4 | | | 16/05/2019 | | | 1.65% | |
Certificates of deposit (unsecured) - USD | | 58 | | | 24/12/2019 | | | 1.85% | |
Certificates of deposit (unsecured) - USD | | 77 | | | 24/12/2019 | | | 1.75% | |
Senior Unsecured Notes | | 19,482 | | | 09/11/2022 | | | 4.125% | |
Structured bank bonds | | 16 | | | 20/02/2020 | | | Guaranteed rate subject to foreign exchange rate | |
Structured bank bonds | | 139 | | | 15/10/2019 | | | 9.54% | |
Structured bank bonds | | 13 | | | 04/01/2019 | | | 0.25% | |
Structured bank bonds | | 32 | | | 14/01/2019 | | | 0.25% | |
Structured bank bonds | | 27 | | | 18/01/2019 | | | 0.25% | |
Structured bank bonds | | 10 | | | 09/01/2019 | | | 11.00% | |
Structured bank bonds | | 16 | | | 25/01/2019 | | | 0.25% | |
Structured bank bonds | | 40 | | | 08/01/2019 | | | Guaranteed rate subject to foreign exchange rate | |
Structured bank bonds | | 24 | | | 10/01/2019 | | | 12.00% | |
Structured bank bonds | | 25 | | | 10/01/2019 | | | 12.00% | |
Structured bank bonds | | 60 | | | 10/01/2019 | | | Guaranteed rate subject to foreign exchange rate | |
Structured bank bonds | | 39 | | | 03/01/2019 | | | 6.34% | |
Structured bank bonds | | 70 | | | 03/01/2019 | | | 12.23% | |
Structured bank bonds | | 10 | | | 18/01/2019 | | | 12.00% | |
Structured bank bonds | | 59 | | | 11/01/2019 | | | 5.81% | |
Structured bank bonds | | 25 | | | 01/02/2019 | | | 0.25% | |
Structured bank bonds | | 15 | | | 05/02/2019 | | | 11.00% | |
Structured bank bonds | | 43 | | | 09/11/2020 | | | Guaranteed rate subject to SXDP | |
Structured bank bonds | | 201 | | | 09/11/2020 | | | Guaranteed rate subject to SXDP | |
Structured bank bonds | | 742 | | | 23/10/2020 | | | TIIE | |
Structured bank bonds | | 430 | | | 26/10/2020 | | | Guaranteed rate subject to SXDP | |
Structured bank bonds | | 19 | | | 07/11/2019 | | | Guaranteed rate subject to SXDP | |
| | | | | | | | | |
Instrument | | Amount | | | Maturity Date | | | Rate | |
| | (Millions of pesos) | | | | | | | |
| | | | | | | | | |
Structured bank bonds | | 8 | | | 05/11/2020 | | | TIIE | |
Structured bank bonds | | 163 | | | 14/11/2019 | | | Guaranteed rate subject to SXDP | |
Structured bank bonds | | 118 | | | 23/11/2020 | | | Guaranteed rate subject to SXDP | |
Structured bank bonds | | 154 | | | 14/12/2020 | | | Guaranteed rate subject to SXDP | |
Structured bank bonds | | 11 | | | 14/02/2019 | | | Guaranteed rate subject to IBEX35 | |
Structured bank bonds | | 40 | | | 23/02/2021 | | | TIIE | |
Structured bank bonds | | 23 | | | 03/03/2021 | | | Guaranteed rate subject to SXDP | |
Structured bank bonds | | 5 | | | 16/03/2021 | | | TIIE | |
Structured bank bonds | | 20 | | | 23/05/2019 | | | Guaranteed rate subject to IBEX35 | |
Structured bank bonds | | 11 | | | 27/03/2019 | | | Guaranteed rate subject to NIKKEI 225 | |
Structured bank bonds | | 18 | | | 03/04/2019 | | | Guaranteed rate subject to NIKKEI 225 | |
Structured bank bonds | | 111 | | | 26/04/2019 | | | Guaranteed rate subject to SX7E | |
Structured bank bonds | | 49 | | | 26/04/2019 | | | Guaranteed rate subject to Euro STOXX 50 | |
Structured bank bonds | | 6 | | | 26/04/2019 | | | Guaranteed rate subject to SX7E | |
Structured bank bonds | | 17 | | | 12/05/2021 | | | TIIE | |
Structured bank bonds | | 1 | | | 06/06/2019 | | | Guaranteed rate subject to IBEX35 | |
Structured bank bonds | | 27 | | | 06/06/2019 | | | Guaranteed rate subject to IBEX35 | |
Structured bank bonds | | 212 | | | 06/06/2019 | | | Guaranteed rate subject to IBEX35 | |
Structured bank bonds | | 57 | | | 06/06/2019 | | | Guaranteed rate subject to IBEX35 | |
Structured bank bonds | | 287 | | | 23/04/2021 | | | TIIE | |
Structured bank bonds | | 99 | | | 04/09/2019 | | | Guaranteed rate subject to IBEX35 | |
Structured bank bonds | | 14 | | | 19/12/2019 | | | Guaranteed rate subject to Euro STOXX 50 | |
Structured bank bonds | | 21 | | | 03/10/2019 | | | Guaranteed rate subject to NKY and SXE | |
Structured bank bonds | | 5 | | | 03/03/2021 | | | Guaranteed rate subject to SXDP | |
Structured bank bonds | | 10 | | | 26/06/2019 | | | TIIE | |
Structured bank bonds | | 55 | | | 24/05/2021 | | | TIIE | |
Structured bank bonds | | 91 | | | 25/09/2019 | | | TIIE | |
Structured bank bonds | | 94 | | | 16/10/2019 | | | Guaranteed rate subject to Euro STOXX 50 | |
Structured bank bonds | | 117 | | | 21/02/2019 | | | Guaranteed rate subject to Euro STOXX 50 | |
Structured bank bonds | | 37 | | | 27/12/2019 | | | Guaranteed rate subject to SX7E | |
Structured bank bonds | | 15 | | | 20/02/2020 | | | Guaranteed rate subject to Euro SX5E | |
Structured bank bonds | | 19 | | | 05/03/2019 | | | Guaranteed rate subject to NIKKEI 225 | |
Structured bank bonds | | 55 | | | 01/03/2019 | | | Guaranteed rate subject to IPC | |
Structured bank bonds | | 29 | | | 27/03/2019 | | | Guaranteed rate subject to IPC | |
Structured bank bonds | | 263 | | | 02/06/2020 | | | Guaranteed rate subject to Euro SX5E | |
Structured bank bonds | | 527 | | | 25/03/2019 | | | Guaranteed rate subject to IPC | |
Structured bank bonds | | 68 | | | 22/11/2019 | | | Guaranteed rate subject to S&P 500 | |
Structured bank bonds | | 15 | | | 27/06/2019 | | | Guaranteed rate subject to IPC | |
Structured bank bonds | | 117 | | | 24/06/2019 | | | Guaranteed rate subject to IPC | |
Structured bank bonds | | 120 | | | 29/05/2019 | | | Guaranteed rate subject to S&P and IPC | |
Structured bank bonds | | 10 | | | 11/07/2019 | | | Guaranteed rate subject to IPC | |
Structured bank bonds | | 10 | | | 30/07/2019 | | | Guaranteed rate subject to IPC | |
Structured bank bonds | | 10 | | | 30/07/2019 | | | Guaranteed rate subject to IPC | |
Structured bank bonds | | 177 | | | 17/05/2019 | | | Guaranteed rate subject to Euro STOXX 50 | |
Promissory notes | | 1,385 | | | 08/08/2019 | | | 8.3300% | |
Promissory notes | | 461 | | | 21/08/2019 | | | 8.3800% | |
Promissory notes | | 1,291 | | | 20/08/2019 | | | 8.3800% | |
Promissory notes | | 646 | | | 06/09/2019 | | | 8.3500% | |
Promissory notes | | 830 | | | 17/09/2019 | | | 8.3900% | |
Promissory notes | | 861 | | | 09/04/2019 | | | 8.2200% | |
Promissory notes | | 2,109 | | | 31/05/2019 | | | 8.6600% | |
Promissory notes | | 3,500 | | | 03/01/2019 | | | 8.2500% | |
Promissory notes | | 3,500 | | | 03/01/2019 | | | 8.2500% | |
Promissory notes | | 2,990 | | | 07/01/2019 | | | 8.2500% | |
Promissory notes | | 2,990 | | | 07/01/2019 | | | 8.2500% | |
Promissory notes | | 2,519 | | | 07/01/2019 | | | 8.2500% | |
Promissory notes | | 3,477 | | | 24/01/2019 | | | 8.6700% | |
Promissory notes | | 3,477 | | | 24/01/2019 | | | 8.6700% | |
Promissory notes | | 3,047 | | | 24/01/2019 | | | 8.6700% | |
Promissory notes | | 2,500 | | | 30/01/2019 | | | 8.25% | |
Promissory notes | | 65 | | | 07/01/2019 | | | 8.20% | |
Unsecured bonds | | 1,700 | | | 09/03/2021 | | | 8.91% | |
Unsecured bonds | | 4,000 | | | 14/06/2021 | | | TIIE + 38 basis points | |
Unsecured bonds | | 3,000 | | | 01/09/2026 | | | 7.19% | |
Unsecured bonds | | 6,484 | | | 10/02/2020 | | | Libor + 20 basis points | |
| | | | | | | | | |
Instrument | | Amount | | | Maturity Date | | | Rate | |
| | (Millions of pesos) | | | | | | | |
| | | | | | | | | |
Unsecured bonds | | 4,461 | | | 06/05/2022 | | | TIIE + 15 basis points | |
Mortgage-backed bonds | | 100 | | | 05/25/2032 | | | 5.00% | |
Mortgage-backed bonds | | 15 | | | 05/25/2032 | | | 6.40% | |
Tier II Subordinated Capital Notes | | 25,873 | | | 10/20/2046 | | | 5.95% | |
Subordinated Additional Tier 1 Capital | | 9,809 | | | 01/30/2024 | | | 8.50% | |
Tier II Subordinated Preferred Capital Notes | | 1,546 | | | 10/01/2028 | | | 5.95% | |
| | 139,852 | | | | | | | |
Transaction costs and accrued interest | | 438 | | | | | | | |
Total issuances | | 140,290 | | | | | | | |
The Additional Tier 1 Capital Notes
On December 29, 2016, we issued perpetual subordinated non-preferred contingent convertible additional Tier 1 capital notes (the “Back-to-Back notes”) in an aggregate principal amount of U.S.$500,000,000, under an indenture dated as of December 27, 2016, as supplemented by a first supplemental indenture dated as of December 27, 2016 (the “Back-to-Back Indenture”), at an issue price of 100%. The Former Holding Company purchased 100% of the aggregate principal amount of the Back-to-Back notes. At the same time, the Former Holding Company issued perpetual subordinated non-preferred contingent convertible additional Tier 1 capital notes (the “AT1 Notes”) in the same principal amount as the aggregate principal amount of the Back-to-Back notes and with substantially the same terms and conditions as the Back-to-Back notes, issued pursuant to an indenture that is substantially the same as the Back-to-Back Indenture (the “Tier 1 indenture”). We used the net proceeds of the offering of the Back-to-Back notes for general corporate purposes and the Former Holding Company used the proceeds of the offering of the AT1 Notes to purchase the Back-to-Back notes. In connection with the Merger, the Back-to-Back notes were cancelled and we assumed all of the payment and other obligations of the Former Holding Company under the AT1 Notes and the Tier 1 indenture by executing a supplemental indenture to the Tier 1 indenture (the “Second Supplemental Indenture”) with the Former Holding Company and The Bank of New York Mellon.
Interest on the AT1 Notes is due and payable only at our sole discretion and we have sole and absolute discretion at all times and for any reason to cancel any interest payment in whole or in part that would otherwise be payable on any interest payment date. In addition, interest due on the AT1 Notes will be automatically canceled upon occurrence of certain capital events. Such canceled interest shall not accumulate or be due and payable at any time thereafter. The AT1 Notes have no fixed maturity or fixed redemption date, and bear interest at a rate equal to 8.5% per annum. Interest on the AT1 Notes is paid quarterly on January 20, April 20, July 20 and October 20 of each year, commencing on April 20, 2017.
Subject to a prior redemption or one or more automatic conversions, from and including the date on which the AT1 Notes were initially issued, to but excluding January 20, 2022 (the “First Call Date”), interest will accrue on the then current principal amount of notes at an initial rate equal to 8.5% per annum. The First Call Date and every fifth anniversary thereafter shall each be a “Reset Date”. Subject to a prior redemption or one or more automatic conversions, from and including each Reset Date, including the First Call Date, to but excluding the next succeeding Reset Date, interest will accrue on the then current principal amount at a rate per annum equal to the sum of the then-prevailing Treasury Yield on the relevant Reset Determination Date and 647.20 basis points (rounded to two decimal places, with 0.005 being rounded down).
We may redeem the AT1 Notes at 100% of their principal amount plus accrued but unpaid (and not canceled) interest, plus additional interest, if any, to but excluding the date fixed for redemption, (i) in whole or in part, on January 20, 2022 and on any interest payment date thereafter, (ii) in whole but not in part upon the occurrence of certain tax events affecting the withholding taxes payable on the AT1 Notes, or (iii) in whole but not in part upon the occurrence of certain special events, subject, in each case, to certain conditions. Any such redemption shall be subject to certain regulatory requirements, including obtaining prior authorization from Banco de México.
Upon the occurrence of certain conversion trigger events (including when our Fundamental Capital Ratio, as calculated pursuant to the applicable Mexican Capitalization Requirements, is equal to or below 5.125%), on the conversion date, the then current principal amount of the AT1 Notes will be automatically reduced in one or more automatic conversions and the converted principal amount relating to such automatic conversions shall be converted exclusively into (i) if the holder of the AT1 Notes is Banco Santander Parent, our Series F shares and (ii) if the holder of the AT1 Notes is not Banco Santander Parent, our Series B shares at the Conversion Price. The AT1 Notes are not convertible at the option of the holders at any time.
The conversion price shall be, if the ordinary shares are: (i) then admitted to trading on the Mexican Stock Exchange, the higher of: (a) the volume weighted average of the Ordinary Shares closing price on the Mexican Stock Exchange for the 30 consecutive business days immediately preceding the conversion date, with each closing price for the 30 consecutive Business Days being converted from Mexican pesos into U.S. dollars at the then-prevailing exchange rate; or (b) floor price of Ps.20.30 converted into U.S. dollars at the then-prevailing exchange rate; (ii) not then admitted to trading on the Mexican Stock Exchange, the floor price of Ps.20.30 converted into U.S. dollars at the then-prevailing exchange rate.
Banco Santander Parent purchased U.S.$441,095,000 aggregate principal amount of the AT1 Notes in the offering made by our Former Holding Company.
The AT1 Notes are subordinated obligations and rank (i) subordinate and junior in right of payment and in liquidation to all of our present and future senior indebtedness and subordinated preferred indebtedness, (ii) pari passu without preference among themselves and with all of our present and future other unsecured subordinated non-preferred indebtedness and (iii) senior only to all classes of our capital stock.
The 2022 Notes
In November 2012, we issued senior notes in an aggregate principal amount of U.S.$1.0 billion under an indenture dated as of November 9, 2012, which we refer to as the 2022 notes. The 2022 notes were issued at an issue price of 98.18%. The 2022 notes mature on November 9, 2022 and bear interest at a rate per annum equal to 4.125%. Interest is paid semi-annually on May 9 and November 9 of each year. The net proceeds from this issuance were used to extend the duration of our liabilities and to refinance indebtedness maturing in the first half of 2013.
The 2022 notes are redeemable at our option at any time prior to maturity, in whole but not in part, at par plus accrued and unpaid interest upon the occurrence of certain specified changes in Mexican laws affecting the withholding tax applicable to payments under the 2022 notes. We may also redeem the 2022 notes, in whole or in part, at the greater of 100% of their principal amount outstanding and a make-whole amount defined as the sum of the present values of the remaining scheduled payments of principal and interest thereon (exclusive of interest accrued to the date of redemption) discounted to the redemption date on a semiannual basis (assuming a 360-day year consisting of twelve 30-day months) at the Treasury Rate plus 40 basis points, plus, in each case, accrued interest thereon to the date of redemption and any additional amounts payable with respect thereto.
The 2022 notes are not secured or guaranteed by any of our affiliated companies, by the IPAB or any other Mexican governmental agency, or by any other entity, and the 2022 notes are not convertible, by their terms, into our shares or equity capital. The 2022 notes, other than as set forth below, rank pari passu in right of payment with all of our other unsecured obligations other than obligations that are, by their terms, expressly subordinated in right of payment to the 2022 notes. The notes are effectively subordinated to (i) all of our secured indebtedness with respect and up to the value of our assets securing that indebtedness, (ii) certain direct, unconditional and unsecured general obligations that in case of our insolvency are granted preferential treatment pursuant to Mexican law (including tax and labor claims) and (iii) all of the existing and future liabilities of our subsidiaries, including trade payables.
The indenture governing the 2022 notes imposes certain restrictions on our ability to consolidate with or merge into any other corporation or convey or transfer its properties and assets substantially as an entirety to any person. However, the indenture does not limit our ability to incur senior, secured or other additional indebtedness (including additional 2022 notes), our ability to grant liens on its assets and properties, its payment of dividends or require us to create or maintain any reserves.
The indenture governing the 2022 notes also provides for events of default, which, if any of them occurs, would permit or require, as applicable, the principal and interest on all then outstanding 2022 notes to be due and payable immediately.
We may issue additional notes from time to time pursuant to the indenture governing the 2022 notes.
The 2024 Notes
In December 2013, we issued Basel III compliant Tier 2 Subordinated Capital Notes in an aggregate principal amount of U.S.$1.3 billion under an indenture dated December 19, 2013, which we refer to as the 2024 notes. Banco Santander Parent purchased 75% or U.S.$975 million of the aggregate principal amount of the 2024 notes. The 2024 notes were issued at an issue price of 99.235%. The 2024 notes mature on January 30, 2024 and bear interest at a rate per annum equal to 5.95%. Interest is paid semi-annually on January 30 and July 30 of each year. The net proceeds from this issuance were used for general corporate purposes, including to enhance our capital in connection with the December 2013 cash dividend payment. See “Item 8. Financial Information—A. Consolidated Statements and Other Financial Information—Dividends and Dividend Policy.” After consummation of the 2024 notes offering and the payment of the December 2013 cash dividend the Bank posted a Tier 1 capital ratio of 12.8 and a Tier 2 capital ratio of 3.2.
The 2024 notes are redeemable at our option on January 30, 2019 only, or at any time if there are certain specified changes in (i) the Mexican laws affecting the withholding tax applicable to payments of interest under the 2024 notes, (ii) the Mexican laws that would change the capital treatment of the 2024 notes or (iii) the applicable tax laws that result in interest on the 2024 notes not being deductible by us.
In September 2018, we launched a cash tender offer for any and all of the outstanding 2024 notes. On October 1, 2018, using the net proceeds from the concurrent offering of the 2028 notes (as defined below), we repurchased U.S.$1.2 billion, or 94.07%, of the 2024 notes outstanding pursuant to the tender offer. In addition, on November 29, 2018, we filed with the Mexican Central Bank an application for the authorization to redeem the remaining 2024 notes outstanding on January 30, 2019, in accordance with the terms of the indenture governing the 2024 notes.
On January 30, 2019, we redeemed in full of all of the 2024 notes. As a result of the foregoing redemption, all outstanding 2024 notes have been redeemed and cancelled.
The 2028 Notes
In October 2018, we issued Basel III-compliant Tier 2 Subordinated Preferred Capital Notes due 2028 in an aggregate principal amount of U.S.$1.3 billion under an indenture dated September 27, 2018, which we refer to as the 2028 notes. Banco Santander Parent purchased 75% or U.S.$975 million of the aggregate principal amount of the 2028 notes. The 2028 notes were issued at an issue price of 100%. The 2028 notes mature on October 1, 2028 and bear interest at a rate per annum equal to 5.95%. Interest is paid semi-annually on April 1 and October 1 of each year. The net proceeds from this issuance were used to repurchase U.S.$1.2 billion, or 94.07%, of the outstanding 2024 notes pursuant to a concurrent cash tender offer.
The 2028 notes are redeemable at our option on October 1, 2023 only, or at any time if there are certain specified changes in (i) the Mexican laws affecting the withholding tax applicable to payments of interest
under the 2028 notes, (ii) the Mexican laws that would change the capital treatment of the 2028 notes or (iii) the applicable tax laws that result in interest on the 2028 notes not being deductible by us.
Principal and interest on the 2028 notes will be deferred and will not be paid under certain circumstances. The indenture governing the 2028 notes provides us with the ability to automatically write down the current principal amount of the 2028 notes upon the occurrence of a trigger event and such write-down will not constitute an event of default.
The 2028 notes are not secured or guaranteed, or otherwise eligible for reimbursement, by the IPAB or any other Mexican governmental agency, or any of our subsidiaries or affiliates and the 2028 notes are not convertible, by their terms, into any debt securities, shares or equity capital of any of our subsidiaries or affiliates. The 2028 notes constitute subordinated indebtedness and rank (i) subordinate and junior in right of payment and in liquidation to all of our present and future senior indebtedness, (ii) pari passu without preference among themselves and with all other unsecured subordinated preferred indebtedness and (iii) senior only to all of our present and future subordinated non-preferred indebtedness and all classes of our equity or capital stock.
The indenture governing the 2028 notes imposes certain restrictions on our ability to consolidate with or merge into any other corporation or convey or transfer its properties and assets substantially as an entirety to any person. However, the indenture does not limit our ability to incur senior, secured or other additional indebtedness (including additional 2028 notes), our ability to grant liens on its assets and properties, its payment of dividends or require us to create or maintain any reserves.
The indenture governing the 2028 notes also provides for events of default, which would permit or require, as applicable, the principal and interest on all then outstanding 2028 notes to be due and payable immediately.
Additional domestic issue
On April 8, 2019, the Bank issued (i) Ps.2.3 billion aggregate principal amount of unsecured notes in the local market with a 1,092-day maturity that will bear interest at an interest rate of TIIE28 plus 0.10%, which will be payable every 28 days, and (ii) Ps.4.6 billion with a 2,548-day maturity that will bear interest at an interest rate of 8.95%, which will be payable every 182 days.
C. Research and Development, Patents and Licenses, etc.
In Mexico, ownership of trademarks can be acquired only through a validly approved registration with the IMPI, the agency responsible for registering trademarks and patents in Mexico. After registration, the owner has exclusive use of the trademark in Mexico for ten years. Trademarks registrations can be renewed indefinitely for additional ten-year periods, if the registrant proves that it has used such trademark within the last three years.
We have several trademarks, most of which are brand names of our products or services. All our material trademarks are registered or have been submitted to IMPI for registration by the Santander Group or us.
We or one of our affiliates owns the principal domain names used in our business, which include www.santander.com.mx, www.llamasantander.com.mx and www.supernetempresas.com.mx. None of the information contained on our websites is incorporated by reference into, or forms part of, this Report.
We do not currently conduct any significant research and development activities.
D. Trend Information
The Mexican financial services sector is likely to remain competitive with many financial services providers and alternative distribution channels. Additionally, further consolidation in the sector (through mergers, acquisitions or alliances) is likely to occur as other major banks look to increase their market share, combine with complementary businesses or strengthen their balance sheets. In addition, regulatory changes will take place in the future that we expect will increase the overall level of regulation in the sector.
The following are the most important trends, uncertainties and events that are reasonably likely to have a material adverse effect on us or that would cause the disclosed financial information not to be indicative of our future operating results or our financial condition:
| · | | uncertainties relating to economic growth expectations and interest rate cycles in Mexico and continued instability and volatility in the financial markets, and the impact they may have over the yield curve and exchange rates; |
| · | | the resulting effect of changes in U.S. monetary policy and its effect on global financial markets and on local interest and exchange rates; |
| · | | changes in the credit quality of our loan portfolio because of inorganic or organic growth; |
| · | | increases in our cost of funding could adversely affect our net interest margin as a consequence of timing differences in the repricing of our assets and liabilities; |
| · | | increased competition that may lead to tightening of our margins; |
| · | | inflationary pressures that may lead to increases in interest rates and decreases in growth; |
| · | | acquisitions or restructurings of businesses that do not perform in accordance with our expectations or that subject us to previously unknown risks; and |
| · | | increased regulation, government intervention and new laws prompted by the global financial crisis which could change our industry and require us to modify our businesses or operations. |
The Mexican economy continues to be influenced by the U.S. economy, and therefore, any changes in U.S. economic conditions may impact the economy of Mexico. In particular, the possible trend of monetary policy in the U.S., the effect on industrial production of the appreciation of the U.S. dollar against other currencies, and any change to the United States’ trade and immigration policies with respect to Mexico could negatively impact the Mexican economy and affect the volatility of its financial markets, interest rates and credit demand, thus having a material adverse effect on our financial condition and results of operations.
E. Off-Balance Sheet Arrangements
In the ordinary course of our business we are a party of certain activities to manage credit, market and operational risk. These activities include commitments to extend credit not otherwise accounted for as contingent loans, such as overdrafts and credit card lines of credit. We record our off-balance sheet arrangements as memorandum accounts, which are described more fully in Note 31 to our audited financial statements included elsewhere in this Report.
We provide customers with off-balance sheet credit support through loan commitments. Such commitments are agreements to lend to a customer at a future date, subject to compliance with the contractual terms. Since substantial portions of these commitments are expected to expire without our granting of any loans, total commitment amounts do not necessarily represent our actual future cash requirements. These loan
commitments totaled Ps.202,723 million, Ps.215,462 million and Ps.238,273 million, as of December 31, 2016, 2017 and 2018, respectively.
The credit risk of both on- and off-balance sheet financial instruments varies based on many factors, including the value of collateral held and other security arrangements. To mitigate credit risk, we generally determine the need for specific covenant, guaranty and collateral requirements on a case-by-case basis depending on the nature of the financial instrument and the customer’s creditworthiness. The amount and type of collateral held to reduce credit risk varies, but may include real estate, machinery, equipment, inventory and accounts receivable as well as deposits, stocks, bonds and other tradable securities that are generally held in our possession or at another appropriate custodian or depository. The collateral is valued and inspected on a regular basis to ensure both its existence and adequacy. Additional collateral is required when it is considered necessary by us.
The following table presents our outstanding contingent loans and other off-balance sheet assets as of December 31, 2016, 2017 and 2018:
| | | | | | | | | | | |
| | As of December 31, |
| | 2016 | | | 2017 | | | 2018 |
| | (Millions of pesos) |
Proprietary record accounts: | | | | | | | | | | | |
Credit commitments | | Ps. | 202,723 | | | Ps. | 215,462 | | | Ps. | 238,273 |
Assets in trust or mandate: | | | | | | | | | | | |
Trusts | | | 154,308 | | | | 161,706 | | | | 173,443 |
Mandates(1) | | | 185 | | | | 1,161 | | | | 1,163 |
Assets in custody or under administration(2) | | | 3,162,552 | | | | 3,219,980 | | | | 2,197,359 |
Subtotal | | Ps. | 3,519,768 | | | Ps. | 3,598,310 | | | Ps. | 2,610,238 |
Collateral received | | | 67,954 | | | | 76,618 | | | | 141,168 |
Collateral received and sold or pledged as guarantee(3) | | | 40,637 | | | | 46,221 | | | | 74,274 |
Investment banking transaction on behalf of third parties (net)(4) | | | 249,350 | | | | 130,240 | | | | 10,148 |
Subtotal | | | 357,941 | | | | 253,079 | | | | 225,590 |
Total | | Ps. | 3,877,709 | | | Ps. | 3,851,389 | | | Ps. | 2,835,828 |
| (1) | | Assets received are managed under independent management trusts. Mandates include the declared value of the assets subject to mandate contracts entered into by us. |
| (2) | | This item includes the activity of third-party assets and securities received in custody or to be managed by us. |
| (3) | | Collateral received and sold or pledged as guarantee is composed of all collateral received in reverse repurchase agreements in which we are the buying party that in turn is sold by us as a selling party. This balance also includes the obligation of the borrower (or lender) to return to the lender (or borrower) the assets subject to the loan transaction carried out by us. |
| (4) | | Cash and securities owned by customers and held in custody, pledged as collateral and managed by us. |
F. Tabular Disclosure of Contractual Obligations
The table below presents our contractual obligations at December 31, 2018.
| | | | | | | | | | | | | | | | | | | |
| | Payment due by period |
| | | | | | More than 1 year | | | More than 3 years | | | | | | | | |
| | | | | | but less than 3 | | | but less than | | | More than | | | | |
| | Less than 1 year | | | years | | | 5 years | | | 5 years | | | Total |
| | (Millions of pesos) |
Demand deposits | | Ps. | 443,223 | | | Ps. | — | | | Ps. | — | | | Ps. | — | | | Ps. | 443,223 |
Time deposits | | | 177,843 | | | | 3,685 | | | | 3,565 | | | | 674 | | | | 185,767 |
Bank and other loans(1) | | | 93,735 | | | | 11,219 | | | | 4,488 | | | | 2,506 | | | | 111,948 |
Marketable debt securities(1) | | | 63,497 | | | | 12,514 | | | | 23,936 | | | | 3,115 | | | | 103,062 |
Subordinated liabilities | | | 413 | | | | — | | | | — | | | | 36,815 | | | | 37,228 |
Repurchase agreements | | | 100,680 | | | | — | | | | — | | | | — | | | | 100,680 |
Short positions | | | 101,754 | | | | — | | | | — | | | | — | | | | 101,754 |
Operating lease obligations | | | 1,756 | | | | 2,930 | | | | 1,074 | | | | 4,255 | | | | 10,015 |
Sundry creditors and other payables | | | 38,625 | | | | 834 | | | | 2 | | | | — | | | | 39,461 |
Contractual interest payments(2) | | | 43,568 | | | | 1,898 | | | | 2,146 | | | | 2,783 | | | | 50,395 |
Total | | Ps. | 1,065,094 | | | Ps. | 33,080 | | | Ps. | 35,211 | | | Ps. | 50,148 | | | Ps. | 1,183,533 |
| (1) | | Includes interest payments that are calculated by applying the interest rate in effect at December 31, 2018. |
| (2) | | Calculated for demand deposits, time deposits, Bank and other loans, marketable debt securities and subordinated liabilities assuming a constant interest rate as of December 31, 2018 over time for all maturities. |
The table above does not reflect amounts that we may have to pay on derivative contracts, as the amounts ultimately payable will depend upon movements in financial markets.
G. Safe Harbor
See “Special Note Regarding Forward-Looking Statements.”
ITEM 6. DIRECTORS, SENIOR MANAGEMENT AND EMPLOYEES
A. Directors and Senior Management
Board of Directors
Our Board of Directors currently comprises of ten directors and ten alternate directors. The directors and alternate directors are elected for one-year terms at our ordinary general shareholders’ meeting and may be reelected. Pursuant to Mexican law, members of our Board of Directors continue to be members of the Board despite the expiration of their term until new Board members are appointed and assumed office.
Under our bylaws and in accordance with the Mexican Banking Law, at least 25% of the members of our Board of Directors must be independent. Independence is determined in accordance with Article 22 of the Mexican Banking Law and our bylaws. The CNBV may contest the determination made by our shareholders as to the independence of our directors. We have not determined whether any of our directors or any of the members of our committees other than the Audit Committee would be considered independent as defined in the U.S. securities laws or the rules of any U.S. securities exchange.
For each director, an alternate director may be appointed, provided the alternate director corresponding to an independent director is also independent. All members of the Board of Directors, whether they are directors or alternate directors, are called to attend the meetings of the Board of Directors. If both a director and an alternate director attend the same meeting, only the vote of the director shall be taken into account.
There are two different categories of directors depending on the type of shareholder appointing each such director: Series B and Series F. Series B shares can be freely subscribed. Series F shares can be acquired directly or indirectly only by Grupo Financiero Santander México and Banco Santander Parent and can be sold only with the previous authorization of the CNBV, unless such shares must be transferred to the IPAB as collateral or as property. Both categories of directors have the same rights and obligations.
In accordance with our bylaws, holders of Series F shares representing 51% of our capital stock shall have the right to appoint 50% plus 1 of our directors and their respective alternates, and to appoint an extra director for each additional 10% of our capital stock above such percentage. Series B shareholders have the right to appoint the remaining directors and their alternates.
The following table sets forth information about the directors and alternate directors of our Board of Directors, each of whom was elected at our general annual shareholders’ meeting on April 30, 2018, for a period of one year. The business address of our directors is Avenida Prolongación Paseo de la Reforma 500, Colonia Lomas de Santa Fe, Delegación Álvaro Obregón, 01219, Mexico City, Mexico.
| | | | | | | | |
Name | | Position | | | Series | | | Director Since |
Marcos Alejandro Martínez Gavica | | Chairman | | | Series F | | | 1997 |
Héctor Blas Grisi Checa | | Director | | | Series F | | | 2016 |
Rodrigo Echenique Gordillo | | Director | | | Series F | | | 2015 |
Francisco Javier García-Carranza Benjumea | | Director | | | Series F | | | 2018 |
Rodrigo Brand de Lara | | Alternate Director | | | Series F | | | 2012 |
Ángel Rivera Congosto | | Alternate Director | | | Series F | | | 2016 |
Didier Mena Campos | | Alternate Director | | | Series F | | | 2018 |
Gina Lorenza Diez Barroso Azcárraga | | Independent Alternate Director | | | Series F | | | 2014 |
Guillermo Güemez García | | Independent Director | | | Series F | | | 2012 |
Guillermo Jorge Quiroz Abed | | Independent Director | | | Series F | | | 2018 |
Juan Ignacio Gallardo Thurlow | | Independent Alternate Director | | | Series F | | | 2013 |
José Eduardo Carredano Fernández | | Independent Alternate Director | | | Series F | | | 1997 |
Antonio Purón Mier y Terán | | Independent Director | | | Series F | | | 2009 |
Fernando Benjamín Ruíz Sahagún | | Independent Director | | | Series B | | | 2003 |
Alberto Torrado Martínez | | Independent Director | | | Series B | | | 2009 |
Joaquin Vargas Guajardo | | Independent Director | | | Series B | | | 2009 |
Jesús Federico Reyes Heroles González Garza | | Independent Alternate Director | | | Series F | | | 2009 |
Rogelio Zambrano Lozano | | Independent Alternate Director | | | Series B | | | 2018 |
Guillermo Francisco Vogel Hinojosa | | Independent Alternate Director | | | Series B | | | 2016 |
María de Lourdes Melgar Palacios | | Independent Alternate Director | | | Series B | | | 2018 |
| (1) | | María de Lourdes Melgar Palacios and Didier Mena Campos were appointed to our Board of Directors at our Special Shareholders’ Meeting held on July 24, 2018. |
Mr. Rogelio Zambrano was appointed to our Board of Directors at our Special Shareholders’ Meeting held-on December 3, 2018.
The Secretary of the Board of Directors is Fernando Borja Mujica, and the Alternate Secretary is Rocío Erika Bulhosen Aracil.
Set forth below are the biographies of the members of our Board of Directors.
Marcos Alejandro Martínez Gavica is Chairman of our Board of Directors and of the boards of directors of Grupo Financiero Santander México, Casa de Bolsa Santander, Santander Consumo and Santander Vivienda. He was our Executive President and Chief Executive Officer from 1997 to 2016. He was a member of the board of directors of Gestión Santander from 2002 to 2013 and President of the Asociación de Bancos de México, A. C. (Mexican Banking Association or ABM) from 2005 to 2007 and from 2017 to
2018. He began his career in 1978 at Banco Nacional de México, S.A., holding various positions and ultimately joining the bank’s management. He holds a degree in chemical engineering from Universidad Iberoamericana and a master in administration with a specialty in financial planning from the Instituto Panamericano de Alta Dirección Empresarial.
Héctor Blas Grisi Checa is a member of our Board of Directors and of the boards of directors of Grupo Financiero Santander México, Casa de Bolsa Santander, Santander Consumo and Santander Vivienda. He is the Executive President and Chief Executive Officer of Grupo Financiero Santander México and of Banco Santander México. He was Executive President and Chief Executive Officer of Credit Suisse México from 2001 to 2015. Prior to that, he was Chief Executive Officer of the same institution from 1997 to 2001, and also Director of Investment Banking of Credit Suisse México. Mr. Grisi was a member of the board of directors of Credit Suisse Americas, of the Global Committee of Credit Suisse and a member of the Operational Committee of the Americas. He held several positions in Grupo Financiero Inverméxico from 1991 to 1997, in the Corporate and Investment Banking Department. From 1986 to 1991 he worked at Casa de Bolsa Inverlat, in the department of Corporate and Investment Banking. He has been the Vice-President of the Asociación de Bancos de México since 2011. He holds a degree in finance from the Universidad Iberoamericana, where he graduated with honors.
Rodrigo Echenique Gordillo is a member of our Board of Directors and of the boards of directors of Grupo Financiero Santander México, Casa de Bolsa Santander, Santander Consumo and Santander Vivienda. From 1999 to 2014 he served as a member of the board of directors and of the Executive Committee of Banco Santander Parent, as well as other committees. During that time, he also served as Vice President of Banco Banif, S.A., President of Allfunds Bank, President and Vice President of SPREA, member of the boards of directors of Santander International and Santander Investment, Executive Vice President of Banco Santander Parent, President of N.H. Hotels, S.A., Vallehermoso, S.A., Lar, S.A., Vocento, S.A., and Director of Inditex, S.A. He also served as a member of the board of directors for various industrial and financial organizations, including Ebro Azúcares y Alcoholes, S.A., Industrias Agrícolas, S.A., SABA, S.A., Accenture, S.A., Lucent Technologies and Quercus y Agrolimen, S.A. He also served as member of the Executive Committee and Board of Governors of the Fundación Banco Santander and other charitable organizations. From 1994 to 1999, he served as member of the board of directors and Executive Committee of Banco Santander Parent, serving on all board committees. During that time he also served as Vice President of Business and Investment for Banco Santander Parent. From 1984 to 1994, he served as Subdirector General of Banco Santander México and Deputy Director General, and in 1988 he was appointed to Banco Santander Parent’s board of directors and named Executive Director and member of the executive committee. From 1976 to 1983, he held several positions at Banco Exterior de España, including as Manager of Legal Services, Deputy Director General and as member of the Planning Committee. From 1973 to 1976, he served in various positions in the Spanish government, including with the Treasury Departments of Pontevedra and Madrid, Secretary General of Telecommunications and Technical Adviser to the executive administration. He holds a law degree from the Universidad Complutense de Madrid.
Francisco Javier García-Carranza Benjumea is a member of our Board of Directors and of the boards of directors of Grupo Financiero Santander México, Casa de Bolsa Santander, Santander Consumo and Santander Vivienda. He is currently Executive Vice President of Banco Santander. He is in charge, globally, of Restructuring, Participations, Real Estate, Recovery Strategy, and Loan and Assets Portfolio Dispositions. Prior to joining Santander in February 2016, he worked for 17 years at Morgan Stanley, based in London, as Co-Head of EMEA (Europe, Middle East and Africa) Real Estate investment banking business. At Morgan Stanley, he advised clients in M&A, and Equity and Debt financing transactions for more than $100 billion to European and Middle East clients. Mr. García-Carranza is Chairman of the board of directors of Merlin Properties, Member of the Executive Committee and Board Member of the Sociedad de Gestión de Activos Procedentes de la Reestructuración Bancaria (Sareb), Chairman and board member of Santander Capital Desarrollo SGEIC SA, and Board Member of Metrovacesa, Banco Popular S.A, Santander España Altamira Asset Management SA, Altamira Real State among others. He has a bachelor’s degree in business administration from the University Carlos III of Madrid.
Rodrigo Brand de Lara is an alternate member of our Board of Directors and of the boards of directors of Grupo Financiero Santander México, Casa de Bolsa Santander, Santander Consumo and Santander Vivienda. He is the Deputy General Director of Research, Strategy, Public Affairs and Chief of Staff of the Chief Executive Officer for Banco Santander Mexico in 2016. From 2011 to 2016, he was Deputy General Director of Research, Public Affairs and Marketing. In 2010, he was the Director General for the Social Communication Division of the Mexican Ministry of Foreign Affairs (Secretaría de Relaciones Exteriores). From 2006 to 2010, he was the head of the Social Communication Unit and the spokesperson for the SHCP. From 2004 to 2006, he served as Director General of Social Communication and Institutional Link for IPAB. Mr. Brand de Lara has previously held the following positions at the Mexican Ministry of Treasury (Secretaría de Hacienda y Crédito Público): Deputy General Director of Economic and Financial Analysis from 2003 to 2004; Senior Advisor to the Subsecretary of Finance and Public Credit from 2000 to 2001; Subdirector of Internal Credit Coordination and Training from 1999 to 2000. From 1996 to 1999, he was an economist in Mexico for Deutsche Morgan Grenfel, and during 1996 he was also an advisor to the Deputy Director of Financial Engineering of BANOBRAS. Mr. Brand de Lara has a degree in economics from Instituto Tecnológico Autónomo de México.
Ángel Rivera Congosto is an alternate member of our Board of Directors and of the boards of directors of Grupo Financiero Santander México, Casa de Bolsa Santander, Santander Consumo and Santander Vivienda. He is the Vice President of Retail Banking of Banco Santander México. Mr. Rivera started working at Grupo Santander Spain in April 2013 as the General Director of Middle Markets, SMEs and Institutions in the Commercial Banking area. He worked at Grupo Banco Popular for 24 years, including positions in retail offices, the Presidential Cabinet, the International Bank Area, where he also had responsibility in Correspondent Banking and the Group's offices abroad; the corporate development and strategy area, the Human Resources department and Media Direction, covering the Directors of Technology, Organization, Operations and Human Resources, as well as its commercial network, where he was responsible for the branch network of Banco Popular and its five subsidiaries, as well as the Marketing and Business Intelligence department. He was a member of the Direction Committee and the Payment Arrears Management and Recoveries and of the ALCO Committee. He holds a diploma in business and tourist activities from the School of Tourism in Spain, a specialization in enterprise direction from the Instituto Panamericano de Alta Dirección Empresarial (IPADE) in IESE (Universidad de Navarra) and a program of development in corporate finance at the Instituto de Empresa in Madrid. He has also studied under various financial programs in the United States and Australia and is a member of the Australian Institute of Banking and Finance.
Didier Mena Campos is an alternate member of our Board of Directors and of the boards of directors of Grupo Financiero Santander México, Santander Consumo, Santander Vivienda and Santander Inclusion Financiera. He has been Chief Financial Officer since May 2016. Before joining Grupo Santander, Mr. Mena worked in several financial institutions as: (i) Execution Finance Division, an investment bank, where he was partner from 2014 to 2016, (ii) Navix, focused on financing the Mexican energy sector companies, financial company where he was Chief Executive Officer from 2013 to 2014, (iii) Credit Suisse, where his last responsibility was as Managing Director of the Group of financial institutions in Latin America between 2010 and 2012, (iv) during 2008 to 2010 was Chief Financial Officer of Financiera Independencia, (v) between 2001 and 2008 he served as Director of Credit Suisse in investment banking and fixed income and (vi) worked for Grupo Financiero BBVA Bancomer from 1994 to 2000, with responsibilities in the ALCO and participated in strategic operations as the merger with BBVA, the acquisition of Banca Promex, the acquisition of the 49% stake that had Afore Aetna insurance and pension Bancomer and the branch network strategy. Outside the financial sector, he worked in Oro Negro, a Mexican drilling company, from 2012 to 2013 as Chief Financial Officer and Chief Investment Officer. He studied economics at ITAM and received his master's degree in business administration from Boston University.
Gina Lorenza Diez Barroso Azcárraga is an alternate independent member of our Board of Directors and of the boards of directors of Grupo Financiero Santander México, Casa de Bolsa Santander, Santander Consumo and Santander Vivienda. She is the founder and has been the Chairman, for over 20 years, of Grupo Diarq, S.A. de C.V. and Fundación Diarq, I.A.P. In 2004 she founded the Center of Design, Film and Television, S.C., which won an award for best College of design for the period 2012 to 2013, she also
founded the Pro Education Center Foundation, which awards scholarships to outstanding students in Mexico. She is currently a member of the Board of management of Americas Society and Council of the Americas, Qualitas of Life Foundation, Grupo Integral de Desarrollo Inmobiliario, S. de R.L. de C.V., C200 Foundation Board, Global Spa and Wellness Summit, The Committee of 200, Women Presidents Organization (WPO), and Women Corporate Directors (WCD). She has a bachelor’s degree in design from the University CDI and also has degrees from the Schools of Psychology and Business at Stanford University in California.
Guillermo Güemez García is an independent member of our Board of Directors and of the boards of directors of Grupo Financiero Santander México, Casa de Bolsa Santander, Santander Consumo and Santander Vivienda. He is an independent member of the board of directors and member of the Investment Committee of ING AFORE. He is also an independent member of the board of directors and President of the Audit Committee of Zurich Compañía de Seguros S.A. He previously served as a member of the board of directors of Zurich Santander México, S.A. In addition, he is a member of the Strategy and Finance Committee of Nacional Monte de Piedad, a member of the board of directors of GEUPEC S.A. de C.V. He is the President of the Advisory Committee of the Economics and Business Administration school of the Universidad Panamericana. He was Deputy Governor of the Mexican Central Bank and President of the Responsibilities Commission of the Mexican Central Bank from 1995 to 2010. He was a cabinet member of the CNBV from 2007 to 2010, an alternate cabinet member of the Mexican National Insurance and Bonding Commission (Comisión Nacional de Seguros y Fianzas, or CNSF) from 1995 to 1997 and Executive Director of the Coordinadora Empresarial para el Tratado de Libre Comercio (Business Coordinator for NAFTA) (Mexico-USA-Canada) from 1991 to 1993. He held several executive positions at Banamex from 1974 to 1990. He has a degree with honors in civil engineering from the Universidad Nacional Autónoma de México. He holds a master’s degree in science from Stanford University.
Guillermo Jorge Quiros Abed is member of our Board of Directors and of the boards of directors of Grupo Financiero Santander México, Santander Consumo and Santander Vivienda. He served as the Corporate Director of Administration and Finance at Grupo Bimbo for the last 18 years. From 1997 to 1999 he was in charge of the Finance Department in Santander Serfin Group, involved in the restructuring of the bank and subsequent sale to Santander Financial Group. He began his professional career as Director of Finance at Grupo Condumex, from 1978 to 1992, and later held the management in the same area at Aeromexico, Mexicana de Aviación and Cintra until 1997. He was a full-time professor in finance area at IPADE. Mr. Quiroz holds a degree in Actuary from the Anahuac University and from the National Autonomous University of Mexico (UNAM) and an MBA from the IPADE.
Juan Ignacio Gallardo Thurlow is an alternate independent member of our Board of Directors and of the boards of directors of Grupo Financiero Santander México, Casa de Bolsa Santander, Santander Consumo and Santander Vivienda. He is the Chairman of the board of directors of Grupo GEPP (Grupo de Embotelladoras de Pepsicola and its brands in Mexico) and Grupo Azucarero México, S.A. de C.V. He serves on the boards of directors of Caterpillar, Inc. and Lafarge, S.A. He is also a member of the International Advisory Board of Bombardier Inc. He is a member of the Consejo Mexicano de Hombres de Negocio, A.C. (CMHN) and the Consejo de Negocios de América Latina (CEAL). He is a General Coordinator on COECE (Coordinadora de Organismos Empresariales de Comercio Exterior for negotiations under the Free Trade Agreements of Mexico). From 1978 to 1989, he was Chairman of the board of directors of Babcock de México, S.A. de C.V. From 1974 to 1988, he was Chairman of the board of directors of Clevite de México, S.A. de C.V. From 1981 to 1983, he was Deputy General Director of Grupo Industrial Minera México, S.A. From 1976 to 1980, he was Chief Executive Officer of the International Division and Investment Bank of Multibanco Comermex, S.A. Institución de Banca Múltiple. He has a law degree from the Escuela Libre de Derecho and studied business management at the Instituto Panamericano de Alta Dirección Empresarial (IPADE).
José Eduardo Carredano Fernández is an alternate independent member of our Board of Directors and of the boards of directors of Grupo Financiero Santander México, Casa de Bolsa Santander, Santander Consumo and Santander Vivienda. He is the President of the board of directors of La Ideal S.A. de C.V., Aceros La Ideal S.A. de C.V., Industrial Formacero, S.A. de C.V., and Fianzas Asecam, S.A. He is also a
member of the boards of directors of Inmobiliaria Silver, S.A. de C.V., Asecam, S.A. de C.V., Grupo Financiero Asecam, S.A. de C.V. He was a member of the board of directors of Credicam, S.A. de C.V., SOFOM Entidad Regulada from 1991 to 2008, Seguros Génesis, S.A. from 1993 to 1997, Fianzas Asecam, S.A. from 1994 to 2014. He studied Public Accountant in the Universidad Iberoamericana.
Antonio Purón Mier y Terán is an independent member of our Board of Directors and of the boards of directors of Grupo Financiero Santander México, Casa de Bolsa Santander, Santander Consumo and Santander Vivienda. He is also a member of the board of directors of Zurich Santander Seguros México, S.A. He served as an associate of the Centro de Investigación y Análisis Económico (Economic Research and Analysis Center, or CIDAC) and was a member of the Instituto de Fomento e Investigación Educativa (Institute for the Promotion of Educational Research, or IFIE) and of Metrópoli 2025. He advised public and private institutions with respect to strategy, transactions and organization in collaboration with the Centro de Investigación y Docencia Económicas (Center for Economic Research and Training, or CIDE) and with other specialists. He served as a director partner in the Mexican office of McKinsey & Company, Inc. for over 26 years. He was professor of training courses to McKinsey’s partners and was in charge of the partners “coaching” program at a worldwide level. He is a member of the board of directors of Nadro, S.A., and of the Patronato del Museo Nacional de Arte (the Patronage of the National Art Museum) of Banco Santander Parent and of the Patronato of the Universidad Iberoamericana. Mr. Purón Mier y Terán holds a master’s in business administration from Stanford University and a degree in chemical engineering from the Universidad Iberoamericana. Before starting at McKinsey, he was a full time professor at the Universidad Iberoamericana and worked at the Mexican Petroleum Institute, Ingeniería Panamericana and Polioles, S.A.
Fernando Benjamín Ruiz Sahagún is an independent member of our Board of Directors and of the boards of directors of Grupo Financiero Santander México, Casa de Bolsa Santander, Santander Consumo, Santander Vivienda and Santander Inclusión Financiera. He also serves on the board of directors of the Mexican Stock Exchange, Grupo México, S.A.B. de C.V., Grupo Palacio de Hierro, S.A.B. de C.V., Grupo Pochteca, S.A.B. de C.V., Fresnillo plc., Grupo Cementos de Chihuahua S.A.B. de C.V., Kimberly Clark de México, S.A.B. de C.V., Mexichen, S.A.B. de C.V. and Arcelor Mittal de México, S.A. de C.V. Mr. Ruiz Sahagún is a member of the International Fiscal Association (IFA) and of the Instituto Mexicano de Ejecutivos de Finanzas, A.C. (Mexican Institute of Finance Executives). He is also a member of the Instituto Mexicano de Contadores Públicos A.C. (Mexican Institute of Public Accountants) and served as a member of its board. He is one of the founding partners of Chevez, Ruiz, Zamarripa y Cia. S.C., a tax law firm in which he now serves as counsel. He holds a degree in public accounting from the Universidad Nacional Autónoma de México.
Alberto Torrado Martínez is an independent member of our Board of Directors and of the boards of directors of Grupo Financiero Santander México, Casa de Bolsa Santander, Santander Consumo and Santander Vivienda. He is a member of the board of directors of the Mexican Stock Exchange, Fideicomiso ProBosque de Chapultepec and a member of the Mexican Business Counsel. He is founder and Chief Executive Officer of Alsea, S.A.B. de C.V. He has been President of the National Association of Fast Food and member of the National Chamber of the Restaurant Industry and Condimented Food. He is one of the founders of Torrquin, S.A. de C.V. (Domino’s franchise), and is its Chief Executive Officer. Mr. Torrado holds a degree in accounting from the Instituto Tecnológico Autónomo de México. He also completed graduate studies at the Instituto Panamericano de Alta Dirección Empresarial and participated in other seminars, and completed studies at Harvard University and the Wharton School of the University of Pennsylvania.
Joaquín Vargas Guajardo is an independent member of our Board of Directors and of the boards of directors of Grupo Financiero Santander México, Casa de Bolsa Santander, Santander Consumo and Santander Vivienda. He is the Chairman of the board of directors of Corporación Mexicana de Restaurantes, S.A.B. de C.V. and was previously President of the board of directors of Grupo MVS Comunicaciones, the Cámara Nacional de la Industria de Radio y Televisión and the Asociación de Directores de Cadenas de Restaurantes. He is also a member of the boards of directors of several companies including Vitro, S.A.B. de C.V., Grupo Posadas, S.A.B de C.V., Médica Sur, S.A.B. de C.V., Grupo Aeroportuario del Pacífico, S.A.B. de C.V., Periódico el Universal and Grupo Costamex, among
others. From April 1997 to April 2005 and from April 2008 to April 2012, he was a member of the board of directors of the Mexican Stock Exchange. He is a member of the Compensation Committee of Grupo Aeroportuario del Pacífico, S.A.B. de C.V. He holds a degree in business administration from the Instituto Tecnológico y de Estudios Superiores de Monterrey and studied business management at the Instituto Panamericano de Alta Dirección Empresarial.
Jesús Federico Reyes Heroles González Garza is an alternate independent member of our Board of Directors and of the boards of directors of Grupo Financiero Santander México, Casa de Bolsa Santander, Santander Consumo and Santander Vivienda. He was the Chief Executive Officer of Petróleos Mexicanos from December 2006 to September 2009. He is the Executive President of StructurA. He is a member of several boards of directors, including OHL México, S.A.B. de C.V. and Water Capital Mexico (WCAP Holdings S.A. de C.V.). He is a member of the Advisory Board of the Energy Intelligence Group (EIG) and served as a member of the Advisory Board of Deutsche Bank from 2010 to 2012. He is President of the Advisory Board of Agua, A.C. and of the Water Committee of Fundación Gonzalo Rio Arronte. From 1997 to 2000, he was the Mexican ambassador to the United States of America. From 1995 to 1997, he was the Secretary of Energy of Mexico. From 1994 to 1995, he was the General Director of Banobras. From 1993 to 1994, he was the representative of Mexico of the Grupo de Personas Eminentes (Eminent Persons Group) of APEC. Mr. Reyes Heroles González Garza graduated with a degree in Economics from ITAM and studied law at UNAM. He earned a doctorate degree in Economics from MIT.
Rogelio Zambrano Lozano is an alternate member of our Board of Directors and of the boards of directors of Grupo Financiero Santander México, Santander Consumo and Santander Vivienda. Since 1977, he has occupied different positions in CEMEX, in areas related to production, distribution, marketing and strategic planning. In 1983, he founded CARZA S.A. de C.V., dedicated to the development of real estate projects in México, which he directed until May 15, 2014, when he was designated as Chairman of the board of directors of CEMEX. He has also chaired the financial committee of CEMEX since 1997. In 1985, he began teaching in the entrepreneurial development division of Instituto Tecnológico y de Estudios Superiores de Monterrey. He also became a member of the corporate executive committee of its business incubator and Chair of the Corporate Board of Business Incubator Campus Monterrey. Among others. Mr. Zambrano holds a degree in industrial and systems engineering from Instituto Tecnológico y de Estudios Superiores de Monterrey and a master’s degree in business administration (1980) from Wharton Business School of the University of Pennsylvania.
Guillermo Francisco Vogel Hinojosa is an alternate independent member of our Board of Directors and of the boards of directors of Grupo Financiero Santander México, Santander Consumo, and Santander Vivienda. He is Chairman of the Cámara Nacional de la Industria del Hierro y el Acero (CANACERO); previously he held the same position from 1987 to 1989 and from 2001 until 2003. He is vice president of the board of directors of Iron & Steel Institute (AISI) and President of the North American Steel Council. He is also a member of the board of directors of Tenaris, Techint México, Corporación ALFA, Universidad Panamericana-IPADE, Rassini, Corporación Mexicana de Inversiones de Capital, Innovare, Grupo Assa y American Iron and Steel Institute among others. He is also President of the board of directors of Grupo Collado y de Exportaciones IM Promoción and member of the Comisión Trilateral, the Consejo Internacional and of the Manhattan School of Music. In 1987 he held the Executive Vice presidency and Chief Executive Officer of TAMSA. In June 1997 he was promoted as vice president of the board of directors. Since 2002 he has been Director and vice president of the board of directors of TENARIS. Mr. Vogel started his career in the Corporate Bank branch of Bank of America in Los Angeles, California in which he achieved the vice presidency position in 1976. In 1979 he worked at Banamex in the Corporate Bank branch, and in 1983 he entered the company Tamsa as a CFO. He holds a degree in business administration from the Universidad Nacional Autónoma de México (UNAM) and an M.B.A. from the University of Texas in Austin.
María de Lourdes Melgar Palacios is an alternate independent member of our Board of Directors and of the boards of directors of Grupo Financiero Santander México, Santander Consumo and Santander Vivienda. She is a professor at the Tecnológico de Monterrey and the Instituto Tecnológico Autónomo de México and a founding director of the Sustainability and Business Center at EGADE Business School of
Tecnológico de Monterrey. Dr. Melgar is also a National Researcher on the National Council of Sciences and Technology. In addition to her time in academia, Dr. Melgar worked at the Ministry of Energy as Undersecretary of Hydrocarbons from 2014 to 2016 and Undersecretary of Electricity from 2012 to 2014. Since 2014, she has also chaired the Technical Group of Energy Reform. Dr. Melgar also previously served as a member of the Governing Board of the Federal Electricity Commission, as Principal Counselor of Petróleos Mexicanos and the National Center for Natural Gas Control and as an alternate member of the boards of the Mexican Petroleum Fund, Nacional Financiera and Bancomext. She is also a member of the Mexican Council of International Affairs and the Trilateral Commission and has held several other positions within Mexican diplomacy. Dr. Melgar holds a bachelor’s degree in International Relations and Comparative Literature from Mount Holyoke College and a doctorate degree in political science from the Massachusetts Institute of Technology.
Executive Officers
Our executive officers are responsible for the management and representation of the Bank. The following table presents the names and positions of our executive officers as of December 31, 2018. The business address of our officers is Avenida Prolongación Paseo de la Reforma 500, Colonia Lomas de Santa Fe, 01219, Mexico City, Mexico. Certain of our executive officers are also members of the Board of Directors and of the boards of directors of our subsidiaries.
| | | | | | | | |
Executive Officers | | Position | | | Gender* | | | Year of appointment to position |
Héctor Blas Grisi Checa | | Executive President and Chief Executive Officer | | | Male | | | 2015 |
Ángel Rivera Congosto | | Vice President of Retail Banking | | | Male | | | 2017 |
Fernando Borja Mujica | | Deputy General Legal and Compliance Director | | | Male | | | 2014 |
Jorge Arturo Arce Gama | | Deputy General Director of Corporate and Investment Banking | | | Male | | | 2016 |
Emilio de Eusebio Saiz | | Deputy General Director of Intervention and Control Management | | | Male | | | 2010 |
Ricardo Alonso Fernandez | | Deputy General Director of Risks | | | Male | | | 2018 |
Rodrigo Brand de Lara | | Deputy General Director of Research, Strategy, Public Affairs and Chief of Staff of the Chief Executive Officer | | | Male | | | 2011 |
Pablo Fernando Quesada Gómez | | Deputy General Director of Business and Institutional Banking | | | Male | | | 2011 |
Jorge Alberto Alfaro Lara | | Deputy General Director of New Business | | | Male | | | 2017 |
Juan Ramón Jiménez Lorenzo | | Chief Audit Executive | | | Male | | | 2018 |
Enrique Luis Mondragón Domínguez | | Deputy General Director of Technology and Operations | | | Male | | | 2018 |
Didier Mena Campos | | Chief Financial Officer | | | Male | | | 2016 |
Alejandro Diego Cecchi González | | Deputy General Director of Business Strategy | | | Male | | | 2017 |
Carlos Hajj Aboumrad | | Deputy General Director of Corporate Resources and Recoveries | | | Male | | | 2016 |
Jorge Alberto Zenteno Cervantes | | Deputy General Director of Digital Factory | | | Male | | | 2017 |
Pablo Elek Hansberg | | Deputy General Director of Retail | | | Male | | | 2017 |
Juan Ignacio Echeverría Fernández | | Executive Director of Human Resources | | | Male | | | 2016 |
Javier Castrillo Penadés | | Executive Director Commercial Transformation and Innovation | | | Male | | | 2017 |
Banco Santander México supports opportunities equality and human rights respect, underlining non-discrimination by means of the General Code of Conduct, the Labor Internal Regulations and the Equality and Diversity Policy (17.14.02.03) contained in the General Manual of Policy and Procedures.
Set forth below are the biographies of our executive officers that are not members of our Board of Directors.
Fernando Borja Mujica is an alternate member of the Boards of Directors of Casa de Bolsa Santander, Santander Consumo and Santander Vivienda. He has served as Deputy General Legal and Compliance Director of Banco Santander México since 2014. From 2004 to 2014, he was general counsel for Banco Nacional de México. From 1988 to 1998 he held several positions in the SHCP, including General Director of Banking Institutions. From 1998 to 2004 he was a partner at the law firm of Mijares, Angoitia, Cortés y Fuentes, S.C. Mr. Borja Mujica has held various Mexican government banking and finance positions. He was also a member of the Governor’s Board of the National Banking and Securities Commission and of the Insurance and Surety National Commission and served as member of several financial institutions, including Shares and Securities, Afore Banamex (member of the investment committee) and Impulsora de Fondos Banamex. He was the secretary of the boards of directors of Grupo Financiero CitiBanamex and
Banco Nacional de México, S.A. He holds a law degree from Escuela Libre de Derecho and a master’s degree in comparative law from Georgetown University.
Jorge Arturo Arce Gama, was appointed Deputy General Director of Corporate and Investment Banking on May 2016 after serving as the President and Chief Executive Officer of Deutsche Bank Mexico, S.A. for over four years. Previously, Mr. Arce was the head of PWM Northern Latin America for Deutsche Bank for approximately seven years. In his more than 20 years at Deutsche Bank, Mr. Arce held several positions including senior investment banker for Latin America. Mr. Arce started his professional career at Citibank Mexico in 1991, where he remained until 1995. Mr. Arce holds a degree in finance from Pace University in New York.
Emilio de Eusebio Saiz was appointed Deputy General Director of Intervention and Control Management in December 2010, after serving as the Director for Control of Corporate Management of Expenses in the Santander Group between March 2008 and November 2010. He worked in the General Intervention and Control Management division of the Santander Group from 1992 to 2008 and in the Financial Division from 1990 to 1992. He worked in Santander Group’s Human Resources Department from 1989 to 1990. Mr. Eusebio Saiz holds a degree in economics from the Universidad Complutense de Madrid and holds an MBA from the Instituto de Empresas de Madrid in Spain.
Ricardo Alonso Fernández was appointed Deputy General Director of Risk in June 2018. During his 25 years of experience at Santander Group, he has worked in the following positions: Risk Analysis Team from 1994 to 1996, Commercial Team, Executive Director in the Wholesale Banking Division from 1996 to 2005, Business Manager in the Global Transaction Banking Managing Director area from 2005 to 2007, Director of the Institutional Banking area, Retail Banking division of Spain from 2007 to 2011, Director of Risks Spain, Risk Division 2011 to 2013, Director of the Risks Area of Recovery and Asset Sanitation from 2013 to 2015, Director of the Global Recovery and Recovery Area in 2015 and Director of the Deputy Chief Credit Officer area until 2017. Mr. Alonso Fernández has a degree from the University of Deusto and a degree in Political Science from the National University of Distance Education (Madrid).
Pablo Fernando Quesada Gómez was appointed Deputy General Director of Business and Institutional Banking in 2013. Beginning in 1993 he has held the following positions in the Santander Group: Regional Executive Director of Business and Institutional Banking from 2009 to 2013; Western Region Executive Director from 2008 to 2009; Executive Director of Business and Institutional Banking from 2007 to 2008; Regional Director from 1998 to 2006; Regional Director of Company Banking from 1997 to 1998; Regional Business Director from 1995 to 1997; and Director of Corporate Banking from 1993 to 1995. Mr. Quesada was also the Subdirector of Corporate Banking for Banco Mercantil Probusa (Mexico) from 1989 to 1992 and Corporate Bank Account Executive Banca Cremi (Mexico) from 1984 to 1988. Pablo Fernando Quesada Gómez graduated with a degree in business administration from the Universidad del Valle of Atemajac, Guadalajara.
Jorge Alberto Alfaro Lara was appointed Deputy General Director of New Business at Banco Santander in November 2017. Prior to this appointment, he served as Deputy General Director of Products from 2014 to 2016. Prior to joining the Santander Group, Mr. Alfaro Lara was the Executive Director of Banking Cards at Grupo Financiero Inverlat (México) from 1993 to 1996, and served on the boards of directors of Total System de México, S.A., Controladora Prosa, S.A. and Transunion de México, S.A. Mr. Alfaro Lara began his career as Vice President of Operations for American Express in 1986. He studied civil engineering at Texas A&M University and received his master’s degree in administration from the Instituto Tecnológico y de Estudios Superiores de Monterrey (ITESM) in Mexico.
Juan Ramón Jiménez Lorenzo has been serving as Chief Audit Executive since 2018, and served as the Executive Director for Internal Audit since 2014. He was responsible for the Internal Audit Division in Banco Santander Río, S.A. (Argentina) from 2012 to 2014 after being the Director of the Credit, Operational and Regulatory Internal Audit Division in Banco Santander México from 2005 to 2012. He previously worked in the Internal Audit Division of Banco Santander Parent and Banesto, S.A. from 1996 to 2005. He began his career in Europcar, S.A. as an assistant in the Financial Department from 1993 to 1994. He holds a degree
in business administration from Universidad CEU San Pablo (Madrid) and a doctor’s degree in public taxation from Universidad Complutense de Madrid.
Enrique Luis Mondragón Domínguez was appointed Deputy General Director of Technology and Operations in 2018. Before, he was Deputy General Director Technology, Operations and Human Resources from 2016 to 2018. Prior to this appointment, he served as Deputy General Director of Human Resources, Organization and Costs. He has also held the following positions at Banco Santander México: Deputy General Director of Human Resources from 2011 to 2013; Executive Director of Human Resources from 2008 to 2011; Executive Regional Director (Southern Metropolis) from 2007 to 2008; and Executive Director of Corporate Resources from 2000 to 2007. Prior to that, he held the following positions at Grupo Financiero Serfin: Executive Director of the General Division from 1997 to 2000; Executive Director of Planning and Projects from 1996 to 1997; Director of Strategic Planning and Marketing from 1993 to 1996; and Subdirector of Company Banking in 1993. Before joining the Santander Group, Mr. Mondragón was the General Manager for Grupo Karat, S.A. de C.V. (Mexico), Account Executive in the Corporate Finance Division of Banamex from 1989 to 1990 and a Credit Analyst from 1986 to 1989. Mr. Mondragón Domínguez has a degree in finance from ITAM, a master’s degree in economics from the University of London (Queen Mary’s College) and a degree in Economics from ITAM.
Alejandro Diego Cecchi González is currently Deputy General Director of Business Strategy. Prior to this appointment he served as Deputy General Director from 2016 to 2017. Prior to this position, Mr. Cecchi acted as the Executive Director of the Individual Segment. As Mr. Cecchi has spent his entire career at Santander bank, he has had the opportunity to work in several countries including Uruguay, Spain and Mexico. In 1998, he was the head of corporate risk in Uruguay and then moved to México taking the position of Regional Branch Director in Coahuila and Chihuahua. In Spain, he spent four years directing SMEs for LATAM and in 2010 became the Executive Director of the SME sector in Mexico. He studied Economics at The National University of Uruguay and later studied high management at IPADE.
Carlos Hajj Aboumrad has served as Deputy General Director of Corporate Resources and Recoveries since July 2016, and he has served as Executive Director since February 2016. Prior to joining the Santander Group, Mr. Hajj was the General Director of Constructora Hifedar in 2016, general Director of Grupo Comercial F.N., from 2013 to 2015. Mr. Hajj, began his career in Grupo Carso, as General Director of Sears de México, Dorians Tijuana, Argos Comunicación, Artes Graficas Unidas and galas de México from 1988 to 2012. He has served on the boards of directors of Banco Inbursa, Arrendadora Inbursa, Sociedad Financiera Inbursa, Grupo Carso, Grupo Sanborns, Porcelanite, Artes Graficas Unidas, Sears Roebuck de Mexico and Sears Operadora México. He has a degree in public accounting from the Universidad Nacional Autónoma de Mexico.
Jorge Alberto Zenteno Cervantes has served as Deputy General Director of Banco Santander México’s new digital, creative and collaborative space, in Spanish known as the fábrica digital, or the “Digital Factory”, since November 2017. Previously, he was the Executive Director of Retail Strategic Projects and Payroll in August 2016. He started working at Banco Santander México in 1995, serving in various roles, responsibilities such as: Director of Corporate Finance, Executive Director of the Business Banking Segment, as well as Executive Director in products and marketing for individuals and SMEs. Additionally he occupied the South Metropolitan Regional Executive Office and the Institutions Segment. For two years he worked at Santander USA as Audit Director and Segment and Pymes Business Director. Mr. Zenteno is an Industrial Engineer with a degree from the Universidad Panamericana and has a Management program certificate from the Pan American Institute of Senior Management (IPADE).
Pablo Elek Hansberg has been Deputy General Director of Retail since November 2017. During his 15 years of experience, he has held the following positions: Executive Director of Sales and Distribution of Individuals and Pymes from 2016 to 2017, Executive Director of Acquisition of Means of Payment, Consumption and Mortgage from 2014 to 2016, Regional Executive Director Metro Norte during the period of 2012 to 2014, Executive Director Consumer Credit during 2011 and 2012, and Executive Director of Banking for Individuals, SMEs and Payroll from 2008 to 2011. Mr. Elek has a bachelor degree and master’s in business administration from Southern Methodist University.
Juan Ignacio Echeverría Fernández was appointed Deputy Director of Human Resources in October 2016. During his 22 years of career he has worked in the following positions: Head of Administrative Logistics in Banamex, S.A. from 1996 to 1997, Banker in Corporate Banking Banamex, S.A. during 1997 to 2000, Regional Director in Citibank Mexico from 2000 to 2001, Deputy Director of District Banamex, Citigroup from 2001 to 2005, Sub director Patrimonial Banamex Citigroup from 2005 to 2007, Director of Commercial Strategy, Banco Santander México from 2007 to 2008, Director of Administration and Compensation Human Resources, Banco Santander México from 2008 to 2011, Executive Director of Administration and Compensation, Banco Santander México during the period of 2011 to 2016. Mr. Echeverria Fernández has a degree in business administration from Universidad Anáhuac del Sur and a MBA from the University of Iowa.
Javier Castrillo Penadés was appointed Deputy Director of Commercial Transformation and Innovation on November 2017. He started working at Santander Group in 2004, holding responsibilities as: Corporate Director of Purchasing and Expense Management, within the Global Technology and Operations Division from 2004 to 2006, Consumer Banking Director, Santander Group from 2006 to 2008, Commercial Director Territorial Madrid Santander Group from 2008 to 2012, Corporate Commercial Strategy Division of the Global Commercial Banking Division from 2012 to 2017. He was partner at McKinsey & Company from 1990 to 2004. Mr. Castrillo Penadés is an Industrial Engineer specializing in Management and Industrial Organization from the Universidad Pontificia Comillas.
B. Compensation
The Bank considers as key management personnel the directors, the executive officers and the members of our audit committee, the corporate practices, nominating and compensation committee, the comprehensive risk management committee and the remuneration committee.
Our shareholders establish the compensation of our directors at the annual shareholders’ meeting. The aggregate amount of compensation and benefits to our executive officers during fiscal year 2018 was Ps.497 million. For the same period, the independent directors who were members of the audit committee, the corporate practices, the nominating and compensation committee, the comprehensive risk management committee, the remuneration committee and our board of directors received an aggregate compensation of Ps.15 million. Only independent directors receive compensation for their duties.
We are not required under Mexican law to disclose on an individual basis the compensation of our executive officers, directors or committee members, and we do not otherwise publicly disclose such information.
The main benefits paid to the our executive officers are: salary, christmas bonus, vacation bonus, holidays, performance bonus and share-based payments.
The criteria for granting and paying bonus compensation vary according to the activities performed by the executive officer and, therefore, payment of the bonuses may vary depending on the department and activities performed by each executive officer.
Our executive officers may participate in the same pension and medical expenses plan that is available to our employees, but at contribution percentages that are different from those of the rest of our employees.
The total post-employment benefits (including pension plan, medical expenses and life insurance policies) to our executive officers amounted to Ps.331.56 million as of December 31, 2018.
Long-term compensation plan 2015
During September 2016, the Bank began to participate in a new corporate share-based variable compensation plan denominated “Long-term incentive plan 2015” applicable only to a certain group of
executive officers. This plan provides a variable compensation linked to the growth of the earnings per share ratio and of the return on tangible equity of Banco Santander Parent.
This plan was recognized as a cash-settled share-based payment transaction as of December 31, 2017.
As a result of the Corporate Restructuring (for additional information on the corporate restructuring, see Note 3.6 of our audited financial statements). The Long term incentive plan 2015 of the Bank will be settled through its own equity instruments starting January 1, 2018. Accordingly the Long term incentive plan 2015 changed from a cash-settled transaction to an equity-settled transaction. The initial fair value of the Long-term incentive plan 2015 amounted to Ps.86 million. As of December 31, 2018, the fair value of the Long-term incentive plan 2015 is Ps.65 million.
During 2017 and 2018, the Bank recognized Ps.27 million and Ps.16 million, respectively, in the consolidated income statement with respect to this plan.
For more information on personnel expenses - long-term incentive plan 2015, see Note 41.c to our audited financial statements included elsewhere in this Report.
Bonus payment policies
As a result of an internal policy of Banco Santander Parent, a portion of the annual variable remuneration plan applicable only to a certain group of executive officers is deferred for a period of three or five years, with one-third or one-fifth vesting each year.
Both the deferred and non-deferred portions are paid equally in cash and in shares of the Bank for the corresponding payment periods. Once delivered, beneficiaries are obligated to keep the shares for a one-year period.
In 2017 and 2018, the Bank recognized in the consolidated income statement an amount of Ps.325 million and Ps.184 million, respectively, for the bonus of the beneficiaries.
See Note 41.d to our audited financial statements included elsewhere in this Report for more details regarding the payment policies for the bonus of the beneficiaries.
C. Board Practices
Our directors and alternate directors are elected for one-year terms at our annual ordinary general shareholders’ meeting and may be reelected. Pursuant to Mexican law, members of our Board of Directors continue to be members of the Board of Directors despite the expiration of their term until new members of the Board of Directors have been appointed and assume office. For each director, an alternate director may be appointed, provided that the alternate director corresponding to an independent director must also be independent. All members of the Board of Directors, whether they are directors or alternate directors, are called to attend the meetings of the Board of Directors. If both a director and an alternate director attend the same meeting, only the vote of the director shall be considered.
The period during which the members of our Board of Directors have served in their offices is shown in the table under Section A of this Item 6. Each of our current members of the Board of Directors was elected at our general annual shareholders’ meeting on April 30, 2018 for a period of one year, except for Dr. Melgar, Mr. Mena and Mr. Zambrano, who were appointed at our special shareholders’ meetings held July 24, 2018 and December 3, 2018 and will hold office until the next general annual Shareholders’ meeting.
The members of our Board of Directors are not entitled to benefits upon termination of employment.
Committees
Pursuant to our bylaws, our Board of Directors has created the following committees, which report to the Board of Directors:
| · | | Corporate Practices, Nominating and Compensation Committee; |
| · | | Comprehensive Risk Management Committee; |
| · | | Remuneration Committee; and |
| · | | Communication and Control. |
Audit Committee
The purpose, composition, authority and responsibilities of our Audit Committee (Comité de Auditoría), which reports to our Board of Directors, derive from Mexican law and the rules of the NYSE applicable to foreign private issuers. The principal functions of our Audit Committee are to (i) evaluate the performance of our external auditors, including the review of their annual audit and recommendation of their approval to the Board of Directors, (ii) review and approve financial statements, and recommend their approval to the Board of Directors, (iii) review our internal controls and inform the board of directors of any irregularities, (iv) review and advise the Board of Directors regarding the financial statements and other matters related to the audit, which includes opinions in respect of (a) whether accounting policies and criteria are adequate and sufficient, and (b) whether financial information fairly reflects our financial condition and results, and (v) ensure that related party transactions and transactions required to be approved by the Board of Directors or the shareholders are approved.
The Audit Committee may generally review our financial information and its preparation and for that purpose may undertake investigations, require opinions of third parties and require explanations and information from our officers. The Audit Committee is responsible, subject to the approval of the Board of Directors, as required under the Mexican Securities Market Law, for the appointment, compensation, retention and oversight of the work (including resolution of any disagreements between management and the auditor regarding financial reporting) of any registered public accounting firm engaged for the purpose of preparing or issuing an audit report or performing other audit, review or attest services, and each such registered public accounting firm must report directly to the Audit Committee. In addition, the Audit Committee has established procedures for (i) the receipt, retention and treatment of complaints we may receive regarding accounting, internal accounting controls or auditing matters, and (ii) the confidential, anonymous submission by our employees of concerns regarding any questionable accounting or auditing matters. The Audit Committee has the authority to engage independent counsel and other advisers, as it determines necessary to carry out its duties. We are required to provide for appropriate funding, as determined by the Audit Committee, for payment of (i) compensation to any registered public accounting firm engaged for the purpose of preparing or issuing an audit report or performing other audit, review or attest services, (ii) compensation to any advisers employed by the Audit Committee, and (iii) ordinary administrative expenses of the Audit Committee that are necessary or appropriate in carrying out is duties.
Pursuant to Mexican law, the members of the Audit Committee must be appointed for their professional qualifications, expertise and reputation. At least one of the members must have broad experience in the financial, auditing and/or internal control sectors. The executives or employees of Banco Santander México cannot be members of the Audit Committee. The Audit Committee must have at least three members and no more than five members, all of whom must be independent members of the Board of Directors, as determined in accordance with the Article 25 of the Mexican Securities Market Law and our bylaws.
Pursuant to Mexican law and our bylaws, the President of the Audit Committee is elected and removed at the general shareholders’ meeting. Such President cannot be the chairman of the Board of Directors. The rest of the members of the Audit Committee are elected and/or removed by the Board of Directors. The Audit Committee’s members remain in office until they are removed or resign, provided they continue to be members of the board of Directors.
The current members of our Audit Committee are:
| | | | | |
Name | | Position | | | Status |
Fernando Ruíz Sahagún | | President of the Audit Committee and Independent Director* | | | Independent* |
José Eduardo Carredano Fernández | | Independent Director* | | | Independent* |
Antonio Purón Mier y Terán | | Independent Director* | | | Independent* |
Guillermo Quiroz Abed | | Independent Director* | | | Independent* |
*As determined in accordance with Article 25 of the Mexican Securities Market Law, our bylaws and the NYSE rules applicable to foreign private issuers.
The Secretary of the Audit Committee is Fernando Borja Mujica and the Assistant Secretary of our Audit Committee is Rocío Erika Bulhosen Aracil.
All of the directors on our Audit Committee are considered independent, as determined in accordance with Articles 25 of the Mexican Securities Market Law and 22 of the Mexican Banking Law. Likewise, all of the members of our Audit Committee are considered independent in accordance with Rule 10A‑3 under the Exchange Act, in compliance with the rules of the NYSE applicable to foreign private issuers. Our Board of Directors has determined that Fernando Ruiz Sahagún is also an “Audit Committee Financial Expert” as defined by the SEC.
Corporate Practices, Nominating and Compensation Committee
The primary functions of our Corporate Practices, Nominating and Compensation Committee (Comité de Prácticas Societarias, Nominaciones y Compensaciones) are to call shareholder meetings, to aid the Board of Directors in the preparation of reports to be presented at shareholder meetings and to propose and provide advice to the Board of Directors on the following subjects:
| · | | policies and guidelines for the use or enjoyment of our property; |
| · | | policies for loans and other transactions with related parties; |
| · | | policies for exempting related party transactions from authorization; |
| · | | policymaking relating to disclosure; |
| · | | transactions with employees; |
| · | | unusual or non-recurring transactions; |
| · | | appointment, dismissal and compensation of the Chief Executive Officer; |
| · | | appointment and compensation of executive officers; |
| · | | policies that set limits on the authority of the Chief Executive Officer and executive officers; |
| · | | organization of human resources; |
| · | | waivers to directors, executive officers or other persons to take advantage of our business opportunities for themselves or on behalf of third parties; |
| · | | policies to promote activities in compliance with the relevant legal framework and access to adequate legal defense; |
| · | | proposed compensation to directors and members of committees; |
| · | | monitoring compliance of established corporate practices and compliance with all applicable laws or regulations; |
| · | | presenting a report to the Board of Directors, based on reports of the activities of the Chief Executive Officer and the internal committees; and |
| · | | proposing appropriate legal actions against our officers who do not comply with the principles of loyalty and diligence. |
The Corporate Practices, Nominating and Compensation Committee may solicit the opinion of independent experts as it deems appropriate for the proper performance of its functions.
The current members of our Corporate Practices, Nominating and Compensation Committee are:
| | |
Members | | Position |
Antonio Purón Mier y Terán | | Independent Director and President |
Fernando Benjamín Ruiz Sahagún | | Independent Director |
José Eduardo Carredano Fernández | | Independent Director |
Jesús Federico Reyes Heroles González Garza | | Independent Director |
Alberto Torrado Martínez | | Independent Director |
The Secretary of the Corporate Practices Committee is Fernando Borja Mujica and the Assistant Secretary of the Corporate Practices, Nominating and Compensation Committee is Rocío Erika Bulhosen Aracil.
The Corporate Practices, Nominating and Compensation Committee must include at least three members of the Board of Directors, which may be acting members or alternate members, all of whom must be independent, as determined in accordance with Article 25 of the Mexican Securities Market Law and our bylaws. Pursuant to Mexican law and our bylaws, the President of the Corporate Practices Committee is elected and removed by the general shareholders’ meeting. Such President cannot be the Chairman of the Board of Directors and shall be elected on the basis of his expertise, competence and professional reputation. The Corporate Practices Committee’s members remain in office until they are removed or resign, provided they continue to be members of the board of Directors.
Comprehensive Risk Management Committee
Our Comprehensive Risk Management Committee (Comité de Administración Integral de Riesgos) reports to the Board of Directors as required by local law. This committee proposes objectives, policies and procedures for the management of risk as well as risk exposure limits to the Board of Directors. In addition, our Comprehensive Risk Management Committee approves the methodologies that we use to measure the various types of risks to which we are subject, as well as the models, parameters and scenarios for risk measurement, and monitors market, liquidity, credit, counterparty, legal and operational risks. See “Item 11. Quantitative and Qualitative Disclosures About Market Risk—Organizational Structure” for additional information about the committee’s activities. The members of the Comprehensive Risk Management
Committee shall be members of the Board of Directors, and they remain in office until they are removed or resign.
The current members of our Comprehensive Risk Management Committee are:
| | |
Members | | Position |
Guillermo Güemez García | | Independent Director and President of the Comprehensive Risk Management Committee |
Marcos Alejandro Martínez Gavica* | | Chairman of the Board |
Héctor Blas Grisi Checa | | Executive President and Chief Executive Officer. |
Alberto Torrado Martínez | | Independent Director |
Joaquín Vargas Guajardo | | Independent Director |
Angel Rivera Congosto | | Vice-president of Retail Banking |
Didier Mena Campos | | Chief Financial Officer |
Juan Ramón Jimenez Lorenzo* | | Executive General Director of Internal Audit |
Fernando Borja Mujica | | Deputy General Legal and Compliance Director |
Guillermo Jorge Quiroz Abed | | Independent Director |
Ricardo Alonso Fernández | | Deputy General Director of Risks |
*No voting rights.
Remuneration Committee
The purpose, composition, authority and responsibilities of our Remuneration Committee (Comité de Remuneraciones), which reports to our Board of Directors, have been established in a charter approved by our Board of Directors in accordance with Mexican law.
The Remuneration Committee’s primary purpose is to assist our Board of Directors in developing norms and policies relating to the administration and evaluation of the compensation plans, that together form our compensation system and to promulgate compensation plan criteria and policies to some of our employees. The Remuneration Committee prepares biannual reports about the administration of our compensation plans and informs the CNBV about modifications to our compensation system.
The Remuneration Committee is responsible for implementing and maintaining our compensation system and informs the Board of Directors twice a year regarding the operation of the compensation system. Additionally, the Remuneration Committee proposes compensation policies and procedures, recommends employees or personnel for inclusion in the compensation system and brings special cases and circumstances to the attention of the Board of Directors for its approval.
Our Remuneration Committee charter provides that:
| · | | it must include at least two members of the Board of Directors, one of whom must be independent, who shall be the one presiding; |
| · | | at least one member must have knowledge and experience in risk management or internal controls; |
| · | | the person responsible for the Comprehensive Risk Management Unit shall be a member; |
| · | | a representative from the Human Resources division shall be a member; |
| · | | a representative from the Financial Planning or Budget Division shall be a member; and |
| · | | the internal auditor may participate without voting rights. |
The Remuneration Committee must meet every quarter, and at least a majority of its members must be present; provided, that an independent director shall at all times be present. The meetings and resolutions adopted at Remuneration Committee meetings must be documented in minutes signed by all of the members who are present.
The current members of our Remuneration Committee are:
| | |
Name | | Position |
Antonio Purón Mier y Terán | | Independent Director |
Fernando Benjamín Ruiz Sahagún | | Independent Director |
José Eduardo Carredano Fernández | | Independent Director |
Marcos Alejandro Martínez Gavica* | | Chairman of the Board |
Juan Ignacio Echeverria Fernández | | Director of Human Resources |
Emilio de Eusebio Saiz | | Deputy General Director of Intervention and Control Management |
Juan Ramón Jimenez Lorenzo* | | Executive General Director of Internal Audit |
Ricardo Alonso Fernández | | Deputy General Director of Risk |
*No voting rights.
The Secretary of the Remuneration Committee is Fernando Borja Mujica, and the Assistant Secretary is Rocío Erika Bulhosen Aracil.
The members of the Remuneration Committee shall be members of the Board of Directors, and they remain in office until they are removed or resign.
Communication and Control Committee
The main functions of the Communication and Control Committee are to monitor the Bank’s money laundering and terrorist financing prevention systems and to determine whether activity is suspicious and that should be reported to the authorities. The Committee also approves the norms and procedures governing money laundering and terrorist financing prevention, reviews special projects and annual training plans relating to money laundering and terrorist financing prevention, approves suspicious activity and engages in other transaction monitoring activities.
In general, this committee is composed of top level managers from the following areas: Commercial, Human Resources, Systems, Corporate and Investment Banking, Legal and Internal Audit, among others.
The current members of the Communication and Control Committee are:
| | |
Name | | Position |
Fernando Borja Mujica | | Deputy General Legal and Compliance Director |
Pablo Fernando Quesada Gómez | | Deputy General Director of Business and Institutional Banking |
Pablo Elek Hansberg | | Deputy General Director of Commercial Network |
Jorge Alberto Alfaro Lara | | Deputy General Director of New Business |
Ricardo Alonso Fernández | | Deputy General Director of Risks |
Jorge Arturo Arce Gama | | Deputy General Director of Corporate and Investment Banking |
Juan Ramón Jiménez Lorenzo* | | Executive General Director of Internal Audit |
Alejandro Cecchi González | | Deputy General Director of Business Strategy |
Enrique González Martínez | | Executive Director of Control and Network Operation |
Juan Manuel Posada Falomir | | Executive Director Regulation and Products |
Roberto Guillermo Carvallo Alvarez (Temporary) | | Chief Compliance Officer |
Enrique Mondragón Domínguez | | Deputy General Director of Technology and Operations |
Francisco Pérez Borrego | | Executive Director of Information Technology |
Santiago Martín Juárez | | Executive Director of Operations |
Oscar José Hernando Moliner | | Executive Director of Non-Financial Risks |
José Leandro Figueroa | | Chief Data Officer |
Norma Angélica Castro Reyes | | Executive Director of Financial Inclusion |
*No voting rights.
D. Employees
As of December 31, 2018, on a consolidated basis we had 16,016 employees, an approximately 6.0% increase since December 31, 2017. We classify our employees as executives, professionals and administrative employees. Executives include the top management. Professionals are middle-management personnel. The remainder of the employees are administrative employees.
We have traditionally enjoyed good relations with our employees and their union. Of the total number of our employees, 3,698 or 23.09%, were members of the Banco Santander México labor union, which is affiliated with the National Federation of Bank Unions (Federación Nacional de Sindicatos Bancarios), as of December 31, 2018. We negotiate salaries with our union on an annual basis and benefits every two years, as required under Mexican law. In 2018 and in 2017, the collective bargaining agreement relating to salaries was renewed. Our collective bargaining agreement applies only to our unionized employees. While terms of employment are generally the same for unionized and non-unionized employees, benefits may differ. As of December 31, 2018, the Bank had 1,505 temporary employees, which represented 9.4% of our total employees.
The following chart summarizes the number and type of our employees as of December 31, 2016, 2017 and 2018.
| | | | | | | | |
| | As of December 31, |
Employees | | 2016 | | | 2017 | | | 2018 |
Executives | | 101 | | | 108 | | | 118 |
Professionals | | 6,860 | | | 7,229 | | | 8,024 |
Administrative | | 7,682 | | | 7,779 | | | 7,874 |
Total | | 14,643 | | | 15,116 | | | 16,016 |
E. Share Ownership
The following table provides the names of our directors and executive officers, indicating who beneficially owned shares as of the date of this annual report.
| | | | | | | | |
Shareholder | | Number of Series B
Shares Owned | | | Percentage of Outstanding
Series B Shares | | | Percentage of Total
Share Capital |
Marcos Alejandro Martínez Gavica | | 326,368 | | | (1) | | | (1) |
Héctor Blas Grisi Checa | | 1,038,922 | | | (1) | | | (1) |
Rodrigo Echenique Gordillo | | — | | | — | | | — |
Francisco Javier García-Carranza Benjumea | | — | | | — | | | — |
Rodrigo Brand de Lara | | 201,457 | | | (1) | | | (1) |
Ángel Rivera Congosto | | 146,613 | | | (1) | | | (1) |
Didier Mena Campos | | 116,736 | | | (1) | | | (1) |
Gina Lorenza Diez Barroso Azcárraga | | — | | | — | | | — |
Guillermo Güemez García | | — | | | — | | | — |
Guillermo Jorge Quiroz Abed | | — | | | — | | | — |
Juan Ignacio Gallardo Thurlow | | — | | | — | | | — |
José Eduardo Carredano Fernández | | — | | | — | | | — |
Antonio Purón Mier y Terán | | — | | | — | | | — |
Fernando Benjamín Ruíz Sahagún | | — | | | — | | | — |
Alberto Torrado Martínez | | 73,099 | | | (1) | | | (1) |
Joaquin Vargas Guajardo | | — | | | — | | | — |
Jesús Federico Reyes Heroles González Garza | | — | | | — | | | — |
Rogelio Zambrano Lozano | | — | | | — | | | — |
Guillermo Francisco Vogel Hinojosa | | — | | | — | | | — |
María de Lourdes Melgar Palacios | | — | | | — | | | — |
Fernando Borja Mujica | | 193,021 | | | (1) | | | (1) |
Jorge Arturo Arce Gama | | 432,810 | | | (1) | | | (1) |
Emilio de Eusebio Saiz | | 82,131 | | | (1) | | | (1) |
Ricardo Alonso Fernandez | | — | | | — | | | — |
Pablo Fernando Quesada Gómez | | — | | | — | | | — |
Jorge Alberto Alfaro Lara | | 308,426 | | | (1) | | | (1) |
Juan Ramón Jiménez Lorenzo | | 41,722 | | | (1) | | | (1) |
Enrique Luis Mondragón Domínguez | | 107,159 | | | (1) | | | (1) |
Alejandro Diego Cecchi González | | 71,268 | | | (1) | | | (1) |
Carlos Hajj Aboumrad | | 56,108 | | | (1) | | | (1) |
Jorge Alberto Zenteno Cervantes | | — | | | — | | | — |
Pablo Elek Hansberg | | — | | | — | | | — |
Juan Ignacio Echeverría Fernández | | 32,143 | | | (1) | | | (1) |
Javier Castrillo Penadés | | — | | | — | | | — |
| (1) | | Beneficially owns less than 1% of each of our outstanding Series B shares and our total outstanding share capital. |
Shares held by members of our Board of Directors and our executive officers do not have voting rights different from shares held by our other shareholders.
For a description of our equity compensation plan, see “Item 6. Directors, Senior Management and Employees ––B. Compensation.”
ITEM 7. MAJOR SHAREHOLDERS AND RELATED PARTY TRANSACTIONS
A. Major Shareholders
As of the date of this Report, our holding company, Grupo Financiero Santander México, directly owns approximately 74.96% of our total capital stock. Banco Santander Parent owns 100% of the capital stock
of Grupo Financiero Santander México and is thus our indirect controlling shareholder. The Santander Group, through its standalone subsidiaries, was one of the largest foreign bank groups in Latin America in terms of assets as of December 31, 2018, based on publicly available annual reports. The Santander Group had a gross margin of €48,424 million, CET1 fully loaded capital ratio of 11.30% and a market capitalization of €64,508 million as of December 31, 2018, and net income attributable to shareholders of €7,810 million in 2017. As of December 31, 2018, the Santander Group had 13,217 branches and a presence in 10 core markets. As a result of its voting control over us, the Santander Group is in a position to cause the election of a majority of the members of our management and to determine substantially all matters to be decided by a vote of shareholders.
Our relationship with the Santander Group has provided us with access to the expertise of the Santander Group in areas such as technology, product innovation, human resources and internal audit control systems. In addition, the Santander Group requires us to follow its banking policies, procedures and standards, especially with respect to credit approval and risk management. Such policies and expertise have been successfully used by the Santander Group in the Spanish and other banking markets, and we believe that such policies and expertise have had and will continue to have a beneficial effect upon our operations. For information about our relationship with Banco Santander Parent, see “Item 7. Major Shareholders and Related Party Transactions—B. Related Party Transactions.”
The following table presents the beneficial ownership of our capital stock as of the date of this Report.
| | | | | | | | | | | | | | | | | | |
| | | | | Percentage of | | | | | | Percentage of | | | | | | Percentage of | |
| | Series | | | Outstanding Series | | | Series B | | | Outstanding Series | | | Total Number | | | Total Capital | |
Name | | F Shares(1) | | | F Shares | | | Shares(1) | | B Shares | | | of Shares(1) | | | Stock | |
Grupo Financiero Santander México, S.A. de C.V. | | 3,464,309,145 | | | 100.00% | | | 1,623,491,117 | | | 48.86% | | | 5,087,800,262 | | | 74.96% | |
Santander Global Facilities, S.A. de C.V. | | — | | | — | | | 1,340 | | | 0.00% | | | 1,340 | | | 0.00% | |
Minority shareholders | | — | | | — | | | 1,699,192,755 | | | 51.14% | | | 1,699,192,755 | | | 25.04% | |
Total Capital Stock | | 3,464,309,145 | | | 100.00% | | | 3,322,685,212 | | | 100.00% | | | 6,786,994,357 | | | 100.00% | |
| (1) | | Number of shares represented by Total Shareholders’ Equity does not include shares held in treasury. |
| (2) | | Based on par value of Ps.3.780782962 per share. |
According to our depository bank, as of the date of this annual report, we had one holder registered in Mexico in addition to JPMorgan Chase Bank, N.A. as depositary of the ADRs evidencing ADSs. As of the date of this annual report, there were a total of 163 ADR holders of record and 158,113,462 ADRs outstanding, representing 790,567,310 Series B shares or 23.8% of outstanding Series B shares. Since some of these ADRs are held by nominees, the number of record holders may not be representative of the number of beneficial holders.
Significant Changes in Percentage Ownership of Principal Shareholders
In October 2012, our Former Holding Company completed an SEC-registered initial public offering in the United States and in other countries outside of the United States and Mexico of 273,913,200 ADSs, each representing five Series B shares, including 35,681,039 ADSs sold to the international underwriters pursuant to their option to purchase additional ADSs, and a public offering in Mexico of 319,977,408 Series B shares, including 41,736,184 Series B shares sold to the Mexican underwriters pursuant to their option to purchase additional shares. The Former Holding Company’ s ADSs began to trade on the NYSE, under the symbol “BSMX” on September 26, 2012, and the Series B shares continued to trade on the
Mexican Stock Exchange under the symbol “SANMEX.” We refer to the public offering in the United States and in other countries outside of the United States and Mexico as the 2012 international offering, and we refer to the public offering in Mexico as the 2012 Mexican offering. We refer to the 2012 international offering and the 2012 Mexican offering together as the 2012 global offering. The selling shareholders, Banco Santander Parent and Santusa Holding, S.L., received all of the proceeds from the 2012 global offering.
Prior to the 2012 global offering, Banco Santander Parent owned 1,608,355,340 Series B shares, or 48.41% of our then-outstanding Series B shares. Banco Santander Parent sold 1,608,355,340 Series B shares (including in the form of ADSs) in the 2012 global offering, including Series B shares (including in the form of ADSs) sold to the underwriters pursuant to their option to purchase additional shares. Immediately after the 2012 global offering, Banco Santander Parent owned 0% of our then-outstanding Series B shares but continued to be our controlling shareholder due to its beneficial ownership of 3,464,309,145 Series F shares.
Prior to the 2012 global offering, Santusa Holding, S.L. owned 1,690,250,753 Series B shares, or 50.88% of our then-outstanding Series B shares. Santusa Holding, S.L. sold 81,188,068 Series B shares (including in the form of ADSs) to the underwriters pursuant to their option to purchase additional shares in the 2012 global offering. Immediately after the 2012 global offering, Santusa Holding, S.L. owned 48.44% of our then-outstanding Series B shares and 23.71% of our total share capital.
On September 8, 2015 Banco Santander Parent acquired 14,428,432 Series “B” shares which were owned by Santander Overseas Bank Inc., representative of the 0.21% of the share capital of the Former Holding Company, Grupo Financiero Santander México, S.A.B. de C.V.
On May 12, 2016 Banco Santander Parent acquired 1,609,062,685 Series “B” shares which were owned by Santusa Holding, S.L., representative of the 23.71% of the share capital of the Former Holding Company.
On October 30, 2017, we filed a registration statement on Form F-4 to register our Series B shares in connection with our merger with our Former Holding Company. The registration statement was declared effective on December 7, 2017. On January 29, 2018, as a result of the Merger, the Former Holding Company’s shares were cancelled and each shareholder of the Former Holding Company received one share of Banco Santander México. Immediately upon effectiveness of the Merger, Banco Santander Parent contributed all of the shares it held in Banco Santander México to our holding company, Grupo Financiero Santander México, which was incorporated by Banco Santander Parent as a new holding company in Mexico wholly owned by Banco Santander Parent. As a result of such contribution, our new holding company owns 74.96% of our capital stock.
Voting Rights of Principal Shareholders
Our principal shareholders do not have voting rights distinct from those of our other shareholders. See “Item 10. Additional Information—B. Memorandum and Articles of Association—Voting Rights.”
B. Related Party Transactions
Loans to Related Parties
Articles 73, 73 Bis and 73 Bis 1 of the Mexican Banking Law (Ley de Instituciones de Crédito) regulates and limits loans and other transactions pursuant to which related parties may be liable to a bank. Transactions covered under the Articles are deposits, any type of loans, restructurings and amendments to such loans, net derivatives positions and investments in securities other than equity securities. For purposes of these provisions, the term “related parties” refers to (1) holders, either directly or indirectly, of 2% or more of our or any of our subsidiaries’ shares; (2) our or any of our subsidiaries’ principal and alternate Board members; (3) relatives of a Board member or of any person specified in (1) and (2) above;
(4) any person not our officer or employee who, nevertheless, is empowered to contractually bind us; (5) any corporation (or its directors or executive employees) in which we or any of our subsidiaries owns, directly or indirectly, 10% or more of its equity stock; (6) any corporation who has a director or officer in common with us or any of our subsidiaries; or (7) any of our directors or officers holds 10% or more of the outstanding capital stock. The majority of our Board of Directors must approve such loans. Before approval, however, the loan must undergo our customary review procedures for loans, which will vary depending on the nature and amount of the loan, except that such loans must always be reviewed and recommended by the highest loan review committee at the management level, and must be recommended by a special committee of directors responsible for reviewing our largest loans and all loans falling within the scope of Articles 73, 73 Bis and 73 Bis 1 of the Mexican Banking Law. In addition, certain filings must be made with the CNBV with respect to such loans. Loans to individuals in amounts less than the greater of (1) two million UDIs (Unidades de inversión, a peso-equivalent unit of account indexed for Mexican inflation) or (2) 1% of a bank’s Tier 1 net capital are exempt from such provisions. Loans to related parties may not exceed 35% of a bank’s Tier 1 capital. The CNBV may, upon request, grant exemptions from these provisions. In our case, all loans to individuals who are related parties, regardless of the amount, are approved by our Board of Directors.
The SHCP has adopted rules which exclude from the category of loans to related parties loans granted to the Mexican government, provided that the recipient does not make a loan to a related party, and loans to our directors or officers if they fall within the minimum thresholds set forth above. The SHCP rules also exclude from the category of loans to related parties loans to companies that provide ancillary services to us, meaning our affiliates that provide the necessary auxiliary services we need in order to carry out our operations, such as administrative, accounting, finance, legal, IT and other services, provided that such companies do not make a loan to a related party. These three categories of loans are not considered for purposes of determining the 35% of Tier 1 Capital limit of our loan portfolio that may consist of loans to related parties, and do not require the prior approval of our Board of Directors.
As of December 31, 2018, our loans granted to related parties per Article 73, 73 Bis and 73 Bis 1 of the Mexican Banking Law totaled Ps.101,746 million (U.S.$5,178 million), respectively, which included loans granted to our subsidiaries Santander Consumo and Santander Vivienda for Ps.43,800 million (U.S.$2,229 million) and Ps.32,686 million (U.S.$1,663 million), respectively, which were eliminated from the balance sheet on consolidation. These loans with related parties were approved by the Board of Directors. According to Mexican Banking Law, loans with subsidiaries that form part of our financial group are not considered to be related party transactions and therefore do not count against the 35% of Tier 1 Capital limit. Pursuant to the methodology to classify the loan portfolio set forth under the loan classification and rating rules, all of the loans granted to related parties have a credit quality of A1. Our loans to related parties are made on terms and conditions comparable to other loans of like quality and risk.
Additionally, pursuant to the Mexican Banking Law, no loans may be made to any bank officers or employees, except in connection with certain employment benefits. As permitted by the Mexican Banking Law, we currently provide loans to our employees at favorable rates.
Loans to Our Directors and Executive Officers
We have granted loans to our directors (excluding directors who are also executive officers) of Ps.0.2 million, Ps.0.6 million and Ps.0.6 million as of December 31, 2016, 2017 and 2018, respectively. None of these loans is disclosed as non-accrual, past due, restructured or potential problems in the “Item 4. Information on the Company—B. Business Overview—Selected Statistical Information” section. All loans were made in the ordinary course of business, were made on substantially the same terms, including interest rates and collateral, as those prevailing at the time for comparable transactions with other persons not related to Banco Santander México, and did not involve more than the normal risk of collectability or present other unfavorable features.
In addition, we have granted loans to our executive officers (including directors who are also executive officers) of Ps.31 million, Ps.27 million and Ps.48 million as of December 31, 2016, 2017 and 2018,
respectively. None of these loans is disclosed as non-accrual, past due, restructured or potential problems in the “Item 4. Information on the Company—B. Business Overview—Selected Statistical Information” section. As of December 31, 2016, 2017 and 2018, 69%, 67% and 82% of the total amount of these loans, respectively, were made pursuant to an employee benefit plan that makes standardized loans available to all of our employees without preferential terms or conditions for any of the executive officers, as permitted by the Mexican Banking Law. The rest of these loans were made in the ordinary course of business, were made on substantially the same terms, including interest rates and collateral, as those prevailing at the time for comparable transactions with other persons not related to Banco Santander México, and did not involve more than the normal risk of collectability or present other unfavorable features.
Under applicable Mexican privacy laws, we are not permitted to disclose the identity of our loan recipients. The following table sets forth unnamed members of our senior management who are the recipients of loans pursuant to an employee benefit plan granted by us to which Instruction 2 of Item 7.B.2. of Form 20‑F does not apply. The recipients of such loans have not waived the application of these privacy laws.
The material terms that differentiate these loans to unnamed members of our senior management listed below from those made in the ordinary course of business in transactions with unrelated persons are the following:
| · | | The applicable interest rate for each of these loans is the 28‑day Mexican benchmark interbank money market rate (Tasa de Interés Interbancaria de Equilibrio, or TIIE) capped at 7%, which is less than the interest rate that would be charged to unrelated persons. The average TIIE rate from January to December 2018 was 10.19%. |
| · | | We do not charge any commissions for these loans, whereas we would normally charge commissions on loans made to unrelated persons. |
| | | | | | | | | | | | | | | | | | | |
| | As of December 31, 2018 |
Nature of loan and transaction | | Mortgage (1) | | | Credit lines (2) | | | | | | |
in which incurred | | Largest amount | | | Amount | | | Largest amount | | | Amount | | | Total amount |
| | outstanding (3) | | | outstanding | | | outstanding (3) | | | outstanding | | | outstanding |
| | (Millions of pesos) |
Officer 1 | | Ps. | 18.00 | | | Ps. | 17.91 | | | Ps. | 1.00 | | | Ps. | 0.67 | | | Ps. | 18.58 |
Officer 2 | | | 3.40 | | | | 1.49 | | | | — | | | | — | | | | 1.49 |
Officer 3 | | | — | | | | — | | | | 1.00 | | | | 0.81 | | | | 0.81 |
Officer 4 | | | — | | | | — | | | | 1.00 | | | | 0.73 | | | | 0.73 |
Officer 5 | | | — | | | | — | | | | 1.00 | | | | 0.86 | | | | 0.86 |
Officer 6 | | | 8.46 | | | | 1.10 | | | | 1.00 | | | | 0.86 | | | | 1.96 |
Officer 7 | | | 6.01 | | | | 4.68 | | | | 1.00 | | | | 0.57 | | | | 5.25 |
Officer 8 | | | 8.87 | | | | 7.44 | | | | 0.91 | | | | 0.15 | | | | 7.59 |
Officer 9 | | | 2.49 | | | | 2.05 | | | | — | | | | — | | | | 2.05 |
Total | | Ps. | 47.23 | | | Ps. | 34.67 | | | Ps. | 6.91 | | | Ps. | 4.65 | | | Ps. | 39.32 |
| (1) | | Under our employee benefit plan, each officer can be granted up to a maximum of three mortgage loans. The amount outstanding column includes all the loans outstanding as of December 31, 2018. |
| (2) | | Under our employee benefit plan, each officer can be granted up to a maximum of two credit lines (these are consumer loans without guarantees). The amount outstanding column includes all the loans outstanding as of December 31, 2018. |
| (3) | | The largest outstanding amount is equal to the aggregate initial amounts of all loans. |
Affiliate Transactions
From time to time, we enter into agreements, including service agreements, with Banco Santander Parent, our subsidiaries and affiliates such as Santander Consumo, SAM Asset Management, S.A. de C.V., Sociedad Operadora de Sociedades de Inversión (formerly Gestión Santander), Santander Tecnología
México, S.A. de C.V. (formerly Isban México, S.A. de C.V.), Gesban México Servicios Administrativos Globales, S.A. de C.V., Santander Global Property, S.A. de C.V., Santander Global Facilities, S.A. de C.V., Geoban, S.A. and Servicios de Cobranza, Recuperación y Seguimiento, S.A. de C.V. Prior to the Merger, we also entered into agreements with the Former Holding Company and our affiliate Casa de Bolsa Santander. We have entered into service agreements pursuant to which we render services, such as administrative, accounting, finance, treasury, legal services and others. We believe that these transactions with our affiliates have been made on terms that are not less favorable to us than those that could be obtained from unrelated third parties.
We have agreements with the following service providers, which are also affiliates of the Santander Group:
| · | | Ingeniería de Software Bancario, S.L., or ISBAN, for the provision of IT services such as project development, quality plans, remediation plans, maintenance of application software, functional support of various applications and consulting; |
| · | | Produban Servicios Informáticos Generales, S.L., or Produban, for the provision of IT services such as data processing, administration of IT services, project development, consulting, software quality management and project development support; |
| · | | Gesban Mexico Servicios Administrativos Globales, S.A. de C.V., or Gesban, for the provision of accounting services, fiscal management, budget control, support services and inspections and audits; |
| · | | Geoban, S.A., or Geoban, for the provision of operational and back-office retail services, such as the execution of management tasks related to fundraising and loan products; and |
| · | | Santander Global Facilities, S.A. de C.V., or SGF, for the leasing of space and positions for our contact center operators. |
On December 29, 2016, we issued a perpetual subordinated non preferred contingent convertible additional Tier 1 capital note in an aggregate principal amount of U.S.$500,000,000, at an issue price of 100%, with no fixed maturity or fixed redemption date, and at an interest rate equal to 8.500% per annum. The Former Holding Company purchased 100% of the aggregate principal amount. This Back-to-Back note was cancelled in connection with the Merger. On December 29, 2016, the Former Holding Company issued perpetual subordinated non preferred contingent convertible additional Back-to-Back notes in an aggregate principal amount of U.S.$500,000,000, at an issue price of 100%, with no fixed maturity or fixed redemption date, and at an interest rate equal to 8.5% per annum. Banco Santander Parent purchased U.S.$441,095,000 aggregate principal amount of the Back-to-Back notes. In connection with the Merger, we assumed all of the payment and other obligations under the Back-to-Back notes and Tier 1 indenture. See “Item 5. Operating and Financial Review and Prospects—B. Liquidity and Capital Resources—Debt Securities Outstanding—The Additional Tier 1 Capital Notes”.
On December 29, 2016, we issued 100% of the Back-to-Back notes to the Former Holding Company in a related party transaction. As of December 31, 2017, the Former Holding Company continued to hold the Back-to-Back notes. In connection with the Merger, the Back-to-Back notes were cancelled and we assumed all of the payment and other obligations of the Former Holding Company under the AT1 Notes.
The following table sets forth our assets and liabilities held in connection with related parties as of December 31, 2016, 2017 and 2018:
| | | | | | | | | | | | | | | | | | | | | | | |
| | As of |
| | December 31, 2016 | | | December 31, 2017 | | | December 31, 2018 |
| | Ultimate Parent | | | Other Related | | | Ultimate Parent | | | Other Related | | | Ultimate Parent | | | Other Related |
| | Company | | | Party | | | Company | | | Party | | | Company | | | Party |
ASSETS | | | | | | | | | | | | | | | | | | | | | | | |
Financial assets held for trading - | | | | | | | | | | | | | | | | | | | | | | | |
Trading derivatives - | | | | | | | | | | | | | | | | | | | | | | | |
Of which - | | | | | | | | | | | | | | | | | | | | | | | |
Banco Santander, S.A. (Spain) | | Ps. | 90,418 | | | Ps. | — | | | Ps. | 73,593 | | | Ps. | — | | | Ps. | — | | | Ps. | — |
Abbey National Treasury Services plc. | | | — | | | | 2,352 | | | | — | | | | 12 | | | | — | | | | — |
Other | | | — | | | | 2 | | | | — | | | | 2 | | | | — | | | | — |
Financial assets at fair value through profit or loss - | | | | | | | | | | | | | | | | | | | | | | | |
Trading derivatives - | | | | | | | | | | | | | | | | | | | | | | | |
Of which - | | | | | | | | | | | | | | | | | | | | | | | |
Banco Santander, S.A. (Spain) | | | — | | | | — | | | | — | | | | — | | | | 69,178 | | | | — |
Other | | | — | | | | — | | | | — | | | | — | | | | — | | | | 9 |
Other financial assets at fair value through profit or loss - | | | | | | | | | | | | | | | | | | | | | | | |
Loans and advances to credit institutions – | | | | | | | | | | | | | | | | | | | | | | | |
Of which - | | | | | | | | | | | | | | | | | | | | | | | |
Banco Santander, S.A. (Spain) | | | — | | | | — | | | | — | | | | — | | | | 13,127 | | | | — |
Other | | | — | | | | — | | | | — | | | | — | | | | — | | | | — |
Loans and advances to customers - | | | | | | | | | | | | | | | | | | | | | | | |
Of which - | | | | | | | | | | | | | | | | | | | | | | | |
Casa de Bolsa Santander, S.A. de C.V., Grupo Financiero Santander México | | | — | | | | 1,283 | | | | — | | | | 2,090 | | | | — | | | | 2,178 |
Other | | | — | | | | 1 | | | | — | | | | — | | | | — | | | | — |
Available for sale financial assets - | | | | | | | | | | | | | | | | | | | | | | | |
Of which - | | | | | | | | | | | | | | | | | | | | | | | |
Grupo Financiero Santander México, S.A.B. de C.V. | | | — | | | | 233 | | | | — | | | | 248 | | | | — | | | | — |
Financial assets at amortized cost - | | | | | | | | | | | | | | | | | | | | | | | |
Loans and advances to credit institutions - | | | | | | | | | | | | | | | | | | | | | | | |
Of which - | | | | | | | | | | | | | | | | | | | | | | | |
Banco Santander, S.A. (Spain) | | | — | | | | — | | | | — | | | | — | | | | 3,472 | | | | — |
Loans and advances to customers - | | | | | | | | | | | | | | | | | | | | | | | |
Of which - | | | | | | | | | | | | | | | | | | | | | | | |
Santander Capital Structuring, S.A. de C.V. | | | — | | | | — | | | | — | | | | — | | | | — | | | | 1,296 |
Santander Global Technology, S.L., Sociedad Unipersonal (formerly Produban Servicios Informáticos Generales, S.L.) | | | — | | | | — | | | | — | | | | — | | | | — | | | | 1,745 |
Key management personnel | | | — | | | | — | | | | — | | | | — | | | | — | | | | 2,430 |
Loans and receivables - | | | | | | | | | | | | | | | | | | | | | | | |
Loans and advances to credit institutions - | | | | | | | | | | | | | | | | | | | | | | | |
Of which - | | | | | | | | | | | | | | | | | | | | | | | |
Banco Santander, S.A. (Spain) | | | 281 | | | | — | | | | 997 | | | | — | | | | — | | | | — |
Banco Santander Rio, S.A. | | | — | | | | 223 | | | | — | | | | 194 | | | | — | | | | — |
Loans and advances to customers - | | | | | | | | | | | | | | | | | | | | | | | |
Of which - | | | | | | | | | | | | | | | | | | | | | | | |
Santander Capital Structuring, S.A. de C.V. | | | — | | | | — | | | | — | | | | 1,176 | | | | — | | | | — |
Santander Global Technology, S.L., Sociedad Unipersonal (formerly Produban Servicios Informáticos Generales, S.L.) | | | — | | | | 1,154 | | | | — | | | | 1,674 | | | | — | | | | — |
Key management personnel | | | — | | | | 1,471 | | | | — | | | | 3,666 | | | | — | | | | — |
Other Intangible assets - | | | | | | | | | | | | | | | | | | | | | | | |
Of which - | | | | | | | | | | | | | | | | | | | | | | | |
Santander Tecnología México, S.A. de C.V. (formerly Isban México, S.A. de C.V.) | | | — | | | | 2,364 | | | | — | | | | 2,811 | | | | — | | | | 3,403 |
Santander Global Technology, S.L., Sociedad Unipersonal (formerly Produban Servicios Informáticos Generales, S.L.) | | | — | | | | 478 | | | | — | | | | 533 | | | | — | | | | 864 |
Ingeniería de Software Bancario, S.L. | | | — | | | | 412 | | | | — | | | | 443 | | | | — | | | | — |
Santander Back-Offices Globales Mayoristas, S.A. | | | — | | | | 74 | | | | — | | | | 74 | | | | — | | | | 78 |
Santander Tecnología México, S.A. de C.V. (formerly Isban Brasil, S.A.) | | | — | | | | 11 | | | | — | | | | 11 | | | | — | | | | 11 |
OTHER ASSETS | | | | | | | | | | | | | | | | | | | | | | | |
Of which - | | | | | | | | | | | | | | | | | | | | | | | |
Santander Issuances, S.A. | | | — | | | | 251 | | | | — | | | | — | | | | — | | | | — |
Casa de Bolsa Santander, S.A. de C.V., Grupo Financiero Santander México | | | — | | | | — | | | | — | | | | 21 | | | | — | | | | — |
Abbey National Treasury Services plc. | | | — | | | | — | | | | — | | | | 76 | | | | — | | | | — |
Zurich Santander Seguros México, S.A. | | | — | | | | 976 | | | | — | | | | 1,053 | | | | — | | | | 1,108 |
SAM Asset Management, S.A. de C.V., Sociedad Operadora de Fondos de Inversión | | | — | | | | 171 | | | | — | | | | 156 | | | | — | | | | 153 |
Other | | | — | | | | 25 | | | | — | | | | 12 | | | | — | | | | 63 |
| | | | | | | | | | | | | | | | | | | | | | | |
LIABILITIES AND EQUITY | | | | | | | | | | | | | | | | | | | | | | | |
Financial liabilities held for trading - | | | | | | | | | | | | | | | | | | | | | | | |
Trading derivatives - | | | | | | | | | | | | | | | | | | | | | | | |
Of which - | | | | | | | | | | | | | | | | | | | | | | | |
Banco Santander, S.A. (Spain) | | | 58,537 | | | | — | | | | 43,827 | | | | — | | | | — | | | | — |
Banco Santander International | | | — | | | | 64 | | | | — | | | | 25 | | | | — | | | | — |
Abbey National Treasury Services plc. | | | — | | | | 1,659 | | | | — | | | | 75 | | | | — | | | | — |
Other | | | — | | | | 2 | | | | — | | | | — | | | | — | | | | — |
Short positions - | | | | | | | | | | | | | | | | | | | | | | | |
Of which - | | | | | | | | | | | | | | | | | | | | | | | |
Casa de Bolsa Santander, S.A. de C.V., Grupo Financiero Santander México | | | — | | | | 2,646 | | | | — | | | | 5,002 | | | | — | | | | — |
Financial liabilities at fair value through profit or loss - | | | | | | | | | | | | | | | | | | | | | | | |
Trading derivatives - | | | | | | | | | | | | | | | | | | | | | | | |
Of which - | | | | | | | | | | | | | | | | | | | | | | | |
| | | | | | | | | | | | | | | | | | | | | | | |
| | As of |
| | December 31, 2016 | | | December 31, 2017 | | | December 31, 2018 |
| | Ultimate Parent | | | Other Related | | | Ultimate Parent | | | Other Related | | | Ultimate Parent | | | Other Related |
| | Company | | | Party | | | Company | | | Party | | | Company | | | Party |
Banco Santander, S.A. (Spain) | | | — | | | | — | | | | — | | | | — | | | | 37,082 | | | | — |
Banco Santander International | | | — | | | | — | | | | — | | | | — | | | | — | | | | 3 |
Other | | | — | | | | — | | | | — | | | | — | | | | — | | | | 2 |
Other financial liabilities at fair value through profit or loss- | | | | | | | | | | | | | | | | | | | | | | | |
Of which - | | | | | | | | | | | | | | | | | | | | | | | |
Customer deposits - Repurchases agreements | | | | | | | | | | | | | | | | | | | | | | | |
Casa de Bolsa Santander, S.A. de C.V., Grupo Financiero Santander México | | | — | | | | 22,162 | | | | — | | | | 19,333 | | | | — | | | | 9,270 |
Banco S3 México, S.A., Institución de Banca Múltiple | | | — | | | | — | | | | — | | | | 1,651 | | | | — | | | | — |
Grupo Financiero Santander México, S.A.B. de C.V. | | | — | | | | — | | | | — | | | | 71 | | | | — | | | | — |
Other | | | — | | | | — | | | | — | | | | 5 | | | | — | | | | 17 |
Financial liabilities at amortized cost - | | | | | | | | | | | | | | | | | | | | | | | |
Deposits from credit institutions - | | | | | | | | | | | | | | | | | | | | | | | |
Of which - | | | | | | | | | | | | | | | | | | | | | | | |
Banco Santander, S.A. (Spain) | | | 33,209 | | | | — | | | | 32,559 | | | | — | | | | 34,525 | | | | — |
Other | | | — | | | | 18 | | | | — | | | | 75 | | | | — | | | | 87 |
Subordinated liabilities - | | | | | | | | | | | | | | | | | | | | | | | |
Of which - | | | | | | | | | | | | | | | | | | | | | | | |
Banco Santander, S.A. (Spain) | | | 22,661 | | | | — | | | | 21,738 | | | | — | | | | 28,109 | | | | — |
Grupo Financiero Santander México, S.A.B. de C.V. | | | — | | | | 10,298 | | | | — | | | | 9,831 | | | | — | | | | — |
Customer deposits - | | | | | | | | | | | | | | | | | | | | | | | |
Of which - | | | | | | | | | | | | | | | | | | | | | | | |
Abbey National Treasury Services plc. | | | — | | | | 683 | | | | — | | | | — | | | | — | | | | — |
Santander Tecnología México, S.A. de C.V. (formerly Isban México, S.A. de C.V.) | | | — | | | | 653 | | | | — | | | | 515 | | | | — | | | | — |
Casa de Bolsa Santander, S.A. de C.V., Grupo Financiero Santander México | | | — | | | | 10 | | | | — | | | | — | | | | — | | | | — |
Operadora de Carteras Gamma, S.A.P.I. de C.V. | | | — | | | | — | | | | — | | | | 145 | | | | — | | | | 153 |
Grupo Financiero Santander México, S.A.B. de C.V. | | | — | | | | 193 | | | | — | | | | 176 | | | | — | | | | — |
Santander Global Facilities, S.A. de C.V. | | | — | | | | 426 | | | | — | | | | 620 | | | | — | | | | 335 |
Servicios de Cobranza, Recuperación y Seguimiento, S.A. de C.V. | | | — | | | | 153 | | | | — | | | | 179 | | | | — | | | | 49 |
Santander Global Technology, S.L., Sociedad Unipersonal (formerly Produban Servicios Informáticos Generales, S.L.) | | | — | | | | 51 | | | | — | | | | 406 | | | | — | | | | 377 |
Grupo Alcanza | | | — | | | | 138 | | | | — | | | | — | | | | — | | | | — |
Santander Capital Structuring | | | — | | | | — | | | | — | | | | 186 | | | | — | | | | 379 |
Other | | | — | | | | 1,072 | | | | — | | | | 234 | | | | — | | | | 1,350 |
Marketable Debt Securities - | | | | | | | | | | | | | | | | | | | | | | | |
Of which - | | | | | | | | | | | | | | | | | | | | | | | |
Banco Santander, S.A. (Spain) | | | 1,016 | | | | — | | | | 1,182 | | | | — | | | | 969 | | | | — |
Other | | | — | | | | 28 | | | | — | | | | 15 | | | | — | | | | 11 |
Other financial liabilities - | | | | | | | | | | | | | | | | | | | | | | | |
Banco Santander, S.A. (Spain) | | | 3 | | | | — | | | | 1,366 | | | | — | | | | 686 | | | | — |
Casa de Bolsa Santander, S.A. de C.V., Grupo Financiero Santander México | | | — | | | | 360 | | | | — | | | | 59 | | | | — | | | | 37 |
Santander Investment Securities Inc. | | | — | | | | 48 | | | | — | | | | — | | | | — | | | | — |
Santander Global Facilities, S.A. de C.V. | | | — | | | | 45 | | | | — | | | | — | | | | — | | | | 408 |
Other | | | — | | | | 43 | | | | — | | | | 66 | | | | — | | | | 56 |
OTHER LIABILITIES | | | | | | | | | | | | | | | | | | | | | | | |
Banco S3 México, S.A., Institución de Banca Múltiple | | | 1,733 | | | | — | | | | — | | | | — | | | | — | | | | 43 |
Santander Global Technology, S.L., Sociedad Unipersonal (formerly Produban Servicios Informáticos Generales, S.L.) | | | — | | | | 352 | | | | — | | | | 409 | | | | — | | | | 128 |
Santander Tecnología México, S.A. de C.V. (formerly Isban México, S.A. de C.V.) | | | — | | | | 188 | | | | — | | | | 184 | | | | — | | | | — |
Santander Back-offices Globales Mayorista | | | — | | | | 10 | | | | — | | | | 18 | | | | — | | | | — |
Ingeniería de Software Bancario, S.L. | | | — | | | | 19 | | | | — | | | | 75 | | | | — | | | | — |
Other | | | — | | | | 18 | | | | — | | | | 4 | | | | — | | | | 4 |
| (1) | | Does not include loans to our directors or executive officers, which are described separately in “—Loans to Related Parties—Loans to Our Directors and Executive Officers” above. |
(*)As of December 31, 2018 and 2017, includes Ps.1,112 million and Ps.52 million, respectively, related to key management personnel transactions.
The following table set forth our income and expense from related parties for the years ended December 31, 2016, 2017 and 2018:
| | | | | | | | | | | | | | | | | | | | | | | |
| | For the year ended December 31, |
| | 2016 | | | 2017 | | | 2018 |
| | Ultimate Parent | | | Other Related | | | Ultimate Parent | | | Other Related | | | Ultimate Parent | | | Other Related |
| | Company | | | Party | | | Company | | | Party | | | Company | | | Party |
| | (Millions of pesos) |
INCOME STATEMENT: | | | | | | | | | | | | | | | | | | | | | | | |
Interest income - | | | | | | | | | | | | | | | | | | | | | | | |
Of which - | | | | | | | | | | | | | | | | | | | | | | | |
Banco Santander, S.A. (Spain) | | Ps. | 5 | | | Ps. | — | | | Ps. | — | | | Ps. | — | | | Ps. | 144 | | | Ps. | — |
Santander Global Technology, S.L., Sociedad Unipersonal (formerly Produban Servicios Informáticos Generales, S.L.) | | | — | | | | 52 | | | | — | | | | 86 | | | | — | | | | 107 |
Casa de Bolsa Santander, S.A. de C.V., Grupo Financiero Santander México | | | — | | | | 57 | | | | — | | | | 95 | | | | — | | | | 127 |
Santander Capital Structuring, S.A. de C.V. | | | — | | | | — | | | | — | | | | — | | | | — | | | | 120 |
Other | | | — | | | | 2 | | | | — | | | | 93 | | | | — | | | | 1 |
Interest expenses and similar charges - | | | | | | | | | | | | | | | | | | | | | | | |
Of which - | | | | | | | | | | | | | | | | | | | | | | | |
Banco Santander, S.A. (Spain) | | | 1,275 | | | | — | | | | 1,440 | | | | — | | | | 1,765 | | | | — |
Casa de Bolsa Santander, S.A. de C.V., Grupo Financiero Santander México | | | — | | | | 1,316 | | | | — | | | | 1,449 | | | | — | | | | 1,824 |
Grupo Financiero Santander México, S.A.B. de C.V. | | | — | | | | 9 | | | | — | | | | 16 | | | | — | | | | — |
Banco S3 México, S.A., Institución de Banca Múltiple | | | — | | | | — | | | | — | | | | 12 | | | | — | | | | 44 |
Servicios de Cobranza, Recuperación y Seguimiento, S.A. de C.V. | | | — | | | | 9 | | | | — | | | | 7 | | | | — | | | | 7 |
Santander Global Facilities, S.A. de C.V. | | | — | | | | 11 | | | | — | | | | 28 | | | | — | | | | 32 |
Santander Tecnología México, S.A. de C.V. (formerly Isban México, S.A. de C.V.) | | | — | | | | 24 | | | | — | | | | 28 | | | | — | | | | — |
Other | | | — | | | | 9 | | | | — | | | | 35 | | | | — | | | | 45 |
Fee and commission income - | | | | | | | | | | | | | | | | | | | | | | | |
Of which - | | | | | | | | | | | | | | | | | | | | | | | |
Banco Santander, S.A. (Spain) | | | 6 | | | | — | | | | 7 | | | | — | | | | 6 | | | | — |
Santander Investment Securities Inc. | | | — | | | | — | | | | — | | | | 10 | | | | — | | | | 6 |
Casa de Bolsa Santander, S.A. de C.V., Grupo Financiero Santander México | | | — | | | | — | | | | — | | | | — | | | | — | | | | 292 |
Zurich Santander Seguros México, S.A. | | | — | | | | 4,165 | | | | — | | | | 4,219 | | | | — | | | | 4,645 |
SAM Asset Management, S.A. de C.V., Sociedad Operadora de Fondos de Inversión | | | — | | | | 1,647 | | | | — | | | | 1,585 | | | | — | | | | 1,564 |
Other | | | — | | | | 16 | | | | — | | | | 9 | | | | — | | | | — |
Fee and commission expense- | | | | | | | | | | | | | | | | | | | | | | | |
Of which - | | | | | | | | | | | | | | | | | | | | | | | |
Banco Santander, S.A. (Spain) | | | 19 | | | | — | | | | 15 | | | | — | | | | 2 | | | | — |
Santander Global Facilities, S.A. de C.V. | | | — | | | | — | | | | — | | | | 15 | | | | — | | | | — |
Servicios de Cobranza, Recuperación y Seguimiento, S.A. de C.V. | | | — | | | | — | | | | — | | | | — | | | | — | | | | 60 |
Casa de Bolsa Santander, S.A. de C.V., Grupo Financiero Santander México | | | — | | | | 41 | | | | — | | | | — | | | | — | | | | — |
SAM Asset Management , S.A. de C.V., Sociedad Operadora de Fondos de Inversión | | | — | | | | 52 | | | | — | | | | 66 | | | | — | | | | 16 |
Santander Investment Securities Inc. | | | — | | | | 62 | | | | — | | | | — | | | | — | | | | — |
Other | | | — | | | | 11 | | | | — | | | | — | | | | — | | | | 8 |
Gains/(losses) on financial assets and liabilities (net) - | | | | | | | | | | | | | | | | | | | | | | | |
Of which - | | | | | | | | | | | | | | | | | | | | | | | |
Banco Santander, S.A. (Spain) | | | 24,211 | | | | — | | | | (4,346) | | | | — | | | | 2,145 | | | | — |
Abbey National Treasury Services plc. | | | — | | | | (280) | | | | — | | | | (739) | | | | — | | | | 56 |
Other | | | — | | | | (44) | | | | — | | | | 19 | | | | — | | | | 19 |
Other operating income | | | | | | | | | | | | | | | | | | | | | | | |
Of which - | | | | | | | | | | | | | | | | | | | | | | | |
Santander Global Facilities, S.A. de C.V. | | | — | | | | 52 | | | | — | | | | 46 | | | | — | | | | 44 |
Casa de Bolsa Santander, S.A. de C.V., Grupo Financiero Santander México | | | — | | | | — | | | | — | | | | 28 | | | | — | | | | 113 |
| | | | | | | | | | | | | | | | | | | | | | | |
| | For the year ended December 31, |
| | 2016 | | | 2017 | | | 2018 |
| | Ultimate Parent | | | Other Related | | | Ultimate Parent | | | Other Related | | | Ultimate Parent | | | Other Related |
| | Company | | | Party | | | Company | | | Party | | | Company | | | Party |
| | (Millions of pesos) |
Santander Global Technology, S.L., Sociedad Unipersonal (formerly Produban Servicios Informáticos Generales, S.L.) | | | — | | | | — | | | | — | | | | — | | | | — | | | | 62 |
Other | | | — | | | | 39 | | | | — | | | | 10 | | | | — | | | | 29 |
| | | | | | | | | | | | | | | | | | | | | | | |
Administrative expenses - | | | | | | | | | | | | | | | | | | | | | | | |
Of which - | | | | | | | | | | | | | | | | | | | | | | | |
Banco Santander, S.A. (Spain) | | | — | | | | — | | | | 66 | | | | — | | | | 335 | | | | — |
Produban Servicios Informáticos Generales, S.L. | | | — | | | | 1,663 | | | | — | | | | 1,601 | | | | — | | | | 1,804 |
Santander Tecnología México, S.A. de C.V. (formerly Isban México, S.A. de C.V.) | | | — | | | | 178 | | | | — | | | | 188 | | | | — | | | | — |
Santander Global Facilities, S.A. de C.V. | | | — | | | | 206 | | | | — | | | | 366 | | | | — | | | | 517 |
Ingeniería de Software Bancario, S.L. | | | — | | | | 151 | | | | — | | | | 165 | | | | — | | | | — |
Gesban México Servicios Administrativos Globales, S.A. de C.V. | | | — | | | | 52 | | | | | | | | 53 | | | | — | | | | 54 |
Santander Back-offices Globales Mayorista, S.A. | | | — | | | | 26 | | | | | | | | 61 | | | | — | | | | 47 |
Casa de Bolsa Santander, S.A. de C.V., Grupo Financiero Santander México | | | — | | | | 54 | | | | — | | | | — | | | | — | | | | 88 |
Geoban, S.A. | | | — | | | | 78 | | | | — | | | | 77 | | | | — | | | | 75 |
Aquanima México, S. de R.L. de C.V. | | | — | | | | 43 | | | | — | | | | 45 | | | | — | | | | 53 |
Servicios de Cobranza, Recuperación y Seguimiento, S.A. de C.V. | | | — | | | | 110 | | | | — | | | | 119 | | | | — | | | | 7 |
Other | | | — | | | | 49 | | | | — | | | | 34 | | | | — | | | | 34 |
C. Interests of Experts and Counsel
Not applicable.
ITEM 8. FINANCIAL INFORMATION
A. Consolidated Statements and Other Financial Information
Financial statements
See “Item 18. Financial Statements,” which contains our audited financial statements prepared in accordance with IFRS.
Legal Proceedings
We are subject to certain claims and are party to certain legal proceedings in the normal course of our business. We do not believe that the liabilities related to such claims and proceedings are likely to have, in the aggregate, a material adverse effect on our financial condition or results of operations. There are no material proceedings in which any of our directors, any members of our senior management, or any of our affiliates is either a party adverse to us or to our affiliates or subsidiaries or has a material interest adverse to us or to our affiliates or subsidiaries.
We estimate that our aggregate liability, if all legal proceedings were determined adversely to us, could result in significant losses not estimated by us. As of December 31, 2018, we have recognized Ps.1,516 million (U.S.$77 million) as provisions for these legal actions (including tax-related litigation). See Note 24.e to our financial statements included elsewhere in this Report .
We estimate and provide for potential losses that may arise out of litigation, regulatory proceedings and uncertain income tax matters, to the extent that a current obligation exists, the losses are probable and can
be reasonably estimated. Significant judgment is required in making these estimates and our final liabilities may ultimately be materially different. Our actual losses may differ materially from recognized amounts.
Dividends and Dividend Policy
On December 29, 2014, we paid a dividend of Ps.3,473 million, equal to Ps.0.0430 per share. On May 28, 2015, we paid a dividend of Ps.3,534 million, equal to Ps.0.0437 per share. On December 21, 2015, we paid a dividend of Ps.3,226 million, equal to Ps.0.0399 per share. On May 26, 2016, we paid a dividend of Ps.3,844 million, equal to Ps.0.0475 per share. On December 30, 2016, we paid a dividend of Ps.13,624 million, equal to Ps.0.1685 per share. On May 30, 2017 we paid a dividend of Ps.4,234 million, equal to Ps.0.0524 per share. On December 27, 2017, we paid a dividend of Ps.4,676 million, equal to Ps.0.0578 per share. On June 29, 2018, we paid a dividend of Ps.4,279 million, equal to Ps.0.6314 per share. On December 28, 2018, we paid a dividend of Ps.4,949 million equal to Ps.0.7292 per share.
Although we have no current plans to adopt a formal dividend policy in respect of the amount and payment of dividends, we currently intend to declare and pay dividends on an annual basis, subject to approval by our shareholders. The declaration and payment of dividends in respect of any period is subject to a number of factors, including our debt service requirements, capital expenditure and investment plans, other cash requirements, our shareholders having approved our financial statements and the payment of dividends, and such other factors as may be deemed relevant at the time. We cannot assure you that we will pay any dividends in the future.
The declaration, payment and amount of any dividend are considered and proposed by our Board of Directors and approved at the general shareholders’ meeting by the affirmative vote of a majority of our shareholders in accordance with the applicable regulatory, corporate, tax and accounting rules and are subject to the statutory limitations set forth below.
Under Mexican law, dividends may only be paid from retained earnings resulting from the relevant year or prior years’ results if (i) the legal reserve has been created or maintained, by annually segregating 5% of net earnings, until the legal reserve equals at least 20% of the fully paid-in capital, (ii) shareholders, at a duly called meeting, have approved the results reflecting the earnings and the payment of dividends, and (iii) losses for prior fiscal years have been repaid or absorbed. The Mexican income tax law also sets forth an additional 10% tax over dividends paid when they are distributed to Mexican individuals or to companies or individuals based abroad, applicable to payments in connection with dividends generated since 2014 (for dividends related to years prior to 2014, the tax is not applicable). This additional tax is paid through its withholding and constitutes a definitive payment in charge of the shareholders. Treaties to avoid double taxation may be applied to foreigners.
All shares of our capital stock rank pari passu with respect to the payment of dividends. The reserve fund is required to be funded on a stand-alone basis for each company, rather than on a consolidated basis. The level of earnings available for the payment of dividends is determined by Mexican Banking GAAP. As of December 31, 2018, Banco Santander México (on an individual basis) had set aside Ps.8,086 million in legal reserves compared to paid-in capital of Ps.8,086 million, and thus was in compliance with the regulations pertaining to its legal reserve.
B. Significant Changes
None.
ITEM 9. THE OFFER AND LISTING
A. Offering and Listing Details
Our ADSs are currently traded on the NYSE, under the symbol “BSMX.” Our Series B shares are currently traded on the Mexican Stock Exchange under the symbol “BSMX.”
B. Plan of Distribution
Not applicable.
C. Markets
Before de Merger, the Former Holding Company’s Series B shares were traded on the BMV under the symbol “SANMEX”. The listing of the Former Holding Company’s Series B shares on the BMV was cancelled on January 26, 2018.
On January 29, 2018 upon consummation of the Merger, our ADSs representing Series B shares began to trade on the NYSE. Our ADSs are listed on the NYSE under the symbol “BSMX.” Our Series B shares currently trade on the Mexican Stock Exchange under the symbol “BSMX.” For information regarding the price history of our ADSs and Series B shares, see “—A. Offering and Listing Details.”
The Mexican Securities Market
We have prepared the information concerning the Mexican securities market set forth below based on materials obtained from public sources, including the CNBV, the Mexican Stock Exchange, the Mexican Central Bank and publications by market participants. The following summary does not purport to be a comprehensive description of all of the material aspects related to the Mexican securities market.
We cannot predict the liquidity of the Mexican Stock Exchange. If the trading volume of our Series B shares in such market is such that fewer than 100 unrelated investors hold our Series B shares or less than 12% of our aggregate outstanding shares are held by the public, our Series B shares could be delisted from the Mexican Stock Exchange or deregistered from the RNV.
Trading on the Mexican Stock Exchange
The Mexican Stock Exchange (BMV), located in Mexico City, is one of two stock exchanges in Mexico (the other stock exchange being BIVA). Operating continuously since 1907, the Mexican Stock Exchange is organized as a variable capital public stock corporation. Securities trading on the Mexican Stock Exchange occurs each business day from 8:30 a.m. to 3:00 p.m., Mexico City time subject to adjustments to operate uniformly with certain U.S. markets.
Trading on the Mexican Stock Exchange is effected electronically. The Mexican Stock Exchange may impose a number of measures to promote an orderly and transparent trading price of securities, including the operation of a system of automatic suspension of trading in shares of a particular issuer when price fluctuation exceeds certain limits.
Settlement on the Mexican Stock Exchange is effected three business days after a share transaction. Deferred settlement is not permitted without the approval of the Mexican Stock Exchange, even where mutually agreed. Most securities traded on the Mexican Stock Exchange are on deposit with Indeval, a privately owned securities depositary that acts as a clearinghouse, depositary, and custodian, as well as a settlement, transfer, and registration agent for Mexican Stock Exchange transactions, eliminating the need for physical transfer of securities. Transactions must be settled in pesos except under limited circumstances in which settlement in foreign currencies may be permitted.
Market Regulation
In 1925, the Mexican National Banking Commission (Comisión Nacional Bancaria) was established to regulate banking activity and in 1946, the Mexican Securities Commission (Comisión Nacional de Valores) was established to regulate stock market activity. In 1995, these two entities merged to form the CNBV.
Among other activities, the CNBV regulates the public offering and trading of securities and participants in the Mexican securities market, and imposes sanctions for the illegal use of insider information and other violations of the Mexican Securities Market Law. The CNBV regulates the Mexican securities market, the Mexican Stock Exchange, and brokerage firms through its staff and a Board of governors comprised of thirteen members.
Mexican Securities Market Law
The current Mexican Securities Market Law was enacted on December 5, 2005, and published in the Federal Official Gazette, and became effective on June 30, 2006. The Mexican Securities Market Law changed Mexican securities laws in various material respects to further align Mexican laws with the securities and corporate governance standards laws in effect in other jurisdictions.
In particular, the Mexican Securities Market Law:
| · | | establishes the variable capital public stock corporation, a corporate form of organization that is subject to the general requirements of the Mexican Corporations Law (Ley General de Sociedades Mercantiles), but is subject to specific requirements for issuers with stock registered with the CNBV and listed in the Mexican Stock Exchange; |
| · | | includes private placement exemptions and specifies the requirements that need to be satisfied for an issuer or underwriter to fall within the exemption when offering securities in Mexico; |
| · | | includes improved rules for tender offers, classifying such tender offers as either voluntary or mandatory; |
| · | | establishes standards for disclosure of holdings applicable to shareholders, including directors, of public companies; |
| · | | expands and strengthens the role of the board of directors of public companies; |
| · | | defines the standards applicable to the Board of Directors and the duties and potential liabilities and penalties applicable to each director, the chief executive officer (director general) and other executive officer (introducing concepts such as the duty of care, duty of loyalty and safe harbors); |
| · | | generally replaces the statutory auditor (comisario) with the audit committee and establishes the corporate practices committee with clearly defined responsibilities; |
| · | | improves the rights of minority shareholders and sets forth the requirements for shareholders’ derivative suits; |
| · | | defines applicable sanctions for violations under the Mexican Securities Market Law; and |
| · | | fully regulates broker-dealers, stock exchanges, depository institutions and other securities market participants. |
Registration and Listing Standards
To offer securities to the public in Mexico, an issuer must meet specific qualitative and quantitative requirements. Securities that have been registered with the RNV, pursuant to CNBV approval, may be listed on the Mexican Stock Exchange.
The general regulations applicable to issuers and other securities market participants (Disposiciones de carácter general aplicables a las emisoras de valores y a otros participantes del Mercado de Valores, or the General Regulations) issued by the CNBV require the Mexican Stock Exchange to adopt minimum requirements for issuers that seek to list their securities in Mexico. These requirements relate to operating history, financial and capital structure, and minimum public floats applicable to shares of public companies, among other things. The General Regulations also require the Mexican Stock Exchange to implement minimum requirements (including minimum public floats) for issuers to maintain their listing in Mexico. These requirements relate to the issuer’s financial condition and capital structure, among others. The CNBV may waive some of these requirements in certain circumstances.
The CNBV’s approval for registration does not imply any kind of certification or assurance related to the investment quality of the securities, the solvency of the issuer, or the accuracy or completeness of any information delivered to the CNBV.
The Mexican Stock Exchange may review compliance with the foregoing requirements and other requirements at any time, but will normally do so on an annual, semiannual and quarterly basis. The Mexican Stock Exchange must inform the CNBV of the results of its review, and this information must, in turn, be disclosed to investors. If an issuer fails to comply with any of these minimum requirements, the Mexican Stock Exchange has the authority to request that the issuer propose a plan to cure the violation. If the issuer fails to propose a plan, if the plan is not satisfactory to the Mexican Stock Exchange, or if an issuer does not make substantial progress with respect to the implementation of the corrective plan, trading of the relevant series of shares on the Mexican Stock Exchange may be temporarily suspended. In addition, if an issuer fails to implement the plan in full, the CNBV may suspend or cancel the registration of the shares with the RNV, in which case the majority shareholder or any controlling group will be required to carry out a tender offer to acquire all of the outstanding shares of the issuer in accordance with the tender offer provisions set forth in the Mexican Securities Market Law.
Reporting Obligations
Issuers of listed securities are required to file unaudited quarterly financial statements and audited annual financial statements and to provide periodic reports, in particular reports dealing with material events, with the CNBV and the Mexican Stock Exchange. Mexican issuers must file the following reports with the CNBV:
| · | | a comprehensive annual report prepared in accordance with the General Regulations, by no later than April 30 of each year; |
| · | | quarterly reports, within 20 days following the end of each of the first three quarters and 40 days following the end of the fourth quarter; |
| · | | reports disclosing material information promptly; |
| · | | reports and disclosure memoranda revealing corporate restructurings such as mergers, spin-offs or acquisitions or sales of assets, approved or to be approved by a shareholders’ meeting or the Board of Directors; and |
| · | | reports regarding the policies and guidelines with respect to the use of the company’s (or its subsidiaries’) assets by related persons. |
The General Regulations and the rules of the Mexican Stock Exchange require issuers of listed securities to publicly disclose information that relates to any event or circumstance that could influence the issuers’ share price. If listed securities experience unusual price volatility, the Mexican Stock Exchange must immediately request that the relevant issuer inform the public of the causes of the volatility or, if the issuer is unaware of the causes, that it make a statement to that effect. In addition, the Mexican Stock Exchange must immediately request that issuers disclose any information relating to material events when it deems the available public information to be insufficient, as well as instruct issuers to clarify the information when necessary. The Mexican Stock Exchange may request that issuers confirm or deny any material event that has been disclosed to the public by third parties when it deems that the material event may affect or influence the price of the listed securities. The Mexican Stock Exchange must immediately inform the CNBV of any such request. In addition, the CNBV may also make any of these requests directly to issuers. An issuer may delay the disclosure of material events if:
| · | | the issuer implements adequate confidentiality measures (including maintaining a log with information relating to parties in possession of the confidential information); |
| · | | the information is related to incomplete transactions; |
| · | | there is no misleading public information relating to the material event; and |
| · | | no unusual price or volume fluctuation occurs. |
Similarly, if an issuer’s securities are traded on both the Mexican Stock Exchange and a foreign securities exchange, the issuer must simultaneously file the information that it is required to file pursuant to the laws and regulations of the foreign jurisdiction with the CNBV and the Mexican Stock Exchange.
Suspension of Trading
In addition to the authority of the Mexican Stock Exchange under its internal regulations as described above, the CNBV and the Mexican Stock Exchange may suspend trading in an issuer’s securities:
| · | | if the issuer does not disclose a material event; or |
| · | | upon price or volume volatility or changes in the trading of the relevant securities that are not consistent with the historic performance of the securities and cannot be explained solely through information made publicly available pursuant to the General Regulations. |
The Mexican Stock Exchange must immediately inform the CNBV and the general public of any suspension. An issuer may request that the CNBV or the Mexican Stock Exchange permit trading to resume if it demonstrates that the causes triggering the suspension have been resolved and that it is in full compliance with periodic reporting requirements. If an issuer’s request has been granted, the Mexican Stock Exchange will determine the appropriate mechanism to resume trading. If trading in an issuer’s securities is suspended for more than 20 business days and the issuer is authorized to resume trading without conducting a public offering, the issuer must disclose before trading may resume a description of the causes that resulted in the suspension and the reasons why it has been authorized to resume trading.
Certain Disclosures
Pursuant to the Mexican Securities Market Law, the following persons must notify the CNBV of any transactions undertaken by them with respect to a listed issuer’s securities:
| · | | members of a listed issuer’s Board of Directors; |
| · | | shareholders controlling 10% or more of a listed issuer’s outstanding capital stock; |
| · | | groups controlling 25% or more of a listed issuer’s outstanding capital stock; and |
These persons must also inform the CNBV of the effect of the transactions within three days following their completion, or, alternatively, that the transactions have not been consummated. In addition, insiders must abstain from purchasing or selling securities of the issuer within three months from the last sale or purchase, respectively.
Subject to certain exceptions, any acquisition of a public company’s shares that results in the acquirer owning 10.0% or more, but less than 30.0%, of an issuer’s outstanding capital stock must be publicly disclosed to the CNBV and the Mexican Stock Exchange by no later than one business day following the acquisition.
Any acquisition by an insider that results in the insider holding an additional 5% or more of a public company’s outstanding capital stock must also be publicly disclosed to the CNBV and the Mexican Stock Exchange no later than one business day following the acquisition. Some insiders must also notify the CNBV of share purchases or sales that occur within any calendar quarter or five-day period and that exceed certain value thresholds. Shareholders and Board members and officers as well as individuals owning, respectively, 5% or 1% of our outstanding shares are required to report to the issuer, on a yearly basis, their shareholdings. The Mexican Securities Market Law requires that convertible securities, warrants and derivatives to be settled in kind be taken into account in the calculation of share ownership percentages.
Tender Offers
The Mexican Securities Market Law contains provisions relating to public tender offers and certain other share acquisitions occurring in Mexico. Under the law, tender offers may be voluntary or mandatory. Voluntary tender offers, or offers where there is no requirement that they be initiated or completed, are required to be made to all shareholders on a pro rata basis, without differentiating between classes of shares. Any intended acquisition of a public company’s shares that results in the acquirer owning 30% or more, but less than a percentage that would result in the acquirer obtaining control, of a company’s voting shares requires the acquirer, with the prior approval of the CNBV, to make a mandatory public tender offer for the greater of (a) the percentage of the capital stock intended to be acquired or (b) 10% of the company’s outstanding capital stock. Finally, any intended acquisition of a public company’s shares that is aimed at obtaining control requires the potential acquirer to make a mandatory tender offer for 100% of the company’s outstanding capital stock (however, under certain circumstances the CNBV may permit an offer for less than 100%). The tender offer must be made at the same price to all shareholders and classes of shares. The Board of Directors, with the advice of the corporate practices committee, must issue its opinion of any tender offer resulting in a change of control, which opinion must take into account minority shareholder rights and which may be accompanied by an independent fairness opinion. Directors and principal officers are required to disclose whether they will participate in the tender.
Under the Mexican Securities Market Law, all tender offers must be open for at least 20 business days and purchases thereunder are required to be made pro rata to all tendering shareholders. The Mexican Securities Market Law only permits the payment of certain amounts to controlling shareholders over and above the offering price if these amounts are fully disclosed, approved by the Board of Directors and paid solely in connection with non-compete or similar obligations. The law also provides exceptions to the mandatory tender offer requirements and specifically sets forth remedies for non-compliance with these tender offer rules (e.g., suspension of voting rights, possible annulment of purchases, etc.) and other rights available to prior shareholders of the issuer.
Joint Trading of Common Shares and Limited or Non-voting Shares
The Mexican Securities Market Law does not permit issuers to implement mechanisms for common shares and limited or non-voting shares to be jointly traded or offered to public investors, unless the limited or non-voting shares are convertible into common shares within a period of up to five years, or when, because of the nationality of the holder, the shares or the securities representing the shares limit the right to vote to comply with foreign investment laws. In addition, the aggregate amount of shares with limited or non-voting rights may not exceed 25% of the aggregate amount of publicly held shares. The CNBV may increase this 25% limit by an additional 25%, provided that the limited or non-voting shares exceeding 25% of the aggregate amount of publicly held shares are convertible into common shares within five years of their issuance.
Anti-Takeover Protections
The Mexican Securities Market Law provides that public companies may include anti-takeover provisions in their bylaws if such provisions (i) are approved by a majority of the shareholders, without shareholders representing 5% or more of the capital stock present at the meeting voting against the approval of such provision, (ii) do not exclude any shareholders or group of shareholders, (iii) do not restrict, in an absolute manner, a change of control, and (iv) do not contravene legal provisions related to tender offers or have the effect of disregarding the economic rights related to the shares held by the acquiring party. Our bylaws do not include any such provisions.
Board of Directors and Committees
Under the Mexican Securities Market Law, public companies must have a Board of Directors composed of no more than 21 members, of which at least 25% must be independent. Independent members must be selected based on their experience, ability and reputation at the issuer’s shareholders’ meeting; whether a director is independent must be determined by the issuer’s shareholders and such determination may be challenged by the CNBV. As a departure from legislative precedents, the Mexican Securities Market Law permits then acting members of the Board of Directors to select, under certain circumstances and on a temporary basis, new members of the Board of Directors.
Boards of directors of public companies are required to meet at least four times during each calendar year and have the following principal duties:
| · | | determine general strategies applicable to the issuer; |
| · | | approve guidelines for the use of corporate assets; |
| · | | approve, on an individual basis, transactions with related parties, subject to certain limited exceptions; |
| · | | approve unusual or non-recurrent transactions and any transactions that imply the acquisition or sale of assets with a value equal to or exceeding 5% of the issuer’s consolidated assets or that imply the provision of collateral or guarantees or the assumption of liabilities equal to or exceeding 5% of the issuer’s consolidated assets; |
| · | | approve the appointment or removal of the chief executive officer; |
| · | | approve accounting and internal control policies; and |
| · | | approve policies for disclosure of information. |
Directors have the general duty to act for the benefit of the issuer, without favoring a shareholder or group of shareholders.
The Mexican Securities Market Law requires the creation of one or more committees that perform audit and corporate practices functions, each of which must maintain at least three members appointed by the Board of Directors and which members must all be independent (except for corporations controlled by a person or group maintaining 50% or more of the outstanding capital stock like us, where solely the majority must be independent). The audit committee (together with the Board of Directors, which has added duties) replaces the statutory auditor (comisario) that previously had been required by the Mexican Corporations Law.
The committee that performs corporate practices functions is required to, among other activities, provide opinions to the Board of Directors, request and obtain opinions from independent third-party experts, call shareholders’ meetings, provide assistance to the Board of Directors in the preparation of annual reports and provide a report to the Board of Directors.
The audit committee’s principal role is to supervise the external auditors of the issuer, analyze the external auditor’s reports, inform the Board of Directors in respect of existing internal controls, supervise the execution of related-party transactions, require the issuer’s executive to prepare reports when deemed necessary, inform the Board of any irregularities that it encounters, supervise the activities of the issuer’s chief executive officer and provide an annual report to the Board of Directors.
Duty of Care and Loyalty of Directors
The Mexican Securities Market Law also imposes duties of care and of loyalty on directors.
The duty of care requires that directors obtain sufficient information and be sufficiently prepared to support their decisions and to act in the best interest of the issuer. The duty of care is discharged, principally, by obtaining and requesting from the issuer and its officers all the information required to participate in discussions, obtaining information from third parties, attending Board meetings and disclosing material information in possession of the relevant director. Failure to act with care by one or more directors subjects the relevant directors to joint liability for damages and losses caused to the issuer and its subsidiaries, which may be limited (except in the instances of bad faith, illegal acts or willful misconduct).
The duty of loyalty primarily consists of acting for the benefit of the issuer and includes a duty to maintain the confidentiality of information received in connection with the performance of a director’s duties and to abstain from discussing or voting on matters where the director has a conflict of interest. In addition, the duty of loyalty is breached if a shareholder or group of shareholders is knowingly favored or if, without the express approval of the Board of Directors, a director takes advantage of a corporate opportunity. The duty of loyalty is breached if the director discloses false or misleading information or fails to register (or cause the registration of) any transaction in the issuer’s records that could affect its financial statements or if the director uses corporate assets or approves the use of corporate assets in violation of an issuer’s policies, discloses false or misleading information, orders or causes material information not to be disclosed or to be modified. The violation of the duty of loyalty subjects the offending director to joint liability for damages and losses caused to the issuer and its subsidiaries. Liability for breach of the duty of loyalty may not be limited by the company’s bylaws, by resolution of a shareholders’ meeting or otherwise.
Claims for breach of the duty of care or the duty of loyalty may be brought solely for the benefit of the issuer (as a derivative suit) and may only be brought by the issuer or by shareholders representing at least 5% of any outstanding shares.
As a safe harbor for directors, the liabilities specified above will not be applicable if the director acted in good faith and (i) complies with applicable law and the bylaws, (ii) facts based upon information are provided by officers or third-party experts, the capacity and credibility of which may not be the subject of reasonable doubt, (iii) selects the more adequate alternative in good faith or in a case where the negative effects of such decision may not have been foreseeable and (iv) actions were taken in compliance with resolutions adopted at the shareholders’ meeting.
Under the Mexican Securities Market Law, the issuer’s chief executive officer and principal executives are also required to act for the benefit of the company and not of a shareholder or group of shareholders. These executives are required to submit to the Board of Directors for approval the principal strategies for the business, to submit to the audit committee proposals relating to internal control systems, to disclose all material information to the public and to maintain adequate accounting and registration systems and internal control mechanisms.
Disclosure of Shareholders’ Agreements
Any shareholders’ agreements containing non-compete clauses, any agreements related to the sale, transfer or exercise of preemptive rights, any agreements which allow for the sale and purchase of shares, voting rights, and sale of shares in a public offering, must be notified to the company within five business days following their execution in order to allow the company to disclose such agreements to investors through the stock exchanges on which its securities are being traded to the public through an annual report prepared by the company. These agreements (i) will be available for the public to review at the company’s offices, (ii) will not be enforceable against the company, and a breach of such agreements will not affect the validity of the vote at a shareholders’ meeting, and (iii) will only be effective between the parties once they have been disclosed to the public.
Miscellaneous
The Mexican Securities Market Law also specifies that any transaction or series of transactions that, during any fiscal year, represent 20% or more of the consolidated assets of the issuer, must be considered and approved by a meeting of shareholders of any public company.
In addition to the right granted to minority shareholders of a public company representing 5% or more of the outstanding shares to initiate a shareholder derivative suit against directors for a breach of the duty of care or the duty of loyalty, the Mexican Securities Market Law recognizes the right of shareholders representing 10% of the outstanding shares entitled to appoint a director, call a shareholder’s meeting and request that voting on resolutions in respect of which they were not sufficiently informed, be postponed. Also, holders of 20% of the outstanding voting shares may judicially oppose resolutions that were passed by a shareholders’ meeting and file a petition for a court order to suspend the resolution, if the claim is filed within 15 days following the adjournment of the meeting at which the action was taken, provided that (i) the challenged resolution violates Mexican law or the company’s bylaws, (ii) the opposing stockholders either did not attend the meeting or voted against the challenged resolution, and (iii) the opposing stockholders deliver a bond to the court to secure payment of any damages that we may suffer as a result of suspending the resolution in the event that the court ultimately rules against the opposing stockholder. These provisions have seldom been invoked in Mexico and, as a result, how a competent court may interpret these provisions is uncertain.
D. Selling Shareholders
Not applicable.
E. Dilution
Not applicable.
F. Expenses of the Issue
Not applicable.
ITEM 10. ADDITIONAL INFORMATION
A. Share Capital
Not applicable.
B. Memorandum and Articles of Association
General
Set forth below is certain information relating to our capital stock, including the material provisions of our bylaws, Mexican corporate and securities laws and certain related laws and regulations of Mexico, including those of the CNBV, all as in effect as at the date of this Report. The following summary description of our capital stock does not purport to be complete and is qualified in its entirety by reference to our bylaws, which are an exhibit to this Report.
We are currently organized as a corporation (sociedad anónima) under the laws of Mexico. A copy of our draft bylaws has been filed with the CNBV and with the Mexican Stock Exchange and is available for inspection at the Mexican Stock Exchange’s website: www.bmv.com.mx, and an English translation thereof is an exhibit to this Report. Our corporate domicile is Mexico City, and our headquarters are located at Avenida Prolongación Paseo de la Reforma 500, Colonia Lomas de Santa Fe, 01219, Ciudad de México, Mexico. Our telephone number is +55 5257‑8000.
Issued Share Capital
Our capital stock is divided into two series of shares, Series F shares and Series B shares. Series F shares may only be transferred with the prior approval of the CNBV. Series B shares may be purchased by Mexican or non-Mexican individuals or entities, subject to certain transfer restrictions. Series B shares may only represent up to 49% of our issued and outstanding capital stock. Since January 29, 2018,our Series B shares have been registered with the RNV and listed on the Mexican Stock Exchange.
As of the date of this Report, our capital stock consists of 6,786,994,357 shares issued and outstanding, represented by 3,322,685,212 Series B shares (one vote per share) and 3,464,309,145 Series F shares (one vote per share), all of which are book-entry shares, fully paid and of a par value of Ps.3.780782962 each. In addition, we will have 331,811,068 Series F shares and 318,188,932 Series B shares authorized, unsubscribed and held in treasury.
Corporate Purpose
Our bylaws provide that our corporate purpose includes, the provision of banking services provided for in the Mexican Banking Law, thus, we can provide all of the services listed in article 46 of such law and other applicable legal and administrative rules and in compliance with the best banking and corporate practices.
Registration and Transfer of Shares
As of January 29, 2018, our Series B shares have been registered with the RNV maintained by the CNBV. If we wish to cancel our registration, or if it is cancelled by the CNBV, we will be required to make a public offer to purchase all outstanding Series B shares, prior to the cancellation.
Our shares are evidenced by share certificates in registered form. The certificates evidencing our shares are and will continue to be deposited with the Mexican depository institution, S.D. Indeval Institución para el Depósito de Valores, S.A. de C.V., or Indeval, and maintained in book-entry form with institutions which have accounts with Indeval. Indeval is the holder of record in respect of all of the shares of our capital stock. Accounts may be maintained at Indeval by brokers, banks and other financial institutions and entities
authorized for this purpose. Ownership of our shares is evidenced by certificates issued by Indeval, together with certificates issued by Indeval’s account holders. We maintain a stock registry and only those persons listed in such stock registry and holding certificates issued in their name as registered holders, or persons holding shares through institutions that maintain accounts with Indeval, will be recognized as our shareholders. Pursuant to Mexican law, any transfer of shares must be registered in our stock registry or through book entries that may be traced back from our stock registry to the records of Indeval.
In accordance with the LIC, LMV and our by-laws, any person or entity, or group of persons or entities, may directly or indirectly, in one or a series of related transactions, acquire our Series B shares, in terms of article 17 of the LIC. In case any person(s) or entity(ies) intend to acquire directly or indirectly more than 5% (five percent) of our Series B shares or grant a guarantee on the shares representing such percentage, the prior authorization of the CNBV is required. In case a person or a group of persons (shareholders or not) intend to purchase 20% (twenty percent) or more of our Series B shares or to obtain the Bank’s control, the prior authorization of the CNBV is required.
Additionally, the persons who acquire or transfer Series B shares for more than 2% (two percent) shall give notice to CNBV within 3 (three) business days following the purchase or the transfer.
Foreign governments shall not participate, directly or indirectly, in the Bank’s capital stock, save in cases provided for by article 13 of the LIC.
In addition, our Series F shares may only be transferred with the prior approval of the CNBV.
Voting Rights
Holders of Series F or Series B shares are entitled to one vote per share and such shares shall, within each series, confer its holders with the same rights. Holders of our shares do not have cumulative voting rights, which generally are not available under Mexican law.
Repurchase Fund
The Board of Directors of Banco Santander México at its meeting held on January 25, 2018, approved the “Shares Acquisition and Placement Policy”, and by means of the Ordinary Shareholders Meeting dated February 21, 2018, the Bank’s Repurchase Fund was approved with an amount of approximately Ps.12,800 million pesos. The Repurchase Fund was established on May 22, 2018. As of December 31, 2018, 5,671,453 shares had been repurchased pursuant to this fund for an aggregate amount of Ps.138.4 million (calculated using a price of Ps.24.40 per share, the closing price of our shares on the BMV as of December 31, 2018).
Conflicts of Interest
A member of our Board of Directors with a conflict of interest must disclose such conflict and abstain from any deliberation or vote in connection therewith. A breach by any member of our Board of Directors of any such obligations may result in such member being liable for damages and losses. Further, any member of our Audit Committee or our Corporate Practices Committee who votes on a transaction in which he or she has a conflict of interest with us may be liable for damages.
Pursuant to the Mexican Banking Law, our Corporate Practices Committees must issue an opinion with regard to, among others, transactions and arrangements with related parties, and these transactions and arrangements must be approved by our Board of Directors.
Shareholders’ Meetings
Calls
Under Mexican law and our bylaws, shareholders’ meetings may be called by:
| · | | shareholders representing at least 10% of our outstanding capital stock who request that the Chairman of our Board of Directors or the Chairman of either our Corporate Practices Committee or Audit Committee call a shareholder meeting; |
| · | | a Mexican court of competent jurisdiction, in the event the Board of Directors does not comply with a valid request of the shareholders described immediately above; |
| · | | the Audit Committee and the Corporate Practices Committee; and |
| · | | any shareholder, provided that no annual ordinary meeting has been held for two consecutive years or the annual shareholders’ meeting did not address the matters required to be addressed in annual shareholders’ meetings. |
Calls for shareholders’ meetings will be required to be made in the electronic system managed by the Ministry of Economy, at least 15 days before the scheduled date of the shareholders’ meeting in the case of first call. If the shareholders’ meeting is not held on the scheduled date, then a second call explaining the circumstances shall be made within a period not greater than 15 business days from the date established in the first call. The second call shall be published at least 5 business days in advance of the rescheduled shareholders’ meeting. Calls need to specify the place, date and time as well as the matters to be addressed at the meeting. From the date on which a call is made until the date of the corresponding meeting, all relevant information will have to be made available to the shareholders at our executive offices. To attend a shareholders’ meeting, shareholders will have to be either registered in the stock registry or present evidence of the deposit of their shares with Indeval or other authorized securities depositary, coupled with a certificate issued by a participant of Indeval or such depositary.
Shareholders’ Meetings
General shareholders’ meetings may be general ordinary shareholders’ meetings or general extraordinary shareholders’ meetings. Shareholders may also hold special meetings of a given series (as for example, meetings of Series B shareholders, as a means to exercise their rights or discuss any matters that may affect such series).
General ordinary shareholders’ meetings will be those called to discuss any issues not reserved for extraordinary meetings. General ordinary shareholders’ meetings will have to be held at least once a year during the first four months following the end of each fiscal year to:
| · | | approve financial statements for the preceding fiscal year prepared by our chief executive officer and the report of the Board of Directors; |
| · | | elect or ratify directors; |
| · | | appoint or ratify the Chairmen of the Audit Committee and the Corporate Practices Committee; |
| · | | discuss and approve the Audit Committee’s and the Corporate Practices Committee’s annual report; |
| · | | determine how to allocate net profits for the preceding year (including, if applicable, the payment of dividends); and |
| · | | determine the maximum amount of funds allocated to share repurchases; |
General extraordinary shareholders’ meetings will be those called to consider:
| · | | an extension of our duration or voluntary dissolution; |
| · | | an increase or decrease in our capital stock; |
| · | | any change in our corporate purpose or nationality; |
| · | | any merger, spin-off or transformation into another type of company; |
| · | | any issuance of preferred stock; |
| · | | the redemption of shares with retained earnings; |
| · | | any amendment to our bylaws; |
| · | | any amendment to our Statutory Responsibilities Agreement; |
| · | | the cancellation of the registration of shares at the RNV or any stock exchange (except for automated quotation systems); or |
| · | | the issuance of treasury shares for its further issuance in the stock markets. |
A special shareholders’ meeting, comprising a single class of shares (such as our Series B shares), may be called if an action is proposed to be taken that may only affect such class. The quorum for a special meeting of shareholders and the vote required to pass a resolution at such meeting are identical to those required for extraordinary meetings of shareholders, except that the calculations are based upon the number of outstanding shares of the series that is the subject of the special meeting of shareholders.
The attendance quorum for a general ordinary shareholders’ meeting will be 50% of the outstanding capital stock; and resolutions may be taken by a majority of the capital stock represented therein. If the attendance quorum is not met upon the first call, a subsequent meeting may be called during which resolutions may be approved by the majority of the capital stock present, regardless of the percentage of outstanding capital stock represented at such meeting. The attendance quorum for general extraordinary shareholders’ meetings will be at least 75% of our outstanding capital stock. If an attendance quorum is not met upon the first call, a subsequent meeting may be called, at which at least 50% of the capital stock must be represented. In either case, resolutions must be taken by the vote of at least 50% of our outstanding capital stock, except for resolutions in respect of the cancellation of the registration of shares at the RNV or any stock exchange which require that at least 95% of the outstanding capital stock vote in favor of such resolution.
Dividends
Our Board of Directors must submit our financial statements for the previous fiscal year, proposed by our chief executive officer and supplemented by a report of our Board of Directors, for approval at our annual general ordinary shareholders’ meeting. Once our shareholders approve our financial statements, they are required to allocate net profits for the previous fiscal year. Under Mexican law and our bylaws, prior to any distribution of dividends, 5% of our earnings must be allocated to a legal reserve fund until such legal
reserve fund is equal to at least 20% of our paid-in capital stock. Additional amounts may be allocated to other reserve funds as the shareholders may determine, including the amount allocated for the repurchase of shares. The remaining balance, if any, may be distributed as dividends.
Changes to Capital Stock
Our capital stock may be increased or decreased by a resolution adopted at a general extraordinary shareholders’ meeting and upon amendment of our bylaws, which amendment shall be previously approved by the CNBV. Increases or decreases in our capital stock must be recorded in our capital variations register. New shares cannot be issued unless the then-issued and outstanding shares have been paid in full.
Our bylaws provide that we may issue treasury shares that may be offered for subscription and payment by the public, provided that:
| · | | the general extraordinary shareholders’ meeting approves the maximum amount of the increase of our capital stock, and the terms and conditions for the issuance of the non-subscribed shares; |
| · | | subscription of the shares representing the increase in the capital stock is made through a public offering, and such shares must be registered in the Mexican National Securities Registry, in accordance with the Mexican Securities Market Law; and |
| · | | the subscribed and paid amount of our capital stock must be disclosed when our authorized capital, including any issued and unsubscribed shares, is made public. |
Election of Directors
Our Board of Directors may consist of up to 15 members and currently consists of nine directors and eight alternate directors. At least 25% of the members of our Board of Directors (and their respective alternates) must be independent, pursuant to the Mexican Securities Market Law and the Mexican Banking Law. In accordance with our bylaws, holders of Series F shares representing 51% of our capital stock shall have the right to appoint 50% plus 1 of our directors and their respective alternates, and to appoint an extra director for each additional 10% of our capital stock above such percentage. Series B shareholders have the right to appoint the remaining directors and their alternates.
For each director, an alternate director may be appointed, provided that the alternate director corresponding to an independent director must also be independent. All members of the Board of Directors, whether they are directors or alternate directors, are called to attend the meetings of the Board of Directors. If both a director and an alternate director attend the same meeting, only the vote of the director shall be considered.
Pursuant to the Mexican Banking Law, none of the following persons may be appointed as a member of our Board: (i) our officers or officers of other entities of our group, except for our chief executive officer and officers of the first two levels of management immediately below the chief executive officer, who may be appointed as long as they do not represent more than one third of our appointed directors; (ii) the spouse of any director, or any relatives of up to the second degree of more than two directors; (iii) persons who have a pending claim against our company or any other member of our financial group; (iv) persons who have been declared bankrupt or in concurso mercantil, condemned by a court for any patrimonial crime or disqualified to engage in commercial or financial activities; (v) persons involved in supervisory and regulatory activities and of those of our subsidiaries; and (vi) persons who participate in the board of directors of any financial entity that belongs to a different financial group, or to such group’s holding company.
A determination in respect of whether a director may be deemed independent must be made by our shareholders (at the general shareholders’ meeting where the director is elected). Such a determination
may be challenged by the CNBV within 30 days from the date the appointment of the director is notified to the CNBV. The CNBV may only challenge the appointment after holding a hearing with us and the affected director. Under the Mexican Securities Market Law, none of the following persons may be deemed as independent directors: (i) our officers or officers of our subsidiaries, who have being in office during the prior 12‑month period; (ii) individuals who have a significant influence or authority on our company or in any member of our group; (iii) persons that are part of our group of controlling shareholders; (iv) clients, service providers, suppliers, debtors, creditors (or employees of any of them) that have material commercial relationships with us (i.e., sales to us or our subsidiaries that exceed 10% of the aggregate sales of any such person, during the prior 12‑month period); (v) relatives of any of the foregoing; (vi) officers or employees of any charity or non-profit organization that receives significant contributions from us; (vii) general directors and first-level officers of any company at which our general director or any first-level member of our management team is an elected director; or (viii) persons who have occupied any management office in our company or any of the members of our financial group.
Under the Mexican Securities Market Law, our Board of Directors may appoint temporary directors, without the vote of our shareholders, in case existing directors have resigned or their appointment has been revoked.
Directors must be elected at a special shareholders’ meeting held by each series of shares. Holders of at least 10% of our outstanding share capital are entitled to appoint one director and his or her respective alternate. Such an appointment may only be revoked by the shareholders when appointment of all directors designated by the same series of shares is revoked. Any director whose appointment is so revoked may not be reelected during the 12‑month period immediately following the revocation. The ordinary shareholders’ meeting acknowledges the appointment of the members of the Board of Directors designated for each series of shares.
The chairman of the Board of Directors will be elected from the members appointed by the Series F shareholders.
Board of Directors
Our management is entrusted to our Board of Directors and our General Director. The Board of Directors sets forth the guidelines and general strategy for the conduct of our business and supervises the execution of such strategy.
Meetings of the Board of Directors are deemed as validly convened and held if 51% of its members are present, including at least one independent director. Resolutions passed at these meetings will be valid if approved by a majority of the members of the Board of Directors that do not have a conflict of interest. If required, the chairman of the Board of Directors may cast a tie-breaking vote.
Meetings of our Board of Directors may be called by (i) 25% of our Board members; (ii) the chairman of the Board of Directors; or (iii) any of the statutory auditors (comisarios). Notice of such meetings must be provided to the members of our Board of Directors at least five days prior to the relevant meeting.
The Mexican Securities Market Law imposes duties of care and loyalty on directors. The duty of care generally requires that directors obtain sufficient information and be sufficiently prepared to act in our best interest. The duty of care is discharged, principally, by requesting and obtaining from us all information that may be necessary to take decisions, attending Board meetings and disclosing to the Board of Directors material information in possession of the relevant director. Failure to act with due care by a director subjects the relevant director to joint and several liability, together with other guilty directors, for damages and losses caused to us and our subsidiaries.
The duty of loyalty consists, primarily, of a duty to act for the benefit of the issuer and includes a duty to maintain the confidentiality of information received in connection with the performance of a director’s duties
and to abstain from discussing or voting on matters where the director has a conflict of interest. In addition, the duty of loyalty is breached if a shareholder or group of shareholders is knowingly favored or if, without the express approval of the Board of Directors, a director takes advantage of a corporate opportunity belonging to us or our subsidiaries.
The duty of loyalty is also breached if the director uses corporate assets or approves the use of corporate assets in violation of our policies, discloses false or misleading information, orders not to, or causes the failure to, register any transaction in our records, that could affect our financial statements, or causes material information not to be disclosed or to be modified.
The violation of the duty of loyalty subjects the breaching director to joint and several liability with all breaching directors, for damages and losses caused to us and to the persons we control. Liability may also arise if damages and losses result from benefits obtained by the directors or third parties, as a result of activities carried out by such directors.
Claims for breach of the duty of care and the duty of loyalty may be brought solely for our benefit (as a derivative suit) and may only be brought by us or by shareholders representing at least 5% of any outstanding shares.
As a safe harbor for the benefit of directors, in respect of perceived violations of the duty of care or the duty of loyalty, the Mexican Securities Market Law provides that liabilities arising from a breach of the duty of care or the duty of loyalty will not be applicable, if the director acted in good faith and (a) complied with applicable law and our bylaws, (b) decided based upon facts and information provided by officers, external auditors or third-party experts, the capacity and credibility of which may not be the subject of reasonable doubt, and (c) selected the more adequate alternative in good faith, or the negative effects of the director’s decision could not have been reasonably foreseeable, based upon the then-available information. Mexican courts have not yet interpreted the meaning of this provision and, as a result, the extent and meaning of it are uncertain.
Under the Mexican Securities Market Law and our bylaws, our chief executive officer and our principal executives are also required to act for our benefit and not for the benefit of a shareholder or group of shareholders. Principally, these executives are required to submit to the Board of Directors for approval the principal strategies for our business and the business of the companies we control, to execute the resolutions of the Board of Directors, to comply with the provisions related to repurchase and offering of our shares, verify the effectiveness of capital contributions, comply with any provisions relating to declaration and payment of dividends, to submit to the audit committee proposals relating to internal control systems, to prepare all material information related to our activities and the activities of the companies we control, to disclose all material information to the public, to maintain adequate accounting and registration systems and internal control mechanisms, and to prepare and submit to the Board the yearly financial statements.
Committees of the Board of Directors
We maintain several committees of the Board of Directors that are required under the Mexican Securities Market Law, the Mexican Banking Law or necessary to discharge our specialized duties and limit conflicts of interest Our Audit Committee is required to consist only of independent Board members and it must comprise at least three directors. Our Corporate Practices Committee is required to consist of a majority of independent Board members and it must comprise at least three directors.
Statutory Auditor (Comisario)
Our internal controls and compliance are supervised by a statutory auditor (comisario) appointed by the Series F shareholders and a statutory auditor (comisario) appointed by the Series B shareholders, in each case, by a majority vote at special shareholders’ meeting of each series. The statutory auditors (comisarios)
have the obligations and responsibilities set forth in article 166 of the General Corporation Law and other applicable statutes and which are generally consistent with the responsibilities of an audit committee.
Preemptive Rights
Under Mexican law, our shareholders have preemptive rights for all share issuances or increases except in the cases noted below. Generally, if we issue additional shares of capital stock, our shareholders will have the right to subscribe and pay the number of shares necessary to maintain their existing ownership percentage and avoid dilution. Shareholders must exercise their preemptive rights within the time period set forth by our shareholders at the general meeting approving the relevant issuance of additional shares. This period must be at least 15 days following the notice of the issuance made in the electronics system of the Ministry of Economy.
The preemptive rights specified in the prior paragraph will not apply (i) in the case of shares issued in connection with mergers, (ii) in the case of resale of shares held in our treasury, as a result of repurchases of shares conducted on the Mexican Stock Exchange, (iii) in the event of an issuance for purposes of a public offering, see “—Changes to Capital Stock” above, and (iv) in respect of shares issued in connection with the conversion of any convertible securities.
We may not be able to offer shares to U.S. shareholders pursuant to preemptive rights granted to our shareholders in connection with any future issuance of shares unless certain conditions are met. See “Item 3. Key Information—D. Risk Factors—Risks Relating to the ADSs and Our Series B Shares— Preemptive rights may be unavailable to non-Mexican holders of our Series B shares and ADSs and, as a result, they may suffer dilution.”
Dissolution or Liquidation
Banks may only be dissolved and liquidated if the CNBV has issued a resolution to that effect. Prior to such dissolution and liquidation, the IPAB may provide temporary financial assistance to banks with liquidity problems.
The Mexican Banking Law sets forth a special judicial liquidation process, accordingly, banks will not be subject to the general insolvency proceedings applicable to other entities in Mexico. Pursuant to the Mexican Banking Law, a bank is considered insolvent when its assets are not enough to cover its liabilities, which is grounds for revocation of its authorization to operate as a bank, and will trigger its liquidation process, under which the IPAB will act as liquidator and will conduct the process of satisfying liabilities in order to protect the interests of a bank’s creditors and depositors and the public in general. In addition, to the liquidation process, banks may be declared bankrupt pursuant to a special proceeding contemplated in Mexico’s Insolvency Law (Ley de Concursos Mercantiles).
Certain Minority Protections
Pursuant to the Mexican Securities Market Law and the Mexican Corporations Law, our bylaws include a number of minority shareholder protections. These minority protections will include provisions that permit:
| · | | holders of at least 10% of our outstanding capital stock: |
| · | | to vote (including in a limited or restricted manner) to request a call for a shareholders’ meeting, |
| · | | to request that resolutions with respect to any matter on which they were not sufficiently informed be postponed, and |
| · | | to appoint one member of our Board of Directors and one alternate member of our Board of Directors; |
| · | | holders of 20% of our outstanding capital stock to oppose any resolution adopted at a shareholders’ meeting and file a petition for a court order to suspend the resolution temporarily, within 15 days following the adjournment of the meeting at which the action was taken, provided that (i) the challenged resolution violates Mexican law or our bylaws, (ii) the opposing shareholders neither attended the meeting nor voted in favor of the challenged resolution, and (iii) the opposing shareholders deliver a bond to the court to secure payment of any damages that we may suffer as a result of suspending the resolution, in the event that the court ultimately rules against the opposing shareholders; and |
| · | | holders of 5% of our outstanding capital stock may initiate a shareholder derivative suit against some or all of our directors, for our benefit, for violations of their duty of care or duty of loyalty, in an amount equal to the damages or losses caused to us. Actions initiated on these grounds have a five-year statute of limitations. |
Other Provisions
Duration
Our corporate existence under our bylaws is indefinite.
Share Repurchases
We can purchase our shares through the Mexican Stock Exchange, at the then-prevailing market prices for the shares at the time of the purchase. The economic and voting rights corresponding to repurchased shares may not be exercised by us during the period the shares are owned by us, and such shares will not be deemed outstanding for purposes of calculating any quorum or vote at any shareholders’ meeting. We are not required to create a special reserve for the repurchase of shares and we do not need the approval of our Board of Directors to effect share repurchases; however, we are required to obtain shareholder approval in respect of the maximum amount that may be used by us for share repurchases (including, subsequent sales of such repurchased shares). In addition, our Board of Directors must appoint an individual or group of individuals responsible for effecting share repurchases.
Share repurchases are required to be made pursuant to the provisions of the Mexican Securities Market Law, and carried out, reported and disclosed in the manner specified by the CNBV. If we intend to repurchase more than 1% of our outstanding shares at a single trading session, we must inform the public of this intention at least ten minutes before submitting our bid. If we intend to repurchase 3% or more of our outstanding shares during a period of 20 trading days, we must conduct a public tender offer for these shares.
Certain Investment Restrictions
Our shares are subject to certain transfer restrictions that may have the effect of delaying or preventing a change in control. See “—Registration and Transfer of Shares” above.
In addition, foreign governmental authorities may not acquire any of our shares.
Tag-Along Rights
Our bylaws do not grant tag-along rights to our shareholders. Notwithstanding, the Mexican Securities Market Law permits our shareholders to enter into these types of agreements or understandings, in which case the applicable shareholders shall notify us within the five business days following the corresponding agreement or understanding so that such information becomes publicly available. Such information is also to be disclosed in our annual report.
Such agreements and understanding shall not be enforceable against us and any breach thereunder shall not affect the validity of the vote taken pursuant to a shareholders’ meeting. Further, the agreement or understanding shall only become effective among the parties thereto once they are disclosed to the public.
Withdrawal Rights
If our shareholders approve a change in our corporate purpose, jurisdiction of organization or transformation from one type of corporate form to another, any shareholder entitled to vote that voted against the approval of these matters has the right to withdraw and receive book value for its shares, as set forth in the financial statements last approved by our shareholders, provided that the shareholder exercises this withdrawal right within 15 days after the meeting, at which the relevant matter was approved.
Cancellation of Registration in the Mexican National Securities Registry
In accordance with our bylaws, and as set forth in the Mexican Securities Market Law, we will be required to make a public tender offer for the purchase of stock held by minority shareholders, in the event that the listing of our Series B shares on the Mexican Stock Exchange is cancelled, either as a result of our determination or by an order of the CNBV. Our controlling shareholders will be secondarily liable for these obligations. A controlling shareholder will be deemed to be a shareholder that holds a majority of our capital stock, has the ability to control the outcome of decisions made at a shareholders’ or Board of Directors’ meeting, or has the ability to appoint a majority of the members of our Board of Directors. Unless otherwise approved by the CNBV, the price at which the stock must be purchased is the higher of:
| · | | the average quotation price on the Mexican Stock Exchange for the 30 days prior to the date of the tender offer, or |
| · | | the book value, as reflected in the report filed with the CNBV and the Mexican Stock Exchange. |
If the tender for cancellation is requested by the CNBV, it must be initiated within 180 days from the date of the request. If initiated by us, under the Mexican Securities Market Law, the cancellation must be approved by 95% of our shareholders.
Our Board of Directors must make a determination with respect to fairness of the tender offer price, taking into consideration the minority shareholders’ interest, and disclose its opinion. The resolution of the Board of Directors may be accompanied by a fairness opinion issued by an expert selected by our Audit Committee. Directors and first level officers are required to disclose whether they will sell their shares in connection with the tender offer.
Certain Differences between Mexican and U.S. Corporate Law
As an investor, you should be aware that the Mexican Banking Law, the Mexican Securities Market Law and the Mexican Corporations Law, all of which apply to us, differ in certain material respects from laws generally applicable to U.S. corporations and their shareholders.
Mergers, Consolidations and Similar Arrangements
Under Mexican law, mergers, spin-offs, transformations or other similar reorganizations must be approved by the ordinary and extraordinary general shareholders’ meeting. Pursuant to the Mexican Corporations Law, shareholders are not entitled to appraisal rights.
In contrast, pursuant to Delaware law, with certain exceptions, a merger, consolidation or sale of all or substantially all of the assets of a corporation must be approved by the Board of Directors and a majority of the outstanding shares entitled to vote thereon. Under Delaware law, a shareholder of a corporation participating in certain major corporate transactions may, under specific circumstances, be entitled to
appraisal rights pursuant to which the shareholder may receive payment in the amount of the fair market value of the shares held by the shareholder (as determined by a court) in lieu of the consideration the shareholder would otherwise receive in the transaction. Delaware law also provides that a parent corporation, by resolution of its Board of Directors and without any shareholder vote, may merge with any subsidiary of which it owns at least 90% of each class of capital share. Upon any such merger, dissenting shareholders of the subsidiary would have appraisal rights.
Transfer Restrictions
In accordance with the LIC, LMV and our by-laws, any person or entity, or group of persons or entities, may directly or indirectly, in one or a series of related transactions, acquire our Series B shares, in terms of article 17 of the LIC. In case any person(s) or entity(ies) intend to acquire directly or indirectly more than 5% (five percent) of our Series B shares or grant a guarantee on the shares representing such percentage, the prior authorization of the CNBV is required. In case a person or a group of persons (shareholders or not) intend to purchase 20% (twenty percent) or more of our Series B shares or to obtain the Bank’s control, the prior authorization of the CNBV is required.
Additionally, the persons who acquire or transfer Series B shares for more than 2% (two percent) shall give notice to CNBV within 3 (three) business days following the purchase or the transfer.
The Mexican Securities Market Law defines control, for these purposes, as (a) the ability to impose decisions, directly or indirectly, at a shareholders’ meeting (b) the right to vote 50% or more of our shares, or (c) the ability to cause, directly or indirectly, that our management, strategy or policies be pursued in any given fashion. See “—Anti-Takeover Protections” above.
In contrast, under Delaware law, corporations can implement shareholder rights plans and other measures, including staggered terms for directors and super-majority voting requirements, to prevent takeover attempts. Delaware law also prohibits a publicly held Delaware corporation from engaging in a business combination with an interested shareholder for a period of three years after the date of the transaction in which the shareholder became an interested shareholder unless:
| · | | prior to the date of the transaction in which the shareholder became an interested shareholder, the board of directors of the corporation approves either the business combination or the transaction that resulted in the shareholder becoming an interested shareholder; |
| · | | upon consummation of the transaction that resulted in the shareholder becoming an interested shareholder, the interested shareholder owns at least 85% of the voting stock of the corporation, excluding shares held by directors, officers, and employee stock plans; or |
| · | | at or after the date of the transaction in which the shareholder became an interested shareholder, the business combination is approved by the Board of Directors and authorized at a shareholders’ meeting by at least 662/3% of the voting stock which is not owned by the interested shareholder. |
Class Action Lawsuits
Applicable Mexican law has been modified to permit the initiation of class actions; however, rules implementing applicable law have not fully developed the relevant procedural requirements. In Mexico, the law concerning fiduciary duties of directors and executive officers has been in existence for a relatively short period. Actions against directors for breach of fiduciary duties may not be initiated as a direct action, but as a shareholder derivative suit (that is for the benefit of our company). The grounds for shareholder derivative actions under Mexican law are limited. See “—Certain Minority Protections” above.
In contrast, under Delaware law, class actions and derivative actions are generally available to shareholders for purposes of, among other things, breaches of fiduciary duty, corporate waste and other
actions or omissions that conflict with applicable law. In these kinds of actions, the court generally has discretion to permit the winning party to recover attorneys’ fees incurred in connection with the action.
Shareholder Proposals
Under Mexican law and our bylaws, holders of at least 10% of our outstanding capital stock may (i) vote to request a call for a shareholders’ meeting; (ii) request that resolutions with respect to any matter on which they were not sufficiently informed be postponed; and (iii) appoint one member of our Board of Directors and its respective alternate.
In contrast, Delaware law does not include a provision restricting the manner in which nominations for directors may be made by shareholders or the manner in which business may be brought before a meeting.
Calling of Shareholders’ Meetings
Under Mexican law and our bylaws, general shareholders’ meetings may be called by (i) our Board of Directors; (ii) shareholders representing at least 10% of our outstanding capital stock; (iii) a Mexican court of competent jurisdiction; (iv) the audit committee and the corporate practices committee; and (v) a shareholder, in limited cases. See “—Shareholders’ Meetings” above.
Delaware law permits the Board of Directors or any person who is authorized under a corporation’s certificate of incorporation or bylaws to call an extraordinary meeting of shareholders.
Cumulative Voting
Cumulative voting rights generally are not available under Mexican law.
Under Delaware law, cumulative voting for the election of directors is permitted only if expressly authorized in the certificate of incorporation.
Approval of Corporate Matters by Written Consent
Under Mexican law and our bylaws, our shareholders may take action by written consent of the holders of all of the outstanding shares of capital stock.
Delaware law permits shareholders to take action by written consent of holders of outstanding shares having more than the minimum number of votes necessary to take the action at a shareholders’ meeting at which all voting shares were present and voted.
Amendment of Bylaws
Under Mexican law, any amendment to our bylaws may only be resolved by our shareholders at a general extraordinary shareholders’ meeting. In addition, the CNBV must previously approve any amendment to our bylaws.
Under Delaware law, holders of a majority of the voting power of a corporation and, if so provided in the certificate of incorporation, the directors of the corporation, have the power to adopt, amend and repeal the bylaws of a corporation.
C. Material Contracts
Merger Agreement. In connection with our merger (the “Merger”) with Grupo Financiero Santander México, S.A.B. de C.V. (the “Former Holding Company”), we entered into a merger agreement with the Former Holding Company on December 8, 2017 (the “Merger Agreement”). The Merger Agreement sets forth the
terms and conditions of the Merger, which became effective between the parties on January 1, 2018 and before third parties on January 26, 2018 upon its registry with the Public Registry of Commerce in Mexico. The form of Merger Agreement is incorporated herein by reference to the registration statement on Form F-4 (File No. 333-221224) that we filed with the Securities and Exchange Commission in connection with the Merger.
Collaboration Agreement. Immediately following the Merger, we sold all of the shares we held in the Former Holding Company’s brokerage subsidiary, Casa de Bolsa Santander, S.A. de C.V., Grupo Financiero Santander México (“Casa de Bolsa”), as a result of the Merger to our new holding company, Grupo Financiero Santander México, S.A. de C.V. In connection with the sale, we entered into a collaboration agreement on January 2, 2018 with Casa de Bolsa pursuant to which Casa de Bolsa has agreed to perform certain brokerage transactions on our behalf that we are not legally able to provide or perform as a commercial bank and we have agreed to pay Casa de Bolsa commissions for the performance of such transactions. The agreement has an indefinite term and can be cancelled by either party upon 30 days’ notice. The collaboration agreement is incorporated by reference to Exhibit 4.2 of our Annual Report on Form 20-F for the year ended December 31, 2017.
Purchase and Sale Agreement. On January 2, 2018, we sold our custodial business to Banco S3 México, S.A. Institución de Banca Múltiple (“Banco S3”), a subsidiary of Banco Santander, S.A. (“Banco Santander Parent”), our indirect controlling shareholder, pursuant to a purchase and sale agreement. Pursuant to the agreement, Banco S3 paid us a purchase price of Ps.850 million in exchange for the transfer of all rights, obligations and assets comprising our custodial business. Pursuant to the agreement, we agreed not to compete with Banco S3 for a 20-year period and agreed to refer business for custodial services to Banco S3. The purchase and sale agreement is incorporated by reference to Exhibit 4.3 of our Annual Report on Form 20-F for the year ended December 31, 2017.
D. Exchange Controls
None.
E. Taxation
The following summary contains a description of material Mexican and U.S. federal income tax consequences of the acquisition, ownership and disposition of ADSs or Series B shares, but it does not purport to be a comprehensive description of all the tax considerations that may be relevant to a decision to hold ADSs or Series B shares. The summary is based upon the tax laws of Mexico and regulations thereunder, the tax laws of the United States and regulations thereunder and the income tax treaty between Mexico and the United States, all as of the date hereof, which are subject to change, possibly with retroactive effect, and to differing interpretations.
Mexican Taxation
The following summary contains a general description of certain tax consequences, under the Mexican Income Tax Law (Ley del Impuesto Sobre la Renta) and regulations thereunder, of the acquisition, ownership and disposition of ADSs or Series B shares by a holder that is a non-Mexican holder (as described below), and it does not purport to be a comprehensive description of all the Mexican federal tax considerations that may be relevant to a decision to purchase, hold or dispose of ADSs or Series B shares. In addition, this summary does not address any non-Mexican or Mexican state or municipal tax considerations, which may be relevant to a non-Mexican holder of ADSs or Series B shares.
This summary is intended to be for general information purposes only, and is based upon the Mexican Income Tax Law and regulations thereunder, as in effect on the date of this Report, all of which are subject to change.
Prospective investors in and holders of ADSs or Series B shares should consult their own tax advisors as to the Mexican or other tax consequences of the purchase, ownership and disposition of ADSs or Series B shares including, in particular, the effect of any foreign, state or local tax laws, and their entitlement to the benefits, if any, afforded by the Convention for the Avoidance of Double Taxation and the Prevention of Fiscal Evasion and a protocol thereto between Mexico and the United States, as amended (the “Tax Treaty”), and other tax treaties to which Mexico is a party and which are in effect.
For purposes of this summary, the term “non-Mexican holder” shall mean a holder that is not a resident of Mexico for tax purposes, and that will not hold ADSs or Series B shares, or a beneficial interest therein, in connection with the conduct of a trade or business, through a permanent establishment for tax purposes, in Mexico.
For purposes of Mexican taxation:
| · | | an individual is a resident of Mexico for tax purposes, if such individual has established his or her place of residence in Mexico or, if such individual has also established a place of residence outside Mexico, if his or her center of vital interests (centro de intereses vitales) is located within the territory of Mexico. This will be deemed to occur if (i) at least 50.0% of his or her aggregate annual income derives from Mexican sources, or (ii) the main center of his or her professional activities is located in Mexico. Mexican nationals who filed a change of tax residence to a country or jurisdiction that does not have a comprehensive exchange of information agreement with Mexico, in which their income is subject to a preferred tax regime pursuant to the provisions of the Mexican Income Tax Law, will be considered Mexican residents for tax purposes during the year of filing of the notice of such residence change and during the following three years; |
| · | | unless otherwise evidenced, a Mexican national individual shall be deemed a Mexican resident for tax purposes. An individual will also be considered a resident of Mexico for tax purposes if such individual is a state employee, regardless of the location of the individual’s core of vital interests; and |
| · | | a legal entity is a resident of Mexico for tax purposes if it maintains the principal administration of its business, or the place of its effective management, in Mexico. |
Non-residents of Mexico (whether individuals or corporate entities) who are deemed to have a permanent establishment in Mexico for tax purposes shall be subject to the Mexican income tax laws, and all income attributable to such permanent establishment will be subject to Mexican taxes in accordance with the Mexican Income Tax Law.
Taxation on Dividends
Pursuant to the provisions of the Mexican Income Tax Law, dividends, either in cash or in kind, paid to non-Mexican holders of ADSs or Series B shares are subject to withholding tax, as follows:
| a) | | Non-Mexican holders who receive any dividends or profits that were generated as from 2014 must pay a 10% additional tax through a withholding made by the financial intermediary. |
| b) | | Tax treaties could limit or reduce the withholding rate to the extent all requisites set forth in the Mexican Income Tax Law and the applicable tax treaty are met. The non-Mexican holders could possibly claim a tax credit for tax withheld if allowed by the domestic law of the recipient’s country of residence. |
| c) | | Profits earned until 2013, and supported with the net after-tax profit account 2013 (CUFIN for its Spanish acronym), would not be subject to 10% withholding tax. |
Taxation on Capital Gains
Gains on the sale of ADSs or Series B shares by a non-Mexican holder are subject to a 10% Mexican withholding tax if the transaction is carried out through a recognized securities market such as the Mexican Stock Exchange, to be withheld by the financial intermediary through which the sale is effected. The Mexican Income Tax Law provides that no withholding tax will apply if the holder is a resident of a country with which Mexico has in force a treaty for the avoidance of double taxation. For that purpose, the non-Mexican holder must provide a statement under oath to that effect to the financial intermediary, which statement must include the non-Mexican tax identification number of the non-Mexican holder. Additionally, to be eligible for the 10% Mexican withholding tax or the exemption, the holder (i) must have purchased and sold Series B shares in a recognized securities market, (ii) must not hold 10% or more of our Series B shares nor transfer 10% or more of our Series B shares in one or several transactions within a 24‑month period, (iii) must not transfer control over us by transferring our Series B shares, and (iv) must not transfer the Series B shares in any transaction that restricts the seller from accepting a more competitive offer.
If the non-Mexican holder is ineligible for the 10% Mexican withholding tax on the gain or the treaty exemption set forth in the Mexican Income Tax Law referred to above (e.g., because the transaction is not carried out through a recognized market, such as the Mexican Stock Exchange), then the proceeds from the sale of our Series B shares by the non-Mexican holder would be subject to the general 25% tax rate applicable to the gross sales price or, alternatively, to a 35% tax rate applicable to the gain arising from the sale of our Series B shares, if certain requirements set forth under applicable law are met (including appointing an agent in Mexico for tax purposes and filing an ad-hoc tax return).
Under the Tax Treaty, a non-Mexican holder that is eligible to claim the benefits under the Tax Treaty may be exempt from Mexican income tax gains realized from a sale or other disposition of Series B shares (directly or through ADSs) that is or is not carried out through the Mexican Stock Exchange or such other approved securities market, to the extent such non-Mexican holder owned, directly or indirectly, less than 25% of our outstanding shares during the 12‑month period preceding the date of the sale or other disposition, and provided that certain formal requirements set forth in the Mexican Income Tax Law are also complied with.
Other Mexican Taxes
There is currently no Mexican estate, gift, inheritance or value-added tax applicable to the purchase, ownership or disposition of ADSs or Series B shares by a non-Mexican holder, provided, however, that gratuitous transfers of our shares may, in certain circumstances, result in the imposition of Mexican federal income tax on the recipient.
There is currently no Mexican stamp, issue, registration or similar tax or duty payable by a non-Mexican holder with respect to the purchase, ownership or disposition of ADSs or Series B shares.
Material U.S. Federal Income Tax Consequences
The following is a description of the material U.S. federal income tax consequences to the U.S. Holders described below of owning and disposing of ADSs or Series B shares. This discussion is not a comprehensive description of all tax considerations that may be relevant to a particular person’s decision to hold the securities. This discussion applies only to a U.S. Holder that holds ADSs or Series B shares as capital assets for tax purposes (generally property held for investment). In addition, it does not describe all of the tax consequences that may be relevant to you in light of your particular circumstances, including alternative minimum tax consequences, the potential application of the provisions of the Internal Revenue Code of 1986, as amended (the “Code”) known as the Medicare contribution tax, and differing tax consequences applicable to you if you are, for instance:
| · | | a financial institution; |
| · | | a dealer or trader in securities; |
| · | | holding ADSs or Series B shares as part of a straddle, wash sale, conversion transaction or integrated transaction or entering into a constructive sale with respect to the ADSs or Series B shares; |
| · | | a person whose functional currency is not the U.S. dollar; |
| · | | a partnership for U.S. federal income tax purposes; |
| · | | a tax-exempt entity, including an “individual retirement account” or “Roth IRA”; |
| · | | a person that owns or is deemed to own ten percent or more of our stock by vote or value; |
| · | | a person who acquired our ADSs or Series B shares pursuant to the exercise of an employee stock option or otherwise as compensation; or |
| · | | holding ADSs or Series B shares in connection with a trade or business conducted outside of the United States. |
If an entity that is classified as a partnership for U.S. federal income tax purposes holds ADSs or Series B shares, the U.S. federal income tax treatment of a partner will generally depend on the status of the partner and upon the activities of the partnership. Partnerships holding ADSs or Series B shares and partners in such partnerships should consult their tax advisers as to the particular U.S. federal income tax consequences of holding and disposing of the ADSs or Series B shares.
This discussion is based on the Code, administrative pronouncements, judicial decisions, final, temporary and proposed U.S. Treasury regulations and the Tax Treaty, all as of the date hereof, any of which is subject to change, possibly with retroactive effect. It also assumes that each obligation under the Deposit Agreement and any related agreement will be performed in accordance with its terms.
A “U.S. Holder” is a holder who, for U.S. federal income tax purposes, is a beneficial owner of ADSs or Series B shares who is eligible for the benefits of the Tax Treaty and is:
| · | | a citizen or individual resident of the United States; |
| · | | a corporation, or other entity taxable as a corporation, created or organized in or under the laws of the United States, any state therein or the District of Columbia; or |
| · | | an estate or trust, the income of which is subject to U.S. federal income taxation regardless of its source. |
In general, a U.S. Holder who owns ADSs will be treated as the owner of the underlying shares represented by those ADSs for U.S. federal income tax purposes. Accordingly, no gain or loss will be recognized if a U.S. Holder exchanges ADSs for the underlying shares represented by those ADSs.
U.S. Holders should consult their tax advisers concerning the U.S. federal, state, local and foreign tax consequences of owning and disposing of ADSs or Series B shares in their particular circumstances.
This discussion assumes we are not a passive foreign investment company, as described below.
Taxation of Distributions
Distributions paid on ADSs or Series B shares, other than certain pro rata distributions of Series B shares, will generally be treated as dividends to the extent paid out of our current or accumulated earnings and profits (as determined under U.S. federal income tax principles). Because we do not maintain calculations of our earnings and profits under U.S. federal income tax principles, it is expected that distributions will generally be reported to U.S. Holders as dividends. Dividends paid by qualified foreign corporations to certain non-corporate U.S. Holders (including individuals) may be eligible for taxation as "qualified dividend income" and therefore may be taxable at rates applicable to long-term capital gains. A foreign corporation is treated as a qualified foreign corporation with respect to dividends paid on stock that is readily tradable on a securities market in the United States, such as the NYSE, where our ADSs are traded. Non-corporate U.S. Holders should consult their tax advisers to determine whether the favorable rates will apply to dividends they receive and whether they are subject to any special rules that limit their ability to be taxed at these favorable rates.
The amount of a dividend will include any amounts withheld in respect of Mexican taxes. The amount of the dividend will be treated as foreign-source dividend income to U.S. Holders and will not be eligible for the dividends-received deduction generally available to U.S. corporations under the Code. Dividends will be included in a U.S. Holder’s income on the date of the U.S. Holder’s (or in the case of ADSs, the Depositary’s) receipt of the dividend. The amount of any dividend income paid in pesos will be the U.S. dollar amount calculated by reference to the exchange rate in effect on the date of receipt regardless of whether the payment is in fact converted into U.S. dollars. If the dividend is converted into U.S. dollars on the date of receipt, U.S. Holders should not be required to recognize foreign currency gain or loss in respect of the dividend income. A U.S. Holder may have foreign currency gain or loss if the dividend is converted into U.S. dollars after the date of receipt.
Subject to applicable limitations, some of which vary depending upon the U.S. Holder’s circumstances, any Mexican income taxes withheld from dividends on ADSs or Series B shares at a rate not exceeding the rate provided by the Tax Treaty generally will be creditable against the U.S. Holder’s U.S. federal income tax liability. Instead of claiming a credit, the U.S. Holder may elect to deduct such Mexican income taxes in computing the U.S. Holder’s taxable income, subject to generally applicable limitations under U.S. law. An election to deduct foreign taxes instead of claiming foreign tax credits applies to all taxes paid or accrued in the taxable year to foreign countries and possessions of the United States. The rules governing foreign tax credits are complex, and U.S. Holders should consult their tax advisers regarding the creditability of foreign taxes in their particular circumstances.
Sale or Other Taxable Disposition of ADSs or Series B Shares
Gain or loss realized on the sale or other taxable disposition of ADSs or Series B shares will be capital gain or loss, and will be long-term capital gain or loss if the U.S. Holder held the ADSs or Series B shares for more than one year. Long-term capital gain of a non-corporate U.S. Holder is generally taxed at preferential rates. The deductibility of capital losses is subject to limitations. The amount of the gain or loss will equal the difference between the U.S. Holder’s tax basis in the ADSs or Series B shares disposed of and the amount realized on the disposition, in each case as determined in U.S. dollars. If a Mexican tax is withheld on the sale or disposition of Series B shares or ADSs, a U.S. Holder’s amount realized will include the gross amount of the proceeds of the sale or disposition before deduction of the Mexican tax. See “—Mexican Taxation —Taxation on Capital Gains” for a description of when a disposition may be subject to taxation by Mexico. This gain or loss will generally be U.S.-source gain or loss for foreign tax credit purposes. A U.S. Holder may elect to treat disposition gain that is subject to Mexican taxation as foreign-source gain for purposes of claiming a credit in respect of the tax. U.S. Holders should consult their tax advisers regarding the creditability of foreign taxes in their particular circumstances.
Passive Foreign Investment Company Rules
Based on proposed U.S. Treasury regulations, which are proposed to be effective for taxable years beginning after December 31, 1994, we believe that neither we nor our Former Holding Company was a “passive foreign investment company” (a “PFIC”) for U.S. federal income tax purposes for 2018. However, because the proposed U.S. Treasury regulations may not be finalized in their current form, because the application of the proposed regulations is not entirely clear and because the composition of our income and assets will vary over time, there can be no assurance that we will not be a PFIC for any taxable year. The determination of whether we are a PFIC is made annually and is based upon the composition of our income and assets (including, among others, entities in which we hold at least a 25% interest), and the nature of our activities.
If we were a PFIC for any taxable year during which a U.S. Holder held ADSs or Series B shares, gain recognized by a U.S. Holder on a sale or other taxable disposition (including certain pledges) of the ADSs or Series B shares would generally be allocated ratably over the U.S. Holder’s holding period for the ADSs or Series B shares. The amounts allocated to the taxable year of the sale or other taxable disposition and to any year before we became a PFIC would be taxed as ordinary income. The amount allocated to each other taxable year would be subject to tax at the highest rate in effect for individuals or corporations for that year, as appropriate, and an interest charge would be imposed. Further, to the extent that any distribution received by a U.S. Holder on its ADSs or Series B shares exceeds 125 percent of the average of the annual distributions on the ADSs or Series B shares received during the preceding three years or the U.S. Holder’s holding period, whichever is shorter, that distribution would be subject to taxation in the same manner as gain, as described immediately above. Certain elections may be available that would result in alternative treatments (such as mark-to-market treatment) of the ADSs or Series B shares. U.S. Holders should consult their tax advisers to determine whether any of these elections would be available and, if so, what the consequences of the alternative treatments would be in their particular circumstances.
Furthermore, if we were a PFIC or, with respect to a particular U.S. Holder, were treated as a PFIC for the taxable year in which we paid a dividend or for the prior taxable year, the preferential dividend rates discussed above with respect to dividends paid to certain non-corporate U.S. Holders would not apply.
If a U.S. Holder owns ADSs or Series B shares during any year in which we are a PFIC, the holder generally must file annual reports containing such information as the U.S. Treasury may require on IRS Form 8621 (or any successor form) with respect to us, generally with the holder’s federal income tax return for that year.
Information Reporting and Backup Withholding
Payments of dividends and sales proceeds that are made within the United States or through certain U.S.-related financial intermediaries generally are subject to information reporting and may be subject to backup withholding unless (i) the U.S. Holder is a corporation or other exempt recipient or (ii) in the case of backup withholding, the U.S. Holder provides a correct taxpayer identification number and certifies that it is not subject to backup withholding. The amount of any backup withholding from a payment to a U.S. Holder will be allowed as a credit against the holder’s U.S. federal income tax liability and may entitle it to a refund, provided that the required information is timely furnished to the Internal Revenue Service.
Certain U.S. Holders who are individuals (and under recently finalized Treasury Regulations, specified entities that are formed or availed of for purposes of holding certain foreign financial assets) may be required to report information relating to their ownership of securities of a non-U.S. person, subject to certain exceptions (including an exception for securities held in certain accounts maintained by U.S. financial institutions, such as our ADSs). U.S. Holders should consult their tax advisers regarding the effect, if any, of these rules on their ownership and disposition of ADSs or Series B shares.
F. Dividends and Paying Agents
Not applicable.
G. Statement by Experts
Not applicable.
H. Documents on Display
We are subject to the informational requirements of the Exchange Act. Accordingly, we are required to file reports and other information with the SEC, including annual reports on Form 20‑F and reports on Form 6‑K. The SEC maintains an Internet website that contains our reports and other information that we file electronically with the SEC. The address of that website is www.sec.gov.
As a foreign private issuer, we are exempt under the Exchange Act from, among other things, the rules prescribing the furnishing and content of proxy statements, and our executive officers, directors and principal shareholders are exempt from the reporting and short-swing profit recovery provisions contained in Section 16 of the Exchange Act. In addition, we will not be required under the Exchange Act to file periodic reports and financial statements with the SEC as frequently or as promptly as U.S. companies whose securities are registered under the Exchange Act.
I. Subsidiary Information
Not applicable.
ITEM 11. QUANTITATIVE AND QUALITATIVE DISCLOSURES ABOUT MARKET RISK
Risk Management
The principal types of risk inherent in our business are market, liquidity, credit and operational risks. The effectiveness with which we are able to manage the balance between risk and reward is a significant factor in our ability to generate long-term, stable earnings growth. Toward that end, our senior management places great emphasis on risk management. For further information on market risk and risk management, see Note 47 to our audited financial statements included elsewhere in this Report.
Organizational Structure
We regard risk management as a competitive element of a strategic nature, the ultimate goal of which is to maximize shareholder value. Risk management is defined, both conceptually and organizationally, as the comprehensive treatment of the different risks (market, liquidity, credit, counterparty, operating, legal and technological risks) that are quantifiable and are assumed by us in the normal course of business. The way we manage the risks inherent in our business is essential to understanding and determining our financial position and creating value in the long term.
The CNBV has issued regulations governing risk management applicable to credit institutions. Our Board of Directors has formed and maintains a Comprehensive Risk Management Committee (Comité de Administración Integral de Riesgos) based on the guidelines set forth in these regulations. The Comprehensive Risk Management Committee must comprise at least five members, including the head of the Comprehensive Risk Management Unit, our Chief Executive Officer, two of our Board members (one of whom is the committee president) and our internal auditor. The Comprehensive Risk Management Committee meets monthly and seeks to ensure that our operations adhere to the objectives, policies and procedures approved by the Board of Directors for risk management, which are set forth in our Comprehensive Risk Management Manual.
The Comprehensive Risk Management Committee proposes to the Board of Directors, for their approval:
| · | | objectives, policies and procedures for the general management of risks; |
| · | | risk exposure limits (on a consolidated basis, for each business unit and for each type of risk); and |
| · | | strategies for assigning resources related to the execution of operations. |
In addition, the Comprehensive Risk Management Committee approves:
| · | | methodologies to identify, measure, monitor, limit, control, inform and disclose the different types of risks to which we are exposed; |
| · | | models, parameters and scenarios used to measure and control risk; and |
| · | | Execution of new transactions and services that involve risks. |
The Comprehensive Risk Management Committee also monitors compliance with the risk limits established by the Board of Directors.
The Comprehensive Risk Management Committee reports existing risk exposure to the senior management and the Board of Directors, at least on a quarterly basis. In particular, it reports our risk levels, as well as any deviation from the risk limits imposed by the risk policies and the corrective measures that have been implemented. When a risk limit is breached, as determined by the credit or market risk department, as applicable, the excess is reported immediately, regardless of the severity of such breach, to the Comprehensive Risk Management Unit, which reports to the Comprehensive Risk Management Committee. The Comprehensive Risk Management Committee, in turn, reports to senior management and the Board of Directors. The relevant business unit must then report to the credit or market risk department, as applicable, regarding the corrective measures that are being implemented to reduce risk below the risk limit. The credit or market risk department, as applicable, monitors the risk until it is reduced below the risk limit.
The Comprehensive Risk Management Committee has delegated to the Comprehensive Risk Management Unit (Unidad de Administración Integral de Riesgos) the responsibility for implementing the procedures for the measurement, management and control of risks, in accordance with established policies. The Comprehensive Risk Management Committee appoints one person responsible for the management of the Comprehensive Risk Management Unit. This person, on behalf of the Comprehensive Risk Management Unit, reports any breaches of the risk limits and the corrective measures that have been implemented monthly to our Comprehensive Risk Management Committee and to the Board of Directors. This person is also responsible for, among other things, presenting to the Board of Directors the Comprehensive Risk Management Committee’s reports, approvals and the risk exposures.
The Comprehensive Risk Management Committee has the power to authorize deviations above the established risk limits, but any deviations must be reported to the board of directors of Banco Santander México on at least a quarterly basis. Generally any breaches of the risk limits are low in severity and last for a few days. Nevertheless, in the infrequent event that a breach is high in severity, the relevant business unit may request authorization from the Comprehensive Risk Management Committee, through the Comprehensive Risk Management Unit, for a specific and temporary deviation during which it will act to reduce the risk. If the authorization is denied, then the business unit must reduce the risk as soon as possible by reducing the open risk position or hedging it, even if such action results in a loss.
The Comprehensive Risk Management Committee may also create any subcommittees necessary to exercise its functions. The Credit Risk Committee, Market Risk Committee, Legal Risk Subcommittee and Operational Risk Subcommittee are subcommittees of the Comprehensive Risk Management Unit. See
“Item 6. Directors, Senior Management and Employees—C. Board Practices—Committees—Comprehensive Risk Management Committee” for additional information about our Comprehensive Risk Management Committee.
Regulatory Review Process
We are subject to the CNBV’s ordinary regulatory review process, specified in regulations that govern the CNBV’s supervisory activities, which includes the annual evaluation of our risk models and risk management. This annual review comprises the following steps:
| · | | The CNBV sends us an official notice stating the date on which its inspection visit will take place, the purpose of the inspection and the initial documents that will be subject to review. |
| · | | The CNBV sends us an official notice confirming the date on which the inspection visit will take place. |
| · | | The inspection visit takes place on the scheduled date at our offices. The visit includes review of information, interviews with officers and additional requests for information. The visit is generally conducted in a fashion that permits dialogue between us and those officers of the CNBV conducting the review. |
| · | | Once the inspection visit is completed, the CNBV prepares an official report, which includes observations arising from the inspection visit regarding regulations or internal processes. These observations may require answers to specific questions and may result in additional information requests. In addition, the official report may require us to take corrective actions and provide a timetable for their implementation. |
| · | | We are entitled to respond to the observations set forth in the CNBV’s official report, including by expressing our disagreement with conclusions reached by the CNBV. |
| · | | After receipt of our responses, the CNBV issues a final report, setting forth its agreement or disagreement with the responses and the information provided. This final report confirms the conclusion of the termination of the annual inspection process. If we disagree with the CNBV’s conclusions, we are entitled to initiate an administrative or judicial action against any such conclusions. |
Market Risk
General
We are exposed to market risk mainly as a result of the following activities:
| · | | trading in financial instruments, which involves interest rate, foreign exchange rate, volatility and equity price risks; |
| · | | engaging in retail banking activities, which involves interest rate risk because a change in interest rates affects interest income, interest expense and customer behavior; |
| · | | investing in assets or instruments, the returns or accounts of which are denominated in currencies other than the peso, which involves foreign exchange rate risk; and |
| · | | all trading and non-trading activities, which involve liquidity risk. |
Primary Market Risks and How They Arise
The primary market risks to which we are exposed are interest rate risk, foreign exchange rate risk, equity price risk and liquidity risk. We are exposed to interest rate risk whenever there is a mismatch between interest rate-sensitive assets and liabilities. Interest rate risk arises in connection with both our trading and non-trading activities. Interest rate risk related to our trading activities primarily results from our investments in short-term Mexican Central Bank bills and notes, cross-currency swaps and sovereign bonds.
We are exposed to foreign exchange rate risk as a result of mismatches between assets and liabilities and off-balance sheet items denominated in different currencies, either as a result of trading or in the normal course of business. Our principal non-trading currency exposure is the U.S. dollar, which, as mandated by our policies, is hedged to the Mexican peso within established limits. Our exposure to trading-related foreign exchange risk is based on our positions in bonds and currency swaps.
We are also exposed to liquidity risk. Market depth is the main liquidity driver in our trading portfolio, even though our policy is to trade the most liquid assets. Our liquidity risk also arises in non-trading activities, due to the maturity gap between assets and liabilities mostly in our retail banking business.
We use derivatives for both trading and non-trading activities. Trading derivatives are used to eliminate, reduce or modify risk in trading portfolios (primarily interest rate and foreign exchange risk) and to provide financial services to customers. Our principal counterparties (in addition to customers) for this activity are financial institutions and clearinghouses, such as the Mexican Derivatives Exchange. Our principal derivative instruments include foreign exchange forwards, cross-currency swaps and interest rate swaps. We also use derivatives in non-trading activity in order to manage the interest rate risk and foreign exchange risk arising from asset and liability management activity.
Market Risk Management Policies
The Market Risk Management Department within the Comprehensive Risk Management Unit is responsible for recommending the market risk management policies to be implemented by us, by establishing the parameters for measuring risks and delivering reports, analyses and evaluations to senior management, to the Comprehensive Risk Management Committee and to the Board of Directors of Banco Santander México.
The measurement of market risk quantifies the potential change in the value of our positions as a result of changes in market risk factors.
Depending on the types of activities performed by the business units, debt and equity instruments are classified as financial assets at fair value through profit or loss (financial assets held for trading up to December 31, 2017), financial assets at fair value through other comprehensive income (available-for-sale financial assets up to December 31, 2017) and financial assets at amortized cost (financial assets held to maturity up to December 31, 2017). In particular, what underlies and identifies financial assets at fair value through other comprehensive income (available-for-sale financial assets up to December 31, 2017) is the business model in which they are included. The business model reflects how the Bank manages the financial assets in order to generate cash flows. The Bank’s objective regarding financial assets at fair value through other comprehensive income (available-for-sale financial assets up to December 31, 2017) is to collect both the contractual cash flows and cash flows arising from the sale of financial assets. Financial assets at fair value through other comprehensive income (available-for-sale financial assets up to December 31, 2017) are handled as a structural part of the consolidated balance sheets. We have established guidelines that must be applied to financial assets at fair value through other comprehensive income (available-for-sale financial assets up to December 31, 2017), as well as controls to seek to ensure compliance.
When significant risks are identified, they are measured and assigned limits with the aim of ensuring adequate control. The risk is measured from a comprehensive perspective through a combination of the methodology applied to trading portfolios and the methodology applied to the management of assets and liabilities.
Trading Portfolios
To measure risks using a comprehensive approach, we follow the VaR method, which is defined as the statistical estimate of the potential loss of value of a specific position in a specific period of time and with a specific level of confidence. VaR is a universal measure of the exposure levels of the various risk portfolios. It helps compare the risk levels among different instruments and markets by expressing the exposure level of each portfolio through a unique figure in economic units.
VaR is calculated using the historical simulation method, based on full valuation with 521 scenarios, a one-day horizon and a confidence level of 99%.
Furthermore, we perform monthly simulations of the losses or gains from the portfolios through revaluations under different scenarios (Stress Tests). These simulations are generated in two ways:
| · | | by applying to the risk factors percentage changes observed in a given historical period that includes significant market turbulence; and |
| · | | by applying to the risk factors changes that depend on the volatility of each risk factor. |
We perform back-testing every month to compare the daily losses and gains that would have occurred if the same positions had been maintained, considering only the change in value due to market movements, against the calculation of VaR, which enables our models to be calibrated. Although they are prepared monthly, these reports include tests for all of the days.
For further information about our methodologies, see Note 47 to our audited financial statements included elsewhere in this Report.
The table below presents our portfolios as of December 31, 2017 and 2018:
| | | | | | | | | | | | | | |
| | At December 31, | |
| | 2017 | | 2018 | |
| | VaR | | | Percentage of net | | | VaR | | | Percentage of net | |
| | (thousands of pesos) | | | capital (%) | | | (thousands of pesos) | | | capital (%) | |
Trading desks | | Ps. | 128,609.10 | | | 0.11% | | | Ps. | 69,112.34 | | | 0.06% | |
Market Making | | | 134,323.11 | | | 0.12% | | | | 71,946.74 | | | 0.06% | |
Proprietary Trading | | | 16,562.56 | | | 0.01% | | | | 8,718.01 | | | 0.01% | |
Risk factor | | | | | | | | | | | | | | |
Interest Rate | | | 125,199.87 | | | 0.11% | | | | 54,636.66 | | | 0.04% | |
Foreign Exchange | | | 25,343.92 | | | 0.02% | | | | 65,249.50 | | | 0.05% | |
Equity | | | 5,074.85 | | | 0.00% | | | | 4,324.90 | | | 0.00% | |
The average VaR (based on month-end amounts) in 2018 was:
| | | | | | | |
| | VaR | | | Percentage of | |
| | (thousands of pesos) | | | net capital (%) | |
Trading desks | | Ps. | 117,863.80 | | | 0.10% | |
Market Making | | | 99,733.68 | | | 0.09% | |
Proprietary Trading | | | 17,401.42 | | | 0.01% | |
Risk factor | | | | | | | |
Interest Rate | | | 105,173.67 | | | 0.09% | |
Foreign Exchange | | | 51,202.93 | | | 0.04% | |
Equity | | | 3,928.35 | | | 0.00% | |
The risk performance of our trading portfolio with regard to trading activity in financial markets during 2018, measured by daily VaR in millions of pesos, is shown in the following graph.
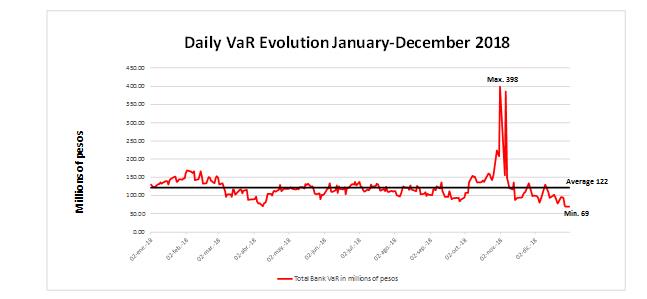
The above graph shows that daily VaR during 2018 remained at levels below the limit of U.S.$13 million (approximately Ps.256 million).
In 2018, the average daily VaR of the Bank’s market trading operations was Ps.122 million, as compared to Ps.95 million in 2017. In 2018, the changes in VaR were mainly due to changes in the interest rate risk factor as a result of our trading book’s strategy. VaR modeling did not change during 2018. At the end of December 2018, VaR was Ps.69 million.
During the first semester of 2018, the average daily VaR was Ps.123 million and during the second semester the average daily VaR was Ps.121 million. VaR remained at levels between Ps.69 million and Ps.398 million, in the second semester, as a result of interest rate increase expectations and volatility in interest rates and exchange rates due to general market risks.
The histogram below compares the distribution of risk in terms of daily VaR between 2017 and 2018. In 2017, the levels of VaR remained between Ps.58 million and Ps.135 million on 98.4% of the days for which they were calculated. Higher values (greater than Ps.135 million) represented 1.6% of the period. In 2018, the levels of VaR remained between Ps.69 million and Ps.150 million on 90.4% of the days for which they were calculated. Higher values (greater than Ps.150 million) represented 9.6% of the period.
Risk Histogram
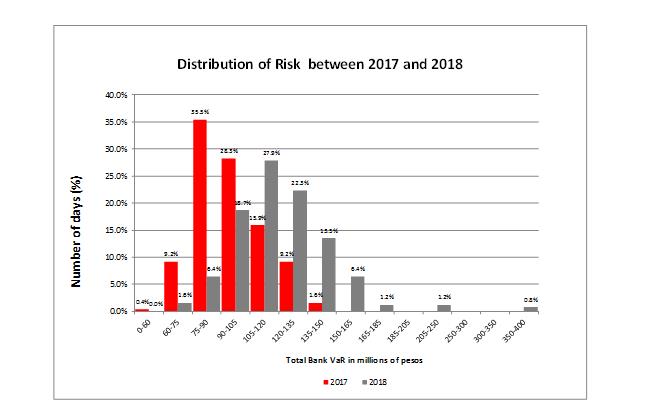
Stress Tests
Below we present the different stress test scenarios based on different hypotheticals calculated for our trading book.
Probable Scenario
This scenario was defined based on movements derived from a standard deviation, with respect to risk factors that have an influence on the valuation of financial instruments included in our trading book for each period. In summary, the movements applied to each risk factor were as follows:
| · | | Interest rate (IR), volatility (Vol) and Exchange rate (FX) risk factors were increased by one standard deviation. |
| · | | Equity risk factors (EQ) were decreased by one standard deviation. |
The following table displays the possible gains (losses) for our trading book at the end of each quarter in 2018 and for the Former Holding Company’s trading book at the end of each quarter in 2017, 2016, 2015 and 2014, in millions of pesos, according to this stress scenario:
| | | | | | | | | | | | | | | | |
| | As of | | | As of | | | As of | | | As of | |
| | March 31 | | | June 30 | | | September 30 | | | December 31 | |
| | (Millions of pesos) | |
2018 | | Ps. | 22 | | | Ps. | (59) | | | Ps. | (16) | | | Ps. | (11) | |
2017 | | | (35) | | | | (43) | | | | (67) | | | | 0.34 | |
2016 | | | (14) | | | | (25) | | | | (6) | | | | (15) | |
2015 | | | 1 | | | | (9) | | | | (19) | | | | (6) | |
2014 | | | (23) | | | | (71) | | | | (57) | | | | (10) | |
Possible Scenario
Under this scenario, risk factors were modified by 25%. In summary, the movements applied to each risk factor were as follows:
| · | | Risk factors: IR, Vol and FX were multiplied by 1.25 (they were increased by 25%). |
| · | | Risk factors EQ were multiplied by 0.75 (they were decreased by 25%). |
The following table shows the possible profits (losses) for Banco Santander México’s trading book at the end of each quarter in the years presented, in millions of pesos, under this stress scenario:
| | | | | | | | | | | | | | | | |
| | As of | | | As of | | | As of | | | As of | |
| | March 31 | | | June 30 | | | September 30 | | | December 31 | |
| | (Millions of pesos) | |
2018 | | Ps. | 281 | | | Ps. | (649) | | | Ps. | (123) | | | Ps. | (168) | |
2017 | | | (482) | | | | (948) | | | | (1,021) | | | | 23 | |
2016 | | | 59 | | | | 56 | | | | 432 | | | | 780 | |
2015 | | | (203) | | | | 189 | | | | (282) | | | | (167) | |
2014 | | | (920) | | | | (855) | | | | (761) | | | | (26) | |
Remote Scenario
Under this scenario, risk factors were modified by 50%. In summary, the modifications applied to each risk factor were as follows:
| · | | Risk factors IR, Vol and FX were multiplied by 1.50 (i.e., they were increased by 50%). |
| · | | Risk factors EQ were multiplied by 0.5 (i.e., they were decreased by 50%). |
The following table shows the possible profits (losses) for our trading book at the end of each quarter in the years presented, in millions of pesos, pursuant to this stress scenario:
| | | | | | | | | | | | | | | | |
| | As of | | | As of | | | As of | | | As of | |
| | March 31 | | | June 30 | | | September 30 | | | December 31 | |
| | (Millions of pesos) | |
2018 | | Ps. | 1,155 | | | Ps. | (630) | | | Ps. | (433) | | | Ps. | (335) | |
2017 | | | (605) | | | | (1,661) | | | | (1,853) | | | | 283 | |
2016 | | | 357 | | | | 355 | | | | 1,218 | | | | 1,985 | |
2015 | | | (276) | | | | 650 | | | | (340) | | | | (148) | |
2014 | | | (2,945) | | | | (2,232) | | | | (2,435) | | | | (346) | |
Assets and Liabilities Management (Banking Books)
Our retail banking activities generate significant balance sheet amounts. Our ALCO is responsible for determining guidelines for managing risk with respect to financial margin, net worth and long-term liquidity, which must be monitored in the different retail portfolios. The ALCO reports to our senior management. Under this approach, our finance senior management is responsible for executing the strategies and policies established by ALCO in order to modify the risk profile of the commercial balance sheet.
The ALCO adopts investment strategies and hedges to keep these sensitivities within the target range and is responsible for the management of interest rate risk, long-term liquidity risk and capital structure. As of the date of this Report, the foreign exchange risk in our banking books is not material and we intend to maintain the foreign exchange risk in the banking books at an immaterial level. Interest rate risk is the possibility of suffering losses as a consequence of the impact on the asset and liability structure from fluctuations in market interest rates. When quantified, interest rate risk is our exposure to movements in the interest rate curves.
As part of corporate activities, we analyze the interest rate sensitivity of the net interest margin, or NIM, and market value of equity, or MVE, of the different balance sheet headings against interest rate variations. This sensitivity derives from the maturity and interest rate repricing gaps for every asset and liability. The analysis is based on the classification of each balance line sensitive to interest rates over time, as a function of their amortization dates, maturity or contractual modification of the applicable interest rate.
The MVE is the net present value of the projected future flows of the financial assets and liabilities in the banking book. We monitor the exposure of MVE to changes in interest rates by measuring the 1% MVE sensitivity, which is an estimate of the impact on MVE from a parallel movement of 100 basis points in market interest rates.
The NIM is the difference between the return on assets and the financial cost of financial liabilities in the banking book in a one-year period. We monitor the exposure of NIM to changes in interest rates by measuring the 1% NIM sensitivity, which is an estimate of the impact on NIM, in a one-year period, from a parallel movement of 100 basis points in market interest rates. The impact on NIM from changes in interest rates is reflected in profit and loss accounts and balance sheet quality.
The 1% NIM sensitivity and 1% MVE sensitivity measures are complementary: while the 1% MVE sensitivity measure estimates the exposure of our assets and liabilities to fixed rates, the 1% NIM sensitivity measure estimates the exposure of the assets and liabilities to variable rates. As a result, if a financial instrument has a high 1% MVE sensitivity, it would have a low 1% NIM sensitivity, and if a financial instrument has a low 1% MVE sensitivity, it would have a high 1% NIM sensitivity.
We use a sensitivity analysis to measure the interest rate risk of local and foreign currency (not included in the trading portfolios). We perform a simulation of scenarios, which are calculated as the difference between the present value of the flows in the chosen scenario (a curve with a parallel movement of 100 basis points in all its segments) and their value in the base scenario (current market). We have also established limits in regard to the maximum loss which these interest rate movements could impose on the economic value, 1% MVE sensitivity, (Ps.5,300 million in local currency and U.S.$65 million in foreign currency) and net financial income, 1% NIM sensitivity (Ps.1,500 million in local currency and U.S.$20 million in foreign currency) in one year. The Comprehensive Risk Management Committee approves the 1% NIM and MVE sensitivity limits on an annual basis. These limits are consistent with our risk policies and with our financial planning. MVE and NIM limit consumption represents the amount of interest rate risk present in the banking books at any given time relative to the above mentioned sensitivity limits.
Although the limit consumption metrics are complementary, they are not directly correlated. A change in interest rates has opposite directional impacts on market consumption levels of these metrics, but the amount of the impact may differ. For this reason, the consumption of limits could be similar. Although having
similar limit consumption on both measures does not necessarily imply that interest rate risk management is optimized or balanced, setting limits on both sensitivities does help ensure that management does not create interest rate exposure which could compromise the MVE or NIM.
The following chart shows our NIM and MVE limit consumption for 2016 to 2018 at year-end as well as for each month in 2018.
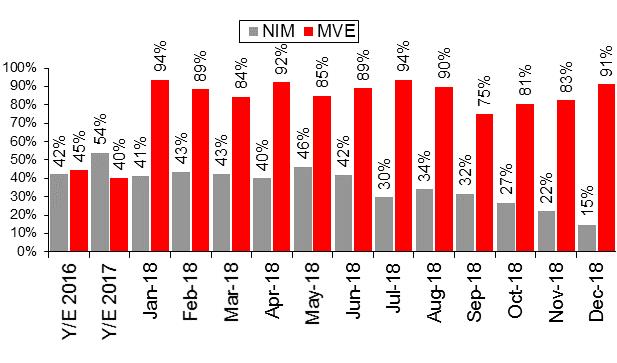
In 2018, 1% MVE sensitivity remained stable with a maximum of 94% in July and a minimum of 75% in September. While 1% NIM sensitivity had a maximum of 46% in May and a minimum of 15% in December, these changes were due to short-term management activities that increased and decreased 1% NIM sensitivity beyond the average, respectively.
The internal risk units propose risk methodology and risk model changes to the Comprehensive Risk Management Committee. The Comprehensive Risk Management Committee is responsible for approving, among other things, (i) methodologies to identify, measure, monitor, limit, control, inform and disclose the different types of risks to which we are exposed; (ii) models, parameters and scenarios used to measure and control risks and (iii) new transactions and services that involve risks. This Committee holds monthly meetings and monitors that transactions are in line with the objectives, policies and procedures approved by the CNBV’s guidelines.
On an annual basis, the CNBV and Mexican Central Bank carry out an inspection visit to verify that we have complied with prudential rules established by CNBV regarding the comprehensive management of risk for credit institutions. The agenda of the inspection visit includes a review of the functions of the Comprehensive Risk Management Committee. Risk methodology and risk model validations and approvals are also reviewed as part of this inspection.
Liquidity Gap
The following table shows the liquidity gap of our assets and liabilities of different maturities as of December 31, 2018. The reported amounts include cash flows from interest on fixed and variable rate
instruments. The interest on variable rate instruments is determined using the forward interest rates for each period presented:
| | | | | | | | | | | | | | | | | | | | | | | | | | | | | | | | | | | | |
| | Total | | | 0-1 months | | | 1-3 months | | | 3-6 months | | | 6-12 months | | | 1-3 years | | | 3-5 years | | | >5 years | | | Not Sensitive | |
| | (Millions of pesos) | |
Money Market | | Ps. | 101,353 | | | Ps. | 35,304 | | | Ps. | — | | | Ps. | — | | | Ps. | — | | | Ps. | 52 | | | Ps. | — | | | Ps. | — | | | Ps. | 65,997 | |
Loans | | | 894,975 | | | | 63,631 | | | | 77,990 | | | | 77,902 | | | | 117,370 | | | | 262,468 | | | | 126,185 | | | | 170,565 | | | | (1,135) | |
Trade Finance | | | — | | | | — | | | | — | | | | — | | | | — | | | | — | | | | — | | | | — | | | | — | |
Intragroup | | | (226) | | | | — | | | | — | | | | — | | | | — | | | | — | | | | — | | | | — | | | | (226) | |
Securities | | | 265,639 | | | | 204,594 | | | | 143 | | | | 1,183 | | | | 42,759 | | | | 1,766 | | | | 3,098 | | | | 11,128 | | | | 968 | |
Permanent | | | 14,417 | | | | — | | | | — | | | | — | | | | — | | | | — | | | | — | | | | — | | | | 14,417 | |
Other Balance Sheet Assets | | | 2,491,052 | | | | — | | | | — | | | | — | | | | — | | | | — | | | | — | | | | — | | | | 2,491,052 | |
Total Balance Sheet Assets | | | 3,767,210 | | | | 303,529 | | | | 78,133 | | | | 79,085 | | | | 160,129 | | | | 264,286 | | | | 129,283 | | | | 181,693 | | | | 2,571,073 | |
Money Market | | | (114,421) | | | | (27,386) | | | | (89) | | | | — | | | | — | | | | — | | | | — | | | | — | | | | (86,945) | |
Deposits | | | (643,226) | | | | (253,793) | | | | (20,848) | | | | (17,375) | | | | (14,367) | | | | (19,813) | | | | (11,475) | | | | (305,556) | | | | — | |
Trade Finance | | | — | | | | — | | | | — | | | | — | | | | — | | | | — | | | | — | | | | — | | | | — | |
Intragroup | | | — | | | | — | | | | — | | | | — | | | | — | | | | — | | | | — | | | | — | | | | — | |
Long-Term Funding | | | (214,803) | | | | (3,470) | | | | (10,517) | | | | (17,219) | | | | (29,238) | | | | (40,266) | | | | (72,295) | | | | (4,010) | | | | (37,788) | |
Equity | | | (125,813) | | | | — | | | | — | | | | — | | | | — | | | | — | | | | — | | | | — | | | | (125,813) | |
Other Balance Sheet Liabilities | | | (2,527,900) | | | | — | | | | — | | | | — | | | | — | | | | — | | | | — | | | | — | | | | (2,527,900) | |
Total Balance Sheet Liabilities | | | (3,626,163) | | | | (284,649) | | | | (31,454) | | | | (34,594) | | | | (43,605) | | | | (60,079) | | | | (83,770) | | | | (309,566) | | | | (2,778,446) | |
Total Balance Sheet Gap | | | 141,047 | | | | 18,880 | | | | 46,679 | | | | 44,491 | | | | 116,524 | | | | 204,207 | | | | 45,513 | | | | (127,873) | | | | (207,373) | |
Total Off-Balance Sheet Gap | | | 30,927 | | | | 755 | | | | 108 | | | | (144) | | | | 1,637 | | | | 5,657 | | | | 6,293 | | | | 3,781 | | | | 12,838 | |
Total Structural Gap | | | — | | | | 19,635 | | | | 46,787 | | | | 44,347 | | | | 118,161 | | | | 209,864 | | | | 51,806 | | | | (124,092) | | | | (194,535) | |
Accumulated Gap | | | — | | | | 19,635 | | | | 66,422 | | | | 110,769 | | | | 228,930 | | | | 438,794 | | | | 490,600 | | | | 366,508 | | | | 171,973 | |
Interest Rate Risk Profile
The table below shows the distribution of interest rate risk by maturity as of December 31, 2018. The reported amounts include estimated interest on fixed and variable rate instruments. Interest on variable rate instruments is determined using the rate in effect as of the balance sheet date for the first scheduled interest payment and amounts determined based on the contractual spread for each period thereafter:
| | | | | | | | | | | | | | | | | | | | | | | | | | | | | | | | | | | | |
| | Total | | | 0-1 months | | | 1-3 months | | | 3-6 months | | | 6-12 months | | | 1-3 years | | | 3-5 years | | | >5 years | | | Not Sensitive | |
| | (Millions of pesos) | |
Money Market | | Ps. | 101,353 | | | Ps. | 35,304 | | | Ps. | — | | | Ps. | — | | | Ps. | — | | | Ps. | 52 | | | Ps. | — | | | Ps. | — | | | Ps. | 65,997 | |
Loans | | | 789,010 | | | | 400,172 | | | | 44,475 | | | | 27,446 | | | | 51,727 | | | | 119,014 | | | | 56,923 | | | | 90,388 | | | | (1,135) | |
Trade Finance | | | — | | | | — | | | | — | | | | — | | | | — | | | | — | | | | — | | | | — | | | | — | |
Intragroup | | | (226) | | | | — | | | | — | | | | — | | | | — | | | | — | | | | — | | | | — | | | | (226) | |
Securities | | | 351,755 | | | | 59,520 | | | | 11,051 | | | | 8,589 | | | | 44,187 | | | | 58,048 | | | | 13,198 | | | | 30,524 | | | | 126,637 | |
Permanent | | | 14,417 | | | | — | | | | — | | | | — | | | | — | | | | — | | | | — | | | | — | | | | 14,417 | |
Other Balance Sheet Assets | | | 2,491,052 | | | | — | | | | — | | | | — | | | | — | | | | — | | | | — | | | | — | | | | 2,491,052 | |
Total Balance Sheet Assets | | | 3,747,361 | | | | 494,996 | | | | 55,526 | | | | 36,035 | | | | 95,914 | | | | 177,114 | | | | 70,121 | | | | 120,912 | | | | 2,696,742 | |
Money Market | | | (114,421) | | | | (27,386) | | | | (89) | | | | — | | | | — | | | | — | | | | — | | | | — | | | | (86,945) | |
Deposits | | | (636,907) | | | | (253,774) | | | | (17,801) | | | | (12,984) | | | | (91,065) | | | | (156,158) | | | | — | | | | (105,126) | | | | — | |
Trade Finance | | | — | | | | — | | | | — | | | | — | | | | — | | | | — | | | | — | | | | — | | | | — | |
Intragroup | | | — | | | | — | | | | — | | | | — | | | | — | | | | — | | | | — | | | | — | | | | — | |
Long-Term Funding | | | (207,327) | | | | (65,439) | | | | (6,383) | | | | (9,993) | | | | (8,361) | | | | (14,760) | | | | (60,990) | | | | (3,727) | | | | (37,675) | |
Equity | | | (125,813) | | | | — | | | | — | | | | — | | | | — | | | | — | | | | — | | | | — | | | | (125,813) | |
Other Balance Sheet Liabilities | | | (2,527,900) | | | | — | | | | — | | | | — | | | | — | | | | — | | | | — | | | | — | | | | (2,527,900) | |
Total Balance Sheet Liabilities | | | (3,612,368) | | | | (346,599) | | | | (24,273) | | | | (22,977) | | | | (99,426) | | | | (170,918) | | | | (60,990) | | | | (108,853) | | | | (2,778,333) | |
Total Balance Sheet Gap | | | 134,991 | | | | 148,397 | | | | 31,253 | | | | 13,058 | | | | (3,512) | | | | 6,196 | | | | 9,131 | | | | 12,059 | | | | (81,591) | |
Total Off-Balance Sheet Gap | | | (5,070) | | | | 27,072 | | | | 576 | | | | (1,096) | | | | 4,739 | | | | (5,802) | | | | (3,267) | | | | (27,293) | | | | — | |
Total Structural Gap | | | — | | | | 175,469 | | | | 31,829 | | | | 11,962 | | | | 1,227 | | | | 394 | | | | 5,864 | | | | (15,234) | | | | (81,591) | |
Accumulated Gap | | | — | | | | 175,469 | | | | 207,298 | | | | 219,260 | | | | 220,487 | | | | 220,881 | | | | 226,745 | | | | 211,511 | | | | 129,920 | |
Market Risk Limits
The Comprehensive Risk Management Committee establishes market risk limits annually to accommodate senior management’s appetite for risk and to comply with the desired risk/return ratio (on a consolidated basis, for each business unit and for each type of risk). The business units must request any subsequent limit modification from the Comprehensive Risk Management Committee through the Comprehensive Risk Management Unit. This level includes trading and investment portfolio activities, balance sheet management and strategic positions (classified in accordance with business intentions).
Our market risk limits are based on each of our portfolios and books. The limits structure is applied to control exposure and establish the total risk applicable to the business units.
We establish market risk limits for:
Trading Books: VaR
Loss Trigger
Stop Loss
Interest Rate equivalent amount
Equity Delta
Fx Open positions
Banking Books: Interest Rate Sensitivity Net Interest Margin (NIM)
Market Value of Equity (MVE)
For further information about the market risk limits established for our trading and banking books, see Note 47 to our audited financial statements included elsewhere in this Report.
Liquidity Risk
Liquidity risk is associated with our capacity to finance the commitments we undertake at reasonable market prices, and it is important to our ability to carry out our business plans with stable financing sources. Factors that influence liquidity risk may be external, such as a liquidity crisis, or internal, such as an excessive concentration of expirations.
The measures used to control liquidity risk in balance sheet management are the liquidity gap, liquidity ratios, stress scenarios, liquidity horizons and contingency plans. We manage expirations of assets and liabilities, performing oversight of maximum profiles for time lags. This oversight is based on analyses of asset and liability expirations, both contractual and related to management. Liquidity risk is measured in terms of liquidity horizons, periods of time for which a survival horizon is established. A survival horizon is a term of days for which liquid assets are sufficient to fulfill our commitments under different stress scenarios. We target a 90‑day survival horizon for local currency and all currency consolidated balance, and a 30‑day survival horizon for foreign currency. During 2018, the balance remained above the established limits, and therefore we maintained a sufficient liquidity buffer. The financial management area within our Corporate Activities segment is in charge of executing the actions recommended by ALCO.
Our liquidity risk, including our liquidity management framework and our current liquidity position, is fully described in Note 47 to our audited financial statements included elsewhere in this Report.
Credit Risk
General
Our Credit Committee is an internal management committee required by Mexican law that has powers to assist our Board of Directors in fulfilling its oversight responsibilities relating to:
| · | | any emerging risks associated with our loan portfolio; |
| · | | investments in our portfolio; and |
| · | | resolving issues with respect to any of our credit operations. |
In addition to the responsibilities mentioned above, and others expressly delegated by our Board of Directors, our Credit Committee also performs the following functions and duties with full authority to act on behalf of our Board of Directors in these matters:
| · | | review and approve any and all amendments or modifications to the requirements, conditions or other provisions relating to the Board of Director’s general authorization of our lending activities; |
| · | | review memoranda or other reports provided by our senior management concerning our loan portfolio and investment activities; |
| · | | periodically review and assess underwriting policies and guidelines; |
| · | | periodically review and assess surveillance and loss remediation policies and guidelines, including those relating to insured credits on the “Watch List;” |
| · | | periodically review, assess and recommend to our Board of Directors investment policies, criteria, guidelines and strategy for its approval; and |
| · | | evaluate our performance on an annual basis and report the results of the evaluation to our Board of Directors. |
The management of credit risk covers the identification, measurement, composition and valuation of aggregated risk and the determination of profitability adjusted to such risk, the purpose of which is to oversee the levels of risk concentration and adjust them to established limits and objectives. We have implemented a policy of selective growth of credit risk and strict treatment of late payments and provisions.
As required under applicable provisions of the Mexican Banking Law and General Rules Applicable to Mexican Banks and pursuant to our internal policies, in connection with each loan (including mortgage and other consumer loans), we apply credit assessment and approval processes undertaken by trained officers and, when applicable, committees that comprise experienced bankers. Furthermore, we maintain systems and personnel that continuously monitor loans, that we believe permit us to react promptly if delinquent conditions are present. Our credit and monitoring personnel is subject to periodic training. Furthermore, we periodically conduct benchmarking against similar systems used by our affiliates.
We manage our credit risk differently for each of our customer segments throughout the three phases of the credit process: admission, follow-up and recovery, as explained below.
Admission
The loans that receive individual treatment (companies, financial institutions and entities) are identified and differentiated from those handled in standardized fashion (consumer and mortgage loans of private individuals and loans to businesses and micro-companies).
In the case of loans to which we apply individual treatment, we have a solvency classification or “rating” system that calculates the probability of non-performance, which enables us to measure the risk associated with each customer from the start of the respective transaction. The customer valuation obtained after analyzing the relevant risk factors in different areas is subsequently adjusted based on the specific characteristics of the transaction (such as guarantee or term).
Standardized risks, given their special characteristics (a large number of transactions involving relatively small amounts) require a different approach that ensures effective treatment and efficient allocation of resources, for which we use automatic decision-making tools, such as expert and credit scoring systems.
Follow-up
Business loans are subject to our “special oversight system” during the follow-up stage. The special oversight system determines the policy to be followed in handling risk with companies or groups classified in such category. There are four distinct special oversight situations or degrees, that in turn give rise to four different possible actions: to follow, to reduce, to get guarantees and to extinguish. When a company and its loans are being evaluated, the risk analyst must decide whether to classify the company in any of these four categories and to begin special supervision until the relevant objective is accomplished (which means the risk is reduced, the guarantees are obtained or the risk is extinguished). The special oversight rating may be determined either by alert signals, systematic reviews or special initiatives promoted by the Risk Division or Internal Audit Areas. Our Risk Division is divided into nine territories, each of which has a group of risk analysts that are responsible for the follow-up of their portfolios according to the policies described above.
Recovery
Risks that we classify as past due loans based on non-compliance with the relevant payment schedule are assigned to our Recovery Units. Our Recovery Units are fundamental to our management of past due loans and are intended to minimize the final losses we incur. The Recovery Unit performs specialized risk management activities such as restructuring of loans, rescheduling payments or reaching a settlement agreement when the client is sued. We have different risk management activities with respect to (i) business installment loans (principally commercial loans), (ii) revolving SME loans, (iii) mortgage loans, and (iv) credit card and consumer loans.
With respect to business installment loans, we do not have prequalified restructuring programs or schemes. Instead, we negotiate with each debtor, review its capacity to make payments and the possibility of obtaining new guarantees, and seek partial upfront payments as a sign of commitment. Based on this information, we decide whether the debtor qualifies for restructuring. Our success rate with respect to restructured business installment loans is approximately 54%. This percentage is calculated based on the peso amount of the loans. The time period that this success rate covers is 12 months. This percentage is based on the total amount of renegotiated loans at the time of renegotiation. Restructured business installment loans refer mainly to our renegotiated commercial loans. For additional information on renegotiated loans, see Note 11.f to our audited financial statements included elsewhere in this Report.
With respect to revolving SME loans, restructuring consists of eliminating the revolving characteristic of the credit and transforming it into an installment loan.
We do not have any prequalified restructuring programs or schemes for mortgage loans that have been classified as past due loans mainly due to the notarial and registration costs that such prequalified programs or schemes would entail. Our recovery activities with respect to mortgage loans have resulted in average recoveries of approximately 43% of the principal amount due plus 90 days of accrued interest.
In relation to credit cards and consumer loans that are past due loans based on non-compliance with the relevant payment schedule, we offer restructuring plans that allow us to adjust the payments of our clients to their capacity to make payments and to address their reasons for missing previous payments. These adjustments include reducing the rate and/or extending the period of payment for up to 60 months. The credit card and consumer restructured loans are classified as non-performing when the loan subject to restructuring is either past due or non-performing. Once the loan is classified as non-performing we must see evidence of sustained payment in order to reclassify the loan as performing. Restructuring plans offered to our credit card holders have a recovery rate average of 50%. Six months after restructuring, approximately 23% of consumer loans are current in terms of repayment.
The following table shows the average during the last 72 months (renegotiation vintages from January 2014 to December 2018) of the accumulated amount of restructured loans (performing and non-performing
loans) that were classified as non-performing or written-off, as a percentage of the total amount of loans that was renegotiated at different points in time after the renegotiation:
| | | | | | | | | |
| | NPLs and written-off loans | |
| | As a % of total renegotiated amount at indicated points in time | |
| | at 6 months | | | at 12 months | | | at 18 months | |
Consumer Loans(1) | | | | | | | | | |
Performing at the time of the renegotiation | | 42% | | | 45% | | | 48% | |
Non-performing at the time of the renegotiation | | 77% | | | 68% | | | 63% | |
Total Consumer Loans | | 47% | | | 49% | | | 50% | |
Commercial Loans(2) | | | | | | | | | |
Performing at the time of the renegotiation | | 37% | | | 43% | | | 42% | |
Non-performing at the time of the renegotiation | | 77% | | | 50% | | | 38% | |
Total Commercial Loans | | 51% | | | 46% | | | 40% | |
| (1) | | Includes credit card and consumer loans. |
| (2) | | Includes business installment and SME loans. |
Based on the table above, the success rates for renegotiation vintages from January 2014 to December 2018 are as follows:
| | | | | | | | | |
| | Success Rates | |
| | at 6 months | | | at 12 months | | | at 18 months | |
Consumer Loans(1) | | | | | | | | | |
Performing at the time of the renegotiation | | 58% | | | 55% | | | 52% | |
Non-performing at the time of the renegotiation | | 23% | | | 32% | | | 37% | |
Total Consumer Loans | | 53% | | | 51% | | | 50% | |
Commercial Loans(2) | | | | | | | | | |
Performing at the time of the renegotiation | | 63% | | | 57% | | | 58% | |
Non-performing at the time of the renegotiation | | 23% | | | 50% | | | 62% | |
Total Commercial Loans | | 49% | | | 54% | | | 60% | |
| (1) | | Includes credit card and consumer loans. |
| (2) | | Includes business installment and SME loans. |
The success rate for mortgages is not presented because renegotiations of mortgage loans are immaterial.
The following table shows point-in-time estimates of the success rates segmented by type of renegotiation, using the 2017 vintage and 2018 vintage performance as of December 31, 2018, to illustrate the different
trends in our success rates for loans renegotiated due to concerns about credit (including impaired loans) and loans renegotiated due to factors other than concerns about credit.
| | | | | | | | | | | | | | | | | | | | | | | | |
| | | For the year ended 12/31/2017 | | | For the year ended 12/31/2018 |
| | | Performing Loans | | | | | | | | | Performing Loans | | | | | | |
| | | Renegotiated due to | | | | | | | | | | | | Renegotiated due to | | | | | | | | | |
| | | concerns about | | | | | | | | | | | | concerns about | | | | | | | | | |
| | | current or potential | | | Renegotiated due to | | | Impaired | | | | | | current or potential | | | Renegotiated due to | | | Impaired | | | |
| | | credit deterioration | | | other factors | | | Loans | | | Total | | | credit deterioration | | | other factors | | | Loans | | | Total |
| | | (Millions of pesos) |
Commercial | | | 3,093 | | | — | | | 1,153 | | | 4,246 | | | 560 | | | — | | | 2,150 | | | 2,709 |
Mortgages | | | - | | | — | | | — | | | — | | | - | | | — | | | — | | | — |
Consumer | | | 1,400 | | | — | | | 283 | | | 1,682 | | | 960 | | | — | | | 235 | | | 1,195 |
Total | | | 4,493 | | | — | | | 1,436 | | | 5,928 | | | 1,519 | | | — | | | 2,385 | | | 3,904 |
| | | | | | | | | | | | | | | | | | | | | | | | |
NPLs and charge offs | | | at December 31, 2018 (12 months)* | | | at December 31, 2018 (12 months)* |
Commercial | | | 29% | | | — | | | 81% | | | 43% | | | — | | | — | | | — | | | — |
Consumer | | | 48% | | | — | | | 83% | | | 54% | | | — | | | — | | | — | | | — |
Total | | | 35% | | | — | | | 81% | | | 46% | | | — | | | — | | | — | | | — |
| | | | | | | | | | | | | | | | | | | | | | | | |
Success Rate | | | at December 31, 2018 (12 months)* | | | at December 31, 2018 (12 months)* |
Commercial | | | 71% | | | — | | | 19% | | | 57% | | | — | | | — | | | — | | | — |
Consumer | | | 52% | | | — | | | 17% | | | 46% | | | — | | | — | | | — | | | — |
Total | | | 65% | | | — | | | 19% | | | 54% | | | — | | | — | | | — | | | — |
Success rates of renegotiated loans are reflected in the probability of default of the total portfolio, which includes performing, non-performing and renegotiated loans. In accordance with our allowance for impairment losses methodology, the probability of default is calculated based on observed default frequencies in the consumer and mortgage loan portfolios, and based on ratings in the commercial portfolio.
Renegotiated loans have decreased from 1.8% of the total consumer loan portfolio as of December 31, 2017, to 1.4% as of December 31, 2018. Our probability of default estimates reflect the behavior of our customer mix, which includes renegotiated and non-renegotiated loans, as well as performing and non-performing loans. The net decrease in the percentage of renegotiated loans between December 31, 2017, and December 31, 2018, is attributed to the movements set forth in the table below:
| | | |
| | % of Total | |
| | Consumer | |
| | Loans | |
Renegotiated Loans at December 31, 2017* | | 1.8% | |
Collections/repayments on renegotiated loans | | 0.6% | |
Written-off loans | | 0.6% | |
Increase in consumer loan portfolio | | 0.0% | |
New renegotiations | | 0.8% | |
Renegotiated Loans at December 31, 2018 | | 1.4% | |
*Our loan renegotiation policy limits renegotiations to once per year up to a maximum of three every five years.
Counterparty Risk
We assume counterparty risk in our dealings with government, government agencies, financial institutions, corporations, companies and individuals in our treasury and correspondent banking activities. We manage counterparty risk through a special unit whose organizational structure is independent of our business units.
We use the Interactive Risk Integrated System, or IRIS, system to ascertain the line of credit available with any counterparty, in any product and for any term and Equivalent Credit Risk, or ECR, to control counterparty lines. ECR is a measure that estimates the potential loss if the counterparty ceases payment. ECR takes into account the Current Credit Exposure, which is defined as the cost to substitute the transaction at market value provided that this value is positive for Banco Santander México, and it is measured as the market value of the transaction (“MtM”). Furthermore, the Gross Equivalent Credit Risk incorporates the Potential Credit Exposure or Potential Additional Risk (RPA), which represents the possible evolution of the current credit exposure until maturity, given the characteristics of the transaction
and the possible variations in the market factors. The Gross ECR considers definitions described above, without considering mitigating by netting or by mitigating collateral.
Mexican Financial Institutions and Foreign Financial Institutions are very active counterparties with which we have current positions for financial instruments with counterparty credit risk. The Gross ECR is mitigated by the existence of netting agreements and, in certain cases, with collateral agreements or revaluation agreements with the counterparties. This mitigated risk is called Net ECR. The methodology continues to be effective.
Another element of credit risk is settlement risk, which arises in any transaction at its expiration date, given the possibility that the counterparty will not comply with its obligations to pay us, once we have satisfied our obligations by issuing our respective payment instructions.
To control these risks, the Financial Risk Senior Management, comprised of the Counterparty and Market Credit Risk Area, supervises on a daily basis our compliance with the counterparty risk limits. These limits are established by counterparty, product and tenor. The Credit Risk Admission Area approves these counterparty risk limits. The Financial Risk Senior Management is also responsible for communicating the limits, consumptions and any excesses incurred on a daily basis. Furthermore, the Financial Risk Senior Management reports monthly to the Comprehensive Risk Management Committee the limits for Counterparty Risk Lines and the limits for Issuer Risk Lines and their usage. It also reports the calculation of the expected loss for current operations in financial markets at the close of each month and presents different stress scenarios of the expected loss. In addition, on a monthly basis, a report is presented to the Global Banking Credit Committee and Retail Credit Committee with respect to incurred excesses and transactions with non-authorized customers. All of the above according to the methodologies and assumptions approved by the Comprehensive Risk Management Committee.
Counterparty Risk Lines refer to the maximum equivalent credit risk amount and the maximum permitted term for derivatives, repos, money market, foreign exchange spot or any other trading transactions. Such risk lines are approved by the Credit Committee and are established for the following sectors: Mexican Sovereign Risk and Local Development Banking, Foreign Financial Institutions, Mexican Financial Institutions, Corporate Head Offices, Corporate Banking-SGC, Institutional Banking, Large Companies Unit and Project Finance. Issuer Risk Lines refer to the maximum amount permitted for the purchase of fixed income securities and, in addition, regulate the maximum term and holding period permitted for each issuer.
Set forth below are the Net ECR of the Counterparty Risk Lines and Issuer Risk Lines of Banco Santander México as of December 31, 2018, and the quarterly average Equivalent Credit Risk of Counterparty Risk Lines and Issuer Risk Lines of Banco Santander México for the fourth quarter of 2018.
| | | | | |
| | Net ECR |
| | As of December 31, | | | Fourth quarter 2018 |
| | 2018 | | | Average |
| | | | | (Millions of dollars) |
Risk Lines | | | | | |
Sovereign Risk, Development Banking and Financial Institutions | | 18,732.34 | | | 19,012.58 |
Corporates | | 773.19 | | | 781.45 |
Companies | | 161.89 | | | 124.56 |
Set forth below are our ECR lines’ maximum gross counterparty risk as of December 31, 2018, corresponding to types of derivatives transactions.
| | |
| | Maximum Gross ECR |
| | As of December 31, 2018 |
| | (Millions of dollars) |
Type of Derivative | | |
Rate Derivatives | | 15,634.34 |
Exchange Rate Derivatives | | 34,831.36 |
Derivatives on bonds | | — |
Equity Derivatives | | 1,087.22 |
TOTAL | | 51,552.92 |
*In IRIS, the Gross ECR does not consider mitigation by netting agreements and by collateral agreements with counterparties.
The expected loss of Banco Santander México as of December 31, 2018, and the quarterly average of the expected loss of the Counterparty Risk Lines and Issuer Risk Lines of the Bank for the fourth quarter of 2018, are concentrated as follows:
| | | | | |
| | Expected Loss |
| | As of December 31, | | | Fourth quarter 2018 |
| | 2018 | | | Average |
| | | | | (Millions of dollars) |
Risk Lines | | | | | |
Sovereign Risk, Development Banking and Financial Institutions | | 10.32 | | | 14.75 |
Corporates | | 1.80 | | | 1.69 |
Companies | | 1.25 | | | 1.39 |
The Mexican Financial Institutions and Foreign Financial Institutions segments are very active counterparties with whom we maintain current positions of financial instruments with Counterparty Credit Risk. We mitigate Equivalent Credit Risk by netting agreements (ISDA-CMOF) and, in some cases, by collateral agreements (CSA-CGAR) or revaluation agreements with counterparties.
The composition of total collateral received for derivatives transactions as of December 31, 2018 is as follows:
| | | |
Cash | | 91.99% | |
Bonds Issued by the Mexican Government | | 8.01% | |
In respect to collateral management in derivatives transactions, counterparty’s positions are valuated according to the frequency established at each collateral agreement. In addition, all credit risk parameters, established at each collateral agreement are considered to obtain the amount of collateral to be delivered or to be received from the counterparty. These amounts, margin calls, will be requested from the counterparty which has the right to receive the collateral, according to the frequency established at the collateral agreement.
The counterparty, which receives the margin call has the right to analyze the valuation and it could result on discrepancies to solve.
In respect to the correlation between the collateral and the counterparty in derivatives transactions, the Institution confirms that, at this time, the eligible collateral consists on government bonds and cash collateral, so as a result there are no adverse effects due to correlation between the counterparty and the collateral.
In the hypothetical stressed scenario, assuming that the Institution’s credit rating decreases and the impact of this credit rating decrease on the collateral that the Institution would have to deliver, this stressed test confirms that there would not be significant impact; a few of the thresholds established on the Institution’s collateral agreements are dependent on the Institution’s credit rating.
Operational Risk
Operational risk is defined as the risk of loss due to inadequate or failed internal processes, personnel or internal systems or due to external events. This definition includes events that may occur as a result of legal or regulatory risk, but excludes those that occur as a result of strategic risks and reputational risks.
The operational risk management has as its main goal to contain or reduce the impact of operational risks through the identification, oversight and control of factors that could trigger loss events.
We have a non-financial risk management unit that is responsible for coordinating and supervise the proper implementation of policies and procedures according to the corporate model defined in Spain, aligned to the regulatory requirements in Mexico by the CNBV. This unit is responsible to submit proposals to the Operational Risk Committee and/or the Comprehensive Risk Management Committee for its approval of the methodologies, models and parameters used to identify measure, limit, report and disclose the operational risk to which we are exposed and the results of embedding under the risk profile. Our non-financial risk unit reports directly to the Deputy General Risk Director in Mexico and to the corporate responsible for operational risk in Spain.
The key processes involved in the model for the management and control of the Operational Risk are summarized as follows:
| · | | strategic planning and budget; |
| · | | identification, measurement and assessment of operational risk; |
| · | | continuous monitoring of Operational Risk profile; |
| · | | determination of the framework to identify the need of mitigation and risk transfer; and |
| · | | communication and governance. |
Anti-Money Laundering and Anti-Terrorist Financing
Our Communications and Control Committee (Comité de Comunicación y Control) approves, modifies and ensures the compliance of internal guidelines regarding the prevention, detection and reporting of money-laundering transactions, among the following functions:
| · | | Establishes and amends our internal policies to prevent and detect acts or transactions that may be of illicit origin and may fall within the threshold of Articles 139 quarter and 400 bis of the Mexican Federal Criminal Code (Código Penal Federal) and rules thereunder; |
| · | | Oversees compliance with our applicable policies; |
| · | | Evaluates the effectiveness of our policies and determines the necessary remedial measures; |
| · | | Decides on certain transactions that may fall within the category of unusual transactions and determines if we should report to the authorities; and |
| · | | Approves anti-money laundering training program for Institution’s personnel. |
The Communication Control Committee reports to the information on anti-money laundering transactions to the Compliance Committee and Audit Committee. Its primary purpose is to monitor the transactions of our prevention system and, in particular, to decide when to communicate unusual transactions to the authorities. In addition, this committee reviews and approves the regulations and procedures relating to prevention, annual office review projects or plans, annual training programs, analyses transactions and the list of clients subject to special authorizations and monitoring.
In general, this committee is integrated into the main control areas of the Bank.
Legal Risk
Legal risk is defined as the potential loss from non-compliance with applicable legal and administrative provisions, the issuance of adverse administrative and court rulings, the imposition of fines and the application of penalties in relation to our transactions.
The following activities are performed in compliance with our Comprehensive Risk Management guidelines:
| · | | establishment of policies and procedures to analyze legal validity and ensure the proper instrumentation of the legal acts performed; |
| · | | estimation of the amount of potential losses derived from unfavorable legal or administrative rulings and the possible application of penalties; |
| · | | analysis of legal acts governed by foreign legal systems; |
| · | | publication among managerial personnel and employees of legal and administrative provisions applicable to transactions; |
| · | | performance, at least annually, of internal legal audits; and |
| · | | maintenance of a historical database relating to judicial and administrative decisions, and their causes and costs, ensuring that those judicial and administrative decisions that result in a loss are registered systematically along with their different types of loss and costs, in accordance with accounting records, and are properly identified with the line or business unit of origin. |
Technological Risk
Technological risk is defined as the potential loss from damages, interruption, alteration or failures derived from the use of or dependence on hardware, software, systems, applications, networks and any other information technology services provided to our customers.
We have developed a model in accordance with the corporate model created by Banco Santander Parent to deal with technological risk. This model is currently integrated into the service and support processes of our corporate technology locations in order to identify, oversee, control and report on the technology risks to which our operations are exposed. This model is intended to prioritize the establishment of control measures that will reduce the probability of risks materializing.
ITEM 12. DESCRIPTION OF SECURITIES OTHER THAN EQUITY SECURITIES
A. Debt Securities
Not applicable.
B. Warrants and Rights
Not applicable.
C. Other Securities
Not applicable.
D. American Depositary Shares
Fees and Expenses
The depositary may charge each person to whom ADSs are issued, including, without limitation, issuances as a result of a distribution of shares, rights and other property, issuances pursuant to a stock dividend or stock split declared by us or issuances pursuant to a merger, exchange of securities or any other transaction or event affecting the ADSs or deposited securities, and each person surrendering ADSs for withdrawal of deposited securities in any manner permitted by the deposit agreement or whose ADRs are cancelled or reduced for any other reason, up to $5.00 for each 100 ADSs (or any portion thereof) issued, delivered, reduced, cancelled or surrendered, as the case may be. The depositary may sell (by public or private sale) sufficient securities and property received in respect of a distribution of shares, rights and/or other property prior to such deposit to pay such charge.
The following additional charges shall be incurred by the ADR holders, by any party depositing or withdrawing Series B shares or by any party surrendering ADSs or to whom ADSs are issued (including, without limitation, issuances pursuant to a stock dividend or stock split declared by us or an exchange of stock regarding the ADRs or the deposited securities or a distribution of ADSs), whichever is applicable:
| · | | a fee of U.S.$0.05 or less per ADS for any cash distribution made pursuant to the deposit agreement; |
| · | | a fee of U.S.$1.50 per ADR for transfers of certificated or direct registration ADRs; |
| · | | a fee for the distribution or sale of securities in connection with a distribution, such fee being in an amount equal to the fee for the execution and delivery of ADSs that would have been charged as a result of the deposit of such securities (treating all such securities as if they were Series B shares) but which securities or the net cash proceeds from the sale thereof are instead distributed by the depositary to those holders entitled thereto; |
| · | | an aggregate fee of U.S.$0.05 or less per ADS per calendar year (or portion thereof) for services performed by the depositary in administering our ADR program (which fee may be charged on a periodic basis during each calendar year and shall be assessed against ADR holders as of the record date or record dates set by the depositary during each calendar year and shall be payable at the sole discretion of the depositary by billing such holders or by deducting such charge from one or more cash dividends or other cash distributions); |
| · | | a fee for the reimbursement of such fees, charges and expenses as are incurred by the depositary or any of the depositary’s agents (including, without limitation, the custodian and expenses incurred on behalf of ADR holders in connection with compliance with foreign exchange control regulations or any law or regulation relating to foreign investment) in connection with the servicing of our Series B shares or other deposited securities, the sale of securities (including, without limitation deposited securities), the delivery of deposited securities or otherwise in connection with the depositary’s or the custodian’s compliance with applicable law, rule or regulation (which fees and charges shall be assessed on a proportionate basis against registered holders of our ADRs as of the record date or dates set by the depositary and shall be payable at the sole discretion of the depositary by billing such registered holders or by deducting such charge from one or more cash dividends or other cash distributions); |
| · | | stock transfer or other taxes and other governmental charges; |
| · | | SWIFT, cable, telex and facsimile transmission and delivery charges incurred at your request in connection with the deposit or delivery of Series B shares, ADRs or deposited securities; |
| · | | transfer or registration fees for the registration or transfer of deposited securities on any applicable register in connection with the deposit or withdrawal of deposited securities; |
| · | | any other charge payable by any of the depositary, any of its agent’s including, without limitation, the custodian, or the agents of the depositary’s agents in connection with the servicing of the Series B shares or other deposited securities; and |
| · | | in connection with the conversion of foreign currency into U.S. dollars, the fees and expenses of the depositary charged by the depositary or its agent (which may be a division, branch or affiliate) so appointed in connection with such conversion. |
We will pay all other charges and expenses of the depositary and any agent of the depositary (except the custodian) pursuant to agreements from time to time between us and the depositary. The fees described above may be amended from time to time.
Direct and Indirect Payments
Our depositary has agreed to make available to us the revenues generated by the ADR program through issuance, cancellation and distributions fees, net of certain fees and expenses incurred by the depositary, including transferee agency fees and reasonable legal fees and expenses. The depositary collects its fees for issuance and cancellation of ADSs directly from investors depositing Series B shares or surrendering ADSs for the purpose of withdrawal or from intermediaries acting for them. The depositary collects fees for making distributions to investors by deducting those fees from the amounts distributed or by selling a portion of distributable property to pay the fees. The depositary may collect its annual fee for depositary services by deduction from cash distributions or by directly billing investors. The depositary may generally refuse to provide services to any holder until the fees and expenses owing by such holder for those services or otherwise are paid.
For the year ended December 31, 2018, we received approximately U.S.$10.7 million in reimbursements from J.P. Morgan Chase Bank, N.A.
PART II
ITEM 13. DEFAULTS, DIVIDEND ARREARS AND DELINQUENCIES
A. Defaults
No matters to report.
B. Arrears and Delinquencies
No matters to report.
ITEM 14. MATERIAL MODIFICATIONS TO THE RIGHTS OF SECURITY HOLDERS AND USE OF PROCEEDS
A. Material Modifications to Instruments
None.
B. Material Modifications to Rights
None.
C. Withdrawal or Substitution of Assets
None.
D. Change in Trustees or Paying Agents
None.
E. Use of Proceeds
Not applicable.
ITEM 15. CONTROLS AND PROCEDURES
A. Disclosure Controls and Procedures
As of December 31, 2018, under the supervision and with the participation of our management, including our disclosure committee, our Chief Executive Officer (CEO) and our Chief Financial Officer (CFO), we performed an evaluation of the effectiveness of the design and operation of our disclosure controls and procedures (as defined in Rule 13a-15(e) under the Exchange Act). There are inherent limitations to the effectiveness of any control system, including disclosure controls and procedures. Accordingly, even effective disclosure controls and procedures can only provide reasonable assurance of achieving their control objectives.
Based on this evaluation, our CEO and CFO concluded that we did not maintain effective disclosure controls and procedures because of the material weaknesses in internal control over financial reporting described below. In light of these material weaknesses, management completed additional procedures and analyses to validate the accuracy and completeness of the audited financial statements impacted by the detected control deficiencies. In addition, management engaged the Audit Committee, in detail, to discuss
the procedures and analysis performed to ensure the reliability of our financial reporting. As a result, management concluded the audited financial statements included elsewhere in this Report fairly present in all material respects our financial position, the results of our operations and cash flows for the periods presented, in conformity with IFRS as issued by the IASB.
B. Management’s Annual Report on Internal Control over Financial Reporting
Our management is responsible for establishing and maintaining adequate internal control over financial reporting as defined in Rule 13a-15(f) under the Exchange Act. Our internal control over financial reporting is a process designed by, or under the supervision of, our CEO and CFO and effected by our Board of Directors, management and other personnel, to provide reasonable assurance regarding the reliability of financial reporting and the preparation of financial statements for external purposes in accordance with IFRS as issued by the IASB. Our internal control over financial reporting includes those policies and procedures that:
| · | | pertain to the maintenance of records that, in reasonable detail, fairly and accurately reflect the transactions and disposition of our assets; |
| · | | provide reasonable assurance that transactions are recorded as necessary to permit the preparation of financial statements in accordance with IFRS as issued by the IASB and that our receipts and expenditures are being made only in accordance with authorizations of our management and directors; and |
| · | | provide reasonable assurance regarding prevention or timely detection of unauthorized acquisition, use or disposition of our assets that could have a material effect on our financial statements. |
Because of its inherent limitations, internal control over financial reporting may not prevent or detect misstatements. In addition, projections of any evaluation of effectiveness to future periods are subject to the risk that controls may become inadequate because of changes in conditions or because the degree of compliance with policies or procedures may deteriorate.
Management assessed the effectiveness of our internal control over financial reporting as of December 31, 2018, based on the criteria established in Internal Control—Integrated Framework (2013) issued by the Committee of Sponsoring Organizations of the Treadway Commission.
A material weakness (as defined in Rule 12b-2 under the Exchange Act) is a deficiency, or combination of deficiencies, in internal control over financial reporting such that there is a reasonable possibility that a material misstatement in our annual or interim financial statements will not be prevented or detected on a timely basis.
Based on the assessment, management determined that Banco Santander México did not maintain effective internal control over financial reporting as of December 31, 2018 because of the material weaknesses described below.
Risk assessment
We did not maintain an effective risk assessment over information technology (“IT”) general controls, in particular with respect to changes to the IT environment. Primarily, we did not adequately assess risks surrounding the implementation of a comprehensive automated monitoring system, which was placed into operation during November 2018, as we did not provide for a sufficiently robust contingency plan in the form of compensating access controls to run parallel with the new automated monitoring system and address risks arising during the implementation period.
This material weakness contributed to the following control deficiencies, which are also considered in aggregate, to be a material weakness:
Application, database and operating system user access management controls
These deficiencies involve IT user access controls, which are intended to ensure that access to financial applications and data is adequately restricted to appropriate personnel. IT user access control deficiencies related to the inadequate operating effectiveness of controls over (i) approval of new IT users access requests, (ii) level of privileges assigned to IT users and management of privileged IT users accounts, (iii) monitoring of IT user activity, and (iv) the performance of periodic IT user access reviews. Accordingly, our management has determined these IT deficiencies in the aggregate constitute a material weakness.
These IT deficiencies did not result in a material misstatement to the annual financial statements. However, the deficiencies, when aggregated, could impact maintaining effective segregation of duties, as well as the effectiveness of IT-dependent controls (such as automated controls that address the risk of material misstatement to one or more financial statement assertions, along with the IT user access controls and underlying data that support the effectiveness of system-generated data and reports) that could result in misstatements of account balances or disclosures that would not be prevented or detected.
The effectiveness of our internal control over financial reporting as of December 31, 2018 has been audited by PricewaterhouseCoopers, S.C., an independent registered public accounting firm, as stated in its report, included with our audited financial statements filed as part of this Report.
Remediation Plan of Reported Material Weaknesses
We have assigned all the necessary resources and are currently working to remediate the material weaknesses described above, including assessing the need for additional remediation steps and implementing additional measures to remediate the underlying causes that gave rise to the material weaknesses. We are committed to maintaining a strong internal control environment and to ensure that a proper, consistent tone is communicated throughout the Bank, including the expectation that previously existing deficiencies will be remediated through implementation of processes and controls that meet the criteria established in Internal Control - Integrated Framework (2013) issued by the Committee of Sponsoring Organizations of the Treadway Commission and ensure the Bank’s compliance with IFRS.
We have developed a strategy to enhance our risk assessment processes and related control procedures over IT change management.
To address the material weaknesses related to application, database and operating system user access management controls, we have initiated the following actions:
| · | | Enhance our regular working group meetings, with oversight by management of both the Bank and its Audit Committee to strengthen accountability for performance of internal control over financial reporting responsibilities and prioritization of corrective activities. |
| · | | Increase our IT resources with additional qualified personnel in order to enhance our technical capabilities and assist with the planning and execution of our remediation strategy. |
| · | | Reallocate additional resources to improve the oversight for certain IT control activities. Specifically, we will continue with a restructuring of personnel managed by our Chief Information Security Officer. |
| · | | Finalize implementation of a comprehensive automated monitoring system that we believe will reduce our dependence on manual procedures and provide a robust solution to the deficiencies in new IT user access controls, controls over level of privileges assigned to IT users and the management thereof, monitoring of user activity and periodic IT user access reviews. As part of our remediation plan, we |
anticipate completion of all phases of this comprehensive automated monitoring solution with respect to significant applications during 2019. |
| · | | Implement detective monitoring IT user access controls, both within and outside of the IT environment, to mitigate the risks we have identified and assessed that arise as a result of the process of remediation of IT general control deficiencies is in process. |
We believe our actions, which will complement our existing compensating internal controls, will be effective in remediating the material weaknesses, and we continue to devote significant time and attention to these efforts. In addition, the material weaknesses will not be considered remediated until the applicable remedial processes and procedures have been in place for a sufficient period of time and management has concluded, through testing, that these internal controls are effective. As we continue to evaluate and work to improve our internal control over financial reporting within the area of IT general controls, we may determine to take additional measures to address IT control deficiencies or determine to modify the remediation plan described above. Management will test, evaluate, and validate the implementation of these new processes and internal controls during 2019 to ascertain whether they are designed and operating effectively to provide reasonable assurance that they will prevent or detect a material misstatement in our financial statements. Subject to the foregoing, we are working towards having these remediation efforts completed as soon as possible.
C. Changes in Internal Control over Financial Reporting
During 2018, we began the implementation of a comprehensive automated user access monitoring system. As we finalize all phases of implementation and the operations of this comprehensive automated monitoring solution continue to mature, we expect to benefit from significant improvements in the efficiency and effectiveness of IT user access controls.
There was otherwise no change in our internal control over financial reporting that occurred during the period covered by this annual report that has materially affected, or is reasonably likely to materially affect, our internal control over financial reporting.
ITEM 16. [RESERVED]
ITEM 16A. AUDIT COMMITTEE FINANCIAL EXPERT
Our Audit Committee has three members, all of whom are nonexecutive independent directors, as determined in accordance with Article 25 of the Mexican Securities Market Law and our bylaws. All of the members of our Audit Committee also meet the independence criteria set by the NYSE, for foreign private issuers. Our Board of Directors has determined that Fernando Ruiz Sahagún is also an “Audit Committee Financial Expert” as defined by the SEC.
ITEM 16B. CODE OF ETHICS
Our Board of Directors has approved and adopted our General Code of Conduct, which are a code of ethics that applies to all of our employees, including executive officers, and to our Board members. The current version of our General Code of Conduct is posted and maintained on our website at www.santander.com.mx under the heading “Conoce al Banco-Código de Conducta”. The information contained on our website is not a part of this annual report.
On October 22, 2018, our Board of Directors approved amendments to the General Code of Conduct to incorporate a catalog of ethical principles and corporate rules of conduct that govern the performance of all Bank employees in our General Code of Conduct.
ITEM 16C. PRINCIPAL ACCOUNTANT FEES AND SERVICES
The following table describes the amounts billed to us by PricewaterhouseCoopers, S.C. for audit and other services performed in fiscal years 2017 and 2018, respectively.
| | | | | | | |
| | 2017 | | | 2018 |
| | | (Millions of pesos) |
Audit fees | | Ps. | 59 | | | Ps. | 81 |
Audit-related fees | | | 14 | | | | 7 |
Tax fees | | | 1 | | | | 1 |
Audit Fees
Audit fees correspond to fees for professional services rendered by the principal accountant for the audit of the registrant’s annual financial statements or services that are normally provided by the accountant in connection with statutory and regulatory filings or engagements for those fiscal years. It includes the audit of our annual consolidated financial statements and other services that generally only the independent accountant reasonably can provide, such as comfort letters, statutory audits, consents and assistance with and review of documents filed with the Securities and Exchange Commission.
Audit-Related Fees
Audit-related fees correspond to fees for assurance and related services that are reasonably related to the performance of the audit or review of our consolidated financial statements for fiscal years 2018 and 2017 and not reported under the previous category. These services would include, among others: due diligence related to mergers and acquisitions, accounting consultations and audits in connection with acquisitions, internal control reviews, attest services that are not required by statute or regulation and consultation concerning financial accounting and reporting standards.
Tax Fees
Tax fees are fees billed for professional services for tax compliance and tax advice.
No amounts were billed to us by PricewaterhouseCoopers, S.C. in 2017 or 2018, respectively for services other than audit, audit-related and tax services.
Preapproval Policies and Procedures
The Audit Committee is required to preapprove the audit and non-audit services performed by the Company’s auditors in order to assure that the provision of such services does not impair the audit firm’s independence.
Each year, the Audit Committee proposes the appointment of the independent auditor to the Board. At that time, the Audit Committee preapproves the audit and audit-related services that the appointed auditors will be required to carry out during the year to comply with the applicable regulation. These services are included in the correspondent audit contracts of the Company with its principal auditing firm.
In addition, all non-audit services provided by the Company’s principal auditing firm or other auditing firms are subject to case-by-case preapproval by the Audit Committee.
All of the audit fees, audit-related fees and tax fees described in this item 16C have been preapproved by the Audit Committee in accordance with these preapproval policies and procedures.
ITEM 16D. EXEMPTIONS FROM THE LISTING STANDARDS FOR AUDIT COMMITTEES
All of the members of our Audit Committee satisfy the independence requirements of the NYSE applicable to foreign private issuers.
ITEM 16E. PURCHASES OF EQUITY SECURITIES BY THE ISSUER AND AFFILIATED PURCHASERS
None.
ITEM 16F. CHANGE IN REGISTRANT’S CERTIFYING ACCOUNTANT
None.
ITEM 16G. CORPORATE GOVERNANCE
Our corporate practices are governed by our bylaws (estatutos), the Mexican Securities Market Law, the Mexican Banking Law and the regulations issued by the CNBV and the Mexican Stock Exchange. In addition, our corporate governance practices reflect the Banco Santander Parent corporate governance framework described below.
In December 2012, primarily in response to the requirements of the European Banking Authority, our controlling shareholder, Banco Santander Parent, adopted a corporate governance framework (Marco de Gobierno Interno del Grupo Santander). The purpose of the framework is to organize and standardize the corporate governance practices of Banco Santander Parent and its most significant subsidiaries, including us, in order to enhance the ability of Banco Santander Parent to manage the risks arising from its operations around the world.
The three pillars of the framework are (i) an organizational model based on functions subject to internal governance, (ii) terms of reference according to which Banco Santander Parent exercises control and oversight over its subsidiaries and participates in specific decisions at the subsidiary level and (iii) corporate models establishing common guidelines for the management and control of Banco Santander Parent’s subsidiaries, subject to local autonomy considerations. In general, the framework purports to implement organizational and procedural changes rather than mandating particular substantive outcomes. However, in some cases, and subject to the limitations set forth in the framework, the framework states that Banco Santander Parent may require that its subsidiaries make substantive changes or take specific actions. The framework enables Banco Santander Parent to participate in the decision-making processes of its subsidiaries by requiring its approval of certain decisions that may have a significant impact on the Santander Group as a whole due to their significance or potential risk, such as decisions relating to mergers and acquisitions, capital structure, dividends and risk appetite, among other things. The framework also requires that a single person at each subsidiary be in charge of each function subject to internal governance and gives Banco Santander Parent the authority to participate in the appointment, evaluation and compensation of each such person.
By its own terms, the framework as a whole is premised on the legal and financial autonomy of the subsidiaries and does not empower Banco Santander Parent to supplant its subsidiaries’ decision-making processes. Moreover, each of the three pillars of the framework is explicitly made subject to local legal requirements. Our Board of Directors approved the adoption of this corporate governance framework in July 2013, subject to certain overarching principles:
| · | | the precedence of applicable laws and regulations and orders of competent authorities over the framework to the extent they are in conflict; |
| · | | the subordination of the framework to our directors’ duty of loyalty and their obligation to create value for all of our shareholders rather than any particular shareholder or group of shareholders; and |
| · | | the disclosure of the adoption of the corporate governance framework to the public and to our employees and subsidiaries. |
As a result of the precedence given to local legal requirements in the framework itself and in our Board of Directors’ adopting resolutions, we do not expect that the adoption of the corporate governance framework will affect our ability to comply with applicable corporate governance regulations, including SEC and NYSE rules applicable to foreign private issuers. For example, although one provision of the framework states that we must obtain Banco Santander Parent’s approval for our audit plan and that Banco Santander Parent may request additional audits at its discretion, to the extent that this provision of the framework would prevent our audit committee from fulfilling any of the requirements of applicable SEC or NYSE rules (including, for example, the audit committee’s obligation to be directly responsible for the appointment, compensation, retention and oversight of the work of any registered public accounting firm engaged for the purpose of preparing an audit report), we understand that this provision would be limited so as not to conflict with such requirements due to the precedence given to local legal requirements in the framework and our adopting resolutions. Similarly, we understand that the authority given to Banco Santander Parent under the framework to approve certain decisions by us and to approve the compensation of certain persons in charge of functions subject to internal governance are limited by the framework and the adopting resolutions so as not to limit the ability of members of our audit committee to make independent decisions or take independent actions as required by the audit committee independence requirements of applicable SEC and NYSE rules.
On July 27, 2015, as a result of the new requirements of the European Central Bank, the Bank of Spain and the regulators in different jurisdictions, Banco Santander Parent established a new corporate governance model for its subsidiaries, with the purpose of setting forth a clear and transparent conceptual framework to govern their relationship. The model reinforces Banco Santander Parent’s corporate governance and provides greater faculties and powers to the boards of directors of the subsidiaries. Our Board of Directors approved the new corporate governance model in January 2016, in compliance with local regulations.
Pursuant to Section 303A.11 of the Listed Company Manual of the NYSE we are required to provide a summary of the significant ways in which our corporate governance practices differ from those required for United States resident companies under the NYSE listing standards. Section 303A of the NYSE Listed Company Manual sets forth certain corporate governance requirements that a company must satisfy to be listed on the NYSE. However, exemptions from many of the requirements are available to foreign private issuers such as us. As a foreign private issuer, we are permitted to, and we will, follow home country practice in lieu of the NYSE corporate governance standards from which we are exempt.
A discussion of the significant differences between the Mexican corporate governance standards that govern our practices and the NYSE standards applicable to U.S. companies follows below. It includes only a brief summary description of our corporate governance practices.
Majority of Independent Directors
Under NYSE Rules, listed companies must have a majority of independent directors. “Controlled companies,” which would include our company if we were a United States issuer, are exempt from this requirement under NYSE Rule §303A.00. Under our bylaws and in accordance with the Mexican Securities Market Law, at least 25% of the members of our Board of Directors must be independent; independence is determined in accordance with Article 22 of the Mexican Banking Law and our bylaws, rather than NYSE standards.
The independence standards in Article 22 of the Mexican Banking Law and our bylaws may not necessarily be consistent with the director independence standards prescribed by the NYSE. Moreover, the definition of “independence” under the Mexican Securities Market Law also differs in some aspects from the NYSE standard and prohibits, among other things, an independent director from being an employee or officer of
the company or a stockholder that may have influence over our officers, relevant clients and contractors, as well as certain relationships between the independent director and family members of the independent director.
In accordance with the Mexican Securities Market Law, our shareholders’ meeting is required to make a determination as to the independence of our directors, though such determination may be challenged by the Mexican Banking and Securities Commission. There is no exemption from the independence requirement for controlled companies under Mexican law.
Executive Sessions
Under NYSE Rule §303A.03, non-management directors must meet in regularly scheduled executive sessions without management’s presence. In addition, independent directors should meet alone in an executive session at least once a year. We are exempt from this NYSE requirement. Our non-management directors have not held executive sessions without management in the past, and under our bylaws and applicable Mexican law, they are not required to do so.
Nominating/Corporate Governance Committee
Under NYSE Rule §303A.04, a nominating/corporate governance committee composed entirely of independent directors is required. The committee must have a charter specifying the purpose, duties and evaluation procedures of such committee. NYSE Rule §303A.00 exempts “controlled companies” such as us from these requirements. However, the Mexican Securities Market Law requires the creation of one or more committees that perform audit and corporate practices functions, and each committee must maintain at least three members appointed by the Board of Directors. Each such appointed member must be independent under Mexican law, except solely in respect of the corporate governance committee, where, for corporations controlled by a person or group maintaining 50% or more of the outstanding capital stock like us, the majority of committee members must be independent under Mexican law. Notwithstanding the foregoing, all of the members of our Corporate Governance Committee are independent, as determined in accordance with Mexican law. Mexican law does not require and we do not have a committee charged with nominating directors for election to the Board.
Under our bylaws, the committee that performs corporate practices functions is required to, among other activities, provide opinions to the Board of Directors, request and obtain opinions from independent third-party experts, call shareholders’ meetings, provide assistance to the Board of Directors in the preparation of annual reports and provide an annual report to the Board of Directors.
Compensation Committee
Under NYSE Rule §303A.05, a compensation committee composed entirely of independent directors is required, and it must evaluate and approve the Chief Executive Officer’s compensation and make recommendations to the Board of Directors with respect to non-Chief Executive Officer compensation and incentive-compensation and equity-based plans that are subject to the approval of the Board of Directors and prepare the compensation committee report required by Item 407(e)(5) of Regulation S-K. The committee must have a charter specifying the purpose, duties and evaluation procedures of the committee. NYSE Rule §303A.00 exempts “controlled companies” such as us from these requirements.
The General Rules Applicable to Mexican Banks require Mexican banks (whether listed or not) to have a remuneration committee, which must include at least two members of the board of directors of such bank, one of whom must be independent, as determined in accordance with Mexican law. The purpose, composition, authority and responsibilities of our Remuneration Committee, which reports to the Board of Directors of Banco Santander México, have been established in a set of policies approved by the Board of Directors of Banco Santander México, in accordance with Mexican law.
Audit Committee
Under NYSE Rule §303A.06, listed companies must have an audit committee that satisfies the independence and other requirements of Exchange Act Rule 10A‑3. NYSE Rule §303A.07 specifies that the audit committee must have a minimum of three members, all of whom must meet additional NYSE independence standards, and it must have a charter specifying the purpose, duties and evaluation procedures of the committee. Foreign private issuers like us are subject to the basic audit committee requirements in §303A.06, but are exempt from the additional independence and charter requirements in §303A.07. Our audit committee has three members. In order to comply with Rule 10A‑3 under the Exchange Act, all of the directors on our Audit Committee are independent, as determined in accordance with Rule 10A‑3.
Mexican law requires that listed companies have an audit committee and that all of its members must be “independent” as defined under Mexican law.
Equity Compensation Plans
Under NYSE Rules §3303A.08 and 312.00, equity compensation plans and all material revisions thereto require shareholder approval, subject to limited exemptions. We are exempt from such NYSE requirements. However, under Mexican rules, the adoption and amendment of an equity compensation plan requires shareholder approval, as a means to be permitted to engage in transactions with the issuer without having to conduct public offerings.
Corporate Governance Guidelines
Under NYSE Rule §303A.09, listed companies are required to adopt and maintain corporate governance guidelines addressing, among other things, director qualification standards, director responsibilities, director access to management and independent advisors, management succession and annual performance evaluations of the Board of Directors. Under Mexican rules, corporate governance guidelines are established by the Corporate Governance Committee in accordance with the applicable Mexican legislation, which imposes, among other things, qualification standards for the members of the Board of Directors and of the executive officers, independence of directors and directors’ responsibilities.
Code of Business Conduct and Ethics
Under NYSE Rule §303A.10, a code of business conduct and ethics is required and any waiver for directors or executive officers must be disclosed. Moreover, such code must contain compliance standards and procedures that will facilitate its effective operation. We are exempt from such NYSE requirements. However, we have adopted a code of conduct and ethics, which has been accepted by all of our directors, executive officers and other personnel.
The Bank has a General Code of Conduct that provides policies and procedures to ensure (i) that all employees receive the same opportunities regarding job access and professional promotion and (ii) the absence of discrimination by reason of sex, sexual orientation, race, religion, origin, civil status or social condition. Such Code was authorized by the Board of Directors and the Compliance Committee.
ITEM 16H. MINE SAFETY DISCLOSURE
Not applicable.
PART III
ITEM 17. FINANCIAL STATEMENTS
We have responded to Item 18 in lieu of this item.
ITEM 18. FINANCIAL STATEMENTS
Financial Statements are filed as part of this annual report. See page F-1.
ITEM 19. EXHIBITS
(a)Index to Audited Financial Statements
| |
Consolidated Financial Statements of Banco Santander México, S.A., Institución de Banca Múltiple, Grupo Financiero Santander México and Subsidiaries | |
Report of PricewaterhouseCoopers, S.C. | F‑2 |
Consolidated Balance Sheets as of December 31, 2017 and 2018 | F‑4 |
Consolidated Income Statements for the Years Ended December 31, 2016, 2017 and 2018 | F‑6 |
Consolidated Statements of Comprehensive Income for the Years Ended December 31, 2016, 2017 and 2018 | F‑7 |
Consolidated Statements of Changes in Total Equity for the Years Ended December 31, 2016, 2017 and 2018 | F��8 |
Consolidated Statements of Cash Flow for the Years Ended December 31, 2016, 2017 and 2018 | F‑9 |
Notes to the Consolidated Financial Statements as of December 31, 2017 and 2018 and for each of the three years in the period ended December 31, 2018 | F‑10 |
(b)List of Exhibits
| | |
Exhibit
Number | | Description |
| 1.1 | | English translation of the bylaws (estatutos) of the Registrant (incorporated by reference to the Report on Form 6‑K of Grupo Financiero Santander México, S.A.B. de C.V. (File No.001‑35658) filed with the SEC on January 16, 2018). |
| | |
| 2.1 | | Form of Deposit Agreement among the Registrant, JPMorgan Chase Bank, N.A., as depositary, and the holders from time to time of American depositary receipts issued thereunder evidencing American depositary shares (incorporated by reference to Exhibit (a) to the Registration Statement on Form F‑6 (File No. 333‑222620) filed with the SEC on January 19, 2018). |
| | |
| 4.1 | | English translation of the form of Merger Agreement between Grupo Financiero Santander México, S.A.B. de C.V. and the Registrant (incorporated by reference to Exhibit 2.1 to the Registration Statement on Form F‑4 (File No.333‑221224) filed with the SEC on October 30, 2017). |
| | |
| 4.2 | | English translation of the form of Purchase and Sale Agreement of the Asset Custody Business between the Registrant and Banco S3 México, S.A., Institución de Banca Múltiple (incorporated by reference to Exhibit 4.2 to the Registrant’s Annual Report on Form 20-F for the year ended December 31, 2017 (File No. 000-55899) filed with the SEC on March 28, 2018). |
| | |
| 4.3 | | English translation of the form of Collaboration Agreement between the Registrant and Casa de Bolsa Santander, S.A. de C.V., Grupo Financiero Santander México (incorporated by reference to Exhibit 4.3 to the Registrant’s Annual Report on Form 20-F for the year ended December 31, 2017 (File No. 000-55899) filed with the SEC on March 28, 2018). |
| | |
*Filed with this Report.
We will furnish to the SEC, upon request, copies of any unfiled instruments that define the rights of holders of long-term debt of the Registrant or any of its consolidated subsidiaries.
SIGNATURES
The registrant hereby certifies that it meets all of the requirements for filing on Form 20-F and that it has duly caused and authorized the undersigned to sign this Report on its behalf.
| | | |
| BANCO SANTANDER MÉXICO, S.A., INSTITUCIÓN DE BANCA MÚLTIPLE, GRUPO FINANCIERO SANTANDER MÉXICO |
| By: | /s/ Hector blas Grisi Checa |
| | Name: | Hector Blas Grisi Checa |
| | Title: | Executive President and Chief Executive Officer |
Date: April 30, 2019
Consolidated Financial Statements of Banco Santander México, S.A., Institución de Banca Múltiple, Grupo Financiero Santander México and Subsidiaries | | |
Report of PricewaterhouseCoopers, S.C. | | F-2 |
Consolidated Balance Sheets as of December 31, 2017 and 2018 | | F-4 |
Consolidated Income Statements for the Years Ended December 31, 2016, 2017 and 2018 | | F-6 |
Consolidated Statements of Comprehensive Income for the Years Ended December 31, 2016, 2017 and 2018 | | F-7 |
Consolidated Statements of Changes in Total Equity for the Years Ended December 31, 2016, 2017 and 2018 | | F-8 |
Consolidated Statements of Cash Flow for the Years Ended December 31, 2016, 2017 and 2018 | | F-9 |
Notes to the Consolidated Financial Statements as of December 31, 2017 and 2018 and for each of the three years in the period ended December 31, 2018 | | F-10 |
Report of Independent Registered Public Accounting Firm
To the Board of Directors and Shareholders of
Banco Santander México, S. A., Institución de Banca Múltiple
Grupo Financiero Santander México
Opinions on the Financial Statements and Internal Control over Financial Reporting
We have audited the accompanying consolidated balance sheets of Banco Santander México, S.A., Institución de Banca Múltiple, Grupo Financiero Santander México and its subsidiaries (the “Company") as of December 31, 2018 and 2017, and the related consolidated statements of income, of comprehensive income, of changes in total equity and of cash flows for each of the three years in the period ended December 31, 2018, including the related notes (collectively referred to as the “consolidated financial statements”). We also have audited the Company’s internal control over financial reporting as of December 31, 2018, based on criteria established in Internal Control - Integrated Framework (2013) issued by the Committee of Sponsoring Organizations of the Treadway Commission (COSO).
In our opinion, the consolidated financial statements referred to above present fairly, in all material respects, the financial position of the Company as of December 31, 2018 and 2017, and the results of its operations and its cash flows for each of the three years in the period ended December 31, 2018 in conformity with International Financial Reporting Standards as issued by the International Accounting Standards Board. Also in our opinion, the Company did not maintain, in all material respects, effective internal control over financial reporting as of December 31, 2018, based on criteria established in Internal Control - Integrated Framework (2013) issued by the COSO because material weaknesses in internal control over financial reporting existed as of that date related to (i) inadequate risk assessment processes to identify the risks in the Company’s information technology (IT) environment over access controls, which contributed to (ii) ineffective user access controls to ensure the control objectives of appropriate segregation of duties and adequate restrictions on user and privileged access to significant applications, databases and operating systems.
A material weakness is a deficiency, or a combination of deficiencies, in internal control over financial reporting, such that there is a reasonable possibility that a material misstatement of the annual or interim financial statements will not be prevented or detected on a timely basis. The material weaknesses referred to above are described in the accompanying Management's Annual Report on Internal Control over Financial Reporting. We considered these material weaknesses in determining the nature, timing, and extent of audit tests applied in our audit of the 2018 consolidated financial statements, and our opinion regarding the effectiveness of the Company’s internal control over financial reporting does not affect our opinion on those consolidated financial statements.
Change in Accounting Principle
As discussed in Note 1 to the consolidated financial statements, the Company changed the manner in which it accounts for financial instruments in 2018.
Basis for Opinions
The Company's management is responsible for these consolidated financial statements, for maintaining effective internal control over financial reporting, and for its assessment of the effectiveness of internal control over financial reporting, included in management’s report referred to above. Our responsibility is to express opinions on the Company’s consolidated financial statements and on the Company's internal control over financial reporting based on our audits. We are a public accounting firm registered with the Public Company Accounting Oversight Board (United States) (PCAOB) and are required to be independent with respect to the Company in accordance with the U.S. federal securities laws and the applicable rules and regulations of the Securities and Exchange Commission and the PCAOB.
We conducted our audits in accordance with the standards of the PCAOB. Those standards require that we plan and perform the audits to obtain reasonable assurance about whether the consolidated financial statements are free of material misstatement, whether due to error or fraud, and whether effective internal control over financial reporting was maintained in all material respects.
Our audits of the consolidated financial statements included performing procedures to assess the risks of material misstatement of the consolidated financial statements, whether due to error or fraud, and performing procedures that respond to those risks. Such procedures included examining, on a test basis, evidence regarding the amounts and disclosures in the consolidated financial statements. Our audits also included evaluating the accounting principles used and significant estimates made by management, as well as evaluating the overall presentation of the consolidated financial statements. Our audit of internal control over financial reporting included obtaining an understanding of internal control over financial reporting, assessing the risk that a material weakness exists, and testing and evaluating the design and operating effectiveness of internal control based on the assessed risk. Our audits also included performing such other procedures as we considered necessary in the circumstances. We believe that our audits provide a reasonable basis for our opinions.
Definition and Limitations of Internal Control over Financial Reporting
A company’s internal control over financial reporting is a process designed to provide reasonable assurance regarding the reliability of financial reporting and the preparation of financial statements for external purposes in accordance with generally accepted accounting principles. A company’s internal control over financial reporting includes those policies and procedures that (i) pertain to the maintenance of records that, in reasonable detail, accurately and fairly reflect the transactions and dispositions of the assets of the company; (ii) provide reasonable assurance that transactions are recorded as necessary to permit preparation of financial statements in accordance with generally accepted accounting principles, and that receipts and expenditures of the company are being made only in accordance with authorizations of management and directors of the company; and (iii) provide reasonable assurance regarding prevention or timely detection of unauthorized acquisition, use, or disposition of the company’s assets that could have a material effect on the financial statements.
Because of its inherent limitations, internal control over financial reporting may not prevent or detect misstatements. Also, projections of any evaluation of effectiveness to future periods are subject to the risk that controls may become inadequate because of changes in conditions, or that the degree of compliance with the policies or procedures may deteriorate.
PricewaterhouseCoopers, S.C.
/s/Antonio Salinas Velasco
Antonio Salinas Velasco
Mexico City, Mexico
April 30, 2019
We have served as the Company’s auditor since 2016.
BANCO SANTANDER MÉXICO, S.A., INSTITUCIÓN DE BANCA MÚLTIPLE, GRUPO FINANCIERO SANTANDER MÉXICO AND SUBSIDIARIES
CONSOLIDATED BALANCE SHEETS AS OF DECEMBER 31, 2017 AND 2018
(Millions of Pesos)
| | | | | | | | | | | | | | | | | | | | | |
ASSETS | | | Note | | | 12/31/2017 | | | 12/31/2018 | | | LIABILITIES AND EQUITY | | | Note | | | 12/31/2017 | | | 12/31/2018 |
| | | | | | | | | | | | | | | | | | | | | |
CASH AND BALANCES WITH THE CENTRAL BANK | | | 6 | | | 57,687 | | | 55,310 | | | FINANCIAL LIABILITIES AT FAIR VALUE THROUGH PROFIT OR LOSS: | | | | | | — | | | 255,481 |
| | | | | | | | | | | | Trading derivatives | | | 10 and 31 | | | — | | | 153,727 |
| | | | | | | | | | | | Short positions | | | 10 | | | — | | | 101,754 |
FINANCIAL ASSETS AT FAIR VALUE THROUGH PROFIT OR LOSS: | | | | | | — | | | 267,524 | | | | | | | | | | | | |
Debt instruments | | | 8 | | | — | | | 110,222 | | | | | | | | | | | | |
Equity instruments | | | 9 | | | — | | | 2,349 | | | | | | | | | | | | |
Trading derivatives | | | 10 and 31 | | | — | | | 154,953 | | | FINANCIAL LIABILITIES HELD FOR TRADING: | | | | | | 239,725 | | | — |
| | | | | | | | | | | | Trading derivatives | | | 10 and 31 | | | 171,282 | | | — |
| | | | | | | | | | | | Short positions | | | 10 | | | 68,443 | | | — |
FINANCIAL ASSETS HELD FOR TRADING: | | | | | | 315,570 | | | — | | | | | | | | | | | | |
Debt instruments | | | 8 | | | 147,747 | | | — | | | | | | | | | | | | |
Equity instruments | | | 9 | | | 2,562 | | | — | | | | | | | | | | | | |
Trading derivatives | | | 10 and 31 | | | 165,261 | | | — | | | OTHER FINANCIAL LIABILITIES AT FAIR VALUE THROUGH | | | | | | | | | |
| | | | | | | | | | | | PROFIT OR LOSS: | | | | | | 120,653 | | | 105,430 |
| | | | | | | | | | | | Deposits from the Central Bank – Repurchase agreements | | | 18 | | | 22,417 | | | 30,995 |
OTHER FINANCIAL ASSETS AT FAIR VALUE THROUGH | | | | | | | | | | | | Deposits from credit institutions – Repurchase agreements | | | 18 | | | 5,942 | | | 4,316 |
PROFIT OR LOSS: | | | | | | 51,705 | | | 107,425 | | | Customer deposits – Repurchase agreements | | | 19 | | | 81,790 | | | 65,369 |
Loans and advances to credit institutions – Reverse repurchase agreements | | | 7 | | | 46,087 | | | 98,332 | | | Marketable debt securities | | | 20 | | | 10,504 | | | 4,750 |
Loans and advances to customers – Reverse repurchase agreements | | | 11 | | | 5,618 | | | 9,093 | | | | | | | | | | | | |
| | | | | | | | | | | | | | | | | | | | | |
| | | | | | | | | | | | | | | | | | | | | |
FINANCIAL ASSETS AT FAIR VALUE THROUGH OTHER | | | | | | | | | | | | FINANCIAL LIABILITIES AT AMORTIZED COST: | | | | | | 820,431 | | | 890,284 |
COMPREHENSIVE INCOME: | | | | | | — | | | 155,789 | | | Deposits from credit institutions | | | 18 | | | 76,515 | | | 94,849 |
Loans and advances to customers | | | 11 | | | — | | | 771 | | | Customer deposits | | | 19 | | | 608,776 | | | 646,089 |
Debt instruments | | | 8 | | | — | | | 154,483 | | | Marketable debt securities | | | 20 | | | 85,792 | | | 98,312 |
Equity instruments | | | 9 | | | — | | | 535 | | | Subordinated liabilities | | | 21 | | | 35,885 | | | 37,228 |
| | | | | | | | | | | | Other financial liabilities | | | 22 | | | 13,463 | | | 13,806 |
| | | | | | | | | | | | | | | | | | | | | |
AVAILABLE-FOR-SALE FINANCIAL ASSETS: | | | | | | 165,742 | | | — | | | | | | | | | | | | |
Debt instruments | | | 8 | | | 164,947 | | | — | | | | | | | | | | | | |
Equity instruments | | | 9 | | | 795 | | | — | | | HEDGING DERIVATIVES | | | 12 and 31 | | | 11,091 | | | 8,393 |
| | | | | | | | | | | | | | | | | | | | | |
| | | | | | | | | | | | | | | | | | | | | |
FINANCIAL ASSETS AT AMORTIZED COST: | | | | | | — | | | 766,225 | | | | | | | | | | | | |
Loans and advances to credit institutions | | | 7 | | | — | | | 47,034 | | | PROVISIONS: | | | 23 | | | 6,730 | | | 6,800 |
Loans and advances to customers | | | 11 | | | — | | | 666,772 | | | Provisions for pensions and similar obligations | | | | | | 3,860 | | | 4,370 |
Debt instruments | | | 8 | | | — | | | 52,419 | | | Provisions for tax and legal matters | | | | | | 1,072 | | | 1,516 |
| | | | | | | | | | | | Provisions for off-balance sheet risk | | | | | | 1,032 | | | 852 |
| | | | | | | | | | | | Other provisions | | | | | | 766 | | | 62 |
LOANS AND RECEIVABLES: | | | | | | 679,300 | | | — | | | | | | | | | | | | |
Loans and advances to credit institutions | | | 7 | | | 59,122 | | | — | | | | | | | | | | | | |
Loans and advances to customers | | | 11 | | | 609,420 | | | — | | | | | | | | | | | | |
Debt instruments | | | 8 | | | 10,758 | | | — | | | TAX LIABILITIES: | | | | | | 71 | | | 194 |
| | | | | | | | | | | | Current | | | | | | 20 | | | 107 |
| | | | | | | | | | | | Deferred | | | 25 | | | 51 | | | 87 |
HEDGING DERIVATIVES | | | 12 and 31 | | | 15,116 | | | 9,285 | | | | | | | | | | | | |
| | | | | | | | | | | | | | | | | | | | | |
| | | | | | | | | | | | | | | | | | | | | |
NON-CURRENT ASSETS HELD FOR SALE | | | 13 | | | 1,295 | | | 1,277 | | | OTHER LIABILITIES | | | 24 | | | 15,080 | | | 18,855 |
| | | | | | | | | | | | | | | | | | | | | |
| | | | | | | | | | | | TOTAL LIABILITIES | | | | | | 1,213,781 | | | 1,285,437 |
TANGIBLE ASSETS | | | 14 | | | 6,498 | | | 8,714 | | | | | | | | | | | | |
| | | | | | | | | | | | SHAREHOLDERS' EQUITY: | | | 28 | | | 116,558 | | | 124,240 |
| | | | | | | | | | | | Share capital | | | | | | 8,086 | | | 25,660 |
INTANGIBLE ASSETS: | | | | | | 6,960 | | | 8,044 | | | Share premium | | | | | | 16,956 | | | — |
Goodwill | | | 15 | | | 1,734 | | | 1,734 | | | Accumulated reserves | | | | | | 72,838 | | | 79,227 |
Other intangible assets | | | 16 | | | 5,226 | | | 6,310 | | | Profit for the year attributable to the Parent | | | | | | 18,678 | | | 19,353 |
| | | | | | | | | | | | | | | | | | | | | |
| | | | | | | | | | | | | | | | | | | | | |
| | | | | | | | | | | | | | | | | | | | | |
ASSETS | | | Note | | | 12/31/2017 | | | 12/31/2018 | | | LIABILITIES AND EQUITY | | | Note | | | 12/31/2017 | | | 12/31/2018 |
| | | | | | | | | | | | | | | | | | | | | |
TAX ASSETS: | | | | | | 20,209 | | | 21,968 | | | | | | | | | | | | |
Current | | | | | | 3,609 | | | 4,394 | | | VALUATION ADJUSTMENTS: | | | 27 | | | (1,177) | | | (985) |
Deferred | | | 25 | | | 16,600 | | | 17,574 | | | Financial assets at fair value through other comprehensive income | | | | | | — | | | (695) |
| | | | | | | | | | | | Available-for-sale financial assets | | | | | | (1,533) | | | — |
| | | | | | | | | | | | Cash flow hedges | | | | | | 356 | | | (290) |
OTHER ASSETS | | | 17 | | | 9,109 | | | 7,163 | | | | | | | | | | | | |
| | | | | | | | | | | | TOTAL SHAREHOLDERS’ EQUITY ATTRIBUTABLE TO THE PARENT | | | | | | 115,381 | | | 123,255 |
| | | | | | | | | | | | | | | | | | | | | |
| | | | | | | | | | | | | | | | | | | | | |
| | | | | | | | | | | | NON-CONTROLLING INTERESTS | | | 26 | | | 29 | | | 32 |
| | | | | | | | | | | | | | | | | | | | | |
| | | | | | | | | | | | TOTAL EQUITY | | | | | | 115,410 | | | 123,287 |
TOTAL ASSETS | | | | | | 1,329,191 | | | 1,408,724 | | | TOTAL LIABILITIES AND EQUITY | | | | | | 1,329,191 | | | 1,408,724 |
The accompanying notes are an integral part of these consolidated financial statements.
BANCO SANTANDER MÉXICO, S.A., INSTITUCIÓN DE BANCA MÚLTIPLE, GRUPO FINANCIERO SANTANDER MÉXICO AND SUBSIDIARIES
CONSOLIDATED INCOME STATEMENTS FOR THE YEARS ENDED DECEMBER 31, 2016, 2017 and 2018
(Millions of Pesos)
| | | | | | | | | | | | | |
| | | | | | (Debit)/Credit | |
| | | Note | | | 2016 | | | 2017 | | | 2018 | |
| | | | | | | | | | | | | |
Interest income | | | 32 | | | 77,453 | | | 98,002 | | | 99,537 | |
Interest income from financial assets at fair value through profit or loss | | | 33 | | | — | | | — | | | 14,049 | |
Interest expenses and similar charges | | | 34 | | | (28,323) | | | (42,158) | | | (51,589) | |
NET INTEREST INCOME | | | | | | 49,130 | | | 55,844 | | | 61,997 | |
Dividend income | | | 35 | | | 94 | | | 150 | | | 210 | |
Fee and commission income | | | 36 | | | 18,770 | | | 20,316 | | | 22,296 | |
Fee and commission expenses | | | 37 | | | (4,830) | | | (5,503) | | | (6,574) | |
Gains/(losses) on financial assets and liabilities (net) | | | 38 | | | 3,760 | | | 3,458 | | | 1,484 | |
Exchange differences (net) | | | 39 | | | 2 | | | 6 | | | — | |
Other operating income | | | 40 | | | 486 | | | 669 | | | 748 | |
Other operating expenses | | | 40 | | | (3,361) | | | (3,614) | | | (4,393) | |
TOTAL INCOME | | | | | | 64,051 | | | 71,326 | | | 75,768 | |
Administrative expenses: | | | | | | (22,655) | | | (25,437) | | | (28,649) | |
Personnel expenses | | | 41 | | | (11,472) | | | (12,748) | | | (14,354) | |
Other general administrative expenses | | | 42 | | | (11,183) | | | (12,689) | | | (14,295) | |
Depreciation and amortization | | | 14 and 16 | | | (2,058) | | | (2,533) | | | (2,973) | |
Impairment losses on financial assets not at fair value through profit or loss (net): | | | | | | (16,661) | | | (18,820) | | | (18,810) | |
Loans and receivables | | | 11 | | | (16,661) | | | (18,820) | | | — | |
Financial assets at amortized cost | | | 11 | | | — | | | — | | | (18,806) | |
Financial assets at fair value through other comprehensive income | | | 8 and 11 | | | — | | | — | | | (4) | |
Impairment losses on other assets (net): | | | | | | | | | | | | | |
Non-current assets held for sale | | | 13 | | | — | | | — | | | (5) | |
Provisions (net) | | | 23 | | | (881) | | | (437) | | | (562) | |
Gains/(losses) on disposal of assets not classified as non-current assets held for sale (net) | | | 43 | | | 20 | | | 6 | | | 7 | |
Gains/(losses) on disposal of non-current assets held for sale not classified as discontinued operations (net) | | | 13 | | | 71 | | | 69 | | | 38 | |
OPERATING PROFIT BEFORE TAX | | | | | | 21,887 | | | 24,174 | | | 24,814 | |
Income tax | | | 25 | | | (5,351) | | | (5,496) | | | (5,458) | |
PROFIT FOR THE YEAR | | | | | | 16,536 | | | 18,678 | | | 19,356 | |
Profit attributable to the Parent | | | | | | 16,536 | | | 18,678 | | | 19,353 | |
Profit attributable to non-controlling interests | | | 26 | | | — | | | — | | | 3 | |
| | | | | | | | | | | | | |
EARNINGS PER SHARE (pesos) | | | | | | | | | | | | | |
Basic earnings per share | | | 4 | | | 2.44 | | | 2.76 | | | 2.86 | |
Diluted earnings per share | | | 4 | | | 2.44 | | | 2.75 | | | 2.85 | |
The accompanying notes are an integral part of these consolidated financial statements.
BANCO SANTANDER MÉXICO, S.A., INSTITUCIÓN DE BANCA MÚLTIPLE, GRUPO FINANCIERO SANTANDER MÉXICO AND SUBSIDIARIES
CONSOLIDATED STATEMENTS OF COMPREHENSIVE INCOME FOR THE YEARS ENDED DECEMBER 31, 2016, 2017 and 2018
(Millions of Pesos)
| | | | | | | | | | | | | |
| | | Note | | | 2016 | | | 2017 | | | 2018 | |
| | | | | | | | | | | | | |
PROFIT FOR THE YEAR | | | | | | 16,536 | | | 18,678 | | | 19,356 | |
| | | | | | | | | | | | | |
OTHER COMPREHENSIVE INCOME/(LOSS): | | | | | | | | | | | | | |
| | | | | | | | | | | | | |
Items that will not be reclassified subsequently to the consolidated income statement: | | | | | | | | | | | | | |
Remeasurement of defined benefit obligation for the year | | | | | | 530 | | | 666 | | | 260 | |
Changes in the fair value of equity instruments at fair value through other comprehensive income | | | | | | — | | | — | | | (13) | |
Changes in the fair value attributable to change in the credit risk of financial liabilities designated at fair value through profit or loss | | | | | | — | | | — | | | (35) | |
Income tax relating to items that will not be reclassified subsequently | | | 25 | | | (158) | | | (200) | | | (64) | |
| | | | | | 372 | | | 466 | | | 148 | |
| | | | | | | | | | | | | |
Items that may be reclassified subsequently to the consolidated income statement: | | | | | | | | | | | | | |
Financial assets at fair value through other comprehensive income: | | | | | | | | | | | | | |
Valuation adjustments | | | | | | — | | | — | | | (1,226) | |
Amounts reclassified to consolidated income statement | | | | | | — | | | — | | | 69 | |
Impairment of debt instruments accounted at fair value through other comprehensive income | | | | | | — | | | — | | | 2 | |
Income tax | | | | | | — | | | — | | | 371 | |
| | | | | | | | | | | | | |
Available-for-sale financial assets: | | | | | | | | | | | | | |
Valuation adjustments | | | 27 | | | (3,505) | | | 1,932 | | | — | |
Amounts reclassified to consolidated income statement | | | 27 | | | (120) | | | (9) | | | — | |
Income tax | | | 25 | | | 1,174 | | | (477) | | | — | |
| | | | | | | | | | | | | |
Cash flow hedges: | | | | | | | | | | | | | |
Valuation adjustments | | | 12 | | | (1,095) | | | (1,585) | | | (882) | |
Amounts reclassified to consolidated income statement | | | 12 | | | 1,785 | | | 118 | | | (40) | |
Income tax | | | 25 | | | (207) | | | 440 | | | 276 | |
| | | | | | (1,968) | | | 419 | | | (1,430) | |
| | | | | | | | | | | | | |
Other comprehensive income/(loss) for the year, net of income tax | | | | | | (1,596) | | | 885 | | | (1,282) | |
| | | | | | | | | | | | | |
| | | | | | | | | | | | | |
TOTAL COMPREHENSIVE INCOME FOR THE YEAR | | | | | | 14,940 | | | 19,563 | | | 18,074 | |
| | | | | | | | | | | | | |
Attributable to the Parent | | | | | | 14,940 | | | 19,563 | | | 18,071 | |
Attributable to non-controlling interests | | | | | | — | | | — | | | 3 | |
The accompanying notes are an integral part of these consolidated financial statements.
BANCO SANTANDER MÉXICO, S.A., INSTITUCIÓN DE BANCA MÚLTIPLE, GRUPO FINANCIERO SANTANDER MÉXICO AND SUBSIDIARIES
CONSOLIDATED STATEMENTS OF CHANGES IN TOTAL EQUITY FOR THE YEARS ENDED DECEMBER 31, 2016, 2017 and 2018
(Millions of Pesos)
| | | | | | | | | | | | | | | | | | | | | | | | | |
| | | | | | | | | | | | Profit | | | | | | Total Shareholders’ | | | | | | | |
| | | Share | | | Share | | | Accumulated | | | Attributable | | | Valuation | | | Equity Attributable | | | Non-Controlling | | | Total | |
| | | Capital | | | Premium | | | Reserves | | | to the Parent | | | Adjustments | | | to the Parent | | | Interests | | | Equity | |
| | | | | | | | | | | | | | | | | | | | | | | | | |
BALANCES AT January 1, 2015 | | | 8,086 | | | 16,956 | | | 68,235 | | | 14,051 | | | 372 | | | 107,700 | | | 58 | | | 107,758 | |
| | | | | | | | | | | | | | | | | | | | | | | | | |
Profit for the year | | | — | | | — | | | — | | | 16,536 | | | — | | | 16,536 | | | | | | 16,536 | |
Other changes in equity: | | | | | | | | | | | | | | | | | | | | | | | | | |
Transfer to accumulated reserves | | | — | | | — | | | 14,051 | | | (14,051) | | | — | | | — | | | — | | | — | |
Dividends declared | | | — | | | — | | | (17,468) | | | — | | | — | | | (17,468) | | | — | | | (17,468) | |
Other changes in non-controlling interest | | | | | | | | | | | | | | | | | | | | | (3) | | | (3) | |
Other comprehensive income/(loss) for the year, net of income tax | | | — | | | — | | | 372 | | | — | | | (1,968) | | | (1,596) | | | — | | | (1,596) | |
BALANCES AT December 31, 2016 | | | 8,086 | | | 16,956 | | | 65,190 | | | 16,536 | | | (1,596) | | | 105,172 | | | 55 | | | 105,227 | |
| | | | | | | | | | | | | | | | | | | | | | | | | |
Profit for the year | | | — | | | — | | | — | | | 18,678 | | | — | | | 18,678 | | | — | | | 18,678 | |
Other changes in equity: | | | | | | | | | | | | | | | | | | | | | | | | | |
Transfer to accumulated reserves | | | — | | | — | | | 16,536 | | | (16,536) | | | — | | | — | | | — | | | — | |
Dividends declared | | | — | | | — | | | (8,910) | | | — | | | — | | | (8,910) | | | — | | | (8,910) | |
Paid interests on Subordinated Additional Tier I Capital Notes | | | — | | | — | | | (444) | | | — | | | — | | | (444) | | | — | | | (444) | |
Other changes in non-controlling interest | | | — | | | — | | | — | | | — | | | — | | | — | | | (26) | | | (26) | |
Other comprehensive income/(loss) for the year, net of income tax | | | — | | | — | | | 466 | | | — | | | 419 | | | 885 | | | — | | | 885 | |
BALANCES AT December 31, 2017 | | | 8,086 | | | 16,956 | | | 72,838 | | | 18,678 | | | (1,177) | | | 115,381 | | | 29 | | | 115,410 | |
| | | | | | | | | | | | | | | | | | | | | | | | | |
Initial adoption of IFRS 9 (see Note 2.h) | | | — | | | — | | | (2,279) | | | — | | | 1,614 | | | (665) | | | — | | | (665) | |
RESTATED BALANCES AT January 1, 2018 | | | 8,086 | | | 16,956 | | | 70,559 | | | 18,678 | | | 437 | | | 114,716 | | | 29 | | | 114,745 | |
| | | | | | | | | | | | | | | | | | | | | | | | | |
Profit for the year | | | — | | | — | | | — | | | 19,353 | | | — | | | 19,353 | | | — | | | 19,353 | |
Other changes in equity: | | | | | | | | | | | | | | | | | | | | | | | | | |
Transfer to accumulated reserves | | | — | | | — | | | 18,678 | | | (18,678) | | | — | | | — | | | — | | | — | |
Dividends declared | | | — | | | — | | | (9,228) | | | — | | | — | | | (9,228) | | | — | | | (9,228) | |
Recognition of equity-settled share-based payments | | | — | | | — | | | 40 | | | — | | | — | | | 40 | | | — | | | 40 | |
Treasury shares | | | — | | | — | | | (434) | | | — | | | — | | | (434) | | | — | | | (434) | |
Paid interests on Subordinated Additional Tier I Capital Notes | | | — | | | — | | | (591) | | | — | | | — | | | (591) | | | — | | | (591) | |
Other changes in non-controlling interest | | | — | | | — | | | — | | | — | | | — | | | — | | | 3 | | | 3 | |
Other comprehensive income/(loss) for the year, net of income tax | | | — | | | — | | | 157 | | | — | | | (1,439) | | | (1,282) | | | | | | (1,282) | |
Effect on sale of the Custody business, net of income tax (see Note 3) | | | — | | | — | | | 506 | | | — | | | — | | | 506 | | | — | | | 506 | |
Effect on acquisition of subsidiary (see Note 3) | | | — | | | — | | | (225) | | | — | | | — | | | (225) | | | — | | | (225) | |
Changes in equity from Corporate Restructuring (see Note 3): | | | | | | | | | | | | | | | | | | | | | | | | | |
Amounts recognized from merger of entities | | | — | | | — | | | 83 | | | — | | | — | | | 83 | | | — | | | 83 | |
Capitalization of share premium and accumulated reserves | | | 17,574 | | | (16,956) | | | (618) | | | — | | | — | | | — | | | — | | | — | |
Recognition of equity-settled share-based payments | | | — | | | — | | | 319 | | | — | | | 17 | | | 336 | | | — | | | 336 | |
Effect on sale of the Brokerage House, net of income tax | | | — | | | — | | | (19) | | | — | | | — | | | (19) | | | — | | | (19) | |
BALANCES AT December 31, 2018 | | | 25,660 | | | — | | | 79,227 | | | 19,353 | | | (985) | | | 123,255 | | | 32 | | | 123,287 | |
The accompanying notes are an integral part of these consolidated financial statements.
BANCO SANTANDER MÉXICO, S.A., INSTITUCIÓN DE BANCA MÚLTIPLE, GRUPO FINANCIERO SANTANDER MÉXICO AND SUBSIDIARIES
CONSOLIDATED STATEMENTS OF CASH FLOWS FOR THE YEARS ENDED DECEMBER 31, 2016, 2017 and 2018
(Millions of Pesos)
| | | | | | | | | | |
| | | 2016 | | | 2017 | | | 2018 | |
A. CASH FLOWS FROM OPERATING ACTIVITIES: | | | 28,818 | | | (7,170) | | | 15,554 | |
Profit for the year | | | 16,536 | | | 18,678 | | | 19,356 | |
Adjustments made to obtain the cash flows from operating activities- | | | 7,129 | | | 7,494 | | | 8,148 | |
Depreciation and amortization | | | 2,058 | | | 2,533 | | | 2,973 | |
Impairment losses on other assets (net) | | | — | | | — | | | 5 | |
(Gains)/losses on disposal of non-current assets held for sale not classified as discontinued operations | | | (71) | | | (69) | | | (38) | |
(Gains)/losses on disposal of assets not classified as non-current assets held for sale | | | (20) | | | (6) | | | (7) | |
Income tax expense recognized in consolidated income statement | | | 5,351 | | | 5,496 | | | 5,458 | |
Expense recognized with respect to share-based payments | | | 131 | | | 283 | | | 401 | |
Effect of foreign exchange rate changes on Subordinated Additional Tier I Capital Notes | | | — | | | (479) | | | 6 | |
Effect of foreign exchange rate changes on cash deposits | | | (320) | | | (264) | | | (650) | |
Net (increase)/decrease in operating assets- | | | (156,934) | | | 218 | | | (80,396) | |
Financial assets held for trading/Financial assets at fair value through profit or loss | | | (15,726) | | | 27,007 | | | 48,013 | |
Other financial assets at fair value through profit or loss | | | (13,903) | | | (9,365) | | | (55,720) | |
Remeasurement of debt instruments reclassified to Financial assets at amortized cost | | | — | | | — | | | 2,287 | |
Available-for-sale financial assets/Financial assets at fair value through other comprehensive income | | | (52,951) | | | (10,877) | | | (67,730) | |
Loans and receivables/Financial assets at amortized cost | | | (74,811) | | | (3,927) | | | (13,996) | |
Other operating assets | | | 457 | | | (2,620) | | | 6,750 | |
Net increase/(decrease) in operating liabilities- | | | 170,895 | | | (29,596) | | | 75,238 | |
Financial liabilities held for trading/Financial liabilities at fair value through profit or loss | | | 94,255 | | | (27,103) | | | 15,756 | |
Other financial liabilities at fair value through profit or loss | | | (71,481) | | | (16,207) | | | (15,223) | |
Financial liabilities at amortized cost | | | 130,265 | | | 16,747 | | | 69,498 | |
Other operating liabilities | | | 17,856 | | | (3,033) | | | 5,207 | |
Income tax paid | | | (8,902) | | | (4,114) | | | (7,002) | |
Dividends received from equity instruments | | | 94 | | | 150 | | | 210 | |
| | | | | | | | | | |
B. CASH FLOWS FROM INVESTING ACTIVITIES: | | | (3,092) | | | (4,525) | | | (5,349) | |
Payments- | | | (3,097) | | | (4,528) | | | (7,291) | |
Tangible assets | | | (1,096) | | | (1,816) | | | (3,307) | |
Intangible assets | | | (2,001) | | | (2,712) | | | (2,964) | |
Acquisition of subsidiary | | | — | | | — | | | (1,020) | |
Proceeds- | | | 5 | | | 3 | | | 1,942 | |
Disposal of tangible assets | | | 5 | | | 3 | | | 3 | |
Sale of the Brokerage House | | | — | | | — | | | 1,175 | |
Sale of the Custody business | | | — | | | — | | | 764 | |
| | | | | | | | | | |
C. CASH FLOWS FROM FINANCING ACTIVITIES: | | | (7,171) | | | (9,545) | | | (13,232) | |
Payments- | | | (17,468) | | | (9,545) | | | (36,513) | |
Dividends paid to owners | | | (17,468) | | | (8,910) | | | (11,050) | |
Paid interests on Subordinated Additional Tier I Capital Notes | | | — | | | (635) | | | (804) | |
Purchase of own shares (treasury shares) | | | — | | | — | | | (437) | |
Early settlement of Tier II Subordinated Capital Notes | | | — | | | — | | | (24,222) | |
Proceeds- | | | 10,297 | | | — | | | 23,281 | |
Issue of Subordinated Additional Tier I Capital Notes | | | 10,297 | | | — | | | — | |
Issue of Tier II Subordinated Capital Notes | | | — | | | — | | | 23,281 | |
| | | | | | | | | | |
D. EFFECT OF FOREIGN EXCHANGE RATE CHANGES ON FOREIGN CURRENCY CASH DEPOSITS | | | 320 | | | 264 | | | 650 | |
E. NET INCREASE/(DECREASE) IN CASH AND CASH EQUIVALENTS | | | 18,875 | | | (20,976) | | | (2,377) | |
F. CASH AND CASH EQUIVALENTS AT THE BEGINNING OF YEAR | | | 59,788 | | | 78,663 | | | 57,687 | |
G. CASH AND CASH EQUIVALENTS AT THE END OF YEAR | | | 78,663 | | | 57,687 | | | 55,310 | |
The accompanying notes are an integral part of these consolidated financial statements.
BANCO SANTANDER MÉXICO, S.A., INSTITUCIÓN DE BANCA MÚLTIPLE, GRUPO FINANCIERO SANTANDER MÉXICO AND SUBSIDIARIES
Notes to the Consolidated Financial Statements as of
December 31, 2017 and 2018 and for each of the three years
in the period ended December 31, 2018
(in millions of Mexican pesos)
1. Introduction, basis of presentation of the consolidated financial statements and other information
a) Introduction
Banco Santander México, S.A., Institución de Banca Múltiple, Grupo Financiero Santander México (hereinafter, Banco Santander México) together with its subsidiaries (hereinafter, the “Bank”) is a subsidiary of Grupo Financiero Santander México, S.A. de C.V. (hereinafter, “the Group”, “Parent” or “Parent company”), which is a subsidiary of Banco Santander, S.A. in Spain (hereinafter, Banco Santander (Spain)) and holds 74.96% of its common stock and is regulated by, among others, the Credit Institutions Law (Ley de Instituciones de Crédito), the General Provisions Applicable to Credit Institutions, Regulated Multiple Purpose Finance Entities and Market Participants in Relation to Derivatives Contracts Listed on the Mexican Market issued by the Mexican National Banking and Securities Commission (hereinafter, the “CNBV”) and the Mexican Central Bank (hereinafter, “the Central Bank”, “Mexican Central Bank” or “Banco de México”). The Bank is also subject to the supervision and oversight of CNBV and the Mexican Central Bank.
The shares of the Bank are listed on the New York Stock Exchange as American Depositary Shares. The Bank is subject to the supervision and oversight of the United States Securities and Exchange Commission.
The Bank’s main activity is to render banking and credit services under the terms of applicable laws, which services include, among others, reception of deposits, granting of loans, trading of securities and the execution of trust contracts.
Per legal requirements, the Bank has unlimited liability for the obligations assumed and losses incurred by each of its subsidiaries.
The Bank conducts its business through branches and offices located throughout Mexico. The Bank is one of the largest private-sector banks in Mexico. The main offices of the Bank are located at Prolongación Paseo de la Reforma 500, Colonia Lomas de Santa Fe, Ciudad de Mexico, Mexico.
The issuance of the consolidated financial statements was authorized by Héctor Blas Grisi Checa, Executive President and Chief Executive Officer (CEO) and Director of the Bank and by the Board of Directors on April 25, 2019. These consolidated financial statements are pending the approval of the ordinary shareholders’ meeting, where they may be modified, based on provisions set forth in the Mexican Corporations Law (Ley General de Sociedades Mercantiles).
b) Basis of presentation of the consolidated financial statements
The consolidated financial statements have been prepared in accordance with International Financial Reporting Standards (hereinafter, IFRS) as issued by the International Accounting Standards Board (hereinafter, IASB) and interpretations issued by the IFRS Interpretations Committee.
The consolidated financial statements have been prepared on a historical cost basis, except for financial assets at fair value through profit or loss (financial assets held for trading up to December 31, 2017), other financial instruments at fair value through profit or loss, derivative financial instruments and financial assets at fair value through other comprehensive income (Available-for-sale financial assets up to December 31,
2017) that have been measured at fair value at the end of each reporting period, as explained in the accounting policies below (see Note 2).
Historical cost is based on the fair value of the consideration given in exchange for goods and services.
The carrying values of recognized assets and liabilities that are designated as hedged items in fair value hedges that would otherwise be carried at amortized cost are adjusted to record changes in the fair values attributable to the risks that are being hedged in effective hedge relationships. The consolidated financial statements are presented in Mexican pesos. As used in this consolidated financial statements, the term “billion” means one thousand million (1,000,000,000).
The consolidated financial statements filed for Mexican statutory purposes are prepared in accordance with accounting principles and regulations prescribed by the CNBV, as amended, which are hereinafter referred to as Mexican Banking GAAP. Mexican Banking GAAP is composed of Mexican Financial Reporting Standards (NIF) as issued by the Mexican Board of Financial Reporting Standards (CINIF), which, in turn, are supplemented and modified by specific rules mandated by the CNBV. The CNBV’s accounting rules principally relate to the recognition and measurement of impairment of loans and receivables, repurchase agreements, securities loans, consolidation of special purpose entities and foreclosed assets.
The most significant differences between Mexican Banking GAAP and IFRS, as they relate to the Bank, are in regard to:
a) Allowance for impairment losses.
For Mexican Banking GAAP purposes, allowance for impairment losses and provisions for off-balance sheet risk are determined using prescribed formulas that are based primarily on an expected loss model. The expected loss model formulas are developed by the CNBV using information compiled from the Mexican lending market as a whole, which may differ from the Bank’s expected credit loss model.
In some cases, CNBV can approve the use of internal models to determine the allowance for impairment losses under Mexican Banking GAAP as an alternative to the regulatory expected loss model.
b) Effects of inflation.
Mexican Banking GAAP requires the recognition of the comprehensive effects of inflation when an economic environment becomes inflationary, which, for purposes of Mexican Banking GAAP, is indicated by a three-year cumulative inflation rate of approximately 26 percent or more.
c) Actuarial gains and losses of the pension plan.
IFRS require the recognition of actuarial gains and losses from the year immediately through other comprehensive income without recycling to profit or loss. Under Mexican Banking GAAP there is an option to recognize actuarial gains and losses from the year, immediately through other comprehensive income as remeasurement of defined benefit obligation and demand their subsequent recycling to profit or loss based on the average remaining life of the pension plan, or to profit or loss of the period in which are determined.
d) Deferred employee profit sharing.
Mexican Banking GAAP requires the recognition of the deferred compulsory employee profit sharing effect based on the temporary differences arising between book and tax value of the assets and liabilities.
e) Consolidation of special purpose entities.
Mexican Banking GAAP does not require the consolidation of those special purpose entities created before January 1, 2009 over which control is exercised.
The notes to the consolidated financial statements contain supplementary information to that presented in the consolidated balance sheets, consolidated income statements, consolidated statements of comprehensive income, consolidated statements of changes in total equity and consolidated statements of cash flows. The notes provide, in a clear, relevant, reliable and comparable manner, narrative descriptions and breakdowns of these consolidated financial statements.
Adoption of new and revised IFRS
In the current year, the Bank has applied a number of new or revised International Accounting Standards (hereinafter, IAS), or IFRS issued by the IASB that are mandatorily effective for the accounting period beginning on January 1, 2018.
| · | | Annual Improvements to IFRS 2014 – 2016 Cycle |
| · | | Amendments to IAS 40 Transfer of Investment Property |
| · | | Amendments to IFRS 2 Classification and Measurement of Share-based Payment Transactions |
| · | | IFRS 9 Financial Instruments |
| · | | IFRS 15 Revenue from Contracts with Customers |
| · | | IFRIC 22 Foreign Currency Transactions and Advance Consideration |
Annual Improvements to IFRS 2014 – 2016 Cycle
(Effective for annual periods beginning on or after January 1, 2018)
| | | | |
Standard | | Subject of amendment | | Details |
| | | | |
IAS 28 Investments in Associates and Joint Ventures | | Measuring an associate or joint venture at fair value through profit or loss | | The amendments clarify that the option for a venture capital organization and other similar entities to measure investments in associates and joint ventures at fair value through profit and loss is available separately for each associate or joint venture, and that election should be made at initial recognition of the associate or joint venture. In respect of the option for an entity that is not an investment entity to retain the fair value measurement applied by its associates and joint ventures that are investment entities when applying the equity method, the amendments make a similar clarification that this choice is available for each investment entity associate of investment entity joint venture. |
| | | | |
Standard | | Subject of amendment | | Details |
| | | | The amendments apply retrospectively. The adoption of these amendments did not have an impact in the amounts recognized in the Bank’s consolidated financial statements. |
Amendments to IAS 40 - Transfer of Investment Property
(Effective for annual periods beginning on or after January 1, 2018)
The amendments reflect the principle that a change in use would involve:
| · | | An assessment of whether a property meets, or has ceased to meet, the definition of investment property; and |
| · | | Supporting evidence that a change in use has occurred. |
The amendments also emphasize that a change in management’s intentions, alone, would not be enough to support a transfer of property. An entity must have taken observable actions to support such a change.
The adoption of these amendments did not have an impact in the amounts recognized in the Bank’s consolidated financial statements as the Bank does not hold any investment property.
Amendments to IFRS 2 - Classification and Measurement of Share-based Payment Transactions
(Effective for annual periods beginning on or after January 1, 2018)
The amendments clarify the following:
| · | | In estimating the fair value of a cash-settled share-based payment, the accounting for the effects of vesting and non-vesting conditions should follow the same approach as for equity-settled share-based payments. |
| · | | Where tax law or regulation requires an entity to withhold a specified number of equity instruments equal to the monetary value of the employee’s tax obligation to meet the employee’s tax liability which is then remitted to the tax authority (typically in cash), i.e., the share-based payment arrangement has a “net settlement feature”, such an arrangement should be classified as equity-settled in its entirety, provided that the share-based payment would have been classified as equity-settled had it not included the net settlement feature. |
| · | | A modification of a share-based payment that changes the transaction from cash-settled to equity-settled should be accounted for as follows: |
The original liability is derecognized;
The equity-settled share-based payment is recognized by reference to the modification date fair value of the equity instrument granted to the extent that services have been rendered up to the modification date; and
Any difference between the carrying amount of the liability at the modification date and the amount recognized in equity should be recognized in profit or loss immediately.
The amendments are effective for annual reporting periods beginning on or after January 1, 2018. Specific transition provisions apply.
As a result of the Corporate Restructuring mentioned in Note 1.d to the consolidated financial statements as of December 31, 2017, the share-based variable compensation plans of the Bank will be settled through its own equity instruments beginning January 1, 2018. Accordingly the share-based payment transactions of the Bank changed from cash-settled transactions to equity-settled transactions. Consequently, it was derecognized the liability regarding those cash-settled transactions and it was recognized in Accumulated reserves within Shareholders’ equity an amount of 319 million pesos related to the equity-settled share-based payment.
IFRS 9 Financial Instruments
(Mandatory for annual periods starting on January 1, 2018)
IFRS 9 establishes the recognition and measurement requirements for financial instruments and certain classes of contracts for trades involving non-financial assets. IFRS 9 also significantly amends other Standards dealing with financial instruments such as IFRS 7 Financial Instruments: Disclosures. The main aspects of the new Standard are described in Note 2.b.
The Bank’s main activity revolves around retail and commercial banking operations, and its exposure does not focus on complex financial products. The Bank's main objective is to achieve consistent classification of financial instruments in the portfolios as established under IFRS 9. The Bank has analyzed its portfolios in order to assign its financial instruments to the appropriate portfolio under IFRS 9, and except as disclosed in Note 1.c and below, no significant changes have been identified.
Based on this analysis, the Bank concluded that:
| · | | All of its financial assets classified as Loans and advances under IAS 39 Financial Instruments: Recognition and Measurement will continue to be recognized at amortized cost under IFRS 9. |
| · | | Some of the debt instruments classified as Available-for-sale financial assets will continue to be measured at fair value with changes recognized through other comprehensive income while other will be measured at amortized cost. |
| · | | 44% of the total balance of Available-for-sale financial assets under IAS 39 has been reclassified to “Held-to-collect” business model which is accounted for at amortized cost according to the business model definition of IFRS 9. The financial assets reclassified amount to 75,418 million pesos (carrying amount). |
The impact of the reclassification mentioned above is an increase in Shareholders’ equity that amounts to 2,287 million pesos (1,601 million pesos, net of income tax) and corresponds to the cancellation of the valuation adjustment recognized as of December 31, 2017.
The Bank has irrevocably elected to classify non-trading equity instruments (previously classified as Available-for-sale equity instruments) as measured at fair value with changes recognized through other comprehensive income under IFRS 9.
IAS 39 financial liabilities classification and measurement criteria remains substantially unchanged under IFRS 9. Nevertheless, the changes in the fair value of financial liabilities designated at fair value with changes recognized through profit or loss, due to the entity credit risk, are recognized in other comprehensive income and are not reclassified subsequently to profit or loss. The cumulative own credit risk from financial liabilities at fair value through profit or loss as of January 1, 2018, amounted to 81 million pesos (57 million pesos, net of income tax), which is deemed to be immaterial.
IFRS 9 includes new hedge accounting requirements which have a twofold objective: to simplify current requirements, and to bring hedge accounting in line with risk management, allowing to be a greater variety of derivative financial instruments which may be considered to be hedging instruments. Furthermore,
additional breakdowns are required providing useful information regarding the effect which hedge accounting has on financial statements and also on the entity’s risk management strategy. The treatment of macro-hedges is being developed as a separate project under IFRS 9. Entities have the option of continuing to apply IAS 39 with respect to accounting hedges until the project has been completed. The Bank will continue to apply IAS 39 for hedge accounting.
Transition
The criteria established by IFRS 9 for the classification, measurement and impairment of financial assets, was applied in a retrospective way, by adjusting the opening balance at January 1, 2018, without restating the comparative consolidated financial statements.
As of January 1, 2018, the impact in Allowance for impairment losses and Provisions for off-balance sheet risk by applying IFRS 9 is an increase in 3,256 million pesos (2,279 million pesos, net of income tax), from 17,961 million pesos under IAS 39 model to 21,217 million pesos under IFRS 9 model.
The main causes of this impact are the requirements to recognize an allowance for impairment losses for the expected life of the transaction for financial assets where a significant risk increase has been identified after initial recognition, in addition to considering forward-looking information in the allowance for impairment losses and in the provisions for off-balance sheet risk.
The implementation of IFRS 9 has not had an effect in the capitalization ratios of the Bank since those ratios are calculated in accordance with Mexican Banking GAAP.
IFRS 15 Revenue from Contracts with Customers
(Effective for annual periods beginning on or after January 1, 2018)
In May 2014, IFRS 15 was issued, which establishes a single comprehensive model for entities to use in accounting for revenue arising from contracts with customers. IFRS 15 superseded the following revenue Standards and Interpretations upon its effective date:
| · | | IAS 11 Construction Contracts; |
| · | | IFRIC 13 Customer Loyalty Programs; |
| · | | IFRIC 15 Agreements for the Construction of Real Estate; |
| · | | IFRIC 18 Transfers of Assets from Customers; and |
| · | | SIC 31 Revenue - Barter Transactions Involving Advertising Services. |
IFRS 15 only covers revenue arising from contracts with customers. Under IFRS 15, a customer of an entity is a party that has contracted with the entity to obtain goods or services that are an output of the entity’s ordinary activities in exchange for consideration. Unlike the scope of IAS 18, the recognition and measurement of interest income and dividend income from debt and equity instruments are no longer within the scope of IFRS 15. Instead, they are within the scope of IFRS 9.
As mentioned above, the new revenue Standard has a single model to deal with revenue from contracts with customers. Its core principle is that an entity should recognize revenue to depict the transfer of promised goods or services to customers in an amount that reflects the consideration to which the entity expects to be entitled in exchange for those goods or services.
The new revenue Standard introduces a five-step approach to revenue recognition and measurement:
| · | | Step 1: Identify the contract with a customer. |
| · | | Step 2: Identify the performance obligations in the contract. |
| · | | Step 3: Determine the transaction price. |
| · | | Step 4: Allocate the transaction price to the performance obligations in the contract. |
| · | | Step 5: Recognize revenue when (or as) the entity satisfies a performance obligation. |
Far more prescriptive guidance has been introduced by the new revenue Standard:
| · | | Whether or not a contract (or a combination of contracts) contains more than one promised good or service, and if so, when and how the promised goods or services should be unbundled. |
| · | | Whether the transaction price allocated to each performance obligation should be recognized as revenue over time or at a point in time. Under IFRS 15, an entity recognizes revenue when a performance obligation is satisfied, which is when “control” of the goods or services underlying the particular performance obligation is transferred to the customer. Unlike IAS 18, the new Standard does not include separate guidance for “sales of goods” and “provision of services”; rather, the new Standard requires entities to assess whether revenue should be recognized over time or at a particular point in time regardless of whether revenue relates to “sales of goods” or “provision of services”. |
| · | | When the transaction price includes a variable consideration element, how it will affect the amount and timing of revenue to be recognized. The concept of variable consideration is broad; a transaction price is considered variable due to discounts, rebates, refunds, credits, price concessions, incentives, performance bonuses, penalties and contingency arrangements. The new Standard introduces a high hurdle for variable consideration to be recognized as revenue – that is, only to the extent that it is highly probable that a significant reversal in the amount of cumulative revenue recognized will not occur when the uncertainty associated with the variable consideration is subsequently resolved. |
| · | | When costs incurred to obtain a contract and costs to fulfill a contract can be recognized as an asset. |
IFRS 15, together with its Clarifications issued in April 2016, was effective for reporting periods beginning on or after January 1, 2018 with early adoption permitted. The majority of the revenues of the Bank are within the scope of IFRS 9. For the remaining revenues, the Bank has applied IFRS 15 retrospectively without restating the comparative consolidated financial statements. IFRS 15 did not have any material effects on the Bank’s consolidated financial statements.
IFRIC 22 Foreign Currency Transactions and Advance Consideration
(Effective for annual periods beginning on or after January 1, 2018)
The Interpretation covers foreign currency transactions when an entity recognizes a non-monetary asset or non-monetary liability arising from the payment or receipt of advance consideration before the entity recognizes the related asset, expense or income. It does not apply when an entity measures the related asset, expense or income on initial recognition at fair value or at the fair value of the consideration received or paid at a date other than the date of initial recognition of the non-monetary asset or non-monetary liability. In addition, the Interpretation need not be applied to income taxes, insurance contracts or reinsurance contracts.
The adoption of the aforementioned Interpretation did not have any material effects on the Bank’s consolidated financial statements.
New and revised IFRS that are not mandatorily effective (but allow early adoption) for the year ending December 31, 2018
The Bank has not yet adopted the following new or revised Standards, as the effective dates are subsequent to the date of these consolidated financial statements. Except as disclosed below, Management is currently analyzing the effects of adopting these new Standards and has not yet quantified the potential impacts they may have on the consolidated financial statements.
IFRS 16 Leases
(Effective for annual periods beginning on or after January 1, 2019)
IFRS 16 establishes the principles for the recognition, measurement, presentation and disclosure of the lease arrangements, in order to ensure that both lessee and lessor provide relevant information that faithfully represents these transactions.
IFRS 16 introduces a single, on-balance sheet lease accounting model for lessees. A lessee recognizes a right-of-use asset representing its right to use the underlying asset and a lease liability representing its obligation to make lease payments. There are recognition exemptions for short-term leases and leases of low-value items. Lessor accounting remains similar to the current Standard – i.e., lessors continue to classify leases as finance or operating leases.
IFRS 16 replaces existing leases guidance, including IAS 17 Leases, IFRIC 4 Determining whether an Arrangement contains a Lease, SIC-15 Operating Leases – Incentives and SIC-27 Evaluating the Substance of Transactions Involving the Legal Form of a Lease.
Transition
The Bank applied IFRS 16 initially on January 1, 2019, using the modified retrospective approach where the asset for right-of-use and the leases liability are the same on transition date. Therefore, there was not a cumulative effect of adopting IFRS 16 recognized as an adjustment to the opening balance of Accumulated reserves as of January 1, 2019.
The Bank decided to apply the available practical expedients on adoption allowed by the Standard of not evaluating in the first adoption if the contracts are or contain a lease (under the new definition), and therefore, IFRS 16 will only apply to those contracts that were previously identified as lease contracts.
The Bank estimates that the adoption of IFRS 16 will have a material impact on the consolidated balance sheet, but will not have a material impact on the consolidated income statement at the adoption date. The most significant impact will be the recognition of the asset for the right-of-use and the leases liability from all the lease contracts active during the first adoption.
The adoption of IFRS 16 will result in the recognition of assets for the right-of-use and additional lease liabilities in approximately 6.4 billion pesos as of January 1, 2019.
Strategy of implementation and governance
The Bank carried out a multidisciplinary project with the objective of adapting its processes to the new Standard of accounting of the lease contracts. Thus, the Bank has worked during 2018 in the analysis and identification of the contracts affected by the Standard, as well as the definition of the main technical criteria that affects the accounting of the lease contracts.
With respect to the structure of the project´s governance, the Bank has created a working group to manage and follow up a periodic meeting of the direction of the project and designated a team in charge that assures the involvement of every responsible individual within each teamwork.
Main steps and milestones of the project
The Bank prepared the accounting policy and a methodological framework that served as a guidance for the process of implementing the Standard, as well as for its adoption as of January 1, 2019.
Likewise, the internal control framework over the recognition process of the lease contracts is complete for the transition phase and is under progress for the adoption of the Standard as of January 1, 2019. The proposed model includes a reference design of the controls to be employed in the new developments made for the implementation of the Standard.
IFRIC 23 Uncertainty over Income Tax Treatments
(Effective for annual periods beginning on or after January 1, 2019)
IFRIC 23 provides requirements that add to the requirements in IAS 12 Income Taxes by specifying how to reflect the effects of uncertainty in accounting for income taxes.
This Interpretation is to be applied to the determination of taxable profit (tax loss), tax bases, unused tax losses, unused tax credits and tax rates, when there is uncertainty over income tax treatment under IAS 12.
Management does not anticipate that the adoption of this Interpretation will have a material effect on the Bank’s consolidated financial statements.
IAS 19 Employee Benefits - Plan amendment, curtailment or settlement
(Effective for annual periods beginning on or after January 1, 2019, early adoption is permitted)
The amendments to IAS 19 related to Plan Amendment, curtailment or settlement are as follows:
| · | | If a plan amendment, curtailment or settlement occurs, it is now mandatory that the current service cost and the net interest for the period after the remeasurement are determined using the assumptions used for the remeasurement. |
| · | | In addition, amendments have been included to clarify the effect of a plan amendment, curtailment or settlement on the requirements regarding the asset ceiling. |
Management does not anticipate that the adoption of this Interpretation will have a material effect on the Bank’s consolidated financial statements.
IAS 28 Investments in Associates and Joint Ventures
(Effective for annual periods beginning on or after January 1, 2019)
The amendments to IAS 28 relate to Long-term Interests in Associates and Joint Ventures are as follows:
| · | | Paragraph 14A has been added to clarify that an entity applies IFRS 9 including its impairment requirements, to long-term interests in an associate or joint venture that form part of the net investment in the associate or joint venture but to which the equity method is not applied. |
| · | | Paragraph 41 has been deleted because the IASB felt that it merely reiterated requirements in IFRS 9 and had created confusion about the accounting for long-term interests. |
Management does not anticipate that the adoption of this Interpretation will have a material effect on the Bank’s consolidated financial statements.
Annual Improvements to IFRS 2015 – 2017 Cycle
(Effective for annual periods beginning on or after January 1, 2019)
| | | | |
Standard | | Subject of amendment | | Details |
| | | | |
IFRS 3 Business Combinations IFRS 11 Joint Arrangements | | Remeasurement of previously held interest | | The amendments to IFRS 3 clarify that when an entity obtains control of a business that is a joint operation, it remeasures previously held interests in that business. The amendments to IFRS 11 clarify that when an entity obtains joint control of a business that is a joint operation, the entity does not remeasure previously held interests in that business. |
IAS 12 Income Taxes | | Income tax consequences of dividends | | The amendments clarify that the requirements in the former paragraph 52B (to recognize the income tax consequences of dividends where the transactions or events that generated distributable profits are recognized) apply to all income tax consequences of dividends by moving the paragraph away from paragraph 52A that only deals with situations where there are different tax rates for distributed and undistributed profits. |
IAS 23 Borrowing Costs | | Borrowing costs eligible for capitalization | | The amendments clarify that if any specific borrowing remains outstanding after the related asset is ready for its intended use or sale, that borrowing becomes part of the funds that an entity borrows generally when calculating the capitalization rate on general borrowings. |
Amendments to IFRS 9 Prepayment Features with Negative Compensation
(Effective for annual periods beginning on or after January 1, 2019, early adoption is permitted)
The amendments to IFRS 9 clarify that for the purpose of assessing whether a prepayment feature meets the Solely Payments of Principal and Interest (SPPI) condition, the party exercising the option may pay or receive reasonable compensation for the prepayment irrespective of the reason for prepayment. In other words, prepayment features with negative compensation do not automatically fail SPPI.
There are specific transition provisions depending on when the amendments are first applied, relative to the initial adoption of IFRS 9.
Management does not anticipate any material impact from the adoption of this amendment.
Revised Conceptual Framework for Financial Reporting that is not mandatorily effective for preparers that develop an accounting policy based on this Conceptual Framework (but allow early adoption) for the year ending December 31, 2018
The revised Conceptual Framework for Financial Reporting (Conceptual Framework) issued in March 2018 is effective immediately for the IASB and the IFRS Interpretations Committee in setting future Standards. For entities that use the Conceptual Framework to develop accounting policies when no IFRS Standard
applies to a particular transaction, the revised Conceptual Framework is effective for annual reporting periods beginning on or after 1 January 2020, with early adoption permitted.
The Conceptual Framework sets out the fundamental concepts for financial reporting that guide the IASB in developing IFRS Standards. It helps to ensure that the Standards are conceptually consistent and that similar transactions are treated the same way, to provide useful information for investors, lenders and other creditors.
The Conceptual Framework also assists entities in developing accounting policies when no IFRS Standard applies to a particular transaction, and more broadly, helps stakeholders to understand and interpret the Standards.
The 2018 Conceptual Framework sets out:
| · | | the objective of general purpose financial reporting; |
| · | | the qualitative characteristics of useful financial information; |
| · | | a description of the reporting entity and its boundary; |
| · | | definitions of an asset, a liability, equity, income and expenses and guidance supporting these definitions; |
| · | | criteria for including assets and liabilities in financial statements (recognition) and guidance on when to remove them (derecognition); |
| · | | measurement bases and guidance on when to use them; |
| · | | concepts and guidance on presentation and disclosure; and |
| · | | concepts relating to capital and capital maintenance. |
Management does not anticipate any material impact from the adoption of the revised Conceptual Framework.
Amendments to IFRS 3 Business Combinations
(Effective for annual periods beginning on or after January 1, 2020, early adoption is permitted)
The amendments to IFRS 3 improve the definition of a business. The amended definition emphasizes that the output of a business is to provide goods and services to customers, whereas the previous definition focused on returns in the form of dividends, lower costs or other economic benefits to investors and others.
Management does not anticipate any material impact from the adoption of this amendment.
Amendments to IAS 1 Presentation of Financial Statements and IAS 8 Accounting Policies, Changes in Accounting Estimates and Errors
(Effective for annual periods beginning on or after January 1, 2020, early adoption is permitted)
The amendments to IAS 1 and IAS 8 use a consistent definition of materiality throughout IFRS and the Conceptual Framework for Financial Reporting, clarify the explanation of the definition of material and incorporate some of the guidance in IAS 1 about immaterial information.
The amended definition is:
“Information is material if omitting, misstating or obscuring it could reasonably be expected to influence decisions that the primary users of general purpose financial statements make on the basis of those financial statements, which provide financial information about a specific reporting entity.”
The amendment clarifies that the reference to obscuring information addresses situations in which the effect is similar to omitting or misstating that information. It also states that an entity assesses materiality in the context of the financial statements as a whole.
The amendment also clarifies the meaning of “primary users of general purpose financial statements” to whom those financial statements are directed, by defining them as “existing and potential investors, lenders and other creditors” that must rely on general purpose financial statements for much of the financial information they need.
Management does not anticipate any material impact from the adoption of this amendment.
IFRS 17 Insurance contracts
(Effective for annual periods beginning on or after January 1, 2021, earlier adoption is permitted)
IFRS 17 establishes the principles for the recognition, measurement, presentation and disclosure of insurance contracts within the scope of the Standard. The objective of IFRS 17 is to ensure that an entity provides relevant information that faithfully represents those contracts. This information gives a basis for users of financial statements to assess the effect that insurance contracts have on the entity's financial position, financial performance and cash flows.
This Standard measures insurance contracts either under the general model or a simplified version of this called the Premium Allocation Approach. The general model is defined such that at initial recognition an entity shall measure a group of contracts at the total of (a) the amount of fulfilment cash flows (FCF), which comprise probability-weighted estimates of future cash flows, an adjustment to reflect the time value of money (TVM) and the financial risks associated with those future cash flows and a risk adjustment for non-financial risk; and (b) the contractual service margin (CSM).
On subsequent measurement, the carrying amount of a group of insurance contracts at the end of each reporting period shall be the sum of the liability for remaining coverage and the liability for incurred claims. The liability for remaining coverage comprises the FCF related to future services and the CSM of the group at that date. The liability for incurred claims is measured as the FCF related to past services allocated to the group at that date.
An entity may simplify the measurement of the liability for remaining coverage of a group of insurance contracts using the premium allocation approach on the condition that, at initial recognition, the entity reasonably expects that doing so would produce a reasonable approximation of the general model, or the coverage period of each contract in the group is one year or less.
This Standard is not applicable as there is no insurance entity as subsidiary of the Bank nor any contracts within the scope of this Standard.
c) Critical accounting estimates
IFRS requires that Management make certain estimates and utilize certain assumptions to determine the valuation of items included in the consolidated financial statements and to make required disclosures. Although the actual results may differ, Management believes that the estimates and assumptions utilized were appropriate under the circumstances.
The critical accounting estimates applied in the preparation of these consolidated financial statements and related footnote disclosures are as follows:
| - | | Fair value measurement of certain financial instruments (see Note 2.d.iii and Note 44.d). |
Fair value is defined as the price that would be received to sell an asset or paid to transfer a liability in an orderly transaction in the principal (or most advantageous) market at the measurement date under current market conditions. The most objective and common reference for the fair value of a financial instrument is the price that would be paid for it on an active, liquid and deep market (quoted price or market price). Fair value under IFRS is an exit price regardless of whether that price is directly observable or estimated using another valuation technique.
If there is no market price for a given financial instrument, its fair value is estimated on the basis of the price established in recent transactions involving similar instruments and, in the absence thereof, of valuation techniques commonly used by the international financial community, taking into account the specific features of the instrument to be measured and, particularly, the various types of risk associated with it.
In estimating the fair value of an asset or a liability, the Bank takes into account the characteristics of the asset or liability if market participants would take those characteristics into account when pricing the asset or liability at the measurement date. Fair value for measurement and/or disclosure purposes in these consolidated financial statements for certain financial instruments is determined on such a basis, except for share-based payment transactions that are within the scope of IFRS 2, leasing transactions that are within the scope of IAS 17 and measurements that have some similarities to fair value but are not fair value, such as value in use in IAS 36 Impairment of Assets.
When there is no market price available for an identical instrument, the Bank measures fair value using other valuation techniques that are commonly used by the financial markets that maximize the use of relevant observable inputs and minimize the use of unobservable inputs as explained in Note 2.d.
The availability of observable prices or inputs varies by product and market, and may change over time. The level of Management judgment required in establishing fair value of financial instruments for which there is a quoted price in an active market is minimal. Similarly, there is little subjectivity or judgment required for instruments valued using valuation models that are standard across the industry and where all parameter inputs are quoted in active markets. The level of subjectivity and degree of Management judgment required are more significant for those instruments valued using specialized and sophisticated models and those where some or all of the parameter inputs are not observable.
In making appropriate valuation adjustments, the Bank follows methodologies that consider factors such as liquidity and credit risk (both counterparty credit risk in relation to financial assets and its own credit risk in relation to financial liabilities, which are at fair value through profit or loss).
| - | | Fair value estimates used in disclosures (see Note 2.d.iii and Note 44.d). |
For financial reporting purposes, fair value measurements are categorized into Level 1, 2 or 3 according to IFRS 13 Fair Value Measurement based on the degree to which the inputs to the fair value measurements are observable and the significance of the inputs to the fair value measurement in its entirety, which are described as follows:
| · | | Level 1: inputs that are quoted market prices (unadjusted) in active markets for identical instruments; |
| · | | Level 2: inputs other than quoted prices included within Level 1 that are observable either directly (i.e., as prices) or indirectly (i.e., derived from prices). This category includes instruments valued using: quoted market prices in active markets for similar instruments; quoted prices for identical or |
similar instruments in markets that are considered less than active; or other valuation techniques in which all significant inputs are directly or indirectly observable from market data; and |
| · | | Level 3: inputs that are unobservable. This category includes all instruments for which the valuation technique includes inputs not based on observable data and the unobservable inputs have a significant effect on the instrument’s valuation. This category includes instruments that are valued based on quoted prices for similar instruments for which significant unobservable adjustments or assumptions are required to reflect differences between the instruments. |
This disclosure is provided in Note 2.d.iii.
For financial instruments measured at amortized cost (which include balances with the Central Bank, loans and advances, debt instruments, deposits and short-term and long-term debt issued), the Bank discloses the fair value. This disclosure is provided in Note 44.d. Generally, there is no trading activity in these instruments and the fair value determination therefore requires significant Management judgment.
| - | | Allowance for impairment losses and provisions for off-balance sheet risk (see Note 2.g, Note 8, Note 9, Note 11.c and Note 23.f). |
From January 1, 2018, the Bank assesses on a forward-looking basis the expected credit losses associated with its financial assets carried at amortized cost and at fair value through other comprehensive income. The impairment methodology applied depends on whether there has been a significant increase in credit risk. The Bank considers a financial asset to have experienced a significant increase in credit risk, since initial recognition, taking into account different quantitative, qualitative or backstop criteria.
The Bank uses the concept of expected credit loss methodology according to IFRS 9 to quantify the credit losses as further discussed in Note 2.g.
The accounting estimates and judgments related to the allowance for impairment losses and provisions for off-balance sheet risk are a critical accounting estimate for the Bank because the underlying assumptions used to assess the impairment can change from period to period and may significantly affect the Bank’s operating results, particularly in circumstances of economic and financial uncertainty. Further, the statistical models incorporate numerous estimates and judgments (for example, Probability of Default, Loss Given Default and segmentation of loans in groups with similar credit risk characteristics, etc.). As such, the actual amount of the future cash flows and their timing may differ from the estimates used by Management and consequently may cause actual credit losses to differ from the recognized allowance for impairment losses or provisions for off-balance sheet risk.
| - | | The recognition and measurement of deferred tax assets (see Note 25). |
As discussed in Note 2.t, deferred tax assets and liabilities include temporary differences, which are identified as the amounts expected to be payable or recoverable on differences between the carrying amounts of assets and liabilities and their related tax bases, tax loss and tax credit carryforwards. These amounts are measured at the tax rates that are expected to apply in the period when the asset is realized or the liability is settled.
In determining the amount of deferred tax assets, the Bank uses current expectations and estimates on projections of future events and trends, which may affect the consolidated financial statements, including a review of the eligible carryforward periods, available tax planning opportunities and other relevant considerations.
The Bank believes that the accounting estimate related to the deferred tax assets is a critical accounting estimate because it requires significant Management judgment and the underlying assumptions used in
the estimate can change from period to period (for example, future projected operating performance of the Bank).
| - | | Goodwill and business combinations (see Note 15). |
Goodwill and intangible assets include the cost of acquired subsidiaries in excess of the fair value of the tangible net assets recognized in connection with acquisitions as well as acquired intangible assets. Accounting for goodwill and acquired intangible assets requires Management’s estimates regarding: (1) the fair value of the acquired intangible assets and the initial amount of goodwill to be recognized, (2) the amortization period (for identified intangible assets other than those with indefinite lives or goodwill) and (3) the recoverability of the carrying value of acquired intangible assets.
The useful lives of acquired intangible assets are estimated based on the period over which the assets are expected to contribute directly or indirectly to the future cash flows of the Bank.
To determine the initial amount of goodwill to be recognized on an acquisition, the Bank determines the fair value of the consideration and the fair value of the net assets acquired. The Bank uses internal analysis, generally based on discounted cash flow techniques, to determine the fair value of the net assets acquired and non-cash components of the consideration paid. The actual fair value of net assets acquired could differ from the fair value determined, resulting in an under- or over-statement of goodwill.
Goodwill arising on an acquisition of a business is carried at cost as established at the date of acquisition of the business less accumulated impairment losses, if any.
| - | | Impairment of goodwill (see Note 15). |
For the purposes of impairment testing, goodwill is allocated to each of the Bank’s cash-generating units (CGUs) (or groups of CGUs) that is expected to benefit from the synergies of the combination. A CGU to which goodwill has been allocated is tested for impairment annually, or more frequently when there is an indication that the CGU may be impaired.
Determining whether goodwill is impaired requires an estimation of the value in use of the CGUs to which goodwill has been allocated. The value in use calculation requires that management estimates the future cash flows expected to arise from the CGU and a suitable discount rate in order to calculate present value. Where the actual future cash flows are less than expected, an impairment loss may arise. The impairment loss is allocated first to reduce the carrying amount of any goodwill allocated to the CGU and then to the other assets of the CGU pro rata based on the carrying amount of each asset in the CGU. Any impairment loss for goodwill is recognized directly in the consolidated income statement. An impairment loss recognized for goodwill is not reversed in subsequent periods.
On disposal of the relevant CGU, the attributable amount of goodwill is included in the determination of the profit or loss on disposal.
Details of the impairment of goodwill calculation are set out in Note 15.
| - | | Defined benefit plan (see Note 23.c). |
The net cost of the defined benefit pension plan and other post-employment medical benefits and the present value of the pension obligation are determined using the projected unit credit method, with actuarial valuations being carried out at the end of each annual reporting period. An actuarial valuation involves making various assumptions that may differ from actual developments in the future. These assumptions include the determination of the discount rate. Any changes in these assumptions will affect the carrying amount of pension obligations.
The Bank determines the appropriate discount rate at the end of each year. This is the interest rate that should be used to determine the present value of estimated future cash outflows expected to be required to settle the pension obligations. The Bank’s defined benefit obligation is discounted at a rate set by reference to market yields on Mexican government bonds at the end of the reporting period.
Further details about pension obligations are given in Note 23.c.
- The recognition and measurement of certain provisions and contingencies (see Note 23).
Provisions are recognized when the Bank has a present obligation (legal or constructive) as a result of a past event; it is probable that the Bank will be required to settle the obligation, and a reliable estimate can be made of the amount of the obligation.
The amount recognized as a provision is the best estimate of the consideration required to settle the present obligation at the end of the reporting period, taking into account the risks and uncertainties surrounding the obligation. When a provision is measured using the cash flows estimated to settle the present obligation, its carrying amount is the present value of those cash flows (when the effect of the time value of money is material).
The Bank estimates and provides for probable losses that may arise out of litigation, regulatory proceedings and uncertain income tax matters to the extent that a current obligation exists, the losses are probable and can be reasonably estimated. Significant judgment is required in making these estimates and the Bank’s final liabilities may ultimately be materially different. The Bank’s actual losses may differ materially from recognized amounts.
d) Events after the reporting period
On April 8, 2019, the Bank issued debt securities denominated unsecured notes with following characteristics: i) 2.3 billion pesos with a 1,092-day maturity that will bear interest at an interest rate of Interbank Equilibrium Interest Rate (Tasa de Interés Interbancaria de Equilibrio, or TIIE) 28-day plus 0.10 % (interest will be paid every 28 days) and ii) 4.6 billion pesos with a 2,548-day maturity that will bear interest at an interest rate of 8.95% (interest will be paid every 182 days).
Banco Santander Parent announced its intention of making a public acquisition offer to acquire approximately 25% of the shares of the Bank, which are owned by investors other than Banco Santander Parent. Investors that accept the offer are expected to receive 0.337 of shares of Banco Santander (Spain) for each share of the Bank and 1.685 American Depositary Shares of Banco Santander Parent for each ADS of the Bank. The offering and the exchange of shares are expected to take place during the second half of 2019.
No additional significant events occurred from January 1, 2019 to the date on which these consolidated financial statements were authorized for issue.
2. Accounting policies
The accounting policies and measurement bases applied in preparing the consolidated financial statements were as follows:
a) Foreign currency transactions
i. Functional currency
The functional currency of all entities comprising the Bank is the Mexican Peso (hereinafter, peso or $). Therefore, all balances and transactions denominated in currencies other than the peso are deemed to be denominated in foreign currency.
ii. Recognition of exchange differences
The gains and losses arising on the translation of foreign currency balances to the functional currency are recognized at their net amount under Exchange differences (net) in the consolidated income statement, except for exchange differences arising on financial instruments at Fair Value Through Profit or Loss (FVTPL), which are recognized under Gains/(losses) on financial assets and liabilities (net) in the consolidated income statement without distinguishing them from other changes in fair value and for exchange differences arising on non-monetary items measured at Fair Value Through Other Comprehensive Income (FVTOCI), which are recognized under Valuation adjustments in the consolidated other comprehensive income.
iii. Exposure to foreign currency risk
In preparing the consolidated financial statements, transactions in currencies other than the Bank’s functional currency (foreign currencies) are recognized at the exchange rates prevailing at the dates of the transactions. Monetary items denominated in foreign currencies are retranslated to the functional currency at the rates prevailing at the consolidated balance sheet date. Non-monetary items carried at fair value in foreign currencies are retranslated to the functional currency at the rates prevailing at the date when the fair value was determined. Non-monetary items that are measured at historical cost in a foreign currency are not maintained at the exchange rate of the transaction.
The Bank performs a large number of foreign currency transactions, mainly in United States dollars (USD). The transactions, assets and liabilities denominated in foreign currencies are translated to pesos based on the exchange rates published by the Central Bank.
The “Fix” (48‑hour) exchange rate used was $19.6629 per one USD and $19.6512 per one USD as of December 31, 2017 and 2018, respectively.
b) Basis of consolidation
i. Subsidiaries
The consolidated financial statements incorporate the financial statements of Banco Santander México and entities (including structured entities) controlled by Banco Santander México together with its subsidiaries. Control is achieved when the Banco Santander México has one of the following:
| · | | has power over the investee; |
| · | | is exposed, or has rights, to variable returns from its involvement with the investee; and |
| · | | has the ability to use its power to affect its returns. |
The Bank reassesses whether or not it controls an investee if facts and circumstances indicate that there are changes to one or more of the three elements of control listed above.
When the Bank has less than a majority of the voting rights of an investee, it has power over the investee when the voting rights are sufficient to give it the practical ability to direct the relevant activities
of the investee unilaterally. The Bank considers all relevant facts and circumstances in assessing whether or not the Bank’s voting rights in an investee are sufficient to give it power, including:
| · | | the size of the Bank’s holding of voting rights relative to the size and dispersion of holdings of the other vote holders; |
| · | | potential voting rights held by the Bank, other vote holders or other parties; |
| · | | rights arising from other contractual arrangements; and |
| · | | any additional facts and circumstances that indicate that the Bank has, or does not have, the current ability to direct the relevant activities at the time that decisions need to be made, including voting patterns at previous shareholders’ meetings. |
Consolidation of a subsidiary begins when the Bank obtains control over the subsidiary and ceases when the Bank loses control of the subsidiary. Specifically, income and expenses of a subsidiary acquired or disposed of during the year are included in the consolidated income statement and other comprehensive income from the date the Bank gains control until the date when the Bank ceases to control the subsidiary.
On acquisition of control of a subsidiary that meets the definition of a business, its assets, liabilities and contingent liabilities are recognized at fair value at the date of acquisition. Any excess of the acquisition cost, the amount recognized for non-controlling interests of the acquiree and the fair value of the acquirer’s previous held equity interest in the acquiree over the fair values of the identifiable net assets acquired are recognized as goodwill (see Note 15). Negative differences are recognized in the consolidated income statement on the date of acquisition.
The consolidated income statement and each component of other comprehensive income are attributed to the owners of the Bank and to the non-controlling interests. Total comprehensive income of subsidiaries is attributed to the owners of the Bank and to the non-controlling interests even if this results in the non-controlling interests having a deficit balance (see Note 26).
When necessary, adjustments are made to the financial statements of subsidiaries to bring their accounting policies into line with the Bank’s accounting policies.
The financial statements of the subsidiaries are fully consolidated with those of the Bank. All intragroup assets and liabilities, equity, income, expenses and cash flows relating to transactions between members of the Bank are eliminated in full on consolidation.
The share of third parties of the Bank’s consolidated equity is presented under Non-controlling interests in the consolidated balance sheet (see Note 26). Their share of the profit for the year is presented under Profit attributable to non-controlling interests in the consolidated income statement.
The results of subsidiaries acquired during the year are included in the consolidated income statement from the date of acquisition to year-end. Similarly, the results of subsidiaries disposed of during the year are included in the consolidated income statement from the beginning of the year to the date of disposal.
A listing of the subsidiaries as of December 31, 2017 and 2018 is summarized in Note 48.
ii. Investments in associates or joint ventures (jointly controlled entities)
An associate is an entity over which the Bank has significant influence. Significant influence is the power to participate in the financial and operating policy decisions of the investee but is not control or joint control over those policies.
A joint venture is a joint arrangement whereby the parties that have joint control of the arrangement have rights to the net assets of the joint arrangement. Joint control is the contractually agreed sharing of control of an arrangement, which exists only when decisions about the relevant activities require unanimous consent of the parties sharing control.
The results and assets and liabilities of associates or joint ventures are incorporated in the consolidated financial statements using the equity method of accounting, except when the investment, or a portion thereof, is classified as held for sale, in which case it is accounted for in accordance with IFRS 5 Non-current Assets Held for Sale and Discontinued Operations. Under the equity method, an investment in an associate or a joint venture is initially recognized in the consolidated balance sheet at cost and adjusted thereafter to recognize the Bank’s share of the consolidated income statement and other comprehensive income of the associate or joint venture. When the Bank’s share of losses of an associate or a joint venture exceeds the Bank’s interest in that associate or joint venture (which includes any long-term interests that, in substance, form part of the Bank’s net investment in the associate or joint venture), the Bank discontinues recognizing its share of further losses. Additional losses are recognized only to the extent that the Bank has incurred legal or constructive obligations or made payments on behalf of the associate or joint venture.
An investment in an associate or a joint venture is accounted for using the equity method from the date on which the investee becomes an associate or a joint venture. On acquisition of the investment in an associate or a joint venture, any excess of the cost of the investment over the Bank’s share of the net fair value of the identifiable assets and liabilities of the investee is recognized as goodwill, which is included within the carrying amount of the investment. Any excess of the Bank’s share of the net fair value of the identifiable assets and liabilities over the cost of the investment, after reassessment, is recognized immediately in the consolidated income statement in the period in which the investment is acquired.
The requirements of IFRS 9 are applied to determine whether it is necessary to recognize any impairment loss with respect to the Bank’s investment in an associate or a joint venture. When necessary, the entire carrying amount of the investment (including goodwill) is tested for impairment in accordance with IAS 36 as a single asset by comparing its recoverable amount (higher of value in use and fair value less costs of disposal) with its carrying amount. Any impairment loss recognized forms part of the carrying amount of the investment. Any reversal of that impairment loss is recognized in accordance with IAS 36 to the extent that the recoverable amount of the investment subsequently increases.
The Bank discontinues the use of the equity method from the date when the investment ceases to be an associate or a joint venture, or when the investment is classified as held for sale. When the Bank retains an interest in the former associate or joint venture and the retained interest is a financial asset, the Bank measures the retained interest at fair value at that date and the fair value is regarded as its fair value on initial recognition in accordance with IFRS 9. The difference between the carrying amount of the associate or joint venture at the date the equity method was discontinued, and the fair value of any retained interest and any proceeds from disposing of a part interest in the associate or joint venture is included in the determination of the gain or loss on disposal of the associate or joint venture. In addition, the Bank accounts for all amounts previously recognized in other comprehensive income in relation to that associate or joint venture on the same basis as would be required if that associate or joint venture had directly disposed of the related assets or liabilities. Therefore, if a gain or loss previously recognized in other comprehensive income by that associate or joint venture would be reclassified to the consolidated income statement on the disposal of the related assets or liabilities, the
Bank reclassifies the gain or loss from equity to the consolidated income statement (as a reclassification adjustment) when the equity method is discontinued.
The Bank continues to use the equity method when an investment in an associate becomes an investment in a joint venture or an investment in a joint venture becomes an investment in an associate. There is no remeasurement to fair value upon such changes in ownership interests.
When the Bank reduces its ownership interest in an associate or a joint venture but the Bank continues to use the equity method, the Bank reclassifies to the consolidated income statement the proportion of the gain or loss that had previously been recognized in other comprehensive income relating to that reduction in ownership interest if that gain or loss would be reclassified to the consolidated income statement on the disposal of the related assets or liabilities.
When a Bank’s subsidiary transacts with an associate or a joint venture of the Bank, profits and losses resulting from the transactions with the associate or joint venture are recognized in the Bank’s consolidated financial statements only to the extent of interests in the associate or joint venture that are not related to the Bank.
As of December 31, 2017 and 2018, the Bank did not have any associates.
As of December 31, 2017 and 2018, the Bank has a commercial alliance with Elavon México in order to share revenues and expenses jointly related to the merchant services. This commercial alliance is not material to the Bank’s consolidated financial statements.
iii. Structured entities
When the Bank incorporates entities, or holds ownership interests therein, to enable its customers to access certain investments, or for the transfer of risks or other purposes (also called structured entities since the voting or similar power is not a key factor in deciding who controls the entity), the Bank determines, using internal criteria and procedures and taking into consideration the applicable legislation, whether control (as defined above) exists and, therefore, whether these entities should be consolidated.
These structured entities include securitization special purpose vehicles (SPV) and employee benefit trusts (EBT) established for employee share-based plans, which are consolidated over which it is considered that the Bank continues to exercise control.
Note 11.g contains information regarding securitized mortgage assets.
Share-based payments are discussed in Note 41.b, 41.c and 41.d.
iv. Business combinations
Acquisitions of businesses are accounted for using the acquisition method. The consideration transferred in a business combination is measured at fair value, which is calculated as the sum of the acquisition-date fair values of the assets transferred by the Bank, liabilities incurred by the Bank to the former owners of the acquiree and the equity interests issued by the Bank in exchange for control of the acquiree. Acquisition-related costs are recognized in the consolidated income statement as incurred.
At the acquisition date, the identifiable assets acquired and the liabilities assumed are recognized at their fair value, except that:
| · | | deferred tax assets or liabilities, and assets or liabilities related to employee benefit arrangements are recognized and measured in accordance with IAS 12 and IAS 19, respectively; |
| · | | liabilities or equity instruments related to share-based payment arrangements of the acquiree or share-based payment arrangements of the Bank entered into to replace share-based payment arrangements of the acquiree are measured in accordance with IFRS 2 at the acquisition date; and |
| · | | assets (or disposal groups) that are classified as held for sale in accordance with IFRS 5 are measured in accordance with that Standard. |
Goodwill is measured as the excess of the sum of the consideration transferred, the amount of any non-controlling interests in the acquiree, and the fair value of the acquirer’s previously held equity interest in the acquiree (if any) over the net of the acquisition-date amounts of the identifiable assets acquired and the liabilities assumed (see Note 2.m). If, after reassessment, the net of the acquisition-date amounts of the identifiable assets acquired and liabilities assumed exceeds the sum of the consideration transferred, the amount of any non-controlling interests in the acquiree and the fair value of the acquirer’s previously held interest in the acquiree (if any), the excess is recognized immediately in the consolidated income statement as a bargain purchase gain.
Non-controlling interests that are present ownership interests and entitle their holders to a proportionate share of the entity’s net assets in the event of liquidation may be initially measured either at fair value or at the non-controlling interests’ proportionate share of the recognized amounts of the acquiree’s identifiable net assets. The choice of measurement basis is made on a transaction-by-transaction basis. Other types of non-controlling interests are measured at fair value or, when applicable, on the basis specified in another IFRS.
When the consideration transferred by the Bank in a business combination includes assets or liabilities resulting from a contingent consideration arrangement, the contingent consideration is measured at its acquisition-date fair value and included as part of the consideration transferred in a business combination. Changes in the fair value of the contingent consideration that qualify as measurement period adjustments are adjusted retrospectively, with corresponding adjustments against goodwill. Measurement period adjustments are adjustments that arise from additional information obtained during the ‘measurement period’ (which cannot exceed one year from the acquisition date) about facts and circumstances that existed at the acquisition date.
The subsequent accounting for changes in the fair value of the contingent consideration that do not qualify as measurement period adjustments depends on how the contingent consideration is classified. Contingent consideration that is classified as equity is not remeasured at subsequent reporting dates and its subsequent settlement is accounted for within equity. Contingent consideration that is classified as an asset or a liability is remeasured at subsequent reporting dates in accordance with IFRS 9, or IAS 37 Provisions, Contingent Liabilities and Contingent Assets, as appropriate, with the corresponding gain or loss being recognized in the consolidated income statement.
When a business combination is achieved in stages, the Bank’s previously held equity interest in the acquiree is remeasured to its acquisition-date fair value and the resulting gain or loss, if any, is recognized in the consolidated income statement. Amounts arising from interests in the acquiree prior to the acquisition date that have previously been recognized in other comprehensive income are reclassified to the consolidated income statement where such treatment would be appropriate if that interest were disposed of.
If the initial accounting for a business combination is incomplete by the end of the reporting period in which the combination occurs, the Bank reports provisional amounts for the items for which the accounting is incomplete. Those provisional amounts are adjusted during the measurement period (see above), or additional assets or liabilities are recognized, to reflect additional information obtained about facts and circumstances that existed at the acquisition date that, if known, would have affected the amounts recognized at that date.
v. Business combinations under common control
A common control transaction is a transfer of net assets or an exchange of equity interests between entities under the control of the same parent. A common-control transaction has no effect on the ultimate parent’s consolidated financial statements. The net assets are derecognized by the transferring entity and recognized by the receiving entity at their historical carrying amounts. Any difference between the consideration paid or received and the carrying amounts of the net assets is recognized in the Shareholders’ equity within Accumulated reserves.
vi. Changes in the Bank’s ownership interests in existing subsidiaries
Changes in the Bank’s ownership interests in subsidiaries that do not result in the Bank losing control over the subsidiaries are accounted for as equity transactions, no gain or loss is recognized in the consolidated income statement and the initially recognized goodwill is not remeasured. The carrying amounts of the Bank’s interests and the non-controlling interests are adjusted to reflect the changes in their relative interests in the subsidiaries. Any difference between the amount by which the non-controlling interests are adjusted and the fair value of the consideration paid or received is recognized directly in Accumulated reserves in Shareholders’ equity and attributed to owners of the Bank.
When the Bank loses control of a subsidiary, a gain or loss is recognized in the consolidated income statement and is calculated as the difference between (i) the aggregate of the fair value of the consideration received and the fair value of any retained interest and (ii) the previous carrying amount of the assets (including goodwill), and liabilities of the subsidiary and any non-controlling interests. All amounts previously recognized in Valuation adjustments in the consolidated other comprehensive income in relation to that subsidiary are accounted for as if the Bank had directly disposed of the related assets or liabilities of the subsidiary (i.e., reclassified to the consolidated income statement or transferred to another category of equity as specified/permitted by applicable IFRS). The fair value of any investment retained in the former subsidiary at the date when control is lost is regarded as the fair value on initial recognition for subsequent accounting under IFRS 9, when applicable, the cost on initial recognition of an investment in an associate or a joint venture.
c) Definitions and classification of financial instruments
i. Definitions
A financial instrument is any contract that gives rise to a financial asset of one entity and a financial liability or equity instrument of another entity. Financial assets and financial liabilities are recognized when the Bank becomes a party to the contractual provisions of the financial instruments.
An equity instrument is any agreement that evidences a residual interest in the assets of the issuing entity after deducting all of its liabilities.
IFRS 9 defines a derivative as a financial instrument or other contract within the scope of the Standard with all three of the following characteristics:
| · | | its value changes in response to the change in a specified interest rate, financial instrument price, commodity price, foreign exchange rate, index of prices or rates, credit rating or credit index, or |
other variable, provided in the case of a non-financial variable that the variable is not specific to a party to the contract (sometimes called the “underlying”); |
| · | | it requires no initial net investment or an initial net investment that is smaller than would be required for other types of contracts that would be expected to have a similar response to changes in market factors; and |
| · | | it is settled at a future date. |
Hybrid financial instruments are contracts that simultaneously include a non-derivative host contract together with a derivative, known as an embedded derivative, that is not separately transferable and has the effect that some of the cash flows of the hybrid contract vary in a way similar to a stand-alone derivative.
Compound financial instruments are contracts that simultaneously create for their issuer a financial liability and an equity instrument (such as convertible bonds, which entitle their holders to convert them into equity instruments of the issuer).
The following transactions are not treated for accounting purposes as financial instruments:
| - | | Pensions and similar obligations (see Note 23.c). |
| - | | Share-based payments (see Note 41.b, 41.c and 41.d). |
ii. Classification of financial assets for measurement purposes
Financial assets are initially classified into the various categories used for management and measurement purposes, unless they relate to Cash and balances with the Central Bank or Hedging derivatives, which are reported separately.
From January 1, 2018, the Bank classifies its financial assets in the following measurement categories:
| - | | Those to be measured subsequently at fair value (either through other comprehensive income or through profit or loss), and |
| - | | Those to be measured at amortized cost. |
The classification depends on the Bank’s business model for managing the financial assets and the contractual terms of its cash flows.
The Bank reclassifies financial assets when, and only when, its business model for managing those financial assets changes.
Business model
The business model reflects how the Bank manages the financial assets in order to generate cash flows. That is, whether the Bank’s objective is solely to collect the contractual cash flows from the financial assets or is to collect both the contractual cash flows and cash flows arising from the sale of financial assets. If neither of these is applicable, then the financial assets are classified as part of other business model and measured at FVTPL.
Solely Payments of Principal and Interest
Where the business model is to hold financial assets to collect contractual cash flows or to collect both the contractual cash flows and cash flows arising from the sale of financial assets, the Bank assesses whether the financial assets’ cash flows represent SPPI. In making this assessment (the “SPPI test”), the Bank considers whether the contractual cash flows are consistent with a basic lending arrangement. Where the contractual terms introduce exposures to risk or volatility that are inconsistent with a basic lending arrangement, the related financial assets are classified and measured at FVTPL.
Financial assets with embedded derivatives are considered in their entirety when determining whether their cash flows are solely payment of principal and interest.
Business models and SPPI significant judgments
Determining the appropriate business models for a group of financial assets and assessing the SPPI requirements may require significant judgment, such as:
| - | | Determining the appropriate level at which to assess the business models. |
| - | | Evaluating past experience on how the cash flows of financial assets were collected. |
| - | | Defining the way financial assets’ performance is evaluated and reported to Management and how risks associated with those financial assets are assessed and managed. |
| - | | Effect of sales of financial assets on the business model assessment (frequency and volume). |
| - | | Considering if certain contractual features (i.e., interest rate reset frequency, prepayment commissions, among others) significantly affect future cash flows. |
| - | | Assessing if a compensation, paid or received on early termination, results in cash flows that are not SPPI. |
Classification of financial assets for measurement purposes up to December 31, 2017 under IAS 39 was as follow:
Financial assets were initially classified into the various categories used for management and measurement purposes, unless they relate to Cash and balances with the Central Bank or Hedging derivatives, which were reported separately.
Financial assets were included for measurement purposes in one of the following categories:
| - | | Financial assets held for trading: This category included the financial assets acquired for the purpose of generating a profit in the near term from fluctuations in their prices and financial derivatives that were not designated as hedging instruments. |
| - | | Other financial assets at fair value through profit or loss: This category included hybrid financial assets not held for trading that were measured entirely at fair value and financial assets not held for trading that were included in this category in order to obtain more relevant information, either because this eliminates or significantly reduces recognition or measurement inconsistencies (accounting mismatches) that would otherwise arise from measuring assets or liabilities or recognizing the gains or losses on them on different bases, or because a group of financial assets or financial assets and liabilities is managed and its performance is evaluated on a fair value basis, such as reverse repurchase agreements, in accordance with a documented risk management or investment strategy, and information about the group is provided on that basis to the Bank’s key |
management personnel. Financial assets may only be included in this category on the date they were acquired or originated. |
| - | | Available-for-sale financial assets: This category included debt instruments not classified as Held-to-maturity investments, Loans and receivables or Financial assets at fair value through profit or loss and equity instruments issued by entities other than subsidiaries, associates and joint ventures, provided that such instruments have not been classified as Financial assets held for trading or as Other financial assets at fair value through profit or loss. |
| - | | Loans and receivables: This category included the investment arising from ordinary lending activities, such as the cash amounts of loans drawn down and not yet repaid by customers or the deposits placed with other credit institutions, whatever the legal instrument and unquoted debt securities constituting part of the Bank’s business. |
The Bank generally intended to hold the Loans and receivables granted by it until their final maturity and, therefore, they are presented in the consolidated balance sheet at their amortized cost (net of allowance for impairment losses).
| - | | Held-to-maturity investments: This category included debt instruments traded in an active market, with fixed maturity and with fixed or determinable payments, for which the Bank has both the intention and proven ability to hold to maturity. |
iii. Classification of financial assets for presentation purposes
Financial assets are classified by nature into the following items in the consolidated balance sheet:
| - | | Cash and balances with the Central Bank: cash balances and balances receivable including the compulsory deposits with the Central Bank. |
| - | | Loans and advances to credit institutions: loans of any nature, including deposits provided to credit institutions. |
| - | | Loans and advances to customers: includes all other loans. |
| - | | Debt instruments: bonds and other debt securities that represent a debt obligation for their issuer and that bear interest. |
| - | | Equity instruments: financial instruments issued by other entities, such as shares, which have the nature of equity instruments for the issuer, other than investments in subsidiaries, associates or jointly controlled entities. |
| - | | Trading derivatives: includes the fair value in favor of the Bank of derivatives, which do not form part of hedge accounting relationship, including embedded derivatives separated from hybrid financial instruments. |
| - | | Hedging derivatives: includes the fair value of derivatives in favor of the Bank, including embedded derivatives separated from hybrid financial instruments, designated as hedging instruments in hedge accounting. |
iv. Classification of financial liabilities for measurement purposes
Financial liabilities are initially classified into the various categories used for management and measurement purposes, unless they relate to hedging derivatives, which are reported separately.
Financial liabilities are classified for measurement purposes into one of the following categories:
| - | | Financial liabilities at fair value through profit or loss (financial liabilities held for trading up to December 31, 2017): this category includes financial liabilities incurred for the purpose of generating a profit in the near term from fluctuations in their prices, financial derivatives not designated as hedging instruments and financial liabilities arising from the outright sale of financial assets acquired under reverse repurchase agreements, securities loans and sales of borrowed securities (short positions). |
| - | | Other financial liabilities at fair value through profit or loss: financial liabilities are included in this category when such classification provides for more relevant information regarding the financial liability, either because this eliminates or significantly reduces recognition or measurement inconsistencies (accounting mismatches) that would otherwise arise from measuring the liabilities or recognizing the gains or losses on them on different bases, or because a group of financial liabilities or financial assets and liabilities is managed and its performance is evaluated on a fair value, such as repurchase agreements, in accordance with a documented risk management or investment strategy, and information about the group is provided on that basis to the Bank’s key management personnel. Liabilities may only be included in this category on the date when they are incurred or originated. |
| - | | Financial liabilities at amortized cost: this category includes financial liabilities, irrespective of their instrumentation and maturity, not included in any of the above-mentioned categories, which arise from the ordinary borrowing activities. |
iv. Classification of financial liabilities for presentation purposes
Financial liabilities are classified by nature into the following items in the consolidated balance sheet:
| - | | Deposits: includes all repayable balances received in cash by the Bank, other than those classified as marketable debt securities and those having the substance of subordinated liabilities. This item also includes cash bonds and cash consignments received the amount of which may be invested without restriction. |
Deposits are classified based on type of depositor as follows:
| - | | Deposits from the Central Bank: deposits of any nature received from the Central Bank. |
| - | | Deposits from credit institutions: deposits of any nature, including credit received and money market operations in the name of credit institutions. |
| - | | Customer deposits: includes the remaining deposits. |
| - | | Marketable debt securities: includes the amount of bonds and other debt represented by marketable securities, other than those having the substance of subordinated liabilities. This item includes the component considered to be a financial liability component of compound financial instruments issued by the Bank. |
| - | | Trading derivatives: includes the fair value of derivatives with a liability balance, including embedded derivatives separated from the host contract, which do not form part of hedge accounting. |
| - | | Short positions: includes the amount of financial liabilities arising from the outright sale or from pledging of financial assets acquired under reverse repurchase agreements, securities loans and sales of borrowed securities. |
| - | | Subordinated liabilities: amount of financing received which, for the purposes of payment priority, ranks behind ordinary debt. This category also includes the financial instruments issued by the Bank, which form part of the Bank’s capital management for regulatory purposes, but do not meet the requirements for classification as equity for accounting purposes. |
| - | | Other financial liabilities: includes the amount of payment obligations having the nature of financial liabilities that are not included in any of the aforementioned categories, including liabilities under financial guarantee contracts. |
| - | | Hedging derivatives: includes the fair value of the Bank’s liability in respect of derivatives, including embedded derivatives separated from hybrid financial instruments, designated as qualified hedging instruments in hedge accounting. |
d) Measurement of financial assets and liabilities and recognition of fair value changes
In general, financial assets and liabilities are initially recognized at fair value, which, in the absence of evidence to the contrary, is deemed to be the transaction price. The amount initially recognized for financial instruments not measured at FVTPL is adjusted for transaction costs that are directly attributable to the acquisition of the financial asset. Transaction costs of financial assets carried at FVTPL are recognized in profit or loss.
If the fair value of a financial instrument at initial recognition differs from the transaction price, that financial instrument shall be accounted for at that date as follows:
| - | | if that fair value is evidenced by a quoted price in an active market for an identical asset or liability (i.e., a Level 1 input) or based on a valuation technique that uses only data from observable markets, the difference between the fair value at initial recognition and the transaction price shall be recognized as a gain or loss. |
| - | | in all other cases, adjusted to defer the difference between the fair value at initial recognition and the transaction price. After initial recognition, that deferred difference shall be recognized as a gain or loss only to the extent that it arises from a change in a factor (including time) that market participants would take into account when pricing the asset or liability. |
Financial assets and liabilities are subsequently measured at each period-end as follows:
i. Measurement of financial assets
Subsequent measurement of financial assets depends on the Bank’s business model for managing the financial assets and the cash flows characteristics of the financial asset. There are three measurement categories into which the Bank classifies its financial assets:
| - | | Amortized cost: financial assets that are held to collect contractual cash flows, where those cash flows represent SPPI and that are not designated at FVTPL are measured at amortized cost. Interest income from these financial assets is included in Interest income in the consolidated income statement using the effective interest rate method. Any gain or loss arising on derecognition is recognized directly in profit or loss and presented in Gains/(losses) from the derecognition of financial assets at amortized cost in the consolidated income statement. Foreign exchange gains and losses are presented in Exchange differences (net) and impairment losses are presented in Impairment losses on financial assets (net) in the consolidated income statement. |
| - | | FVTOCI: financial assets that are held to collect both the contractual cash flows and cash flows arising from the sale of financial assets, where the financial assets’ cash flows represent SPPI and that are not designated at FVTPL are measured at FVTOCI. Changes in the fair value are taken |
through other comprehensive income, except for the recognition of impairment gains and losses, interest revenue and foreign exchange gains and losses on the instrument’s amortized cost which are recognized in profit or loss. |
When the financial assets are derecognized, the cumulative gain or loss previously recognized in other comprehensive income is reclassified to profit or loss and recognized in Gains/(losses) on financial assets and liabilities (net) in the consolidated income statement. Interest income from these financial assets is included in Interest income using the effective interest rate method in the consolidated income statement. Foreign exchange gains and losses are presented in Exchange differences (net) and impairment losses are presented within Impairment losses on financial assets not at fair value through profit or loss (net) in the consolidated income statement.
| - | | FVTPL: financial assets that do not meet the criteria for being measured at amortized cost or at FVTOCI are measured at FVTPL. Changes in the fair value of financial assets at FVTPL are recognized in profit or loss and presented net within Gains/(losses) on financial assets and liabilities (net) in the consolidated income statement in the period in which it arises. Interest income from these financial assets is included as a separate line item within the consolidated income statement in Interest income from financial assets at fair value through profit or loss using the effective interest rate method. |
All financial assets are accounted for at the trade date.
Loans with different components
The Bank originates loans to hold to maturity and to collect and sell or sub-participate to other lenders, resulting in a transfer of substantially all the risk and rewards and derecognition of the loan or portion of it. The Bank considers the activities of lending to hold and lending to collect and sell or sub-participate as two separate business models. Financial assets considered to be within a business model that has an objective to hold the financial assets to collect contractual cash flows are accounted for at amortized cost. Financial assets considered to be within a business model that has an objective to collect contractual cash flows and to sell or sub-participate to other lenders are accounted for at FVTOCI.
Amortized cost and effective interest rate
The amortized cost is the amount at which the financial asset or financial liability is measured at initial recognition minus the principal repayments, plus or minus the cumulative amortization using the effective interest method of any difference between that initial amount and the maturity amount and, for financial assets, adjusted for any allowance for impairment losses.
The effective interest rate is the rate that exactly discounts estimated future cash payments or receipts through the expected life of the financial asset or financial liability to the gross carrying amount of a financial asset or to the amortized cost of a financial liability. The calculation does not consider expected credit losses and includes transaction costs, premiums or discounts and fees and points paid or received that are integral to the effective interest rate, such as origination fees.
For purchased or originated credit-impaired (POCI) financial assets, the Bank calculates the credit-adjusted effective interest rate, which is calculated based on the amortized cost of the financial asset instead of its gross carrying amount and incorporates the impact of expected credit losses in estimated future cash flows.
When the Bank revises the estimates of future cash flows, the carrying amount of the respective financial assets or financial liabilities is adjusted to reflect the new estimate discounted using the original effective interest rate. Any changes are recognized in profit or loss.
Interest income
Interest income is calculated by applying the effective interest rate to the gross carrying amount of financial assets measured at fair value through profit or loss, at fair value through other comprehensive income and at amortized cost, except for:
| - | | POCI financial assets, for which the original credit-adjusted effective interest rate is applied to the amortized cost of the financial asset. |
| - | | Financial assets that are not POCI but have subsequently become credit-impaired (or Stage 3), for which interest revenue is calculated by applying the effective interest rate to their amortized cost. |
Equity instruments
The Bank measures at initial recognition all equity instruments at its fair value plus transaction costs that are directly attributable to its acquisition. The Bank subsequently measures all equity instruments at fair value. The Management has elected to irrevocably present fair value gains and losses on equity instruments in other comprehensive income, consequently there is no subsequent reclassification on fair value gains and losses to profit or loss following the derecognition of the equity instrument including on disposal; fair value gains and losses on equity instruments are reclassified to Accumulated reserves on derecognition. The fair value gains and losses on equity instruments presented in other comprehensive income includes any related foreign exchange component.
Up to December 31, 2017 the Bank subsequently reclassified the fair value gains and losses from other comprehensive income to profit or loss following the derecognition of the equity instruments including on disposal.
Dividends from such equity instruments continue to be recognized in profit or loss as Dividend income in the consolidated income statement when the Bank’s right to receive payments is established.
As of 31 December 2017 and 2018, there were no significant investments in quoted financial instruments that had ceased to be recognized at their quoted price because their market could not be deemed to be active.
Up to December 31, 2017, equity instruments whose fair value could not be determined in a sufficiently objective manner and financial derivatives that had those instruments as their underlying and were settled by delivery of those instruments were measured at acquisition cost adjusted, where appropriate, by any related impairment loss.
Derivatives
All derivatives are recognized in the consolidated balance sheet at fair value from the trade date. If the fair value is positive, they are recognized as an asset and if the fair value is negative, they are recognized as a liability. In the absence of evidence to the contrary, the fair value on the trade date is deemed to be the transaction price. The changes in the fair value of derivatives from the trade date are recognized in Gains/(losses) on financial assets and liabilities (net) in the consolidated income statement. Specifically, the fair value of derivatives traded in organized markets included in the portfolios of financial assets or liabilities held for trading is deemed to be their daily quoted price. If for exceptional reasons the quoted price cannot be determined on a given date, these financial derivatives are measured using methods similar to those used to measure over-the-counter (OTC) derivatives.
The fair value of OTC derivatives is determined using the most appropriate valuation techniques commonly used by the financial markets based on the characteristics of each financial instrument such as present value, option pricing models and other methods.
ii. Measurement of financial liabilities
In general, financial liabilities are measured at amortized cost, as defined above, except for those included under Financial liabilities at fair value through profit or loss and Other financial liabilities at fair value through profit or loss and financial liabilities designated as hedged items (or hedging instruments) in fair value hedges, which are measured at fair value.
iii. Valuation techniques
The following table shows a summary of the fair values at December 31, 2017 and 2018 of the financial assets and liabilities indicated below, classified on the basis of the various measurement methods used by the Bank to determine their fair value:
| | | | | | | | | | | | | | | | | | | |
| | | 12/31/2017 | | | 12/31/2018 | |
| | | Published | | | | | | | | | Published | | | | | | | |
| | | Price | | | | | | | | | Price | | | | | | | |
| | | Quotations | | | | | | | | | Quotations | | | | | | | |
| | | in Active | | | | | | | | | in Active | | | | | | | |
| | | Markets – | | | Internal | | | | | | Markets – | | | Internal | | | | |
| | | Level 1 | | | Models | | | Total | | | Level 1 | | | Models | | | Total | |
| | | | | | | | | | | | | | | | | | | |
ASSETS: | | | | | | | | | | | | | | | | | | | |
Financial assets held for trading | | | 147,784 | | | 167,786 | | | 315,570 | | | — | | | — | | | — | |
Financial assets at fair value through profit or loss | | | — | | | — | | | — | | | 109,858 | | | 157,666 | | | 267,524 | |
Other financial assets at fair value through profit or loss | | | — | | | 51,705 | | | 51,705 | | | — | | | 107,425 | | | 107,425 | |
Available-for-sale financial assets | | | 164,999 | | | 743 | | | 165,742 | | | — | | | — | | | — | |
Financial assets at fair value through other comprehensive income | | | — | | | — | | | — | | | 125,383 | | | 30,406 | | | 155,789 | |
Hedging derivatives | | | — | | | 15,116 | | | 15,116 | | | — | | | 9,285 | | | 9,285 | |
| | | 312,783 | | | 235,350 | | | 548,133 | | | 235,241 | | | 304,782 | | | 540,023 | |
LIABILITIES: | | | | | | | | | | | | | | | | | | | |
Financial liabilities held for trading | | | 620 | | | 239,105 | | | 239,725 | | | — | | | — | | | — | |
Financial liabilities at fair value through profit or loss | | | — | | | — | | | — | | | 689 | | | 254,792 | | | 255,481 | |
Other financial liabilities at fair value through profit or loss | | | — | | | 120,653 | | | 120,653 | | | — | | | 105,430 | | | 105,430 | |
Hedging derivatives | | | — | | | 11,091 | | | 11,091 | | | — | | | 8,393 | | | 8,393 | |
| | | 620 | | | 370,849 | | | 371,469 | | | 689 | | | 368,615 | | | 369,304 | |
The fair value of the financial instruments is determined, when possible, on the basis of a quoted price in an active market for an identical asset or liability (Level 1). This group includes government debt securities, private-sector debt securities without optional characteristics, derivatives traded in organized markets, shares and short positions.
In cases where price quotations cannot be observed, Management makes its best estimate of the price that the market would set using its own internal models (valuation techniques). These internal models use data based on observable market parameters as significant inputs (Level 2) and, in very specific cases, they use significant inputs not observable in market data (Level 3). The use of observable market data assumes that markets are efficient and therefore the data that is derived therefrom is representative.
The best evidence of the fair value of a financial instrument on initial recognition is the transaction price, unless the fair value of the instrument can be obtained from other market transactions performed with the same or similar instruments or can be measured by using a valuation technique in which the variables used include only observable market data, mainly interest rates.
The objective of valuation techniques is to arrive at a fair value measurement that reflects the price that would be received to sell the asset or paid to transfer the liability in an orderly transaction between market participants at the measurement date.
Still, other internal models use unobservable data as inputs. Examples of such unobservable inputs and assumptions are as follows:
Correlation: Historical correlation between equity prices and exchange rates is assumed for valuing quanto and composite options.
Dividends: The estimation for the dividend used as inputs in the internal models is based on the dividend payments expected from the issuer companies.
Volatility: There is no liquid option market for certain long-term assets. For most Mexican underlying assets, the option market is for up to one year. In the case of the Mexican Stock Exchange Prices and Quotations Index (IPC), there is an option market up to three years. In these cases, Bank’s Management assumes a local volatility model using maturities for which market data exists and extrapolates the curve for unknown terms.
Rate curve for estimating the interest rate index known as the 91‑day TIIE: there is no liquid market for interest rate swaps (IRS) with 91‑day payment terms. For these fair value measurements, the 28‑day IRS curve is used instead.
Market credit spreads: For some counterparties there is no credit default swaps (CDS) market quotes from which it is possible to infer a credit curve, this aspect is common for most of the Mexican counterparties. When there is no credit default swaps quote, generic credit curves are used instead. These curves are inferred from a proxy of quoted market credit default swaps considering geography, sector and rating.
Whenever unobservable market data is used in valuation techniques, the valuation is adjusted considering unobservable assumptions that market participants would use when pricing the asset or liability, including assumptions about risk.
The Bank also adjusts the value of some assets when they have very low market trading volume, even when prices are available.
Fair value measurements that incorporate significant unobservable inputs are classified as Level 3. Significant unobservable inputs are defined as inputs for which observable market data are not available and that are significant to the fair value measurement. Such inputs are developed using the best information available about assumptions that market participants would use when pricing the asset or liability.
iv. Valuation of financial instruments
General measurement bases
The Bank has implemented a formal process for systematic valuation and management of financial instruments. The governance scheme for this process distributes responsibilities between two independent areas inside the Bank: Treasury (development, marketing and daily management of
financial products and market data) and Risks (on a periodic basis, validation of pricing models and market data, computation of risk metrics, new transactions approval policies, management of market risk and implementation of fair value adjustment policies).
The approval of new products follows a sequence of steps (request, development, validation, integration in corporate systems and quality assurance) before the product is brought into production. This process ensures that pricing systems have been properly reviewed and are stable before they are used.
The related valuation techniques and inputs by asset class are as follows:
| a. | | Financial assets at fair value through profit or loss (financial assets held for trading) and at fair value through other comprehensive income (available-for-sale financial assets) |
The estimated fair value of these financial assets is determined using quoted prices or yield curves provided by a price vendor.
| b. | | Loans and advances to credit institutions and customers – reverse repurchase agreements |
The fair value is estimated by using the discounted cash flow (forward estimation) technique using the interest rates that are currently offered for loans and advances with terms similar to those of borrowers having a similar credit quality.
| c. | | Loans and advances to customers at fair value through other comprehensive income |
The estimated fair value of these financial assets is calculated by a default estimation method. This method consists of: a) estimating the default probabilities through a bootstrapping method from market credit spreads to incorporate the credit risk in the risk interest rate and b) discounting the expected cash flow at risk interest rate through the applicable discount factor. Both steps use observable market data (yield curves and market credit spreads) which are provided by a price vendor. The model assumes a deterministic approximation for modelling the cancellation prepayment: it is assumed that the obligor has a rational behavior and will exercise at the best moment, and then it assumes that the cancellation will be total.
| d. | | Short positions, deposits from the Central Bank and deposits from credit institutions and customers – repurchase agreements |
The fair value of these financial instruments is calculated by using the discounted cash flow (forward estimation) technique based on the current incremental lending rates for similar types of deposits having similar maturities.
| e. | | Financial derivatives (assets and liabilities) |
The estimated fair value of futures contracts is calculated using the prices quoted on the Derivatives Exchange Markets (Mercado Mexicano de Derivados and Chicago Mercantile Exchange) of identical instruments.
If there are no quoted prices on the market (either direct or indirect) for a derivative instrument, the respective fair value estimates are calculated by using one of the following models and valuation techniques:
| i. Non-closed formula solution |
In the valuation of financial instruments permitting static hedging (such as loans and receivables, deposits, forwards and swaps), the present value method (forward estimation) is used. This method consists of a) calculating the expected cash flows and b) discounting the expected cash flows at the risk interest rate through the applicable discount factor. Both steps use observable market data (yield curves, foreign exchange spot rates and so forth) which are provided by a market data supplier (price vendor).
| ii. Closed-formula solution |
The Black-Scholes model and Black model are used for the valuation of plain vanilla options, the first for foreign exchange and securities and the latter for interest rates. These models assume that the underlying price follows a lognormal distribution.
The Monte Carlo method with the local volatility model is the market proxy or reference model to price a wider range of exotic equity products.
The partial differential equation method with the local volatility model is particularly appropriate to price and manage callable products and products including barrier features on a single underlying. This method is quicker, more stable and more precise than the standard Monte Carlo method, but the latter is needed when the underlying is a basket. The local volatility models assume that share and index prices are lognormally distributed and volatility is a deterministic function of time and the market price.
The trinomial trees method is intended for American foreign exchange products, which can be canceled at any time throughout the life of the option. It assumes deterministic interest rates and represents the evolution of the underlying foreign exchange using the Black-Scholes model.
The partial differential equation solver using a mixed volatility model is used for pricing barrier products in foreign exchange. The development of a mixed volatility model was motivated by some very sensitive barrier products (double-no-touch options), which were quoted in the market with prices in between those provided by a local volatility model and a pure stochastic volatility model. The mixed volatility model is a combination of both models, which provides a price between them.
| f. | | Marketable debt securities |
The fair value of these financial instruments is calculated by using the discounted cash flow (forward estimation) technique, based on the current incremental lending rates for similar types of deposits having similar maturities, for the debt obligation component and one of the financial derivatives valuation techniques for the embedded derivative component, that depends on the payoff.
Valuation adjustment for counterparty risk or default risk
The Credit Valuation Adjustment (CVA) is a valuation adjustment to OTC derivatives as a result of the risk associated with the credit exposure assumed with each counterparty.
The CVA is calculated taking into account expected positive exposure with each counterparty in each future period. The CVA for a specific counterparty is equal to the sum of the CVA for all the periods.
The following inputs are used to calculate the CVA:
| · | | Expected positive exposure: average positive exposure to the counterparty, across all paths, all evaluated on a certain future date using a Monte Carlo method to simulate the future values of the derivatives’ portfolio. Mitigating factors such as collateral and netting agreements are taken into account. |
| · | | Loss Given Default: percentage of final loss assumed in a counterparty credit event /default. |
| · | | Probability of Default: credit default swaps are used to infer the Probability of Default. For cases where there is no market information, probabilities are inferred using a market proxy based on market information from companies in the same industry and with the same external ratings as the counterparty, to ensure best practice. |
The Debt Valuation Adjustment (DVA) is a similar valuation adjustment to the CVA but, in this case, it arises as a result of the Bank’s risk assumed by its counterparties in OTC derivatives.
The CVA and DVA recognized at December 31, 2017 amounted to 370 million pesos and 2,397 million pesos, respectively. The CVA and DVA recognized at December 31, 2018 amounted to 369 million pesos and 2,026 million pesos, respectively.
All financial instruments fair values are calculated on a daily basis.
Set forth below are the financial instruments at fair value whose measurement was based on internal models (Level 2 and 3) at December 31, 2017 and 2018.
| | | | | | | | | |
| | Fair | Fair | | |
| | Values | Values | | |
| | Calculated | Calculated | | |
| | Using Internal | Using Internal | Valuation Techniques | Key Inputs |
| | Models at | Models at | | |
| | 12/31/2017 | 12/31/2018 | | |
| | Level 2 | Level 3 | Total | Level 2 | Level 3 | Total | | |
| | | | | | | | | |
ASSETS: | | | | | | | | | |
Financial assets held for trading/Financial assets at fair value through profit or loss: | | 167,535 | 251 | 167,786 | 156,872 | 794 | 157,666 | | |
| | | | | | | | | |
Debt and equity instruments | | 2,593 | — | 2,593 | 3,588 | — | 3,588 | Forward estimation (non-closed formula) | Interest rate yield curve |
Trading derivatives: | | | | | | | | | |
| | | | | | | | | |
Interest rate options | | 1,339 | — | 1,339 | 1,450 | — | 1,450 | Black model (closed-formula solution) | Interest rate yield curve and implied volatility surface |
| | | | | | | | | |
Market index options: | | 581 | — | 581 | 49 | | 49 | | |
| | | | | | | | | |
European options | | 548 | — | 548 | — | — | — | Black-Scholes model (closed-formula solution) | Interest rate yield curves, quoted equity prices and index levels, implied volatility surface and dividends estimation |
| | | | | | | | | |
Asian (Single underlying Quanto) | | 18 | — | 18 | — | — | — | Local volatility model with partial differential equation method | Interest rate yield curves, quoted equity prices and index levels, implied volatility surface, historical correlations and dividends estimation |
| | | | | | | | | |
Best of options (Basket) | | 15 | — | 15 | 2 | — | 2 | Local volatility model with Monte Carlo method | Interest rate yield curves, equity prices and index levels, implied volatility surface, historical correlations and dividends estimation |
| | | | | | | | | |
Quanto options | | — | — | — | 36 | — | 36 | Local volatility model with partial differential equation method | Interest rate yield curves, quoted equity prices and index levels, implied volatility surface, historical correlations and dividends estimation |
| | | | | | | | | |
Asian (Quanto) | | — | — | — | 11 | — | 11 | Local volatility model with partial differential equation method | Interest rate yield curves, quoted equity prices and index levels, implied volatility surface, historical correlations and dividends estimation |
| | | | | | | | | |
Exchange rate options: | | 1,885 | 172 | 2,057 | 1,192 | 44 | 1,236 | | |
| | | | | | | | | |
American forwards | | 23 | — | 23 | — | — | — | Black and Scholes model with trinomial tree method | Interest rate yield curves, quoted exchange rates and implied volatility surface |
| | | | | | | | | |
American Barrier & Touch options | | 39 | — | 39 | — | — | — | Mixed volatility model with partial differential equation method | Interest rate yield curves, quoted exchange rates and implied volatility surface |
| | | | | | | | | |
European options | | 1,823 | 172 | 1,995 | 1,192 | 44 | 1,236 | Black-Scholes model (closed-formula solution) | Interest rate yield curves, quoted exchange rates and implied volatility surface |
| | | | | | | | | |
Swaps | | 155,799 | 23 | 155,822 | 142,977 | 222 | 143,199 | Forward estimation (non-closed formula) | Interest rate yield curve and quoted exchange rates |
| | | | | | | | | |
Index and securities futures | | 93 | — | 93 | 936 | — | 936 | Forward estimation (non-closed formula) | Interest rate yield curve and quoted exchange rates |
| | | | | | | | | |
Interest rate futures | | — | — | — | — | — | — | Forward estimation (non-closed formula) | Interest rate yield curve |
| | | | | | | | | |
Exchange rate futures | | 5,245 | 56 | 5,301 | 6,680 | 528 | 7,208 | Forward estimation (non-closed formula) | Interest rate yield curve and quoted exchange rates |
| | | | | | | | | |
Other financial assets at fair value through profit or loss: | | 51,705 | — | 51,705 | 107,425 | — | 107,425 | | |
| | | | | | | | | |
Loans and advances to credit institutions – Reverse repurchase agreements | | 46,087 | — | 46,087 | 98,332 | — | 98,332 | Forward estimation (non-closed formula) | Interest rate yield curve |
| | | | | | | | | |
Loans and advances to customers – Reverse repurchase agreements | | 5,618 | — | 5,618 | 9,093 | — | 9,093 | Forward estimation (non-closed formula) | Interest rate yield curve |
| | | | | | | | | |
Available-for-sale financial assets/Financial assets at fair value through other comprehensive income: | | 743 | — | 743 | 29,635 | 771 | 30,406 | | |
| | | | | | | | | |
Debt instruments | | 675 | — | 675 | 29,575 | — | 29,575 | Forward estimation (non-closed formula) | Interest rate yield curve |
| | | | | | | | | |
Equity instruments | | 68 | — | 68 | 60 | — | 60 | Other | Value of shareholders’ equity |
| | | | | | | | | |
Loans and advances to customers | | — | — | — | — | 771 | 771 | Estimation of credit default probabilities from credit spreads | Interest rate yield curves and market credit spreads |
| | | | | | | | | |
Hedging derivatives: | | 15,116 | — | 15,116 | 9,285 | — | 9,285 | | |
| | | | | | | | | |
Swaps | | 12,727 | — | 12,727 | 4,174 | — | 4,174 | Forward estimation (non-closed formula) | Interest rate yield curve and quoted exchange rates |
| | | | | | | | | |
Exchange rate forwards | | 2,389 | — | 2,389 | 5,111 | — | 5,111 | Forward estimation (non-closed formula) | Interest rate yield curve and quoted exchange rates |
| | | | | | | | | |
| | 235,099 | 251 | 235,350 | 303,217 | 1,565 | 304,782 | | |
| | | | | | | | | |
| | Fair | Fair | | |
| | Values | Values | | |
| | Calculated | Calculated | | |
| | Using Internal | Using Internal | | |
| | Models at | Models at | Valuation | |
| | 12/31/2017 | 12/31/2018 | Techniques | Key Inputs |
| | Level 2 | Level 3 | Total | Level 2 | Level 3 | Total | | |
| | | | | | | | | |
LIABILITIES: | | | | | | | | | |
Financial liabilities held for trading/Financial liabilities at fair value through profit or loss: | | | | | | | | | |
| | 238,747 | 358 | 239,105 | 254,637 | 155 | 254,792 | | |
| | | | | | | | | |
Trading derivatives: | | | | | | | | | |
| | | | | | | | | |
Interest rate options | | 1,197 | — | 1,197 | 973 | — | 973 | Black model (closed-formula solution) | Interest rate yield curve and implied volatility surface |
| | | | | | | | | |
Market index options: | | 298 | — | 298 | 179 | — | 179 | | |
| | | | | | | | | |
European | | 163 | — | 163 | 1 | — | 1 | Black-Scholes model (closed-formula solution) | Interest rate yield curves, quoted equity prices, index levels, implied volatility surface and dividends estimation |
| | | | | | | | | |
Auto-callable | | 129 | — | 129 | 167 | — | 167 | Local volatility model with partial differential equation method | Interest rate yield curves, quoted equity prices and index levels, implied volatility surface, historical correlations and dividends estimation |
| | | | | | | | | |
Asian (Single underlying Quanto) | | 6 | — | 6 | — | — | — | Local volatility model with partial differential equation method | Interest rate yield curves, quoted equity prices and index levels, implied volatility surface, historical correlations and dividends estimation |
| | | | | | | | | |
Best of options [Basket] | | — | — | — | 1 | — | 1 | Local volatility model with partial differential equation method | Interest rate yield curves, quoted equity prices and index levels, implied volatility surface, historical correlations and dividends estimation |
| | | | | | | | | |
Quanto options | | — | — | — | 10 | — | 10 | Local volatility model with partial differential equation method | Interest rate yield curves, quoted equity prices and index levels, implied volatility surface, historical correlations and dividends estimation |
| | | | | | | | | |
Exchange rate options: | | 2,397 | 198 | 2,595 | 1,348 | 153 | 1,501 | | |
| | | | | | | | | |
American forwards | | 53 | — | 53 | — | — | — | Black and Scholes model with trinomial tree method | Interest rate yield curves, quoted exchange rates and implied volatility surface |
| | | | | | | | | |
European options | | 2,238 | 198 | 2,436 | 1,341 | 153 | 1,494 | Black-Scholes model with (closed-formula solution) | Interest rate yield curves, quoted exchange rates and implied volatility surface |
| | | | | | | | | |
American barrier and touch options | | 47 | — | 47 | 7 | — | 7 | Mixed volatility model with partial differential equation method | Interest rate yield curves, quoted exchange rates and implied volatility surface |
| | | | | | | | | |
American options | | 59 | — | 59 | — | — | — | Black-Scholes model (closed-formula solution) | Interest rate yield curves, quoted exchange rates and implied volatility surface |
| | | | | | | | | |
Swaps | | 161,389 | — | 161,389 | 143,448 | — | 143,448 | Forward estimation (non- closed formula solution) | Interest rate yield curves and quoted exchange rates |
| | | | | | | | | |
Index and securities futures | | 90 | — | 90 | 839 | — | 839 | Forward estimation (non- closed formula solution) | Interest rate yield curves, quoted equity prices and index levels exchange rates |
| | | | | | | | | |
Interest rate futures | | — | — | — | — | — | — | Forward estimation (non- closed formula solution) | Interest rate yield curve |
| | | | | | | | | |
Exchange rate futures | | 4,933 | 160 | 5,093 | 6,096 | 2 | 6,098 | Forward estimation (non- closed formula solution) | Interest rate yield curve and quoted exchange rates |
| | . | | | | | | | |
Short positions: | | | | | | | | | |
| | | | | | | | | |
Debt instruments | | 68,443 | — | 68,443 | 101,754 | — | 101,754 | Forward estimation (non- closed formula solution) | Interest rate yield curve |
| | | | | | | | | |
Other financial liabilities at fair value through profit or loss: | | 120,653 | — | 120,653 | 105,430 | — | 105,430 | | |
| | | | | | | | | |
Deposits from the Central Bank – Repurchase agreements | | 22,417 | — | 22,417 | 30,995 | — | 30,995 | Forward estimation (non- closed formula solution) | Interest rate yield curve |
| | | | | | | | | |
Deposits from credit institutions – Repurchase agreements | | 5,942 | — | 5,942 | 4,316 | — | 4,316 | Forward estimation (non- closed formula solution) | Interest rate yield curve |
| | | | | | | | | |
Customer deposits – Repurchase agreements | | 81,790 | — | 81,790 | 65,369 | — | 65,369 | Forward estimation (non- closed formula solution) | Interest rate yield curve |
| | | | | | | | | |
Marketable debt securities | | 10,504 | — | 10,504 | 4,750 | — | 4,750 | Present value (non-closed formula solution) and Black-Scholes model with closed-formula solution | Interest rate yield curve, quoted
equity prices and index levels,
implied volatility surface, historical
correlations and dividends estimation |
| | | | | | | | | |
Hedging derivatives: | | 11,091 | — | 11,091 | 8,393 | — | 8,393 | | |
| | | | | | | | | |
Swaps | | 10,370 | — | 10,370 | 8,047 | — | 8,047 | Forward estimation (non- closed formula solution) | Interest rate yield curve and quoted exchange rates |
| | | | | | | | | |
Exchange rate forwards | | 721 | — | 721 | 346 | — | 346 | Forward estimation (non- closed formula solution) | Interest rate yield curve and quoted exchange rates |
| | 370,491 | 358 | 370,849 | 368,460 | 155 | 368,615 | | |
Some of the financial instruments of the fair-value hierarchy have identical or similar offsetting exposures to certain inputs, but in accordance with IFRS, are presented as gross assets and liabilities in the consolidated balance sheet.
The measurements calculated through valuation techniques, might have other methods or assumptions than those related to interest rate risk, credit risk and foreign currency risk spreads, or their related correlations and volatilities. Nevertheless, Bank’s Management believes that the fair value of the financial assets and liabilities recognized in the consolidated balance sheet and the gains and losses arising from these financial instruments are reasonably stated.
Financial instruments categorized in Level 3
Set forth below are the Bank’s financial instruments measured using unobservable market data as significant inputs of the internal models (Level 3):
As of December 31, 2018, the financial assets at fair value through profit or loss categorized in Level 3 are the structure denominated as “Red Compartida”, six cross currency swaps (CCS) with maturity above of twenty years of which five of them are USD/Mexican Peso (MXN) and the remaining corresponds to UDI/MXN and one loan classified as part of the Held to collect and sell business model according to IFRS 9.
| - | | The structure denominated as “Red Compartida” (Nominal USD 526 million) is composed of foreign currency exchange (Fx) forwards and plain vanilla Fx options over USD/MXN with maturity from two to five years (the nominal amount is distributed along this term in nine periods). For the Fx options there is a substantial risk of uncertainty in the market data used for the valuation, specifically in the long-term volatility, because the USD/MXN options market in these terms may not have the necessary market liquidity. The lack of sufficient liquidity make the Fx options to be valued using an unobservable input, thus “Red Compartida” has been categorized as Level 3. |
| - | | Two CCS USD/MXN (Nominal USD 100 million) were traded with a maturity of twenty two years. The lack of liquidity beyond twenty years make these CCS USD/MXN to be categorized as Level 3. |
| - | | Three CCS USD/MXN (Nominal USD 12 million) were traded with a maturity of thirty years. The lack of liquidity beyond thirty years makes these CCS USD/MXN to be categorized as Level 3. |
| - | | During the last quarter of 2018, one CCS UDI/MXN (Nominal 200 million pesos) was traded with a maturity of twenty five years which is classified as Level 3, because one of the inputs needed to value this financial instrument is not observable in the market (UDI/MXN 30 year quote) which turns out significant in the value of this CCS. |
| - | | In December 2018, one loan (Nominal USD 39 million) classified as part of the Held to collect and sell business model was granted to a small-medium size customer. In order to calculate the fair value of this loan, market credit spreads per counterparty are needed; but given that this counterparty does not have a market credit quote (CDS), a generic credit curve is used as proxy to represent its credit risk. Therefore, this loan is categorized as Level 3. |
As of December 31, 2017, the financial assets held for trading categorized in Level 3 are the structure denominated as “Red Compartida” and two Cross Currency Swaps USD/Mexican Peso (MXN) with maturity of twenty two years.
| - | | The structure denominated as “Red Compartida” is composed of Fx forwards and plain vanilla Fx options over USD/MXN with maturity from two to five years. For the Fx options, there is a substantial risk of uncertainty in the market data used for the valuation, specifically in the long-term volatility, because the USD/MXN options market in these terms may not have the necessary market liquidity. The lack of sufficient liquidity make the Fx options to be valued using an unobservable input, thus “Red Compartida” has been categorized as Level 3. |
| - | | Two CCS USD/MXN (Nominal USD 100 million) were traded with a maturity of twenty two years. The lack of liquidity beyond twenty years makes these CCS USD/MXN to be categorized as Level 3. |
The following table provides a reconciliation of the movement between opening and closing balances of Level 3 financial instruments, measured at fair value using a valuation technique with significant unobservable inputs:
| | | | | | | | | | | | | |
| | | | | | | Assets | | | | | | |
| | | Debt and Equity | | | Trading | | | Loans and advances | | | | |
| | | Instruments | | | derivatives | | | to customers | | | Total | |
| | | | | | | | | | | | | |
Balance at January 1, 2016 | | | 219 | | | — | | | — | | | 219 | |
Total gains/losses recognized in the consolidated income statement: | | | | | | | | | | | | | |
Gains/(losses) on financial assets and liabilities (net) | | | 73 | | | — | | | — | | | 73 | |
Purchases | | | — | | | — | | | — | | | — | |
Sales | | | (102) | | | — | | | — | | | (102) | |
Settlements | | | (18) | | | — | | | — | | | (18) | |
Balance at December 31, 2016 | | | 172 | | | — | | | — | | | 172 | |
Total gains/losses recognized in the consolidated income statement: | | | | | | | | | | | | | |
Gains/(losses) on financial assets and liabilities (net) | | | (13) | | | 91 | | | — | | | 78 | |
Purchases | | | — | | | — | | | — | | | — | |
Sales | | | (143) | | | — | | | — | | | (143) | |
New issuances | | | | | | 160 | | | — | | | 160 | |
Settlements | | | (16) | | | — | | | — | | | (16) | |
Balance at December 31, 2017 | | | — | | | 251 | | | — | | | 251 | |
Total gains/losses recognized in the consolidated income statement: | | | | | | | | | | | | | |
Gains/(losses) on financial assets and liabilities (net) | | | — | | | 543 | | | — | | | 543 | |
Purchases | | | — | | | — | | | — | | | — | |
Sales | | | — | | | — | | | — | | | — | |
New issuances | | | — | | | — | | | 771 | | | 771 | |
Settlements | | | — | | | — | | | — | | | — | |
Balance at December 31, 2018 | | | — | | | 794 | | | 771 | | | 1,565 | |
| | | | | | | | | | |
| | | | | | Liabilities | | | | |
| | | Debt and Equity | | | Trading | | | | |
| | | Instruments | | | derivatives | | | Total | |
| | | | | | | | | | |
Balance at December 31, 2017 | | | — | | | (358) | | | (358) | |
Total gains/losses recognized in the consolidated income statement: | | | | | | | | | | |
Gains/(losses) on financial assets and liabilities (net) | | | — | | | 203 | | | 203 | |
Purchases | | | — | | | — | | | — | |
Sales | | | — | | | — | | | — | |
New issuances | | | | | | — | | | — | |
Settlements | | | — | | | — | | | — | |
Balance at December 31, 2018 | | | — | | | (155) | | | (155) | |
Unobservable inputs used in measuring fair value
The table below sets out information about significant unobservable inputs used at December 31, 2018 in measuring financial instruments categorized as Level 3 in the fair value hierarchy:
| | | | | | | | | | | | | | | |
| | | | | | | | | Significant | | | Range of Estimates | | | Fair value Measurement |
| | | | | | Valuation | | | Unobservable | | | (weighted-average) | | | Sensitivity to |
Financial Instrument | | | Fair value | | | Technique | | | Input | | | for Unobservable Input | | | Unobservable Inputs |
Cross Currency Swaps | | | 223 | | | Forward estimation (non-closed formula solution) | | | Long term MXN rates | | | Bid Offer Spread IRS TIIE 2 basis points - 6 basis points (3 basis points) CCS USD/MXN 3 basis points -10 basis points (4 basis points) Swaps UDI/MXN 5 basis points -10 basis points (10 basis points) | | | A significant increase in MXN rates would result in a lower fair value |
Long term Fx options (Red Compartida) | | | 427 | | | Black-Scholes model (closed-formula solution) | | | Long term Fx USD/MXN volatility | | | 11%-17% (14.7%) | | | A significant increase in volatility would result in a lower fair value |
Loans and advances to customers | | | 771 | | | Estimation of credit default probabilities from credit spreads | | | Market credit quotes (credit default swaps) | | | Credit spread
365 basis points – 662 basis points (386 basis points)
| | | A significant rating downgrade would result in a lower fair value |
Although the Management believes that its estimates of fair value are appropriate, the use of different inputs could lead to different measures of fair value. As of December 31, 2018, the potential impact on the consolidated income statement of changing the main inputs used for the measurement of Level 3 financial instruments for other inputs, taking the highest (most favorable
input) or lowest (least favorable) value of the range deemed reasonably possible, would be as follows:
| | | | | | | |
| | | Potential Impact on Consolidated | |
| | | Income Statement as of | |
| | | December 31, 2018 | |
| | | Most | | | Least | |
| | | Favorable | | | Favorable | |
| | | Input | | | Input | |
| | | | | | | |
ASSETS: | | | | | | | |
Cross Currency Swaps | | | 11 | | | (11) | |
Red Compartida | | | 19 | | | (2) | |
Loans and advances to customers | | | — | | | (95) | |
LIABILITIES: | | | | | | | |
Red Compartida | | | 7 | | | (53) | |
Cross Currency Swaps
The least favorable scenario assumed the following:
| - | | The MXN and UDI market rates (IRS TIIE, X-CCY USD/MXN and X-CCY UDI/MXN) needed to valuation were moved up 6 basis points, 10 basis points and 10 basis points, respectively. The scenarios were determined by the following: 0.95 percentile over a 1 year historical period of the difference between the bid and offer quotations of these market rates divided by two. |
The most favorable scenario assumed the following:
| - | | The MXN and UDI market rates (IRS TIIE, X-CCY USD/MXN and X-CCY UDI/MXN) needed to valuation were moved down 6 basis points, 10 basis points and 10 basis points, respectively. |
Red Compartida
The least favorable scenario assumed the following:
| - | | The volatility of the underlying asset of the long term Fx USD/MXN options at its maturity moved from 14.75% to 16.58%. |
The volatility used as input for the internal model (14.75%) is an extrapolation of the observable volatility surface of a shorter-term option market of the underlying, provided by the local price vendor. The scenario was based on two factors: the difference between the bid and offer quotations of these options divided by two and the 0.95% percentile of the movement price distribution.
The most favorable scenario assumed the following:
| - | | The volatility of the underlying asset of the long term Fx USD/MXN options at its maturity moved from 14.75% to 14.48%. |
Loans and advances to customers
The least favorable scenario assumed the following:
| - | | Stress of the credit spread equivalent to a downgrade of three notches to represent the possible volatility of assigning a proxy credit curve to the counterparty. The rating has been moved from BB+ to B+ employing an internal-external rating equivalency. |
There is no favorable scenario regarding this loan, since the greatest fair value of this financial asset is the total amount granted (value at par).
v. Sensitivity analysis
As an alternative to sensitivity analysis, the Bank uses a Value at Risk (VaR) technique. A detailed explanation about VaR technique and the main assumptions incorporated therein are described in Note 47. The VaR amounts as of December 31, 2018, including all financial instruments in the trading book position of the Bank are as follows:
| | | | | | | | | | | | | |
| | | Average | | | High | | | Low | | | 12/31/2018 | |
| | | | | | | | | | | | | |
All financial instruments | | | 122 | | | 399 | | | 69 | | | 69 | |
By category: | | | | | | | | | | | | | |
Instruments sensitive to interest rate | | | 110 | | | 153 | | | 52 | | | 55 | |
Instruments sensitive to equity market prices | | | 6 | | | 55 | | | 1 | | | 4 | |
Instruments sensitive to foreign currency exchange rates | | | 48 | | | 139 | | | 4 | | | 65 | |
Instruments sensitive to volatility movements | | | 11 | | | 24 | | | 7 | | | 10 | |
The Bank’s VaR should be interpreted in light of the limitations of the methodologies. These limitations include the following:
Historical data may not provide the best estimate of the joint distribution of risk factor changes in the future and may fail to capture the risk of possible extreme adverse market movements, which have not occurred in the historical window used in the calculations.
VaR using a one-day time horizon does not fully capture the market risk of positions that cannot be liquidated or hedged within one day.
The Bank largely computes the VaR of the trading portfolios at the close of business and positions may change substantially during the course of the trading day.
VaR using a 99 percent confidence level does not reflect the extent of potential losses beyond that percentile.
These limitations and the nature of the VaR measure mean that the Bank can neither guarantee that losses will not exceed the VaR amounts indicated nor that losses in excess of the VaR amounts will not occur more frequently than once in 100 business days.
vi. Recognition of fair value changes
Changes in the fair value of certain financial assets and liabilities subject to those changes are recognized, either in the consolidated income statement or in the consolidated other comprehensive income. A distinction is made between the changes resulting from the accrual of interest and similar items which are recognized under Interest income or Interest expenses and similar charges, as
appropriate, and those arising for other reasons which are recognized at their net amount under Gain/(losses) on financial assets and liabilities (net).
The recognition of the adjustments due to changes in fair value arising from financial assets at fair value through other comprehensive income are described in Note 2d.i.
vii. Hedging transactions
The Bank uses derivatives for the following purposes: (i) to facilitate these instruments to customers who request them in the management of their market and credit risks (trading derivatives); (ii) to use these derivatives in the management of the risks of the Bank entities’ own positions and assets and liabilities (hedging derivatives); and (iii) to obtain gains from changes in the prices of these derivatives (trading derivatives).
Derivatives that do not qualify for hedge accounting are treated for accounting purposes as trading derivatives.
A derivative qualifies for hedge accounting if all the following conditions are met:
| 1. | | The derivative hedges one of the following three types of exposure: |
| a. | | Changes in the fair value of assets and liabilities due to fluctuations in, among others, the interest rate and/or exchange rate to which the position or balance to be hedged is subject and firm commitments (fair value hedge); |
| b. | | Changes in the estimated cash flows arising from financial assets and liabilities and highly probable forecasted transactions (cash flow hedge); and |
| c. | | The net investment in a foreign operation (hedge of a net investment in a foreign operation). |
| 2. | | It is effective in offsetting exposure inherent in the hedged item throughout the expected term of the hedge, which means that: |
| a. | | At the date of arrangement, the hedge is expected, under normal conditions, to be highly effective (prospective effectiveness). |
| b. | | There is sufficient evidence that the hedge was effective during the whole life of the hedged item (retrospective effectiveness). To this end, the Bank checks that the results of the hedge were within a range of 80% to 125% of the results of the hedged item. |
| 3. | | There must be adequate documentation evidencing the specific designation of the derivative to hedge certain balances or transactions and how this hedge was expected to be achieved and measured, provided that this is consistent with the Bank’s Management of its own risks. |
The changes in value of financial instruments qualifying for hedge accounting are recognized as follows:
| a. | | In fair value hedges, the gains or losses arising on both the hedging instruments and the hedged items attributable to the type of risk being hedged are recognized directly in the consolidated income statement. |
| b. | | In cash flow hedges, the effective portion of the change in value of the hedging instrument is recognized in the consolidated other comprehensive income under Valuation adjustments - Cash flow hedges until the forecast transactions occur, when it is recognized in the |
consolidated income statement, unless, if the forecast transactions result in the recognition of non-financial assets or liabilities, it is included in the cost of the non-financial asset or liability. |
| c. | | In hedges of a net investment in a foreign operation, the gains or losses attributable to the portion of the hedging instruments qualifying as an effective hedge are recognized temporarily in the consolidated other comprehensive income under Valuation adjustments - Hedges of net investments in foreign operations until the gains or losses on the hedged item are recognized in the consolidated income statement. |
| d. | | The ineffective portion of the gains or losses on the hedging instruments of cash flow hedges and hedges of a net investment in a foreign operation are recognized directly under Gain/(losses) on financial assets and liabilities in the consolidated income statement. |
If a derivative designated as a hedge no longer meets the requirements described above due to expiration, ineffectiveness or for any other reason, the derivative is classified for accounting purposes as a trading derivative.
When fair-value hedge accounting is discontinued, the adjustments previously recognized on the hedged item are reclassified to the consolidated income statement at the effective interest rate recalculated at the date of hedge discontinuation. The adjustments must be fully amortized at maturity.
When cash flow hedges are discontinued, any cumulative gain or loss on the hedging instrument recognized in the consolidated other comprehensive income under Valuation adjustments - Cash flow hedges (from the period when the hedge was effective) remains in this consolidated equity item until the forecast transaction occurs, at which time it is recognized in the consolidated income statement, unless the transaction is no longer expected to occur, in which case the cumulative gain or loss is recognized immediately in the consolidated income statement.
vii. Embedded derivatives in hybrid financial instruments
Embedded derivatives in other financial instruments or in other host contracts are accounted for separately as derivatives if: i) their risks and characteristics are not closely related to those of the host contracts; ii) a separate instrument with the same terms would meet the definition of a derivative and iii) the hybrid contract is not measured at fair value through profit or loss.
e) Derecognition of financial assets and liabilities
The accounting treatment of transfers of financial assets depends on the extent to which the risks and rewards associated with the transferred assets are transferred to third parties:
| 1. | | If the Bank transfers substantially all the risks and rewards to third parties – unconditional sale of financial assets, sale of financial assets under an agreement to repurchase them at their fair value at the date of repurchase, sale of financial assets with a purchased call option or written put option that is deeply out of the money, securitization of assets in which the transferor does not retain a subordinated debt or grant any credit enhancement to the new holders, and other similar cases – the transferred financial asset is derecognized and any rights or obligations retained or created in the transfer are recognized simultaneously. |
| 2. | | If the Bank retains substantially all the risks and rewards associated with the transferred financial asset – sale of financial assets under an agreement to repurchase them at a fixed price or at the sale price plus interest, a securities lending agreement in which the borrower undertakes to return the same or similar assets, and other similar cases –, the transferred financial asset is not derecognized and continues to be measured by the same criteria as those used before the transfer. However, the following items are recognized: |
| a. | | An associated financial liability, which is recognized for an amount equal to the consideration received and is subsequently measured at amortized cost, unless it meets the requirements for classification under Other financial liabilities at fair value through profit or loss. |
| b. | | The income from the transferred financial asset not derecognized and any expense incurred on the new financial liability, without offsetting. |
| 3. | | If the Bank neither transfers nor retains substantially all the risks and rewards associated with the transferred financial asset – sale of financial assets with a purchased call option or written put option that is not deeply in or out of the money, securitization of assets in which the transferor retains a subordinated debt or other type of credit enhancement for a portion of the transferred asset, and other similar cases – the following distinction is made: |
| a. | | If the transferor does not retain control of the transferred financial asset, the asset is derecognized and any rights or obligations retained or created in the transfer are recognized. |
| b. | | If the transferor retains control of the transferred financial asset, it continues to recognize it for an amount equal to its exposure to changes in value and recognizes a financial liability associated with the transferred financial asset. The net carrying amount of the transferred asset and the associated liability is the amortized cost of the rights and obligations retained, if the transferred asset is measured at amortized cost, or the fair value of the rights and obligations retained, if the transferred asset is measured at fair value. |
Accordingly, financial assets are only derecognized when the rights on the cash flows they generate have expired or when substantially all the inherent risks and rewards have been transferred to third parties.
Financial liabilities are only derecognized when the obligations they generate have been extinguished, that is when the contractual obligations have been paid or cancelled, or have been expired.
The exchange between the Bank and its original lenders of debt instruments with substantially different terms, as well as substantial modifications of the terms of existing financial liabilities, are accounted for as an extinguishment of the original financial liability and the recognition of a new financial liability. The terms are substantially different if the discounted present value of the cash flows under the new terms, including any fees paid net of any fees received and discounted using the original effective interest rate, is at least 10% different from the discounted present value of the remaining cash flows of the original financial liability, both discounted at the original effective interest rate of the original liability. In addition, other qualitative factors, such as the currency that the instrument is denominated in, changes in the type of interest rate, new conversion features attached to the instrument and change in covenants are also taken into consideration. If an exchange of debt instruments or modification of terms is accounted for an extinguishment, any costs of fees incurred are recognized as part of the gain or loss on the extinguishment. If the exchange or modification is not accounted for as an extinguishment, any costs or fees incurred adjust the carrying amount of the liability and are amortized over the remaining term of the modified liability.
f) Offsetting of financial instruments
Financial asset and liability balances are offset, i.e., reported in the consolidated balance sheet at their net amount, only if the Bank currently have a legally enforceable right to set-off the recognized amounts and intend either to settle on a net basis or to realize the asset and settle the liability simultaneously.
The disclosures set out in the tables below include financial assets and financial liabilities that:
| · | | Are offset in the Bank’s consolidated balance sheet; or |
| · | | Are subject to an enforceable master netting arrangement or similar agreement that covers similar financial instruments, irrespective of whether they are offset in the consolidated balance sheet. |
The similar agreements include derivative clearing agreements, global master repurchase agreements and global master securities lending agreements. Similar financial instruments include derivatives, repurchase agreements, reverse repurchase agreements and securities borrowing and lending agreements. Financial instruments such as loans and receivables and deposits are not disclosed in the tables below unless they are offset in the consolidated balance sheet.
Derivative transactions are either transacted on an exchange or entered into under International Swaps and Derivatives Association (ISDA) master netting agreements. In general, under ISDA master netting agreements in certain circumstances (e.g. when a credit event such as a default occurs) all outstanding transactions under the agreement are terminated, the termination value is assessed and only a single net amount is due or payable in settlement of all transactions.
Repurchase agreements, reverse repurchase agreements, securities borrowing and lending agreements are covered by master agreements with netting terms similar to those of ISDA master netting agreements.
The ISDA and similar master netting arrangements do not meet the criteria for offsetting in the consolidated balance sheet. This is because they create for the parties to the agreement a right of set-off of recognized amounts that is enforceable only following an event of default, insolvency or bankruptcy of the Bank or the counterparties or following other predetermined events. In addition, the Bank does not intend to settle on a net basis or to realize the assets and settle the liabilities simultaneously.
The Bank receives and gives collateral in the form of cash, debt and equity securities in connection with the following transactions:
| · | | Repurchase agreements and reverse repurchase agreements; and |
| · | | Securities lending and borrowing agreements. |
Such collateral is subject to standard industry terms including, when appropriate, an ISDA Credit Support Annex. This means that securities received/given as collateral can be pledged or sold during the term of the transaction but have to be returned on maturity of the transaction. The terms also give each party the right to terminate the related transactions on the counterparty’s failure to post collateral.
The following financial assets are subject to offsetting, enforceable master netting arrangements and similar agreements:
As at December 31, 2017:
| | | | | | | | | | | | | | | | | | | | | | |
| | | | | | | | | | | | Amount not offset in the consolidated balance sheet | | | | |
| | | | | | Gross amount of | | | Net amount of | | | | | | | | | | | | | |
| | | | | | financial liabilities | | | financial assets | | | | | | | | | | | | | |
| | | | | | offset in the | | | presented in the | | | | | | | | | | | | | |
| | | Gross amount of | | | consolidated balance | | | consolidated | | | Impact of Master | | | Financial instrument | | | Cash | | | Net | |
| | | financial assets | | | sheet | | | balance sheet | | | Netting Agreements | | | collateral | | | collateral | | | amount | |
| | | | | | | | | | | | | | | | | | | | | | |
Derivative financial assets | | | 180,377 | | | — | | | 180,377 | | | (116,078) | | | (3,783) | | | (44,971) | | | 15,545 | |
| | | | | | | | | | | | | | | | | | | | | | |
Reverse repurchase agreements | | | 51,705 | | | — | | | 51,705 | | | — | | | (51,693) | | | — | | | 12 | |
| | | | | | | | | | | | | | | | | | | | | | |
Equity instruments (see Note 9.a) | | | 6 | | | — | | | 6 | | | — | | | (7) | | | — | | | (1) | |
| | | | | | | | | | | | | | | | | | | | | | |
| | | | | | | | | | | | | | | | | | | | | | |
Total | | | 232,088 | | | — | | | 232,088 | | | (116,078) | | | (55,483) | | | (44,971) | | | 15,556 | |
As at December 31, 2018:
| | | | | | | | | | | | | | | | | | | | | | |
| | | | | | | | | | | | Amount not offset in the consolidated balance sheet | | | | |
| | | | | | Gross amount of | | | Net amount of | | | | | | | | | | | | | |
| | | | | | financial liabilities | | | financial assets | | | | | | | | | | | | | |
| | | | | | offset in the | | | presented in the | | | | | | | | | | | | | |
| | | Gross amount of | | | consolidated balance | | | consolidated | | | Impact of Master | | | Financial Instrument | | | Cash | | | Net | |
| | | financial assets | | | sheet | | | balance sheet | | | Netting Agreements | | | collateral | | | collateral | | | amount | |
| | | | | | | | | | | | | | | | | | | | | | |
| | | | | | | | | | | | | | | | | | | | | | |
Derivative financial assets | | | 164,238 | | | — | | | 164,238 | | | (92,928) | | | (4,044) | | | (42,391) | | | 24,875 | |
| | | | | | | | | | | | | | | | | | | | | | |
Reverse repurchase agreements | | | 107,425 | | | — | | | 107,425 | | | — | | | (107,560) | | | — | | | (135) | |
| | | | | | | | | | | | | | | | | | | | | | |
Equity instruments (*) (see Note 9.a) | | | 250 | | | — | | | 250 | | | — | | | (250) | | | — | | | — | |
| | | | | | | | | | | | | | | | | | | | | | |
| | | | | | | | | | | | | | | | | | | | | | |
Total | | | 271,913 | | | — | | | 271,913 | | | (92,928) | | | (111,854) | | | (42,391) | | | 24,740 | |
(*) As of December 31, 2018, the financial instruments received as collateral in lending transactions amount to 333 million pesos, which are limited to the net equities lent under the aforementioned lending transactions.
The following financial liabilities are subject to offsetting, enforceable master netting arrangements and similar agreements:
As at December 31, 2017:
| | | | | | | | | | | | | | | | | | | | | | |
| | | | | | | | | | | | Amount not offset in the consolidated balance sheet | | | | |
| | | | | | Gross amount of | | | Net amount of | | | | | | | | | | | | | |
| | | | | | financial assets | | | financial liabilities | | | | | | | | | | | | | |
| | | | | | offset in the | | | presented in the | | | | | | | | | | | | | |
| | | Gross amount of | | | consolidated balance | | | consolidated | | | Impact of Master | | | Financial Instrument | | | Cash | | | Net | |
| | | financial liabilities | | | sheet | | | balance sheet | | | Netting Agreements | | | collateral | | | collateral | | | amount | |
| | | | | | | | | | | | | | | | | | | | | | |
Derivative financial liabilities | | | 182,373 | | | — | | | 182,373 | | | (116,078) | | | (2,822) | | | (34,454) | | | 29,019 | |
| | | | | | | | | | | | | | | | | | | | | | |
Repurchase agreements | | | 110,149 | | | — | | | 110,149 | | | — | | | (110,337) | | | — | | | (188) | |
| | | | | | | | | | | | | | | | | | | | | | |
Short positions - Securities loans (see Note 10.b) | | | 21,132 | | | — | | | 21,132 | | | — | | | (21,555) | | | — | | | (423) | |
| | | | | | | | | | | | | | | | | | | | | | |
Short positions – Short sales (see Note 10.b) | | | 46,233 | | | — | | | 46,233 | | | — | | | (46,221) | | | — | | | 12 | |
| | | | | | | | | | | | | | | | | | | | | | |
| | | | | | | | | | | | | | | | | | | | | | |
Total | | | 359,887 | | | — | | | 359,887 | | | (116,078) | | | (180,935) | | | (34,454) | | | 28,420 | |
As at December 31, 2018:
| | | | | | | | | | | | | | | | | | | | | | |
| | | | | | | | | | | | Amount not offset in the consolidated balance sheet | | | | |
| | | | | | Gross amount of | | | Net amount of | | | | | | | | | | | | | |
| | | | | | financial assets | | | financial liabilities | | | | | | | | | | | | | |
| | | | | | offset in the | | | presented in the | | | | | | | | | | | | | |
| | | Gross amount of | | | consolidated balance | | | consolidated | | | Impact of Master | | | Financial instrument | | | Cash | | | Net | |
| | | financial liabilities | | | sheet | | | balance sheet | | | Netting Agreements | | | collateral | | | collateral | | | amount | |
| | | | | | | | | | | | | | | | | | | | | | |
Derivative financial liabilities | | | 162,120 | | | — | | | 162,120 | | | (92,928) | | | (6,234) | | | (29,409) | | | 33,549 | |
| | | | | | | | | | | | | | | | | | | | | | |
Repurchase agreements | | | 100,680 | | | — | | | 100,680 | | | — | | | (101,197) | | | | | | (517) | |
| | | | | | | | | | | | | | | | | | | | | | |
Short positions - Securities loans (see Note 10.b) | | | 28,239 | | | — | | | 28,239 | | | — | | | (29,086) | | | | | | (847) | |
| | | | | | | | | | | | | | | | | | | | | | |
Short positions - Short sales (see Note 10.b) | | | 72,835 | | | — | | | 72,835 | | | — | | | (72,809) | | | | | | 26 | |
| | | | | | | | | | | | | | | | | | | | | | |
| | | | | | | | | | | | | | | | | | | | | | |
Total | | | 363,874 | | | — | | | 363,874 | | | (92,928) | | | (209,326) | | | (29,409) | | | 32,211 | |
g) Impairment of financial assets
Allowance for impairment losses
From January 1, 2018, the Bank assesses on a forward-looking basis the expected credit losses associated with its financial assets carried at amortized cost and at fair value through other comprehensive income. The impairment methodology applied depends on whether there has been a significant increase in credit risk.
The impairment estimation methodology segregates financial assets in three categories, based on the stage of each financial asset with regard to its level of credit risk:
| · | | Stage 1: financial assets for which no significant increase in credit risk is identified since their initial recognition. In this case, the allowance for impairment losses reflects credit losses arising from expected defaults over the following 12 months from the reporting date. |
| · | | Stage 2: if there has been a significant increase in credit risk since the date of initial recognition but the impairment event has not materialized, the financial asset is classified as Stage 2. In this case, the allowance for impairment losses reflects the expected losses from expected defaults over the life of the financial asset. |
| · | | Stage 3: a financial asset is classified in this Stage when it shows effective signs of impairment as a result of one or more credit events that have already occurred resulting in a credit loss. In this case, the amount of the allowance for impairment losses reflects the expected losses for credit risk over the expected life of the financial asset. |
For POCI financial assets, the allowance for impairment losses reflects a deep discount that considers the incurred expected credit risk losses of the financial asset.
Once the Bank has classified its financial assets according to the Stage mentioned above, those financial assets are assessed for impairment individually or collectively in order to recognize the allowance for impairment losses arising from credit risk, as follows:
Individual assessment
Financial assets individually assessed for credit impairment are evaluated by the following methodologies: i) Calculating the present value of expected cash flows discounted at an appropriate discount rate of those individually significant financial assets considering the debtor’s financial situation and any guarantees in place. The Bank takes into account all available information (external or internal), including expert judgment and reasonable and supportable forecasts of future events, to estimate the present value of expected cash flows and ii) Calculating the expected recovery from available collateral and guarantees, minus the estimated dispositions costs. Subsequently, expected cash flows, discounted at an appropriate rate, are estimates using the expected values from the sale or foreclosure of guarantees. The Bank takes into account all available information (external or internal), including expert judgment and reasonable and supportable forecasts of future events, to estimate the present value of expected cash flows.
The Bank has defined as an “individually significant financial asset” those financial assets with a total current risk exposure amounting more than 8 million pesos for wholesale and small and medium-sized enterprises (SMEs) loan portfolios. This threshold is reviewed annually to adapt it to the Bank’s business circumstances.
Collective assessment
Financial assets collectively assessed for credit impairment are evaluated by taking into consideration the historical impairment loss experience at the time of assessment adjusted to reflect current economic conditions and taking into account the characteristics of the counterparty, reasonable and supportable forecasts of futures events, the guarantees and collateral associated with the transaction.
In estimating the parameters used for allowance for impairment losses and for provisions for off-balance sheet risk calculation such as Exposure at Default (EAD), Probability of Default (PD), Loss Given Default (LGD) and discount rate, the Bank leveraged on its experience developing internal models for calculating parameters for regulatory and management purposes. The Bank is aware of the differences between such models and IFRS 9 requirements for impairment purposes. As a result, it has focused on adapting to such requirements to the development of its IFRS 9 allowance for impairment models.
Grouping of financial assets for collective assessment
Financial assets assessed collectively are grouped together considering those that have similar credit risk characteristics indicative of the debtors’ ability to pay all principal and interest amounts in accordance with the contractual terms. The credit risk characteristics considered for the purpose of grouping the financial assets are, inter alia, instrument type, debtor’s industry, type of guarantee or collateral, age of past due amounts and any other relevant factor for the estimation of future cash flows.
In performing this grouping, there must be sufficient information for the group to be statistically credible. Where sufficient information is not available internally, the Bank has considered internal/external supplementary data to use for assessing purposes. The characteristics and any supplementary data used to determine groupings are outlined below:
| a) | | Middle-market corporations loans |
| · | | Loan to value ratio band |
| · | | Credit conversion from variable to fixed rate |
| e) | | Small and medium-sized enterprises loans |
| · | | Guarantee from development banks |
| · | | Percentage of granted amount |
The appropriateness of grouping is monitored and reviewed on a periodic basis.
Significant increase in credit risk
The Bank considers a financial asset to have experienced a significant increase in credit risk, since initial recognition, assigning a classification into Stage 2, when one or more of the following quantitative, qualitative or backstop criteria have been met:
Quantitative criteria
For commercial loans to small and medium-sized enterprises, mortgage loans and installment loans to individuals (revolving consumer credit card loans and non-revolving consumer loans), the Bank has established a comparison between the “Lifetime PD” at the reporting date and the “Remaining Lifetime PD Originated” when the financial asset was initially recognized. The financial assets are classified by the “Remaining Lifetime PD Originated” into bands. If the financial asset exceeds the predefined threshold for its band, it is classified as Stage 2 with the corresponding “Lifetime PD” at the reporting date.
Each “Remaining Lifetime PD Originated” band classifies all the financial assets with similar characteristics of probability of default within a 12 month period. In order to determine the applicable thresholds for each band, the Bank has analyzed the distribution of “Observed Default Frequency” within a 12 month period in order to determine the threshold for each band where the defaults observed are concentrated.
“Observed Default Frequency” is defined as the rate in which loans that were not impaired become credit-impaired in a lifetime period.
The different bands of thresholds for each type of financial asset are shown below.
Commercial loans to small and medium-sized enterprises (SMEs)
| | | | |
“Lifetime PD” band at | | | Increase in “Lifetime PD” at reporting date which | |
initial recognition (%) | | | is considered significant (basis points) | |
| | | |
≤1.66 | | | 2.00 | |
1.66 - 3.00 | | | 6.00 | |
3.00 - 6.00 | | | 11.00 | |
6.00 - 8.00 | | | 14.25 | |
8.00 - 10.00 | | | 17.50 | |
10.00 - 13.00 | | | 20.75 | |
13.00 - 15.00 | | | 22.00 | |
15.00 - 18.00 | | | 23.00 | |
18.00 - 22.00 | | | 24.00 | |
>22.00 | | | 25.00 | |
| | | |
Mortgage loans
| | | | |
“Lifetime PD” band at | | | Increase in “Lifetime PD” at reporting date which | |
initial recognition (%) | | | is considered significant (basis points) | |
| | | |
≤3.81 | | | 19.00 | |
3.81 - 5.43 | | | 25.50 | |
5.43 - 6.53 | | | 32.00 | |
6.53 - 7.64 | | | 38.50 | |
>7.64 | | | 45.00 | |
| | | |
Revolving consumer credit card loans
| | | | |
“Lifetime PD” band at | | | Increase in “Lifetime PD” at reporting date which | |
initial recognition (%) | | | is considered significant (basis points) | |
| | | |
≤0.5 | | | 13.00 | |
0.5 - 1.0 | | | 15.00 | |
1.0 - 1.5 | | | 17.00 | |
1.5 - 2.0 | | | 20.00 | |
2.0 - 4.0 | | | 23.00 | |
4.0 - 6.0 | | | 25.00 | |
6.0 - 8.0 | | | 28.00 | |
8.0 - 10.0 | | | 31.00 | |
>10.0 | | | 34.00 | |
| | | |
Non-revolving consumer loans (payroll loans)
| | | | |
“Lifetime PD” band at | | | Increase in “Lifetime PD” at reporting date which | |
initial recognition (%) | | | is considered significant (basis points) | |
| | | |
≤10.06 | | | 15.00 | |
10.06 - 14.10 | | | 18.00 | |
14.10 - 16.41 | | | 19.00 | |
16.41 - 17.94 | | | 20.00 | |
17.94 - 20.80 | | | 22.00 | |
20.80 - 22.15 | | | 25.00 | |
22.15 - 24.39 | | | 27.00 | |
24.39 - 30.14 | | | 28.00 | |
30.14 - 36.29 | | | 30.00 | |
>36.29 | | | 32.00 | |
| | | |
Non-revolving consumer loans (personal loans)
| | | | |
“Lifetime PD” band at | | | Increase in “Lifetime PD” at reporting date which | |
initial recognition (%) | | | is considered significant (basis points) | |
| | | |
≤16.18 | | | 25.00 | |
16.18 - 23.84 | | | 27.00 | |
23.84 - 25.92 | | | 28.00 | |
25.92 - 27.74 | | | 29.60 | |
27.74 - 31.84 | | | 31.20 | |
31.84 - 34.61 | | | 32.80 | |
34.61 - 40.67 | | | 34.40 | |
>40.67 | | | 36.00 | |
| | | |
The “Lifetime PD” movements on financial assets which do not subsequently become more than 30 days past due have also been assessed to identify the “natural” movement in “Lifetime PD” which is not considered indicative of a significant increase in credit risk.
For corporate and investment banking customers (global and local), debt instruments at amortized cost and debt instruments at fair value through other comprehensive income, the assessment is performed by comparing the current credit rating with the initial credit rating for each financial asset.
Qualitative criteria
For commercial loans to small and medium-sized enterprises, mortgage loans and installment loans to individuals (revolving consumer credit card loans and non-revolving consumer loans), if the borrower meets one or more of the following criteria:
| · | | In short-term forbearance. |
| · | | Extension to the terms granted. |
For global corporate and investment banking customers, debt instruments at amortized cost and debt instruments at fair value through other comprehensive income, if the borrower requires closer monitoring and a review of its credit rating and/or the financial asset meets one or more of the following criteria:
| · | | Significant debt instrument price variation. |
| · | | Significant adverse changes in business, financial and/or economic conditions in which the borrower operates. |
| · | | Actual or expected forbearance or restructuring. |
| · | | Actual or expected significant adverse change in operating results of the borrower. |
| · | | Significant change in collateral value which is expected to increase risk of default. |
| · | | Early signs of cash flow/ liquidity problems. |
The assessment of significant increase in credit risk incorporates forward-looking information and is performed on a monthly basis at a portfolio level for all retail financial assets held by the Bank. For non-
retail financial assets, where a “Watchlist” is used to monitor credit risk, this assessment is performed at counterparty level on a periodic basis. The criteria used to identify the significant increase in credit risk are monitored and reviewed periodically for appropriateness by the Bank.
The Bank does not consider the low credit risk as an indicator that a financial asset has not increased significantly in risk since initial recognition.
Backstop criteria
A backstop is applied and the financial asset is considered to have experienced a significant increase in credit risk if the borrower is more than 30 days past due on its contractual payments.
Definition of default and credit-impaired financial assets
The Bank defines a financial asset as in default, when the financial asset is considered as credit-impaired. Credit-impaired loans include customers which are in financial difficulties and have been renegotiated.
Credit-impaired financial assets are classified as Stage 3 category according to IFRS 9.
The Bank applies the following criteria to classify financial assets as credit-impaired loans:
| · | | Commercial, financial and industrial loans |
Loans with a single payment of principal and interest (non-amortizing loans), generally commercial loans for a short period of time, are considered impaired after 90 days of the maturity date.
Loans with a single payment of principal at maturity and with periodic interest payments (interest-only loans) are considered impaired after 90 days interest or principal become due.
Loans whose principal and interest payments have been agreed in periodic installments (amortizing loans) are considered impaired after 90 days an installment becomes due.
Mortgage loans are considered credit-impaired when a payment is past due more than 90 days.
| · | | Installment loans to individuals |
Revolving consumer credit cards loans are considered credit-impaired when payment is not received after 90 days it becomes due.
Non-revolving consumer loans whose principal and interest payments have been agreed in periodic installments are considered impaired after 90 days an installment becomes due.
| · | | If the borrower is declared bankrupt in accordance with the Mexican Commercial Bankruptcy Law. |
The Bank considers also as credit-impaired financial assets (loans), the sum of all transactions of a customer when the loan balances of the same customer categorized as credit-impaired (Stage 3) are equivalent to more than 20% of the total outstanding amounts of that customer.
Financial assets (loans) which are not credit-impaired due to default but for which there are reasonable doubts about their full repayment (principal and interest) according to its contractual terms are
considered credit-impaired. This analysis includes, among others: customers in situations involving deterioration in their creditworthiness, such as negative equity, continued losses, general delay in payments, inadequate economic or financial structure and insufficient cash flows to settle debt or inability to obtain additional financing.
Credit-impaired loans, which are renegotiated will remain classified as Stage 3 category until there exists evidence of sustained payment. Sustained payment is considered as the payment by the borrower without payment delay for the total amount due and payable in terms of principal and interest during certain period of time.
A financial asset (loans) is considered to be no longer in default (i.e., to have been cured) when all the contractual payments have been settled, except for those cases in which the borrower is in long-term forbearance and the financial asset does not fulfill the criteria to be considered as credit-impaired. For these particular cases, a twelve month probation period is necessary in order to be considered as not in default.
Debt instruments are considered credit-impaired when a payment is past due more than 90 days.
Measuring expected credit losses
Measurement of expected credit losses requires the use of complex models and significant assumptions about future economic conditions and credit behavior (i.e., the likelihood of customers defaulting and the resulting credit losses) and also requires significant judgments that must be supported by past, present and future information, such as:
| · | | Determining criteria for significant increase in credit risk. |
| · | | Choosing appropriate models and assumptions for the measurement of expected credit losses. |
| · | | Making assumptions and estimates to incorporate relevant information about past events, current conditions and forecasts of macroeconomic conditions. |
| · | | Determining the lifetime and point of initial recognition of revolving consumer credit card loans. |
| · | | Establishing the number and relative weightings of forward-looking scenarios. |
| · | | Establishing groups of similar financial assets for the purpose of measuring expected credit losses. |
The methodology for the quantification of expected credit losses is based on an unbiased and weighted consideration of the occurrence of up to three possible future scenarios that could impact the collection of contractual cash flows, taking into account the time-value of money, all available information relevant to past events and current conditions and projections of macroeconomic factors, such as Gross Domestic Product (GDP), Consumer Price Index (CPI) or unemployment rate, deemed relevant to the measurement of expected credit losses.
Expected credit losses (ECL) are recognized for financial assets measured at amortized cost, financial assets measured at FVTOCI, financial guarantees and loan commitments. ECL are also recognized on the undrawn portion of revolving credit lines, which include credit card limits.
The ECL are measured on either a twelve-month or “Lifetime” basis depending on whether a significant increase in credit risk has occurred since initial recognition or whether a financial asset is considered to be credit-impaired.
Expected credit losses are the discounted product of the PD, EAD and LGD, defined as follows:
| · | | The PD is the probability of the counterparty failing to meet its principal and/or interest payment obligations. The PD has been defined as the probability that an operation accumulates more than 90 days past due or is deemed to be in default as per the criteria mentioned above, either over the next twelve months or over the remaining lifetime (Lifetime PD) of the obligation. |
| · | | EAD is the amount of risk exposure at the date of default (more than 90 days of default) by the counterparty. |
| · | | LGD is the loss arising in the event of default. It depends on the guarantees and collateral associated with the transaction. LGD is expressed as a percentage loss per unit of exposure at the time of default (EAD). LGD is calculated on a twelve-month or “Lifetime” basis, where twelve-month LGD is the percentage of loss expected to be incurred if the default occurs in the next twelve months and “Lifetime” LGD is the percentage of loss expected to be incurred if the default occurs over the remaining expected lifetime of the loan. |
The ECL are determined by projecting the PD, LGD and EAD for each future year and for each loan. These three components are multiplied together and adjusted for the likelihood of survival (i.e., the exposure has not prepaid or defaulted in an earlier month). This effectively calculates the ECL for each future year, which is then discounted back to the reporting date and added. The discount rate used in the ECL calculation is the original effective interest rate of the exposure or an approximation thereof.
The “Lifetime PD” is developed by applying a maturity profile to the current twelve-month PD. The maturity profile looks at how defaults develop on a financial assets portfolio from the point of initial recognition throughout the lifetime of the financial assets. The maturity profile is based on historical observed data and is assumed to be the same across all financial assets within a portfolio. This is supported by historical analysis.
The twelve-month EAD and “Lifetime” EAD are determined based on the expected payment profile, which varies by financial asset type.
| · | | For amortizing products and bullet repayment loans, this is based on the contractual repayments owed by the borrower over a twelve-month or “Lifetime” basis. “Lifetime” EAD will also be adjusted for any expected overpayments made by a borrower. Early repayment/refinance assumptions are also incorporated into the “Lifetime” EAD calculation. |
| · | | For revolving consumer loans, the EAD is predicted by taking current drawn balance and adding a “Credit Conversion Factor” (CCF) which allows for the expected drawdown of the remaining limit by the time of default. These assumptions vary by loan type and current limit utilization band, based on analysis of the Bank´s recent historical default data. |
The twelve-month LGD and “Lifetime” LGD are determined based on the factors which impact the recoveries made post default. These vary by financial asset type.
| · | | For secured financial assets, this is primarily based on collateral type and projected collateral values, historical discounts to market/book values due to forced sales, time to repossession and recovery costs observed. |
| · | | For unsecured financial assets, LGD is typically set by financial asset due to the limited differentiation in recoveries archived across different borrowers. The LGD is influenced by collection strategies, including contracted debt sales and price. |
Forward-looking economic information is also included in determining the twelve-month PD, “Lifetime PD” and LGD. These assumptions vary by financial asset type.
The assumptions underlying the ECL calculation – such as how the maturity profile of the PD and how collateral values change – are monitored and reviewed on a monthly basis.
The Bank performs a periodic assessment to evaluate if the assumptions and methodology need to be updated.
The assessments performed during the year ended December 31, 2018 have not identified significant changes in facts and circumstances that would require updates on estimation techniques, significant assumptions or methodologies currently employed in the ECL calculation.
Expected life of the financial assets
For the purpose of estimating the expected life of the financial assets, all the contractual terms have been taken into account (i.e., prepayments, duration, purchase options, etc.), being the contractual period (including extension options) the maximum period considered to measure the expected credit losses. In the case of financial assets with an uncertain maturity period and a component of undrawn commitment (i.e., credit cards), expected life is estimated considering the period for which the Bank is exposed to credit risk and the effectiveness of credit risk practices to mitigate such exposure.
Forward-looking information incorporated in the expected credit losses models
The Bank already uses forward-looking information in internal administration and regulatory processes and has leveraged its experience in the management of such information, maintaining consistency with the information used in the other processes. The assessment of significant increase in credit risk and the calculation of ECL both incorporate forward-looking information.
The Bank has performed historical analysis and identifies the key macroeconomic and microeconomic variables impacting credit risk and expected credit losses for each financial assets portfolio.
The following represent the most significant factors that could substantially change the estimated ECL:
| · | | GDP growth rates, given their significant effect on borrowers’ performance. |
| · | | Real estate housing prices, given their significant effect on mortgage collateral valuations. |
| · | | Unemployment rate, given their significant effect on customers’ ability to meet contractual obligations. |
| · | | CPI, given their overall relevance for entities’ performance, customers’ purchasing power and economic stability. |
These macroeconomic variables and their associated impact on the PD and LGD vary by type of financial asset. Expert judgment has also been applied in this process. Forecasts of these macroeconomic variables (“base economic scenario”) are provided by the Bank´s economics area on a periodic basis and offer the best estimate view of the economy over the next three years. After three years, to project the macroeconomic variables out for the full remaining lifetime of each financial asset, a mean reversion approach has been used. With this approach, the projected macroeconomic variables in the long-term will have statistical patterns such as average rate (i.e., for unemployment) or a growth rate (i.e., GDP) over a period of two to five years.
The impact of these macroeconomic variables on the PD, EAD and LGD has been determined by performing statistical regression analysis to understand the impact changes in these variables have had historically on default rates and on the components of LGD and EAD.
In addition to the base economic scenario, the Bank´s economics area also provide other possible scenarios along with scenario weightings. The number of other scenarios used is set based on the analysis of each major financial asset type to ensure non-linearities are considered. The number of scenarios and their attributes are reassessed on a quarterly basis. On January 1, 2018, for all financial assets portfolios, the Bank concluded that three scenarios appropriately consider non-linearities. The scenario weightings are determined by a combination of statistical analysis and expert judgment, taking into account the range of possible outcomes each chosen scenarios is representative of. These weightings are presented for approval by the executive risk committee.
The assessment of significant increase in credit risk is performed using the “Lifetime PD” under each of the base, and the other two scenarios (“upside” and “downside”) multiplied by the associated scenario weighting, along with qualitative and backstop indicators. This determines whether the whole financial asset is in Stage 1, Stage 2 or Stage 3 and hence whether twelve-month ECL or “Lifetime” ECL should be recognized. Following this assessment, the Bank measures ECL as either a probability weighted twelve-month ECL (Stage 1) or a probability weighted “Lifetime” ECL (Stage 2 and Stage 3). These probability-weighted ECL are determined by running each scenario (“base”, “upside” and “downside”), through the relevant ECL model and multiplying it by the appropriate scenario weighting (as opposed to weighting the inputs).
As with any macroeconomic forecasts, the projection and likelihoods of occurrence are subject to a high degree of inherent uncertainty and therefore the actual outcomes may be significantly different to those projected. Moreover, applying expert judgment in measuring ECL requires the use of assumptions which are highly subjective and very sensitive to macroeconomic changes and credit conditions. The Bank considers these forecasts to represent its best estimate of the possible outcomes and has analyzed the non-linearities and asymmetries within the Bank´s different financial assets portfolios to establish that the chosen scenarios are appropriately representative of the range of possible scenarios.
The macroeconomic variable assumptions used for the ECL estimate as at January 1, 2018 and as at December 31, 2018 are set out below. The “base”, “upside” and “downside” scenarios were used for all financial assets portfolios, except for global corporates for which the Bank applies the same global macroeconomic scenarios as Banco Santander (Spain). Risk parameters, including a forward-looking add-ons for this portfolio are provided by the Banco Santander (Spain).
| | | | | | | | | | | | | | | | |
| | | | | December 31, 2018: | | | | | | | | | | | |
Variable | | | Scenario | | | December 2018 | | | December 2019 | | | December 2020 | | | December 2021 | |
| | | Base | | | 2.20% | | | 1.90% | | | 1.70% | | | 1.70% | |
GDP
(% year over year) | | | Upside | | | 2.20% | | | 2.80% | | | 2.90% | | | 3.30% | |
| | | Downside | | | 2.20% | | | (6.00)% | | | 1.10% | | | 1.50% | |
| | | Base | | | 4.09% | | | 3.61% | | | 3.50% | | | 3.50% | |
CPI
(% year over year) | | | Upside | | | 4.09% | | | 3.13% | | | 2.89% | | | 3.03% | |
| | | Downside | | | 4.09% | | | 9.80% | | | 8.50% | | | 7.30% | |
| | | Base | | | 3.40% | | | 3.49% | | | 3.56% | | | 3.66% | |
Unemployment rate
(% active population) | | | Upside | | | 3.40% | | | 3.07% | | | 3.05% | | | 3.03% | |
| | | Downside | | | 3.40% | | | 8.50% | | | 6.10% | | | 5.40% | |
| | | Base | | | 19.05 | | | 18.70 | | | 19.05 | | | 19.35 | |
MXN/USD
(end of period) | | | Upside | | | 18.80 | | | 17.79 | | | 18.16 | | | 18.51 | |
| | | Downside | | | 19.05 | | | 25.49 | | | 25.13 | | | 25.90 | |
| | | Base | | | 7.10% | | | 6.60% | | | 6.20% | | | 6.00% | |
Real estate: housing prices
(% year over year) | | | Upside | | | 7.10% | | | 6.60% | | | 6.20% | | | 6.00% | |
| | | Downside | | | 7.10% | | | (2.70)% | | | 0.47% | | | 1.90% | |
| | | | | | | | | | | | | | | | |
| | | | | January 1, 2018: | | | | | | | | | | | |
Variable | | | Scenario | | | December 2018 | | | December 2019 | | | December 2020 | | | December 2021 | |
| | | Base | | | 2.30% | | | 2.50% | | | 2.50% | | | 2.40% | |
GDP
(% year over year) | | | Upside | | | 2.50% | | | 3.05% | | | 3.00% | | | 3.30% | |
| | | Downside | | | (6.90)% | | | 1.10% | | | 1.30% | | | 1.80% | |
| | | Base | | | 3.96% | | | 3.61% | | | 3.39% | | | 3.25% | |
CPI
(% year over year) | | | Upside | | | 3.03% | | | 3.10% | | | 3.09% | | | 3.05% | |
| | | Downside | | | 7.49% | | | 6.34% | | | 4.30% | | | 4.35% | |
| | | Base | | | 3.19% | | | 3.18% | | | 3.21% | | | 3.18% | |
Unemployment rate
(% active population) | | | Upside | | | 2.90% | | | 2.89% | | | 3.07% | | | 3.05% | |
| | | Downside | | | 8.50% | | | 6.60% | | | 5.70% | | | 4.80% | |
| | | Base | | | 18.09 | | | 18.68 | | | 19.02 | | | 19.34 | |
MXN/USD
(end of period) | | | Upside | | | 18.01 | | | 18.28 | | | 18.23 | | | 18.63 | |
| | | Downside | | | 26.36 | | | 25.63 | | | 26.39 | | | 26.55 | |
| | | Base | | | 6.11% | | | 5.63% | | | 5.24% | | | 5.03% | |
Real estate: housing prices
(% year over year) | | | Upside | | | 7.28% | | | 8.17% | | | 6.74% | | | 7.48% | |
| | | Downside | | | (4.90)% | | | 0.13% | | | 1.60% | | | 2.90% | |
The weightings assigned to each macroeconomic scenario at January 1, 2018 and at December 31, 2018 were as follows:
| | | | |
December 31, 2018 |
Scenario | | | Weighting |
| | | |
Base | | | 55.0% | |
Upside | | | 10.0% | |
Downside | | | 35.0% | |
| | | |
| | | | |
January 1, 2018 |
Scenario | | | Weighting |
| | | |
Base | | | 60.0% | |
Upside | | | 10.0% | |
Downside | | | 30.0% | |
| | | |
Sensitivity analysis
The ECL recognized in the consolidated balance sheet as of December 31, 2018 reflect the effect on expected credit losses of a range of possible outcomes, calculated on a probability-weighted basis, according to the scenarios described above. Many of the factors and assumptions used to calculate ECL have a high degree of interdependency and there is not a single factor or assumption to which ECL, as a whole, are sensitive. The ECL determined by using the “base” scenario, which is used to calculate an unbiased expected credit loss, provides an indication of the overall sensitivity of ECL to different macroeconomic assumptions.
Set out below are the changes to the ECL as of December 31, 2018 that would result from reasonably possible changes in the weightings from the actual assumptions used in the Bank’s macroeconomic scenarios, considering a weightings of 100% for the most favorable scenario and a weighting of 100% for the least favorable scenario:
| | | | | | | |
| | | Most Favorable | | | Least Favorable | |
| | | Scenario | | | Scenario | |
| | | | | | | |
Retail loan portfolios | | | (12.7)% | | | 8.9% | |
Non-retail loan portfolios | | | (3.2)% | | | 4.9% | |
| | | | | | | |
Modification of loans and advances to customers
The Bank sometimes renegotiates or otherwise modifies the contractual cash flows of loans and advances to customers. When this happens, the Bank assesses whether or not the new terms are substantially different to the original terms. The Bank does this by considering, among others, the following factors:
| · | | When the borrower is in financial difficulty, whether the modification merely reduces the contractual cash flows to amounts the borrower is expected to be able to pay. |
| · | | Whether any substantial new terms are introduced that affects the risk profile of the loan. |
| · | | Significant extension of the loan term when the borrower is not in financial difficulty. |
| · | | Significant change in the interest rate. |
| · | | Change in the currency the loan is denominated in. |
| · | | Insertion of collateral, other security or credit enhancement that significantly affect the credit risk associated with the loan. |
If the terms are substantially different, the Bank derecognizes the original financial asset and recognizes a “new” financial asset at fair value and recalculates a new effective interest rate for the financial asset. The date of renegotiation is consequently considered to be the date of initial recognition of the “new” financial asset for impairment calculation purposes, including the determination whether a significant increase in credit risk has occurred.
If the terms are not substantially different, the renegotiation or modification does not result in derecognition and the Bank recalculates the gross carrying amount based on the revised cash flows of the financial asset discounted at the financial asset’s original effective interest rate (or credit-adjusted effective interest rate for POCI) and recognizes a modification gain or loss in profit or loss in the consolidated income statement.
IFRS 9 did not have material effects on loans that were renegotiated or modified as of December 31, 2017 on the Bank’s consolidated financial statements.
Written-off loans
The entire loan balance relating to credit-impaired financial assets continue to be recognized on the consolidated balance sheet, for their full amounts, until the recovery of any recognized amount is considered to be unlikely. The recovery of a loan is considered to be unlikely when there is a significant and irreversible deterioration of the borrower’s overall financial condition, resources, value of any guarantees and payment record which would lead a borrower to bankruptcy.
When the recovery of a loan is considered to be unlikely, it is written-off together with the corresponding allowance for impairment losses from the consolidated balance sheet without prejudice to any actions that the Bank may initiate to seek collection until their contractual rights are extinguished due to the expiration of the statute-of-limitations period, forgiveness or any other cause.
Loans and the related allowance for impairment losses are normally written-off considering the following:
| · | | Commercial, financial and industrial loans are evaluated on a case-by-case basis; as such, write-off will only take place after considering all relevant information such as the occurrence of a significant change in the borrower’s financial position, guarantees and collaterals and payment records. Within this portfolio, small and medium-sized enterprises loans and revolving small and medium-sized enterprises loans are written-off when the loans become 181 and 151 days past due, respectively. |
| · | | Mortgage loans are written-off when they have been past due for 36 months. |
| · | | For installment loans to individuals, any portion of the balance that the Bank does not expect to collect is generally written-off at 151 days past due for revolving consumer credit card loans and 181 days past due for other non-revolving consumer loans. |
In the event of bankruptcy or similar proceedings, write-off may occur earlier than at the periods stated above. Collections procedures may continue after write-off.
Up to December 31, 2017, the Bank applied an incurred loss methodology under IAS 39 for determining the allowance for impairment losses, which also sought to identify the amount of incurred losses as of the consolidated balance sheet date of loans and receivables that had not yet been reported as impaired, but that the Bank estimated based on its past history or other quantitative factors that the loss event had already occurred. As part of this methodology, Management also considered qualitative factors that are probable to cause estimated credit losses associated with the Bank’s loan portfolio to differ from historical loss experience, such as changes in GDP, unemployment rate, housing prices, interest rates, IPC, etc., in order to adjust this historical loss experience to reflect current economic and market conditions as of the date of the consolidated financial statements.
The Bank estimated probable losses for off-balance sheet risk related to unfunded lending commitments such as available credit on lines of credit, credit cards and non-revolving consumer loans. The process to determine the provisions for off-balance sheet risk was similar to the methodology used for allowance for impairment losses for loans and receivables as described above.
h) Change in accounting estimates and accounting policies
Initial adoption of IFRS 9
The Bank has adopted IFRS 9 as issued by the IASB in July 2014 with a date of transition of January 1, 2018, which resulted in changes in accounting policies for recognition, classification and measurement of financial assets and financial liabilities and impairment of financial assets and adjustments to the amounts previously recognized in the consolidated financial statements.
As permitted by the transitional provisions of IFRS 9, the Bank elected not to restate comparative figures. As a result, some disclosures presented for certain financial assets are not comparable because their classification may have changed from IAS 39 to IFRS 9. This means that some IFRS 9 disclosures are not directly comparable and some disclosures that relate to information presented on an IAS 39 basis are no longer relevant in the current period. Any adjustments to the carrying amounts of financial assets and liabilities at the date of transition were recognized in the opening balance of Accumulated reserves of the current period. The Bank has also elected to continue to apply the hedge accounting requirements of IAS 39 on adoption of IFRS 9. Consequently, the amendments to IFRS 7 have also only been applied to the current period.
Set out below are the disclosures relating to the impact of the adoption of IFRS 9 on the Bank. Further details of the specific IFRS 9 accounting policies applied in the current period (as well as the previous IAS 39 accounting policies applied in the comparative period) are described in more detail in Notes 2.b and 2.c.
Impact on the consolidated financial statements
The adjustments recognized for each individual line item of the consolidated balance sheet are as follows:
| | | | | | | | | | | | | |
| | | December 31, 2017 as originally presented | | | Adjustments on initial adoption of IFRS 9 | | | January 1, 2018 restated | | | Measurement category under IFRS 9 | |
| | | | | | | | | | | | | |
Financial assets | | | | | | | | | | | | | |
Available-for-sale financial assets | | | 165,742 | | | (165,742) | | | — | | | | |
Financial assets at fair value through other comprehensive income (FVTOCI) | | | — | | | 92,611 | | | 92,611 | | | FVTOCI | |
Loans and receivables | | | 679,300 | | | (679,300) | | | — | | | | |
Financial assets at amortized cost | | | — | | | 751,448 | | | 751,448 | | | Amortized cost | |
| | | | | | | | | | | | | |
Tax assets | | | | | | | | | | | | | |
Deferred | | | 16,600 | | | 286 | | | 16,886 | | | | |
| | | | | | | | | | | | | |
Provisions | | | | | | | | | | | | | |
Provisions for off-balance sheet risk | | | 1,032 | | | (32) | | | 1,000 | | | | |
| | | | | | | | | | | | | |
Shareholders' equity | | | | | | | | | | | | | |
Accumulated reserves | | | 72,838 | | | (2,279) | | | 70,559 | | | | |
| | | | | | | | | | | | | |
Valuation adjustments | | | | | | | | | | | | | |
Available-for-sale financial assets | | | (1,533) | | | 1,533 | | | — | | | | |
Financial assets at fair value through other comprehensive income (FVTOCI) | | | | | | 81 | | | 81 | | | | |
| | | | | | | | | | | | | |
The total impact on Accumulated reserves as of January 1, 2018 is as follows:
| | | | |
| | | Accumulated reserves | |
| | | | |
Balance as of December 31, 2017 | | | 72,838 | |
| | | | |
Increase in allowance for impairment losses and provisions for off-balance sheet risk | | | (3,238) | |
Increase in allowance for impairment losses for debt instruments at FVTOCI | | | (18) | |
Increase in deferred tax assets relating to allowance for impairment losses and provisions for off-balance sheet risk | | | 977 | |
| | | | |
Adjustments to Accumulated reserves from adoption of IFRS 9 as of January 1, 2018 | | | (2,279) | |
| | | | |
Balance as of January 1, 2018 | | | 70,559 | |
| | | | |
i)Classification and measurement
On January 1, 2018, the Bank’s Management has assessed which business model apply to the financial assets held by the Bank and has classified its financial instruments into the appropriate IFRS 9 categories. The main effects resulting from its classification are as follows:
| | | | | | | | | | | | | | | | |
| | | | | | Available-for-sale financial assets | | | Loans and receivables | | | FVTOCI | | | Amortized cost | |
| | | | | | | | | | | | | | | | |
Balance as of December 31, 2017 | | | | | | 165,742 | | | 679,300 | | | — | | | — | |
| | | | | | | | | | | | | | | | |
Reclassification of debt instruments from Available-for-sale to Amortized cost | | | (a) | | | (73,131) | | | — | | | — | | | 73,131 | |
Remeasurement of debt instruments reclassified to Amortized cost | | | (a) | | | — | | | — | | | — | | | 2,287 | |
Reclassification of equity instruments from Available-for-sale to FVTOCI | | | (b) | | | (795) | | | — | | | 795 | | | — | |
Reclassification of debt instruments from Available-for-sale to FVTOCI | | | (c) | | | (91,816) | | | — | | | 91,816 | | | — | |
Reclassification of debt instruments from Loans and receivables to Amortized cost | | | (d) | | | — | | | (10,758) | | | — | | | 10,758 | |
Reclassification of Loans and advances to customers and credit institutions from Loans and receivables to Amortized cost | | | (e) | | | — | | | (668,542) | | | — | | | 668,542 | |
Allowance for impairment losses | | | (e) | | | — | | | — | | | — | | | (3,270) | |
| | | | | | | | | | | | | | | | |
Balance as of January 1, 2018 | | | | | | — | | | — | | | 92,611 | | | 751,448 | |
| | | | | | | | | | | | | | | | |
The impact of these changes on Total equity is as follows:
| | | | | | | | | | | | | |
| | | | | | Valuation adjustments: Available-for-sale financial assets | | | Valuation adjustments: Financial assets at FVTOCI | | | Accumulated reserves | |
| | | | | | | | | | | | | |
Balance as of December 31, 2017 | | | | | | (1,533) | | | — | | | 72,838 | |
| | | | | | | | | | | | | |
Reclassifications of debt instruments from Available-for-sale to Amortized cost (*) | | | (a) | | | 1,601 | | | — | | | — | |
Reclassifications of equity instruments from Available-for-sale to FVTOCI (*) | | | (b) | | | 28 | | | (28) | | | — | |
Reclassifications of debt instruments from Available-for-sale to FVTOCI (*) | | | (c) | | | (109) | | | 109 | | | — | |
Allowance for impairment losses for debt instruments at FVTOCI | | | (c) | | | 18 | | | — | | | (18) | |
Allowance for impairment losses | | | (e) | | | — | | | — | | | (3,270) | |
Provisions for off-balance sheet risk | | | | | | — | | | — | | | 32 | |
Income tax | | | | | | (5) | | | — | | | 977 | |
| | | | | | | | | | | | | |
Balance as of January 1, 2018 | | | | | | — | | | 81 | | | 70,559 | |
| | | | | | | | | | | | | |
(*) These amounts are presented net of income tax.
a)Reclassification of debt instruments from Available-for-sale financial assets to Financial assets at amortized cost.
Certain debt instruments were reclassified from Available-for-sale financial assets to Financial assets at amortized cost. Such debt instruments amount to 75,418 million pesos (amortized cost) as of January 1, 2018. The impact of the reclassification is an increase in Shareholders’ equity that amounts to 2,287 million pesos (1,601 million pesos, net of income tax) related to the valuation adjustment of those debt instruments recognized as of December 31, 2017. The valuation adjustment that would have been recognized in other comprehensive income as of December 31, 2018 if the aforementioned debt instruments had not been reclassified to Financial assets at amortized cost is a decrease of 1,326 million pesos (928 million pesos, net of income tax).
b)Reclassification of equity instruments from Available-for-sale financial assets to Financial assets at FVTOCI
The Bank has irrevocably elected to present in other comprehensive income changes in the fair value of all its equity instruments previously classified as Available-for-sale financial assets, because these equity instruments are held as long-term strategic investments that are not expected to be sold in the short to medium term. Accordingly, equity instruments with a fair value of 795 million pesos were reclassified from Available-for-sale financial assets to Financial assets at FVTOCI on January 1, 2018.
c)Reclassification of debt instruments from Available-for-sale financial assets to Financial assets at FVTOCI and recognition of an allowance for impairment losses for debt instruments at FVTOCI
Debt instruments with a fair value of 91,816 million pesos were reclassified from Available-for-sale financial assets to Financial assets at FVTOCI on January 1, 2018.
As of January 1, 2018, it was recognized in other comprehensive income an allowance for impairment losses for debt instruments at FVTOCI of 18 million pesos (13 million pesos, net of income tax) with a corresponding charge to Accumulated reserves.
d)Reclassification of debt instruments from Loans and receivables to Financial assets at amortized cost
Debt instruments with a carrying value of 10,758 million pesos were reclassified from Loans and receivables to Financial assets at amortized cost on January 1, 2018.
e)Reclassification of Loans and advances to customers and credit institutions from Loans and receivables to Financial assets at amortized cost and recognition of the allowance for impairment losses for Loans and advances to customers at amortized cost
Loans and advances to customers and credit institutions for an amount of 668,542 million pesos (carrying value) were reclassified from Loans and receivables to Financial assets at amortized cost on January 1, 2018.
As of January 1, 2018, it was recognized an increase of 3,270 million pesos in the allowance for impairment losses for Loans and advances to customers at amortized cost with a corresponding charge to Accumulated reserves.
ii)Impairment of financial assets
The reconciliation of the allowance for impairment losses and of the provisions for off-balance sheet risk measured in accordance with the IAS 39 incurred loss model and the allowance for impairment losses and the provisions for off-balance sheet risk measured in accordance with the IFRS 9 expected loss model as of January 1, 2018, is as follows:
| | | | | | | | | | |
| | | December 31, 2017 | | | Remeasurements | | | January 1, 2018 | |
| | | | | | | | | | |
Loans and advances to customers | | | 16,929 | | | 3,270 | | | 20,199 | |
Loans and advances to credit institutions | | | — | | | — | | | — | |
Debt instruments | | | — | | | 18 | | | 18 | |
Contingent commitments: | | | | | | | | | | |
Available lines of credit cards and non-revolving consumer loans | | | 838 | | | 4 | | | 842 | |
Guarantees and loan commitments of commercial and public sector loans | | | 194 | | | (36) | | | 158 | |
| | | | | | | | | | |
Total | | | 17,961 | | | 3,256 | | | 21,217 | |
| | | | | | | | | | |
As of January 1, 2018, there was no material impact on the allowance for impairment losses of Other assets from the initial adoption of IFRS 9.
iii)Coverage ratio
As of January 1, 2018, the coverage ratio of the Bank (defined as the allowance for impairment losses divided by Loans and advances to customers at amortized cost) by stage was as follows:
| | | | | | | | | | | | | |
| | As of January 1, 2018 |
Loans and advances to customers | | | Stage 1 | | | Stage 2 | | | Stage 3 | | | Total | |
| | | | | | | | | | | | | |
| | | | | | | | | | | | | |
Carrying amount | | | 583,871 | | | 24,346 | | | 18,132 | | | 626,349 | |
Allowance for impairment losses | | | 7,456 | | | 4,780 | | | 7,963 | | | 20,199 | |
Coverage ratio | | | 1.28% | | | 19.63% | | | 43.92% | | | 3.22% | |
| | | | | | | | | | | | | |
Useful lives for automated teller machines
During 2016, the Bank revised its estimates for useful lives of automated teller machines (ATM) recognized within Tangible Assets in the consolidated balance sheet. The review performed by the Bank was based on the acquired observable experience and the economic benefits obtained by the use of ATM. The Bank determined that the period over which ATM is expected to be available for use and to generate economic benefits is 8 years instead of 4 years.
The change in the aforementioned accounting estimates did not have a material impact on Tangible assets as of December 31, 2016 and in the Profit for the year then ended. However, the change in the useful lives of ATM resulted in a decrease of 49 million pesos in the depreciation charge recognized in the consolidated income statement of 2016.
Management considered that it was impracticable to estimate the effect on forthcoming periods of this change in accounting estimates due to the fact that the Bank could not reliably determine the number of ATM that would be acquired.
i) Repurchase agreements and Reverse repurchase agreements
Purchases of financial instruments under a non-optional resale agreement are measured at fair value and recognized as assets in the consolidated balance sheet under Loans and advances to credit institutions – Reverse repurchase agreements or Loans and advances to customers – Reverse repurchase agreements.
The excess of the purchase prices over the resale prices are recognized as interest income over the contract term.
Sales of financial instruments under a non-optional repurchase agreement are measured at fair value and recognized as liabilities in the consolidated balance sheet under Deposits from the Central Bank – Repurchase agreements, Deposits from credit institutions – Repurchase agreements or Customer deposits – Repurchase agreements.
The excess of the sales prices over the repurchase prices are recognized as interest expense over the contract term.
Repurchase agreements are designated as financial instruments at FVTPL when this designation eliminates or significantly reduces an accounting mismatch or when they are managed and its performance is evaluated on a fair value basis.
j) Non-current assets held for sale and liabilities associated with non-current assets held for sale
Non-current assets held for sale include the carrying amount of individual items, disposal groups or items forming part of a business unit earmarked for disposal (discontinued operations). Therefore, the carrying amount of these items, which may or may not be of a financial nature, will likely be recovered through the proceeds from their disposal.
Specifically, property or other non-current assets (foreclosed assets) received by the Bank as total or partial settlement of their debtors’ payment obligations to them are deemed to be non-current assets held for sale, unless the Bank has decided to make continuing use of these assets.
Liabilities associated with non-current assets held for sale include the balances payable arising from the assets held for sale or disposal groups and from discontinued operations.
Non-current assets held for sale are measured at the lower of fair value less costs to sell and their carrying amount at the date of classification in this category. Non-current assets held for sale are not depreciated as long as they remain in this category.
Impairment losses on an asset or disposal group arising from a reduction in its carrying amount to its fair value (less costs to sell) are recognized under Gains/(losses) on disposal of non-current assets held for sale not classified as discontinued operations (net) in the consolidated income statement. The gains on a non-current asset held for sale resulting from subsequent increases in fair value (less costs to sell) increase its carrying amount and are recognized in the consolidated income statement up to an amount equal to the impairment losses previously recognized.
k) Tangible assets
Tangible assets include the amount of buildings, land, furniture, vehicles, computer hardware and other fixtures owned by the Bank or acquired under finance leases.
Property, plant and equipment for own use
Property, plant and equipment for own use are presented at acquisition cost, less the related accumulated depreciation and any estimated impairment losses (excess of carrying amount over the recoverable amount).
Depreciation is calculated using the straight-line method on the basis of the acquisition cost of the assets less their residual value. The land on which the buildings and other structures stand has an indefinite life and therefore is not depreciated.
The period tangible asset depreciation charge is recognized in the consolidated income statement and is calculated using the following depreciation rates (based on the average years of estimated useful life of the various assets):
| | | | |
| | | Average Annual | |
| | | Rate | |
| | | | |
Buildings for own use | | | 2% to 5% | |
Furniture and vehicles | | | 10% to 20% | |
Information Technology (IT) equipment and fixtures | | | 25% | |
Others | | | 5% to 20% | |
The Bank assesses at the reporting date whether there is any indication that a tangible asset may be impaired (i.e., its carrying amount exceeds its recoverable amount). If this is the case, the carrying amount
of the tangible asset is reduced to its recoverable amount and future depreciation charges are adjusted in proportion to the revised carrying amount and to the new remaining useful life (if the useful life has to be re-estimated).
Similarly, if there is an indication of a recovery in the value of a tangible asset, the Bank recognizes the reversal of the impairment loss recognized in prior periods and adjusts the future depreciation charges accordingly. In no circumstances may the reversal of an impairment loss on a tangible asset raise its carrying amount above that which it would have if no impairment losses had been recognized in prior years.
The estimated useful lives of the items of property, plant and equipment for own use are reviewed at least at the end of the reporting period to identify significant changes therein. If changes are identified, the useful lives of the tangible assets are adjusted by correcting the depreciation charge to be recognized in the consolidated income statement in future years on the basis of the new useful lives.
Upkeep and maintenance expenses relating to property, plant and equipment for own use are recognized as an expense in the period in which they are incurred, since they do not increase the useful lives of the assets.
l) Accounting for leases
Leases are classified as finance leases whenever the terms of the lease transfer substantially all the risks and rewards of ownership to the lessee. All other leases are classified as operating leases.
i. Operating leases
In operating leases, ownership of the leased asset and substantially all the risks and rewards incidental thereto remain with the lessor.
When the Bank acts as the lessor, the acquisition cost of the leased assets is presented under Tangible assets in the consolidated balance sheet. The depreciation policy for these assets is consistent with that for similar items of property, plant and equipment for own use, and income from operating leases is recognized on a straight-line basis over the term of the lease under Other operating income in the consolidated income statement. Initial direct costs incurred in negotiating and arranging an operating lease are added to the carrying amount of the leased asset and recognized on a straight-line basis over the lease term.
When the Bank acts as the lessee, the lease expenses, including any incentives granted by the lessor, are charged on a straight-line basis over the lease term to Other general administrative expenses in the consolidated income statement.
In the event that lease incentives are received to enter into operating leases, such incentives are recognized as a liability. The aggregate benefit of incentives is recognized as a reduction of rental expense on a straight-line basis.
ii. Sale and leaseback transactions
In sale and leaseback transactions, where the sale is at fair value and the leaseback is an operating lease, any profit or loss is recognized at the time of sale. In the case of finance leasebacks, any profit or loss is amortized over the lease term.
In accordance with IAS 17, in determining whether a sale and leaseback transaction results in an operating lease or finance lease, the Bank analyzes, among other things, whether at the inception of the lease there are purchase options whose terms and conditions make it reasonably certain that they
will be exercised, and to whom the gains or losses from the fluctuations in the fair value of the residual value of the related asset will accrue.
m) Intangible assets
Intangible assets are identifiable non-monetary assets (separable from other assets) without physical substance which arise as a result of a legal transaction or which are developed internally by the Bank. Only assets whose cost can be estimated reliably and from which the Bank considers it probable that future economic benefits will be generated are recognized.
Intangible assets are recognized initially at acquisition or development cost and are subsequently measured at cost less any accumulated amortization and any accumulated impairment losses.
i. Goodwill
Any excess of the cost of the investments made by the Bank over the corresponding underlying carrying amounts acquired, adjusted at the acquisition date, is allocated as follows:
If it is attributable to specific and identifiable assets and liabilities of the subsidiaries acquired, by increasing the value of the assets (or reducing the value of the liabilities) whose fair values were higher (lower) than the carrying amounts at which they had been recognized in the acquired subsidiaries’ balance sheets.
If it is attributable to specific intangible assets, by recognizing such intangible assets in the consolidated balance sheet provided that the fair value of these assets within twelve months following the date of acquisition can be measured reliably.
The remaining amount is recognized as goodwill, which is allocated to one or more CGUs. A CGU is the smallest identifiable group of assets that, as a result of continuing operation, generates cash inflows that are largely independent of the cash inflows from other assets or groups of assets.
Goodwill is only recognized when it has been acquired for a consideration and represents, therefore, a payment made by the acquirer in anticipation of future economic benefits from assets of the acquired subsidiary that are not capable of being individually identified and separately recognized.
At the end of each reporting period, or whenever there is any indication of impairment, goodwill is reviewed for impairment (i.e., a reduction in its recoverable amount to below its carrying amount) and if there is any impairment, the goodwill is written down with a charge to Impairment losses on other assets (net) - Goodwill and other intangible assets in the consolidated income statement.
For the purposes of the impairment analysis, goodwill is allocated to one or more CGUs expected to benefit from the synergies arising from business combinations. The CGUs represent the Bank’s smallest identifiable asset groups that generate cash flows for the Bank and that are largely independent of the flows generated from other assets or groups of assets. Each CGU or CGUs to which goodwill is allocated:
is the lowest level at which the entity manages goodwill internally; and
is not larger than an operating segment.
The CGUs to which goodwill has been allocated are tested for impairment by including the allocated goodwill in their carrying amount. This analysis is performed at least annually as of December 31 and more frequently in cases where indicators of impairment are noted by Management.
For the purpose of determining the impairment of a CGU to which a part of goodwill has been allocated, the carrying amount of that unit is compared with its recoverable amount.
The recoverable amount of a CGU is equal to the higher of the fair value less costs to sell and its value in use. Value in use is calculated as the discounted value of the cash flow projections that the Bank estimates and is based on the latest budgets approved for the next five years. The principal hypotheses are a sustainable growth rate to extrapolate the cash flows indefinitely, and the discount rate used to discount the cash flows is equal to the weighted cost of capital assigned to each CGU.
If the carrying amount of the CGU exceeds the related recoverable amount, the Bank recognizes an impairment loss; the resulting loss is apportioned by reducing, first, the carrying amount of the goodwill allocated to that CGU and, second, if there are still impairment losses remaining to be recognized, the carrying amount of the rest of the assets. This is done by allocating the remaining loss in proportion to the carrying amount of each of the assets in the unit. No impairment of goodwill attributable to the minority interests may be recognized.
Impairment losses on goodwill are recognized under Impairment losses on other assets (net) - Goodwill and other intangible assets in the consolidated income statement.
An impairment loss recognized for goodwill is not reversed in a subsequent period.
ii. Other intangible assets
Other intangible assets include the amount of identifiable intangible assets (such as computer software).
Other intangible assets can have an indefinite useful life when, based on an analysis of all the relevant factors, it is concluded that there is no foreseeable limit to the period over which the asset is expected to generate net cash inflows for the Bank - or a finite useful life, in all other cases.
Intangible assets with indefinite useful lives acquired separately are not amortized and are carried at cost less accumulated impairment losses. At the end of each reporting period or whenever there is any indication of impairment, the Bank reviews the remaining useful lives of the assets in order to determine whether they continue to be indefinite and, if this is not the case, to take the appropriate steps.
Intangible assets with finite useful lives that are acquired separately are carried at cost less accumulated amortization and accumulated impairment losses. Amortization is recognized on a straight-line basis over their estimated useful lives. The estimated useful lives are reviewed at the end of each reporting period, with the effect of any changes in estimate being accounted for on a prospective basis. The intangible asset amortization charge is recognized under Depreciation and amortization in the consolidated income statement.
Intangible assets acquired in a business combination and recognized separately from goodwill are initially recognized at their fair value at the acquisition date (which is regarded as their cost). Subsequent to initial recognition, intangible assets acquired in a business combination are reported at cost less accumulated amortization and accumulated impairment losses, on the same basis as intangible assets that are acquired separately.
An intangible asset is derecognized on disposal, or when no future economic benefits are expected from use or disposal. Gains or losses arising from derecognition of an intangible asset, measured as the difference between the net disposal proceeds and the carrying amount of the asset, are recognized in the consolidated income statement when the asset is derecognized.
Impairment charges are included in Impairment losses on other assets (net) – Goodwill and other intangible assets in the consolidated income statement. The criteria used to recognize the impairment losses on these assets and, where applicable, the reversal of impairment losses recognized in prior years, are similar to those used for tangible assets (see Note 2.k).
n) Provisions and contingent assets and liabilities
When preparing the consolidated financial statements of the Bank, Management distinguishes between:
Provisions: credit balances covering present obligations at the reporting date arising from past events which could give rise to a loss for the Bank, which is considered to be more likely than not to occur and certain as to its nature but uncertain as to its amount and/or timing.
Contingent liabilities: possible obligations that arise from past events and whose existence will be confirmed only by the occurrence or non-occurrence of one or more future events not wholly within the control of the Bank. They include the present obligations of the Bank when it is not probable that an outflow of resources embodying economic benefits will be required to settle them.
Contingent assets: possible assets that arise from past events and whose existence is conditional on, and will be confirmed only by, the occurrence or non-occurrence of events beyond the control of the Bank. Contingent assets are not recognized in the consolidated balance sheet or in the consolidated income statement, but rather are disclosed in the notes to the consolidated financial statements, provided that it is probable that these assets will give rise to an increase in resources embodying economic benefits.
Provisions
The amount recognized as a provision is the best estimate of the consideration required to settle the present obligation at the end of the reporting period, taking into account the risks and uncertainties surrounding the obligation. When a provision is measured using the cash flows estimated to settle the present obligation, its carrying amount is the present value of those cash flows (when the effect of the time value of money is material).
When some or all of the economic benefits required to settle a provision are expected to be recovered from a third party, a receivable is recognized as an asset if it is virtually certain that reimbursement will be received and the amount of the receivable can be measured reliably.
The Bank’s consolidated financial statements include all the material provisions with respect to which it is considered that it is more likely than not that the obligation will have to be settled. In accordance with IFRS, contingent liabilities must not be recognized in the consolidated financial statements, but must rather be disclosed in the notes to the consolidated financial statements.
Provisions are reviewed and adjusted at the end of each year. Provisions are also used to cater for the specific obligations for which they were originally recognized. Provisions are fully or partially reversed when such obligations cease to exist or are reduced.
Provisions are classified according to the obligations covered as follows:
Provisions for pensions and similar obligations: includes the amount of all the provisions made to cover post-employment benefits, including obligations to pre-retirees and similar obligations.
Provisions for tax and legal matters: include the amount of the provisions recognized to cover tax and legal obligations.
Provisions for off-balance sheet risk: include the amount of the provisions made to cover obligations arising as the result of those transactions in which the Bank guarantees the obligations of a third party arising as a result of financial guarantees granted or other contracts and unfunded lending commitments such as letters of credit, financial guarantees and available lines of credit cards and non-revolving consumer loans, which are irrevocable commitments that may give rise to the recognition of financial assets.
Other provisions: include the amount of other provisions recognized by the Bank (see Note 23).
o) Litigation and/or claims in process
At the end of 2017 and 2018, certain litigation and claims were in process against the Bank arising from the ordinary course of their operations (see Note 23).
p) Share-based payments
For share-based payment transactions, the goods or services received are measured as an equity-settled share-based payment transaction when the awards granted are the Bank’s own equity instruments. In all other circumstances, the goods or services received by the Bank are measured as a cash-settled share-based payment transaction.
Equity-settled shared-based payments to employees and others providing similar services are measured at the fair value of the equity instruments at the grant date. The fair value determined at the grant date of the equity-settled shared-based payments is expensed on a straight-line basis over the vesting period, based on the Bank’s estimate of equity instruments that will eventually vest, with a corresponding increase in consolidated equity. At the end of each reporting period, the Bank revises its estimate of the number of equity instruments expected to vest. The impact of the revision of the original estimates, if any, is recognized in the consolidated income statement such that the cumulative expense reflects the revised estimate, with a corresponding adjustment to Accumulated reserves in consolidated equity.
For cash-settled share-based payments to employees and others providing similar services, the services acquired and the liability incurred are measured at the fair value of the liability. The fair value determined at the grant date of the cash-settled share-based payments is expensed on a straight-line basis over the vesting period, based on the Bank’s estimate of equity instruments that will eventually vest, with a corresponding increase in liability. At the end of each reporting period, the Bank revises its estimate of the number of equity instruments expected to vest. Until the liability is settled, the fair value of the liability is remeasured at the end of each reporting period and at the date of settlement, with any changes in fair value recognized in the consolidated income statement for the year. The services received and the liability to pay for those services are recognized as the employees render service.
Share-based payments are discussed in Note 41.b, 41.c and 41.d.
q) Recognition of income and expenses
The most significant criteria used by the Bank to recognize its income and expenses are summarized as follows:
i. Interest income, interest expenses and similar items
Interest income, interest expenses and similar items are generally recognized on an accrual basis using the effective interest method. Dividends received from other companies are recognized as income when the Bank’s right to receive them arises.
ii. Fee and commission income and expenses
Fee and commission income and expenses are recognized in the consolidated income statement using criteria that vary according to their nature. The main criteria are as follows:
| - | | Fee and commission income and expenses relating to financial assets and financial liabilities measured at FVTPL are recognized when received or paid. |
| - | | Those arising from transactions or services that are performed over a period of time are recognized over the life of these transactions or services. |
| - | | Those relating to services provided in a single act are recognized when the single act is carried out. |
iii. Non-finance income and expenses
These are recognized for accounting purposes on an accrual basis.
iv. Deferred collections and payments
These are recognized for accounting purposes at the amount resulting from discounting the expected cash flows at market rates.
v. Loan arrangement fees
Loan arrangement fees that are an integral part of the effective interest rate of a financial instrument, mainly loan origination fees, are accrued and recognized in income over the term of the loan as a part of the effective interest method.
r) Financial guarantees
Financial guarantees are defined as contracts whereby an entity undertakes to make specific payments on behalf of a third party if the latter fails to do so, irrespective of the various legal forms they may have, such as guarantees, insurance policies or credit derivatives.
When the Bank purchases a financial guarantee contract in respect of a financial asset and pays the cost of the guarantee at inception of the guarantee, considers the following:
| - | | If the financial guarantee is an integral part of the guaranteed financial asset, it is treated as an adjustment to the effective interest rate of the guaranteed financial asset as a transaction cost, unless the financial asset is measured at FVTPL, and include the expected cash flows from the financial guarantee when measuring the ECL of the guaranteed financial asset. |
| - | | If the financial guarantee is not an integral part of the guaranteed financial asset, the cost is recognized as a separate pre-payment asset, and it is amortized over the shorter of the life of the guarantee and the expected life of the guaranteed financial asset. The pre-payment asset is tested for impairment under IAS 36. The expected cash flows from the financial guarantee are not included in the measurement of the ECL of the guaranteed financial asset and a separate reimbursement asset is recognized in the consolidated balance sheet in accordance with IAS 37. |
When the Bank provides financial guarantees, these are initially recognized on the liability side of the consolidated balance sheet at fair value, which is generally the present value of the fees, commissions and interest receivable from these contracts over the term thereof.
Financial guarantee contracts issued by the Bank and, if not designated as at FVTPL, are subsequently measured at the higher of:
•the amount of the obligation under the contract, as determined in accordance with IAS 37; and
•the amount initially recognized less, where appropriate, cumulative amortization recognized in accordance with the revenue recognition policies.
Financial guarantees provided by the Bank, regardless of the guarantor, instrumentation or other circumstances, are reviewed periodically to determine the credit risk to which they are exposed and, if appropriate, to consider whether a provision is required. The credit risk is determined by application of criteria similar to those established for quantifying impairment losses on financial assets carried at amortized cost (described in Note 2.g above).
s) Loan commitments
Loan commitments granted by the Bank are subject to the impairment requirements of IFRS 9 and are accounted for as off-balance sheet risk in memorandum accounts.
The provisions made for these transactions are recognized under Provisions for off-balance sheet risk in the consolidated balance sheet (see Note 23). These provisions are recognized and reversed with a charge or credit, respectively, to Provisions (net) in the consolidated income statement.
If a specific provision is required for financial guarantees, the related unearned commissions recognized under Financial liabilities at amortized cost - Other financial liabilities in the consolidated balance sheet are reclassified to the appropriate provision.
t) Post-employment benefits
The Bank’s post-employment obligations to its employees are deemed to be defined contribution plans when the Bank makes pre-determined contributions to a separate entity and will have no legal or effective obligation to make further contributions if the separate entity cannot pay the employee benefits relating to the service rendered in the current and prior periods. Post-employment obligations that do not meet the aforementioned conditions are classified as defined benefit plans (see Note 23.c).
Defined contribution plans
The contributions made in each year related to defined contribution plans are recognized under Personnel expenses in the consolidated income statement. The amounts not yet contributed at each year-end are recognized under Provisions - Provision for pensions and similar obligations on the liability side of the consolidated balance sheet.
Defined benefit plans
The Bank recognizes under Provisions - Provision for pensions and similar obligations on the liability side of the consolidated balance sheet (or under Other assets on the asset side, as appropriate) the present value of its defined benefit post-employment obligations, net of the fair value of the plan assets.
Plan assets are defined as those that will be directly used to settle obligations and that meet the following conditions:
They are not owned by the Bank, but by a legally separate entity that is not a party related to the Bank.
They are only available to pay or fund post-employment benefits and they cannot be returned to the Bank unless the assets remaining in the plan are sufficient to meet all the benefit obligations of the plan and of the Bank to current and former employees, or they are returned to reimburse employee benefits already paid by the Bank.
Post-employment benefits are recognized as follows:
Service cost is recognized in the consolidated income statement and includes the following items:
Current service cost, i.e., the increase in the present value of the obligations resulting from employee service in the current period, is recognized under Personnel expenses.
The past service cost, which arises from changes to existing post-employment benefits or from the introduction of new benefits and includes the cost of reductions, is recognized under Provisions (net).
Any gain or loss arising from plan settlements is recognized under Provisions (net).
Net interest on the net defined benefit liability (asset), i.e., the change during the period in the net defined benefit liability (asset) that arises from the passage of time, is recognized under Interest expense and similar charges (Interest and similar income if it constitutes income) in the consolidated income statement.
The remeasurement of defined benefit obligation is recognized in the consolidated other comprehensive income and includes:
Actuarial gains and losses generated in the year, arising from the differences between the previous actuarial assumptions and what has actually occurred and from the effects of changes in actuarial assumptions.
The return on plan assets, excluding amounts included in net interest on the net defined benefit liability (asset).
Any change in the effect of the asset ceiling, excluding amounts included in net interest on the net defined benefit liability (asset).
Further details about post-employment benefits are given in Note 23.c.
u) Income tax
Income tax expense represents the sum of the income tax currently payable and deferred income tax.
Current tax
Income tax is recognized in profit for the year in which they are incurred. The income tax currently payable is based on taxable profit for the year. Taxable profit differs from Operating profit before tax as reported in the consolidated income statement because of items of income or expense that are taxable or deductible in other years and items that are never taxable or deductible. The Bank’s current tax is calculated using income tax rates that have been enacted or substantively enacted by the end of the reporting period.
Deferred income tax
Deferred income tax is recognized on temporary differences between the carrying amounts of assets and liabilities in the consolidated financial statements and the corresponding tax bases used in the computation of taxable profit. Deferred tax liabilities are recognized for all taxable temporary differences. Deferred tax assets are recognized for all deductible temporary differences to the extent that it is probable that taxable profits will be available against which those deductible temporary differences can be utilized. Such deferred tax assets and liabilities are not recognized if the temporary difference arises from the initial recognition (other than in a business combination) of assets and liabilities in a transaction that affects neither the taxable profit nor the accounting profit. In addition, deferred tax liabilities are not recognized if the temporary difference arises from the initial recognition of goodwill.
Deferred tax liabilities are recognized for taxable temporary differences related to investments in subsidiaries, associates and interests in joint ventures, except where the Bank is able to control the reversal of the temporary difference and it is probable that the temporary difference will not reverse in the near future. Deferred tax assets arising from deductible temporary differences associated with such investments and interests are only recognized to the extent that it is probable that there will be sufficient taxable profits against which to utilize the benefits of the temporary differences and they are expected to reverse in the near future.
The carrying amount of deferred tax assets is reviewed at the end of each reporting period and reduced to the extent that it is no longer probable that sufficient taxable profits will be available to allow all or part of the asset to be recovered.
Deferred tax assets and liabilities are measured at the income tax rates that are expected to apply in the period in which the liability is settled or the asset realized, based on income tax rates (and tax laws) that have been enacted or substantively enacted by the end of the reporting period.
The measurement of deferred tax assets and liabilities reflects the tax consequences that would follow from the way in which the Bank expects, at the end of the reporting period, to recover or settle the carrying amount of its assets and liabilities
Current and deferred income tax for the year
Current and deferred income tax are recognized in the consolidated income statement, except when they relate to items that are recognized in the consolidated other comprehensive income or directly in consolidated equity, in which case, the current and deferred income tax are also recognized in the consolidated other comprehensive income or directly in consolidated equity, respectively. Where current income tax or deferred income tax arises from the initial accounting for a business combination, the tax effect is included in the accounting for the business combination.
v) Remaining maturity periods
The analysis of the maturities of the balances of certain items in the consolidated balance sheet at 2017 and 2018 year-end is provided in Note 44.
w) Segment reporting
Operating segments are reported in a manner consistent with the internal reporting provided to the Chief Operating Decision Maker. The Chief Operating Decision Maker (CODM), who is responsible for allocating resources and assessing performance of the operating segments, has been identified as the CEO.
x) Dividend distribution
Dividend distributions to the Bank’s shareholders are recognized as a liability in the Bank’s consolidated financial statements in the period in which the dividends are proposed by the Board of Directors and approved by the Bank’s shareholders.
y) Treasury shares
Own equity instruments that are reacquired (treasury shares) are recognized at cost and deducted from consolidated equity. No gain or loss is recognized in the consolidated income statement on the purchase, sale, issue or cancellation of the Bank’s own equity instruments. Any difference between the carrying amount and the consideration, if reissued, is recognized under Accumulated reserves in consolidated equity.
z) Consolidated statement of cash flows
The following terms are used in the consolidated statement of cash flows with the meanings specified:
| · | | Cash flows: inflows and outflows of cash and cash equivalents, which are short-term, highly liquid investments that are subject to an insignificant risk of changes in value, irrespective of the portfolio in which they are classified. The Bank classifies as cash and cash equivalents the balances recognized under Cash and balances with the Central Bank in the consolidated balance sheet. |
| · | | Operating activities: the principal revenue-producing activities of credit institutions and other activities that are not investing or financing activities. |
| · | | Investing activities: the acquisition and disposal of long-term assets and other investments not included in cash and cash equivalents. |
| · | | Financing activities: activities that result in changes in the size and composition of the equity and liabilities that are not operating activities. |
aa) Consolidated income statement and other comprehensive income
This consolidated statement presents the income and expenses generated by the Bank as a result of its business activity in the year, and a distinction is made between the income and expenses recognized in the consolidated income statement for the year and the other income and expenses recognized directly in consolidated equity.
Accordingly, this consolidated statement presents:
| b. | | The net amount of the income and expenses recognized directly to consolidated equity that will not be reclassified subsequently to the consolidated income statement. |
| c. | | The net amount of the income and expenses recognized directly to consolidated equity that may be reclassified subsequently to the consolidated income statement when certain conditions are met. |
| d. | | The income tax incurred in respect of the items indicated in b) and c) above, except for the valuation adjustments arising from investments in associates or jointly controlled entities accounted for using the equity method, which are presented net. |
| e. | | Total consolidated comprehensive income, calculated as the sum of a) to d) above, presenting separately the amount attributable to the Parent and the amount relating to non-controlling interests. |
The amount of the income and expenses relating to entities accounted for using the equity method recognized directly in consolidated equity is presented in this consolidated statement, irrespective of the nature of the related items, under Entities accounted for using the equity method.
This consolidated statement presents the items separately by nature, grouping together items that, in accordance with the applicable IFRS, will not be reclassified subsequently to the consolidated income statement since the requirements established by the corresponding accounting Standard are met.
ab) Consolidated statement of changes in total equity
This consolidated statement presents all the changes in consolidated equity, including the adjustments in the opening balance on Accumulated reserves arising from changes in accounting policies and from the correction of errors.
Accordingly, this consolidated statement presents a reconciliation of the carrying amount at the beginning and end of the year of all the consolidated equity items and the changes are grouped together based on their nature into the following items:
| a. | | Adjustments in the opening balance on Accumulated reserves due to changes in accounting policies and from the correction of errors: include those in consolidated equity arising as a result of the retrospective restatement of the balances in the consolidated financial statements, distinguishing between those resulting from changes in accounting policies and those relating to the correction of errors. |
| b. | | Income and expense recognized in the year: includes, in aggregate form, the total of the aforementioned items recognized in the consolidated income statement. |
| c. | | Other changes in consolidated equity: include the remaining items recognized in consolidated equity, including, inter alia, increases and decreases in share capital, distribution of profit, transactions involving own equity instruments (treasury shares), transfers between equity items and any other increases or decreases in consolidated equity. |
3. Significant events
The following is a summary of the significant corporate transactions undertaken by the Bank over the last three years:
3.1 Sale of the Custody business
On July 24, 2015, Banco Santander (Spain) made an offer to the Bank to purchase their custody business. This offer was accepted by the Bank. The agreed sale price on that date was 1,191 million pesos. This offer required the Bank to transfer their custody business; however, this obligation was subject to the following conditions: i) was valid until June 30, 2016; ii) was subject to the same conditions established in a global agreement signed by Banco Santander (Spain) consisted of the sale of the custody businesses in Spain, Mexico and Brazil; iii) authorizations must have been obtained from the Mexican authorities to establish a special purpose entity whose objective was the operation of the custody business in Mexico; iv) was dependent on the global transaction, if it was terminated, the transaction would also terminate in Mexico; and v) the transaction should have been formalized through the signing of the respective contracts.
On August 22, 2016, Mexican authorities authorized Banco Santander (Spain) to establish and operate a new bank in Mexico named Banco S3 México, S.A., Institución de Banca Múltiple (Banco S3). The activities of Banco S3 would be focused on the specialized business of deposits, custody and management of
securities and cash in Mexico. On February 2, 2018, the Mexican Ministry of Finance and Public Credit (Secretaría de Hacienda y Crédito Público or SHCP by its Spanish acronym) and the CNBV authorized Banco S3 to operate as a financial institution in Mexico.
On January 2, 2018, the Bank, as seller, and Banco S3, as buyer, entered into a purchase-sale agreement of the custody business of the Bank. The agreed sale price was 850 million pesos, of which 90% of the total amount was paid on February 9, 2018 and the remaining 10% would be paid one year after January 2, 2018. It was agreed by both parties, that the remaining 10% of the sale price could be adjusted contingent on the successful transfer of customers from the Bank to Banco S3. Later during October 2018, the agreed sale price was adjusted by 128 million pesos due to the low transfer rate of clients from the Bank to Banco S3 being the final sale price agreed of 722 million pesos.
This transaction is considered executed between entities under common control, therefore the effect from the sale of the custody business was an increase of 506 million pesos in Accumulated reserves within Shareholders’ equity in the consolidated balance sheet.
3.2 Issuance of subordinated liabilities
On December 29, 2016, the Bank issued Perpetual Subordinated Non-Preferred Contingent Convertible Additional Tier I Capital Notes (Subordinated Additional Tier I Capital Notes) for an amount of 500 million USD. The Subordinated Additional Tier I Capital Notes are convertible in common Series “F” shares, depending on the occurrence of some trigger events (see Note 21). This issue was privately acquired in its entirety by Banco Santander (Spain) (see Note 21).
3.3 Auction of Bonos de Regulación Monetaria Reportables
The Central Bank carried out an auction of Bonos de Regulación Monetaria Reportables (BREMS R) whose objective is to contribute to the healthy development of the Mexican Financial System as well as to make its monetary policy more efficient. On May 12, 2016, the Central Bank established in the Federal Official Gazette (DOF by its Spanish acronym) the rules of the auction for these BREMS R as an alternative for Mexican banks to comply with the compulsory deposits required by the Central Bank.
BREMS R can only be acquired by Mexican banks through auctions carried out by the Central Bank as well as through repurchase agreement transactions between them or between Mexican banks as per the provisions established by the Central Bank.
As of December 31, 2017 and 2018, the Bank’s position of BREMS R amounted to 7,783 million pesos and 7,785 million pesos, respectively, which were settled with resources originated from the cancelation of the compulsory deposits required by the Central Bank (see Note 8).
3.4 Acquisition of shares of Bolsa Mexicana de Valores, S.A.B. de C.V.
As mentioned in Note 44, on November 22, 2017, through an assignment contract, the Bank acquired from Casa de Bolsa Santander México, S.A. de C.V., Grupo Financiero Santander México (hereinafter, “the Brokerage House”) its participation held in the Trust 1576 as depositary of 14,176,749 shares of Bolsa Mexicana de Valores, S.A.B. of C.V. (BOLSA A), as well as the rights and obligations derived from the Trust's contract, for an amount of 449 million pesos. This purchase of shares has been recognized within Available for sale financial assets in the consolidated balance sheet of the Bank on that date.
3.5 Authorization to incorporate Santander Inclusión Financiera, S.A. de C.V.
On October 5, 2017, the SHCP authorized the incorporation of a new company called Santander Inclusión Financiera, S.A. de C.V., Sociedad Financiera de Objeto Múltiple, Entidad Regulada, Grupo Financiero Santander México (Inclusión Financiera) as a subsidiary of the Bank, which its main activity is granting
credits to low income creditors. The aim of this incorporation is to achieve a social impact through a competitive offer in the sector of microcredits.
3.6 Corporate Restructuring
Through the Ordinary and Extraordinary Shareholders' Meeting held on December 8, 2017, it was approved to carry out a “Corporate Restructuring” process that involved Grupo Financiero Santander México, S.A.B. de C.V. (hereinafter, “the Former Group”), the Bank and the Brokerage House, as well as the constitution of a new holding company. The Corporate Restructuring was authorized by the SHCP through Official Letter UBVA/077/2017 dated December 13, 2017.
The purpose of the Corporate Restructuring is to comply with certain guidelines issued by the European Central Bank, which establish, among other matters, that the contributions from minority shareholders can only be computed in the consolidated regulatory capital of Banco Santander, S.A. (Spain), if: (i) the company in which they own shares collects deposits from the general public (a credit institution in the case of Mexico) and (ii) such company’s equity is regulated.
The process of the Corporate Restructuring considered the following:
Merger of companies
On January 1, 2018, as part of the Corporate Restructuring, the Former Group was merged, as the merged entity, with the Bank, as the merging entity that subsists, the latter assuming all rights and obligations of the merged entity (the “Merger”). The Merger was carried out in accordance with the merger procedures provided in the Mexican Corporation Law, as well as specifically in the Financial Group Regulations Law and the Credit Institutions Law.
The Merger consisted in carrying out the corporate acts necessary for the Bank to merge the Former Group, which ceased to exist and therefore its shares were deregistered from the National Registry of Securities of Mexico (Registro Nacional de Valores or RNV by its acronym in Spanish). As a result the shareholders of the Former Group received one share of the Bank for each share they owned of the Former Group. Accordingly, the shareholders that previously participated in the Former Group's share capital, now participate in the Bank’s share capital.
To ensure that the exchange factor between the Former Group and the Bank's shares is equivalent to one, various corporate actions were approved at the Shareholders' Meeting of the Former Group on December 8, 2017, including a decree and payment of a cash dividend to the shareholders of the Former Group for an amount up to 1,950 million pesos and an equity concentration (reverse split) of the Bank's shares. The final amount of the dividend to make equivalent the book value of the shares of the Former Group with those of the Bank amounted to 1,822 million pesos, which was paid on January 25, 2018.
Prior to the Merger, the Former Group was a “foreign private issuer” and its Series “B” shares were listed on the Bolsa Mexicana de Valores and its American Depositary Shares (ADS) representing the Former Group’s Series “B” shares were listed on the New York Stock Exchange (NYSE). Following the Merger, the Bank became the “foreign private issuer” and its Series “B” shares are listed on the Bolsa Mexicana de Valores and its ADS representing the Bank’s Series “B” shares are listed on the NYSE.
On January 26, 2018, the merger agreements were registered in the Public Registry of Commerce; on the same date, the delivery of the Bank's shares through S.D. INDEVAL Institución para el Depósito de Valores, S.A. de C.V. (Institution for the Deposit of Securities or INDEVAL) to the Bank's shareholders was completed.
The merger was accounted at the existing carrying amounts of the Bank and the Former Group given that this transaction is considered under common control. The total assets and total liabilities of the Former Group merged by the Bank amounted to 117 million pesos and 175 million pesos, respectively.
Constitution of a new holding company
Immediately after the Merger was fully effective, a new holding company called Grupo Financiero Santander México, S.A. de C.V. (hereinafter, the “New Financial Group”) was created, which was authorized to be organized as a financial group by resolution issued by the SHCP. As part of the constitution, Banco Santander, S.A. (Spain), as owner, contributed of all the shares representing the capital stock of the Bank. Consequently, the New Financial Group owns 74.96% of the shares representing the share capital of the Bank and 99.99% of the shares representing the share capital of the Brokerage House.
Transfer of ownership of shares of the Brokerage House
As part of the Merger, the Brokerage House became a direct subsidiary of the Bank due to the transfer of ownership of shares of the merged entity. However, according to Article 89 of the Credit Institutions Law, commercial banks in Mexico cannot hold ownership interest in broker-dealers. The aforementioned acquisition act is exclusively instrumental for the achievement of the Corporate Restructuring.
Therefore, the Bank, as the merging entity of the Former Group, agreed to dispose of the shares of the Brokerage House simultaneously as the Merger was effective. The sale of shares representing the share capital of the Brokerage House is considered as part of the Corporate Restructuring. The sale price has been agreed between the Bank and the New Financial Group for an amount of 1,175 million pesos.
The sale of shares representing the share capital of the Brokerage House originated a charge of 19 million pesos (net of income tax) to Accumulated reserves within Shareholders’ equity in the consolidated balance sheet given that this transaction is considered executed by entities under common control.
Share-based payment transactions
As a result of the Corporate Restructuring detailed above, the share-based payment transactions of the Bank will be settled through its own equity instruments starting January 1, 2018. The Bank changed from a cash-settled transaction to an equity-settled transaction. Consequently, it was derecognized the liability regarding those cash-settled transactions and it was recognized in Accumulated reserves within Shareholders’ equity an amount of 319 million pesos related to the equity-settled share-based payment.
3.7 Acquisition of Isban México, S.A. de C.V.
On October 26, 2017, the Board of Directors approved the purchase of Isban México, S.A. de C.V. (ISBAN) with the objective of creating a new technology operating model for the Bank.
The CNBV authorized on September 14, 2018, the acquisition by the Bank of all the shares representing the capital stock of ISBAN.
On October 11, 2018, the Bank acquired from Banco Santander, S.A. (Spain) for 1,077 million pesos, all the shares representing the capital stock of ISBAN. This acquisition originated a charge of 225 million pesos in Accumulated reserves within Shareholders’ equity in the consolidated balance sheet given that this transaction is considered executed by entities under common control.
On October 15, 2018, the Board of Directors of ISBAN approved the change of its corporate name from ISBAN to Santander Tecnología México, S.A. de C.V. (Santander Tecnología México).
The carrying amount of the assets acquired and liabilities assumed at the date of the acquisition were as follows:
| | | | |
| | | Carrying amount | |
| | | | |
Assets: | | | | |
Cash | | | 715 | |
Tangible assets | | | 457 | |
Other assets | | | 318 | |
| | | 1,490 | |
Liabilities: | | | | |
Other liabilities | | | (638) | |
| | | | |
Net assets acquired | | | 852 | |
Acquisition cost | | | (1,077) | |
Effect on acquisition | | | (225) | |
| | | | |
3.8 Merger of Santander Vivienda, S.A. de C.V.
On December 21, 2016, the SHCP authorized the merger of Santander Vivienda, S.A. de C.V. (Santander Vivienda) as merging entity with Santander Hipotecario, S.A. de C.V. (Santander Hipotecario) and Santander Holding Vivienda, S.A. de C.V. (Santander Holding Vivienda) both as merged entities, which became extinct. The merger of these entities was effective on January 1, 2017. This merger was authorized by the Extraordinary General Shareholders' Meeting held on December 30, 2016.
3.9 Early settlement of Tier II Subordinated Capital Notes - Expiration of cash tender offer
On September 26, 2018, the Bank announced the expiration of its previously announced cash tender offer (Tender Offer) for any and all of its outstanding 5.95% Tier II Subordinated Capital Notes issued on December 27, 2013 with a ten-year maturity (January 30, 2024). Approximately 1,221,907,000 USD in aggregate principal amount of the Tier II Subordinated Capital Notes subject to the Tender Offer were validly tendered and not validly withdrawn on September 26, 2018, and an additional 1,000,000 USD in aggregate principal amount were submitted pursuant to Notice of Guaranteed Delivery procedures.
Existing holders tendered 94.07% of Tier II Subordinated Capital Notes.
3.10 Issue of Tier II Subordinated Capital Notes due 2028
On October 1, 2018, the Bank issued 5.95% Tier II Subordinated Capital Notes due 2028 for a total of 1,300 million USD, meeting the capital requirements under Basel III criteria for complementary capital/Tier II. Banco Santander (Spain) purchased 975 million USD, or 75%, of these Subordinated Notes.
The Tier II Subordinated Capital Notes due 2028 were offered in the United States of America through a private placement to qualified institutional buyers, in accordance with Rule 144A under the U.S. Securities Act of 1933, as amended (Securities Act), and outside the United States of America, in accordance with Regulation S under the Securities Act.
3.11 Change of corporate name
On October 10, 2018, a modification in the Bank’s corporate name was duly approved such that, from that date, the Bank will be called Banco Santander México, S.A., Institución de Banca Múltiple, Grupo
Financiero Santander México. The modification consisted of eliminating the parentheses around the word “México”.
4. Distribution of the Bank’s profit and Earnings per share
4.1 Distribution of the Bank’s profit
The distributions of the Bank’s net profit for the years ended December 31, 2016, 2017 and 2018 approved by the Board of Directors during the annual general meetings are as follows:
| | | | | | | | | |
| | | | | | | | | |
| | | 2016 | | | 2017 | | | 2018 |
| | | | | | | | | |
Profit of the year | | | 16,536 | | | 18,678 | | | 19,356 |
Dividends declared | | | 17,468 | | | 8,910 | | | 9,228 |
Dividend per share (pesos) | | | 2.58 | | | 1.31 | | | 1.36 |
Date of payment | | | 05/26/2016 and | | | 05/30/2017 and | | | 06/29/2018 and |
| | | 12/30/2016 | | | 12/27/2017 | | | 12/28/2018 |
As mentioned in Notes 3.6 and 28.d, the Former Group declared a dividend of 1,822 million pesos in December 2018 to make equivalent the book value of the shares of the Former Group with those of the Bank, which was paid on January 25, 2018 by the Bank.
4.2 Earnings per share
According to IAS 33 Earnings per share, the Bank should present and adjust retrospectively, the basic and diluted earnings per share, if the number of ordinary or potential shares outstanding increases as a result of a capitalization, bonus issue or share split, or decreases as a result of a reverse share split.
i. Basic earnings per share
Basic earnings per share are calculated by dividing the profit attributable to the Parent by the weighted average number of shares outstanding during the year, excluding the average number of treasury shares, if any, held in the year (see Note 28.d).
Accordingly, basic earnings per share after the Merger were determined as follows:
| | | | | | | | | |
| | | | | | | | | |
| | | 2016 | | | 2017 | | | 2018 |
| | | | | | | | | |
Profit attributable to the Parent | | | 16,536 | | | 18,678 | | | 19,353 |
Profit attributable to the Parent (net of non-controlling interest) | | | 16,536 | | | 18,678 | | | 19,353 |
Weighted average number of shares outstanding | | | 6,777,381,551 | | | 6,777,381,551 | | | 6,776,220,369 |
Basic earnings per share (pesos) | | | 2.44 | | | 2.76 | | | 2.86 |
ii. Diluted earnings per share
In calculating diluted earnings per share, the amount of profit attributable to the Parent and the weighted average number of shares issued, excluding the average number of treasury shares, are adjusted to consider all the dilutive effects inherent to potential shares (see Note 28.d).
Accordingly, diluted earnings per share after the Merger were determined as follows:
| | | | | | | | | |
| | | | | | | | | |
| | | 2016 | | | 2017 | | | 2018 |
| | | | | | | | | |
Profit attributable to the Parent | | | 16,536 | | | 18,678 | | | 19,353 |
Profit attributable to the Parent (net of non-controlling interest) | | | 16,536 | | | 18,678 | | | 19,353 |
Weighted average number of shares outstanding | | | 6,777,381,551 | | | 6,777,381,551 | | | 6,776,220,369 |
Dilutive effect of rights on shares | | | 9,612,806 | | | 9,612,806 | | | 10,773,988 |
Adjusted number of shares | | | 6,786,994,357 | | | 6,786,994,357 | | | 6,786,994,357 |
Diluted earnings per share (pesos) | | | 2.44 | | | 2.75 | | | 2.85 |
5. Compensation of directors, executive officers and other key management personnel
The Bank considers as key management personnel the directors, the executive officers and the members of the audit committee, the corporate practices, nominating and compensation committee, the comprehensive risk management committee and the remuneration committee.
In May 2018, the Chief Risk Officer decided to step down and joined Banco Santander Río, S.A. in Argentina to lead risk activities. Other than the aforementioned personnel change, there were no significant changes in the Bank’s main key personnel from December 31, 2018 to the date on which these consolidated financial statements were authorized for issue.
a) Remuneration of directors
Our shareholders establish the compensation of our directors at the annual shareholders’ meeting. Accordingly, only independent directors receive compensation for their duties. Under Mexican law, we are not required to disclose on an individual basis the compensation of our directors, our executive officers and the members of the audit committee, the corporate practices, nominating and compensation committee, the comprehensive risk management committee and the remuneration committee and we do not otherwise publicly disclose such information.
The aggregate compensation paid to independent directors who were members of the audit committee, the corporate practices, nominating and compensation committee, the comprehensive risk management committee, the remuneration committee and the Board of Directors of the Bank amounted to 13 million pesos during 2016, 12 million pesos during 2017 and 15 million pesos during 2018, paid as attendance fees.
b) Remuneration of executive officers
The aggregate amount for compensation and benefits to executive officers amounted to 401 million pesos during 2016, 416 million pesos during 2017 and 496 million pesos during 2018. The main benefits paid to the Bank’s executive officers are: salary, Christmas bonus, vacation bonus, holidays, performance bonus and share-based payments.
The criteria for granting and paying bonus compensation vary according to the activities performed by the different areas and, therefore, payment of the bonus may vary depending on the department and activities performed by each member.
c) Post-employment and other long-term benefits
Our executive officers may participate in the same pension and medical expenses plan that is available to the Bank’s employees, but at different contribution percentages to the ones made by the rest of the employees.
The total post-employment benefits (including pension plan, medical expenses and life insurance policies) to executive officers amounted to 265 million pesos at December 31, 2016, 265 million pesos at December 31, 2017 and 331 million pesos at December 31, 2018.
d) Corporate performance shares plan 2014
On March 28, 2014, the shareholders of Banco Santander (Spain) approved a new share-based variable compensation plan denominated “Corporate performance shares plan 2014” applicable only to a certain group of executive officers. This plan provides a variable compensation linked to the performance of the stock of Banco Santander (Spain).
Details of the plan are presented in Note 41.b.
e) Long-term incentive plan 2015
During September 2016, the Bank began to participate in a new corporate share-based variable compensation plan denominated “Long-term incentive plan 2015” applicable only to a certain group of executive officers. This plan provides a variable compensation linked to the growth of the earnings per share ratio and of the return on tangible equity of Banco Santander (Spain).
Details of the plan are presented in Note 41.c.
f) Loans to executive officers
The loans granted to executive officers amount to 27 million pesos and 48 million pesos as of December 31, 2017 and 2018, respectively.
6. Cash and balances with the Central Bank
The breakdown by type of balances of Cash and balances with the Central Bank is as follows:
| | | | | | |
| | | | | | |
| | | 12/31/2017 | | | 12/31/2018 |
| | | | | | |
Cash | | | 21,538 | | | 25,080 |
Central Bank compulsory deposits | | | 28,094 | | | 28,094 |
Deposits in the Central Bank | | | 8,034 | | | 2,110 |
Accrued interest | | | 21 | | | 26 |
| | | 57,687 | | | 55,310 |
Central Bank compulsory deposits relate to a minimum balance financial institutions are required to maintain with the Central Bank based on a percentage of deposits received from third parties.
Note 44.a includes a breakdown of the remaining maturity of Cash and balances with the Central Bank. The compulsory deposits required by the Central Bank have an indefinite term. Additionally, Note 44.d includes the fair value amounts of these assets.
7. Loans and advances to credit institutions
The breakdown by classification, type and currency of the balances of Loans and advances to credit institutions in the consolidated balance sheets is as follows:
| | | | | | |
| | | | | | |
| | | 12/31/2017 | | | 12/31/2018 |
| | | | | | |
Classification: | | | | | | |
Other financial assets at fair value through profit or loss | | | 46,087 | | | 98,332 |
Financial assets at amortized cost | | | — | | | 47,034 |
Loans and receivables | | | 59,122 | | | — |
| | | 105,209 | | | 145,366 |
Type: | | | | | | |
Reciprocal accounts | | | 18,569 | | | 15,310 |
Time deposits | | | 71 | | | 51 |
Guarantee deposits - Collateral delivered for OTC derivatives transactions (Note 31) | | | 34,542 | | | 29,508 |
Reverse repurchase agreements | | | 46,087 | | | 98,332 |
Other accounts | | | 5,940 | | | 2,165 |
| | | 105,209 | | | 145,366 |
Currency: | | | | | | |
Peso | | | 69,311 | | | 100,409 |
USD | | | 35,229 | | | 43,986 |
Other currencies | | | 669 | | | 971 |
| | | 105,209 | | | 145,366 |
As of December 31, 2017 and 2018, time deposits consist of 71 million pesos and 51 million pesos, respectively related to deposits that the Bank holds in Mexican banks that reprices every 182 days with a fixed interest rate of 1.5%.
As of December 31, 2017 and 2018, 34,542 million pesos and 29,508 million pesos, respectively, of loans and advances to credit institutions, have been pledged in connection with OTC derivatives transactions, and are classified as restricted assets within Loans and advances to credit institutions - Loans and receivables (see Note 31).
As of December 31, 2017 and 2018, 46,075 million pesos and 98,458 million pesos, respectively, of debt instruments have been received as collaterals in connection with the reverse repurchase agreement transactions within Loans and advances to credit institutions - Other financial assets at fair value through profit or loss (see Note 30).
Note 44.a includes a breakdown of the remaining maturity of Loans and advances to credit institutions. Additionally, Note 44.d includes the fair value amounts of these assets classified as Loans and advances to credit institutions - Loans and receivables.
8. Debt instruments
a) Breakdown
The breakdown by classification, type and currency of the balances of Debt instruments is as follows:
| | | | | | |
| | | 12/31/2017 | | | 12/31/2018 |
| | | | | | |
Classification: | | | | | | |
Financial assets at fair value through profit or loss | | | — | | | 110,222 |
Financial assets held for trading | | | 147,747 | | | — |
Financial assets at fair value through other comprehensive income | | | — | | | 154,483 |
Available-for-sale financial assets | | | 164,947 | | | — |
Financial assets at amortized cost | | | — | | | 52,419 |
Loans and receivables | | | 10,758 | | | — |
| | | 323,452 | | | 317,124 |
Type: | | | | | | |
Mexican government debt securities | | | 224,003 | | | 253,547 |
Of which: | | | | | | |
Collateral delivered for OTC transactions (Note 31) | | | 2,964 | | | 4,769 |
Foreign government debt securities | | | 89,585 | | | 54,297 |
Of which: | | | | | | |
Brazilian Government Notes | | | 34,488 | | | 31,210 |
US Government Treasury Bills (T-BILLS) | | | 55,097 | | | 23,087 |
Debt securities issued by financial institutions | | | 3,975 | | | 5,998 |
Other debt securities | | | 5,889 | | | 3,282 |
| | | 323,452 | | | 317,124 |
Currency: | | | | | | |
Peso | | | 200,666 | | | 227,252 |
USD | | | 61,080 | | | 27,749 |
Brazilian Real (BRL) | | | 34,488 | | | 31,210 |
Other currencies | | | 27,218 | | | 30,913 |
| | | 323,452 | | | 317,124 |
The breakdown of the Debt instruments classified as at fair value through profit or loss (Held for trading up to December 31, 2017) is as follows:
| | | | | | |
| | | 12/31/2017 | | | 12/31/2018 |
| | | | | | |
Federal Treasury Securities (CETES) | | | 9,188 | | | 14,270 |
United Mexican States Bonds (UMS) | | | 44 | | | 40 |
Federal Mexican Government Development Bonds (BONDES) | | | 33,291 | | | 20,910 |
M and M10 Mexican Government Bonds | | | 14,069 | | | 27,783 |
Mexican Bank Saving Protection Bonds (BPATS) | | | 25,092 | | | 29,208 |
Federal Mexican Government Development Bonds in UDIS(1) (UDIBONDS) | | | 6,930 | | | 10,524 |
T-BILLS | | | 55,038 | | | 1,473 |
Other debt securities | | | 4,095 | | | 6,014 |
| | | 147,747 | | | 110,222 |
“UDIs” are Unidades de inversión, a peso-equivalent unit of account indexed for Mexican inflation. UDIs are units of account created by the Central Bank on April 4, 1995, the value of which in pesos is indexed to inflation on a daily basis, as measured by the change in the Mexican National Consumer Price Index (Índice Nacional de Precios al Consumidor or INPC). Under a UDI-based loan or financial instrument, the borrower’s nominal peso principal balance is converted either at origination or upon restructuring to a UDI
principal balance and interest on the loan or financial instrument is calculated on the outstanding UDI balance of the loan or financial instrument. Principal and interest payments are made by the borrower in an amount of pesos equivalent to the amount due in UDIs at the stated value of UDIs on the day of payment. As of December 31, 2017 and 2018, one UDI was equal to 5.93455 pesos and 6.22663 pesos, respectively.
As of December 31, 2017 and 2018, 2,964 million pesos and 4,769 million pesos, respectively, of debt instruments, have been pledged in connection with OTC derivatives transactions, and are classified as restricted assets within Debt instruments - Financial assets at fair value through profit or loss (held for trading up to December 31, 2017) (see Note 31).
As of December 31, 2017 and 2018, 21,555 million pesos and 27,592 million pesos, respectively, of Debt instruments, have been pledged in connection with securities loans transactions and are classified as restricted assets within Debt instruments - Financial assets at fair value through profit or loss (held for trading up to December 31, 2017), of which 21,448 million pesos and 27,301 million pesos, respectively, in which the lender is the Central Bank.
As of December 31, 2017 and 2018, 89,147 million pesos and 74,548 million pesos, respectively, of Debt instruments, have been pledged in connection with repurchase agreement and are classified as restricted assets within Debt instruments - Financial assets at fair value through profit or loss (held for trading up to December 31, 2017).
The breakdown of the Debt instruments classified as Financial assets at fair value through other comprehensive income (Available-for-sale financial assets up to December 31, 2017) is as follows:
| | | | | | |
| | | 12/31/2017 | | | 12/31/2018 |
| | | | | | |
CETES | | | — | | | 17,146 |
UMS | | | 29,832 | | | 34,688 |
M, M3 and M5 Mexican Government Bonds | | | 76,174 | | | 29,919 |
BPATS | | | 13,586 | | | 11,509 |
UDIBONDS | | | 5,039 | | | 5,131 |
T-BILLS | | | 59 | | | 21,614 |
Brazilian Government Notes | | | 34,488 | | | 31,210 |
Other debt securities | | | 5,769 | | | 3,266 |
| | | 164,947 | | | 154,483 |
As of December 31, 2017 and 2018, 13,881 million pesos and 18,463 million pesos, respectively, of Mexican government securities (M Bonds, BPATS, UMS and other debt securities) have been pledged in connection with repurchase agreements transactions, and are classified as restricted assets within Debt instruments - Financial assets at fair value through other comprehensive income (Available-for-sale financial assets up to December 31, 2017).
The following is a breakdown of the gross carrying amount of the Financial assets at fair value through other comprehensive income as of December 31, 2018:
| | | | | | | | | | | | | | | |
| | Fair value |
| | | Stage 1 | | | Stage 2 | | | Subtotal | | | Stage 3 | | | Total |
| | | | | | | | | | | | | | | |
Financial assets at fair value through other comprehensive income | | | | | | | | | | | | | | | |
Of which: | | | | | | | | | | | | | | | |
Mexican government debt instruments | | | 98,393 | | | — | | | 98,393 | | | — | | | 98,393 |
Foreign government debt instruments | | | 52,824 | | | — | | | 52,824 | | | — | | | 52,824 |
Other fixed-income interest debt instruments | | | 3,266 | | | — | | | 3,266 | | | — | | | 3,266 |
| | | | | | | | | | | | | | | |
| | | 154,483 | | | — | | | 154,483 | | | — | | | 154,483 |
During 2018, there were no transfers between stages related to the fair value (neither the corresponding allowance for impairment losses) of the financial assets at fair value through other comprehensive income, which are classified within Stage 1.
The breakdown by issuer rating of Debt instruments at December 31, 2017 is as follows:
| | | | | | | | | | | | | |
| | | Private | | | | | | | | | | |
| | | Debt | | | Sovereign Debt | | | Total | | | % | |
| | | | | | | | | | | | | |
AAA | | | — | | | 55,097 | | | 55,097 | | | 17.03 | % |
A | | | 2,651 | | | 181,965 | | | 184,616 | | | 57.08 | % |
BBB | | | 3,685 | | | 29,876 | | | 33,561 | | | 10.38 | % |
BB | | | 3,528 | | | 46,650 | | | 50,178 | | | 15.51 | % |
| | | | | | | | | | | | | |
| | | 9,864 | | | 313,588 | | | 323,452 | | | 100 | % |
The breakdown by issuer rating of Debt instruments at December 31, 2018 is as follows:
| | | | | | | | | | | | | |
| | | Private | | | | | | | | | | |
| | | Debt | | | Sovereign Debt | | | Total | | | % | |
| | | | | | | | | | | | | |
AAA | | | — | | | 23,087 | | | 23,087 | | | 7.28 | % |
A | | | 3,189 | | | 184,195 | | | 187,384 | | | 59.09 | % |
BBB | | | 847 | | | 34,728 | | | 35,575 | | | 11.22 | % |
BB | | | 5,013 | | | 34,624 | | | 39,637 | | | 12.50 | % |
Below B | | | — | | | 31,210 | | | 31,210 | | | 9.84 | % |
Below BBB | | | 231 | | | — | | | 231 | | | 0.07 | % |
| | | 9,280 | | | 307,844 | | | 317,124 | | | 100 | % |
As of December 31, 2017 and 2018, BBB ratings balance include mainly sovereign exposures in Mexico. As of December 31, 2017 ratings balance BB includes both sovereign exposures in Brazil and Mexico and as of December 31, 2018 includes sovereign exposures in Mexico. The rating of PEMEX Bonds was downgraded from above BBB to below BBB during the first quarter of 2019.
The breakdown of the Debt instruments classified as Financial assets at amortized cost (Loans and receivables up to December 31, 2017) is as follows:
| | | | | | |
| | | 12/31/2017 | | | 12/31/2018 |
| | | | | | |
Special CETES | | | 2,975 | | | 3,208 |
BREMS R | | | 7,783 | | | 7,785 |
M, M3 and M5 Mexican Government Bonds | | | — | | | 41,426 |
| | | 10,758 | | | 52,419 |
| | | | | | |
Type: | | | | | | |
Unquoted | | | 2,975 | | | 3,208 |
Quoted | | | 7,783 | | | 49,211 |
| | | | | | |
As of December 31, 2017 and 2018, 7,350 million pesos and 6,622 million pesos, respectively, of BREMS R have been pledged in connection with repurchase agreements transactions and are classified as restricted assets within Debt instruments - Financial assets at amortized cost (Loans and receivables up to December 31, 2017).
As of December 31, 2018, 1,672 million pesos of Mexican Government Bonds have been pledged in connection with repurchase agreements transactions and are classified as restricted assets within Debt instruments - Financial assets at amortized cost.
As of December 31, 2018, 535 million pesos of Mexican Government Bonds have been pledged in connection with securities loans transactions and are classified as restricted assets within Debt instruments - Financial assets at amortized cost.
The following is a breakdown of the gross carrying amount of the Financial assets at amortized cost as of December 31, 2018:
| | | | | | | | | | | | | | | |
| | Gross carrying amount |
| | | Stage 1 | | | Stage 2 | | | Subtotal | | | Stage 3 | | | Total |
| | | | | | | | | | | | | | | |
Financial assets at amortized cost | | | | | | | | | | | | | | | |
Of which: | | | | | | | | | | | | | | | |
Mexican government debt instruments | | | 52,419 | | | — | | | 52,419 | | | — | | | 52,419 |
| | | | | | | | | | | | | | | |
During 2018, there were no transfers between stages related to the gross carrying amount of the Financial assets at amortized cost, which are classified within Stage 1.
b) Changes
The changes in Financial assets at fair value through other comprehensive income (Available-for-sale financial assets up to December 31, 2017) - Debt instruments, were as follows:
| | | | | | | | | | |
| | | 2016 | | | 2017 | | | 2018 | |
| | | | | | | | | | |
Beginning balance | | | 113,525 | | | 154,318 | | | 164,947 | |
Reclassification from Available-for-sale to Amortized cost | | | — | | | — | | | (73,131) | |
Beginning balance as restated | | | 113,525 | | | 154,318 | | | 91,816 | |
Net additions/(disposals) | | | 44,366 | | | 8,703 | | | 63,824 | |
Valuation adjustments | | | (3,453) | | | 1,935 | | | (1,226) | |
Amounts reclassified to consolidated income statement | | | (120) | | | (9) | | | 69 | |
Balance at year-end | | | 154,318 | | | 164,947 | | | 154,483 | |
c) Allowance for impairment losses
As of December 31, 2017 and during 2016 and 2017, the Bank has not recognized any impairment on Debt Instruments - Available-for-sale (see Note 27).
The following is a breakdown of the allowance for loan losses of Financial assets at fair value through other comprehensive income and at amortized cost as of December 31, 2018:
| | | | | | | | | | | | | | | |
| | Allowance for impairment losses |
| | | Stage 1 | | | Stage 2 | | | Stage 3 | | | Total | | | Written-off financial assets |
| | | | | | | | | | | | | | | |
Financial assets at fair value through other comprehensive income | | | 20 | | | — | | | — | | | 20 | | | — |
Of which: | | | | | | | | | | | | | | | |
Mexican government debt instruments | | | 19 | | | — | | | — | | | 19 | | | — |
Other fixed-income interest debt instruments | | | 1 | | | — | | | — | | | 1 | | | — |
| | | | | | | | | | | | | | | |
Financial assets at amortized cost | | | — | | | — | | | — | | | — | | | — |
| | | | | | | | | | | | | | | |
| | | 20 | | | — | | | — | | | 20 | | | — |
The change in the allowance for impairment losses of Financial assets at fair value through other comprehensive income during 2018, amounts to 2 million pesos.
There were no allowance for impairment losses recognized during 2018, related to Financial assets at amortized cost.
d) Other information
Note 44.a contains a breakdown of the remaining maturity periods of Financial assets at fair value through other comprehensive income (Available-for-sale financial assets up to December 31, 2017) - Debt
Instruments. Additionally, Note 44.d includes the fair value amounts of these assets classified as Debt instruments - Financial assets at amortized cost (Loans and receivables up to December 31, 2017).
9. Equity instruments
a) Breakdown
The breakdown by classification and type of Equity instruments is as follows:
| | | | | | |
| | | 12/31/2017 | | | 12/31/2018 |
| | | | | | |
Classification: | | | | | | |
Financial assets held for trading | | | 2,562 | | | — |
Financial assets at fair value through profit or loss | | | — | | | 2,349 |
Available-for-sale financial assets | | | 795 | | | — |
Financial assets at fair value through other comprehensive income | | | — | | | 535 |
| | | 3,357 | | | 2,884 |
Type: | | | | | | |
Shares of Mexican companies | | | 3,357 | | | 2,884 |
Shares of foreign companies | | | — | | | — |
| | | 3,357 | | | 2,884 |
As of December 31, 2017 and 2018, 7 million pesos and 333 million pesos, respectively, of equity instruments have been received as guarantees and/or collateral in connection with the securities loans transactions within Equity instruments - Financial assets at fair value through profit or loss (Financial assets held for trading up to December 31, 2017) (see Note 30).
As of December 31, 2017 and 2018, 107 million pesos and 959 million pesos, respectively, of Equity instruments, have been pledged in connection with securities loans transactions and are classified as restricted assets within Equity instruments - Financial assets at fair value through profit or loss (Financial assets held for trading up to December 31, 2017).
Note 44.a contains a breakdown of the remaining maturity periods of these assets.
b) Changes
The changes in Financial assets at fair value through other comprehensive income (Available-for-sale financial assets up to December 31, 2017) - Equity instruments, were as follows:
| | | | | | | | | | |
| | | 2016 | | | 2017 | | | 2018 | |
| | | | | | | | | | |
Beginning balance as of January 1 | | | 348 | | | 326 | | | 795 | |
Recognition of own equity instruments held for future equity-settled share-based payments (Note 3.6) | | | — | | | — | | | (247) | |
Transfer to non-current assets held for sale | | | — | | | — | | | — | |
Net additions/(disposals) | | | 30 | | | 472 | | | — | |
Valuation adjustments | | | (52) | | | (3) | | | (13) | |
Amounts reclassified to consolidated income statement | | | — | | | — | | | — | |
Balance at year-end | | | 326 | | | 795 | | | 535 | |
Note 27.a includes a breakdown of the valuation adjustments recognized in the consolidated other comprehensive income under Valuation adjustments - Financial assets at fair value through other comprehensive income (Available-for-sale financial assets up to December 31, 2017).
c) Allowance for impairment losses
As of December 31, 2017 and 2018 and during 2016, 2017 and 2018, the Bank has not recognized any impairment on equity instruments.
10. Trading derivatives (assets and liabilities) and Short positions
a) Trading derivatives
The breakdown by type of inherent risk of the fair value of the Trading derivatives arranged by the Bank is as follows (see Note 31):
| | | | | | | | | | | | |
| | | 12/31/2017 | | | 12/31/2018 |
| | | Debit | | | Credit | | | Debit | | | Credit |
| | | Balance | | | Balance | | | Balance | | | Balance |
| | | | | | | | | | | | |
Interest rate risk | | | 58,895 | | | 61,027 | | | 71,269 | | | 71,578 |
Currency risk | | | 105,424 | | | 109,813 | | | 82,619 | | | 80,986 |
Market price risk | | | 942 | | | 442 | | | 1,065 | | | 1,163 |
| | | 165,261 | | | 171,282 | | | 154,953 | | | 153,727 |
Note 44.a contains a breakdown of the remaining maturity periods of trading derivatives.
b) Short positions
Following is a breakdown of the carrying amount of Short positions:
| | | | | | |
| | | 12/31/2017 | | | 12/31/2018 |
| | | | | | |
Securities loans: | | | | | | |
Debt instruments | | | 21,050 | | | 27,279 |
Equity instruments | | | 82 | | | 960 |
| | | 21,132 | | | 28,239 |
Short sales: | | | | | | |
Debt instruments (*) | | | 47,311 | | | 73,515 |
| | | 68,443 | | | 101,754 |
(*)These figures include financial liabilities arising from the outright sale and from pledging of financial assets acquired under reverse repurchase agreements of 46,233 million pesos and 72,835 million pesos as of December 31, 2017 and December 31, 2018, respectively.
Note 44.a contains a breakdown of the remaining maturity periods of these liabilities.
11. Loans and advances to customers
a) Detail
The detail by classification of Loans and advances to customers in the consolidated balance sheets is as follows:
| | | | | | | |
| | | 12/31/2017 | | | 12/31/2018 | |
| | | | | | | |
Other financial assets at fair value through profit or loss | | | 5,618 | | | 9,093 | |
Financial assets at fair value through other comprehensive income | | | — | | | 771 | |
Financial assets at amortized cost | | | — | | | 666,772 | |
Loans and receivables | | | 609,420 | | | — | |
| | | 615,038 | | | 676,636 | |
Of which: | | | | | | | |
Before allowance for impairment losses | | | 631,967 | | | 698,152 | |
Allowance for impairment losses | | | (16,929) | | | (21,516) | |
| | | 615,038 | | | 676,636 | |
As of December 31, 2017 and 2018, 2,566 million pesos and 3,689 million pesos, respectively, of Loans and advances to customers have been pledged in connection with derivatives traded in organized markets, and are classified as restricted assets within Loans and advances to customers (see Note 31).
Note 44.a includes a breakdown of the remaining maturity of Loans and advances to customers. Additionally, Note 44.d includes the fair value amounts of these assets classified as Loans and advances to customers - Loans and receivables.
b) Breakdown
The following is a breakdown by loan type, borrower sector, geographical area of residence and interest rate formula of the Loans and advances to customers. This breakdown reflects the Bank’s exposure to credit risk in its core business, disregarding the allowance for impairment losses:
| | | | | | |
| | | 12/31/2017 | | | 12/31/2018 |
| | | | | | |
By loan type: | | | | | | |
Commercial, financial and industrial loans | | | 329,098 | | | 365,438 |
Public sector loans | | | 49,294 | | | 59,547 |
Mortgage loans | | | 126,835 | | | 137,404 |
Reverse repurchase agreements | | | 5,618 | | | 9,093 |
Installment loans to individuals - | | | | | | |
Revolving consumer credit card loans | | | 52,037 | | | 54,511 |
Non-revolving consumer loans | | | 50,953 | | | 53,730 |
Impaired loans | | | 18,132 | | | 18,429 |
| | | 631,967 | | | 698,152 |
By borrower sector: | | | | | | |
Public sector | | | 49,294 | | | 59,547 |
Individuals | | | 241,951 | | | 257,132 |
Communications and transportation | | | 31,339 | | | 33,373 |
Construction | | | 29,386 | | | 45,333 |
Manufacturing | | | 60,261 | | | 65,273 |
Services | | | 189,846 | | | 185,382 |
Tourism | | | 14,008 | | | 21,870 |
Other sectors | | | 15,882 | | | 30,242 |
| | | 631,967 | | | 698,152 |
By geographical area: | | | | | | |
Mexico | | | 631,967 | | | 698,152 |
| | | 631,967 | | | 698,152 |
By interest rate: | | | | | | |
Fixed rate | | | 245,530 | | | 255,571 |
Floating rate | | | 386,437 | | | 442,581 |
| | | 631,967 | | | 698,152 |
As of December 31, 2017 and 2018, 5,618 million pesos and 9,103 million pesos, respectively, of debt instruments have been received as collaterals in connection with the reverse repurchase agreement transactions within Loans and advances to customers - Other financial assets at fair value through profit or loss (see Note 30).
c) Valuation adjustments for impairment of financial assets
The following is a breakdown of the gross carrying amount of the Financial assets at fair value through other comprehensive income and the Financial assets at amortized cost as of December 31, 2018:
| | | | | | | | | | | | | | | |
| | Fair value/Gross carrying amount |
| | | Stage 1 | | | Stage 2 | | | Subtotal | | | Stage 3 (*) | | | Total |
| | | | | | | | | | | | | | | |
Financial assets at fair value through other comprehensive income | | | 773 | | | — | | | 773 | | | — | | | 773 |
Of which: | | | | | | | | | | | | | | | |
Commercial, financial and industrial loans | | | 773 | | | — | | | 773 | | | — | | | 773 |
| | | | | | | | | | | | | | | |
Financial assets at amortized cost | | | 643,475 | | | 26,382 | | | 669,857 | | | 18,429 | | | 688,286 |
Of which: | | | | | | | | | | | | | | | |
Commercial, financial and industrial loans | | | 354,825 | | | 9,840 | | | 364,665 | | | 6,538 | | | 371,203 |
Public sector loans | | | 59,547 | | | — | | | 59,547 | | | — | | | 59,547 |
Mortgage loans | | | 128,269 | | | 9,135 | | | 137,404 | | | 8,345 | | | 145,749 |
Installment to individuals - | | | 100,834 | | | 7,407 | | | 108,241 | | | 3,546 | | | 111,787 |
Revolving consumer credit card loans | | | 51,169 | | | 3,342 | | | 54,511 | | | 1,716 | | | 56,227 |
Non-revolving consumer loans | | | 49,665 | | | 4,065 | | | 53,730 | | | 1,830 | | | 55,560 |
| | | | | | | | | | | | | | | |
(*) As of December 31, 2018 there were no POCI financial assets.
The following is a breakdown of the transfers of Financial assets at amortized cost between stages as of December 31, 2018:
| | | | | | | | | | | | |
| | Gross carrying amount |
| | | Stage 1 | | | Stage 2 | | | Stage 3 | | | Total |
| | | | | | | | | | | | |
As of January 1, 2018 | | | 583,871 | | | 24,346 | | | 18,132 | | | 626,349 |
Transfers: | | | | | | | | | | | | |
Transfer from Stage 1 to Stage 2 | | | (77,762) | | | 77,762 | | | — | | | — |
Transfer from Stage 1 to Stage 3 | | | (3,453) | | | — | | | 3,453 | | | — |
Transfer from Stage 2 to Stage 3 | | | — | | | (25,926) | | | 25,926 | | | — |
Transfer from Stage 2 to Stage 1 | | | 46,673 | | | (46,673) | | | — | | | — |
Transfer from Stage 3 to Stage 2 | | | — | | | 3,972 | | | (3,972) | | | — |
Transfer from Stage 3 to Stage 1 | | | 2,992 | | | — | | | (2,992) | | | — |
| | | | | | | | | | | | |
Remaining in same stage | | | (113,862) | | | (1,382) | | | (561) | | | (115,805) |
Financial assets derecognized during the period other than write-offs | | | (660,706) | | | (3,703) | | | (1,647) | | | (666,056) |
Originated financial assets | | | 871,091 | | | — | | | — | | | 871,091 |
Write-offs | | | — | | | — | | | (19,678) | | | (19,678) |
Other movements | | | (5,369) | | | (2,014) | | | (232) | | | (7,615) |
| | | | | | | | | | | | |
As of December 31, 2018 | | | 643,475 | | | 26,382 | | | 18,429 | | | 688,286 |
| · | | The change in the gross carrying amount of financial instruments that were transferred from Stage 1 to Stage 2 amounting 77,762 million pesos, result in additional Allowance for impairment losses of 13,517 million pesos. The main driver of the change is the increase in the PD lifetime used to determine the Allowance for impairment losses of these instruments. |
| · | | The change in the gross carrying amount of financial instruments that were transferred from Stage 2 to Stage 3 amounting 25,926 million pesos, result in additional Allowance for impairment losses of 4,891 million pesos. The change is not significant because PD lifetime is used to determine the Allowance for impairment losses for both stages. |
| · | | The change in the gross carrying amount of financial instruments that were transferred from Stage 2 to Stage 1 amounting 46,673 million pesos, result in a decrease in the Allowance for impairment losses of 6,162 million pesos. The main driver of the change is the use of a “12 months” PD instead of PD forward-looking. |
| · | | The gross carrying amount of financial instruments originated in 2018 that amounts to 871,091 million pesos, result in an increase in the Allowance for impairment losses of 5,997 million pesos. |
d) Allowance for impairment losses
The changes in the allowance for impairment losses on Loans and advances to customers were as follows:
| | | | | | | | | | |
| | | 2016 | | | 2017 | | | 2018 | |
| | | | | | | | | | |
Beginning balance as of January 1 (as originally presented) | | | (18,749) | | | (17,883) | | | (16,929) | |
Adjustments on initial adoption of IFRS 9 | | | — | | | — | | | (3,270) | |
Beginning balance as of January 1 (restated) | | | (18,749) | | | (17,883) | | | (20,199) | |
| | | | | | | | | | |
Impairment losses on financial assets - Financial assets at amortized cost (*) | | | (19,022) | | | (20,771) | | | (20,947) | |
Impairment losses on financial assets - Financial assets at fair value through other comprehensive income | | | — | | | — | | | (2) | |
Write-off of impaired loans applied against the allowance for impairment losses | | | 20,045 | | | 21,733 | | | 19,678 | |
Others | | | (157) | | | (8) | | | (46) | |
Balance at year-end | | | (17,883) | | | (16,929) | | | (21,516) | |
| | | | | | | | | | |
Of which: | | | | | | | | | | |
By geographical location of risk: | | | | | | | | | | |
Mexico | | | (17,883) | | | (16,929) | | | (21,516) | |
| | | | | | | | | | |
(*)The amount of Impairment losses on financial assets - Loans and receivables presented in the consolidated income statement is net of recoveries of loans previously written-off and recovery expenses in the amount of 2,361 million pesos in 2016, 1,951 million pesos in 2017 and 2,141 million pesos in 2018.
The following is a breakdown of the allowance for loan losses and the written-off financial assets as of December 31, 2018:
| | | | | | | | | | | | | | | |
| | Allowance for impairment losses |
| | | Stage 1 | | | Stage 2 | | | Stage 3 | | | Total | | | Written-off financial assets |
| | | | | | | | | | | | | | | |
Financial assets at fair value through other comprehensive income | | | 2 | | | — | | | — | | | 2 | | | — |
Of which: | | | | | | | | | | | | | | | |
Commercial, financial and industrial loans | | | 2 | | | — | | | — | | | 2 | | | — |
| | | | | | | | | | | | | | | |
Financial assets at amortized cost | | | 7,033 | | | 5,309 | | | 9,172 | | | 21,514 | | | 19,678 |
Of which: | | | | | | | | | | | | | | | |
Commercial, financial and industrial loans | | | 1,968 | | | 1,502 | | | 3,980 | | | 7,450 | | | 5,808 |
Public sector loans | | | 4 | | | — | | | — | | | 4 | | | — |
Mortgage loans | | | 506 | | | 656 | | | 2,416 | | | 3,578 | | | 861 |
Installment to individuals - | | | 4,555 | | | 3,151 | | | 2,776 | | | 10,482 | | | 13,009 |
Revolving consumer credit card loans | | | 2,220 | | | 1,743 | | | 1,391 | | | 5,354 | | | 7,482 |
Non-revolving consumer loans | | | 2,335 | | | 1,408 | | | 1,385 | | | 5,128 | | | 5,527 |
| | | | | | | | | | | | | | | |
The contractual amount outstanding of financial assets written-off during 2018, that are still subject to enforcement activities amounts to 17,327 million pesos.
The following is a breakdown of the transfers of allowance for impairment losses of Financial assets at amortized cost between stages as of December 31, 2018:
| | | | | | | | | | | | |
| | Allowance for impairment losses |
| | | Stage 1 | | | Stage 2 | | | Stage 3 | | | Total |
| | | | | | | | | | | | |
Beginning balance as of January 1 (as originally presented) | | | 6,768 | | | 3,664 | | | 6,497 | | | 16,929 |
Adjustments on initial adoption of IFRS 9 | | | 688 | | | 1,116 | | | 1,466 | | | 3,270 |
Beginning balance as of January 1 (restated) | | | 7,456 | | | 4,780 | | | 7,963 | | | 20,199 |
| | | | | | | | | | | | |
As of January 1, 2018 | | | | | | | | | | | | |
Transfers: | | | | | | | | | | | | |
Transfer from Stage 1 to Stage 2 | | | (4,804) | | | 18,321 | | | — | | | 13,517 |
Transfer from Stage 1 to Stage 3 | | | (164) | | | — | | | 613 | | | 449 |
Transfer from Stage 2 to Stage 3 | | | — | | | (11,379) | | | 16,270 | | | 4,891 |
Transfer from Stage 2 to Stage 1 | | | 2,287 | | | (8,449) | | | | | | (6,162) |
Transfer from Stage 3 to Stage 2 | | | — | | | 572 | | | (1,285) | | | (713) |
Transfer from Stage 3 to Stage 1 | | | 133 | | | — | | | (634) | | | (501) |
| | | | | | | | | | | | |
Financial assets derecognized during the period other than write-offs | | | (2,841) | | | (799) | | | (2,736) | | | (6,376) |
Contracts remaining at the same stage | | | (1,140) | | | 2,525 | | | 8,646 | | | 10,031 |
Write-offs | | | — | | | — | | | (19,678) | | | (19,678) |
Originated financial assets | | | 5,997 | | | — | | | — | | | 5,997 |
Foreign exchange and other movements | | | 111 | | | (262) | | | 13 | | | (138) |
| | | | | | | | | | | | |
As of December 31, 2018 | | | 7,035 | | | 5,309 | | | 9,172 | | | 21,516 |
e) Impaired loans
The breakdown of the changes in the balance of the financial assets classified as Loans and receivables - Loans and advances to customers that are considered to be impaired due to credit risk is as follows:
| | | | | | | | | | |
| | | | | | | | | | |
| | | 2016 | | | 2017 | | | 2018 | |
| | | | | | | | | | |
Beginning balance | | | 19,742 | | | 17,595 | | | 18,132 | |
Additions | | | 30,431 | | | 34,180 | | | 32,461 | |
Transfers to performing loans | | | (12,533) | | | (11,910) | | | (12,486) | |
Written-off loans | | | (20,045) | | | (21,733) | | | (19,678) | |
Balance at year-end | | | 17,595 | | | 18,132 | | | 18,429 | |
The breakdown of the balance of the financial assets classified as Loans and receivables - Loans and advances to customers between no past due and past due as of December 31, 2017 is as follows:
| | | | | | | | | | | | | | | | | | |
| | | | | | With Balances Past Due by |
| | | With no Past | | | | | | | | | | | | | | | |
| | | Due Balances | | | | | | | | | | | | | | | |
| | | or Less than 3 | | | | | | | | | | | | | | | |
| | | Months Past | | | | | | | | | | | | More than 12 | | | |
| | | Due | | | 3 to 6 Months | | | 6 to 9 Months | | | 9 to 12 Months | | | Months | | | Total |
| | | | | | | | | | | | | | | | | | |
By type of loan: | | | | | | | | | | | | | | | | | | |
Commercial, financial and industrial loans | | | 2,509 | | | 2,472 | | | 664 | | | 127 | | | 235 | | | 6,007 |
Mortgage loans | | | 1,086 | | | 1,624 | | | 1,186 | | | 815 | | | 2,650 | | | 7,361 |
Installment loans to individuals | | | | | | | | | | | | | | | | | | |
Of which: | | | | | | | | | | | | | | | | | | |
Revolving consumer credit card loans | | | 868 | | | 1,467 | | | — | | | — | | | — | | | 2,335 |
Non-revolving consumer loans | | | 647 | | | 1,287 | | | 472 | | | 4 | | | 19 | | | 2,429 |
| | | 5,110 | | | 6,850 | | | 2,322 | | | 946 | | | 2,904 | | | 18,132 |
The breakdown of the balance of the financial assets classified as Loans and receivables - Loans and advances to customers between no past due and past due as of December 31, 2018 is as follows:
| | | | | | | | | | | | | | | | | | |
| | | | | | With Balances Past Due by |
| | | With no Past | | | | | | | | | | | | | | | |
| | | Due Balances | | | | | | | | | | | | | | | |
| | | or Less than 3 | | | | | | | | | | | | | | | |
| | | Months Past | | | | | | | | | | | | More than 12 | | | |
| | | Due | | | 3 to 6 Months | | | 6 to 9 Months | | | 9 to 12 Months | | | Months | | | Total |
| | | | | | | | | | | | | | | | | | |
By type of loan: | | | | | | | | | | | | | | | | | | |
Commercial, financial and industrial loans | | | 2,138 | | | 1,531 | | | 112 | | | 880 | | | 1,877 | | | 6,538 |
Mortgage loans | | | 2,098 | | | 1,447 | | | 844 | | | 662 | | | 3,294 | | | 8,345 |
Installment loans to individuals | | | | | | | | | | | | | | | | | | |
Of which: | | | | | | | | | | | | | | | | | | |
Revolving consumer credit card loans | | | 530 | | | 1,186 | | | — | | | — | | | — | | | 1,716 |
Non-revolving consumer loans | | | 484 | | | 1,345 | | | — | | | — | | | 1 | | | 1,830 |
| | | 5,250 | | | 5,509 | | | 956 | | | 1,542 | | | 5,172 | | | 18,429 |
f) Renegotiated loans
Renegotiated loans include renegotiation of performing loans and impaired loans, as contractual terms of a loan may be modified not only due to concerns about the borrower’s ability to meet contractual payments, but also for customer retention purposes and other factors not related to current or potential credit deterioration of the customer. A breakdown of renegotiated loans during the years ended December 31, 2016, 2017 and 2018 is as follows:
| | | | | | | | | | | | | | | | | | | | | | | | | | | | | | | | | | | | | |
| | | For the Year Ended 12/31/2016 | | | For the Year Ended 12/31/2017 | | | For the Year Ended 12/31/2018 | |
| | | Performing loans | | | | | | | | | Performing loans | | | | | | | | | Performing loans | | | | | | | |
| | | Due to | | | | | | | | | | | | Due to | | | | | | | | | | | | Due to | | | | | | | | | | |
| | | Concerns | | | | | | | | | | | | Concerns | | | | | | | | | | | | Concerns | | | | | | | | | | |
| | | About | | | | | | | | | | | | About | | | | | | | | | | | | About | | | | | | | | | | |
| | | Current or | | | | | | | | | | | | Current or | | | | | | | | | | | | Current or | | | | | | | | | | |
| | | Potential | | | Due to | | | | | | | | | Potential | | | Due to | | | | | | | | | Potential | | | Due to | | | | | | | |
| | | Credit | | | Other | | | Impaired | | | | | | Credit | | | Other | | | Impaired | | | | | | Credit | | | Other | | | Impaired | | | | |
| | | Deterioration | | | Factors | | | Loans | | | Total | | | Deterioration | | | Factors | | | Loans | | | Total | | | Deterioration | | | Factors | | | Loans | | | Total | |
| | | | | | | | | | | | | | | | | | | | | | | | | | | | | | | | | | | | | |
Commercial, financial and industrial loans | | | 3,576 | | | — | | | 1,606 | | | 5,182 | | | 879 | | | — | | | 1,028 | | | 1,907 | | | 1,318 | | | — | | | 3,011 | | | 4,329 | |
Mortgage loans | | | | | | | | | | | | — | | | 22 | | | — | | | 1 | | | 23 | | | 603 | | | — | | | 530 | | | 1,133 | |
Installment loans to individuals | | | 1,073 | | | — | | | 158 | | | 1,231 | | | 1,086 | | | — | | | 186 | | | 1,272 | | | 1,147 | | | — | | | 205 | | | 1,352 | |
| | | 4,649 | | | — | | | 1,764 | | | 6,413 | | | 1,987 | | | — | | | 1,215 | | | 3,202 | | | 3,068 | | | — | | | 3,746 | | | 6,814 | |
Percentage | | | 72 | % | | — | | | 28 | % | | 100 | % | | 62 | % | | — | | | 38 | % | | 100 | % | | 45 | % | | — | | | 55 | % | | 100 | % |
Impaired loans that are renegotiated continue to be classified as impaired loans until the sustained payment criteria is reached as described in Note 2.g.
The types of terms that are typically renegotiated include: (a) modifications to the contractual terms of loans, such as payment terms, interest rates and currency, or (b) modifications to the guarantees that cover the loans.
The Bank has implemented renegotiation programs which include options for the borrowers to extend payment terms, reduction in scheduled installments of principal and interest repayments, consolidation of debt and other forms of loan modifications, among others.
The net modification effect from financial assets whose cash flows were modified during the period as part of the Bank’s renegotiation programs was deemed to be immaterial.
See Note 47(b) 3.6 Recovery and collections management for additional information regarding renegotiated loans.
g) Maximum exposure to credit risk and credit quality information
Maximum exposure to credit risk
The tables below represent the Bank’s maximum exposure to credit risk by class of financial instrument (except for hedging derivatives) and the respective collateral and other credit enhancements mitigating credit risk for these classes of financial instruments. The maximum exposure to credit risk includes the carrying amounts of financial instruments recognized on the consolidated balance sheet subject to credit risk and the nominal amounts for off-balance sheet commitments.
Where available, collaterals are presented at fair value; for other collaterals, such as real estate and other assets, best estimates of fair value are used. Other credit enhancements such as guarantees are included at their nominal amounts.
Collateral or guarantees are credit enhancements in the form of an asset or third-party obligation that serve to mitigate the inherent risk of credit loss in an exposure, by either substituting the borrower default risk or
improving recoveries in the event of a default. The Bank’s collaterals or guarantees are contractual and are typically classified as follows:
| · | | Financial and other collateral, which enables the Bank to recover all or part of the outstanding exposure by liquidating the collateral asset provided in cases where the borrower is unable or unwilling to fulfill its primary obligations. Cash collateral, securities (debt or equity instruments), collection rights, inventory, equipment and real estate are included in this category: |
Cash collateral received - cash collateral requested from financial and corporate customers to secure the payments in OTC derivative transactions.
Collateralized by securities - collateral to secure the payments in repurchase agreements and reverse repurchase agreements.
Collection rights - highly liquid and realizable guarantees, which are mainly comprised of standby letters and pledges on funds and securities.
Real estate.
| · | | Guarantee collateral, which complements the borrower’s ability to fulfill its obligation under the legal contract and, as such, is provided by third parties in the form of individual guarantee by endorsement or cosigners, where individuals or companies act as guarantors of the loan transaction. |
Collaterals and other credit enhancements related to the commercial portfolio are subject to at least an annual review. In the case of guarantees, the guarantor’s ability to perform under the guarantee contract is reviewed through an analysis of the financial position of the borrower and the guarantor. There are cases where the Bank has attempted to seek recovery through the execution of a third-party guarantee and has been denied such recovery. Please see Note 2.g for an explanation of how the credit ratings of guarantors affect our allowance for impairment losses.
For the retail portfolio, a review of its collaterals and other credit enhancements is performed on a periodic basis depending on the history of the payment performance of the borrower.
For the real estate collaterals, appraisals are obtained as of the date of origination of the loans and when the loan is classified as impaired.
See Note 47(b) 3.4 Transaction decision-making for additional information regarding credit risk mitigation techniques.
The breakdown is as follows:
| | | | | | | | | | | | | | | | | | | | | | | | |
| | | | | | 12/31/2017 |
| | | | | | Maximum Exposure | | | | | | | | | | | | | | | |
| | | Maximum | | | to Credit Risk (1) | | | Collaterals | | | Other Credit Enhancements |
| | | Exposure to | | | | | | | | | Cash Collateral | | | Collateralized by | | | | | | | | | |
| | | Credit Risk | | | Unsecured | | | Secured | | | Received | | | Securities | | | Collection Rights (3) | | | Real Estate (2) | | | Guarantees |
| | | | | | | | | | | | | | | | | | | | | | | | |
Financial assets held for trading | | | 313,008 | | | 264,201 | | | 48,807 | | | 45,024 | | | 3,783 | | | — | | | — | | | — |
Other financial assets at fair value through profit or loss | | | 51,705 | | | — | | | 51,705 | | | — | | | 51,693 | | | — | | | — | | | — |
Available-for-sale financial assets | | | 164,947 | | | 164,947 | | | — | | | — | | | — | | | — | | | — | | | — |
Loans and receivables: | | | 696,229 | | | 308,252 | | | 387,977 | | | — | | | — | | | 165,696 | | | 196,146 | | | 76,030 |
Of which: | | | | | | | | | | | | | | | | | | | | | | | | �� |
Loans and advances to credit institutions | | | 59,122 | | | 59,122 | | | — | | | — | | | — | | | — | | | — | | | — |
Loans and advances to customers | | | 626,349 | | | 238,372 | | | 387,977 | | | — | | | — | | | 165,696 | | | 196,146 | | | 76,030 |
Commercial, financial and industrial loans | | | 335,104 | | | 107,980 | | | 227,124 | | | — | | | — | | | 141,806 | | | 66,619 | | | 76,028 |
Public sector loans | | | 49,294 | | | 18,963 | | | 30,331 | | | — | | | — | | | 23,845 | | | — | | | — |
Mortgage loans | | | 134,197 | | | 4,397 | | | 129,800 | | | — | | | — | | | — | | | 128,106 | | | 2 |
Installment loans to individuals: | | | | | | | | | | | | | | | | | | | | | | | | |
Revolving consumer credit card loans | | | 54,372 | | | 54,372 | | | — | | | — | | | — | | | — | | | — | | | — |
Non-revolving consumer loans | | | 53,382 | | | 52,660 | | | 722 | | | — | | | — | | | 45 | | | 1,421 | | | — |
Debt instruments | | | 10,758 | | | 10,758 | | | — | | | — | | | — | | | — | | | — | | | — |
Guarantees and loan commitments | | | 78,812 | | | 78,812 | | | — | | | — | | | — | | | — | | | — | | | — |
Available lines of credit cards and non-revolving consumer loans | | | 38,291 | | | 38,291 | | | — | | | — | | | — | | | — | | | — | | | — |
| | | 1,342,992 | | | 854,503 | | | 488,489 | | | 45,024 | | | 55,476 | | | 165,696 | | | 196,146 | | | 76,030 |
| (1) | | Related to loans and receivables and available lines of credit cards and non-revolving consumer loans in the first column (Maximum Exposure to Credit Risk) that are secured by the collaterals and other credit enhancements disclosed in the table. As such, unsecured amounts are the amounts that are not covered by any collateral or other credit enhancement. The secured amounts may differ from the total collaterals and other credit enhancements as certain loans and receivables are secured by multiple credit enhancements. |
| (2) | | Appraisals to support estimated fair value of the real estate collaterals are obtained at the moment of the loan origination and when the financial asset is classified as impaired. |
| (3) | | Public sector loan rights are guaranteed by Mexican government entities. |
| | | | | | | | | | | | | | | | | | | | | | | | |
| | | | | | 12/31/2018 |
| | | | | | Maximum Exposure | | | | | | | | | | | | | | | |
| | | Maximum | | | to Credit Risk (1) | | | Collaterals | | | Other Credit Enhancements |
| | | Exposure to | | | | | | | | | Cash Collateral | | | Collateralized by | | | | | | | | | |
| | | Credit Risk | | | Unsecured | | | Secured | | | Received | | | Securities | | | Collection Rights (3) | | | Real Estate (2) | | | Guarantees |
| | | | | | | | | | | | | | | | | | | | | | | | |
Financial assets at fair value through profit or loss | | | 265,175 | | | 218,651 | | | 46,524 | | | 42,480 | | | 4,044 | | | — | | | — | | | — |
Other financial assets at fair value through profit or loss | | | 107,425 | | | — | | | 107,425 | | | — | | | 107,560 | | | — | | | — | | | — |
Financial assets at fair value through other comprehensive income | | | 155,256 | | | 155,256 | | | — | | | — | | | — | | | — | | | — | | | — |
Financial assets at amortized cost: | | | 787,739 | | | 348,767 | | | 438,972 | | | — | | | — | | | 124,725 | | | 222,490 | | | 11,945 |
Of which: | | | | | | | | | | | | | | | | | | | | | | | | |
Loans and advances to credit institutions | | | 47,034 | | | 47,034 | | | — | | | — | | | — | | | — | | | — | | | — |
Loans and advances to customers | | | 688,286 | | | 249,314 | | | 438,972 | | | — | | | — | | | 124,725 | | | 222,490 | | | 11,945 |
Commercial, financial and industrial loans | | | 371,203 | | | 96,967 | | | 274,236 | | | — | | | — | | | 102,905 | | | 97,167 | | | 11,945 |
Public sector loans | | | 59,547 | | | 21,385 | | | 38,162 | | | — | | | — | | | 21,794 | | | — | | | — |
Mortgage loans | | | 145,749 | | | 20,226 | | | 125,523 | | | — | | | — | | | — | | | 123,353 | | | — |
Installment loans to individuals: | | | | | | | | | | | | | | | | | | | | | | | | |
Revolving consumer credit card loans | | | 56,227 | | | 56,227 | | | — | | | — | | | — | | | — | | | — | | | — |
Non-revolving consumer loans | | | 55,560 | | | 54,509 | | | 1,051 | | | — | | | — | | | 26 | | | 1,970 | | | — |
Debt instruments | | | 52,419 | | | 52,419 | | | — | | | — | | | — | | | — | | | — | | | — |
Guarantees and loan commitments | | | 94,267 | | | 94,267 | | | — | | | — | | | — | | | — | | | — | | | — |
Available lines of credit cards and non-revolving consumer loans | | | — | | | | | | | | | — | | | — | | | — | | | — | | | — |
| | | 1,409,862 | | | 816,941 | | | 592,921 | | | 42,480 | | | 111,604 | | | 124,725 | | | 222,490 | | | 11,945 |
| (1) | | Related to loans and receivables and available lines of credit cards and non-revolving consumer loans in the first column (Maximum Exposure to Credit Risk) that are secured by the collaterals and other credit enhancements disclosed in the table. As such, unsecured amounts are the amounts that are not covered by any collateral or other credit enhancement. The secured amounts may differ from the total collaterals |
and other credit enhancements as certain loans and receivables are secured by multiple credit enhancements. |
| (2) | | Appraisals to support estimated fair value of the real estate collaterals are obtained at the moment of the loan origination and when the financial asset is classified as impaired. |
| (3) | | Public sector loan rights are guaranteed by Mexican government entities. |
Credit quality information
For commercial loans (except SMEs) and public sector loans, in order to achieve equivalent internal ratings in the different models available and to make them comparable with the external ratings of rating agencies, the Bank has developed a master rating scale. The equivalence is established through the PD associated with each rating. Internally calibrated PDs are compared against the default rates associated with the external ratings, which are published periodically by rating agencies. The internal rating scale and mapping with external ratings are as follows:
| | | | | | |
| | | Equivalence with |
| | | Standard & | | | |
Internal Rating | | | Poor’s | | | Moody’s |
| | | | | | |
9.3 | | | AAA | | | Aaa |
9.2 | | | AA+ | | | Aa1 |
9.0 | | | AA | | | Aa2 |
8.6 | | | AA- | | | Aa3 |
8.1 | | | A+ | | | A1 |
7.7 | | | A | | | A2 |
7.3 | | | A- | | | A3 |
6.7 | | | BBB+ | | | Baa1 |
6.1 | | | BBB | | | Baa2 |
5.6 | | | BBB- | | | Baa3 |
5.0 | | | BB+ | | | Ba1 |
4.4 | | | BB | | | Ba2 |
3.9 | | | BB- | | | Ba3 |
3.3 | | | B+ | | | B1 |
2.7 | | | B | | | B2 |
2.2 | | | B- | | | B3 |
1.6 | | | CCC | | | Caa1 |
1.0 | | | CC | | | Ca |
For commercial loans (SMEs), mortgage loans and installment loans (revolving credit card consumer loans and non-revolving consumer loans), expected credit losses are calculated using statistical methods without taking internal ratings into consideration. However, based on criteria set forth by the CNBV and a
combination of internal scorecards, client financial information and qualitative criteria, ratings are assigned as follows:
| | | |
| | | |
Rating | | | Equivalence |
| | | |
A-1 | | | Minimum Risk (Solid) |
A-2 | | | Low Risk (Outstanding) |
B-1 | | | Normal Risk (Good) |
B-2 | | | Normal Risk |
B-3 | | | Satisfactory |
C-1 | | | Normal Risk (Adequate) |
C-2 | | | Medium Risk (Weak) |
D | | | High Risk (Poor) |
E | | | Probable Loss |
Credit quality information by rating category
The tables below represent the classification by rating category of commercial loans (except SMEs) and public sector loans and their related guarantees and loan commitments not recognized on the consolidated balance sheet:
| | | | | | | | | | | | | | | | | | | | | | | | | | | | | | | | | | | | | | | | | | |
| | 12/31/2017 |
| | | | | | | | | | | | | | | | | | | | | | | | | | | | | | | | | | | | | | | | Not | | |
Rating Category | | 9.3 | | 9.2 | | 9.0 | | 8.5 | | 8.0 | | 7.5 | | 7.0 | | 6.5 | | 6.0 | | 5.5 | | 5.0 | | 4.5 | | 4.0 | | 3.5 | | 3.0 | | 2.5 | | 2.0 | | 1.5 | | 1.0 | | Rated | | Total |
| | | | | | | | | | | | | | | | | | | | | | | | | | | | | | | | | | | | | | | | | | |
Commercial loans (except SMEs) | | — | | — | | — | | — | | 3,380 | | 496 | | 9,116 | | 28,807 | | 48,849 | | 74,722 | | 63,662 | | 13,901 | | 2,898 | | 1,396 | | 413 | | 112 | | 1,870 | | 564 | | — | | 12,639 | | 262,825 |
Public sector loans | | — | | — | | 3,504 | | — | | — | | 20,077 | | 1 | | 983 | | — | | 9,751 | | 13,493 | | 1,278 | | — | | — | | — | | — | | — | | — | | — | | 208 | | 49,295 |
| | — | | — | | 3,504 | | — | | 3,380 | | 20,573 | | 9,117 | | 29,790 | | 48,849 | | 84,473 | | 77,155 | | 15,179 | | 2,898 | | 1,396 | | 413 | | 112 | | 1,870 | | 564 | | — | | 12,847 | | 312,120 |
| | | | | | | | | | | | | | | | | | | | | | | | | | | | | | | | | | | | | | | | | | |
Financial instruments not recognized on the consolidated balance sheet: | | | | | | | | | | | | | | | | | | | | | | | | | | | | | | | | | | | | | | | | | | |
Guarantees | | — | | 623 | | — | | 2,576 | | 5,262 | | 11,037 | | 19,265 | | 7,043 | | 9,060 | | 3,219 | | 2,391 | | 392 | | 3 | | — | | — | | — | | 75 | | — | | — | | 2,133 | | 63,079 |
Loan commitments | | — | | — | | — | | 7 | | 491 | | 501 | | 597 | | 253 | | 2,137 | | 5,728 | | 4,210 | | 862 | | 86 | | 25 | | — | | — | | 78 | | — | | — | | 196 | | 15,171 |
| | — | | 623 | | — | | 2,583 | | 5,753 | | 11,538 | | 19,862 | | 7,296 | | 11,197 | | 8,947 | | 6,601 | | 1,254 | | 89 | | 25 | | — | | — | | 153 | | — | | — | | 2,329 | | 78,250 |
| | — | | 623 | | 3,504 | | 2,583 | | 9,133 | | 32,111 | | 28,979 | | 37,086 | | 60,046 | | 93,420 | | 83,756 | | 16,433 | | 2,987 | | 1,421 | | 413 | | 112 | | 2,023 | | 564 | | — | | 15,176 | | 390,370 |
| | | | | | | | | | | | | | | | | | | | | | | | | | | | | | | | | | | | | | | | | | |
| | 12/31/2018 |
| | | | | | | | | | | | | | | | | | | | | | | | | | | | | | | | | | | | | | | | Not | | |
Rating Category | | 9.3 | | 9.2 | | 9.0 | | 8.5 | | 8.0 | | 7.5 | | 7.0 | | 6.5 | | 6.0 | | 5.5 | | 5.0 | | 4.5 | | 4.0 | | 3.5 | | 3.0 | | 2.5 | | 2.0 | | 1.5 | | 1.0 | | Rated | | Total |
| | | | | | | | | | | | | | | | | | | | | | | | | | | | | | | | | | | | | | | | | | |
Commercial loans (except SMEs) | | — | | — | | — | | — | | — | | 2,012 | | 17,068 | | 25,236 | | 54,471 | | 85,467 | | 73,559 | | 15,383 | | 4,814 | | 833 | | 1,158 | | 246 | | 218 | | — | | 2,140 | | 12,098 | | 294,703 |
Public sector loans | | — | | — | | 5,200 | | — | | — | | 23,195 | | 179 | | — | | 6,049 | | 9,278 | | 14,190 | | 1,456 | | — | | — | | — | | — | | — | | — | | — | | — | | 59,547 |
| | — | | — | | 5,200 | | — | | — | | 25,207 | | 17,247 | | 25,236 | | 60,520 | | 94,745 | | 87,749 | | 16,839 | | 4,814 | | 833 | | 1,158 | | 246 | | 218 | | — | | 2,140 | | 12,098 | | 354,250 |
| | | | | | | | | | | | | | | | | | | | | | | | | | | | | | | | | | | | | | | | | | |
Financial instruments not recognized on the consolidated balance sheet: | | | | | | | | | | | | | | | | | | | | | | | | | | | | | | | | | | | | | | | | | | |
Guarantees | | 622 | | — | | — | | 2,840 | | 12,897 | | 8,313 | | 26,172 | | 4,551 | | 10,822 | | 3,936 | | 2,040 | | 1,299 | | 3 | | — | | — | | — | | 75 | | — | | — | | 2,586 | | 76,156 |
Loan commitments | | — | | — | | — | | 203 | | 366 | | 237 | | 239 | | 113 | | 2,290 | | 7,798 | | 5,273 | | 756 | | 63 | | 3 | | 5 | | — | | 19 | | — | | — | | 485 | | 17,850 |
| | 622 | | — | | — | | 3,043 | | 13,263 | | 8,550 | | 26,411 | | 4,664 | | 13,112 | | 11,734 | | 7,313 | | 2,055 | | 66 | | 3 | | 5 | | — | | 94 | | — | | — | | 3,071 | | 94,006 |
| | 622 | | — | | 5,200 | | 3,043 | | 13,263 | | 33,757 | | 43,658 | | 29,900 | | 73,632 | | 106,479 | | 95,062 | | 18,894 | | 4,880 | | 836 | | 1,163 | | 246 | | 312 | | — | | 2,140 | | 15,169 | | 448,256 |
The tables below represent the classification by rating category of commercial loans (SMEs), mortgage loans, revolving consumer credit card loans and non-revolving consumer loans and their related commitments not recognized on the consolidated balance sheet:
| | | | | | | | | | | | | | | | | | | | | | | | | | | | | | | | | |
| | | 12/31/2017 |
Rating Category | | | A-1 | | | A-2 | | | B-1 | | | B-2 | | | B-3 | | | C-1 | | | C-2 | | | D | | | E | | | Not Rated | | | Total |
| | | | | | | | | | | | | | | | | | | | | | | | | | | | | | | | | |
Commercial loans (SMEs) | | | 47,231 | | | 11,515 | | | 1,899 | | | 1,946 | | | 4,656 | | | 1,683 | | | 874 | | | 1,968 | | | 507 | | | — | | | 72,279 |
Mortgage loans | | | 98,015 | | | 2,999 | | | 1,174 | | | 1,634 | | | 846 | | | 17,535 | | | 3,919 | | | 3,153 | | | 1,218 | | | 3,704 | | | 134,197 |
Revolving consumer credit card loans | | | 2,995 | | | 13,789 | | | 12,848 | | | 6,181 | | | 3,543 | | | 4,961 | | | 4,829 | | | 3,830 | | | 1,397 | | | — | | | 54,373 |
Non-revolving consumer loans | | | 7,009 | | | 7,312 | | | 9,978 | | | 8,670 | | | 6,577 | | | 5,415 | | | 2,876 | | | 1,267 | | | 3,390 | | | 889 | | | 53,383 |
| | | 155,250 | | | 35,615 | | | 25,899 | | | 18,431 | | | 15,622 | | | 29,594 | | | 12,498 | | | 10,218 | | | 6,512 | | | 4,593 | | | 314,232 |
| | | | | | | | | | | | | | | | | | | | | | | | | | | | | | | | | |
Financial instruments not recognized on the consolidated balance sheet: | | | | | | | | | | | | | | | | | | | | | | | | | | | | | | | | | |
Available lines of credit cards and non-revolving consumer loans | | | 7,118 | | | 5,500 | | | 5,943 | | | 3,902 | | | 3,149 | | | 4,373 | | | 4,268 | | | 1,696 | | | 2,343 | | | — | | | 38,292 |
Guarantees | | | 282 | | | — | | | — | | | — | | | — | | | — | | | — | | | — | | | — | | | — | | | 282 |
Loan commitments | | | 150 | | | — | | | — | | | — | | | — | | | — | | | — | | | — | | | — | | | — | | | 150 |
| | | 7,550 | | | 5,500 | | | 5,943 | | | 3,902 | | | 3,149 | | | 4,373 | | | 4,268 | | | 1,696 | | | 2,343 | | | — | | | 38,724 |
| | | 162,800 | | | 41,115 | | | 31,842 | | | 22,333 | | | 18,771 | | | 33,967 | | | 16,766 | | | 11,914 | | | 8,855 | | | 4,593 | | | 352,956 |
| | | | | | | | | | | | | | | | | | | | | | | | | | | | | | | | | |
| | | 12/31/2018 |
Rating Category | | | A-1 | | | A-2 | | | B-1 | | | B-2 | | | B-3 | | | C-1 | | | C-2 | | | D | | | E | | | Not Rated | | | Total |
| | | | | | | | | | | | | | | | | | | | | | | | | | | | | | | | | |
Commercial loans (SMEs) | | | 57,411 | | | 7,716 | | | 1,843 | | | 2,276 | | | 4,176 | | | 1,308 | | | 538 | | | 1,673 | | | 332 | | | — | | | 77,273 |
Mortgage loans | | | 107,435 | | | 4,623 | | | 3,576 | | | 9,504 | | | 2,712 | | | 5,731 | | | 3,655 | | | 3,525 | | | 889 | | | 4,099 | | | 145,749 |
Revolving consumer credit card loans | | | 2,896 | | | 15,463 | | | 15,052 | | | 5,743 | | | 2,858 | | | 4,694 | | | 4,580 | | | 3,584 | | | 1,357 | | | — | | | 56,227 |
Non-revolving consumer loans | | | 9,180 | | | 6,953 | | | 11,815 | | | 8,092 | | | 7,111 | | | 5,068 | | | 2,534 | | | 1,064 | | | 2,862 | | | 881 | | | 55,560 |
| | | 176,922 | | | 34,755 | | | 32,286 | | | 25,615 | | | 16,857 | | | 16,801 | | | 11,307 | | | 9,846 | | | 5,440 | | | 4,980 | | | 334,809 |
| | | | | | | | | | | | | | | | | | | | | | | | | | | | | | | | | |
Financial instruments not recognized on the consolidated balance sheet: | | | | | | | | | | | | | | | | | | | | | | | | | | | | | | | | | |
Available lines of credit cards and non-revolving consumer loans | | | 6,365 | | | 5,240 | | | 5,743 | | | 3,460 | | | 2,601 | | | 3,603 | | | 3,676 | | | 1,600 | | | 1,907 | | | — | | | 34,195 |
Guarantees | | | 85 | | | — | | | — | | | — | | | — | | | — | | | — | | | — | | | — | | | — | | | 85 |
Loan commitments | | | 174 | | | — | | | — | | | — | | | — | | | — | | | — | | | — | | | — | | | — | | | 174 |
| | | 6,624 | | | 5,240 | | | 5,743 | | | 3,460 | | | 2,601 | | | 3,603 | | | 3,676 | | | 1,600 | | | 1,907 | | | — | | | 34,454 |
| | | 183,546 | | | 39,995 | | | 38,029 | | | 29,075 | | | 19,458 | | | 20,404 | | | 14,983 | | | 11,446 | | | 7,347 | | | 4,980 | | | 369,263 |
The following is a breakdown of the retail portfolios that are past due but not impaired at December 31, 2017, classified by type of loan and by age of the oldest past due amount.
| | | | | | | | | | | | | | | |
| | | | | | Balances Past Due by | | | |
| | | Current | | | 1 to 30 Days | | | 31 to 60 Days | | | 61 to 90 Days | | | Total |
By type of loan: | | | | | | | | | | | | | | | |
Commercial loans (SMEs) | | | 68,157 | | | 1,590 | | | 771 | | | 733 | | | 71,251 |
Mortgage loans | | | 116,293 | | | 4,545 | | | 4,205 | | | 1,792 | | | 126,835 |
Installment loans to individuals | | | | | | | | | | | | | | | |
Of which: | | | | | | | | | | | | | | | |
Revolving consumer credit card loans | | | 49,253 | | | 1,145 | | | 851 | | | 788 | | | 52,037 |
Non-revolving consumer loans | | | 48,129 | | | 1,520 | | | 687 | | | 616 | | | 50,952 |
| | | 281,832 | | | 8,800 | | | 6,514 | | | 3,929 | | | 301,075 |
h) Securitization
Loans and advances to customers includes the securitized loans transferred to third parties on which the Bank has retained the risks and rewards, albeit partially, and which therefore, in accordance with the applicable IFRS, cannot be derecognized. Note 20 details the liabilities associated with these securitization transactions (mortgage-backed bonds). As of December 31, 2017 and 2018, the securitized loans retained
on the consolidated balance sheet relate to securitized mortgage assets amount to 162 million pesos and 133 million pesos, respectively.
Securitization is used as a tool for diversifying the Bank’s liquidity sources. The Bank had not performed any securitization in 2016, 2017 and 2018 and prior years. This securitization corresponds to a transaction performed by the acquired entity Santander Vivienda in 2006.
The loans transferred through securitization are mortgage loans.
12. Hedging derivatives
The Bank, as part of its financial risk management strategy and for reducing mismatches in the accounting treatment of its transactions, enters into interest rate and foreign currency hedging derivatives, depending on the nature of the hedged risk.
In line with its objective, the Bank classifies its hedges into the following categories:
Cash flow hedges: hedging the exposure to variability in cash flows associated with an asset, liability or highly probable forecast transaction.
Fair value hedges: hedging the exposure to changes in the fair value of assets or liabilities attributable to an identified hedged risk.
a) Breakdown
The breakdown by type of hedge of the derivatives qualifying for hedge accounting is as follows:
| | | | | | | | | | | | |
| | | 12/31/2017 | | | 12/31/2018 |
| | | Assets | | | Liabilities | | | Assets | | | Liabilities |
| | | | | | | | | | | | |
Fair value hedges | | | 59 | | | 6,572 | | | 202 | | | 5,136 |
Cash flow hedges | | | 15,057 | | | 4,519 | | | 9,083 | | | 3,257 |
| | | 15,116 | | | 11,091 | | | 9,285 | | | 8,393 |
b) Quantitative information
Fair value hedges
As of December 31, 2017, the hedging derivative positions are as follows:
| | | | | | | | | | | | |
| | | | | | Nominal | | | | | | |
| | | | | | (Million in | | | | | | |
| | | Nominal | | | Transaction | | | Transaction | | | |
| | | (Million Pesos) | | | Currency) | | | Currency | | | Hedged Item and Risk Hedged |
| | | | | | | | | | | | |
IRS | | | 1,785 | | | 1,785 | | | Peso | | | Loans and receivables - Interest rate risk |
| | | | | | | | | | | | |
IRS | | | 354 | | | 18 | | | USD | | | Loans and receivables - Interest rate risk |
| | | | | | | | | | | | |
CCS | | | 52 | | | 4 | | | USD | | | Loans and receivables - Interest rate and foreign exchange risk |
| | | | | | | | | | | | |
CCS | | | 17,598 | | | 840 | | | Euro | | | UMS - Interest rate and foreign exchange risk |
| | | | | | | | | | | | |
CCS | | | 1,275 | | | 67 | | | USD | | | UMS - Interest rate and foreign exchange risk |
| | | | | | | | | | | | |
CCS | | | 251 | | | 15 | | | Euro | | | PEMEX Bonds - Interest rate and foreign exchange risk |
| | | | | | | | | | | | |
CCS | | | 73 | | | 3 | | | Pound Sterling | | | UMS - Interest rate and foreign exchange risk |
| | | | | | | | | | | | |
CCS | | | 602 | | | 30 | | | Pound Sterling | | | PEMEX Bonds - Interest rate and foreign exchange risk |
| | | | | | | | | | | | |
CCS | | | 969 | | | 76 | | | USD | | | PEMEX Bonds - Interest rate and foreign exchange risk |
| | | | | | | | | | | | |
CCS | | | 3,860 | | | 825 | | | UDIS | | | UDIBONDS - Interest rate and inflation risk |
| | | | | | | | | | | | |
As of December 31, 2018, the hedging derivative positions are as follows:
| | | | | | | | | | | | |
| | | | | | Nominal | | | | | | |
| | | | | | (Million in | | | | | | |
| | | Nominal | | | Transaction | | | Transaction | | | |
| | | (Million Pesos) | | | Currency) | | | Currency | | | Hedged Item and Risk Hedged |
| | | | | | | | | | | | |
IRS | | | 1,797 | | | 1,797 | | | Peso | | | Loans - Interest rate risk |
| | | | | | | | | | | | |
IRS | | | 236 | | | 12 | | | USD | | | Loans - Interest rate risk |
| | | | | | | | | | | | |
IRS | | | 7,583 | | | 7,583 | | | Peso | | | Promissory notes - Interest rate risk |
| | | | | | | | | | | | |
CCS | | | 40 | | | 3 | | | USD | | | Loans - Interest rate and foreign exchange risk |
| | | | | | | | | | | | |
CCS | | | 22,842 | | | 1,069 | | | Euro | | | UMS - Interest rate and foreign exchange risk |
| | | | | | | | | | | | |
CCS | | | 1,275 | | | 67 | | | USD | | | UMS - Interest rate and foreign exchange risk |
| | | | | | | | | | | | |
CCS | | | 1,492 | | | 58 | | | Pound Sterling | | | UMS - Interest rate and foreign exchange risk |
| | | | | | | | | | | | |
CCS | | | 473 | | | 39 | | | USD | | | PEMEX Bonds - Interest rate and foreign exchange risk |
| | | | | | | | | | | | |
CCS | | | 3,859 | | | 825 | | | UDIS | | | UDIBONDS - Interest rate and inflation risk |
| | | | | | | | | | | | |
The fair value hedges carried out by the Bank are extended in certain cases up to the year 2031.
For 2016, 2017 and 2018, the effect of valuation for the period of derivative financial instruments for fair value hedging purposes recognized in the consolidated income statement under Gains/(losses) on financial assets and liabilities (net) is (363) million pesos, (117) million pesos and 474 million pesos, respectively (see Note 38).
For 2016, 2017 and 2018, the effect of valuation arising from the risk being hedged of the hedged items for fair value hedging purposes recognized in the consolidated income statement in Gains/(losses) on financial assets and liabilities (net) is 375 million pesos, 341 million pesos and (606) million pesos, respectively (see Note 38).
Each of these hedging derivative instruments is presented in the consolidated balance sheet under Hedging derivatives.
Cash flow hedges
As of December 31, 2017, the positions in derivatives for cash flow hedging purposes are as follows:
| | | | | | | | | | | | |
| | | | | | Nominal | | | | | | |
| | | | | | (Million in | | | | | | |
| | | Nominal | | | Transaction | | | Transaction | | | |
| | | (Million Pesos) | | | Currency) | | | Currency | | | Hedged Item and Risk Hedged |
| | | | | | | | | | | | |
IRS | | | 700 | | | 700 | | | Peso | | | BPATS with additional interest rate (BPAGS) Bonds - Interest rate risk |
| | | | | | | | | | | | |
IRS | | | 4,000 | | | 4,000 | | | Peso | | | Unsecured notes - Interest rate risk |
| | | | | | | | | | | | |
CCS | | | 3,056 | | | 221 | | | USD | | | Loans and receivables - Foreign exchange risk |
| | | | | | | | | | | | |
CCS | | | 3,055 | | | 166 | | | Euro | | | Loans and receivables - Foreign exchange risk |
| | | | | | | | | | | | |
CCS | | | 778 | | | 34 | | | Pound Sterling | | | Loans and receivables - Foreign exchange risk |
| | | | | | | | | | | | |
CCS | | | 10,667 | | | 543 | | | USD | | | Senior Unsecured Notes - Foreign exchange risk |
| | | | | | | | | | | | |
CCS | | | 20,548 | | | 1,045 | | | USD | | | Tier II Subordinated Capital Notes - Foreign exchange risk |
| | | | | | | | | | | | |
CCS | | | 2,657 | | | 136 | | | Euro | | | UMS - Foreign exchange risk |
| | | | | | | | | | | | |
CCS | | | 260 | | | 10 | | | Pound Sterling | | | UMS - Foreign exchange risk |
| | | | | | | | | | | | |
CCS | | | 911 | | | 50 | | | USD | | | UMS - Foreign exchange risk |
| | | | | | | | | | | | |
Forward Fx-BRL | | | 15,970 | | | 2,952 | | | BRL | | | Brazilian Government Notes - Foreign exchange risk |
| | | | | | | | | | | | |
Forward Fx-USD | | | 37,853 | | | 1,747 | | | USD | | | Brazilian Government Notes - Foreign exchange risk |
| | | | | | | | | | | | |
As of December 31, 2018, the hedging derivative positions are as follows:
| | | | | | | | | | | | |
| | | | | | Nominal | | | | | | |
| | | | | | (Million in | | | | | | |
| | | Nominal | | | Transaction | | | Transaction | | | |
| | | (Million Pesos) | | | Currency) | | | Currency | | | Hedged Item and Risk Hedged |
| | | | | | | | | | | | |
IRS | | | 4,000 | | | 4,000 | | | Peso | | | Unsecured notes - Interest rate risk |
| | | | | | | | | | | | |
CCS | | | 2,948 | | | 150 | | | USD | | | Unsecured notes - Foreign exchange risk |
| | | | | | | | | | | | |
CCS | | | 2,707 | | | 193 | | | USD | | | Loans - Foreign exchange risk |
| | | | | | | | | | | | |
CCS | | | 1,994 | | | 113 | | | Euro | | | Loans - Foreign exchange risk |
| | | | | | | | | | | | |
CCS | | | 777 | | | 34 | | | Pound Sterling | | | Loans - Foreign exchange risk |
| | | | | | | | | | | | |
CCS | | | 10,661 | | | 543 | | | USD | | | Senior Unsecured Notes - Foreign exchange risk |
| | | | | | | | | | | | |
CCS | | | 2,657 | | | 136 | | | Euro | | | UMS - Foreign exchange risk |
| | | | | | | | | | | | |
CCS | | | 260 | | | 10 | | | Pound Sterling | | | UMS - Foreign exchange risk |
| | | | | | | | | | | | |
CCS | | | 911 | | | 50 | | | USD | | | UMS - Foreign exchange risk |
| | | | | | | | | | | | |
CCS | | | 983 | | | 50 | | | USD | | | Borrowing from banks - Foreign exchange risk |
| | | | | | | | | | | | |
Forward Fx-BRL | | | 35,645 | | | 6,493 | | | BRL | | | Brazilian Government Notes - Foreign exchange risk |
| | | | | | | | | | | | |
Forward Fx-USD | | | 38,015 | | | 1,814 | | | USD | | | Brazilian Government Notes - Foreign exchange risk |
| | | | | | | | | | | | |
During October 2018, the Bank discontinued a cash flow hedge of Tier II Subordinated Capital Notes for an amount of 1,045 million USD (nominal value).
During November 2017, the Bank discontinued a cash flow hedge of Loans and receivables for an amount of 37 million USD (nominal value).
During March 2017, the Bank discontinued a cash flow hedge of UMS for an amount of 10 million USD (nominal value).
During April 2015, the Bank discontinued a cash flow hedge of Senior Unsecured Notes for an amount of 318 million USD (nominal value). This cash flow hedge began in December 2012 and February 2013, and at the date of discontinuance an amount of 64 million pesos, corresponding to the effective part of the hedging instrument, was recognized in the consolidated other comprehensive income under Valuation adjustments - Cash flow hedges, such amount will be reclassified to the consolidated income statement over the original term of the Senior Unsecured Notes, which extended through the year 2022.
During April 2015, the Bank discontinued a cash flow hedge of Tier II Subordinated Capital Notes for an amount of 200 million USD (nominal value). This cash flow hedge began in April 2014 and at the date of discontinuance an amount of 44 million pesos, corresponding to the effective part of the hedging instrument, was recognized in the consolidated other comprehensive income under Valuation adjustments - Cash flow hedges, such amount will be reclassified to the consolidated income statement over the original term of the subordinated capital notes, which extended through the year 2019.
During June 2014, the Bank discontinued a cash flow hedge of the Central Bank compulsory deposits for an amount of 500 million pesos (nominal value). This cash flow hedge began in February 2014 and at the date of discontinuance an amount of 12 million pesos, corresponding to the effective part of the hedging instrument, was recognized in the consolidated other comprehensive income under Valuation adjustments -
Cash flow hedges, which amount will be reclassified to the consolidated income statement over the original term of the Central Bank compulsory deposits, which extended through the year 2018.
As of December 31, 2017 and 2018, included in the consolidated other comprehensive income under Valuation adjustments - Cash flow hedges, are 54 million pesos and 25 million pesos (see Note 27), respectively, which refer to the accumulated unamortized gain (net of the related deferred tax effect) of hedging derivatives for which hedge accounting was discontinued. Such balances are being reclassified based on the original terms of the forecast transactions. The term of such reclassifying extends through the year 2022. The remaining amount of the total valuation adjustment for cash flow hedges reflected in the consolidated other comprehensive income consists of accumulated unrealized gain or loss on effective cash flow hedges currently in effect.
The cash flow hedges entered into by the Bank are extended in certain cases up to the year 2019 for the borrowing from banks, up to the year 2020 for Unsecured Notes, up to the year 2021 for Brazilian Government Notes, up to the year 2022 for Senior Unsecured Notes, up to the year 2025 for Loans and receivables and up to the year 2026 for UMS.
A reconciliation of Valuation adjustments – Cash flow hedges is as follows:
| | | | | | | | | | |
| | | 2016 | | | 2017 | | | 2018 | |
| | | | | | | | | | |
Balance at January 1 | | | 900 | | | 1,383 | | | 356 | |
Valuation adjustments | | | (1,095) | | | (1,585) | | | (882) | |
Amounts recycled to consolidated income statement | | | 1,785 | | | 118 | | | (40) | |
Of which: | | | | | | | | | | |
Income from cash flow hedging derivatives and discontinued cash flow hedge accounting | | | 1,787 | | | 120 | | | (42) | |
Cash flow hedges ineffectiveness (Note 38) | | | (2) | | | (2) | | | 2 | |
Income taxes | | | (207) | | | 440 | | | 276 | |
Balance at December 31 | | | 1,383 | | | 356 | | | (290) | |
As of December 31, 2018, the breakdown of the estimated cash flows of the cash flow hedges that are expected to be reclassified from consolidated other comprehensive income to the consolidated income statement is as follows:
| | | | | | | | | | | | | | | | |
| | | | | | Between 3 Months and | | | Between 1 Year and 5 | | | | | | | |
| | | Less than 3 Months | | | 1 Year | | | Years | | | More than 5 Years | | | Total | |
| | | | | | | | | | | | | | | | |
Cash flows to be received | | | 158 | | | 470 | | | 1,302 | | | 3 | | | 1,933 | |
Cash flows to be paid | | | (566) | | | (642) | | | (1,084) | | | (55) | | | (2,347) | |
Note 44.a contains a breakdown of the remaining maturity periods of hedging derivatives.
13. Non-current assets held for sale
a) Breakdown
As of December 31, 2017 and 2018, non-current assets held for sale consist of foreclosed assets that amounted to 1,295 million pesos and 1,277 million pesos, respectively.
In 2016, 2017 and 2018, the Bank recognized a gain of 71 million pesos, a gain of 69 million pesos and a gain of 38 million pesos, respectively, under Gains/(losses) on disposal of non-current assets held for sale not classified as discontinued operations (net) in the consolidated income statement.
For the years ended December 31, 2016 and 2017, there were no impairment losses recognized by the Bank. For the year ended December 31, 2018, the Bank recognized an impairment loss of 5 million pesos, under Impairment losses on other assets (net) in the consolidated income statement.
b) Changes
The changes in foreclosed assets in the consolidated balance sheet were as follows:
| | | | |
| | | Foreclosed Assets | |
| | | | |
Cost: | | | | |
Balances at January 1, 2017 | | | 1,107 | |
Additions | | | 389 | |
Disposals | | | (201) | |
Impairment losses | | | — | |
Balances at December 31, 2017 | | | 1,295 | |
Additions | | | 213 | |
Disposals | | | (226) | |
Impairment losses | | | (5) | |
Balances at December 31, 2018 | | | 1,277 | |
14. Tangible assets
a) Changes
The changes in Tangible assets in the consolidated balance sheet were as follows:
| | | | |
Property, Plant and Equipment | | | | |
| | | | |
Cost: | | | | |
Balances at January 1, 2017 | | | 11,614 | |
Additions | | | 1,816 | |
Disposals | | | (123) | |
Balances at December 31, 2017 | | | 13,307 | |
Additions | | | 2,857 | |
Assets acquired from Santander Tecnología México | | | 815 | |
Disposals | | | (151) | |
Balances at December 31, 2018 | | | 16,828 | |
| | | | |
Accumulated depreciation: | | | | |
Balances at January 1, 2017 | | | (5,922) | |
Additions | | | (1,010) | |
Disposals | | | 123 | |
Balances at December 31, 2017 | | | (6,809) | |
Additions | | | (1,091) | |
Assets acquired from Santander Tecnología México | | | (358) | |
Disposals | | | 144 | |
Balances at December 31, 2018 | | | (8,114) | |
| | | | |
Balances at December 31, 2017 | | | 6,498 | |
Balances at December 31, 2018 | | | 8,714 | |
As of December 31, 2018, there are no restrictions on title and no tangible assets have been pledged as collateral for liabilities.
In the second quarter of 2012, the Bank entered into an agreement with a non-related party, Fibra Uno, S.A. de C.V. (hereinafter, Fibra Uno) regarding the sale of 220 properties (branches, offices and parking spaces) and the subsequent leaseback thereof for a term of 20 years.
The corresponding lease contract, which is accounted for as an operating lease, is non-cancellable and includes an option to renew up to an additional four consecutive periods of five years each with a market rate to be determined on the date of the renewal. The lease agreement includes rent adjustments based on the INPC and does not contain volume-based or leveraged contingent rent payment clauses or purchase options, or impose any restrictions on the Bank’s ability to pay dividends, engage in debt financing transactions or enter into further lease agreements. The lease payments are recognized as Other general administrative expenses in the consolidated income statement.
As of December 31, 2018, the future minimum lease payments required under the Bank’s operating leases are as follows:
| | | | | | | | | |
| | | 12/31/2018 |
| | | | | | Other Operating | | | |
Operating Lease Due | | | Fibra Uno | | | Leases | | | Total |
| | | | | | | | | |
2019 | | | 276 | | | 1,480 | | | 1,756 |
2020 | | | 276 | | | 1,278 | | | 1,554 |
2021 | | | 276 | | | 1,100 | | | 1,376 |
2022 | | | 276 | | | 798 | | | 1,074 |
2023 | | | 276 | | | 492 | | | 768 |
2024 and thereafter | | | 2,296 | | | 1,191 | | | 3,487 |
Total commitments for minimum payments under operating lease | | | 3,676 | | | 6,339 | | | 10,015 |
b) Breakdown
The breakdown by asset class of Tangible assets for own use in the consolidated balance sheet is as follows:
| | | | | | | | | | | | |
| | | | | | Accumulated | | | | | | |
| | | Cost | | | Depreciation | | | Impairment Losses | | | Carrying Amount |
| | | | | | | | | | | | |
Buildings | | | 8,057 | | | (4,492) | | | — | | | 3,565 |
IT equipment and fixtures | | | 2,857 | | | (1,290) | | | — | | | 1,567 |
Furniture and vehicles | | | 1,670 | | | (1,027) | | | — | | | 643 |
Others | | | 723 | | | — | | | — | | | 723 |
Balances at December 31, 2017 | | | 13,307 | | | (6,809) | | | — | | | 6,498 |
| | | | | | | | | | | | |
Buildings | | | 9,780 | | | (5,179) | | | — | | | 4,601 |
IT equipment and fixtures | | | 3,715 | | | (1,620) | | | — | | | 2,095 |
Furniture and vehicles | | | 2,241 | | | (1,315) | | | — | | | 926 |
Others | | | 1,092 | | | — | | | — | | | 1,092 |
Balances at December 31, 2018 | | | 16,828 | | | (8,114) | | | — | | | 8,714 |
15. Intangible assets – Goodwill
a) Breakdown
The breakdown of Goodwill based on the CGUs to which Goodwill has been allocated is as follows:
| | | | | | |
| | | 12/31/2017 | | | 12/31/2018 |
| | | | | | |
Santander Vivienda | | | 1,734 | | | 1,734 |
| | | 1,734 | | | 1,734 |
b) Changes
There were no changes in Goodwill during 2017 and 2018.
c) Impairment test
Management performed impairment test on a single CGU basis due to the merger of Santander Vivienda, Santander Hipotecario and Santander Holding Vivienda as described in Note 3.8.
The main assumptions used in the calculation of the impairment of Goodwill are as follows:
| | | |
| | | Hypotheses |
| | | |
Basis of valuation | | | Value in use: discounted cash flows |
Period of projection of cash flows(1) | | | 5 years |
Perpetual cash flow | | | (2) |
Discount rate(6) | | | 9.47% |
Of which: | | | |
Cost of Equity(3) | | | 17.2% |
Cost of Debt(4) | | | 8.0% |
Equity Structure(5) | | | 16% Equity / 84% Debt |
| (1) | | The period of projections of cash flow are prepared using internal budgets and growth plans of Management, based on historical data, market expectations and conditions such as industry growth and inflation. |
| (2) | | The perpetual cash flow has been calculated based on the following formula over the last cash flow estimated [D*(1+g)//i-g)]*(1+i)^-n, where: |
| § | | D = Last estimated cash flow, |
| § | | g = Perpetual growth (0%), |
| § | | n= Number of year of last estimated cash flow. |
| (3) | | The Cost of Equity has been calculated based on the following formula Rf+(ß*Pr), where: |
| § | | Rf = Risk free rate (8.60%), |
| § | | Pr = Equity Risk Premium (7.63%). |
| (4) | | The Cost of Debt has been calculated based on the actual pretax financing cost of the Bank. |
| (5) | | The Equity Structure has been calculated based on the following formula: Equity/(Total Liability+Equity). The Debt Structure has been calculated based on the following formula: Debt/(Total Liability+Equity). |
| (6) | | The Discount rate has been calculated based on the following formula: (Cost of Equity*Equity Structure) + (Cost of Debt*Debt Structure). |
Based on the foregoing, and in accordance with the estimates, projections and measurements available to the Bank’s Management in 2016, 2017 and 2018, the Bank has not recognized any impairment losses on Goodwill.
16. Intangible assets - Other intangible assets
a) Changes
The changes in Other intangible assets in the consolidated balance sheet were as follows:
| | | | |
| | | Intangible Assets | |
| | | with Finite Useful Life | |
| | | | |
Cost: | | | | |
Balances at January 1, 2017 | | | 8,219 | |
Additions | | | 2,712 | |
Disposals | | | (142) | |
Balances at December 31, 2017 | | | 10,789 | |
Additions | | | 2,964 | |
Disposals | | | — | |
Balances at December 31, 2018 | | | 13,753 | |
| | | | |
Accumulated amortization and impairment: | | | | |
Balances at January 1, 2017 | | | (4,181) | |
Additions | | | (1,523) | |
Disposals | | | 141 | |
Balances at December 31, 2017 | | | (5,563) | |
Additions | | | (1,880) | |
Disposals | | | — | |
Balances at December 31, 2018 | | | (7,443) | |
Balances at December 31, 2017 | | | 5,226 | |
Balances at December 31, 2018 | | | 6,310 | |
b) Breakdown
The breakdown of Other intangible assets in the consolidated balance sheet is as follows:
| | | | | | | | | | | | | | | |
| | | Estimated | | | | | | Accumulated | | | Impairment | | | Carrying |
| | | Useful Life | | | Cost | | | Amortization | | | Losses | | | Amount |
IT developments | | | 3 years | | | 10,702 | | | (5,548) | | | — | | | 5,154 |
Others | | | 10 years | | | 87 | | | (15) | | | — | | | 72 |
Balances at December 31, 2017 | | | | | | 10,789 | | | (5,563) | | | — | | | 5,226 |
| | | | | | | | | | | | | | | |
IT developments | | | 3 years | | | 13,666 | | | (7,420) | | | — | | | 6,246 |
Others | | | 10 years | | | 87 | | | (23) | | | — | | | 64 |
Balances at December 31, 2018 | | | | | | 13,753 | | | (7,443) | | | — | | | 6,310 |
As of December 31, 2017 and 2018, there are no intangible assets with restricted title or intangible assets pledged as security for liabilities.
17. Other assets
The breakdown of Other assets is as follows:
| | | | | | |
| | | | | | |
| | | 12/31/2017 | | | 12/31/2018 |
| | | | | | |
Credit card operating balances | | | 1,597 | | | 2,192 |
Insurance commission receivables | | | 1,053 | | | 1,108 |
Prepayments | | | 793 | | | 630 |
Other | | | 5,666 | | | 3,233 |
| | | 9,109 | | | 7,163 |
The following is a breakdown by maturity of Other assets which are measured at amortized cost as of December 31, 2018:
| | | | | | | | | | | | | | | |
| | | Current | | | More than 30 days less than 60 | | | More than 60 days less than 90 | | | More than 90 days | | | Total |
| | | | | | | | | | | | | | | |
Other assets | | | | | | | | | | | | | | | |
| | | | | | | | | | | | | | | |
Credit card operating balances | | | 1,187 | | | 16 | | | 78 | | | 911 | | | 2,192 |
Insurance commission receivables | | | 20 | | | 9 | | | 39 | | | 1,040 | | | 1,108 |
Prepaid expenses | | | 381 | | | 38 | | | 13 | | | 198 | | | 630 |
Other | | | 2,894 | | | 400 | | | 91 | | | 653 | | | 4,038 |
| | | | | | | | | | | | | | | |
Expected credit loss rate | | | 3% | | | 7% | | | 40% | | | 20% | | | |
Gross carrying amount | | | 4,482 | | | 463 | | | 221 | | | 2,802 | | | 7,968 |
Lifetime expected credit losses | | | (126) | | | (33) | | | (90) | | | (556) | | | (805) |
| | | | | | | | | | | | | | | |
Balances at December 31, 2018 | | | 4,356 | | | 430 | | | 131 | | | 2,246 | | | 7,163 |
18. Deposits from the Central Bank and Deposits from credit institutions
The breakdown by classification, type and currency of Deposits from the Central Bank and Deposits from credit institutions is as follows:
| | | | | | |
| | | | | | |
| | | 12/31/2017 | | | 12/31/2018 |
| | | | | | |
Classification: | | | | | | |
Other financial liabilities at fair value through profit or loss | | | 28,359 | | | 35,311 |
Financial liabilities at amortized cost | | | 76,515 | | | 94,849 |
| | | 104,874 | | | 130,160 |
Type: | | | | | | |
Reciprocal accounts | | | 2,316 | | | 3,999 |
Time deposits | | | 4,506 | | | 10,125 |
Overnight deposits | | | 13,688 | | | 23,359 |
Repurchase agreements | | | 28,359 | | | 35,311 |
Other accounts | | | 55,848 | | | 57,315 |
Of which: | | | | | | |
Collateral received for OTC derivatives transactions (Note 31) | | | 31,157 | | | 32,606 |
Others | | | 24,691 | | | 24,709 |
Accrued interest | | | 157 | | | 51 |
| | | 104,874 | | | 130,160 |
Currency: | | | | | | |
Peso | | | 100,347 | | | 116,354 |
USD | | | 4,470 | | | 13,791 |
Other currencies | | | 57 | | | 15 |
| | | 104,874 | | | 130,160 |
Note 44.a includes a breakdown of the remaining maturity periods of Deposits from the Central Bank and Deposits from credit institutions. In addition, Note 44.d contains the fair value amounts of these liabilities classified as Deposits from the Central Bank and Deposits from credit institutions - Financial liabilities at amortized cost.
19. Customer deposits
The breakdown by classification, type and currency of the balance of Customer deposits is as follows:
| | | | | | |
| | | | | | |
| | | 12/31/2017 | | | 12/31/2018 |
| | | | | | |
Classification: | | | | | | |
Other financial liabilities at fair value through profit or loss | | | 81,790 | | | 65,369 |
Financial liabilities at amortized cost | | | 608,776 | | | 646,089 |
| | | 690,566 | | | 711,458 |
Type: | | | | | | |
Repurchase agreements | | | 81,790 | | | 65,369 |
Demand deposits: | | | | | | |
Current accounts | | | 422,028 | | | 443,223 |
Other deposits | | | 26,230 | | | 25,904 |
Of which: | | | | | | |
Collateral received for OTC derivatives transactions (Note 31) | | | 13,867 | | | 9,874 |
Others | | | 12,363 | | | 16,030 |
Time deposits: | | | | | | |
Fixed-term deposits | | | 159,464 | | | 175,642 |
Accrued interest | | | 1,054 | | | 1,320 |
| | | 690,566 | | | 711,458 |
Currency: | | | | | | |
Peso | | | 584,637 | | | 601,185 |
USD | | | 105,929 | | | 110,120 |
Other currencies | | | — | | | 153 |
| | | 690,566 | | | 711,458 |
As of December 31, 2017 and 2018, customer deposits of 13,867 million pesos and 9,874 million pesos, respectively, have been received in connection with OTC derivatives transactions (see Note 31).
Note 44.a includes a breakdown of the remaining maturity periods of Customer deposits. In addition, Note 44.d contains the fair value amounts of these liabilities classified as Customer deposits - Financial liabilities at amortized cost.
20. Marketable debt securities
a) Breakdown
The breakdown by classification, type and currency of issue of Marketable debt securities is as follows:
| | | | | | |
| | | 12/31/2017 | | | 12/31/2018 |
| | | | | | |
Classification: | | | | | | |
Other financial liabilities at fair value through profit or loss designated as such upon initial recognition | | | 10,504 | | | 4,750 |
Financial liabilities at amortized cost | | | 85,792 | | | 98,312 |
| | | 96,296 | | | 103,062 |
Type: | | | | | | |
Certificates of deposit (unsecured) | | | 27,467 | | | 22,433 |
Senior Unsecured Notes | | | 19,558 | | | 19,590 |
Structured bank bonds | | | 10,748 | | | 5,376 |
Promissory notes | | | 23,577 | | | 35,831 |
Unsecured bonds | | | 14,798 | | | 19,717 |
Mortgage-backed bonds | | | 148 | | | 115 |
| | | 96,296 | | | 103,062 |
Currency: | | | | | | |
Peso | | | 68,788 | | | 76,075 |
USD | | | 27,508 | | | 26,987 |
| | | 96,296 | | | 103,062 |
Note 44.a includes a breakdown of the remaining maturity periods of Marketable debt securities. In addition, Note 44.d contains the fair value amounts of these liabilities classified as Marketable debt securities - Financial liabilities at amortized cost.
b) Changes in Marketable debt securities classified as Financial liabilities at fair value through profit or loss
The changes in Marketable debt securities classified as Financial liabilities at fair value through profit or loss were as follows:
| | | | | | | |
| | | 2017 | | | 2018 | |
| | | | | | | |
Beginning balance | | | 12,335 | | | 10,504 | |
Issues | | | 2,299 | | | 1,243 | |
Of which: | | | | | | | |
Structured bank bonds | | | 2,299 | | | 1,243 | |
Of which: | | | | | | | |
Banco Santander México, S.A. | | | 2,299 | | | 1,243 | |
Redemptions | | | (4,590) | | | (6,715) | |
Of which: | | | | | | | |
Structured bank bonds | | | (4,590) | | | (6,715) | |
Of which: | | | | | | | |
Banco Santander México, S.A. | | | (4,590) | | | (6,715) | |
Changes in fair value | | | 460 | | | (282) | |
Balance at year-end | | | 10,504 | | | 4,750 | |
c) Changes in Marketable debt securities classified as Financial liabilities at amortized cost
The changes in Marketable debt securities classified as Financial liabilities at amortized cost were as follows:
| | | | | | | |
| | | 2017 | | | 2018 | |
| | | | | | | |
Beginning balance | | | 77,668 | | | 85,792 | |
Issues | | | 2,251,910 | | | 2,458,603 | |
Of which: | | | | | | | |
Certificates of deposit (unsecured) | | | 70,705 | | | 54,486 | |
Structured bank bonds | | | 6,238 | | | 10,710 | |
Promissory notes | | | 2,174,967 | | | 2,382,790 | |
Unsecured bonds | | | — | | | 10,617 | |
Of which: | | | | | | | |
Banco Santander México, S.A. | | | 2,251,910 | | | 2,458,603 | |
Redemptions | | | (2,243,323) | | | (2,446,455) | |
Of which: | | | | | | | |
Certificates of deposit (unsecured) | | | (69,455) | | | (59,578) | |
Structured bank bonds | | | (6,190) | | | (10,294) | |
Promissory notes | | | (2,167,658) | | | (2,370,551) | |
Unsecured bonds | | | — | | | (6,000) | |
Mortgage backed bonds | | | (20) | | | (32) | |
Of which: | | | | | | | |
Banco Santander México, S.A. | | | (2,243,303) | | | (2,446,422) | |
Santander Vivienda, S.A. de C.V. | | | (20) | | | (32) | |
Accrued interest | | | 292 | | | (31) | |
Effect of changes in foreign exchange rates | | | (755) | | | 403 | |
Balance at year-end | | | 85,792 | | | 98,312 | |
d) Other disclosures
Issuance program
In April 2007, the Board of Directors authorized an issuance program for up to 4,000,000,000 USD of different types of instruments denominated in pesos, USD, euros or UDIS, up to 30 years. In October 2010, the Board of Directors renewed this authorization.
In October 2011, the Board of Directors authorized to increase the amount of issuance program up to 6,500,000,000 USD. In October 2013, the Board of Directors endorsed the total amount of issuance program, establishing that the maximum term of the issuances must be 15 years.
As of December 31, 2017, the balance of the issues performed by the Bank under the aforementioned program is as follows:
| | | | | | | | | | |
| | | Amount | | | Maturity Date | | | Rate |
| | | | | | | | | | |
Certificates of deposit (unsecured) | | | 36 | | | 12/28/2018 | | | 7.42 | % |
Certificates of deposit (unsecured) | | | 11 | | | 12/27/2018 | | | 7.43 | % |
Certificates of deposit (unsecured) | | | 23 | | | 12/26/2018 | | | 7.42 | % |
Certificates of deposit (unsecured) | | | 28 | | | 12/24/2018 | | | 7.42 | % |
Certificates of deposit (unsecured) | | | 40 | | | 12/21/2018 | | | 7.42 | % |
Certificates of deposit (unsecured) | | | 28 | | | 12/20/2018 | | | 7.41 | % |
Certificates of deposit (unsecured) | | | 13 | | | 12/19/2018 | | | 7.41 | % |
Certificates of deposit (unsecured) | | | 13 | | | 12/18/2018 | | | 7.40 | % |
Certificates of deposit (unsecured) | | | 24 | | | 12/17/2018 | | | 7.40 | % |
Certificates of deposit (unsecured) | | | 28 | | | 12/14/2018 | | | 7.26 | % |
Certificates of deposit (unsecured) | | | 29 | | | 12/13/2018 | | | 7.25 | % |
Certificates of deposit (unsecured) | | | 31 | | | 12/11/2018 | | | 7.23 | % |
Certificates of deposit (unsecured) | | | 18 | | | 12/10/2018 | | | 7.20 | % |
Certificates of deposit (unsecured) | | | 20 | | | 12/07/2018 | | | 7.19 | % |
Certificates of deposit (unsecured) | | | 27 | | | 12/06/2018 | | | 7.19 | % |
Certificates of deposit (unsecured) | | | 19 | | | 12/05/2018 | | | 7.19 | % |
Certificates of deposit (unsecured) | | | 11 | | | 12/04/2018 | | | 7.19 | % |
Certificates of deposit (unsecured) | | | 8 | | | 12/03/2018 | | | 7.19 | % |
Certificates of deposit (unsecured) | | | 16 | | | 11/30/2018 | | | 7.42 | % |
Certificates of deposit (unsecured) | | | 1,200 | | | 12/06/2018 | | | 7.42 | % |
Certificates of deposit (unsecured) | | | 11 | | | 11/29/2018 | | | 7.43 | % |
Certificates of deposit (unsecured) | | | 600 | | | 11/28/2018 | | | 7.66 | % |
Certificates of deposit (unsecured) | | | 4 | | | 11/28/2018 | | | 7.42 | % |
Certificates of deposit (unsecured) | | | 300 | | | 11/28/2018 | | | 7.66 | % |
Certificates of deposit (unsecured) | | | 6 | | | 11/27/2018 | | | 7.42 | % |
Certificates of deposit (unsecured) | | | 4 | | | 11/26/2018 | | | 7.42 | % |
Certificates of deposit (unsecured) | | | 5 | | | 11/23/2018 | | | 7.42 | % |
Certificates of deposit (unsecured) | | | 7 | | | 11/22/2018 | | | 7.41 | % |
Certificates of deposit (unsecured) | | | 6 | | | 11/21/2018 | | | 7.41 | % |
Certificates of deposit (unsecured) | | | 7 | | | 11/20/2018 | | | 7.40 | % |
Certificates of deposit (unsecured) | | | 1 | | | 11/16/2018 | | | 7.26 | % |
Certificates of deposit (unsecured) | | | 6 | | | 11/15/2018 | | | 7.25 | % |
Certificates of deposit (unsecured) | | | 1 | | | 11/14/2018 | | | 7.23 | % |
Certificates of deposit (unsecured) | | | 500 | | | 11/05/2018 | | | 7.43 | % |
Certificates of deposit (unsecured) | | | 2,000 | | | 11/01/2018 | | | 7.67 | % |
Certificates of deposit (unsecured) | | | 1,200 | | | 09/17/2018 | | | 7.44 | % |
Certificates of deposit (unsecured) | | | 500 | | | 09/13/2018 | | | 7.43 | % |
Certificates of deposit (unsecured) | | | 2,000 | | | 09/13/2018 | | | 7.43 | % |
Certificates of deposit (unsecured) | | | 3,800 | | | 08/17/2018 | | | 7.43 | % |
Certificates of deposit (unsecured) | | | 100 | | | 08/16/2018 | | | 7.43 | % |
Certificates of deposit (unsecured) | | | 1,100 | | | 08/16/2018 | | | 7.62 | % |
Certificates of deposit (unsecured) | | | 50 | | | 07/27/2018 | | | 7.46 | % |
Certificates of deposit (unsecured) | | | 1,000 | | | 07/17/2018 | | | 7.55 | % |
Certificates of deposit (unsecured) | | | 1,000 | | | 06/25/2018 | | | 7.55 | % |
Certificates of deposit (unsecured) | | | 1,000 | | | 06/08/2018 | | | 7.59 | % |
Certificates of deposit (unsecured) | | | 500 | | | 05/24/2018 | | | 7.69 | % |
Certificates of deposit (unsecured) | | | 700 | | | 05/09/2018 | | | 7.64 | % |
Certificates of deposit (unsecured) | | | 750 | | | 02/23/2018 | | | 7.54 | % |
Certificates of deposit (unsecured) | | | 1,000 | | | 02/22/2018 | | | 7.50 | % |
Certificates of deposit (unsecured)-USD | | | 3 | | | 05/09/2018 | | | 0.96 | % |
Certificates of deposit (unsecured)-USD | | | 98 | | | 04/30/2018 | | | 0.99 | % |
Certificates of deposit (unsecured)-USD | | | 3,933 | | | 11/14/2018 | | | 1.62 | % |
Certificates of deposit (unsecured)-USD | | | 1 | | | 07/31/2018 | | | 0.40 | % |
Certificates of deposit (unsecured)-USD | | | 3 | | | 07/31/2018 | | | 0.99 | % |
Certificates of deposit (unsecured)-USD | | | 1 | | | 06/29/2018 | | | 0.40 | % |
Certificates of deposit (unsecured)-USD | | | 3 | | | 06/29/2018 | | | 0.98 | % |
Certificates of deposit (unsecured)-USD | | | 12 | | | 06/27/2018 | | | 0.98 | % |
Certificates of deposit (unsecured)-USD | | | 12 | | | 06/15/2018 | | | 0.98 | % |
Certificates of deposit (unsecured)-USD | | | 23 | | | 06/04/2018 | | | 0.98 | % |
Certificates of deposit (unsecured)-USD | | | 23 | | | 05/21/2018 | | | 0.98 | % |
Certificates of deposit (unsecured)-USD | | | 34 | | | 05/18/2018 | | | 0.98 | % |
Certificates of deposit (unsecured)-USD | | | 23 | | | 05/18/2018 | | | 0.98 | % |
Certificates of deposit (unsecured)-USD | | | 5 | | | 05/09/2018 | | | 0.96 | % |
Certificates of deposit (unsecured)-USD | | | 17 | | | 04/18/2018 | | | 1.05 | % |
Certificates of deposit (unsecured)-USD | | | 17 | | | 04/18/2018 | | | 1.05 | % |
Certificates of deposit (unsecured)-USD | | | 17 | | | 04/18/2018 | | | 1.05 | % |
Certificates of deposit (unsecured)-USD | | | 17 | | | 04/18/2018 | | | 1.05 | % |
Certificates of deposit (unsecured)-USD | | | 44 | | | 02/28/2018 | | | 0.65 | % |
Certificates of deposit (unsecured)-USD | | | 79 | | | 01/04/2018 | | | 0.85 | % |
Certificates of deposit (unsecured)-USD | | | 2,514 | | | 01/26/2018 | | | 1.70 | % |
Certificates of deposit (unsecured)-USD | | | 37 | | | 01/19/2018 | | | 0.85 | % |
Certificates of deposit (unsecured)-USD | | | 68 | | | 01/19/2018 | | | 0.85 | % |
Certificates of deposit (unsecured)-USD | | | 585 | | | 01/16/2018 | | | 1.20 | % |
| | | 27,350 | | | | | | | |
Accrued interest | | | 117 | | | | | | | |
| | | 27,467 | | | | | | | |
| | | | | | | | | | |
Senior Unsecured Notes | | | 19,449 | | | 11/09/2022 | | | 4.125 | % |
Accrued interest | | | 109 | | | | | | | |
| | | 19,558 | | | | | | | |
| | | | | | | | | | |
Structured bank bonds | | | 151 | | | 05/31/2018 | | | Guaranteed rate subject to foreign exchange rate | |
Structured bank bonds | | | 59 | | | 01/04/2018 | | | Guaranteed rate subject to foreign exchange rate | |
| | | | | | | | | | |
| | | Amount | | | Maturity Date | | | Rate |
| | | | | | | | | | |
Structured bank bonds | | | 10 | | | 01/17/2018 | | | Guaranteed rate subject to foreign exchange rate | |
Structured bank bonds(*) | | | 57 | | | 05/24/2021 | | | TIIE | |
Structured bank bonds(*) | | | 18 | | | 05/12/2021 | | | TIIE | |
Structured bank bonds(*) | | | 347 | | | 04/23/2021 | | | TIIE | |
Structured bank bonds(*) | | | 7 | | | 03/16/2021 | | | TIIE | |
Structured bank bonds(*) | | | 4 | | | 03/03/2021 | | | Guaranteed rate subject to SXDP | |
Structured bank bonds(*) | | | 23 | | | 03/03/2021 | | | Guaranteed rate subject to SXDP | |
Structured bank bonds(*) | | | 41 | | | 02/23/2021 | | | TIIE | |
Structured bank bonds(*) | | | 167 | | | 12/14/2020 | | | Guaranteed rate subject to SXDP | |
Structured bank bonds(*) | | | 128 | | | 11/23/2020 | | | Guaranteed rate subject to SXDP | |
Structured bank bonds(*) | | | 66 | | | 11/09/2020 | | | Guaranteed rate subject to SXDP | |
Structured bank bonds(*) | | | 212 | | | 11/09/2020 | | | Guaranteed rate subject to SXDP | |
Structured bank bonds(*) | | | 45 | | | 11/09/2020 | | | Guaranteed rate subject to SXDP | |
Structured bank bonds(*) | | | 8 | | | 11/05/2020 | | | TIIE | |
Structured bank bonds(*) | | | 515 | | | 10/26/2020 | | | Guaranteed rate subject to SXDP | |
Structured bank bonds(*) | | | 771 | | | 10/23/2020 | | | TIIE | |
Structured bank bonds(*) | | | 36 | | | 12/27/2019 | | | Guaranteed rate subject to Euro SX7E | |
Structured bank bonds(*) | | | 15 | | | 12/19/2019 | | | Guaranteed rate subject to Euro STOXX 50 | |
Structured bank bonds(*) | | | 66 | | | 11/22/2019 | | | Guaranteed rate subject to S&P 500 | |
Structured bank bonds(*) | | | 155 | | | 11/14/2019 | | | Guaranteed rate subject to SXDP | |
Structured bank bonds(*) | | | 18 | | | 11/07/2019 | | | Guaranteed rate subject to SXDP | |
Structured bank bonds(*) | | | 103 | | | 10/16/2019 | | | Guaranteed rate subject to Euro STOXX 50 | |
Structured bank bonds(*) | | | 20 | | | 10/03/2019 | | | Guaranteed rate subject to NKY and SXE | |
Structured bank bonds(*) | | | 90 | | | 09/25/2019 | | | TIIE | |
Structured bank bonds(*) | | | 99 | | | 09/04/2019 | | | Guaranteed rate subject to IBEX35 | |
Structured bank bonds(*) | | | 10 | | | 06/26/2019 | | | TIIE | |
Structured bank bonds(*) | | | 58 | | | 06/06/2019 | | | Guaranteed rate subject to IBEX35 | |
Structured bank bonds(*) | | | 27 | | | 06/06/2019 | | | Guaranteed rate subject to IBEX35 | |
Structured bank bonds(*) | | | 219 | | | 06/06/2019 | | | Guaranteed rate subject to IBEX35 | |
Structured bank bonds(*) | | | 7 | | | 06/06/2019 | | | Guaranteed rate subject to IBEX35 | |
Structured bank bonds(*) | | | 21 | | | 05/23/2019 | | | Guaranteed rate subject to IBEX35 | |
Structured bank bonds(*) | | | 15 | | | 04/26/2019 | | | Guaranteed rate subject to Euro SX7E | |
Structured bank bonds(*) | | | 50 | | | 04/26/2019 | | | Guaranteed rate subject to Euro STOXX 50 | |
Structured bank bonds(*) | | | 118 | | | 04/26/2019 | | | Guaranteed rate subject to Euro SX7E | |
Structured bank bonds(*) | | | 18 | | | 04/03/2019 | | | Guaranteed rate subject to NIKKEI 225 | |
Structured bank bonds(*) | | | 10 | | | 03/27/2019 | | | Guaranteed rate subject to NIKKEI 225 | |
Structured bank bonds(*) | | | 110 | | | 02/21/2019 | | | Guaranteed rate subject to Euro STOXX 50 | |
Structured bank bonds(*) | | | 11 | | | 02/14/2019 | | | Guaranteed rate subject to IBEX35 | |
Structured bank bonds(*) | | | 19 | | | 11/16/2018 | | | Guaranteed rate subject to S&P 500 and IPC | |
Structured bank bonds(*) | | | 167 | | | 10/19/2018 | | | Guaranteed rate subject to INDU | |
Structured bank bonds(*) | | | 135 | | | 09/27/2018 | | | Guaranteed rate subject to Euro STOXX 50 | |
Structured bank bonds(*) | | | 166 | | | 09/26/2018 | | | Guaranteed rate subject to S&P 500 | |
Structured bank bonds(*) | | | 105 | | | 09/20/2018 | | | Guaranteed rate subject to Euro STOXX 50 | |
Structured bank bonds(*) | | | 133 | | | 08/30/2018 | | | Guaranteed rate subject to Euro STOXX 50 | |
Structured bank bonds(*) | | | 6 | | | 08/02/2018 | | | Guaranteed rate subject to DAX | |
Structured bank bonds(*) | | | 11 | | | 08/02/2018 | | | Guaranteed rate subject to DAX | |
Structured bank bonds(*) | | | 126 | | | 07/12/2018 | | | Guaranteed rate subject to Euro SX6E | |
Structured bank bonds(*) | | | 305 | | | 06/29/2018 | | | Guaranteed rate subject to IPC and S&P 500 | |
Structured bank bonds(*) | | | 10 | | | 06/29/2018 | | | Guaranteed rate subject to IPC | |
Structured bank bonds(*) | | | 925 | | | 06/29/2018 | | | Guaranteed rate subject to Euro SX6E | |
Structured bank bonds(*) | | | 10 | | | 06/29/2018 | | | Guaranteed rate subject to Euro SX6E | |
Structured bank bonds(*) | | | 150 | | | 06/29/2018 | | | Guaranteed rate subject to Euro SX6E | |
Structured bank bonds(*) | | | 467 | | | 06/27/2018 | | | 2.00 | % |
Structured bank bonds(*) | | | 13 | | | 06/08/2018 | | | Guaranteed rate subject to IPC | |
Structured bank bonds(*) | | | 159 | | | 06/06/2018 | | | TIIE | |
Structured bank bonds(*) | | | 127 | | | 05/31/2018 | | | Guaranteed rate subject to Euro SX5E | |
Structured bank bonds(*) | | | 715 | | | 05/30/2018 | | | Guaranteed rate subject to IPC | |
Structured bank bonds(*) | | | 10 | | | 05/25/2018 | | | Guaranteed rate subject to IPC | |
Structured bank bonds(*) | | | 148 | | | 05/16/2018 | | | Guaranteed rate subject to Euro SX5E | |
Structured bank bonds(*) | | | 101 | | | 05/09/2018 | | | Guaranteed rate subject to IPC | |
Structured bank bonds(*) | | | 6 | | | 04/03/2018 | | | Guaranteed rate subject to SXEE | |
Structured bank bonds(*) | | | 892 | | | 04/03/2018 | | | Guaranteed rate subject to Euro STOXX Oil & Gas | |
Structured bank bonds(*) | | | 49 | | | 03/22/2018 | | | Guaranteed rate subject to IPC | |
Structured bank bonds(*) | | | 46 | | | 03/20/2018 | | | Guaranteed rate subject to IPC | |
Structured bank bonds(*) | | | 21 | | | 03/14/2018 | | | Guaranteed rate subject to IPC | |
Structured bank bonds(*) | | | 90 | | | 03/12/2018 | | | Guaranteed rate subject to IPC | |
Structured bank bonds(*) | | | 41 | | | 03/05/2018 | | | Guaranteed rate subject to NIKKEI 225 | |
Structured bank bonds(*) | | | 41 | | | 03/05/2018 | | | Guaranteed rate subject to IBEX35 | |
Structured bank bonds(*) | | | 476 | | | 03/02/2018 | | | Guaranteed rate subject to FSTE 100 | |
Structured bank bonds(*) | | | 10 | | | 02/21/2018 | | | Guaranteed rate subject to IPC | |
Structured bank bonds(*) | | | 24 | | | 02/20/2018 | | | Guaranteed rate subject to IPC | |
Structured bank bonds(*) | | | 310 | | | 02/19/2018 | | | Guaranteed rate subject to IXE | |
Structured bank bonds(*) | | | 40 | | | 02/16/2018 | | | Guaranteed rate subject to IPC | |
Structured bank bonds(*) | | | 14 | | | 01/04/2018 | | | Guaranteed rate subject to EURO STOXX Oil & Gas | |
Structured bank bonds(*) | | | 572 | | | 01/04/2018 | | | Guaranteed rate subject to EURO STOXX Oil & Gas | |
Structured bank bonds(*) | | | 181 | | | 05/17/2019 | | | Guaranteed rate subject to Euro STOXX 50 | |
| | | 10,726 | | | | | | | |
Transaction costs and accrued interest (net) | | | 22 | | | | | | | |
| | | 10,748 | | | | | | | |
| | | | | | | | | | |
Promissory notes | | | 1,115 | | | 08/22/2018 | | | 7.53 | % |
Promissory notes | | | 499 | | | 08/10/2018 | | | 7.56 | % |
Promissory notes | | | 1,022 | | | 08/06/2018 | | | 7.57 | % |
Promissory notes | | | 511 | | | 08/03/2018 | | | 7.58 | % |
Promissory notes | | | 96 | | | 06/04/2018 | | | 7.38 | % |
Promissory notes | | | 868 | | | 06/04/2018 | | | 7.38 | % |
Promissory notes | | | 2,677 | | | 02/28/2018 | | | 7.38 | % |
Promissory notes | | | 1 | | | 01/23/2018 | | | 7.25 | % |
| | | | | | | | | | |
| | | Amount | | | Maturity Date | | | Rate |
| | | | | | | | | | |
Promissory notes | | | 58 | | | 01/23/2018 | | | 7.25 | % |
Promissory notes | | | 60 | | | 01/02/2018 | | | 7.20 | % |
Promissory notes | | | 10,001 | | | 01/02/2018 | | | 7.25 | % |
Promissory notes | | | 6,500 | | | 01/02/2018 | | | 7.25 | % |
| | | 23,408 | | | | | | | |
Accrued interest | | | 169 | | | | | | | |
| | | 23,577 | | | | | | | |
| | | | | | | | | | |
Unsecured bonds | | | 3,000 | | | 03/16/2018 | | | 8.91 | % |
Unsecured bonds | | | 3,000 | | | 09/01/2026 | | | 7.19 | % |
Unsecured bonds | | | 4,000 | | | 06/14/2021 | | | TIIE + 38 basis points | |
Unsecured bonds | | | 1,700 | | | 03/09/2021 | | | TIIE + 15 basis points | |
Unsecured bonds | | | 3,000 | | | 12/06/2018 | | | TIIE + 18 basis points | |
| | | 14,700 | | | | | | | |
Accrued interest | | | 98 | | | | | | | |
| | | 14,798 | | | | | | | |
| | | | | | | | | | |
Mortgage-backed bonds | | | 133 | | | 05/25/2032 | | | 5.00 | % |
Mortgage-backed bonds | | | 15 | | | 05/25/2032 | | | 6.40 | % |
| | | 148 | | | | | | | |
Accrued interest | | | — | | | | | | | |
| | | 148 | | | | | | | |
(*)Marketable debt securities classified as financial liabilities at fair value through profit or loss.
As of December 31, 2018, the balance of the issues performed by the Bank under the aforementioned program is as follows:
| | | | | | | | | | |
| | | Amount | | | Maturity Date | | | Rate |
| | | | | | | | | | |
Certificates of deposit (unsecured) | | | 8 | | | 01/02/2019 | | | 8.14 | % |
Certificates of deposit (unsecured) | | | 15 | | | 01/03/2019 | | | 8.14 | % |
Certificates of deposit (unsecured) | | | 28 | | | 01/04/2019 | | | 8.14 | % |
Certificates of deposit (unsecured) | | | 28 | | | 01/07/2019 | | | 8.15 | % |
Certificates of deposit (unsecured) | | | 23 | | | 01/08/2019 | | | 8.14 | % |
Certificates of deposit (unsecured) | | | 26 | | | 01/09/2019 | | | 8.16 | % |
Certificates of deposit (unsecured) | | | 21 | | | 01/10/2019 | | | 8.16 | % |
Certificates of deposit (unsecured) | | | 16 | | | 01/11/2019 | | | 8.15 | % |
Certificates of deposit (unsecured) | | | 22 | | | 01/14/2019 | | | 8.15 | % |
Certificates of deposit (unsecured) | | | 19 | | | 01/15/2019 | | | 8.15 | % |
Certificates of deposit (unsecured) | | | 12 | | | 01/16/2019 | | | 8.17 | % |
Certificates of deposit (unsecured) | | | 20 | | | 01/17/2019 | | | 8.17 | % |
Certificates of deposit (unsecured) | | | 1,050 | | | 01/17/2019 | | | 8.12 | % |
Certificates of deposit (unsecured) | | | 20 | | | 01/18/2019 | | | 8.18 | % |
Certificates of deposit (unsecured) | | | 23 | | | 01/21/2019 | | | 8.36 | % |
Certificates of deposit (unsecured) | | | 21 | | | 01/22/2019 | | | 8.38 | % |
Certificates of deposit (unsecured) | | | 16 | | | 01/23/2019 | | | 8.38 | % |
Certificates of deposit (unsecured) | | | 28 | | | 01/24/2019 | | | 8.38 | % |
Certificates of deposit (unsecured) | | | 19 | | | 01/25/2019 | | | 8.39 | % |
Certificates of deposit (unsecured) | | | 34 | | | 01/28/2019 | | | 8.40 | % |
Certificates of deposit (unsecured) | | | 24 | | | 01/29/2019 | | | 8.13 | % |
Certificates of deposit (unsecured) | | | 39 | | | 01/30/2019 | | | 8.14 | % |
Certificates of deposit (unsecured) | | | 65 | | | 01/31/2019 | | | 8.14 | % |
Certificates of deposit (unsecured) | | | 1,000 | | | 02/08/2019 | | | 8.12 | % |
Certificates of deposit (unsecured) | | | 60 | | | 02/11/2019 | | | 8.38 | % |
Certificates of deposit (unsecured) | | | 900 | | | 02/15/2019 | | | 8.12 | % |
Certificates of deposit (unsecured) | | | 1,000 | | | 02/08/2019 | | | 8.38 | % |
Certificates of deposit (unsecured) | | | 700 | | | 02/25/2019 | | | 8.12 | % |
Certificates of deposit (unsecured) | | | 1,500 | | | 03/15/2019 | | | 8.12 | % |
Certificates of deposit (unsecured) | | | 1,500 | | | 03/26/2019 | | | 8.44 | % |
Certificates of deposit (unsecured) | | | 550 | | | 02/01/2019 | | | 8.34 | % |
Certificates of deposit (unsecured) | | | 1,000 | | | 05/16/2019 | | | 8.12 | % |
Certificates of deposit (unsecured) | | | 800 | | | 06/13/2019 | | | 8.12 | % |
Certificates of deposit (unsecured) | | | 9 | | | 06/20/2019 | | | 8.89 | % |
Certificates of deposit (unsecured) | | | 12 | | | 06/21/2019 | | | 8.89 | % |
Certificates of deposit (unsecured) | | | 26 | | | 06/24/2019 | | | 8.90 | % |
Certificates of deposit (unsecured) | | | 8 | | | 06/25/2019 | | | 8.89 | % |
Certificates of deposit (unsecured) | | | 23 | | | 06/26/2019 | | | 8.91 | % |
Certificates of deposit (unsecured) | | | 40 | | | 06/27/2019 | | | 8.91 | % |
Certificates of deposit (unsecured) | | | 40 | | | 06/28/2019 | | | 8.90 | % |
Certificates of deposit (unsecured) | | | 80 | | | 07/01/2019 | | | 8.90 | % |
Certificates of deposit (unsecured) | | | 23 | | | 07/02/2019 | | | 8.90 | % |
Certificates of deposit (unsecured) | | | 36 | | | 07/03/2019 | | | 8.92 | % |
Certificates of deposit (unsecured) | | | 43 | | | 07/04/2019 | | | 8.92 | % |
Certificates of deposit (unsecured) | | | 1,200 | | | 07/04/2019 | | | 8.12 | % |
Certificates of deposit (unsecured) | | | 43 | | | 07/05/2019 | | | 8.93 | % |
Certificates of deposit (unsecured) | | | 51 | | | 07/08/2019 | | | 9.11 | % |
Certificates of deposit (unsecured) | | | 57 | | | 07/09/2019 | | | 9.13 | % |
Certificates of deposit (unsecured) | | | 66 | | | 07/10/2019 | | | 9.13 | % |
Certificates of deposit (unsecured) | | | 48 | | | 07/11/2019 | | | 9.13 | % |
Certificates of deposit (unsecured) | | | 36 | | | 07/12/2019 | | | 9.14 | % |
Certificates of deposit (unsecured) | | | 52 | | | 07/15/2019 | | | 9.15 | % |
Certificates of deposit (unsecured) | | | 41 | | | 07/16/2019 | | | 8.88 | % |
Certificates of deposit (unsecured) | | | 33 | | | 07/17/2019 | | | 8.88 | % |
| | | | | | | | | | |
| | | Amount | | | Maturity Date | | | Rate |
| | | | | | | | | | |
Certificates of deposit (unsecured) | | | 43 | | | 07/18/2019 | | | 8.89 | % |
Certificates of deposit (unsecured) | | | 46 | | | 07/19/2019 | | | 8.89 | % |
Certificates of deposit (unsecured) | | | 1,000 | | | 07/19/2019 | | | 8.12 | % |
Certificates of deposit (unsecured) | | | 39 | | | 07/22/2019 | | | 8.90 | % |
Certificates of deposit (unsecured) | | | 28 | | | 07/23/2019 | | | 8.89 | % |
Certificates of deposit (unsecured) | | | 41 | | | 07/24/2019 | | | 8.91 | % |
Certificates of deposit (unsecured) | | | 500 | | | 07/24/2019 | | | 8.12 | % |
Certificates of deposit (unsecured) | | | 40 | | | 07/25/2019 | | | 8.91 | % |
Certificates of deposit (unsecured) | | | 34 | | | 07/26/2019 | | | 8.90 | % |
Certificates of deposit (unsecured) | | | 43 | | | 07/29/2019 | | | 8.90 | % |
Certificates of deposit (unsecured) | | | 50 | | | 07/25/2019 | | | 8.36 | % |
Certificates of deposit (unsecured) | | | 66 | | | 07/30/2019 | | | 8.90 | % |
Certificates of deposit (unsecured) | | | 92 | | | 07/31/2019 | | | 8.92 | % |
Certificates of deposit (unsecured) | | | 32 | | | 08/01/2019 | | | 8.92 | % |
Certificates of deposit (unsecured) | | | 200 | | | 08/01/2019 | | | 8.40 | % |
Certificates of deposit (unsecured) | | | 18 | | | 08/02/2019 | | | 8.93 | % |
Certificates of deposit (unsecured) | | | 32 | | | 08/05/2019 | | | 9.11 | % |
Certificates of deposit (unsecured) | | | 20 | | | 08/06/2019 | | | 9.13 | % |
Certificates of deposit (unsecured) | | | 52 | | | 08/07/2019 | | | 9.13 | % |
Certificates of deposit (unsecured) | | | 71 | | | 08/08/2019 | | | 9.13 | % |
Certificates of deposit (unsecured) | | | 2,000 | | | 06/13/2019 | | | 8.12 | % |
Certificates of deposit (unsecured) | | | 1 | | | 08/13/2019 | | | 8.88 | % |
Certificates of deposit (unsecured) | | | 350 | | | 08/22/2019 | | | 8.39 | % |
Certificates of deposit (unsecured) | | | 600 | | | 08/28/2019 | | | 8.12 | % |
Certificates of deposit (unsecured) | | | 1,700 | | | 09/02/2019 | | | 8.12 | % |
Certificates of deposit (unsecured) | | | 500 | | | 09/25/2019 | | | 8.40 | % |
Certificates of deposit (unsecured) | | | 600 | | | 09/27/2019 | | | 8.41 | % |
Certificates of deposit (unsecured)-USD | | | 1 | | | 01/04/2019 | | | 0.98 | % |
Certificates of deposit (unsecured)-USD | | | 2 | | | 05/03/2019 | | | 0.98 | % |
Certificates of deposit (unsecured)-USD | | | 1,100 | | | 11/08/2019 | | | 8.12 | % |
Certificates of deposit (unsecured)-USD | | | 112 | | | 01/04/2019 | | | 2.00 | % |
Certificates of deposit (unsecured)-USD | | | 13 | | | 03/04/2019 | | | 1.50 | % |
Certificates of deposit (unsecured)-USD | | | 13 | | | 05/16/2019 | | | 1.51 | % |
Certificates of deposit (unsecured)-USD | | | 22 | | | 09/30/2019 | | | 1.70 | % |
Certificates of deposit (unsecured)-USD | | | 33 | | | 11/20/2019 | | | 1.75 | % |
Certificates of deposit (unsecured)-USD | | | 1 | | | 11/20/2019 | | | 1.75 | % |
Certificates of deposit (unsecured)-USD | | | 12 | | | 11/20/2019 | | | 1.75 | % |
Certificates of deposit (unsecured)-USD | | | 12 | | | 11/20/2019 | | | 1.75 | % |
Certificates of deposit (unsecured)-USD | | | 12 | | | 11/29/2019 | | | 1.75 | % |
Certificates of deposit (unsecured)-USD | | | 22 | | | 12/17/2019 | | | 1.75 | % |
Certificates of deposit (unsecured)-USD | | | 105 | | | 12/24/2019 | | | 1.75 | % |
Certificates of deposit (unsecured)-USD | | | 4 | | | 05/16/2019 | | | 1.65 | % |
Certificates of deposit (unsecured)-USD | | | 4 | | | 05/16/2019 | | | 1.65 | % |
Certificates of deposit (unsecured)-USD | | | 4 | | | 05/16/2019 | | | 1.65 | % |
Certificates of deposit (unsecured)-USD | | | 4 | | | 05/16/2019 | | | 1.65 | % |
Certificates of deposit (unsecured)-USD | | | 58 | | | 12/24/2019 | | | 1.85 | % |
Certificates of deposit (unsecured)-USD | | | 77 | | | 12/24/2019 | | | 1.75 | % |
| | | 22,363 | | | | | | | |
Accrued interest | | | 70 | | | | | | | |
| | | 22,433 | | | | | | | |
| | | | | | | | | | |
Senior Unsecured Notes | | | 19,482 | | | 11/09/2022 | | | 4.125 | % |
Accrued interest | | | 108 | | | | | | | |
| | | 19,590 | | | | | | | |
| | | | | | | | | | |
Structured bank bonds | | | 16 | | | 02/20/2020 | | | Guaranteed rate subject to foreign exchange rate | |
Structured bank bonds | | | 139 | | | 10/15/2019 | | | 9.54 | % |
Structured bank bonds | | | 13 | | | 01/04/2019 | | | 0.25 | % |
Structured bank bonds | | | 32 | | | 01/14/2019 | | | 0.25 | % |
Structured bank bonds | | | 27 | | | 01/18/2019 | | | 0.25 | % |
Structured bank bonds | | | 10 | | | 01/09/2019 | | | 11.00 | % |
Structured bank bonds | | | 16 | | | 01/25/2019 | | | 0.25 | % |
Structured bank bonds | | | 40 | | | 01/08/2019 | | | Guaranteed rate subject to foreign exchange rate | |
Structured bank bonds | | | 24 | | | 01/10/2019 | | | 12.00 | % |
Structured bank bonds | | | 25 | | | 01/10/2019 | | | 12.00 | % |
Structured bank bonds | | | 60 | | | 01/10/2019 | | | Guaranteed rate subject to foreign exchange rate | |
Structured bank bonds | | | 39 | | | 01/03/2019 | | | 6.34 | % |
Structured bank bonds | | | 70 | | | 01/03/2019 | | | 12.23 | % |
Structured bank bonds | | | 10 | | | 01/18/2019 | | | 12.00 | % |
Structured bank bonds | | | 59 | | | 01/11/2019 | | | 5.81 | % |
Structured bank bonds | | | 25 | | | 02/01/2019 | | | 0.25 | % |
Structured bank bonds | | | 15 | | | 02/05/2019 | | | 11.00 | % |
Structured bank bonds(*) | | | 43 | | | 11/09/2020 | | | Guaranteed rate subject to SXDP | |
Structured bank bonds(*) | | | 201 | | | 11/09/2020 | | | Guaranteed rate subject to SXDP | |
Structured bank bonds(*) | | | 742 | | | 10/23/2020 | | | TIIE | |
Structured bank bonds(*) | | | 430 | | | 10/26/2020 | | | Guaranteed rate subject to SXDP | |
Structured bank bonds(*) | | | 19 | | | 11/07/2019 | | | Guaranteed rate subject to SXDP | |
Structured bank bonds(*) | | | 8 | | | 11/05/2020 | | | TIIE | |
Structured bank bonds(*) | | | 163 | | | 11/14/2019 | | | Guaranteed rate subject to SXDP | |
Structured bank bonds(*) | | | 118 | | | 11/23/2020 | | | Guaranteed rate subject to SXDP | |
Structured bank bonds(*) | | | 154 | | | 12/14/2020 | | | Guaranteed rate subject to SXDP | |
Structured bank bonds(*) | | | 11 | | | 02/14/2019 | | | Guaranteed rate subject to IBEX35 | |
Structured bank bonds(*) | | | 40 | | | 02/23/2021 | | | TIIE | |
Structured bank bonds(*) | | | 23 | | | 03/03/2021 | | | Guaranteed rate subject to SXDP | |
Structured bank bonds(*) | | | 5 | | | 03/16/2021 | | | TIIE | |
Structured bank bonds(*) | | | 20 | | | 05/23/2019 | | | Guaranteed rate subject to IBEX35 | |
Structured bank bonds(*) | | | 11 | | | 03/27/2019 | | | Guaranteed rate subject to NIKKEI 225 | |
Structured bank bonds(*) | | | 18 | | | 04/03/2019 | | | Guaranteed rate subject to NIKKEI 225 | |
| | | | | | | | | | |
| | | Amount | | | Maturity Date | | | Rate |
| | | | | | | | | | |
Structured bank bonds(*) | | | 111 | | | 04/26/2019 | | | Guaranteed rate subject to SX7E | |
Structured bank bonds(*) | | | 49 | | | 04/26/2019 | | | Guaranteed rate subject to Euro STOXX 50 | |
Structured bank bonds(*) | | | 6 | | | 04/26/2019 | | | Guaranteed rate subject to SX7E | |
Structured bank bonds(*) | | | 17 | | | 05/12/2021 | | | TIIE | |
Structured bank bonds(*) | | | 1 | | | 06/06/2019 | | | Guaranteed rate subject to IBEX35 | |
Structured bank bonds(*) | | | 27 | | | 06/06/2019 | | | Guaranteed rate subject to IBEX35 | |
Structured bank bonds(*) | | | 212 | | | 06/06/2019 | | | Guaranteed rate subject to IBEX35 | |
Structured bank bonds(*) | | | 57 | | | 06/06/2019 | | | Guaranteed rate subject to IBEX35 | |
Structured bank bonds(*) | | | 287 | | | 04/23/2021 | | | TIIE | |
Structured bank bonds(*) | | | 99 | | | 09/04/2019 | | | Guaranteed rate subject to IBEX35 | |
Structured bank bonds(*) | | | 14 | | | 12/19/2019 | | | Guaranteed rate subject to Euro STOXX 50 | |
Structured bank bonds(*) | | | 21 | | | 10/03/2019 | | | Guaranteed rate subject to NKY and SXE | |
Structured bank bonds(*) | | | 5 | | | 03/03/2021 | | | Guaranteed rate subject to SXDP | |
Structured bank bonds(*) | | | 10 | | | 06/26/2019 | | | TIIE | |
Structured bank bonds(*) | | | 55 | | | 05/24/2021 | | | TIIE | |
Structured bank bonds(*) | | | 91 | | | 09/25/2019 | | | TIIE | |
Structured bank bonds(*) | | | 94 | | | 10/16/2019 | | | Guaranteed rate subject to Euro STOXX 50 | |
Structured bank bonds(*) | | | 117 | | | 02/21/2019 | | | Guaranteed rate subject to Euro STOXX 50 | |
Structured bank bonds(*) | | | 37 | | | 12/27/2019 | | | Guaranteed rate subject to SX7E | |
Structured bank bonds(*) | | | 15 | | | 02/20/2020 | | | Guaranteed rate subject to Euro SX5E | |
Structured bank bonds(*) | | | 19 | | | 03/05/2019 | | | Guaranteed rate subject to NIKKEI 225 | |
Structured bank bonds(*) | | | 55 | | | 03/01/2019 | | | Guaranteed rate subject to IPC | |
Structured bank bonds(*) | | | 29 | | | 03/27/2019 | | | Guaranteed rate subject to IPC | |
Structured bank bonds(*) | | | 263 | | | 06/02/2020 | | | Guaranteed rate subject to Euro SX5E | |
Structured bank bonds(*) | | | 527 | | | 03/25/2019 | | | Guaranteed rate subject to IPC | |
Structured bank bonds(*) | | | 68 | | | 11/22/2019 | | | Guaranteed rate subject to S&P 500 | |
Structured bank bonds(*) | | | 15 | | | 06/27/2019 | | | Guaranteed rate subject to IPC | |
Structured bank bonds(*) | | | 117 | | | 06/24/2019 | | | Guaranteed rate subject to IPC | |
Structured bank bonds(*) | | | 120 | | | 05/29/2019 | | | Guaranteed rate subject to S&P 500 and IPC | |
Structured bank bonds(*) | | | 10 | | | 07/11/2019 | | | Guaranteed rate subject to IPC | |
Structured bank bonds(*) | | | 10 | | | 07/30/2019 | | | Guaranteed rate subject to IPC | |
Structured bank bonds(*) | | | 10 | | | 07/30/2019 | | | Guaranteed rate subject to IPC | |
Structured bank bonds(*) | | | 177 | | | 05/17/2019 | | | Guaranteed rate subject to Euro STOXX 50 | |
| | | 5,371 | | | | | | | |
Transaction costs and accrued interest (net) | | | 5 | | | | | | | |
| | | 5,376 | | | | | | | |
| | | | | | | | | | |
Promissory notes | | | 1,385 | | | 08/08/2019 | | | 8.33 | % |
Promissory notes | | | 461 | | | 08/21/2019 | | | 8.38 | % |
Promissory notes | | | 1,291 | | | 08/20/2019 | | | 8.38 | % |
Promissory notes | | | 646 | | | 09/06/2019 | | | 8.35 | % |
Promissory notes | | | 830 | | | 09/17/2019 | | | 8.39 | % |
Promissory notes | | | 861 | | | 04/09/2019 | | | 8.22 | % |
Promissory notes | | | 2,109 | | | 05/31/2019 | | | 8.66 | % |
Promissory notes | | | 3,500 | | | 01/03/2019 | | | 8.25 | % |
Promissory notes | | | 3,500 | | | 01/03/2019 | | | 8.25 | % |
Promissory notes | | | 2,990 | | | 01/07/2019 | | | 8.25 | % |
Promissory notes | | | 2,990 | | | 01/07/2019 | | | 8.25 | % |
Promissory notes | | | 2,519 | | | 01/07/2019 | | | 8.25 | % |
Promissory notes | | | 3,477 | | | 01/24/2019 | | | 8.67 | % |
Promissory notes | | | 3,477 | | | 01/24/2019 | | | 8.67 | % |
Promissory notes | | | 3,047 | | | 01/24/2019 | | | 8.67 | % |
Promissory notes | | | 2,500 | | | 01/30/2019 | | | 8.25 | % |
Promissory notes | | | 65 | | | 01/07/2019 | | | 8.20 | % |
| | | 35,648 | | | | | | | |
Accrued interest | | | 183 | | | | | | | |
| | | 35,831 | | | | | | | |
| | | | | | | | | | |
Unsecured bonds | | | 1,700 | | | 03/09/2021 | | | 8.91 | % |
Unsecured bonds | | | 4,000 | | | 06/14/2021 | | | TIIE + 38 basis points | |
Unsecured bonds | | | 3,000 | | | 09/01/2026 | | | 7.19 | % |
Unsecured bonds | | | 6,484 | | | 02/10/2020 | | | London Inter-Bank Offered Rate (LIBOR) + 20 basis points | |
Unsecured bonds | | | 4,461 | | | 05/06/2022 | | | TIIE + 15 basis points | |
| | | 19,645 | | | | | | | |
Accrued interest | | | 72 | | | | | | | |
| | | 19,717 | | | | | | | |
| | | | | | | | | | |
Mortgage-backed bonds | | | 100 | | | 05/25/2032 | | | 5.00 | % |
Mortgage-backed bonds | | | 15 | | | 05/25/2032 | | | 6.40 | % |
| | | 115 | | | | | | | |
Accrued interest | | | — | | | | | | | |
| | | 115 | | | | | | | |
(*)Marketable debt securities classified as financial liabilities at fair value through profit or loss.
21. Subordinated liabilities
The breakdown of the balance of Subordinated liabilities is as follows:
| | | | | | | | | | | | | | | |
| | | | | | | | | | | | 12/31/2018 |
| | | | | | | | | | | | Outstanding | | | |
| | | | | | | | | | | | Issue Amount | | | Annual |
Type | | | Currency of Issue | | | 12/31/2017 | | | 12/31/2018 | | | in Foreign Currency | | | Interest Rate (%) |
| | | | | | | | | | | | | | | |
Tier II Subordinated Capital Notes | | | USD | | | 26,054 | | | 1,546 | | | 77,093,000 | | | 5.95 |
Subordinated Additional Tier I Capital Notes | | | USD | | | 9,831 | | | 9,809 | | | 500,000,000 | | | 8.50 |
Tier II Subordinated Capital Notes | | | USD | | | — | | | 25,873 | | | 1,300,000,000 | | | 5.95 |
| | | Balance at year-end | | | 35,885 | | | 37,228 | | | | | | |
Note 44.a includes a breakdown of the remaining maturity of Subordinated liabilities. Additionally, Note 44.d includes the fair value amounts of these liabilities.
b) Changes
The changes in Subordinated liabilities were as follows:
| | | | | | | |
| | | 2017 | | | 2018 | |
Beginning balance (million USD) | | | 1,822 | | | 1,825 | |
Issues | | | — | | | 1,300 | |
Redemptions | | | — | | | (1,223) | |
Transaction costs and accrued interest | | | 3 | | | (8) | |
Balance at year-end (million USD) | | | 1,825 | | | 1,894 | |
Exchange rate per one USD as of December 31, | | | 19.6629 | | | 19.6512 | |
Balance at year-end (million pesos) | | | 35,885 | | | 37,228 | |
c) Other disclosures
2013 Tier II Subordinated Capital Notes
On December 27, 2013, the Bank issued debt securities denominated as Tier II Subordinated Capital Notes in the amount of USD 1,300 million equivalent to 1,300,000 securities with a nominal value of 1,000 USD each with a ten-year maturity (January 30, 2024) and with an option to be prepaid in year five. The instruments were issued in accordance with Rule 144A and Regulation S of the US Securities Act of 1933, as amended, with a discount of 10 million USD. Interest will be paid semiannually, on January 30 and July 30, respectively, beginning July 30, 2014. The instruments bear interest at an initial rate of 5.95% per year during the first five years.
As mentioned in Note 3.9, 94.07% of existing holders tendered the cash offer announced by the Bank for the Tier II Subordinated Capital Notes.
The main features of this issue were as follows:
| a) | | If notes are not redeemed in year five, the interest rate for the second five-year period shall be based on the interest rate on US five-year Treasury Notes in effect at that moment plus the spread defined in the offering memorandum. |
| b) | | Loss absorption mechanism through a write-down of the issue being the trigger event a computation of the Bank’s Basic Capital index of 4.5%. |
| c) | | Partial write-down until the Bank achieves a Basic Capital index of 7.0%. |
| d) | | When the Bank computes a Basic Capital index of 8.0%: |
Possible deferral of principal or interest or other remedies determined by the CNBV.
Possible write-down due to breach of remediation.
Possible early prepayment in an event of non-deductibility of interest or by the increase in the applicable withholding tax led by the consideration of the notes issued as Tier II Complementary Capital.
2016 Subordinated Additional Tier I Capital Notes
On December 29, 2016, the Bank issued Subordinated Additional Tier I Capital Notes for an amount of 500 million USD. Subordinated Additional Tier I Capital Notes are convertible into common Series “F” shares and are callable (either fully or partially) at par in cash at the first call date (January 20, 2022) and subsequently every interest payment date. Interests are non-cumulative and fully discretionary. Some trigger events originate the cancellation of interest payment.
Additional characteristics of the Subordinated Additional Tier I Capital Notes are as follows:
| · | | Automatically convertible into common shares when the Common Equity Tier I (CET I) or Basic Capital is equal to or below 5.125% (among other trigger events) at Conversion price (defined below). |
| · | | Conversion price: The conversion price shall be, if the common shares are: |
| i. | | traded on the Mexican Stock Exchange, the higher of: |
| a. | | the weighted average volume of the ordinary shares closing price on the Mexican Stock Exchange for the thirty consecutive business days immediately preceding the conversion date, with each closing price for the thirty consecutive business days being converted from pesos into USD at the then prevailing exchange rate; or; |
| b. | | the floor price of 20.30 pesos converted into USD at the then-prevailing exchange rate. |
| ii. | | not traded on the Mexican Stock Exchange, the floor price of 20.30 pesos converted into USD at the then-prevailing exchange rate. |
| · | | Subordinated Additional Tier I Capital Notes will accrue interest on an annual rate of 8.5% (subject to not being called in advance at the first call date or if the automatic conversion occurs), which will reset every five years considering the current five-year US Government Treasury Bills interest rate plus the original credit spread. Interest payments will be recognized as a reduction of Accumulated reserves. |
| · | | Fully callable in advance if the Subordinated Additional Tier I Capital Notes: i) fail to be considered as Fundamental Basic Capital, ii) interests are considered non-deductible for tax purposes or iii) the applicable withholding tax increases. |
| · | | Any call in advance must be authorized by the Central Bank. |
These Subordinated Additional Tier I Capital Notes are accounted for as a compound instrument with both liability and equity components (that arises from the contingent settlement provision and from the right of the holders to receive discretional interest payments, respectively). The payment of discretionary interest is recorded to Accumulated reserves.
The liability component is recognized at the par value of the Subordinated Additional Tier I Capital Notes and is then deducted from the fair value of the compound financial instrument as a whole to arrive at the value of the equity component. A zero balance to the equity component is assigned, since there is an obligation to pay the full redemption amount and cannot avoid settlement in cash or another financial asset for the full redemption amount.
In addition, an embedded derivative arises from the call option features on the Subordinated Additional Tier I Capital Notes within five years subsequent to the issuance date and on every interest payment date thereafter. This call option is deemed to be closely related to the Subordinated Additional Tier I Capital Notes and is not accounted for separately.
2018 Tier II Subordinated Notes
On October 1, 2018, the Bank issued debt securities denominated as Tier II Subordinated Notes in the amount of 1,300 million USD equivalent to 1,300,000 securities with a nominal value of 1,000 USD each with a ten-year maturity (October 30, 2028) and with an option to be prepaid in year five. The instruments were issued in accordance with Rule 144A and Regulation S of the US Securities Act of 1933. Interest will be paid semiannually, on April 1 and October 1, respectively, beginning April 30, 2019. The instruments bear interest at an initial rate of 5.95% per year during the first five years.
The main features of this issue are as follows:
| e) | | If notes are not redeemed in year five, the interest rate for the second five-year period shall be based on the interest rate on US five-year Treasury Notes in effect at that moment plus the spread defined in the offering memorandum. |
| f) | | Loss absorption mechanism through a write-down of the issue being the trigger event a computation of the Bank’s Basic Capital index of 4.5%. |
| g) | | Partial write-down until the Bank achieves a Basic Capital index of 7.0%. |
| h) | | When the Bank computes a Basic Capital index of 8.0%: |
Possible deferral of principal or interest or other remedies determined by the CNBV.
Possible write-down due to breach of remediation.
Possible early prepayment in an event of non-deductibility of interest or by the increase in the applicable withholding tax led by the consideration of the notes issued as Tier II Complementary Capital.
With the proceeds obtained from the issue of these Tier II Subordinated Notes, the Bank redeemed in advance 1,223 million USD of the Tier II Subordinated Capital Notes issued on December 27, 2013 (see Note 3.9).
d) Reconciliation of liabilities arising from financing activities
The table below details changes in the Bank’s liabilities arising from financing activities, including both cash and non-cash changes. Liabilities arising from financing activities are those for which cash flows were, or
future cash flows will be, classified in the Bank’s consolidated statement of cash flows as cash flows from financing activities.
| | | | | | | | | | | | | | | | | | |
| | | | | | | | | Non-cash changes | | | |
| | | | | | | | | | | | | | | Foreign | | | |
| | | January 1,2017 | | | Cash flows | | | Accrued | | | Transaction | | | exchange | | | December 31, 2017 |
Type | | | | | | | | | interest | | | costs | | | movements | | | |
| | | | | | | | | | | | | | | | | | |
Tier II Subordinated Capital Notes | | | 27,278 | | | (803) | | | 825 | | | 33 | | | (1,279) | | | 26,054 |
Subordinated Additional Tier I Capital Notes | | | 10,298 | | | — | (*) | | — | | | 12 | | | (479) | | | 9,831 |
Balances at | | | 37,576 | | | (803) | | | 825 | | | 45 | | | (1,758) | | | 35,885 |
(*) As of December 31, 2017, the Bank paid 635 million pesos related to interests on the Subordinated Additional Tier I Capital Notes, which are recognized against Accumulated reserves within Shareholders’ equity.
| | | | | | | | | | | | | | | | | | |
| | | | | | | | | Non-cash changes | | | |
| | | | | | | | | | | | | | | Foreign | | | |
| | | Beginning balance | | | Cash flows | | | Accrued | | | Transaction | | | exchange | | | December 31, 2018 |
Type | | | | | | | | | interest | | | costs | | | movements | | | |
| | | | | | | | | | | | | | | | | | |
Tier II Subordinated Capital Notes | | | 26,054 | | | (24,481) | | | 826 | | | 151 | | | (1,004) | | | 1,546 |
Subordinated Additional Tier I Capital Notes | | | 9,831 | | | — | (*) | | — | | | (16) | | | (6) | | | 9,809 |
Tier II Subordinated Capital Notes | | | — | | | 24,249 | | | 375 | | | (48) | | | 1,297 | | | 25,873 |
Balances at | | | 35,885 | | | (232) | | | 1,201 | | | 87 | | | 287 | | | 37,228 |
(*) As of December 31, 2018, the Bank paid 804 million pesos related to interests on the Subordinated Additional Tier I Capital Notes, which are recognized against Accumulated reserves within Shareholders’ equity.
22. Other financial liabilities
The breakdown of Other financial liabilities is as follows:
| | | | | | |
| | | 12/31/2017 | | | 12/31/2018 |
| | | | | | |
Trade payables | | | 1,895 | | | 2,277 |
Collection accounts: | | | | | | |
Tax payables | | | 939 | | | 1,187 |
Financial transactions pending settlement | | | 5,468 | | | 5,061 |
Other financial liabilities | | | 5,161 | | | 5,281 |
| | | 13,463 | | | 13,806 |
Note 44.a includes a breakdown of the remaining maturity periods of Other financial liabilities. In addition, Note 44.d contains the fair value amounts of these liabilities.
The breakdown of Financial transactions pending settlement is as follows:
| | | | | | |
| | | 12/31/2017 | | | 12/31/2018 |
| | | | | | |
Mexican government securities | | | 4,575 | | | 4,827 |
BPATS | | | — | | | 201 |
Equity instruments | | | 119 | | | 1 |
Other financial instruments | | | 774 | | | 32 |
| | | 5,468 | | | 5,061 |
The breakdown of Other financial liabilities is as follows:
| | | | | | |
| | | 12/31/2017 | | | 12/31/2018 |
| | | | | | |
Retentions related to loans (*) | | | 1,587 | | | 1,000 |
Other payable account | | | 3,574 | | | 4,281 |
| | | 5,161 | | | 5,281 |
(*)These amounts correspond to temporary retention accounts for customers that have their payroll deposits with the Bank and to whom the Bank has granted a loan.
23. Provisions
a) Breakdown
The breakdown of Provisions is as follows:
| | | | | | |
| | | 12/31/2017 | | | 12/31/2018 |
| | | | | | |
Provisions for pensions and similar obligations | | | 3,860 | | | 4,370 |
Provisions for tax and legal matters | | | 1,072 | | | 1,516 |
Provisions for off-balance sheet risk | | | 1,032 | | | 852 |
Other provisions | | | 766 | | | 62 |
Provisions | | | 6,730 | | | 6,800 |
b) Changes
The changes in Provisions were as follows:
| | | | | | | | | | | | | | | | | | | | | | | | | | | | | | | | | | | | | | | | | | | | | | |
| | | 2016 | | | 2017 | | | 2018 | |
| | | Provisions | | | | | | Provisions | | | | | | | | | Provisions | | | Provisions | | | Provisions | | | | | | | | | Provisions | | | Provisions | | | Provisions | | | | | | | |
| | | for Pensions | | | Provisions | | | for Off- | | | | | | | | | for Pensions | | | for Tax and | | | for Off- | | | | | | | | | for Pensions | | | for Tax and | | | for Off- | | | | | | | |
| | | and Similar | | | for Tax and | | | Balance- | | | Other | | | | | | and Similar | | | Legal | | | Balance- | | | Other | | | | | | and Similar | | | Legal | | | Balance- | | | Other | | | | |
| | | Obligations | | | Legal Matters | | | Sheet Risk | | | Provisions | | | Total | | | Obligations | | | Matters | | | Sheet Risk | | | Provisions | | | Total | | | Obligations | | | Matters | | | Sheet Risk | | | Provisions | | | Total | |
| | | | | | | | | | | | | | | | | | | | | | | | | | | | | | | | | | | | | | | | | | | | | | |
Balance at the beginning of year (as originally presented) | | | 4,004 | | | 1,005 | | | 952 | | | 619 | | | 6,580 | | | 3,972 | | | 1,306 | | | 874 | | | 1,050 | | | 7,202 | | | 3,860 | | | 1,072 | | | 1,032 | | | 766 | | | 6,730 | |
Adjustments on initial adoption of IFRS 9 | | | — | | | — | | | — | | | — | | | — | | | — | | | — | | | — | | | — | | | — | | | — | | | — | | | (32) | | | — | | | (32) | |
Beginning balance as of January 1 (restated) | | | 4,004 | | | 1,005 | | | 952 | | | 619 | | | 6,580 | | | 3,972 | | | 1,306 | | | 874 | | | 1,050 | | | 7,202 | | | 3,860 | | | 1,072 | | | 1,000 | | | 766 | | | 6,698 | |
Additions charged (credited) to net income: | | | | | | | | | | | | | | | | | | | | | | | | | | | | | | | | | | | | | | | | | | | | | | |
Interest expense and similar charges | | | 317 | | | — | | | — | | | — | | | 317 | | | 332 | | | — | | | — | | | — | | | 332 | | | 359 | | | — | | | — | | | — | | | 359 | |
Personnel expenses – Defined Benefit Plan | | | 201 | | | — | | | — | | | — | | | 201 | | | 146 | | | — | | | — | | | — | | | 146 | | | 157 | | | — | | | — | | | — | | | 157 | |
Personnel expenses – Defined Contribution Plan (Note 41) | | | 300 | | | — | | | — | | | — | | | 300 | | | 330 | | | — | | | — | | | — | | | 330 | | | 373 | | | — | | | — | | | — | | | 373 | |
Other | | | (186) | | | — | | | — | | | — | | | (186) | | | 51 | | | — | | | — | | | — | | | 51 | | | 129 | | | — | | | — | | | — | | | 129 | |
Actuarial (gains)/losses recognized in the year in other comprehensive income | | | (530) | | | — | | | — | | | — | | | (530) | | | (666) | | | — | | | — | | | — | | | (666) | | | (260) | | | — | | | — | | | — | | | (260) | |
Period provisions | | | — | | | 624 | | | (78) | | | 521 | | | 1,067 | | | — | | | 197 | | | 158 | | | 31 | | | 386 | | | — | | | 576 | | | (148) | | | 5 | | | 433 | |
Contributions from the employer | | | 542 | | | — | | | — | | | — | | | 542 | | | 225 | | | — | | | — | | | — | | | 225 | | | 246 | | | — | | | — | | | — | | | 246 | |
Payments to pensioners and pre-retirees with a charge to internal provisions | | | (365) | | | — | | | — | | | — | | | (365) | | | (191) | | | — | | | — | | | — | | | (191) | | | (234) | | | — | | | — | | | — | | | (234) | |
Other payments (*) | | | — | | | (323) | | | — | | | (90) | | | (413) | | | — | | | (431) | | | — | | | (315) | | | (746) | | | — | | | (284) | | | — | | | | | | (284) | |
Payments to Defined Contribution Plan | | | (300) | | | — | | | — | | | — | | | (300) | | | (330) | | | — | | | — | | | — | | | (330) | | | (347) | | | — | | | — | | | — | | | (347) | |
Recognition of pension obligations from acquisition of SANTEC | | | — | | | — | | | — | | | — | | | — | | | — | | | — | | | — | | | — | | | — | | | 95 | | | — | | | — | | | — | | | 95 | |
Transfers and other changes | | | (11) | | | — | | | — | | | — | | | (11) | | | (9) | | | — | | | — | | | — | | | (9) | | | (8) | | | 152 | | | — | | | (709) | | | (565) | |
Balances at the end of year | | | 3,972 | | | 1,306 | | | 874 | | | 1,050 | | | 7,202 | | | 3,860 | | | 1,072 | | | 1,032 | | | 766 | | | 6,730 | | | 4,370 | | | 1,516 | | | 852 | | | 62 | | | 6,800 | |
(*)Included in these amounts are payments made by the Bank to the Mexican Tax Administration Service of 18 million pesos in 2016, 5 million pesos in 2017 and 1 million pesos in 2018 due to the fact that the Bank was not withholding income tax in transactions with derivative financial instruments with certain counterparties.
c) Provisions for pensions and similar obligations
Defined contribution plan
The Bank sponsors a defined contribution retirement benefit plan for all qualifying employees of its subsidiaries whereby the Bank agrees to contribute pre-established cash amounts to a given investment fund, in which the employee’s benefits consist of the sum of such contributions, plus or minus the gains or losses from the management of such funds of those employees who form part of this defined contribution retirement benefit plan. The qualifying employees are those who began working for the Bank after 2006. The retirement age is 65 years.
The assets of the plan are held separately from those of the Bank in funds under the control of trustees.
The Bank recognized as Administrative expenses - Personnel expenses in the consolidated income statement the amounts of 300 million pesos, 330 million pesos and 373 million pesos in 2016, 2017 and 2018, respectively (see Note 41), related to contributions payable to the defined contribution retirement benefit plan.
Defined benefit plan
According to Mexican Labor Law, the Bank is liable for severance payments for employees who are terminated by the Bank and seniority premiums, which are statutory retirement benefits. In addition, the Bank offers a defined benefit pension plan and other post-retirement benefits agreed under a collective bargaining agreement. The defined benefit plans are administered in a pension fund that is legally separated from the Bank. The trustee of the pension fund is required by law to act in the best interests of the plan participants and is responsible for setting certain policies (e.g. investment, contribution and indexation policies) of the fund.
During the year, the Bank estimates and records the net periodic cost to create a provision that covers the net projected obligation from pensions, medical expenses, seniority premiums and severance payments. These estimates are related to the obligations derived from Mexican Labor Law, as well as the obligations derived from the collective bargaining agreement. Therefore, the liability is accrued at the present value of future cash flows required to settle the obligation from benefits projected to the estimated retirement date of the Bank’s employees calculated based on the projected unit credit method.
The plans typically expose the Bank to actuarial risks such as investment risk, interest rate risk, longevity risk and salary risk.
| |
Investment risk | The present value of the defined benefit plan liability is calculated using a discount rate determined by reference to Mexican government bond yields; if the return on plan asset is below this rate, it will create a plan deficit. Currently the plan has a relatively balanced investment in debt instruments and equity securities. Due to the long-term nature of the plan liabilities, the board of the pension fund considers it appropriate that a reasonable portion of the plan assets should be invested in equity securities to leverage the return generated by the fund. |
Interest risk | A decrease in the bond interest rate will increase the plan liability; however, this will be partially offset by an increase in the return on the plan’s debt investments. |
Longevity risk | The present value of the defined benefit plan liability is calculated by reference to the best estimate of the mortality of plan participants both during and after their employment. An increase in the life expectancy of the plan participants will increase the plan’s liability. |
Salary risk | The present value of the defined benefit plan liability is calculated by reference to the future salaries of plan participants. As such, an increase in the salary of the plan participants will increase the plan’s liability. |
Provisions for defined benefit post-employment plan, which benefits include a pension and medical expenses plan, severance payments and seniority premiums, amounted to 3,830 million pesos and 4,322 million pesos as of December 31, 2017 and 2018, respectively.
The investment fund of the defined benefit post-employment plan was 2,901 million pesos and 2,196 million pesos as of December 31, 2017 and 2018, respectively. Investments are well-diversified, such that the failure of any single investment would not have a material impact on the overall level of assets. Plan assets in 2017 and 2018 consist of debt and equity instruments. The Bank believes that equities offer the best returns over the long-term with an acceptable level of risk.
Prior to January 1, 2006, the Bank offered a defined benefit medical expenses plan to all eligible employees (and their families) that upon retirement provided for the payment of 100% of medical expenses due to illness or accidents. Under this medical expenses plan, the Bank accrues the estimated medical expenses based upon actuarial calculations during the period of employment up to the date of retirement.
Beginning on January 1, 2006, the Bank introduced a new defined contribution medical expenses plan referred to as the “Retirement Medical Coverage Plan”. All individuals employed after January 1, 2006 were automatically enrolled in this plan. Employees with more than six months of service as of January 1, 2006 were given the option of remaining under the defined benefit medical expenses plan or to be transferred to the “Retirement Medical Coverage Plan”. Under the “Retirement Medical Coverage Plan”, the Bank pays pre-established cash amounts to a given investment fund. An employee’s benefit consists of the sum of such contributions, plus or minus the gains or losses from the management of such funds.
As of December 31, 2017 and 2018, approximately 1.00%, both years, of the Bank’s employees, respectively, were still enrolled in the defined benefit pension plan while the rest of the employees were enrolled in the defined contribution pension plan.
As of December 31, 2017 and 2018, approximately 81% and 83% of the Bank’s employees enrolled in the defined contribution pension plan have been included in the “Retirement Medical Coverage Plan”. Employees that start working for the Bank on August 16, 2014 and later, do not have the option to be enrolled in the “Retirement Medical Coverage Plan” because they are registered in the Mexican Institute of Social Security (IMSS) as their medical coverage. In addition, they have a medical insurance that covers its major medical expenses.
The breakdown of Provisions for pensions and similar obligations is as follows:
| | | | | | |
| | | 12/31/2017 | | | 12/31/2018 |
| | | | | | |
Provisions for post-employment plans | | | | | | |
Of which: Defined benefit pension plan | | | 3,830 | | | 4,322 |
Provisions for defined contribution pension plan | | | 30 | | | 48 |
Provisions for pensions and similar obligations | | | 3,860 | | | 4,370 |
The amount of the defined benefit obligations was determined using the following actuarial techniques:
| 1. | | Valuation method: projected unit credit method, which sees each period of service as giving rise to an additional unit of benefit entitlement and measures each unit separately. |
| 2. | | Actuarial assumptions used: The most significant actuarial assumptions used in the calculations were as follows: |
| | | | | | | |
| | | Defined Benefit Pension Plan |
| | | 12/31/2017 | | | 12/31/2018 |
| | | | | | | |
Annual discount rate | | | 9.3 | % | | 9.5 | % |
Mortality tables | | | EMSSA 1997 | | | EMSSA 1997 and 2009 | |
Expected return on plan assets | | | 9.3 | % | | 9.5 | % |
Cumulative annual INPC growth | | | 3.5 | % | | 3.5 | % |
Annual salary increase rate | | | 4.5 | % | | 4.5 | % |
Annual minimum salary increase rate | | | 3.5 | % | | 3.5 | % |
Medical cost trend rates | | | 7.12 | % | | 5.00 | % |
The determination of the discount rate considers the term and performance of Mexican government bonds.
| 3. | | The estimated retirement age of each employee is the first year in which the employee is entitled to retire or the agreed-upon age, as appropriate. |
The funding status of the defined benefit obligations is as follows:
| | | | | | | |
| | | Defined Benefit | |
| | | Pension Plan | |
| | | 12/31/2017 | | | 12/31/2018 | |
| | | | | | | |
Present value of the obligations: | | | | | | | |
Pension plan | | | 2,019 | | | 2,032 | |
Post-employment benefits | | | 4,000 | | | 3,644 | |
Long-term benefits | | | 712 | | | 842 | |
| | | 6,731 | | | 6,518 | |
Less: | | | | | | | |
Fair value of plan assets | | | (2,901) | | | (2,196) | |
| | | | | | | |
Provisions – Provisions for pensions | | | 3,830 | | | 4,322 | |
Of which: | | | | | | | |
Internal provisions for pensions | | | 3,830 | | | 4,322 | |
The amounts recognized in the consolidated income statement in relation to the aforementioned defined benefit obligations are as follows:
| | | | | | | | | | |
| | | Defined Benefit | |
| | | Pension Plan | |
| | | 2016 | | | 2017 | | | 2018 | |
| | | | | | | | | | |
Current service cost (Note 41) | | | 201 | | | 146 | | | 157 | |
Interest cost (net) | | | 317 | | | 332 | | | 359 | |
Other | | | (186) | | | 51 | | | 129 | |
| | | 332 | | | 529 | | | 645 | |
The changes in the present value of the accrued defined benefit obligations were as follows:
| | | | | | | |
| | | Defined Benefit | |
| | | Pension Plans | |
| | | 2017 | | | 2018 | |
| | | | | | | |
Present value of the obligations at the beginning of year | | | 7,377 | | | 6,731 | |
Current service cost (Note 41) | | | 146 | | | 157 | |
Interest cost | | | 633 | | | 592 | |
Benefits paid | | | (737) | | | (735) | |
Actuarial (gains)/losses | | | (681) | | | (321) | |
Recognition of defined benefit obligations from acquisition of SANTEC | | | — | | | 95 | |
Other | | | (7) | | | (1) | |
Present value of the obligations at the end of year | | | 6,731 | | | 6,518 | |
The duration of the defined benefit obligation is 9.17 years.
The changes in the fair value of plan assets were as follows:
| | | | | | | |
| | | Defined Benefit | |
| | | Pension Plan | |
| | | 2017 | | | 2018 | |
| | | | | | | |
Fair value of plan assets at the beginning of year | | | 3,426 | | | 2,901 | |
Actual return on plan assets | | | 242 | | | 43 | |
Transfer of funds to defined contribution plan | | | (225) | | | (246) | |
Benefits paid | | | (542) | | | (502) | |
| | | | | | | |
Fair value of plan assets at the end of year | | | 2,901 | | | 2,196 | |
The fair value of the plan assets is determined based on quoted market prices in active markets.
The Bank does not expect to make contributions to post-employment benefit plans for the year ending December 31, 2019.
The major categories of plan assets as a percentage over the total plan assets are as follows:
| | | | | | | |
| | | Defined Benefit |
| | | Pension Plan |
| | | 12/31/2017 | | | 12/31/2018 |
| | | | | | | |
Equity instruments | | | 29 | % | | 33 | % |
Cash and debt instruments | | | 71 | % | | 67 | % |
The fair value measurement of the financial instruments that comprises the plan assets is categorized as Level 1 since the inputs to the fair value measurement are quoted market prices in active markets.
Sensitivity analysis
Significant actuarial assumptions for the determination of the defined benefit obligation are discount rate, medical cost trend rate, annual salary increase, annual INPC growth and mortality. The sensitivity analyses
below have been determined based on reasonably possible changes of the respective assumptions occurring at the end of the reporting period, while holding all other assumptions constant.
| · | | If the discount rate is 50 basis points higher (lower), the defined benefit obligation would decrease by 246 million pesos (increase by 267 million pesos). |
| · | | If the medical cost trend rate is 50 basis points higher (lower), the defined benefit obligation would increase by 157 million pesos (decrease by 148 million pesos). |
| · | | If the annual salary growth increases (decreases) by 0.50%, the defined benefit obligation would increase by 9 million pesos (decrease by 9 million pesos). |
| · | | If the annual INPC growth increases (decreases) by 0.50%, the defined benefit obligation would increase by 8 million pesos (decrease by 8 million pesos). |
| · | | If the mortality increases (decreases) by two years for men and women, the defined benefit obligation would decrease by 286 million pesos (increase by 284 million pesos). |
The sensitivity analysis presented above may not be representative of the actual change in the defined benefit obligation as it is unlikely that the change in assumptions would occur in isolation of one another as some of the assumptions may be correlated.
Furthermore, in presenting the above sensitivity analysis, the present value of the defined benefit obligation has been calculated using the projected unit credit method at the end of the reporting period, which is the same as that applied in calculating the defined benefit obligation recognized in the consolidated balance sheet.
d) Other disclosures
In July 2001, the Bank entered into a collective lifetime payment insurance operation agreement for certain retirees with Principal México Compañía de Seguros, S.A. de C.V. (Principal). Such agreement establishes that with the payment of the single premium by the Bank, Principal commits to paying insured retirees a lifetime payment until the death of the last insured retiree.
Under such agreement, the Bank’s net worth would not be affected in the future by these insured persons, since the risk was transferred to Principal. However, in order to record the Bank’s legal obligation to its retirees in the consolidated balance sheet, the Bank recognizes the projected benefit obligation of the insured retirees surrendered to Principal under Provisions - Provisions for pensions and similar obligations, and a long-term account receivable with Principal, which is recognized also under Provisions - Provisions for pensions and similar obligations for the funds that it transferred thereto. The amount of the projected benefits obligation was calculated at the close of the year, based on the estimates used for labor liabilities and the remaining personnel. As of December 31, 2017 and 2018, such liability was 826 and 764 million pesos, respectively. For presentation purposes, the arrangement has not impact on net assets as the asset and liability are offset.
e) Provisions for tax and legal matters
i. Tax-related proceedings
The main tax-related proceeding concerning the Bank was as follows:
| · | | On May 8, 2013, Santander Consumo, S.A. de C.V. (Santander Consumo) filed a claim of nullity with the Metropolitan Regional Chamber of the Federal Court of Tax and Administrative Justice against the resolution contained in the notice 900 06‑03‑2013‑5228 through which a tax credit of |
58 million pesos was determined by the Mexican Tax Administration Service related to the income tax and its related inflation effects, surcharges and fines corresponding to fiscal year 2008. After several unsuccessful instances of the claim of nullity, Santander Consumo settled an amount of 53 million pesos to the tax authorities in 2016. The aforementioned claim has been definitively concluded. |
The Bank is a party to various tax claims for which it has recognized total provisions of 49 million pesos and 50 million pesos as of December 31, 2017 and 2018, respectively.
ii. Other tax issues
The Bank operates a branch in Nassau, Bahamas through which it carries out tax-free operations principally involving derivative financial instruments. The Mexican Tax Administration Service has reviewed the operations of the Nassau branch and determined that the Bank is liable for Mexican withholding taxes. During December 2009, the Bank negotiated a settlement with the Mexican Tax Administration Service for cumulative back withholding taxes on transactions carried out from 2004 through 2009. The Bank made settlement payments of 5 million pesos in 2017 and 1 million pesos in 2018.
iii. Non-tax-related proceedings
As of December 31, 2017 and 2018, as a result of its business activities, the Bank has had certain claims and lawsuits representing contingent liabilities filed against it. Notwithstanding, Management and its internal and external legal and labor advisers do not expect such proceedings to have a material effect on the consolidated financial statements in the event of an unfavorable outcome. As of December 31, 2017 and 2018, the Bank has recognized provisions for the amounts of 1,023 million pesos and 1,466 million pesos, respectively, for matters which based on the opinion of its internal and external legal advisers, Management has assessed losses to be probable. Management considers such provisions to be adequate and, based on its best estimates, does not believe that actual losses will vary materially from the recognized provisions.
The total amount of payments made by the Bank arising from litigation in 2016, 2017 and 2018 is not material with respect to these consolidated financial statements.
During 2017 and 2018, the amount paid by the Bank to external lawyers was 431 million pesos and 284 million pesos, respectively, for the management of all the outstanding claims.
f) Provisions for off-balance sheet risk
The Provisions for off-balance sheet risk are estimated with the same methodology used for calculating the impairment of loans and receivables. Refer to Note 2.g above for further description.
The breakdown of the off-balance sheet risks is as follows:
| | | | | | |
| | | 12/31/2017 | | | 12/31/2018 |
| | | | | | |
Available lines of credit cards and non-revolving consumer loans | | | 838 | | | 718 |
Guarantees and loan commitments of commercial and public sector loans | | | 194 | | | 134 |
| | | 1,032 | | | 852 |
As of December 31, 2018, the breakdown of the Provisions for off-balance sheet risks by stages is as follows:
| | | | | | | | | | | | |
| | Provision for off-balance sheet risk |
| | | Stage 1 | | | Stage 2 | | | Stage 3 | | | Total |
| | | | | | | | | | | | |
Available lines of credit cards and non-revolving consumer loans | | | 595 | | | 112 | | | 11 | | | 718 |
| | | | | | | | | | | | |
Guarantees, documentary credits and loan commitments of commercial and public-sector loans | | | 70 | | | 4 | | | 5 | | | 79 |
| | | | | | | | | | | | |
Guarantees, documentary credits and loan commitments of commercial loans of small and medium-sized enterprises (SMEs) | | | 40 | | | 15 | | | — | | | 55 |
| | | | | | | | | | | | |
Total | | | 705 | | | 131 | | | 16 | | | 852 |
As of December 31, 2018, the transfers between stages of the Provisions for off-balance sheet risks is as follows:
| | | | | | | | | | | | |
| | Provision for off-balance sheet risk |
| | | Stage 1 | | | Stage 2 | | | Stage 3 | | | Total |
| | | | | | | | | | | | |
As of January 1, 2018 | | | 918 | | | 48 | | | 66 | | | 1,032 |
Adjustments on initial adoption of IFRS 9 | | | (85) | | | 106 | | | (53) | | | (32) |
As of January 1, 2018 restated: | | | 833 | | | 154 | | | 13 | | | 1,000 |
| | | | | | | | | | | | |
Financial assets derecognized during the period other than write-offs | | | — | | | — | | | — | | | — |
Write-offs | | | — | | | — | | | — | | | — |
Originated financial assets | | | — | | | — | | | — | | | — |
Foreign exchange and other movements | | | (128) | | | (23) | | | 3 | | | (148) |
| | | | | | | | | | | | |
As of December 31, 2018 | | | 705 | | | 131 | | | 16 | | | 852 |
24. Other liabilities
The breakdown of Other liabilities is as follows:
| | | | | | |
| | | 12/31/2017 | | | 12/31/2018 |
| | | | | | |
Sundry creditors | | | 3,493 | | | 6,788 |
Cash balances undrawn | | | 5,167 | | | 3,894 |
Cash-settled share-based payments | | | 784 | | | — |
Accrued personnel obligations | | | 2,211 | | | 3,735 |
Other obligations | | | 1,735 | | | 2,337 |
Credit and debit card operation balances | | | 1,690 | | | 2,101 |
| | | 15,080 | | | 18,855 |
25. Tax matters
a) Income tax
The components of Income tax for 2016, 2017 and 2018 are as follows:
| | | | | | | | | |
| | | 2016 | | | 2017 | | | 2018 |
| | | | | | | | | |
Current income tax expense: | | | | | | | | | |
Tax expense for current year | | | 5,138 | | | 4,215 | | | 5,615 |
Deferred income tax expense (benefit): | | | | | | | | | |
Origination and reversal of temporary difference and usage (accrual) of tax carryforward benefits | | | 213 | | | 1,281 | | | (157) |
Total Income tax | | | 5,351 | | | 5,496 | | | 5,458 |
b) Income tax reconciliation
The reconciliation of the income tax calculated at the corporate income tax rate of 30% to the income tax recognized and the breakdown of the effective tax rate are as follows:
| | | | | | | | | | |
| | | 2016 | | | 2017 | | | 2018 |
| | | | | | | | | | |
Profit before tax | | | 21,887 | | | 24,174 | | | 24,814 | |
| | | | | | | | | | |
Income tax at 30% | | | 6,566 | | | 7,252 | | | 7,444 | |
| | | | | | | | | | |
Increase/(Decrease) due to permanent differences | | | | | | | | | | |
Of which: | | | | | | | | | | |
Due to effect of inflation | | | (982) | | | (1,742) | | | (1,542) | |
Due to effect of tangible assets | | | (154) | | | (78) | | | (76) | |
Due to effect of non-deductible expenses, non-taxable income and others | | | (79) | | | 64 | | | (368) | |
Income Tax | | | 5,351 | | | 5,496 | | | 5,458 | |
| | | | | | | | | | |
Effective tax rate | | | 24.45 | % | | 22.74 | % | | 22.00 | % |
Current tax liability | | | — | | | — | | | | |
| | | | | | | | | | |
Income tax | | | 5,351 | | | 5,496 | | | 5,458 | |
Of which: | | | | | | | | | | |
Current | | | 5,138 | | | 4,215 | | | 5,615 | |
Deferred | | | 213 | | | 1,281 | | | (157) | |
The Bank is subject to regular reviews by the Mexican Tax Administration Service. As of December 31, 2018, there are no tax contingencies arising because of such tax reviews requiring disclosure.
c) Tax recognized in consolidated equity
In addition to the income tax recognized in the consolidated income statement, the Bank recognized the following amounts in consolidated equity:
| | | | | | | | | | |
| | | 2016 | | | 2017 | | | 2018 | |
| | | | | | | | | | |
Net tax credited/(charged) to consolidated equity: | | | | | | | | | | |
Remeasurement of defined benefit obligation | | | (158) | | | (200) | | | (64) | |
Measurement of Available-for-sale - Debt instruments | | | 1,158 | | | (478) | | | — | |
Measurement of Available-for-sale - Equity instruments | | | 16 | | | 1 | | | — | |
Measurement of Financial assets at fair value through other comprehensive income - Debt instruments | | | — | | | — | | | 371 | |
Measurement of Financial derivatives (Cash flow hedges) | | | (207) | | | 440 | | | 276 | |
Paid interests on Subordinated Additional Tier I Capital Notes | | | — | | | 191 | | | 254 | |
Income tax from sale of the Custody business | | | — | | | — | | | 255 | |
| | | 809 | | | (46) | | | 1,092 | |
d) Deferred tax assets and liabilities
Main components of the Bank’s gross deferred tax assets and liabilities are as follows:
| | | | | | | |
| | | 12/31/2017 | | | 12/31/2018 | |
| | | | | | | |
Total deferred tax assets prior to offsetting | | | 17,184 | | | 20,791 | |
Of which: | | | | | | | |
Tangible assets and deferred charges | | | 2,457 | | | 1,984 | |
Provisions | | | 1,659 | | | 2,295 | |
Impairment losses on loans and receivables | | | 8,337 | | | — | |
Impairment losses on financial assets at amortized cost | | | — | | | 10,057 | |
Net operating losses carryforward (*) | | | 106 | | | — | |
Capital losses carryforward(*) | | | 2,689 | | | 2,683 | |
Labor provisions | | | 1,022 | | | 1,135 | |
Fees and interest collected in advance | | | 579 | | | 1,060 | |
Foreign exchange rate derivatives | | | 335 | | | 1,577 | |
Total deferred tax liabilities prior to offsetting | | | (635) | | | (3,304) | |
Of which: | | | | | | | |
Unrealized gains on financial instruments | | | (20) | | | (2,729) | |
Prepayments | | | (467) | | | (355) | |
Other | | | (148) | | | (220) | |
(*)The net operating losses carryforward and the capital losses carryforward can be deducted during the ten-year period following the fiscal year in which the net operating loss and the capital loss were originated.
As of December 31, 2018, the detail of capital losses carryforward is as follows:
| | | | | | | | | |
Year of origination | | | Year of expiration | | | Amount | | | Deferred tax asset |
| | | | | | | | | |
2016 | | | 2026 | | | 2,587 | | | 776 |
2017 | | | 2027 | | | 3,048 | | | 914 |
2018 | | | 2028 | | | 3,308 | | | 993 |
| | | | | | 8,943 | | | 2,683 |
The Bank only recognizes deferred tax assets for temporary differences and tax credit carryforward where it is considered probable that the consolidated entities that generated them will have sufficient future taxable profits against which they can be utilized.
After offsetting, deferred tax assets and liabilities are presented on the consolidated balance sheet as follows:
| | | | | | | |
| | | 12/31/2017 | | | 12/31/2018 | |
| | | | | | | |
Presented as deferred tax assets (*) | | | 16,600 | | | 17,574 | |
Presented as deferred tax liabilities | | | (51) | | | (87) | |
Net | | | 16,549 | | | 17,487 | |
(*)This amount represents the deferred tax asset whose realization is dependent on future taxable profits in excess of the profits arising from the reversal of existing taxable temporary differences. Management has concluded that the realization of such assets is probable based on the Bank’s history of generating sufficient taxable income to utilize all available tax benefits.
The change in the balance of deferred tax assets and deferred tax liabilities does not equal the deferred income tax expense/(benefit). This is due to deferred taxes that are recognized directly in consolidated equity and the acquisition and disposal of entities as part of ordinary activities.
The changes in the total deferred tax assets and liabilities, prior to offsetting, in the last two years were as follows:
| | | | | | | | | | | | | | | | |
| | | | | | | | | (Charge)/ | | | | | | |
| | | | | | | | | Credit to | | | | | | |
| | | | | | | | | Consolidated | | | | | | |
| | | | | | (Charge)/ Credit to | | | Other | | | | | | |
| | | | | | Consolidated | | | Comprehensive | | Other | | | | |
| | | 01/01/2017 | | | Income | | | Income | | Movements | | | 12/31/2017 | |
| | | | | | | | | | | | | | | | |
Deferred tax assets | | | 20,881 | | | (3,561) | | | (136) | | | — | | | 17,184 | |
Deferred tax liabilities | | | (2,841) | | | 2,280 | | | (101) | | | 27 | | | (635) | |
| | | 18,040 | | | (1,281) | | | (237) | | | 27 | | | 16,549 | |
| | | | | | | | | | | | | | | | |
| | | | | | | | | (Charge)/ | | | | | | | |
| | | | | | | | | Credit to | | | | | | | |
| | | | | | | | | Consolidated | | | | | | | |
| | | | | | (Charge)/ Credit to | | | Other | | | | | | | |
| | | | | | Consolidated | | | Comprehensive | | | Other | | | | |
| | | 01/01/2018 | | | Income | | | Income | | | Movements | | | 12/31/2018 | |
| | | | | | | | | | | | | | | | |
Deferred tax assets | | | 17,184 | | | 2,882 | | | 725 | | | — | | | 20,791 | |
Deferred tax liabilities | | | (635) | | | (2,725) | | | 14 | | | 42 | | | (3,304) | |
| | | 16,549 | | | 157 | | | 739 | | | 42 | | | 17,487 | |
26. Non-controlling interests
Non-controlling interests include the net amount of the equity of subsidiaries attributable to equity instruments that do not belong, directly or indirectly, to the Bank, including the portion attributed to them of profit for the year.
a) Breakdown
The breakdown by subsidiary of Equity - Non-controlling interests is as follows:
| | | | | | |
| | | 12/31/2017 | | | 12/31/2018 |
| | | | | | |
Equity as of balance-sheet date attributable to non-controlling interests: | | | | | | |
Of which: | | | | | | |
Fideicomiso GFSSLPT, Banco Santander México, S.A. | | | 14 | | | 17 |
Other | | | 15 | | | 15 |
| | | 29 | | | 32 |
Profit for the year attributable to non-controlling interests: | | | | | | |
Of which: | | | | | | |
Fideicomiso GFSSLPT, Banco Santander México, S.A. | | | — | | | 3 |
Other | | | — | | | — |
b) Changes
The changes in Non-controlling interests are summarized as follows:
| | | | | | |
| | | 2017 | | | 2018 |
| | | | | | |
Beginning balance | | | 55 | | | 29 |
Profit for the year attributable to non-controlling interests | | | — | | | 3 |
Other | | | (26) | | | — |
Balance at year-end | | | 29 | | | 32 |
The foregoing changes are shown in the consolidated statement of changes in equity.
27. Valuation adjustments
The balance of Valuation adjustments include the amounts, net of the related deferred income tax effect, of the adjustments to assets and liabilities recognized temporarily in consolidated equity through the consolidated other comprehensive income. The amounts arising from subsidiaries are presented, on a line by line basis, in the appropriate items according to their nature.
It should be noted that the consolidated statement of comprehensive income presents items separately according to their nature, grouping together those, which pursuant to the applicable IFRS, will not be subsequently reclassified to the consolidated income statement when the requirements established by the related IFRS are met. In addition, with respect to items that may be reclassified to the consolidated income statement, the consolidated statement of comprehensive income includes changes in Valuation adjustments as follows:
a) Financial assets at fair value through other comprehensive income
(Available-for-sale financial assets up to December 31, 2017)
Valuation adjustments - Financial assets at fair value through other comprehensive income (Available-for-sale financial assets up to December 31, 2017) include the net amount of unrealized gains or losses in the valuation of financial assets at fair value through other comprehensive income (Available-for-sale financial assets up to December 31, 2017) (see Notes 8 and 9).
The breakdown by type of financial instrument of Valuation adjustments - Available-for-sale financial assets at December 31, 2017 and Valuation adjustments - Financial assets at fair value through other comprehensive income at December 31, 2018 is as follows:
| | | | | | | | | | | | | | | | | | | | | | | | |
| | | 12/31/2017 | | | 12/31/2018 |
| | | | | | | | | Net | | | | | | | | | | | | Net | | | |
| | | | | | | | | Valuation | | | | | | | | | | | | Valuation | | | |
| | | Valuation | | | Valuation | | | Gains/ | | | Fair | | | Valuation | | | Valuation | | | Gains/ | | | Fair |
| | | Gains | | | Losses | | | (Losses) | | | Value | | | Gains | | | Losses | | | (Losses) | | | Value |
| | | | | | | | | | | | | | | | | | | | | | | | |
Debt instruments | | | 2,784 | | | (849) | | | 1,935 | | | 164,947 | | | 930 | | | (2,156) | | | (1,226) | | | 154,483 |
Equity instruments | | | 23 | | | (26) | | | (3) | | | 795 | | | — | | | (13) | | | (13) | | | 535 |
Up to December 31, 2017, the Bank assessed whether there was any objective evidence that the financial instruments (debt and equity instruments) classified as Available-for-sale financial assets were impaired.
This assessment included but was not limited to an analysis of the following information: i) the issuer’s economic and financial position, the existence of default or late payment, analysis of the issuer’s solvency, the evolution of its business, short-term projections, trends observed with respect to its earnings and, if applicable, its dividend distribution policy; ii) market-related information such as changes in the general economic situation, changes in the issuer’s sector which might affect its ability to pay; iii) changes in the fair value of the security analyzed, analysis of the origins of such changes - whether they were intrinsic or the result of the general uncertainty concerning the economy or the country - and iv) independent analysts’ reports and forecasts and other independent market information.
In the case of quoted equity instruments, when the changes in the fair value of the instrument under analysis were assessed, the duration and significance of the fall in its market price below cost for the Bank was taken into account. As a general rule, for these purposes the Bank considered a significant fall to be a 40% drop in the value of the asset or a continued fall over a period of 18 months. Nevertheless, it should be noted that the Bank assesses, on a case-by-case basis, each of the securities that have suffered losses, and monitors the performance of their prices, recognizing an impairment loss as soon as it was considered that the recoverable amount could be affected, even though the price may not have fallen by the percentage or for the duration mentioned above.
If, after the above assessment had been carried out, the Bank considered that the presence of one or more of these factors could affect recovery of the cost of the asset, an impairment loss was recognized in the consolidated income statement for the loss in the consolidated other comprehensive income under Valuation adjustments. In addition, where the Bank did not intend and/or was not able to hold the investment for a sufficient amount of time to recover the cost, the instrument was written down to its fair value.
As of December 31, 2016 and as of December 31, 2017, the Bank did not recognized any losses incurred in more than twelve months arising from quoted equity instruments.
A summary of changes in the cumulative valuation adjustments recorded to Financial assets at fair value through other comprehensive income (Available-for-sale financial assets up to December 31, 2017) is as follows:
| | | | | | | | | | |
| | | Debt | | | Equity | | | | |
| | | Instruments | | | Instruments | | | Total | |
| | | | | | | | | | |
Balance at January 1, 2016 | | | (538) | | | 10 | | | (528) | |
Valuation adjustments | | | (3,453) | | | (52) | | | (3,505) | |
Amounts reclassified to consolidated income statement | | | (120) | | | — | | | (120) | |
Income taxes | | | 1,158 | | | 16 | | | 1,174 | |
Balance at December 31, 2016 | | | (2,953) | | | (26) | | | (2,979) | |
Valuation adjustments | | | 1,935 | | | (3) | | | 1,932 | |
Amounts reclassified to consolidated income statement | | | (9) | | | — | | | (9) | |
Income taxes | | | (478) | | | 1 | | | (477) | |
Balance at December 31, 2017 | | | (1,505) | | | (28) | | | (1,533) | |
Adjustments on initial adoption of IFRS 9 | | | | | | | | | | |
Reclassification from Available-for-sale to Amortized cost | | | 1,601 | | | — | | | 1,601 | |
Allowance for impairment losses | | | 13 | | | — | | | 13 | |
Balance at January 1, 2018 as restated | | | 109 | | | (28) | | | 81 | |
Recognition of valuation adjustment of own equity instruments held for future equity-settled share-based payments (Note 3.6) | | | — | | | 17 | | | 17 | |
Valuation adjustments | | | (1,226) | | | (13) | | | (1,239) | |
Amounts reclassified to consolidated income statement | | | 69 | | | — | | | 69 | |
Allowance for impairment losses | | | 2 | | | — | | | 2 | |
Income taxes | | | 371 | | | 4 | | | 375 | |
Balance at December 31, 2018 | | | (675) | | | (20) | | | (695) | |
b) Cash flow hedges
Valuation adjustments - Cash flow hedges include the gains or losses attributable to hedging instruments that qualify as effective hedges. These amounts will remain under this heading until they are reclassified in the consolidated income statement in the periods in which the hedged items affect profit or loss (see Note 12).
The breakdown of the accumulated gain or loss on the effective portion of the hedging to the cumulative valuation adjustment for cash flow hedges is presented as follows:
| | | | | | |
| | | 2017 | | | 2018 |
| | | | | | |
Accumulated (loss)/gain on cash flow hedges | | | 302 | | | (315) |
Accumulated gain related to discontinued cash flow hedges (Note 12) | | | 54 | | | 25 |
Balance at December 31, | | | 356 | | | (290) |
28. Shareholders’ equity
a) Share capital
As of December 31, 2017 and 2018, Share capital, at par value, was as follows:
| | | | | | | | | | | | |
| | | | | | | | | Total Par Value |
| | | Number of Shares | | | (Millions of Pesos) |
| | | 12/31/2017 | | | 12/31/2018 | | | 12/31/2017 | | | 12/31/2018 |
| | | | | | | | | | | | |
Fixed capital: | | | | | | | | | | | | |
Series "F" shares | | | 67,792,912,762 | | | 3,464,309,145 | | | 6,779 | | | 13,098 |
Series "B" shares | | | 13,062,491,041 | | | 3,322,685,212 | | | 1,307 | | | 12,562 |
| | | 80,855,403,803 | | | 6,786,994,357 | | | 8,086 | | | 25,660 |
| | | | | | | | | | | | |
Authorized unsubscribed capital: | | | | | | | | | | | | |
Series "F" shares | | | 7,862,838,825 | | | 331,811,068 | | | — | | | — |
Series "B" shares | | | — | | | 318,188,932 | | | — | | | — |
| | | 7,862,838,825 | | | 650,000,000 | | | — | | | — |
| | | 88,718,242,628 | | | 7,436,994,357 | | | 8,086 | | | 25,660 |
Share capital is comprised of fixed shares, which cannot be increased and variable shares, which may be increased without limit.
Series “F” shares may only be acquired by our Parent company or, directly or indirectly, by Banco Santander, S.A. (Spain), except when such shares are transferred in guarantee or in ownership to the Mexican Bank Savings Protection Institute (hereinafter, IPAB). These shares can only be sold with the prior authorization of the SHCP. No authorization shall be required from such Authority and corporate bylaws will not have to be amended when the transfer of shares is either in guarantee or ownership to the IPAB.
At all times, Series “F” share capital shall represent at least 51% of share capital and Series “B” share capital can represent up to 49% of the share capital.
Foreign governments may not direct or indirectly own any share capital of the Bank, except when: i) they do it temporarily as part of financial supporting or bailout; ii) they do it through official entities and iii) they do it indirectly and do not have control on the Bank, pursuant Article 13 of the Credit Institutions Law. All the aforementioned exceptions must be authorized by the CNBV.
Capital reductions will incur taxation on the excess of the amount distributed against the corresponding tax value determined according to the Income Tax Law.
b) Share premium
Share premium includes the amount paid up by the Bank’s shareholders in capital issues in excess of the par value.
The Mexican Corporation Law expressly permits the use of the share premium account balance to increase capital at the entities at which it is recognized and does not establish any specific restrictions as to its use.
c) Accumulated reserves
Accumulated reserves include the net amount of the accumulated profit recognized in previous years through the consolidated income statement that was appropriated to consolidated equity, the legal reserve,
the differences between the selling price of treasury shares and its cost of acquisition thereof, the remeasurement of defined benefit obligation and the recognition of equity-settled share-based payments.
Accumulated profit
This includes the accumulated profit not distributed to shareholders.
Dividend policy and payment of dividends
Income tax must be paid in the event that payment of dividends from profits is not previously subject to income tax. Accordingly, the Bank must keep track of profits subject to each rate and maintain such accumulated profits in a Net tax profit account.
In accordance with amendments to the Income Tax Law, dividends paid from profits earned in fiscal year 2014 and thereafter by Mexican companies to Mexican resident individuals or foreign residents (including foreign corporations) are subject to an additional withholding tax of 10%. International tax treaties may apply to avoid double taxation on dividends paid to overseas shareholders.
Dividends paid by the Bank to Mexican resident individuals and foreign residents in 2016, 2017 and 2018 are not subject to the 10% additional withholding tax as such dividends were paid from profits obtained prior to 2014.
Legal reserve
The Bank is subject to the legal reserve provision whereby at least 10% of net profits each year must be allocated and transferred to a capital reserve fund until reaching the equivalent of 100% of the paid-in share capital. Regarding Bank’s subsidiaries, the legal reserve provision requires the creation of a legal reserve equal to 5% of net profits until reaching 20% of paid-in share capital. The legal reserve fund cannot be distributed to the shareholders during the existence of the aforementioned entities, except in the form of a stock dividend.
As of December 31, 2017 and 2018, the Bank and its subsidiaries comply with the percentage of legal reserve required.
Treasury shares
Transactions involving own equity instruments are recognized directly in consolidated equity, and no profit or loss may be recognized on these transactions. The costs of any transaction involving own equity instruments are deducted directly from consolidated equity, net of any related income tax effect.
d) Other disclosures
During the Ordinary General Meeting of April 28, 2016, the following resolution was adopted:
The amount of 3,844 million pesos was allocated from Accumulated reserves for the payment of dividends. This amount was paid to shareholders on May 26, 2016.
The aforementioned dividend paid to shareholders was taken from the Net tax profit account.
During the Ordinary General Meeting of December 5, 2016, it was authorized to increase the capital stock by 786 million pesos through the issuance of 7,862,838,825 Series “F” shares, which par value is 0.10 pesos per share. The aforementioned shares are recognized as treasury shares which will guarantee the contingent obligation to convert into the Bank’s common shares related to the Subordinated Additional Tier I Capital Notes described in Note 21.
During the Ordinary General Annual Meeting of December 22, 2016, the following resolution was adopted:
The amount of 13,624 million pesos was allocated from Accumulated reserves for the payment of dividends. This amount was paid to shareholders on December 30, 2016.
The aforementioned dividend paid to shareholders was taken from the Net tax profit account.
During the Ordinary General Annual Meeting of April 28, 2017, the following resolution was adopted:
The amount of 4,234 million pesos was allocated from Accumulated reserves for the payment of dividends. This amount was paid to shareholders on May 30, 2017.
The aforementioned dividend paid to shareholders was taken from the Net tax profit account.
During the Ordinary and Extraordinary General Meeting of December 8, 2017, the following resolutions were adopted:
-The amount of 4,676 million pesos was allocated from Accumulated reserves for the payment of dividends. This amount was paid to shareholders on December 27, 2017.
-It was agreed to carry out a Corporate Restructuring process, which considers, among other corporate actions, the merger of the Former Group, as the merged entity, with the Bank, as the merging entity. (see Note 3.6).
To carry out the Merger, the following resolutions were adopted:
i. Increase the share capital of the Bank by capitalizing the share premium in the amount of 17,574 million pesos, through the issuance of 175,746,122,497 shares, with a nominal value of 0.10 pesos per share, of which 147,353,683,122 shares correspond to the Series "F” and 28,392,439,375 shares correspond to the Series "B".
ii. Perform an equity concentration (reverse split) by increasing the nominal value of the Bank's shares from 0.10 pesos per share to 3.780782962 and decreasing the number of outstanding shares. As a result of the reverse split, 264,464,365,125 shares representing the share capital of the Bank were cancelled and 6,994,962,889 new shares representing the share capital of the Bank were issued.
iii. Complete the exchange of shares, between the Bank and the Former Group once the Merger has been registered in the Public Registry of Commerce. The exchange of shares will be carried out by cancelling the shares representing the Former Group and the issuance of new shares of the Bank whose holders will be the shareholders of the Former Group.
iv. Increase the unsubscribed share capital of the Bank by 1,671 million pesos through the cancellation of 207,968,532 treasury shares and the issuance of 650,000,000 new shares representing the Bank's share capital, which will be held as treasury shares by the Bank to guarantee the conversion of the Subordinated Additional Tier I Capital Notes issued by the Bank in December 2016 (see Note 21).
Additionally, a decree and payment of a cash dividend to the shareholders of the Former Group for an amount up to 1,950 million pesos was approved to equal to one the book value of the shares of the Former Group with those of the Bank. The final amount of the dividend to make equivalent to one the book value of the shares of the Former Group with those of the Bank amounted to 1,822 million pesos, which was paid on January 25, 2018.
The aforementioned resolutions were effective on January 26, 2018, once the Ordinary and Extraordinary General Meeting minute and the merger agreements between the Bank and the Group were registered in the Public Registry of Commerce. On the same date, the delivery of the Bank's shares through INDEVAL to the Bank's shareholders was completed.
The transactions performed as part of the Corporate Restructuring process were as follows:
| | | | | | | | | | | | | | | | | | | | | | | | | |
| | | | | | | | | | | | Profit | | | | | | Total Shareholders’ | | | | | | | |
| | | Share | | | Share | | | Accumulated | | | Attributable | | | Valuation | | | Equity Attributable | | | Non-Controlling | | | Total | |
| | | Capital | | | Premium | | | Reserves | | | to the Parent | | | Adjustments | | | to the Parent | | | Interests | | | Equity | |
| | | | | | | | | | | | | | | | | | | | | | | | | |
As of January 1, 2018 | | | 8,086 | | | 16,956 | | | 72,838 | | | 18,678 | | | (1,177) | | | 115,381 | | | 29 | | | 115,410 | |
| | | | | | | | | | | | | | | | | | | | | | | | | |
Amounts recognized from merger of entities | | | — | | | — | | | 83 | | | — | | | — | | | 83 | | | — | | | 83 | |
Capitalization of share premium and accumulated reserves | | | 17,574 | | | (16,956) | | | (618) | | | — | | | — | | | — | | | — | | | — | |
Recognition of equity-settled share-based payments | | | — | | | — | | | 319 | | | — | | | 17 | | | 336 | | | — | | | 336 | |
Effect on sale of the Brokerage House, net of income tax | | | — | | | — | | | (19) | | | — | | | — | | | (19) | | | — | | | (19) | |
| | | | | | | | | | | | | | | | | | | | | | | | | |
As of January 1, 2018 after Corporate Restructuring | | | 25,660 | | | — | | | 72,603 | | | 18,678 | | | (1,160) | | | 115,781 | | | 29 | | | 115,810 | |
During the Ordinary General Annual Meeting of February 21, 2018, it was decided to approve the creation of a fund to repurchase own shares that amounts to 12,800 million pesos. Based on the aforementioned approval, during the period ended December 31, 2018, the Bank acquired 5,671,453 own shares that amounted to 145 million pesos.
During the Ordinary and Extraordinary General Annual Meeting of April 30, 2018, it was decided to allocate 4,279 million pesos from Accumulated reserves for the payment of dividends, which were paid to shareholders on June 29, 2018.
In Ordinary General Meeting of December 3, 2018, it was decided to allocate 4,949 million pesos from Accumulated reserves for the payment of dividends, which were paid to shareholders on December 28, 2018.
29. Minimum capital requirements
The Bank’s risk-weighted assets and capitalization ratios are calculated in accordance with Mexican Banking GAAP. The management of capital is performed at regulatory and economic levels.
As established in the Sole Circular for Banks (Circular Única de Bancos) issued by the CNBV, the Bank must maintain a minimum net capital in relation to the market, credit and operational risks inherent to its operations, which is based on the Basel Agreements within the Mexican legislation. Such minimum capital is determined based on the sum of the capital requirements stipulated for each aforementioned type of risk.
Net Capital
Net capital is divided into two parts: Basic Capital and Complementary Capital. Additionally, Basic Capital is divided into two portions: Fundamental Basic Capital and Non-Fundamental Basic Capital. Basic Capital (Tier I Capital) is the sum of Fundamental Basic Capital and Non-Fundamental Basic Capital.
Fundamental Basic Capital is composed mainly of shareholders’ equity plus other equity instruments, less, among other deductions: stock investments on financial institutions, organizational expenses, other intangibles assets, excess of deferred tax assets derived from tax losses of Tier I Capital and excess of deferred income taxes from temporary differences that exceed the 10% of Tier I Capital.
Non-Fundamental Basic Capital is composed mainly of a bank’s equity instruments, which are not included as Fundamental Basic Capital according to the current legislation.
Complementary Capital (Tier II) is composed mainly of a bank’s equity instruments, which are not included as Basic Capital according to the current legislation, and the positive difference resulting from subtracting to the total permitted reserves, the total expected losses, up to an amount that does not exceed 0.6% of the assets subject to credit risk.
Assets Subject to Credit Risk
Deposits, securities, loans and receivables, reverse repurchase agreements, swaps, forward contracts, securities loans, options, certain derivative instruments and all other bank transactions exposed to credit risk in accordance with established regulations are classified in their respective risk groups and the weight factors stipulated for each group are applied, ranging from zero up to 150%, depending on the counterparty and scores determined by the ratings agencies accredited by the CNBV or by the Bank in the event it is an authorized institution for the use of internal models. Counterparty risk is calculated by incorporating an add-on and calculating a CVA for OTC derivatives transactions.
Assets Subject to Market Risk
In interest bearing transactions, the capital requirement is calculated by determining the residual term of the financial asset or financial liability and by applying the corresponding Market Risk Charge Coefficient based on the residual term and currency of the financial asset or financial liability.
For those transactions, whose return is based on changes in the price of a share, basket of shares or market index, a 22.23% of General Market Risk Charge Coefficient is applied to the net position, to which additional specific market risk requirements are added for long net positions and short net positions by 8%.
For foreign currency positions, a 12% Market Risk Charge Coefficient is applied on the higher of the sum of the long net position or short net position.
For transactions linked to Mexican inflation and denominated in UDIS, a capital requirement is calculated by applying a Market Risk Charge Coefficient of 1.25% over the increase of the INPC (calculated as the average of the previous twelve months) to the absolute value of the total net position.
For options and warrants, a Vega (variations on volatility) and Gamma (variations on the subjacent) capital requirement is calculated by applying the rules defined on Article 2 bis 109 of the Sole Circular for Banks issued by the CNBV.
For transactions linked to the annual minimum salary growth, a capital requirement is calculated by applying a Market Risk Charge Coefficient of 1.25% over the increase of the annual minimum salary growth (calculated as the average of the actual month and the previous eleven months) to the absolute value of the total net position.
The equivalent assets for market risk are determined by multiplying by 12.5, the sum of the capital requirements of all the transactions described above.
Assets Subject to Operational Risk
Since November 2016, the Bank uses the Alternative Standardized Approach under Basel II standards to calculate the assets subject to operational risk. This method consists first of dividing the business into 8 lines. For six of them, the capital requirement is calculated multiplying a “Beta” factor for the average net revenues for the 36 months prior to the month being calculated and for the two remaining (Retail and Commercial) the capital requirement is calculated by determining the average net balance for the 36 months prior to the month being calculated multiplied for a “Beta” factor and for 3.5. The equivalent assets for operational risk are determined by multiplying the capital requirement by 12.5.
At the date of these consolidated financial statements, the Bank complied with these minimum capital requirements (see below).
The minimum capital requirements calculated in accordance with the Mexican Banking GAAP for the Bank is as follows:
| | | | | | | |
| | | 12/31/2017 | | | 12/31/2018 | |
| | | | | | | |
Computable capital: | | | 115,321 | | | 121,454 | |
Core capital | | | 116,126 | | | 125,621 | |
Supplementary capital | | | 26,054 | | | 27,419 | |
Deductible items | | | (36,671) | | | (41,395) | |
Subordinated Additional Tier I Capital Notes (see Note 21.c) | | | 9,812 | | | 9,809 | |
| | | | | | | |
Capital requirements: | | | 58,668 | | | 61,054 | |
Market risk | | | 11,039 | | | 14,280 | |
Credit risk | | | 44,313 | | | 42,732 | |
Operational risk | | | 3,316 | | | 4,042 | |
| | | | | | | |
Excess of capital requirements | | | 56,653 | | | 60,400 | |
Risk-weighted assets | | | 733,346 | | | 763,170 | |
As of December 31, 2017 and 2018, in accordance with the capitalization requirements applicable to full service banks, the Bank has the following capitalization ratios, which exceed the minimum legal capital required by the CNBV.
The capital ratios included in this table are in accordance to the data published by the CNBV.
| | | | | | | |
| | | 12/31/2017 | | | 12/31/2018 |
| | | | | | | |
Net Capital / Required Capital | | | 1.97 | | | 1.99 | |
Minimum capital requirements | | | Not applicable | | | Not applicable | |
| | | | | | | |
Basic Fundamental Capital / Assets subject to Credit, Market and Operating Risk | | | 10.83 | % | | 11.04 | % |
Minimum capital requirements | | | 7.60 | % | | 7.90 | % |
| | | | | | | |
Basic Capital / Assets subject to Credit, Market and Operating Risk | | | 12.17 | % | | 12.32 | % |
Minimum capital requirements | | | 9.10 | % | | 9.40 | % |
| | | | | | | |
Net Capital / Assets subject to Credit Risk | | | 20.82 | % | | 22.74 | % |
Minimum capital requirements | | | Not applicable | | | Not applicable | |
| | | | | | | |
Net Capital / Assets subject to Credit, Market and Operating Risk | | | 15.73 | % | | 15.91 | % |
| | | | | | | |
Minimum capital requirements | | | 11.10 | % | | 11.40 | % |
30. Memorandum accounts
Memorandum items relate to balances representing rights, obligations and other legal matters that in the future may have an impact on net assets, as well as any other balances needed to reflect all transactions performed by the Bank, although they may not impact on their net assets, including contingent commitments and financial instruments received as collateral in OTC derivative transactions, reverse repurchase agreements and securities loans transactions in which the lender is the Bank.
a) Contingent commitments
Contingent commitments include those irrevocable commitments that could give rise to the recognition of financial assets.
The breakdown is as follows:
| | | | | | |
Contingent commitments | | | 12/31/2017 | | | 12/31/2018 |
| | | | | | |
Available lines of credit cards and non-revolving consumer loans | | | 136,649 | | | 144,006 |
Guarantees, documentary credits and loan commitments of commercial and public sector loans | | | 78,381 | | | 94,014 |
Guarantees, documentary credits and loan commitments of commercial loans (SMEs) | | | 432 | | | 253 |
Total | | | 215,462 | | | 238,273 |
At December 31, 2017 and 2018, the Bank had recognized provisions for off-balance sheet risk of 1,032 million pesos and 852 million pesos, respectively, to cover contingent liabilities arising from available lines of credit cards and non-revolving consumer loans (see Note 23).
A significant portion of the guarantees and loan commitments will expire without any payment obligation materializing for the Bank and, therefore, the aggregate balance of these commitments cannot be considered an actual future need for financing or liquidity to be provided by the Bank to third parties.
Income from guarantee instruments is recognized under Fee and commission income in the consolidated income statements and is calculated by applying the rate established in the related contract to the nominal amount of the guarantee.
As of December 31, 2018, the breakdown of the carrying amount of the contingent commitments by stages is as follows:
| | | | | | | | | | | | |
| | Carrying amount |
| | | Stage 1 | | | Stage 2 | | | Stage 3 | | | Total |
| | | | | | | | | | | | |
Available lines of credit cards and non-revolving consumer loans | | | 142,927 | | | 939 | | | 140 | | | 144,006 |
Guarantees, documentary credits and loan commitments of commercial and public sector loans | | | 93,715 | | | 294 | | | 5 | | | 94,014 |
Guarantees, documentary credits and loan commitments of commercial loans (SMEs) | | | 253 | | | — | | | — | | | 253 |
| | | | | | | | | | | | |
Total | | | 236,895 | | | 1,233 | | | 145 | | | 238,273 |
b) Financial instruments received as collateral
Financial instruments include those securities received by the Bank in which there is not transfer of the contractual rights or risk and rewards of the financial instruments that could give rise to the recognition of financial assets since the Bank received them to engage in OTC derivatives transactions, reverse repurchase agreements and securities loan transactions in which the lender is the Bank.
The breakdown is as follows:
| | | | | | |
Financial instruments received as collateral | | | 12/31/2017 | | | 12/31/2018 |
| | | | | | |
Debt instruments received in OTC derivatives transactions | | | 3,783 | | | 4,044 |
Debt instruments received in reverse repurchase agreement transactions | | | 51,693 | | | 107,560 |
Equity instruments received in securities loans transactions | | | 7 | | | 333 |
Total | | | 55,483 | | | 111,937 |
31. Derivatives - Nominal amounts and fair values of trading and hedging derivatives
The breakdown of the fair value and nominal amount of trading derivative assets as of December 31, 2017 and 2018 is as follows:
| | | | | | | | | | | | | |
| | | 12/31/2017 | | | 12/31/2018 |
Trading | | | Nominal | | | Fair Value | | | Nominal | | | Fair Value | |
| | | | | | | | | | | | | |
Futures: | | | | | | | | | | | | | |
Foreign Currency Futures | | | 6,263 | | | — | | | 2,537 | | | — | |
Interest Rate Futures | | | 1,505 | | | — | | | — | | | — | |
Market Index Futures | | | — | | | — | | | 426 | | | — | |
| | | | | | | | | | | | | |
Forwards: | | | | | | | | | | | | | |
Foreign Currency Forwards | | | 117,917 | | | 5,188 | | | 237,777 | | | 7,127 | |
Foreign Exchange (Spot) | | | 54,653 | | | 112 | | | 62,701 | | | 80 | |
Interest Rate Forwards | | | — | | | — | | | — | | | — | |
Equity Forwards | | | 7,744 | | | 93 | | | 11,770 | | | 936 | |
| | | | | | | | | | | | | |
Options: | | | | | | | | | | | | | |
Foreign Currency Options | | | 104,023 | | | 2,072 | | | 87,711 | | | 1,236 | |
Interest Rate Options | | | 125,931 | | | 1,339 | | | 132,484 | | | 1,450 | |
Market Index Options | | | 7,644 | | | 579 | | | 2,950 | | | 67 | |
Equity Options | | | 93 | | | 3 | | | 148 | | | 3 | |
| | | | | | | | | | | | | |
Swaps: | | | | | | | | | | | | | |
IRS | | | 2,663,538 | | | 57,556 | | | 2,803,464 | | | 69,819 | |
Equity Swaps | | | 1,674 | | | 267 | | | 1,008 | | | 59 | |
CCS | | | 464,667 | | | 98,052 | | | 435,698 | | | 74,176 | |
Total Trading | | | 3,555,652 | | | 165,261 | | | 3,778,674 | | | 154,953 | |
As of December 31, 2017 and 2018, 165,246 million pesos and 154,953 million pesos (assets) are OTC derivatives of the total amount of the trading derivative assets, respectively.
The breakdown of the fair value and nominal amount of hedging derivative assets as of December 31, 2017 and 2018 is as follows:
| | | | | | | | | | | | | |
| | | 12/31/2017 | | | 12/31/2018 |
Hedging | | | Nominal | | | Fair Value | | | Nominal | | | Fair Value | |
| | | | | | | | | | | | | |
Cash flow hedge: | | | | | | | | | | | | | |
IRS | | | 4,000 | | | 91 | | | 4,000 | | | 111 | |
CCS | | | 31,215 | | | 12,577 | | | 13,609 | | | 4,798 | |
Foreign Currency Forwards | | | 22,061 | | | 2,389 | | | 59,619 | | | 4,174 | |
| | | | | | | | | | | | | |
Fair value hedge: | | | | | | | | | | | | | |
IRS | | | 2,138 | | | 59 | | | 8,416 | | | 157 | |
CCS | | | — | | | — | | | 1,492 | | | 45 | |
Total Hedging | | | 59,414 | | | 15,116 | | | 87,136 | | | 9,285 | |
Total Derivative Assets | | | 3,615,066 | | | 180,377 | | | 3,865,810 | | | 164,238 | |
The breakdown of the fair value and nominal amount of trading derivative liabilities as of December 31, 2017 and 2018 is as follows:
| | | | | | | | | | | | | |
| | | 12/31/2017 | | | 12/31/2018 |
Trading | | | Nominal | | | Fair Value | | | Nominal | | | Fair Value | |
| | | | | | | | | | | | | |
Futures: | | | | | | | | | | | | | |
Foreign Currency Futures | | | — | | | — | | | 5,735 | | | — | |
Interest Rate Futures | | | 3,500 | | | — | | | — | | | — | |
Market Index Futures | | | 190 | | | — | | | 462 | | | — | |
| | | | | | | | | | | | | |
Forwards: | | | | | | | | | | | | | |
Foreign Currency Forwards | | | 113,417 | | | 5,022 | | | 237,127 | | | 5,988 | |
Foreign Exchange (Spot) | | | 35,776 | | | 71 | | | 41,423 | | | 110 | |
Market Index Forwards | | | 7,742 | | | 90 | | | 11,768 | | | 839 | |
| | | | | | | | | | | | | |
Options: | | | | | | | | | | | | | |
Foreign Currency Options | | | 123,537 | | | 2,655 | | | 87,616 | | | 1,504 | |
Interest Rate Options | | | 117,167 | | | 1,197 | | | 142,477 | | | 971 | |
Market Index Options | | | 3,297 | | | 323 | | | 4,141 | | | 303 | |
Equity Options | | | 93 | | | 3 | | | 117 | | | 5 | |
| | | | | | | | | | | | | |
Swaps: | | | | | | | | | | | | | |
IRS | | | 2,682,892 | | | 59,830 | | | 2,795,454 | | | 70,607 | |
Equity Swaps | | | — | | | 26 | | | — | | | 16 | |
CCS | | | 431,644 | | | 102,065 | | | 395,656 | | | 73,384 | |
Total Trading | | | 3,519,255 | | | 171,282 | | | 3,721,976 | | | 153,727 | |
As of December 31, 2017 and 2018, 171,222 million pesos and 153,727 million pesos (liabilities), respectively are OTC derivatives of the total amount of the trading portfolio.
The breakdown of the fair value and nominal amount of hedging derivative liabilities as of December 31, 2017 and 2018 is as follows:
| | | | | | | | | | | | | |
| | | 12/31/2017 | | | 12/31/2018 |
Hedging | | | Nominal | | | Fair Value | | | Nominal | | | Fair Value | |
| | | | | | | | | | | | | |
Cash flow hedge: | | | | | | | | | | | | | |
IRS | | | 700 | | | — | | | — | | | — | |
CCS | | | 10,717 | | | 3,799 | | | 10,289 | | | 2,912 | |
Foreign Currency Forwards | | | 31,762 | | | 720 | | | 14,041 | | | 345 | |
| | | | | | | | | | | | | |
Fair value hedge: | | | | | | | | | | | | | |
IRS | | | 1 | | | — | | | 1,200 | | | 14 | |
CCS | | | 24,680 | | | 6,572 | | | 28,489 | | | 5,122 | |
Total Hedging | | | 67,860 | | | 11,091 | | | 54,019 | | | 8,393 | |
Total Derivative Liabilities | | | 3,587,115 | | | 182,373 | | | 3,775,995 | | | 162,120 | — |
As of December 31, 2017 and 2018, the collateral provided to engage in derivative transactions in organized markets is as follows:
| | | | | | | | | |
| | | | | | 12/31/2017 | | | 12/31/2018 |
| | | | | | | | | |
Collateral provided: | | | | | | | | | |
Of which: | | | | | | | | | |
Mercado Mexicano de Derivados, S.A. de C.V. (MexDer) | | | Cash | | | 2,216 | | | 2,093 |
Chicago Mercantile Exchange | | | Cash | | | 350 | | | 1,297 |
Foreign financial institutions | | | Cash | | | — | | | 299 |
| | | | | | | | | |
| | | | | | 2,566 | | | 3,689 |
Deposits of collateral back up positions operated on the MexDer such as interest rate futures, futures based on the IPC, USD futures, listed option futures, positions operated on the Chicago Mercantile Exchange such as Standard & Poor’s futures, US Treasury Notes futures and equity options and positions operated through foreign financial institutions.
The guarantees and/or collateral delivered for the OTC derivative transactions as of December 31, 2017 and 2018 are as follows:
| | | | | | | | | |
| | | | | | 12/31/2017 | | | 12/31/2018 |
| | | | | | | | | |
Loans and receivables - Loans and advances to credit institutions: | | | | | | | | | |
Of which (Note 7): | | | | | | | | | |
Mexican financial institutions | | | Cash | | | 15,916 | | | — |
Foreign financial institutions | | | Cash | | | 18,626 | | | — |
Financial assets at amortized cost - Loans and advances to credit institutions: | | | | | | | | | |
Of which (Note 7): | | | | | | | | | |
Mexican financial institutions | | | Cash | | | — | | | 20,597 |
Foreign financial institutions | | | Cash | | | — | | | 8,911 |
| | | | | | 34,542 | | | 29,508 |
Financial assets held for trading - Debt instruments: | | | | | | | | | |
Of which (Note 8): | | | | | | | | | |
Mexican financial institutions | | | Bonds | | | 2,822 | | | — |
Foreign financial institutions | | | Bonds | | | 142 | | | — |
Financial assets at fair value through profit or loss - Debt instruments: | | | | | | | | | |
Of which (Note 8): | | | | | | | | | |
Mexican financial institutions | | | Bonds | | | — | | | 4,438 |
Foreign financial institutions (*) | | | Bonds | | | — | | | 1,796 |
| | | | | | 2,964 | | | 6,234 |
(*) As of December 31, 2018, includes 1,465 million pesos of debt instruments received as collateral (registered in memorandum accounts), which were delivered in OTC transactions as collateral.
The guarantees and/or collateral received for the OTC derivative transactions as of December 31, 2017 and 2018 are as follows:
| | | | | | | | | |
| | | | | | 12/31/2017 | | | 12/31/2018 |
| | | | | | | | | |
Deposits from credit institutions and Customer deposits: | | | | | | | | | |
Of which (Notes 18 and 19): | | | | | | | | | |
Mexican financial institutions | | | Cash | | | 8,425 | | | 5,288 |
Foreign financial institutions | | | Cash | | | 36,350 | | | 37,192 |
Other | | | Cash | | | 249 | | | — |
| | | | | | 45,024 | | | 42,480 |
| | | | | | | | | |
| | | | | | 12/31/2017 | | | 12/31/2018 |
| | | | | | | | | |
Memorandum accounts: | | | | | | | | | |
Of which (Note 30): | | | | | | | | | |
Mexican financial institutions | | | Bonds | | | 3,783 | | | 4,044 |
| | | | | | 3,783 | | | 4,044 |
Upon executing transactions with OTC derivatives, the Bank agrees to deliver and/or receive collateral to cover any exposure to market risk and the credit risk of such transactions. Such collateral is contractually agreed to with each of the counterparties.
Currently, debt instruments, mainly government bonds, are posted as collateral for transactions with domestic financial entities. Cash deposits are used for transactions with foreign financial entities and institutional customers.
The nominal and/or contractual amounts of the derivative contracts traded by the Bank do not reflect the actual risk assumed by the Bank since the net position in these financial instruments is the result of offsetting and/or combining them. The net position is used by the Bank to hedge interest rates, underlying asset prices or foreign currency risk and to assume directional exposure to risk factors limited by the Bank’s risk appetite. The results of these financial instruments are recognized in Gains/(losses) on financial assets and liabilities (net) in the consolidated income statement. If their purpose is to hedge other exposures, they increase or offset, as appropriate, the gains or losses on the hedged investments (see Note 12).
The Bank manages the credit risk exposure of these contracts through setting credit lines, establishing netting arrangements with its main counterparties and by receiving assets as collateral (see Note 2.f).
The cumulative credit risk exposure is measured in terms of Equivalent Credit Risk (hereinafter, ECR). ECR is composed of the current exposure of the contract (at fair value in the case of derivatives) and the Potential Future Exposure (hereinafter, PFE) which is defined as the maximum expected credit risk exposure over a specified period of time calculated at a 97.5% level of confidence and which expresses its potential future exposure. This metric is used internally for management purposes.
ECR by Profiles Methodology introduces the concept of Exposure Profile per deal, where risk exposure may vary depending on the time-band considered. There is not a unique exposure figure per deal. However, many exposures figure as time-bands are affected and each time-band exposure equals the maximum exposure within the time-band.
Deal risk aggregation per counterparty and per time-band requires aggregation of a Potential Future Exposure for each of the time-bands and considering the netting agreement for the Current Exposure and also, if applicable, collateral mitigation; so, there is an aggregated net exposure per counterparty as time-bands are impacted.
For derivatives, where ECR is equal to the Current Exposure plus the nominal amount multiplied by the Risk Factor (PFE), the Profiles Methodology implies that PFE figure is not unique but is calculated for each of the time-bands.
The Counterparty Credit Risk Area compares, on a monthly basis, the nominal amounts used to calculate the PFE against the nominal amounts recognized in the accounting records and also compares the Current Exposure amounts used for the Current Exposure of the ECR against the Current Exposure amounts also recognized in the accounting books.
As of December 31, 2017 and 2018, the cumulative net credit risk exposure of the Bank was 385,059 million pesos and 390,324 million pesos, respectively. The net credit risk exposure comprises the total counterparty credit risk and issuer risk (which includes derivatives, repurchase agreements and debt securities), less any received assets as collateral for mitigating these risks.
32. Interest income
Interest income in the consolidated income statement comprises the interest accrued in the year on all financial assets with an implicit or explicit return (except for those at fair value through profit or loss starting January 1, 2018), calculated by applying the effective interest method, irrespective of measurement at fair value, and the adjustment to interest income as a result of hedge accounting.
The breakdown of the main interest income items earned in 2016, 2017 and 2018 is as follows:
| | | | | | | | | |
| | | 2016 | | | 2017 | | | 2018 |
| | | | | | | | | |
Cash and balances with the Central Bank | | | 1,418 | | | 2,081 | | | 2,361 |
Loans and advances to credit institutions | | | 2,832 | | | 4,804 | | | 2,178 |
Loans and advances to customers | | | 59,264 | | | 72,263 | | | 81,976 |
Debt instruments | | | 13,149 | | | 16,791 | | | 10,039 |
Hedging derivatives | | | 703 | | | 1,895 | | | 2,858 |
Other interest income | | | 87 | | | 168 | | | 125 |
| | | 77,453 | | | 98,002 | | | 99,537 |
33.Interest income from financial assets at fair value through profit or loss
Interest income from financial assets at fair value through profit or loss in the consolidated income statement comprises the interest accrued in the year on financial assets at fair value through profit or loss with an implicit or explicit return, calculated by applying the effective interest method.
The breakdown of the main interest income from financial assets at fair value through profit or loss items earned in 2018 is as follows:
| | | | | | | | | |
| | | 2016 | | | 2017 | | | 2018 |
| | | | | | | | | |
Loans and advances to credit institutions | | | — | | | — | | | 5,981 |
Loans and advances to customers | | | — | | | — | | | 518 |
Debt instruments | | | — | | | — | | | 7,550 |
| | | — | | | — | | | 14,049 |
34. Interest expenses and similar charges
Interest expenses and similar charges in the consolidated income statement include the interest accrued during the year on all financial liabilities with an implicit or explicit return, calculated by applying the effective interest method, irrespective of measurement at fair value, the adjustment to interest expense as a result of hedge accounting and the net interest cost attributable to pension funds.
The breakdown of the main items of interest expenses and similar charges accrued in 2016, 2017 and 2018 is as follows:
| | | | | | | | | |
| | | 2016 | | | 2017 | | | 2018 |
| | | | | | | | | |
Deposits from credit institutions | | | 6,145 | | | 7,564 | | | 7,420 |
Customer deposits | | | 14,609 | | | 24,560 | | | 31,913 |
Marketable debt securities | | | 2,625 | | | 3,696 | | | 4,244 |
Subordinated liabilities | | | 1,473 | | | 1,600 | | | 1,610 |
Hedging derivatives | | | 167 | | | 129 | | | 108 |
Other interest expenses | | | 3,304 | | | 4,609 | | | 6,294 |
| | | 28,323 | | | 42,158 | | | 51,589 |
35. Dividend income
Dividend income includes the dividends and payments on equity instruments out of profits generated by investees after the acquisition of the equity interest.
The breakdown of Dividend income is as follows:
| | | | | | | | | |
| | | 2016 | | | 2017 | | | 2018 |
| | | | | | | | | |
Equity instruments classified as: | | | | | | | | | |
Financial assets held for trading | | | 16 | | | 5 | | | — |
Of which: | | | | | | | | | |
NAFTRAC (Exchange-traded fund or ETF) | | | 6 | | | 2 | | | — |
América Móvil, S.A.B, de C.V. | | | 1 | | | 1 | | | — |
Wal-Mart de México, S.A.B. de C.V. | | | 3 | | | 1 | | | — |
Fomento Económico Mexicano, S.A.B. de C.V. | | | 1 | | | — | | | — |
Others | | | 5 | | | 1 | | | — |
| | | | | | | | | |
Financial assets at fair value through profit or loss | | | — | | | — | | | 33 |
Of which: | | | | | | | | | |
NAFTRAC (Exchange-traded fund or ETF) | | | — | | | — | | | 18 |
Grupo Cementos de Chihuahua, S.A.B. de C.V. | | | — | | | — | | | 11 |
América Móvil, S.A.B, de C.V. | | | — | | | — | | | 1 |
Grupo México, S.A.B. de C.V. | | | — | | | — | | | 1 |
Wal-Mart de México, S.A.B. de C.V. | | | — | | | — | | | 1 |
Others | | | — | | | — | | | 1 |
| | | | | | | | | |
Available-for-sale financial assets | | | 78 | | | 145 | | | — |
Of which: | | | | | | | | | |
Controladora Prosa, S.A. de C.V. | | | — | | | 62 | | | — |
Trans Unión de México, S.A. | | | 57 | | | 83 | | | — |
Dun & Bradstreet de México, S.A. de C.V. | | | 20 | | | — | | | — |
Others | | | 1 | | | — | | | — |
| | | | | | | | | |
Financial assets at fair value through other comprehensive income | | | — | | | — | | | 177 |
Of which: | | | | | | | | | |
Controladora Prosa, S.A. de C.V. | | | — | | | — | | | 50 |
Trans Unión de México, S.A. | | | — | | | — | | | 88 |
Bolsa Mexicana de Valores, S.A.B. de C.V. | | | — | | | — | | | 21 |
Dun & Bradstreet de México, S.A. de C.V. | | | — | | | — | | | 17 |
Others | | | — | | | — | | | 1 |
| | | 94 | | | 150 | | | 210 |
36. Fee and commission income
Fee and commission income comprises the amount of all fees and commissions accruing in favor of the Bank during the year, except those that form part of the effective interest rate on financial instruments.
The breakdown of Fee and commission income is as follows:
| | | | | | | | | |
| | | 2016 | | | 2017 | | | 2018 |
| | | | | | | | | |
Collection and payment services: | | | | | | | | | |
Service charges on deposit accounts | | | 951 | | | 1,046 | | | 1,217 |
Credit and debit cards | | | 5,369 | | | 6,268 | | | 7,398 |
Checks and others | | | 253 | | | 252 | | | 240 |
| | | 6,573 | | | 7,566 | | | 8,855 |
Marketing of nonbanking financial products: | | | | | | | | | |
Investment funds management | | | 1,486 | | | 1,457 | | | 1,569 |
Capital markets and securities activities | | | 439 | | | 513 | | | 738 |
Collection and payment services | | | 2,334 | | | 2,568 | | | 2,832 |
Insurance | | | 4,272 | | | 4,341 | | | 4,575 |
Financial advisory services | | | 1,222 | | | 1,341 | | | 1,212 |
| | | 9,753 | | | 10,220 | | | 10,926 |
Securities services: | | | | | | | | | |
Administration and custody | | | 528 | | | 524 | | | 368 |
| | | 528 | | | 524 | | | 368 |
Other: | | | | | | | | | |
Foreign currency transactions | | | 1,080 | | | 1,111 | | | 1,255 |
Other fees and commissions | | | 836 | | | 895 | | | 892 |
| | | 1,916 | | | 2,006 | | | 2,147 |
| | | 18,770 | | | 20,316 | | | 22,296 |
37. Fee and commission expenses
Fee and commission expenses comprises the amount of all fees and commissions paid or payable by the Bank in the year, except those that form part of the effective interest rate on financial instruments.
The breakdown of Fee and commission expenses is as follows:
| | | | | | | | | |
| | | 2016 | | | 2017 | | | 2018 |
| | | | | | | | | |
Credit and debit cards | | | 2,894 | | | 3,250 | | | 3,680 |
Checks and others | | | 26 | | | 25 | | | 26 |
Collections and transactional services | | | 158 | | | 226 | | | 287 |
Fund management | | | 4 | | | 2 | | | 1 |
Capital markets and securities activities | | | 135 | | | 199 | | | 189 |
Financial advisory services | | | 16 | | | 6 | | | 13 |
Correspondent services | | | 327 | | | 465 | | | 614 |
Other fees and commissions | | | 1,270 | | | 1,330 | | | 1,764 |
| | | 4,830 | | | 5,503 | | | 6,574 |
38. Gains/(losses) on financial assets and liabilities (net)
Gains/(losses) on financial assets and liabilities (net) include the amount of the valuation adjustments of financial instruments, except those attributable to interest accrued as a result of application of the effective interest method, impairment losses and the realized gains or losses obtained from the sale and purchase thereof.
The breakdown of Gains/(losses) on financial assets and liabilities (net) by type of instrument is as follows:
| | | | | | | | | | |
| | | 2016 | | | 2017 | | | 2018 | |
| | | | | | | | | | |
Financial instruments held for trading | | | 3,626 | | | 3,223 | | | — | |
Of which: | | | | | | | | | | |
Debt instruments | | | 784 | | | 494 | | | — | |
Equity instruments | | | 109 | | | 29 | | | — | |
Derivatives | | | 2,765 | | | 2,736 | | | — | |
Others | | | (32) | | | (36) | | | — | |
Financial instruments at fair value through profit or loss | | | — | | | — | | | 1,687 | |
Of which: | | | | | | | | | | |
Debt instruments | | | — | | | — | | | 166 | |
Equity instruments | | | — | | | — | | | 35 | |
Derivatives | | | — | | | — | | | 1,482 | |
Others | | | — | | | — | | | 4 | |
Recognized profit from sale of available-for-sale financial instruments | | | 120 | | | 9 | | | (69) | |
Hedging derivatives | | | 14 | | | 226 | | | (134) | |
Of which: | | | | | | | | | | |
Fair value hedge - hedged items (Note 12) | | | 375 | | | 341 | | | (606) | |
Fair value hedge - hedging derivative instruments (Note 12) | | | (363) | | | (117) | | | 474 | |
Cash flow hedge inefficiency (Note 12) | | | 2 | | | 2 | | | (2) | |
| | | 3,760 | | | 3,458 | | | 1,484 | |
39. Exchange differences (net)
Exchange differences (net) shows the gains or losses arising on the translation of monetary items in foreign currency to the functional currency as a result of changes in foreign exchange rates.
40. Other operating income and other operating expenses
Other operating income and other operating expenses in the consolidated income statement include:
| | | | | | | | | | |
| | | 2016 | | | 2017 | | | 2018 | |
| | | | | | | | | | |
Other operating income: | | | | | | | | | | |
Other operating income | | | 486 | | | 669 | | | 748 | |
| | | 486 | | | 669 | | | 748 | |
Other operating expenses: | | | | | | | | | | |
IPAB fund contribution | | | (2,631) | | | (2,894) | | | (3,134) | |
Other operating expenses | | | (730) | | | (720) | | | (1,259) | |
| | | (3,361) | | | (3,614) | | | (4,393) | |
On January 19, 1999, the IPAB was created in order to establish a bank savings protection system in favor of depositors that perform guaranteed banking transactions, and to regulate financial support granted to full service banking institutions in order to protect the interests of depositors.
IPAB’s resources come from the mandatory contributions paid by financial entities, according to the risk to which they are exposed. Such contributions are calculated based on the capitalization level of each financial group and other indicators set forth in IPAB’s bylaws issued by its Board of Directors. These contributions must be equivalent to one-twelfth of four-thousandths of the monthly average of the daily balances of funding activities of the applicable month.
41. Personnel expenses
a) Breakdown
The breakdown of Personnel expenses is as follows:
| | | | | | | | | |
| | | 2016 | | | 2017 | | | 2018 |
| | | | | | | | | |
Wages and salaries | | | 5,542 | | | 6,300 | | | 7,274 |
Social security costs | | | 1,037 | | | 1,105 | | | 1,283 |
Service expense related to defined contribution pension plan (Note 23) | | | 300 | | | 330 | | | 373 |
Service expense related to defined benefit pension plan (Note 23) | | | 201 | | | 146 | | | 157 |
Share-based payments | | | 131 | | | 283 | | | 161 |
Bonus and benefits granted to employees | | | 2,787 | | | 3,295 | | | 3,691 |
Other staff costs | | | 1,474 | | | 1,289 | | | 1,415 |
| | | 11,472 | | | 12,748 | | | 14,354 |
b) Corporate performance shares plan 2014
During the Shareholders’ Meeting of Banco Santander (Spain) on March 28, 2014, a new share-based payment plan was approved that is applicable only to a certain group of executive officers (known as the “Identified Staff”).
The plan was denominated “Corporate performance shares plan 2014” and provided a variable compensation linked to the performance of the stock of Banco Santander (Spain), as established in the Annual Shareholders’ Meeting of Banco Santander (Spain). This multiannual compensation plan was payable in shares of the Former Group with annual deliveries of shares to the beneficiaries during a period of three years beginning on July 1, 2015. This plan was recognized as a cash-settled share-based payment transaction as of December 31, 2017.
The total number of shares that will be granted to each beneficiary was established in early 2015 depending on Banco Santander (Spain)’s performance (Total Shareholders Return or TSR) during 2014 against a peer group of financial institutions.
A percentage of one-third of the total number of vested shares would be paid at the end of each year (June 2016, June 2017 and June 2018) based on Banco Santander (Spain)’s cumulative performance (TSR) (2014 and 2015 for the first tranche; 2014 to 2016 for the second tranche and 2014 to 2017 for the third tranche) against that of a peer group of financial institutions.
Since the conditions of this share-based variable compensation plan were not achieved, the Bank derecognized the original liability as part of the Corporate Restructuring mentioned in Note 3.6. The fair
value of the Corporate performance shares plan 2014 amounted to 36 million pesos as of December 31, 2017.
During 2017, the Bank recognized 16 million pesos in the consolidated income statement with respect to this plan.
c) Long-term incentive plan 2015
During September 2016, the Bank began to participate in a new corporate share-based variable compensation plan denominated “Long-term incentive plan 2015” applicable to the Identified Staff. This plan provides a variable compensation linked to the growth of the earnings per share ratio and of the return on tangible equity of Banco Santander (Spain).
This plan was recognized as a cash-settled share-based payment transaction as of December 31, 2017.
As a result of the Corporate Restructuring mentioned in Note 3.6, the Long term incentive plan 2015 of the Bank will be settled through its own equity instruments starting January 1, 2018. Accordingly the Long term incentive plan 2015 changed from a cash-settled transaction to an equity-settled transaction. The initial fair value of the Long-term incentive plan 2015 amounted to 86 million pesos. As of December 31, 2018, the fair value of the Long-term incentive plan 2015 is 65 million pesos.
During 2016, 2017 and 2018, the Bank recognized 10 million pesos, 27 million pesos and 16 million pesos, respectively, in the consolidated income statement with respect to this plan.
d) Bonus payment policies
As a result of an internal policy of Banco Santander (Spain), a portion of the annual variable remuneration plan for the Identified Staff is deferred for a period of three or five years, with one-third or one-fifth vesting each year.
Both the deferred and non-deferred portions are paid equally in cash and in shares of the Bank for the corresponding payment periods. Once delivered, beneficiaries are obligated to keep the shares for a one-year period.
In 2016, 2017 and 2018, the Bank recognized the bonus of the Identified Staff in the consolidated income statement for an amount of 105 million pesos, 325 million pesos and 184 million pesos, respectively.
The bonus of the Identified Staff for financial years 2016, 2017 and 2018 are paid according to the following percentages, depending on the time of payment and on the group to which the beneficiary belongs (the “Immediate Payment Percentage” to identify the portion for which payment is not deferred and the “Deferred Percentage” to identify the portion for which payment is deferred):
| | | | | | | | | |
Beneficiaries | | | Immediate Payment | | | | | | |
(millions of Euros) | | | Percentage | | | Deferred Percentage | | | Deferred period |
| | | | | | | | | |
Members of the Identified Staff with total variable remuneration ≥ 2.7 | | | 40 | % | | 60 | % | | 5 years |
Members of the Identified Staff with total variable remuneration ≥ 1.7 (< 2.7) | | | 50 | % | | 50 | % | | 5 years |
Other beneficiaries | | | 60 | % | | 40 | % | | 3 years |
Taking the foregoing into account, the bonus for financial years 2016, 2017 and 2018 of the Identified Staff are paid as follows:
| · | | Each beneficiary will receive in 2016, 2017 and 2018, depending on the group to which such beneficiary belongs, the Immediate Payment Percentage at the Initial Date applicable in each case, in halves and net of income tax (or withholdings), in cash and in shares (the “Initial Date”, meaning the specific date on which the Immediate Payment Percentage is paid). |
| · | | Payment of the Deferred Percentage of the bonus applicable in each case depending on the group to which the beneficiary belongs will be deferred over a period of 3 or 5 years and will be paid in thirds or fifths, as applicable, within thirty days of the anniversaries of the Initial Date, provided that the conditions described below are met. |
| · | | After deduction of any income taxes (or withholdings) applicable at any time, the net amount of the deferred portion will be paid in thirds or fifths, 50% in cash and the other 50% in shares of the Bank. |
| · | | The beneficiaries receiving shares of the Bank may not transfer them or hedge them directly or indirectly for one year as from each delivery of shares. |
Up to December 31, 2016, the beneficiaries were be paid an amount in cash equal to the dividends paid on the deferred amount in shares and the interest on the amount accrued in cash. In accordance to an internal policy of Banco Santander (Spain), since 2017 the deferred amount portion to be payable in thirds or fifths excludes the payment of dividends and interests.
In 2015 and 2016, the accrual of the deferred remuneration is conditioned, in addition to requirement that the beneficiary remains in the Bank’s employ, upon none of the following circumstances existing during the period prior to each of the deliveries: (i) poor financial performance of the Bank; (ii) breach by the beneficiary of internal regulations, including, in particular, those relating to risks; (iii) material restatement of the Bank’s consolidated financial statements, except when is required pursuant to a change in accounting Standards, or (iv) significant changes in the Bank’s economic capital or risk profile.
In 2017 and 2018, the accrual of deferred remuneration is conditioned, in addition to the permanence of the beneficiary in the Bank, to no assumptions in which there is a poor performance of the Bank as a whole or of a specific division or area of the Bank or of the exposures generated by the personnel, and at least the following factors must be considered: (i) significant failures in risk management committed by the Bank, or by a business unit or risk control unit; (ii) the increase suffered by the Bank or by a business unit of its capital needs, not foreseen at the time of generation of the exposures; (iii) regulatory sanctions or court rulings for events that could be attributable to the Bank or the personnel responsible for those. Also, the breach of internal codes of conduct of the Bank; and (iv) irregular behaviors, whether individual or collective, considering in particular the negative effects derived from the marketing of inappropriate products and the responsibilities of persons or bodies that made those decisions.
If the abovementioned requirements are met on each delivery date, the bonus beneficiaries shall receive the cash and shares, in thirds or fifths, as applicable, within thirty days of the first, second, third and, if applicable, fourth and fifth anniversary.
42. Other general administrative expenses
a) Breakdown
The breakdown of Other general administrative expenses is as follows:
| | | | | | | | | |
| | | 2016 | | | 2017 | | | 2018 |
| | | | | | | | | |
Maintenance, conservation and repair | | | 1,073 | | | 1,227 | | | 646 |
Information technology and systems | | | 2,555 | | | 2,790 | | | 4,820 |
Stationery and supplies | | | 197 | | | 215 | | | 227 |
Advertising and communications | | | 901 | | | 968 | | | 890 |
Rents | | | 1,839 | | | 1,963 | | | 1,120 |
Administrative services | | | 926 | | | 936 | | | 503 |
Taxes other than income tax | | | 1,360 | | | 1,454 | | | 1,820 |
Surveillance and cash courier services | | | 699 | | | 894 | | | 979 |
Insurance premiums | | | 82 | | | 78 | | | 75 |
Travel costs | | | 215 | | | 293 | | | 364 |
Other administrative expenses | | | 1,336 | | | 1,871 | | | 2,851 |
| | | 11,183 | | | 12,689 | | | 14,295 |
b) Other information
The fees for audit and tax services to the audit of the consolidated financial statements by the respective auditors are as follows:
| | | | | | | | | |
| | | 2016 | | | 2017 | | | 2018 |
| | | | | | | | | |
Audit fees and audit-related fees (*) | | | 58 | | | 72 | | | 88 |
Tax fees | | | — | | | 1 | | | 1 |
| | | 58 | | | 73 | | | 89 |
(*)The audit-related fees amounted to 8 million pesos in 2016, 14 million pesos in 2017 and 7 million pesos in 2018.
43. Gains/(losses) on disposal of assets not classified as non-current assets held for sale (net)
The breakdown of Gains/(losses) on disposal of assets not classified as non-current assets held for sale (net) is as follows:
| | | | | | | | | |
| | | 2016 | | | 2017 | | | 2018 |
| | | | | | | | | |
Gains: | | | | | | | | | |
On disposal of tangible assets | | | 20 | | | 6 | | | 7 |
| | | | | | | | | |
| | | 20 | | | 6 | | | 7 |
44. Other disclosures
a) Remaining maturity periods
The breakdown by maturity of the balances of certain items in the consolidated balance sheets as of December 31, 2017, is as follows:
| | | | | | | | | | | | | | | | | | | | | | | | |
| | | 12/31/2017 |
| | | | | | Less | | | | | | | | | | | | | | | More | | | |
| | | On | | | than 1 | | | 1 to 3 | | | 3 to 12 | | | 1 to 3 | | | 3 to 5 | | | than 5 | | | |
| | | Demand | | | Month | | | Months | | | Months | | | Years | | | Years | | | Years | | | Total |
| | | | | | | | | | | | | | | | | | | | | | | | |
Assets: | | | | | | | | | | | | | | | | | | | | | | | | |
Cash and balances with the Central Bank | | | 21,539 | | | 8,054 | | | — | | | — | | | — | | | — | | | 28,094 | | | 57,687 |
Financial assets held for trading | | | | | | | | | | | | | | | | | | | | | | | | |
Debt instruments | | | — | | | 67,280 | | | 2,551 | | | 15,455 | | | 23,077 | | | 32,379 | | | 7,005 | | | 147,747 |
Equity instruments | | | 2,562 | | | — | | | — | | | — | | | — | | | — | | | — | | | 2,562 |
Trading derivatives | | | 9,118 | | | 2,738 | | | 4,223 | | | 11,273 | | | 25,527 | | | 28,714 | | | 83,668 | | | 165,261 |
Other financial assets at fair value through profit or loss | | | | | | | | | | | | | | | | | | | | | | | | |
Loans and advances to credit institutions - Reverse repurchase agreements | | | — | | | 46,087 | | | — | | | — | | | — | | | — | | | — | | | 46,087 |
Loans and advances to customers - Reverse repurchase agreements | | | — | | | 5,618 | | | — | | | — | | | — | | | — | | | — | | | 5,618 |
Available-for-sale financial assets | | | | | | | | | | | | | | | | | | | | | | | | |
Debt instruments | | | — | | | 18,693 | | | 59 | | | 35,567 | | | 58,067 | | | 21,987 | | | 30,574 | | | 164,947 |
Equity instruments | | | — | | | — | | | — | | | — | | | — | | | — | | | 795 | | | 795 |
Loans and receivables | | | | | | | | | | | | | | | | | | | | | | | | |
Loans and advances to credit institutions | | | — | | | 59,122 | | | — | | | — | | | — | | | — | | | — | | | 59,122 |
Loans and advances to customers | | | 13,455 | | | 33,027 | | | 52,867 | | | 143,821 | | | 164,881 | | | 76,258 | | | 125,111 | | | 609,420 |
Debt instruments | | | — | | | — | | | — | | | — | | | — | | | 1,378 | | | 9,380 | | | 10,758 |
Hedging derivatives | | | 2,375 | | | — | | | — | | | — | | | 7,707 | | | 5,017 | | | 17 | | | 15,116 |
| | | 49,049 | | | 240,619 | | | 59,700 | | | 206,116 | | | 279,259 | | | 165,733 | | | 284,644 | | | 1,285,120 |
Liabilities: | | | | | | | | | | | | | | | | | | | | | | | | |
Financial liabilities held for trading | | | | | | | | | | | | | | | | | | | | | | | | |
Trading derivatives | | | 9,320 | | | 2,333 | | | 3,059 | | | 13,769 | | | 26,343 | | | 25,818 | | | 90,640 | | | 171,282 |
Short positions | | | — | | | 68,443 | | | — | | | — | | | — | | | — | | | — | | | 68,443 |
Other financial liabilities at fair value through profit or loss | | | | | | | | | | | | | | | | | | | | | | | | |
Deposits from the Central Bank | | | — | | | 22,417 | | | — | | | — | | | — | | | — | | | — | | | 22,417 |
Deposits from credit institutions | | | — | | | 5,942 | | | — | | | — | | | — | | | — | | | — | | | 5,942 |
Customer deposits | | | — | | | 81,009 | | | 781 | | | — | | | — | | | — | | | — | | | 81,790 |
Marketable debt securities | | | — | | | 586 | | | 1,146 | | | 4,907 | | | 3,368 | | | 497 | | | — | | | 10,504 |
Financial liabilities at amortized cost | | | | | | | | | | | | | | | | | | | | | | | | |
Deposits from credit institutions | | | 14,828 | | | 35,815 | | | 2,127 | | | 2,368 | | | 11,094 | | | 7,475 | | | 2,808 | | | 76,515 |
Customer deposits | | | 422,495 | | | 102,395 | | | 39,643 | | | 38,355 | | | 3,060 | | | 1,939 | | | 889 | | | 608,776 |
Marketable debt securities | | | — | | | 20,138 | | | 7,583 | | | 29,734 | | | 47 | | | 25,141 | | | 3,149 | | | 85,792 |
Subordinated liabilities | | | — | | | 650 | | | — | | | — | | | — | | | — | | | 35,235 | | | 35,885 |
Other financial liabilities | | | 42 | | | 5,543 | | | 6,306 | | | 904 | | | 34 | | | 634 | | | — | | | 13,463 |
Hedging derivatives | | | — | | | — | | | — | | | 145 | | | 2,070 | | | 1,630 | | | 7,246 | | | 11,091 |
| | | 446,685 | | | 345,271 | | | 60,645 | | | 90,182 | | | 46,016 | | | 63,134 | | | 139,967 | | | 1,191,900 |
Difference (assets less liabilities) | | | (397,636) | | | (104,652) | | | (945) | | | 115,934 | | | 233,243 | | | 102,599 | | | 144,677 | | | 93,220 |
The breakdown by maturity of the balances of certain items in the consolidated balance sheets as of December 31, 2018, is as follows:
| | | | | | | | | | | | | | | | | | | | | | | | |
| | | 12/31/2018 |
| | | | | | Less | | | | | | | | | | | | | | | More | | | |
| | | On | | | than 1 | | | 1 to 3 | | | 3 to 12 | | | 1 to 3 | | | 3 to 5 | | | than 5 | | | |
| | | Demand | | | Month | | | Months | | | Months | | | Years | | | Years | | | Years | | | Total |
| | | | | | | | | | | | | | | | | | | | | | | | |
Assets: | | | | | | | | | | | | | | | | | | | | | | | | |
Cash and balances with the Central Bank | | | 25,080 | | | 2,136 | | | — | | | — | | | — | | | — | | | 28,094 | | | 55,310 |
Financial assets at fair value through profit or loss | | | | | | | | | | | | | | | | | | | | | | | | |
Debt instruments | | | | | | 17,102 | | | 3,200 | | | 27,649 | | | 26,266 | | | 18,605 | | | 17,400 | | | 110,222 |
Equity instruments | | | 2,349 | | | — | | | — | | | — | | | — | | | — | | | — | | | 2,349 |
Trading derivatives | | | 466 | | | 599 | | | 6,268 | | | 9,782 | | | 25,090 | | | 36,633 | | | 76,115 | | | 154,953 |
Other financial assets at fair value through profit or loss | | | | | | | | | | | | | | | | | | | | | | | | |
Loans and advances to credit institutions - Reverse repurchase agreements | | | — | | | 98,332 | | | — | | | — | | | — | | | — | | | — | | | 98,332 |
Loans and advances to customers - Reverse repurchase agreements | | | — | | | 9,093 | | | — | | | — | | | — | | | — | | | — | | | 9,093 |
Financial assets at fair value through other comprehensive income | | | | | | | | | | | | | | | | | | | | | | | | |
Loans and advances to customers | | | — | | | 7 | | | 13 | | | 58 | | | 155 | | | 155 | | | 383 | | | 771 |
Debt instruments | | | — | | | 48,280 | | | 1,961 | | | 3,304 | | | 60,140 | | | 10,716 | | | 30,082 | | | 154,483 |
Equity instruments | | | — | | | — | | | — | | | — | | | — | | | — | | | 535 | | | 535 |
Financial assets at amortized cost | | | | | | | | | | | | | | | | | | | | | | | | |
Loans and advances to credit institutions | | | — | | | 47,034 | | | — | | | — | | | — | | | — | | | — | | | 47,034 |
Loans and advances to customers | | | 9,257 | | | 42,431 | | | 68,276 | | | 139,392 | | | 180,792 | | | 88,697 | | | 137,927 | | | 666,772 |
Debt instruments | | | — | | | — | | | — | | | 41,426 | | | — | | | 1,485 | | | 9,508 | | | 52,419 |
Hedging derivatives | | | — | | | 2,332 | | | — | | | 186 | | | 2,046 | | | 4,677 | | | 44 | | | 9,285 |
| | | 37,152 | | | 267,346 | | | 79,718 | | | 221,797 | | | 294,489 | | | 160,968 | | | 300,088 | | | 1,361,558 |
Liabilities: | | | | | | | | | | | | | | | | | | | | | | | | |
Financial liabilities at fair value through profit or loss | | | | | | | | | | | | | | | | | | | | | | | | |
Trading derivatives | | | 220 | | | 1,978 | | | 4,796 | | | 13,137 | | | 24,660 | | | 35,900 | | | 73,036 | | | 153,727 |
Short positions | | | — | | | 101,754 | | | — | | | — | | | — | | | — | | | — | | | 101,754 |
Other financial liabilities at fair value through profit or loss | | | | | | | | | | | | | | | | | | | | | | | | |
Deposits from the Central Bank | | | — | | | 30,995 | | | — | | | — | | | — | | | — | | | — | | | 30,995 |
Deposits from credit institutions | | | — | | | 4,316 | | | — | | | — | | | — | | | — | | | — | | | 4,316 |
Customer deposits | | | — | | | 65,369 | | | — | | | — | | | — | | | — | | | — | | | 65,369 |
Marketable debt securities | | | — | | | 3,191 | | | 182 | | | 1,063 | | | 314 | | | — | | | — | | | 4,750 |
Financial liabilities at amortized cost | | | | | | | | | | | | | | | | | | | | | | | | |
Deposits from credit institutions | | | 17,644 | | | 46,869 | | | 5,776 | | | 6,347 | | | 11,219 | | | 4,488 | | | 2,506 | | | 94,849 |
Customer deposits | | | 443,660 | | | 115,779 | | | 33,999 | | | 44,727 | | | 3,685 | | | 3,565 | | | 674 | | | 646,089 |
Marketable debt securities | | | — | | | 30,249 | | | 7,375 | | | 21,437 | | | 12,200 | | | 23,936 | | | 3,115 | | | 98,312 |
Subordinated liabilities | | | | | | 413 | | | | | | | | | | | | | | | 36,815 | | | 37,228 |
Other financial liabilities | | | 12 | | | 7,376 | | | 3,638 | | | 1,944 | | | 834 | | | 2 | | | — | | | 13,806 |
Hedging derivatives | | | — | | | 39 | | | 39 | | | 416 | | | 1,460 | | | 2,350 | | | 4,089 | | | 8,393 |
| | | 461,536 | | | 408,328 | | | 55,805 | | | 89,071 | | | 54,372 | | | 70,241 | | | 120,235 | | | 1,259,588 |
Difference (assets less liabilities) | | | (424,384) | | | (140,982) | | | 23,913 | | | 132,726 | | | 240,117 | | | 90,727 | | | 179,853 | | | 101,970 |
b) Undiscounted contractual maturity periods
The detail of the undiscounted contractual maturities of the existing financial liabilities at amortized cost as of December 31, 2017, is as follows:
| | | | | | | | | | | | | | | | | | | | | | | | |
| | 12/31/2017 |
| | | | | | Less | | | | | | | | | | | | | | | More | | | |
| | | On | | | than 1 | | | 1 to 3 | | | 3 to 12 | | | 1 to 3 | | | 3 to 5 | | | than 5 | | | |
| | | Demand | | | Month | | | Months | | | Months | | | Years | | | Years | | | Years | | | Total |
| | | | | | | | | | | | | | | | | | | | | | | | |
Financial liabilities at amortized cost: | | | | | | | | | | | | | | | | | | | | | | | | |
Deposits from credit institutions | | | 14,828 | | | 36,126 | | | 2,518 | | | 3,820 | | | 13,721 | | | 8,739 | | | 5,052 | | | 84,804 |
Customer deposits | | | 422,495 | | | 103,171 | | | 40,737 | | | 40,802 | | | 3,770 | | | 2,286 | | | 1,325 | | | 614,586 |
Marketable debt securities | | | — | | | 20,589 | | | 8,617 | | | 33,392 | | | 3,618 | | | 28,706 | | | 4,141 | | | 99,063 |
Subordinated liabilities | | | — | | | 847 | | | 392 | | | 1,768 | | | 4,713 | | | 4,713 | | | 48,697 | | | 61,130 |
Other financial liabilities | | | 42 | | | 5,543 | | | 6,306 | | | 904 | | | 34 | | | 634 | | | — | | | 13,463 |
| | | 437,365 | | | 166,276 | | | 58,570 | | | 80,686 | | | 25,856 | | | 45,078 | | | 59,215 | | | 873,046 |
The detail of the undiscounted contractual maturities of the existing financial liabilities at amortized cost as of December 31, 2018, is as follows:
| | | | | | | | | | | | | | | | | | | | | | | | |
| | 12/31/2018 |
| | | | | | Less | | | | | | | | | | | | | | | More | | | |
| | | On | | | than 1 | | | 1 to 3 | | | 3 to 12 | | | 1 to 3 | | | 3 to 5 | | | than 5 | | | |
| | | Demand | | | Month | | | Months | | | Months | | | Years | | | Years | | | Years | | | Total |
| | | | | | | | | | | | | | | | | | | | | | | | |
Financial liabilities at amortized cost: | | | | | | | | | | | | | | | | | | | | | | | | |
Deposits from credit institutions | | | 17,644 | | | 47,340 | | | 6,320 | | | 8,176 | | | 13,969 | | | 5,545 | | | 4,966 | | | 103,960 |
Customer deposits | | | 443,660 | | | 116,799 | | | 35,325 | | | 48,013 | | | 4,858 | | | 4,205 | | | 1,081 | | | 653,941 |
Marketable debt securities | | | — | | | 30,795 | | | 8,512 | | | 25,493 | | | 17,446 | | | 27,551 | | | 4,156 | | | 113,953 |
Subordinated liabilities | | | — | | | 616 | | | 407 | | | 1,831 | | | 4,882 | | | 4,882 | | | 50,625 | | | 63,243 |
Other financial liabilities | | | 12 | | | 7,376 | | | 3,638 | | | 1,944 | | | 834 | | | 2 | | | — | | | 13,806 |
| | | 461,316 | | | 202,926 | | | 54,202 | | | 85,457 | | | 41,989 | | | 42,185 | | | 60,828 | | | 948,903 |
c) Foreign currency balances
The breakdown of the main foreign currency balances in the consolidated balance sheet based on the nature of the related items is as follows:
| | | | | | | | | | | | |
| | | Equivalent Value in Millions of Pesos |
| | | 12/31/2017 | | 12/31/2018 |
| | | Assets | | | Liabilities | | | Assets | | | Liabilities |
| | | | | | | | | | | | |
Cash and balances with the Central Bank | | | 2,987 | | | — | | | 3,637 | | | — |
Debt instruments (Note 8) | | | 122,786 | | | — | | | 89,872 | | | — |
Equity instruments (Note 9) | | | — | | | — | | | — | | | — |
Loans and advances to credit institutions (Note 7) | | | 35,898 | | | — | | | 44,957 | | | — |
Loans and advances to customers | | | 69,879 | | | — | | | 70,957 | | | — |
Other assets | | | 561 | | | — | | | 628 | | | — |
Marketable debt securities (Note 20) | | | — | | | 27,508 | | | — | | | 26,987 |
Subordinated liabilities | | | — | | | 35,926 | | | — | | | 37,268 |
Derivatives | | | — | | | 48,926 | | | — | | | 27,924 |
Deposits from credit institutions (Note 18) | | | — | | | 4,527 | | | — | | | 13,806 |
Customer deposits (Note 19) | | | — | | | 105,929 | | | — | | | 110,273 |
Other financial liabilities | | | — | | | 2,328 | | | — | | | 2,752 |
Provisions | | | — | | | — | | | — | | | — |
Other liabilities | | | — | | | 1,221 | | | — | | | 1,501 |
d) Fair value of financial assets and financial liabilities that are not measured at fair value (but fair value disclosures are required)
i. Financial assets measured at other than fair value
The following table sets out the fair values of financial assets not measured at fair value and analyses them by the level in the fair value hierarchy into which each fair value measurement is categorized.
Except as detailed in the following table, the Bank considers the carrying amounts of financial assets recognized in the consolidated financial statements approximate their fair values.
As of December 31, 2017:
| | | | | | | | | | | | | | | |
| | | | | | | | | | | | Total fair | | | Total |
Assets | | | Level 1 | | | Level 2 | | | Level 3 | | | values | | | carrying amount |
| | | | | | | | | | | | | | | |
Financial assets at amortized cost: | | | | | | | | | | | | | | | |
Balances with the Central Bank (Note 6) | | | 36,148 | | | — | | | — | | | 36,148 | | | 36,148 |
Loans and advances to credit institutions (Note 7) | | | 34,542 | | | — | | | 24,580 | | | 59,122 | | | 59,122 |
Loans and advances to customers (Note 11) | | | 2,587 | | | — | | | 636,713 | | | 639,300 | | | 609,420 |
Debt instruments (unlisted) (Note 8) | | | — | | | — | | | 10,758 | | | 10,758 | | | 10,758 |
As of December 31, 2018:
| | | | | | | | | | | | | | | |
| | | | | | | | | | | | Total fair | | | Total |
Assets | | | Level 1 | | | Level 2 | | | Level 3 | | | values | | | carrying amount |
| | | | | | | | | | | | | | | |
Financial assets at amortized cost: | | | | | | | | | | | | | | | |
Balances with the Central Bank (Note 6) | | | 30,230 | | | — | | | — | | | 30,230 | | | 30,230 |
Loans and advances to credit institutions (Note 7) | | | — | | | 28,839 | | | 18,163 | | | 47,002 | | | 47,034 |
Loans and advances to customers (Note 11) | | | — | | | 6,339 | | | 635,342 | | | 641,681 | | | 666,772 |
Debt instruments (unlisted) (Note 8) | | | 40,063 | | | 11,030 | | | — | | | 51,093 | | | 52,419 |
ii. Financial liabilities measured at other than fair value
The following table sets out the fair values of financial liabilities not measured at fair value and analyses them by the level in the fair value hierarchy into which each fair value measurement is categorized.
Except as detailed in the following table, the Bank considers the carrying amounts of financial liabilities recognized in the consolidated financial statements approximate their fair values.
As of December 31, 2017:
| | | | | | | | | | | | | | | |
| | | | | | | | | | | | Total fair | | | Total |
Liabilities | | | Level 1 | | | Level 2 | | | Level 3 | | | values | | | carrying amount |
| | | | | | | | | | | | | | | |
Financial liabilities at amortized cost: | | | | | | | | | | | | | | | |
Deposits from credit institutions (Note 18) | | | 31,157 | | | 42,988 | | | 2,316 | | | 76,461 | | | 76,515 |
Customer deposits (Note 19) | | | 13,867 | | | 594,592 | | | — | | | 608,459 | | | 608,776 |
Marketable debt securities (Note 20) | | | 20,330 | | | 66,168 | | | — | | | 86,498 | | | 85,792 |
Subordinated liabilities (Note 21) | | | 37,434 | | | — | | | — | | | 37,434 | | | 35,885 |
Other financial liabilities (Note 22) | | | 13,463 | | | — | | | — | | | 13,463 | | | 13,463 |
As of December 31, 2018:
| | | | | | | | | | | | | | | |
| | | | | | | | | | | | Total fair | | | Total |
Liabilities | | | Level 1 | | | Level 2 | | | Level 3 | | | values | | | carrying amount |
| | | | | | | | | | | | | | | |
Financial liabilities at amortized cost: | | | | | | | | | | | | | | | |
Deposits from credit institutions (Note 18) | | | — | | | 89,298 | | | 3,999 | | | 93,297 | | | 94,849 |
Customer deposits (Note 19) | | | — | | | 647,451 | | | — | | | 647,451 | | | 646,089 |
Marketable debt securities (Note 20) | | | 98,053 | | | — | | | — | | | 98,053 | | | 98,312 |
Subordinated liabilities (Note 21) | | | 37,609 | | | — | | | — | | | 37,609 | | | 37,228 |
Other financial liabilities (Note 22) | | | 13,804 | | | — | | | — | | | 13,804 | | | 13,806 |
The methodology and inputs used to calculate the fair value for each financial asset and liability class are as follows:
-Balances with the Central Bank: Their fair value has been estimated to be equal to their amortized cost given because they are mainly composed by the compulsory deposits required by the Central Bank.
-Loans and receivables at amortized cost at a variable or fixed interest rate and maturing in less than one year: Their fair value has been estimated to match their book value because there are no material differences.
-Loans and receivables at amortized cost with maturity greater than one year: Fair value has been obtained using the present value model that discounts future cash flows at the current date using
interest rates based on directly or indirectly observable market data to calculate the discount rate, but also using certain non-observable market input, such as the credit risk associated with the loan portfolio for the allowance of future flows and current loan portfolio conditions (net commissions, operating expenses, medium-term, etc.).
-Unlisted debt instruments: Their fair value has been estimated to be equal to their amortized cost given that, because they are non-negotiable financial instruments issued by the Mexican Government, this value would be considered to execute a prepayment transaction at fair value.
-Financial liabilities at amortized cost at a variable or fixed interest rate and maturing in less than one year: Their fair value has been estimated to match their book value because there are no material differences.
-Financial liabilities at amortized cost with maturity greater than one year: Their fair value has been obtained by using the present value model that discounts future cash flows at the current date using interest rates based on directly or indirectly observable market data to calculate the discount rate.
-Marketable debt securities and subordinated liabilities: Fair value has been obtained using quoted market price, if available, or the present value model that discounts future cash flows at the current date using interest rates based on directly or indirectly observable market data to calculate the discount rate.
-Other financial liabilities: Their fair value has been estimated to be equal to their amortized cost since they are mainly composed by short-term balances.
e) Significant restrictions
See Note 48.b for significant restrictions on the ability to access or use the assets and settle the liabilities of the Bank as of December 31, 2018.
f) Restriction on accumulated reserves distribution
As of December 31, 2017 and 2018, the Bank did not have any restriction on accumulated reserves distribution, except for the legal reserve as mentioned in Note 28 (10,683 million pesos in legal reserve that include 8,086 million pesos in legal reserve of the Bank on an individual basis as of December 31, 2017 and 11,080 million pesos in legal reserve that include 8,086 million pesos in legal reserve of the Bank on an individual basis as of December 31, 2018), the remeasurement of defined benefit obligation and the recognition of equity-settled share-based payments. In addition, the Bank is restricted from distributing dividends that will result in non-compliance with minimum capitalization requirements established by the CNBV (see Note 29).
45. Operating segments
The Bank has three operating segments, as described below:
-Retail Banking: this segment encompasses the entire commercial banking business. The retail banking activities include products and services for SMEs such as personal loans, deposit-taking, employee payroll accounts for corporate customers, credit and debit cards and overdraft facilities.
-Corporate and Investment Banking: this segment reflects the Global Corporate and Investment Banking business in Mexico, including all the managed treasury departments and the equities business. The global corporate and investment banking activities include products and services for our corporate customers, such as investment banking and project finance.
-Corporate Activities: this segment includes the centralized management business relating to financial and industrial investments, the financial management of the structural currency position and its structural interest rate risk position and the management of liquidity and equity through issues and securitizations and assets and liabilities management.
The Bank does not have any customers that individually accounted for 10% or more of the Bank’s interest and similar income for 2016, 2017 and 2018.
The 2016 consolidated income statement and other significant data are as follows:
| | | | | | | | | | | | | |
| | | | | | Corporate | | | | | | | |
| | | Retail | | | and Investment | | | Corporate | | | | |
2016 | | | Banking | | | Banking | | | Activities | | | Total | |
| | | | | | | | | | | | | |
Net interest income | | | 42,277 | | | 4,899 | | | 1,954 | | | 49,130 | |
Dividend income | | | — | | | — | | | 94 | | | 94 | |
Net fee and commission income | | | 12,211 | | | 1,749 | | | (20) | | | 13,940 | |
Gains/(losses) on financial assets and liabilities and exchange differences (net) | | | 721 | | | 2,682 | | | 359 | | | 3,762 | |
Other operating income/(expenses) | | | (2,104) | | | (649) | | | (122) | | | (2,875) | |
Total income | | | 53,105 | | | 8,681 | | | 2,265 | | | 64,051 | |
Administrative expenses | | | (19,955) | | | (2,440) | | | (260) | | | (22,655) | |
Depreciation and amortization | | | (1,890) | | | (158) | | | (10) | | | (2,058) | |
Impairment losses on financial assets (net) | | | (15,955) | | | (706) | | | — | | | (16,661) | |
Provisions (net) | | | (75) | | | (29) | | | (777) | | | (881) | |
Gains/(losses) on disposal of assets not classified as non-current assets held for sale (net) | | | — | | | — | | | 20 | | | 20 | |
Gains/(losses) on disposal of non-current assets not classified as discontinued operations (net) | | | — | | | — | | | 71 | | | 71 | |
| | | — | | | — | | | | | | — | |
Operating profit before tax | | | 15,230 | | | 5,348 | | | 1,309 | | | 21,887 | |
Income tax | | | | | | | | | | | | (5,351) | |
Profit for the year | | | | | | | | | | | | 16,536 | |
Profit attributable to the Parent | | | | | | | | | | | | 16,536 | |
Profit attributable to non-controlling interest | | | | | | | | | | | | — | |
Total assets | | | 519,589 | | | 588,596 | | | 242,752 | | | 1,350,937 | |
Total liabilities | | | 475,625 | | | 564,131 | | | 205,954 | | | 1,245,710 | |
The 2017 consolidated income statement and other significant data are as follows:
| | | | | | | | | | | | | |
| | | | | | Corporate | | | | | | | |
| | | Retail | | | and Investment | | | Corporate | | | | |
2017 | | | Banking | | | Banking | | | Activities | | | Total | |
| | | | | | | | | | | | | |
Net interest income | | | 47,969 | | | 5,295 | | | 2,580 | | | 55,844 | |
Dividend income | | | — | | | 5 | | | 145 | | | 150 | |
Net fee and commission income | | | 13,047 | | | 1,758 | | | 8 | | | 14,813 | |
Gains/(losses) on financial assets and liabilities and exchange differences (net) | | | 786 | | | 2,532 | | | 146 | | | 3,464 | |
Other operating income/(expenses) | | | (2,136) | | | (505) | | | (304) | | | (2,945) | |
Total income | | | 59,666 | | | 9,085 | | | 2,575 | | | 71,326 | |
Administrative expenses | | | (22,377) | | | (2,759) | | | (301) | | | (25,437) | |
Depreciation and amortization | | | (2,317) | | | (204) | | | (12) | | | (2,533) | |
Impairment losses on financial assets (net) | | | (17,763) | | | (1,057) | | | — | | | (18,820) | |
Provisions (net) | | | (98) | | | 20 | | | (359) | | | (437) | |
Gains/(losses) on disposal of assets not classified as non-current assets held for sale (net) | | | — | | | — | | | 6 | | | 6 | |
Gains/(losses) on disposal of non-current assets not classified as discontinued operations (net) | | | — | | | — | | | 69 | | | 69 | |
Operating profit before tax | | | 17,111 | | | 5,085 | | | 1,978 | | | 24,174 | |
Income tax | | | | | | | | | | | | (5,496) | |
Profit for the year | | | | | | | | | | | | 18,678 | |
Profit attributable to the Parent | | | | | | | | | | | | 18,678 | |
Profit attributable to non-controlling interest | | | | | | | | | | | | — | |
Total assets | | | 551,250 | | | 531,295 | | | 246,646 | | | 1,329,191 | |
Total liabilities | | | 521,787 | | | 521,284 | | | 170,710 | | | 1,213,781 | |
The 2018 consolidated income statement and other significant data are as follows:
| | | | | | | | | | | | | |
| | | | | | Global | | | | | | | |
| | | Retail | | | Corporate | | | Corporate | | | | |
2018 | | | Banking | | | Banking | | | Activities | | | Total | |
| | | | | | | | | | | | | |
Net interest income | | | 54,005 | | | 6,121 | | | 1,871 | | | 61,997 | |
Dividend income | | | — | | | 34 | | | 176 | | | 210 | |
Net fee and commission income | | | 14,181 | | | 1,700 | | | (159) | | | 15,722 | |
Gains/(losses) on financial assets and liabilities and exchange differences (net) | | | 1,086 | | | 689 | | | (291) | | | 1,484 | |
Other operating income/(expenses) | | | (2,561) | | | (672) | | | (412) | | | (3,645) | |
Total income | | | 66,711 | | | 7,872 | | | 1,185 | | | 75,768 | |
Administrative expenses | | | (24,574) | | | (3,530) | | | (545) | | | (28,649) | |
Depreciation and amortization | | | (2,769) | | | (200) | | | (4) | | | (2,973) | |
Impairment losses on financial assets not at fair value through profit or loss (net) | | | (17,813) | | | (997) | | | — | | | (18,810) | |
Impairment losses on other assets (net) | | | — | | | — | | | (5) | | | (5) | |
Provisions (net) | | | 178 | | | 10 | | | (750) | | | (562) | |
Gains/(losses) on disposal of assets not classified as non-current assets held for sale (net) | | | — | | | — | | | 7 | | | 7 | |
Gains/(losses) on disposal of non-current assets not classified as discontinued operations (net) | | | — | | | — | | | 38 | | | 38 | |
Operating profit before tax | | | 21,733 | | | 3,155 | | | (74) | | | 24,814 | |
Income tax | | | | | | | | | | | | (5,458) | |
Profit for the year | | | | | | | | | | | | 19,356 | |
Profit attributable to the Parent | | | | | | | | | | | | 19,353 | |
Profit attributable to non-controlling interest | | | | | | | | | | | | 3 | |
Total assets | | | 599,270 | | | 547,006 | | | 262,448 | | | 1,408,724 | |
Total liabilities | | | 567,829 | | | 486,372 | | | 231,236 | | | 1,285,437 | |
46. Related-party transactions
Transactions with related parties
The parties related to the Bank are deemed to include, in addition to its subsidiaries, associates and jointly controlled entities, the Bank’s key management personnel (the member of its Board of Directors, executive officers and other key management personnel, together with their close family members) and the entities over which the key management personnel may exercise significant influence or control.
The Bank also considers the companies that are part of Banco Santander (Spain).
Transactions between the Bank and its related parties were made on terms equivalent to those that prevail in arm’s-length transactions and are specified below. To facilitate comprehension, we have divided the information into the following categories:
Ultimate Parent Company
This category includes balances with Banco Santander (Spain).
Santander Group Companies
This category includes all the companies that are controlled by Banco Santander (Spain) around the world, and hence, it also includes the companies over which the Bank exercises any degree of control.
The information related to directors, executive officers and other key management personnel is detailed in Note 5.
| | | | | | | | | | | | | |
| | 12/31/2017 | | 12/31/2018 |
| | | Ultimate | | | Santander | | | Ultimate | | | Santander | |
| | | Parent | | | Group | | | Parent | | | Group | |
| | | Company | | | Companies | | | Company | | | Companies | |
| | | | | | | | | | | | | |
ASSETS: | | | | | | | | | | | | | |
Financial assets held for trading - | | | | | | | | | | | | | |
Trading derivatives - | | | | | | | | | | | | | |
Of which - | | | | | | | | | | | | | |
Banco Santander, S.A. (Spain) | | | 73,593 | | | — | | | — | | | — | |
Abbey National Treasury Services plc. | | | — | | | 12 | | | — | | | — | |
Other | | | — | | | 2 | | | — | | | — | |
Financial assets at fair value through profit or loss - | | | | | | | | | | | | | |
Trading derivatives - | | | | | | | | | | | | | |
Of which - | | | | | | | | | | | | | |
Banco Santander, S.A. (Spain) | | | — | | | — | | | 69,178 | | | — | |
Other | | | — | | | — | | | — | | | 9 | |
Other financial assets at fair value through profit or loss - | | | | | | | | | | | | | |
Loans and advances to credit institutions - | | | | | | | | | | | | | |
Of which - | | | | | | | | | | | | | |
Banco Santander, S.A. (Spain) | | | — | | | — | | | 13,127 | | | — | |
Loans and advances to customers - | | | | | | | | | | | | | |
Of which - | | | | | | | | | | | | | |
Casa de Bolsa Santander, S.A. de C.V., Grupo Financiero Santander México | | | — | | | 2,090 | | | — | | | 2,178 | |
Other | | | — | | | — | | | — | | | — | |
Available for sale financial assets - | | | | | | | | | | | | | |
Of which - | | | | | | | | | | | | | |
Grupo Financiero Santander México, S.A.B. de C.V. | | | — | | | 248 | | | — | | | — | |
Financial assets at amortized cost - | | | | | | | | | | | | | |
Loans and advances to credit institutions - | | | | | | | | | | | | | |
Of which - | | | | | | | | | | | | | |
Banco Santander, S.A. (Spain) | | | — | | | — | | | 3,472 | | | — | |
Loans and advances to customers - | | | | | | | | | | | | | |
Of which - | | | | | | | | | | | | | |
Santander Capital Structuring, S.A. de C.V. | | | — | | | — | | | — | | | 1,296 | |
Santander Global Technology, S.L., Sociedad Unipersonal (formerly Produban Servicios Informáticos Generales, S.L.) | | | — | | | — | | | — | | | 1,745 | |
Key management personnel | | | — | | | — | | | — | | | 2,430 | |
Loans and receivables - | | | | | | | | | | | | | |
Loans and advances to credit institutions - | | | | | | | | | | | | | |
Of which - | | | | | | | | | | | | | |
Banco Santander, S.A. (Spain) | | | 997 | | | — | | | — | | | — | |
Banco Santander Rio, S.A. | | | — | | | 194 | | | — | | | — | |
Loans and advances to customers - | | | | | | | | | | | | | |
Of which - | | | | | | | | | | | | | |
Santander Capital Structuring, S.A. de C.V. | | | — | | | 1,176 | | | — | | | — | |
Santander Global Technology, S.L., Sociedad Unipersonal (formerly Produban Servicios Informáticos Generales, S.L.) | | | — | | | 1,674 | | | — | | | — | |
Key management personnel | | | — | | | 3,666 | | | — | | | — | |
Other intangible assets - | | | | | | | | | | | | | |
Of which - | | | | | | | | | | | | | |
Santander Tecnología México, S.A. de C.V. (formerly Isban México, S.A. de C.V.) | | | — | | | 2,811 | | | — | | | 3,403 | |
Santander Global Technology, S.L., Sociedad Unipersonal (formerly Produban Servicios Informáticos Generales, S.L.) | | | — | | | 533 | | | — | | | 864 | |
Ingeniería de Software Bancario, S.L. | | | — | | | 443 | | | — | | | — | |
Santander Back-Offices Globales Mayoristas, S.A. | | | — | | | 74 | | | — | | | 78 | |
Santander Brasil Tecnologia, S.A (formerly Isban Brasil, S.A.) | | | — | | | 11 | | | — | | | 11 | |
Other assets - | | | | | | | | | | | | | |
Of which - | | | | | | | | | | | | | |
Casa de Bolsa Santander, S.A. de C.V., Grupo Financiero Santander México | | | — | | | 21 | | | — | | | — | |
Abbey National Treasury Services plc | | | — | | | 76 | | | — | | | — | |
Zurich Santander Seguros México, S.A. | | | — | | | 1,053 | | | — | | | 1,108 | |
SAM Asset Management, S.A. de C.V., Sociedad Operadora de Fondos de Inversión | | | — | | | 156 | | | — | | | 153 | |
Other | | | — | | | 12 | | | — | | | 63 | |
| | | | | | | | | | | | | |
| | 12/31/2017 | | 12/31/2018 |
| | | Ultimate | | | Santander | | | Ultimate | | | Santander | |
| | | Parent | | | Group | | | Parent | | | Group | |
| | | Company | | | Companies | | | Company | | | Companies | |
| | | | | | | | | | | | | |
LIABILITIES AND EQUITY: | | | | | | | | | | | | | |
Financial liabilities held for trading - | | | | | | | | | | | | | |
Trading derivatives - | | | | | | | | | | | | | |
Of which - | | | | | | | | | | | | | |
Banco Santander, S.A. (Spain) | | | 43,827 | | | — | | | — | | | — | |
Banco Santander International | | | — | | | 25 | | | — | | | — | |
Abbey National Treasury Services plc. | | | — | | | 75 | | | — | | | — | |
Short positions - | | | | | | | | | | | | | |
Of which - | | | | | | | | | | | | | |
Casa de Bolsa Santander, S.A. de C.V., Grupo Financiero Santander México | | | — | | | 5,002 | | | — | | | — | |
Financial liabilities at fair value through profit or loss - | | | | | | | | | | | | | |
Trading derivatives - | | | | | | | | | | | | | |
Of which - | | | | | | | | | | | | | |
Banco Santander, S.A. (Spain) | | | — | | | — | | | 37,082 | | | — | |
Banco Santander International | | | — | | | — | | | — | | | 3 | |
Other | | | — | | | — | | | — | | | 2 | |
Other financial liabilities at fair value through profit or loss - | | | | | | | | | | | | | |
Customer deposits - Repurchase agreements | | | | | | | | | | | | | |
Of which - | | | | | | | | | | | | | |
Casa de Bolsa Santander, S.A. de C.V., Grupo Financiero Santander México | | | — | | | 19,333 | | | — | | | 9,270 | |
Banco S3 México, S.A., Institución de Banca Múltiple | | | — | | | 1,651 | | | — | | | — | |
Grupo Financiero Santander México, S.A.B. de C.V. | | | — | | | 71 | | | — | | | — | |
Other | | | — | | | 5 | | | — | | | 17 | |
Financial liabilities at amortized cost - | | | | | | | | | | | | | |
Deposits from credit institutions - | | | | | | | | | | | | | |
Of which - | | | | | | | | | | | | | |
Banco Santander, S.A. (Spain) | | | 32,559 | | | — | | | 34,525 | | | — | |
Other | | | — | | | 75 | | | — | | | 87 | |
Subordinated liabilities - | | | | | | | | | | | | | |
Of which - | | | | | | | | | | | | | |
Banco Santander, S.A. (Spain) | | | 21,738 | | | — | | | 28,109 | | | — | |
Grupo Financiero Santander México, S.A.B. de C.V. | | | — | | | 9,831 | | | — | | | — | |
Customer deposits - | | | | | | | | | | | | | |
Of which- | | | | | | | | | | | | | |
Santander Tecnología México, S.A. de C.V. (formerly Isban México, S.A. de C.V.) | | | — | | | 515 | | | — | | | — | |
Operadora de Carteras Gamma, S.A.P.I. de C.V. | | | — | | | 145 | | | — | | | 153 | |
Grupo Financiero Santander México, S.A.B. de C.V. | | | — | | | 176 | | | — | | | — | |
Santander Global Facilities, S.A. de C.V. | | | — | | | 620 | | | — | | | 335 | |
Servicios de Cobranza, Recuperación y Seguimiento, S.A. de C.V. | | | — | | | 179 | | | — | | | 49 | |
Santander Global Technology, S.L., Sociedad Unipersonal (formerly Produban Servicios Informáticos Generales, S.L.) | | | — | | | 406 | | | — | | | 377 | |
Santander Capital Structuring, S.A. de C.V. | | | — | | | 186 | | | — | | | 379 | |
Other(*) | | | — | | | 234 | | | — | | | 1,350 | |
Marketable debt securities - | | | | | | | | | | | | | |
Of which - | | | | | | | | | | | | | |
Banco Santander, S.A. (Spain) | | | 1,182 | | | — | | | 969 | | | — | |
Other | | | — | | | 15 | | | — | | | 11 | |
Other financial liabilities - | | | | | | | | | | | | | |
Of which - | | | | | | | | | | | | | |
Banco Santander, S.A. (Spain) | | | 1,366 | | | — | | | 686 | | | — | |
Casa de Bolsa Santander, S.A. de C.V., Grupo Financiero Santander México | | | — | | | 59 | | | — | | | 37 | |
Santander Global Facilities, S.A. de C.V. | | | — | | | — | | | — | | | 408 | |
Other | | | — | | | 66 | | | — | | | 56 | |
Other liabilities - | | | | | | | | | | | | | |
Of which - | | | | | | | | | | | | | |
Banco S3 México, S.A., Institución de Banca Múltiple | | | — | | | — | | | — | | | 43 | |
Santander Global Technology, S.L., Sociedad Unipersonal (formerly Produban Servicios Informáticos Generales, S.L.) | | | — | | | 409 | | | — | | | 128 | |
Santander Tecnología México, S.A. de C.V. (formerly Isban México, S.A. de C.V.) | | | — | | | 184 | | | — | | | — | |
Santander Back-offices Globales Mayorista, S.A. | | | — | | | 18 | | | — | | | — | |
Ingenieria de Software Bancario, S.L. | | | — | | | 75 | | | — | | | — | |
Other | | | — | | | 4 | | | — | | | 4 | |
(*)As of December 31, 2017 and 2018, includes 52 million pesos and 1,112 million pesos, respectively, related to key management personnel transactions.
| | | | | | | | | | | | | | | | | | | |
| | 2016 | | | 2017 | | | 2018 | |
| | | Ultimate | | | Santander | | | Ultimate | | | Santander | | | Ultimate | | | Santander | |
| | | Parent | | | Group | | | Parent | | | Group | | | Parent | | | Group | |
| | | Company | | | Companies | | | Company | | | Companies | | | Company | | | Companies | |
| | | | | | | | | | | | | | | | | | | |
INCOME STATEMENT: | | | | | | | | | | | | | | | | | | | |
Interest income - | | | | | | | | | | | | | | | | | | | |
Of which - | | | | | | | | | | | | | | | | | | | |
Banco Santander, S.A. (Spain) | | | 5 | | | — | | | — | | | — | | | 144 | | | — | |
Santander Global Technology, S.L., Sociedad Unipersonal (formerly Produban Servicios Informáticos Generales, S.L.) | | | — | | | 52 | | | — | | | 86 | | | — | | | 107 | |
Casa de Bolsa Santander, S.A. de C.V., Grupo Financiero Santander México | | | — | | | 57 | | | — | | | 95 | | | — | | | 127 | |
Santander Capital Structuring, S.A. de C.V. | | | — | | | — | | | — | | | — | | | — | | | 120 | |
Other | | | — | | | 2 | | | — | | | 93 | | | — | | | 1 | |
Interest expenses and similar charges - | | | | | | | | | | | | | | | | | | | |
Of which - | | | | | | | | | | | | | | | | | | | |
Banco Santander, S.A. (Spain) | | | 1,275 | | | — | | | 1,440 | | | — | | | 1,765 | | | — | |
Casa de Bolsa Santander, S.A. de C.V., Grupo Financiero Santander México | | | — | | | 1,316 | | | — | | | 1,449 | | | — | | | 1,824 | |
Grupo Financiero Santander México, S.A.B. de C.V. | | | — | | | 9 | | | — | | | 16 | | | — | | | — | |
Banco S3 México, S.A., Institución de Banca Múltiple | | | — | | | — | | | — | | | 12 | | | — | | | 44 | |
Servicios de Cobranza, Recuperación y Seguimiento, S.A. de C.V. | | | — | | | 9 | | | — | | | 7 | | | — | | | 7 | |
Santander Global Facilities, S.A. de C.V. | | | — | | | 11 | | | — | | | 28 | | | — | | | 32 | |
Santander Tecnología México, S.A. de C.V. (formerly Isban México, S.A. de C.V.) | | | — | | | 24 | | | — | | | 28 | | | — | | | — | |
Other | | | — | | | 9 | | | — | | | 35 | | | — | | | 45 | |
Fee and commission income - | | | | | | | | | | | | | | | | | | | |
Of which - | | | | | | | | | | | | | | | | | | | |
Banco Santander, S.A. (Spain) | | | 6 | | | — | | | 7 | | | — | | | 6 | | | — | |
Santander Investment Securities Inc. | | | — | | | — | | | — | | | 10 | | | — | | | 6 | |
Casa de Bolsa Santander, S.A. de C.V., Grupo Financiero Santander México | | | — | | | — | | | — | | | — | | | — | | | 292 | |
Zurich Santander Seguros México, S.A. | | | — | | | 4,165 | | | — | | | 4,219 | | | — | | | 4,645 | |
SAM Asset Management, S.A. de C.V., Sociedad Operadora de Fondos de Inversión | | | — | | | 1,647 | | | — | | | 1,585 | | | — | | | 1,564 | |
Other | | | — | | | 16 | | | — | | | 9 | | | — | | | — | |
Fee and commission expense- | | | | | | | | | | | | | | | | | | | |
Of which - | | | | | | | | | | | | | | | | | | | |
Banco Santander, S.A. (Spain) | | | 19 | | | — | | | 15 | | | — | | | 2 | | | — | |
Santander Global Facilities, S.A. de C.V. | | | — | | | — | | | — | | | 15 | | | — | | | — | |
Servicios de Cobranza, Recuperación y Seguimiento, S.A. de C.V. | | | — | | | — | | | — | | | — | | | — | | | 60 | |
Casa de Bolsa Santander, S.A. de C.V., Grupo Financiero Santander México | | | — | | | 41 | | | — | | | — | | | — | | | — | |
SAM Asset Management , S.A. de C.V., Sociedad Operadora de Fondos de Inversión | | | — | | | 52 | | | — | | | 66 | | | — | | | 16 | |
Santander Investment Securities Inc. | | | — | | | 62 | | | — | | | — | | | — | | | — | |
Other | | | — | | | 11 | | | — | | | — | | | — | | | 8 | |
Gains/(losses) on financial assets and liabilities (net) - | | | | | | | | | | | | | | | | | | | |
Of which - | | | | | | | | | | | | | | | | | | | |
Banco Santander, S.A. (Spain) | | | 24,211 | | | — | | | (4,346) | | | — | | | 2,145 | | | — | |
Abbey National Treasury Services plc. | | | — | | | (280) | | | — | | | (739) | | | — | | | 56 | |
Other | | | — | | | (44) | | | — | | | 19 | | | — | | | 19 | |
Other operating income | | | | | | | | | | | | | | | | | | | |
Of which - | | | | | | | | | | | | | | | | | | | |
Santander Global Facilities, S.A. de C.V. | | | — | | | 52 | | | — | | | 46 | | | — | | | 44 | |
Casa de Bolsa Santander, S.A. de C.V., Grupo Financiero Santander México | | | — | | | — | | | — | | | 28 | | | — | | | 113 | |
Santander Global Technology, S.L., Sociedad Unipersonal (formerly Produban Servicios Informáticos Generales, S.L.) | | | — | | | — | | | — | | | — | | | — | | | 62 | |
Other | | | — | | | 39 | | | — | | | 10 | | | — | | | 29 | |
| | | | | | | | | | | | | | | | | | | |
| | 2016 | | | 2017 | | | 2018 | |
| | | Ultimate | | | Santander | | | Ultimate | | | Santander | | | Ultimate | | | Santander | |
| | | Parent | | | Group | | | Parent | | | Group | | | Parent | | | Group | |
| | | Company | | | Companies | | | Company | | | Companies | | | Company | | | Companies | |
| | | | | | | | | | | | | | | | | | | |
| | | | | | | | | | | | | | | | | | | |
Administrative expenses - | | | | | | | | | | | | | | | | | | | |
Of which - | | | | | | | | | | | | | | | | | | | |
Banco Santander, S.A. (Spain) | | | — | | | — | | | 66 | | | — | | | 335 | | | — | |
Santander Global Technology, S.L., Sociedad Unipersonal (formerly Produban Servicios Informáticos Generales, S.L.) | | | — | | | 1,663 | | | — | | | 1,601 | | | — | | | 1,804 | |
Santander Tecnología México, S.A. de C.V. (formerly Isban México, S.A. de C.V.) | | | — | | | 178 | | | — | | | 188 | | | — | | | — | |
Santander Global Facilities, S.A. de C.V. | | | — | | | 206 | | | — | | | 366 | | | — | | | 517 | |
Ingeniería de Software Bancario, S.L. | | | — | | | 151 | | | — | | | 165 | | | — | | | — | |
Gesban México Servicios Administrativos Globales, S.A. de C.V. | | | — | | | 52 | | | | | | 53 | | | — | | | 54 | |
Santander Back-offices Globales Mayorista, S.A. | | | — | | | 26 | | | | | | 61 | | | — | | | 47 | |
Casa de Bolsa Santander, S.A. de C.V., Grupo Financiero Santander México | | | — | | | 54 | | | — | | | — | | | — | | | 88 | |
Geoban, S.A. | | | — | | | 78 | | | — | | | 77 | | | — | | | 75 | |
Aquanima México, S. de R.L. de C.V. | | | — | | | 43 | | | — | | | 45 | | | — | | | 53 | |
Servicios de Cobranza, Recuperación y Seguimiento, S.A. de C.V. | | | — | | | 110 | | | — | | | 119 | | | — | | | 7 | |
Other | | | — | | | 49 | | | — | | | 34 | | | — | | | 34 | |
See Note 3 for significant transactions with related parties.
47. Risk management
a) Cornerstones of the risk function
The risk management and control model is based on the principles set down below:
| · | | Advanced risk management policy, with a forward-looking approach that allows the Bank to maintain a medium-low risk profile, through a risk appetite defined by the Board of Directors. |
| · | | Risk culture that applies to all employees throughout the Bank. |
| · | | Clearly defined three lines of defense that enable the Bank to identify, manage, control, monitor and challenge all risks. |
| · | | Autonomous model with robust governance based on a clear structure that separates the risk management and the risk control functions. |
| · | | Information and data management processes that allow all risks to be identified, assessed, managed and reported at appropriate levels |
| · | | Risks are managed by the business units that generate them. |
These principles are aligned with the Bank’s strategy and its business model, taking into account the requirements of regulators and supervisors, as well as the best market practices.
The Board of Directors is responsible for approving the general risk control and management policy, including tax risks.
1. Main risks of the Bank’s financial instruments
The main risk categories in which the Bank has its most significant current and/or potential exposures, thus facilitating the identification thereof, includes the following:
| · | | Credit risk: risk of financial loss arising from the default or credit quality deterioration of a customer or other third party, to which the Bank has either directly provided credit or for which it has assumed a contractual obligation. |
| · | | Market risk: risk incurred as a result of changes in market factors that affect the value of positions in the trading book. |
| · | | Liquidity risk: risk of the Bank does not have the liquid financial assets necessary to meet its obligations at maturity, or can only obtain them at high cost. |
| · | | Capital risks: risk of the Bank not having an adequate amount or quality of capital to meet its internal business objectives, regulatory requirements or market expectations. |
In addition, the Bank considers the following risks:
| · | | Operational risk: is defined as the risk of loss due to the inadequacy or failure of internal processes, people and systems or due to external events. This definition includes legal risk. |
| · | | Compliance and conduct risk: is that which arises from practices, processes or behaviors that are not adequate or that do not comply with internal regulations, legality or supervisory requirements. |
| · | | Reputational risk: is defined as the risk of a current or potential negative economic impact due to a reduction in the perception of the Bank by employees, customers, shareholders/investors and society in general. |
| · | | Model risk: is the risk of loss arising from inaccurate predictions, that may lead the Bank to make sub-optimal decisions, or from the inappropriate use of a model. |
| · | | Strategic risk: the risk of loss or damage arising from strategic decisions or their poor implementation, which affect the long term interests of our main stakeholders, or from an inability to adapt to the changing environment. |
2. Risk governance
The Bank has a strong governance framework, which pursues the effective control of the risk profile, within the risk appetite defined by the Board of Directors.
This governance framework is underpinned by the distribution of roles among the three lines of defense, a robust structure of committees and a strong relationship between Banco Santander (Spain) and the Bank.
2.1 Lines of defense
The Bank follows a three lines of defense control model:
| · | | The first line of defense is all business functions and business support functions that originate risks and have primary responsibility in the management of those risks. The role of these functions is to establish a management structure for the risks generated as part of their activity ensuring that these remain within approved risk limits. |
| · | | The second line of defense is risk control and compliance and conduct function. The role of these functions is to provide independent oversight and challenge to the risk management activities of the first line of defense. |
| · | | The third line of defense: internal audit function. This function controls and regularly checks that the policies and procedures are adequate and effectively implemented in the management and control of all risks. |
The risk control, compliance and conduct and internal audit functions are appropriately separated and independent from each other, as well as from other functions they control or supervise, and have direct access to the Board of Directors and/or its committees.
2.2 Risk committee structure
Ultimately, the Board of Directors is responsible for risk management and control and, in particular, for approving and periodically reviewing the Bank's risk culture and risk appetite framework.
Except for specific topics detailed in its bylaws, the Board of Directors has the capacity to delegate its faculties to other committees. This is the case of the risk supervision, regulation and compliance committee and the Bank’s executive risk committee, which has specific risk related responsibilities.
The Chief Risk Officer leads the risk function within the Bank, advises and challenges the executive line and reports independently to the risk supervision, regulation and compliance committee and to the Board of Directors.
Other bodies that form the highest level of risk governance, with authorities delegated by the Board of Directors, are the executive risk committee and the risk control committee, detailed below:
Comprehensive risk management committee
To control and ensure that risks are managed in accordance with the risk appetite approved by the Board of Directors, providing a comprehensive overview of all risks. This includes identifying and monitoring both current and potential risks, as well as evaluating their potential impact on the Bank’s risk profile.
This committee is chaired by the Chief Risk Officer (CRO).
Additionally, each risk factor has its own fora, committees and meetings to manage the risks under their control. Among others, they have the following responsibilities:
| - | | Advice the CRO and the Comprehensive risk management committee that risks are managed in line with the Bank’s risk appetite. |
| - | | Carrying out complete and regular monitoring of each risk factor. |
| - | | Oversee the measures adopted to comply with the expectations of the supervisors and internal and external auditors. |
Executive risk committee
This committee is responsible for managing all risks, within the powers delegated by the Board of Directors. The committee makes decisions on risks assumed at the highest level, ensuring that they are within the established risk appetite limits for the Bank.
This committee is chaired by the CEO and it is composed with nominated executive directors and other Bank’s senior management. The Risk, Finance and Compliance and Conduct functions, among others, are represented. The CRO has a veto right on the committee’s decisions.
3. Management processes and tools
3.1 Risk appetite and structure of limits
The Bank defines the risk appetite as the amount and type of risks that are considered prudent to assume for implementing its business strategy in the event of unexpected circumstances. Severe scenarios that could have a negative impact on the levels of capital, liquidity, profitability and/or the share price are taken into account.
The risk appetite is set by the Board of Directors. Every main business unit sets its own risk appetite according to the adaptation of the Bank methodology and its own circumstances. The Board of Directors is responsible for approving the respective risk appetite proposals.
The Bank shares a common risk appetite model. It sets out the requirements for processes, metrics, governance bodies, controls and standards for implementation across the Bank, cascading down to lower level management policies and limits.
The Bank shares a common risk appetite model. It sets out the requirements for processes, metrics, governance bodies, controls and standards for implementation across the bank, cascading down management policies and limits to lower levels.
Risk appetite principles
The following principles govern the Bank’s risk appetite:
| · | | Responsibility of the Board of Directors and of senior management. |
| · | | Holistic risk view (Enterprise Wide Risk), risk profile backtesting and challenge. The risk appetite must consider all significant risks and facilitate an aggregate view of the risk profile through the use of quantitative metrics and qualitative indicators. |
| · | | Forward-looking view. The risk appetite must consider the desirable risk profile for the short and medium term, taking into account both the most plausible circumstances and adverse/stress scenarios. |
| · | | Embedding and alignment with strategic and business plans. The risk appetite is an integral part of the strategic and business planning, and is embedded in the daily management through the transfer of the aggregated limits to those set at portfolio level, business unit or business line, as well as through the key risk appetite processes. |
| · | | Coherence across the various business units and a common risk language throughout the Bank. The risk appetite of each business unit of the Bank must be coherent with that across the Bank. |
| · | | Periodic review, backtesting and adoption of best practices and regulatory requirements. Monitoring and control mechanisms are established to ensure the risk profile is maintained, and the necessary corrective and mitigating actions are taken in the event of non-compliance. |
Limits, monitoring and control structure
The risk appetite is formulated annually and includes a series of metrics and limits to establish in quantitative and qualitative terms the maximum risk exposure that every business unit and the Bank as a whole is willing to assume.
Compliance with risk appetite limits is regularly monitored. The specialized control functions report the risk profile adequacy to the Board of Directors and its committees, on quarterly basis.
Limit breaches and non-compliance with the risk appetite are reported to the relevant governance bodies. An analysis of the causes, an estimation of the duration of the breach and corrective actions proposals are also submitted.
Linkage between the risk appetite limits and those of the business units and portfolios is a key element for making the risk appetite an effective risk management tool.
Pillars of the risk appetite
The risk appetite is expressed via limits on quantitative metrics and qualitative indicators that measure the exposure or risk profile by type of risk, portfolio and, segment and business line, under both current and stressed conditions. These metrics and risk appetite limits are articulated in five axes that define the positioning that the Bank wants to adopt or maintain in the deployment of its business model, described as follows:
| · | | The volatility in the consolidated income statement that the Bank is willing to accept. |
| · | | The solvency position that the Bank wants to maintain. |
| · | | The minimum liquidity position that the Bank wants to have. |
| · | | The maximum levels of concentration that the Bank considers reasonable to admit. |
| · | | Non-financial transversal risks. |
3.2 Risk identification and assessment (RIA)
The Bank carries out the identification and assessment of the different risks it is exposed to, involving the different lines of defense, establishing management standards that not only meet regulatory requirements but also reflect best practices in the market, and reinforce the risk culture.
In 2018, the approach centered on three main areas: standards control environment review, perimeter completeness by integrating new business units, together with the risk performance indicators review and their alignment with the risk appetite.
In addition the RIA exercise analyses the evolution of risks and identifies areas of improvement:
| · | | Risk performance, enabling the understanding of residual risk by risk type through a set of metrics and indicators calibrated using international standards. |
| · | | Control environment assessment, measuring the degree of implementation of the target operating model, as part of the advanced risk management of the Bank. |
| · | | Forward-looking analysis, based on stress metrics and identification and/or assessment of the main threats to the strategic plan (Top risks), enabling specific action plans to be put in place to mitigate potential impacts and monitoring these plans. |
Based on the periodic RIA exercise, the Bank’s risk profile as of December 31, 2018 remains as solid medium-low.
3.3 Scenario analysis
The Bank analyses the impact triggered by different scenarios in the environment, in which the Bank operates. These scenarios are expressed both in terms of macroeconomic variables, as well as other variables that impact the Bank’s risk profile.
Scenario analysis is a very robust and useful tool for management at all levels. It enables the Bank to assess its resilience in stressed environments or scenarios, and identifies measures to reduce exposure under these scenarios. The objective is to reinforce the stability of income, capital and liquidity.
The robustness and consistency of the scenario analysis exercises are based on the following pillars:
| · | | Development and integration of models that estimate the future performance of metrics (for example, credit losses), based on both historic information (internal to the Bank and external from the market), and simulation models. |
| · | | Inclusion of expert judgment and portfolio manager’s know-how. |
| · | | •Challenge and backtesting of model results to ensure they are adequate. |
| · | | Robust governance of the whole process, covering models, scenarios, assumptions and rationale for the results, and their impact on management. |
Scenario analysis forms an integral part of several key processes of the Bank:
| · | | Regulatory uses: stress test scenarios using the guidelines set by the various regulators that supervise the Bank. |
| · | | Internal capital adequacy assessment (ICAAP) or liquidity assessment (ILAAP) in which, while the regulators can impose certain requirements, the Bank develops its own methodology to assess its |
capital and liquidity levels under different stress scenarios to support planning and adequately managing the Bank's capital and liquidity. |
| · | | Risk appetite. Contains stressed metrics on which maximum levels of losses (minimum liquidity levels) are established that the Bank does not want to exceed. These exercises are related to those for capital and liquidity, although they have different frequencies and present different granularity levels. |
| · | | Recurrent risk management in different processes/exercises: |
| - | | Budgetary and strategic planning process, in the development of business policies for risk approval, in the risk analysis made by Management and in specific analysis regarding the profile of activities or portfolios. |
| - | | Identification of Top risks on the basis of, a systematic process to identify and assess all the risks to which the Bank is exposed to. Top risks are selected and a macroeconomic or idiosyncratic scenario is associated with each one, to assess their impact on the Bank. |
| - | | Recovery plan performed annually to establish the available tools the Bank will have, to survive in the event of an extremely severe financial crisis. The plan sets out a series of financial and macroeconomic stress scenarios, with differing degrees of severity, that include idiosyncratic and/or systemic events. |
| - | | IFRS 9 from January 1, 2018, the processes, models and scenario analysis methodology are included in the new regulatory provision requirements. |
3.4 Risk Reporting Framework (RRF)
The reporting model has strengthened by consolidating the overall view of all risks, based on complete, precise and recurring information that allows the Management to assess the risk profile and decide accordingly.
The risk reporting taxonomy, contains three types of reports received by the Management on a monthly basis: the Bank risk report, the risk reports of each business unit and the reports of each of the risk factors identified in the Bank’s risk map.
b) Credit risk
1. Credit risk treatment
Credit risk is the risk of financial loss arising from the default or credit quality deterioration of a customer or other third party, to which the Bank has either directly provided credit or for which it has assumed a contractual obligation.
There are different limit models depending on the segment:
| · | | Large corporate groups: The Bank uses a pre-classification model based on a system for measuring and monitoring economic capital. The result is the level of risk that the Bank is willing to assume with a customer/group, in terms of Capital at Risk, nominal CAP and maximum periods according to the type of transaction (in the case of financial entities, limits are managed through Equivalent Credit Risk). It includes the actual and expected risk with a customer based on its usual operations, always within the limits defined in the risk appetite and established credit policies. |
| · | | Corporates and institutions that meet certain requirements (deep knowledge, rating, etc.): The Bank uses a more simplified pre-classification model through an internal limit that establishes a reference of |
the level of risk to be assumed with the customer. The criteria will include, among others, repayment capacity, debt in the system and the banking pool distribution. |
In both cases, transactions over certain thresholds or with specific characteristics might require the approval of an analyst or committee.
| · | | For individual customers and SMEs with low turnover, large volumes of credit transactions can be managed more easily with the use of automatic decision models for classifying the customer/ transaction binomial. |
In specific situations where a series of requirements are met, pre-approved transactions are granted to customers or potential customers (campaigns).
2. Other credit risk aspects
2.1 Credit risk by activity in the financial markets
This section covers credit risk generated in treasury activities with customers, mainly with credit institutions. Transactions are undertaken through money market financial products with different financial institutions and through counterparty risk products which serve the Bank’s customer’s needs.
Counterparty credit risk is the risk that the client in an transaction could default before the definitive settlement of the cash flows of the transaction. It includes the following types of transactions: derivative instruments, transactions with repurchase agreement, stock lending, operations with deferred settlement and financing of guarantees.
There are two methodologies for measuring this exposure: (i) mark-to-market (MtM) methodology (replacement value of derivatives) plus potential future exposure (add-on) and (ii) the calculation of exposure using Monte Carlo simulation for some products. The Capital at Risk or unexpected loss is also calculated, i.e., the loss which, once the expected loss has been subtracted, constitutes the economic capital, net of guarantees and recoveries.
After markets close, exposures are re-calculated by adjusting all transactions to their new time frame, adjusting the potential future exposure and applying mitigation measures (netting, collateral, etc.), so that the exposures can be controlled directly against the limits approved by Management. Risk control is performed through an integrated system and in real time, enabling the exposure limit available with any counterparty, product and maturity to be known at any time.
2.2 Concentration risk
Concentration risk control is a vital part of management. The Bank continuously monitors the degree of concentration of its credit risk portfolios using various criteria: geographical areas, economic sectors, products and groups of customers.
The Board of Directors, via the risk appetite framework, determines the maximum levels of concentration. In line with these maximum levels and limits, the executive risk committee establishes the risk policies and reviews the appropriate exposure levels for the adequate management of the degree of concentration in the Bank’s credit risk portfolios.
The concentration risk is subject to CNBV regulations on “Large Exposures” as follows:
| a) | | As of December 31, 2017 and 2018, there is no financing granted to debtors or groups of individuals or entities representing a joint risk in an amount that exceeds 10% of the Bank’s Basic Capital (of the month immediately preceding the reporting date). |
| b) | | As of December 31, 2017, assets and liabilities transactions with the three main debtors or groups of individuals representing a joint risk for the aggregate amount of 48,729 million pesos and represent 54.60% of the Bank’s Basic Capital. |
| c) | | As of December 31, 2018, assets and liabilities transactions with the three main debtors or groups of individuals representing a joint risk for the aggregate amount of 33,160 million pesos and represent 35.30% of the Bank’s Basic Capital. |
2.3 Sovereign risk and exposure to other public sector entities
Sovereign risk is that related to transactions with the Central Bank (including the regulatory cash reserve requirement – compulsory deposits), issuer risk from public debt portfolio and that related to transactions with public institutions with the following features: their funds only come from the state’s budgeted income and the activities are of a non-commercial nature.
3. Credit risk management
The credit risk management process consists of identifying, analyzing, controlling and deciding on the credit risk incurred by the Bank's operations. It considers a holistic view of the credit risk cycle including transaction, customer and portfolio view. Both business units and risk areas, together with the Management participate in the management process.
The identification of credit risk is a key component for the active management and effective control of portfolios. The identification and classification of external and internal risks in each business unit allows corrective and mitigating measures to be adopted.
3.1 Planning
Identification
Planning allows to set business targets and define specific action plans, within the risk appetite established by the Bank. These targets are met by assigning the necessary means (models, resources, systems).
Strategic Commercial Plans
Strategic commercial plans (SCPs) are a basic management and control tool for the Bank’s credit portfolios. The SCPs are prepared jointly by the commercial and risks areas, and define the commercial strategies, risk policies and measures/infrastructures required to meet the annual budget targets. These three factors are considered as a whole, ensuring a holistic view of the portfolio to be planned and allowing a map of all the Bank’s credit portfolios to be drawn.
SCP management integration provides at all times an updated view on the credit portfolios quality, allows to measure credit risk, perform internal controls and periodic monitoring of planned strategies, anticipate deviations and identify significant changes in risk and its potential impact, as well as the application of corrective actions.
The SCPs approval corresponds to the executive risk committee. The periodic monitoring of SCPs is also carried out by the executive risk committee.
The process pursues the SCPs alignment with the capital objectives of the Bank.
Scenario analysis
Credit risk scenario analysis enables Management to better understand the portfolio evolution in the face of market conditions and changes in the environment. It is a key tool for assessing the sufficiency of capital provisions for stress scenarios.
Scenario analysis is applied to all of the Bank's significant portfolios, usually over a three-year horizon. The process involves the following main stages:
| · | | Definition of benchmark scenarios, either central or most plausible scenarios (baseline), as well as less likely and more adverse economic scenarios (stress scenarios). |
| · | | Determination of risk parameters value (PD, LGD, etc.) for the scenarios defined. These parameters are established using internally developed statistical-econometric models, based on default and historical losses, in relation to historical data for macroeconomic variables taking into consideration a complete economic cycle. |
| · | | Adaptation of the projection methodology to IFRS 9, with an impact on the estimation of the expected loss in each of the IFRS 9 stages, associated with each of the scenarios put forward, as well as with other important credit risk metrics deriving from the parameters obtained (non-performing loans, allowance for impairment losses, etc.). |
| · | | Analysis and rationale for the credit risk profile evolution at portfolio, segment, business unit and Bank levels in different scenarios and compared to previous years. |
| · | | Integration of management indicators to supplement the analysis of the impact caused by macroeconomic factors on risk metrics. |
| · | | Likewise, the process is completed with a set of controls and backtesting that ensure the adequacy of metrics and calculations. |
The entire process takes place within a governance framework, and is adapted to the growing importance of this framework as well as market best practices, assisting the Management in gathering knowledge for decision making.
3.2 Assessment of the risk and credit rating process
The connection between the credit risk appetite of the Bank and management of the credit portfolios is implemented through the SCPs, which define the portfolio and new originations limits in order to anticipate the portfolio risk profile. The transposition and cascading down of the Bank’s risk appetite framework credit risk metrics, strengthens the existing control over credit portfolios.
The Bank has processes that determine the risk that each customer is able to assume. These limits are set jointly by the business units and risks areas and have to be approved by the executive risk committee (or committees in which it has delegated such authority) and reflect the expected results of the business units in terms of risk-return.
In order to assign a rating that reflects the credit quality of the customer, the Bank uses valuation and parameter estimation models in each of the segments where it operates: Corporate and Investment Banking (sovereigns, financial institutions and large corporates), commercial banking, institutions, SMEs and individuals.
The decision models applied are based on credit rating drivers which are monitored and controlled in order to calibrate and precisely adjust the decisions and ratings they assign. Depending on the segment, drivers may be:
| · | | Rating: resulting from the application of mathematical algorithms incorporating a quantitative model based on balance sheet ratios or macroeconomic variables, and a qualitative module supplemented by the analyst’s expert judgment. Used for the Corporate and Investment Banking, commercial banking, institutions and SMEs (treated on an individual basis) segments. |
| · | | Scoring: an automatic assessment system for credit applications. It automatically assigns an individual grade to the customer for subsequent decision making. |
Parameter estimation models are obtained through econometric statistical models, internally developed, based on historical loss and default of the portfolios for which they are developed and used to calculate the economic and regulatory capital of each portfolio.
Periodic model monitoring and evaluation is carried out, assessing among others, the adequacy of its use, its predictive capacity, correct performance, and level of granularity. In the same way, the existence and compliance of the policies corresponding to each and every segment is verified (these policies enable the execution of business plans defined under the approved risk appetite).
The resulting ratings are regularly reviewed, incorporating the latest available financial information and experience in the development of banking relations. The depth and frequency of the reviews are increased in the case of customers who require a more detailed monitoring or through automatic warnings in the systems.
3.3 Limits, pre-classifications and pre-approvals definition
There are different limit models depending on the segment:
| · | | Large corporate groups: The Bank uses a pre-classification model based on a system for measuring and monitoring economic capital. The result is the level of risk that the Bank is willing to assume with a customer/group, in terms of Capital at Risk, nominal CAP, and maximum periods according to the type of transaction (in the case of financial entities, limits are managed through Equivalent Credit Risk). It includes the actual and expected risk with a customer based on its usual operations, always within the limits defined in the risk appetite and established credit policies. |
| · | | Corporates and institutions that meet certain requirements (deep knowledge, rating, etc.): The Bank uses a more simplified pre-classification model through an internal limit that establishes a reference of the level of risk to be assumed with the customer. The criteria will include, among others, repayment capacity, debt in the system and the banking pool distribution. |
In both cases, transactions over certain thresholds or with specific characteristics might require the approval of an analyst or committee.
| · | | For individual customers and SMEs with low turnover, large volumes of credit transactions can be managed more easily with the use of automatic decision models for classifying the customer/ transaction binomial. |
In specific situations where a series of requirements are met, pre-approved transactions are granted to customers or potential customers (campaigns).
3.4 Transaction decision-making
From a risk admission point of view, the concession criteria are linked to the payment capacity of the borrower to comply, in time and form, with the total of the assumed financial obligations - this does not imply an impediment to requiring a higher level of real or personal guarantees.
The payment capacity will be evaluated based on the funds or net cash flows from the customer´s businesses or usual sources of income, without depending on guarantors or assets given as collateral. Such guarantors or assets should always be considered, when evaluating the approval of the transaction, as a second and exceptional way of recovery in case the first has failed.
A guarantee is defined as a reinforcement measure added to a credit transaction for the purpose of mitigating the loss due to a breach of the payment obligation.
Mitigation techniques implementation follows the minimum requirements established in the guarantee management policy: legal certainty (possibility of legally requiring the settlement of guarantees at all times), the lack of substantial positive correlation between the counterparty and the value of the collateral, the correct documentation of all guarantees, the availability of documentation for the methodologies used for each mitigation technique and appropriate monitoring, traceability and regular control of the goods/assets used for the guarantee.
The Bank applies several credit risk mitigation techniques on the basis, among other factors, of the type of customer and product. Some are inherent to specific transactions (e.g. real estate guarantees) while others apply to a series of transactions (e.g. derivatives netting and collateral). The different mitigation techniques can be grouped into the following categories:
Effective guarantees are those real and personal guarantees for which its effectiveness as a credit risk mitigant is proved and whose valuation complies with the established policies and procedures. The analysis of the effectiveness of the guarantees must take into account, among others, the necessary time for the execution and ability to enforce the guarantees.
3.5 Monitoring / Anticipation
Monitoring business performance on a regular basis, and comparing performance against agreed plans is a key risk management activity.
All customers must be monitored on an ongoing and holistic manner that enables the earliest possible detection of any incidents that may arise impacting the customer’s credit rating. Monitoring is carried out through an ongoing review of all customers, assigning a monitoring classification, establishing pre-defined actions associated to each classification and executing specific measures (pre-defined or ad-hoc) to correct any deviations that could have a negative impact for the Bank.
In this monitoring, the consideration of forecasts and transactions characteristics throughout its life, is assured. It also takes into consideration any variations that may have occurred in the classification and its adequacy in the moment of the review.
Monitoring is carried out by the risk team, supplemented by internal audit. It is based on customer segmentation:
| · | | In the Corporate and Investment Banking segment, monitoring, in the first instance, is a direct function of both the commercial manager and the risk analyst, who maintain the direct relationship with the customer and manage the portfolio. This function ensures that an up-to-date view of the customers’ credit quality is always available and allows anticipating situations of concern and taking the necessary actions. |
| · | | In the commercial banking, institutions and SMEs with an analyst assigned, the function consists of identifying and tracking customers whose situations require closer monitoring, reviewing ratings and continuously analyzing indicators. |
| · | | In the individual customers, businesses and SMEs with low turnover segments monitoring is carried out through automatic alerts for the main indicators, in order to detect shifts in the performance of the loan portfolio with respect to the forecasts in strategic plans. |
3.6 Recovery and collections management
Recovery activity is a significant element in the Bank’s risk management. This function is carried out by the recoveries area, which defines a strategy and an enterprise-wide focus for recovery management.
The Bank has a recovery management model that sets the guidelines and general lines of action to be applied, taking always into account the particularities that the recovery activity requires, such as economic environment, business model or a mixture of both.
Recovery has been aligned with the socio-economic reality of the country and different risk management mechanisms are used with adequate prudential criteria considering unpaid debt conditions.
The diverse features of Bank’s customers make segmentation necessary in order to manage recoveries adequately. Mass management of large groups of customers with similar profiles and products is conducted through processes with a high technological and digital component, while personalized management focuses on customers who, because of their profile, require a specific manager and a more customized management.
Recovery management is divided into four phases: irregularity or early non-payment, non-performing loans recoveries, written-off loans recoveries and management of foreclosed assets.
The management scope for the recovery function includes non-productive assets (NPAs), corresponding to the forborne portfolios, non-performing loans, written-off loans and foreclosed assets, where the Bank may use mechanisms to rapidly reduce these assets, such as portfolios or foreclosed assets sales. Therefore, the Bank is constantly seeking alternative solutions to juridical processes for collecting debt.
In the written-off loans category, debt instruments are included, whether due or not, for which, after an individualized analysis, their recovery is considered remote due to a notorious and unrecoverable impairment of the solvency of the transaction or the holder. Classification in this category involves full cancellation of the gross carrying amount of the loan and it’s derecognition, which does not mean that the Bank interrupts negotiations and legal proceedings to recover its amount.
Renegotiated loan portfolio - forborne loan portfolio
The term “renegotiated loan portfolio” or “forborne loan portfolio” refers, for the purposes of the Bank’s risk management, to the modification of the payment conditions of a transaction that allow a customer, who is experiencing financial difficulties (current or foreseeable), to fulfil their payment obligations. If the
modification was not made, it would be reasonably certain that the customer would not be able to meet their financial obligations. The modification could be made to the original transaction or through a new transaction replacing the previous one.
The Bank follows rigorous criteria for the evaluation, classification and monitoring of such transactions, ensuring the strictest possible care and diligence in their granting and follow up. Therefore, the forbearance transaction must be focused on recovery of the amounts due, the payment obligations must be adapted to the customer's actual situation and losses must be recognized as soon as possible if any amounts are deemed irrecoverable.
Forbearances may never be used to delay the immediate recognition of losses or to hinder the appropriate recognition of risk of default
Further, the Bank defines the classification criteria for the forborne transactions in order to ensure that the risks are suitably recognized, bearing in mind that they must remain classified as non-performing or in watch-list for a prudential period of time to attain reasonable certainty that repayment capacity can be recovered.
Certain information regarding renegotiated loans is included in Note 11.e.
c) Trading market risk and structural risk
1. Activities subject to market risk and types of market risk
The perimeter of activities subject to market risk involves operations where patrimonial risk is assumed as a consequence of variations in market factors. Thus they include trading risks and also structural risks, which are also affected by market shifts.
This risk arises from changes in risk factors - interest rates, inflation rates, exchange rates, stock prices, credit spreads, commodity prices and the volatility of each of these elements - as well as from the liquidity risk of the various products and markets in which the Bank operates and balance sheet liquidity risk:
| · | | Interest rate risk is the possibility that changes in interest rates could adversely affect the value of a financial instrument, a portfolio or the Bank as a whole. It affects loans, deposits, debt securities, most assets and liabilities in the trading books and derivatives, among others. |
| · | | Inflation rate risk is the possibility that changes in inflation rates could adversely affect the value of a financial instrument, a portfolio or the Bank as a whole. It affects instruments such as loans, debt securities and derivatives, where the return is linked to inflation or to a change in the actual rate. |
| · | | Exchange rate risk is the sensitivity of the value of a position in a currency other than the base currency to a movement in exchange rates. Hence, a long or open position in a foreign currency will produce a loss if that currency depreciates against the base currency. The exposure affected by this risk are the Bank’s foreign currency transactions. |
| · | | Equity risk is the sensitivity of the value of positions in equities to adverse movements in market prices or expectations of future dividends. Among other instruments, this affects positions in shares, stock market indices, convertible bonds and derivatives using shares as the underlying asset (put, call, equity swaps, etc.). |
| · | | Credit spread risk is the risk or sensitivity of the value of positions in fixed income securities to movements in credit spread curves or in recovery rates associated with issuers and specific types of debt. The spread is the difference between financial instruments listed with a margin over other benchmark instruments, mainly the interest rate risk of government bonds and interbank interest rates. |
| · | | Commodities price risk is the risk derived from the effect of potential changes in commodities prices. |
| · | | Volatility risk is the risk or sensitivity of the value of a portfolio to changes in the volatility of risk factors: interest rates, exchange rates, shares, credit spreads and commodities. This risk is incurred by all financial instruments where volatility is a variable in the valuation model. The most significant case is financial options portfolios. |
All these market risks can be partly or fully mitigated by using options, futures, forwards and swaps.
In addition to the above market risks, balance sheet liquidity risk must also be considered. Unlike market liquidity risk, balance sheet liquidity risk is defined as the possibility of not meeting payment obligations on time, or doing so at excessive cost. Among the losses caused by this risk are losses due to forced sales of assets or margin impacts due to the mismatch between expected cash inflows and outflows.
2. Trading market risk management
The Bank's trading risk profile remained moderately low in 2018, in line with previous years, due to the fact that the Bank’s activity has traditionally focused on providing services to its customers, with no exposure to complex structured assets, as well as the diversification and risk factors.
Value at Risk
The standard methodology the Bank applies to trading activities is Value at Risk (VaR), which measures the maximum expected loss with a certain confidence level and time frame. The standard for historic simulation is a confidence level of 99% and a time frame of one day. Statistical adjustments are applied enabling the most recent developments affecting the levels of risk assumed to be incorporated efficiently and on a timely manner. A time frame of two years or at least 520 days from the reference date of the VaR calculation is used. Two figures are calculated every day: one applying an exponential decay factor that accords less weight to the observations furthest away in time and another with the same weight for all observations. The higher of the two is reported as the VaR.
The average daily Total VaR of the Bank’s market trading operations in 2016 stood at 77 million pesos, higher than that for 2015 at 71 million pesos. In 2016, the changes in VaR were due mainly to changes in the interest rate risk factor as a result of the trading book’s strategy. VaR modeling did not change during 2016. At the end of December 2016, VaR stood at 132 million pesos.
Average daily Total VaR increased by 6 million pesos with respect to 2015. This increment was concentrated in interest rate VaR, where the average daily increased from 68 million pesos to 71 million pesos. The average daily equity VaR and exchange rate VaR fell from 17 million pesos to 4 million pesos, and increased 10 million pesos to 17 million pesos, respectively.
The risk assumption profile, in terms of VaR and results, showed that VaR during 2016 remained at levels below the limit of 230 million pesos. During the first semester of 2016, the average daily Total VaR was 73 million pesos and during the second semester of 2016, the average daily Total VaR was 79 million pesos. VaR stayed in levels between 48 million pesos and 189 million pesos in the second semester, as a result of interest rates increase expectation.
The average daily Total VaR of the Bank’s market trading operations in 2017 stood at 95 million pesos, higher than that for 2016 at 77 million pesos. In 2017, the changes in VaR were due mainly to changes in the interest rate risk factor as a result of the trading book’s strategy. VaR modeling did not change during 2017. At the end of December 2017, VaR stood at 129 million pesos.
Average daily Total VaR increased by 19 million pesos with respect to 2016. This increment was concentrated in interest rate VaR, where the average daily increased from 71 million pesos to 96 million
pesos. The average daily equity VaR and exchange rate VaR increased from 4 million pesos to 5 million pesos, and 17 million pesos to 51 million pesos, respectively.
The risk assumption profile, in terms of VaR and results, showed that VaR during 2017 remained at levels below the limit of 245 million pesos. During the first semester of 2017, the average daily total VaR was 97 million pesos and during the second semester of 2017, the average daily Total VaR was 93 million pesos. VaR stayed in levels between 58 million pesos and 138 million pesos in the second semester, as a result of interest rates increase expectation.
The average daily Total VaR of the Bank’s market trading operations in 2018 stood at 122 million pesos, higher than that for 2017 at 95 million pesos. In 2018, the changes in VaR were due mainly to changes in the interest rate risk factor as a result of the trading book’s strategy. VaR modeling did not change during 2018. At the end of December 2018, VaR stood at 69 million pesos.
Average daily Total VaR increased by 27 million pesos with respect to 2017. This increment was concentrated in interest rate VaR, where the average daily increased from 96 million pesos to 110 million pesos. The average daily equity VaR and exchange rate VaR increased from 5 million pesos to 6 million pesos and decreased from 51 million pesos to 48 million pesos, respectively.
The risk assumption profile, in terms of VaR and results, showed that VaR during 2018 remained at levels below the limit of 256 million pesos. During the first semester of 2018, the average daily total VaR was 123 million pesos and during the second semester of 2018, the average daily Total VaR was 121 million pesos. VaR stayed in levels between 69 million pesos and 398 million pesos in the second semester, as a result of interest rates increase expectation.
Exposures related to complex structured assets
The Bank does not have exposure to instruments or complex structured assets, a management culture for which prudence in risk management is one of its hallmarks in risk management.
The Bank’s policy for approving new transactions involving complex structures remains very prudent and conservative. It is subject to strict supervision by the Management. Before approving a new transaction, product or underlying asset, the CRO verifies:
-The existence of an appropriate valuation model to monitor the value of each exposure: mark-to-market, mark-to-model or mark-to-liquidity.
-The availability in the market of observable data (inputs) needed to be able to apply this valuation model.
And provided these two conditions are met:
-The availability of adequate systems, duly adapted to calculate and monitor every day the results, positions and risks of new transactions.
-The degree of liquidity of the product or underlying asset, in order to make possible their coverage when deemed appropriate.
Calibration and test measures
Actual losses can differ from those forecast by VaR for various reasons related to the limitations of this metric. The Bank regularly analyses and contrasts the accuracy of the VaR calculation model in order to confirm its reliability.
The most important test consists of backtesting exercises analyzed in all cases with the same methodology. Backtesting consists of comparing the forecast VaR measurements, with a certain level of confidence and time frame, with the actual obtained in the same time frame. This enables anomalies in the VaR model of the portfolio in question to be detected (for example, shortcomings in the parameterization of the valuation models of certain instruments, not very adequate proxies, etc.).
The Bank calculates and evaluates three types of backtesting:
| · | | “Clean” backtesting: the daily VaR is compared with the results obtained without taking into account intraday results or changes in the portfolio’s positions. This method compares the effectiveness of the individual models used to assess and measure the risks of positions. |
| · | | Backtesting on complete results: daily VaR is compared with the day’s net results, including the results of intraday transactions and those generated by fees and commissions. |
| · | | Backtesting on complete results without mark-ups or fees: the daily VaR is compared to the day’s net results from of intraday transactions but excluding those generated by mark-ups and fees. This method aims to give an idea of the intraday risk assumed by the Bank’s treasury. |
In 2016, there were one exception to 99% VaR (i.e., days when the daily loss exceeded VaR). During 2016, there were twelve Value at Earnings (VaE) breaks (i.e., days when the daily gain exceeded VaE), due mainly to the changes in the interest rates and foreign exchange.
In 2017, there were no exception to 99% VaR (i.e., days when the daily loss exceeded VaR). During 2017, there were no VaE breaks (i.e., days when the daily gain exceeded VaE).
In 2018, there were two exception to 99% VaR (i.e., days when the daily loss exceeded VaR). During 2018, there were one VaE break (i.e., days when the daily gain exceeded VaE).
The number of exceptions which occurred is consistent with the assumptions specified in the VaR calculation model.
3. Structural balance sheet risks
3.1 Main aggregates and variations
The market risk profile inherent in the Bank’s balance sheet, in relation to its asset volumes and shareholders’ funds, as well as the budgeted financial margin, remained moderate in 2018, in line with previous years.
Structural VaR
A standardized metric such as VaR can be used for monitoring total market risk for the banking book, excluding the trading activity of Corporate and Investment Banking, distinguishing between fixed income (considering both interest rates and credit spreads on Asset and Liability Committees or ALCO portfolios), exchange rates and equities.
Structural VaR is not significant according to the assets amounts or capital of the Bank.
Structural interest rate risk
The interest rate risk in the balance sheet management portfolios, measured in terms of sensitivity of the net interest margin (NIM) at one year to a parallel increase of 100 basis points in the yield curve, remained stable throughout 2016 under 1,000 million pesos, mainly due to the short-term repricing of the credit portfolio. At the end of December 2016, the risk consumption measured in terms of 100 basis points sensitivity of the market value of equity (MVE) stood under 3,700 million pesos.
The table below shows in millions of pesos the distribution of interest rate risk by maturity as of December 31, 2016. The reported amounts include estimated interest on fixed and variable rate instruments. Interest on variable rate instruments is determined using the rate in effect as of the balance sheet date for the first scheduled interest payment and amounts are determined based on the contractual spread for each period thereafter.
| | | | | | | | | | | | | | | | | | | | | | | | | | | | |
| | | Total | | | 0 - 1 Months | | | 1 - 3 Months | | | 3 - 6 Months | | 6 - 12 Months | | | 1 - 3 Years | | | 3 - 5 Years | | | > 5 Years | | | Not Sensitive | |
| | | | | | | | | | | | | | | | | | | | | | | | | | | | |
Money Market | | | 146,736 | | | 38,460 | | | 203 | | | 104 | | | 11 | | | 44 | | | 32 | | | — | | | 107,882 | |
Loans | | | 647,729 | | | 349,076 | | | 45,789 | | | 42,250 | | | 36,673 | | | 82,230 | | | 37,336 | | | 67,475 | | | (13,100) | |
Trade Finance | | | — | | | — | | | — | | | — | | | — | | | — | | | — | | | — | | | — | |
Intragroup | | | 343 | | | — | | | — | | | — | | | — | | | — | | | — | | | — | | | 343 | |
Securities | | | 356,407 | | | 46,103 | | | 11,459 | | | 5,643 | | | 2,428 | | | 84,499 | | | 7,459 | | | 25,513 | | | 173,303 | |
Permanent | | | 5,535 | | | — | | | — | | | — | | | — | | | — | | | — | | | — | | | 5,535 | |
Other Assets | | | 84,864 | | | — | | | — | | | — | | | — | | | — | | | — | | | — | | | 84,864 | |
Total Balance Sheet Assets | | | 1,241,614 | | | 433,639 | | | 57,451 | | | 47,997 | | | 39,112 | | | 166,773 | | | 44,827 | | | 92,988 | | | 358,827 | |
Money Market | | | (205,188) | | | (44,538) | | | (22,754) | | | (2,364) | | | — | | | — | | | — | | | — | | | (135,532) | |
Deposits | | | (551,067) | | | (239,723) | | | (12,275) | | | (2,824) | | | (31,574) | | | (264,671) | | | — | | | — | | | — | |
Trade Finance | | | (308) | | | — | | | — | | | — | | | — | | | — | | | — | | | — | | | (308) | |
Intragroup | | | — | | | — | | | — | | | — | | | — | | | — | | | — | | | — | | | — | |
Long-Term Funding | | | (179,255) | | | (62,846) | | | (1,061) | | | (4,070) | | | (2,678) | | | (35,274) | | | (7,255) | | | (36,420) | | | (29,651) | |
Equity | | | (105,283) | | | — | | | — | | | — | | | — | | | — | | | — | | | — | | | (105,283) | |
Other Liabilities | | | (114,846) | | | — | | | — | | | — | | | — | | | — | | | — | | | — | | | (114,846) | |
Total Balance Sheet Liabilities | | | (1,155,947) | | | (347,107) | | | (36,090) | | | (9,258) | | | (34,252) | | | (299,945) | | | (7,255) | | | (36,420) | | | (385,620) | |
Total Balance Sheet Gap | | | 85,667 | | | 86,532 | | | 21,361 | | | 38,739 | | — | 4,860 | | | (133,172) | | | 37,572 | | | 56,568 | | | (26,793) | |
Total Off-Balance Sheet Gap | | | (6,638) | | | 9,323 | | | 4,698 | | | (5,031) | | | (1,266) | | | 5,995 | | | (3,781) | | | (11,111) | | | (5,464) | |
Total Structural Gap | | | | | | 95,854 | | | 26,058 | | | 33,708 | | | 3,594 | | | (127,178) | | | 33,791 | | | 45,457 | | | (32,255) | |
Accumulated Gap | | | | | | 95,854 | | | 121,912 | | | 155,620 | | | 159,214 | | | 32,036 | | | 65,827 | | | 111,284 | | | 79,028 | |
The interest rate risk in the balance sheet management portfolios, measured in terms of sensitivity of the NIM at one year to a parallel increase of 100 basis points in the yield curve, remained stable throughout 2017 under 900 million pesos, mainly due to the short-term repricing of the credit portfolio. At the end of December 2017, the risk consumption measured in terms of 100 basis points sensitivity of the MVE stood under 3,000 million pesos.
The table below shows in millions of pesos the distribution of interest rate risk by maturity as of December 31, 2017. The reported amounts include estimated interest on fixed and variable rate instruments. Interest on variable rate instruments is determined using the rate in effect as of the balance sheet date for the first
scheduled interest payment and amounts are determined based on the contractual spread for each period thereafter.
| | | | | | | | | | | | | | | | | | | | | | | | | | | | |
| | | Total | | | 0 - 1 Months | | | 1 - 3 Months | | | 3 - 6 Months | | | 6 - 12 Months | | | 1 - 3 Years | | | 3 - 5 Years | | | > 5 Years | | | Not Sensitive | |
| | | | | | | | | | | | | | | | | | | | | | | | | | | | |
Money Market | | | 80,851 | | | 41,236 | | | — | | | 11 | | | 11 | | | 41 | | | 10 | | | — | | | 39,543 | |
Loans | | | 697,027 | | | 357,785 | | | 62,290 | | | 27,359 | | | 28,877 | | | 99,802 | | | 45,376 | | | 75,518 | | | 20 | |
Trade Finance | | | — | | | — | | | — | | | — | | | — | | | — | | | — | | | — | | | — | |
Intragroup | | | (72) | | | — | | | — | | | — | | | — | | | — | | | — | | | — | | | (72) | |
Securities | | | 346,672 | | | 23,391 | | | 16,893 | | | 39,293 | | | 1,845 | | | 63,697 | | | 14,855 | | | 31,081 | | | 155,618 | |
Permanent | | | 472 | | | — | | | — | | | — | | | — | | | — | | | — | | | — | | | 472 | |
Other Assets | | | 185,908 | | | — | | | — | | | — | | | — | | | — | | | — | | | — | | | 185,908 | |
Total Balance Sheet Assets | | | 1,310,858 | | | 422,412 | | | 79,183 | | | 66,663 | | | 30,733 | | | 163,540 | | | 60,241 | | | 106,599 | | | 381,489 | |
Money Market | | | (113,294) | | | (20,523) | | | (791) | | | — | | | — | | | — | | | — | | | — | | | (91,981) | |
Deposits | | | (597,248) | | | (567,359) | | | (15,954) | | | (9,378) | | | (4,535) | | | (22) | | | — | | | — | | | — | |
Trade Finance | | | — | | | — | | | — | | | — | | | — | | | — | | | — | | | — | | | — | |
Intragroup | | | — | | | — | | | — | | | — | | | — | | | — | | | — | | | — | | | — | |
Long-Term Funding | | | (184,681) | | | (62,590) | | | (6,173) | | | (5,922) | | | (6,396) | | | (36,660) | | | (35,173) | | | (2,869) | | | (28,898) | |
Equity | | | (116,134) | | | — | | | — | | | — | | | — | | | — | | | — | | | — | | | (116,134) | |
Other Liabilities | | | (198,480) | | | — | | | — | | | — | | | — | | | — | | | — | | | — | | | (198,480) | |
Total Balance Sheet Liabilities | | | (1,209,837) | | | (650,472) | | | (22,918) | | | (15,300) | | | (10,931) | | | (36,682) | | | (35,173) | | | (2,869) | | | (435,493) | |
Total Balance Sheet Gap | | | 101,021 | | | (228,060) | | | 56,265 | | | 51,363 | | | 19,802 | | | 126,858 | | | 25,068 | | | 103,730 | | | (54,004) | |
Total Off-Balance Sheet Gap | | | (561) | | | 31,675 | | | 2,142 | | | (2,719) | | | (606) | | | (35) | | | (6,798) | | | (24,220) | | | — | |
Total Structural Gap | | | | | | (196,385) | | | 58,407 | | | 48,644 | | | 19,196 | | | 126,823 | | | 18,270 | | | 79,510 | | | (54,004) | |
Accumulated Gap | | | — | | | (196,385) | | | (137,978) | | | (89,334) | | | (70,138) | | | 56,685 | | | 74,955 | | | 154,465 | | | 100,461 | |
The interest rate risk in the balance sheet management portfolios, measured in terms of sensitivity of the net interest margin (NIM) at one year to a parallel increase of 100 basis points in the yield curve, remained stable throughout 2018 under 700 million pesos, mainly due to the short-term repricing of the credit portfolio. At the end of December 2018, the risk consumption measured in terms of 100 basis points sensitivity of the MVE stood under 3,900 million pesos.
The table below shows in millions of pesos the distribution of interest rate risk by maturity as of December 31, 2018. The reported amounts include estimated interest on fixed and variable rate instruments. Interest on variable rate instruments is determined using the rate in effect as of the balance sheet date for the first scheduled interest payment and amounts are determined based on the contractual spread for each period thereafter.
| | | | | | | | | | | | | | | | | | | | | | | | | | | | |
| | | Total | | | 0 - 1 Months | | | 1 - 3 Months | | | 3 - 6 Months | | | 6 - 12 Months | | | 1 - 3 Years | | | 3 - 5 Years | | | > 5 Years | | | Not Sensitive | |
| | | | | | | | | | | | | | | | | | | | | | | | | | | | |
Money Market | | | 101,353 | | | 35,304 | | | — | | | — | | | — | | | 52 | | | — | | | — | | | 65,997 | |
Loans | | | 789,010 | | | 400,172 | | | 44,475 | | | 27,446 | | | 51,727 | | | 119,014 | | | 56,923 | | | 90,388 | | | (1,135) | |
Trade Finance | | | — | | | — | | | — | | | — | | | — | | | — | | | — | | | — | | | — | |
Intragroup | | | (226) | | | — | | | — | | | — | | | — | | | — | | | — | | | — | | | (226) | |
Securities | | | 351,755 | | | 59,520 | | | 11,051 | | | 8,589 | | | 44,187 | | | 58,048 | | | 13,198 | | | 30,524 | | | 126,637 | |
Permanent | | | 14,417 | | | — | | | — | | | — | | | — | | | — | | | — | | | — | | | 14,417 | |
Other Assets | | | 2,491,052 | | | — | | | — | | | — | | | — | | | — | | | — | | | — | | | 2,491,052 | |
Total Balance Sheet Assets | | | 3,747,361 | | | 494,996 | | | 55,526 | | | 36,035 | | | 95,914 | | | 177,114 | | | 70,121 | | | 120,912 | | | 2,696,742 | |
Money Market | | | (114,421) | | | (27,386) | | | (89) | | | — | | | — | | | — | | | — | | | — | | | (86,945) | |
Deposits | | | (636,907) | | | (253,774) | | | (17,801) | | | (12,984) | | | (91,065) | | | (156,158) | | | — | | | (105,126) | | | — | |
Trade Finance | | | — | | | — | | | — | | | — | | | — | | | — | | | — | | | — | | | — | |
Intragroup | | | — | | | — | | | — | | | — | | | — | | | — | | | — | | | — | | | — | |
Long-Term Funding | | | (207,327) | | | (65,439) | | | (6,383) | | | (9,993) | | | (8,361) | | | (14,760) | | | (60,990) | | | (3,727) | | | (37,675) | |
Equity | | | (125,813) | | | — | | | — | | | — | | | — | | | — | | | — | | | — | | | (125,813) | |
Other Liabilities | | | (2,527,900) | | | — | | | — | | | — | | | — | | | — | | | — | | | — | | | (2,527,900) | |
Total Balance Sheet Liabilities | | | (3,612,368) | | | (346,599) | | | (24,273) | | | (22,977) | | | (99,426) | | | (170,918) | | | (60,990) | | | (108,853) | | | (2,778,333) | |
Total Balance Sheet Gap | | | 134,993 | | | 148,397 | | | 31,253 | | | 13,058 | | | (3,512) | | | 6,196 | | | 9,131 | | | 12,059 | | | (81,591) | |
Total Off-Balance Sheet Gap | | | (5,070) | | | 27,072 | | | 576 | | | (1,096) | | | 4,739 | | | (5,802) | | | (3,267) | | | (27,293) | | | — | |
Total Structural Gap | | | | | | 175,469 | | | 31,829 | | | 11,962 | | | 1,227 | | | 394 | | | 5,864 | | | (15,234) | | | (81,591) | |
Accumulated Gap | | | — | | | 175,469 | | | 207,298 | | | 219,260 | | | 220,487 | | | 220,881 | | | 226,745 | | | 211,511 | | | 129,920 | |
Structural foreign currency risk
Structural exchange-rate risk arises from Bank transactions in foreign currencies. The Bank´s objective is to maintain the structural exchange-rate risk completely hedged with a limit of USD 15 million that represents 0.02% of the total assets as of December 31, 2018.
Structural equity risk
As of December 31, 2018, the Bank does not maintain any equity positions in its banking book.
3.2 Methodologies
Structural interest rate risk
The Bank analyzes the sensitivity of its net interest income and equity value to changes in interest rates. This sensitivity arises from differences in maturity dates and interest rate repricing gaps in the various balance sheet items.
Taking into consideration the balance-sheet interest rate position and the market situation and outlook, the necessary financial actions are adopted to align this position with that desired by the Bank. These measures can range from opening positions on markets to the definition of the interest rate features of commercialized products.
The metrics used by the Bank to control interest rate risk in these activities are the repricing gap, the sensitivity of NIM and MVE to changes in interest rates, the duration of capital and VaR for economic capital calculation purposes.
The interest rate gap analysis (repricing gap) focuses on the mismatches between the interest reset periods of both on and off-balance sheet assets and liabilities. This analysis facilitates a basic snapshot of the balance-sheet structure and enables concentrations of interest rate risks in the various maturity buckets to be detected. Additionally, it is a useful tool for estimating the possible impact of potential changes in interest rates on the Bank’s NIM and MVE.
The flows of all the on- and off-balance sheet aggregates must be broken down and placed at the point of repricing or maturity. The duration and sensitivity of aggregates that do not have a contractual maturity date are analyzed and estimated using an internal model.
The sensitivity of the NIM measures the change in the expected net interest income for a specific period (12 months) given a parallel shift in the yield curve.
The sensitivity of the NIM is calculated by simulating the margin both for a scenario of changes in the yield curve and for the current scenario, the sensitivity being the difference between the two margins so calculated.
The sensitivity of the MVE is a complementary measure to the sensitivity of the net interest.
This sensitivity measures the interest rate risk implicit in the MVE based on the effect of changes in interest rates on the present values of financial assets and liabilities.
Structural exchange-rate risk
These activities are monitored via position measurements, VaR and results, on a daily basis.
Structural equity risk
These activities are monitored via position measurements, VaR and results, on a monthly basis.
4. Liquidity risk
Structural liquidity management aims to fund the Bank’s recurring business with optimizing maturities and costs, while avoiding taking undesired liquidity risks.
The Bank’s liquidity management is based on the following principles:
| · | | Decentralized liquidity model. |
| · | | Medium- and long-term funding needs must be covered by medium- and long-term instruments. |
| · | | High contribution from customer deposits due to the retail nature of the balance sheet. |
| · | | Diversification of wholesale funding sources by instruments/investors; markets/currencies and maturities. |
| · | | Limited recourse to short-term. |
| · | | Availability of a sufficient liquidity reserves, including standing facilities/discount windows at the Central Bank to be used in adverse situations. |
| · | | Compliance with the regulatory liquidity requirements, as a new factor conditioning management. |
The effective application of these principles required the development of a unique management framework built upon three essential pillars:
| · | | A solid organizational and governance model that ensures the involvement of the Management in decision-taking and its integration into the Bank’s strategy. The decision-making process for all structural risks, including liquidity and funding risk, is carried out by the Asset and Liability Committees (ALCO), which is the body empowered by the Board of Directors in accordance with the Asset and Liability Management (ALM) framework. |
This governance model has been reinforced as it has been included within the Bank’s risk appetite framework. This framework meets the demands of regulators and market players emanating from the financial crisis to strengthen banks’ risk management and control systems.
| · | | An in-depth balance-sheet analysis and measurement of liquidity risk, supporting decision-taking and its control. The objective is to ensure the Bank maintains adequate liquidity levels necessary to cover its short- and long-term needs with stable funding sources, optimizing the impact of their costs on the consolidated income statement. |
The Bank’s liquidity risk management processes are contained within a conservative risk appetite framework in accordance with its commercial strategy. This risk appetite establishes the limits within which the Bank can operate in order to achieve its strategic objectives.
| · | | Management adapted in practice to the liquidity needs of each business unit. Every year, based on business needs, a liquidity plan is developed which seeks to achieve: |
| - | | A solid balance sheet structure, with a diversified presence in the wholesale markets. |
| - | | The use of liquidity buffers and limited encumbrance of assets. |
| - | | Compliance with both regulatory metrics and other metrics included in the Bank’s risk appetite statement. |
Over the course of the year, all dimensions of the plan are monitored.
The Bank continues developing the ILAAP (Internal Liquidity Adequacy Assessment Process), an internal self-assessment process of liquidity adequacy which must be integrated into the Bank’s other risk management and strategic processes. It focuses on both quantitative and qualitative matters. The ILAAP evaluates the liquidity position both in ordinary and stressed scenarios.
The table below shows in millions of pesos the distribution of the liquidity risk by maturity as of December 31, 2016. The reported amounts include cash flows from interest on fixed and variable rate instruments. The interest on variable rate instruments is determined using the forward interest rates for each period presented.
| | | | | | | | | | | | | | | | | | | | | | | | | | | | |
| | | Total | | | 0 - 1 Months | | | 1 - 3 Months | | | 3 - 6 Months | | | 6 - 12 Months | | | 1 - 3 Years | | | 3 - 5 Years | | | > 5 Years | | | Not Sensitive | |
| | | | | | | | | | | | | | | | | | | | | | | | | | | | |
Money Market | | | 146,748 | | | 105,566 | | | 203 | | | 104 | | | 11 | | | 44 | | | 32 | | | — | | | 40,788 | |
Loans | | | 726,450 | | | 101,397 | | | 66,892 | | | 62,277 | | | 89,069 | | | 197,379 | | | 86,306 | | | 136,230 | | | (13,100) | |
Trade Finance | | | — | | | — | | | — | | | — | | | — | | | — | | | — | | | — | | | — | |
Intragroup | | | 343 | | | — | | | — | | | — | | | — | | | — | | | — | | | — | | | 343 | |
Securities | | | 330,254 | | | 290,900 | | | — | | | 1 | | | 1 | | | 11,511 | | | — | | | — | | | 27,841 | |
Permanent | | | 5,535 | | | — | | | — | | | — | | | — | | | — | | | — | | | — | | | 5,535 | |
Other Assets | | | 85,864 | | | — | | | — | | | — | | | — | | | — | | | — | | | — | | | 84,864 | |
Total Balance Sheet Assets | | | 1,295,194 | | | 497,863 | | | 67,095 | | | 62,382 | | | 89,081 | | | 208,934 | | | 86,338 | | | 136,230 | | | 146,271 | |
Money Market | | | (205,899) | | | (174,477) | | | (4,406) | | | (842) | | | (19,379) | | | (1,276) | | | (2,947) | | | — | | | (2,572) | |
Deposits | | | (551,068) | | | (178,389) | | | (57,904) | | | (152) | | | (21,348) | | | (293,275) | | | — | | | — | | | — | |
Trade Finance | | | (308) | | | — | | | — | | | — | | | — | | | — | | | — | | | — | | | (308) | |
Intragroup | | | - | | | — | | | — | | | — | | | — | | | — | | | — | | | — | | | — | |
Long-Term Funding | | | (183,446) | | | (18,762) | | | (9,763) | | | (17,956) | | | (16,861) | | | (68,710) | | | (14,747) | | | (36,647) | | | — | |
Equity | | | (105,283) | | | — | | | — | | | — | | | — | | | — | | | — | | | — | | | (105,283) | |
Other Liabilities | | | (114,846) | | | — | | | — | | | — | | | — | | | — | | | — | | | — | | | (114,846) | |
Total Balance Sheet Liabilities | | | (1,160,850) | | | (371,628) | | | (72,073) | | | (18,950) | | | (57,588) | | | (363,261) | | | (17,694) | | | (36,647) | | | (223,009) | |
Total Balance Sheet Gap | | | 134,344 | | | 126,235 | | | (4,978) | | | 43,432 | | | 31,493 | | | (154,327) | | | 68,644 | | | 99,583 | | | (76,738) | |
Total Off-Balance Sheet Gap | | | 3,474 | | | 178,907 | | | 4,463 | | | 744 | | | (2,149) | | | 7,714 | | | (3,086) | | | 1,324 | | | (184,443) | |
Total Structural Gap | | | | | | 305,142 | | | (515) | | | 44,175 | | | 29,343 | | | (146,612) | | | 65,558 | | | 100,907 | | | (261,180) | |
Accumulated Gap | | | | | | 305,142 | | | 304,627 | | | 348,802 | | | 378,146 | | | 231,533 | | | 297,092 | | | 397,999 | | | 136,819 | |
The table below shows in millions of pesos the distribution of the liquidity risk by maturity as of December 31, 2017. The reported amounts include cash flows from interest on fixed and variable rate instruments. The interest on variable rate instruments is determined using the forward interest rates for each period presented.
| | | | | | | | | | | | | | | | | | | | | | | | | | | | |
| | | Total | | | 0 - 1 Months | | | 1 - 3 Months | | | 3 - 6 Months | | | 6 - 12 Months | | | 1 - 3 Years | | | 3 - 5 Years | | | > 5 Years | | | Not Sensitive | |
| | | | | | | | | | | | | | | | | | | | | | | | | | | | |
Money Market | | | 80,851 | | | 41,236 | | | — | | | 11 | | | 11 | | | 41 | | | 10 | | | — | | | 39,543 | |
Loans | | | 774,862 | | | 53,125 | | | 64,611 | | | 68,058 | | | 101,213 | | | 234,382 | | | 106,830 | | | 146,624 | | | 20 | |
Trade Finance | | | — | | | — | | | — | | | — | | | — | | | — | | | — | | | — | | | — | |
Intragroup | | | (72) | | | — | | | — | | | — | | | — | | | — | | | — | | | — | | | (72) | |
Securities | | | 372,029 | | | 330,590 | | | 123 | | | 192 | | | 381 | | | 1,523 | | | 2,855 | | | 11,441 | | | 24,924 | |
Permanent | | | 11,652 | | | — | | | — | | | — | | | — | | | — | | | — | | | — | | | 11,652 | |
Other Assets | | | 174,727 | | | — | | | — | | | — | | | — | | | — | | | — | | | — | | | 174,727 | |
Total Balance Sheet Assets | | | 1,414,049 | | | 424,951 | | | 64,734 | | | 68,261 | | | 101,605 | | | 235,946 | | | 109,695 | | | 158,065 | | | 250,794 | |
Money Market | | | (113,294) | | | (20,523) | | | (791) | | | — | | | — | | | — | | | — | | | — | | | (91,981) | |
Deposits | | | (607,532) | | | (239,107) | | | (19,463) | | | (14,194) | | | (12,780) | | | (21,136) | | | (11,777) | | | (289,075) | | | — | |
Trade Finance | | | — | | | — | | | — | | | — | | | — | | | — | | | — | | | — | | | — | |
Intragroup | | | — | | | — | | | — | | | — | | | — | | | — | | | — | | | — | | | — | |
Long-Term Funding | | | (191,378) | | | (4,292) | | | (11,334) | | | (11,619) | | | (31,917) | | | (50,504) | | | (49,477) | | | (3,250) | | | (28,985) | |
Equity | | | (116,134) | | | — | | | — | | | — | | | — | | | — | | | — | | | — | | | (116,134) | |
Other Liabilities | | | (198,480) | | | — | | | — | | | — | | | — | | | — | | | — | | | — | | | (198,480) | |
Total Balance Sheet Liabilities | | | (1,226,818) | | | (263,922) | | | (31,588) | | | (25,813) | | | (44,697) | | | (71,640) | | | (61,254) | | | (292,325) | | | (435,580) | |
Total Balance Sheet Gap | | | 187,231 | | | 161,029 | | | 33,146 | | | 42,448 | | | 56,908 | | | 164,306 | | | 48,441 | | | (134,260) | | | (184,786) | |
Total Off-Balance Sheet Gap | | | 15,009 | | | (8,956) | | | 596 | | | 117 | | | 599 | | | 7,423 | | | 4,090 | | | (864) | | | 12,005 | |
Total Structural Gap | | | | | | 152,073 | | | 33,742 | | | 42,565 | | | 57,507 | | | 171,729 | | | 52,531 | | | (135,124) | | | (172,781) | |
Accumulated Gap | | | | | | 152,073 | | | 185,815 | | | 228,380 | | | 285,887 | | | 457,616 | | | 510,147 | | | 375,023 | | | 202,242 | |
The table below shows in millions of pesos the distribution of the liquidity risk by maturity as of December 31, 2018. The reported amounts include cash flows from interest on fixed and variable rate instruments.
The interest on variable rate instruments is determined using the forward interest rates for each period presented.
| | | | | | | | | | | | | | | | | | | | | | | | | | | | |
| | | Total | | | 0 - 1 Months | | | 1 - 3 Months | | | 3 - 6 Months | | | 6 - 12 Months | | | 1 - 3 Years | | | 3 - 5 Years | | | > 5 Years | | | Not Sensitive | |
| | | | | | | | | | | | | | | | | | | | | | | | | | | | |
Money Market | | | 101,353 | | | 35,304 | | | — | | | — | | | — | | | 52 | | | — | | | — | | | 65,997 | |
Loans | | | 894,975 | | | 63,631 | | | 77,990 | | | 77,902 | | | 117,370 | | | 262,468 | | | 126,185 | | | 170,565 | | | (1,135) | |
Trade Finance | | | — | | | — | | | — | | | — | | | — | | | — | | | — | | | — | | | — | |
Intragroup | | | (226) | | | — | | | — | | | — | | | — | | | — | | | — | | | — | | | (226) | |
Securities | | | 265,639 | | | 204,594 | | | 143 | | | 1,183 | | | 42,759 | | | 1,766 | | | 3,098 | | | 11,128 | | | 968 | |
Permanent | | | 14,417 | | | — | | | — | | | — | | | — | | | — | | | — | | | — | | | 14,417 | |
Other Assets | | | 2,491,052 | | | — | | | — | | | — | | | — | | | — | | | — | | | — | | | 2,491,052 | |
Total Balance Sheet Assets | | | 3,767,210 | | | 303,529 | | | 78,133 | | | 79,085 | | | 160,129 | | | 264,286 | | | 129,283 | | | 181,693 | | | 2,571,073 | |
Money Market | | | (114,421) | | | (27,386) | | | (89) | | | — | | | — | | | — | | | — | | | — | | | (86,945) | |
Deposits | | | (643,226) | | | (253,793) | | | (20,848) | | | (17,375) | | | (14,367) | | | (19,813) | | | (11,475) | | | (305,556) | | | — | |
Trade Finance | | | — | | | — | | | — | | | — | | | — | | | — | | | — | | | — | | | — | |
Intragroup | | | — | | | — | | | — | | | — | | | — | | | — | | | — | | | — | | | — | |
Long-Term Funding | | | (214,803) | | | (3,470) | | | (10,517) | | | (17,219) | | | (29,238) | | | (40,266) | | | (72,295) | | | (4,010) | | | (37,788) | |
Equity | | | (125,813) | | | — | | | — | | | — | | | — | | | — | | | — | | | — | | | (125,813) | |
Other Liabilities | | | (2,527,900) | | | — | | | — | | | — | | | — | | | — | | | — | | | — | | | (2,527,900) | |
Total Balance Sheet Liabilities | | | (3,626,163) | | | (284,649) | | | (31,454) | | | (34,594) | | | (43,605) | | | (60,079) | | | (83,770) | | | (309,566) | | | (2,778,446) | |
Total Balance Sheet Gap | | | 141,047 | | | 18,880 | | | 46,679 | | | 44,491 | | | 116,524 | | | 204,207 | | | 45,513 | | | (127,873) | | | (207,373) | |
Total Off-Balance Sheet Gap | | | 30,927 | | | 755 | | | 108 | | | (144) | | | 1,637 | | | 5,657 | | | 6,293 | | | 3,781 | | | 12,838 | |
Total Structural Gap | | | | | | 19,635 | | | 46,787 | | | 44,347 | | | 118,161 | | | 209,864 | | | 51,806 | | | (124,092) | | | (194,535) | |
Accumulated Gap | | | | | | 19,635 | | | 66,422 | | | 110,769 | | | 228,930 | | | 438,794 | | | 490,600 | | | 366,508 | | | 171,973 | |
Compliance with regulatory ratios
As part of its liquidity management model, in recent years the Bank has been managing the implementation, monitoring and compliance with the liquidity and leverage requirements set by local and international financial legislation.
LCR (Liquidity Coverage Ratio)
On December 31, 2014, the CNBV and the Central Bank published in the DOF, the General Provisions on Liquidity Requirements for Banking Institutions, which establish liquidity requirements that credit institutions must comply always in accordance with the guidelines established by the Committee on Regulation of Bank Liquidity at its meeting held on October 17, 2014.
The objectives of the liquidity requirements are as follows:
| · | | To anticipate that banking institutions in Mexico has available liquid assets with high credit quality to manage their obligations and liquidity necessities along 30 days. |
| · | | To establish a liquidity coverage ratio as per a methodology in line with the international standards, which must include all foreign currencies. |
| · | | To include both on and off balance transactions in the liquidity coverage ratio calculation, as long as those transactions represent a liquidity potential risk for banking institutions. |
| · | | To anticipate that banking institutions in Mexico consolidate their subsidiaries, which core business, relates to financial operations. |
The liquidity coverage ratio is the result of dividing the liquid assets by the net cash flow.
During the fourth quarter of 2018, the weighted average LCR for the Bank is 143.31%, complying with the Bank´s desired risk profile and well above the regulatory minimum established.
NSFR (Net Stable Funding Ratio)
The CNBV and Mexican Central Bank have not issued its final definition of the net stable funding ratio based on the guidelines approved by the Basel Committee in October 2014.
This ratio seeks to reduce the liquidity risk for a longer time horizon, by requiring the banks that finance their activities through stable sources of financing, in accordance with the liquidity and maturity of its assets, mitigating the risk of episodes of liquidity stress in the future, and also prevents excessive dependence on sources of short-term wholesale financing.
d) Capital risk
The capital risk function, as second line of defense, carries out the control and supervision of the capital activities developed by the first line of defense, which independently challenges mainly through the following processes:
| · | | Supervision of capital planning and adequacy exercises through a review of all their components (balance sheet, profit and loss account, risk-weighted assets and available capital). |
| · | | Ongoing supervision of measurement of the Bank’s regulatory capital by identifying the key metrics for the calculation, setting tolerance levels for identified metrics and reviewing their consumption and the consistency of the calculations, including single transactions with a capital impact. |
The function is designed to carry out full and regular monitoring of capital risk by verifying that capital is sufficient and adequately covered in accordance with the Bank's risk profile.
Regulatory capital
The Basel III regulatory framework implemented in Mexico since January 2013 establishes minimum capital levels in a very significant manner, both quantitatively (increased minimum requirements for Core Capital and Tier I Basic Capital, plus higher deductions from capital base) and from a qualitative point of view (higher quality of required capital).
From the capital standpoint, Basel III redefines what is considered to be available capital at financial institutions (including new deductions and raising the requirements for eligible equity instruments), increases the minimum capital requirements, requires financial institutions to operate permanently with capital buffers, and adds new requirements in relation to the risks considered.
The Bank currently has robust capital ratios, in keeping with its business model and risk profile, which, coupled with its substantial capacity to generate capital organically.
As of December 31, 2017 and as of December 31, 2018, the Bank met the minimum capital requirements established by current legislation.
Model roll-out
As regards credit risk, the Bank continued its plan to implement Basel’s internal ratings-based (IRB) approach for regulatory capital calculation for credit risk. As of December 31, 2018, the Bank currently has supervisory authorization to use the AIRB approach for calculating the regulatory capital requirements for the following loan portfolios: local corporates and real estate developers and using a FIRB approach for the following portfolios: Global Corporate and financial institutions (banks.
With regard to operational risk, until September 2015, the CNBV considered the application of the Basic Indicator method for calculating the capital requirement for this type of risk. As a result of regulatory changes published in October 2015 by the CNBV, it was made available for banks to utilize -with previous approval from the CNBV- the application of the Standardized Approach (TSA), the Alternative Standardized Approach (ASA) or the Advanced method (AMA) for calculating the capital requirement for operational risk. The Bank started calculating the operational risk capital requirements under the ASA in November 2016.
For market risk, the calculation of the capital requirement is made under the standard methodology according to the provisions established by CNBV.
Leverage ratio
To ensure the financial stability of the banking system as a whole, as well as to comply with the agreements of the Basel Committee on Banking Supervision, the CNBV established the methodology to calculate the leverage ratio for banks. This leverage ratio shows if the capital of the banks adequately supports their assets. Such information is helpful for the market participants, as well as for the supervisory work of the CNBV.
This ratio is calculated as Tier I capital divided by leverage exposure. Exposure is calculated as the sum of the following items:
| · | | Accounting assets, excluding derivatives and items treated as deductions from Tier I capital (for example, the balance of loans is included, but not that of goodwill). |
| · | | Off-balance sheet items (mainly guarantees, unused credit limits granted and documentary credits) weighted using credit conversion factors. |
| · | | Inclusion of the net value of derivatives (gains and losses are netted with the same counterparty minus collaterals if they comply with certain criteria) plus a charge for the future potential exposure. |
| · | | A charge for the potential risk of securities funding transactions. |
The Sole Circular for Banks issued by the CNBV does not establish a minimum percentage of compliance, as it is considered for the baseline reference effect (the minimum of 3%).
As of December 31, 2018, the leverage ratio for the Bank is 7.03%.
Systemic important bank
On April 29, 2016, the Bank was appointed by the CNBV as a systemic important bank, assigning a Grade III of systemic importance. As a result, the Bank should progressively constitute in four years a capital preservation supplement of 1.20%, starting 2016.
As of December 31, 2018, the Bank has constituted 75% of the capital preservation supplement required.
48. Consolidated Subsidiaries
a) Composition of the Bank
The subsidiaries of the Bank, all of which have been included in the consolidated financial statements as of December 31, 2018, are as follows:
| | | | | | | | | | |
| | | | | | Proportion of | | | Proportion of | |
| | | | | | ownership interest | | | voting power | |
Name of subsidiary | | | Principal activity | | | held by the Bank | | | held by the Bank | |
Santander Consumo, S.A. de C.V., Sociedad Financiera de Objeto Múltiple, E.R. | | | Credit card loans | | | 99.99 | % | | 100 | % |
Santander Vivienda, S.A. de C.V., Sociedad Financiera de Objeto Múltiple, E.R. | | | Mortgage loans | | | 99.99 | % | | 100 | % |
Santander Inclusión Financiera, S.A. de C.V., Sociedad Financiera de Objeto Múltiple, E.R. | | | Retail loans | | | 99.99 | % | | 100 | % |
Centro de Capacitación Santander, A.C. | | | Not-for-profit (Educational institute) | | | 99.99 | % | | 100 | % |
Banco Santander, S.A. Fideicomiso 100740 | | | Settlement trust | | | 99.99 | % | | 100 | % |
Fideicomiso GFSSLPT, Banco Santander, S.A. | | | Settlement trust | | | 89.14 | % | | 100 | % |
Santander Servicios Corporativos, S.A. de C.V. | | | Services | | | 99.99 | % | | 100 | % |
Santander Servicios Especializados, S.A. de C.V. | | | Services | | | 99.99 | % | | 100 | % |
Santander Tecnología México, S.A. de C.V. (formerly ISBAN México, S.A. de C.V.) | | | Technology services | | | 99.99 | % | | 100 | % |
The total non-controlling interest as of December 31, 2018, amount to 32 million pesos.
Information in respect to non-controlling interest is presented in Note 26.
b) Significant restrictions
The Bank has the following significant restrictions on its ability to access or use the assets and settle the liabilities of the Bank as of December 31, 2018:
| · | | Compulsory deposits with the Central Bank |
Compulsory deposits relate to a minimum balance financial institutions are required to maintain with the Central Bank based on a percentage of deposits received by third parties. The amount of this compulsory deposit is 28,094 million pesos (see Note 6).
| · | | Reverse repurchase agreements |
107,561 million pesos of debt instruments have been received as collateral in connection with reverse repurchase agreement transactions (see Notes 7 and 11).
18,463 million pesos of Mexican government securities (M Bonds, BPATs, UMS and other debt securities) classified as financial assets at fair value through other comprehensive income have been pledged in connection with repurchase agreements transactions (see Note 8).
74,548 million pesos of debt instruments classified as financial assets at fair value through profit or loss have been pledged in connection with repurchase agreement transactions (see Note 8).
6,622 million pesos of BREMS R classified as financial assets at amortized cost have been pledged in connection with repurchase agreements transactions (see Note 8).
3,208 million pesos of Special CETES in connection with the program of credit support and additional benefits to Mexican States and Municipalities and the support program for housing loan debtors, which can only be repurchased by the Central Bank (see Note 8).
7,785 million pesos of BREMS R that can only be acquired by Mexican banks through auctions carried out by the Central Bank as well as through repurchase agreement transactions between them or between Mexican banks as per the provisions established by the Central Bank (see Notes 3.6 and 8).
1,672 million pesos of Mexican Government Bonds have been pledged in connection with repurchase agreements transactions (see Note 8).
535 million pesos of Mexican Government Bonds have been pledged in connection with securities loans transactions (see Note 8).
27,592 million pesos of Mexican government securities (CETES and UDIBONDS) have been pledged in connection with securities loans transactions (see Note 8).
959 million pesos, respectively, of equity instruments, have been pledged in connection with securities loans transactions (see Note 9).
333 million pesos of equity instruments have been received in connection with securities loans transactions (see Note 9).
| · | | Collaterals in derivatives transactions traded in organized markets |
3,689 million pesos of loans and advances to customers have been pledged in connection with derivatives traded in organized markets (see Note 11).
| · | | Collaterals in OTC derivatives transactions |
29,508 million pesos of loans and advances to credit institutions have been pledged in connection with OTC derivatives transactions (see Note 7).
4,769 million pesos of debt instruments classified as financial assets at fair value through profit or loss have been pledged in connection with OTC derivatives transactions (see Note 8).
42,480 million pesos of deposits from credit institutions and customer deposits have been received in connection with OTC derivatives transactions (see Note 31).
4,044 million pesos of debt instruments have been received in connection with OTC derivatives transactions (see Note 31).
The Bank has restrictions on earnings distribution related to the legal reserve of 11,080 million pesos that include 8,086 million pesos in legal reserve of the Bank on an individual basis (see Note 44). In addition, the Bank is restricted from distributing dividends that will result in noncompliance with minimum capitalization requirements established by the CNBV (see Note 29).
| · | | Loans to other entities within the Bank |
The Bank granted a loan to Santander Consumo and Santander Vivienda for 43,800 million pesos and 32,686 million pesos, respectively, which were eliminated from the consolidated balance sheet for consolidation purposes.
c) Financial support
The Bank did not give any financial support to a consolidated structured entity during 2017 and 2018.
*****