Exhibit 99.1
Investor presentation National Energy Services Reunited Corp. NASDAQ -NESR November 2017

Disclaimer and Forward Looking Statement Thispresentation(the“Presentation”)isforinformationpurposesonlyandisbeingdeliveredtoyouforthe olepurposeofyour onsiderationandevaluationofapotentialinvestmentinequity ecuritiesofNationalEnergy solicitationofanoffertobuy,or recommendationtopurchaseanyotherequity,debtorotherfinancialinstrumentsofNESR,NESRHoldingsLtd.(the“Sponsor”),thetargetcompaniesdescribedherein,ortheirrespective Presentationdoesnotpurportto ontainalloftheinformationthatmayberequiredtoevaluate potentialinvestmentintheCompanyandyoushouldseekyourownlegal,accountingandotherrelevantprofessionaladvice. noneofNESR,theSponsor,thetargetcompaniesandtheirrespectiveaffiliates,directors,officers,employees,partners,members,controllingpersons,agentsoradvisers(collectively,theirrespective“Representatives”)(i) oftheinformationcontainedherein (ii)shallhaveanyliabilitytotherecipient itsrepresentativesrelatingto arisingfromtheinformationcontainedherein anyomissionsfromsuchinformation, anyotherwritten potential investment in NESR. The NESR s ecurities described in this Presentation have not been registered under the Securities Act of 1933, as amended (the “Securities Act”) or the s ecurities or “Blue Sky” laws of any s tate. It is intended that the NESR “accredited investors”, as defined in Rule 501(a) of Regulation D promulgated under the Securities Act in reliance on one or more available exemptions from the registration requirements of the Securities Act and s tate s disapprovedbytheSEC,any tate ecuritiescommissionorotherregulatoryauthority,norhaveanyoftheforegoingauthoritiespasseduponorendorsedthemeritsof potentialinvestmentortheaccuracyoradequacyof All information herein s peaksonly as of the date hereof, unless stated otherwise. Neither NESR nor the target c ompanies undertake anyobligation to update or otherwise revise any information contained in this Presentation. The financial information included in this investor presentation is preliminary, unaudited and s ubject to revision upon c ompletion of the Company's c losing and audit processes. This financial information has not been accounting measures which the c ompanymay be required to adopt. As s uch, potential investors are cautioned not to rely on such information, as audited results may differ materially from the information provided herein. UseofProjections:ThisPresentationcontainscertainfinancialforecastswithrespecttotheCompanyandthetargetcompanies. T hesefinancialprojectionshavebeenprovidedbytheirrespectivemanagement procedures with respect thereto for the purpose of their inclusion in this Presentation, and accordingly, do not express an opinion or provide any other form of assurance with respect thereto for the purpose of this future results. T he inclusion of s uch information is not an admission or representation by them that s uch information is material. In this Presentation, certain of the above-mentioned financial projections (in each c ase, with herein) have been prepared for purposes of providing c omparisons with historical data. T he assumptions and estimates underlying the projections are inherently uncertain and are s ubject to a wide v ariety of significant materially from those c ontained in the projections. Accordingly, there c an be no assurance that the prospective results are indicative of the future performance of NESR or the target c ompanies or that actual results will not should not be regarded as a representation by any person that the results c ontained in the projections will be achieved. T he information c ontained herein is not a guarantee of future performance. Forward-Looking Statements: This Presentation includes “forward-looking s tatements” regarding the Company and the target c ompanies that reflect their current v iews and information c urrently available. This believes,asofthedatehereof,provideareasonablebasisfortheinformationcontainedherein.Forward -lookingstatementscangenerallybeidentifiedbytheuseofforward -lookingwordssuchas“may”,“will”,“expect”, statements may include, for example, s tatements about: the parties’ ability to effect the business combination; the timing of the c lose of the transaction, the benefits of the business c ombination; the future financial future operations, financial position, estimated revenues, and losses, projected c osts, prospects, plans and objectives of management. These forward-looking s tatements are based on information available as of the date of this investor presentation, and c urrent expectations, forecasts and assumptions, and involve a number of judgments, risks and NESR’sviewsasofanysubsequentdate,andNESRdoesnotundertakeanyobligationtoupdateforward-lookingstatementstoreflectevents circumstancesafterthedatetheyweremade,whetheras resultofnew laws.Youshouldnotplaceunduerelianceontheseforward-lookingstatements.Asaresultofanumberofknownandunknownrisksanduncertainties,NESR’sactualresultsorperformancemaybemateriallydifferentfrom cause actual results to differ include: (i) the occurrence of any event, c hange or other c ircumstances that c ould delay the business c ombination or give rise to the termination of the definitive agreements relating to the following announcement of the business c ombination; (iii) the inability to c omplete the business c ombination due to the failure to obtain approval of the s tockholders of NESR, or other c onditions to c losing in the combination disrupts c urrent plans and operations of NESR, NPS or GES as a result of the announcement and c onsummation of the business c ombination; (v) NESR’s ability to realize the anticipated benefits of the NESRtogrowandmanagegrowthprofitablyfollowingthebusinesscombination;(vi)costsrelatedtothebusinesscombination;(vii)changesinapplicablelawsorregulations;and(viii)thepossibilitythatNESR,NPSorGES The foregoing list of factors is not exclusive. Additional information c oncerning these and other risk factors are c ontained in NESR’s most recent filings with the SEC. All s ubsequent written and oral forward-looking s attributable to NESR, GES, NPS, and GES’ and NPS’ s hareholders or any person acting on their behalf are expressly qualified in their entirety by the c autionary s tatements above. Non-GAAPFinancialMeasures:ThisPresentationincludescertainfinancialmeasuresnotpresentedinaccordancewithgenerallyacceptedaccountingprinciples(“GAAP”)including,butnotlimitedto,EBITDAandcertain financialresultsprovidesusefulinformationtomanagementandinvestorsregardingcertainfinancialandbusinesstrendsrelatingtoNPS,GESandNESR’sfinancialconditionandresultsofoperations.NESR’smanagement amongotherreasons,trendanalysis forbudgeting planningpurposes.NESRbelievesthattheuseofthesenon-GAAPmeasuresprovides additionaltoolforinvestorstouseinevaluatingongoingoperatingresults of which present s imilar non-GAAP measures to investors. Management of NESR does not c onsider these non-GAAP measures in isolation or as an alternative to financial measures determined in accordance with GAAP. T thatarerequiredbyGAAPtoberecordedintheCompany’sfinancialstatements.Inaddition,thesemeasuresaresubjecttoinherentlimitationsastheyreflecttheexerciseofjudgmentbymanagementaboutwhichexpenses notplaceunduerelianceonthesenon-GAAPmeasures.Weurgeyou reviewNPS,GESandNESR’sfinancialstatements,whichwillbepresentedinNESR’sproxystatement befiledwiththeSECanddelivered preliminary, unaudited and s ubject to revision upon c ompletion of the Company's c losing and audit processes. This financial information has not been adjusted to reflect the c onversion of any local GAAP measures of adopt. As s uch, potential investors are c autioned not to rely on s uch information, as audited results may differ materially from the information provided herein. AdditionalInformation:InconnectionwiththeproposedbusinesscombinationbetweenNESRandthetargetcompanies,NESRintendstofilewiththeSEC preliminaryproxys andwillmail definitiveproxys contain all the information that s hould be c onsidered c oncerning the proposed business c ombination. It is not intended to form the basis of any investment decision or any other decision in respect to the proposed available, the preliminary proxy s tatement and any amendments thereto, and the definitive proxy s tatement, in c onnection with NESR’s s olicitation of proxies for the s hareholders meeting to be held to approve the important information about NESR, the target c ompanies and the proposed transactions. T he definitive proxy s tatement will be mailed to NESR s tockholders as of a record date to be established for v oting on the obtain a c opyof the preliminary proxy s tatement and definitive proxy s tatement once they are available, without charge, at the SEC’s website at http://sec.gov or by directing a request to NESR at 777 Post Oak Blvd., Suite This Presentation s hall not c onstitute a s olicitation of a proxy, c onsent or authorization with respect to any s ecurities or in respect of the proposed business c ombination. NESR itsdirectors officersmaybedeemedparticipantsinthesolicitationofproxiesofNESR’sstockholderwithrespecttotheapprovalofthebusinesscombination.InformationregardingtheCompany’sdirectors proxy s tatement and amendments thereto, and the definitive proxy statement for the business c ombination, when available. Each of these documents will be available at the SEC’s website or by directing a request to the 2

Proven Senior Leadership and Sponsors 3
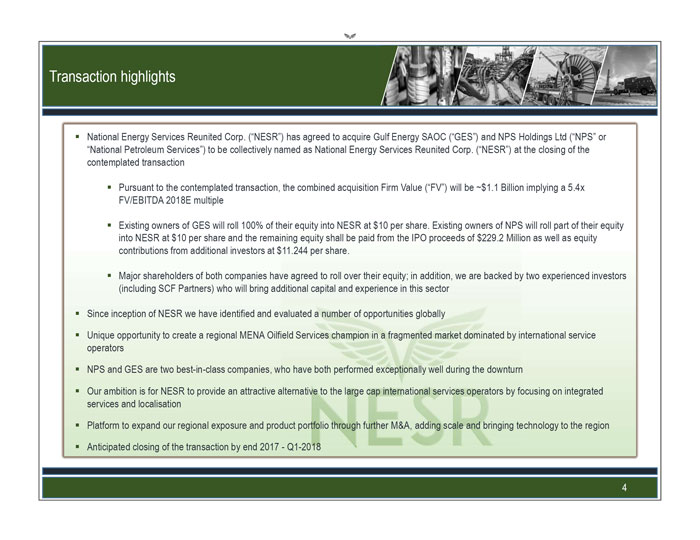
Transaction highlights National Energy Services Reunited Corp. (“NESR”) has agreed to acquire Gulf Energy SAOC (“GES”) and NPS Holdings Ltd (“NPS” or “National Petroleum Services”) to be collectively named as National Energy Services Reunited Corp. (“NESR”) at the closing ofthe contemplated transaction Pursuant to the contemplated transaction, the combined acquisition Firm Value (“FV”) will be ~$1.1 Billion implying a 5.4x FV/EBITDA 2018E multiple Existing owners of GES will roll 100% of their equity into NESR at $10 per share. Existing owners of NPS will roll part of their equity into NESR at $10 per share and the remaining equity shall be paid from the IPO proceeds of $229.2 Million as well as equity contributions from additional investors at $11.244 per share. Major shareholders of both companies have agreed to roll over their equity; in addition, we are backed by two experienced investors (including SCF Partners) who will bring additional capital and experience in this sector Since inception of NESR we have identified and evaluated a number of opportunities globally Unique opportunity to create a regional MENA Oilfield Services champion in a fragmented market dominated by international service operators NPS and GES are two best-in-class companies, who have both performed exceptionally well during the downturn Our ambition is for NESR to provide an attractive alternative to the large cap international services operators by focusing on integrated services and localisation Platform to expand our regional exposure and product portfolio through further M&A, adding scale and bringing technology to the region Anticipated closing of the transaction by end 2017 -Q1-2018 4
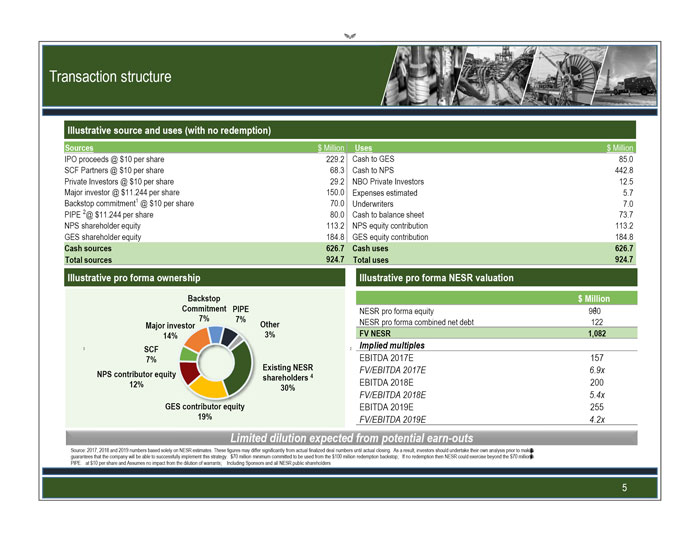
Transaction structure Illustrative source and uses (with no redemption) Sources $ Million Uses $ Million IPO proceeds @ $10 per share 229.2 Cashto GES 85.0 SCF Partners @ $10 per share 68.3 Cash to NPS 442.8 Private Investors @ $10 per share 29.2 NBO Private Investors 12.5 Majorinvestor @ $11.244 per share 150.0 Expenses estimated 5.7 Backstop commitment1@ $10 per share 70.0 Underwriters 7.0 PIPE2@ $11.244 per share 80.0 Cash to balance sheet 73.7 NPS shareholder equity 113.2 NPS equity contribution 113.2 GES shareholder equity 184.8 GES equity contribution 184.8 Cash sources 626.7 Cash uses 626.7 Total sources 924.7 Total uses 924.7 Illustrative pro forma ownership Illustrative pro forma NESR valuation Backstop $ Million Commitment PIPE NESR pro forma equity 960 7% 7% NESR pro forma combined net debt 122 Major investor Other 14% 3% FV NESR 1,082 SCF Implied multiples 7% EBITDA 2017E 157 Existing NESR FV/EBITDA 2017E 6.9x NPS contributor equity shareholders412% EBITDA 2018E 200 30% FV/EBITDA 2018E 5.4x GES contributor equity EBITDA 2019E 255 19% FV/EBITDA 2019E 4.2x Limited dilution expected from potential earn-outs Source: 2017, 2018 and 2019 numbers based solely on NESR estimates. These figures may differ significantly from actual finalizeddeal numbers until actual closing. As a result, investors should undertake their own analysis prior to guarantees that the company will be able to successfully implement this strategy. $70 million minimum committed to be used from the $100 million redemption backstop; If no redemption then NESR could exercise beyond the $70 PIPE. at $10 per share and Assumes no impact from the dilution of warrants; Including Sponsors and all NESR public shareholders 5
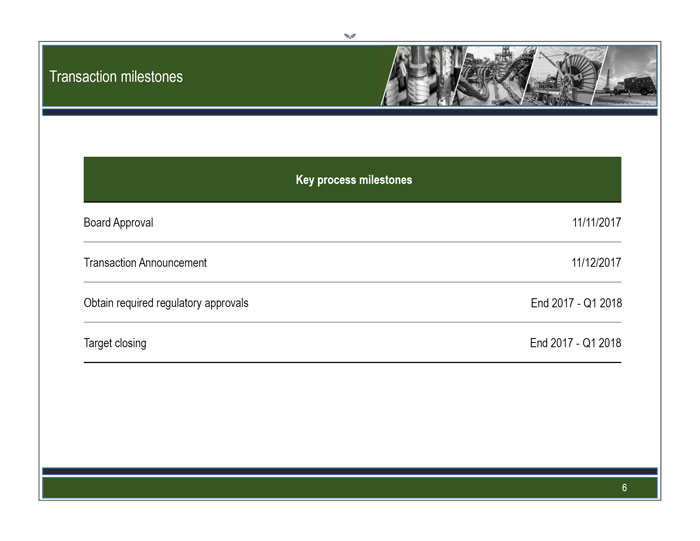
Transaction milestones Key processmilestones Board Approval 11/11/2017 Transaction Announcement 11/12/2017 Obtain required regulatory approvals End 2017 -Q1 2018 Target closing End 2017 -Q1 2018 6

Transaction overview Equity story Targets detailed overview 7
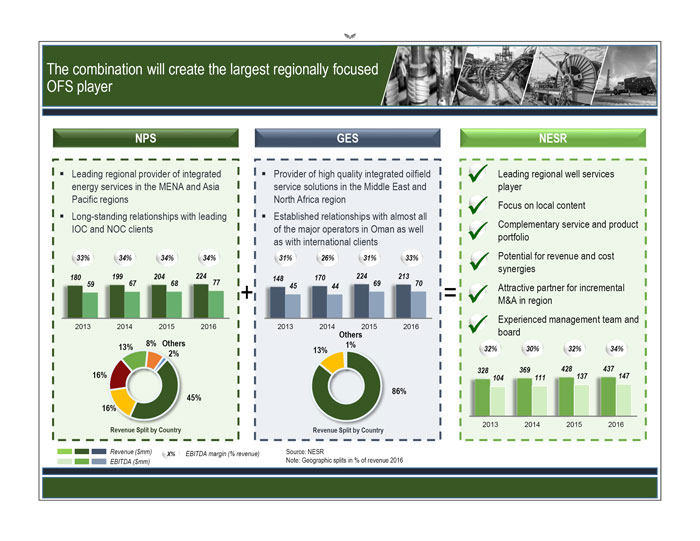
The combination will create the largest regionally focused OFS player NPS Leading regional provider of integrated energy services in the MENA and Asia Pacific regions Long-standing relationships with leading IOC and NOC clients 33% 34% 34% 34% 180 199 204 224 59 67 68 77 2013 2014 2015 2016 13% 8% Others 2% 16% 45% 16% Revenue Split by Country GES Provider of high quality integrated oilfield service solutions in the Middle East and North Africa region Established relationships with almost all of the major operators in Oman as well as with international clients 31% 26% 31% 33% 148 170 224 213 45 44 69 70 2013 2014 2015 2016 Others 1% 13% 86% Revenue Split by Country NESR Leading regional well services player Focus on local content Complementary service and product portfolio Potential for revenue and cost synergies Attractive partner for incremental M&A in region Experienced management team and board 32% 30% 32% 34% 328 369 428 437 104 111 137 147 2013 2014 2015 2016 Revenue ($mm) X% EBITDA margin (% revenue) Source: NESR EBITDA ($mm) Note: Geographic splits in % of revenue 2016 8
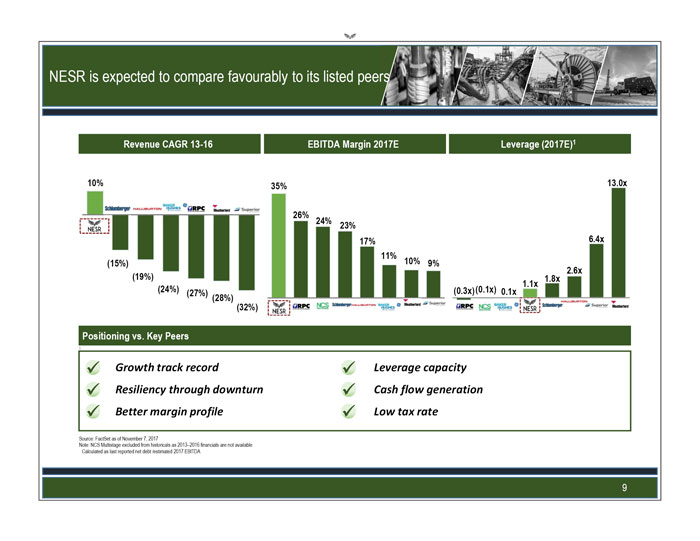
NESR is expected to compare favourably to its listed peers Revenue CAGR 13-16 EBITDA Margin 2017E Leverage (2017E)1(32%) Positioning vs. Key Peers Growth track record Leverage capacity Resiliency through downturn Cash flow generation Better margin profile Low tax rate Source: FactSet as of November 7, 2017 Note: NCS Multistage excluded from historicals as 2013 2016 financials are not available Calculated as last reported net debt /estimated 2017 EBITDA 9
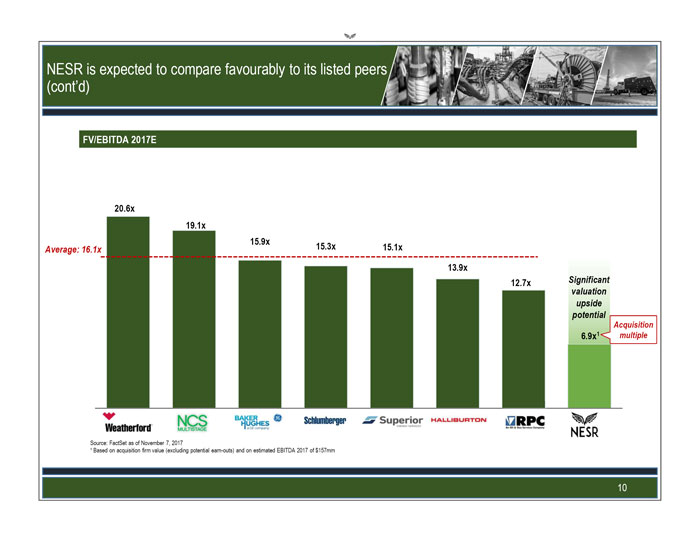
NESR is expected to compare favourably to its listed peers (cont’d) FV/EBITDA 2017E 20.6x 19.1x 15.9x Average: 16.1x 15.3x 15.1x 13.9x 12.7x Significant valuation upside potential Acquisition 6.9x1 multiple Source: FactSet as of November 7, 2017 1 Based on acquisition firm value (excluding potential earn-outs) and on estimated EBITDA 2017 of $157mm 10

NESR is expected to compare favourably to its listed peers (cont’d) FV/EBITDA 2018E Acquisition multiple Source: FactSet as of November 7, 2017 1 Based on acquisition firm value (excluding potential earn-outs) and on estimated EBITDA 2018 of $200mm 11
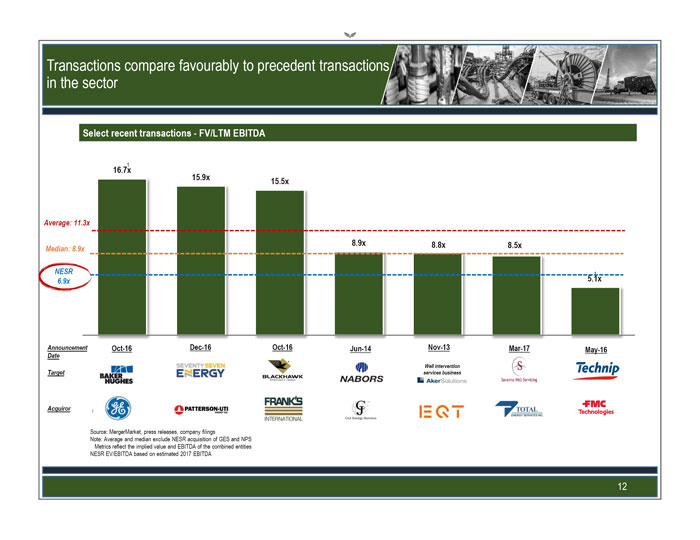
Transactions compare favourably to precedent transactions in the sector Select recent transactions -FV/LTM EBITDA Source: MergerMarket, press releases, company filings Note: Average and median exclude NESR acquisition of GES and NPS Metrics reflect the implied value and EBITDA of the combined entities NESREV/EBITDA based on estimated 2017 EBITDA 12

Transaction overview Equity story Targets detailed overview 13
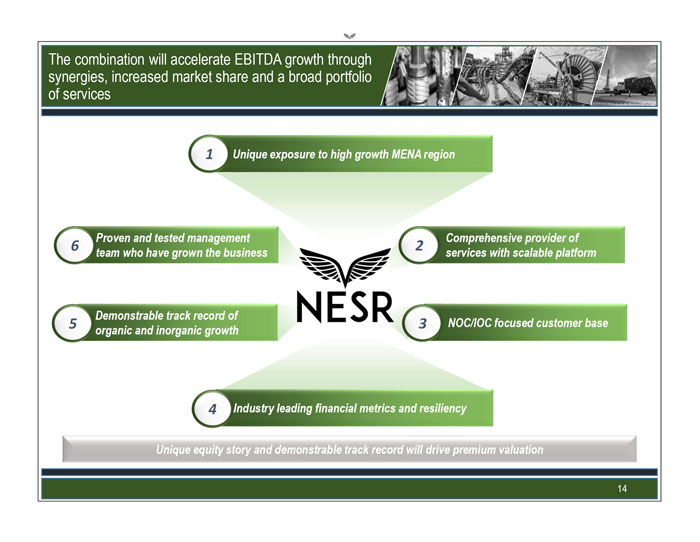
The combination will accelerate EBITDA growth through synergies, increased market share and a broad portfolio of services 1 Unique exposure to high growth MENA region 6 Proven and tested management Comprehensive provider of team who have grown the business services with scalable platform Demonstrable track record of 5 NOC/IOC focused customer base organic and inorganic growth 4 Industry leading financial metrics and resiliency Unique equity story and demonstrable track record will drive premium valuation 14
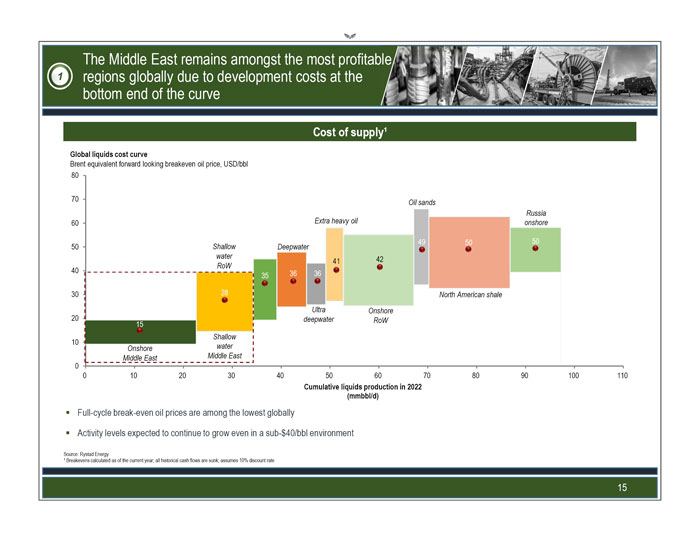
The Middle East remains amongst the most profitable 1 regions globally due to development costs at the bottom end of the curve Cost of supply1 Global liquids cost curve Brent equivalent forward looking breakeven oil price, USD/bbl 80 70 Oil sands Russia 60 Extra heavy oil onshore 49 50 50 50 Shallow Deepwater water 42 41 RoW 40 36 36 35 30 28 North American shale Ultra Onshore 20 deepwater RoW 15 Shallow 10 Onshore water Middle East Middle East 0 0 10 20 30 40 50 60 70 80 90 100 110 Cumulative liquids production in 2022 (mmbbl/d) Full-cycle break-even oil prices are among the lowest globally Activity levels expected to continue to grow even in a sub-$40/bbl environment Source: RystadEnergy 1 Breakevens calculated as of the current year; all historical cash flows are sunk; assumes 10% discount rate 15

NESR’s future growth story is supported by robust 1 growth profile across its key services and countries of operations… 2016A pro forma rev% by country Resilient and growing onshore rig market Middle East OFS spend by country ($mm) GCC onshore rig count 280 21,188 21,390 6% 3% 260 7% 26% 3,578 3,624 16,274 240 1,772 1,273 16% GCC onshore rig count 2,796 220 US onshore rig count 4,784 4,527 30% 1,178 Higher growth rate 1,482 200 3,710 1,853 Kuwait 2,203 Saudi 1,938 1,654 180 Oman 1,507 42% 5,642 5,974 160 4,324 (46%) Growth Jan-14 to Sep-17 1,604 1,722 140 960 Jan 2014 Mar 2015 Jun 2016 Sep 2017 2016 2019 2021 Bahrain Iraq Saudi Arabia United Arab Emirates Qatar Oman Kuwait Other Source: Baker Hughes, rig count for Kuwait, Saudi Arabia, UAE, Qatar, Oman 16
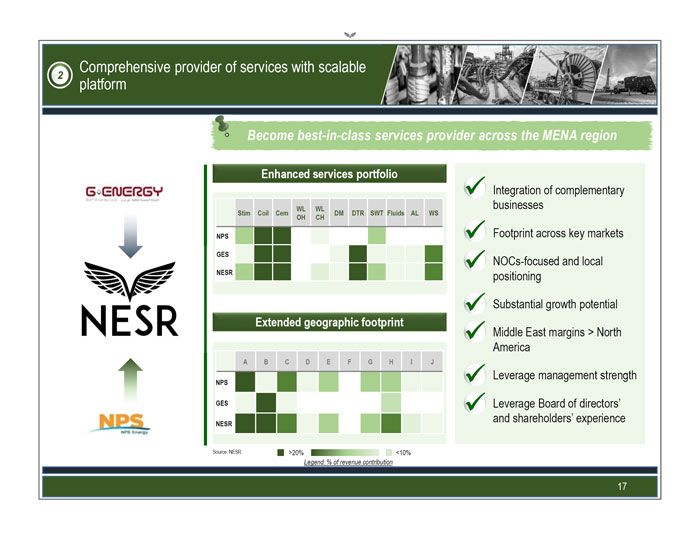
Comprehensive provider of services with scalable 2 platform Become best-in-class services provider across the MENA region Enhanced services portfolio Integration of complementary WL WL businesses Stim Coil Cem DM DTR SWT Fluids AL WS OH CH NPS Footprint across key markets GES NOCs-focused and local NESR positioning Substantial growth potential Extended geographic footprint Middle East margins > North America A B C D E F G H I J Leverage management strength NPS GES Leverage Board of directors’ and shareholders’ experience NESR Source: NESR >20% <10% Legend: % of revenue contribution 17
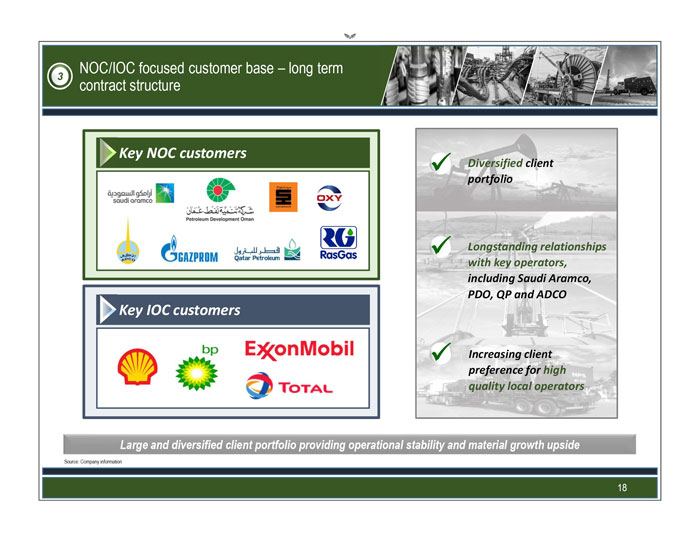
NOC/IOC focused customer base long term 3 contract structure Key NOC customers Diversifiedclient portfolio Longstanding relationships with key operators, including Saudi Aramco, PDO, QP and ADCO Key IOC customers Increasing client preference for high quality local operators Large and diversified client portfolio providing operational stability and material growth upside Source: Company information 18

NPS and GES have demonstrated sector leading 4 resiliency since 2013 given strong service delivery and cost management Revenue CAGR 13A 16A1 EBITDA CAGR 13A 16A1 2016 vs. 2013 EBITDA 13% 10% 7% 155% 141% 130% 15% 12% 9% Growth 20% (21%) (78%) 0% (106%) (29%) US Large US US Large US US Large US Cap Mid/Small Cap Mid/Small Cap Mid/Small Pro forma Pro forma Pro forma Average EBITDA margin 13A 16A 40% 34% 35% 32% 30% 30% 25% Margins 20% 16% 16% 15% 10% 5% 0% US Large Cap US Mid/Small Source: NESR management, FactSet Revenue and EBITDA CAGR 13A-16A for groups defined as average revenue and EBITDA CAGR 13A-16A for each group; Average EBITDA margin for each group based on average margins from 2013 to 2016 for each large cap include Schlumberger, Halliburton, Baker Hughes, Weatherford; US mid/small cap include RPC, Superior Energy Services; NCS Multistage has been excluded as no disclosure on 2013 financials 19

Demonstrable track record of organic and inorganic 5 growth 2014: 2015: ~ 90% of NPS is acquired by 4 institutional investors NPS establishes 2017: and refinances existing NPS enters GES increases focus Oman and andoperations 2017 acquires an 428 437 Indonesia based 369 2013: wireline 328 2016 264 NPS enters logging/slickline GES establishes business technology NPS refinances GES initiates 2015 existing debt region starting Saudi Arabia and 2012 2013 2014 2015 2016 2014 Iraq with BP worth Combined revenue ($mm) 2013 forward to focus on 2012: Kuwait, Algeria and on GES extends by 5 years main client’s contract for in Oman stimulation services, with enhanced scope and pricing 2012 2007: 2010: NPS enters Brunei and acquires Integrated 2011 NPS enters India Petroleum Services (Saudi Arabia) 2010 2005: GES incorporated as a JV between Oman 2009 Investment Company and 2 Omani founders 2011: 2008 2007 NPS enters Kuwait 2006 GES establishes well solutions and 2005 2004 servicessubsidiary 2009: GES starts sand management system NPS enters Iraq services and well maintenance services 2004: NPS formed by merger of key regional O&G services providers 2008: 2006: NPS acquires Oiltech (Singapore) GES first contract from PDO for drilling technology solutions GES gets additional contracts from non-PDO entities Source: Company information Note: Milestones stand for main service line introductions only for GES and main new locations of operations overtime only for NPS 20
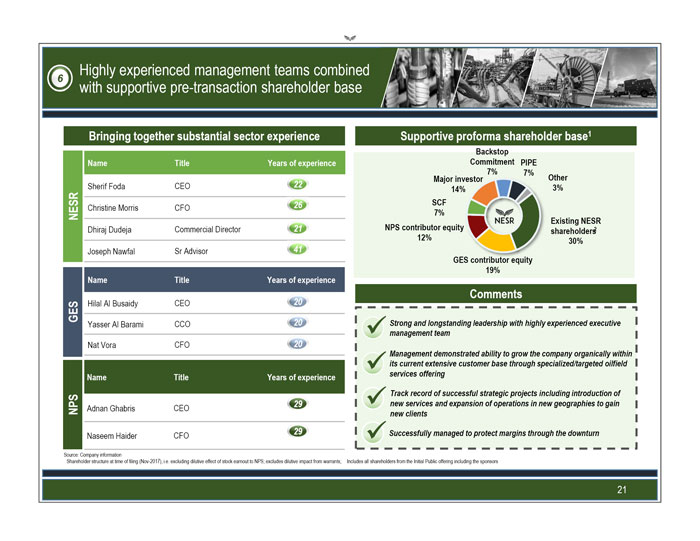
Highly experienced management teams combined 6 with supportive pre-transaction shareholder base Bringing together substantial sector experience Supportive proforma shareholder base1Backstop Name Title Years of experience Commitment PIPE 7% 7% Major investor Other Sherif Foda CEO 22 3% 14% 26 SCF Christine Morris CFO NESR 7% Existing NESR Dhiraj Dudeja Commercial Director 21 NPS contributor equity shareholders 12% 30% Joseph Nawfal Sr Advisor 41 GES contributor equity 19% Name T itle Years of experience Comments HilalAl Busaidy CEO 20 GES 20 Strong and longstanding leadership with highly experienced executive YasserAl Barami CCO management team Nat Vora CFO 20 Management demonstrated ability to grow the company organically within its current extensive customer base through specialized/targeted oilfield Name T itle Years of experience services offering Track record of successful strategic projects including introduction of 29 new services and expansion of operations in new geographies to gain NPS Adnan Ghabris CEO new clients CFO 29 Successfully managed to protect margins through the downturn NaseemHaider Source: Company information Shareholder structure at time of filing (Nov-2017), i.e. excluding dilutive effect of stock earnout to NPS; excludes dilutive impact from warrants; Includes all shareholders from the Initial Public offering including the sponsors 21

NESR Strategy and Ambition NESR’s strategy to deliver superior returns and growth in shareholder value Growth Ambition Create the leading regional MENA Oilfield Services player Leverage cost synergies and savings for incremental margins Substantial organic revenue synergies through cross-selling of complementary tools and services Focus on differentiated localization through on the ground presence, facilities and management Continue to target and acquire value enhancing acquisitions through the introduction of new technologies into the region 2017 Geographical Geographical Geographical Drilling Portfolio Evaluation Completions Drilling Evaluation Technology Expansion A unique opportunity to take part in creating a Middle-East bellwether with significant upside return potential 22
Transaction overview Equity story Target detailed overview 23
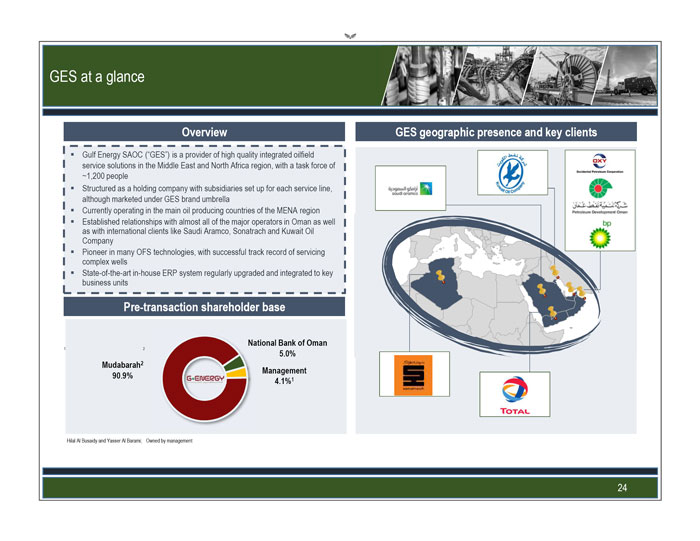
GES at a glance Overview GES geographic presence and key clients Gulf Energy SAOC (“GES”) is a provider of high quality integrated oilfield service solutions in the Middle East and North Africa region, with a task force of ~1,200 people Structured as a holding company with subsidiaries set up for each service line, although marketed under GES brand umbrella Currently operating in the main oil producing countries of the MENA region Established relationships with almost all of the major operators in Oman as well as with international clients like Saudi Aramco, Sonatrach and Kuwait Oil Company Pioneer in many OFS technologies, with successful track record of servicing complex wells State-of-the-art in-house ERP system regularly upgraded and integrated to key business units Pre-transaction shareholder base National Bank of Oman 5.0% Mudabarah2Management 90.9% 4.1%1Hilal Al Busaidy and Yasser Al Barami; Owned by management 24
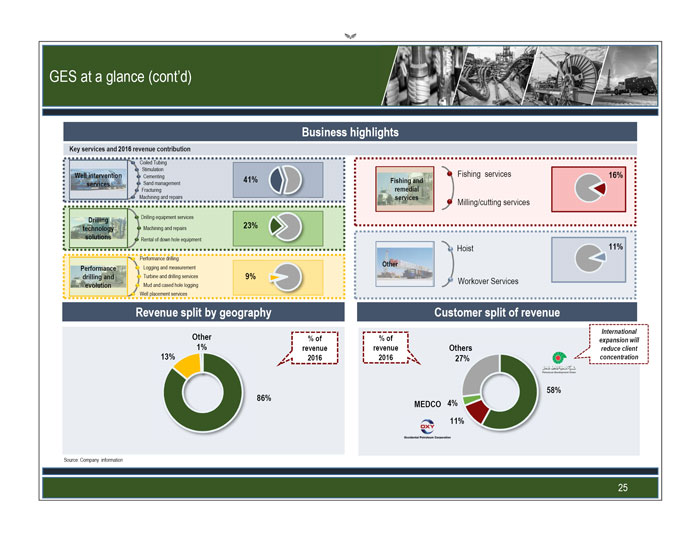
GES at a glance (cont’d) Business highlights Key services and 2016 revenue contribution Coiled Tubing Stimulation Well intervention Cementing Fishing services 16% 41% Fishing and services Sand management Fracturing remedial Machining and repairs services Milling/cutting services Drilling Drilling equipment services technology Machining and repairs 23% solutions Rental of down hole equipment Hoist 11% Performance drilling Other Performance Logging and measurement drilling and Turbine and drilling services 9% Workover Services evolution Mud and cased hole logging Well placement services Revenue split by geography Customer split of revenue International Other % of % of expansion will 1% revenue revenue Others reduce client 13% 2016 2016 27% concentration 58% 86% MEDCO 4% 11% Source: Company information 25
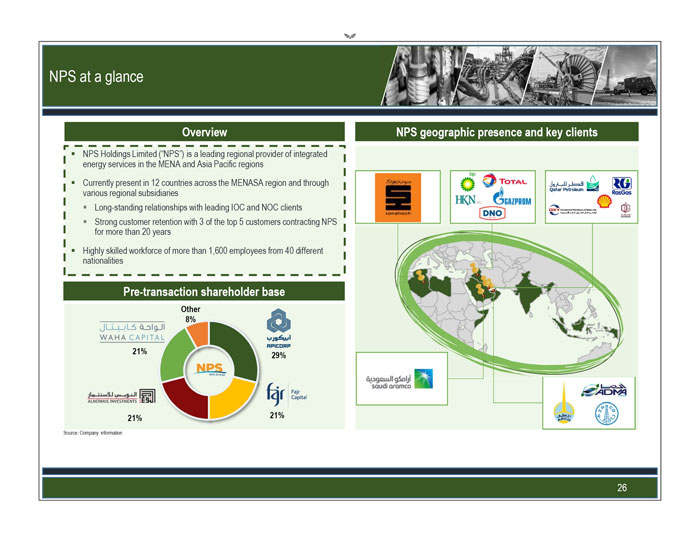
NPS at a glance Overview NPS geographic presence and key clients NPS Holdings Limited (“NPS”) is a leading regional provider of integrated energy services in the MENA and Asia Pacific regions Currently present in 12 countries across the MENASA region and through various regional subsidiaries Long-standing relationships with leading IOC and NOC clients Strong customer retention with 3 of the top 5 customers contracting NPS for more than 20 years Highly skilled workforce of more than 1,600 employees from 40 different nationalities Pre-transaction shareholder base Other 8% 21% 29% 21% 21% Source: Company information 26
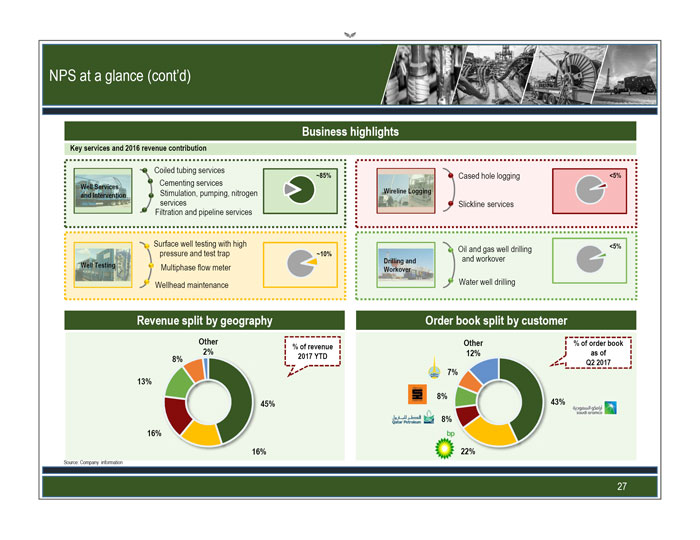
NPS at a glance (cont’d) Business highlights Key services and 2016 revenue contribution Coiled tubing services ~85% Cased hole logging <5% Well Services Cementing services Stimulation, pumping, nitrogen Wireline Logging and Intervention services Slickline services Filtration and pipeline services Surface well testing with high <5% Oil and gas well drilling pressure and test trap ~10% Drilling and and workover Well Testing Multiphase flow meter Workover Wellhead maintenance Water well drilling Revenue split by geography Order book split by customer Other Other % of order book % of revenue 2% 12% as of 8% 2017 YTD Q2 2017 7% 13% 8% 45% 43% 8% 16% 16% 22% Source: Company information 27
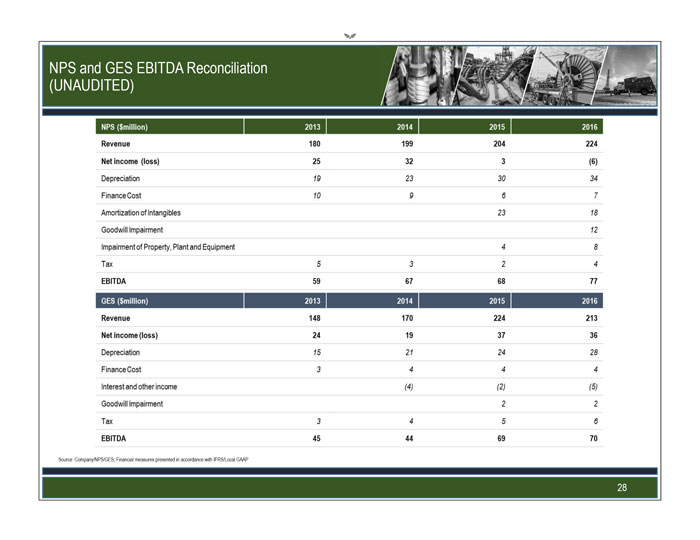
NPSandGESEBITDA Reconciliation (UNAUDITED) Source: Company/NPS/GES; Financial measures presented in accordance with IFRS/Local GAAP 28