UNITED STATES
SECURITIES AND EXCHANGE COMMISSION
Washington, D.C. 20549
FORM N-CSR
CERTIFIED SHAREHOLDER REPORT OF REGISTERED
MANAGEMENT INVESTMENT COMPANIES
Investment Company Act file number 811-23234
BMT Investment Funds
(Exact name of registrant as specified in charter)
10 South Bryn Mawr Avenue
Bryn Mawr, PA 19010
(Address of principal executive offices) (Zip code)
Francis J. Leto
10 South Bryn Mawr Avenue
Bryn Mawr, PA 19010
(Name and address of agent for service)
(610) 581-4730
Registrant's telephone number, including area code
Date of fiscal year end: May 31, 2018
Date of reporting period: November 30, 2017
Item 1. Reports to Stockholders.

BMT Multi-Cap Fund
Semi-Annual Report
November 30, 2017
Letter from the Investment Adviser
Dear Shareholders,
At Bryn Mawr Trust, we are committed to being stewards of the capital you have invested. We are pleased to provide our first semi-annual report for the BMT Multi-Cap Fund (“BMTMX”), which is advised by BMT Investment Advisers. BMTMX has an inception date of Aug. 15, 2017.
The following general market and macroeconomic commentary and relative performance insights will cover the period from Aug. 15, 2017 through Nov. 30, 2017. Over this timeframe, BMTMX returned 7.60%, compared to 8.08% for the S&P 500 Index.
Macroeconomic Review
Economic activity, both in the United States and abroad, continued to show signs of strengthening for the three-and-a-half-month period ending Nov. 30, 2017.
Data released by the U.S. Bureau of Labor Statistics over that period revealed that the labor market is showing no visible signs of weakening. For the month of November, total non-farm payrolls rose by 228,000 jobs, while the unemployment rate remained at 4.1%, a level last seen 17 years ago, in December 2000. Aside from a robust jobs report, other key economic data, such as Conference Board USA Index of Leading Indicators (designed to forecast future business activity), Personal Income, Consumer Confidence, and ISM Manufacturing and Non-Manufacturing surveys, provided no evidence that U.S. business activity is on the verge of decelerating. A combination of solid economic growth (Real GDP increased 3.2%, annualized for the third quarter of 2017), tepid inflation, and low, but steadily rising, interest rates created a favorable backdrop for equity markets.
Furthermore, the Federal Reserve did not precipitate any surprises from a monetary policy standpoint, and it made changes to its benchmark interest rate target that were in line with investor expectations. In addition, Jerome Powell’s nomination as the next Fed chairman was welcomed by the markets.
BMTMX Performance Commentary
BMTMX trailed its benchmark, the S&P 500 Index, by 48 basis points (0.48%) for the three-and-a-half-month period ending Nov. 30, 2017.
Absolute results were strong, but relative results were adversely impacted by BMTMX’s cash position, which was the primary detractor for the period. Cash levels were elevated for part of the period, due to an influx of cash coming into the recently established BMTMX. Given the strong returns of equity markets, this cash created a headwind from a relative performance standpoint. Cash levels are expected to decline going forward.
With regard to BMTMX’s Health Care exposure, a combination of negative stock selection and an overweight position relative to the benchmark detracted value. Aceto Corporation and Envision Healthcare Corporation were among the top individual detractors within the Health Care sector. Teleflex Incorporated, a medical equipment company, helped to counteract some of the weakness in this sector, as its shares easily outpaced the S&P 500 Index during this time period.
Conversely, strong selection within the Financials sector had a positive impact from a relative performance standpoint. BMTMX’s bank holdings collectively added value, but stock selection within the capital markets industry, led by Cboe Global Markets, Inc., was the main positive outlier.
BMTMX’s exposure across the market capitalization spectrum was beneficial, as equity returns were more robust within the mid-cap and small-cap segment of the market. BMTMX had considerable exposure (approximately 60% of its portfolio) to this portion of the U.S. equity market, and over the long term, is expected to have a larger allocation to mid- and small-caps compared to its benchmark.
Market Outlook
The seasonally volatile period of late summer/early fall ended with risk assets having a favorable showing. Barring any major setbacks, equities are on the verge of closing out the year with strong gains once again. While the prospects of tax reform, fiscal stimulus, and deregulation have ignited investor optimism, we believe that above-average valuations have led to some degree of complacency, given how low volatility has been.
We are cautiously optimistic as we approach 2018. A favorable macroeconomic environment should help boost corporate profits and allow companies to maintain above-average operating margins. While we pay considerable attention to various macro factors, especially credit spreads and developments on the interest rate front, we continue to believe that sound, bottom-up security selection is vital for adding value at this stage of the economic cycle.
Sincerely,
Ernest E. Cecilia, CFA
Andrew G. Keefer, CFA, CFP®
BMTMX Portfolio Managers
Must be preceded or accompanied by a prospectus.
Past performance does not guarantee future results.
This shareholder letter reflects opinions of BMTMX managers as of 11/30/2017, which are subject to change. Any forecast made cannot be guaranteed and should not be considered investment advice.
BMTMX invests in mid-cap and small-cap companies, which involves risks such as limited liquidity and greater volatility. BMTMX also may invest in other investment companies (to the extent it does so, an investor will indirectly bear the principal risks and its share of the fees and expenses of the underlying investment companies), foreign securities (which involves political, economic and currency risks, greater volatility, and differences in accounting methods), and/or debt securities (which typically decrease in value when interest rates rise).
Basis point (bp) is a unit equal to 1/100th of 1% and is used to denote the change in a financial instrument.
Market cap is the market price of an entire company, calculated by multiplying the number of shares outstanding by the price per share.
The S&P 500 Index is a broad-based unmanaged index of 500 stocks, which is widely recognized as representative of the equity market in general. It is not possible to invest in an index.
BMTMX holdings are subject to change and should not be considered a recommendation to buy or sell any security. Please see the “Schedule of Investments” section of this report for a full listing of BMTMX’s holdings.
BMT Investment Advisers, a subsidiary of Bryn Mawr Bank Corporation, is the advisor to BMTMX. BMTMX is distributed by Quasar Distributors, LLC. Bryn Mawr Bank Corporation and Quasar Distributors, LLC are independent entities.
Not a Deposit; Not FDIC Insured; No Bank Guarantee; May Lose Value
Expense Example
November 30, 2017 (Unaudited)
As a shareholder of the BMT Multi-Cap (“the Fund”), you incur ongoing costs, including management fees and other expenses incurred by the Fund. This example is intended to help you understand your ongoing costs (in dollars) of investing in the Fund and to compare these costs with the ongoing costs of investing in other mutual funds. The example is based on an investment of $1,000 invested at August 15, 2017, the commencement of operations through November 30, 2017.
Actual Expenses
The first line of the following table provides information about actual account values and actual expenses. Although the Fund charges no sales load or transaction fees, you will be assessed fees for outgoing wire transfers, returned checks or stop payment orders at prevailing rates charged by U.S. Bancorp Fund Services, LLC, the Funds’ transfer agent. To the extent that a Fund invests in shares of other investment companies as part of its investment strategy, you will indirectly bear your proportionate share of any fees and expenses charged by the underlying funds in which the Fund invests in addition to the expenses of the Fund. Actual expenses of the underlying funds are expected to vary among the various underlying funds. These expenses are not included in the following example. The example includes, but is not limited to, management fees, fund accounting, custody and transfer agent fees. However, the example below does not include portfolio trading commissions and related expenses, interest expense and other extraordinary expenses as determined under generally accepted accounting principles. You may use the information in this line, together with the amount you invested, to estimate the expenses that you paid over the period. Simply divide your account value by $1,000 (for example, an $8,600 account value divided by $1,000 = 8.6), then multiply the result by the number in the first line under the heading entitled “Expenses Paid During Period” to estimate the expenses you paid on your account during this period.
Hypothetical Example for Comparison Purposes
The second line of the following table provides information about hypothetical account values and hypothetical expenses based on the Funds’ actual expense ratio and an assumed rate of return of 5% per year before expenses, which is not the Funds’ actual return. The hypothetical account values and expenses may not be used to estimate the actual ending account balance or expenses you paid for the period. You may use this information to compare the ongoing costs of investing in the Fund and other funds. To do so, compare this 5% hypothetical example with the 5% hypothetical examples that appear in the shareholder reports of the other funds.
Please note that the expenses shown in the table are meant to highlight your ongoing costs only and do not reflect any transactional costs, such as sales charges (loads), redemption fees, or exchange fees. Therefore, the second line of the table is useful in comparing ongoing costs only, and will not help you determine the relative costs of owning different funds. In addition, if these transactional costs were included, your costs would have been higher.
BMT Multi-Cap Fund
Beginning Account Value August 15, 2017 | Ending Account Value November 30, 2017 | Expenses Paid During Period* August 15, 2017 – November 30, 2017 | ||||||||||
Actual | $ | 1,000.00 | $ | 1,076.00 | $ | 3.04 | ||||||
Hypothetical (5% return before expenses) | 1,000.00 | 1,011.73 | 2.95 | |||||||||
*Expenses are equal to the Fund’s annualized expense ratio of 1.00%, multiplied by the average account value over the period, multiplied by 107/365 to reflect the period.
| BMT Multi-Cap Fund |
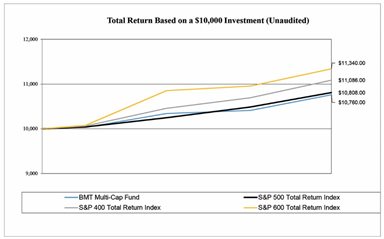
This chart assumes an initial investment of $10,000 made on August 15, 2017 (commencement of operations). Returns shown include the reinvestment of all dividends. Returns shown do not reflect the deduction of taxes that a shareholder would pay on fund distributions or the redemption of fund shares. In the absence of fee waivers and reimbursements, total return would be reduced. Past performance is not predictive of future performance. Investment return and principal value will fluctuate, so that your shares, when redeemed, may be worth more or less than the original cost.
S&P 500 TOTAL RETURN INDEX – A capitalization-weighted index of 500 stocks. The index is designed to measure performance of the broad domestic economy through changes in the aggregate market value of 500 stocks representing all major industries.
S&P 400 TOTAL RETURN INDEX – A capitalization-weighted index of 400 stocks. The index is designed to measure performance of the mid-range sector of the U.S. stock market.
S&P 600 TOTAL RETURN INDEX – A capitalization-weighted index of 600 stocks. The index is designed to measure performance of selected U.S. stocks with a small market capitalization.
Total Returns (for periods ended November 30, 2017)
|
| 1 Month |
|
| 3 Month |
|
| Since Inception (08/15/17) |
| |||
BMT Multi-Cap Fund |
|
| 3.36 | % |
|
| 7.28 | % |
|
| 7.60 | % |
S&P 500 Total Return Index |
|
| 3.07 | % |
|
| 7.65 | % |
|
| 8.08 | % |
S&P 400 Total Return Index | 3.68 | % | 10.17 | % | 10.86 | % | ||||||
S&P 600 Total Return Index | 3.52 | % | 12.56 | % | 13.40 | % | ||||||
Allocation of Portfolio Holdings (as a % of total net assets)
November 30, 2017 (Unaudited)
BMT Multi-Cap Fund

Components of Portfolio Holdings | ||||
Information Technology | $ | 26,623,434 | ||
Health Care | 25,657,557 | |||
Industrials | 20,273,246 | |||
Financials | 18,471,384 | |||
Consumer Discretionary | 10,151,135 | |||
Consumer Staples | 9,696,892 | |||
Energy | 6,940,636 | |||
Materials | 4,431,472 | |||
Utilities | 1,692,853 | |||
Telecommunications | 1,402,885 | |||
Cash* | 11,856,690 | |||
| $ | 137,198,184 |
The sector and industry classifications presented in this report, present the Global Industry Classification Standard (GICS®). GICS® was developed by and/or is the exclusive property of MSCI, Inc. and Standard & Poor Financial Services LLC (“S&P”). GICS® is a service mark of MSCI and S&P and has been licensed for use by U.S. Bancorp Fund Services, LLC.
*Cash, cash equivalents and other assets less liabilities.
BMT Multi-Cap Fund | |||||||
Schedule of Investments as of November 30, 2017 | |||||||
(Unaudited) |
Shares | Value | |||||||
COMMON STOCKS - 91.36% | ||||||||
Automobiles & Components - 2.07% | ||||||||
Cooper Tire & Rubber Co. | 39,383 | $ | 1,447,325 | |||||
Delphi Automotive PLC (a) | 13,337 | 1,395,984 | ||||||
| 2,843,309 | ||||||||
Banks - 8.63% | ||||||||
BB&T Corp. | 42,280 | 2,089,477 | ||||||
Camden National Corp. | 38,388 | 1,753,948 | ||||||
JPMorgan Chase & Co. | 26,762 | 2,797,164 | ||||||
South State Corp. | 18,656 | 1,717,285 | ||||||
Union Bankshares Corp. | 55,920 | 2,107,625 | ||||||
Wells Fargo & Co. | 24,289 | 1,371,600 | ||||||
| 11,837,099 | ||||||||
Capital Goods - 9.19% | ||||||||
Astec Industries, Inc. | 24,705 | 1,367,916 | ||||||
Cubic Corp. | 26,804 | 1,660,508 | ||||||
Hexcel Corp. | 27,586 | 1,710,332 | ||||||
Honeywell International, Inc. | 11,102 | 1,731,468 | ||||||
Johnson Controls International plc (a) | 44,664 | 1,681,153 | ||||||
Nordson Corp. | 13,539 | 1,737,866 | ||||||
Spirit AeroSystems Holdings, Inc. - Class A | 12,135 | 1,022,374 | ||||||
Standex International Corp. | 15,796 | 1,690,172 | ||||||
| 12,601,789 | ||||||||
Commercial & Professional Services - 1.99% | ||||||||
ABM Industries, Inc. | 32,251 | 1,380,343 | ||||||
Brady Corp. - Class A | 34,543 | 1,350,631 | ||||||
| 2,730,974 | ||||||||
Consumer Durables & Apparel - 2.24% | ||||||||
VF Corp. | 18,554 | 1,353,700 | ||||||
Wolverine World Wide, Inc. | 59,313 | 1,718,297 | ||||||
| 3,071,997 | ||||||||
Consumer Services - 1.00% | ||||||||
Darden Restaurants, Inc. | 16,258 | 1,370,875 | ||||||
Diversified Financials - 3.57% | ||||||||
Cboe Global Markets, Inc. | 14,266 | 1,760,852 | ||||||
The Charles Schwab Corp. | 29,398 | 1,434,328 | ||||||
Raymond James Financial, Inc. | 19,326 | 1,706,486 | ||||||
| 4,901,666 | ||||||||
See notes to financial statements.
BMT Multi-Cap Fund | ||||||||
Schedule of Investments as of November 30, 2017 - (Continued) | ||||||||
| (Unaudited) |
Shares | Value | |||||||
Energy - 5.06% | ||||||||
Apache Corp. | 33,417 | 1,397,833 | ||||||
EOG Resources, Inc. | 13,491 | 1,380,399 | ||||||
EQT Corp. | 23,663 | 1,410,315 | ||||||
Occidental Petroleum Corp. | 19,514 | 1,375,737 | ||||||
Schlumberger Ltd. (a) | 21,899 | 1,376,352 | ||||||
| 6,940,636 | ||||||||
Food & Staples Retailing - 1.97% | ||||||||
Sysco Corp. | 29,695 | 1,714,292 | ||||||
Walgreens Boots Alliance, Inc. | 13,528 | 984,297 | ||||||
| 2,698,589 | ||||||||
Food, Beverage & Tobacco - 3.16% | ||||||||
Hormel Foods Corp. | 48,630 | 1,772,563 | ||||||
McCormick & Co., Inc. | 11,763 | 1,201,943 | ||||||
PepsiCo, Inc. | 11,648 | 1,357,225 | ||||||
| 4,331,731 | ||||||||
Health Care Equipment & Services - 14.47% | ||||||||
Abbott Laboratories | 30,609 | 1,725,429 | ||||||
Almost Family, Inc. (b) | 24,714 | 1,468,012 | ||||||
Becton Dickinson and Co. | 11,015 | 2,513,733 | ||||||
Envision Healthcare Corp. (b) | 28,796 | 919,456 | ||||||
Henry Schein, Inc. (b) | 13,320 | 951,714 | ||||||
Laboratory Corp. of America Holdings (b) | 8,899 | 1,408,445 | ||||||
Masimo Corp. (b) | 15,423 | 1,370,179 | ||||||
Merit Medical Systems, Inc. (b) | 33,760 | 1,466,872 | ||||||
Patterson Companies, Inc. | 36,987 | 1,351,875 | ||||||
STERIS PLC (a) | 18,915 | 1,701,593 | ||||||
Stryker Corp. | 11,040 | 1,722,240 | ||||||
Teleflex, Inc. | 6,820 | 1,810,846 | ||||||
US Physical Therapy, Inc. | 19,732 | 1,441,423 | ||||||
| 19,851,817 | ||||||||
Household & Personal Products - 1.94% | ||||||||
Church & Dwight Co., Inc. | 33,316 | 1,568,850 | ||||||
Kimberly-Clark Corp. | 9,166 | 1,097,720 | ||||||
| 2,666,570 | ||||||||
Insurance - 1.26% | ||||||||
Prudential Financial, Inc. | 14,957 | 1,732,619 | ||||||
See notes to financial statements.
BMT Multi-Cap Fund | |||||||
Schedule of Investments as of November 30, 2017 - (Continued) | |||||||
(Unaudited) |
Shares | Value | |||||||
Materials - 3.23% | ||||||||
Bemis Co., Inc. | 29,071 | 1,364,011 | ||||||
Quaker Chemical Corp. | 8,302 | 1,368,004 | ||||||
Sensient Technologies Corp. | 21,920 | 1,699,458 | ||||||
| 4,431,473 | ||||||||
Pharmaceuticals, Biotechnology & Life Sciences - 4.23% | ||||||||
Gilead Sciences, Inc. | 23,093 | 1,726,895 | ||||||
Johnson & Johnson | 12,168 | 1,695,367 | ||||||
Thermo Fisher Scientific, Inc. | 12,365 | 2,383,477 | ||||||
| 5,805,739 | ||||||||
Retailing - 2.09% | ||||||||
The TJX Companies, Inc. | 21,114 | 1,595,163 | ||||||
Williams-Sonoma, Inc. | 24,820 | 1,269,791 | ||||||
| 2,864,954 | ||||||||
Semiconductors & Semiconductor Equipment - 3.23% | ||||||||
Analog Devices, Inc. | 19,861 | 1,710,231 | ||||||
Cirrus Logic, Inc. (b) | 24,723 | 1,365,699 | ||||||
Skyworks Solutions, Inc. | 12,921 | 1,353,346 | ||||||
| 4,429,276 | ||||||||
Software & Services - 8.80% | ||||||||
CACI International, Inc. - Class A (b) | 13,102 | 1,728,809 | ||||||
DST Systems, Inc. | 21,996 | 1,376,510 | ||||||
Mastercard, Inc. - Class A | 13,761 | 2,070,618 | ||||||
MAXIMUS, Inc. | 24,832 | 1,715,395 | ||||||
Microsoft Corp. | 24,426 | 2,055,936 | ||||||
Paychex, Inc. | 25,564 | 1,720,713 | ||||||
Total System Services, Inc. | 18,817 | 1,399,232 | ||||||
| 12,067,213 | ||||||||
Technology Hardware & Equipment - 7.38% | ||||||||
Apple, Inc. | 16,061 | 2,760,083 | ||||||
Avnet, Inc. | 30,639 | 1,268,761 | ||||||
Badger Meter, Inc. | 28,133 | 1,305,371 | ||||||
Cisco Systems, Inc. | 46,432 | 1,731,914 | ||||||
Corning, Inc. | 52,378 | 1,696,523 | ||||||
MTS Systems Corp. | 24,406 | 1,364,295 | ||||||
| 10,126,947 | ||||||||
See notes to financial statements.
BMT Multi-Cap Fund | |||||||
Schedule of Investments as of November 30, 2017 - (Continued) | |||||||
(Unaudited) |
Shares | Value | |||||||
Telecommunication Services - 1.02% | ||||||||
Verizon Communications, Inc. | 27,567 | 1,402,885 | ||||||
Transportation - 3.60% | ||||||||
Atlas Air Worldwide Holdings, Inc. (b) | 30,164 | 1,741,971 | ||||||
Norfolk Southern Corp. | 10,279 | 1,424,978 | ||||||
United Parcel Service, Inc. - Class B | 14,603 | 1,773,534 | ||||||
| 4,940,483 | ||||||||
Utilities - 1.23% | ||||||||
American Water Works Co., Inc. | 18,489 | 1,692,853 | ||||||
Total Common Stocks (Cost $114,838,150) | 125,341,494 | |||||||
Short-Term Investment - 9.77% | ||||||||
Money Market Fund - 9.77% | ||||||||
Dreyfus Government Cash Management - Class I, 0.96% (c) | 13,411,212 | 13,411,212 | ||||||
Total Short-Term Investment (Cost $13,411,212) | 13,411,212 | |||||||
Total Investments (Cost $128,249,362) - 101.13% | 138,752,706 | |||||||
Liabilities in Excess of Other Assets - (1.13%) | (1,554,522 | ) | ||||||
TOTAL NET ASSETS - 100.00% | $ | 137,198,184 | ||||||
Percentages are stated as a percent of net assets.
(a) | Foreign issued security. Foreign concentration (including ADRs) was as follows: Curacao 1.00%; Ireland 1.23%; Jersey 1.02%; United Kingdom 1.24%. |
(b) | Non-income producing security. |
(c) | Variable rate security. Rate listed is the 7-day yield as of November 30, 2017. |
See notes to financial statements.
Statement of Assets & Liabilities | ||||
Period Ended November 30, 2017 (Unaudited) | ||||
Assets: | ||||
Investments, at value (cost $128,249,362) | $ | 138,752,706 | ||
Income receivable | 163,970 | |||
Receivable for fund shares sold | 672,393 | |||
Deferred offering costs | 101,261 | |||
Other assets | 14,449 | |||
Total assets | 139,704,779 | |||
Liabilities: | ||||
Payable for organizational costs | 1,000 | |||
Payable for investments purchased | 2,382,148 | |||
Payable to Investment Adviser | 57,562 | |||
Payable to Custodian | 2,324 | |||
Payable for fund shares redeemed | 20,112 | |||
Other expenses payable | 43,449 | |||
Total liabilities | 2,506,595 | |||
Total net assets | $ | 137,198,184 | ||
Net Assets Consist of: | ||||
Capital Stock | 127,478,347 | |||
Accumulated undistributed net investment income | 225,720 | |||
Accumulated undistributed net realized loss on investments | (1,009,227 | ) | ||
Unrealized appreciation on investments | 10,503,344 | |||
Total net assets | $ | 137,198,184 | ||
Net assets | $ | 137,198,184 | ||
Shares outstanding | 12,755,248 | |||
Net asset value, offering and redemption price per share | $ | 10.76 |
See notes to financial statements.
Statement of Operations | ||||
Period Ended November 30, 2017(1) (Unaudited) | ||||
Investment Income: | ||||
Dividend income | $ | 527,485 | ||
Interest income | 35,546 | |||
Total investment income | 563,031 | |||
Expenses: | ||||
Investment Advisory fees (See Note 3) | 219,252 | |||
Organizational costs (See Note 4) | 58,793 | |||
Deferred offering costs (See Note 4) | 35,963 | |||
Trustees fees and expenses | 32,660 | |||
Administration fees | 28,848 | |||
Compliance fees | 20,599 | |||
Professional fees | 14,606 | |||
Fund accounting fees | 10,633 | |||
Transfer agent fees and expenses | 7,838 | |||
Federal and state registration fees | 5,655 | |||
Custody fees | 3,705 | |||
Reports to shareholders | 1,498 | |||
Miscellaneous expenses | 1,072 | |||
Total expenses before Adviser waiver | 441,122 | |||
Expenses waived by Adviser (See Note 3) | (103,811 | ) | ||
Total net expenses | 337,311 | |||
Net investment income | 225,720 | |||
Net Realized and Unrealized Gain(Loss) on Investments: | ||||
Net realized loss on investment transactions | (1,009,227 | ) | ||
Net change in unrealized appreciation on investments | 10,503,344 | |||
Net realized and unrealized gain on investments | 9,494,117 | |||
Net increase in net assets resulting from operations | $ | 9,719,837 |
(1) The Fund commenced operations on August 15, 2017.
See notes to financial statements.
Statements of Changes in Net Assets | ||||
Period Ended November 30, 2017(1) | ||||
(Unaudited) | ||||
Operations: | ||||
Net investment income | 225,720 | |||
Net realized loss on investment transactions | (1,009,227 | ) | ||
Net change in unrealized appreciation on investments | 10,503,344 | |||
Net increase in net assets resulting from operations | 9,719,837 | |||
Capital Share Transactions: | ||||
Proceeds from shares sold | 103,256,528 | |||
| Proceeds from shares issued from transfer in-kind (See Note 5) | 25,437,031 | |||
Proceeds from shares issued in reinvestment of dividends | – | |||
Cost of shares redeemed | (1,215,212 | ) | ||
Net increase in net assets from capital share transactions | 127,478,347 | |||
Distributions to Shareholders: | ||||
From net investment income | – | |||
From net realized gain | – | |||
Total distributions | – | |||
Total Increase in Net Assets | 137,198,184 | |||
Net Assets: | ||||
Beginning of period | – | |||
End of period (including accumulated undistributed net investment income of $225,720) | $ | 137,198,184 | ||
(1) The Fund commenced operations on August 15, 2017.
See notes to financial statements.
Financial Highlights | ||||
August 15, 2017(1) through November 30, 2017 | ||||
(Unaudited) | ||||
Per Share Data: | ||||
Net asset value, beginning of period | $ | 10.00 | ||
Investment Operations: | ||||
Net investment income(2) | 0.02 | |||
Net realized and unrealized gain on investments | 0.74 | |||
Total from investment operations | 0.76 | |||
Less Distributions: | ||||
From net investment income | – | |||
From net realized gains | – | |||
Total distributions | $ | – | ||
Net asset value, end of period | $ | 10.76 | ||
Total return(3) | 7.60 | % | ||
Supplemental Data and Ratios: | ||||
Net assets, end of period(000's omitted) | $ | 137,198 | ||
Ratio of Expenses to Average Net Assets: | ||||
Before expense reimbursement/recoupment(4) | 1.31 | % | ||
After expense reimbursement/recoupment(4) | 1.00 | % | ||
Ratio of Net Investment Income to Average Net Assets: | ||||
Before expense reimbursement/recoupment(4) | 0.67 | % | ||
After expense reimbursement/recoupment(4) | 0.98 | % | ||
Portfolio turnover rate(3) | 2.70 | % | ||
| (1) | Commencement of operations. |
| (2) | Net investment income per share is calculated using the ending accumulated net investment income balances prior to consideration or adjustment for permanent book-to-tax differences. |
| (3) | Not annualized for the period ended November 30, 2017. |
| (4) | Annualized for the period ended November 30, 2017. |
See notes to financial statements.
Notes to Financial Statements
November 30, 2017 (Unaudited)
1. Organization
BMT Investment Funds (the "Trust") was organized as a Delaware Statutory Trust on February 9, 2017 and is registered under the Investment Company Act of 1940, as amended (the "1940 Act"), as an open-end management investment company. At November 30, 2017, The Trust consisted of one series, BMT Multi-Cap Fund (the "Fund"), which commenced operations on August 15, 2017.
2. Summary of Significant Accounting Policies
The following is a summary of significant accounting policies consistently followed by the Fund in the preparation of its financial statements. These policies are in conformity with accounting principles generally accepted in the United States ("GAAP"). The Fund is an investment company and, accordingly, follows the investment company accounting and reporting guidance of the Financial Accounting Standards Board Accounting Standards Codification Topic 946, Investment Companies.
Valuation of Securities
The Fund has adopted authoritative fair valuation accounting standards which establish an authoritative definition of fair value and set out a hierarchy for measuring fair value. These standards require additional disclosures about the various inputs and valuation techniques used to develop the measurements of fair value and a discussion in changes in valuation techniques and related inputs during the period. These inputs are summarized in the three broad levels listed below.
• | Level 1 - Quoted prices in active markets for identical securities. |
• | Level 2 - Other significant observable inputs (including quoted prices for similar securities, interest rates, prepayment speeds, credit risk, etc.). |
• | Level 3 - Significant unobservable inputs (including the Fund's own assumptions in determining the fair value of investments). |
Equity investments, including common stocks, foreign issued common stocks, preferred stocks, convertible securities, warrants, rights, exchange-traded funds, closed end mutual funds and real estate investment trusts, which are traded on an exchange (other than The NASDAQ OMX Group, Inc., referred to as "NASDAQ") are valued at the last sale price reported by the exchange on which the securities are primarily traded on the day of valuation. Portfolio securities primarily traded on the NASDAQ Stock Market ("NASDAQ") shall be valued using the NASDAQ Official Closing Price ("NOCP"), which may not necessarily represent the last sale price. If the NOCP is not available, such securities shall be valued at the last sale price on the day of valuation, or if there has been no sale on such day, at the mean between the bid and asked prices. OTC securities that are not traded on NASDAQ shall be valued at the most recent trade price. When using the market quotations or closing price provided by the pricing service, the security will be classified as a Level 1 security. When market quotations or closing price provided by the pricing service are unavailable, the mean of the bid and ask price will be used. These securities will generally be classified as Level 2 securities.
Investments in mutual funds, including money market funds, are generally priced at the ending net asset value (NAV) provided by the service agent of the funds and will be classified as Level 1 securities.
Any securities or other assets for which market quotations are not readily available are valued at fair value as determined in good faith by the Fund's adviser pursuant to procedures established under the general supervision and responsibility of the Fund's Board of Trustees and will be classified as Level 3 assets.
The inputs and methodology used for valuing securities may not be an indication of the risk associated with investing in those securities.
As of November 30, 2017, the Fund's assets and liabilities carried at fair value were classified as follows:
Description | Level 1 | Level 2 | Level 3 | Total | ||||||||||||
BMT Multi-Cap Fund | ||||||||||||||||
Assets | ||||||||||||||||
Total Common Stocks* | $ | 125,341,494 | $ | - | $ | - | $ | 125,341,494 | ||||||||
Total Money Market Fund* | 13,411,212 | - | - | 13,411,212 | ||||||||||||
Total Assets | $ | 138,752,706 | $ | - | $ | - | $ | 138,752,706 | ||||||||
* For further information regarding security characteristics, please see the Schedule of Investments.
The Fund did not hold any investments during the period ended November 30, 2017 with significant unobservable inputs which would be classified as Level 3. There were no transfers of securities between levels during the reporting period. It is the Fund's policy to record transfers between levels as of the end of the reporting period. The Fund did not hold any derivative instruments during the reporting period.
Use of Estimates
The preparation of financial statements in conformity with GAAP requires management to make estimates and assumptions that affect the reported amounts of assets and liabilities and disclosure of contingent assets and liabilities at the date of the financial statements and the reported amounts of revenues and expenses during the reporting period. Actual results could differ from those estimates.
Indemnification
In the normal course of business the Fund enters into contracts that contain general indemnification clauses. The Fund's maximum exposure under these arrangements is unknown, as this would involve future claims against the Fund that have not yet occurred. Based on experiences, the Fund expects the risk of loss associated with these indemnification clauses to be remote.
Securities Transactions and Investment Income
The Fund records security transactions based on trade date. Dividend income is recognized on the ex-dividend date, and interest income is recognized on an accrual basis. Net realized gains or losses are determined using the identified cost method.
Distribution to Shareholder Policy
Dividends from net investment income, if any, are declared and paid annually. Distributions of net realized capital gains, if any, are declared and paid at least annually.
Federal Income Taxes
The Fund complies with, and intends to continue to comply with, the requirements of Subchapter M of the Internal Revenue Code necessary to qualify as a regulated investment company and to make the requisite distributions of income and capital gains to its shareholders sufficient to relieve it from Federal income taxes.
Subsequent Events Evaluation
In preparing these financial statements, the Fund has evaluated events and transactions for potential recognition or disclosure resulting from subsequent events after the Statement of Assets and Liabilities date of November 30, 2017 through the date the financial statements were available for issue. This evaluation did not result in any subsequent events, other than those noted above, that necessitated disclosure and/or adjustments.
3. Investment Adviser
The Fund has entered into an investment advisory agreement ("Advisory Agreement") with BMT Investment Advisers (the "Adviser"). The Adviser is a registered investment adviser with the U.S. Securities and Exchange Commission ("SEC") that provides investment advisory services to BMT Investment Funds. Under the Advisory Agreement, the Adviser manages the Fund's investments subject to the supervision of the Board of Trustees.
The Adviser has overall supervisory responsibility for the general management and investment of the Fund's securities portfolio. For its services, the Fund pays the Adviser a monthly management fee that is calculated at the annual rate of 0.65% of the Fund's average daily net assets.
The Fund is responsible for its own operating expenses. Pursuant to an Expense Limitation Agreement between the Adviser and the Fund, the Adviser has agreed to reduce its management fees, and reimburse the Fund for its operating expenses, in order to ensure that Total Annual Fund Operating Expenses (excluding any acquired fund fees and expenses, taxes, interest, brokerage fees, certain insurance costs and extraordinary and other non-routine expenses) do not exceed 1.00% of the Fund’s average daily net assets. Expenses reimbursed and/or fees reduced by the Adviser may be recouped by the Adviser for a period of three years following the time at which such reimbursement or reduction was made, if such recoupment can be achieved without exceeding the expense limit in effect at the time the waiver and/or reimbursement occurred and at the time of the recoupment. Waived/reimbursed expenses subject to potential recovery by year of expiration are as follows:
Year of Expiration |
| |
2020 |
| |
$ | 103,811 |
|
4. Organizational and Offering Costs
Organizational costs consist of costs incurred to establish the Fund and enable it to legally do business. The Fund expenses organizational costs as incurred. Offering costs include state registration fees, legal fees, insurance fees, and printing and mailing fees regarding the preparation of the initial registration statement. Offering costs are accounted for as deferred costs until operations begin. Offering costs are then amortized to expense over twelve months on a straight-line basis. Many of these organization and offering costs were advanced by the Adviser, subject to potential recovery (see Note 3). The total amount of the organizational costs and offering costs incurred by the Fund is $58,793 and $137,224, respectively.
5. Transfer In-Kind
Upon commencement of operations, the BMT Multi-Cap Fund accepted securities eligible for investment by the Fund as consideration for Fund Shares issued at a value of $25,437,031. As a result of the in-kind contribution, the BMT Multi-Cap Fund issued $2,543,703 shares at net asset value of $10.00.
6. Investment Transactions
The aggregate purchases and sales of securities (excluding short-term securities) by the Fund for the period ended November 30, 2017 was as follows:
Non-U.S. Government | ||||||||
Purchases | Sales | |||||||
BMT Multi-Cap Fund | $ | 118,922,080 | $ | 3,074,624 | ||||
7. Capital Share Transactions
Period Ended | ||||
November 30, 2017 | ||||
BMT Multi-Cap Fund | ||||
Shares sold | 10,329,416 | |||
| Shares issued from transfer in-kind (See Note 5) | 2,543,703 | |||
Shares issued to holders in reinvestment of dividends | - | |||
Shares redeemed | (117,871 | ) | ||
Net increase in shares | 12,755,248 | |||
Shares outstanding: | ||||
Beginning of period | - | |||
End of period | 12,755,248 | |||
Additional Information
November 30, 2017 (Unaudited)
Investment Advisory Agreement Disclosure
On May 10, 2017, the Board of Trustees of BMT Investment Funds (the “Trustees”) approved the investment advisory agreement (the “Investment Advisory Agreement”) for the BMT Multi-Cap Fund (the “Fund”) with the investment adviser to the Fund, BMT Investment Advisers (the “Adviser”).
In considering approval of the Investment Advisory Agreement, the Board, including the Independent Trustees, reviewed certain information from counsel and from the Adviser, including: (i) a copy of the form of Investment Advisory Agreement; (ii) information describing the nature, quality and extent of the services that the Adviser expected to provide to the Fund; (iii) information concerning the financial condition, business, operations, portfolio management teams, and compliance program of the Adviser and its affiliates, as applicable; (iv) information describing the Fund’s proposed investment advisory fee and operating expenses; (v) a copy of the current Form ADV for the Adviser; and (vi) a memorandum from counsel regarding the responsibilities of the Trustees in considering investment advisory arrangements under the Investment Company Act of 1940. The Board also considered presentations made by, and discussions held with, representatives of the Adviser. The Board also received information comparing the advisory fee and expenses of the Fund to other investment companies considered to be in the Fund’s peer group.
During its review of this information, the Board focused on and analyzed the factors that the Board deemed relevant, including: (i) the nature, extent and quality of the services expected to be provided to the Fund by the Adviser; (ii) the Adviser’s personnel and operations; (iii) the Fund’s proposed expense levels; (iv) the anticipated profitability to the Adviser under the Investment Advisory Agreement at anticipated asset levels; (v) any “fall-out” benefits to the Adviser and its affiliates (i.e., the ancillary benefits realized by the Adviser and its affiliates from the Adviser’s relationship with the Trust); (vi) the effect of asset growth on the Fund’s expenses; and (vii) possible conflicts of interest.
The Board, including the Independent Trustees, considered the following in respect of the Fund:
(a) The nature, extent and quality of services expected to be provided to the Fund by the Adviser; personnel and operations of the Adviser. The Board reviewed the services that the Adviser was expected to provide to the Fund. The Board noted the responsibilities that the Adviser would have as the Fund’s investment adviser, including: the responsibility for the management and investment of the Fund’s portfolio; executing portfolio security trades; monitoring compliance with the Fund’s investment objective, policies and limitations; the responsibility for quarterly reporting to the Board; the oversight of general portfolio compliance with relevant law; and the implementation of Board directives as they relate to the Fund.
The Board reviewed the Adviser’s affiliates’ experience in managing other securities portfolios. Based on its consideration and review of the foregoing information, the Board determined that the Fund was likely to benefit from the nature, quality and extent of these services, as well as the Adviser’s and its affiliates’ ability to render such services based on their experience, personnel, operations and resources.
(b) Comparison of services expected to be provided and fees to be paid to those under other investment advisory contracts, and the cost of the services to be provided and profits to be realized by the Adviser from the relationship with the Fund; “fall-out” benefits. The Board compared both the services to be provided to the Fund by the Adviser and the related fees to those of other investment advisers with respect to similar funds. In particular, the Board compared the Fund’s proposed advisory fee and projected expense ratio to other investment companies considered to be in the Fund’s peer group. The Board noted that the Adviser proposed to enter into the Expense Limitation Agreement whereby the Adviser would waive advisory fees and/or reimburses expenses to keep the Fund’s expenses from exceeding certain levels. The Board received and considered information about the fee rates charged to other accounts and clients that are managed by the Adviser’s affiliates. The Board also discussed the anticipated costs and projected profitability of the Adviser in connection with its serving as investment adviser to the Fund, including operational costs. After comparing the Fund’s proposed fees with those of other funds in the Fund’s peer group and considering the information about fee rates charged to other accounts and clients managed by the Adviser’s affiliates, and in light of the nature, quality and extent of services proposed to be provided by the Adviser and the costs expected to be incurred by the Adviser in providing those services, the Board concluded that the level of fees proposed to be paid to the Adviser with respect to the Fund were fair and reasonable.
The Board considered that the Adviser may experience certain “fall-out” benefits based on the potential success of the Fund, but that such benefits are not presently quantifiable. The Board noted that the Trust’s service providers are not affiliated with the Adviser, so that such services do not give rise to “fall-out” benefits for the Adviser and its affiliates.
(c) The extent to which economies of scale would be realized as the Fund grows, and whether fee levels would reflect such economies of scale. The Board discussed potential economies of scale. Because the Trust is newly formed, the Fund had not commenced operations, and the eventual amount of Fund assets was uncertain, the Adviser was not able to provide the Board with specific information concerning the extent to which economies of scale would be realized as the Fund grows and whether fee levels would reflect such economies of scale, if any. The Board recognized the uncertainty in launching a new investment product and estimating future asset levels.
(d) Investment performance of the Fund and the Adviser. Because the Fund is newly formed and had not commenced operations, the Board did not consider the investment performance of the Fund. The Board considered the performance of the Adviser’s affiliates and the portfolio managers in managing other discretionary investment management accounts using the same investment strategy as the Fund. The Board also considered information regarding the performance of other funds in the Fund’s peer group.
Conclusion. No single factor was determinative to the decision of the Board. Based on the foregoing and such other matters as were deemed relevant the Board concluded that the proposed advisory fee and projected total expense ratio were reasonable in relation to the services to be provided by the Adviser to the Fund, as well as the costs to be incurred and benefits to be gained by the Adviser in providing such services. The Board also found the proposed advisory fees to be reasonable in comparison to the fees charged by advisers to other comparable funds. As a result, the Board concluded that the initial approval of the Investment Advisory Agreement was in the best interests of the Fund.
Additional Information
November 30, 2017 (Unaudited)
Disclosure Regarding Fund Trustees and Officers
Name, Address* and Age | Position(s) Held with the Trust | Term of Office** and Length of Time Served | Number of Portfolios in Trust Overseen by Trustee | Principal Occupation(s) During the Past Five Years | Other Directorships Held by Trustee During the Past Five Years |
Independent Trustees |
|
|
|
| |
George M. Chamberlain, Jr. Age: 70 | Trustee | Since 2017 | 1 | Principal, GMC Consulting (Corporate consulting) (1999 to present); Vice President and General Counsel, SCM Advantage LLC (Supply chain consulting) (2009 to 2016). | Trapp Family Lodge Housing Cooperative (2008 to present), The Vantagepoint Funds (2012 to 2016), Alzheimer’s Association, Delaware Valley Chapter (2008 to 2016). |
H. Richard Haverstick, Jr. Age: 64 | Trustee | Since 2017 | 1 | Accounting and Auditing Consultant (2015 to 2016); Partner, EY (Accounting and business management consulting) (1987 to 2013). | Thomas Jefferson University and Jefferson Health (2013 to present); Brandywine Realty Trust (2016 to present); Actua Corporation (2016 to present). |
Barbara A. Nugent Age: 61 | Lead Independent Trustee | Since 2017 | 1 | President, True North Board Governance, LLC (Corporate consulting) (2014 to present); Partner, Stradley Ronon Stevens & Young, LLP (Law firm) (1999 to 2013). | Brighthouse Funds Trust I and Trust II (2014 to present). |
Disclosure Regarding Fund Trustees and Officers – (Continued)
Name, Address* and Age | Position(s) Held with the Trust | Term of Office** and Length of Time Served | Number of Portfolios in Trust Overseen by Trustee | Principal Occupation(s) During the Past Five Years | Other Directorships Held by Trustee During the Past Five Years |
Interested Trustee |
|
|
| ||
Francis J. Leto*** Age: 57 | Chairman, Trustee, President and Principal Executive Officer | Since 2017 | 1 | President (2014 to present), Chief Executive Officer (2015 to present), Chief Operating Officer (2014 to 2015), Executive Vice President and head of Wealth Management Division (2009 to 2014) and General Counsel (2012 to 2014), Bryn Mawr Bank Corporation. | None |
* | Each Trustee may be contacted by writing to the Trustees of BMT Investment Funds, 10 South Bryn Mawr Avenue, Bryn Mawr, Pennsylvania 19010. |
** | Each Trustee serves until his or her successor is duly elected or appointed and qualified. |
*** | Mr. Leto is considered an “interested person” of the Trust because of his relationship with the Adviser. |
Officers |
| ||
Name, Address* and Age | Position(s) Held with the Trust | Term of Office and Length of Time Served | Principal Occupation(s) During the Past Five Years |
Francis J. Leto Age: 57 | Chairman, Trustee, President and Principal Executive Officer | Since 2017 | President (2014 to present), Chief Executive Officer (2015 to present), Chief Operating Officer (2014 to 2015), Executive Vice President and head of Wealth Management Division (2009 to 2014) and General Counsel (2012 to 2014), Bryn Mawr Bank Corporation. |
Michael W. Harrington Age: 54 | Treasurer and Principal Financial Officer | Since 2017 | Executive Vice President and Chief Financial Officer, Bryn Mawr Bank Corporation (2015 to present); Chief Financial Officer and Treasurer, Susquehanna Bancshares (2012 to 2015); Treasurer, Chief Investment Officer and Chief Financial Officer, First Niagara Financial Group (2003 to 2012). |
Lori Buchanan Goldman Age: 36 | Secretary | Since 2017 | Senior Vice President, General Counsel and Corporate Secretary, Bryn Mawr Bank Corporation (2015 to present); Attorney, Stradley Ronon Stevens & Young, LLP (2007 to 2015). |
David C. Lebisky Age: 45 | Chief Compliance Officer and Chief Anti-Money Laundering Officer | Since 2017 | President, Lebisky Compliance Consulting LLC (2015 to present); Consultant, Duff & Phelps Compliance Consulting (2016 to present); Senior Consultant, Freeh Group International Solutions, LLC (a global risk management firm) (2015 to present); Director of Regulatory Administration, Scotia Institutional Investments US, LP (2010 to 2014). |
* | The address for each officer is 10 South Bryn Mawr Avenue, Bryn Mawr, Pennsylvania 19010. |
The Statement of Additional information includes additional information about the Fund’s Trustees and is available free of charge upon request by calling the Fund toll free at 866.268.4701.
Availability of Quarterly Portfolio Holdings Schedules
The Fund is required to file its complete schedule of portfolio holdings with the SEC for the first and third quarters of each fiscal year on Form N-Q. Once filed, the Fund’s Form N-Q is available without charge, upon request on the SEC’s website (http://www.sec.gov) and may be available by calling 1.866.996.3863. You may also obtain copies at the SEC’s Public Reference Room in Washington, D.C. Information on the operation of the Public Reference Room may be obtained by calling 1.800.SEC.0330.
Proxy Voting Policies and Procedures and Proxy Voting Record (Unaudited)
A description of the policies and procedures that the Fund uses to determine how to vote proxies relating to portfolio securities is available without charge, upon request, by calling 1.866.996.3863 and on the SEC’s website (http://www.sec.gov). The Fund is required to disclose how it voted proxies related to portfolio securities during the most recent 12-month period ended June 30. Once filed, the information is available without charge, upon request, by calling 1.866.996.3863 and on the SEC’s website (http://www.sec.gov).
PRIVACY NOTICE
The Fund collects non-public information about you from the following sources:
● | Information we receive about you on applications or other forms; |
● | Information you give us orally; and/or |
● | Information about your transactions with us or others. |
We do not disclose any non-public personal information about our customers or former customers without the customer’s authorization, except as permitted by law or in response to inquiries from governmental authorities. We may share information with affiliated and unaffiliated third parties with whom we have contracts for servicing the Fund. We will provide unaffiliated third parties with only the information necessary to carry out their assigned responsibilities. We maintain physical, electronic and procedural safeguards to guard your non-public personal information and require third parties to treat your personal information with the same high degree of confidentiality.
In the event that you hold shares of the Fund through a Financial Intermediary, including, but not limited to, a broker-dealer, bank, or trust company, the privacy policy of your Financial Intermediary would govern how your non-public personal information would be shared by those entities with unaffiliated third parties.
Board of Trustees
George M. Chamberlain, Jr.
H. Richard Haverstick, Jr.
Barbara A. Nugent
Francis J. Leto
Investment Adviser
BMT Investment Advisers
10 South Bryn Mawr Avenue
Bryn Mawr, Pennsylvania 19010
Independent Registered Public Accounting Firm
Tait, Weller & Baker LLP
1818 Market Street, Suite 2400
Philadelphia, Pennsylvania 19103
Legal Counsel
Stradley Ronon Stevens & Young, LLP
2005 Market Street, Suite 2600
Philadelphia, Pennsylvania 19103
Custodian
U.S. Bank, N.A.
1555 N. RiverCenter Drive, Suite 302
Milwaukee, WI 53212
Distributor
Quasar Distributors, LLC
777 East Wisconsin Avenue
Milwaukee, WI 53212
Administrator, Transfer Agent and Dividend Disbursing Agent
U.S. Bancorp Fund Services, LLC
615 East Michigan Street
Milwaukee, WI 53202
Shareholder/Investor Information
1.866.268.4701
www.bmtc.com/mutual-fund
Item 2. Code of Ethics.
Not applicable for semi-annual reports
Item 3. Audit Committee Financial Expert.
Not applicable for semi-annual reports
Item 4. Principal Accountant Fees and Services.
Not applicable for semi-annual reports
Item 5. Audit Committee of Listed Registrants.
Not applicable to registrants who are not listed issuers (as defined in Rule 10A-3 under the Securities Exchange Act of 1934).
Item 6. Investments.
Schedule of Investments is included as part of the report to shareholders filed under Item 1 of this Form.
Item 7. Disclosure of Proxy Voting Policies and Procedures for Closed-End Management Investment Companies.
Not applicable to open-end investment companies.
Item 8. Portfolio Managers of Closed-End Management Investment Companies.
Not applicable to open-end investment companies.
Item 9. Purchases of Equity Securities by Closed-End Management Investment Company and Affiliated Purchasers.
Not applicable to open-end investment companies.
Item 10. Submission of Matters to a Vote of Security Holders.
There have been no material changes to the procedures by which shareholders may recommend nominees to the registrant’s board of trustees.
Item 11. Controls and Procedures.
| (a) | The Registrant’s principal executive officer and principal financial officer have concluded that the Registrant's disclosure controls and procedures (as defined in Rule 30a-3(c) under the Investment Company Act of 1940 (the “1940 Act”)) (17 CFR 270.30a-3(c)) are effective as of a date within 90 days of the filing date of the report that includes the disclosure required by this paragraph, based on the evaluation of these controls and procedures required by Rule 30a-3(b) under the 1940 Act (17 CFR 270.30a-3(b)) and Rule 13a-15(b) or Rule 15d-15(b) under the Securities Exchange Act of 1934, as amended (17 CFR 240.13a-15(b) or 240.15d-15(d)). |
| (b) | There were no changes in the Registrant's internal control over financial reporting (as defined in Rule 30a-3(d) under the 1940 Act) (17 CFR 270.30a-3(d)) that occurred during the Registrant's last fiscal quarter that have materially affected, or are reasonably likely to materially affect, the Registrant's internal control over financial reporting. |
Item 12. Disclosure of Securities Lending Activities for Closed-End Management Investment Companies
Not applicable to open-end investment companies.
Item 13. Exhibits.
| (a) | (1) Any code of ethics or amendment thereto, that is the subject of the disclosure required by Item 2, to the extent that the registrant intends to satisfy Item 2 requirements through filing an exhibit. 1) Not Applicable |
| (2) A separate certification for each principal executive officer and principal financial officer pursuant to Section 302 of the Sarbanes-Oxley Act of 2002. Filed herewith. | |
| (3) Any written solicitation to purchase securities under Rule 23c-1 under the Act sent or given during the period covered by the report by or on behalf of the registrant to 10 or more persons. Not applicable to open-end investment companies. | |
| (b) | Certifications pursuant to Section 906 of the Sarbanes-Oxley Act of 2002. Furnished herewith. |
SIGNATURES
Pursuant to the requirements of the Securities Exchange Act of 1934 and the Investment Company Act of 1940, the registrant has duly caused this report to be signed on its behalf by the undersigned, thereunto duly authorized.
(Registrant) BMT Investment Funds
| By (Signature and Title)* | /s/ Francis J. Leto | ||
| Francis J. Leto, President | |||
| Date | 1/22/18 |
Pursuant to the requirements of the Securities Exchange Act of 1934 and the Investment Company Act of 1940, this report has been signed below by the following persons on behalf of the registrant and in the capacities and on the dates indicated.
By (Signature and Title)* | /s/ Francis J. Leto | ||
Francis J. Leto, President | |||
Date | 1/22/18 |
By (Signature and Title)* | /s/ Michael W. Harrington | ||
Michael W. Harrington, Treasurer | |||
Date | 1/22/18 |
* Print the name and title of each signing officer under his or her signature.
3