UNITED STATES
SECURITIES AND EXCHANGE COMMISSION
Washington, D.C. 20549
FORM N-CSR
CERTIFIED SHAREHOLDER REPORT OF REGISTERED
MANAGEMENT INVESTMENT COMPANIES
Investment Company Act file number 811-23234
BMT Investment Funds
(Exact name of registrant as specified in charter)
1436 Lancaster Avenue
Berwyn, PA 19312
(Address of principal executive offices) (Zip code)
Jennifer Dempsey Fox
1436 Lancaster Avenue
Berwyn, PA 19312
(Name and address of agent for service)
(610) 581-4748
Registrant's telephone number, including area code
Date of fiscal year end: May 31, 2019
Date of reporting period: May 31, 2019
Item 1. Reports to Stockholders.
BMT Multi-Cap Fund
Annual Report
May 31, 2019
Beginning on January 1, 2021, as permitted by regulations adopted by the U.S. Securities and Exchange Commission, paper copies of the Fund’s shareholder reports will no longer be sent by mail, unless you specifically request paper copies of the reports from the Fund (defined herein) or from your financial intermediary, such as a broker-dealer or bank. Instead, the reports will be made available on the Fund’s website (www.bmtc.com/mutual-fund), and you will be notified by mail each time a report is posted and provided with a website link to access the report.
If you already elected to receive shareholder reports electronically, you will not be affected by this change and you need not take any action. You may elect to receive shareholder reports and other communications from the Fund by contacting your financial intermediary (such as a broker-dealer or bank) or, if you are a direct investor, by calling 1-866-268-4701.
You may elect to receive all future reports in paper free of charge. If you invest through a financial intermediary, you can contact your financial intermediary to request that you continue to receive paper copies of your shareholder reports. If you invest directly with the Fund, you can call 1-866-268-4701 to let the Fund know you wish to continue receiving paper copies of your shareholder reports. Your election to receive reports in paper will apply to all funds held in your account if you invest through your financial intermediary.
Letter from the Investment Adviser
Dear Shareholders,
At BMT Investment Funds, we are committed to being stewards of the capital you have invested. We are pleased to provide our second annual report for the BMT Multi-Cap Fund (“BMTMX” or “Fund”), which is advised by BMT Investment Advisers. BMTMX has an inception date of Aug. 15, 2017.
The following general market and macroeconomic commentary and relative performance insights cover the period from June 1, 2018 through May 31, 2019.
Over that timeframe, BMTMX produced a total return of 2.84%, compared to 2.50% for the Russell 3000 Index, the Fund’s benchmark
Within the U.S. Equity Mid-Cap Blend universe, consisting of 411 funds, BMTMX’s category assigned by Morningstar, Inc., BMTMX ranked in the first quartile for the one-year period ended May 31, 2019.
Macroeconomic Commentary
Data continues to paint a picture of both the global and U.S. economies in expansion, albeit at a slower pace.
The most recent Atlanta Federal Reserve estimates for second quarter Real GDP forecast growth at a pace of 2.0%, down slightly from a previous estimate of 2.1%, as new real residential construction in May 2019 came in at 0.3% versus a forecast of 0.4%.
At its June 19, 2019 meeting, the Federal Reserve set its projections for Real GDP growth for 2019 at 2.1% and 2.0% in 2020 and 1.8% in 2021.
We would also note that credit spreads remain positive, indicative of plentiful liquidity and good corporate balance sheet conditions.
Regarding monetary policy, the Federal Reserve has clearly taken a dovish stance.
At their June 19 meeting, the Federal Open Market Committee (“FOMC” or “Fed”) met and left the Federal Funds Target Rate unchanged, currently between the range of 2.25% to 2.50%. Although not making any changes to its policy, the FOMC has not ruled out the prospect for possible interest rate cuts this year.
The FOMC also reiterated its positive outlook for U.S. economic growth for 2019 and its overall favorable assessment of the U.S. economy. The Fed commented on the strong labor market as well as the positive underlying fundamentals supporting U.S. economic growth as rationale for not making any monetary policy adjustments at its June meeting.
However, the FOMC added a cautious tone regarding the business sector, noting that declining business confidence levels as well as stagnant corporate investment spending is somewhat concerning and in need of continued monitoring. The FOMC next meets in late July 2019.
Multiple interest rate cuts are now built into the Fed Funds Futures Market for the latter half of this year.
BMTMX Performance Commentary
During the fiscal year ended May 31, 2019, the Fund’s holdings in the Healthcare sector proved to be the most accretive to relative performance.
The Fund had an overweight allocation to the Healthcare sector, relative to its benchmark. The strong performance of this sector relative to the benchmark index contributed significantly to the Fund’s outperformance.
At the issuer level, the Fund’s holdings of LHC Group (LHC), Thermo Fisher Scientific (TMO), Masimo Corp (MASI) and Steris Plc (STE), were among the standout performers.
The Information Technology sector also yielded positive results, despite the Fund’s modest underweight allocation to the Information Technology sector.
Excess return in the Information Technology sector was achieved by holding several specific names, including: Total System Services (TSS), Paychex (PAYX), and Mastercard Inc. (MA).
The benign interest rate environment proved difficult for financial issuers during the year. As a result, the Fund’s holdings in the Financial sector detracted from returns on a relative basis.
Issuers contributing to the negative outcome in the Financial sector, included: South State Corp (SSB), Atlantic Union Bankshares (AUB), and Charles Schwab (SHW).
Market Outlook
Economic growth in the U.S. remains expansionary and corporate profitability, although off its peak margin levels, remains strong. Liquidity remains robust but there is no doubt that trade tensions have clouded capital spending and allocation decisions in corporate boardrooms.
Beyond the volatility on the trade front, we remain optimistic on the long-term prospects for financial assets. However, the uptick in volatility once again underscores the importance of developing and maintaining a diversified portfolio, as to sector, security and market cap strata.
Given the many crosscurrents noted, we acknowledge that the current economic expansion is long in duration as it approaches 10 years. In these latter stages of expansion, forecasting is often uneven and less predictable. As a result, volatility accelerates as stresses develop and uncertainties rise.
Sincerely,
Jennifer Dempsey Fox, CFP®
President, BMT Investment Advisers
Must be preceded or accompanied by a prospectus.
Past performance does not guarantee future results.
This shareholder letter reflects opinions of BMTMX managers as of May 31, 2019, which are subject to change. Any forecast made cannot be guaranteed and should not be considered investment advice.
BMTMX invests in mid-cap and small-cap companies, which involves risks such as limited liquidity and greater volatility. BMTMX also may invest in other investment companies (to the extent it does so, an investor will indirectly bear the principal risks and its share of the fees and expenses of the underlying investment companies), foreign securities (which involves political, economic and currency risks, greater volatility, and differences in accounting methods), and/or debt securities (which typically decrease in value when interest rates rise).
Morningstar Rankings represent a fund’s total-return percentile rank relative to all funds that have the same Morningstar Category. The highest percentile rank is 1 and the lowest is 100. It is based on Morningstar total return, which includes both income and capital gains or losses and is not adjusted for sales charges or redemption fees. Morningstar ranked the BMT Multi-Cap Fund in the top quartile (11th percentile), out of 411 Mid-cap Blend funds for the one-year period ending May 31, 2019. Past performance does not guarantee future results.
The Russell 3000 Index is a market-capitalization-weighted equity index that provides exposure to the entire U.S. stock market. It tracks the performance of the 3,000 largest U.S. traded stocks, which represent about 98% of all U.S. incorporated equity securities. It is not possible to invest directly in an index.
BMTMX holdings are subject to change and should not be considered a recommendation to buy or sell any security. Please see the “Schedule of Investments” section in this report for a full listing of BMTMX’s holdings. BMT Investment Advisers, a subsidiary of Bryn Mawr Bank Corporation, is the adviser to BMTMX. BMTMX is distributed by Quasar Distributors, LLC. Bryn Mawr Bank Corporation and Quasar Distributors, LLC are independent entities.
Expense Example
May 31, 2019 (Unaudited)
As a shareholder of the BMT Multi-Cap Fund (“the Fund”), you incur ongoing costs, including management fees and other expenses incurred by the Fund. This example is intended to help you understand your ongoing costs (in dollars) of investing in the Fund and to compare these costs with the ongoing costs of investing in other mutual funds. The example is based on an investment of $1,000 invested at the beginning of the period and held the entire period of December 1, 2018 – May 31, 2019.
Actual Expenses
The first line of the following table provides information about actual account values and actual expenses. Although the Fund charges no sales load or transaction fees, you will be assessed fees for outgoing wire transfers, returned checks or stop payment orders at prevailing rates charged by U.S. Bancorp Fund Services, LLC, doing business as U.S. Bank Global Fund Services, the Fund’s transfer agent. To the extent that the Fund invests in shares of other investment companies as part of its investment strategy, you will indirectly bear your proportionate share of any fees and expenses charged by the underlying funds in which the Fund invests in addition to the expenses of the Fund. Actual expenses of the underlying funds are expected to vary among the various underlying funds. These expenses are not included in the following example. The example includes, but is not limited to, management fees, fund accounting, custody and transfer agent fees. However, the example below does not include portfolio trading commissions and related expenses and other extraordinary expenses as determined under generally accepted accounting principles. You may use the information in this line, together with the amount you invested, to estimate the expenses that you paid over the period. Simply divide your account value by $1,000 (for example, an $8,600 account value divided by $1,000 = 8.6), then multiply the result by the number in the first line under the heading entitled “Expenses Paid During Period” to estimate the expenses you paid on your account during this period.
Hypothetical Example for Comparison Purposes
The second line of the following table provides information about hypothetical account values and hypothetical expenses based on the Fund’s actual expense ratio and an assumed rate of return of 5% per year before expenses, which is not the Fund’s actual return. The hypothetical account values and expenses may not be used to estimate the actual ending account balance or expenses you paid for the period. You may use this information to compare the ongoing costs of investing in the Fund and other funds. To do so, compare this 5% hypothetical example with the 5% hypothetical examples that appear in the shareholder reports of the other funds.
Please note that the expenses shown in the table are meant to highlight your ongoing costs only and do not reflect any transactional costs, such as sales charges (loads), redemption fees, or exchange fees. Therefore, the second line of the table is useful in comparing ongoing costs only, and will not help you determine the relative costs of owning different funds. In addition, if these transactional costs were included, your costs would have been higher.
BMT Multi-Cap Fund
Beginning Account Value December 1, 2018 | Ending Account Value May 31, 2019 | Expenses Paid During Period* December 1, 2018 – May 31, 2019 | ||||||||||
Actual | $ | 1,000.00 | $ | 993.20 | $ | 4.97 | ||||||
Hypothetical (5% return before expenses) | 1,000.00 | 1,019.95 | 5.04 | |||||||||
*Expenses are equal to the Fund’s annualized expense ratio of 1.00%, multiplied by the average account value over the period, multiplied by 182/365 to reflect the one-half year period.
BMT Multi-Cap Fund |
Total Return Based on a $10,000 Investment (Unaudited)
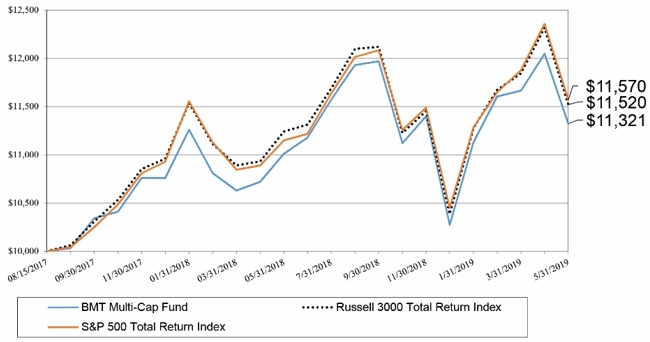
This chart assumes an initial gross investment of $10,000 made on August 15, 2017 (commencement of operations). Returns shown include the reinvestment of all dividends. Returns shown do not reflect the deduction of taxes that a shareholder would pay on fund distributions or the redemption of fund shares. In the absence of fee waivers and reimbursements, total return would be reduced. Past performance is not predictive of future performance. Investment return and principal value will fluctuate, so that your shares, when redeemed, may be worth more or less than the original cost.
Russell 3000 Total Return Index - The Russell 3000 Total Return Index is a popular measure of stock performance. It is comprised of the 3,000 largest U.S. companies based on stock market capitalization. The Fund changed its benchmark from the S&P 500 Total Return Index to the Russell 3000 Total Return Index during the year because the Fund’s investment adviser believes that the Russell 3000 Total Return Index is more representative of the investment approach used to manage the Fund.
S&P 500 Total Return Index - A capitalization-weighted index of 500 stocks. The index is designed to measure performance of the broad domestic economy through changes in the aggregate market value of 500 stocks representing all major industries.
Total Returns (for the periods ended May 31, 2019)
Average Annual | ||||||||
1 Year | Since Inception (08/15/17) | |||||||
BMT Multi-Cap Fund | 2.84 | % | 7.17 | % | ||||
Russell 3000 Total Return Index | 2.50 | % | 8.21 | % | ||||
S&P 500 Total Return Index | 3.78 | % | 8.48 | % | ||||
Allocation of Portfolio Holdings (as a % of total net assets)
May 31, 2019 (Unaudited)
BMT Multi-Cap Fund
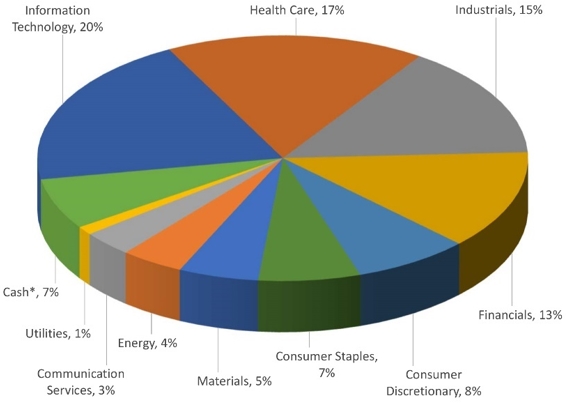
Components of Portfolio Holdings | ||||
Information Technology | $ | 38,517,734 | ||
Health Care | 32,735,770 | |||
Industrials | 28,390,014 | |||
Financials | 24,914,143 | |||
Consumer Discretionary | 14,650,630 | |||
Consumer Staples | 12,863,972 | |||
Materials | 10,087,922 | |||
Energy | 7,958,727 | |||
Communication Services | 6,424,622 | |||
Utilities | 2,117,543 | |||
Cash* | 13,226,070 | |||
Total Net Assets | $ | 191,887,147 |
The sector and industry classifications presented in this report present the Global Industry Classification Standard (GICS®). GICS® was developed by and/or is the exclusive property of MSCI, Inc. and Standard & Poor’s Financial Services LLC (“S&P”). GICS® is a service mark of MSCI and S&P and has been licensed for use by U.S. Bancorp Fund Services, LLC.
*Cash, cash equivalents and other assets less liabilities.
BMT Multi-Cap Fund
Schedule of Investments as of May 31, 2019
|
| Shares |
|
| Value |
| ||
COMMON STOCKS - 93.11% |
|
|
|
|
|
|
|
|
Automobiles & Components - 1.36% |
|
|
|
|
|
|
|
|
Aptiv PLC (a) |
|
| 23,929 |
|
| $ | 1,532,413 |
|
Dorman Products, Inc. (b) |
|
| 13,147 |
|
|
| 1,073,584 |
|
|
|
|
|
|
|
| 2,605,997 |
|
Banks - 8.73% |
|
|
|
|
|
|
|
|
Atlantic Union Bankshares Corp. |
|
| 87,263 |
|
|
| 2,818,595 |
|
BB&T Corp. |
|
| 61,647 |
|
|
| 2,881,997 |
|
Camden National Corp. |
|
| 52,694 |
|
|
| 2,231,591 |
|
JPMorgan Chase & Co. |
|
| 37,955 |
|
|
| 4,021,712 |
|
South State Corp. |
|
| 44,097 |
|
|
| 2,905,551 |
|
Wells Fargo & Co. |
|
| 42,828 |
|
|
| 1,900,279 |
|
|
|
|
|
|
|
| 16,759,725 |
|
Capital Goods - 9.99% |
|
|
|
|
|
|
|
|
Astec Industries, Inc. |
|
| 42,951 |
|
|
| 1,264,048 |
|
Cubic Corp. |
|
| 37,084 |
|
|
| 2,092,279 |
|
Hexcel Corp. |
|
| 37,226 |
|
|
| 2,709,681 |
|
Honeywell International, Inc. |
|
| 19,130 |
|
|
| 3,143,250 |
|
Johnson Controls International PLC (a) |
|
| 65,116 |
|
|
| 2,508,268 |
|
Nordson Corp. |
|
| 18,637 |
|
|
| 2,341,180 |
|
Spirit AeroSystems Holdings, Inc. - Class A |
|
| 23,000 |
|
|
| 1,863,920 |
|
Standex International Corp. |
|
| 29,668 |
|
|
| 1,929,607 |
|
Universal Forest Products, Inc. |
|
| 40,996 |
|
|
| 1,322,121 |
|
|
|
|
|
|
|
| 19,174,354 |
|
Commercial & Professional Services - 2.16% |
|
|
|
|
|
|
|
|
ABM Industries, Inc. |
|
| 63,074 |
|
|
| 2,286,432 |
|
Brady Corp. - Class A |
|
| 40,000 |
|
|
| 1,852,000 |
|
|
|
|
|
|
|
| 4,138,432 |
|
Consumer Durables & Apparel - 2.81% |
|
|
|
|
|
|
|
|
Brunswick Corp. |
|
| 34,013 |
|
|
| 1,410,859 |
|
Kontoor Brands, Inc. (b) |
|
| 3,655 |
|
|
| 107,083 |
|
VF Corp. |
|
| 25,583 |
|
|
| 2,094,736 |
|
Wolverine World Wide, Inc. |
|
| 63,992 |
|
|
| 1,787,937 |
|
|
|
|
|
|
|
| 5,400,615 |
|
Consumer Services - 1.17% |
|
|
|
|
|
|
|
|
Darden Restaurants, Inc. |
|
| 19,242 |
|
|
| 2,238,229 |
|
The accompanying notes are an integral part of these financial statements.
BMT Multi-Cap Fund
Schedule of Investments as of May 31, 2019
|
| Shares |
|
| Value |
| ||
Diversified Financials - 3.01% |
|
|
|
|
|
|
|
|
Cboe Global Markets, Inc. |
|
| 17,082 |
|
| $ | 1,854,080 |
|
Charles Schwab Corp. |
|
| 44,368 |
|
|
| 1,846,152 |
|
Raymond James Financial, Inc. |
|
| 25,132 |
|
|
| 2,075,401 |
|
|
|
|
|
|
|
| 5,775,633 |
|
Energy - 4.15% |
|
|
|
|
|
|
|
|
Anadarko Petroleum Corp. |
|
| 27,560 |
|
|
| 1,939,397 |
|
Apache Corp. |
|
| 46,652 |
|
|
| 1,216,218 |
|
EOG Resources, Inc. |
|
| 21,531 |
|
|
| 1,762,958 |
|
Occidental Petroleum Corp. |
|
| 35,490 |
|
|
| 1,766,337 |
|
Schlumberger Ltd. (a) |
|
| 36,720 |
|
|
| 1,273,817 |
|
|
|
|
|
|
|
| 7,958,727 |
|
Food & Staples Retailing - 1.66% |
|
|
|
|
|
|
|
|
Sysco Corp. |
|
| 36,693 |
|
|
| 2,525,212 |
|
Walgreens Boots Alliance, Inc. |
|
| 13,528 |
|
|
| 667,472 |
|
|
|
|
|
|
|
| 3,192,684 |
|
Food, Beverage & Tobacco - 3.14% |
|
|
|
|
|
|
|
|
Hormel Foods Corp. |
|
| 51,187 |
|
|
| 2,021,375 |
|
McCormick & Co., Inc. |
|
| 11,263 |
|
|
| 1,757,478 |
|
PepsiCo, Inc. |
|
| 17,509 |
|
|
| 2,241,152 |
|
|
|
|
|
|
|
| 6,020,005 |
|
Health Care Equipment & Services - 13.03% |
|
|
|
|
|
|
|
|
Abbott Laboratories |
|
| 34,589 |
|
|
| 2,633,261 |
|
Becton Dickinson and Co. |
|
| 14,778 |
|
|
| 3,449,776 |
|
Laboratory Corp of America Holdings (b) |
|
| 13,374 |
|
|
| 2,174,746 |
|
LHC Group, Inc. (b) |
|
| 20,987 |
|
|
| 2,377,407 |
|
Masimo Corp. (b) |
|
| 16,260 |
|
|
| 2,125,833 |
|
Merit Medical Systems, Inc. (b) |
|
| 37,267 |
|
|
| 1,924,095 |
|
STERIS PLC (a) |
|
| 22,120 |
|
|
| 2,957,002 |
|
Stryker Corp. |
|
| 14,370 |
|
|
| 2,633,159 |
|
Teleflex, Inc. |
|
| 9,716 |
|
|
| 2,801,123 |
|
US Physical Therapy, Inc. |
|
| 17,278 |
|
|
| 1,930,125 |
|
|
|
|
|
|
|
| 25,006,527 |
|
Household & Personal Products - 1.90% |
|
|
|
|
|
|
|
|
Church & Dwight Co., Inc. |
|
| 33,316 |
|
|
| 2,479,043 |
|
Kimberly-Clark Corp. |
|
| 9,166 |
|
|
| 1,172,240 |
|
|
|
|
|
|
|
| 3,651,283 |
|
The accompanying notes are an integral part of these financial statements.
BMT Multi-Cap Fund
Schedule of Investments as of May 31, 2019
|
| Shares |
|
| Value |
| ||
Insurance - 1.24% |
|
|
|
|
|
|
|
|
Prudential Financial, Inc. |
|
| 25,750 |
|
| $ | 2,378,785 |
|
|
|
|
|
|
|
|
|
|
Materials - 5.26% |
|
|
|
|
|
|
|
|
Bemis Co, Inc. |
|
| 39,310 |
|
|
| 2,293,739 |
|
Dow, Inc. |
|
| 17,782 |
|
|
| 831,486 |
|
DowDuPont, Inc. |
|
| 53,347 |
|
|
| 1,628,150 |
|
Mosaic Co. |
|
| 58,902 |
|
|
| 1,264,626 |
|
Quaker Chemical Corp. |
|
| 9,878 |
|
|
| 1,786,535 |
|
Sensient Technologies Corp. |
|
| 33,728 |
|
|
| 2,283,386 |
|
|
|
|
|
|
|
| 10,087,922 |
|
Media & Entertainment - 2.15% |
|
|
|
|
|
|
|
|
Alphabet, Inc. - Class C (b) |
|
| 2,160 |
|
|
| 2,383,841 |
|
CBS Corp. - Class B |
|
| 36,000 |
|
|
| 1,738,080 |
|
|
|
|
|
|
|
| 4,121,921 |
|
Pharmaceuticals, Biotechnology & Life Sciences - 4.03% |
|
|
|
|
|
|
|
|
Amgen, Inc. |
|
| 9,985 |
|
|
| 1,664,500 |
|
Johnson & Johnson |
|
| 18,187 |
|
|
| 2,385,225 |
|
Thermo Fisher Scientific, Inc. |
|
| 13,782 |
|
|
| 3,679,518 |
|
|
|
|
|
|
|
| 7,729,243 |
|
Retailing - 2.30% |
|
|
|
|
|
|
|
|
TJX Companies, Inc. |
|
| 54,206 |
|
|
| 2,726,020 |
|
Williams-Sonoma, Inc. |
|
| 28,714 |
|
|
| 1,679,769 |
|
|
|
|
|
|
|
| 4,405,789 |
|
Semiconductors & Semiconductor Equipment - 2.88% |
|
|
|
|
|
|
|
|
Analog Devices, Inc. |
|
| 25,646 |
|
|
| 2,477,916 |
|
Cirrus Logic, Inc. (b) |
|
| 36,680 |
|
|
| 1,370,732 |
|
Skyworks Solutions, Inc. |
|
| 25,108 |
|
|
| 1,672,946 |
|
|
|
|
|
|
|
| 5,521,594 |
|
Software & Services - 9.80% |
|
|
|
|
|
|
|
|
CACI International, Inc. - Class A (b) |
|
| 15,063 |
|
|
| 3,065,622 |
|
Mastercard, Inc. - Class A |
|
| 15,085 |
|
|
| 3,793,727 |
|
MAXIMUS, Inc. |
|
| 33,756 |
|
|
| 2,405,115 |
|
Microsoft Corp. |
|
| 31,553 |
|
|
| 3,902,475 |
|
Paychex, Inc. |
|
| 34,675 |
|
|
| 2,974,768 |
|
Total System Services, Inc. |
|
| 21,586 |
|
|
| 2,666,518 |
|
|
|
|
|
|
|
| 18,808,225 |
|
The accompanying notes are an integral part of these financial statements.
BMT Multi-Cap Fund
Schedule of Investments as of May 31, 2019
|
| Shares |
|
| Value |
| ||
Technology Hardware & Equipment - 7.39% |
|
|
|
|
|
|
|
|
Apple, Inc. |
|
| 23,722 |
|
| $ | 4,153,010 |
|
Avnet, Inc. |
|
| 34,439 |
|
|
| 1,406,489 |
|
Badger Meter, Inc. |
|
| 32,171 |
|
|
| 1,698,629 |
|
Cisco Systems, Inc. |
|
| 54,857 |
|
|
| 2,854,210 |
|
Corning, Inc. |
|
| 79,962 |
|
|
| 2,306,104 |
|
MTS Systems Corp. |
|
| 32,611 |
|
|
| 1,769,473 |
|
|
|
|
|
|
|
| 14,187,915 |
|
Telecommunication Services - 1.20% |
|
|
|
|
|
|
|
|
Verizon Communications, Inc. |
|
| 42,368 |
|
|
| 2,302,701 |
|
|
|
|
|
|
|
|
|
|
Transportation - 2.65% |
|
|
|
|
|
|
|
|
Atlas Air Worldwide Holdings, Inc. (b) |
|
| 31,436 |
|
|
| 1,112,520 |
|
Norfolk Southern Corp. |
|
| 11,350 |
|
|
| 2,214,839 |
|
United Parcel Service, Inc. - Class B |
|
| 18,832 |
|
|
| 1,749,869 |
|
|
|
|
|
|
|
| 5,077,228 |
|
Utilities - 1.10% |
|
|
|
|
|
|
|
|
American Water Works Co., Inc. |
|
| 18,736 |
|
|
| 2,117,543 |
|
Total Common Stocks (Cost $162,327,714) |
|
|
|
|
|
| 178,661,077 |
|
|
|
|
|
|
|
|
|
|
Short-Term Investment - 6.71% |
|
|
|
|
|
|
|
|
Money Market Mutual Fund - 6.71% |
|
|
|
|
|
|
|
|
Dreyfus Government Cash Management - Institutional Class, 2.28% (c) |
|
| 12,886,176 |
|
|
| 12,886,176 |
|
Total Short-Term Investment (Cost $12,886,176) |
|
|
|
|
|
| 12,886,176 |
|
|
|
|
|
|
|
|
|
|
Total Investments (Cost $175,213,890) - 99.82% |
|
|
|
|
|
| 191,547,253 |
|
Other Assets in Excess of Liabilities - 0.18% |
|
|
|
|
|
| 339,894 |
|
TOTAL NET ASSETS - 100.00% |
|
|
|
|
| $ | 191,887,147 |
|
The accompanying notes are an integral part of these financial statements.
BMT Multi-Cap Fund
Schedule of Investments as of May 31, 2019
Percentages are stated as a percent of net assets.
Notes to Schedule of Investments
(a) | Foreign issued security. Foreign concentration (including ADRs) were as follows: Curacao 0.66%, Ireland 2.85%, Jersey 0.80%. |
(b) | Non-income producing security. |
(c) | Variable rate security. Rate listed is the 7-day yield as of May 31, 2019. |
Industry classifications shown in the Schedule of Investments are based off of the Global Industry Classification Standard(GICS®).
GICS was developed by and/or is the exclusive property of MSCI, Inc. and Standard & Poor’s Financial Services LLC(“S&P”).
GICS is a service mark of MSCI and S&P and has been licensed for use by U.S. Bank Global Fund Services.
The accompanying notes are an integral part of these financial statements.
Statement of Assets & Liabilities
May 31, 2019
Assets: | ||||
Investments, at value (cost $175,213,890) | $ | 191,547,253 | ||
Income receivable | 325,844 | |||
Receivable for fund shares sold | 342,750 | |||
Prepaid expenses and other assets | 27,170 | |||
Total assets | 192,243,017 | |||
Liabilities: | ||||
Payable to Investment Adviser (see Note 3) | 224,416 | |||
Payable to Trustees | 4,199 | |||
Payable to CCO | 6,850 | |||
Payable to Custodian | 5,628 | |||
Accrued administration fees | 41,372 | |||
Accrued professional fees | 42,385 | |||
Accrued fund accounting fees | 14,024 | |||
Accrued shareholder servicing fees | 11,363 | |||
Accrued expenses and other liabilities | 5,633 | |||
Total liabilities | 355,870 | |||
Total net assets | $ | 191,887,147 | ||
Net Assets Consist of: | ||||
Capital stock | $ | 174,619,161 | ||
Total distributable earnings | 17,267,986 | |||
Total net assets | $ | 191,887,147 | ||
Net assets | $ | 191,887,147 | ||
Shares issued and outstanding (unlimited shares authorized, no par value) | 17,101,298 | |||
Net asset value, offering price and redemption price per share | $ | 11.22 |
The accompanying notes are an integral part of these financial statements.
Statement of Operations
Year Ended May 31, 2019
Investment Income: | ||||
Dividend income (net of issuance fees of $19) | $ | 3,092,515 | ||
Interest income | 223,016 | |||
Total investment income | 3,315,531 | |||
Expenses: | ||||
Investment Advisory fees (see Note 3) | 1,197,356 | |||
Administration fees | 153,353 | |||
Professional fees | 105,356 | |||
Trustee fees and expenses | 80,699 | |||
Compliance fees | 80,369 | |||
Fund accounting fees | 55,075 | |||
Shareholder servicing fees and expenses | 45,088 | |||
Deferred offering costs (see Note 4) | 29,553 | |||
Federal and state registration fees | 25,511 | |||
Custody fees | 20,648 | |||
Reports to shareholders | 8,688 | |||
Other expenses | 16,519 | |||
Total expenses before fee recovery | 1,818,215 | |||
Fees recovered by Adviser (see Note 3) | 23,871 | |||
Total net expenses | 1,842,086 | |||
Net investment income | 1,473,445 | |||
Net Realized and Unrealized Gain (Loss) on Investments: | ||||
Net realized gain on investment transactions | 216,082 | |||
Net change in unrealized appreciation on investments | 2,824,596 | |||
Net realized and unrealized gain on investments | 3,040,678 | |||
Net increase in net assets resulting from operations | $ | 4,514,123 |
The accompanying notes are an integral part of these financial statements.
Statements of Changes in Net Assets
Period from | ||||||||
August 15, 2017 | ||||||||
(commencement of operations) | ||||||||
Year Ended | through | |||||||
May 31, 2019 | May 31, 2018 | |||||||
Operations: | ||||||||
Net investment income | $ | 1,473,445 | $ | 712,853 | ||||
Net realized gain (loss) on investment transactions | 216,082 | (948,813 | ) | |||||
Net realized change in unrealized appreciation on investments | 2,824,596 | 13,508,767 | ||||||
Net increase in net assets resulting from operations | 4,514,123 | 13,272,807 | ||||||
Distributions to Shareholders: | ||||||||
Net distributions to shareholders (a) | (1,281,011 | ) | (235,694 | ) | ||||
Total distributions | (1,281,011 | ) | (235,694 | ) | ||||
Capital Share Transactions: | ||||||||
Proceeds from shares sold | 32,433,713 | 133,604,980 | ||||||
Proceeds from shares issued from transfer in-kind (See Note 5) | – | 25,437,031 | ||||||
Proceeds from shares issued in reinvestment of dividends | 11,386 | 1,590 | ||||||
Cost of shares redeemed | (10,927,352 | ) | (4,944,426 | ) | ||||
Net increase in net assets from capital share transactions | 21,517,747 | 154,099,175 | ||||||
Total Increase in Net Assets | 24,750,859 | 167,136,288 | ||||||
Net Assets: | ||||||||
Beginning of period | 167,136,288 | – | ||||||
End of period (b) | $ | 191,887,147 | $ | 167,136,288 | ||||
(a) | Distributions from net investment income and from net realized gains are no longer required to be separately disclosed. See Note 2. For the period from August 15, 2017 (commencement of operations) through May 31, 2018, total distributions to shareholders represented distributions from net investment income of $235,694. |
(b) | Parenthetical disclosure of accumulated undistributed net investment income is no longer required. See Note 2. For the period from August 15, 2017 (commencement of operations) through May 31, 2018, end of period net assets included accumulated undistributed net investment income of $477,159. |
The accompanying notes are an integral part of these financial statements.
Financial Highlights |
Period from | ||||||||
August 15, 2017 | ||||||||
(commencement of operations) | ||||||||
Year Ended | through | |||||||
May 31, 2019 | May 31, 2018* | |||||||
Per Share Data: | ||||||||
Net asset value, beginning of period | $ | 10.99 | $ | 10.00 | ||||
Investment Operations: | ||||||||
Net investment income | 0.09 | (a) | 0.05 | (b) | ||||
Net realized and unrealized gain on investments | 0.22 | 0.96 | ||||||
Total from investment operations | 0.31 | 1.01 | ||||||
Less Distributions: | ||||||||
From net investment income | (0.08 | ) | (0.02 | ) | ||||
Total distributions | (0.08 | ) | (0.02 | ) | ||||
Net asset value, end of period | $ | 11.22 | $ | 10.99 | ||||
Total return | 2.84 | % | 10.09 | % | ||||
Supplemental Data and Ratios: | ||||||||
Net assets, end of period ($000's) | $ | 191,887 | $ | 167,136 | ||||
Ratio of Expenses to Average Net Assets: | ||||||||
Before fee waiver or recovery | 0.99 | % | 1.23 | % | ||||
After fee waiver or recovery | 1.00 | % | 1.00 | % | ||||
Ratio of Net Investment Income to Average Net Assets: | ||||||||
Before fee waiver or recovery | 0.81 | % | 0.41 | % | ||||
After fee waiver or recovery | 0.80 | % | 0.64 | % | ||||
Portfolio turnover rate | 6.24 | % | 8.29 | % | ||||
* | All ratios have been annualized except total investment return and portfolio turnover. |
(a) | Net investment income per share is based on average shares outstanding. |
(b) | Net investment income per share is calculated using the ending accumulated net investment income balances prior to consideration or adjustment for permanent book-to-tax differences. |
The accompanying notes are an integral part of these financial statements.
Notes to Financial Statements
May 31, 2019
1. Organization
BMT Investment Funds (the "Trust") was organized as a Delaware Statutory Trust on February 9, 2017 and is registered under the Investment Company Act of 1940, as amended (the "1940 Act"), as an open-end management investment company. At May 31, 2019, the Trust consisted of one series, BMT Multi-Cap Fund (the "Fund"), which commenced operations on August 15, 2017.
2. Summary of Significant Accounting Policies
The following is a summary of significant accounting policies consistently followed by the Fund in the preparation of its financial statements. These policies are in conformity with accounting principles generally accepted in the United States ("GAAP"). The Fund is an investment company and, accordingly, follows the investment company accounting and reporting guidance of the Financial Accounting Standards Board (“FASB”) Accounting Standards Codification Topic 946, Financial Services – Investment Companies.
Valuation of Securities
The Fund has adopted authoritative fair valuation accounting standards which establish an authoritative definition of fair value and set out a hierarchy for measuring fair value. These standards require additional disclosures about the various inputs and valuation techniques used to develop the measurements of fair value and a discussion on changes in valuation techniques and related inputs during the period. These standards define fair value as the price that would be received to sell an asset or paid to transfer a liability in an orderly transaction between market participants at the measurement date. Management has determined that these standards have no material impact on the Funds' financial statements.
The fair value hierarchy is organized into three levels based upon the assumptions (referred to as "inputs") used in pricing the asset or liability. These standards state that "observable inputs" reflect the assumptions market participants would use in pricing the asset or liability based on market data obtained from independent sources and "unobservable inputs" reflect an entity's own assumptions about the assumptions market participants would use in pricing the asset or liability. These inputs are summarized into three broad levels and described below:
Level 1 - | Unadjusted quoted prices in active markets for identical unrestricted securities. |
Level 2 - | Other significant observable inputs (including quoted prices for similar securities, quoted prices in inactive markets, dealer indications, interest rates, yield curves, prepayment speeds, credit risk, default rates, inputs corroborated by observable market data, etc.). |
Level 3 - | Significant unobservable inputs (including the Fund's own assumptions about the factors that market participants would use in valuing the security) based on the best information available. |
The inputs or methodology used for valuing securities are not necessarily an indication of the risk associated with investing in those securities.
The following is a summary of the inputs used to value the Fund's investments as of May 31, 2019:
Level 1 | Level 2 | Level 3 | Total | |||||||||||||
Equity | ||||||||||||||||
Common Stocks | $ | 178,661,077 | $ | – | $ | – | $ | 178,661,077 | ||||||||
Total Equity | 178,661,077 | – | – | 178,661,077 | ||||||||||||
Short-Term Investment | ||||||||||||||||
Money Market Mutual Fund | 12,886,176 | – | – | 12,886,176 | ||||||||||||
Total Short-Term Investment | 12,886,176 | – | – | 12,886,176 | ||||||||||||
Total Investments* | $ | 191,547,253 | $ | – | $ | – | $ | 191,547,253 | ||||||||
* | Additional information regarding the industry classifications of these investments is disclosed in the Schedule of Investments. |
Changes in valuation techniques may result in transfers into or out of assigned levels within the fair value hierarchy. There were no transfers into or out of Level 3 during the reporting period, as compared to the security classifications from the prior year's annual report.
Equity investments, including common stocks, foreign issued common stocks, preferred stocks, convertible securities, warrants, rights, exchange-traded funds, closed end funds and real estate investment trusts, which are traded on an exchange (other than The NASDAQ OMX Group, Inc., referred to as "NASDAQ") are valued at the last sale price reported by the exchange on which the securities are primarily traded on the day of valuation. Portfolio securities primarily traded on the NASDAQ Stock Market ("NASDAQ") shall be valued using the NASDAQ Official Closing Price ("NOCP"), which may not necessarily represent the last sale price. If the NOCP is not available, such securities shall be valued at the last sale price on the day of valuation, or if there has been no sale on such day, at the mean between the bid and asked prices. OTC securities that are not traded on NASDAQ shall be valued at the most recent trade price. When using the market quotations or closing price provided by the pricing service, the security will be classified as a Level 1 security. When market quotations or closing price provided by the pricing service are unavailable, the mean of the bid and ask prices will be used. These securities will generally be classified as Level 2 securities.
Investment in mutual funds, including money market funds, are generally priced at the ending net asset value (NAV) provided by the service agent of the funds and will be classified as Level 1 securities.
Any securities or other assets for which market quotations are not readily available are valued at fair value as determined in good faith by the Fund’s adviser pursuant to procedures established under the general supervision and responsibility of the Fund’s Board of Trustees and will be classified as Level 3 assets.
The Fund did not hold any investments during the year ended May 31, 2019 with significant unobservable inputs which would be classified as Level 3 assets. The Fund did not hold any derivative instruments during the year.
Use of Estimates
The preparation of financial statements in conformity with GAAP requires management to make estimates and assumptions that affect the reported amounts of assets and liabilities and disclosure of contingent assets and liabilities at the date of the financial statements and the reported amounts of revenues and expenses during the reporting period. Actual results could differ from those estimates.
Indemnification
In the normal course of business the Fund enters into contracts that contain general indemnification clauses. The Fund's maximum exposure under these arrangements is unknown, as this would involve future claims against the Fund that have not yet occurred. Based on experiences, the Fund expects the risk of loss to be remote.
Securities Transactions and Investment Income
The Fund records security transactions based on trade date. Dividend income is recognized on the ex-dividend date, and interest income is recognized on an accrual basis. Net realized gains or losses are determined using the identified cost method.
Distribution to Shareholder Policy
Dividends from net investment income, if any, are declared and paid annually. Distributions of net realized capital gains, if any, are declared and paid at least annually.
Uninvested Cash
The Fund may maintain cash in bank deposit accounts which, at times, may exceed United States federally insured limits.
Federal Income Taxes
The Fund complies with, and intends to continue to comply with, the requirements of Subchapter M of the Internal Revenue Code necessary to qualify as a regulated investment company and to make the requisite distributions of income and capital gains to its shareholders sufficient to relieve it from federal income taxes.
Recent Accounting Pronouncements
In August 2018, FASB issued ASU 2018-13, Fair Value Measurement (Topic 820): Disclosure Framework—Changes to the Disclosure Requirements for Fair Value Measurement (“ASU 2018-13”). The primary focus of ASU 2018-13 is to improve the effectiveness of the disclosure requirements for fair value measurements. The changes affect all companies that are required to include fair value measurement disclosures. In general, the amendments in ASU 2018-13 are effective for all entities for fiscal years and interim periods within those fiscal years, beginning after December 15, 2019. An entity is permitted to early adopt the removed or modified disclosures upon the issuance of ASU 2018-13. Management has evaluated the impact these changes will have on the Fund’s financial statements and disclosures and decided to early adopt.
Regulatory Matters
In August 2018, the SEC issued Final Rule Release No. 33-10532, Disclosure Update and Simplification, which in part amends certain disclosure requirements of Regulation S-X that have become redundant, duplicative, overlapping, outdated, or superseded, in light of other SEC disclosure requirements, GAAP, or changes in the information environment. The amendments are intended to facilitate the disclosure of information to investors and simplify compliance without significantly altering the total mix of information provided to investors. The effective date for these disclosures was November 5, 2018. Management has adopted these amendments as currently required and these are reflected in the Funds’ financial statements and related disclosures. Certain prior year information has been adjusted to conform with these amendments.
3. Investment Adviser
The Fund has entered into an investment advisory agreement ("Advisory Agreement") with BMT Investment Advisers (the "Adviser"). The Adviser is a registered investment adviser with the U.S. Securities and Exchange Commission ("SEC") that provides investment advisory services to BMT Investment Funds. Under the Advisory Agreement, the Adviser manages the Fund's investments subject to the supervision of the Trust’s Board of Trustees.
The Adviser has overall supervisory responsibility for the general management and investment of the Fund's securities portfolio. For its services, the Fund pays the Adviser a monthly management fee that is calculated at the annual rate of 0.65% of the Fund's average daily net assets.
The Fund is responsible for its own operating expenses. Pursuant to an Expense Limitation Agreement between the Adviser and the Fund, the Adviser has agreed to reduce its management fees, and reimburse the Fund for its operating expenses, in order to ensure that Total Annual Fund Operating Expenses (excluding any acquired fund fees and expenses, taxes, interest, brokerage fees, certain insurance costs and extraordinary and other non-routine expenses) do not exceed 1.00% of the Fund’s average daily net assets. Expenses reimbursed and/or fees reduced by the Adviser may be recouped by the Adviser for a period of three years following the month in which the related reimbursement or waiver occurred, if such recoupment can be achieved without exceeding the expense limit in effect at the time the waiver and/or reimbursement occurred and at the time of the recoupment. Waived/reimbursed expenses subject to potential recovery by year of expiration are as follows:
Year of Expiration | ||||||||||
2020 | 2021 | 2022 | ||||||||
| $ | 75,930 | $ | 149,928 | $ | 5,100 | |||||
For the year ended May 31, 2019, the Adviser recouped expenses of $23,871 of the previously waived expenses of $254,830.
4. Offering Costs
Offering costs include state registration fees, legal fees, insurance fees, and printing and mailing fees regarding the preparation of the initial registration statement. Offering costs are accounted for as deferred costs until operations begin and thereafter amortized to expense over twelve months on a straight-line basis. For the year ended May 31, 2019, the Fund amortized $29,553 in deferred offering costs. As of May 31, 2019, the Fund fully amortized all of its deferred offering costs.
5. Transfer In-Kind
Upon commencement of operations, the Fund accepted securities eligible for investment by the Fund as consideration for Fund shares issued at a value of $25,437,031. As a result of the in-kind contribution, the Fund issued 2,543,703 shares at the net asset value of $10.00.
6. Investment Transactions
The aggregate purchases and sales of securities (excluding short-term securities) by the Fund for the year ended May 31, 2019 was as follows:
Non-U.S. Government | ||||||||
Purchases | Sales | |||||||
BMT Multi-Cap Fund | $ | 30,313,895 | $ | 10,808,846 | ||||
7. Capital Share Transactions
For the year ended May 31, 2019 | For the period from August 15, 2017 (commencement of operations) through May 31, 2018 | |||||||||||||||
Shares | Amount | Shares | Amount | |||||||||||||
BMT Multi-Cap Fund | ||||||||||||||||
Shares sold | 2,887,642 | $ | 32,433,713 | 13,120,644 | $ | 133,604,980 | ||||||||||
Shares issued from transfer in-kind (See Note 5) | - | - | 2,543,703 | 25,437,031 | ||||||||||||
Shares issued in reinvestment of dividends | 1,082 | 11,386 | 150 | 1,590 | ||||||||||||
Shares redeemed | (988,823 | ) | (10,927,352 | ) | (463,100 | ) | (4,944,426 | ) | ||||||||
Net increase (decrease) | 1,899,901 | $ | 21,517,747 | 15,201,397 | $ | 154,099,175 | ||||||||||
Shares Outstanding: | ||||||||||||||||
Beginning of period | 15,201,397 | - | ||||||||||||||
End of period | 17,101,298 | 15,201,397 | ||||||||||||||
8. Federal Income Tax Information
The tax components of distributions paid during the fiscal years May 31, 2018 and May 31, 2019 are as follows:
Ordinary Income | Capital Gains | |||||||
2019 | $ | 1,281,011 | $ | — | ||||
2018 | $ | 235,694 | $ | — | ||||
Additionally, GAAP require that certain components of net assets relating to permanent differences be reclassified between financial and tax reporting. These reclassifications have no effect on net assets or net asset value per share. For the year ended May 31, 2019, the following table shows the reclassifications made:
Distributable Earnings | Paid-in Capital | |||||||
BMT Multi-Cap Fund | $ | 275,020 | $ | (275,020 | ) | |||
These reclassifications primarily relate to adjustments with differing book and tax methods of accounting for transfer in-kind sales and stock issuance costs.
As of May 31, 2019, the components of accumulated earnings (losses) for income tax purposes were as follows:
BMT Multi-Cap Fund | ||||
Cost of investments | $ | 175,256,376 | ||
Unrealized appreciation | 28,546,873 | |||
Unrealized depreciation | (12,255,996 | ) | ||
Net unrealized appreciation | 16,290,877 | |||
Undistributed ordinary income | 856,834 | |||
Undistributed long-term gain | 202,827 | |||
Distributable earnings | 1,059,661 | |||
Other accumulated loss | (82,552 | ) | ||
Total accumulated gain | $ | 17,267,986 | ||
Other accumulated loss of $82,552 is due to the timing difference of deducting offering costs and disallowed losses on wash sales.
The difference between book-basis and tax-basis unrealized appreciation is attributable primarily to the tax deferral of losses on wash sales.
At May 31, 2019, the Fund had tax basis capital losses of $0. To the extent that the BMT Multi-Cap Fund may realize future net capital gains, those gains will be offset by any of its unused capital loss carryfowards. These losses do not expire.
There is no tax liability resulting from unrecognized tax benefits relating to uncertain income tax positions taken or expected to be taken on the tax returns for the year ended May 31, 2019. The BMT Multi-Cap Fund has open tax years of 2018-2019. The Trust is also not aware of any tax positions for which it is reasonably possible that the total amounts of unrecognized tax benefits will significantly change in the next year. The Fund recognizes interest and penalties, if any, related to unrecognized tax benefits as income tax expense in the Statement of Operations. During the period, the Fund did not incur any interest or penalties, nor were any accrued as of May 31, 2019.
9. Line of Credit
The Trust entered into an unsecured, uncommitted Loan Agreement (“Line of Credit” or “LOC”) with U.S. Bank, National Association (“U.S. Bank”) on behalf of the BMT Multi-Cap Fund. The $15 million LOC expires on April 7, 2020. The LOC was established for temporary emergency purposes, including the meeting of redemption requests that otherwise might require the untimely disposition of securities. U.S. Bank charges an interest rate per annum equal to the Prime Rate (5.50% as of May 31, 2019). At May 31, 2019, the Fund had no outstanding borrowings under the LOC and for the year ended May 31, 2019, the Fund did not utilize the LOC.
10. Subsequent Events Evaluation
In preparing these financial statements, the Fund has evaluated events and transactions for potential recognition or disclosure resulting from subsequent events after the Statement of Assets and Liabilities date of May 31, 2019 through the date the financial statements were available for issue. This evaluation did not result in any subsequent events, other than those noted above, that necessitated disclosure and/or adjustments.
REPORT OF INDEPENDENT REGISTERED PUBLIC
ACCOUNTING FIRM
To the Board of Trustees of BMT Investment Funds
and Shareholders of BMT Multi-Cap Fund
Opinion on the Financial Statements
We have audited the accompanying statement of assets and liabilities of BMT Multi-Cap Fund (the “Fund”), a series of BMT Investment Funds, including the schedule of investments, as of May 31, 2019, the related statement of operations for the year then ended, the statements of changes in net assets and financial highlights for the year then ended and for the period August 17, 2017 (commencement of operations) to May 31, 2018, and the related notes (collectively referred to as the “financial statements”). In our opinion, the financial statements present fairly, in all material respects, the financial position of the Fund as of May 31, 2019, the results of its operations for the year then ended, and the changes in its net assets and the financial highlights for the year then ended and for the period August 17, 2017 to May 31, 2018, in conformity with accounting principles generally accepted in the United States of America.
Basis for Opinion
These financial statements are the responsibility of the Fund’s management. Our responsibility is to express an opinion on the Fund’s financial statements based on our audits. We are a public accounting firm registered with the Public Company Accounting Oversight Board (United States) (“PCAOB”) and are required to be independent with respect to the Fund in accordance with the U.S. federal securities laws and the applicable rules and regulations of the Securities and Exchange Commission and the PCAOB. We have served as the Fund’s auditor since 2018.
We conducted our audits in accordance with the standards of the PCAOB. Those standards require that we plan and perform the audit to obtain reasonable assurance about whether the financial statements are free of material misstatement, whether due to error or fraud. The Fund is not required to have, nor were we engaged to perform, an audit of its internal control over financial reporting. As part of our audits we are required to obtain an understanding of internal control over financial reporting, but not for the purpose of expressing an opinion on the effectiveness of the Fund’s internal control over financial reporting. Accordingly, we express no such opinion.
Our audits included performing procedures to assess the risks of material misstatement of the financial statements, whether due to error or fraud, and performing procedures that respond to those risks. Such procedures included examining, on a test basis, evidence regarding the amounts and disclosures in the financial statements. Our audits also included evaluating the accounting principles used and significant estimates made by management, as well as evaluating the overall presentation of the financial statements. Our procedures included confirmation of securities owned as of May 31, 2019 by correspondence with the custodian. We believe that our audits provide a reasonable basis for our opinion.
TAIT, WELLER & BAKER LLP
Philadelphia, Pennsylvania
July 17, 2019
Additional Information
May 31, 2019 (Unaudited)
Disclosure Regarding Fund Trustees and Officers
The Statement of Additional Information (“SAI”) includes additional information about the Independent Trustees/Interested Trustees and other Officers and is available without charge, upon request, by calling 1.866.268.4701.
Name, Address* and Age | Position(s) Held with the Trust | Term of Office** and Length of Time Served | Number of Portfolios in Trust Overseen by Trustee | Principal Occupation(s) During the Past Five Years | Other Directorships Held by Trustee | |
Independent Trustees |
|
|
|
| ||
George M. Chamberlain, Jr. Age: 72 | Trustee | Indefinite Term; Since 2017 | 1 | Principal, GMC Consulting (Corporate consulting) (1999 to present); Vice President and General Counsel, SCM Advantage LLC (Supply chain consulting) (2009 to 2016). | Trapp Family Lodge Housing Cooperative (2008 to present), The Vantagepoint Funds (2012 to 2016), Alzheimer’s Association, Delaware Valley Chapter (2016 to 2018). | |
H. Richard Haverstick, Jr. Age: 66 | Trustee | Indefinite Term; Since 2017 | 1 | Accounting and Auditing Consultant (2015 to 2016); Partner, EY (Accounting and business management consulting) (1987 to 2013). | Thomas Jefferson University and Jefferson Health (2013 to present); Brandywine Realty Trust (2016 to present); Actua Corporation (Venture capital firm) (2016 to present). | |
Barbara A. Nugent Age: 63 | Lead Independent Trustee | Indefinite Term; Since 2017 | 1 | President, True North Board Governance, LLC (Corporate consulting) (2014 to present); Partner, Stradley Ronon Stevens & Young, LLP (Law firm) (1999 to 2013). | Brighthouse Funds Trust I (45 portfolios) and Trust II (29 portfolios) (2014 to present). | |
Disclosure Regarding Fund Trustees and Officers – (Continued)
Name, Address* and Age | Position(s) Held with the Trust | Term of Office** and Length of Time Served | Number of Portfolios in Trust Overseen by Trustee | Principal Occupation(s) During the Past Five Years | Other Directorships Held by Trustee | |
Interested Trustee |
|
|
| |||
Francis J. Leto*** Age: 59 | Chairman, Trustee | Indefinite Term; Since 2017 | 1 | President (2014 to present), Chief Executive Officer (2015 to present), Chief Operating Officer (2014 to 2015), Executive Vice President and head of Wealth Management Division (2009 to 2014) and General Counsel (2012 to 2014), Bryn Mawr Bank Corporation. | None | |
* | Each Trustee may be contacted by writing to the Trustees of BMT Investment Funds, 1436 Lancaster Avenue, Berwyn, PA 19312. |
** | Each Trustee serves until his or her successor is duly elected or appointed and qualified. |
*** | Mr. Leto is considered an “interested person” of the Trust because of his relationship with the Adviser. |
Officers |
| ||
Name, Address* and Age | Position(s) Held with the Trust | Term of Office and Length of Time Served | Principal Occupation(s) During the Past Five Years |
Jennifer Dempsey Fox Age: 48 | President and Principal Executive Officer | Indefinite Term; Since 2018 | President, Bryn Mawr Trust Company Wealth Management Division (2017 to present) and President, BMT Investment Advisers (since January 2018); Executive Vice President and Chief Wealth Strategist, PNC Asset Management Group (2011 to 2017). |
Marc Jenkins Age: 48 | Treasurer and Principal Financial Officer | Indefinite Term; Since 2019 | Senior Vice President & Chief Financial Officer, Bryn Mawr Trust Wealth Management Division (2018 to Present); Regional Finance Manager, Wells Fargo Company (2003 to 2018); Senior Vice President & Regional Investment Manager Wells Fargo Company (2014 to 2018); Senior Vice President & Regional Finance Manager, Wells Fargo Company (2009 to 2013). |
Lori Buchanan Goldman Age: 38 | Secretary | Indefinite Term; Since 2017 | Senior Vice President, General Counsel and Corporate Secretary, Bryn Mawr Bank Corporation (2015 to present); Attorney, Stradley Ronon Stevens & Young, LLP (2007 to 2015). |
David C. Lebisky Age: 47 | Chief Compliance Officer and Chief Anti-Money Laundering Officer | Indefinite Term; Since 2017 | President, Lebisky Compliance Consulting LLC (2015 to present); Consultant, Duff & Phelps Compliance Consulting (2016 to present); Senior Consultant, Freeh Group International Solutions, LLC (a global risk management firm) (2015 to 2018); Director of Regulatory Administration, Scotia Institutional Investments US, LP (2010 to 2014). |
Stephen M. Wellman Age: 56 | Assistant Secretary | Indefinite Term; Since 2018 | Senior Vice President, Chief Operating Officer Bryn Mawr Trust Company Wealth Management Division (2016 to present); Senior Vice President, Cipperman Compliance Services (2015-2016); Senior Vice President, Chief Operating Officer Echo Point Investment Management |
* | The address for each officer is 1436 Lancaster Avenue, Berwyn, PA 19312. |
The Statement of Additional information includes additional information about the Fund’s Trustees and is available free of charge upon request by calling the Fund toll free at 866.268.4701.
Investment Advisory Agreement Disclosure (Unaudited)
On April 10, 2019 the Board of Trustees of BMT Investment Funds (the “Trustees”) approved the renewal of the investment advisory agreement (the “Investment Advisory Agreement”) for the BMT Multi-Cap Fund (the “Fund”) with the investment adviser to the Fund, BMT Investment Advisers (the “Adviser”) for a three-month period ending July 31, 2019. In its consideration to renew the Investment Advisory Agreement, it was the expectation of the Board to reevaluate the renewal and continuation of the Investment Advisory Agreement in July 2019 for a period ending July 31, 2020.
In considering renewal of the Investment Advisory Agreement, the Board, including the Independent Trustees, reviewed certain information from counsel and from the Adviser, including: (i) a copy of the Investment Advisory Agreement; (ii) information describing the nature, quality and extent of the services that the Adviser provides to the Fund; (iii) information concerning the financial condition, business, operations, portfolio management teams, and compliance program of the Adviser; (iv) information describing the Fund’s investment advisory fee and operating expenses; (v) a copy of the current Form ADV for the Adviser; and (vi) a copy of the current Form ADV for the Adviser. The Board also considered presentations made by, and discussions held with, representatives of the Adviser. The Board also received information comparing the advisory fee and expenses of the Fund to other investment companies considered to be in the Fund’s peer group.
During its review of this information, the Board focused on and analyzed the factors that the Board deemed relevant, including: (i) the nature, extent and quality of the services provided to the Fund by the Adviser; (ii) the Adviser’s personnel and operations; (iii) the Fund’s expense levels; (iv) the profitability to the Adviser under the Investment Advisory Agreement; (v) any “fall-out” benefits to the Adviser and its affiliates (i.e., the ancillary benefits realized by the Adviser and its affiliates from the Adviser’s relationship with the Trust); (vi) the effect of asset growth on the Fund’s expenses; and (vii) possible conflicts of interest.
The Board, including the Independent Trustees, considered the following in respect of the Fund:
(a) The nature, extent and quality of services provided to the Fund by the Adviser; personnel and operations of the Adviser. The Board reviewed the services that the Adviser provides to the Fund. The Board noted the responsibilities that the Adviser has as the Fund’s investment adviser, including: the responsibility for the management and investment of the Fund’s portfolio; executing portfolio security trades; monitoring compliance with the Fund’s investment objective, policies and limitations; the responsibility for quarterly reporting to the Board; the oversight of general portfolio compliance with relevant law; and the implementation of Board directives as they relate to the Fund.
Based on its consideration and review of the foregoing information, the Board determined that they are satisfied with the nature, quality and extent of these services provided to the Fund, as well as the Adviser’s ability to render such services based on their experience, personnel, operations and resources.
(b) Comparison of services provided and fees paid to those under other investment advisory contracts, and the cost of the services provided and profits realized by the Adviser from the relationship with the Fund; “fall-out” benefits. The Board compared both the services provided to the Fund by the Adviser and the related fees to those of other investment advisers with respect to similar funds. In particular, the Board compared the Fund’s advisory fee and expense ratio to other investment companies considered to be in the Fund’s peer group. The Board noted that the Adviser has entered into an Expense Limitation Agreement whereby the Adviser waives advisory fees and/or reimburses expenses to keep the Fund’s expenses from exceeding certain levels. The Board received and considered information about the fee rates charged to other accounts and clients that are managed by the Adviser’s affiliates. The Board also discussed the costs and profitability of the Adviser in connection with its serving as investment adviser to the Fund, including operational costs. After comparing the Fund’s fees with those of other funds in the Fund’s peer group and considering the information about fee rates charged to other accounts and clients managed by the Adviser’s affiliates, and in light of the nature, quality and extent of services provided by the Adviser and the costs incurred by the Adviser in providing those services, the Board concluded that the level of fees paid to the Adviser with respect to the Fund were fair and reasonable.
The Board considered that the Adviser may experience certain “fall-out” benefits based on the success of the Fund, but that such benefits are not presently quantifiable. The Board noted that the Trust’s service providers are not affiliated with the Adviser, so that such services do not give rise to “fall-out” benefits for the Adviser and its affiliates.
(c) The extent to which economies of scale would be realized as the Fund grows, and whether fee levels would reflect such economies of scale. The Board discussed potential economies of scale. The Board considered whether the Fund may benefit from any economies of scale, noting that the investment advisory fee for the Fund does not contain breakpoints. The Board noted given current asset levels, it was not necessary to consider the implementation of fee breakpoints at the present time, but agreed to revisit the issue in the future as circumstances change and asset levels increase.
(d) Investment performance of the Fund and the Adviser. In assessing the quality of the portfolio management delivered by the Adviser, the Trustees reviewed the performance of the Fund on both an absolute basis and in comparison to the primary benchmark index and the Fund’s peer funds according to Morningstar classifications. When comparing the Fund’s performance against its Morningstar peer group, the Board took into account that the investment objective and strategies of the Fund, as well as the Fund’s level of risk tolerance, may differ significantly from funds in the peer group. The Board noted that the Fund was in the 4th quintile for the calendar quarter ended March 31, 2019 and the 1st quintile for the one-year and since inception periods. The Board observed that the Fund had outperformed its benchmark Russell 3000 over the year-to-date period ended February 28, 2019 but underperformed over the year-to-date period ended March 31, 2019. The Board also noted that the Fund outperformed the Russell 3000 over the one-year periods ended February 28, 2019 and March 31, 2019, but underperformed the Russell 3000 for the since inception periods ended February 28, 2019 and March 31, 2019.
Conclusion. No single factor was determinative to the decision of the Board. Based on the foregoing and such other matters as were deemed relevant the Board concluded that the advisory fee and total expense ratio were reasonable in relation to the services provided by the Adviser to the Fund, as well as the costs incurred and benefits gained by the Adviser in providing such services. The Board also found the advisory fees to be reasonable in comparison to the fees charged by advisers to other comparable funds. As a result, the Board concluded that the renewal of the Investment Advisory Agreement was in the best interests of the Fund.
Qualified Dividend Income (“QDI”)/Dividends Received Deduction (“DRD”) (Unaudited)
For the fiscal year ended May 31, 2019, certain dividends paid by the Fund may be subject to a maximum tax rate of 15%, as provided for by the Jobs and Growth Tax Relief Reconciliation Act of 2003.
The percentage of dividends declared from ordinary income designated as qualified dividend income was as follows:
BMT Multi-Cap Fund | 100 | % |
For corporate shareholders, the percent of ordinary income distributions qualifying for the corporate dividends received deduction for the fiscal year ended May 31, 2019, was as follows:
BMT Multi-Cap Fund | 100 | % |
The percentage of taxable ordinary income distributions that are designated as short-term capital gain distributions under Internal Revenue Section 871(k)(2)(C) for the Fund was as follows.
BMT Multi-Cap Fund | 0.00 | % |
Availability of Quarterly Portfolio Holdings Schedules
The Fund files a complete schedule of portfolio holdings with the U.S. Securities and Exchange Commission (the “SEC”) for the first and third quarters of each fiscal year on Form N-Q or Part F of Form N-PORT (beginning with filings after March 31, 2020). The Fund’s Form N-Q or Part F of Form N-PORT are available on the SEC’s website at www.sec.gov and may be reviewed and copied at the SEC’s Public Reference Room in Washington, D.C. Information on the operation of the Public Reference Room may be obtained by calling 1-800-732-0330. The Fund’s Form N-Q or Part F of Form N-PORT may also be obtained by calling toll-free 1.866.268.4701.
Proxy Voting Policies and Procedures and Proxy Voting Record (Unaudited)
A description of the policies and procedures that the Fund uses to determine how to vote proxies relating to portfolio securities is available without charge, upon request, by calling 1.866.268.4701 and on the SEC’s website (http://www.sec.gov). The Fund is required to disclose how it voted proxies related to portfolio securities during the most recent 12-month period ended June 30. Once filed, the information is available without charge, upon request, by calling 1.866.268.4701 and on the SEC’s website (http://www.sec.gov).
Privacy Notice
The Fund collects non-public information about you from the following sources:
● | Information we receive about you on applications or other forms; |
● | Information you give us orally; and/or |
● | Information about your transactions with us or others. |
We do not disclose any non-public personal information about our customers or former customers without the customer’s authorization, except as permitted by law or in response to inquiries from governmental authorities. We may share information with affiliated and unaffiliated third parties with whom we have contracts for servicing the Fund. We will provide unaffiliated third parties with only the information necessary to carry out their assigned responsibilities. We maintain physical, electronic and procedural safeguards to guard your non-public personal information and require third parties to treat your personal information with the same high degree of confidentiality.
In the event that you hold shares of the Fund through a Financial Intermediary, including, but not limited to, a broker-dealer, bank, or trust company, the privacy policy of your Financial Intermediary would govern how your non-public personal information would be shared by those entities with unaffiliated third parties.
Board of Trustees
George M. Chamberlain, Jr.
H. Richard Haverstick, Jr.
Barbara A. Nugent
Francis J. Leto
Investment Adviser
BMT Investment Advisers
1436 Lancaster Avenue
Berwyn, Pennsylvania 19312
Independent Registered Public Accounting Firm
Tait, Weller & Baker LLP
50 South 16th Street, Suite 2900
Philadelphia, Pennsylvania 19102
Legal Counsel
Stradley Ronon Stevens & Young, LLP
2005 Market Street, Suite 2600
Philadelphia, Pennsylvania 19103
Custodian
U.S. Bank, N.A.
1555 N. RiverCenter Drive, Suite 302
Milwaukee, WI 53212
Distributor
Quasar Distributors, LLC
777 East Wisconsin Avenue
Milwaukee, WI 53212
Administrator, Transfer Agent and Dividend Disbursing Agent
U.S. Bancorp Fund Services, LLC
doing business as U.S. Bank Global Fund Services
615 East Michigan Street
Milwaukee, WI 53202
Shareholder/Investor Information
1.866.268.4701
www.bmtc.com/mutual-fund
Item 2. Code of Ethics.
The registrant has adopted a code of ethics that applies to the registrant’s principal executive officer and principal financial officer. The registrant has not made any substantive amendments to its code of ethics during the period covered by this report. The registrant has not granted any waivers from any provisions of the code of ethics during the period covered by this report.
A copy of the registrant’s Code of Ethics is filed herewith.
Item 3. Audit Committee Financial Expert.
The registrant’s board of trustees has determined that there is at least one audit committee financial expert serving on its audit committee. H. Richard Haverstick, Jr. is the “audit committee financial expert” and is considered to be “independent” as each term is defined in Item 3 of Form N-CSR.
Item 4. Principal Accountant Fees and Services.
The registrant has engaged its principal accountant to perform audit services, audit-related services, tax services and other services during the past two fiscal years. “Audit services” refer to performing an audit of the registrant's annual financial statements or services that are normally provided by the accountant in connection with statutory and regulatory filings or engagements for those fiscal years. “Audit-related services” refer to the assurance and related services by the principal accountant that are reasonably related to the performance of the audit. “Tax services” refer to professional services rendered by the principal accountant for tax compliance, tax advice, and tax planning. There were no “Other services” provided by the principal accountant. The following table details the aggregate fees billed or expected to be billed for the last fiscal year for audit fees, audit-related fees, tax fees and other fees by the principal accountant.
FYE 05/31/2019 | FYE 05/31/2018 | |||||||
Audit Fees | $16,000 | $15,000 | ||||||
Audit-Related Fees | $0 | $1,000 | ||||||
Tax Fees | $3,000 | $3,000 | ||||||
All Other Fees | $0 | $0 | ||||||
The audit committee has adopted pre-approval policies and procedures that require the audit committee to pre-approve all audit and non-audit services of the registrant, including services provided to any entity affiliated with the registrant.
The percentage of fees billed by Tait Weller applicable to non-audit services pursuant to waiver of pre-approval requirement were as follows:
FYE 05/31/2019 | FYE 05/31/2018 | |||||||
Audit-Related Fees | 0% | 0% | ||||||
Tax Fees | 0% | 0% | ||||||
All Other Fees | 0% | 0% | ||||||
All of the principal accountant’s hours spent on auditing the registrant’s financial statements were attributed to work performed by full-time permanent employees of the principal accountant.
The following table indicates the non-audit fees billed or expected to be billed by the registrant’s accountant for services to the registrant and to the registrant’s investment adviser (and any other controlling entity, etc.—not sub-adviser) for the last year. The audit committee of the board of trustees/directors has considered whether the provision of non-audit services that were rendered to the registrant's investment adviser is compatible with maintaining the principal accountant's independence and has concluded that the provision of such non-audit services by the accountant has not compromised the accountant’s independence.
Non-Audit Related Fees | FYE 05/31/2019 | FYE 05/31/2018 | ||||||
Registrant | $3,000 | $3,000 | ||||||
Registrant’s Investment Adviser | $0 | $0 | ||||||
Item 5. Audit Committee of Listed Registrants.
Not applicable to registrants who are not listed issuers (as defined in Rule 10A-3 under the Securities Exchange Act of 1934).
Item 6. Investments.
Schedule of Investments is included as part of the report to shareholders filed under Item 1 of this Form.
Item 7. Disclosure of Proxy Voting Policies and Procedures for Closed-End Management Investment Companies.
Not applicable to open-end investment companies.
Item 8. Portfolio Managers of Closed-End Management Investment Companies.
Not applicable to open-end investment companies.
Item 9. Purchases of Equity Securities by Closed-End Management Investment Company and Affiliated Purchasers.
Not applicable to open-end investment companies.
Item 10. Submission of Matters to a Vote of Security Holders.
There have been no material changes to the procedures by which shareholders may recommend nominees to the registrant’s board of trustees.
Item 11. Controls and Procedures.
(a) | The Registrant’s principal executive officer and principal financial officer have concluded that the Registrant's disclosure controls and procedures (as defined in Rule 30a-3(c) under the Investment Company Act of 1940 (the “1940 Act”)) (17 CFR 270.30a-3(c)) are effective as of a date within 90 days of the filing date of the report that includes the disclosure required by this paragraph, based on the evaluation of these controls and procedures required by Rule 30a-3(b) under the 1940 Act (17 CFR 270.30a-3(b)) and Rule 13a-15(b) or Rule 15d-15(b) under the Securities Exchange Act of 1934, as amended (17 CFR 240.13a-15(b) or 240.15d-15(d)). |
(b) | There were no changes in the Registrant's internal control over financial reporting (as defined in Rule 30a-3(d) under the 1940 Act) (17 CFR 270.30a-3(d)) that occurred during the Registrant's last fiscal quarter that have materially affected, or are reasonably likely to materially affect, the Registrant's internal control over financial reporting. |
Item 12. Disclosure of Securities Lending Activities for Closed-End Management Investment Companies
Not applicable to open-end investment companies.
Item 13. Exhibits.
(a) | (1) Any code of ethics or amendment thereto, that is the subject of the disclosure required by Item 2, to the extent that the registrant intends to satisfy Item 2 requirements through filing an exhibit. Filed herewith. |
(2) A separate certification for each principal executive officer and principal financial officer pursuant to Section 302 of the Sarbanes-Oxley Act of 2002. Filed herewith.
(3) Any written solicitation to purchase securities under Rule 23c-1 under the Act sent or given during the period covered by the report by or on behalf of the registrant to 10 or more persons. Not applicable to open-end investment companies.
(b) | Certifications pursuant to Section 906 of the Sarbanes-Oxley Act of 2002. Furnished herewith. |
SIGNATURES
Pursuant to the requirements of the Securities Exchange Act of 1934 and the Investment Company Act of 1940, the registrant has duly caused this report to be signed on its behalf by the undersigned, thereunto duly authorized.
(Registrant) BMT Investment Funds
| By (Signature and Title)* |  |
| Jennifer Dempsey Fox, President |
| Date | July 31, 2019 |
Pursuant to the requirements of the Securities Exchange Act of 1934 and the Investment Company Act of 1940, this report has been signed below by the following persons on behalf of the registrant and in the capacities and on the dates indicated.
| By (Signature and Title)* | |
| Jennifer Dempsey Fox, President |
| Date | July 31, 2019 |
| By (Signature and Title)* |  |
| Marc Jenkins, Treasurer |
| Date | July 31, 2019 |
* Print the name and title of each signing officer under his or her signature.
4