Exhibit 99.1 Magnolia Oil & Gas Corporation Investor Presentation – February 2019Exhibit 99.1 Magnolia Oil & Gas Corporation Investor Presentation – February 2019
Disclaimer FORWARD LOOKING STATEMENTS The information in this presentation and the oral statements made in connection therewith include “forward‐looking statements” within the meaning of Section 27A of the Securities Act of 1933, as amended (the “Securities Act”), and Section 21E of the Securities Exchange Act of 1934, as amended. All statements, other than statements of present or historical fact included in this presentation, regarding Magnolia Oil & Gas Corporation’s (“Magnolia,” “we,” “us,” “our” or the “Company”) financial and production guidance, strategy, future operations, financial position, estimated revenues, and losses, projected costs, prospects, plans and objectives of management are forward‐looking statements. When used in this presentation, including any oral statements made in connection therewith, the words “could,” “should,” “will,” “may,” “believe,” “anticipate,” “intend,” “estimate,” “expect,” “project,” the negative of such terms and other similar expressions are intended to identify forward‐looking statements, although not all forward‐looking statements contain such identifying words. These forward‐looking statements are based on management’s current expectations and assumptions about future events. Except as otherwise required by applicable law, Magnolia disclaims any duty to update any forward‐looking statements, all of which are expressly qualified by the statements in this section, to reflect events or circumstances after the date of this presentation. Magnolia cautions you that these forward‐looking statements are subject to all of the risks and uncertainties, most of which are difficult to predict and many of which are beyond the control of Magnolia, incident to the development, production, gathering and sale of oil, natural gas and natural gas liquids. These risks include, but are not limited to, commodity price volatility, low prices for oil and/or natural gas, global economic conditions, inflation, increased operating costs, lack of availability of drilling and production equipment, supplies, services and qualified personnel, processing volumes and pipeline throughput, and certificates related to new technologies, geographical concentration of operations, environmental risks, weather risks, security risks, drilling and other operating risks, regulatory changes, the uncertainty inherent in estimating oil and natural gas reserves and in projecting future rates of production, reductions in cash flow, lack of access to capital, Magnolia’s ability to satisfy future cash obligations, restrictions in existing or future debt agreements, the timing of development expenditures, managing growth and integration of acquisitions, failure to realize expected value creation from property acquisitions, and the defects and limited control over non‐operated properties. Should one or more of the risks or uncertainties described in this presentation and the oral statements made in connection therewith occur, or should underlying assumptions prove incorrect, actual results and plans could different materially from those expressed in any forward‐looking statements. Additional information concerning these and other factors that may impact Magnolia's operations and projections can be found in its filings with the Securities and Exchange Commission (the SEC ), including its Annual Report on Form 10‐K for the fiscal year ended December 31, 2017 and its Annual Report on Form 10‐K for the fiscal year ended December 31, 2018 expected to be filed on February 27, 2019. Magnolia’s SEC filings are available publicly on the SEC’s website at www.sec.gov. NON‐GAAP FINANCIAL MEASURES This presentation includes non‐GAAP financial measures, including Adjusted EBITDAX, adjusted operating margin and adjusted earnings. Magnolia believes these metrics are useful because they allow Magnolia to more effectively evaluate its operating performance and compare the results of its operations from period to period and against its peers without regard to financing methods or capital structure. Magnolia does not consider these non‐GAAP measures in isolation or as an alternative to similar financial measures determined in accordance with GAAP. The computations of these non‐GAAP measures may not be comparable to other similarly titled measures of other companies. Magnolia excludes certain items from net income in arriving at adjusted operating margin and adjusted earnings because these amounts can vary substantially from company to company within its industry depending upon accounting methods, book values of assets and the method by which the assets were acquired. Adjusted EBITDAX, adjusted operating margin, and adjusted earnings should not be considered as alternatives to, or more meaningful than, net income as determined in accordance with GAAP. Certain items excluded from Adjusted EBITDAX, adjusted operating margin, and adjusted earnings are significant components in understanding and assessing a company’s financial performance, and should not be construed as an inference that its results will be unaffected by unusual or non‐ recurring terms. As performance measures, adjusted operating margin and Adjusted EBITDAX may be useful to investors in facilitating comparisons to others in the Company’s industry because certain items can vary substantially in the oil and gas industry from company to company depending upon accounting methods, book value of assets, and capital structure, among other factors. Management believes excluding these items facilitates investors and analysts in evaluating and comparing the underlying operating and financial performance of our business from period to period by eliminating differences caused by the existence and timing of certain expense and income items that would not otherwise be apparent on a GAAP basis. However, our presentation of adjusted operating margin, adjusted operating margin per Boe, and Adjusted EBITDAX may not be comparable to similar measures of other companies in our industry. An adjusted operating margin per Boe reconciliation is shown on page 8 of the presentation and an Adjusted EBITDAX reconciliation is shown on page 23 of the presentation. INDUSTRY AND MARKET DATA This presentation has been prepared by Magnolia and includes market data and other statistical information from sources believed by Magnolia to be reliable, including independent industry publications, governmental publications or other published independent sources. Some data is also based on the good faith estimates of Magnolia, which are derived from its review of internal sources as well as the independent sources described above. Although Magnolia believes these sources are reliable, it has not independently verified the information and cannot guarantee its accuracy and completeness. 2Disclaimer FORWARD LOOKING STATEMENTS The information in this presentation and the oral statements made in connection therewith include “forward‐looking statements” within the meaning of Section 27A of the Securities Act of 1933, as amended (the “Securities Act”), and Section 21E of the Securities Exchange Act of 1934, as amended. All statements, other than statements of present or historical fact included in this presentation, regarding Magnolia Oil & Gas Corporation’s (“Magnolia,” “we,” “us,” “our” or the “Company”) financial and production guidance, strategy, future operations, financial position, estimated revenues, and losses, projected costs, prospects, plans and objectives of management are forward‐looking statements. When used in this presentation, including any oral statements made in connection therewith, the words “could,” “should,” “will,” “may,” “believe,” “anticipate,” “intend,” “estimate,” “expect,” “project,” the negative of such terms and other similar expressions are intended to identify forward‐looking statements, although not all forward‐looking statements contain such identifying words. These forward‐looking statements are based on management’s current expectations and assumptions about future events. Except as otherwise required by applicable law, Magnolia disclaims any duty to update any forward‐looking statements, all of which are expressly qualified by the statements in this section, to reflect events or circumstances after the date of this presentation. Magnolia cautions you that these forward‐looking statements are subject to all of the risks and uncertainties, most of which are difficult to predict and many of which are beyond the control of Magnolia, incident to the development, production, gathering and sale of oil, natural gas and natural gas liquids. These risks include, but are not limited to, commodity price volatility, low prices for oil and/or natural gas, global economic conditions, inflation, increased operating costs, lack of availability of drilling and production equipment, supplies, services and qualified personnel, processing volumes and pipeline throughput, and certificates related to new technologies, geographical concentration of operations, environmental risks, weather risks, security risks, drilling and other operating risks, regulatory changes, the uncertainty inherent in estimating oil and natural gas reserves and in projecting future rates of production, reductions in cash flow, lack of access to capital, Magnolia’s ability to satisfy future cash obligations, restrictions in existing or future debt agreements, the timing of development expenditures, managing growth and integration of acquisitions, failure to realize expected value creation from property acquisitions, and the defects and limited control over non‐operated properties. Should one or more of the risks or uncertainties described in this presentation and the oral statements made in connection therewith occur, or should underlying assumptions prove incorrect, actual results and plans could different materially from those expressed in any forward‐looking statements. Additional information concerning these and other factors that may impact Magnolia's operations and projections can be found in its filings with the Securities and Exchange Commission (the SEC ), including its Annual Report on Form 10‐K for the fiscal year ended December 31, 2017 and its Annual Report on Form 10‐K for the fiscal year ended December 31, 2018 expected to be filed on February 27, 2019. Magnolia’s SEC filings are available publicly on the SEC’s website at www.sec.gov. NON‐GAAP FINANCIAL MEASURES This presentation includes non‐GAAP financial measures, including Adjusted EBITDAX, adjusted operating margin and adjusted earnings. Magnolia believes these metrics are useful because they allow Magnolia to more effectively evaluate its operating performance and compare the results of its operations from period to period and against its peers without regard to financing methods or capital structure. Magnolia does not consider these non‐GAAP measures in isolation or as an alternative to similar financial measures determined in accordance with GAAP. The computations of these non‐GAAP measures may not be comparable to other similarly titled measures of other companies. Magnolia excludes certain items from net income in arriving at adjusted operating margin and adjusted earnings because these amounts can vary substantially from company to company within its industry depending upon accounting methods, book values of assets and the method by which the assets were acquired. Adjusted EBITDAX, adjusted operating margin, and adjusted earnings should not be considered as alternatives to, or more meaningful than, net income as determined in accordance with GAAP. Certain items excluded from Adjusted EBITDAX, adjusted operating margin, and adjusted earnings are significant components in understanding and assessing a company’s financial performance, and should not be construed as an inference that its results will be unaffected by unusual or non‐ recurring terms. As performance measures, adjusted operating margin and Adjusted EBITDAX may be useful to investors in facilitating comparisons to others in the Company’s industry because certain items can vary substantially in the oil and gas industry from company to company depending upon accounting methods, book value of assets, and capital structure, among other factors. Management believes excluding these items facilitates investors and analysts in evaluating and comparing the underlying operating and financial performance of our business from period to period by eliminating differences caused by the existence and timing of certain expense and income items that would not otherwise be apparent on a GAAP basis. However, our presentation of adjusted operating margin, adjusted operating margin per Boe, and Adjusted EBITDAX may not be comparable to similar measures of other companies in our industry. An adjusted operating margin per Boe reconciliation is shown on page 8 of the presentation and an Adjusted EBITDAX reconciliation is shown on page 23 of the presentation. INDUSTRY AND MARKET DATA This presentation has been prepared by Magnolia and includes market data and other statistical information from sources believed by Magnolia to be reliable, including independent industry publications, governmental publications or other published independent sources. Some data is also based on the good faith estimates of Magnolia, which are derived from its review of internal sources as well as the independent sources described above. Although Magnolia believes these sources are reliable, it has not independently verified the information and cannot guarantee its accuracy and completeness. 2
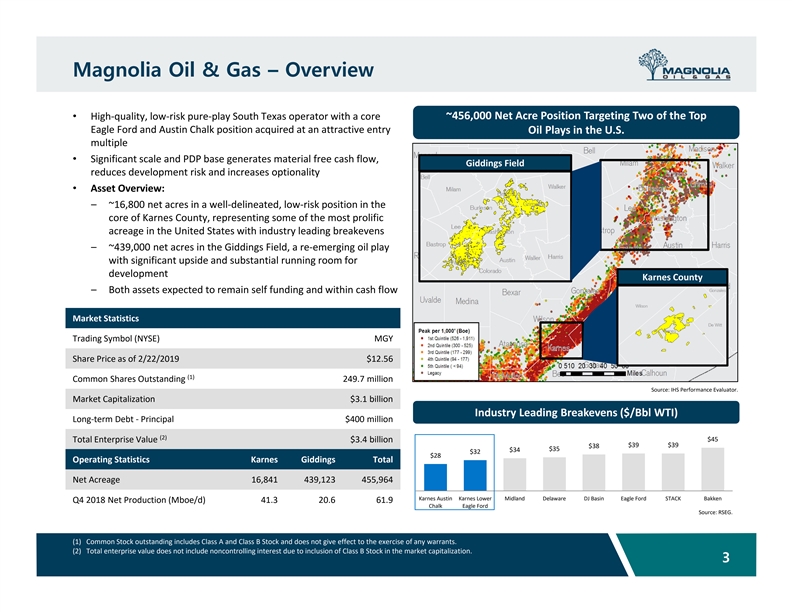
Magnolia Oil & Gas – Overview ~456,000 Net Acre Position Targeting Two of the Top • High‐quality, low‐risk pure‐play South Texas operator with a core Eagle Ford and Austin Chalk position acquired at an attractive entry Oil Plays in the U.S. multiple • Significant scale and PDP base generates material free cash flow, Giddings Field reduces development risk and increases optionality • Asset Overview: – ~16,800 net acres in a well‐delineated, low‐risk position in the core of Karnes County, representing some of the most prolific acreage in the United States with industry leading breakevens – ~439,000 net acres in the Giddings Field, a re‐emerging oil play with significant upside and substantial running room for development Karnes County – Both assets expected to remain self funding and within cash flow Market Statistics Trading Symbol (NYSE) MGY Share Price as of 2/22/2019 $12.56 (1) Common Shares Outstanding 249.7 million Source: IHS Performance Evaluator. Market Capitalization $3.1 billion Industry Leading Breakevens ($/Bbl WTI) Long‐term Debt ‐ Principal $400 million (2) $45 Total Enterprise Value $3.4 billion $39 $39 $38 $35 $34 $32 $28 Operating Statistics Karnes Giddings Total Net Acreage 16,841 439,123 455,964 Karnes Austin Karnes Lower Midland Delaware DJ Basin Eagle Ford STACK Bakken Q4 2018 Net Production (Mboe/d) 41.3 20.6 61.9 Chalk Eagle Ford Source: RSEG. (1) Common Stock outstanding includes Class A and Class B Stock and does not give effect to the exercise of any warrants. (2) Total enterprise value does not include noncontrolling interest due to inclusion of Class B Stock in the market capitalization. 3Magnolia Oil & Gas – Overview ~456,000 Net Acre Position Targeting Two of the Top • High‐quality, low‐risk pure‐play South Texas operator with a core Eagle Ford and Austin Chalk position acquired at an attractive entry Oil Plays in the U.S. multiple • Significant scale and PDP base generates material free cash flow, Giddings Field reduces development risk and increases optionality • Asset Overview: – ~16,800 net acres in a well‐delineated, low‐risk position in the core of Karnes County, representing some of the most prolific acreage in the United States with industry leading breakevens – ~439,000 net acres in the Giddings Field, a re‐emerging oil play with significant upside and substantial running room for development Karnes County – Both assets expected to remain self funding and within cash flow Market Statistics Trading Symbol (NYSE) MGY Share Price as of 2/22/2019 $12.56 (1) Common Shares Outstanding 249.7 million Source: IHS Performance Evaluator. Market Capitalization $3.1 billion Industry Leading Breakevens ($/Bbl WTI) Long‐term Debt ‐ Principal $400 million (2) $45 Total Enterprise Value $3.4 billion $39 $39 $38 $35 $34 $32 $28 Operating Statistics Karnes Giddings Total Net Acreage 16,841 439,123 455,964 Karnes Austin Karnes Lower Midland Delaware DJ Basin Eagle Ford STACK Bakken Q4 2018 Net Production (Mboe/d) 41.3 20.6 61.9 Chalk Eagle Ford Source: RSEG. (1) Common Stock outstanding includes Class A and Class B Stock and does not give effect to the exercise of any warrants. (2) Total enterprise value does not include noncontrolling interest due to inclusion of Class B Stock in the market capitalization. 3
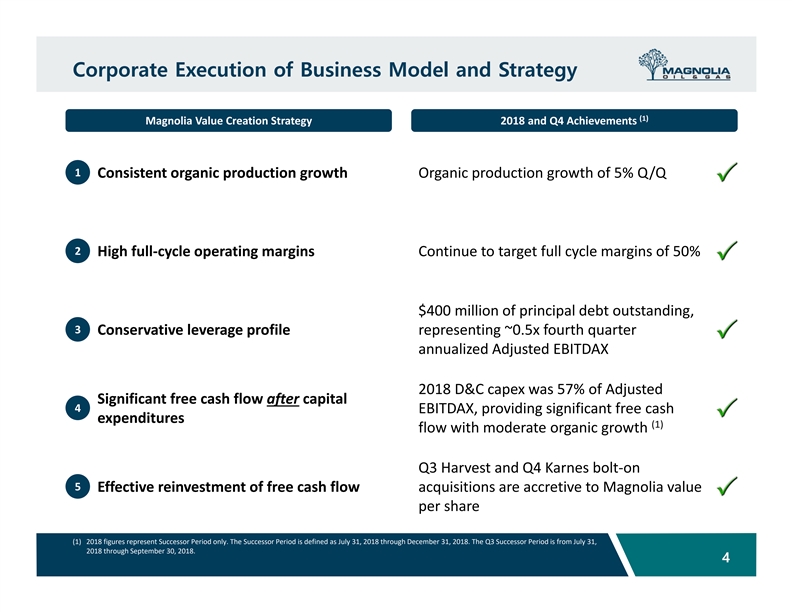
Corporate Execution of Business Model and Strategy (1) Magnolia Value Creation Strategy 2018 and Q4 Achievements 1 Consistent organic production growth Organic production growth of 5% Q/Q 2 High full‐cycle operating margins Continue to target full cycle margins of 50% $400 million of principal debt outstanding, 3 Conservative leverage profile representing ~0.5x fourth quarter annualized Adjusted EBITDAX 2018 D&C capex was 57% of Adjusted Significant free cash flow after capital 4 EBITDAX, providing significant free cash expenditures (1) flow with moderate organic growth Q3 Harvest and Q4 Karnes bolt‐on 5 Effective reinvestment of free cash flow acquisitions are accretive to Magnolia value per share (1) 2018 figures represent Successor Period only. The Successor Period is defined as July 31, 2018 through December 31, 2018. The Q3 Successor Period is from July 31, 2018 through September 30, 2018. 4Corporate Execution of Business Model and Strategy (1) Magnolia Value Creation Strategy 2018 and Q4 Achievements 1 Consistent organic production growth Organic production growth of 5% Q/Q 2 High full‐cycle operating margins Continue to target full cycle margins of 50% $400 million of principal debt outstanding, 3 Conservative leverage profile representing ~0.5x fourth quarter annualized Adjusted EBITDAX 2018 D&C capex was 57% of Adjusted Significant free cash flow after capital 4 EBITDAX, providing significant free cash expenditures (1) flow with moderate organic growth Q3 Harvest and Q4 Karnes bolt‐on 5 Effective reinvestment of free cash flow acquisitions are accretive to Magnolia value per share (1) 2018 figures represent Successor Period only. The Successor Period is defined as July 31, 2018 through December 31, 2018. The Q3 Successor Period is from July 31, 2018 through September 30, 2018. 4
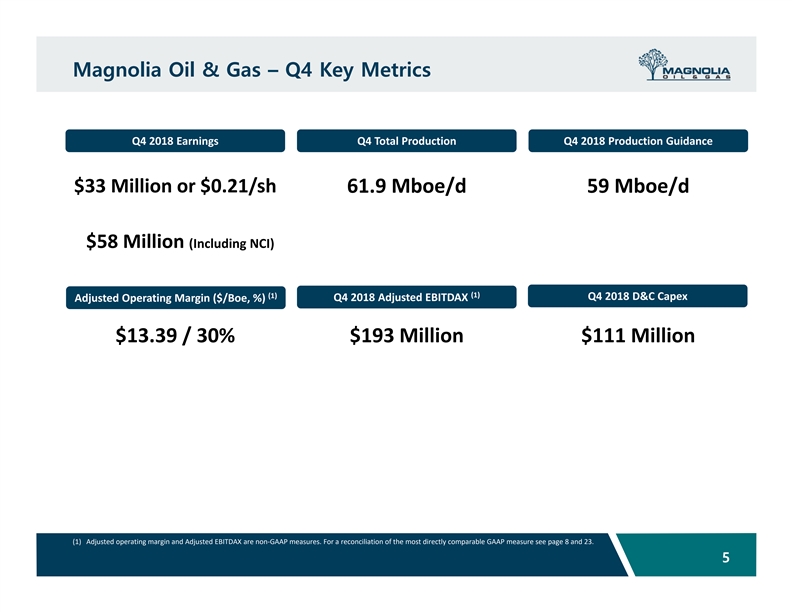
Magnolia Oil & Gas – Q4 Key Metrics Q4 2018 Earnings Q4 Total Production Q4 2018 Production Guidance $33 Million or $0.21/sh 61.9 Mboe/d 59 Mboe/d $58 Million (Including NCI) (1) (1) Q4 2018 D&C Capex Q4 2018 Adjusted EBITDAX Adjusted Operating Margin ($/Boe, %) $13.39 / 30% $193 Million $111 Million (1) Adjusted operating margin and Adjusted EBITDAX are non‐GAAP measures. For a reconciliation of the most directly comparable GAAP measure see page 8 and 23. 5Magnolia Oil & Gas – Q4 Key Metrics Q4 2018 Earnings Q4 Total Production Q4 2018 Production Guidance $33 Million or $0.21/sh 61.9 Mboe/d 59 Mboe/d $58 Million (Including NCI) (1) (1) Q4 2018 D&C Capex Q4 2018 Adjusted EBITDAX Adjusted Operating Margin ($/Boe, %) $13.39 / 30% $193 Million $111 Million (1) Adjusted operating margin and Adjusted EBITDAX are non‐GAAP measures. For a reconciliation of the most directly comparable GAAP measure see page 8 and 23. 5
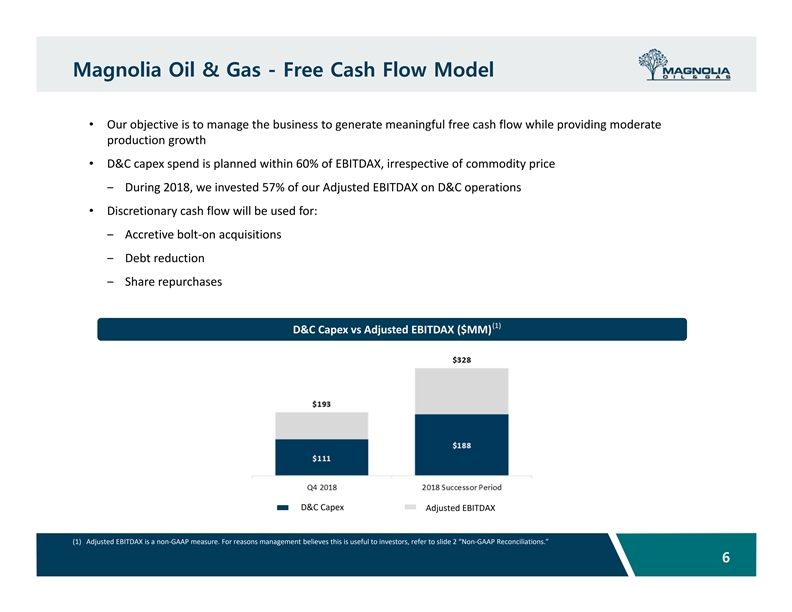
Magnolia Oil & Gas - Free Cash Flow Model • Our objective is to manage the business to generate meaningful free cash flow while providing moderate production growth • D&C capex spend is planned within 60% of EBITDAX, irrespective of commodity price ‒ During 2018, we invested 57% of our Adjusted EBITDAX on D&C operations • Discretionary cash flow will be used for: ‒ Accretive bolt‐on acquisitions ‒ Debt reduction ‒ Share repurchases (1) D&C Capex vs Adjusted EBITDAX ($MM) D&C Capex Adjusted EBITDAX (1) Adjusted EBITDAX is a non‐GAAP measure. For reasons management believes this is useful to investors, refer to slide 2 “Non‐GAAP Reconciliations.” 6Magnolia Oil & Gas - Free Cash Flow Model • Our objective is to manage the business to generate meaningful free cash flow while providing moderate production growth • D&C capex spend is planned within 60% of EBITDAX, irrespective of commodity price ‒ During 2018, we invested 57% of our Adjusted EBITDAX on D&C operations • Discretionary cash flow will be used for: ‒ Accretive bolt‐on acquisitions ‒ Debt reduction ‒ Share repurchases (1) D&C Capex vs Adjusted EBITDAX ($MM) D&C Capex Adjusted EBITDAX (1) Adjusted EBITDAX is a non‐GAAP measure. For reasons management believes this is useful to investors, refer to slide 2 “Non‐GAAP Reconciliations.” 6
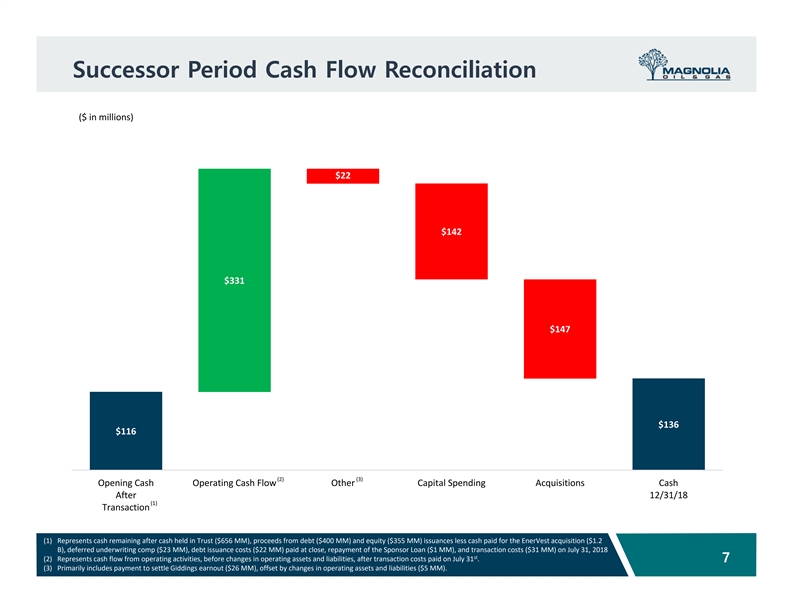
Successor Period Cash Flow Reconciliation ($ in millions) $22 $142 $331 $147 $136 $116 (2) (3) Opening Cash Operating Cash Flow Other Capital Spending Acquisitions Cash After 12/31/18 (1) Transaction (1) Represents cash remaining after cash held in Trust ($656 MM), proceeds from debt ($400 MM) and equity ($355 MM) issuances less cash paid for the EnerVest acquisition ($1.2 B), deferred underwriting comp ($23 MM), debt issuance costs ($22 MM) paid at close, repayment of the Sponsor Loan ($1 MM), and transaction costs ($31 MM) on July 31, 2018 st (2) Represents cash flow from operating activities, before changes in operating assets and liabilities, after transaction costs paid on July 31 . 7 (3) Primarily includes payment to settle Giddings earnout ($26 MM), offset by changes in operating assets and liabilities ($5 MM).Successor Period Cash Flow Reconciliation ($ in millions) $22 $142 $331 $147 $136 $116 (2) (3) Opening Cash Operating Cash Flow Other Capital Spending Acquisitions Cash After 12/31/18 (1) Transaction (1) Represents cash remaining after cash held in Trust ($656 MM), proceeds from debt ($400 MM) and equity ($355 MM) issuances less cash paid for the EnerVest acquisition ($1.2 B), deferred underwriting comp ($23 MM), debt issuance costs ($22 MM) paid at close, repayment of the Sponsor Loan ($1 MM), and transaction costs ($31 MM) on July 31, 2018 st (2) Represents cash flow from operating activities, before changes in operating assets and liabilities, after transaction costs paid on July 31 . 7 (3) Primarily includes payment to settle Giddings earnout ($26 MM), offset by changes in operating assets and liabilities ($5 MM).
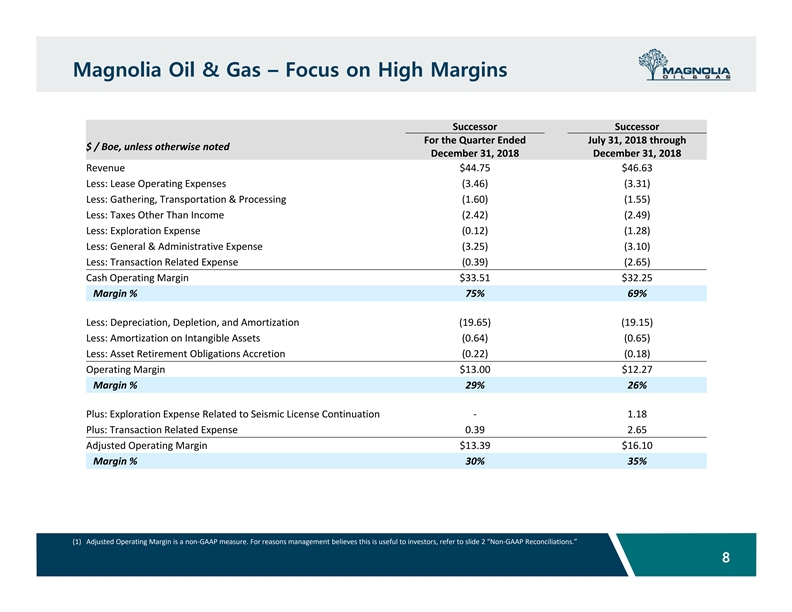
Magnolia Oil & Gas – Focus on High Margins Successor Successor For the Quarter Ended July 31, 2018 through $ / Boe, unless otherwise noted December 31, 2018 December 31, 2018 Revenue $44.75 $46.63 Less: Lease Operating Expenses (3.46) (3.31) Less: Gathering, Transportation & Processing (1.60) (1.55) Less: Taxes Other Than Income (2.42) (2.49) Less: Exploration Expense (0.12) (1.28) Less: General & Administrative Expense (3.25) (3.10) Less: Transaction Related Expense (0.39) (2.65) Cash Operating Margin $33.51 $32.25 Margin % 75% 69% Less: Depreciation, Depletion, and Amortization (19.65) (19.15) Less: Amortization on Intangible Assets (0.64) (0.65) Less: Asset Retirement Obligations Accretion (0.22) (0.18) Operating Margin $13.00 $12.27 Margin % 29% 26% Plus: Exploration Expense Related to Seismic License Continuation ‐ 1.18 Plus: Transaction Related Expense 0.39 2.65 Adjusted Operating Margin $13.39 $16.10 Margin % 30% 35% (1) Adjusted Operating Margin is a non‐GAAP measure. For reasons management believes this is useful to investors, refer to slide 2 “Non‐GAAP Reconciliations.” 8Magnolia Oil & Gas – Focus on High Margins Successor Successor For the Quarter Ended July 31, 2018 through $ / Boe, unless otherwise noted December 31, 2018 December 31, 2018 Revenue $44.75 $46.63 Less: Lease Operating Expenses (3.46) (3.31) Less: Gathering, Transportation & Processing (1.60) (1.55) Less: Taxes Other Than Income (2.42) (2.49) Less: Exploration Expense (0.12) (1.28) Less: General & Administrative Expense (3.25) (3.10) Less: Transaction Related Expense (0.39) (2.65) Cash Operating Margin $33.51 $32.25 Margin % 75% 69% Less: Depreciation, Depletion, and Amortization (19.65) (19.15) Less: Amortization on Intangible Assets (0.64) (0.65) Less: Asset Retirement Obligations Accretion (0.22) (0.18) Operating Margin $13.00 $12.27 Margin % 29% 26% Plus: Exploration Expense Related to Seismic License Continuation ‐ 1.18 Plus: Transaction Related Expense 0.39 2.65 Adjusted Operating Margin $13.39 $16.10 Margin % 30% 35% (1) Adjusted Operating Margin is a non‐GAAP measure. For reasons management believes this is useful to investors, refer to slide 2 “Non‐GAAP Reconciliations.” 8
Asset OverviewAsset Overview
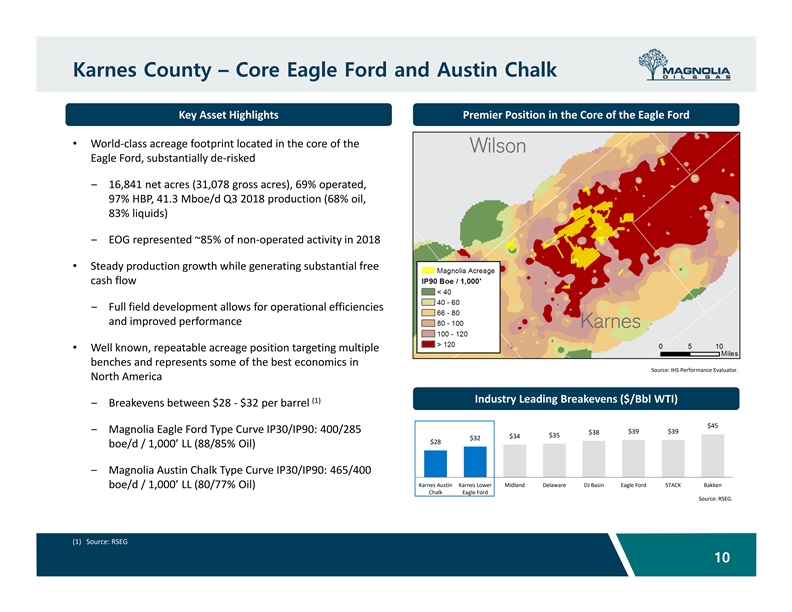
Karnes County – Core Eagle Ford and Austin Chalk Key Asset Highlights Premier Position in the Core of the Eagle Ford • World‐class acreage footprint located in the core of the Eagle Ford, substantially de‐risked ‒ 16,841 net acres (31,078 gross acres), 69% operated, 97% HBP, 41.3 Mboe/d Q3 2018 production (68% oil, 83% liquids) ‒ EOG represented ~85% of non‐operated activity in 2018 • Steady production growth while generating substantial free cash flow ‒ Full field development allows for operational efficiencies and improved performance • Well known, repeatable acreage position targeting multiple benches and represents some of the best economics in Source: IHS Performance Evaluator. North America (1) Industry Leading Breakevens ($/Bbl WTI) ‒ Breakevens between $28 ‐ $32 per barrel $45 ‒ Magnolia Eagle Ford Type Curve IP30/IP90: 400/285 $39 $39 $38 $34 $35 $32 $28 boe/d / 1,000’ LL (88/85% Oil) ‒ Magnolia Austin Chalk Type Curve IP30/IP90: 465/400 Karnes Austin Karnes Lower Midland Delaware DJ Basin Eagle Ford STACK Bakken boe/d / 1,000’ LL (80/77% Oil) Chalk Eagle Ford Source: RSEG. (1) Source: RSEG 10Karnes County – Core Eagle Ford and Austin Chalk Key Asset Highlights Premier Position in the Core of the Eagle Ford • World‐class acreage footprint located in the core of the Eagle Ford, substantially de‐risked ‒ 16,841 net acres (31,078 gross acres), 69% operated, 97% HBP, 41.3 Mboe/d Q3 2018 production (68% oil, 83% liquids) ‒ EOG represented ~85% of non‐operated activity in 2018 • Steady production growth while generating substantial free cash flow ‒ Full field development allows for operational efficiencies and improved performance • Well known, repeatable acreage position targeting multiple benches and represents some of the best economics in Source: IHS Performance Evaluator. North America (1) Industry Leading Breakevens ($/Bbl WTI) ‒ Breakevens between $28 ‐ $32 per barrel $45 ‒ Magnolia Eagle Ford Type Curve IP30/IP90: 400/285 $39 $39 $38 $34 $35 $32 $28 boe/d / 1,000’ LL (88/85% Oil) ‒ Magnolia Austin Chalk Type Curve IP30/IP90: 465/400 Karnes Austin Karnes Lower Midland Delaware DJ Basin Eagle Ford STACK Bakken boe/d / 1,000’ LL (80/77% Oil) Chalk Eagle Ford Source: RSEG. (1) Source: RSEG 10
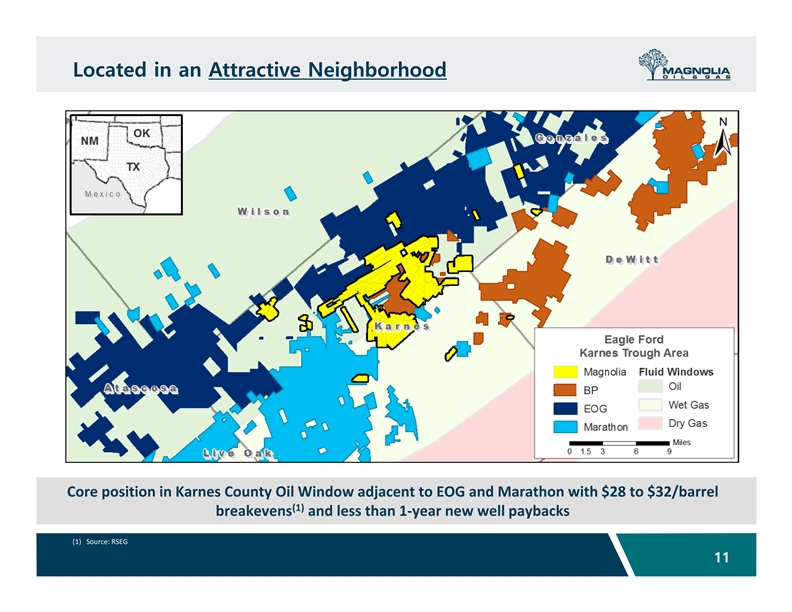
Located in an Attractive Neighborhood BP Core position in Karnes County Oil Window adjacent to EOG and Marathon with $28 to $32/barrel (1) breakevens and less than 1‐year new well paybacks (1) Source: RSEG 11Located in an Attractive Neighborhood BP Core position in Karnes County Oil Window adjacent to EOG and Marathon with $28 to $32/barrel (1) breakevens and less than 1‐year new well paybacks (1) Source: RSEG 11
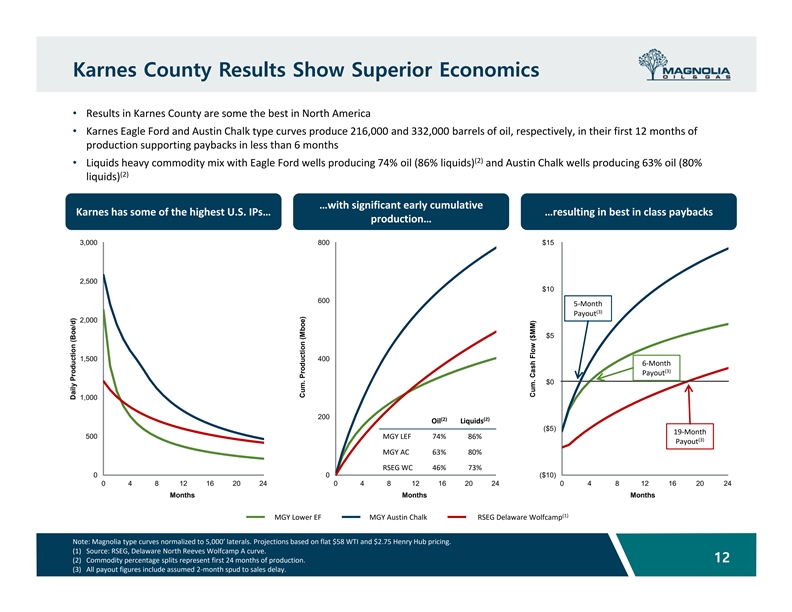
Karnes County Results Show Superior Economics • Results in Karnes County are some the best in North America • Karnes Eagle Ford and Austin Chalk type curves produce 216,000 and 332,000 barrels of oil, respectively, in their first 12 months of production supporting paybacks in less than 6 months (2) • Liquids heavy commodity mix with Eagle Ford wells producing 74% oil (86% liquids) and Austin Chalk wells producing 63% oil (80% (2) liquids) …with significant early cumulative Karnes has some of the highest U.S. IPs… …resulting in best in class paybacks production… 3,000 800 $15 2,500 $10 600 5‐Month (3) Payout 2,000 $5 1,500 400 6‐Month (3) Payout $0 1,000 12 200 (2) (2) Oil Liquids ($5) 19‐Month 500 MGY LEF 74% 86% (3) Payout MGY AC 63% 80% RSEG WC 46% 73% 0 0 ($10) 0 4 8 12 16 20 24 0 4 8 12 16 20 24 0 4 8 121620 24 Months Months Months (1) MGY Lower EF MGY Austin Chalk RSEG Delaware Wolfcamp Note: Magnolia type curves normalized to 5,000’ laterals. Projections based on flat $58 WTI and $2.75 Henry Hub pricing. (1) Source: RSEG, Delaware North Reeves Wolfcamp A curve. 12 (2) Commodity percentage splits represent first 24 months of production. (3) All payout figures include assumed 2‐month spud to sales delay. Daily Production (Boe/d) Cum. Production (Mboe) Cum. Cash Flow ($MM)Karnes County Results Show Superior Economics • Results in Karnes County are some the best in North America • Karnes Eagle Ford and Austin Chalk type curves produce 216,000 and 332,000 barrels of oil, respectively, in their first 12 months of production supporting paybacks in less than 6 months (2) • Liquids heavy commodity mix with Eagle Ford wells producing 74% oil (86% liquids) and Austin Chalk wells producing 63% oil (80% (2) liquids) …with significant early cumulative Karnes has some of the highest U.S. IPs… …resulting in best in class paybacks production… 3,000 800 $15 2,500 $10 600 5‐Month (3) Payout 2,000 $5 1,500 400 6‐Month (3) Payout $0 1,000 12 200 (2) (2) Oil Liquids ($5) 19‐Month 500 MGY LEF 74% 86% (3) Payout MGY AC 63% 80% RSEG WC 46% 73% 0 0 ($10) 0 4 8 12 16 20 24 0 4 8 12 16 20 24 0 4 8 121620 24 Months Months Months (1) MGY Lower EF MGY Austin Chalk RSEG Delaware Wolfcamp Note: Magnolia type curves normalized to 5,000’ laterals. Projections based on flat $58 WTI and $2.75 Henry Hub pricing. (1) Source: RSEG, Delaware North Reeves Wolfcamp A curve. 12 (2) Commodity percentage splits represent first 24 months of production. (3) All payout figures include assumed 2‐month spud to sales delay. Daily Production (Boe/d) Cum. Production (Mboe) Cum. Cash Flow ($MM)
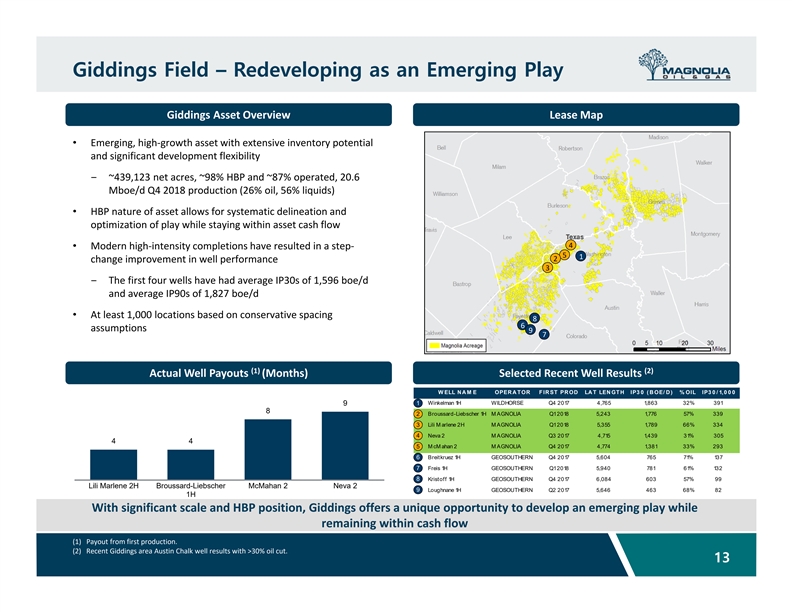
Giddings Field – Redeveloping as an Emerging Play Giddings Asset Overview Lease Map • Emerging, high‐growth asset with extensive inventory potential and significant development flexibility ‒ ~439,123 net acres, ~98% HBP and ~87% operated, 20.6 Mboe/d Q4 2018 production (26% oil, 56% liquids) • HBP nature of asset allows for systematic delineation and optimization of play while staying within asset cash flow 4 • Modern high‐intensity completions have resulted in a step‐ 5 1 2 change improvement in well performance 3 ‒ The first four wells have had average IP30s of 1,596 boe/d and average IP90s of 1,827 boe/d • At least 1,000 locations based on conservative spacing 8 6 assumptions 9 7 (1) (2) Actual Well Payouts (Months) Selected Recent Well Results WELL NAM E OPERATOR FIRST PROD LAT LENGTH IP30 (BOE/ D) % OIL IP30/ 1,00 0 1 Winkelman 1H WILDHORSE Q4 2017 4,765 1,863 32% 391 9 8 2 Broussard-Liebscher 1H M AGNOLIA Q1 2018 5,243 1,776 57% 339 3 Lili M arlene 2H M AGNOLIA Q1 2018 5,355 1,789 66% 334 4 Neva 2 MAGNOLIA Q3 2017 4,715 1,439 31% 305 4 4 McMahan 2 MAGNOLIA Q4 2017 4,774 1,381 33% 293 5 6 Breitkruez 1H GEOSOUTHERN Q4 2017 5,604 765 71% 137 7 Freis 1H GEOSOUTHERN Q1 2018 5,940 781 61% 132 8 Kristoff 1H GEOSOUTHERN Q4 2017 6,084 603 57% 99 Lili Marlene 2H Broussard-Liebscher McMahan 2 Neva 2 9 Loughnane 1H GEOSOUTHERN Q2 2017 5,646 463 68% 82 1H With significant scale and HBP position, Giddings offers a unique opportunity to develop an emerging play while remaining within cash flow (1) Payout from first production. (2) Recent Giddings area Austin Chalk well results with >30% oil cut. 13Giddings Field – Redeveloping as an Emerging Play Giddings Asset Overview Lease Map • Emerging, high‐growth asset with extensive inventory potential and significant development flexibility ‒ ~439,123 net acres, ~98% HBP and ~87% operated, 20.6 Mboe/d Q4 2018 production (26% oil, 56% liquids) • HBP nature of asset allows for systematic delineation and optimization of play while staying within asset cash flow 4 • Modern high‐intensity completions have resulted in a step‐ 5 1 2 change improvement in well performance 3 ‒ The first four wells have had average IP30s of 1,596 boe/d and average IP90s of 1,827 boe/d • At least 1,000 locations based on conservative spacing 8 6 assumptions 9 7 (1) (2) Actual Well Payouts (Months) Selected Recent Well Results WELL NAM E OPERATOR FIRST PROD LAT LENGTH IP30 (BOE/ D) % OIL IP30/ 1,00 0 1 Winkelman 1H WILDHORSE Q4 2017 4,765 1,863 32% 391 9 8 2 Broussard-Liebscher 1H M AGNOLIA Q1 2018 5,243 1,776 57% 339 3 Lili M arlene 2H M AGNOLIA Q1 2018 5,355 1,789 66% 334 4 Neva 2 MAGNOLIA Q3 2017 4,715 1,439 31% 305 4 4 McMahan 2 MAGNOLIA Q4 2017 4,774 1,381 33% 293 5 6 Breitkruez 1H GEOSOUTHERN Q4 2017 5,604 765 71% 137 7 Freis 1H GEOSOUTHERN Q1 2018 5,940 781 61% 132 8 Kristoff 1H GEOSOUTHERN Q4 2017 6,084 603 57% 99 Lili Marlene 2H Broussard-Liebscher McMahan 2 Neva 2 9 Loughnane 1H GEOSOUTHERN Q2 2017 5,646 463 68% 82 1H With significant scale and HBP position, Giddings offers a unique opportunity to develop an emerging play while remaining within cash flow (1) Payout from first production. (2) Recent Giddings area Austin Chalk well results with >30% oil cut. 13
Financial OverviewFinancial Overview
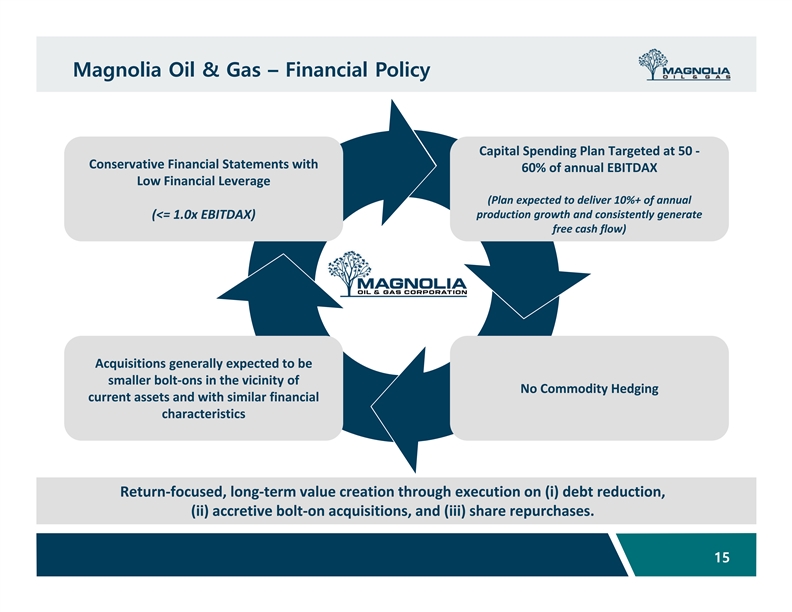
Magnolia Oil & Gas – Financial Policy Capital Spending Plan Targeted at 50 ‐ Conservative Financial Statements with 60% of annual EBITDAX Low Financial Leverage (Plan expected to deliver 10%+ of annual production growth and consistently generate (<= 1.0x EBITDAX) free cash flow) Acquisitions generally expected to be smaller bolt‐ons in the vicinity of No Commodity Hedging current assets and with similar financial characteristics Return‐focused, long‐term value creation through execution on (i) debt reduction, (ii) accretive bolt‐on acquisitions, and (iii) share repurchases. 15Magnolia Oil & Gas – Financial Policy Capital Spending Plan Targeted at 50 ‐ Conservative Financial Statements with 60% of annual EBITDAX Low Financial Leverage (Plan expected to deliver 10%+ of annual production growth and consistently generate (<= 1.0x EBITDAX) free cash flow) Acquisitions generally expected to be smaller bolt‐ons in the vicinity of No Commodity Hedging current assets and with similar financial characteristics Return‐focused, long‐term value creation through execution on (i) debt reduction, (ii) accretive bolt‐on acquisitions, and (iii) share repurchases. 15
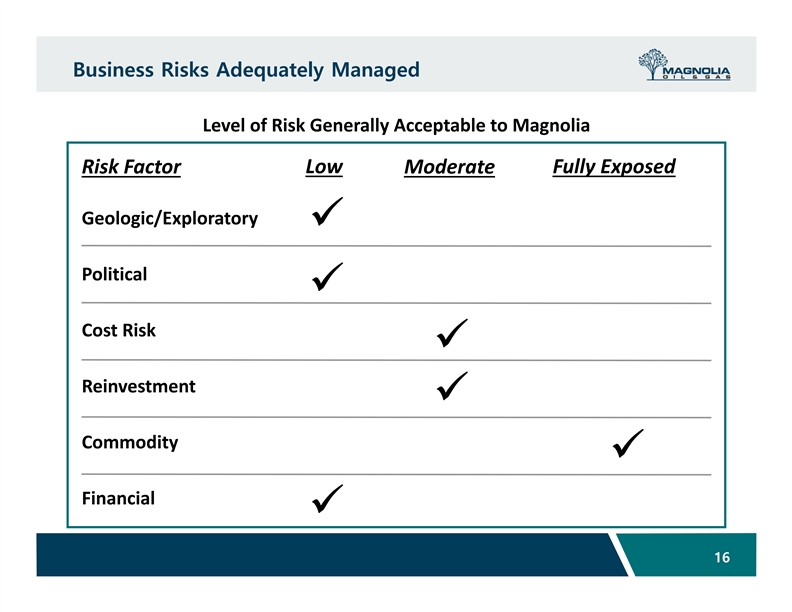
Business Risks Adequately Managed Level of Risk Generally Acceptable to Magnolia Low Fully Exposed Risk Factor Moderate Geologic/Exploratory Political Cost Risk Reinvestment Commodity Financial 16Business Risks Adequately Managed Level of Risk Generally Acceptable to Magnolia Low Fully Exposed Risk Factor Moderate Geologic/Exploratory Political Cost Risk Reinvestment Commodity Financial 16
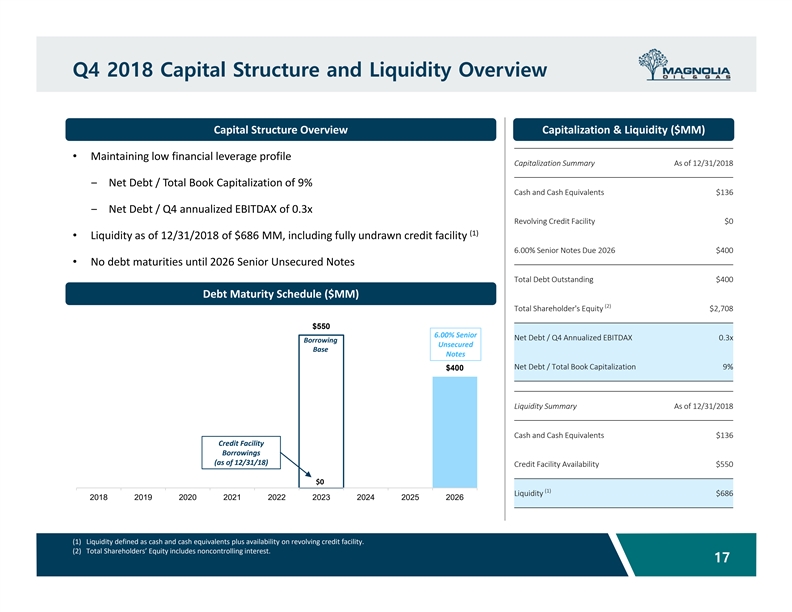
Q4 2018 Capital Structure and Liquidity Overview Capital Structure Overview Capitalization & Liquidity ($MM) • Maintaining low financial leverage profile Capitalization Summary As of 12/31/2018 ‒ Net Debt / Total Book Capitalization of 9% Cash and Cash Equivalents $136 ‒ Net Debt / Q4 annualized EBITDAX of 0.3x Revolving Credit Facility $0 (1) • Liquidity as of 12/31/2018 of $686 MM, including fully undrawn credit facility 6.00% Senior Notes Due 2026 $400 • No debt maturities until 2026 Senior Unsecured Notes Total Debt Outstanding $400 Debt Maturity Schedule ($MM) (2) Total Shareholder's Equity $2,708 $550 6.00% Senior Net Debt / Q4 Annualized EBITDAX 0.3x Borrowing Unsecured Base Notes Net Debt / Total Book Capitalization 9% $400 Liquidity Summary As of 12/31/2018 Cash and Cash Equivalents $136 Credit Facility Borrowings (as of 12/31/18) Credit Facility Availability $550 $0 (1) Liquidity $686 2018 2019 2020 2021 2022 2023 2024 2025 2026 (1) Liquidity defined as cash and cash equivalents plus availability on revolving credit facility. (2) Total Shareholders’ Equity includes noncontrolling interest. 17Q4 2018 Capital Structure and Liquidity Overview Capital Structure Overview Capitalization & Liquidity ($MM) • Maintaining low financial leverage profile Capitalization Summary As of 12/31/2018 ‒ Net Debt / Total Book Capitalization of 9% Cash and Cash Equivalents $136 ‒ Net Debt / Q4 annualized EBITDAX of 0.3x Revolving Credit Facility $0 (1) • Liquidity as of 12/31/2018 of $686 MM, including fully undrawn credit facility 6.00% Senior Notes Due 2026 $400 • No debt maturities until 2026 Senior Unsecured Notes Total Debt Outstanding $400 Debt Maturity Schedule ($MM) (2) Total Shareholder's Equity $2,708 $550 6.00% Senior Net Debt / Q4 Annualized EBITDAX 0.3x Borrowing Unsecured Base Notes Net Debt / Total Book Capitalization 9% $400 Liquidity Summary As of 12/31/2018 Cash and Cash Equivalents $136 Credit Facility Borrowings (as of 12/31/18) Credit Facility Availability $550 $0 (1) Liquidity $686 2018 2019 2020 2021 2022 2023 2024 2025 2026 (1) Liquidity defined as cash and cash equivalents plus availability on revolving credit facility. (2) Total Shareholders’ Equity includes noncontrolling interest. 17
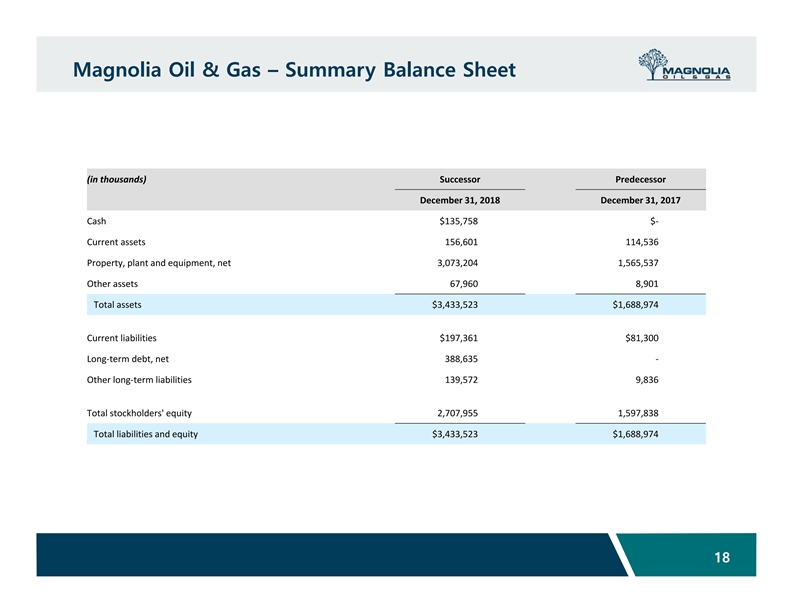
Magnolia Oil & Gas – Summary Balance Sheet (in thousands) Successor Predecessor December 31, 2018 December 31, 2017 Cash $135,758 $‐ Current assets 156,601 114,536 Property, plant and equipment, net 3,073,204 1,565,537 Other assets 67,960 8,901 Total assets $3,433,523 $1,688,974 Current liabilities $197,361 $81,300 Long‐term debt, net 388,635 ‐ Other long‐term liabilities 139,572 9,836 Total stockholders' equity 2,707,955 1,597,838 Total liabilities and equity $3,433,523 $1,688,974 18Magnolia Oil & Gas – Summary Balance Sheet (in thousands) Successor Predecessor December 31, 2018 December 31, 2017 Cash $135,758 $‐ Current assets 156,601 114,536 Property, plant and equipment, net 3,073,204 1,565,537 Other assets 67,960 8,901 Total assets $3,433,523 $1,688,974 Current liabilities $197,361 $81,300 Long‐term debt, net 388,635 ‐ Other long‐term liabilities 139,572 9,836 Total stockholders' equity 2,707,955 1,597,838 Total liabilities and equity $3,433,523 $1,688,974 18
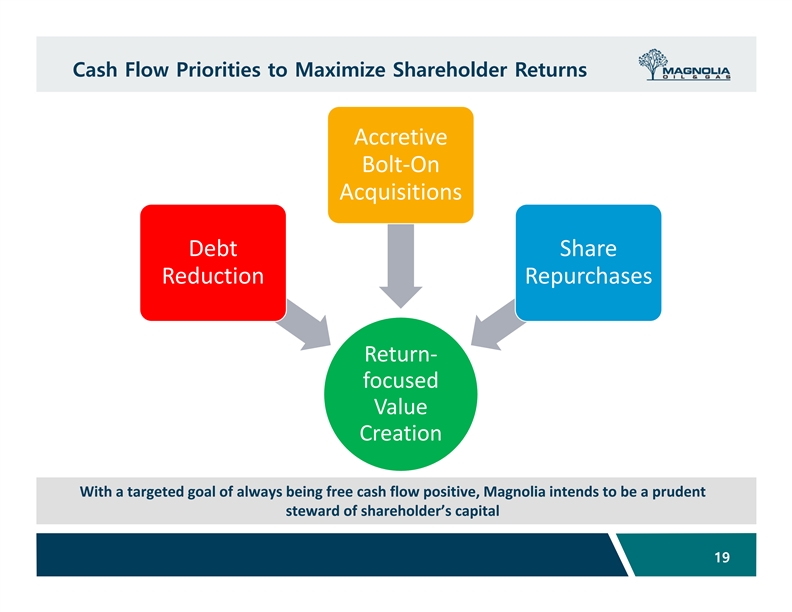
Cash Flow Priorities to Maximize Shareholder Returns Accretive Bolt‐On Acquisitions Debt Share Reduction Repurchases Return‐ focused Value Creation With a targeted goal of always being free cash flow positive, Magnolia intends to be a prudent steward of shareholder’s capital 19Cash Flow Priorities to Maximize Shareholder Returns Accretive Bolt‐On Acquisitions Debt Share Reduction Repurchases Return‐ focused Value Creation With a targeted goal of always being free cash flow positive, Magnolia intends to be a prudent steward of shareholder’s capital 19
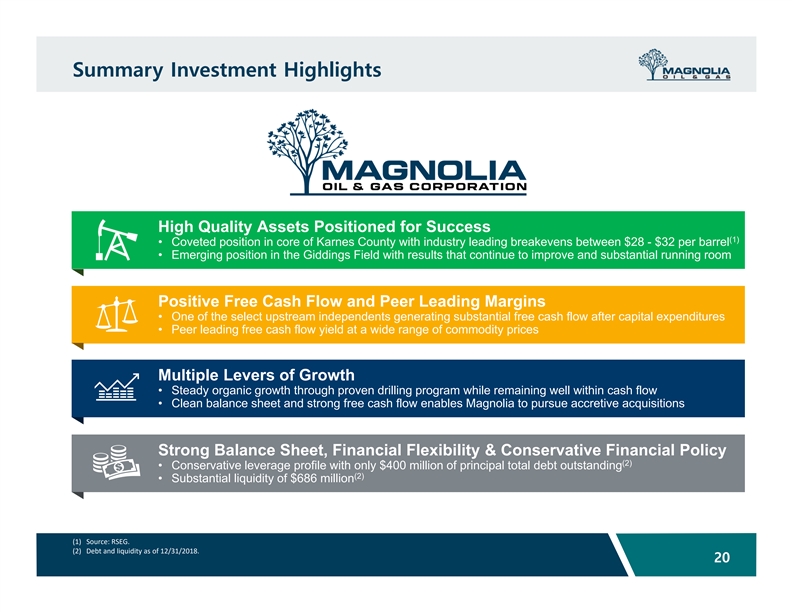
Summary Investment Highlights High Quality Assets Positioned for Success (1) • Coveted position in core of Karnes County with industry leading breakevens between $28 - $32 per barrel • Emerging position in the Giddings Field with results that continue to improve and substantial running room Positive Free Cash Flow and Peer Leading Margins • One of the select upstream independents generating substantial free cash flow after capital expenditures • Peer leading free cash flow yield at a wide range of commodity prices Multiple Levers of Growth • Steady organic growth through proven drilling program while remaining well within cash flow • Clean balance sheet and strong free cash flow enables Magnolia to pursue accretive acquisitions Strong Balance Sheet, Financial Flexibility & Conservative Financial Policy (2) • Conservative leverage profile with only $400 million of principal total debt outstanding (2) • Substantial liquidity of $686 million (1) Source: RSEG. (2) Debt and liquidity as of 12/31/2018. 20Summary Investment Highlights High Quality Assets Positioned for Success (1) • Coveted position in core of Karnes County with industry leading breakevens between $28 - $32 per barrel • Emerging position in the Giddings Field with results that continue to improve and substantial running room Positive Free Cash Flow and Peer Leading Margins • One of the select upstream independents generating substantial free cash flow after capital expenditures • Peer leading free cash flow yield at a wide range of commodity prices Multiple Levers of Growth • Steady organic growth through proven drilling program while remaining well within cash flow • Clean balance sheet and strong free cash flow enables Magnolia to pursue accretive acquisitions Strong Balance Sheet, Financial Flexibility & Conservative Financial Policy (2) • Conservative leverage profile with only $400 million of principal total debt outstanding (2) • Substantial liquidity of $686 million (1) Source: RSEG. (2) Debt and liquidity as of 12/31/2018. 20
AppendixAppendix
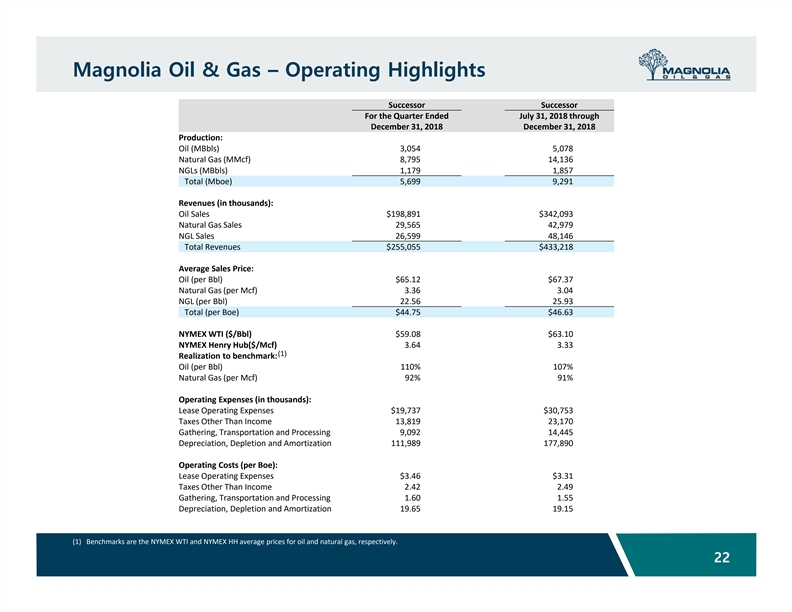
Magnolia Oil & Gas – Operating Highlights Successor Successor For the Quarter Ended July 31, 2018 through December 31, 2018 December 31, 2018 Production: Oil (MBbls) 3,054 5,078 Natural Gas (MMcf) 8,795 14,136 NGLs (MBbls) 1,179 1,857 Total (Mboe) 5,699 9,291 Revenues (in thousands): Oil Sales $198,891 $342,093 Natural Gas Sales 29,565 42,979 NGL Sales 26,599 48,146 Total Revenues $255,055 $433,218 Average Sales Price: Oil (per Bbl) $65.12 $67.37 Natural Gas (per Mcf) 3.36 3.04 NGL (per Bbl) 22.56 25.93 Total (per Boe) $44.75 $46.63 NYMEX WTI ($/Bbl) $59.08 $63.10 NYMEX Henry Hub($/Mcf) 3.64 3.33 (1) Realization to benchmark: Oil (per Bbl) 110% 107% Natural Gas (per Mcf) 92% 91% Operating Expenses (in thousands): Lease Operating Expenses $19,737 $30,753 Taxes Other Than Income 13,819 23,170 Gathering, Transportation and Processing 9,092 14,445 Depreciation, Depletion and Amortization 111,989 177,890 Operating Costs (per Boe): Lease Operating Expenses $3.46 $3.31 Taxes Other Than Income 2.42 2.49 Gathering, Transportation and Processing 1.60 1.55 Depreciation, Depletion and Amortization 19.65 19.15 (1) Benchmarks are the NYMEX WTI and NYMEX HH average prices for oil and natural gas, respectively. 22Magnolia Oil & Gas – Operating Highlights Successor Successor For the Quarter Ended July 31, 2018 through December 31, 2018 December 31, 2018 Production: Oil (MBbls) 3,054 5,078 Natural Gas (MMcf) 8,795 14,136 NGLs (MBbls) 1,179 1,857 Total (Mboe) 5,699 9,291 Revenues (in thousands): Oil Sales $198,891 $342,093 Natural Gas Sales 29,565 42,979 NGL Sales 26,599 48,146 Total Revenues $255,055 $433,218 Average Sales Price: Oil (per Bbl) $65.12 $67.37 Natural Gas (per Mcf) 3.36 3.04 NGL (per Bbl) 22.56 25.93 Total (per Boe) $44.75 $46.63 NYMEX WTI ($/Bbl) $59.08 $63.10 NYMEX Henry Hub($/Mcf) 3.64 3.33 (1) Realization to benchmark: Oil (per Bbl) 110% 107% Natural Gas (per Mcf) 92% 91% Operating Expenses (in thousands): Lease Operating Expenses $19,737 $30,753 Taxes Other Than Income 13,819 23,170 Gathering, Transportation and Processing 9,092 14,445 Depreciation, Depletion and Amortization 111,989 177,890 Operating Costs (per Boe): Lease Operating Expenses $3.46 $3.31 Taxes Other Than Income 2.42 2.49 Gathering, Transportation and Processing 1.60 1.55 Depreciation, Depletion and Amortization 19.65 19.15 (1) Benchmarks are the NYMEX WTI and NYMEX HH average prices for oil and natural gas, respectively. 22
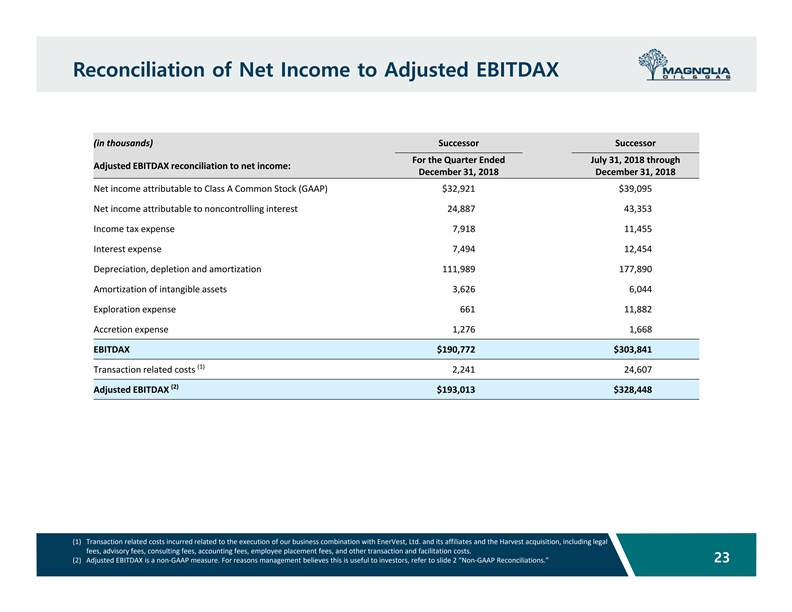
Reconciliation of Net Income to Adjusted EBITDAX (in thousands) Successor Successor For the Quarter Ended July 31, 2018 through Adjusted EBITDAX reconciliation to net income: December 31, 2018 December 31, 2018 Net income attributable to Class A Common Stock (GAAP) $32,921 $39,095 Net income attributable to noncontrolling interest 24,887 43,353 Income tax expense 7,918 11,455 Interest expense 7,494 12,454 Depreciation, depletion and amortization 111,989 177,890 Amortization of intangible assets 3,626 6,044 Exploration expense 661 11,882 Accretion expense 1,276 1,668 EBITDAX $190,772 $303,841 (1) Transaction related costs 2,241 24,607 (2) Adjusted EBITDAX $193,013 $328,448 (1) Transaction related costs incurred related to the execution of our business combination with EnerVest, Ltd. and its affiliates and the Harvest acquisition, including legal fees, advisory fees, consulting fees, accounting fees, employee placement fees, and other transaction and facilitation costs. 23 (2) Adjusted EBITDAX is a non‐GAAP measure. For reasons management believes this is useful to investors, refer to slide 2 “Non‐GAAP Reconciliations.”Reconciliation of Net Income to Adjusted EBITDAX (in thousands) Successor Successor For the Quarter Ended July 31, 2018 through Adjusted EBITDAX reconciliation to net income: December 31, 2018 December 31, 2018 Net income attributable to Class A Common Stock (GAAP) $32,921 $39,095 Net income attributable to noncontrolling interest 24,887 43,353 Income tax expense 7,918 11,455 Interest expense 7,494 12,454 Depreciation, depletion and amortization 111,989 177,890 Amortization of intangible assets 3,626 6,044 Exploration expense 661 11,882 Accretion expense 1,276 1,668 EBITDAX $190,772 $303,841 (1) Transaction related costs 2,241 24,607 (2) Adjusted EBITDAX $193,013 $328,448 (1) Transaction related costs incurred related to the execution of our business combination with EnerVest, Ltd. and its affiliates and the Harvest acquisition, including legal fees, advisory fees, consulting fees, accounting fees, employee placement fees, and other transaction and facilitation costs. 23 (2) Adjusted EBITDAX is a non‐GAAP measure. For reasons management believes this is useful to investors, refer to slide 2 “Non‐GAAP Reconciliations.”
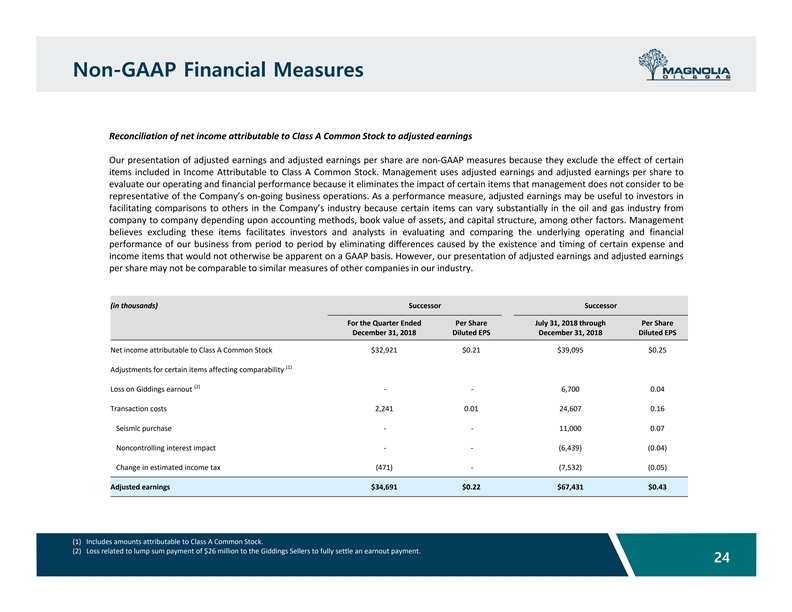
Non-GAAP Financial Measures Reconciliation of net income attributable to Class A Common Stock to adjusted earnings Our presentation of adjusted earnings and adjusted earnings per share are non‐GAAP measures because they exclude the effect of certain items included in Income Attributable to Class A Common Stock. Management uses adjusted earnings and adjusted earnings per share to evaluate our operating and financial performance because it eliminates the impact of certain items that management does not consider to be representative of the Company’s on‐going business operations. As a performance measure, adjusted earnings may be useful to investors in facilitating comparisons to others in the Company’s industry because certain items can vary substantially in the oil and gas industry from company to company depending upon accounting methods, book value of assets, and capital structure, among other factors. Management believes excluding these items facilitates investors and analysts in evaluating and comparing the underlying operating and financial performance of our business from period to period by eliminating differences caused by the existence and timing of certain expense and income items that would not otherwise be apparent on a GAAP basis. However, our presentation of adjusted earnings and adjusted earnings per share may not be comparable to similar measures of other companies in our industry. (in thousands) Successor Successor For the Quarter Ended Per Share July 31, 2018 through Per Share December 31, 2018 Diluted EPS December 31, 2018 Diluted EPS Net income attributable to Class A Common Stock $32,921 $0.21 $39,095 $0.25 (1) Adjustments for certain items affecting comparability (2) Loss on Giddings earnout ‐ ‐ 6,700 0.04 Transaction costs 2,241 0.01 24,607 0.16 Seismic purchase ‐ ‐ 11,000 0.07 Noncontrolling interest impact ‐ ‐ (6,439) (0.04) Change in estimated income tax (471) ‐ (7,532) (0.05) Adjusted earnings $34,691 $0.22 $67,431 $0.43 (1) Includes amounts attributable to Class A Common Stock. (2) Loss related to lump sum payment of $26 million to the Giddings Sellers to fully settle an earnout payment. 24Non-GAAP Financial Measures Reconciliation of net income attributable to Class A Common Stock to adjusted earnings Our presentation of adjusted earnings and adjusted earnings per share are non‐GAAP measures because they exclude the effect of certain items included in Income Attributable to Class A Common Stock. Management uses adjusted earnings and adjusted earnings per share to evaluate our operating and financial performance because it eliminates the impact of certain items that management does not consider to be representative of the Company’s on‐going business operations. As a performance measure, adjusted earnings may be useful to investors in facilitating comparisons to others in the Company’s industry because certain items can vary substantially in the oil and gas industry from company to company depending upon accounting methods, book value of assets, and capital structure, among other factors. Management believes excluding these items facilitates investors and analysts in evaluating and comparing the underlying operating and financial performance of our business from period to period by eliminating differences caused by the existence and timing of certain expense and income items that would not otherwise be apparent on a GAAP basis. However, our presentation of adjusted earnings and adjusted earnings per share may not be comparable to similar measures of other companies in our industry. (in thousands) Successor Successor For the Quarter Ended Per Share July 31, 2018 through Per Share December 31, 2018 Diluted EPS December 31, 2018 Diluted EPS Net income attributable to Class A Common Stock $32,921 $0.21 $39,095 $0.25 (1) Adjustments for certain items affecting comparability (2) Loss on Giddings earnout ‐ ‐ 6,700 0.04 Transaction costs 2,241 0.01 24,607 0.16 Seismic purchase ‐ ‐ 11,000 0.07 Noncontrolling interest impact ‐ ‐ (6,439) (0.04) Change in estimated income tax (471) ‐ (7,532) (0.05) Adjusted earnings $34,691 $0.22 $67,431 $0.43 (1) Includes amounts attributable to Class A Common Stock. (2) Loss related to lump sum payment of $26 million to the Giddings Sellers to fully settle an earnout payment. 24