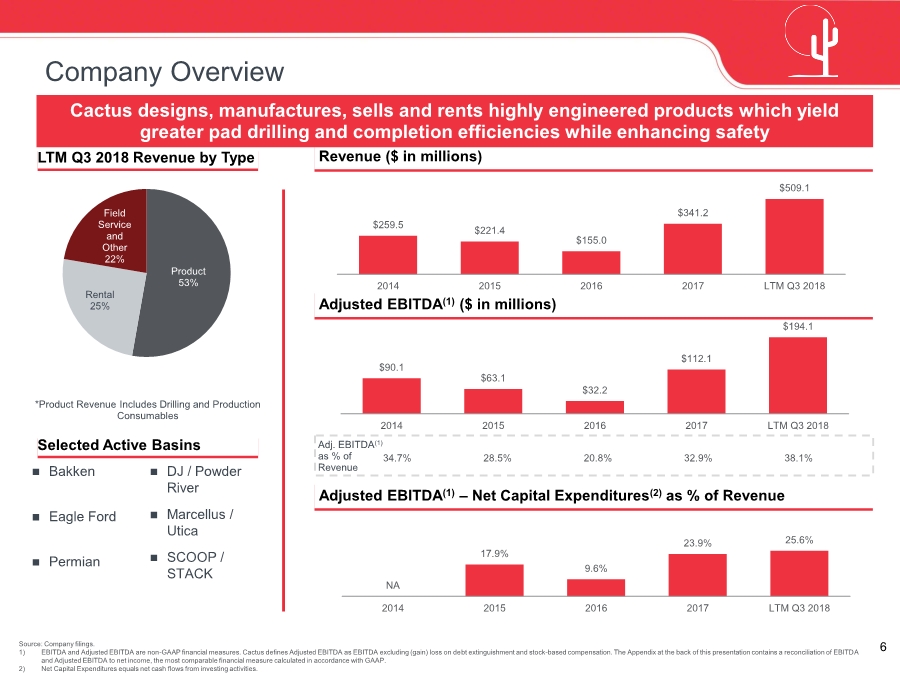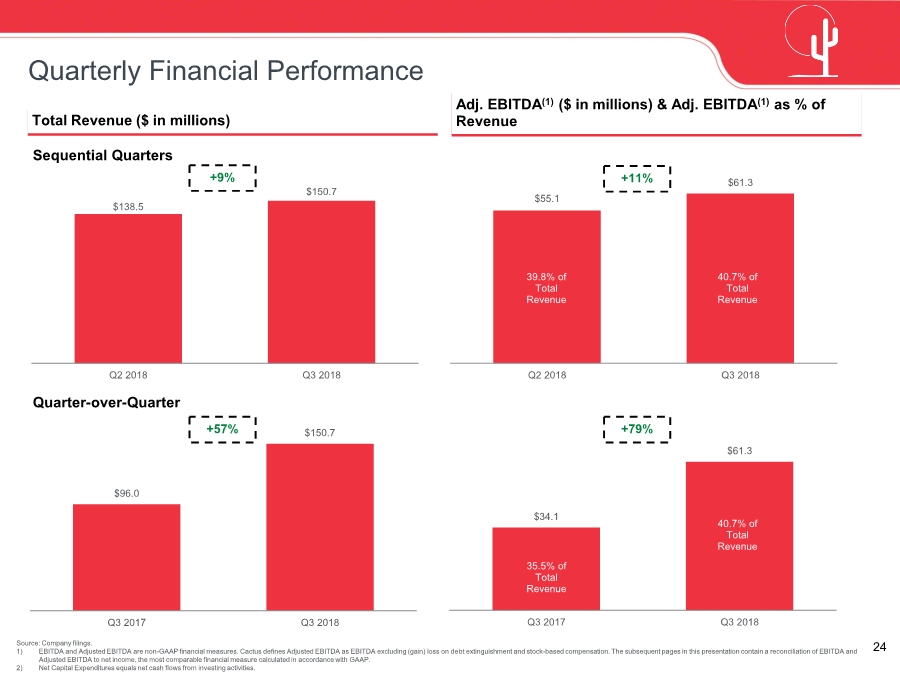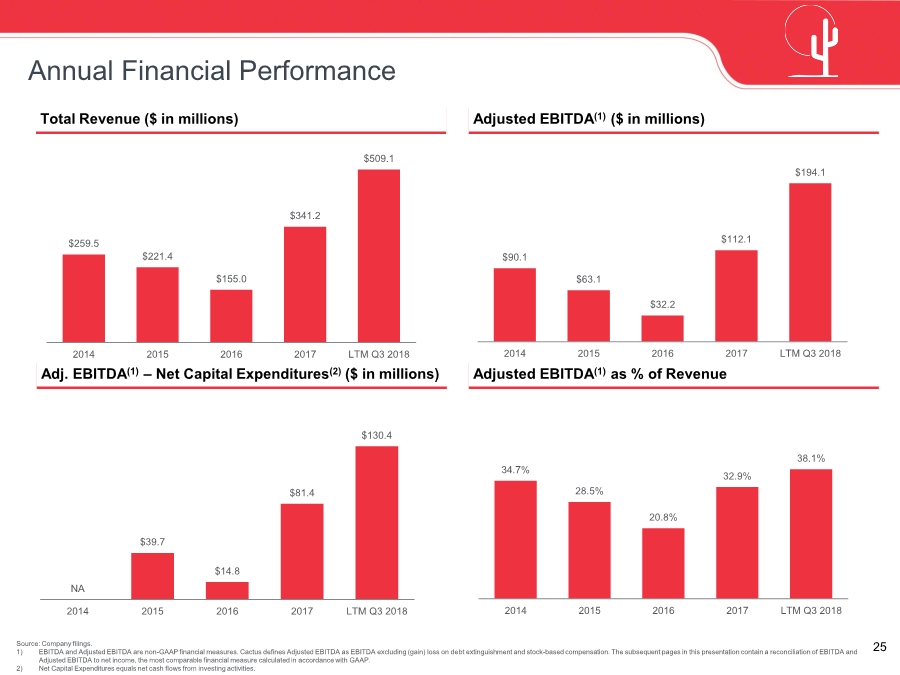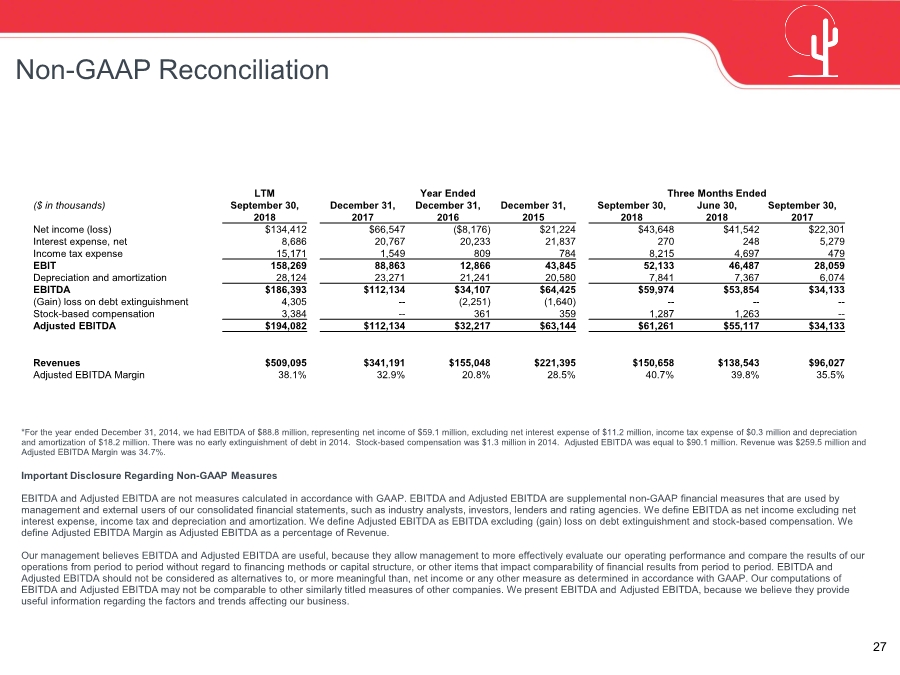
| 27 Non-GAAP Reconciliation Important Disclosure Regarding Non-GAAP Measures EBITDA and Adjusted EBITDA are not measures calculated in accordance with GAAP. EBITDA and Adjusted EBITDA are supplemental non-GAAP financial measures that are used by management and external users of our consolidated financial statements, such as industry analysts, investors, lenders and rating agencies. We define EBITDA as net income excluding net interest expense, income tax and depreciation and amortization. We define Adjusted EBITDA as EBITDA excluding (gain) loss on debt extinguishment and stock-based compensation. We define Adjusted EBITDA Margin as Adjusted EBITDA as a percentage of Revenue. Our management believes EBITDA and Adjusted EBITDA are useful, because they allow management to more effectively evaluate our operating performance and compare the results of our operations from period to period without regard to financing methods or capital structure, or other items that impact comparability of financial results from period to period. EBITDA and Adjusted EBITDA should not be considered as alternatives to, or more meaningful than, net income or any other measure as determined in accordance with GAAP. Our computations of EBITDA and Adjusted EBITDA may not be comparable to other similarly titled measures of other companies. We present EBITDA and Adjusted EBITDA, because we believe they provide useful information regarding the factors and trends affecting our business. *For the year ended December 31, 2014, we had EBITDA of $88.8 million, representing net income of $59.1 million, excluding net interest expense of $11.2 million, income tax expense of $0.3 million and depreciation and amortization of $18.2 million. There was no early extinguishment of debt in 2014. Stock-based compensation was $1.3 million in 2014. Adjusted EBITDA was equal to $90.1 million. Revenue was $259.5 million and Adjusted EBITDA Margin was 34.7%. LTM Year Ended Three Months Ended ($ in thousands) September 30, December 31, December 31, December 31, September 30, June 30, September 30, 2018 2017 2016 2015 2018 2018 2017 Net income (loss) $134,412 $66,547 ($8,176) $21,224 $43,648 $41,542 $22,301 Interest expense, net 8,686 20,767 20,233 21,837 270 248 5,279 Income tax expense 15,171 1,549 809 784 8,215 4,697 479 EBIT 158,269 88,863 12,866 43,845 52,133 46,487 28,059 Depreciation and amortization 28,124 23,271 21,241 20,580 7,841 7,367 6,074 EBITDA $186,393 $112,134 $34,107 $64,425 $59,974 $53,854 $34,133 (Gain) loss on debt extinguishment 4,305 -- (2,251) (1,640) -- -- -- Stock-based compensation 3,384 -- 361 359 1,287 1,263 -- Adjusted EBITDA $194,082 $112,134 $32,217 $63,144 $61,261 $55,117 $34,133 $509,095 38.1% $341,191 32.9% $155,048 20.8% $221,395 28.5% $150,658 40.7% $138,543 39.8% $96,027 35.5% Revenues Adjusted EBITDA Margin |