UNITED STATES
SECURITIES AND EXCHANGE COMMISSION
Washington, D.C. 20549
FORM N-CSR
CERTIFIED SHAREHOLDER REPORT OF REGISTERED
MANAGEMENT INVESTMENT COMPANIES
Investment Company Act file number 811-23235
Morningstar Funds Trust
(Exact name of registrant as specified in charter)
Morningstar Funds Trust
22 W. Washington Street
Chicago, IL 60602
(Address of principal executive offices) (Zip code)
D. Scott Schilling
Morningstar Funds Trust
22 W. Washington Street
Chicago, IL 60602
With a copy to:
Eric S. Purple
Stradley Ronon Stevens & Young, LLP
2000 K Street N.W., Suite 700
Washington, District of Columbia, 20006
(Name and address of agent for service)
Registrant’s telephone number, including area code: (312) 696-6000
Date of fiscal year end: April 30
Date of reporting period: October 31, 2023
Item 1. Reports to Stockholders.
| (a) | Report pursuant to Rule 30e-1 |
October 31, 2023 (unaudited)
| Morningstar U.S. Equity Fund | |
| Morningstar International Equity Fund | |
| Morningstar Global Income Fund | |
| Morningstar Total Return Bond Fund | |
| Morningstar Municipal Bond Fund | |
| Morningstar Defensive Bond Fund | |
| Morningstar Multisector Bond Fund | |
| Morningstar Global Opportunistic Equity Fund | |
| Morningstar Alternatives Fund | |
Regulatory Update
The SEC recently adopted a rule requiring mutual funds to produce “concise and visually engaging” annual and semiannual reports to shareholders. This streamlined format is intended to highlight key information for retail shareholders to permit them to assess and monitor their fund investments. More detailed information that has historically been part of shareholder reports, such as the shareholder letter, financial statements and financial highlights, will not appear in the new streamlined shareholder reports, but may accompany the reports (in the case of the shareholder letter), or will be available free of charge upon request to the fund or via the fund's Form N-CSR filed with the SEC on its EDGAR database. The compliance date for funds to implement streamlined shareholder reports is July 24, 2024; therefore, Morningstar Funds Trust will issue its first streamlined shareholder reports beginning with its October 31, 2024 semi-annual report. The new rule requires that each series of a mutual fund issue a separate streamlined shareholder report. For example, if you are a shareholder of all nine (9) series of the Morningstar Funds Trust, you will receive nine (9) separate streamlined shareholder reports, one for each fund, upon implementation of the new rule. In addition, the new rule requires that a hard copy of a fund’s streamlined shareholder report be mailed to each shareholder, unless the shareholder elects to receive such reports electronically. If you wish to ‘opt-in’ for electronic delivery of Morningstar Funds Trust’s annual and semi-annual shareholder reports, please contact your financial advisor for assistance in enrolling your account in paperless (i.e., electronic) delivery of shareholder materials.
Morningstar Funds Trust October 31, 2023 (unaudited)
Introduction
Morningstar Investment Management LLC launched an open end management investment company consisting of nine separate portfolios (each a Fund) that span the investment opportunity set1. Most of these Funds are designed to provide exposure to a broad asset class, such as U.S. equities, while our active management of each Fund’s asset allocation, allocation to active managers (known as “subadvisers”), and exposures to exchange traded funds (ETFs), or direct equities allow us to adjust sub-asset class allocations (such as small-cap value) based on our valuation views and those of the subadvisers.
Concept and Structure
We created the Morningstar Funds Trust using an open architecture, multimanager approach, hiring as active subadvisers both institutional managers and other managers whose mutual funds were previously used in Morningstar® Managed PortfoliosSM. Our analysts and portfolio managers continually use research, data, and analysis from Morningstar, Inc. and its affiliates to study the subadvisers and their investments closely and determine which fit best with our investment philosophy and the investment objectives of each Morningstar Fund2. We have recommended subadvisers we believed were independent, skilled investors in their respective asset classes to manage the Funds and we continuously monitor such subadvisers to confirm that they continue to meet our standards.
Consistent with our investment approach, our asset allocation process for the Morningstar Funds is based on fundamentals and driven by valuations. We look for asset classes and sub-asset classes around the globe that, in our view, offer fundamental value relative to price. Allocations within each Fund are in line with what we believe to reflect the best risk-adjusted opportunities.
How to Read This Report
Unless stated otherwise, this report outlines the structure and performance of the assets comprised by the Morningstar Funds Trust from May 1, 2023 through October 31, 2023. Included are fund holdings and positioning that may aid understanding of returns for the period.
Statements made within this report are not guarantees of future performance or investment results and should not be taken as investment advice. Investment decisions reflect a variety of factors, and we reserve the right to change views about individual holdings, sectors, and markets at any time. As a result, the views expressed should not be relied upon as a forecast of the Morningstar Funds’ future investment intent.
1All references to "we" or "our" in this report, including the funds' performance summaries, refer to Morningstar Investment Management LLC.
2 Morningstar Funds Trust is an open end management investment company registered under the Investment Company Act of 1940 (as amended). Use of the term “Morningstar Funds” hereafter refers to Morningstar Funds Trust, or its individual series, as applicable.
Morningstar Funds Trust October 31, 2023 (unaudited)
Morningstar Funds Trust October 31, 2023 (unaudited)
Statement of Shareholder Rights
It is important to note that as a shareholder, you have certain rights and protections, chief among them an independent Board of Trustees (the "Trustees"), whose main role is to represent your interests.
The Trustees are responsible for the overall management of the Trust, including general supervision and review of the investment activities of each Fund. The Trustees, in turn, elect the officers of the Trust, who are responsible for administering the day-to-day operations of the Trust and each Fund. The “Independent Trustees” are Trustees who are not “interested persons” of the Trust, as that term is defined in the Investment Company Act of 1940 ("1940 Act") (e.g. not a Morningstar employee).
For more information about the Independent Trustees, please see the Fund Governance Matters section of this shareholder report.
You may contact the Trustees with comments or concerns about your investment in the Morningstar Funds:
By mail: Morningstar Funds Trust
c/o D. Scott Schilling, Chief Compliance Officer
22 West Washington Street
Chicago, IL 60602
By email: BoardofTrustees.MorningstarFundsTrust@morningstar.com
Morningstar Funds Trust October 31, 2023 (unaudited)
Who is representing you as a shareholder of a Morningstar Fund?
The Morningstar Funds’ Board of Trustees represents shareholder interests. As of October 31, 2023, the Morningstar Funds’ Board of Trustees is comprised of 5 trustees – 4 are “independent” trustees and 1 is an “interested” trustee as a result of being an employee of Morningstar. Additional information about the Board can be found in Morningstar Fund Trust's Statement of Additional Information (SAI), available at https://connect.rightprospectus.com/Morningstar. Information about the Trustees and the Board’s policies are available at https://www.morningstar.com/company/morningstar-funds-governance.
What is the diversity of the Board of Trustees?
The 4 Independent Trustees self-identify as follows:
• 3 as women, and 1 as a man; and
• 3 as white and 1 as Asian American
The 1 Interested Trustee self-identifies as a white man.
In terms of leadership positions of the Board:
• Chair of the Board is a white woman;
• Chair of the Governance Committee is a white woman; and
• Chair of the Audit Committee is a white man.
How are Independent Trustees compensated?
The compensation adopted by the Board provides for an annual retainer for Independent Trustees of $148,000 per year. The Chair of the Board (an Independent Trustee) is paid an additional retainer of $43,000, while the Chair of the Audit Committee (an Independent Trustee) is paid an additional $15,000 and the Chair of the Governance Committee (an Independent Trustee) is paid an additional $10,000.
All Independent Trustees are reimbursed for expenses connected with attending a Board meeting, most notably airfare and lodging expenses. Independent Trustees’ annual retainer and costs in connection with attending a Board meeting are allocated among each of the nine Morningstar Funds. The Trust has no pension or retirement plan for the Independent Trustees.
Morningstar Funds Trust October 31, 2023 (unaudited)
Fund Governance Matters (continued)
Are Independent Trustees required to invest in the Morningstar Funds?
Yes, the Independent Trustees have adopted a policy to invest, at a minimum, at least $148,000 in the Funds, which is equal to the base annual retainer to be paid to each Independent Trustee. There is a phase-in period for Independent Trustees who have joined the Board after 2018 that requires them to invest at least $49,333 a year (i.e., one-third of the base annual retainer) until they have invested $148,000 in the Funds. Except for the Independent Trustee who joined the Board effective April 1, 2023, the Independent Trustees have satisfied this investment requirement as of October 31, 2023. For more information on the Independent Trustees investments in Morningstar Funds, please see the Trustee Ownership of Portfolio Shares table within the Trustees and Executive Officers section of the Statement of Additional Information available at https://connect.rightprospectus.com/Morningstar.
Morningstar Funds Trust October 31, 2023 (unaudited)
Dear Shareholders:
We are delighted to present you with the Morningstar Mutual Funds semi-annual report. This report features data for the previous six months ending October 31, 2023.
Morningstar Wealth’s1 mission is to empower advisor and investor success. That commitment serves as the foundation for our offerings—a series of nine open-end multi-manager mutual funds. We aim to provide our investment team with greater control of asset allocation, and operating in a more cost-effective way, all while maintaining the same open-architecture access.
We created the Morningstar Mutual Funds which are primarily used within the Morningstar® Managed PortfoliosSM lineup of products. Our multi-asset portfolios cover a mix of asset classes in a single portfolio, which we believe is ideal as a core investment. From our Asset Allocation Series, designed to diversify core solutions able to match an investor’s risk tolerance, to our Outcome-Based Series, built with an investor’s goal in mind, each portfolio targets a consistent approach to help reach its investors' financial goals. Overall, the funds provide access to investment strategies designed to help investors, drawing on our core capabilities in asset allocation, investment selection, and portfolio construction.
At Morningstar Wealth, we hold ourselves to the same high standards set by our parent company, Morningstar, Inc., which has been a leader in the business of fund manager research for almost 40 years. Those standards inform the composition of the Funds’ Board of Trustees, reporting transparency, and more. We hope that as you learn about how we operate, you will agree that the Morningstar Mutual Funds are offered the Morningstar Wealth way: by supporting financial advisors, institutions, and the investors they serve with a fundamentally based investment approach.
We greatly appreciate your trust in the Funds and in Morningstar Wealth—and for that, we thank you. We look forward to continuing to empower advisor and investor success together.
Marta K. Norton
Chief Investment Officer, Americas
Morningstar Investment Management LLC
1 Morningstar Wealth refers to products provided by Morningstar's Investment Management Group which includes Morningstar Investment Management LLC, the investment adviser of Morningstar Funds Trust. Morningstar Mutual Funds refers to Morningstar Funds Trust, an open-end management investment company registered with the Securities and Exchange Commission under the Investment Company Act of 1940 (as amended). Investing in mutual funds involves risk, please read the prospectus carefully before investing (connect.rightprospectus.com/morningstar). Asset Allocation Series and Outcome-Based Series refers to model portfolios created and maintained by Morningstar Investment Management LLC and made available on the Morningstar Wealth Platform.
Morningstar Funds Trust October 31, 2023 (unaudited)
Morningstar U.S. Equity Fund
| General Information | |
| Net Asset Value Per Share | $10.75 |
| Total Net Assets (millions) | $1,414 |
| Net Expense Ratio(a) | 0.85% |
| Gross Expense Ratio(a) | 0.88% |
| Portfolio Turnover Rate | 35% |
| Fund Inception | November 2, 2018 |
| No sales charges or distribution fees |
| Portfolio Characteristics | |
| Weighted Average Market Capitalization (billions) | $77.67 |
| Price-to-Earnings Ratio(b) | 19.60 |
| Ten Largest Equities (%)(c)(d)(e) | |
| Microsoft Corp. | 3.9 |
| Alphabet, Inc., Class A | 2.9 |
| Amazon.com, Inc. | 2.9 |
| Apple, Inc. | 2.6 |
| Meta Platforms, Inc., Class A | 2.4 |
| NVIDIA Corp. | 1.5 |
| Visa, Inc., Class A | 1.4 |
| Netflix, Inc. | 1.1 |
| Comcast Corp., Class A | 1.1 |
| Marsh & McLennan Cos., Inc. | 1.1 |
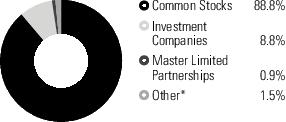
| Sector Diversification (%)(c)(d) | |
| Technology | 19.6 |
| Financials | 12.1 |
| Industrials | 10.8 |
| Health Care | 10.3 |
| Communications | 10.0 |
| Consumer Discretionary | 7.3 |
| Consumer Staples | 5.1 |
| Energy | 4.6 |
| Materials | 3.4 |
| Real Estate | 2.8 |
| Utilities | 2.8 |
* Includes, if any, cash, short-term investments, receivables, payables and investments rounding to less than 0.05%.
(a)Expense ratios are as of the most recent Prospectus dated August 31, 2023. Net expense ratio reflects fee waivers and/or expense reimbursements, if any, pursuant to an agreement that is in effect to cap the expenses whereas the gross expense ratio does not. Morningstar Investment Management LLC (“Morningstar” or “adviser” or “we”) has contractually agreed, through at least August 31, 2024, to waive all or a portion of its advisory fees and, if necessary, to assume certain other expenses (to the extent permitted by the Internal Revenue Code of 1986, as amended) to ensure that the Institutional shares’ Total Annual Fund Operating Expenses (excluding taxes, interest, brokerage commissions, trading costs, AFFE, short sale dividend and interest expenses, litigation expenses, and extraordinary expenses) do not exceed 0.84% (the Expense Limitation Agreement). Prior to August 31, 2024, the Expense Limitation Agreement may be terminated only upon mutual agreement between the Trust (which would require the approval of the Trust’s board of trustees) and the adviser, or automatically upon the termination of the Investment Advisory Agreement between the Trust and the adviser.
(b) Price-to-earnings (P/E) ratio is the share price relative to its earnings per share. The P/E ratio is calculated using 12-month forward earnings estimates from third party sources deemed reliable.
(c) Percentages shown are based on Net Assets.
(d) Excludes Investment Companies, Master Limited Partnerships and Other.
(e) The Fund’s portfolio holdings are subject to change without notice. The mention of specific securities is not a recommendation to buy, sell, or hold any particular security and is not indicative of current or future trading activity.
Morningstar Funds Trust October 31, 2023 (unaudited)
Fund Information (continued)
Morningstar U.S. Equity Fund
Investment Objective
Morningstar U.S. Equity Fund seeks long-term capital appreciation.
Investment Strategies
In seeking long-term capital appreciation, the Fund will normally invest at least 80% of its assets in equity securities of U.S.-based companies, and may invest up to 100% of its assets in such securities. The Fund seeks to provide broad U.S. equity exposure across market capitalizations and investment styles and has the flexibility to invest in large-cap, mid-cap, and small-cap common stocks across the growth and value style spectrum. The Fund may use quantitative models to select equity securities based on certain shared characteristics as determined by the Fund's adviser. The Fund may also invest in real estate investment trusts (REITs), master limited partnerships and non-U.S. companies. To meet its objective, the Fund may invest in investment companies such as ETFs, which could represent a significant percentage of assets. The Fund may invest in derivatives, including futures and forward foreign currency contracts, for risk management purposes or as part of its investment strategies.
Multimanager Approach—The Fund uses a multimanager approach, meaning the adviser may allocate assets to one or more subadvisers, in addition to open- and closed-end investment companies, ETFs, and individual securities (collectively “Allocation Decisions”). The adviser and each subadviser acts independently from the others and uses its own investment style and process to select securities, within the constraints of the Fund’s investment objective, strategies, and restrictions. Morningstar is responsible for selecting the investment strategies and making Allocation Decisions, with the goal of maximizing return in the context of pursuing the Fund’s investment objective with a prudent level of risk for the strategy. Morningstar may change subadvisers, subject to the oversight of the board of trustees, and sell holdings at any time.
Investment Adviser:
Morningstar Investment Management LLC
Investment Subadvisers:
ClearBridge Investments, LLC
Diversified large-cap growth equity across stable, cyclical and select growth companies.
Diamond Hill Capital Management, Inc.
Targeted exposure to U.S. mid-cap value companies.
Massachusetts Financial Services Company, d/b/a MFS Investment Management
Provides large-cap value exposure, favoring higher-quality, value companies with stronger balance sheets and more consistent profitability.
Wasatch Advisors, LP, d/b/a Wasatch Global Investors
Small-/mid-cap growth companies with the potential to deliver more stable profits while avoiding earlier-stage companies that may lack a proven track record of revenues and earnings.
Morningstar Funds Trust October 31, 2023 (unaudited)
Fund Information (continued)
Morningstar U.S. Equity Fund
Westwood Management Corp.
Provides small-cap equity exposure with an emphasis on value.
Morningstar Funds Trust October 31, 2023 (unaudited)
Morningstar International Equity Fund
| General Information | |
| Net Asset Value Per Share | $9.19 |
| Total Net Assets (millions) | $709 |
| Net Expense Ratio(a) | 1.00% |
| Gross Expense Ratio(a) | 1.09% |
| Portfolio Turnover Rate | 14% |
| Number of Issuers | 399 |
| Fund Inception | November 2, 2018 |
| No sales charges or distribution fees |
| Portfolio Characteristics | |
| Weighted Average Market Capitalization (billions) | $39.67 |
| Price-to-Earnings Ratio(b) | 11.96 |
| Countries Represented | 43 |
| Emerging Markets(c)(d) | 30.1% |
| Ten Largest Equities (%)(c)(d)(e) | |
| Shell PLC | 2.1 |
| Allianz S.E. | 1.4 |
| Tencent Holdings Ltd. | 1.3 |
| Samsung Electronics Co. Ltd. | 1.2 |
| Taiwan Semiconductor Manufacturing Co. Ltd. | 1.2 |
| Alibaba Group Holding Ltd. | 1.1 |
| Chugai Pharmaceutical Co. Ltd. | 1.1 |
| Samsung Electronics Co. Ltd. GDR | 1.0 |
| Lloyds Banking Group PLC | 1.0 |
| Roche Holding A.G. (Genusschein) | 0.9 |
| Sector Diversification (%)(c)(d) | |
| Financials | 17.5 |
| Industrials | 12.8 |
| Technology | 12.6 |
| Consumer Discretionary | 12.0 |
| Consumer Staples | 9.9 |
| Health Care | 8.4 |
| Energy | 7.3 |
| Materials | 6.8 |
| Communications | 6.8 |
| Utilities | 0.7 |
| Real Estate | 0.6 |
| Region Diversification (%)(c)(d) | |
| Europe (excluding United Kingdom) | 28.8 |
| Pacific (excluding Japan) | 27.4 |
| Japan | 16.8 |
| United Kingdom | 8.6 |
| Latin America | 4.8 |
| United States | 4.6 |
| Canada | 2.5 |
| Africa | 1.2 |
| Middle East | 0.7 |
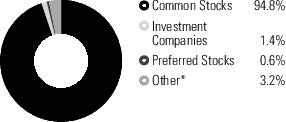
* Includes, if any, cash, short-term investments, receivables, payables, derivatives and investments rounding to less than 0.05%.
(a) Expense ratios are as of the most recent Prospectus dated August 31, 2023. Net expense ratio reflects fee waivers and/or expense reimbursements, if any, pursuant to an agreement that is in effect to cap the expenses whereas the gross expense ratio does not. Morningstar Investment Management LLC (“Morningstar” or “adviser” or “we”) has contractually agreed, through at least August 31, 2024, to waive all or a portion of its advisory fees and, if necessary, to assume certain other expenses (to the extent permitted by the Internal Revenue Code of 1986, as amended) to ensure that the Institutional shares’ Total Annual Fund Operating Expenses (excluding taxes, interest, brokerage commissions, trading costs, AFFE, short sale dividend and interest expenses, litigation expenses, and extraordinary expenses) do not exceed 0.99% (the Expense Limitation Agreement). Prior to August 31, 2024, the Expense Limitation Agreement may be terminated only upon mutual agreement between the Trust (which would require the approval of the Trust’s board of trustees) and the adviser, or automatically upon the termination of the Investment Advisory Agreement between the Trust and the adviser.
(b) Price-to-earnings (P/E) ratio is the share price relative to its earnings per share. The P/E ratio is calculated using 12-month forward earnings estimates from third party sources deemed reliable.
(c) Percentages shown are based on Net Assets.
(d) Excludes Investment Companies and Other.
(e) The Fund’s portfolio holdings are subject to change without notice. The mention of specific securities is not a recommendation to buy, sell, or hold any particular security and is not indicative of current or future trading activity.
Morningstar Funds Trust October 31, 2023 (unaudited)
Fund Information (continued)
Morningstar International Equity Fund
Investment Objective
Morningstar International Equity Fund seeks long-term capital appreciation.
Investment Strategies
In seeking long-term capital appreciation, the Fund will normally invest at least 80% of its assets in equity securities. Under normal circumstances, the Fund will invest approximately 80-100% of its assets in securities of issuers domiciled outside of the United States. The Fund may invest in developed and emerging markets and will typically invest in a minimum of 10 countries. The Fund seeks to provide broad international equity exposure across market capitalizations and investment styles and has the flexibility to invest in large-cap, mid-cap, and small-cap common stocks across the growth and value style spectrum. The Fund may use quantitative models to select equity securities based on certain shared characteristics as determined by the Fund’s adviser. To meet its objective, the Fund may invest in investment companies such as ETFs, which could represent a significant percentage of assets. The Fund may also invest in derivatives, including futures and forward foreign currency contracts, for risk management purposes, including to hedge its currency exposure, or as part of its investment strategies.
Multimanager Approach—The Fund uses a multimanager approach, meaning the adviser may allocate assets to one or more subadvisers, in addition to open- and closed-end investment companies, ETFs, and individual securities (collectively “Allocation Decisions”). The adviser and each subadviser acts independently from the others and uses its own investment style and process to select securities, within the constraints of the Fund’s investment objective, strategies, and restrictions. Morningstar is responsible for selecting the investment strategies and making Allocation Decisions, with the goal of maximizing return in the context of pursuing the Fund’s investment objective with a prudent level of risk for the strategy. Morningstar may change subadvisers, subject to the oversight of the board of trustees, and sell holdings at any time.
Investment Adviser:
Morningstar Investment Management LLC
Investment Subadvisers:
Harding Loevner L.P.
Provides growth-leaning exposure to non-U.S. developed equity markets.
Harris Associates L.P.
Provides value-leaning exposure to non-U.S. developed equity markets.
Lazard Asset Management LLC
Provides equity exposure to emerging-markets value companies.
T. Rowe Price Associates, Inc.
Provides exposure to emerging-markets growth companies.
Morningstar Funds Trust October 31, 2023 (unaudited)
Morningstar Global Income Fund
| General Information | |
| Net Asset Value Per Share | $8.49 |
| Total Net Assets (millions) | $195 |
| Net Expense Ratio(a) | 0.75% |
| Gross Expense Ratio(a) | 0.75% |
| Portfolio Turnover Rate | 25% |
| Fund Inception | November 2, 2018 |
| No sales charges or distribution fees |
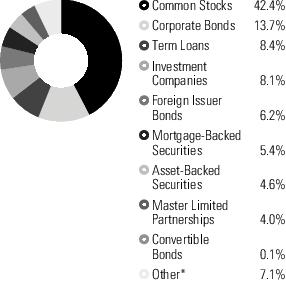
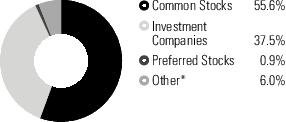
| Equity Portfolio (42.4%) | |
| Number of Common Stocks | 123 |
| Five Largest Sectors (%)(b)(c) | |
| Financials | 6.3 |
| Consumer Staples | 5.0 |
| Technology | 4.3 |
| Materials | 4.1 |
| Communications | 3.9 |
| Ten Largest Equities (%)(b)(c)(d) | |
| OPAP S.A. | 2.1 |
| Petroleo Brasileiro S.A. | 1.7 |
| BAE Systems PLC | 1.6 |
| Arca Continental S.A.B. de C.V. | 1.5 |
| Broadcom, Inc. | 1.5 |
| TF Administradora Industrial S. de R.L. de C.V. | 1.4 |
| Nippon Telegraph & Telephone Corp. | 1.4 |
| British American Tobacco PLC ADR | 1.2 |
| Macquarie Korea Infrastructure Fund | 1.2 |
| Softbank Corp. | 1.2 |
| Fixed Income Portfolio (38.4%) | |
| Number of Issuers | 327 |
| Sector Diversification (%)(b)(e) | |
| Corporate | 8.4 |
| Mortgage Securities | 5.0 |
| Asset Backed Securities | 4.8 |
| Energy | 4.2 |
| Consumer Discretionary | 3.9 |
| Industrials | 2.9 |
| Communications | 2.1 |
| Financials | 1.8 |
| Government | 1.5 |
| Health Care | 1.2 |
| Materials | 1.1 |
| Technology | 0.9 |
| Utilities | 0.3 |
| Real Estate | 0.2 |
| Consumer Staples | 0.1 |
| Five Largest Issuers (%)(b)(d)(e) | |
| Energy Transfer L.P. | 2.2 |
| Enterprise Products Partners L | 1.9 |
| Freddie Mac - STACR | 0.8 |
| BX Trust | 0.8 |
| United Rentals North America | 0.5 |
Morningstar Funds Trust October 31, 2023 (unaudited)
Fund Information (continued)
Morningstar Global Income Fund
| Credit Quality (%)(b)(e)(f) | |
| AAA | 0.9 |
| AA | 0.2 |
| A | 0.2 |
| BBB | 3.2 |
| BB | 7.8 |
| B | 7.5 |
| CCC | 2.2 |
| CC | 0.1 |
| C | 0.1 |
| Not Rated | 16.3 |
| CCC | 2.2 |
* Includes, if any, cash, short-term investments, receivables, payables, derivatives and investments rounding to less than 0.05%.
(a) Expense ratios are as of the most recent Prospectus dated August 31, 2023. Net expense ratio reflects fee waivers and/or expense reimbursements, if any, pursuant to an agreement that is in effect to cap the expenses whereas the gross expense ratio does not. Morningstar Investment Management LLC (“Morningstar” or “adviser” or “we”) has contractually agreed, through at least August 31, 2024, to waive all or a portion of its advisory fees and, if necessary, to assume certain other expenses (to the extent permitted by the Internal Revenue Code of 1986, as amended) to ensure that the Institutional shares’ Total Annual Fund Operating Expenses (excluding taxes, interest, brokerage commissions, trading costs, AFFE, short sale dividend and interest expenses, litigation expenses, and extraordinary expenses) do not exceed 0.73% (the Expense Limitation Agreement). Prior to August 31, 2024, the Expense Limitation Agreement may be terminated only upon mutual agreement between the Trust (which would require the approval of the Trust’s board of trustees) and the adviser, or automatically upon the termination of the Investment Advisory Agreement between the Trust and the adviser.
(b) Percentages shown are based on Net Assets.
(c) Excludes Master Limited Partnerships, Investment Companies and Other.
(d) The Fund’s portfolio holdings are subject to change without notice. The mention of specific securities is not a recommendation to buy, sell, or hold any particular security and is not indicative of current or future trading activity.
(e) Excludes Common Stocks, Master Limited Partnerships, Investment Companies and Other.
(f) Credit quality ratings are based on Moody’s, S&P Global and Fitch ratings. If ratings from all three rating agencies disagree, the model assigns the middle rating to the security. If two of the three agree, the model assigns the rating from those two to the security. If none of these three rating agencies has assigned a rating, the Fund will assign a rating of not rated. The ratings, expressed in S&P Global’s nomenclature, range from AAA (extremely strong capacity to meet its financial commitment) to D (in default). Short-term ratings, expressed in S&P Global’s nomenclature, range from A1 to D (in default). The ratings represent the rating agencies’ opinions of the quality of the securities they rate. Ratings are relative and subjective and are not absolute standards of quality.
Morningstar Funds Trust October 31, 2023 (unaudited)
Fund Information (continued)
Morningstar Global Income Fund
Investment Objective
Morningstar Global Income Fund seeks current income and long-term capital appreciation.
Investment Strategies
In seeking current income and long-term capital appreciation, the Fund has significant flexibility and invests across asset classes and geographies, according to the adviser’s assessment of their valuations, fundamental characteristics, and income levels. The Fund invests in investment companies such as ETFs which could represent a significant percentage of the Fund’s assets. The Fund generally expects to invest at least 20% (or, if market conditions are not deemed favorable, at least 10%) of its assets in securities of issuers domiciled outside of the United States and may invest up to 100% of its assets in such securities.
The Fund invests in income-generating equity securities, which may include common stocks, preferred stocks, real estate investment trusts (REITs), and master limited partnerships (MLPs). The Fund may invest in companies of any size from any country, including emerging markets.
The Fund also invests in fixed-income securities of varying maturity, duration, and quality. These may include U.S. and non-U.S. corporate debt securities, U.S. and non-U.S. government debt securities, emerging market debt securities, mortgage-backed and asset-backed securities, convertible securities, loans (including covenant lite loans) and floating-rate notes. The Fund may invest up to 60% of its assets in fixed-income securities that are rated below investment grade (commonly known as junk bonds) or, if unrated, are determined by the Fund's subadviser(s) to be of comparable quality.
The Fund may also invest in derivatives, including options, futures, swaps, and forward foreign currency contracts, for risk management purposes, including to hedge its currency exposure, or as part of its investment strategies.
The nature of the strategies in this Fund is to engage in active and frequent trading of its portfolio securities which may result in higher portfolio turnover. Turnover is mainly driven by a few strategies employed to help manage duration and curve risk.
Multimanager Approach—The Fund uses a multimanager approach, meaning the adviser may allocate assets to one or more subadvisers, in addition to open- and closed-end investment companies, ETFs, and individual securities (collectively “Allocation Decisions”). The adviser and each subadviser acts independently from the others and uses its own investment style and process to select securities, within the constraints of the Fund’s investment objective, strategies, and restrictions. Morningstar is responsible for selecting the investment strategies and making Allocation Decisions, with the goal of generating income and maximizing return in the context of pursuing the Fund’s investment objective with a prudent level of risk for the strategy. Morningstar may change subadvisers, subject to the oversight of the board of trustees, and sell holdings at any time.
Investment Adviser:
Morningstar Investment Management LLC
Morningstar Funds Trust October 31, 2023 (unaudited)
Fund Information (continued)
Morningstar Global Income Fund
Investment Subadvisers:
Cullen Capital Management LLC
Global income manager that seeks exposure to attractively priced, high-quality, dividend-paying companies in the U.S. and international markets, including emerging markets.
Western Asset Management Company, LLC
The multi-asset income sleeve seeks to generate high income across all global credit markets by leveraging Western Asset's best income ideas.
Morningstar Funds Trust October 31, 2023 (unaudited)
Morningstar Total Return Bond Fund
| General Information | |
| Net Asset Value Per Share | $8.30 |
| Total Net Assets (millions) | $755 |
| Net Expense Ratio(a) | 0.54% |
| Gross Expense Ratio(a) | 0.74% |
| Portfolio Turnover Rate | 179% |
| Fund Inception | November 2, 2018 |
| No sales charges or distribution fees |
| Portfolio Characteristics | |
| Effective Duration (years)(b) | 6.2 |
| Non-USD Exposure(c)(d)(e) | 0.1% |
| Five Largest Issuers (%)(c)(d)(f) | |
| U.S. Treasury | 13.5 |
| Federal National Mortgage Association | 11.4 |
| Federal Home Loan Mortgage Corporation | 7.6 |
| Government National Mortgage Association | 4.9 |
| Fannie Mae or Freddie Mac | 2.5 |
| Credit Quality (%)(c)(d)(g) | |
| U.S. Treasury | 13.5 |
| U.S. Agency | 29.2 |
| AAA | 0.9 |
| AA | 0.7 |
| A | 8.2 |
| BBB | 10.6 |
| BB | 0.7 |
| B | 0.1 |
| Not Rated | 11.9 |
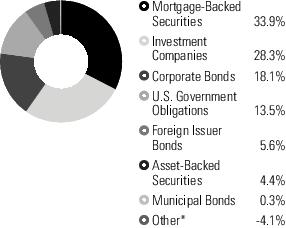
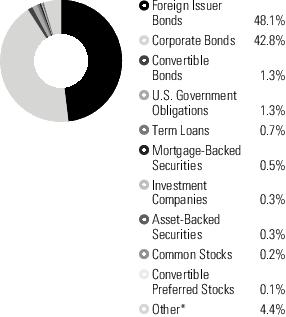
| Sector Diversification (%)(c)(d) | |
| Mortgage Securities | 33.9 |
| Government | 14.6 |
| Financials | 7.3 |
| Energy | 4.6 |
| Asset Backed Securities | 4.4 |
| Communications | 1.9 |
| Health Care | 1.7 |
| Industrials | 1.7 |
| Utilities | 1.5 |
| Technology | 1.1 |
| Materials | 0.9 |
| Consumer Discretionary | 0.8 |
| Real Estate | 0.8 |
| Consumer Staples | 0.6 |
| Region Diversification (%)(c)(d) | |
| United States | 67.3 |
| Latin America | 4.2 |
| Europe (excluding United Kingdom) | 2.2 |
| Pacific (excluding Japan) | 1.1 |
| United Kingdom | 0.4 |
| Middle East | 0.3 |
| Canada | 0.2 |
| Africa | 0.1 |
| Japan | 0.0 |
* Includes, if any, cash, short-term investments, receivables, payables, derivatives and investments rounding to less than 0.05%. Additionally, "Other" investments are not included in the pie chart as they represent less than 0.0% of the Fund's Net Assets.
(a) Expense ratios are as of the most recent Prospectus dated August 31, 2023. Net expense ratio reflects fee waivers and/or expense reimbursements, if any, pursuant to an agreement that is in effect to cap the expenses whereas the gross expense ratio does not. Morningstar Investment Management LLC (“Morningstar” or “adviser” or “we”) has contractually agreed, through at least August 31, 2024, to waive all or a portion of its advisory fees and, if necessary, to assume certain other expenses (to the extent permitted by the Internal Revenue Code of 1986, as amended) to ensure that the Institutional shares’ Total Annual Fund Operating Expenses (excluding taxes, interest, brokerage commissions, trading costs, AFFE, short sale dividend and interest expenses, litigation expenses, and extraordinary expenses) do not exceed 0.53% (the Expense Limitation Agreement). Prior to August 31,
Morningstar Funds Trust October 31, 2023 (unaudited)
Fund Information (continued)
Morningstar Total Return Bond Fund
2024, the Expense Limitation Agreement may be terminated only upon mutual agreement between the Trust (which would require the approval of the Trust’s board of trustees) and the adviser, or automatically upon the termination of the Investment Advisory Agreement between the Trust and the adviser.
(b) Effective duration is a measure of a Fund's interest-rate sensitivity—the longer a Fund's duration, the more sensitive the Fund is to shifts in interest rates. Duration is determined by a formula that includes coupon rates and bond maturities. Small coupons tend to increase duration, while shorter maturities and higher coupons shorten duration.
(c) Percentages shown are based on Net Assets.
(d) Excludes Investment Companies and Other.
(e) Non-USD currency exposure for the Fund reflects the value of the portfolio’s non-U.S. dollar denominated investments, as well as the impact of currency derivatives.
(f) The Fund’s portfolio holdings are subject to change without notice. The mention of specific securities is not a recommendation to buy, sell, or hold any particular security and is not indicative of current or future trading activity.
(g) Credit quality ratings are based on Moody’s, S&P Global and Fitch ratings. If ratings from all three rating agencies disagree, the model assigns the middle rating to the security. If two of the three agree, the model assigns the rating from those two to the security. If none of these three rating agencies has assigned a rating, the Fund will assign a rating of not rated. The ratings, expressed in S&P Global’s nomenclature, range from AAA (extremely strong capacity to meet its financial commitment) to D (in default). Short-term ratings, expressed in S&P Global’s nomenclature, range from A‐1 to D (in default). The ratings represent the rating agencies’ opinions of the quality of the securities they rate. Ratings are relative and subjective and are not absolute standards of quality.
Morningstar Funds Trust October 31, 2023 (unaudited)
Fund Information (continued)
Morningstar Total Return Bond Fund
Investment Objective
Morningstar Total Return Bond Fund seeks to maximize total return while also generating income and preserving capital.
Investment Strategies
In seeking to maximize total return while also generating income and preserving capital, the Fund will normally invest at least 80% of its assets in debt securities (commonly referred to as “bonds”) of varying maturity, duration, and quality. To meet its objective, the Fund may invest in investment companies such as ETFs, which could represent a significant percentage of assets.
The Fund invests primarily in investment-grade fixed-income securities. These may include U.S. and non-U.S. investment-grade corporate debt securities, U.S. government debt securities, including Treasury Inflation Protected Bond Securities and zero-coupon securities, non-U.S. government debt securities, emerging-market debt securities, and mortgage-backed and asset-backed securities. The Fund may also invest up to 20% of its assets in fixed-income securities that are rated below investment grade (commonly known as junk bonds), or if unrated, are determined by the Fund’s subadviser(s) to be of comparable quality.
In addition, the Fund may invest in collateralized debt obligations (CDOs), which may include collateralized loan obligations (CLOs). CDOs are types of asset-backed securities. CLOs are ordinarily issued by a trust or other special purpose entity and are typically collateralized by a pool of loans, which may include, among others, domestic and non-U.S. senior secured loans, senior unsecured loans, and subordinate corporate loans, including loans that may be rated below investment grade or equivalent unrated loans, held by such issuer.
The Fund may invest up to 10% of its assets in securities denominated in foreign currencies. The Fund may also invest in securities acquired in a private placement, such as Rule 144A securities, as well as derivatives, including options, futures, swaps, and forward foreign currency contracts, for risk management purposes or as part of its investment strategies. The Fund may also enter into reverse repurchase agreements and dollar rolls. The Fund may also invest in short-term, high-quality fixed-income securities, cash or cash equivalents, including money market funds.
The nature of the strategies in this Fund is to engage in active and frequent trading of its portfolio securities which may result in higher portfolio turnover. Turnover is mainly driven by a few strategies employed to help manage duration and curve risk.
Multimanager Approach—The Fund uses a multimanager approach, meaning the adviser may allocate assets to one or more subadvisers, in addition to open- and closed-end investment companies, ETFs, and individual securities (collectively “Allocation Decisions”). The adviser and each subadviser acts independently from the others and uses its own investment style and process to select securities, within the constraints of the Fund’s investment objective, strategies, and restrictions. Morningstar is responsible for selecting the investment strategies and making Allocation Decisions, with the goal of maximizing return in the context of pursuing the Fund’s investment objective with a prudent level of risk for the strategy. Morningstar may change subadvisers, subject to the oversight of the board of trustees, and sell holdings at any time.
Morningstar Funds Trust October 31, 2023 (unaudited)
Fund Information (continued)
Morningstar Total Return Bond Fund
Investment Adviser:
Morningstar Investment Management LLC
Investment Subadvisers:
BlackRock Financial Management, Inc.
Core-plus total return objective; aims to primarily invest in investment-grade, domestic fixed-income securities with opportunistic, out-of-benchmark allocations and derivatives.
Western Asset Management Company, LLC
Provides core-bond exposure seeking exposure to investment-grade, domestic fixed-income securities.
Morningstar Funds Trust October 31, 2023 (unaudited)
Morningstar Municipal Bond Fund
| General Information | |
| Net Asset Value Per Share | $9.41 |
| Total Net Assets (millions) | $314 |
| Net Expense Ratio(a) | 0.59% |
| Gross Expense Ratio(a) | 0.68% |
| Portfolio Turnover Rate | 16% |
| Number of Issuers | 432 |
| Fund Inception | November 2, 2018 |
| No sales charges or distribution fees |
| Portfolio Characteristics | |
| Effective Duration (years)(b) | 5.1 |
| Five Largest Issuers (%)(c)(d)(e) | |
| Port Authority of New York & New Jersey | 1.2 |
| Wisconsin State Health & Educational Facilities Authority Revenue | 1.1 |
| Main Street Natural Gas Inc Ga Gas Supply Revenue | 1.1 |
| Maryland State Health & Higher Educational Facilities Authority Revenue | 1.1 |
| Black Belt Energy Gas District Al Gas Project Revenue | 1.0 |
| Credit Quality (%)(c)(d)(f) | |
| AAA | 1.6 |
| AA | 18.0 |
| A | 15.2 |
| BBB | 5.0 |
| BB | 0.6 |
| A1+ (Short Term) | 0.2 |
| Not Rated | 44.1 |
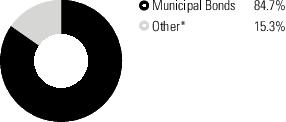
| Sector Diversification (%)(c)(d) | |
| General | 15.3 |
| Medical | 13.2 |
| Airport | 8.8 |
| Transportation | 8.7 |
| General Obligation | 6.5 |
| Higher Education | 4.8 |
| Development | 4.7 |
| Education | 3.7 |
| Nursing Home | 3.4 |
| Water | 3.3 |
| School District | 3.0 |
| Power | 2.8 |
| Multifamily Housing | 2.1 |
| Housing | 1.1 |
| Utilities | 0.7 |
| Bond Banks | 0.7 |
| Single Family Housing | 0.4 |
| Pollution | 0.4 |
| Tobacco Settlement | 0.4 |
| Student Loan | 0.3 |
| Government | 0.2 |
| Facilities | 0.2 |
* Includes, if any, cash, short-term investments, receivables, payables, derivatives and investments rounding to less than 0.05%.
(a) Expense ratios are as of the most recent Prospectus dated August 31, 2023. Net expense ratio reflects fee waivers and/or expense reimbursements, if any, pursuant to an agreement that is in effect to cap the expenses whereas the gross expense ratio does not. Morningstar Investment Management LLC (“Morningstar” or “adviser” or “we”) has contractually agreed, through at least August 31, 2024, to waive all or a portion of its advisory fees and, if necessary, to assume certain other expenses (to the extent permitted by the Internal Revenue Code of 1986, as amended) to ensure that the Institutional shares’ Total Annual Fund Operating Expenses (excluding taxes, interest, brokerage commissions, trading costs, AFFE, short sale dividend and interest expenses, litigation expenses, and extraordinary expenses) do not exceed 0.58% (the Expense Limitation Agreement). Prior to August 31, 2024, the Expense Limitation Agreement may be terminated only upon mutual agreement between the Trust (which would require the approval of the Trust’s board of trustees) and the adviser, or automatically upon the termination of the Investment Advisory Agreement between the Trust and the adviser.
(b) Effective duration is a measure of a Fund's interest-rate sensitivity—the longer a Fund's duration, the more sensitive the Fund is to shifts in interest rates. Duration is determined by a formula that includes coupon rates and bond maturities. Small coupons tend to increase duration, while shorter maturities and higher coupons shorten duration.
(c) Percentages shown are based on Net Assets.
(d) Excludes Investment Companies and Other.
(e) The Fund’s portfolio holdings are subject to change without notice. The mention of specific securities is not a recommendation to buy, sell, or hold any particular security and is not indicative of current or future trading activity.
(f) Credit quality ratings are based on Moody’s, S&P Global and Fitch ratings. If ratings from all three rating agencies disagree, the model assigns the middle rating to the security. If two of the three agree, the model assigns the rating from those two to the security. If none of these three rating agencies
Morningstar Funds Trust October 31, 2023 (unaudited)
Fund Information (continued)
Morningstar Municipal Bond Fund
has assigned a rating, the Fund will assign a rating of not rated. The ratings, expressed in S&P Global’s nomenclature, range from AAA (extremely strong capacity to meet its financial commitment) to D (in default). Short-term ratings, expressed in S&P Global’s nomenclature, range from A‐1 to D (in default). The ratings represent the rating agencies’ opinions of the quality of the securities they rate. Ratings are relative and subjective and are not absolute standards of quality.
Morningstar Funds Trust October 31, 2023 (unaudited)
Fund Information (continued)
Morningstar Municipal Bond Fund
Investment Objective
Morningstar Municipal Bond Fund seeks income exempt from federal income taxes as well as capital preservation.
Investment Strategies
In seeking income exempt from federal income taxes consistent with the preservation of capital, the Fund will invest, under normal circumstances, at least 80% of its net assets, plus borrowings for investment purposes, in securities of municipal issuers within the United States and its territories, the income of which is exempt from U.S. taxation. To meet its objective, the Fund may invest in investment companies such as ETFs, which could represent a significant percentage of assets.
The Fund intends to invest primarily in investment-grade municipal securities, but may invest up to 25% of assets in high-yield fixed-income securities that are rated below investment grade (commonly known as junk bonds) or, if unrated, are determined by the Fund’s subadviser(s) to be of comparable quality. The Fund may also invest in derivatives, including options, futures, swaps, and inverse floating-rate debt instruments (inverse floaters), for risk management purposes or as part of its investment strategies. The Fund may invest in obligations that pay interest at fixed or variable rates.
Multimanager Approach—The Fund uses a multimanager approach, meaning the adviser may allocate assets to one or more subadvisers, in addition to open- and closed-end investment companies, ETFs, and individual securities (collectively “Allocation Decisions”). The adviser and each subadviser acts independently from the others and uses its own investment style and process to select securities, within the constraints of the Fund’s investment objective, strategies, and restrictions. Morningstar is responsible for selecting the investment strategies and making Allocation Decisions, with the goal of maximizing return in the context of pursuing the Fund’s investment objective with a prudent level of risk for the strategy. Morningstar may change subadvisers, subject to the oversight of the board of trustees, and sell holdings at any time.
Investment Adviser:
Morningstar Investment Management LLC
Investment Subadvisers:
Allspring Global Investments, LLC
Exposure to intermediate and short-term municipal bonds and derivatives, including investment-grade and below-investment-grade securities.
T. Rowe Price Associates, Inc.
Core-plus exposure to intermediate and long-term municipal bonds and derivatives, including both investment-grade and below-investment-grade securities.
Morningstar Funds Trust October 31, 2023 (unaudited)
Morningstar Defensive Bond Fund
| General Information | |
| Net Asset Value Per Share | $9.39 |
| Total Net Assets (millions) | $129 |
| Net Expense Ratio(a) | 0.51% |
| Gross Expense Ratio(a) | 0.76% |
| Portfolio Turnover Rate | 30% |
| Number of Issuers | 112 |
| Fund Inception | November 2, 2018 |
| No sales charges or distribution fees |
| Portfolio Characteristics | |
| Effective Duration (years)(b) | 2.2 |
| Non-USD Exposure(c)(d)(e) | 0.0% |
| Five Largest Issuers (%)(c)(d)(f) | |
| Fhlmc Multifamily Structured P | 4.4 |
| Golub Capital Partners Funding | 2.1 |
| U.S. Treasury | 1.7 |
| Cerberus | 1.7 |
| VCP CLO II Ltd | 1.4 |
| Credit Quality (%)(c)(d)(g) | |
| U.S. Treasury | 1.5 |
| U.S. Agency | 1.6 |
| AAA | 8.8 |
| AA | 0.9 |
| A | 1.8 |
| BBB | 0.7 |
| B | 2.4 |
| CCC | 0.3 |
| Not Rated | 32.1 |
| Sector Diversification (%)(c)(d) | |
| Asset Backed Securities | 34.5 |
| Mortgage Securities | 8.1 |
| Government | 1.8 |
| Financials | 1.6 |
| Communications | 0.8 |
| Industrials | 0.8 |
| Real Estate | 0.7 |
| Utilities | 0.7 |
| Technology | 0.5 |
| Health Care | 0.3 |
| Consumer Discretionary | 0.2 |
| Corporate | 0.2 |
| Region Diversification (%)(c)(d) | |
| United States | 43.2 |
| Latin America | 6.4 |
| Canada | 0.5 |
| Europe (excluding United Kingdom) | 0.1 |
* Includes, if any, cash, short-term investments, receivables, payables, derivatives and investments rounding to less than 0.05%.
(a) Expense ratios are as of the most recent Prospectus dated August 31, 2023. Net expense ratio reflects fee waivers and/or expense reimbursements, if any, pursuant to an agreement that is in effect to cap the expenses whereas the gross expense ratio does not. Morningstar Investment Management LLC (“Morningstar” or “adviser” or “we”) has contractually agreed, through at least August 31, 2024, to waive all or a portion of its advisory fees and, if necessary, to assume certain other expenses (to the extent permitted by the Internal Revenue Code of 1986, as amended) to ensure that the Institutional shares’ Total Annual Fund Operating Expenses (excluding taxes, interest, brokerage commissions, trading costs, AFFE, short sale dividend and interest expenses, litigation expenses, and extraordinary expenses) do not exceed 0.48% (the Expense Limitation Agreement). Prior to August 31, 2024, the Expense Limitation Agreement may be terminated only upon mutual agreement between the Trust (which would require the approval of the Trust’s board of trustees) and the adviser, or automatically upon the termination of the Investment Advisory Agreement between the Trust and the adviser.
Morningstar Funds Trust October 31, 2023 (unaudited)
Fund Information (continued)
Morningstar Defensive Bond Fund
(b) Effective duration is a measure of a Fund's interest-rate sensitivity—the longer a Fund's duration, the more sensitive the Fund is to shifts in interest rates. Duration is determined by a formula that includes coupon rates and bond maturities. Small coupons tend to increase duration, while shorter maturities and higher coupons shorten duration.
(c) Percentages shown are based on Net Assets.
(d) Excludes Investment Companies, Common Stocks and Other.
(e) Non-USD currency exposure for the Fund reflects the value of the portfolio’s non-U.S. dollar denominated investments, as well as the impact of currency derivatives.
(f) The Fund’s portfolio holdings are subject to change without notice. The mention of specific securities is not a recommendation to buy, sell, or hold any particular security and is not indicative of current or future trading activity.
(g) Credit quality ratings are based on Moody’s, S&P Global and Fitch ratings. If ratings from all three rating agencies disagree, the model assigns the middle rating to the security. If two of the three agree, the model assigns the rating from those two to the security. If none of these three rating agencies has assigned a rating, the Fund will assign a rating of not rated. The ratings, expressed in S&P Global’s nomenclature, range from AAA (extremely strong capacity to meet its financial commitment) to D (in default). Short-term ratings, expressed in S&P Global’s nomenclature, range from A‐1 to D (in default). The ratings represent the rating agencies’ opinions of the quality of the securities they rate. Ratings are relative and subjective and are not absolute standards of quality.
Morningstar Funds Trust October 31, 2023 (unaudited)
Fund Information (continued)
Morningstar Defensive Bond Fund
Investment Objective
Morningstar Defensive Bond Fund seeks capital preservation.
Investment Strategies
In seeking capital preservation, the Fund will normally invest at least 80% of its assets in a diversified portfolio of debt securities (commonly referred to as “bonds”) of varying maturity, duration, and quality. Under normal conditions, the Fund intends to pursue a defensive strategy of limiting its interest-rate sensitivity by maintaining a portfolio duration of three years or less. The Fund may also invest in investment companies such as ETFs, which could represent a significant percentage of assets.
The Fund invests primarily in short- and intermediate-term investment-grade fixed-income securities. These may include U.S. and non-U.S. investment-grade corporate debt securities, U.S. and non-U.S. government debt securities, and mortgage-backed and asset-backed securities. In most market environments, the Fund will not invest more than 20% of assets in fixed-income securities that are rated below investment grade (commonly known as junk bonds), or if unrated, are determined by the Fund’s subadviser(s) to be of comparable quality.
In addition, the Fund may invest a significant portion of its assets in collateralized debt obligations (CDOs), including collateralized loan obligations (CLOs). CDOs are types of asset-backed securities. CLOs are ordinarily issued by a trust or other special purpose entity and are typically collateralized by a pool of loans, which may include, among others, domestic and non-U.S. senior secured loans, senior unsecured loans, and subordinate corporate loans, including loans that may be rated below investment grade or equivalent unrated loans, held by such issuer.
Multimanager Approach—The Fund uses a multimanager approach, meaning the adviser may allocate assets to one or more subadvisers, in addition to open- and closed-end investment companies, ETFs, and individual securities (collectively “Allocation Decisions”). The adviser and each subadviser acts independently from the others and uses its own investment style and process to select securities, within the constraints of the Fund’s investment objective, strategies, and restrictions. Morningstar is responsible for selecting the investment strategies and making Allocation Decisions, with the goal of maximizing return in the context of pursuing the Fund’s investment objective with a prudent level of risk for the strategy. Morningstar may change subadvisers, subject to the oversight of the board of trustees, and sell holdings at any time.
Investment Adviser:
Morningstar Investment Management LLC
Investment Subadviser:
First Pacific Advisors, LP
Diversified portfolio of short-duration, fixed-income securities designed to anchor a portfolio of defensive assets.
Morningstar Funds Trust October 31, 2023 (unaudited)
Morningstar Multisector Bond Fund
| General Information | |
| Net Asset Value Per Share | $8.26 |
| Total Net Assets (millions) | $167 |
| Net Expense Ratio(a) | 0.80% |
| Gross Expense Ratio(a) | 1.05% |
| Portfolio Turnover Rate | 71% |
| Number of Issuers | 679 |
| Fund Inception | November 2, 2018 |
| No sales charges or distribution fees |
| Portfolio Characteristics | |
| Effective Duration (years)(b) | 5.1 |
| Non-USD Exposure(c)(d)(e) | 19.9% |
| Five Largest Issuers (%)(c)(d)(f) | |
| Nota Do Tesouro Nacional | 2.7 |
| Government of Indonesia | 2.4 |
| Republic of South Africa | 2.2 |
| Mexican Bonos Desarollo | 2.0 |
| Malaysia Government | 1.9 |
| Credit Quality (%)(c)(d)(g) | |
| U.S. Treasury | 1.3 |
| AA | 1.5 |
| A | 9.4 |
| BBB | 19.2 |
| BB | 16.4 |
| B | 7.9 |
| CCC | 1.5 |
| C | 0.1 |
| Not Rated | 37.7 |
| Sector Diversification (%)(c)(d) | |
| Government | 35.1 |
| Financials | 10.4 |
| Energy | 8.9 |
| Communications | 8.3 |
| Consumer Discretionary | 7.2 |
| Health Care | 5.4 |
| Industrials | 4.6 |
| Utilities | 4.2 |
| Technology | 3.6 |
| Materials | 3.1 |
| Consumer Staples | 1.9 |
| Real Estate | 1.6 |
| Mortgage Securities | 0.5 |
| Asset Backed Securities | 0.2 |
| Region Diversification (%)(c)(d) | |
| United States | 46.8 |
| Latin America | 14.3 |
| Pacific (excluding Japan) | 11.4 |
| Europe (excluding United Kingdom) | 7.7 |
| Africa | 6.5 |
| Middle East | 5.7 |
| Canada | 1.6 |
| United Kingdom | 0.7 |
| Japan | 0.3 |
* Includes, if any, cash, short-term investments, receivables, payables, derivatives and investments rounding to less than 0.05%.
Morningstar Funds Trust October 31, 2023 (unaudited)
Fund Information (continued)
Morningstar Multisector Bond Fund
(a) Expense ratios are as of the most recent Prospectus dated August 31, 2023. Net expense ratio reflects fee waivers and/or expense reimbursements, if any, pursuant to an agreement that is in effect to cap the expenses whereas the gross expense ratio does not. Morningstar Investment Management LLC (“Morningstar” or “adviser” or “we”) has contractually agreed, through at least August 31, 2024, to waive all or a portion of its advisory fees and, if necessary, to assume certain other expenses (to the extent permitted by the Internal Revenue Code of 1986, as amended) to ensure that the Institutional shares’ Total Annual Fund Operating Expenses (excluding taxes, interest, brokerage commissions, trading costs, AFFE, short sale dividend and interest expenses, litigation expenses, and extraordinary expenses) do not exceed 0.79% (the Expense Limitation Agreement). Prior to August 31, 2024, the Expense Limitation Agreement may be terminated only upon mutual agreement between the Trust (which would require the approval of the Trust’s board of trustees) and the adviser, or automatically upon the termination of the Investment Advisory Agreement between the Trust and the adviser.
(b) Effective duration is a measure of a Fund's interest-rate sensitivity—the longer a Fund's duration, the more sensitive the Fund is to shifts in interest rates. Duration is determined by a formula that includes coupon rates and bond maturities. Small coupons tend to increase duration, while shorter maturities and higher coupons shorten duration.
(c) Percentages shown are based on Net Assets.
(d) Excludes Common Stocks, Convertible Preferred Stocks and Other.
(e) Non-USD currency exposure for the Fund reflects the value of the portfolio’s non-U.S. dollar denominated investments, as well as the impact of currency derivatives.
(f) The Fund’s portfolio holdings are subject to change without notice. The mention of specific securities is not a recommendation to buy, sell, or hold any particular security and is not indicative of current or future trading activity.
(g) Credit quality ratings are based on Moody’s, S&P Global and Fitch ratings. If ratings from all three rating agencies disagree, the model assigns the middle rating to the security. If two of the three agree, the model assigns the rating from those two to the security. If none of these three rating agencies has assigned a rating, the Fund will assign a rating of not rated. The ratings, expressed in S&P Global’s nomenclature, range from AAA (extremely strong capacity to meet its financial commitment) to D (in default). Short-term ratings, expressed in S&P Global’s nomenclature, range from A‐1 to D (in default). The ratings represent the rating agencies’ opinions of the quality of the securities they rate. Ratings are relative and subjective and are not absolute standards of quality.
Morningstar Funds Trust October 31, 2023 (unaudited)
Fund Information (continued)
Morningstar Multisector Bond Fund
Investment Objective
Morningstar Multisector Bond Fund seeks total return through a combination of current income and capital appreciation.
Investment Strategies
In seeking total return through a combination of current income and capital appreciation, the Fund will normally invest at least 80% of its assets in debt securities (commonly referred to as “bonds”) of varying maturity, duration, and quality across various sectors of the fixed-income market. These may include U.S. and non- U.S. corporate debt securities, U.S. and non-U.S. government debt securities, emerging-market debt securities, mortgage-backed and asset-backed securities, municipal securities, and floating-rate notes.
The Fund invests in investment grade and below investment grade fixed income securities. The Fund may invest without limit in fixed-income securities that are rated below investment grade (commonly known as junk bonds), or if unrated, are determined by the Fund’s subadviser(s) to be of comparable quality. The Fund may invest without limit in securities denominated in foreign currencies and in U.S. dollar-denominated securities of foreign issuers.
The Fund may invest in securities acquired in a private placement, such as Rule 144A securities, as well as derivatives, including options, futures, swaps, forward foreign currency contracts and currency options, for risk management purposes or as part of its investment strategies. Due to the opportunistic nature of its strategy, the Fund may also invest up to 20% of its assets in equity securities, including common stocks and convertible securities.
The nature of the strategies in this Fund is to engage in active and frequent trading of its portfolio securities which may result in higher portfolio turnover. Turnover is mainly driven by a few strategies employed to help manage duration and curve risk.
Multimanager Approach—The Fund uses a multimanager approach, meaning the adviser may allocate assets to one or more subadvisers, in addition to open- and closed-end investment companies, ETFs, and individual securities (collectively “Allocation Decisions”). The adviser and each subadviser acts independently from the others and uses its own investment style and process to select securities, within the constraints of the Fund’s investment objective, strategies, and restrictions. Morningstar is responsible for selecting the investment strategies and making Allocation Decisions, with the goal of maximizing return in the context of pursuing the Fund’s investment objective with a prudent level of risk for the strategy. Morningstar may change subadvisers, subject to the oversight of the board of trustees, and sell holdings at any time.
Investment Adviser:
Morningstar Investment Management LLC
Morningstar Funds Trust October 31, 2023 (unaudited)
Fund Information (continued)
Morningstar Multisector Bond Fund
Investment Subadvisers:
Loomis, Sayles & Company, L.P.
High-yield bond exposure with opportunistic bond allocations to bank loans, convertible bonds, investment-grade credit, agency and non-agency mortgage-backed securities.
TCW Investment Management Company LLC
Diversified, emerging-markets bond exposure across hard-currency, local-currency, and corporate emerging-markets debt.
Voya Investment Management Company, LLC
U.S. Investment grade corporate bond strategy with opportunistic exposure to high-yield credits.
Morningstar Funds Trust October 31, 2023 (unaudited)
Morningstar Global Opportunistic Equity Fund
| General Information | |
| Net Asset Value Per Share | $9.41 |
| Total Net Assets (millions) | $258 |
| Net Expense Ratio(a) | 0.89% |
| Gross Expense Ratio(a) | 0.89% |
| Portfolio Turnover Rate | 40% |
| Number of Issuers | 256 |
| Fund Inception | November 2, 2018 |
| No sales charges or distribution fees |
| Portfolio Characteristics | |
| Weighted Average Market Capitalization (billions) | $48.40 |
| Price-to-Earnings Ratio(b) | 13.91 |
| Countries Represented | 25 |
| Emerging Markets(c)(d) | 5.7% |
| Ten Largest Equities (%)(b)(c)(d) | |
| H&R Block, Inc. | 2.0 |
| CVS Health Corp. | 2.0 |
| Omnicom Group, Inc. | 1.8 |
| eBay, Inc. | 1.7 |
| National Grid PLC | 1.6 |
| United Utilities Group PLC | 1.6 |
| Visa, Inc., Class A | 1.6 |
| Knorr-Bremse A.G. | 1.3 |
| Fresenius Medical Care A.G. & Co. KGaA | 1.3 |
| Alphabet, Inc., Class A | 1.3 |
| Sector Diversification (%)(b)(c) | |
| Communications | 9.8 |
| Financials | 8.8 |
| Consumer Discretionary | 6.8 |
| Industrials | 6.3 |
| Health Care | 6.1 |
| Technology | 5.4 |
| Utilities | 4.5 |
| Energy | 4.3 |
| Consumer Staples | 3.9 |
| Materials | 0.6 |
| Real Estate | 0.1 |
* Includes, if any, cash, short-term investments, receivables, payables, derivatives and investments rounding to less than 0.05%.
(a) Expense ratios are as of the most recent Prospectus dated August 31, 2023. Net expense ratio reflects fee waivers and/or expense reimbursements, if any, pursuant to an agreement that is in effect to cap the expenses whereas the gross expense ratio does not. Morningstar Investment Management LLC (“Morningstar” or “adviser” or “we”) has contractually agreed, through at least August 31, 2024, to waive all or a portion of its advisory fees and, if necessary, to assume certain other expenses (to the extent permitted by the Internal Revenue Code of 1986, as amended) to ensure that the Institutional shares’ Total Annual Fund Operating Expenses (excluding taxes, interest, brokerage commissions, trading costs, AFFE, short sale dividend and interest expenses, litigation expenses, and extraordinary expenses) do not exceed 0.84% (the Expense Limitation Agreement). Prior to August 31, 2024, the Expense Limitation Agreement may be terminated only upon mutual agreement between the Trust (which would require the approval of the Trust’s board of trustees) and the adviser, or automatically upon the termination of the Investment Advisory Agreement between the Trust and the adviser.
(b) Price-to-earnings (P/E) ratio is the share price relative to its earnings per share. The P/E ratio is calculated using 12-month forward earnings estimates from third party sources deemed reliable.
(c) Percentages shown are based on Net Assets.
(d) Excludes Investment Companies and Other.
(e) The Fund’s portfolio holdings are subject to change without notice. The mention of specific securities is not a recommendation to buy, sell, or hold any particular security and is not indicative of current or future trading activity.
Morningstar Funds Trust October 31, 2023 (unaudited)
Fund Information (continued)
Morningstar Global Opportunistic Equity Fund
Investment Objective
Morningstar Global Opportunistic Equity Fund seeks long-term capital appreciation over a full market cycle.
Investment Strategies
In seeking long-term capital appreciation over a full market cycle, the Fund has significant flexibility and invests predominantly in equities across asset classes and geographies according to the portfolio management team’s assessment of their valuations and fundamental characteristics. The Fund will normally invest at least 80% of its assets in equity securities. The Fund invests in investment companies such as ETFs, which could represent a significant percentage of assets.
The Fund invests in equity securities, which may include common stocks and real estate investment trusts (REITs). The Fund may invest in companies of any size from any country, including emerging markets. Under normal market conditions, the Fund will invest significantly (e.g., at least 40% of its assets, unless market conditions are not deemed favorable, in which case the Fund would invest at least 30% of its assets) in companies organized or located in multiple countries outside the United States or doing a substantial amount of business in multiple countries outside the United States.
To meet its objective, the Fund may also invest up to 20% of its assets in fixed-income securities of varying maturity, duration, and quality. These may include U.S. and non-U.S. corporate debt securities, U.S. government debt securities, including Treasury Inflation Protected Bond Securities and zero-coupon securities, non-U.S. government debt securities, emerging-market debt securities, and mortgage-backed and asset-backed securities. The Fund may invest up to 20% of its assets in fixed-income securities that are rated below investment grade (commonly known as junk bonds) or, if unrated, are determined by the Fund’s subadviser(s) to be of comparable quality.
The Fund may also invest in derivatives, including options, futures, swaps, and forward foreign currency contracts, for risk management purposes, including to hedge its currency exposure, or as part of its investment strategies.
Multimanager Approach—The Fund uses a multimanager approach, meaning the adviser may allocate assets to one or more subadvisers, in addition to open- and closed-end investment companies, ETFs, and individual securities (collectively “Allocation Decisions”). The adviser and each subadviser acts independently from the others and uses its own investment style and process to select securities, within the constraints of the Fund’s investment objective, strategies, and restrictions. Morningstar is responsible for selecting the investment strategies and making Allocation Decisions, with the goal of maximizing return in the context of pursuing the Fund’s investment objective with a prudent level of risk for the strategy. Morningstar may change subadvisers, subject to the oversight of the board of trustees, and sell holdings at any time.
Investment Adviser:
Morningstar Investment Management LLC
Morningstar Funds Trust October 31, 2023 (unaudited)
Fund Information (continued)
Morningstar Global Opportunistic Equity Fund
Investment Subadviser:
Lazard Asset Management LLC
Anchor global equity exposure focused on quality, attractively valued stocks, which have appeal throughout a market cycle.
Morningstar Funds Trust October 31, 2023 (unaudited)
Morningstar Alternatives Fund
| General Information | |
| Net Asset Value Per Share | $9.96 |
| Total Net Assets (millions) | $258 |
| Net Expense Ratio(a) | 1.36% |
| Gross Expense Ratio(a) | 1.49% |
| Portfolio Turnover Rate | 107% |
| Fund Inception | November 2, 2018 |
| No sales charges or distribution fees |
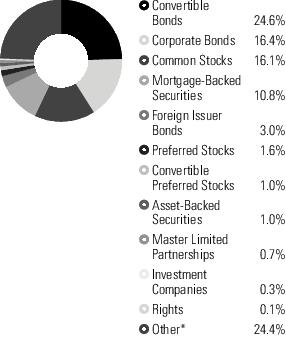
| Allocation Strategy Type (%)(b) | |
| Convertible Arbitrage | 28.1 |
| Merger Arbitrage | 19.2 |
| Multi-Strategy | 40.1 |
| Short-term investments and ETFs | 12.6 |
| Region Diversification (%)(c)(d) | |
| United States | 66.5 |
| United Kingdom | 2.7 |
| Europe (excluding United Kingdom) | 2.6 |
| Pacific (excluding Japan) | 1.8 |
| Canada | 0.9 |
| Japan | 0.6 |
| Middle East | 0.2 |
| Latin America | 0.1 |
* Includes, if any, cash, short-term investments, receivables, payables, derivatives and investments rounding to less than 0.05%.
(a) Expense ratios are as of the most recent Prospectus dated August 31, 2023. Net expense ratio reflects fee waivers and/or expense reimbursements, if any, pursuant to an agreement that is in effect to cap the expenses whereas the gross expense ratio does not. Morningstar Investment Management LLC (“Morningstar” or “adviser” or “we”) has contractually agreed, through at least August 31, 2024, to waive all or a portion of its advisory fees and, if necessary, to assume certain other expenses (to the extent permitted by the Internal Revenue Code of 1986, as amended) to ensure that the Institutional shares’ Total Annual Fund Operating Expenses (excluding taxes, interest, brokerage commissions, trading costs, AFFE, short sale dividend and interest expenses, litigation expenses, and extraordinary expenses) do not exceed 1.16% (the Expense Limitation Agreement). Prior to August 31, 2024, the Expense Limitation Agreement may be terminated only upon mutual agreement between the Trust (which would require the approval of the Trust’s board of trustees) and the adviser, or automatically upon the termination of the Investment Advisory Agreement between the Trust and the adviser.
(b) Percentages shown are based on Total Investments excluding derivatives.
(c) Percentages shown are based on Net Assets.
(d) Excludes Investment Companies and Other.
Morningstar Funds Trust October 31, 2023 (unaudited)
Fund Information (continued)
Morningstar Alternatives Fund
Investment Objective
Morningstar Alternatives Fund seeks long-term capital appreciation and low sensitivity to traditional U.S. asset classes.
Investment Strategies
In seeking long-term capital appreciation and low sensitivity to traditional U.S. asset classes, the Fund allocates assets to strategies that provide alternative sources of return including those described below. The Fund will normally invest in both U.S. and non-U.S. securities, including securities of companies located in emerging markets. The Fund may invest in non-U.S. dollar denominated investments, including investments denominated in European and Asian currencies and in other non-U.S. and emerging market currencies. The Fund may also seek returns through core allocation across fixed income and equity markets. The Fund may use quantitative models to evaluate and select debt securities based on certain shared characteristics as determined by the Fund’s sub-adviser.
In particular, the Fund has the latitude to invest in the following alternative strategies:
Long-Short Equity—Combines long equity positions with short equity positions (selling borrowed securities). Since the strategy is both long and short, total net exposure is typically less than 100%.
Convertible Arbitrage—Includes the purchase of convertible securities and the sale of the underlying common stock. These securities tend to be convertible bonds or convertible preferred stocks that may be converted into the stock of the same company.
Merger Arbitrage—Seeks to profit from the successful completion of corporate re-organizations. The process typically involves purchasing shares of an announced acquisition target company at a discount to its expected value upon completion of the acquisition. Hedging strategies may be used to reduce market exposure and volatility.
Credit Arbitrage—Seeks to exploit the mispricing of different classes of securities that are usually of the same company, and may include investments in investment-grade and/or non-investment-grade corporate debt (otherwise known as junk bonds), credit derivatives, loans, equities, credit index securities, and private debt.
Global Macro—Establishes long (number of contracts bought exceeds number sold) with a short (number of contracts sold exceeds number bought) exposures around the globe to take advantage of what the subadvisers believe to be attractive opportunities. This strategy may include investments in fixed-income and equity securities and a wide variety of derivative instruments. Such investments will likely have significant exposure to foreign investments and may be concentrated in a geographic region or country.
Hedged Equity—Seeks to limit investment loss by creating a transaction that offsets an existing position in a contract that provides the right to buy or sell shares of a security at a specific price for a certain time. Specifically, this strategy attempts to reduce the systematic risk created by factors such as exposures to
Morningstar Funds Trust October 31, 2023 (unaudited)
Fund Information (continued)
Morningstar Alternatives Fund
sectors, market-cap ranges, investment styles, currencies, and/or countries; the strategy strives to achieve this by matching short positions within each area against long positions. This strategy may be managed as beta-neutral, dollar-neutral, or sector-neutral in order to achieve low beta exposures to certain market indexes.
Market Neutral—Attempts to significantly reduce the systematic risk created by factors such as exposures to sectors, market-cap ranges, investment styles, currencies, and/or countries. This strategy seeks to achieve this by matching short positions within each area against long positions, and the strategy may be managed as beta-neutral, dollar-neutral, or sector-neutral. In attempting to significantly reduce systematic risk, issue selection may be emphasized, with profits dependent on the ability to sell short and buy long the chosen securities.
Nontraditional Bond—Pursues strategies that diverge in one or more ways from conventional practice in the broader bond-fund universe. In pursuing this strategy, the Fund may seek to avoid losses and produce returns uncorrelated with the overall bond market and may employ a variety of methods to achieve those aims, including investing tactically across a wide swath of individual sectors, including high-yield and foreign debt.
Debt Securities—Investment in debt securities may include U.S. Government and agency securities, foreign government and supranational debt securities, corporate bonds, mortgage-related securities and asset-backed securities, mortgage to-be-announced (“TBA”) securities, emerging market debt securities, preferred securities, structured products, credit-linked notes, mezzanine securities, senior secured floating rate and fixed rate loans or debt, second lien or other subordinated or unsecured floating rate and fixed rate loans or debt, convertible debt securities, and derivatives with similar economic characteristics. These debt securities may be of any credit quality, which may include investment grade securities and high yield securities, including unrated securities (commonly called “junk bonds”). The Fund may invest in fixed, variable and floating rate instruments, including participations and assignments, of any duration or maturity.
Equity Securities—Investment in equity securities may include common stock, preferred stock, securities convertible into common stock, including contingent convertible bonds which are securities convertible into equity if a pre-specified trigger event occurs, and non-convertible preferred stock.
Derivatives—Exposure to equity securities may be done through derivatives which at times may be significant. Types of derivatives include, but are not limited to, swaps, (including total return some of which may be referred to as contracts for difference), credit default, index and interest rate swaps; options; forward contracts; futures; options on futures and swaps; and foreign exchange transactions, for hedging purposes, as well as to enhance returns. Use of derivatives may be to maintain a portion of its portfolio long and short positions. Investments in indexed and inverse securities may also be made to provide a potential return based on a particular index of value or interest rates. This strategy may also include investments in repurchase agreements, reverse repurchase agreements and dollar rolls.
Short Sales—Short sales may be used for hedging purposes or to enhance total return. Short sales “against the box” may also be used. In this type of short sale, at the time of the sale, the Fund owns or has the immediate and unconditional right to acquire the identical security at no additional cost.
Morningstar Funds Trust October 31, 2023 (unaudited)
Fund Information (continued)
Morningstar Alternatives Fund
Currency—The Fund may invest in non-U.S. dollar denominated investments, including investments denominated in European and Asian currencies and in other non-U.S. and emerging market currencies. As a result, the Fund may have significant exposure to foreign currencies and investments in non-U.S. dollar-based assets may be made on a currency hedged or unhedged basis.
To meet its objective, the Fund may invest in investment companies such as mutual funds and ETFs, which could represent a significant percentage of assets.
Multimanager Approach—The Fund uses a multimanager approach, meaning the adviser may allocate assets to one or more subadvisers, in addition to open- and closed-end investment companies, ETFs, and individual securities (collectively “Allocation Decisions”). The adviser and each subadviser acts independently from the others and uses its own investment style and process to select securities, within the constraints of the Fund’s investment objective, strategies, and restrictions. Morningstar is responsible for selecting the investment strategies and making Allocation Decisions, with the goal of maximizing return in the context of pursuing the Fund’s investment objective with a prudent level of risk for the strategy. Morningstar may change subadvisers, subject to the oversight of the board of trustees, and sell holdings at any time.
The nature of the strategies in this Fund is to engage in active and frequent trading of its portfolio securities which may result in higher portfolio turnover. Turnover is mainly driven by a few strategies employed to help manage duration and curve risk.
Investment Adviser:
Morningstar Investment Management LLC
Investment Subadvisers:
BlackRock Financial Management, Inc.
Seeks to deliver equity upside participation, balanced returns through defensive alpha and diversified fixed income exposure. The systematic, credit-oriented approach can offer downside risk mitigation.
SSI Investment Management LLC
Short-term cash exposure that pursues minimal correlation to broad markets and bond-like volatility through an unlevered convertible arbitrage strategy.
Water Island Capital, LLC
Seeks to provide cash-plus returns while remaining broadly uncorrelated to equity markets.
Morningstar Funds Trust October 31, 2023 (unaudited)
Morningstar U.S. Equity Fund
| | | Number
of Shares | Value |
| Common Stocks – 88.8% |
| Advertising & Marketing – 0.0%(a) |
| Interpublic Group of Cos. (The), Inc. | | 4,753 | $ 134,985 |
| Omnicom Group, Inc. | | 2,166 | 162,255 |
| | | | 297,240 |
| Aerospace & Defense – 2.4% |
| Boeing (The) Co.* | | 1,581 | 295,362 |
| General Dynamics Corp. | | 32,689 | 7,888,183 |
| Huntington Ingalls Industries, Inc. | | 994 | 218,501 |
| L3Harris Technologies, Inc. | | 13,232 | 2,373,953 |
| Lockheed Martin Corp. | | 2,112 | 960,200 |
| Mercury Systems, Inc.* | | 18,512 | 666,062 |
| Moog, Inc., Class A | | 12,388 | 1,437,627 |
| Northrop Grumman Corp. | | 19,230 | 9,065,599 |
| RTX Corp. | | 127,918 | 10,411,246 |
| Textron, Inc. | | 2,763 | 209,988 |
| | | | 33,526,721 |
| Apparel & Textile Products – 0.5% |
| Crocs, Inc.* | | 248 | 22,151 |
| Deckers Outdoor Corp.* | | 212 | 126,577 |
| Hanesbrands, Inc. | | 183,720 | 769,787 |
| NIKE, Inc., Class B | | 58,400 | 6,001,768 |
| Ralph Lauren Corp. | | 743 | 83,610 |
| Skechers USA, Inc., Class A* | | 1,881 | 90,702 |
| Tapestry, Inc. | | 2,160 | 59,529 |
| VF Corp. | | 1,985 | 29,239 |
| | | | 7,183,363 |
| Asset Management – 0.9% |
| Ameriprise Financial, Inc. | | 389 | 122,368 |
| BlackRock, Inc. | | 5,947 | 3,641,229 |
| Charles Schwab (The) Corp. | | 14,013 | 729,237 |
| Cohen & Steers, Inc.(b) | | 31,210 | 1,630,410 |
| Franklin Resources, Inc. | | 3,437 | 78,329 |
| Hamilton Lane, Inc., Class A | | 35,061 | 2,949,331 |
| Invesco Ltd. | | 3,881 | 50,337 |
| KKR & Co., Inc. | | 39,778 | 2,203,701 |
| LPL Financial Holdings, Inc. | | 324 | 72,744 |
| Stifel Financial Corp. | | 13,390 | 763,230 |
| T. Rowe Price Group, Inc. | | 563 | 50,952 |
| | | | 12,291,868 |
| Automotive – 0.8% |
| Aptiv PLC* | | 44,071 | 3,842,991 |
| Autoliv, Inc. (Sweden) | | 1,179 | 108,055 |
| BorgWarner, Inc. | | 19,005 | 701,285 |
| | | Number
of Shares | Value |
| Automotive (Continued) |
| Fox Factory Holding Corp.* | | 21,334 | $ 1,738,081 |
| Gentex Corp. | | 6,577 | 188,628 |
| Lear Corp. | | 7,500 | 973,200 |
| Phinia, Inc. | | 693 | 17,935 |
| Tesla, Inc.* | | 14,400 | 2,892,096 |
| XPEL, Inc.(b)* | | 26,469 | 1,225,515 |
| | | | 11,687,786 |
| Banking – 4.3% |
| Atlantic Union Bankshares Corp. | | 50,187 | 1,445,888 |
| Bank of America Corp. | | 77,743 | 2,047,751 |
| Bank OZK(b) | | 110,430 | 3,954,498 |
| Banner Corp. | | 17,297 | 730,106 |
| BOK Financial Corp. | | 17,441 | 1,142,734 |
| Citigroup, Inc. | | 129,708 | 5,122,169 |
| Citizens Financial Group, Inc. | | 42,312 | 991,370 |
| City Holding Co.(b) | | 16,417 | 1,490,335 |
| Comerica, Inc. | | 10,030 | 395,182 |
| Cullen/Frost Bankers, Inc. | | 7,609 | 692,343 |
| Fifth Third Bancorp | | 45,524 | 1,079,374 |
| First Bancorp | | 49,675 | 1,441,569 |
| Huntington Bancshares, Inc. | | 139,001 | 1,341,360 |
| JPMorgan Chase & Co. | | 111,257 | 15,471,398 |
| KeyCorp | | 79,516 | 812,654 |
| M&T Bank Corp. | | 12,400 | 1,398,100 |
| National Bank Holdings Corp., Class A | | 25,900 | 807,562 |
| PNC Financial Services Group (The), Inc. | | 41,345 | 4,732,762 |
| Provident Financial Services, Inc. | | 45,684 | 641,860 |
| Regions Financial Corp. | | 34,234 | 497,420 |
| Renasant Corp. | | 55,373 | 1,350,547 |
| Seacoast Banking Corp. of Florida | | 70,663 | 1,428,099 |
| Triumph Financial, Inc.* | | 23,498 | 1,462,751 |
| Truist Financial Corp. | | 53,103 | 1,506,001 |
| U.S. Bancorp | | 51,861 | 1,653,329 |
| Veritex Holdings, Inc. | | 41,432 | 713,459 |
| Webster Financial Corp. | | 88,329 | 3,353,852 |
| Wells Fargo & Co. | | 66,657 | 2,650,949 |
| | | | 60,355,422 |
| Beverages – 1.3% |
| Brown-Forman Corp., Class B | | 3,289 | 184,710 |
| Constellation Brands, Inc., Class A | | 2,574 | 602,702 |
| Diageo PLC (United Kingdom) | | 135,690 | 5,131,257 |
See accompanying Notes to Financial Statements
Morningstar Funds Trust October 31, 2023 (unaudited)
Schedule of Investments (continued)
Morningstar U.S. Equity Fund
| | | Number
of Shares | Value |
| Beverages (Continued) |
| Duckhorn Portfolio (The), Inc.(b)* | | 80,886 | $ 843,641 |
| Keurig Dr. Pepper, Inc. | | 31,215 | 946,751 |
| Monster Beverage Corp.* | | 124,084 | 6,340,693 |
| PepsiCo, Inc. | | 25,415 | 4,149,761 |
| | | | 18,199,515 |
| Biotechnology & Pharmaceuticals – 3.0% |
| AbbVie, Inc. | | 30,485 | 4,303,872 |
| Amgen, Inc. | | 3,549 | 907,479 |
| Biogen, Inc.* | | 1,875 | 445,388 |
| Certara, Inc.* | | 63,452 | 773,480 |
| Eli Lilly & Co. | | 7,900 | 4,376,047 |
| Exelixis, Inc.* | | 6,657 | 137,068 |
| Gilead Sciences, Inc. | | 10,100 | 793,254 |
| Intra-Cellular Therapies, Inc.* | | 19,177 | 954,248 |
| Johnson & Johnson | | 61,964 | 9,191,740 |
| Merck & Co., Inc. | | 45,972 | 4,721,324 |
| Pfizer, Inc. | | 219,948 | 6,721,611 |
| Prestige Consumer Healthcare, Inc.* | | 23,737 | 1,409,028 |
| Regeneron Pharmaceuticals, Inc.* | | 708 | 552,162 |
| Roche Holding A.G. (Genusschein) | | 4,039 | 1,040,889 |
| United Therapeutics Corp.* | | 552 | 123,019 |
| Zoetis, Inc. | | 36,940 | 5,799,580 |
| | | | 42,250,189 |
| Cable & Satellite – 1.4% |
| Charter Communications, Inc., Class A(b)* | | 9,189 | 3,701,329 |
| Comcast Corp., Class A | | 388,772 | 16,052,396 |
| Sirius XM Holdings, Inc.(b) | | 31,341 | 134,140 |
| | | | 19,887,865 |
| Chemicals – 2.4% |
| Albemarle Corp. | | 215 | 27,258 |
| Ashland Global Holdings, Inc. | | 51,392 | 3,938,169 |
| Axalta Coating Systems Ltd.* | | 3,355 | 88,002 |
| Balchem Corp. | | 24,714 | 2,872,755 |
| CF Industries Holdings, Inc. | | 1,167 | 93,103 |
| Corteva, Inc. | | 39,730 | 1,912,602 |
| DuPont de Nemours, Inc. | | 71,916 | 5,241,238 |
| Eastman Chemical Co. | | 1,174 | 87,733 |
| Ecovyst, Inc.* | | 76,828 | 706,818 |
| Innospec, Inc. | | 32,895 | 3,223,710 |
| LyondellBasell Industries N.V., Class A | | 1,250 | 112,800 |
| | | Number
of Shares | Value |
| Chemicals (Continued) |
| PPG Industries, Inc. | | 19,749 | $ 2,424,585 |
| Sherwin-Williams (The) Co. | | 38,874 | 9,260,175 |
| Stepan Co. | | 19,180 | 1,434,664 |
| Valvoline, Inc. | | 81,623 | 2,421,754 |
| Westlake Corp. | | 638 | 73,600 |
| | | | 33,918,966 |
| Commercial Support Services – 0.1% |
| Legalzoom.com, Inc.(b)* | | 67,450 | 672,477 |
| Robert Half, Inc. | | 1,625 | 121,501 |
| Waste Management, Inc. | | 5,959 | 979,242 |
| | | | 1,773,220 |
| Construction Materials – 0.3% |
| Carlisle Cos., Inc. | | 647 | 164,396 |
| Owens Corning | | 900 | 102,033 |
| Summit Materials, Inc., Class A* | | 23,232 | 764,333 |
| Trex Co., Inc.* | | 50,507 | 2,838,998 |
| | | | 3,869,760 |
| Containers & Packaging – 0.2% |
| AptarGroup, Inc. | | 1,929 | 235,859 |
| Berry Global Group, Inc. | | 2,527 | 138,985 |
| Crown Holdings, Inc. | | 1,100 | 88,660 |
| Graphic Packaging Holding Co. | | 6,453 | 138,804 |
| International Paper Co. | | 3,418 | 115,289 |
| Packaging Corp. of America | | 1,071 | 163,917 |
| Sealed Air Corp. | | 2,541 | 78,237 |
| TriMas Corp. | | 54,816 | 1,327,095 |
| Westrock Co. | | 3,101 | 111,419 |
| | | | 2,398,265 |
| Diversified Industrials – 1.3% |
| 3M Co. | | 5,122 | 465,846 |
| Emerson Electric Co. | | 6,244 | 555,529 |
| Honeywell International, Inc. | | 36,510 | 6,690,823 |
| Illinois Tool Works, Inc. | | 23,296 | 5,221,099 |
| Parker-Hannifin Corp. | | 14,752 | 5,442,160 |
| | | | 18,375,457 |
| E-Commerce Discretionary – 2.9% |
| Amazon.com, Inc.* | | 304,468 | 40,521,646 |
| eBay, Inc. | | 2,072 | 81,284 |
| Etsy, Inc.* | | 336 | 20,933 |
| | | | 40,623,863 |
| Electric Utilities – 2.7% |
| Ameren Corp. | | 2,498 | 189,124 |
See accompanying Notes to Financial Statements
Morningstar Funds Trust October 31, 2023 (unaudited)
Schedule of Investments (continued)
Morningstar U.S. Equity Fund
| | | Number
of Shares | Value |
| Electric Utilities (Continued) |
| American Electric Power Co., Inc. | | 29,403 | $ 2,221,103 |
| Avista Corp. | | 46,503 | 1,473,680 |
| CMS Energy Corp. | | 3,591 | 195,135 |
| Consolidated Edison, Inc. | | 2,738 | 240,369 |
| Dominion Energy, Inc. | | 96,060 | 3,873,139 |
| Duke Energy Corp. | | 80,189 | 7,128,000 |
| Eversource Energy | | 2,662 | 143,189 |
| Exelon Corp. | | 89,900 | 3,500,706 |
| NextEra Energy, Inc. | | 61,900 | 3,608,770 |
| NorthWestern Corp. | | 30,664 | 1,472,179 |
| NRG Energy, Inc. | | 2,244 | 95,101 |
| OGE Energy Corp. | | 6,187 | 211,595 |
| PG&E Corp.* | | 162,061 | 2,641,594 |
| Southern (The) Co. | | 107,563 | 7,238,990 |
| Xcel Energy, Inc. | | 54,771 | 3,246,277 |
| | | | 37,478,951 |
| Electrical Equipment – 1.8% |
| A.O. Smith Corp. | | 1,345 | 93,827 |
| Allegion PLC | | 1,012 | 99,540 |
| AMETEK, Inc. | | 1,555 | 218,897 |
| Amphenol Corp., Class A | | 7,813 | 629,337 |
| Eaton Corp. PLC | | 65,322 | 13,581,097 |
| Generac Holdings, Inc.* | | 278 | 23,371 |
| Hubbell, Inc. | | 380 | 102,638 |
| Johnson Controls International PLC | | 42,591 | 2,087,811 |
| Lennox International, Inc. | | 283 | 104,863 |
| Novanta, Inc.* | | 17,450 | 2,304,447 |
| Otis Worldwide Corp. | | 14,155 | 1,092,908 |
| Rockwell Automation, Inc. | | 405 | 106,438 |
| Sensata Technologies Holding PLC | | 62,407 | 1,989,535 |
| TE Connectivity Ltd. | | 1,150 | 135,528 |
| Trane Technologies PLC | | 15,387 | 2,928,300 |
| | | | 25,498,537 |
| Engineering & Construction – 0.2% |
| Comfort Systems USA, Inc. | | 8,118 | 1,476,258 |
| EMCOR Group, Inc. | | 713 | 147,341 |
| Installed Building Products, Inc. | | 7,465 | 833,617 |
| | | | 2,457,216 |
| Entertainment Content – 0.6% |
| Electronic Arts, Inc. | | 12,880 | 1,594,415 |
| Paramount Global, Class B(b) | | 2,146 | 23,349 |
| Walt Disney (The) Co.* | | 84,834 | 6,921,606 |
| | | | 8,539,370 |
| | | Number
of Shares | Value |
| Food – 1.6% |
| BellRing Brands, Inc.* | | 76,762 | $ 3,356,802 |
| Campbell Soup Co. | | 4,307 | 174,046 |
| Conagra Brands, Inc. | | 8,088 | 221,288 |
| General Mills, Inc. | | 8,981 | 585,921 |
| Hershey (The) Co. | | 3,348 | 627,248 |
| J&J Snack Foods Corp. | | 9,507 | 1,488,891 |
| J.M. Smucker (The) Co. | | 1,878 | 213,792 |
| Kraft Heinz (The) Co. | | 29,592 | 930,964 |
| Lamb Weston Holdings, Inc. | | 1,808 | 162,358 |
| Lancaster Colony Corp. | | 19,187 | 3,245,865 |
| Mondelez International, Inc., Class A | | 14,516 | 961,104 |
| Nestle S.A.(c) | | 50,411 | 5,436,261 |
| Post Holdings, Inc.(b)* | | 65,208 | 5,234,898 |
| Tyson Foods, Inc., Class A | | 4,257 | 197,312 |
| | | | 22,836,750 |
| Forestry, Paper & Wood Products – 0.1% |
| Boise Cascade Co. | | 15,220 | 1,426,875 |
| Gas & Water Utilities – 0.1% |
| American Water Works Co., Inc. | | 1,281 | 150,710 |
| UGI Corp. | | 94,209 | 1,959,547 |
| | | | 2,110,257 |
| Health Care Facilities & Services – 3.6% |
| Cardinal Health, Inc. | | 2,267 | 206,297 |
| Catalent, Inc.* | | 800 | 27,512 |
| Charles River Laboratories International, Inc.* | | 300 | 50,508 |
| Cigna Group (The) | | 36,375 | 11,247,150 |
| CVS Health Corp. | | 11,677 | 805,830 |
| DaVita, Inc.* | | 1,310 | 101,171 |
| Elevance Health, Inc. | | 1,882 | 847,069 |
| Encompass Health Corp. | | 2,316 | 144,889 |
| Ensign Group (The), Inc. | | 35,077 | 3,388,438 |
| HCA Healthcare, Inc. | | 2,103 | 475,573 |
| HealthEquity, Inc.* | | 48,501 | 3,476,552 |
| Henry Schein, Inc.* | | 2,259 | 146,790 |
| ICON PLC* | | 12,727 | 3,104,879 |
| McKesson Corp. | | 20,635 | 9,396,354 |
| Medpace Holdings, Inc.* | | 8,987 | 2,180,875 |
| Patterson Cos., Inc. | | 46,539 | 1,417,578 |
| Quest Diagnostics, Inc. | | 2,007 | 261,111 |
| Tenet Healthcare Corp.* | | 782 | 41,993 |
| UnitedHealth Group, Inc. | | 25,818 | 13,827,088 |
| Universal Health Services, Inc., Class B | | 870 | 109,524 |
| | | | 51,257,181 |
See accompanying Notes to Financial Statements
Morningstar Funds Trust October 31, 2023 (unaudited)
Schedule of Investments (continued)
Morningstar U.S. Equity Fund
| | | Number
of Shares | Value |
| Home & Office Products – 0.0%(a) |
| Tempur Sealy International, Inc. | | 1,923 | $ 76,785 |
| Whirlpool Corp.(b) | | 718 | 75,074 |
| | | | 151,859 |
| Home Construction – 0.6% |
| Century Communities, Inc. | | 12,058 | 741,567 |
| DR Horton, Inc. | | 949 | 99,076 |
| Fortune Brands Innovations, Inc. | | 12,387 | 691,194 |
| Lennar Corp., Class A | | 988 | 105,400 |
| Masco Corp. | | 1,753 | 91,314 |
| Masonite International Corp.* | | 17,905 | 1,417,002 |
| Mohawk Industries, Inc.* | | 520 | 41,798 |
| NVR, Inc.* | | 847 | 4,584,489 |
| PulteGroup, Inc. | | 1,306 | 96,108 |
| Toll Brothers, Inc.(b) | | 1,626 | 114,974 |
| | | | 7,982,922 |
| Household Products – 1.0% |
| Central Garden & Pet Co., Class A* | | 18,164 | 720,929 |
| Clorox (The) Co. | | 1,018 | 119,818 |
| Colgate-Palmolive Co. | | 12,724 | 955,827 |
| Estee Lauder (The) Cos., Inc., Class A | | 29,600 | 3,814,552 |
| Kenvue, Inc. | | 167,947 | 3,123,814 |
| Kimberly-Clark Corp. | | 30,751 | 3,679,050 |
| Reckitt Benckiser Group PLC (United Kingdom) | | 23,350 | 1,562,278 |
| | | | 13,976,268 |
| Industrial Intermediate Products – 0.3% |
| AZZ, Inc. | | 15,739 | 743,983 |
| RBC Bearings, Inc.(b)* | | 16,778 | 3,688,475 |
| | | | 4,432,458 |
| Industrial Support Services – 1.2% |
| Fastenal Co. | | 2,906 | 169,536 |
| Ferguson PLC | | 10,186 | 1,529,937 |
| United Rentals, Inc. | | 196 | 79,629 |
| W.W. Grainger, Inc.(b) | | 12,899 | 9,414,077 |
| Watsco, Inc.(b) | | 244 | 85,129 |
| WESCO International, Inc. | | 49,819 | 6,386,796 |
| | | | 17,665,104 |
| Institutional Financial Services – 1.7% |
| Bank of New York Mellon (The) Corp. | | 27,039 | 1,149,158 |
| CME Group, Inc. | | 4,721 | 1,007,745 |
| Goldman Sachs Group (The), Inc. | | 4,949 | 1,502,566 |
| | | Number
of Shares | Value |
| Institutional Financial Services (Continued) |
| Houlihan Lokey, Inc. | | 1,757 | $ 176,614 |
| Intercontinental Exchange, Inc. | | 17,000 | 1,826,480 |
| Moelis & Co., Class A(b) | | 79,447 | 3,308,173 |
| Morgan Stanley | | 101,972 | 7,221,657 |
| Nasdaq, Inc. | | 100,294 | 4,974,582 |
| Northern Trust Corp. | | 14,544 | 958,595 |
| Piper Sandler Cos. | | 10,530 | 1,472,620 |
| SEI Investments Co. | | 3,785 | 203,103 |
| State Street Corp. | | 6,526 | 421,775 |
| | | | 24,223,068 |
| Insurance – 4.5% |
| Allstate (The) Corp. | | 21,986 | 2,817,066 |
| American International Group, Inc. | | 85,267 | 5,227,720 |
| AMERISAFE, Inc. | | 15,204 | 774,948 |
| Aon PLC, Class A | | 28,069 | 8,684,548 |
| BRP Group, Inc., Class A* | | 45,734 | 957,213 |
| Chubb Ltd. | | 36,050 | 7,737,051 |
| Goosehead Insurance, Inc., Class A* | | 12,800 | 830,336 |
| Hartford Financial Services Group (The), Inc. | | 28,852 | 2,119,179 |
| Loews Corp. | | 10,257 | 656,550 |
| Marsh & McLennan Cos., Inc. | | 82,000 | 15,551,300 |
| Progressive (The) Corp. | | 63,019 | 9,962,674 |
| Skyward Specialty Insurance Group, Inc.(b)* | | 21,945 | 617,752 |
| Travelers (The) Cos., Inc. | | 32,488 | 5,439,791 |
| Willis Towers Watson PLC | | 10,721 | 2,528,977 |
| | | | 63,905,105 |
| Internet Media & Services – 7.0% |
| Alphabet, Inc., Class A* | | 335,669 | 41,649,810 |
| Meta Platforms, Inc., Class A* | | 114,427 | 34,473,422 |
| Netflix, Inc.* | | 39,286 | 16,173,653 |
| Uber Technologies, Inc.* | | 159,779 | 6,915,235 |
| | | | 99,212,120 |
| Leisure Facilities & Services – 1.0% |
| Chipotle Mexican Grill, Inc.* | | 144 | 279,677 |
| Chuy's Holdings, Inc.* | | 20,831 | 701,171 |
| Domino's Pizza, Inc. | | 307 | 104,070 |
| Marriott International, Inc., Class A | | 24,665 | 4,650,832 |
| Papa John's International, Inc.(b) | | 23,078 | 1,500,532 |
| Red Rock Resorts, Inc., Class A(b) | | 152,207 | 6,019,787 |
See accompanying Notes to Financial Statements
Morningstar Funds Trust October 31, 2023 (unaudited)
Schedule of Investments (continued)
Morningstar U.S. Equity Fund
| | | Number
of Shares | Value |
| Leisure Facilities & Services (Continued) |
| TKO Group Holdings, Inc.(b) | | 766 | $ 62,797 |
| Vail Resorts, Inc. | | 4,288 | 910,128 |
| Wingstop, Inc. | | 307 | 56,110 |
| | | | 14,285,104 |
| Leisure Products – 0.1% |
| Brunswick Corp. | | 1,033 | 71,762 |
| Hasbro, Inc. | | 898 | 40,545 |
| Polaris, Inc.(b) | | 947 | 81,840 |
| YETI Holdings, Inc.* | | 38,681 | 1,644,716 |
| | | | 1,838,863 |
| Machinery – 1.4% |
| Alamo Group, Inc. | | 8,884 | 1,424,105 |
| Albany International Corp., Class A | | 16,470 | 1,344,117 |
| Caterpillar, Inc. | | 2,107 | 476,287 |
| CSW Industrials, Inc. | | 9,715 | 1,722,081 |
| Esab Corp. | | 59,203 | 3,747,550 |
| Federal Signal Corp. | | 23,373 | 1,356,569 |
| Graco, Inc. | | 1,672 | 124,313 |
| Helios Technologies, Inc. | | 27,704 | 1,432,851 |
| IDEX Corp. | | 915 | 175,140 |
| Kadant, Inc.(b) | | 14,417 | 3,171,740 |
| Middleby (The) Corp.* | | 665 | 75,059 |
| Regal Rexnord Corp.(b) | | 32,305 | 3,825,235 |
| Snap-on, Inc. | | 697 | 179,784 |
| Stanley Black & Decker, Inc. | | 760 | 64,638 |
| Veralto Corp.* | | 2,377 | 164,013 |
| Xylem, Inc. | | 1,215 | 113,651 |
| | | | 19,397,133 |
| Medical Equipment & Devices – 3.7% |
| Abbott Laboratories | | 41,383 | 3,912,763 |
| Alcon, Inc. (Switzerland) | | 80,314 | 5,727,995 |
| Align Technology, Inc.* | | 98 | 18,090 |
| Avanos Medical, Inc.* | | 60,628 | 1,113,130 |
| Baxter International, Inc. | | 1,803 | 58,471 |
| Boston Scientific Corp.* | | 134,990 | 6,910,138 |
| CONMED Corp. | | 15,373 | 1,498,253 |
| Enovis Corp.* | | 60,612 | 2,782,091 |
| Envista Holdings Corp.* | | 33,096 | 770,144 |
| Inspire Medical Systems, Inc.* | | 5,958 | 876,779 |
| Intuitive Surgical, Inc.* | | 26,668 | 6,992,883 |
| Medtronic PLC | | 35,429 | 2,499,870 |
| Merit Medical Systems, Inc.* | | 18,877 | 1,297,605 |
| Neogen Corp.* | | 75,161 | 1,119,147 |
| QuidelOrtho Corp.* | | 700 | 42,756 |
| Silk Road Medical, Inc.(b)* | | 31,026 | 233,005 |
| | | Number
of Shares | Value |
| Medical Equipment & Devices (Continued) |
| Stryker Corp. | | 24,600 | $ 6,647,412 |
| Thermo Fisher Scientific, Inc. | | 21,936 | 9,756,475 |
| Waters Corp.* | | 389 | 92,788 |
| | | | 52,349,795 |
| Metals & Mining – 0.4% |
| Encore Wire Corp.(b) | | 8,068 | 1,442,801 |
| Freeport-McMoRan, Inc. | | 127,930 | 4,321,475 |
| | | | 5,764,276 |
| Oil & Gas Producers – 4.5% |
| Antero Midstream Corp. | | 88,535 | 1,092,522 |
| Cheniere Energy, Inc. | | 33,045 | 5,499,349 |
| ConocoPhillips | | 89,032 | 10,577,002 |
| Coterra Energy, Inc. | | 128,507 | 3,533,942 |
| Diamondback Energy, Inc. | | 627 | 100,521 |
| Enbridge, Inc. (Canada) | | 154,680 | 4,956,899 |
| Enerplus Corp. (Canada) | | 81,190 | 1,372,923 |
| EOG Resources, Inc. | | 30,459 | 3,845,449 |
| Equitrans Midstream Corp. | | 210,260 | 1,865,006 |
| Kinder Morgan, Inc. | | 276,217 | 4,474,715 |
| Murphy USA, Inc. | | 495 | 179,531 |
| Northern Oil and Gas, Inc. | | 38,296 | 1,468,269 |
| ONEOK, Inc. | | 69,546 | 4,534,399 |
| Pembina Pipeline Corp. (Canada) | | 44,353 | 1,365,052 |
| Pioneer Natural Resources Co. | | 26,405 | 6,310,795 |
| Sitio Royalties Corp., Class A(b) | | 57,690 | 1,426,097 |
| SM Energy Co. | | 26,309 | 1,060,779 |
| Targa Resources Corp. | | 23,889 | 1,997,359 |
| TC Energy Corp. (Canada) | | 101,172 | 3,484,388 |
| Texas Pacific Land Corp. | | 43 | 79,376 |
| Williams (The) Cos., Inc. | | 133,215 | 4,582,596 |
| | | | 63,806,969 |
| Oil, Gas Services & Equipment – 0.1% |
| Weatherford International PLC* | | 7,839 | 729,733 |
| Publishing & Broadcasting – 0.1% |
| Liberty Media Corp.-Liberty Formula One, Class C* | | 27,911 | 1,805,562 |
| Nexstar Media Group, Inc. | | 573 | 80,266 |
| | | | 1,885,828 |
| Real Estate Investment Trusts – 2.7% |
| Boston Properties, Inc. | | 1,421 | 76,123 |
| Brixmor Property Group, Inc. | | 7,047 | 146,507 |
| COPT Defense Properties | | 58,123 | 1,325,204 |
See accompanying Notes to Financial Statements
Morningstar Funds Trust October 31, 2023 (unaudited)
Schedule of Investments (continued)
Morningstar U.S. Equity Fund
| | | Number
of Shares | Value |
| Real Estate Investment Trusts (Continued) |
| CubeSmart | | 108,411 | $ 3,695,731 |
| Douglas Emmett, Inc. | | 58,331 | 653,890 |
| Easterly Government Properties, Inc. | | 66,697 | 717,660 |
| Equinix, Inc. | | 7,729 | 5,639,387 |
| Extra Space Storage, Inc. | | 11,474 | 1,188,592 |
| Four Corners Property Trust, Inc. | | 67,046 | 1,428,080 |
| Kimco Realty Corp. | | 6,772 | 121,490 |
| Mid-America Apartment Communities, Inc. | | 8,991 | 1,062,287 |
| National Storage Affiliates Trust | | 69,417 | 1,979,773 |
| NNN REIT, Inc. | | 6,805 | 247,226 |
| Plymouth Industrial REIT, Inc. | | 72,334 | 1,442,340 |
| PotlatchDeltic Corp. | | 32,741 | 1,402,952 |
| Prologis, Inc. | | 53,794 | 5,419,745 |
| Public Storage | | 5,985 | 1,428,679 |
| Rayonier, Inc. | | 61,120 | 1,542,669 |
| Ryman Hospitality Properties, Inc. | | 27,668 | 2,368,381 |
| SBA Communications Corp. | | 8,811 | 1,838,239 |
| Simon Property Group, Inc. | | 1,157 | 127,143 |
| Sunstone Hotel Investors, Inc. | | 94,032 | 874,497 |
| UDR, Inc. | | 65,357 | 2,079,006 |
| Urban Edge Properties | | 89,673 | 1,422,214 |
| | | | 38,227,815 |
| Real Estate Services – 0.1% |
| Jones Lang LaSalle, Inc.* | | 11,178 | 1,429,890 |
| Renewable Energy – 0.0%(a) |
| Enphase Energy, Inc.* | | 175 | 13,927 |
| SolarEdge Technologies, Inc.* | | 96 | 7,291 |
| | | | 21,218 |
| Retail - Consumer Staples – 1.0% |
| Dollar General Corp. | | 2,615 | 311,290 |
| Five Below, Inc.* | | 18,803 | 3,271,346 |
| Kroger (The) Co. | | 4,668 | 211,787 |
| Ollie's Bargain Outlet Holdings, Inc.* | | 20,828 | 1,608,755 |
| Target Corp. | | 78,908 | 8,742,217 |
| | | | 14,145,395 |
| Retail - Discretionary – 1.2% |
| Academy Sports & Outdoors, Inc. | | 31,734 | 1,422,952 |
| Advance Auto Parts, Inc. | | 725 | 37,722 |
| AutoNation, Inc.* | | 508 | 66,081 |
| | | Number
of Shares | Value |
| Retail - Discretionary (Continued) |
| AutoZone, Inc.* | | 288 | $ 713,413 |
| Avis Budget Group, Inc.* | | 240 | 39,072 |
| Bath & Body Works, Inc. | | 944 | 27,990 |
| Best Buy Co., Inc. | | 1,126 | 75,239 |
| Builders FirstSource, Inc.* | | 543 | 58,926 |
| CarMax, Inc.(b)* | | 14,069 | 859,475 |
| Dick's Sporting Goods, Inc. | | 425 | 45,454 |
| Floor & Decor Holdings, Inc., Class A(b)* | | 18,629 | 1,535,029 |
| Freshpet, Inc.(b)* | | 19,429 | 1,115,225 |
| Home Depot (The), Inc. | | 1,458 | 415,078 |
| Lithia Motors, Inc. | | 236 | 57,161 |
| Lowe's Cos., Inc. | | 35,668 | 6,797,251 |
| Lululemon Athletica, Inc.(b)* | | 504 | 198,314 |
| Mister Car Wash, Inc.(b)* | | 136,414 | 709,353 |
| Monro, Inc. | | 30,979 | 768,899 |
| O'Reilly Automotive, Inc.* | | 869 | 808,552 |
| Sonic Automotive, Inc. Class A | | 14,013 | 670,522 |
| Tractor Suppy Co. | | 712 | 137,103 |
| Ulta Beauty, Inc.* | | 483 | 184,173 |
| Williams-Sonoma, Inc. | | 537 | 80,679 |
| | | | 16,823,663 |
| Semiconductors – 4.0% |
| Advanced Micro Devices, Inc.* | | 1,431 | 140,954 |
| Analog Devices, Inc. | | 40,177 | 6,321,047 |
| Applied Materials, Inc. | | 1,535 | 203,157 |
| ASML Holding N.V. (Netherlands) | | 10,320 | 6,179,719 |
| Intel Corp. | | 107,985 | 3,941,453 |
| KLA Corp. | | 11,833 | 5,557,960 |
| Lam Research Corp. | | 283 | 166,466 |
| Micron Technology, Inc. | | 2,943 | 196,798 |
| Monolithic Power Systems, Inc. | | 3,436 | 1,517,819 |
| Nova Ltd. (Israel)(b)* | | 14,964 | 1,421,131 |
| NVIDIA Corp. | | 50,750 | 20,695,850 |
| NXP Semiconductors N.V. (China) | | 26,883 | 4,635,436 |
| QUALCOMM, Inc. | | 2,052 | 223,647 |
| Skyworks Solutions, Inc. | | 694 | 60,198 |
| Teradyne, Inc.(b) | | 770 | 64,118 |
| Texas Instruments, Inc. | | 36,162 | 5,135,366 |
| | | | 56,461,119 |
| Software – 8.6% |
| Adobe, Inc.* | | 17,506 | 9,314,242 |
| Akamai Technologies, Inc.* | | 1,471 | 151,998 |
| Atlassian Corp., Class A* | | 24,580 | 4,440,131 |
See accompanying Notes to Financial Statements
Morningstar Funds Trust October 31, 2023 (unaudited)
Schedule of Investments (continued)
Morningstar U.S. Equity Fund
| | | Number
of Shares | Value |
| Software (Continued) |
| Check Point Software Technologies Ltd. (Israel)* | | 19,431 | $ 2,608,612 |
| Clearwater Analytics Holdings, Inc., Class A(b)* | | 142,005 | 2,567,450 |
| CyberArk Software Ltd.(b)* | | 11,943 | 1,954,352 |
| Five9, Inc.* | | 23,631 | 1,367,526 |
| Guidewire Software, Inc.* | | 34,274 | 3,089,116 |
| Intuit, Inc. | | 10,500 | 5,196,975 |
| Microsoft Corp. | | 163,081 | 55,139,317 |
| Palo Alto Networks, Inc.* | | 38,077 | 9,253,473 |
| Paylocity Holding Corp.* | | 12,153 | 2,180,248 |
| PowerSchool Holdings, Inc., Class A(b)* | | 57,311 | 1,141,635 |
| Q2 Holdings, Inc.* | | 40,119 | 1,204,774 |
| Roper Technologies, Inc. | | 1,534 | 749,466 |
| Salesforce, Inc.* | | 41,678 | 8,370,193 |
| Splunk, Inc.* | | 30,157 | 4,437,904 |
| SS&C Technologies Holdings, Inc. | | 59,388 | 2,984,247 |
| Workday, Inc., Class A* | | 25,560 | 5,411,308 |
| Zoom Video Communications, Inc., Class A* | | 612 | 36,708 |
| | | | 121,599,675 |
| Specialty Finance – 0.7% |
| American Express Co. | | 42,663 | 6,230,078 |
| Capital One Financial Corp. | | 12,948 | 1,311,503 |
| Credit Acceptance Corp.(b)* | | 90 | 36,219 |
| Mr. Cooper Group, Inc.* | | 49,554 | 2,801,287 |
| Synchrony Financial | | 2,215 | 62,131 |
| | | | 10,441,218 |
| Steel – 0.0%(a) |
| Cleveland-Cliffs, Inc.* | | 2,417 | 40,557 |
| Nucor Corp. | | 457 | 67,540 |
| | | | 108,097 |
| Technology Hardware – 3.3% |
| Apple, Inc. | | 218,903 | 37,382,065 |
| Arista Networks, Inc.* | | 1,902 | 381,104 |
| Arrow Electronics, Inc.* | | 9,812 | 1,112,779 |
| Ciena Corp.* | | 62,531 | 2,638,808 |
| Cisco Systems, Inc. | | 13,641 | 711,105 |
| F5, Inc.* | | 938 | 142,192 |
| Fabrinet (Thailand)* | | 13,355 | 2,070,025 |
| Garmin Ltd. | | 1,645 | 168,662 |
| Hewlett Packard Enterprise Co. | | 9,026 | 138,820 |
| HP, Inc. | | 4,034 | 106,215 |
| Juniper Networks, Inc. | | 5,926 | 159,528 |
| NetApp, Inc. | | 2,075 | 151,019 |
| | | Number
of Shares | Value |
| Technology Hardware (Continued) |
| Seagate Technology Holdings PLC(b) | | 1,099 | $ 75,007 |
| TD SYNNEX Corp. | | 1,502 | 137,703 |
| Viavi Solutions, Inc.* | | 132,453 | 1,030,484 |
| | | | 46,405,516 |
| Technology Services – 3.7% |
| Accenture PLC, Class A | | 24,703 | 7,339,014 |
| Amdocs Ltd. | | 3,187 | 255,470 |
| Automatic Data Processing, Inc. | | 2,674 | 583,520 |
| Booz Allen Hamilton Holding Corp. | | 2,316 | 277,758 |
| CDW Corp. | | 630 | 126,252 |
| Cognizant Technology Solutions Corp., Class A | | 1,480 | 95,416 |
| Equifax, Inc. | | 17,935 | 3,041,238 |
| FactSet Research Systems, Inc. | | 390 | 168,437 |
| Fidelity National Information Services, Inc. | | 29,051 | 1,426,695 |
| FleetCor Technologies, Inc.* | | 403 | 90,743 |
| Globant S.A.* | | 15,240 | 2,595,220 |
| International Business Machines Corp. | | 7,864 | 1,137,449 |
| Jack Henry & Associates, Inc. | | 639 | 90,093 |
| MarketAxess Holdings, Inc. | | 8,155 | 1,743,131 |
| Moody's Corp. | | 947 | 291,676 |
| Open Lending Corp.* | | 103,398 | 619,354 |
| Paychex, Inc. | | 1,451 | 161,133 |
| PayPal Holdings, Inc.* | | 83,799 | 4,340,788 |
| S&P Global, Inc. | | 20,728 | 7,240,498 |
| Shift4 Payments, Inc., Class A(b)* | | 29,458 | 1,311,470 |
| Verisk Analytics, Inc. | | 706 | 160,516 |
| Visa, Inc., Class A(b) | | 81,267 | 19,105,872 |
| | | | 52,201,743 |
| Telecommunications – 0.8% |
| AT&T, Inc. | | 29,085 | 447,909 |
| Cogent Communications Holdings, Inc. | | 6,927 | 450,117 |
| T-Mobile U.S., Inc.* | | 21,347 | 3,070,979 |
| Verizon Communications, Inc. | | 229,100 | 8,048,283 |
| | | | 12,017,288 |
| Tobacco & Cannabis – 0.1% |
| Altria Group, Inc. | | 23,196 | 931,783 |
See accompanying Notes to Financial Statements
Morningstar Funds Trust October 31, 2023 (unaudited)
Schedule of Investments (continued)
Morningstar U.S. Equity Fund
| | | Number
of Shares | Value |
| Transportation & Logistics – 1.9% |
| Alaska Air Group, Inc.* | | 41,655 | $ 1,317,548 |
| Allegiant Travel Co. | | 18,746 | 1,248,858 |
| ArcBest Corp. | | 12,745 | 1,387,675 |
| C.H. Robinson Worldwide, Inc. | | 1,059 | 86,658 |
| Canadian National Railway Co. (Canada)(b) | | 18,106 | 1,915,253 |
| CSX Corp. | | 16,182 | 483,033 |
| Expeditors International of Washington, Inc. | | 935 | 102,149 |
| FedEx Corp. | | 1,537 | 369,034 |
| JB Hunt Transport Services, Inc. | | 586 | 100,716 |
| Kirby Corp.* | | 8,073 | 603,053 |
| Knight-Swift Transportation Holdings, Inc. | | 1,530 | 74,802 |
| Landstar System, Inc. | | 895 | 147,478 |
| Norfolk Southern Corp. | | 2,372 | 452,554 |
| Saia, Inc.* | | 5,948 | 2,132,298 |
| Union Pacific Corp. | | 59,979 | 12,452,240 |
| United Parcel Service, Inc., Class B | | 31,092 | 4,391,745 |
| | | | 27,265,094 |
| Transportation Equipment – 0.2% |
| Cummins, Inc. | | 811 | 175,419 |
| PACCAR, Inc. | | 33,841 | 2,792,898 |
| | | | 2,968,317 |
| Wholesale - Consumer Staples – 0.2% |
| Archer-Daniels-Midland Co. | | 35,218 | 2,520,552 |
| Wholesale - Discretionary – 0.2% |
| Pool Corp. | | 8,083 | 2,552,369 |
Total Common Stocks
(Cost $1,140,310,900) | 1,255,971,994 |
|
| Master Limited Partnerships – 0.9% |
| Oil & Gas Producers – 0.9% |
| Energy Transfer L.P. | | 250,633 | 3,295,824 |
| Enterprise Products Partners L.P. | | 196,313 | 5,111,991 |
| | | Number
of Shares | Value |
| Oil & Gas Producers (Continued) |
| MPLX L.P. | | 49,876 | $ 1,797,531 |
| Plains All American Pipeline L.P. | | 133,934 | 2,029,100 |
Total Master Limited Partnerships
(Cost $10,704,978) | 12,234,446 |
|
| Investment Companies – 8.8% |
| Materials Select Sector SPDR® Fund ETF(b) | | 268,006 | 20,384,536 |
| Vanguard Consumer Staples ETF(b) | | 188,727 | 33,874,609 |
| Vanguard Health Care ETF(b) | | 312,268 | 70,510,115 |
Total Investment Companies
(Cost $128,848,527) | 124,769,260 |
| | | Par (d)/Number
of Shares | |
| Short-Term Investments – 2.3% |
| Money Market Funds – 2.2% |
| Northern Institutional Funds - Liquid Assets Portfolio (Shares), 5.41%(e)(f) | | 11,876,126 | 11,876,126 |
| Northern Institutional Funds - Treasury Portfolio (Premier), 5.21%(e) | | 18,920,337 | 18,920,337 |
| | | | 30,796,463 |
| U.S. Government Agencies – 0.1%(g) |
| Freddie Mac Discount Notes, 0.00%, 11/1/23(h) | | $ 1,630,000 | 1,630,000 |
Total Short-Term Investments
(Cost $32,426,463) | 32,426,463 |
Total Investments – 100.8%
(Cost $1,312,290,868) | 1,425,402,163 |
| Liabilities less Other Assets – (0.8)% | (11,645,824) |
| NET ASSETS – 100.0% | $1,413,756,339 |
| Percentages shown are based on Net Assets. |
| All securities are United States companies, unless noted otherwise in parentheses. |
| (a) | Amount rounds to less than 0.05%. | | |
| (b) | Security either partially or fully on loan. (See Note 7). | | |
| (c) | Security sold outside United States without registration under the Securities Act of 1933. | | |
| (d) | Par value is in USD unless otherwise indicated. | | |
| (e) | 7-day current yield as of October 31, 2023 is disclosed. | | |
| (f) | Security purchased with the cash proceeds from securities loaned. (See Note 7). | | |
See accompanying Notes to Financial Statements
Morningstar Funds Trust October 31, 2023 (unaudited)
Schedule of Investments (continued)
Morningstar U.S. Equity Fund
| (g) | The obligations of certain U.S. government-sponsored entities are neither issued nor guaranteed by the United States Treasury. | | |
| (h) | Zero coupon bond. | | |
| * | Non-Income Producing Security | | |
| ETF | Exchange-Traded Fund |
| Freddie Mac | Federal Home Loan Mortgage Corporation |
| L.P. | Limited Partnership |
| PLC | Public Limited Company |
| REIT | Real Estate Investment Trust |
| S&P | Standards & Poor's |
| SPDR | Standard & Poor's Depositary Receipt |
Valuation Hierarchy
The following is a summary of the inputs used, as of October 31, 2023, in valuing the Fund's investments carried at fair value:
| Morningstar U.S. Equity Fund | Level 1 | Level 2 | Level 3 | Totals |
| Investments | | | | |
| Assets: | | | | |
| Common Stocks | $1,242,801,309 | $13,170,685 | $— | $1,255,971,994 |
| Master Limited Partnerships | 12,234,446 | — | — | 12,234,446 |
| Investment Companies | 124,769,260 | — | — | 124,769,260 |
| Short-Term Investments | 30,796,463 | 1,630,000 | — | 32,426,463 |
| Total Investments | $1,410,601,478 | $14,800,685 | $— | $1,425,402,163 |
See accompanying Notes to Financial Statements
Morningstar Funds Trust October 31, 2023 (unaudited)
Morningstar International Equity Fund
| | | Number
of Shares | Value |
| Common Stocks – 94.8% |
| Advertising & Marketing – 0.8% |
| Dentsu Group, Inc. (Japan) | | 14,394 | $ 418,088 |
| Publicis Groupe S.A. (France) | | 29,078 | 2,214,096 |
| WPP PLC (United Kingdom) | | 396,946 | 3,418,194 |
| | | | 6,050,378 |
| Aerospace & Defense – 0.1% |
| BAE Systems PLC (United Kingdom) | | 72,270 | 971,770 |
| Apparel & Textile Products – 1.7% |
| adidas A.G. (Germany) | | 13,967 | 2,483,442 |
| Cie Financiere Richemont S.A., Class A (Switzerland)(a) | | 13,824 | 1,630,893 |
| Kering S.A. (France) | | 14,671 | 5,966,721 |
| Swatch Group (The) A.G. (Bearer) (Switzerland) | | 7,693 | 1,969,224 |
| Titan Co. Ltd. (India) | | 7,395 | 283,493 |
| | | | 12,333,773 |
| Asset Management – 1.5% |
| EXOR N.V. (Netherlands)(b) | | 38,551 | 3,308,801 |
| HDFC Asset Management Co. Ltd. (India)(c) | | 12,367 | 406,221 |
| Sanlam Ltd. (South Africa) | | 333,527 | 1,169,828 |
| Schroders PLC (United Kingdom) | | 800,124 | 3,603,005 |
| St. James's Place PLC (United Kingdom) | | 31,615 | 246,464 |
| XP, Inc., Class A (Brazil) | | 83,596 | 1,671,920 |
| | | | 10,406,239 |
| Automotive – 4.5% |
| Bajaj Auto Ltd. (India) | | 6,667 | 425,294 |
| Bayerische Motoren Werke A.G. (Germany) | | 40,255 | 3,743,891 |
| Bridgestone Corp. (Japan) | | 45,300 | 1,714,388 |
| Continental A.G. (Germany) | | 64,175 | 4,189,921 |
| Denso Corp. (Japan) | | 56,400 | 832,821 |
| Fuyao Glass Industry Group Co. Ltd., Class A (China) | | 252,800 | 1,282,027 |
| Honda Motor Co. Ltd. (Japan) | | 216,900 | 2,222,959 |
| Huayu Automotive Systems Co. Ltd., Class A (China) | | 322,000 | 769,683 |
| Hyundai Mobis Co. Ltd. (South Korea) | | 4,525 | 700,763 |
| Kia Corp. (South Korea) | | 8,493 | 485,217 |
| Li Auto, Inc. ADR (China)* | | 31,404 | 1,061,769 |
| | | Number
of Shares | Value |
| Automotive (Continued) |
| Li Auto, Inc., Class A (China)* | | 2,500 | $ 42,284 |
| Maruti Suzuki India Ltd. (India) | | 3,452 | 431,074 |
| Mercedes-Benz Group A.G. (Germany) | | 81,690 | 4,806,172 |
| Nissan Motor Co. Ltd. (Japan) | | 226,676 | 872,246 |
| Stanley Electric Co. Ltd. (Japan) | | 46,800 | 748,547 |
| Sumitomo Electric Industries Ltd. (Japan) | | 40,600 | 426,228 |
| Toyota Motor Corp. (Japan) | | 282,600 | 4,943,734 |
| Valeo SE (France) | | 153,136 | 2,023,400 |
| | | | 31,722,418 |
| Banking – 10.8% |
| Al Rajhi Bank (Saudi Arabia) | | 12,090 | 216,418 |
| Axis Bank Ltd. (India) | | 234,050 | 2,761,746 |
| Banco Bilbao Vizcaya Argentaria S.A. (Spain) | | 552,981 | 4,350,431 |
| Banco do Brasil S.A. (Brazil) | | 174,800 | 1,677,012 |
| Banco Santander Chile ADR (Chile)(b) | | 17,132 | 298,097 |
| Bank Central Asia Tbk PT (Indonesia) | | 1,758,500 | 968,794 |
| Bank for Foreign Trade of Vietnam JSC (Vietnam)* | | 93,100 | 329,240 |
| Bank Mandiri Persero Tbk PT (Indonesia) | | 4,082,300 | 1,458,410 |
| Barclays PLC (United Kingdom) | | 290,611 | 466,445 |
| BDO Unibank, Inc. (Philippines) | | 267,704 | 602,595 |
| BNP Paribas S.A. (France) | | 95,698 | 5,503,021 |
| Capitec Bank Holdings Ltd. (South Africa) | | 6,258 | 556,052 |
| China Construction Bank Corp., Class H (China) | | 3,613,000 | 2,043,361 |
| China Merchants Bank Co. Ltd., Class H (China) | | 231,113 | 876,680 |
| CIMB Group Holdings Bhd. (Malaysia) | | 293,300 | 351,402 |
| Commercial International Bank Egypt S.A.E. GDR (Egypt)(a) | | 435,761 | 495,896 |
| Credicorp Ltd. (Peru) | | 17,171 | 2,145,688 |
| DBS Group Holdings Ltd. (Singapore) | | 254,952 | 6,124,797 |
| First Abu Dhabi Bank PJSC (United Arab Emirates) | | 109,386 | 377,624 |
See accompanying Notes to Financial Statements
Morningstar Funds Trust October 31, 2023 (unaudited)
Schedule of Investments (continued)
Morningstar International Equity Fund
| | | Number
of Shares | Value |
| Banking (Continued) |
| Grupo Financiero Banorte S.A.B. de C.V., Class O (Mexico) | | 150,432 | $ 1,218,625 |
| HDFC Bank Ltd. (India) | | 39,236 | 696,225 |
| HDFC Bank Ltd. ADR (India) | | 59,399 | 3,359,013 |
| HSBC Holdings PLC (United Kingdom) | | 364,295 | 2,630,365 |
| ICICI Bank Ltd. (India) | | 60,431 | 664,850 |
| ICICI Bank Ltd. ADR (India) | | 112,375 | 2,493,601 |
| Intesa Sanpaolo S.p.A. (Italy) | | 1,856,739 | 4,838,274 |
| Kasikornbank PCL (Thailand)(a) | | 191,100 | 699,097 |
| KB Financial Group, Inc. (South Korea) | | 31,529 | 1,201,831 |
| Kotak Mahindra Bank Ltd. (India) | | 33,758 | 705,705 |
| Lloyds Banking Group PLC (United Kingdom) | | 14,629,682 | 7,120,266 |
| Mitsubishi UFJ Financial Group, Inc. (Japan) | | 156,900 | 1,316,257 |
| Mizuho Financial Group, Inc. (Japan) | | 30,700 | 521,237 |
| National Bank of Greece S.A. (Greece)* | | 15,663 | 89,708 |
| NatWest Group PLC (United Kingdom) | | 146,191 | 318,085 |
| Nedbank Group Ltd. (South Africa) | | 104,573 | 1,125,377 |
| OTP Bank Nyrt. (Hungary) | | 63,294 | 2,355,804 |
| Qatar National Bank QPSC (Qatar) | | 219,450 | 897,449 |
| Resona Holdings, Inc. (Japan) | | 102,800 | 549,294 |
| Saudi Awwal Bank (Saudi Arabia) | | 31,414 | 280,499 |
| Saudi National Bank (The) (Saudi Arabia) | | 128,220 | 1,147,332 |
| Sberbank of Russia PJSC (Russia)(d) | | 405,212 | — |
| Shinhan Financial Group Co. Ltd. (South Korea) | | 37,021 | 951,596 |
| Skandinaviska Enskilda Banken AB, Class A (Sweden) | | 447,217 | 4,990,725 |
| Standard Bank Group Ltd. (South Africa) | | 92,251 | 905,260 |
| Standard Chartered PLC (United Kingdom) | | 62,271 | 477,453 |
| Sumitomo Mitsui Financial Group, Inc. (Japan) | | 44,900 | 2,164,538 |
| Sumitomo Mitsui Trust Holdings, Inc. (Japan) | | 34,700 | 1,301,139 |
| | | | 76,623,314 |
| | | Number
of Shares | Value |
| Beverages – 2.4% |
| Ambev S.A. ADR (Brazil)* | | 871,167 | $ 2,204,053 |
| Anheuser-Busch InBev S.A./N.V. (Belgium) | | 48,900 | 2,782,314 |
| Asahi Group Holdings Ltd. (Japan) | | 13,200 | 477,449 |
| Becle S.A.B. de C.V. (Mexico) | | 96,200 | 169,627 |
| Budweiser Brewing Co. APAC Ltd. (China)(c) | | 437,500 | 831,402 |
| Diageo PLC (United Kingdom) | | 51,859 | 1,961,101 |
| Fomento Economico Mexicano S.A.B. de C.V. ADR (Mexico) | | 49,276 | 5,588,391 |
| Kirin Holdings Co. Ltd. (Japan) | | 93,000 | 1,306,959 |
| Kweichow Moutai Co. Ltd., Class A (China) | | 1,700 | 390,221 |
| Nongfu Spring Co. Ltd., Class H (China)(c) | | 76,600 | 436,294 |
| Tingyi Cayman Islands Holding Corp. (China) | | 756,000 | 1,002,815 |
| | | | 17,150,626 |
| Biotechnology & Pharmaceuticals – 5.3% |
| Astellas Pharma, Inc. (Japan) | | 61,400 | 776,702 |
| AstraZeneca PLC (United Kingdom) | | 29,101 | 3,643,555 |
| Bayer A.G. (Germany)(a) | | 101,660 | 4,392,583 |
| BioNTech S.E. ADR (Germany)* | | 22,403 | 2,095,577 |
| China Medical System Holdings Ltd. (China) | | 398,000 | 636,441 |
| Chugai Pharmaceutical Co. Ltd. (Japan) | | 263,700 | 7,820,436 |
| Daiichi Sankyo Co. Ltd. (Japan) | | 28,500 | 734,849 |
| Genmab A/S (Denmark)* | | 9,074 | 2,565,065 |
| GSK PLC | | 84,608 | 1,508,288 |
| Hypera S.A. (Brazil)* | | 59,000 | 355,047 |
| Novartis A.G. (Switzerland)(a) | | 22,400 | 2,097,078 |
| Ono Pharmaceutical Co. Ltd. (Japan) | | 22,500 | 388,564 |
| Roche Holding A.G. (Genusschein) | | 23,814 | 6,137,097 |
| Sandoz Group A.G. (Switzerland)* | | 4,860 | 126,355 |
| Shionogi & Co. Ltd. (Japan) | | 54,100 | 2,519,147 |
| Takeda Pharmaceutical Co. Ltd. (Japan) | | 60,400 | 1,639,543 |
| | | | 37,436,327 |
See accompanying Notes to Financial Statements
Morningstar Funds Trust October 31, 2023 (unaudited)
Schedule of Investments (continued)
Morningstar International Equity Fund
| | | Number
of Shares | Value |
| Cable & Satellite – 0.3% |
| Liberty Global PLC, Class A (United Kingdom)* | | 115,900 | $ 1,803,404 |
| Chemicals – 2.8% |
| Air Liquide S.A. (France) | | 14,533 | 2,490,262 |
| Akzo Nobel N.V. (Netherlands) | | 24,000 | 1,610,033 |
| Asian Paints Ltd. (India) | | 16,295 | 586,966 |
| Brenntag S.E. (Germany) | | 31,500 | 2,342,391 |
| LG Chem Ltd. (South Korea) | | 2,709 | 887,854 |
| Linde PLC | | 8,571 | 3,275,493 |
| Nitto Denko Corp. (Japan) | | 12,700 | 821,763 |
| Novozymes A/S, Class B (Denmark)(b) | | 32,464 | 1,459,029 |
| Saudi Basic Industries Corp. (Saudi Arabia) | | 34,042 | 699,538 |
| Shin-Etsu Chemical Co. Ltd. (Japan) | | 64,200 | 1,919,797 |
| Symrise A.G. (Germany) | | 25,914 | 2,648,133 |
| Toray Industries, Inc. (Japan) | | 91,000 | 440,243 |
| UPL Ltd. (India) | | 140,873 | 914,683 |
| | | | 20,096,185 |
| Commercial Support Services – 1.7% |
| Bidvest Group (The) Ltd. (South Africa) | | 47,067 | 666,224 |
| Compass Group PLC (United Kingdom) | | 82,661 | 2,083,998 |
| Edenred (France) | | 35,400 | 1,884,394 |
| Eurofins Scientific S.E. (France) | | 46,335 | 2,350,843 |
| Pony Testing International Group Co. Ltd., Class A (China) | | 157,602 | 286,553 |
| Recruit Holdings Co. Ltd. (Japan) | | 122,900 | 3,523,876 |
| Rentokil Initial PLC (United Kingdom) | | 52,522 | 267,468 |
| Secom Co. Ltd. (Japan) | | 13,800 | 958,477 |
| | | | 12,021,833 |
| Construction Materials – 0.5% |
| Anhui Conch Cement Co. Ltd., Class H (China) | | 332,000 | 826,247 |
| Holcim Ltd.* | | 44,415 | 2,746,080 |
| Siam Cement (The) PCL (Thailand)(a) | | 43,900 | 351,762 |
| | | | 3,924,089 |
| Containers & Packaging – 0.0% |
| Klabin S.A. (Brazil) | | 90,200 | 382,859 |
| | | Number
of Shares | Value |
| Diversified Industrials – 1.1% |
| Alfa Laval AB (Sweden) | | 106,437 | $ 3,449,281 |
| Hitachi Ltd. (Japan) | | 18,900 | 1,198,007 |
| Siemens A.G. (Germany)(a) | | 21,957 | 2,913,669 |
| | | | 7,560,957 |
| E-Commerce Discretionary – 2.1% |
| Alibaba Group Holding Ltd. (China)* | | 791,856 | 8,152,220 |
| Alibaba Group Holding Ltd. ADR (China)* | | 17,177 | 1,417,790 |
| JD.com, Inc. ADR (China) | | 19,932 | 506,671 |
| JD.com, Inc., Class A (China) | | 122,633 | 1,559,053 |
| MercadoLibre, Inc. (Brazil)* | | 529 | 656,352 |
| PDD Holdings, Inc. (China)* | | 19,352 | 1,962,680 |
| Sea Ltd. ADR (Singapore)* | | 4,301 | 179,352 |
| Vipshop Holdings Ltd. ADR (China)* | | 21,890 | 312,151 |
| | | | 14,746,269 |
| Electric Utilities – 0.3% |
| Chubu Electric Power Co., Inc. (Japan) | | 39,581 | 478,303 |
| Engie Brasil Energia S.A. (Brazil) | | 75,800 | 593,110 |
| National Grid PLC (United Kingdom) | | 64,599 | 770,212 |
| SSE PLC (United Kingdom) | | 17,453 | 346,853 |
| | | | 2,188,478 |
| Electrical Equipment – 2.0% |
| Assa Abloy AB, Class B (Sweden) | | 96,820 | 2,063,726 |
| Daikin Industries Ltd. (Japan) | | 6,900 | 994,834 |
| Mitsubishi Electric Corp. (Japan) | | 132,500 | 1,519,313 |
| Schindler Holding A.G. (Switzerland) | | 6,875 | 1,390,969 |
| Schneider Electric S.E. | | 38,842 | 5,976,124 |
| Shenzhen Inovance Technology Co. Ltd., Class A (China) | | 42,000 | 346,023 |
| Toshiba Corp. (Japan)* | | 28,330 | 861,251 |
| Voltas Ltd. (India) | | 85,574 | 861,127 |
| | | | 14,013,367 |
| Engineering & Construction – 0.2% |
| Indus Towers Ltd. (India)* | | 466,353 | 965,058 |
| Larsen & Toubro Ltd. (India) | | 14,137 | 497,494 |
| | | | 1,462,552 |
| Entertainment Content – 0.3% |
| NetEase, Inc. (China) | | 64,200 | 1,373,980 |
See accompanying Notes to Financial Statements
Morningstar Funds Trust October 31, 2023 (unaudited)
Schedule of Investments (continued)
Morningstar International Equity Fund
| | | Number
of Shares | Value |
| Entertainment Content (Continued) |
| Nexon Co. Ltd. (Japan) | | 22,300 | $ 409,188 |
| Square Enix Holdings Co. Ltd. (Japan) | | 10,500 | 348,829 |
| | | | 2,131,997 |
| Food – 1.2% |
| Chacha Food Co. Ltd., Class A (China) | | 78,100 | 393,920 |
| Danone S.A. (France) | | 41,200 | 2,451,007 |
| Gruma S.A.B. de C.V., Class B (Mexico) | | 27,730 | 482,987 |
| MEIJI Holdings Co. Ltd. (Japan) | | 50,300 | 1,238,086 |
| Nestle S.A. ADR | | 23,375 | 2,518,890 |
| Universal Robina Corp. (Philippines) | | 107,970 | 208,148 |
| Want Want China Holdings Ltd. (China) | | 871,000 | 541,204 |
| Yamazaki Baking Co. Ltd. (Japan) | | 24,300 | 513,815 |
| | | | 8,348,057 |
| Gas & Water Utilities – 0.4% |
| ENN Energy Holdings Ltd. (China) | | 204,800 | 1,551,390 |
| ENN Natural Gas Co. Ltd., Class A (China) | | 243,200 | 572,050 |
| Osaka Gas Co. Ltd. (Japan) | | 31,100 | 586,477 |
| Severn Trent PLC (United Kingdom) | | 8,494 | 274,207 |
| | | | 2,984,124 |
| Health Care Facilities & Services – 1.8% |
| Alfresa Holdings Corp. (Japan) | | 30,800 | 487,890 |
| Bangkok Dusit Medical Services PCL NVDR (Thailand) | | 508,000 | 374,480 |
| Bumrungrad Hospital PCL (Thailand)(a) | | 45,200 | 326,967 |
| Fresenius Medical Care A.G. & Co. KGaA (Germany) | | 115,300 | 3,830,977 |
| Fresenius S.E. & Co. KGaA (Germany) | | 146,300 | 3,763,317 |
| Life Healthcare Group Holdings Ltd. (South Africa) | | 535,175 | 533,237 |
| Lonza Group A.G. (Switzerland)(a) | | 4,669 | 1,635,102 |
| Nahdi Medical Co. (Saudi Arabia) | | 21,052 | 795,980 |
| Sinopharm Group Co. Ltd., Class H (China) | | 455,923 | 1,090,241 |
| | | | 12,838,191 |
| | | Number
of Shares | Value |
| Home & Office Products – 0.7% |
| Coway Co. Ltd. (South Korea) | | 16,039 | $ 513,261 |
| Gree Electric Appliances, Inc. of Zhuhai, Class A (China) | | 221,100 | 1,022,085 |
| Haier Smart Home Co. Ltd., Class A (China) | | 862,300 | 2,611,280 |
| Midea Group Co. Ltd., Class A (China) | | 142,400 | 1,026,718 |
| | | | 5,173,344 |
| Home Construction – 0.1% |
| Berkeley Group Holdings (The) PLC (United Kingdom) | | 8,867 | 435,872 |
| Sekisui House Ltd. (Japan) | | 24,869 | 487,004 |
| | | | 922,876 |
| Household Products – 3.8% |
| Haleon PLC | | 1,365,051 | 5,471,248 |
| Hengan International Group Co. Ltd. (China) | | 271,000 | 907,660 |
| Henkel A.G. & Co. KGaA (Germany) | | 33,600 | 2,123,533 |
| Hindustan Unilever Ltd. (India) | | 15,233 | 454,604 |
| Kao Corp. (Japan) | | 44,200 | 1,612,589 |
| Kimberly-Clark de Mexico S.A.B. de C.V., Series A (Mexico) | | 423,507 | 776,120 |
| L'Oreal S.A. (France) | | 12,449 | 5,232,698 |
| Reckitt Benckiser Group PLC (United Kingdom) | | 44,796 | 2,997,164 |
| Shiseido Co. Ltd. (Japan) | | 48,000 | 1,522,343 |
| Unicharm Corp. (Japan) | | 79,400 | 2,697,923 |
| Unilever PLC (United Kingdom) | | 50,467 | 2,390,152 |
| Unilever PLC (London Exchange) (United Kingdom) | | 21,950 | 1,038,330 |
| | | | 27,224,364 |
| Industrial Intermediate Products – 0.4% |
| SKF AB, Class B (Sweden) | | 189,500 | 3,072,262 |
| Industrial Support Services – 0.3% |
| Ashtead Group PLC (United Kingdom) | | 36,434 | 2,089,581 |
| Institutional Financial Services – 0.3% |
| B3 S.A. - Brasil Bolsa Balcao (Brazil) | | 277,810 | 546,975 |
| Daiwa Securities Group, Inc. (Japan) | | 91,200 | 525,902 |
| Japan Exchange Group, Inc. (Japan) | | 25,900 | 512,167 |
See accompanying Notes to Financial Statements
Morningstar Funds Trust October 31, 2023 (unaudited)
Schedule of Investments (continued)
Morningstar International Equity Fund
| | | Number
of Shares | Value |
| Institutional Financial Services (Continued) |
| London Stock Exchange Group PLC (United Kingdom) | | 8,393 | $ 846,813 |
| Moscow Exchange MICEX PJSC (Russia)(d) | | 83,130 | — |
| | | | 2,431,857 |
| Insurance – 4.7% |
| AIA Group Ltd. (Hong Kong) | | 545,800 | 4,739,622 |
| Allianz S.E. (Germany)(a) | | 40,936 | 9,588,953 |
| Aviva PLC (United Kingdom) | | 53,582 | 259,528 |
| BB Seguridade Participacoes S.A. (Brazil) | | 283,500 | 1,725,151 |
| Dai-ichi Life Holdings, Inc. (Japan) | | 41,200 | 870,351 |
| HDFC Life Insurance Co. Ltd. (India)(c) | | 116,564 | 865,916 |
| Legal & General Group PLC (United Kingdom) | | 94,894 | 244,495 |
| Manulife Financial Corp. (Canada) | | 277,700 | 4,834,093 |
| MS&AD Insurance Group Holdings, Inc. (Japan) | | 25,900 | 948,990 |
| Ping An Insurance Group Co. of China Ltd., Class H (China) | | 522,000 | 2,647,833 |
| Prudential PLC (Hong Kong) | | 480,792 | 5,027,348 |
| Sompo Holdings, Inc. (Japan) | | 10,300 | 446,196 |
| Tokio Marine Holdings, Inc. (Japan) | | 40,200 | 899,364 |
| | | | 33,097,840 |
| Internet Media & Services – 3.4% |
| Baidu, Inc., Class A (China)* | | 117,700 | 1,545,261 |
| Meituan, Class B (China)(c)* | | 129,690 | 1,838,357 |
| NAVER Corp. (South Korea) | | 27,111 | 3,790,204 |
| Prosus N.V. (China)* | | 150,707 | 4,214,609 |
| Tencent Holdings Ltd. (China) | | 250,900 | 9,285,497 |
| Tencent Music Entertainment Group ADR (China)* | | 142,510 | 1,034,623 |
| Trip.com Group Ltd. (China)* | | 29,800 | 1,015,632 |
| Trip.com Group Ltd. ADR (China)* | | 35,958 | 1,222,572 |
| | | | 23,946,755 |
| Leisure Facilities & Services – 1.3% |
| Accor S.A. (France) | | 94,219 | 3,005,831 |
| | | Number
of Shares | Value |
| Leisure Facilities & Services (Continued) |
| Entain PLC (United Kingdom) | | 20,529 | $ 233,051 |
| InterContinental Hotels Group PLC (United Kingdom) | | 6,376 | 451,820 |
| Jiumaojiu International Holdings Ltd. (China)(c) | | 285,000 | 310,114 |
| Jollibee Foods Corp. (Philippines) | | 127,710 | 461,646 |
| Las Vegas Sands Corp. | | 21,906 | 1,039,659 |
| OPAP S.A. (Greece) | | 32,089 | 543,533 |
| Yum China Holdings, Inc. (China) | | 6,800 | 356,334 |
| Yum China Holdings, Inc. (New York Stock Exchange) (China) | | 56,240 | 2,955,974 |
| | | | 9,357,962 |
| Leisure Products – 0.4% |
| Shimano, Inc. (Japan) | | 17,700 | 2,547,138 |
| Machinery – 4.6% |
| Atlas Copco AB, Class A (Sweden) | | 264,307 | 3,422,517 |
| CNH Industrial N.V. (United Kingdom)(b) | | 453,466 | 5,025,300 |
| Daifuku Co. Ltd. (Japan) | | 103,400 | 1,708,468 |
| Epiroc AB, Class A (Sweden) | | 160,340 | 2,641,557 |
| FANUC Corp. (Japan) | | 74,200 | 1,841,378 |
| Hangcha Group Co. Ltd., Class A (China) | | 119,000 | 356,559 |
| Hongfa Technology Co. Ltd., Class A (China) | | 76,300 | 301,763 |
| Keyence Corp. (Japan) | | 9,100 | 3,522,780 |
| Komatsu Ltd. (Japan) | | 225,200 | 5,174,285 |
| Nabtesco Corp. (Japan) | | 23,666 | 419,165 |
| Sandvik AB (Sweden) | | 77,800 | 1,325,169 |
| SMC Corp. (Japan) | | 2,500 | 1,154,408 |
| Smiths Group PLC (United Kingdom) | | 74,744 | 1,466,152 |
| Sumitomo Heavy Industries Ltd. (Japan) | | 21,164 | 484,439 |
| WEG S.A. (Brazil) | | 68,029 | 444,329 |
| Zhejiang Sanhua Intelligent Controls Co. Ltd., Class A (China) | | 951,200 | 3,469,752 |
| | | | 32,758,021 |
| Medical Equipment & Devices – 1.4% |
| Alcon, Inc. (Switzerland) | | 47,609 | 3,395,474 |
| FUJIFILM Holdings Corp. (Japan) | | 16,700 | 913,453 |
| Hoya Corp. (Japan) | | 8,100 | 779,776 |
See accompanying Notes to Financial Statements
Morningstar Funds Trust October 31, 2023 (unaudited)
Schedule of Investments (continued)
Morningstar International Equity Fund
| | | Number
of Shares | Value |
| Medical Equipment & Devices (Continued) |
| Olympus Corp. (Japan) | | 57,600 | $ 769,268 |
| Smith & Nephew PLC (United Kingdom) | | 30,066 | 336,473 |
| Sonova Holding A.G. (Switzerland)(a) | | 7,913 | 1,875,487 |
| Sysmex Corp. (Japan) | | 33,000 | 1,580,792 |
| | | | 9,650,723 |
| Metals & Mining – 2.8% |
| Anglo American PLC (South Africa) | | 51,460 | 1,311,181 |
| BHP Group Ltd. ADR (Australia)(b) | | 74,562 | 4,254,508 |
| Cameco Corp. (Canada) | | 7,295 | 298,428 |
| China Shenhua Energy Co. Ltd., Class H (China) | | 167,500 | 513,383 |
| Glencore PLC (Australia) | | 802,103 | 4,248,604 |
| Grupo Mexico S.A.B. de C.V., Series B (Mexico) | | 241,755 | 1,003,949 |
| Hindalco Industries Ltd. (India) | | 75,256 | 415,395 |
| Rio Tinto PLC (Australia) | | 89,902 | 5,735,795 |
| Sumitomo Metal Mining Co. Ltd. (Japan) | | 15,300 | 429,807 |
| United Tractors Tbk PT (Indonesia) | | 324,600 | 513,682 |
| Vale S.A. ADR (Brazil) | | 66,061 | 905,696 |
| | | | 19,630,428 |
| Oil & Gas Producers – 7.0% |
| Bharat Petroleum Corp. Ltd. (India) | | 129,305 | 542,067 |
| BP PLC (United Kingdom) | | 934,721 | 5,707,425 |
| Canadian Natural Resources Ltd. (Canada) | | 26,646 | 1,692,047 |
| Cenovus Energy, Inc. (Canada) | | 20,829 | 396,829 |
| Chevron Corp. | | 5,184 | 755,464 |
| China Petroleum & Chemical Corp., Class H (China) | | 1,067,092 | 545,751 |
| Ecopetrol S.A. ADR (Colombia)(b) | | 13,677 | 161,525 |
| ENEOS Holdings, Inc. (Japan) | | 144,000 | 533,580 |
| Eni S.p.A. (Italy) | | 74,026 | 1,210,152 |
| Equinor ASA (Norway) | | 27,585 | 924,738 |
| Exxon Mobil Corp. | | 17,338 | 1,835,227 |
| Galp Energia SGPS S.A. (Portugal) | | 168,723 | 2,540,086 |
| Gazprom PJSC (Russia)(d)* | | 421,794 | — |
| Imperial Oil Ltd. (Canada) | | 4,733 | 269,731 |
| Inpex Corp. (Japan) | | 85,100 | 1,234,876 |
| LUKOIL PJSC (Russia)(d) | | 61,010 | — |
| | | Number
of Shares | Value |
| Oil & Gas Producers (Continued) |
| MOL Hungarian Oil & Gas PLC (Hungary) | | 84,671 | $ 673,714 |
| Neste OYJ (Finland) | | 23,474 | 788,913 |
| OMV A.G. (Austria) | | 6,107 | 267,842 |
| Petroleo Brasileiro S.A. ADR (Brazil) | | 233,664 | 3,504,960 |
| Petronet LNG Ltd. (India) | | 269,396 | 645,732 |
| PTT Exploration & Production PCL (Thailand)(a) | | 172,900 | 789,660 |
| Reliance Industries Ltd. (India) | | 62,805 | 1,726,999 |
| Repsol S.A. (Spain) | | 35,377 | 517,995 |
| Rosneft Oil Co. PJSC (Russia)(d) | | 210,931 | — |
| Santos Ltd. (Australia) | | 51,994 | 253,703 |
| Shell PLC (Netherlands) | | 471,114 | 15,182,522 |
| Suncor Energy, Inc. (Canada) | | 32,366 | 1,048,175 |
| TotalEnergies S.E. (France) | | 66,838 | 4,468,621 |
| Vibra Energia S.A. (Brazil)* | | 198,800 | 781,518 |
| Woodside Energy Group Ltd. (Australia) | | 22,524 | 490,568 |
| | | | 49,490,420 |
| Publishing & Broadcasting – 0.3% |
| Focus Media Information Technology Co. Ltd., Class A (China) | | 648,200 | 610,695 |
| Informa PLC (United Kingdom) | | 172,311 | 1,492,986 |
| | | | 2,103,681 |
| Real Estate Owners & Developers – 0.5% |
| China Overseas Land & Investment Ltd. (China) | | 202,000 | 381,196 |
| China Vanke Co. Ltd., Class H (China) | | 465,595 | 435,591 |
| Mitsubishi Estate Co. Ltd. (Japan) | | 115,100 | 1,473,317 |
| Mitsui Fudosan Co. Ltd. (Japan) | | 23,300 | 505,024 |
| Sumitomo Realty & Development Co. Ltd. (Japan) | | 17,800 | 446,672 |
| | | | 3,241,800 |
| Real Estate Services – 0.1% |
| KE Holdings, Inc. ADR (China) | | 52,482 | 772,010 |
| Renewable Energy – 0.3% |
| LONGi Green Energy Technology Co. Ltd., Class A (China) | | 627,900 | 2,065,630 |
See accompanying Notes to Financial Statements
Morningstar Funds Trust October 31, 2023 (unaudited)
Schedule of Investments (continued)
Morningstar International Equity Fund
| | | Number
of Shares | Value |
| Retail - Consumer Staples – 1.6% |
| Alibaba Health Information Technology Ltd. (China)(b)* | | 1,132,000 | $ 666,837 |
| Alimentation Couche-Tard, Inc. (Canada) | | 65,973 | 3,591,348 |
| Clicks Group Ltd. (South Africa) | | 54,264 | 799,628 |
| Jeronimo Martins SGPS S.A. (Portugal) | | 20,328 | 468,660 |
| Raia Drogasil S.A. (Brazil) | | 249,719 | 1,278,375 |
| Seven & i Holdings Co. Ltd. (Japan) | | 22,800 | 835,363 |
| Sumber Alfaria Trijaya Tbk PT (Indonesia) | | 1,780,200 | 323,876 |
| Tesco PLC (United Kingdom) | | 229,653 | 753,621 |
| Wal-Mart de Mexico S.A.B. de C.V. (Mexico) | | 365,484 | 1,309,572 |
| Woolworths Holdings Ltd. (South Africa) | | 75,073 | 279,507 |
| Yifeng Pharmacy Chain Co. Ltd., Class A (China) | | 234,356 | 1,046,328 |
| | | | 11,353,115 |
| Retail - Discretionary – 1.1% |
| Associated British Foods PLC (United Kingdom) | | 15,741 | 388,300 |
| Astra International Tbk PT (Indonesia) | | 1,530,500 | 556,765 |
| Fast Retailing Co. Ltd. (Japan) | | 4,500 | 996,284 |
| Kingfisher PLC (United Kingdom) | | 98,393 | 251,248 |
| Li Ning Co. Ltd. (China) | | 178,500 | 546,996 |
| Localiza Rent a Car S.A. (Brazil)* | | 150,521 | 1,522,302 |
| Nitori Holdings Co. Ltd. (Japan) | | 18,200 | 1,970,966 |
| Zhongsheng Group Holdings Ltd. (China) | | 546,500 | 1,262,030 |
| | | | 7,494,891 |
| Semiconductors – 4.0% |
| ASE Technology Holding Co. Ltd. (Taiwan) | | 577,000 | 2,020,066 |
| ASMPT Ltd. (Hong Kong) | | 60,600 | 513,255 |
| Globalwafers Co. Ltd. (Taiwan) | | 45,000 | 661,496 |
| Infineon Technologies A.G. (Germany) | | 183,069 | 5,347,486 |
| MediaTek, Inc. (Taiwan) | | 93,000 | 2,427,241 |
| Novatek Microelectronics Corp. (Taiwan) | | 88,000 | 1,239,311 |
| | | Number
of Shares | Value |
| Semiconductors (Continued) |
| SK Hynix, Inc. (South Korea) | | 16,909 | $ 1,468,413 |
| Taiwan Semiconductor Manufacturing Co. Ltd. (Taiwan) | | 500,945 | 8,181,694 |
| Taiwan Semiconductor Manufacturing Co. Ltd. ADR (Taiwan) | | 54,850 | 4,734,104 |
| Tokyo Electron Ltd. (Japan) | | 10,300 | 1,361,018 |
| Vanguard International Semiconductor Corp. (Taiwan) | | 168,000 | 364,849 |
| | | | 28,318,933 |
| Software – 1.7% |
| Dassault Systemes S.E. (France) | | 66,857 | 2,754,065 |
| Hundsun Technologies, Inc., Class A (China) | | 5,113 | 21,701 |
| Open Text Corp. (Canada) | | 91,348 | 3,049,874 |
| SAP S.E. (Germany) | | 21,500 | 2,883,845 |
| SAP S.E. ADR (Germany) | | 25,078 | 3,360,452 |
| ZWSOFT Co. Ltd. (Guangzhou), Class A (China) | | 19,350 | 284,116 |
| | | | 12,354,053 |
| Specialty Finance – 0.2% |
| Chailease Holding Co. Ltd. (Taiwan) | | 107,080 | 580,860 |
| Jio Financial Services Ltd. (India)* | | 42,276 | 111,201 |
| ORIX Corp. (Japan) | | 36,500 | 663,802 |
| | | | 1,355,863 |
| Steel – 0.5% |
| Mitsui & Co. Ltd. (Japan) | | 40,800 | 1,482,843 |
| Ternium S.A. ADR (Mexico) | | 13,143 | 492,731 |
| thyssenkrupp A.G. (Germany) | | 214,400 | 1,494,295 |
| | | | 3,469,869 |
| Technology Hardware – 3.8% |
| Casio Computer Co. Ltd. (Japan) | | 53,100 | 425,491 |
| Hon Hai Precision Industry Co. Ltd. (Taiwan) | | 192,000 | 573,065 |
| Kyocera Corp. (Japan) | | 17,200 | 847,812 |
| Lenovo Group Ltd. (China) | | 1,576,000 | 1,834,042 |
| Murata Manufacturing Co. Ltd. (Japan) | | 96,600 | 1,654,698 |
| Nidec Corp. (Japan) | | 17,900 | 656,591 |
| Nintendo Co. Ltd. (Japan) | | 53,600 | 2,214,455 |
See accompanying Notes to Financial Statements
Morningstar Funds Trust October 31, 2023 (unaudited)
Schedule of Investments (continued)
Morningstar International Equity Fund
| | | Number
of Shares | Value |
| Technology Hardware (Continued) |
| Panasonic Holdings Corp. (Japan) | | 99,300 | $ 871,208 |
| Samsung Electronics Co. Ltd. (South Korea) | | 99,885 | 4,971,763 |
| Samsung Electronics Co. Ltd. GDR (South Korea)(a) | | 5,948 | 7,437,829 |
| Sony Group Corp. (Japan) | | 44,000 | 3,658,111 |
| TDK Corp. (Japan) | | 36,100 | 1,350,689 |
| Yageo Corp. (Taiwan) | | 50,000 | 815,177 |
| | | | 27,310,931 |
| Technology Services – 2.6% |
| Adyen N.V. (Netherlands)(c)* | | 2,331 | 1,572,227 |
| Amadeus IT Group S.A. (Spain) | | 44,400 | 2,534,033 |
| Arabian Internet & Communications Services Co. (Saudi Arabia) | | 3,858 | 322,018 |
| Capgemini S.E. (France) | | 20,500 | 3,622,940 |
| Experian PLC | | 17,040 | 516,974 |
| Fujitsu Ltd. (Japan) | | 22,200 | 2,875,956 |
| Globant S.A.* | | 3,600 | 613,044 |
| Infosys Ltd. (India) | | 85,447 | 1,405,241 |
| Infosys Ltd. ADR (India) | | 45,198 | 742,151 |
| RELX PLC (United Kingdom) | | 35,687 | 1,246,465 |
| Sangfor Technologies, Inc., Class A (China)* | | 800 | 9,147 |
| Tata Consultancy Services Ltd. (India) | | 26,086 | 1,056,055 |
| Worldline S.A. (France)(c)* | | 137,500 | 1,748,439 |
| | | | 18,264,690 |
| Telecommunications – 1.7% |
| America Movil S.A.B. de C.V. ADR (Mexico) | | 47,855 | 794,393 |
| BT Group PLC (United Kingdom) | | 155,181 | 213,130 |
| KDDI Corp. (Japan) | | 66,900 | 2,001,296 |
| KT Corp. (South Korea) | | 37,438 | 905,707 |
| Mobile TeleSystems PJSC ADR (Russia)(d)* | | 138,416 | — |
| Nippon Telegraph & Telephone Corp. (Japan) | | 1,047,500 | 1,232,673 |
| Softbank Corp. (Japan) | | 44,900 | 507,678 |
| SoftBank Group Corp. (Japan) | | 44,900 | 1,838,838 |
| Telkom Indonesia Persero Tbk PT (Indonesia) | | 10,814,000 | 2,370,600 |
| Telkom Indonesia Persero Tbk PT ADR (Indonesia)(b) | | 28,694 | 631,268 |
| | | Number
of Shares | Value |
| Telecommunications (Continued) |
| Vodacom Group Ltd. (South Africa) | | 127,481 | $ 693,989 |
| Vodafone Group PLC (United Kingdom) | | 697,882 | 642,428 |
| | | | 11,832,000 |
| Tobacco & Cannabis – 0.4% |
| British American Tobacco PLC (United Kingdom) | | 53,879 | 1,609,498 |
| Japan Tobacco, Inc. (Japan) | | 23,600 | 549,381 |
| KT&G Corp. (South Korea) | | 8,702 | 548,951 |
| | | | 2,707,830 |
| Transportation & Logistics – 1.3% |
| Canadian National Railway Co. (Canada)(b) | | 20,913 | 2,212,177 |
| CCR S.A. (Brazil) | | 413,260 | 986,070 |
| DSV A/S (Denmark) | | 11,000 | 1,643,850 |
| East Japan Railway Co. (Japan) | | 31,000 | 1,610,057 |
| Ryanair Holdings PLC ADR (Ireland)* | | 35,891 | 3,147,641 |
| | | | 9,599,795 |
| Transportation Equipment – 1.1% |
| Daimler Truck Holding A.G. (Germany) | | 113,739 | 3,573,705 |
| Volvo AB, Class B (Sweden) | | 140,600 | 2,786,016 |
| Weichai Power Co. Ltd., Class H (China) | | 798,000 | 1,194,464 |
| | | | 7,554,185 |
| Wholesale - Consumer Staples – 0.5% |
| Bid Corp. Ltd. (South Africa) | | 9,814 | 208,202 |
| ITOCHU Corp. (Japan) | | 51,800 | 1,865,889 |
| Mitsubishi Corp. (Japan) | | 32,300 | 1,505,683 |
| | | | 3,579,774 |
| Wholesale - Discretionary – 0.1% |
| Bunzl PLC (United Kingdom) | | 19,326 | 689,479 |
Total Common Stocks
(Cost $719,411,451) | 672,659,307 |
|
| Preferred Stocks – 0.6% |
| Chemicals – 0.1% |
| Sociedad Quimica y Minera de Chile S.A. ADR, 1.26% (Chile)(b)(e) | | 12,398 | 600,063 |
See accompanying Notes to Financial Statements
Morningstar Funds Trust October 31, 2023 (unaudited)
Schedule of Investments (continued)
Morningstar International Equity Fund
| | | Number
of Shares | Value |
| Technology Hardware – 0.5% |
| Samsung Electronics Co. Ltd., 2.70% (South Korea)(e) | | 81,100 | $ 3,237,896 |
Total Preferred Stocks
(Cost $5,106,714) | 3,837,959 |
|
| Rights – 0.0% |
| Retail - Discretionary – 0.0% |
| Localiza Rent a Car S.A. (Brazil)* | | 1,085 | 1,177 |
Total Rights
(Cost $—) | 1,177 |
|
| Investment Companies – 1.4% |
| iShares MSCI South Korea ETF(b) | | 182,979 | 10,054,696 |
Total Investment Companies
(Cost $11,032,022) | 10,054,696 |
| | | Number
of Shares | Value |
| Short-Term Investments – 3.7% |
| Money Market Funds – 3.7% |
| Northern Institutional Funds - Liquid Assets Portfolio (Shares), 5.41%(f)(g) | | 7,145,629 | $ 7,145,629 |
| Northern Institutional Funds - Treasury Portfolio (Premier), 5.21%(f) | | 19,280,515 | 19,280,515 |
Total Short-Term Investments
(Cost $26,426,144) | 26,426,144 |
Total Investments – 100.5%
(Cost $761,976,331) | 712,979,283 |
| Liabilities less Other Assets – (0.5)% | (3,630,984) |
| NET ASSETS – 100.0% | $709,348,299 |
| Percentages shown are based on Net Assets. |
| All securities are United States companies, unless noted otherwise in parentheses. |
| (a) | Security sold outside United States without registration under the Securities Act of 1933. | | |
| (b) | Security either partially or fully on loan. (See Note 7). | | |
| (c) | Securities exempt from registration under Rule 144A of the Securities Act of 1933. These securities may be resold in transactions exempt from registration, normally to qualified institutional buyers. | | |
| (d) | Investment is valued using significant unobservable inputs (Level 3) (See Note 4 regarding investments in Russian securities). | | |
| (e) | Current yield is disclosed. Dividends are calculated based on a percentage of the issuer’s net income. | | |
| (f) | 7-day current yield as of October 31, 2023 is disclosed. | | |
| (g) | Security purchased with the cash proceeds from securities loaned. (See Note 7). | | |
| * | Non-Income Producing Security | | |
| ADR | American Depositary Receipt |
| ETF | Exchange-Traded Fund |
| GDR | Global Depositary Receipt |
| JSC | Joint Stock Company |
| MSCI | Morgan Stanley Capital International |
| NVDR | Non-Voting Depositary Receipt |
| PCL | Public Company Limited |
| PJSC | Public Joint Stock Company |
| PLC | Public Limited Company |
| QPSC | Qualified Personal Service Corporation |
See accompanying Notes to Financial Statements
Morningstar Funds Trust October 31, 2023 (unaudited)
Schedule of Investments (continued)
Morningstar International Equity Fund
| Concentration by Currency (%)(a) | |
| Euro | 21.1 |
| Japanese Yen | 16.8 |
| British Pound | 13.0 |
| U.S. Dollar | 12.8 |
| Hong Kong Dollar | 7.3 |
| All other currencies less than 5% | 29.0 |
| Total | 100.0 |
| (a) Percentages shown are based on Net Assets. | |
| Country Diversification (%)(a) | |
| Japan | 16.8 |
| China | 11.1 |
| Germany | 9.2 |
| United Kingdom | 8.6 |
| France | 6.4 |
| United States | 6.0 |
| All other countries less than 5%(b) | 41.9 |
| Total | 100.0 |
| (a) Percentages shown are based on Net Assets. |
| (b) Includes Other. |
Valuation Hierarchy
The following is a summary of the inputs used, as of October 31, 2023, in valuing the Fund's investments carried at fair value:
| Morningstar International Equity Fund | Level 1 | Level 2 | Level 3 | Totals |
| Investments | | | | |
| Assets: | | | | |
| Common Stocks | $103,632,522 | $569,026,785 | $—* | $672,659,307 |
| Preferred Stocks | 600,063 | 3,237,896 | — | 3,837,959 |
| Rights | 1,177 | — | — | 1,177 |
| Investment Companies | 10,054,696 | — | — | 10,054,696 |
| Short-Term Investments | 26,426,144 | — | — | 26,426,144 |
| Total Investments | $140,714,602 | $572,264,681 | $— | $712,979,283 |
| *Includes securities determined to have no value as of October 31, 2023. |
See accompanying Notes to Financial Statements
Morningstar Funds Trust October 31, 2023 (unaudited)
Morningstar Global Income Fund
| | | Par (a) | Value |
| Asset-Backed Securities – 4.6% |
| Other – 4.4% |
| AB BSL CLO 4 Ltd., Series 2023-4A, Class A, (3M CME Term SOFR + 2.00%, 2.00% Floor), 7.42%, 4/20/36(b)(c) | | $100,000 | $100,694 |
| AGL CLO Ltd., Series 2021-12A, Class D, (3M CME Term SOFR + 3.11%, 2.85% Floor), 8.53%, 7/20/34(b)(c) | | 250,000 | 240,128 |
| Aimco CLO 12 Ltd., Series 2020-12A, Class DR, (3M CME Term SOFR + 2.90%, 2.90% Floor), 8.30%, 1/17/32(b)(c) | | 250,000 | 240,130 |
| Ameriquest Mortgage Securities, Inc. Asset-Backed Pass-Through Certificates, Series 2005-R3, Class M4, (1M CME Term SOFR + 1.04%, 0.93% Floor), 6.37%, 5/25/35(c) | | 107,777 | 105,347 |
| Apex Credit CLO Ltd., Series 2022-1A, Class D, (3M CME Term SOFR + 4.40%, 4.40% Floor), 9.81%, 4/22/33(b)(c) | | 130,000 | 123,351 |
| Bain Capital Credit CLO Ltd., Series 2022-2A, Class D1, (3M CME Term SOFR + 3.65%, 3.65% Floor), 9.06%, 4/22/35(b)(c) | | 250,000 | 240,429 |
| Barings CLO Ltd., | | | |
| Series 2016-2A, Class ER2, (3M CME Term SOFR + 6.76%, 6.50% Floor), 12.18%, 1/20/32(b)(c) | | 390,000 | 372,679 |
| Series 2018-3A, Class D, (3M CME Term SOFR + 3.16%), 8.58%, 7/20/29(b)(c) | | 260,000 | 255,134 |
|
| BlueMountain CLO XXIX Ltd., Series 2020-29A, Class ER, (3M CME Term SOFR + 7.12%, 6.86% Floor), 12.50%, 7/25/34(b)(c) | | 250,000 | 219,660 |
| Bristol Park CLO Ltd., | | | |
| Series 2016-1A, Class DR, (3M CME Term SOFR + 3.21%, 2.95% Floor), 8.61%, 4/15/29(b)(c) | | 250,000 | 237,212 |
| | | Par (a) | Value |
| Other (Continued) |
| Bristol Park CLO Ltd., | | | |
| Series 2016-1A, Class ER, (3M CME Term SOFR + 7.26%, 7.00% Floor), 12.66%, 4/15/29(b)(c) | | $350,000 | $316,892 |
|
| Canyon CLO Ltd., Series 2020-1A, Class BR, (3M CME Term SOFR + 1.96%, 1.70% Floor), 7.36%, 7/15/34(b)(c) | | 250,000 | 243,603 |
| CarVal CLO VII-C Ltd., Series 2023-1A, Class A1, (3M CME Term SOFR + 2.20%, 2.20% Floor), 7.62%, 1/20/35(b)(c) | | 240,000 | 241,856 |
| Cook Park CLO Ltd., Series 2018-1A, Class D, (3M CME Term SOFR + 2.86%), 8.26%, 4/17/30(b)(c) | | 250,000 | 232,788 |
| GoodLeap Sustainable Home Solutions Trust, Series 2021-3CS, Class C, 3.50%, 5/20/48(b) | | 472,403 | 306,266 |
| Greenwood Park CLO Ltd., Series 2018-1A, Class E, (3M CME Term SOFR + 5.21%), 10.61%, 4/15/31(b)(c) | | 250,000 | 207,275 |
| Hildene Community Funding CDO Ltd., Series 2015-1A, Class ARR, 2.60%, 11/01/35(b) | | 234,271 | 187,589 |
| JP Morgan Mortgage Acquisition Trust, Series 2007-CH4, Class M1, (1M CME Term SOFR + 0.34%, 0.23% Floor), 5.67%, 5/25/37(c) | | 270,000 | 251,017 |
| KKR CLO 40 Ltd., Series 40A, Class D, (3M CME Term SOFR + 3.90%, 3.90% Floor), 9.32%, 10/20/34(b)(c) | | 300,000 | 284,182 |
| National Collegiate Student Loan Trust, Series 2007-2, Class A4, (1M USD LIBOR + 0.29%), 5.73%, 1/25/33(c) | | 363,490 | 336,453 |
| Neuberger Berman Loan Advisers CLO 33 Ltd., Series 2019-33A, Class DR, (3M CME Term SOFR + 3.16%, 2.90% Floor), 8.56%, 10/16/33(b)(c) | | 250,000 | 239,017 |
See accompanying Notes to Financial Statements
Morningstar Funds Trust October 31, 2023 (unaudited)
Schedule of Investments (continued)
Morningstar Global Income Fund
| | | Par (a) | Value |
| Other (Continued) |
|
| Oaktree CLO Ltd., Series 2022-1A, Class E, (3M CME Term SOFR + 7.76%, 7.76% Floor), 13.12%, 5/15/33(b)(c) | | $487,000 | $466,488 |
| Ocean Trails CLO IX, Series 2020-9A, Class DR, (3M CME Term SOFR + 4.01%, 3.75% Floor), 9.41%, 10/15/34(b)(c) | | 280,000 | 256,921 |
| Ocean Trails CLO XIV Ltd., Series 2023-14A, Class A1, (3M CME Term SOFR + 2.00%, 2.00% Floor), 7.42%, 1/20/35(b)(c) | | 220,000 | 219,394 |
| Palmer Square Loan Funding Ltd., Series 2022-3A, Class C, (3M CME Term SOFR + 5.40%, 5.40% Floor), 10.79%, 4/15/31(b)(c) | | 210,000 | 210,649 |
| Pioneer Aircraft Finance Ltd., Series 2019-1, Class A, 3.97%, 6/15/44(b) | | 193,282 | 168,106 |
| RAD CLO 21 Ltd., Series 2023-21A, Class D, (3M CME Term SOFR + 4.40%, 4.40% Floor), 9.77%, 1/25/33(b)(c)(d) | | 160,000 | 160,000 |
| SMB Private Education Loan Trust, Series 2021-A, Class D1, 3.86%, 1/15/53(b) | | 270,947 | 239,191 |
| Stonepeak ABS, Series 2021-1A, Class A, 2.68%, 2/28/33(b) | | 277,664 | 247,276 |
| Sycamore Tree CLO Ltd., Series 2023-2A, Class A, (3M CME Term SOFR + 2.33%, 2.33% Floor), 7.75%, 4/20/35(b)(c) | | 250,000 | 252,395 |
| Symphony CLO 37 Ltd., Series 2022-37A, Class A1A, (3M CME Term SOFR + 2.30%, 2.30% Floor), 7.72%, 10/20/34(b)(c) | | 250,000 | 250,340 |
| Symphony CLO XXV Ltd., Series 2021-25A, Class D, (3M CME Term SOFR + 3.86%, 3.60% Floor), 9.26%, 4/19/34(b)(c) | | 250,000 | 235,409 |
| | | Par (a) | Value |
| Other (Continued) |
|
| TSTAT Ltd., Series 2022-2A, Class C, (3M CME Term SOFR + 4.80%, 4.80% Floor), 10.22%, 1/20/31(b)(c) | | $250,000 | $ 252,605 |
| Valley Stream Park CLO Ltd., Series 2022-1A, Class DR, (3M CME Term SOFR + 4.15%, 4.15% Floor), 9.57%, 10/20/34(b)(c) | | 110,000 | 109,442 |
| VERDE CLO Ltd., Series 2019-1A, Class DR, (3M CME Term SOFR + 3.51%, 3.25% Floor), 8.91%, 4/15/32(b)(c) | | 250,000 | 240,068 |
| Voya CLO Ltd., Series 2020-3A, Class DR, (3M CME Term SOFR + 3.51%, 3.25% Floor), 8.93%, 10/20/34(b)(c) | | 260,000 | 247,908 |
| | | | 8,537,894 |
| Specialty Finance – 0.2% |
| MF1 LLC, Series 2022-FL9, Class A, (1M CME Term SOFR + 2.15%, 2.15% Floor), 7.48%, 6/19/37(b)(c) | | 240,000 | 239,888 |
| Whitebox CLO IV Ltd., Series 2023-4A, Class A1, (3M CME Term SOFR + 2.15%, 2.15% Floor), 7.57%, 4/20/36(b)(c) | | 260,000 | 261,734 |
| | | | 501,622 |
Total Asset-Backed Securities
(Cost $9,311,764) | 9,039,516 |
| | | Number
of Shares | |
| Common Stocks – 42.4% |
| Advertising & Marketing – 0.0%(e) |
| WPP PLC (United Kingdom) | | 4,171 | 35,917 |
| Aerospace & Defense – 1.6% |
| BAE Systems PLC (United Kingdom) | | 232,913 | 3,131,837 |
| Asset Management – 1.6% |
| BlackRock, Inc. | | 531 | 325,121 |
| Blackstone, Inc. | | 2,169 | 200,307 |
| Macquarie Korea Infrastructure Fund (South Korea) | | 260,573 | 2,321,845 |
See accompanying Notes to Financial Statements
Morningstar Funds Trust October 31, 2023 (unaudited)
Schedule of Investments (continued)
Morningstar Global Income Fund
| | | Number
of Shares | Value |
| Asset Management (Continued) |
| St. James's Place PLC (United Kingdom) | | 3,908 | $ 30,466 |
| T. Rowe Price Group, Inc. | | 3,265 | 295,482 |
| | | | 3,173,221 |
| Automotive – 0.9% |
| Mercedes-Benz Group A.G. (Germany) | | 28,226 | 1,660,656 |
| Banking – 2.2% |
| Barclays PLC (United Kingdom) | | 25,363 | 40,709 |
| BNP Paribas S.A. (France) | | 18,582 | 1,068,540 |
| HSBC Holdings PLC (United Kingdom) | | 32,583 | 235,263 |
| JPMorgan Chase & Co. | | 14,810 | 2,059,479 |
| Lloyds Banking Group PLC (United Kingdom) | | 171,980 | 83,703 |
| NatWest Group PLC (United Kingdom) | | 13,127 | 28,562 |
| PNC Financial Services Group (The), Inc. | | 2,384 | 272,896 |
| Standard Chartered PLC (United Kingdom) | | 5,463 | 41,887 |
| Truist Financial Corp. | | 3,253 | 92,255 |
| U.S. Bancorp | | 9,739 | 310,479 |
| | | | 4,233,773 |
| Beverages – 2.3% |
| Arca Continental S.A.B. de C.V. (Mexico) | | 325,722 | 2,922,808 |
| Coca-Cola (The) Co. | | 13,493 | 762,220 |
| Diageo PLC (United Kingdom) | | 4,858 | 183,710 |
| PepsiCo, Inc. | | 3,174 | 518,251 |
| | | | 4,386,989 |
| Biotechnology & Pharmaceuticals – 3.4% |
| AbbVie, Inc. | | 4,613 | 651,263 |
| Amgen, Inc. | | 1,780 | 455,146 |
| AstraZeneca PLC (United Kingdom) | | 2,703 | 338,426 |
| Bristol-Myers Squibb Co. | | 7,349 | 378,694 |
| Gilead Sciences, Inc. | | 5,899 | 463,307 |
| GSK PLC | | 7,491 | 133,540 |
| Johnson & Johnson | | 5,487 | 813,942 |
| Merck & Co., Inc. | | 8,014 | 823,038 |
| Novartis A.G. ADR (Switzerland)(f) | | 22,906 | 2,143,544 |
| Pfizer, Inc. | | 15,621 | 477,378 |
| | | | 6,678,278 |
| Cable & Satellite – 0.4% |
| Comcast Corp., Class A | | 20,348 | 840,169 |
| | | Number
of Shares | Value |
| Chemicals – 0.3% |
| Air Products and Chemicals, Inc. | | 2,040 | $ 576,178 |
| Commercial Support Services – 0.1% |
| Compass Group PLC (United Kingdom) | | 3,129 | 78,886 |
| Rentokil Initial PLC (United Kingdom) | | 5,391 | 27,454 |
| | | | 106,340 |
| Construction Materials – 0.6% |
| Cie de Saint-Gobain (France) | | 12,547 | 682,985 |
| Xinyi Glass Holdings Ltd. (China)(f) | | 436,745 | 501,829 |
| | | | 1,184,814 |
| Containers & Packaging – 0.2% |
| Amcor PLC | | 45,635 | 405,695 |
| Diversified Industrials – 0.9% |
| Emerson Electric Co. | | 4,632 | 412,109 |
| Illinois Tool Works, Inc. | | 927 | 207,759 |
| Siemens A.G. (Germany)(g) | | 8,820 | 1,170,404 |
| | | | 1,790,272 |
| Electric Utilities – 0.7% |
| American Electric Power Co., Inc. | | 5,005 | 378,078 |
| Dominion Energy, Inc. | | 7,050 | 284,256 |
| Duke Energy Corp. | | 2,252 | 200,180 |
| Edison International | | 5,637 | 355,469 |
| National Grid PLC (United Kingdom) | | 6,330 | 75,473 |
| SSE PLC (United Kingdom) | | 2,085 | 41,436 |
| | | | 1,334,892 |
| Food – 0.2% |
| Mondelez International, Inc., Class A | | 6,656 | 440,694 |
| Forestry, Paper & Wood Products – 0.7% |
| UPM-Kymmene OYJ (Finland) | | 41,078 | 1,383,340 |
| Gas & Water Utilities – 0.1% |
| NiSource, Inc. | | 8,206 | 206,463 |
| Severn Trent PLC (United Kingdom) | | 1,003 | 32,379 |
| | | | 238,842 |
| Health Care Facilities & Services – 0.2% |
| CVS Health Corp. | | 5,075 | 350,226 |
See accompanying Notes to Financial Statements
Morningstar Funds Trust October 31, 2023 (unaudited)
Schedule of Investments (continued)
Morningstar Global Income Fund
| | | Number
of Shares | Value |
| Home Construction – 0.0%(e) |
| Berkeley Group Holdings (The) PLC (United Kingdom) | | 788 | $ 38,735 |
| Household Products – 0.8% |
| Haleon PLC | | 12,292 | 49,267 |
| Kimberly-Clark Corp. | | 2,712 | 324,464 |
| Procter & Gamble (The) Co. | | 5,303 | 795,609 |
| Reckitt Benckiser Group PLC (United Kingdom) | | 1,658 | 110,932 |
| Unilever PLC (United Kingdom) | | 4,711 | 223,116 |
| | | | 1,503,388 |
| Industrial Support Services – 0.0%(e) |
| Ashtead Group PLC (United Kingdom) | | 532 | 30,512 |
| Institutional Financial Services – 1.3% |
| CME Group, Inc. | | 3,364 | 718,080 |
| London Stock Exchange Group PLC (United Kingdom) | | 768 | 77,487 |
| Morgan Stanley | | 20,502 | 1,451,952 |
| Northern Trust Corp. | | 3,755 | 247,492 |
| | | | 2,495,011 |
| Insurance – 1.2% |
| Aviva PLC (United Kingdom) | | 6,096 | 29,526 |
| Legal & General Group PLC (United Kingdom) | | 11,144 | 28,713 |
| Prudential PLC (Hong Kong) | | 5,414 | 56,611 |
| Zurich Insurance Group A.G. (Switzerland) | | 4,710 | 2,237,215 |
| | | | 2,352,065 |
| Leisure Facilities & Services – 2.4% |
| Entain PLC (United Kingdom) | | 2,232 | 25,338 |
| InterContinental Hotels Group PLC (United Kingdom) | | 517 | 36,636 |
| McDonald's Corp. | | 1,196 | 313,555 |
| OPAP S.A. (Greece) | | 236,206 | 4,000,925 |
| Starbucks Corp. | | 2,494 | 230,047 |
| | | | 4,606,501 |
| Leisure Products – 0.1% |
| Hasbro, Inc. | | 3,461 | 156,264 |
| Machinery – 0.0%(e) |
| Smiths Group PLC (United Kingdom) | | 1,564 | 30,679 |
| | | Number
of Shares | Value |
| Medical Equipment & Devices – 0.3% |
| Medtronic PLC | | 7,060 | $ 498,154 |
| Smith & Nephew PLC (United Kingdom) | | 3,068 | 34,334 |
| | | | 532,488 |
| Metals & Mining – 2.3% |
| Anglo American PLC (South Africa) | | 2,486 | 63,342 |
| BHP Group Ltd. (Australia) | | 56,091 | 1,587,795 |
| Glencore PLC (Australia) | | 188,485 | 998,373 |
| Rio Tinto Ltd. (Australia) | | 22,109 | 1,651,500 |
| Rio Tinto PLC (Australia) | | 2,306 | 147,124 |
| | | | 4,448,134 |
| Oil & Gas Producers – 3.6% |
| BP PLC (United Kingdom) | | 31,030 | 189,470 |
| Exxon Mobil Corp. | | 4,424 | 468,280 |
| Gazprom PJSC (Russia)(h)* | | 33,780 | — |
| Kinder Morgan, Inc. | | 12,609 | 204,266 |
| LUKOIL PJSC (Russia)(h) | | 1,232 | — |
| ONEOK, Inc. | | 5,389 | 351,363 |
| Petroleo Brasileiro S.A. (Brazil) | | 445,890 | 3,343,014 |
| Rosneft Oil Co. PJSC (Russia)(h) | | 17,410 | — |
| Shell PLC (Netherlands) | | 11,814 | 380,728 |
| Williams (The) Cos., Inc. | | 10,415 | 358,276 |
| Woodside Energy Group Ltd. (Australia) | | 74,270 | 1,617,586 |
| | | | 6,912,983 |
| Publishing & Broadcasting – 0.0%(e) |
| Informa PLC (United Kingdom) | | 3,223 | 27,926 |
| Real Estate Investment Trusts – 3.6% |
| Crown Castle, Inc. | | 4,536 | 421,757 |
| Federal Realty Investment Trust | | 3,265 | 297,735 |
| PowerGrid Infrastructure Investment Trust (India)(b) | | 1,387,453 | 1,637,606 |
| Realty Income Corp. | | 4,031 | 190,989 |
| Simon Property Group, Inc. | | 3,063 | 336,593 |
| TF Administradora Industrial S. de R.L. de C.V. (Mexico) | | 1,726,309 | 2,799,782 |
| VICI Properties, Inc. | | 46,620 | 1,300,698 |
| | | | 6,985,160 |
| Retail - Consumer Staples – 0.0%(e) |
| Tesco PLC (United Kingdom) | | 20,768 | 68,151 |
See accompanying Notes to Financial Statements
Morningstar Funds Trust October 31, 2023 (unaudited)
Schedule of Investments (continued)
Morningstar Global Income Fund
| | | Number
of Shares | Value |
| Retail - Discretionary – 0.0%(e) |
| Associated British Foods PLC (United Kingdom) | | 1,565 | $ 38,605 |
| Kingfisher PLC (United Kingdom) | | 10,194 | 26,031 |
| | | | 64,636 |
| Semiconductors – 2.9% |
| Broadcom, Inc. | | 3,454 | 2,906,092 |
| MediaTek, Inc. (Taiwan) | | 84,000 | 2,192,347 |
| Texas Instruments, Inc. | | 4,208 | 597,578 |
| | | | 5,696,017 |
| Technology Hardware – 1.0% |
| NetApp, Inc. | | 3,127 | 227,583 |
| Unimicron Technology Corp. (Taiwan) | | 399,620 | 1,782,271 |
| | | | 2,009,854 |
| Technology Services – 0.4% |
| Experian PLC | | 1,751 | 53,123 |
| International Business Machines Corp. | | 4,063 | 587,673 |
| RELX PLC (United Kingdom) | | 3,178 | 111,000 |
| | | | 751,796 |
| Telecommunications – 3.5% |
| BCE, Inc. (Canada)(f) | | 28,053 | 1,041,608 |
| BT Group PLC (United Kingdom) | | 20,635 | 28,341 |
| Nippon Telegraph & Telephone Corp. (Japan) | | 2,264,000 | 2,664,220 |
| Softbank Corp. (Japan) | | 199,285 | 2,253,289 |
| Verizon Communications, Inc. | | 18,944 | 665,503 |
| Vodafone Group PLC (United Kingdom) | | 60,848 | 56,013 |
| | | | 6,708,974 |
| Tobacco & Cannabis – 1.7% |
| British American Tobacco PLC (United Kingdom) | | 5,075 | 151,603 |
| British American Tobacco PLC ADR (United Kingdom) | | 80,255 | 2,396,414 |
| Philip Morris International, Inc. | | 8,613 | 767,935 |
| | | | 3,315,952 |
| Transportation & Logistics – 0.2% |
| United Parcel Service, Inc., Class B | | 2,686 | 379,397 |
| Transportation Equipment – 0.7% |
| Volvo AB, Class B (Sweden) | | 71,079 | 1,408,444 |
| | | Number
of Shares | Value |
| Wholesale - Discretionary – 0.0%(e) |
| Bunzl PLC (United Kingdom) | | 1,121 | $ 39,993 |
Total Common Stocks
(Cost $85,121,486) | 82,515,193 |
| | | Par (a) | |
| Convertible Bonds – 0.1% |
| Cable & Satellite – 0.1% |
| DISH Network Corp., | | | |
| 0.00%, 12/15/25(i) | | $220,000 | 134,204 |
| 3.38%, 8/15/26 | | 80,000 | 41,000 |
| | | | 175,204 |
| Publishing & Broadcasting – 0.0%(e) |
| Gannett Co., Inc., 6.00%, 12/01/27(b) | | 20,000 | 16,590 |
Total Convertible Bonds
(Cost $201,540) | 191,794 |
|
| Corporate Bonds – 13.7% |
| Aerospace & Defense – 0.5% |
| Boeing (The) Co., 3.25%, 2/01/35 | | 270,000 | 199,632 |
| TransDigm, Inc., | | | |
| 6.25%, 3/15/26(b) | | 160,000 | 156,234 |
| 6.75%, 8/15/28(b) | | 280,000 | 271,875 |
|
| Triumph Group, Inc., 9.00%, 3/15/28(b) | | 260,000 | 252,522 |
| | | | 880,263 |
| Automotive – 0.8% |
| Clarios Global L.P./Clarios U.S. Finance Co., 8.50%, 5/15/27(b) | | 250,000 | 246,144 |
| Ford Motor Co., | | | |
| 3.25%, 2/12/32(f) | | 920,000 | 694,369 |
| 6.10%, 8/19/32(f) | | 10,000 | 9,249 |
|
| Ford Motor Credit Co. LLC, 3.63%, 6/17/31 | | 270,000 | 213,300 |
| PM General Purchaser LLC, 9.50%, 10/01/28(b) | | 390,000 | 366,600 |
| | | | 1,529,662 |
| Biotechnology & Pharmaceuticals – 0.1% |
| Bausch Health Cos., Inc., | | | |
| 5.50%, 11/01/25(b) | | 110,000 | 94,875 |
| 6.13%, 2/01/27(b)(f) | | 90,000 | 50,206 |
| 5.00%, 1/30/28(b) | | 20,000 | 7,339 |
| | | | 152,420 |
See accompanying Notes to Financial Statements
Morningstar Funds Trust October 31, 2023 (unaudited)
Schedule of Investments (continued)
Morningstar Global Income Fund
| | | Par (a) | Value |
| Cable & Satellite – 1.0% |
| CCO Holdings LLC/CCO Holdings Capital Corp., | | | |
| 4.25%, 2/01/31(b) | | $460,000 | $ 357,971 |
| 4.50%, 5/01/32 | | 80,000 | 61,240 |
|
| Charter Communications Operating LLC/Charter Communications Operating Capital, 5.13%, 7/01/49 | | 70,000 | 48,432 |
| CSC Holdings LLC, | | | |
| 7.50%, 4/01/28(b)(f) | | 640,000 | 410,194 |
| 6.50%, 2/01/29(b)(f) | | 200,000 | 158,138 |
|
| Directv Financing LLC/Directv Financing Co-Obligor, Inc., 5.88%, 8/15/27(b) | | 230,000 | 201,534 |
| DISH DBS Corp., | | | |
| 5.88%, 11/15/24 | | 220,000 | 201,853 |
| 7.75%, 7/01/26 | | 80,000 | 53,606 |
| 5.75%, 12/01/28(b) | | 150,000 | 108,938 |
|
| DISH Network Corp., 11.75%, 11/15/27(b) | | 200,000 | 198,112 |
| Time Warner Cable LLC, 6.75%, 6/15/39 | | 90,000 | 78,487 |
| | | | 1,878,505 |
| Commercial Support Services – 0.3% |
| Allied Universal Holdco LLC/Allied Universal Finance Corp., 6.63%, 7/15/26(b) | | 160,000 | 149,840 |
| Clean Harbors, Inc., 5.13%, 7/15/29(b) | | 100,000 | 89,943 |
| CoreCivic, Inc., 8.25%, 4/15/26 | | 180,000 | 182,237 |
| RR Donnelley & Sons Co., 9.75%, 7/31/28(b) | | 80,000 | 78,400 |
| TKC Holdings, Inc., 6.88%, 5/15/28(b) | | 50,000 | 43,250 |
| ZipRecruiter, Inc., 5.00%, 1/15/30(b)(f) | | 60,000 | 46,862 |
| | | | 590,532 |
| Construction Materials – 0.2% |
| Advanced Drainage Systems, Inc., 6.38%, 6/15/30(b)(f) | | 270,000 | 254,925 |
| Smyrna Ready Mix Concrete LLC, 6.00%, 11/01/28(b) | | 160,000 | 147,934 |
| | | | 402,859 |
| Consumer Services – 0.1% |
| Carriage Services, Inc., 4.25%, 5/15/29(b)(f) | | 140,000 | 114,513 |
| | | Par (a) | Value |
| Consumer Services (Continued) |
| StoneMor, Inc., 8.50%, 5/15/29(b) | | $170,000 | $ 135,788 |
| Upbound Group, Inc., 6.38%, 2/15/29(b) | | 40,000 | 34,400 |
| | | | 284,701 |
| Containers & Packaging – 0.1% |
| Ardagh Metal Packaging Finance USA LLC/Ardagh Metal Packaging Finance PLC, 6.00%, 6/15/27(b) | | 210,000 | 198,454 |
| Sealed Air Corp./Sealed Air Corp. U.S., 6.13%, 2/01/28(b)(f) | | 60,000 | 57,109 |
| | | | 255,563 |
| Electrical Equipment – 0.1% |
| Vertiv Group Corp., 4.13%, 11/15/28(b) | | 280,000 | 244,721 |
| Engineering & Construction – 0.2% |
| TopBuild Corp., | | | |
| 3.63%, 3/15/29(b) | | 150,000 | 125,036 |
| 4.13%, 2/15/32(b) | | 10,000 | 7,911 |
|
| Tutor Perini Corp., 6.88%, 5/01/25(b)(f) | | 310,000 | 266,600 |
| | | | 399,547 |
| Food – 0.1% |
| Darling Ingredients, Inc., 6.00%, 6/15/30(b) | | 240,000 | 225,168 |
| Health Care Facilities & Services – 0.6% |
| AdaptHealth LLC, 4.63%, 8/01/29(b) | | 220,000 | 164,450 |
| Akumin Escrow, Inc., 7.50%, 8/01/28(b)(j) | | 150,000 | 118,611 |
| Akumin, Inc., 7.00%, 11/01/25(b)(f)(j) | | 110,000 | 92,950 |
| CHS/Community Health Systems, Inc., | | | |
| 8.00%, 3/15/26(b)(f) | | 90,000 | 82,265 |
| 6.13%, 4/01/30(b) | | 400,000 | 155,000 |
| 4.75%, 2/15/31(b) | | 160,000 | 107,239 |
|
| LifePoint Health, Inc., 9.88%, 8/15/30(b) | | 260,000 | 234,975 |
| Option Care Health, Inc., 4.38%, 10/31/29(b) | | 230,000 | 192,223 |
| U.S. Renal Care, Inc., 10.63%, 6/28/28(b) | | 52,500 | 32,025 |
| | | | 1,179,738 |
| Home & Office Products – 0.1% |
| Newell Brands, Inc., 5.20%, 4/01/26(f) | | 210,000 | 198,272 |
See accompanying Notes to Financial Statements
Morningstar Funds Trust October 31, 2023 (unaudited)
Schedule of Investments (continued)
Morningstar Global Income Fund
| | | Par (a) | Value |
| Home Construction – 0.0%(e) |
| MDC Holdings, Inc., 6.00%, 1/15/43 | | $ 50,000 | $ 39,278 |
| Industrial Intermediate Products – 0.1% |
| Park-Ohio Industries, Inc., 6.63%, 4/15/27 | | 230,000 | 199,525 |
| Industrial Support Services – 0.6% |
| H&E Equipment Services, Inc., 3.88%, 12/15/28(b)(f) | | 150,000 | 127,055 |
| PECF USS Intermediate Holding III Corp., 8.00%, 11/15/29(b)(f) | | 160,000 | 75,901 |
| United Rentals North America, Inc., | | | |
| 5.50%, 5/15/27(f) | | 100,000 | 96,608 |
| 6.00%, 12/15/29(b) | | 850,000 | 817,855 |
| | | | 1,117,419 |
| Institutional Financial Services – 0.2% |
| Jane Street Group/JSG Finance, Inc., 4.50%, 11/15/29(b) | | 180,000 | 153,385 |
| LPL Holdings, Inc., 4.00%, 3/15/29(b) | | 170,000 | 146,177 |
| StoneX Group, Inc., 8.63%, 6/15/25(b) | | 180,000 | 180,450 |
| | | | 480,012 |
| Insurance – 0.3% |
| Highlands Holdings Bond Issuer Ltd./Highlands Holdings Bond Co-Issuer, Inc., (100% Cash), 7.63%, 10/15/25(b)(k) | | 400,000 | 389,784 |
| NMI Holdings, Inc., 7.38%, 6/01/25(b) | | 150,000 | 150,155 |
| | | | 539,939 |
| Internet Media & Services – 0.1% |
| Ziff Davis, Inc., 4.63%, 10/15/30(b)(f) | | 210,000 | 175,816 |
| Leisure Facilities & Services – 1.5% |
| AMC Entertainment Holdings, Inc., 7.50%, 2/15/29(b)(f) | | 110,000 | 77,037 |
| Boyne USA, Inc., 4.75%, 5/15/29(b)(f) | | 120,000 | 104,479 |
| Caesars Entertainment, Inc., 7.00%, 2/15/30(b) | | 200,000 | 193,019 |
| Caesars Resort Collection LLC/CRC Finco, Inc., 5.75%, 7/01/25(b) | | 120,000 | 118,082 |
| | | Par (a) | Value |
| Leisure Facilities & Services (Continued) |
| Carnival Corp., | | | |
| 5.75%, 3/01/27(b) | | $410,000 | $ 366,074 |
| 4.00%, 8/01/28(b)(f) | | 90,000 | 78,284 |
|
| Carnival Holdings Bermuda Ltd., 10.38%, 5/01/28(b) | | 80,000 | 85,297 |
| Full House Resorts, Inc., 8.25%, 2/15/28(b) | | 200,000 | 168,406 |
| Mohegan Tribal Gaming Authority, | | | |
| 8.00%, 2/01/26(b) | | 40,000 | 36,750 |
| 13.25%, 12/15/27(b) | | 290,000 | 307,400 |
| NCL Corp. Ltd., | | | |
| 5.88%, 3/15/26(b) | | 250,000 | 224,375 |
| 8.13%, 1/15/29(b) | | 120,000 | 117,239 |
| Royal Caribbean Cruises Ltd., | | | |
| 4.25%, 7/01/26(b) | | 230,000 | 211,508 |
| 5.50%, 8/31/26(b) | | 340,000 | 320,851 |
| 11.63%, 8/15/27(b) | | 90,000 | 97,611 |
| 8.25%, 1/15/29(b) | | 60,000 | 61,507 |
| 9.25%, 1/15/29(b) | | 80,000 | 83,507 |
| Viking Cruises Ltd., | | | |
| 5.88%, 9/15/27(b) | | 20,000 | 18,018 |
| 9.13%, 7/15/31(b) | | 150,000 | 147,375 |
|
| VOC Escrow Ltd., 5.00%, 2/15/28(b) | | 20,000 | 17,969 |
| | | | 2,834,788 |
| Leisure Products – 0.1% |
| Winnebago Industries, Inc., 6.25%, 7/15/28(b) | | 200,000 | 188,066 |
| Machinery – 0.2% |
| Titan International, Inc., 7.00%, 4/30/28 | | 480,000 | 438,609 |
| Medical Equipment & Devices – 0.2% |
| Bausch & Lomb Escrow Corp., 8.38%, 10/01/28(b) | | 120,000 | 119,190 |
| Medline Borrower L.P., 5.25%, 10/01/29(b)(f) | | 260,000 | 221,318 |
| | | | 340,508 |
| Metals & Mining – 0.0%(e) |
| Freeport-McMoRan, Inc., 5.45%, 3/15/43 | | 60,000 | 49,349 |
| Oil & Gas Producers – 3.4% |
| Berry Petroleum Co. LLC, 7.00%, 2/15/26(b) | | 540,000 | 518,400 |
See accompanying Notes to Financial Statements
Morningstar Funds Trust October 31, 2023 (unaudited)
Schedule of Investments (continued)
Morningstar Global Income Fund
| | | Par (a) | Value |
| Oil & Gas Producers (Continued) |
| Blue Racer Midstream LLC/Blue Racer Finance Corp., 7.63%, 12/15/25(b) | | $220,000 | $220,314 |
| Chord Energy Corp., 6.38%, 6/01/26(b) | | 260,000 | 255,252 |
| Continental Resources, Inc., 5.75%, 1/15/31(b) | | 170,000 | 157,656 |
| Crescent Energy Finance LLC, 9.25%, 2/15/28(b) | | 110,000 | 110,788 |
| DCP Midstream Operating L.P., 6.75%, 9/15/37(b) | | 200,000 | 197,713 |
| Devon Energy Corp., 5.00%, 6/15/45 | | 170,000 | 130,989 |
| Earthstone Energy Holdings LLC, 9.88%, 7/15/31(b)(f) | | 150,000 | 161,534 |
| Endeavor Energy Resources L.P./EER Finance, Inc., 5.75%, 1/30/28(b) | | 160,000 | 153,486 |
| Energy Transfer L.P., | | | |
| (5Y US Treasury CMT + 5.31%), 7.13%, 5/15/30(l)(m) | | 70,000 | 58,130 |
| 5.35%, 5/15/45 | | 90,000 | 70,723 |
| EQM Midstream Partners L.P., | | | |
| 7.50%, 6/01/30(b) | | 100,000 | 98,114 |
| 4.75%, 1/15/31(b)(f) | | 150,000 | 126,300 |
|
| EQT Corp., 3.13%, 5/15/26(b) | | 20,000 | 18,523 |
| Hilcorp Energy I L.P./Hilcorp Finance Co., 6.25%, 4/15/32(b) | | 120,000 | 104,796 |
| Howard Midstream Energy Partners LLC, | | | |
| 6.75%, 1/15/27(b) | | 130,000 | 122,863 |
| 8.88%, 7/15/28(b) | | 110,000 | 110,586 |
|
| Northern Oil and Gas, Inc., 8.13%, 3/01/28(b) | | 220,000 | 217,257 |
| Occidental Petroleum Corp., | | | |
| 7.15%, 5/15/28 | | 120,000 | 122,400 |
| 6.45%, 9/15/36 | | 240,000 | 233,107 |
| 7.95%, 6/15/39 | | 400,000 | 427,600 |
| 4.40%, 8/15/49 | | 60,000 | 39,233 |
|
| Permian Resources Operating LLC, 5.88%, 7/01/29(b) | | 340,000 | 316,449 |
| Range Resources Corp., | | | |
| 8.25%, 1/15/29 | | 500,000 | 510,619 |
| 4.75%, 2/15/30(b) | | 120,000 | 106,578 |
| | | Par (a) | Value |
| Oil & Gas Producers (Continued) |
|
| Rockies Express Pipeline LLC, 7.50%, 7/15/38(b) | | $100,000 | $ 92,435 |
| Southwestern Energy Co., 4.75%, 2/01/32 | | 300,000 | 257,996 |
| Summit Midstream Holdings LLC/Summit Midstream Finance Corp., 9.00%, 10/15/26(b) | | 120,000 | 115,200 |
| Tallgrass Energy Partners L.P./Tallgrass Energy Finance Corp., 6.00%, 12/31/30(b)(f) | | 80,000 | 67,347 |
| Targa Resources Partners L.P./Targa Resources Partners Finance Corp., 4.88%, 2/01/31 | | 250,000 | 220,383 |
| Transcontinental Gas Pipe Line Co. LLC, 4.60%, 3/15/48 | | 100,000 | 75,247 |
| Venture Global Calcasieu Pass LLC, | | | |
| 6.25%, 1/15/30(b) | | 190,000 | 179,238 |
| 4.13%, 8/15/31(b) | | 220,000 | 176,882 |
| 3.88%, 11/01/33(b) | | 150,000 | 113,347 |
|
| Venture Global LNG, Inc., 8.38%, 6/01/31(b) | | 130,000 | 124,053 |
| Western Midstream Operating L.P., | | | |
| 5.45%, 4/01/44 | | 340,000 | 261,672 |
| 5.30%, 3/01/48 | | 410,000 | 306,292 |
|
| Williams (The) Cos., Inc., 8.75%, 3/15/32 | | 30,000 | 33,337 |
| | | | 6,612,839 |
| Oil, Gas Services & Equipment – 0.0%(e) |
| Noble Finance II LLC, 8.00%, 4/15/30(b)(f) | | 90,000 | 89,945 |
| Publishing & Broadcasting – 0.1% |
| McClatchy (The) Co. LLC, (100% Cash), 11.00%, 7/15/27(b)(f)(k) | | 139,380 | 151,924 |
| Real Estate Investment Trusts – 0.1% |
| Service Properties Trust, 5.50%, 12/15/27 | | 210,000 | 177,293 |
| Real Estate Owners & Developers – 0.0%(e) |
| Five Point Operating Co. L.P./Five Point Capital Corp., 7.88%, 11/15/25(b) | | 90,000 | 84,527 |
| Real Estate Services – 0.1% |
| Cushman & Wakefield U.S. Borrower LLC, 8.88%, 9/01/31(b) | | 100,000 | 94,809 |
See accompanying Notes to Financial Statements
Morningstar Funds Trust October 31, 2023 (unaudited)
Schedule of Investments (continued)
Morningstar Global Income Fund
| | | Par (a) | Value |
| Renewable Energy – 0.2% |
| Sunnova Energy Corp., 5.88%, 9/01/26(b)(f) | | $500,000 | $ 405,015 |
| Retail - Discretionary – 0.5% |
| Bath & Body Works, Inc., | | | |
| 5.25%, 2/01/28 | | 150,000 | 137,542 |
| 6.63%, 10/01/30(b)(f) | | 70,000 | 64,806 |
|
| Builders FirstSource, Inc., 4.25%, 2/01/32(b)(f) | | 160,000 | 127,337 |
| Foot Locker, Inc., 4.00%, 10/01/29(b) | | 260,000 | 191,108 |
| Michaels (The) Cos., Inc., 5.25%, 5/01/28(b)(f) | | 140,000 | 101,438 |
| QVC, Inc., | | | |
| 4.45%, 2/15/25(f) | | 40,000 | 34,453 |
| 4.38%, 9/01/28 | | 100,000 | 50,671 |
|
| Sally Holdings LLC/Sally Capital, Inc., 5.63%, 12/01/25 | | 320,000 | 309,331 |
| | | | 1,016,686 |
| Software – 0.5% |
| athenahealth Group, Inc., 6.50%, 2/15/30(b) | | 270,000 | 220,656 |
| Central Parent, Inc./CDK Global, Inc., 7.25%, 6/15/29(b) | | 340,000 | 326,634 |
| Crowdstrike Holdings, Inc., 3.00%, 2/15/29 | | 100,000 | 83,587 |
| Gen Digital, Inc., 7.13%, 9/30/30(b)(f) | | 220,000 | 214,027 |
| Rackspace Technology Global, Inc., 3.50%, 2/15/28(b) | | 70,000 | 30,684 |
| | | | 875,588 |
| Specialty Finance – 0.5% |
| Burford Capital Global Finance LLC, 9.25%, 7/01/31(b) | | 200,000 | 197,400 |
| FirstCash, Inc., 5.63%, 1/01/30(b) | | 180,000 | 160,231 |
| Ladder Capital Finance Holdings LLLP/Ladder Capital Finance Corp., | | | |
| 4.25%, 2/01/27(b) | | 20,000 | 17,472 |
| 4.75%, 6/15/29(b) | | 80,000 | 64,320 |
|
| Midcap Financial Issuer Trust, 6.50%, 5/01/28(b) | | 200,000 | 169,482 |
| Rocket Mortgage LLC/Rocket Mortgage Co-Issuer, Inc., 3.63%, 3/01/29(b) | | 520,000 | 422,601 |
| | | | 1,031,506 |
| | | Par (a) | Value |
| Technology Hardware – 0.2% |
| CommScope, Inc., | | | |
| 6.00%, 3/01/26(b) | | $ 20,000 | $ 16,799 |
| 4.75%, 9/01/29(b) | | 140,000 | 95,550 |
|
| NCR Voyix Corp., 5.13%, 4/15/29(b) | | 160,000 | 137,587 |
| Viavi Solutions, Inc., 3.75%, 10/01/29(b) | | 60,000 | 46,703 |
| | | | 296,639 |
| Technology Services – 0.2% |
| GTCR W-2 Merger Sub LLC, 7.50%, 1/15/31(b) | | 210,000 | 207,343 |
| Paysafe Finance PLC/Paysafe Holdings U.S. Corp., 4.00%, 6/15/29(b) | | 120,000 | 96,469 |
| | | | 303,812 |
| Tobacco & Cannabis – 0.0%(e) |
| Altria Group, Inc., 5.95%, 2/14/49 | | 80,000 | 67,866 |
| Transportation & Logistics – 0.4% |
| American Airlines Pass Through Trust, Series 2017-1, Class B, 4.95%, 2/15/25 | | 102,000 | 98,286 |
| American Airlines, Inc., 7.25%, 2/15/28(b)(f) | | 160,000 | 148,772 |
| American Airlines, Inc./AAdvantage Loyalty IP Ltd., 5.75%, 4/20/29(b) | | 170,000 | 153,349 |
| Carriage Purchaser, Inc., 7.88%, 10/15/29(b) | | 70,000 | 51,497 |
| Mileage Plus Holdings LLC/Mileage Plus Intellectual Property Assets Ltd., 6.50%, 6/20/27(b) | | 298 | 294 |
| Spirit Loyalty Cayman Ltd./Spirit IP Cayman Ltd., | | | |
| 8.00%, 9/20/25(b) | | 100,000 | 73,750 |
| 8.00%, 9/20/25(b) | | 180,000 | 132,750 |
|
| United Airlines Pass Through Trust, Series 2020-1, Class B, 4.88%, 1/15/26 | | 36,480 | 34,954 |
| United Airlines, Inc., 4.63%, 4/15/29(b) | | 110,000 | 92,917 |
| XPO CNW, Inc., 6.70%, 5/01/34 | | 30,000 | 27,747 |
| XPO Escrow Sub LLC, 7.50%, 11/15/27(b) | | 50,000 | 49,987 |
| | | | 864,303 |
See accompanying Notes to Financial Statements
Morningstar Funds Trust October 31, 2023 (unaudited)
Schedule of Investments (continued)
Morningstar Global Income Fund
| | | Par (a) | Value |
| Transportation Equipment – 0.0%(e) |
| Allison Transmission, Inc., 4.75%, 10/01/27(b) | | $ 70,000 | $ 63,838 |
Total Corporate Bonds
(Cost $29,058,198) | 26,761,850 |
|
| Foreign Issuer Bonds – 6.2% |
| Angola – 0.1% |
| Angolan Government International Bond, 8.75%, 4/14/32(b) | | 210,000 | 163,194 |
| Argentina – 0.3% |
| Provincia de Buenos Aires, (Step to 6.63% on 9/1/24), 6.38%, 9/01/37(b)(n) | | 600,000 | 193,537 |
| Provincia de Cordoba, 6.99%, 6/01/27(b) | | 200,000 | 149,000 |
| YPF S.A., 8.50%, 7/28/25(b) | | 200,000 | 184,255 |
| | | | 526,792 |
| Brazil – 0.3% |
| MercadoLibre, Inc., 3.13%, 1/14/31 | | 270,000 | 204,482 |
| Petrobras Global Finance B.V., 5.30%, 1/27/25 | | 150,000 | 147,644 |
| Suzano Austria GmbH, 3.13%, 1/15/32 | | 160,000 | 120,582 |
| Vale Overseas Ltd., 6.25%, 8/10/26 | | 130,000 | 130,869 |
| | | | 603,577 |
| Canada – 0.8% |
| Air Canada, 3.88%, 8/15/26(b) | | 250,000 | 227,466 |
| Bombardier, Inc., 7.88%, 4/15/27(b) | | 250,000 | 240,493 |
| GFL Environmental, Inc., | | | |
| 4.25%, 6/01/25(b) | | 50,000 | 48,063 |
| 5.13%, 12/15/26(b) | | 10,000 | 9,489 |
| 4.75%, 6/15/29(b)(f) | | 240,000 | 210,096 |
|
| Hudbay Minerals, Inc., 6.13%, 4/01/29(b) | | 90,000 | 80,533 |
| MEG Energy Corp., | | | |
| 7.13%, 2/01/27(b) | | 200,000 | 201,436 |
| 5.88%, 2/01/29(b) | | 40,000 | 37,379 |
|
| Superior Plus L.P./Superior General Partner, Inc., 4.50%, 3/15/29(b) | | 50,000 | 42,647 |
| TransAlta Corp., | | | |
| 7.75%, 11/15/29(f) | | 90,000 | 89,542 |
| 6.50%, 3/15/40 | | 380,000 | 334,896 |
| | | | 1,522,040 |
| | | Par (a) | Value |
| China – 0.1% |
| Prosus N.V., 3.06%, 7/13/31(b) | | $ 270,000 | $194,496 |
| Denmark – 0.1% |
| Danske Bank A/S, (1Y US Treasury CMT + 2.10%), 6.47%, 1/09/26(b)(m) | | 270,000 | 268,887 |
| Dominican Republic – 0.1% |
| Dominican Republic International Bond, 4.88%, 9/23/32 | | 310,000 | 250,506 |
| Egypt – 0.1% |
| Egypt Government International Bond, 5.80%, 9/30/27 | | 300,000 | 193,413 |
| France – 0.3% |
| Banijay Entertainment SASU, 8.13%, 5/01/29(b)(f) | | 200,000 | 194,997 |
| BNP Paribas S.A., (5Y US Treasury CMT + 4.90%), 7.75%, 8/16/29(b)(l)(m) | | 200,000 | 185,435 |
| Credit Agricole S.A., (5Y USD Swap Rate + 6.19%), 8.13%, 12/23/25(b)(l)(m) | | 200,000 | 197,500 |
| | | | 577,932 |
| Germany – 0.2% |
| ZF North America Capital, Inc., | | | |
| 4.75%, 4/29/25(b) | | 330,000 | 318,399 |
| 7.13%, 4/14/30(b)(f) | | 160,000 | 155,210 |
| | | | 473,609 |
| Guatemala – 0.1% |
| Millicom International Cellular S.A., 4.50%, 4/27/31(b) | | 250,000 | 188,569 |
| Hong Kong – 0.2% |
| Melco Resorts Finance Ltd., | | | |
| 4.88%, 6/06/25(b) | | 200,000 | 189,000 |
| 5.38%, 12/04/29(b) | | 200,000 | 158,311 |
| | | | 347,311 |
| Indonesia – 0.3% |
| Indonesia Treasury Bond, 6.50%, 2/15/31 | IDR | 8,192,000,000 | 495,129 |
| Israel – 0.3% |
| Teva Pharmaceutical Finance Co. LLC, 6.15%, 2/01/36(f) | | 200,000 | 167,995 |
See accompanying Notes to Financial Statements
Morningstar Funds Trust October 31, 2023 (unaudited)
Schedule of Investments (continued)
Morningstar Global Income Fund
| | | Par (a) | Value |
| Israel (Continued) |
| Teva Pharmaceutical Finance Netherlands III B.V., | | | |
| 3.15%, 10/01/26 | | $ 50,000 | $ 44,021 |
| 4.75%, 5/09/27 | | 460,000 | 417,652 |
| | | | 629,668 |
| Italy – 0.1% |
| UniCredit S.p.A., (5Y US Treasury CMT + 4.75%), 5.46%, 6/30/35(b)(m) | | 210,000 | 172,278 |
| Ivory Coast – 0.1% |
| Ivory Coast Government International Bond, 5.75%, 12/31/32 | | 141,736 | 126,677 |
| Jamaica – 0.0%(e) |
| Jamaica Government International Bond, 9.63%, 11/03/30 | JMD | 10,000,000 | 64,058 |
| Jordan – 0.1% |
| Jordan Government International Bond, 7.75%, 1/15/28(b) | | 230,000 | 218,834 |
| Kazakhstan – 0.1% |
| KazMunayGas National Co. JSC, 4.75%, 4/19/27(b) | | 250,000 | 233,260 |
| Kuwait – 0.1% |
| MEGlobal Canada ULC, 5.88%, 5/18/30(b) | | 210,000 | 204,488 |
| Luxembourg – 0.4% |
| Altice Financing S.A., 5.75%, 8/15/29(b) | | 310,000 | 239,726 |
| Altice France Holding S.A., 10.50%, 5/15/27(b) | | 620,000 | 337,342 |
| ARD Finance S.A., (100% Cash), 6.50%, 6/30/27(b)(k) | | 200,000 | 116,436 |
| | | | 693,504 |
| Macau – 0.2% |
| Sands China Ltd., 3.10%, 3/08/29(f) | | 450,000 | 363,134 |
| Mexico – 0.3% |
| Banco Mercantil del Norte S.A., (10Y US Treasury CMT + 5.47%), 7.50%, 6/27/29(b)(l)(m) | | 250,000 | 215,786 |
| | | Par (a) | Value |
| Mexico (Continued) |
| Mexican Bonos, 5.75%, 3/05/26 | MXN | $ 4,910,000 | $244,988 |
| Mexico Government International Bond, 4.75%, 3/08/44 | | 150,000 | 111,015 |
| | | | 571,789 |
| Panama – 0.1% |
| Panama Government International Bond, 4.50%, 4/01/56 | | 200,000 | 121,084 |
| Peru – 0.1% |
| Petroleos del Peru S.A., 5.63%, 6/19/47(b) | | 250,000 | 136,795 |
| Supranational – 0.2% |
| Inter-American Development Bank, 7.35%, 10/06/30 | INR | 34,000,000 | 396,115 |
| Switzerland – 0.2% |
| Credit Suisse A.G., 7.95%, 1/09/25 | | 250,000 | 253,566 |
| VistaJet Malta Finance PLC/Vista Management Holding, Inc., | | | |
| 7.88%, 5/01/27(b)(f) | | 200,000 | 153,816 |
| 9.50%, 6/01/28(b)(f) | | 50,000 | 38,308 |
| | | | 445,690 |
| Turkey – 0.1% |
| Turk Telekomunikasyon AS, 6.88%, 2/28/25(b) | | 250,000 | 243,123 |
| United Arab Emirates – 0.2% |
| DP World Ltd., 5.63%, 9/25/48(b) | | 290,000 | 238,369 |
| Shelf Drilling Holdings Ltd., 9.63%, 4/15/29(b)(f) | | 210,000 | 199,662 |
| | | | 438,031 |
| United Kingdom – 0.2% |
| Mclaren Finance PLC, 7.50%, 8/01/26(b)(f) | | 200,000 | 171,000 |
| Vmed O2 UK Financing I PLC, 4.75%, 7/15/31(b) | | 200,000 | 160,981 |
| | | | 331,981 |
| Uruguay – 0.0%(e) |
| Uruguay Government International Bond, 3.88%, 7/02/40 | UYU | 1,530,000 | 48,503 |
See accompanying Notes to Financial Statements
Morningstar Funds Trust October 31, 2023 (unaudited)
Schedule of Investments (continued)
Morningstar Global Income Fund
| | | Par (a) | Value |
| Zambia – 0.4% |
| First Quantum Minerals Ltd., | | | |
| 6.88%, 10/15/27(b) | | $280,000 | $ 238,483 |
| 8.63%, 6/01/31(b) | | 700,000 | 590,871 |
| | | | 829,354 |
Total Foreign Issuer Bonds
(Cost $13,699,211) | 12,073,821 |
| | | Number
of Shares | |
| Master Limited Partnerships – 4.0% |
| Oil & Gas Producers – 4.0% |
| Energy Transfer L.P. | | 312,783 | 4,113,097 |
| Enterprise Products Partners L.P. | | 139,884 | 3,642,579 |
Total Master Limited Partnerships
(Cost $7,313,829) | 7,755,676 |
| | | Par (a) | |
| Mortgage-Backed Securities – 5.4% |
| Commercial Mortgage-Backed Securities – 2.6% |
| Benchmark Mortgage Trust, Series 2023-V3, Class D, 4.00%, 7/15/56(b) | | $250,000 | 173,098 |
| BX Commercial Mortgage Trust, | | | |
| Series 2021-ACNT, Class A, (1M CME Term SOFR + 0.96%, 0.85% Floor), 6.30%, 11/15/38(b)(c) | | 197,000 | 192,686 |
| Series 2021-VOLT, Class D, (1M CME Term SOFR + 1.76%, 1.65% Floor), 7.10%, 9/15/36(b)(c) | | 270,000 | 257,758 |
| Series 2022-AHP, Class A, (1M CME Term SOFR + 0.99%, 0.99% Floor), 6.32%, 1/17/39(b)(c) | | 212,000 | 206,771 |
| Series 2023-VLT2, Class E, (1M CME Term SOFR + 5.87%, 5.87% Floor), 11.21%, 6/15/40(b)(c) | | 170,000 | 169,332 |
| BX Trust, | | | |
| Series 2021-ARIA, Class A, (1M CME Term SOFR + 1.01%, 0.90% Floor), 6.35%, 10/15/36(b)(c) | | 270,000 | 261,215 |
| | | Par (a) | Value |
Commercial Mortgage-Backed Securities
(Continued) |
| BX Trust, | | | |
| Series 2021-SDMF, Class F, (1M CME Term SOFR + 2.05%, 1.94% Floor), 7.39%, 9/15/34(b)(c) | | $210,000 | $193,685 |
| Series 2022-CLS, Class A, 5.76%, 10/13/27(b) | | 230,000 | 221,125 |
|
| BXHPP Trust, Series 2021-FILM, Class C, (1M CME Term SOFR + 1.21%, 1.10% Floor), 6.55%, 8/15/36(b)(c) | | 270,000 | 242,377 |
| Citigroup Commercial Mortgage Trust, Series 2017-P8, Class A3, 3.20%, 9/15/50 | | 250,000 | 223,461 |
| Commercial Mortgage Trust, Series 2015-CR25, Class A4, 3.76%, 8/10/48 | | 260,000 | 248,415 |
| Extended Stay America Trust, | | | |
| Series 2021-ESH, Class C, (1M CME Term SOFR + 1.81%, 1.70% Floor), 7.15%, 7/15/38(b)(c) | | 246,311 | 241,063 |
| Series 2021-ESH, Class E, (1M CME Term SOFR + 2.96%, 2.85% Floor), 8.30%, 7/15/38(b)(c) | | 246,311 | 240,754 |
| GS Mortgage Securities Trust, | | | |
| Series 2015-GC32, Class D, 3.35%, 7/10/48 | | 220,000 | 185,912 |
| Series 2017-GS6, Class A2, 3.16%, 5/10/50 | | 190,517 | 171,644 |
| J.P. Morgan Chase Commercial Mortgage Securities Trust, | | | |
| Series 2022-ACB, Class A, (30D Average SOFR + 1.40%, 1.40% Floor), 6.72%, 3/15/39(b)(c) | | 350,000 | 343,421 |
| Series 2022-ACB, Class D, (30D Average SOFR + 2.90%, 2.90% Floor), 8.22%, 3/15/39(b)(c) | | 190,000 | 180,480 |
|
| JP Morgan Chase Commercial Mortgage Securities Trust, Series 2015-JP1, Class A5, 3.91%, 1/15/49 | | 200,000 | 189,157 |
See accompanying Notes to Financial Statements
Morningstar Funds Trust October 31, 2023 (unaudited)
Schedule of Investments (continued)
Morningstar Global Income Fund
| | | Par (a) | Value |
Commercial Mortgage-Backed Securities
(Continued) |
|
| KREF Ltd., Series 2022-FL3, Class D, (1M CME Term SOFR + 2.80%, 2.80% Floor), 8.13%, 2/17/39(b)(c) | | $150,000 | $ 140,994 |
| MF1 Ltd., Series 2020-FL4, Class A, (1M CME Term SOFR + 1.81%, 1.70% Floor), 7.15%, 11/15/35(b)(c) | | 129,807 | 129,395 |
| MTN Commercial Mortgage Trust, | | | |
| Series 2022-LPFL, Class A, (1M CME Term SOFR + 1.40%, 1.40% Floor), 6.74%, 3/15/39(b)(c) | | 260,000 | 254,149 |
| Series 2022-LPFL, Class F, (1M CME Term SOFR + 5.29%, 5.29% Floor), 10.63%, 3/15/39(b)(c) | | 200,000 | 184,480 |
|
| NCMF Trust, Series 2022-MFP, Class G, (1M CME Term SOFR + 5.13%, 5.13% Floor), 10.46%, 3/15/39(b)(c) | | 195,000 | 185,303 |
| Wells Fargo Commercial Mortgage Trust, Series 2014-LC18, Class B, 3.96%, 12/15/47 | | 190,000 | 175,895 |
| | | | 5,012,570 |
| Whole Loan – 2.8% |
| BRAVO Residential Funding Trust, | | | |
| Series 2022-NQM1, Class A1, 3.63%, 9/25/61(b)(o) | | 189,793 | 169,991 |
| Series 2022-NQM2, Class A1, 4.27%, 11/25/61(b)(o) | | 157,794 | 151,400 |
| Series 2022-NQM2, Class A3, 5.24%, 11/25/61(b) | | 197,242 | 189,103 |
|
| Citigroup Mortgage Loan Trust, Series 2022-A, Class A1, (Step to 9.17% on 9/25/25), 6.17%, 9/25/62(b)(n) | | 228,604 | 226,091 |
| COLT Mortgage Loan Trust, Series 2022-3, Class A1, 3.90%, 2/25/67(b)(o) | | 222,461 | 196,261 |
| CSMC Trust, Series 2020-RPL4, Class A1, 2.00%, 1/25/60(b) | | 203,142 | 170,397 |
| | | Par (a) | Value |
| Whole Loan (Continued) |
| FNMA Connecticut Avenue Securities, | | | |
| Series 2017-C06, Class 1B1, (30D Average SOFR + 4.26%, 4.15% Floor), 9.59%, 2/25/30(c) | | $330,000 | $352,218 |
| Series 2022-R03, Class 1M2, (30D Average SOFR + 3.50%), 8.82%, 3/25/42(b)(c) | | 250,000 | 259,724 |
| Series 2022-R08, Class 1M2, (30D Average SOFR + 3.60%, 3.60% Floor), 8.92%, 7/25/42(b)(c) | | 200,000 | 208,050 |
|
| Freddie Mac STACR Debt Notes, Series 2021-DNA2, Class B1, (30D Average SOFR + 3.40%), 8.72%, 8/25/33(b)(c) | | 270,000 | 275,132 |
| Freddie Mac STACR REMIC Trust, | | | |
| Series 2020-DNA3, Class B1, (30D Average SOFR + 5.21%), 10.54%, 6/25/50(b)(c) | | 152,647 | 165,512 |
| Series 2020-DNA5, Class B1, (30D Average SOFR + 4.80%), 10.12%, 10/25/50(b)(c) | | 180,000 | 194,700 |
| Series 2020-DNA6, Class B1, (30D Average SOFR + 3.00%), 8.32%, 12/25/50(b)(c) | | 260,000 | 260,972 |
| Series 2021-DNA1, Class B2, (30D Average SOFR + 4.75%), 10.07%, 1/25/51(b)(c) | | 240,000 | 234,239 |
| Series 2022-DNA2, Class M2, (30D Average SOFR + 3.75%), 9.07%, 2/25/42(b)(c) | | 225,000 | 228,094 |
| Series 2022-DNA2, Class M1B, (30D Average SOFR + 2.40%), 7.72%, 2/25/42(b)(c) | | 210,000 | 210,393 |
|
| GS Mortgage-Backed Securities Trust, Series 2022-NQM1, Class A4, 4.00%, 5/25/62(b)(o) | | 205,761 | 173,313 |
| Mill City Mortgage Loan Trust, Series 2018-2, Class M3, 3.75%, 5/25/58(b)(o) | | 209,684 | 170,632 |
| New Residential Mortgage Loan Trust, Series 2022-NQM2, Class A1, 3.08%, 3/27/62(b)(o) | | 223,806 | 191,949 |
See accompanying Notes to Financial Statements
Morningstar Funds Trust October 31, 2023 (unaudited)
Schedule of Investments (continued)
Morningstar Global Income Fund
| | | Par (a) | Value |
| Whole Loan (Continued) |
|
| OBX Trust, Series 2022-NQM6, Class A1, (Step to 4.73% on 7/25/26), 4.70%, 7/25/62(b)(n) | | $233,296 | $ 219,237 |
| Residential Mortgage Loan Trust, Series 2020-2, Class A2, 2.51%, 5/25/60(b) | | 360,000 | 339,766 |
| Seasoned Credit Risk Transfer Trust, Series 2022-1, Class M, 4.50%, 11/25/61(b) | | 100,000 | 75,512 |
| SG Residential Mortgage Trust, Series 2022-1, Class A1, 3.17%, 3/27/62(b)(o) | | 231,824 | 197,373 |
| Towd Point Mortgage Trust, | | | |
| Series 2015-5, Class B3, 4.01%, 5/25/55(b)(o) | | 220,000 | 187,776 |
| Series 2017-5, Class B1, (1M CME Term SOFR + 1.91%), 5.51%, 2/25/57(b)(c) | | 250,000 | 244,707 |
| Series 2019-HY2, Class B1, (1M CME Term SOFR + 2.36%, 2.25% Floor), 7.69%, 5/25/58(b)(c) | | 190,000 | 188,883 |
| | | | 5,481,425 |
Total Mortgage-Backed Securities
(Cost $10,807,584) | 10,493,995 |
|
| Term Loans – 8.4%(c) |
| Advertising & Marketing – 0.1% |
| CB Poly US Holdings, Inc., Initial Term Loan, (1M USD CME Term SOFR + 5.50%, 0.75% Floor), 10.82%, 5/18/29 | | 198,000 | 187,704 |
| Aerospace & Defense – 0.4% |
| Barnes Group, Inc., Initial Term Loan, (1M USD CME Term SOFR + 3.00%), 8.42%, 9/03/30 | | 230,000 | 226,934 |
| | | Par (a) | Value |
| Aerospace & Defense (Continued) |
| Vertex Aerospace Services Corp., Initial Term Loan, (1M USD CME Term SOFR + 3.75%, 0.75% Floor), 9.17%, 12/06/28 | | $242,071 | $241,769 |
| WP CPP Holdings LLC, Initial Term Loan, (3M USD CME Term SOFR + 3.75%, 1.00% Floor), 9.29%, 4/30/25 | | 334,125 | 319,209 |
| | | | 787,912 |
| Asset Management – 0.2% |
| Jump Financial LLC, Term Loan, (3M USD CME Term SOFR + 4.50%, 0.50% Floor), 10.15%, 8/07/28 | | 378,658 | 362,565 |
| Osaic Holdings, Inc., Term B-2 Loan, (1M USD CME Term SOFR + 4.50%), 9.82%, 8/17/28 | | 130,000 | 129,253 |
| | | | 491,818 |
| Automotive – 0.1% |
| Clarios Global L.P., Incremental Term Loan, (1M USD CME Term SOFR + 3.75%), 9.07%, 5/06/30 | | 130,000 | 129,675 |
| First Brands Group LLC, 2022-II Incremental Term Loan, (6M USD CME Term SOFR + 5.00%, 1.00% Floor), 10.88%, 3/30/27 | | 139,298 | 137,035 |
| | | | 266,710 |
| Beverages – 0.1% |
| Triton Water Holdings, Inc., Initial Term Loan, (3M USD CME Term SOFR + 3.25%, 0.50% Floor), 8.90%, 3/31/28 | | 232,471 | 219,897 |
| Cable & Satellite – 0.0%(e) |
| Virgin Media Bristol LLC, Facility Y, (6M USD CME Term SOFR + 3.25%), 8.79%, 3/31/31 | | 100,000 | 97,672 |
| Commercial Support Services – 0.6% |
| Allied Universal Holdco LLC, Initial U.S. Dollar Term Loan, (1M USD CME Term SOFR + 3.75%, 0.50% Floor), 9.17%, 5/12/28 | | 196,491 | 186,250 |
See accompanying Notes to Financial Statements
Morningstar Funds Trust October 31, 2023 (unaudited)
Schedule of Investments (continued)
Morningstar Global Income Fund
| | | Par (a) | Value |
| Commercial Support Services (Continued) |
| Allied Universal Holdco LLC, Amendment No. 3 Term Loan, (1M USD CME Term SOFR + 4.75%, 0.50% Floor), 10.07%, 5/12/28 | | $100,000 | $ 96,813 |
| Garda World Security Corp., Term B-2 Loan, (3M USD CME Term SOFR + 4.25%), 9.75%, 10/30/26 | | 360,000 | 358,369 |
| GEO Group, Inc., The Tranche 1 Loan, | | | |
| 3/23/27 (p) | | 229 | 233 |
| (1M USD CME Term SOFR + 7.13%, 0.75% Floor), 12.45%, 3/23/27 | | 127,485 | 129,557 |
|
| LRS Holdings LLC, Initial Term Loan, (1M USD CME Term SOFR + 4.25%, 0.50% Floor), 9.69%, 8/31/28 | | 232,509 | 227,277 |
| Prime Security Services Borrower LLC, 2023 Refinancing Term B-1 Loan, (3M USD CME Term SOFR + 2.50%), 7.83%, 10/13/30 | | 90,000 | 89,775 |
| | | | 1,088,274 |
| Communications – 0.1% |
| Learfield Communications LLC, 2023 Term Loan, 6/30/28(p) | | 140,000 | 133,234 |
| Construction Materials – 0.1% |
| Smyrna Ready Mix Concrete LLC, Initial Term Loan, (1M USD CME Term SOFR + 4.25%, 0.50% Floor), 9.67%, 4/02/29 | | 188,568 | 188,568 |
| Consumer Cyclical – 0.1% |
| Cinemark USA, Inc., Term Loan, | | | |
| (3M USD CME Term SOFR + 3.75%, 0.50% Floor), 9.14%, 5/24/30 | | 81,727 | 81,522 |
| (1M USD CME Term SOFR + 3.75%, 0.50% Floor), 9.07%, 5/24/30 | | 186,923 | 186,456 |
| | | | 267,978 |
| | | Par (a) | Value |
| Consumer Non-Cyclical – 0.1% |
| Topgolf Callaway Brands Corp., Initial Term Loan, (1M USD CME Term SOFR + 3.50%), 8.92%, 3/15/30 | | $149,250 | $148,411 |
| Consumer Services – 0.0%(e) |
| Adtalem Global Education, Inc., Term B Loan, (1M USD CME Term SOFR + 4.00%, 0.75% Floor), 9.44%, 8/12/28 | | 29,125 | 29,074 |
| WW International, Inc., Initial Term Loan, 4/13/28(p) | | 20,000 | 14,133 |
| | | | 43,207 |
| Electrical Equipment – 0.1% |
| EMRLD Borrower L.P., Initial Term B Loan, (1M USD CME Term SOFR + 3.00%), 8.32%, 5/31/30 | | 110,000 | 109,707 |
| Entertainment Content – 0.2% |
| Allen Media LLC, Initial Term Loan, (3M USD CME Term SOFR + 5.50%), 11.04%, 2/10/27 | | 451,805 | 398,153 |
| Health Care Facilities & Services – 0.7% |
| Agiliti Health, Inc., Term Loan, (3M USD CME Term SOFR + 3.00%), 8.39%, 5/01/30 | | 140,000 | 137,900 |
| Cardinal Parent, Inc., Initial Term Loan, (3M USD CME Term SOFR + 4.50%, 0.75% Floor), 10.04%, 11/12/27 | | 239,667 | 217,098 |
| EyeCare Partners LLC, Initial Term Loan, (3M USD CME Term SOFR + 6.75%), 12.39%, 11/15/29 | | 380,000 | 152,000 |
| Gainwell Acquisition Corp., Term B Loan, (3M USD CME Term SOFR + 4.00%, 0.75% Floor), 9.49%, 10/01/27 | | 253,299 | 241,691 |
| LifePoint Health, Inc., 2023 Refinancing Term Loan, (3M USD CME Term SOFR + 5.50%), 14.00%, 11/16/28 | | 301,289 | 284,107 |
See accompanying Notes to Financial Statements
Morningstar Funds Trust October 31, 2023 (unaudited)
Schedule of Investments (continued)
Morningstar Global Income Fund
| | | Par (a) | Value |
| Health Care Facilities & Services (Continued) |
| PDS Holdco, Inc., Delayed Draw Term Loan, (3M USD CME Term SOFR + 4.50%), 10.18%, 8/18/28 | | $ 31,878 | $ 24,207 |
| PDS Holdco, Inc., Initial Term Loan, (3M USD CME Term SOFR + 4.50%), 10.18%, 8/18/28 | | 312,035 | 236,953 |
| | | | 1,293,956 |
| Home & Office Products – 0.1% |
| Hunter Douglas Holding B.V., Tranche B-1 Term Loan, (3M USD CME Term SOFR + 3.50%, 0.50% Floor), 8.89%, 2/26/29 | | 245,625 | 231,656 |
| Industrial Support Services – 0.2% |
| Accession Risk Management Group, Inc., 2023 Delayed Draw Term Loan, | | | |
| 10/30/26 (p)(q) | | 101,201 | 99,935 |
| (3M USD CME Term SOFR + 6.00%, 0.75% Floor), 11.58%, 10/30/26 | | 8,800 | 8,690 |
| PECF USS Intermediate Holding III Corp., Initial Term Loan, | | | |
| (1M USD CME Term SOFR + 4.25%, 0.50% Floor), 9.69%, 12/15/28 | | 1,150 | 866 |
| (3M USD CME Term SOFR + 4.25%, 0.50% Floor), 9.89%, 12/15/28 | | 450,800 | 339,398 |
| | | | 448,889 |
| Institutional Financial Services – 0.7% |
| CTC Holdings L.P., Term Loan, (3M USD CME Term SOFR + 5.00%, 0.50% Floor), 10.34%, 2/20/29 | | 423,401 | 415,992 |
| Hudson River Trading LLC, Term Loan, (1M USD CME Term SOFR + 3.00%), 8.44%, 3/20/28 | | 232,452 | 228,835 |
| Jane Street Group LLC, Dollar Term Loan, (1M USD CME Term SOFR + 2.75%), 8.19%, 1/26/28 | | 422,399 | 421,026 |
| Mercury Borrower, Inc., Initial Term Loan, (1M USD CME Term SOFR + 3.50%, 0.50% Floor), 8.94%, 8/02/28 | | 246,638 | 241,500 |
| | | | 1,307,353 |
| | | Par (a) | Value |
| Insurance – 0.6% |
| Acrisure LLC, 2022 Additional Term Loan, (3M USD CME Term SOFR + 5.75%, 1.00% Floor), 11.12%, 2/15/27 | | $198,500 | $ 198,500 |
| Acrisure LLC, 2021-2 Additional Term Loan, (1M USD Syn LIBOR + 4.25%, 0.50% Floor), 9.69%, 2/15/27 | | 334,050 | 331,404 |
| AssuredPartners, Inc., 2023 Term Loan, 2/12/27(p) | | 120,000 | 119,350 |
| Asurion LLC, New B-4 Term Loan, (1M USD CME Term SOFR + 5.25%), 10.69%, 1/20/29 | | 300,000 | 255,429 |
| Asurion LLC, New B-9 Term Loan, (1M USD CME Term SOFR + 3.25%), 8.69%, 7/31/27 | | 184,389 | 176,014 |
| HIG Finance 2 Ltd., 2023 Term Loan, (1M USD CME Term SOFR + 4.00%, 0.50% Floor), 9.32%, 4/18/30 | | 39,800 | 39,738 |
| Sedgwick Claims Management Services, Inc. (Lightning Cayman Merger Sub, Ltd.), 2023 Term Loan, (1M USD CME Term SOFR + 3.75%), 9.07%, 2/24/28 | | 139,300 | 138,691 |
| | | | 1,259,126 |
| Leisure Facilities & Services – 0.4% |
| 1011778 B.C. Unlimited Liability Co., Term B-5 Loan, (1M USD CME Term SOFR + 2.25%), 7.57%, 9/23/30 | | 130,000 | 128,667 |
| Alterra Mountain Co., Series B-2 Term Loan, (1M USD CME Term SOFR + 3.50%, 0.50% Floor), 8.94%, 8/17/28 | | 451,930 | 451,365 |
| Caesars Entertainment, Inc., Term Loan B, (1M USD CME Term SOFR + 3.25%, 0.50% Floor), 8.67%, 2/06/30 | | 79,600 | 79,213 |
See accompanying Notes to Financial Statements
Morningstar Funds Trust October 31, 2023 (unaudited)
Schedule of Investments (continued)
Morningstar Global Income Fund
| | | Par (a) | Value |
| Leisure Facilities & Services (Continued) |
| Carnival Corp., Initial Advance, (1M USD CME Term SOFR + 3.00%, 0.75% Floor), 8.34%, 8/09/27 | | $ 79,800 | $ 78,304 |
| UFC Holdings LLC, Term B-3 Loan, (3M USD CME Term SOFR + 2.75%, 0.75% Floor), 8.40%, 4/29/26 | | 144,808 | 144,587 |
| | | | 882,136 |
| Leisure Products – 0.3% |
| 19th Holdings Golf LLC, Initial Term Loan, (1M USD CME Term SOFR + 3.25%, 0.50% Floor), 8.68%, 2/07/29 | | 454,250 | 429,266 |
| Hayward Industries, Inc., 2022 Incremental Term Loan, (1M USD CME Term SOFR + 3.25%), 8.67%, 5/30/28 | | 89,100 | 87,764 |
| | | | 517,030 |
| Machinery – 0.1% |
| SPX Flow, Inc., Term Loan, (1M USD CME Term SOFR + 4.50%, 0.50% Floor), 9.92%, 4/05/29 | | 243,996 | 241,556 |
| Medical Equipment & Devices – 0.1% |
| Sotera Health Holdings LLC, Term Loan, (1M USD CME Term SOFR + 3.75%, 0.50% Floor), 9.09%, 12/11/26 | | 139,650 | 139,301 |
| Retail - Discretionary – 0.5% |
| Great Outdoors Group LLC, Term B-2 Loan, (3M USD CME Term SOFR + 3.75%, 0.75% Floor), 9.40%, 3/06/28 | | 343,860 | 340,779 |
| Harbor Freight Tools USA, Inc., Initial Loan, (1M USD CME Term SOFR + 2.75%, 0.50% Floor), 8.19%, 10/19/27 | | 278,564 | 274,762 |
| Leslie's Poolmart, Inc., Initial Term Loan, (1M USD CME Term SOFR + 2.75%, 0.50% Floor), 8.19%, 3/09/28 | | 232,096 | 225,906 |
| | | Par (a) | Value |
| Retail - Discretionary (Continued) |
| Michaels Companies, Inc., The Term B Loan, (3M USD CME Term SOFR + 4.25%), 9.90%, 4/15/28 | | $ 20,000 | $ 16,655 |
| Peer Holding III B.V., Term Loan B4, 10/19/30(p) | | 120,000 | 119,438 |
| | | | 977,540 |
| Software – 0.9% |
| athenahealth Group, Inc., Initial Term Loan, (1M USD CME Term SOFR + 3.25%, 0.50% Floor), 8.58%, 2/15/29 | | 44,655 | 43,196 |
| Cloudera, Inc., Initial Term Loan, | | | |
| (1M USD CME Term SOFR + 3.75%, 0.50% Floor), 9.17%, 10/08/28 | | 232,508 | 223,401 |
| (1M USD CME Term SOFR + 6.00%), 11.42%, 10/08/29 | | 50,000 | 44,729 |
|
| DCert Buyer, Inc., First Amendment Refinancing Loan, (1M USD CME Term SOFR + 7.00%), 12.32%, 2/19/29 | | 340,000 | 303,168 |
| DCert Buyer, Inc., Initial Term Loan, (1M USD CME Term SOFR + 4.00%), 9.32%, 10/16/26 | | 313,925 | 307,793 |
| Magenta Buyer LLC, Initial Term Loan, | | | |
| (3M USD CME Term SOFR + 5.00%, 0.75% Floor), 10.64%, 7/27/28 | | 133,714 | 93,599 |
| (3M USD CME Term SOFR + 8.25%, 0.75% Floor), 13.89%, 7/27/29 | | 300,000 | 129,000 |
|
| MRI Software LLC, Closing Date Term Loan, (3M USD CME Term SOFR + 5.50%, 1.00% Floor), 10.99%, 2/10/26 | | 129,144 | 126,238 |
| MRI Software LLC, Second Amendment Term Loan, (3M USD CME Term SOFR + 5.50%, 1.00% Floor), 10.99%, 2/10/26 | | 39,855 | 38,959 |
| Planview Parent, Inc., Closing Date Term Loan, (3M USD CME Term SOFR + 4.00%, 0.75% Floor), 9.65%, 12/17/27 | | 219,002 | 214,896 |
| Project Alpha Intermediate Holding, Inc., Initial Term Loan, 10/28/30(p) | | 150,000 | 145,383 |
| | | | 1,670,362 |
See accompanying Notes to Financial Statements
Morningstar Funds Trust October 31, 2023 (unaudited)
Schedule of Investments (continued)
Morningstar Global Income Fund
| | | Par (a) | Value |
| Specialty Finance – 0.2% |
| Apollo Commercial Real Estate Finance, Inc., Initial Term Loan, (1M USD CME Term SOFR + 2.75%), 8.19%, 5/15/26 | | $ 74,697 | $ 72,083 |
| Greystone Select Financial LLC, Initial Term Loan, (3M USD CME Term SOFR + 5.00%), 10.66%, 6/16/28 | | 251,887 | 243,700 |
| | | | 315,783 |
| Technology Services – 1.0% |
| Amentum Government Services Holdings LLC, Tranche 1 Term Loan, (1M USD CME Term SOFR + 4.00%), 9.44%, 1/29/27 | | 451,827 | 442,791 |
| Evertec Group LLC, Term Loan B, 10/12/30(p) | | 80,000 | 80,000 |
| GTCR W Merger Sub LLC, Term Loan B, 9/20/30(p) | | 100,000 | 99,208 |
| MPH Acquisition Holdings LLC, Initial Term Loan, (3M USD CME Term SOFR + 4.25%, 0.50% Floor), 9.92%, 9/01/28 | | 139,644 | 129,326 |
| Neptune BidCo US, Inc., Term A Loan, (3M USD CME Term SOFR + 4.75%, 0.50% Floor), 10.26%, 10/11/28 | | 248,750 | 214,858 |
| UST Global, Inc., Initial Term Loan, (1M USD CME Term SOFR + 3.50%), 8.93%, 11/20/28 | | 451,950 | 448,560 |
| Verscend Holding Corp., Term B-1 Loan, (1M USD CME Term SOFR + 4.00%), 9.44%, 8/27/25 | | 461,694 | 461,020 |
| | | | 1,875,763 |
| Telecommunications – 0.1% |
| R.R. Donnelley & Sons Co., 2023 Replacement Term Loan, (1M USD CME Term SOFR + 7.25%, 0.75% Floor), 12.67%, 3/17/28 | | 215,444 | 214,690 |
| Transportation & Logistics – 0.3% |
| Brown Group Holding LLC, Incremental Term B-2 Facility, | | | |
| (3M USD CME Term SOFR + 3.75%, 0.50% Floor), 9.17%, 7/02/29 | | 7,525 | 7,502 |
| (3M USD CME Term SOFR + 3.75%, 0.50% Floor), 9.13%, 7/02/29 | | 15,858 | 15,809 |
| | | Par (a) | Value |
| Transportation & Logistics (Continued) |
| Brown Group Holding LLC, Incremental Term B-2 Facility, | | | |
| (1M USD CME Term SOFR + 3.75%, 0.50% Floor), 9.07%, 7/02/29 | | $ 6,466 | $ 6,446 |
|
| Brown Group Holding LLC, Initial Term Loan, (1M USD CME Term SOFR + 2.75%, 0.50% Floor), 8.17%, 6/07/28 | | 304,179 | 298,347 |
| WWEX UNI TopCo Holdings LLC, Initial Term Loan, (3M USD CME Term SOFR + 4.00%, 0.75% Floor), 9.65%, 7/26/28 | | 243,541 | 232,506 |
| | | | 560,610 |
Total Term Loans
(Cost $17,283,727) | 16,364,996 |
| | | Number
of Shares | |
| Investment Companies – 8.1% |
| Schwab Short-Term U.S. Treasury ETF | | 214,601 | 10,277,242 |
| Vanguard Long-Term Treasury ETF(f) | | 103,063 | 5,422,144 |
Total Investment Companies
(Cost $19,197,101) | 15,699,386 |
| | | Par (a)/Number
of Shares | |
| Short-Term Investments – 8.8% |
| Corporate Bonds – 0.7% |
| Aspen Insurance Holdings Ltd., 4.65%, 11/15/23 | | 10,000 | 9,991 |
|
| Comerica Bank, 2.50%, 7/23/24 | | 510,000 | 490,050 |
|
| CSC Holdings LLC, 5.25%, 6/01/24(f) | | 320,000 | 299,207 |
|
| Las Vegas Sands Corp., 3.20%, 8/08/24 | | 280,000 | 272,455 |
|
| Plains All American Pipeline L.P., (3M CME Term SOFR + 4.37%), 9.74%, 12/04/23(c)(l) | | 180,000 | 169,148 |
|
| QVC, Inc., 4.85%, 4/01/24 | | 140,000 | 134,319 |
| | | | 1,375,170 |
See accompanying Notes to Financial Statements
Morningstar Funds Trust October 31, 2023 (unaudited)
Schedule of Investments (continued)
Morningstar Global Income Fund
| | | Par (a)/Number
of Shares | Value |
| Foreign Issuer Bonds – 0.7% |
| Credit Suisse A.G., 4.75%, 8/09/24 | | 260,000 | $ 256,565 |
|
| Global Aircraft Leasing Co. Ltd., (100% Cash), 6.50%, 9/15/24(b)(k) | | 259,062 | 234,118 |
|
| UBS Group A.G., (5Y USD Swap Rate + 4.34%), 7.00%, 1/31/24(b)(l)(m) | | 500,000 | 495,792 |
|
| Wynn Macau Ltd., 4.88%, 10/01/24(b)(f) | | 480,000 | 466,309 |
| | | | 1,452,784 |
| Money Market Funds – 7.4% |
| Northern Institutional Funds - Liquid Assets Portfolio (Shares), 5.41%(r)(s) | | 4,901,136 | 4,901,136 |
|
| Northern Institutional Funds - Treasury Portfolio (Premier), 5.21%(r) | | 9,481,127 | 9,481,127 |
| | | | 14,382,263 |
Total Short-Term Investments
(Cost $17,219,128) | 17,210,217 |
Number of
Contracts | Notional
Amount | |
| Purchased Options – 0.0%(e) |
| Call Options - Exchange Traded – 0.0%(e) |
| 10-Year U.S. Treasury Note Future, Strike Price USD 118.50, Expires 12/22/23 | 1 | 106,453 | 31 |
| 3-Month SOFR Future, Strike Price USD 99.25, Expires 12/15/23 | 2 | 472,800 | 13 |
| 5-Year U.S. Treasury Note Future, Strike Price USD 104.50, Expires 11/24/23 | 11 | 1,149,243 | 6,016 |
| | | | 6,060 |
Number of
Contracts | Notional
Amount | Value |
| Put Options - Over the Counter – 0.0%(e) |
| Canadian Dollar vs. U.S. Dollar, Strike Price CAD 1.33, Expires 11/09/23, Counterparty: BNP Paribas | 1 | $1,020,000 | $ — |
| U.S. Dollar vs. Euro, Strike Price USD 1.06, Expires 02/05/24, Counterparty: JPMorgan Chase | 1 | 456,193 (t) | 5,333 |
| U.S. Dollar vs. Euro, Strike Price USD 1.06, Expires 02/05/24, Counterparty: Citibank | 1 | 58,067 (t) | 679 |
| | | | 6,012 |
Total Purchased Options
(Premiums Paid $22,356) | 12,072 |
Total Investments – 101.7%
(Cost $209,235,924) | 198,118,516 |
| Liabilities less Other Assets – (1.7)%(u) | (3,405,769) |
| NET ASSETS – 100.0% | $194,712,747 |
| Percentages shown are based on Net Assets. |
| All securities are United States companies, unless noted otherwise in parentheses. |
| (a) | Par value is in USD unless otherwise indicated. | | |
| (b) | Securities exempt from registration under Rule 144A of the Securities Act of 1933. These securities may be resold in transactions exempt from registration, normally to qualified institutional buyers. | | |
| (c) | Variable or floating rate security. Rate as of October 31, 2023 is disclosed. | | |
| (d) | When-Issued Security. Coupon rate was not yet in effect at October 31, 2023. | | |
| (e) | Amount rounds to less than 0.05%. | | |
| (f) | Security either partially or fully on loan. (See Note 7). | | |
| (g) | Security sold outside United States without registration under the Securities Act of 1933. | | |
| (h) | Investment is valued using significant unobservable inputs (Level 3). (See Note 4 regarding investments in Russian securities). | | |
See accompanying Notes to Financial Statements
Morningstar Funds Trust October 31, 2023 (unaudited)
Schedule of Investments (continued)
Morningstar Global Income Fund
| (i) | Zero coupon bond. | | |
| (j) | Issuer has defaulted on terms of debt obligation. Income is not being accrued. | | |
| (k) | Distributions from this security are made via payments in-kind (PIK) unless otherwise noted in the description. | | |
| (l) | Perpetual bond. Maturity date represents next call date. | | |
| (m) | Variable rate security. Security issued at a fixed coupon rate, which converts to a variable rate at a future date. Rate as of October 31, 2023 is disclosed. | | |
| (n) | Step coupon bond. Rate as of October 31, 2023 is disclosed. | | |
| (o) | Variable or floating rate security, the interest rate of which adjusts periodically based on changes in current interest rates and prepayments on the underlying pool of assets. Rate as of October 31, 2023 is disclosed. | | |
| (p) | Position is unsettled. Contract rate was not determined at October 31, 2023 and does not take effect until settlement date. | | |
| (q) | Unfunded loan commitment. As of October 31, 2023, total value of unfunded loan commitment is $99,935. | | |
| (r) | 7-day current yield as of October 31, 2023 is disclosed. | | |
| (s) | Security purchased with the cash proceeds from securities loaned. (See Note 7). | | |
| (t) | The notional amount is EUR. | | |
| (u) | Includes appreciation/(depreciation) on forward foreign currency exchange, futures and swap contracts. | | |
| * | Non-Income Producing Security | | |
| 1M | 1 Month |
| 1Y | 1 Year |
| 3M | 3 Month |
| 5Y | 5 Year |
| 6M | 6 Month |
| 10Y | 10 Year |
| 30D | 30 Day |
| ABS | Asset-Backed Security |
| ADR | American Depositary Receipt |
| AUD | Australian Dollar |
| BANXICO | Banco de Mexico |
| BRL | Brazilian Real |
| BZDIO | Brazil Interbank Rate |
| CAD | Canadian Dollar |
| CDO | Collateralized Debt Obligation |
| CLO | Collateralized Loan Obligation |
| CME | Chicago Mercantile Exchange |
| CMT | Constant Maturity |
| ETF | Exchange-Traded Fund |
| EUR | Euro |
| FNMA | Federal National Mortgage Association |
| Freddie Mac | Federal Home Loan Mortgage Corporation |
| GBP | British Pound |
| IDR | Indonesian Rupiah |
| INR | Indian Rupee |
| JMD | Jamaica Dollar |
| JSC | Joint Stock Company |
| L.P. | Limited Partnership |
| LIBOR | London Interbank Offered Rate |
| LLC | Limited Liability Company |
| MTN | Medium Term Note |
| MXN | Mexican Peso |
| PJSC | Public Joint Stock Company |
| PLC | Public Limited Company |
| REMIC | Real Estate Mortgage Investment Conduit |
| SASU | Société par Actions Simplifiée Unipersonnelle |
See accompanying Notes to Financial Statements
Morningstar Funds Trust October 31, 2023 (unaudited)
Schedule of Investments (continued)
Morningstar Global Income Fund
| SOFR | United States Secured Overnight Financing Rate |
| SONIA | Sterling Overnight Index Average |
| STACR | Structured Agency Credit Risk |
| TIIE | Tasa de Interés Interbancaria de Equilibrio |
| USD | United States Dollar |
| UYU | Uruguay Peso |
| Concentration by Currency (%)(a) | |
| U.S. Dollar | 67.1 |
| Euro | 5.1 |
| All other currencies less than 5% | 27.8 |
| Total | 100.0 |
| (a) Percentages shown are based on Net Assets. | |
| Country Diversification (%)(a) | |
| United States | 54.9 |
| All other countries less than 5%(b) | 45.1 |
| Total | 100.0 |
| (a) Percentages shown are based on Net Assets. |
| (b) Includes Other. |
Futures Contracts outstanding at October 31, 2023:
Exchange Traded |
| | | | | | |
| Description | Number of
Contracts | Expiration
Date | Trading
Currency | Notional
Amount | Value/
Unrealized
Appreciation
(Depreciation) |
| Long Contracts | | | | | |
| Euro-Bund | 20 | 12/07/2023 | EUR | 2,729,686 | $ 36,660 |
| 10-Year Australian Treasury Bond | 8 | 12/15/2023 | AUD | 549,320 | (35,860) |
| 10-Year U.S. Treasury Note | 75 | 12/19/2023 | USD | 7,962,891 | (274,741) |
| U.S. Treasury Long Bond | 34 | 12/19/2023 | USD | 3,720,875 | (340,013) |
| Ultra U.S. Treasury Bond | 32 | 12/19/2023 | USD | 3,602,000 | (435,456) |
| 3-Month SONIA | 37 | 12/20/2023 | GBP | 10,654,909 | (61,182) |
| Long Gilt | 8 | 12/27/2023 | GBP | 905,851 | (14,237) |
| 2-Year U.S. Treasury Note | 67 | 12/29/2023 | USD | 13,562,266 | (59,771) |
| 5-Year U.S. Treasury Note | 78 | 12/29/2023 | USD | 8,149,172 | (158,257) |
| 3-Month SONIA | 12 | 3/20/2024 | GBP | 3,453,276 | 31,988 |
| 3-Month SONIA | 13 | 9/18/2024 | GBP | 3,748,357 | 20,647 |
| CME 3-Month SOFR | 17 | 3/18/2025 | USD | 4,052,587 | (53,887) |
| Total Long Contracts | | | | | $(1,344,109) |
| Short Contracts | | | | | |
| CME 3-Month SOFR | (28) | 3/19/2024 | USD | 6,619,200 | $ 42,200 |
| 10-Year U.S. Treasury Note | (7) | 6/18/2024 | USD | 1,655,938 | (887) |
| Total Short Contracts | | | | | $ 41,313 |
| | | | | | $(1,302,796) |
See accompanying Notes to Financial Statements
Morningstar Funds Trust October 31, 2023 (unaudited)
Schedule of Investments (continued)
Morningstar Global Income Fund
| Forward Foreign Currency Exchange Contracts outstanding at October 31, 2023: |
| | | | | | | |
Settlement
Date | Currency
Purchased | Amount
of Currency
Purchased | Currency
Sold | Amount
of Currency
Sold | Counterparty | Unrealized
Appreciation
(Depreciation) |
| | | | | | | |
| 11/09/23 | U.S. Dollars | 357,000 | Canadian Dollars | 480,236 | BNP Paribas | $ 10,654 |
| 1/19/24 | U.S. Dollars | 384,731 | Indonesian Rupiahs | 6,031,820,000 | JPMorgan Chase | 6,597 |
| 1/19/24 | U.S. Dollars | 247,306 | Canadian Dollars | 336,270 | BNP Paribas | 4,463 |
| 11/13/23 | Brazilian Reals | 1,200,000 | U.S. Dollars | 233,909 | Goldman Sachs | 3,714 |
| 1/19/24 | Mexican Pesos | 7,640,000 | U.S. Dollars | 414,267 | JPMorgan Chase | 3,619 |
| 1/19/24 | U.S. Dollars | 560,483 | British Pounds | 458,576 | BNP Paribas | 2,733 |
| 1/19/24 | Mexican Pesos | 4,480,000 | U.S. Dollars | 242,327 | Goldman Sachs | 2,717 |
| 1/19/24 | Brazilian Reals | 320,000 | U.S. Dollars | 62,499 | Morgan Stanley | 365 |
| 11/16/23 | Brazilian Reals | 820,000 | U.S. Dollars | 162,023 | Goldman Sachs | 291 |
| 1/19/24 | U.S. Dollars | 180,660 | Euro | 170,000 | BNP Paribas | 80 |
| Total Unrealized Appreciation | $ 35,233 |
| | | | | | | |
| 1/19/24 | U.S. Dollars | 146,308 | Euro | 138,000 | BNP Paribas | $ (281) |
| 1/19/24 | British Pounds | 242,411 | U.S. Dollars | 295,580 | BNP Paribas | (744) |
| 1/19/24 | Australian Dollars | 2,716,409 | U.S. Dollars | 1,728,634 | BNP Paribas | (826) |
| 1/19/24 | Mexican Pesos | 3,400,000 | U.S. Dollars | 187,332 | Goldman Sachs | (1,361) |
| 1/19/24 | U.S. Dollars | 426,369 | Mexican Pesos | 7,829,971 | JPMorgan Chase | (1,909) |
| 1/19/24 | Canadian Dollars | 400,000 | U.S. Dollars | 292,781 | Morgan Stanley | (3,915) |
| 1/19/24 | Norwegian Kroner | 3,761,171 | U.S. Dollars | 349,306 | Morgan Stanley | (11,829) |
| 1/19/24 | Japanese Yen | 127,275,808 | U.S. Dollars | 863,905 | Morgan Stanley | (12,605) |
| 1/19/24 | Canadian Dollars | 1,289,453 | U.S. Dollars | 946,742 | Goldman Sachs | (15,544) |
| Total Unrealized Depreciation | $ (49,014) |
| Net Unrealized Depreciation | $(13,781) |
Interest Rate Swap Contracts outstanding at October 31, 2023:
Centrally Cleared |
| | | | | | | | |
Pay Rate Index/
Pay Rate | Receive Rate Index/
Receive Rate | Maturity
Date | | Notional
Amount | Value | Upfront
Premiums
Paid
(Received) | Unrealized
Appreciation
(Depreciation) |
| 28-Day MXN-TIIE-BANXICO (Monthly) | 8.97% (Monthly) | 3/1/2030 | MXN | 27,411,000 | $ (50,497) | $ — | $ (50,497) |
| 2.60% (Annually) | 2-Day USD SOFR (Annually) | 2/15/2048 | USD | 168,000 | 47,969 | 19,894 | 28,075 |
| 3.05% (Annually) | 2-Day USD SOFR (Annually) | 2/15/2048 | USD | 964,000 | 208,375 | 37,136 | 171,239 |
| 3.15% (Annually) | 2-Day USD SOFR (Annually) | 5/15/2048 | USD | 979,000 | 192,682 | 8 | 192,674 |
| Total | | | | | $398,529 | $57,038 | $341,491 |
See accompanying Notes to Financial Statements
Morningstar Funds Trust October 31, 2023 (unaudited)
Schedule of Investments (continued)
Morningstar Global Income Fund
Interest Rate Swap Contracts outstanding at October 31, 2023:
Over the Counter |
| | | | | | | | | |
Pay Rate Index/
Pay Rate | Receive Rate Index/
Receive Rate | Counterparty | Maturity
Date | | Notional
Amount | Value | Upfront
Premiums
Paid
(Received) | Unrealized
Appreciation
(Depreciation) |
| 1-Day BRL BZDIO (At Maturity) | 10.23% (At Maturity) | JPMorgan Chase | 1/2/2029 | BRL | 4,416,982 | $ (58,731) | $— | $ (58,731) |
| Total | | | | | | $(58,731) | $— | $(58,731) |
Valuation Hierarchy
The following is a summary of the inputs used, as of October 31, 2023, in valuing the Fund's investments carried at fair value:
| Morningstar Global Income Fund | Level 1 | Level 2 | Level 3 | Totals |
| Investments | | | | |
| Assets: | | | | |
| Asset-Backed Securities | $ — | $ 9,039,516 | $— | $ 9,039,516 |
| Common Stocks | 43,001,039 | 39,514,154 | —* | 82,515,193 |
| Convertible Bonds | — | 191,794 | — | 191,794 |
| Corporate Bonds | — | 26,761,850 | — | 26,761,850 |
| Foreign Issuer Bonds | — | 12,073,821 | — | 12,073,821 |
| Master Limited Partnerships | 7,755,676 | — | — | 7,755,676 |
| Mortgage-Backed Securities | — | 10,493,995 | — | 10,493,995 |
| Term Loans | — | 16,364,996 | — | 16,364,996 |
| Investment Companies | 15,699,386 | — | — | 15,699,386 |
| Short-Term Investments | 14,382,263 | 2,827,954 | — | 17,210,217 |
| Purchased Options | 6,060 | 6,012 | — | 12,072 |
| Total Investments | $80,844,424 | $117,274,092 | $— | $198,118,516 |
| *Includes securities determined to have no value as of October 31, 2023. |
| Morningstar Global Income Fund | Level 1 | Level 2 | Level 3 | Totals |
| Derivative Financial Instruments | | | | |
| Assets: | | | | |
| Futures Contracts | $ 131,495 | $ — | $— | $ 131,495 |
| Forward Foreign Currency Exchange Contracts | — | 35,233 | — | 35,233 |
| Swap Agreements | — | 449,026 | — | 449,026 |
| Total Assets - Derivative Financial Instruments | $ 131,495 | $484,259 | $— | $ 615,754 |
| Liabilities: | | | | |
| Futures Contracts | $(1,434,291) | $ — | $— | $(1,434,291) |
See accompanying Notes to Financial Statements
Morningstar Funds Trust October 31, 2023 (unaudited)
Schedule of Investments (continued)
Morningstar Global Income Fund
| Morningstar Global Income Fund | Level 1 | Level 2 | Level 3 | Totals |
| Forward Foreign Currency Exchange Contracts | $ — | $ (49,014) | $— | $ (49,014) |
| Swap Agreements | — | (109,228) | — | (109,228) |
| Total Liabilities - Derivative Financial Instruments | $(1,434,291) | $(158,242) | $— | $(1,592,533) |
| Net Derivative Financial Instruments | $(1,302,796) | $ 326,017 | $— | $ (976,779) |
See accompanying Notes to Financial Statements
Morningstar Funds Trust October 31, 2023 (unaudited)
Morningstar Total Return Bond Fund
| | | Par (a) | Value |
| Long Positions – 109.6% |
| Asset-Backed Securities – 4.4% |
| Other – 4.3% |
| 522 Funding CLO Ltd., Series 2020-6A, Class A1R, (3M CME Term SOFR + 1.41%, 1.15% Floor), 6.82%, 10/23/34(b)(c) | | $610,000 | $602,070 |
| AB BSL CLO 4 Ltd., Series 2023-4A, Class A, (3M CME Term SOFR + 2.00%, 2.00% Floor), 7.42%, 4/20/36(b)(c) | | 100,000 | 100,694 |
| ABPCI Direct Lending Fund CLO X L.P., Series 2020-10A, Class A1A, (3M CME Term SOFR + 2.21%, 1.95% Floor), 7.54%, 1/20/32(b)(c) | | 400,000 | 397,380 |
| AGL CLO 13 Ltd., Series 2021-13A, Class A1, (3M CME Term SOFR + 1.42%, 1.16% Floor), 6.84%, 10/20/34(b)(c) | | 250,000 | 248,288 |
| AIMCO CLO, Series 2017-AA, Class AR, (3M CME Term SOFR + 1.31%, 1.05% Floor), 6.73%, 4/20/34(b)(c) | | 270,000 | 266,428 |
| Allegro CLO VII Ltd., Series 2018-1A, Class A, (3M CME Term SOFR + 1.36%, 1.10% Floor), 6.76%, 6/13/31(b)(c) | | 237,832 | 236,980 |
| AMMC CLO Ltd., Series 2017-21A, Class A, (3M CME Term SOFR + 1.51%), 6.89%, 11/02/30(b)(c) | | 225,362 | 224,826 |
| Anchorage Capital CLO Ltd., Series 2013-1A, Class A1R, (3M CME Term SOFR + 1.51%), 6.91%, 10/13/30(b)(c) | | 325,923 | 325,000 |
| Ares Loan Funding IV Ltd., Series 2023-ALF4A, Class A1, (3M CME Term SOFR + 1.75%, 1.75% Floor), 7.12%, 10/15/36(b)(c)(d) | | 630,000 | 629,774 |
| Ares LXIII CLO Ltd., Series 2022-63A, Class A1A, (3M CME Term SOFR + 1.38%, 1.38% Floor), 6.80%, 4/20/35(b)(c) | | 540,000 | 535,889 |
| | | Par (a) | Value |
| Other (Continued) |
| Ares XLII CLO Ltd., Series 2017-42A, Class BR, (3M CME Term SOFR + 1.76%, 1.50% Floor), 7.17%, 1/22/28(b)(c) | | $500,000 | $495,675 |
| ARES XLIV CLO Ltd., Series 2017-44A, Class A1R, (3M CME Term SOFR + 1.34%, 1.08% Floor), 6.74%, 4/15/34(b)(c) | | 460,000 | 456,559 |
| Atrium IX, Series 9A, Class AR2, (3M CME Term SOFR + 1.25%, 0.99% Floor), 6.64%, 5/28/30(b)(c) | | 517,620 | 515,558 |
| Avis Budget Rental Car Funding AESOP LLC, Series 2021-1A, Class A, 1.38%, 8/20/27(b) | | 770,000 | 679,349 |
| Ballyrock CLO Ltd., Series 2019-2A, Class A1BR, (3M CME Term SOFR + 1.46%, 1.20% Floor), 6.84%, 11/20/30(b)(c) | | 250,000 | 247,142 |
| Benefit Street Partners CLO V-B Ltd., Series 2018-5BA, Class A1A, (3M CME Term SOFR + 1.35%), 6.77%, 4/20/31(b)(c) | | 240,958 | 240,627 |
| Birch Grove CLO 7 Ltd., Series 2023-7A, Class A1, (3M CME Term SOFR + 1.80%), 7.17%, 10/20/36(b)(c)(d) | | 270,000 | 270,000 |
| BlueMountain CLO Ltd., | | | |
| Series 2013-2A, Class A1R, (3M CME Term SOFR + 1.44%), 6.85%, 10/22/30(b)(c) | | 172,646 | 171,951 |
| Series 2015-3A, Class A1R, (3M CME Term SOFR + 1.26%), 6.68%, 4/20/31(b)(c) | | 223,746 | 223,290 |
|
| BlueMountain Fuji U.S. CLO I Ltd., Series 2017-1A, Class A1R, (3M CME Term SOFR + 1.24%, 0.98% Floor), 6.66%, 7/20/29(b)(c) | | 215,381 | 214,308 |
| BlueMountain Fuji U.S. CLO II Ltd., Series 2017-2A, Class A1AR, (3M CME Term SOFR + 1.26%), 6.68%, 10/20/30(b)(c) | | 221,345 | 220,454 |
See accompanying Notes to Financial Statements
Morningstar Funds Trust October 31, 2023 (unaudited)
Schedule of Investments (continued)
Morningstar Total Return Bond Fund
| | | Par (a) | Value |
| Other (Continued) |
|
| Brightwood Capital MM CLO Ltd., Series 2023-1A, Class A1A, (3M CME Term SOFR + 2.75%, 2.75% Floor), 8.15%, 10/15/35(b)(c) | | $320,000 | $319,923 |
| Carbone CLO Ltd., Series 2017-1A, Class A1, (3M CME Term SOFR + 1.40%), 6.82%, 1/20/31(b)(c) | | 217,291 | 216,680 |
| Carlyle Global Market Strategies CLO Ltd., | | | |
| Series 2014-1A, Class A1R2, (3M CME Term SOFR + 1.23%, 0.97% Floor), 6.63%, 4/17/31(b)(c) | | 237,941 | 237,007 |
| Series 2014-2RA, Class A1, (3M CME Term SOFR + 1.31%), 6.68%, 5/15/31(b)(c) | | 726,750 | 724,093 |
| Series 2014-3RA, Class A1A, (3M CME Term SOFR + 1.31%), 6.70%, 7/27/31(b)(c) | | 467,666 | 466,420 |
|
| Cascade MH Asset Trust, Series 2021-MH1, Class A1, 1.75%, 2/25/46(b) | | 117,499 | 97,873 |
| Cayuga Park CLO Ltd., Series 2020-1A, Class AR, (3M CME Term SOFR + 1.38%, 1.38% Floor), 6.78%, 7/17/34(b)(c) | | 690,000 | 685,013 |
| CIFC Funding Ltd., | | | |
| Series 2013-3RA, Class A1, (3M CME Term SOFR + 1.24%, 0.98% Floor), 6.64%, 4/24/31(b)(c) | | 247,052 | 246,032 |
| Series 2014-2RA, Class A1, (3M CME Term SOFR + 1.31%, 1.05% Floor), 6.71%, 4/24/30(b)(c) | | 199,294 | 198,764 |
| Series 2015-3A, Class AR, (3M CME Term SOFR + 1.13%), 6.53%, 4/19/29(b)(c) | | 179,916 | 179,499 |
| Series 2017-3A, Class A1, (3M CME Term SOFR + 1.48%), 6.90%, 7/20/30(b)(c) | | 205,172 | 204,751 |
| | | Par (a) | Value |
| Other (Continued) |
| CIFC Funding Ltd., | | | |
| Series 2017-4A, Class A1R, (3M CME Term SOFR + 1.21%, 0.95% Floor), 6.61%, 10/24/30(b)(c) | | $210,931 | $210,354 |
| Series 2017-5A, Class A1, (3M CME Term SOFR + 1.44%), 6.84%, 11/16/30(b)(c) | | 222,276 | 221,685 |
|
| Citigroup Mortgage Loan Trust, Inc., Series 2007-WFH4, Class M3A, (1M CME Term SOFR + 2.61%, 2.50% Floor), 7.94%, 7/25/37(c) | | 500,000 | 452,814 |
| CLI Funding VIII LLC, Series 2023-1A, Class A, 6.31%, 6/18/48(b) | | 289,853 | 284,978 |
| Dewolf Park CLO Ltd., Series 2017-1A, Class AR, (3M CME Term SOFR + 1.18%, 0.90% Floor), 6.58%, 10/15/30(b)(c) | | 237,955 | 236,910 |
| Dryden 87 CLO Ltd., Series 2021-87A, Class A1, (3M CME Term SOFR + 1.36%, 1.10% Floor), 6.74%, 5/20/34(b)(c) | | 770,000 | 764,577 |
| Dryden XXVI Senior Loan Fund, Series 2013-26A, Class AR, (3M CME Term SOFR + 1.16%), 6.56%, 4/15/29(b)(c) | | 184,457 | 183,940 |
| Elmwood CLO IV Ltd., Series 2020-1A, Class A, (3M CME Term SOFR + 1.50%, 1.24% Floor), 6.90%, 4/15/33(b)(c) | | 290,000 | 289,188 |
| Enterprise Fleet Financing LLC, Series 2023-1, Class A2, 5.51%, 1/22/29(b) | | 360,000 | 356,840 |
| First Franklin Mortgage Loan Trust, | | | |
| Series 2003-FF4, Class M1, (1M CME Term SOFR + 1.91%, 1.80% Floor), 7.23%, 10/25/33(c) | | 237,784 | 221,215 |
| Series 2006-FF13, Class A1, (1M CME Term SOFR + 0.35%, 0.24% Floor), 5.68%, 10/25/36(c) | | 27,559 | 17,727 |
See accompanying Notes to Financial Statements
Morningstar Funds Trust October 31, 2023 (unaudited)
Schedule of Investments (continued)
Morningstar Total Return Bond Fund
| | | Par (a) | Value |
| Other (Continued) |
| First Franklin Mortgage Loan Trust, | | | |
| Series 2006-FF13, Class A2C, (1M CME Term SOFR + 0.43%, 0.32% Floor), 5.76%, 10/25/36(c) | | $ 16,079 | $ 10,070 |
|
| Flatiron CLO 17 Ltd., Series 2017-1A, Class AR, (3M CME Term SOFR + 1.24%, 0.98% Floor), 6.61%, 5/15/30(b)(c) | | 170,643 | 169,563 |
| Ford Credit Auto Owner Trust, Series 2023-1, Class A, 4.85%, 8/15/35(b) | | 830,000 | 790,358 |
| Generate CLO 2 Ltd., Series 2015-1A, Class AR, (3M CME Term SOFR + 1.41%, 1.15% Floor), 6.82%, 1/22/31(b)(c) | | 232,342 | 231,776 |
| GoldentTree Loan Management U.S. CLO 1 Ltd., Series 2021-11A, Class A, (3M CME Term SOFR + 1.39%, 1.13% Floor), 6.81%, 10/20/34(b)(c) | | 300,000 | 296,816 |
| Golub Capital Partners CLO Ltd., Series 2015-25A, Class AR, (3M CME Term SOFR + 1.64%, 1.38% Floor), 7.01%, 5/05/30(b)(c) | | 227,478 | 225,510 |
| GSAA Home Equity Trust, Series 2006-4, Class 1A1, 3.66%, 3/25/36(e) | | 44,355 | 29,675 |
| Hardee's Funding LLC, Series 2021-1A, Class A2, 2.87%, 6/20/51(b) | | 410,550 | 320,679 |
| Hertz Vehicle Financing LLC, | | | |
| Series 2021-1A, Class A, 1.21%, 12/26/25(b) | | 630,000 | 600,366 |
| Series 2021-1A, Class C, 2.05%, 12/26/25(b) | | 420,000 | 399,585 |
|
| Hildene Community Funding CDO Ltd., Series 2015-1A, Class ARR, 2.60%, 11/01/35(b) | | 431,058 | 345,164 |
| Home Equity Asset Trust, Series 2006-4, Class 2A4, (1M CME Term SOFR + 0.67%, 0.56% Floor), 6.00%, 8/25/36(c) | | 328,084 | 315,743 |
| | | Par (a) | Value |
| Other (Continued) |
|
| KKR CLO 32 Ltd., Series 32A, Class A1, (3M CME Term SOFR + 1.58%, 1.32% Floor), 6.98%, 1/15/32(b)(c) | | $150,000 | $149,518 |
| Long Beach Mortgage Loan Trust, Series 2006-6, Class 2A3, (1M CME Term SOFR + 0.41%, 0.30% Floor), 5.74%, 7/25/36(c) | | 729,018 | 271,106 |
| Madison Park Funding XIII Ltd., Series 2014-13A, Class AR2, (3M CME Term SOFR + 1.21%, 0.95% Floor), 6.61%, 4/19/30(b)(c) | | 369,817 | 368,930 |
| Madison Park Funding XVIII Ltd., Series 2015-18A, Class ARR, (3M CME Term SOFR + 1.20%, 0.94% Floor), 6.61%, 10/21/30(b)(c) | | 488,746 | 486,157 |
| Madison Park Funding XXIII Ltd., Series 2017-23A, Class AR, (3M CME Term SOFR + 1.23%, 0.97% Floor), 6.62%, 7/27/31(b)(c) | | 242,591 | 241,738 |
| Madison Park Funding XXX Ltd., Series 2018-30A, Class A, (3M CME Term SOFR + 1.01%, 1.01% Floor), 6.41%, 4/15/29(b)(c) | | 232,580 | 231,014 |
| Merrill Lynch Mortgage Investors Trust, Series 2004-WMC5, Class M1, (1M CME Term SOFR + 1.04%, 0.93% Floor), 6.37%, 7/25/35(c) | | 152,037 | 147,416 |
| Myers Park CLO Ltd., Series 2018-1A, Class B1, (3M CME Term SOFR + 1.86%, 1.60% Floor), 7.28%, 10/20/30(b)(c) | | 250,000 | 246,311 |
| Navient Student Loan Trust, | | | |
| Series 2017-1A, Class A3, (30D Average SOFR + 1.26%), 6.59%, 7/26/66(b)(c) | | 193,341 | 192,619 |
| Series 2017-2A, Class A, (30D Average SOFR + 1.16%), 6.49%, 12/27/66(b)(c) | | 91,896 | 91,266 |
See accompanying Notes to Financial Statements
Morningstar Funds Trust October 31, 2023 (unaudited)
Schedule of Investments (continued)
Morningstar Total Return Bond Fund
| | | Par (a) | Value |
| Other (Continued) |
|
| Neuberger Berman Loan Advisers CLO 29 Ltd., Series 2018-29A, Class A1, (3M CME Term SOFR + 1.39%, 1.13% Floor), 6.79%, 10/19/31(b)(c) | | $260,000 | $259,124 |
| NP SPE X L.P., Series 2021-1A, Class A1, 2.23%, 3/19/51(b) | | 775,881 | 678,699 |
| OCP CLO Ltd., Series 2017-14A, Class A1A, (3M CME Term SOFR + 1.41%, 1.15% Floor), 6.79%, 11/20/30(b)(c) | | 240,493 | 240,043 |
| Octagon 66 Ltd., Series 2022-1A, Class A1R, (3M CME Term SOFR + 1.75%, 1.75% Floor), 7.12%, 11/16/36(b)(c)(d) | | 650,000 | 650,000 |
| Octagon Investment Partners 31 Ltd., Series 2017-1A, Class AR, (3M CME Term SOFR + 1.31%, 1.05% Floor), 6.73%, 7/20/30(b)(c) | | 201,663 | 200,983 |
| Octagon Investment Partners XXI Ltd., | | | |
| Series 2012-1A, Class AAR3, (3M CME Term SOFR + 1.26%, 1.00% Floor), 6.63%, 2/14/31(b)(c) | | 260,000 | 258,497 |
| Series 2012-1A, Class AARR, (3M CME Term SOFR + 1.21%, 0.95% Floor), 6.61%, 7/15/29(b)(c) | | 883,242 | 879,251 |
|
| OHA Credit Funding 7 Ltd., Series 2020-7A, Class AR, (3M CME Term SOFR + 1.30%, 1.30% Floor), 6.70%, 2/24/37(b)(c) | | 350,000 | 345,175 |
| Option One Mortgage Loan Trust, Series 2004-3, Class M1, (1M CME Term SOFR + 0.89%, 0.78% Floor), 6.22%, 11/25/34(c) | | 73,110 | 70,374 |
| Owl Rock CLO III Ltd., Series 2020-3A, Class A1L, (3M CME Term SOFR + 2.06%), 7.48%, 4/20/32(b)(c) | | 270,000 | 269,606 |
| PFS Financing Corp., Series 2021-B, Class A, 0.77%, 8/15/26(b) | | 910,000 | 871,641 |
| | | Par (a) | Value |
| Other (Continued) |
|
| Point Au Roche Park CLO Ltd., Series 2021-1A, Class A, (3M CME Term SOFR + 1.34%, 1.08% Floor), 6.76%, 7/20/34(b)(c) | | $620,000 | $614,879 |
| PRPM LLC, Series 2022-1, Class A1, (Step to 6.72% on 3/25/25), 3.72%, 2/25/27(b)(f) | | 318,333 | 302,338 |
| Rad CLO 1 Ltd., Series 2018-1A, Class AR, (3M CME Term SOFR + 1.24%), 6.64%, 7/15/31(b)(c) | | 229,825 | 228,805 |
| Rad CLO 22 Ltd., Series 2023-22A, Class A1, (3M CME Term SOFR + 1.83%, 1.83% Floor), 7.20%, 1/20/37(b)(c)(d) | | 550,000 | 550,000 |
| Renaissance Home Equity Loan Trust, Series 2005-2, Class AV3, (1M CME Term SOFR + 0.85%, 0.74% Floor, 14.00% Cap), 6.18%, 8/25/35(c) | | 291,609 | 250,050 |
| RR 3 Ltd., Series 2018-3A, Class A1R2, (3M CME Term SOFR + 1.35%, 1.09% Floor), 6.75%, 1/15/30(b)(c) | | 200,916 | 200,286 |
| SBA Small Business Investment Cos., Series 2021-10A, Class 1, 1.67%, 3/10/31 | | 210,181 | 174,219 |
| Silver Rock CLO I Ltd., Series 2020-1A, Class A, (3M CME Term SOFR + 1.91%, 1.65% Floor), 7.33%, 10/20/31(b)(c) | | 440,000 | 439,148 |
| SLM Private Credit Student Loan Trust, Series 2006-B, Class A5, (3M CME Term SOFR + 0.53%), 5.94%, 12/15/39(c) | | 158,367 | 151,948 |
| SMB Private Education Loan Trust, | | | |
| Series 2020-A, Class A2A, 2.23%, 9/15/37(b) | | 145,414 | 133,375 |
| Series 2021-A, Class A2B, 1.59%, 1/15/53(b) | | 473,861 | 407,440 |
| Series 2021-E, Class A1A, 1.68%, 2/15/51(b) | | 140,782 | 124,820 |
See accompanying Notes to Financial Statements
Morningstar Funds Trust October 31, 2023 (unaudited)
Schedule of Investments (continued)
Morningstar Total Return Bond Fund
| | | Par (a) | Value |
| Other (Continued) |
|
| Storm King Park CLO Ltd., Series 2022-1A, Class A1, (3M CME Term SOFR + 2.05%, 2.05% Floor), 7.44%, 10/15/35(b)(c) | | $250,000 | $251,260 |
| Structured Asset Investment Loan Trust, Series 2004-7, Class A8, (1M CME Term SOFR + 1.31%, 1.20% Floor), 6.64%, 8/25/34(c) | | 161,750 | 157,244 |
| Sunrun Vulcan Issuer LLC, Series 2021-1A, Class A, 2.46%, 1/30/52(b) | | 569,314 | 467,532 |
| Symphony CLO 40 Ltd., Series 2023-40A, Class A1, (3M CME Term SOFR + 1.64%, 1.64% Floor), 7.01%, 1/14/34(b)(c)(d) | | 520,000 | 520,000 |
| TCI-Symphony CLO Ltd., Series 2016-1A, Class AR2, (3M CME Term SOFR + 1.28%, 1.02% Floor), 6.68%, 10/13/32(b)(c) | | 250,000 | 248,567 |
| United States Small Business Administration, | | | |
| Series 2019-20D, Class 1, 2.98%, 4/01/39 | | 32,045 | 27,780 |
| Series 2019-25G, Class 1, 2.69%, 7/01/44 | | 55,262 | 45,659 |
|
| Venture 31 CLO Ltd., Series 2018-31A, Class A1, (3M CME Term SOFR + 1.29%, 1.03% Floor), 6.71%, 4/20/31(b)(c) | | 403,259 | 400,951 |
| Voya CLO Ltd., | | | |
| Series 2015-1A, Class A1R, (3M CME Term SOFR + 1.16%, 0.90% Floor), 6.56%, 1/18/29(b)(c) | | 115,728 | 115,545 |
| Series 2017-3A, Class A1R, (3M CME Term SOFR + 1.30%), 6.72%, 4/20/34(b)(c) | | 230,000 | 226,895 |
| Series 2018-2A, Class A1, (3M CME Term SOFR + 1.26%, 1.00% Floor), 6.66%, 7/15/31(b)(c) | | 530,423 | 529,558 |
| | | Par (a) | Value |
| Other (Continued) |
|
| Whitebox CLO II Ltd., Series 2020-2A, Class A1R, (3M CME Term SOFR + 1.48%, 1.22% Floor), 6.88%, 10/24/34(b)(c) | | $290,000 | $ 287,012 |
| Whitebox CLO III Ltd., Series 2021-3A, Class A1, (3M CME Term SOFR + 1.48%, 1.22% Floor), 6.88%, 10/15/34(b)(c) | | 420,000 | 414,233 |
| | | | 32,272,842 |
| Specialty Finance – 0.1% |
| Brazos Higher Education Authority, Inc., Series 2011-2, Class A3, (90D Average SOFR + 1.26%), 6.32%, 10/27/36(c) | | 138,948 | 138,681 |
| SLM Private Education Loan Trust, Series 2010-C, Class A5, (1M CME Term SOFR + 4.86%), 10.20%, 10/15/41(b)(c) | | 204,539 | 214,668 |
| Whitebox CLO IV Ltd., Series 2023-4A, Class A1, (3M CME Term SOFR + 2.15%, 2.15% Floor), 7.57%, 4/20/36(b)(c) | | 540,000 | 543,601 |
| | | | 896,950 |
Total Asset-Backed Securities
(Cost $34,222,836) | 33,169,792 |
|
| Corporate Bonds – 18.1% |
| Aerospace & Defense – 1.0% |
| Boeing (The) Co., | | | |
| 4.88%, 5/01/25 | | 360,000 | 353,663 |
| 2.20%, 2/04/26 | | 390,000 | 358,344 |
| 3.10%, 5/01/26 | | 40,000 | 37,295 |
| 2.70%, 2/01/27 | | 30,000 | 27,012 |
| 2.80%, 3/01/27 | | 40,000 | 35,989 |
| 3.20%, 3/01/29 | | 130,000 | 112,330 |
| 5.15%, 5/01/30 | | 370,000 | 346,671 |
| 3.25%, 2/01/35 | | 290,000 | 214,420 |
| 5.71%, 5/01/40 | | 230,000 | 203,451 |
| 3.75%, 2/01/50 | | 160,000 | 101,765 |
| 5.81%, 5/01/50 | | 350,000 | 301,315 |
| 3.95%, 8/01/59 | | 216,000 | 133,039 |
| 5.93%, 5/01/60 | | 140,000 | 117,783 |
| General Dynamics Corp., | | | |
| 4.25%, 4/01/40 | | 10,000 | 8,106 |
| 4.25%, 4/01/50 | | 70,000 | 54,528 |
See accompanying Notes to Financial Statements
Morningstar Funds Trust October 31, 2023 (unaudited)
Schedule of Investments (continued)
Morningstar Total Return Bond Fund
| | | Par (a) | Value |
| Aerospace & Defense (Continued) |
| Huntington Ingalls Industries, Inc., | | | |
| 3.48%, 12/01/27 | | $314,000 | $ 284,480 |
| 2.04%, 8/16/28 | | 343,000 | 285,624 |
| 4.20%, 5/01/30 | | 153,000 | 135,469 |
| L3Harris Technologies, Inc., | | | |
| 1.80%, 1/15/31 | | 321,000 | 239,161 |
| 5.40%, 7/31/33 | | 275,000 | 256,967 |
| 4.85%, 4/27/35 | | 60,000 | 52,476 |
| Lockheed Martin Corp., | | | |
| 4.45%, 5/15/28(g) | | 100,000 | 95,848 |
| 3.90%, 6/15/32 | | 90,000 | 78,778 |
| 3.60%, 3/01/35 | | 145,000 | 118,344 |
| 4.15%, 6/15/53 | | 390,000 | 290,071 |
| Northrop Grumman Corp., | | | |
| 2.93%, 1/15/25 | | 40,000 | 38,634 |
| 3.25%, 1/15/28 | | 280,000 | 255,163 |
| 4.70%, 3/15/33 | | 243,000 | 221,320 |
| 4.03%, 10/15/47 | | 100,000 | 72,689 |
| 5.25%, 5/01/50 | | 820,000 | 712,945 |
| 4.95%, 3/15/53 | | 100,000 | 82,833 |
| RTX Corp., | | | |
| 3.15%, 12/15/24 | | 50,000 | 48,468 |
| 7.00%, 11/01/28 | | 168,000 | 171,137 |
| 4.13%, 11/16/28 | | 580,000 | 532,598 |
| 2.25%, 7/01/30 | | 100,000 | 78,465 |
| 4.50%, 6/01/42 | | 30,000 | 23,279 |
| 4.15%, 5/15/45 | | 150,000 | 107,506 |
| 4.63%, 11/16/48 | | 40,000 | 30,780 |
| 3.13%, 7/01/50 | | 120,000 | 69,604 |
| 3.03%, 3/15/52 | | 321,000 | 179,385 |
|
| Textron, Inc., 3.90%, 9/17/29 | | 368,000 | 327,069 |
| | | | 7,194,804 |
| Apparel & Textile Products – 0.0%(h) |
| NIKE, Inc., | | | |
| 2.75%, 3/27/27(g) | | 100,000 | 92,106 |
| 2.85%, 3/27/30 | | 100,000 | 85,537 |
| 3.25%, 3/27/40 | | 50,000 | 36,011 |
| 3.38%, 3/27/50(g) | | 20,000 | 13,458 |
| | | | 227,112 |
| Asset Management – 0.1% |
| Charles Schwab (The) Corp., | | | |
| 5.88%, 8/24/26 | | 350,000 | 347,579 |
| (SOFR + 2.50%), 5.85%, 5/19/34(i) | | 205,000 | 188,021 |
| (SOFR + 2.01%), 6.14%, 8/24/34(i) | | 233,000 | 218,228 |
| | | Par (a) | Value |
| Asset Management (Continued) |
|
| Nuveen LLC, 4.00%, 11/01/28(b) | | $ 100,000 | $ 92,161 |
| Vanguard Group (The), Inc., 3.05%, 8/22/50(j) | | 170,000 | 93,381 |
| | | | 939,370 |
| Automotive – 0.0%(h) |
| General Motors Co., | | | |
| 5.60%, 10/15/32(g) | | 60,000 | 54,788 |
| 6.60%, 4/01/36 | | 10,000 | 9,404 |
| 5.95%, 4/01/49 | | 70,000 | 56,596 |
| | | | 120,788 |
| Banking – 3.2% |
| Bank of America Corp., | | | |
| (SOFR + 1.15%), 1.32%, 6/19/26(i) | | 1,090,000 | 1,001,732 |
| (SOFR + 1.58%), 4.38%, 4/27/28(i) | | 430,000 | 401,398 |
| (3M CME Term SOFR + 1.63%), 3.59%, 7/21/28(i) | | 160,000 | 144,792 |
| (3M CME Term SOFR + 1.30%), 3.42%, 12/20/28(i) | | 600,000 | 534,078 |
| (3M CME Term SOFR + 1.33%), 3.97%, 3/05/29(i) | | 138,000 | 124,867 |
| (SOFR + 1.57%), 5.82%, 9/15/29(i) | | 1,498,000 | 1,458,645 |
| (3M CME Term SOFR + 1.47%), 3.97%, 2/07/30(i) | | 620,000 | 548,313 |
| (SOFR + 2.15%), 2.59%, 4/29/31(i) | | 990,000 | 780,481 |
| (SOFR + 1.53%), 1.90%, 7/23/31(i) | | 200,000 | 148,795 |
| (SOFR + 1.21%), 2.57%, 10/20/32(i) | | 270,000 | 202,215 |
| (SOFR + 1.33%), 2.97%, 2/04/33(i) | | 689,000 | 528,073 |
| (SOFR + 1.83%), 4.57%, 4/27/33(i) | | 336,000 | 289,770 |
| (SOFR + 1.91%), 5.29%, 4/25/34(i) | | 64,000 | 57,804 |
| 5.00%, 1/21/44 | | 170,000 | 142,523 |
| (3M CME Term SOFR + 1.78%), 4.33%, 3/15/50(i) | | 30,000 | 22,025 |
| (3M CME Term SOFR + 3.41%), 4.08%, 3/20/51(i) | | 530,000 | 371,582 |
| Citigroup, Inc., | | | |
| 3.30%, 4/27/25 | | 180,000 | 173,196 |
| 5.50%, 9/13/25 | | 90,000 | 88,735 |
See accompanying Notes to Financial Statements
Morningstar Funds Trust October 31, 2023 (unaudited)
Schedule of Investments (continued)
Morningstar Total Return Bond Fund
| | | Par (a) | Value |
| Banking (Continued) |
| Citigroup, Inc., | | | |
| (SOFR + 2.84%), 3.11%, 4/08/26(i) | | $ 80,000 | $ 76,350 |
| (SOFR + 1.89%), 4.66%, 5/24/28(i) | | 538,000 | 509,540 |
| (3M CME Term SOFR + 1.41%), 3.52%, 10/27/28(i) | | 1,344,000 | 1,208,100 |
| (3M CME Term SOFR + 1.45%), 4.08%, 4/23/29(i) | | 150,000 | 136,429 |
| (3M CME Term SOFR + 1.60%), 3.98%, 3/20/30(i) | | 550,000 | 486,596 |
| (SOFR + 3.91%), 4.41%, 3/31/31(i) | | 290,000 | 256,564 |
| (SOFR + 2.11%), 2.57%, 6/03/31(i) | | 270,000 | 211,425 |
| (SOFR + 1.35%), 3.06%, 1/25/33(i) | | 399,000 | 307,194 |
| (SOFR + 1.94%), 3.79%, 3/17/33(i) | | 340,000 | 276,019 |
| (SOFR + 2.09%), 4.91%, 5/24/33(i) | | 210,000 | 186,109 |
| (SOFR + 2.34%), 6.27%, 11/17/33(i) | | 593,000 | 575,779 |
| 8.13%, 7/15/39 | | 460,000 | 518,666 |
| 4.65%, 7/23/48(g) | | 30,000 | 23,106 |
| JPMorgan Chase & Co., | | | |
| (3M CME Term SOFR + 1.26%), 4.02%, 12/05/24(i) | | 470,000 | 468,819 |
| (SOFR + 1.85%), 2.08%, 4/22/26(i) | | 200,000 | 187,965 |
| (SOFR + 0.89%), 1.58%, 4/22/27(i) | | 530,000 | 472,831 |
| (SOFR + 1.33%), 6.07%, 10/22/27(i) | | 500,000 | 498,943 |
| 3.63%, 12/01/27 | | 190,000 | 173,609 |
| (3M CME Term SOFR + 1.52%), 4.20%, 7/23/29(i) | | 280,000 | 256,789 |
| (SOFR + 1.45%), 5.30%, 7/24/29(i) | | 62,000 | 59,691 |
| (SOFR + 1.57%), 6.09%, 10/23/29(g)(i) | | 454,000 | 451,308 |
| (3M CME Term SOFR + 1.59%), 4.45%, 12/05/29(i) | | 320,000 | 294,335 |
| (SOFR + 1.75%), 4.57%, 6/14/30(i) | | 444,000 | 407,488 |
| (SOFR + 2.04%), 2.52%, 4/22/31(i) | | 510,000 | 405,621 |
| (3M CME Term SOFR + 1.25%), 2.58%, 4/22/32(i) | | 320,000 | 247,147 |
| | | Par (a) | Value |
| Banking (Continued) |
| JPMorgan Chase & Co., | | | |
| (SOFR + 1.18%), 2.55%, 11/08/32(i) | | $130,000 | $ 98,496 |
| (SOFR + 1.26%), 2.96%, 1/25/33(i) | | 607,000 | 472,910 |
| 4.95%, 6/01/45 | | 220,000 | 180,140 |
| (SOFR + 2.44%), 3.11%, 4/22/51(i) | | 50,000 | 29,451 |
| PNC Financial Services Group (The), Inc., | | | |
| (SOFR + 1.32%), 5.81%, 6/12/26(i) | | 80,000 | 78,939 |
| (SOFR + 1.84%), 5.58%, 6/12/29(i) | | 270,000 | 258,514 |
|
| Truist Financial Corp., (SOFR + 2.05%), 6.05%, 6/08/27(i) | | 160,000 | 156,722 |
| U.S. Bancorp, | | | |
| 1.45%, 5/12/25 | | 190,000 | 177,114 |
| (SOFR + 0.73%), 2.22%, 1/27/28(i) | | 30,000 | 26,118 |
| (SOFR + 2.02%), 5.78%, 6/12/29(i) | | 170,000 | 163,465 |
| (SOFR + 2.26%), 5.84%, 6/12/34(i) | | 60,000 | 55,264 |
| Wells Fargo & Co., | | | |
| (SOFR + 2.00%), 2.19%, 4/30/26(i) | | 570,000 | 536,199 |
| 3.00%, 10/23/26 | | 80,000 | 73,285 |
| 4.30%, 7/22/27 | | 270,000 | 251,659 |
| (3M CME Term SOFR + 1.57%), 3.58%, 5/22/28(i) | | 300,000 | 273,072 |
| (SOFR + 2.10%), 2.39%, 6/02/28(i) | | 130,000 | 113,317 |
| 4.15%, 1/24/29 | | 230,000 | 208,903 |
| (SOFR + 1.74%), 5.57%, 7/25/29(i) | | 561,000 | 540,963 |
| (SOFR + 1.79%), 6.30%, 10/23/29(i) | | 820,000 | 813,219 |
| (3M CME Term SOFR + 1.43%), 2.88%, 10/30/30(i) | | 250,000 | 204,437 |
| (3M CME Term SOFR + 4.03%), 4.48%, 4/04/31(i) | | 300,000 | 266,554 |
| (SOFR + 1.50%), 3.35%, 3/02/33(g)(i) | | 80,000 | 62,989 |
| (SOFR + 2.02%), 5.39%, 4/24/34(i) | | 94,000 | 85,094 |
| (SOFR + 1.99%), 5.56%, 7/25/34(i) | | 526,000 | 481,496 |
| 4.40%, 6/14/46 | | 360,000 | 251,813 |
| 4.75%, 12/07/46 | | 370,000 | 272,497 |
See accompanying Notes to Financial Statements
Morningstar Funds Trust October 31, 2023 (unaudited)
Schedule of Investments (continued)
Morningstar Total Return Bond Fund
| | | Par (a) | Value |
| Banking (Continued) |
| Wells Fargo & Co., | | | |
| (3M CME Term SOFR + 4.50%), 5.01%, 4/04/51(i) | | $1,940,000 | $ 1,538,538 |
|
| Wells Fargo Bank N.A., 5.45%, 8/07/26 | | 562,000 | 556,719 |
| | | | 23,943,334 |
| Beverages – 0.0%(h) |
| Coca-Cola (The) Co., | | | |
| 2.50%, 6/01/40 | | 50,000 | 32,287 |
| 2.60%, 6/01/50 | | 80,000 | 45,538 |
|
| Constellation Brands, Inc., 4.35%, 5/09/27 | | 130,000 | 124,005 |
| PepsiCo, Inc., | | | |
| 2.63%, 3/19/27 | | 10,000 | 9,169 |
| 1.63%, 5/01/30(g) | | 40,000 | 31,460 |
| 2.88%, 10/15/49(g) | | 40,000 | 24,320 |
| | | | 266,779 |
| Biotechnology & Pharmaceuticals – 0.8% |
| AbbVie, Inc., | | | |
| 2.60%, 11/21/24 | | 490,000 | 473,468 |
| 3.80%, 3/15/25 | | 410,000 | 399,110 |
| 3.60%, 5/14/25 | | 40,000 | 38,696 |
| 2.95%, 11/21/26 | | 100,000 | 92,616 |
| 3.20%, 11/21/29 | | 480,000 | 418,305 |
| 4.55%, 3/15/35 | | 201,000 | 176,710 |
| 4.50%, 5/14/35 | | 360,000 | 314,497 |
| 4.88%, 11/14/48 | | 20,000 | 16,560 |
| 4.25%, 11/21/49 | | 472,000 | 354,230 |
| Amgen, Inc., | | | |
| 4.05%, 8/18/29(g) | | 193,000 | 176,532 |
| 5.25%, 3/02/30 | | 324,000 | 311,039 |
| 2.30%, 2/25/31 | | 122,000 | 95,379 |
| 4.40%, 5/01/45 | | 20,000 | 15,021 |
| 4.40%, 2/22/62 | | 414,000 | 286,414 |
| 5.75%, 3/02/63 | | 324,000 | 280,623 |
| Bristol-Myers Squibb Co., | | | |
| 3.40%, 7/26/29 | | 65,000 | 58,316 |
| 4.55%, 2/20/48 | | 60,000 | 47,259 |
| Gilead Sciences, Inc., | | | |
| 1.65%, 10/01/30(g) | | 265,000 | 202,399 |
| 2.60%, 10/01/40 | | 82,000 | 51,286 |
| 4.50%, 2/01/45 | | 268,000 | 209,666 |
| 4.75%, 3/01/46 | | 156,000 | 126,093 |
| Johnson & Johnson, | | | |
| 3.63%, 3/03/37 | | 70,000 | 56,802 |
| 2.10%, 9/01/40 | | 260,000 | 157,910 |
| Merck & Co., Inc., | | | |
| 1.45%, 6/24/30 | | 70,000 | 53,820 |
| 2.75%, 12/10/51 | | 250,000 | 141,170 |
| | | Par (a) | Value |
| Biotechnology & Pharmaceuticals (Continued) |
| Pfizer Investment Enterprises Pte. Ltd., | | | |
| 4.75%, 5/19/33 | | $330,000 | $ 303,271 |
| 5.30%, 5/19/53 | | 453,000 | 396,306 |
| 5.34%, 5/19/63 | | 72,000 | 61,679 |
| Pfizer, Inc., | | | |
| 2.63%, 4/01/30 | | 160,000 | 133,722 |
| 1.70%, 5/28/30 | | 100,000 | 78,763 |
| 2.55%, 5/28/40 | | 240,000 | 152,357 |
| 2.70%, 5/28/50(g) | | 180,000 | 104,433 |
| | | | 5,784,452 |
| Cable & Satellite – 0.6% |
| Charter Communications Operating LLC/Charter Communications Operating Capital, | | | |
| 4.91%, 7/23/25 | | 320,000 | 312,889 |
| 4.20%, 3/15/28 | | 90,000 | 81,908 |
| 5.05%, 3/30/29 | | 700,000 | 647,513 |
| 4.40%, 4/01/33(g) | | 400,000 | 330,958 |
| 5.38%, 4/01/38 | | 60,000 | 47,354 |
| 3.50%, 6/01/41 | | 300,000 | 179,760 |
| 3.50%, 3/01/42 | | 60,000 | 35,433 |
| 5.38%, 5/01/47 | | 161,000 | 116,442 |
| 5.75%, 4/01/48 | | 171,000 | 129,742 |
| 5.13%, 7/01/49 | | 70,000 | 48,432 |
| 4.80%, 3/01/50 | | 30,000 | 19,776 |
| 3.70%, 4/01/51 | | 216,000 | 118,416 |
| 3.90%, 6/01/52 | | 781,000 | 440,835 |
| 6.83%, 10/23/55 | | 50,000 | 42,188 |
| 3.85%, 4/01/61 | | 271,000 | 143,161 |
| 5.50%, 4/01/63 | | 110,000 | 77,339 |
| Comcast Corp., | | | |
| 3.95%, 10/15/25 | | 160,000 | 155,163 |
| 3.15%, 3/01/26 | | 50,000 | 47,440 |
| 3.30%, 4/01/27 | | 50,000 | 46,334 |
| 4.15%, 10/15/28 | | 520,000 | 485,763 |
| 2.65%, 2/01/30 | | 61,000 | 50,623 |
| 3.40%, 4/01/30 | | 70,000 | 60,600 |
| 4.25%, 10/15/30 | | 390,000 | 352,789 |
| 3.25%, 11/01/39 | | 20,000 | 13,792 |
| 3.75%, 4/01/40 | | 180,000 | 132,281 |
| 3.40%, 7/15/46 | | 20,000 | 12,846 |
| 4.00%, 8/15/47 | | 30,000 | 21,134 |
| 3.97%, 11/01/47 | | 140,000 | 98,267 |
| 4.00%, 3/01/48 | | 20,000 | 14,102 |
| 4.00%, 11/01/49 | | 240,000 | 167,638 |
| 3.45%, 2/01/50 | | 60,000 | 37,931 |
| 2.80%, 1/15/51 | | 190,000 | 103,827 |
| 2.89%, 11/01/51 | | 120,000 | 66,272 |
| 2.94%, 11/01/56 | | 40,000 | 21,192 |
See accompanying Notes to Financial Statements
Morningstar Funds Trust October 31, 2023 (unaudited)
Schedule of Investments (continued)
Morningstar Total Return Bond Fund
| | | Par (a) | Value |
| Cable & Satellite (Continued) |
| Comcast Corp., | | | |
| 4.95%, 10/15/58 | | $ 20,000 | $ 16,096 |
| Time Warner Cable LLC, | | | |
| 6.55%, 5/01/37 | | 50,000 | 43,897 |
| 5.88%, 11/15/40 | | 130,000 | 102,555 |
| | | | 4,822,688 |
| Commercial Support Services – 0.0%(h) |
| Cintas Corp. No. 2, | | | |
| 3.70%, 4/01/27 | | 20,000 | 18,851 |
| 4.00%, 5/01/32(g) | | 120,000 | 104,788 |
|
| Republic Services, Inc., 2.38%, 3/15/33(g) | | 53,000 | 39,595 |
| Waste Management, Inc., 4.88%, 2/15/34 | | 73,000 | 66,849 |
| | | | 230,083 |
| Containers & Packaging – 0.1% |
| Berry Global, Inc., 1.57%, 1/15/26 | | 618,000 | 558,344 |
| Diversified Industrials – 0.1% |
| 3M Co., | | | |
| 2.38%, 8/26/29 | | 410,000 | 334,639 |
| 3.70%, 4/15/50(g) | | 100,000 | 66,163 |
|
| Emerson Electric Co., 2.80%, 12/21/51 | | 460,000 | 260,506 |
| | | | 661,308 |
| E-Commerce Discretionary – 0.2% |
| Amazon.com, Inc., | | | |
| 3.30%, 4/13/27(g) | | 50,000 | 46,841 |
| 1.20%, 6/03/27 | | 380,000 | 329,352 |
| 3.15%, 8/22/27 | | 140,000 | 129,528 |
| 3.45%, 4/13/29(g) | | 110,000 | 100,417 |
| 1.50%, 6/03/30(g) | | 70,000 | 54,558 |
| 2.10%, 5/12/31 | | 80,000 | 63,062 |
| 3.60%, 4/13/32(g) | | 320,000 | 277,847 |
| 3.88%, 8/22/37 | | 200,000 | 163,806 |
| 4.05%, 8/22/47 | | 140,000 | 106,728 |
| 2.50%, 6/03/50 | | 700,000 | 387,128 |
| 4.25%, 8/22/57 | | 240,000 | 181,622 |
| | | | 1,840,889 |
| Electric Utilities – 1.2% |
| AEP Texas, Inc., | | | |
| 3.95%, 6/01/28 | | 280,000 | 256,962 |
| 5.40%, 6/01/33 | | 158,000 | 146,656 |
| 3.45%, 5/15/51 | | 267,000 | 159,722 |
|
| AEP Transmission Co. LLC, 3.80%, 6/15/49 | | 303,000 | 205,479 |
| Alabama Power Co., | | | |
| 3.75%, 3/01/45 | | 94,000 | 64,786 |
| 3.00%, 3/15/52 | | 170,000 | 95,874 |
| | | Par (a) | Value |
| Electric Utilities (Continued) |
|
| Ameren Illinois Co., 3.25%, 3/15/50 | | $106,000 | $ 65,428 |
| American Transmission Systems, Inc., 2.65%, 1/15/32(b) | | 317,000 | 243,991 |
| Baltimore Gas and Electric Co., | | | |
| 3.75%, 8/15/47 | | 195,000 | 132,562 |
| 2.90%, 6/15/50 | | 156,000 | 87,624 |
|
| CenterPoint Energy Houston Electric LLC, 3.35%, 4/01/51 | | 221,000 | 138,298 |
| Cleveland Electric Illuminating (The) Co., 3.50%, 4/01/28(b) | | 100,000 | 89,397 |
| Commonwealth Edison Co., | | | |
| 4.00%, 3/01/49 | | 42,000 | 29,849 |
| 3.00%, 3/01/50 | | 51,000 | 29,452 |
| 3.13%, 3/15/51 | | 63,000 | 37,040 |
| 5.30%, 2/01/53 | | 138,000 | 119,084 |
| Consumers Energy Co., | | | |
| 4.63%, 5/15/33 | | 69,000 | 62,487 |
| 3.75%, 2/15/50 | | 207,000 | 140,722 |
|
| Dominion Energy South Carolina, Inc., 6.25%, 10/15/53 | | 50,000 | 48,650 |
| DTE Electric Co., | | | |
| 3.95%, 3/01/49 | | 174,000 | 122,134 |
| 3.25%, 4/01/51 | | 183,000 | 110,660 |
| Duke Energy Carolinas LLC, | | | |
| 3.75%, 6/01/45 | | 71,000 | 48,346 |
| 3.95%, 3/15/48 | | 122,000 | 84,867 |
| 3.20%, 8/15/49 | | 46,000 | 27,552 |
| 3.55%, 3/15/52 | | 206,000 | 130,734 |
| Duke Energy Florida LLC, | | | |
| 2.50%, 12/01/29 | | 62,000 | 51,605 |
| 1.75%, 6/15/30 | | 195,000 | 150,042 |
| 3.00%, 12/15/51 | | 241,000 | 136,431 |
| 5.95%, 11/15/52 | | 164,000 | 151,768 |
| Duke Energy Progress LLC, | | | |
| 3.45%, 3/15/29 | | 232,000 | 207,618 |
| 2.50%, 8/15/50 | | 257,000 | 131,845 |
| 4.00%, 4/01/52 | | 5,000 | 3,425 |
| 5.35%, 3/15/53 | | 52,000 | 44,272 |
| Edison International, | | | |
| 5.75%, 6/15/27 | | 235,000 | 231,010 |
| 5.25%, 11/15/28 | | 268,000 | 254,287 |
| 6.95%, 11/15/29 | | 249,000 | 253,141 |
|
| Eversource Energy, 5.45%, 3/01/28 | | 152,000 | 148,385 |
| Exelon Corp., 5.60%, 3/15/53(g) | | 84,000 | 72,062 |
See accompanying Notes to Financial Statements
Morningstar Funds Trust October 31, 2023 (unaudited)
Schedule of Investments (continued)
Morningstar Total Return Bond Fund
| | | Par (a) | Value |
| Electric Utilities (Continued) |
| FirstEnergy Corp., | | | |
| 2.05%, 3/01/25 | | $ 22,000 | $ 20,654 |
| 1.60%, 1/15/26 | | 40,000 | 36,003 |
| 4.15%, 7/15/27(g) | | 499,000 | 461,870 |
| 5.10%, 7/15/47 | | 77,000 | 63,850 |
| 3.40%, 3/01/50 | | 167,000 | 100,994 |
|
| FirstEnergy Transmission LLC, 4.55%, 4/01/49(b) | | 299,000 | 221,019 |
| Florida Power & Light Co., 3.99%, 3/01/49 | | 174,000 | 124,598 |
| Georgia Power Co., 4.95%, 5/17/33 | | 102,000 | 93,102 |
| MidAmerican Energy Co., 3.65%, 4/15/29 | | 160,000 | 144,256 |
| Mid-Atlantic Interstate Transmission LLC, 4.10%, 5/15/28(b) | | 40,000 | 36,726 |
| Northern States Power Co., | | | |
| 2.60%, 6/01/51 | | 201,000 | 106,675 |
| 3.20%, 4/01/52 | | 212,000 | 126,415 |
|
| NRG Energy, Inc., 2.45%, 12/02/27(b) | | 36,000 | 30,313 |
| Ohio Power Co., | | | |
| 2.60%, 4/01/30 | | 126,000 | 102,362 |
| 5.00%, 6/01/33 | | 266,000 | 242,119 |
| 4.15%, 4/01/48 | | 52,000 | 36,881 |
| 4.00%, 6/01/49 | | 190,000 | 131,249 |
|
| Oncor Electric Delivery Co. LLC, 2.70%, 11/15/51 | | 116,000 | 61,683 |
| Pacific Gas and Electric Co., | | | |
| 2.10%, 8/01/27 | | 50,000 | 42,337 |
| 2.50%, 2/01/31 | | 180,000 | 133,437 |
| 3.30%, 8/01/40 | | 20,000 | 12,135 |
| 4.95%, 7/01/50 | | 138,000 | 96,328 |
| 3.50%, 8/01/50(g) | | 919,000 | 511,434 |
| 6.70%, 4/01/53(g) | | 40,000 | 35,430 |
|
| Progress Energy, Inc., 7.75%, 3/01/31 | | 70,000 | 74,752 |
| Public Service Co. of New Hampshire, 5.15%, 1/15/53 | | 121,000 | 103,154 |
| Public Service Electric and Gas Co., | | | |
| 4.90%, 12/15/32 | | 200,000 | 185,771 |
| 2.05%, 8/01/50(g) | | 261,000 | 124,804 |
| San Diego Gas & Electric Co., | | | |
| 3.32%, 4/15/50 | | 129,000 | 77,293 |
| 2.95%, 8/15/51(g) | | 248,000 | 140,974 |
| | | Par (a) | Value |
| Electric Utilities (Continued) |
| Southern California Edison Co., | | | |
| 5.65%, 10/01/28 | | $ 30,000 | $ 29,706 |
| 2.25%, 6/01/30(g) | | 255,000 | 201,014 |
| 2.50%, 6/01/31 | | 208,000 | 161,847 |
| 5.95%, 11/01/32 | | 330,000 | 322,279 |
|
| Virginia Electric and Power Co., 4.00%, 1/15/43 | | 167,000 | 121,340 |
| | | | 9,029,051 |
| Electric, Gas Marketing & Trading – 0.0%(h) |
| Consolidated Edison Co. of New York, Inc., | | | |
| 3.35%, 4/01/30 | | 50,000 | 43,027 |
| 3.95%, 4/01/50 | | 20,000 | 13,956 |
| PECO Energy Co., | | | |
| 3.05%, 3/15/51 | | 150,000 | 87,021 |
| 2.85%, 9/15/51 | | 215,000 | 118,452 |
| | | | 262,456 |
| Electrical Equipment – 0.0%(h) |
| Carrier Global Corp., 3.58%, 4/05/50 | | 10,000 | 6,271 |
| Otis Worldwide Corp., | | | |
| 2.06%, 4/05/25 | | 50,000 | 47,383 |
| 5.25%, 8/16/28(g) | | 106,000 | 103,108 |
| | | | 156,762 |
| Entertainment Content – 0.2% |
| Fox Corp., | | | |
| 6.50%, 10/13/33 | | 140,000 | 136,733 |
| 5.48%, 1/25/39 | | 370,000 | 306,161 |
|
| Time Warner Cable Enterprises LLC, 8.38%, 7/15/33 | | 170,000 | 177,361 |
| Warnermedia Holdings, Inc., | | | |
| 6.41%, 3/15/26 | | 140,000 | 139,714 |
| 3.76%, 3/15/27 | | 80,000 | 73,648 |
| 4.05%, 3/15/29(g) | | 140,000 | 123,882 |
| 4.28%, 3/15/32 | | 110,000 | 91,203 |
| 5.05%, 3/15/42 | | 30,000 | 22,222 |
| 5.14%, 3/15/52 | | 80,000 | 56,609 |
| | | | 1,127,533 |
| Food – 0.1% |
| Kraft Heinz Foods Co., 3.00%, 6/01/26 | | 102,000 | 95,315 |
| Mars, Inc., | | | |
| 3.20%, 4/01/30(b) | | 80,000 | 68,847 |
| 2.38%, 7/16/40(b) | | 200,000 | 120,070 |
See accompanying Notes to Financial Statements
Morningstar Funds Trust October 31, 2023 (unaudited)
Schedule of Investments (continued)
Morningstar Total Return Bond Fund
| | | Par (a) | Value |
| Food (Continued) |
|
| Mondelez International, Inc., 1.50%, 5/04/25 | | $250,000 | $234,122 |
| | | | 518,354 |
| Gas & Water Utilities – 0.1% |
| Atmos Energy Corp., 4.13%, 3/15/49 | | 40,000 | 28,625 |
| CenterPoint Energy Resources Corp., 5.25%, 3/01/28 | | 84,000 | 82,122 |
| NiSource, Inc., | | | |
| 5.25%, 3/30/28 | | 396,000 | 384,470 |
| 5.40%, 6/30/33 | | 80,000 | 74,441 |
|
| Piedmont Natural Gas Co., Inc., 2.50%, 3/15/31 | | 62,000 | 47,763 |
| | | | 617,421 |
| Health Care Facilities & Services – 0.8% |
| Cigna Group (The), | | | |
| 4.13%, 11/15/25 | | 20,000 | 19,378 |
| 4.38%, 10/15/28 | | 440,000 | 411,240 |
| 4.80%, 8/15/38 | | 210,000 | 177,886 |
| 4.90%, 12/15/48(g) | | 130,000 | 103,959 |
| CVS Health Corp., | | | |
| 3.63%, 4/01/27 | | 40,000 | 37,130 |
| 4.30%, 3/25/28(g) | | 217,000 | 203,304 |
| 3.75%, 4/01/30 | | 300,000 | 261,003 |
| 1.88%, 2/28/31 | | 40,000 | 29,736 |
| 2.13%, 9/15/31 | | 130,000 | 96,871 |
| 4.78%, 3/25/38 | | 400,000 | 330,838 |
| 4.13%, 4/01/40 | | 40,000 | 29,627 |
| 5.05%, 3/25/48 | | 470,000 | 369,460 |
| Elevance Health, Inc., | | | |
| 3.65%, 12/01/27 | | 300,000 | 276,366 |
| 4.10%, 5/15/32 | | 80,000 | 69,416 |
| 4.55%, 5/15/52 | | 40,000 | 30,283 |
| 6.10%, 10/15/52 | | 171,000 | 161,690 |
| HCA, Inc., | | | |
| 5.25%, 4/15/25 | | 191,000 | 188,314 |
| 5.88%, 2/15/26 | | 198,000 | 196,258 |
| 5.25%, 6/15/26 | | 163,000 | 159,146 |
| 4.13%, 6/15/29 | | 202,000 | 179,289 |
| 3.50%, 9/01/30 | | 686,000 | 567,763 |
| Humana, Inc., | | | |
| 4.50%, 4/01/25 | | 20,000 | 19,647 |
| 3.95%, 3/15/27 | | 140,000 | 132,004 |
| 3.70%, 3/23/29 | | 310,000 | 280,375 |
| 3.13%, 8/15/29 | | 310,000 | 268,800 |
| 2.15%, 2/03/32 | | 50,000 | 36,928 |
| UnitedHealth Group, Inc., | | | |
| 1.25%, 1/15/26 | | 40,000 | 36,507 |
| 3.85%, 6/15/28 | | 130,000 | 121,266 |
| | | Par (a) | Value |
| Health Care Facilities & Services (Continued) |
| UnitedHealth Group, Inc., | | | |
| 3.88%, 12/15/28 | | $ 110,000 | $ 102,305 |
| 4.00%, 5/15/29 | | 160,000 | 148,044 |
| 2.00%, 5/15/30 | | 40,000 | 31,785 |
| 2.30%, 5/15/31 | | 30,000 | 23,606 |
| 4.20%, 5/15/32 | | 110,000 | 97,528 |
| 2.75%, 5/15/40 | | 260,000 | 168,329 |
| 2.90%, 5/15/50 | | 100,000 | 57,690 |
| 3.25%, 5/15/51 | | 563,000 | 345,835 |
| 4.75%, 5/15/52 | | 179,000 | 143,288 |
| 3.88%, 8/15/59(g) | | 233,000 | 154,053 |
| | | | 6,066,947 |
| Household Products – 0.1% |
| Haleon U.S. Capital LLC, 3.38%, 3/24/29 | | 480,000 | 424,214 |
| Kenvue, Inc., 4.90%, 3/22/33 | | 200,000 | 187,408 |
| Kimberly-Clark Corp., 3.10%, 3/26/30 | | 30,000 | 25,873 |
| Procter & Gamble (The) Co., 3.00%, 3/25/30 | | 60,000 | 52,217 |
| | | | 689,712 |
| Institutional Financial Services – 1.4% |
| Bank of New York Mellon (The) Corp., 1.60%, 4/24/25 | | 60,000 | 56,288 |
| Goldman Sachs Group (The), Inc., | | | |
| 3.50%, 4/01/25 | | 140,000 | 134,741 |
| 3.50%, 11/16/26 | | 570,000 | 528,623 |
| (SOFR + 0.91%), 1.95%, 10/21/27(i) | | 142,000 | 124,536 |
| (SOFR + 1.85%), 3.62%, 3/15/28(i) | | 60,000 | 54,935 |
| (SOFR + 1.73%), 4.48%, 8/23/28(i) | | 205,000 | 191,932 |
| (3M CME Term SOFR + 1.42%), 3.81%, 4/23/29(i) | | 290,000 | 260,502 |
| (3M CME Term SOFR + 1.56%), 4.22%, 5/01/29(i) | | 1,699,000 | 1,550,823 |
| (SOFR + 1.77%), 6.48%, 10/24/29(g)(i) | | 219,000 | 218,949 |
| (SOFR + 1.28%), 2.62%, 4/22/32(g)(i) | | 319,000 | 243,046 |
| (SOFR + 1.25%), 2.38%, 7/21/32(i) | | 110,000 | 81,647 |
| (SOFR + 1.26%), 2.65%, 10/21/32(i) | | 504,000 | 378,934 |
| (SOFR + 1.41%), 3.10%, 2/24/33(i) | | 241,000 | 187,352 |
See accompanying Notes to Financial Statements
Morningstar Funds Trust October 31, 2023 (unaudited)
Schedule of Investments (continued)
Morningstar Total Return Bond Fund
| | | Par (a) | Value |
| Institutional Financial Services (Continued) |
| Goldman Sachs Group (The), Inc., | | | |
| (SOFR + 1.51%), 3.21%, 4/22/42(i) | | $ 80,000 | $ 51,919 |
| (SOFR + 1.47%), 2.91%, 7/21/42(i) | | 160,000 | 98,570 |
| 5.15%, 5/22/45 | | 250,000 | 202,662 |
| 4.75%, 10/21/45 | | 230,000 | 183,653 |
| Intercontinental Exchange, Inc., | | | |
| 4.60%, 3/15/33 | | 60,000 | 53,641 |
| 4.95%, 6/15/52 | | 30,000 | 24,544 |
| Morgan Stanley, | | | |
| (SOFR + 1.99%), 2.19%, 4/28/26(i) | | 460,000 | 432,673 |
| (3M CME Term SOFR + 1.40%), 3.77%, 1/24/29(i) | | 300,000 | 270,580 |
| (SOFR + 1.59%), 5.16%, 4/20/29(i) | | 532,000 | 506,160 |
| (SOFR + 1.63%), 5.45%, 7/20/29(i) | | 764,000 | 734,769 |
| (SOFR + 1.83%), 6.41%, 11/01/29(i) | | 835,000 | 834,616 |
| (3M CME Term SOFR + 1.89%), 4.43%, 1/23/30(i) | | 10,000 | 9,105 |
| (SOFR + 1.14%), 2.70%, 1/22/31(i) | | 1,033,000 | 829,991 |
| (SOFR + 3.12%), 3.62%, 4/01/31(i) | | 340,000 | 287,870 |
| (SOFR + 1.03%), 1.79%, 2/13/32(i) | | 285,000 | 206,187 |
| (SOFR + 1.18%), 2.24%, 7/21/32(i) | | 350,000 | 258,141 |
| (SOFR + 1.20%), 2.51%, 10/20/32(i) | | 230,000 | 172,032 |
| (SOFR + 2.56%), 6.34%, 10/18/33(i) | | 487,000 | 477,444 |
| (SOFR + 1.87%), 5.25%, 4/21/34(i) | | 127,000 | 114,428 |
| (SOFR + 1.88%), 5.42%, 7/21/34(i) | | 413,000 | 376,938 |
| Nasdaq, Inc., | | | |
| 5.55%, 2/15/34 | | 41,000 | 38,031 |
| 6.10%, 6/28/63 | | 149,000 | 131,734 |
| | | | 10,307,996 |
| Insurance – 0.1% |
| American International Group, Inc., 2.50%, 6/30/25 | | 40,000 | 37,751 |
| Aon Corp./Aon Global Holdings PLC, | | | |
| 5.00%, 9/12/32 | | 89,000 | 80,718 |
| | | Par (a) | Value |
| Insurance (Continued) |
| Aon Corp./Aon Global Holdings PLC, | | | |
| 5.35%, 2/28/33 | | $198,000 | $ 184,534 |
|
| Berkshire Hathaway Finance Corp., 4.25%, 1/15/49 | | 150,000 | 115,799 |
| Guardian Life Global Funding, 1.10%, 6/23/25(b)(g) | | 50,000 | 46,301 |
| Marsh & McLennan Cos., Inc., 2.90%, 12/15/51 | | 104,000 | 58,113 |
| MetLife, Inc., 6.40%, 12/15/36 | | 100,000 | 93,748 |
| New York Life Global Funding, 0.95%, 6/24/25(b) | | 80,000 | 73,971 |
| Principal Life Global Funding II, 1.25%, 6/23/25(b) | | 40,000 | 37,013 |
| Teachers Insurance & Annuity Association of America, 4.90%, 9/15/44(b) | | 80,000 | 64,683 |
| | | | 792,631 |
| Internet Media & Services – 0.0%(h) |
| Alphabet, Inc., | | | |
| 1.10%, 8/15/30 | | 60,000 | 45,989 |
| 1.90%, 8/15/40 | | 70,000 | 41,856 |
| 2.05%, 8/15/50 | | 40,000 | 20,677 |
|
| Meta Platforms, Inc., 5.75%, 5/15/63(g) | | 145,000 | 130,086 |
| | | | 238,608 |
| Leisure Facilities & Services – 0.2% |
| Las Vegas Sands Corp., 2.90%, 6/25/25 | | 380,000 | 356,817 |
| McDonald's Corp., | | | |
| 1.45%, 9/01/25 | | 140,000 | 129,768 |
| 3.70%, 1/30/26 | | 60,000 | 57,676 |
| 3.50%, 3/01/27 | | 30,000 | 28,035 |
| 3.50%, 7/01/27 | | 60,000 | 55,747 |
| 3.80%, 4/01/28 | | 270,000 | 250,500 |
| 2.13%, 3/01/30 | | 170,000 | 136,644 |
| 3.60%, 7/01/30 | | 80,000 | 70,066 |
| 4.88%, 12/09/45 | | 30,000 | 24,695 |
| 4.20%, 4/01/50 | | 240,000 | 174,727 |
| | | | 1,284,675 |
| Machinery – 0.0%(h) |
| Deere & Co., | | | |
| 3.10%, 4/15/30 | | 30,000 | 25,889 |
| 3.75%, 4/15/50(g) | | 200,000 | 148,028 |
See accompanying Notes to Financial Statements
Morningstar Funds Trust October 31, 2023 (unaudited)
Schedule of Investments (continued)
Morningstar Total Return Bond Fund
| | | Par (a) | Value |
| Machinery (Continued) |
|
| Eaton Corp., 4.15%, 11/02/42 | | $ 30,000 | $ 23,328 |
| | | | 197,245 |
| Medical Equipment & Devices – 0.1% |
| Abbott Laboratories, | | | |
| 4.75%, 11/30/36 | | 40,000 | 36,463 |
| 4.90%, 11/30/46 | | 90,000 | 77,630 |
|
| Becton Dickinson & Co., 4.69%, 12/15/44 | | 15,000 | 11,989 |
| Thermo Fisher Scientific, Inc., | | | |
| 2.00%, 10/15/31 | | 64,000 | 48,293 |
| 5.09%, 8/10/33 | | 282,000 | 263,771 |
| | | | 438,146 |
| Metals & Mining – 0.0%(h) |
| Freeport-McMoRan, Inc., 5.45%, 3/15/43 | | 80,000 | 65,799 |
| Newmont Corp., 2.25%, 10/01/30 | | 120,000 | 93,776 |
| | | | 159,575 |
| Oil & Gas Producers – 4.1% |
| Antero Resources Corp., | | | |
| 7.63%, 2/01/29(b) | | 80,000 | 80,999 |
| 5.38%, 3/01/30(b) | | 185,000 | 168,816 |
| Apache Corp., | | | |
| 5.10%, 9/01/40 | | 169,000 | 131,321 |
| 4.75%, 4/15/43 | | 153,000 | 107,454 |
| 4.25%, 1/15/44 | | 380,000 | 235,851 |
| BP Capital Markets America, Inc., | | | |
| 3.41%, 2/11/26 | | 20,000 | 19,067 |
| 3.12%, 5/04/26 | | 220,000 | 207,674 |
| 3.94%, 9/21/28 | | 110,000 | 102,118 |
| 3.63%, 4/06/30 | | 80,000 | 70,666 |
| 1.75%, 8/10/30 | | 200,000 | 154,918 |
| 3.00%, 2/24/50 | | 190,000 | 112,098 |
| Cameron LNG LLC, | | | |
| 2.90%, 7/15/31(b) | | 160,000 | 128,928 |
| 3.30%, 1/15/35(b) | | 681,000 | 521,216 |
| 3.40%, 1/15/38(b) | | 279,000 | 210,356 |
| Cheniere Corpus Christi Holdings LLC, | | | |
| 5.88%, 3/31/25 | | 233,000 | 231,871 |
| 5.13%, 6/30/27 | | 830,000 | 800,823 |
| 3.70%, 11/15/29(g) | | 311,000 | 270,979 |
| 2.74%, 12/31/39 | | 83,000 | 59,838 |
| Cheniere Energy Partners L.P., | | | |
| 4.50%, 10/01/29 | | 874,000 | 782,534 |
| 4.00%, 3/01/31 | | 195,000 | 163,286 |
| | | Par (a) | Value |
| Oil & Gas Producers (Continued) |
| Cheniere Energy Partners L.P., | | | |
| 3.25%, 1/31/32 | | $ 758,000 | $ 587,782 |
| Chevron Corp., | | | |
| 2.00%, 5/11/27 | | 40,000 | 35,725 |
| 3.08%, 5/11/50 | | 230,000 | 144,377 |
|
| Chevron USA, Inc., 3.85%, 1/15/28 | | 240,000 | 227,195 |
| Columbia Pipelines Operating Co. LLC, | | | |
| 6.04%, 11/15/33(b) | | 340,000 | 322,879 |
| 6.54%, 11/15/53(b) | | 100,000 | 91,853 |
| Continental Resources, Inc., | | | |
| 4.38%, 1/15/28 | | 130,000 | 119,774 |
| 5.75%, 1/15/31(b) | | 20,000 | 18,548 |
| 4.90%, 6/01/44 | | 590,000 | 416,599 |
| Coterra Energy, Inc., | | | |
| 3.90%, 5/15/27 | | 280,000 | 261,067 |
| 4.38%, 3/15/29 | | 750,000 | 686,148 |
| Crestwood Midstream Partners L.P./Crestwood Midstream Finance Corp., | | | |
| 5.63%, 5/01/27(b) | | 5,000 | 4,809 |
| 6.00%, 2/01/29(b) | | 5,000 | 4,838 |
| 7.38%, 2/01/31(b)(g) | | 500,000 | 504,005 |
| Devon Energy Corp., | | | |
| 5.85%, 12/15/25 | | 90,000 | 89,402 |
| 5.25%, 10/15/27 | | 12,000 | 11,625 |
| 4.50%, 1/15/30 | | 112,000 | 99,600 |
| 5.60%, 7/15/41(g) | | 291,000 | 247,026 |
| 4.75%, 5/15/42 | | 440,000 | 335,456 |
| 5.00%, 6/15/45 | | 150,000 | 115,579 |
| Diamondback Energy, Inc., | | | |
| 3.25%, 12/01/26 | | 1,605,000 | 1,495,988 |
| 3.50%, 12/01/29(g) | | 2,247,000 | 1,965,692 |
| 3.13%, 3/24/31 | | 584,000 | 478,133 |
| 4.40%, 3/24/51 | | 310,000 | 219,969 |
| Energy Transfer L.P., | | | |
| 2.90%, 5/15/25 | | 200,000 | 190,519 |
| 5.50%, 6/01/27 | | 130,000 | 126,793 |
| 4.95%, 6/15/28 | | 20,000 | 18,903 |
| 5.25%, 4/15/29 | | 60,000 | 56,944 |
| 3.75%, 5/15/30 | | 430,000 | 367,512 |
| 6.40%, 12/01/30(g) | | 185,000 | 182,999 |
| 6.55%, 12/01/33 | | 45,000 | 44,406 |
| 4.95%, 1/15/43 | | 66,000 | 49,266 |
| 5.15%, 2/01/43 | | 139,000 | 106,671 |
| 5.30%, 4/01/44 | | 160,000 | 125,736 |
| 5.35%, 5/15/45 | | 210,000 | 165,021 |
| 5.30%, 4/15/47 | | 165,000 | 127,892 |
| 5.40%, 10/01/47 | | 417,000 | 327,494 |
See accompanying Notes to Financial Statements
Morningstar Funds Trust October 31, 2023 (unaudited)
Schedule of Investments (continued)
Morningstar Total Return Bond Fund
| | | Par (a) | Value |
| Oil & Gas Producers (Continued) |
| Energy Transfer L.P., | | | |
| 6.25%, 4/15/49 | | $ 50,000 | $ 43,998 |
| 5.00%, 5/15/50(g) | | 700,000 | 524,850 |
| Enterprise Products Operating LLC, | | | |
| 4.15%, 10/16/28 | | 270,000 | 250,940 |
| 3.13%, 7/31/29 | | 100,000 | 86,808 |
| 2.80%, 1/31/30 | | 300,000 | 250,595 |
| 6.65%, 10/15/34 | | 80,000 | 82,931 |
| 7.55%, 4/15/38 | | 10,000 | 10,904 |
| 4.85%, 3/15/44 | | 80,000 | 66,254 |
| 5.10%, 2/15/45 | | 100,000 | 85,127 |
| 4.80%, 2/01/49(g) | | 40,000 | 32,332 |
| 4.20%, 1/31/50 | | 60,000 | 43,947 |
| 3.70%, 1/31/51 | | 170,000 | 113,700 |
| 3.95%, 1/31/60(g) | | 70,000 | 46,875 |
| (3M CME Term SOFR + 2.83%), 5.38%, 2/15/78(i) | | 50,000 | 42,461 |
| EOG Resources, Inc., | | | |
| 4.38%, 4/15/30 | | 270,000 | 250,018 |
| 3.90%, 4/01/35 | | 180,000 | 147,685 |
| 4.95%, 4/15/50(g) | | 410,000 | 344,210 |
| EQT Corp., | | | |
| 3.13%, 5/15/26(b) | | 166,000 | 153,738 |
| 3.90%, 10/01/27 | | 161,000 | 148,134 |
| 5.70%, 4/01/28 | | 129,000 | 125,491 |
| 5.00%, 1/15/29 | | 334,000 | 311,449 |
| 7.00%, 2/01/30 | | 431,000 | 436,698 |
| 3.63%, 5/15/31(b) | | 193,000 | 158,916 |
| Exxon Mobil Corp., | | | |
| 2.44%, 8/16/29 | | 240,000 | 204,959 |
| 3.48%, 3/19/30 | | 120,000 | 106,362 |
| 4.11%, 3/01/46 | | 20,000 | 15,244 |
| 4.33%, 3/19/50 | | 10,000 | 7,744 |
| 3.45%, 4/15/51 | | 300,000 | 197,130 |
| Kinder Morgan Energy Partners L.P., | | | |
| 6.50%, 2/01/37 | | 96,000 | 90,734 |
| 4.70%, 11/01/42 | | 156,000 | 115,661 |
| 5.50%, 3/01/44 | | 10,000 | 8,146 |
| Kinder Morgan, Inc., | | | |
| 4.30%, 6/01/25 | | 90,000 | 87,599 |
| 4.30%, 3/01/28 | | 350,000 | 326,409 |
| 5.55%, 6/01/45 | | 210,000 | 172,856 |
| 5.05%, 2/15/46 | | 40,000 | 30,508 |
| 5.20%, 3/01/48 | | 60,000 | 46,680 |
| MPLX L.P., | | | |
| 4.00%, 3/15/28 | | 200,000 | 183,223 |
| 4.80%, 2/15/29 | | 30,000 | 28,061 |
| 4.50%, 4/15/38 | | 90,000 | 70,115 |
| 5.20%, 3/01/47 | | 60,000 | 46,402 |
| | | Par (a) | Value |
| Oil & Gas Producers (Continued) |
| MPLX L.P., | | | |
| 5.20%, 12/01/47 | | $100,000 | $ 76,984 |
| 4.70%, 4/15/48 | | 210,000 | 151,808 |
| 5.50%, 2/15/49 | | 60,000 | 48,430 |
| NGPL PipeCo LLC, | | | |
| 4.88%, 8/15/27(b) | | 118,000 | 110,654 |
| 3.25%, 7/15/31(b) | | 489,000 | 382,471 |
|
| Northwest Pipeline LLC, 4.00%, 4/01/27 | | 508,000 | 476,703 |
| Occidental Petroleum Corp., | | | |
| 5.55%, 3/15/26 | | 160,000 | 157,851 |
| 3.00%, 2/15/27 | | 220,000 | 197,530 |
| 7.88%, 9/15/31(g) | | 347,000 | 371,516 |
| 4.50%, 7/15/44 | | 80,000 | 55,593 |
| 6.60%, 3/15/46(g) | | 150,000 | 144,436 |
| 4.10%, 2/15/47 | | 50,000 | 32,259 |
| 4.20%, 3/15/48 | | 230,000 | 155,027 |
| ONEOK, Inc., | | | |
| 5.55%, 11/01/26 | | 70,000 | 69,155 |
| 5.80%, 11/01/30 | | 100,000 | 96,254 |
| 6.05%, 9/01/33 | | 170,000 | 162,921 |
| 6.63%, 9/01/53 | | 416,000 | 388,773 |
| Pioneer Natural Resources Co., | | | |
| 1.13%, 1/15/26 | | 30,000 | 27,222 |
| 1.90%, 8/15/30 | | 150,000 | 117,199 |
| 2.15%, 1/15/31(g) | | 380,000 | 298,439 |
| Sabine Pass Liquefaction LLC, | | | |
| 5.63%, 3/01/25 | | 898,000 | 892,127 |
| 5.88%, 6/30/26 | | 626,000 | 621,327 |
| 5.90%, 9/15/37(g) | | 127,000 | 121,709 |
|
| Southern Natural Gas Co. LLC, 8.00%, 3/01/32 | | 80,000 | 86,880 |
| Targa Resources Corp., | | | |
| 5.20%, 7/01/27 | | 357,000 | 345,427 |
| 6.13%, 3/15/33 | | 174,000 | 166,647 |
| 4.95%, 4/15/52 | | 60,000 | 43,780 |
| Targa Resources Partners L.P./Targa Resources Partners Finance Corp., | | | |
| 5.00%, 1/15/28 | | 272,000 | 256,692 |
| 5.50%, 3/01/30 | | 180,000 | 165,874 |
| 4.88%, 2/01/31 | | 344,000 | 303,247 |
|
| Tennessee Gas Pipeline Co. LLC, 2.90%, 3/01/30(b) | | 210,000 | 171,910 |
| Texas Eastern Transmission L.P., 3.50%, 1/15/28(b) | | 435,000 | 394,513 |
See accompanying Notes to Financial Statements
Morningstar Funds Trust October 31, 2023 (unaudited)
Schedule of Investments (continued)
Morningstar Total Return Bond Fund
| | | Par (a) | Value |
| Oil & Gas Producers (Continued) |
| Transcontinental Gas Pipe Line Co. LLC, | | | |
| 7.85%, 2/01/26 | | $670,000 | $ 691,749 |
| 4.00%, 3/15/28 | | 436,000 | 401,172 |
| 4.60%, 3/15/48 | | 157,000 | 118,138 |
| Viper Energy Partners L.P., | | | |
| 5.38%, 11/01/27(b)(g) | | 816,000 | 773,364 |
| 7.38%, 11/01/31(b)(g) | | 515,000 | 513,712 |
| Western Midstream Operating L.P., | | | |
| 3.10%, 2/01/25 | | 50,000 | 48,037 |
| 4.65%, 7/01/26 | | 90,000 | 86,049 |
| 6.35%, 1/15/29 | | 115,000 | 114,382 |
| Williams (The) Cos., Inc., | | | |
| 4.90%, 1/15/45 | | 440,000 | 337,477 |
| 5.10%, 9/15/45 | | 140,000 | 112,534 |
| 4.85%, 3/01/48 | | 110,000 | 84,223 |
| | | | 30,803,127 |
| Real Estate Investment Trusts – 0.8% |
| American Tower Corp., | | | |
| 3.95%, 3/15/29 | | 239,000 | 212,909 |
| 3.80%, 8/15/29 | | 472,000 | 413,259 |
| 2.10%, 6/15/30(g) | | 127,000 | 96,732 |
| 2.70%, 4/15/31 | | 302,000 | 233,506 |
| Crown Castle, Inc., | | | |
| 3.10%, 11/15/29 | | 416,000 | 345,896 |
| 3.30%, 7/01/30 | | 72,000 | 59,185 |
| 2.10%, 4/01/31 | | 463,000 | 342,707 |
| Equinix, Inc., | | | |
| 2.00%, 5/15/28 | | 40,000 | 33,364 |
| 3.20%, 11/18/29 | | 103,000 | 87,033 |
| 2.15%, 7/15/30 | | 174,000 | 133,609 |
|
| Extra Space Storage L.P., 5.50%, 7/01/30 | | 33,000 | 31,214 |
| GLP Capital L.P./GLP Financing II, Inc., | | | |
| 5.75%, 6/01/28(g) | | 445,000 | 417,208 |
| 4.00%, 1/15/30 | | 439,000 | 366,366 |
| NNN REIT, Inc., | | | |
| 3.10%, 4/15/50 | | 42,000 | 22,962 |
| 3.50%, 4/15/51(g) | | 158,000 | 94,509 |
|
| Prologis L.P., 5.13%, 1/15/34 | | 178,000 | 163,002 |
| Realty Income Corp., 3.25%, 1/15/31 | | 149,000 | 122,093 |
| VICI Properties L.P., 4.75%, 2/15/28 | | 438,000 | 403,354 |
| VICI Properties L.P./VICI Note Co., Inc., | | | |
| 4.50%, 9/01/26(b) | | 453,000 | 422,857 |
| 4.25%, 12/01/26(b) | | 135,000 | 124,594 |
| 5.75%, 2/01/27(b) | | 181,000 | 173,220 |
| | | Par (a) | Value |
| Real Estate Investment Trusts (Continued) |
| VICI Properties L.P./VICI Note Co., Inc., | | | |
| 3.75%, 2/15/27(b) | | $ 382,000 | $ 343,733 |
| 4.63%, 12/01/29(b) | | 1,074,000 | 928,967 |
| 4.13%, 8/15/30(b) | | 153,000 | 126,217 |
| | | | 5,698,496 |
| Retail - Consumer Staples – 0.0%(h) |
| Costco Wholesale Corp., | | | |
| 1.38%, 6/20/27 | | 190,000 | 165,366 |
| 1.75%, 4/20/32(g) | | 90,000 | 67,358 |
| Walmart, Inc., | | | |
| 1.50%, 9/22/28 | | 60,000 | 50,509 |
| 2.38%, 9/24/29 | | 20,000 | 17,112 |
| 1.80%, 9/22/31 | | 40,000 | 30,761 |
| | | | 331,106 |
| Retail - Discretionary – 0.1% |
| Home Depot (The), Inc., | | | |
| 2.50%, 4/15/27 | | 60,000 | 54,462 |
| 3.90%, 12/06/28 | | 10,000 | 9,310 |
| 2.70%, 4/15/30 | | 80,000 | 66,984 |
| 3.30%, 4/15/40 | | 160,000 | 113,124 |
| 3.90%, 6/15/47 | | 20,000 | 14,310 |
| 3.35%, 4/15/50 | | 210,000 | 133,082 |
| Lowe's Cos., Inc., | | | |
| 1.70%, 9/15/28 | | 180,000 | 148,908 |
| 4.50%, 4/15/30 | | 261,000 | 238,742 |
| 2.80%, 9/15/41 | | 284,000 | 172,501 |
| | | | 951,423 |
| Semiconductors – 0.3% |
| Applied Materials, Inc., 1.75%, 6/01/30 | | 210,000 | 164,872 |
| Broadcom, Inc., | | | |
| 3.47%, 4/15/34(b) | | 161,000 | 122,672 |
| 3.14%, 11/15/35(b) | | 1,062,000 | 749,132 |
| 3.19%, 11/15/36(b) | | 213,000 | 147,515 |
| Intel Corp., | | | |
| 1.60%, 8/12/28 | | 100,000 | 83,683 |
| 5.13%, 2/10/30 | | 120,000 | 116,118 |
| 5.20%, 2/10/33 | | 90,000 | 84,966 |
| 4.75%, 3/25/50(g) | | 80,000 | 62,822 |
| 3.05%, 8/12/51 | | 80,000 | 45,802 |
| KLA Corp., | | | |
| 4.65%, 7/15/32 | | 70,000 | 64,886 |
| 3.30%, 3/01/50 | | 209,000 | 131,715 |
|
| Micron Technology, Inc., 5.88%, 2/09/33 | | 70,000 | 65,119 |
| NVIDIA Corp., | | | |
| 3.50%, 4/01/50 | | 150,000 | 102,649 |
| 3.70%, 4/01/60 | | 150,000 | 100,886 |
See accompanying Notes to Financial Statements
Morningstar Funds Trust October 31, 2023 (unaudited)
Schedule of Investments (continued)
Morningstar Total Return Bond Fund
| | | Par (a) | Value |
| Semiconductors (Continued) |
| Texas Instruments, Inc., | | | |
| 2.90%, 11/03/27(g) | | $220,000 | $ 200,345 |
| 1.75%, 5/04/30 | | 70,000 | 55,802 |
| 3.88%, 3/15/39 | | 100,000 | 79,485 |
| | | | 2,378,469 |
| Software – 0.3% |
| Adobe, Inc., 2.30%, 2/01/30 | | 200,000 | 166,250 |
| Intuit, Inc., 5.50%, 9/15/53 | | 30,000 | 27,291 |
| Microsoft Corp., | | | |
| 2.53%, 6/01/50 | | 200,000 | 114,484 |
| 2.92%, 3/17/52 | | 70,000 | 43,212 |
| Oracle Corp., | | | |
| 1.65%, 3/25/26 | | 310,000 | 281,166 |
| 2.95%, 4/01/30 | | 30,000 | 24,864 |
| 4.65%, 5/06/30 | | 120,000 | 110,012 |
| 2.88%, 3/25/31 | | 360,000 | 288,561 |
| 3.85%, 7/15/36 | | 79,000 | 60,253 |
| 3.80%, 11/15/37 | | 162,000 | 119,211 |
| 3.60%, 4/01/40 | | 101,000 | 69,352 |
| 5.38%, 7/15/40 | | 94,000 | 79,996 |
| 4.13%, 5/15/45 | | 166,000 | 114,989 |
| 4.00%, 7/15/46 | | 414,000 | 278,157 |
| 3.60%, 4/01/50 | | 75,000 | 45,958 |
|
| Salesforce, Inc., 3.70%, 4/11/28 | | 190,000 | 177,973 |
| | | | 2,001,729 |
| Specialty Finance – 0.2% |
| Air Lease Corp., | | | |
| 3.38%, 7/01/25 | | 70,000 | 66,442 |
| 5.30%, 2/01/28 | | 160,000 | 153,037 |
| American Express Co., | | | |
| 4.20%, 11/06/25 | | 70,000 | 67,740 |
| 4.05%, 5/03/29 | | 140,000 | 128,054 |
| Capital One Financial Corp., | | | |
| (SOFR + 3.07%), 7.62%, 10/30/31(i) | | 140,000 | 139,932 |
| (SOFR + 2.86%), 6.38%, 6/08/34(i) | | 86,000 | 78,426 |
| Penske Truck Leasing Co. L.P./PTL Finance Corp., | | | |
| 5.88%, 11/15/27(b) | | 193,000 | 188,210 |
| 6.05%, 8/01/28(b) | | 186,000 | 182,482 |
|
| USAA Capital Corp., 2.13%, 5/01/30(b) | | 150,000 | 118,490 |
| | | | 1,122,813 |
| | | Par (a) | Value |
| Technology Hardware – 0.1% |
| Dell International LLC/EMC Corp., | | | |
| 4.90%, 10/01/26 | | $172,000 | $ 167,409 |
| 5.25%, 2/01/28 | | 147,000 | 143,656 |
|
| Hewlett Packard Enterprise Co., 5.25%, 7/01/28 | | 126,000 | 121,665 |
| Motorola Solutions, Inc., | | | |
| 2.75%, 5/24/31 | | 276,000 | 213,959 |
| 5.60%, 6/01/32 | | 311,000 | 291,418 |
| 5.50%, 9/01/44 | | 121,000 | 101,529 |
| | | | 1,039,636 |
| Technology Services – 0.3% |
| Booz Allen Hamilton, Inc., 5.95%, 8/04/33 | | 192,000 | 182,482 |
| FactSet Research Systems, Inc., 3.45%, 3/01/32 | | 265,000 | 214,323 |
| Global Payments, Inc., | | | |
| 3.20%, 8/15/29 | | 293,000 | 245,919 |
| 2.90%, 5/15/30 | | 187,000 | 149,788 |
| Mastercard, Inc., | | | |
| 3.35%, 3/26/30 | | 120,000 | 105,433 |
| 3.85%, 3/26/50 | | 280,000 | 204,585 |
| MSCI, Inc., | | | |
| 4.00%, 11/15/29(b) | | 258,000 | 222,096 |
| 3.88%, 2/15/31(b) | | 190,000 | 156,825 |
| 3.63%, 11/01/31(b) | | 372,000 | 295,337 |
| PayPal Holdings, Inc., | | | |
| 1.65%, 6/01/25(g) | | 90,000 | 84,456 |
| 2.30%, 6/01/30 | | 80,000 | 64,137 |
| 4.40%, 6/01/32(g) | | 70,000 | 62,731 |
| S&P Global, Inc., | | | |
| 2.90%, 3/01/32 | | 100,000 | 80,236 |
| 5.25%, 9/15/33(b) | | 60,000 | 56,610 |
|
| Visa, Inc., 4.30%, 12/14/45 | | 170,000 | 135,723 |
| | | | 2,260,681 |
| Telecommunications – 1.0% |
| AT&T, Inc., | | | |
| 3.80%, 2/15/27 | | 170,000 | 158,662 |
| 2.30%, 6/01/27 | | 170,000 | 150,193 |
| 4.30%, 2/15/30(b) | | 105,000 | 94,165 |
| 2.25%, 2/01/32 | | 30,000 | 22,170 |
| 2.55%, 12/01/33 | | 290,000 | 208,133 |
| 5.40%, 2/15/34 | | 390,000 | 358,343 |
| 4.50%, 5/15/35 | | 150,000 | 125,090 |
| 5.35%, 9/01/40 | | 50,000 | 42,494 |
| 5.55%, 8/15/41 | | 40,000 | 34,525 |
| 4.80%, 6/15/44 | | 22,000 | 16,819 |
| 3.50%, 9/15/53 | | 297,000 | 174,888 |
| 3.55%, 9/15/55 | | 373,000 | 216,824 |
See accompanying Notes to Financial Statements
Morningstar Funds Trust October 31, 2023 (unaudited)
Schedule of Investments (continued)
Morningstar Total Return Bond Fund
| | | Par (a) | Value |
| Telecommunications (Continued) |
| AT&T, Inc., | | | |
| 3.80%, 12/01/57 | | $277,000 | $ 166,810 |
| 3.65%, 9/15/59 | | 403,000 | 233,161 |
| Sprint LLC, | | | |
| 7.63%, 2/15/25 | | 521,000 | 528,414 |
| 7.63%, 3/01/26 | | 292,000 | 299,923 |
| T-Mobile USA, Inc., | | | |
| 3.50%, 4/15/25 | | 230,000 | 222,208 |
| 3.75%, 4/15/27 | | 20,000 | 18,599 |
| 3.88%, 4/15/30 | | 769,000 | 669,571 |
| 2.55%, 2/15/31 | | 70,000 | 54,540 |
| 2.25%, 11/15/31 | | 400,000 | 296,974 |
| 3.00%, 2/15/41 | | 190,000 | 119,928 |
| 3.30%, 2/15/51 | | 70,000 | 41,136 |
| Verizon Communications, Inc., | | | |
| 2.63%, 8/15/26 | | 10,000 | 9,207 |
| 4.13%, 3/16/27 | | 60,000 | 56,835 |
| 3.00%, 3/22/27 | | 30,000 | 27,402 |
| 2.10%, 3/22/28 | | 360,000 | 307,079 |
| 4.33%, 9/21/28 | | 250,000 | 232,769 |
| 3.88%, 2/08/29 | | 30,000 | 27,237 |
| 3.15%, 3/22/30 | | 90,000 | 75,504 |
| 1.75%, 1/20/31 | | 615,000 | 454,742 |
| 2.55%, 3/21/31 | | 380,000 | 296,880 |
| 2.36%, 3/15/32 | | 245,000 | 183,199 |
| 5.05%, 5/09/33 | | 108,000 | 98,850 |
| 4.50%, 8/10/33 | | 310,000 | 268,650 |
| 4.40%, 11/01/34 | | 581,000 | 491,864 |
| 2.65%, 11/20/40 | | 360,000 | 217,612 |
| 3.40%, 3/22/41 | | 50,000 | 33,740 |
| 3.85%, 11/01/42 | | 60,000 | 42,442 |
| 4.13%, 8/15/46 | | 70,000 | 50,057 |
| 4.00%, 3/22/50 | | 160,000 | 108,793 |
| 2.88%, 11/20/50 | | 40,000 | 21,863 |
| 3.55%, 3/22/51 | | 330,000 | 207,348 |
| 3.00%, 11/20/60 | | 113,000 | 57,846 |
| | | | 7,523,489 |
| Tobacco & Cannabis – 0.2% |
| Altria Group, Inc., | | | |
| 2.35%, 5/06/25 | | 30,000 | 28,432 |
| 4.40%, 2/14/26 | | 172,000 | 166,353 |
| 4.80%, 2/14/29(g) | | 80,000 | 74,927 |
| 2.45%, 2/04/32 | | 180,000 | 131,354 |
| 6.88%, 11/01/33 | | 485,000 | 480,794 |
| 5.80%, 2/14/39 | | 70,000 | 62,221 |
| 3.40%, 2/04/41 | | 156,000 | 95,597 |
| 4.25%, 8/09/42 | | 244,000 | 167,006 |
| 4.50%, 5/02/43 | | 119,000 | 84,003 |
| 5.95%, 2/14/49 | | 255,000 | 216,322 |
| | | Par (a) | Value |
| Tobacco & Cannabis (Continued) |
| Altria Group, Inc., | | | |
| 6.20%, 2/14/59 | | $ 24,000 | $ 21,438 |
| Philip Morris International, Inc., | | | |
| 5.13%, 11/17/27 | | 92,000 | 89,678 |
| 2.10%, 5/01/30 | | 70,000 | 54,940 |
| 4.50%, 3/20/42 | | 60,000 | 45,896 |
| | | | 1,718,961 |
| Transportation & Logistics – 0.3% |
| American Airlines Pass Through Trust, | | | |
| Series 2017-1, Class AA, 3.65%, 2/15/29 | | 7,549 | 6,753 |
| Series 2019-1, Class AA, 3.15%, 2/15/32 | | 54,280 | 45,235 |
| Burlington Northern Santa Fe LLC, | | | |
| 4.55%, 9/01/44 | | 97,000 | 77,204 |
| 3.30%, 9/15/51 | | 189,000 | 117,808 |
| 2.88%, 6/15/52 | | 134,000 | 76,471 |
|
| CSX Corp., 3.35%, 9/15/49 | | 174,000 | 109,113 |
| Delta Air Lines Pass Through Trust, | | | |
| Series 2019-1, Class AA, 3.20%, 10/25/25 | | 137,000 | 134,666 |
| Series 2015-1, Class AA, 3.63%, 7/30/27 | | 48,859 | 44,915 |
| Delta Air Lines, Inc./SkyMiles IP Ltd., | | | |
| 4.50%, 10/20/25(b) | | 146,969 | 142,850 |
| 4.75%, 10/20/28(b) | | 260,000 | 244,395 |
| Norfolk Southern Corp., | | | |
| 3.05%, 5/15/50 | | 258,000 | 149,671 |
| 3.16%, 5/15/55(g) | | 148,000 | 83,897 |
|
| Ryder System, Inc., 5.25%, 6/01/28 | | 40,000 | 38,500 |
| Union Pacific Corp., | | | |
| 2.15%, 2/05/27 | | 120,000 | 107,733 |
| 2.40%, 2/05/30 | | 150,000 | 123,235 |
| 3.84%, 3/20/60 | | 272,000 | 179,148 |
| 2.97%, 9/16/62 | | 187,000 | 98,620 |
| 3.75%, 2/05/70 | | 238,000 | 147,689 |
| United Airlines Pass Through Trust, | | | |
| Series 2020-1, Class B, 4.88%, 1/15/26 | | 39,520 | 37,867 |
| Series 2014-1, Class A, 4.00%, 4/11/26 | | 74,908 | 70,440 |
| Series 2016-2, Class B, 3.65%, 4/07/27 | | 1,944 | 1,820 |
| Series 2016-1, Class AA, 3.10%, 7/07/28 | | 2,050 | 1,823 |
See accompanying Notes to Financial Statements
Morningstar Funds Trust October 31, 2023 (unaudited)
Schedule of Investments (continued)
Morningstar Total Return Bond Fund
| | | Par (a) | Value |
| Transportation & Logistics (Continued) |
| United Airlines Pass Through Trust, | | | |
| Series 2016-2, Class AA, 2.88%, 10/07/28 | | $ 15,133 | $ 13,125 |
| Series 2019-2, Class AA, 2.70%, 5/01/32 | | 13,744 | 11,152 |
| | | | 2,064,130 |
Total Corporate Bonds
(Cost $156,809,300) | 136,371,123 |
|
| Foreign Issuer Bonds – 5.6% |
| Argentina – 0.0%(h) |
| Argentine Republic Government International Bond, | | | |
| (Step to 4.13% on 7/9/24), 3.63%, 7/09/35(f) | | 43,000 | 10,550 |
| (Step to 5.00% on 7/9/24), 4.25%, 1/09/38(f) | | 23,000 | 6,917 |
| YPF S.A., | | | |
| 6.95%, 7/21/27 | | 10,000 | 7,558 |
| 7.00%, 9/30/33 | | 9,682 | 7,296 |
| 7.00%, 12/15/47(b) | | 18,000 | 11,483 |
| | | | 43,804 |
| Australia – 0.1% |
| BHP Billiton Finance USA Ltd., 5.00%, 9/30/43 | | 160,000 | 138,236 |
| Glencore Funding LLC, | | | |
| 4.00%, 3/27/27(b) | | 160,000 | 149,219 |
| 3.88%, 10/27/27(b) | | 70,000 | 64,149 |
| 6.38%, 10/06/30(b) | | 209,000 | 204,756 |
| | | | 556,360 |
| Belgium – 0.2% |
| Anheuser-Busch Cos. LLC/Anheuser-Busch InBev Worldwide, Inc., | | | |
| 3.65%, 2/01/26 | | 300,000 | 288,417 |
| 4.90%, 2/01/46 | | 200,000 | 166,555 |
| Anheuser-Busch InBev Worldwide, Inc., | | | |
| 4.00%, 4/13/28 | | 140,000 | 131,658 |
| 4.75%, 1/23/29 | | 260,000 | 250,921 |
| 3.50%, 6/01/30 | | 50,000 | 43,943 |
| 4.35%, 6/01/40 | | 130,000 | 104,963 |
| 5.55%, 1/23/49 | | 260,000 | 235,877 |
| | | | 1,222,334 |
| | | Par (a) | Value |
| Brazil – 0.3% |
| Petrorio Luxembourg Trading S.a.r.l., 6.13%, 6/09/26(b) | | $ 23,000 | $ 21,871 |
| Suzano Austria GmbH, 6.00%, 1/15/29 | | 1,150,000 | 1,106,641 |
| Vale Overseas Ltd., | | | |
| 6.25%, 8/10/26 | | 560,000 | 563,741 |
| 6.88%, 11/21/36 | | 300,000 | 296,194 |
| | | | 1,988,447 |
| Canada – 0.2% |
| Bank of Montreal, | | | |
| 1.85%, 5/01/25 | | 210,000 | 197,360 |
| (5Y USD Swap Rate + 1.43%), 3.80%, 12/15/32(i) | | 40,000 | 34,666 |
| Bank of Nova Scotia (The), | | | |
| 3.45%, 4/11/25(g) | | 430,000 | 414,377 |
| 1.30%, 6/11/25 | | 120,000 | 111,292 |
| (5Y US Treasury CMT + 2.05%), 4.59%, 5/04/37(i) | | 140,000 | 113,214 |
|
| Barrick North America Finance LLC, 5.75%, 5/01/43 | | 190,000 | 174,893 |
| Enbridge, Inc., 5.70%, 3/08/33 | | 166,000 | 155,216 |
| Royal Bank of Canada, | | | |
| 1.15%, 6/10/25(g) | | 100,000 | 92,885 |
| 3.88%, 5/04/32(g) | | 340,000 | 286,013 |
| Toronto-Dominion Bank (The), | | | |
| 1.15%, 6/12/25(g) | | 110,000 | 101,933 |
| 4.46%, 6/08/32 | | 70,000 | 61,040 |
| | | | 1,742,889 |
| Chile – 0.1% |
| Chile Government International Bond, 3.10%, 1/22/61 | | 310,000 | 166,386 |
| Corp. Nacional del Cobre de Chile, | | | |
| 3.63%, 8/01/27(b) | | 330,000 | 300,765 |
| 3.70%, 1/30/50(b) | | 660,000 | 387,579 |
|
| Kenbourne Invest S.A., 6.88%, 11/26/24(b)(g) | | 200,000 | 151,094 |
| | | | 1,005,824 |
| China – 0.1% |
| NXP B.V./NXP Funding LLC/NXP USA, Inc., | | | |
| 2.70%, 5/01/25 | | 80,000 | 76,031 |
| 4.30%, 6/18/29 | | 193,000 | 174,149 |
See accompanying Notes to Financial Statements
Morningstar Funds Trust October 31, 2023 (unaudited)
Schedule of Investments (continued)
Morningstar Total Return Bond Fund
| | | Par (a) | Value |
| China (Continued) |
| Prosus N.V., | | | |
| 3.68%, 1/21/30(b) | | $ 600,000 | $ 475,671 |
| 4.03%, 8/03/50(b) | | 380,000 | 204,880 |
| | | | 930,731 |
| Colombia – 0.3% |
| Avianca Midco 2 PLC, 9.00%, 12/01/28(b) | | 4,000 | 3,288 |
| Colombia Government International Bond, | | | |
| 3.25%, 4/22/32 | | 620,000 | 443,564 |
| 5.00%, 6/15/45 | | 810,000 | 518,169 |
| 5.20%, 5/15/49 | | 460,000 | 294,156 |
| Colombian TES, | | | |
| 7.50%, 8/26/26 | COP | 783,100,000 | 175,157 |
| 5.75%, 11/03/27 | COP | 258,000,000 | 52,497 |
| Ecopetrol S.A., | | | |
| 8.88%, 1/13/33 | | 18,000 | 17,287 |
| 5.88%, 5/28/45 | | 1,220,000 | 795,574 |
| | | | 2,299,692 |
| Czech Republic – 0.0%(h) |
| Czech Republic Government Bond, | | | |
| 5.50%, 12/12/28 | CZK | 1,580,000 | 71,434 |
| 5.00%, 9/30/30 | CZK | 840,000 | 37,152 |
| 4.20%, 12/04/36 | CZK | 280,000 | 11,470 |
| | | | 120,056 |
| Denmark – 0.0%(h) |
| Danske Bank A/S, (1Y US Treasury CMT + 0.55%), 0.98%, 9/10/25(b)(i) | | 220,000 | 209,539 |
| France – 0.3% |
| BNP Paribas S.A., | | | |
| (SOFR + 2.07%), 2.22%, 6/09/26(b)(i) | | 600,000 | 560,314 |
| (1Y US Treasury CMT + 1.45%), 5.13%, 1/13/29(b)(i) | | 500,000 | 478,063 |
| (3M CME Term SOFR + 2.83%), 5.20%, 1/10/30(b)(i) | | 300,000 | 281,138 |
| (SOFR + 1.51%), 3.05%, 1/13/31(b)(i) | | 200,000 | 161,108 |
|
| Credit Agricole S.A., (SOFR + 1.68%), 1.91%, 6/16/26(b)(i) | | 250,000 | 232,599 |
| Danone S.A., 2.95%, 11/02/26(b) | | 200,000 | 185,532 |
| | | | 1,898,754 |
| | | Par (a) | Value |
| Germany – 0.1% |
| Deutsche Bank A.G., | | | |
| 5.37%, 9/09/27 | | $493,000 | $ 476,772 |
| (SOFR + 1.32%), 2.55%, 1/07/28(i) | | 150,000 | 129,833 |
| | | | 606,605 |
| India – 0.1% |
| Export-Import Bank of India, 3.38%, 8/05/26(b) | | 200,000 | 188,152 |
| Reliance Industries Ltd., | | | |
| 2.88%, 1/12/32(b)(g) | | 250,000 | 194,774 |
| 3.63%, 1/12/52(b) | | 450,000 | 271,948 |
| | | | 654,874 |
| Indonesia – 0.2% |
| Indonesia Government International Bond, | | | |
| 2.85%, 2/14/30 | | 200,000 | 168,978 |
| 3.05%, 3/12/51 | | 222,000 | 135,173 |
|
| Pertamina Persero PT, 6.00%, 5/03/42(b) | | 280,000 | 244,926 |
| Perusahaan Perseroan Persero PT Perusahaan Listrik Negara, 5.45%, 5/21/28(b) | | 770,000 | 746,827 |
| | | | 1,295,904 |
| Ireland – 0.1% |
| AerCap Ireland Capital DAC/AerCap Global Aviation Trust, | | | |
| 2.45%, 10/29/26 | | 400,000 | 355,812 |
| 3.00%, 10/29/28 | | 400,000 | 336,898 |
| 3.30%, 1/30/32 | | 150,000 | 116,128 |
| | | | 808,838 |
| Israel – 0.1% |
| Energian Israel Finance Ltd., 8.50%, 9/30/33(b) | | 2,059 | 1,804 |
| Israel Government International Bond, | | | |
| 2.75%, 7/03/30 | | 500,000 | 411,200 |
| 4.50%, 4/03/20(k) | | 220,000 | 144,148 |
|
| Leviathan Bond Ltd., 6.75%, 6/30/30(b) | | 250 | 213 |
| | | | 557,365 |
| Japan – 0.0%(h) |
| Mitsubishi UFJ Financial Group, Inc., (1Y US Treasury CMT + 1.13%), 3.84%, 4/17/26(i) | | 200,000 | 193,211 |
| Takeda Pharmaceutical Co. Ltd., 2.05%, 3/31/30 | | 200,000 | 158,055 |
| | | | 351,266 |
See accompanying Notes to Financial Statements
Morningstar Funds Trust October 31, 2023 (unaudited)
Schedule of Investments (continued)
Morningstar Total Return Bond Fund
| | | Par (a) | Value |
| Kazakhstan – 0.1% |
| Kazakhstan Government International Bond, 4.88%, 10/14/44 | | $ 600,000 | $ 496,399 |
| KazMunayGas National Co. JSC, 6.38%, 10/24/48(b) | | 420,000 | 328,440 |
| | | | 824,839 |
| Kuwait – 0.1% |
| MEGlobal B.V., | | | |
| 4.25%, 11/03/26(b) | | 210,000 | 197,649 |
| 2.63%, 4/28/28(b)(g) | | 450,000 | 384,075 |
| | | | 581,724 |
| Macau – 0.3% |
| Sands China Ltd., | | | |
| 5.38%, 8/08/25 | | 300,000 | 290,362 |
| 4.30%, 1/08/26(g) | | 1,000,000 | 927,610 |
| 4.88%, 6/18/30 | | 900,000 | 755,077 |
| | | | 1,973,049 |
| Mexico – 0.6% |
| Comision Federal de Electricidad, 3.88%, 7/26/33(b) | | 720,000 | 521,893 |
| Grupo Posadas S.A.B. de C.V., (Step to 7.00% on 12/30/23), 5.00%, 12/30/27(f) | | 22,234 | 18,732 |
| Mexican Bonos, | | | |
| 7.50%, 6/03/27 | MXN | 1,500,000 | 76,216 |
| 8.50%, 5/31/29 | MXN | 4,545,000 | 234,472 |
| 8.50%, 11/18/38 | MXN | 991,600 | 48,052 |
|
| Mexico Cetes, 0.00%, 11/28/24(l) | MXN | 51,700,000 | 254,155 |
| Mexico Government International Bond, | | | |
| 2.66%, 5/24/31 | | 568,000 | 442,438 |
| 4.75%, 3/08/44 | | 930,000 | 688,295 |
| 4.50%, 1/31/50(g) | | 420,000 | 289,530 |
| 4.40%, 2/12/52(g) | | 1,150,000 | 763,471 |
| Orbia Advance Corp. S.A.B. de C.V., | | | |
| 1.88%, 5/11/26(b) | | 280,000 | 248,954 |
| 2.88%, 5/11/31(b) | | 270,000 | 200,230 |
| Petroleos Mexicanos, | | | |
| 6.88%, 8/04/26 | | 104,000 | 96,027 |
| 6.38%, 1/23/45(g) | | 50,000 | 28,273 |
| 5.63%, 1/23/46(g) | | 560,000 | 296,835 |
|
| Southern Copper Corp., 5.25%, 11/08/42 | | 770,000 | 644,264 |
| | | | 4,851,837 |
| | | Par (a) | Value |
| Morocco – 0.0%(h) |
| OCP S.A., 4.50%, 10/22/25(b) | | $ 200,000 | $ 191,160 |
| Netherlands – 0.2% |
| Cooperatieve Rabobank U.A., | | | |
| 4.38%, 8/04/25 | | 440,000 | 422,567 |
| (1Y US Treasury CMT + 1.22%), 3.65%, 4/06/28(b)(i) | | 250,000 | 227,973 |
| (1Y US Treasury CMT + 1.42%), 3.76%, 4/06/33(b)(i) | | 250,000 | 204,042 |
| Shell International Finance B.V., | | | |
| 2.38%, 11/07/29 | | 200,000 | 167,359 |
| 2.75%, 4/06/30 | | 150,000 | 126,806 |
| 4.38%, 5/11/45 | | 150,000 | 117,115 |
| 4.00%, 5/10/46 | | 80,000 | 58,910 |
| 3.25%, 4/06/50(g) | | 340,000 | 214,334 |
| | | | 1,539,106 |
| Panama – 0.1% |
| Panama Government International Bond, | | | |
| 3.88%, 3/17/28 | | 400,000 | 358,768 |
| 4.50%, 4/16/50 | | 920,000 | 575,815 |
| 4.50%, 4/01/56(g) | | 247,000 | 149,539 |
| | | | 1,084,122 |
| Peru – 0.1% |
| Peruvian Government International Bond, | | | |
| 5.63%, 11/18/50(g) | | 110,000 | 96,984 |
| 3.55%, 3/10/51(g) | | 220,000 | 138,278 |
| 3.60%, 1/15/72(g) | | 120,000 | 68,045 |
| Petroleos del Peru S.A., | | | |
| 4.75%, 6/19/32(b) | | 700,000 | 466,864 |
| 5.63%, 6/19/47(b) | | 200,000 | 109,436 |
| | | | 879,607 |
| Philippines – 0.0%(h) |
| Philippine Government International Bond, 3.20%, 7/06/46 | | 267,000 | 166,824 |
| Romania – 0.0%(h) |
| Romanian Government International Bond, 2.13%, 3/07/28 | EUR | 23,000 | 21,185 |
| Russia – 0.0%(h) |
| Russian Federal Bond - OFZ, 6.10%, 7/18/35 | RUB | 6,245,000 | 23,832 |
See accompanying Notes to Financial Statements
Morningstar Funds Trust October 31, 2023 (unaudited)
Schedule of Investments (continued)
Morningstar Total Return Bond Fund
| | | Par (a) | Value |
| Saudi Arabia – 0.0%(h) |
| Gaci First Investment Co., 5.00%, 10/13/27 | | $ 350,000 | $ 340,225 |
| South Africa – 0.1% |
| Anglo American Capital PLC, 4.00%, 9/11/27(b) | | 400,000 | 370,542 |
| Republic of South Africa Government Bond, 7.00%, 2/28/31 | ZAR | 1,414,000 | 60,054 |
| | | | 430,596 |
| Spain – 0.1% |
| Banco Santander S.A., 2.75%, 5/28/25 | | 600,000 | 565,395 |
| Telefonica Emisiones S.A., 4.10%, 3/08/27 | | 150,000 | 140,399 |
| | | | 705,794 |
| Switzerland – 1.0% |
| Credit Suisse A.G., | | | |
| 7.95%, 1/09/25 | | 870,000 | 882,409 |
| 3.70%, 2/21/25 | | 1,902,000 | 1,831,755 |
| 2.95%, 4/09/25 | | 250,000 | 237,380 |
| 5.00%, 7/09/27 | | 750,000 | 715,664 |
| 7.50%, 2/15/28 | | 480,000 | 498,388 |
| UBS Group A.G., | | | |
| (SOFR + 1.56%), 2.59%, 9/11/25(b)(i) | | 250,000 | 241,100 |
| (1Y US Treasury CMT + 1.55%), 4.49%, 5/12/26(b)(i) | | 250,000 | 242,285 |
| 4.28%, 1/09/28(b) | | 381,000 | 347,585 |
| 4.25%, 3/23/28(b) | | 770,000 | 700,076 |
| (SOFR + 3.73%), 4.19%, 4/01/31(b)(i) | | 250,000 | 213,741 |
| (SOFR + 1.73%), 3.09%, 5/14/32(b)(i) | | 500,000 | 384,578 |
| (1Y US Treasury CMT + 1.10%), 2.75%, 2/11/33(b)(i) | | 600,000 | 439,333 |
| (SOFR + 5.02%), 9.02%, 11/15/33(b)(i) | | 650,000 | 728,140 |
| | | | 7,462,434 |
| Taiwan – 0.1% |
| TSMC Arizona Corp., 2.50%, 10/25/31 | | 1,020,000 | 806,645 |
| Ukraine – 0.0%(h) |
| Ukraine Government International Bond, 7.75%, 8/01/41(c)(m) | | 30,000 | 12,578 |
| United Arab Emirates – 0.1% |
| DP World Ltd., 5.63%, 9/25/48(b) | | 700,000 | 575,372 |
| | | Par (a) | Value |
| United Kingdom – 0.4% |
| BAE Systems PLC, 3.40%, 4/15/30(b) | | $627,000 | $ 536,393 |
| Barclays PLC, (SOFR + 2.62%), 6.69%, 9/13/34(i) | | 225,000 | 212,789 |
| BAT Capital Corp., | | | |
| 3.56%, 8/15/27 | | 77,000 | 69,804 |
| 2.26%, 3/25/28 | | 100,000 | 83,921 |
| 4.54%, 8/15/47 | | 190,000 | 122,924 |
| 4.76%, 9/06/49(g) | | 85,000 | 56,508 |
| 3.98%, 9/25/50 | | 326,000 | 191,801 |
| 7.08%, 8/02/53 | | 105,000 | 93,714 |
| HSBC Holdings PLC, | | | |
| (SOFR + 1.93%), 2.10%, 6/04/26(i) | | 200,000 | 186,362 |
| (3M CME Term SOFR + 1.81%), 4.04%, 3/13/28(i) | | 240,000 | 220,434 |
| (3M CME Term SOFR + 1.87%), 3.97%, 5/22/30(i) | | 350,000 | 302,393 |
|
| Lloyds Banking Group PLC, 4.38%, 3/22/28 | | 290,000 | 266,054 |
| Natwest Group PLC, | | | |
| (3M USD LIBOR + 1.76%), 4.27%, 3/22/25(i) | | 200,000 | 197,988 |
| (3M USD LIBOR + 1.91%), 5.08%, 1/27/30(i) | | 200,000 | 183,574 |
|
| Reynolds American, Inc., 5.85%, 8/15/45 | | 108,000 | 84,426 |
| | | | 2,809,085 |
| Uruguay – 0.1% |
| Uruguay Government International Bond, | | | |
| 4.38%, 1/23/31 | | 170,000 | 160,583 |
| 5.75%, 10/28/34(g) | | 380,000 | 380,261 |
| 5.10%, 6/18/50(g) | | 617,641 | 533,999 |
| | | | 1,074,843 |
Total Foreign Issuer Bonds
(Cost $50,411,449) | 42,648,139 |
|
| Mortgage-Backed Securities – 36.2% |
| Commercial Mortgage-Backed Securities – 2.6% |
| 245 Park Avenue Trust, Series 2017-245P, Class E, 3.66%, 6/05/37(b)(e) | | 740,000 | 576,795 |
| Arbor Realty Commercial Real Estate Notes Ltd., Series 2022-FL1, Class A, (30D Average SOFR + 1.45%, 1.45% Floor), 6.77%, 1/15/37(b)(c) | | 378,000 | 373,359 |
See accompanying Notes to Financial Statements
Morningstar Funds Trust October 31, 2023 (unaudited)
Schedule of Investments (continued)
Morningstar Total Return Bond Fund
| | | Par (a) | Value |
Commercial Mortgage-Backed Securities
(Continued) |
| AREIT Trust, Series 2022-CRE6, Class A, (30D Average SOFR + 1.25%, 1.25% Floor), 6.57%, 1/16/37(b)(c) | | $ 751,023 | $730,262 |
| BANK, | | | |
| Series 2017-BNK5, Class A4, 3.13%, 6/15/60 | | 330,000 | 298,189 |
| Series 2017-BNK7, Class A5, 3.44%, 9/15/60 | | 100,000 | 90,104 |
| Series 2018-BN13, Class A5, 4.22%, 8/15/61 | | 480,000 | 437,760 |
| Series 2019-BN19, Class C, 4.03%, 8/15/61(e) | | 280,000 | 166,206 |
|
| Bayview Commercial Asset Trust, Series 2006-1A, Class A1, (1M CME Term SOFR + 0.52%), 5.84%, 4/25/36(b)(c) | | 240,201 | 213,209 |
| Benchmark Mortgage Trust, | | | |
| Series 2018-B2, Class A5, 3.88%, 2/15/51 | | 390,000 | 349,178 |
| Series 2019-B10, Class A4, 3.72%, 3/15/62 | | 500,000 | 439,569 |
| Series 2019-B9, Class XA, 1.02%, 3/15/52(e) | | 1,683,892 | 67,166 |
| Series 2020-IG1, Class AS, 2.91%, 9/15/43 | | 720,000 | 532,378 |
| Series 2021-B25, Class XA, 1.09%, 4/15/54(e) | | 6,698,694 | 359,877 |
| Series 2021-B27, Class XA, 1.26%, 7/15/54(e) | | 5,223,215 | 336,512 |
|
| BHMS, Series 2018-ATLS, Class A, (1M CME Term SOFR + 1.55%, 1.50% Floor), 6.88%, 7/15/35(b)(c) | | 190,000 | 186,672 |
| BX Commercial Mortgage Trust, | | | |
| Series 2021-SOAR, Class A, (1M CME Term SOFR + 0.78%, 0.67% Floor), 6.12%, 6/15/38(b)(c) | | 622,031 | 609,360 |
| | | Par (a) | Value |
Commercial Mortgage-Backed Securities
(Continued) |
| BX Commercial Mortgage Trust, | | | |
| Series 2021-XL2, Class A, (1M CME Term SOFR + 0.80%, 0.69% Floor), 6.14%, 10/15/38(b)(c) | | $ 828,846 | $808,593 |
|
| BXP Trust, Series 2017-GM, Class D, 3.42%, 6/13/39(b)(e) | | 370,000 | 306,015 |
| CAMB Commercial Mortgage Trust, Series 2019-LIFE, Class D, (1M CME Term SOFR + 1.80%, 1.75% Floor), 7.13%, 12/15/37(b)(c) | | 100,000 | 98,654 |
| CFK Trust, Series 2019-FAX, Class D, 4.64%, 1/15/39(b)(e) | | 100,000 | 83,904 |
| Citigroup Commercial Mortgage Trust, | | | |
| Series 2014-GC23, Class B, 4.18%, 7/10/47 | | 240,000 | 225,067 |
| Series 2016-P6, Class A4, 3.46%, 12/10/49 | | 88,681 | 82,292 |
| Series 2017-C4, Class A4, 3.47%, 10/12/50 | | 420,000 | 376,908 |
| Series 2019-SMRT, Class D, 4.74%, 1/10/36(b)(e) | | 500,000 | 499,104 |
| Series 2019-SMRT, Class E, 4.74%, 1/10/36(b)(e) | | 500,000 | 499,097 |
|
| Commercial Mortgage Trust, Series 2020-CX, Class A, 2.17%, 11/10/46(b) | | 290,000 | 215,524 |
| CSMC OA LLC, Series 2014-USA, Class B, 4.18%, 9/15/37(b) | | 530,000 | 408,727 |
| DBGS Mortgage Trust, Series 2019-1735, Class X, 0.29%, 4/10/37(b)(e) | | 13,945,000 | 166,852 |
| GS Mortgage Securities Corp. Trust, | | | |
| Series 2020-DUNE, Class A, (1M CME Term SOFR + 1.21%, 1.10% Floor), 6.55%, 12/15/36(b)(c) | | 960,000 | 942,467 |
| Series 2021-ROSS, Class A, (1M CME Term SOFR + 1.26%, 1.15% Floor), 6.60%, 5/15/26(b)(c) | | 700,000 | 619,441 |
See accompanying Notes to Financial Statements
Morningstar Funds Trust October 31, 2023 (unaudited)
Schedule of Investments (continued)
Morningstar Total Return Bond Fund
| | | Par (a) | Value |
Commercial Mortgage-Backed Securities
(Continued) |
|
| GS Mortgage Securities Trust, Series 2017-GS8, Class A4, 3.47%, 11/10/50 | | $ 240,000 | $215,221 |
| HGI CRE CLO Ltd., Series 2021-FL1, Class A, (1M CME Term SOFR + 1.16%, 1.16% Floor), 6.50%, 6/16/36(b)(c) | | 565,060 | 554,049 |
| J.P. Morgan Chase Commercial Mortgage Securities Trust, Series 2022-NXSS, Class A, (1M CME Term SOFR + 2.18%, 2.18% Floor), 7.51%, 8/15/39(b)(c) | | 120,000 | 119,999 |
| JPMorgan Chase Commercial Mortgage Securities Trust, Series 2020-MKST, Class D, (1M CME Term SOFR + 1.86%, 1.50% Floor), 7.20%, 12/15/36(b)(c)(n) | | 710,000 | 234,648 |
| KREF Ltd., Series 2022-FL3, Class A, (1M CME Term SOFR + 1.45%, 1.45% Floor), 6.78%, 2/15/39(b)(c) | | 820,000 | 799,512 |
| LSTAR Commercial Mortgage Trust, Series 2015-3, Class AS, 3.12%, 4/20/48(b)(e) | | 31,198 | 30,154 |
| MF1 LLC, Series 2022-FL10, Class A, (1M CME Term SOFR + 2.64%, 2.64% Floor), 7.97%, 9/17/37(b)(c) | | 800,000 | 801,594 |
| Morgan Stanley Capital I Trust, | | | |
| Series 2019-BPR, Class A, (1M CME Term SOFR + 1.99%, 1.40% Floor), 7.31%, 5/15/36(b)(c) | | 310,737 | 300,631 |
| Series 2019-L2, Class XA, 1.00%, 3/15/52(e) | | 2,496,874 | 99,948 |
|
| Multifamily Structured Pass Through Certificates, Series K124, Class X1, 0.72%, 12/25/30(e) | | 4,979,198 | 196,119 |
| OPG Trust, Series 2021-PORT, Class A, (1M CME Term SOFR + 0.60%, 0.48% Floor), 5.93%, 10/15/36(b)(c) | | 559,308 | 543,539 |
| | | Par (a) | Value |
Commercial Mortgage-Backed Securities
(Continued) |
|
| PFP Ltd., Series 2022-9, Class A, (1M CME Term SOFR + 2.27%, 2.27% Floor), 7.61%, 8/19/35(b)(c) | | $ 120,000 | $ 119,374 |
| SFO Commercial Mortgage Trust, Series 2021-555, Class A, (1M CME Term SOFR + 1.26%, 1.15% Floor), 6.60%, 5/15/38(b)(c) | | 200,000 | 182,472 |
| SMRT, Series 2022-MINI, Class A, (1M CME Term SOFR + 1.00%, 1.00% Floor), 6.34%, 1/15/39(b)(c) | | 790,000 | 767,236 |
| Soho Trust, Series 2021-SOHO, Class A, 2.70%, 8/10/38(b)(e) | | 846,000 | 578,435 |
| SREIT Trust, Series 2021-MFP, Class A, (1M CME Term SOFR + 0.85%, 0.73% Floor), 6.18%, 11/15/38(b)(c) | | 800,000 | 782,708 |
| STWD Ltd., Series 2022-FL3, Class A, (30D Average SOFR + 1.35%, 1.35% Floor), 6.67%, 11/15/38(b)(c) | | 430,000 | 414,978 |
| TRTX Issuer Ltd., Series 2022-FL5, Class A, (30D Average SOFR + 1.65%, 1.65% Floor), 6.97%, 2/15/39(b)(c) | | 810,000 | 790,103 |
| VASA Trust, Series 2021-VASA, Class A, (1M CME Term SOFR + 1.01%, 0.90% Floor), 6.35%, 7/15/39(b)(c) | | 410,000 | 366,738 |
| Wells Fargo Commercial Mortgage Trust, | | | |
| Series 2016-BNK1, Class B, 2.97%, 8/15/49 | | 300,000 | 218,752 |
| Series 2017-C38, Class A5, 3.45%, 7/15/50 | | 315,000 | 284,489 |
| | | | 19,499,940 |
| Federal Home Loan Mortgage Corporation – 7.3% |
| Multiclass Certificates, Series 2020-RR07, Class BX, 2.61%, 10/27/28 | | 4,160,000 | 394,100 |
| Multifamily Structured Pass Through Certificates, | | | |
| Series K095, Class XAM, 1.24%, 6/25/29(e) | | 500,000 | 29,115 |
See accompanying Notes to Financial Statements
Morningstar Funds Trust October 31, 2023 (unaudited)
Schedule of Investments (continued)
Morningstar Total Return Bond Fund
| | | Par (a) | Value |
Federal Home Loan Mortgage Corporation
(Continued) |
| Multifamily Structured Pass Through Certificates, | | | |
| Series K-1517, Class X1, 1.32%, 7/25/35(e) | | $ 234,659 | $ 23,383 |
| Series K736, Class X1, 1.28%, 7/25/26(e) | | 958,435 | 25,810 |
|
| Multifamily WI Certificates, Series K161, Class A2, 4.90%, 1/25/34 | | 200,000 | 187,737 |
| Pool, | | | |
| 3.65%, 10/01/29 | | 600,000 | 541,792 |
| 0.00%, 11/01/33(d) | | 200,000 | 198,859 |
| 3.50%, 1/01/34 - 6/01/52 | | 1,273,793 | 1,096,692 |
| 2.00%, 9/01/35 - 2/01/52 | | 16,563,537 | 12,647,956 |
| 1.50%, 4/01/36 - 2/01/51 | | 2,855,715 | 2,155,865 |
| 3.00%, 9/01/37 - 8/01/52 | | 7,357,791 | 6,014,448 |
| 4.00%, 1/01/45 - 2/01/53 | | 4,685,603 | 4,120,696 |
| 4.50%, 3/01/47 - 12/01/52 | | 2,727,781 | 2,467,712 |
| (1Y Refinitiv USD IBOR Consumer Cash Fallbacks + 1.62%, 1.62% Floor, 7.87% Cap), 2.87%, 11/01/47(c) | | 166,562 | 157,272 |
| 4.00%, 1/01/48(d) | | 329,788 | 290,513 |
| (1Y Refinitiv USD IBOR Consumer Cash Fallbacks + 1.63%, 1.63% Floor, 8.01% Cap), 3.01%, 11/01/48(c) | | 589,385 | 543,833 |
| 5.00%, 11/01/49 - 6/01/53 | | 2,062,088 | 1,905,926 |
| (1Y Refinitiv USD IBOR Consumer Cash Fallbacks + 1.62%, 1.62% Floor, 8.10% Cap), 3.10%, 2/01/50(c) | | 287,807 | 270,512 |
| 2.50%, 7/01/50 - 4/01/52 | | 13,887,943 | 10,822,025 |
| 2.50%, 1/01/52(o) | | 4,437,240 | 3,431,539 |
| 6.00%, 11/01/52 - 6/01/53 | | 1,325,839 | 1,294,703 |
| 5.50%, 12/01/52 - 8/01/53 | | 2,520,320 | 2,393,028 |
| 6.50%, 2/01/53 - 5/01/53 | | 1,032,119 | 1,028,105 |
| 5.00%, 4/01/53(d) | | 289,050 | 268,127 |
| 5.50%, 4/01/53(d) | | 95,153 | 90,303 |
| 6.00%, 7/01/53 - 9/01/53(d) | | 392,687 | 383,753 |
| Real Estate Mortgage Investment Conduits, | | | |
| Series 2019-RR01, Class X, 1.53%, 6/25/28 | | 2,500,000 | 140,355 |
| Series 4391, Class MZ, 3.00%, 9/15/44 | | 262,559 | 211,110 |
| | | Par (a) | Value |
Federal Home Loan Mortgage Corporation
(Continued) |
| Real Estate Mortgage Investment Conduits, | | | |
| Series 5010, Class IK, 2.50%, 9/25/50 | | $ 65,961 | $ 9,863 |
| Series 5010, Class JI, 2.50%, 9/25/50 | | 313,572 | 47,584 |
| Series 5013, Class IN, 2.50%, 9/25/50 | | 79,982 | 12,528 |
| Series 5018, Class MI, 2.00%, 10/25/50 | | 247,954 | 32,340 |
| Series 5040, Class IB, 2.50%, 11/25/50 | | 70,280 | 11,997 |
| Series 5052, Class KI, 4.00%, 12/25/50 | | 176,118 | 35,531 |
| Series 5059, Class IB, 2.50%, 1/25/51 | | 333,289 | 51,980 |
| Series 5069, Class MI, 2.50%, 2/25/51 | | 74,744 | 10,723 |
| Series 5081, Class AI, 3.50%, 3/25/51 | | 84,909 | 15,087 |
| Series 5081, Class PI, 3.00%, 3/25/51 | | 192,231 | 31,193 |
| Series 5092, Class AP, 2.00%, 4/25/41 | | 78,912 | 64,561 |
| Series 5112, Class KI, 3.50%, 6/25/51 | | 407,105 | 74,447 |
| Series 5127, Class AI, 3.00%, 6/25/51 | | 159,421 | 25,325 |
| Series 5129, Class IO, 3.00%, 9/25/50 | | 93,656 | 15,645 |
| Series 5140, Class NI, 2.50%, 5/25/49 | | 350,364 | 50,051 |
| Series 5145, Class HI, 3.00%, 9/25/51 | | 76,054 | 12,104 |
| Series 5148, Class BI, 2.50%, 1/25/49 | | 814,030 | 112,841 |
| Series 5148, Class CI, 2.00%, 6/25/49 | | 455,184 | 50,160 |
| Series 5152, Class EI, 3.50%, 10/25/51 | | 229,228 | 42,181 |
| Series 5155, Class NI, 3.00%, 10/25/51 | | 151,179 | 21,772 |
| Series 5161, Class LI, 3.00%, 11/25/51 | | 147,507 | 20,098 |
| Series 5164, Class IB, 3.00%, 11/25/51 | | 71,950 | 11,012 |
| Series 5167, Class MI, 3.00%, 11/25/51 | | 78,637 | 10,922 |
| Series 5196, Class DI, 3.00%, 2/25/52 | | 263,166 | 41,843 |
| Series 5200, Class KQ, 3.00%, 9/25/49 | | 80,185 | 69,301 |
| Series 5224, Class HL, 4.00%, 4/25/52 | | 500,000 | 408,623 |
See accompanying Notes to Financial Statements
Morningstar Funds Trust October 31, 2023 (unaudited)
Schedule of Investments (continued)
Morningstar Total Return Bond Fund
| | | Par (a) | Value |
Federal Home Loan Mortgage Corporation
(Continued) |
| Real Estate Mortgage Investment Conduits, | | | |
| Series 5230, Class PE, 2.00%, 12/25/51 | | $ 300,000 | $ 213,135 |
| Series 5274, Class IO, 2.50%, 1/25/51 | | 659,776 | 105,805 |
| Strips, | | | |
| Series 334, Class S7, (5.99% - 30D Average SOFR, 6.10% Cap), 0.67%, 8/15/44(c) | | 117,234 | 8,984 |
| Series 389, Class C45, 3.00%, 10/15/52 | | 652,229 | 108,617 |
| | | | 54,861,522 |
Federal Home Loan Mortgage Corporation Gold –
0.4% |
| Pool, | | | |
| 3.00%, 10/01/32 - 12/01/32 | | 525,200 | 487,675 |
| 3.50%, 6/01/46 - 4/01/49 | | 2,206,506 | 1,889,424 |
| 4.50%, 4/01/47 - 4/01/49 | | 556,561 | 509,402 |
| 4.00%, 6/01/48 | | 643,529 | 569,968 |
| 5.00%, 11/01/48 | | 29,212 | 27,472 |
| | | | 3,483,941 |
| Federal National Mortgage Association – 11.4% |
| Alternative Credit Enhancement Securities, | | | |
| Series 2013-M6, Class 1AC, 3.39%, 2/25/43(e) | | 44,281 | 39,809 |
| Series 2019-M23, Class 3A3, 2.72%, 10/25/31(e) | | 91,665 | 75,843 |
| Series 2019-M6, Class A2, 3.45%, 1/01/29 | | 47,956 | 44,579 |
| Series 2020-M36, Class X1, 1.45%, 9/25/34(e) | | 526,300 | 32,547 |
| Interest Strip, | | | |
| Series 409, Class C18, 4.00%, 4/25/42 | | 7,632 | 1,407 |
| Series 427, Class C71, 3.00%, 10/25/49 | | 455,741 | 75,685 |
| Series 427, Class C85, 3.50%, 8/25/49 | | 179,007 | 32,419 |
| Series 428, Class C16, 3.00%, 3/25/50 | | 283,449 | 49,109 |
| Series 437, Class C11, 3.00%, 7/25/52 | | 993,168 | 170,825 |
| Pool, | | | |
| 3.00%, 9/01/28 - 12/01/54 | | 10,612,994 | 8,841,299 |
| 5.34%, 9/01/28 | | 100,000 | 99,095 |
| 5.05%, 10/01/28 | | 100,000 | 97,835 |
| | | Par (a) | Value |
| Federal National Mortgage Association (Continued) |
| Pool, | | | |
| 5.13%, 10/01/28 | | $ 200,000 | $ 196,487 |
| 3.78%, 1/01/29 | | 194,787 | 180,042 |
| 2.93%, 6/01/30 | | 18,707 | 16,239 |
| 2.15%, 2/01/32(e) | | 19,890 | 15,488 |
| 3.35%, 6/01/32 | | 100,000 | 84,664 |
| 3.84%, 7/01/32 | | 100,000 | 87,905 |
| 3.89%, 7/01/32 | | 200,000 | 173,442 |
| 4.06%, 7/01/32 | | 100,000 | 87,802 |
| 4.84%, 10/01/32 | | 98,808 | 93,650 |
| 5.18%, 11/01/32 | | 100,000 | 96,759 |
| 2.50%, 12/01/33 - 9/01/61 | | 20,947,864 | 16,476,717 |
| 3.50%, 1/01/34 - 6/01/52 | | 6,644,691 | 5,681,753 |
| 2.00%, 9/01/35 - 3/01/52 | | 22,887,285 | 17,335,239 |
| 1.50%, 3/01/36 - 3/01/51 | | 4,973,869 | 3,694,930 |
| 4.50%, 11/01/43 - 1/01/59 | | 5,007,601 | 4,546,842 |
| 4.00%, 4/01/44 - 7/01/52 | | 14,355,602 | 12,626,553 |
| 5.00%, 8/01/48 - 7/01/53 | | 2,719,457 | 2,535,821 |
| 3.50%, 1/01/51(o) | | 2,028,812 | 1,728,964 |
| 4.00%, 5/01/51 - 10/01/51(d) | | 1,671,598 | 1,472,452 |
| 3.00%, 9/01/51(d) | | 78,761 | 63,425 |
| 5.50%, 11/01/52 - 7/01/53(d) | | 572,559 | 543,701 |
| 6.00%, 11/01/52 - 8/01/53 | | 2,724,968 | 2,658,517 |
| 5.50%, 1/01/53 - 9/01/53 | | 3,547,482 | 3,367,858 |
| 6.50%, 1/01/53 | | 274,275 | 274,007 |
| 6.00%, 7/01/53(d) | | 96,978 | 95,213 |
| Real Estate Mortgage Investment Conduits, | | | |
| Series 2012-118, Class VZ, 3.00%, 11/25/42 | | 130,714 | 111,247 |
| Series 2013-54, Class BS, (6.04% - 30D Average SOFR, 6.15% Cap), 0.71%, 6/25/43(c) | | 17,095 | 1,410 |
| Series 2014-6, Class Z, 2.50%, 2/25/44 | | 255,140 | 201,225 |
| Series 2015-65, Class CZ, 3.50%, 9/25/45 | | 266,063 | 198,709 |
| Series 2018-74, Class AB, 3.50%, 10/25/48 | | 165,952 | 140,943 |
| Series 2020-32, Class PI, 4.00%, 5/25/50 | | 83,872 | 17,526 |
| Series 2020-47, Class GZ, 2.00%, 7/25/50 | | 213,776 | 105,685 |
| Series 2020-56, Class AQ, 2.00%, 8/25/50 | | 700,000 | 493,481 |
See accompanying Notes to Financial Statements
Morningstar Funds Trust October 31, 2023 (unaudited)
Schedule of Investments (continued)
Morningstar Total Return Bond Fund
| | | Par (a) | Value |
| Federal National Mortgage Association (Continued) |
| Real Estate Mortgage Investment Conduits, | | | |
| Series 2020-56, Class DI, 2.50%, 8/25/50 | | $ 76,455 | $ 11,731 |
| Series 2020-57, Class TA, 2.00%, 4/25/50 | | 199,239 | 163,707 |
| Series 2020-74, Class EI, 2.50%, 10/25/50 | | 74,789 | 12,007 |
| Series 2020-77, Class HI, 4.00%, 11/25/50 | | 264,645 | 53,261 |
| Series 2020-89, Class DI, 2.50%, 12/25/50 | | 222,278 | 34,016 |
| Series 2020-97, Class AI, 2.00%, 1/25/51 | | 434,721 | 57,481 |
| Series 2021-1, Class IG, 2.50%, 2/25/51 | | 168,655 | 27,831 |
| Series 2021-3, Class MI, 3.50%, 2/25/51 | | 154,902 | 28,132 |
| Series 2021-3, Class QI, 2.50%, 2/25/51 | | 700,163 | 108,259 |
| Series 2021-31, Class IB, 4.00%, 6/25/51 | | 233,893 | 46,410 |
| Series 2021-50, Class IO, 4.00%, 8/25/51 | | 256,542 | 49,512 |
| Series 2021-61, Class KI, 2.50%, 4/25/49 | | 529,036 | 74,267 |
| Series 2021-65, Class JA, 2.00%, 1/25/46 | | 73,885 | 61,261 |
| Series 2021-69, Class IJ, 2.50%, 1/25/49 | | 821,760 | 112,271 |
| Series 2022-57, Class BC, 4.00%, 9/25/52 | | 89,348 | 80,139 |
| Series 2023-39, Class IO, 3.00%, 10/25/52 | | 885,719 | 147,472 |
| | | | 86,032,905 |
| Government National Mortgage Association – 3.3% |
| Pool, | | | |
| 3.00%, 11/01/50(d) | | 1,476,271 | 1,216,554 |
| 2.00%, 11/01/52(d) | | 2,592,900 | 1,998,863 |
| 2.50%, 11/01/52(d) | | 2,047,488 | 1,630,472 |
| 4.50%, 11/01/52(d) | | 1,538,000 | 1,389,583 |
| 3.50%, 11/01/53(d) | | 3,060,000 | 2,607,853 |
| 4.00%, 11/01/53(d) | | 1,582,000 | 1,390,491 |
| 5.00%, 11/01/53(d) | | 2,056,000 | 1,912,963 |
| 5.50%, 11/01/53 - 1/01/54(d) | | 2,042,000 | 2,010,397 |
| 6.00%, 11/01/53 - 1/01/54(d) | | 2,645,000 | 2,651,557 |
| 6.50%, 11/01/53 - 1/01/54(d) | | 1,769,000 | 1,761,015 |
| Series 2013-107, Class AD, 2.84%, 11/16/47(e) | | 74,160 | 63,328 |
| Series 2014-17, Class AM, 3.54%, 6/16/48(e) | | 7,694 | 7,063 |
| | | Par (a) | Value |
Government National Mortgage Association
(Continued) |
| Pool, | | | |
| Series 2014-H20, Class FA, (1M CME Term SOFR + 0.54%, 0.43% Floor), 5.87%, 10/20/64(c) | | $ 133,271 | $132,343 |
| Series 2018-168, Class PA, 4.00%, 8/20/48 | | 86,235 | 77,690 |
| Series 2019-18, Class TP, 3.50%, 2/20/49 | | 91,710 | 78,506 |
| Series 2020-103, Class AD, 1.45%, 1/16/63 | | 583,500 | 414,088 |
| Series 2020-123, Class IL, 2.50%, 8/20/50 | | 70,304 | 9,159 |
| Series 2020-123, Class NI, 2.50%, 8/20/50 | | 150,109 | 20,162 |
| Series 2020-127, Class IN, 2.50%, 8/20/50 | | 73,821 | 10,021 |
| Series 2020-129, Class IE, 2.50%, 9/20/50 | | 75,823 | 10,358 |
| Series 2020-144, Class IO, 2.50%, 9/20/50 | | 133,735 | 17,755 |
| Series 2020-146, Class DI, 2.50%, 10/20/50 | | 69,672 | 9,285 |
| Series 2020-151, Class MI, 2.50%, 10/20/50 | | 139,615 | 18,434 |
| Series 2020-160, Class IH, 2.50%, 10/20/50 | | 79,243 | 10,710 |
| Series 2020-160, Class VI, 2.50%, 10/20/50 | | 76,640 | 10,849 |
| Series 2020-160, Class YI, 2.50%, 10/20/50 | | 232,061 | 32,975 |
| Series 2020-181, Class WI, 2.00%, 12/20/50 | | 366,734 | 39,316 |
| Series 2020-185, Class MI, 2.50%, 12/20/50 | | 73,292 | 9,727 |
| Series 2020-190, Class IO, 1.05%, 11/16/62(e) | | 3,034,954 | 219,879 |
| Series 2020-47, Class MI, 3.50%, 4/20/50 | | 246,431 | 42,329 |
| Series 2020-47, Class NI, 3.50%, 4/20/50 | | 69,352 | 11,518 |
| Series 2020-H04, Class FP, (1M CME Term SOFR + 0.61%, 0.50% Floor), 5.47%, 6/20/69(c) | | 168,379 | 167,034 |
| Series 2020-H09, Class FL, (1M CME Term SOFR + 1.26%, 1.15% Floor), 4.85%, 5/20/70(c) | | 123,708 | 122,500 |
| Series 2020-H13, Class FA, (1M CME Term SOFR + 0.56%, 0.45% Floor, 7.50% Cap), 5.01%, 7/20/70(c) | | 695,352 | 671,640 |
See accompanying Notes to Financial Statements
Morningstar Funds Trust October 31, 2023 (unaudited)
Schedule of Investments (continued)
Morningstar Total Return Bond Fund
| | | Par (a) | Value |
Government National Mortgage Association
(Continued) |
| Pool, | | | |
| Series 2020-H13, Class FM, (1M CME Term SOFR + 0.51%, 0.40% Floor, 11.00% Cap), 5.84%, 8/20/70(c) | | $ 123,517 | $121,702 |
| Series 2021-14, Class AB, 1.34%, 6/16/63 | | 289,217 | 208,235 |
| Series 2021-15, Class GI, 3.50%, 1/20/51 | | 68,399 | 11,907 |
| Series 2021-161, Class IB, 4.00%, 9/20/51 | | 62,638 | 11,840 |
| Series 2021-176, Class IA, 3.50%, 10/20/51 | | 65,228 | 11,349 |
| Series 2021-188, Class PA, 2.00%, 10/20/51 | | 928,608 | 730,344 |
| Series 2021-21, Class AH, 1.40%, 6/16/63 | | 435,153 | 314,744 |
| Series 2021-214, Class AI, 4.00%, 12/20/51 | | 94,427 | 17,851 |
| Series 2021-215, Class LI, 3.00%, 12/20/51 | | 81,970 | 11,923 |
| Series 2021-29, Class AG, 5.00%, 2/20/51 | | 74,244 | 69,208 |
| Series 2021-29, Class TI, 2.50%, 2/20/51 | | 455,380 | 79,313 |
| Series 2021-5, Class IO, 1.11%, 1/16/61(e) | | 3,229,339 | 233,192 |
| Series 2021-58, Class IY, 3.00%, 2/20/51 | | 741,669 | 113,945 |
| Series 2021-67, Class QI, 3.00%, 4/20/51 | | 74,679 | 11,390 |
| Series 2021-76, Class JI, 3.00%, 8/20/50 | | 76,695 | 11,679 |
| Series 2021-78, Class IP, 3.00%, 5/20/51 | | 703,479 | 109,039 |
| Series 2021-8, Class AQ, 5.00%, 1/20/51 | | 74,063 | 70,490 |
| Series 2021-83, Class PI, 3.00%, 5/20/51 | | 308,857 | 45,811 |
| Series 2021-96, Class MI, 3.00%, 6/20/51 | | 134,105 | 20,465 |
| Series 2021-96, Class VI, 2.50%, 6/20/51 | | 1,540,654 | 209,391 |
| Series 2021-97, Class LI, 3.00%, 8/20/50 | | 897,067 | 138,104 |
| Series 2022-139, Class AL, 4.00%, 7/20/51 | | 200,000 | 162,610 |
| Series 2022-189, Class PT, 2.50%, 10/20/51 | | 94,326 | 72,201 |
| Series 2022-196, Class BE, 3.00%, 10/16/64(e) | | 100,000 | 64,629 |
| Series 2022-220, Class E, 3.00%, 10/16/64 | | 200,000 | 132,526 |
| | | Par (a) | Value |
Government National Mortgage Association
(Continued) |
| Pool, | | | |
| Series 2022-3, Class IO, 0.64%, 2/16/61(e) | | $ 96,773 | $ 4,675 |
| Series 2022-4, Class Z, 1.90%, 3/16/64 | | 206,756 | 79,436 |
| Series 2022-63, Class LM, 3.50%, 10/20/50 | | 400,000 | 298,564 |
| Series 2022-78, Class IO, 3.00%, 8/20/51 | | 79,929 | 12,416 |
| Series 2022-82, Class Z, 2.00%, 2/16/64 | | 925,843 | 451,595 |
| Series 2022-85, Class IK, 3.00%, 5/20/51 | | 412,185 | 63,889 |
| | | | 24,670,880 |
| Government National Mortgage Association II – 3.4% |
| Pool, | | | |
| 3.00%, 9/15/42 - 12/20/52 | | 6,843,297 | 5,647,508 |
| 3.50%, 3/20/45 - 12/20/52 | | 3,201,717 | 2,748,257 |
| 4.00%, 8/20/46 - 4/20/53 | | 2,616,942 | 2,330,748 |
| 4.50%, 4/20/47 - 9/20/52 | | 2,727,858 | 2,490,418 |
| 5.00%, 5/20/48 - 5/20/53 | | 3,117,921 | 2,917,186 |
| 2.50%, 10/20/49 - 1/20/53 | | 6,039,860 | 4,799,877 |
| 2.00%, 8/20/50 - 3/20/51 | | 2,756,675 | 2,132,468 |
| 5.50%, 11/20/52 - 8/20/53 | | 1,851,411 | 1,773,091 |
| 6.00%, 7/20/53 | | 695,012 | 681,230 |
| | | | 25,520,783 |
| Uniform Mortgage-Backed Securities – 5.9% |
| Pool, | | | |
| 1.50%, 11/01/38 - 11/01/53(d) | | 278,318 | 204,961 |
| 2.00%, 11/01/38 - 11/01/52(d) | | 4,367,235 | 3,250,674 |
| 2.50%, 11/01/38 - 11/01/52(d) | | 874,000 | 705,077 |
| 3.50%, 11/01/38 - 11/01/52(d) | | 1,159,000 | 968,710 |
| 4.00%, 11/01/38(d) | | 160,000 | 149,153 |
| 4.50%, 11/01/38 - 11/01/53(d) | | 5,266,000 | 4,715,306 |
| 3.00%, 11/01/52(d) | | 11,061,047 | 8,848,947 |
| 5.50%, 1/01/53 - 11/01/53(d) | | 8,577,591 | 8,135,309 |
| 6.00%, 1/01/53 - 11/01/53(d) | | 7,946,300 | 7,729,213 |
| 5.00%, 11/01/53(d) | �� | 8,970,745 | 8,269,906 |
| 6.50%, 1/01/54(d) | | 1,900,000 | 1,886,632 |
| | | | 44,863,888 |
See accompanying Notes to Financial Statements
Morningstar Funds Trust October 31, 2023 (unaudited)
Schedule of Investments (continued)
Morningstar Total Return Bond Fund
| | | Par (a) | Value |
| Whole Loan – 1.9% |
| Adjustable Rate Mortgage Trust, Series 2005-9, Class 5A1, (1M CME Term SOFR + 0.65%, 0.54% Floor, 11.00% Cap), 5.98%, 11/25/35(c) | | $ 66,254 | $ 64,529 |
| Angel Oak Mortgage Trust, Series 2022-3, Class A1, 4.00%, 1/10/67(b) | | 691,653 | 604,922 |
| Bayview Commercial Asset Trust, Series 2007-4A, Class A1, (1M CME Term SOFR + 0.79%, 0.68% Floor), 6.11%, 9/25/37(b)(c) | | 233,024 | 208,567 |
| CIM Trust, Series 2021-R6, Class A1, 1.43%, 7/25/61(b) | | 237,146 | 198,446 |
| COLT Mortgage Loan Trust, Series 2022-2, Class A1, (Step to 3.96% on 3/25/26), 2.99%, 2/25/67(b)(f) | | 158,659 | 134,971 |
| CSMC, | | | |
| Series 2019-NQM1, Class A2, (Step to 3.86% on 12/25/23), 2.86%, 10/25/59(b)(f) | | 201,243 | 192,393 |
| Series 2021-NQM2, Class A3, 1.54%, 2/25/66(b) | | 79,133 | 63,920 |
| Series 2021-NQM6, Class A3, 1.59%, 7/25/66(b) | | 583,805 | 443,139 |
| Series 2021-NQM7, Class A1, 1.76%, 10/25/66(b) | | 139,252 | 109,896 |
| Series 2022-NQM1, Class A1, 2.27%, 11/25/66(b)(e) | | 653,118 | 529,332 |
| CSMC Trust, | | | |
| Series 2021-RPL2, Class A1, 2.00%, 1/25/60(b) | | 111,349 | 91,666 |
| Series 2021-RPL4, Class A1, 1.80%, 12/27/60(b)(e) | | 145,239 | 133,942 |
| Series 2021-RPL6, Class A1, 2.00%, 10/25/60(b) | | 137,356 | 116,476 |
|
| Deephaven Residential Mortgage Trust, Series 2022-1, Class A1, 2.21%, 1/25/67(b) | | 371,536 | 318,178 |
| Ellington Financial Mortgage Trust, | | | |
| Series 2021-2, Class A1, 0.93%, 6/25/66(b) | | 291,415 | 220,164 |
| | | Par (a) | Value |
| Whole Loan (Continued) |
| Ellington Financial Mortgage Trust, | | | |
| Series 2022-1, Class A1, 2.21%, 1/25/67(b) | | $176,998 | $141,054 |
|
| FNMA Connecticut Avenue Securities, Series 2016-C03, Class 1M2, (30D Average SOFR + 5.41%), 10.74%, 10/25/28(c) | | 138,306 | 147,625 |
| Freddie Mac STACR Debt Notes, Series 2021-DNA2, Class M2, (30D Average SOFR + 2.30%), 7.62%, 8/25/33(b)(c) | | 172,101 | 172,746 |
| Freddie Mac STACR REMIC Trust, | | | |
| Series 2021-DNA6, Class M2, (30D Average SOFR + 1.50%), 6.82%, 10/25/41(b)(c) | | 580,000 | 571,192 |
| Series 2022-DNA2, Class M1A, (30D Average SOFR + 1.30%), 6.62%, 2/25/42(b)(c) | | 394,469 | 394,276 |
| Series 2022-DNA3, Class M1B, (30D Average SOFR + 2.90%), 8.22%, 4/25/42(b)(c) | | 550,000 | 560,312 |
| Series 2022-DNA4, Class M1A, (30D Average SOFR + 2.20%), 7.52%, 5/25/42(b)(c) | | 183,740 | 186,093 |
| Series 2022-DNA2, Class M1B, (30D Average SOFR + 2.40%), 7.72%, 2/25/42(b)(c) | | 200,000 | 200,374 |
|
| GSR Mortgage Loan Trust, Series 2007-1F, Class 2A4, 5.50%, 1/25/37 | | 106,658 | 136,712 |
| HarborView Mortgage Loan Trust, | | | |
| Series 2005-9, Class 2A1B, (1M CME Term SOFR + 0.85%, 0.74% Floor, 11.00% Cap), 6.19%, 6/20/35(c) | | 129,748 | 115,104 |
| Series 2005-9, Class 2A1C, (1M CME Term SOFR + 1.01%, 0.90% Floor, 11.00% Cap), 6.35%, 6/20/35(c) | | 478,285 | 421,899 |
|
| Impac CMB Trust, Series 2007-A, Class A, (1M CME Term SOFR + 0.61%, 0.50% Floor, 11.50% Cap), 5.94%, 5/25/37(b)(c) | | 158,449 | 145,289 |
See accompanying Notes to Financial Statements
Morningstar Funds Trust October 31, 2023 (unaudited)
Schedule of Investments (continued)
Morningstar Total Return Bond Fund
| | | Par (a) | Value |
| Whole Loan (Continued) |
| Legacy Mortgage Asset Trust, | | | |
| Series 2021-GS2, Class A1, (Step to 4.75% on 5/25/24), 1.75%, 4/25/61(b)(f) | | $261,189 | $241,087 |
| Series 2021-GS5, Class A1, (Step to 5.25% on 12/25/24), 2.25%, 7/25/67(b)(f) | | 156,184 | 143,676 |
| MASTR Asset Securitization Trust, | | | |
| Series 2007-1, Class 1A4, 6.50%, 11/25/37 | | 568,118 | 137,842 |
| Series 2007-2, Class A2, 6.25%, 1/25/38 | | 322,543 | 175,534 |
|
| Merrill Lynch Mortgage Investors Trust, Series 2004-A1, Class 2A2, 4.67%, 2/25/34(e) | | 202,954 | 181,041 |
| Mill City Mortgage Loan Trust, Series 2019-1, Class A1, 3.25%, 10/25/69(b) | | 247,676 | 231,973 |
| Morgan Stanley Resecuritization Trust, Series 2015-R2, Class 2A1, (12MTA + 1.09%, 1.09% Floor), 4.97%, 12/26/46(b)(c) | | 23,609 | 23,359 |
| New Residential Mortgage Loan Trust, | | | |
| Series 2015-2A, Class A1, 3.75%, 8/25/55(b) | | 194,974 | 176,115 |
| Series 2017-2A, Class B2, 4.75%, 3/25/57(b)(e) | | 227,144 | 206,868 |
| Series 2018-3A, Class A1, 4.50%, 5/25/58(b)(e) | | 549,569 | 510,499 |
| Series 2018-RPL1, Class M2, 3.50%, 12/25/57(b) | | 280,000 | 206,228 |
| Series 2019-6A, Class A1B, 3.50%, 9/25/59(b)(e) | | 518,483 | 464,700 |
| Series 2019-6A, Class B3C, 3.75%, 9/25/59(b)(e) | | 520,430 | 447,015 |
| Series 2019-NQM4, Class A1, 2.49%, 9/25/59(b) | | 80,319 | 72,360 |
| Series 2021-NQM3, Class A1, 1.16%, 11/27/56(b) | | 161,651 | 128,105 |
| | | Par (a) | Value |
| Whole Loan (Continued) |
| New Residential Mortgage Loan Trust, | | | |
| Series 2022-NQM4, Class A1, (Step to 4.98% on 7/25/25), 5.00%, 6/25/62(b)(f) | | $220,176 | $205,627 |
| OBX Trust, | | | |
| Series 2021-NQM2, Class A1, 1.10%, 5/25/61(b) | | 490,095 | 356,135 |
| Series 2021-NQM3, Class A1, 1.05%, 7/25/61(b) | | 166,444 | 119,534 |
| Series 2022-NQM1, Class A1, 2.31%, 11/25/61(b) | | 635,106 | 516,573 |
|
| PRKCM Trust, Series 2021-AFC2, Class A1, 2.07%, 11/25/56(b) | | 174,125 | 138,053 |
| Residential Mortgage Loan Trust, | | | |
| Series 2019-2, Class A1, 2.91%, 5/25/59(b) | | 13,862 | 13,700 |
| Series 2020-2, Class A1, 1.65%, 5/25/60(b) | | 32,845 | 32,289 |
| SG Residential Mortgage Trust, | | | |
| Series 2022-1, Class A1, 3.17%, 3/27/62(b)(e) | | 704,389 | 599,711 |
| Series 2022-2, Class A1, (Step to 5.31% on 4/25/24), 5.35%, 8/25/62(b)(f) | | 686,890 | 657,690 |
| Towd Point Mortgage Trust, | | | |
| Series 2016-3, Class B1, 4.12%, 4/25/56(b)(e) | | 190,000 | 175,118 |
| Series 2017-4, Class B2, 3.62%, 6/25/57(b)(e) | | 330,000 | 229,593 |
| Series 2019-HY2, Class A1, (1M CME Term SOFR + 1.11%, 1.00% Floor), 6.44%, 5/25/58(b)(c) | | 512,926 | 516,018 |
| Series 2020-2, Class M1B, 3.00%, 4/25/60(b)(e) | | 240,000 | 158,762 |
| Series 2022-4, Class A1, 3.75%, 9/25/62(b) | | 486,617 | 431,185 |
See accompanying Notes to Financial Statements
Morningstar Funds Trust October 31, 2023 (unaudited)
Schedule of Investments (continued)
Morningstar Total Return Bond Fund
| | | Par (a) | Value |
| Whole Loan (Continued) |
|
| Voyager OPTONE Delaware Trust, Series 2009-1, Class SAA7, 5.72%, 2/25/38(b)(e) | | $170,068 | $ 38,294 |
| WaMu Mortgage Pass-Through Certificates, Series 2006-AR13, Class 1A, (12MTA + 0.88%, 0.88% Floor), 5.68%, 10/25/46(c) | | 262,416 | 210,724 |
| | | | 14,368,625 |
Total Mortgage-Backed Securities
(Cost $303,872,495) | 273,302,484 |
|
| Municipal Bonds – 0.3% |
| California – 0.1% |
| Bay Area Toll Authority Toll Bridge Subordinate Revenue Bonds, Series S1, Build America Bonds, 7.04%, 4/01/50 | | 150,000 | 168,813 |
| California State Taxable GO Unlimited Refunding Bonds, 4.60%, 4/01/38 | | 215,000 | 187,285 |
| California State Various Purpose Taxable GO Unlimited Bonds, Build America Bonds, | | | |
| 7.50%, 4/01/34 | | 65,000 | 72,753 |
| 7.55%, 4/01/39 | | 20,000 | 22,822 |
|
| Los Angeles Community College District GO Unlimited Bonds, Build America Bonds, 6.60%, 8/01/42 | | 45,000 | 47,195 |
| Los Angeles Unified School District GO Unlimited Bonds, Series RY, Build America Bonds, 6.76%, 7/01/34 | | 215,000 | 227,246 |
| University of California Taxable General Revenue Bonds, Series AD, 4.86%, 5/15/12(p) | | 25,000 | 19,520 |
| | | | 745,634 |
| Georgia – 0.0%(h) |
| Municipal Electric Authority of Georgia Taxable Revenue Bonds, Build America Bonds, 6.64%, 4/01/57 | | 39,000 | 39,754 |
| Illinois – 0.1% |
| Illinois State Taxable GO Unlimited Pension Bonds, 5.10%, 6/01/33 | | 380,000 | 352,088 |
| | | Par (a) | Value |
| Louisiana – 0.0%(h) |
| Louisiana State Local Government Environmental Facilities & Community Development Authority Taxable Revenue Bonds, Louisiana Utilities Restoration Corp. Project, 4.15%, 2/01/33 | | $ 70,000 | $ 64,917 |
| New Jersey – 0.0%(h) |
| New Jersey State Turnpike Authority Taxable Revenue Bonds, Build America Bonds, 7.41%, 1/01/40 | | 106,000 | 119,177 |
| New York – 0.1% |
| MTA Revenue Bonds, Build America Bonds, | | | |
| 6.67%, 11/15/39 | | 70,000 | 69,902 |
| 5.87%, 11/15/39 | | 45,000 | 42,490 |
|
| New York City Municipal Water Finance Authority Water & Sewer System Second General Resolution Taxable Revenue Bonds, 5.88%, 6/15/44 | | 30,000 | 29,066 |
| New York City Municipal Water Finance Authority Water & Sewer System Taxable Revenue Bonds, Build America Bonds, 6.01%, 6/15/42 | | 65,000 | 64,335 |
| New York State Dormitory Authority Personal Income TRB, Build America Bonds, 5.39%, 3/15/40 | | 30,000 | 28,126 |
| Port Authority of New York & New Jersey Consolidated 164th Taxable Revenue Bonds, 5.65%, 11/01/40 | | 35,000 | 33,378 |
| Port Authority of New York & New Jersey Consolidated 168th Revenue Bonds, 4.93%, 10/01/51 | | 55,000 | 47,124 |
| Port Authority of New York & New Jersey Consolidated Taxable Revenue Bonds, Series 181, 4.96%, 8/01/46 | | 60,000 | 51,120 |
| | | | 365,541 |
See accompanying Notes to Financial Statements
Morningstar Funds Trust October 31, 2023 (unaudited)
Schedule of Investments (continued)
Morningstar Total Return Bond Fund
| | | Par (a) | Value |
| Ohio – 0.0%(h) |
| American Municipal Power-Ohio, Inc., Taxable Revenue Bonds, Series B, Combined Hydroelectric Projects, 8.08%, 2/15/50 | | $ 75,000 | $ 91,030 |
| Texas – 0.0%(h) |
| San Antonio Electric & Gas Junior Lien Revenue Bonds, Build America Bonds, 5.81%, 2/01/41 | | 75,000 | 72,738 |
| Texas State Taxable GO Unlimited Bonds, Build America Bonds, 5.52%, 4/01/39 | | 115,000 | 110,509 |
| | | | 183,247 |
| Washington – 0.0%(h) |
| Seattle Municipal Light & Power Improvement Revenue Bonds, 5.00%, 4/01/44 | | 275,000 | 278,056 |
Total Municipal Bonds
(Cost $2,800,775) | 2,239,444 |
|
| Term Loans – 0.0%(c)(h) |
| Chemicals – 0.0%(h) |
| Bakelite US Holdco, Inc., Initial Loan, (3M USD CME Term SOFR + 4.00%, 0.50% Floor), 9.54%, 5/29/29 | | 90 | 87 |
| Construction Materials – 0.0%(h) |
| CP Iris Holdco I, Inc., Delayed Draw Term Loan, 10/02/28(q)(r) | | 99 | 96 |
| Publishing & Broadcasting – 0.0%(h) |
| Gray Television, Inc., Term D Loan, (1M USD CME Term SOFR + 3.00%), 8.43%, 12/01/28 | | 90 | 86 |
| Software – 0.0%(h) |
| ConnectWise LLC, Initial Term Loan, (1M USD CME Term SOFR + 3.50%, 0.50% Floor), 8.94%, 9/29/28 | | 23,078 | 22,420 |
Total Term Loans
(Cost $23,251) | 22,689 |
|
| U.S. Government Obligations – 13.5% |
| U.S. Treasury Bonds – 4.6% |
| 4.25%, 5/15/39 | | 44,000 | 39,708 |
| 4.50%, 8/15/39 | | 44,000 | 40,812 |
| | | Par (a) | Value |
| U.S. Treasury Bonds (Continued) |
| 4.38%, 11/15/39 | | $ 44,000 | $ 40,098 |
| 4.63%, 2/15/40 | | 318,000 | 298,249 |
| 1.13%, 5/15/40 | | 953,000 | 519,273 |
| 3.88%, 8/15/40 | | 318,000 | 270,201 |
| 1.13%, 8/15/40 | | 953,000 | 514,583 |
| 4.25%, 11/15/40 | | 911,700 | 811,555 |
| 1.38%, 11/15/40 | | 953,000 | 537,142 |
| 4.75%, 2/15/41 | | 1,090,200 | 1,031,942 |
| 4.38%, 5/15/41 | | 496,500 | 447,936 |
| 2.00%, 11/15/41 | | 6,010,000 | 3,720,096 |
| 2.75%, 8/15/42 | | 2,960,000 | 2,071,653 |
| 4.00%, 11/15/42 | | 730,100 | 618,931 |
| 3.13%, 2/15/43 | | 170,000 | 125,760 |
| 3.88%, 2/15/43 | | 664,500 | 552,470 |
| 2.88%, 5/15/43 | | 170,000 | 120,242 |
| 3.88%, 5/15/43 | | 5,750,000 | 4,775,195 |
| 3.63%, 8/15/43 | | 973,000 | 776,196 |
| 4.38%, 8/15/43 | | 1,350,000 | 1,204,031 |
| 3.75%, 11/15/43 | | 973,000 | 789,688 |
| 3.00%, 11/15/44 | | 3,040,000 | 2,158,756 |
| 2.50%, 2/15/45(o) | | 2,723,000 | 1,757,292 |
| 3.00%, 5/15/45 | | 2,450,000 | 1,731,748 |
| 2.88%, 11/15/46 | | 166,000 | 112,887 |
| 2.75%, 11/15/47(o) | | 2,873,000 | 1,890,456 |
| 3.00%, 2/15/48(o) | | 586,000 | 404,500 |
| 2.25%, 8/15/49(o) | | 993,000 | 579,974 |
| 1.38%, 8/15/50 | | 2,188,700 | 996,372 |
| 2.38%, 5/15/51 | | 3,000 | 1,787 |
| 2.00%, 8/15/51 | | 810,000 | 437,906 |
| 1.88%, 11/15/51 | | 809,000 | 421,944 |
| 2.25%, 2/15/52 | | 3,000 | 1,727 |
| 3.00%, 8/15/52 | | 18,000 | 12,347 |
| 4.00%, 11/15/52 | | 803,000 | 671,070 |
| 3.63%, 2/15/53(g) | | 684,000 | 532,986 |
| 3.63%, 5/15/53(g) | | 2,904,500 | 2,264,149 |
| 4.13%, 8/15/53 | | 1,754,000 | 1,500,492 |
| | | | 34,782,154 |
| U.S. Treasury Notes – 8.9% |
| 1.13%, 1/15/33 | | 2,980,000 | 2,720,957 |
| 4.50%, 11/30/24 | | 128,000 | 126,735 |
| 1.75%, 12/31/24(o) | | 5,759,000 | 5,524,816 |
| 4.25%, 12/31/24 | | 919,000 | 907,261 |
| 2.00%, 2/15/25 | | 419,000 | 401,864 |
| 3.88%, 3/31/25 | | 1,231,000 | 1,208,015 |
| 0.38%, 4/30/25 | | 10,559,000 | 9,827,707 |
| 3.88%, 4/30/25 | | 246,000 | 241,234 |
| 2.13%, 5/15/25 | | 361,000 | 344,642 |
| 2.75%, 5/15/25 | | 1,554,800 | 1,498,317 |
| 2.88%, 6/15/25 | | 1,600,000 | 1,542,812 |
| 0.25%, 6/30/25 | | 1,490,000 | 1,374,292 |
See accompanying Notes to Financial Statements
Morningstar Funds Trust October 31, 2023 (unaudited)
Schedule of Investments (continued)
Morningstar Total Return Bond Fund
| | | Par (a) | Value |
| U.S. Treasury Notes (Continued) |
| 3.00%, 7/15/25 | | $ 154,000 | $ 148,598 |
| 0.25%, 7/31/25 | | 1,562,000 | 1,435,271 |
| 4.75%, 7/31/25 | | 30,000 | 29,804 |
| 3.13%, 8/15/25 | | 213,000 | 205,720 |
| 3.50%, 9/15/25 | | 2,090,000 | 2,029,912 |
| 4.50%, 11/15/25 | | 456,000 | 451,013 |
| 0.38%, 11/30/25 | | 4,000 | 3,634 |
| 4.00%, 12/15/25 | | 2,098,000 | 2,053,909 |
| 3.88%, 1/15/26 | | 90,000 | 87,855 |
| 0.50%, 2/28/26 | | 1,655,800 | 1,493,842 |
| 4.63%, 3/15/26 | | 70,000 | 69,423 |
| 3.75%, 4/15/26 | | 614,000 | 596,779 |
| 3.63%, 5/15/26 | | 282,000 | 273,143 |
| 0.75%, 5/31/26 | | 166,000 | 149,264 |
| 0.88%, 6/30/26 | | 1,606,000 | 1,446,780 |
| 0.63%, 7/31/26 | | 993,000 | 884,817 |
| 1.50%, 8/15/26 | | 480,000 | 437,550 |
| 4.38%, 8/15/26 | | 126,000 | 124,199 |
| 4.63%, 9/15/26(g) | | 50,000 | 49,633 |
| 4.63%, 10/15/26 | | 268,000 | 266,011 |
| 2.00%, 11/15/26 | | 1,337,000 | 1,228,525 |
| 1.63%, 11/30/26 | | 1,986,000 | 1,802,295 |
| 1.88%, 2/28/27 | | 537,000 | 487,768 |
| 0.50%, 4/30/27 | | 534,000 | 459,428 |
| 2.38%, 5/15/27 | | 528,000 | 485,183 |
| 0.50%, 5/31/27 | | 93,000 | 79,737 |
| 2.75%, 7/31/27 | | 2,000 | 1,855 |
| 2.25%, 8/15/27(o) | | 2,202,000 | 2,002,960 |
| 3.13%, 8/31/27 | | 5,000 | 4,695 |
| 0.38%, 9/30/27 | | 673,000 | 566,082 |
| 4.13%, 10/31/27 | | 37,000 | 35,997 |
| 0.63%, 11/30/27 | | 6,000 | 5,066 |
| 3.88%, 11/30/27 | | 1,860,000 | 1,791,921 |
| 3.88%, 12/31/27 | | 31,000 | 29,854 |
| 3.50%, 1/31/28 | | 7,000 | 6,637 |
| 4.00%, 2/29/28 | | 12,000 | 11,604 |
| 3.50%, 4/30/28 | | 51,000 | 48,259 |
| 4.13%, 7/31/28(g) | | 255,000 | 247,380 |
| 4.38%, 8/31/28 | | 20,000 | 19,619 |
| 1.25%, 9/30/28 | | 87,000 | 73,342 |
| 3.13%, 11/15/28 | | 283,000 | 260,946 |
| 1.38%, 12/31/28 | | 3,000 | 2,524 |
| 2.63%, 2/15/29 | | 471,000 | 421,729 |
| 2.38%, 3/31/29 | | 4,000 | 3,522 |
| 2.38%, 5/15/29 | | 471,000 | 413,799 |
| 3.88%, 9/30/29 | | 1,100,800 | 1,041,890 |
| 4.00%, 10/31/29(g)(o) | | 1,985,700 | 1,890,991 |
| 3.88%, 12/31/29(o) | | 5,083,000 | 4,800,060 |
| 3.50%, 1/31/30 | | 61,000 | 56,346 |
| 1.50%, 2/15/30 | | 747,000 | 610,702 |
| 4.00%, 2/28/30 | | 17,000 | 16,146 |
| | | Par (a) | Value |
| U.S. Treasury Notes (Continued) |
| 3.75%, 5/31/30 | | $ 552,000 | $ 515,732 |
| 4.00%, 7/31/30 | | 146,000 | 138,301 |
| 4.13%, 8/31/30 | | 2,556,500 | 2,438,661 |
| 4.63%, 9/30/30 | | 10,000 | 9,831 |
| 1.63%, 5/15/31 | | 1,318,000 | 1,049,406 |
| 1.25%, 8/15/31 | | 2,694,000 | 2,063,436 |
| 2.88%, 5/15/32 | | 5,600 | 4,805 |
| 2.75%, 8/15/32 | | 1,813,700 | 1,534,277 |
| 4.13%, 11/15/32 | | 356,000 | 335,391 |
| 3.38%, 5/15/33(g) | | 1,274,000 | 1,126,495 |
| 3.88%, 8/15/33(g) | | 1,106,000 | 1,018,038 |
| | | | 67,097,044 |
Total U.S. Government Obligations
(Cost $116,228,268) | 101,879,198 |
| | | Number
of Shares | |
| Investment Companies – 28.3% |
| BlackRock Allocation Target Shares - BATS, Series A | | 6,455,774 | 59,070,337 |
| iShares U.S. Treasury Bond ETF | | 4,781,729 | 103,906,971 |
| Schwab Short-Term U.S. Treasury ETF(g) | | 1,064,395 | 50,973,877 |
Total Investment Companies
(Cost $227,362,405) | 213,951,185 |
| | | Par (a)/Number
of Shares | |
| Short-Term Investments – 3.0% |
| Corporate Bonds – 0.5% |
| AbbVie, Inc., 3.75%, 11/14/23 | | $ 20,000 | 19,985 |
| American Express Co., | | | |
| 3.38%, 5/03/24 | | 170,000 | 167,902 |
| 2.50%, 7/30/24 | | 410,000 | 399,934 |
|
| Bank of America Corp., 4.20%, 8/26/24 | | 60,000 | 59,031 |
| Becton Dickinson & Co., 3.36%, 6/06/24 | | 87,000 | 85,619 |
| Boeing (The) Co., 1.43%, 2/04/24 | | 110,000 | 108,605 |
| Bristol-Myers Squibb Co., 2.90%, 7/26/24(g) | | 192,000 | 188,078 |
| Constellation Brands, Inc., 3.60%, 5/09/24 | | 90,000 | 88,828 |
| Continental Resources, Inc., 3.80%, 6/01/24 | | 130,000 | 128,038 |
See accompanying Notes to Financial Statements
Morningstar Funds Trust October 31, 2023 (unaudited)
Schedule of Investments (continued)
Morningstar Total Return Bond Fund
| | | Par (a)/Number
of Shares | Value |
| Corporate Bonds (Continued) |
| Goldman Sachs Group (The), Inc., | | | |
| 3.63%, 2/20/24 | | $ 120,000 | $ 119,096 |
| 3.85%, 7/08/24 | | 30,000 | 29,556 |
| (SOFR + 0.51%), 5.85%, 9/10/24(c) | | 561,000 | 559,542 |
|
| International Business Machines Corp., 3.00%, 5/15/24 | | 410,000 | 404,023 |
| Kinder Morgan Energy Partners L.P., 4.25%, 9/01/24 | | 100,000 | 98,382 |
| Las Vegas Sands Corp., 3.20%, 8/08/24 | | 100,000 | 97,305 |
| Occidental Petroleum Corp., 6.95%, 7/01/24 | | 94,000 | 94,395 |
| Republic Services, Inc., 2.50%, 8/15/24 | | 70,000 | 68,097 |
| Sprint LLC, 7.13%, 6/15/24 | | 898,000 | 902,549 |
| Wells Fargo & Co., 3.75%, 1/24/24 | | 160,000 | 159,082 |
| | | | 3,778,047 |
| Foreign Issuer Bonds – 0.1% |
| Credit Suisse A.G., 4.75%, 8/09/24 | | 306,000 | 301,957 |
| Danske Bank A/S, 5.38%, 1/12/24(b) | | 200,000 | 199,421 |
| Glencore Funding LLC, 4.13%, 3/12/24(b) | | 330,000 | 327,551 |
| Petroleos Mexicanos, | | | |
| 4.88%, 1/18/24 | | 19,000 | 18,884 |
|
| 7.19%, 9/12/24 | MXN | 403,000 | 21,088 |
|
| Shell International Finance B.V., 3.50%, 11/13/23 | | 170,000 | 169,871 |
| | | | 1,038,772 |
| Money Market Funds – 1.9% |
| Northern Institutional Funds - Liquid Assets Portfolio (Shares), 5.41%(s)(t) | | 10,092,376 | 10,092,376 |
| Northern Institutional Funds - Treasury Portfolio (Premier), 5.21%(s) | | 4,001,897 | 4,001,897 |
| | | | 14,094,273 |
| Mortgage-Backed Securities – 0.0%(h) |
| CSMC, Series 2022-NWPT, Class A, (1M CME Term SOFR + 3.14%, 3.14% Floor), 8.48%, 9/09/24(b)(c) | | 100,000 | 100,618 |
| | | Par (a)/Number
of Shares | Value |
| U.S. Government Obligations – 0.3% |
| U.S. Treasury Notes, | | | |
| 0.25%, 11/15/23 | | $ 9,000 | $ 8,982 |
| 2.50%, 4/30/24 | | 142,000 | 139,909 |
| 1.75%, 7/31/24 | | 569,000 | 553,419 |
| 2.13%, 7/31/24 | | 337,000 | 328,707 |
| 3.00%, 7/31/24 | | 314,000 | 308,272 |
| 3.25%, 8/31/24 | | 595,000 | 584,146 |
| 4.25%, 9/30/24(g) | | 185,000 | 183,005 |
| 4.38%, 10/31/24 | | 143,000 | 141,503 |
| | | | 2,247,943 |
| U.S. Treasury Bills – 0.2% |
| U.S. Treasury Bill, 5.09%, 1/30/24(g)(u) | | 1,290,000 | 1,272,831 |
Total Short-Term Investments
(Cost $22,622,481) | 22,532,484 |
Number of
Contracts | Notional
Amount | |
| Purchased Options – 0.2% |
| Call Options - Exchange Traded – 0.0%(h) |
| 10-Year U.S. Treasury Note Future, Strike Price USD 106.00, Expires 11/24/23 | 18 | 1,911,094 | 17,156 |
| 10-Year U.S. Treasury Note Future, Strike Price USD 106.50, Expires 11/24/23 | 18 | 1,911,094 | 12,656 |
| 10-Year U.S. Treasury Note Future, Strike Price USD 106.75, Expires 11/03/23 | 76 | 8,069,063 | 15,438 |
| 10-Year U.S. Treasury Note Future, Strike Price USD 107.00, Expires 11/24/23 | 29 | 3,078,984 | 14,953 |
| 10-Year U.S. Treasury Note Future, Strike Price USD 108.50, Expires 11/24/23 | 16 | 1,698,750 | 2,750 |
| 3-Month SOFR 1-Year Mid Curve Future, Strike Price USD 95.69, Expires 12/15/23 | 104 | 24,585,600 | 28,600 |
| 5-Year U.S. Treasury Note Future, Strike Price USD 104.50, Expires 11/24/23 | 40 | 4,179,065 | 21,875 |
| 5-Year U.S. Treasury Note Future, Strike Price USD 104.75, Expires 11/24/23 | 38 | 3,970,111 | 16,625 |
See accompanying Notes to Financial Statements
Morningstar Funds Trust October 31, 2023 (unaudited)
Schedule of Investments (continued)
Morningstar Total Return Bond Fund
Number of
Contracts | Notional
Amount | Value |
| Call Options - Exchange Traded (Continued) |
| 5-Year U.S. Treasury Note Future, Strike Price USD 105.00, Expires 11/24/23 | 2 | $208,953 | $ 688 |
| 5-Year U.S. Treasury Note Future, Strike Price USD 105.50, Expires 11/24/23 | 4 | 417,906 | 844 |
| 5-Year U.S. Treasury Note Future, Strike Price USD 106.00, Expires 11/24/23 | 4 | 417,906 | 531 |
| 5-Year U.S. Treasury Note Future, Strike Price USD 106.50, Expires 11/24/23 | 4 | 417,906 | 313 |
| | | | 132,429 |
| Call Options - Over the Counter – 0.0%(h) |
| Brazilian Real vs. U.S. Dollar, Strike Price BRL 5.05, Expires 11/16/23, Counterparty: Bank of America | 2 | 66,000 | 750 |
| Polish Zloty vs. Euro, Strike Price PLN $4.66, Expires 11/01/23, Counterparty: HSBC | 2 | 8,000 | — |
| U.S. Dollar vs. Euro, Strike Price USD 1.06, Expires 11/02/23, Counterparty: Bank of America | 2 | 154,000 (v) | 322 |
| | | | 1,072 |
| Call Swaptions - Over the Counter – 0.1% |
| Pay 1-Day USD SOFR (Annually); Receive 3.21% (Semi-Annually): Interest Rate Swap Maturing 7/22/2036, Strike Price USD 3.21, Expires 7/20/26, Counterparty: Barclays | 1 | 182,600 | 3,114 |
| Pay 1-Day USD SOFR (Annually); Receive 3.23% (Semi-Annually): Interest Rate Swap Maturing 7/22/2036, Strike Price USD 3.23, Expires 7/20/26, Counterparty: Barclays | 1 | 350,500 | 6,061 |
| Pay 1-Day USD SOFR (Annually); Receive 3.24% (Semi-Annually): Interest Rate Swap Maturing 6/17/2036, Strike Price USD 3.24, Expires 6/15/26, Counterparty: Barclays | 1 | 350,500 | 2,739 |
Number of
Contracts | Notional
Amount | Value |
| Call Swaptions - Over the Counter (Continued) |
| Pay 1-Day USD SOFR (Annually); Receive 3.77% (Semi-Annually): Interest Rate Swap Maturing 9/10/2036, Strike Price USD 3.77, Expires 9/08/26, Counterparty: Goldman Sachs | 1 | $ 493,904 | $14,547 |
| Pay 1-Day USD SOFR (Annually); Receive 4.00% (Semi-Annually): Interest Rate Swap Maturing 10/01/2035, Strike Price USD 4.00, Expires 9/29/25, Counterparty: Goldman Sachs | 1 | 121,892 | 3,837 |
| Pay 1-Day USD SOFR (Annually); Receive 4.03% (Semi-Annually): Interest Rate Swap Maturing 9/30/2036, Strike Price USD 4.03, Expires 9/28/26, Counterparty: Goldman Sachs | 1 | 242,272 | 8,931 |
| Pay 1-Day USD SOFR (Annually); Receive 4.07% (Semi-Annually): Interest Rate Swap Maturing 9/30/2036, Strike Price USD 4.07, Expires 9/28/26, Counterparty: Goldman Sachs | 1 | 605,663 | 23,092 |
| Pay 1-Day USD SOFR (Annually); Receive 4.20% (Semi-Annually): Interest Rate Swap Maturing 10/15/2036, Strike Price USD 4.20, Expires 10/13/26, Counterparty: Goldman Sachs | 1 | 443,000 | 18,838 |
| Pay 1-Day USD SOFR (Annually); Receive 4.22% (Semi-Annually): Interest Rate Swap Maturing 10/15/2036, Strike Price USD 4.22, Expires 10/13/26, Counterparty: Deutsche Bank | 1 | 677,000 | 29,187 |
| Pay 1-Day USD SOFR (Annually); Receive 4.24% (Semi-Annually): Interest Rate Swap Maturing 3/28/2029, Strike Price USD 4.24, Expires 3/26/24, Counterparty: Citibank | 1 | 6,751,000 | 69,202 |
See accompanying Notes to Financial Statements
Morningstar Funds Trust October 31, 2023 (unaudited)
Schedule of Investments (continued)
Morningstar Total Return Bond Fund
Number of
Contracts | Notional
Amount | Value |
| Call Swaptions - Over the Counter (Continued) |
| Pay 1-Day USD SOFR (Annually); Receive 4.28% (Semi-Annually): Interest Rate Swap Maturing 10/07/2036, Strike Price USD 4.28, Expires 10/05/26, Counterparty: Bank of America | 1 | $ 534,576 | $ 24,163 |
| Pay 1-Day USD SOFR (Annually); Receive 4.33% (Semi-Annually): Interest Rate Swap Maturing 10/07/2035, Strike Price USD 4.33, Expires 10/03/25, Counterparty: Bank of America | 1 | 747,417 | 31,827 |
| Pay 1-Day USD SOFR (Annually); Receive 4.41% (Semi-Annually): Interest Rate Swap Maturing 10/21/2036, Strike Price USD 4.41, Expires 10/19/26, Counterparty: Goldman Sachs | 1 | 1,240,929 | 62,050 |
| Pay 1-Day USD SOFR (Annually); Receive 4.47% (Semi-Annually): Interest Rate Swap Maturing 10/28/2036, Strike Price USD 4.47, Expires 10/26/26, Counterparty: Goldman Sachs | 1 | 177,907 | 9,263 |
| Pay 1-Day USD SOFR (Annually); Receive 4.50% (At Maturity): Interest Rate Swap Maturing 1/24/2025, Strike Price USD 4.50, Expires 1/22/24, Counterparty: Citibank | 1 | 68,280,000 | 16,769 |
| Pay 1-Day USD SOFR (Annually); Receive 4.55% (At Maturity): Interest Rate Swap Maturing 1/26/2025, Strike Price USD 4.55, Expires 1/24/24, Counterparty: Citibank | 1 | 68,280,000 | 20,197 |
| | | | 343,817 |
| Put Options - Exchange Traded – 0.0%(h) |
| 10-Year U.S. Treasury Note Future, Strike Price USD 101.25, Expires 11/24/23 | 4 | 809,687 | 2,000 |
Number of
Contracts | Notional
Amount | Value |
| Put Options - Exchange Traded (Continued) |
| 3-Month SOFR 1-Year Mid Curve Future, Strike Price USD 95.88, Expires 12/15/23 | 49 | $11,583,600 | $72,888 |
| 3-Month SOFR 1-Year Mid Curve Future, Strike Price USD 96.00, Expires 12/15/23 | 13 | 3,073,200 | 22,831 |
| | | | 97,719 |
| Put Options - Over the Counter – 0.0%(h) |
| Brazilian Real vs. U.S. Dollar, Strike Price BRL 5.10, Expires 11/01/23, Counterparty: Bank of America | 2 | 66,000 | 784 |
| Chilean Peso vs. U.S. Dollar, Strike Price CLP 1.13, Expires 11/30/23, Counterparty: Bank of America | 1 | 33,000 | 688 |
| Chilean Peso vs. U.S. Dollar, Strike Price CLP 900.00, Expires 11/30/23, Counterparty: Bank of America | 1 | 33,000 | 688 |
| Chilean Peso vs. U.S. Dollar, Strike Price CLP 930.00, Expires 11/30/23, Counterparty: Bank of America | 2 | 66,000 | 2,942 |
| Japanese Yen vs. U.S. Dollar, Strike Price JPY 148.00, Expires 11/13/23, Counterparty: Morgan Stanley | 2 | 96,000 | 152 |
| Mexican Peso vs. Euro, Strike Price MXN 18.50, Expires 12/08/23, Counterparty: Bank of America | 2 | 6,000 | 2,206 |
| Mexican Peso vs. U.S. Dollar, Strike Price MXN 18.00, Expires 11/08/23, Counterparty: HSBC | 2 | 64,000 | 450 |
| Polish Zloty vs. Euro, Strike Price PLN $4.42, Expires 12/07/23, Counterparty: Goldman Sachs | 2 | 10,000 | 7,164 |
| U.S. Dollar vs. Euro, Strike Price USD 1.04, Expires 1/12/24, Counterparty: Bank of America | 1 | 1,020,000 (v) | 5,712 |
See accompanying Notes to Financial Statements
Morningstar Funds Trust October 31, 2023 (unaudited)
Schedule of Investments (continued)
Morningstar Total Return Bond Fund
Number of
Contracts | Notional
Amount | Value |
| Put Options - Over the Counter (Continued) |
| U.S. Dollar vs. Euro, Strike Price USD 1.04, Expires 1/17/24, Counterparty: Deutsche Bank | 1 | $510,000 (v) | $ 2,995 |
| U.S. Dollar vs. Euro, Strike Price USD 1.05, Expires 11/16/23, Counterparty: HSBC | 1 | 6,000 (v) | 3,543 |
| U.S. Dollar vs. Euro, Strike Price USD 1.05, Expires 11/22/23, Counterparty: Barclays | 2 | 120,000 (v) | 446 |
| U.S. Dollar vs. Thai Baht, Strike Price THB $36.50, Expires 11/02/23, Counterparty: Standard Chartered Bank | 2 | 64,000 | 716 |
| | | | 28,486 |
| Put Swaptions - Over the Counter – 0.1% |
| Pay 3.21% (Semi-Annually); Receive 1-Day USD SOFR (Annually): Interest Rate Swap Maturing 7/22/2036, Strike Price USD 3.21, Expires 7/20/26, Counterparty: Barclays | 1 | 182,600 | 19,869 |
| Pay 3.23% (Semi-Annually); Receive 1-Day USD SOFR (Annually): Interest Rate Swap Maturing 7/22/2036, Strike Price USD 3.23, Expires 7/20/26, Counterparty: Barclays | 1 | 350,500 | 37,876 |
| Pay 3.24% (Semi-Annually); Receive 1-Day USD SOFR (Annually): Interest Rate Swap Maturing 6/17/2036, Strike Price USD 3.24, Expires 6/15/26, Counterparty: Barclays | 1 | 159,800 | 17,123 |
| Pay 3.77% (Semi-Annually); Receive 1-Day USD SOFR (Annually): Interest Rate Swap Maturing 9/10/2036, Strike Price USD 3.77, Expires 9/08/26, Counterparty: Goldman Sachs | 1 | 493,904 | 40,522 |
| Pay 4.00% (Semi-Annually); Receive 1-Day USD SOFR (Annually): Interest Rate Swap Maturing 10/01/2035, Strike Price USD 4.00, Expires 9/29/25, Counterparty: Goldman Sachs | 1 | 121,892 | 7,958 |
Number of
Contracts | Notional
Amount | Value |
| Put Swaptions - Over the Counter (Continued) |
| Pay 4.03% (Semi-Annually); Receive 1-Day USD SOFR (Annually): Interest Rate Swap Maturing 9/30/2036, Strike Price USD 4.03, Expires 9/28/26, Counterparty: Goldman Sachs | 1 | $ 242,272 | $ 17,364 |
| Pay 4.07% (Semi-Annually); Receive 1-Day USD SOFR (Annually): Interest Rate Swap Maturing 9/30/2036, Strike Price USD 4.07, Expires 9/28/26, Counterparty: Goldman Sachs | 1 | 605,663 | 42,440 |
| Pay 4.20% (Semi-Annually); Receive 1-Day USD SOFR (Annually): Interest Rate Swap Maturing 10/15/2036, Strike Price USD 4.20, Expires 10/13/26, Counterparty: Goldman Sachs | 1 | 443,000 | 28,932 |
| Pay 4.22% (Semi-Annually); Receive 1-Day USD SOFR (Annually): Interest Rate Swap Maturing 10/15/2036, Strike Price USD 4.22, Expires 10/13/26, Counterparty: Deutsche Bank | 1 | 677,000 | 43,785 |
| Pay 4.24% (Semi-Annually); Receive 1-Day USD SOFR (Annually): Interest Rate Swap Maturing 3/28/2029, Strike Price USD 4.24, Expires 3/26/24, Counterparty: Citibank | 1 | 6,751,000 | 132,725 |
| Pay 4.28% (Semi-Annually); Receive 1-Day USD SOFR (Annually): Interest Rate Swap Maturing 10/07/2036, Strike Price USD 4.28, Expires 10/05/26, Counterparty: Bank of America | 1 | 534,576 | 33,320 |
| Pay 4.33% (Semi-Annually); Receive 1-Day USD SOFR (Annually): Interest Rate Swap Maturing 10/07/2035, Strike Price USD 4.33, Expires 10/03/25, Counterparty: Bank of America | 1 | 747,417 | 39,404 |
See accompanying Notes to Financial Statements
Morningstar Funds Trust October 31, 2023 (unaudited)
Schedule of Investments (continued)
Morningstar Total Return Bond Fund
Number of
Contracts | Notional
Amount | Value |
| Put Swaptions - Over the Counter (Continued) |
| Pay 4.41% (Semi-Annually); Receive 1-Day USD SOFR (Annually): Interest Rate Swap Maturing 10/21/2036, Strike Price USD 4.41, Expires 10/19/26, Counterparty: Goldman Sachs | 1 | $1,240,929 | $ 72,131 |
| Pay 4.47% (Semi-Annually); Receive 1-Day USD SOFR (Annually): Interest Rate Swap Maturing 10/28/2036, Strike Price USD 4.47, Expires 10/26/26, Counterparty: Goldman Sachs | 1 | 177,907 | 10,051 |
| | | | 543,500 |
Total Purchased Options
(Premiums Paid $1,450,914) | 1,147,023 |
Total Long Positions – 109.6%
(Cost $915,804,174) | 827,263,561 |
| | | Par (a) | Value |
| Short Positions – (2.3)%(w) |
| Mortgage-Backed Securities – (2.3)% |
| Uniform Mortgage-Backed Securities – (2.3)% |
| Pool, | | | |
| 3.00%, 11/01/38(d) | | (4,400) | (3,934) |
| 2.50%, 12/01/51(d) | | (4,725,400) | (3,630,436) |
| 4.00%, 12/01/51 - 11/01/52(d) | | (11,126,700) | (9,616,676) |
| 6.50%, 11/01/53(d) | | (3,610,000) | (3,587,985) |
| | | | (16,839,031) |
Total Mortgage-Backed Securities
(Proceeds $16,920,494) | (16,839,031) |
Total Written Options – (0.1)%
(Premiums Received $1,054,580) | (969,161) |
| Liabilities less Other Assets – (7.2)%(x) | (54,503,211) |
| NET ASSETS – 100.0% | $754,952,158 |
| Percentages shown are based on Net Assets. |
| |
| (a) | Par value is in USD unless otherwise indicated. |
| (b) | Securities exempt from registration under Rule 144A of the Securities Act of 1933. These securities may be resold in transactions exempt from registration, normally to qualified institutional buyers. |
| (c) | Variable or floating rate security. Rate as of October 31, 2023 is disclosed. |
See accompanying Notes to Financial Statements
Morningstar Funds Trust October 31, 2023 (unaudited)
Schedule of Investments (continued)
Morningstar Total Return Bond Fund
| (d) | When-Issued Security. Coupon rate was not yet in effect at October 31, 2023. |
| (e) | Variable or floating rate security, the interest rate of which adjusts periodically based on changes in current interest rates and prepayments on the underlying pool of assets. Rate as of October 31, 2023 is disclosed. |
| (f) | Step coupon bond. Rate as of October 31, 2023 is disclosed. |
| (g) | Security either partially or fully on loan. (See Note 7). |
| (h) | Amount rounds to less than 0.05%. |
| (i) | Variable rate security. Security issued at a fixed coupon rate, which converts to a variable rate at a future date. Rate as of October 31, 2023 is disclosed. |
| (j) | Investment is valued using significant unobservable inputs (Level 3). |
| (k) | Century bond maturing in 2120. |
| (l) | Zero coupon bond. |
| (m) | These securities are remarketed by an agent, and the interest rate is determined by general market conditions and supply and demand. |
| (n) | Restricted security that has been deemed illiquid and is classified as Level 2. At October 31, 2023, the value of these restricted illiquid securities amounted to $234,648 or 0.03% of net assets. Additional information on these restricted illiquid securities is as follows: |
| | Security | Acquisition Date | Acquisition Cost |
| | JPMorgan Chase Commercial Mortgage Securities Trust, 7.20%, 12/15/36 | 1/29/20 | $710,000 |
| |
|
| (o) | All or a portion of the security was held as collateral for open futures, options, securities sold short and/or swap agreements. |
| (p) | Century bond maturing in 2112. |
| (q) | Unfunded loan commitment. As of October 31, 2023, total value of unfunded loan commitment is $96. |
| (r) | Position is unsettled. Contract rate was not determined at October 31, 2023 and does not take effect until settlement date. |
| (s) | 7-day current yield as of October 31, 2023 is disclosed. |
| (t) | Security purchased with the cash proceeds from securities loaned. (See Note 7). |
| (u) | Discount rate at the time of purchase. |
| (v) | The notional amount is EUR. |
| (w) | Securities sold short are not owned by the Fund. |
| (x) | Includes appreciation/(depreciation) on forward foreign currency exchange, futures and swap contracts. |
| 1M | 1 Month |
| 1Y | 1 Year |
| 3M | 3 Month |
| 5Y | 5 Year |
| 6M | 6 Month |
| 12MTA | 12 Month Treasury Average |
| 30D | 30 Day |
| BANXICO | Banco de Mexico |
| BATS | Better Alternative Trading System |
| BRL | Brazilian Real |
| BZDIO | Brazil Interbank Rate |
| CAD | Canadian Dollar |
| CDO | Collateralized Debt Obligation |
| CDX | Credit Default Swap Index |
| CLO | Collateralized Loan Obligation |
| CLP | Chilean Peso |
| CMBX | Commercial Mortgage Backed Securities Index |
| CME | Chicago Mercantile Exchange |
| CMT | Constant Maturity |
| COOVI | Columbian Overnight Index Average |
| COP | Colombian Peso |
| CORRA | Canadian Overnight Repo Rate Average |
| CZK | Czech Republic Koruna |
See accompanying Notes to Financial Statements
Morningstar Funds Trust October 31, 2023 (unaudited)
Schedule of Investments (continued)
Morningstar Total Return Bond Fund
| ESTR | Euro Short Term Rate |
| ETF | Exchange-Traded Fund |
| EUR | Euro |
| EURIBOR | Euro Interbank Offered Rate |
| FNMA | Federal National Mortgage Association |
| Freddie Mac | Federal Home Loan Mortgage Corporation |
| GBP | British Pound |
| GO | Government Obligation |
| IO | Interest Only |
| JPY | Japanese Yen |
| JSC | Joint Stock Company |
| KRW | South Korean Won |
| KSDA | Korea Securities Dealers Association |
| L.P. | Limited Partnership |
| LIBOR | London Interbank Offered Rate |
| LLC | Limited Liability Company |
| MSCI | Morgan Stanley Capital International |
| MTA | Metropolitan Transportation Authority |
| MXN | Mexican Peso |
| PLC | Public Limited Company |
| PLN | Polish Zloty |
| REIT | Real Estate Investment Trust |
| REMIC | Real Estate Mortgage Investment Conduit |
| RUB | Russian Ruble |
| S&P | Standards & Poor's |
| SOFR | United States Secured Overnight Financing Rate |
| SONIA | Sterling Overnight Index Average |
| STACR | Structured Agency Credit Risk |
| Strip | Separate Trading of Registered Interest and Principal |
| THB | Thai Baht |
| TIIE | Tasa de Interés Interbancaria de Equilibrio |
| TONAR | Tokyo Overnight Average Rate |
| TRB | Tax Revenue Bonds |
| USD | United States Dollar |
| ZAR | South African Rand |
Futures Contracts outstanding at October 31, 2023:
Exchange Traded |
| | | | | | |
| Description | Number of
Contracts | Expiration
Date | Trading
Currency | Notional
Amount | Value/
Unrealized
Appreciation
(Depreciation) |
| Long Contracts | | | | | |
| Euro-Bobl | 1 | 12/07/2023 | EUR | 123,046 | $ 315 |
| U.S. Treasury Long Bond | 167 | 12/19/2023 | USD | 18,276,063 | (1,058,255) |
| Ultra 10-Year U.S. Treasury Note | 26 | 12/19/2023 | USD | 2,829,531 | (14,420) |
| Ultra U.S. Treasury Bond | 172 | 12/19/2023 | USD | 19,360,751 | (2,179,627) |
| 2-Year U.S. Treasury Note | 15 | 12/29/2023 | USD | 3,036,328 | (480) |
| 5-Year U.S. Treasury Note | 502 | 12/29/2023 | USD | 52,447,234 | (189,864) |
See accompanying Notes to Financial Statements
Morningstar Funds Trust October 31, 2023 (unaudited)
Schedule of Investments (continued)
Morningstar Total Return Bond Fund
Futures Contracts outstanding at October 31, 2023:
Exchange Traded (continued) |
| | | | | | |
| Description | Number of
Contracts | Expiration
Date | Trading
Currency | Notional
Amount | Value/
Unrealized
Appreciation
(Depreciation) |
| CME 3-Month SOFR | 233 | 3/18/2025 | USD | 55,544,287 | $ (592,500) |
| CME 3-Month SOFR | 240 | 3/17/2026 | USD | 57,516,000 | (164,037) |
| Total Long Contracts | | | | | $(4,198,868) |
| Short Contracts | | | | | |
| 10-Year Japanese Treasury Bond | (4) | 12/13/2023 | JPY | 3,793,502 | $ 12,297 |
| 10-Year Canadian Government Bond | (10) | 12/18/2023 | CAD | 828,772 | 241 |
| 10-Year U.S. Treasury Note | (288) | 12/19/2023 | USD | 30,577,500 | 508,764 |
| CME 3-Month SOFR | (239) | 12/19/2023 | USD | 56,553,375 | 38,630 |
| Ultra 10-Year U.S. Treasury Note | (43) | 12/19/2023 | USD | 4,679,609 | 254,851 |
| CME 3-Month SOFR | (283) | 3/19/2024 | USD | 66,901,200 | 513,145 |
| 10-Year U.S. Treasury Note | (142) | 6/18/2024 | USD | 33,591,875 | (2,540) |
| CME 3-Month SOFR | (19) | 3/18/2025 | USD | 4,529,363 | (3,712) |
| Total Short Contracts | | | | | $ 1,321,676 |
| | | | | | $(2,877,192) |
| Forward Foreign Currency Exchange Contracts outstanding at October 31, 2023: |
| | | | | | | |
Settlement
Date | Currency
Purchased | Amount
of Currency
Purchased | Currency
Sold | Amount
of Currency
Sold | Counterparty | Unrealized
Appreciation
(Depreciation) |
| | | | | | | |
| 11/15/23 | U.S. Dollars | 736,222 | Mexican Pesos | 12,917,526 | Citibank | $ 21,564 |
| 12/20/23 | U.S. Dollars | 282,078 | Japanese Yen | 41,000,000 | HSBC | 9,207 |
| 12/20/23 | U.S. Dollars | 137,367 | Japanese Yen | 20,000,000 | Bank of America | 4,259 |
| 12/20/23 | U.S. Dollars | 417,747 | Euro | 390,000 | UBS | 4,086 |
| 11/07/23 | South African Rand | 1,944,605 | U.S. Dollars | 101,175 | Morgan Stanley | 3,097 |
| 12/20/23 | U.S. Dollars | 353,033 | Euro | 330,000 | JPMorgan Chase | 3,013 |
| 1/31/24 | U.S. Dollars | 80,408 | Indonesian Rupiahs | 1,240,219,383 | Citibank | 2,678 |
| 11/16/23 | U.S. Dollars | 141,000 | Canadian Dollars | 192,071 | Deutsche Bank | 2,466 |
| 12/20/23 | U.S. Dollars | 267,569 | Euro | 250,000 | Citibank | 2,402 |
| 12/20/23 | U.S. Dollars | 278,126 | Euro | 260,000 | HSBC | 2,352 |
| 11/16/23 | South African Rand | 2,450,688 | U.S. Dollars | 129,000 | Citibank | 2,301 |
| 12/20/23 | Euro | 700,000 | U.S. Dollars | 740,260 | JPMorgan Chase | 2,209 |
| 12/20/23 | U.S. Dollars | 342,418 | British Pounds | 280,000 | Barclays | 1,949 |
| 3/04/24 | U.S. Dollars | 66,710 | Czech Republic Koruna | 1,507,339 | Bank of America | 1,916 |
| 12/20/23 | U.S. Dollars | 68,289 | Canadian Dollars | 92,000 | RBS | 1,886 |
| 11/15/23 | U.S. Dollars | 81,751 | Colombian Pesos | 329,926,000 | Citibank | 1,878 |
See accompanying Notes to Financial Statements
Morningstar Funds Trust October 31, 2023 (unaudited)
Schedule of Investments (continued)
Morningstar Total Return Bond Fund
| Forward Foreign Currency Exchange Contracts outstanding at October 31, 2023: (continued) |
| | | | | | | |
Settlement
Date | Currency
Purchased | Amount
of Currency
Purchased | Currency
Sold | Amount
of Currency
Sold | Counterparty | Unrealized
Appreciation
(Depreciation) |
| 3/04/24 | U.S. Dollars | 96,276 | Czech Republic Koruna | 2,196,159 | HSBC | $ 1,874 |
| 11/16/23 | Colombian Pesos | 146,902,000 | British Pounds | 28,000 | Citibank | 1,520 |
| 12/04/23 | U.S. Dollars | 66,000 | Brazilian Reals | 327,092 | JPMorgan Chase | 1,394 |
| 12/20/23 | U.S. Dollars | 135,123 | British Pounds | 110,000 | Goldman Sachs | 1,368 |
| 12/20/23 | U.S. Dollars | 41,552 | Japanese Yen | 6,046,000 | RBS | 1,313 |
| 11/03/23 | Brazilian Reals | 616,758 | U.S. Dollars | 121,000 | Citibank | 1,285 |
| 11/16/23 | Euro | 217,000 | U.S. Dollars | 228,911 | HSBC | 854 |
| 12/20/23 | Euro | 570,000 | U.S. Dollars | 603,738 | Barclays | 842 |
| 11/07/23 | U.S. Dollars | 22,220 | Euro | 20,216 | UBS | 823 |
| 11/16/23 | Czech Republic Koruna | 1,969,740 | U.S. Dollars | 84,000 | Toronto-Dominion Bank | 778 |
| 11/16/23 | Chilean Pesos | 22,186,320 | U.S. Dollars | 24,000 | Barclays | 767 |
| 11/03/23 | Brazilian Reals | 417,421 | U.S. Dollars | 82,000 | Deutsche Bank | 762 |
| 11/16/23 | Hungarian Forints | 12,194,573 | U.S. Dollars | 33,000 | JPMorgan Chase | 643 |
| 12/20/23 | Colombian Pesos | 67,608,989 | U.S. Dollars | 15,679 | Barclays | 560 |
| 11/16/23 | Colombian Pesos | 68,254,400 | U.S. Dollars | 16,000 | Citibank | 520 |
| 11/16/23 | Mexican Pesos | 587,496 | U.S. Dollars | 32,000 | Barclays | 497 |
| 11/16/23 | Mexican Pesos | 583,088 | Euro | 30,000 | BNP Paribas | 488 |
| 11/16/23 | Hungarian Forints | 11,689,100 | Euro | 30,000 | JPMorgan Chase | 484 |
| 12/20/23 | Colombian Pesos | 114,365,819 | U.S. Dollars | 27,022 | Citibank | 448 |
| 11/16/23 | Chilean Pesos | 29,056,000 | U.S. Dollars | 32,000 | Standard Chartered Bank | 436 |
| 12/20/23 | U.S. Dollars | 138,299 | Euro | 130,000 | RBS | 412 |
| 11/16/23 | U.S. Dollars | 26,000 | Japanese Yen | 3,869,247 | Toronto-Dominion Bank | 404 |
| 11/16/23 | South African Rand | 306,110 | U.S. Dollars | 16,000 | Goldman Sachs | 401 |
| 12/20/23 | U.S. Dollars | 201,926 | Euro | 190,000 | State Street | 399 |
| 11/16/23 | South African Rand | 304,244 | U.S. Dollars | 16,000 | Deutsche Bank | 301 |
| 11/03/23 | Brazilian Reals | 248,398 | U.S. Dollars | 49,000 | JPMorgan Chase | 250 |
| 11/16/23 | Japanese Yen | 18,462,242 | Canadian Dollars | 169,000 | Goldman Sachs | 237 |
| 11/16/23 | U.S. Dollars | 31,998 | Euro | 30,000 | Barclays | 234 |
| 11/16/23 | Mexican Pesos | 871,760 | U.S. Dollars | 48,000 | JPMorgan Chase | 222 |
| 3/04/24 | Czech Republic Koruna | 727,964 | U.S. Dollars | 31,074 | HSBC | 218 |
| 11/16/23 | Euro | 30,000 | Mexican Pesos | 570,678 | Toronto-Dominion Bank | 198 |
| 11/16/23 | South African Rand | 596,526 | Euro | 30,000 | Nomura | 196 |
| 12/04/23 | U.S. Dollars | 16,000 | Brazilian Reals | 80,133 | BNP Paribas | 173 |
| 11/03/23 | U.S. Dollars | 32,000 | Brazilian Reals | 160,560 | UBS | 166 |
| 12/20/23 | U.S. Dollars | 60,963 | British Pounds | 50,000 | JPMorgan Chase | 165 |
| 1/17/24 | U.S. Dollars | 47,000 | Taiwan Dollars | 1,512,132 | Morgan Stanley | 150 |
| 11/16/23 | Mexican Pesos | 581,068 | U.S. Dollars | 32,000 | Bank of America | 142 |
See accompanying Notes to Financial Statements
Morningstar Funds Trust October 31, 2023 (unaudited)
Schedule of Investments (continued)
Morningstar Total Return Bond Fund
| Forward Foreign Currency Exchange Contracts outstanding at October 31, 2023: (continued) |
| | | | | | | |
Settlement
Date | Currency
Purchased | Amount
of Currency
Purchased | Currency
Sold | Amount
of Currency
Sold | Counterparty | Unrealized
Appreciation
(Depreciation) |
| 11/16/23 | Norwegian Kroner | 180,055 | U.S. Dollars | 16,000 | Goldman Sachs | $ 126 |
| 12/20/23 | Euro | 59,177 | U.S. Dollars | 62,646 | Bank of America | 121 |
| 11/16/23 | Chilean Pesos | 7,271,421 | U.S. Dollars | 8,000 | BNP Paribas | 117 |
| 11/16/23 | U.S. Dollars | 48,820 | Euro | 46,000 | JPMorgan Chase | 114 |
| 11/03/23 | U.S. Dollars | 65,000 | Brazilian Reals | 327,307 | Deutsche Bank | 105 |
| 11/16/23 | Norwegian Kroner | 358,362 | U.S. Dollars | 32,000 | Barclays | 96 |
| 12/20/23 | U.S. Dollars | 233,443 | Euro | 220,000 | Deutsche Bank | 96 |
| 11/03/23 | U.S. Dollars | 25,000 | Brazilian Reals | 125,637 | Goldman Sachs | 90 |
| 11/03/23 | U.S. Dollars | 24,000 | Brazilian Reals | 120,735 | JPMorgan Chase | 62 |
| 11/16/23 | U.S. Dollars | 24,000 | Polish Zloty | 100,847 | Bank of America | 62 |
| 11/16/23 | Euro | 46,000 | U.S. Dollars | 48,646 | Citibank | 60 |
| 11/16/23 | U.S. Dollars | 34,000 | South Korean Won | 45,845,600 | JPMorgan Chase | 54 |
| 11/16/23 | U.S. Dollars | 40,000 | Canadian Dollars | 55,394 | JPMorgan Chase | 46 |
| 11/16/23 | South African Rand | 94,166 | U.S. Dollars | 5,000 | HSBC | 46 |
| 11/16/23 | Polish Zloty | 101,286 | U.S. Dollars | 24,000 | Goldman Sachs | 42 |
| 11/16/23 | Canadian Dollars | 110,000 | Japanese Yen | 11,987,598 | JPMorgan Chase | 39 |
| 11/16/23 | Mexican Pesos | 835,751 | British Pounds | 38,000 | Barclays | 38 |
| 12/20/23 | British Pounds | 50,000 | U.S. Dollars | 60,763 | Toronto-Dominion Bank | 34 |
| 11/16/23 | U.S. Dollars | 8,000 | Mexican Pesos | 144,154 | Goldman Sachs | 26 |
| Total Unrealized Appreciation | $ 90,561 |
| | | | | | | |
| 11/16/23 | Mexican Pesos | 108,408 | U.S. Dollars | 6,000 | Barclays | $ (4) |
| 11/15/23 | Mexican Pesos | 898,882 | U.S. Dollars | 49,736 | JPMorgan Chase | (6) |
| 1/31/24 | Indonesian Rupiahs | 8,605,763 | U.S. Dollars | 554 | Citibank | (15) |
| 11/16/23 | Indian Rupees | 4,163,800 | U.S. Dollars | 50,000 | Citibank | (18) |
| 11/16/23 | Euro | 46,000 | U.S. Dollars | 48,724 | Citibank | (18) |
| 11/16/23 | U.S. Dollars | 32,000 | Polish Zloty | 134,905 | BNP Paribas | (22) |
| 11/16/23 | U.S. Dollars | 31,742 | Euro | 30,000 | UBS | (23) |
| 11/16/23 | U.S. Dollars | 32,000 | Norwegian Kroner | 357,593 | JPMorgan Chase | (27) |
| 11/16/23 | Mexican Pesos | 288,296 | U.S. Dollars | 16,000 | Goldman Sachs | (53) |
| 11/16/23 | U.S. Dollars | 40,000 | Canadian Dollars | 55,535 | JPMorgan Chase | (55) |
| 11/16/23 | Polish Zloty | 100,823 | U.S. Dollars | 24,000 | Citibank | (68) |
| 12/04/23 | U.S. Dollars | 60,733 | South African Rand | 1,136,669 | Citibank | (68) |
| 11/16/23 | Euro | 30,000 | U.S. Dollars | 31,842 | JPMorgan Chase | (76) |
| 11/16/23 | Australian Dollars | 50,000 | U.S. Dollars | 31,840 | UBS | (106) |
| 11/16/23 | British Pounds | 60,000 | U.S. Dollars | 73,058 | UBS | (124) |
| 12/20/23 | Euro | 120,000 | U.S. Dollars | 127,408 | Deutsche Bank | (128) |
| 11/03/23 | U.S. Dollars | 32,000 | Brazilian Reals | 162,080 | UBS | (136) |
| 11/16/23 | U.S. Dollars | 32,000 | Mexican Pesos | 580,960 | HSBC | (136) |
| 11/16/23 | Mexican Pesos | 865,109 | U.S. Dollars | 48,000 | JPMorgan Chase | (146) |
| 11/16/23 | Norwegian Kroner | 355,541 | U.S. Dollars | 32,000 | Deutsche Bank | (156) |
See accompanying Notes to Financial Statements
Morningstar Funds Trust October 31, 2023 (unaudited)
Schedule of Investments (continued)
Morningstar Total Return Bond Fund
| Forward Foreign Currency Exchange Contracts outstanding at October 31, 2023: (continued) |
| | | | | | | |
Settlement
Date | Currency
Purchased | Amount
of Currency
Purchased | Currency
Sold | Amount
of Currency
Sold | Counterparty | Unrealized
Appreciation
(Depreciation) |
| 12/20/23 | U.S. Dollars | 52,866 | Euro | 50,000 | Toronto-Dominion Bank | $ (167) |
| 11/16/23 | Euro | 30,000 | Polish Zloty | 134,528 | Goldman Sachs | (168) |
| 12/20/23 | U.S. Dollars | 10,908 | Colombian Pesos | 46,139,411 | Citibank | (175) |
| 11/16/23 | U.S. Dollars | 65,472 | Euro | 62,000 | State Street | (176) |
| 11/16/23 | U.S. Dollars | 73,938 | Euro | 70,000 | BNP Paribas | (180) |
| 11/16/23 | U.S. Dollars | 50,620 | Euro | 48,000 | JPMorgan Chase | (204) |
| 11/16/23 | U.S. Dollars | 24,000 | Polish Zloty | 102,059 | Deutsche Bank | (225) |
| 11/16/23 | U.S. Dollars | 48,000 | Mexican Pesos | 871,872 | Citibank | (228) |
| 11/03/23 | U.S. Dollars | 57,000 | Brazilian Reals | 288,835 | Deutsche Bank | (268) |
| 11/16/23 | U.S. Dollars | 16,000 | South African Rand | 303,869 | Toronto-Dominion Bank | (280) |
| 11/16/23 | U.S. Dollars | 34,000 | Polish Zloty | 144,438 | Toronto-Dominion Bank | (284) |
| 11/03/23 | Brazilian Reals | 402,040 | U.S. Dollars | 80,000 | Goldman Sachs | (288) |
| 11/16/23 | South Korean Won | 64,430,400 | U.S. Dollars | 48,000 | BNP Paribas | (294) |
| 11/16/23 | Japanese Yen | 2,827,582 | U.S. Dollars | 19,000 | Toronto-Dominion Bank | (295) |
| 11/16/23 | South Korean Won | 45,461,740 | U.S. Dollars | 34,000 | Citibank | (338) |
| 11/16/23 | U.S. Dollars | 32,000 | Mexican Pesos | 584,937 | JPMorgan Chase | (356) |
| 11/03/23 | U.S. Dollars | 41,000 | Brazilian Reals | 208,735 | Morgan Stanley | (386) |
| 12/20/23 | U.S. Dollars | 95,074 | Euro | 90,000 | Deutsche Bank | (387) |
| 11/16/23 | Japanese Yen | 3,718,987 | U.S. Dollars | 25,000 | BNP Paribas | (398) |
| 11/15/23 | Mexican Pesos | 418,190 | U.S. Dollars | 23,583 | State Street | (447) |
| 11/03/23 | U.S. Dollars | 98,000 | Brazilian Reals | 496,888 | Citibank | (517) |
| 11/03/23 | U.S. Dollars | 24,000 | Brazilian Reals | 124,124 | JPMorgan Chase | (610) |
| 11/16/23 | U.S. Dollars | 32,000 | South African Rand | 609,248 | Goldman Sachs | (642) |
| 11/16/23 | U.S. Dollars | 32,000 | South African Rand | 611,027 | Bank of America | (737) |
| 11/16/23 | Indonesian Rupiahs | 911,180,000 | U.S. Dollars | 58,000 | Barclays | (740) |
| 11/16/23 | Malaysian Ringgit | 320,066 | U.S. Dollars | 68,000 | Morgan Stanley | (752) |
| 11/16/23 | U.S. Dollars | 32,000 | Mexican Pesos | 592,253 | Barclays | (760) |
| 11/16/23 | U.S. Dollars | 32,000 | Colombian Pesos | 135,661,760 | Bank of America | (834) |
| 11/16/23 | U.S. Dollars | 48,000 | Mexican Pesos | 883,067 | Goldman Sachs | (847) |
| 11/16/23 | U.S. Dollars | 97,000 | South African Rand | 1,826,807 | HSBC | (875) |
| 12/20/23 | U.S. Dollars | 264,168 | Euro | 250,000 | BNP Paribas | (999) |
| 12/04/23 | Brazilian Reals | 237,936 | U.S. Dollars | 48,000 | Citibank | (1,004) |
| 12/20/23 | Euro | 220,823 | U.S. Dollars | 235,229 | Bank of America | (1,010) |
| 8/15/24 | Colombian Pesos | 329,926,000 | U.S. Dollars | 76,319 | Morgan Stanley | (1,083) |
| 11/16/23 | U.S. Dollars | 24,000 | Chilean Pesos | 22,496,640 | Barclays | (1,114) |
| 11/07/23 | U.S. Dollars | 103,070 | South African Rand | 1,944,605 | Toronto-Dominion Bank | (1,202) |
| 11/03/23 | Brazilian Reals | 325,885 | U.S. Dollars | 66,000 | JPMorgan Chase | (1,387) |
| 11/16/23 | Canadian Dollars | 244,404 | U.S. Dollars | 178,000 | JPMorgan Chase | (1,720) |
See accompanying Notes to Financial Statements
Morningstar Funds Trust October 31, 2023 (unaudited)
Schedule of Investments (continued)
Morningstar Total Return Bond Fund
| Forward Foreign Currency Exchange Contracts outstanding at October 31, 2023: (continued) |
| | | | | | | |
Settlement
Date | Currency
Purchased | Amount
of Currency
Purchased | Currency
Sold | Amount
of Currency
Sold | Counterparty | Unrealized
Appreciation
(Depreciation) |
| 11/16/23 | U.S. Dollars | 32,000 | Chilean Pesos | 30,240,000 | BNP Paribas | $ (1,758) |
| 1/31/24 | Indonesian Rupiahs | 1,231,613,620 | U.S. Dollars | 79,254 | BNP Paribas | (2,063) |
| 11/16/23 | U.S. Dollars | 68,000 | Colombian Pesos | 290,942,800 | Citibank | (2,418) |
| 12/20/23 | British Pounds | 390,000 | U.S. Dollars | 476,672 | Barclays | (2,448) |
| 12/20/23 | Euro | 260,000 | U.S. Dollars | 278,247 | Barclays | (2,473) |
| 12/20/23 | U.S. Dollars | 400,227 | Euro | 380,000 | State Street | (2,827) |
| 12/20/23 | U.S. Dollars | 442,551 | Euro | 420,000 | Barclays | (2,929) |
| 12/20/23 | Euro | 260,000 | U.S. Dollars | 278,995 | HSBC | (3,221) |
| 12/20/23 | Indonesian Rupiahs | 1,715,949,628 | U.S. Dollars | 111,367 | JPMorgan Chase | (3,735) |
| 12/20/23 | Euro | 770,000 | U.S. Dollars | 823,977 | JPMorgan Chase | (7,262) |
| 12/20/23 | U.S. Dollars | 186,454 | Colombian Pesos | 811,214,353 | Bank of America | (8,398) |
| 12/20/23 | Japanese Yen | 61,000,000 | U.S. Dollars | 420,812 | Toronto-Dominion Bank | (14,834) |
| Total Unrealized Depreciation | $(78,128) |
| Net Unrealized Appreciation | $ 12,433 |
Written Call Option Contracts outstanding at October 31, 2023:
Exchange Traded |
| | | | | | | |
| Description | Number of
Contracts | Notional
Amount | Exercise
Price | Expiration
Date | Value |
| 10-Year U.S. Treasury Note Future | 76 | USD | 8,069,062 | 107.75 | 11/3/2023 | $ (3,563) |
| 10-Year U.S. Treasury Note Future | 42 | USD | 4,459,219 | 107.50 | 11/24/2023 | (15,094) |
| 5-Year U.S. Treasury Note Future | 76 | USD | 7,940,222 | 105.75 | 11/24/2023 | (12,469) |
| U.S. Treasury Long Bond Future | 21 | USD | 2,298,187 | 111.00 | 11/24/2023 | (25,266) |
| Total Written Call Options Contracts (Premiums Received $88,083) | $(56,392) |
Written Put Option Contracts outstanding at October 31, 2023:
Exchange Traded |
| | | | | | | |
| Description | Number of
Contracts | Notional
Amount | Exercise
Price | Expiration
Date | Value |
| 10-Year U.S. Treasury Note Future | 3 | USD | 318,516 | 105.00 | 11/24/2023 | $ (1,219) |
| 10-Year U.S. Treasury Note Future | 4 | USD | 809,688 | 101.00 | 11/24/2023 | (1,000) |
| 3-Month SOFR 1-Year Mid Curve Future | 26 | USD | 6,146,400 | 95.38 | 12/15/2023 | (14,300) |
| 3-Month SOFR 1-Year Mid Curve Future | 98 | USD | 23,167,200 | 95.25 | 12/15/2023 | (36,750) |
| Total Written Put Options Contracts (Premiums Received $52,354) | $(53,269) |
See accompanying Notes to Financial Statements
Morningstar Funds Trust October 31, 2023 (unaudited)
Schedule of Investments (continued)
Morningstar Total Return Bond Fund
Written Call Option Contracts outstanding at October 31, 2023:
Over the Counter |
| | | | | | | | | |
| Description | Counterparty | Number of
Contracts | Notional
Amount | Exercise
Price | Expiration
Date | Value |
| Brazilian Real vs. U.S. Dollar | Bank of America | 2 | USD | 100,000 | BRL | 5.25 | 11/16/2023 | $ (210) |
| Chilean Peso vs. U.S. Dollar | Bank of America | 2 | USD | 48,000 | CLP | 950.00 | 11/30/2023 | (192) |
| Mexican Peso vs. U.S. Dollar | HSBC | 2 | USD | 32,000 | MXN | 19.00 | 11/8/2023 | (13) |
| Polish Zloty vs. Euro | Citibank | 2 | EUR | 30,000 | PLN | 4.44 | 11/16/2023 | (258) |
| Total Written OTC Call Options Contracts (Premiums Received $1,630) | $(673) |
Written Put Option Contracts outstanding at October 31, 2023:
Over the Counter |
| | | | | | | | | |
| Description | Counterparty | Number of
Contracts | Notional
Amount | Exercise
Price | Expiration
Date | Value |
| Chilean Peso vs. U.S. Dollar | Bank of America | 2 | USD | 66,000 | CLP | 860.00 | 11/30/2023 | $ (264) |
| Chilean Peso vs. U.S. Dollar | Bank of America | 2 | USD | 66,000 | CLP | 900.00 | 11/30/2023 | (1,376) |
| Total Written OTC Put Options Contracts (Premiums Received $770) | $(1,640) |
Written Call Interest Rate Swaption Contracts outstanding at October 31, 2023:
Over the Counter |
| | | | | | | | |
| Description | Pay Rate Index/
Pay Rate | Receive Rate Index/
Receive Rate | Counterparty | Expiration
Date | Exercise
Rate | Notional
Amount | Value |
| Interest Rate Swap Maturing 1/24/2025 | 3.80% (At Maturity) | 1-Day USD SOFR (Annually) | Citibank | 1/22/2024 | 3.80% | 68,280,000 | $ (3,708) |
| Interest Rate Swap Maturing 1/26/2025 | 3.85% (At Maturity) | 1-Day USD SOFR (Annually) | Citibank | 1/24/2024 | 3.85 | 68,280,000 | (4,513) |
| Interest Rate Swap Maturing 10/22/2035 | 4.48% (Semi-Annually) | 1-Day USD SOFR (Annually) | JPMorgan Chase | 10/20/2025 | 4.48 | 254,486 | (12,457) |
| Interest Rate Swap Maturing 10/22/2035 | 4.54% (Semi-Annually) | 1-Day USD SOFR (Annually) | JPMorgan Chase | 10/20/2025 | 4.54 | 250,689 | (12,852) |
| Interest Rate Swap Maturing 3/13/2029 | 4.00% (Semi-Annually) | 1-Day USD SOFR (Annually) | Citibank | 3/11/2024 | 4.00 | 6,750,500 | (41,452) |
| Interest Rate Swap Maturing 3/14/2029 | 4.00% (Semi-Annually) | 1-Day USD SOFR (Annually) | Citibank | 3/12/2024 | 4.00 | 6,750,500 | (41,805) |
| Interest Rate Swap Maturing 3/18/2029 | 3.96% (Semi-Annually) | 1-Day USD SOFR (Annually) | Barclays | 3/14/2024 | 3.96 | 6,750,500 | (39,489) |
| Interest Rate Swap Maturing 3/19/2029 | 4.03% (Semi-Annually) | 1-Day USD SOFR (Annually) | Morgan Stanley | 3/15/2024 | 4.03 | 3,375,250 | (22,667) |
| Interest Rate Swap Maturing 9/30/2036 | 4.17% (Semi-Annually) | 1-Day USD SOFR (Annually) | JPMorgan Chase | 9/28/2026 | 4.17 | 272,431 | (11,297) |
| Total Written OTC Call Swaptions Contracts (Premiums Received $523,810) | $(190,240) |
See accompanying Notes to Financial Statements
Morningstar Funds Trust October 31, 2023 (unaudited)
Schedule of Investments (continued)
Morningstar Total Return Bond Fund
Written Put Interest Rate Swaption Contracts outstanding at October 31, 2023:
Over the Counter |
| | | | | | | | | |
| Description | Pay Rate Index/
Pay Rate | Receive Rate Index/
Receive Rate | Counterparty | Expiration
Date | Exercise
Rate | Notional
Amount | Value |
| Interest Rate Swap Maturing 10/22/2035 | 1-Day USD SOFR (Annually) | 4.54% (Semi-Annually) | JPMorgan Chase | 10/20/2025 | 4.54% | USD | 505,175 | $ (23,724) |
| Interest Rate Swap Maturing 3/13/2029 | 1-Day USD SOFR (Annually) | 4.00% (Semi-Annually) | Citibank | 3/11/2024 | 4.00 | USD | 6,750,500 | (176,797) |
| Interest Rate Swap Maturing 3/14/2029 | 1-Day USD SOFR (Annually) | 4.00% (Semi-Annually) | Citibank | 3/12/2024 | 4.00 | USD | 6,750,500 | (176,941) |
| Interest Rate Swap Maturing 3/18/2029 | 1-Day USD SOFR (Annually) | 3.96% (Semi-Annually) | Barclays | 3/14/2024 | 3.96 | USD | 6,750,500 | (186,146) |
| Interest Rate Swap Maturing 3/19/2029 | 1-Day USD SOFR (Annually) | 4.03% (Semi-Annually) | Morgan Stanley | 3/15/2024 | 4.03 | USD | 3,375,250 | (85,320) |
| Interest Rate Swap Maturing 9/30/2036 | 1-Day USD SOFR (Annually) | 4.17% (Semi-Annually) | JPMorgan Chase | 9/28/2026 | 4.17 | USD | 272,431 | (18,019) |
| Total Written OTC Put Swaptions Contracts (Premiums Received $387,933) | $(666,947) |
Interest Rate Swap Contracts outstanding at October 31, 2023:
Centrally Cleared |
| | | | | | | | |
Pay Rate Index/
Pay Rate | Receive Rate Index/
Receive Rate | Maturity
Date | | Notional
Amount | Value | Upfront
Premiums
Paid
(Received) | Unrealized
Appreciation
(Depreciation) |
| 5.41% (At Maturity) | 1-Day U.S. Federal Funds Rate (At Maturity) | 1/31/2024 | USD | 70,982,000 | $ (170) | $ — | $ (170) |
| 2-Day USD SOFR (At Maturity) | 4.19% (At Maturity) | 7/29/2025 | USD | 3,620,500 | (18,674) | — | (18,674) |
| 3.23% (At Maturity) | 1-Day EUR ESTR (At Maturity) | 7/29/2025 | EUR | 3,203,000 | (4,874) | — | (4,874) |
| 0.35% (At Maturity) | 1-Day JPY TONAR (At Maturity) | 9/13/2025 | JPY | 244,000,000 | 986 | — | 986 |
| 28-Day MXN-TIIE-BANXICO (Monthly) | 9.43% (Monthly) | 9/17/2025 | MXN | 8,432,000 | (2,455) | — | (2,455) |
| 28-Day MXN-TIIE-BANXICO (Monthly) | 9.20% (Monthly) | 9/17/2025 | MXN | 1,982,000 | (795) | — | (795) |
| 0.38% (At Maturity) | 1-Day JPY TONAR (At Maturity) | 9/24/2025 | JPY | 200,000,000 | 519 | — | 519 |
| 28-Day MXN-TIIE-BANXICO (Monthly) | 10.84% (Monthly) | 9/25/2025 | MXN | 2,501,000 | 267 | — | 267 |
| 28-Day MXN-TIIE-BANXICO (Monthly) | 10.72% (Monthly) | 10/16/2025 | MXN | 2,095,000 | 35 | — | 35 |
| 1-Day GBP SONIA Rate (At Maturity) | 4.78% (At Maturity) | 10/28/2025 | GBP | 1,410,000 | 2,392 | — | 2,392 |
| 4.60% (At Maturity) | 2-Day USD SOFR (At Maturity) | 10/29/2025 | USD | 1,720,000 | (1,380) | — | (1,380) |
| 3M KRW KSDA (Quarterly) | 3.38% (Quarterly) | 9/20/2026 | KRW | 181,949,097 | (2,577) | — | (2,577) |
| 3M KRW KSDA (Quarterly) | 3.55% (Quarterly) | 9/20/2026 | KRW | 115,565,000 | (1,236) | — | (1,236) |
| 3M KRW KSDA (Quarterly) | 3.33% (Quarterly) | 9/20/2026 | KRW | 90,960,903 | (1,387) | — | (1,387) |
| 1-Day GBP SONIA Rate (At Maturity) | 4.13% (At Maturity) | 10/16/2027 | GBP | 780,000 | (89) | 83 | (172) |
| 2.93% (At Maturity) | 1-Day EUR ESTR (At Maturity) | 10/21/2027 | EUR | 840,000 | (1,450) | 222 | (1,672) |
| 2-Day USD SOFR (Annually) | 4.18% (Annually) | 2/29/2028 | USD | 17,611,000 | (237,900) | 13,002 | (250,902) |
| 2-Day USD SOFR (Annually) | 4.00% (Annually) | 2/29/2028 | USD | 15,890,000 | (323,487) | (2,814) | (320,673) |
See accompanying Notes to Financial Statements
Morningstar Funds Trust October 31, 2023 (unaudited)
Schedule of Investments (continued)
Morningstar Total Return Bond Fund
Interest Rate Swap Contracts outstanding at October 31, 2023:
Centrally Cleared (continued) |
| | | | | | | | |
Pay Rate Index/
Pay Rate | Receive Rate Index/
Receive Rate | Maturity
Date | | Notional
Amount | Value | Upfront
Premiums
Paid
(Received) | Unrealized
Appreciation
(Depreciation) |
| 6M EUR EURIBOR (Semi-Annually) | 3.15% (Annually) | 7/21/2028 | EUR | 111,000 | $ (817) | $ — | $ (817) |
| 4.30% (Annually) | 2-Day USD SOFR (Annually) | 9/21/2028 | USD | 681,869 | 7,754 | — | 7,754 |
| 28-Day MXN-TIIE-BANXICO (Monthly) | 9.67% (Monthly) | 10/23/2028 | MXN | 1,846,000 | (252) | — | (252) |
| 28-Day MXN-TIIE-BANXICO (Monthly) | 9.69% (Monthly) | 10/25/2028 | MXN | 1,851,000 | (174) | — | (174) |
| 2.85% (Annually) | 2-Day USD SOFR (Annually) | 2/15/2029 | USD | 2,329,000 | 219,732 | 7,375 | 212,357 |
| 4.37% (Annually) | 2-Day USD SOFR (Annually) | 3/20/2029 | USD | 2,387,975 | 6,634 | — | 6,634 |
| 4.45% (Annually) | 2-Day USD SOFR (Annually) | 3/20/2029 | USD | 1,842,070 | (1,371) | — | (1,371) |
| 4.51% (Annually) | 2-Day USD SOFR (Annually) | 3/20/2029 | USD | 1,501,015 | (4,870) | — | (4,870) |
| 3.85% (Annually) | 2-Day USD SOFR (Annually) | 6/30/2029 | USD | 4,375,000 | 166,670 | 4,627 | 162,043 |
| 3.25% (Annually) | 2-Day USD SOFR (Annually) | 9/30/2029 | USD | 2,157,000 | 143,954 | 818 | 143,136 |
| 1-Day CORRA (Semi-Annually) | 3.54% (Semi-Annually) | 6/15/2033 | CAD | 1,023,040 | (40,286) | — | (40,286) |
| 1-Day JPY TONAR (Annually) | 1.32% (Annually) | 9/13/2033 | JPY | 52,000,000 | (4,243) | — | (4,243) |
| 1-Day CORRA (Semi-Annually) | 4.00% (Semi-Annually) | 9/21/2033 | CAD | 270,000 | (2,824) | — | (2,824) |
| 1-Day JPY TONAR (Annually) | 1.32% (Annually) | 9/21/2033 | JPY | 42,000,000 | (3,375) | — | (3,375) |
| 3.15% (Annually) | 2-Day USD SOFR (Annually) | 5/15/2048 | USD | 11,585,000 | 2,280,107 | (41,294) | 2,321,401 |
| 2.50% (Annually) | 2-Day USD SOFR (Annually) | 4/21/2052 | USD | 115,000 | 35,546 | 102 | 35,444 |
| 3.40% (Semi-Annually) | 1-Day CORRA (Semi-Annually) | 6/15/2053 | CAD | 455,000 | 34,519 | — | 34,519 |
| 3.72% (Semi-Annually) | 1-Day CORRA (Semi-Annually) | 9/21/2053 | CAD | 120,000 | 3,954 | — | 3,954 |
| Total | | | | | $2,248,383 | $(17,879) | $2,266,262 |
Interest Rate Swap Contracts outstanding at October 31, 2023:
Over the Counter |
| | | | | | | | | |
Pay Rate Index/
Pay Rate | Receive Rate Index/
Receive Rate | Counterparty | Maturity
Date | | Notional
Amount | Value | Upfront
Premiums
Paid
(Received) | Unrealized
Appreciation
(Depreciation) |
| 12.62% (At Maturity) | 1-Day BRL BZDIO (At Maturity) | Citibank | 1/2/2024 | BRL | 3,224,657 | $ 15 | $— | $ 15 |
| 1-Day BRL BZDIO (At Maturity) | 11.07% (At Maturity) | Barclays | 1/2/2025 | BRL | 928,000 | (259) | — | (259) |
| 1-Day BRL BZDIO (At Maturity) | 11.87% (At Maturity) | Bank of America | 1/2/2025 | BRL | 616,569 | 204 | — | 204 |
| 8.62% (At Maturity) | 1-Day COP COOVI (At Maturity) | JPMorgan Chase | 11/5/2025 | COP | 781,128,000 | (413) | — | (413) |
| 1-Day BRL BZDIO (At Maturity) | 9.98% (At Maturity) | HSBC | 1/2/2026 | BRL | 737,000 | (3,961) | — | (3,961) |
| 1-Day BRL BZDIO (At Maturity) | 11.80% (At Maturity) | Citibank | 1/2/2026 | BRL | 578,798 | 807 | — | 807 |
| 1-Day BRL BZDIO (At Maturity) | 11.75% (At Maturity) | Citibank | 1/2/2026 | BRL | 563,000 | 611 | — | 611 |
See accompanying Notes to Financial Statements
Morningstar Funds Trust October 31, 2023 (unaudited)
Schedule of Investments (continued)
Morningstar Total Return Bond Fund
Interest Rate Swap Contracts outstanding at October 31, 2023:
Over the Counter (continued) |
| | | | | | | | | |
Pay Rate Index/
Pay Rate | Receive Rate Index/
Receive Rate | Counterparty | Maturity
Date | | Notional
Amount | Value | Upfront
Premiums
Paid
(Received) | Unrealized
Appreciation
(Depreciation) |
| 1-Day BRL BZDIO (At Maturity) | 10.11% (At Maturity) | Goldman Sachs | 1/2/2026 | BRL | 231,260 | (1,127) | $— | $ (1,127) |
| 10.56% (At Maturity) | 1-Day BRL BZDIO (At Maturity) | Morgan Stanley | 1/4/2027 | BRL | 404,000 | 1,721 | — | 1,721 |
| Total | | | | | | $(2,402) | $— | $(2,402) |
Credit Default Swap Contracts outstanding - Buy Protection as of October 31, 2023:
Centrally Cleared
| Reference Obligation | Fixed
Deal
Pay Rate | Maturity
Date | | | Notional
Amount | Value | Upfront
Premiums
Paid/
(Received) | Unrealized
Appreciation
(Depreciation) |
| Markit iTraxx Europe Main Index Series (Pay Quarterly) | 5.00% | 12/20/2028 | | EUR | 148,546 | $ (3,994) | $ (3,372) | $ (622) |
| Total | | | | | | $(3,994) | $(3,372) | $(622) |
Credit Default Swap Contracts outstanding - Sell Protection as of October 31, 2023:
Centrally Cleared |
| | | | | | | | | |
| Reference Obligation | Implied
Credit
Spread | Fixed
Deal
Receive Rate | Maturity
Date | | Notional
Amount | Value | Upfront
Premiums
Paid/
(Received) | Unrealized
Appreciation
(Depreciation) |
| Markit CDX North America High Yield Index Series 41 (Pay Quarterly) | 5.14% | 5.00% | 12/20/2028 | USD | 2,263,572 | $ 1,232 | $ (24,307) | $ 25,539 |
| Markit CDX North America Investment Grade Index Series 41 (Pay Quarterly) | 0.79% | 1.00% | 12/20/2028 | USD | 20,787,900 | 226,220 | 261,774 | (35,554) |
| Total | | | | | | $227,452 | $237,467 | $(10,015) |
Credit Default Swap Contracts outstanding - Buy Protection at October 31, 2023:
Over the Counter |
| | | | | | | | | |
| Reference Obligation | Fixed
Deal
Pay Rate | Maturity
Date | Counterparty | | Notional
Amount | Value | Upfront
Premiums
Paid/
(Received) | Unrealized
Appreciation
(Depreciation) |
| Federal Republic of Brazil, 4.25%, Due: 1/07/2025 (Pay Quarterly) | 1.00% | 12/20/2024 | Barclays | USD | 336,000 | $ (2,586) | $ 1,908 | $ (4,494) |
| Abbott Laboratories 3.4% 11/30/2023 (Pay Quarterly) | 1.00% | 12/20/2028 | JPMorgan Chase | USD | 129,000 | (3,243) | (2,502) | (741) |
| American Electric Power, 3.2%, Due: 11/13/2027 (Pay Quarterly) | 1.00% | 12/20/2028 | Goldman Sachs | USD | 360,000 | (8,149) | (8,943) | 794 |
See accompanying Notes to Financial Statements
Morningstar Funds Trust October 31, 2023 (unaudited)
Schedule of Investments (continued)
Morningstar Total Return Bond Fund
Credit Default Swap Contracts outstanding - Buy Protection at October 31, 2023:
Over the Counter (continued) |
| | | | | | | | | |
| Reference Obligation | Fixed
Deal
Pay Rate | Maturity
Date | Counterparty | | Notional
Amount | Value | Upfront
Premiums
Paid/
(Received) | Unrealized
Appreciation
(Depreciation) |
| American Electric Power, 3.2%, Due: 11/13/2027 (Pay Quarterly) | 1.00% | 12/20/2028 | Deutsche Bank | USD | 190,770 | $ (4,318) | $ (3,958) | $ (360) |
| American Electric Power, 3.2%, Due: 11/13/2027 (Pay Quarterly) | 1.00% | 12/20/2028 | Bank of America | USD | 152,230 | (3,446) | (3,579) | 133 |
| American Express Co., 4.05%, Due: 5/03/2029 (Pay Quarterly) | 1.00% | 12/20/2028 | Citibank | USD | 360,000 | (6,647) | (7,934) | 1,287 |
| Dominion Energy, Inc., 4.25%, Due: 6/01/2028 (Pay Quarterly) | 1.00% | 12/20/2028 | Bank of America | USD | 152,233 | (2,096) | (2,531) | 435 |
| Dominion Energy, Inc., 4.25%, Due: 6/01/2028 (Pay Quarterly) | 1.00% | 12/20/2028 | Barclays | USD | 38,422 | (529) | (619) | 90 |
| Federal Republic of Brazil, 4.25%, Due: 1/07/2025 (Pay Quarterly) | 1.00% | 12/20/2028 | Goldman Sachs | USD | 36,100 | 1,259 | 1,527 | (268) |
| Republic of South Africa, 5.88%, Due: 9/16/2025 (Pay Quarterly) | 1.00% | 12/20/2028 | Barclays | USD | 98,000 | 7,261 | 7,859 | (598) |
| United Mexican States, 4.15%, Due: 3/28/2027 (Pay Quarterly) | 1.00% | 12/20/2028 | BNP Paribas | USD | 151,000 | 1,272 | 1,556 | (284) |
| United Mexican States, 4.15%, Due: 3/28/2027 (Pay Quarterly) | 1.00% | 12/20/2028 | Barclays | USD | 76,506 | 645 | 619 | 26 |
| United Mexican States, 4.15%, Due: 3/28/2027 (Pay Quarterly) | 1.00% | 12/20/2028 | JPMorgan Chase | USD | 28,800 | 243 | 294 | (51) |
| Total | | | | | | $(20,334) | $(16,303) | $(4,031) |
Credit Default Swap Contracts outstanding - Sell Protection at October 31, 2023:
Over the Counter |
| | | | | | | | | | |
| Reference Obligation | Implied
Credit
Spread | Fixed
Deal
Receive Rate | Maturity
Date | Counterparty | | Notional
Amount | Value | Upfront
Premiums
Paid/
(Received) | Unrealized
Appreciation
(Depreciation) |
| Markit CMBX North America Index Series 14 (Pay Monthly) | 0.00% | 3.00% | 12/16/2072 | Goldman Sachs | USD | 40,000 | $ (11,182) | $ (6,765) | $ (4,417) |
| Total | | | | | | | $(11,182) | $(6,765) | $(4,417) |
Inflation Swap Contracts outstanding at October 31, 2023:
Centrally Cleared |
| | | | | | | | |
Pay Rate Index/
Pay Rate | Receive Rate Index/
Receive Rate | Maturity
Date | | Notional
Amount | Value | Upfront
Premiums
Paid
(Received) | Unrealized
Appreciation
(Depreciation) |
| 2.59% (At Maturity) | 1-Day U.S. Consumer Price Index (At Maturity) | 10/31/2028 | USD | 1,749,000 | $ (929) | $ (401) | $ (528) |
See accompanying Notes to Financial Statements
Morningstar Funds Trust October 31, 2023 (unaudited)
Schedule of Investments (continued)
Morningstar Total Return Bond Fund
Inflation Swap Contracts outstanding at October 31, 2023:
Centrally Cleared (continued) |
| | | | | | | | |
Pay Rate Index/
Pay Rate | Receive Rate Index/
Receive Rate | Maturity
Date | | Notional
Amount | Value | Upfront
Premiums
Paid
(Received) | Unrealized
Appreciation
(Depreciation) |
| 2.60% (At Maturity) | 1-Day U.S. Consumer Price Index (At Maturity) | 11/1/2028 | USD | 1,749,000 | (1,677) | $(2,221) | $ 544 |
| 1-Day U.S. Consumer Price Index (At Maturity) | 2.68% (At Maturity) | 10/31/2033 | USD | 1,749,000 | 2,482 | 402 | 2,080 |
| 1-Day U.S. Consumer Price Index (At Maturity) | 2.67% (At Maturity) | 11/1/2033 | USD | 1,749,000 | 1,603 | 2,222 | (619) |
| 3.40% (At Maturity) | 1-Day UK Retail Price Index (At Maturity) | 10/15/2053 | GBP | 115,000 | (761) | — | (761) |
| 1-Day U.S. Consumer Price Index (At Maturity) | 2.67% (At Maturity) | 10/20/2053 | USD | 165,000 | (742) | — | (742) |
| Total | | | | | $ (24) | $ 2 | $ (26) |
Valuation Hierarchy
The following is a summary of the inputs used, as of October 31, 2023, in valuing the Fund's investments carried at fair value:
| Morningstar Total Return Bond Fund | Level 1 | Level 2 | Level 3 | Totals |
| Investments | | | | |
| Assets: | | | | |
| Asset-Backed Securities | $ — | $ 33,169,792 | $ — | $ 33,169,792 |
| Corporate Bonds | — | 136,277,742 | 93,381 | 136,371,123 |
| Foreign Issuer Bonds | — | 42,648,139 | — | 42,648,139 |
| Mortgage-Backed Securities | — | 273,302,484 | — | 273,302,484 |
| Municipal Bonds | — | 2,239,444 | — | 2,239,444 |
| Term Loans | — | 22,689 | — | 22,689 |
| U.S. Government Obligations | — | 101,879,198 | — | 101,879,198 |
| Investment Companies | 213,951,185 | — | — | 213,951,185 |
| Short-Term Investments | 14,094,273 | 8,438,211 | — | 22,532,484 |
| Purchased Options | 230,148 | 916,875 | — | 1,147,023 |
| Total Assets – Investments at value | $228,275,606 | $598,894,574 | $93,381 | $827,263,561 |
| Liabilities: | | | | |
| Mortgage-Backed Securities | $ — | $ (16,839,031) | $ — | $ (16,839,031) |
| Total Liabilities – Investments at value | $ — | $ (16,839,031) | $ — | $ (16,839,031) |
| Net Investments | $228,275,606 | $582,055,543 | $93,381 | $810,424,530 |
| Morningstar Total Return Bond Fund | Level 1 | Level 2 | Level 3 | Totals |
| Derivative Financial Instruments | | | | |
See accompanying Notes to Financial Statements
Morningstar Funds Trust October 31, 2023 (unaudited)
Schedule of Investments (continued)
Morningstar Total Return Bond Fund
| Morningstar Total Return Bond Fund | Level 1 | Level 2 | Level 3 | Totals |
| Assets: | | | | |
| Futures Contracts | $ 1,328,243 | $ — | $— | $ 1,328,243 |
| Forward Foreign Currency Exchange Contracts | — | 90,561 | — | 90,561 |
| Swap Agreements | — | 3,148,644 | — | 3,148,644 |
| Total Assets - Derivative Financial Instruments | $ 1,328,243 | $ 3,239,205 | $— | $ 4,567,448 |
| Liabilities: | | | | |
| Futures Contracts | $(4,205,435) | $ — | $— | $(4,205,435) |
| Forward Foreign Currency Exchange Contracts | — | (78,128) | — | (78,128) |
| Written Options | (109,661) | (859,500) | — | (969,161) |
| Swap Agreements | — | (710,745) | — | (710,745) |
| Total Liabilities - Derivative Financial Instruments | $(4,315,096) | $(1,648,373) | $— | $(5,963,469) |
| Net Derivative Financial Instruments | $(2,986,853) | $ 1,590,832 | $— | $(1,396,021) |
See accompanying Notes to Financial Statements
Morningstar Funds Trust October 31, 2023 (unaudited)
Morningstar Municipal Bond Fund
| | | Par | Value |
| Municipal Bonds – 84.7% |
| Alabama – 3.1% |
| Alabama State Corrections Institution Finance Authority Revenue Bonds, 5.25%, 7/01/47 | | $ 500,000 | $ 507,743 |
| Black Belt Energy Gas District Gas Prepay Revenue Bonds, Series A-1, Project No. 4, 4.00%, 6/01/25 | | 990,000 | 978,299 |
| Black Belt Energy Gas District Gas Prepay Revenue Bonds, Series A-1, Project No. 5, 4.00%, 10/01/26(a)(b)(c) | | 525,000 | 508,707 |
| Black Belt Energy Gas District Gas Project Revenue Bonds, Series C-1, 5.25%, 6/01/29(a)(b)(c) | | 1,030,000 | 1,031,856 |
| Black Belt Energy Gas District Gas Supply Revenue Refunding Bonds, 4.00%, 12/01/31(a)(b)(c) | | 500,000 | 459,934 |
| Black Belt Energy Gas District Project Variable Revenue Bonds, Series B-2, (SIFMA Municipal Swap Index Yield + 0.65%), 4.74%, 10/01/27(a)(c) | | 250,000 | 245,304 |
| Black Belt Energy Gas District Revenue Bonds, Project No. 7, 4.00%, 12/01/26(a)(b)(c) | | 2,110,000 | 2,032,356 |
| Jefferson County Sewer Warrants Senior Lien Revenue Bonds, Series A (AGM Insured), 5.50%, 10/01/53 | | 300,000 | 300,407 |
| Lower Alabama Gas District Gas Project Revenue Bonds, 4.00%, 12/01/25(a)(b)(c) | | 500,000 | 488,732 |
| Mobile Industrial Development Board PCR Bonds, Alabama Power Company Barry Plant Project, 1.00%, 6/26/25(a)(b)(c) | | 1,000,000 | 944,746 |
| Southeast Energy Authority Commodity Supply Revenue Bonds, Series B, Project No. 6, | | | |
| 5.00%, 6/01/30 | | 475,000 | 476,350 |
| 5.00%, 6/01/30(a)(b)(c) | | 500,000 | 496,623 |
| | | Par | Value |
| Alabama (Continued) |
|
| Southeast Energy Authority Commodity Supply Revenue Bonds, Series B-1, Project No. 4, 5.00%, 8/01/28(a)(b)(c) | | $150,000 | $ 148,545 |
| Tuscaloosa County IDA Gulf Opportunity Zone Revenue Refunding Bonds, Series A, Hunt Refining Project, 5.25%, 5/01/44(d) | | 410,000 | 336,753 |
| University of South Alabama University Revenue Bonds (BAM Insured), 5.00%, 4/01/27 | | 375,000 | 385,841 |
| University of West Alabama University Revenue Refunding Bonds (AGM Insured), 5.00%, 1/01/27 | | 505,000 | 513,673 |
| | | | 9,855,869 |
| Alaska – 0.2% |
| Alaska State Municipal Bond Bank Authority Revenue Bonds, Series 2 (AMT), 5.00%, 12/01/29 | | 590,000 | 603,450 |
| Arizona – 0.5% |
| Arizona State IDA Education Revenue Bonds, Series B, Jerome Facilities Project, Social Bonds, 4.00%, 7/01/51 | | 175,000 | 130,144 |
| Maricopa County IDA Revenue Bonds, Series A, Banner Health, 4.00%, 1/01/41 | | 250,000 | 219,769 |
| Maricopa County IDA Variable Revenue Bonds, Series A-3, Banner Health, 5.00%, 11/01/30(a)(b)(c) | | 300,000 | 310,736 |
| Pima County IDA Education Revenue Facility Revenue Bonds, Paideia Academies Project, 6.13%, 7/01/45(d) | | 240,000 | 223,541 |
| Pima County IDA Education Revenue Refunding Bonds, Series A, 4.00%, 12/15/24(d) | | 260,000 | 256,278 |
| Salt River Project Agricultural Improvement & Power District Electric System Revenue Refunding Bonds, Series A, 5.00%, 12/01/45 | | 500,000 | 507,390 |
| | | | 1,647,858 |
See accompanying Notes to Financial Statements
Morningstar Funds Trust October 31, 2023 (unaudited)
Schedule of Investments (continued)
Morningstar Municipal Bond Fund
| | | Par | Value |
| Arkansas – 0.1% |
| Bentonville Sales & Use Tax Revenue Refunding Bonds, Series B, 1.05%, 11/01/46 | | $ 235,000 | $ 232,998 |
| Springdale Sales & Use Revenue Bonds, Series B (BAM Insured), | | | |
| 5.00%, 8/01/28 | | 125,000 | 130,419 |
| 5.00%, 8/01/29 | | 120,000 | 125,794 |
| | | | 489,211 |
| California – 6.2% |
| Bay Area Toll Bridge Authority Variable Revenue Refunding Bonds, San Francisco Bay, (SIFMA Municipal Swap Index Yield + 0.45%), 4.30%, 4/01/26(a)(c) | | 2,000,000 | 1,962,513 |
| California Community Choice Financing Authority Variable Revenue Bonds, Clean Energy Project, Green Bonds, 5.00%, 10/01/30 | | 450,000 | 439,459 |
| California Housing Finance Agency Municipal Certificates Revenue Bonds, Series 2, Class A, 4.00%, 3/20/33 | | 234,477 | 220,953 |
| California PFA Revenue Refunding Bonds, Henry Mayo Newhall Hospital, 5.00%, 10/15/47 | | 580,000 | 527,551 |
| California State GO Unlimited Bonds, 4.25%, 9/01/52 | | 125,000 | 113,403 |
| California State Infrastructure & Economic Development Bank National Charter Equitable School Revolving Fund Revenue Bonds, 5.00%, 11/01/57 | | 100,000 | 90,904 |
| California State Infrastructure & Economic Development Bank Revenue Refunding Bonds, Los Angeles County Museum of Natural History Foundation, 4.00%, 7/01/50 | | 1,510,000 | 1,268,387 |
| | | Par | Value |
| California (Continued) |
| California State Municipal Finance Authority Refunding COPS, Series A, Palomar Health (AGM Insured), 5.25%, 11/01/52 | | $ 110,000 | $ 111,421 |
| California State Municipal Finance Authority Revenue Bonds, Charter School John Adams Academies-Lincoln Project, 5.00%, 10/01/57(d) | | 330,000 | 264,412 |
| California State Municipal Finance Authority Revenue Refunding Bonds, Series A, Eisenhower Medical Center, 5.00%, 7/01/25 | | 650,000 | 652,925 |
| California State Municipal Finance Authority Senior Living Revenue Bonds, Mt. San Antonio Garden, 2.13%, 11/15/26 | | 250,000 | 240,109 |
| California State Municipal Finance Authority Senior Living Revenue Refunding Bonds, Mt. San Antonio Gardens Project, 5.00%, 11/15/39 | | 300,000 | 264,573 |
| California State Municipal Finance Authority Student Housing Revenue Bonds, CHF-Davis I, LLC-West Village, 5.00%, 5/15/36 | | 1,130,000 | 1,145,024 |
| California State Municipal Finance Authority Student Housing Revenue Bonds, Series A-P3, Claremont Colleges Project, 5.00%, 7/01/30(d) | | 320,000 | 307,699 |
| California State Municipal Finance Authority Student Housing Revenue Bonds, UCR North District Phase 1 (BAM Insured), 5.00%, 5/15/28 | | 500,000 | 518,566 |
| California State School Finance Authority Charter School Revenue Bonds, Series A, John Adams Academies, 5.00%, 7/01/52(d) | | 520,000 | 425,483 |
| California State University Systemwide Revenue Bonds, Series C, 4.00%, 11/01/45 | | 200,000 | 176,924 |
See accompanying Notes to Financial Statements
Morningstar Funds Trust October 31, 2023 (unaudited)
Schedule of Investments (continued)
Morningstar Municipal Bond Fund
| | | Par | Value |
| California (Continued) |
| California Statewide Communities Development Authority Revenue Bonds, Lancer Educational Standard Housing Project, 5.00%, 6/01/34(d) | | $375,000 | $351,223 |
| California Statewide Communities Development Authority Revenue Bonds, Loma Linda University Medical, 5.50%, 12/01/58(d) | | 500,000 | 456,672 |
| California Statewide Communities Development Authority Revenue Bonds, Series A, Enloe Medical Center (AGM Insured), 5.25%, 8/15/52 | | 450,000 | 459,188 |
| California Statewide Communities Development Authority Revenue Bonds, Series A, Loma Linda University Medical Center, 5.25%, 12/01/56(d) | | 250,000 | 221,162 |
| California Statewide Communities Development Authority Special Assessment Bonds, Statewide Community Infrastructure Program, | | | |
| 5.00%, 9/02/34 | | 100,000 | 101,059 |
| 5.25%, 9/02/43 | | 200,000 | 181,816 |
|
| California Tobacco Securitization Agency Tobacco Settlement Senior Revenue Refunding Bonds, Series A, 4.00%, 6/01/40 | | 300,000 | 265,279 |
| Cathedral City Redevelopment Agency Successor Agency Tax Allocation Revenue Refunding Bonds, Merged Redevelopment Project Area (BAM Insured), 4.00%, 8/01/26 | | 250,000 | 249,070 |
| Compton Community Redevelopment Agency Successor Agency Tax Allocation Revenue Refunding Bonds, Series A (AGM Insured), 5.00%, 8/01/42 | | 250,000 | 252,427 |
| | | Par | Value |
| California (Continued) |
|
| CSCDA Community Improvement Authority Essential Housing Mezzanine Lien Revenue Bonds, City of Orange, 4.00%, 3/01/57(d) | | $ 200,000 | $ 127,790 |
| Foothill Eastern Transportation Corridor Agency Toll Road Junior Lien Revenue Bonds, Series C, 5.00%, 1/15/26 | | 200,000 | 201,779 |
| Foothill Eastern Transportation Corridor Agency Toll Road Junior Lien Revenue Refunding Bonds, Series C, 4.00%, 1/15/43 | | 250,000 | 212,679 |
| Lodi Unified School District GO Unlimited Bonds, 3.00%, 8/01/46 | | 400,000 | 277,498 |
| Los Angeles Department of Airports Airport Subordinate Revenue Bonds (AMT), Los Angeles International Airport, 5.00%, 5/15/34 | | 510,000 | 511,975 |
| Los Angeles Department of Airports Airport Subordinate Revenue Bonds, Series C (AMT), Los Angeles International Airport, 5.00%, 5/15/29 | | 1,000,000 | 1,021,833 |
| Los Angeles Department of Airports Subordinate Revenue Bonds, Series A (AMT), Private Activity, 4.00%, 5/15/41 | | 1,000,000 | 851,991 |
| Los Angeles Department of Airports Subordinate Revenue Refunding Bonds (AMT), 5.00%, 5/15/43 | | 500,000 | 484,114 |
| Mesa Water District COPS, 4.00%, 3/15/39 | | 300,000 | 281,367 |
| Newman-Crows Landing Unified School District GO Unlimited CABS, 0.00%, 8/01/25(e) | | 250,000 | 231,524 |
| Pittsburg Public Financing Authority Water Revenue Bonds, Series A (AGM Insured), 4.13%, 8/01/47 | | 250,000 | 225,335 |
| Port of Oakland Intermediate Lien Revenue Refunding Bonds (AMT), 5.00%, 11/01/29 | | 250,000 | 258,427 |
See accompanying Notes to Financial Statements
Morningstar Funds Trust October 31, 2023 (unaudited)
Schedule of Investments (continued)
Morningstar Municipal Bond Fund
| | | Par | Value |
| California (Continued) |
|
| Rocklin Community Facilities District No. 10 Special Tax Bonds, 5.00%, 9/01/34 | | $150,000 | $ 151,037 |
| Sacramento Railyards Community Facilities District No. 2018 Special Tax Bonds, 5.25%, 9/01/47(d) | | 550,000 | 504,105 |
| San Diego County Regional Airport Authority Subordinate Revenue Refunding Bonds, Series A, 4.00%, 7/01/37 | | 300,000 | 287,341 |
| San Diego County Regional Airport Authority Subordinate Revenue Refunding Bonds, Series B (AMT), 5.00%, 7/01/39 | | 525,000 | 516,707 |
| San Francisco City & County Airports Commission International Airport Revenue Bonds, Series A (AMT), 5.00%, 5/01/44 | | 250,000 | 240,692 |
| San Mateo Foster City School District GO Unlimited Bonds, Series B, 4.00%, 8/01/48 | | 500,000 | 443,289 |
| Susanville Natural Gas Revenue Refunding Bonds, Natural Gas Enterprise (AGM Insured), 3.00%, 6/01/26 | | 595,000 | 576,489 |
| Tobacco Securitization Authority of Southern California Tobacco Settlement Revenue Refunding Bonds, San Diego Asset Securities, 5.00%, 6/01/35 | | 100,000 | 103,761 |
| Washington Township Health Care District 2020 Election GO Unlimited Bonds, Series B, 5.50%, 8/01/53 | | 750,000 | 786,353 |
| | | | 19,564,288 |
| Colorado – 3.7% |
| Aurora Crossroads Metropolitan District No. 2 Senior Lien GO Limited Bonds, Series A, 5.00%, 12/01/40 | | 500,000 | 432,093 |
| | | Par | Value |
| Colorado (Continued) |
| Colorado Educational & Cultural Authority Revenue Refunding Bonds, Prospect Ridge Academy Project (Moral Obligation Insured), | | | |
| 5.00%, 3/15/25 | | $ 485,000 | $ 488,369 |
| 5.00%, 3/15/26 | | 510,000 | 515,257 |
| 5.00%, 3/15/29 | | 590,000 | 603,091 |
| 5.00%, 3/15/30 | | 310,000 | 316,812 |
| 5.00%, 3/15/35 | | 590,000 | 598,041 |
|
| Colorado High Performance Transportation Enterprise Revenue Bonds, C-470 Express Lane, 5.00%, 12/31/56 | | 1,000,000 | 896,159 |
| Colorado State Bridge Enterprise Revenue Bonds (AMT), Central 70 Project, 4.00%, 12/31/24 | | 630,000 | 623,845 |
| Colorado State COPS, | | | |
| 6.00%, 12/15/40 | | 1,000,000 | 1,114,847 |
| 6.00%, 12/15/41 | | 500,000 | 555,681 |
| Colorado State COPS, Series A, | | | |
| 4.00%, 12/15/35 | | 1,250,000 | 1,199,305 |
| 4.00%, 12/15/36 | | 200,000 | 187,841 |
|
| Colorado State Health Facilities Authority Revenue Bonds, Commonspirit Health, Series B-2, 5.00%, 8/01/26(a)(b)(c) | | 615,000 | 620,622 |
| Colorado State Health Facilities Authority Revenue Refunding Bonds, Parkview Medical Center, Inc., Project, Series B, 5.00%, 9/01/29 | | 1,000,000 | 1,004,426 |
| Denver City & County Airport Revenue Refunding Bonds, Series D (AMT), | | | |
| 5.00%, 11/15/24 | | 500,000 | 502,424 |
| 5.75%, 11/15/41 | | 325,000 | 344,309 |
|
| Denver City & County Airport System Subordinate Revenue Refunding Bonds, Series A (AMT), 5.25%, 12/01/43 | | 500,000 | 493,742 |
| Denver Convention Center Hotel Authority Senior Revenue Refunding Bonds, 5.00%, 12/01/40 | | 250,000 | 226,150 |
See accompanying Notes to Financial Statements
Morningstar Funds Trust October 31, 2023 (unaudited)
Schedule of Investments (continued)
Morningstar Municipal Bond Fund
| | | Par | Value |
| Colorado (Continued) |
|
| Denver Health & Hospital Authority Healthcare Revenue Bonds, Series A, 4.00%, 12/01/27 | | $180,000 | $ 173,218 |
| Park Creek Metropolitan District Revenue Refunding Bonds, Series A (NATL, IBC Insured), 5.00%, 12/01/45 | | 500,000 | 485,102 |
| Public Authority for Colorado State Energy Natural Gas Purchase Revenue Bonds, 6.50%, 11/15/38 | | 250,000 | 276,211 |
| | | | 11,657,545 |
| Connecticut – 1.1% |
| Connecticut State Health & Educational Facilities Authority Revenue Bonds, Series K, Sacred Heart University, 5.00%, 7/01/27 | | 400,000 | 411,345 |
| Connecticut State Health & Educational Facilities Authority Revenue Refunding Bonds, Forward Delivery, Stamford Hospital Issue, 4.00%, 7/01/42 | | 250,000 | 207,019 |
| Connecticut State Health & Educational Facilities Authority Revenue Refunding Bonds, Series B-1, 5.00%, 1/01/25(a)(b)(c) | | 500,000 | 502,540 |
| Connecticut State Health & Educational Facilities Authority Revenue Refunding Bonds, Series F, Masonicare Issue, 5.00%, 7/01/27 | | 220,000 | 216,378 |
| Connecticut State Health & Educational Facilities Authority Revenue Refunding Bonds, University of Hartford, | | | |
| 5.00%, 7/01/25 | | 260,000 | 256,523 |
| 5.00%, 7/01/31 | | 500,000 | 479,071 |
| 4.00%, 7/01/39 | | 120,000 | 90,783 |
| 4.00%, 7/01/49 | | 100,000 | 65,597 |
| | | Par | Value |
| Connecticut (Continued) |
|
| Connecticut State HFA Mortgage Finance Program Variable Revenue Bonds, Series A-4, Social Bonds, (SIFMA Municipal Swap Index Yield + 0.30%), 4.39%, 11/15/24(a)(c) | | $1,000,000 | $ 996,281 |
| Hamden Revenue Refunding Bonds, Whitney Center Project, 5.00%, 1/01/40 | | 125,000 | 102,595 |
| | | | 3,328,132 |
| Delaware – 0.1% |
| Kent County Student Housing & Dining Facilities Revenue Bonds, CHF-Dover LLC-Delaware State University Project, | | | |
| 5.00%, 7/01/32 | | 250,000 | 247,045 |
| 5.00%, 7/01/48 | | 100,000 | 87,924 |
| | | | 334,969 |
| District of Columbia – 1.2% |
| District of Columbia Hospital Revenue Refunding Bonds, Children's Hospital, 5.00%, 7/15/44 | | 300,000 | 284,805 |
| District of Columbia Revenue Bonds, Ingleside Rock Creek Project, 5.00%, 7/01/52 | | 400,000 | 299,613 |
| District of Columbia Revenue Bonds, KIPP DC Project, 4.00%, 7/01/39 | | 100,000 | 86,492 |
| District of Columbia University Revenue Refunding Bonds, Georgetown University, 5.00%, 4/01/29 | | 350,000 | 357,727 |
| Metropolitan Washington Airports Authority Airport System Revenue Refunding Bonds, Series A (AMT), 5.25%, 10/01/48 | | 1,000,000 | 991,716 |
| Metropolitan Washington Airports Authority Dulles Toll Road Subordinate Lien Revenue Refunding Bonds, Dulles Metrorail & Capital Improvement Projects, Series B, 4.00%, 10/01/35 | | 350,000 | 322,232 |
See accompanying Notes to Financial Statements
Morningstar Funds Trust October 31, 2023 (unaudited)
Schedule of Investments (continued)
Morningstar Municipal Bond Fund
| | | Par | Value |
| District of Columbia (Continued) |
| Metropolitan Washington Airports Authority System Revenue Refunding Bonds, Series A (AMT), 5.00%, 10/01/46 | | $ 500,000 | $ 478,844 |
| Washington Metropolitan Area Transit Authority Dedicated Revenue Bonds, Series A, Green Bonds, 5.50%, 7/15/51 | | 525,000 | 550,790 |
| Washington Metropolitan Area Transit Authority Dedicated Revenue Bonds, Sustainability Financed, 5.25%, 7/15/53 | | 450,000 | 460,567 |
| | | | 3,832,786 |
| Florida – 4.0% |
| Alachua County Health Facilities Authority Revenue Bonds, Shands Teaching Hospital & Clinics, 5.00%, 12/01/44 | | 500,000 | 476,614 |
| Broward County Airport System Revenue Bonds, Series A (AMT), 5.00%, 10/01/36 | | 750,000 | 735,406 |
| Central Florida Expressway Authority Senior Lien Revenue Refunding Bonds, 5.00%, 7/01/42 | | 350,000 | 350,779 |
| Collier County Water-Sewer District Revenue Bonds, 4.00%, 7/01/40 | | 500,000 | 449,398 |
| Florida State Municipal Power Agency Revenue Refunding Bonds, Series A, 5.00%, 10/01/31 | | 300,000 | 304,903 |
| Greater Orlando Aviation Authority Airport Facilities Revenue Bonds, Series A (AMT), 5.00%, 10/01/40 | | 500,000 | 486,456 |
| JEA Electric System Revenue Refunding Bonds, Series Three A, 4.00%, 10/01/37 | | 1,395,000 | 1,204,548 |
| Lakeland Hospital System Revenue Refunding Bonds, Lakeland Regional Health Systems, 5.00%, 11/15/26 | | 425,000 | 432,781 |
| Lakewood Ranch Stewardship District Utility Revenue Bonds, System Acquisition Project (AGM Insured), 5.25%, 10/01/48 | | 350,000 | 354,574 |
| | | Par | Value |
| Florida (Continued) |
| Lee County IDA Healthcare Facilities Revenue Bonds, Shell Point/Waterside Health Project, 5.00%, 11/15/39 | | $300,000 | $276,333 |
| Lee County Local Optional Gas TRB, 5.25%, 8/01/49 | | 355,000 | 355,102 |
| Lee Memorial Health System Hospital Revenue Refunding Bonds, Series A-1, 5.00%, 4/01/44 | | 600,000 | 573,506 |
| Leon County School District Sales TRB, 4.00%, 9/01/26 | | 800,000 | 799,960 |
| Miami-Dade County Aviation Revenue Bonds, Series A (AMT), 5.00%, 10/01/49 | | 500,000 | 465,049 |
| Miami-Dade County Aviation Revenue Refunding Bonds, Series A (AMT), 5.00%, 10/01/33 | | 500,000 | 490,801 |
| Miami-Dade County Educational Facilities Authority Revenue Refunding Bonds, Series A, University of Miami, 5.00%, 4/01/30 | | 250,000 | 250,922 |
| Miami-Dade County Expressway Authority Toll System Revenue Bonds, Series A, 5.00%, 7/01/28 | | 250,000 | 251,323 |
| Miami-Dade County GO Unlimited Bonds, Public Health Trust Program, 4.00%, 7/01/42 | | 250,000 | 214,502 |
| Miami-Dade County Seaport Revenue Refunding Bonds, Series A (AMT), Senior Bonds, 5.25%, 10/01/52 | | 500,000 | 480,692 |
| Miami-Dade County, Florida Aviation Revenue Refunding Bonds, Series A (AMT), 5.00%, 10/01/34 | | 290,000 | 283,739 |
| Osceola County Florida Transportation Revenue Refunding CABS, Series A-2, | | | |
| 0.00%, 10/01/25(e) | | 125,000 | 112,958 |
| 0.00%, 10/01/26(e) | | 275,000 | 236,307 |
| 0.00%, 10/01/27(e) | | 360,000 | 294,849 |
|
| Polk County Utility System Revenue Refunding Bonds, 4.00%, 10/01/43 | | 400,000 | 344,931 |
See accompanying Notes to Financial Statements
Morningstar Funds Trust October 31, 2023 (unaudited)
Schedule of Investments (continued)
Morningstar Municipal Bond Fund
| | | Par | Value |
| Florida (Continued) |
|
| Sarasota County Public Hospital District Revenue Bonds, Sarasota Memorial Hospital Project, 5.00%, 7/01/52 | | $250,000 | $ 241,289 |
| Tampa Hospital Revenue Bonds, H. Lee Moffitt Cancer Center, | | | |
| 5.00%, 7/01/25 | | 150,000 | 151,584 |
| 5.00%, 7/01/26 | | 125,000 | 126,954 |
| 5.00%, 7/01/27 | | 125,000 | 127,523 |
|
| Village Community Development District No. 14 Special Assessment Revenue Bonds, 5.50%, 5/01/53 | | 240,000 | 228,921 |
| Volusia County Educational Facilities Authority Revenue Refunding Bonds, Embry-Riddle Aeronautical, 5.00%, 10/15/44 | | 500,000 | 491,795 |
| Wildwood Utility Dependent District Senior Lien Revenue Bonds, South Sumter Utility Project (BAM Insured), 5.00%, 10/01/41 | | 465,000 | 469,766 |
| Wildwood Utility Dependent District Subordinate Revenue Bonds, South Sumter Utility Project (BAM Insured), 5.00%, 10/01/36 | | 400,000 | 415,402 |
| | | | 12,479,667 |
| Georgia – 2.5% |
| Atlanta Airport Passenger Facility Charge Subordinate Revenue Bonds, Series C, 5.00%, 7/01/40 | | 365,000 | 375,758 |
| Atlanta Development Authority Senior Lien Revenue Bonds, Series A-1, 5.00%, 7/01/30 | | 200,000 | 202,475 |
| Bartow County Development Authority Revenue Refunding Bonds, Georgia Power Company Plant Bowen Project, 1.80%, 9/01/29(b)(c) | | 250,000 | 199,494 |
| City of Atlanta Airport Passenger Facility Charge Subordinate Lien Green Revenue Bonds (AMT), 5.25%, 7/01/41 | | 500,000 | 505,362 |
| | | Par | Value |
| Georgia (Continued) |
| Fulton County Development Authority Transportation Corp., Toll Revenue Refunding Bonds, Robert W. Woodruff Arts Center, Inc., Project, 5.00%, 3/15/32 | | $ 200,000 | $ 206,847 |
| Gainesville & Hall County Hospital Authority Revenue Refunding Bonds, Northeast Georgia Health System, Inc., Project, 5.00%, 2/15/37 | | 500,000 | 503,954 |
| Georgia State GO Unlimited Bonds, Bidding Group 2, Series A, 4.00%, 7/01/42 | | 1,000,000 | 930,039 |
| Glynn-Brunswick Memorial Hospital Authority Revenue Refunding Anticipation Certificates Bonds, Southeast Georgia Health System, 5.00%, 8/01/34 | | 530,000 | 521,122 |
| Griffin-Spalding County Hospital Authority Revenue Anticipation Certificates Bonds, Wellstar, 5.00%, 4/01/35 | | 150,000 | 152,293 |
| Main Street Natural Gas, Inc., Gas Supply Revenue Bonds, Series A, 4.00%, 9/01/27(a)(b)(c) | | 1,125,000 | 1,082,390 |
| Main Street Natural Gas, Inc., Gas Supply Revenue Bonds, Series B, | | | |
| 5.00%, 6/01/29(a)(b)(c) | | 700,000 | 689,959 |
| 5.00%, 3/01/30(a)(b)(c) | | 335,000 | 332,800 |
|
| Main Street Natural Gas, Inc., Gas Supply Revenue Bonds, Series C, 4.00%, 11/01/27(a)(b)(c)(d) | | 1,000,000 | 931,211 |
| Main Street Natural Gas, Inc., Gas Supply Revenue Bonds, Series D, 5.00%, 12/01/30(a)(b)(c) | | 250,000 | 245,588 |
| Main Street Natural Gas, Inc., Gas Supply Revenue Bonds, Series E-1, 5.00%, 6/01/31(a)(b)(c) | | 150,000 | 148,861 |
| Main Street Natural Gas, Inc., Gas Supply Variable Revenue Bonds, Series B, 4.00%, 12/02/24(a)(b)(c) | | 100,000 | 99,038 |
See accompanying Notes to Financial Statements
Morningstar Funds Trust October 31, 2023 (unaudited)
Schedule of Investments (continued)
Morningstar Municipal Bond Fund
| | | Par | Value |
| Georgia (Continued) |
|
| Municipal Electric Authority of Georgia Power Revenue Refunding Bonds, Series HH, 5.00%, 1/01/29 | | $500,000 | $ 514,467 |
| Municipal Electric Authority of Georgia Revenue Bonds, Plant Vogtle Units 3&4 Project (AGM Insured), 5.00%, 7/01/55 | | 250,000 | 241,079 |
| | | | 7,882,737 |
| Guam – 0.1% |
| Guam Government Business Privilege Tax Revenue Refunding Bonds, Series F, 4.00%, 1/01/42 | | 250,000 | 206,938 |
| Hawaii – 0.0%(f) |
| Honolulu City & County Multifamily Variable Revenue Bonds, Maunakea Tower Apartments (Housing & Urban Development Sector 8 Program), 5.00%, 6/01/26(a)(b)(c) | | 135,000 | 136,765 |
| Illinois – 6.9% |
| Chicago Board of Education GO Unlimited Bonds, Series A, | | | |
| 5.00%, 12/01/38 | | 500,000 | 463,926 |
| 5.00%, 12/01/42 | | 250,000 | 221,526 |
|
| Chicago Board of Education GO Unlimited Bonds, Series D, 5.00%, 12/01/46 | | 350,000 | 303,341 |
| Chicago Board of Education GO Unlimited Refunding Bonds, Dedicated, Series D, 5.00%, 12/01/31 | | 750,000 | 736,995 |
| Chicago City Colleges Capital Appreciation GO Unlimited Bonds (NATL Insured), 0.00%, 1/01/30(e) | | 750,000 | 551,309 |
| Chicago GO Unlimited Bonds, Project & Refunding Series A, 5.25%, 1/01/30 | | 500,000 | 500,937 |
| Chicago GO Unlimited Bonds, Series A, 5.50%, 1/01/49 | | 100,000 | 97,466 |
| | | Par | Value |
| Illinois (Continued) |
|
| Chicago GO Unlimited Bonds, Series A, Chicago Works, 5.50%, 1/01/39 | | $250,000 | $252,716 |
| Chicago Heights Multifamily Variable Revenue Bonds, Olympic Village Apartments Project (FHA Insured, Housing & Urban Development Sector 8 Program), 2.88%, 8/01/25(a)(b)(c) | | 500,000 | 485,006 |
| Chicago O'Hare International Airport Passenger Facility Charge Revenue Refunding Bonds (AMT), 5.00%, 1/01/32 | | 500,000 | 495,078 |
| Chicago O'Hare International Airport Senior Lien General Revenue Bonds, Series D (AMT), 5.00%, 1/01/26 | | 140,000 | 141,215 |
| Chicago O'Hare International Airport Senior Lien Revenue Refunding Bonds (AMT), 5.00%, 1/01/28 | | 680,000 | 689,720 |
| Chicago O'Hare International Airport Senior Lien Revenue Refunding Bonds, Series A (AMT), 5.00%, 1/01/31 | | 250,000 | 253,142 |
| Chicago Park District GO Limited Tax Refunding Bonds, Series B, 5.00%, 1/01/26 | | 395,000 | 393,686 |
| Chicago Special Assessment Refunding Bonds, Lakeshore East Project, 2.87%, 12/01/27(d) | | 254,000 | 230,807 |
| Chicago Transit Authority Sales Tax Receipts Revenue Bonds, 5.25%, 12/01/49 | | 495,000 | 485,963 |
| Chicago Wastewater Transmission Second Lien Revenue Bonds, 5.00%, 1/01/39 | | 550,000 | 528,619 |
| City of Chicago GO Unlimited Refunding Bonds, Series A, 5.00%, 1/01/27 | | 250,000 | 253,804 |
See accompanying Notes to Financial Statements
Morningstar Funds Trust October 31, 2023 (unaudited)
Schedule of Investments (continued)
Morningstar Municipal Bond Fund
| | | Par | Value |
| Illinois (Continued) |
|
| City of Chicago O'Hare International Airport Senior Lien Revenue Refunding Bonds, Customer Facility (BAM Insured), 5.00%, 1/01/28 | | $220,000 | $227,266 |
| Illinois State Finance Authority Revenue Bonds, Series A, The University of Chicago, 5.25%, 5/15/48 | | 100,000 | 103,487 |
| Illinois State Finance Authority Revenue Refunding Bonds, Series A, 4.00%, 7/15/39 | | 250,000 | 218,530 |
| Illinois State Finance Authority Revenue Refunding Bonds, Series A, Bradley University Project, 4.00%, 8/01/43 | | 250,000 | 200,198 |
| Illinois State Finance Authority Revenue Refunding Bonds, Series A, Lutheran Communities, 5.00%, 11/01/40 | | 350,000 | 282,544 |
| Illinois State Finance Authority Revenue Refunding Bonds, Series A, The Carle Foundation, 5.00%, 2/15/45 | | 250,000 | 241,478 |
| Illinois State Finance Authority Variable Revenue Bonds, Series B-2, 5.00%, 11/15/26(a)(b)(c) | | 925,000 | 936,836 |
| Illinois State GO Unlimited Bonds, | | | |
| 5.50%, 5/01/25 | | 845,000 | 858,834 |
| 5.00%, 5/01/30 | | 350,000 | 346,181 |
| Illinois State GO Unlimited Bonds, Series B, | | | |
| 5.00%, 10/01/31 | | 250,000 | 257,490 |
| 5.50%, 5/01/47 | | 100,000 | 100,513 |
|
| Illinois State GO Unlimited Refunding Bonds, Series A, 5.00%, 10/01/25 | | 110,000 | 111,297 |
| Illinois State GO Unlimited Refunding Bonds, Series B, 5.00%, 10/01/28 | | 250,000 | 257,279 |
| Illinois State HDA Revenue Refunding Bonds, Series H, Social Bonds (GNMA, FNMA, FHLMC Insured), 5.75%, 10/01/53 | | 250,000 | 257,324 |
| | | Par | Value |
| Illinois (Continued) |
|
| Illinois State Housing Development Authority MFH Variable Revenue Bonds, Marshall Field Garden (FNMA LOC), (SIFMA Municipal Swap Index Yield + 1.00%), 4.85%, 5/15/25(a)(c) | | $500,000 | $498,388 |
| Illinois State Sales Tax Revenue Refunding Bonds, Subseries D (BAM, TCRS Insured), 3.00%, 6/15/31 | | 390,000 | 332,749 |
| Illinois State Sports Facilities Authority State Tax Supported Revenue CABS (AMBAC Insured), 0.00%, 6/15/25(e) | | 95,000 | 87,377 |
| Illinois State Sports Facilities Authority State Tax Supported Revenue Refunding Bonds (AGM Insured), 5.00%, 6/15/27 | | 400,000 | 400,058 |
| Illinois State Toll Highway Authority Revenue Bonds, Series A, | | | |
| 5.00%, 1/01/46 | | 750,000 | 748,780 |
| 4.00%, 1/01/46 | | 250,000 | 211,349 |
| Illinois State Toll Highway Authority Senior Revenue Bonds, Series A, | | | |
| 5.00%, 1/01/40 | | 500,000 | 507,830 |
| 5.00%, 1/01/45 | | 250,000 | 249,518 |
|
| Illinois State Toll Highway Authority Senior Revenue Refunding Bonds, Series A, 5.00%, 1/01/31 | | 525,000 | 549,917 |
| Kane, Cook & Dupage Counties, Illinois School District, GO Unlimited Refunding Bonds, Series D, 5.00%, 1/01/28 | | 215,000 | 214,996 |
| Metropolitan Pier & Exposition Authority Dedicated Capital Appreciation Tax Revenue Refunding Bonds, Series B, McCormick Project (AGM Insured), 0.00%, 6/15/26(e) | | 250,000 | 222,418 |
| Metropolitan Pier & Exposition Authority Revenue Refunding Bonds, McCormick Place Expansion, | | | |
| 4.00%, 12/15/42 | | 375,000 | 310,850 |
| 4.00%, 6/15/52 | | 245,000 | 188,443 |
See accompanying Notes to Financial Statements
Morningstar Funds Trust October 31, 2023 (unaudited)
Schedule of Investments (continued)
Morningstar Municipal Bond Fund
| | | Par | Value |
| Illinois (Continued) |
| Metropolitan Pier & Exposition Authority Revenue Refunding Bonds, McCormick Place Expansion Project, | | | |
| 5.00%, 6/15/42 | | $500,000 | $482,787 |
| 5.00%, 6/15/50 | | 500,000 | 464,293 |
|
| Metropolitan Pier & Exposition Authority Revenue Refunding CABS, McCormick Place Expansion, 0.00%, 12/15/35(e) | | 150,000 | 79,840 |
| Northern University Board of Trustees Revenue Bonds, Auxiliary Facilities System (BAM Insured), | | | |
| 5.00%, 10/01/25 | | 325,000 | 328,728 |
| 5.00%, 10/01/26 | | 250,000 | 253,581 |
|
| Peoria County School District No. 150 GO Unlimited Refunding Bonds, Series A (AGM Insured), 4.00%, 12/01/26 | | 390,000 | 391,154 |
| Regional Transportation Authority Revenue Bonds, Series B (NATL Insured), 5.50%, 6/01/27 | | 350,000 | 362,128 |
| Sales Tax Securitization Corp., Second Lien Revenue Refunding Bonds, Series A, 4.00%, 1/01/38 | | 250,000 | 222,992 |
| Sangamon Logan & Menard Counties Community Unit School District No. 15 GO Unlimited Bonds, Series B (BAM Insured), | | | |
| 5.00%, 12/01/25 | | 300,000 | 304,318 |
| 4.00%, 12/01/39 | | 250,000 | 215,521 |
|
| Springfield Illinois Electric Senior Lien Revenue Refunding Bonds, 5.00%, 3/01/29 | | 590,000 | 593,215 |
| Waukegan City Lake County Water & Sewer System Revenue Refunding Bonds (AGM Insured), | | | |
| 5.00%, 12/30/26 | | 200,000 | 206,530 |
| 4.00%, 12/30/38 | | 500,000 | 439,318 |
| 4.00%, 12/30/40 | | 500,000 | 430,297 |
| | | Par | Value |
| Illinois (Continued) |
|
| Waukegan GO Unlimited Bonds, Series A (AGM Insured), 5.00%, 12/30/32 | | $ 250,000 | $ 252,862 |
| Will County Community High School District No. 210 Lincoln-Way Refunding GO Unlimited Refunding Bonds (AGM Insured), 4.00%, 1/01/34 | | 650,000 | 615,639 |
| | | | 21,650,389 |
| Indiana – 2.1% |
| Fort Wayne Redevelopment Authority Lease Rental Revenue Refunding Bonds, Grand Wayne Center Project (State Intercept Program), 4.00%, 2/01/26 | | 760,000 | 760,868 |
| Indiana Bond Bank Revenue CABS, Hamilton Co., Projects, | | | |
| 0.00%, 7/15/25(e) | | 450,000 | 418,060 |
| 0.00%, 7/15/28(e) | | 900,000 | 735,492 |
| 0.00%, 1/15/29(e) | | 560,000 | 447,338 |
|
| Indiana Finance Authority Educational Facilities Revenue Refunding Bonds, Series A, Depauw University Project, 5.50%, 7/01/52 | | 255,000 | 239,638 |
| Indiana State Finance Authority Variable Revenue Refunding Bonds, Deaconess Health System, (SIFMA Municipal Swap Index Yield + 0.30%), 4.15%, 3/01/27(a)(c) | | 1,390,000 | 1,344,680 |
| Knox Middle School Building Corp., Revenue Bonds (State Intercept Program), 5.00%, 1/15/27 | | 440,000 | 454,447 |
| Tippecanoe County School Building Corp., Revenue Bonds, Series B (State Intercept Program), 5.00%, 7/15/29 | | 195,000 | 204,767 |
| Vinton-Tecumseh School Building Corp., Ad Valorem Property Tax First Mortgage Revenue Bonds (State Intercept Program), | | | |
| 4.00%, 7/15/26 | | 530,000 | 529,757 |
| 4.00%, 1/15/27 | | 540,000 | 540,334 |
| 4.00%, 7/15/27 | | 550,000 | 551,045 |
See accompanying Notes to Financial Statements
Morningstar Funds Trust October 31, 2023 (unaudited)
Schedule of Investments (continued)
Morningstar Municipal Bond Fund
| | | Par | Value |
| Indiana (Continued) |
|
| Whiting Environmental Facilities Revenue Refunding Bonds (AMT), BP Products North America, 5.00%, 6/05/26(a)(b)(c) | | $ 440,000 | $ 439,135 |
| | | | 6,665,561 |
| Kansas – 0.5% |
| City of Valley Center GO Unlimited Temporary Notes, Series 1, 4.38%, 12/01/25 | | 500,000 | 498,286 |
| Dodge City GO Unlimited Temporary Notes, Series 2023-1, 4.13%, 9/01/25 | | 1,000,000 | 998,379 |
| | | | 1,496,665 |
| Kentucky – 1.6% |
| Fayette County School District Finance Corp., Revenue Bonds, Series A (State Intercept Program), 4.00%, 5/01/38 | | 250,000 | 217,558 |
| Kenton County Airport Board Revenue Refunding Bonds, 5.00%, 1/01/32 | | 400,000 | 403,824 |
| Kentucky Bond Development Corp., Educational Facilities Revenue Refunding Bonds, Transylvania University Project, 5.00%, 3/01/27 | | 155,000 | 158,282 |
| Kentucky State Economic Development Finance Authority Revenue Bonds, Owensboro Health, 5.25%, 6/01/50 | | 250,000 | 229,118 |
| Kentucky State Economic Development Finance Authority Revenue Refunding Bonds, Masonic Home Independent Living, | | | |
| 5.00%, 5/15/36 | | 200,000 | 158,983 |
| 5.00%, 5/15/46 | | 100,000 | 68,273 |
|
| Kentucky State Economic Development Finance Authority Revenue Refunding Bonds, Series B, Owensboro Health, 5.00%, 6/01/40 | | 300,000 | 279,080 |
| Kentucky State Interlocal School Transportation Association Equipment Lease COPS (State Intercept Program), 4.00%, 3/01/29 | | 310,000 | 297,819 |
| | | Par | Value |
| Kentucky (Continued) |
|
| Kentucky State Public Energy Authority Gas Supply Revenue Bonds, Series A-1, 4.00%, 6/01/25(a)(b)(c) | | $ 500,000 | $ 491,291 |
| Kentucky State Public Energy Authority Revenue Bonds, Series B, Gas Supply, 4.00%, 1/01/25(a)(b)(c) | | 650,000 | 641,843 |
| Kentucky State University COPS, Kentucky State University Project (BAM Insured), 5.00%, 11/01/24 | | 230,000 | 231,992 |
| Louisville & Jefferson County Metro Government PCR Refunding Bonds (AMT), Louisville Gas & Electric, 1.35%, 11/01/27 | | 1,500,000 | 1,280,805 |
| Owen County Water Facilities Variable Revenue Refunding Bonds, American Water Company Project, 3.88%, 9/01/28(a)(b)(c) | | 500,000 | 481,641 |
| | | | 4,940,509 |
| Louisiana – 1.2% |
| East Baton Rouge Parish Sewerage Commission Revenue Refunding Bonds, Series A, | | | |
| 5.00%, 2/01/25 | | 475,000 | 481,795 |
| 5.00%, 2/01/26 | | 100,000 | 102,482 |
|
| East Baton Rouge Parish Sewerage Commission Variable Revenue Refunding Bonds, Series A, 1.30%, 2/01/28(a)(b)(c) | | 500,000 | 412,326 |
| Louisiana Public Facilities Authority Revenue Refunding Bonds, Loyola University Project, | | | |
| 5.00%, 10/01/25 | | 250,000 | 252,091 |
| 5.00%, 10/01/26 | | 215,000 | 217,786 |
|
| Louisiana State Public Facilities Authority Revenue Refunding Bonds, Ochsner Clinic Foundation Project, 5.00%, 5/15/26 | | 400,000 | 404,070 |
See accompanying Notes to Financial Statements
Morningstar Funds Trust October 31, 2023 (unaudited)
Schedule of Investments (continued)
Morningstar Municipal Bond Fund
| | | Par | Value |
| Louisiana (Continued) |
|
| Louisiana State Public Facilities Authority Solid Waste Disposal Variable Revenue Bonds (AMT), Waste Pro USA Inc., Project, 6.75%, 10/01/28(a)(b)(c)(d) | | $ 200,000 | $ 199,975 |
| Saint James Parish Variable Revenue Bonds, Nustar Logistics, 5.85%, 6/01/25(a)(b)(c)(d) | | 525,000 | 530,722 |
| Saint John The Baptist Parish Revenue Refunding Bonds, Marathon Oil Corp., Project, 4.05%, 7/01/26(a)(b)(c) | | 1,250,000 | 1,224,612 |
| Saint John The Baptist Parish Variable Revenue Refunding Bonds, Marathon Oil Corp., Project, 2.38%, 7/01/26(a)(b)(c) | | 125,000 | 116,640 |
| | | | 3,942,499 |
| Maine – 0.4% |
| Maine Health & Higher Educational Facilities Authority Revenue Bonds, Series A, 5.00%, 7/01/27 | | 215,000 | 220,437 |
| Maine State Finance Authority Student Loan Revenue Refunding Bonds (AMT) (AGM Insured), 5.00%, 12/01/24 | | 500,000 | 501,840 |
| Maine State Health & Higher Educational Facilities Authority Revenue Refunding Bonds, Series A (State Intercept State Resource Fund Guaranty Program), Prerefunded, 5.00%, 7/01/27(g) | | 30,000 | 31,234 |
| Maine State Health & Higher Educational Facilities Authority Revenue Refunding Bonds, Series A (State Intercept State Resource Fund Guaranty Program), Unrefunded Balance, 5.00%, 7/01/28 | | 620,000 | 635,889 |
| | | | 1,389,400 |
| | | Par | Value |
| Maryland – 2.7% |
| Baltimore Convention Center Hotel Revenue Refunding Bonds, Convention Center Hotel, 5.00%, 9/01/39 | | $ 500,000 | $ 426,156 |
| Maryland State Community Development Administration Department Housing & Community Development Revenue Bonds, Social Bonds (GNMA, FNMA, FHLMC Insured), 5.05%, 3/01/47 | | 500,000 | 492,569 |
| Maryland State Community Development Administration Housing Revenue Bonds, Series I, Rosemont L.P., 4.38%, 1/01/25(d) | | 1,000,000 | 989,687 |
| Maryland State Department of Transportation Revenue Bonds (AMT), Baltimore Washington International, 4.00%, 8/01/37 | | 270,000 | 241,984 |
| Maryland State Economic Development Corp., Private Activity Revenue Bonds (AMT), Purple Line Light Rail Project, Green Bonds, | | | |
| 5.00%, 11/12/28 | | 500,000 | 496,495 |
| 5.25%, 6/30/55 | | 1,000,000 | 915,028 |
|
| Maryland State Economic Development Corp., Revenue Bonds (AMT), Seagirt Marine Terminal Projects, 5.00%, 6/01/44 | | 500,000 | 471,165 |
| Maryland State Economic Development Corp., Senior Lien Revenue Bonds, Annapolis Mobility & Resilience, 5.00%, 12/31/42 | | 145,000 | 136,100 |
| Maryland State Health & Higher Educational Facilities Authority Revenue Bonds, Adventist Healthcare Obligated, 5.50%, 1/01/31 | | 400,000 | 411,987 |
| Maryland State Health & Higher Educational Facilities Authority Revenue Bonds, Peninsula Regional Health System, 5.00%, 7/01/27 | | 1,320,000 | 1,347,539 |
See accompanying Notes to Financial Statements
Morningstar Funds Trust October 31, 2023 (unaudited)
Schedule of Investments (continued)
Morningstar Municipal Bond Fund
| | | Par | Value |
| Maryland (Continued) |
|
| Maryland State Health & Higher Educational Facilities Authority Revenue Refunding Bonds, Adventist Healthcare, 4.00%, 1/01/26 | | $ 875,000 | $ 854,471 |
| Maryland State Health & Higher Educational Facilities Authority Revenue Refunding Bonds, Series A, Broadmead Issue, 4.00%, 7/01/35 | | 285,000 | 249,656 |
| Maryland State Health & Higher Educational Facilities Authority Revenue Refunding Bonds, Series A, Mercy Medical Center, 4.00%, 7/01/42 | | 120,000 | 97,307 |
| Maryland State Health & Higher Educational Facilities Authority Revenue Refunding Bonds, Stevenson University Project, 4.00%, 6/01/51 | | 325,000 | 252,070 |
| Maryland State Health & Higher Educational Facilities Authority Variable Revenue Refunding Bonds, University of Maryland, 5.00%, 7/01/27(a)(b)(c) | | 200,000 | 204,621 |
| Montgomery County GO Unlimited Refunding Bonds, Series A, Consolidated Public Improvement Project, 2.00%, 8/01/41 | | 1,000,000 | 595,183 |
| Montgomery County Housing Opportunities Commission Multifamily & Reconstruction Development Revenue Bonds, Series C (FHA 542 (C) Insured), 2.85%, 1/01/51 | | 250,000 | 152,927 |
| Washington County Economic Development Revenue Refunding Bonds, Homewood Maryland Obligated Group Project, 4.00%, 5/01/42 | | 225,000 | 155,579 |
| | | | 8,490,524 |
| | | Par | Value |
| Massachusetts – 1.3% |
| Massachusetts State Development Finance Agency Revenue Bonds, UMass Boston Student Housing Project, 5.00%, 10/01/48 | | $ 500,000 | $ 434,007 |
| Massachusetts State Development Finance Agency Revenue Refunding Bonds, Lasell University, | | | |
| 4.00%, 7/01/25 | | 235,000 | 230,254 |
| 4.00%, 7/01/26 | | 240,000 | 232,734 |
|
| Massachusetts State Development Finance Agency Revenue Refunding Bonds, Series F, Lahey Clinic Obligated Group, 5.00%, 8/15/45 | | 250,000 | 242,927 |
| Massachusetts State Development Financing Agency Variable Revenue Bonds, Partners Healthcare System, (SIFMA Municipal Swap Index Yield + 0.60%), 4.45%, 1/29/26(a)(c)(d) | | 1,000,000 | 989,796 |
| Massachusetts State GO Limited Refunding Bonds, Series B, 5.00%, 7/01/34 | | 1,350,000 | 1,447,740 |
| Massachusetts State Port Authority Revenue Bonds, Series E (AMT), 5.00%, 7/01/27 | | 365,000 | 372,367 |
| | | | 3,949,825 |
| Michigan – 2.5% |
| Detroit Downtown Development Authority Tax Allocation Increment Revenue Refunding Bonds, Series A, Catalyst Development Project (AGM Insured), | | | |
| 5.00%, 7/01/43 | | 100,000 | 95,626 |
| 5.00%, 7/01/48 | | 200,000 | 186,077 |
|
| Detroit GO Unlimited Bonds, 5.00%, 4/01/27 | | 50,000 | 50,164 |
| Detroit GO Unlimited Bonds, Series A, Social Bonds, 4.00%, 4/01/40 | | 250,000 | 202,809 |
| Gerald R. Ford International Airport Authority Revenue Bonds (AMT) (County Gtd), 5.00%, 1/01/51 | | 525,000 | 503,295 |
See accompanying Notes to Financial Statements
Morningstar Funds Trust October 31, 2023 (unaudited)
Schedule of Investments (continued)
Morningstar Municipal Bond Fund
| | | Par | Value |
| Michigan (Continued) |
|
| Great Lakes Water Authority Sewage Disposal System Second Lien Revenue Refunding Bonds, Series C, 5.00%, 7/01/36 | | $ 495,000 | $ 499,572 |
| Michigan State Finance Authority Limited Obligation Revenue Refunding Bonds, Lawrence Technological University, 4.00%, 2/01/27 | | 185,000 | 175,234 |
| Michigan State Finance Authority Limited Obligation Revenue Refunding Bonds, University Of Detroit Mercy, 5.63%, 11/01/52 | | 300,000 | 284,651 |
| Michigan State Finance Authority Local Government Loan Program Revenue Refunding Bonds, | | | |
| 5.00%, 7/01/29 | | 425,000 | 429,896 |
| 4.50%, 10/01/29 | | 250,000 | 244,369 |
|
| Michigan State Finance Authority Revenue Bonds, Local Government Loan Program, 5.00%, 7/01/33 | | 350,000 | 352,912 |
| Michigan State Finance Authority Revenue Refunding Bonds, Trinity Health Credit Group, 4.00%, 12/01/35 | | 515,000 | 482,613 |
| Michigan State Finance Authority Variable Revenue Refunding Bonds, Beaumont Spectrum, (SIFMA Municipal Swap Index Yield + 0.75%), 4.84%, 4/15/27(a)(c) | | 1,500,000 | 1,490,959 |
| Michigan State Hospital Finance Authority Revenue Refunding Bonds, Ascenion Senior, 5.00%, 11/15/47 | | 420,000 | 405,338 |
| Michigan State Strategic Fund Limited Obligation Variable Revenue Bonds (AMT), Green Bonds, 4.00%, 10/01/26(a)(b)(c) | | 100,000 | 96,895 |
| Michigan State Strategic Fund Variable Limited Obligation Revenue Bonds (AMT), DTE Electric Company Exempt, 3.88%, 6/03/30(a)(b)(c) | | 1,000,000 | 932,883 |
| | | Par | Value |
| Michigan (Continued) |
|
| Michigan State Trunk Line Revenue Bonds, Rebuilding Michagan Program, 5.50%, 11/15/49 | | $1,000,000 | $1,064,278 |
| Wayne State University Revenue Refunding Bonds, Series A (BAM, TCRS Insured), 5.00%, 11/15/27 | | 300,000 | 307,150 |
| | | | 7,804,721 |
| Minnesota – 1.1% |
| City of Shakopee Senior Housing Revenue Bonds, Benedictine Living Community of Shakopee LLC Project, 5.85%, 11/01/25(a)(b)(c)(d) | | 250,000 | 243,239 |
| Gibbon Independent School District No. 2365 GO Unlimited Bonds, Series A (School District Credit Program), 6.00%, 2/01/28 | | 200,000 | 216,978 |
| Minneapolis Health Care System Variable Revenue Bonds, Series B, Allina Health System, 5.00%, 11/15/30(a)(b)(c) | | 1,000,000 | 1,034,698 |
| Saint Francis Independent School District No. 15 GO Unlimited Bonds, Series A (School District Credit Program), 4.00%, 2/01/33 | | 410,000 | 409,900 |
| Saint Paul Housing & Redevelopment Authority Health Care Facilities Revenue Refunding Bonds, HealthPartners Obligated Group, 5.00%, 7/01/31 | | 1,635,000 | 1,638,715 |
| | | | 3,543,530 |
| Mississippi – 0.1% |
| Mississippi State Hospital Equipment & Facilities Authority Adjustable Revenue Refunding Bonds, North Mississippi Health, 5.00%, 3/01/27(a)(b)(c) | | 265,000 | 269,019 |
| Missouri – 0.8% |
| Central Southwest Community College District COPS, | | | |
| 5.00%, 3/01/26 | | 225,000 | 229,961 |
| 5.00%, 3/01/27 | | 225,000 | 232,301 |
See accompanying Notes to Financial Statements
Morningstar Funds Trust October 31, 2023 (unaudited)
Schedule of Investments (continued)
Morningstar Municipal Bond Fund
| | | Par | Value |
| Missouri (Continued) |
|
| Missouri State Health & Educational Facilities Authority Health Facilities Revenue Refunding Bonds, Series A, St. Luke's Health System, Inc., 5.00%, 11/15/30 | | $250,000 | $ 252,708 |
| Missouri State Health & Educational Facilities Authority Revenue Refunding Bonds, | | | |
| 5.00%, 2/15/26 | | 200,000 | 199,131 |
| 5.00%, 2/15/27 | | 215,000 | 213,818 |
| 5.00%, 2/15/28 | | 250,000 | 248,245 |
|
| Missouri State Health & Educational Facilities Authority Revenue Refunding Bonds, Bethesda Health Group, Inc., 4.00%, 8/01/26 | | 200,000 | 190,088 |
| Missouri State Health & Educational Facilities Authority Revenue Refunding Bonds, Webster University Project, 5.00%, 4/01/26 | | 500,000 | 492,424 |
| Saint Louis County IDA Senior Living Facilities Revenue Refunding Bonds, Friendship Village St. Louis, 5.00%, 9/01/48 | | 500,000 | 394,255 |
| | | | 2,452,931 |
| Nebraska – 0.9% |
| Central Plains Energy Gas Project Variable Revenue Refunding Bonds, Series A, Project No. 4, 5.00%, 11/01/29(a)(b)(c) | | 500,000 | 497,407 |
| Douglas County Educational Facilities Variable Revenue Refunding Bonds, Creighton University Project, (SIFMA Municipal Swap Index Yield + 0.53%), 4.38%, 9/01/26(a)(c) | | 735,000 | 721,968 |
| Douglas County Hospital Authority No. 2 Revenue Bonds, Children's Hospital Obligated Group, 5.00%, 11/15/25(a)(b)(c) | | 600,000 | 605,062 |
| | | Par | Value |
| Nebraska (Continued) |
| Douglas County Hospital Authority No. 3 Nebraska Health Facilities Revenue Refunding Bonds, Nebraska Methodist Health, 5.00%, 11/01/27 | | $ 500,000 | $ 505,362 |
| Gretna COPS, 5.00%, 12/15/25 | | 500,000 | 504,418 |
| | | | 2,834,217 |
| Nevada – 0.8% |
| Clark County PCR Refunding Bonds, Southern California Edison Company, 2.10%, 6/01/31 | | 250,000 | 188,681 |
| Clark County Stadium Improvement GO Limited Bonds, Series A, 5.00%, 5/01/48 | | 500,000 | 499,410 |
| Las Vegas Convention & Visitors Authority Convention Center Expansion Revenue Bonds, Series B, 5.00%, 7/01/43 | | 250,000 | 251,060 |
| Las Vegas New Convention & Visitors Authority Revenue Bonds, Series B, 5.00%, 7/01/37 | | 1,000,000 | 1,025,158 |
| Las Vegas Special Improvement District No. 814 Summerlin Village 21 & 24A Special Assessment Bonds, 4.00%, 6/01/49 | | 95,000 | 70,309 |
| Reno Sales Tax First Lien Revenue Refunding Bonds, Retrac-Reno Transportation Rail Access Corridor Project, 5.00%, 6/01/48 | | 500,000 | 466,224 |
| | | | 2,500,842 |
| New Hampshire – 0.4% |
| National Finance Authority Municipal Certificates Revenue Bonds, Series 1-A, 4.13%, 1/20/34 | | 873,356 | 803,791 |
| National Finance Authority Revenue Bonds, Series A, 4.00%, 7/01/51 | | 250,000 | 204,814 |
| New Hampshire State Health & Education Facilities Authority Revenue Refunding Bonds, Kendal at Hanover Issue, 5.00%, 10/01/36 | | 180,000 | 169,368 |
| | | | 1,177,973 |
See accompanying Notes to Financial Statements
Morningstar Funds Trust October 31, 2023 (unaudited)
Schedule of Investments (continued)
Morningstar Municipal Bond Fund
| | | Par | Value |
| New Jersey – 2.7% |
| Atlantic City Board of Education GO Unlimited Refunding Bonds (AGM School Board Resource Fund Insured), 4.00%, 4/01/25 | | $ 350,000 | $ 350,007 |
| Garden State Preservation Trust Open Space & Farmland Preservation Revenue Bonds, Series A (AGM Insured), 5.75%, 11/01/28 | | 400,000 | 417,440 |
| New Jersey State EDA Energy Facility Revenue Bonds, Series A (AMT), UMM Energy Partners, | | | |
| 5.00%, 6/15/37 | | 190,000 | 176,009 |
| 5.13%, 6/15/43 | | 350,000 | 318,236 |
|
| New Jersey State EDA Motor Vehicle Surcharge Revenue Refunding Bonds, Subseries A, 3.38%, 7/01/30 | | 250,000 | 225,129 |
| New Jersey State EDA Private Activity Revenue Bonds (AMT), The Goethals Project, 5.38%, 1/01/43 | | 100,000 | 96,798 |
| New Jersey State EDA Revenue Bonds, Portal North Bridge Project NJ Transit, 5.25%, 11/01/41 | | 235,000 | 241,866 |
| New Jersey State EDA Revenue Bonds, Provident Group Rowan Properties LLC, 5.00%, 1/01/48 | | 125,000 | 104,282 |
| New Jersey State EDA Revenue Refunding Bonds, Cranes Mill Project, 5.00%, 1/01/49 | | 260,000 | 198,339 |
| New Jersey State EDA Special Facility Revenue Refunding Bonds (AMT), Port Newark Container, 5.00%, 10/01/47 | | 300,000 | 270,582 |
| New Jersey State EDA Water Facilities Revenue Refunding Bonds (AMT), New Jersey American Water Co., Inc. Project, 2.20%, 12/03/29(a)(b)(c) | | 775,000 | 630,698 |
| New Jersey State Health Care Facilities Financing Authority Revenue Bonds, Valley Health System Obligated Group Series, 5.00%, 7/01/33 | | 1,000,000 | 1,031,229 |
| | | Par | Value |
| New Jersey (Continued) |
|
| New Jersey State Health Care Facilities Financing Authority Revenue Refunding Bonds, Inspira Health Obligated Group, 5.00%, 7/01/30 | | $1,000,000 | $1,009,726 |
| New Jersey State Health Care Facilities Financing Authority Revenue Refunding Bonds, RWJ Barnabas Health Obligated Group, 5.00%, 7/01/26(a)(b)(c) | | 400,000 | 406,253 |
| New Jersey State Higher Education Assistance Authority Student Loan Revenue Bonds, Series B (AMT), 5.00%, 12/01/24 | | 570,000 | 572,217 |
| New Jersey State Transportation Trust Fund Authority Revenue Bonds, Series A, 4.00%, 6/15/42 | | 250,000 | 218,364 |
| New Jersey State Transportation Trust Fund Authority Revenue Bonds, Series AA, 5.00%, 6/15/40 | | 500,000 | 503,393 |
| New Jersey State Transportation Trust Fund Authority Revenue Bonds, Transportation Program, | | | |
| 5.25%, 6/15/43 | | 625,000 | 630,642 |
| 4.00%, 6/15/50 | | 280,000 | 232,442 |
|
| New Jersey State Transportation Trust Fund Authority Revenue Refunding Bonds, Series A, 4.00%, 6/15/34 | | 175,000 | 167,113 |
| New Jersey State Transportation Trust Fund Authority Transportation System Revenue Refunding Bonds, 5.00%, 12/15/25 | | 100,000 | 101,860 |
| New Jersey State Turnpike Authority Revenue Bonds, Series A, 5.00%, 1/01/33 | | 230,000 | 230,160 |
| New Jersey State Turnpike Authority Revenue Bonds, Series B, 5.25%, 1/01/52 | | 350,000 | 356,862 |
| | | | 8,489,647 |
| New Mexico – 0.3% |
| Farmington Pollution Control Variable Revenue Refunding Bonds, Public Service Company of New Mexico San Juan, 3.90%, 6/01/28(a)(b)(c) | | 1,000,000 | 964,036 |
See accompanying Notes to Financial Statements
Morningstar Funds Trust October 31, 2023 (unaudited)
Schedule of Investments (continued)
Morningstar Municipal Bond Fund
| | | Par | Value |
| New York – 7.3% |
| Build Resource Corp., Revenue Bonds, Friends of Hellenic Classical Charter Schools, Inc., 4.00%, 12/01/31(d) | | $ 500,000 | $ 437,851 |
| Hempstead Town Local Develop Corp., Education Revenue Refunding Bonds, Academy Charter School Project, 5.66%, 2/01/44 | | 250,000 | 210,199 |
| Hempstead Town Local Development Corp., Education Revenue Bonds, Academy Charter School Project, 4.60%, 2/01/51 | | 250,000 | 168,012 |
| Hempstead Town Local Development Corp., Revenue Refunding Bonds, Adelphi University Project, 5.00%, 6/01/27 | | 300,000 | 306,176 |
| Hudson Yards Infrastructure Corp., Revenue Refunding Bonds, Second Indenture Series, Fiscal 2022, Green Bonds, 4.00%, 2/15/43 | | 1,000,000 | 868,878 |
| Monroe County Industrial Development Agency School Facility Revenue Bonds, Rochester Schools Modernization Project (State Aid Withholding), 5.00%, 5/01/35 | | 800,000 | 851,044 |
| Monroe County Industrial Development Corp., Revenue Bonds, University of Rochester Project, 4.00%, 7/01/50 | | 1,600,000 | 1,321,755 |
| MTA, New York Transportation Variable Revenue Refunding Bonds, Subseries G-3, (SIFMA Municipal Swap Index Yield + 0.43%), 4.52%, 2/01/25(a)(c) | | 1,000,000 | 987,297 |
| New York City Housing Development Corp., MFH Variable Revenue Bonds, Sustainable Development, 3.70%, 12/30/27(a)(b)(c) | | 500,000 | 484,943 |
| | | Par | Value |
| New York (Continued) |
| New York City Municipal Water Finance Authority Water & Sewer System Revenue Bonds, Second General Resolution, Series CC-1, 5.00%, 6/15/49 | | $ 250,000 | $ 248,933 |
| New York City Municipal Water Finance Authority Water & Sewer System Revenue Bonds, Series AA-1, 5.25%, 6/15/52 | | 250,000 | 256,741 |
| New York City Transitional Finance Authority Future Tax Subordinate Revenue Bonds, 4.00%, 5/01/36 | | 1,000,000 | 950,574 |
| New York City Transitional Finance Authority Subordinate Revenue Bonds, Series F-1, 5.00%, 2/01/47 | | 625,000 | 626,783 |
| New York GO Unlimited Bonds, Series A-1, 5.25%, 9/01/42 | | 250,000 | 259,234 |
| New York GO Unlimited Bonds, Series D, Subseries D1, 5.00%, 12/01/42 | | 250,000 | 251,410 |
| New York State Convention Center Development Corp., Revenue Refunding Bonds, Hotel Unit Fee Secured, 5.00%, 11/15/40 | | 600,000 | 586,331 |
| New York State Dormitory Authority Non State Supported Debt Revenue Refunding Bonds, Series A, Barnard College, 4.00%, 7/01/49 | | 300,000 | 233,288 |
| New York State Dormitory Authority Personal Income Tax Revenue Refunding Bonds, Series A, 5.00%, 3/15/41 | | 2,000,000 | 2,053,959 |
| New York State Dormitory Authority Revenues Non State Supported Debt Revenue Refunding Bonds, Memorial Sloan Kettering Cancer Center, 5.00%, 7/01/42 | | 200,000 | 200,888 |
| New York State Dormitory Authority Revenues Non State Supported Debt Revenue Refunding Bonds, Series A, Montefiore Obligated Group, 4.00%, 9/01/50 | | 500,000 | 372,547 |
See accompanying Notes to Financial Statements
Morningstar Funds Trust October 31, 2023 (unaudited)
Schedule of Investments (continued)
Morningstar Municipal Bond Fund
| | | Par | Value |
| New York (Continued) |
| New York State Dormitory Authority State Personal Income Tax Revenue Refunding Bonds, Series E, Unrefunded Balance, 5.00%, 2/15/44 | | $425,000 | $421,896 |
| New York State Energy Research & Development Authority PCR Refunding Bonds, New York Electric & Gas, Series C, 4.00%, 4/01/34 | | 250,000 | 232,594 |
| New York State Housing Finance Agency Affordable Housing Sustainability Revenue Bonds, Series L-2 (SonyMA Insured), 0.75%, 11/01/25 | | 465,000 | 418,109 |
| New York State Liberty Development Corp., Revenue Refunding Bonds, 4 World Trade Center Project, Green Bonds, 1.20%, 11/15/28 | | 500,000 | 408,383 |
| New York State Liberty Development Corp., Revenue Refunding Bonds, Class 2, 3 World Trade Center Project, | | | |
| 5.15%, 11/15/34(d) | | 500,000 | 471,821 |
| 5.38%, 11/15/40(d) | | 150,000 | 138,573 |
|
| New York State Transportation Development Corp., Special Facilities Revenue Bonds (AMT), Delta Air Lines, Inc., Laguardia Airport Terminal C&D Redevelopment Project, 5.00%, 10/01/35 | | 500,000 | 474,210 |
| New York State Transportation Development Corp., Special Facilities Revenue Bonds, Delta Air Lines, Inc. (AMT), 5.00%, 1/01/30 | | 345,000 | 336,971 |
| New York State Transportation Development Corp., Special Facility Revenue Refunding Bonds (AMT), John F. Kennedy International Airport Project, 5.38%, 8/01/36 | | 250,000 | 241,587 |
| | | Par | Value |
| New York (Continued) |
|
| New York State Transportation Development Corp., Special Facility Revenue Refunding Bonds (AMT), Terminal 4 John F. Kennedy International Airport Project, 5.00%, 12/01/33 | | $ 250,000 | $ 250,959 |
| New York State Urban Development Corp., Personal Income TRB, Series A, | | | |
| 4.00%, 3/15/38 | | 500,000 | 458,267 |
| 5.00%, 3/15/41 | | 250,000 | 254,242 |
|
| New York State Urban Development Corp., Revenue Refunding Bonds, Series E Group 3, 4.00%, 3/15/43 | | 500,000 | 436,209 |
| Niagara Frontier Transportation Authority Revenue Refunding Bonds (AMT), Buffalo Niagara International Airport, 5.00%, 4/01/26 | | 250,000 | 251,454 |
| Onondaga County Trust Cultural Resource Revenue Refunding Bonds, Syracuse University Project, 4.00%, 12/01/47 | | 500,000 | 418,310 |
| Onondaga County Trust Cultural Resources Revenue Refunding Bonds, Syracuse University Project, 4.00%, 12/01/41 | | 250,000 | 221,106 |
| Port Authority of New York & New Jersey Consolidated 211th Revenue Refunding Bonds, 5.00%, 9/01/48 | | 830,000 | 824,109 |
| Port Authority of New York & New Jersey Consolidated Revenue Bonds, Series 218 (AMT), 5.00%, 11/01/31 | | 1,065,000 | 1,094,531 |
| Port Authority of New York & New Jersey Consolidated Revenue Bonds, Series 221 (AMT), 4.00%, 7/15/40 | | 500,000 | 425,659 |
| Port Authority of New York & New Jersey Consolidated Revenue Refunding Bonds (AMT), 5.50%, 8/01/52 | | 600,000 | 608,286 |
See accompanying Notes to Financial Statements
Morningstar Funds Trust October 31, 2023 (unaudited)
Schedule of Investments (continued)
Morningstar Municipal Bond Fund
| | | Par | Value |
| New York (Continued) |
|
| Port Authority of New York & New Jersey Revenue Bonds, Series 179, 5.00%, 12/01/25 | | $ 750,000 | $ 750,874 |
| Poughkeepsie City GO Limited Refunding Bonds, 4.00%, 4/15/25 | | 440,000 | 432,058 |
| Triborough Bridge & Tunnel Authority General Revenue Bonds, Series A, MTA Bridges & Tunnels, 4.00%, 11/15/54 | | 1,300,000 | 1,068,055 |
| Triborough Bridge & Tunnel Authority Payroll Mobility Tax Revenue Refunding Bonds, Series A, MTA Bridges & Tunnels, 5.00%, 5/15/47 | | 250,000 | 248,752 |
| Troy Capital Resource Corp., Revenue Bonds, Rensselaer Polytechnic Institute Project, 4.00%, 9/01/33 | | 100,000 | 91,863 |
| Yonkers Economic Development Corp., Educational Revenue Bonds, Charter School Educational Excellence Project, 5.00%, 10/15/49 | | 100,000 | 80,670 |
| Yonkers GO Limited Bonds, Series F (BAM Insured), 5.00%, 11/15/27 | | 100,000 | 104,673 |
| | | | 22,841,064 |
| North Carolina – 1.7% |
| Forsyth County GO Unlimited Bonds, Series B, 2.00%, 3/01/37 | | 1,000,000 | 695,085 |
| Greater Asheville Regional Airport Authority Airport System Revenue Bonds (AMT) (AGM Insured), 5.25%, 7/01/48 | | 250,000 | 246,579 |
| Greater Asheville Regional Airport Authority Airport System Revenue Bonds, Series A (AMT) (AGM Insured), 5.50%, 7/01/47 | | 1,000,000 | 1,011,851 |
| North Carolina State Capital Facilities Finance Agency Educational Facilities Revenue Refunding Bonds, High Point University, | | | |
| 5.00%, 5/01/25 | | 240,000 | 242,151 |
| 5.00%, 5/01/26 | | 275,000 | 278,970 |
| | | Par | Value |
| North Carolina (Continued) |
| North Carolina State Capital Facilities Finance Agency Revenue Refunding Bonds, The Arc of North Carolina (Housing & Urban Development Sector 8 Program), | | | |
| 5.00%, 10/01/28 | | $300,000 | $ 291,469 |
| 5.00%, 10/01/34 | | 250,000 | 232,640 |
| North Carolina State Medical Care Commission Retirement Facilities Revenue Bonds, The Forest At Duke Project, | | | |
| 4.00%, 9/01/33 | | 180,000 | 158,442 |
| 4.00%, 9/01/34 | | 185,000 | 160,783 |
|
| North Carolina State Medical Care Commission Retirement Facilities Revenue Refunding Bonds, First Mortgage, 4.00%, 1/01/25 | | 250,000 | 244,825 |
| North Carolina State Medical Care Commission Retirement Facilities Revenue Refunding Bonds, Series A, Sharon Towers, 5.00%, 7/01/49 | | 100,000 | 77,382 |
| North Carolina State Turnpike Authority Senior Lien Revenue Bonds, Triangle Expressway, 4.00%, 1/01/55 | | 425,000 | 331,935 |
| North Carolina State Turnpike Authority Senior Lien Revenue Bonds, Triangle Expressway (AGM Insured), 5.00%, 1/01/49 | | 500,000 | 491,570 |
| North Carolina State Turnpike Authority Senior Lien Revenue Refunding Bonds, 5.00%, 1/01/40 | | 550,000 | 541,988 |
| Union County GO Unlimited Bonds, Series C, 2.50%, 9/01/38 | | 590,000 | 423,979 |
| | | | 5,429,649 |
See accompanying Notes to Financial Statements
Morningstar Funds Trust October 31, 2023 (unaudited)
Schedule of Investments (continued)
Morningstar Municipal Bond Fund
| | | Par | Value |
| North Dakota – 0.2% |
| City of Grand Forks Health Care System Revenue Bonds, Altru Health System, Series A (AGM Insured), 5.00%, 12/01/29 | | $125,000 | $129,798 |
| University of North Dakota COPS, Infrastructure Energy Improvement, 5.00%, 4/01/48 | | 500,000 | 486,210 |
| | | | 616,008 |
| Ohio – 2.2% |
| Akron Bath Copley Joint Township Hospital District Revenue Refunding Bonds, Summa Health Obligated Group Hospital, | | | |
| 5.00%, 11/15/26 | | 350,000 | 354,125 |
| 5.00%, 11/15/27 | | 370,000 | 375,235 |
|
| Buckeye Tobacco Settlement Financing Authority Revenue Refunding Bonds, Senior-Class 2, Series B-2, 5.00%, 6/01/55 | | 900,000 | 736,229 |
| Cleveland-Cuyahoga County Port Authority Cultural Facilities Revenue Refunding Bonds, Playhouse Square Foundation Project, 5.50%, 12/01/43 | | 175,000 | 162,736 |
| Cleveland-Cuyahoga County Port Authority Cultural Facility Revenue Bonds, Cleveland Museum Of Natural History Project, | | | |
| 5.00%, 7/01/25 | | 125,000 | 126,721 |
| 5.00%, 7/01/26 | | 125,000 | 127,743 |
| 5.00%, 7/01/27 | | 125,000 | 128,803 |
| 5.00%, 7/01/28 | | 155,000 | 161,193 |
|
| Cleveland-Cuyahoga County Port Authority Financing Senior Tax Allocation Increment Revenue Refunding Bonds, Flats East Bank Project, 4.00%, 12/01/55(d) | | 250,000 | 177,525 |
| Conotton Valley Union Local School District COPS, School Facilities Project (FHLMC Insured), 4.00%, 12/01/42 | | 500,000 | 426,012 |
| | | Par | Value |
| Ohio (Continued) |
|
| Cuyahoga Metropolitan Housing Authority MFH Variable Revenue Bonds, Wade Park Apartments (FHA Insured, Housing & Urban Development Sector 8 Program), 4.75%, 12/01/25(a)(b)(c) | | $350,000 | $349,179 |
| Franklin County Convention Facilities Authority Hotel Project Revenue Bonds, Greater Columbus Convention Center, | | | |
| 5.00%, 12/01/34 | | 170,000 | 158,551 |
| 5.00%, 12/01/36 | | 305,000 | 275,242 |
|
| Franklin County Health Care Facilities Revenue Refunding Bonds, Ohio Living Communities, 5.00%, 7/01/31 | | 255,000 | 243,564 |
| Hamilton County Hospital Facilities Revenue Bonds, Cincinnati Children's Hospital Project, 5.00%, 11/15/41 | | 250,000 | 249,787 |
| Lancaster Port Authority Gas Revenue Refunding Bonds, Series A, 5.00%, 2/01/25(a)(b)(c) | | 225,000 | 224,769 |
| Marion County Health Care Facilities Revenue Refunding Bonds, United Church Homes, Inc., 5.13%, 12/01/49 | | 100,000 | 70,956 |
| Miami Valley Career Technology Center GO Unlimited Bonds, 4.00%, 12/01/37 | | 250,000 | 221,428 |
| Middleburg Heights Hospital Revenue Refunding Bonds, Southwest General Health Center, 4.00%, 8/01/41 | | 500,000 | 406,146 |
| Ohio State Air Quality Development Authority Revenue Refunding Bonds, Ohio Valley Electric Corp., 3.25%, 9/01/29 | | 50,000 | 45,831 |
| Ohio State Air Quality Development Authority Variable Revenue Refunding Bonds (AMT), Duke Energy Corp., Project, 4.25%, 6/01/27(a)(b)(c) | | 250,000 | 244,621 |
See accompanying Notes to Financial Statements
Morningstar Funds Trust October 31, 2023 (unaudited)
Schedule of Investments (continued)
Morningstar Municipal Bond Fund
| | | Par | Value |
| Ohio (Continued) |
|
| Ohio State Higher Educational Facilities Commission Revenue Refunding Bonds, Xavier University 2020 Project, 5.00%, 5/01/35 | | $880,000 | $ 908,573 |
| Ohio State Higher Educational Facility Commission Healthcare Revenue Bonds, Ashtabula County Medical Center Obligated Group, 5.00%, 1/01/26 | | 100,000 | 99,971 |
| Ohio State Higher Educational Facility Commission Revenue Refunding Bonds, Otterbein University 2022 Project, 4.00%, 12/01/46 | | 500,000 | 371,788 |
| Ohio State Hospital Revenue Refunding Bonds, Premier Health Partners Obligated Group, 5.00%, 11/15/26 | | 145,000 | 145,893 |
| | | | 6,792,621 |
| Oklahoma – 0.8% |
| Carter County Public Facilities Authority Educational Facilities Lease Revenue Bonds, 5.00%, 9/01/27 | | 500,000 | 505,272 |
| Muskogee Industrial Trust Educational Facilities Lease Revenue Bonds, Muskogee Public Schools Project, 5.00%, 9/01/26 | | 150,000 | 150,792 |
| Oklahoma County Finance Authority Revenue Refunding Bonds, Series A, Epworth Villa Project, 5.88%, 4/01/30(h) | | 50,000 | 32,500 |
| Oklahoma State Turnpike Authority Senior Lien Revenue Bonds, 5.50%, 1/01/53 | | 475,000 | 498,797 |
| Oklahoma State Water Resources Board Revolving Fund Revenue Bonds, Drinking Water Program 2019 Master Trust, 4.00%, 4/01/48 | | 300,000 | 254,716 |
| | | Par | Value |
| Oklahoma (Continued) |
| Tulsa County Industrial Authority Educational Facilities Lease Revenue Bonds, Berryhill Public Schools Project, 4.00%, 9/01/26 | | $500,000 | $ 497,785 |
| Washington County Educational Facilities Authority Lease Revenue Bonds, Dewey Public Schools Project, 5.00%, 9/01/29 | | 435,000 | 443,317 |
| | | | 2,383,179 |
| Oregon – 1.4% |
| Klamath Falls Intercommunity Hospital Authority Revenue Refunding Bonds, Sky Lakes Medical Center Project, 4.00%, 9/01/25 | | 550,000 | 541,436 |
| Medford Hospital Facilities Authority Revenue Refunding Bonds, Series A, Asante Projects, 5.00%, 8/15/45 | | 500,000 | 474,141 |
| Multnomah County Hospital Facilities Authority Revenue Refunding Bonds, Adventist Health System, 5.00%, 3/01/25(a)(b)(c) | | 500,000 | 501,726 |
| Multnomah County Hospital Facilities Authority Revenue Refunding Bonds, Terwilliger Plaza-Parkview Project, Green Bonds, 0.95%, 6/01/27 | | 500,000 | 430,345 |
| Oregon State Business Development Commission Variable Revenue Bonds, Series 232, Intel Corp. Project, 3.80%, 6/15/28(a)(b)(c) | | 500,000 | 487,534 |
| Oregon State Facilities Authority Revenue Refunding Bonds, Series A, Legacy Health Project, 5.00%, 6/01/46 | | 500,000 | 476,152 |
| Port of Morrow GO Limited Refunding Bonds, Series D, | | | |
| 4.00%, 12/01/26 | | 170,000 | 169,332 |
| 4.00%, 12/01/27 | | 240,000 | 239,012 |
See accompanying Notes to Financial Statements
Morningstar Funds Trust October 31, 2023 (unaudited)
Schedule of Investments (continued)
Morningstar Municipal Bond Fund
| | | Par | Value |
| Oregon (Continued) |
|
| Port of Portland Airport Revenue Refunding Bonds, Portland International Airport (AMT), 5.00%, 7/01/25 | | $ 750,000 | $ 756,122 |
| Salem Hospital Facility Authority Revenue Refunding Bonds, Capital Manor Project, 5.00%, 5/15/27 | | 260,000 | 255,529 |
| | | | 4,331,329 |
| Pennsylvania – 3.3% |
| Allentown Neighborhood Improvement Zone Development Authority Tax Revenue Refunding Bonds, Forward Delivery, 5.00%, 5/01/42 | | 250,000 | 226,113 |
| Commonwealth Financing Authority Taxable Revenue Refunding Bonds, Series B-1, 5.00%, 6/01/26 | | 300,000 | 304,364 |
| Cumberland County Municipal Authority Revenue Refunding Bonds, Asbury Pennsylvania Obligated, 4.50%, 1/01/40(d) | | 185,000 | 141,086 |
| Laurel Highlands School District GO Limited Refunding Bonds (BAM State Aid Withholding), 4.00%, 2/01/26 | | 350,000 | 349,580 |
| Lehigh County General Purpose Authority Revenue Refunding Bonds, Muhlenberg College Project, (SIFMA Municipal Swap Index Yield + 0.58%), 4.67%, 11/01/24(a)(c) | | 415,000 | 414,777 |
| Luzerne County IDA Revenue Refunding Bonds (AMT), Pennsylvania-American Water Co., Project, 2.45%, 12/03/29(a)(b)(c) | | 750,000 | 640,168 |
| Montgomery County IDA Revenue Bonds, Acts Retirement-Life Communities, 5.00%, 11/15/45 | | 1,500,000 | 1,341,478 |
| Oil City GO Unlimited Bonds, Series A (AGM Insured), 4.00%, 12/01/24 | | 150,000 | 149,944 |
| | | Par | Value |
| Pennsylvania (Continued) |
| Pennsylvania State Economic Development Financing Authority Tax-Exempt Private Activity Revenue Bonds (AMT), The Penndot Major Bridges, 5.75%, 6/30/48 | | $ 575,000 | $ 584,777 |
| Pennsylvania State Economic Development Financing Authority UPMC Revenue Bonds, Series A-1, | | | |
| 5.00%, 4/15/25 | | 200,000 | 202,409 |
| 4.00%, 4/15/45 | | 500,000 | 411,332 |
|
| Pennsylvania State Economic Development Financing Authority UPMC Revenue Bonds, Series A-2, 4.00%, 5/15/48 | | 250,000 | 200,421 |
| Pennsylvania State Higher Educational Facilities Authority Revenue Refunding Bonds, Thomas Jefferson University, | | | |
| 5.00%, 9/01/39 | | 500,000 | 488,418 |
| 5.00%, 9/01/45 | | 250,000 | 238,488 |
|
| Pennsylvania State Housing Finance Agency SFM Revenue Refunding Bonds (AMT), Series 125A, 2.38%, 10/01/25 | | 485,000 | 465,207 |
| Pennsylvania State Turnpike Commission Registration Fee Variable Revenue Refunding Bonds, (SIFMA Municipal Swap Index Yield + 0.85%), 4.94%, 7/15/26(a)(c) | | 1,000,000 | 1,000,012 |
| Pennsylvania State Turnpike Commission Revenue Refunding Bonds, Series B, 5.25%, 12/01/52 | | 250,000 | 254,134 |
| Pennsylvania State Turnpike Commission Subordinate Revenue Bonds, Series A (AGM Insured), 4.00%, 12/01/49 | | 350,000 | 290,979 |
| Philadelphia Airport Revenue Refunding Bonds, Series B (AMT), | | | |
| 5.00%, 7/01/30 | | 510,000 | 513,041 |
| 5.00%, 7/01/33 | | 400,000 | 400,808 |
See accompanying Notes to Financial Statements
Morningstar Funds Trust October 31, 2023 (unaudited)
Schedule of Investments (continued)
Morningstar Municipal Bond Fund
| | | Par | Value |
| Pennsylvania (Continued) |
| Philadelphia Airport Revenue Refunding Bonds, Series B (AMT), | | | |
| 5.00%, 7/01/35 | | $ 155,000 | $ 153,048 |
|
| Philadelphia Airport Revenue Refunding Bonds, Series C (AMT), 4.00%, 7/01/40 | | 250,000 | 214,734 |
| Southcentral General Authority Revenue Bonds, York College of Pennsylvania Project, | | | |
| 5.00%, 5/01/27 | | 300,000 | 305,802 |
| 5.00%, 5/01/28 | | 215,000 | 220,691 |
|
| Southeastern Pennsylvania Transportation Authority Revenue Bonds, Asset Improvement Program, 5.25%, 6/01/47 | | 250,000 | 257,012 |
| West Cornwall Township Municipal Authority Healthcare Facilities Revenue Refunding Bonds, Lebanon Valley Brethren Home Project, | | | |
| 4.00%, 11/15/24 | | 115,000 | 113,238 |
| 4.00%, 11/15/25 | | 115,000 | 111,525 |
| 4.00%, 11/15/26 | | 125,000 | 119,350 |
| 4.00%, 11/15/27 | | 130,000 | 122,173 |
| 4.00%, 11/15/28 | | 105,000 | 97,105 |
| | | | 10,332,214 |
| Puerto Rico – 1.1% |
| Puerto Rico Commonwealth Aqueduct & Sewer Authority Senior Lien Revenue Refunding Bonds, Series A, 5.00%, 7/01/30(d) | | 250,000 | 248,168 |
| Puerto Rico Commonwealth Notes, | | | |
| 3.55%, 11/01/43(b)(c) | | 22,633 | 11,260 |
| 2.46%, 11/01/51(b)(c) | | 446,000 | 225,787 |
| Puerto Rico Commonwealth Restructured GO Unlimited Bonds, Series A1, | | | |
| 5.38%, 7/01/25 | | 160,394 | 161,255 |
| 5.63%, 7/01/27 | | 309,847 | 315,145 |
| 5.63%, 7/01/29 | | 1,058,875 | 1,081,927 |
| 5.75%, 7/01/31 | | 57,185 | 58,820 |
| 4.00%, 7/01/33 | | 54,226 | 47,152 |
| 4.00%, 7/01/35 | | 48,742 | 40,862 |
| 4.00%, 7/01/37 | | 106,285 | 86,301 |
| 4.00%, 7/01/41 | | 56,878 | 43,862 |
| | | Par | Value |
| Puerto Rico (Continued) |
|
| Puerto Rico Commonwealth Restructured GO Unlimited CABS, Series A, 0.00%, 7/01/33(e) | | $ 69,785 | $ 39,860 |
| Puerto Rico Sales Tax Financing Corp., Restructured TRB, Series A-1, 4.75%, 7/01/53 | | 527,000 | 445,115 |
| Puerto Rico Sales Tax Financing Corp., Sales Tax Revenue CABS, Series A-1, | | | |
| 0.00%, 7/01/27(e) | | 225,000 | 190,079 |
| 0.00%, 7/01/31(e) | | 500,000 | 347,508 |
| 0.00%, 7/01/46(e) | | 875,000 | 216,892 |
| | | | 3,559,993 |
| Rhode Island – 0.3% |
| Providence GO Unlimited Refunding Bonds, Series A, 5.00%, 1/15/25 | | 400,000 | 403,734 |
| Rhode Island Commerce Corp., First Lien Special Facility Revenue Refunding Bonds, Rhode Island Airport Corp., International, 5.00%, 7/01/31 | | 500,000 | 513,657 |
| | | | 917,391 |
| South Carolina – 0.7% |
| Connector 2000 Association, Inc., Toll Road Revenue CABS, Senior Series A-1, | | | |
| 0.00%, 1/01/32(e) | | 460,096 | 239,534 |
| 0.00%, 1/01/42(e) | | 228,148 | 50,738 |
| 0.00%, 7/22/51(e) | | 265,293 | 26,394 |
|
| South Carolina State Jobs EDA Hospital Revenue Refunding Bonds, Prisma Health Obligated Group, 5.00%, 5/01/38 | | 400,000 | 392,745 |
| South Carolina State Jobs EDA Hospital Variable Revenue Bonds, Bon Secours Mercy Health, 5.00%, 10/01/25(a)(b)(c) | | 850,000 | 858,973 |
See accompanying Notes to Financial Statements
Morningstar Funds Trust October 31, 2023 (unaudited)
Schedule of Investments (continued)
Morningstar Municipal Bond Fund
| | | Par | Value |
| South Carolina (Continued) |
|
| South Carolina State Public Service Authority Revenue Bonds, Series E, Santee Cooper, 5.75%, 12/01/47 | | $ 250,000 | $ 255,190 |
| South Carolina State Public Service Authority Revenue Refunding Bonds, Series A, 4.00%, 12/01/36 | | 350,000 | 314,450 |
| | | | 2,138,024 |
| South Dakota – 0.1% |
| South Dakota State Board of Regents Housing & Auxiliary Facilities System Revenue Refunding Bonds, 4.00%, 4/01/26 | | 375,000 | 374,389 |
| Tennessee – 1.4% |
| Metropolitan Government Nashville & Davidson County Health & Educational Facilities Board Revenue Bonds, Vanderbilt University Medical Center, 5.00%, 7/01/40 | | 400,000 | 391,358 |
| Metropolitan Nashville Airport Authority Revenue Bonds, Series B (AMT), 5.00%, 7/01/26 | | 600,000 | 607,573 |
| Metropolitan Nashville Airport Authority Subordinate Revenue Bonds, Series B (AMT), 5.00%, 7/01/39 | | 1,000,000 | 968,531 |
| Tennergy Corp., Gas Revenue Bonds, Series A, 4.00%, 9/01/28(a)(b)(c) | | 1,500,000 | 1,414,216 |
| Tennergy Corp., Gas Supply Revenue Bonds, Series A, 5.50%, 12/01/30(a)(b)(c) | | 1,000,000 | 1,003,226 |
| | | | 4,384,904 |
| Texas – 6.2% |
| Arlington Higher Education Finance Corp., Revenue Bonds, Riverwalk Education Foundation (PSF, Gtd), 5.00%, 8/15/47 | | 500,000 | 493,040 |
| Austin Convention Enterprises, Inc., Convention Center Revenue Refunding Bonds, First Tier, 5.00%, 1/01/32 | | 625,000 | 614,764 |
| | | Par | Value |
| Texas (Continued) |
| Board of Managers Joint Guadalupe County-City of Seguin Hospital Mortgage Revenue Refunding Bonds, 5.00%, 12/01/40 | | $ 200,000 | $ 168,892 |
| Central Texas Regional Mobility Authority Revenue Bonds, Series C, 5.00%, 1/01/27 | | 275,000 | 279,374 |
| Central Texas Regional Mobility Authority Senior Lien Revenue Refunding Bonds, Series A, 5.00%, 1/01/49 | | 500,000 | 481,305 |
| Dallas Texas Hotel Occupancy Tax Revenue Refunding Bonds, 4.00%, 8/15/30 | | 300,000 | 287,030 |
| Dallas-Fort Worth International Airport Joint Improvement Revenue Bonds, Series C, 5.00%, 11/01/34 | | 445,000 | 445,000 |
| Dallas-Fort Worth International Airport Joint Revenue Refunding Bonds, Series A (AMT), 5.25%, 11/01/30 | | 1,100,000 | 1,100,000 |
| Dallas-Fort Worth International Airport Revenue Refunding Bonds, Series B, 5.00%, 11/01/25 | | 400,000 | 408,184 |
| El Paso Texas Airport Revenue Bonds (AMT), 5.00%, 8/15/27 | | 375,000 | 381,472 |
| Fort Bend Independent School District Variable GO Unlimited Refunding Bonds, Series B (PSF, Gtd), 0.72%, 8/01/26(a)(b)(c) | | 840,000 | 729,779 |
| Grand Parkway Transportation Corp., System Toll Revenue Refunding Bonds, Grand Parkway System - First, 4.00%, 10/01/45 | | 265,000 | 218,336 |
| Greater Texoma Utility Authority Contract Revenue Bonds, Series A, City of Sherman Project (BAM Insured), | | | |
| 5.00%, 10/01/29 | | 350,000 | 368,576 |
| 4.00%, 10/01/43 | | 250,000 | 207,801 |
See accompanying Notes to Financial Statements
Morningstar Funds Trust October 31, 2023 (unaudited)
Schedule of Investments (continued)
Morningstar Municipal Bond Fund
| | | Par | Value |
| Texas (Continued) |
|
| Harris County Cultural Education Facilities Finance Corp., Variable Revenue Refunding Bonds, Memorial Hermann Health, 5.00%, 12/01/28(a)(b)(c) | | $570,000 | $588,515 |
| Harris County Cultural Educational Facilities Finance Corp., Revenue Refunding Bonds, Texas Children's Hospital, 4.00%, 10/01/38 | | 350,000 | 308,948 |
| Harris County Flood Control District GO Limited Bonds, Sustainability Bond, Series A, 4.00%, 9/15/43 | | 250,000 | 217,108 |
| Houston Airport System Revenue Bonds, Subseries A (AMT), 5.00%, 7/01/25 | | 500,000 | 503,682 |
| Houston Airport System Revenue Refunding Bonds (AMT), United Airlines, Inc., Improvement Projects, 5.00%, 7/15/27 | | 175,000 | 169,025 |
| Houston Airport System Revenue Refunding Bonds (AMT), United Airlines, Inc., Terminal, 5.00%, 7/01/27 | | 125,000 | 120,773 |
| Houston Airport System Subordinate Lien Revenue Refunding Bonds, Series A (AMT) (AGM Insured), 5.25%, 7/01/43 | | 400,000 | 400,208 |
| Houston Hotel Occupancy Tax & Special Revenue Refunding Bonds, Convention & Entertainment, 5.00%, 9/01/36 | | 510,000 | 521,125 |
| Kermit Independent School District GO Unlimited Bonds (PSF, Gtd), 5.00%, 2/15/26 | | 325,000 | 332,368 |
| Kilgore Independent School District GO Unlimited Bonds (PSF, Gtd), 3.00%, 2/15/41 | | 730,000 | 536,025 |
| Lower Colorado River Authority Transmission Contract Revenue Refunding Bonds, LCRA Transmission Services Corp., Project, 5.00%, 5/15/35 | | 250,000 | 256,999 |
| | | Par | Value |
| Texas (Continued) |
|
| Matagorda County Navigation District No. 1 Revenue Refunding Bonds (AMBAC Insured), 4.40%, 5/01/30 | | $1,500,000 | $1,431,544 |
| Montgomery County Toll Road Authority Senior Lien Revenue Bonds, 5.00%, 9/15/37 | | 500,000 | 479,053 |
| New Hope Cultural Educational Facilities Finance Corp., Retirement Facilities Revenue Refunding Bonds, Presbyterian Village North Project, 5.25%, 10/01/49 | | 100,000 | 72,232 |
| New Hope Cultural Educational Facilities Finance Corp., Retirement Facilities Revenue Refunding Bonds, Westminster Manor Project, 5.00%, 11/01/31 | | 250,000 | 250,482 |
| Odessa Junior College District Consolidated Revenue Bonds (AGM Insured), 4.00%, 7/01/27 | | 435,000 | 436,074 |
| Pasadena Independent School District GO Unlimited Bonds, Series A (PSF, Gtd), 4.00%, 2/15/32 | | 700,000 | 686,488 |
| Port Arthur Certificates GO Limited Bonds (BAM Insured), 5.00%, 2/15/27 | | 345,000 | 353,991 |
| Port Beaumont Navigation District Dock & Wharf Facility Revenue Refunding Bonds (AMT), Jefferson Gulf Coast Energy Project, 4.00%, 1/01/50(d) | | 375,000 | 242,115 |
| San Antonio Airport System Subordinate Lien Revenue Refunding Bonds, Series A (AMT), 5.00%, 7/01/30 | | 250,000 | 254,067 |
| San Antonio Water Junior Lien Revenue Refunding Bonds, Series A, 5.00%, 5/15/43 | | 500,000 | 504,163 |
| Tarrant County Cultural Educational Facilities Finance Corp., Revenue Refunding Bonds, Texas Health Resources System Obligation, 5.00%, 2/15/34 | | 400,000 | 406,969 |
See accompanying Notes to Financial Statements
Morningstar Funds Trust October 31, 2023 (unaudited)
Schedule of Investments (continued)
Morningstar Municipal Bond Fund
| | | Par | Value |
| Texas (Continued) |
|
| Texas City Industrial Development Corp., Revenue Bonds, Series 2012, NRG Energy Project, 4.13%, 12/01/45 | | $ 545,000 | $ 422,184 |
| Texas State PFA Lease Revenue Refunding Bonds, 4.00%, 2/01/36 | | 250,000 | 235,810 |
| Texas State Private Activity Bond Surface Transportation Corp., Revenue Bonds (AMT), Segment 3C Project, 5.00%, 6/30/58 | | 1,100,000 | 1,002,552 |
| Texas State Private Activity Bond Surface Transportation Corp., Senior Lien Revenue Bonds (AMT), Blueridge Transportation, | | | |
| 5.00%, 12/31/45 | | 500,000 | 451,243 |
| 5.00%, 12/31/55 | | 200,000 | 174,656 |
|
| Texas State Private Activity Bond Surface Transportation Corp., Senior Lien Revenue Refunding Bonds, North Tarrant Express, 4.00%, 12/31/38 | | 750,000 | 655,057 |
| Texas State Transportation Commission First Tier Toll Revenue Bonds, State Highway, 5.00%, 8/01/57 | | 100,000 | 87,650 |
| Texas State Transportation Commission First Tier Toll Revenue CABS, 0.00%, 8/01/29(e) | | 480,000 | 356,788 |
| Texas State Water Development Board Revenue Bonds, State Water Implementation Fund, 4.00%, 10/15/38 | | 510,000 | 467,411 |
| University of Houston Revenue Refunding Bonds, Series A, 5.00%, 2/15/47 | | 250,000 | 251,857 |
| Waller Independent School District GO Unlimited Bonds (BAM Insured), 5.00%, 2/15/44 | | 235,000 | 236,139 |
| | | | 19,596,854 |
| Utah – 0.3% |
| Salt Lake City Airport Revenue Bonds, Series A (AMT), 5.00%, 7/01/51 | | 1,000,000 | 934,930 |
| | | Par | Value |
| Virginia – 2.6% |
| Arlington County IDA Hospital Facilities Revenue Refunding Bonds, Virginia Hospital Center, 3.75%, 7/01/50 | | $ 500,000 | $387,654 |
| Chesapeake Bay Bridge & Tunnel District Revenue Bonds, First Tier General Resolution (AGM Insured), 5.00%, 7/01/41 | | 1,000,000 | 984,141 |
| Chesapeake Bay Bridge & Tunnel District Revenue First Tier General Resolution Revenue Bonds, 5.00%, 7/01/51 | | 750,000 | 695,156 |
| Chesapeake Hospital Authority Hospital Facilities Revenue Refunding Bonds, Chesapeake Regional Medical Center, 5.00%, 7/01/31 | | 500,000 | 514,478 |
| Chesapeake Transportation System Senior Toll Road Revenue Bonds, Series A, 5.00%, 7/15/47 | | 500,000 | 467,299 |
| Fairfax County GO Unlimited Bonds, Series A (State Aid Withholding), 2.00%, 10/01/41 | | 1,000,000 | 603,517 |
| Fairfax County IDA Health Care Revenue Refunding Bonds, Inova Health System Project, 3.50%, 5/15/39 | | 500,000 | 417,664 |
| Newport News EDA Residential Care Facilities Revenue Refunding Bonds, Lifespire of Virginia, 5.00%, 12/01/38 | | 560,000 | 526,061 |
| Virginia State Commonwealth Transportation Board Capital Projects Revenue Bonds, 3.00%, 5/15/37 | | 1,000,000 | 797,299 |
| Virginia State Small Business Financing Authority Senior Lien Revenue Bonds (AMT), Elizabeth River Crossings OpCo, LLC Project, | | | |
| 4.00%, 7/01/32 | | 275,000 | 251,135 |
| 4.00%, 1/01/37 | | 660,000 | 575,173 |
See accompanying Notes to Financial Statements
Morningstar Funds Trust October 31, 2023 (unaudited)
Schedule of Investments (continued)
Morningstar Municipal Bond Fund
| | | Par | Value |
| Virginia (Continued) |
| Virginia State Small Business Financing Authority Senior Lien Revenue Refunding Bonds (AMT), 95 Express Lanes, | | | |
| 5.00%, 7/01/38 | | $ 645,000 | $ 622,978 |
| 4.00%, 7/01/39 | | 240,000 | 204,828 |
| 4.00%, 1/01/40 | | 280,000 | 236,910 |
| 4.00%, 1/01/48 | | 225,000 | 178,888 |
|
| Virginia State Small Business Financing Authority Senior Lien Revenue Refunding Bonds (AMT), I-495 Hot Lanes, 5.00%, 12/31/57 | | 850,000 | 779,721 |
| | | | 8,242,902 |
| Washington – 2.7% |
| Energy Northwest Electric Revenue Refunding Bonds, Columbia Generating Station, 4.00%, 7/01/42 | | 1,515,000 | 1,334,450 |
| King County Public Hospital District No. 1 GO Limited Tax Refunding Bonds, Valley Medical Center, 5.00%, 12/01/26 | | 550,000 | 565,193 |
| King County Sewer Revenue Refunding Bonds, 5.00%, 7/01/42 | | 250,000 | 253,862 |
| Port of Seattle Airport Intermediate Lien Revenue Bonds (AMT), 5.00%, 4/01/44 | | 500,000 | 482,383 |
| Port of Seattle Intermediate Lien Revenue Refunding Bonds (AMT), 5.00%, 8/01/47 | | 250,000 | 237,002 |
| Seattle Housing Authority Revenue Refunding Bonds, Northgate Plaza Project, 1.00%, 6/01/26 | | 500,000 | 452,399 |
| Seattle Municipal Light & Power Revenue Refunding Bonds, 4.00%, 9/01/40 | | 500,000 | 449,817 |
| Seattle Municipal Light & Power Variable Revenue Refunding Bonds, Series B, (SIFMA Municipal Swap Index Yield + 0.25%), 4.10%, 11/01/26(a)(c) | | 750,000 | 728,406 |
| | | Par | Value |
| Washington (Continued) |
| Skagit County Public Hospital District No. 1 Revenue Improvement & Refunding Bonds, Skagit Regional Health, | | | |
| 5.00%, 12/01/27 | | $ 500,000 | $ 488,991 |
| 5.00%, 12/01/28 | | 440,000 | 428,805 |
|
| Washington State GO Unlimited Bonds, Series C, 5.00%, 2/01/40 | | 2,000,000 | 2,059,117 |
| Washington State Health Care Facilities Authority Revenue Bonds, Series A, Providence Health & Services, 4.00%, 10/01/34 | | 500,000 | 449,251 |
| Washington State Higher Educational Facilities Authority Revenue Bonds, Seattle University Project, 4.00%, 5/01/50 | | 250,000 | 195,274 |
| Washington State Housing Finance Commission Nonprofit Revenue Refunding Bonds, Emerald Heights Project, Series A, 5.00%, 7/01/26 | | 285,000 | 287,454 |
| | | | 8,412,404 |
| Wisconsin – 3.2% |
| Clayton Town NANS, Series B, 2.00%, 6/01/25 | | 225,000 | 212,458 |
| Milwaukee Corp., Purpose GO Unlimited Bonds, Series B3, 4.00%, 4/01/26 | | 1,000,000 | 998,144 |
| Milwaukee GO Unlimited Bonds, Promissory Notes, Series N3 (AGM Insured), 5.00%, 4/01/31 | | 500,000 | 524,805 |
| Milwaukee Metropolitan Sewerage District GO Unlimited Bonds, Green Bonds, Climate Bond Certified, 4.00%, 10/01/43 | | 500,000 | 435,725 |
| Monroe School District GO Unlimited Refunding Bonds (AGM Insured), 5.00%, 3/01/25 | | 300,000 | 303,957 |
| Park Falls NANS, Series B, 3.00%, 3/01/25 | | 975,000 | 947,375 |
| PFA Education Revenue Bonds, North Carolina Leadership Academy, 5.00%, 6/15/49(d) | | 100,000 | 80,657 |
See accompanying Notes to Financial Statements
Morningstar Funds Trust October 31, 2023 (unaudited)
Schedule of Investments (continued)
Morningstar Municipal Bond Fund
| | | Par | Value |
| Wisconsin (Continued) |
| PFA Educational Revenue Bonds, Piedmont Community Charter School, | | | |
| 5.00%, 6/15/39 | | $490,000 | $444,549 |
| 5.00%, 6/15/49 | | 150,000 | 126,199 |
|
| PFA Exempt Facilities Revenue Refunding Bonds (AMT), National Gypsum Co., 4.00%, 8/01/35 | | 370,000 | 303,303 |
| PFA Pollution Control Variable Revenue Refunding Bonds, Duke Energy Progress Project, 3.30%, 10/01/26(a)(b)(c) | | 500,000 | 487,247 |
| PFA Project Revenue Bonds, CFP3 - Eastern Michigan University Housing Project (BAM Insured), 5.50%, 7/01/52 | | 250,000 | 256,573 |
| PFA Revenue Bonds, Roseman University, Unrefunded Balance, 5.00%, 4/01/50(d) | | 250,000 | 209,263 |
| PFA Variable Revenue Refunding Bonds, Providence St. Joseph, 4.00%, 10/01/30(a)(b)(c) | | 370,000 | 350,453 |
| Public Financial Authority Solid Waste Disposal Revenue Refunding Bonds (AMT), Waste Management, Inc., Project, 2.88%, 5/01/27 | | 495,000 | 455,055 |
| Wisconsin Center District Appropriation Revenue Bonds, Milwaukee Arena Project, 5.00%, 12/15/27 | | 200,000 | 204,878 |
| Wisconsin Center District TRB, CABS, Junior Dedicated, Series D (AGM Moral Obligation Insured), 0.00%, 12/15/45(e) | | 250,000 | 76,338 |
| Wisconsin State Health & Educational Facilities Authority Revenue Bonds, Series A, Unitypoint Health, 5.00%, 12/01/28 | | 590,000 | 591,275 |
| Wisconsin State Health & Educational Facilities Authority Revenue Bonds, Three Pillars Senior Living Communities, 4.00%, 8/15/31 | | 375,000 | 337,747 |
| | | Par | Value |
| Wisconsin (Continued) |
|
| Wisconsin State Health & Educational Facilities Authority Revenue Refunding Bonds, Ascension Health Credit Group, 4.00%, 11/15/39 | | $290,000 | $ 257,680 |
| Wisconsin State Health & Educational Facilities Authority Revenue Refunding Bonds, Benevolent Corp., Cedar Community, 5.00%, 6/01/41 | | 250,000 | 203,129 |
| Wisconsin State Health & Educational Facilities Authority Revenue Refunding Bonds, Fort Healthcare, Inc., 5.00%, 5/01/25 | | 350,000 | 350,791 |
| Wisconsin State Health & Educational Facilities Authority Revenue Refunding Bonds, Rogers Memorial Hospital, Inc., 5.00%, 7/01/25 | | 385,000 | 386,644 |
| Wisconsin State Health & Educational Facilities Authority Revenue Refunding Bonds, Series B5, 5.00%, 12/03/24(a)(b)(c) | | 935,000 | 941,216 |
| Wisconsin State Health & Educational Facilities Authority Variable Revenue Refunding Bonds, Advocate Aurora Health Credit Group, 5.00%, 1/29/25(a)(b)(c) | | 500,000 | 503,734 |
| | | | 9,989,195 |
| Wyoming – 0.1% |
| Sublette County Hospital District Revenue Bonds, Series A, Hospital Construction Project, 5.00%, 6/15/26 | | 500,000 | 489,984 |
Total Municipal Bonds
(Cost $296,683,493) | 266,349,537 |
| | | Par/Number
of Shares | |
| Short-Term Investments – 14.2% |
| Money Market Fund – 2.2% |
| Northern Institutional Funds - Treasury Portfolio (Premier), 5.21%(i) | | 7,079,523 | 7,079,523 |
See accompanying Notes to Financial Statements
Morningstar Funds Trust October 31, 2023 (unaudited)
Schedule of Investments (continued)
Morningstar Municipal Bond Fund
| | | Par/Number
of Shares | Value |
| Municipal – 12.0% |
| Arkansas State Development Finance Authority Multi Family Housing Variable Revenue Bonds, The Cottages Apartments (Housing & Urban Development Sector 8 Program), 1.25%, 12/01/23(a)(b)(c) | | 3,000,000 | $2,993,516 |
|
| Bay Area Toll Bridge Authority Variable Revenue Refunding Bonds, San Francisco Bay, (SIFMA Municipal Swap Index Yield + 0.28%), 4.37%, 4/01/24(a)(c) | | 250,000 | 249,118 |
|
| California State Infrastructure & Economic Development Bank Variable Revenue Bonds (AMT), Brightline West Passenger Rail Project, 3.65%, 1/31/24(a)(b)(c)(d) | | 1,200,000 | 1,193,290 |
|
| Capital Trust Agency Sustainability Revenue Bonds, The Marie, 4.00%, 6/15/24(d) | | 105,000 | 103,917 |
|
| Cass County Joint Water Resource District GO Unlimited Bonds, Series A, 0.48%, 5/01/24 | | 600,000 | 583,178 |
|
| Charlotte-Mecklenburg Hospital Authority Health Care System Variable Revenue Refunding Bonds, 3.10%, 11/01/23(a)(c)(j) | | 800,000 | 800,000 |
|
| Chesapeake Bay Bridge & Tunnel District Revenue First Tier General Resolution Revenue BANS, 5.00%, 11/01/23 | | 300,000 | 300,000 |
|
| Chicago Park District GO Limited Tax Refunding Bonds, Series B, 5.00%, 1/01/24 | | 175,000 | 175,197 |
|
| Clarksville Sewage Works Revenue BANS, 2.75%, 12/11/23 | | 125,000 | 124,684 |
|
| Clayton Town NANS, Series B, 2.00%, 6/01/24 | | 100,000 | 97,821 |
| | | Par/Number
of Shares | Value |
| Municipal (Continued) |
|
| Connecticut State Health & Educational Facilities Authority Revenue Refunding Bonds, University of Hartford, 5.00%, 7/01/24 | | 240,000 | $ 238,748 |
|
| County Square Redevelopment Corp., Installment Purchase Revenue BANS, Greenville County South Carolina Project, 5.00%, 2/09/24 | | 2,000,000 | 2,005,066 |
|
| Fairfax County EDA Residential Care Facilities Revenue Refunding Bonds, Series A, Goodwin House, Inc., Prerefunded, 5.00%, 10/01/24(g) | | 150,000 | 154,098 |
|
| Farmington PCR Refunding Bonds, Public Service Company of New Mexico San Juan Project, 1.15%, 6/01/24(a)(b)(c) | | 250,000 | 244,130 |
|
| Fort Bend Independent School District Variable GO Unlimited Bonds, Series B (PSF, Gtd), 3.65%, 8/01/24(a)(b)(c) | | 500,000 | 497,325 |
|
| Hamden GO Unlimited Refunding Bonds, Series A (BAM Insured), 5.00%, 8/01/24 | | 500,000 | 502,811 |
|
| Houston Housing Finance Corp., MFH Variable Revenue Bonds, Temenos Place Apartments, 4.08%, 2/01/24(a)(b)(c) | | 450,000 | 449,204 |
|
| Idaho State Health Facilities Authority Hospital Variable Revenue Bonds, Che Trinity Health Credit Group, 4.30%, 2/01/24(a)(b)(c) | | 500,000 | 500,000 |
|
| Illinois State GO Unlimited Bonds, Series B, 5.00%, 3/01/24 | | 250,000 | 250,442 |
|
| Kentucky State Economic Development Finance Authority Health System Revenue Bonds, Norton Healthcare, Inc., Series B (NATL Insured), 0.00%, 10/01/24(e) | | 280,000 | 267,763 |
See accompanying Notes to Financial Statements
Morningstar Funds Trust October 31, 2023 (unaudited)
Schedule of Investments (continued)
Morningstar Municipal Bond Fund
| | | Par/Number
of Shares | Value |
| Municipal (Continued) |
|
| Kentucky State Economic Development Finance Authority Solid Waste Disposal Revenue Refunding Bonds, Republic Services, Inc. Project, 3.95%, 12/01/23(a)(b)(c) | | 250,000 | $ 249,943 |
|
| Kentucky State Public Energy Authority Gas Supply Revenue Bonds, Series A, 4.00%, 4/01/24(a)(b)(c) | | 475,000 | 472,733 |
|
| Kingfisher Special Projects Authority Educational Facilities Lease Revenue Bonds, Kingfisher Public Schools Project, 4.00%, 3/01/24 | | 600,000 | 599,684 |
|
| Long Island Power Authority Electric System Variable Revenue Bonds, Series B, 1.65%, 9/01/24(a)(b)(c) | | 1,650,000 | 1,611,473 |
|
| Lowville GO Limited BANS, Series A, 4.63%, 8/22/24 | | 500,000 | 498,800 |
|
| Main Street Natural Gas, Inc., Gas Supply Revenue Bonds, Subseries C, 4.00%, 12/01/23(a)(b)(c) | | 950,000 | 949,894 |
|
| Main Street Natural Gas, Inc., Gas Supply Variable Revenue Bonds, Series B, 4.00%, 12/01/23 | | 355,000 | 354,911 |
|
| Maryland State Community Development Administration Department Housing Revenue Bonds, Series A, Woodside Gardens, 1.33%, 1/01/24(d) | | 2,000,000 | 1,983,704 |
|
| Maryland State Health & Higher Educational Facilities Authority Revenue Bonds, Peninsula Regional Health System, 5.00%, 7/01/24 | | 350,000 | 351,374 |
|
| Metropolitan Government Nashville & Davidson County Health & Educational Facility Board Revenue Refunding Bonds, Trevecca Nazarene University, 3.00%, 10/01/24 | | 110,000 | 107,597 |
| | | Par/Number
of Shares | Value |
| Municipal (Continued) |
|
| Miami-Dade County COPS, Series A, Prerefunded, 5.00%, 5/01/24(b)(c)(g) | | 515,000 | $517,345 |
|
| Michigan State Strategic Fund Limited Obligation Variable Revenue Bonds (AMT), Consumers Energy Co., 1.80%, 10/01/24(a)(b)(c) | | 500,000 | 486,303 |
|
| Mississippi State Hospital Equipment & Facilities Authority Revenue Refunding Bonds, Forrest Country General Hospital Project, 5.00%, 1/01/24 | | 400,000 | 400,417 |
|
| Missouri State Health & Educational Facilities Authority Health Facilities Revenue Refunding Bonds, Series A, St. Luke's Health System, Inc., 5.00%, 11/15/23 | | 150,000 | 150,041 |
|
| Missouri State Health & Educational Facilities Authority Revenue Refunding Bonds, Bethesda Health Group, Inc., 4.00%, 8/01/24 | | 320,000 | 315,641 |
|
| MTA Variable Revenue Bonds, Subseries D-1, (SOFR + 0.33%), 3.92%, 4/01/24(a)(c) | | 900,000 | 897,766 |
|
| Neshannock Township School District GO Limited Refunding Bonds, Series B (State Aid Withholding), 2.00%, 9/01/24 | | 190,000 | 185,011 |
|
| New Jersey State EDA Private Activity Revenue Bonds (AMT), The Goethals Project, 5.00%, 1/01/24 | | 150,000 | 150,029 |
|
| New Jersey State EDA Revenue Refunding Bonds, Series A, United Methodist Homes, Prerefunded, 5.00%, 7/01/24(g) | | 100,000 | 100,380 |
|
| New Jersey Transportation Trust Fund Authority Revenue Refunding Bonds, Series AA, 5.00%, 6/15/24 | | 600,000 | 603,072 |
See accompanying Notes to Financial Statements
Morningstar Funds Trust October 31, 2023 (unaudited)
Schedule of Investments (continued)
Morningstar Municipal Bond Fund
| | | Par/Number
of Shares | Value |
| Municipal (Continued) |
|
| New Orleans Sewarage Service Revenue Refunding Bonds, 5.00%, 6/01/24 | | 500,000 | $ 502,199 |
|
| New York State Dormitory Authority Revenues Non State Supported Debt Revenue Bonds, Northwell Health Obligated Group, 5.00%, 5/01/24(a)(b)(c) | | 250,000 | 250,139 |
|
| New York State Transportation Development Corp., Special Facility Revenue Refunding Bonds (AMT), Terminal 4 John F. Kennedy International Airport Project, 5.00%, 12/01/23 | | 1,000,000 | 1,000,087 |
|
| Newark Housing Authority Port Newark Marine Terminal Rental Revenue Refunding Bonds, Additional Newark Redevelopment Project (NATL Insured), 5.25%, 1/01/24 | | 500,000 | 499,976 |
|
| North Carolina State Capital Facilities Finance Agency Educational Facilities Revenue Refunding Bonds, High Point University, 4.00%, 5/01/24 | | 240,000 | 239,620 |
|
| North Carolina State Housing Fiance Agency MFH Variable Revenue Bonds, Wind Creek Senior Living, 4.50%, 6/01/24 | | 481,000 | 480,632 |
|
| North Carolina State Medical Care Commission Retirement Facilities Revenue Refunding Bonds, First Mortgage, United Church Services, Prerefunded, 5.00%, 9/01/24(g) | | 155,000 | 156,443 |
|
| North Carolina State Turnpike Authority Triangle Expressway System Revenue BANS, Escrowed to Maturity, 5.00%, 2/01/24 | | 200,000 | 200,428 |
| | | Par/Number
of Shares | Value |
| Municipal (Continued) |
|
| Northside Texas Independent School District GO Unlimited Refunding Bonds (PSF, Gtd), 1.60%, 8/01/24(a)(b)(c) | | 335,000 | $ 328,126 |
|
| Ohio State Air Quality Development Authority Revenue Refunding Bonds (AMT), American Electric Power Company Project, 2.10%, 10/01/24(a)(b)(c) | | 500,000 | 483,324 |
|
| Ohio State Solid Waste Revenue Refunding Bonds, Republic Services, Inc., Project, 3.95%, 12/01/23(a)(b)(c) | | 1,000,000 | 999,770 |
|
| Oklahoma State Development Finance Authority Revenue Refunding Bonds, Oklahoma City University Project, 5.00%, 8/01/24 | | 590,000 | 587,952 |
|
| Orlando Tourist Development Senior Lien Tax Revenue Refunding Bonds (AGM Insured), 5.00%, 11/01/23 | | 1,000,000 | 1,000,000 |
|
| Pennsylvania State Turnpike Commission Variable Revenue Refunding Bonds, Series B, (SIFMA Municipal Swap Index Yield + 0.70%), 4.79%, 12/01/23(c) | | 500,000 | 500,171 |
|
| PMA Levy & Aid Anticipation Notes Program Revenue Notes, Series A, 5.00%, 9/25/24 | | 1,000,000 | 1,007,251 |
|
| PMA Levy & Aid Anticipation Program Note Participations Revenue Bonds, Series B, 5.00%, 4/03/24 | | 400,000 | 401,228 |
|
| Puerto Rico Commonwealth Restructured GO Unlimited CABS, Series A, 0.00%, 7/01/24(e) | | 8,821 | 8,545 |
|
| Salem Hospital Facility Authority Revenue Refunding Bonds, Capital Manor Project, 5.00%, 5/15/24 | | 110,000 | 109,722 |
See accompanying Notes to Financial Statements
Morningstar Funds Trust October 31, 2023 (unaudited)
Schedule of Investments (continued)
Morningstar Municipal Bond Fund
| | | Par/Number
of Shares | Value |
| Municipal (Continued) |
|
| San Antonio Water Junior Lien Variable Revenue Bonds, Series A, 2.63%, 5/01/24(a)(b)(c) | | 1,125,000 | $1,113,629 |
|
| Sand Creek Metropolitan District GO Limited Refunding Bonds, Series A (AGM Insured), 4.00%, 12/01/23 | | 180,000 | 179,954 |
|
| Southeast Alabama State Gas Supply District Revenue Bonds, Series A, Project No. 2, 4.00%, 6/01/24(a)(b)(c) | | 600,000 | 596,050 |
|
| Stratford GO Unlimited BANS, Series B, 5.00%, 1/30/24 | | 500,000 | 500,412 |
|
| Tennergy Corp., Gas Revenue Bonds, Series A, 5.00%, 10/01/24(a)(b)(c) | | 500,000 | 500,047 |
|
| United Local School District COPS (BAM Insured), 3.00%, 12/01/23 | | 330,000 | 329,468 |
|
| University of North Carolina Hospital Chapel Hill Revenue Bonds, Series A, 3.05%, 11/01/23(a)(c)(j) | | 1,600,000 | 1,600,000 |
| | | Par/Number
of Shares | Value |
| Municipal (Continued) |
|
| Village Community Development District No. 13 Special Assessment Bonds, Limited Offering, 2.63%, 5/01/24 | | 125,000 | $ 123,594 |
|
| Watford City North Dakota State Aid Certificates Indebtedness Revenue Refunding Bonds (AGM Insured), 3.00%, 12/01/23 | | 800,000 | 798,381 |
|
| Will County Community School District No. 161 Summit Hill Refunding GO Unlimited Refunding Bonds, 4.00%, 1/01/24 | | 470,000 | 469,837 |
| | | | 37,683,411 |
Total Short-Term Investments
(Cost $45,064,423) | 44,762,934 |
Total Investments – 98.9%
(Cost $341,747,916) | 311,112,471 |
| Other Assets less Liabilities – 1.1% | 3,360,982 |
| NET ASSETS – 100.0% | $314,473,453 |
| Percentages shown are based on Net Assets. |
| |
| (a) | Maturity date represents the puttable date. | | |
| (b) | These securities are remarketed by an agent, and the interest rate is determined by general market conditions and supply and demand. | | |
| (c) | Variable or floating rate security. Rate as of October 31, 2023 is disclosed. | | |
| (d) | Securities exempt from registration under Rule 144A of the Securities Act of 1933. These securities may be resold in transactions exempt from registration, normally to qualified institutional buyers. | | |
| (e) | Zero coupon bond. | | |
| (f) | Amount rounds to less than 0.05%. | | |
| (g) | Maturity date represents the prerefunded date. | | |
| (h) | Issuer has defaulted on terms of debt obligation. Income is not being accrued. | | |
| (i) | 7-day current yield as of October 31, 2023 is disclosed. | | |
| (j) | Rate is determined by a Remarketing Agent which, in its judgment, on the basis of prevailing financial markets, will be the lowest interest rate necessary to enable the remarketing agent to sell the bonds at a price equal to 100% of the principal amount. | | |
| AGM | Assured Guarantee Municipal Corporation |
| AMBAC | American Municipal Bond Assurance Corporation |
| AMT | Alternative Minimum Tax |
| BAM | Build America Mutual |
| BANS | Bond Anticipation Notes |
| CABS | Capital Appreciation Bonds |
| COPS | Certificates of Participation |
| EDA | Economic Development Administration |
See accompanying Notes to Financial Statements
Morningstar Funds Trust October 31, 2023 (unaudited)
Schedule of Investments (continued)
Morningstar Municipal Bond Fund
| FHA | Federal Housing Administration |
| FHLMC | Federal Home Loan Mortgage Corporation |
| FNMA | Federal National Mortgage Association |
| GNMA | Government National Mortgage Association |
| GO | Government Obligation |
| Gtd | Guaranteed |
| HFA | Housing Finance Authority |
| IBC | Insured Bond Certificates |
| IDA | Industrial Development Association |
| L.P. | Limited Partnership |
| LLC | Limited Liability Company |
| LOC | Letter of Credit |
| MFH | Multifamily Housing |
| MTA | Metropolitan Transportation Authority |
| NATL | National Interstate Insurance |
| PCR | Pollution Control Revenue |
| PFA | Public Finance Authority |
| PSF | Permanent School Fund |
| SFM | Single Family Mortgage |
| SIFMA | Securities Industry and Financial Markets Association |
| SOFR | United States Secured Overnight Financing Rate |
| SonyMA | State of New York Mortgage Agency |
| TCRS | Transferable Custodial Receipts |
| TRB | Tax Revenue Bonds |
| Municipal Issue Type (%)(a),(b) | |
| Revenue Bonds | 81.7 |
| General Obligation Unlimited Bonds | 8.9 |
| Certificates of Participation | 2.1 |
| General Obligation Limited Bonds | 1.8 |
| Revenue Notes | 1.0 |
| Tax Allocation Bonds | 0.3 |
| Special Assessment Bonds | 0.3 |
| Special Tax Bonds | 0.2 |
| General Obligation Unlimited Notes | 0.2 |
| General Obligation Limited Notes | 0.2 |
| Total | 96.7 |
| (a)Percentages shown are based on Net Assets. |
| (b)Excludes Short-Term Investments and Other. |
See accompanying Notes to Financial Statements
Morningstar Funds Trust October 31, 2023 (unaudited)
Schedule of Investments (continued)
Morningstar Municipal Bond Fund
Valuation Hierarchy
The following is a summary of the inputs used, as of October 31, 2023, in valuing the Fund's investments carried at fair value:
| Morningstar Municipal Bond Fund | Level 1 | Level 2 | Level 3 | Totals |
| Investments | | | | |
| Municipal Bonds | $ — | $266,349,537 | $— | $266,349,537 |
| Short-Term Investments | 7,079,523 | 37,683,411 | — | 44,762,934 |
| Total Investments | $7,079,523 | $304,032,948 | $— | $311,112,471 |
See accompanying Notes to Financial Statements
Morningstar Funds Trust October 31, 2023 (unaudited)
Morningstar Defensive Bond Fund
| | | Par | Value |
| Asset-Backed Securities – 34.4% |
| Automotive – 0.1% |
| Volkswagen Auto Loan Enhanced Trust, Series 2023-1, Class A4, 5.01%, 1/22/30 | | $100,000 | $ 97,530 |
| Banking – 0.3% |
| Chase Issuance Trust, Series 2023-A2, Class A, 5.08%, 9/15/30 | | 409,000 | 398,842 |
| Consumer Services – 0.8% |
| Avis Budget Rental Car Funding AESOP LLC, | | | |
| Series 2023-1A, Class A, 5.25%, 4/20/29(a) | | 101,000 | 96,516 |
| Series 2023-4A, Class A, 5.49%, 6/20/29(a) | | 300,000 | 289,082 |
| Series 2023-6A, Class A, 5.81%, 12/20/29(a) | | 423,000 | 410,811 |
| Series 2023-8A, Class A, 6.02%, 2/20/30(a) | | 306,000 | 300,024 |
| | | | 1,096,433 |
| Other – 31.7% |
| ABPCI Direct Lending Fund ABS I Ltd., Series 2020-1A, Class B, 4.94%, 12/20/30(a)(b) | | 807,351 | 744,012 |
| ABPCI Direct Lending Fund ABS II LLC, | | | |
| Series 2022-2A, Class A1, (3M CME Term SOFR + 2.10%, 2.10% Floor), 7.49%, 3/01/32(a)(b)(c) | | 224,000 | 222,304 |
| Series 2022-2A, Class C, 8.24%, 3/01/32(a)(b) | | 935,000 | 799,043 |
|
| ABPCI Direct Lending Fund CLO II LLC, Series 2017-1A, Class ER, (3M CME Term SOFR + 7.86%, 7.60% Floor), 13.28%, 4/20/32(a)(c) | | 746,000 | 701,259 |
| ABPCI Direct Lending Fund CLO X L.P., Series 2020-10A, Class A1A, (3M CME Term SOFR + 2.21%, 1.95% Floor), 7.54%, 1/20/32(a)(c) | | 250,000 | 248,362 |
| ABPCI Direct Lending Fund IX LLC, Series 2020-9A, Class A1R, (3M CME Term SOFR + 1.66%, 1.40% Floor), 7.05%, 11/18/31(a)(c) | | 378,000 | 374,113 |
| | | Par | Value |
| Other (Continued) |
|
| Ally Auto Receivables Trust, Series 2023-1, Class A4, 5.27%, 11/15/28 | | $100,000 | $ 98,343 |
| American Express Credit Account Master Trust, | | | |
| Series 2023-2, Class A, 4.80%, 5/15/30 | | 590,000 | 572,519 |
| Series 2023-4, Class A, 5.15%, 9/15/30 | | 567,000 | 555,811 |
|
| BMW Vehicle Lease Trust, Series 2022-1, Class A4, 1.23%, 5/27/25 | | 255,000 | 249,344 |
| BMW Vehicle Owner Trust, Series 2023-A, Class A4, 5.25%, 11/26/29 | | 100,000 | 98,507 |
| CARS-DB4 L.P., Series 2020-1A, Class A1, 2.69%, 2/15/50(a) | | 144,049 | 136,706 |
| Cascade Funding Mortgage Trust, Series 2021-HB6, Class A, 0.90%, 6/25/36(a) | | 89,013 | 86,231 |
| Cerberus Loan Funding XL LLC, Series 2023-1A, Class A, (3M CME Term SOFR + 2.40%, 2.40% Floor), 7.79%, 3/22/35(a)(c) | | 250,000 | 249,987 |
| Cerberus Loan Funding XLI LLC, Series 2023-2A, Class A1, (3M CME Term SOFR + 2.55%, 2.55% Floor), 7.94%, 7/15/35(a)(c) | | 419,000 | 414,709 |
| Cerberus Loan Funding XXIX L.P., Series 2020-2A, Class A, (3M CME Term SOFR + 2.16%, 1.90% Floor), 7.56%, 10/15/32(a)(c) | | 708,000 | 708,969 |
| Cerberus Loan Funding XXVIII L.P., Series 2020-1A, Class D, (3M CME Term SOFR + 5.56%, 5.30% Floor), 10.96%, 10/15/31(a)(c) | | 764,000 | 762,593 |
| CFMT LLC, | | | |
| Series 2021-HB5, Class A, 0.80%, 2/25/31(a) | | 117,118 | 115,956 |
| Series 2021-HB7, Class A, 1.15%, 10/27/31(a) | | 111,709 | 106,785 |
| Series 2021-HB7, Class M1, 2.12%, 10/27/31(a) | | 192,000 | 177,874 |
See accompanying Notes to Financial Statements
Morningstar Funds Trust October 31, 2023 (unaudited)
Schedule of Investments (continued)
Morningstar Defensive Bond Fund
| | | Par | Value |
| Other (Continued) |
|
| Chesapeake Funding II LLC, Series 2020-1A, Class C, 2.14%, 8/15/32(a) | | $159,000 | $155,434 |
| CNH Equipment Trust, | | | |
| Series 2023-A, Class A4, 4.77%, 10/15/30 | | 100,000 | 96,579 |
| Series 2023-B, Class A4, 5.46%, 3/17/31 | | 154,000 | 151,672 |
|
| Coinstar Funding LLC, Series 2017-1A, Class A2, 5.22%, 4/25/47(a) | | 867,680 | 707,794 |
| Cologix Data Centers U.S. Issuer LLC, Series 2021-1A, Class A2, 3.30%, 12/26/51(a) | | 412,000 | 360,664 |
| Dell Equipment Finance Trust, Series 2021-2, Class C, 0.94%, 12/22/26(a) | | 104,000 | 101,071 |
| Diamond Infrastructure Funding LLC, Series 2021-1A, Class C, 3.48%, 4/15/49(a) | | 104,000 | 90,317 |
| Diamond Issuer, Series 2021-1A, Class C, 3.79%, 11/20/51(a) | | 282,000 | 224,974 |
| Drive Auto Receivables Trust, Series 2021-3, Class C, 1.47%, 1/15/27 | | 625,000 | 607,177 |
| DT Auto Owner Trust, | | | |
| Series 2021-3A, Class C, 0.87%, 5/17/27(a) | | 149,000 | 144,360 |
| Series 2021-4A, Class C, 1.50%, 9/15/27(a) | | 116,000 | 110,222 |
| Series 2022-1A, Class C, 2.96%, 11/15/27(a) | | 162,000 | 157,035 |
| Elm Trust, | | | |
| Series 2020-3A, Class A2, 2.95%, 8/20/29(a) | | 90,427 | 85,316 |
| Series 2020-3A, Class B, 4.48%, 8/20/29(a) | | 234,728 | 212,435 |
| Series 2020-4A, Class A2, 2.29%, 10/20/29(a) | | 87,489 | 81,683 |
| Series 2020-4A, Class B, 3.87%, 10/20/29(a) | | 297,423 | 263,894 |
|
| Enterprise Fleet Financing, Series 2023-3, Class A3, 6.41%, 6/20/30(a) | | 305,000 | 306,562 |
| Enterprise Fleet Financing LLC, | | | |
| Series 2023-1, Class A3, 5.42%, 10/22/29(a) | | 226,000 | 222,607 |
| Series 2023-2, Class A3, 5.50%, 4/22/30(a) | | 313,000 | 307,117 |
| | | Par | Value |
| Other (Continued) |
|
| Exeter Automobile Receivables Trust, Series 2021-4A, Class C, 1.46%, 10/15/27 | | $356,000 | $345,616 |
| FCI Funding, Series 2021-1A, Class A, 1.13%, 4/15/33(a) | | 23,017 | 22,481 |
| Flagship Credit Auto Trust, | | | |
| Series 2021-2, Class C, 1.27%, 6/15/27(a) | | 150,000 | 140,279 |
| Series 2021-4, Class B, 1.49%, 2/15/27(a) | | 73,000 | 69,567 |
| Ford Credit Auto Owner Trust, | | | |
| Series 2022-A, Class A3, 1.29%, 6/15/26 | | 238,307 | 230,916 |
| Series 2023-A, Class A4, 4.56%, 12/15/28 | | 114,000 | 110,289 |
| Series 2023-B, Class A4, 5.06%, 2/15/29 | | 100,000 | 97,941 |
|
| Ford Credit Floorplan Master Owner Trust, Series 2018-4, Class A, 4.06%, 11/15/30 | | 645,000 | 590,709 |
| Fortress Credit Opportunities IX CLO Ltd., Series 2017-9A, Class A1TR, (3M CME Term SOFR + 1.81%, 1.55% Floor), 7.21%, 10/15/33(a)(c) | | 954,000 | 936,561 |
| Fortress Credit Opportunities XI CLO Ltd., Series 2018-11A, Class A1T, (3M CME Term SOFR + 1.56%), 6.96%, 4/15/31(a)(c) | | 323,688 | 321,697 |
| Fortress Credit Opportunities XVII CLO Ltd., Series 2022-17A, Class A, (3M CME Term SOFR + 1.37%, 1.37% Floor), 6.76%, 1/15/30(a)(c) | | 239,954 | 238,888 |
| GM Financial Consumer Automobile Receivables Trust, Series 2020-3, Class C, 1.37%, 1/16/26 | | 50,000 | 48,269 |
| GM Financial Revolving Receivables Trust, | | | |
| Series 2021-1, Class A, 1.17%, 6/12/34(a) | | 302,000 | 265,367 |
| Series 2023-1, Class A, 5.12%, 4/11/35(a) | | 437,000 | 423,912 |
|
| GMF Floorplan Owner Revolving Trust, Series 2023-2, Class A, 5.34%, 6/15/30(a) | | 165,000 | 161,742 |
See accompanying Notes to Financial Statements
Morningstar Funds Trust October 31, 2023 (unaudited)
Schedule of Investments (continued)
Morningstar Defensive Bond Fund
| | | Par | Value |
| Other (Continued) |
| Golub Capital Partners ABS Funding Ltd., | | | |
| Series 2020-1A, Class A2, 3.21%, 1/22/29(a) | | $446,087 | $417,636 |
| Series 2020-1A, Class B, 4.50%, 1/22/29(a) | | 306,748 | 279,312 |
| Series 2021-1A, Class A2, 2.77%, 4/20/29(a) | | 144,255 | 135,254 |
| Series 2021-1A, Class B, 3.82%, 4/20/29(a) | | 382,000 | 352,709 |
| Series 2021-2A, Class A, 2.94%, 10/19/29(a) | | 796,000 | 709,422 |
| Series 2021-2A, Class B, 3.99%, 10/19/29(a) | | 926,000 | 755,665 |
|
| Golub Capital Partners CLO 36m Ltd., Series 2018-36A, Class A, (3M CME Term SOFR + 1.56%), 6.95%, 2/05/31(a)(c) | | 269,620 | 268,002 |
| Golub Capital Partners CLO Ltd., | | | |
| Series 2018-38A, Class C, (3M CME Term SOFR + 3.06%, 2.80% Floor), 8.48%, 7/20/30(a)(c) | | 507,000 | 494,152 |
| Series 2019-42A, Class A2, (3M CME Term SOFR + 2.26%, 2.00% Floor), 7.68%, 4/20/31(a)(c) | | 472,000 | 468,846 |
|
| Great America Leasing Receivables, Series 2023-1, Class A4, 5.06%, 3/15/30(a) | | 137,000 | 132,568 |
| Helios Issuer LLC, Series 2023-GRID1, Class 1A, 5.75%, 12/20/50(a)(d) | | 100,000 | 98,257 |
| Hertz Vehicle Financing LLC, | | | |
| Series 2022-2A, Class A, 2.33%, 6/26/28(a) | | 298,000 | 259,894 |
| Series 2022-5A, Class A, 3.89%, 9/25/28(a) | | 614,000 | 563,620 |
| Series 2023-4A, Class A, 6.15%, 3/25/30(a) | | 285,000 | 280,931 |
|
| Honda Auto Receivables Owner Trust, Series 2021-4, Class A3, 0.88%, 1/21/26 | | 304,052 | 293,687 |
| Hotwire Funding LLC, Series 2023-1A, Class A2, 5.69%, 5/20/53(a) | | 115,000 | 109,635 |
| | | Par | Value |
| Other (Continued) |
| HPEFS Equipment Trust, | | | |
| Series 2022-1A, Class B, 1.79%, 5/21/29(a) | | $226,000 | $218,584 |
| Series 2022-1A, Class C, 1.96%, 5/21/29(a) | | 150,000 | 143,575 |
|
| Hyundai Auto Receivables Trust, Series 2021-C, Class A3, 0.74%, 5/15/26 | | 199,758 | 193,179 |
| Ivy Hill Middle Market Credit Fund XVIII Ltd., Series 18A, Class E, (3M CME Term SOFR + 8.01%, 7.75% Floor), 13.42%, 4/22/33(a)(c) | | 970,000 | 881,590 |
| John Deere Owner Trust, Series 2023-B, Class A4, 5.11%, 5/15/30 | | 102,000 | 100,175 |
| Kubota Credit Owner Trust, | | | |
| Series 2023-1A, Class A4, 5.07%, 2/15/29(a) | | 100,000 | 97,362 |
| Series 2023-2A, Class A4, 5.23%, 6/15/28(a) | | 116,000 | 113,955 |
| Lake Shore MM CLO III LLC, | | | |
| Series 2019-2A, Class A1R, (3M CME Term SOFR + 1.74%, 1.48% Floor), 7.14%, 10/17/31(a)(c) | | 202,000 | 199,370 |
| Series 2019-2A, Class A2R, 2.52%, 10/17/31(a) | | 100,000 | 94,155 |
|
| Lake Shore MM CLO IV Ltd., Series 2021-1A, Class X, (3M CME Term SOFR + 1.44%, 1.18% Floor), 6.84%, 10/15/33(a)(c) | | 77,333 | 77,219 |
| M&T Equipment, Series 2023-1A, Class A4, 5.75%, 7/15/30(a) | | 100,000 | 98,231 |
| MCF CLO IX Ltd., Series 2019-1A, Class A1R, (3M CME Term SOFR + 1.50%, 1.50% Floor), 6.90%, 7/17/31(a)(c) | | 905,598 | 901,143 |
| MMAF Equipment Finance LLC, | | | |
| Series 2020-A, Class A5, 1.56%, 10/09/42(a) | | 100,000 | 86,309 |
| Series 2023-A, Class A4, 5.50%, 12/13/38(a) | | 217,000 | 212,602 |
See accompanying Notes to Financial Statements
Morningstar Funds Trust October 31, 2023 (unaudited)
Schedule of Investments (continued)
Morningstar Defensive Bond Fund
| | | Par | Value |
| Other (Continued) |
| Monroe Capital ABS Funding Ltd., | | | |
| Series 2021-1A, Class A2, 2.82%, 4/22/31(a)(b) | | $385,709 | $368,804 |
| Series 2021-1A, Class B, 3.91%, 4/22/31(a)(b) | | 221,000 | 212,015 |
|
| Nissan Auto Receivables Owner Trust, Series 2023-A, Class A4, 4.85%, 6/17/30 | | 126,000 | 122,726 |
| Oportun Funding XIV LLC, Series 2021-A, Class A, 1.21%, 3/08/28(a) | | 85,593 | 81,071 |
| Oportun Issuance Trust, | | | |
| Series 2021-B, Class A, 1.47%, 5/08/31(a) | | 230,000 | 209,148 |
| Series 2021-C, Class A, 2.18%, 10/08/31(a) | | 803,000 | 725,845 |
|
| Owl Rock CLO III Ltd., Series 2020-3A, Class A1L, (3M CME Term SOFR + 2.06%), 7.48%, 4/20/32(a)(c) | | 400,000 | 399,416 |
| Owl Rock CLO VI Ltd., Series 2021-6A, Class A, (3M CME Term SOFR + 1.71%, 1.45% Floor), 7.11%, 6/21/32(a)(c) | | 915,000 | 906,024 |
| Parliament CLO II Ltd., Series 2021-2A, Class A, (3M CME Term SOFR + 1.61%, 1.35% Floor), 6.99%, 8/20/32(a)(c) | | 328,696 | 325,097 |
| PFS Financing Corp., | | | |
| Series 2021-B, Class B, 1.09%, 8/15/26(a) | | 101,000 | 96,578 |
| Series 2022-A, Class A, 2.47%, 2/15/27(a) | | 899,000 | 858,218 |
|
| Porsche Financial Auto Securitization Trust, Series 2023-1A, Class A4, 4.72%, 6/23/31(a) | | 142,000 | 137,776 |
| Prestige Auto Receivables Trust, Series 2021-1A, Class C, 1.53%, 2/15/28(a) | | 116,000 | 108,810 |
| PRET LLC, | | | |
| Series 2021-NPL5, Class A1, (Step to 5.49% on 11/25/24), 2.49%, 10/25/51(a)(e) | | 702,305 | 656,664 |
| Series 2021-NPL6, Class A1, (Step to 5.49% on 12/25/24), 2.49%, 7/25/51(a)(e) | | 150,784 | 143,399 |
| | | Par | Value |
| Other (Continued) |
| Pretium Mortgage Credit Partners I LLC, | | | |
| Series 2021-NPL2, Class A1, (Step to 3.46% on 7/27/24), 1.99%, 6/27/60(a)(e) | | $291,535 | $268,721 |
| Series 2021-NPL4, Class A1, (Step to 3.29% on 11/27/24), 2.36%, 10/27/60(a)(e) | | 540,176 | 504,423 |
| Progress Residential Trust, | | | |
| Series 2021-SFR11, Class A, 2.28%, 1/17/39(a) | | 121,730 | 100,378 |
| Series 2021-SFR7, Class A, 1.69%, 8/17/40(a) | | 112,794 | 91,230 |
| Series 2023-SFR2, Class A, 4.50%, 10/17/28(a) | | 246,000 | 228,687 |
| PRPM LLC, | | | |
| Series 2021-10, Class A1, (Step to 5.49% on 11/25/24), 2.49%, 10/25/26(a)(e) | | 312,823 | 291,417 |
| Series 2021-11, Class A1, (Step to 5.49% on 12/25/24), 2.49%, 11/25/26(a)(e) | | 361,986 | 340,913 |
| Series 2021-2, Class A1, 2.12%, 3/25/26(a)(f) | | 189,386 | 181,191 |
| Series 2021-9, Class A1, (Step to 5.36% on 11/25/24), 2.36%, 10/25/26(a)(e) | | 311,467 | 289,245 |
|
| Santander Drive Auto Receivables Trust, Series 2021-4, Class C, 1.26%, 2/16/27 | | 518,000 | 503,367 |
| Santander Retail Auto Lease Trust, Series 2022-A, Class B, 1.61%, 1/20/26(a) | | 86,000 | 82,308 |
| SFS Auto Receivables Securitization Trust, Series 2023-1A, Class A4, 5.47%, 12/20/29(a) | | 100,000 | 97,942 |
| SpringCastle America Funding LLC, Series 2020-AA, Class A, 1.97%, 9/25/37(a) | | 244,330 | 222,147 |
| Toyota Auto Loan Extended Note Trust, Series 2022-1A, Class A, 3.82%, 4/25/35(a) | | 429,000 | 400,951 |
See accompanying Notes to Financial Statements
Morningstar Funds Trust October 31, 2023 (unaudited)
Schedule of Investments (continued)
Morningstar Defensive Bond Fund
| | | Par | Value |
| Other (Continued) |
|
| Toyota Auto Receivables, Series 2023-C, Class A4, 5.01%, 2/15/29 | | $ 228,000 | $ 222,272 |
| TVEST LLC, Series 2020-A, Class A, 4.50%, 7/15/32(a) | | 24,070 | 23,906 |
| Vantage Data Centers Issuer LLC, Series 2020-1A, Class A2, 1.65%, 9/15/45(a) | | 140,000 | 126,811 |
| VCAT LLC, | | | |
| Series 2021-NPL1, Class A1, (Step to 5.29% on 1/25/24), 2.29%, 12/26/50(a)(e) | | 30,155 | 29,402 |
| Series 2021-NPL2, Class A1, (Step to 5.12% on 4/25/24), 2.12%, 3/27/51(a)(e) | | 179,319 | 171,095 |
| VCP CLO II Ltd., | | | |
| Series 2021-2A, Class A1, (3M CME Term SOFR + 1.93%), 7.33%, 4/15/31(a)(b)(c) | | 755,747 | 753,638 |
| Series 2021-2A, Class E, (3M CME Term SOFR + 8.67%), 14.07%, 4/15/31(a)(b)(c) | | 1,119,000 | 1,071,405 |
| VCP RRL ABS I Ltd., | | | |
| Series 2021-1A, Class A, 2.15%, 10/20/31(a) | | 279,878 | 255,136 |
| Series 2021-1A, Class B, 2.85%, 10/20/31(a)(b) | | 250,214 | 226,621 |
| Verizon Master Trust, | | | |
| Series 2023-3, Class A, 4.73%, 4/21/31(a) | | 526,000 | 507,550 |
| Series 2023-6, Class A, 5.35%, 9/22/31(a) | | 689,000 | 678,201 |
|
| Volkswagen Auto Loan Enhanced Trust, Series 2021-1, Class A3, 1.02%, 6/22/26 | | 346,115 | 334,087 |
| VOLT C LLC, Series 2021-NPL9, Class A1, (Step to 4.99% on 5/25/24), 1.99%, 5/25/51(a)(e) | | 185,697 | 171,395 |
| VOLT XCIV LLC, Series 2021-NPL3, Class A1, (Step to 5.24% on 2/25/24), 2.24%, 2/27/51(a)(e) | | 245,575 | 231,310 |
| VOLT XCV LLC, Series 2021-NPL4, Class A1, (Step to 5.24% on 3/25/24), 2.24%, 3/27/51(a)(e) | | 221,736 | 212,461 |
| | | Par | Value |
| Other (Continued) |
|
| WEPCO Environmental Trust Finance I LLC, Series 2021-1, Class A, 1.58%, 12/15/35 | | $ 85,433 | $ 69,982 |
| Westlake Automobile Receivables Trust, | | | |
| Series 2021-2A, Class C, 0.89%, 7/15/26(a) | | 406,000 | 394,679 |
| Series 2021-3A, Class C, 1.58%, 1/15/27(a) | | 598,000 | 572,512 |
| Series 2022-1A, Class C, 3.11%, 3/15/27(a) | | 448,000 | 432,710 |
|
| Woodmont Trust, Series 2019-6A, Class A1R, (3M CME Term SOFR + 1.74%, 1.48% Floor), 7.14%, 7/15/31(a)(c) | | 268,765 | 264,246 |
| World Omni Auto Receivables Trust, | | | |
| Series 2020-C, Class C, 1.39%, 5/17/27 | | 50,000 | 47,429 |
| Series 2023-B, Class A4, 4.68%, 5/15/29 | | 175,000 | 168,803 |
| Series 2023-C, Class A4, 5.03%, 11/15/29 | | 100,000 | 97,381 |
| | | | 40,869,156 |
| Specialty Finance – 1.5% |
| CarMax Auto Owner Trust, | | | |
| Series 2023-1, Class A4, 4.65%, 1/16/29 | | 100,000 | 96,518 |
| Series 2023-2, Class A4, 5.01%, 11/15/28 | | 172,000 | 167,285 |
| Series 2023-3, Class A4, 5.26%, 2/15/29 | | 183,000 | 179,108 |
| GM Financial Consumer Automobile Receivables Trust, | | | |
| Series 2023-1, Class A4, 4.59%, 7/17/28 | | 122,000 | 117,985 |
| Series 2023-3, Class A4, 5.34%, 12/18/28 | | 121,000 | 119,450 |
|
| Hyundai Auto Receivables Trust, Series 2023-B, Class A4, 5.31%, 8/15/29 | | 100,000 | 98,628 |
| John Deere Owner Trust, | | | |
| Series 2023-A, Class A4, 5.01%, 12/17/29 | | 123,000 | 120,916 |
| Series 2023-C, Class A4, 5.39%, 8/15/30 | | 142,000 | 140,635 |
|
| Mercedes-Benz Auto Receivables Trust, Series 2023-1, Class A4, 4.31%, 4/16/29 | | 100,000 | 96,098 |
See accompanying Notes to Financial Statements
Morningstar Funds Trust October 31, 2023 (unaudited)
Schedule of Investments (continued)
Morningstar Defensive Bond Fund
| | | Par | Value |
| Specialty Finance (Continued) |
|
| Toyota Auto Loan Extended Note Trust, Series 2023-1A, Class A, 4.93%, 6/25/36(a) | | $387,000 | $ 372,303 |
| Toyota Auto Receivables Owner Trust, | | | |
| Series 2023-A, Class A4, 4.42%, 8/15/28 | | 125,000 | 120,274 |
| Series 2023-B, Class A4, 4.66%, 9/15/28 | | 163,000 | 157,363 |
|
| World Omni Auto Receivables Trust, Series 2023-A, Class A4, 4.66%, 5/15/29 | | 114,000 | 110,160 |
| | | | 1,896,723 |
Total Asset-Backed Securities
(Cost $46,478,175) | 44,358,684 |
| | | Number
of Shares | |
| Common Stocks – 1.0% |
| Institutional Financial Services – 0.0%(g) |
| J.C. Penney Earnout* | | 3,405 | 9,364 |
| Real Estate Services – 0.2% |
| Copper Property CTL Pass Through Trust | | 25,536 | 265,574 |
| Telecommunications – 0.0%(g) |
| Windstream Corp.(h)* | | 3,665 | 32,985 |
| Transportation & Logistics – 0.8% |
| PHI Group, Inc. | | 44,387 | 1,020,901 |
Total Common Stocks
(Cost $1,040,620) | 1,328,824 |
| | | Par | |
| Corporate Bonds – 4.1% |
| Asset Management – 1.1% |
| Ares Capital Corp., 2.88%, 6/15/28 | | $398,000 | 329,409 |
| Blue Owl Credit Income Corp., | | | |
| 4.70%, 2/08/27 | | 660,000 | 598,742 |
| 7.95%, 6/13/28(a) | | 468,000 | 457,521 |
| | | | 1,385,672 |
| Commercial Support Services – 0.1% |
| VT Topco, Inc., 8.50%, 8/15/30(a) | | 100,000 | 97,559 |
| | | Par | Value |
| Electric Utilities – 0.4% |
| DTE Electric Securitization Funding II LLC, 5.97%, 3/01/32(d) | | $261,000 | $ 261,797 |
| PG&E Recovery Funding LLC, 5.05%, 7/15/32 | | 326,081 | 314,119 |
| | | | 575,916 |
| Gas & Water Utilities – 0.3% |
| Kansas Gas Service Securitization I LLC, 5.49%, 8/01/32 | | 429,762 | 419,331 |
| Health Care Facilities & Services – 0.3% |
| Heartland Dental LLC/Heartland Dental Finance Corp., 10.50%, 4/30/28(a) | | 359,000 | 345,046 |
| Home & Office Products – 0.2% |
| CD&R Smokey Buyer, Inc., 6.75%, 7/15/25(a)(i) | | 315,000 | 301,077 |
| Real Estate Investment Trusts – 0.7% |
| American Tower Trust #1, 5.49%, 3/15/28(a) | | 685,000 | 672,610 |
| SBA Tower Trust, | | | |
| 1.63%, 11/15/26(a) | | 117,000 | 101,278 |
| 2.33%, 1/15/28(a) | | 151,000 | 127,111 |
| | | | 900,999 |
| Specialty Finance – 0.5% |
| Midcap Financial Issuer Trust, 6.50%, 5/01/28(a) | | 761,000 | 644,879 |
| Telecommunications – 0.5% |
| Consolidated Communications, Inc., 6.50%, 10/01/28(a)(i) | | 381,000 | 300,799 |
| Frontier Communications Holdings LLC, | | | |
| 5.88%, 10/15/27(a) | | 137,000 | 124,899 |
| 6.00%, 1/15/30(a) | | 214,000 | 161,087 |
| | | | 586,785 |
Total Corporate Bonds
(Cost $5,648,207) | 5,257,264 |
|
| Foreign Issuer Bonds – 0.5% |
| Canada – 0.4% |
| Air Canada Pass Through Trust, Series 2020-1, Class C, 10.50%, 7/15/26(a) | | 470,000 | 503,409 |
See accompanying Notes to Financial Statements
Morningstar Funds Trust October 31, 2023 (unaudited)
Schedule of Investments (continued)
Morningstar Defensive Bond Fund
| | | Par | Value |
| Ireland – 0.1% |
| Cimpress PLC, 7.00%, 6/15/26 | | $175,000 | $ 161,949 |
Total Foreign Issuer Bonds
(Cost $618,970) | 665,358 |
|
| Mortgage-Backed Securities – 8.1% |
| Commercial Mortgage-Backed Securities – 2.1% |
| BX Commercial Mortgage Trust, | | | |
| Series 2021-VOLT, Class E, (1M CME Term SOFR + 2.11%, 2.00% Floor), 7.45%, 9/15/36(a)(c) | | 242,000 | 229,447 |
| Series 2021-VOLT, Class F, (1M CME Term SOFR + 2.51%, 2.40% Floor), 7.85%, 9/15/36(a)(c) | | 370,000 | 343,623 |
|
| BX Trust, Series 2019-OC11, Class A, 3.20%, 12/09/41(a) | | 418,000 | 344,927 |
| Hawaii Hotel Trust, Series 2019-MAUI, Class C, (1M CME Term SOFR + 1.70%, 1.65% Floor), 7.03%, 5/15/38(a)(c) | | 616,000 | 602,476 |
| Manhattan West Mortgage Trust, Series 2020-1MW, Class A, 2.13%, 9/10/39(a) | | 407,000 | 345,202 |
| Multifamily Structured Pass Through Certificates, | | | |
| Series K073, Class A2, 3.35%, 1/25/28 | | 261,000 | 241,257 |
| Series K088, Class A2, 3.69%, 1/25/29 | | 100,000 | 92,228 |
| Series K114, Class A2, 1.37%, 6/25/30 | | 100,000 | 76,902 |
|
| SLG Office Trust, Series 2021-OVA, Class A, 2.59%, 7/15/41(a) | | 455,000 | 345,122 |
| VMC Finance LLC, Series 2021-HT1, Class A, (1M CME Term SOFR + 1.76%, 1.65% Floor), 7.10%, 1/18/37(a)(c) | | 172,297 | 167,792 |
| | | | 2,788,976 |
| Federal Home Loan Mortgage Corporation – 4.8% |
| Multifamily Structured Pass Through Certificates, | | | |
| Series K068, Class A2, 3.24%, 8/25/27 | | 100,000 | 92,729 |
| | | Par | Value |
Federal Home Loan Mortgage Corporation
(Continued) |
| Multifamily Structured Pass Through Certificates, | | | |
| Series K072, Class A2, 3.44%, 12/25/27 | | $100,000 | $ 92,901 |
| Series K076, Class A2, 3.90%, 4/25/28 | | 144,000 | 135,575 |
| Series K077, Class A2, 3.85%, 5/25/28 | | 100,000 | 93,826 |
| Series K079, Class A2, 3.93%, 6/25/28 | | 273,000 | 256,561 |
| Series K080, Class A2, 3.93%, 7/25/28 | | 219,000 | 205,633 |
| Series K081, Class A2, 3.90%, 8/25/28 | | 556,000 | 521,109 |
| Series K082, Class A2, 3.92%, 9/25/28 | | 413,000 | 387,263 |
| Series K083, Class A2, 4.05%, 9/25/28 | | 209,000 | 196,843 |
| Series K084, Class A2, 3.78%, 10/25/28 | | 489,000 | 456,811 |
| Series K085, Class A2, 4.06%, 10/25/28 | | 244,000 | 229,478 |
| Series K089, Class A2, 3.56%, 1/25/29 | | 226,000 | 207,028 |
| Series K091, Class A2, 3.51%, 3/25/29 | | 198,000 | 180,410 |
| Series K093, Class A2, 2.98%, 5/25/29 | | 100,000 | 88,506 |
| Series K094, Class A2, 2.90%, 6/25/29 | | 532,000 | 466,923 |
| Series K095, Class A2, 2.79%, 6/25/29 | | 697,000 | 607,684 |
| Series K096, Class A2, 2.52%, 7/25/29 | | 694,000 | 594,450 |
| Series K097, Class A2, 2.51%, 7/25/29 | | 359,000 | 306,668 |
| Series K109, Class A2, 1.56%, 4/25/30 | | 139,000 | 109,377 |
|
| Pool, 1.50%, 11/01/35 | | 995,000 | 824,153 |
| Real Estate Mortgage Investment Conduits, Series 4162, Class P, 3.00%, 2/15/33 | | 115,711 | 110,020 |
| | | | 6,163,948 |
| Federal National Mortgage Association – 0.6% |
| Interest Strip, Series 284, Class 1, 0.00%, 7/25/27(j) | | 45,922 | 42,174 |
| Pool, 1.50%, 12/01/35 | | 741,000 | 613,859 |
| Real Estate Mortgage Investment Conduits, Series 2012-144, Class PD, 3.50%, 4/25/42 | | 88,303 | 83,136 |
| | | | 739,169 |
See accompanying Notes to Financial Statements
Morningstar Funds Trust October 31, 2023 (unaudited)
Schedule of Investments (continued)
Morningstar Defensive Bond Fund
| | | Par | Value |
| Government National Mortgage Association – 0.3% |
| Series 2012-150, Class IO, 0.44%, 11/16/52(f) | | $ 659,807 | $ 5,919 |
| Series 2015-108, Class IO, 0.34%, 10/16/56(f) | | 40,537 | 736 |
| Series 2015-7, Class IO, 0.45%, 1/16/57(f) | | 1,485,931 | 29,917 |
| Series 2020-42, Class IO, 0.94%, 3/16/62(f) | | 1,409,329 | 84,792 |
| Series 2020-43, Class IO, 1.26%, 11/16/61(f) | | 955,416 | 67,117 |
| Series 2020-71, Class IO, 1.09%, 1/16/62(f) | | 1,246,847 | 82,769 |
| Series 2020-75, Class IO, 0.87%, 2/16/62(f) | | 2,246,330 | 129,141 |
| | | | 400,391 |
| Whole Loan – 0.3% |
| Towd Point Mortgage Trust, | | | |
| Series 2018-2, Class A1, 3.25%, 3/25/58(a) | | 174,952 | 166,948 |
| Series 2020-4, Class A1, 1.75%, 10/25/60(a) | | 67,418 | 57,614 |
| Series 2023-1, Class A1, 3.75%, 1/25/63(a) | | 184,559 | 165,859 |
| | | | 390,421 |
Total Mortgage-Backed Securities
(Cost $11,561,477) | 10,482,905 |
|
| Municipal Bonds – 0.1% |
| Texas – 0.1% |
| Texas Natural Gas Securitization Finance Corp., Taxable Customer Rate Relief Revenue Bonds, 5.10%, 4/01/35 | | 100,000 | 96,777 |
Total Municipal Bonds
(Cost $100,000) | 96,777 |
|
| Term Loans – 1.2%(c) |
| Commercial Support Services – 0.2% |
| Cimpress PLC, Tranche B-1 Term Loan, (1M USD CME Term SOFR + 3.50%), 8.94%, 5/17/28 | | 265,880 | 260,951 |
| Retail - Discretionary – 0.0%(g) |
| J.C. Penney Corp., Inc., Term Loan(k) | | 233,386 | 23 |
| | | Par | Value |
| Software – 0.5% |
| Azalea TopCo, Inc., Initial Term Loan, (3M USD CME Term SOFR + 3.50%), 9.18%, 7/24/26 | | $325,404 | $ 308,320 |
| Polaris Newco LLC, Dollar Term Loan, (1M USD CME Term SOFR + 4.00%, 0.50% Floor), 9.44%, 6/02/28 | | 323,400 | 304,805 |
| | | | 613,125 |
| Telecommunications – 0.5% |
| Frontier Communications Corp., TLB, (1M USD CME Term SOFR + 3.75%, 0.75% Floor), 9.19%, 10/08/27 | | 360,750 | 346,771 |
| Windstream Services II LLC, Initial Term Loan, (1M USD CME Term SOFR + 6.25%, 1.00% Floor), 11.67%, 9/21/27 | | 305,605 | 281,792 |
| | | | 628,563 |
Total Term Loans
(Cost $1,566,557) | 1,502,662 |
| | | | |
| U.S. Government Obligations – 1.8% |
| U.S. Treasury Notes – 1.8% |
| 4.38%, 8/31/28 | | 1,106,000 | 1,084,917 |
| 4.63%, 9/30/28(i) | | 294,000 | 291,336 |
| 4.63%, 9/30/30 | | 883,000 | 868,099 |
Total U.S. Government Obligations
(Cost $2,251,407) | 2,244,352 |
| | | Number
of Shares | |
| Investment Companies – 43.2% |
| Schwab Intermediate-Term U.S. Treasury ETF(i) | | 221,251 | 10,489,510 |
| Schwab Short-Term U.S. Treasury ETF | | 789,537 | 37,810,927 |
| Vanguard Short-Term Corporate Bond ETF | | 35,486 | 2,656,482 |
| Vanguard Short-Term Inflation-Protected Securities ETF | | 100,747 | 4,749,213 |
Total Investment Companies
(Cost $59,540,639) | 55,706,132 |
See accompanying Notes to Financial Statements
Morningstar Funds Trust October 31, 2023 (unaudited)
Schedule of Investments (continued)
Morningstar Defensive Bond Fund
| | | Par/Number
of Shares | Value |
| Short-Term Investments – 6.0% |
| Corporate Bonds – 0.4% |
| Golub Capital BDC, Inc., 3.38%, 4/15/24 | | 513,000 | $ 504,949 |
| Money Market Funds – 5.6% |
| Northern Institutional Funds - Liquid Assets Portfolio (Shares), 5.41%(l)(m) | | 1,272,762 | 1,272,762 |
|
| Northern Institutional Funds - Treasury Portfolio (Premier), 5.21%(l) | | 5,951,188 | 5,951,188 |
| | | | 7,223,950 |
Total Short-Term Investments
(Cost $7,736,938) | 7,728,899 |
Total Investments – 100.4%
(Cost $136,542,990) | 129,371,857 |
| Liabilities less Other Assets – (0.4)% | (498,548) |
| NET ASSETS – 100.0% | $128,873,309 |
| Percentages shown are based on Net Assets. |
| |
| (a) | Securities exempt from registration under Rule 144A of the Securities Act of 1933. These securities may be resold in transactions exempt from registration, normally to qualified institutional buyers. | | |
| (b) | Restricted security that has been deemed illiquid and is classified as Level 2. At October 31, 2023, the value of these restricted illiquid securities amounted to $4,397,840 or 3.41% of net assets. Additional information on these restricted illiquid securities is as follows: | | |
| | Security | Acquisition Date | Acquisition Cost |
| | ABPCI Direct Lending Fund ABS I Ltd., 4.94%, 12/20/30 | 12/16/20 | $ 807,351 |
| | ABPCI Direct Lending Fund ABS II LLC, 7.49%, 3/1/32 | 2/15/22 | 224,000 |
| | ABPCI Direct Lending Fund ABS II LLC, 8.24%, 3/1/32 | 2/15/22 | 935,000 |
| | Monroe Capital ABS Funding Ltd., 2.82%, 4/22/31 | 2/18/21-3/25/21 | 385,476 |
| | Monroe Capital ABS Funding Ltd., 3.91%, 4/22/31 | 2/18/21 | 221,000 |
| | VCP CLO II Ltd., 7.33%, 4/15/31 | 3/7/22 | 752,441 |
| | VCP CLO II Ltd., 14.07%, 4/15/31 | 2/5/21 | 1,085,430 |
| | VCP RRL ABS I Ltd., 2.85%, 10/20/31 | 7/28/21 | 250,214 |
| |
|
| (c) | Variable or floating rate security. Rate as of October 31, 2023 is disclosed. |
| (d) | When-Issued Security. Coupon rate was not yet in effect at October 31, 2023. |
| (e) | Step coupon bond. Rate as of October 31, 2023 is disclosed. |
| (f) | Variable or floating rate security, the interest rate of which adjusts periodically based on changes in current interest rates and prepayments on the underlying pool of assets. Rate as of October 31, 2023 is disclosed. |
| (g) | Amount rounds to less than 0.05%. |
| (h) | Investment is valued using significant unobservable inputs (Level 3). |
| (i) | Security either partially or fully on loan. (See Note 7). |
| (j) | Zero coupon bond. |
| (k) | Issuer has defaulted on terms of debt obligation. Income is not being accrued. |
| (l) | 7-day current yield as of October 31, 2023 is disclosed. |
| (m) | Security purchased with the cash proceeds from securities loaned. (See Note 7). |
See accompanying Notes to Financial Statements
Morningstar Funds Trust October 31, 2023 (unaudited)
Schedule of Investments (continued)
Morningstar Defensive Bond Fund
| * | Non-Income Producing Security |
| 1M | 1 Month |
| 3M | 3 Month |
| ABS | Asset-Backed Security |
| BDC | Business Development Company |
| CLO | Collateralized Loan Obligation |
| CME | Chicago Mercantile Exchange |
| ETF | Exchange-Traded Fund |
| IO | Interest Only |
| L.P. | Limited Partnership |
| LLC | Limited Liability Company |
| PLC | Public Limited Company |
| SOFR | United States Secured Overnight Financing Rate |
| Strip | Separate Trading of Registered Interest and Principal |
| USD | United States Dollar |
Valuation Hierarchy
The following is a summary of the inputs used, as of October 31, 2023, in valuing the Fund's investments carried at fair value:
| Morningstar Defensive Bond Fund | Level 1 | Level 2 | Level 3 | Totals |
| Investments | | | | |
| Assets: | | | | |
| Asset-Backed Securities | $ — | $44,358,684 | $ — | $ 44,358,684 |
| Common Stocks | 1,020,901 | 274,938 | 32,985 | 1,328,824 |
| Corporate Bonds | — | 5,257,264 | — | 5,257,264 |
| Foreign Issuer Bonds | — | 665,358 | — | 665,358 |
| Mortgage-Backed Securities | — | 10,482,905 | — | 10,482,905 |
| Municipal Bonds | — | 96,777 | — | 96,777 |
| Term Loans | — | 1,502,662 | — | 1,502,662 |
| U.S. Government Obligations | — | 2,244,352 | — | 2,244,352 |
| Investment Companies | 55,706,132 | — | — | 55,706,132 |
| Short-Term Investments | 7,223,950 | 504,949 | — | 7,728,899 |
| Total Investments | $63,950,983 | $65,387,889 | $32,985 | $129,371,857 |
See accompanying Notes to Financial Statements
Morningstar Funds Trust October 31, 2023 (unaudited)
Morningstar Multisector Bond Fund
| | | Par (a) | Value |
| Asset-Backed Securities – 0.3% |
| Other – 0.3% |
| Clover CLO LLC, Series 2021-2A, Class E, (3M CME Term SOFR + 6.76%, 6.50% Floor), 12.18%, 7/20/34(b)(c) | | $250,000 | $242,865 |
| Pikes Peak CLO 4, Series 2019-4A, Class ER, (3M CME Term SOFR + 6.87%, 6.61% Floor), 12.27%, 7/15/34(b)(c) | | 250,000 | 225,600 |
| PRPM LLC, Series 2022-5, Class A1, (Step to 9.90% on 9/25/25), 6.90%, 9/27/27(b)(d) | | 115,362 | 114,244 |
Total Asset-Backed Securities
(Cost $613,109) | 582,709 |
| | | Number
of Shares | |
| Common Stocks – 0.2% |
| Biotechnology & Pharmaceuticals – 0.1% |
| AbbVie, Inc. | | 590 | 83,296 |
| Cable & Satellite – 0.0%(e) |
| Altice USA, Inc., Class A* | | 16,055 | 46,399 |
| Engineering & Construction – 0.0%(e) |
| Mcdermott International Ltd.* | | 1,932 | 367 |
| Oil & Gas Producers – 0.1% |
| Battalion Oil Corp.* | | 363 | 2,178 |
| Canadian Natural Resources Ltd. (Canada) | | 1,464 | 93,008 |
| Diamondback Energy, Inc. | | 558 | 89,458 |
| | | | 184,644 |
| Technology Services – 0.0%(e) |
| Clarivate PLC* | | 78 | 498 |
Total Common Stocks
(Cost $594,347) | 315,204 |
| | | Par (a) | |
| Convertible Bonds – 1.3% |
| Biotechnology & Pharmaceuticals – 0.3% |
| BioMarin Pharmaceutical, Inc., 1.25%, 5/15/27 | | $335,000 | 322,083 |
| Livongo Health, Inc., 0.88%, 6/01/25 | | 120,000 | 109,061 |
| | | | 431,144 |
| | | Par (a) | Value |
| Cable & Satellite – 0.4% |
| DISH Network Corp., | | | |
| 0.00%, 12/15/25(f) | | $ 185,000 | $ 112,854 |
| 3.38%, 8/15/26 | | 1,185,000 | 607,312 |
| | | | 720,166 |
| Health Care Facilities & Services – 0.2% |
| Teladoc Health, Inc., 1.25%, 6/01/27 | | 460,000 | 357,190 |
| Household Products – 0.1% |
| Beauty Health (The) Co., 1.25%, 10/01/26(b) | | 135,000 | 101,064 |
| Internet Media & Services – 0.0%(e) |
| Zillow Group, Inc., 1.38%, 9/01/26 | | 30,000 | 31,590 |
| Leisure Facilities & Services – 0.1% |
| NCL Corp. Ltd., 1.13%, 2/15/27 | | 150,000 | 116,225 |
| Penn Entertainment, Inc., 2.75%, 5/15/26 | | 30,000 | 32,877 |
| | | | 149,102 |
| Medical Equipment & Devices – 0.1% |
| Envista Holdings Corp., 1.75%, 8/15/28(b) | | 155,000 | 133,455 |
| Lantheus Holdings, Inc., 2.63%, 12/15/27(b) | | 60,000 | 66,506 |
| | | | 199,961 |
| Semiconductors – 0.0%(e) |
| Wolfspeed, Inc., | | | |
| 0.25%, 2/15/28 | | 15,000 | 9,293 |
| 1.88%, 12/01/29(b) | | 35,000 | 20,825 |
| | | | 30,118 |
| Transportation & Logistics – 0.1% |
| Southwest Airlines Co., 1.25%, 5/01/25 | | 210,000 | 199,185 |
Total Convertible Bonds
(Cost $2,959,307) | 2,219,520 |
| | | Number
of Shares | |
| Convertible Preferred Stocks – 0.1% |
| Technology Services – 0.1% |
| Clarivate PLC, 5.25% | | 4,753 | 132,751 |
Total Convertible Preferred Stocks
(Cost $266,943) | 132,751 |
See accompanying Notes to Financial Statements
Morningstar Funds Trust October 31, 2023 (unaudited)
Schedule of Investments (continued)
Morningstar Multisector Bond Fund
| | | Par (a) | Value |
| Corporate Bonds – 42.8% |
| Advertising & Marketing – 0.2% |
| Outfront Media Capital LLC/Outfront Media Capital Corp., 5.00%, 8/15/27(b) | | $ 75,000 | $ 66,621 |
| Stagwell Global LLC, 5.63%, 8/15/29(b) | | 295,000 | 243,815 |
| | | | 310,436 |
| Aerospace & Defense – 0.9% |
| Boeing (The) Co., | | | |
| 3.25%, 2/01/28 | | 117,000 | 104,559 |
| 5.71%, 5/01/40 | | 126,000 | 111,456 |
| 3.85%, 11/01/48 | | 23,000 | 14,870 |
| 5.81%, 5/01/50 | | 88,000 | 75,759 |
| 5.93%, 5/01/60 | | 52,000 | 43,748 |
| HEICO Corp., | | | |
| 5.25%, 8/01/28 | | 66,000 | 63,666 |
| 5.35%, 8/01/33 | | 94,000 | 86,278 |
|
| L3Harris Technologies, Inc., 5.40%, 7/31/33 | | 49,000 | 45,787 |
| Lockheed Martin Corp., 5.20%, 2/15/55 | | 50,000 | 43,594 |
| Northrop Grumman Corp., | | | |
| 5.15%, 5/01/40 | | 52,000 | 45,571 |
| 4.95%, 3/15/53 | | 4,000 | 3,313 |
| RTX Corp., | | | |
| 3.50%, 3/15/27 | | 109,000 | 100,786 |
| 5.15%, 2/27/33 | | 58,000 | 53,509 |
| 4.45%, 11/16/38 | | 65,000 | 51,833 |
| 4.50%, 6/01/42 | | 67,000 | 51,991 |
| 4.80%, 12/15/43 | | 7,000 | 5,547 |
| 5.38%, 2/27/53 | | 109,000 | 92,396 |
| TransDigm, Inc., | | | |
| 6.25%, 3/15/26(b) | | 200,000 | 195,292 |
| 6.75%, 8/15/28(b) | | 300,000 | 291,295 |
| 6.88%, 12/15/30(b) | | 85,000 | 82,073 |
| | | | 1,563,323 |
| Apparel & Textile Products – 0.0%(e) |
| Crocs, Inc., 4.13%, 8/15/31(b) | | 20,000 | 15,199 |
| Asset Management – 0.8% |
| BlackRock, Inc., 4.75%, 5/25/33 | | 41,000 | 37,543 |
| Blackstone Holdings Finance Co. LLC, 2.00%, 1/30/32(b) | | 66,000 | 46,655 |
| Blackstone Secured Lending Fund, | | | |
| 3.63%, 1/15/26 | | 140,000 | 129,325 |
| 2.75%, 9/16/26 | | 30,000 | 26,325 |
| | | Par (a) | Value |
| Asset Management (Continued) |
|
| Blue Owl Capital Corp., 3.40%, 7/15/26 | | $160,000 | $ 142,762 |
| Blue Owl Credit Income Corp., 7.75%, 9/16/27 | | 57,000 | 56,125 |
| Charles Schwab (The) Corp., | | | |
| (10Y US Treasury CMT + 3.08%), 4.00%, 12/01/30(g)(h) | | 80,000 | 54,593 |
| (SOFR + 2.01%), 6.14%, 8/24/34(h) | | 76,000 | 71,182 |
| Icahn Enterprises L.P./Icahn Enterprises Finance Corp., | | | |
| 6.38%, 12/15/25 | | 15,000 | 14,111 |
| 5.25%, 5/15/27 | | 625,000 | 535,156 |
| NFP Corp., | | | |
| 6.88%, 8/15/28(b) | | 100,000 | 85,391 |
| 4.88%, 8/15/28(b) | | 35,000 | 30,645 |
| 8.50%, 10/01/31(b) | | 85,000 | 83,576 |
|
| Sixth Street Specialty Lending, Inc., 6.95%, 8/14/28 | | 59,000 | 57,390 |
| | | | 1,370,779 |
| Automotive – 1.7% |
| American Axle & Manufacturing, Inc., 5.00%, 10/01/29 | | 70,000 | 55,294 |
| American Honda Finance Corp., | | | |
| 5.13%, 7/07/28 | | 57,000 | 55,549 |
| 5.85%, 10/04/30 | | 71,000 | 70,498 |
| Ford Motor Credit Co. LLC, | | | |
| 4.06%, 11/01/24 | | 505,000 | 491,618 |
| 2.30%, 2/10/25 | | 475,000 | 448,547 |
| 6.95%, 6/10/26 | | 220,000 | 220,550 |
| 4.13%, 8/17/27 | | 200,000 | 181,582 |
|
| General Motors Co., 6.13%, 10/01/25 | | 60,000 | 59,893 |
| General Motors Financial Co., Inc., | | | |
| (3M USD LIBOR + 3.60%), 5.75%, 9/30/27(g)(h) | | 260,000 | 202,682 |
| (3M USD LIBOR + 3.44%), 6.50%, 9/30/28(g)(h) | | 120,000 | 98,317 |
| 5.85%, 4/06/30 | | 34,000 | 32,134 |
| (5Y US Treasury CMT + 5.00%), 5.70%, 9/30/30(g)(h) | | 150,000 | 125,965 |
| Hyundai Capital America, | | | |
| 6.25%, 11/03/25(b) | | 146,000 | 145,979 |
| 5.68%, 6/26/28(b) | | 65,000 | 62,887 |
| 6.10%, 9/21/28(b) | | 103,000 | 101,301 |
See accompanying Notes to Financial Statements
Morningstar Funds Trust October 31, 2023 (unaudited)
Schedule of Investments (continued)
Morningstar Multisector Bond Fund
| | | Par (a) | Value |
| Automotive (Continued) |
| Hyundai Capital America, | | | |
| 5.70%, 6/26/30(b) | | $338,000 | $ 320,098 |
|
| Toyota Motor Credit Corp., 4.45%, 6/29/29 | | 60,000 | 56,758 |
| Wheel Pros, Inc., 6.50%, 5/15/29(b) | | 65,000 | 19,714 |
| | | | 2,749,366 |
| Banking – 2.3% |
| Bank of America Corp., | | | |
| (3M CME Term SOFR + 1.30%), 3.42%, 12/20/28(h) | | 128,000 | 113,937 |
| (SOFR + 1.63%), 5.20%, 4/25/29(h) | | 56,000 | 53,243 |
| (SOFR + 1.06%), 2.09%, 6/14/29(h) | | 6,000 | 4,954 |
| (3M CME Term SOFR + 1.57%), 4.27%, 7/23/29(h) | | 103,000 | 93,732 |
| (3M CME Term SOFR + 1.44%), 3.19%, 7/23/30(h) | | 85,000 | 71,281 |
| (SOFR + 2.15%), 2.59%, 4/29/31(h) | | 41,000 | 32,323 |
| (SOFR + 1.53%), 1.90%, 7/23/31(h) | | 121,000 | 90,021 |
| (SOFR + 1.22%), 2.65%, 3/11/32(h) | | 90,000 | 68,973 |
| (SOFR + 1.32%), 2.69%, 4/22/32(h) | | 137,000 | 105,045 |
| (SOFR + 1.22%), 2.30%, 7/21/32(h) | | 122,000 | 90,007 |
| (SOFR + 1.33%), 2.97%, 2/04/33(h) | | 128,000 | 98,104 |
| (SOFR + 1.83%), 4.57%, 4/27/33(h) | | 76,000 | 65,543 |
| (SOFR + 1.91%), 5.29%, 4/25/34(h) | | 44,000 | 39,740 |
| (SOFR + 1.84%), 5.87%, 9/15/34(h) | | 95,000 | 89,459 |
| (5Y US Treasury CMT + 1.20%), 2.48%, 9/21/36(h) | | 69,000 | 49,176 |
| (5Y US Treasury CMT + 2.00%), 3.85%, 3/08/37(h) | | 67,000 | 52,855 |
| (SOFR + 1.93%), 2.68%, 6/19/41(h) | | 7,000 | 4,268 |
| Citizens Financial Group, Inc., | | | |
| 2.50%, 2/06/30 | | 70,000 | 52,107 |
| (5Y US Treasury CMT + 2.75%), 5.64%, 5/21/37(h) | | 92,000 | 73,384 |
| | | Par (a) | Value |
| Banking (Continued) |
|
| Fifth Third Bancorp, (SOFR + 2.34%), 6.34%, 7/27/29(h) | | $ 93,000 | $ 90,080 |
| First Horizon Bank, 5.75%, 5/01/30 | | 250,000 | 211,589 |
| Huntington Bancshares, Inc., | | | |
| (SOFR + 2.02%), 6.21%, 8/21/29(h) | | 38,000 | 36,529 |
| (5Y US Treasury CMT + 1.17%), 2.49%, 8/15/36(h) | | 25,000 | 16,827 |
| JPMorgan Chase & Co., | | | |
| (3M CME Term SOFR + 0.58%), 0.97%, 6/23/25(h) | | 137,000 | 131,978 |
| (SOFR + 1.16%), 2.30%, 10/15/25(h) | | 75,000 | 72,186 |
| (3M CME Term SOFR + 1.51%), 3.96%, 1/29/27(h) | | 58,000 | 55,286 |
| (3M CME Term SOFR + 0.70%), 1.04%, 2/04/27(h) | | 179,000 | 159,171 |
| (SOFR + 0.89%), 1.58%, 4/22/27(h) | | 67,000 | 59,773 |
| (SOFR + 0.77%), 1.47%, 9/22/27(h) | | 79,000 | 68,820 |
| (SOFR + 1.33%), 6.07%, 10/22/27(h) | | 138,000 | 137,708 |
| (SOFR + 1.17%), 2.95%, 2/24/28(h) | | 106,000 | 95,412 |
| (SOFR + 1.89%), 2.18%, 6/01/28(h) | | 42,000 | 36,510 |
| (3M CME Term SOFR + 1.21%), 3.51%, 1/23/29(h) | | 136,000 | 122,024 |
| (SOFR + 1.02%), 2.07%, 6/01/29(h) | | 64,000 | 53,197 |
| (3M CME Term SOFR + 1.59%), 4.45%, 12/05/29(h) | | 126,000 | 115,894 |
| (SOFR + 1.07%), 1.95%, 2/04/32(h) | | 45,000 | 33,430 |
| (SOFR + 1.81%), 6.25%, 10/23/34(h) | | 94,000 | 92,733 |
|
| KeyCorp, (SOFR Index + 2.06%), 4.79%, 6/01/33(h) | | 111,000 | 87,532 |
| Truist Financial Corp., | | | |
| (3M CME Term SOFR + 0.91%), 6.32%, 3/15/28(c) | | 106,000 | 94,022 |
| (SOFR + 2.24%), 4.92%, 7/28/33(h) | | 35,000 | 28,581 |
| (SOFR + 2.36%), 5.87%, 6/08/34(h) | | 207,000 | 188,308 |
See accompanying Notes to Financial Statements
Morningstar Funds Trust October 31, 2023 (unaudited)
Schedule of Investments (continued)
Morningstar Multisector Bond Fund
| | | Par (a) | Value |
| Banking (Continued) |
|
| U.S. Bancorp, (SOFR + 2.11%), 4.97%, 7/22/33(h) | | $121,000 | $ 101,260 |
| Wells Fargo & Co., | | | |
| (SOFR + 2.02%), 5.39%, 4/24/34(h) | | 95,000 | 85,999 |
| (SOFR + 1.99%), 5.56%, 7/25/34(h) | | 26,000 | 23,800 |
| (SOFR + 2.06%), 6.49%, 10/23/34(h) | | 188,000 | 184,729 |
| (SOFR + 2.53%), 3.07%, 4/30/41(h) | | 21,000 | 13,419 |
| (3M CME Term SOFR + 4.50%), 5.01%, 4/04/51(h) | | 48,000 | 38,067 |
| (SOFR + 2.13%), 4.61%, 4/25/53(h) | | 150,000 | 110,594 |
| | | | 3,793,610 |
| Beverages – 0.0%(e) |
| Molson Coors Beverage Co., 4.20%, 7/15/46 | | 33,000 | 23,401 |
| Biotechnology & Pharmaceuticals – 1.7% |
| AbbVie, Inc., | | | |
| 3.20%, 5/14/26 | | 68,000 | 64,125 |
| 3.20%, 11/21/29 | | 110,000 | 95,862 |
| 4.50%, 5/14/35 | | 83,000 | 72,509 |
| 4.05%, 11/21/39 | | 66,000 | 51,568 |
| 4.63%, 10/01/42 | | 17,000 | 13,669 |
| 4.25%, 11/21/49 | | 55,000 | 41,277 |
| Amgen, Inc., | | | |
| 2.20%, 2/21/27 | | 59,000 | 52,875 |
| 2.45%, 2/21/30 | | 36,000 | 29,392 |
| 5.25%, 3/02/30 | | 41,000 | 39,360 |
| 2.30%, 2/25/31 | | 22,000 | 17,199 |
| 5.25%, 3/02/33 | | 33,000 | 30,776 |
| 3.15%, 2/21/40 | | 96,000 | 64,293 |
| 5.60%, 3/02/43 | | 178,000 | 158,761 |
| 5.65%, 3/02/53 | | 85,000 | 74,759 |
| 2.77%, 9/01/53 | | 46,000 | 24,033 |
| 4.40%, 2/22/62 | | 54,000 | 37,358 |
| 5.75%, 3/02/63 | | 53,000 | 45,904 |
| Bausch Health Cos., Inc., | | | |
| 6.13%, 2/01/27(b) | | 65,000 | 36,260 |
| 4.88%, 6/01/28(b) | | 520,000 | 259,371 |
| 6.25%, 2/15/29(b) | | 120,000 | 43,840 |
| 5.00%, 2/15/29(b) | | 5,000 | 1,753 |
| 5.25%, 1/30/30(b) | | 140,000 | 48,475 |
| Bristol-Myers Squibb Co., | | | |
| 3.20%, 6/15/26 | | 46,000 | 43,590 |
| 3.40%, 7/26/29 | | 11,000 | 9,869 |
| 4.55%, 2/20/48 | | 40,000 | 31,506 |
| | | Par (a) | Value |
| Biotechnology & Pharmaceuticals (Continued) |
| Bristol-Myers Squibb Co., | | | |
| 11/15/53 (i) | | $ 63,000 | $ 62,346 |
| 11/15/63 (i) | | 60,000 | 59,444 |
|
| Eli Lilly & Co., 5.55%, 3/15/37 | | 53,000 | 52,084 |
| Gilead Sciences, Inc., 5.55%, 10/15/53 | | 47,000 | 42,456 |
| Johnson & Johnson, | | | |
| 3.63%, 3/03/37 | | 61,000 | 49,499 |
| 5.85%, 7/15/38 | | 43,000 | 43,943 |
| 2.10%, 9/01/40 | | 40,000 | 24,294 |
| Merck & Co., Inc., | | | |
| 4.50%, 5/17/33 | | 20,000 | 18,181 |
| 4.90%, 5/17/44 | | 34,000 | 29,399 |
| 5.00%, 5/17/53 | | 47,000 | 40,136 |
| 5.15%, 5/17/63 | | 53,000 | 45,161 |
|
| Mylan, Inc., 5.20%, 4/15/48 | | 22,000 | 15,126 |
| Organon & Co./Organon Foreign Debt Co-Issuer B.V., 5.13%, 4/30/31(b) | | 240,000 | 187,420 |
| Pfizer Investment Enterprises Pte. Ltd., | | | |
| 4.65%, 5/19/30 | | 43,000 | 40,435 |
| 4.75%, 5/19/33 | | 130,000 | 119,470 |
| 5.11%, 5/19/43 | | 77,000 | 67,584 |
| 5.30%, 5/19/53 | | 98,000 | 85,735 |
| 5.34%, 5/19/63 | | 205,000 | 175,615 |
|
| Prestige Brands, Inc., 3.75%, 4/01/31(b) | | 45,000 | 35,741 |
| Royalty Pharma PLC, | | | |
| 1.75%, 9/02/27 | | 101,000 | 85,999 |
| 3.30%, 9/02/40 | | 116,000 | 73,302 |
| 3.35%, 9/02/51 | | 62,000 | 34,192 |
|
| Utah Acquisition Sub, Inc., 5.25%, 6/15/46 | | 12,000 | 8,406 |
| Viatris, Inc., 3.85%, 6/22/40 | | 64,000 | 39,833 |
| | | | 2,824,185 |
| Cable & Satellite – 3.0% |
| Block Communications, Inc., 4.88%, 3/01/28(b) | | 25,000 | 20,528 |
| CCO Holdings LLC/CCO Holdings Capital Corp., | | | |
| 4.75%, 3/01/30(b) | | 620,000 | 511,452 |
| 4.25%, 2/01/31(b) | | 25,000 | 19,455 |
| 4.50%, 6/01/33(b) | | 305,000 | 227,520 |
| 4.25%, 1/15/34(b) | | 1,140,000 | 823,425 |
See accompanying Notes to Financial Statements
Morningstar Funds Trust October 31, 2023 (unaudited)
Schedule of Investments (continued)
Morningstar Multisector Bond Fund
| | | Par (a) | Value |
| Cable & Satellite (Continued) |
| Charter Communications Operating LLC/Charter Communications Operating Capital, | | | |
| 2.80%, 4/01/31 | | $ 29,000 | $ 22,177 |
| 2.30%, 2/01/32 | | 27,000 | 19,289 |
| 4.80%, 3/01/50 | | 79,000 | 52,076 |
| 3.95%, 6/30/62 | | 67,000 | 35,764 |
| Comcast Corp., | | | |
| 5.35%, 11/15/27 | | 10,000 | 9,928 |
| 1.95%, 1/15/31 | | 36,000 | 27,614 |
| 5.65%, 6/15/35 | | 72,000 | 68,607 |
| 6.50%, 11/15/35 | | 11,000 | 11,235 |
| 3.20%, 7/15/36 | | 23,000 | 16,975 |
| 3.90%, 3/01/38 | | 48,000 | 37,234 |
| 3.25%, 11/01/39 | | 88,000 | 60,683 |
| 2.94%, 11/01/56 | | 87,000 | 46,093 |
| 5.50%, 5/15/64 | | 152,000 | 129,609 |
| CSC Holdings LLC, | | | |
| 5.75%, 1/15/30(b) | | 900,000 | 470,853 |
| 4.63%, 12/01/30(b) | | 1,000,000 | 507,122 |
| 3.38%, 2/15/31(b) | | 200,000 | 127,915 |
|
| Directv Financing LLC/Directv Financing Co-Obligor, Inc., 5.88%, 8/15/27(b) | | 495,000 | 433,736 |
| DISH DBS Corp., | | | |
| 7.75%, 7/01/26 | | 315,000 | 211,072 |
| 5.25%, 12/01/26(b) | | 285,000 | 229,896 |
| 7.38%, 7/01/28 | | 80,000 | 45,179 |
| 5.75%, 12/01/28(b) | | 190,000 | 137,988 |
| 5.13%, 6/01/29 | | 610,000 | 314,150 |
|
| Radiate Holdco LLC/Radiate Finance, Inc., 6.50%, 9/15/28(b) | | 130,000 | 64,350 |
| Sirius XM Radio, Inc., 3.88%, 9/01/31(b) | | 330,000 | 248,552 |
| | | | 4,930,477 |
| Chemicals – 0.2% |
| Ashland, Inc., 3.38%, 9/01/31(b) | | 35,000 | 26,830 |
| ASP Unifrax Holdings, Inc., 5.25%, 9/30/28(b) | | 175,000 | 118,203 |
| Dow Chemical (The) Co., | | | |
| 6.30%, 3/15/33 | | 20,000 | 20,090 |
| 4.38%, 11/15/42 | | 71,000 | 52,739 |
| LYB International Finance III LLC, | | | |
| 4.20%, 5/01/50 | | 23,000 | 15,216 |
| 3.63%, 4/01/51 | | 16,000 | 9,642 |
|
| Mosaic (The) Co., 4.88%, 11/15/41 | | 19,000 | 14,539 |
| | | Par (a) | Value |
| Chemicals (Continued) |
|
| RPM International, Inc., 2.95%, 1/15/32 | | $ 86,000 | $ 65,358 |
| Westlake Corp., 3.13%, 8/15/51 | | 17,000 | 9,156 |
| WR Grace Holdings LLC, 5.63%, 8/15/29(b) | | 15,000 | 11,625 |
| | | | 343,398 |
| Commercial Support Services – 0.5% |
| ADT Security (The) Corp., 4.13%, 8/01/29(b) | | 265,000 | 227,277 |
| Aramark Services, Inc., 5.00%, 2/01/28(b) | | 25,000 | 22,929 |
| Clean Harbors, Inc., | | | |
| 5.13%, 7/15/29(b) | | 5,000 | 4,497 |
| 6.38%, 2/01/31(b) | | 50,000 | 47,523 |
|
| Covanta Holding Corp., 4.88%, 12/01/29(b) | | 255,000 | 198,900 |
| Prime Security Services Borrower LLC/Prime Finance, Inc., 3.38%, 8/31/27(b) | | 30,000 | 26,376 |
| Republic Services, Inc., 2.90%, 7/01/26 | | 35,000 | 32,712 |
| VT Topco, Inc., 8.50%, 8/15/30(b) | | 80,000 | 78,047 |
| Waste Management, Inc., | | | |
| 4.88%, 2/15/29 | | 24,000 | 23,130 |
| 2.00%, 6/01/29 | | 47,000 | 38,775 |
| 4.63%, 2/15/30 | | 34,000 | 31,953 |
| 4.63%, 2/15/33 | | 23,000 | 20,859 |
| 4.88%, 2/15/34 | | 120,000 | 109,889 |
| | | | 862,867 |
| Construction Materials – 0.1% |
| Advanced Drainage Systems, Inc., 6.38%, 6/15/30(b) | | 85,000 | 80,254 |
| Standard Industries, Inc., 4.38%, 7/15/30(b) | | 80,000 | 65,362 |
| | | | 145,616 |
| Containers & Packaging – 0.1% |
| Graham Packaging Co., Inc., 7.13%, 8/15/28(b) | | 75,000 | 57,460 |
| LABL, Inc., 5.88%, 11/01/28(b) | | 45,000 | 38,081 |
| Sealed Air Corp./Sealed Air Corp. U.S., 6.13%, 2/01/28(b) | | 60,000 | 57,109 |
| WRKCo, Inc., 4.65%, 3/15/26 | | 20,000 | 19,379 |
| | | | 172,029 |
See accompanying Notes to Financial Statements
Morningstar Funds Trust October 31, 2023 (unaudited)
Schedule of Investments (continued)
Morningstar Multisector Bond Fund
| | | Par (a) | Value |
| Diversified Industrials – 0.0%(e) |
| Honeywell International, Inc., 5.00%, 2/15/33 | | $ 25,000 | $ 23,619 |
| Parker-Hannifin Corp., 4.25%, 9/15/27 | | 54,000 | 51,209 |
| | | | 74,828 |
| E-Commerce Discretionary – 0.1% |
| Amazon.com, Inc., | | | |
| 2.10%, 5/12/31 | | 17,000 | 13,400 |
| 4.70%, 12/01/32 | | 31,000 | 29,071 |
| 3.10%, 5/12/51 | | 60,000 | 37,174 |
| 3.95%, 4/13/52 | | 27,000 | 19,739 |
| 3.25%, 5/12/61 | | 73,000 | 43,716 |
| 4.10%, 4/13/62 | | 21,000 | 15,098 |
| | | | 158,198 |
| Electric Utilities – 3.0% |
| AES (The) Corp., | | | |
| 5.45%, 6/01/28 | | 52,000 | 49,658 |
| 2.45%, 1/15/31 | | 41,000 | 30,808 |
| Alabama Power Co., | | | |
| 3.75%, 3/01/45 | | 33,000 | 22,744 |
| 4.30%, 7/15/48 | | 38,000 | 27,772 |
| 3.45%, 10/01/49 | | 26,000 | 16,353 |
|
| Alliant Energy Finance LLC, 3.60%, 3/01/32(b) | | 28,000 | 22,581 |
| American Electric Power Co., Inc., | | | |
| 5.63%, 3/01/33 | | 41,000 | 38,484 |
| (5Y US Treasury CMT + 2.68%), 3.88%, 2/15/62(h) | | 30,000 | 23,560 |
| Appalachian Power Co., | | | |
| 3.40%, 6/01/25 | | 25,000 | 24,028 |
| 4.50%, 3/01/49 | | 33,000 | 23,925 |
|
| Avangrid, Inc., 3.15%, 12/01/24 | | 47,000 | 45,413 |
| Baltimore Gas and Electric Co., 5.40%, 6/01/53 | | 35,000 | 30,357 |
| Calpine Corp., | | | |
| 5.25%, 6/01/26(b) | | 40,000 | 38,284 |
| 4.50%, 2/15/28(b) | | 355,000 | 320,103 |
|
| CMS Energy Corp., (5Y US Treasury CMT + 4.12%), 4.75%, 6/01/50(h) | | 207,000 | 171,657 |
| Commonwealth Edison Co., 5.90%, 3/15/36 | | 73,000 | 70,830 |
| Consumers Energy Co., 4.90%, 2/15/29 | | 87,000 | 84,063 |
| | | Par (a) | Value |
| Electric Utilities (Continued) |
|
| Dominion Energy South Carolina, Inc., 6.25%, 10/15/53 | | $ 51,000 | $ 49,623 |
| Dominion Energy, Inc., 5.38%, 11/15/32 | | 53,000 | 49,077 |
| DTE Electric Co., 5.40%, 4/01/53 | | 19,000 | 16,683 |
| Duke Energy Carolinas LLC, | | | |
| 6.45%, 10/15/32 | | 34,000 | 34,164 |
| 4.25%, 12/15/41 | | 18,000 | 13,721 |
| 4.00%, 9/30/42 | | 32,000 | 23,405 |
| 3.75%, 6/01/45 | | 6,000 | 4,086 |
| 5.35%, 1/15/53 | | 47,000 | 40,291 |
|
| Duke Energy Corp., 3.15%, 8/15/27 | | 32,000 | 28,978 |
| Duke Energy Florida LLC, | | | |
| 2.40%, 12/15/31 | | 35,000 | 26,918 |
| 5.95%, 11/15/52 | | 29,000 | 26,837 |
|
| Duke Energy Indiana LLC, 3.25%, 10/01/49 | | 29,000 | 17,339 |
| Duke Energy Ohio, Inc., | | | |
| 5.25%, 4/01/33 | | 22,000 | 20,672 |
| 3.70%, 6/15/46 | | 44,000 | 28,772 |
| 4.30%, 2/01/49 | | 49,000 | 35,465 |
| 5.65%, 4/01/53 | | 15,000 | 13,301 |
| Duke Energy Progress LLC, | | | |
| 5.25%, 3/15/33 | | 21,000 | 19,791 |
| 4.10%, 5/15/42 | | 62,000 | 46,183 |
| 4.10%, 3/15/43 | | 42,000 | 30,683 |
| 4.20%, 8/15/45 | | 61,000 | 44,364 |
| 5.35%, 3/15/53 | | 41,000 | 34,907 |
| Entergy Arkansas LLC, | | | |
| 4.00%, 6/01/28 | | 10,000 | 9,342 |
| 5.15%, 1/15/33 | | 23,000 | 21,409 |
| 4.20%, 4/01/49 | | 23,000 | 16,415 |
| 2.65%, 6/15/51 | | 14,000 | 7,302 |
| 3.35%, 6/15/52 | | 34,000 | 20,426 |
|
| Entergy Louisiana LLC, 3.25%, 4/01/28 | | 5,000 | 4,482 |
| Entergy Mississippi LLC, | | | |
| 5.00%, 9/01/33 | | 51,000 | 46,668 |
| 3.50%, 6/01/51 | | 15,000 | 9,220 |
|
| Entergy Texas, Inc., 5.80%, 9/01/53 | | 20,000 | 17,885 |
| Evergy Kansas Central, Inc., 5.70%, 3/15/53 | | 37,000 | 32,535 |
| Eversource Energy, | | | |
| 1.40%, 8/15/26 | | 119,000 | 105,419 |
| 2.90%, 3/01/27 | | 68,000 | 61,617 |
| 5.45%, 3/01/28 | | 51,000 | 49,787 |
| 5.13%, 5/15/33 | | 34,000 | 30,732 |
See accompanying Notes to Financial Statements
Morningstar Funds Trust October 31, 2023 (unaudited)
Schedule of Investments (continued)
Morningstar Multisector Bond Fund
| | | Par (a) | Value |
| Electric Utilities (Continued) |
| Exelon Corp., | | | |
| 5.15%, 3/15/28 | | $82,000 | $79,546 |
| 4.95%, 6/15/35 | | 97,000 | 84,049 |
| Florida Power & Light Co., | | | |
| 4.63%, 5/15/30 | | 33,000 | 30,842 |
| 4.80%, 5/15/33 | | 23,000 | 21,080 |
| 5.40%, 9/01/35 | | 31,000 | 28,874 |
| 5.65%, 2/01/37 | | 20,000 | 18,932 |
| 2.88%, 12/04/51 | | 4,000 | 2,268 |
|
| Idaho Power Co., 5.80%, 4/01/54 | | 69,000 | 62,443 |
| Indiana Michigan Power Co., | | | |
| 3.85%, 5/15/28 | | 22,000 | 20,477 |
| 6.05%, 3/15/37 | | 12,000 | 11,539 |
| 5.63%, 4/01/53 | | 73,000 | 64,626 |
|
| IPALCO Enterprises, Inc., 4.25%, 5/01/30 | | 66,000 | 56,836 |
| Kentucky Utilities Co., 5.45%, 4/15/33 | | 25,000 | 23,828 |
| Louisville Gas and Electric Co., 5.45%, 4/15/33 | | 25,000 | 23,892 |
| Metropolitan Edison Co., | | | |
| 4.00%, 4/15/25(b) | | 71,000 | 67,389 |
| 5.20%, 4/01/28(b) | | 43,000 | 41,489 |
| MidAmerican Energy Co., | | | |
| 4.80%, 9/15/43 | | 15,000 | 12,287 |
| 4.40%, 10/15/44 | | 95,000 | 73,366 |
| 4.25%, 5/01/46 | | 59,000 | 43,975 |
| Mississippi Power Co., | | | |
| 4.75%, 10/15/41 | | 11,000 | 8,261 |
| 4.25%, 3/15/42 | | 26,000 | 19,098 |
| Monongahela Power Co., | | | |
| 3.55%, 5/15/27(b) | | 47,000 | 43,254 |
| 5.85%, 2/15/34(b) | | 66,000 | 62,876 |
| National Rural Utilities Cooperative Finance Corp., | | | |
| 5.60%, 11/13/26 | | 96,000 | 95,962 |
| 3.40%, 2/07/28 | | 22,000 | 20,046 |
| 2.75%, 4/15/32 | | 32,000 | 24,962 |
| 4.02%, 11/01/32 | | 41,000 | 35,033 |
| 4.15%, 12/15/32 | | 50,000 | 43,103 |
| 5.80%, 1/15/33 | | 29,000 | 28,049 |
| (3M USD LIBOR + 3.63%), 5.25%, 4/20/46(h) | | 97,000 | 91,554 |
| (5Y US Treasury CMT + 3.53%), 7.13%, 9/15/53(h) | | 32,000 | 31,726 |
|
| Nevada Power Co., 6.00%, 3/15/54 | | 24,000 | 22,061 |
| | | Par (a) | Value |
| Electric Utilities (Continued) |
| NextEra Energy Capital Holdings, Inc., | | | |
| 4.45%, 6/20/25 | | $ 51,000 | $ 49,726 |
| 1.88%, 1/15/27 | | 70,000 | 61,481 |
| NRG Energy, Inc., | | | |
| 5.25%, 6/15/29(b) | | 10,000 | 8,823 |
| 3.88%, 2/15/32(b) | | 100,000 | 74,316 |
|
| Oklahoma Gas and Electric Co., 5.40%, 1/15/33 | | 24,000 | 22,661 |
| Pacific Gas and Electric Co., | | | |
| 3.25%, 6/01/31 | | 31,000 | 24,066 |
| 4.45%, 4/15/42 | | 52,000 | 35,128 |
| 4.30%, 3/15/45 | | 46,000 | 29,766 |
| 6.75%, 1/15/53 | | 32,000 | 28,322 |
| PacifiCorp., | | | |
| 4.10%, 2/01/42 | | 90,000 | 63,628 |
| 5.35%, 12/01/53 | | 30,000 | 23,862 |
|
| Pattern Energy Operations L.P./Pattern Energy Operations, Inc., 4.50%, 8/15/28(b) | | 45,000 | 39,225 |
| PG&E Corp., | | | |
| 5.00%, 7/01/28 | | 105,000 | 95,124 |
| 5.25%, 7/01/30 | | 15,000 | 13,139 |
|
| Public Service Co. of New Hampshire, 5.15%, 1/15/53 | | 12,000 | 10,230 |
| Public Service Co. of Oklahoma, | | | |
| 2.20%, 8/15/31 | | 59,000 | 44,369 |
| 3.15%, 8/15/51 | | 57,000 | 32,236 |
| Public Service Electric and Gas Co., | | | |
| 3.00%, 5/15/27 | | 14,000 | 12,858 |
| 5.20%, 8/01/33 | | 57,000 | 54,113 |
| 3.80%, 3/01/46 | | 5,000 | 3,524 |
| 5.45%, 8/01/53 | | 45,000 | 40,608 |
| Public Service Enterprise Group, Inc., | | | |
| 5.85%, 11/15/27 | | 54,000 | 53,713 |
| 2.45%, 11/15/31 | | 90,000 | 68,021 |
|
| Sempra, (5Y US Treasury CMT + 2.87%), 4.13%, 4/01/52(h) | | 103,000 | 79,338 |
| Southern (The) Co., (5Y US Treasury CMT + 3.73%), 4.00%, 1/15/51(h) | | 214,000 | 195,250 |
| Southern California Edison Co., | | | |
| 4.05%, 3/15/42 | | 60,000 | 42,927 |
| 4.00%, 4/01/47 | | 33,000 | 22,588 |
| 3.65%, 2/01/50 | | 15,000 | 9,529 |
See accompanying Notes to Financial Statements
Morningstar Funds Trust October 31, 2023 (unaudited)
Schedule of Investments (continued)
Morningstar Multisector Bond Fund
| | | Par (a) | Value |
| Electric Utilities (Continued) |
|
| Southwestern Electric Power Co., 5.30%, 4/01/33 | | $ 34,000 | $ 31,315 |
| Talen Energy Supply LLC, 8.63%, 6/01/30(b) | | 45,000 | 45,725 |
| Tucson Electric Power Co., 4.00%, 6/15/50 | | 27,000 | 18,018 |
| Union Electric Co., | | | |
| 2.15%, 3/15/32 | | 24,000 | 17,983 |
| 5.45%, 3/15/53 | | 19,000 | 16,548 |
| Virginia Electric and Power Co., | | | |
| 3.80%, 4/01/28 | | 104,000 | 96,088 |
| 5.45%, 4/01/53 | | 47,000 | 40,061 |
| 5.70%, 8/15/53 | | 38,000 | 33,632 |
| WEC Energy Group, Inc., | | | |
| 5.00%, 9/27/25 | | 15,000 | 14,779 |
| 5.15%, 10/01/27 | | 20,000 | 19,514 |
|
| Wisconsin Power and Light Co., 3.00%, 7/01/29 | | 33,000 | 28,465 |
| | | | 4,973,541 |
| Electric, Gas Marketing & Trading – 0.1% |
| New York State Electric & Gas Corp., | | | |
| 3.25%, 12/01/26(b) | | 95,000 | 87,349 |
| 5.85%, 8/15/33(b) | | 35,000 | 33,629 |
| PECO Energy Co., | | | |
| 4.90%, 6/15/33 | | 46,000 | 42,562 |
| 2.85%, 9/15/51 | | 36,000 | 19,834 |
| | | | 183,374 |
| Electrical Equipment – 0.4% |
| Carrier Global Corp., 2.49%, 2/15/27 | | 29,000 | 25,951 |
| Lennox International, Inc., 5.50%, 9/15/28 | | 68,000 | 66,326 |
| Otis Worldwide Corp., 5.25%, 8/16/28 | | 65,000 | 63,227 |
| Sensata Technologies, Inc., | | | |
| 4.38%, 2/15/30(b) | | 20,000 | 16,904 |
| 3.75%, 2/15/31(b) | | 125,000 | 100,043 |
| Trane Technologies Financing Ltd., | | | |
| 3.55%, 11/01/24 | | 257,000 | 251,003 |
| 3.50%, 3/21/26 | | 25,000 | 23,748 |
| 3.80%, 3/21/29 | | 20,000 | 18,253 |
| 5.25%, 3/03/33 | | 60,000 | 56,166 |
|
| Trane Technologies Global Holding Co. Ltd., 3.75%, 8/21/28 | | 20,000 | 18,386 |
| | | | 640,007 |
| | | Par (a) | Value |
| Engineering & Construction – 0.0%(e) |
| Installed Building Products, Inc., 5.75%, 2/01/28(b) | | $ 30,000 | $ 27,066 |
| Entertainment Content – 0.5% |
| Activision Blizzard, Inc., 2.50%, 9/15/50 | | 132,000 | 73,791 |
| Diamond Sports Group LLC/Diamond Sports Finance Co., | | | |
| 5.38%, 8/15/26(b)(j)(k) | | 215,000 | 2,215 |
| 6.63%, 8/15/27(b)(j)(k) | | 115,000 | 1,150 |
| Paramount Global, | | | |
| 4.95%, 1/15/31 | | 70,000 | 58,458 |
| 4.20%, 5/19/32 | | 48,000 | 37,060 |
| 5.50%, 5/15/33 | | 18,000 | 14,985 |
| 4.38%, 3/15/43 | | 88,000 | 52,793 |
| 5.85%, 9/01/43 | | 74,000 | 53,425 |
| 5.25%, 4/01/44 | | 17,000 | 11,052 |
| 4.95%, 5/19/50 | | 73,000 | 46,297 |
| (5Y US Treasury CMT + 4.00%), 6.38%, 3/30/62(h) | | 42,000 | 30,909 |
|
| Playtika Holding Corp., 4.25%, 3/15/29(b) | | 60,000 | 48,404 |
| Time Warner Cable Enterprises LLC, 8.38%, 7/15/33 | | 37,000 | 38,602 |
| Walt Disney (The) Co., 2.00%, 9/01/29 | | 20,000 | 16,410 |
| Warnermedia Holdings, Inc., | | | |
| 3.76%, 3/15/27 | | 107,000 | 98,504 |
| 4.28%, 3/15/32 | | 45,000 | 37,310 |
| 5.05%, 3/15/42 | | 101,000 | 74,814 |
| 5.14%, 3/15/52 | | 119,000 | 84,206 |
| 5.39%, 3/15/62 | | 34,000 | 23,813 |
| | | | 804,198 |
| Food – 0.6% |
| Cargill, Inc., | | | |
| 2.13%, 4/23/30(b) | | 34,000 | 27,297 |
| 1.70%, 2/02/31(b) | | 39,000 | 29,467 |
| 2.13%, 11/10/31(b) | | 18,000 | 13,634 |
|
| General Mills, Inc., 5.50%, 10/17/28 | | 124,000 | 121,754 |
| HLF Financing S.a.r.l. LLC/Herbalife International, Inc., 4.88%, 6/01/29(b) | | 70,000 | 47,775 |
| J M Smucker (The) Co., | | | |
| 6.20%, 11/15/33 | | 33,000 | 32,077 |
| 2.75%, 9/15/41 | | 40,000 | 23,806 |
| 6.50%, 11/15/43 | | 60,000 | 56,942 |
See accompanying Notes to Financial Statements
Morningstar Funds Trust October 31, 2023 (unaudited)
Schedule of Investments (continued)
Morningstar Multisector Bond Fund
| | | Par (a) | Value |
| Food (Continued) |
| J M Smucker (The) Co., | | | |
| 6.50%, 11/15/53 | | $ 48,000 | $ 45,258 |
| Kraft Heinz Foods Co., | | | |
| 5.00%, 6/04/42 | | 29,000 | 23,902 |
| 5.20%, 7/15/45 | | 29,000 | 23,965 |
|
| Lamb Weston Holdings, Inc., 4.38%, 1/31/32(b) | | 180,000 | 148,926 |
| Mars, Inc., 2.38%, 7/16/40(b) | | 99,000 | 59,435 |
| Mondelez International, Inc., 2.63%, 3/17/27 | | 30,000 | 27,147 |
| Nestle Holdings, Inc., 4.70%, 1/15/53(b) | | 150,000 | 125,220 |
| Post Holdings, Inc., 4.63%, 4/15/30(b) | | 165,000 | 138,169 |
| Simmons Foods, Inc., 4.63%, 3/01/29(b) | | 65,000 | 52,801 |
| | | | 997,575 |
| Gas & Water Utilities – 0.2% |
| Atmos Energy Corp., 6.20%, 11/15/53 | | 25,000 | 24,263 |
| Ferrellgas L.P./Ferrellgas Finance Corp., 5.38%, 4/01/26(b) | | 65,000 | 60,839 |
| South Jersey Industries, Inc., 5.02%, 4/15/31 | | 161,000 | 121,993 |
| Suburban Propane Partners L.P./Suburban Energy Finance Corp., 5.00%, 6/01/31(b) | | 95,000 | 78,689 |
| | | | 285,784 |
| Health Care Facilities & Services – 1.7% |
| AdaptHealth LLC, | | | |
| 4.63%, 8/01/29(b) | | 35,000 | 26,163 |
| 5.13%, 3/01/30(b) | | 185,000 | 140,138 |
| Centene Corp., | | | |
| 2.45%, 7/15/28 | | 122,000 | 102,625 |
| 3.00%, 10/15/30 | | 241,000 | 190,721 |
| 2.63%, 8/01/31 | | 40,000 | 30,040 |
|
| CHS/Community Health Systems, Inc., 5.25%, 5/15/30(b) | | 270,000 | 191,742 |
| Cigna Group (The), | | | |
| 4.13%, 11/15/25 | | 23,000 | 22,285 |
| 4.80%, 8/15/38 | | 130,000 | 110,120 |
| 3.20%, 3/15/40 | | 43,000 | 29,151 |
| CVS Health Corp., | | | |
| 5.00%, 1/30/29 | | 41,000 | 39,249 |
| 4.78%, 3/25/38 | | 204,000 | 168,727 |
| 2.70%, 8/21/40 | | 34,000 | 20,589 |
| | | Par (a) | Value |
| Health Care Facilities & Services (Continued) |
| CVS Health Corp., | | | |
| 5.05%, 3/25/48 | | $ 63,000 | $ 49,523 |
| 6.00%, 6/01/63 | | 38,000 | 32,921 |
|
| DaVita, Inc., 3.75%, 2/15/31(b) | | 215,000 | 154,543 |
| Elevance Health, Inc., | | | |
| 2.88%, 9/15/29 | | 54,000 | 45,876 |
| 2.55%, 3/15/31 | | 20,000 | 15,818 |
| 5.50%, 10/15/32 | | 58,000 | 55,483 |
|
| Encompass Health Corp., 4.75%, 2/01/30 | | 105,000 | 90,738 |
| Fortrea Holdings, Inc., 7.50%, 7/01/30(b) | | 25,000 | 24,125 |
| HCA, Inc., | | | |
| 5.88%, 2/01/29 | | 15,000 | 14,532 |
| 3.38%, 3/15/29 | | 35,000 | 30,086 |
| 4.13%, 6/15/29 | | 75,000 | 66,568 |
| 3.50%, 9/01/30 | | 31,000 | 25,657 |
| 2.38%, 7/15/31 | | 32,000 | 23,793 |
| 3.63%, 3/15/32 | | 36,000 | 28,918 |
| 5.25%, 6/15/49 | | 77,000 | 59,186 |
| 5.90%, 6/01/53 | | 30,000 | 25,361 |
|
| Humana, Inc., 5.75%, 3/01/28 | | 41,000 | 40,842 |
| LifePoint Health, Inc., 5.38%, 1/15/29(b) | | 205,000 | 124,199 |
| Molina Healthcare, Inc., | | | |
| 3.88%, 11/15/30(b) | | 15,000 | 12,234 |
| 3.88%, 5/15/32(b) | | 135,000 | 106,078 |
| Quest Diagnostics, Inc., | | | |
| 2.95%, 6/30/30 | | 20,000 | 16,423 |
| 2.80%, 6/30/31 | | 25,000 | 19,789 |
| 6.40%, 11/30/33 | | 49,000 | 48,853 |
|
| RP Escrow Issuer LLC, 5.25%, 12/15/25(b) | | 50,000 | 35,625 |
| Star Parent, Inc., 9.00%, 10/01/30(b) | | 205,000 | 203,439 |
| U.S. Acute Care Solutions LLC, 6.38%, 3/01/26(b) | | 50,000 | 42,538 |
| UnitedHealth Group, Inc., | | | |
| 1.15%, 5/15/26 | | 38,000 | 34,308 |
| 4.20%, 5/15/32 | | 10,000 | 8,866 |
| 3.50%, 8/15/39 | | 32,000 | 23,498 |
| 2.75%, 5/15/40 | | 78,000 | 50,499 |
| 3.05%, 5/15/41 | | 35,000 | 23,355 |
| 3.75%, 10/15/47 | | 9,000 | 6,232 |
| 4.45%, 12/15/48 | | 9,000 | 6,940 |
| 3.25%, 5/15/51 | | 42,000 | 25,799 |
| 4.75%, 5/15/52 | | 16,000 | 12,808 |
See accompanying Notes to Financial Statements
Morningstar Funds Trust October 31, 2023 (unaudited)
Schedule of Investments (continued)
Morningstar Multisector Bond Fund
| | | Par (a) | Value |
| Health Care Facilities & Services (Continued) |
| UnitedHealth Group, Inc., | | | |
| 5.88%, 2/15/53 | | $ 47,000 | $ 44,448 |
| 5.20%, 4/15/63 | | 53,000 | 44,280 |
| | | | 2,745,731 |
| Home & Office Products – 0.1% |
| Newell Brands, Inc., 5.20%, 4/01/26 | | 155,000 | 146,344 |
| Tempur Sealy International, Inc., 3.88%, 10/15/31(b) | | 70,000 | 52,421 |
| | | | 198,765 |
| Home Construction – 0.2% |
| ACProducts Holdings, Inc., 6.38%, 5/15/29(b) | | 100,000 | 61,000 |
| Camelot Return Merger Sub, Inc., 8.75%, 8/01/28(b) | | 20,000 | 18,674 |
| Cornerstone Building Brands, Inc., 6.13%, 1/15/29(b) | | 120,000 | 87,732 |
| Fortune Brands Innovations, Inc., 5.88%, 6/01/33 | | 44,000 | 41,030 |
| Meritage Homes Corp., 3.88%, 4/15/29(b) | | 5,000 | 4,201 |
| MIWD Holdco II LLC/MIWD Finance Corp., 5.50%, 2/01/30(b) | | 90,000 | 71,437 |
| Mohawk Industries, Inc., 5.85%, 9/18/28 | | 38,000 | 37,336 |
| | | | 321,410 |
| Household Products – 0.5% |
| Coty, Inc./HFC Prestige Products, Inc./HFC Prestige International U.S. LLC, | | | |
| 4.75%, 1/15/29(b) | | 70,000 | 61,966 |
| 6.63%, 7/15/30(b) | | 125,000 | 119,090 |
|
| Energizer Holdings, Inc., 4.38%, 3/31/29(b) | | 410,000 | 334,692 |
| Estee Lauder (The) Cos., Inc., 4.65%, 5/15/33 | | 33,000 | 30,000 |
| Kenvue, Inc., | | | |
| 5.05%, 3/22/28 | | 35,000 | 34,347 |
| 4.90%, 3/22/33 | | 68,000 | 63,719 |
| 5.10%, 3/22/43 | | 48,000 | 42,464 |
| 5.05%, 3/22/53 | | 35,000 | 30,072 |
| 5.20%, 3/22/63 | | 47,000 | 39,904 |
| | | | 756,254 |
| | | Par (a) | Value |
| Industrial Intermediate Products – 0.0%(e) |
| Chart Industries, Inc., 7.50%, 1/01/30(b) | | $ 65,000 | $ 63,829 |
| Industrial Support Services – 0.1% |
| Resideo Funding, Inc., 4.00%, 9/01/29(b) | | 190,000 | 152,475 |
| WW Grainger, Inc., 3.75%, 5/15/46 | | 76,000 | 53,302 |
| | | | 205,777 |
| Institutional Financial Services – 1.6% |
| Bank of New York Mellon (The) Corp., | | | |
| (SOFR + 1.03%), 4.95%, 4/26/27(h) | | 61,000 | 59,285 |
| (SOFR + 1.60%), 6.32%, 10/25/29(h) | | 104,000 | 104,805 |
| (SOFR + 1.85%), 6.47%, 10/25/34(h) | | 178,000 | 178,595 |
| Coinbase Global, Inc., | | | |
| 3.38%, 10/01/28(b) | | 45,000 | 33,041 |
| 3.63%, 10/01/31(b) | | 50,000 | 33,993 |
|
| Goldman Sachs Capital I, 6.35%, 2/15/34 | | 82,000 | 79,113 |
| Goldman Sachs Group (The), Inc., | | | |
| 3.50%, 4/01/25 | | 38,000 | 36,573 |
| 3.85%, 1/26/27 | | 130,000 | 121,075 |
| (3M CME Term SOFR + 2.01%), 7.40%, 10/28/27(c) | | 43,000 | 43,878 |
| (SOFR + 1.73%), 4.48%, 8/23/28(h) | | 203,000 | 190,060 |
| (SOFR + 1.77%), 6.48%, 10/24/29(h) | | 207,000 | 206,951 |
| (SOFR + 1.25%), 2.38%, 7/21/32(h) | | 8,000 | 5,938 |
| 6.25%, 2/01/41 | | 8,000 | 7,745 |
| Intercontinental Exchange, Inc., | | | |
| 4.00%, 9/15/27 | | 167,000 | 156,206 |
| 2.10%, 6/15/30 | | 131,000 | 102,801 |
| 4.25%, 9/21/48 | | 31,000 | 23,144 |
| Morgan Stanley, | | | |
| (SOFR + 1.15%), 2.72%, 7/22/25(h) | | 58,000 | 56,433 |
| (SOFR + 0.88%), 1.59%, 5/04/27(h) | | 74,000 | 65,755 |
| (SOFR + 0.86%), 1.51%, 7/20/27(h) | | 300,000 | 263,352 |
| (SOFR + 1.00%), 2.48%, 1/21/28(h) | | 29,000 | 25,701 |
| 3.59%, 7/22/28(c) | | 22,000 | 19,952 |
| (SOFR + 2.24%), 6.30%, 10/18/28(h) | | 17,000 | 16,969 |
See accompanying Notes to Financial Statements
Morningstar Funds Trust October 31, 2023 (unaudited)
Schedule of Investments (continued)
Morningstar Multisector Bond Fund
| | | Par (a) | Value |
| Institutional Financial Services (Continued) |
| Morgan Stanley, | | | |
| (SOFR + 1.59%), 5.16%, 4/20/29(h) | | $ 72,000 | $ 68,503 |
| (SOFR + 1.02%), 1.93%, 4/28/32(h) | | 77,000 | 55,776 |
| (SOFR + 1.20%), 2.51%, 10/20/32(h) | | 18,000 | 13,463 |
| (SOFR + 2.56%), 6.34%, 10/18/33(h) | | 124,000 | 121,567 |
| (SOFR + 1.87%), 5.25%, 4/21/34(h) | | 14,000 | 12,614 |
| (SOFR + 1.88%), 5.42%, 7/21/34(h) | | 46,000 | 41,983 |
| (SOFR + 2.05%), 6.63%, 11/01/34(h) | | 170,000 | 169,745 |
| (SOFR + 2.62%), 5.30%, 4/20/37(h) | | 139,000 | 120,549 |
| (5Y US Treasury CMT + 2.43%), 5.95%, 1/19/38(h) | | 235,000 | 213,092 |
|
| Northern Trust Corp., (3M USD LIBOR + 1.13%), 3.38%, 5/08/32(h) | | 43,000 | 37,766 |
| State Street Corp., (SOFR + 1.72%), 5.82%, 11/04/28(h) | | 44,000 | 43,491 |
| | | | 2,729,914 |
| Insurance – 1.1% |
| Acrisure LLC/Acrisure Finance, Inc., 4.25%, 2/15/29(b) | | 90,000 | 73,797 |
| Alleghany Corp., 3.25%, 8/15/51 | | 162,000 | 99,201 |
| Alliant Holdings Intermediate LLC/Alliant Holdings Co-Issuer, 4.25%, 10/15/27(b) | | 25,000 | 21,979 |
| American International Group, Inc., | | | |
| 3.90%, 4/01/26 | | 40,000 | 38,111 |
| 3.40%, 6/30/30 | | 62,000 | 52,153 |
| 5.13%, 3/27/33 | | 123,000 | 111,851 |
| 4.75%, 4/01/48 | | 50,000 | 39,159 |
|
| AmWINS Group, Inc., 4.88%, 6/30/29(b) | | 125,000 | 107,005 |
| Assurant, Inc., 3.70%, 2/22/30 | | 56,000 | 46,411 |
| AssuredPartners, Inc., 5.63%, 1/15/29(b) | | 100,000 | 84,833 |
| BroadStreet Partners, Inc., 5.88%, 4/15/29(b) | | 95,000 | 82,826 |
| Corebridge Financial, Inc., | | | |
| 3.90%, 4/05/32 | | 105,000 | 85,892 |
| 6.05%, 9/15/33(b) | | 48,000 | 45,057 |
| | | Par (a) | Value |
| Insurance (Continued) |
| Corebridge Financial, Inc., | | | |
| (5Y US Treasury CMT + 3.85%), 6.88%, 12/15/52(h) | | $ 77,000 | $ 71,137 |
| Hartford Financial Services Group (The), Inc., | | | |
| 5.95%, 10/15/36 | | 44,000 | 41,877 |
| (3M CME Term SOFR + 2.39%), 7.75%, 2/12/47(b)(c) | | 87,000 | 74,484 |
|
| HUB International Ltd., 7.25%, 6/15/30(b) | | 175,000 | 170,706 |
| Liberty Mutual Group, Inc., | | | |
| 3.95%, 5/15/60(b) | | 35,000 | 20,473 |
| 4.30%, 2/01/61(b) | | 190,000 | 99,033 |
| Marsh & McLennan Cos., Inc., | | | |
| 5.40%, 9/15/33 | | 81,000 | 76,990 |
| 5.70%, 9/15/53 | | 67,000 | 61,509 |
|
| Metropolitan Life Global Funding I, 2.40%, 1/11/32(b) | | 154,000 | 116,136 |
| PartnerRe Finance B LLC, (5Y US Treasury CMT + 3.82%), 4.50%, 10/01/50(h) | | 250,000 | 205,472 |
| Teachers Insurance & Annuity Association of America, 4.90%, 9/15/44(b) | | 15,000 | 12,128 |
| Travelers (The) Cos., Inc., 4.30%, 8/25/45 | | 15,000 | 11,367 |
| Willis North America, Inc., 5.05%, 9/15/48 | | 36,000 | 27,657 |
| | | | 1,877,244 |
| Internet Media & Services – 1.2% |
| ANGI Group LLC, 3.88%, 8/15/28(b) | | 80,000 | 59,999 |
| Arches Buyer, Inc., | | | |
| 4.25%, 6/01/28(b) | | 50,000 | 41,415 |
| 6.13%, 12/01/28(b) | | 50,000 | 40,386 |
| Match Group Holdings II LLC, | | | |
| 5.00%, 12/15/27(b) | | 55,000 | 50,728 |
| 3.63%, 10/01/31(b) | | 25,000 | 19,187 |
| Meta Platforms, Inc., | | | |
| 3.50%, 8/15/27 | | 33,000 | 31,026 |
| 4.45%, 8/15/52 | | 87,000 | 65,777 |
| 4.65%, 8/15/62 | | 15,000 | 11,311 |
| 5.75%, 5/15/63 | | 93,000 | 83,435 |
|
| Newfold Digital Holdings Group, Inc., 11.75%, 10/15/28(b) | | 300,000 | 303,030 |
See accompanying Notes to Financial Statements
Morningstar Funds Trust October 31, 2023 (unaudited)
Schedule of Investments (continued)
Morningstar Multisector Bond Fund
| | | Par (a) | Value |
| Internet Media & Services (Continued) |
| Uber Technologies, Inc., | | | |
| 8.00%, 11/01/26(b) | | $ 165,000 | $ 166,164 |
| 7.50%, 9/15/27(b) | | 95,000 | 95,239 |
| 4.50%, 8/15/29(b) | | 1,025,000 | 903,983 |
|
| Ziff Davis, Inc., 4.63%, 10/15/30(b) | | 98,000 | 82,047 |
| | | | 1,953,727 |
| Leisure Facilities & Services – 2.6% |
| Bloomin' Brands, Inc./OSI Restaurant Partners LLC, 5.13%, 4/15/29(b) | | 90,000 | 78,049 |
| Caesars Entertainment, Inc., 6.25%, 7/01/25(b) | | 150,000 | 147,583 |
| Carnival Corp., | | | |
| 5.75%, 3/01/27(b) | | 335,000 | 299,109 |
| 6.00%, 5/01/29(b) | | 280,000 | 236,543 |
| 7.00%, 8/15/29(b) | | 20,000 | 19,611 |
|
| Everi Holdings, Inc., 5.00%, 7/15/29(b) | | 50,000 | 42,014 |
| Hilton Domestic Operating Co., Inc., 3.63%, 2/15/32(b) | | 45,000 | 35,571 |
| Hilton Grand Vacations Borrower Escrow LLC/Hilton Grand Vacations Borrower Escrow, | | | |
| 5.00%, 6/01/29(b) | | 205,000 | 171,687 |
| 4.88%, 7/01/31(b) | | 305,000 | 241,524 |
|
| KFC Holding Co./Pizza Hut Holdings LLC/Taco Bell of America LLC, 4.75%, 6/01/27(b) | | 180,000 | 170,109 |
| Light & Wonder International, Inc., | | | |
| 7.00%, 5/15/28(b) | | 280,000 | 272,941 |
| 7.25%, 11/15/29(b) | | 35,000 | 33,942 |
| 7.50%, 9/01/31(b) | | 50,000 | 48,821 |
|
| Marriott Ownership Resorts, Inc., 4.50%, 6/15/29(b) | | 425,000 | 349,240 |
| McDonald's Corp., | | | |
| 5.70%, 2/01/39 | | 23,000 | 21,650 |
| 5.45%, 8/14/53 | | 40,000 | 35,260 |
| NCL Corp. Ltd., | | | |
| 5.88%, 3/15/26(b) | | 335,000 | 300,663 |
| 5.88%, 3/15/26 | | 5,000 | 4,488 |
| 8.13%, 1/15/29(b) | | 115,000 | 112,354 |
|
| NCL Finance Ltd., 6.13%, 3/15/28(b) | | 55,000 | 45,993 |
| Papa John's International, Inc., 3.88%, 9/15/29(b) | | 165,000 | 135,375 |
| | | Par (a) | Value |
| Leisure Facilities & Services (Continued) |
|
| Penn Entertainment, Inc., 4.13%, 7/01/29(b) | | $ 5,000 | $ 3,885 |
| Royal Caribbean Cruises Ltd., | | | |
| 4.25%, 7/01/26(b) | | 160,000 | 147,136 |
| 11.63%, 8/15/27(b) | | 115,000 | 124,725 |
| 3.70%, 3/15/28 | | 115,000 | 98,012 |
| 5.50%, 4/01/28(b) | | 320,000 | 291,793 |
|
| Speedway Motorsports LLC/Speedway Funding II, Inc., 4.88%, 11/01/27(b) | | 70,000 | 62,475 |
| Travel + Leisure Co., | | | |
| 6.63%, 7/31/26(b) | | 145,000 | 141,482 |
| 6.00%, 4/01/27 | | 10,000 | 9,340 |
| 4.50%, 12/01/29(b) | | 55,000 | 45,330 |
| 4.63%, 3/01/30(b) | | 95,000 | 77,771 |
| Viking Cruises Ltd., | | | |
| 5.88%, 9/15/27(b) | | 110,000 | 99,099 |
| 7.00%, 2/15/29(b) | | 60,000 | 54,300 |
|
| Viking Ocean Cruises Ship VII Ltd., 5.63%, 2/15/29(b) | | 105,000 | 93,056 |
| VOC Escrow Ltd., 5.00%, 2/15/28(b) | | 100,000 | 89,842 |
| Wynn Resorts Finance LLC/Wynn Resorts Capital Corp., 5.13%, 10/01/29(b) | | 150,000 | 127,921 |
| Yum! Brands, Inc., 3.63%, 3/15/31 | | 40,000 | 32,481 |
| | | | 4,301,175 |
| Machinery – 0.4% |
| CNH Industrial Capital LLC, | | | |
| 5.45%, 10/14/25 | | 20,000 | 19,847 |
| 4.55%, 4/10/28 | | 72,000 | 67,663 |
|
| Deere & Co., 3.10%, 4/15/30 | | 44,000 | 37,970 |
| GrafTech Finance, Inc., 4.63%, 12/15/28(b) | | 130,000 | 95,295 |
| GrafTech Global Enterprises, Inc., 9.88%, 12/15/28(b) | | 90,000 | 80,594 |
| Ingersoll Rand, Inc., | | | |
| 5.40%, 8/14/28 | | 20,000 | 19,488 |
| 5.70%, 8/14/33 | | 50,000 | 47,243 |
| John Deere Capital Corp., | | | |
| 4.95%, 7/14/28 | | 45,000 | 43,894 |
| 3.35%, 4/18/29 | | 68,000 | 61,243 |
|
| Madison IAQ LLC, 5.88%, 6/30/29(b) | | 80,000 | 61,971 |
| Nordson Corp., | | | |
| 5.60%, 9/15/28 | | 33,000 | 32,391 |
| 5.80%, 9/15/33 | | 33,000 | 31,413 |
See accompanying Notes to Financial Statements
Morningstar Funds Trust October 31, 2023 (unaudited)
Schedule of Investments (continued)
Morningstar Multisector Bond Fund
| | | Par (a) | Value |
| Machinery (Continued) |
|
| Veralto Corp., 5.45%, 9/18/33(b) | | $ 23,000 | $ 21,492 |
| Xylem, Inc., 3.25%, 11/01/26 | | 102,000 | 94,905 |
| | | | 715,409 |
| Medical Equipment & Devices – 0.5% |
| Bausch & Lomb Escrow Corp., 8.38%, 10/01/28(b) | | 280,000 | 278,110 |
| Becton Dickinson & Co., 4.69%, 2/13/28 | | 73,000 | 69,877 |
| Garden Spinco Corp., 8.63%, 7/20/30(b) | | 90,000 | 92,859 |
| Hologic, Inc., | | | |
| 4.63%, 2/01/28(b) | | 60,000 | 54,564 |
| 3.25%, 2/15/29(b) | | 45,000 | 37,778 |
|
| Medline Borrower L.P., 3.88%, 4/01/29(b) | | 120,000 | 101,324 |
| Medtronic Global Holdings S.C.A., 4.50%, 3/30/33 | | 44,000 | 39,982 |
| Thermo Fisher Scientific, Inc., | | | |
| 5.09%, 8/10/33 | | 97,000 | 90,730 |
| 5.40%, 8/10/43 | | 42,000 | 38,086 |
| | | | 803,310 |
| Metals & Mining – 0.1% |
| Novelis Corp., 4.75%, 1/30/30(b) | | 175,000 | 148,483 |
| Oil & Gas Producers – 4.5% |
| Antero Midstream Partners L.P./Antero Midstream Finance Corp., | | | |
| 7.88%, 5/15/26(b) | | 60,000 | 60,423 |
| 5.38%, 6/15/29(b) | | 90,000 | 81,724 |
|
| Antero Resources Corp., 5.38%, 3/01/30(b) | | 115,000 | 104,940 |
| Apache Corp., | | | |
| 4.38%, 10/15/28 | | 10,000 | 8,937 |
| 4.75%, 4/15/43 | | 50,000 | 35,116 |
|
| Ascent Resources Utica Holdings LLC/ARU Finance Corp., 7.00%, 11/01/26(b) | | 155,000 | 149,682 |
| Blue Racer Midstream LLC/Blue Racer Finance Corp., 7.63%, 12/15/25(b) | | 130,000 | 130,186 |
| BP Capital Markets America, Inc., | | | |
| 3.94%, 9/21/28 | | 89,000 | 82,622 |
| 4.89%, 9/11/33 | | 29,000 | 26,545 |
| 3.00%, 2/24/50 | | 43,000 | 25,370 |
| | | Par (a) | Value |
| Oil & Gas Producers (Continued) |
| BP Capital Markets America, Inc., | | | |
| 2.94%, 6/04/51 | | $ 38,000 | $ 21,848 |
| Buckeye Partners L.P., | | | |
| 5.85%, 11/15/43 | | 55,000 | 38,867 |
| 5.60%, 10/15/44 | | 30,000 | 20,138 |
|
| Cameron LNG LLC, 2.90%, 7/15/31(b) | | 78,000 | 62,853 |
| Cheniere Corpus Christi Holdings LLC, 3.70%, 11/15/29 | | 11,000 | 9,584 |
| Cheniere Energy Partners L.P., 5.95%, 6/30/33(b) | | 48,000 | 44,889 |
| Chesapeake Energy Corp., | | | |
| 5.50%, 2/01/26(b) | | 240,000 | 232,987 |
| 6.75%, 4/15/29(b) | | 50,000 | 48,923 |
| Civitas Resources, Inc., | | | |
| 8.38%, 7/01/28(b) | | 195,000 | 196,201 |
| 8.63%, 11/01/30(b) | | 60,000 | 61,070 |
| ConocoPhillips Co., | | | |
| 5.30%, 5/15/53 | | 53,000 | 45,756 |
| 5.55%, 3/15/54 | | 84,000 | 75,085 |
| 5.70%, 9/15/63 | | 85,000 | 75,851 |
| Continental Resources, Inc., | | | |
| 5.75%, 1/15/31(b) | | 85,000 | 78,828 |
| 2.88%, 4/01/32(b) | | 260,000 | 192,112 |
| 4.90%, 6/01/44 | | 50,000 | 35,305 |
| Crescent Energy Finance LLC, | | | |
| 7.25%, 5/01/26(b) | | 110,000 | 106,491 |
| 9.25%, 2/15/28(b) | | 95,000 | 95,680 |
|
| Crestwood Midstream Partners L.P./Crestwood Midstream Finance Corp., 6.00%, 2/01/29(b) | | 100,000 | 96,750 |
| CVR Energy, Inc., 5.25%, 2/15/25(b) | | 155,000 | 152,050 |
| Diamondback Energy, Inc., | | | |
| 6.25%, 3/15/33 | | 11,000 | 10,857 |
| 4.40%, 3/24/51 | | 57,000 | 40,446 |
| 4.25%, 3/15/52 | | 105,000 | 72,166 |
| Energy Transfer L.P., | | | |
| (5Y US Treasury CMT + 5.69%), 6.50%, 11/15/26(g)(h) | | 82,000 | 74,266 |
| 6.10%, 12/01/28 | | 33,000 | 32,590 |
| (5Y US Treasury CMT + 5.31%), 7.13%, 5/15/30(g)(h) | | 66,000 | 54,808 |
| 6.55%, 12/01/33 | | 72,000 | 71,050 |
| 5.95%, 10/01/43 | | 55,000 | 46,520 |
| 5.40%, 10/01/47 | | 46,000 | 36,126 |
See accompanying Notes to Financial Statements
Morningstar Funds Trust October 31, 2023 (unaudited)
Schedule of Investments (continued)
Morningstar Multisector Bond Fund
| | | Par (a) | Value |
| Oil & Gas Producers (Continued) |
| Energy Transfer L.P., | | | |
| 6.00%, 6/15/48 | | $ 92,000 | $ 78,223 |
|
| EnLink Midstream LLC, 6.50%, 9/01/30(b) | | 105,000 | 100,786 |
| EnLink Midstream Partners L.P., | | | |
| 5.60%, 4/01/44 | | 45,000 | 35,381 |
| 5.05%, 4/01/45 | | 20,000 | 14,338 |
| 5.45%, 6/01/47 | | 130,000 | 97,722 |
| Enterprise Products Operating LLC, | | | |
| 3.70%, 1/31/51 | | 14,000 | 9,364 |
| 3.95%, 1/31/60 | | 105,000 | 70,313 |
| (3M CME Term SOFR + 3.29%), 5.25%, 8/16/77(h) | | 10,000 | 8,582 |
| EQM Midstream Partners L.P., | | | |
| 6.00%, 7/01/25(b) | | 28,000 | 27,382 |
| 7.50%, 6/01/27(b) | | 170,000 | 168,365 |
| 6.50%, 7/01/27(b) | | 140,000 | 136,081 |
| 5.50%, 7/15/28 | | 30,000 | 27,998 |
| 7.50%, 6/01/30(b) | | 35,000 | 34,340 |
| 6.50%, 7/15/48 | | 30,000 | 25,367 |
| Exxon Mobil Corp., | | | |
| 2.28%, 8/16/26 | | 80,000 | 73,911 |
| 3.00%, 8/16/39 | | 34,000 | 23,664 |
| 4.23%, 3/19/40 | | 103,000 | 83,587 |
|
| Gulfport Energy Corp., 8.00%, 5/17/26(b) | | 55,000 | 54,905 |
| Hess Midstream Operations L.P., | | | |
| 5.63%, 2/15/26(b) | | 89,000 | 86,191 |
| 5.13%, 6/15/28(b) | | 85,000 | 78,485 |
| 4.25%, 2/15/30(b) | | 200,000 | 171,135 |
|
| Holly Energy Partners L.P./Holly Energy Finance Corp., 5.00%, 2/01/28(b) | | 45,000 | 41,656 |
| Kinder Morgan Energy Partners L.P., | | | |
| 5.00%, 8/15/42 | | 46,000 | 35,940 |
| 4.70%, 11/01/42 | | 51,000 | 37,812 |
| Kinder Morgan, Inc., | | | |
| 4.80%, 2/01/33 | | 93,000 | 81,325 |
| 5.05%, 2/15/46 | | 20,000 | 15,254 |
|
| Kinetik Holdings L.P., 5.88%, 6/15/30(b) | | 140,000 | 128,457 |
| Marathon Petroleum Corp., | | | |
| 6.50%, 3/01/41 | | 64,000 | 60,742 |
| 5.00%, 9/15/54 | | 65,000 | 47,928 |
| Matador Resources Co., | | | |
| 5.88%, 9/15/26 | | 150,000 | 144,539 |
| | | Par (a) | Value |
| Oil & Gas Producers (Continued) |
| Matador Resources Co., | | | |
| 6.88%, 4/15/28(b) | | $ 75,000 | $ 73,498 |
| MPLX L.P., | | | |
| 1.75%, 3/01/26 | | 23,000 | 20,868 |
| 4.95%, 3/14/52 | | 20,000 | 14,822 |
|
| Murphy Oil Corp., 5.88%, 12/01/42 | | 120,000 | 92,196 |
| Murphy Oil USA, Inc., 4.75%, 9/15/29 | | 25,000 | 22,134 |
| Northern Oil and Gas, Inc., | | | |
| 8.13%, 3/01/28(b) | | 60,000 | 59,252 |
| 8.75%, 6/15/31(b) | | 225,000 | 223,863 |
| Occidental Petroleum Corp., | | | |
| 8.50%, 7/15/27 | | 35,000 | 37,291 |
| 6.13%, 1/01/31 | | 25,000 | 24,449 |
| 7.50%, 5/01/31 | | 26,000 | 27,263 |
| 6.60%, 3/15/46 | | 130,000 | 125,178 |
| Ovintiv, Inc., | | | |
| 5.65%, 5/15/28 | | 20,000 | 19,418 |
| 6.25%, 7/15/33 | | 27,000 | 25,666 |
| 7.10%, 7/15/53 | | 59,000 | 56,151 |
|
| PBF Holding Co. LLC/PBF Finance Corp., 7.88%, 9/15/30(b) | | 60,000 | 57,901 |
| Permian Resources Operating LLC, | | | |
| 6.88%, 4/01/27(b) | | 90,000 | 88,303 |
| 5.88%, 7/01/29(b) | | 60,000 | 55,844 |
| 7.00%, 1/15/32(b) | | 70,000 | 67,858 |
| Plains All American Pipeline L.P./PAA Finance Corp., | | | |
| 3.55%, 12/15/29 | | 31,000 | 26,347 |
| 4.30%, 1/31/43 | | 8,000 | 5,418 |
|
| Range Resources Corp., 8.25%, 1/15/29 | | 55,000 | 56,168 |
| Sabine Pass Liquefaction LLC, 4.20%, 3/15/28 | | 148,000 | 136,178 |
| Sitio Royalties Operating Partnership L.P./Sitio Finance Corp., 7.88%, 11/01/28(b) | | 290,000 | 286,056 |
| SM Energy Co., | | | |
| 5.63%, 6/01/25 | | 80,000 | 77,871 |
| 6.75%, 9/15/26 | | 75,000 | 73,666 |
|
| Southwestern Energy Co., 5.38%, 2/01/29 | | 50,000 | 46,189 |
| Sunoco L.P./Sunoco Finance Corp., 4.50%, 5/15/29 | | 60,000 | 51,974 |
| Targa Resources Corp., | | | |
| 4.95%, 4/15/52 | | 24,000 | 17,512 |
See accompanying Notes to Financial Statements
Morningstar Funds Trust October 31, 2023 (unaudited)
Schedule of Investments (continued)
Morningstar Multisector Bond Fund
| | | Par (a) | Value |
| Oil & Gas Producers (Continued) |
| Targa Resources Corp., | | | |
| 6.25%, 7/01/52 | | $ 41,000 | $ 35,835 |
| 6.50%, 2/15/53 | | 13,000 | 11,853 |
| Targa Resources Partners L.P./Targa Resources Partners Finance Corp., | | | |
| 4.88%, 2/01/31 | | 95,000 | 83,746 |
| 4.00%, 1/15/32 | | 40,000 | 32,921 |
|
| Transcontinental Gas Pipe Line Co. LLC, 3.25%, 5/15/30 | | 29,000 | 24,286 |
| Venture Global Calcasieu Pass LLC, | | | |
| 4.13%, 8/15/31(b) | | 175,000 | 140,701 |
| 3.88%, 11/01/33(b) | | 290,000 | 219,138 |
| Western Midstream Operating L.P., | | | |
| 3.10%, 2/01/25 | | 50,000 | 48,037 |
| 4.50%, 3/01/28 | | 25,000 | 23,086 |
| 4.75%, 8/15/28 | | 80,000 | 74,419 |
| 5.30%, 3/01/48 | | 80,000 | 59,764 |
| 5.25%, 2/01/50 | | 55,000 | 40,643 |
|
| Williams (The) Cos., Inc., 5.10%, 9/15/45 | | 67,000 | 53,856 |
| | | | 7,553,034 |
| Oil, Gas Services & Equipment – 0.6% |
| Diamond Foreign Asset Co./Diamond Finance LLC, 8.50%, 10/01/30(b) | | 75,000 | 73,103 |
| Oceaneering International, Inc., 6.00%, 2/01/28(b) | | 35,000 | 32,113 |
| Schlumberger Investment S.A., 2.65%, 6/26/30 | | 40,000 | 33,109 |
| Solaris Midstream Holdings LLC, 7.63%, 4/01/26(b) | | 90,000 | 85,855 |
| Transocean Aquila Ltd., 8.00%, 9/30/28(b) | | 75,000 | 73,902 |
| Transocean Poseidon Ltd., 6.88%, 2/01/27(b) | | 352,500 | 345,450 |
| Transocean Titan Financing Ltd., 8.38%, 2/01/28(b) | | 70,000 | 70,283 |
| Transocean, Inc., 7.50%, 1/15/26(b) | | 115,000 | 110,154 |
| Weatherford International Ltd., 8.63%, 4/30/30(b) | | 135,000 | 136,415 |
| | | | 960,384 |
| | | Par (a) | Value |
| Publishing & Broadcasting – 0.3% |
| iHeartCommunications, Inc., | | | |
| 6.38%, 5/01/26 | | $115,000 | $ 93,737 |
| 5.25%, 8/15/27(b) | | 175,000 | 128,265 |
| 4.75%, 1/15/28(b) | | 335,000 | 236,839 |
| | | | 458,841 |
| Real Estate Investment Trusts – 1.5% |
| Alexandria Real Estate Equities, Inc., | | | |
| 3.55%, 3/15/52 | | 9,000 | 5,367 |
| 5.15%, 4/15/53 | | 8,000 | 6,300 |
| American Homes 4 Rent L.P., | | | |
| 3.63%, 4/15/32 | | 15,000 | 12,114 |
| 3.38%, 7/15/51 | | 57,000 | 32,092 |
| American Tower Corp., | | | |
| 4.40%, 2/15/26 | | 26,000 | 25,029 |
| 3.65%, 3/15/27 | | 35,000 | 32,226 |
| 3.60%, 1/15/28 | | 48,000 | 43,150 |
| 1.50%, 1/31/28 | | 98,000 | 80,652 |
| 5.25%, 7/15/28 | | 27,000 | 25,756 |
| 2.70%, 4/15/31 | | 66,000 | 51,031 |
| 5.65%, 3/15/33 | | 32,000 | 29,772 |
| Camden Property Trust, | | | |
| 5.85%, 11/03/26 | | 71,000 | 71,047 |
| 2.80%, 5/15/30 | | 79,000 | 65,334 |
| Crown Castle, Inc., | | | |
| 4.80%, 9/01/28 | | 106,000 | 99,045 |
| 3.30%, 7/01/30 | | 41,000 | 33,702 |
| 2.10%, 4/01/31 | | 40,000 | 29,607 |
| 2.50%, 7/15/31 | | 58,000 | 43,803 |
| 5.10%, 5/01/33 | | 42,000 | 37,309 |
|
| CubeSmart L.P., 2.50%, 2/15/32 | | 64,000 | 47,448 |
| Extra Space Storage L.P., | | | |
| 3.90%, 4/01/29 | | 45,000 | 39,910 |
| 4.00%, 6/15/29 | | 20,000 | 17,804 |
| 2.40%, 10/15/31 | | 60,000 | 44,867 |
|
| Healthpeak OP LLC, 5.25%, 12/15/32 | | 70,000 | 63,394 |
| Highwoods Realty L.P., 2.60%, 2/01/31 | | 22,000 | 15,349 |
| Invitation Homes Operating Partnership L.P., | | | |
| 2.30%, 11/15/28 | | 85,000 | 70,326 |
| 5.45%, 8/15/30 | | 36,000 | 33,567 |
| 2.00%, 8/15/31 | | 94,000 | 67,683 |
| 5.50%, 8/15/33 | | 20,000 | 18,132 |
| 2.70%, 1/15/34 | | 42,000 | 29,758 |
| Iron Mountain, Inc., | | | |
| 5.25%, 3/15/28(b) | | 60,000 | 54,878 |
See accompanying Notes to Financial Statements
Morningstar Funds Trust October 31, 2023 (unaudited)
Schedule of Investments (continued)
Morningstar Multisector Bond Fund
| | | Par (a) | Value |
| Real Estate Investment Trusts (Continued) |
| Iron Mountain, Inc., | | | |
| 4.88%, 9/15/29(b) | | $190,000 | $ 165,502 |
| 5.25%, 7/15/30(b) | | 55,000 | 47,744 |
| 4.50%, 2/15/31(b) | | 85,000 | 69,528 |
| Kilroy Realty L.P., | | | |
| 2.50%, 11/15/32 | | 15,000 | 9,925 |
| 2.65%, 11/15/33 | | 35,000 | 22,871 |
|
| Mid-America Apartments L.P., 3.60%, 6/01/27 | | 47,000 | 43,674 |
| MPT Operating Partnership L.P./MPT Finance Corp., 3.50%, 3/15/31 | | 145,000 | 87,907 |
| NNN REIT, Inc., 5.60%, 10/15/33 | | 50,000 | 46,086 |
| Prologis L.P., 3.88%, 9/15/28 | | 71,000 | 65,144 |
| Realty Income Corp., | | | |
| 5.05%, 1/13/26 | | 34,000 | 33,391 |
| 4.13%, 10/15/26 | | 73,000 | 69,445 |
| 3.95%, 8/15/27 | | 62,000 | 57,569 |
|
| Rexford Industrial Realty L.P., 2.15%, 9/01/31 | | 130,000 | 94,197 |
| Service Properties Trust, | | | |
| 7.50%, 9/15/25 | | 110,000 | 106,873 |
| 4.75%, 10/01/26 | | 80,000 | 68,023 |
| 3.95%, 1/15/28 | | 30,000 | 22,431 |
|
| STORE Capital Corp., 2.70%, 12/01/31 | | 73,000 | 48,929 |
| Uniti Group L.P./Uniti Group Finance, Inc./CSL Capital LLC, 4.75%, 4/15/28(b) | | 125,000 | 101,022 |
| Welltower OP LLC, 2.75%, 1/15/31 | | 55,000 | 43,176 |
| Weyerhaeuser Co., 4.00%, 3/09/52 | | 27,000 | 18,419 |
| | | | 2,448,308 |
| Real Estate Services – 0.1% |
| CBRE Services, Inc., 5.95%, 8/15/34 | | 43,000 | 39,095 |
| Realogy Group LLC/Realogy Co-Issuer Corp., | | | |
| 5.75%, 1/15/29(b) | | 120,000 | 75,623 |
| 5.25%, 4/15/30(b) | | 65,000 | 40,471 |
| | | | 155,189 |
| Retail - Consumer Staples – 0.1% |
| Dollar General Corp., 5.20%, 7/05/28 | | 35,000 | 33,625 |
| | | Par (a) | Value |
| Retail - Consumer Staples (Continued) |
| Target Corp., 4.40%, 1/15/33 | | $ 82,000 | $ 73,942 |
| Walmart, Inc., 4.10%, 4/15/33 | | 116,000 | 103,838 |
| | | | 211,405 |
| Retail - Discretionary – 1.1% |
| Asbury Automotive Group, Inc., | | | |
| 4.50%, 3/01/28 | | 94,000 | 83,290 |
| 4.63%, 11/15/29(b) | | 160,000 | 135,343 |
| 4.75%, 3/01/30 | | 27,000 | 22,912 |
|
| AutoZone, Inc., 6.25%, 11/01/28 | | 27,000 | 27,272 |
| Bath & Body Works, Inc., | | | |
| 5.25%, 2/01/28 | | 40,000 | 36,678 |
| 6.63%, 10/01/30(b) | | 10,000 | 9,258 |
| 6.88%, 11/01/35 | | 35,000 | 30,886 |
| 6.75%, 7/01/36 | | 75,000 | 64,693 |
|
| Beacon Roofing Supply, Inc., 6.50%, 8/01/30(b) | | 145,000 | 138,453 |
| Builders FirstSource, Inc., | | | |
| 5.00%, 3/01/30(b) | | 55,000 | 47,997 |
| 4.25%, 2/01/32(b) | | 70,000 | 55,710 |
|
| Foundation Building Materials, Inc., 6.00%, 3/01/29(b) | | 240,000 | 197,974 |
| Home Depot (The), Inc., | | | |
| 2.70%, 4/15/30 | | 191,000 | 159,924 |
| 3.25%, 4/15/32 | | 20,000 | 16,651 |
| 3.30%, 4/15/40 | | 65,000 | 45,956 |
| 3.63%, 4/15/52 | | 21,000 | 13,985 |
| 4.95%, 9/15/52 | | 20,000 | 16,834 |
|
| Ken Garff Automotive LLC, 4.88%, 9/15/28(b) | | 60,000 | 50,742 |
| LBM Acquisition LLC, 6.25%, 1/15/29(b) | | 105,000 | 82,950 |
| Lithia Motors, Inc., 4.38%, 1/15/31(b) | | 55,000 | 44,530 |
| Lowe's Cos., Inc., | | | |
| 4.65%, 4/15/42 | | 33,000 | 26,081 |
| 5.75%, 7/01/53 | | 36,000 | 31,589 |
| 4.45%, 4/01/62 | | 28,000 | 19,117 |
| 5.80%, 9/15/62 | | 33,000 | 27,962 |
| 5.85%, 4/01/63 | | 27,000 | 23,035 |
|
| Michaels (The) Cos., Inc., 7.88%, 5/01/29(b) | | 70,000 | 39,025 |
| Nordstrom, Inc., 4.25%, 8/01/31 | | 15,000 | 10,989 |
| Patrick Industries, Inc., 4.75%, 5/01/29(b) | | 105,000 | 85,206 |
See accompanying Notes to Financial Statements
Morningstar Funds Trust October 31, 2023 (unaudited)
Schedule of Investments (continued)
Morningstar Multisector Bond Fund
| | | Par (a) | Value |
| Retail - Discretionary (Continued) |
| Sonic Automotive, Inc., | | | |
| 4.63%, 11/15/29(b) | | $130,000 | $ 108,219 |
| 4.88%, 11/15/31(b) | | 120,000 | 95,559 |
|
| Specialty Building Products Holdings LLC/SBP Finance Corp., 6.38%, 9/30/26(b) | | 150,000 | 139,550 |
| Victoria's Secret & Co., 4.63%, 7/15/29(b) | | 5,000 | 3,676 |
| | | | 1,892,046 |
| Semiconductors – 0.8% |
| Advanced Micro Devices, Inc., 4.39%, 6/01/52 | | 57,000 | 43,908 |
| Analog Devices, Inc., 1.70%, 10/01/28 | | 43,000 | 35,973 |
| Broadcom, Inc., | | | |
| 2.45%, 2/15/31(b) | | 35,000 | 26,860 |
| 3.19%, 11/15/36(b) | | 260,000 | 180,065 |
| 4.93%, 5/15/37(b) | | 64,000 | 53,339 |
|
| Entegris Escrow Corp., 5.95%, 6/15/30(b) | | 210,000 | 192,117 |
| Intel Corp., | | | |
| 3.70%, 7/29/25 | | 32,000 | 30,978 |
| 5.13%, 2/10/30 | | 60,000 | 58,059 |
| 5.20%, 2/10/33 | | 10,000 | 9,441 |
| 2.80%, 8/12/41 | | 132,000 | 82,627 |
| 5.70%, 2/10/53 | | 83,000 | 74,279 |
| KLA Corp., | | | |
| 4.95%, 7/15/52 | | 39,000 | 32,676 |
| 5.25%, 7/15/62 | | 40,000 | 33,897 |
|
| Micron Technology, Inc., 6.75%, 11/01/29 | | 170,000 | 170,827 |
| QUALCOMM, Inc., 6.00%, 5/20/53 | | 96,000 | 92,387 |
| Texas Instruments, Inc., | | | |
| 3.88%, 3/15/39 | | 90,000 | 71,536 |
| 5.00%, 3/14/53 | | 25,000 | 21,289 |
| 5.05%, 5/18/63 | | 55,000 | 45,798 |
| | | | 1,256,056 |
| Software – 0.7% |
| Cloud Software Group, Inc., 6.50%, 3/31/29(b) | | 180,000 | 158,030 |
| Concentrix Corp., | | | |
| 6.60%, 8/02/28 | | 41,000 | 39,362 |
| 6.85%, 8/02/33 | | 129,000 | 116,535 |
|
| GoTo Group, Inc., 5.50%, 9/01/27(b) | | 165,000 | 86,043 |
| Intuit, Inc., | | | |
| 5.20%, 9/15/33 | | 107,000 | 101,786 |
| 5.50%, 9/15/53 | | 136,000 | 123,719 |
| | | Par (a) | Value |
| Software (Continued) |
| Microsoft Corp., | | | |
| 3.45%, 8/08/36 | | $ 19,000 | $ 15,493 |
| 2.53%, 6/01/50 | | 14,000 | 8,014 |
| 2.92%, 3/17/52 | | 28,000 | 17,285 |
| Oracle Corp., | | | |
| 2.95%, 5/15/25 | | 37,000 | 35,413 |
| 2.80%, 4/01/27 | | 53,000 | 47,952 |
| 3.25%, 11/15/27 | | 122,000 | 110,454 |
| 2.30%, 3/25/28 | | 68,000 | 58,388 |
| 6.15%, 11/09/29 | | 47,000 | 47,170 |
| 4.30%, 7/08/34 | | 58,000 | 48,345 |
| 3.80%, 11/15/37 | | 16,000 | 11,774 |
| 4.00%, 11/15/47 | | 33,000 | 21,940 |
| 6.90%, 11/09/52 | | 51,000 | 50,256 |
| 4.38%, 5/15/55 | | 24,000 | 16,238 |
| 3.85%, 4/01/60 | | 43,000 | 25,809 |
| | | | 1,140,006 |
| Specialty Finance – 1.9% |
| Aircastle Ltd., | | | |
| (5Y US Treasury CMT + 4.41%), 5.25%, 6/15/26(b)(g)(h) | | 55,000 | 43,128 |
| 6.50%, 7/18/28(b) | | 65,000 | 62,603 |
| American Express Co., | | | |
| (SOFR + 1.00%), 4.99%, 5/01/26(h) | | 27,000 | 26,482 |
| (SOFR + 1.33%), 6.34%, 10/30/26(h) | | 109,000 | 109,309 |
| (SOFR + 1.28%), 5.28%, 7/27/29(h) | | 74,000 | 71,033 |
| (SOFR + 1.94%), 6.49%, 10/30/31(h) | | 64,000 | 64,096 |
|
| Capital One Financial Corp., (SOFR + 1.79%), 3.27%, 3/01/30(h) | | 92,000 | 75,441 |
| Discover Financial Services, | | | |
| 4.10%, 2/09/27 | | 34,000 | 30,519 |
| 6.70%, 11/29/32 | | 11,000 | 10,191 |
| (SOFR Index + 3.37%), 7.96%, 11/02/34(h) | | 89,000 | 88,380 |
|
| GATX Corp., 6.90%, 5/01/34 | | 94,000 | 93,762 |
| Nationstar Mortgage Holdings, Inc., | | | |
| 5.00%, 2/01/26(b) | | 100,000 | 92,950 |
| 6.00%, 1/15/27(b) | | 175,000 | 162,666 |
| 5.13%, 12/15/30(b) | | 80,000 | 64,735 |
| 5.75%, 11/15/31(b) | | 145,000 | 120,763 |
| Navient Corp., | | | |
| 5.00%, 3/15/27 | | 300,000 | 263,499 |
| 4.88%, 3/15/28 | | 115,000 | 94,452 |
See accompanying Notes to Financial Statements
Morningstar Funds Trust October 31, 2023 (unaudited)
Schedule of Investments (continued)
Morningstar Multisector Bond Fund
| | | Par (a) | Value |
| Specialty Finance (Continued) |
| OneMain Finance Corp., | | | |
| 6.88%, 3/15/25 | | $100,000 | $ 98,659 |
| 7.13%, 3/15/26 | | 140,000 | 135,968 |
| 3.50%, 1/15/27 | | 155,000 | 130,975 |
| 3.88%, 9/15/28 | | 15,000 | 11,860 |
| 5.38%, 11/15/29 | | 40,000 | 32,889 |
| 4.00%, 9/15/30 | | 170,000 | 124,355 |
|
| Penske Truck Leasing Co. L.P./PTL Finance Corp., 4.20%, 4/01/27(b) | | 92,000 | 85,481 |
| Provident Funding Associates L.P./PFG Finance Corp., 6.38%, 6/15/25(b) | | 105,000 | 93,450 |
| Rocket Mortgage LLC/Rocket Mortgage Co-Issuer, Inc., | | | |
| 2.88%, 10/15/26(b) | | 110,000 | 95,763 |
| 2.88%, 10/15/26 | | 15,000 | 13,059 |
| 3.63%, 3/01/29(b) | | 40,000 | 32,508 |
| 3.63%, 3/01/29 | | 80,000 | 65,015 |
| 3.88%, 3/01/31(b) | | 290,000 | 224,257 |
| 4.00%, 10/15/33(b) | | 565,000 | 415,275 |
|
| Synchrony Financial, 7.25%, 2/02/33 | | 70,000 | 59,361 |
| | | | 3,092,884 |
| Steel – 0.2% |
| ATI, Inc., | | | |
| 4.88%, 10/01/29 | | 50,000 | 42,581 |
| 7.25%, 8/15/30 | | 95,000 | 91,455 |
|
| Commercial Metals Co., 4.13%, 1/15/30 | | 120,000 | 101,276 |
| Nucor Corp., 4.30%, 5/23/27 | | 39,000 | 37,227 |
| United States Steel Corp., 6.88%, 3/01/29 | | 22,000 | 21,373 |
| | | | 293,912 |
| Technology Hardware – 0.7% |
| Avnet, Inc., | | | |
| 6.25%, 3/15/28 | | 45,000 | 44,404 |
| 5.50%, 6/01/32 | | 52,000 | 46,430 |
|
| CDW LLC/CDW Finance Corp., 4.25%, 4/01/28 | | 5,000 | 4,545 |
| CommScope Technologies LLC, 5.00%, 3/15/27(b) | | 625,000 | 230,019 |
| CommScope, Inc., 4.75%, 9/01/29(b) | | 15,000 | 10,237 |
| HP, Inc., 2.65%, 6/17/31 | | 65,000 | 49,605 |
| NCR Atleos Escrow Corp., 9.50%, 4/01/29(b) | | 260,000 | 254,860 |
| | | Par (a) | Value |
| Technology Hardware (Continued) |
| NCR Voyix Corp., | | | |
| 5.00%, 10/01/28(b) | | $255,000 | $ 220,167 |
| 5.13%, 4/15/29(b) | | 70,000 | 60,194 |
| Seagate HDD Cayman, | | | |
| 4.88%, 6/01/27 | | 25,000 | 23,479 |
| 4.09%, 6/01/29 | | 70,000 | 60,350 |
| 8.25%, 12/15/29(b) | | 95,000 | 96,542 |
| 9.63%, 12/01/32(b) | | 3,825 | 4,078 |
|
| Viasat, Inc., 6.50%, 7/15/28(b) | | 65,000 | 46,078 |
| Western Digital Corp., | | | |
| 4.75%, 2/15/26 | | 40,000 | 37,507 |
| 3.10%, 2/01/32 | | 25,000 | 17,671 |
| | | | 1,206,166 |
| Technology Services – 1.0% |
| Block, Inc., 2.75%, 6/01/26 | | 165,000 | 148,065 |
| Booz Allen Hamilton, Inc., | | | |
| 3.88%, 9/01/28(b) | | 66,000 | 58,976 |
| 4.00%, 7/01/29(b) | | 216,000 | 190,620 |
|
| Dun & Bradstreet (The) Corp., 5.00%, 12/15/29(b) | | 55,000 | 47,317 |
| Fiserv, Inc., | | | |
| 5.45%, 3/02/28 | | 39,000 | 38,230 |
| 3.50%, 7/01/29 | | 111,000 | 97,370 |
| 2.65%, 6/01/30 | | 15,000 | 12,088 |
| 5.63%, 8/21/33 | | 80,000 | 75,039 |
|
| Gartner, Inc., 3.75%, 10/01/30(b) | | 90,000 | 74,492 |
| Global Payments, Inc., | | | |
| 4.45%, 6/01/28 | | 131,000 | 120,608 |
| 5.95%, 8/15/52 | | 24,000 | 20,262 |
|
| GTCR W-2 Merger Sub LLC, 7.50%, 1/15/31(b) | | 201,000 | 198,457 |
| International Business Machines Corp., 4.15%, 7/27/27 | | 36,000 | 34,115 |
| Moody's Corp., 3.75%, 3/24/25 | | 50,000 | 48,540 |
| Neptune Bidco U.S., Inc., 9.29%, 4/15/29(b) | | 120,000 | 105,906 |
| PayPal Holdings, Inc., | | | |
| 2.85%, 10/01/29 | | 12,000 | 10,206 |
| 2.30%, 6/01/30 | | 60,000 | 48,103 |
| 4.40%, 6/01/32 | | 15,000 | 13,442 |
| 5.25%, 6/01/62 | | 26,000 | 21,528 |
|
| Paysafe Finance PLC/Paysafe Holdings U.S. Corp., 4.00%, 6/15/29(b) | | 60,000 | 48,234 |
See accompanying Notes to Financial Statements
Morningstar Funds Trust October 31, 2023 (unaudited)
Schedule of Investments (continued)
Morningstar Multisector Bond Fund
| | | Par (a) | Value |
| Technology Services (Continued) |
| Presidio Holdings, Inc., | | | |
| 4.88%, 2/01/27(b) | | $ 30,000 | $ 27,486 |
| 8.25%, 2/01/28(b) | | 30,000 | 28,390 |
| S&P Global, Inc., | | | |
| 2.45%, 3/01/27 | | 68,000 | 61,535 |
| 2.70%, 3/01/29 | | 34,000 | 29,483 |
| 1.25%, 8/15/30 | | 32,000 | 23,793 |
| 2.90%, 3/01/32 | | 94,000 | 75,422 |
| 5.25%, 9/15/33(b) | | 33,000 | 31,136 |
|
| Sabre GLBL, Inc., 11.25%, 12/15/27(b) | | 40,000 | 35,619 |
| | | | 1,724,462 |
| Telecommunications – 1.1% |
| AT&T, Inc., | | | |
| 5.40%, 2/15/34 | | 25,000 | 22,971 |
| 3.50%, 6/01/41 | | 127,000 | 84,905 |
| 3.50%, 9/15/53 | | 54,000 | 31,798 |
| 3.80%, 12/01/57 | | 132,000 | 79,491 |
| 3.65%, 9/15/59 | | 210,000 | 121,498 |
| Frontier Communications Holdings LLC, | | | |
| 5.88%, 10/15/27(b) | | 185,000 | 168,659 |
| 5.00%, 5/01/28(b) | | 235,000 | 202,897 |
| 8.75%, 5/15/30(b) | | 60,000 | 57,165 |
| Level 3 Financing, Inc., | | | |
| 4.25%, 7/01/28(b) | | 45,000 | 25,446 |
| 3.63%, 1/15/29(b) | | 125,000 | 63,837 |
|
| Lumen Technologies, Inc., 4.00%, 2/15/27(b) | | 85,000 | 57,375 |
| Sprint Capital Corp., | | | |
| 6.88%, 11/15/28 | | 61,000 | 62,560 |
| 8.75%, 3/15/32 | | 157,000 | 176,726 |
| T-Mobile USA, Inc., | | | |
| 2.25%, 2/15/26 | | 97,000 | 89,226 |
| 2.63%, 4/15/26 | | 45,000 | 41,590 |
| 2.63%, 2/15/29 | | 24,000 | 20,121 |
| 3.38%, 4/15/29 | | 60,000 | 52,240 |
| 2.88%, 2/15/31 | | 63,000 | 50,167 |
| 2.55%, 2/15/31 | | 23,000 | 17,920 |
| 3.50%, 4/15/31 | | 209,000 | 173,502 |
| 6.00%, 6/15/54 | | 47,000 | 42,674 |
| 5.80%, 9/15/62 | | 21,000 | 18,096 |
| Verizon Communications, Inc., | | | |
| 1.75%, 1/20/31 | | 26,000 | 19,225 |
| 2.55%, 3/21/31 | | 27,000 | 21,094 |
| 4.40%, 11/01/34 | | 107,000 | 90,584 |
| 4.81%, 3/15/39 | | 116,000 | 96,131 |
| | | | 1,887,898 |
| | | Par (a) | Value |
| Tobacco & Cannabis – 0.1% |
| Altria Group, Inc., 6.20%, 11/01/28 | | $ 60,000 | $ 59,666 |
| Philip Morris International, Inc., 5.38%, 2/15/33 | | 100,000 | 92,390 |
| | | | 152,056 |
| Transportation & Logistics – 1.5% |
| Allegiant Travel Co., 7.25%, 8/15/27(b) | | 80,000 | 72,400 |
| American Airlines Pass Through Trust, | | | |
| Series 2015-2, Class AA, 3.60%, 9/22/27 | | 7,092 | 6,465 |
| Series 2015-2, Class A, 4.00%, 9/22/27 | | 45,130 | 40,405 |
| Series 2016-1, Class AA, 3.58%, 1/15/28 | | 3,334 | 3,039 |
| Series 2016-2, Class AA, 3.20%, 6/15/28 | | 18,819 | 16,596 |
| Series 2016-2, Class A, 3.65%, 6/15/28 | | 12,546 | 10,903 |
| Series 2016-3, Class A, 3.25%, 10/15/28 | | 76,031 | 64,508 |
| Series 2017-2, Class AA, 3.35%, 10/15/29 | | 224,745 | 197,168 |
| Series 2019-1, Class AA, 3.15%, 2/15/32 | | 4,861 | 4,051 |
| Series 2019-1, Class A, 3.50%, 2/15/32 | | 132,053 | 105,367 |
|
| American Airlines, Inc./AAdvantage Loyalty IP Ltd., 5.75%, 4/20/29(b) | | 645,000 | 581,825 |
| Burlington Northern Santa Fe LLC, | | | |
| 4.40%, 3/15/42 | | 65,000 | 51,531 |
| 4.38%, 9/01/42 | | 12,000 | 9,454 |
| 4.45%, 3/15/43 | | 2,000 | 1,583 |
| 5.15%, 9/01/43 | | 39,000 | 33,930 |
| 4.90%, 4/01/44 | | 35,000 | 29,386 |
| 3.90%, 8/01/46 | | 42,000 | 29,760 |
| 3.30%, 9/15/51 | | 19,000 | 11,843 |
| 5.20%, 4/15/54 | | 64,000 | 55,262 |
| CSX Corp., | | | |
| 5.20%, 11/15/33 | | 24,000 | 22,525 |
| 4.50%, 11/15/52 | | 52,000 | 39,670 |
| 4.65%, 3/01/68 | | 67,000 | 49,661 |
| Delta Air Lines Pass Through Trust, | | | |
| Series 2015-1, Class A, 3.88%, 7/30/27 | | 7,818 | 7,036 |
| Series 2020-1, Class A, 2.50%, 6/10/28 | | 39,362 | 34,117 |
See accompanying Notes to Financial Statements
Morningstar Funds Trust October 31, 2023 (unaudited)
Schedule of Investments (continued)
Morningstar Multisector Bond Fund
| | | Par (a) | Value |
| Transportation & Logistics (Continued) |
|
| Delta Air Lines, Inc./SkyMiles IP Ltd., 4.75%, 10/20/28(b) | | $ 16,073 | $ 15,108 |
| FedEx Corp., 4.55%, 4/01/46 | | 23,000 | 17,350 |
| Mileage Plus Holdings LLC/Mileage Plus Intellectual Property Assets Ltd., 6.50%, 6/20/27(b) | | 48,749 | 48,158 |
| Norfolk Southern Corp., | | | |
| 2.55%, 11/01/29 | | 24,000 | 19,915 |
| 5.05%, 8/01/30 | | 39,000 | 36,871 |
| 3.95%, 10/01/42 | | 61,000 | 44,441 |
| 2.90%, 8/25/51 | | 24,000 | 13,343 |
| 5.35%, 8/01/54 | | 60,000 | 51,205 |
|
| Rand Parent LLC, 8.50%, 2/15/30(b) | | 380,000 | 347,014 |
| Ryder System, Inc., | | | |
| 6.30%, 12/01/28 | | 49,000 | 48,815 |
| 6.60%, 12/01/33 | | 61,000 | 60,547 |
| U.S. Airways Pass Through Trust, | | | |
| Series 2012-2, Class A, 4.63%, 6/03/25 | | 42,823 | 40,753 |
| Series 2013-1, Class A, 3.95%, 11/15/25 | | 56,309 | 53,107 |
| Union Pacific Corp., | | | |
| 3.38%, 2/01/35 | | 13,000 | 10,167 |
| 3.60%, 9/15/37 | | 14,000 | 10,764 |
| 3.55%, 8/15/39 | | 59,000 | 43,438 |
| 3.80%, 10/01/51 | | 27,000 | 18,655 |
| 3.88%, 2/01/55 | | 9,000 | 6,078 |
| 3.95%, 8/15/59 | | 20,000 | 13,424 |
| 3.84%, 3/20/60 | | 50,000 | 32,932 |
| 3.75%, 2/05/70 | | 7,000 | 4,344 |
| United Airlines Pass Through Trust, | | | |
| Series 2020-1, Class A, 5.88%, 10/15/27 | | 42,054 | 41,404 |
| Series 2016-1, Class A, 3.45%, 7/07/28 | | 62,190 | 54,447 |
| Series 2016-2, Class AA, 2.88%, 10/07/28 | | 2,751 | 2,386 |
| Series 2018-1, Class AA, 3.50%, 3/01/30 | | 44,054 | 38,955 |
| Series 2018-1, Class A, 3.70%, 3/01/30 | | 9,115 | 7,663 |
| Series 2019-1, Class AA, 4.15%, 8/25/31 | | 17,447 | 15,446 |
| | | | 2,575,215 |
| | | Par (a) | Value |
| Transportation Equipment – 0.1% |
| Allison Transmission, Inc., 4.75%, 10/01/27(b) | | $155,000 | $ 141,354 |
Total Corporate Bonds
(Cost $79,052,063) | 71,219,501 |
|
| Foreign Issuer Bonds – 48.1% |
| Angola – 0.5% |
| Angolan Government International Bond, | | | |
| 8.25%, 5/09/28(b) | | 460,000 | 388,700 |
| 8.00%, 11/26/29 | | 200,000 | 160,096 |
| 8.75%, 4/14/32(b) | | 270,000 | 209,822 |
| | | | 758,618 |
| Argentina – 0.3% |
| Argentine Republic Government International Bond, | | | |
| (Step to 4.13% on 7/9/24), 3.63%, 7/09/35(d) | | 640,380 | 157,123 |
| (Step to 5.00% on 7/9/24), 4.25%, 1/09/38(d) | | 204,592 | 61,526 |
| (Step to 4.88% on 7/9/29), 3.50%, 7/09/41(d) | | 751,974 | 196,135 |
| | | | 414,784 |
| Australia – 0.5% |
| BHP Billiton Finance USA Ltd., | | | |
| 5.25%, 9/08/30 | | 62,000 | 59,637 |
| 4.90%, 2/28/33 | | 79,000 | 73,061 |
| 5.25%, 9/08/33 | | 68,000 | 63,914 |
| 5.50%, 9/08/53 | | 19,000 | 17,271 |
|
| CSL Finance PLC, 4.95%, 4/27/62(b) | | 31,000 | 24,295 |
| Mineral Resources Ltd., | | | |
| 8.13%, 5/01/27(b) | | 110,000 | 107,014 |
| 8.00%, 11/01/27(b) | | 90,000 | 86,966 |
| 9.25%, 10/01/28(b) | | 125,000 | 125,000 |
|
| NBN Co. Ltd., 2.50%, 1/08/32(b) | | 200,000 | 152,400 |
| Newcrest Finance Pty. Ltd., | | | |
| 3.25%, 5/13/30(b) | | 36,000 | 30,203 |
| 4.20%, 5/13/50(b) | | 41,000 | 29,298 |
|
| Rio Tinto Finance USA Ltd., 2.75%, 11/02/51 | | 35,000 | 19,487 |
| Rio Tinto Finance USA PLC, | | | |
| 5.00%, 3/09/33 | | 22,000 | 20,617 |
| 5.13%, 3/09/53 | | 63,000 | 54,258 |
| | | | 863,421 |
See accompanying Notes to Financial Statements
Morningstar Funds Trust October 31, 2023 (unaudited)
Schedule of Investments (continued)
Morningstar Multisector Bond Fund
| | | Par (a) | Value |
| Azerbaijan – 0.1% |
| Republic of Azerbaijan International Bond, 3.50%, 9/01/32 | | $ 250,000 | $ 196,000 |
| Bahrain – 0.7% |
| Bahrain Government International Bond, | | | |
| 6.75%, 9/20/29 | | 800,000 | 774,720 |
| 5.63%, 5/18/34 | | 200,000 | 164,505 |
| 7.75%, 4/18/35(b) | | 250,000 | 239,719 |
| | | | 1,178,944 |
| Belgium – 0.1% |
| Anheuser-Busch Cos. LLC/Anheuser-Busch InBev Worldwide, Inc., 4.90%, 2/01/46 | | 197,000 | 164,057 |
| Anheuser-Busch InBev Worldwide, Inc., 4.38%, 4/15/38 | | 93,000 | 76,929 |
| | | | 240,986 |
| Brazil – 3.7% |
| Acu Petroleo Luxembourg S.a.r.l., 7.50%, 1/13/32(b) | | 245,405 | 221,467 |
| Aegea Finance S.a.r.l., 9.00%, 1/20/31(b) | | 200,000 | 199,500 |
| Braskem Netherlands Finance B.V., 8.50%, 1/12/31(b) | | 200,000 | 187,240 |
| Brazil Notas do Tesouro Nacional, Serie F, | | | |
| 10.00%, 1/01/25 | BRL | 8,477,000 | 1,660,367 |
| 10.00%, 1/01/27 | BRL | 5,982,000 | 1,147,284 |
| 10.00%, 1/01/29 | BRL | 8,232,000 | 1,537,287 |
| 10.00%, 1/01/31 | BRL | 446,000 | 81,373 |
| Brazilian Government International Bond, | | | |
| 3.75%, 9/12/31 | | 250,000 | 207,249 |
| 6.00%, 10/20/33 | | 400,000 | 370,068 |
|
| CSN Resources S.A., 4.63%, 6/10/31(b) | | 200,000 | 149,072 |
| Embraer Netherlands Finance B.V., 7.00%, 7/28/30(b) | | 200,000 | 195,278 |
| Minerva Luxembourg S.A., 8.88%, 9/13/33(b) | | 200,000 | 196,290 |
| | | | 6,152,475 |
| Canada – 1.6% |
| 1011778 B.C. ULC/New Red Finance, Inc., | | | |
| 3.88%, 1/15/28(b) | | 475,000 | 424,079 |
| 3.50%, 2/15/29(b) | | 40,000 | 34,199 |
|
| Bank of Montreal, 3.70%, 6/07/25 | | 68,000 | 65,545 |
| | | Par (a) | Value |
| Canada (Continued) |
| Bank of Nova Scotia (The), | | | |
| 4.85%, 2/01/30 | | $ 44,000 | $ 40,460 |
| (5Y US Treasury CMT + 2.05%), 4.59%, 5/04/37(h) | | 121,000 | 97,849 |
| Baytex Energy Corp., | | | |
| 8.75%, 4/01/27(b) | | 165,000 | 166,299 |
| 8.50%, 4/30/30(b) | | 45,000 | 44,570 |
|
| Bell Telephone Co. of Canada or Bell Canada, 5.10%, 5/11/33 | | 115,000 | 104,707 |
| Bombardier, Inc., | | | |
| 7.13%, 6/15/26(b) | | 380,000 | 365,631 |
| 6.00%, 2/15/28(b) | | 35,000 | 30,971 |
|
| Brookfield Finance, Inc., 3.63%, 2/15/52 | | 76,000 | 44,988 |
| Brookfield Residential Properties, Inc./Brookfield Residential U.S. LLC, 4.88%, 2/15/30(b) | | 70,000 | 53,232 |
| Canadian National Railway Co., 2.75%, 3/01/26 | | 95,000 | 89,214 |
| Canadian Pacific Railway Co., 2.88%, 11/15/29 | | 29,000 | 24,443 |
| Enbridge, Inc., | | | |
| 5.70%, 3/08/33 | | 59,000 | 55,167 |
| (5Y US Treasury CMT + 3.71%), 7.38%, 1/15/83(h) | | 25,000 | 23,128 |
| (5Y US Treasury CMT + 4.42%), 7.63%, 1/15/83(h) | | 24,000 | 21,467 |
|
| GFL Environmental, Inc., 4.00%, 8/01/28(b) | | 80,000 | 68,847 |
| Intact Financial Corp., 5.46%, 9/22/32(b) | | 71,000 | 65,754 |
| MEG Energy Corp., 5.88%, 2/01/29(b) | | 30,000 | 28,035 |
| Nutrien Ltd., | | | |
| 5.95%, 11/07/25 | | 24,000 | 24,000 |
| 4.90%, 3/27/28 | | 19,000 | 18,201 |
| 2.95%, 5/13/30 | | 179,000 | 147,335 |
| 5.88%, 12/01/36 | | 7,000 | 6,488 |
| 5.80%, 3/27/53 | | 9,000 | 7,864 |
|
| Open Text Corp., 6.90%, 12/01/27(b) | | 130,000 | 129,356 |
| Open Text Holdings, Inc., 4.13%, 2/15/30(b) | | 5,000 | 4,143 |
| Parkland Corp., | | | |
| 5.88%, 7/15/27(b) | | 95,000 | 90,958 |
| 4.50%, 10/01/29(b) | | 85,000 | 73,108 |
See accompanying Notes to Financial Statements
Morningstar Funds Trust October 31, 2023 (unaudited)
Schedule of Investments (continued)
Morningstar Multisector Bond Fund
| | | Par (a) | Value |
| Canada (Continued) |
|
| Precision Drilling Corp., 6.88%, 1/15/29(b) | | $ 55,000 | $ 50,925 |
| Strathcona Resources Ltd., 6.88%, 8/01/26(b) | | 60,000 | 55,350 |
| Telesat Canada/Telesat LLC, 5.63%, 12/06/26(b) | | 80,000 | 51,063 |
| Toronto-Dominion Bank (The), | | | |
| 4.11%, 6/08/27 | | 72,000 | 67,502 |
| 5.52%, 7/17/28 | | 57,000 | 55,571 |
|
| Triton Container International Ltd., 3.15%, 6/15/31(b) | | 49,000 | 35,703 |
| | | | 2,666,152 |
| Chile – 1.1% |
| Bonos de la Tesoreria de la Republica en pesos, | | | |
| 5.00%, 10/01/28(b) | CLP | 95,000,000 | 98,899 |
| 4.70%, 9/01/30(b) | CLP | 420,000,000 | 419,576 |
| 6.00%, 4/01/33(b) | CLP | 115,000,000 | 123,439 |
| 5.00%, 3/01/35 | CLP | 100,000,000 | 99,149 |
| Chile Government International Bond, | | | |
| 2.75%, 1/31/27 | | 200,000 | 182,747 |
| 2.55%, 7/27/33 | | 200,000 | 149,723 |
| 4.95%, 1/05/36 | | 400,000 | 355,101 |
|
| Corp. Nacional del Cobre de Chile, 3.00%, 9/30/29 | | 200,000 | 165,944 |
| Empresa Nacional del Petroleo, 6.15%, 5/10/33(b) | | 200,000 | 185,529 |
| | | | 1,780,107 |
| China – 1.2% |
| Agile Group Holdings Ltd., 6.05%, 10/13/25 | | 205,000 | 17,425 |
| China Evergrande Group, 8.75%, 6/28/25(j) | | 200,000 | 3,000 |
| China Government Bond, | | | |
| 3.27%, 11/19/30 | CNH | 2,860,000 | 407,252 |
| 2.60%, 9/01/32 | CNH | 5,280,000 | 712,370 |
| 2.67%, 5/25/33 | CNH | 4,350,000 | 590,599 |
|
| Fantasia Holdings Group Co. Ltd., 11.88%, 6/01/23(j) | | 200,000 | 4,000 |
| NXP B.V./NXP Funding LLC/NXP USA, Inc., | | | |
| 4.30%, 6/18/29 | | 63,000 | 56,847 |
| 5.00%, 1/15/33 | | 62,000 | 55,278 |
| 3.13%, 2/15/42 | | 23,000 | 14,253 |
| 3.25%, 11/30/51 | | 55,000 | 31,136 |
| | | Par (a) | Value |
| China (Continued) |
|
| Sunac China Holdings Ltd., 6.50%, 1/26/26 | | $ 200,000 | $ 31,000 |
| Times China Holdings Ltd., 6.20%, 3/22/26(j) | | 215,000 | 4,300 |
| Yuzhou Group Holdings Co. Ltd., 6.35%, 1/31/27(j) | | 200,000 | 12,000 |
| Zhenro Properties Group Ltd., 6.63%, 1/07/26(j) | | 200,000 | 1,000 |
| | | | 1,940,460 |
| Colombia – 1.6% |
| Colombia Government International Bond, | | | |
| 3.88%, 4/25/27 | | 200,000 | 182,043 |
| 7.50%, 2/02/34 | | 400,000 | 374,075 |
| 7.38%, 9/18/37 | | 350,000 | 315,037 |
| Colombian TES, | | | |
| 7.50%, 8/26/26 | COP | 205,200,000 | 45,897 |
| 6.00%, 4/28/28 | COP | 1,425,600,000 | 287,024 |
| 7.75%, 9/18/30 | COP | 1,803,600,000 | 367,585 |
| 7.00%, 6/30/32 | COP | 2,029,800,000 | 373,279 |
| 6.25%, 7/09/36 | COP | 500,100,000 | 78,228 |
| Ecopetrol S.A., | | | |
| 8.63%, 1/19/29 | | 310,000 | 309,163 |
| 8.88%, 1/13/33 | | 170,000 | 163,268 |
|
| Gran Tierra Energy, Inc., 9.50%, 10/15/29(b) | | 200,000 | 171,782 |
| | | | 2,667,381 |
| Czech Republic – 1.3% |
| Czech Republic Government Bond, | | | |
| 1.25%, 2/14/25 | CZK | 8,090,000 | 331,970 |
| 1.00%, 6/26/26 | CZK | 6,500,000 | 255,801 |
| 0.25%, 2/10/27 | CZK | 6,000,000 | 225,790 |
| 5.50%, 12/12/28 | CZK | 3,810,000 | 172,255 |
| 2.75%, 7/23/29 | CZK | 8,230,000 | 323,565 |
| 0.95%, 5/15/30 | CZK | 8,670,000 | 298,613 |
| 1.75%, 6/23/32 | CZK | 5,220,000 | 180,214 |
| 2.00%, 10/13/33 | CZK | 10,070,000 | 344,131 |
| | | | 2,132,339 |
| Dominican Republic – 0.7% |
| Dominican Republic International Bond, | | | |
| 6.00%, 7/19/28 | | 150,000 | 141,990 |
| 5.50%, 2/22/29(b) | | 200,000 | 182,010 |
| 4.50%, 1/30/30(b) | | 605,000 | 511,987 |
| 4.88%, 9/23/32(b) | | 200,000 | 161,617 |
| 6.85%, 1/27/45 | | 225,000 | 187,235 |
| | | | 1,184,839 |
See accompanying Notes to Financial Statements
Morningstar Funds Trust October 31, 2023 (unaudited)
Schedule of Investments (continued)
Morningstar Multisector Bond Fund
| | | Par (a) | Value |
| Ecuador – 0.3% |
| Ecuador Government International Bond, | | | |
| (Step to 6.90% on 7/31/24), 6.00%, 7/31/30(d) | | $230,519 | $ 116,625 |
| (Step to 5.50% on 7/31/24), 3.50%, 7/31/35(b)(d) | | 566,291 | 214,254 |
| (Step to 5.00% on 7/31/24), 2.50%, 7/31/40(d) | | 400,000 | 133,779 |
| | | | 464,658 |
| Egypt – 0.8% |
| Egypt Government International Bond, | | | |
| 5.88%, 2/16/31 | | 400,000 | 220,220 |
| 7.05%, 1/15/32(b) | | 535,000 | 301,323 |
| 7.30%, 9/30/33 | | 280,000 | 155,180 |
| 8.50%, 1/31/47 | | 800,000 | 418,702 |
| 7.50%, 2/16/61 | | 300,000 | 149,238 |
| | | | 1,244,663 |
| El Salvador – 0.2% |
| El Salvador Government International Bond, | | | |
| 6.38%, 1/18/27 | | 30,000 | 24,491 |
| 8.25%, 4/10/32 | | 110,000 | 86,181 |
| 7.12%, 1/20/50 | | 450,000 | 280,770 |
| | | | 391,442 |
| France – 0.2% |
| Altice France S.A., | | | |
| 8.13%, 2/01/27(b) | | 200,000 | 168,593 |
| 5.13%, 1/15/29(b) | | 290,000 | 200,144 |
|
| Orange S.A., 9.00%, 3/01/31 | | 37,000 | 42,387 |
| | | | 411,124 |
| Gabon – 0.3% |
| Gabon Government International Bond, 6.63%, 2/06/31 | | 600,000 | 426,649 |
| Germany – 0.4% |
| BMW U.S. Capital LLC, 5.15%, 8/11/33(b) | | 56,000 | 51,738 |
| Deutsche Bank A.G., (5Y USD Swap Rate + 2.55%), 4.88%, 12/01/32(h) | | 400,000 | 336,811 |
| | | Par (a) | Value |
| Germany (Continued) |
| Deutsche Telekom International Finance B.V., 4.38%, 6/21/28(b) | | $ 150,000 | $ 140,742 |
| ZF North America Capital, Inc., 6.88%, 4/14/28(b) | | 150,000 | 145,357 |
| | | | 674,648 |
| Ghana – 0.4% |
| Ghana Government International Bond, | | | |
| 6.38%, 2/11/27 | | 260,000 | 111,116 |
| 7.75%, 4/07/29 | | 200,000 | 85,920 |
| 7.63%, 5/16/29 | | 400,000 | 171,412 |
| 8.13%, 3/26/32 | | 325,000 | 137,829 |
| 8.63%, 4/07/34 | | 200,000 | 85,300 |
| 8.88%, 5/07/42 | | 200,000 | 83,632 |
| | | | 675,209 |
| Guatemala – 0.4% |
| Central American Bottling Corp./CBC Bottling Holdco SL/Beliv Holdco SL, 5.25%, 4/27/29(b) | | 110,000 | 96,800 |
| Guatemala Government Bond, | | | |
| 4.90%, 6/01/30 | | 200,000 | 177,942 |
| 3.70%, 10/07/33(b) | | 200,000 | 147,210 |
| 6.60%, 6/13/36(b) | | 200,000 | 184,743 |
| | | | 606,695 |
| Hong Kong – 0.1% |
| Melco Resorts Finance Ltd., 5.38%, 12/04/29(b) | | 200,000 | 158,311 |
| Hungary – 1.1% |
| Hungary Government Bond, | | | |
| 5.50%, 6/24/25 | HUF | 45,250,000 | 120,515 |
| 1.00%, 11/26/25 | HUF | 39,680,000 | 96,140 |
| 3.00%, 10/27/27 | HUF | 62,670,000 | 147,324 |
| 3.25%, 10/22/31 | HUF | 59,400,000 | 125,619 |
| 4.75%, 11/24/32 | HUF | 143,210,000 | 326,487 |
| Hungary Government International Bond, | | | |
| 6.13%, 5/22/28(b) | | 210,000 | 208,173 |
| 6.75%, 9/25/52(b) | | 200,000 | 184,604 |
|
| Magyar Export-Import Bank Zrt., 6.13%, 12/04/27(b) | | 400,000 | 391,242 |
| MVM Energetika Zrt, 7.50%, 6/09/28 | | 200,000 | 200,357 |
| | | | 1,800,461 |
See accompanying Notes to Financial Statements
Morningstar Funds Trust October 31, 2023 (unaudited)
Schedule of Investments (continued)
Morningstar Multisector Bond Fund
| | | Par (a) | Value |
| India – 0.2% |
| Clean Renewable Power Mauritius Pte. Ltd., 4.25%, 3/25/27(b) | | $ 180,000 | $ 153,247 |
| India Green Power Holdings, 4.00%, 2/22/27 | | 250,000 | 214,065 |
| | | | 367,312 |
| Indonesia – 3.4% |
| Freeport Indonesia PT, 5.32%, 4/14/32(b) | | 400,000 | 356,435 |
| Indonesia Asahan Aluminium PT/Mineral Industri Indonesia Persero PT, | | | |
| 4.75%, 5/15/25(b) | | 200,000 | 195,800 |
| 5.45%, 5/15/30(b) | | 500,000 | 463,750 |
|
| Indonesia Government International Bond, 5.65%, 1/11/53 | | 200,000 | 183,054 |
| Indonesia Treasury Bond, | | | |
| 6.50%, 6/15/25 | IDR | 11,034,000,000 | 689,624 |
| 8.38%, 9/15/26 | IDR | 5,700,000,000 | 371,464 |
| 6.13%, 5/15/28 | IDR | 3,148,000,000 | 190,927 |
| 9.00%, 3/15/29 | IDR | 9,247,000,000 | 628,814 |
| 7.00%, 9/15/30 | IDR | 3,482,000,000 | 217,418 |
| 6.38%, 4/15/32 | IDR | 3,817,000,000 | 229,550 |
| 7.50%, 8/15/32 | IDR | 5,944,000,000 | 379,138 |
| 7.00%, 2/15/33 | IDR | 15,925,000,000 | 994,220 |
| 8.38%, 3/15/34 | IDR | 2,453,000,000 | 167,077 |
| 7.50%, 6/15/35 | IDR | 2,678,000,000 | 172,108 |
| Perusahaan Penerbit SBSN Indonesia III, | | | |
| 2.55%, 6/09/31 | | 200,000 | 159,694 |
| 4.70%, 6/06/32(b) | | 200,000 | 185,235 |
|
| Perusahaan Perseroan Persero PT Perusahaan Listrik Negara, 4.88%, 7/17/49 | | 200,000 | 142,362 |
| | | | 5,726,670 |
| Iraq – 0.1% |
| Iraq International Bond, 5.80%, 1/15/28 | | 140,625 | 125,367 |
| Ireland – 0.1% |
| SMBC Aviation Capital Finance DAC, 5.70%, 7/25/33(b) | | 202,000 | 182,079 |
| Israel – 1.2% |
| Energian Israel Finance Ltd., | | | |
| 4.88%, 3/30/26(b) | | 354,568 | 313,350 |
| 5.38%, 3/30/28(b) | | 210,432 | 172,994 |
| | | Par (a) | Value |
| Israel (Continued) |
| Leviathan Bond Ltd., | | | |
| 6.13%, 6/30/25(b) | | $100,000 | $ 93,090 |
| 6.75%, 6/30/30(b) | | 390,000 | 331,717 |
|
| Teva Pharmaceutical Finance Co. LLC, 6.15%, 2/01/36 | | 60,000 | 50,399 |
| Teva Pharmaceutical Finance Netherlands III B.V., | | | |
| 3.15%, 10/01/26 | | 500,000 | 440,212 |
| 7.88%, 9/15/29 | | 200,000 | 197,220 |
| 4.10%, 10/01/46 | | 787,000 | 470,790 |
| | | | 2,069,772 |
| Italy – 0.4% |
| Intesa Sanpaolo S.p.A., 6.63%, 6/20/33(b) | | 400,000 | 366,880 |
| Telecom Italia Capital S.A., | | | |
| 6.38%, 11/15/33 | | 70,000 | 59,690 |
| 6.00%, 9/30/34 | | 10,000 | 8,230 |
| 7.20%, 7/18/36 | | 59,000 | 51,012 |
|
| UniCredit S.p.A., (5Y US Treasury CMT + 4.75%), 5.46%, 6/30/35(b)(h) | | 200,000 | 164,075 |
| | | | 649,887 |
| Japan – 0.3% |
| SoftBank Group Corp., 4.63%, 7/06/28 | | 405,000 | 346,934 |
| Takeda Pharmaceutical Co. Ltd., 5.00%, 11/26/28 | | 200,000 | 193,082 |
| | | | 540,016 |
| Jordan – 0.2% |
| Jordan Government International Bond, | | | |
| 7.75%, 1/15/28(b) | | 200,000 | 190,290 |
| 7.50%, 1/13/29(b) | | 200,000 | 185,763 |
| | | | 376,053 |
| Kazakhstan – 0.6% |
| KazMunayGas National Co. JSC, | | | |
| 4.75%, 4/19/27(b) | | 800,000 | 746,432 |
| 5.38%, 4/24/30 | | 200,000 | 178,900 |
| | | | 925,332 |
| Kenya – 0.2% |
| Republic of Kenya Government International Bond, | | | |
| 7.00%, 5/22/27 | | 200,000 | 173,588 |
| 6.30%, 1/23/34 | | 205,000 | 140,190 |
| | | | 313,778 |
See accompanying Notes to Financial Statements
Morningstar Funds Trust October 31, 2023 (unaudited)
Schedule of Investments (continued)
Morningstar Multisector Bond Fund
| | | Par (a) | Value |
| Luxembourg – 0.1% |
| Altice Financing S.A., 5.00%, 1/15/28(b) | | $ 240,000 | $ 195,184 |
| Macau – 0.5% |
| MGM China Holdings Ltd., 4.75%, 2/01/27 | | 200,000 | 175,860 |
| Sands China Ltd., 5.65%, 8/08/28 | | 200,000 | 185,012 |
| Studio City Finance Ltd., 5.00%, 1/15/29(b) | | 200,000 | 143,560 |
| Wynn Macau Ltd., | | | |
| 5.50%, 1/15/26(b) | | 200,000 | 185,771 |
| 5.13%, 12/15/29(b) | | 200,000 | 157,013 |
| | | | 847,216 |
| Malaysia – 2.1% |
| Malaysia Government Bond, | | | |
| 3.88%, 3/14/25 | MYR | 2,554,000 | 538,712 |
| 3.73%, 6/15/28 | MYR | 3,553,000 | 739,069 |
| 3.89%, 8/15/29 | MYR | 3,048,000 | 634,874 |
| 4.76%, 4/07/37 | MYR | 2,369,000 | 523,183 |
| 4.89%, 6/08/38 | MYR | 2,185,000 | 489,902 |
| 3.76%, 5/22/40 | MYR | 778,000 | 150,017 |
|
| Malaysia Government Investment Issue, 3.47%, 10/15/30 | MYR | 1,720,000 | 346,756 |
| | | | 3,422,513 |
| Mexico – 4.1% |
| Cemex S.A.B. de C.V., | | | |
| (5Y US Treasury CMT + 4.53%), 5.13%, 6/08/26(b)(g)(h) | | 200,000 | 185,033 |
| (5Y US Treasury CMT + 5.16%), 9.13%, 12/31/49(b)(g)(h) | | 275,000 | 281,912 |
| Mexican Bonos, | | | |
| 10.00%, 12/05/24 | MXN | 8,900,900 | 487,193 |
| 5.00%, 3/06/25 | MXN | 4,630,800 | 238,285 |
| 5.75%, 3/05/26 | MXN | 7,445,100 | 371,478 |
| 8.50%, 5/31/29 | MXN | 14,008,700 | 722,696 |
| 7.75%, 5/29/31 | MXN | 11,900,900 | 575,467 |
| 7.50%, 5/26/33 | MXN | 7,756,800 | 359,887 |
| 7.75%, 11/23/34 | MXN | 8,382,900 | 391,475 |
| 10.00%, 11/20/36 | MXN | 1,224,400 | 67,297 |
| 8.50%, 11/18/38 | MXN | 10,499,200 | 508,782 |
| Mexico Government International Bond, | | | |
| 3.25%, 4/16/30 | | 570,000 | 479,942 |
| 6.35%, 2/09/35 | | 800,000 | 764,770 |
| 6.34%, 5/04/53 | | 330,000 | 288,493 |
| Petroleos Mexicanos, | | | |
| 6.88%, 8/04/26 | | 470,000 | 433,970 |
| | | Par (a) | Value |
| Mexico (Continued) |
| Petroleos Mexicanos, | | | |
| 6.49%, 1/23/27 | | $280,000 | $ 247,975 |
| 5.35%, 2/12/28 | | 99,000 | 79,911 |
| 5.95%, 1/28/31 | | 307,000 | 219,659 |
| 6.63%, 6/15/35 | | 90,000 | 59,362 |
| | | | 6,763,587 |
| Morocco – 0.2% |
| Morocco Government International Bond, 5.95%, 3/08/28(b) | | 400,000 | 391,500 |
| Mozambique – 0.1% |
| Mozambique International Bond, 9.00%, 9/15/31 | | 200,000 | 155,340 |
| Netherlands – 0.4% |
| Cooperatieve Rabobank U.A., (1Y US Treasury CMT + 1.75%), 4.66%, 8/22/28(b)(h) | | 250,000 | 234,486 |
| Shell International Finance B.V., | | | |
| 4.13%, 5/11/35 | | 23,000 | 19,608 |
| 2.88%, 11/26/41 | | 29,000 | 18,751 |
| 4.00%, 5/10/46 | | 55,000 | 40,501 |
| 3.00%, 11/26/51 | | 46,000 | 27,122 |
|
| Ziggo Bond Co. B.V., 6.00%, 1/15/27(b) | | 345,000 | 316,079 |
| | | | 656,547 |
| Nigeria – 0.7% |
| IHS Netherlands Holdco B.V., 8.00%, 9/18/27 | | 200,000 | 163,706 |
| Nigeria Government International Bond, | | | |
| 6.13%, 9/28/28(b) | | 200,000 | 163,148 |
| 8.38%, 3/24/29 | | 200,000 | 176,110 |
| 7.38%, 9/28/33 | | 600,000 | 453,768 |
| 7.70%, 2/23/38(b) | | 390,000 | 277,387 |
| | | | 1,234,119 |
| Oman – 0.6% |
| Oman Government International Bond, | | | |
| 6.00%, 8/01/29 | | 400,000 | 388,724 |
| 6.25%, 1/25/31(b) | | 700,000 | 679,328 |
| | | | 1,068,052 |
| Pakistan – 0.3% |
| Pakistan Government International Bond, | | | |
| 6.00%, 4/08/26(b) | | 600,000 | 327,000 |
| 6.88%, 12/05/27 | | 335,000 | 178,857 |
| | | | 505,857 |
See accompanying Notes to Financial Statements
Morningstar Funds Trust October 31, 2023 (unaudited)
Schedule of Investments (continued)
Morningstar Multisector Bond Fund
| | | Par (a) | Value |
| Panama – 0.4% |
| Panama Government International Bond, | | | |
| 3.16%, 1/23/30 | | $ 400,000 | $ 322,722 |
| 2.25%, 9/29/32 | | 200,000 | 136,299 |
| 6.40%, 2/14/35 | | 250,000 | 229,226 |
| | | | 688,247 |
| Paraguay – 0.1% |
| Paraguay Government International Bond, 3.85%, 6/28/33 | | 300,000 | 240,408 |
| Peru – 1.0% |
| Peru Government Bond, | | | |
| 6.15%, 8/12/32 | PEN | 417,000 | 99,300 |
| 7.30%, 8/12/33(b) | PEN | 400,000 | 102,093 |
| 5.40%, 8/12/34 | PEN | 525,000 | 114,174 |
| Peruvian Government International Bond, | | | |
| 2.78%, 1/23/31 | | 505,000 | 404,273 |
| 7.30%, 8/12/33(b) | PEN | 270,000 | 68,913 |
| 3.00%, 1/15/34 | | 740,000 | 559,696 |
| 6.90%, 8/12/37 | PEN | 1,134,000 | 273,890 |
|
| Volcan Cia Minera S.A.A., 4.38%, 2/11/26(b) | | 35,000 | 16,804 |
| | | | 1,639,143 |
| Philippines – 0.5% |
| Philippine Government International Bond, | | | |
| 3.56%, 9/29/32 | | 600,000 | 505,161 |
| 2.95%, 5/05/45 | | 200,000 | 122,401 |
| 3.20%, 7/06/46 | | 350,000 | 218,683 |
| | | | 846,245 |
| Poland – 1.6% |
| Bank Gospodarstwa Krajowego, 6.25%, 10/31/28(b) | | 200,000 | 202,372 |
| Republic of Poland Government Bond, | | | |
| 3.25%, 7/25/25 | PLN | 1,011,000 | 232,519 |
| 2.50%, 7/25/26 | PLN | 1,665,000 | 369,539 |
| 2.50%, 7/25/27 | PLN | 981,000 | 212,329 |
| 2.75%, 10/25/29 | PLN | 1,005,000 | 207,957 |
| 1.25%, 10/25/30 | PLN | 2,014,000 | 366,214 |
| 1.75%, 4/25/32 | PLN | 2,257,000 | 399,752 |
| Republic of Poland Government International Bond, | | | |
| 5.50%, 11/16/27 | | 250,000 | 250,986 |
| 4.88%, 10/04/33 | | 282,000 | 261,065 |
| 5.50%, 4/04/53 | | 213,000 | 187,717 |
| | | | 2,690,450 |
| | | Par (a) | Value |
| Qatar – 0.3% |
| Qatar Energy, | | | |
| 2.25%, 7/12/31 | | $ 350,000 | $ 273,908 |
| 3.30%, 7/12/51 | | 400,000 | 244,890 |
| | | | 518,798 |
| Romania – 1.4% |
| Romania Government Bond, | | | |
| 4.75%, 2/24/25 | RON | 360,000 | 75,533 |
| 3.25%, 6/24/26 | RON | 1,710,000 | 340,344 |
| 5.00%, 2/12/29 | RON | 470,000 | 92,132 |
| 7.35%, 4/28/31 | RON | 1,605,000 | 352,957 |
| 6.70%, 2/25/32 | RON | 2,280,000 | 477,999 |
| Romanian Government International Bond, | | | |
| 6.63%, 2/17/28(b) | | 470,000 | 470,000 |
| 7.13%, 1/17/33(b) | | 280,000 | 278,447 |
| 7.63%, 1/17/53(b) | | 170,000 | 166,989 |
| | | | 2,254,401 |
| Saudi Arabia – 0.9% |
| Gaci First Investment Co., | | | |
| 4.75%, 2/14/30 | | 400,000 | 376,451 |
| 4.88%, 2/14/35 | | 400,000 | 353,704 |
| 5.13%, 2/14/53 | | 200,000 | 154,750 |
|
| TMS Issuer S.a.r.l., 5.78%, 8/23/32 | | 600,000 | 584,414 |
| | | | 1,469,319 |
| South Africa – 2.7% |
| Eskom Holdings SOC Ltd., | | | |
| 8.45%, 8/10/28 | | 400,000 | 379,949 |
| 6.35%, 8/10/28 | | 300,000 | 272,258 |
| Republic of South Africa Government Bond, | | | |
| 10.50%, 12/21/26 | ZAR | 3,654,517 | 202,271 |
| 7.00%, 2/28/31 | ZAR | 12,825,574 | 544,713 |
| 8.25%, 3/31/32 | ZAR | 12,846,227 | 566,888 |
| 8.88%, 2/28/35 | ZAR | 24,404,861 | 1,042,649 |
| 8.50%, 1/31/37 | ZAR | 15,024,445 | 596,060 |
| 9.00%, 1/31/40 | ZAR | 10,406,227 | 415,132 |
| Republic of South Africa Government International Bond, | | | |
| 5.88%, 6/22/30 | | 200,000 | 175,380 |
| 5.65%, 9/27/47 | | 200,000 | 129,848 |
|
| Sasol Financing USA LLC, 8.75%, 5/03/29(b) | | 200,000 | 190,000 |
| | | | 4,515,148 |
See accompanying Notes to Financial Statements
Morningstar Funds Trust October 31, 2023 (unaudited)
Schedule of Investments (continued)
Morningstar Multisector Bond Fund
| | | Par (a) | Value |
| South Korea – 0.2% |
| POSCO, 5.75%, 1/17/28(b) | | $ 200,000 | $ 196,920 |
| SK Hynix, Inc., 6.38%, 1/17/28(b) | | 200,000 | 197,779 |
| | | | 394,699 |
| Spain – 0.1% |
| Banco Santander S.A., 6.94%, 11/07/33 | | 200,000 | 200,539 |
| Iberdrola International B.V., 5.81%, 3/15/25 | | 33,000 | 32,958 |
| | | | 233,497 |
| Sri Lanka – 0.1% |
| Sri Lanka Government International Bond, 6.75%, 4/18/28 | | 400,000 | 198,745 |
| Switzerland – 0.3% |
| Swiss Re Treasury U.S. Corp., 4.25%, 12/06/42(b) | | 43,000 | 32,454 |
| UBS A.G., 5.65%, 9/11/28 | | 200,000 | 195,724 |
| UBS Group A.G., (1Y US Treasury CMT + 1.75%), 4.75%, 5/12/28(b)(h) | | 200,000 | 187,893 |
| | | | 416,071 |
| Thailand – 1.6% |
| Thailand Government Bond, | | | |
| 2.13%, 12/17/26 | THB | 9,883,000 | 270,448 |
| 2.88%, 12/17/28 | THB | 29,638,000 | 825,288 |
| 1.60%, 12/17/29 | THB | 5,919,000 | 152,161 |
| 2.00%, 12/17/31 | THB | 20,100,000 | 512,615 |
| 3.78%, 6/25/32 | THB | 2,316,000 | 67,206 |
| 3.35%, 6/17/33 | THB | 4,551,000 | 128,507 |
| 1.59%, 12/17/35 | THB | 19,080,000 | 436,341 |
| 3.30%, 6/17/38 | THB | 8,000,000 | 214,730 |
| | | | 2,607,296 |
| Turkey – 1.0% |
| Turkiye Government International Bond, | | | |
| 9.88%, 1/15/28 | | 220,000 | 229,933 |
| 9.38%, 3/14/29 | | 200,000 | 203,600 |
| 9.13%, 7/13/30 | | 400,000 | 399,500 |
| 5.75%, 5/11/47 | | 625,000 | 406,975 |
|
| Yapi ve Kredi Bankasi AS, 9.25%, 10/16/28(b) | | 400,000 | 401,872 |
| | | | 1,641,880 |
| Ukraine – 0.2% |
| Ukraine Government International Bond, | | | |
| 7.75%, 9/01/27 | | 300,000 | 85,708 |
| | | Par (a) | Value |
| Ukraine (Continued) |
| Ukraine Government International Bond, | | | |
| 7.25%, 3/15/35 | | $600,000 | $ 153,300 |
| 7.75%, 8/01/41(c)(l) | | 191,000 | 80,081 |
| | | | 319,089 |
| United Arab Emirates – 0.7% |
| Abu Dhabi Government International Bond, 3.13%, 9/30/49 | | 200,000 | 123,055 |
| Finance Department Government of Sharjah, 6.50%, 11/23/32(b) | | 400,000 | 387,032 |
| Galaxy Pipeline Assets Bidco Ltd., | | | |
| 2.16%, 3/31/34(b) | | 169,888 | 137,535 |
| 2.63%, 3/31/36(b) | | 350,000 | 263,674 |
| 2.94%, 9/30/40(b) | | 209,952 | 154,919 |
|
| MDGH GMTN RSC Ltd., 5.08%, 5/22/53 | | 200,000 | 167,202 |
| | | | 1,233,417 |
| United Kingdom – 0.7% |
| BAT Capital Corp., | | | |
| 6.42%, 8/02/33 | | 50,000 | 47,116 |
| 7.08%, 8/02/43 | | 54,000 | 49,230 |
| 7.08%, 8/02/53 | | 75,000 | 66,938 |
|
| Coca-Cola Europacific Partners PLC, 1.50%, 1/15/27(b) | | 200,000 | 173,823 |
| Jaguar Land Rover Automotive PLC, 5.50%, 7/15/29(b) | | 200,000 | 172,396 |
| LSEGA Financing PLC, 1.38%, 4/06/26(b) | | 200,000 | 179,498 |
| RELX Capital, Inc., 4.00%, 3/18/29 | | 39,000 | 35,909 |
| Reynolds American, Inc., 5.85%, 8/15/45 | | 16,000 | 12,508 |
| Virgin Media Secured Finance PLC, 5.50%, 5/15/29(b) | | 250,000 | 221,374 |
| Vodafone Group PLC, | | | |
| 5.13%, 6/19/59 | | 22,000 | 16,550 |
| 5.75%, 2/10/63 | | 28,000 | 23,331 |
| (5Y US Treasury CMT + 3.07%), 5.13%, 6/04/81(h) | | 155,000 | 98,466 |
| | | | 1,097,139 |
| Uruguay – 0.3% |
| Uruguay Government International Bond, | | | |
| 4.38%, 1/23/31 | | 225,000 | 212,536 |
See accompanying Notes to Financial Statements
Morningstar Funds Trust October 31, 2023 (unaudited)
Schedule of Investments (continued)
Morningstar Multisector Bond Fund
| | | Par (a) | Value |
| Uruguay (Continued) |
| Uruguay Government International Bond, | | | |
| 5.75%, 10/28/34 | | $275,000 | $ 275,189 |
| 5.10%, 6/18/50 | | 40,000 | 34,583 |
| | | | 522,308 |
| Zambia – 0.6% |
| First Quantum Minerals Ltd., | | | |
| 6.88%, 3/01/26(b) | | 710,000 | 623,604 |
| 8.63%, 6/01/31(b) | | 200,000 | 168,820 |
|
| Zambia Government International Bond, 5.38%, 9/20/22(j) | | 300,000 | 165,017 |
| | | | 957,441 |
Total Foreign Issuer Bonds
(Cost $87,186,539) | 80,030,288 |
|
| Mortgage-Backed Securities – 0.5% |
| Commercial Mortgage-Backed Securities – 0.5% |
| Citigroup Commercial Mortgage Trust, Series 2014-GC21, Class D, 4.94%, 5/10/47(b)(m) | | 175,000 | 108,145 |
| Commercial Mortgage Trust, Series 2012-CR3, Class B, 3.92%, 10/15/45(b) | | 100,000 | 78,800 |
| GS Mortgage Securities Trust, | | | |
| Series 2011-GC5, Class C, 5.15%, 8/10/44(b)(m) | | 35,000 | 24,413 |
| Series 2011-GC5, Class D, 5.15%, 8/10/44(b)(m) | | 315,000 | 92,806 |
| Series 2013-GC13, Class C, 3.83%, 7/10/46(b)(m) | | 320,000 | 220,310 |
| Series 2014-GC22, Class D, 4.69%, 6/10/47(b)(m) | | 50,000 | 20,279 |
|
| JP Morgan Chase Commercial Mortgage Securities Trust, Series 2011-C3, Class C, 5.36%, 2/15/46(b) | | 100,000 | 83,985 |
| Morgan Stanley Bank of America Merrill Lynch Trust, Series 2013-C11, Class B, 4.08%, 8/15/46(m) | | 110,000 | 56,375 |
| | | Par (a) | Value |
Commercial Mortgage-Backed Securities
(Continued) |
|
| MSBAM Commercial Mortgage Securities Trust, Series 2012-CKSV, Class C, 4.28%, 10/15/30(b)(m) | | $100,000 | $ 58,370 |
| Wells Fargo Commercial Mortgage Trust, | | | |
| Series 2014-LC16, Class C, 4.46%, 8/15/50 | | 75,000 | 28,012 |
| Series 2016-C36, Class C, 4.12%, 11/15/59(m) | | 45,000 | 30,649 |
| WFRBS Commercial Mortgage Trust, | | | |
| Series 2011-C3, Class D, 5.85%, 3/15/44(b)(m) | | 52,576 | 15,904 |
| Series 2012-C10, Class C, 4.33%, 12/15/45(m) | | 120,000 | 82,031 |
Total Mortgage-Backed Securities
(Cost $1,567,998) | 900,079 |
|
| Term Loans – 0.7%(c) |
| Chemicals – 0.0%(e) |
| Chemours Co., The Tranche B-3 US$ Term Loan, (1M USD CME Term SOFR + 3.50%, 0.50% Floor), 8.82%, 8/18/28 | | 101,000 | 97,970 |
| Electric Utilities – 0.0%(e) |
| Talen Energy Supply LLC, Initial Term B Loan, (3M USD CME Term SOFR + 4.50%, 0.50% Floor), 9.88%, 5/17/30 | | 36,907 | 36,835 |
| Health Care Facilities & Services – 0.1% |
| Star Parent, Inc., Term Loan, | | | |
| 9/27/30 (n) | | 75,740 | 72,076 |
| (3M USD CME Term SOFR + 4.00%), 9.39%, 9/27/30 | | 90,000 | 85,647 |
| | | | 157,723 |
| Insurance – 0.1% |
| AssuredPartners, Inc., 2023 Term Loan, 2/12/27(n) | | 13,965 | 13,889 |
| USI, Inc., 2022 New Term Loan, (3M USD CME Term SOFR + 3.75%, 0.50% Floor), 9.14%, 11/22/29 | | 71,638 | 71,385 |
See accompanying Notes to Financial Statements
Morningstar Funds Trust October 31, 2023 (unaudited)
Schedule of Investments (continued)
Morningstar Multisector Bond Fund
| | | Par (a) | Value |
| Insurance (Continued) |
| USI, Inc., 2023 First Funding New Term Loan, (3M USD CME Term SOFR + 3.25%), 8.64%, 9/27/30 | | $ 6,913 | $ 6,885 |
| USI, Inc., 2023 Second Funding New Term Loan, 9/27/30(n) | | 10,369 | 10,304 |
| | | | 102,463 |
| Internet Media & Services – 0.2% |
| MH Sub I LLC (Micro Holding Corp.), 2023 May Incremental Term Loan, (1M USD CME Term SOFR + 4.25%, 0.50% Floor), 9.57%, 5/03/28 | | 299,250 | 285,616 |
| Leisure Facilities & Services – 0.2% |
| Carnival Corp., 2021 Incremental Term B Advance, | | | |
| 10/18/28 (n) | | 12,464 | 12,220 |
| (1M USD CME Term SOFR + 3.25%, 0.75% Floor), 8.69%, 10/18/28 | | 237,518 | 232,867 |
| Carnival Corp., Initial Advance, | | | |
| (1M USD CME Term SOFR + 3.00%, 0.75% Floor), 8/09/27(n) | | 10,688 | 10,488 |
| (1M USD CME Term SOFR + 3.00%, 0.75% Floor), 8.34%, 8/09/27 | | 56,750 | 55,686 |
| | | | 311,261 |
| Technology Services – 0.1% |
| Neptune BidCo US, Inc., Dollar Term B Loan, (3M USD CME Term SOFR + 5.00%, 0.50% Floor), 10.51%, 4/11/29 | | 132,245 | 115,302 |
Total Term Loans
(Cost $1,127,611) | 1,107,170 |
| | | | |
| U.S. Government Obligations – 1.3% |
| U.S. Treasury Bonds – 0.4% |
| 4.38%, 8/15/43 | | 281,900 | 251,419 |
| 3.63%, 5/15/53 | | 508,200 | 396,158 |
| | | | 647,577 |
| U.S. Treasury Notes – 0.9% |
| 4.63%, 10/15/26 | | 77,000 | 76,428 |
| 4.88%, 10/31/28 | | 60,100 | 60,227 |
| | | Par(a) | Value |
| U.S. Treasury Notes (Continued) |
| 4.88%, 10/31/30 | | $ 73,000 | $ 72,852 |
| 3.88%, 8/15/33 | | 1,345,600 | 1,238,583 |
| | | | 1,448,090 |
Total U.S. Government Obligations
(Cost $2,107,157) | 2,095,667 |
| | | Number
of Shares | |
| Warrants – 0.0%(e) |
| Engineering & Construction – 0.0%(e) |
| Mcdermott International Ltd., Class A(o)* | | 3,868 | — |
| Mcdermott International Ltd., Class B(o)* | | 4,298 | — |
Total Warrants
(Cost $6,000) | — |
|
| Investment Companies – 0.3% |
| iShares iBoxx High Yield Corporate Bond ETF | | 7,750 | 562,417 |
Total Investment Companies
(Cost $567,406) | 562,417 |
| | | Par (a)/Number
of Shares | |
| Short-Term Investments – 3.5% |
| Corporate Bonds – 0.4% |
| Dominion Energy, Inc., 3.07%, 8/15/24 | | 38,000 | 37,095 |
|
| Energy Transfer L.P., (3M USD LIBOR + 4.03%), 9.65%, 12/31/49(c)(g) | | 315,000 | 296,835 |
|
| Entergy Louisiana LLC, 0.62%, 11/17/23 | | 46,000 | 45,889 |
|
| Phillips 66, 0.90%, 2/15/24 | | 42,000 | 41,349 |
|
| QVC, Inc., 4.85%, 4/01/24 | | 5,000 | 4,797 |
|
| Toyota Motor Credit Corp., 4.40%, 9/20/24 | | 290,000 | 286,729 |
|
| U.S. Airways Pass Through Trust, Series 2012-1, Class A, 5.90%, 10/01/24 | | 39,764 | 39,590 |
| | | | 752,284 |
| Foreign Issuer Bonds – 0.9% |
| Global Aircraft Leasing Co. Ltd., (100% Cash), 6.50%, 9/15/24(b)(p) | | 92,718 | 83,791 |
See accompanying Notes to Financial Statements
Morningstar Funds Trust October 31, 2023 (unaudited)
Schedule of Investments (continued)
Morningstar Multisector Bond Fund
| | | Par (a)/Number
of Shares | Value |
| Foreign Issuer Bonds (Continued) |
| Hungary Government Bond, | | | |
| 3.00%, 6/26/24 | HUF | 84,090,000 | $ 224,294 |
| 2.50%, 10/24/24 | HUF | 25,460,000 | 66,601 |
|
| Kaisa Group Holdings Ltd., 9.38%, 6/30/24(j) | | 200,000 | 6,250 |
| Republic of Poland Government Bond, | | | |
| 2.50%, 4/25/24 | PLN | 1,152,000 | 270,201 |
| 2.25%, 10/25/24 | PLN | 2,539,000 | 586,777 |
|
| UBS A.G., 5.13%, 5/15/24 | | 200,000 | 197,455 |
| | | | 1,435,369 |
| Money Market Fund – 1.1% |
| Northern Institutional Funds - Treasury Portfolio (Premier), 5.21%(q) | | 1,776,704 | 1,776,704 |
| U.S. Treasury Bills – 1.1% |
| U.S. Treasury Bills, 5.20%, 1/04/24(r) | | 1,855,000 | 1,837,522 |
Total Short-Term Investments
(Cost $5,850,523) | 5,801,879 |
Number of
Contracts | Notional
Amount | Value |
| Purchased Options – 0.0%(e) |
| Call Options - Over the Counter – 0.0%(e) |
| South African Rand vs. U.S. Dollar, Strike Price ZAR 19.30, Expires 12/15/23, Counterparty: Barclays | 1 | $925,000 | $ 9,479 |
| South African Rand vs. U.S. Dollar, Strike Price ZAR 19.30, Expires 12/15/23, Counterparty: Bank of America | 1 | 406,000 | 4,161 |
Total Purchased Options
(Premiums Paid $34,445) | 13,640 |
Total Investments – 99.1%
(Cost $181,933,448) | 164,980,825 |
Total Written Options — 0.0%(e)
(Premiums Received $11,650) | (2,023) |
| Other Assets less Liabilities – 0.9%(s) | 1,534,036 |
| NET ASSETS – 100.0% | $166,514,861 |
| Percentages shown are based on Net Assets. |
| |
| (a) | Par value is in USD unless otherwise indicated. | | |
| (b) | Securities exempt from registration under Rule 144A of the Securities Act of 1933. These securities may be resold in transactions exempt from registration, normally to qualified institutional buyers. | | |
| (c) | Variable or floating rate security. Rate as of October 31, 2023 is disclosed. | | |
| (d) | Step coupon bond. Rate as of October 31, 2023 is disclosed. | | |
| (e) | Amount rounds to less than 0.05%. | | |
| (f) | Zero coupon bond. | | |
| (g) | Perpetual bond. Maturity date represents next call date. | | |
| (h) | Variable rate security. Security issued at a fixed coupon rate, which converts to a variable rate at a future date. Rate as of October 31, 2023 is disclosed. | | |
| (i) | When-Issued Security. Coupon rate was not yet in effect at October 31, 2023. | | |
| (j) | Issuer has defaulted on terms of debt obligation. Income is not being accrued. | | |
| (k) | Restricted security that has been deemed illiquid and is classified as Level 2. At October 31, 2023, the value of these restricted illiquid securities amounted to $3,365 or 0.00% of net assets. Additional information on these restricted illiquid securities is as follows: | | |
| | Security | Acquisition Date | Acquisition Cost |
| | Diamond Sports Group LLC/Diamond Sports Finance Co., 5.38%, 8/15/26 | 4/15/20-12/5/22 | $ 134,640 |
| | Diamond Sports Group LLC/Diamond Sports Finance Co., 6.63%, 8/15/27 | 9/29/20-12/5/22 | 47,148 |
| |
|
| (l) | These securities are remarketed by an agent, and the interest rate is determined by general market conditions and supply and demand. |
| (m) | Variable or floating rate security, the interest rate of which adjusts periodically based on changes in current interest rates and prepayments on the underlying pool of assets. Rate as of October 31, 2023 is disclosed. |
| (n) | Position is unsettled. Contract rate was not determined at October 31, 2023 and does not take effect until settlement date. |
| (o) | Investment is valued using significant unobservable inputs (Level 3). |
| (p) | Distributions from this security are made via payments in-kind (PIK) unless otherwise noted in the description. |
| (q) | 7-day current yield as of October 31, 2023 is disclosed. |
See accompanying Notes to Financial Statements
Morningstar Funds Trust October 31, 2023 (unaudited)
Schedule of Investments (continued)
Morningstar Multisector Bond Fund
| (r) | Discount rate at the time of purchase. |
| (s) | Includes appreciation/(depreciation) on forward foreign currency exchange, futures and swap contracts. |
| * | Non-Income Producing Security |
| 1Y | 1 Year |
| 1M | 1 Month |
| 3M | 3 Month |
| 5Y | 5 Year |
| 10Y | 10 Year |
| BRL | Brazilian Real |
| CDX | Credit Default Swap Index |
| CLO | Collateralized Loan Obligation |
| CLP | Chilean Peso |
| CME | Chicago Mercantile Exchange |
| CMT | Constant Maturity |
| CNH | Chinese Yuan Renminbi |
| COP | Colombian Peso |
| CZK | Czech Republic Koruna |
| ETF | Exchange-Traded Fund |
| GMTN | Global Medium Term Note |
| HUF | Hungarian Forint |
| IDR | Indonesian Rupiah |
| JSC | Joint Stock Company |
| L.P. | Limited Partnership |
| LIBOR | London Interbank Offered Rate |
| LLC | Limited Liability Company |
| MXN | Mexican Peso |
| MYR | Malaysian Ringgit |
| PEN | Peruvian Nuevo Sole |
| PLC | Public Limited Company |
| PLN | Polish Zloty |
| REIT | Real Estate Investment Trust |
| RON | Romania New Leu |
| S&P | Standards & Poor's |
| SOFR | United States Secured Overnight Financing Rate |
| THB | Thai Baht |
| USD | United States Dollar |
| ZAR | South African Rand |
| Concentration by Currency (%)(a) | |
| U.S. Dollar | 76.4 |
| All other currencies less than 5% | 23.6 |
| Total | 100.0 |
| (a) Percentages shown are based on Net Assets. | |
| Composition by Type (%)(a) | |
| Non-Government | 62.3 |
| Sovereign | 36.8 |
| Others | 0.9 |
| Total | 100.0 |
| (a) Percentages shown are based on Net Assets. | |
See accompanying Notes to Financial Statements
Morningstar Funds Trust October 31, 2023 (unaudited)
Schedule of Investments (continued)
Morningstar Multisector Bond Fund
Futures Contracts outstanding at October 31, 2023:
Exchange Traded |
| | | | | | |
| Description | Number of
Contracts | Expiration
Date | Trading
Currency | Notional
Amount | Value/
Unrealized
Appreciation
(Depreciation) |
| Long Contracts | | | | | |
| Ultra U.S. Treasury Bond | 1 | 12/19/2023 | USD | 112,562 | $ (13,531) |
| 2-Year U.S. Treasury Note | 24 | 12/29/2023 | USD | 4,858,125 | (18,445) |
| 5-Year U.S. Treasury Note | 1 | 12/29/2023 | USD | 104,477 | (946) |
| Total Long Contracts | | | | | $ (32,922) |
| Short Contracts | | | | | |
| U.S. Treasury Long Bond | (2) | 12/19/2023 | USD | 218,875 | $ 15,742 |
| Ultra 10-Year U.S. Treasury Note | (41) | 12/19/2023 | USD | 4,461,953 | 249,422 |
| Total Short Contracts | | | | | $265,164 |
| | | | | | $232,242 |
| Forward Foreign Currency Exchange Contracts outstanding at October 31, 2023: |
| | | | | | | |
Settlement
Date | Currency
Purchased | Amount
of Currency
Purchased | Currency
Sold | Amount
of Currency
Sold | Counterparty | Unrealized
Appreciation
(Depreciation) |
| | | | | | | |
| 11/29/23 | U.S. Dollars | 730,594 | Indonesian Rupiahs | 11,200,000,000 | Barclays | $ 27,782 |
| 3/18/24 | U.S. Dollars | 540,000 | Peruvian Nuevo Soles | 2,020,140 | Citibank | 16,592 |
| 12/07/23 | Polish Zloty | 1,954,422 | U.S. Dollars | 451,712 | Bank of America | 11,902 |
| 1/12/24 | Thai Baht | 26,215,099 | U.S. Dollars | 724,975 | JPMorgan Chase | 9,337 |
| 1/12/24 | U.S. Dollars | 513,450 | Malaysian Ringgit | 2,390,621 | Goldman Sachs | 9,291 |
| 12/12/23 | U.S. Dollars | 1,084,548 | Chinese Offshore Yuan | 7,906,898 | Goldman Sachs | 4,331 |
| 3/18/24 | U.S. Dollars | 361,300 | Euro | 335,461 | BNP Paribas | 3,965 |
| 1/12/24 | Turkish Lira | 6,363,000 | U.S. Dollars | 210,000 | Morgan Stanley | 1,415 |
| 1/12/24 | U.S. Dollars | 59,054 | Malaysian Ringgit | 274,987 | Morgan Stanley | 1,062 |
| 11/15/23 | Colombian Pesos | 518,596,688 | U.S. Dollars | 124,722 | JPMorgan Chase | 826 |
| 11/15/23 | Colombian Pesos | 309,707,491 | U.S. Dollars | 74,431 | BNP Paribas | 547 |
| Total Unrealized Appreciation | $ 87,050 |
| | | | | | | |
| 11/02/23 | U.S. Dollars | 52,209 | Nigerian Neria | 47,288,500 | BNP Paribas | $ (29) |
| 12/12/23 | Chinese Offshore Yuan | 7,906,898 | U.S. Dollars | 1,080,340 | Bank of America | (123) |
| 11/15/23 | Colombian Pesos | 333,107,739 | U.S. Dollars | 80,861 | BNP Paribas | (218) |
| 12/07/23 | Polish Zloty | 732,311 | U.S. Dollars | 174,008 | Bank of America | (294) |
| 12/07/23 | Polish Zloty | 2,001,796 | U.S. Dollars | 475,579 | Goldman Sachs | (729) |
| 12/11/23 | Turkish Lira | 2,704,297 | U.S. Dollars | 94,000 | Morgan Stanley | (1,552) |
See accompanying Notes to Financial Statements
Morningstar Funds Trust October 31, 2023 (unaudited)
Schedule of Investments (continued)
Morningstar Multisector Bond Fund
| Forward Foreign Currency Exchange Contracts outstanding at October 31, 2023: (continued) |
| | | | | | | |
Settlement
Date | Currency
Purchased | Amount
of Currency
Purchased | Currency
Sold | Amount
of Currency
Sold | Counterparty | Unrealized
Appreciation
(Depreciation) |
| 11/15/23 | Colombian Pesos | 1,092,946,200 | U.S. Dollars | 266,800 | Citibank | $ (2,206) |
| 11/15/23 | U.S. Dollars | 213,000 | Colombian Pesos | 889,498,650 | Barclays | (2,340) |
| 11/29/23 | Indian Rupees | 60,582,700 | U.S. Dollars | 730,000 | Citibank | (3,084) |
| 11/15/23 | Colombian Pesos | 1,529,320,800 | U.S. Dollars | 374,100 | JPMorgan Chase | (3,864) |
| 11/02/23 | Nigerian Neria | 47,288,500 | U.S. Dollars | 59,000 | BNP Paribas | (6,762) |
| 1/12/24 | Malaysian Ringgit | 2,665,608 | U.S. Dollars | 570,245 | Barclays | (8,094) |
| 9/18/24 | Turkish Lira | 6,561,000 | U.S. Dollars | 180,000 | Morgan Stanley | (8,731) |
| 9/18/24 | Turkish Lira | 9,794,664 | U.S. Dollars | 268,200 | JPMorgan Chase | (12,519) |
| 11/15/23 | Nigerian Neria | 105,047,856 | U.S. Dollars | 131,310 | BNP Paribas | (16,505) |
| 11/13/23 | Nigerian Neria | 145,851,000 | U.S. Dollars | 183,000 | BNP Paribas | (23,373) |
| 3/18/24 | Colombian Pesos | 3,712,152,000 | U.S. Dollars | 903,200 | Morgan Stanley | (30,009) |
| 12/07/23 | U.S. Dollars | 1,065,042 | Polish Zloty | 4,688,529 | JPMorgan Chase | (47,136) |
| Total Unrealized Depreciation | $(167,568) |
| Net Unrealized Depreciation | $ (80,518) |
Written Call Option Contracts outstanding at October 31, 2023:
Over the Counter |
| | | | | | | | | |
| Description | Counterparty | Number of
Contracts | Notional
Amount | Exercise
Price | Expiration
Date | Value |
| South African Rand vs. U.S. Dollar | Barclays | 1 | USD | 925,000 | ZAR | 20.80 | 12/15/2023 | $ (1,406) |
| South African Rand vs. U.S. Dollar | Bank of America | 1 | USD | 406,000 | ZAR | 20.80 | 12/15/2023 | (617) |
| Total Written OTC Call Options Contracts (Premiums Received $11,650) | $(2,023) |
Credit Default Swap Contracts outstanding - Sell Protection as of October 31, 2023:
Centrally Cleared |
| | | | | | | | | |
| Reference Obligation | Implied
Credit
Spread | Fixed
Deal
Receive Rate | Maturity
Date | | Notional
Amount | Value | Upfront
Premiums
Paid/
(Received) | Unrealized
Appreciation
(Depreciation) |
| Markit CDX North America High Yield Index Series 41 (Pay Quarterly) | 5.14% | 10.00% | 12/20/2028 | USD | 1,115,000 | 607 | (11,470) | $12,077 |
| Total | | | | | | $607 | $(11,470) | $12,077 |
See accompanying Notes to Financial Statements
Morningstar Funds Trust October 31, 2023 (unaudited)
Schedule of Investments (continued)
Morningstar Multisector Bond Fund
Valuation Hierarchy
The following is a summary of the inputs used, as of October 31, 2023, in valuing the Fund's investments carried at fair value:
| Morningstar Multisector Bond Fund | Level 1 | Level 2 | Level 3 | Totals |
| Investments | | | | |
| Assets: | | | | |
| Asset-Backed Securities | $ — | $ 582,709 | $— | $ 582,709 |
| Common Stocks | 315,204 | — | — | 315,204 |
| Convertible Bonds | — | 2,219,520 | — | 2,219,520 |
| Convertible Preferred Stocks | 132,751 | — | — | 132,751 |
| Corporate Bonds | — | 71,219,501 | — | 71,219,501 |
| Foreign Issuer Bonds | — | 80,030,288 | — | 80,030,288 |
| Mortgage-Backed Securities | — | 900,079 | — | 900,079 |
| Term Loans | — | 1,107,170 | — | 1,107,170 |
| U.S. Government Obligations | — | 2,095,667 | — | 2,095,667 |
| Warrants | — | — | —* | — |
| Investment Companies | 562,417 | — | — | 562,417 |
| Short-Term Investments | 1,776,704 | 4,025,175 | — | 5,801,879 |
| Purchased Options | — | 13,640 | — | 13,640 |
| Total Investments | $2,787,076 | $162,193,749 | $— | $164,980,825 |
| *Includes securities determined to have no value as of October 31, 2023. |
| Morningstar Multisector Bond Fund | Level 1 | Level 2 | Level 3 | Totals |
| Derivative Financial Instruments | | | | |
| Assets: | | | | |
| Futures Contracts | $265,164 | $ — | $— | $ 265,164 |
| Forward Foreign Currency Exchange Contracts | — | 87,050 | — | 87,050 |
| Swap Agreements | — | 607 | — | 607 |
| Total Assets - Derivative Financial Instruments | $265,164 | $ 87,657 | $— | $ 352,821 |
| Liabilities: | | | | |
| Futures Contracts | $ (32,922) | $ — | $— | $ (32,922) |
| Forward Foreign Currency Exchange Contracts | — | (167,568) | — | (167,568) |
| Written Options | — | (2,023) | — | (2,023) |
| Total Liabilities - Derivative Financial Instruments | $ (32,922) | $(169,591) | $— | $(202,513) |
| Net Derivative Financial Instruments | $232,242 | $ (81,934) | $— | $ 150,308 |
See accompanying Notes to Financial Statements
Morningstar Funds Trust October 31, 2023 (unaudited)
Morningstar Global Opportunistic Equity Fund
| | | Number
of Shares | Value |
| Common Stocks – 55.6% |
| Advertising & Marketing – 1.9% |
| Dentsu Group, Inc. (Japan) | | 1,900 | $ 55,188 |
| Omnicom Group, Inc. | | 63,488 | 4,755,886 |
| WPP PLC (United Kingdom) | | 7,613 | 65,557 |
| | | | 4,876,631 |
| Aerospace & Defense – 0.1% |
| BAE Systems PLC (United Kingdom) | | 10,926 | 146,915 |
| Asset Management – 0.4% |
| Charles Schwab (The) Corp. | | 5,364 | 279,142 |
| Investor AB, Class B (Sweden) | | 7,449 | 136,742 |
| Julius Baer Group Ltd. (Switzerland) | | 1,475 | 87,411 |
| Schroders PLC (United Kingdom) | | 6,224 | 28,025 |
| St. James's Place PLC (United Kingdom) | | 12,321 | 96,052 |
| UBS Group A.G. (Switzerland)(a) | | 13,250 | 311,328 |
| | | | 938,700 |
| Automotive – 0.8% |
| Bridgestone Corp. (Japan) | | 7,700 | 291,408 |
| Denso Corp. (Japan) | | 9,600 | 141,757 |
| Honda Motor Co. Ltd. (Japan) | | 43,500 | 445,822 |
| Nissan Motor Co. Ltd. (Japan) | | 37,400 | 143,915 |
| Stanley Electric Co. Ltd. (Japan) | | 8,400 | 134,354 |
| Sumitomo Electric Industries Ltd. (Japan) | | 5,700 | 59,840 |
| Toyota Motor Corp. (Japan) | | 55,200 | 965,655 |
| | | | 2,182,751 |
| Banking – 5.7% |
| ABN AMRO Bank N.V. - CVA (Netherlands)(b) | | 4,945 | 66,602 |
| Banco Bilbao Vizcaya Argentaria S.A. (Spain) | | 23,328 | 183,527 |
| Banco Santander S.A. (Spain) | | 67,628 | 248,731 |
| Bank of America Corp. | | 39,562 | 1,042,063 |
| Barclays PLC (United Kingdom) | | 128,603 | 206,414 |
| BNP Paribas S.A. (France) | | 6,283 | 361,298 |
| CaixaBank S.A. (Spain) | | 17,759 | 72,200 |
| Citigroup, Inc. | | 17,033 | 672,633 |
| Citizens Financial Group, Inc. | | 21,084 | 493,998 |
| | | Number
of Shares | Value |
| Banking (Continued) |
| Comerica, Inc. | | 5,139 | $ 202,477 |
| Cullen/Frost Bankers, Inc. | | 3,831 | 348,583 |
| DNB Bank ASA (Norway) | | 3,714 | 67,008 |
| Erste Group Bank A.G. (Austria) | | 2,261 | 80,965 |
| Fifth Third Bancorp | | 22,807 | 540,754 |
| HSBC Holdings PLC (United Kingdom) | | 131,839 | 951,934 |
| Huntington Bancshares, Inc. | | 68,909 | 664,972 |
| ING Groep N.V. (Netherlands) | | 19,712 | 252,718 |
| Intesa Sanpaolo S.p.A. (Italy) | | 61,857 | 161,186 |
| JPMorgan Chase & Co. | | 5,752 | 799,873 |
| KBC Group N.V. (Belgium) | | 1,109 | 61,034 |
| KeyCorp | | 40,778 | 416,751 |
| Lloyds Banking Group PLC (United Kingdom) | | 698,093 | 339,762 |
| M&T Bank Corp. | | 6,092 | 686,873 |
| Mitsubishi UFJ Financial Group, Inc. (Japan) | | 30,800 | 258,386 |
| Mizuho Financial Group, Inc. (Japan) | | 4,900 | 83,194 |
| NatWest Group PLC (United Kingdom) | | 58,517 | 127,323 |
| Nordea Bank Abp (Finland) | | 12,127 | 127,724 |
| PNC Financial Services Group (The), Inc. | | 6,890 | 788,698 |
| Regions Financial Corp. | | 16,914 | 245,760 |
| Resona Holdings, Inc. (Japan) | | 12,500 | 66,792 |
| Skandinaviska Enskilda Banken AB, Class A (Sweden) | | 7,898 | 88,138 |
| Standard Chartered PLC (United Kingdom) | | 20,028 | 153,561 |
| Sumitomo Mitsui Financial Group, Inc. (Japan) | | 9,000 | 433,872 |
| Sumitomo Mitsui Trust Holdings, Inc. (Japan) | | 5,600 | 209,982 |
| Svenska Handelsbanken AB, Class A (Sweden) | | 10,900 | 92,930 |
| Swedbank AB, Class A (Sweden) | | 5,545 | 91,067 |
| Truist Financial Corp. | | 27,827 | 789,174 |
| U.S. Bancorp | | 26,014 | 829,326 |
| UniCredit S.p.A. (Italy) | | 4,966 | 124,496 |
| Wells Fargo & Co. | | 33,210 | 1,320,762 |
| | | | 14,753,541 |
| Beverages – 0.5% |
| Anheuser-Busch InBev S.A./N.V. (Belgium) | | 13,973 | 795,036 |
See accompanying Notes to Financial Statements
Morningstar Funds Trust October 31, 2023 (unaudited)
Schedule of Investments (continued)
Morningstar Global Opportunistic Equity Fund
| | | Number
of Shares | Value |
| Beverages (Continued) |
| Asahi Group Holdings Ltd. (Japan) | | 2,100 | $ 75,958 |
| Diageo PLC (United Kingdom) | | 8,584 | 324,613 |
| Kirin Holdings Co. Ltd. (Japan) | | 15,000 | 210,800 |
| | | | 1,406,407 |
| Biotechnology & Pharmaceuticals – 0.6% |
| Astellas Pharma, Inc. (Japan) | | 9,000 | 113,849 |
| AstraZeneca PLC (United Kingdom) | | 4,594 | 575,186 |
| Chugai Pharmaceutical Co. Ltd. (Japan) | | 7,700 | 228,356 |
| Daiichi Sankyo Co. Ltd. (Japan) | | 5,600 | 144,391 |
| GSK PLC | | 12,667 | 225,812 |
| Ono Pharmaceutical Co. Ltd. (Japan) | | 3,300 | 56,989 |
| Takeda Pharmaceutical Co. Ltd. (Japan) | | 9,200 | 249,732 |
| | | | 1,594,315 |
| Cable & Satellite – 0.3% |
| Comcast Corp., Class A | | 16,241 | 670,591 |
| Chemicals – 0.2% |
| Nitto Denko Corp. (Japan) | | 2,000 | 129,412 |
| Shin-Etsu Chemical Co. Ltd. (Japan) | | 10,000 | 299,034 |
| Toray Industries, Inc. (Japan) | | 11,800 | 57,086 |
| | | | 485,532 |
| Commercial Support Services – 2.2% |
| Compass Group PLC (United Kingdom) | | 5,566 | 140,327 |
| H&R Block, Inc. | | 125,714 | 5,160,560 |
| Recruit Holdings Co. Ltd. (Japan) | | 9,000 | 258,054 |
| Rentokil Initial PLC (United Kingdom) | | 9,430 | 48,022 |
| Secom Co. Ltd. (Japan) | | 2,100 | 145,855 |
| | | | 5,752,818 |
| Diversified Industrials – 0.1% |
| Hitachi Ltd. (Japan) | | 3,000 | 190,160 |
| E-Commerce Discretionary – 3.6% |
| Alibaba Group Holding Ltd. (China)* | | 263,100 | 2,708,635 |
| eBay, Inc. | | 113,144 | 4,438,639 |
| | | Number
of Shares | Value |
| E-Commerce Discretionary (Continued) |
| JD.com, Inc., Class A (China) | | 87,100 | $1,107,317 |
| PDD Holdings, Inc. (China)* | | 9,533 | 966,837 |
| | | | 9,221,428 |
| Electric Utilities – 1.7% |
| Chubu Electric Power Co., Inc. (Japan) | | 6,500 | 78,547 |
| National Grid PLC (United Kingdom) | | 351,627 | 4,192,441 |
| SSE PLC (United Kingdom) | | 3,341 | 66,398 |
| | | | 4,337,386 |
| Electrical Equipment – 0.2% |
| Daikin Industries Ltd. (Japan) | | 1,300 | 187,432 |
| Mitsubishi Electric Corp. (Japan) | | 24,100 | 276,343 |
| Toshiba Corp. (Japan)* | | 4,088 | 124,278 |
| | | | 588,053 |
| Engineering & Construction – 0.9% |
| Ferrovial S.E. | | 76,042 | 2,288,563 |
| Entertainment Content – 0.7% |
| Electronic Arts, Inc. | | 1,160 | 143,596 |
| NetEase, Inc. (China) | | 39,600 | 847,501 |
| Nexon Co. Ltd. (Japan) | | 3,200 | 58,718 |
| Square Enix Holdings Co. Ltd. (Japan) | | 1,900 | 63,121 |
| Walt Disney (The) Co.* | | 7,338 | 598,708 |
| | | | 1,711,644 |
| Food – 1.3% |
| Kerry Group PLC, Class A (Ireland) | | 29,325 | 2,265,175 |
| Kraft Heinz (The) Co. | | 27,176 | 854,957 |
| MEIJI Holdings Co. Ltd. (Japan) | | 6,600 | 162,453 |
| Yamazaki Baking Co. Ltd. (Japan) | | 5,586 | 118,114 |
| | | | 3,400,699 |
| Gas & Water Utilities – 2.8% |
| Osaka Gas Co. Ltd. (Japan) | | 3,700 | 69,774 |
| Severn Trent PLC (United Kingdom) | | 52,697 | 1,701,183 |
| Snam S.p.A. (Italy) | | 335,628 | 1,539,037 |
| United Utilities Group PLC (United Kingdom)(c) | | 313,580 | 4,055,708 |
| | | | 7,365,702 |
| Health Care Facilities & Services – 5.2% |
| Alfresa Holdings Corp. (Japan) | | 5,400 | 85,539 |
See accompanying Notes to Financial Statements
Morningstar Funds Trust October 31, 2023 (unaudited)
Schedule of Investments (continued)
Morningstar Global Opportunistic Equity Fund
| | | Number
of Shares | Value |
| Health Care Facilities & Services (Continued) |
| CVS Health Corp. | | 73,756 | $ 5,089,902 |
| DaVita, Inc.* | | 9,493 | 733,144 |
| Fresenius Medical Care A.G. & Co. KGaA (Germany) | | 98,854 | 3,284,540 |
| Henry Schein, Inc.* | | 34,324 | 2,230,374 |
| Pediatrix Medical Group, Inc.* | | 183,129 | 2,098,658 |
| | | | 13,522,157 |
| Home & Office Products – 0.9% |
| Scotts Miracle-Gro (The) Co.(c) | | 51,107 | 2,271,195 |
| Home Construction – 0.0%(d) |
| Berkeley Group Holdings (The) PLC (United Kingdom) | | 1,334 | 65,575 |
| Sekisui House Ltd. (Japan) | | 2,961 | 57,984 |
| | | | 123,559 |
| Household Products – 0.3% |
| Haleon PLC | | 20,894 | 83,745 |
| Kao Corp. (Japan) | | 6,700 | 244,442 |
| Reckitt Benckiser Group PLC (United Kingdom) | | 2,882 | 192,826 |
| Unilever PLC (United Kingdom) | | 8,187 | 387,742 |
| | | | 908,755 |
| Industrial Support Services – 0.0%(d) |
| Ashtead Group PLC (United Kingdom) | | 870 | 49,897 |
| Institutional Financial Services – 1.3% |
| Bank of New York Mellon (The) Corp. | | 13,239 | 562,658 |
| Daiwa Securities Group, Inc. (Japan) | | 14,300 | 82,461 |
| Deutsche Boerse A.G. (Germany) | | 938 | 154,391 |
| Goldman Sachs Group (The), Inc. | | 2,442 | 741,416 |
| Japan Exchange Group, Inc. (Japan) | | 4,600 | 90,964 |
| London Stock Exchange Group PLC (United Kingdom) | | 3,118 | 314,591 |
| Morgan Stanley | | 10,420 | 737,944 |
| Northern Trust Corp. | | 7,231 | 476,595 |
| State Street Corp. | | 3,216 | 207,850 |
| | | | 3,368,870 |
| Insurance – 1.1% |
| Allianz S.E. (Germany)(a) | | 1,781 | 417,186 |
| | | Number
of Shares | Value |
| Insurance (Continued) |
| Assicurazioni Generali S.p.A. (Italy) | | 3,287 | $ 65,292 |
| Aviva PLC (United Kingdom) | | 27,517 | 133,281 |
| AXA S.A. (France) | | 9,384 | 278,052 |
| Dai-ichi Life Holdings, Inc. (Japan) | | 5,700 | 120,413 |
| Hannover Rueck S.E. (Germany) | | 313 | 69,115 |
| Legal & General Group PLC (United Kingdom) | | 61,486 | 158,419 |
| Mandatum OYJ (Finland)* | | 1,595 | 6,163 |
| MS&AD Insurance Group Holdings, Inc. (Japan) | | 4,100 | 150,226 |
| Muenchener Rueckversicherungs-Gesellschaft A.G. (Germany)(a) | | 511 | 205,068 |
| NN Group N.V. (Netherlands) | | 2,485 | 79,700 |
| Prudential PLC (Hong Kong) | | 27,547 | 288,042 |
| Sampo OYJ, Class A (Finland) | | 1,595 | 62,730 |
| Sompo Holdings, Inc. (Japan) | | 1,600 | 69,312 |
| Swiss Life Holding A.G. (Switzerland)(a) | | 161 | 103,407 |
| Swiss Re A.G. | | 1,462 | 159,742 |
| Tokio Marine Holdings, Inc. (Japan) | | 6,700 | 149,894 |
| Tryg A/S (Denmark) | | 2,537 | 49,541 |
| Zurich Insurance Group A.G. (Switzerland) | | 660 | 313,495 |
| | | | 2,879,078 |
| Internet Media & Services – 5.1% |
| Alphabet, Inc., Class A* | | 26,377 | 3,272,858 |
| Alphabet, Inc., Class C* | | 5,495 | 688,524 |
| Baidu, Inc., Class A (China)* | | 92,950 | 1,220,323 |
| Meituan, Class B (China)(b)* | | 88,470 | 1,254,063 |
| Meta Platforms, Inc., Class A* | | 5,299 | 1,596,430 |
| Netflix, Inc.* | | 603 | 248,249 |
| Tencent Holdings Ltd. (China) | | 71,900 | 2,660,930 |
| Tencent Music Entertainment Group ADR (China)* | | 107,575 | 780,994 |
| Trip.com Group Ltd. (China)* | | 38,750 | 1,320,663 |
| | | | 13,043,034 |
See accompanying Notes to Financial Statements
Morningstar Funds Trust October 31, 2023 (unaudited)
Schedule of Investments (continued)
Morningstar Global Opportunistic Equity Fund
| | | Number
of Shares | Value |
| Leisure Facilities & Services – 1.3% |
| Entain PLC (United Kingdom) | | 4,874 | $ 55,331 |
| InterContinental Hotels Group PLC (United Kingdom) | | 918 | 65,052 |
| International Game Technology PLC | | 123,705 | 3,144,581 |
| | | | 3,264,964 |
| Leisure Products – 0.1% |
| Shimano, Inc. (Japan) | | 1,000 | 143,906 |
| Machinery – 0.4% |
| FANUC Corp. (Japan) | | 9,500 | 235,756 |
| Keyence Corp. (Japan) | | 500 | 193,559 |
| Komatsu Ltd. (Japan) | | 5,300 | 121,775 |
| Nabtesco Corp. (Japan) | | 3,038 | 53,808 |
| SMC Corp. (Japan) | | 500 | 230,882 |
| Smiths Group PLC (United Kingdom) | | 2,599 | 50,981 |
| Sumitomo Heavy Industries Ltd. (Japan) | | 2,800 | 64,091 |
| | | | 950,852 |
| Medical Equipment & Devices – 0.2% |
| FUJIFILM Holdings Corp. (Japan) | | 2,600 | 142,214 |
| Hoya Corp. (Japan) | | 1,300 | 125,149 |
| Olympus Corp. (Japan) | | 11,900 | 158,929 |
| Smith & Nephew PLC (United Kingdom) | | 5,327 | 59,615 |
| | | | 485,907 |
| Metals & Mining – 0.3% |
| Anglo American PLC (South Africa) | | 4,402 | 112,161 |
| Cameco Corp. (Canada) | | 2,678 | 109,553 |
| Glencore PLC (Australia) | | 36,826 | 195,061 |
| Rio Tinto PLC (Australia) | | 4,114 | 262,476 |
| Sumitomo Metal Mining Co. Ltd. (Japan) | | 2,000 | 56,184 |
| | | | 735,435 |
| Oil & Gas Producers – 4.3% |
| BP PLC (United Kingdom) | | 257,617 | 1,573,015 |
| Canadian Natural Resources Ltd. (Canada) | | 9,614 | 610,499 |
| Cenovus Energy, Inc. (Canada) | | 7,892 | 150,356 |
| Chevron Corp. | | 2,036 | 296,706 |
| China Petroleum & Chemical Corp., Class H (China) | | 460,250 | 235,389 |
| Ecopetrol S.A. ADR (Colombia)(c) | | 6,719 | 79,351 |
| | | Number
of Shares | Value |
| Oil & Gas Producers (Continued) |
| ENEOS Holdings, Inc. (Japan) | | 17,600 | $ 65,215 |
| Eni S.p.A. (Italy) | | 24,827 | 405,863 |
| Equinor ASA (Norway) | | 9,118 | 305,665 |
| Exxon Mobil Corp. | | 6,750 | 714,488 |
| Galp Energia SGPS S.A. (Portugal) | | 6,650 | 100,114 |
| Gazprom PJSC (Russia)(e)* | | 100,532 | — |
| Imperial Oil Ltd. (Canada) | | 1,610 | 91,753 |
| Inpex Corp. (Japan) | | 19,300 | 280,060 |
| LUKOIL PJSC (Russia)(e) | | 3,271 | — |
| Neste OYJ (Finland) | | 8,225 | 276,425 |
| OMV A.G. (Austria) | | 1,876 | 82,278 |
| Petroleo Brasileiro S.A. ADR (Brazil) | | 39,838 | 597,570 |
| Repsol S.A. (Spain) | | 13,802 | 202,091 |
| Rosneft Oil Co. PJSC (Russia)(e) | | 48,304 | — |
| Santos Ltd. (Australia) | | 17,507 | 85,425 |
| Shell PLC (Netherlands) | | 84,395 | 2,719,786 |
| Suncor Energy, Inc. (Canada) | | 12,518 | 405,396 |
| TotalEnergies S.E. (France) | | 22,921 | 1,532,441 |
| Woodside Energy Group Ltd. (Australia) | | 8,573 | 186,718 |
| | | | 10,996,604 |
| Publishing & Broadcasting – 0.0%(d) |
| Informa PLC (United Kingdom) | | 5,609 | 48,599 |
| Real Estate Owners & Developers – 0.1% |
| Mitsubishi Estate Co. Ltd. (Japan) | | 16,700 | 213,765 |
| Mitsui Fudosan Co. Ltd. (Japan) | | 3,500 | 75,862 |
| Sumitomo Realty & Development Co. Ltd. (Japan) | | 2,900 | 72,773 |
| | | | 362,400 |
| Retail - Consumer Staples – 0.4% |
| Alibaba Health Information Technology Ltd. (China)(c)* | | 1,174,000 | 691,579 |
| Seven & i Holdings Co. Ltd. (Japan) | | 3,500 | 128,235 |
| Tesco PLC (United Kingdom) | | 35,929 | 117,903 |
| | | | 937,717 |
| Retail - Discretionary – 0.1% |
| Associated British Foods PLC (United Kingdom) | | 2,654 | 65,469 |
See accompanying Notes to Financial Statements
Morningstar Funds Trust October 31, 2023 (unaudited)
Schedule of Investments (continued)
Morningstar Global Opportunistic Equity Fund
| | | Number
of Shares | Value |
| Retail - Discretionary (Continued) |
| Fast Retailing Co. Ltd. (Japan) | | 800 | $ 177,117 |
| Kingfisher PLC (United Kingdom) | | 18,575 | 47,432 |
| | | | 290,018 |
| Semiconductors – 0.1% |
| Tokyo Electron Ltd. (Japan) | | 1,700 | 224,634 |
| Specialty Finance – 0.3% |
| Capital One Financial Corp. | | 6,621 | 670,641 |
| ORIX Corp. (Japan) | | 5,900 | 107,300 |
| | | | 777,941 |
| Steel – 0.1% |
| Mitsui & Co. Ltd. (Japan) | | 7,800 | 283,485 |
| Technology Hardware – 0.7% |
| Casio Computer Co. Ltd. (Japan) | | 6,300 | 50,482 |
| Kyocera Corp. (Japan) | | 2,900 | 142,945 |
| Murata Manufacturing Co. Ltd. (Japan) | | 15,900 | 272,357 |
| Nidec Corp. (Japan) | | 2,900 | 106,375 |
| Nintendo Co. Ltd. (Japan) | | 8,700 | 359,436 |
| Panasonic Holdings Corp. (Japan) | | 18,200 | 159,677 |
| Sony Group Corp. (Japan) | | 6,200 | 515,461 |
| TDK Corp. (Japan) | | 5,900 | 220,750 |
| | | | 1,827,483 |
| Technology Services – 4.6% |
| Cognizant Technology Solutions Corp., Class A | | 45,939 | 2,961,687 |
| Experian PLC | | 3,100 | 94,050 |
| Fiserv, Inc.* | | 13,332 | 1,516,515 |
| Nexi SpA (Italy)(b)* | | 531,414 | 3,087,946 |
| RELX PLC (United Kingdom) | | 5,635 | 196,818 |
| Visa, Inc., Class A(c) | | 17,180 | 4,039,018 |
| | | | 11,896,034 |
| Telecommunications – 1.9% |
| BT Group PLC (United Kingdom) | | 37,502 | 51,506 |
| KDDI Corp. (Japan) | | 11,400 | 341,028 |
| Nippon Telegraph & Telephone Corp. (Japan) | | 164,600 | 193,697 |
| SES S.A. (France) | | 479,186 | 2,795,809 |
| Softbank Corp. (Japan) | | 5,900 | 66,711 |
| SoftBank Group Corp. (Japan) | | 7,600 | 311,251 |
| T-Mobile U.S., Inc.* | | 2,064 | 296,927 |
| | | Number
of Shares | Value |
| Telecommunications (Continued) |
| Verizon Communications, Inc. | | 18,172 | $ 638,382 |
| Vodafone Group PLC (United Kingdom) | | 103,061 | 94,872 |
| | | | 4,790,183 |
| Tobacco & Cannabis – 0.1% |
| British American Tobacco PLC (United Kingdom) | | 8,905 | 266,014 |
| Japan Tobacco, Inc. (Japan) | | 3,600 | 83,804 |
| | | | 349,818 |
| Transportation & Logistics – 1.2% |
| CSX Corp. | | 13,247 | 395,423 |
| East Japan Railway Co. (Japan) | | 5,300 | 275,268 |
| Norfolk Southern Corp. | | 12,106 | 2,309,704 |
| Poste Italiane S.p.A. (Italy)(b) | | 6,050 | 59,896 |
| | | | 3,040,291 |
| Transportation Equipment – 1.3% |
| Knorr-Bremse A.G. (Germany) | | 59,523 | 3,324,626 |
| Wholesale - Consumer Staples – 0.2% |
| ITOCHU Corp. (Japan) | | 9,100 | 327,791 |
| Mitsubishi Corp. (Japan) | | 6,500 | 303,001 |
| | | | 630,792 |
| Wholesale - Discretionary – 0.0%(d) |
| Bunzl PLC (United Kingdom) | | 1,937 | 69,105 |
Total Common Stocks
(Cost $147,093,550) | 143,509,175 |
|
| Preferred Stocks – 0.9% |
| Household Products – 0.9% |
| Henkel A.G. & Co. KGaA, 2.72%(f) | | 33,145 | 2,390,917 |
Total Preferred Stocks
(Cost $2,349,719) | 2,390,917 |
|
| Investment Companies – 37.5% |
| Franklin FTSE Brazil ETF | | 223,997 | 3,982,667 |
| iShares Core DAX UCITS ETF DE (Germany)* | EUR | 28,861 | 3,783,637 |
| iShares Global Consumer Staples ETF | | 159,457 | 8,972,645 |
| iShares MSCI South Korea ETF(c) | | 135,523 | 7,446,989 |
| Materials Select Sector SPDR® Fund ETF(c) | | 50,763 | 3,861,034 |
See accompanying Notes to Financial Statements
Morningstar Funds Trust October 31, 2023 (unaudited)
Schedule of Investments (continued)
Morningstar Global Opportunistic Equity Fund
| | | Number
of Shares | Value |
|
| Schwab Fundamental Emerging Markets Large Company Index ETF(c) | | 618,425 | $15,664,705 |
| Vanguard Consumer Staples ETF(c) | | 22,658 | 4,066,884 |
| Vanguard Health Care ETF(c) | | 28,053 | 6,334,367 |
| Vanguard Total Stock Market ETF(c) | | 205,586 | 42,513,129 |
Total Investment Companies
(Cost $99,404,302) | 96,626,057 |
| | | Number
of Shares | Value |
| Short-Term Investments – 11.1% |
| Money Market Funds – 11.1% |
| Northern Institutional Funds - Liquid Assets Portfolio (Shares), 5.41%(g)(h) | | 13,615,016 | $ 13,615,016 |
|
| Northern Institutional Funds - Treasury Portfolio (Premier), 5.21%(g) | | 14,969,561 | 14,969,561 |
Total Short-Term Investments
(Cost $28,584,577) | 28,584,577 |
Total Investments – 105.1%
(Cost $277,432,148) | 271,110,726 |
| Liabilities less Other Assets – (5.1)%(i) | (13,071,421) |
| NET ASSETS – 100.0% | $258,039,305 |
| Percentages shown are based on Net Assets. |
| All securities are United States companies, unless noted otherwise in parentheses. |
| (a) | Security sold outside United States without registration under the Securities Act of 1933. | | |
| (b) | Securities exempt from registration under Rule 144A of the Securities Act of 1933. These securities may be resold in transactions exempt from registration, normally to qualified institutional buyers. | | |
| (c) | Security either partially or fully on loan. (See Note 7). | | |
| (d) | Amount rounds to less than 0.05%. | | |
| (e) | Investment is valued using significant unobservable inputs (Level 3) (See Note 4 regarding investments in Russian securities). | | |
| (f) | Current yield is disclosed. Dividends are calculated based on a percentage of the issuer’s net income. | | |
| (g) | 7-day current yield as of October 31, 2023 is disclosed. | | |
| (h) | Security purchased with the cash proceeds from securities loaned. (See Note 7). | | |
| (i) | Includes appreciation/(depreciation) on forward foreign currency exchange contracts. | | |
| * | Non-Income Producing Security | | |
| ADR | American Depositary Receipt |
| CVA | Credit Valuation Adjustment |
| DAX | Deutscher Aktienindex |
| ETF | Exchange-Traded Fund |
| EUR | Euro |
| FTSE | Financial Times Stock Exchange |
| MSCI | Morgan Stanley Capital International |
| PJSC | Public Joint Stock Company |
| PLC | Public Limited Company |
| UCITS | Undertakings for Collective Investment in Transferable Securities |
See accompanying Notes to Financial Statements
Morningstar Funds Trust October 31, 2023 (unaudited)
Schedule of Investments (continued)
Morningstar Global Opportunistic Equity Fund
| Concentration by Currency (%)(a) | |
| U.S. Dollar | 62.5 |
| Euro | 12.1 |
| British Pound | 8.2 |
| Japanese Yen | 5.6 |
| All other currencies less than 5% | 11.6 |
| Total | 100.0 |
| (a) Percentages shown are based on Net Assets. | |
| Country Diversification (%)(a) | |
| United States | 62.2 |
| United Kingdom | 6.7 |
| Japan | 5.6 |
| China | 5.4 |
| Germany | 5.3 |
| All other countries less than 5%(b) | 14.8 |
| Total | 100.0 |
| (a) Percentages shown are based on Net Assets. |
| (b) Includes Other. |
| Forward Foreign Currency Exchange Contracts outstanding at October 31, 2023: |
| | | | | | | |
Settlement
Date | Currency
Purchased | Amount
of Currency
Purchased | Currency
Sold | Amount
of Currency
Sold | Counterparty | Unrealized
Appreciation
(Depreciation) |
| | | | | | | |
| 11/30/23 | British Pounds | 95,546 | U.S. Dollars | 115,885 | State Street | $ 268 |
| Total Unrealized Appreciation | $ 268 |
| | | | | | | |
| 11/30/23 | Norwegian Kroner | 42,238 | U.S. Dollars | 3,827 | State Street | $ (42) |
| 11/30/23 | Swedish Kronor | 311,669 | U.S. Dollars | 28,301 | State Street | (345) |
| Total Unrealized Depreciation | $ (387) |
| Net Unrealized Depreciation | $(119) |
Valuation Hierarchy
The following is a summary of the inputs used, as of October 31, 2023, in valuing the Fund's investments carried at fair value:
| Morningstar Global Opportunistic Equity Fund | Level 1 | Level 2 | Level 3 | Totals |
| Investments | | | | |
| Assets: | | | | |
| Common Stocks | $ 68,483,117 | $75,026,058 | $—* | $143,509,175 |
| Preferred Stocks | — | 2,390,917 | — | 2,390,917 |
| Investment Companies | 96,626,057 | — | — | 96,626,057 |
| Short-Term Investments | 28,584,577 | — | — | 28,584,577 |
| Total Investments | $193,693,751 | $77,416,975 | $— | $271,110,726 |
| *Includes securities determined to have no value as of October 31, 2023. |
See accompanying Notes to Financial Statements
Morningstar Funds Trust October 31, 2023 (unaudited)
Schedule of Investments (continued)
Morningstar Global Opportunistic Equity Fund
| Morningstar Global Opportunistic Equity Fund | Level 1 | Level 2 | Level 3 | Totals |
| Derivative Financial Instruments | | | | |
| Assets: | | | | |
| Forward Foreign Currency Exchange Contracts | $— | $ 268 | $— | $ 268 |
| Total Assets - Derivative Financial Instruments | $— | $ 268 | $— | $ 268 |
| Liabilities: | | | | |
| Forward Foreign Currency Exchange Contracts | $— | $(387) | $— | $(387) |
| Total Liabilities - Derivative Financial Instruments | $— | $(387) | $— | $(387) |
| Net Derivative Financial Instruments | $— | $(119) | $— | $(119) |
See accompanying Notes to Financial Statements
Morningstar Funds Trust October 31, 2023 (unaudited)
Morningstar Alternatives Fund
| | | Par (a) | Value |
| Long Positions – 97.4% |
| Asset-Backed Securities – 1.0% |
| Other – 1.0% |
| Affirm Asset Securitization Trust, | | | |
| Series 2022-A, Class 1A, 4.30%, 5/17/27(b) | | $550,000 | $ 537,227 |
| Series 2023-A, Class 1A, 6.61%, 1/18/28(b) | | 474,000 | 453,263 |
| Series 2023-B, Class B, 7.44%, 9/15/28(b) | | 300,000 | 299,437 |
|
| Avant Loans Funding Trust, Series 2021-REV1, Class A, 1.21%, 7/15/30(b) | | 136,160 | 134,671 |
| Carvana Auto Receivables Trust, Series 2021-N2, Class B, 0.75%, 3/10/28 | | 44,529 | 41,159 |
| Drive Auto Receivables Trust, Series 2021-3, Class C, 1.47%, 1/15/27 | | 600,000 | 582,890 |
| JPMorgan Chase Bank NA - CACLN, | | | |
| Series 2021-2, Class B, 0.89%, 12/26/28(b) | | 72,531 | 70,570 |
| Series 2021-3, Class B, 0.76%, 2/26/29(b) | | 209,510 | 200,957 |
|
| Santander Bank NA - SBCLN, Series 2021-1A, Class B, 1.83%, 12/15/31(b) | | 64,651 | 63,025 |
| Upstart Securitization Trust, | | | |
| Series 2021-4, Class A, 0.84%, 9/20/31(b) | | 49,528 | 49,137 |
| Series 2021-5, Class A, 1.31%, 11/20/31(b) | | 86,029 | 84,938 |
| | | | 2,517,274 |
Total Asset-Backed Securities
(Cost $2,548,677) | 2,517,274 |
| | | Number
of Shares | |
| Common Stocks – 26.9% |
| Aerospace & Defense – 0.1% |
| General Dynamics Corp. | | 545 | 131,514 |
| Huntington Ingalls Industries, Inc. | | 224 | 49,239 |
| Lockheed Martin Corp. | | 298 | 135,483 |
| | | | 316,236 |
| Apparel & Textile Products – 0.8% |
| Capri Holdings Ltd.* | | 40,817 | 2,089,014 |
| | | Number
of Shares | Value |
| Asset Management – 1.2% |
| Avantax, Inc.* | | 105,694 | $ 2,727,962 |
| Gresham House PLC (United Kingdom) | | 34,768 | 454,282 |
| | | | 3,182,244 |
| Banking – 0.4% |
| Credicorp Ltd. (Peru) | | 462 | 57,732 |
| First Horizon Corp. | | 81,971 | 881,188 |
| | | | 938,920 |
| Beverages – 0.0%(c) |
| Coca-Cola Europacific Partners PLC (United Kingdom) | | 2,016 | 117,956 |
| Biotechnology & Pharmaceuticals – 4.4% |
| AbbVie, Inc. | | 816 | 115,203 |
| Abcam PLC Sponsored - ADR (United Kingdom)(d)* | | 79,646 | 1,825,486 |
| Amgen, Inc. | | 461 | 117,878 |
| Bristol-Myers Squibb Co. | | 2,103 | 108,368 |
| Dechra Pharmaceuticals PLC (United Kingdom) | | 24,620 | 1,141,113 |
| Gilead Sciences, Inc. | | 1,642 | 128,963 |
| Merck & Co., Inc. | | 1,182 | 121,391 |
| Mirati Therapeutics, Inc.(d)* | | 13,894 | 771,534 |
| Olink Holding AB ADR (Sweden)(d)* | | 34,225 | 852,887 |
| Orchard Therapeutics PLC ADR (United Kingdom)(d)* | | 49,438 | 786,558 |
| Pfizer, Inc. | | 3,550 | 108,488 |
| Point Biopharma Global, Inc.* | | 85,908 | 1,087,595 |
| Royalty Pharma PLC, Class A | | 307 | 8,249 |
| Seagen, Inc.(d)* | | 18,341 | 3,903,148 |
| Swedish Orphan Biovitrum AB (Sweden)* | | 18,689 | 384,474 |
| | | | 11,461,335 |
| Chemicals – 0.2% |
| Rogers Corp.(d)* | | 4,177 | 513,312 |
| Commercial Support Services – 2.6% |
| Applus Services S.A. (Spain) | | 31,467 | 331,288 |
| Caverion OYJ (Finland) | | 167,873 | 1,515,153 |
| H&R Block, Inc. | | 1,202 | 49,342 |
| Sovos Brands, Inc.(d)* | | 176,883 | 3,840,130 |
| SP Plus Corp.(d)* | | 19,310 | 975,734 |
| | | | 6,711,647 |
| Construction Materials – 0.0%(c) |
| MDU Resources Group, Inc. | | 809 | 15,056 |
See accompanying Notes to Financial Statements
Morningstar Funds Trust October 31, 2023 (unaudited)
Schedule of Investments (continued)
Morningstar Alternatives Fund
| | | Number
of Shares | Value |
| Containers & Packaging – 0.3% |
| Amcor PLC | | 2,519 | $ 22,394 |
| Westrock Co.(d) | | 19,079 | 685,508 |
| | | | 707,902 |
| Electric Utilities – 1.6% |
| Alliant Energy Corp. | | 278 | 13,564 |
| Ameren Corp. | | 357 | 27,028 |
| American Electric Power Co., Inc. | | 527 | 39,810 |
| Brookfield Renewable Corp., Class A | | 1,560 | 35,506 |
| CenterPoint Energy, Inc. | | 952 | 25,590 |
| CMS Energy Corp. | | 816 | 44,341 |
| Consolidated Edison, Inc. | | 1,447 | 127,032 |
| DTE Energy Co. | | 210 | 20,240 |
| Duke Energy Corp. | | 1,403 | 124,713 |
| Edison International | | 117 | 7,378 |
| Evergy, Inc. | | 1,890 | 92,875 |
| Exelon Corp. | | 2,249 | 87,576 |
| OGE Energy Corp. | | 645 | 22,059 |
| Pinnacle West Capital Corp. | | 880 | 65,278 |
| PNM Resources, Inc.(d) | | 76,536 | 3,234,411 |
| Public Service Enterprise Group, Inc. | | 768 | 47,347 |
| Sempra | | 345 | 24,160 |
| WEC Energy Group, Inc. | | 1,346 | 109,551 |
| Xcel Energy, Inc. | | 1,592 | 94,358 |
| | | | 4,242,817 |
| Entertainment Content – 1.0% |
| TEGNA, Inc.(d) | | 168,837 | 2,449,825 |
| Food – 1.0% |
| Campbell Soup Co. | | 3,018 | 121,957 |
| Conagra Brands, Inc. | | 3,418 | 93,517 |
| Flowers Foods, Inc. | | 3,808 | 83,509 |
| General Mills, Inc. | | 1,912 | 124,739 |
| Hershey (The) Co. | | 610 | 114,284 |
| Hormel Foods Corp. | | 1,102 | 35,870 |
| Hostess Brands, Inc.* | | 54,882 | 1,833,059 |
| Ingredion, Inc. | | 214 | 20,026 |
| Kellanova | | 2,271 | 114,617 |
| Kraft Heinz (The) Co. | | 3,635 | 114,357 |
| | | | 2,655,935 |
| Gas & Water Utilities – 0.1% |
| Atmos Energy Corp. | | 1,153 | 124,132 |
| Brookfield Infrastructure Corp., Class A (Canada) | | 816 | 21,020 |
| New Jersey Resources Corp. | | 352 | 14,284 |
| | | Number
of Shares | Value |
| Gas & Water Utilities (Continued) |
| NiSource, Inc. | | 1,640 | $ 41,263 |
| ONE Gas, Inc. | | 538 | 32,495 |
| | | | 233,194 |
| Health Care Facilities & Services – 0.8% |
| Amedisys, Inc.(d)* | | 17,938 | 1,641,148 |
| Cardinal Health, Inc. | | 1,386 | 126,126 |
| CVS Health Corp. | | 1,383 | 95,441 |
| Patterson Cos., Inc. | | 686 | 20,895 |
| Quest Diagnostics, Inc. | | 994 | 129,319 |
| | | | 2,012,929 |
| Household Products – 0.0%(c) |
| Kimberly-Clark Corp. | | 998 | 119,401 |
| Industrial Support Services – 0.4% |
| MSC Industrial Direct Co., Inc., Class A | | 498 | 47,186 |
| Textainer Group Holdings Ltd. (China)(d) | | 17,660 | 867,459 |
| | | | 914,645 |
| Insurance – 0.3% |
| Aflac, Inc. | | 1,595 | 124,586 |
| American Financial Group, Inc. | | 328 | 35,870 |
| Hartford Financial Services Group (The), Inc. | | 1,415 | 103,932 |
| Old Republic International Corp. | | 4,584 | 125,510 |
| Reinsurance Group of America, Inc. | | 262 | 39,161 |
| TOWER Ltd. (New Zealand) | | 173,173 | 64,570 |
| Travelers (The) Cos., Inc. | | 748 | 125,245 |
| Unum Group | | 1,317 | 64,401 |
| | | | 683,275 |
| Leisure Facilities & Services – 0.1% |
| Darden Restaurants, Inc. | | 717 | 104,345 |
| Wendy's (The) Co. | | 927 | 17,632 |
| | | | 121,977 |
| Medical Equipment & Devices – 0.0%(c) |
| Medtronic PLC | | 1,518 | 107,110 |
| Oil & Gas Producers – 2.8% |
| Chevron Corp. | | 721 | 105,071 |
| Denbury, Inc.* | | 33,519 | 2,979,504 |
| Exxon Mobil Corp. | | 783 | 82,880 |
| Hess Corp.(d) | | 11,930 | 1,722,692 |
| Phillips 66 | | 495 | 56,465 |
See accompanying Notes to Financial Statements
Morningstar Funds Trust October 31, 2023 (unaudited)
Schedule of Investments (continued)
Morningstar Alternatives Fund
| | | Number
of Shares | Value |
| Oil & Gas Producers (Continued) |
| Pioneer Natural Resources Co.(d) | | 9,284 | $ 2,218,876 |
| Williams (The) Cos., Inc. | | 3,650 | 125,560 |
| | | | 7,291,048 |
| Real Estate Investment Trusts – 1.1% |
| Hersha Hospitality Trust, Class A | | 66,963 | 664,273 |
| NNN REIT, Inc. | | 755 | 27,429 |
| Public Storage | | 129 | 30,794 |
| Spirit Realty Capital, Inc. | | 55,162 | 1,985,280 |
| | | | 2,707,776 |
| Retail - Consumer Staples – 0.6% |
| Albertsons Cos., Inc., Class A(d) | | 68,767 | 1,492,244 |
| Kroger (The) Co. | | 2,357 | 106,937 |
| | | | 1,599,181 |
| Retail - Discretionary – 0.4% |
| Chico's FAS, Inc.(d)* | | 106,504 | 796,650 |
| Dick's Sporting Goods, Inc. | | 316 | 33,796 |
| Genuine Parts Co. | | 590 | 76,028 |
| | | | 906,474 |
| Semiconductors – 0.6% |
| Magnachip Semiconductor Corp. (South Korea)* | | 26,184 | 193,500 |
| Silicon Motion Technology Corp. ADR (Taiwan)* | | 26,454 | 1,417,405 |
| | | | 1,610,905 |
| Software – 4.7% |
| Avid Technology, Inc.* | | 102,314 | 2,764,524 |
| EngageSmart, Inc.(d)* | | 43,053 | 975,150 |
| Kahoot! ASA (Norway)* | | 301,764 | 945,261 |
| Splunk, Inc.(d)* | | 5,555 | 817,474 |
| Tabula Rasa HealthCare, Inc.* | | 108,734 | 1,134,096 |
| VMware, Inc., Class A* | | 38,258 | 5,572,278 |
| | | | 12,208,783 |
| Steel – 0.1% |
| Kloeckner & Co. S.E. (Germany) | | 19,511 | 199,427 |
| Technology Hardware – 0.1% |
| Cisco Systems, Inc. | | 2,243 | 116,928 |
| Garmin Ltd. | | 285 | 29,221 |
| Juniper Networks, Inc. | | 4,368 | 117,586 |
| NetApp, Inc. | | 233 | 16,958 |
| | | | 280,693 |
| | | Number
of Shares | Value |
| Technology Services – 0.3% |
| Amdocs Ltd. | | 563 | $ 45,130 |
| Automatic Data Processing, Inc. | | 501 | 109,328 |
| International Business Machines Corp. | | 857 | 123,956 |
| Moneylion, Inc.* | | 837 | 16,104 |
| Network International Holdings PLC (United Arab Emirates)(b)* | | 85,168 | 401,441 |
| | | | 695,959 |
| Telecommunications – 0.0%(c) |
| GCI Liberty Escrow, Inc., Class A(e)* | | 31,520 | — |
| Tobacco & Cannabis – 0.0%(c) |
| Philip Morris International, Inc. | | 236 | 21,042 |
| Transportation & Logistics – 0.9% |
| Euronav N.V. (Belgium)(d) | | 129,557 | 2,310,001 |
| Union Pacific Corp. | | 364 | 75,570 |
| | | | 2,385,571 |
Total Common Stocks
(Cost $73,204,997) | 69,501,589 |
| | | Par (a) | |
| Convertible Bonds – 24.6% |
| Asset Management – 0.8% |
| RWT Holdings, Inc., 5.75%, 10/01/25(d) | | $1,073,000 | 996,161 |
| WisdomTree, Inc., 5.75%, 8/15/28(b)(d) | | 1,056,000 | 1,036,200 |
| | | | 2,032,361 |
| Automotive – 0.2% |
| Rivian Automotive, Inc., 4.63%, 3/15/29(b)(d) | | 598,000 | 628,797 |
| Biotechnology & Pharmaceuticals – 1.9% |
| Amphastar Pharmaceuticals, Inc., 2.00%, 3/15/29(b)(d) | | 195,000 | 189,832 |
| Bridgebio Pharma, Inc., 2.25%, 2/01/29(d) | | 720,000 | 526,651 |
| Coherus Biosciences, Inc., 1.50%, 4/15/26(d) | | 657,000 | 365,993 |
| Collegium Pharmaceutical, Inc., 2.88%, 2/15/29(b)(d) | | 1,151,000 | 988,239 |
| Halozyme Therapeutics, Inc., 0.25%, 3/01/27(d) | | 1,367,000 | 1,114,238 |
See accompanying Notes to Financial Statements
Morningstar Funds Trust October 31, 2023 (unaudited)
Schedule of Investments (continued)
Morningstar Alternatives Fund
| | | Par (a) | Value |
| Biotechnology & Pharmaceuticals (Continued) |
| Insmed, Inc., 0.75%, 6/01/28(d) | | $ 413,000 | $ 397,306 |
| Mirum Pharmaceuticals, Inc., 4.00%, 5/01/29(b)(d) | | 548,000 | 637,392 |
| Revance Therapeutics, Inc., 1.75%, 2/15/27(d) | | 808,000 | 604,659 |
| | | | 4,824,310 |
| Cable & Satellite – 0.9% |
| Cable One, Inc., 1.13%, 3/15/28(d) | | 1,343,000 | 991,805 |
| Liberty Media Corp., 3.75%, 3/15/28(b)(d) | | 1,343,000 | 1,459,841 |
| | | | 2,451,646 |
| Commercial Support Services – 0.0%(c) |
| PureCycle Technologies, Inc., 7.25%, 8/15/30(b)(d) | | 202,000 | 119,223 |
| Consumer Services – 0.4% |
| Chegg, Inc., 0.13%, 3/15/25(d) | | 1,275,000 | 1,122,000 |
| E-Commerce Discretionary – 0.8% |
| PDD Holdings, Inc., 0.00%, 12/01/25(f) | | 1,190,000 | 1,183,454 |
| Wayfair, Inc., 1.00%, 8/15/26(d) | | 1,029,000 | 772,779 |
| | | | 1,956,233 |
| Electric Utilities – 0.9% |
| CenterPoint Energy, Inc., 4.25%, 8/15/26(b) | | 409,000 | 399,389 |
| Duke Energy Corp., 4.13%, 4/15/26(b)(d) | | 996,000 | 969,775 |
| NRG Energy, Inc., 2.75%, 6/01/48(d) | | 798,000 | 891,366 |
| | | | 2,260,530 |
| Electrical Equipment – 0.5% |
| Advanced Energy Industries, Inc., 2.50%, 9/15/28(b)(d) | | 234,000 | 216,162 |
| Itron, Inc., 0.00%, 3/15/26(d)(f) | | 499,000 | 421,440 |
| Mesa Laboratories, Inc., 1.38%, 8/15/25(d) | | 622,000 | 552,774 |
| | | | 1,190,376 |
| Engineering & Construction – 0.1% |
| Tetra Tech, Inc., 2.25%, 8/15/28(b)(d) | | 199,000 | 192,532 |
| | | Par (a) | Value |
| Health Care Facilities & Services – 0.0%(c) |
| UpHealth, Inc., | | | |
| (SOFR + 9.00%), 14.32%, 12/15/25(b)(g) | | $ 91,000 | $ 72,345 |
| 6.25%, 6/15/26(b) | | 66,000 | 15,180 |
| | | | 87,525 |
| Household Products – 0.4% |
| Beauty Health (The) Co., 1.25%, 10/01/26(b)(d) | | 1,394,000 | 1,043,581 |
| Internet Media & Services – 2.4% |
| Airbnb, Inc., 0.00%, 3/15/26(d)(f) | | 786,000 | 679,497 |
| Liberty TripAdvisor Holdings, Inc., 0.50%, 6/30/51(b)(d) | | 1,969,000 | 1,545,665 |
| Lyft, Inc., 1.50%, 5/15/25 | | 1,391,000 | 1,268,592 |
| Snap, Inc., 0.00%, 5/01/27(d)(f) | | 1,353,000 | 1,008,661 |
| Upwork, Inc., 0.25%, 8/15/26(d) | | 1,498,000 | 1,225,364 |
| Ziff Davis, Inc., 1.75%, 11/01/26 | | 567,000 | 510,017 |
| | | | 6,237,796 |
| Leisure Facilities & Services – 1.3% |
| Cheesecake Factory (The), Inc., 0.38%, 6/15/26(d) | | 1,492,000 | 1,238,014 |
| Live Nation Entertainment, Inc., 3.13%, 1/15/29(b)(d) | | 852,000 | 855,408 |
| Marcus (The) Corp., 5.00%, 9/15/25(b)(d) | | 316,000 | 488,536 |
| Marriott Vacations Worldwide Corp., 3.25%, 12/15/27(b)(d) | | 883,000 | 742,603 |
| | | | 3,324,561 |
| Medical Equipment & Devices – 1.2% |
| CONMED Corp., 2.25%, 6/15/27 | | 698,000 | 650,187 |
| Enovis Corp., 3.88%, 10/15/28(b) | | 357,000 | 371,994 |
| Haemonetics Corp., 0.00%, 3/01/26(d)(f) | | 1,609,000 | 1,379,797 |
| Integer Holdings Corp., 2.13%, 2/15/28(b)(d) | | 631,000 | 692,054 |
| | | | 3,094,032 |
| Metals & Mining – 0.2% |
| Equinox Gold Corp., 4.75%, 10/15/28(b)(d) | | 547,000 | 538,467 |
See accompanying Notes to Financial Statements
Morningstar Funds Trust October 31, 2023 (unaudited)
Schedule of Investments (continued)
Morningstar Alternatives Fund
| | | Par (a) | Value |
| Oil, Gas Services & Equipment – 0.3% |
| Helix Energy Solutions Group, Inc., 6.75%, 2/15/26(d) | | $ 488,000 | $ 761,524 |
| Real Estate Investment Trusts – 1.2% |
| HAT Holdings I LLC/HAT Holdings II LLC, 0.00%, 5/01/25(b)(f) | | 928,000 | 877,254 |
| Pebblebrook Hotel Trust, 1.75%, 12/15/26(d) | | 1,469,000 | 1,157,002 |
| Summit Hotel Properties, Inc., 1.50%, 2/15/26(d) | | 1,464,000 | 1,211,742 |
| | | | 3,245,998 |
| Real Estate Services – 0.2% |
| Realogy Group LLC/Realogy Co-Issuer Corp., 0.25%, 6/15/26(d) | | 711,000 | 527,100 |
| Renewable Energy – 0.4% |
| Sunnova Energy International, Inc., | | | |
| 0.25%, 12/01/26 | | 1,027,000 | 549,445 |
| 2.63%, 2/15/28 | | 860,000 | 413,660 |
| | | | 963,105 |
| Retail - Discretionary – 0.3% |
| Patrick Industries, Inc., 1.75%, 12/01/28(d) | | 841,000 | 790,961 |
| Software – 2.8% |
| Bentley Systems, Inc., 0.38%, 7/01/27(d) | | 984,000 | 834,924 |
| Ceridian HCM Holding, Inc., 0.25%, 3/15/26(d) | | 1,538,000 | 1,338,747 |
| Envestnet, Inc., | | | |
| 0.75%, 8/15/25(d) | | 577,000 | 523,339 |
| 2.63%, 12/01/27(b) | | 729,000 | 623,295 |
|
| i3 Verticals LLC, 1.00%, 2/15/25(d) | | 1,035,000 | 945,084 |
| Jamf Holding Corp., 0.13%, 9/01/26(d) | | 709,000 | 581,904 |
| Kaleyra, Inc., 6.13%, 6/01/26(b) | | 82,000 | 81,612 |
| Mitek Systems, Inc., 0.75%, 2/01/26(d) | | 825,000 | 709,021 |
| NextGen Healthcare, Inc., 3.75%, 11/15/27(b)(d) | | 422,000 | 474,263 |
| Q2 Holdings, Inc., 0.75%, 6/01/26(d) | | 359,000 | 308,823 |
| Verint Systems, Inc., 0.25%, 4/15/26(d) | | 1,102,000 | 928,435 |
| | | | 7,349,447 |
| | | Par (a) | Value |
| Specialty Finance – 3.8% |
| Arbor Realty Trust, Inc., 7.50%, 8/01/25(b) | | $ 547,000 | $ 519,650 |
| EZCORP, Inc., | | | |
| 2.38%, 5/01/25 | | 521,000 | 478,960 |
| 3.75%, 12/15/29(b) | | 398,000 | 379,045 |
|
| LendingTree, Inc., 0.50%, 7/15/25 | | 1,842,000 | 1,436,760 |
| PennyMac Corp., | | | |
| 5.50%, 11/01/24(d) | | 2,100,000 | 2,042,250 |
| 5.50%, 3/15/26 | | 923,000 | 838,786 |
|
| SoFi Technologies, Inc., 0.00%, 10/15/26(b)(d)(f) | | 1,950,000 | 1,467,375 |
| Two Harbors Investment Corp., 6.25%, 1/15/26(d) | | 1,835,000 | 1,643,243 |
| Upstart Holdings, Inc., 0.25%, 8/15/26 | | 1,499,000 | 945,869 |
| | | | 9,751,938 |
| Technology Hardware – 0.2% |
| Lumentum Holdings, Inc., 0.50%, 12/15/26(d) | | 764,000 | 622,675 |
| Technology Services – 1.4% |
| Affirm Holdings, Inc., 0.00%, 11/15/26(f) | | 1,162,000 | 828,622 |
| Block, Inc., | | | |
| 0.13%, 3/01/25 | | 356,000 | 327,876 |
| 0.25%, 11/01/27 | | 647,000 | 483,633 |
|
| CSG Systems International, Inc., 3.88%, 9/15/28(b)(d) | | 388,000 | 359,653 |
| Perficient, Inc., 0.13%, 11/15/26 | | 1,266,000 | 1,011,982 |
| Repay Holdings Corp., 0.00%, 2/01/26(b)(f) | | 632,000 | 501,840 |
| | | | 3,513,606 |
| Transportation & Logistics – 1.6% |
| Air Transport Services Group, Inc., 3.88%, 8/15/29(b)(d) | | 1,014,000 | 935,922 |
| American Airlines Group, Inc., 6.50%, 7/01/25 | | 1,296,000 | 1,312,848 |
| CryoPort, Inc., 0.75%, 12/01/26(b)(d) | | 1,341,000 | 1,053,490 |
| Spirit Airlines, Inc., 1.00%, 5/15/26(d) | | 1,321,000 | 767,329 |
| | | | 4,069,589 |
See accompanying Notes to Financial Statements
Morningstar Funds Trust October 31, 2023 (unaudited)
Schedule of Investments (continued)
Morningstar Alternatives Fund
| | | Par (a) | Value |
| Transportation Equipment – 0.4% |
| Greenbrier (The) Cos., Inc., 2.88%, 4/15/28(d) | | $1,106,000 | $ 955,252 |
Total Convertible Bonds
(Cost $69,167,984) | 63,655,165 |
| | | Number
of Shares | |
| Convertible Preferred Stocks – 1.0% |
| Asset Management – 0.2% |
| Apollo Global Management, Inc., 6.75% | | 11,468 | 551,725 |
| Banking – 0.3% |
| New York Community Capital Trust V, 6.00% | | 23,824 | 840,034 |
| Chemicals – 0.2% |
| Lyondellbasell Advanced Polymers, Inc., 6.00% | | 669 | 565,305 |
| Technology Hardware – 0.3% |
| NCR Voyix Corp., (100% Cash), 5.50%(h) | | 556 | 673,421 |
Total Convertible Preferred Stocks
(Cost $3,005,481) | 2,630,485 |
| | | Par (a) | |
| Corporate Bonds – 16.4% |
| Advertising & Marketing – 0.0%(c) |
| Advantage Sales & Marketing, Inc., 6.50%, 11/15/28(b) | | $ 35,000 | $ 28,525 |
| Interpublic (The) Group of Cos., Inc, 2.40%, 3/01/31 | | 5,000 | 3,850 |
| | | | 32,375 |
| Aerospace & Defense – 0.4% |
| Boeing (The) Co., | | | |
| 2.20%, 2/04/26 | | 60,000 | 55,130 |
| 5.15%, 5/01/30 | | 105,000 | 98,380 |
| General Dynamics Corp., | | | |
| 3.50%, 4/01/27 | | 130,000 | 121,886 |
| 3.75%, 5/15/28 | | 70,000 | 65,215 |
| Lockheed Martin Corp., | | | |
| 5.10%, 11/15/27 | | 40,000 | 39,539 |
| 3.90%, 6/15/32 | | 105,000 | 91,908 |
| 5.25%, 1/15/33 | | 170,000 | 163,798 |
| 4.75%, 2/15/34 | | 320,000 | 294,140 |
|
| Moog, Inc., 4.25%, 12/15/27(b) | | 5,000 | 4,451 |
| | | Par (a) | Value |
| Aerospace & Defense (Continued) |
| TransDigm, Inc., | | | |
| 5.50%, 11/15/27 | | $ 54,000 | $ 50,272 |
| 6.75%, 8/15/28(b) | | 114,000 | 110,692 |
| 6.88%, 12/15/30(b) | | 12,000 | 11,587 |
| | | | 1,106,998 |
| Apparel & Textile Products – 0.0%(c) |
| Tapestry, Inc., 3.05%, 3/15/32 | | 140,000 | 100,447 |
| Asset Management – 0.2% |
| Ameriprise Financial, Inc., | | | |
| 3.00%, 4/02/25 | | 100,000 | 96,033 |
| 5.15%, 5/15/33 | | 85,000 | 78,455 |
| Ares Capital Corp., | | | |
| 2.15%, 7/15/26 | | 48,000 | 42,158 |
| 2.88%, 6/15/27 | | 60,000 | 52,037 |
| 2.88%, 6/15/28 | | 40,000 | 33,106 |
|
| Barings BDC, Inc., 3.30%, 11/23/26 | | 35,000 | 30,628 |
| Charles Schwab (The) Corp., | | | |
| 1.15%, 5/13/26 | | 50,000 | 43,945 |
| 5.88%, 8/24/26 | | 75,000 | 74,481 |
|
| Compass Group Diversified Holdings LLC, 5.25%, 4/15/29(b) | | 23,000 | 19,641 |
| FS KKR Capital Corp., | | | |
| 2.63%, 1/15/27 | | 105,000 | 89,515 |
| 3.25%, 7/15/27 | | 10,000 | 8,595 |
|
| Golub Capital BDC, Inc., 2.50%, 8/24/26 | | 10,000 | 8,744 |
| NFP Corp., | | | |
| 6.88%, 8/15/28(b) | | 31,000 | 26,471 |
| 8.50%, 10/01/31(b) | | 20,000 | 19,665 |
| | | | 623,474 |
| Automotive – 0.2% |
| Adient Global Holdings Ltd., | | | |
| 7.00%, 4/15/28(b) | | 10,000 | 9,843 |
| 8.25%, 4/15/31(b) | | 9,000 | 8,759 |
|
| American Honda Finance Corp., 1.20%, 7/08/25 | | 75,000 | 69,649 |
| General Motors Financial Co., Inc., | | | |
| 4.35%, 4/09/25 | | 80,000 | 77,784 |
| 2.35%, 2/26/27 | | 200,000 | 175,819 |
|
| Lear Corp., 3.80%, 9/15/27 | | 60,000 | 54,964 |
See accompanying Notes to Financial Statements
Morningstar Funds Trust October 31, 2023 (unaudited)
Schedule of Investments (continued)
Morningstar Alternatives Fund
| | | Par (a) | Value |
| Automotive (Continued) |
|
| Tenneco, Inc., 8.00%, 11/17/28(b) | | $ 30,000 | $ 24,075 |
| Toyota Motor Credit Corp., 1.13%, 6/18/26 | | 30,000 | 26,829 |
| | | | 447,722 |
| Banking – 1.8% |
| Bank of America Corp., | | | |
| 4.00%, 1/22/25 | | 50,000 | 48,662 |
| (SOFR + 0.91%), 0.98%, 9/25/25(i) | | 20,000 | 19,036 |
| (3M CME Term SOFR + 1.07%), 3.37%, 1/23/26(i) | | 25,000 | 24,029 |
| (SOFR + 1.33%), 3.38%, 4/02/26(i) | | 695,000 | 665,915 |
| (SOFR + 1.15%), 1.32%, 6/19/26(i) | | 210,000 | 192,994 |
| (SOFR + 1.75%), 4.83%, 7/22/26(i) | | 105,000 | 102,319 |
| (SOFR + 2.04%), 4.95%, 7/22/28(i) | | 110,000 | 104,538 |
| (SOFR + 1.99%), 6.20%, 11/10/28(i) | | 125,000 | 124,157 |
| (3M CME Term SOFR + 1.25%), 2.50%, 2/13/31(i) | | 80,000 | 63,056 |
| (SOFR + 1.22%), 2.65%, 3/11/32(i) | | 50,000 | 38,319 |
| (SOFR + 1.21%), 2.57%, 10/20/32(i) | | 30,000 | 22,468 |
| (SOFR + 1.91%), 5.29%, 4/25/34(i) | | 80,000 | 72,255 |
| Citigroup, Inc., | | | |
| (SOFR + 1.37%), 4.14%, 5/24/25(i) | | 110,000 | 108,642 |
| (SOFR + 0.77%), 1.46%, 6/09/27(i) | | 375,000 | 330,076 |
| 4.45%, 9/29/27 | | 100,000 | 92,374 |
| (SOFR + 1.94%), 3.79%, 3/17/33(i) | | 140,000 | 113,655 |
|
| Fifth Third Bancorp, (SOFR + 2.34%), 6.34%, 7/27/29(i) | | 30,000 | 29,058 |
| JPMorgan Chase & Co., | | | |
| (SOFR + 0.61%), 1.56%, 12/10/25(i) | | 25,000 | 23,658 |
| (SOFR + 0.92%), 2.60%, 2/24/26(i) | | 327,000 | 311,667 |
| (3M CME Term SOFR + 1.59%), 2.01%, 3/13/26(i) | | 300,000 | 283,097 |
| (SOFR + 0.80%), 1.05%, 11/19/26(i) | | 180,000 | 161,887 |
| | | Par (a) | Value |
| Banking (Continued) |
| JPMorgan Chase & Co., | | | |
| (3M CME Term SOFR + 0.70%), 1.04%, 2/04/27(i) | | $205,000 | $ 182,291 |
| (SOFR + 0.77%), 1.47%, 9/22/27(i) | | 95,000 | 82,758 |
| (SOFR + 1.99%), 4.85%, 7/25/28(i) | | 245,000 | 234,099 |
| (SOFR + 2.08%), 4.91%, 7/25/33(i) | | 90,000 | 80,841 |
| (SOFR + 1.85%), 5.35%, 6/01/34(i) | | 120,000 | 110,678 |
| Santander Holdings USA, Inc., | | | |
| (SOFR Index + 1.38%), 4.26%, 6/09/25(i) | | 70,000 | 68,471 |
| (SOFR + 2.36%), 6.50%, 3/09/29(i) | | 10,000 | 9,672 |
| Truist Financial Corp., | | | |
| 4.00%, 5/01/25 | | 50,000 | 48,042 |
| (SOFR + 1.46%), 4.26%, 7/28/26(i) | | 90,000 | 86,198 |
|
| U.S. Bancorp, (SOFR + 1.66%), 4.55%, 7/22/28(i) | | 20,000 | 18,565 |
| Wells Fargo & Co., | | | |
| (3M CME Term SOFR + 1.09%), 2.41%, 10/30/25(i) | | 12,000 | 11,514 |
| (SOFR + 1.32%), 3.91%, 4/25/26(i) | | 165,000 | 159,094 |
| (SOFR + 1.51%), 3.53%, 3/24/28(i) | | 160,000 | 145,884 |
| (SOFR + 1.98%), 4.81%, 7/25/28(i) | | 240,000 | 227,037 |
| (SOFR + 1.74%), 5.57%, 7/25/29(i) | | 80,000 | 77,143 |
| (SOFR + 1.99%), 5.56%, 7/25/34(i) | | 90,000 | 82,385 |
| | | | 4,556,534 |
| Beverages – 0.1% |
| Constellation Brands, Inc., 4.35%, 5/09/27 | | 65,000 | 62,002 |
| PepsiCo, Inc., 4.45%, 2/15/33 | | 100,000 | 93,662 |
| | | | 155,664 |
| Biotechnology & Pharmaceuticals – 0.6% |
| AbbVie, Inc., | | | |
| 2.60%, 11/21/24 | | 370,000 | 357,516 |
| 3.80%, 3/15/25 | | 70,000 | 68,141 |
| 3.60%, 5/14/25 | | 170,000 | 164,459 |
|
| Bausch Health Americas, Inc., 8.50%, 1/31/27(b) | | 2,000 | 895 |
See accompanying Notes to Financial Statements
Morningstar Funds Trust October 31, 2023 (unaudited)
Schedule of Investments (continued)
Morningstar Alternatives Fund
| | | Par (a) | Value |
| Biotechnology & Pharmaceuticals (Continued) |
|
| Bausch Health Cos., Inc., 11.00%, 9/30/28(b) | | $ 69,000 | $ 42,090 |
| Biogen, Inc., 2.25%, 5/01/30 | | 135,000 | 106,025 |
| Bristol-Myers Squibb Co., | | | |
| 1.45%, 11/13/30 | | 50,000 | 37,680 |
| 5.75%, 2/01/31(j) | | 90,000 | 89,454 |
|
| Eli Lilly & Co., 4.70%, 2/27/33 | | 70,000 | 65,736 |
| Jazz Securities DAC, 4.38%, 1/15/29(b) | | 42,000 | 36,526 |
| Merck & Co., Inc., 4.50%, 5/17/33 | | 240,000 | 218,178 |
| Organon & Co./Organon Foreign Debt Co-Issuer B.V., 5.13%, 4/30/31(b) | | 70,000 | 54,664 |
| Perrigo Finance Unlimited Co., 4.65%, 6/15/30 | | 40,000 | 33,402 |
| Pfizer Investment Enterprises Pte. Ltd., 4.45%, 5/19/28 | | 30,000 | 28,674 |
| Regeneron Pharmaceuticals, Inc., 1.75%, 9/15/30 | | 280,000 | 211,014 |
| Zoetis, Inc., | | | |
| 3.00%, 9/12/27 | | 140,000 | 127,213 |
| 2.00%, 5/15/30 | | 20,000 | 15,752 |
| | | | 1,657,419 |
| Cable & Satellite – 0.4% |
| Cable One, Inc., 4.00%, 11/15/30(b) | | 30,000 | 22,350 |
| CCO Holdings LLC/CCO Holdings Capital Corp., | | | |
| 5.38%, 6/01/29(b) | | 5,000 | 4,376 |
| 6.38%, 9/01/29(b) | | 40,000 | 36,608 |
| 7.38%, 3/01/31(b) | | 115,000 | 108,677 |
| 4.75%, 2/01/32(b) | | 135,000 | 105,376 |
| 4.50%, 6/01/33(b) | | 32,000 | 23,871 |
| Charter Communications Operating LLC/Charter Communications Operating Capital, | | | |
| 2.25%, 1/15/29 | | 15,000 | 12,146 |
| 2.30%, 2/01/32 | | 120,000 | 85,731 |
| Comcast Corp., | | | |
| 3.40%, 4/01/30 | | 50,000 | 43,286 |
| 4.80%, 5/15/33 | | 110,000 | 100,328 |
|
| Directv Financing LLC/Directv Financing Co-Obligor, Inc., 5.88%, 8/15/27(b) | | 155,000 | 135,816 |
| DISH DBS Corp., | | | |
| 7.75%, 7/01/26 | | 22,000 | 14,742 |
| | | Par (a) | Value |
| Cable & Satellite (Continued) |
| DISH DBS Corp., | | | |
| 5.75%, 12/01/28(b) | | $ 28,000 | $ 20,335 |
|
| GCI LLC, 4.75%, 10/15/28(b) | | 20,000 | 17,162 |
| Sirius XM Radio, Inc., | | | |
| 5.00%, 8/01/27(b) | | 80,000 | 73,352 |
| 5.50%, 7/01/29(b) | | 134,000 | 118,734 |
| 4.13%, 7/01/30(b) | | 30,000 | 23,821 |
| | | | 946,711 |
| Chemicals – 0.5% |
| Air Products and Chemicals, Inc., 1.85%, 5/15/27 | | 110,000 | 97,198 |
| Ashland, Inc., 3.38%, 9/01/31(b) | | 70,000 | 53,660 |
| Celanese U.S. Holdings LLC, 6.35%, 11/15/28 | | 65,000 | 63,461 |
| Chemours (The) Co., | | | |
| 5.38%, 5/15/27 | | 61,000 | 55,108 |
| 5.75%, 11/15/28(b) | | 89,000 | 75,272 |
|
| CVR Partners L.P./CVR Nitrogen Finance Corp., 6.13%, 6/15/28(b) | | 69,000 | 60,893 |
| LYB International Finance II B.V., 3.50%, 3/02/27 | | 30,000 | 27,723 |
| PPG Industries, Inc., 1.20%, 3/15/26 | | 165,000 | 148,046 |
| Rain Carbon, Inc., 12.25%, 9/01/29(b) | | 32,000 | 32,560 |
| SK Invictus Intermediate II S.a.r.l., 5.00%, 10/30/29(b) | | 7,000 | 5,286 |
| Tronox, Inc., 4.63%, 3/15/29(b) | | 28,000 | 22,057 |
| Valvoline, Inc., 4.25%, 2/15/30(b) | | 735,000 | 719,985 |
| | | | 1,361,249 |
| Commercial Support Services – 0.2% |
| ADT Security (The) Corp., 4.13%, 8/01/29(b) | | 36,000 | 30,876 |
| Allied Universal Holdco LLC/Allied Universal Finance Corp., 9.75%, 7/15/27(b) | | 25,000 | 21,716 |
| APX Group, Inc., | | | |
| 6.75%, 2/15/27(b) | | 7,000 | 6,758 |
| 5.75%, 7/15/29(b) | | 42,000 | 34,917 |
| Cintas Corp. No. 2, | | | |
| 3.45%, 5/01/25 | | 87,000 | 84,197 |
| 3.70%, 4/01/27 | | 171,000 | 161,178 |
See accompanying Notes to Financial Statements
Morningstar Funds Trust October 31, 2023 (unaudited)
Schedule of Investments (continued)
Morningstar Alternatives Fund
| | | Par (a) | Value |
| Commercial Support Services (Continued) |
| Prime Security Services Borrower LLC/Prime Finance, Inc., | | | |
| 5.75%, 4/15/26(b) | | $ 50,000 | $ 48,505 |
| 6.25%, 1/15/28(b) | | 33,000 | 30,601 |
|
| TriNet Group, Inc., 7.13%, 8/15/31(b) | | 23,000 | 22,237 |
| VT Topco, Inc., 8.50%, 8/15/30(b) | | 15,000 | 14,634 |
| Waste Connections, Inc., | | | |
| 2.60%, 2/01/30 | | 5,000 | 4,138 |
| 3.20%, 6/01/32 | | 55,000 | 44,522 |
|
| Williams Scotsman International, Inc., 4.63%, 8/15/28(b) | | 46,000 | 40,865 |
| Williams Scotsman, Inc., | | | |
| 6.13%, 6/15/25(b) | | 51,000 | 50,110 |
| 7.38%, 10/01/31(b) | | 10,000 | 9,836 |
| | | | 605,090 |
| Construction Materials – 0.1% |
| AmeriTex HoldCo Intermediate LLC, 10.25%, 10/15/28(b) | | 15,000 | 14,183 |
| Eagle Materials, Inc., 2.50%, 7/01/31 | | 38,000 | 28,972 |
| Smyrna Ready Mix Concrete LLC, 6.00%, 11/01/28(b) | | 28,000 | 25,888 |
| Standard Industries, Inc., 4.38%, 7/15/30(b) | | 135,000 | 110,298 |
| | | | 179,341 |
| Consumer Services – 0.0%(c) |
| Adtalem Global Education, Inc., 5.50%, 3/01/28(b) | | 3,000 | 2,732 |
| Service Corp. International, 4.00%, 5/15/31 | | 54,000 | 43,708 |
| | | | 46,440 |
| Containers & Packaging – 0.0%(c) |
| Mauser Packaging Solutions Holding Co., | | | |
| 7.88%, 8/15/26(b) | | 10,000 | 9,366 |
| 9.25%, 4/15/27(b) | | 11,000 | 9,161 |
| | | | 18,527 |
| Diversified Industrials – 0.0%(c) |
| Honeywell International, Inc., 4.50%, 1/15/34 | | 80,000 | 71,894 |
| E-Commerce Discretionary – 0.0%(c) |
| eBay, Inc., 1.90%, 3/11/25 | | 50,000 | 47,379 |
| | | Par (a) | Value |
| Electric Utilities – 0.9% |
| AEP Texas, Inc., 3.95%, 6/01/28 | | $ 50,000 | $45,886 |
| AES (The) Corp., 5.45%, 6/01/28 | | 30,000 | 28,649 |
| Alabama Power Co., 3.05%, 3/15/32 | | 35,000 | 28,412 |
| Appalachian Power Co., 4.50%, 8/01/32 | | 50,000 | 43,646 |
| Arizona Public Service Co., 2.20%, 12/15/31 | | 50,000 | 36,963 |
| Berkshire Hathaway Energy Co., | | | |
| 3.70%, 7/15/30 | | 60,000 | 52,199 |
| 1.65%, 5/15/31 | | 25,000 | 18,236 |
|
| Black Hills Corp., 3.15%, 1/15/27 | | 20,000 | 18,248 |
| Calpine Corp., | | | |
| 4.63%, 2/01/29(b) | | 25,000 | 21,116 |
| 5.00%, 2/01/31(b) | | 53,000 | 42,749 |
|
| CenterPoint Energy Houston Electric LLC, 4.45%, 10/01/32 | | 30,000 | 26,830 |
| CenterPoint Energy, Inc., 5.25%, 8/10/26 | | 22,000 | 21,665 |
| Constellation Energy Generation LLC, 3.25%, 6/01/25 | | 50,000 | 47,846 |
| Dominion Energy, Inc., 3.38%, 4/01/30 | | 50,000 | 42,048 |
| DTE Electric Co., 5.20%, 4/01/33 | | 50,000 | 47,105 |
| DTE Energy Co., 1.05%, 6/01/25 | | 55,000 | 50,808 |
| Duke Energy Carolinas LLC, 4.95%, 1/15/33 | | 20,000 | 18,471 |
| Duke Energy Corp., | | | |
| 2.65%, 9/01/26 | | 100,000 | 91,644 |
| 3.40%, 6/15/29 | | 50,000 | 43,782 |
| 5.75%, 9/15/33 | | 5,000 | 4,749 |
| Duke Energy Progress LLC, | | | |
| 3.40%, 4/01/32 | | 20,000 | 16,528 |
| 5.25%, 3/15/33 | | 10,000 | 9,424 |
|
| Entergy Louisiana LLC, 1.60%, 12/15/30 | | 90,000 | 66,250 |
| Eversource Energy, 5.13%, 5/15/33 | | 50,000 | 45,194 |
| Exelon Corp., 5.15%, 3/15/28 | | 40,000 | 38,803 |
| Florida Power & Light Co., | | | |
| 2.45%, 2/03/32 | | 30,000 | 23,395 |
| 4.80%, 5/15/33 | | 30,000 | 27,496 |
| Georgia Power Co., | | | |
| 4.65%, 5/16/28 | | 30,000 | 28,659 |
| 4.70%, 5/15/32 | | 20,000 | 18,107 |
See accompanying Notes to Financial Statements
Morningstar Funds Trust October 31, 2023 (unaudited)
Schedule of Investments (continued)
Morningstar Alternatives Fund
| | | Par (a) | Value |
| Electric Utilities (Continued) |
|
| ITC Holdings Corp., 3.35%, 11/15/27 | | $ 90,000 | $ 81,723 |
| National Rural Utilities Cooperative Finance Corp., | | | |
| 1.00%, 6/15/26 | | 85,000 | 75,481 |
| 2.40%, 3/15/30 | | 50,000 | 40,252 |
| NextEra Energy Capital Holdings, Inc., | | | |
| 4.45%, 6/20/25 | | 190,000 | 185,255 |
| 5.75%, 9/01/25 | | 30,000 | 29,859 |
| NRG Energy, Inc., | | | |
| 5.25%, 6/15/29(b) | | 119,000 | 104,989 |
| 3.88%, 2/15/32(b) | | 31,000 | 23,038 |
|
| Oncor Electric Delivery Co. LLC, 4.30%, 5/15/28(b) | | 25,000 | 23,621 |
| Pacific Gas and Electric Co., 2.50%, 2/01/31 | | 80,000 | 59,305 |
| PG&E Corp., 5.25%, 7/01/30 | | 119,000 | 104,232 |
| PPL Capital Funding, Inc., 3.10%, 5/15/26 | | 20,000 | 18,695 |
| PPL Electric Utilities Corp., 5.00%, 5/15/33 | | 10,000 | 9,274 |
| Public Service Co. of Colorado, 4.10%, 6/01/32 | | 25,000 | 21,630 |
| Public Service Electric and Gas Co., | | | |
| 4.65%, 3/15/33 | | 10,000 | 9,111 |
| 5.20%, 8/01/33 | | 20,000 | 18,987 |
|
| Public Service Enterprise Group, Inc., 1.60%, 8/15/30 | | 10,000 | 7,504 |
| San Diego Gas & Electric Co., 4.95%, 8/15/28 | | 45,000 | 43,383 |
| Sempra, 5.50%, 8/01/33 | | 10,000 | 9,300 |
| Southern (The) Co., 5.20%, 6/15/33 | | 50,000 | 45,959 |
| Southern California Edison Co., | | | |
| 2.95%, 2/01/51 | | 6,000 | 3,334 |
| 5.88%, 12/01/53 | | 10,000 | 8,896 |
|
| Southwestern Electric Power Co., 5.30%, 4/01/33 | | 10,000 | 9,210 |
| Talen Energy Supply LLC, 8.63%, 6/01/30(b) | | 15,000 | 15,242 |
| Union Electric Co., 2.95%, 3/15/30 | | 70,000 | 58,919 |
| Virginia Electric and Power Co., 2.30%, 11/15/31 | | 45,000 | 34,364 |
| | | Par (a) | Value |
| Electric Utilities (Continued) |
| Vistra Operations Co. LLC, | | | |
| 5.50%, 9/01/26(b) | | $ 25,000 | $ 23,784 |
| 5.63%, 2/15/27(b) | | 76,000 | 71,517 |
| 5.00%, 7/31/27(b) | | 50,000 | 45,739 |
| 7.75%, 10/15/31(b) | | 35,000 | 33,783 |
|
| WEC Energy Group, Inc., 5.60%, 9/12/26 | | 15,000 | 14,910 |
| Wisconsin Electric Power Co., 1.70%, 6/15/28 | | 10,000 | 8,455 |
| Wisconsin Power and Light Co., 1.95%, 9/16/31 | | 5,000 | 3,709 |
| Xcel Energy, Inc., 4.60%, 6/01/32 | | 10,000 | 8,840 |
| | | | 2,257,208 |
| Electric, Gas Marketing & Trading – 0.0%(c) |
| PECO Energy Co., 4.90%, 6/15/33 | | 20,000 | 18,505 |
| Electrical Equipment – 0.1% |
| Atkore, Inc., 4.25%, 6/01/31(b) | | 55,000 | 45,444 |
| BWX Technologies, Inc., 4.13%, 6/30/28(b) | | 115,000 | 101,198 |
| Emerald Debt Merger Sub LLC, 6.63%, 12/15/30(b) | | 15,000 | 14,269 |
| | | | 160,911 |
| Engineering & Construction – 0.0%(c) |
| Brand Industrial Services, Inc., 10.38%, 8/01/30(b) | | 15,000 | 14,887 |
| Quanta Services, Inc., 2.35%, 1/15/32 | | 50,000 | 35,993 |
| TopBuild Corp., 4.13%, 2/15/32(b) | | 20,000 | 15,822 |
| Tutor Perini Corp., 6.88%, 5/01/25(b) | | 13,000 | 11,180 |
| | | | 77,882 |
| Entertainment Content – 0.1% |
| ROBLOX Corp., 3.88%, 5/01/30(b) | | 13,000 | 10,548 |
| TEGNA, Inc., | | | |
| 4.63%, 3/15/28 | | 53,000 | 45,713 |
| 5.00%, 9/15/29 | | 200,000 | 167,500 |
| Univision Communications, Inc., | | | |
| 6.63%, 6/01/27(b) | | 23,000 | 21,008 |
| 8.00%, 8/15/28(b) | | 5,000 | 4,722 |
| 7.38%, 6/30/30(b) | | 116,000 | 102,139 |
| | | | 351,630 |
See accompanying Notes to Financial Statements
Morningstar Funds Trust October 31, 2023 (unaudited)
Schedule of Investments (continued)
Morningstar Alternatives Fund
| | | Par (a) | Value |
| Finance Companies – 0.0%(c) |
| Blackstone Private Credit Fund, 2.70%, 1/15/25 | | $ 60,000 | $ 56,940 |
| Food – 0.1% |
| BellRing Brands, Inc., 7.00%, 3/15/30(b) | | 37,000 | 35,936 |
| General Mills, Inc., | | | |
| 4.00%, 4/17/25 | | 30,000 | 29,195 |
| 4.95%, 3/29/33 | | 35,000 | 31,787 |
|
| Hershey (The) Co., 4.50%, 5/04/33 | | 35,000 | 32,162 |
| Lamb Weston Holdings, Inc., 4.38%, 1/31/32(b) | | 103,000 | 85,219 |
| Mondelez International, Inc., 2.63%, 3/17/27 | | 40,000 | 36,197 |
| Post Holdings, Inc., 5.50%, 12/15/29(b) | | 63,000 | 56,184 |
| | | | 306,680 |
| Forestry, Paper & Wood Products – 0.0%(c) |
| Boise Cascade Co., 4.88%, 7/01/30(b) | | 61,000 | 52,474 |
| Domtar Corp., 6.75%, 10/01/28(b) | | 21,000 | 17,089 |
| Louisiana-Pacific Corp., 3.63%, 3/15/29(b) | | 28,000 | 23,063 |
| | | | 92,626 |
| Gas & Water Utilities – 0.1% |
| American Water Capital Corp., 4.45%, 6/01/32 | | 30,000 | 26,990 |
| AmeriGas Partners L.P./AmeriGas Finance Corp., | | | |
| 5.88%, 8/20/26 | | 11,000 | 10,312 |
| 5.75%, 5/20/27 | | 42,000 | 38,599 |
| 9.38%, 6/01/28(b) | | 48,000 | 47,436 |
|
| NiSource, Inc., 0.95%, 8/15/25 | | 100,000 | 91,367 |
| ONE Gas, Inc., 4.25%, 9/01/32 | | 25,000 | 22,025 |
| Piedmont Natural Gas Co., Inc., 5.40%, 6/15/33 | | 10,000 | 9,286 |
| Southern California Gas Co., 5.20%, 6/01/33 | | 30,000 | 27,717 |
| Southern Co. Gas Capital Corp., 5.75%, 9/15/33 | | 10,000 | 9,518 |
| | | Par (a) | Value |
| Gas & Water Utilities (Continued) |
|
| Southwest Gas Corp., 4.05%, 3/15/32 | | $ 25,000 | $ 21,173 |
| Suburban Propane Partners L.P./Suburban Energy Finance Corp., 5.00%, 6/01/31(b) | | 26,000 | 21,536 |
| | | | 325,959 |
| Health Care Facilities & Services – 0.7% |
| Acadia Healthcare Co., Inc., 5.50%, 7/01/28(b) | | 21,000 | 19,387 |
| Aetna, Inc., 3.50%, 11/15/24 | | 40,000 | 38,992 |
| Cencora, Inc., 2.70%, 3/15/31 | | 90,000 | 71,317 |
| CHS/Community Health Systems, Inc., | | | |
| 8.00%, 3/15/26(b) | | 33,000 | 30,164 |
| 6.88%, 4/15/29(b) | | 33,000 | 13,626 |
|
| Cigna Group (The), 1.25%, 3/15/26 | | 100,000 | 89,965 |
| DaVita, Inc., 4.63%, 6/01/30(b) | | 102,000 | 79,939 |
| Fortrea Holdings, Inc., 7.50%, 7/01/30(b) | | 3,000 | 2,895 |
| HCA, Inc., | | | |
| 3.50%, 9/01/30 | | 50,000 | 41,382 |
| 3.63%, 3/15/32 | | 121,000 | 97,195 |
|
| Heartland Dental LLC/Heartland Dental Finance Corp., 10.50%, 4/30/28(b) | | 20,000 | 19,223 |
| Humana, Inc., | | | |
| 4.50%, 4/01/25 | | 57,000 | 55,993 |
| 5.75%, 3/01/28 | | 70,000 | 69,730 |
| LifePoint Health, Inc., | | | |
| 9.88%, 8/15/30(b) | | 35,000 | 31,631 |
| 11.00%, 10/15/30(b) | | 25,000 | 23,527 |
|
| McKesson Corp., 0.90%, 12/03/25 | | 75,000 | 67,991 |
| Molina Healthcare, Inc., 4.38%, 6/15/28(b) | | 200,000 | 178,003 |
| Star Parent, Inc., 9.00%, 10/01/30(b) | | 10,000 | 9,924 |
| Tenet Healthcare Corp., | | | |
| 6.13%, 10/01/28 | | 124,000 | 115,010 |
| 6.13%, 6/15/30 | | 13,000 | 12,032 |
| 6.75%, 5/15/31(b) | | 20,000 | 18,993 |
| UnitedHealth Group, Inc., | | | |
| 4.25%, 1/15/29 | | 30,000 | 28,204 |
| 5.30%, 2/15/30 | | 390,000 | 382,839 |
| 2.00%, 5/15/30 | | 125,000 | 99,327 |
| 4.50%, 4/15/33 | | 320,000 | 288,129 |
| | | | 1,885,418 |
See accompanying Notes to Financial Statements
Morningstar Funds Trust October 31, 2023 (unaudited)
Schedule of Investments (continued)
Morningstar Alternatives Fund
| | | Par (a) | Value |
| Home & Office Products – 0.0%(c) |
| Steelcase, Inc., 5.13%, 1/18/29 | | $ 17,000 | $ 14,980 |
| Tempur Sealy International, Inc., | | | |
| 4.00%, 4/15/29(b) | | 25,000 | 20,510 |
| 3.88%, 10/15/31(b) | | 43,000 | 32,202 |
| | | | 67,692 |
| Home Construction – 0.1% |
| Lennar Corp., 5.00%, 6/15/27 | | 35,000 | 33,775 |
| Masco Corp., 3.50%, 11/15/27 | | 45,000 | 40,680 |
| NVR, Inc., 3.00%, 5/15/30 | | 135,000 | 110,801 |
| Toll Brothers Finance Corp., | | | |
| 4.35%, 2/15/28 | | 60,000 | 55,106 |
| 3.80%, 11/01/29 | | 30,000 | 25,842 |
| | | | 266,204 |
| Household Products – 0.0%(c) |
| Coty, Inc./HFC Prestige Products, Inc./HFC Prestige International U.S. LLC, 4.75%, 1/15/29(b) | | 21,000 | 18,590 |
| Industrial Support Services – 0.0%(c) |
| EquipmentShare.com, Inc., 9.00%, 5/15/28(b) | | 15,000 | 14,100 |
| NESCO Holdings II, Inc., 5.50%, 4/15/29(b) | | 2,000 | 1,715 |
| United Rentals North America, Inc., 6.00%, 12/15/29(b) | | 10,000 | 9,622 |
| | | | 25,437 |
| Institutional Financial Services – 0.9% |
| Bank of New York Mellon (The) Corp., (SOFR + 1.17%), 4.54%, 2/01/29(i) | | 50,000 | 46,913 |
| Coinbase Global, Inc., | | | |
| 3.38%, 10/01/28(b) | | 42,000 | 30,838 |
| 3.63%, 10/01/31(b) | | 18,000 | 12,238 |
| Goldman Sachs Group (The), Inc., | | | |
| (3M CME Term SOFR + 1.46%), 3.27%, 9/29/25(i) | | 25,000 | 24,261 |
| (SOFR + 0.61%), 0.86%, 2/12/26(i) | | 90,000 | 83,478 |
| 3.50%, 11/16/26 | | 50,000 | 46,370 |
| (SOFR + 0.79%), 1.09%, 12/09/26(i) | | 450,000 | 401,741 |
| (SOFR + 0.80%), 1.43%, 3/09/27(i) | | 110,000 | 97,694 |
| | | Par (a) | Value |
| Institutional Financial Services (Continued) |
| Goldman Sachs Group (The), Inc., | | | |
| (3M CME Term SOFR + 1.42%), 3.81%, 4/23/29(i) | | $ 50,000 | $ 44,914 |
| 3.80%, 3/15/30 | | 50,000 | 43,199 |
| (SOFR + 1.09%), 1.99%, 1/27/32(i) | | 65,000 | 47,685 |
| (SOFR + 1.28%), 2.62%, 4/22/32(i) | | 10,000 | 7,619 |
| (SOFR + 1.25%), 2.38%, 7/21/32(i) | | 75,000 | 55,669 |
|
| Intercontinental Exchange, Inc., 1.85%, 9/15/32 | | 30,000 | 21,341 |
| Jefferies Financial Group, Inc., 5.88%, 7/21/28 | | 45,000 | 43,439 |
| Morgan Stanley, | | | |
| (SOFR + 1.99%), 2.19%, 4/28/26(i) | | 20,000 | 18,812 |
| (SOFR + 1.67%), 4.68%, 7/17/26(i) | | 260,000 | 252,631 |
| (SOFR + 0.72%), 0.99%, 12/10/26(i) | | 360,000 | 320,382 |
| (SOFR + 0.88%), 1.59%, 5/04/27(i) | | 70,000 | 62,200 |
| (3M CME Term SOFR + 1.89%), 4.43%, 1/23/30(i) | | 50,000 | 45,526 |
| (SOFR + 3.12%), 3.62%, 4/01/31(i) | | 145,000 | 122,768 |
| (SOFR + 1.03%), 1.79%, 2/13/32(i) | | 350,000 | 253,212 |
| (SOFR + 1.87%), 5.25%, 4/21/34(i) | | 160,000 | 144,161 |
| | | | 2,227,091 |
| Insurance – 0.6% |
| Aflac, Inc., 1.13%, 3/15/26 | | 30,000 | 26,937 |
| Alliant Holdings Intermediate LLC/Alliant Holdings Co-Issuer, | | | |
| 6.75%, 10/15/27(b) | | 11,000 | 10,046 |
| 6.75%, 4/15/28(b) | | 10,000 | 9,502 |
|
| Aon Corp., 2.80%, 5/15/30 | | 20,000 | 16,320 |
| Arthur J Gallagher & Co., | | | |
| 2.40%, 11/09/31 | | 20,000 | 15,066 |
| 5.50%, 3/02/33 | | 170,000 | 158,353 |
| 6.50%, 2/15/34 | | 75,000 | 74,439 |
|
| Assurant, Inc., 4.90%, 3/27/28 | | 65,000 | 61,550 |
| Assured Guaranty U.S. Holdings, Inc., 6.13%, 9/15/28 | | 70,000 | 69,517 |
See accompanying Notes to Financial Statements
Morningstar Funds Trust October 31, 2023 (unaudited)
Schedule of Investments (continued)
Morningstar Alternatives Fund
| | | Par (a) | Value |
| Insurance (Continued) |
|
| AssuredPartners, Inc., 5.63%, 1/15/29(b) | | $ 3,000 | $ 2,545 |
| Brown & Brown, Inc., | | | |
| 4.50%, 3/15/29 | | 90,000 | 82,294 |
| 4.20%, 3/17/32 | | 50,000 | 41,911 |
|
| Corebridge Financial, Inc., 3.50%, 4/04/25 | | 10,000 | 9,615 |
| Enstar Group Ltd., 3.10%, 9/01/31 | | 165,000 | 121,978 |
| HUB International Ltd., | | | |
| 7.00%, 5/01/26(b) | | 10,000 | 9,734 |
| 7.25%, 6/15/30(b) | | 10,000 | 9,755 |
| Marsh & McLennan Cos., Inc., | | | |
| 2.25%, 11/15/30 | | 50,000 | 39,329 |
| 2.38%, 12/15/31 | | 410,000 | 313,771 |
| 5.75%, 11/01/32 | | 100,000 | 97,499 |
| 5.40%, 9/15/33 | | 96,000 | 91,247 |
|
| Principal Financial Group, Inc., 5.38%, 3/15/33 | | 40,000 | 37,378 |
| Progressive (The) Corp., | | | |
| 2.50%, 3/15/27 | | 90,000 | 81,254 |
| 3.20%, 3/26/30 | | 60,000 | 51,125 |
|
| Unum Group, 4.00%, 6/15/29 | | 135,000 | 120,275 |
| | | | 1,551,440 |
| Internet Media & Services – 0.4% |
| Booking Holdings, Inc., 4.63%, 4/13/30 | | 23,000 | 21,429 |
| Meta Platforms, Inc., | | | |
| 3.50%, 8/15/27 | | 130,000 | 122,222 |
| 4.60%, 5/15/28 | | 50,000 | 48,467 |
| 4.80%, 5/15/30 | | 40,000 | 38,570 |
| 3.85%, 8/15/32 | | 235,000 | 204,245 |
| 4.95%, 5/15/33 | | 220,000 | 206,235 |
| VeriSign, Inc., | | | |
| 4.75%, 7/15/27 | | 100,000 | 95,316 |
| 2.70%, 6/15/31 | | 300,000 | 231,678 |
|
| Ziff Davis, Inc., 4.63%, 10/15/30(b) | | 187,000 | 156,560 |
| | | | 1,124,722 |
| Leisure Facilities & Services – 0.6% |
| Affinity Interactive, 6.88%, 12/15/27(b) | | 9,000 | 7,336 |
| Boyne USA, Inc., 4.75%, 5/15/29(b) | | 10,000 | 8,707 |
| Caesars Entertainment, Inc., 7.00%, 2/15/30(b) | | 32,000 | 30,883 |
| Carnival Corp., | | | |
| 7.63%, 3/01/26(b) | | 15,000 | 14,586 |
| | | Par (a) | Value |
| Leisure Facilities & Services (Continued) |
| Carnival Corp., | | | |
| 6.00%, 5/01/29(b) | | $ 23,000 | $ 19,430 |
| 10.50%, 6/01/30(b) | | 86,000 | 87,258 |
|
| Carnival Holdings Bermuda Ltd., 10.38%, 5/01/28(b) | | 63,000 | 67,171 |
| Choice Hotels International, Inc., 3.70%, 12/01/29 | | 5,000 | 4,095 |
| Churchill Downs, Inc., 6.75%, 5/01/31(b) | | 53,000 | 48,892 |
| Darden Restaurants, Inc., 6.30%, 10/10/33 | | 30,000 | 29,140 |
| Hilton Domestic Operating Co., Inc., | | | |
| 4.88%, 1/15/30 | | 128,000 | 114,909 |
| 4.00%, 5/01/31(b) | | 50,000 | 41,408 |
| Hilton Grand Vacations Borrower Escrow LLC/Hilton Grand Vacations Borrower Escrow, | | | |
| 5.00%, 6/01/29(b) | | 32,000 | 26,800 |
| 4.88%, 7/01/31(b) | | 70,000 | 55,432 |
|
| Hyatt Hotels Corp., 5.75%, 1/30/27 | | 30,000 | 29,649 |
| Live Nation Entertainment, Inc., 6.50%, 5/15/27(b) | | 10,000 | 9,756 |
| Marriott International, Inc., | | | |
| 5.75%, 5/01/25 | | 9,000 | 8,972 |
| 5.00%, 10/15/27 | | 35,000 | 33,809 |
| 5.55%, 10/15/28 | | 30,000 | 29,235 |
| 2.85%, 4/15/31 | | 110,000 | 86,442 |
|
| Marriott Ownership Resorts, Inc., 4.50%, 6/15/29(b) | | 25,000 | 20,544 |
| McDonald's Corp., 4.60%, 9/09/32 | | 320,000 | 293,652 |
| Midwest Gaming Borrower LLC/Midwest Gaming Finance Corp., 4.88%, 5/01/29(b) | | 10,000 | 8,325 |
| NCL Corp. Ltd., | | | |
| 5.88%, 3/15/26(b) | | 65,000 | 58,337 |
| 8.13%, 1/15/29(b) | | 15,000 | 14,655 |
| 7.75%, 2/15/29(b) | | 2,000 | 1,746 |
|
| Resorts World Las Vegas LLC/RWLV Capital, Inc., 8.45%, 7/27/30(b) | | 65,000 | 59,783 |
| Royal Caribbean Cruises Ltd., | | | |
| 5.50%, 8/31/26(b) | | 36,000 | 33,972 |
| 11.63%, 8/15/27(b) | | 104,000 | 112,795 |
See accompanying Notes to Financial Statements
Morningstar Funds Trust October 31, 2023 (unaudited)
Schedule of Investments (continued)
Morningstar Alternatives Fund
| | | Par (a) | Value |
| Leisure Facilities & Services (Continued) |
|
| Station Casinos LLC, 4.63%, 12/01/31(b) | | $ 15,000 | $ 11,843 |
| Travel + Leisure Co., | | | |
| 6.63%, 7/31/26(b) | | 35,000 | 34,151 |
| 6.00%, 4/01/27 | | 34,000 | 31,756 |
| 4.63%, 3/01/30(b) | | 23,000 | 18,829 |
| Wynn Resorts Finance LLC/Wynn Resorts Capital Corp., | | | |
| 5.13%, 10/01/29(b) | | 9,000 | 7,675 |
| 7.13%, 2/15/31(b) | | 12,000 | 11,175 |
| Yum! Brands, Inc., | | | |
| 4.75%, 1/15/30(b) | | 50,000 | 44,511 |
| 4.63%, 1/31/32 | | 96,000 | 81,799 |
| | | | 1,599,458 |
| Leisure Products – 0.0%(c) |
| Thor Industries, Inc., 4.00%, 10/15/29(b) | | 24,000 | 19,345 |
| Machinery – 0.2% |
| Eaton Corp., 4.15%, 3/15/33 | | 20,000 | 17,596 |
| GrafTech Finance, Inc., 4.63%, 12/15/28(b) | | 25,000 | 18,326 |
| IDEX Corp., 2.63%, 6/15/31 | | 180,000 | 140,466 |
| Ingersoll Rand, Inc., | | | |
| 5.40%, 8/14/28 | | 90,000 | 87,695 |
| 5.70%, 8/14/33 | | 60,000 | 56,692 |
|
| Oshkosh Corp., 3.10%, 3/01/30 | | 103,000 | 87,052 |
| Pentair Finance S.a.r.l., 4.50%, 7/01/29 | | 60,000 | 54,283 |
| Terex Corp., 5.00%, 5/15/29(b) | | 22,000 | 19,258 |
| Titan International, Inc., 7.00%, 4/30/28 | | 51,000 | 46,602 |
| | | | 527,970 |
| Medical Equipment & Devices – 0.1% |
| Agilent Technologies, Inc., 2.30%, 3/12/31 | | 30,000 | 23,242 |
| Bausch & Lomb Escrow Corp., 8.38%, 10/01/28(b) | | 15,000 | 14,899 |
| Becton Dickinson & Co., 3.70%, 6/06/27 | | 55,000 | 51,177 |
| Edwards Lifesciences Corp., 4.30%, 6/15/28 | | 70,000 | 65,588 |
| Embecta Corp., 5.00%, 2/15/30(b) | | 18,000 | 14,293 |
| | | Par (a) | Value |
| Medical Equipment & Devices (Continued) |
| Hologic, Inc., 4.63%, 2/01/28(b) | | $ 50,000 | $ 45,470 |
| Medline Borrower L.P., 5.25%, 10/01/29(b) | | 40,000 | 34,049 |
| | | | 248,718 |
| Metals & Mining – 0.1% |
| Arsenal AIC Parent LLC, 8.00%, 10/01/30(b) | | 15,000 | 14,813 |
| Freeport-McMoRan, Inc., 4.13%, 3/01/28 | | 35,000 | 31,809 |
| Novelis Corp., 4.75%, 1/30/30(b) | | 55,000 | 46,666 |
| SunCoke Energy, Inc., 4.88%, 6/30/29(b) | | 20,000 | 16,740 |
| | | | 110,028 |
| Oil & Gas Producers – 1.9% |
| Antero Midstream Partners L.P./Antero Midstream Finance Corp., 5.75%, 3/01/27(b) | | 26,000 | 24,850 |
| Cheniere Corpus Christi Holdings LLC, 5.13%, 6/30/27 | | 41,000 | 39,559 |
| Chesapeake Energy Corp., 6.75%, 4/15/29(b) | | 5,000 | 4,892 |
| Chevron USA, Inc., 3.25%, 10/15/29 | | 20,000 | 17,769 |
| Civitas Resources, Inc., | | | |
| 5.00%, 10/15/26(b) | | 20,000 | 18,713 |
| 8.38%, 7/01/28(b) | | 53,000 | 53,327 |
| 8.63%, 11/01/30(b) | | 10,000 | 10,178 |
| 8.75%, 7/01/31(b) | | 30,000 | 30,278 |
| CNX Resources Corp., | | | |
| 7.25%, 3/14/27(b) | | 12,000 | 11,810 |
| 6.00%, 1/15/29(b) | | 40,000 | 36,678 |
| 7.38%, 1/15/31(b) | | 26,000 | 24,842 |
|
| Columbia Pipeline Group, Inc., 4.50%, 6/01/25 | | 235,000 | 229,281 |
| Comstock Resources, Inc., | | | |
| 6.75%, 3/01/29(b) | | 64,000 | 58,241 |
| 5.88%, 1/15/30(b) | | 6,000 | 5,130 |
|
| CQP Holdco L.P./BIP-V Chinook Holdco LLC, 5.50%, 6/15/31(b) | | 60,000 | 52,185 |
| Crescent Energy Finance LLC, | | | |
| 7.25%, 5/01/26(b) | | 36,000 | 34,852 |
| 9.25%, 2/15/28(b) | | 30,000 | 30,215 |
|
| DCP Midstream Operating L.P., 3.25%, 2/15/32 | | 5,000 | 3,932 |
See accompanying Notes to Financial Statements
Morningstar Funds Trust October 31, 2023 (unaudited)
Schedule of Investments (continued)
Morningstar Alternatives Fund
| | | Par (a) | Value |
| Oil & Gas Producers (Continued) |
|
| Earthstone Energy Holdings LLC, 9.88%, 7/15/31(b) | | $ 25,000 | $ 26,922 |
| Energy Transfer L.P., | | | |
| 4.05%, 3/15/25 | | 50,000 | 48,603 |
| 2.90%, 5/15/25 | | 80,000 | 76,208 |
| 5.75%, 2/15/33 | | 90,000 | 84,370 |
| 6.55%, 12/01/33 | | 50,000 | 49,341 |
| EnLink Midstream LLC, | | | |
| 5.63%, 1/15/28(b) | | 25,000 | 23,573 |
| 5.38%, 6/01/29 | | 12,000 | 10,980 |
|
| EnLink Midstream Partners L.P., 5.45%, 6/01/47 | | 8,000 | 6,014 |
| EQM Midstream Partners L.P., 7.50%, 6/01/30(b) | | 90,000 | 88,302 |
| EQT Corp., | | | |
| 3.90%, 10/01/27 | | 100,000 | 92,009 |
| 7.00%, 2/01/30 | | 100,000 | 101,322 |
|
| FTAI Infra Escrow Holdings LLC, 10.50%, 6/01/27(b) | | 15,000 | 14,579 |
| Global Partners L.P./GLP Finance Corp., 6.88%, 1/15/29 | | 100,000 | 88,255 |
| Gulfport Energy Corp., 8.00%, 5/17/26 | | 11,000 | 10,981 |
| Harvest Midstream I L.P., 7.50%, 9/01/28(b) | | 35,000 | 33,164 |
| Hess Corp., 4.30%, 4/01/27 | | 50,000 | 47,843 |
| Hess Midstream Operations L.P., | | | |
| 5.13%, 6/15/28(b) | | 75,000 | 69,252 |
| 4.25%, 2/15/30(b) | | 25,000 | 21,392 |
| 5.50%, 10/15/30(b) | | 6,000 | 5,447 |
| Hilcorp Energy I L.P./Hilcorp Finance Co., | | | |
| 6.25%, 11/01/28(b) | | 20,000 | 18,699 |
| 6.00%, 2/01/31(b) | | 63,000 | 55,186 |
| 6.25%, 4/15/32(b) | | 40,000 | 34,932 |
|
| Howard Midstream Energy Partners LLC, 8.88%, 7/15/28(b) | | 15,000 | 15,080 |
| Kinder Morgan, Inc., | | | |
| 1.75%, 11/15/26 | | 60,000 | 53,172 |
| 7.75%, 1/15/32 | | 20,000 | 21,227 |
| 5.20%, 6/01/33 | | 10,000 | 9,012 |
|
| Marathon Petroleum Corp., 4.70%, 5/01/25 | | 50,000 | 48,958 |
| MPLX L.P., | | | |
| 4.88%, 12/01/24 | | 12,000 | 11,838 |
| 4.88%, 6/01/25 | | 735,000 | 720,535 |
| 4.13%, 3/01/27 | | 180,000 | 169,044 |
| | | Par (a) | Value |
| Oil & Gas Producers (Continued) |
| MPLX L.P., | | | |
| 4.25%, 12/01/27 | | $ 90,000 | $ 83,719 |
| 2.65%, 8/15/30 | | 50,000 | 39,500 |
| 5.00%, 3/01/33 | | 260,000 | 230,238 |
|
| Murphy Oil USA, Inc., 3.75%, 2/15/31(b) | | 20,000 | 16,068 |
| New Fortress Energy, Inc., | | | |
| 6.75%, 9/15/25(b) | | 115,000 | 106,689 |
| 6.50%, 9/30/26(b) | | 25,000 | 22,392 |
| Northern Oil and Gas, Inc., | | | |
| 8.13%, 3/01/28(b) | | 35,000 | 34,564 |
| 8.75%, 6/15/31(b) | | 6,000 | 5,970 |
| ONEOK, Inc., | | | |
| 2.20%, 9/15/25 | | 80,000 | 74,550 |
| 5.85%, 1/15/26 | | 77,000 | 76,924 |
| 4.00%, 7/13/27 | | 255,000 | 237,047 |
| 6.05%, 9/01/33 | | 110,000 | 105,419 |
|
| Ovintiv, Inc., 5.38%, 1/01/26 | | 10,000 | 9,827 |
| PBF Holding Co. LLC/PBF Finance Corp., | | | |
| 6.00%, 2/15/28 | | 38,000 | 34,934 |
| 7.88%, 9/15/30(b) | | 19,000 | 18,335 |
|
| Plains All American Pipeline L.P./PAA Finance Corp., 3.55%, 12/15/29 | | 62,000 | 52,693 |
| Sunoco L.P./Sunoco Finance Corp., | | | |
| 5.88%, 3/15/28 | | 109,000 | 103,113 |
| 7.00%, 9/15/28(b) | | 30,000 | 29,197 |
| 4.50%, 5/15/29 | | 35,000 | 30,318 |
|
| Tallgrass Energy Partners L.P./Tallgrass Energy Finance Corp., 5.50%, 1/15/28(b) | | 100,000 | 87,605 |
| Targa Resources Corp., 5.20%, 7/01/27 | | 160,000 | 154,813 |
| Targa Resources Partners L.P./Targa Resources Partners Finance Corp., | | | |
| 6.50%, 7/15/27 | | 17,000 | 16,801 |
| 5.00%, 1/15/28 | | 46,000 | 43,411 |
| 5.50%, 3/01/30 | | 25,000 | 23,038 |
| 4.88%, 2/01/31 | | 20,000 | 17,631 |
| Transcontinental Gas Pipe Line Co. LLC, | | | |
| 7.85%, 2/01/26 | | 105,000 | 108,409 |
| 3.25%, 5/15/30 | | 30,000 | 25,124 |
|
| Venture Global Calcasieu Pass LLC, 6.25%, 1/15/30(b) | | 112,000 | 105,656 |
See accompanying Notes to Financial Statements
Morningstar Funds Trust October 31, 2023 (unaudited)
Schedule of Investments (continued)
Morningstar Alternatives Fund
| | | Par (a) | Value |
| Oil & Gas Producers (Continued) |
| Venture Global LNG, Inc., | | | |
| 8.13%, 6/01/28(b) | | $ 60,000 | $ 58,249 |
| 9.50%, 2/01/29(b) | | 27,000 | 27,430 |
| 8.38%, 6/01/31(b) | | 35,000 | 33,399 |
| 9.88%, 2/01/32(b) | | 27,000 | 27,378 |
|
| Viper Energy Partners L.P., 7.38%, 11/01/31(b) | | 28,000 | 27,930 |
| | | | 4,811,343 |
| Oil, Gas Services & Equipment – 0.1% |
| Diamond Foreign Asset Co./Diamond Finance LLC, 8.50%, 10/01/30(b) | | 5,000 | 4,874 |
| Noble Finance II LLC, 8.00%, 4/15/30(b) | | 45,000 | 44,972 |
| Patterson-UTI Energy, Inc., 7.15%, 10/01/33 | | 55,000 | 53,659 |
| Transocean, Inc., | | | |
| 7.50%, 1/15/26(b) | | 10,000 | 9,579 |
| 8.00%, 2/01/27(b) | | 9,000 | 8,448 |
| 8.75%, 2/15/30(b) | | 63,650 | 63,462 |
| USA Compression Partners L.P./USA Compression Finance Corp., | | | |
| 6.88%, 4/01/26 | | 21,000 | 20,393 |
| 6.88%, 9/01/27 | | 43,000 | 41,199 |
|
| Valaris Ltd., 8.38%, 4/30/30(b) | | 60,000 | 58,875 |
| | | | 305,461 |
| Publishing & Broadcasting – 0.1% |
| Belo Corp., 7.25%, 9/15/27 | | 14,000 | 13,342 |
| Nexstar Media, Inc., | | | |
| 5.63%, 7/15/27(b) | | 100,000 | 89,996 |
| 4.75%, 11/01/28(b) | | 33,000 | 27,717 |
|
| Urban One, Inc., 7.38%, 2/01/28(b) | | 19,000 | 15,622 |
| | | | 146,677 |
| Real Estate Investment Trusts – 0.6% |
| American Tower Corp., | | | |
| 2.95%, 1/15/25 | | 105,000 | 101,085 |
| 5.80%, 11/15/28 | | 55,000 | 53,732 |
|
| Brookfield Property REIT, Inc./BPR Cumulus LLC/BPR Nimbus LLC/GGSI Sellco LL, 5.75%, 5/15/26(b) | | 70,000 | 64,096 |
| Crown Castle, Inc., | | | |
| 3.65%, 9/01/27 | | 80,000 | 72,727 |
| 3.80%, 2/15/28 | | 17,000 | 15,332 |
|
| EPR Properties, 4.75%, 12/15/26 | | 20,000 | 18,243 |
| | | Par (a) | Value |
| Real Estate Investment Trusts (Continued) |
|
| Equinix, Inc., 1.45%, 5/15/26 | | $ 70,000 | $ 62,520 |
| Iron Mountain Information Management Services, Inc., 5.00%, 7/15/32(b) | | 60,000 | 49,095 |
| Iron Mountain, Inc., | | | |
| 5.00%, 7/15/28(b) | | 75,000 | 67,116 |
| 4.88%, 9/15/29(b) | | 20,000 | 17,421 |
| 5.25%, 7/15/30(b) | | 40,000 | 34,723 |
| 5.63%, 7/15/32(b) | | 50,000 | 42,714 |
| Omega Healthcare Investors, Inc., | | | |
| 4.50%, 1/15/25 | | 50,000 | 48,483 |
| 4.50%, 4/01/27 | | 80,000 | 73,677 |
| 4.75%, 1/15/28 | | 60,000 | 54,725 |
| Park Intermediate Holdings LLC/PK Domestic Property LLC/PK Finance Co-Issuer, | | | |
| 5.88%, 10/01/28(b) | | 29,000 | 26,106 |
| 4.88%, 5/15/29(b) | | 2,000 | 1,669 |
| Prologis L.P., | | | |
| 4.88%, 6/15/28 | | 20,000 | 19,238 |
| 4.75%, 6/15/33 | | 40,000 | 35,818 |
| Public Storage Operating Co., | | | |
| 1.50%, 11/09/26 | | 20,000 | 17,838 |
| 1.95%, 11/09/28 | | 125,000 | 104,712 |
| 3.39%, 5/01/29 | | 25,000 | 22,208 |
| 2.25%, 11/09/31 | | 120,000 | 91,519 |
| 5.10%, 8/01/33 | | 25,000 | 23,165 |
|
| RLJ Lodging Trust L.P., 4.00%, 9/15/29(b) | | 40,000 | 32,600 |
| Service Properties Trust, 7.50%, 9/15/25 | | 25,000 | 24,289 |
| Simon Property Group L.P., | | | |
| 3.50%, 9/01/25 | | 65,000 | 62,269 |
| 1.38%, 1/15/27 | | 10,000 | 8,673 |
| 5.50%, 3/08/33 | | 40,000 | 37,171 |
| Uniti Group L.P./Uniti Group Finance, Inc./CSL Capital LLC, | | | |
| 10.50%, 2/15/28(b) | | 38,000 | 36,592 |
| 6.50%, 2/15/29(b) | | 24,000 | 15,586 |
| VICI Properties L.P./VICI Note Co., Inc., | | | |
| 4.63%, 6/15/25(b) | | 35,000 | 33,617 |
| 5.75%, 2/01/27(b) | | 100,000 | 95,701 |
| 4.13%, 8/15/30(b) | | 50,000 | 41,248 |
See accompanying Notes to Financial Statements
Morningstar Funds Trust October 31, 2023 (unaudited)
Schedule of Investments (continued)
Morningstar Alternatives Fund
| | | Par (a) | Value |
| Real Estate Investment Trusts (Continued) |
|
| Welltower OP LLC, 4.00%, 6/01/25 | | $ 57,000 | $ 55,095 |
| XHR L.P., 4.88%, 6/01/29(b) | | 40,000 | 33,843 |
| | | | 1,594,646 |
| Real Estate Owners & Developers – 0.1% |
| Greystar Real Estate Partners LLC, 7.75%, 9/01/30(b) | | 10,000 | 9,825 |
| Howard Hughes (The) Corp., | | | |
| 5.38%, 8/01/28(b) | | 46,000 | 40,439 |
| 4.13%, 2/01/29(b) | | 8,000 | 6,420 |
| 4.38%, 2/01/31(b) | | 26,000 | 19,791 |
| Kennedy-Wilson Inc., | | | |
| 4.75%, 3/01/29 | | 41,000 | 30,852 |
| 4.75%, 2/01/30 | | 11,000 | 8,030 |
| 5.00%, 3/01/31 | | 11,000 | 7,893 |
| | | | 123,250 |
| Retail - Consumer Staples – 0.1% |
| Albertsons Cos., Inc./Safeway, Inc./New Albertsons L.P./Albertsons LLC, 4.88%, 2/15/30(b) | | 57,000 | 50,890 |
| Costco Wholesale Corp., 1.38%, 6/20/27 | | 140,000 | 121,849 |
| Ingles Markets, Inc., 4.00%, 6/15/31(b) | | 35,000 | 27,825 |
| | | | 200,564 |
| Retail - Discretionary – 0.4% |
| Academy Ltd., 6.00%, 11/15/27(b) | | 23,000 | 21,652 |
| Asbury Automotive Group, Inc., 5.00%, 2/15/32(b) | | 55,000 | 44,608 |
| AutoZone, Inc., | | | |
| 5.05%, 7/15/26 | | 120,000 | 117,961 |
| 4.50%, 2/01/28 | | 40,000 | 37,821 |
|
| Bath & Body Works, Inc., 5.25%, 2/01/28 | | 25,000 | 22,924 |
| Beacon Roofing Supply, Inc., 6.50%, 8/01/30(b) | | 19,000 | 18,142 |
| Builders FirstSource, Inc., 6.38%, 6/15/32(b) | | 85,000 | 77,798 |
| Gap (The), Inc., 3.63%, 10/01/29(b) | | 19,000 | 14,517 |
| Genuine Parts Co., 1.75%, 2/01/25 | | 190,000 | 179,594 |
| Lowe's Cos., Inc., | | | |
| 4.00%, 4/15/25 | | 45,000 | 43,861 |
| 4.40%, 9/08/25 | | 65,000 | 63,542 |
| | | Par (a) | Value |
| Retail - Discretionary (Continued) |
| Lowe's Cos., Inc., | | | |
| 3.35%, 4/01/27 | | $ 55,000 | $ 50,930 |
| 3.10%, 5/03/27 | | 95,000 | 87,060 |
| 2.63%, 4/01/31 | | 10,000 | 7,898 |
| Macy's Retail Holdings LLC, | | | |
| 5.88%, 4/01/29(b) | | 27,000 | 23,803 |
| 5.88%, 3/15/30(b) | | 37,000 | 31,302 |
| 6.13%, 3/15/32(b) | | 70,000 | 57,810 |
|
| Metis Merger Sub LLC, 6.50%, 5/15/29(b) | | 14,000 | 11,440 |
| Nordstrom, Inc., | | | |
| 4.38%, 4/01/30 | | 23,000 | 17,853 |
| 4.25%, 8/01/31 | | 26,000 | 19,047 |
|
| Ross Stores, Inc., 4.70%, 4/15/27 | | 2,000 | 1,918 |
| | | | 951,481 |
| Semiconductors – 0.4% |
| Analog Devices, Inc., | | | |
| 1.70%, 10/01/28 | | 40,000 | 33,463 |
| 2.10%, 10/01/31 | | 30,000 | 23,131 |
|
| Broadcom Corp./Broadcom Cayman Finance Ltd., 3.88%, 1/15/27 | | 350,000 | 327,132 |
| Broadcom, Inc., | | | |
| 3.46%, 9/15/26 | | 70,000 | 65,675 |
| 4.00%, 4/15/29(b) | | 145,000 | 129,521 |
| 4.15%, 4/15/32(b) | | 40,000 | 33,845 |
| 2.60%, 2/15/33(b) | | 270,000 | 195,897 |
| 3.42%, 4/15/33(b) | | 140,000 | 108,853 |
|
| Intel Corp., 3.75%, 3/25/27 | | 50,000 | 47,179 |
| Marvell Technology, Inc., 5.95%, 9/15/33 | | 40,000 | 37,992 |
| Texas Instruments, Inc., | | | |
| 1.90%, 9/15/31 | | 54,000 | 41,615 |
| 4.90%, 3/14/33 | | 25,000 | 23,522 |
| | | | 1,067,825 |
| Software – 0.3% |
| athenahealth Group, Inc., 6.50%, 2/15/30(b) | | 35,000 | 28,604 |
| Central Parent LLC/CDK Global II LLC/CDK Financing Co., Inc., 8.00%, 6/15/29(b) | | 10,000 | 9,877 |
| Cloud Software Group, Inc., | | | |
| 6.50%, 3/31/29(b) | | 48,000 | 42,141 |
| 9.00%, 9/30/29(b) | | 47,000 | 40,025 |
|
| Elastic N.V., 4.13%, 7/15/29(b) | | 11,000 | 9,270 |
| Fortinet, Inc., 2.20%, 3/15/31 | | 10,000 | 7,625 |
See accompanying Notes to Financial Statements
Morningstar Funds Trust October 31, 2023 (unaudited)
Schedule of Investments (continued)
Morningstar Alternatives Fund
| | | Par (a) | Value |
| Software (Continued) |
| Intuit, Inc., | | | |
| 1.65%, 7/15/30 | | $ 16,000 | $ 12,369 |
| 5.20%, 9/15/33 | | 100,000 | 95,127 |
|
| McAfee Corp., 7.38%, 2/15/30(b) | | 22,000 | 17,599 |
| Oracle Corp., | | | |
| 1.65%, 3/25/26 | | 180,000 | 163,258 |
| 4.65%, 5/06/30 | | 25,000 | 22,919 |
| 2.88%, 3/25/31 | | 390,000 | 312,608 |
|
| Roper Technologies, Inc., 1.00%, 9/15/25 | | 45,000 | 41,218 |
| Veritas U.S., Inc./Veritas Bermuda Ltd., 7.50%, 9/01/25(b) | | 6,000 | 4,912 |
| VMware, Inc., 4.50%, 5/15/25 | | 10,000 | 9,767 |
| | | | 817,319 |
| Specialty Finance – 0.5% |
| Air Lease Corp., 3.38%, 7/01/25 | | 45,000 | 42,713 |
| American Express Co., | | | |
| 3.95%, 8/01/25 | | 70,000 | 67,632 |
| 4.20%, 11/06/25 | | 50,000 | 48,386 |
| 4.05%, 5/03/29 | | 43,000 | 39,331 |
| (SOFR + 1.84%), 5.04%, 5/01/34(i) | | 180,000 | 161,588 |
|
| Apollo Commercial Real Estate Finance, Inc., 4.63%, 6/15/29(b) | | 35,000 | 26,791 |
| Burford Capital Global Finance LLC, | | | |
| 6.88%, 4/15/30(b) | | 5,000 | 4,500 |
| 9.25%, 7/01/31(b) | | 5,000 | 4,935 |
| Capital One Financial Corp., | | | |
| (SOFR + 1.37%), 4.17%, 5/09/25(i) | | 85,000 | 83,279 |
| (SOFR + 2.16%), 4.99%, 7/24/26(i) | | 45,000 | 43,385 |
|
| FirstCash, Inc., 5.63%, 1/01/30(b) | | 18,000 | 16,023 |
| Fortress Transportation and Infrastructure Investors LLC, | | | |
| 6.50%, 10/01/25(b) | | 22,000 | 21,782 |
| 9.75%, 8/01/27(b) | | 120,000 | 123,450 |
| Freedom Mortgage Corp., | | | |
| 12.00%, 10/01/28(b) | | 10,000 | 10,032 |
| 12.25%, 10/01/30(b) | | 20,000 | 20,007 |
|
| MGIC Investment Corp., 5.25%, 8/15/28 | | 44,000 | 40,444 |
| | | Par (a) | Value |
| Specialty Finance (Continued) |
| Nationstar Mortgage Holdings, Inc., | | | |
| 5.00%, 2/01/26(b) | | $108,000 | $ 100,386 |
| 5.50%, 8/15/28(b) | | 25,000 | 22,092 |
| 5.13%, 12/15/30(b) | | 80,000 | 64,735 |
|
| Navient Corp., 6.75%, 6/15/26 | | 6,000 | 5,685 |
| OneMain Finance Corp., | | | |
| 7.13%, 3/15/26 | | 35,000 | 33,992 |
| 6.63%, 1/15/28 | | 41,000 | 37,300 |
| PennyMac Financial Services, Inc., | | | |
| 5.38%, 10/15/25(b) | | 27,000 | 25,712 |
| 5.75%, 9/15/31(b) | | 26,000 | 21,199 |
|
| SLM Corp., 4.20%, 10/29/25 | | 15,000 | 13,950 |
| United Wholesale Mortgage LLC, | | | |
| 5.50%, 11/15/25(b) | | 48,000 | 45,623 |
| 5.75%, 6/15/27(b) | | 30,000 | 27,298 |
| 5.50%, 4/15/29(b) | | 51,000 | 42,712 |
| | | | 1,194,962 |
| Steel – 0.1% |
| Carpenter Technology Corp., 6.38%, 7/15/28 | | 9,000 | 8,561 |
| Cleveland-Cliffs, Inc., 6.75%, 4/15/30(b) | | 42,000 | 38,942 |
| Nucor Corp., 3.13%, 4/01/32 | | 50,000 | 40,394 |
| Reliance Steel & Aluminum Co., 1.30%, 8/15/25 | | 40,000 | 36,760 |
| | | | 124,657 |
| Technology Hardware – 0.4% |
| Apple, Inc., 3.35%, 8/08/32 | | 25,000 | 21,465 |
| CDW LLC/CDW Finance Corp., | | | |
| 5.50%, 12/01/24 | | 40,000 | 39,586 |
| 2.67%, 12/01/26 | | 9,000 | 8,051 |
| 3.57%, 12/01/31 | | 110,000 | 88,205 |
|
| Dell International LLC/EMC Corp., 5.85%, 7/15/25 | | 80,000 | 79,850 |
| Flex Ltd., 4.88%, 6/15/29 | | 90,000 | 82,298 |
| Imola Merger Corp., 4.75%, 5/15/29(b) | | 33,000 | 28,769 |
| Jabil, Inc., | | | |
| 1.70%, 4/15/26 | | 65,000 | 58,587 |
| 4.25%, 5/15/27 | | 70,000 | 65,689 |
| 5.45%, 2/01/29 | | 30,000 | 28,837 |
See accompanying Notes to Financial Statements
Morningstar Funds Trust October 31, 2023 (unaudited)
Schedule of Investments (continued)
Morningstar Alternatives Fund
| | | Par (a) | Value |
| Technology Hardware (Continued) |
| Motorola Solutions, Inc., | | | |
| 4.60%, 5/23/29 | | $100,000 | $ 93,182 |
| 2.75%, 5/24/31 | | 100,000 | 77,521 |
| 5.60%, 6/01/32 | | 60,000 | 56,222 |
|
| NCR Atleos Escrow Corp., 9.50%, 4/01/29(b) | | 30,000 | 29,407 |
| NCR Voyix Corp., 5.00%, 10/01/28(b) | | 40,000 | 34,536 |
| Seagate HDD Cayman, | | | |
| 8.25%, 12/15/29(b) | | 103,000 | 104,671 |
| 8.50%, 7/15/31(b) | | 3,000 | 3,053 |
| 9.63%, 12/01/32(b) | | 66,000 | 70,357 |
|
| Teledyne Technologies, Inc., 2.75%, 4/01/31 | | 30,000 | 23,663 |
| Xerox Holdings Corp., 5.50%, 8/15/28(b) | | 47,000 | 36,300 |
| | | | 1,030,249 |
| Technology Services – 0.7% |
| ASGN, Inc., 4.63%, 5/15/28(b) | | 20,000 | 17,710 |
| Conduent Business Services LLC/Conduent State & Local Solutions, Inc., 6.00%, 11/01/29(b) | | 26,000 | 21,433 |
| FactSet Research Systems, Inc., 2.90%, 3/01/27 | | 150,000 | 135,490 |
| Fidelity National Information Services, Inc., 4.50%, 7/15/25 | | 50,000 | 48,828 |
| Fiserv, Inc., | | | |
| 5.38%, 8/21/28 | | 30,000 | 29,341 |
| 5.60%, 3/02/33 | | 220,000 | 207,017 |
| Gartner, Inc., | | | |
| 4.50%, 7/01/28(b) | | 38,000 | 34,189 |
| 3.63%, 6/15/29(b) | | 13,000 | 10,978 |
| 3.75%, 10/01/30(b) | | 33,000 | 27,314 |
| International Business Machines Corp., | | | |
| 3.30%, 5/15/26 | | 200,000 | 189,154 |
| 2.20%, 2/09/27 | | 100,000 | 89,645 |
| 4.15%, 7/27/27 | | 285,000 | 270,079 |
|
| Kyndryl Holdings, Inc., 2.70%, 10/15/28 | | 5,000 | 4,043 |
| Mastercard, Inc., | | | |
| 3.30%, 3/26/27 | | 130,000 | 121,395 |
| 1.90%, 3/15/31 | | 22,000 | 17,078 |
|
| MPH Acquisition Holdings LLC, 5.50%, 9/01/28(b) | | 77,000 | 65,458 |
| | | Par (a) | Value |
| Technology Services (Continued) |
|
| Neptune Bidco U.S., Inc., 9.29%, 4/15/29(b) | | $ 46,000 | $ 40,597 |
| S&P Global, Inc., | | | |
| 2.45%, 3/01/27 | | 150,000 | 135,739 |
| 1.25%, 8/15/30 | | 110,000 | 81,788 |
| 2.90%, 3/01/32 | | 90,000 | 72,212 |
|
| Sabre GLBL, Inc., 11.25%, 12/15/27(b) | | 34,000 | 30,276 |
| Verisk Analytics, Inc., 4.00%, 6/15/25 | | 83,000 | 80,404 |
| | | | 1,730,168 |
| Telecommunications – 0.4% |
| AT&T, Inc., 1.70%, 3/25/26 | | 375,000 | 340,373 |
| Consolidated Communications, Inc., 6.50%, 10/01/28(b) | | 14,000 | 11,053 |
| Frontier Communications Holdings LLC, | | | |
| 5.88%, 10/15/27(b) | | 10,000 | 9,117 |
| 6.75%, 5/01/29(b) | | 10,000 | 7,913 |
| 8.75%, 5/15/30(b) | | 10,000 | 9,527 |
| 8.63%, 3/15/31(b) | | 24,000 | 22,565 |
|
| Intelsat Jackson Holdings S.A., 6.50%, 3/15/30(b) | | 33,000 | 28,975 |
| Level 3 Financing, Inc., 10.50%, 5/15/30(b) | | 55,000 | 55,043 |
| T-Mobile USA, Inc., | | | |
| 3.50%, 4/15/25 | | 425,000 | 410,602 |
| 2.88%, 2/15/31 | | 46,000 | 36,630 |
|
| Verizon Communications, Inc., 3.00%, 3/22/27 | | 100,000 | 91,341 |
| Windstream Escrow LLC/Windstream Escrow Finance Corp., 7.75%, 8/15/28(b) | | 11,000 | 8,723 |
| | | | 1,031,862 |
| Tobacco & Cannabis – 0.6% |
| Altria Group, Inc., | | | |
| 2.35%, 5/06/25 | | 260,000 | 246,408 |
| 2.63%, 9/16/26 | | 260,000 | 238,677 |
| 3.40%, 5/06/30 | | 30,000 | 25,090 |
| 2.45%, 2/04/32 | | 250,000 | 182,436 |
| 6.88%, 11/01/33 | | 110,000 | 109,046 |
| Philip Morris International, Inc., | | | |
| 1.50%, 5/01/25 | | 100,000 | 93,941 |
| 5.63%, 11/17/29 | | 270,000 | 264,222 |
| 2.10%, 5/01/30 | | 60,000 | 47,091 |
| 5.75%, 11/17/32 | | 85,000 | 81,209 |
| 5.38%, 2/15/33 | | 80,000 | 73,912 |
| 5.63%, 9/07/33 | | 90,000 | 84,492 |
See accompanying Notes to Financial Statements
Morningstar Funds Trust October 31, 2023 (unaudited)
Schedule of Investments (continued)
Morningstar Alternatives Fund
| | | Par (a) | Value |
| Tobacco & Cannabis (Continued) |
|
| Vector Group Ltd., 5.75%, 2/01/29(b) | | $ 60,000 | $ 50,845 |
| | | | 1,497,369 |
| Transportation & Logistics – 0.2% |
| American Airlines, Inc., | | | |
| 11.75%, 7/15/25(b) | | 25,000 | 26,487 |
| 7.25%, 2/15/28(b) | | 2,000 | 1,860 |
| American Airlines, Inc./AAdvantage Loyalty IP Ltd., | | | |
| 5.50%, 4/20/26(b) | | 16,667 | 16,207 |
| 5.75%, 4/20/29(b) | | 99,000 | 89,303 |
|
| Forward Air Corp., 9.50%, 10/15/31(b) | | 47,000 | 45,825 |
| Rand Parent LLC, 8.50%, 2/15/30(b) | | 23,000 | 21,004 |
| Ryder System, Inc., | | | |
| 5.65%, 3/01/28 | | 50,000 | 48,842 |
| 6.60%, 12/01/33 | | 80,000 | 79,406 |
|
| Spirit Loyalty Cayman Ltd./Spirit IP Cayman Ltd., 8.00%, 9/20/25(b) | | 29,920 | 22,066 |
| United Airlines, Inc., | | | |
| 4.38%, 4/15/26(b) | | 70,000 | 64,933 |
| 4.63%, 4/15/29(b) | | 185,000 | 156,270 |
|
| United Parcel Service, Inc., 4.45%, 4/01/30 | | 15,000 | 14,070 |
| | | | 586,273 |
| Wholesale - Consumer Staples – 0.0%(c) |
| United Natural Foods, Inc., 6.75%, 10/15/28(b) | | 14,000 | 11,016 |
Total Corporate Bonds
(Cost $45,609,653) | 42,502,840 |
|
| Foreign Issuer Bonds – 3.0% |
| Australia – 0.3% |
| BHP Billiton Finance USA Ltd., | | | |
| 4.75%, 2/28/28 | | 270,000 | 260,666 |
| 4.90%, 2/28/33 | | 65,000 | 60,114 |
| FMG Resources August 2006 Pty. Ltd., | | | |
| 5.88%, 4/15/30(b) | | 30,000 | 26,922 |
| 6.13%, 4/15/32(b) | | 116,000 | 102,385 |
| Mineral Resources Ltd., | | | |
| 8.13%, 5/01/27(b) | | 59,000 | 57,398 |
| 8.00%, 11/01/27(b) | | 8,000 | 7,730 |
| 9.25%, 10/01/28(b) | | 15,000 | 15,000 |
| 8.50%, 5/01/30(b) | | 60,000 | 57,445 |
| | | Par (a) | Value |
| Australia (Continued) |
|
| Rio Tinto Finance USA Ltd., 7.13%, 7/15/28 | | $ 8,000 | $ 8,477 |
| Rio Tinto Finance USA PLC, 5.00%, 3/09/33 | | 110,000 | 103,087 |
| | | | 699,224 |
| Austria – 0.0%(c) |
| Benteler International A.G., 10.50%, 5/15/28(b) | | 15,000 | 15,108 |
| Bermuda – 0.1% |
| RenaissanceRe Holdings Ltd., 5.75%, 6/05/33 | | 120,000 | 110,396 |
| Canada – 0.8% |
| 1011778 B.C. ULC/New Red Finance, Inc., | | | |
| 3.88%, 1/15/28(b) | | 50,000 | 44,640 |
| 4.38%, 1/15/28(b) | | 32,000 | 28,812 |
| 4.00%, 10/15/30(b) | | 163,000 | 133,501 |
| Bank of Montreal, | | | |
| 3.70%, 6/07/25 | | 215,000 | 207,239 |
| 5.72%, 9/25/28 | | 50,000 | 48,959 |
| Bank of Nova Scotia (The), | | | |
| 1.05%, 3/02/26 | | 65,000 | 57,965 |
| 1.35%, 6/24/26 | | 160,000 | 141,883 |
|
| Baytex Energy Corp., 8.75%, 4/01/27(b) | | 75,000 | 75,590 |
| Brookfield Corp., 4.00%, 1/15/25 | | 50,000 | 48,738 |
| Canadian Imperial Bank of Commerce, 3.95%, 8/04/25 | | 50,000 | 48,234 |
| Canadian National Railway Co., 3.85%, 8/05/32 | | 60,000 | 51,937 |
| Canadian Natural Resources Ltd., 2.05%, 7/15/25 | | 80,000 | 74,709 |
| Enbridge, Inc., 4.25%, 12/01/26 | | 60,000 | 57,010 |
| Fairfax Financial Holdings Ltd., | | | |
| 3.38%, 3/03/31 | | 25,000 | 20,129 |
| 5.63%, 8/16/32 | | 70,000 | 64,675 |
| GFL Environmental, Inc., | | | |
| 3.75%, 8/01/25(b) | | 25,000 | 23,644 |
| 4.75%, 6/15/29(b) | | 9,000 | 7,879 |
|
| MEG Energy Corp., 5.88%, 2/01/29(b) | | 94,000 | 87,841 |
| Methanex Corp., 5.25%, 12/15/29 | | 73,000 | 64,553 |
| Open Text Holdings, Inc., | | | |
| 4.13%, 2/15/30(b) | | 34,000 | 28,172 |
See accompanying Notes to Financial Statements
Morningstar Funds Trust October 31, 2023 (unaudited)
Schedule of Investments (continued)
Morningstar Alternatives Fund
| | | Par (a) | Value |
| Canada (Continued) |
| Open Text Holdings, Inc., | | | |
| 4.13%, 12/01/31(b) | | $ 32,000 | $ 25,137 |
|
| Parkland Corp., 4.50%, 10/01/29(b) | | 68,000 | 58,487 |
| Royal Bank of Canada, | | | |
| 1.20%, 4/27/26 | | 70,000 | 62,424 |
| 2.05%, 1/21/27 | | 100,000 | 88,504 |
| 5.20%, 8/01/28 | | 40,000 | 38,575 |
|
| Superior Plus L.P./Superior General Partner, Inc., 4.50%, 3/15/29(b) | | 26,000 | 22,176 |
| Taseko Mines Ltd., 7.00%, 2/15/26(b) | | 50,000 | 45,355 |
| Toronto-Dominion Bank (The), | | | |
| 3.77%, 6/06/25 | | 62,000 | 59,914 |
| 0.75%, 1/06/26 | | 160,000 | 143,083 |
| 4.69%, 9/15/27 | | 80,000 | 76,188 |
| | | | 1,935,953 |
| France – 0.0%(c) |
| Calderys Financing LLC, 11.25%, 6/01/28(b) | | 4,000 | 4,035 |
| Iliad Holding SASU, | | | |
| 6.50%, 10/15/26(b) | | 20,000 | 18,689 |
| 7.00%, 10/15/28(b) | | 20,000 | 18,099 |
| | | | 40,823 |
| Hong Kong – 0.0%(c) |
| Melco Resorts Finance Ltd., 5.75%, 7/21/28(b) | | 45,000 | 38,008 |
| Ireland – 0.1% |
| AerCap Ireland Capital DAC/AerCap Global Aviation Trust, 6.10%, 1/15/27 | | 150,000 | 147,540 |
| Japan – 0.6% |
| Honda Motor Co. Ltd., 2.53%, 3/10/27 | | 70,000 | 63,282 |
| Mitsubishi UFJ Financial Group, Inc., | | | |
| (1Y US Treasury CMT + 1.70%), 4.79%, 7/18/25(i) | | 200,000 | 197,725 |
| (1Y US Treasury CMT + 0.45%), 0.96%, 10/11/25(i) | | 200,000 | 189,881 |
| (1Y US Treasury CMT + 0.83%), 2.34%, 1/19/28(i) | | 275,000 | 243,035 |
| | | Par (a) | Value |
| Japan (Continued) |
|
| Mizuho Financial Group, Inc., (1Y US Treasury CMT + 1.90%), 5.75%, 7/06/34(i) | | $200,000 | $ 185,914 |
| Nomura Holdings, Inc., 1.85%, 7/16/25 | | 200,000 | 185,268 |
| Sumitomo Mitsui Financial Group, Inc., | | | |
| 1.40%, 9/17/26 | | 200,000 | 175,547 |
| 5.71%, 1/13/30 | | 200,000 | 192,666 |
| 5.85%, 7/13/30 | | 200,000 | 193,924 |
| | | | 1,627,242 |
| Luxembourg – 0.0%(c) |
| Altice France Holding S.A., 10.50%, 5/15/27(b) | | 25,000 | 13,602 |
| Macau – 0.0%(c) |
| Sands China Ltd., 5.65%, 8/08/28 | | 50,000 | 46,253 |
| Mexico – 0.0%(c) |
| Southern Copper Corp., 3.88%, 4/23/25 | | 5,000 | 4,836 |
| Netherlands – 0.0%(c) |
| UPC Broadband Finco B.V., 4.88%, 7/15/31(b) | | 50,000 | 39,921 |
| Ziggo Bond Co. B.V., | | | |
| 6.00%, 1/15/27(b) | | 30,000 | 27,485 |
| 5.13%, 2/28/30(b) | | 30,000 | 21,858 |
| | | | 89,264 |
| Norway – 0.0%(c) |
| Seadrill Finance Ltd., 8.38%, 8/01/30(b) | | 50,000 | 50,016 |
| Spain – 0.1% |
| Banco Santander S.A., | | | |
| 1.85%, 3/25/26 | | 200,000 | 178,679 |
| 6.92%, 8/08/33 | | 200,000 | 185,756 |
| | | | 364,435 |
| Switzerland – 0.0%(c) |
| Novartis Capital Corp., 2.20%, 8/14/30 | | 10,000 | 8,131 |
| VistaJet Malta Finance PLC/Vista Management Holding, Inc., 9.50%, 6/01/28(b) | | 20,000 | 15,324 |
| | | | 23,455 |
| United Kingdom – 1.0% |
| 180 Medical, Inc., 3.88%, 10/15/29(b) | | 40,000 | 33,231 |
| Astrazeneca Finance LLC, 1.20%, 5/28/26 | | 100,000 | 89,941 |
See accompanying Notes to Financial Statements
Morningstar Funds Trust October 31, 2023 (unaudited)
Schedule of Investments (continued)
Morningstar Alternatives Fund
| | | Par (a) | Value |
| United Kingdom (Continued) |
| AstraZeneca PLC, 3.13%, 6/12/27 | | $ 49,000 | $ 45,324 |
| Barclays PLC, (3M USD LIBOR + 1.61%), 3.93%, 5/07/25(i) | | 205,000 | 202,208 |
| BAT Capital Corp., 6.34%, 8/02/30 | | 110,000 | 106,757 |
| BAT International Finance PLC, | | | |
| 4.45%, 3/16/28 | | 20,000 | 18,428 |
| 5.93%, 2/02/29 | | 100,000 | 97,241 |
|
| Diageo Capital PLC, 5.50%, 1/24/33 | | 260,000 | 253,485 |
| HSBC Holdings PLC, | | | |
| (SOFR + 1.43%), 3.00%, 3/10/26(i) | | 400,000 | 381,425 |
| (3M CME Term SOFR + 1.87%), 3.97%, 5/22/30(i) | | 530,000 | 457,910 |
| (SOFR + 4.25%), 8.11%, 11/03/33(i) | | 200,000 | 206,967 |
|
| Lloyds Banking Group PLC, 4.58%, 12/10/25 | | 200,000 | 190,213 |
| Macquarie Airfinance Holdings Ltd., 8.13%, 3/30/29(b) | | 15,000 | 14,776 |
| Reynolds American, Inc., 4.45%, 6/12/25 | | 121,000 | 117,987 |
| Santander UK Group Holdings PLC, (SOFR + 0.79%), 1.09%, 3/15/25(i) | | 300,000 | 292,976 |
| Virgin Media Secured Finance PLC, 5.50%, 5/15/29(b) | | 50,000 | 44,275 |
| Virgin Media Vendor Financing Notes IV DAC, 5.00%, 7/15/28(b) | | 50,000 | 42,453 |
| Vodafone Group PLC, (5Y US Treasury CMT + 3.07%), 5.13%, 6/04/81(i) | | 69,000 | 43,833 |
| | | | 2,639,430 |
Total Foreign Issuer Bonds
(Cost $8,306,134) | 7,845,585 |
| | | Number
of Shares | |
| Master Limited Partnerships – 0.7% |
| Oil & Gas Producers – 0.7% |
| Holly Energy Partners L.P. | | 79,411 | 1,687,484 |
Total Master Limited Partnerships
(Cost $1,707,237) | 1,687,484 |
| | | Par (a) | Value |
| Mortgage-Backed Securities – 10.9% |
| Federal Home Loan Mortgage Corporation – 0.3% |
| Pool, | | | |
| 3.00%, 3/01/30 - 8/01/50 | | $ 546,173 | $ 464,327 |
| 2.50%, 4/01/32 - 7/01/50 | | 250,170 | 217,155 |
| 4.50%, 4/01/49 | | 38,837 | 35,260 |
| 2.00%, 10/01/50 | | 55,409 | 41,177 |
| | | | 757,919 |
Federal Home Loan Mortgage Corporation Gold –
0.1% |
Pool,
3.00%, 3/01/46 - 12/01/46 | | 217,171 | 180,049 |
| Federal National Mortgage Association – 1.2% |
| Pool, | | | |
| 2.50%, 10/01/35 - 12/01/51 | | 1,235,354 | 964,028 |
| 3.50%, 8/01/45 - 1/01/49 | | 81,355 | 69,833 |
| 4.00%, 9/01/48 - 3/01/51 | | 555,743 | 487,945 |
| 3.00%, 11/01/48 | | 17,396 | 14,323 |
| 4.50%, 1/01/49 - 2/01/50 | | 356,416 | 323,009 |
| 2.00%, 2/01/51 - 11/01/51 | | 916,616 | 678,582 |
| 5.00%, 2/01/53 - 4/01/53 | | 336,602 | 310,584 |
| 5.50%, 2/01/53 | | 191,351 | 182,589 |
| | | | 3,030,893 |
| Government National Mortgage Association – 0.3% |
| Pool, | | | |
| 3.00%, 11/01/50(j) | | 825,000 | 679,860 |
| 4.50%, 11/01/52(j) | | 100,000 | 90,350 |
| | | | 770,210 |
| Government National Mortgage Association II – 1.0% |
| Pool, | | | |
| 2.50%, 12/20/46 - 7/20/51 | | 544,569 | 432,390 |
| 3.50%, 1/20/48 - 8/20/48 | | 838,218 | 726,410 |
| 4.50%, 9/20/48 - 1/20/50 | | 109,248 | 100,113 |
| 3.00%, 1/20/50 - 7/20/50 | | 360,088 | 299,176 |
| 2.00%, 2/20/51 - 10/20/51 | | 1,445,483 | 1,117,914 |
| | | | 2,676,003 |
See accompanying Notes to Financial Statements
Morningstar Funds Trust October 31, 2023 (unaudited)
Schedule of Investments (continued)
Morningstar Alternatives Fund
| | | Par (a) | Value |
| Uniform Mortgage-Backed Securities – 1.1% |
| Pool, | | | |
| 2.00%, 11/01/38 - 11/01/52(j) | | $ 950,000 | $ 720,008 |
| 2.50%, 11/01/38 - 11/01/52(j) | | 1,415,000 | 1,121,812 |
| 3.50%, 11/01/38 - 11/01/52(j) | | 875,000 | 730,558 |
| 4.00%, 11/01/38 - 11/01/52(j) | | 400,000 | 350,634 |
| | | | 2,923,012 |
| Whole Loan – 6.9% |
| FNMA Connecticut Avenue Securities, | | | |
| Series 2018-C03, Class 1EB2, (30D Average SOFR + 0.96%, 0.85% Floor), 6.29%, 10/25/30(g) | | 254,764 | 254,349 |
| Series 2018-R07, Class 1M2, (30D Average SOFR + 2.51%), 7.84%, 4/25/31(b)(g) | | 36,474 | 36,474 |
| Series 2018-R07, Class 1M2C, (30D Average SOFR + 2.51%), 7.84%, 4/25/31(b)(g) | | 51,447 | 51,477 |
| Series 2019-R01, Class 2M2, (30D Average SOFR + 2.56%), 7.89%, 7/25/31(b)(g) | | 59,091 | 59,162 |
| Series 2019-R01, Class 2M2C, (30D Average SOFR + 2.56%), 7.89%, 7/25/31(b)(g) | | 115,995 | 116,218 |
| Series 2019-R07, Class 1M2, (30D Average SOFR + 2.21%), 7.54%, 10/25/39(b)(g) | | 9,546 | 9,546 |
| Series 2020-R01, Class 1B1, (30D Average SOFR + 3.36%, 3.25% Floor), 8.69%, 1/25/40(b)(g) | | 100,870 | 101,937 |
| Series 2020-R01, Class 1M2, (30D Average SOFR + 2.16%), 7.49%, 1/25/40(b)(g) | | 886,199 | 895,061 |
| Series 2020-R02, Class 2M2, (30D Average SOFR + 2.11%), 7.44%, 1/25/40(b)(g) | | 861,927 | 863,001 |
| Series 2020-SBT1, Class 1M2, (30D Average SOFR + 3.76%), 9.09%, 2/25/40(b)(g) | | 275,000 | 286,063 |
| | | Par (a) | Value |
| Whole Loan (Continued) |
| FNMA Connecticut Avenue Securities, | | | |
| Series 2020-SBT1, Class 2M2, (30D Average SOFR + 3.76%), 9.09%, 2/25/40(b)(g) | | $245,000 | $255,005 |
| Series 2021-R01, Class 1B1, (30D Average SOFR + 3.10%), 8.42%, 10/25/41(b)(g) | | 380,200 | 379,016 |
| Series 2021-R01, Class 1M2, (30D Average SOFR + 1.55%), 6.87%, 10/25/41(b)(g) | | 190,000 | 188,240 |
| Series 2021-R02, Class 2B1, (30D Average SOFR + 3.30%), 8.62%, 11/25/41(b)(g) | | 500,000 | 496,250 |
| Series 2021-R02, Class 2M1, (30D Average SOFR + 0.90%), 6.22%, 11/25/41(b)(g) | | 391,254 | 389,591 |
| Series 2021-R03, Class 1B1, (30D Average SOFR + 2.75%, 2.75% Floor), 8.07%, 12/25/41(b)(g) | | 250,000 | 247,243 |
| Series 2022-R01, Class 1B1, (30D Average SOFR + 3.15%), 8.47%, 12/25/41(b)(g) | | 550,000 | 548,285 |
| Series 2022-R02, Class 2B1, (30D Average SOFR + 4.50%), 9.82%, 1/25/42(b)(g) | | 536,000 | 546,625 |
| Series 2022-R02, Class 2M1, (30D Average SOFR + 1.20%), 6.52%, 1/25/42(b)(g) | | 132,488 | 132,033 |
| Series 2022-R02, Class 2M2, (30D Average SOFR + 3.00%), 8.32%, 1/25/42(b)(g) | | 450,000 | 449,825 |
| Series 2022-R07, Class 1M1, (30D Average SOFR + 2.95%), 8.27%, 6/25/42(b)(g) | | 448,127 | 458,327 |
| Series 2022-R08, Class 1M1, (30D Average SOFR + 2.55%, 2.55% Floor), 7.87%, 7/25/42(b)(g) | | 187,959 | 191,067 |
| Series 2023-R05, Class 1B1, (30D Average SOFR + 4.75%, 4.75% Floor), 10.07%, 6/25/43(b)(g) | | 100,000 | 103,634 |
See accompanying Notes to Financial Statements
Morningstar Funds Trust October 31, 2023 (unaudited)
Schedule of Investments (continued)
Morningstar Alternatives Fund
| | | Par (a) | Value |
| Whole Loan (Continued) |
| Freddie Mac STACR Debt Notes, | | | |
| Series 2016-DNA4, Class M3, (30D Average SOFR + 3.91%), 9.24%, 3/25/29(g) | | $380,093 | $396,224 |
| Series 2017-HQA3, Class M2, (30D Average SOFR + 2.46%), 7.79%, 4/25/30(g) | | 463,298 | 471,215 |
| Series 2018-HQA1, Class M2, (30D Average SOFR + 2.41%), 7.74%, 9/25/30(g) | | 284,535 | 289,178 |
| Series 2021-DNA2, Class B1, (30D Average SOFR + 3.40%), 8.72%, 8/25/33(b)(g) | | 200,000 | 203,801 |
| Series 2022-HQA2, Class M1A, (30D Average SOFR + 2.65%), 7.97%, 7/25/42(b)(g) | | 282,501 | 287,394 |
| Freddie Mac STACR REMIC Trust, | | | |
| Series 2020-DNA1, Class M2, (30D Average SOFR + 1.81%), 7.14%, 1/25/50(b)(g) | | 233,458 | 233,678 |
| Series 2020-DNA2, Class M2, (30D Average SOFR + 1.96%), 7.29%, 2/25/50(b)(g) | | 967,532 | 975,059 |
| Series 2020-DNA5, Class M2, (30D Average SOFR + 2.80%), 8.12%, 10/25/50(b)(g) | | 153,121 | 155,151 |
| Series 2020-HQA1, Class M2, (30D Average SOFR + 2.01%), 7.34%, 1/25/50(b)(g) | | 25,429 | 25,429 |
| Series 2020-HQA2, Class M2, (30D Average SOFR + 3.21%), 8.54%, 3/25/50(b)(g) | | 376,774 | 389,530 |
| Series 2021-DNA1, Class B1, (30D Average SOFR + 2.65%), 7.97%, 1/25/51(b)(g) | | 200,000 | 195,252 |
| Series 2021-DNA3, Class M2, (30D Average SOFR + 2.10%), 7.42%, 10/25/33(b)(g) | | 30,000 | 30,051 |
| Series 2021-DNA5, Class B1, (30D Average SOFR + 3.05%), 8.37%, 1/25/34(b)(g) | | 150,000 | 150,000 |
| | | Par (a) | Value |
| Whole Loan (Continued) |
| Freddie Mac STACR REMIC Trust, | | | |
| Series 2021-DNA5, Class M2, (30D Average SOFR + 1.65%), 6.97%, 1/25/34(b)(g) | | $592,467 | $592,602 |
| Series 2021-DNA6, Class B1, (30D Average SOFR + 3.40%), 8.72%, 10/25/41(b)(g) | | 400,000 | 402,000 |
| Series 2021-DNA6, Class M1, (30D Average SOFR + 0.80%), 6.12%, 10/25/41(b)(g) | | 148,125 | 147,673 |
| Series 2021-DNA7, Class B1, (30D Average SOFR + 3.65%), 8.97%, 11/25/41(b)(g) | | 760,000 | 769,596 |
| Series 2021-DNA7, Class M1, (30D Average SOFR + 0.85%), 6.17%, 11/25/41(b)(g) | | 453,673 | 450,508 |
| Series 2021-HQA3, Class M2, (30D Average SOFR + 2.10%), 7.42%, 9/25/41(b)(g) | | 355,000 | 344,794 |
| Series 2021-HQA4, Class B1, (30D Average SOFR + 3.75%), 9.07%, 12/25/41(b)(g) | | 750,000 | 745,795 |
| Series 2022-DNA1, Class M2, (30D Average SOFR + 2.50%), 7.82%, 1/25/42(b)(g) | | 250,000 | 244,375 |
| Series 2022-DNA2, Class M2, (30D Average SOFR + 3.75%), 9.07%, 2/25/42(b)(g) | | 300,000 | 304,125 |
| Series 2022-DNA3, Class M1A, (30D Average SOFR + 2.00%), 7.32%, 4/25/42(b)(g) | | 680,532 | 686,664 |
| Series 2022-DNA5, Class M1A, (30D Average SOFR + 2.95%), 8.27%, 6/25/42(b)(g) | | 728,513 | 746,546 |
| Series 2022-DNA6, Class M1A, (30D Average SOFR + 2.15%), 7.47%, 9/25/42(b)(g) | | 362,232 | 365,099 |
| Series 2022-DNA7, Class M2, (30D Average SOFR + 7.00%), 12.32%, 3/25/52(b)(g) | | 250,000 | 280,000 |
| Series 2022-HQA1, Class M1A, (30D Average SOFR + 2.10%), 7.42%, 3/25/42(b)(g) | | 500,250 | 504,282 |
See accompanying Notes to Financial Statements
Morningstar Funds Trust October 31, 2023 (unaudited)
Schedule of Investments (continued)
Morningstar Alternatives Fund
| | | Par (a) | Value |
| Whole Loan (Continued) |
| Freddie Mac STACR REMIC Trust, | | | |
| Series 2022-HQA1, Class M2, (30D Average SOFR + 5.25%), 10.57%, 3/25/42(b)(g) | | $282,000 | $ 296,013 |
|
Freddie Mac STACR Trust,
Series 2019-DNA4, Class M2, (30D Average SOFR + 2.06%), 7.39%, 10/25/49(b)(g) | | 19,311 | 19,334 |
| | | | 17,759,797 |
Total Mortgage-Backed Securities
(Cost $29,536,986) | 28,097,883 |
| | | Number
of Shares | |
| Preferred Stocks – 1.6% |
| Specialty Finance – 1.6% |
| AGNC Investment Corp., 6.50%(g) | | 3,228 | 68,724 |
| AGNC Investment Corp., 6.13%(g) | | 21,599 | 431,764 |
| Annaly Capital Management, Inc., 6.75%(g) | | 16,561 | 382,725 |
| Arbor Realty Trust, Inc., 6.25%(g) | | 39,458 | 689,331 |
| Granite Point Mortgage Trust, Inc., 7.00%(g) | | 23,230 | 373,771 |
| MFA Financial, Inc., 6.50%(g) | | 41,438 | 761,216 |
| New York Mortgage Trust, Inc., 7.88%(g) | | 2,103 | 44,625 |
| New York Mortgage Trust, Inc., 6.88%(g) | | 21,682 | 396,564 |
| Redwood Trust, Inc., 10.00%(g) | | 7,133 | 160,136 |
| Rithm Capital Corp., 7.13%(g) | | 2,335 | 51,720 |
| Rithm Capital Corp., 6.38%(g) | | 43,302 | 839,193 |
Total Preferred Stocks
(Cost $5,140,375) | 4,199,769 |
|
| Rights – 0.1% |
| Biotechnology & Pharmaceuticals – 0.1% |
| Albireo Pharma CVR(e)* | | 21,904 | 50,156 |
| Amryt Pharma CVR(e)* | | 130,430 | 3,299 |
| Amryt Pharma CVR (London Exchange)(e)* | | 130,430 | 2,200 |
| | | Number
of Shares | Value |
| Biotechnology & Pharmaceuticals (Continued) |
| CinCor Pharma CVR(e)* | | 24,888 | $ 81,304 |
| Concert Pharmaceuticals, Inc. CVR(e)* | | 97,290 | 38,313 |
| | | | 175,272 |
| Forestry, Paper & Wood Products – 0.0%(c) |
| Resolute Forest CVR(e)* | | 44,100 | 66,714 |
| Medical Equipment & Devices – 0.0%(c) |
| Abiomed, Inc. CVR(e)* | | 8,954 | 15,669 |
Total Rights
(Cost $—) | 257,655 |
|
| Investment Companies – 0.3% |
| ProShares Short 20+ Year Treasury ETF | | 26,963 | 719,912 |
Total Investment Companies
(Cost $538,934) | 719,912 |
| | | Par (a)/Number
of Shares | |
| Short-Term Investments – 10.9% |
| Convertible Bonds – 4.1% |
| 8x8, Inc., 0.50%, 2/01/24(d) | | $1,220,000 | 1,173,565 |
| DISH Network Corp., 2.38%, 3/15/24 | | 504,000 | 481,950 |
| Herbalife Ltd., 2.63%, 3/15/24 | | 1,149,000 | 1,119,701 |
| Jazz Investments I Ltd., 1.50%, 8/15/24(d) | | 768,000 | 738,816 |
| Kaman Corp., 3.25%, 5/01/24(d) | | 705,000 | 683,709 |
| MFA Financial, Inc., 6.25%, 6/15/24(d) | | 2,854,000 | 2,832,597 |
| NextEra Energy Partners L.P., 0.00%, 6/15/24(b)(f) | | 665,000 | 631,085 |
| Redwood Trust, Inc., 5.63%, 7/15/24 | | 1,367,000 | 1,325,989 |
| Turning Point Brands, Inc., 2.50%, 7/15/24 | | 524,000 | 503,039 |
| Uniti Fiber Holdings, Inc., 4.00%, 6/15/24(b) | | 1,023,000 | 978,381 |
| | | | 10,468,832 |
| Corporate Bonds – 0.3% |
| Black Hills Corp., 1.04%, 8/23/24 | | 10,000 | 9,586 |
| Boeing (The) Co., 1.43%, 2/04/24 | | 20,000 | 19,746 |
See accompanying Notes to Financial Statements
Morningstar Funds Trust October 31, 2023 (unaudited)
Schedule of Investments (continued)
Morningstar Alternatives Fund
| | | Par (a)/Number
of Shares | Value |
| Corporate Bonds (Continued) |
| Broadcom Corp./Broadcom Cayman Finance Ltd., 3.63%, 1/15/24 | | $ 220,000 | $ 218,880 |
| Charles Schwab (The) Corp., 0.75%, 3/18/24 | | 30,000 | 29,398 |
| Duke Energy Corp., 3.75%, 4/15/24 | | 30,000 | 29,706 |
| Ecolab, Inc., 0.90%, 12/15/23 | | 35,000 | 34,787 |
| Eversource Energy, | | | |
| 4.20%, 6/27/24 | | 85,000 | 83,963 |
| 2.90%, 10/01/24 | | 50,000 | 48,598 |
|
| Hewlett Packard Enterprise Co., 5.90%, 10/01/24 | | 100,000 | 99,820 |
| ONEOK, Inc., 2.75%, 9/01/24 | | 50,000 | 48,594 |
| Quanta Services, Inc., 0.95%, 10/01/24 | | 85,000 | 80,980 |
| VMware, Inc., 1.00%, 8/15/24 | | 65,000 | 62,429 |
| Welltower OP LLC, 3.63%, 3/15/24 | | 50,000 | 49,534 |
| Williams (The) Cos., Inc., 4.30%, 3/04/24 | | 75,000 | 74,532 |
| | | | 890,553 |
| Foreign Issuer Bonds – 0.1% |
| BAT Capital Corp., 3.22%, 8/15/24 | | 57,000 | 55,723 |
| Canadian Natural Resources Ltd., 3.80%, 4/15/24 | | 150,000 | 148,400 |
| Thomson Reuters Corp., 4.30%, 11/23/23 | | 10,000 | 9,984 |
| | | | 214,107 |
| Money Market Fund – 4.2% |
| Northern Institutional Funds - Treasury Portfolio (Premier), 5.21%(k) | | 10,735,879 | 10,735,879 |
| Mortgage-Backed Securities – 0.5% |
| FNMA Connecticut Avenue Securities, | | | |
| Series 2014-C01, Class M2, (30D Average SOFR + 4.51%), 9.84%, 1/25/24(g) | | 110,366 | 111,189 |
| Series 2014-C03, Class 1M2, (30D Average SOFR + 3.11%, 3.00% Floor), 8.44%, 7/25/24(g) | | 504,876 | 511,089 |
| | | Par (a)/Number
of Shares | Value |
| Mortgage-Backed Securities (Continued) |
|
| Freddie Mac STACR Debt Notes, Series 2013-DN2, Class M2, (30D Average SOFR + 4.36%), 9.69%, 11/25/23(g) | | $ 639,532 | $ 640,922 |
| | | | 1,263,200 |
| U.S. Treasury Bills – 1.7% |
| U.S. Treasury Bills, | | | |
| 5.24%, 2/08/24(l) | | 900,000 | 886,876 |
| 5.27%, 3/21/24(l) | | 2,500,000 | 2,447,871 |
| 5.29%, 3/28/24(l) | | 190,000 | 185,842 |
| 5.29%, 4/18/24(l) | | 900,000 | 877,501 |
| 5.22%, 4/25/24(l) | | 100,000 | 97,393 |
| | | | 4,495,483 |
Total Short-Term Investments
(Cost $28,224,578) | 28,068,054 |
Number of
Contracts | Notional
Amount | |
| Purchased Options – 0.0%(c) |
| Call Options - Exchange Traded – 0.0%(c) |
| MaxLinear, Inc., Strike Price $25.00, Expires 12/15/23 | 102 | 155,040 | 1,020 |
| Call Options - Over the Counter – 0.0%(c) |
| Japanese Yen vs. U.S. Dollar, Strike Price $1.13, Expires 1/19/24, Counterparty: Bank of America | 1 | 279,469 | 2,340 |
| Put Options - Exchange Traded – 0.0%(c) |
| PacWest Bancorp, Strike Price $6.00, Expires 11/17/23 | 114 | 80,712 | 2,850 |
Total Purchased Options
(Premiums Paid $18,069) | 6,210 |
Total Long Positions – 97.4%
(Cost $267,009,105) | 251,689,905 |
| | | Number
of Shares | Value |
| Short Positions – (10.9)%(m) |
| Common Stocks – (10.8)% |
| Asset Management – (0.3)% |
| Apollo Global Management, Inc. | | (4,300) | (332,992) |
| WisdomTree, Inc. | | (61,152) | (379,142) |
| | | | (712,134) |
See accompanying Notes to Financial Statements
Morningstar Funds Trust October 31, 2023 (unaudited)
Schedule of Investments (continued)
Morningstar Alternatives Fund
| | | Number
of Shares | Value |
| Automotive – (0.2)% |
| Rivian Automotive, Inc., Class A | | (23,760) | $ (385,387) |
| Banking – (0.1)% |
| New York Community Bancorp, Inc. | | (20,778) | (196,975) |
| Biotechnology & Pharmaceuticals – (0.6)% |
| Amphastar Pharmaceuticals, Inc. | | (1,985) | (89,861) |
| Bridgebio Pharma, Inc. | | (2,865) | (74,605) |
| Coherus Biosciences, Inc. | | (9,715) | (32,545) |
| Collegium Pharmaceutical, Inc. | | (20,129) | (438,007) |
| Halozyme Therapeutics, Inc. | | (7,108) | (240,748) |
| Insmed, Inc. | | (9,228) | (231,254) |
| Jazz Pharmaceuticals PLC | | (95) | (12,067) |
| Mirum Pharmaceuticals, Inc. | | (13,175) | (361,390) |
| Revance Therapeutics, Inc. | | (8,726) | (68,848) |
| | | | (1,549,325) |
| Cable & Satellite – (0.0)%(c) |
| Cable One, Inc. | | (90) | (49,488) |
| Commercial Support Services – (0.0)%(c) |
| PureCycle Technologies, Inc. | | (8,080) | (35,956) |
| Containers & Packaging – (0.2)% |
| Smurfit Kappa Group PLC (Ireland) | | (19,079) | (607,666) |
| E-Commerce Discretionary – (0.0)%(c) |
| Wayfair, Inc., Class A | | (1,750) | (74,568) |
| Electric Utilities – (0.3)% |
| CenterPoint Energy, Inc. | | (2,904) | (78,060) |
| Duke Energy Corp. | | (2,029) | (180,358) |
| NRG Energy, Inc. | | (12,619) | (534,793) |
| | | | (793,211) |
| Electrical Equipment – (0.1)% |
| Advanced Energy Industries, Inc. | | (899) | (78,447) |
| Itron, Inc. | | (991) | (56,764) |
| Mesa Laboratories, Inc. | | (102) | (9,571) |
| | | | (144,782) |
| Engineering & Construction – (0.0)%(c) |
| Tetra Tech, Inc. | | (597) | (90,093) |
| Food – (0.1)% |
| J.M. Smucker (The) Co. | | (1,647) | (187,494) |
| | | Number
of Shares | Value |
| Home & Office Products – (0.0)%(c) |
| iRobot Corp. | | (3,654) | $ (120,326) |
| Household Products – (0.0)%(c) |
| Beauty Health (The) Co. | | (4,250) | (17,213) |
| Internet Media & Services – (0.1)% |
| Airbnb, Inc., Class A | | (550) | (65,060) |
| Snap, Inc., Class A | | (1,546) | (15,475) |
| TripAdvisor, Inc. | | (2,628) | (38,789) |
| Upwork, Inc. | | (2,284) | (23,868) |
| Ziff Davis, Inc. | | (2,075) | (125,455) |
| | | | (268,647) |
| Leisure Facilities & Services – (0.4)% |
| Cheesecake Factory (The), Inc. | | (3,440) | (106,881) |
| Live Nation Entertainment, Inc. | | (5,216) | (417,384) |
| Marcus (The) Corp. | | (26,038) | (404,630) |
| Marriott Vacations Worldwide Corp. | | (1,251) | (112,415) |
| | | | (1,041,310) |
| Medical Equipment & Devices – (0.4)% |
| CONMED Corp. | | (2,433) | (237,120) |
| Enovis Corp. | | (3,356) | (154,040) |
| Haemonetics Corp. | | (2,061) | (175,659) |
| Integer Holdings Corp. | | (5,256) | (426,630) |
| | | | (993,449) |
| Metals & Mining – (0.1)% |
| Equinox Gold Corp. (Canada) | | (60,790) | (267,476) |
| Oil & Gas Producers – (3.3)% |
| Chevron Corp. | | (12,228) | (1,781,986) |
| Exxon Mobil Corp. | | (49,726) | (5,263,497) |
| HF Sinclair Corp. | | (25,015) | (1,385,331) |
| | | | (8,430,814) |
| Oil, Gas Services & Equipment – (0.2)% |
| Helix Energy Solutions Group, Inc. | | (55,957) | (548,379) |
| Publishing & Broadcasting – (0.3)% |
| Liberty Media Corp., Class A | | (31,050) | (760,415) |
| Real Estate Investment Trusts – (0.9)% |
| Pebblebrook Hotel Trust | | (20,434) | (243,778) |
| Realty Income Corp. | | (42,023) | (1,991,050) |
| Summit Hotel Properties, Inc. | | (28,418) | (160,277) |
| | | | (2,395,105) |
See accompanying Notes to Financial Statements
Morningstar Funds Trust October 31, 2023 (unaudited)
Schedule of Investments (continued)
Morningstar Alternatives Fund
| | | Number
of Shares | Value |
| Real Estate Services – (0.0)%(c) |
| Anywhere Real Estate, Inc. | | (3,147) | $ (14,696) |
| Renewable Energy – (0.1)% |
| Sunnova Energy International, Inc. | | (27,154) | (247,916) |
| Retail - Discretionary – (0.2)% |
| Patrick Industries, Inc. | | (5,540) | (416,331) |
| Semiconductors – (1.6)% |
| Broadcom, Inc. | | (4,821) | (4,056,245) |
| MaxLinear, Inc.(n) | | (10,249) | (155,785) |
| | | | (4,212,030) |
| Software – (0.4)% |
| Bentley Systems, Inc., Class B | | (4,619) | (224,668) |
| Ceridian HCM Holding, Inc. | | (2,899) | (185,565) |
| Envestnet, Inc. | | (4,036) | (149,332) |
| Jamf Holding Corp. | | (2,348) | (37,709) |
| Mitek Systems, Inc. | | (16,236) | (173,401) |
| NextGen Healthcare, Inc. | | (9,859) | (235,827) |
| Q2 Holdings, Inc. | | (1,005) | (30,180) |
| Verint Systems, Inc. | | (1,791) | (33,689) |
| | | | (1,070,371) |
| Specialty Finance – (0.2)% |
| EZCORP, Inc., Class A | | (26,337) | (215,963) |
| SoFi Technologies, Inc. | | (24,689) | (186,402) |
| | | | (402,365) |
| Technology Hardware – (0.1)% |
| Lumentum Holdings, Inc. | | (1,918) | (75,205) |
| NCR Atleos Corp. | | (1,684) | (37,160) |
| NCR Voyix Corp. | | (14,696) | (224,702) |
| | | | (337,067) |
| Technology Services – (0.1)% |
| Block, Inc. | | (400) | (16,100) |
| CSG Systems International, Inc. | | (3,277) | (153,560) |
| I3 Verticals, Inc., Class A | | (2,686) | (50,362) |
| Perficient, Inc. | | (1,656) | (96,363) |
| | | | (316,385) |
| Transportation & Logistics – (0.3)% |
| Air Transport Services Group, Inc. | | (18,621) | (364,413) |
| | | Number
of Shares | Value |
| Transportation & Logistics (Continued) |
| American Airlines Group, Inc. | | (37,991) | $ (423,600) |
| CryoPort, Inc. | | (1,138) | (11,038) |
| Spirit Airlines, Inc. | | (7,852) | (90,141) |
| | | | (889,192) |
| Transportation Equipment – (0.2)% |
| Greenbrier (The) Cos., Inc. | | (11,945) | (413,178) |
Total Common Stocks
(Proceeds $29,183,121) | (27,989,744) |
| | | Par (a) | |
| Mortgage-Backed Securities – (0.1)% |
| Government National Mortgage Association – (0.1)% |
Pool,
2.00%, 11/01/52(j) | | $(150,000) | (115,635) |
Total Mortgage-Backed Securities
(Proceeds $116,748) | (115,635) |
| | | Number
of Shares | |
| Rights – 0.0%(c) |
| Biotechnology & Pharmaceuticals — 0.0%(c) |
| Ligand Pharmaceuticals, Inc. CVR (Switzerland Exchange)(e) | | (52) | — |
| Ligand Pharmaceuticals, Inc. CVR(e) | | (52) | — |
Total Rights
(Proceeds $—) | — |
Total Short Positions – (10.9)%
(Proceeds $29,299,869) | (28,105,379) |
| Other Assets less Liabilities – 13.5%(o) | 34,829,660 |
| NET ASSETS – 100.0% | $258,414,186 |
| Percentages shown are based on Net Assets. |
| All securities are United States companies, unless noted otherwise in parentheses. |
| (a) | Par value is in USD unless otherwise indicated. |
| (b) | Securities exempt from registration under Rule 144A of the Securities Act of 1933. These securities may be resold in transactions exempt from registration, normally to qualified institutional buyers. |
| (c) | Amount rounds to less than 0.05%. |
| (d) | All or a portion of the security was held as collateral for open futures, options, securities sold short and/or swap agreements. |
| (e) | Investment is valued using significant unobservable inputs (Level 3). |
See accompanying Notes to Financial Statements
Morningstar Funds Trust October 31, 2023 (unaudited)
Schedule of Investments (continued)
Morningstar Alternatives Fund
| (f) | Zero coupon bond. |
| (g) | Variable or floating rate security. Rate as of October 31, 2023 is disclosed. |
| (h) | Distributions from this security are made via payments in-kind (PIK) unless otherwise noted in the description. |
| (i) | Variable rate security. Security issued at a fixed coupon rate, which converts to a variable rate at a future date. Rate as of October 31, 2023 is disclosed. |
| (j) | When-Issued Security. Coupon rate was not yet in effect at October 31, 2023. |
| (k) | 7-day current yield as of October 31, 2023 is disclosed. |
| (l) | Discount rate at the time of purchase. |
| (m) | Securities sold short are not owned by the Fund. |
| (n) | Security represents underlying investment on open options contracts. |
| (o) | Includes appreciation/(depreciation) on forward foreign currency exchange, futures and swap contracts. |
| * | Non-Income Producing Security |
| 1Y | 1 Year |
| 3M | 3 Month |
| 5Y | 5 Year |
| 30D | 30 Day |
| ADR | American Depositary Receipt |
| AUD | Australian Dollar |
| BDC | Business Development Company |
| CAD | Canadian Dollar |
| CDX | Credit Default Swap Index |
| CME | Chicago Mercantile Exchange |
| CMT | Constant Maturity |
| CVR | Contingent Value RIghts |
| ETF | Exchange-Traded Fund |
| EUR | Euro |
| FNMA | Federal National Mortgage Association |
| Freddie Mac | Federal Home Loan Mortgage Corporation |
| GBP | British Pound |
| L.P. | Limited Partnership |
| LIBOR | London Interbank Offered Rate |
| LLC | Limited Liability Company |
| OAT | Obligations Assimilables du Trésor |
| PLC | Public Limited Company |
| REIT | Real Estate Investment Trust |
| REMIC | Real Estate Mortgage Investment Conduit |
| S&P | Standards & Poor's |
| SASU | Société par Actions Simplifiée Unipersonnelle |
| SOFR | United States Secured Overnight Financing Rate |
| STACR | Structured Agency Credit Risk |
| USD | United States Dollar |
See accompanying Notes to Financial Statements
Morningstar Funds Trust October 31, 2023 (unaudited)
Schedule of Investments (continued)
Morningstar Alternatives Fund
Futures Contracts outstanding at October 31, 2023:
Exchange Traded |
| | | | | | |
| Description | Number of
Contracts | Expiration
Date | Trading
Currency | Notional
Amount | Value/
Unrealized
Appreciation
(Depreciation) |
| Long Contracts | | | | | |
| Euro-Bund | 15 | 12/07/2023 | EUR | 2,047,265 | $ (10,703) |
| 10-Year Australian Treasury Bond | 5 | 12/15/2023 | AUD | 343,325 | (9,958) |
| Ultra U.S. Treasury Bond | 30 | 12/19/2023 | USD | 3,376,875 | (453,686) |
| 2-Year U.S. Treasury Note | 358 | 12/29/2023 | USD | 72,467,031 | (314,796) |
| Total Long Contracts | | | | | $ (789,143) |
| Short Contracts | | | | | |
| Euro-OAT | (8) | 12/07/2023 | EUR | 1,043,625 | $ 25,352 |
| 10-Year Canadian Government Bond | (23) | 12/18/2023 | CAD | 1,906,176 | 45,048 |
| 10-Year U.S. Treasury Note | (123) | 12/19/2023 | USD | 13,059,141 | 389,765 |
| U.S. Treasury Long Bond | (37) | 12/19/2023 | USD | 4,049,188 | 393,152 |
| Ultra 10-Year U.S. Treasury Note | (57) | 12/19/2023 | USD | 6,203,203 | 346,844 |
| Long Gilt | (12) | 12/27/2023 | GBP | 1,358,776 | 18,058 |
| 5-Year U.S. Treasury Note | (120) | 12/29/2023 | USD | 12,537,187 | 217,465 |
| Total Short Contracts | | | | | $1,435,684 |
| | | | | | $ 646,541 |
| Forward Foreign Currency Exchange Contracts outstanding at October 31, 2023: |
| | | | | | | |
Settlement
Date | Currency
Purchased | Amount
of Currency
Purchased | Currency
Sold | Amount
of Currency
Sold | Counterparty | Unrealized
Appreciation
(Depreciation) |
| | | | | | | |
| 12/15/23 | U.S. Dollars | 2,939,288 | British Pounds | 2,365,000 | Morgan Stanley | $ 63,715 |
| 12/15/23 | U.S. Dollars | 3,136,220 | Euro | 2,915,380 | Morgan Stanley | 44,853 |
| 12/15/23 | U.S. Dollars | 990,653 | Norwegian Kroner | 10,561,700 | Morgan Stanley | 43,886 |
| 12/15/23 | U.S. Dollars | 2,012,139 | Danish Kroner | 13,934,900 | Morgan Stanley | 31,415 |
| 12/20/23 | U.S. Dollars | 627,015 | Canadian Dollars | 850,000 | Barclays | 13,515 |
| 12/15/23 | Danish Kroner | 13,934,900 | U.S. Dollars | 1,968,686 | Morgan Stanley | 12,038 |
| 12/20/23 | U.S. Dollars | 850,850 | New Zealand Dollars | 1,440,000 | Morgan Stanley | 11,759 |
| 12/20/23 | U.S. Dollars | 331,615 | Indonesian Rupiahs | 5,137,610,000 | Deutsche Bank | 9,357 |
| 12/20/23 | U.S. Dollars | 254,617 | Israeli Shekels | 1,000,000 | Citibank | 6,477 |
| 12/20/23 | U.S. Dollars | 669,390 | Swedish Kronor | 7,400,000 | Goldman Sachs | 4,737 |
| 12/20/23 | Thai Baht | 10,500,000 | U.S. Dollars | 288,940 | Barclays | 4,548 |
| 12/20/23 | Swiss Francs | 710,000 | U.S. Dollars | 780,623 | Morgan Stanley | 4,516 |
| 12/20/23 | U.S. Dollars | 165,712 | Norwegian Kroner | 1,800,000 | Deutsche Bank | 4,334 |
| 12/20/23 | U.S. Dollars | 247,387 | Swiss Francs | 220,000 | Goldman Sachs | 4,105 |
| 12/20/23 | U.S. Dollars | 243,610 | Japanese Yen | 36,000,000 | Morgan Stanley | 4,015 |
| 12/20/23 | U.S. Dollars | 214,035 | Swiss Francs | 190,000 | Morgan Stanley | 3,927 |
See accompanying Notes to Financial Statements
Morningstar Funds Trust October 31, 2023 (unaudited)
Schedule of Investments (continued)
Morningstar Alternatives Fund
| Forward Foreign Currency Exchange Contracts outstanding at October 31, 2023: (continued) |
| | | | | | | |
Settlement
Date | Currency
Purchased | Amount
of Currency
Purchased | Currency
Sold | Amount
of Currency
Sold | Counterparty | Unrealized
Appreciation
(Depreciation) |
| 12/20/23 | U.S. Dollars | 215,157 | South Korean Won | 285,000,000 | Citibank | $ 3,903 |
| 12/20/23 | U.S. Dollars | 189,783 | Israeli Shekels | 750,000 | Morgan Stanley | 3,678 |
| 12/20/23 | U.S. Dollars | 133,113 | Mexican Pesos | 2,354,035 | Citibank | 3,635 |
| 12/20/23 | South African Rand | 4,500,000 | U.S. Dollars | 236,838 | Citibank | 3,535 |
| 12/20/23 | Czech Republic Koruna | 9,500,000 | U.S. Dollars | 405,242 | Goldman Sachs | 3,480 |
| 12/20/23 | U.S. Dollars | 101,884 | Norwegian Kroner | 1,100,000 | JPMorgan Chase | 3,265 |
| 12/20/23 | U.S. Dollars | 89,506 | Japanese Yen | 13,000,000 | Deutsche Bank | 2,985 |
| 12/20/23 | U.S. Dollars | 52,575 | Israeli Shekels | 200,000 | Deutsche Bank | 2,947 |
| 12/20/23 | U.S. Dollars | 1,048,667 | British Pounds | 860,000 | Barclays | 2,942 |
| 12/15/23 | U.S. Dollars | 389,670 | Swedish Kronor | 4,309,600 | Morgan Stanley | 2,719 |
| 12/20/23 | U.S. Dollars | 233,746 | British Pounds | 190,000 | Morgan Stanley | 2,714 |
| 12/20/23 | U.S. Dollars | 339,308 | Australian Dollars | 530,000 | Barclays | 2,521 |
| 12/20/23 | U.S. Dollars | 83,073 | Norwegian Kroner | 900,000 | Bank of America | 2,384 |
| 12/20/23 | U.S. Dollars | 101,302 | Mexican Pesos | 1,800,000 | Goldman Sachs | 2,299 |
| 12/20/23 | U.S. Dollars | 110,139 | Australian Dollars | 170,000 | Citibank | 2,113 |
| 12/20/23 | U.S. Dollars | 168,041 | Canadian Dollars | 230,000 | Morgan Stanley | 2,034 |
| 12/20/23 | U.S. Dollars | 160,890 | Australian Dollars | 250,000 | Deutsche Bank | 2,028 |
| 12/20/23 | Colombian Pesos | 240,000,000 | U.S. Dollars | 55,731 | Goldman Sachs | 1,917 |
| 12/20/23 | Polish Zloty | 300,000 | U.S. Dollars | 69,204 | Morgan Stanley | 1,899 |
| 12/20/23 | U.S. Dollars | 122,317 | Indonesian Rupiahs | 1,920,000,000 | Goldman Sachs | 1,886 |
| 12/15/23 | Euro | 501,980 | U.S. Dollars | 530,397 | Morgan Stanley | 1,885 |
| 12/20/23 | Thai Baht | 2,800,000 | U.S. Dollars | 76,464 | Morgan Stanley | 1,800 |
| 12/20/23 | U.S. Dollars | 186,000 | Australian Dollars | 290,000 | Bank of America | 1,720 |
| 12/20/23 | U.S. Dollars | 112,408 | New Zealand Dollars | 190,000 | JPMorgan Chase | 1,694 |
| 12/20/23 | U.S. Dollars | 145,383 | Swedish Kronor | 1,600,000 | Morgan Stanley | 1,674 |
| 12/20/23 | U.S. Dollars | 100,285 | Norwegian Kroner | 1,100,000 | Goldman Sachs | 1,665 |
| 12/20/23 | U.S. Dollars | 224,814 | Swedish Kronor | 2,485,000 | Bank of America | 1,616 |
| 12/20/23 | Polish Zloty | 900,000 | U.S. Dollars | 211,770 | Goldman Sachs | 1,539 |
| 12/20/23 | Australian Dollars | 380,000 | U.S. Dollars | 239,949 | Morgan Stanley | 1,521 |
| 12/20/23 | Polish Zloty | 500,000 | U.S. Dollars | 117,025 | JPMorgan Chase | 1,479 |
| 12/20/23 | U.S. Dollars | 272,273 | Swedish Kronor | 3,015,000 | Deutsche Bank | 1,471 |
| 12/20/23 | British Pounds | 170,000 | U.S. Dollars | 205,270 | Barclays | 1,443 |
| 12/20/23 | U.S. Dollars | 103,103 | Australian Dollars | 160,000 | JPMorgan Chase | 1,431 |
| 12/20/23 | U.S. Dollars | 149,904 | Euro | 140,000 | Deutsche Bank | 1,412 |
| 12/20/23 | Mexican Pesos | 1,800,000 | U.S. Dollars | 97,677 | Morgan Stanley | 1,327 |
| 12/20/23 | U.S. Dollars | 67,275 | Indonesian Rupiahs | 1,052,390,000 | JPMorgan Chase | 1,264 |
| 12/20/23 | Chilean Pesos | 30,000,000 | U.S. Dollars | 32,193 | Morgan Stanley | 1,222 |
| 12/20/23 | U.S. Dollars | 82,736 | South Korean Won | 110,000,000 | JPMorgan Chase | 1,200 |
| 12/20/23 | Colombian Pesos | 170,000,000 | U.S. Dollars | 39,646 | Morgan Stanley | 1,188 |
| 12/20/23 | U.S. Dollars | 121,909 | Australian Dollars | 190,000 | Morgan Stanley | 1,174 |
| 12/20/23 | U.S. Dollars | 172,743 | Australian Dollars | 270,000 | Goldman Sachs | 1,171 |
| 12/20/23 | U.S. Dollars | 49,304 | South Korean Won | 65,000,000 | Barclays | 1,123 |
See accompanying Notes to Financial Statements
Morningstar Funds Trust October 31, 2023 (unaudited)
Schedule of Investments (continued)
Morningstar Alternatives Fund
| Forward Foreign Currency Exchange Contracts outstanding at October 31, 2023: (continued) |
| | | | | | | |
Settlement
Date | Currency
Purchased | Amount
of Currency
Purchased | Currency
Sold | Amount
of Currency
Sold | Counterparty | Unrealized
Appreciation
(Depreciation) |
| 12/20/23 | U.S. Dollars | 69,097 | Taiwan Dollars | 2,200,000 | Morgan Stanley | $ 1,119 |
| 12/20/23 | U.S. Dollars | 70,494 | Indonesian Rupiahs | 1,106,172,413 | Bank of America | 1,109 |
| 12/20/23 | Colombian Pesos | 130,000,000 | U.S. Dollars | 30,137 | Barclays | 1,089 |
| 12/20/23 | South African Rand | 1,100,000 | U.S. Dollars | 57,739 | Barclays | 1,019 |
| 12/20/23 | Hungarian Forints | 15,000,000 | U.S. Dollars | 40,217 | JPMorgan Chase | 975 |
| 12/20/23 | Hungarian Forints | 21,000,000 | U.S. Dollars | 56,775 | Deutsche Bank | 893 |
| 12/20/23 | U.S. Dollars | 75,030 | Taiwan Dollars | 2,400,000 | Barclays | 872 |
| 12/20/23 | U.S. Dollars | 27,478 | Japanese Yen | 4,000,000 | JPMorgan Chase | 857 |
| 12/15/23 | U.S. Dollars | 65,896 | New Zealand Dollars | 111,700 | Morgan Stanley | 809 |
| 12/20/23 | U.S. Dollars | 161,848 | Singapore Dollars | 220,000 | Goldman Sachs | 800 |
| 12/20/23 | Hungarian Forints | 11,000,000 | U.S. Dollars | 29,459 | Barclays | 748 |
| 12/20/23 | U.S. Dollars | 36,827 | Canadian Dollars | 50,000 | Goldman Sachs | 739 |
| 12/20/23 | U.S. Dollars | 168,520 | Czech Republic Koruna | 3,900,000 | Citibank | 728 |
| 12/20/23 | U.S. Dollars | 98,142 | Canadian Dollars | 135,000 | JPMorgan Chase | 703 |
| 12/20/23 | Mexican Pesos | 800,000 | U.S. Dollars | 43,373 | Bank of America | 629 |
| 12/20/23 | U.S. Dollars | 71,696 | Taiwan Dollars | 2,300,000 | Goldman Sachs | 627 |
| 12/20/23 | U.S. Dollars | 13,011 | Israeli Shekels | 50,000 | Goldman Sachs | 604 |
| 12/20/23 | Australian Dollars | 200,000 | U.S. Dollars | 126,493 | Barclays | 596 |
| 12/20/23 | U.S. Dollars | 51,839 | Brazilian Reals | 260,000 | Bank of America | 572 |
| 12/20/23 | U.S. Dollars | 45,468 | Swedish Kronor | 500,000 | Barclays | 559 |
| 12/20/23 | U.S. Dollars | 62,032 | Thai Baht | 2,200,000 | Citibank | 539 |
| 12/20/23 | U.S. Dollars | 33,809 | Japanese Yen | 5,000,000 | Barclays | 532 |
| 12/20/23 | U.S. Dollars | 191,446 | Euro | 180,000 | Barclays | 525 |
| 12/20/23 | South African Rand | 1,000,000 | U.S. Dollars | 52,956 | Morgan Stanley | 460 |
| 12/20/23 | U.S. Dollars | 129,660 | Chilean Pesos | 116,000,000 | JPMorgan Chase | 453 |
| 12/20/23 | U.S. Dollars | 35,408 | New Zealand Dollars | 60,000 | Goldman Sachs | 446 |
| 12/20/23 | U.S. Dollars | 40,126 | Canadian Dollars | 55,000 | Citibank | 429 |
| 12/20/23 | Brazilian Reals | 280,000 | U.S. Dollars | 54,795 | Morgan Stanley | 416 |
| 12/20/23 | Chilean Pesos | 20,000,000 | U.S. Dollars | 21,862 | Barclays | 415 |
| 12/20/23 | U.S. Dollars | 45,764 | Brazilian Reals | 230,000 | Barclays | 412 |
| 12/20/23 | U.S. Dollars | 81,941 | Indonesian Rupiahs | 1,300,000,000 | Morgan Stanley | 399 |
| 12/20/23 | Polish Zloty | 50,000 | U.S. Dollars | 11,469 | Deutsche Bank | 381 |
| 12/20/23 | Singapore Dollars | 260,000 | U.S. Dollars | 189,953 | Morgan Stanley | 377 |
| 12/20/23 | U.S. Dollars | 32,136 | Euro | 30,000 | JPMorgan Chase | 316 |
| 12/20/23 | Euro | 80,000 | U.S. Dollars | 84,553 | Barclays | 301 |
| 12/20/23 | Indian Rupees | 22,400,000 | U.S. Dollars | 268,271 | Deutsche Bank | 298 |
| 12/20/23 | Norwegian Kroner | 1,000,000 | U.S. Dollars | 89,380 | Deutsche Bank | 274 |
| 12/20/23 | Hungarian Forints | 10,000,000 | U.S. Dollars | 27,230 | Goldman Sachs | 230 |
| 12/20/23 | U.S. Dollars | 79,449 | Philippine Pesos | 4,500,000 | JPMorgan Chase | 204 |
| 12/20/23 | Chilean Pesos | 25,217,779 | U.S. Dollars | 27,901 | Citibank | 188 |
| 12/20/23 | U.S. Dollars | 219,059 | British Pounds | 180,000 | Goldman Sachs | 187 |
| 12/20/23 | Indian Rupees | 18,300,000 | U.S. Dollars | 219,235 | Goldman Sachs | 176 |
See accompanying Notes to Financial Statements
Morningstar Funds Trust October 31, 2023 (unaudited)
Schedule of Investments (continued)
Morningstar Alternatives Fund
| Forward Foreign Currency Exchange Contracts outstanding at October 31, 2023: (continued) |
| | | | | | | |
Settlement
Date | Currency
Purchased | Amount
of Currency
Purchased | Currency
Sold | Amount
of Currency
Sold | Counterparty | Unrealized
Appreciation
(Depreciation) |
| 12/20/23 | Singapore Dollars | 70,000 | U.S. Dollars | 51,074 | Barclays | $ 169 |
| 12/20/23 | U.S. Dollars | 56,097 | Czech Republic Koruna | 1,300,000 | Goldman Sachs | 167 |
| 12/20/23 | New Zealand Dollars | 130,000 | U.S. Dollars | 75,591 | Morgan Stanley | 161 |
| 12/20/23 | U.S. Dollars | 44,914 | Indonesian Rupiahs | 713,827,587 | Citibank | 140 |
| 12/20/23 | U.S. Dollars | 27,588 | Hungarian Forints | 10,000,000 | Morgan Stanley | 128 |
| 12/20/23 | Polish Zloty | 100,000 | U.S. Dollars | 23,574 | Barclays | 127 |
| 12/20/23 | Indian Rupees | 9,300,000 | U.S. Dollars | 111,377 | Morgan Stanley | 126 |
| 12/20/23 | Mexican Pesos | 700,000 | U.S. Dollars | 38,391 | Goldman Sachs | 110 |
| 12/20/23 | U.S. Dollars | 27,005 | Norwegian Kroner | 300,000 | Morgan Stanley | 109 |
| 12/20/23 | South Korean Won | 100,000,000 | U.S. Dollars | 74,019 | Goldman Sachs | 106 |
| 12/20/23 | U.S. Dollars | 37,155 | South Korean Won | 50,000,000 | Bank of America | 93 |
| 12/20/23 | Czech Republic Koruna | 900,000 | U.S. Dollars | 38,637 | Morgan Stanley | 84 |
| 12/20/23 | Indian Rupees | 4,200,000 | U.S. Dollars | 50,274 | Bank of America | 83 |
| 12/20/23 | U.S. Dollars | 34,844 | Indian Rupees | 2,900,000 | Bank of America | 74 |
| 12/20/23 | U.S. Dollars | 64,169 | New Zealand Dollars | 110,000 | Bank of America | 72 |
| 12/20/23 | U.S. Dollars | 81,598 | Indian Rupees | 6,800,000 | Barclays | 68 |
| 12/20/23 | U.S. Dollars | 56,339 | Hong Kong Dollars | 440,000 | Morgan Stanley | 65 |
| 12/20/23 | Swiss Francs | 80,000 | U.S. Dollars | 88,403 | Barclays | 63 |
| 12/20/23 | U.S. Dollars | 40,826 | South Korean Won | 55,000,000 | Goldman Sachs | 57 |
| 12/20/23 | Indonesian Rupiahs | 330,000,000 | U.S. Dollars | 20,667 | Deutsche Bank | 32 |
| 12/20/23 | Indian Rupees | 4,700,000 | U.S. Dollars | 56,325 | Barclays | 26 |
| 12/20/23 | U.S. Dollars | 27,526 | Mexican Pesos | 500,000 | Morgan Stanley | 25 |
| 12/20/23 | U.S. Dollars | 19,589 | Thai Baht | 700,000 | Barclays | 23 |
| 12/20/23 | U.S. Dollars | 33,648 | Colombian Pesos | 140,000,000 | Bank of America | 20 |
| 12/20/23 | U.S. Dollars | 56,367 | Philippine Pesos | 3,200,000 | Citibank | 15 |
| 12/20/23 | U.S. Dollars | 10,990 | Hungarian Forints | 4,000,000 | Deutsche Bank | 5 |
| 12/15/23 | New Zealand Dollars | 3,500 | U.S. Dollars | 2,034 | Morgan Stanley | 5 |
| 12/20/23 | Singapore Dollars | 40,000 | U.S. Dollars | 29,279 | Goldman Sachs | 2 |
| 12/20/23 | U.S. Dollars | 8,029 | Mexican Pesos | 145,965 | Barclays | 1 |
| 12/20/23 | U.S. Dollars | 24,715 | Hungarian Forints | 9,000,000 | Goldman Sachs | — |
| 12/20/23 | U.S. Dollars | 65,884 | Singapore Dollars | 90,000 | Barclays | — |
| Total Unrealized Appreciation | $ 380,261 |
| | | | | | | |
| 12/15/23 | U.S. Dollars | 1,513 | New Zealand Dollars | 2,600 | Morgan Stanley | $ (2) |
| 12/20/23 | U.S. Dollars | 8,976 | Swedish Kronor | 100,000 | Morgan Stanley | (6) |
| 12/20/23 | British Pounds | 20,000 | U.S. Dollars | 24,334 | Citibank | (15) |
| 12/15/23 | U.S. Dollars | 29,181 | Swedish Kronor | 325,200 | Morgan Stanley | (17) |
| 12/20/23 | Hungarian Forints | 46,000,000 | U.S. Dollars | 126,339 | Goldman Sachs | (20) |
| 12/20/23 | Swedish Kronor | 300,000 | U.S. Dollars | 26,969 | Goldman Sachs | (24) |
| 12/20/23 | U.S. Dollars | 54,890 | Hungarian Forints | 20,000,000 | Barclays | (31) |
See accompanying Notes to Financial Statements
Morningstar Funds Trust October 31, 2023 (unaudited)
Schedule of Investments (continued)
Morningstar Alternatives Fund
| Forward Foreign Currency Exchange Contracts outstanding at October 31, 2023: (continued) |
| | | | | | | |
Settlement
Date | Currency
Purchased | Amount
of Currency
Purchased | Currency
Sold | Amount
of Currency
Sold | Counterparty | Unrealized
Appreciation
(Depreciation) |
| 12/20/23 | U.S. Dollars | 36,936 | Philippine Pesos | 2,100,000 | Deutsche Bank | $ (45) |
| 12/15/23 | Euro | 519,150 | U.S. Dollars | 550,536 | Morgan Stanley | (48) |
| 12/20/23 | South Korean Won | 25,000,000 | U.S. Dollars | 18,585 | Barclays | (54) |
| 12/15/23 | U.S. Dollars | 117,034 | British Pounds | 96,300 | Morgan Stanley | (56) |
| 12/20/23 | U.S. Dollars | 148,429 | Euro | 140,000 | Citibank | (65) |
| 12/20/23 | Polish Zloty | 150,000 | U.S. Dollars | 35,617 | Deutsche Bank | (66) |
| 12/20/23 | U.S. Dollars | 17,542 | Philippine Pesos | 1,000,000 | Citibank | (68) |
| 12/20/23 | U.S. Dollars | 85,042 | British Pounds | 70,000 | JPMorgan Chase | (75) |
| 12/20/23 | U.S. Dollars | 16,425 | Mexican Pesos | 300,000 | Morgan Stanley | (76) |
| 12/20/23 | U.S. Dollars | 21,132 | Euro | 20,000 | Bank of America | (82) |
| 12/20/23 | Philippine Pesos | 3,200,000 | U.S. Dollars | 56,447 | Morgan Stanley | (95) |
| 12/20/23 | Czech Republic Koruna | 2,100,000 | U.S. Dollars | 90,451 | Citibank | (101) |
| 12/20/23 | U.S. Dollars | 80,735 | Swedish Kronor | 900,000 | Deutsche Bank | (102) |
| 12/20/23 | Indonesian Rupiahs | 430,000,000 | U.S. Dollars | 27,079 | Deutsche Bank | (107) |
| 12/20/23 | U.S. Dollars | 86,541 | Thai Baht | 3,100,000 | Goldman Sachs | (108) |
| 12/20/23 | U.S. Dollars | 30,078 | Hungarian Forints | 11,000,000 | JPMorgan Chase | (129) |
| 12/20/23 | Euro | 10,000 | U.S. Dollars | 10,740 | Barclays | (133) |
| 12/20/23 | U.S. Dollars | 52,880 | Euro | 50,000 | Goldman Sachs | (153) |
| 12/20/23 | U.S. Dollars | 105,497 | Philippine Pesos | 6,000,000 | Morgan Stanley | (165) |
| 12/20/23 | U.S. Dollars | 119,571 | Philippine Pesos | 6,800,000 | Bank of America | (178) |
| 12/20/23 | Colombian Pesos | 80,000,000 | U.S. Dollars | 19,397 | Citibank | (181) |
| 12/20/23 | U.S. Dollars | 107,297 | South Korean Won | 145,000,000 | Barclays | (183) |
| 12/20/23 | U.S. Dollars | 97,644 | Thai Baht | 3,500,000 | Morgan Stanley | (185) |
| 12/20/23 | Czech Republic Koruna | 300,000 | U.S. Dollars | 13,099 | JPMorgan Chase | (192) |
| 12/20/23 | Australian Dollars | 100,000 | U.S. Dollars | 63,739 | Goldman Sachs | (194) |
| 12/20/23 | Polish Zloty | 400,000 | U.S. Dollars | 95,001 | Morgan Stanley | (197) |
| 12/20/23 | Indian Rupees | 15,800,000 | U.S. Dollars | 189,650 | Goldman Sachs | (212) |
| 12/20/23 | U.S. Dollars | 59,053 | South Korean Won | 80,000,000 | Morgan Stanley | (246) |
| 12/20/23 | Czech Republic Koruna | 600,000 | U.S. Dollars | 26,066 | Barclays | (252) |
| 12/20/23 | Japanese Yen | 3,000,000 | U.S. Dollars | 20,222 | JPMorgan Chase | (256) |
| 12/20/23 | Singapore Dollars | 80,000 | U.S. Dollars | 58,837 | JPMorgan Chase | (274) |
| 12/20/23 | Swiss Francs | 60,000 | U.S. Dollars | 66,624 | Barclays | (274) |
| 12/20/23 | U.S. Dollars | 158,586 | Australian Dollars | 250,000 | Morgan Stanley | (275) |
| 12/20/23 | Australian Dollars | 40,000 | U.S. Dollars | 25,701 | Morgan Stanley | (283) |
| 12/20/23 | Taiwan Dollars | 1,651,352 | U.S. Dollars | 51,322 | Bank of America | (296) |
| 12/20/23 | Euro | 80,000 | U.S. Dollars | 85,153 | JPMorgan Chase | (299) |
| 12/20/23 | U.S. Dollars | 96,497 | Philippine Pesos | 5,500,000 | JPMorgan Chase | (358) |
| 12/20/23 | Norwegian Kroner | 100,000 | U.S. Dollars | 9,334 | JPMorgan Chase | (369) |
| 12/20/23 | U.S. Dollars | 81,375 | Czech Republic Koruna | 1,900,000 | JPMorgan Chase | (370) |
See accompanying Notes to Financial Statements
Morningstar Funds Trust October 31, 2023 (unaudited)
Schedule of Investments (continued)
Morningstar Alternatives Fund
| Forward Foreign Currency Exchange Contracts outstanding at October 31, 2023: (continued) |
| | | | | | | |
Settlement
Date | Currency
Purchased | Amount
of Currency
Purchased | Currency
Sold | Amount
of Currency
Sold | Counterparty | Unrealized
Appreciation
(Depreciation) |
| 12/20/23 | U.S. Dollars | 70,044 | South Korean Won | 95,000,000 | Goldman Sachs | $ (374) |
| 12/20/23 | U.S. Dollars | 318,348 | Philippine Pesos | 18,100,000 | Barclays | (394) |
| 12/20/23 | U.S. Dollars | 242,794 | British Pounds | 200,000 | Morgan Stanley | (397) |
| 12/15/23 | U.S. Dollars | 67,782 | Euro | 64,300 | Morgan Stanley | (400) |
| 12/20/23 | Singapore Dollars | 160,000 | U.S. Dollars | 117,536 | Morgan Stanley | (410) |
| 12/20/23 | Australian Dollars | 190,000 | U.S. Dollars | 121,147 | Barclays | (412) |
| 12/20/23 | Chilean Pesos | 44,000,000 | U.S. Dollars | 49,433 | Goldman Sachs | (424) |
| 12/20/23 | Polish Zloty | 300,000 | U.S. Dollars | 71,528 | Barclays | (425) |
| 12/20/23 | Mexican Pesos | 2,800,000 | U.S. Dollars | 154,434 | Morgan Stanley | (429) |
| 12/20/23 | British Pounds | 70,000 | U.S. Dollars | 85,549 | Goldman Sachs | (432) |
| 12/20/23 | Czech Republic Koruna | 1,300,000 | U.S. Dollars | 56,413 | Goldman Sachs | (483) |
| 12/20/23 | Swiss Francs | 70,000 | U.S. Dollars | 77,892 | JPMorgan Chase | (484) |
| 12/20/23 | Japanese Yen | 4,000,000 | U.S. Dollars | 27,109 | Barclays | (488) |
| 12/20/23 | U.S. Dollars | 157,569 | British Pounds | 130,000 | Barclays | (505) |
| 12/20/23 | U.S. Dollars | 76,891 | Swiss Francs | 70,000 | JPMorgan Chase | (517) |
| 12/20/23 | Singapore Dollars | 160,000 | U.S. Dollars | 117,681 | Goldman Sachs | (555) |
| 12/20/23 | Colombian Pesos | 130,000,000 | U.S. Dollars | 31,800 | Bank of America | (575) |
| 12/15/23 | Swedish Kronor | 463,500 | U.S. Dollars | 42,193 | Morgan Stanley | (576) |
| 12/20/23 | Mexican Pesos | 400,000 | U.S. Dollars | 22,581 | Citibank | (580) |
| 12/20/23 | Brazilian Reals | 100,000 | U.S. Dollars | 20,305 | Goldman Sachs | (586) |
| 12/20/23 | Czech Republic Koruna | 2,100,000 | U.S. Dollars | 90,936 | Deutsche Bank | (587) |
| 12/20/23 | Mexican Pesos | 300,000 | U.S. Dollars | 17,094 | Goldman Sachs | (593) |
| 12/20/23 | U.S. Dollars | 59,619 | Czech Republic Koruna | 1,400,000 | Morgan Stanley | (614) |
| 12/20/23 | Swedish Kronor | 3,000,000 | U.S. Dollars | 270,100 | Barclays | (646) |
| 12/20/23 | U.S. Dollars | 37,825 | Mexican Pesos | 700,000 | Barclays | (677) |
| 12/20/23 | Euro | 60,000 | U.S. Dollars | 64,321 | Goldman Sachs | (681) |
| 12/20/23 | U.S. Dollars | 24,473 | Thai Baht | 900,000 | Barclays | (683) |
| 12/20/23 | Japanese Yen | 7,000,000 | U.S. Dollars | 47,307 | Bank of America | (719) |
| 12/20/23 | U.S. Dollars | 264,443 | Euro | 250,000 | Barclays | (724) |
| 12/20/23 | Polish Zloty | 850,000 | U.S. Dollars | 202,210 | Bank of America | (752) |
| 12/20/23 | U.S. Dollars | 65,143 | Hungarian Forints | 24,000,000 | Deutsche Bank | (762) |
| 12/20/23 | Israeli Shekels | 50,000 | U.S. Dollars | 13,173 | Morgan Stanley | (766) |
| 12/20/23 | Israeli Shekels | 50,000 | U.S. Dollars | 13,173 | JPMorgan Chase | (766) |
| 12/20/23 | Indonesian Rupiahs | 380,000,000 | U.S. Dollars | 24,648 | JPMorgan Chase | (813) |
| 12/20/23 | South Korean Won | 145,000,000 | U.S. Dollars | 108,310 | Morgan Stanley | (828) |
| 12/20/23 | South Korean Won | 60,000,000 | U.S. Dollars | 45,367 | JPMorgan Chase | (892) |
| 12/20/23 | Swedish Kronor | 400,000 | U.S. Dollars | 36,835 | Bank of America | (907) |
| 12/20/23 | U.S. Dollars | 169,280 | British Pounds | 140,000 | Goldman Sachs | (954) |
| 12/20/23 | U.S. Dollars | 30,211 | Colombian Pesos | 130,000,000 | Goldman Sachs | (1,015) |
| 12/20/23 | Taiwan Dollars | 4,848,648 | U.S. Dollars | 150,848 | Barclays | (1,029) |
See accompanying Notes to Financial Statements
Morningstar Funds Trust October 31, 2023 (unaudited)
Schedule of Investments (continued)
Morningstar Alternatives Fund
| Forward Foreign Currency Exchange Contracts outstanding at October 31, 2023: (continued) |
| | | | | | | |
Settlement
Date | Currency
Purchased | Amount
of Currency
Purchased | Currency
Sold | Amount
of Currency
Sold | Counterparty | Unrealized
Appreciation
(Depreciation) |
| 12/20/23 | U.S. Dollars | 26,808 | Chilean Pesos | 25,000,000 | Goldman Sachs | $ (1,039) |
| 12/20/23 | U.S. Dollars | 42,174 | Colombian Pesos | 180,000,000 | JPMorgan Chase | (1,061) |
| 12/20/23 | South Korean Won | 410,000,000 | U.S. Dollars | 305,147 | Goldman Sachs | (1,236) |
| 12/20/23 | Brazilian Reals | 190,000 | U.S. Dollars | 38,735 | Citibank | (1,271) |
| 12/20/23 | U.S. Dollars | 174,987 | Czech Republic Koruna | 4,100,000 | Citibank | (1,408) |
| 12/20/23 | Japanese Yen | 11,000,000 | U.S. Dollars | 74,620 | Morgan Stanley | (1,410) |
| 12/20/23 | Israeli Shekels | 100,000 | U.S. Dollars | 26,353 | Barclays | (1,539) |
| 12/20/23 | U.S. Dollars | 80,802 | Chilean Pesos | 74,000,000 | Bank of America | (1,623) |
| 12/20/23 | U.S. Dollars | 27,117 | Colombian Pesos | 120,000,000 | Bank of America | (1,707) |
| 12/20/23 | U.S. Dollars | 62,130 | South African Rand | 1,200,000 | Goldman Sachs | (1,969) |
| 12/20/23 | Swedish Kronor | 1,100,000 | U.S. Dollars | 100,801 | Morgan Stanley | (2,001) |
| 12/20/23 | U.S. Dollars | 68,985 | Polish Zloty | 300,000 | JPMorgan Chase | (2,118) |
| 12/20/23 | U.S. Dollars | 68,773 | Polish Zloty | 300,000 | Citibank | (2,330) |
| 12/20/23 | New Zealand Dollars | 210,000 | U.S. Dollars | 124,749 | Citibank | (2,381) |
| 12/20/23 | British Pounds | 90,000 | U.S. Dollars | 111,859 | Barclays | (2,422) |
| 12/15/23 | British Pounds | 352,200 | U.S. Dollars | 430,782 | Morgan Stanley | (2,546) |
| 12/20/23 | U.S. Dollars | 146,954 | South African Rand | 2,800,000 | Deutsche Bank | (2,611) |
| 12/20/23 | British Pounds | 220,000 | U.S. Dollars | 270,173 | Bank of America | (2,662) |
| 12/20/23 | U.S. Dollars | 119,863 | South African Rand | 2,300,000 | JPMorgan Chase | (2,995) |
| 12/20/23 | Mexican Pesos | 1,400,000 | U.S. Dollars | 80,268 | JPMorgan Chase | (3,265) |
| 12/20/23 | New Zealand Dollars | 180,000 | U.S. Dollars | 108,431 | Bank of America | (3,544) |
| 12/20/23 | Czech Republic Koruna | 4,900,000 | U.S. Dollars | 214,448 | Morgan Stanley | (3,633) |
| 12/20/23 | New Zealand Dollars | 390,000 | U.S. Dollars | 231,058 | Deutsche Bank | (3,805) |
| 12/20/23 | Euro | 220,000 | U.S. Dollars | 237,315 | Bank of America | (3,968) |
| 12/20/23 | U.S. Dollars | 124,218 | South African Rand | 2,400,000 | Morgan Stanley | (3,982) |
| 12/20/23 | Canadian Dollars | 250,000 | U.S. Dollars | 184,448 | Morgan Stanley | (4,006) |
| 12/20/23 | Australian Dollars | 520,000 | U.S. Dollars | 334,599 | Citibank | (4,166) |
| 12/20/23 | Israeli Shekels | 300,000 | U.S. Dollars | 78,638 | Deutsche Bank | (4,197) |
| 12/20/23 | U.S. Dollars | 102,395 | Polish Zloty | 450,000 | Deutsche Bank | (4,259) |
| 12/20/23 | U.S. Dollars | 610,646 | Euro | 580,000 | JPMorgan Chase | (4,542) |
| 12/20/23 | Taiwan Dollars | 11,900,000 | U.S. Dollars | 372,804 | Deutsche Bank | (5,103) |
| 12/20/23 | Colombian Pesos | 740,000,000 | U.S. Dollars | 183,168 | Morgan Stanley | (5,422) |
| 12/20/23 | U.S. Dollars | 164,024 | Chilean Pesos | 153,000,000 | Barclays | (6,395) |
| 12/20/23 | Brazilian Reals | 2,100,000 | U.S. Dollars | 420,650 | Morgan Stanley | (6,570) |
| 12/20/23 | Canadian Dollars | 430,000 | U.S. Dollars | 316,975 | Bank of America | (6,616) |
| 12/20/23 | Israeli Shekels | 550,000 | U.S. Dollars | 143,558 | Citibank | (7,082) |
| 12/20/23 | New Zealand Dollars | 750,000 | U.S. Dollars | 444,314 | Morgan Stanley | (7,288) |
| 12/20/23 | New Zealand Dollars | 560,000 | U.S. Dollars | 333,853 | Goldman Sachs | (7,539) |
| 12/20/23 | New Zealand Dollars | 590,000 | U.S. Dollars | 351,357 | Barclays | (7,564) |
| 12/20/23 | Swiss Francs | 450,000 | U.S. Dollars | 506,558 | Morgan Stanley | (8,933) |
| 12/20/23 | Norwegian Kroner | 4,100,000 | U.S. Dollars | 376,751 | Goldman Sachs | (9,169) |
See accompanying Notes to Financial Statements
Morningstar Funds Trust October 31, 2023 (unaudited)
Schedule of Investments (continued)
Morningstar Alternatives Fund
| Forward Foreign Currency Exchange Contracts outstanding at October 31, 2023: (continued) |
| | | | | | | |
Settlement
Date | Currency
Purchased | Amount
of Currency
Purchased | Currency
Sold | Amount
of Currency
Sold | Counterparty | Unrealized
Appreciation
(Depreciation) |
| 12/20/23 | Canadian Dollars | 510,000 | U.S. Dollars | 378,750 | JPMorgan Chase | $ (10,650) |
| 12/20/23 | Norwegian Kroner | 4,500,000 | U.S. Dollars | 415,064 | Morgan Stanley | (11,621) |
| 12/20/23 | British Pounds | 480,000 | U.S. Dollars | 596,747 | JPMorgan Chase | (13,088) |
| 12/20/23 | Norwegian Kroner | 4,500,000 | U.S. Dollars | 416,663 | Deutsche Bank | (13,219) |
| 12/20/23 | Israeli Shekels | 950,000 | U.S. Dollars | 249,032 | Bank of America | (13,299) |
| 12/20/23 | U.S. Dollars | 700,348 | Polish Zloty | 3,050,000 | Morgan Stanley | (22,532) |
| Total Unrealized Depreciation | $(273,557) |
| Net Unrealized Appreciation | $ 106,704 |
Long Contracts for Difference at October 31, 2023:
Over the Counter |
| | | | | | | | |
| Reference Company | The Fund Pays
Financing Rate | Expiration
Date | Counterparty | Notional
Amount | Pay
Frequency | Value | Unrealized
Appreciation
(Depreciation) |
| 3M Co. | U.S. Fed Funds + (0.15)% | 8/19/2026 | Goldman Sachs | 3,415 | Monthly | $ 310,034 | $ 4,877 |
| AbbVie, Inc. | U.S. Fed Funds | 1/24/2024 | Barclays | 2,084 | Monthly | 296,852 | (307) |
| Agilent Technologies, Inc. | U.S. Fed Funds + 0.20% | 8/19/2026 | Goldman Sachs | 998 | Monthly | 102,992 | (5,831) |
| Albemarle Corp. | U.S. Fed Funds | 1/24/2024 | Barclays | 768 | Monthly | 97,273 | (7,793) |
| Alcoa Corp. | U.S. Fed Funds | 1/24/2024 | Barclays | 4,398 | Monthly | 112,670 | 9,713 |
| Alexandria Real Estate Equities, Inc. | U.S. Fed Funds + (0.15)% | 8/19/2026 | Goldman Sachs | 860 | Monthly | 79,919 | (6,855) |
| Allstate Corp. | U.S. Fed Funds + 0.20% | 8/19/2026 | Goldman Sachs | 3,049 | Monthly | 389,908 | 9,027 |
| Altria Group, Inc. | U.S. Fed Funds + 0.20% | 8/19/2026 | Goldman Sachs | 16,292 | Monthly | 653,092 | (43,794) |
| Amazon.com, Inc. | U.S. Fed Funds | 1/24/2024 | Barclays | 112 | Monthly | 14,906 | 42 |
| American Electric Power Co., Inc. | U.S. Fed Funds | 1/24/2024 | Barclays | 2,100 | Monthly | 158,456 | 4,421 |
| American Express Co. | U.S. Fed Funds | 1/24/2024 | Barclays | 189 | Monthly | 27,579 | 360 |
| American Express Co. | U.S. Fed Funds + 0.20% | 8/19/2026 | Goldman Sachs | 2,521 | Monthly | 367,372 | (17,811) |
| American International Group, Inc. | U.S. Fed Funds | 1/24/2024 | Barclays | 5,233 | Monthly | 320,551 | 11,909 |
| American International Group, Inc. | U.S. Fed Funds + (0.15)% | 8/19/2026 | Goldman Sachs | 3,563 | Monthly | 218,048 | (3,755) |
| American Water Works Company, Inc. | U.S. Fed Funds + (0.15)% | 8/19/2026 | Goldman Sachs | 1,557 | Monthly | 182,864 | (2,835) |
| Apache Corp. | U.S. Fed Funds + 0.20% | 8/19/2026 | Goldman Sachs | 9,246 | Monthly | 366,472 | (23,617) |
| Applied Materials, Inc. | U.S. Fed Funds + (0.15)% | 8/19/2026 | Goldman Sachs | 2,187 | Monthly | 288,834 | (19,533) |
| AT&T, Inc. | U.S. Fed Funds + (0.15)% | 8/19/2026 | Goldman Sachs | 29,848 | Monthly | 458,800 | 28,691 |
| Atmos Energy Corp. | U.S. Fed Funds | 1/24/2024 | Barclays | 243 | Monthly | 26,161 | 180 |
| Autodesk, Inc. | U.S. Fed Funds | 1/24/2024 | Barclays | 66 | Monthly | 13,031 | (150) |
| AutoZone, Inc. | U.S. Fed Funds | 1/24/2024 | Barclays | 148 | Monthly | 366,284 | 6,227 |
| Avis Budget Group, Inc. | U.S. Fed Funds | 1/24/2024 | Barclays | 505 | Monthly | 82,020 | (5,249) |
| Barrick Gold Corp. | U.S. Fed Funds | 1/24/2024 | Barclays | 5,728 | Monthly | 91,446 | (3,352) |
| Baxter International, Inc. | U.S. Fed Funds | 1/24/2024 | Barclays | 11,170 | Monthly | 361,906 | (5,029) |
| Best Buy Co., Inc. | U.S. Fed Funds + 0.20% | 2/8/2024 | JPMorgan Chase | 4,584 | Monthly | 305,402 | (14,771) |
See accompanying Notes to Financial Statements
Morningstar Funds Trust October 31, 2023 (unaudited)
Schedule of Investments (continued)
Morningstar Alternatives Fund
Long Contracts for Difference at October 31, 2023:
Over the Counter (continued) |
| | | | | | | | |
| Reference Company | The Fund Pays
Financing Rate | Expiration
Date | Counterparty | Notional
Amount | Pay
Frequency | Value | Unrealized
Appreciation
(Depreciation) |
| Booking Holdings, Inc. | U.S. Fed Funds | 1/24/2024 | Barclays | 103 | Monthly | $ 287,120 | $ (2,125) |
| BorgWarner, Inc. | U.S. Fed Funds | 1/24/2024 | Barclays | 5,500 | Monthly | 202,927 | (7,338) |
| BorgWarner, Inc. | U.S. Fed Funds + (0.15)% | 8/19/2026 | Goldman Sachs | 7,989 | Monthly | 294,180 | (21,066) |
| Boyd Gaming Corp. | U.S. Fed Funds | 1/24/2024 | Barclays | 4,831 | Monthly | 266,644 | (25,148) |
| Bristol-Myers Squibb Co. | U.S. Fed Funds | 1/24/2024 | Barclays | 6,904 | Monthly | 355,441 | (27,892) |
| Camden Property Trust REIT | U.S. Fed Funds + 0.20% | 2/8/2024 | JPMorgan Chase | 1,769 | Monthly | 149,859 | (14,420) |
| Campbell Soup | U.S. Fed Funds + (0.15)% | 8/19/2026 | Goldman Sachs | 2,395 | Monthly | 96,522 | 482 |
| Capital One Financial Corp. | U.S. Fed Funds + 0.20% | 8/19/2026 | Goldman Sachs | 2,363 | Monthly | 238,628 | 10,572 |
| Cardinal Health, Inc. | U.S. Fed Funds | 1/24/2024 | Barclays | 3,226 | Monthly | 293,293 | (3,467) |
| Cardinal Health, Inc. | U.S. Fed Funds + 0.20% | 8/19/2026 | Goldman Sachs | 4,002 | Monthly | 363,708 | (6,908) |
| Carnival Corp. | U.S. Fed Funds + 0.20% | 2/8/2024 | JPMorgan Chase | 26,799 | Monthly | 306,170 | (29,229) |
| Caterpillar, Inc. | U.S. Fed Funds | 1/24/2024 | Barclays | 1,239 | Monthly | 279,806 | (26,350) |
| Caterpillar, Inc. | U.S. Fed Funds + 0.20% | 8/19/2026 | Goldman Sachs | 1,533 | Monthly | 345,765 | (65,688) |
| CH Robinson Worldwide, Inc. | U.S. Fed Funds | 8/19/2026 | Goldman Sachs | 3,548 | Monthly | 289,738 | (14,434) |
| Chubb Limited | U.S. Fed Funds | 8/19/2026 | Goldman Sachs | 1,711 | Monthly | 367,208 | 2,585 |
| Church & Dwight Co., Inc. | U.S. Fed Funds + 0.20% | 8/19/2026 | Goldman Sachs | 857 | Monthly | 77,795 | 1,456 |
| Ciena Corpment, Corp. | U.S. Fed Funds | 1/24/2024 | Barclays | 2,955 | Monthly | 124,608 | 3,576 |
| Cigna Corp. | U.S. Fed Funds + (0.15)% | 8/19/2026 | Goldman Sachs | 300 | Monthly | 92,432 | (1,207) |
| Cisco Systems, Inc. | U.S. Fed Funds + 0.20% | 8/19/2026 | Goldman Sachs | 6,941 | Monthly | 361,084 | (14,841) |
| Cleveland Cliffs, Inc. | U.S. Fed Funds + 0.20% | 2/8/2024 | JPMorgan Chase | 23,102 | Monthly | 387,345 | 40,046 |
| Clorox (The) Co. | U.S. Fed Funds + (0.15)% | 8/19/2026 | Goldman Sachs | 2,507 | Monthly | 294,484 | (17,606) |
| CME Group, Inc., Class A | U.S. Fed Funds + 0.20% | 8/19/2026 | Goldman Sachs | 1,452 | Monthly | 309,309 | (8,417) |
| Colgate-Palmolive Co. | U.S. Fed Funds | 1/24/2024 | Barclays | 4,268 | Monthly | 320,330 | 13,204 |
| Comcast Corp., Class A | U.S. Fed Funds | 1/24/2024 | Barclays | 5,425 | Monthly | 223,838 | (5,602) |
| Conagra Brands, Inc. | U.S. Fed Funds + 0.20% | 2/8/2024 | JPMorgan Chase | 10,727 | Monthly | 293,202 | (350) |
| ConocoPhillips | U.S. Fed Funds | 1/24/2024 | Barclays | 2,809 | Monthly | 333,475 | (5,182) |
| Coterra Energy, Inc. | U.S. Fed Funds | 1/24/2024 | Barclays | 10,839 | Monthly | 297,789 | (10,038) |
| Crown Castle International Corp. | U.S. Fed Funds | 1/24/2024 | Barclays | 1,881 | Monthly | 174,642 | 11,729 |
| CSX Corp. | U.S. Fed Funds + 0.20% | 2/8/2024 | JPMorgan Chase | 7,314 | Monthly | 217,626 | (9,693) |
| CSX Corp. | U.S. Fed Funds + 0.20% | 8/19/2026 | Goldman Sachs | 12,077 | Monthly | 359,741 | (19,598) |
| CVS Health Corp. | U.S. Fed Funds + 0.20% | 2/8/2024 | JPMorgan Chase | 5,569 | Monthly | 383,101 | (13,690) |
| Darden Restaurants, Inc. | U.S. Fed Funds | 1/24/2024 | Barclays | 413 | Monthly | 60,077 | 1,522 |
| Darden Restaurants, Inc. | U.S. Fed Funds + (0.15)% | 8/19/2026 | Goldman Sachs | 1,925 | Monthly | 279,612 | 12,402 |
| Darling Ingredients, Inc. | U.S. Fed Funds | 1/24/2024 | Barclays | 420 | Monthly | 18,591 | 1,542 |
| DaVita, Inc. | U.S. Fed Funds | 1/24/2024 | Barclays | 261 | Monthly | 20,154 | (72) |
| DaVita, Inc. | U.S. Fed Funds + 0.20% | 2/8/2024 | JPMorgan Chase | 974 | Monthly | 75,028 | (8,264) |
| Dell Technologies, Inc., Class C | U.S. Fed Funds | 1/24/2024 | Barclays | 5,525 | Monthly | 369,345 | 7,236 |
| Dell Technologies, Inc., Class C | U.S. Fed Funds + 0.20% | 8/19/2026 | Goldman Sachs | 4,582 | Monthly | 305,994 | (4,057) |
| Devon Energy Corp. | U.S. Fed Funds | 1/24/2024 | Barclays | 8,061 | Monthly | 375,047 | (9,543) |
| Devon Energy Corp. | U.S. Fed Funds | 2/8/2024 | JPMorgan Chase | 5,642 | Monthly | 261,998 | 1,879 |
| Discovery Incment, Inc. | U.S. Fed Funds + (0.15)% | 8/19/2026 | Goldman Sachs | 4,909 | Monthly | 48,718 | (3,372) |
| Dominion Energy, Inc. | U.S. Fed Funds + 0.20% | 2/8/2024 | JPMorgan Chase | 9,138 | Monthly | 367,311 | (16,822) |
See accompanying Notes to Financial Statements
Morningstar Funds Trust October 31, 2023 (unaudited)
Schedule of Investments (continued)
Morningstar Alternatives Fund
Long Contracts for Difference at October 31, 2023:
Over the Counter (continued) |
| | | | | | | | |
| Reference Company | The Fund Pays
Financing Rate | Expiration
Date | Counterparty | Notional
Amount | Pay
Frequency | Value | Unrealized
Appreciation
(Depreciation) |
| Duke Energy Corp. | U.S. Fed Funds + 0.20% | 8/19/2026 | Goldman Sachs | 4,116 | Monthly | $ 365,136 | $ (3,081) |
| DuPont de Nemours, Inc. | U.S. Fed Funds + 0.20% | 2/8/2024 | JPMorgan Chase | 2,434 | Monthly | 176,773 | (6,434) |
| Eaton Corp. PLC | U.S. Fed Funds | 1/24/2024 | Barclays | 40 | Monthly | 8,295 | 310 |
| Elastic N.V. | U.S. Fed Funds | 1/24/2024 | Barclays | 3,804 | Monthly | 285,193 | (14,377) |
| Energy, Inc. | U.S. Fed Funds + 0.20% | 8/19/2026 | Goldman Sachs | 6,145 | Monthly | 301,346 | (8,546) |
| EQT Corp. | U.S. Fed Funds | 1/24/2024 | Barclays | 4,856 | Monthly | 205,586 | 323 |
| Equity Residential | U.S. Fed Funds + 0.20% | 2/8/2024 | JPMorgan Chase | 263 | Monthly | 14,504 | (1,284) |
| Equity Residential | U.S. Fed Funds + 0.20% | 8/19/2026 | Goldman Sachs | 6,492 | Monthly | 358,448 | (30,679) |
| Eversource Energy | U.S. Fed Funds | 1/24/2024 | Barclays | 4,600 | Monthly | 247,212 | 5,896 |
| Exelon Corp. | U.S. Fed Funds + 0.20% | 8/19/2026 | Goldman Sachs | 9,654 | Monthly | 375,152 | (12,649) |
| Expedia Group, Inc. | U.S. Fed Funds + (0.15)% | 8/19/2026 | Goldman Sachs | 3,632 | Monthly | 345,427 | (15,599) |
| Extra Space Storage Incment, Inc. | U.S. Fed Funds + 0.20% | 8/19/2026 | Goldman Sachs | 2,868 | Monthly | 296,479 | (41,206) |
| FedEx Corp. | U.S. Fed Funds + 0.20% | 2/8/2024 | JPMorgan Chase | 1,604 | Monthly | 383,965 | (22,798) |
| FedEx Corp. | U.S. Fed Funds + (0.15)% | 8/19/2026 | Goldman Sachs | 1,217 | Monthly | 291,600 | (9,680) |
| Fidelity National Information Services, Inc. | U.S. Fed Funds + 0.20% | 8/19/2026 | Goldman Sachs | 368 | Monthly | 18,070 | 175 |
| Ford Motor Co. | U.S. Fed Funds + 0.20% | 8/19/2026 | Goldman Sachs | 42,274 | Monthly | 411,002 | (78,342) |
| Fortune Brands Home & Security, Inc. | U.S. Fed Funds + 0.20% | 8/19/2026 | Goldman Sachs | 2,082 | Monthly | 115,925 | (10,672) |
| Fox Corp., Class A | U.S. Fed Funds + (0.15)% | 8/19/2026 | Goldman Sachs | 1,689 | Monthly | 51,238 | (1,655) |
| Gap (The), Inc. | U.S. Fed Funds | 1/24/2024 | Barclays | 23,371 | Monthly | 302,036 | 12,960 |
| Gap (The), Inc. | U.S. Fed Funds + 0.20% | 8/19/2026 | Goldman Sachs | 29,869 | Monthly | 381,604 | 21,683 |
| General Electric Co. | U.S. Fed Funds | 1/24/2024 | Barclays | 2,717 | Monthly | 294,881 | 5,004 |
| General Electric Co. | U.S. Fed Funds + 0.20% | 8/19/2026 | Goldman Sachs | 1,868 | Monthly | 202,788 | 273 |
| General Motors Co. | U.S. Fed Funds + 0.20% | 8/19/2026 | Goldman Sachs | 13,366 | Monthly | 376,182 | (24,085) |
| Halliburton Co. | U.S. Fed Funds + 0.20% | 8/19/2026 | Goldman Sachs | 10,184 | Monthly | 399,986 | (24,040) |
| Hartford Financial Services Group (The), Inc. | U.S. Fed Funds + 0.20% | 2/8/2024 | JPMorgan Chase | 3,098 | Monthly | 226,873 | 6,853 |
| Hasbro, Inc. | U.S. Fed Funds | 1/24/2024 | Barclays | 2,455 | Monthly | 110,800 | (8,133) |
| HCA Healthcare, Inc. | U.S. Fed Funds + 0.20% | 2/8/2024 | JPMorgan Chase | 584 | Monthly | 131,736 | (11,874) |
| Healthpeak Properties, Inc. | U.S. Fed Funds | 1/24/2024 | Barclays | 14,255 | Monthly | 221,449 | (13,759) |
| Hershey (The) Co. | U.S. Fed Funds + 0.20% | 8/19/2026 | Goldman Sachs | 304 | Monthly | 56,838 | (1,478) |
| HF Sinclair Corporation | U.S. Fed Funds + 0.20% | 8/19/2026 | Goldman Sachs | 1,692 | Monthly | 93,517 | 474 |
| Home Depot (The), Inc. | U.S. Fed Funds | 1/24/2024 | Barclays | 1,315 | Monthly | 374,039 | (295) |
| Honeywell International, Inc. | U.S. Fed Funds | 1/24/2024 | Barclays | 2,006 | Monthly | 367,286 | 5,163 |
| Hormel Foods Corp | U.S. Fed Funds | 1/24/2024 | Barclays | 443 | Monthly | 14,407 | 692 |
| Host Hotels & Resorts, Inc. | U.S. Fed Funds + 0.20% | 8/19/2026 | Goldman Sachs | 2,329 | Monthly | 36,054 | 493 |
| HP, Inc. | U.S. Fed Funds + 0.20% | 2/8/2024 | JPMorgan Chase | 11,493 | Monthly | 301,692 | 1,955 |
| HP, Inc. | U.S. Fed Funds + 0.20% | 8/19/2026 | Goldman Sachs | 14,218 | Monthly | 373,597 | (8,583) |
| Humana, Inc. | U.S. Fed Funds + 0.20% | 8/19/2026 | Goldman Sachs | 602 | Monthly | 314,631 | (943) |
| Illumina, Inc. | U.S. Fed Funds | 1/24/2024 | Barclays | 995 | Monthly | 108,863 | (51) |
| International Paper Co. | U.S. Fed Funds | 1/24/2024 | Barclays | 8,167 | Monthly | 275,243 | 10,092 |
| JM Smucker (The) Co. | U.S. Fed Funds + (0.06)% | 8/19/2026 | Goldman Sachs | 1,335 | Monthly | 151,676 | 1,195 |
See accompanying Notes to Financial Statements
Morningstar Funds Trust October 31, 2023 (unaudited)
Schedule of Investments (continued)
Morningstar Alternatives Fund
Long Contracts for Difference at October 31, 2023:
Over the Counter (continued) |
| | | | | | | | |
| Reference Company | The Fund Pays
Financing Rate | Expiration
Date | Counterparty | Notional
Amount | Pay
Frequency | Value | Unrealized
Appreciation
(Depreciation) |
| Johnson Controls International PLC | U.S. Fed Funds + 0.20% | 2/8/2024 | JPMorgan Chase | 6,068 | Monthly | $ 296,511 | $ (21,484) |
| Johnson Controls International PLC | U.S. Fed Funds + (0.15)% | 8/19/2026 | Goldman Sachs | 7,603 | Monthly | 371,954 | (25,640) |
| KB Home | U.S. Fed Funds | 1/24/2024 | Barclays | 337 | Monthly | 14,797 | 236 |
| KB Home | U.S. Fed Funds + (0.15)% | 8/19/2026 | Goldman Sachs | 3,541 | Monthly | 156,217 | 1,355 |
| Keysight Technologies, Inc. | U.S. Fed Funds + 0.20% | 2/8/2024 | JPMorgan Chase | 273 | Monthly | 33,210 | (2,597) |
| Kimberly-Clarke Corp. | U.S. Fed Funds | 1/24/2024 | Barclays | 2,411 | Monthly | 288,182 | (5,502) |
| Kimco Realty Corp. | U.S. Fed Funds | 1/24/2024 | Barclays | 999 | Monthly | 17,907 | 1,443 |
| Kinder Morgan, Inc. | U.S. Fed Funds + 0.20% | 2/8/2024 | JPMorgan Chase | 21,625 | Monthly | 349,303 | (14,733) |
| KLA Corp. | U.S. Fed Funds | 1/24/2024 | Barclays | 613 | Monthly | 287,665 | 4,116 |
| Kroger (The) Co. | U.S. Fed Funds + 0.20% | 2/8/2024 | JPMorgan Chase | 6,231 | Monthly | 281,850 | 3,822 |
| L Brands, Inc. | U.S. Fed Funds + 0.20% | 2/8/2024 | JPMorgan Chase | 8,898 | Monthly | 263,582 | (3,404) |
| L Brands, Inc. | U.S. Fed Funds + 0.20% | 8/19/2026 | Goldman Sachs | 10,251 | Monthly | 303,321 | (16,847) |
| L3Harris Technologies, Inc. | U.S. Fed Funds | 1/24/2024 | Barclays | 607 | Monthly | 108,691 | 1,330 |
| Lam Research Corp. | U.S. Fed Funds | 1/24/2024 | Barclays | 507 | Monthly | 297,963 | (5,547) |
| Las Vegas Sands Corp. | U.S. Fed Funds | 1/24/2024 | Barclays | 860 | Monthly | 40,816 | (129) |
| Lennar Corp. | U.S. Fed Funds + 0.20% | 2/8/2024 | JPMorgan Chase | 2,834 | Monthly | 301,503 | (10,185) |
| Lockheed Martin Corp. | U.S. Fed Funds | 1/24/2024 | Barclays | 815 | Monthly | 370,197 | 6,577 |
| Lowe's Cos., Inc. | U.S. Fed Funds | 1/24/2024 | Barclays | 2,224 | Monthly | 423,442 | 4,485 |
| Marathon Petroleum Corp. | U.S. Fed Funds + U.S. Fed Funds | 1/24/2024 | Barclays | 5,482 | Monthly | 472,217 | 4,326 |
| Marathon Petroleum Corp. | U.S. Fed Funds + 0.20% | 2/8/2024 | JPMorgan Chase | 1,646 | Monthly | 248,393 | 5,139 |
| Marriott International, Inc., Class A | U.S. Fed Funds + (0.15)% | 8/19/2026 | Goldman Sachs | 543 | Monthly | 102,335 | (420) |
| Marsh & McLennan Cos., Inc. | U.S. Fed Funds + (0.15)% | 8/19/2026 | Goldman Sachs | 1,766 | Monthly | 334,482 | (2,464) |
| Martin Marietta Materials, Inc. | U.S. Fed Funds | 1/24/2024 | Barclays | 351 | Monthly | 143,451 | (95) |
| Masco Corp. | U.S. Fed Funds | 1/24/2024 | Barclays | 772 | Monthly | 40,200 | 717 |
| Match Group, Inc. | U.S. Fed Funds + 0.20% | 8/19/2026 | Goldman Sachs | 4,557 | Monthly | 157,371 | (7,109) |
| McCormick & Co., Inc. (Non Voting) | U.S. Fed Funds | 1/24/2024 | Barclays | 3,211 | Monthly | 205,024 | 7,623 |
| Mcdonalds Corp. | U.S. Fed Funds | 1/24/2024 | Barclays | 800 | Monthly | 209,549 | 5,749 |
| Mcdonalds Corp. | U.S. Fed Funds + 0.20% | 2/8/2024 | JPMorgan Chase | 685 | Monthly | 179,077 | 7,990 |
| Mcdonalds Corp. | U.S. Fed Funds + (0.15)% | 8/19/2026 | Goldman Sachs | 1,178 | Monthly | 308,248 | 13,819 |
| McKesson Corp. | U.S. Fed Funds + 0.20% | 2/8/2024 | JPMorgan Chase | 809 | Monthly | 367,274 | 1,096 |
| Medtronic, PLC | U.S. Fed Funds | 1/24/2024 | Barclays | 748 | Monthly | 52,729 | (1,419) |
| Meta Platform Inc., Class A | U.S. Fed Funds + (0.15)% | 8/19/2026 | Goldman Sachs | 987 | Monthly | 296,765 | (17,750) |
| Mid-America Apartment Communities, Inc. | U.S. Fed Funds + 0.20% | 2/8/2024 | JPMorgan Chase | 2,515 | Monthly | 296,189 | (36,900) |
| Mohawk Industries, Inc. | U.S. Fed Funds | 1/24/2024 | Barclays | 162 | Monthly | 13,010 | 162 |
| Mondelez International, Inc., Class A | U.S. Fed Funds | 1/24/2024 | Barclays | 3,487 | Monthly | 230,589 | 7,456 |
| Moodys Corp. | U.S. Fed Funds + 0.20% | 8/19/2026 | Goldman Sachs | 300 | Monthly | 92,224 | (3,621) |
| Mosaic (The) Co. | U.S. Fed Funds | 1/24/2024 | Barclays | 8,690 | Monthly | 281,984 | (10,893) |
See accompanying Notes to Financial Statements
Morningstar Funds Trust October 31, 2023 (unaudited)
Schedule of Investments (continued)
Morningstar Alternatives Fund
Long Contracts for Difference at October 31, 2023:
Over the Counter (continued) |
| | | | | | | | |
| Reference Company | The Fund Pays
Financing Rate | Expiration
Date | Counterparty | Notional
Amount | Pay
Frequency | Value | Unrealized
Appreciation
(Depreciation) |
| Motorola Solutions, Inc. | U.S. Fed Funds | 1/24/2024 | Barclays | 761 | Monthly | $ 211,712 | $ (934) |
| Murphy Oil Corp. | U.S. Fed Funds + (0.15)% | 8/19/2026 | Goldman Sachs | 8,141 | Monthly | 364,634 | (15,908) |
| National Oilwell Varco, Inc. | U.S. Fed Funds + 0.20% | 8/19/2026 | Goldman Sachs | 2,647 | Monthly | 52,726 | (1,538) |
| Newmont Corp. | U.S. Fed Funds + 0.20% | 2/8/2024 | JPMorgan Chase | 9,949 | Monthly | 371,970 | (11,699) |
| Newmont Corp. | U.S. Fed Funds + 0.20% | 8/19/2026 | Goldman Sachs | 7,873 | Monthly | 294,372 | (20,942) |
| Norfolk Southern Corp. | U.S. Fed Funds | 1/24/2024 | Barclays | 1,968 | Monthly | 375,145 | (10,301) |
| Northrop Grumman Corp. | U.S. Fed Funds + 0.20% | 8/19/2026 | Goldman Sachs | 772 | Monthly | 363,190 | (14,372) |
| Nucor Corp. | U.S. Fed Funds | 1/24/2024 | Barclays | 94 | Monthly | 13,882 | 47 |
| Nutrien ltd. | U.S. Fed Funds + (0.15)% | 8/19/2026 | Goldman Sachs | 4,422 | Monthly | 237,084 | (25,932) |
| NXP Semiconductors N.V. | U.S. Fed Funds | 1/24/2024 | Barclays | 287 | Monthly | 49,474 | (1,623) |
| Occidental Petroleum Corp. | U.S. Fed Funds | 1/24/2024 | Barclays | 5,866 | Monthly | 362,238 | (6,264) |
| Olin Corp. | U.S. Fed Funds + 0.20% | 2/8/2024 | JPMorgan Chase | 1,476 | Monthly | 62,841 | (7,284) |
| Olin Corp. | U.S. Fed Funds + 0.20% | 8/19/2026 | Goldman Sachs | 1,494 | Monthly | 63,638 | (8,029) |
| Omnicom Group, Inc. | U.S. Fed Funds + 0.20% | 2/8/2024 | JPMorgan Chase | 4,960 | Monthly | 370,258 | (1,246) |
| Oracle Corp. | U.S. Fed Funds | 1/24/2024 | Barclays | 2,627 | Monthly | 277,463 | 5,148 |
| O'Reilly Automotive, Inc. | U.S. Fed Funds + 0.20% | 8/19/2026 | Goldman Sachs | 1 | Monthly | 929 | (17) |
| Otis Worldwide Corp. | U.S. Fed Funds + 0.20% | 2/8/2024 | JPMorgan Chase | 432 | Monthly | 33,301 | (493) |
| Ovintiv, Inc. | U.S. Fed Funds | 1/24/2024 | Barclays | 7,522 | Monthly | 360,716 | (8,614) |
| Owens Corning | U.S. Fed Funds | 1/24/2024 | Barclays | 777 | Monthly | 88,051 | (2,861) |
| Packaging Corp. Of America | U.S. Fed Funds | 1/24/2024 | Barclays | 1,788 | Monthly | 274,429 | 13,701 |
| Packaging Corp. Of America | U.S. Fed Funds + 0.20% | 2/8/2024 | JPMorgan Chase | 2,555 | Monthly | 389,838 | (2,942) |
| Parker-Hannifin Corp. | U.S. Fed Funds + 0.20% | 8/19/2026 | Goldman Sachs | 788 | Monthly | 290,090 | (21,920) |
| PBF Energy, Inc., Class A | U.S. Fed Funds | 1/24/2024 | Barclays | 765 | Monthly | 36,871 | 771 |
| Pfizer, Inc. | U.S. Fed Funds + 0.20% | 2/8/2024 | JPMorgan Chase | 11,427 | Monthly | 348,877 | (1,849) |
| PPG Industries, Inc. | U.S. Fed Funds + 0.20% | 2/8/2024 | JPMorgan Chase | 2,407 | Monthly | 294,665 | (14,682) |
| Procter & Gamble (The) Co. | U.S. Fed Funds + (0.15)% | 8/19/2026 | Goldman Sachs | 302 | Monthly | 45,309 | 232 |
| Public Storage | U.S. Fed Funds | 1/24/2024 | Barclays | 4 | Monthly | 954 | (38) |
| Ralph Lauren Corp., Class A | U.S. Fed Funds + 0.20% | 8/19/2026 | Goldman Sachs | 2,692 | Monthly | 302,330 | 1,283 |
| Range Resources Corp. | U.S. Fed Funds + (0.15)% | 8/19/2026 | Goldman Sachs | 4,543 | Monthly | 162,475 | 3,197 |
| Royal Caribbean Cruises Ltd. | U.S. Fed Funds | 1/24/2024 | Barclays | 3,569 | Monthly | 302,134 | 12,046 |
| Royalty Pharma PLC, Class A | U.S. Fed Funds | 1/24/2024 | Barclays | 9,807 | Monthly | 263,267 | (5,249) |
| Salesforce.com, Inc. | U.S. Fed Funds | 1/24/2024 | Barclays | 1,439 | Monthly | 288,727 | (1,951) |
| SBA Communications Corp. | U.S. Fed Funds + 0.20% | 2/8/2024 | JPMorgan Chase | 1,415 | Monthly | 294,446 | 18,912 |
| Sherwin-Williams (The) Co. | U.S. Fed Funds + (0.15)% | 1/24/2024 | Barclays | 1,894 | Monthly | 450,834 | (442) |
| SM Energy Co. | U.S. Fed Funds + 0.20% | 2/8/2024 | JPMorgan Chase | 2,813 | Monthly | 113,078 | 1,543 |
| Southern Copper Corp. | U.S. Fed Funds + (0.15)% | 8/19/2026 | Goldman Sachs | 956 | Monthly | 67,668 | (1,133) |
| Southwestern Energy | U.S. Fed Funds + 0.20% | 8/19/2026 | Goldman Sachs | 3,638 | Monthly | 25,846 | 1,216 |
| Stanley Black & Decker, Inc. | U.S. Fed Funds + 0.20% | 8/19/2026 | Goldman Sachs | 2,160 | Monthly | 183,473 | 7,855 |
| Starbucks Corp. | U.S. Fed Funds | 1/24/2024 | Barclays | 81 | Monthly | 7,464 | (166) |
| Steel Dynamics, Inc. | U.S. Fed Funds | 1/24/2024 | Barclays | 2,873 | Monthly | 305,742 | 22,033 |
| Steris, PLC | U.S. Fed Funds | 1/24/2024 | Barclays | 2,437 | Monthly | 301,414 | (4,811) |
| Stryker Corp. | U.S. Fed Funds + 0.20% | 2/8/2024 | JPMorgan Chase | 953 | Monthly | 256,918 | 4,641 |
| Synchrony Financial | U.S. Fed Funds + 0.20% | 2/8/2024 | JPMorgan Chase | 9,554 | Monthly | 267,084 | (13,422) |
| Sysco Corp. | U.S. Fed Funds | 1/24/2024 | Barclays | 3,286 | Monthly | 218,290 | 4,700 |
See accompanying Notes to Financial Statements
Morningstar Funds Trust October 31, 2023 (unaudited)
Schedule of Investments (continued)
Morningstar Alternatives Fund
Long Contracts for Difference at October 31, 2023:
Over the Counter (continued) |
| | | | | | | | |
| Reference Company | The Fund Pays
Financing Rate | Expiration
Date | Counterparty | Notional
Amount | Pay
Frequency | Value | Unrealized
Appreciation
(Depreciation) |
| Tapestry, Inc. | U.S. Fed Funds | 1/24/2024 | Barclays | 6,896 | Monthly | $ 189,877 | $ (2,522) |
| Target Corp. | U.S. Fed Funds | 1/24/2024 | Barclays | 4,279 | Monthly | 473,684 | 11,730 |
| Tenet Healthcare Corp. | U.S. Fed Funds | 1/24/2024 | Barclays | 1,740 | Monthly | 93,325 | (1,784) |
| TJX (The) Cos., Inc. | U.S. Fed Funds + (0.15)% | 8/19/2026 | Goldman Sachs | 1,254 | Monthly | 110,188 | (2,303) |
| Toll Brothers, Inc. | U.S. Fed Funds | 1/24/2024 | Barclays | 5,201 | Monthly | 367,430 | 6,221 |
| Toll Brothers, Inc. | U.S. Fed Funds + (0.15)% | 8/19/2026 | Goldman Sachs | 4,258 | Monthly | 300,489 | (4,022) |
| Trane Technologies PLC | U.S. Fed Funds | 1/24/2024 | Barclays | 416 | Monthly | 79,111 | 1,141 |
| Travelers (The) Cos., Inc. | U.S. Fed Funds + 0.20% | 8/19/2026 | Goldman Sachs | 1,836 | Monthly | 306,805 | (1,000) |
| Twilio Inc. | U.S. Fed Funds | 1/24/2024 | Barclays | 245 | Monthly | 12,559 | (1) |
| Uber Technologies, Inc. | U.S. Fed Funds + (0.15)% | 8/19/2026 | Goldman Sachs | 6,077 | Monthly | 262,406 | (9,297) |
| UDR, Inc. | U.S. Fed Funds + 0.20% | 2/8/2024 | JPMorgan Chase | 5,553 | Monthly | 176,070 | (24,512) |
| Union Pacific Corp. | U.S. Fed Funds | 1/24/2024 | Barclays | 1,807 | Monthly | 374,806 | (616) |
| United Parcel Service, Inc., Class B | U.S. Fed Funds | 1/24/2024 | Barclays | 1,533 | Monthly | 216,405 | (3,101) |
| United States Steel Corp. | U.S. Fed Funds + 0.20% | 2/8/2024 | JPMorgan Chase | 5,435 | Monthly | 183,642 | 4,233 |
| Universal Health Services, Inc., Class B | U.S. Fed Funds + 0.20% | 8/19/2026 | Goldman Sachs | 43 | Monthly | 5,297 | (125) |
| Valero Energy Corp. | U.S. Fed Funds | 1/24/2024 | Barclays | 2,869 | Monthly | 364,018 | (11,046) |
| Valero Energy Corp. | U.S. Fed Funds + 0.20% | 8/19/2026 | Goldman Sachs | 2,335 | Monthly | 296,145 | (2,185) |
| VeriSign, Inc. | U.S. Fed Funds + 0.20% | 8/19/2026 | Goldman Sachs | 1,250 | Monthly | 249,048 | (14,927) |
| Vistra Operations Co. LLC | U.S. Fed Funds + (0.15)% | 8/19/2026 | Goldman Sachs | 8,912 | Monthly | 291,090 | 3,004 |
| Vulcan Materials Co. | U.S. Fed Funds | 1/24/2024 | Barclays | 569 | Monthly | 111,697 | (3,526) |
| W.P. Carey, Inc. | U.S. Fed Funds | 1/24/2024 | Barclays | 5,208 | Monthly | 279,169 | 4,204 |
| Walmart, Inc. | U.S. Fed Funds + (0.15)% | 8/19/2026 | Goldman Sachs | 1,202 | Monthly | 196,373 | 546 |
| Waste Connections, Inc. | U.S. Fed Funds + 0.20% | 8/19/2026 | Goldman Sachs | 501 | Monthly | 64,840 | (1,945) |
| Weyerhaeuser Co. | U.S. Fed Funds | 1/24/2024 | Barclays | 9,269 | Monthly | 265,682 | (1,636) |
| Workday, Inc. | U.S. Fed Funds | 8/19/2026 | Goldman Sachs | 181 | Monthly | 38,242 | (786) |
| Yum Brands, Inc. | U.S. Fed Funds + (0.15)% | 8/19/2026 | Goldman Sachs | 5,350 | Monthly | 645,571 | 9,172 |
| Zimmer Biomet Holdings, Inc. | U.S. Fed Funds | 1/24/2024 | Barclays | 347 | Monthly | 36,197 | (294) |
| Zoetis , Inc. | U.S. Fed Funds | 1/24/2024 | Barclays | 1,844 | Monthly | 289,296 | (13,355) |
| ZoomInfo Technologies, Inc. | U.S. Fed Funds | 8/19/2026 | Goldman Sachs | 3,835 | Monthly | 49,570 | (16,200) |
| Total (Cost $50,582,879) | | | | 912,299 | | $49,643,187 | $(939,692) |
Short Contracts for Difference at October 31, 2023:
Over the Counter |
| | | | | | | | |
| Reference Company | The Fund Receives
Financing Rate | Expiration
Date | Counterparty | Notional
Amount | Pay
Frequency | Value | Unrealized
Appreciation
(Depreciation) |
| Advance Drainage Systems, Inc. | U.S. Fed Funds + (0.15)% | 8/19/2026 | Goldman Sachs | 2,678 | Monthly | $ (285,523) | $ 28,598 |
| Advanced Auto Parts, Inc. | U.S. Fed Funds | 1/24/2024 | Barclays | 2,840 | Monthly | (146,847) | (9,249) |
| Advanced Micro Devices, Inc. | U.S. Fed Funds | 1/24/2024 | Barclays | 3,793 | Monthly | (373,314) | 94 |
See accompanying Notes to Financial Statements
Morningstar Funds Trust October 31, 2023 (unaudited)
Schedule of Investments (continued)
Morningstar Alternatives Fund
Short Contracts for Difference at October 31, 2023:
Over the Counter (continued) |
| | | | | | | | |
| Reference Company | The Fund Receives
Financing Rate | Expiration
Date | Counterparty | Notional
Amount | Pay
Frequency | Value | Unrealized
Appreciation
(Depreciation) |
| AES (The) Corp. | U.S. Fed Funds + (0.15)% | 2/8/2024 | JPMorgan Chase | 26,573 | Monthly | $ (394,231) | $ (54,461) |
| Aflac, Inc. | U.S. Fed Funds | 1/24/2024 | Barclays | 906 | Monthly | (70,724) | (761) |
| Air Products & Chemicals, Inc. | U.S. Fed Funds | 1/24/2024 | Barclays | 198 | Monthly | (55,890) | (1,173) |
| Allstate Corp. | U.S. Fed Funds + (0.15)% | 2/8/2024 | JPMorgan Chase | 473 | Monthly | (60,587) | (1,277) |
| Ally Financial, Inc. | U.S. Fed Funds + (0.15)% | 2/8/2024 | JPMorgan Chase | 485 | Monthly | (11,710) | 230 |
| Ally Financial, Inc. | U.S. Fed Funds + (0.15)% | 8/19/2026 | Goldman Sachs | 15,697 | Monthly | (378,455) | 14,068 |
| Amcor, PLC | U.S. Fed Funds | 1/24/2024 | Barclays | 22,678 | Monthly | (201,442) | (9,813) |
| American Airlines Group, Inc. | U.S. Fed Funds + (0.15)% | 2/8/2024 | JPMorgan Chase | 18,048 | Monthly | (199,923) | 20,187 |
| AmerisourceBergen Corp. | U.S. Fed Funds + (0.15)% | 2/8/2024 | JPMorgan Chase | 674 | Monthly | (124,768) | 1,600 |
| Amgen, Inc. | U.S. Fed Funds | 1/24/2024 | Barclays | 816 | Monthly | (208,293) | 14,524 |
| Apollo Global Management, Inc. | U.S. Fed Funds + (0.15)% | 8/19/2026 | Goldman Sachs | 1,619 | Monthly | (125,111) | 16,146 |
| Aramark Services, Inc. | U.S. Fed Funds | 1/24/2024 | Barclays | 6,245 | Monthly | (168,134) | (1,547) |
| Arthur J Gallagher & Co. | U.S. Fed Funds | 1/24/2024 | Barclays | 1,295 | Monthly | (304,723) | (9,207) |
| Avantor, Inc. | U.S. Fed Funds | 1/24/2024 | Barclays | 16,036 | Monthly | (279,249) | 45,588 |
| Avery Dennison Corp. | U.S. Fed Funds + (0.15)% | 2/8/2024 | JPMorgan Chase | 1,555 | Monthly | (269,791) | 17,433 |
| Avis Budget Group, Inc. | U.S. Fed Funds + (0.15)% | 2/8/2024 | JPMorgan Chase | 2,284 | Monthly | (370,718) | 37,940 |
| Ball Corp. | U.S. Fed Funds + (0.15)% | 1/24/2024 | Barclays | 7,956 | Monthly | (382,800) | (39,721) |
| Best Buy Co., Inc. | U.S. Fed Funds + (0.15)% | 8/19/2026 | Goldman Sachs | 5,177 | Monthly | (345,242) | 21,083 |
| Boeing (The) Co. | U.S. Fed Funds + (0.15)% | 8/19/2026 | Goldman Sachs | 2,031 | Monthly | (378,749) | (3,762) |
| Booz Allen Hamilton Holding Corp. | U.S. Fed Funds + (0.15)% | 8/19/2026 | Goldman Sachs | 2,490 | Monthly | (298,026) | 22,437 |
| Boston Properties, Inc. | U.S. Fed Funds + (0.15)% | 2/8/2024 | JPMorgan Chase | 281 | Monthly | (15,051) | 13 |
| Boston Scientific Corp. | U.S. Fed Funds | 1/24/2024 | Barclays | 6,894 | Monthly | (352,440) | (6,844) |
| Broadcom, Inc. | U.S. Fed Funds | 2/8/2024 | JPMorgan Chase | 54 | Monthly | (45,384) | 1,081 |
| Brookfield Asset Management, Inc. | U.S. Fed Funds | 1/24/2024 | Barclays | 4,298 | Monthly | (125,174) | 6,947 |
| Brown & Brown, Inc. | U.S. Fed Funds + (0.15)% | 8/19/2026 | Goldman Sachs | 4,277 | Monthly | (295,921) | 2,656 |
| Brown-Forman Corp., Class B | U.S. Fed Funds + (0.15)% | 2/8/2024 | JPMorgan Chase | 5,360 | Monthly | (300,170) | (79) |
| Builders FirstSource, Inc. | U.S. Fed Funds + (0.15)% | 2/8/2024 | JPMorgan Chase | 153 | Monthly | (16,552) | 1,600 |
| Bunge Ltd. | U.S. Fed Funds | 1/24/2024 | Barclays | 2,446 | Monthly | (258,927) | (10,804) |
| Caesars Entertainment, Inc. | U.S. Fed Funds + (0.15)% | 2/8/2024 | JPMorgan Chase | 2,237 | Monthly | (89,216) | 31 |
| Campbell Soup | U.S. Fed Funds | 1/24/2024 | Barclays | 8,886 | Monthly | (358,788) | (7,166) |
| Canadian Natural Resources Ltd. | U.S. Fed Funds | 1/24/2024 | Barclays | 10,655 | Monthly | (676,322) | 12,844 |
| Carnival Corp. | U.S. Fed Funds + (0.15)% | 8/19/2026 | Goldman Sachs | 32,107 | Monthly | (367,433) | 7,547 |
| Cboe Global Markets, Inc. | U.S. Fed Funds | 1/24/2024 | Barclays | 441 | Monthly | (72,228) | (908) |
| CBRE Group, Inc., Class A | U.S. Fed Funds + (0.15)% | 8/19/2026 | Goldman Sachs | 4,327 | Monthly | (299,460) | 13,040 |
| CDW Corporation of Delaware | U.S. Fed Funds + (0.15)% | 2/8/2024 | JPMorgan Chase | 1,453 | Monthly | (290,313) | 12,086 |
| Celanese Corp. | U.S. Fed Funds | 1/24/2024 | Barclays | 2,565 | Monthly | (293,468) | (3,367) |
| Cenovus Energy, Inc. | U.S. Fed Funds + (0.15)% | 8/19/2026 | Goldman Sachs | 14,575 | Monthly | (277,074) | 29,147 |
| Centene Corp. | U.S. Fed Funds + (0.15)% | 8/19/2026 | Goldman Sachs | 4,267 | Monthly | (293,770) | 9,699 |
See accompanying Notes to Financial Statements
Morningstar Funds Trust October 31, 2023 (unaudited)
Schedule of Investments (continued)
Morningstar Alternatives Fund
Short Contracts for Difference at October 31, 2023:
Over the Counter (continued) |
| | | | | | | | |
| Reference Company | The Fund Receives
Financing Rate | Expiration
Date | Counterparty | Notional
Amount | Pay
Frequency | Value | Unrealized
Appreciation
(Depreciation) |
| CF Industries Holdings, Inc. | U.S. Fed Funds | 1/24/2024 | Barclays | 794 | Monthly | $ (63,291) | $ 443 |
| Charles River Laboratories International, Inc. | U.S. Fed Funds + (0.15)% | 8/19/2026 | Goldman Sachs | 1,659 | Monthly | (278,743) | 39,334 |
| Charter Communications, Inc., Class A | U.S. Fed Funds | 1/24/2024 | Barclays | 983 | Monthly | (395,632) | 22,563 |
| Charter Communications, Inc., Class A | U.S. Fed Funds + (0.15)% | 2/8/2024 | JPMorgan Chase | 795 | Monthly | (319,338) | 27,334 |
| Chubb Limited | U.S. Fed Funds | 2/8/2024 | JPMorgan Chase | 9 | Monthly | (1,331) | 564 |
| Cintas Corp. | U.S. Fed Funds + (0.15)% | 8/19/2026 | Goldman Sachs | 454 | Monthly | (230,034) | (1,271) |
| Coherent Corp. | U.S. Fed Funds + (0.15)% | 8/19/2026 | Goldman Sachs | 9,063 | Monthly | (267,689) | 39,909 |
| Comcast Corp., Class A | U.S. Fed Funds + (0.15)% | 8/19/2026 | Goldman Sachs | 3,682 | Monthly | (151,659) | 11,269 |
| ConocoPhillips | U.S. Fed Funds + (0.15)% | 8/19/2026 | Goldman Sachs | 2,455 | Monthly | (291,198) | 15,622 |
| Corteva, Inc. | U.S. Fed Funds | 1/24/2024 | Barclays | 6,183 | Monthly | (297,404) | 3,988 |
| Corteva, Inc. | U.S. Fed Funds + (0.15)% | 2/8/2024 | JPMorgan Chase | 7,555 | Monthly | (362,639) | 18,911 |
| Crocs, Inc. | U.S. Fed Funds | 1/24/2024 | Barclays | 2,960 | Monthly | (264,232) | (9,186) |
| Crown Holdings, Inc. | U.S. Fed Funds | 1/24/2024 | Barclays | 2,002 | Monthly | (161,213) | (7,019) |
| D.R. Horton, Inc. | U.S. Fed Funds | 1/24/2024 | Barclays | 1,170 | Monthly | (122,046) | (2,566) |
| Danaher Corp. | U.S. Fed Funds | 1/24/2024 | Barclays | 1,898 | Monthly | (364,130) | 21,995 |
| Danaher Corp. | U.S. Fed Funds + (0.15)% | 8/19/2026 | Goldman Sachs | 100 | Monthly | (19,161) | 1,884 |
| Deere & Co. | U.S. Fed Funds | 1/24/2024 | Barclays | 460 | Monthly | (167,918) | 3,786 |
| Delta Air Lines, Inc. | U.S. Fed Funds | 1/24/2024 | Barclays | 1,468 | Monthly | (45,669) | 188 |
| Dick's Sporting Goods, Inc. | U.S. Fed Funds + (0.15)% | 8/19/2026 | Goldman Sachs | 2,892 | Monthly | (308,702) | 10,632 |
| Discover Financial Services | U.S. Fed Funds | 1/24/2024 | Barclays | 3,668 | Monthly | (300,821) | 1,020 |
| Dollar General Corp. | U.S. Fed Funds + (0.15)% | 8/19/2026 | Goldman Sachs | 2,688 | Monthly | (319,408) | (14,132) |
| Dollar Tree, Inc. | U.S. Fed Funds + (0.15)% | 8/19/2026 | Goldman Sachs | 1,064 | Monthly | (118,041) | (514) |
| Dow, Inc. | U.S. Fed Funds + (0.15)% | 8/19/2026 | Goldman Sachs | 7,582 | Monthly | (365,826) | 14,323 |
| Eastman Chemical Co. | U.S. Fed Funds + (0.15)% | 8/19/2026 | Goldman Sachs | 3,283 | Monthly | (244,888) | (3,916) |
| Enbridge, Inc. | U.S. Fed Funds + (0.15)% | 2/8/2024 | JPMorgan Chase | 11,651 | Monthly | (372,333) | 4,160 |
| Entegris, Inc. | U.S. Fed Funds + (0.15)% | 8/19/2026 | Goldman Sachs | 3,411 | Monthly | (299,266) | 31,172 |
| Equinix, Inc. | U.S. Fed Funds | 1/24/2024 | Barclays | 33 | Monthly | (24,058) | (977) |
| Estee Lauder (The) Cos., Inc., Class A | U.S. Fed Funds + (0.15)% | 2/8/2024 | JPMorgan Chase | 2,252 | Monthly | (289,354) | 28,345 |
| Exxon Mobil Corp. | U.S. Fed Funds | 2/8/2024 | JPMorgan Chase | 327 | Monthly | (34,613) | 9 |
| FirstEnergy Corp. | U.S. Fed Funds | 1/24/2024 | Barclays | 808 | Monthly | (28,741) | (469) |
| FirstEnergy Corp. | U.S. Fed Funds + (0.15)% | 8/19/2026 | Goldman Sachs | 10,889 | Monthly | (386,912) | 6,834 |
| Fiserv, Inc. | U.S. Fed Funds | 1/24/2024 | Barclays | 2,890 | Monthly | (331,739) | (14,966) |
| FMC Corp. | U.S. Fed Funds | 1/24/2024 | Barclays | 5,301 | Monthly | (281,763) | 25,621 |
| Foot Locker, Inc. | U.S. Fed Funds | 1/24/2024 | Barclays | 15,088 | Monthly | (316,444) | (6,692) |
| Freeport-McMoRan, Inc. | U.S. Fed Funds + (0.15)% | 8/19/2026 | Goldman Sachs | 13,692 | Monthly | (461,621) | 27,844 |
| Gartner, Inc. | U.S. Fed Funds | 1/24/2024 | Barclays | 268 | Monthly | (88,908) | 2,890 |
| Gen Digital Inc. | U.S. Fed Funds + (0.15)% | 8/19/2026 | Goldman Sachs | 12,421 | Monthly | (206,528) | 10,840 |
| General Mills, Inc. | U.S. Fed Funds + (0.15)% | 8/19/2026 | Goldman Sachs | 2,966 | Monthly | (193,345) | (2,004) |
| General Motors Co. | U.S. Fed Funds | 1/24/2024 | Barclays | 6,867 | Monthly | (193,380) | 7,273 |
| Genuine Parts Co. | U.S. Fed Funds + (0.15)% | 8/19/2026 | Goldman Sachs | 1,271 | Monthly | (163,487) | 21,285 |
See accompanying Notes to Financial Statements
Morningstar Funds Trust October 31, 2023 (unaudited)
Schedule of Investments (continued)
Morningstar Alternatives Fund
Short Contracts for Difference at October 31, 2023:
Over the Counter (continued) |
| | | | | | | | |
| Reference Company | The Fund Receives
Financing Rate | Expiration
Date | Counterparty | Notional
Amount | Pay
Frequency | Value | Unrealized
Appreciation
(Depreciation) |
| Global Payments, Inc. | U.S. Fed Funds | 1/24/2024 | Barclays | 145 | Monthly | $ (15,388) | $ 385 |
| GoDaddy, Inc., Class A | U.S. Fed Funds + (0.15)% | 2/8/2024 | JPMorgan Chase | 3,502 | Monthly | (254,999) | 7,490 |
| Graphic Packaging Holding Company | U.S. Fed Funds + (0.15)% | 8/19/2026 | Goldman Sachs | 13,865 | Monthly | (297,687) | (3,610) |
| Hartford Financial Services Group (The), Inc. | U.S. Fed Funds | 1/24/2024 | Barclays | 152 | Monthly | (11,139) | (574) |
| Hilton Worldwide Finance LLC/Hilton Worldwide Finance Corp. | U.S. Fed Funds + (0.15)% | 2/8/2024 | JPMorgan Chase | 446 | Monthly | (67,392) | (634) |
| Hologic, Inc. | U.S. Fed Funds + (0.15)% | 8/19/2026 | Goldman Sachs | 4,437 | Monthly | (293,154) | 10,960 |
| Howmet Aerospace Inc. | U.S. Fed Funds + (0.15)% | 1/24/2024 | Barclays | 8,460 | Monthly | (372,784) | (4,385) |
| Intel Corp. | U.S. Fed Funds + (0.15)% | 8/19/2026 | Goldman Sachs | 2,337 | Monthly | (84,686) | 754 |
| International Business Machines Corp. | U.S. Fed Funds + (0.15)% | 1/24/2024 | Barclays | 2,637 | Monthly | (381,106) | (21,472) |
| International Business Machines Corp. | U.S. Fed Funds + (0.15)% | 8/19/2026 | Goldman Sachs | 2,155 | Monthly | (311,151) | (11,417) |
| International Flavors & Fragrances, Inc. | U.S. Fed Funds | 1/24/2024 | Barclays | 4,635 | Monthly | (316,544) | (16,381) |
| Intui, Inc. | U.S. Fed Funds | 1/24/2024 | Barclays | 489 | Monthly | (238,878) | 7,593 |
| Iron Mountain, Inc. | U.S. Fed Funds + (0.15)% | 1/24/2024 | Barclays | 11,263 | Monthly | (664,734) | 458 |
| Jabil, Inc. | U.S. Fed Funds + (0.15)% | 2/8/2024 | JPMorgan Chase | 1,161 | Monthly | (142,218) | 13,882 |
| Johnson & Johnson | U.S. Fed Funds + (0.15)% | 8/19/2026 | Goldman Sachs | 863 | Monthly | (127,221) | 8,727 |
| Keurig Dr Pepper, Inc. | U.S. Fed Funds | 1/24/2024 | Barclays | 549 | Monthly | (16,638) | (1,085) |
| KKR & Co., Inc. | U.S. Fed Funds + (0.15)% | 2/8/2024 | JPMorgan Chase | 1,808 | Monthly | (99,158) | 12,215 |
| Kohls Corp. | U.S. Fed Funds | 1/24/2024 | Barclays | 17,928 | Monthly | (403,101) | (21,818) |
| Kraft Heinz Foods Co. | U.S. Fed Funds | 1/24/2024 | Barclays | 11,869 | Monthly | (373,084) | (3,720) |
| Lamb Weston Holdings, Inc. | U.S. Fed Funds | 1/24/2024 | Barclays | 2,359 | Monthly | (211,663) | (6,029) |
| Lamb Weston Holdings, Inc. | U.S. Fed Funds + (5.00)% | 8/19/2026 | Goldman Sachs | 4,348 | Monthly | (389,755) | (21,740) |
| Leidos Holdings, Inc. | U.S. Fed Funds + (0.15)% | 8/19/2026 | Goldman Sachs | 1,676 | Monthly | (165,826) | (5,919) |
| Lennar Corp. | U.S. Fed Funds | 1/24/2024 | Barclays | 2,050 | Monthly | (218,509) | (2,644) |
| LIncoln National Corp. | U.S. Fed Funds + (0.15)% | 8/19/2026 | Goldman Sachs | 5,835 | Monthly | (126,882) | 6,832 |
| Macys, Inc. | U.S. Fed Funds + (0.15)% | 2/8/2024 | JPMorgan Chase | 21,747 | Monthly | (263,227) | (21,645) |
| Marriott International, Inc., Class A | U.S. Fed Funds | 2/8/2024 | JPMorgan Chase | 980 | Monthly | (184,203) | 6,338 |
| Medical Properties Trust, Inc. | U.S. Fed Funds + (0.29)% | 1/24/2024 | Barclays | 26,584 | Monthly | (126,969) | (4,682) |
| Medical Properties Trust, Inc. | U.S. Fed Funds + (0.45)% | 2/8/2024 | JPMorgan Chase | 16,073 | Monthly | (76,604) | 5,850 |
| Merck & Co., Inc. | U.S. Fed Funds + (0.15)% | 8/19/2026 | Goldman Sachs | 2,706 | Monthly | (277,459) | 3,714 |
| Metlife, Inc. | U.S. Fed Funds + (0.15)% | 2/8/2024 | JPMorgan Chase | 6,253 | Monthly | (374,170) | 12,110 |
| Metlife, Inc. | U.S. Fed Funds | 8/19/2026 | Goldman Sachs | 4,780 | Monthly | (286,287) | 16,526 |
| MGIC Investment Corp. | U.S. Fed Funds + (0.15)% | 1/24/2024 | Barclays | 3,636 | Monthly | (61,178) | (857) |
| MGIC Investment Corp. | U.S. Fed Funds + (0.15)% | 8/19/2026 | Goldman Sachs | 5,643 | Monthly | (94,843) | 3,909 |
| MGM Resorts International | U.S. Fed Funds + (0.15)% | 8/19/2026 | Goldman Sachs | 9,195 | Monthly | (320,521) | 16,552 |
| Micron Technology, Inc. | U.S. Fed Funds + (0.15)% | 8/19/2026 | Goldman Sachs | 4,345 | Monthly | (289,989) | 10,164 |
See accompanying Notes to Financial Statements
Morningstar Funds Trust October 31, 2023 (unaudited)
Schedule of Investments (continued)
Morningstar Alternatives Fund
Short Contracts for Difference at October 31, 2023:
Over the Counter (continued) |
| | | | | | | | |
| Reference Company | The Fund Receives
Financing Rate | Expiration
Date | Counterparty | Notional
Amount | Pay
Frequency | Value | Unrealized
Appreciation
(Depreciation) |
| Molina Healthcare, Inc. | U.S. Fed Funds + (0.15)% | 8/19/2026 | Goldman Sachs | 904 | Monthly | $ (300,385) | $ 21,195 |
| Murphy Oil USA, Inc. | U.S. Fed Funds + (0.15)% | 8/19/2026 | Goldman Sachs | 320 | Monthly | (115,844) | 806 |
| Netflix, Inc. | U.S. Fed Funds + 20.00% | 8/19/2026 | Goldman Sachs | 62 | Monthly | (25,558) | (539) |
| NextEra Energy, Inc. | U.S. Fed Funds + (7.50)% | 8/19/2026 | Goldman Sachs | 10,660 | Monthly | (620,379) | (40,688) |
| Nordstrom, Inc. | U.S. Fed Funds + (0.25)% | 1/24/2024 | Barclays | 1,638 | Monthly | (22,880) | (505) |
| Nordstrom, Inc. | U.S. Fed Funds + (0.57)% | 2/8/2024 | JPMorgan Chase | 20,588 | Monthly | (287,080) | 1,152 |
| Nordstrom, Inc. | U.S. Fed Funds + (0.45)% | 8/19/2026 | Goldman Sachs | 1,132 | Monthly | (15,797) | 187 |
| Norwegian Cruise Line Holdings Ltd. | U.S. Fed Funds | 1/24/2024 | Barclays | 21,767 | Monthly | (295,773) | 7,224 |
| NRG Energy, Inc. | U.S. Fed Funds + (0.15)% | 2/8/2024 | JPMorgan Chase | 7,640 | Monthly | (322,172) | (18,864) |
| NRG Energy, Inc. | U.S. Fed Funds + (9.21)% | 8/19/2026 | Goldman Sachs | 9,459 | Monthly | (399,557) | (6,630) |
| Onemain Holdings, Inc. | U.S. Fed Funds + (0.15)% | 8/19/2026 | Goldman Sachs | 5,802 | Monthly | (208,046) | 16,201 |
| Option Care Health, Inc. | U.S. Fed Funds + (0.15)% | 2/8/2024 | JPMorgan Chase | 1,241 | Monthly | (34,377) | 5,886 |
| Penn National Gaming, Inc. | U.S. Fed Funds | 1/24/2024 | Barclays | 1,009 | Monthly | (19,908) | (3) |
| Penn National Gaming, Inc. | U.S. Fed Funds + (0.45)% | 2/8/2024 | JPMorgan Chase | 1,958 | Monthly | (38,628) | (1,269) |
| Perkinelmer, Inc. | U.S. Fed Funds | 1/24/2024 | Barclays | 1,316 | Monthly | (108,915) | 25,685 |
| Permian Resources Corp. | U.S. Fed Funds | 1/24/2024 | Barclays | 8,217 | Monthly | (119,640) | 2,229 |
| Pfizer, Inc. | U.S. Fed Funds + (0.15)% | 8/19/2026 | Goldman Sachs | 9,822 | Monthly | (299,586) | 25,217 |
| Philip Morris International, Inc. | U.S. Fed Funds + (0.15)% | 8/19/2026 | Goldman Sachs | 3,380 | Monthly | (300,811) | 13,106 |
| Progressive Corp. | U.S. Fed Funds | 1/24/2024 | Barclays | 2,035 | Monthly | (321,446) | (9,114) |
| Prologis, Inc. | U.S. Fed Funds + (0.15)% | 2/8/2024 | JPMorgan Chase | 12 | Monthly | (928) | 385 |
| Prudential Financial, Inc. | U.S. Fed Funds + (0.15)% | 8/19/2026 | Goldman Sachs | 3,730 | Monthly | (340,457) | 15,225 |
| PTC Therapeutics, Inc. | U.S. Fed Funds + (0.15)% | 2/8/2024 | JPMorgan Chase | 130 | Monthly | (18,237) | (330) |
| PulteGroup, Inc. | U.S. Fed Funds + (0.15)% | 1/24/2024 | Barclays | 4,709 | Monthly | (346,249) | (13,935) |
| Quanta Services, Inc. | U.S. Fed Funds + (0.15)% | 2/8/2024 | JPMorgan Chase | 1,752 | Monthly | (291,973) | 11,572 |
| Quest Diagnostics, Inc. | U.S. Fed Funds + (0.15)% | 2/8/2024 | JPMorgan Chase | 2,228 | Monthly | (289,844) | (1,844) |
| Radian Group, Inc. | U.S. Fed Funds + (0.15)% | 2/8/2024 | JPMorgan Chase | 8,741 | Monthly | (220,827) | 12,383 |
| Radian Group, Inc. | U.S. Fed Funds + (0.15)% | 8/19/2026 | Goldman Sachs | 634 | Monthly | (16,034) | 894 |
| Raymond James Financial, Inc. | U.S. Fed Funds + (0.15)% | 8/19/2026 | Goldman Sachs | 3,138 | Monthly | (298,917) | 18,285 |
| Raytheon Technologies Corp. | U.S. Fed Funds + (0.15)% | 2/8/2024 | JPMorgan Chase | 4,654 | Monthly | (378,721) | (9,630) |
| Raytheon Technologies Corp. | U.S. Fed Funds + (0.15)% | 8/19/2026 | Goldman Sachs | 3,982 | Monthly | (323,602) | (29,111) |
| Royal Caribbean Cruises Ltd. | U.S. Fed Funds + (0.15)% | 8/19/2026 | Goldman Sachs | 4,569 | Monthly | (386,663) | (9,292) |
| Schlumberger Ltd. | U.S. Fed Funds + (0.15)% | 8/19/2026 | Goldman Sachs | 1,930 | Monthly | (106,882) | 7,856 |
| Seagate Technology, LLC | U.S. Fed Funds + (0.15)% | 2/8/2024 | JPMorgan Chase | 4,221 | Monthly | (287,576) | (2,634) |
| Seagate Technology, LLC | U.S. Fed Funds + (0.15)% | 8/19/2026 | Goldman Sachs | 269 | Monthly | (18,325) | 223 |
| Sealed Air Corp. | U.S. Fed Funds + (0.15)% | 8/19/2026 | Goldman Sachs | 12,797 | Monthly | (393,322) | (9,629) |
| Semiconductor Corp. | U.S. Fed Funds | 1/24/2024 | Barclays | 2,467 | Monthly | (154,508) | 16,832 |
| Sempra Energy | U.S. Fed Funds + (0.15)% | 8/19/2026 | Goldman Sachs | 287 | Monthly | (20,061) | 291 |
| Simon Property Group, Inc. | U.S. Fed Funds + (0.15)% | 8/19/2026 | Goldman Sachs | 3,463 | Monthly | (379,869) | (5,116) |
| Southern (The) Co. | U.S. Fed Funds + (0.15)% | 8/19/2026 | Goldman Sachs | 3,480 | Monthly | (233,787) | 452 |
| Southwest Airlines Co. | U.S. Fed Funds | 1/24/2024 | Barclays | 16,029 | Monthly | (356,011) | 31,510 |
See accompanying Notes to Financial Statements
Morningstar Funds Trust October 31, 2023 (unaudited)
Schedule of Investments (continued)
Morningstar Alternatives Fund
Short Contracts for Difference at October 31, 2023:
Over the Counter (continued) |
| | | | | | | | |
| Reference Company | The Fund Receives
Financing Rate | Expiration
Date | Counterparty | Notional
Amount | Pay
Frequency | Value | Unrealized
Appreciation
(Depreciation) |
| Spirit AeroSystems Holdings, Inc., Class A | U.S. Fed Funds | 1/24/2024 | Barclays | 14,197 | Monthly | $ (320,587) | $ (9,246) |
| Stellantis N.V. | U.S. Fed Funds | 1/24/2024 | Barclays | 8,211 | Monthly | (155,256) | 261 |
| Suncor Energy, Inc. | U.S. Fed Funds + (0.15)% | 1/24/2024 | Barclays | 7,890 | Monthly | (255,275) | 9,119 |
| Targa Resources Partners L.P./Targa Resources Partners Finance Corp. | U.S. Fed Funds + (0.15)% | 2/8/2024 | JPMorgan Chase | 1,615 | Monthly | (134,483) | 899 |
| TC Energy Corp. | U.S. Fed Funds + (0.15)% | 2/8/2024 | JPMorgan Chase | 10,610 | Monthly | (364,491) | (2,143) |
| Teck Resources Ltd., Class B | U.S. Fed Funds | 1/24/2024 | Barclays | 3,919 | Monthly | (138,379) | 12,598 |
| Teck Resources Ltd., Class B | U.S. Fed Funds + (0.15)% | 2/8/2024 | JPMorgan Chase | 5,015 | Monthly | (176,975) | 12,733 |
| Teledyne Technologies, Inc. | U.S. Fed Funds | 1/24/2024 | Barclays | 4 | Monthly | (1,497) | 43 |
| Tempur Sealy International, Inc. | U.S. Fed Funds | 1/24/2024 | Barclays | 7,773 | Monthly | (310,125) | (1,443) |
| Tesla, Inc. | U.S. Fed Funds + 10.00% | 8/19/2026 | Goldman Sachs | 1,853 | Monthly | (371,712) | 48,540 |
| Thermo Fisher Scientific, Inc. | U.S. Fed Funds + (0.15)% | 2/8/2024 | JPMorgan Chase | 658 | Monthly | (291,801) | 31,396 |
| T-Mobile US, Inc. | U.S. Fed Funds | 1/24/2024 | Barclays | 3,553 | Monthly | (510,713) | (21,323) |
| T-Mobile US, Inc. | U.S. Fed Funds + (0.15)% | 2/8/2024 | JPMorgan Chase | 1,362 | Monthly | (195,389) | (4,518) |
| TransDigm, Inc. | U.S. Fed Funds + (0.15)% | 2/8/2024 | JPMorgan Chase | 259 | Monthly | (213,832) | 10,737 |
| TransDigm, Inc. | U.S. Fed Funds + (0.15)% | 8/19/2026 | Goldman Sachs | 185 | Monthly | (152,898) | 6,926 |
| Transocean Ltd. | U.S. Fed Funds | 1/24/2024 | Barclays | 3,542 | Monthly | (23,448) | (257) |
| Tyson Foods, Inc., Class A | U.S. Fed Funds + (0.15)% | 8/19/2026 | Goldman Sachs | 14,100 | Monthly | (652,316) | 14,589 |
| United Airlines Holdings, Inc. | U.S. Fed Funds + (0.15)% | 8/19/2026 | Goldman Sachs | 10,789 | Monthly | (377,006) | 43,035 |
| United Rentals North America, Inc. | U.S. Fed Funds | 1/24/2024 | Barclays | 1,504 | Monthly | (610,558) | 4,428 |
| United States Steel Corp. | U.S. Fed Funds | 1/24/2024 | Barclays | 5,559 | Monthly | (188,244) | (12,246) |
| UnitedHealth Group, Inc. | U.S. Fed Funds | 1/24/2024 | Barclays | 551 | Monthly | (294,848) | (7,463) |
| UnitedHealth Group, Inc. | U.S. Fed Funds + (0.15)% | 8/19/2026 | Goldman Sachs | 491 | Monthly | (261,936) | 1,014 |
| US Foods Holding Corp. | U.S. Fed Funds + (0.15)% | 8/19/2026 | Goldman Sachs | 3,665 | Monthly | (142,515) | (6,797) |
| Verizon Communications, Inc. | U.S. Fed Funds | 1/24/2024 | Barclays | 11,516 | Monthly | (404,249) | (42,761) |
| VF Corp. | U.S. Fed Funds + (0.15)% | 8/19/2026 | Goldman Sachs | 17,095 | Monthly | (251,292) | 25,476 |
| ViacomCBS, Inc., Class B | U.S. Fed Funds + (0.25)% | 1/24/2024 | Barclays | 50,534 | Monthly | (549,155) | 15,942 |
| Viatris, Inc. | U.S. Fed Funds + (0.15)% | 2/8/2024 | JPMorgan Chase | 9,254 | Monthly | (82,104) | 7,289 |
| VICI Properties, Inc. | U.S. Fed Funds | 1/24/2024 | Barclays | 10,527 | Monthly | (293,456) | (6,280) |
| Walgreen Boots Alliance, Inc. | U.S. Fed Funds + (0.15)% | 8/19/2026 | Goldman Sachs | 13,910 | Monthly | (292,646) | 22,627 |
| Walt Disney (The) Co. | U.S. Fed Funds + (0.15)% | 8/19/2026 | Goldman Sachs | 5,847 | Monthly | (476,411) | 14,921 |
| Welltower, Inc. | U.S. Fed Funds | 1/24/2024 | Barclays | 2,905 | Monthly | (242,732) | (1,703) |
| Western Digital Corp. | U.S. Fed Funds | 1/24/2024 | Barclays | 6,050 | Monthly | (242,529) | 8,983 |
| Westinghouse Air Brake Technologies Corp. | U.S. Fed Funds | 1/24/2024 | Barclays | 720 | Monthly | (76,274) | (5,181) |
| Whirlpool Corp. | U.S. Fed Funds | 1/24/2024 | Barclays | 1,929 | Monthly | (201,484) | 44,656 |
| Williams (The) Cos., Inc. | U.S. Fed Funds | 1/24/2024 | Barclays | 11,200 | Monthly | (384,944) | 5,264 |
See accompanying Notes to Financial Statements
Morningstar Funds Trust October 31, 2023 (unaudited)
Schedule of Investments (continued)
Morningstar Alternatives Fund
Short Contracts for Difference at October 31, 2023:
Over the Counter (continued) |
| | | | | | | | |
| Reference Company | The Fund Receives
Financing Rate | Expiration
Date | Counterparty | Notional
Amount | Pay
Frequency | Value | Unrealized
Appreciation
(Depreciation) |
| Williams (The) Cos., Inc. | U.S. Fed Funds + (0.15)% | 2/8/2024 | JPMorgan Chase | 2,503 | Monthly | $ (85,856) | $ 147 |
| Wynn Resorts Finance LLC/Wynn Resourts Capital Corp. | U.S. Fed Funds + (0.15)% | 2/8/2024 | JPMorgan Chase | 3,388 | Monthly | (297,264) | 4,136 |
| Xcel Energy, Inc. | U.S. Fed Funds + (0.15)% | 2/8/2024 | JPMorgan Chase | 829 | Monthly | (49,118) | (354) |
| Xylem, Inc. | U.S. Fed Funds | 1/24/2024 | Barclays | 3,298 | Monthly | (308,243) | (12,608) |
| Total (Cost $46,831,961) | | | | 1,060,718 | | $(46,036,209) | $795,752 |
Credit Default Swap Contracts outstanding - Buy Protection as of October 31, 2023:
Centrally Cleared
| Reference Obligation | Fixed
Deal
Pay Rate | Maturity
Date | | | Notional
Amount | Value | Upfront
Premiums
Paid/
(Received) | Unrealized
Appreciation
(Depreciation) |
| Markit CDX North America High Yield Index Series 41 (Pay Quarterly) | 5.00% | 12/20/2028 | | USD | 955,000 | $ (520) | $ (1,472) | $952 |
| Total | | | | | | $(520) | $(1,472) | $952 |
Valuation Hierarchy
The following is a summary of the inputs used, as of October 31, 2023, in valuing the Fund's investments carried at fair value:
| Morningstar Alternatives Fund | Level 1 | Level 2 | Level 3 | Totals |
| Investments | | | | |
| Assets: | | | | |
| Asset-Backed Securities | $ — | $ 2,517,274 | $ — | $ 2,517,274 |
| Common Stocks | 65,451,018 | 4,050,571 | —* | 69,501,589 |
| Convertible Bonds | — | 63,655,165 | — | 63,655,165 |
| Convertible Preferred Stocks | 1,391,759 | 1,238,726 | — | 2,630,485 |
| Corporate Bonds | — | 42,502,840 | — | 42,502,840 |
| Foreign Issuer Bonds | — | 7,845,585 | — | 7,845,585 |
| Master Limited Partnerships | 1,687,484 | — | — | 1,687,484 |
| Mortgage-Backed Securities | — | 28,097,883 | — | 28,097,883 |
| Preferred Stocks | 4,199,769 | — | — | 4,199,769 |
| Rights | — | — | 257,655 | 257,655 |
| Investment Companies | 719,912 | — | — | 719,912 |
See accompanying Notes to Financial Statements
Morningstar Funds Trust October 31, 2023 (unaudited)
Schedule of Investments (continued)
Morningstar Alternatives Fund
| Morningstar Alternatives Fund | Level 1 | Level 2 | Level 3 | Totals |
| Short-Term Investments | $ 10,735,879 | $ 17,332,175 | $ — | $ 28,068,054 |
| Purchased Options | 3,870 | 2,340 | — | 6,210 |
| Total Assets – Investments at value | $ 84,189,691 | $167,242,559 | $257,655 | $251,689,905 |
| Liabilities: | | | | |
| Common Stocks | $(27,989,744) | $ — | $ — | $ (27,989,744) |
| Mortgage-Backed Securities | — | (115,635) | — | (115,635) |
| Rights | — | — | —* | — |
| Total Liabilities – Investments at value | $(27,989,744) | $ (115,635) | $ — | $ (28,105,379) |
| Net Investments | $ 56,199,947 | $167,126,924 | $257,655 | $223,584,526 |
| *Includes securities determined to have no value as of October 31, 2023. |
| Morningstar Alternatives Fund | Level 1 | Level 2 | Level 3 | Totals |
| Derivative Financial Instruments | | | | |
| Assets: | | | | |
| Futures Contracts | $1,435,684 | $ — | $— | $ 1,435,684 |
| Forward Foreign Currency Exchange Contracts | — | 380,261 | — | 380,261 |
| Contracts for Difference | — | 49,643,187 | — | 49,643,187 |
| Total Assets - Derivative Financial Instruments | $1,435,684 | $ 50,023,448 | $— | $ 51,459,132 |
| Liabilities: | | | | |
| Futures Contracts | $ (789,143) | $ — | $— | $ (789,143) |
| Forward Foreign Currency Exchange Contracts | — | (273,557) | — | (273,557) |
| Contracts for Difference | — | (46,036,209) | — | (46,036,209) |
| Swap Agreements | — | (520) | — | (520) |
| Total Liabilities - Derivative Financial Instruments | $ (789,143) | $(46,310,286) | $— | $(47,099,429) |
| Net Derivative Financial Instruments | $ 646,541 | $ 3,713,162 | $— | $ 4,359,703 |
See accompanying Notes to Financial Statements
Morningstar Funds Trust October 31, 2023 (unaudited)
Statements of Assets and Liabilities
| | Morningstar
U.S. Equity
Fund | Morningstar
International
Equity Fund | Morningstar
Global
Income Fund | Morningstar
Total Return
Bond Fund | Morningstar
Municipal
Bond Fund |
| Assets | | | | | |
| Investments in non-affiliates, at value* | $1,425,402,163 | $712,979,283 | $198,118,516 | $827,263,561 | $311,112,471 |
| Cash | 1,942 | — | — | — | 1,800 |
| Foreign currencies, at value | 57,787 | 976,857 | 279,371 | 805,666 | — |
| Due from broker | — | — | 1,479,648 | 7,770,871 | — |
| Receivable from Adviser | 51,907 | 69,999 | — | 137,036 | 25,647 |
| Receivable for: | | | | | |
| Dividends and interest | 1,231,211 | 1,530,413 | 1,481,743 | 4,603,256 | 4,169,577 |
| Securities lending income | 8,487 | 2,069 | 5,452 | 8,365 | — |
| Foreign tax reclaims | 149,996 | 1,414,152 | 449,447 | 24,862 | — |
| Investments sold | 1,137,993 | 1,515,220 | 924,028 | 72,380,140 | — |
| Fund shares sold | 1,078,236 | 644,559 | 40,688 | 549,697 | 181,160 |
| Variation margin on futures contracts | — | — | 24,096 | 109,777 | — |
| Variation margin on centrally cleared swap agreements | — | — | 3,037 | 154,902 | — |
| Unrealized appreciation on OTC swap agreements and contracts for differences | — | — | — | 6,123 | — |
| Unrealized appreciation on forward foreign currency exchange contracts | — | — | 35,233 | 90,561 | — |
| Upfront premiums paid on swap agreements | — | — | 57,038 | 304,390 | — |
| Prepaid expenses and other assets | 53,139 | 35,016 | 36,902 | 34,798 | 22,987 |
| Total assets | 1,429,172,861 | 719,167,568 | 202,935,199 | 914,244,005 | 315,513,642 |
| Liabilities | | | | | |
| Investments sold short, at value | — | — | — | 16,839,031 | — |
| Written options, at value | — | — | — | 969,161 | — |
| Due to broker | — | — | 505,613 | 4,013,087 | — |
| Unrealized depreciation on OTC swap agreements and contracts for differences | — | — | 58,731 | 16,973 | — |
| Unrealized depreciation on forward foreign currency exchange contracts | — | — | 49,014 | 78,128 | — |
| Payable for: | | | | | |
| Dividends on short sales | — | — | — | 58,036 | — |
| Investments purchased on a delayed-delivery basis | — | — | — | 122,606,451 | — |
| Investments purchased | 1,367,688 | 1,330,658 | 2,097,349 | 2,538,718 | 500,000 |
| Unrealized depreciation on unfunded loan commitments | — | — | 106 | — | — |
| Fund shares redeemed | 1,076,439 | 560,538 | 422,185 | 1,272,763 | 320,512 |
| Variation margin on futures contracts | — | — | 24,083 | 83,054 | — |
| Variation margin on centrally cleared swap agreements | — | — | 2,223 | 39,597 | — |
See accompanying Notes to Financial Statements
Morningstar Funds Trust October 31, 2023 (unaudited)
Statements of Assets and Liabilities (continued)
| | Morningstar
U.S. Equity
Fund | Morningstar
International
Equity Fund | Morningstar
Global
Income Fund | Morningstar
Total Return
Bond Fund | Morningstar
Municipal
Bond Fund |
| Deferred capital gains tax | — | 33,875 | — | — | — |
| Collateral for securities lending | 11,876,126 | 7,145,629 | 4,901,136 | 10,092,376 | — |
| Upfront premiums received from swap agreements | — | — | — | 111,240 | — |
| Accrued management fees | 818,324 | 510,716 | 58,793 | 284,553 | 118,867 |
| Accrued trustee fees | 13,788 | 6,581 | 1,843 | 7,012 | 2,912 |
| Accrued expenses | 264,157 | 231,272 | 101,376 | 281,667 | 97,898 |
| Total liabilities | 15,416,522 | 9,819,269 | 8,222,452 | 159,291,847 | 1,040,189 |
| Net assets | $1,413,756,339 | $709,348,299 | $194,712,747 | $ 754,952,158 | $314,473,453 |
| Analysis of net assets: | | | | | |
| Paid in capital | $1,252,462,287 | $758,622,488 | $233,331,400 | $ 957,947,979 | $352,702,865 |
| Distributable earnings (loss) | 161,294,052 | (49,274,189) | (38,618,653) | (202,995,821) | (38,229,412) |
| Net assets | $1,413,756,339 | $709,348,299 | $194,712,747 | $ 754,952,158 | $314,473,453 |
| Shares outstanding: | 131,535,697 | 77,209,190 | 22,928,609 | 90,978,333 | 33,405,519 |
| Net asset value, offering price and redemption price per share: | $ 10.75 | $ 9.19 | $ 8.49 | $ 8.30 | $ 9.41 |
| Investments in non-affiliates, at cost | $1,312,290,868 | $761,976,331 | $209,235,924 | $ 915,804,174 | $341,747,916 |
| Foreign currencies, at cost | $ 57,789 | $ 1,081,202 | $ 286,840 | $ 815,864 | $ — |
| Investments sold short proceeds | $ — | $ — | $ — | $ 16,920,494 | $ — |
| Written option premiums | $ — | $ — | $ — | $ 1,054,580 | $ — |
| *Market value of securities on loan | $ 63,640,880 | $ 14,845,033 | $ 6,410,992 | $ 22,852,570 | $ — |
See accompanying Notes to Financial Statements
Morningstar Funds Trust October 31, 2023 (unaudited)
Statements of Assets and Liabilities (continued)
| | Morningstar
Defensive
Bond Fund | Morningstar
Multisector
Bond Fund | Morningstar
Global Opportunistic
Equity Fund | Morningstar
Alternatives
Fund |
| Assets | | | | |
| Investments in non-affiliates, at value* | $129,371,857 | $164,980,825 | $271,110,726 | $251,689,905 |
| Cash | — | 38,189 | — | 30,032,931 |
| Foreign currencies, at value | — | 147,035 | 101,812 | 421,375 |
| Due from broker | — | 273,251 | — | 2,314,328 |
| Receivable from Adviser | 27,036 | 35,632 | — | 40,101 |
| Receivable for: | | | | |
| Dividends and interest | 310,314 | 2,506,192 | 355,170 | 1,380,435 |
| Securities lending income | 848 | — | 5,022 | — |
| Foreign tax reclaims | — | 89,851 | 54,463 | 10,595 |
| Investments sold | 1,409,525 | 2,225,941 | 1,986,164 | 8,516,448 |
| Fund shares sold | 27,628 | 128,628 | 241,337 | 100,213 |
| Variation margin on futures contracts | — | 344 | — | 31,593 |
| Variation margin on centrally cleared swap agreements | — | 12,077 | — | — |
| Unrealized appreciation on OTC swap agreements and contracts for differences | — | — | — | 1,933,908 |
| Unrealized appreciation on forward foreign currency exchange contracts | — | 87,050 | 268 | 380,261 |
| Prepaid expenses and other assets | 25,784 | 33,383 | 28,676 | 26,532 |
| Total assets | 131,172,992 | 170,558,398 | 273,883,638 | 296,878,625 |
| Liabilities | | | | |
| Investments sold short, at value | — | — | — | 28,105,379 |
| Written options, at value | — | 2,023 | — | — |
| Due to broker | — | 12,077 | — | 279,846 |
| Unrealized depreciation on OTC swap agreements and contracts for differences | — | — | — | 2,077,848 |
| Unrealized depreciation on forward foreign currency exchange contracts | — | 167,568 | 387 | 273,557 |
| Payable for: | | | | |
| Dividends on short sales | — | — | — | 15,340 |
| Investments purchased on a delayed-delivery basis | 358,444 | 122,813 | — | 3,849,125 |
| Investments purchased | 318,300 | 3,085,277 | 1,844,196 | 3,101,032 |
| Fund shares redeemed | 237,045 | 433,577 | 227,200 | 285,135 |
| Variation margin on futures contracts | — | 6,444 | — | 64,315 |
| Variation margin on centrally cleared swap agreements | — | — | — | 2,384 |
| Collateral for securities lending | 1,272,762 | — | 13,615,016 | — |
| Upfront premiums received from swap agreements | — | 11,470 | — | 1,472 |
| Accrued management fees | 39,952 | 86,760 | 105,007 | 188,909 |
| Accrued trustee fees | 1,189 | 1,539 | 2,630 | 2,339 |
| Accrued expenses | 71,991 | 113,989 | 49,897 | 217,758 |
| Total liabilities | 2,299,683 | 4,043,537 | 15,844,333 | 38,464,439 |
| Net assets | $128,873,309 | $166,514,861 | $258,039,305 | $258,414,186 |
| Analysis of net assets: | | | | |
| Paid in capital | $140,465,240 | $208,583,543 | $263,359,823 | $272,625,321 |
| Distributable earnings (loss) | (11,591,931) | (42,068,682) | (5,320,518) | (14,211,135) |
| Net assets | $128,873,309 | $166,514,861 | $258,039,305 | $258,414,186 |
See accompanying Notes to Financial Statements
Morningstar Funds Trust October 31, 2023 (unaudited)
Statements of Assets and Liabilities (continued)
| | Morningstar
Defensive
Bond Fund | Morningstar
Multisector
Bond Fund | Morningstar
Global Opportunistic
Equity Fund | Morningstar
Alternatives
Fund |
| Shares outstanding: | 13,721,458 | 20,170,690 | 27,435,734 | 25,933,309 |
| Net asset value, offering price and redemption price per share: | $ 9.39 | $ 8.26 | $ 9.41 | $ 9.96 |
| Investments in non-affiliates, at cost | $136,542,990 | $181,933,448 | $277,432,148 | $267,009,105 |
| Foreign currencies, at cost | $ — | $ 172,854 | $ 118,222 | $ 421,959 |
| Investments sold short proceeds | $ — | $ — | $ — | $ 29,299,869 |
| Written option premiums | $ — | $ 11,650 | $ — | $ — |
| *Market value of securities on loan | $ 1,839,705 | $ — | $ 18,028,544 | $ — |
See accompanying Notes to Financial Statements
Morningstar Funds Trust October 31, 2023 (unaudited)
| | Morningstar
U.S. Equity
Fund | Morningstar
International
Equity Fund | Morningstar
Global
Income Fund | Morningstar
Total Return
Bond Fund | Morningstar
Municipal
Bond Fund |
| Investment income | | | | | |
| Dividend income from non-affiliates (net of foreign withholding taxes) | $ 13,281,044 | $ 13,411,587 | $ 3,505,110 | $ 2,960,098 | $ 201,170 |
| Interest income (net of foreign withholding taxes) | 72,617 | 805 | 3,695,185 | 13,827,287 | 5,484,297 |
| Securities lending income, net | 91,076 | 16,397 | 35,787 | 48,821 | — |
| Total investment income | 13,444,737 | 13,428,789 | 7,236,082 | 16,836,206 | 5,685,467 |
| Expenses | | | | | |
| Management fees (Note 5) | 5,040,611 | 3,234,443 | 367,559 | 1,748,243 | 725,901 |
| Administration and custody fees | 370,018 | 353,692 | 126,476 | 505,693 | 90,226 |
| Transfer agent fees | 4,701 | 4,580 | 4,488 | 4,583 | 4,565 |
| Sub-accounting fees | 739,960 | 405,481 | 106,632 | 401,997 | 165,127 |
| Audit and tax fees | 29,608 | 42,054 | 38,149 | 51,048 | 26,748 |
| Legal fees | 94,999 | 49,723 | 13,323 | 49,891 | 20,687 |
| Trustees’ fees | 117,861 | 62,511 | 16,671 | 62,732 | 26,021 |
| Registration and filing fees | 22,462 | 18,280 | 12,632 | 21,433 | 14,207 |
| Printing and postage fees | 50,005 | 41,887 | 21,884 | 34,803 | 11,489 |
| Dividend and interest on securities sold short | — | — | — | 40,398 | — |
| Other expenses | 70,754 | 41,959 | 24,040 | 48,932 | 21,640 |
| Total expenses | 6,540,979 | 4,254,610 | 731,854 | 2,969,753 | 1,106,611 |
| Less waiver of management fees (Note 5) | (250,767) | (417,623) | — | (834,166) | (144,370) |
| Net expenses | 6,290,212 | 3,836,987 | 731,854 | 2,135,587 | 962,241 |
| Net investment income | 7,154,525 | 9,591,802 | 6,504,228 | 14,700,619 | 4,723,226 |
| Realized and unrealized gains (losses) | | | | | |
| Net realized gains (losses) on: | | | | | |
| Investments | 39,192,108 | 1,678,105 1 | (1,864,301) | (19,543,749) | (2,889,219) |
| Investments sold short | — | — | — | 176,250 | — |
| Swap agreements | — | — | 59,533 | (993,951) | — |
| Futures contracts | — | — | (2,158,029) | (9,023,797) | — |
| Written options contracts | — | — | 38,177 | (112,614) | — |
| Forward foreign currency exchange contracts | — | 121,560 | (60,202) | (165,679) | — |
| Foreign currency transactions | (9,294) | (204,306) | (54,390) | (66,818) | — |
| Net realized gains (losses) | 39,182,814 | 1,595,359 | (4,039,212) | (29,730,358) | (2,889,219) |
| Net change in unrealized appreciation (depreciation) on: | | | | | |
| Investments | (38,069,395) | (68,394,846) 2 | (8,427,484) | (39,334,922) | (12,460,392) |
| Investments sold short | — | — | — | 82,882 | — |
| Swap agreements | — | — | 196,440 | 2,073,144 | — |
| Futures contracts | — | — | (1,920,670) | (2,490,126) | — |
| Written options contracts | — | — | (12,524) | (54,936) | — |
| Forward foreign currency exchange contracts | — | — | 57,208 | 59,690 | — |
See accompanying Notes to Financial Statements
Morningstar Funds Trust October 31, 2023 (unaudited)
Statements of Operations (continued)
| | Morningstar
U.S. Equity
Fund | Morningstar
International
Equity Fund | Morningstar
Global
Income Fund | Morningstar
Total Return
Bond Fund | Morningstar
Municipal
Bond Fund |
| Foreign currency transactions | (2,212) | (110,643) | (10,454) | 4,297 | — |
| Net change in unrealized appreciation (depreciation) | (38,071,607) | (68,505,489) | (10,117,484) | (39,659,971) | (12,460,392) |
| Net realized and unrealized gains (losses) | 1,111,207 | (66,910,130) | (14,156,696) | (69,390,329) | (15,349,611) |
| Net increase (decrease) in net assets resulting from operations | $ 8,265,732 | $(57,318,328) | $ (7,652,468) | $(54,689,710) | $(10,626,385) |
| Foreign withholding taxes on dividend income | $ 76,418 | $ 1,319,927 | $ 257,881 | $ 1,070 | $ — |
| Foreign withholding taxes on interest income | $ — | $ — | $ — | $ — | $ — |
| | |
| 1 | Net of foreign capital gains taxes (refunded)/paid of $(29,360). |
| 2 | Net of change in deferred foreign capital gains tax expense of $18,946. |
See accompanying Notes to Financial Statements
Morningstar Funds Trust October 31, 2023 (unaudited)
Statements of Operations (continued)
| | Morningstar
Defensive
Bond Fund | Morningstar
Multisector
Bond Fund | Morningstar
Global Opportunistic
Equity Fund | Morningstar
Alternatives
Fund |
| Investment income | | | | |
| Dividend income from non-affiliates (net of foreign withholding taxes) | $ 1,143,347 | $ 105,758 | $ 3,501,669 | $ 1,062,729 |
| Interest income (net of foreign withholding taxes) | 2,002,654 | 5,697,643 | 124 | 5,046,438 |
| Securities lending income, net | 8,212 | — | 35,100 | — |
| Total investment income | 3,154,213 | 5,803,401 | 3,536,893 | 6,109,167 |
| Expenses | | | | |
| Management fees (Note 5) | 242,536 | 533,197 | 615,778 | 1,148,222 |
| Administration and custody fees | 60,695 | 114,389 | 85,686 | 382,035 |
| Transfer agent fees | 4,577 | 4,588 | 4,576 | 4,582 |
| Sub-accounting fees | 67,762 | 87,376 | 118,721 | 139,509 |
| Audit and tax fees | 32,958 | 48,414 | 18,395 | 42,074 |
| Legal fees | 8,437 | 10,998 | 16,358 | 16,998 |
| Trustees’ fees | 10,600 | 13,785 | 19,929 | 21,586 |
| Registration and filing fees | 13,134 | 13,298 | 13,107 | 15,761 |
| Printing and postage fees | 12,889 | 28,428 | 28,019 | 33,735 |
| Dividend and interest on securities sold short | — | — | — | 280,929 |
| Other expenses | 13,550 | 22,630 | 17,674 | 26,781 |
| Total expenses | 467,138 | 877,103 | 938,243 | 2,112,212 |
| Less waiver of management fees (Note 5) | (143,757) | (183,690) | — | (243,854) |
| Net expenses | 323,381 | 693,413 | 938,243 | 1,868,358 |
| Net investment income | 2,830,832 | 5,109,988 | 2,598,650 | 4,240,809 |
| Realized and unrealized gains (losses) | | | | |
| Net realized gains (losses) on: | | | | |
| Investments | (2,076,624) | (2,930,475) | (1,815,996) | (702,744) |
| Investments sold short | — | — | — | 592,589 |
| Swap agreements | — | (15,997) | — | 1,316,750 |
| Futures contracts | — | 136,948 | — | 769,140 |
| Written options contracts | — | 9,544 | — | 45,284 |
| Forward foreign currency exchange contracts | — | (225,189) | 137,008 | 117,364 |
| Foreign currency transactions | — | 26,705 | 110,360 | (21,946) |
| Net realized gains (losses) | (2,076,624) | (2,998,464) | (1,568,628) | 2,116,437 |
| Net change in unrealized appreciation (depreciation) on: | | | | |
| Investments | 668,603 | (7,451,774) | (12,209,108) | (3,603,377) |
| Investments sold short | — | — | — | 8,266 |
| Swap agreements | — | 12,077 | — | 547,050 |
| Futures contracts | — | 263,221 | — | 1,591,449 |
| Written options contracts | — | 9,627 | — | (57,501) |
| Forward foreign currency exchange contracts | — | (103,655) | 40,191 | 259,121 |
| Foreign currency transactions | — | (40,064) | 6,074 | (8,692) |
| Net change in unrealized appreciation (depreciation) | 668,603 | (7,310,568) | (12,162,843) | (1,263,684) |
| Net realized and unrealized gains (losses) | (1,408,021) | (10,309,032) | (13,731,471) | 852,753 |
| Net increase (decrease) in net assets resulting from operations | $ 1,422,811 | $ (5,199,044) | $(11,132,821) | $ 5,093,562 |
| Foreign withholding taxes on dividend income | $ — | $ 14,805 | $ 122,885 | $ 4,111 |
| Foreign withholding taxes on interest income | $ — | $ — | $ — | $ — |
See accompanying Notes to Financial Statements
Morningstar Funds Trust October 31, 2023 (unaudited)
Statements of Changes in Net Assets
| | Morningstar
U.S. Equity Fund | Morningstar
International Equity Fund |
| | Six Months Ended
October 31, 2023
(unaudited) | Year Ended
April 30, 2023 | Six Months Ended
October 31, 2023
(unaudited) | Year Ended
April 30, 2023 |
| Operations: | | | | |
| Net investment income | $ 7,154,525 | $ 13,977,813 | $ 9,591,802 | $ 19,550,459 |
| Net realized gains (losses) | 39,182,814 | 33,183,317 | 1,595,359 | (11,042,912) |
| Net change in unrealized appreciation (depreciation) | (38,071,607) | (8,619,394) | (68,505,489) | 50,303,118 |
| Net increase (decrease) in net assets resulting from operations | 8,265,732 | 38,541,736 | (57,318,328) | 58,810,665 |
| Distributions paid from: | | | | |
| Distributable earnings | — | (122,368,733) | — | (28,222,108) |
| Total distributions paid | — | (122,368,733) | — | (28,222,108) |
| Capital share transactions: | | | | |
| Proceeds from shares sold | 101,173,141 | 210,902,774 | 58,260,025 | 108,253,119 |
| Reinvestment of dividends | — | 122,368,733 | — | 28,222,108 |
| Payments for shares redeemed | (154,608,712) | (280,417,166) | (95,573,999) | (275,002,951) |
| Net increase (decrease) in net assets from capital share transactions | (53,435,571) | 52,854,341 | (37,313,974) | (138,527,724) |
| Total increase (decrease) in net assets | (45,169,839) | (30,972,656) | (94,632,302) | (107,939,167) |
| Net assets: | | | | |
| Beginning of period | 1,458,926,178 | 1,489,898,834 | 803,980,601 | 911,919,768 |
| End of period | $1,413,756,339 | $1,458,926,178 | $709,348,299 | $ 803,980,601 |
| Capital share transactions | | | | |
| Shares sold | 9,070,231 | 19,809,277 | 5,909,002 | 11,756,238 |
| Shares from reinvested dividends | — | 12,325,143 | — | 3,108,151 |
| Shares redeemed | (13,830,697) | (26,228,031) | (9,603,409) | (29,254,436) |
| Net increase (decrease) | (4,760,466) | 5,906,389 | (3,694,407) | (14,390,047) |
See accompanying Notes to Financial Statements
Morningstar Funds Trust October 31, 2023 (unaudited)
Statements of Changes in Net Assets (continued)
| | Morningstar
Global Income Fund | Morningstar
Total Return Bond Fund |
| | Six Months Ended
October 31, 2023
(unaudited) | Year Ended
April 30, 2023 | Six Months Ended
October 31, 2023
(unaudited) | Year Ended
April 30, 2023 |
| Operations: | | | | |
| Net investment income | $ 6,504,228 | $ 12,517,215 | $ 14,700,619 | $ 22,675,268 |
| Net realized gains (losses) | (4,039,212) | (16,566,026) | (29,730,358) | (58,471,204) |
| Net change in unrealized appreciation (depreciation) | (10,117,484) | 6,534,428 | (39,659,971) | 27,090,040 |
| Net increase (decrease) in net assets resulting from operations | (7,652,468) | 2,485,617 | (54,689,710) | (8,705,896) |
| Distributions paid from: | | | | |
| Distributable earnings | (7,236,505) | (19,352,530) | (14,521,843) | (22,208,256) |
| Total distributions paid | (7,236,505) | (19,352,530) | (14,521,843) | (22,208,256) |
| Capital share transactions: | | | | |
| Proceeds from shares sold | 12,029,180 | 26,263,775 | 73,449,879 | 166,265,015 |
| Reinvestment of dividends | 7,236,506 | 19,352,489 | 14,521,844 | 22,207,983 |
| Payments for shares redeemed | (24,392,987) | (60,980,034) | (76,422,859) | (174,157,657) |
| Net increase (decrease) in net assets from capital share transactions | (5,127,301) | (15,363,770) | 11,548,864 | 14,315,341 |
| Total increase (decrease) in net assets | (20,016,274) | (32,230,683) | (57,662,689) | (16,598,811) |
| Net assets: | | | | |
| Beginning of period | 214,729,021 | 246,959,704 | 812,614,847 | 829,213,658 |
| End of period | $194,712,747 | $214,729,021 | $754,952,158 | $ 812,614,847 |
| Capital share transactions | | | | |
| Shares sold | 1,348,809 | 2,856,138 | 8,404,522 | 18,397,389 |
| Shares from reinvested dividends | 811,257 | 2,131,637 | 1,673,441 | 2,478,205 |
| Shares redeemed | (2,730,869) | (6,638,807) | (8,760,105) | (19,247,263) |
| Net increase (decrease) | (570,803) | (1,651,032) | 1,317,858 | 1,628,331 |
See accompanying Notes to Financial Statements
Morningstar Funds Trust October 31, 2023 (unaudited)
Statements of Changes in Net Assets (continued)
| | Morningstar
Municipal Bond Fund | Morningstar
Defensive Bond Fund |
| | Six Months Ended
October 31, 2023
(unaudited) | Year Ended
April 30, 2023 | Six Months Ended
October 31, 2023
(unaudited) | Year Ended
April 30, 2023 |
| Operations: | | | | |
| Net investment income | $ 4,723,226 | $ 8,082,300 | $ 2,830,832 | $ 4,125,804 |
| Net realized gains (losses) | (2,889,219) | (4,095,158) | (2,076,624) | (1,661,588) |
| Net change in unrealized appreciation (depreciation) | (12,460,392) | 995,239 | 668,603 | (1,727,687) |
| Net increase (decrease) in net assets resulting from operations | (10,626,385) | 4,982,381 | 1,422,811 | 736,529 |
| Distributions paid from: | | | | |
| Distributable earnings | (4,716,862) | (8,029,279) | (2,802,515) | (3,670,466) |
| Total distributions paid | (4,716,862) | (8,029,279) | (2,802,515) | (3,670,466) |
| Capital share transactions: | | | | |
| Proceeds from shares sold | 34,966,804 | 54,677,480 | 11,743,812 | 36,381,030 |
| Reinvestment of dividends | 4,716,862 | 8,029,187 | 2,802,515 | 3,670,466 |
| Payments for shares redeemed | (40,605,106) | (110,891,451) | (19,021,278) | (46,306,485) |
| Net increase (decrease) in net assets from capital share transactions | (921,440) | (48,184,784) | (4,474,951) | (6,254,989) |
| Total increase (decrease) in net assets | (16,264,687) | (51,231,682) | (5,854,655) | (9,188,926) |
| Net assets: | | | | |
| Beginning of period | 330,738,140 | 381,969,822 | 134,727,964 | 143,916,890 |
| End of period | $314,473,453 | $ 330,738,140 | $128,873,309 | $134,727,964 |
| Capital share transactions | | | | |
| Shares sold | 3,574,100 | 5,544,927 | 1,242,578 | 3,840,070 |
| Shares from reinvested dividends | 486,555 | 818,905 | 297,375 | 388,482 |
| Shares redeemed | (4,170,055) | (11,272,498) | (2,015,194) | (4,882,636) |
| Net increase (decrease) | (109,400) | (4,908,666) | (475,241) | (654,084) |
See accompanying Notes to Financial Statements
Morningstar Funds Trust October 31, 2023 (unaudited)
Statements of Changes in Net Assets (continued)
| | Morningstar
Multisector Bond Fund | Morningstar
Global Opportunistic Equity Fund |
| | Six Months Ended
October 31, 2023
(unaudited) | Year Ended
April 30, 2023 | Six Months Ended
October 31, 2023
(unaudited) | Year Ended
April 30, 2023 |
| Operations: | | | | |
| Net investment income | $ 5,109,988 | $ 8,592,585 | $ 2,598,650 | $ 4,280,767 |
| Net realized gains (losses) | (2,998,464) | (13,531,145) | (1,568,628) | 1,953,386 |
| Net change in unrealized appreciation (depreciation) | (7,310,568) | 5,371,792 | (12,162,843) | 4,453,185 |
| Net increase (decrease) in net assets resulting from operations | (5,199,044) | 433,232 | (11,132,821) | 10,687,338 |
| Distributions paid from: | | | | |
| Distributable earnings | (5,212,869) | (4,767,523) | — | (5,851,851) |
| Total distributions paid | (5,212,869) | (4,767,523) | — | (5,851,851) |
| Capital share transactions: | | | | |
| Proceeds from shares sold | 15,404,031 | 44,978,679 | 62,164,473 | 67,581,311 |
| Reinvestment of dividends | 5,212,869 | 4,767,479 | — | 5,851,850 |
| Payments for shares redeemed | (19,941,769) | (41,436,492) | (25,946,964) | (45,535,119) |
| Net increase (decrease) in net assets from capital share transactions | 675,131 | 8,309,666 | 36,217,509 | 27,898,042 |
| Total increase (decrease) in net assets | (9,736,782) | 3,975,375 | 25,084,688 | 32,733,529 |
| Net assets: | | | | |
| Beginning of period | 176,251,643 | 172,276,268 | 232,954,617 | 200,221,088 |
| End of period | $166,514,861 | $176,251,643 | $258,039,305 | $232,954,617 |
| Capital share transactions | | | | |
| Shares sold | 1,787,757 | 5,186,619 | 6,212,021 | 7,165,593 |
| Shares from reinvested dividends | 606,258 | 549,926 | — | 640,324 |
| Shares redeemed | (2,317,140) | (4,786,819) | (2,612,525) | (4,882,657) |
| Net increase (decrease) | 76,875 | 949,726 | 3,599,496 | 2,923,260 |
See accompanying Notes to Financial Statements
Morningstar Funds Trust October 31, 2023 (unaudited)
Statements of Changes in Net Assets (continued)
| | Morningstar
Alternatives Fund |
| | Six Months Ended
October 31, 2023
(unaudited) | Year Ended
April 30, 2023 |
| Operations: | | |
| Net investment income | $ 4,240,809 | $ 6,334,536 |
| Net realized gains (losses) | 2,116,437 | 1,069,518 |
| Net change in unrealized appreciation (depreciation) | (1,263,684) | (6,683,214) |
| Net increase (decrease) in net assets resulting from operations | 5,093,562 | 720,840 |
| Distributions paid from: | | |
| Distributable earnings | — | (11,517,692) |
| Total distributions paid | — | (11,517,692) |
| Capital share transactions: | | |
| Proceeds from shares sold | 23,060,231 | 69,848,746 |
| Reinvestment of dividends | — | 11,517,691 |
| Payments for shares redeemed | (44,469,393) | (164,320,530) |
| Net increase (decrease) in net assets from capital share transactions | (21,409,162) | (82,954,093) |
| Total increase (decrease) in net assets | (16,315,600) | (93,750,945) |
| Net assets: | | |
| Beginning of period | 274,729,786 | 368,480,731 |
| End of period | $258,414,186 | $ 274,729,786 |
| Capital share transactions | | |
| Shares sold | 2,331,021 | 7,011,646 |
| Shares from reinvested dividends | — | 1,173,356 |
| Shares redeemed | (4,488,958) | (16,499,943) |
| Net increase (decrease) | (2,157,937) | (8,314,941) |
See accompanying Notes to Financial Statements
Morningstar Funds Trust October 31, 2023 (unaudited)
| Morningstar U.S. Equity Fund |
| | Six Months
Ended
October 31 | Year Ended
April 30 | Year Ended
April 30 | Year Ended
April 30 | Year Ended
April 30 | Since Inception1 |
| Selected per share data | 2023
(unaudited) | 2023 | 2022 | 2021 | 2020 | 2019 |
| Net asset value, beginning of period | $10.70 | $11.43 | $13.74 | $9.27 | $10.68 | $10.00 |
| Income (loss) from investment operations: | | | | | | |
| Net investment income2 | 0.05 | 0.11 | 0.12 | 0.14 | 0.13 | 0.05 |
| Net realized and unrealized gains (losses) | — | 0.13 | (0.36) | 4.59 | (1.31) | 0.64 |
| Total income (loss) from investment operations | 0.05 | 0.24 | (0.24) | 4.73 | (1.18) | 0.69 |
| Less distributions paid: | | | | | | |
| From net investment income | — | (0.07) | (0.13) | (0.14) | (0.09) | (0.01) |
| From realized gains | — | (0.90) | (1.94) | (0.12) | (0.14) | — |
| Total distributions paid | — | (0.97) | (2.07) | (0.26) | (0.23) | (0.01) |
| Net asset value, end of period | $10.75 | $10.70 | $11.43 | $13.74 | $9.27 | $10.68 |
| Total return3 | 0.47% | 2.79% | (3.11%) | 51.43% | (11.42%) | 6.98% |
| Supplemental data and ratios: | | | | | | |
| Net assets, end of period (millions) | $1,414 | $1,459 | $1,490 | $1,703 | $1,179 | $678 |
| Ratio to average net assets of:4, 5 | | | | | | |
| Total expenses before waivers/reimbursements | 0.87% | 0.87% | 0.86% | 0.87% | 0.93% | 1.08% |
| Total expenses after waivers/reimbursements | 0.84% | 0.84% | 0.83% | 0.81% | 0.81% | 0.82% |
| Net investment income, net of waivers/reimbursements | 0.95% | 0.99% | 0.89% | 1.19% | 1.25% | 0.98% 6 |
| Net investment income, before waivers/reimbursements | 0.92% | 0.96% | 0.86% | 1.13% | 1.13% | 0.72% 6 |
| Portfolio turnover rate7 | 35% | 53% | 61% | 68% | 58% | 20% |
| | |
| 1 | Commencement of operations was November 2, 2018. |
| 2 | Calculated using the average shares outstanding method. |
| 3 | Assumes investment at net asset value at the beginning of the period, reinvestment of all dividends and distributions, and a complete redemption of the investment at net asset value at the end of the period. The total return is not annualized for periods less than one year. |
| 4 | Ratios are annualized for periods less than one year. |
| 5 | Ratios do not include impact of the expenses of the underlying funds in which the fund invests. |
| 6 | As the Fund commenced investment operations on November 2, 2018, annualized net investment income ratios may not be reflective of actual amounts the Fund might obtain in a full year of operation. |
| 7 | Portfolio turnover rate is not annualized for periods less than one year. |
See accompanying Notes to Financial Statements
Morningstar Funds Trust October 31, 2023 (unaudited)
Financial Highlights (continued)
| Morningstar International Equity Fund |
| | Six Months
Ended
October 31 | Year Ended
April 30 | Year Ended
April 30 | Year Ended
April 30 | Year Ended
April 30 | Since Inception1 |
| Selected per share data | 2023
(unaudited) | 2023 | 2022 | 2021 | 2020 | 2019 |
| Net asset value, beginning of period | $9.94 | $9.57 | $12.72 | $8.76 | $10.79 | $10.00 |
| Income (loss) from investment operations: | | | | | | |
| Net investment income2 | 0.12 | 0.22 | 0.23 | 0.12 | 0.21 | 0.08 |
| Net realized and unrealized gains (losses) | (0.87) | 0.47 | (1.66) | 4.17 | (1.94) | 0.74 |
| Total income (loss) from investment operations | (0.75) | 0.69 | (1.43) | 4.29 | (1.73) | 0.82 |
| Less distributions paid: | | | | | | |
| From net investment income | — | (0.10) | (0.18) | (0.14) | (0.19) | (0.03) |
| From realized gains | — | (0.22) | (1.54) | (0.19) | (0.11) | — |
| Total distributions paid | — | (0.32) | (1.72) | (0.33) | (0.30) | (0.03) |
| Net asset value, end of period | $9.19 | $9.94 | $9.57 | $12.72 | $8.76 | $10.79 |
| Total return3 | (7.54%) | 7.61% | (12.77%) | 49.22% | (16.65%) | 8.19% |
| Supplemental data and ratios: | | | | | | |
| Net assets, end of period (millions) | $709 | $804 | $912 | $1,074 | $764 | $469 |
| Ratio to average net assets of:4, 5 | | | | | | |
| Total expenses before waivers/reimbursements | 1.09% | 1.08% | 1.06% | 1.08% | 1.14% | 1.29% |
| Total expenses after waivers/reimbursements | 0.98% | 0.99% | 0.98% | 0.89% | 0.92% | 0.94% |
| Net investment income, net of waivers/reimbursements | 2.46% | 2.33% | 1.89% | 1.09% | 2.08% | 1.66% 6 |
| Net investment income, before waivers/reimbursements | 2.35% | 2.24% | 1.81% | 0.90% | 1.86% | 1.31% 6 |
| Portfolio turnover rate7 | 14% | 21% | 67% | 41% | 36% | 19% |
| | |
| 1 | Commencement of operations was November 2, 2018. |
| 2 | Calculated using the average shares outstanding method. |
| 3 | Assumes investment at net asset value at the beginning of the period, reinvestment of all dividends and distributions, and a complete redemption of the investment at net asset value at the end of the period. The total return is not annualized for periods less than one year. |
| 4 | Ratios are annualized for periods less than one year. |
| 5 | Ratios do not include impact of the expenses of the underlying funds in which the fund invests. |
| 6 | As the Fund commenced investment operations on November 2, 2018, annualized net investment income ratios may not be reflective of actual amounts the Fund might obtain in a full year of operation. |
| 7 | Portfolio turnover rate is not annualized for periods less than one year. |
See accompanying Notes to Financial Statements
Morningstar Funds Trust October 31, 2023 (unaudited)
Financial Highlights (continued)
| Morningstar Global Income Fund |
| | Six Months
Ended
October 31 | Year Ended
April 30 | Year Ended
April 30 | Year Ended
April 30 | Year Ended
April 30 | Since Inception1 |
| Selected per share data | 2023
(unaudited) | 2023 | 2022 | 2021 | 2020 | 2019 |
| Net asset value, beginning of period | $9.14 | $9.82 | $11.62 | $9.54 | $10.58 | $10.00 |
| Income (loss) from investment operations: | | | | | | |
| Net investment income2 | 0.28 | 0.53 | 0.42 | 0.35 | 0.37 | 0.16 |
| Net realized and unrealized gains (losses) | (0.62) | (0.38) | (1.03) | 2.09 | (0.94) | 0.52 |
| Total income (loss) from investment operations | (0.34) | 0.15 | (0.61) | 2.44 | (0.57) | 0.68 |
| Less distributions paid: | | | | | | |
| From net investment income | (0.31) | (0.49) | (0.45) | (0.35) | (0.42) | (0.10) |
| From realized gains | — | (0.34) | (0.74) | (0.01) | (0.05) | — |
| Total distributions paid | (0.31) | (0.83) | (1.19) | (0.36) | (0.47) | (0.10) |
| Net asset value, end of period | $8.49 | $9.14 | $9.82 | $11.62 | $9.54 | $10.58 |
| Total return3 | (3.82%) | 1.88% | (6.00%) | 26.01% | (5.73%) | 6.85% |
| Supplemental data and ratios: | | | | | | |
| Net assets, end of period (millions) | $195 | $215 | $247 | $272 | $235 | $186 |
| Ratio to average net assets of:4, 5 | | | | | | |
| Total expenses before waivers/reimbursements | 0.70% | 0.73% | 0.62% | 0.62% | 0.64% | 0.90% |
| Total expenses after waivers/reimbursements | 0.70% | 0.73% | 0.62% | 0.61% | 0.58% | 0.58% |
| Net investment income, net of waivers/reimbursements | 6.19% | 5.73% | 3.76% | 3.28% | 3.52% | 3.15% 6 |
| Net investment income, before waivers/reimbursements | 6.19% | 5.73% | 3.76% | 3.27% | 3.46% | 2.83% 6 |
| Portfolio turnover rate7 | 25% | 63% | 138% | 59% | 62% | 27% |
| | |
| 1 | Commencement of operations was November 2, 2018. |
| 2 | Calculated using the average shares outstanding method. |
| 3 | Assumes investment at net asset value at the beginning of the period, reinvestment of all dividends and distributions, and a complete redemption of the investment at net asset value at the end of the period. The total return is not annualized for periods less than one year. |
| 4 | Ratios are annualized for periods less than one year. |
| 5 | Ratios do not include impact of the expenses of the underlying funds in which the fund invests. |
| 6 | As the Fund commenced investment operations on November 2, 2018, annualized net investment income ratios may not be reflective of actual amounts the Fund might obtain in a full year of operation. |
| 7 | Portfolio turnover rate is not annualized for periods less than one year. |
See accompanying Notes to Financial Statements
Morningstar Funds Trust October 31, 2023 (unaudited)
Financial Highlights (continued)
| Morningstar Total Return Bond Fund |
| | Six Months
Ended
October 31 | Year Ended
April 30 | Year Ended
April 30 | Year Ended
April 30 | Year Ended
April 30 | Since Inception1 |
| Selected per share data | 2023
(unaudited) | 2023 | 2022 | 2021 | 2020 | 2019 |
| Net asset value, beginning of period | $9.06 | $9.42 | $10.69 | $10.88 | $10.48 | $10.00 |
| Income (loss) from investment operations: | | | | | | |
| Net investment income2 | 0.16 | 0.26 | 0.61 | 0.16 | 0.26 | 0.15 |
| Net realized and unrealized gains (losses) | (0.76) | (0.36) | (1.65) | 0.17 | 0.68 | 0.45 |
| Total income (loss) from investment operations | (0.60) | (0.10) | (1.04) | 0.33 | 0.94 | 0.60 |
| Less distributions paid: | | | | | | |
| From net investment income | (0.16) | (0.26) | (0.17) | (0.21) | (0.28) | (0.12) |
| From realized gains | — | — | (0.06) | (0.31) | (0.26) | — |
| Total distributions paid | (0.16) | (0.26) | (0.23) | (0.52) | (0.54) | (0.12) |
| Net asset value, end of period | $8.30 | $9.06 | $9.42 | $10.69 | $10.88 | $10.48 |
| Total return3 | (6.68%) | (1.03%) | (9.97%) | 2.95% | 9.13% | 6.01% |
| Supplemental data and ratios: | | | | | | |
| Net assets, end of period (millions) | $755 | $813 | $829 | $833 | $519 | $415 |
| Ratio to average net assets of:4, 5 | | | | | | |
| Total expenses before waivers/reimbursements6 | 0.75% | 0.73% | 0.71% | 0.74% | 0.81% | 0.88% |
| Total expenses after waivers/reimbursements6 | 0.54% | 0.53% | 0.53% | 0.53% | 0.53% | 0.53% |
| Total expenses after waivers/reimbursements and excluding dividend and interest expense | 0.54% | 0.53% | 0.52% | 0.53% | 0.53% | 0.53% |
| Net investment income, net of waivers/reimbursements | 3.70% | 2.89% | 1.39% | 1.41% | 2.43% | 2.89% 7 |
| Net investment income, before waivers/reimbursements | 3.49% | 2.69% | 1.21% | 1.20% | 2.15% | 2.54% 7 |
| Portfolio turnover rate8 | 179% | 302% | 346% | 438% | 612% | 318% |
| | |
| 1 | Commencement of operations was November 2, 2018. |
| 2 | Calculated using the average shares outstanding method. |
| 3 | Assumes investment at net asset value at the beginning of the period, reinvestment of all dividends and distributions, and a complete redemption of the investment at net asset value at the end of the period. The total return is not annualized for periods less than one year. |
| 4 | Ratios are annualized for periods less than one year. |
| 5 | Ratios do not include impact of the expenses of the underlying funds in which the fund invests. |
| 6 | Expenses include dividend and interest expense of less than 0.01% for April 30, 2023, 0.01% for April 30, 2022 and less than 0.01% for April 30, 2021, April 30, 2020 and April 30, 2019, respectively. |
| 7 | As the Fund commenced investment operations on November 2, 2018, annualized net investment income ratios may not be reflective of actual amounts the Fund might obtain in a full year of operation. |
| 8 | Portfolio turnover rate is not annualized for periods less than one year. |
See accompanying Notes to Financial Statements
Morningstar Funds Trust October 31, 2023 (unaudited)
Financial Highlights (continued)
| Morningstar Municipal Bond Fund |
| | Six Months
Ended
October 31 | Year Ended
April 30 | Year Ended
April 30 | Year Ended
April 30 | Year Ended
April 30 | Since Inception1 |
| Selected per share data | 2023
(unaudited) | 2023 | 2022 | 2021 | 2020 | 2019 |
| Net asset value, beginning of period | $9.87 | $9.94 | $10.75 | $10.14 | $10.38 | $10.00 |
| Income (loss) from investment operations: | | | | | | |
| Net investment income2 | 0.14 | 0.23 | 0.18 | 0.21 | 0.23 | 0.12 |
| Net realized and unrealized gains (losses) | (0.46) | (0.07) | (0.81) | 0.61 | (0.21) | 0.36 |
| Total income (loss) from investment operations | (0.32) | 0.16 | (0.63) | 0.82 | 0.02 | 0.48 |
| Less distributions paid: | | | | | | |
| From net investment income | (0.14) | (0.23) | (0.18) | (0.21) | (0.23) | (0.10) |
| From realized gains | — | — | — 3 | — | (0.03) | — |
| Total distributions paid | (0.14) | (0.23) | (0.18) | (0.21) | (0.26) | (0.10) |
| Net asset value, end of period | $9.41 | $9.87 | $9.94 | $10.75 | $10.14 | $10.38 |
| Total return4 | (3.27%) | 1.67% | (5.93%) | 8.14% | 0.11% | 4.79% |
| Supplemental data and ratios: | | | | | | |
| Net assets, end of period (millions) | $314 | $331 | $382 | $417 | $340 | $105 |
| Ratio to average net assets of:5, 6 | | | | | | |
| Total expenses before waivers/reimbursements | 0.67% | 0.67% | 0.65% | 0.66% | 0.77% | 1.05% |
| Total expenses after waivers/reimbursements | 0.58% | 0.58% | 0.58% | 0.58% | 0.58% | 0.58% |
| Net investment income, net of waivers/reimbursements | 2.86% | 2.34% | 1.65% | 1.98% | 2.17% | 2.48% 7 |
| Net investment income, before waivers/reimbursements | 2.77% | 2.25% | 1.58% | 1.90% | 1.98% | 2.01% 7 |
| Portfolio turnover rate8 | 16% | 22% | 41% | 53% | 127% | 115% |
| | |
| 1 | Commencement of operations was November 2, 2018. |
| 2 | Calculated using the average shares outstanding method. |
| 3 | Rounds to less than 0.01. |
| 4 | Assumes investment at net asset value at the beginning of the period, reinvestment of all dividends and distributions, and a complete redemption of the investment at net asset value at the end of the period. The total return is not annualized for periods less than one year. |
| 5 | Ratios are annualized for periods less than one year. |
| 6 | Ratios do not include impact of the expenses of the underlying funds in which the fund invests. |
| 7 | As the Fund commenced investment operations on November 2, 2018, annualized net investment income ratios may not be reflective of actual amounts the Fund might obtain in a full year of operation. |
| 8 | Portfolio turnover rate is not annualized for periods less than one year. |
See accompanying Notes to Financial Statements
Morningstar Funds Trust October 31, 2023 (unaudited)
Financial Highlights (continued)
| Morningstar Defensive Bond Fund |
| | Six Months
Ended
October 31 | Year Ended
April 30 | Year Ended
April 30 | Year Ended
April 30 | Year Ended
April 30 | Since Inception1 |
| Selected per share data | 2023
(unaudited) | 2023 | 2022 | 2021 | 2020 | 2019 |
| Net asset value, beginning of period | $9.49 | $9.69 | $10.24 | $10.17 | $10.10 | $10.00 |
| Income (loss) from investment operations: | | | | | | |
| Net investment income2 | 0.20 | 0.29 | 0.20 | 0.20 | 0.20 | 0.11 |
| Net realized and unrealized gains (losses) | (0.10) | (0.23) | (0.46) | 0.16 | 0.13 | 0.08 |
| Total income (loss) from investment operations | 0.10 | 0.06 | (0.26) | 0.36 | 0.33 | 0.19 |
| Less distributions paid: | | | | | | |
| From net investment income | (0.20) | (0.26) | (0.19) | (0.19) | (0.23) | (0.09) |
| From realized gains | — | — | (0.08) | (0.10) | (0.03) | — |
| From return of capital | — | — | (0.02) | — | — | — |
| Total distributions paid | (0.20) | (0.26) | (0.29) | (0.29) | (0.26) | (0.09) |
| Net asset value, end of period | $9.39 | $9.49 | $9.69 | $10.24 | $10.17 | $10.10 |
| Total return3 | 1.06% | 0.63% | (2.61%) | 3.56% | 3.36% | 1.87% |
| Supplemental data and ratios: | | | | | | |
| Net assets, end of period (millions) | $129 | $135 | $144 | $201 | $183 | $156 |
| Ratio to average net assets of:4, 5 | | | | | | |
| Total expenses before waivers/reimbursements | 0.69% | 0.73% | 0.64% | 0.64% | 0.66% | 0.93% |
| Total expenses after waivers/reimbursements | 0.48% | 0.48% | 0.48% | 0.48% | 0.48% | 0.48% |
| Net investment income, net of waivers/reimbursements | 4.20% | 3.03% | 1.96% | 1.92% | 2.02% | 2.28% 6 |
| Net investment income, before waivers/reimbursements | 3.99% | 2.78% | 1.80% | 1.76% | 1.84% | 1.83% 6 |
| Portfolio turnover rate7 | 30% | 16% | 45% | 53% | 88% | 4% |
| | |
| 1 | Commencement of operations was November 2, 2018. |
| 2 | Calculated using the average shares outstanding method. |
| 3 | Assumes investment at net asset value at the beginning of the period, reinvestment of all dividends and distributions, and a complete redemption of the investment at net asset value at the end of the period. The total return is not annualized for periods less than one year. |
| 4 | Ratios are annualized for periods less than one year. |
| 5 | Ratios do not include impact of the expenses of the underlying funds in which the fund invests. |
| 6 | As the Fund commenced investment operations on November 2, 2018, annualized net investment income ratios may not be reflective of actual amounts the Fund might obtain in a full year of operation. |
| 7 | Portfolio turnover rate is not annualized for periods less than one year. |
See accompanying Notes to Financial Statements
Morningstar Funds Trust October 31, 2023 (unaudited)
Financial Highlights (continued)
| Morningstar Multisector Bond Fund |
| | Six Months
Ended
October 31 | Year Ended
April 30 | Year Ended
April 30 | Year Ended
April 30 | Year Ended
April 30 | Since Inception1 |
| Selected per share data | 2023
(unaudited) | 2023 | 2022 | 2021 | 2020 | 2019 |
| Net asset value, beginning of period | $8.77 | $9.00 | $10.52 | $9.39 | $10.28 | $10.00 |
| Income (loss) from investment operations: | | | | | | |
| Net investment income2 | 0.25 | 0.45 | 0.43 | 0.44 | 0.46 | 0.27 |
| Net realized and unrealized gains (losses) | (0.50) | (0.44) | (1.54) | 0.94 | (0.83) | 0.21 |
| Total income (loss) from investment operations | (0.25) | 0.01 | (1.11) | 1.38 | (0.37) | 0.48 |
| Less distributions paid: | | | | | | |
| From net investment income | (0.26) | (0.24) | (0.30) | (0.25) | (0.43) | (0.20) |
| From realized gains | — | — | (0.11) | — | (0.09) | — |
| Total distributions paid | (0.26) | (0.24) | (0.41) | (0.25) | (0.52) | (0.20) |
| Net asset value, end of period | $8.26 | $8.77 | $9.00 | $10.52 | $9.39 | $10.28 |
| Total return3 | (2.93%) | 0.23% | (10.95%) | 14.79% | (3.97%) | 4.86% |
| Supplemental data and ratios: | | | | | | |
| Net assets, end of period (millions) | $167 | $176 | $172 | $237 | $192 | $161 |
| Ratio to average net assets of:4, 5 | | | | | | |
| Total expenses before waivers/reimbursements | 1.00% | 1.04% | 0.92% | 0.91% | 0.98% | 1.18% |
| Total expenses after waivers/reimbursements | 0.79% | 0.80% | 0.79% | 0.79% | 0.79% | 0.80% |
| Net investment income, net of waivers/reimbursements | 5.83% | 5.14% | 4.25% | 4.31% | 4.52% | 5.41% 6 |
| Net investment income, before waivers/reimbursements | 5.62% | 4.90% | 4.12% | 4.19% | 4.33% | 5.03% 6 |
| Portfolio turnover rate7 | 71% | 131% | 97% | 127% | 138% | 53% |
| | |
| 1 | Commencement of operations was November 2, 2018. |
| 2 | Calculated using the average shares outstanding method. |
| 3 | Assumes investment at net asset value at the beginning of the period, reinvestment of all dividends and distributions, and a complete redemption of the investment at net asset value at the end of the period. The total return is not annualized for periods less than one year. |
| 4 | Ratios are annualized for periods less than one year. |
| 5 | Ratios do not include impact of the expenses of the underlying funds in which the fund invests. |
| 6 | As the Fund commenced investment operations on November 2, 2018, annualized net investment income ratios may not be reflective of actual amounts the Fund might obtain in a full year of operation. |
| 7 | Portfolio turnover rate is not annualized for periods less than one year. |
See accompanying Notes to Financial Statements
Morningstar Funds Trust October 31, 2023 (unaudited)
Financial Highlights (continued)
| Morningstar Global Opportunistic Equity Fund |
| | Six Months
Ended
October 31 | Year Ended
April 30 | Year Ended
April 30 | Year Ended
April 30 | Year Ended
April 30 | Since Inception1 |
| Selected per share data | 2023
(unaudited) | 2023 | 2022 | 2021 | 2020 | 2019 |
| Net asset value, beginning of period | $9.77 | $9.57 | $12.08 | $9.28 | $10.38 | $10.00 |
| Income (loss) from investment operations: | | | | | | |
| Net investment income2 | 0.10 | 0.20 | 0.21 | 0.14 | 0.23 | 0.12 |
| Net realized and unrealized gains (losses) | (0.46) | 0.27 | (0.43) | 2.99 | (0.91) | 0.37 |
| Total income (loss) from investment operations | (0.36) | 0.47 | (0.22) | 3.13 | (0.68) | 0.49 |
| Less distributions paid: | | | | | | |
| From net investment income | — | (0.12) | (0.26) | (0.23) | (0.21) | (0.11) |
| From realized gains | — | (0.15) | (2.03) | (0.10) | (0.21) | — |
| Total distributions paid | — | (0.27) | (2.29) | (0.33) | (0.42) | (0.11) |
| Net asset value, end of period | $9.41 | $9.77 | $9.57 | $12.08 | $9.28 | $10.38 |
| Total return3 | (3.68%) | 5.15% | (2.77%) | 34.01% | (7.07%) | 4.97% |
| Supplemental data and ratios: | | | | | | |
| Net assets, end of period (millions) | $258 | $233 | $200 | $211 | $138 | $56 |
| Ratio to average net assets of:4, 5 | | | | | | |
| Total expenses before waivers/reimbursements | 0.72% | 0.80% | 0.78% | 0.78% | 0.94% | 1.48% |
| Total expenses after waivers/reimbursements | 0.72% | 0.80% | 0.78% | 0.74% | 0.73% | 0.64% |
| Net investment income, net of waivers/reimbursements | 1.98% | 2.15% | 1.81% | 1.28% | 2.29% | 2.38% 6 |
| Net investment income, before waivers/reimbursements | 1.98% | 2.15% | 1.81% | 1.24% | 2.08% | 1.54% 6 |
| Portfolio turnover rate7 | 40% | 47% | 96% | 52% | 66% | 76% |
| | |
| 1 | Commencement of operations was November 2, 2018. |
| 2 | Calculated using the average shares outstanding method. |
| 3 | Assumes investment at net asset value at the beginning of the period, reinvestment of all dividends and distributions, and a complete redemption of the investment at net asset value at the end of the period. The total return is not annualized for periods less than one year. |
| 4 | Ratios are annualized for periods less than one year. |
| 5 | Ratios do not include impact of the expenses of the underlying funds in which the fund invests. |
| 6 | As the Fund commenced investment operations on November 2, 2018, annualized net investment income ratios may not be reflective of actual amounts the Fund might obtain in a full year of operation. |
| 7 | Portfolio turnover rate is not annualized for periods less than one year. |
See accompanying Notes to Financial Statements
Morningstar Funds Trust October 31, 2023 (unaudited)
Financial Highlights (continued)
| Morningstar Alternatives Fund |
| | Six Months
Ended
October 31 | Year Ended
April 30 | Year Ended
April 30 | Year Ended
April 30 | Year Ended
April 30 | Since Inception1 |
| Selected per share data | 2023
(unaudited) | 2023 | 2022 | 2021 | 2020 | 2019 |
| Net asset value, beginning of period | $9.78 | $10.12 | $10.71 | $10.12 | $10.10 | $10.00 |
| Income (loss) from investment operations: | | | | | | |
| Net investment income2 | 0.16 | 0.19 | 0.07 | 0.12 | 0.25 | 0.05 |
| Net realized and unrealized gains (losses) | 0.02 | (0.15) | (0.14) | 0.77 | (0.05) | 0.08 |
| Total income (loss) from investment operations | 0.18 | 0.04 | (0.07) | 0.89 | 0.20 | 0.13 |
| Less distributions paid: | | | | | | |
| From net investment income | — | (0.20) | (0.14) | (0.13) | (0.14) | (0.03) |
| From realized gains | — | (0.18) | (0.38) | (0.17) | (0.04) | — |
| Total distributions paid | — | (0.38) | (0.52) | (0.30) | (0.18) | (0.03) |
| Net asset value, end of period | $9.96 | $9.78 | $10.12 | $10.71 | $10.12 | $10.10 |
| Total return3 | 1.84% | 0.42% | (0.78%) | 8.92% | 1.94% | 1.26% |
| Supplemental data and ratios: | | | | | | |
| Net assets, end of period (millions) | $258 | $275 | $368 | $328 | $186 | $112 |
| Ratio to average net assets of:4, 5 | | | | | | |
| Total expenses before waivers/reimbursements6 | 1.46% | 1.44% | 1.45% | 1.68% | 1.48% | 1.91% |
| Total expenses after waivers/reimbursements6 | 1.28% | 1.31% | 1.31% | 1.26% | 1.13% | 0.96% |
| Total expenses after waivers/reimbursements and excluding dividend and interest expense | 0.21% | 1.16% | 1.15% | 1.12% | 0.87% | 0.77% |
| Net investment income, net of waivers/reimbursements | 3.14% | 1.91% | 0.63% | 1.14% | 2.45% | 1.08% 7 |
| Net investment income, before waivers/reimbursements | 2.96% | 1.78% | 0.49% | 0.72% | 2.10% | 0.13% 7 |
| Portfolio turnover rate8 | 107% | 358% | 433% | 372% | 154% | 103% |
| | |
| 1 | Commencement of operations was November 2, 2018. |
| 2 | Calculated using the average shares outstanding method. |
| 3 | Assumes investment at net asset value at the beginning of the period, reinvestment of all dividends and distributions, and a complete redemption of the investment at net asset value at the end of the period. The total return is not annualized for periods less than one year. |
| 4 | Ratios are annualized for periods less than one year. |
| 5 | Ratios do not include impact of the expenses of the underlying funds in which the fund invests. |
| 6 | Expenses include dividend and interest expense of 0.21%, 0.16%, 0.16%, 0.14%, 0.26%, and 0.19% for October 31, 2023, April 30, 2023, April 30, 2022, April 30, 2021, April 30, 2020, and April 30, 2019, respectively. |
| 7 | As the Fund commenced investment operations on November 2, 2018, annualized net investment income ratios may not be reflective of actual amounts the Fund might obtain in a full year of operation. |
| 8 | Portfolio turnover rate is not annualized for periods less than one year. |
See accompanying Notes to Financial Statements
Morningstar Funds Trust October 31, 2023 (unaudited)
Notes to Financial Statements
1. Organization
Morningstar Funds Trust (the "Trust") was organized as a Delaware statutory trust on March 1, 2017. The Trust is registered with the Securities and Exchange Commission (the “SEC”) as an open end management investment company under the Investment Company Act of 1940, as amended (the “1940 Act”). The Trust has authorized capital of unlimited shares of beneficial interest at no par value, which may be issued in one or more series of the Trust.
The Trust is currently authorized to offer shares in nine separate series which commenced operations on November 2, 2018 (each a "Fund" and collectively, the "Funds"):
| Morningstar U.S. Equity Fund | Morningstar Defensive Bond Fund |
| Morningstar International Equity Fund | Morningstar Multisector Bond Fund |
| Morningstar Global Income Fund | Morningstar Global Opportunistic Equity Fund |
| Morningstar Total Return Bond Fund | Morningstar Alternatives Fund |
| Morningstar Municipal Bond Fund | |
Each Fund represents a distinct portfolio with its own investment objectives and is treated as a separate legal entity. Each Fund is classified and operates as a diversified fund under the 1940 Act. Each Fund's shares are classified as Institutional shares. Morningstar Investment Management LLC (“MIM” or “Adviser”) serves as the investment adviser of each Fund.
The investment objective of each Fund is as follows:
| Morningstar Funds | Investment Objective |
| U.S. Equity Fund | Long-term capital appreciation |
| International Equity Fund | Long-term capital appreciation |
| Global Income Fund | Current income and long-term capital appreciation |
| Total Return Bond Fund | Total return maximization, income generation and capital preservation |
| Municipal Bond Fund | Income exempt from federal income taxes as well as capital preservation |
| Defensive Bond Fund | Capital preservation |
| Multisector Bond Fund | Total return through a combination of current income and capital appreciation |
| Global Opportunistic Equity Fund | Long-term capital appreciation over a full market cycle |
| Alternatives Fund | Long-term capital appreciation and low sensitivity to traditional U.S. asset classes |
2. Significant Accounting Policies
The following is a summary of significant accounting policies consistently followed by the Funds in the preparation of the financial statements. These policies are in conformity with accounting principles generally accepted in the United States of America ("U.S. GAAP").
The Trust follows accounting and reporting guidance under Financial Accounting Standards Board (“FASB”) Accounting Standards Codification Topic 946, Financial Services-Investment Companies.
Morningstar Funds Trust October 31, 2023 (unaudited)
Notes to Financial Statements (continued)
Use of Estimates: The preparation of financial statements in conformity with U.S. GAAP requires management to make estimates and assumptions that affect the reported amounts of assets and liabilities and disclosure of contingent assets and liabilities at the date of the financial statements and the reported amounts of revenues and expenses during the reporting period. Actual results could differ from those estimates and such differences could be material.
Valuation of Investments: All securities and other investments are valued at their estimated fair value, as described in Note 4.
Cash and Foreign Currencies: Cash comprises U.S. Dollar and foreign currency deposits held at a bank(s) or custodian bank(s) which may exceed insured limits. In the event of the financial institution’s insolvency, recovery of the Fund’s cash may be limited to the insurance afforded by Federal Deposit Insurance Corporation (FDIC) or Securities Investor Protection Corporation (SIPC).
Due to/from Brokers: Due to/from brokers represents cash balances and securities on deposit with, or cash balances owed to, the Funds’ prime brokers and counterparties. Cash held with brokers is not available for withdrawal upon demand, and is considered restricted as it is not available for use until it is returned to the Fund upon exiting the position to which the collateral relates. The Funds are subject to credit risk should the prime brokers or counterparties be unable to meet their obligations to the Funds.
| | Morningstar
Global
Income Fund | Morningstar
Total Return
Bond Fund | Morningstar
Multisector
Bond Fund | Morningstar
Alternatives
Fund |
| Assets | | | | |
| Cash collateral for derivatives | $ 658,971 | $5,724,643 | $150,859 | $1,492,070 |
| Deposits with broker for futures contracts | 820,677 | 2,046,228 | 122,392 | 822,258 |
| Due from broker | $1,479,648 | $7,770,871 | $273,251 | $2,314,328 |
| Liabilities | | | | |
| Cash collateral for derivatives | $ 505,613 | $3,935,067 | $ 12,077 | $ 273,000 |
| Deposits with broker for futures contracts | — | 78,020 | — | 6,846 |
| Due to broker | $ 505,613 | $4,013,087 | $ 12,077 | $ 279,846 |
Foreign Currency Translation: The books and records of the Funds are maintained in U.S. Dollars. The Funds’ assets and liabilities in foreign currencies are translated into U.S. Dollars at the prevailing exchange rate at the valuation date. Transactions denominated in foreign currencies are translated into U.S. Dollars at the prevailing exchange rate on the date of the transaction. The Funds’ income earned and expense incurred in foreign denominated currencies are translated into U.S. Dollars at the prevailing exchange rate on the date of such activity.
The Funds do not isolate that portion of the results of operations arising from changes in the foreign exchange rates on investments and derivatives from the fluctuations that result from changes in the market prices of investments and derivatives held or sold during the period. Accordingly, such foreign currency gains (losses) are
Morningstar Funds Trust October 31, 2023 (unaudited)
Notes to Financial Statements (continued)
included in the reported net realized gain (loss) from transactions in investment securities and derivatives and net change in unrealized appreciation (depreciation) on investment securities and derivatives on the Statements of Operations.
Realized gains (losses) from settlement of foreign currency and foreign currency transactions reported on the Statements of Operations arise from the disposition of foreign currency and a change between the amounts of dividends, interest and foreign withholding taxes recorded on the Funds’ books on the transaction date and the U.S. Dollar equivalent of the amounts actually received or paid. Changes in unrealized appreciation (depreciation) on foreign currency and foreign currency translations reported on the Statements of Operations arise from changes (due to the changes in the exchange rate) in the value of foreign currency and assets and liabilities (other than investments) denominated in foreign currencies, which are held at period end.
Investment Transactions and Investment Income: Investment transactions are accounted for as of trade date. Realized gains and losses on investment transactions are recorded on a specifically identified cost basis. Interest income is recorded on an accrual basis and includes the accretion of discounts and amortization of premiums using the effective yield method. In the case of a defaulted debt obligation, the accrual of interest income is halted when management becomes aware that the interest income is not collectible, and already accrued interest income may be written off. Dividend income (expense) net of foreign taxes withheld, if any, is recorded on the ex-dividend date or when a Fund first learns of the ex-date dividend notification. Withholding taxes on foreign dividends have been provided for in accordance with the Funds' understanding of the applicable country's tax rules and rates. Other non-cash dividends are recognized as investment income at the fair value of the assets received.
Expenses: Each Fund is charged for those expenses that are directly attributable to that Fund. Expenses incurred which do not specifically relate to an individual Fund generally are allocated among all Funds in the Trust in proportion to each Fund’s relative average net assets.
Federal Income Taxes: Each Fund’s policy is to comply with all sections of Subchapter M of the Internal Revenue Code of 1986, as amended ("Code"), necessary to qualify for federal income tax purposes as a regulated investment company and to distribute substantially all of its taxable income and capital gains to shareholders as required. No provision for federal income or excise taxes is thus required. Each Fund is treated as a separate entity for federal income tax purposes.
The Funds may be subject to taxes imposed by countries on securities sold or held in certain foreign jurisdictions. Such taxes are generally based on income and/or capital gains earned or repatriated. The Funds accrue such taxes when the related income is earned. Gains realized by the Funds on the sale of securities in certain countries are subject to non-U.S. taxes. The Funds record a liability based on unrealized gains to provide for potential non-U.S. taxes payable upon the sale of these securities. As of October 31, 2023, the International Equity Fund had non-U.S. taxes accrued in the amount of $33,875, which is included as payable for deferred capital gains tax in the Statements of Assets and Liabilities and net against the change in unrealized appreciation (depreciation) on investments on the Statements of Operations.
Morningstar Funds Trust October 31, 2023 (unaudited)
Notes to Financial Statements (continued)
Management evaluates tax positions taken or expected to be taken in the course of preparing the Funds' tax returns to determine whether the tax positions are “more-likely-than-not” of being sustained by the applicable tax authority. Tax positions deemed to meet the more-likely-than-not threshold would be recorded as a tax benefit or expense in the current year. The Funds are required to analyze all open tax years. Open tax years are those years that are open for examination by the relevant income taxing authority. The Funds have concluded that there is no tax liability/benefit resulting from uncertain income tax positions taken or expected to be taken. The Funds are not aware of any tax positions for which it is reasonably possible that the total amounts of unrecognized tax expense will materially change in the next twelve months. The Funds recognize interest and penalties, if any, related to unrecognized tax benefits as income tax expense on the Statements of Operations. The returns of the Funds for the prior three fiscal years as well as current year are open for examination. As of October 31, 2023, the Funds had no examinations in progress.
Distributions to Shareholders: Distributions to shareholders are recorded on the ex-dividend date. Distributions of net investment income, if any, are declared and paid as follows:
| Morningstar Funds | Frequency |
| U.S. Equity Fund | Annually |
| International Equity Fund | Annually |
| Global Income Fund | Monthly |
| Total Return Bond Fund | Monthly |
| Municipal Bond Fund | Monthly |
| Defensive Bond Fund | Monthly |
| Multisector Bond Fund | Monthly |
| Global Opportunistic Equity Fund | Annually |
| Alternatives Fund | Annually |
Distributions of net realized capital gains, if any, are declared and paid at least annually. Income and capital gain distributions will be determined in accordance with federal income tax regulations which may differ from U.S. GAAP. Differences may be permanent or temporary. Permanent differences are reclassified among capital accounts in the financial statements to reflect their tax character. Temporary differences arise when certain items of income, expense, gain, or loss are recognized in different periods for financial statement and tax purposes. These differences will reverse at some time in the future. Differences in classification may also result from the treatment of short-term gains as ordinary income for tax purposes. As a result, income dividends and capital gain distributions declared during a fiscal period may differ significantly from the net investment income (loss) and realized gain (loss) reported on the Funds’ financial statements presented under U.S. GAAP.
Indemnifications: Under the Trust’s organizational documents, its officers and trustees are indemnified against certain liabilities arising out of the performance of their duties to the Trust. In addition, in the normal course of business the Trust enters into contracts that provide general indemnifications to other parties.
3. Investment Types
The Funds may utilize the following types of investments described below to execute their investment strategy to the extent permitted by the Funds' investment policies.
Morningstar Funds Trust October 31, 2023 (unaudited)
Notes to Financial Statements (continued)
Borrowed Bond Agreements: Repurchase agreements may be referred to as borrowed bond agreements when entered into in connection with short sales of bonds. In a borrowed bond agreement, a Fund borrows a bond from a counterparty in exchange for cash collateral. The agreement contains a commitment that the security and the cash will be returned to the counterparty and a Fund at a mutually agreed upon date. Certain agreements have no stated maturity and can be terminated by either party at any time. Earnings on cash collateral and compensation to the lender of the bond are based on agreed upon rates between a Fund and the counterparty. The value of the underlying cash collateral approximates the market value and accrued interest of the borrowed bond. To the extent that a borrowed bond transaction exceeds one business day, the value of the cash collateral in the possession of the counterparty is monitored on a daily basis to ensure the adequacy of the collateral. As the market value of the borrowed bond changes, the cash collateral is periodically increased or decreased with a frequency and in amounts prescribed in the borrowed bond agreement. A Fund may also experience delays in gaining access to the collateral.
Collateralized Bond Obligations (CBOs), Collateralized Loan Obligations (CLOs), and Other Collateralized Debt Obligations (CDOs): A CBO is a trust which is often backed by a pool of high risk, below investment grade fixed-income securities, such as high-yield bonds, privately issued mortgage-related securities, commercial mortgage-related securities, trust preferred securities, or emerging-market debt. A CLO is a trust typically backed by a pool of loans, which may include senior secured loans, senior unsecured loans, and subordinate corporate loans, including loans that may be below investment grade. Other CDOs are trusts backed by other types of assets. The assets backing a CBO, CLO, or CDO trust may be referred to as “the collateral.” CBOs, CLOs and other CDOs may charge management fees and administrative expenses. The cash flows from the trust are split into two or more portions, called tranches, varying in risk and yield. Senior tranches can often be rated investment grade. CBO, CLO or other CDO tranches can experience substantial losses due to defaults, deterioration of protecting tranches, market participants’ perception of credit risk, as well as aversion to these securities generally. The risks of an investment in a CBO, CLO or other CDO often depend on the collateral securities and the particular tranche in which a Fund invests. These securities are often privately offered and not registered under securities laws. In addition to the normal risks associated with fixed-income securities (e.g., interest-rate risk and credit risk), CBOs, CLOs and other CDOs carry additional risks including the possibility that distributions from collateral securities will not be adequate to make interest or other payments, the possibility that the quality of the collateral may decline in value or default, the risk that a Fund may invest in CBOs, CLOs or other CDOs that are subordinate to other tranches, as well as risks related to the complexity of the security and its structure.
Federal, state and local government officials and representatives as well as certain private parties have proposed actions to assist homeowners who own or occupy property subject to mortgages. Certain of those proposals involve actions that would affect the mortgages that underlie or relate to certain mortgage-related securities, including securities or other instruments which a Fund may hold or in which they may invest. Some of those proposals include, among other things, lowering or forgiving principal balances; forbearing, lowering or eliminating interest payments; or utilizing eminent domain powers to seize mortgages, potentially for below market compensation. The prospective or actual implementation of one or more of these proposals may significantly and adversely affect the value and liquidity of securities held by a Fund and could cause the Fund’s net asset value ("NAV") to decline, potentially significantly. Uncertainty remains in the market concerning the resolution of these issues; the range of proposals and the potential implications of any implemented solution is impossible to predict.
Morningstar Funds Trust October 31, 2023 (unaudited)
Notes to Financial Statements (continued)
Convertible Securities and Warrants: Convertible securities are securities (such as debt securities or preferred stock) that may be converted into or exchanged for a specified amount of common stock of the same or different issuer within a particular period of time at a specified price or formula. Convertible securities also include corporate bonds, notes, and preferred stock. A convertible security entitles the holder to receive interest paid or accrued on debt or dividends paid on preferred stock until the convertible stock matures or is redeemed, converted or exchanged. While no investment is without some risk, investments in convertible securities generally entail less risk than an issuer’s common stock. However, any reduction in risk depends in large measure upon the degree to which the convertible security sells above its value as a fixed-income security. In addition to the general risks associated with equity securities, the market value of convertible securities is also affected by prevailing interest rates, the credit quality of the issuer, and any call provisions. While convertible securities generally offer lower interest or dividend yields than nonconvertible debt securities of similar quality, they do enable the investor to benefit from increases in the market price of the underlying common stock.
Warrants and similar rights are instruments that give a Fund the right to purchase certain securities from an issuer at a specific price (the strike price) for a limited period of time. The strike price of warrants typically is much lower than the current market price of the underlying securities, yet they are subject to similar price fluctuations. As a result, warrants may be more volatile investments than the underlying securities and may offer greater potential for capital appreciation as well as capital loss. Warrants do not entitle a holder to dividends or voting rights with respect to the underlying securities and do not represent any rights in the assets of the issuing company. Also, the value of the warrant does not necessarily change with the value of the underlying securities and a warrant ceases to have value if it is not exercised before the expiration date. These factors can make warrants more speculative than other types of investments. Certain warrants may permit, without legal obligation, net settlement for stock or cash. The Funds' have no obligation to exercise the warrant and buy the stock.
Equity-Linked Investments: Equity-linked investments are subject to the same risks as direct investments in securities of the underlying investment. If the underlying investment decreases in value, the value of the equity-linked investment will decrease; however, the performance of such investments may not correlate exactly to the performance of the underlying investment that they seek to replicate. Equity-linked investments are also subject to counterparty risk, which is the risk that the issuer of such investment — which is different from the issuer of the underlying investment — may be unwilling or unable to fulfill its obligations. There is no guarantee that a liquid market will exist or that the counterparty or issuer of such investments will be willing to repurchase them when a Fund wishes to sell them.
Forward Commitments and Dollar Rolls: A Fund may enter into contracts to purchase mortgage securities for a fixed price at a future date beyond customary settlement time (forward commitments). In the case of to-be-announced (TBA) mortgage purchase commitments, the unit price and the estimated principal amount are established when a Fund enters into a contract, with the actual principal amount being within a specified range of the estimate. TBA mortgages shall not exceed 20% of a Fund’s net assets. Forward commitments may be considered securities in themselves and involve a risk of loss if the value of the security to be purchased declines before the settlement date, which is in addition to the risk of decline in the value of a Fund’s other assets. Where such purchases are made through dealers, a Fund relies on the dealer to consummate the sale. The dealer’s failure to do so may result in the loss to a Fund of an advantageous yield or price. Although a Fund
Morningstar Funds Trust October 31, 2023 (unaudited)
Notes to Financial Statements (continued)
will generally enter into forward commitments with the intention of acquiring securities for its portfolio, the Fund may dispose of a commitment before settlement if a subadviser deems it appropriate to do so. A Fund may realize short-term profits or losses upon the sale of forward commitments.
A Fund may enter into TBA sale commitments to hedge its portfolio positions or to sell securities it owns under delayed delivery arrangements. Proceeds of TBA sale commitments are not received until the contractual settlement date. Unsettled TBA sale commitments are valued at current market value of the underlying securities. If the TBA sale commitment is closed through the acquisition of an offsetting purchase commitment, a Fund realizes a gain or loss on the commitment without regard to any unrealized gain or loss on the underlying security. If a Fund delivers securities under the commitment, the Fund realizes a gain or loss from the sale of the securities based upon the unit price established at the date the commitment was entered into.
A Fund may enter into mortgage dollar roll transactions (generally using TBAs) in which it sells a fixed-income security for delivery in the current month and simultaneously contracts to purchase similar securities (for example, same type, coupon and maturity) at an agreed upon future time. By engaging in a dollar roll transaction, a Fund foregoes principal and interest paid on the security that is sold but receives the difference between the current sales price and the forward price for the future purchase. A Fund would also be able to earn interest on the proceeds of the sale before they are reinvested. A Fund accounts for dollar rolls as purchases and sales. Dollar rolls may be used to create investment leverage and may increase a Fund’s risk and volatility.
The obligation to purchase securities on a specified future date involves the risk that the market value of the securities that a Fund is obligated to purchase may decline below the purchase price. In addition, in the event the other party to the transaction files for bankruptcy, becomes insolvent or defaults on its obligation, a Fund may be adversely affected.
Inflation-Protected Securities: A Fund may invest in U.S. Treasury Inflation Protected Securities (U.S. TIPS), which are fixed-income securities issued by the U.S. Department of Treasury, the principal amounts of which are adjusted daily based upon changes in the rate of inflation. A Fund may also invest in other inflation-protected securities issued by non-U.S. governments or by private issuers. U.S. TIPS pay interest on a semi-annual basis, equal to a fixed percentage of the inflation-adjusted principal amount. The interest rate on these bonds is fixed at issuance, but over the life of the bond this interest may be paid on an increasing or decreasing principal value that has been adjusted for inflation.
Repayment of the original bond principal upon maturity (as adjusted for inflation) is guaranteed for U.S. TIPS, even during a period of deflation. However, because the principal amount of U.S. TIPS would be adjusted downward during a period of deflation, a Fund will be subject to deflation risk with respect to its investments in these securities. In addition, the current market value of the bonds is not guaranteed and will fluctuate. If a Fund purchases in the secondary market U.S. TIPS whose principal values have been adjusted upward due to inflation since issuance, a Fund may experience a loss if there is a subsequent period of deflation. A Fund may also invest in other inflation-related bonds which may or may not provide a guarantee of principal. If a guarantee of principal is not provided, the adjusted principal value of the bond repaid at maturity may be less than the original principal amount.
Morningstar Funds Trust October 31, 2023 (unaudited)
Notes to Financial Statements (continued)
The periodic adjustment of U.S. TIPS is currently tied to the Consumer Price Index for All Urban Consumers ("CPI-U"), which is calculated by the U.S. Department of Treasury. The CPI-U is a measurement of changes in the cost of living, made up of components such as housing, food, transportation and energy. Inflation-protected bonds issued by a non-U.S. government are generally adjusted to reflect a comparable inflation index, calculated by that government. There can be no assurance that the CPI-U or any non-U.S. inflation index will accurately measure the real rate of inflation in the prices of goods and services. If interest rates rise due to reasons other than inflation (for example, due to changes in currency exchange rates), investors in these securities may not be protected to the extent that the increase is not reflected in the bond’s inflation measure. In addition, there can be no assurance that the rate of inflation in a non-U.S. country will be correlated to the rate of inflation in the United States.
In general, the value of inflation-protected bonds is expected to fluctuate in response to changes in real interest rates, which are in turn tied to the relationship between nominal interest rates and the rate of inflation. Therefore, if inflation were to rise at a faster rate than nominal interest rates, real interest rates might decline, leading to an increase in value of inflation-protected bonds. In contrast, if nominal interest rates increased at a faster rate than inflation, real interest rates might rise, leading to a decrease in value of inflation-protected bonds. If inflation is lower than expected during the period a Fund holds the security, the Fund may earn less on the security than on a conventional bond. Any increase in principal value is taxable in the year the increase occurs, even though holders do not receive cash representing the increase at that time. As a result, if a Fund invests in inflation-protected securities, it could be required at times to liquidate other investments, including when it is not advantageous to do so, to satisfy its distribution requirements as a Registered Investment Company (RIC) and to eliminate any fund level income tax liability under the Code.
Distressed Companies, Loan Participations, Assignments and Unfunded Commitments: From time to time, a Fund may purchase the direct indebtedness of various companies (Indebtedness), or participation interests in Indebtedness (Participations), including Indebtedness and Participations of reorganizing companies. Indebtedness can be distinguished from traditional debt securities in that debt securities are part of a large issue of securities to the general public which is typically registered with a securities registration organization, such as the SEC, and which is held by a large group of investors. Indebtedness may not be a security, but rather, may represent a specific commercial loan or portion of a loan which has been given to a company by a financial institution such as a bank or insurance company. The company is typically obligated to repay such commercial loan over a specified time period. By purchasing the Indebtedness of companies, a Fund in effect steps into the role of the lender which made the loan to the company before its restructuring or refinancing. Indebtedness purchased by a Fund may be in the form of loans, notes or bonds.
The length of time remaining until maturity on the Indebtedness is one factor the subadvisers consider in purchasing a particular Indebtedness. Indebtedness which represents a specific Indebtedness of the company to a bank, is not considered to be a security issued by the bank selling it. A Fund may purchase loans from national and state-chartered banks as well as foreign banks, and they normally invest in the Indebtedness of a company which has the highest priority in terms of payment by the company, although on occasion lower priority Indebtedness also may be acquired.
Morningstar Funds Trust October 31, 2023 (unaudited)
Notes to Financial Statements (continued)
Participations represent fractional interests in a company’s Indebtedness. The financial institutions that typically make Participations available are banks or insurance companies, governmental institutions, such as the Resolution Trust Corporation, the Federal Deposit Insurance Corporation or the Pension Benefit Guaranty Corporation, or certain organizations such as the World Bank, which are known as “supranational organizations.” Supranational organizations are entities established or financially supported by the national governments of one or more countries to promote reconstruction or development. Indebtedness and Participations may be illiquid as described below.
When a Fund purchases a loan participation, the Fund enters into a contractual relationship with the lender or a third party selling such participations (“Selling Participant”), but not the borrower. In this case, the Fund assumes the credit risk of the borrower and the Selling Participant and any other persons inter-positioned between the Fund and the borrower (“Intermediate Participants”). In contrast, when one of the Funds purchases an assignment, the contractual relationship is with the borrower and the credit risk assumed by the Fund is only with the borrower. Although certain loan participations or assignments are secured by collateral, the Fund could experience delays or limitations in realizing such collateral or have its interest subordinated to other indebtedness of the obligor.
The Funds may also enter into unfunded commitments, which are contractual obligations for future funding. These unfunded commitments represent a future obligation in full, even though a percentage of the commitment may not be utilized by the borrower. Loan commitments are made pursuant to a term loan, a revolving credit line or a combination thereof. A term loan is generally a loan in a fixed amount that borrowers repay in a scheduled series of repayments or a lump-sum payment at maturity. A revolving credit line permits borrowers to draw down, repay, and re-borrow specified amounts on demand. These types of investments may include standby financing commitments, which obligate the Fund to supply additional cash to the borrower on demand. The value of the unfunded portion of the investment is determined using a pro-rata allocation, based on its par value relative to the par value of the entire investment. The unfunded commitments are marked to market daily and any unrealized appreciation (depreciation) from unfunded commitments is reported in the Statements of Assets and Liabilities as well as the Statements of Operations in the Funds’ Financial Statements. When investing in a loan participation, the Fund has the right to receive payments of principal, interest and any fees to which it is entitled only from the lender selling the loan agreement and only upon receipt of payments by the lender from the borrower. The Fund may receive a commitment fee based on the undrawn portion of the underlying line of credit portion of a loan. In certain circumstances, the Fund may receive a penalty fee upon the prepayment of a loan by a borrower. Fees earned or paid are recorded as a component of interest income or interest expense, respectively, on the Statements of Operations. In addition, loan participations and assignments are vulnerable to market conditions such that economic conditions or other events may reduce the demand for loan participations and assignments and certain loan participations and assignments which were liquid, when purchased, may become illiquid.
Potential lack of investor protections under federal and state securities laws. If a corporate loan purchased by a Fund is not considered to be a “security,” the Fund will not receive the same investor protections with respect to such investment that are available to purchasers of investments that are considered “securities” under federal and state securities laws, including any possible recourse against an underwriter.
Morningstar Funds Trust October 31, 2023 (unaudited)
Notes to Financial Statements (continued)
Mortgage Dollar Rolls: A Fund may enter into mortgage dollar rolls with a bank or a broker-dealer. A mortgage dollar roll is a transaction in which a Fund sells mortgage-related securities for immediate settlement and simultaneously purchases the same type of securities for forward settlement at a discount. While a Fund begins accruing interest on the newly purchased securities from the purchase or trade date, it is able to invest the proceeds from the sale of its previously owned securities, which will be used to pay for the new securities. The use of mortgage dollar rolls is a speculative technique involving leverage and can have an economic effect similar to borrowing money for investment purposes.
Private Placement and Restricted Securities: A Fund may invest in securities that are purchased in private placements and, accordingly, are subject to restrictions on resale as a matter of contract or under federal securities laws. Private placement and restricted securities are not registered under the Securities Act of 1933 (the "Securities Act"), as amended, and may be neither listed on an exchange nor traded in other established markets. Some of these securities are new and complex, and trade only among institutions; the markets for these securities are still developing and may not function as efficiently as established markets. Because there may be relatively few potential purchasers for such investments, especially under adverse market or economic conditions or in the event of adverse changes in the financial condition of the issuer, a Fund could find it more difficult to sell such securities when a subadviser believes it advisable to do so or may be able to sell such securities only at prices lower than if such securities were more widely held, and potentially at prices lower than their fair market value. At times, it may also be more difficult to determine the fair value of such securities for purposes of computing a Fund’s NAV.
Certain of the Funds’ investments in private placements may consist of direct investments and may include investments in smaller, less seasoned issuers, which may involve greater risks. These issuers may have limited product lines, markets or financial resources, or they may be dependent on a limited management group. In making investments in such securities, a Fund may obtain access to material non-public information, which may restrict the Fund’s ability to conduct portfolio transactions in such securities.
While such private placements may offer attractive opportunities for investment not otherwise available on the open market, the securities so purchased are often restricted securities, i.e., securities which cannot be sold to the public without registration under the Securities Act or the availability of an exemption from registration (such as Rules 144 or 144A), or which are not readily marketable because they are subject to other legal or contractual delays in or restrictions on resale.
The absence of a trading market can make it difficult to ascertain a market value for illiquid investments. Disposing of illiquid investments may involve time-consuming negotiation and legal expenses, and it may be difficult or impossible for a Fund to sell them promptly at an acceptable price. A Fund may have to bear the extra expense of registering such securities for resale and the risk of substantial delay in effecting such registration. In addition, market quotations are less readily available. The judgment of the adviser may at times play a greater role in valuing these securities than in the case of publicly traded securities.
Generally speaking, restricted securities may be sold only to qualified institutional buyers, or in a privately negotiated transaction to a limited number of purchasers, or in limited quantities after they have been held for a specified period of time and other conditions are met pursuant to an exemption from registration, or in a public
Morningstar Funds Trust October 31, 2023 (unaudited)
Notes to Financial Statements (continued)
offering for which a registration statement is in effect under the Securities Act. Issuers whose securities are not publicly traded may not be subject to the disclosure and other investor protection requirements that may be applicable if their securities were registered or publicly traded.
From time to time, a restricted security may be registered for resale. A considerable time period may elapse between the time a Fund decides to sell the security and the time it is actually permitted to sell the security freely under an effective registration statement. If during such period, adverse market conditions were to develop, the Fund might obtain less favorable pricing terms than when it decided to sell the security. Transactions in restricted securities may entail other transaction costs that are higher than those for transactions in unrestricted securities.
When selling restricted securities to the public, a Fund may be deemed to be an underwriter for purposes of the Securities Act, and in such event the Fund may be liable to purchasers of such securities if the registration statement prepared by the issuer, or the Prospectuses forming a part of it, is materially inaccurate or misleading.
Restricted securities held by each Fund as of October 31, 2023 are disclosed in the Schedules of Investments.
Securities Sold Short: Certain Funds may sell securities they do not own (a short sale) as a hedge against some of their long positions and/or in anticipation of a decline in the market value of that security. When a Fund makes a short sale, it must borrow the security sold short and deliver it to the broker through which it made the short sale. A Fund may have to pay a fee to borrow the particular security and may be obligated to remit any interest or dividends received on such borrowed securities. Dividends declared on short positions are recorded on the ex-date as an expense. A gain, limited to the price at which the Fund sold the security short, or a loss, which could be unlimited in magnitude, will be recognized upon the termination of a short sale if the market price at termination is less than or greater than, respectively, the proceeds originally received. The Fund is also subject to the risk that it may be unable to reacquire a security to terminate a short position except at a price substantially in excess of the last quoted price. A Fund is also subject to risk of loss if the broker were to fail to perform its obligations under the contractual terms. Liabilities for securities sold short are reported at market value on the Statements of Assets and Liabilities and the change in market value is recorded as net change in unrealized appreciation (depreciation) on the Statements of Operations.
The Funds are required to pledge cash or liquid securities to the broker as collateral for securities sold short. Collateral requirements are calculated daily based on the current market value of the short positions. Daily market fluctuations and trading activity could cause the value of securities sold short to be more or less than the value of the collateral segregated. Cash deposited with the broker for collateral for securities sold short is recorded as an asset on the Statements of Assets and Liabilities and securities segregated as collateral are denoted in the Schedules of Investments. The Funds may receive or pay the net of the following amounts: (i) a portion of the income from the investment of cash collateral; (ii) the broker’s fee on the borrowed securities; and (iii) a financing charge for the difference in the market value of the short position and cash collateral deposited with the broker. This income or fee is calculated daily based upon the market value of each borrowed security and a variable rate that is dependent on the availability of the security.
Morningstar Funds Trust October 31, 2023 (unaudited)
Notes to Financial Statements (continued)
Special Purpose Acquisition Companies (SPACs): The Morningstar Alternatives Fund may invest in the common stock of and other interests (e.g., warrants and rights) in special purpose acquisition companies or similar special purpose entities (collectively, “SPACs”). A SPAC is a special purpose vehicle that seeks to identify and effect an acquisition of, or merger with, an operating company in a particular industry or sector. SPACs typically issue public shares and warrants or rights pursuant to an initial public offering, and also typically issue “founders” shares and warrants or rights to the SPAC sponsor. During the period when management of the SPAC seeks to identify a potential acquisition or merger target, typically most of the capital raised for that purpose (less a portion retained to cover expenses) is invested in income-producing investments. The Morningstar Alternatives Fund may invest in SPACs for a variety of investment purposes, including to achieve income. These investments may include investments in the public shares, warrants or rights issued directly with a SPAC or may include founder’s shares, warrants or rights, either directly or indirectly through shares of a holding company. Some SPACs provide the opportunity for public common shareholders to have some or all of their shares redeemed by the SPAC at or around the time a proposed merger or acquisition is expected to occur. If not subject to a restriction on resale, the Fund may sell its investments in SPACs at any time, including before, at or after the time of a merger or acquisition. The Morningstar Alternatives Fund may invest in certain SPAC founder investments where the SPAC securities or the securities of a holding company owning SPAC securities will not be registered under the Securities Act, as amended and/or no public market may exist for such securities. Such investments involve a high degree of risk which could cause the Fund to lose all or part of its investment. The restrictions on resale of certain unregistered SPAC investments may be for an extended time (e.g., two to three years). The Morningstar Alternatives Fund does not presently intend to invest more than 5% of its net assets in unregistered SPACs at time of purchase, but reserves the right to increase that amount in appropriate situations.
Because SPACs and similar entities have no operating history or ongoing business other than seeking acquisitions, the value of their securities is particularly dependent on the ability of the entity’s management to identify and complete a profitable acquisition. Some SPACs may pursue acquisitions only within certain industries or regions, which may increase the volatility of their prices. In addition, these securities, which are typically traded in the over-the-counter market, may be considered illiquid and/or may be subject to restrictions on resale. An investment in a SPAC is subject to a variety of risks, including that (i) a significant portion of the monies raised by the SPAC for the purpose of identifying and effecting an acquisition or merger may be expended during the search for a target transaction; (ii) an attractive acquisition or merger target may not be identified at all and the SPAC will be required to return any remaining monies to shareholders; (iii) any proposed merger or acquisition may be unable to obtain the requisite approval, if any, of SPAC shareholders; (iv) an acquisition or merger once effected may prove unsuccessful and an investment in the SPAC may lose value; (v) the warrants or other rights with respect to the SPAC held by the Fund may expire worthless or may be repurchased or retired by the SPAC at an unfavorable price; (vi) the Fund will be delayed in receiving any redemption or liquidation proceeds from a SPAC to which it is entitled; (vii) an investment in a SPAC may be diluted by additional later offerings of interests in the SPAC or by other investors exercising existing rights to purchase shares of the SPAC; (viii) no or only a thinly traded market for shares of or interests in a SPAC may develop, leaving the Fund unable to sell its interest in a SPAC or to sell its interest only at a price below what the Fund believes is the SPAC interest’s intrinsic value; and (ix) founders shares, warrants or rights are subject to a greater risk of loss than public securities issued by a SPAC, and (x) the values of investments in SPACs may be highly volatile and may depreciate significantly over time. As of October 31, 2023, there were no SPACs or funding commitments held by the Morningstar Alternatives Fund.
Morningstar Funds Trust October 31, 2023 (unaudited)
Notes to Financial Statements (continued)
Zero Coupon and Payment In-Kind Bonds: A Fund may invest without limit in so-called zero-coupon bonds and payment-in-kind bonds. Zero-coupon bonds are issued at a significant discount from their principal amount in lieu of paying interest periodically. Payment-in-kind bonds allow the issuer, at its option, to make current interest payments on the bonds either in cash or in additional bonds. Because zero-coupon and payment-in-kind bonds do not pay current interest in cash, their value is subject to greater fluctuation in response to changes in market interest rates than bonds that pay interest currently. Both zero-coupon and payment-in-kind bonds allow an issuer to avoid the need to generate cash to meet current interest payments. Accordingly, such bonds may involve greater credit risks than bonds paying interest currently in cash. A Fund is required to accrue interest income on such investments and to distribute such amounts at least annually to shareholders even though the investments do not make any current interest payments. Thus, it may be necessary at times for the Fund to liquidate other investments to satisfy its distribution requirements under the Code. The daily market quotations of the original bonds may include the accrued interest (referred to as a dirty price) and require a pro rata adjustment, if any, from the unrealized appreciation (depreciation) on investments to interest receivable on the Statements of Assets and Liabilities.
4. Investment Valuation and Fair Value Measurements
Investment Valuation Policies: The NAV of the Funds’ shares are valued as of the close of regular trading on the New York Stock Exchange (“NYSE”) (generally 4:00 p.m. Eastern time) on each day that the NYSE is open (each a “Business Day”). The NAV per share of each Fund is computed by dividing the total current value of the assets of such Fund, less liabilities, by the total number of shares of the Fund outstanding at the time the computation is made. In general, investments for which market quotations are readily available are valued at current market value, while investments whose market quotations are not readily available (as defined by Rule 2a-5 of the Investment Company Act of 1940, as amended) are fair valued.
As permitted under Rule 2a-5, the Trust’s Board of Trustees (the “Board”) designated Morningstar Investment Management LLC to serve as the valuation designee. MIM, as valuation designee, carries out its day-to-day fair value responsibilities required under Rule 2a-5 through its Pricing Committee (the “Pricing Committee”) in accordance with procedures approved by the Board.
U.S. exchange-traded equity securities for which market quotations are readily available shall be valued at the regular trading session’s closing price on the exchange or system in which such securities are principally traded. Securities not traded on the valuation date are priced at the most recent quoted bid price. Non-U.S. exchange-traded equity securities prices are based on primary local market quotations. Depending upon local market convention or regulation, the price may represent the last sale price or the mean between the last bid and ask price at the close of the appropriate exchange or at designated times as determined by the appropriate governing body. For countries that allow securities to trade on multiple exchanges (e.g., U.S., Japan, Germany and India), the value of the security will be taken to be the last reported closing price from the security’s primary exchange. Over the Counter (“OTC”) securities which are not traded in the NASDAQ Global Market® shall be valued at the most recent trade price. Securities and assets for which market quotations are not readily available (including restricted securities which are subject to limitations as to their sale) are valued at fair value as determined in good faith by the Pricing Committee under procedures approved by the Board.
Morningstar Funds Trust October 31, 2023 (unaudited)
Notes to Financial Statements (continued)
Short-term debt obligations with remaining maturities in excess of 60 days are typically valued using evaluated prices provided by a pricing service provider. To reflect their fair value, short-term securities with 60 days or less remaining to maturity may, unless conditions indicate otherwise, utilize amortized cost to maturity based on their cost to a Fund.
Each Fund may invest in foreign securities, and as a result, the calculation of the Fund’s NAV may not take place contemporaneously with the determination of the prices of certain of the Fund securities used in the calculation. Occasionally, events which affect the values of such securities and such exchange rates may occur between the times at which they are determined and the close of the NYSE and will therefore not be reflected in the computation of a Fund’s NAV. If events materially affecting the value of such securities occur during such period, then these securities may be valued at their fair value as determined in good faith by the Pricing Committee under procedures approved by the Board. Portfolio securities that are traded both on an exchange and in the OTC market will be valued according to the broadest and most representative market. All assets and liabilities initially expressed in foreign currency values will be converted into U.S. Dollar values at the mean between the bid and offered quotations of the currencies against U.S. Dollars as last quoted by any recognized dealer.
The Pricing Committee uses independently provided quantitative models that may adjust the closing prices of certain foreign equity and fixed income securities based on information that becomes available after the foreign market closes, through the application of an adjustment factor to such securities’ closing price. Adjustment factors may be greater than, less than, or equal to 1. Thus, use of these quantitative models could cause a Fund to value a security higher, lower or equal to its closing market price, which in turn could cause the Fund’s NAV per share to differ from that which would have been calculated using closing market prices. The use of these quantitative models is also intended to decrease the opportunities for persons to engage in ‘‘time zone arbitrage,’’ i.e., trading intended to take advantage of stale closing prices in foreign markets that could affect the NAV of the Funds. Securities subjected to an adjustment factor due to the use of these quantitative models are not specifically designated as such on the Funds’ Schedule of Investments. Securities with a fair value factor applied are classified as Level 2.
All other assets of a Fund are valued in such manner as the Pricing Committee in good faith deems appropriate to reflect their fair value. U.S. GAAP defines fair value as the price the Funds would receive to sell an asset or pay to transfer a liability in an orderly transaction between market participants at the measurement date.
Securities for which market quotations are not readily available or are unreliable are fair valued by the Pricing Committee in accordance with the methodologies approved by such Committee and are classified as Level 3.
Valuation Techniques: The following inputs and techniques may be used by the Funds to value their portfolio holdings and to evaluate how to classify each major category of assets and liabilities into the appropriate fair value hierarchy in accordance with U.S. GAAP.
Equity securities, including securities sold short, rights, warrants, exchange traded funds (“ETFs”) and closed-end investment companies, are valued at the last quoted sales prices or official closing prices taken from the primary market, or composite in which each security trades. Shares of open end investment companies, other than exchange-traded funds, are valued at their NAV.
Morningstar Funds Trust October 31, 2023 (unaudited)
Notes to Financial Statements (continued)
An equity for which no sales are reported, as in the case of a security that is traded in the OTC market or a less liquid listed equity, is generally valued at its last bid price (in the case of short sales, at the ask price).
Listed options are generally valued at the last reported settlement price on the exchange or OTC market on which they principally trade. If the settlement price is not available, then listed options will be valued at the last traded price if the last traded price falls between bid/ask spread; and if the last traded price falls outside of the bid/ask spread, then the calculated mean based on bid/ ask prices obtained from the primary exchange will be used.
Futures contracts are generally valued at the last reported settlement price on the exchange or OTC market on which they principally trade. If the settlement price is not available, then futures contracts will be valued at the last traded price.
Exchange-traded derivatives, such as futures contracts and exchange-traded option contracts, are typically classified within Level 1 of the fair value hierarchy depending on whether or not they are deemed to be actively traded. Futures and option contracts that are listed on national exchanges and are freely transferable are valued at fair value based on their last reported settlement price on the date of determination on the exchange that constitutes the principal market or, if the settlement price is not available, generally at the last traded price. For listed options contracts, if the last traded price falls outside the bid/ask spread, then the calculated mean based on bid/ask prices obtained from the primary exchange will be used. Centrally cleared swaps listed or traded on a multilateral trade facility platform are valued on a daily basis using quotations provided by an independent pricing service.
Fixed income securities (other than certain short-term investments maturing in 60 days or less) and other investments that trade in markets that are not considered to be active, are valued based on a methodology approved by the Pricing Committee. This includes certain U.S. government and sovereign obligations, most government agency securities, investment-grade corporate bonds and less liquid listed equities. Corporate and sovereign bonds and other fixed-income instruments are valued at estimated fair value using the latest bid prices or evaluated quotes furnished by independent pricing services, as well as quotations from counterparties and other market participants. Evaluated quotes are based on a matrix system, which may consider such factors as quoted prices for identical or similar assets, yields, maturities and ratings and are not necessarily reliant on quoted prices. Short-term debt investments of sufficient credit quality maturing in 60 days or less are generally valued at amortized cost (unless conditions indicate otherwise), which approximates fair value.
When observable prices are not available, the Pricing Committee may use one or more valuation approaches (e.g., the market approach or the income approach), including proprietary models for which sufficient and reliable data is available. These investments are classified as Level 3 and have significant unobservable inputs, as they trade infrequently or not at all. Level 3 instruments may include illiquid securities. Within Level 3, the market approach generally is based on the technique of using comparable market transactions/multiples, while the use of the income approach includes the estimation of future cash flows discounted to calculate fair value. Discounts may also be applied due to the nature or durations of any restrictions on the disposition of the investment or adjusted as appropriate for credit, market and/or other risk factors.
Morningstar Funds Trust October 31, 2023 (unaudited)
Notes to Financial Statements (continued)
Securities for which market quotations are not readily available or are unreliable are fair valued by the Pricing Committee in accordance with the procedures approved by the Board. Attempts to determine the fair value of securities introduce an element of subjectivity to the pricing of securities. This fair value may be higher or lower than any available market price or quotation for such security and, because this process necessarily depends upon judgment, this value also may vary from valuations determined by other funds using their own valuation procedures. While each Fund’s use of fair value pricing is intended to result in calculation of a NAV that fairly reflects security values as of the time of pricing, a Fund cannot guarantee that any fair value price will, in fact, approximate the amount the Fund would actually realize upon the sale of the securities in question. If a reliable market quotation becomes available for a security formerly valued through fair valuation techniques, a Fund would compare the new market quotation to the fair value price to evaluate the effectiveness of its fair valuation procedures. If any significant discrepancies are found, the fair valuation procedures may be reviewed or adjusted.
The inputs used by the Pricing Committee in estimating the value of Level 3 investments may include, if applicable, such factors as described in the procedures approved by the Board, including, but not limited to, the original transaction price, recent transactions in the same or similar instruments, completed or pending third party transactions in the underlying investment or comparable issuers, third party broker quotes, deal terms, subsequent rounds of financing, recapitalizations and other transactions across the capital structure, offerings in the equity or debt capital markets, changes in financial ratios or cash flows, benchmark yield curves, credit spreads, estimated default rates, underlying collateral, and other unique security features. Level 3 investments may also be adjusted to reflect illiquidity and/or non-transferability, with the amount of such discount estimated by the Pricing Committee in the absence of market information. Assumptions used by the Pricing Committee due to the lack of observable inputs may significantly impact the fair value of an investment.
Forward contracts are typically classified within Level 2 of the fair value hierarchy. The U.S. Dollar value of forward foreign currency exchange contracts is determined using current forward currency exchange rates supplied by an independent pricing service.
OTC derivatives, including options on forward contracts, put and call options, contracts for differences and swap contracts, are valued by the Pricing Committee on a daily basis using observable inputs, such as quotations provided by an independent pricing service, the counterparty, dealers or brokers, whenever available and considered reliable.
The price a Fund could receive upon the sale of any particular portfolio investment may differ from the Fund’s valuation of the investment, particularly for securities that trade in thin or volatile markets or that are valued using a fair valuation methodology or a price provided by an independent pricing service. As a result, the price received upon the sale of an investment may be less than the value ascribed by a Fund, and the Fund could realize a greater than expected loss or lesser than expected gain upon the sale of the investment. Pricing services that value fixed-income securities generally utilize a range of market-based and security-specific inputs and assumptions, as well as considerations about general market conditions, to establish a price. Pricing services generally value fixed-income securities assuming orderly transactions of an institutional round lot size, but may be held or transactions may be conducted in such securities in smaller, odd lot sizes. Odd lots often trade at lower prices than institutional round lots. A Fund’s ability to value its investments may also be impacted by technological issues and/or errors by pricing services or other third-party service providers.
Morningstar Funds Trust October 31, 2023 (unaudited)
Notes to Financial Statements (continued)
Fair Valuation Hierarchy: Fair value is defined as the price that a Fund would receive to sell an asset or pay to transfer a liability in an orderly transaction between market participants at the measurement date. It establishes a framework and requires disclosure of a fair value hierarchy, separately for each major category of assets and liabilities that segregates fair value measurements into levels (Levels 1, 2, and 3). Categorizations of fair value measurements, and the criteria used to determine each categorization, are as follows:
Level 1 – unadjusted quoted prices in active markets for identical assets and liabilities (e.g. equity securities and open end investment companies).
Level 2 – prices determined using other significant observable inputs including, but not limited to, quoted prices for similar assets and liabilities in markets that are not active, inputs other than quoted prices that are observable for the assets or liabilities (such as interest rates, yield curves, prepayment speeds, credit risk, etc.) or other market corroborated inputs.
Level 3 – prices determined using significant unobservable inputs (including the Pricing Committee’s own assumptions in determining the fair value of investments).
Valuation levels are not necessarily an indication of the risk associated with investing in those securities. Changes in valuation techniques may result in transfers into or out of an assigned level within the disclosure hierarchy. Transfers between different levels of the fair value disclosure hierarchy are deemed to have occurred as of the end of the reporting period.
A valuation hierarchy including information regarding Level 3 securities, where applicable, is shown at the end of each Fund’s Schedule of Investments.
The Pricing Committee determined that based on their analysis of the market and access to market participants, the Russian equity securities held by the Funds had little or no value as of October 31, 2023. Refer to European Market Risk in Note 10 for more information.
5. Investment Advisory and Other Agreements
The Trust has an Investment Advisory Agreement (the “Agreement”) with the Adviser, with whom certain officers and trustees of the Trust are affiliated, to furnish certain portfolio management services to the Funds.
Pursuant to the Agreement, the Funds have contractually agreed to pay the Adviser a management fee calculated on the average daily net assets of each Fund, in the annual ratios below.
| Morningstar Funds | Ratio |
| U.S. Equity Fund | 0.67% |
| International Equity Fund | 0.83% |
| Global Income Fund | 0.35% |
| Total Return Bond Fund | 0.44% |
| Municipal Bond Fund | 0.44% |
| Defensive Bond Fund | 0.36% |
| Multisector Bond Fund | 0.61% |
| Global Opportunistic Equity Fund | 0.47% |
Morningstar Funds Trust October 31, 2023 (unaudited)
Notes to Financial Statements (continued)
| Morningstar Funds | Ratio |
| Alternatives Fund | 0.85% |
Pursuant to the Agreement, the Adviser is responsible for performing and overseeing portfolio management services to the Funds. In addition to selecting the overall investment strategies of the Funds, the Adviser oversees and monitors the selection and performance of the subadvisers and allocates assets among the subadvisers. The subadvisers manage each Fund’s investment portfolio pursuant to subadvisory agreements with the Adviser. The Adviser manages a portion of each Fund which may include securities such as equities, ETFs, mutual funds, money market fund investments and, where applicable, transacting in forward foreign currency contracts.
Beginning September 1, 2023, pursuant to an Expense Limitation Agreement, Morningstar has contractually agreed, through at least August 31, 2024, to waive all or a portion of its advisory fees and, if necessary, to assume certain other expenses (to the extent permitted by the Code) to ensure that each Fund’s Total Annual Fund Operating Expenses (excluding taxes, interest, brokerage commissions, trading costs, acquired fund fees and expenses (AFFE), short sale dividend and interest expenses, litigation expenses, and extraordinary expenses) do not exceed the following rates, based on each Fund’s average daily net assets. The amount the Adviser owes a Fund as of the reporting date is recorded as a Receivable from Adviser in the Statements of Assets and Liabilities. The Adviser reimburses the Funds on a monthly basis. This management fee waiver and/or expense reimbursement will not be subject to future recoupment. For the period from September 1, 2023 through October 31, 2023, the Funds’ Adviser waived fees and/or reimbursed expenses pursuant to the Expense Limitation Agreement for each of the Funds as follows:
| Morningstar Funds | Expense Cap | Management Fees Waived |
| U.S. Equity Fund | 0.84% | $92,583 |
| International Equity Fund | 0.99% | 133,721 |
| Global Income Fund | 0.73% | — |
| Total Return Bond Fund | 0.53% | 268,487 |
| Municipal Bond Fund | 0.58% | 49,585 |
| Defensive Bond Fund | 0.48% | 49,697 |
| Multisector Bond Fund | 0.79% | 65,787 |
| Global Opportunistic Equity Fund | 0.84% | — |
| Alternatives Fund | 1.16% | 77,534 |
Prior to and until August 31, 2023, Morningstar had contractually agreed, to waive all or a portion of its advisory fees and, if necessary, to assume certain other expenses (to the extent permitted by the Code) to ensure that each Fund’s Total Annual Fund Operating Expenses (excluding taxes, interest, brokerage commissions, trading costs, AFFE, short sale dividend and interest expenses, litigation expenses, and extraordinary expenses) did not exceed the caps, based on each Fund's average daily net assets, set forth in the table below under “Prior Expense Cap Before Inclusion of AFFE in Cap” (the Prior Expense Limitation Agreement). Additionally, Morningstar had also contractually agreed, in addition to the Prior Expense Limitation Agreement, to waive all or a portion of its advisory fees and, if necessary, to assume certain other expenses (to the extent permitted by the Code) through at least August 31, 2023, to ensure that each Fund’s Total Annual Fund Operating Expenses (excluding taxes, interest, brokerage commissions, trading costs, short sale dividend and interest expenses, litigation expenses, and extraordinary expenses) did not exceed the caps, based on each Fund's average daily
Morningstar Funds Trust October 31, 2023 (unaudited)
Notes to Financial Statements (continued)
net assets, set forth in the table below under “Prior Expense Cap After Inclusion of AFFE in Cap” (the Prior Supplemental Expense Limitation Agreement). For the period ended August 31, 2023, the Funds’ Adviser waived fees and/or reimbursed expenses pursuant to the Prior Expense Limitation Agreement and the Prior Supplemental Expense Limitation Agreement for each of the Funds as follows:
| Morningstar Funds | Prior Expense
Cap Before
Inclusion of AFFE
(through 8/31/23) | Fees Waived/
Reimbursed Before
Inclusion of AFFE
(through 8/31/23) | Prior Expense
Cap After
Inclusion of AFFE
(through 8/31/23) | Fees Waived/
Reimbursed After
Inclusion of AFFE
(through 8/31/23) |
| U.S. Equity Fund | 0.85% | $78,144 | 0.85% | $80,040 |
| International Equity Fund | 1.00% | 236,340 | 1.00% | 47,562 |
| Global Income Fund | 0.89% | — | 0.75% | — |
| Total Return Bond Fund | 0.53% | 555,032 | 0.54% | 10,647 |
| Municipal Bond Fund | 0.59% | 89,053 | 0.59% | 5,732 |
| Defensive Bond Fund | 0.48% | 94,060 | 0.55% | — |
| Multisector Bond Fund | 0.80% | 114,885 | 0.80% | 3,018 |
| Global Opportunistic Equity Fund | 1.00% | — | 0.93% | — |
| Alternatives Fund | 1.29% | 68,588 | 1.20% | 97,732 |
As of October 31, 2023, the Trust has entered into subadvisory agreements with the following entities by Fund:
| Morningstar Funds | Subadvisers |
| U.S. Equity Fund | ClearBridge Investments, LLC
Diamond Hill Capital Management, Inc.
Massachusetts Financial Services Company, d/b/a MFS Investment Management
Wasatch Advisors, LP, d/b/a Wasatch Global Investors
Westwood Management Corp. |
| International Equity Fund | Harding Loevner, L.P.
Harris Associates, L.P.
Lazard Asset Management LLC
T. Rowe Price Associates, Inc. |
| Global Income Fund | Cullen Capital Management LLC
Western Asset Management Company, LLC |
| Total Return Bond Fund | BlackRock Financial Management, Inc.
Western Asset Management Company, LLC |
| Municipal Bond Fund | Allspring Global Investments, LLC
T. Rowe Price Associates, Inc. |
| Defensive Bond Fund | First Pacific Advisors, LP |
| Multisector Bond Fund | Loomis, Sayles & Company, L.P.
TCW Investment Management Company LLC
Voya Investment Management Company, LLC |
| Global Opportunistic Equity Fund | Lazard Asset Management LLC |
| Alternatives Fund | BlackRock Financial Management, Inc.
SSI Investment Management LLC
Water Island Capital, LLC |
Morningstar Funds Trust October 31, 2023 (unaudited)
Notes to Financial Statements (continued)
Pursuant to the subadvisory agreements between the subadvisers, the Adviser and the Trust, the Adviser will pay the subadvisers out of the management fees it receives from the Funds.
The Trust has an administration agreement with The Northern Trust Company (“Northern Trust”), which provides certain accounting, clerical and bookkeeping services, Blue Sky, corporate secretarial services and assistance in the preparation and filing of tax returns and reports to shareholders and the SEC. Northern Trust also serves as custodian of each Fund’s securities and cash, transfer agent and dividend disbursing agent.
Foreside Fund Services, LLC, a wholly owned subsidiary of Foreside Financial Group, LLC (doing business as ACA Group) (the “Distributor”), a registered broker-dealer and member of the Financial Industry Regulatory Authority, Inc. (“FINRA”), serves as the principal underwriter and distributor of the Trust’s shares. The Adviser, at its own expense, pays the Distributor an annual fee in consideration for certain distribution related services. Foreside Management Services, LLC, a wholly owned subsidiary of Foreside Financial Group, LLC (doing business as ACA Group) (“FMS”) provides a Principal Financial Officer to the Trust. The Trust has agreed to pay FMS an annual base fee and has agreed to reimburse FMS for certain expenses incurred on behalf of the Trust. FMS has no role in determining the investment policies or which securities are to be sold or purchased by the Trust or the Funds.
The Trust, on behalf of the Funds, has agreements with various financial intermediaries and “mutual fund supermarkets”, under which customers of these intermediaries may purchase and hold Fund shares. These intermediaries assess asset-based fees in consideration for providing certain account maintenance, record keeping and transactional and other shareholder services reflected as "Sub-accounting fees" on the Statement of Operations.
6. Investment Transactions
During the six months ended October 31, 2023, the cost of purchases and the proceeds from sales of investments (excluding in-kind transactions, derivatives and short-term investments) were as follows:
| | Purchases | Sales | | |
| Morningstar Funds | U.S. Government | Other | U.S. Government | Other | Securities
Sold Short | Covers on
Securities
Sold Short |
| U.S. Equity Fund | $ — | $514,888,164 | $ — | $539,992,762 | $ — | $ — |
| International Equity Fund | — | 105,255,061 | — | 109,349,513 | — | — |
| Global Income Fund | — | 50,080,567 | — | 60,478,027 | — | — |
| Total Return Bond Fund | 1,158,871,009 | 208,213,296 | 1,113,999,855 | 208,627,068 | 193,559,501 | 196,916,778 |
| Municipal Bond Fund | — | 50,866,147 | — | 54,278,489 | — | — |
| Defensive Bond Fund | — | 39,764,931 | — | 38,583,329 | — | — |
| Multisector Bond Fund | 26,572,174 | 93,721,510 | 26,547,678 | 92,084,260 | — | — |
| Global Opportunistic Equity Fund | — | 140,008,453 | — | 95,590,696 | — | — |
| Alternatives Fund | — | 282,682,376 | — | 306,842,641 | 38,924,536 | 28,392,212 |
| | | | | | | |
Morningstar Funds Trust October 31, 2023 (unaudited)
Notes to Financial Statements (continued)
7. Securities Lending
The Morningstar U.S. Equity Fund, Morningstar International Equity Fund, Morningstar Global Income Fund, Morningstar Total Return Bond Fund, Morningstar Defensive Bond Fund, and Morningstar Global Opportunistic Equity Fund participate in a securities lending program. Under the securities lending program, Northern Trust serves as the Securities Lending Agent (or "Agent") pursuant to a Securities Lending Authorization Agreement (the “Securities Lending Agreement”). The Securities Lending Agent provides the following services for the aforementioned Funds in connection with securities lending activities: (i) entering into loans with approved entities subject to guidelines or restrictions contained in the Securities Lending Agreement; (ii) selecting securities to be loaned pursuant to the Securities Lending Agent’s impartial sequencing; (iii) reviewing creditworthiness of securities lending counterparties; (iv) receiving and holding collateral from borrowers, and facilitating the investment and reinvestment of cash collateral; (v) each business day, monitoring the value of the loaned securities and collateral, including receiving and delivering additional collateral as necessary from/to borrowers; (vi) negotiating loan terms; (vii) recordkeeping and account servicing; (viii) monitoring dividend/distribution activity relating to loaned securities; and (ix) arranging for return of loaned securities to the Funds at loan termination.
Each Fund will limit lending to be less than one third of the value of its total assets. The Funds’ securities held at the Securities Lending Agent as custodian shall be available to be lent except those securities the Funds specifically identify in writing as not being available for lending. The borrower pledges and maintains with each Fund collateral consisting of cash and securities issued or guaranteed by the U.S. government or its agencies or instrumentalities. The initial collateral received by each Fund is required to have a value of no less than 102% of the market value of the loaned securities for U.S. securities and a value of no less than 105% of the market value for non-U.S. securities. The collateral is maintained thereafter, at a market value equal to not less than 102% of the current value of the U.S. securities on loan and not less than 105% of the current value of the non-U.S. securities on loan. The market value of the loaned securities is determined at the close of each business day and any additional required collateral is delivered to each Fund on the next business day. During the term of the loan, each Fund is entitled to all distributions made on, or in respect of, the loaned securities. Loans of securities are terminable at any time and the borrower, after notice, is required to return borrowed securities within the customary time period for settlement of securities transactions.
Cash collateral received is invested in a money market fund managed by Northern Trust Investments, Inc., an indirect subsidiary of Northern Trust Corporation as disclosed in each Fund’s Schedule of Investments and reflected on the Statements of Assets and Liabilities as a payable for collateral upon return of securities loaned. Non-cash collateral, in the form of securities issued or guaranteed by the U.S. government or its agencies or instrumentalities, is held by the Securities Lending Agent on behalf of each Fund, and each Fund does not have the ability to re-hypothecate these securities. Each Fund receives compensation for lending securities from interest or dividends earned on the cash, cash equivalents or U.S. government securities held as collateral, net of fee rebates paid to the borrower and reasonable administrative and custody fees paid to the lending agent. Such compensation is accrued daily and payable to the Fund monthly. The dividend and interest income earned on the securities loaned is accounted for in the same manner as other dividend and interest income. The borrower pays to the Funds an amount equal to any dividends or interest received on loaned securities. These payments from the borrower are not eligible for reduced tax rates as "qualified dividend income" under the Jobs and Growth Tax Reconciliation Act of 2003. The securities lending income earned by the Funds is disclosed on the Statement of Operations.
Morningstar Funds Trust October 31, 2023 (unaudited)
Notes to Financial Statements (continued)
The following is a summary of the Funds' securities on loan and related cash and non-cash collateral received as of October 31, 2023:
| Morningstar Funds | Market Value
of Securities
on Loan | Cash Collateral
Received | Non-Cash
Collateral
Received* | Total Collateral
Received |
| U.S. Equity Fund | $ 63,640,880 | $ 11,876,126 | $ 52,737,784 | $ 64,613,910 |
| International Equity Fund | 14,845,033 | 7,145,629 | 8,286,911 | 15,432,540 |
| Global Income Fund | 6,410,992 | 4,901,136 | 1,668,767 | 6,569,903 |
| Total Return Bond Fund | 22,852,570 | 10,092,376 | 13,404,541 | 23,496,917 |
| Defensive Bond Fund | 1,839,705 | 1,272,762 | 621,255 | 1,894,017 |
| Global Opportunistic Equity Fund | 18,028,544 | 13,615,016 | 4,957,937 | 18,572,953 |
| | | | | |
| | | | | |
| *There are no restrictions or maturity dates on the cash collateral received from borrower. The remaining contractual maturity of securities lending transactions with non-cash collateral are as follows: |
| Morningstar Funds | Up to 30 Days | 30-90 Days | Over 90 Days | Total Non-Cash
Collateral Received |
| U.S. Equity Fund | $ 1,369,010 | $ 1,437,981 | $ 49,930,793 | $ 52,737,784 |
| International Equity Fund | 47,664 | 113,061 | 8,126,186 | 8,286,911 |
| Global Income Fund | 51,284 | 109,397 | 1,508,086 | 1,668,767 |
| Total Return Bond Fund | 273,465 | 50,997 | 13,080,079 | 13,404,541 |
| Defensive Bond Fund | 15,056 | 3,432 | 602,767 | 621,255 |
| Global Opportunistic Equity Fund | 176,298 | 192,219 | 4,589,420 | 4,957,937 |
| | | | | |
| | | | | |
Securities lending involves two primary risks: “investment risk” and “borrower default risk.” Investment risk is the risk that a Fund will lose money from the investment of the cash collateral received from the borrower. Borrower default risk is the risk that a Fund will lose money due to the failure of a borrower to return a borrowed security in a timely manner. There also may be risks of delay in receiving additional collateral, in recovering the securities loaned, or a loss of rights in the collateral should the borrower of the securities fail financially. In the event a Fund is unsuccessful in seeking to enforce the contractual obligation to deliver additional collateral, then the Fund could suffer a loss. To mitigate borrower default risk, the Funds benefit from a borrower default indemnity provided by the Securities Lending Agent. The Securities Lending Agent’s indemnity allows for full replacement of securities lent wherein the Agent will purchase the unreturned loaned securities on the open market applying the proceeds of the collateral, or to the extent such proceeds are insufficient or the collateral is unavailable, the Securities Lending Agent will purchase the unreturned loan securities at the Agent’s expense. However, the Funds could suffer a loss if the value of the investments purchased with cash collateral falls below the value of the cash collateral received.
Due to the absence of a master netting agreement related to the Funds' participation in securities lending, no offsetting disclosure has been made on behalf of the Funds.
Morningstar Funds Trust October 31, 2023 (unaudited)
Notes to Financial Statements (continued)
8. Financial Derivative Instruments
Certain Funds may transact in derivatives as part of their principal investment strategies in an attempt to achieve their investment objective. The Funds’ derivative contracts are not accounted for as hedging instruments under U.S. GAAP. For financial reporting purposes, the Funds do not offset financial assets and financial liabilities that are subject to master netting arrangements or similar agreements on the Statements of Assets and Liabilities.
Forward Foreign Currency Contracts: A forward foreign currency contract is an obligation to purchase or sell a specific non-U.S. currency in exchange for another currency, which may be U.S. dollars, at an agreed exchange rate (price) at a future date. Currency forwards are typically individually negotiated and privately traded by currency traders and their customers in the interbank market. A forward foreign currency contract will tend to reduce or eliminate exposure to the currency that is sold, and increase exposure to the currency that is purchased, similar to when a Fund sells a security denominated in one currency and purchases a security denominated in another currency.
At the maturity of a forward foreign currency contract, a Fund may either exchange the currencies specified at the maturity of a forward foreign currency contract or, prior to maturity, the Fund may enter into a closing transaction involving the purchase or sale of an offsetting contract. Closing transactions with respect to forward foreign currency contract are usually effected with the counterparty to the original forward contract. A Fund may also enter into forward foreign currency contracts that do not provide for physical settlement of the two currencies but instead provide for settlement by a single cash payment calculated as the difference between the agreed upon exchange rate and the spot rate at settlement based upon an agreed upon notional amount (non-deliverable forwards).
Under definitions adopted by the Commodity Futures Trading Commission (CFTC) and SEC, non-deliverable forwards are considered swaps, and therefore are included in the definition of “commodity interests.” Although non-deliverable forwards have historically been traded in the OTC market, as swaps they may in the future be required to be centrally cleared and traded on public facilities. Forward foreign currency contracts that qualify as deliverable forwards are not regulated as swaps for most purposes, and are not included in the definition of “commodity interests.” However these forwards are subject to some requirements applicable to swaps, including reporting to swap data repositories, documentation requirements, and business conduct rules applicable to swap dealers.
CFTC regulation of forward foreign currency contracts, especially non-deliverable forwards, may restrict a Fund’s ability to use these instruments in the manner described above or subject the adviser to CFTC registration and regulation as a commodity pool operator with respect to that Fund.
The successful use of these transactions will usually depend on the adviser’s or a subadviser’s ability to accurately forecast currency exchange rate movements. Should exchange rates move in an unexpected manner, a Fund may not achieve the anticipated benefits of the transaction, or it may realize losses. In addition, these techniques could result in a loss if the counterparty to the transaction does not perform as promised, including because of the counterparty’s bankruptcy or insolvency. In unusual or extreme market conditions, a counterparty’s creditworthiness and ability to perform may deteriorate rapidly, and the availability of suitable
Morningstar Funds Trust October 31, 2023 (unaudited)
Notes to Financial Statements (continued)
replacement counterparties may become limited. Moreover, investors should bear in mind that the Funds are not obligated to actively engage in hedging or other currency transactions. For example, a Fund may not have attempted to hedge its exposure to a particular foreign currency at a time when doing so might have avoided a loss.
Forward foreign currency contracts may limit potential gain from a positive change in the relationship between the U.S. dollar and foreign currencies. Unanticipated changes in currency prices may result in poorer overall performance for a Fund than if it had not engaged in such contracts. Moreover, there may be an imperfect correlation between a Fund’s portfolio holdings of securities denominated in a particular currency and the currencies bought or sold in the forward foreign currency contracts entered into by the Fund. This imperfect correlation may cause a Fund to sustain losses that will prevent the Fund from achieving a complete hedge or expose the Fund to risk of foreign exchange loss.
Forward foreign currency exchange contracts outstanding at period end, if any, are listed after each Fund’s Schedule of Investments and presented as gross unrealized appreciation (depreciation) on the Statement of Assets and Liabilities. Any resulting unrealized gains or losses are recorded in Net change in unrealized appreciation (depreciation) on forward foreign currency exchange contracts in the Statements of Operations. Gains or losses are recorded for financial statement purposes as unrealized until settlement date. Realized gains or losses, if any, are included in Net realized gains (losses) on forward foreign currency exchange contracts in the Statements of Operations.
Futures Contracts: A Fund may enter into futures contracts. Generally, a futures contract is a standard binding agreement to buy or sell a specified quantity of an underlying reference instrument, such as a specific security, rate, currency or commodity, at a specified price at a specified later date. A Fund may purchase or sell interest rate futures for the purpose of hedging some or all of the value of its portfolio securities against changes in prevailing interest rates or to manage its duration or effective maturity. If MIM or a subadviser anticipates that interest rates may rise and, concomitantly, the price of certain of its portfolio securities may fall, a Fund may sell futures contracts. If declining interest rates are anticipated, a Fund may purchase futures contracts to protect against a potential increase in the price of securities the Fund intends to purchase. Subsequently, appropriate securities may be purchased by a Fund in an orderly fashion; as securities are purchased, corresponding futures positions would be terminated by offsetting sales of contracts.
When a Fund enters into a futures contract, it must deliver to an account controlled by a futures commission merchant ("FCM") an amount referred to as “initial margin” that is typically calculated as an amount equal to the volatility in market value of a contract over a fixed period. Initial margin requirements are determined by the respective exchanges on which the futures contracts are traded and the FCM. Thereafter, a “variation margin” amount may be required to be paid by a Fund or received by the Fund in accordance with margin controls set for such accounts, depending upon changes in the marked-to-market value of the futures contract. The account is marked-to-market daily and the variation margin is monitored by a Fund’s investment manager and custodian on a daily basis. When the futures contract is closed out, if a Fund has a loss equal to or greater than the margin amount, the margin amount is paid to the FCM along with any loss in excess of the margin amount. If a Fund has a loss of less than the margin amount, the excess margin is returned to the Fund. If a Fund has a gain, the full margin amount and the amount of the gain is paid to the Fund.
Morningstar Funds Trust October 31, 2023 (unaudited)
Notes to Financial Statements (continued)
A Fund’s use of futures contracts is subject to the risks associated with derivative instruments generally. In addition, if MIM’s or a subadviser’s judgment about the general direction of interest rates or markets is wrong, a Fund’s overall performance may be poorer than if no financial futures contracts had been entered into. For example, in some cases, securities called for by a financial futures contract may not have been issued at the time the contract was written. In addition, the market prices of financial futures contracts may be affected by certain factors.
There is a risk of loss by a Fund of the initial and variation margin deposits in the event of bankruptcy of the FCM with which the Fund has an open position in a futures contract. The assets of a Fund may not be fully protected in the event of the bankruptcy of the FCM or central counterparty because the Fund might be limited to recovering only a pro rata share of all available funds and margin segregated on behalf of an FCM’s customers. If an FCM does not provide accurate reporting, a Fund is also subject to the risk that the FCM could use the Fund’s assets, which are held in an omnibus account with assets belonging to the FCM’s other customers, to satisfy its own financial obligations or the payment obligations of another customer to the central counterparty.
The risk of loss in trading financial futures can be substantial due to the low margin deposits required and the extremely high degree of leverage involved in futures pricing. Relatively small price movements in a financial futures contract could have an immediate and substantial impact, which may be favorable or unfavorable to a Fund. It is possible for a price-related loss to exceed the amount of a Fund’s margin deposit.
Each Fund will incur brokerage fees in connection with its futures transactions. In addition, while futures contracts will be purchased and sold to reduce certain risks, those transactions themselves entail certain other risks. Thus, while a Fund may benefit from the use of futures, unanticipated changes in interest rates or stock price movements may result in a poorer overall performance for the Fund than if it had not entered into any futures contracts. Moreover, in the event of an imperfect correlation between the futures position and the portfolio position that is intended to be protected, the desired protection may not be obtained and the Fund may be exposed to risk of loss.
Although some financial futures contracts by their terms call for the actual delivery or acquisition of securities at expiration, in most cases the contractual commitment is closed out before expiration. The offsetting of a contractual obligation is accomplished by purchasing (or selling as the case may be) on a commodities or futures exchange an identical financial futures contract calling for delivery in the same month. Such a transaction, if effected through a member of an exchange, cancels the obligation to make or take delivery of the securities. A Fund will incur brokerage fees when it purchases or sells financial futures contracts, and will be required to maintain margin deposits. If a liquid secondary market does not exist when a Fund wishes to close out a financial futures contract, it will not be able to do so and will continue to be required to make daily cash payments of variation margin in the event of adverse price movements. There is no assurance that a Fund will be able to enter into closing transactions.
The CFTC and the various exchanges have established limits referred to as “speculative position limits” on the maximum net long or net short position that any person, such as a Fund, may hold or control in a particular futures contract. Trading limits are also imposed on the maximum number of contracts that any person may
Morningstar Funds Trust October 31, 2023 (unaudited)
Notes to Financial Statements (continued)
trade on a particular trading day. An exchange may order the liquidation of positions found to be in violation of these limits and it may impose other sanctions or restrictions. The regulation of futures, as well as other derivatives, is a rapidly changing area of law.
Futures exchanges may also limit the amount of fluctuation permitted in certain futures contract prices during a single trading day. This daily limit establishes the maximum amount that the price of a futures contract may vary either up or down from the previous day’s settlement price. Once the daily limit has been reached in a futures contract subject to the limit, no more trades may be made on that day at a price beyond that limit. The daily limit governs only price movements during a particular trading day and does not limit potential losses because the limit may prevent the liquidation of unfavorable positions. For example, futures prices have occasionally moved to the daily limit for several consecutive trading days with little or no trading, thereby preventing prompt liquidation of positions and subjecting some holders of futures contracts to substantial losses.
Futures contracts outstanding at period end, if any, are listed after each Fund’s Schedule of Investments.The Statements of Operations include any realized gains or losses on closed futures contracts in Net realized gains (losses) on futures contracts, and any unrealized gains or losses on open futures contracts in Net change in unrealized appreciation (depreciation) on futures contracts. As of October 31, 2023, the Morningstar Global Income Fund, the Morningstar Total Return Bond Fund, the Morningstar Multisector Bond Fund and the Morningstar Alternatives Fund pledged cash to cover margin requirements for open futures positions in an amount of $711,195, $4,990,158, $120,167 and $882,134, respectively, which is included in Due from Broker on the Statements of Assets and Liabilities.
Options on Futures Contracts: Options on futures contracts trade on the same contract markets as the underlying futures contract. When a Fund buys an option, it pays a premium for the right, but does not have the obligation, to purchase (call) or sell (put) a futures contract at a set price (called the exercise price). The purchase of a call or put option on a futures contract, whereby a Fund has the right to purchase or sell, respectively, a particular futures contract, is similar in some respects to the purchase of a call or put option on an individual security or currency. Depending on the premium paid for the option compared to either the price of the futures contract upon which it is based or the price of the underlying reference instrument, the option may be less risky than direct ownership of the futures contract or the underlying reference instrument.
The seller (writer) of an option becomes contractually obligated to take the opposite futures position if the buyer of the option exercises its rights to the futures position specified in the option. In return for the premium paid by the buyer, the seller assumes the risk of taking a possibly adverse futures position. In addition, the seller will be required to post and maintain initial and variation margin with the FCM.
A Fund’s use of options on futures contracts is subject to the risks related to derivative instruments generally. In addition, the amount of risk the Fund assumes when it purchases an option on a futures contract is the premium paid for the option plus related transaction costs. The purchase of an option also entails the risk that changes in the value of the underlying futures contract will not be fully reflected in the value of the option purchased. The seller (writer) of an option on a futures contract is subject to the risk of having to take a possibly adverse futures position if the purchaser of the option exercises its rights. If the seller were required to take such a position, it could bear substantial losses. An option writer has potentially unlimited economic risk
Morningstar Funds Trust October 31, 2023 (unaudited)
Notes to Financial Statements (continued)
because its potential loss, except to the extent offset by the premium received, is equal to the amount the option is “in-the-money” at the expiration date. A call option is in-the-money if the value of the underlying futures contract exceeds the exercise price of the option. A put option is in-the-money if the exercise price of the option exceeds the value of the underlying futures contract.
Options: A Fund may purchase and sell call and put options. An option is a contract that gives the purchaser of the option, in return for the premium paid, the right to buy an underlying reference instrument, such as a specified security, currency, index, or other instrument, from the writer of the option (in the case of a call option), or to sell a specified reference instrument to the writer of the option (in the case of a put option) at a designated price during the term of the option. The premium paid by the buyer of an option will reflect, among other things, the relationship of the exercise price to the market price and the volatility of the underlying reference instrument, the remaining term of the option, supply, demand, interest rates and/or currency exchange rates. An American style put or call option may be exercised at any time during the option period while a European style put or call option may be exercised only upon expiration or during a fixed period prior thereto. Put and call options are traded on national securities exchanges and in the OTC market.
As the buyer of a call option, a Fund has a right to buy the underlying reference instrument (e.g., a currency or security) at the exercise price at any time during the option period (for American style options). A Fund may enter into closing sale transactions with respect to call options, exercise them, or permit them to expire. Unless the price of the underlying reference instrument changes sufficiently, a call option purchased by a Fund may expire without any value to the Fund, in which case the Fund would experience a loss to the extent of the premium paid for the option plus related transaction costs.
As the buyer of a put option, a Fund has the right to sell the underlying reference instrument at the exercise price at any time during the option period (for American style options). Like a call option, a Fund may enter into closing sale transactions with respect to put options, exercise them or permit them to expire. If a put option is not terminated in a closing sale transaction when it has remaining value, and if the market price of the underlying reference instrument remains equal to or greater than the exercise price during the life of the put option, the buyer would not make any gain upon exercise of the option and would experience a loss to the extent of the premium paid for the option plus related transaction costs. In order for the purchase of a put option to be profitable, the market price of the underlying reference instrument must decline sufficiently below the exercise price to cover the premium and transaction costs.
Writing options may permit the writer to generate additional income in the form of the premium received for writing the option. The writer of an option may have no control over when the underlying reference instruments must be sold (in the case of a call option) or purchased (in the case of a put option) because the writer may be notified of exercise at any time prior to the expiration of the option (for American style options). In general, though, options are infrequently exercised prior to expiration. Whether or not an option expires unexercised, the writer retains the amount of the premium. Writing “covered” call options means that the writer owns the underlying reference instrument that is subject to the call option. Call options may also be written on reference instruments that the writer does not own.
Morningstar Funds Trust October 31, 2023 (unaudited)
Notes to Financial Statements (continued)
If a call option written by a Fund expires unexercised, the Fund will realize a gain in the amount of the premium received. If the market price of the underlying reference instrument decreases, the call option will not be exercised and the Fund will be able to use the amount of the premium received to hedge against the loss in value of the underlying reference instrument. The exercise price of a call option will be chosen based upon the expected price movement of the underlying reference instrument. The exercise price of a call option may be below, equal to (at-the money), or above the current value of the underlying reference instrument at the time the option is written.
As the writer of a put option, a Fund has a risk of loss should the underlying reference instrument decline in value. If the value of the underlying reference instrument declines below the exercise price of the put option and the put option is exercised, the Fund, as the writer of the put option, will be required to buy the instrument at the exercise price, which will exceed the market value of the underlying reference instrument at that time. A Fund will incur a loss to the extent that the current market value of the underlying reference instrument is less than the exercise price of the put option. However, the loss will be offset in part by the premium received from the buyer of the put. If a put option written by a Fund expires unexercised, the Fund will realize a gain in the amount of the premium received.
Options involve certain risks, including general risks related to derivative instruments. There can be no assurance that a liquid secondary market on an exchange will exist for any particular option, or at any particular time, and a Fund may have difficulty effecting closing transactions in particular options. Therefore, a Fund would have to exercise the options it purchased in order to realize any profit, thus taking or making delivery of the underlying reference instrument when not desired. A Fund could then incur transaction costs upon the sale of the underlying reference instruments. Similarly, when a Fund cannot effect a closing transaction with respect to a put option it wrote, and the buyer exercises, the Fund would be required to take delivery and would incur transaction costs upon the sale of the underlying reference instruments purchased. If a Fund, as a covered call option writer, is unable to effect a closing purchase transaction in a secondary market, it will not be able to sell the underlying reference instrument until the option expires, it delivers the underlying instrument upon exercise, or it segregates enough liquid assets to purchase the underlying reference instrument at the marked-to-market price during the term of the option. When trading options on non-U.S. exchanges or in the OTC market, many of the protections afforded to exchange participants will not be available. For example, there may be no daily price fluctuation limits, and adverse market movements could therefore continue to an unlimited extent over an indefinite period of time.
The effectiveness of an options strategy for hedging depends on the degree to which price movements in the underlying reference instruments correlate with price movements in the relevant portion of a Fund’s portfolio that is being hedged. In addition, a Fund bears the risk that the prices of its portfolio investments will not move in the same amount as the option it has purchased or sold for hedging purposes, or that there may be a negative correlation that would result in a loss on both the investments and the option. If the investment adviser is not successful in using options in managing a Fund’s investments, the Fund’s performance will be worse than if the investment adviser did not employ such strategies.
Options on Interest-Rate Swaps: An option on an interest-rate swap (sometimes referred to as a “swaption”) is a contract that gives the purchaser the right, but not the obligation, in return for payment of a premium, to enter into a new interest-rate swap. Options on swap agreements involve the risks associated with
Morningstar Funds Trust October 31, 2023 (unaudited)
Notes to Financial Statements (continued)
derivative instruments generally, as well as the additional risks associated with both options and swaps generally. A pay fixed option on an interest-rate swap gives the buyer the right to establish a position in an interest-rate swap where the buyer will pay (and the writer will receive) the fixed-rate cash flows and receive (and the writer will pay) the floating-rate cash flows. In general, most options on interest-rate swaps are “European” exercise, which means that they can only be exercised at the end of the option term.
Depending on the movement of interest rates between the time of purchase and expiration, the value of the underlying interest-rate swap and therefore also the value of the option on the interest-rate swap will change. When a Fund purchases an option on a swap agreement, it risks losing only the amount of the premium it has paid should it decide to let the option expire unexercised, plus any related transaction costs. However, if a Fund writes (sells) a swaption, the Fund is bound by the terms of the underlying swap agreement upon exercise of the option by the buyer, which may result in losses to the Fund in excess of the premium it received.
Options on swap agreements are considered to be swaps for purposes of CFTC regulation. Although they are traded OTC, the CFTC may in the future designate certain options on swaps as subject to mandatory clearing.
When a Fund purchases an option on a swap, an amount equal to the premium paid by the Fund is recorded as an Investment on the Schedules of Investments, the value of which is marked-to-market daily based upon quotations from market makers to reflect its current market value. If the option on a swap expires, a Fund realizes a loss equal to the amount of the premium paid. Changes in the value of an option on a swap are reported as unrealized gains or losses.
Interest Rate, Inflation Index and Total Return Swap Contracts: A Fund may purchase interest-rate swaps. A Fund may use interest-rate swaps to increase or decrease exposure to a particular interest rate or rates, which may result in the Fund experiencing a gain or loss depending on whether the interest rates increased or decreased during the term of the agreement. A Fund may also enter into inflation index swaps to manage exposure to inflation risk. An inflation index swap is an agreement between two parties, whereby one party makes payments based on the cumulative percentage increase in an index that serves as a measure of inflation (typically, the Consumer Price Index) and the other party makes a regular payment based on a compounded fixed rate. The value of an inflation index swap is expected to change in response to changes in the rate of inflation. If inflation increases at a faster rate than anticipated at the time the swap is entered into, the swap will increase in value. Similarly, if inflation increases at a rate slower than anticipated at the time the swap is entered into, the swap will decrease in value. A Fund may also engage in total return swaps, in which payments made by the Fund or the counterparty are based on the total return of a particular reference asset or assets (such as a fixed-income security, a combination of securities, or an index). The value of a Fund’s swap positions would increase or decrease depending on the changes in value of the underlying rates, currency values, volatility or other indexes or measures. Caps and floors have an effect similar to buying or writing options. Depending on how they are used, swap agreements may increase or decrease the overall volatility of a Fund’s investments and its share price. A Fund’s ability to engage in certain swap transactions may be limited by tax considerations.
A Fund’s ability to realize a profit from such transactions will depend on the ability of the financial institutions with which it enters into the transactions to meet their obligations to the Fund. If a counterparty’s creditworthiness declines, the value of the agreement would be likely to decline, potentially resulting in losses.
Morningstar Funds Trust October 31, 2023 (unaudited)
Notes to Financial Statements (continued)
If a default occurs by the other party to such transaction, a Fund will have contractual remedies pursuant to the agreements related to the transaction, which may be limited by applicable law in the case of a counterparty’s insolvency. Under certain circumstances, suitable transactions may not be available to a Fund, or the Fund may be unable to close out its position under such transactions at the same time, or at the same price, as if it had purchased comparable publicly traded securities. Swaps carry counterparty risks that cannot be fully anticipated. Also, because swap transactions typically involve a contract between the two parties, such swap investments can be extremely illiquid, as it is uncertain as to whether another counterparty would wish to take assignment of the rights under the swap contract at a price acceptable to a Fund.
For centrally cleared swaps, the Schedules of Investments include the cumulative appreciation (depreciation), while only the current day’s variation margin is reported within the Statements of Assets and Liabilities. For interest rate contracts, an up-front payment received by a Fund is recorded as a liability and an upfront payment made by a Fund is recorded as an asset on the Fund’s Statement of Assets and Liabilities. Upfront payments are amortized over the term of the contract. If there is no upfront payment or receipt, market value will equal unrealized appreciation (depreciation). Periodic payments received (paid) by a Fund are recorded as realized gains (losses) from the expiration or closing of swap contracts on the Fund’s Statement of Operations.
Interest rate swaps are marked to market daily and the change is recorded as unrealized gain (loss) on swap contracts in the Statements of Operations. The Funds’ risk of loss associated with these instruments may exceed their value, as recorded in the Schedules of Investments. Non-deliverable interest rate swap contracts are settled with the counterparty in U.S. Dollars without the delivery of foreign currency. Centrally cleared interest rate swaps may have forward effective dates. The amortization of the upfront premiums (if applicable) and payments related to these swap contracts begin on the effective date of the contract. Interest rate, inflation index and total return swaps contracts outstanding, including their respective notional amounts at period end, if any, are listed after each Fund’s Schedule of Investments.
Credit Default Swaps: A Fund may purchase credit default swaps. A credit default swap is an agreement between a Fund and a counterparty that enables the Fund to buy or sell protection against a credit event related to a particular issuer. One party, acting as a protection buyer, makes periodic payments, which may be based on, among other things, a fixed or floating rate of interest, to the other party, a protection seller, in exchange for a promise by the protection seller to make a payment to the protection buyer if a negative credit event (such as a delinquent payment or default) occurs with respect to a referenced bond or group of bonds. Credit default swaps may also be structured based on the debt of a basket of issuers, rather than a single issuer, and may be customized with respect to the default event that triggers purchase or other factors, or defaults by a particular combination of issuers within the basket, may trigger a payment obligation. As a credit protection seller in a credit default swap contract, a Fund would be required to pay the par (or other agreed-upon) value of a referenced debt obligation to the counterparty following certain negative credit events as to a specified third party debtor, such as default by a U.S. or non-U.S. corporate issuer on its debt obligations. In return for its obligation, a Fund would receive from the counterparty a periodic stream of payments, which may be based on, among other things, a fixed or floating rate of interest, over the term of the contract provided that no event of default has occurred. If no default occurs, a Fund would keep the stream of payments, and would have no payment obligations to the counterparty. A Fund may sell credit protection to earn additional income and/or to take a synthetic long position in the underlying security or basket of securities.
Morningstar Funds Trust October 31, 2023 (unaudited)
Notes to Financial Statements (continued)
A Fund may enter into credit default swap contracts as protection buyer to hedge against the risk of default on the debt of a particular issuer or basket of issuers or attempt to profit from a deterioration or perceived deterioration in the creditworthiness of the particular issuer(s) (also known as buying credit protection). This would involve the risk that the investment may expire worthless and would only generate gain in the event of an actual default by the issuer(s) of the underlying obligation(s) (or, as applicable, a credit downgrade or other indication of financial instability). It would also involve the risk that the seller may fail to satisfy its payment obligations to a Fund. The purchase of credit default swaps involves costs, which will reduce a Fund’s return.
Credit default swaps involve a number of special risks. A protection seller may have to pay out amounts following a negative credit event greater than the value of the reference obligation delivered to it by its counterparty and the amount of periodic payments previously received by it from the counterparty. When a Fund acts as a seller of a credit default swap, it is exposed to, among other things, leverage risk because if an event of default occurs the seller must pay the buyer the full notional value of the reference obligation. Each party to a credit default swap is subject to the credit risk of its counterparty (the risk that its counterparty may be unwilling or unable to perform its obligations on the swap as they come due). The value of the credit default swap to each party will change based on changes in the actual or perceived creditworthiness of the underlying issuer.
A protection buyer may lose its investment and recover nothing should an event of default not occur. A Fund may seek to realize gains on its credit default swap positions, or limit losses on its positions, by selling those positions in the secondary market. There can be no assurance that a liquid secondary market will exist at any given time for any particular credit default swap or for credit default swaps generally.
The market for credit default swaps has become more volatile in recent years as the creditworthiness of certain counterparties has been questioned and/or downgraded. The parties to a credit default swap may be required to post collateral to each other. If a Fund posts initial or periodic collateral to its counterparty, it may not be able to recover that collateral from the counterparty in accordance with the terms of the swap. In addition, if a Fund receives collateral from its counterparty, it may be delayed or prevented from realizing on the collateral in the event of the insolvency or bankruptcy of the counterparty. A Fund may exit its obligations under a credit default swap only by terminating the contract and paying applicable breakage fees, or by entering into an offsetting credit default swap position, which may cause the Fund to incur more losses.
For centrally cleared swaps, the Schedules of Investments include the cumulative appreciation (depreciation), while only the current day’s variation margin is reported within the Statements of Assets and Liabilities. For credit default swap contracts, an up-front payment received by a Fund is recorded as a liability and an upfront payment made by a Fund is recorded as an asset on the Fund’s Statement of Assets and Liabilities. Upfront payments are amortized over the term of the contract. If there is no upfront payment or receipt, market value will equal unrealized appreciation (depreciation). Periodic payments received (paid) by a Fund are recorded as realized gains (losses) from the expiration or closing of swap contracts on the Fund’s Statement of Operations.
Morningstar Funds Trust October 31, 2023 (unaudited)
Notes to Financial Statements (continued)
The credit default contracts are marked to market daily and the change, if any, is recorded as an unrealized gain or loss. Changes in market value are accounted for as unrealized appreciation or depreciation until the contract is closed, at which time the gains or losses are realized. Upon the occurrence of a credit event, the difference between the par value and market value of the reference obligation, net of any proportional amount of the up-front payment, is recorded as a realized gain or loss on swap contracts in the Statements of Operations.
Each Fund's risk of loss associated with these instruments may exceed their fair value, as recorded in the Schedules of Investments. Credit default swap contracts outstanding, including their respective notional amounts at period end, if any, are listed within each Fund’s Schedule of Investments.
Implied credit spreads, represented in absolute terms, utilized in determining the market value of credit default contracts on corporate issues or sovereign issues of an emerging country as of period end are disclosed in the Schedules of Investments and serve as an indicator of the current status of the payment/performance risk and represent the likelihood or risk of default for the credit derivative. The implied credit spread of a particular referenced entity reflects the cost of buying/selling protection and may include upfront payments required to be made to enter into the agreement. For credit default contracts on asset-backed securities and credit indices, the quoted market prices and resulting values serve as the indicator of the current status of the payment/performance risk. Wider credit spreads and increasing market values, in absolute terms when compared to the notional amount of the swap, represent a deterioration of the referenced entity’s credit soundness and a greater likelihood or risk of default or other credit event occurring as defined under the terms of the agreement.
Contracts for Differences: The Morningstar Alternatives Fund may enter into Contracts for Differences (“CFDs”). CFDs are leveraged derivative instruments that allow the Fund to take a position on the change in the market price of an underlying asset, such as a stock, or the value of an index or currency exchange rate. With a short CFD, the Fund is seeking to profit from falls in the market price of the asset. CFDs are subject to liquidity risk because the liquidity of CFDs is based on the liquidity of the underlying instrument, and are subject to counterparty risk, i.e., the risk that the counterparty to the CFD transaction may be unable or unwilling to make payments or to otherwise honor its financial obligations under the terms of the contract. It is also possible that the market price of the CFD will move between the time the order is placed by the Fund and when it is executed by the issuer, which can result in the trade being executed at a less favorable price. CFDs, like many other derivative instruments, involve the risk that, if the derivative security declines in value, additional margin would be required to maintain the margin level. The seller may require the Fund to deposit additional sums to cover this decline in value, and the margin call may be at short notice. If additional margin is not provided in time, the seller may liquidate the positions at a loss for which the Fund is liable. The potential for margin calls and large losses are much greater in CFDs than in other leveraged products. Most CFDs are traded OTC. CFDs are not registered with the SEC or any U.S. regulator, and are not subject to U.S. regulation. In a short position, the Fund will receive or pay an amount based upon the amount, if any, by which the notional amount of the CFD would have decreased or increased in value had it sold the particular stocks short, less the dividends that would have been paid on those stocks, plus a floating rate of interest on the notional amount of the CFD. All of these components are reflected in the market value of the CFD.
Morningstar Funds Trust October 31, 2023 (unaudited)
Notes to Financial Statements (continued)
Master Netting Agreements: Certain Funds are parties to master netting arrangements with counterparties (“Master Agreements”). Master Agreements govern the terms of certain like transactions, and reduce the counterparty risk associated with relevant transactions by specifying payment netting mechanisms across multiple transactions and providing standardization that improves legal certainty. Since different types of transactions have different mechanics and are sometimes traded by different legal entities of a particular counterparty organization, each type of transaction may be covered by a different Master Agreement, resulting in the need for multiple Master Agreements with a counterparty and its affiliates.
As the Master Agreements are specific to unique operations of different asset types, they allow the Funds to i) close out and net their total exposure to a counterparty in the event of a default with respect to all the transactions governed under a single Master Agreement with a counterparty, ii) exit transactions through means other than sale, such as through a negotiated agreement with the Funds’ counterparty, a transfer to another party, or close out of the position through execution of an offsetting transaction.
Master Repurchase Agreements govern repurchase agreements, borrowed bond agreements and reverse repurchase transactions, relating to government bonds between certain Funds and select counterparties. Master Repurchase Agreements maintain provisions for initiation, income payments, events of default, and maintenance of collateral. With borrowed bond agreements and reverse repurchase transactions, typically a Fund and counterparty under a Master Repurchase Agreement are permitted to sell, repledge, or use the collateral associated with the transaction.
Prime Broker Arrangements may be entered into to facilitate execution and/or clearing of equities, bonds, equity options or short sales of securities between certain Funds and selected counterparties. These arrangements provide financing terms for such transactions and include guidelines surrounding the rights, obligations, and other events, including, but not limited to, margin, execution, and settlement. These agreements maintain provisions for payments, maintenance of collateral, events of default, and termination. Margin and other assets delivered as collateral are typically held by the prime broker and offset any obligations due to the prime broker.
Customer Account Agreements govern cleared derivatives transactions and exchange-traded futures and options transactions. Upon entering into an exchange-traded or centrally cleared derivative contract, the Funds are required to deposit with the relevant clearing organization cash or securities, which is referred to as the initial margin. Securities deposited as initial margin are designated on the Schedules of Investments and cash deposited is recorded as Deposits with brokers for centrally cleared swaps and Deposits with brokers for futures contracts on the Statements of Assets and Liabilities. For exchange-traded futures or centrally cleared swaps, initial margin is posted, and daily changes in fair value are recorded as a payable or receivable on the Statements of Assets and Liabilities as Variation margin on centrally cleared swaps and Variation margin on futures contracts. Variation margin is determined separately for exchange-traded futures and centrally cleared swaps and cannot be netted.
International Swaps and Derivatives Association, Inc. Master Agreements and Credit Support Annexes (“ISDA Master Agreements”) govern OTC derivative transactions entered into between certain Funds and a counterparty. ISDA Master Agreements maintain provisions for general obligations, representations, netting of settlement payments, agreements to deliver supporting documents, collateral transfer and events of default or
Morningstar Funds Trust October 31, 2023 (unaudited)
Notes to Financial Statements (continued)
termination. Events of termination include a decline in a Fund’s net assets below a specified threshold over a certain period of time or a decline in the counterparty’s long-term and short-term credit ratings below a specified level. In each case, upon occurrence, the other party may elect to terminate early and cause settlement of all OTC contracts outstanding, including the payment of any losses and costs resulting from such early termination, as reasonably determined by the terminating party. Any decision by a party to elect early termination could be material to the financial statements and impact a Fund’s future derivative activity.
Collateral and margin requirements differ according to the terms of each type of Master Agreement. Collateral is routinely transferred if the total net exposure net of existing collateral already in place governed under the relevant Master Agreement with a counterparty in a given account exceeds a specified threshold. Collateral can be in the form of cash, debt securities issued by the U.S. government, money market funds and other securities as agreed to by a Fund and the applicable counterparty, or as permitted by the clearing house or exchange.
Collateral pledged by a Fund for OTC derivatives pursuant to a Master Agreement is segregated by the Fund’s custodian and identified as an asset in the Statements of Assets and Liabilities either as a component of Investments in non-affiliates, at value (securities) or in Due from broker (cash). Segregation of a Fund’s collateral in the custodian account helps mitigate counterparty risk.
Collateral posted for the benefit of a Fund pursuant to a Master Agreement is held by a custodian of the Fund. Amounts which can be invested or repledged, are presented in each Fund's Schedule of Investments. Collateral received is reflected as a liability within Due to broker in the Statements of Assets and Liabilities.
The Funds use derivative instruments as part of their principal investment strategy to achieve their investment objectives. The Funds’ derivative contracts are not accounted for as hedging instruments under GAAP. The effects of such derivative instruments on the Funds' financial position and financial performance for the six months ended October 31, 2023 are as follows:
| | Assets | Liabilities |
| | Unrealized
Appreciation
on Futures
Contracts(1) | Swaps and
Contracts for
Difference at
Fair Value(2) | Unrealized
Appreciation
on Forward
Currency
Exchange
Contracts | Purchased
Options and
Swaptions at
Fair Market
Value | Total | Unrealized
Depreciation
on Futures
Contracts(1) | Swaps and
Contracts for
Difference at
Fair Value(2) | Unrealized
Depreciation
on Forward
Currency
Exchange
Contracts | Written
Options and
Swaptions at
Fair Market
Value | Total |
| Morningstar Global Income Fund | | | | | | |
| Foreign exchange rate risk | $ — | $ — | $ 35,233 | $ 6,012 | $ 41,245 | $ — | $ — | $ 49,014 | $— | $ 49,014 |
| Interest rate risk | 131,495 | 449,026 | — | 6,060 | 586,581 | 1,434,291 | 109,228 | — | — | 1,543,519 |
| Total | 131,495 | 449,026 | 35,233 | 12,072 | 627,826 | 1,434,291 | 109,228 | 49,014 | — | 1,592,533 |
| Netting positions | (131,495) | (109,228) | (35,233) | — | (275,956) | (131,495) | (109,228) | (35,233) | — | (275,956) |
| Net Fair Value of Derivative Contracts | $ — | $ 339,798 | $ — | $12,072 | $ 351,870 | $1,302,796 | $ — | $ 13,781 | $— | $1,316,577 |
| Morningstar Total Return Bond Fund | | | | | | |
| Credit risk | $ — | $ 238,132 | $ — | $ — | $ 238,132 | $ — | $ 46,190 | $ — | $— | $ 46,190 |
Morningstar Funds Trust October 31, 2023 (unaudited)
Notes to Financial Statements (continued)
| | Assets | Liabilities |
| | Unrealized
Appreciation
on Futures
Contracts(1) | Swaps and
Contracts for
Difference at
Fair Value(2) | Unrealized
Appreciation
on Forward
Currency
Exchange
Contracts | Purchased
Options and
Swaptions at
Fair Market
Value | Total | Unrealized
Depreciation
on Futures
Contracts(1) | Swaps and
Contracts for
Difference at
Fair Value(2) | Unrealized
Depreciation
on Forward
Currency
Exchange
Contracts | Written
Options and
Swaptions at
Fair Market
Value | Total |
| Morningstar Total Return Bond Fund (continued) | | | | | | |
| Foreign exchange rate risk | $ — | $ — | $ 90,561 | $ 29,558 | $ 120,119 | $ — | $ — | $ 78,128 | $ 2,313 | $ 80,441 |
| Inflation risk | — | 4,085 | — | — | 4,085 | — | 4,109 | — | — | 4,109 |
| Interest rate risk | 1,328,243 | 2,906,427 | — | 1,117,465 | 5,352,135 | 4,205,435 | 660,446 | — | 966,848 | 5,832,729 |
| Total | 1,328,243 | 3,148,644 | 90,561 | 1,147,023 | 5,714,471 | 4,205,435 | 710,745 | 78,128 | 969,161 | 5,963,469 |
| Netting positions | (1,328,243) | (710,745) | (78,128) | (969,161) | (3,086,277) | (1,328,243) | (710,745) | (78,128) | (969,161) | (3,086,277) |
| Net Fair Value of Derivative Contracts | $ — | $ 2,437,899 | $ 12,433 | $ 177,862 | $ 2,628,194 | $ 2,877,192 | $ — | $ — | $ — | $ 2,877,192 |
| Morningstar Multisector Bond Fund | | | | | | |
| Credit risk | $ — | $ 607 | $ — | $ — | $ 607 | $ — | $ — | $ — | $ — | $ — |
| Foreign exchange rate risk | — | — | 87,050 | 13,640 | 100,690 | — | — | 167,568 | 2,023 | 169,591 |
| Interest rate risk | 265,164 | — | — | — | 265,164 | 32,922 | — | — | — | 32,922 |
| Total | 265,164 | 607 | 87,050 | 13,640 | 366,461 | 32,922 | — | 167,568 | 2,023 | 202,513 |
| Netting positions | (32,922) | — | (87,050) | (2,023) | (121,995) | (32,922) | — | (87,050) | (2,023) | (121,995) |
| Net Fair Value of Derivative Contracts | $ 232,242 | $ 607 | $ — | $ 11,617 | $ 244,466 | $ — | $ — | $ 80,518 | $ — | $ 80,518 |
| Morningstar Global Opportunistic Equity Fund | | | | | | |
| Foreign exchange rate risk | $ — | $ — | $ 268 | $ — | $ 268 | $ — | $ — | $ 387 | $ — | $ 387 |
| Total | — | — | 268 | — | 268 | — | — | 387 | — | 387 |
| Netting positions | — | — | (268) | — | (268) | — | — | (268) | — | (268) |
| Net Fair Value of Derivative Contracts | $ — | $ — | $ — | $ — | $ — | $ — | $ — | $ 119 | $ — | $ 119 |
| Morningstar Alternatives Fund | | | | | | |
| Credit risk | $ — | $ — | $ — | $ — | $ — | $ — | $ 520 | $ — | $ — | $ 520 |
| Equity risk | — | 49,643,187 | — | 3,870 | 49,647,057 | — | 46,036,209 | — | — | 46,036,209 |
| Foreign exchange rate risk | — | — | 380,261 | 2,340 | 382,601 | — | — | 273,557 | — | 273,557 |
Morningstar Funds Trust October 31, 2023 (unaudited)
Notes to Financial Statements (continued)
| | Assets | Liabilities |
| | Unrealized
Appreciation
on Futures
Contracts(1) | Swaps and
Contracts for
Difference at
Fair Value(2) | Unrealized
Appreciation
on Forward
Currency
Exchange
Contracts | Purchased
Options and
Swaptions at
Fair Market
Value | Total | Unrealized
Depreciation
on Futures
Contracts(1) | Swaps and
Contracts for
Difference at
Fair Value(2) | Unrealized
Depreciation
on Forward
Currency
Exchange
Contracts | Written
Options and
Swaptions at
Fair Market
Value | Total |
| Morningstar Alternatives Fund (continued) | | | | | | |
| Interest rate risk | $1,435,684 | $ — | $ — | $ — | $ 1,435,684 | $ 789,143 | $ — | $ — | $— | $ 789,143 |
| Total | 1,435,684 | 49,643,187 | 380,261 | 6,210 | 51,465,342 | 789,143 | 46,036,729 | 273,557 | — | 47,099,429 |
| Netting positions | (789,143) | (46,036,729) | (273,557) | — | (47,099,429) | (789,143) | (46,036,729) | (273,557) | — | (47,099,429) |
| Net Fair Value of Derivative Contracts | $ 646,541 | $ 3,606,458 | $ 106,704 | $6,210 | $ 4,365,913 | $ — | $ — | $ — | $— | $ — |
| 1 | Includes cumulative appreciation/depreciation on futures contracts as reported in the Schedule of Investments’ footnotes. Only the current day’s variation margin is reported within the Statements of Assets and Liabilities. |
| 2 | Includes cumulative appreciation/depreciation on centrally-cleared swap agreements as reported in the Schedule of Investments’ footnotes. Only the current day’s variation margin is reported within the Statements of Assets and Liabilities. |
The following table indicates the effects of derivative instruments, by primary underlying risk exposure and contract type, on the Statements of Operations for the six months ended October 31, 2023:
| | Net Realized Gain (Loss)
on Derivatives Recognized
as a Result from Operations | Net Change in Unrealized
Appreciation (Depreciation)
on Derivatives Recognized
as a Result from Operations |
| | Futures
Contracts | Swaps and
Contracts for
Difference | Forward
Currency
Exchange
Contracts | Purchased/
Written
Options and
Swaptions | Total | Futures
Contracts | Swaps and
Contracts for
Difference | Forward
Currency
Exchange
Contracts | Purchased/
Written
Options and
Swaptions | Total |
| Morningstar International Equity Fund | | | | | | |
| Foreign exchange rate risk | $ — | $ — | $ 121,560 | $ — | $ 121,560 | $ — | $ — | $ — | $ — | $ — |
| Total | $ — | $ — | $ 121,560 | $ — | $ 121,560 | $ — | $ — | $ — | $ — | $ — |
| Morningstar Global Income Fund | | | | | | |
| Credit risk | $ — | $ — | $ — | $ (1) | $ (1) | $ — | $ — | $ — | $ — | $ — |
| Foreign exchange rate risk | — | — | (60,202) | (34,516) | (94,718) | — | — | 57,208 | (28,020) | 29,188 |
| Interest rate risk | (2,158,029) | 59,533 | — | (9,054) | (2,107,550) | (1,920,670) | 196,440 | — | (7,799) | (1,732,029) |
| Total | $(2,158,029) | $ 59,533 | $ (60,202) | $ (43,571) | $ (2,202,269) | $(1,920,670) | $ 196,440 | $57,208 | $ (35,819) | $(1,702,841) |
| Morningstar Total Return Bond Fund | | | | | | |
| Credit risk | $ — | $ 629,394 | $ — | $ — | $ 629,394 | $ — | $ (339,441) | $ — | $ — | $ (339,441) |
| Equity risk | — | (82,060) | — | — | (82,060) | — | — | — | — | — |
| Foreign exchange rate risk | — | — | (165,679) | (103,751) | (269,430) | — | — | 59,690 | 30,332 | 90,022 |
| Inflation risk | — | — | — | — | — | — | (26) | — | — | (26) |
| Interest rate risk | (9,023,797) | (1,541,285) | — | (8,847) | (10,573,929) | (2,490,126) | 2,412,611 | — | (262,253) | (339,768) |
| Total | $(9,023,797) | $ (993,951) | $(165,679) | $(112,598) | $(10,296,025) | $(2,490,126) | $2,073,144 | $59,690 | $(231,921) | $ (589,213) |
| Morningstar Multisector Bond Fund | | | | | | |
| Credit risk | $ — | $ (15,997) | $ — | $ — | $ (15,997) | $ — | $ 12,077 | $ — | $ — | $ 12,077 |
Morningstar Funds Trust October 31, 2023 (unaudited)
Notes to Financial Statements (continued)
| | Net Realized Gain (Loss)
on Derivatives Recognized
as a Result from Operations | Net Change in Unrealized
Appreciation (Depreciation)
on Derivatives Recognized
as a Result from Operations |
| | Futures
Contracts | Swaps and
Contracts for
Difference | Forward
Currency
Exchange
Contracts | Purchased/
Written
Options and
Swaptions | Total | Futures
Contracts | Swaps and
Contracts for
Difference | Forward
Currency
Exchange
Contracts | Purchased/
Written
Options and
Swaptions | Total |
| Foreign exchange rate risk | $ — | $ — | $(225,189) | $ (46,511) | $ (271,700) | $ — | $ — | $(103,655) | $(11,179) | $ (114,834) |
| Interest rate risk | 136,948 | — | — | — | 136,948 | 263,221 | — | — | — | 263,221 |
| Total | $136,948 | $ (15,997) | $(225,189) | $ (46,511) | $ (150,749) | $ 263,221 | $ 12,077 | $(103,655) | $(11,179) | $ 160,464 |
| Morningstar Global Opportunistic Equity Fund | | | | | | |
| Foreign exchange rate risk | $ — | $ — | $ 137,008 | $ — | $ 137,008 | $ — | $ — | $ 40,191 | $ — | $ 40,191 |
| Total | $ — | $ — | $ 137,008 | $ — | $ 137,008 | $ — | $ — | $ 40,191 | $ — | $ 40,191 |
| Morningstar Alternatives Fund | | | | | | |
| Credit risk | $ — | $1,406,202 | $ — | $ — | $1,406,202 | $ — | $ (44,568) | $ — | $ — | $ (44,568) |
| Equity risk | — | — | — | (419,579) | (419,579) | — | 482,587 | — | 97,109 | 579,696 |
| Foreign exchange rate risk | — | — | 117,364 | 2,420 | 119,784 | — | — | 259,121 | 1,029 | 260,150 |
| Inflation risk | — | — | — | — | — | — | (2,449) | — | — | (2,449) |
| Interest rate risk | 769,140 | (89,452) | — | — | 679,688 | 1,591,449 | 111,480 | — | — | 1,702,929 |
| Total | $769,140 | $1,316,750 | $ 117,364 | $(417,159) | $1,786,095 | $1,591,449 | $547,050 | $ 259,121 | $ 98,138 | $2,495,758 |
The following tables present the Funds’ gross OTC derivative assets and liabilities by counterparty and contract type net of amounts available for offset under netting arrangements and any related collateral received or posted by the Funds’ as of October 31, 2023.
Morningstar Global Income Fund
| Derivative Financial Instruments: | Assets | Liabilities |
| Forward foreign currency exchange contracts | $ 35,233 | $ 49,014 |
| Futures contracts | 131,495 | 1,434,291 |
| Interest rate swap contracts* | 449,026 | 109,228 |
| Purchased options | 12,072 | — |
| Total gross amount of derivatives in the Statement of Assets and Liabilities | $ 627,826 | $ 1,592,533 |
| Less: Derivatives not subject to MNA or similar agreements | (586,581) | (1,484,788) |
| Total gross amount of derivatives subject to MNA or similar agreement | $ 41,245 | $ 107,745 |
| * | The values of swap agreements are the market values listed on the Schedules of Investments. |
| Counterparty | Gross Assets | Offset | Net Amount
Before
Collateral | Collateral
(Received)
Pledged | Net Exposure |
| BNP Paribas | $17,930 | $(1,851) | $16,079 | $— | $16,079 |
| Citibank | 679 | — | 679 | — | 679 |
| Goldman Sachs | 6,722 | (6,722) | — | — | — |
Morningstar Funds Trust October 31, 2023 (unaudited)
Notes to Financial Statements (continued)
Morningstar Global Income Fund (continued)
| Counterparty | Gross Assets | Offset | Net Amount
Before
Collateral | Collateral
(Received)
Pledged | Net Exposure |
| JPMorgan Chase | $15,549 | (15,549) | $ — | $— | $ — |
| Morgan Stanley | 365 | (365) | — | — | — |
| Total | $41,245 | $(24,487) | $16,758 | $— | $16,758 |
| Counterparty | Gross Liabilities | Offset | Net Amount
Before
Collateral | Collateral
(Received)
Pledged | Net Exposure |
| BNP Paribas | $ (1,851) | $ 1,851 | $ — | $— | $ — |
| Goldman Sachs | (16,905) | 6,722 | (10,183) | — | (10,183) |
| JPMorgan Chase | (60,640) | 15,549 | (45,091) | — | (45,091) |
| Morgan Stanley | (28,349) | 365 | (27,984) | — | (27,984) |
| Total | $(107,745) | $24,487 | $(83,258) | $— | $(83,258) |
Morningstar Total Return Bond Fund
| Derivative Financial Instruments: | Assets | Liabilities |
| Forward foreign currency exchange contracts | $ 90,561 | $ 78,128 |
| Futures contracts | 1,328,243 | 4,205,435 |
| Interest rate swap contracts* | 2,906,427 | 660,446 |
| Credit default swap contracts* | 238,132 | 46,190 |
| Inflation swap contracts* | 4,085 | 4,109 |
| Purchased options | 259,706 | — |
| Purchased swaptions | 887,317 | — |
| Written options | — | 111,974 |
| Written swaptions | — | 857,187 |
| Total gross amount of derivatives in the Statement of Assets and Liabilities | $ 5,714,471 | $ 5,963,469 |
| Less: Derivatives not subject to MNA or similar agreements | (4,692,997) | (4,977,885) |
| Total gross amount of derivatives subject to MNA or similar agreement | $ 1,021,474 | $ 985,584 |
| * | The values of swap agreements are the market values listed on the Schedules of Investments. |
��
| Counterparty | Gross Assets | Offset | Net Amount
Before
Collateral | Collateral
(Received)
Pledged | Net Exposure |
| Bank of America(a) | $149,510 | $ (18,563) | $130,947 | $ (70,000) | $60,947 |
| Barclays | 100,117 | (100,117) | — | — | — |
| BNP Paribas | 2,050 | (2,050) | — | — | — |
| Citibank | 274,982 | (274,982) | — | — | — |
| Deutsche Bank(a) | 79,697 | (5,482) | 74,215 | (74,215) | — |
| Goldman Sachs(a) | 370,669 | (22,456) | 348,213 | (340,000) | 8,213 |
| HSBC | 18,544 | (8,206) | 10,338 | — | 10,338 |
| JPMorgan Chase | 8,938 | (8,938) | — | — | — |
| Morgan Stanley | 5,120 | (5,120) | — | — | — |
Morningstar Funds Trust October 31, 2023 (unaudited)
Notes to Financial Statements (continued)
Morningstar Total Return Bond Fund (continued)
| Counterparty | Gross Assets | Offset | Net Amount
Before
Collateral | Collateral
(Received)
Pledged | Net Exposure |
| Nomura | $ 196 | $ — | $ 196 | $ — | $ 196 |
| RBS | 3,611 | — | 3,611 | — | 3,611 |
| Standard Chartered Bank | 1,152 | — | 1,152 | — | 1,152 |
| State Street | 399 | (399) | — | — | — |
| Toronto—Dominion Bank | 1,414 | (1,414) | — | — | — |
| UBS | 5,075 | (389) | 4,686 | — | 4,686 |
| Total | $1,021,474 | $(448,116) | $573,358 | $(484,215) | $89,143 |
| Counterparty | Gross Liabilities | Offset | Net Amount
Before
Collateral | Collateral
(Received)
Pledged | Net Exposure |
| Bank of America | $ (18,563) | $ 18,563 | $ — | $ — | $ — |
| Barclays (a) | (239,477) | 100,117 | (139,360) | 139,360 | — |
| BNP Paribas | (5,714) | 2,050 | (3,664) | — | (3,664) |
| Citibank (a) | (456,988) | 274,982 | (182,006) | 182,006 | — |
| Deutsche Bank | (5,482) | 5,482 | — | — | — |
| Goldman Sachs | (22,456) | 22,456 | — | — | — |
| HSBC | (8,206) | 8,206 | — | — | — |
| JPMorgan Chase(a) | (97,589) | 8,938 | (88,651) | 88,651 | — |
| Morgan Stanley(a) | (110,208) | 5,120 | (105,088) | 105,088 | — |
| State Street(a) | (3,450) | 399 | (3,051) | 3,051 | — |
| Toronto—Dominion Bank | (17,062) | 1,414 | (15,648) | — | (15,648) |
| UBS | (389) | 389 | — | — | — |
| Total | $(985,584) | $448,116 | $(537,468) | $518,157 | $(19,312) |
| (a) | Actual amount of collateral received from Bank of America and Goldman Sachs and pledged by the Fund to Barclays, Citibank, JPMorgan Chase, Morgan Stanley and State Street exceeded the net amount before collateral and is included in Due to broker and Due from broker, respectively in the Statements of Assets and Liabilities. |
Morningstar Multisector Bond Fund
| Derivative Financial Instruments: | Assets | Liabilities |
| Forward foreign currency exchange contracts | $ 87,050 | $167,568 |
| Futures contracts | 265,164 | 32,922 |
| Credit default swap contracts* | 607 | — |
| Purchased options | 13,640 | — |
| Written options | — | 2,023 |
| Total gross amount of derivatives in the Statement of Assets and Liabilities | $ 366,461 | $202,513 |
| Less: Derivatives not subject to MNA or similar agreements | (265,771) | (32,922) |
| Total gross amount of derivatives subject to MNA or similar agreement | $ 100,690 | $169,591 |
| * | The values of swap agreements are the market values listed on the Schedules of Investments. |
Morningstar Funds Trust October 31, 2023 (unaudited)
Notes to Financial Statements (continued)
Morningstar Multisector Bond Fund (continued)
| Counterparty | Gross Assets | Offset | Net Amount
Before
Collateral | Collateral
(Received)
Pledged | Net Exposure |
| Bank of America | $ 16,063 | $ (1,034) | $15,029 | $— | $15,029 |
| Barclays | 37,261 | (11,840) | 25,421 | — | 25,421 |
| BNP Paribas | 4,512 | (4,512) | — | — | — |
| Citibank | 16,592 | (5,290) | 11,302 | — | 11,302 |
| Goldman Sachs | 13,622 | (729) | 12,893 | — | 12,893 |
| JPMorgan Chase | 10,163 | (10,163) | — | — | — |
| Morgan Stanley | 2,477 | (2,477) | — | — | — |
| Total | $100,690 | $(36,045) | $64,645 | $— | $64,645 |
| Counterparty | Gross Liabilities | Offset | Net Amount
Before
Collateral | Collateral
(Received)
Pledged | Net Exposure |
| Bank of America | $ (1,034) | $ 1,034 | $ — | $— | $ — |
| Barclays | (11,840) | 11,840 | — | — | — |
| BNP Paribas | (46,887) | 4,512 | (42,375) | — | (42,375) |
| Citibank | (5,290) | 5,290 | — | — | — |
| Goldman Sachs | (729) | 729 | — | — | — |
| JPMorgan Chase | (63,519) | 10,163 | (53,356) | — | (53,356) |
| Morgan Stanley | (40,292) | 2,477 | (37,815) | — | (37,815) |
| Total | $(169,591) | $36,045 | $(133,546) | $— | $(133,546) |
Morningstar Global Opportunistic Equity Fund
| Derivative Financial Instruments: | Assets | Liabilities |
| Forward foreign currency exchange contracts | $268 | $387 |
| Total gross amount of derivatives in the Statement of Assets and Liabilities | $268 | $387 |
| Less: Derivatives not subject to MNA or similar agreements | — | — |
| Total gross amount of derivatives subject to MNA or similar agreement | $268 | $387 |
| Counterparty | Gross Assets | Offset | Net Amount
Before
Collateral | Collateral
(Received)
Pledged | Net Exposure |
| State Street | $268 | $(268) | $— | $— | $— |
| Total | $268 | $(268) | $— | $— | $— |
| Counterparty | Gross Liabilities | Offset | Net Amount
Before
Collateral | Collateral
(Received)
Pledged | Net Exposure |
| State Street | $(387) | $268 | $(119) | $— | $(119) |
| Total | $(387) | $268 | $(119) | $— | $(119) |
Morningstar Funds Trust October 31, 2023 (unaudited)
Notes to Financial Statements (continued)
Morningstar Alternatives Fund
| Derivative Financial Instruments: | Assets | Liabilities |
| Forward foreign currency exchange contracts | $ 380,261 | $ 273,557 |
| Futures contracts | 1,435,684 | 789,143 |
| Contracts for difference* | 49,643,187 | 46,036,209 |
| Credit default swap contracts* | — | 520 |
| Purchased options | 6,210 | — |
| Total gross amount of derivatives in the Statement of Assets and Liabilities | $51,465,342 | $47,099,429 |
| Less: Derivatives not subject to MNA or similar agreements | (1,439,554) | (789,663) |
| Total gross amount of derivatives subject to MNA or similar agreement | $50,025,788 | $46,309,766 |
| * | The values of contracts for differences and swap agreements are the market values listed on the Schedules of Investments. |
| Counterparty | Gross Assets | Offset | Net Amount
Before
Collateral | Collateral
(Received)
Pledged | Net Exposure |
| Bank of America | $ 10,712 | $ (10,712) | $ — | $ — | $ — |
| Barclays | 19,661,665 | (18,470,023) | 1,191,642 | — | 1,191,642 |
| Citibank (a) | 21,702 | (19,648) | 2,054 | (2,054) | — |
| Deutsche Bank | 26,417 | (26,417) | — | — | — |
| Goldman Sachs(b) | 20,279,744 | (18,527,107) | 1,752,637 | (130,000) | 1,622,637 |
| JPMorgan Chase(b) | 9,776,306 | (9,135,182) | 641,124 | (50,000) | 591,124 |
| Morgan Stanley | 249,242 | (86,015) | 163,227 | — | 163,227 |
| Total | $50,025,788 | $(46,275,104) | $3,750,684 | $(182,054) | $3,568,630 |
| Counterparty | Gross Liabilities | Offset | Net Amount
Before
Collateral | Collateral
(Received)
Pledged | Net Exposure |
| Bank of America | $ (36,928) | $ 10,712 | $(26,216) | $— | $(26,216) |
| Barclays | (18,470,023) | 18,470,023 | — | — | — |
| Citibank | (19,648) | 19,648 | — | — | — |
| Deutsche Bank | (34,863) | 26,417 | (8,446) | — | (8,446) |
| Goldman Sachs | (18,527,107) | 18,527,107 | — | — | — |
| JPMorgan Chase | (9,135,182) | 9,135,182 | — | — | — |
| Morgan Stanley | (86,015) | 86,015 | — | — | — |
| Total | $(46,309,766) | $46,275,104 | $(34,662) | $— | $(34,662) |
| (a) | Actual amount of collateral received from Citibank exceeded the net amount before collateral and is included in Due to broker in the Statements of Assets and Liabilities. |
| (b) | Actual amount of collateral received from Goldman Sachs and JPMorgan Chase is included in Due to broker in the Statements of Assets and Liabilities. |
Morningstar Funds Trust October 31, 2023 (unaudited)
Notes to Financial Statements (continued)
For the six months ended October 31, 2023, the quarterly average notional values were as follows and are representative of the trading volume of the derivatives held by the Funds.
| | Morningstar
Global
Income Fund | Morningstar
Total Return
Bond Fund | Morningstar
Multisector
Bond Fund | Morningstar
Global Opportunistic
Equity Fund | Morningstar
Alternatives
Fund |
| Futures Contracts: | | | | |
| Average Notional Balance - Long | $64,268,854 | $248,587,792 | $5,310,707 | $ — | $33,247,793 |
| Average Notional Balance - Short | 8,895,519 | 213,447,226 | 4,269,352 | — | 40,157,296 |
| Ending Notional Balance - Long | 63,091,190 | 209,133,240 | 5,075,164 | — | 78,234,494 |
| Ending Notional Balance - Short | 8,275,138 | 201,455,196 | 4,680,828 | — | 40,157,296 |
| Forward Foreign Currency Exchange Contracts: | | | | |
| Average Settlement Value - Purchased | 4,611,471 | 7,316,720 | 2,934,169 | 1,987,621 | 14,432,120 |
| Average Settlement Value - Sold | 5,935,122 | 6,064,598 | 6,954,397 | 37,003 | 7,631,708 |
| Ending Settlement Value - Purchased | 2,302,857 | 7,447,159 | 4,619,197 | — | 26,350,798 |
| Ending Settlement Value - Sold | 5,779,305 | 6,686,532 | 7,156,483 | 148,013 | 19,676,931 |
| Contracts for Difference: | | | | |
| Average Notional Balance - Long | — | — | — | — | 1,006,504 |
| Average Notional Balance - Short | — | — | — | — | 1,063,634 |
| Ending Notional Balance - Long | — | — | — | — | 912,299 |
| Ending Notional Balance - Short | — | — | — | — | 1,060,718 |
| Inflation Swaps: | | | | |
| Average Notional Balance - Pays Fixed Rate | — | 1,833,402 | — | — | 472,442 |
| Average Notional Balance - Receives Fixed Rate | — | 1,839,765 | — | — | 675,357 |
| Ending Notional Balance - Pays Fixed Rate | — | 3,637,547 | — | — | — |
| Ending Notional Balance - Receives Fixed Rate | — | 3,663,000 | — | — | — |
| Interest Rate Swaps: | | | | |
| Average Notional Balance - Pays Fixed Rate | 2,841,000 | 79,967,827 | — | — | 4,253,629 |
| Average Notional Balance - Receives Fixed Rate | 1,388,725 | 41,741,039 | — | — | 4,339,364 |
Morningstar Funds Trust October 31, 2023 (unaudited)
Notes to Financial Statements (continued)
| | Morningstar
Global
Income Fund | Morningstar
Total Return
Bond Fund | Morningstar
Multisector
Bond Fund | Morningstar
Global Opportunistic
Equity Fund | Morningstar
Alternatives
Fund |
| Interest Rate Swaps (continued): | | | | |
| Ending Notional Balance - Pays Fixed Rate | $2,111,000 | $108,203,694 | $ — | $— | $ — |
| Ending Notional Balance - Receives Fixed Rate | 2,394,226 | 43,496,951 | — | — | — |
| Credit Default Swaps: | | | | |
| Average Notional Balance - Buy Protection | — | 1,628,752 | 745,713 | — | 5,440,000 |
| Average Notional Balance - Sell Protection | — | 55,462,961 | 278,750 | — | — |
| Ending Notional Balance - Buy Protection | — | 2,266,074 | — | — | 955,000 |
| Ending Notional Balance - Sell Protection | — | 23,091,472 | 1,115,000 | — | — |
| Options: | | | | |
| Average Notional Balance - Purchased | 3,643,936 | 162,867,197 | 1,025,500 | — | 10,232,743 |
| Average Notional Balance - Written | 1,318,110 | 219,701,849 | 665,500 | — | 8,760,968 |
| Ending Notional Balance - Purchased | 3,262,756 | 68,654,919 | 1,331,000 | — | 515,221 |
| Ending Notional Balance - Written | — | 53,550,494 | 1,331,000 | — | — |
| Swaptions: | | | | |
| Average Notional Balance - Purchased | 431,250 | 121,035,830 | — | — | — |
| Average Notional Balance - Written | — | 143,343,103 | — | — | — |
| Ending Notional Balance - Purchased | 2,156,000 | 162,207,620 | — | — | — |
| Ending Notional Balance - Written | — | 185,368,712 | — | — | — |
9. Federal Income Tax Matters
As of October 31, 2023, the cost and aggregate gross unrealized appreciation (depreciation) of long security positions, short security positions and derivative instruments for federal income tax purposes were as follows:
| Morningstar Funds | Cost of
Investments | Gross
Unrealized
Appreciation | Gross
Unrealized
(Depreciation) | Net
Unrealized
Appreciation
(Depreciation) |
| U.S. Equity Fund | $1,325,960,861 | $179,773,089 | $ (80,331,787) | $ 99,441,302 |
| International Equity Fund | 777,157,519 | 58,628,749 | (122,806,985) | (64,178,236) |
| Global Income Fund | 211,049,788 | 6,021,201 | (19,929,252) | (13,908,051) |
Morningstar Funds Trust October 31, 2023 (unaudited)
Notes to Financial Statements (continued)
| Morningstar Funds | Cost of
Investments | Gross
Unrealized
Appreciation | Gross
Unrealized
(Depreciation) | Net
Unrealized
Appreciation
(Depreciation) |
| Total Return Bond Fund | $657,391,346 | $4,782,873 | $(92,048,281) | $(87,265,408) |
| Municipal Bond Fund | 341,826,966 | 105,135 | (30,819,630) | (30,714,495) |
| Defensive Bond Fund | 135,799,976 | 764,397 | (7,192,516) | (6,428,119) |
| Multisector Bond Fund | 183,089,487 | 912,909 | (18,871,234) | (17,958,325) |
| Global Opportunistic Equity Fund | 281,441,769 | 8,354,515 | (18,685,677) | (10,331,162) |
| Alternatives Fund | 244,342,382 | 7,202,606 | (23,606,968) | (16,404,362) |
The differences between book basis and tax basis appreciation (depreciation) on investments is primarily attributable to wash sale loss deferrals, mark to market on credit default swaps, contracts for difference, futures contracts, foreign exchange contracts, passive foreign investment companies (“PFICs”), 305(c) deemed dividends, straddle loss deferrals, investment in interest only ("IO") securities and contingent payment debt instruments ("CPDIs"), and timing of income recognition from Real Estate Investment Trusts (“REITs”).
As of April 30, 2023, the components of distributable earnings (loss) (excluding paid in capital) on a tax basis were as follows:
| Morningstar Funds | Current
Distributable
Tax-Exempt
Income | Current
Distributable
Ordinary
Income | Current
Distributable
Long-Term
Capital Gain
or Tax Basis
Capital Loss
Carryforwards | Net
Unrealized
Appreciation
(Depreciation) | Accumulated
Capital and
Other Losses | Other
Temporary
Differences | Total
Accumulated
Earnings |
| U.S. Equity Fund | $ — | $ 5,450,542 | $ 17,133,007 | $130,444,771 | $ — | $ — | $ 153,028,320 |
| International Equity Fund | — | 14,735,360 | (9,579,354) | 2,888,225 | — | (92) | 8,044,139 |
| Global Income Fund | — | 1,498,085 | (20,508,265) | (4,719,475) | — | (25) | (23,729,680) |
| Total Return Bond Fund | — | 699,468 | (79,072,112) | (55,411,356) | — | (268) | (133,784,268) |
| Municipal Bond Fund | 167,124 | — | (4,799,187) | (18,254,102) | — | — | (22,886,165) |
| Defensive Bond Fund | — | 36,353 | (3,120,048) | (7,128,532) | — | — | (10,212,227) |
| Multisector Bond Fund | — | 456,786 | (21,459,699) | (10,653,812) | — | (44) | (31,656,769) |
| Global Opportunistic Equity Fund | — | 2,548,034 | 937,412 | 2,326,857 | — | — | 5,812,303 |
| Alternatives Fund | — | 1,905,757 | — | (13,900,981) | (7,309,473) | — | (19,304,697) |
Income dividends and capital gains distributions are determined in accordance with federal income tax regulations. Such amounts may differ from income and capital gains recorded in accordance with U.S. GAAP. Accordingly, the Funds may periodically make reclassifications among certain of their capital accounts to reflect differences between financial reporting and federal income tax basis distributions. These reclassifications are reported in order to reflect the tax treatment for certain permanent differences that exist between income tax regulations and U.S. GAAP. These reclassifications have no impact on the total net assets or the NAVs per share of the Funds. At April 30, 2023, no reclassification was recorded.
Morningstar Funds Trust October 31, 2023 (unaudited)
Notes to Financial Statements (continued)
The tax character of distributions paid during the fiscal year ended April 30, 2023 were as follows:
| | Fiscal Year Ended April 30, 2023 |
| Morningstar Funds | Tax-Exempt Income | Ordinary Income | Capital Gains | Total Distributions Paid |
| U.S. Equity Fund | $ — | $18,811,662 | $103,557,071 | $122,368,733 |
| International Equity Fund | — | 14,561,814 | 13,660,294 | 28,222,108 |
| Global Income Fund | — | 11,680,371 | 7,672,134 | 19,352,505 |
| Total Return Bond Fund | — | 22,207,988 | — | 22,207,988 |
| Municipal Bond Fund | 7,795,775 | 233,504 | — | 8,029,279 |
| Defensive Bond Fund | — | 3,670,466 | — | 3,670,466 |
| Multisector Bond Fund | — | 4,767,479 | — | 4,767,479 |
| Global Opportunistic Equity Fund | — | 4,269,209 | 1,582,642 | 5,851,851 |
| Alternatives Fund | — | 11,324,569 | 193,123 | 11,517,692 |
The tax character of distributions paid during the fiscal year ended April 30, 2022 were as follows:
| | Fiscal Year Ended April 30, 2022 |
| Morningstar Funds | Tax Exempt Income | Ordinary Income | Capital Gains | Return of Capital | Total Distributions Paid |
| U.S. Equity Fund | $ — | $110,198,770 | $128,287,273 | $ — | $238,486,043 |
| International Equity Fund | — | 45,662,593 | 96,994,386 | — | 142,656,979 |
| Global Income Fund | — | 14,947,148 | 13,613,661 | — | 28,560,809 |
| Total Return Bond Fund | — | 13,881,661 | 4,639,870 | — | 18,521,531 |
| Municipal Bond Fund | 6,838,232 | 64,365 | 241,086 | — | 7,143,683 |
| Defensive Bond Fund | — | 4,600,989 | 785,732 | 262,291 | 5,649,012 |
| Multisector Bond Fund | — | 8,172,757 | 1,078,319 | — | 9,251,076 |
| Global Opportunistic Equity Fund | — | 14,334,709 | 25,786,433 | — | 40,121,142 |
| Alternatives Fund | — | 13,669,424 | 2,977,689 | — | 16,647,113 |
Funds are permitted to carry forward capital losses incurred in taxable years beginning after December 22, 2010 for an unlimited period. Capital loss carry forwards with no expiration will retain their character as either short-term or long-term capital losses.
At April 30, 2023, the Morningstar International Equity Fund, Global Income Fund, Total Return Bond Fund, Municipal Bond Fund, Defensive Bond Fund, and Multisector Bond Fund had capital losses incurred that will be carried forward indefinitely under the provisions of the Act in the amount of $7,050,714, $14,175,080, $32,826,860, $1,014,677, $521,173, $15,068,238 for short-term capital loss carry-forward and $2,528,640, $6,333,185, $46,245,252, $3,784,510, $2,598,875, $6,391,461 for long-term capital loss carry-forward, respectively.
Morningstar Funds Trust October 31, 2023 (unaudited)
Notes to Financial Statements (continued)
For the period subsequent to October 31, 2022, through the fiscal year ended April 30, 2023, the following Funds incurred net capital losses and/or late year ordinary losses for which the Funds intend to treat as having been incurred in the following fiscal year:
| Morningstar Funds | |
| Alternatives Fund | $ 7,309,473 |
10. Principal Risks and Concentrations
Absolute Return Strategy Risk: In seeking low sensitivity to traditional U.S. asset classes, the Alternatives Fund uses an absolute return strategy and a benchmark index of cash-like instruments. Unlike most equity funds, the Fund should not be expected to benefit from broad equity market returns, and unlike traditional bond funds, it may not generate current income or benefit when interest rates decline.
Active Management Risk: The Funds are actively managed with discretion and may underperform market indexes or other mutual funds with similar investment objectives. The Funds' performance depends heavily on Morningstar’s skill and judgments around allocating assets to subadvisers, open- and closed-end investment companies, ETFs and individual securities and each subadviser’s skill in selecting securities and executing its strategy. A Fund could experience losses if these judgments prove to be incorrect.
Asian Market Risk: Investments in securities of Asian issuers involve risks and special considerations not typically associated with investments in the U.S. securities markets. Certain Asian economies have experienced over-extension of credit, currency devaluations and restrictions, high unemployment, high inflation, rapid fluctuations in inflation and interest rates, decreased exports, economic recessions and political unrest. Economic and political events in any one Asian country can have a significant effect on the entire Asian region as well as on major trading partners outside Asia, and any adverse effect on some or all of the Asian countries and regions in which a Fund invests. The securities markets in some Asian economies are relatively underdeveloped and may subject a Fund to a higher degree of risk.
Asset Allocation Risk: In an attempt to invest in areas that look most attractive on a valuation basis, the Funds may favor asset classes or market segments that cause the Funds to underperform their benchmarks.
Call Risk: During periods of falling interest rates, an issuer may call or repay a higher-yielding fixed income security before its maturity date, forcing a Fund to reinvest in fixed income securities with lower interest rates than the original obligations.
Cash/Cash Equivalents Risk: In rising markets, holding cash or cash equivalents will negatively affect the Fund’s performance relative to its benchmark.
China Market Risk: To the extent certain Funds invest in securities of companies located in or operating in China, those companies may be subject to decisions made by the Chinese government including through monetary policy and currency exchange rates. Heightened trade tensions or political disputes may disrupt supply chains or adversely impact revenues of companies selling to or within China. Actions outside of the Funds' control may result in the Funds' inability to buy/sell securities listed on Chinese exchanges. For securities of companies located in or operating in China, difficulties may arise in the Public Company
Morningstar Funds Trust October 31, 2023 (unaudited)
Notes to Financial Statements (continued)
Accounting Oversight Board’s (“PCAOB’s”) ability to inspect audit work papers and practices of PCAOB-registered accounting firms in China with respect to their audit work of U.S. reporting companies, which may impose significant additional risks associated with investments in China.
Collateralized Debt Obligations (CDOs) Risk: In addition to the typical risks associated with fixed-income securities and asset-backed securities, CDOs carry additional risks including, but not limited to: (i) the possibility that distributions from collateral securities will not be adequate to make interest or other payments; (ii) the risk that the collateral may default or decline in value or be downgraded, if rated by a nationally recognized statistical rating organization; (iii) a Fund may invest in tranches of CDOs that are subordinate to other tranches; (iv) the structure and complexity of the transaction and the legal documents could lead to disputes among investors regarding the characterization of proceeds; (v) the investment return achieved by a Fund could be significantly different than those predicted by financial models; (vi) the lack of a readily available secondary market for CDOs; (vii) the risk of forced “fire sale” liquidation due to technical defaults such as coverage test failures; and (viii) the CDO’s manager may perform poorly. In addition, investments in CDOs may be characterized by a Fund as illiquid investments.
Communications Sector Risk: Companies in the communications sector may be affected by competitive pressures (including innovation by competitors and pricing competition), substantial capital requirements, government regulation, cyclicality of revenues and earnings, obsolescence of communications products and services due to technological advancement, a potential decrease in the discretionary income of targeted individuals and fluctuating demand due to changing consumer tastes and interests.
Consumer Discretionary Sector Risk: Companies in the consumer discretionary sector may be affected by the performance of domestic and international economies, interest rates, exchange rates, competition, consumer confidence, changes in demographics and consumer preferences. Companies in the consumer discretionary sector depend heavily on disposable household income and consumer spending, and may be strongly impacted by social trends and marketing campaigns.
Consumer Staples Sector: The consumer staples sector consists of companies that are involved in areas such as the production, manufacture, distribution, or sale of consumer goods and services whose businesses are less sensitive to economic cycles, such as manufacturers and distributors of food, beverages and tobacco; producers of non-durable household goods and personal products; and distributors and retailers of consumer staples products, including food & drug retailing companies. These companies may be adversely impacted by changes in domestic and global economic conditions, natural and man-made disasters, epidemics and pandemics, war, terrorism, political, social or labor unrest, consumer confidence and preferences, disposable household income and consumer spending, product cycles, marketing, demographics, production spending, competition, government regulations and factors impacting the supply, demand and prices of raw materials. Supply chain disruptions may negatively impact these companies as well.
Contingent Capital Securities Risk: Contingent capital securities (sometimes referred to as “CoCos”) are debt or preferred securities with loss absorption characteristics built into the terms of the security for the benefit of the issuer, for example, an automatic write-down of principal or a mandatory conversion into common stock of the issuer under certain circumstances, such as the issuer’s capital ratio falling below a certain level. CoCos may be subject to an automatic write-down (i.e., the automatic write-down of the principal amount or
Morningstar Funds Trust October 31, 2023 (unaudited)
Notes to Financial Statements (continued)
value of the securities, potentially to zero, and the cancellation of the securities) under certain circumstances, which could result a loss of value in such securities. An automatic write-down could also result in a reduced income rate if the dividend or interest payment is based on the security’s par value. If a CoCo provides for mandatory conversion of the security into common stock of the issuer under certain circumstances, such as an adverse event, the security could experience a reduced income rate, potentially to zero, as a result of the issuer’s common stock not paying a dividend. In addition, a conversion event would likely be the result of or related to the deterioration of the issuer’s financial condition (e.g., such as a decrease in the issuer’s capital ratio) and status as a going concern, so the market price of the issuer’s common stock may have declined, perhaps substantially, and may continue to decline. Further, the issuer’s common stock would be subordinate to the issuer’s other security classes and therefore worsen our standing in a bankruptcy proceeding. In March 2023, a Swiss regulator required a write-down of outstanding CoCos to zero notwithstanding the fact that the issuer’s equity shares continued to exist and have economic value. It is currently unclear whether regulators of issuers in other jurisdictions will take similar actions. In addition, most CoCos are considered to be high yield or “junk” securities and are therefore subject to the risks of investing in below investment grade securities.
Convertible Securities Risk: Convertible securities are generally debt securities or preferred stocks that may be converted into common stock. The value of a convertible security is influenced by changes in interest rates, with investment value declining as interest rates increase and increasing as interest rates decline. The credit standing of the issuer and other factors also may have an effect on the convertible security’s investment value.
Covenant Lite Loans Risk: A covenant lite loan typically contains fewer clauses which allow an investor to proactively enforce financial covenants or prevent undesired actions by the borrower/issuer. Covenant lite loans also generally provide fewer investor protections if certain criteria are breached. A Fund may experience losses or delays in enforcing its rights on its holdings of covenant lite loans.
Credit Risk: Issuers of fixed-income securities could default or be downgraded if they fail to make required payments of principal or interest.
Currency Risk: Because certain Funds may invest in securities of non-U.S. issuers, changes in currency exchange rates (including in the markets in which such non-U.S. issuers’ securities are traded) could hurt performance. Morningstar or a subadviser may decide not to hedge, or may not be successful in hedging, its currency exposure.
Cybersecurity Risk: A Fund, like all companies, may be susceptible to operational and information security risks. Cybersecurity failures or breaches of a Fund or its service providers or the issuers of securities in which a Fund invests, have the ability to cause disruptions and impact business operations, and the Funds and their shareholders could be negatively impacted as a result.
Derivatives Risk: A derivative is an instrument with a value based on the performance of an underlying currency, security, index, or other reference asset. Derivatives involve risks different from, or possibly greater than, the risks of investing in more traditional investments. Derivatives involve costs, may create leverage, and may be illiquid, volatile, or difficult to value. In addition, derivatives could cause losses if the counterparty to the transaction does not perform as promised. The investment results achieved by using derivatives may not match or fully offset changes in the value of the underlying currency, security, index, or other reference asset that a
Morningstar Funds Trust October 31, 2023 (unaudited)
Notes to Financial Statements (continued)
Fund was attempting to hedge or the investment opportunity it was trying to pursue. Derivatives also are susceptible to operational risks, such as system failures and inadequate controls, and legal risks, such as insufficient documentation and lack of enforceability of a contract.
Dollar Rolls Risk: Dollar rolls involve the risk that the market value of the securities that a Fund is committed to buy may decline below the price of the securities the Fund has sold. These transactions may involve leverage.
Emerging-Markets Risk: Emerging-market countries may have relatively unstable governments and economies based on only a few industries, which can cause greater instability. These countries are also more likely to experience higher levels of inflation, deflation, or currency devaluations, which could hurt their economies and securities markets.
Energy Sector Risk: Companies in the energy sector may be affected by worldwide energy prices, exploration production spending, changes in exchange rates, government regulation, world events, depletion of resources, natural disasters and economic conditions. Companies in the energy sector are subject to the market, economic and political risks of the countries where they are located or do business.
European Market Risk: Adverse economic and political events in Europe may cause a Fund’s investments to decline in value. Member states of the European Union (“EU”) are subject to restrictions on inflation rates, deficits, interest rates, debt levels and fiscal and monetary controls, each of which may significantly affect every country in Europe. Decreasing imports or exports, changes in governmental or EU regulations on trade, changes in the exchange rate of the euro, the default or threat of default by an EU member country on its sovereign debt, recessions in an EU member country, the departure of a member state from the EU (such as the United Kingdom's departure known as "Brexit"), and war in or around the European region may have a significant adverse effect on the economies of other EU member countries. In addition, Brexit could create actual or perceived additional economic stresses for the United Kingdom, including potential for decreased trade, capital outflows, devaluation of the British pound, wider corporate bond spreads due to uncertainty, and possible declines in business and consumer spending, as well as foreign direct investment. Moreover, the United Kingdom had been one of the EU’s largest economies; its departure also may negatively impact the EU and Europe by triggering prolonged economic downturns in certain European countries or sparking additional member states to contemplate departing the EU (thereby perpetuating political instability in the region). If one or more other countries were to exit the EU or abandon the use of the euro as a currency, the value of investments tied to those countries or the euro could decline significantly and unpredictably.
Russia’s invasion of Ukraine in late February 2022 has significantly amplified already existing geopolitical tensions among Russia, Ukraine, Europe, NATO, and North America. The resulting responses of various countries, the European Union and NATO to Russia’s actions, the potential for further sanctions, military escalation and other corresponding events, including potential retaliatory actions by Russia, have had, and could continue to have, severe negative effects on regional and global economic and financial markets, including increased volatility, reduced liquidity and overall uncertainty. Certain sectors including, but not limited to, energy, financials, commodities, engineering, and defense may be particularly affected. This could negatively impact Fund performance and the value of an investment in a Fund, even beyond any direct
Morningstar Funds Trust October 31, 2023 (unaudited)
Notes to Financial Statements (continued)
investment exposure the Fund may have to Russian issuers or the adjoining geographic regions. Any such disruptions caused by Russian military action, resulting sanctions or other actions (including cyberattacks) may magnify the impact of other risks described in this report.
Financials Sector Risk: Financial services companies are subject to extensive government regulation and, as a result, their profitability may be affected by new regulations or regulatory interpretations. Unstable interest rates can have a disproportionate effect on the financial services sector and financial services companies whose securities a Fund may purchase may themselves have concentrated portfolios, which makes them vulnerable to economic conditions that affect that sector. Financial services companies have also been affected by increased competition, which could adversely affect the profitability or viability of such companies.
Floating-Rate Notes Risk: Floating-rate notes are subject to credit risk and interest-rate risk. The interest rate of a floating rate instrument may be based on a known lending rate, such as a bank’s prime rate, and is reset whenever such rate is adjusted. The interest rate on a variable-rate demand note is reset at specified intervals at a market rate. Some floating- and variable-rate securities may be callable by the issuer, meaning that they can be paid off before their maturity date and the proceeds may be required to be invested in lower yielding securities that reduce a Fund’s income.
Foreign Securities Risk: Securities of non-U.S. issuers may be less liquid, more volatile, and harder to value than U.S. securities. They may also be subject to political, economic, and regulatory risks, and market instability.
Geographic Concentration Risk: To the extent that a Fund invests a significant portion of its assets in a particular country, region or continent, economic, political, social and environmental conditions in such country, region or continent will have a greater effect on the Fund’s performance than they would in a more geographically diversified equity fund.
Health Care Sector Risk: The profitability of companies in the health care sector may be affected by government regulations, limited product lines, and product liability claims. Many health care companies are heavily dependent on patent protection, which may be time consuming and costly, and the expiration of a company’s patent may adversely affect that company’s profitability. Health care companies may be thinly capitalized and susceptible to product obsolescence. Many new products in the health care sector require significant research and development and may be subject to regulatory approvals. The process of obtaining such approvals may be long and costly, and ultimately unsuccessful.
High-Yield Risk: High-yield securities are considered primarily speculative with respect to the issuer’s continuing ability to make principal and interest payments. High-yield securities and unrated securities of similar credit quality (commonly known as junk bonds) are subject to greater levels of credit and liquidity risks. Changes in general economic conditions, changes in the financial condition of the issuer, and changes in interest rates may adversely impact the value of high-yield securities.
Indexed and Inverse Securities Risk: Indexed and inverse securities provide a potential return based on a particular index of value or interest rates. A Fund’s return on these securities will be subject to risk with respect to the value of the particular index. These securities are subject to leverage risk and correlation risk. Certain
Morningstar Funds Trust October 31, 2023 (unaudited)
Notes to Financial Statements (continued)
indexed and inverse securities have greater sensitivity to changes in interest rates or index levels than other securities, and the Fund’s investment in such instruments may decline significantly in value if interest rates or index levels move in a way Fund management does not anticipate.
Industrials Sector Risk: Companies in the industrials sector may be affected by changes in supply and demand for their specific product or service and for industrial sector products in general, including decline in demand for such products due to rapid technological developments and frequent new product introduction. Performance of such companies may be affected by factors including government regulation, world events, economic conditions and risks for environmental damage and product liability claims.
Interest-Rate Risk: The value of fixed-income securities, as well as some income-oriented equity securities that pay dividends, will typically decline when interest rates rise. A Fund may be subject to a greater risk of rising interest rates during low interest rate environments.
Investment Company/ETF Risk: An investment company, including an open or closed-end mutual fund or ETF, in which a Fund invests may not achieve its investment objective or execute its investment strategies effectively, or a large purchase or redemption activity by shareholders might negatively affect the value of the shares. A Fund must also pay its pro rata portion of an investment company’s fees and expenses. Shares of ETFs trade on exchanges and may be bought and sold at market value. ETF shares may be thinly traded, making it difficult for a Fund to sell shares at a particular time or an anticipated price. ETF shares may also trade at a premium or discount to the NAV of the ETF; at times, this premium or discount could be significant.
Loan Risk: Loans may be unrated, less liquid and more difficult to value than traditional debt securities. Loans may be made to finance highly leveraged corporate operations or acquisitions. The highly leveraged capital structure of the borrowers in such transactions may make such loans especially vulnerable to adverse changes in financial, economic or market conditions. Loans generally are subject to restrictions on transfer, and only limited opportunities may exist to sell such loans in secondary markets. As a result, a Fund may be unable to sell loans at a desired time or price. Extended trade settlement periods for certain loans may result in cash not being immediately available to a Fund upon sale of the loan. As a result, a Fund may have to sell other investments with shorter settlement periods or engage in borrowing transactions to raise cash to meet its obligations. Loans are also subject to the risk of price declines and to increases in prevailing interest rates. If a Fund acquires only an assignment or a participation in a loan made by a third party, the Fund may not be able to control amendments, waivers or the exercise of any remedies that a lender would have under a direct loan and may assume liability as a lender. In addition, loans held by a Fund may not be considered “securities” under the federal securities laws and therefore a Fund may not receive the same investor protections with respect to such investments that are available to purchasers of investments that are considered “securities” under the federal securities laws.
Long/Short Strategy Risk: While the Alternatives Fund may invest in long positions and short positions, there is the risk that the investments will not perform as expected and losses on one type of position could more than offset gains on the other, or the Fund could lose money on both positions, if the portfolio managers judge the market incorrectly.
Morningstar Funds Trust October 31, 2023 (unaudited)
Notes to Financial Statements (continued)
Market Risk: The value of stocks and other securities can be highly volatile and prices may fluctuate widely, which means you should expect a wide range of returns and could lose money, even over a long time period. Various economic, industry, regulatory, political or other factors (such as natural disasters, epidemics and pandemics, war, terrorism, conflicts or social unrest) may disrupt U.S. and world economies and can dramatically affect markets generally, certain industry sectors, and/or individual companies.
Master Limited Partnership (MLP) Risk: MLPs are subject to, among other risks, cash flow risks, tax risk, deferred tax risk and capital market risk. Cash flow risk is the risk that MLPs will not make distributions to holders (including us) at anticipated levels or that such distributions will not have the expected tax character. MLPs also are subject to tax risk, which is the risk that an MLP might lose its partnership status for tax purposes. Deferred tax risk is the risk that we incur a current tax liability on that portion of an MLP’s income and gains that is not offset by tax deductions and losses. Capital markets risk is the risk that MLPs will be unable to raise capital to meet their obligations as they come due or execute their growth strategies, complete future acquisitions, take advantage of other business opportunities or respond to competitive pressures.
Merger Arbitrage Risk: Investments in companies that are the subject of a publicly-announced transaction carry the risk the transaction is renegotiated, takes longer to complete than originally planned and that the transaction is never completed. Any such event could cause a Fund to incur a loss. In the case of an investment in a potential target company, if the proposed transaction appears likely not to be consummated, in fact is not consummated, or is delayed, the market price of the security will usually decline sharply, resulting in a loss to a Fund. The risk/reward payout of merger arbitrage strategies typically is asymmetric, with the losses in failed transactions often far exceeding the gains in successful transactions. During periods of market stress, the availability of transactions of the type in which a Fund invests may be significantly limited. In certain circumstances, a sub-adviser may engage in litigation related to the appraisal of securities held by a Fund to maximize value for Fund shareholders in connection with its merger arbitrage strategy.
Mortgage-Related and Other Asset-Backed Securities Risk: Mortgage- and asset-backed securities represent interests in “pools” of mortgages or other assets, including consumer loans or receivables held in trust. Mortgage- and asset-backed securities are subject to credit and interest rate risks, as well as extension and prepayment risks:
Extension Risk: Rising interest rates tend to extend the duration of mortgage-related securities, making them more sensitive to changes in interest rates. As a result, in a period of rising interest rates, if a Fund holds mortgage-related securities, it may exhibit additional volatility.
Prepayment Risk: When interest rates decline, the value of mortgage-related securities with prepayment features may not increase as much as other fixed-income securities because borrowers may pay off their mortgages sooner than expected. In addition, the potential impact of prepayment on the price of asset-backed and mortgage-backed securities may be difficult to predict and result in greater volatility.
These securities also are subject to risk of default on the underlying mortgage or asset, particularly during periods of economic downturn. Small movements in interest rates (both increases and decreases) may quickly and significantly reduce the value of certain mortgage-backed securities. TBA (or “to be announced”)
Morningstar Funds Trust October 31, 2023 (unaudited)
Notes to Financial Statements (continued)
commitments are forward agreements for the purchase or sale of securities, including mortgage-backed securities for a fixed price, with payment and delivery on an agreed upon future settlement date. The specific securities to be delivered are not identified at the trade date. However, delivered securities must meet specified terms, including issuer, rate and mortgage terms.
Multimanager and Subadviser Selection Risk: To a significant extent, a Fund’s performance depends on Morningstar’s skill in selecting subadvisers and each subadviser’s skill in selecting securities and executing its strategy. Subadviser strategies may occasionally be out of favor and subadvisers may underperform relative to their peers or benchmarks.
Municipal Focus Risk: Certain Funds may be more sensitive to adverse economic, business or political developments if a substantial portion of its assets are invested in municipal securities that finance similar types of projects in a segment of the municipal bond market (such as medical, education, health care, housing, utilities or transportation). A change that affects one project in a particular segment of the market, such as proposed legislation on the financing of the project, a shortage of the materials needed for the project, or a declining need for the project may impact projects in similar segments, thereby increasing the risk of loss to a Fund.
Municipal Securities Risk: The municipal securities market could be significantly affected by negative political and legislative changes, as well as uncertainties related to taxation or the rights of municipal security holders. Changes in the financial health of a municipality may make it difficult for it to pay interest and principal when due.
Portfolio Turnover Risk: Certain Funds may engage in active and frequent trading of their portfolio securities. Such a strategy often involves higher transaction costs, including brokerage commissions and dealer mark-ups, and may increase the amount of capital gains (in particular, short-term gains) realized by a Fund. Shareholders may pay tax on such capital gains. These effects of higher than normal portfolio turnover may adversely affect Fund performance.
Preferred Stock Risk: Preferred stocks are subject to issuer-specific and market risks applicable generally to equity securities, however, unlike common stocks, participation in the growth of an issuer may be limited. Distributions on preferred stocks are generally payable at the discretion of the issuer’s board of directors, after the company makes required payments to holders of its bonds and other debt securities. For this reason, the value of preferred stock will usually react more strongly than bonds and other debt securities to actual or perceived changes in the company’s financial condition or prospects. Preferred stock of smaller companies may be more vulnerable to adverse developments than preferred stock of larger companies. Preferred stocks may be less liquid than common stocks. Preferred shareholders may have certain rights if distributions are not paid but generally have no legal recourse against the issuer and may suffer a loss of value if distributions are not paid.
Private Placements Risk: Securities that are purchased in private placements are subject to restrictions on resale as a matter of contract or under federal securities laws. Because there may be relatively few potential purchasers for these investments, especially under adverse circumstances, a Fund could find it more difficult to sell private placements at an advisable time or attractive price. Additionally, such securities may not be listed
Morningstar Funds Trust October 31, 2023 (unaudited)
Notes to Financial Statements (continued)
on an exchange and may have no active trading market. Accordingly, many private placement securities may be illiquid. At times, it may also be more difficult to determine the fair value of such securities for purposes of computing a Fund’s NAV.
Quantitative Models Risk: Morningstar may utilize quantitative models in managing all or a portion of a Fund. Such quantitative models may not perform as expected and may cause a Fund to underperform other investment strategies. Flaws or errors in the quantitative model’s assumptions, design, execution, or data inputs may adversely affect Fund performance. Due to the significant role technology plays in a quantitative model, use of a quantitative model carries the risk of potential issues with the design, coding, implementation, or maintenance of the technology used in the quantitative model. These issues could negatively impact investment returns. Quantitative models may underperform in certain market environments including in stressed or volatile market conditions. There can be no assurance that the use of quantitative models by Morningstar will enable a Fund to achieve its objective.
REITs and Other Real Estate Companies Risk: REITs and other real estate company securities are subject to, among other risks: declines in property values; defaults by mortgagors or other borrowers and tenants; increases in property taxes and other operating expenses; overbuilding in their sector of the real estate market; fluctuations in rental income; changes in interest rates; lack of availability of mortgage funds or financing; extended vacancies of properties, especially during economic downturns; changes in tax and regulatory requirements; losses due to environmental liabilities; or casualty or condemnation losses.
Reverse Repurchase Agreements Risk: Reverse repurchase agreements involve the sale of securities held by a Fund with an agreement to repurchase the securities at an agreed-upon price, date and interest payment. Reverse repurchase agreements involve the risk that the other party may fail to return the securities in a timely manner or at all. A Fund could lose money if it is unable to recover the securities and the value of the collateral held by the Fund, including the value of the investments made with cash collateral, is less than the value of securities. These events could also trigger adverse tax consequences to a Fund.
Risks of Investing in Latin American Issuers: The economies of certain Latin American countries have experienced high interest rates, economic volatility, inflation, currency devaluations, government debt defaults and high unemployment rates. Certain Latin American countries have experienced periods of political and economic instability and social unrest in the past. International economic conditions, particularly those in the U.S., Europe and Asia, as well as world prices for oil and other commodities may also influence the development of Latin American economies. These risks, among others, may adversely affect the value of a Fund’s investments.
Short Sales Risk: Short sales involve selling a security a Fund does not own in anticipation that the security’s price will decline. To complete the transaction, the Fund must borrow the security to make delivery to the buyer. The Fund is then obligated to replace the security borrowed by purchasing the security at the market price at the time of replacement. Short sales are highly speculative and may subject a Fund to, at least theoretically, unlimited risk due to the fact that the value of the security underlying the short sale may appreciate indefinitely. Short sales also create leverage which increases a Fund’s exposure to the market.
Morningstar Funds Trust October 31, 2023 (unaudited)
Notes to Financial Statements (continued)
Smaller Companies Risk: The stocks of small- or mid-sized companies may be subject to more abrupt or erratic market movements than stocks of larger, more established companies. Small companies may have limited product lines or financial resources, or may be dependent upon a small or inexperienced management group, and their securities may trade less frequently and in lower volume than the securities of larger companies, which could lead to higher transaction costs.
Sovereign Debt Securities Risk: Sovereign debt instruments are subject to the risk that a governmental entity may delay or refuse to pay interest or repay principal on its sovereign debt, due, for example, to cash flow problems, insufficient foreign currency reserves, political considerations, the relative size of the governmental entity’s debt position in relation to the economy, or the failure to put in place economic reforms required by the International Monetary Fund or other multilateral agencies.
Supranational Entities Risk: A Fund may invest in obligations issued or guaranteed by the International Bank for Reconstruction and Development (the “World Bank”). The government members, or “stockholders,” usually make initial capital contributions to the World Bank and in many cases are committed to make additional capital contributions if the World Bank is unable to repay its borrowings. There is no guarantee that one or more stockholders of the World Bank will continue to make any necessary additional capital contributions. If such contributions are not made, the entity may be unable to pay interest or repay principal on its debt securities, and the Fund may lose money on such investments.
Technology Sector Risk: Securities issued by technology companies have historically been volatile due to the rapid pace of product change and development within the sector. Technology companies are subject to intense competition, rapid obsolescence of their products or lack of commercial success, issues with obtaining financing or regulatory approvals, product incompatibility, delays in or cancellation of the release of anticipated products, and high required corporate capital expenditure for research and development of new products. The activities of these companies may also be adversely affected by changes in government regulations, worldwide technological developments, and changes in consumer preferences or investor perception of a company and/or its products or services. Technology companies are also heavily dependent on patent and other intellectual property rights, and the loss or impairment of these rights may adversely affect the company’s profitability. The stock prices of companies operating within this sector may be subject to abrupt or erratic movements.
U.S. Government Securities Risk: U.S. government obligations have different levels of credit support and, therefore, different degrees of credit risk. The U.S. government does not guarantee the market value of the securities it issues, so those values may fluctuate. Like most fixed-income securities, the prices of government securities typically fall when interest rates increase and rise when interest rates decline. In addition, the payment obligations on certain securities in which a Fund may invest, including securities issued by certain U.S. Government agencies and U.S. Government sponsored enterprises, are not guaranteed by the U.S. Government or supported by the full faith and credit of the United States.
When-Issued and Delayed Delivery Securities Risk: When-issued and delayed delivery securities and forward commitments involve the risk that the security a Fund buys will lose value prior to its delivery. There also is the risk that the security will not be issued or that the other party to the transaction will not meet its obligation. If this occurs, the Fund may lose both the investment opportunity for the assets it set aside to pay for the security and any gain in the security’s price.
Morningstar Funds Trust October 31, 2023 (unaudited)
Notes to Financial Statements (continued)
11. Principal Ownership
As of October 31, 2023, the Funds had omnibus accounts owning more than 5% of the total Institutional shares outstanding of each Fund as follows:
| Morningstar Funds | Number of
Shareholders | % Ownership1 |
| U.S. Equity Fund | 4 | 99% |
| International Equity Fund | 4 | 99% |
| Global Income Fund | 4 | 99% |
| Total Return Bond Fund | 4 | 99% |
| Municipal Bond Fund | 4 | 99% |
| Defensive Bond Fund | 3 | 96% |
| Multisector Bond Fund | 4 | 99% |
| Global Opportunistic Equity Fund | 4 | 99% |
| Alternatives Fund | 4 | 99% |
| | | |
| 1Includes omnibus positions of broker-dealers representing numerous shareholder accounts. |
Investment activities of these shareholders may have a material effect on the Funds.
12. Line of Credit
The Funds have a $50 million line of credit agreement with Northern Trust. Borrowings are made solely to facilitate the handling of redemptions or unusual or unanticipated short-term cash requirements. Because several Funds participate and collateral requirements apply, there is no assurance that an individual Fund will have access to the entire $50 million at any particular time. Interest is charged to each Fund based on its borrowings at an amount of 1.25% above the Federal Funds rate. In addition, an administration fee of $10,000 is payable annually and allocated among the Funds based on net assets.
During the six months ended October 31, 2023, the Funds made no borrowings against the line of credit.
13. Subsequent Events
Management has evaluated subsequent events for the Funds through the date this report was issued.
SSI Investment Management LLC (“SSI”), a subadviser to the Alternatives Fund, underwent a change in ownership, which is anticipated to close the fourth quarter of 2023, and will result in the automatic termination of the subadvisory agreement that was then in effect between SSI and MIM. As of that date, SSI will begin operating under a new subadvisory agreement pursuant to which the same investment subadvisory services will continue to be provided to the Alternatives Fund. (See the Board Approval of New Subadvisory Agreement section below for more information on the approval of the new subadvisory agreement.)
Morningstar Funds Trust October 31, 2023 (unaudited)
As a shareholder of a series within Morningstar Funds Trust, you incur ongoing costs, including management fees, administration, custody, sub-accounting, trustees and other fund expenses. The following examples are intended to help you understand your ongoing costs (in dollars and cents) of investing in a Fund and to compare these costs with the ongoing costs of investing in other mutual funds.
The examples are based on an investment of $1,000 invested at the beginning of a six month period and held for the entire period, May 1, 2023 through October 31, 2023.
Actual Expenses
The three columns for each Fund in the table under the "Actual" heading provide information about actual account values and actual expenses. You may use the information in these columns, together with the amount you invested, to estimate the expenses that you paid over the period. Simply divide your account value by $1,000 (for example, an $8,600 account value divided by $1,000 = 8.6), then multiply the result by the number in the second column for your Fund under the heading entitled “Expenses Paid During Period” to estimate the expenses you paid on your account during this period.
Hypothetical Example for Comparison Purposes
The last three columns for each Fund in the table under the "Hypothetical (5% return)" heading provides information about hypothetical account values and hypothetical expenses based on the Fund’s actual expense ratio and an assumed rate of return of 5% per year before expenses, which is not the Fund’s actual return. The hypothetical account values and expenses may not be used to estimate the actual ending account balance or expenses you paid for the period. You may use this information to compare the ongoing costs of investing in your Fund and other funds. To do so, compare this 5% hypothetical example with the 5% hypothetical examples that appear in the shareholder reports of the other funds. Please note that the expenses shown in the table are meant to highlight your ongoing costs only. Therefore, the last three columns for each Fund in the table is useful in comparing ongoing costs only and will not help you determine the relative total costs of owning different funds.
| | | Actual | Hypothetical (5% return) |
| | Annualized
Expense
Ratio | Beginning
Account Value | Ending
Account Value | Expenses Paid*
During Period | Beginning
Account Value | Ending
Account Value | Expenses Paid *
During Period |
| Morningstar U.S. Equity Fund | 0.84% | $1,000.00 | $1,004.70 | $4.23 | $1,000.00 | $1,020.91 | $4.27 |
| Morningstar International Equity Fund | 0.98 | 1,000.00 | 924.60 | 4.74 | 1,000.00 | 1,020.21 | 4.98 |
| Morningstar Global Income Fund | 0.70 | 1,000.00 | 961.80 | 3.45 | 1,000.00 | 1,021.62 | 3.56 |
| Morningstar Total Return Bond Fund | 0.53 | 1,000.00 | 933.20 | 2.58 | 1,000.00 | 1,022.47 | 2.69 |
| Morningstar Municipal Bond Fund | 0.58 | 1,000.00 | 967.30 | 2.87 | 1,000.00 | 1,022.22 | 2.95 |
Morningstar Funds Trust October 31, 2023 (unaudited)
Fund Expenses (continued)
| | | Actual | Hypothetical (5% return) |
| | Annualized
Expense
Ratio | Beginning
Account Value | Ending
Account Value | Expenses Paid*
During Period | Beginning
Account Value | Ending
Account Value | Expenses Paid *
During Period |
| Morningstar Defensive Bond Fund | 0.48% | $1,000.00 | $1,010.60 | $2.43 | $1,000.00 | $1,022.72 | $2.44 |
| Morningstar Multisector Bond Fund | 0.79 | 1,000.00 | 970.70 | 3.91 | 1,000.00 | 1,021.17 | 4.01 |
| Morningstar Global Opportunistic Equity Fund | 0.72 | 1,000.00 | 963.20 | 3.55 | 1,000.00 | 1,021.52 | 3.66 |
| Morningstar Alternatives Fund | 1.18 | 1,000.00 | 1,018.40 | 5.99 | 1,000.00 | 1,019.20 | 5.99 |
| | | | | | | | |
| * | Expenses are equal to the Fund's annualized expense ratios, multiplied by the average account value over the period, multiplied by [184/366] (to reflect the one-half year period). |
| | | Morningstar Funds Trust Privacy Policy (unaudited) |
| | | PLEASE READ "OTHER IMPORTANT INFORMATION" SECTION BELOW FOR INFORMATION ABOUT MORNINGSTAR FUNDS TRUST ACCESS TO YOUR PERSONAL INFORMATION |
| |
| Why? | | Financial companies can choose how they share your personal information. Federal law gives consumers the right to limit some, but not all sharing. Federal law also requires us to tell you how we collect, share, and protect your personal information. Please read this notice carefully to understand Morningstar Funds Trust access to your personal information. |
| |
| What? | | Personal information includes, but is not limited to: |
| | ► | Your name, address, phone number, and email address; |
| | ► | Your social security number or other unique identifier; |
| | ► | Your account information, such as account balance and transactions (including account transaction history); |
| | ► | Your demographic information, such as age, income, investment preferences, investment experience, and risk profile. |
| |
| How? | | All financial companies need to share clients’ personal information to run their everyday business. In the section below, we list the reasons financial companies can share their clients’ personal information; the reasons Trust chooses to share; and whether you can limit this sharing. |
| Reasons financial companies can share your personal information | Does Morningstar
Funds Trust share? | Can you limit
this sharing? |
For our everyday business purposes—such as to process your
transactions, maintain your account(s), or respond to court orders and
legal investigations. | See “Other Important
Information” below. | No |
| For our marketing purposes—to offer our products and services. | No | N/A |
| For joint marketing with other financial companies. | No | N/A |
For our affiliates’ everyday business purposes—information about
your transactions and experiences. | No | N/A |
For our affiliates’ everyday business purposes—information about
your creditworthiness. | No | N/A |
| For our affiliates to market to you. | No | N/A |
| For nonaffiliates to market to you. | No | N/A |
| |
| Who we are | | Who is providing this notice? Morningstar Funds Trust |
| |
| What we do | | How does Morningstar Funds Trust protect your personal information? |
| | | Security measures are in place to protect against unauthorized access to, or unauthorized alteration, disclosure or destruction of personal information. Secure data networks are protected by industry standard firewall and password protection systems. |
| | | How does Morningstar Funds Trust collect your personal information? |
| | | We will collect your personal information if you open an account directly with us or if you gave us your personal information; however, please read the "Other Important Information" section below. |
| | | Why can’t you limit sharing? |
| | | Federal law gives you the right to limit only: |
| | ► | sharing for affiliates’ everyday business purposes—information about your creditworthiness; |
| | ► | affiliates from using your information to market to you; |
| | ► | sharing for nonaffiliates to market to you. |
| | | State laws and individual companies’ policies may give you additional rights to limit sharing. |
| |
| Definitions | | Affiliates |
| | | Companies related by common ownership or control. They can be financial and nonfinancial companies. |
| | ► | Morningstar Funds Trust’s investment adviser is Morningstar Investment Management LLC, a wholly owned subsidiary of Morningstar, Inc. Morningstar Investment Services LLC, a wholly owned subsidiary of Morningstar Investment Management LLC, is the sponsor of the Morningstar Managed Portfolios advisory service. |
| | | Nonaffiliates |
| | | Companies not related by common ownership or control. They can be financial and nonfinancial companies. |
| | ► | The Trust does not share your personal information with nonaffiliates for marketing their services to you. |
| | | Joint marketing |
| | | A formal agreement between nonaffiliated financial companies that together market financial products or services to you. |
| | ► | The Trust does not have such an agreement in place. |
| |
| Other Important Information | | Morningstar Funds Trust ("Morningstar Funds") are available through investment platforms provided by financial institutions on a stand-alone basis and/or as part of a model portfolio ("Solutions") |
| | Such Solutions include, Morningstar Managed Portfolios, an investment advisory program sponsored by Morningstar Investment Services LLC, investment advisory programs provided by unaffiliated financial advisers, managed account advisory services certain third party retirement plan sponsors (e.g., employers) and/or retirement plan recordkeepers make available to their retirement plan participants, and solutions provided in model marketplaces. The financial institution’s client’s assets are held at a nonaffiliated custodian (“Custodian”) who report buy/sells of Morningstar Funds shares to the Trust’s transfer agent at an aggregate level (e.g., omnibus). Because of this, under normal circumstances, the Trust does not have personal information of the shareholders of the Morningstar Funds. From time-to-time, Morningstar Funds Trust may seek shareholder’s personal information to fulfill regulatory requirements and/or obligations. In those instances, Morningstar Funds Trust will not make your personal information available to anyone other than the above-mentioned affiliates. Morningstar Funds Trust reserves the right to change this policy at any time by distributing and/or posting a new privacy policy without notice. |
Morningstar Funds Trust October 31, 2023 (unaudited)
Liquidity Risk Management Program
Consistent with Rule 22e-4 under the Investment Company Act of 1940 (as amended), Morningstar Funds Trust (the “Trust”) has established a written liquidity risk management program (“Program”) to govern the approach in managing liquidity risk within each series of the Trust (each a “Fund” and collectively the “Funds”). For purposes of the Program, liquidity risk means the risk that a Fund could not meet requests to redeem shares issued by the fund without significant dilution of remaining investors’ interests in the Fund.
The Program is overseen by the Liquidity Committee which is comprised of representatives of the Funds' investment adviser, Morningstar Investment Management LLC (“MIM”) and certain officers of the Trust (e.g., the Trust’s Principal Financial Officer). The Funds’ Board of Trustees (“Board”) has approved the Program on behalf of the Trust as well as the designation of the Liquidity Committee to oversee the Program. In administering the Program, the Liquidity Committee seeks input from MIM and/or subadviser(s) when such input is deemed necessary or appropriate by the Liquidity Committee.
In general, liquidity risk is managed taking into account the investment strategy, liquidity profile, and redemption policy and history of a Fund, with the objective of maintaining a level of liquidity that is appropriate considering the Fund’s obligations to current and future shareholders. Liquidity management for each Fund is based on an assessment of the liquidity of each portfolio asset, considering the time required to liquidate an asset and the price or value at which those assets can be liquidated, in accordance with the requirements of Rule 22e-4.
At a meeting of the Board held on September 14, 2023, a written report from the Liquidity Committee was provided to the Board addressing the operation of the Program and assessing its adequacy and effectiveness of implementation (the “Report”) for the annual period from July 1, 2022 through June 30, 2023 (the “Reporting Period”).
During the Reporting Period, each Fund maintained a high level of liquidity and was deemed to primarily hold assets that are defined as highly liquid investments. As a result, no Fund was required to establish or adopted a Highly Liquid Investment Minimum during the Reporting Period.
The Report did not identify any significant liquidity events that materially affected the performance of any Fund or its ability to timely meet redemptions without dilution to existing shareholders during the Reporting Period. In addition, all Funds complied with the 15% limitation on illiquid investments during the Reporting Period, consistent with the Program and the relevant requirements of Rule 22e-4.
The Liquidity Committee has determined that the Program operated adequately and effectively to manage each Fund’s liquidity risk during the Reporting Period and is reasonably designed to manage each Fund’s liquidity risk. However, please note, there can be no assurance that the Program will achieve its objectives in the future. Please refer to your Fund's prospectus for more information regarding the Fund's exposure to liquidity risk and other principal risks to which an investment in the Fund may be subject.
Morningstar Funds Trust October 31, 2023 (unaudited)
Board Approval of New Subadvisory Agreement (unaudited)
At a meeting of the Board of Trustees (the “Board”) of Morningstar Funds Trust (the “Trust”) on September 14, 2023, the Board unanimously approved a new subadvisory agreement for the Morningstar Alternatives Fund (the “Fund”) by and among SSI Investment Management LLC (“SSI”), the Trust and Morningstar Investment Management LLC (“MIM”) (the “New SSI Subadvisory Agreement”). The New SSI Subadvisory Agreement was approved in anticipation of an ownership change of SSI’s majority owner, Resolute Investment Managers, Inc. (“RIM”), which was expected to close in the fourth quarter of 2023 (the “Transaction”).
It was anticipated that the Transaction would result in a “change in control” of SSI, and therefore, would constitute an “assignment,” as such term is defined in the Investment Company Act of 1940, as amended, of the existing subadvisory agreement (dated May 31, 2019) by and among SSI, the Trust, and MIM, on behalf of the Fund (the “Original SSI Subadvisory Agreement”). The terms of the proposed New SSI Subadvisory Agreement, other than its effective date, were identical in all respects to the Original SSI Subadvisory Agreement that had been considered and approved by the Board at the meeting held on March 14, 2023 (the “March Meeting”). In order to permit SSI to continue to provide investment advisory services to the Fund, the Board considered and approved the New SSI Subadvisory Agreement, to become effective following the Transaction.
The material factors considered and the conclusions that formed the bases of the Board’s approval of the New SSI Subadvisory Agreement are described below. This summary describes the most significant, but not all, of the factors evaluated by the Board. The Board did not quantify or assign relative weights to the factors. Each member of the Board may have assigned different weights to the factors.
In considering the approval of the New SSI Subadvisory Agreement, the Board was able to draw on its knowledge of the Trust, the Fund, MIM, and SSI. The Board considered the approval of the Original SSI Subadvisory Agreement, and considered the nature, extent and quality of services provided by SSI, its investment performance with regard to the management of its allocated portion of the Fund, and the subadvisory fee.
The Board reviewed information provided by MIM and SSI regarding the Transaction, as well as a copy of the proposed New SSI Subadvisory Agreement. The Board noted that the New SSI Subadvisory Agreement provided for the same services and fees as the Original SSI Subadvisory Agreement and that the New SSI Subadvisory Agreement was in all respects identical to the Original SSI Subadvisory Agreement, except for the effective date. Given that the services and fees provided under the New SSI Subadvisory Agreement were identical to the services and fees under the Original SSI Subadvisory Agreement, the Board’s deliberations at the March Meeting remained relevant.
At the March Meeting, the Board considered multiple factors that it deemed relevant, including, but not limited to:
• The form of the Original SSI Subadvisory Agreement.
• The investment performance of the Fund and the performance of MIM and SSI in achieving this performance.
• Whether the Fund had operated in accordance with its investment objective.
Morningstar Funds Trust October 31, 2023 (unaudited)
Board Approval of New Subadvisory Agreement (unaudited) (continued)
• The fairness of the compensation under the Fund’s investment advisory agreement and the Original SSI Subadvisory Agreement.
• The expense ratio to be borne by shareholders, considering the combined effect of the pricing structure of the Fund and existing fee waivers and expense reimbursements.
• MIM’s investment principles.
• The nature, extent and quality of services that SSI provided and would be expected to provide to the Fund.
• The background, experience, personnel (including talent management and related diversity, equity, and inclusion matters), operations, technology, policies, procedures and compliance functions of SSI, including its experience as a manager of other funds and accounts, its investment management approach and resources, its financial condition and reputation in the industry.
• The compatibility of SSI’s operations, policies, procedures and compliance functions with those of MIM and other service providers to the Fund.
• The Trust’s Chief Compliance Officer’s review of the compliance programs and capabilities of SSI, including the policies and procedures in place to address actual and potential conflicts of interest.
• MIM’s risk management program, especially those aspects of the program related to selecting and overseeing subadvisers for the Fund.
• The use of derivatives and other complex instruments to carry out the Fund’s investment goals.
• SSI’s risk management program.
• Profitability matters and economies of scale.
MIM recommended the approval of the New SSI Subadvisory Agreement, pursuant to which SSI would continue to serve as a subadviser to the Fund following the Transaction. The approval of the New SSI Subadvisory Agreement was recommended by MIM because, among other factors: (i) the Transaction was not expected to have a material effect on the nature, extent or quality of the services provided by SSI to the Fund; (ii) the SSI personnel who have been responsible for managing SSI’s allocated portion of the Fund would continue to serve in their respective capacities following the Transaction; (iii) the terms of the New SSI Subadvisory Agreement were similar, in all material respects other than the effective date, to the Original SSI Subadvisory Agreement that was approved by the Board at the March Meeting; and (iv) SSI’s historical investment performance with respect to its allocated portion of the Fund had been acceptable.
Morningstar Funds Trust October 31, 2023 (unaudited)
Board Approval of New Subadvisory Agreement (unaudited) (continued)
Significant factors considered by the Board included the following:
Services Provided
The Board considered its analysis at the March Meeting of the nature, extent and quality of the services provided by SSI to the Fund. At the March Meeting, the Board considered the Fund’s investment goal, MIM’s and SSI’s investment strategy to achieve that goal, and MIM’s and SSI’s success in achieving, and ability to continue to achieve, that investment strategy. The Board also took note of the responsibilities that SSI has with respect to the portion of the Fund’s assets allocated to it by MIM. The Board noted its consideration at the March Meeting of the other investment advisory services offered by SSI and reviewed the allocation of assets and expenses among those services, as well as their fees, the reasons for differences in fees and any potential conflicts in connection with providing these services. The Board considered MIM’s rationale for recommending the continued retention of SSI, and that the Transaction was not expected to have a material effect on the nature, extent or quality of the services provided by SSI to the Fund.
Based on its consideration and review of the foregoing factors, the Board concluded that it was satisfied with the nature, extent and quality of the overall services provided and to be provided by SSI. The Board was confident in the abilities of SSI to continue to implement the investment strategy of the Fund and to continue to provide quality services to the Fund.
Investment Performance
The Board considered its analysis at the March Meeting regarding SSI’s investment performance. The Board considered its prior comparison of this performance to the Fund’s peer group and benchmark. The Board concluded that its prior consideration of the performance record for SSI in managing its portion of the Fund supported a decision to approve the New SSI Subadvisory Agreement.
The Cost of Services and Fund Expenses
The Board considered its analysis at the March Meeting regarding the cost of services provided and to be provided by MIM and SSI and the losses realized by MIM from a relationship with the Fund. At the March Meeting the Board had considered profitability information, expenses absorbed by MIM through fee waivers and reimbursements, comparative fee data, and actual and potential benefits (often called “fall-out benefits”) that accrue to MIM and SSI from managing the Fund. The Board noted that the subadvisory fee is paid to SSI by MIM and is not an additional fee borne by the Fund, and that this fee was the product of arms-length negotiations between MIM and SSI. The Board considered that the subadvisory fee set forth under the proposed New SSI Subadvisory Agreement would be the same as that set forth under the Original SSI Subadvisory Agreement approved by the Board at the March Meeting, and that the investment advisory fee paid by the Fund would similarly remain unaffected by the Transaction. The Board also considered its analysis at the March Meeting regarding fund expenses. The Board concluded that its prior consideration of the cost of services and fund expenses was relevant to SSI and the Fund, and supported a decision to approve the New SSI Subadvisory Agreement.
Morningstar Funds Trust October 31, 2023 (unaudited)
Board Approval of New Subadvisory Agreement (unaudited) (continued)
Economies of Scale
The Board considered its analysis at the March Meeting of the economies of scale that may be realized by MIM and SSI as the Fund grows larger and the extent to which these economies would be shared with the Fund’s shareholders. For the reasons discussed at the March Meeting, the Board concluded that economies of scale continued to not be a significant factor with regard to the management fees paid by the Fund at this time given the current assets in the Fund and the limited operating history of the Fund and the expense limitation arrangements that are in effect.
Conclusion
After consideration of the foregoing factors, and such other matters as were deemed relevant, and with no single factor being determinative to its decision, the Board—including a majority of the Independent Trustees with the assistance of counsel—approved the New SSI Subadvisory Agreement and concluded that the subadvisory fee structure provided for in the agreement continued to be fair and reasonable.
Morningstar Funds Trust October 31, 2023 (unaudited)
Proxy Voting Policies and Proxy Voting Record
The Board has delegated responsibility for decisions regarding proxy voting for securities held by the Funds to the Adviser, which, in turn, has delegated such responsibility to the subadvisers for their respective assets managed, as applicable. The Adviser and each subadviser will vote such proxies in accordance with its proxy policies and procedures, which are available, free of charge, by calling 877-626-3224. Information about how each Fund voted proxies relating to portfolio securities during the most recent 12-month period ended June 30 may be obtained (1) without charge, upon request, by call 877-626-3224 and (2) on the SEC’s website at http://sec.gov.
Form N-PORT Disclosure
The Trust files its complete schedule of portfolio holdings with the U.S. Securities and Exchange Commission ("SEC") for the first and third quarters of each fiscal year as an exhibit to its reports on Form N-PORT. The Trust’s Form N-PORT (and its predecessor form, Form N-Q) filings are available on the SEC’s website at http://www.sec.gov.
Morningstar Funds Trust is available to citizens or
legal residents of the United States or its territories through
model portfolios designed and maintained by a financial institution including the Adviser.
Adviser
Morningstar Investment Management LLC
22 West Washington Street
Chicago, Illinois 60602
Distributor
Foreside Fund Services, LLC
Three Canal Plaza, Suite 100
Portland, ME 04101
Prospectus
Please go to http://connect.rightprospectus.com/Morningstar
to access the Morningstar Funds Trust prospectus.
Shareholder Rights
When you buy shares in a fund of the Morningstar Funds Trust, you become a shareholder of that fund. As a shareholder, you have certain rights and protections, chief among them an independent board of trustees, whose main role is to represent your interests. The Board of Trustees for the Morningstar Funds Trust is committed to representing your interests as well as implementing and maintaining sound fund governance principles. To learn more about the Board of Trustees please go to https://www.morningstar.com/company/morningstar-funds-governance.
This report is general information for the shareholders of the Morningstar Funds. It is not authorized for distribution to prospective investors unless preceded or accompanied by the Funds’ current prospectus. Past performance results shown in this report should not be considered a representation of future performance. Investment returns and principal value of shares will fluctuate so that shares, when redeemed, may be worth more or less than their original cost. Views, opinions, portfolio holdings and other information expressed or noted herein are as of the end of the reporting period and are subject to change. Such views and opinions are not to be viewed as investment advice.
Item 2. Code of Ethics.
Not applicable for this reporting period.
Item 3. Audit Committee Financial Expert.
Not applicable for this reporting period.
Item 4. Principal Accountant Fees and Services.
Not applicable for this reporting period.
Item 5. Audit Committee of Listed Registrants.
Not applicable.
Item 6. Investments.
| (a) | The registrant has elected to include the schedule of investments in securities of unaffiliated issuers as part of the report to shareholders filed under Item 1 of this report on Form N-CSR. |
Item 7. Disclosure of Proxy Voting Policies and Procedures for Closed-End Management Investment Companies.
Not applicable.
Item 8. Portfolio Managers of Closed-End Management Investment Companies.
Not applicable.
Item 9. Purchases of Equity Securities by Closed-End Management Investment Company and Affiliated Purchasers.
Not applicable.
Item 10. Submission of Matters to a Vote of Security Holders.
There have been no material changes to the procedures by which shareholders may recommend nominees to the registrant’s Board of Trustees.
Item 11. Controls and Procedures.
| (a) | The registrant’s principal executive and principal financial officers, or persons performing similar functions, have concluded that the registrant’s disclosure controls and procedures (as defined in Rule 30a-3(c) under the Investment Company Act of 1940 (the “1940 Act”)) are effective, based on the evaluation of these controls and procedures required by Rule 30a-3(b) under the 1940 Act and Rules 13a-15(b) or 15d-15(b) under the Securities Exchange Act of 1934, as of a date within 90 days of the filing date of this report. |
| (b) | There were no changes in the registrant’s internal control over financial reporting (as defined in Rule 30a-3(d) under the 1940 Act) that occurred during the period covered by this report that have materially affected, or are reasonably likely to materially affect, the registrant’s internal control over financial reporting. |
Item 12. Disclosure of Securities Lending Activities for Closed-End Management Investment Companies.
Not applicable.
Item 13. Exhibits.
SIGNATURES
Pursuant to the requirements of the Securities Exchange Act of 1934 and the Investment Company Act of 1940, the registrant has duly caused this report to be signed on its behalf by the undersigned, thereunto duly authorized.
Morningstar Funds Trust
| | |
| By | | /s/ Daniel E. Needham |
| | Daniel E. Needham, President |
| | (Principal Executive Officer) |
Date: December 26, 2023
Pursuant to the requirements of the Securities Exchange Act of 1934 and the Investment Company Act of 1940, this report has been signed below by the following persons on behalf of the registrant and in the capacities and on the dates indicated.
| | |
| By | | /s/ Daniel E. Needham |
| | Daniel E. Needham, President |
| | (Principal Executive Officer) |
Date: December 26, 2023
| | |
| By | | /s/ Tracy L. Dotolo |
| | Tracy L. Dotolo, Treasurer |
| | (Principal Financial Officer) |
Date: December 26, 2023