UNITED STATES SECURITIES AND EXCHANGE COMMISSION
Washington, D.C. 20549
FORM 1‑U
CURRENT REPORT
Pursuant to Regulation A of the Securities Act of 1933
August 15, 2018
(Date of Report (Date of earliest event reported))
MOGULREIT II, Inc.
(Exact name of issue as specified in its charter)
|
|
|
Maryland |
| 81-5263630 |
(State or other jurisdiction |
| (I.R.S. Employer |
of incorporation or organization) |
| Identification No.) |
|
|
|
|
|
|
| 10780 Santa Monica Blvd, Suite 140 |
|
| Los Angeles, CA, 90025 |
|
| (Full mailing address of |
|
| principal executive offices) |
|
(877) 781‑7153
(Issuer’s telephone number, including area code)
Common Stock
(Title of each class of securities issued pursuant to Regulation A)
1
Item 9. Other Events.
On August 15, 2018, we issued an offering overview discussing our financial results for the quarter ended June 30, 2018. The text of the offering overview is set forth below.

Q2 2018*
MOGULREIT II
|
|
|
|
OFFERING OVERVIEW |
| TOTAL INVESTMENT VALUE1 | $11,440,000 |
|
| TOTAL ASSET VALUE2 | $91,000,000 |
|
| NUMBER OF INVESTMENTS | 6 |
MogulREIT II is a public, non-traded REIT, investing in |
| TOTAL NUMBER OF MULTIFAMILY UNITS | 1,095 |
value-add multifamily strategies with a focus on providing capital appreciation to investors. |
| WEIGHTED AVERAGE PROJECTED HOLD PERIOD | 54 Months |
|
| ANNUALIZED DISTRIBUTION RATE3 | 4.5% |
|
|
|
|
KEY OBJECTIVES |
| TAX REPORTING FORM | 1099-DIV |
|
|
|
|
To preserve, protect, increase, and return your capital contribution; and |
| DISTRIBUTION FREQUENCY | Quarterly |
To pay cash distributions quarterly. |
|
|
|
PORTFOLIO STATISTICS 4
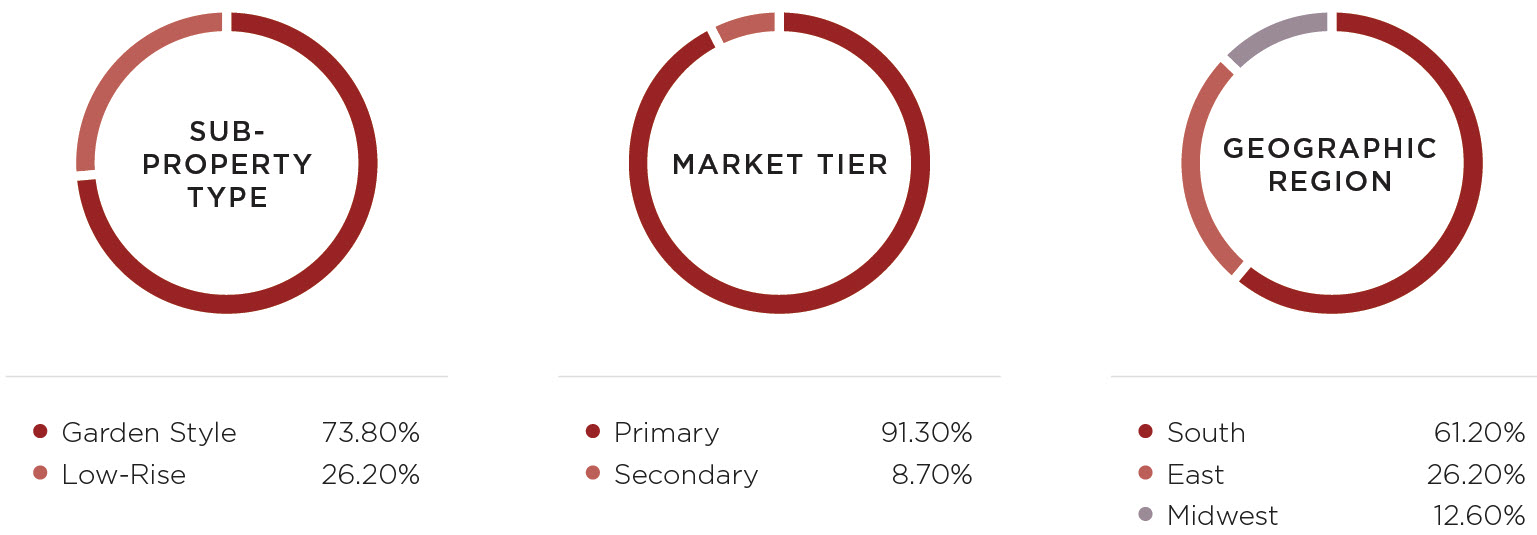
Garden Style 73.80% Primary 91.30% South 61.20% Low-Rise 26.20% Secondary 8.70% East 26.20% Midwest 12.60% |
*All data as of June 30, 2018.
1 Aggregate value of all underlying investments in MogulREIT II, Inc. based on the current outstanding investment amount.
2 Aggregate value of all underlying properties in MogulREIT II, Inc. based on the most recent purchase price of each asset.
3 MogulREIT II has declared distributions on a quarterly basis since January 1, 2018. The quarterly distributions equate to approximately 4.50% on an annualized basis based upon the $10.00 per share purchase price. The annualized distribution rate is not a guarantee or projection of future distributions, and the board of directors may in the future declare lower distributions or no distributions at all for any given period.
4. Based on the current outstanding investment amount.
2
INVESTMENT ACTIVITY
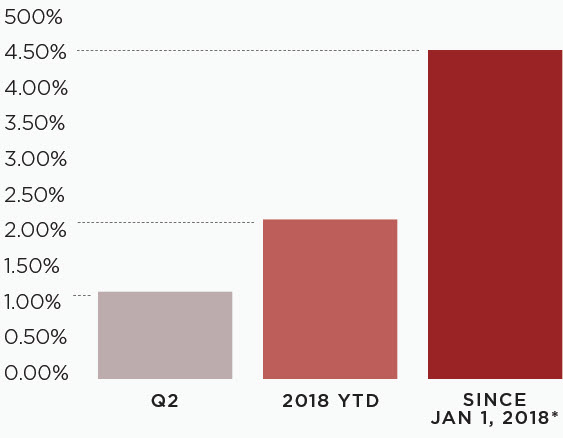
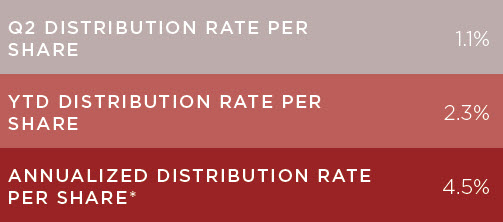
Distributions
MogulREIT II declared a distribution for the second quarter of 2018 on March 21, 2018. MogulREIT II has declared distributions on a quarterly basis since January 1, 2018 which equate to approximately 4.50% on an annualized basis based upon the $10.00 per share purchase price.
|
|
|
|
|
|
|
|
|
|
|
| Asset Additions |
|
|
|
|
|
|
|
|
|
|
|
|
|
| On June 22, 2018, we acquired a $1,440,000 preferred equity investment in connection with the acquisition and renovation of Ashland Apartments, a 31-unit Class B multifamily complex in Chicago, Illinois. The real estate company for the project plans to substantially enhance the exterior appearance, add new amenities and implement a new interior upgrade package in order to push rents to market. |
|
|
|
| The property is located on the border of two of Chicago’s most well-established neighborhoods – Ravenswood and Andersonville. In connection with the preferred equity Investment, we have partnered with an experienced real estate company that reports currently managing over 306,000 square feet of commercial, mixed-use retail and industrial space along with 129 multifamily residential units built and under development. The 129 units are spread across ten different transactions, nine of which are in Chicago. |
|
|
|
|
|
|
|

3
MARKET OVERVIEW AND PORFOLIO UPDATES
|
|
|
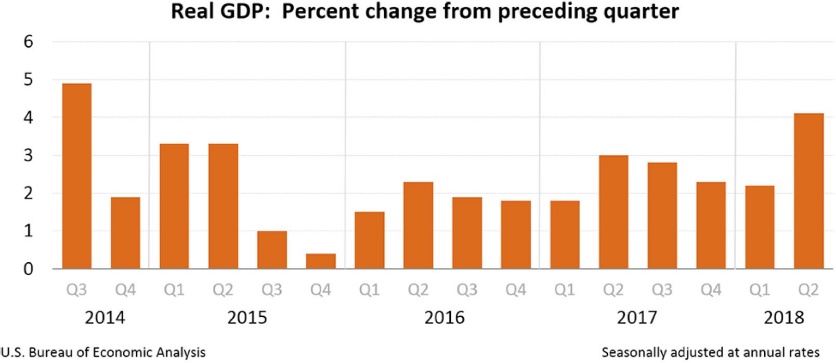
GDP GROWTH
We believe one important indicator of economic health is the real GDP growth rate as a positive growth rate indicates an expanding economy. As depicted in the chart to the right from the U.S. Bureau of Economic Analysis, GDP growth in Q2 2018 reached its highest rate in approximately four years and has averaged over 2% since 2010. |
|
|
|
|
|
|
|
|
|
|
|
EMPLOYMENT GROWTH
Job growth has also remained strong, and unemployment rates are at their lowest levels in a decade, ending Q2 2018 at 4.0%. We believe that this is one of the most important macroeconomic indicators for real estate.
|
| |
|
|
|
|
|
|
|
|
|
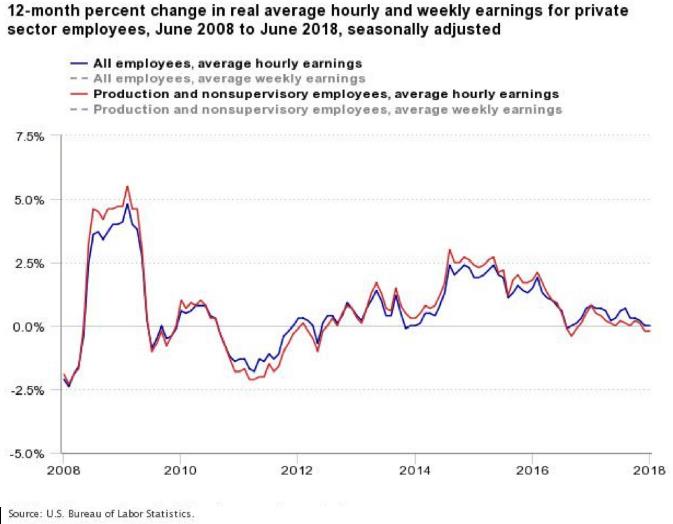
RISK MITIGATION
While the real GDP growth and unemployment metrics are strong, there are certain macroeconomic indicators that we are consistently monitoring for the purposes of risk mitigation. Firstly, although employment growth is positive, wage growth has remained static. As a result, we believe that consumers may not be capturing the full benefit of the growing economy. |
|
|

4
|
|
|
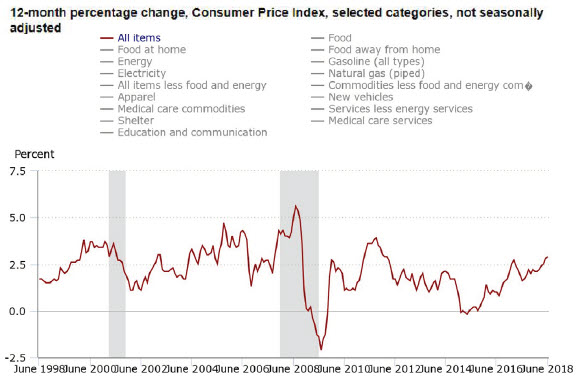
RISK MITIGATION (CONT.)
Further, one of the drawbacks of high real GDP growth may be an increase in inflation, which would partially erase gains as the dollar becomes less valuable. The U.S. Bureau of Labor Statistics’ Consumer Price Index, or CPI, measures the price changes in consumer goods and service. As indicated in the chart to the right, CPI has been steadily increasing since June 2014. |
|
|
|
|
|
|
|
|
|
|
|
POTENTIAL CONSEQUENCES OF CONTINUED GROWTH
Though a high GDP and rising CPI indicate an expanding economy, there may be other consequences if such growth becomes unmanageable. In order to curb excessive inflation, the Federal Reserve may raise interest rates, which would decrease the money supply and encourage saving rather than spending. The Federal Reserve raised rates three times in 2017 and twice in 2018.
In a rising interest rate environment, one might expect to see cap rates rise with interest rates as valuations decrease due to the increased financing costs; however, as interest rates have risen over the past two years, cap rates have decreased. According to CBRE’s Cap Rate Survey for H1 2018, cap rates have decreased year-over-year for all sectors aside from retail and suburban office despite a narrowing spread against the 10-year treasury. |
|
|
|
|
|
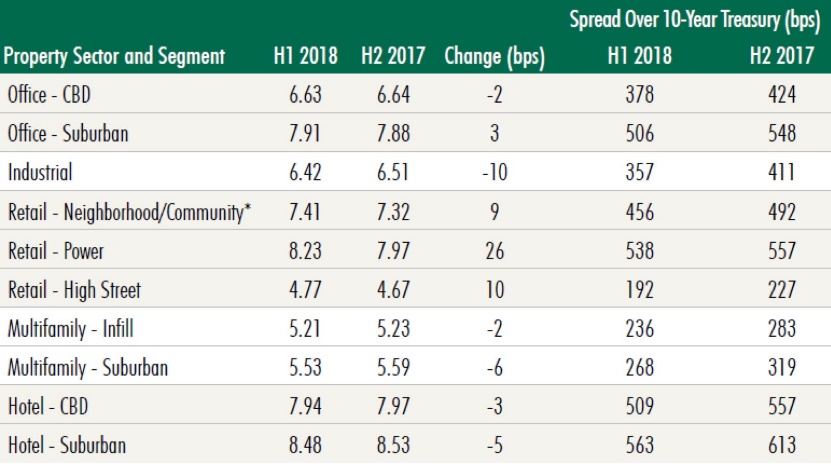

Cap rates have continued to fall leading to higher valuations. Despite this sentiment, we believe that MogulREIT II can differentiate itself as an investment vehicle as we rely on our stringent underwriting and pipeline of investments generated by our proprietary technology to continue to source deals that we believe are in the best interests of our investors.
5
|
|
|
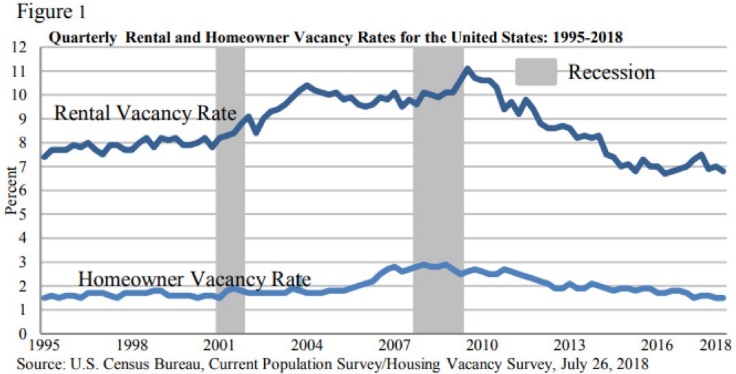
MULTIFAMILY MARKET GROWTH
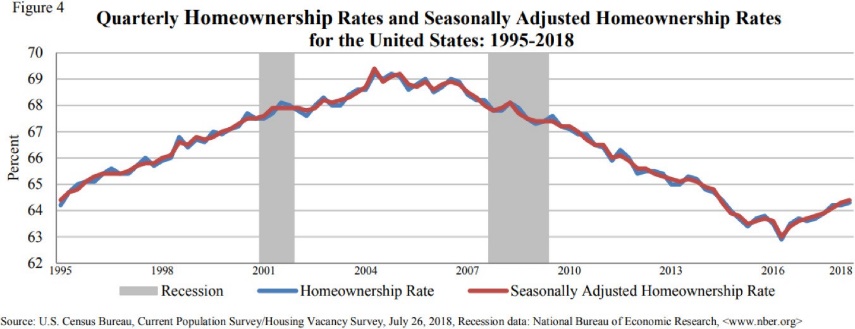
Multifamily assets in particular have exemplified the strong growth and high valuations of the overall market. Since the 2008 recession, the rental vacancy rate has fallen by approximately 4% compared to a 1% drop in homeowner vacancy. We believe that this indicates a growing demand for rental units compared to home purchases.
Further, during the same period, homeownership rates have fallen by approximately 3% despite a 1% uptick in the past two years. |
|
|
|
|
|
|
|
|
|
|
|
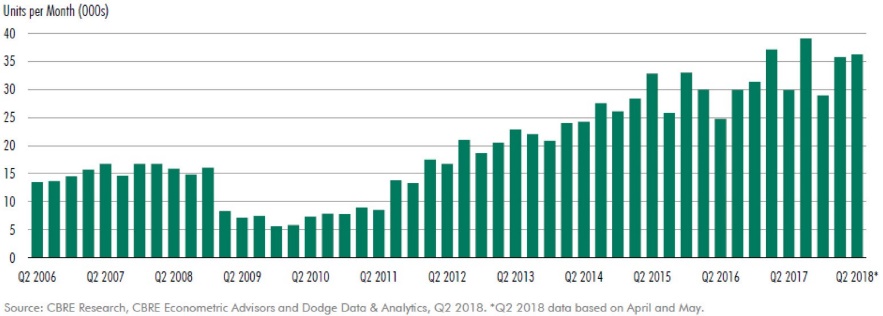
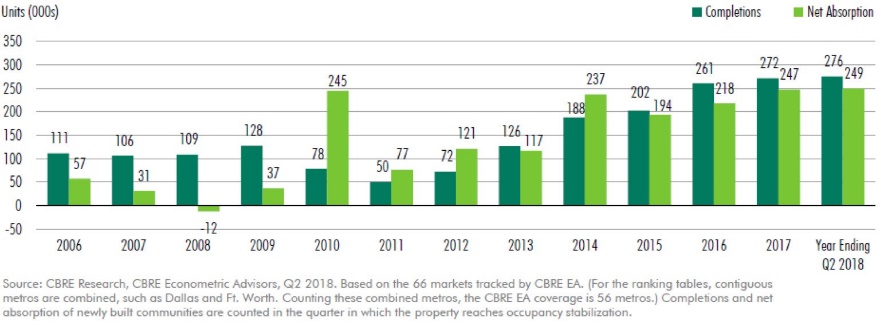
MUTIFAMILY DEVELOPEMENT
As a result of the strong multifamily metrics on a national level, development has increased steadily since 2009, with the market delivering over 35,000 new units per month in 2018.
|
|
|
|
|
|
|
|
|
MULTIFAMILY MARKET SUPPLY AND DEMAND
The increased development is encouraging for the market; but even more so is the high absorption of the new supply. Net absorption in both 2017 and 2018 has nearly matched the total delivery, representing approximately 90.5% of completions.
|
|
|
|
|
|
6
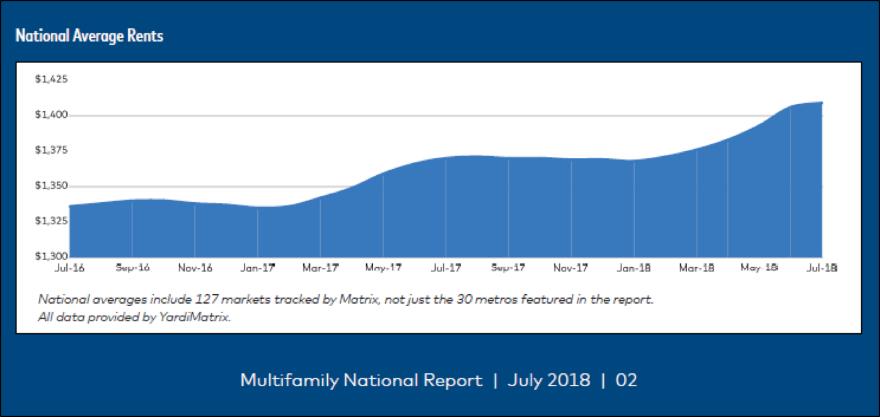
MULTIFAMILY MARKET SUPPLY AND DEMAND (CONT.)
As multifamily demand has kept up with the significant increase in supply, we believe that it has had an inflationary impact on rents. According to the Q2 Yardi Matrix Multifamily National Report, rents have risen by 2.8% year over-year and reached an all-time high of $1,409. |
|
|
TEXAS MULTIFAMILY SPOTLIGHT
MogulREIT II has invested in four multifamily assets in Texas, representing 61.2% of the total REIT.
|
|
|
|
|
|
|
|
|
|
PROPERTY | DATE | CITY | STATE | UNITS | INVESTMENT | % OF | |||
Serendipity Apartments | 9/1/17 | Dallas | TX | 343 | $4,000,000 | 35.0% | |||
Plano Portfolio | 9/1/17 | Plano | TX | 156 | $1,000,000 | 8.7% | |||
Tuscany at | 1/31/18 | San Antonio | TX | 190 | $1,000,000 | 8.7% | |||
Villas del Mar | 2/28/18 | Fort Worth | TX | 263 | $1,000,000 | 8.7% | |||
|
|
|
| 952 | $7,000,000 | 61.2% | |||
We have targeted this allocation given the long-term outperformance of the Texas market when compared to other regional submarkets. According to the Q2 2018 NCREIF Property Index, the Southwest sub-region generated returns of 6.88% over the past year, which ranks 4th out of the 8
sub-regions; however, over the 10-year period since 2008, it has generated returns of 7.37%, the highest of all sub-regions.
The multifamily-specific metrics reveal a similar trend. The 5.40% return over the past year ranks 5th of the 8 sub-regions, but the 10-year return of 7.33% ranks first. The long-term stability of the Southwest sub-region is a cornerstone of our investment thesis.
Lastly, according to the Q2 2018 NCREIF Property Index, garden-style multifamily assets in the Dallas- Plano-Irving MSA have achieved 6.27% returns, composed of 1.42% appreciation and 4.79% income.
7
|
|
|
|
|
|
|
|
|
|
|
|
|
|
|
|
|
|
Q2 DISTRIBUTION RATE PER SHARE 1.1% YTD DISTRIBUTION RATE PER SHARE 2.3% ANNUALIZED DISTRIBUTION RATE PER SHARE*4.5% |
|
NET ASSET VALUE (NAV)
|
|
|
|
|
|
PRICE PER SHARE $10.00 |
| NAV PER SHARE N/A | |||
Our board of directors set our initial offering price at $10.00 per share, which will be the purchase price of our shares of common stock through September 30, 2019.
Thereafter, our price per share will be adjusted at the beginning of every fiscal quarter (or as soon as commercially reasonable thereafter), and will equal the greater of (i) $10.00 per share or (ii) our NAV per share (calculated as our NAV divided by the number of shares of our common stock outstanding as of the end of the prior fiscal quarter). Investors will pay the most recent publicly announced offering price as of the date of their subscription.
NAV per share is calculated by taking the total value of our assets less the total value of our liabilities, divided by the number of shares outstanding.
Copyright © 2018 RM Adviser, LLC, All rights reserved.
8
Previous Updates
Please follow the below links to access descriptions of other investments in prior quarters.
We remain excited about all that 2018 has in store for MogulREIT II and our investors. We continue to expand our real estate, technology and investor relations teams and look forward to bringing even more exclusive, highly vetted deals to our clients. We hope you will join us in your pursuit of building wealth as we continue to source institutional quality real estate investments on behalf of discerning investors.
We are excited by the investment opportunities MogulREIT II offers and we appreciate your continued support. As always, please feel free to contact us at info@realtymogul.com or call directly with any questions you may have.
Sincerely,
/s/ Jilliene Helman
Jilliene Helman
CEO, RM Adviser, LLC
CEO, MogulREIT II, Inc.
Forward-Looking Statements
This Current Report on Form 1-U contains forward-looking statements within the meaning of the federal securities laws. The words “believe,” “estimate,” “expect,” “anticipate,” “intend,” “plan,” “seek,” “may,” “continue,” “could,” “might,” “potential,” “predict,” “should,” “will,” “would,” and similar expressions or statements regarding future periods or the negative of these terms are intended to identify forward-looking statements. These forward-looking statements involve known and unknown risks, uncertainties and other important factors that could cause our actual results, performance or achievements, or industry results, to differ materially from any predictions of future results, performance or achievements that we express or imply in this Current Report on Form 1-U.
9
SIGNATURES
Pursuant to the requirements of Regulation A, the issuer has duly caused this report to be signed on its behalf by the undersigned, thereunto duly authorized.
| MOGULREIT II, INC. | |
|
|
|
|
|
|
| By: | /s/ Jilliene Helman |
| Name: | Jilliene Helman |
| Title: | Chief Executive Officer |
|
|
|
| Date: | August 15, 2018 |
10