UNITED STATES SECURITIES AND EXCHANGE COMMISSION
Washington, D.C. 20549
FORM 1‑U
CURRENT REPORT
Pursuant to Regulation A of the Securities Act of 1933
November 15, 2018
(Date of Report (Date of earliest event reported))
MOGULREIT II, Inc.
(Exact name of issue as specified in its charter)
|
|
|
Maryland |
| 81-5263630 |
(State or other jurisdiction |
| (I.R.S. Employer |
of incorporation or organization) |
| Identification No.) |
|
|
|
|
|
|
| 10780 Santa Monica Blvd, Suite 140 |
|
| Los Angeles, CA, 90025 |
|
| (Full mailing address of |
|
| principal executive offices) |
|
(877) 781‑7153
(Issuer’s telephone number, including area code)
Common Stock
(Title of each class of securities issued pursuant to Regulation A)
1
Item 9. Other Events.
On November 15, 2018, we issued an offering overview discussing our financial results for the quarter ended September 30, 2018. The text of the offering overview is set forth below.

Q3 2018*
MOGULREIT II
|
|
|
|
OFFERING OVERVIEW |
| TOTAL INVESTMENT VALUE1 | $11,440,000 |
|
| TOTAL ASSET VALUE2 | $91,380,750 |
|
| NUMBER OF INVESTMENTS | 6 |
MogulREIT II is a public, non-traded REIT, focused on providing investors with the opportunity for capital appreciation by investing in value-add multifamily |
| TOTAL NUMBER OF MULTIFAMILY UNITS | 1,095 |
apartment buildings with both preferred and joint venture equity. |
| WEIGHTED AVERAGE PROJECTED HOLD PERIOD | 54 Months |
|
| ANNUALIZED DISTRIBUTION RATE3 | 4.5% |
|
|
|
|
KEY OBJECTIVES |
| TAX REPORTING FORM | 1099-DIV |
|
|
|
|
To realize capital appreciation in the value of our investments over the long term |
| DISTRIBUTION FREQUENCY | Quarterly |
To pay attractive and stable cash distributions. |
|
|
|
PORTFOLIO STATISTICS 4
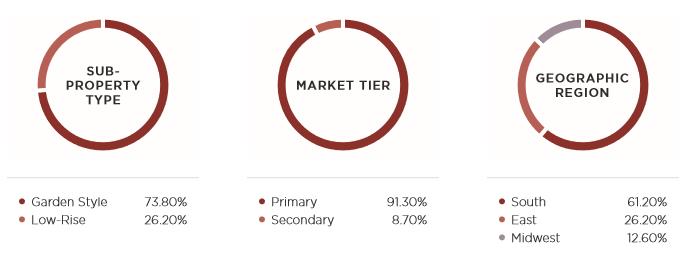
Garden Style 73.80% Primary 91.30% South 61.20% Low-Rise 26.20% Secondary 8.70% East 26.20% Midwest 12.60% |
*All data as of September 30, 2018. 1 Aggregate value of all underlying investments in MogulREIT II, Inc. based on the current outstanding investment amount.
2 Aggregate value of all underlying properties in MogulREIT II, Inc. based on the most recent purchase price of each asset.
3 MogulREIT II has declared distributions on a quarterly basis since January 1, 2018. The quarterly distributions equate to approximately 4.50% on an annualized basis based upon the $10.00 per share purchase price. The annualized distribution rate is not a guarantee or projection of future distributions, and the board of directors may in the future declare lower distributions or no distributions at all for any given period.
4 Based on the current outstanding investment amount.
2
INVESTMENT ACTIVITY
Distributions
The board of directors authorized a distribution for the third quarter of 2018 on June 20, 2018. This distribution, in addition to all prior distributions, equates to approximately 4.50% on an annualized basis assuming a $10.00 per share purchase price and calculated for the period beginning July 1, 2018 and ending September 30, 2018.
The annualized distribution rate is not a guarantee or projection of future distributions, and the board of directors may in the future declare lower distributions or no distributions at all for any given period. While the board of directors is under no obligation to do so, the annualized distribution rate assumes that the board of directors will declare quarterly distributions in the future similar to the distribution disclosed herein.
|
|
|
|
| |||||
|
|
|
|
| |||||
|
| Portfolio Overview |
|
| |||||
|
|
|
|
| |||||
|
|
|
|
| |||||
|
|
|
|
| |||||
|
| INVESTMENT | LOCATION | PROPERTY TYPE | INVESTMENT TYPE | WEIGHT |
|
| |
|
|
| Serendipity Apartments | Dallas, TX | Garden-style | Joint Venture Equity | 35% |
|
|
|
|
| Brooklyn Diversified Multifamily Portfolio | Brooklyn, NY | Low-rise | Joint Venture Equity | 26% |
|
|
|
|
| Ashland Apartments | Chicago, IL | Garden-style | Preferred Equity | 12% |
|
|
|
|
| Plano Multifamily Portfolio | Plano, TX | Garden-style | Joint Venture Equity | 9% |
|
|
|
|
| Tuscany at Westover Hills | San Antonio, TX | Garden-style | Joint Venture Equity | 9% |
|
|
|
|
| Villas Del Mar | Fort Worth, TX | Garden-style | Joint Venture Equity | 9% |
|
|
|
|
|
|
| |||||
|
|
|
|
| |||||


3
Transaction Spotlight
|
|
| |||
|
| ||||
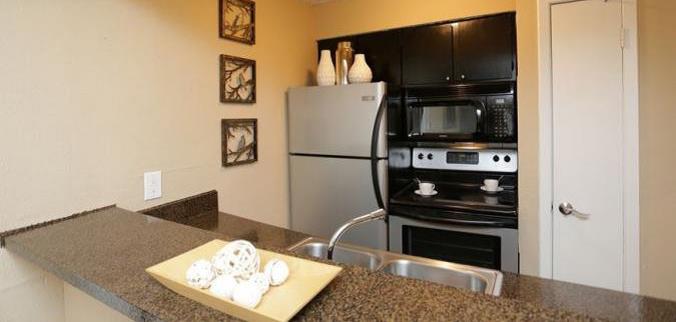
SERENDIPITY / CLOVER APARTMENTS
On November 5, 2018, Jilliene Helman, the CEO of our Manager, visited Serendipity Apartments, renamed Clover Apartments after our investment closed. As of Q3 2018, over 150 units out of the 343-unit apartment building have completed renovations and 95% of the exterior renovations are now done. The transaction has performed within 2% of our proforma on an NOI basis as of September 30, 2018. The property exterior and interiors look great and extensive renovations have led to higher rental rates across the property on renovated units | |||||
BEFORE RENOVATIONS | |||||
|
|
| |||
AFTER RENOVATIONS | |||||
|
|
| |||


4
MARKET OVERVIEW AND PORTFOLIO UPDATES
|
|
|
GDP GROWTH
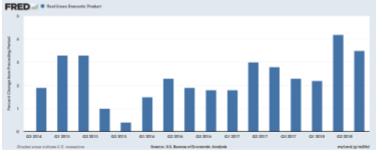
On a macroeconomic level, GDP is one of the primary indicators used to gauge the economic health of a country as it measures economic production and growth. As depicted in the chart to the right from the U.S. Bureau of Economic Analysis, GDP experienced a second straight quarter of greater than 3.5% growth, primarily due to an increase in consumer spending, which comprises approximately 70% of GDP. |
|
|
|
|
|
|
|
|
|
|
|
EMPLOYMENT GROWTH
Job growth has also remained strong, and unemployment rates are at their lowest levels in a decade, ending Q3 2018 at 3.7%, a decrease of 0.3% from Q2 2018. We believe that this is one of the most important macroeconomic indicators for real estate as it contributes to Federal Reserve monetary policy, and it is one of the foundations of our positive near-term outlook |
|
|
|
|
|
|
|
|
|
|
|
RISK MITIGATION
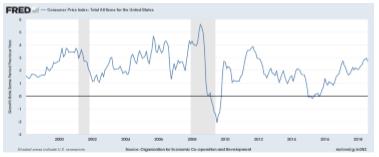
One of the drawbacks of high real GDP growth may be an increase in inflation, which would partially offset gains as the dollar becomes less valuable. The U.S. Bureau of Labor Statistics’ Consumer Price Index, or CPI, measures the price changes in consumer goods and services. As indicated in the chart to the right, CPI has been steadily increasing since June 2014. |
|
|
|
|
|
|
|
|
|
|
|
|
|
|
|
| |
|
|
|

5
MARKET OVERVIEW AND PORTFOLIO UPDATES (CONT. ) | ||
POTENTIAL CONSEQUENCES OF CONTINUED GROWTH
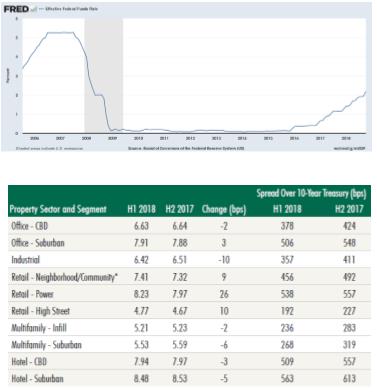
Though a high GDP and rising CPI indicate an expanding economy, in order to curb excessive inflation, the Federal Reserve has increased the federal funds rate, the rate banks charge each other for overnight loans, three times in 2017 and three times in 2018. As depicted in the graph to the right, the Federal Reserve left rates at or near zero for almost six years as the economy recovered from the Great Recession. We believe that the interest rate hikes indicate that the Federal Reserve is confident in the U.S. economy.
In a rising interest rate environment, one might expect to see cap rates rise with interest rates as valuations decrease due to the increased financing costs; however, as interest rates have risen over the past two years, cap rates have decreased. According to CBRE’s Cap Rate Survey for H1 2018, cap rates have decreased year over-year for all sectors aside from retail and suburban office despite a narrowing spread against the 10-year treasury |
|
|
|
|
|
|
|
|
MULTIFAMILY MARKET GROWTH As cap rates have continued to fall leading to higher valuations, we believe that the economy may be near the top of the market. Despite this sentiment, we believe that MogulREIT II can differentiate itself as an investment vehicle as we rely on our stringent underwriting and pipeline of investments generated by our proprietary technology to continue to source deals that are in the best interests of our investors. |
|
|


6
MARKET OVERVIEW AND PORTFOLIO UPDATES (CONT. )
|
|
|
MULTIFAMILY MARKET GROWTH (CONT.)
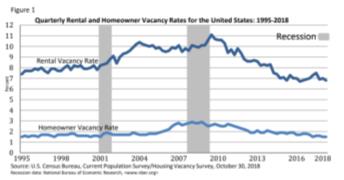
Multifamily assets in particular have exemplified the strong growth and high valuations of the overall market. National vacancy rates in Q3 2018 were 1.6% for homeowner housing and 7.1% for rental housing. While the homeowner housing vacancy has remained largely static over the past five years, rental housing vacancy has experienced a precipitous drop. Since the 2008 recession, the rental vacancy rate has fallen by approximately 4% compared to a 1% drop in homeowner vacancy, which comparison is depicted in the graph to the right (See Figure 1). We believe that this decreasing spread indicates the growing demand for rental units as compared to home purchases.
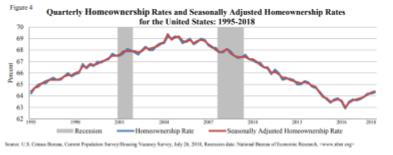
Further, during the same period, homeownership rates have fallen by approximately 3%, despite a 1% uptick in the past two years. |
|
|
|
|
|
|
|
|
|
|
|
MUTIFAMILY DEVELOPMENT
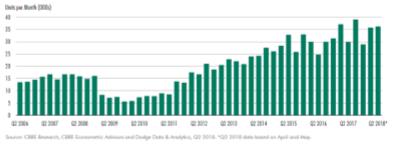
As a result of the strong multifamily metrics on a national level, development has increased steadily since 2009, with the market delivering over 35,000 new units per month in 2018. |
|
|
|
|
|
|
|
|
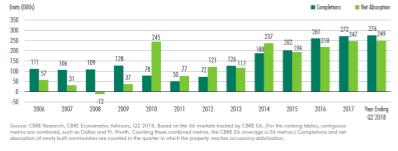
MULTIFAMILY MARKET SUPPLY AND DEMAND
The increased development is encouraging for the market; but even more so is the high absorption of the new supply. Net absorption in both 2017 and 2018 has nearly matched the total delivery, representing approximately 90.5% of completions. |
|
|
|
|
|
7
MARKET OVERVIEW AND PORTFOLIO UPDATES (CONT. )
MULTIFAMILY MARKET SUPPLY AND DEMAND (CONT.)
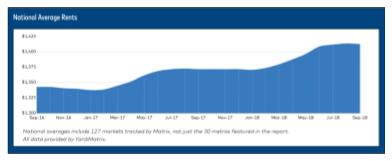
As multifamily demand has kept up with the increase in supply, we believe that it has had an inflationary impact on rents. According to the Q3 Yardi Matrix Multifamily National Report, rents have risen by 3.0% year-over-year and reached an all-time high of $1,412. It has been a strong year thus far for multifamily assets as September 2018 was the first month that rents had not increased since January. Further, overall occupancy rates of stabilized properties bottomed at 95.0% in late 2017/early 2018, but since then have slowly climbed back up to 95.4%, which indicates that even at stabilized properties, multifamily demand has continued to increase |
|
|
TEXAS MULTIFAMILY SPOTLIGHT
MogulREIT II has invested in four multifamily assets in Texas, representing 61.2% of the total REIT.
|
|
|
|
|
|
|
|
|
|
PROPERTY | DATE | CITY | STATE | UNITS | INVESTMENT | % OF | |||
Serendipity Apartments | 9/1/17 | Dallas | TX | 343 | $4,000,000 | 35.0% | |||
Plano Portfolio | 1/9/18 | Plano | TX | 156 | $1,000,000 | 8.7% | |||
Tuscany at | 1/31/18 | San Antonio | TX | 190 | $1,000,000 | 8.7% | |||
Villas del Mar | 2/28/18 | Fort Worth | TX | 263 | $1,000,000 | 8.7% | |||
|
|
|
| 952 | $7,000,000 | 61.2% | |||
We have targeted this allocation given the long-term outperformance of the Texas market when compared to other regional submarkets. According to the Q3 2018 NCREIF Property Index, over the 10-year period since 2008, the Southwest sub-region has generated the highest returns out of the 8 sub-regions. The multifamily-specific metrics reveal a similar trend. The 10-year return for Texas multifamily assets ranks first out of all sub-regions. The long-term stability of the Southwest sub-region is a cornerstone of our investment thesis.
8
|
MARKET OVERVIEW AND PORTFOLIO UPDATES (CONT. ) |
TEXAS MULTIFAMILY SPOTLIGHT (CONT.)
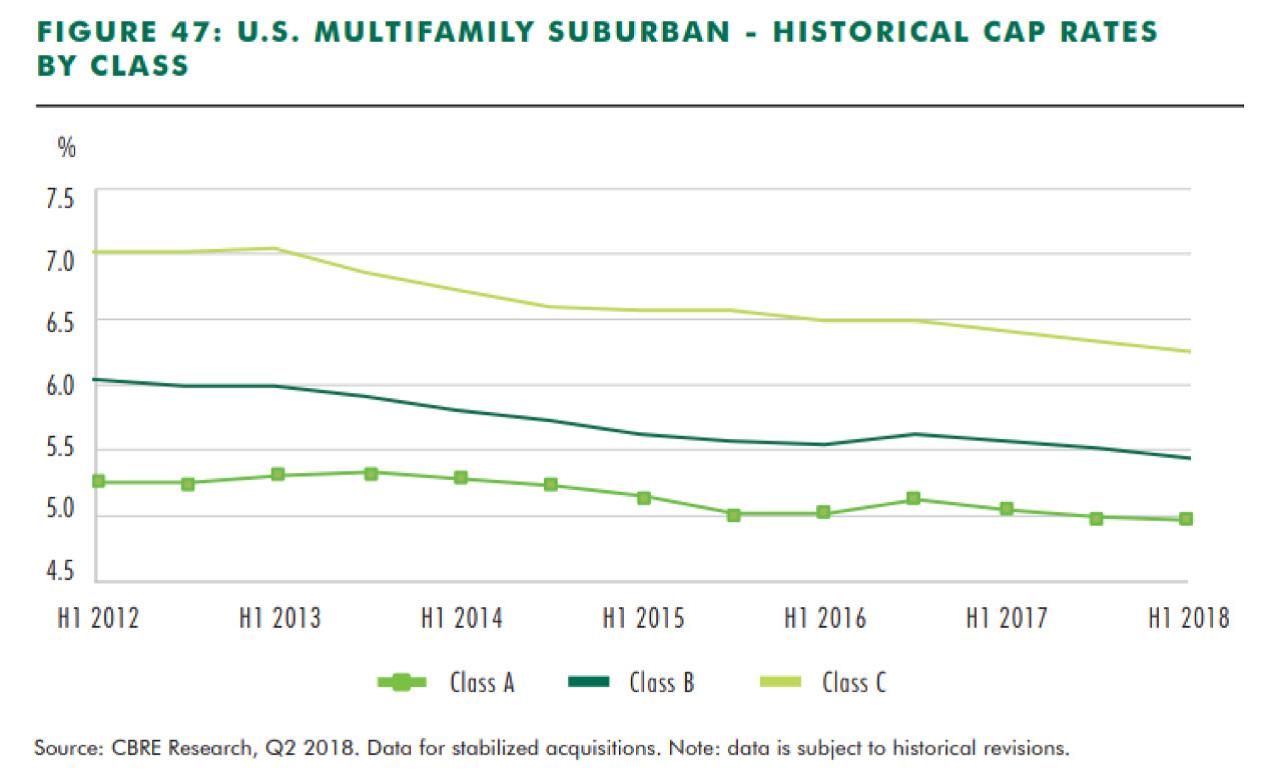
Lastly, according to the CBRE’s Cap Rate Survey for H1 2018, the San Antonio submarket was one of five submarkets with the largest year-over-year cap-rate declines in stabilized Class B multifamily properties. This submarket achieved a cap rate range of 4.75% to 5.50% compared to the national average of 5.42%. The Dallas submarket remained in line with the national average with a range of 5.00% to 6.00%. |
|
On a national scale, over the last six years, cap rates for all classes of multifamily assets have fallen, which has had a positive effect on property valuations. While cap rate compression benefits the assets of MogulREIT II given its strategy as a growth and appreciation vehicle, we do not rely on it. We have partnered with real estate companies that have experience adding value to properties via capital projects, revenue maximizing strategies and operational efficiencies, and we continue to underwrite rent growth and cap rates conservatively to provide optimal downside protection for our investors. We believe that this multifamily environment will provide MogulREIT II ample opportunity for investment. |
9
DISTRIBUTION SUMMARY
|
|
|
|
|
|
|
|
|
|
|
|
|
|
|
|
|
|
Q2 DISTRIBUTION RATE PER SHARE 1.1% YTD DISTRIBUTION RATE PER SHARE 2.3% ANNUALIZED DISTRIBUTION RATE PER SHARE*4.5% |
|
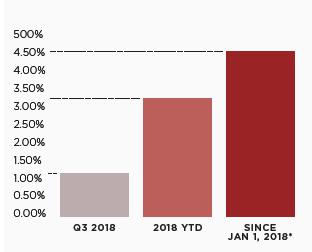
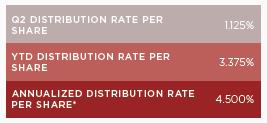
* The board of directors have authorized distributions on a quarterly basis since January 1, 2018. The quarterly distributions equate to approximately 4.50% on an annualized basis based upon the $10.00 per share purchase price. The annualized distribution rate is not a guarantee or projection of future distributions, and the board of directors may in the future declare lower distributions or no distributions at all for any given period. While the board of directors in under no obligation to do so, the annualized distribution rate assumes that the board of directors will declare quarterly distributions in the future similar to the distribution disclosed herein.
NET ASSET VALUE (NAV)
|
|
|
|
|
|
PRICE PER SHARE $10.00 |
| NAV PER SHARE N/A | |||
Our board of directors has decided to begin valuation of NAV for the first time at a date no later than October 1, 2019.
The purchase price will remain at $10.00 per share until a change in valuation of NAV per share takes place, at which time it will be the greater of (i) $10.00 per share or (ii) the current NAV. Investors will pay the most recent publicly announced offering price as of the date of their subscription.
NAV per share is calculated by taking the total value of our assets less the total value of our liabilities, divided by the number of shares outstanding.
Copyright © 2018 RM Adviser, LLC, All rights reserved.
10
Previous Updates
Please follow the below links to access descriptions of other investments in prior quarters.
|
|
| |
| |
| |
|
We remain excited about all that 2018 has in store for MogulREIT II and our investors. We continue to expand our real estate, technology and investor relations teams and look forward to bringing even more exclusive, highly vetted deals to our clients. We hope you will join us in your pursuit of building wealth as we continue to source institutional quality real estate investments on behalf of discerning investors.
We are excited by the investment opportunities MogulREIT II offers and we appreciate your continued support. As always, please feel free to contact us at info@realtymogul.com or call directly with any questions you may have.
Sincerely,
/s/ Jilliene Helman
Jilliene Helman
CEO, RM Adviser, LLC
CEO, MogulREIT II, Inc.
Forward-Looking Statements
This Current Report on Form 1-U contains forward-looking statements within the meaning of the federal securities laws. The words “believe,” “estimate,” “expect,” “anticipate,” “intend,” “plan,” “seek,” “may,” “continue,” “could,” “might,” “potential,” “predict,” “should,” “will,” “would,” and similar expressions or statements regarding future periods or the negative of these terms are intended to identify forward-looking statements. These forward-looking statements involve known and unknown risks, uncertainties and other important factors that could cause our actual results, performance or achievements, or industry results, to differ materially from any predictions of future results, performance or achievements that we express or imply in this Current Report on Form 1-U.
11
SIGNATURES
Pursuant to the requirements of Regulation A, the issuer has duly caused this report to be signed on its behalf by the undersigned, thereunto duly authorized.
| MOGULREIT II, INC. | |
|
|
|
|
|
|
| By: | /s/ Jilliene Helman |
| Name: | Jilliene Helman |
| Title: | Chief Executive Officer and Secretary |
|
|
|
| Date: | November 19, 2018 |
12