Exhibit 99.3
PRO FORMA VALUATION REPORT
STANDARD CONVERSION
Heritage NOLA Bancorp, Inc.│Covington, Louisiana
PROPOSED HOLDING COMPANY FOR:
Heritage Bank of St. Tammany│Covington, Louisiana
Dated as of February 10, 2017

1100 North Glebe Road Suite 600
Arlington, Virginia 22201
703.528.1700
rpfinancial.com

Board of Directors
Heritage NOLA Bancorp, Inc.
Heritage Bank of St. Tammany
205 North Columbia Street
Covington, Louisiana 70433
Members of the Board of Directors:
At your request, we have completed and hereby provide an independent appraisal ("Appraisal") of the estimated pro forma market value of the common stock which is to be issued in connection with the mutual-to-stock conversion transaction described below.
This Appraisal is furnished pursuant to the requirements stipulated in the Code of Federal Regulations and has been prepared in accordance with the “Guidelines for Appraisal Reports for the Valuation of Savings and Loan Associations Converting from Mutual to Stock Form of Organization” of the Office of Thrift Supervision (“OTS”) and accepted by the Office of the Comptroller of the Currency (“OCC”) and the Federal Reserve Board (“FRB”), and applicable regulatory interpretations thereof.
Description of Plan of Conversion
The Board of Directors of Heritage Bank of St. Tammany, Covington, Louisiana (“”Heritage Bank” or the “Bank”) adopted the plan of conversion on March 7, 2017, incorporated herein by reference. Pursuant to the plan of conversion, the Bank will convert from a federally-chartered mutual savings association to a federally-chartered stock savings association and become a wholly-owned subsidiary of Heritage NOLA Bancorp, Inc. (“Heritage NOLA Bancorp” or the “Company”), a Maryland corporation organized by Heritage Bank. Heritage NOLA Bancorp will offer 100% of its common stock to qualifying depositors of the Bank in a subscription offering to Eligible Account Holders, Tax-Qualified Plans including Heritage Bank’s employee stock ownership plan (the “ESOP”), Supplemental Eligible Account Holders and Other Members, as such terms are defined for purposes of applicable federal regulatory guidelines governing mutual-to-stock conversions. To the extent that shares remain available for purchase after satisfaction of all subscriptions received in the subscription offering, the shares may be offered for sale to the public at large in a community offering. Going forward, Heritage NOLA Bancorp will own 100% of the Bank's stock, and the Bank will initially be Heritage NOLA Bancorp’s sole subsidiary. A portion of the net proceeds received from the sale of common stock will be used to purchase all of the then to be issued and outstanding capital stock of the Bank and the balance of the net proceeds will be retained by the Company.
At this time, no other activities are contemplated for the Company other than the ownership of the Bank, a loan to the newly-formed ESOP and reinvestment of the proceeds that are retained by the Company. In the future, Heritage NOLA Bancorp may acquire or organize other operating subsidiaries, diversify into other banking-related activities, pay dividends or repurchase its stock, although there are no specific plans to undertake such activities at the
| Washington Headquarters | |
| Three Ballston Plaza | Telephone: (703) 528-1700 |
| 1100 North Glebe Road, Suite 600 | Fax No.: (703) 528-1788 |
| Arlington, VA 22201 | Toll-Free No.: (866) 723-0594 |
| www.rpfinancial.com | E-Mail: mail@rpfinancial.com |
Board of Directors
February 10, 2017
Page 2
present time.
RP® Financial, LC.
RP® Financial, LC. (“RP Financial”) is a financial consulting firm serving the financial services industry nationwide that, among other things, specializes in financial valuations and analyses of business enterprises and securities, including the pro forma valuation for savings institutions converting from mutual-to-stock form. The background and experience of RP Financial is detailed in Exhibit V-1. For its appraisal services, RP Financial is being compensated on a fixed fee basis for the original appraisal and for any subsequent updates, and such fees are payable regardless of the valuation conclusion or the completion of the conversion offering transaction. We believe that we are independent of the Bank and the other parties engaged by Heritage Bank or the Company to assist in the stock conversion process.
Valuation Methodology
In preparing our Appraisal, we have reviewed the regulatory applications of the Bank and the Company, including the prospectus as filed with the FRB, the OCC and the Securities and Exchange Commission (“SEC”). We have conducted a financial analysis of the Bank that has included a review of audited financial information for the years ended December 31, 2012 through December 31, 2016 and a review of various unaudited information and internal financial reports through December 31, 2016. We have also conducted due diligence related discussions with Heritage Bank’s management; Hannis T Bourgeois, LLP, Heritage Bank’s independent auditor; Luse Gorman, PC, Heritage Bank’s conversion counsel; and FIG Partners, LLC, Heritage Bank’s financial and marketing advisor in connection with the stock offering. All assumptions and conclusions set forth in the Appraisal were reached independently from such discussions. In addition, where appropriate, we have considered information based on other available published sources that we believe are reliable. While we believe the information and data gathered from all these sources are reliable, we cannot guarantee the accuracy and completeness of such information.
We have investigated the competitive environment within which Heritage Bank operates and have assessed the Bank’s relative strengths and weaknesses. We have monitored all material regulatory and legislative actions affecting financial institutions generally and analyzed the potential impact of such developments on Heritage Bank and the industry as a whole to the extent we were aware of such matters. We have analyzed the potential effects of the stock conversion on the Bank’s operating characteristics and financial performance as they relate to the pro forma market value of Heritage Bank. We have reviewed the economy and demographic characteristics of the primary market area in which the Bank currently operates. We have compared Heritage Bank’s financial performance and condition with publicly-traded thrift institutions evaluated and selected in accordance with the Valuation Guidelines, as well as all publicly-traded thrifts and thrift holding companies. We have reviewed conditions in the securities markets in general and the market for thrifts and thrift holding companies, including the market for new issues.
The Appraisal is based on Heritage Bank’s representation that the information contained in the regulatory applications and additional information furnished to us by the Bank and its independent auditors, legal counsel, investment bankers and other authorized agents are
Board of Directors
February 10, 2017
Page 3
truthful, accurate and complete. We did not independently verify the financial statements and other information provided by the Bank, or its independent auditors, legal counsel, investment bankers and other authorized agents nor did we independently value the assets or liabilities of Heritage Bank. The valuation considers Heritage Bank only as a going concern and should not be considered as an indication of the Bank’s liquidation value.
Our appraised value is predicated on a continuation of the current operating environment for the Bank and for all thrifts and their holding companies. Changes in the local and national economy, the federal and state legislative and regulatory environments for financial institutions, the stock market, interest rates, and other external forces (such as natural disasters or significant world events) may occur from time to time, often with great unpredictability, and may materially impact the value of thrift stocks as a whole or the Bank’s value alone. It is our understanding that Heritage Bank intends to remain an independent institution and there are no current plans for selling control of the Bank as a converted institution. To the extent that such factors can be foreseen, they have been factored into our analysis.
The estimated pro forma market value is defined as the price at which the Company’s stock, immediately upon completion of the offering, would change hands between a willing buyer and a willing seller, neither being under any compulsion to buy or sell and both having reasonable knowledge of relevant facts.
Valuation Conclusion
It is our opinion that, as of February 10, 2017, the estimated aggregate pro forma market value of the shares to be issued immediately following the conversion equaled $12,500,000 at the midpoint, equal to 1,250,000 shares offered at a per share value of $10.00. Pursuant to the conversion guidelines, the 15% offering range indicates a minimum value of $10,625,000 and a maximum value of $14,375,000. Based on the $10.00 per share offering price determined by the Board, this valuation range equates to total shares outstanding of 1,062,500 at the minimum and 1,437,500 at the maximum. In the event the appraised value is subject to an increase, the aggregate pro forma market value may be increased up to a super maximum value of $16,531,250 without a resolicitation. Based on the $10.00 per share offering price, the super maximum value would result in total shares outstanding of 1,653,125.
Limiting Factors and Considerations
The valuation is not intended, and must not be construed, as a recommendation of any kind as to the advisability of purchasing shares of the common stock. Moreover, because such valuation is determined in accordance with applicable regulatory guidelines and is necessarily based upon estimates and projections of a number of matters, all of which are subject to change from time to time, no assurance can be given that persons who purchase shares of common stock in the conversion will thereafter be able to buy or sell such shares at prices related to the foregoing valuation of the estimated pro forma market value thereof. The appraisal reflects only a valuation range as of this date for the pro forma market value of Heritage NOLA Bancorp immediately upon issuance of the stock and does not take into account any trading activity with respect to the purchase and sale of common stock in the secondary market on the date of issuance of such securities or at anytime thereafter following the completion of the public stock offering.
Board of Directors
February 10, 2017
Page 4
The valuation prepared by RP Financial, in accordance with applicable regulatory guidelines, was based on the financial condition and operations of Heritage Bank as of December 31, 2016, the date of the financial data included in the prospectus.
RP Financial is not a seller of securities within the meaning of any federal and state securities laws and any report prepared by RP Financial shall not be used as an offer or solicitation with respect to the purchase or sale of any securities. RP Financial maintains a policy which prohibits RP Financial, its principals or employees from purchasing stock of its financial institution clients.
The valuation will be updated as provided for in the conversion regulations and guidelines. These updates will consider, among other things, any developments or changes in the financial performance and condition of Heritage Bank, management policies, and current conditions in the equity markets for thrift stocks, both existing issues and new issues. These updates may also consider changes in other external factors which impact value including, but not limited to: various changes in the federal and state legislative and regulatory environments for financial institutions, the stock market in general, the market for thrift stocks and interest rates. Should any such new developments or changes be material, in our opinion, to the valuation of the shares, appropriate adjustments to the estimated pro forma market value will be made. The reasons for any such adjustments will be explained in the update at the date of the release of the update.
| | Respectfully submitted, |
| | |
| | RP® FINANCIAL, LC. |
| |  |
| | Ronald S. Riggins |
| | Managing Director |
| |  |
| | Gregory E. Dunn |
| | Director |
| RP® Financial, LC. | TABLE OF CONTENTS i |
TABLE OF CONTENTS
Heritage NOLA Bancorp, Inc.
Heritage Bank of St. Tammany
Covington, Louisiana
| DESCRIPTION | | | PAGE
NUMBER |
| | | | |
| CHAPTER ONE | OVERVIEW AND FINANCIAL ANALYSIS | | |
| | | | |
| Introduction | | I.1 |
| Plan of Conversion | | I.1 |
| Strategic Overview | | I.2 |
| Balance Sheet Trends | | I.4 |
| Income and Expense Trends | | I.7 |
| Interest Rate Risk Management | | I.11 |
| Lending Activities and Strategy | | I.12 |
| Asset Quality | | I.14 |
| Funding Composition and Strategy | | I.15 |
| Legal Proceedings | | I.16 |
| | | | |
| CHAPTER TWO | MARKET AREA | | |
| | | | |
| Introduction | | II.1 |
| National Economic Factors | | II.1 |
| Market Area Demographics | | II.5 |
| Local Economy | | II.5 |
| Unemployment Trends | | II.8 |
| Market Area Deposit Characteristics and Competition | | II.9 |
| | | | |
| CHAPTER THREE | PEER GROUP ANALYSIS | | |
| | | | |
| Peer Group Selection | | III.1 |
| Financial Condition | | III.5 |
| Income and Expense Components | | III.8 |
| Loan Composition | | III.11 |
| Interest Rate Risk | | III.11 |
| Credit Risk | | III.14 |
| Summary | | III.14 |
| RP® Financial, LC. | TABLE OF CONTENTS ii |
TABLE OF CONTENTS
Heritage NOLA Bancorp, Inc.
Heritage Bank of St. Tammany
Covington, Louisiana
(continued)
| | | | | | PAGE |
| DESCRIPTION | | | NUMBER |
| | | | | | |
| CHAPTER FOUR | VALUATION ANALYSIS | | |
| | | | | | |
| Introduction | | IV.1 |
| Appraisal Guidelines | | IV.1 |
| RP Financial Approach to the Valuation | | IV.1 |
| Valuation Analysis | | IV.2 |
| | 1. | Financial Condition | | IV.2 |
| | 2. | Profitability, Growth and Viability of Earnings | | IV.4 |
| | 3. | Asset Growth | | IV.5 |
| | 4. | Primary Market Area | | IV.6 |
| | 5. | Dividends | | IV.7 |
| | 6. | Liquidity of the Shares | | IV.8 |
| | 7. | Marketing of the Issue | | IV.8 |
| | | A. | The Public Market | | IV.9 |
| | | B. | The New Issue Market | | IV.12 |
| | | C. | The Acquisition Market | | IV.14 |
| | 8. | Management | | IV.14 |
| | 9. | Effect of Government Regulation and Regulatory Reform | | IV.16 |
| Summary of Adjustments | | IV.16 |
| Valuation Approaches: | | IV.16 |
| | 1. | Price-to-Earnings ("P/E") | | IV.18 |
| | 2. | Price-to-Book ("P/B") | | IV.20 |
| | 3. | Price-to-Assets ("P/A") | | IV.20 |
| Comparison to Recent Offerings | | IV.20 |
| Valuation Conclusion | | IV.21 |
| RP® Financial, LC. | LIST OF TABLES iii |
LIST OF TABLES
Heritage NOLA Bancorp, Inc.
Heritage Bank of St. Tammany
Covington, Louisiana
| TABLE | | | | |
| Number | | DESCRIPTION | | page |
| | | | | |
| 1.1 | | Historical Balance Sheet Data | | I.5 |
| 1.2 | | Historical Income Statements | | I.8 |
| | | | | |
| 2.1 | | Summary Demographic Data | | II.6 |
| 2.2 | | Primary Market Area Employment Sectors | | II.7 |
| 2.3 | | Market Area Largest Employers | | II.8 |
| 2.4 | | Unemployment Trends | | II.8 |
| 2.5 | | Deposit Summary | | II.9 |
| 2.6 | | Market Area Deposit Competitors – As of June 30, 2016 | | II.10 |
| | | | | |
| 3.1 | | Peer Group of Publicly-Traded Thrifts | | III.3 |
| 3.2 | | Balance Sheet Composition and Growth Rates | | III.6 |
| 3.3 | | Income as a Pct. of Avg. Assets and Yields, Costs, Spreads | | III.9 |
| 3.4 | | Loan Portfolio Composition and Related Information | | III.12 |
| 3.5 | | Interest Rate Risk Measures and Net Interest Income Volatility | | III.13 |
| 3.6 | | Credit Risk Measures and Related Information | | III.15 |
| | | | | |
| 4.1 | | Market Area Unemployment Rates | | IV.7 |
| 4.2 | | Pricing Characteristics and After-Market Trends | | IV.13 |
| 4.3 | | Market Pricing Comparatives | | IV.15 |
| 4.4 | | Public Market Pricing Versus Peer Group | | IV.19 |
| RP® Financial, LC. | OVERVIEW AND FINANCIAL ANALYSIS
I.1 |
I. Overview and Financial Analysis
Introduction
Heritage Bank of St. Tammany (“Heritage Bank” or the “Bank”), founded in 1924, is a federally-chartered mutual savings association headquartered in Covington, Louisiana. The Bank serves the New Orleans metropolitan area through the main office in Covington and one branch office in Slidell, Louisiana, both of which are located in St. Tammany Parish. A map of the Bank’s office locations is provided in Exhibit I-1. The Bank is a member of the Federal Home Loan Bank (“FHLB”) system, and its deposits are insured up to the regulatory maximums by the Federal Deposit Insurance Corporation (“FDIC”). At December 31, 2016, the Bank had $98.0 million in assets, $74.3 million in deposits and total equity of $9.5 million, equal to 9.65% of total assets. The Bank’s audited financial statements are incorporated by reference as Exhibit I-2.
Plan of Conversion
On March 7, 2017, the Board of Directors of the Bank adopted a plan of conversion, incorporated herein by reference, in which the Bank will convert from a federally-chartered mutual savings association to a federally-chartered stock savings association and become a wholly-owned subsidiary of Heritage NOLA Bancorp, Inc. ("Heritage NOLA Bancorp" or the "Company"), a newly formed Maryland corporation.
Heritage NOLA Bancorp will offer will offer its common stock in a subscription offering to Eligible Account Holders, Tax-Qualified Plans including Heritage Bank’s employee stock ownership plan (the “ESOP”), Supplemental Eligible Account Holders and Other Members, as such terms are defined for purposes of applicable federal regulatory guidelines governing mutual-to-stock conversions. To the extent that shares remain available for purchase after satisfaction of all subscriptions received in the subscription offering, the shares may be offered for sale to members of the general public in a community offering. A portion of the net proceeds received from the sale of the common stock will be used to purchase all of the then to be issued and outstanding capital stock of Heritage Bank and the balance of the net proceeds will be retained by the Company.
At this time, no other activities are contemplated for the Company other than the ownership of the Bank, extending a loan to the newly-formed employee stock ownership plan
| RP® Financial, LC. | OVERVIEW AND FINANCIAL ANALYSIS
I.2 |
(the "ESOP") and reinvestment of the proceeds that are retained by the Company. In the future, Heritage NOLA Bancorp may acquire or organize other operating subsidiaries, diversify into other banking-related activities, pay dividends or repurchase its stock, although there are no specific plans to undertake such activities at the present time.
Strategic Overview
Heritage Bank maintains a local community banking emphasis, with a primary strategic objective of meeting the borrowing and savings needs of its local customer base. Heritage Bank’s operating strategy has been fairly reflective of a traditional thrift operating strategy, in which lending has emphasized originating 1-4 family residential mortgage loans and funding has been largely generated through retail deposits. Growth strategies are to continue to focus on 1-4 family, while also pursuing increased lending diversification that will emphasize growth of commercial real estate and commercial business loans. The Bank’s objective is to fund asset growth primarily through deposit growth, emphasizing growth of lower cost core deposits.
Investments serve as a supplement to the Bank’s lending activities and the investment portfolio is considered to be indicative of a low risk investment philosophy. As of December 31, 2016, the Bank’s holdings of investment securities consisted entirely of mortgage-backed securities that are guaranteed or insured by government sponsored enterprises (“GSEs”) or backed by GInnie Mae.
The Bank’s lending and investment strategies have generally supported management of credit risk exposure, as evidenced by favorable credit quality measures for non-performing assets. Heritage Bank does not conduct subprime lending.
Retail deposits have consistently served as the primary interest-bearing funding source for the Bank. Certificate of deposits (“CDs”) constitute the largest portion of the Bank’s deposit base. The Bank utilizes borrowings as a supplemental funding source to facilitate management of funding costs and interest rate risk. Borrowing currently held by the Bank consist of FHLB advances.
Heritage Bank’s earnings base is largely dependent upon net interest income and operating expense levels. The Bank has been effective in preserving its net interest income to average assets ratio, despite the prolonged low interest rate environment and relatively flat yield curve. Preservation of the Bank’s net interest income has been facilitated by a shift in the Bank’s interest-earning asset composition towards a higher concentration of loans that earn
| RP® Financial, LC. | OVERVIEW AND FINANCIAL ANALYSIS
I.3 |
higher yields relative to cash and investments. Non-interest operating income has become a more significant contributor to the Bank’s earnings in recent years, which has been mostly related to mortgage banking income derived from sale of loans sold into the secondary market and loan servicing income. After declining in 2013 and 2014, operating expenses as a percent of average assets have been maintained at a relatively stable level as asset growth has kept pace with increases in operating expenses recorded in recent years. The decrease in the operating expense ratio during 2013 and 2014 was primarily due to a reduction in expense for maintaining and writing down foreclosed real estate. After recording significant loss provisions during 2012, loan loss provisions have been a less significant factor in the Bank’s earnings over the past four years.
The post-offering business plan of the Bank is expected to remain consistent with current strategic objectives. Specifically, Heritage Bank will continue to be an independent community-oriented financial institution with a commitment to lending in local markets with operations funded primarily by retail deposits. Growth strategies will continue to be implemented within the context of managing the Bank’s exposure to risk.
The Bank’s Board of Directors has elected to complete a public stock offering to improve the competitive position of Heritage Bank and to facilitate implementation of its strategic plan. The capital realized from the stock offering will increase the Bank’s operating flexibility and allow for additional growth of the balance sheet. The additional funds realized from the stock offering will provide an alternative funding source to deposits and borrowings in meeting the Bank’s future funding needs, which may facilitate a reduction in Heritage Bank’s funding costs. Additionally, Heritage Bank’s higher equity-to-assets ratio will enable the Bank to pursue expansion opportunities as opportunities arise. Such expansion would most likely occur through the establishment or acquisition of additional banking offices to gain a market presence in nearby markets that are complementary to the Bank’s existing branch network. At this time, the Bank has no specific plans for expansion. The projected uses of proceeds are highlighted below.
| o | Heritage NOLA Bancorp. The Company is expected to retain up to 50% of the net offering proceeds. At present, funds at the Company level, net of the loan to the ESOP, are expected to be primarily invested initially into liquid funds held as a deposit at the Bank. Over time, the funds may be utilized for various corporate purposes, possibly including acquisitions, infusing additional equity into the Bank, repurchases of common stock, and the payment of regular and/or special cash dividends. |
| RP® Financial, LC. | OVERVIEW AND FINANCIAL ANALYSIS
I.4 |
| o | Heritage Bank. Approximately 50% of the net stock proceeds will be infused into the Bank in exchange for all of the Bank's newly issued stock. Cash proceeds (i.e., net proceeds less deposits withdrawn to fund stock purchases) infused into the Bank are anticipated to become part of general operating funds, and are expected to be primarily utilized to fund loan growth over time. |
Overall, it is the Bank’s objective to pursue growth that will serve to increase returns, while, at the same time, growth will not be pursued that could potentially compromise the overall risk associated with Heritage Bank’s operations.
Balance Sheet Trends
Table 1.1 shows the Bank’s historical balance sheet data for the past five years. From year end 2012 through year end 2016, Heritage Bank’s assets increased at a 1.54% annual rate. Asset growth was largely sustained by loan growth, which was primarily funded with borrowings and cash and investments. A summary of Heritage Bank’s key operating ratios is presented in Exhibit I-3.
Heritage Bank’s loans receivable portfolio increased at an 8.17% annual rate from year end 2012 through year end 2016, in which loan growth was sustained throughout the period. The Bank’s higher lower loan growth rate compared to its asset growth rate provided for an increase the loans-to-assets ratio from 59.15% at yearend 2012 to 76.17% at yearend 2016. Heritage Bank’s historical emphasis on 1-4 family lending is reflected in its loan portfolio composition, as 75.12% of total loans receivable consisted of 1-4 family loans at year end 2016.
Trends in the Bank’s loan portfolio composition over the past two years show that the concentration of 1-4 family permanent mortgage loans comprising total loans increased from 73.61% at yearend 2015 to 75.12% at yearend 2016. Commercial real estate/multi-family loans and construction/land loans constitute the primary types of lending diversification for the Bank, with both of those areas of lending diversification showing a decline in loans outstanding during 2016. From yearend 2015 to yearend 2016, commercial real estate/multi-family loans decreased from 13.91% of total loans to 12.87% of total loans and construction/land loans decreased from 9.27% of total loans to 8.32% of total loans. Other areas of lending diversification for the Bank have been fairly limited, consisting primarily of home equity lines of credit and, to a lesser extent, commercial business loans and consumer loans. As of December 31, 2016, home equity lines of credit equaled 2.93% of total loans, commercial business loans equaled 0.38% of total loans and other consumer loans equaled 0.35% of total loans.
| RP® Financial, LC. | OVERVIEW AND FINANCIAL ANALYSIS
I.5 |
Table 1.1
Heritage Bank of St. Tammany
Historical Balance Sheet Data
| | | | | | | | | | | | | | | | | | | | | | | | | | | | | | | | | 12/31/12- | |
| | | | | | | | | | | | | | | | | | | | | | | | | | | | | | | | | 12/31/16 | |
| | | At December 31, | | | Annual. | |
| | | 2012 | | | 2013 | | | 2014 | | | 2015 | | | 2016 | | | Growth Rate | |
| | | Amount | | | Pct(1) | | | Amount | | | Pct(1) | | | Amount | | | Pct(1) | | | Amount | | | Pct(1) | | | Amount | | | Pct(1) | | | Pct | |
| | | ($000) | | | (%) | | | ($000) | | | (%) | | | ($000) | | | (%) | | | ($000) | | | (%) | | | ($000) | | | (%) | | | (%) | |
| | | | | | | | | | | | | | | | | | | | | | | | | | | | | | | | | | |
| Total Amount of: | | | | | | | | | | | | | | | | | | | | | | | | | | | | | | | | | | | | | | | | | | | | |
| Assets | | $ | 92,193 | | | | 100.00 | % | | $ | 88,132 | | | | 100.00 | % | | $ | 88,847 | | | | 100.00 | % | | $ | 96,462 | | | | 100.00 | % | | $ | 98,015 | | | | 100.00 | % | | | 1.54 | % |
| Cash and cash equivalents | | | 12,853 | | | | 13.94 | % | | | 8,951 | | | | 10.16 | % | | | 9,386 | | | | 10.56 | % | | | 8,572 | | | | 8.89 | % | | | 8,014 | | | | 8.18 | % | | | -11.14 | % |
| Investment securities | | | 15,171 | | | | 16.46 | % | | | 13,834 | | | | 15.70 | % | | | 11,636 | | | | 13.10 | % | | | 8,010 | | | | 8.30 | % | | | 8,007 | | | | 8.17 | % | | | -14.77 | % |
| Loans receivable, net | | | 54,535 | | | | 59.15 | % | | | 57,060 | | | | 64.74 | % | | | 60,133 | | | | 67.68 | % | | | 71,966 | | | | 74.61 | % | | | 74,659 | | | | 76.17 | % | | | 8.17 | % |
| FHLB/FNBB stock | | | 776 | | | | 0.84 | % | | | 779 | | | | 0.88 | % | | | 292 | | | | 0.33 | % | | | 460 | | | | 0.48 | % | | | 673 | | | | 0.69 | % | | | -3.50 | % |
| Bank-owned life insurance | | | 1,299 | | | | 1.41 | % | | | 1,838 | | | | 2.09 | % | | | 1,894 | | | | 2.13 | % | | | 1,949 | | | | 2.02 | % | | | 2,001 | | | | 2.04 | % | | | 11.41 | % |
| | | | | | | | | | | | | | | | | | | | | | | | | | | | | | | | | | | | | | | | | | | | | |
| Deposits | | $ | 77,404 | | | | 83.96 | % | | $ | 74,251 | | | | 84.25 | % | | $ | 72,217 | | | | 81.28 | % | | $ | 73,572 | | | | 76.27 | % | | $ | 74,251 | | | | 75.75 | % | | | -1.03 | % |
| Borrowings | | | 3,945 | | | | 4.28 | % | | | 3,765 | | | | 4.27 | % | | | 6,268 | | | | 7.05 | % | | | 12,656 | | | | 13.12 | % | | | 13,274 | | | | 13.54 | % | | | 35.44 | % |
| | | | | | | | | | | | | | | | | | | | | | | | | | | | | | | | | | | | | | | | | | | | | |
| Equity | | $ | 9,197 | | | | 9.98 | % | | $ | 8,769 | | | | 9.95 | % | | $ | 9,088 | | | | 10.23 | % | | $ | 9,326 | | | | 9.67 | % | | $ | 9,460 | | | | 9.65 | % | | | 0.71 | % |
| | | | | | | | | | | | | | | | | | | | | | | | | | | | | | | | | | | | | | | | | | | | | |
| Loans/Deposits | | | | | | | 70.46 | % | | | | | | | 76.85 | % | | | | | | | 83.27 | % | | | | | | | 97.82 | % | | | | | | | 100.55 | % | | | | |
| | | | | | | | | | | | | | | | | | | | | | | | | | | | | | | | | | | | | | | | | | | | | |
| Number of offices | | | 2 | | | | | | | | 2 | | | | | | | | 2 | | | | | | | | 2 | | | | | | | | 2 | | | | | | | | | |
(1) Ratios are as a percent of ending assets.
Sources: Heritage Bank's prospectus, audited and unaudited financial statements, SNL Financial and RP Financial calculations.
| RP® Financial, LC. | OVERVIEW AND FINANCIAL ANALYSIS
I.6 |
The intent of the Bank’s investment policy is to provide adequate liquidity and to generate a favorable return within the context of supporting Heritage Bank’s overall credit and interest rate risk objectives. It is anticipated that proceeds retained at the holding company level will primarily be invested into a deposit at the Bank. Over the past five years, the Bank’s level of cash and investment securities (inclusive of FHLB/FNBB stock) ranged from a low of 17.67% at yearend 2015 to a high of 31.26% at yearend 2012. As of December 31, 2016, the Bank maintained total cash and investments of $16.7 million or 17.85% of assets. Mortgage-backed securities have consistently comprised the major portion of the Bank’s investment holdings over the past five years and comprised the entire investment portfolio at yearend 2016. Mortgage-backed securities held by Heritage Bank consist of mortgage-pass-through certificates that are backed by Ginnie Mae or GSEs. Mortgage-backed securities are generally purchased as a means to deploy excess liquidity at more favorable yields than other investment alternatives that are consistent with Heritage Bank’s investment philosophy. As of December 31, 2016, the mortgage-backed securities portfolio totaled $8.0 million or 8.17% of assets. Mortgage-backed securities maintained as available for sale equaled $7.2 million at December 31, 2016, with the remaining $832,000 of the portfolio maintained as held to maturity. As of December 31, 2016, the net unrealized gain on the available for sale mortgage-backed securities portfolio equaled $49,000. Exhibit I-4 provides historical detail of the Bank’s investment securities portfolio. As of December 31, 2016, the Bank also held cash and cash equivalents of $8.0 million or 8.18% of assets and FHLB/FNBB stock of $673,000 or 0.69% of assets.
The Bank also maintains an investment in bank-owned life insurance (“BOLI”) policies, which cover the lives of the Bank’s Board of Directors. The purpose of the investment is to provide funding for the Bank’s benefit plans. As of December 31, 2016, the cash surrender value of the Bank’s BOLI equaled $2.0 million or 2.04% of assets.
Over the past five years, Heritage Bank’s funding needs have been largely addressed through retail deposits and internal cash flows, with supplemental funding provided by borrowings and retained earnings. From yearend 2012 through yearend 2016, the Bank’s deposits decreased at an annual rate of 1.03%. Total deposits trended lower from yearend 2012 through yearend 2014, which was followed by two years of slightly positive deposit growth. Deposits as a percent of assets ranged from a low of 75.75% at yearend 2016 to a high of 84.25% at yearend 2013. CDs account for the largest concentration of the Bank’s deposits and comprised 69.60% of the Bank’s average balance of deposits during 2016. Transaction and
| RP® Financial, LC. | OVERVIEW AND FINANCIAL ANALYSIS
I.7 |
savings account deposits comprised 30.40% of the Bank’s average balance of deposits during 2016, with savings account deposits comprising the largest portion of the Bank’s core deposits.
Borrowings serve as an alternative funding source for the Bank to address funding needs for growth and to support management of deposit costs and interest rate risk. From yearend 2012 to year end 2016, borrowings increased at an annual rate of 35.44%. Over the five year period, borrowings ranged from a low of $3.8 million or 4.27% of assets at yearend 2013 to a peak balance of $13.3 million or 13.54% of assets at yearend 2016. The Bank’s utilization of borrowings over the past five years has been limited to FHLB advances.
Since yearend 2012, retention of earnings and the adjustment for accumulated other comprehensive income translated into an annual capital growth rate of 0.71% for the Bank. Capital growth was slightly less than the Bank’s asset growth rate, as Heritage Bank’s equity-to-assets ratio decreased from 9.98% at yearend 2012 to 9.65% at yearend 2016. All of the Bank’s capital is tangible capital, and the Bank maintained capital surpluses relative to all of its regulatory capital requirements at December 31, 2016. The addition of stock proceeds will serve to strengthen the Bank’s capital position, as well as support growth opportunities. At the same time, as the result of the significant increase that will be realized in the Bank’s pro forma capital position, Heritage Bank’s ROE will initially be depressed following its stock conversion.
Income and Expense Trends
Table 1.2 shows the Bank’s historical income statements for the past five years. The Bank reported earnings over the past five years ranged from a net loss equal to 1.12% of average assets during 2012 to net income equal to 0.30% of average assets during 2015. For the year ended December 31, 2016, the Bank reported net income of $158,000 or 0.16% of average assets. Net interest income and operating expenses represent the primary components of the Bank’s earnings. Other revenues for the Bank are largely derived from loan servicing income and gains on sale of loan originations sold into the secondary market, which have become a more significant contributor to the Bank’s earnings in recent years. With the exception of 2012, generally improving credit quality trends have served to limit the amount of loan loss provisions the Bank has established since 2012. Gains and losses from the sale of investments and real estate owned have been a relatively minor factor in the Bank’s earnings over the past five years.
| RP® Financial, LC. | OVERVIEW AND FINANCIAL ANALYSIS
I.8 |
Table 1.2
Heritage Bank of St. Tammany
Historical Income Statements
| | | For the Year Ended December 31, | |
| | | 2012 | | | 2013 | | | 2014 | | | 2015 | | | 2016 | |
| | | Amount | | | Pct(1) | | | Amount | | | Pct(1) | | | Amount | | | Pct(1) | | | Amount | | | Pct(1) | | | Amount | | | Pct(1) | |
| | | ($000) | | | (%) | | | ($000) | | | (%) | | | ($000) | | | (%) | | | ($000) | | | (%) | | | ($000) | | | (%) | |
| | | | | | | | | | | | | | | | | | | | | | | | | | | | | | | |
| Interest income | | $ | 4,296 | | | | 4.44 | % | | $ | 3,841 | | | | 4.26 | % | | $ | 3,668 | | | | 4.15 | % | | $ | 3,659 | | | | 4.01 | % | | $ | 4,085 | | | | 4.21 | % |
| Interest expense | | | (1,307 | ) | | | -1.35 | % | | | (1,032 | ) | | | -1.14 | % | | | (928 | ) | | | -1.05 | % | | | (924 | ) | | | -1.01 | % | | | (993 | ) | | | -1.02 | % |
| Net interest income | | $ | 2,989 | | | | 3.09 | % | | $ | 2,809 | | | | 3.12 | % | | $ | 2,740 | | | | 3.10 | % | | $ | 2,735 | | | | 3.00 | % | | $ | 3,092 | | | | 3.18 | % |
| Provision for loan losses | | | (1,212 | ) | | | -1.25 | % | | | (100 | ) | | | -0.11 | % | | | - | | | | 0.00 | % | | | (20 | ) | | | -0.02 | % | | | (180 | ) | | | -0.19 | % |
| Net interest income after provisions | | $ | 1,777 | | | | 1.83 | % | | $ | 2,709 | | | | 3.00 | % | | $ | 2,740 | | | | 3.10 | % | | $ | 2,715 | | | | 2.97 | % | | $ | 2,912 | | | | 3.00 | % |
| | | | | | | | | | | | | | | | | | | | | | | | | | | | | | | | | | | | | | | | | |
| Non-interest operating income | | $ | 309 | | | | 0.32 | % | | $ | 120 | | | | 0.13 | % | | $ | 70 | | | | 0.08 | % | | $ | 335 | | | | 0.37 | % | | $ | 401 | | | | 0.41 | % |
| Operating expense | | | (3,729 | ) | | | -3.85 | % | | | (3,003 | ) | | | -3.33 | % | | | (2,713 | ) | | | -3.07 | % | | | (2,842 | ) | | | -3.11 | % | | | (2,995 | ) | | | -3.08 | % |
| Net operating income | | $ | (1,643 | ) | | | -1.70 | % | | $ | (174 | ) | | | -0.19 | % | | $ | 97 | | | | 0.11 | % | | $ | 208 | | | | 0.23 | % | | $ | 318 | | | | 0.33 | % |
| | | | | | | | | | | | | | | | | | | | | | | | | | | | | | | | | | | | | | | | | |
| Non-Operating Income/(Losses) | | | | | | | | | | | | | | | | | | | | | | | | | | | | | | | | | | | | | | | | |
| Gain(loss) on sale of REO | | $ | (11 | ) | | | -0.01 | % | | $ | (25 | ) | | | -0.03 | % | | $ | 66 | | | | 0.07 | % | | $ | 68 | | | | 0.07 | % | | $ | (50 | ) | | | -0.05 | % |
| Gain(loss) on sale of securities, net | | | 0 | | | | 0.00 | % | | | - | | | | 0.00 | % | | | 9 | | | | 0.01 | % | | | - | | | | 0.00 | % | | | - | | | | 0.00 | % |
| Net non-operating income(loss) | | $ | (11 | ) | | | -0.01 | % | | $ | (25 | ) | | | -0.03 | % | | $ | 75 | | | | 0.08 | % | | $ | 68 | | | | 0.07 | % | | $ | (50 | ) | | | -0.05 | % |
| | | | | | | | | | | | | | | | | | | | | | | | | | | | | | | | | | | | | | | | | |
| Net income before tax | | $ | (1,654 | ) | | | -1.71 | % | | $ | (199 | ) | | | -0.22 | % | | $ | 172 | | | | 0.19 | % | | $ | 276 | | | | 0.30 | % | | $ | 268 | | | | 0.28 | % |
| Income tax provision | | | 567 | | | | 0.59 | % | | | 67 | | | | 0.07 | % | | | 13 | | | | 0.01 | % | | | 1 | | | | 0.00 | % | | | (110 | ) | | | -0.11 | % |
| Net income (loss) | | $ | (1,087 | ) | | | -1.12 | % | | $ | (132 | ) | | | -0.15 | % | | $ | 185 | | | | 0.21 | % | | $ | 277 | | | | 0.30 | % | | $ | 158 | | | | 0.16 | % |
| | | | | | | | | | | | | | | | | | | | | | | | | | | | | | | | | | | | | | | | | |
| Adjusted Earnings | | | | | | | | | | | | | | | | | | | | | | | | | | | | | | | | | | | | | | | | |
| Net income | | $ | (1,087 | ) | | | -1.12 | % | | $ | (132 | ) | | | -0.15 | % | | $ | 185 | | | | 0.21 | % | | $ | 277 | | | | 0.30 | % | | $ | 158 | | | | 0.16 | % |
| Add(Deduct): Non-operating income | | | 11 | | | | 0.01 | % | | | 25 | | | | 0.03 | % | | | (75 | ) | | | -0.08 | % | | | (68 | ) | | | -0.07 | % | | | 50 | | | | 0.05 | % |
| Tax effect (2) | | | (4 | ) | | | 0.00 | % | | | (9 | ) | | | -0.01 | % | | | 26 | | | | 0.03 | % | | | 23 | | | | 0.03 | % | | | (17 | ) | | | -0.02 | % |
| Adjusted earnings | | $ | (1,080 | ) | | | -1.11 | % | | $ | (116 | ) | | | -0.13 | % | | $ | 136 | | | | 0.15 | % | | $ | 232 | | | | 0.25 | % | | $ | 191 | | | | 0.20 | % |
| | | | | | | | | | | | | | | | | | | | | | | | | | | | | | | | | | | | | | | | | |
| Expense Coverage Ratio (3) | | | 0.80 | x | | | | | | | 0.94 | x | | | | | | | 1.01 | x | | | | | | | 0.96 | x | | | | | | | 1.03 | x | | | | |
| Efficiency Ratio (4) | | | 112.90 | % | | | | | | | 102.46 | % | | | | | | | 96.54 | % | | | | | | | 92.28 | % | | | | | | | 85.79 | % | | | | |
(1) Ratios are as a percent of average assets.
(2) Assumes a 34.0% effective tax rate.
(3) Expense coverage ratio calculated as net interest income before provisions for loan losses divided by operating expenses.
(4) Efficiency ratio calculated as operating expenses divided by the sum of net interest income before provisions for loan losses plus non-interest operating income.
Sources: Heritage Bank's prospectus, audited & unaudited financial statements, SNL Financial and RP Financial calculations.
| RP® Financial, LC. | OVERVIEW AND FINANCIAL ANALYSIS
I.9 |
Over the past five years, the Bank’s net interest income to average assets ratio ranged from a low of 3.00% during 2015 to a high of 3.18% during 2016. The Bank’s net interest income to average assets ratio was relatively stable during 2012 through 2014, as the decrease in the interest income ratio was comparable to the decrease in the interest expense ratio. Comparatively, the decline in the Bank’s net interest income ratio during 2015 was largely attributable to interest rate spread compression that resulted from a more significant decrease in the yield earned on interest-earnings assets relative to the cost of interest-bearing liabilities. As the result of the prolonged low interest rate environment and relatively flat yield curve, the decline in yield earned on less rate sensitive interest-earning assets became more significant relative to the decline in rate paid on more rate sensitive liabilities. The increase in the Bank’s net interest income ratio during fiscal 2016 was attributable to a wider yield-cost spread, which increased from 3.20% during 2015 to 3.36% during 2016. An increase in yield earned on interest-earning assets drove the increase in the Bank’s yield-cost spread during 2016, as the concentration of loans comprising interest-earning assets has trended higher over the past two years. The Bank’s net interest rate spreads and yields and costs for the past two years are set forth in Exhibits I-3 and I-5.
Non-interest operating income has generally been somewhat of a limited contributor to the Bank’s earnings over the past five years, but has increased in recent years largely due to an increase in mortgage banking related income. Over the past five years, non-interest operating income ranged from a low of 0.08% of average assets in 2014 to a high of 0.41% of average assets in 2014. Loan servicing income and gains on sale of loan originations sold into the secondary market were the primary sources of non-interest operating income for the Bank during 2016, with such income accounting for slightly more than three-quarters of non-interest operating income in 2016.
Operating expenses represent the other major component of the Bank’s earnings, ranging from a low of 3.07% of average assets during 2014 to a high of 3.85% of average assets during 2012. The relatively high level of operating expenses reported for 2012 was largely due to expenses related to maintaining and writing down foreclose real estate. For 2016, operating expenses totaled $3.0 million or 3.08% of average assets. In general, the Bank has maintained a relatively high level of operating expenses, which can in part be attributed to certain inherent fixed costs Heritage Bank incurs as a regulated financial institution that are spread over a relatively small asset base. Further upward pressure will be placed on the Bank’s operating expense ratio following the stock offering, due to expenses associated with operating
| RP® Financial, LC. | OVERVIEW AND FINANCIAL ANALYSIS
I.10 |
as a publicly-traded company, including expenses related to the stock benefit plans. At the same time, the increase in capital realized from the stock offering will increase the Bank’s capacity to leverage operating expenses through pursuing a more aggressive growth strategy.
Overall, the general trends in the Bank’s net interest income and operating expense ratios over the past five years reflect an in core earnings, as indicated by the Bank’s expense coverage ratio (net interest income divided by operating expenses). Heritage Bank’s expense coverage ratio increased from 0.80 times during 2012 to 1.03 times during 2016 The increase in the expense coverage ratio was primarily attributable to a decrease in the operating expense ratio and, to a lesser extent, an increase in the net interest income ratio. Similarly, Heritage Bank’s efficiency ratio (operating expenses as a percent of the sum of net interest income plus non-interest operating income) improved from 112.90% during 2012 to 85.79% during 2016. A decrease in the operating expense ratio and increases in the ratios for net interest income and non-interest operating income all contributed to the improvement in the Bank’s efficiency ratio.
After recording significant loan loss provisions during 2012, improving and generally favorable credit quality measures served to limit the amount of loss provisions the Bank has established over the past four years. Loan loss provisions established by the Bank ranged from a peak of 1.25% of average assets during 2012 to the establishment of no loan loss provisions during 2014. For the year ended December 31, 2016, loan loss provisions established by the Bank amounted to $180,000 or 0.19% of average assets. As of December 31, 2016, the Bank maintained allowance for loan losses of $692,000, equal to 0.90% loans receivable and 133.59% of non-performing loans. Exhibit I-6 sets forth the Bank’s loan loss allowance activity during the past two years.
Non-operating income and losses over the past five years has been fairly limited, consisting of gains and losses from the sale of investment securities and real estate owned. For 2016, the Bank reported a non-operating loss of $50,000 or 0.05% of average assets. The non-operating loss for 2016 consisted of a loss on the sale of REO. In general, the gains and losses recorded by Bank were viewed as non-recurring income items.
The Bank’s effective tax rate ranged from a benefit of 34.28% during 2012 to an expense of 41.04% during 2016. As set forth in the prospectus, the Bank’s marginal effective statutory tax rate is 34.0%.
| RP® Financial, LC. | OVERVIEW AND FINANCIAL ANALYSIS
I.11 |
Interest Rate Risk Management
The Bank’s balance sheet is liability-sensitive in the short-term (less than one year). While financial institutions in general have been experiencing some interest spread compression during recent periods, due to the average yield earned on interest-earning assets declining more relative to the average rate paid on interest-bearing liabilities, the Bank has been effective in increasing its interest rate spread through increasing the concentration of interest-earning assets comprised of loans relative to lower yielding cash and investments. As of December 31, 2016, an analysis of the Bank’s Economic Value of Equity (“EVE”) and net interest income indicated that a 2.0% instantaneous and sustained parallel increase in the yield curve would result in a 17.3% decline in EVE and a 3.5% decrease in net interest income over a one year period (see Exhibit I-7).
The Bank pursues a number of strategies to manage interest rate risk, particularly with respect to seeking to limit the repricing mismatch between interest rate sensitive assets and liabilities. The Bank manages interest rate risk from the asset side of the balance sheet through selling originations of 1-4 family fixed rate loans, retaining originations of adjustable rate mortgage (“ARM”) loans for its own portfolio, diversifying into other types of lending beyond 1-4 family permanent mortgage loans which consist primarily of adjustable rate or shorter term fixed rate balloon loans, maintaining most investments as available for sale and maintaining a relatively high level of liquidity in the prevailing low interest rate environment. As of December 31, 2016, of the Bank’s total loans due after December 31, 2017, ARM loans comprised 10.8% of those loans (see Exhibit I-8). On the liability side of the balance sheet, management of interest rate risk has been pursued through emphasizing growth of lower costing and less interest rate sensitive transaction and savings account deposits, utilizing longer term fixed rate FHLB advances with laddered terms out to ten years and seeking to extend CD maturities through offering relatively attractive rates on certain longer term CDs. Transaction and savings account deposits comprised 30.4% of the Bank’s average deposits during 2016.
The infusion of stock proceeds will serve to further limit the Bank’s interest rate risk exposure, as most of the net proceeds will be redeployed into interest-earning assets and the increase in the Bank’s capital position will lessen the proportion of interest rate sensitive liabilities funding assets.
| RP® Financial, LC. | OVERVIEW AND FINANCIAL ANALYSIS
I.12 |
Lending Activities and Strategy
Heritage Bank’s lending activities have emphasized 1-4 family permanent mortgage loans and such loans comprise the major portion of the Bank’s loan portfolio. Beyond 1-4 family loans, lending diversification by the Bank has emphasized commercial real estate/multi-family loans followed by construction/land loans. Other areas of lending diversification for the Bank include home equity lines of credit, commercial business loans and consumer loans. Pursuant to the Bank’s strategic plan, the Bank is pursuing a diversified lending strategy emphasizing commercial real estate and commercial business loans as the primary area of targeted loan growth. Exhibit I-9 provides historical detail of Heritage Bank’s loan portfolio composition over the past two years and Exhibit I-10 provides the contractual maturity of the Bank’s loan portfolio by loan type as of December 31, 2016.
1-4 Family Residential Loans. Heritage Bank offers both fixed rate and ARM 1-4 family permanent mortgage loans with terms of up to 30 years. Loans are underwritten to secondary market guidelines, as the Bank’s current philosophy has been to sell most originations of conforming fixed rate loans. Loans are generally sold on a servicing retained basis. ARM loans and non-conforming fixed rate loan originations are retained for the Bank’s loans portfolio. On a limited basis, the Bank has supplemented originations of 1-4 family loans with loan purchases. ARM loans offered by the Bank have repricing terms of three or five years and are indexed to the Federal Cost of Funds Index. As of December 31, 2016, the Bank’s outstanding balance of 1-4 residential mortgage loans totaled $56.9 million or 75.12% of total loans outstanding. At December 31, 2016, $11.2 million or 19.51% of the Bank’s 1-4 family residential mortgage loans were secured by non-owner occupied properties.
Home Equity Lines Credit. The Bank’s 1-4 family lending activities include home equity lines of credit. Home equity lines of credit are indexed to the prime rate as published inThe Wall Street Journal and are offered as interest-only revolving lines of credit with a draw period of up to 10 ten years. The Bank will generally originate home equity lines of credit up to a maximum loan-to value (“LTV”) ratio of 89%, inclusive of other liens on the property. As of December 31, 2016, the Bank’s outstanding balance of home equity lines of credit totaled $2.2 million equal to 2.93% of total loans outstanding.
Construction and Land Loans. Construction loans originated by the Bank consist of loans to finance the construction of 1-4 family residences and commercial real estate. Construction loans are interest only loans during the construction period, which is usually up to
| RP® Financial, LC. | OVERVIEW AND FINANCIAL ANALYSIS
I.13 |
12 months, and are generally offered up to a LTV ratio of 85% of the lesser of the appraised market value of the completed property or the total cost of the construction project. At December 31, 2016, the Bank’s largest construction loan had an outstanding balance of $575,000 and is secured by an owner-occupied 1-4 family residential real estate loan. At December 31, 2016, this loan was performing in accordance with its terms. As of December 31, 2016, Heritage Bank’s outstanding balance of construction loans totaled $3.5 million or 4.53% of total loans outstanding.
Land loans consist of properties acquired for development, as well as unimproved land. Land loans are typically extended up to a LTV ratio of 65% of the lesser of the appraised value or the purchase price of the property. Land loans are generally offered as fixed rate loans with terms of up to 15 years. As of December 31, 2016, Heritage Bank’s outstanding balance of land loans equaled $2.9 million or 3.79% of total loans outstanding.
Commercial Real Estate and Multi-Family Loans. Commercial real estate and multi-family loans consist largely of loans originated by the Bank, which are generally collateralized by properties in the New Orleans metropolitan area. On a limited basis, the Bank has supplemented originations of commercial real estate and multi-family loans with purchased loan participations from local banks. Loan participations are subject to the same underwriting criteria and loan approvals as applied to loans originated by the Bank. Heritage Bank generally originates commercial real estate and multi-family loans up to a loan-to-value LTV ratio of 80% of the lesser of the purchase price or the appraised value of the property securing the loan and generally requires a minimum debt-coverage ratio of 1.2 times. Commercial real estate and multi-family loans are generally originated as fixed rate loans with amortization terms of up to 20 years. Loan terms offered on commercial real estate and multi-family loans include fixed rate loans, balloon loans, and adjustable rate loans. Interest rates on adjustable rate loans adjust every three years and are generally indexed to the prime rate as published inThe Wall Street Journal. Properties securing the commercial real estate and multi-family loan portfolio include office buildings, retail facilities and apartments. At December 31, 2016, the Bank’s largest commercial real estate loan had an outstanding balance of $831,000 and is secured by a commercial office building. At December 31, 2016, this loan was performing in accordance with its original terms. At December 31, 2016, the Bank’s largest multi-family loan had an outstanding balance of $1.4 million and is secured by a 58-unit apartment complex. At December 31, 2016, this loan was performing in accordance with its original terms. As of
| RP® Financial, LC. | OVERVIEW AND FINANCIAL ANALYSIS
I.14 |
December 31, 2016, the Bank’s outstanding balance of commercial real estate and multi-family loans totaled $9.9 million or 12.87% of total loans outstanding
Commercial Business Loans Prior to 2016, commercial business lending was not an active area of lending diversification for the Bank. In 2016, the Bank began to purchase loans from the Banker Healthcare Group, a national lender to healthcare professionals. The purchased loans are generally fixed rate loans for terms of up to seven years and are secured by personal guarantees from the borrower. Loans purchased by the Bank generally have been in the range of $30,000 to $40,000. Subject to market conditions, the Bank’s plan is to grow the portfolio of purchased loans to healthcare professionals going forward. As of December 31, 2016, the Bank’s outstanding of purchased commercial business loans totaled $295,000 or 0.38% of total loans outstanding.
Consumer Loans. Consumer lending other than home equity lines of credit has been a limited area of lending diversification for the Bank, with such loans consisting primarily of loans secured by savings accounts or CDs. As of December 31, 2016, the Bank held $285,000 of consumer loans or 0.37% of total loans receivable.
Exhibit I-11 provides a summary of the Bank’s lending activities over the past two years. Total loans originated decreased from $24.0 million in 2015 to $20.9 million in 2016 The decrease in loans originated during 2016 was primarily related to a decrease in 1-4 family loan originations and, to a lesser extent, lending volumes for commercial real estate, multi-family and construction loans also declined in 2016. Comparatively, originations of home equity lines of credit, land loans and consumer loans increased slightly during 2016. The Bank’s self-generated loan production was supplemented with loan purchases of $5.7 million in 2015 and $3.4 million in 2016. Loans sold by the Bank, which consisted entirely of 1-4 family fixed rate loan originations, increased from $5.0 million during 2015 to $6.6 million during 2016 and loan principal repayments increased from $11.7 million in 2015 to $15.6 million in 2016. Overall, net loan activity decreased from an increase of $13.0 million in 2015 to an increase of $2.1 million during 2016.
Asset Quality
Historically, the Bank’s lending emphasis on lending in local and familiar markets generally supported maintenance of relatively favorable credit quality measures. However, following the national recession and bursting of the housing bubble in 2008, the Bank experienced elevated levels of problems assets. In recent years, the Bank has taken proactive
| RP® Financial, LC. | OVERVIEW AND FINANCIAL ANALYSIS
I.15 |
measures to address credit quality deterioration and significantly reduce the balance of non-performing balance assets from peak levels. Over the past two years, Heritage Bank’s balance of non-performing assets ranged from a high of $2.0 million or 2.06% of assets at yearend 2015 to a low of $611,000 or 0.62% of assets at yearend 2016. As shown in Exhibit I-12, non-performing assets at December 31, 2016 consisted of $518,000 of non-accruing loans and $93,000 of real estate owned. Non-accruing loans held by the Bank at June 30, 2106 were concentrated in 1-4 family permanent mortgage loans totaling $501,000.
To track the Bank’s asset quality and the adequacy of valuation allowances, the Bank has established detailed asset classification policies and procedures which are consistent with regulatory guidelines. Classified assets are reviewed monthly by senior management and the Board. Pursuant to these procedures, when needed, the Bank establishes additional valuation allowances to cover anticipated losses in classified or non-classified assets. As of December 31, 2016, the Bank maintained loan loss allowances of $692,000, equal to 0.90% of total loans receivable and 133.59% of non-performing loans.
Funding Composition and Strategy
Deposits have consistently served as the Bank’s primary funding source and at December 31, 2016 deposits accounted for 84.83% of Heritage Bank’s interest-bearing funding composition. Exhibit I-13 sets forth the Bank’s deposit composition for the past two years and Exhibit I-14 provides the interest rate and maturity composition of the CD portfolio at December 31, 2016. CDs constitute the largest component of the Bank’s deposit composition; although, the concentration of CDs comprising total deposits declined slightly during 2016, as the result of growth of transaction and savings account deposits and a decrease in CDs. For 2016, the balance of CDs averaged $51.5 million or 69.60% of average deposits, versus comparable measures of $52.3 million and 71.68% of average deposits for 2015. CDs with scheduled maturities of one year or less comprised 46.41% of the Bank’s CDs at December 31, 2016. As of December 31, 2016, jumbo CDs (CD accounts with balances of $100,000 or more) amounted to $29.4 million or 57.66% of total CDs. As of December 31, 2016, the Bank maintained $99,000 of brokered deposits.
The balance of savings and transaction account deposits averaged $22.5 million or 30.40% of average deposits for 2016. Statement savings account deposits comprise the largest concentration of the Bank’s core deposits and, for 2016, statement savings account deposits averaged $16.2 million or 72.17% of average core deposits.
| RP® Financial, LC. | OVERVIEW AND FINANCIAL ANALYSIS
I.16 |
Borrowings serve as an alternative funding source for the Bank to facilitate management of funding costs and interest rate risk. FHLB advances have been the only source of borrowings utilized by the Bank over the past five years. The Bank maintained $13.3 million of FHLB advances at December 31, 2016 with a weighted average rate of 1.61%. FHLB advances held by the Company at December 31, 2016 had fixed interest rates with ladder terms out to 10 years. Exhibit I-15 provides further detail of the Bank’s borrowings activities during the past two years.
Legal Proceedings
Heritage Bank is not currently party to any pending legal proceedings that the Bank’s management believes would have a material adverse effect on the Bank’s financial condition, results of operations or cash flows.
| RP® Financial, LC. | MARKET AREA
II.1 |
II. MARKET AREA
Introduction
Heritage Bank serves the New Orleans Metropolitan Statistical Area (“MSA”) through the main office in Covington and one branch office in Slidell. Both Covington and Slidell are located in St. Tammany Parish. Covington is approximately 40 miles north of the city of New Orleans. Exhibit II-1 provides information on the Bank’s office properties.
St. Tammany Parish can be characterized as a bedroom community for neighboring New Orleans and is often referred to as the gateway of New Orleans. The oil industry remains a significant part of the local economy, which has become more diversified following the severe downturn experienced in the oil and chemical industries during the mid- and late-1980s. St. Tammany Parish maintains a large commuter population in which residents commute to jobs throughout the New Orleans metropolitan area. The New Orleans MSA has an economy that is dominated by four major sectors: oil/gas and related activities, tourism, the port and ship/boat building, aerospace and manufacturing. Tourism remains the largest contributor to the New Orleans economy; although the industry has been hampered by a number of factors over the past several years. Most notably, the devastation and destruction caused by Hurricane Katrina, which occurred in August 2005, severely impacted tourism in New Orleans. More recently, the national recession followed by a slow recovery and the oil spill off the Gulf Coast depressed tourism activity in the New Orleans, as well as the regional economy in general.
Future growth opportunities for the Bank depend on the future growth and stability of the regional economy, demographic growth trends, and the nature and intensity of the competitive environment. These factors have been briefly examined to help determine the growth potential that exists for the Bank and the relative economic health of the Bank’s market area.
National Economic Factors
The future success of the Bank’s operations is partially dependent upon national economic factors and trends. In assessing national economic trends over the past few quarters, manufacturing and service sector activity expanded at slightly lower rates in July 2016, with respective index readings of 52.6 and 55.5. The U.S. economy added a better-than-expected 255,000 jobs in July, while the July unemployment rate held steady at 4.9%. Retail sales for July showed little change compared to June. Housing starts were up 2.1% in July and July new
| RP® Financial, LC. | MARKET AREA
II.2 |
home sales were up a solid 12.1% compared to June. However, July existing home sales fell 3.2%, suggesting that higher home prices were reducing housing demand. Durable-goods orders for July rose 4.4%, which was the largest monthly jump since October 2015. Readings for manufacturing and service activity in August signaled a slowing U.S. economy, as August manufacturing activity contracted and August service sector activity expanded at a slower rate. Job growth also slowed in August, with a monthly gain of 151,000 jobs. The August unemployment rate remained at 4.9%. A 0.3% decline in August retail sales provided another indication of a slowing U.S. economy. Both new and existing home sales were also lower in August, while durable-goods orders were unchanged for August. Manufacturing activity for September rebounded with an index reading of 51.5. Likewise, service sector activity for September picked-up as well with an index reading of 57.1. Comparatively, September employment data was fairly stagnant, as employers added 156,000 jobs in September and the unemployment rate edged up to 5.0% as more people entered the labor force. Retail sales increased 0.4% in September, keeping the Federal Reserve on a path to raise interest rates in 2016. September data for housing showed a pick-up in home demand, as September existing and new home sales increased 3.2% and 3.1%, respectively. Pending home sales were also up 1.5% in September. Third quarter GDP growth provided another indication that the U.S. economy was gaining traction, as third quarter GDP increased at an annual rate of 2.9% (subsequently revised up to 3.5%).
Manufacturing activity picked up slightly in October 2016 with an index reading of 51.9. Comparatively, service sector activity for October expanded at a slower rate with an index reading of 54.8. Employers added 161,000 jobs in October and the unemployment rate for October ticked down to 4.9%, which was due to a decline in the number of people participating in the workforce. Notably, wage gains for October were the strongest since 2009 and, thereby, keeping the Federal Reserve on a pace for a December rate hike. Housing starts jumped 25.5% in October, while existing home sales for October climbed 2.0%. Comparatively, new home sales declined 1.9% in October and October pending home sales increased 0.1%. U.S. employers added 178,000 jobs in November and the November unemployment rate fell to a nine-year low of 4.6%. Manufacturing and service sector activity accelerated in November, with respective readings of 53.2 and 57.2. Following a strong October, housing starts declined 18.7% in November. However, existing home sales were up for the third straight month in November, increasing 0.7% which was the highest sales pace since February 2007. Sales of new homes for November showed a healthy increase of 5.2%, while November pending home
| RP® Financial, LC. | MARKET AREA
II.3 |
sales declined 2.5%. Manufacturing activity for December rose to 54.7, hitting its highest level since December 2014, and December service sector activity held steady with a reading of 57.2. The U.S. economy added 156,000 jobs in December and the December unemployment rate ticked up to 4.7%. The pace of home sales slowed in December, as existing home sales for sales decreased 2.8% compared to November. New home sales plunged 10.4% in December compared to the prior month, which was viewed as an indication that affordability challenges were beginning to cut into demand. However, December pending home sales increased 1.6% compared to November. Fourth quarter GDP increased at a 1.6% annual rate.
Job growth for the first month of 2017 was stronger than expected, as U.S. employers added 227,000 in January 2017. However, the January 2017 unemployment rate for the U.S. edged up to 4.8%, due to more Americans actively seeking employment. Manufacturing activity for January accelerated with a reading of 56.0, while January service sector activity grew at a slightly slower pace with a reading of 56.5.
In terms of interest rates trends over the past few quarters, investors sold risky assets in favor of safe haven investments in early-July 2016, which drove the yield on the 10-year Treasury to a record low of 1.37%. Long-term Treasury yields rose going into mid-July, as investors moved back into riskier assets on the heels of the strong job growth reported for June. During the second half of July and into early-August, long-term Treasury yields remained fairly stable, as the Federal Reserve concluded its late-July policy meeting keeping its target interest rate unchanged as expected. Long-term Treasury yields remained fairly stable throughout August and into-early September. Going into the second half of September the 10-year Treasury yield edged higher ahead of the Federal Reserve’s policy meeting. The Federal Reserve concluded its September meeting leaving interest rates unchanged, but signaled it expected to raise rates before the end of the year. Following the Federal Reserve meeting, the 10-year Treasury yield edged back below 1.60% in late-September.
Stronger readings for September manufacturing and service sector activity helped to push the 10-year Treasury yield above 1.70% in mid-October 2016. Long-term Treasury yields continued to edge higher going into late-October, as signs of inflation ticking up pushed the 10-year Treasury yield to its highest level in four months. The Federal Reserve concluded its early-November policy meeting leaving interest rates unchanged, but noted that inflation had increased somewhat and left the door open for a rate increase in December. Interest rates stabilized ahead of the Presidential election and then surged higher followings the election, based on expectations that there would be an increase in government spending and a pick-up in
| RP® Financial, LC. | MARKET AREA
II.4 |
inflation under the Trump administration. The upward trend in long-term Treasury yields continued through the end of November and into December, in which the 10-year Treasury yield rose to a 17 month high of 2.44% on December 1, 2016. Treasury prices continued to slide lower through mid-December, as the Federal Reserve concluded its two-day policy meeting raising its target interest rate by 0.25% and signaled interest rates would rise faster than previously projected based on growing optimism about the strength of the U.S. economy. After hitting a mid-December high of 2.60%, the yield on the 10-year Treasury eased lower in the closing weeks of 2016.
Long-term Treasury yields edged lower during the first half of January 2017, as the December employment report showed weaker than expected job growth. Treasury yields reversed course in the second half of January, with renewed optimism about the U.S. economy prompting investors to buy stocks and lighten up on their holdings of safer assets such as Treasury bonds. At the start of February, the Federal Reserve concluded its two-day policy meeting with no change in its target interest rate and indicated it remained on track to gradually raise short-term interest rates this year. Long-term Treasury yields edged lower following the release of the January jobs report. As of February 10, 2017, the bond equivalent yields for U.S. Treasury bonds with terms of one and ten years equaled 0.81% and 2.41%, respectively, versus comparable year ago yields of 0.52% and 1.71%. Exhibit II-2 provides historical interest rate trends.
Based on the consensus outlook of economists surveyed by The Wall Street Journal in January 2017, GDP growth was projected to increase to 2.4% in 2017. The unemployment rate was forecasted to decline to 4.6% in June 2017 and to 4.5% in December 2016. An average of 166,000 jobs were projected to be added per month during 2017. On average, the economists forecasted an increase in the federal funds rate to 0.93% in June 2017 and to 1.31% in December 2017. On average, the economists forecasted that the 10-year Treasury yield would increase to 2.65% in June 2017 and increase to 2.89% by the end of 2017. The surveyed economists also forecasted home prices would rise 4.4% in 2017 and housing starts were forecasted to continue to trend slightly higher in 2017.
The January 2017 mortgage finance forecast from the Mortgage Bankers Association (the “MBA”) was for 2017 existing home sales to increase by 5.3% from 2016 sales and new home sales were forecasted to increase by 13.8% in 2017 from sales in 2016. The 2017 median sale prices for new and existing homes were forecasted to increase by 1.9% and 5.2%, respectively. Total mortgage production was forecasted to decline in 2017 to $1.563 trillion,
| RP® Financial, LC. | MARKET AREA
II.5 |
compared to $1.891 trillion in 2016. The forecasted decrease in 2017 originations was based on a 10.3% increase in purchase volume and a 47.7% decrease in refinancing volume. Purchase mortgage originations were forecasted to total $1.092 trillion in 2017, versus refinancing volume totaling $471 billion. Housing starts for 2017 were projected to increase by 8.3% to total $1.265 billion.
Market Area Demographics
Key demographic and economic indicators for the Bank’s market area include population, number of households and household/per capita income levels. Demographic data for St. Tammany Parish, as well as comparative data for Louisiana and the U.S., is provided in Table 2.1. St. Tammany Parish’s population showed a 1.3% annual growth rate from 2010 to 2017, versus comparable Louisiana and U.S. annual population growth rates of 0.5% and 0.7%, respectively. Age distribution measures reflect that St. Tammany Parish has a somewhat similarly-aged population relative to Louisiana and the U.S. Similar to population growth trends, St. Tammany Parish’s annual rate of household growth outpaced the comparable Louisiana and U.S. annual household growth rates for the past seven years. Projected five-year growth rates for St. Tammany Parish showed slightly lower population and household growth rates, but remained above the comparable projected growth rates for Louisiana and the U.S.
St. Tammany Parish’s 2017 median household income of $65,516 was somewhat above the Louisiana median of $47,163 and the U.S. median of $57,462. Similarly, per capita and household income distribution measures also generally reflected higher levels of income for St. Tammany Parish relative to the comparable Louisiana and U.S. measures. Over the next five years, St. Tammany Parish is projected to experience similar growth rates in household and per capita income relative to the comparable projected Louisiana and U.S. growth rates.
Local Economy
Economic activity in the New Orleans MSA is heavily influenced by four industries: oil/gas and related activities, tourism, the port and ship/boat building, and aerospace manufacturing. The regional economy is further supported by the presence of major universities
| RP® Financial, LC. | MARKET AREA
II.6 |
Table 2.1
Heritage Bank of St. Tammany
Summary Demographic Data
| | | Year | | | Growth Rate | |
| | | 2010 | | | 2017 | | | 2022 | | | 2010-2017 | | | 2017-2022 | |
| | | | | | | | | | | | (%) | | | (%) | |
| Population (000) | | | | | | | | | | | | | | | | | | | | |
| USA | | | 308,746 | | | | 325,139 | | | | 337,393 | | | | 0.7 | % | | | 0.7 | % |
| Louisiana | | | 4,533 | | | | 4,706 | | | | 4,839 | | | | 0.5 | % | | | 0.6 | % |
| St. Tammany, LA | | | 234 | | | | 255 | | | | 270 | | | | 1.3 | % | | | 1.1 | % |
| | | | | | | | | | | | | | | | | | | | | |
| Households (000) | | | | | | | | | | | | | | | | | | | | |
| USA | | | 116,716 | | | | 123,357 | | | | 128,247 | | | | 0.8 | % | | | 0.8 | % |
| Louisiana | | | 1,728 | | | | 1,819 | | | | 1,882 | | | | 0.7 | % | | | 0.7 | % |
| St. Tammany, LA | | | 88 | | | | 97 | | | | 103 | | | | 1.5 | % | | | 1.2 | % |
| | | | | | | | | | | | | | | | | | | | | |
| Median Household Income ($) | | | | | | | | | | | | | | | | | | | | |
| USA | | | NA | | | | 57,462 | | | | 61,642 | | | | NA | | | | 1.4 | % |
| Louisiana | | | NA | | | | 47,163 | | | | 49,765 | | | | NA | | | | 1.1 | % |
| St. Tammany, LA | | | NA | | | | 65,516 | | | | 69,585 | | | | NA | | | | 1.2 | % |
| | | | | | | | | | | | | | | | | | | | | |
| Per Capita Income ($) | | | | | | | | | | | | | | | | | | | | |
| USA | | | NA | | | | 31,459 | | | | 34,068 | | | | NA | | | | 1.6 | % |
| Louisiana | | | NA | | | | 27,021 | | | | 29,145 | | | | NA | | | | 1.5 | % |
| St. Tammany, LA | | | NA | | | | 33,772 | | | | 36,535 | | | | NA | | | | 1.6 | % |
| 2017 Age Distribution (%) | | | 0-14 Yrs. | | | | 15-34 Yrs. | | | | 35-54 Yrs. | | | | 55-69 Yrs. | | | | 70+ Yrs. | |
| USA | | | 18.8 | | | | 27.1 | | | | 25.7 | | | | 18.1 | | | | 10.3 | |
| Louisiana | | | 19.8 | | | | 27.9 | | | | 24.9 | | | | 17.8 | | | | 9.6 | |
| St. Tammany, LA | | | 19.1 | | | | 24.2 | | | | 26.3 | | | | 20.1 | | | | 10.3 | |
| | | | Less Than | | | | $25,000 to | | | | $50,000 to | | | | | | | | | |
| 2017 HH Income Dist. (%) | | | 25,000 | | | | 50,000 | | | | 100,000 | | | | $100,000+ | | | | | |
| USA | | | 21.9 | | | | 22.9 | | | | 29.5 | | | | 25.7 | | | | | |
| Louisiana | | | 28.6 | | | | 23.9 | | | | 26.9 | | | | 20.6 | | | | | |
| St. Tammany, LA | | | 17.6 | | | | 21.5 | | | | 30.7 | | | | 30.3 | | | | | |
Source: SNL Financial, LC.
| RP® Financial, LC. | MARKET AREA
II.7 |
and hospitals. Similar to state and national figures, service jobs represent the largest employment sector in St. Tammany Parish. Jobs in education/healthcare/social services were the second largest source of employment in St. Tammany Parish, followed by jobs in wholesale/retail trade. Table 2.2 provides an overview of employment by sector in the state of Louisiana, as well as for St. Tammany Parish.
Table 2.2
Heritage Bank of St. Tammany
Primary Market Area Employment Sectors
(Percent of Labor Force)
| | | | | | St. Tammany | |
| Employment Sector | | Louisiana | | | Parish | |
| | | | | | | |
| Services | | | 25.1 | % | | | 27.3 | % |
| Education,Healthcare, Soc. Serv. | | | 23.6 | % | | | 20.6 | % |
| Government | | | 5.4 | % | | | 6.1 | % |
| Wholesale/Retail Trade | | | 14.0 | % | | | 16.5 | % |
| Finance/Insurance/Real Estate | | | 5.2 | % | | | 6.5 | % |
| Manufacturing | | | 7.8 | % | | | 5.5 | % |
| Construction | | | 7.9 | % | | | 8.4 | % |
| Information | | | 1.6 | % | | | 1.6 | % |
| Transportation/Utility | | | 5.1 | % | | | 5.0 | % |
| Agriculture | | | 4.2 | % | | | 2.4 | % |
| | | | 100.0 | % | | | 100.0 | % |
Source: U.S. Census Bureau. 2015
Table 2.3, which lists the largest employers in Greater New Orleans, which includes St. Tammany Parish, further reveals the economic makeup of the Bank’s market area. The largest employers in the New Orleans MSA are concentrated in healthcare and government jobs, which tend to be relatively stable sources of employment.
| RP® Financial, LC. | MARKET AREA
II.8 |
Table 2.3
Heritage Bank of St. Tammany
Market Area Largest Employers
| Employer | | Industry | | Size | |
| | | | | | |
| Ochsner Health System | | Health Care | | | 14,500 | |
| Tulane University | | Education | | | 8,600 | |
| LCMC Health | | Health Care | | | 6,100 | |
| United States Postal Service | | Government | | | 4,000 | |
| East Jefferson General Hospital | | Health Care | | | 3,650 | |
| University of New Orleans | | Government | | | 3,000 | |
| Caesars Entertainment Corporation | | Leisure/Hospitality | | | 2,400 | |
| Acme Truck Line, Inc. | | Transportation/Utilities | | | 2,100 | |
| New Orleans Police Department | | Government | | | 2,100 | |
| St. Tammany Parish Sherrif's Office | | Government | | | 2,000 | |
Note: Excludes local school districts.
Source: U.S. Department of Housing and Urban Development, Comprehensive Housing Market Analysis as of October 2015.
Unemployment Trends
Comparative unemployment rates for St. Tammany Parish, as well as for the U.S. and Louisiana, are shown in Table 2.4. The December 2016 unemployment rate for St. Tammany Parish equaled 4.3%, versus 5.4% for the state of Louisiana and 4.5% for the U.S. The December 2016 unemployment rate for St. Tammany Parish and the state of Louisiana were up slightly compared to their respective year ago unemployment rates, while the December 2016 unemployment rate for the U.S. was down slightly compared to its year ago unemployment rate.
Table 2.4
Heritage Bank of St. Tammany
Unemployment Trends
| | | Unemployment Rate | | | Net | |
| Region | | Dec. 2015 | | | Dec. 2016 | | | Change | |
| | | | | | | | | | |
| USA | | | 4.8 | % | | | 4.5 | % | | | -0.3 | % |
| Louisiana | | | 5.0 | % | | | 5.4 | % | | | 0.4 | % |
| Saint Tammany, LA | | | 4.1 | % | | | 4.3 | % | | | 0.2 | % |
Source: SNL Financial, LC.
| RP® Financial, LC. | MARKET AREA
II.9 |
Market Area Deposit Characteristics and Competition
The Bank’s deposit base is closely tied to the economic fortunes of St. Tammany Parish and, in particular, the areas of St. Tammany Parish that are nearby to one of Heritage Bank’s two office locations. Table 2.5 displays deposit market trends from June 30, 2012 through June 30, 2016 for Heritage Bank, as well as for all commercial bank and savings institution branches located in St. Tammany Parish and the state of Louisiana. Consistent with the state of Louisiana, commercial banks maintained a significantly larger market share of deposits than savings institutions in St. Tammany Parish. For the four year period covered in Table 2.5, savings institutions experienced a decline in deposits and deposit market share in St. Tammany Parish, as well as statewide. Overall, from June 30, 2012 to June 30, 2016, bank and thrift deposits increased at an annual rate of 7.5% in St. Tammany Parish.
Based on June 30, 2016 deposit data, the Bank maintained a 1.4% deposit market share of bank and thrift deposits in St. Tammany Parish. During the four year period covered in Table 2.5, the Bank’s deposit market share in St. Tammany Parish declined slightly.
Table 2.5
Heritage Bank of St. Tammany
Deposit Summary
| | | As of June 30, | | | | |
| | | 2012 | | | 2016 | | | Deposit | |
| | | | | | Market | | | No. of | | | | | | Market | | | No. of | | | Growth Rate | |
| | | Deposits | | | Share | | | Branches | | | Deposits | | | Share | | | Branches | | | 2012-2016 | |
| | | (Dollars in Thousands) | | | (%) | |
| | | | | | | | | | | | | | | | | | | | | | |
| Louisiana | | $ | 88,771,000 | | | | 100.0 | % | | | 1,631 | | | $ | 102,141,000 | | | | 100.0 | % | | | 1,554 | | | | 3.6 | % |
| Commercial Banks | | | 84,275,000 | | | | 94.9 | % | | | 1,522 | | | | 98,942,000 | | | | 96.9 | % | | | 1,471 | | | | 4.1 | % |
| Savings Institutions | | | 4,496,000 | | | | 5.1 | % | | | 109 | | | | 3,199,000 | | | | 3.1 | % | | | 83 | | | | -8.2 | % |
| | | | | | | | | | | | | | | | | | | | | | | | | | | | | |
| St. Tammany Parish | | $ | 4,136,598 | | | | 100.0 | % | | | 98 | | | $ | 5,514,231 | | | | 100.0 | % | | | 94 | | | | 7.5 | % |
| Commercial Banks | | | 3,748,609 | | | | 90.6 | % | | | 82 | | | | 5,304,973 | | | | 96.2 | % | | | 85 | | | | 9.1 | % |
| Savings Institutions | | | 387,989 | | | | 9.4 | % | | | 16 | | | | 209,258 | | | | 3.8 | % | | | 9 | | | | -14.3 | % |
| Heritage Bank of St. Tammy | | | 81,874 | | | | 2.0 | % | | | 2 | | | | 76,069 | | | | 1.4 | % | | | 2 | | | | -1.8 | % |
Source: FDIC.
As implied by the Bank’s very low market share of deposits, competition among financial institutions in St. Tammany Parish is significant. Financial institution competitors in St. Tammany Parish include other locally-based thrifts and banks, as well as regional, super-regional and money center banks. With regard to lending competition, the Bank encounters the most significant competition from the same institutions providing deposit services. In addition,
| RP® Financial, LC. | MARKET AREA
II.10 |
the Bank competes with mortgage companies and independent mortgage brokers in originating mortgage loans.
Table 2.6 lists the Bank’s largest competitors in St. Tammany Parish, based on deposit market share. As of June 30, 2016, the Bank’s market share of deposits represented the 12th largest market share of bank and thrift deposits in St. Tammany Parish.
Table 2.6
Heritage Bank of St. Tammamy
Market Area Deposit Competitors - As of June 30, 2016
| | | | | Market | | | | |
| Location | | Name | | Share | | | Rank | |
| | | | | (%) | | | | |
| St. Tammany Parish | | Capital One Financial Corp. (VA) | | | 17.36 | | | | | |
| | | Hancook Holding Co. (MS) | | | 17.07 | | | | | |
| | | JPMorgan Chase & Co. (NY) | | | 16.00 | | | | | |
| | | Regions Financial Corp. (AL) | | | 14.24 | | | | | |
| | | First NBC Bank Holding Co. (LA) | | | 9.56 | | | | | |
| | | Heritage Bank of St. Tammany | | | 1.38 | | | | 12 | |
Source: SNL Financial, LC.
| RP® Financial, LC. | PEER GROUP ANALYSIS
III.1 |
III. PEER GROUP ANALYSIS
This chapter presents an analysis of Heritage Bank’s operations versus a group of comparable savings institutions (the "Peer Group") selected from the universe of all publicly-traded savings institutions in a manner consistent with the regulatory valuation guidelines. The basis of the pro forma market valuation of Heritage Bank is derived from the pricing ratios of the Peer Group institutions, incorporating valuation adjustments for key differences in relation to the Peer Group. Since no Peer Group can be exactly comparable to Heritage Bank, key areas examined for differences are: financial condition; profitability, growth and viability of earnings; asset growth; primary market area; dividends; liquidity of the shares; marketing of the issue; management; and effect of government regulations and regulatory reform.
Peer Group Selection
The Peer Group selection process is governed by the general parameters set forth in the regulatory valuation guidelines. Accordingly, the Peer Group is comprised of only those publicly-traded savings institutions whose common stock is either listed on a national exchange (NYSE), or is NASDAQ listed, since their stock trading activity is regularly reported and generally more frequent than non-publicly traded and closely-held institutions. Institutions that are not listed on a national exchange or NASDAQ are inappropriate, since the trading activity for thinly-traded or closely-held stocks is typically highly irregular in terms of frequency and price and thus may not be a reliable indicator of market value. We have also excluded from the Peer Group those companies under acquisition or subject to rumored acquisition, mutual holding companies and recent conversions, since their pricing ratios are subject to unusual distortion and/or have limited trading history. A recent listing of the universe of all publicly-traded savings institutions is included as Exhibit III-1.
Ideally, the Peer Group, which must have at least 10 members to comply with the regulatory valuation guidelines, should be comprised of locally- or regionally-based institutions with comparable resources, strategies and financial characteristics. There are approximately 84 publicly-traded institutions nationally and, thus, it is typically the case that the Peer Group will be comprised of institutions with relatively comparable characteristics. To the extent that differences exist between the converting institution and the Peer Group, valuation adjustments will be applied to account for the differences. Since Heritage Bank will be a fully-converted
| RP® Financial, LC. | PEER GROUP ANALYSIS
III.2 |
public company upon completion of the offering, we considered only fully-converted public companies to be viable candidates for inclusion in the Peer Group. In the selection process for Heritage Bank’s Peer Group, we applied three “screens” to the universe of all public companies that were eligible for consideration:
| · | Screen #1 Southwest and Southeast institutions with assets less than $550 million, tangible equity-to-assets ratios of greater than 8.0% and positive core earnings. Two companies met the criteria for Screen #1 and one was included in the Peer Group: Home Federal Bancorp, Inc. of Louisiana. Bancorp 34, Inc. of New Mexico was excluded from consideration due to its recent conversion status (conversion completed in October 2016). Exhibit III-2 provides financial and public market pricing characteristics of all publicly-traded Southwest and Southeast thrifts. |
| · | Screen #2 Midwest institutions with assets less than $550 million, tangible equity-to-assets ratios of greater than 8.0% and positive core earnings. Eight companies met the criteria for Screen #2 and six were included in the Peer Group: Equitable Financial Corp. of Nebraska, Jacksonville Bancorp, Inc. of Illinois, Poage Bankshares, Inc. of Kentucky, United Community Bancorp of Indiana, Wayne Savings Bancshares, Inc. of Ohio and Wolverine Bancorp, Inc. of Michigan. Ottawa Bancorp, Inc. of Illinois and WCF Bancorp, Inc. of Iowa were excluded due to their recent conversion status, as the result of completing conversions in October 2016 and July 2016, respectively. Exhibit III-3 provides financial and public market pricing characteristics of all publicly-traded Midwest thrifts. |
| · | Screen #3 Mid-Atlantic institutions with assets less than $550 million, tangible equity-to-assets ratios of greater than 8.0% and positive core earnings. Five companies met the criteria for Screen #3 and three were included in the Peer Group: Hamilton Bancorp, Inc. of Maryland, MSB Financial Corp. of New Jersey and WVS Financial Corp. of Pennsylvania. FSB Bancorp, Inc. of New York and HV Bancorp of Pennsylvania were excluded due to their conversion status, as the result of completing conversions in July 2016 and January 2017, respectively. Exhibit III-4 provides financial and public market pricing characteristics of all publicly-traded Mid-Atlantic thrifts. |
Table 3.1 shows the general characteristics of each of the 10 Peer Group companies and Exhibit III-5 provides summary demographic and deposit market share data for the primary market areas served by each of the Peer Group companies. While there are expectedly some differences between the Peer Group companies and Heritage Bank, we believe that the Peer Group companies, on average, provide a good basis for valuation subject to valuation adjustments. The following sections present a comparison of Heritage Bank’s financial condition, income and expense trends, loan composition, interest rate risk and credit risk versus the Peer Group as of the most recent publicly available date.
| RP® Financial, LC. | PEER GROUP ANALYSIS
III.3 |
Table 3.1
Peer Group of Publicly-Traded Thrifts
As of September 30, 2016
| | | | | | | | | | | | | | | | | | | | | As of | |
| | | | | | | | | | | | | | | | | | | | | December 30, 2016 | |
| | | | | | | | | | | Total | | | | | | Fiscal | | Conv. | | Stock | | | Market | |
| Ticker | | Financial Institution | | Exchange | | City | | State | | Assets | | | Offices | | | Year End | | Date | | Price | | | Value | |
| | | | | | | | | | | ($Mil) | | | | | | | | | | ($) | | | ($Mil) | |
| | | | | | | | | | | | | | | | | | | | | | | | | |
| EQFN | | Equitable Financial Corp. | | NASDAQ | | Grand Island | | NE | | | 228 | | | | 6 | | | Jun | | 7/9/2015 | | | 9.90 | | | | 34.42 | |
| HBK | | Hamilton Bancorp, Inc. | | NASDAQ | | Towson | | MD | | | 517 | | | | 7 | | | Mar | | 10/10/2012 | | | 14.25 | | | | 48.64 | |
| HFBL | | Home Federal Bancorp, Inc. of Louisiana | | NASDAQ | | Shreveport | | LA | | | 390 | | | | 7 | | | Jun | | 12/22/2010 | | | 26.86 | | | | 52.81 | |
| JXSB | | Jacksonville Bancorp, Inc. | | NASDAQ | | Jacksonville | | IL | | | 331 | | | | 6 | | | Dec | | 7/15/2010 | | | 30.00 | | | | 53.96 | |
| MSBF | | MSB Financial Corp. | | NASDAQ | | Millington | | NJ | | | 434 | | | | 5 | | | Dec | | 7/17/2015 | | | 14.70 | | | | 83.95 | |
| PBSK | | Poage Bankshares, Inc. | | NASDAQ | | Ashland | | KY | | | 449 | | | | 10 | | | Dec | | 9/13/2011 | | | 18.80 | | | | 69.81 | |
| UCBA | | United Community Bancorp | | NASDAQ | | Lawrenceburg | | IN | | | 528 | | | | 8 | | | Jun | | 1/10/2013 | | | 16.70 | | | | 70.11 | |
| WAYN | | Wayne Savings Bancshares, Inc. | | NASDAQ | | Wooster | | OH | | | 446 | | | | 11 | | | Dec | | 1/9/2003 | | | 16.50 | | | | 45.90 | |
| WBKC | | Wolverine Bancorp, Inc. | | NASDAQ | | Midland | | MI | | | 369 | | | | 3 | | | Dec | | 1/20/2011 | | | 31.60 | | | | 66.32 | |
| WVFC | | WVS Financial Corp. | | NASDAQ | | Pittsburgh | | PA | | | 335 | | | | 6 | | | Jun | | 11/29/1993 | | | 14.73 | | | | 29.57 | |
Source: SNL Financial, LC.
| RP® Financial, LC. | PEER GROUP ANALYSIS
III.4 |
In addition to the selection criteria used to identify the Peer Group companies, a summary description of the key comparable characteristics of each of the Peer Group companies relative to Heritage Bank’s characteristics is detailed below.
| · | Equitable Financial Corp. of Nebraska. Selected due to relatively small asset size, similar net interest income to average assets ratio and similar impact of loan loss provisions on earnings. |
| · | Hamilton Bancorp, Inc. of Maryland. Selected due to similar interest-bearing funding composition, similar impact of loan loss provisions on earnings, limited earnings contribution from sources of non-interest operating income and relatively favorable credit quality measures. |
| · | Home Federal Bancorp, Inc. of Louisiana. Selected due to Louisiana market area, similar interest-earning asset composition, similar interest-bearing funding composition, similar impact of loan loss provisions on earnings, similar ratio of operating expenses as a percent of average assets and relatively favorable credit quality measures. |
| · | Jacksonville Bancorp, Inc. of Illinois. Selected due to relatively favorable credit quality measures. |
| · | MSB Financial Corp. of New Jersey. Selected due to similar interest-earning asset composition, similar interest-bearing funding composition, similar return on average assets ratio, similar impact of loan loss provisions on earnings, limited earnings contribution from sources of non-interest operating income and loan portfolio composition with a relatively high concentration of 1-4 family permanent mortgage loans. |
| · | Poage Bankshares, Inc. of Kentucky. Selected due to similar interest-earning asset composition, similar impact of loan loss provisions on earnings and loan portfolio composition with a relative high concentration of 1-4 family permanent mortgage loans. |
| · | United Community Bancorp of Indiana. Selected due to relatively favorable credit quality measures. |
| · | Wayne Savings Bancshares, Inc. of Ohio. Selected due to similar interest-earning asset composition, similar interest-bearing funding composition, loan portfolio composition with a relatively high concentration of 1-4 family permanent mortgage loans and relatively favorable credit quality measures. |
| · | Wolverine Bancorp, Inc. of Michigan. Selected due to relatively small asset size, similar size of branch network and limited earnings contribution from sources of non-interest operating income |
| · | WVS Financial Corp. of Pennsylvania. Selected due to relative small asset size, limited earnings contribution from sources of non-interest operating income and relatively favorable credit quality measures. |
In aggregate, the Peer Group companies maintained a higher level of tangible equity than the industry average (13.17% of assets versus 12.03%
| RP® Financial, LC. | PEER GROUP ANALYSIS
III.5 |
for all public companies), generated lower core earnings as a percent of average assets (0.59% core ROAA versus 0.72% for all public companies), and earned a lower core ROE (4.43% core ROE versus 6.03% for all public companies). Overall, the Peer Group's average P/TB ratio and average core P/E multiple were below and above the respective averages for all publicly-traded thrifts.
| | | All | | | | |
| | | Publicly-Traded | | | Peer Group | |
| | | | | | | |
| Financial Characteristics (Averages) | | | | | | | | |
| Assets ($Mil) | �� | $ | 3,317 | | | $ | 403 | |
| Market capitalization ($Mil) | | $ | 573 | | | $ | 58 | |
| Tangible equity/assets (%) | | | 12.03 | % | | | 13.17 | % |
| Core return on average assets (%) | | | 0.72 | | | | 0.59 | |
| Core return on average equity (%) | | | 6.03 | | | | 4.43 | |
| | | | | | | | | |
| Pricing Ratios (Averages)(1) | | | | | | | | |
| Price core/earnings (x) | | | 20.32 | x | | | 22.41 | x |
| Price/tangible book (%) | | | 144.21 | % | | | 112.27 | % |
| Price/assets (%) | | | 16.09 | | | | 14.52 | |
(1) Based on market prices as of February 10, 2017.
Ideally, the Peer Group companies would be comparable to Heritage Bank in terms of all of the selection criteria, but the universe of publicly-traded thrifts does not provide for an appropriate number of such companies. However, in general, the companies selected for the Peer Group were fairly comparable to Heritage Bank, as will be highlighted in the following comparative analysis.
Financial Condition
Table 3.2 shows comparative balance sheet measures for Heritage Bank and the Peer Group, reflecting the expected similarities and some differences given the selection procedures outlined above. The Bank’s and the Peer Group's ratios reflect balances as of December 31, 2016 and September 30, 2016, respectively. Heritage Bank’s equity-to-assets ratio of 9.65% was below the Peer Group's average net worth ratio of 13.58%. However, the Bank’s pro forma capital position will increase with the addition of stock proceeds, providing the Bank with an equity-to-assets ratio that will exceed the Peer Group’s ratio. Tangible equity-to-assets ratios for the Bank and the Peer Group equaled 9.65% and 13.17%, respectively. The increase in Heritage Bank’s pro forma capital position will be favorable from a risk perspective and in terms of future earnings potential that could be realized through leverage and lower funding costs. At the same time, the Bank’s higher pro forma capitalization will initially depress return on equity.
| RP® Financial, LC. | PEER GROUP ANALYSIS
III.6 |
Table 3.2
Balance Sheet Composition and Growth Rates
Comparable Institution Analysis
As of September 30, 2016
| | | Balance Sheet as a Percent of Assets | |
| | | Cash & | | | MBS & | | | | | | Net | | | | | | Borrowed | | | Sub. | | | Total | | | Goodwill | | | Tangible | |
| | | Equivalents | | | Invest | | | BOLI | | | Loans (1) | | | Deposits | | | Funds | | | Debt | | | Equity | | | & Intang | | | Equity | |
| | | | | | | | | | | | | | | | | | | | | | | | | | | | | | | |
| Heritage Bank of St. Tammany | LA | | | | | | | | | | | | | | | | | | | | | | | | | | | | | | | | | | | | | | | | |
| December 31, 2016 | | | 8.18 | % | | | 8.86 | % | | | 2.04 | % | | | 76.17 | % | | | 75.75 | % | | | 13.54 | % | | | 0.00 | % | | | 9.65 | % | | | 0.00 | % | | | 9.65 | % |
| | | | | | | | | | | | | | | | | | | | | | | | | | | | | | | | | | | | | | | | | |
| All Public Companies | | | | | | | | | | | | | | | | | | | | | | | | | | | | | | | | | | | | |
| Averages | | | 5.60 | % | | | 16.64 | % | | | 1.84 | % | | | 72.37 | % | | | 73.77 | % | | | 11.70 | % | | | 0.47 | % | | | 12.77 | % | | | 0.74 | % | | | 12.03 | % |
| Medians | | | 3.72 | % | | | 14.60 | % | | | 1.78 | % | | | 75.08 | % | | | 73.31 | % | | | 11.45 | % | | | 0.00 | % | | | 11.52 | % | | | 0.09 | % | | | 11.09 | % |
| | | | | | | | | | | | | | | | | | | | | | | | | | | | | | | | | | | | | | | | | |
| State of LA | | | | | | | | | | | | | | | | | | | | | | | | | | | | | | | | | | | | |
| Averages | | | 1.61 | % | | | 15.16 | % | | | 1.68 | % | | | 77.68 | % | | | 76.84 | % | | | 10.96 | % | | | 0.00 | % | | | 11.29 | % | | | 0.00 | % | | | 11.29 | % |
| Medians | | | 1.61 | % | | | 15.16 | % | | | 1.68 | % | | | 77.68 | % | | | 76.84 | % | | | 10.96 | % | | | 0.00 | % | | | 11.29 | % | | | 0.00 | % | | | 11.29 | % |
| | | | | | | | | | | | | | | | | | | | | | | | | | | | | | | | | | | | | | | | | |
| Comparable Group | | | | | | | | | | | | | | | | | | | | | | | | | | | | | | | | | | | | |
| Averages | | | 5.93 | % | | | 21.99 | % | | | 1.89 | % | | | 66.96 | % | | | 76.04 | % | | | 9.37 | % | | | 0.06 | % | | | 13.58 | % | | | 0.41 | % | | | 13.17 | % |
| Medians | | | 5.06 | % | | | 17.00 | % | | | 1.94 | % | | | 73.95 | % | | | 80.70 | % | | | 5.16 | % | | | 0.00 | % | | | 13.99 | % | | | 0.19 | % | | | 13.31 | % |
| | | | | | | | | | | | | | | | | | | | | | | | | | | | | | | | | | | | | | | | | |
| Comparable Group | | | | | | | | | | | | | | | | | | | | | | | | | | | | | | | | | | | | | | |
| EQFN | | Equitable Financial Corp. | | NE | | | 3.92 | % | | | 0.70 | % | | | 0.00 | % | | | 90.74 | % | | | 83.23 | % | | | 0.00 | % | | | 0.00 | % | | | 15.92 | % | | | 0.00 | % | | | 15.92 | % |
| HBK | | Hamilton Bancorp, Inc. | | MD | | | 9.52 | % | | | 18.83 | % | | | 3.48 | % | | | 63.47 | % | | | 81.66 | % | | | 5.09 | % | | | 0.00 | % | | | 11.95 | % | | | 1.82 | % | | | 10.13 | % |
| HFBL | | Home Federal Bancorp, Inc. of Louisiana | | LA | | | 1.61 | % | | | 15.16 | % | | | 1.68 | % | | | 77.68 | % | | | 76.84 | % | | | 10.96 | % | | | 0.00 | % | | | 11.29 | % | | | 0.00 | % | | | 11.29 | % |
| JXSB | | Jacksonville Bancorp, Inc. | | IL | | | 9.47 | % | | | 28.31 | % | | | 2.19 | % | | | 56.14 | % | | | 81.25 | % | | | 2.04 | % | | | 0.00 | % | | | 14.60 | % | | | 0.82 | % | | | 13.77 | % |
| MSBF | | MSB Financial Corp. | | NJ | | | 7.30 | % | | | 10.63 | % | | | 3.15 | % | | | 75.92 | % | | | 77.18 | % | | | 5.23 | % | | | 0.00 | % | | | 16.74 | % | | | 0.00 | % | | | 16.74 | % |
| PBSK | | Poage Bankshares, Inc. | | KY | | | 4.79 | % | | | 13.61 | % | | | 1.58 | % | | | 75.81 | % | | | 80.15 | % | | | 2.85 | % | | | 0.63 | % | | | 15.54 | % | | | 0.53 | % | | | 15.01 | % |
| UCBA | | United Community Bancorp | | IN | | | 5.34 | % | | | 36.45 | % | | | 3.29 | % | | | 52.04 | % | | | 83.70 | % | | | 2.27 | % | | | 0.00 | % | | | 13.38 | % | | | 0.53 | % | | | 12.85 | % |
| WAYN | | Wayne Savings Bancshares, Inc. | | OH | | | 1.99 | % | | | 21.04 | % | | | 2.19 | % | | | 72.09 | % | | | 84.46 | % | | | 5.39 | % | | | 0.00 | % | | | 9.29 | % | | | 0.39 | % | | | 8.90 | % |
| WBKC | | Wolverine Bancorp, Inc. | | MI | | | 11.88 | % | | | 0.87 | % | | | 0.00 | % | | | 85.56 | % | | | 69.25 | % | | | 12.73 | % | | | 0.00 | % | | | 17.20 | % | | | 0.00 | % | | | 17.20 | % |
| WVFC | | WVS Financial Corp. | | PA | | | 3.45 | % | | | 74.33 | % | | | 1.33 | % | | | 20.12 | % | | | 42.69 | % | | | 47.08 | % | | | 0.00 | % | | | 9.85 | % | | | 0.00 | % | | | 9.85 | % |
| | | | | | | | | | | | | | | | | | | | | | | | | | | | | | | | | | | | | | | | | | | | | |
| | | | | | | Balance Sheet Annual Growth Rates | | | Regulatory Capital | |
| | | | | | | | | | MBS, Cash & | | | | | | | | | Borrows. | | | Total | | | Tangible | | | Tier 1 | | | Tier 1 | | | Risk-Based | |
| | | | | | | Assets | | | Investments | | | Loans (1) | | | Deposits | | | &Subdebt | | | Equity | | | Equity | | | Leverage | | | Risk-Based | | | Capital | |
| | | | | | | | | | | | | | | | | | | | | | | | | | | | | | | | | | | |
| Heritage Bank of St. Tammany | | LA | | | | | | | | | | | | | | | | | | | | | | | | | | | | | | | | | | | | | | | | |
| December 31, 2016 | | | | | 1.61 | % | | | -2.04 | % | | | 3.74 | % | | | 0.92 | % | | | 4.88 | % | | | 1.44 | % | | | 1.44 | % | | | 9.79 | % | | | 17.35 | % | | | 18.59 | % |
| | | | | | | | | | | | | | | | | | | | | | | | | | | | | | | | | | | | | | | | | | | | | |
| All Public Companies | | | | | | | | | | | | | | | | | | | | | | | | | | | | | | | | | | | | | | | | |
| Averages | | | | | 14.12 | % | | | 8.38 | % | | | 17.61 | % | | | 15.87 | % | | | 17.03 | % | | | 9.70 | % | | | 8.87 | % | | | 12.19 | % | | | 18.38 | % | | | 19.51 | % |
| Medians | | | | | 10.15 | % | | | 0.68 | % | | | 14.36 | % | | | 11.19 | % | | | 0.79 | % | | | 3.79 | % | | | 3.56 | % | | | 11.09 | % | | | 15.49 | % | | | 16.70 | % |
| | | | | | | | | | | | | | | | | | | | | | | | | | | | | | | | | | | | | | | | | | | | | |
| State of LA | | | | | | | | | | | | | | | | | | | | | | | | | | | | | | | | | | | | | | | | |
| Averages | | | | | 6.39 | % | | | -0.94 | % | | | 8.10 | % | | | 2.06 | % | | | 62.05 | % | | | -0.10 | % | | | -0.10 | % | | | 11.51 | % | | | 17.18 | % | | | 18.40 | % |
| Medians | | | | | 6.39 | % | | | -0.94 | % | | | 8.10 | % | | | 2.06 | % | | | 62.05 | % | | | -0.10 | % | | | -0.10 | % | | | 11.51 | % | | | 17.18 | % | | | 18.40 | % |
| | | | | | | | | | | | | | | | | | | | | | | | | | | | | | | | | | | | | | | | | | | | | |
| Comparable Group | | | | | | | | | | | | | | | | | | | | | | | | | | | | | | | | | | | | | | | | |
| Averages | | | | | 10.10 | % | | | 5.59 | % | | | 15.22 | % | | | 13.62 | % | | | 0.44 | % | | | 0.84 | % | | | 0.53 | % | | | 11.85 | % | | | 17.52 | % | | | 18.53 | % |
| Medians | | | | | 6.86 | % | | | -2.40 | % | | | 10.36 | % | | | 7.90 | % | | | -1.95 | % | | | 1.45 | % | | | 0.72 | % | | | 11.66 | % | | | 18.20 | % | | | 18.95 | % |
| | | | | | | | | | | | | | | | | | | | | | | | | | | | | | | | | | | | | | | | | | | | | |
| Comparable Group | | | | | | | | | | | | | | | | | | | | | | | | | | | | | | | | | | | | | | | | |
| EQFN | | Equitable Financial Corp. | | NE | | | 7.67 | % | | | -30.32 | % | | | 11.21 | % | | | 8.53 | % | | | 0.00 | % | | | 3.29 | % | | | 3.29 | % | | | 11.80 | % | | | 13.40 | % | | | 14.70 | % |
| HBK | | Hamilton Bancorp, Inc. | | MD | | | 42.13 | % | | | 32.55 | % | | | 46.80 | % | | | 49.02 | % | | | 55.97 | % | | | 1.36 | % | | | -2.72 | % | | | 7.65 | % | | | 11.71 | % | | | 12.31 | % |
| HFBL | | Home Federal Bancorp, Inc. of Louisiana | | LA | | | 6.39 | % | | | -0.94 | % | | | 8.10 | % | | | 2.06 | % | | | 62.05 | % | | | -0.10 | % | | | -0.10 | % | | | 11.51 | % | | | 17.18 | % | | | 18.40 | % |
| JXSB | | Jacksonville Bancorp, Inc. | | IL | | | 7.97 | % | | | 31.18 | % | | | -2.45 | % | | | 15.16 | % | | | -65.61 | % | | | 3.35 | % | | | 3.56 | % | | | 13.16 | % | | | 18.96 | % | | | 20.21 | % |
| MSBF | | MSB Financial Corp. | | NJ | | | 16.94 | % | | | -20.85 | % | | | 30.52 | % | | | 29.67 | % | | | -30.60 | % | | | -4.95 | % | | | -4.95 | % | | | 13.52 | % | | | 17.68 | % | | | 18.93 | % |
| PBSK | | Poage Bankshares, Inc. | | KY | | | 5.54 | % | | | -3.87 | % | | | 9.51 | % | | | 7.28 | % | | | 3.00 | % | | | -1.53 | % | | | -1.08 | % | | | 13.85 | % | | | 20.64 | % | | | 21.43 | % |
| UCBA | | United Community Bancorp | | IN | | | 1.57 | % | | | -0.57 | % | | | 3.96 | % | | | 2.50 | % | | | -7.69 | % | | | -0.98 | % | | | -0.85 | % | | | 11.42 | % | | | 21.11 | % | | | 22.36 | % |
| WAYN | | Wayne Savings Bancshares, Inc. | | OH | | | 5.14 | % | | | -14.35 | % | | | 13.82 | % | | | 6.59 | % | | | -8.85 | % | | | 4.20 | % | | | 4.39 | % | | | 8.74 | % | | | 13.26 | % | | | 14.25 | % |
| WBKC | | Wolverine Bancorp, Inc. | | MI | | | 7.33 | % | | | 68.18 | % | | | 2.44 | % | | | 10.63 | % | | | 0.00 | % | | | 1.54 | % | | | 1.54 | % | | | 17.02 | % | | | 22.50 | % | | | 23.78 | % |
| WVFC | | WVS Financial Corp. | | PA | | | 0.29 | % | | | -5.08 | % | | | 28.31 | % | | | 4.79 | % | | | -3.90 | % | | | 2.17 | % | | | 2.17 | % | | | 9.81 | % | | | 18.72 | % | | | 18.97 | % |
(1) Includes loans held for sale.
(2) Ratios are based on the date of the most recent financial statements disclosed in the offering prospectus.
| Source: | SNL Financial, LC. and RP® Financial, LC. calculations. The information provided in this table has been obtained from sources we believe are reliable, but we cannot guarantee the accuracy or completeness of such information. |
Copyright (c) 2017 by RP® Financial, LC.
| RP® Financial, LC. | PEER GROUP ANALYSIS
III.7 |
Both Heritage Bank’s and the Peer Group's capital ratios reflected capital surpluses with respect to the regulatory capital requirements.
The interest-earning asset compositions for the Bank and the Peer Group were somewhat similar, with loans constituting the bulk of interest-earning assets for both Heritage Bank and the Peer Group. The Bank’s loans-to-assets ratio of 76.17% was higher than the comparable Peer Group ratio of 66.96%. Comparatively, the Bank’s cash and investments-to-assets ratio of 17.04% was lower than the comparable ratio for the Peer Group of 27.92%. Overall, Heritage Bank’s interest-earning assets amounted to 93.21% of assets, which was slightly less than the comparable Peer Group ratio of 94.88%. The Peer Group’s non-interest earning assets included bank-owned life insurance (“BOLI”) equal to 1.89% of assets and goodwill/intangibles equal to 0.41% of assets, while the Bank maintained BOLI equal to 2.04% of assets and a zero balances of goodwill/intangibles.
Heritage Bank’s funding liabilities reflected a funding strategy that was fairly similar to that of the Peer Group's funding composition. The Bank’s deposits equaled 75.75% of assets, which approximated the Peer Group’s comparable ratio of 76.04%. Comparatively, the Bank maintained a slightly higher level of borrowings than the Peer Group, as indicated by borrowings-to-assets ratios of 13.54% and 9.43% for Heritage Bank and the Peer Group, respectively. Total interest-bearing liabilities maintained by the Bank and the Peer Group, as a percent of assets, equaled 89.29% and 85.47%, respectively, with the Peer Group’s lower ratio supported by maintenance of a higher capital position.
A key measure of balance sheet strength for a thrift institution is its IEA/IBL ratio. Presently, the Bank’s IEA/IBL ratio is lower than the Peer Group’s ratio, based on IEA/IBL ratios of 104.39% and 111.01%, respectively. The additional capital realized from stock proceeds should serve to provide Heritage Bank with an IEA/IBL ratio that is more comparable to the Peer Group’s ratio, as the increase in capital provided by the infusion of stock proceeds will serve to lower the level of interest-bearing liabilities funding assets and will be primarily deployed into interest-earning assets.
The growth rate section of Table 3.2 shows annual growth rates for key balance sheet items. Growth rates for the Bank and the Peer Group are based on annual growth for the twelve months ended December 31, 2016 and September 30, 2016, respectively. Heritage Bank recorded a 1.61% increase in assets, versus a 10.10% increase in assets recorded by the Peer Group. Asset growth for the Peer Group included acquisition related growth recorded by Hamilton Bancorp during the twelve month period. Asset growth for Heritage Bank was
| RP® Financial, LC. | PEER GROUP ANALYSIS
III.8 |
primarily sustained by a 3.74% increase in loans, which was in part funded with a 2.04% decrease in cash and investments. Asset growth for the Peer Group was primarily sustained by a 15.22% increase in loans and was supplemented with a 5.59% increase in cash and investments.
Heritage Bank’s asset growth was funded by a 0.92% increase in deposits and a 4.88% increase in borrowings. Deposit growth of 13.62% funded most of the Peer Group’s assets growth, which was supplemented with a 0.44% increase in borrowings. The Bank’s and Peer Group’s tangible capital increased by 1.44% and 0.53%, respectively. The Bank’s post-conversion capital growth rate will initially be constrained by maintenance of a higher pro forma capital position. Dividend payments and stock repurchases, pursuant to regulatory limitations and guidelines, could also potentially slow the Bank’s capital growth rate in the longer term following the stock offering.
Income and Expense Components
Table 3.3 displays statements of operations for the Bank and the Peer Group. The Bank’s and the Peer Group’s ratios are based on earnings for the twelve months ended December 31, 2016 and September 30, 2016, respectively. Heritage Bank and the Peer Group reported net income to average assets ratios of 0.16% and 0.58%, respectively. The Bank maintained an earnings advantage with respect to net interest income, which was more than offset by the Peer Group’s earnings advantages with respect to non-interest operating income, loan loss provisions, operating expenses, non-operating income and effective tax rate.
The Bank’s slightly stronger net interest income to average assets ratio was realized through maintenance of a higher interest income ratio, which was largely offset by the Peer Group’s lower interest expense ratio. The Bank’s higher interest income ratio was supported by maintaining a higher overall yield earned on interest-earning assets (4.56% versus 3.78% for the Peer Group). Likewise, the Peer Group’s lower interest expense ratio was supported by maintaining a lower cost of funds (0.73% versus 1.20% for the Bank), as well as maintaining a lower level of interest-bearing liabilities as a percent of assets. Overall, Heritage Bank and the Peer Group reported net interest income to average assets ratios of 3.18% and 3.04%, respectively.
In another key area of core earnings strength, the Bank maintained a higher level of operating expenses than the Peer Group. For the period covered in Table 3.3, the Bank and the Peer Group reported operating expense to average assets ratios of 3.08%
| RP® Financial, LC. | PEER GROUP ANALYSIS
III.9 |
Table 3.3
Income as Percent of Average Assets and Yields, Costs, Spreads
Comparable Institution Analysis
For the 12 Months Ended September 30, 2016
| | | | | | | | | | Net Interest Income | | | | | | Non-Interest Income | | | | |
| | | | | | | | | | | | | | | | | | | Loss | | | NII | | | Recurring | | | Other | | | Total | |
| | | | | | | Net | | | | | | | | | | | | Provis. | | | After | | | Gain on Sale | | | Non-Int | | | Non-Int | |
| | | | | | | Income | | | Income | | | Expense | | | NII | | | on IEA | | | Provis. | | | of Loans | | | Income | | | Expense | |
| | | | | | | (%) | | | (%) | | | (%) | | | (%) | | | (%) | | | (%) | | | (%) | | | (%) | | | (%) | |
| Heritage Bank of St. Tammany | | LA | | | | | | | | | | | | | | | | | | | | | | | | | | | | | | | | | | | | |
| December 31, 2016 | | | | | 0.16 | % | | | 4.21 | % | | | 1.02 | % | | | 3.18 | % | | | 0.19 | % | | | 3.00 | % | | | 0.11 | % | | | 0.30 | % | | | 3.08 | % |
| | | | | | | | | | | | | | | | | | | | | | | | | | | | | | | | | | | | | | | | | |
| All Public Companies | | | | | | | | | | | | | | | | | | | | | | | | | | | | | | | | | | | | | | |
| Averages | | | | | | | 0.70 | % | | | 3.54 | % | | | 0.59 | % | | | 2.95 | % | | | 0.07 | % | | | 2.87 | % | | | 0.35 | % | | | 0.54 | % | | | 2.77 | % |
| Medians | | | | | | | 0.62 | % | | | 3.52 | % | | | 0.56 | % | | | 2.92 | % | | | 0.07 | % | | | 2.86 | % | | | 0.06 | % | | | 0.44 | % | | | 2.65 | % |
| | | | | | | | | | | | | | | | | | | | | | | | | | | | | | | | | | | | | | | | | |
| State ofLA | | | | | | | | | | | | | | | | | | | | | | | | | | | | | | | | | | | | | | |
| Averages | | | | | 0.92 | % | | | 4.19 | % | | | 0.69 | % | | | 3.50 | % | | | 0.14 | % | | | 3.37 | % | | | 0.68 | % | | | 0.21 | % | | | 2.89 | % |
| Medians | | | | | 0.92 | % | | | 4.19 | % | | | 0.69 | % | | | 3.50 | % | | | 0.14 | % | | | 3.37 | % | | | 0.68 | % | | | 0.21 | % | | | 2.89 | % |
| | | | | | | | | | | | | | | | | | | | | | | | | | | | | | | | | | | | | | | | | |
| Comparable Group | | | | | | | | | | | | | | | | | | | | | | | | | | | | | | | | | | | | | | |
| Averages | | | | | 0.58 | % | | | 3.59 | % | | | 0.55 | % | | | 3.04 | % | | | 0.08 | % | | | 2.97 | % | | | 0.15 | % | | | 0.45 | % | | | 2.72 | % |
| Medians | | | | | 0.52 | % | | | 3.61 | % | | | 0.50 | % | | | 3.14 | % | | | 0.10 | % | | | 3.04 | % | | | 0.08 | % | | | 0.33 | % | | | 2.68 | % |
| | | | | | | | | | | | | | | | | | | | | | | | | | | | | | | | | | | | | | | | | |
| Comparable Group | | | | | | | | | | | | | | | | | | | | | | | | | | | | | | | | | | | | | | |
| EQFN | | Equitable Financial Corp. | | NE | | | 0.46 | % | | | 3.73 | % | | | 0.47 | % | | | 3.26 | % | | | 0.16 | % | | | 3.10 | % | | | 0.34 | % | | | 0.76 | % | | | 3.47 | % |
| HBK | | Hamilton Bancorp, Inc. | | MD | | | -0.01 | % | | | 3.33 | % | | | 0.56 | % | | | 2.76 | % | | | 0.13 | % | | | 2.63 | % | | | 0.01 | % | | | 0.22 | % | | | 2.64 | % |
| HFBL | | Home Federal Bancorp, Inc. of Louisiana | | LA | | | 0.92 | % | | | 4.19 | % | | | 0.69 | % | | | 3.50 | % | | | 0.14 | % | | | 3.37 | % | | | 0.68 | % | | | 0.21 | % | | | 2.89 | % |
| JXSB | | Jacksonville Bancorp, Inc. | | IL | | | 0.99 | % | | | 3.76 | % | | | 0.33 | % | | | 3.42 | % | | | 0.04 | % | | | 3.38 | % | | | 0.07 | % | | | 1.20 | % | | | 3.43 | % |
| MSBF | | MSB Financial Corp. | | NJ | | | 0.18 | % | | | 3.47 | % | | | 0.55 | % | | | 2.92 | % | | | 0.15 | % | | | 2.76 | % | | | 0.00 | % | | | 0.26 | % | | | 2.62 | % |
| PBSK | | Poage Bankshares, Inc. | | KY | | | 0.43 | % | | | 4.45 | % | | | 0.53 | % | | | 3.92 | % | | | 0.19 | % | | | 3.73 | % | | | 0.13 | % | | | 0.40 | % | | | 3.57 | % |
| UCBA | | United Community Bancorp | | IN | | | 0.68 | % | | | 3.02 | % | | | 0.43 | % | | | 2.59 | % | | | 0.03 | % | | | 2.56 | % | | | 0.09 | % | | | 0.77 | % | | | 2.70 | % |
| WAYN | | Wayne Savings Bancshares, Inc. | | OH | | | 0.57 | % | | | 3.49 | % | | | 0.47 | % | | | 3.03 | % | | | 0.06 | % | | | 2.97 | % | | | 0.06 | % | | | 0.40 | % | | | 2.67 | % |
| WBKC | | Wolverine Bancorp, Inc. | | MI | | | 1.13 | % | | | 4.38 | % | | | 0.98 | % | | | 3.40 | % | | | -0.16 | % | | | 3.56 | % | | | 0.13 | % | | | 0.15 | % | | | 2.11 | % |
| WVFC | | WVS Financial Corp. | | PA | | | 0.42 | % | | | 2.08 | % | | | 0.45 | % | | | 1.63 | % | | | 0.02 | % | | | 1.61 | % | | | 0.00 | % | | | 0.16 | % | | | 1.12 | % |
| | | | | | | Non-Op. Items | | | | | | Yields, Costs, and Spreads | | | | | | | |
| | | | | | | | | | | | | Provision | | | | | | | | | | | | MEMO: | | | MEMO: | |
| | | | | | | Net Gains/ | | | Extrao. | | | for | | | Yield | | | Cost | | | Yld-Cost | | | Assets/ | | | Effective | |
| | | | | | | Losses (2) | | | Items | | | Taxes | | | On IEA | | | Of IBL | | | Spread | | | FTE Emp. | | | Tax Rate | |
| | | | | | | (%) | | | (%) | | | (%) | | | (%) | | | (%) | | | (%) | | | | | | (%) | |
| Heritage Bank of St. Tammany | | LA | | | | | | | | | | | | | | | | | | | | | | | | | | | | | | | | |
| December 31, 2016 | | | | | -0.05 | % | | | 0.00 | % | | | 0.11 | % | | | 4.56 | % | | | 1.20 | % | | | 3.36 | % | | $ | 4,667 | | | | 41.04 | % |
| | | | | | | | | | | | | | | | | | | | | | | | | | | | | | | | | | | | | |
| All Public Companies | | | | | | | | | | | | | | | | | | | | | | | | | | | | | | | | | | |
| Averages | | | | | | | -0.01 | % | | | 0.00 | % | | | 0.27 | % | | | 3.78 | % | | | 0.79 | % | | | 2.99 | % | | $ | 7,034 | | | | 22.90 | % |
| Medians | | | | | | | 0.00 | % | | | 0.00 | % | | | 0.28 | % | | | 3.73 | % | | | 0.73 | % | | | 2.96 | % | | $ | 5,792 | | | | 32.98 | % |
| | | | | | | | | | | | | | | | | | | | | | | | | | | | | | | | | | | | | |
| State ofLA | | | | | | | | | | | | | | | | | | | | | | | | | | | | | | | | | | |
| Averages | | | | | 0.00 | % | | | 0.00 | % | | | 0.45 | % | | | 4.47 | % | | | 0.95 | % | | | 3.52 | % | | $ | 6,392 | | | | 32.98 | % |
| Medians | | | | | 0.00 | % | | | 0.00 | % | | | 0.45 | % | | | 4.47 | % | | | 0.95 | % | | | 3.52 | % | | $ | 6,392 | | | | 32.98 | % |
| | | | | | | | | | | | | | | | | | | | | | | | | | | | | | | | | | | | | |
| Comparable Group | | | | | | | | | | | | | | | | | | | | | | | | | | | | | | | | | | |
| Averages | | | | | -0.01 | % | | | 0.00 | % | | | 0.26 | % | | | 3.78 | % | | | 0.73 | % | | | 3.06 | % | | $ | 5,597 | | | | 38.16 | % |
| Medians | | | | | 0.00 | % | | | 0.00 | % | | | 0.24 | % | | | 3.79 | % | | | 0.69 | % | | | 3.11 | % | | $ | 5,481 | | | | 33.96 | % |
| | | | | | | | | | | | | | | | | | | | | | | | | | | | | | | | | | | | | |
| Comparable Group | | | | | | | | | | | | | | | | | | | | | | | | | | | | | | | | | | |
| EQFN | | Equitable Financial Corp. | | NE | | | -0.02 | % | | | 0.00 | % | | | 0.26 | % | | | 3.93 | % | | | 0.68 | % | | | 3.25 | % | | $ | 3,202 | | | | 35.69 | % |
| HBK | | Hamilton Bancorp, Inc. | | MD | | | -0.15 | % | | | 0.00 | % | | | 0.07 | % | | | 3.61 | % | | | 0.73 | % | | | 2.88 | % | | $ | 6,989 | | | | 107.28 | % |
| HFBL | | Home Federal Bancorp, Inc. of Louisiana | | LA | | | 0.00 | % | | | 0.00 | % | | | 0.45 | % | | | 4.47 | % | | | 0.95 | % | | | 3.52 | % | | $ | 6,392 | | | | 32.98 | % |
| JXSB | | Jacksonville Bancorp, Inc. | | IL | | | 0.11 | % | | | 0.00 | % | | | 0.35 | % | | | 4.00 | % | | | 0.45 | % | | | 3.55 | % | | $ | 3,518 | | | | 25.99 | % |
| MSBF | | MSB Financial Corp. | | NJ | | | -0.13 | % | | | 0.00 | % | | | 0.09 | % | | | 3.66 | % | | | 0.79 | % | | | 2.87 | % | | $ | 6,883 | | | | 33.04 | % |
| PBSK | | Poage Bankshares, Inc. | | KY | | | -0.02 | % | | | 0.00 | % | | | 0.24 | % | | | 4.71 | % | | | 0.70 | % | | | 4.01 | % | | $ | 4,079 | | | | 35.44 | % |
| UCBA | | United Community Bancorp | | IN | | | 0.08 | % | | | 0.00 | % | | | 0.13 | % | | | 3.25 | % | | | 0.56 | % | | | 2.69 | % | | $ | 4,570 | | | | 15.62 | % |
| WAYN | | Wayne Savings Bancshares, Inc. | | OH | | | 0.00 | % | | | 0.00 | % | | | 0.19 | % | | | 3.66 | % | | | 0.58 | % | | | 3.08 | % | | $ | 3,878 | | | | 24.69 | % |
| WBKC | | Wolverine Bancorp, Inc. | | MI | | | 0.00 | % | | | 0.00 | % | | | 0.60 | % | | | 4.43 | % | | | 1.28 | % | | | 3.15 | % | | $ | 7,404 | | | | 34.87 | % |
| WVFC | | WVS Financial Corp. | | PA | | | 0.01 | % | | | 0.00 | % | | | 0.24 | % | | | 2.12 | % | | | 0.53 | % | | | 1.59 | % | | $ | 9,053 | | | | 35.96 | % |
(1) Net gains/losses includes gain/loss on sale of securities and nonrecurring income and expense.
(2) Ratios are based on the date of the most recent financial statements disclosed in the offering prospectus.
| Source: | SNL Financial, LC. and RP® Financial, LC. calculations. The information provided in this table has been obtained from sources we believe are reliable, but we cannot guarantee the accuracy or completeness of such information. |
Copyright (c) 2017 by RP® Financial, LC.
| RP® Financial, LC. | PEER GROUP ANALYSIS
III.10 |
and 2.72%, respectively. Consistent with the Bank’s higher operating expense ratio, the Bank’s ratio for assets per full time equivalent employee of $4.7 million was less than the comparable Peer Group ratio of $5.6 million. On a post-offering basis, the Bank’s operating expenses can be expected to increase with the addition of stock benefit plans and certain expenses that result from being a publicly-traded company, with such expenses already impacting the Peer Group's operating expenses. At the same time, Heritage Bank’s capacity to leverage operating expenses will increase and be more consistent or greater than the Peer Group’s leverage capacity following the increase in capital realized from the infusion of net stock proceeds.
When viewed together, net interest income and operating expenses provide considerable insight into a thrift's earnings strength, since those sources of income and expenses are typically the most prominent components of earnings and are generally more predictable than losses and gains realized from the sale of assets or other non-recurring activities. In this regard, as measured by their expense coverage ratios (net interest income divided by operating expenses), the Bank’s earnings were slightly less favorable than the Peer Group’s. Expense coverage ratios posted by Heritage Bank and the Peer Group equaled 1.03x and 1.12x, respectively.
Sources of non-interest operating income were a less significant contributor to the Bank’s earnings, with such income amounting to 0.41% and 0.60% of Heritage Bank’s and the Peer Group’s average assets, respectively. Taking non-interest operating income into account in comparing the Bank’s and the Peer Group's earnings, Heritage Ban’s efficiency ratio (operating expenses as a percent of the sum of non-interest operating income and net interest income) of 85.79% was less favorable than the Peer Group's efficiency ratio of 74.73%.
Loan loss provisions had a larger impact on the Bank’s earnings, with loan loss provisions established by the Bank and the Peer Group equaling 0.19% and 0.08% of average assets, respectively.
Net gains and losses realized from the sale of assets and other non-operating items equaled a net loss of 0.05% of average assets for the Bank, versus a net loss of 0.01% of average assets for the Peer Group. Typically, gains and losses generated from the sale of assets or other non-recurring activities such as merger related expenses are viewed as earnings with a relatively high degree of volatility, particularly to the extent that such gains and losses result from the sale of investments or other not ongoing activities that are not considered to be part of an institution’s core operations. Extraordinary items were not a factor in either the Bank’s or the Peer Group's earnings.
| RP® Financial, LC. | PEER GROUP ANALYSIS
III.11 |
Taxes had a slightly larger impact on the Bank’s earnings, as Heritage Bank and the Peer Group posted effective tax rates of 41.04% and 38.16%, respectively. As indicated in the prospectus, the Bank’s effective marginal tax rate is equal to 34.0%.
Loan Composition
Table 3.4 presents data related to the Bank’s and the Peer Group’s loan portfolio compositions (including the investment in mortgage-backed securities). The Bank’s loan portfolio composition reflected a higher combined concentration of 1-4 family permanent mortgage loans and mortgage-backed securities relative to the Peer Group (66.93% of assets versus 44.51% for the Peer Group). The Bank maintained a higher concentration of 1-4 family permanent mortgage loans, while the Peer Group maintained a higher concentration of mortgage-backed securities. Loans serviced for others equaled 42.76% and 9.60% of the Bank’s and the Peer Group’s assets respectively, thereby, indicating that loan servicing has a more impact on the Bank’s earnings. Loan servicing intangibles constituted a relatively small balance sheet item for the Bank and the Peer Group.
Diversification into higher yielding and higher risk types of loans was more significant for the Peer Group. Commercial real estate loans constituted the most significant area of lending diversification for the Bank (7.38% of assets), followed by construction/land loans (6.51% of assets), and multi-family loans (2.68% of assets). Likewise, commercial real estate loans comprised the most significant area of lending diversification for the Peer Group (20.04% of assets), followed by commercial business loans (4.87% of assets) and construction/land loans (3.98% of assets). In total, construction/land, commercial real estate, multi-family, commercial business and consumer loans comprised 19.45% and 34.08% of the Bank’s and the Peer Group’s assets, respectively. Overall, the Bank’s less significant diversification into higher risk types of lending translated into a lower risk weighted assets-to-assets ratio compared to the Peer Group’s ratio. The Bank’s risk weighted assets-to-assets ratio equaled 55.40%, versus a comparable ratio of 67.22% for the Peer Group.
Interest Rate Risk
Table 3.5 reflects various key ratios highlighting the relative interest rate risk exposure of the Bank versus the Peer Group. In terms of balance sheet composition, Heritage Bank’s’ interest rate risk characteristics were considered to be less favorable than the Peer Group’s measures. Most notably, the Bank’s tangible equity-to-assets ratio and IEA/IBL ratio were lower
| RP® Financial, LC. | PEER GROUP ANALYSIS
III.12 |
Table 3.4
Loan Portfolio Composition and Related Information
Comparable Institution Analysis
As of September 30, 2016
| | | | | | | Portfolio Composition as a Percent of Assets | | | | | | | | | | |
| | | | | | | | | | 1-4 | | | Constr. | | | Multi- | | | | | | Commerc. | | | | | | RWA/ | | | Serviced | | | Servicing | |
| Institution | | | | MBS | | | Family | | | & Land | | | Family | | | Comm RE | | | Business | | | Consumer | | | Assets | | | For Others | | | Assets | |
| | | | | | | (%) | | | (%) | | | (%) | | | (%) | | | (%) | | | (%) | | | (%) | | | (%) | | | ($000) | | | ($000) | |
| | | | | | | | | | | | | | | | | | | | | | | | | | | | | | | | | | | |
| Heritage Bank of St. Tammany | | LA | | | 8.17 | % | | | 58.76 | % | | | 6.51 | % | | | 2.68 | % | | | 7.38 | % | | | 0.30 | % | | | 2.58 | % | | | 55.40 | % | | $ | 41,908 | | | $ | 325 | |
| December 31, 2016 | | | | | | | | | | | | | | | | | | | | | | | | | | | | | | | | | | | | | | | | | | |
| | | | | | | | | | | | | | | | | | | | | | | | | | | | | | | | | | | | | | | | | | | | | |
| All Public Companies | | | | | | | | | | | | | | | | | | | | | | | | | | | | | | | | | | | | | | | | | | |
| Averages | | | | | 9.42 | % | | | 32.65 | % | | | 3.88 | % | | | 10.03 | % | | | 19.13 | % | | | 5.17 | % | | | 1.55 | % | | | 69.64 | % | | $ | 1,399,105 | | | $ | 7,896 | |
| Medians | | | | | 7.77 | % | | | 32.74 | % | | | 2.92 | % | | | 3.76 | % | | | 17.84 | % | | | 4.27 | % | | | 0.39 | % | | | 71.35 | % | | $ | 58,500 | | | $ | 389 | |
| | | | | | | | | | | | | | | | | | | | | | | | | | | | | | | | | | | | | | | | | | | | | |
| State ofLA | | | | | | | | | | | | | | | | | | | | | | | | | | | | | | | | | | | | | | | | | | |
| Averages | | | | | 5.70 | % | | | 36.00 | % | | | 1.55 | % | | | 21.29 | % | | | 14.88 | % | | | 3.66 | % | | | 1.03 | % | | | 65.89 | % | | $ | 3,121,777 | | | $ | 28,112 | |
| Medians | | | | | 5.36 | % | | | 31.56 | % | | | 0.74 | % | | | 2.31 | % | | | 15.91 | % | | | 2.39 | % | | | 0.03 | % | | | 69.00 | % | | $ | 27,214 | | | $ | 191 | |
| | | | | | | | | | | | | | | | | | | | | | | | | | | | | | | | | | | | | | | | | | | | | |
| Comparable Group | | | | | | | | | | | | | | | | | | | | | | | | | | | | | | | | | | | | | | | | | | |
| Averages | | | | | 12.46 | % | | | 31.74 | % | | | 3.93 | % | | | 3.99 | % | | | 20.33 | % | | | 4.86 | % | | | 1.21 | % | | | 67.35 | % | | $ | 39,112 | | | $ | 309 | |
| Medians | | | | | 12.04 | % | | | 35.80 | % | | | 2.71 | % | | | 2.86 | % | | | 17.95 | % | | | 5.18 | % | | | 0.40 | % | | | 66.05 | % | | $ | 24,425 | | | $ | 296 | |
| | | | | | | | | | | | | | | | | | | | | | | | | | | | | | | | | | | | | | | | | | | | | |
| Comparable Group | | | | | | | | | | | | | | | | | | | | | | | | | | | | | | | | | | | | | | | | | | |
| EQFN | | Equitable Financial Corp. | | NE | | | 0.34 | % | | | 22.51 | % | | | 8.13 | % | | | 2.93 | % | | | 39.32 | % | | | 7.75 | % | | | 1.58 | % | | | 90.75 | % | | $ | 103,050 | | | $ | 748 | |
| HBK | | Hamilton Bancorp Inc | | MD | | | 14.69 | % | | | 38.05 | % | | | 2.62 | % | | | 1.92 | % | | | 17.17 | % | | | 3.61 | % | | | 0.52 | % | | | 63.52 | % | | $ | 0 | | | $ | 0 | |
| HFBL | | Home Fedl Bncp Inc. LA | | LA | | | 14.48 | % | | | 39.77 | % | | | 9.19 | % | | | 3.97 | % | | | 18.45 | % | | | 7.02 | % | | | 0.12 | % | | | 65.77 | % | | $ | 36,639 | | | $ | 246 | |
| JXSB | | Jacksonville Bancorp | | IL | | | 9.59 | % | | | 16.99 | % | | | 2.79 | % | | | 1.82 | % | | | 19.90 | % | | | 6.90 | % | | | 4.21 | % | | | 66.19 | % | | $ | 128,982 | | | $ | 585 | |
| MSBF | | MSB Financial Corp. | | NJ | | | 5.80 | % | | | 44.26 | % | | | 2.04 | % | | | 6.07 | % | | | 17.44 | % | | | 3.56 | % | | | 0.11 | % | | | 72.00 | % | | $ | 0 | | | $ | 0 | |
| PBSK | | Poage Bankshares Inc. | | KY | | | 6.01 | % | | | 43.22 | % | | | 3.64 | % | | | 1.26 | % | | | 15.95 | % | | | 8.19 | % | | | 4.12 | % | | | 66.89 | % | | $ | 0 | | | $ | 345 | |
| UCBA | | United Community Bancorp | | IN | | | 19.01 | % | | | 33.54 | % | | | 1.53 | % | | | 3.06 | % | | | 12.48 | % | | | 0.87 | % | | | 0.88 | % | | | 53.14 | % | | $ | 72,752 | | | $ | 694 | |
| WAYN | | Wayne Savings Bancshares | | OH | | | 14.59 | % | | | 41.79 | % | | | 1.62 | % | | | 2.78 | % | | | 21.60 | % | | | 4.80 | % | | | 0.29 | % | | | 65.92 | % | | $ | 37,489 | | | $ | 414 | |
| WBKC | | Wolverine Bancorp Inc. | | MI | | | 0.00 | % | | | 20.59 | % | | | 6.20 | % | | | 14.93 | % | | | 40.53 | % | | | 5.56 | % | | | 0.26 | % | | | 76.28 | % | | $ | 12,211 | | | $ | 60 | |
| WVFC | | WVS Financial Corp. | | PA | | | 40.11 | % | | | 16.71 | % | | | 1.51 | % | | | 1.16 | % | | | 0.49 | % | | | 0.31 | % | | | 0.05 | % | | | 53.06 | % | | $ | 0 | | | $ | 0 | |
(1) Ratios are based on the date of the most recent financial statements disclosed in the offering prospectus.
| Source: | SNL Financial LC. and RP® Financial, LC. calculations. The information provided in this table has been obtained from sources we believe are reliable, but we cannot guarantee the accuracy or completeness of such information. |
Copyright (c) 2017 by RP® Financial, LC.
| RP® Financial, LC. | PEER GROUP ANALYSIS
III.13 |
Table 3.5
Interest Rate Risk Measures and Net Interest Income Volatility
Comparable Institution Analysis
As of September 30, 2016
| | | | | | | Balance Sheet Measures | | | | | | | | | | | | | | | | | | | |
| | | | | | | Tangible | | | | | | Non-IEA | | | | |
| | | | | | | Equity/ | | | IEA/ | | | Assets/ | | | Quarterly Change in Net Interest Income | |
| | | | | Assets | | | IBL | | | Assets | | | 9/30/2016 | | | 6/30/2016 | | | 3/31/2016 | | | 12/31/2015 | | | 9/30/2015 | | | 6/30/2015 | |
| | | | | | | (%) | | | (%) | | | (%) | | | (change in net interest income is annualized in basis points) | |
| Heritage Bank of St. Tammany | | LA | | | | | | | | | | | | | | | | | | | | | | | | | | | | | | | | | | | | |
| December 31, 2016 | | | | | 9.7 | % | | | 104.4 | % | | | 6.8 | % | | | -29 | | | | 33 | | | | -3 | | | | 24 | | | | 0 | | | | -15 | |
| | | | | | | | | | | | | | | | | | | | | | | | | | | | | | | | | | | | | | | | | |
| All Public Companies | | | | | 12.1 | % | | | 129.0 | % | | | 7.4 | % | | | 0 | | | | 2 | | | | -5 | | | | 1 | | | | 3 | | | | 1 | |
| State ofLA | | | | | 11.3 | % | | | 124.5 | % | | | 6.0 | % | | | -9 | | | | 12 | | | | 16 | | | | -8 | | | | -3 | | | | -3 | |
| | | | | | | | | | | | | | | | | | | | | | | | | | | | | | | | | | | | | | | | | |
| Comparable Group | | | | | | | | | | | | | | | | | | | | | | | | | | | | | | | | | | | | | | |
| Average | | | | | 13.2 | % | | | 111.1 | % | | | 5.1 | % | | | 3 | | | | 3 | | | | -6 | | | | 1 | | | | 10 | | | | -4 | |
| Median | | | | | 13.4 | % | | | 110.9 | % | | | 5.7 | % | | | 1 | | | | 1 | | | | 4 | | | | 4 | | | | 4 | | | | -3 | |
| | | | | | | | | | | | | | | | | | | | | | | | | | | | | | | | | | | | | | | | | |
| Comparable Group | | | | | | | | | | | | | | | | | | | | | | | | | | | | | | | | | | | | | | |
| EQFN | | Equitable Financial Corp. | | NE | | | 15.9 | % | | | 114.6 | % | | | 4.6 | % | | | 18 | | | | 17 | | | | -20 | | | | -26 | | | | 38 | | | | 22 | |
| HBK | | Hamilton Bancorp, Inc. | | MD | | | 10.3 | % | | | 105.8 | % | | | 8.2 | % | | | 4 | | | | 1 | | | | -29 | | | | 21 | | | | 4 | | | | -3 | |
| HFBL | | Home Federal Bancorp, Inc. of Louisiana | | LA | | | 11.3 | % | | | 107.6 | % | | | 5.5 | % | | | -9 | | | | 12 | | | | 16 | | | | -8 | | | | -3 | | | | -3 | |
| JXSB | | Jacksonville Bancorp, Inc. | | IL | | | 13.9 | % | | | 112.8 | % | | | 6.1 | % | | | -18 | | | | -12 | | | | 7 | | | | 13 | | | | -4 | | | | 0 | |
| MSBF | | MSB Financial Corp. | | NJ | | | 16.7 | % | | | 113.9 | % | | | 6.1 | % | | | -14 | | | | 5 | | | | 18 | | | | 6 | | | | -5 | | | | -1 | |
| PBSK | | Poage Bankshares, Inc. | | KY | | | 15.1 | % | | | 112.7 | % | | | 5.8 | % | | | 0 | | | | -11 | | | | -40 | | | | 36 | | | | 15 | | | | -15 | |
| UCBA | | United Community Bancorp | | IN | | | 12.9 | % | | | 109.1 | % | | | 6.2 | % | | | -12 | | | | 0 | | | | 1 | | | | 2 | | | | 4 | | | | 5 | |
| WAYN | | Wayne Savings Bancshares, Inc. | | OH | | | 8.9 | % | | | 105.9 | % | | | 4.9 | % | | | 9 | | | | -12 | | | | 8 | | | | 5 | | | | 4 | | | | -3 | |
| WBKC | | Wolverine Bancorp, Inc. | | MI | | | 17.2 | % | | | 119.9 | % | | | 1.7 | % | | | 45 | | | | 26 | | | | -31 | | | | -31 | | | | 50 | | | | -7 | |
| WVFC | | WVS Financial Corp. | | PA | | | 9.9 | % | | | 109.1 | % | | | 2.1 | % | | | 2 | | | | 2 | | | | 6 | | | | -3 | | | | 2 | | | | -31 | |
NA=Change is greater than 100 basis points during the quarter.
(1) Ratios are based on the date of the most recent financial statements disclosed in the offering prospectus.
| Source: | SNL Financial LC. and RP® Financial, LC. calculations. The information provided in this table has been obtained from sources we believe are reliable, but we cannot guarantee the accuracy or completeness of such information. |
Copyright (c) 2017 by RP® Financial, LC.
| RP® Financial, LC. | PEER GROUP ANALYSIS
III.14 |
than the comparable Peer Group ratios. Additionally, the Peer Group maintained an advantage with respect to its lower ratio of non-interest earning assets as a percent of assets. On a pro forma basis, the infusion of stock proceeds should serve to largely address the current comparative advantages reflected in the Peer Group's balance sheet interest rate risk characteristics.
To analyze interest rate risk associated with the net interest margin, we reviewed quarterly changes in net interest income as a percent of average assets for Heritage Bank and the Peer Group. In general, the comparative fluctuations in the Bank’s and the Peer Group’s ratios implied that the interest rate risk associated with the Bank’s net interest income was greater compared to the interest rate risk associated with Peer Group’s net interest income, based on the interest rate environment that prevailed during the period covered in Table 3.5. The stability of the Bank’s net interest margin should be enhanced by the infusion of stock proceeds, as interest rate sensitive liabilities will be funding a lower portion of Heritage Bank’s assets and the proceeds will be substantially deployed into interest-earning assets.
Credit Risk
Overall, based on a comparison of credit quality measures, the Bank’s implied credit risk exposure was considered to be less than Peer Group’s implied credit risk exposure. As shown in Table 3.6, the Bank’s non-performing assets/assets and non-performing loans/loans ratios equaled 0.64% and 0.70%, respectively, versus comparable measures of 1.41% and 1.85% for the Peer Group. It should be noted that the measures for non-performing assets and non-performing loans include performing loans that are classified as troubled debt restructurings. The Bank’s and Peer Group’s loss reserves as a percent of non-performing loans equaled 128.62% and 101.01%, respectively. Loss reserves maintained as percent of loans receivable equaled 0.90% for the Bank, versus 1.26% for the Peer Group. Net loan charge-offs were slightly higher for the Bank, as net loan charge-offs for the Bank equaled 0.10% of loans versus 0.06% of loans for the Peer Group.
Summary
Based on the above analysis, RP Financial concluded that the Peer Group forms a reasonable basis for determining the pro forma market value of the Bank. Such general characteristics as asset size, capital position, interest-earning asset composition, funding composition, core earnings measures, loan portfolio composition, credit quality and exposure to
| RP® Financial, LC. | PEER GROUP ANALYSIS
III.15 |
Table 3.6
Credit Risk Measures and Related Information
Comparable Institution Analysis
As of September 30, 2016
| | | | | | | | | | NPAs & | | | Adj NPAs & | | | | | | | | | | | | Rsrves/ | | | | | | | |
| | | | | | | REO/ | | | 90+Del/ | | | 90+Del/ | | | NPLs/ | | | Rsrves/ | | | Rsrves/ | | | NPAs & | | | Net Loan | | | NLCs/ | |
| | | | | Assets | | | Assets (1) | | | Assets (2) | | | Loans (1) | | | Loans HFI | | | NPLs (1) | | | 90+Del (1) | | | Chargeoffs (3) | | | Loans | |
| | | | | | | (%) | | | (%) | | | (%) | | | (%) | | | (%) | | | (%) | | | (%) | | | ($000) | | | (%) | |
| Heritage Bank of St. Tammany | | LA | | | | | | | | | | | | | | | | | | | | | | | | | | | | | | | | | | | | |
| December 31, 2016 | | | | | 0.09 | % | | | 0.64 | % | | | 0.62 | % | | | 0.70 | % | | | 0.90 | % | | | 128.62 | % | | | 109.67 | % | | $ | 80 | | | | 0.10 | % |
| | | | | | | | | | | | | | | | | | | | | | | | | | | | | | | | | | | | | | | | | |
| All Public Companies | | | | | | | | | | | | | | | | | | | | | | | | | | | | | | | | | | | | | | |
| Averages | | | | | | 0.10 | % | | | 1.08 | % | | | 0.67 | % | | | 1.35 | % | | | 1.00 | % | | | 117.87 | % | | | 99.34 | % | | $ | 1,621 | | | | 0.06 | % |
| Medians | | | | | 0.04 | % | | | 0.88 | % | | | 0.54 | % | | | 1.08 | % | | | 0.94 | % | | | 92.03 | % | | | 82.77 | % | | $ | 180 | | | | 0.03 | % |
| | | | | | | | | | | | | | | | | | | | | | | | | | | | | | | | | | | | | | | | | |
| State ofLA | | | | | | | | | | | | | | | | | | | | | | | | | | | | | | | | | | | | | | |
| Averages | | | | | 0.00 | % | | | 0.29 | % | | | 0.29 | % | | | 0.31 | % | | | 1.08 | % | | | 331.61 | % | | | 281.85 | % | | $ | (18 | ) | | | -0.01 | % |
| Medians | | | | | 0.00 | % | | | 0.29 | % | | | 0.29 | % | | | 0.31 | % | | | 1.08 | % | | | 331.61 | % | | | 281.85 | % | | $ | (18 | ) | | | -0.01 | % |
| | | | | | | | | | | | | | | | | | | | | | | | | | | | | | | | | | | | | | | | | |
| Comparable Group | | | | | | | | | | | | | | | | | | | | | | | | | | | | | | | | | | | | | | |
| Averages | | | | | | | 0.06 | % | | | 1.41 | % | | | 0.86 | % | | | 1.85 | % | | | 1.26 | % | | | 101.01 | % | | | 93.64 | % | | $ | 153 | | | | 0.06 | % |
| Medians | | | | | | | 0.02 | % | | | 1.28 | % | | | 0.92 | % | | | 1.89 | % | | | 1.15 | % | | | 74.55 | % | | | 68.84 | % | | $ | 76 | | | | 0.03 | % |
| | | | | | | | | | | | | | | | | | | | | | | | | | | | | | | | | | | | | | | | | |
| Comparable Group | | | | | | | | | | | | | | | | | | | | | | | | | | | | | | | | | | | | | | |
| EQFN | | Equitable Financial Corp. | | NE | | | 0.20 | % | | | 1.93 | % | | | 0.98 | % | | | 1.87 | % | | | 1.47 | % | | | 77.76 | % | | | 69.57 | % | | $ | (17 | ) | | | -0.01 | % |
| HBK | | Hamilton Bancorp, Inc. | | MD | | | 0.09 | % | | | 1.23 | % | | | 0.86 | % | | | 1.68 | % | | | 0.59 | % | | | 34.98 | % | | | 30.61 | % | | $ | 376 | | | | 0.15 | % |
| HFBL | | Home Federal Bancorp, Inc. of Louisiana | | LA | | | 0.00 | % | | | 0.29 | % | | | 0.29 | % | | | 0.31 | % | | | 1.08 | % | | | 331.61 | % | | | 281.85 | % | | $ | (18 | ) | | | -0.01 | % |
| JXSB | | Jacksonville Bancorp, Inc. | | IL | | | 0.07 | % | | | 1.33 | % | | | 0.57 | % | | | 2.22 | % | | | 1.58 | % | | | 71.34 | % | | | 67.78 | % | | $ | 52 | | | | 0.03 | % |
| MSBF | | MSB Financial Corp. | | NJ | | | 0.00 | % | | | 3.60 | % | | | 1.45 | % | | | 4.59 | % | | | 1.21 | % | | | 26.42 | % | | | 25.94 | % | | $ | 127 | | | | 0.05 | % |
| PBSK | | Poage Bankshares, Inc. | | KY | | | 0.22 | % | | | 1.78 | % | | | 1.07 | % | | | 2.04 | % | | | 0.68 | % | | | 33.13 | % | | | 29.03 | % | | $ | 537 | | | | 0.16 | % |
| UCBA | | United Community Bancorp | | IN | | | 0.01 | % | | | 1.03 | % | | | 1.03 | % | | | 1.90 | % | | | 1.62 | % | | | 84.53 | % | | | 82.99 | % | | $ | 818 | | | | 0.30 | % |
| WAYN | | Wayne Savings Bancshares, Inc. | | OH | | | 0.00 | % | | | 0.96 | % | | | 0.35 | % | | | 1.31 | % | | | 0.90 | % | | | 68.18 | % | | | 68.11 | % | | $ | 99 | | | | 0.03 | % |
| WBKC | | Wolverine Bancorp, Inc. | | MI | | | 0.02 | % | | | 1.92 | % | | | 1.87 | % | | | 2.16 | % | | | 2.87 | % | | | 132.93 | % | | | 131.27 | % | | $ | (448 | ) | | | -0.14 | % |
| WVFC | | WVS Financial Corp. | | PA | | | 0.00 | % | | | 0.08 | % | | | 0.08 | % | | | 0.37 | % | | | 0.55 | % | | | 149.21 | % | | | 149.21 | % | | $ | 0 | | | | 0.00 | % |
(1) Includes TDRs for the Company and the Peer Group.
(2) Excludes TDRs that are in compliance with their modified terms.
(3) Net loan chargeoffs are shown on a last twelve month basis.
(4) Ratios are based on the date of the most recent financial statements disclosed in the offering prospectus.
| Source: | SNL Financial, LC and RP® Financial, LC. calculations. The information provided in this table has been obrained from sources we believe are reliable, but we cannot guarantee the accuracy or completeness of such information. |
Copyright (c) 2017 by RP® Financial, LC.
| RP® Financial, LC. | PEER GROUP ANALYSIS
III.16 |
interest rate risk all tend to support the reasonability of the Peer Group from a financial standpoint. Those areas where differences exist will be addressed in the form of valuation adjustments to the extent necessary.
| RP® Financial, LC. | VALUATION ANALYSIS |
IV.1
IV. VALUATION ANALYSIS
Introduction
This chapter presents the valuation analysis and methodology prepared pursuant to the regulatory valuation guidelines, and valuation adjustments and assumptions used to determine the estimated pro forma market value of the common stock to be issued in conjunction with the Bank’s conversion transaction.
Appraisal Guidelines
The federal regulatory appraisal guidelines required by the OCC, the FRB and the FDIC specify the pro forma market value methodology for estimating the pro forma market value of a converting thrift. Pursuant to this methodology: (1) a peer group of comparable publicly-traded institutions is selected; (2) a financial and operational comparison of the subject company to the peer group is conducted to discern key differences; and (3) a valuation analysis in which the pro forma market value of the subject company is determined based on the market pricing of the peer group as of the date of valuation, incorporating valuation adjustments for key differences. In addition, the pricing characteristics of recent conversions, both at conversion and in the aftermarket, must be considered.
RP Financial Approach to the Valuation
The valuation analysis herein complies with such regulatory approval guidelines. Accordingly, the valuation incorporates a detailed analysis based on the Peer Group, discussed in Chapter III, which constitutes “fundamental analysis” techniques. Additionally, the valuation incorporates a “technical analysis” of recently completed stock conversions, including closing pricing and aftermarket trading of such offerings. It should be noted that these valuation analyses cannot possibly fully account for all the market forces which impact trading activity and pricing characteristics of a particular stock on a given day.
The pro forma market value determined herein is a preliminary value for the Bank’s to-be-issued stock. Throughout the conversion process, RP Financial will: (1) review changes in Heritage Bank’s operations and financial condition; (2) monitor Heritage Bank’s operations and financial condition relative to the Peer Group to identify any fundamental changes; (3) monitor the external factors affecting value including, but not limited to, local and national economic
| RP® Financial, LC. | VALUATION ANALYSIS |
IV.2
conditions, interest rates, and the stock market environment, including the market for thrift stocks; and (4) monitor pending conversion offerings (including those in the offering phase), both regionally and nationally. If material changes should occur during the conversion process, RP Financial will evaluate if updated valuation reports should be prepared reflecting such changes and their related impact on value, if any. RP Financial will also prepare a final valuation update at the closing of the offering to determine if the prepared valuation analysis and resulting range of value continues to be appropriate.
The appraised value determined herein is based on the current market and operating environment for the Bank and for all thrifts. Subsequent changes in the local and national economy, the legislative and regulatory environment, the stock market, interest rates, and other external forces (such as natural disasters or major world events), which may occur from time to time (often with great unpredictability) may materially impact the market value of all thrift stocks, including Heritage Bank’s value, or Heritage Bank’s value alone. To the extent a change in factors impacting the Bank’s value can be reasonably anticipated and/or quantified, RP Financial has incorporated the estimated impact into the analysis.
Valuation Analysis
A fundamental analysis discussing similarities and differences relative to the Peer Group was presented in Chapter III. The following sections summarize the key differences between the Bank and the Peer Group and how those differences affect the pro forma valuation. Emphasis is placed on the specific strengths and weaknesses of the Bank relative to the Peer Group in such key areas as financial condition, profitability, growth and viability of earnings, asset growth, primary market area, dividends, liquidity of the shares, marketing of the issue, management, and the effect of government regulations and/or regulatory reform. We have also considered the market for thrift stocks, in particular new issues, to assess the impact on value of the Bank coming to market at this time.
The financial condition of an institution is an important determinant in pro forma market value because investors typically look to such factors as liquidity, capital, asset composition and quality, and funding sources in assessing investment attractiveness. The similarities and differences in the Bank’s and the Peer Group’s financial strengths are noted as follows:
| RP® Financial, LC. | VALUATION ANALYSIS |
IV.3
| § | Overall A/L Composition. In comparison to the Peer Group, the Bank’s interest-earning asset composition showed a higher concentration of loans and a lower concentration of cash and investments as a percent of assets. Lending diversification into higher risk and higher yielding types of loans was more significant for the Peer Group. Overall, in comparison to the Peer Group, the Bank’s interest-earning asset composition provided for a higher yield earned on interest-earning assets and a lower risk weighted assets-to-assets ratio. Heritage Bank’s funding composition reflected a similar level of deposits and a slightly higher level of borrowings than the comparable Peer Group ratios, which translated into a higher cost of funds for the Bank. Overall, as a percent of assets, the Bank maintained a lower level of interest-earning assets and a higher level interest-bearing liabilities compared to the Peer Group’s ratios, which resulted in a lower IEA/IBL ratio for the Bank. After factoring in the impact of the net stock proceeds, the Bank’s IEA/IBL ratio should be comparable to or exceed the Peer Group’s ratio. On balance, RP Financial concluded that asset/liability composition was a neutral factor in our adjustment for financial condition. |
| § | Credit Quality. The Bank’s ratios for non-performing assets and non-performing loans were more favorable than the comparable Peer Group ratios. Loss reserves as a percent of non-performing loans were higher for the Bank, while the Peer Group maintained a higher level of loss reserves as a percent of loans. Net loan charge-offs were a slightly more significant factor for the Bank. As noted above, the Bank’s risk weighted assets-to-assets ratio was lower than the Peer Group’s ratio. Overall, RP Financial concluded that credit quality was a slightly positive factor in our adjustment for financial condition. |
| § | Balance Sheet Liquidity. The Bank operated with a lower level of cash and investment securities relative to the Peer Group (17.04% of assets versus 27.92% for the Peer Group). Following the infusion of stock proceeds, the Bank’s cash and investments ratio is expected to increase as the proceeds retained at the holding company level will be initially deployed into investments. The Bank’s future borrowing capacity was considered to be slightly less than the Peer Group’s, based on the slightly higher level of borrowings funding the Bank’s assets. Overall, RP Financial concluded that balance sheet liquidity was a neutral factor in our adjustment for financial condition. |
| § | Funding Liabilities. The Bank’s interest-bearing funding composition reflected a similar concentration of deposits and a slightly higher concentration of borrowings relative to the comparable Peer Group ratios, which translated into a higher cost of funds for the Bank. Total interest-bearing liabilities as a percent of assets were higher for the Bank compared to the Peer Group’s ratio, which was attributable to Heritage Bank’s lower capital position. Following the stock offering, the increase in the Bank’s capital position will reduce the level of interest-bearing liabilities funding the Bank’s assets to a ratio that is lower than the Peer Group’s level of interest-bearing liabilities funding assets. Overall, RP Financial concluded that funding liabilities were a neutral factor in our adjustment for financial condition. |
| § | Capital. The Bank currently operates with a lower equity-to-assets ratio than the Peer Group. However, following the stock offering, Heritage Bank’s pro forma capital position can be expected to exceed the Peer Group's equity-to-assets ratio. The Bank’s higher pro forma capital position implies greater leverage capacity, lower dependence on interest-bearing liabilities to fund assets and a greater capacity to absorb unanticipated losses. At the same time, the Bank’s more significant capital |
| RP® Financial, LC. | VALUATION ANALYSIS |
IV.4
surplus will make it difficult to achieve a competitive ROE. On balance, RP Financial concluded that capital strength was a slightly positive factor in our adjustment for financial condition.
On balance, Heritage Bank’s balance sheet strength was considered to be more favorable than the Peer Group’s and, thus, a slight upward adjustment was applied for the Bank’s financial condition.
| 2. | Profitability, Growth and Viability of Earnings |
Earnings are a key factor in determining pro forma market value, as the level and risk characteristics of an institution’s earnings stream and the prospects and ability to generate future earnings heavily influence the multiple that the investment community will pay for earnings. The major factors considered in the valuation are described below.
| § | Reported Earnings. The Bank’s reported earnings were lower than the Peer Group’s on a ROAA basis (0.16% of average assets versus 0.58% of average assets). The Bank’s earnings reflected an earnings advantage with respect to higher net interest income, which was more than offset by the Peer Group’s earnings advantages with respect to higher non-interest operating income, lower operating expenses, lower loan loss provisions, lower non-operating loss and lower effective tax rate. Reinvestment and leveraging of stock proceeds into interest-earning assets will serve to increase the Bank’s earnings, with the benefit of reinvesting proceeds expected to be somewhat offset by higher operating expenses associated with operating as a publicly-traded company and the implementation of stock benefit plans. On balance, RP Financial concluded that the Bank’s reported earnings were a moderately negative factor in our adjustment for profitability, growth and viability of earnings. |
| § | Core Earnings. Net interest income, operating expenses, non-interest operating income and loan loss provisions were reviewed in assessing the relative strengths and weaknesses of the Bank’s and the Peer Group’s core earnings. In these measures, the Bank operated with a higher net interest income ratio, a higher operating expense ratio, a lower level of non-interest operating income and a higher level of loss provisions. The Bank’s higher ratios for net interest income and operating expenses translated into a slightly lower expense coverage ratio in comparison to the Peer Group’s ratio (equal to 1.08x versus 1.12X for the Peer Group). Likewise, the Bank’s efficiency ratio of 83.05% was less favorable than the Peer Group’s efficiency ratio of 74.73%. Loan loss provisions had a slightly more significant impact on the Bank’s earnings (0.19% of average assets versus 0.08% of average assets for the Peer Group). Overall, these measures, as well as the expected earnings benefits the Bank should realize from the redeployment of stock proceeds into interest-earning assets and leveraging of post-conversion capital, which will be somewhat negated by expenses associated with the stock benefit plans and operating as a publicly-traded company, indicate that the Bank’s pro forma core earnings will be less than the Peer Group’s core earnings. Therefore, RP Financial concluded that this was a moderately negative factor in our adjustment for profitability, growth and viability of earnings. |
| RP® Financial, LC. | VALUATION ANALYSIS |
IV.5
| § | Interest Rate Risk. Quarterly changes in the Bank’s and the Peer Group's net interest income to average assets ratios indicated that a greater degree of volatility was associated with the Bank’s net interest margin. Other measures of interest rate risk, such as capital and IEA/IBL ratios were more favorable for the Peer Group. On a pro forma basis, the infusion of stock proceeds can be expected to provide the Bank with equity-to-assets and IEA/ILB ratios that will be comparable to or exceed the Peer Group’s ratios, as well as enhance the stability of the Bank’s net interest margin through the reinvestment of stock proceeds into interest-earning assets. On balance, RP Financial concluded that interest rate risk was a neutral factor in our adjustment for profitability, growth and viability of earnings. |
| § | Credit Risk. Loan loss provisions were a slightly larger factor in the Bank’s earnings (0.19% of average assets versus 0.08% of average assets for the Peer Group). In terms of future exposure to credit quality related losses, the Bank maintained a higher concentration of assets in loans, while lending diversification into higher risk types of loans was more significant for the Peer Group. Credit quality measures generally implied lower credit risk exposure for the Bank relative to the comparable credit quality measures for the Peer Group. Overall, RP Financial concluded that credit risk was a slightly positive factor in our adjustment for profitability, growth and viability of earnings. |
| § | Earnings Growth Potential. Several factors were considered in assessing earnings growth potential. First, the Bank maintained a slightly more favorable interest rate spread than the Peer Group, which would tend to support a stronger net interest margin going forward for the Bank. Second, the infusion of stock proceeds will provide the Bank with greater growth potential through leverage than currently maintained by the Peer Group. Third, the Peer Group’s higher ratio of non-interest operating income and lower operating expense ratio were viewed as advantages to sustain earnings growth during periods when net interest margins come under pressure as the result of adverse changes in interest rates. Overall, earnings growth potential was considered to be a neutral factor in our adjustment for profitability, growth and viability of earnings. |
| § | Return on Equity. Currently, the Bank’s core ROE is lower than the Peer Group’s ROE. Accordingly, as the result of the significant increase in capital that will be realized from the infusion of net stock proceeds into the Bank’s equity, the Bank’s pro forma return on equity on a core earnings basis will continue be less than the Peer Group’s return on equity ratio. Therefore, this was a moderately negative factor in the adjustment for profitability, growth and viability of earnings. |
On balance, Heritage Bank’s pro forma earnings strength was considered to be less favorable than the Peer Group’s and, thus, a moderate downward adjustment was applied for profitability, growth and viability of earnings.
Comparative 12-month asset growth rates for the Bank and the Peer Group showed a 1.61% increase in the Bank’s assets, versus a 10.10% increase in the Peer Group’s assets.
| RP® Financial, LC. | VALUATION ANALYSIS |
IV.6
Asset growth for the Peer Group included acquisition related growth by one of the Peer Group companies. Asset growth for the Bank consisted of loans, which was partially offset by a decrease in cash and investments. Comparatively, asset growth for the Peer Group was primarily sustained by loan growth and supplemented with a less significant increase in cash and investments. The Peer Group’s asset growth trends would tend to be viewed more favorably than the Bank’s asset growth trends, particularly given the higher yields generally earned on loans relative to cash and investments. On a pro forma basis, the Bank’s tangible equity-to-assets ratio will exceed the Peer Group's tangible equity-to-assets ratio, indicating greater leverage capacity for the Bank. On balance, no adjustment was applied for asset growth.
The general condition of an institution’s market area has an impact on value, as future success is in part dependent upon opportunities for profitable activities in the local market served. Heritage Bank serves the New Orleans metropolitan area through the main office and one branch office, which are both located in St. Tammany Parish. Operating in the suburbs of a large a metropolitan market area provides the Bank with growth opportunities, but such growth must be achieved in a highly competitive market environment. The Bank competes against significantly larger institutions that provide a larger array of services and have significantly larger branch networks than maintained by Heritage Bank. The competitiveness of the market area is highlighted by the Bank’s relatively low market share of deposits in St. Tammany Parish.
The Peer Group companies generally operate in a mix of suburban and rural markets, with the majority of the markets served by the Peer Group companies having smaller populations compared to St. Tammany Parish. Population growth for the primary market area counties served by the Peer Group companies reflected a range of growth rates, but overall population growth rates in the markets served by the Peer Group companies were less than St. Tammany Parish’s recent historical growth and projected population growth rates. St. Tammany Parish has a higher per capita income compared to the Peer Group’s average and median per capita income measures and the Peer Group’s primary market area counties were relatively less affluent markets within their respective states compared to St. Tammany Parish which had a comparatively higher per capita income as a percent of Louisiana’s per capita income (125.0% versus 101.5% for the Peer Group average). The average and median deposit market shares maintained by the Peer Group companies were well above the Bank’s market
| RP® Financial, LC. | VALUATION ANALYSIS |
IV.7
share of deposits in St. Tammany Parish. Overall, the degree of competition faced by the Peer Group companies was viewed to be less than faced by the Bank, while the growth potential in the markets served by the Peer Group companies was for the most part viewed to be not as strong as the Bank’s primary market area. Summary demographic and deposit market share data for the Bank and the Peer Group companies is provided in Exhibit III-5. As shown in Table 4.1, the average unemployment rate for the primary market area counties served by the Peer Group companies was slightly above the unemployment rate reflected for St. Tammany Parish. On balance, we concluded that a slight upward adjustment was appropriate for the Bank’s market area.
Table 4.1
Market Area Unemployment Rates
Heritage Bank of St. Tammany and the Peer Group Companies(1)
| | | | | December 2016 | |
| | | County | | Unemployment | |
| | | | | | |
| Heritage Bank of St. Tammany - LA | | St. Tammany | | | 4.3 | % |
| | | | | | | |
| Peer Group Average | | | | | 4.6 | % |
| | | | | | | |
| Equitable Financial Corp. – NE | | Hall | | | 3.6 | |
| Hamilton Bancorp, Inc. – MD | | Baltimore | | | 4.1 | |
| Home Federal Bancorp, Inc. – LA | | Caddo | | | 6.0 | |
| Jacksonville Bancorp, Inc. – IL | | Morgan | | | 5.1 | |
| MSB Financial Corp. - NJ | | Morris | | | 3.2 | |
| Poage Bankshares, Inc. - KY | | Boyd | | | 7.2 | |
| United Community Bancorp, Inc. – IN | | Dearborn | | | 4.4 | |
| Wayne Savings Bancshares, Inc. – OH | | Wayne | | | 3.9 | |
| Wolverine Bancorp, Inc. – MI | | Midland | | | 4.1 | |
| WVS Financial Corp. – PA | | Allegheny | | | 4.7 | |
| (1) | Unemployment rates are not seasonally adjusted. |
Source: U.S. Bureau of Labor Statistics.
At this time the Bank has not established a dividend policy. Future declarations of dividends by the Board of Directors will depend upon a number of factors, including investment opportunities, growth objectives, financial condition, profitability, tax considerations, minimum capital requirements, regulatory limitations, stock market characteristics and general economic conditions.
| RP® Financial, LC. | VALUATION ANALYSIS |
IV.8
Seven out of the ten of the Peer Group companies pay regular cash dividends, with implied dividend yields ranging from 1.19% to 4.76%. The average dividend yield on the stocks of the Peer Group institutions equaled 1.35% as of February 10, 2017. Comparatively, as of February 10, 2017, the average dividend yield on the stocks of all fully-converted publicly-traded thrifts equaled 1.56%
While the Bank has not established a definitive dividend policy prior to converting, the Bank will have the capacity to pay a dividend comparable to the Peer Group’s average dividend yield based on its higher pro forma capitalization. On balance, we concluded that no adjustment was warranted for this factor.
| 6. | Liquidity of the Shares |
The Peer Group is by definition composed of companies that are traded in the public markets. All ten of the Peer Group members trade on the NASDAQ. Typically, the number of shares outstanding and market capitalization provides an indication of how much liquidity there will be in a particular stock. The market capitalization of the Peer Group companies ranged from $29.1 million to $86.6 million as of February 10, 2017, with average and median market values of $58.4 million and $55.7 million, respectively. The shares issued and outstanding to the public shareholders of the Peer Group members ranged from 1.8 million to 5.7 million, with average and median shares outstanding both equaling 3.1 million. The Bank’s stock offering is expected to have a pro forma market value and shares outstanding that will be below the Peer Group’s averages and medians indicated for market value and shares outstanding, as well as below the bottom of the range of market values and lower end of the range of shares outstanding indicated for the Peer Group companies. It is anticipated that the Bank’s stock will be quoted on the OTC Pink Marketplace following the stock offering, which generally suggests lower liquidity compared to a stock listed on NASDAQ or an exchange. Overall, we anticipate that the Bank’s public stock will have a less liquid trading market compared to the stocks of the Peer Group companies and, therefore, concluded a slight downward adjustment was necessary for this factor.
We believe that three separate markets exist for thrift stocks, including those coming to market such as Heritage Bank: (1) the after-market for public companies, in which trading activity is regular and investment decisions are made based upon financial condition, earnings,
| RP® Financial, LC. | VALUATION ANALYSIS |
IV.9
capital, ROE, dividends and future prospects; (2) the new issue market in which converting thrifts are evaluated on the basis of the same factors, but on a pro forma basis without the benefit of prior operations as a fully-converted publicly-held company and stock trading history; and (3) the acquisition market for thrift franchises in Louisiana. All three of these markets were considered in the valuation of the Bank’s to-be-issued stock.
The value of publicly-traded thrift stocks is easily measurable, and is tracked by most investment houses and related organizations. Exhibit IV-1 provides pricing and financial data on all publicly-traded thrifts. In general, thrift stock values react to market stimuli such as interest rates, inflation, perceived industry health, projected rates of economic growth, regulatory issues and stock market conditions in general. Exhibit IV-2 displays historical stock market trends for various indices and includes historical stock price index values for thrifts and commercial banks. Exhibit IV-3 displays various stock price indices as of February 10, 2017.
In terms of assessing general stock market conditions, the overall stock market has trended higher in recent quarters. The broader stock market rallied higher at the start of July 2016, with the stronger-than-expected job growth reflected in the June employment report propelling the S&P 500 to a record high close. Stocks continued to trend higher going in the second half of July, as a string of economic data releases that showed improvement in home building, retail sales and job creation helped to propel the Dow Jones Industrial Average (the “DJI”) higher for nine consecutive sessions. Following the extended rally, the DJIA closed lower for seven consecutive sessions going into early-August. A decline in oil prices amid concerns of a glut in the supply of oil and weaker-than-expected second quarter GDP growth were factors that contributed to the downturn in the broader stock market. A rally in energy and financial shares helped to snap the seven day losing streak in the DJIA ahead of the July employment report. Better-than-expected job growth reflected in the July employment report fueled a rally in the broader stock market to close out the first week of trading in August. All three major stock indexes closed at record highs in mid-August, led by gains in commodity-linked shares. The broader stock market eased lower during the second half of August with the DJIA finishing down for the month of August, which snapped a six-month winning streak for the DJIA. Some lackluster data for the U.S. economy provided for a narrow trading range in the broader stock market in early-September, as investors reassessed the likelihood of a rate increase in the near term. Volatility prevailed in the broader stock market in mid-September, based on various hawkish and dovish comments from Federal Reserve officials for a near term rate hike. Stocks
| RP® Financial, LC. | VALUATION ANALYSIS |
IV.10
rebounded after the Federal Reserve concluded its September meeting leaving interest rates unchanged and then seesawed higher and lower to close out the third quarter. Overall, all three of the major U.S. stock indexes posted gains for the third quarter.
Stocks traded unevenly at the start of the fourth quarter of 2016, as investors reacted to third quarter earnings reports that had varied results. Consumer shares weighed on the broader stock market in the second half of October, following a string of disappointing earnings reports coming out of the consumer sector and a downbeat outlook for the rest of 2016. The DJIA fell for a third month in a row to close out October, with a monthly decline of 0.9%. Stocks extended their losing streak in early-November, as investors reacted to tightening polls for the presidential election. News of the FBI finding no new evidence to warrant charges against Democratic candidate Hillary Clinton sent stocks sharply higher the day before the presidential election. However, investors embraced Trump’s election, as stocks surged higher based on expectations for reduced corporate taxes and regulation and greater infrastructure spending under a Trump administration. Following seven consecutive sessions of closing higher, the DJIA closed down in mid-November 2016 as investors pared gains in shares that led the post-election stock market rally. The post-election stock market rally resumed during the second half of November, as U.S. stocks notched new record highs. Overall, the DJIA finished up 5.4% for the month of November. Led by gains in financial shares, stocks continued to surge higher during the first half of December. Stocks retreated after the Federal Reserve raised its target rate by a quarter of a percentage point at the conclusion of its mid-December policy meeting. After trading in a narrow range heading into late-December, stocks slumped in the final trading days of 2016. However, overall, the major U.S. stock indexes posted solid gains for 2016, with the DJIA and NASDAQ increasing 13.4% and 7.5%, respectively, in 2016.
Bank and healthcare stocks led the stock market higher at the start of 2017, as the DJIA approached the 20000 milestone in the first week of trading during 2017. Stocks traded in a narrow range heading into the fourth quarter earnings season and then edged lower in mid-January, as investors weighed both the timing and ultimate impact of expected policy changes from the Trump administration. The DJIA closed above 20000 for the first time in late-January, as President Trump’s moves during his first week in office to promote infrastructure spending and cut regulation propelled stocks higher. Stocks stumbled at the end of January, as President Trump’s restriction on immigration took a toll on the stock market’s optimism. The broader stock market rebounded during the first half of February, as the major U.S. stock indexes moved to fresh highs in response to President Trump taking action to scale back
| RP® Financial, LC. | VALUATION ANALYSIS |
IV.11
financial regulations and advancing campaign promises to lower taxes. On February 10, 2017, the DJIA closed at 20269.37, an increase of 26.9% from one year ago and an increase of 2.6% year-to-date, and the NASDAQ closed at 5734.13, an increase of 32.3% from one year ago and an increase of 6.5% year-to-date. The Standard & Poor’s 500 Index closed at 2316.10 on February 10, 2017, an increase of 24.2% from one year ago and an increase of 3.5% year-to-date.
The market for thrift stocks has also generally trended higher in recent quarters. Thrift stocks participated in the broader stock market rally at the start of July 2016, with the strong jobs report for June fueling additional gains for the thrift sector. Some stronger-than-expected second quarter earnings reports coming out of the banking sector, along with favorable data on the U.S. economy, helped to sustain the positive trend in thrift shares going into the second half of July. Financial shares traded in a narrow range to closeout July and into early-August, as the Federal Reserve concluded its late-July policy meeting with no change in its target interest rate as expected. Financial shares posted healthy gains on the heels of the favorable jobs report for July, as the S&P 500’s financial sector moved into positive territory for the first time in 2016. After trading in a narrow range into the second half of August, some favorable housing data helped thrift shares to rally in late-August. The positive trend in thrift stocks continued into early-September, as a slowdown in August job growth reduced expectations that the Federal Reserve would soon raise rates. Thrift shares followed the broader stock market lower in mid-September, as investors reacted to oil prices moving to a one-month low. For the balance of September, thrift shares traded in a narrow range.
In advance of third quarter earnings reports, thrift shares remained stable during the first half of October 2016. Financial shares led the stock market higher heading into the second half of October, in light of third quarter earnings reports generally offering fresh evidence of profitability improving for banks. Thrift stocks were largely trendless through the end of October and then pulled back along with the broader stock market in early-November. Bank and thrift stocks were among the strongest performers in leading the post-election stock market rally, reflecting investor expectations for reduced regulation of the banking sector. Financial shares retreated along with the broader stock market following the mid-December rate hike by the Federal Reserve. While thrift shares traded in a tight range in the closing weeks of 2016, the SNL Index for all publicly-traded thrifts finished 2016 with a gain of 19.49% in which the substantial portion of the gains occurred following the presidential election.
| RP® Financial, LC. | VALUATION ANALYSIS |
IV.12
Financial shares led the stock market higher at the start of 2017, which was followed by a pullback as investors dumped shares of financial companies and bought government bonds. Despite generally favorable fourth quarter earnings reports posted by the money center banks, the downturn in financial shares continued heading into the second half of January. Financial shares paralleled trends in the broader stock market in late-January and then led the stock market rally in early-February following action by President Trump to scale back financial regulations. Financial shares also led the market lower heading into mid-February, as investors reacted to a flattening of the yield curve. On February 10, 2017, the SNL Index for all publicly-traded thrifts closed at 934.8, an increase of 27.2% from one year ago and a decrease of 3.3% year-to-date.
In addition to thrift stock market conditions in general, the new issue market for converting thrifts is also an important consideration in determining the Bank’s pro forma market value. The new issue market is separate and distinct from the market for seasoned thrift stocks in that the pricing ratios for converting issues are computed on a pro forma basis, specifically: (1) the numerator and denominator are both impacted by the conversion offering amount, unlike existing stock issues in which price change affects only the numerator; and (2) the pro forma pricing ratio incorporates assumptions regarding source and use of proceeds, effective tax rates, stock plan purchases, etc. which impact pro forma financials, whereas pricing for existing issues are based on reported financials. The distinction between pricing of converting and existing issues is perhaps no clearer than in the case of the price/book (“P/B”) ratio in that the P/B ratio of a converting thrift will typically result in a discount to book value whereas in the current market for existing thrifts the P/B ratio may reflect a premium to book value. Therefore, it is appropriate to also consider the market for new issues, both at the time of the conversion and in the aftermarket.
As shown in Table 4.2, two standard conversion offerings have been completed during the past three months. The average closing pro forma price/tangible book ratio of the two recent standard conversion offerings equaled 63.7%. On average, the two standard conversion offerings reflected price appreciation of 40.4% after the first week of trading. As of February 10, 2017, the two recent standard conversion offerings reflected an average stock
| RP® Financial, LC. | VALUATION ANALYSIS |
IV.13
Table 4.2
Pricing Characteristics and After-Market Trends
Conversions Completed in the Last Three Months
| Institutional Information | | Pre-Conversion Data | | | Offering Information | | | Contribution to | |
| | | Financial Info. | | | Asset Quality | | | | | | | | | | | | | | | Char. Found. | |
| | | | | | | | | | | | | | | | | | | Excluding Foundation | | | | | % of | |
| | | Conversion | | | | | | | Equity/ | | | NPAs/ | | | Res. | | | Gross | | | % | | | % of | | | Exp./ | | | | | Public Off. | |
| Institution | | Date | | Ticker | | Assets | | | Assets | | | Assets | | | Cov. | | | Proc. | | | Offer | | | Mid. | | | Proc. | | | Form | | Inc. Fdn. | |
| | | | | | | ($Mil) | | | (%) | | | (%) | | | (%) | | | ($Mil.) | | | (%) | | | (%) | | | (%) | | | | | (%) | |
| | | | | | | | | | | | | | | | | | | | | | | | | | | | | | | | | | |
| Standard Conversions | | | | | | | | | | | | | | | | | | | | | | | | | | | | | | | | | | | | | | | | | |
| HV Bancorp Inc. -PA* | | 1/12/17 | | HVBC-NASDAQ | | $ | 177 | | | | 7.46 | % | | | 0.76 | % | | | 54 | % | | $ | 21.8 | | | | 100 | % | | | 132 | % | | | 6.0 | % | | N.A. | | N.A. | |
| Community Savings Bancorp Inc. - OH | | 1/11/17 | | CCSB-OTC Pink | | $ | 54 | | | | 12.43 | % | | | 0.65 | % | | | 78 | % | | $ | 4.4 | | | | 100 | % | | | 96 | % | | | 27.2 | % | | N.A. | | N.A. | |
| | | | | | | | | | | | | | | | | | | | | | | | | | | | | | | | | | | | | | | | | | |
| | | Averages - Standard Conversions: | | $ | 115 | | | | 9.95 | % | | | 0.71 | % | | | 66 | % | | $ | 13.1 | | | | 100 | % | | | 114 | % | | | 16.6 | % | | N.A. | | N.A. | |
| | | Medians - Standard Conversions: | | $ | 115 | | | | 9.95 | % | | | 0.71 | % | | | 66 | % | | $ | 13.1 | | | | 100 | % | | | 114 | % | | | 16.6 | % | | N.A. | | N.A. | |
| Institutional Information | | Insider Purchases | | | | | | Pro Forma Data | |
| | | % Off Incl. Fdn.+Merger Shares | | | | | | Pricing Ratios(2)(5) | | | Financial Charac. | |
| | | | | | | Benefit Plans | | | | | | Initial | | | | | | | | | | | | | | | | | | | |
| | | Conversion | | | | | | | Recog. | | | Stk | | | Mgmt.& | | | Div. | | | | | | Core | | | | | | Core | | | | | | Core | |
| Institution | | Date | | Ticker | | ESOP | | | Plans | | | Option | | | Dirs. | | | Yield | | | P/TB | | | P/E | | | P/A | | | ROA | | | TE/A | | | ROE | |
| | | | | | | (%) | | | (%) | | | (%) | | | (%)(1) | | | (%) | | | (%) | | | (x) | | | (%) | | | (%) | | | (%) | | | (%) | |
| | | | | | | | | | | | | | | | | | | | | | | | | | | | | | | | | | | | | | |
| Standard Conversions | | | | | | | | | | | | | | | | | | | | | | | | | | | | | | | | | | | | | | | | | | | | | | | | |
| HV Bancorp Inc. -PA* | | 1/12/17 | | HVBC-NASDAQ | | | 8.0 | % | | | 4.0 | % | | | 10.0 | % | | | 8.5 | % | | | 0.00 | % | | | 70.2 | % | | | 24.9 | x | | | 11.2 | % | | | 0.5 | % | | | 16.0 | % | | | 2.8 | % |
| Community Savings Bancorp Inc. - OH | | 1/11/17 | | CCSB-OTC Pink | | | 8.0 | % | | | 4.0 | % | | | 10.0 | % | | | 41.9 | % | | | 0.00 | % | | | 57.3 | % | | | 96.0 | x | | | 8.1 | % | | | 0.1 | % | | | 14.1 | % | | | 0.6 | % |
| | | | | | | | | | | | | | | | | | | | | | | | | | | | | | | | | | | | | | | | | | | | | | | | | |
| | | Averages - Standard Conversions: | | | 8.0 | % | | | 4.0 | % | | | 10.0 | % | | | 25.2 | % | | | 0.00 | % | | | 63.7 | % | | | 60.5 | x | | | 9.6 | % | | | 0.3 | % | | | 15.0 | % | | | 1.7 | % |
| | | Medians - Standard Conversions: | | | 8.0 | % | | | 4.0 | % | | | 10.0 | % | | | 25.2 | % | | | 0.00 | % | | | 63.7 | % | | | 60.5 | x | | | 9.6 | % | | | 0.3 | % | | | 15.0 | % | | | 1.7 | % |
| Institutional Information | | | | | Post-IPO Pricing Trends | |
| | | | | | Closing Price: | |
| | | | | | | | | | First | | | | | | After | | | | | | After | | | | | | | | | | |
| | | Conversion | | | | IPO | | | Trading | | | % | | | First | | | % | | | First | | | % | | | Thru | | | % | |
| Institution | | Date | | Ticker | | Price | | | Day | | | Chge | | | Week(3) | | | Chge | | | Month(4) | | | Chge | | | 2/10/17 | | | Chge | |
| | | | | | | ($) | | | ($) | | | (%) | | | ($) | | | (%) | | | ($) | | | (%) | | | ($) | | | (%) | |
| | | | | | | | | | | | | | | | | | | | | | | | | | | | | | | | |
| Standard Conversions | | | | | | | | | | | | | | | | | | | | | | | | | | | | | | | | | | | | | | | | |
| HV Bancorp Inc. -PA* | | 1/12/17 | | HVBC-NASDAQ | | $ | 10.00 | | | $ | 13.67 | | | | 36.7 | % | | $ | 14.08 | | | | 40.8 | % | | $ | 14.00 | | | | 40.0 | % | | $ | 14.00 | | | | 40.0 | % |
| Community Savings Bancorp Inc. - OH | | 1/11/17 | | CCSB-OTC Pink | | $ | 10.00 | | | $ | 10.00 | | | | 0.0 | % | | $ | 14.00 | | | | 40.0 | % | | $ | 13.00 | | | | 30.0 | % | | $ | 13.00 | | | | 30.0 | % |
| | | | | | | | | | | | | | | | | | | | | | | | | | | | | | | | | | | | | | | | | |
| | | Averages - Standard Conversions: | | $ | 10.00 | | | $ | 11.84 | | | | 18.4 | % | | $ | 14.04 | | | | 40.4 | % | | $ | 13.50 | | | | 35.0 | % | | $ | 13.50 | | | | 35.0 | % |
| | | Medians - Standard Conversions: | | $ | 10.00 | | | $ | 11.84 | | | | 18.4 | % | | $ | 14.04 | | | | 40.4 | % | | $ | 13.50 | | | | 35.0 | % | | $ | 13.50 | | | | 35.0 | % |
Note: * - Appraisal performed by RP Financial; BOLD = RP Fin. Did the business plan, "NT" - Not Traded; "NA" - Not Applicable, Not Available; C/S-Cash/Stock.
| (1) | As a percent of MHC offering for MHC transactions. |
| (2) | Does not take into account the adoption of SOP 93-6. |
| (3) | Latest price if offering is less than one week old. |
| (4) | Latest price if offering is more than one week but less than one month old. |
| (5) | Mutual holding company pro forma data on full conversion basis. |
| (6) | Simultaneously completed acquisition of another financial institution. |
| (7) | Simultaneously converted to a commercial bank charter. |
February 10, 2017
| RP® Financial, LC. | VALUATION ANALYSIS |
IV.14
price of 35.0% from their IPO prices.
Shown in Table 4.3 are the current pricing ratios for the only fully-converted offering completed during the past three months that trades on NASDAQ. The current P/TB ratio of HV Bancorp equaled 98.25%, based on closing stock prices as of February 10, 2017.
Also considered in the valuation was the potential impact on Heritage Bank’s stock price of recently completed and pending acquisitions of other financial institutions operating in Louisiana. As shown in Exhibit IV-4, there were seven acquisitions of Louisiana banks and thrifts completed from the beginning of 2013 through February 20, 2017, and there is currently one acquisition pending for a Louisiana bank. The recent acquisition activity involving Louisiana financial institutions may imply a certain degree of acquisition speculation for the Bank’s stock. To the extent that acquisition speculation may impact the Bank’s offering, we have largely taken this into account in selecting companies for the Peer Group that could be subject to the same type of acquisition speculation that may influence Heritage Bank’s’ stock. However, since converting thrifts are subject to a three-year regulatory moratorium from being acquired, acquisition speculation in Heritage Bank’s stock would tend to be less compared to the stocks of the Peer Group companies.
* * * * * * * * * * *
In determining our valuation adjustment for marketing of the issue, we considered trends in both the overall thrift market, the new issue market including the new issue market for thrift conversions and the local acquisition market for thrift stocks. Taking these factors and trends into account, RP Financial concluded that no adjustment was appropriate in the valuation analysis for purposes of marketing of the issue.
Heritage Bank’s management team appears to have experience and expertise in all of the key areas of the Bank’s operations. Exhibit IV-5 provides summary resumes of Heritage Bank’s Board of Directors and senior management. While the Bank does not have the resources to develop a great deal of management depth, given its asset size and the impact it would have on operating expenses, management and the Board have been effective in implementing an operating strategy that can be well managed by the Bank’s present
| RP® Financial, LC. | VALUATION ANALYSIS |
IV.15
Table 4.3
Market Pricing Comparatives
As of February 10, 2017
| | | | | | Market | | | Per Share Data | | | | | | | | | | | | | | | | |
| | | | | | Capitalization | | | Core | | | Book | | | | | | | | | | | | | | | | |
| | | | | | Price/ | | | Market | | | 12 Month | | | Value/ | | | Pricing Ratios(2) | |
| | | | | | Share | | | Value | | | EPS(1) | | | Share | | | P/E | | | P/B | | | P/A | | | P/TB | | | P/Core | |
| | | | | | ($) | | | ($Mil) | | | ($) | | | ($) | | | (x) | | | (%) | | | (%) | | | (%) | | | (x) | |
| | | | | | | | | | | | | | | | | | | | | | | | | | | | | | | |
| All Non-MHC Public Companies(6) | | | | | | | | | | | | | | | | | | | | | | | | | | | | | | | | | | | | | | | | |
| Averages | | | | | | $ | 22.48 | | | $ | 573.04 | | | $ | 1.07 | | | $ | 16.18 | | | | 19.70 | x | | | 130.77 | % | | | 16.09 | % | | | 144.21 | % | | | 20.32 | x |
| Median | | | | | | $ | 17.84 | | | $ | 160.12 | | | $ | 0.79 | | | $ | 14.60 | | | | 19.18 | x | | | 125.98 | % | | | 15.93 | % | | | 132.12 | % | | | 20.29 | x |
| | | | | | | | | | | | | | | | | | | | | | | | | | | | | | | | | | | | | | | | | |
| Comparable Group | | | | | | | | | | | | | | | | | | | | | | | | | | | | | | | | | | | | | | | | |
| Averages | | | | | | $ | 14.00 | | | $ | 30.55 | | | $ | 0.40 | | | $ | 14.25 | | | | 34.15 | x | | | 98.25 | % | | | 15.68 | % | | | 98.25 | % | | | 35.00 | x |
| Medians | | | | | | $ | 14.00 | | | $ | 30.55 | | | $ | 0.40 | | | $ | 14.25 | | | | 34.15 | x | | | 98.25 | % | | | 15.68 | % | | | 98.25 | % | | | 35.00 | x |
| | | | | | | | | | | | | | | | | | | | | | | | | | | | | | | | | | | | | | | | | |
| Comparable Group | | | | | | | | | | | | | | | | | | | | | | | | | | | | | | | | | | | | | | | | |
| HVBC HV Bancorp Inc. | | | PA | | | $ | 14.00 | | | $ | 30.55 | | | $ | 0.40 | | | $ | 14.25 | | | | 34.15 | x | | | 98.25 | % | | | 15.68 | % | | | 98.25 | % | | | 35.00 | x |
| | | | | Dividends(3) | | | Financial Characteristics(5) | |
| | | | | Amount/ | | | | | | Payout | | | Total | | | Equity/ | | | Tang. Eq./ | | | NPAs/ | | | Reported | | | Core | |
| | | | | Share | | | Yield | | | Ratio(4) | | | Assets | | | Assets | | | T. Assets | | | Assets | | | ROAA | | | ROAE | | | ROAA | | | ROAE | |
| | | | | ($) | | | (%) | | | (%) | | | ($Mil) | | | (%) | | | (%) | | | (%) | | | (%) | | | (%) | | | (%) | | | (%) | |
| | | | | | | | | | | | | | | | | | | | | | | | | | | | | | | | | | | | |
| All Non-MHC Public Companies(6) | | | | | | | | | | | | | | | | | | | | | | | | | | | | | | | | | | | | | | | | | | | |
| Averages | | | | $ | 0.36 | | | | 1.56 | % | | | 48.05 | % | | $ | 3,317 | | | | 12.77 | % | | | 12.11 | % | | | 1.06 | % | | | 0.70 | % | | | 5.90 | % | | | 0.72 | % | | | 6.03 | % |
| Median | | | | $ | 0.24 | | | | 1.38 | % | | | 40.74 | % | | $ | 984 | | | | 11.52 | % | | | 11.12 | % | | | 0.88 | % | | | 0.62 | % | | | 5.14 | % | | | 0.65 | % | | | 5.22 | % |
| | | | | | | | | | | | | | | | | | | | | | | | | | | | | | | | | | | | | | | | | | | | | | | |
| Comparable Group | | | | | | | | | | | | | | | | | | | | | | | | | | | | | | | | | | | | | | | | | | | | | | |
| Averages | | | | $ | 0.00 | | | | 0.00 | % | | | NM | | | $ | 195 | | | | 15.95 | % | | | 15.95 | % | | | 0.76 | % | | | 0.46 | % | | | 2.88 | % | | | 0.45 | % | | | 2.81 | % |
| Medians | | | | $ | 0.00 | | | | 0.00 | % | | | NM | | | $ | 195 | | | | 15.95 | % | | | 15.95 | % | | | 0.76 | % | | | 0.46 | % | | | 2.88 | % | | | 0.45 | % | | | 2.81 | % |
| | | | | | | | | | | | | | | | | | | | | | | | | | | | | | | | | | | | | | | | | | | | | | | |
| Comparable Group | | | | | | | | | | | | | | | | | | | | | | | | | | | | | | | | | | | | | | | | | | | | | | |
| HVBC HV Bancorp Inc. | | | PA | $ | 0.00 | | | | 0.00 | % | | | NM | | | $ | 195 | | | | 15.95 | % | | | 15.95 | % | | | 0.76 | % | | | 0.46 | % | | | 2.88 | % | | | 0.45 | % | | | 2.81 | % |
| (1) | Core income, on a diluted per-share basis. Core income is net income after taxes and before extraordinary items, less net income attributable to noncontrolling interest, gain on the sale of securities, amortization of intangibles, goodwill and nonrecurring items. Assumed tax rate is 35%. |
| (2) | P/E = Price to earnings; P/B = Price to book; P/A = Price to assets; P/TB = Price to tangible book value; and P/Core = Price to core earnings. P/E and P/Core =NM if the ratio is negative or above 35x. |
| (3) | Indicated 12 month dividend, based on last quarterly dividend declared. |
| (4) | Indicated 12 month dividend as a percent of trailing 12 month earnings. |
| (5) | ROAA (return on average assets) and ROAE (return on average equity) are indicated ratios based on trailing 12 month earnings and average equity and assets balances. |
| (6) | Excludes from averages and medians those companies the subject of actual or rumored acquisition activities or unusual operating characteristics. |
| Source: | SNL Financial, LC. and RP Financial, LC. calculations. The information provided in this report has been obtained from sources we believe are reliable, but we cannot guarantee the accuracy or completeness of such information. |
Copyright (c) 2017 by RP® Financial, LC.
| RP® Financial, LC. | VALUATION ANALYSIS |
IV.16
organizational structure. Heritage Bank currently does not have any executive management positions that are vacant.
Similarly, the returns, equity positions and other operating measures of the Peer Group companies are indicative of well-managed financial institutions, which have Boards and management teams that have been effective in implementing competitive operating strategies. Therefore, on balance, we concluded no valuation adjustment relative to the Peer Group was appropriate for this factor.
| 9. | Effect of Government Regulation and Regulatory Reform |
In summary, as a fully-converted FDIC insured institution, Heritage Bank will operate in substantially the same regulatory environment as the Peer Group members — all of whom are adequately capitalized institutions and are operating with no apparent restrictions. Exhibit IV-6 reflects the Bank’s pro forma regulatory capital ratios. On balance, no adjustment has been applied for the effect of government regulation and regulatory reform.
Summary of Adjustments
Overall, based on the factors discussed above, we concluded that the Bank’s pro forma market value should reflect the following valuation adjustments relative to the Peer Group:
| Key Valuation Parameters: | | Valuation Adjustment |
| | | |
| Financial Condition | | Slight Upward |
| Profitability, Growth and Viability of Earnings | | Moderate Downward |
| Asset Growth | | No Adjustment |
| Primary Market Area | | Slight Upward |
| Dividends | | No Adjustment |
| Liquidity of the Shares | | Slight Downward |
| Marketing of the Issue | | No Adjustment |
| Management | | No Adjustment |
| Effect of Govt. Regulations and Regulatory Reform | | No Adjustment |
Valuation Approaches
In applying the accepted valuation methodology promulgated by the OCC i.e., the pro forma market value approach, we considered the three key pricing ratios in valuing the Bank’s to-be-issued stock — price/earnings (“P/E”), price/book (“P/B”), and price/assets (“P/A”) approaches — all performed on a pro forma basis including the effects of the stock proceeds. In
| RP® Financial, LC. | VALUATION ANALYSIS |
IV.17
computing the pro forma impact of the conversion and the related pricing ratios, we have incorporated the valuation parameters disclosed in the Bank’s prospectus for reinvestment rate, effective tax rate, stock benefit plan assumptions and expenses (summarized in Exhibits IV-7 and IV-8).
In our estimate of value, we assessed the relationship of the pro forma pricing ratios relative to the Peer Group and recent conversion offerings.
RP Financial’s valuation placed an emphasis on the following:
| · | P/E Approach. The P/E approach is generally the best indicator of long-term value for a stock. Given the similarities between the Bank’s and the Peer Group’s operating strategies, earnings composition and overall financial condition, the P/E approach was carefully considered in this valuation. At the same time, since reported earnings for both the Bank and the Peer Group included certain non-recurring items, we also made adjustments to earnings to arrive at core earnings estimates for the Bank and the Peer Group and resulting price/core earnings ratios. |
| · | P/B Approach. P/B ratios have generally served as a useful benchmark in the valuation of thrift stocks, particularly in the context of an initial public offering, as the earnings approach involves assumptions regarding the use of proceeds. RP Financial considered the P/B approach to be a useful indicator of pro forma value, taking into account the pricing ratios under the P/E and P/A approaches. We have also modified the P/B approach to exclude the impact of intangible assets (i.e., price/tangible book value or “P/TB”), in that the investment community frequently makes this adjustment in its evaluation of this pricing approach. |
| · | P/A Approach. P/A ratios are generally a less reliable indicator of market value, as investors typically assign less weight to assets and attribute greater weight to book value and earnings. Furthermore, this approach as set forth in the regulatory valuation guidelines does not take into account the amount of stock purchases funded by deposit withdrawals, thus understating the pro forma P/A ratio. At the same time, the P/A ratio is an indicator of franchise value, and, in the case of highly capitalized institutions, high P/A ratios may limit the investment community’s willingness to pay market multiples for earnings or book value when ROE is expected to be low. |
The Bank will adopt “Employers’ Accounting for Employee Stock Ownership Plans” (“ASC 718-40”), which will cause earnings per share computations to be based on shares issued and outstanding excluding unreleased ESOP shares. For purposes of preparing the pro forma pricing analyses, we have reflected all shares issued in the offering, including all ESOP shares, to capture the full dilutive impact, particularly since the ESOP shares are economically dilutive, receive dividends and can be voted. However, we did consider the impact of the adoption of ASC 718-40 in the valuation.
| RP® Financial, LC. | VALUATION ANALYSIS |
IV.18
Based on the application of the three valuation approaches, taking into consideration the valuation adjustments discussed above, RP Financial concluded that, as of February 10, 2017, the pro forma market value of Heritage Bank’s conversion stock was $12,500,000 at the midpoint, equal to 1,250,000 shares at $10.00 per share.
1. Price-to-Earnings (“P/E”). The application of the P/E valuation method requires calculating the Bank’s pro forma market value by applying a valuation P/E multiple to the pro forma earnings base. In applying this technique, we considered both reported earnings and a recurring earnings base, that is, earnings adjusted to exclude any one-time non-operating items, plus the estimated after-tax earnings benefit of the reinvestment of the net proceeds. The Bank’s reported earnings equaled $158,000 for the twelve months ended December 31, 2016. In deriving Heritage Bank’s core earnings, the only adjustment made to reported earnings was to eliminate the losses on the sale of REO, which equaled $50,000 for the twelve months ended December 31, 2016. As shown below, on a tax effected basis, assuming an effective marginal tax rate of 34.0% for the earnings adjustment, the Bank’s core earnings were determined to equal $191,000 for the twelve months ended December 31, 2016.
| | | Amount | |
| | | ($000) | |
| | | | |
| Net income(loss) | | $ | 158 | |
| Add: Loss on sale of REO(1) | | | 33 | |
| Core earnings estimate | | $ | 191 | |
(1) Tax effected at 34.0%.
Based on the Bank’s reported and estimated core earnings and incorporating the impact of the pro forma assumptions discussed previously, the Bank’s pro forma reported and core P/E multiples at the $12.5 million midpoint value equaled 1,611.88 times and 306.71 times, respectively, which provided for premiums of 7,947.33% and 1,286.63% relative to the Peer Group’s average reported and core P/E multiples of 20.03 times and 22.41 times, respectively (see Table 4.4). In comparison to the Peer Group’s median reported and core earnings multiples which equaled 18.53 times and 20.38 times, respectively, the Bank’s pro forma reported and core P/E multiples at the midpoint value indicated premiums of 8,598.76% and 1,404.96%, respectively. The Bank’s pro forma P/E ratios based on reported earnings at the minimum equaled 559.25 times and at the super maximum was not meaningful (“NM”) as the result of negative pro forma earnings, and based on core earnings at the minimum and the super maximum equaled 204.33 times and 976.42 times, respectively.
| RP® Financial, LC. | VALUATION ANALYSIS |
IV.19
Table 4.4
Public Market Pricing Versus Peer Group
Heritage Bank of St. Tammany
As of February 10, 2017
| | | | | Market | | | Per Share Data | | | | | | | | | | | | | | | | |
| | | | | Capitalization | | | Core | | | Book | | | | | | | | | | | | | | | | |
| | | | | Price/ | | | Market | | | 12 Month | | | Value/ | | | Pricing Ratios(2) | |
| | | | | Share | | | Value | | | EPS(1) | | | Share | | | P/E | | | P/B | | | P/A | | | P/TB | | | P/Core | |
| | | | | ($) | | | ($Mil) | | | ($) | | | ($) | | | (x) | | | (%) | | | (%) | | | (%) | | | (x) | |
| Heritage Bank of St. Tammany | | LA | | | | | | | | | | | | | | | | | | | | | | | | | | | | | | | | | | | | |
| Super Maximum | | | | $ | 10.00 | | | $ | 16.53 | | | $ | 0.01 | | | $ | 13.79 | | | | NM | | | | 72.52 | % | | | 14.84 | % | | | 72.52 | % | | | 976.42 | x |
| Maximum | | | | $ | 10.00 | | | $ | 14.38 | | | $ | 0.02 | | | $ | 14.55 | | | | NM | | | | 68.73 | % | | | 13.13 | % | | | 68.73 | % | | | 487.11 | x |
| Midpoint | | | | $ | 10.00 | | | $ | 12.50 | | | $ | 0.03 | | | $ | 15.41 | | | | 1611.88 | x | | | 64.89 | % | | | 11.59 | % | | | 64.89 | % | | | 306.71 | x |
| Minimum | | | | $ | 10.00 | | | $ | 10.63 | | | $ | 0.05 | | | $ | 16.57 | | | | 559.25 | x | | | 60.35 | % | | | 10.01 | % | | | 60.35 | % | | | 204.33 | x |
| | | | | | | | | | | | | | | | | | | | | | | | | | | | | | | | | | | | | | | |
| All Non-MHC Public Companies(6) | | | | | | | | | | | | | | | | | | | | | | | | | | | | | | | | | | | | | | |
| Averages | | | | $ | 22.48 | | | $ | 573.04 | | | $ | 1.07 | | | $ | 16.18 | | | | 19.70 | x | | | 130.77 | % | | | 16.09 | % | | | 144.21 | % | | | 20.32 | x |
| Median | | | | $ | 17.84 | | | $ | 160.12 | | | $ | 0.79 | | | $ | 14.60 | | | | 19.18 | x | | | 125.98 | % | | | 15.93 | % | | | 132.12 | % | | | 20.29 | x |
| | | | | | | | | | | | | | | | | | | | | | | | | | | | | | | | | | | | | | | |
| All Non-MHC State of LA(6) | | | | | | | | | | | | | | | | | | | | | | | | | | | | | | | | | | | | | | |
| Averages | | | | $ | 28.00 | | | $ | 54.70 | | | $ | 1.80 | | | $ | 22.44 | | | | 15.14 | x | | | 124.02 | % | | | 13.34 | % | | | 124.02 | % | | | 15.14 | x |
| Medians | | | | $ | 28.00 | | | $ | 54.70 | | | $ | 1.80 | | | $ | 22.44 | | | | 15.14 | x | | | 124.02 | % | | | 13.34 | % | | | 124.02 | % | | | 15.14 | x |
| | | | | | | | | | | | | | | | | | | | | | | | | | | | | | | | | | | | | | | |
| State of LA(1) | | | | | | | | | | | | | | | | | | | | | | | | | | | | | | | | | | | | | | |
| HFBL | Home Federal Bancorp, Inc. of Louisiana | | LA | | $ | 28.00 | | | $ | 54.70 | | | $ | 1.80 | | | $ | 22.44 | | | | 15.14 | x | | | 124.02 | % | | | 13.34 | % | | | 124.02 | % | | | 15.14 | x |
| | | | | | | | | | | | | | | | | | | | | | | | | | | | | | | | | | | | | | | |
| Comparable Group | | | | | | | | | | | | | | | | | | | | | | | | | | | | | | | | | | | | | | |
| Averages | | | | $ | 20.44 | | | $ | 58.36 | | | $ | 0.92 | | | $ | 18.74 | | | | 20.03 | x | | | 108.54 | % | | | 14.52 | % | | | 112.27 | % | | | 22.41 | x |
| Medians | | | | $ | 17.93 | | | $ | 55.67 | | | $ | 0.77 | | | $ | 17.47 | | | | 18.53 | x | | | 109.85 | % | | | 14.27 | % | | | 111.74 | % | | | 20.38 | x |
| | | | | | | | | | | | | | | | | | | | | | | | | | | | | | | | | | | | | | | |
| Comparable Group | | | | | | | | | | | | | | | | | | | | | | | | | | | | | | | | | | | | | | |
| EQFN | Equitable Financial Corp. | | NE | | $ | 10.15 | | | $ | 34.42 | | | $ | 0.32 | | | $ | 10.43 | | | | 30.76 | x | | | 96.32 | % | | | 14.89 | % | | | 96.32 | % | | | 30.00 | x |
| HBK | Hamilton Bancorp, Inc. | | MD | | $ | 15.45 | | | $ | 52.74 | | | $ | 0.15 | | | $ | 18.10 | | | | NM | | | | 86.92 | % | | | 10.55 | % | | | 102.85 | % | | | NM | |
| HFBL | Home Federal Bancorp, Inc. of Louisiana | | LA | | $ | 28.00 | | | $ | 54.70 | | | $ | 1.80 | | | $ | 22.44 | | | | 15.14 | x | | | 124.02 | % | | | 13.34 | % | | | 124.02 | % | | | 15.14 | x |
| JXSB | Jacksonville Bancorp, Inc. | | IL | | $ | 31.50 | | | $ | 56.65 | | | $ | 1.57 | | | $ | 26.84 | | | | 18.53 | x | | | 122.62 | % | | | 17.74 | % | | | 130.31 | % | | | 20.26 | x |
| MSBF | MSB Financial Corp. | | NJ | | $ | 15.15 | | | $ | 86.57 | | | $ | 0.12 | | | $ | 12.71 | | | | NM | | | | 118.29 | % | | | 18.75 | % | | | 118.29 | % | | | NM | |
| PBSK | Poage Bankshares, Inc. | | KY | | $ | 20.20 | | | $ | 75.01 | | | $ | 0.60 | | | $ | 18.78 | | | | NM | | | | 107.55 | % | | | 16.71 | % | | | 111.33 | % | | | 33.65 | x |
| UCBA | United Community Bancorp | | IN | | $ | 17.10 | | | $ | 71.70 | | | $ | 0.81 | | | $ | 16.83 | | | | 21.38 | x | | | 104.19 | % | | | 13.65 | % | | | 108.57 | % | | | 21.77 | x |
| WAYN | Wayne Savings Bancshares, Inc. | | OH | | $ | 18.75 | | | $ | 52.16 | | | $ | 0.92 | | | $ | 14.88 | | | | 20.38 | x | | | 125.98 | % | | | 11.70 | % | | | 131.43 | % | | | 20.38 | x |
| WBKC | Wolverine Bancorp, Inc. | | MI | | $ | 33.61 | | | $ | 70.54 | | | $ | 2.14 | | | $ | 29.97 | | | | 15.71 | x | | | 112.15 | % | | | 19.29 | % | | | 112.15 | % | | | 15.71 | x |
| WVFC | WVS Financial Corp. | | PA | | $ | 14.50 | | | $ | 29.13 | | | $ | 0.73 | | | $ | 16.44 | | | | 18.35 | x | | | 87.40 | % | | | 8.56 | % | | | 87.40 | % | | | NM | |
| | | | | Dividends(3) | | | Financial Characteristics(5) | |
| | | | | Amount/ | | | | | | Payout | | | Total | | | Comm Eq./ | | | Comm T. Eq./ | | | NPAs/ | | | Reported | | | Core | |
| | | | | Share | | | Yield | | | Ratio(4) | | | Assets | | | Assets | | | Assets | | | Assets | | | ROAA | | | ROAE | | | ROAA | | | ROAE | |
| | | | | ($) | | | (%) | | | (%) | | | ($Mil) | | | (%) | | | (%) | | | (%) | | | (%) | | | (%) | | | (%) | | | (%) | |
| Heritage Bank of St. Tammany | | LA | | | | | | | | | | | | | | | | | | | | | | | | | | | | | | | | | | | | | | | | | | | | |
| Super Maximum | | | | $ | 0.00 | | | | 0.00 | % | | | 0.00 | % | | $ | 111 | | | | 20.48 | % | | | 20.48 | % | | | 0.57 | % | | | -0.01 | % | | | -0.07 | % | | | 0.02 | % | | | 0.07 | % |
| Maximum | | | | $ | 0.00 | | | | 0.00 | % | | | 0.00 | % | | $ | 109 | | | | 19.10 | % | | | 19.10 | % | | | 0.58 | % | | | 0.01 | % | | | -0.02 | % | | | 0.03 | % | | | 0.14 | % |
| Midpoint | | | | $ | 0.00 | | | | 0.00 | % | | | 0.00 | % | | $ | 108 | | | | 17.86 | % | | | 17.86 | % | | | 0.59 | % | | | 0.01 | % | | | 0.04 | % | | | 0.04 | % | | | 0.21 | % |
| Minimum | | | | $ | 0.00 | | | | 0.00 | % | | | 0.00 | % | | $ | 106 | | | | 16.59 | % | | | 16.59 | % | | | 0.59 | % | | | 0.02 | % | | | 0.11 | % | | | 0.05 | % | | | 0.30 | % |
| | | | | | | | | | | | | | | | | | | | | | | | | | | | | | | | | | | | | | | | | | | | | | | |
| All Non-MHC Public Companies(6) | | | | | | | | | | | | | | | | | | | | | | | | | | | | | | | | | | | | | | | | | | | | | | |
| Averages | | | | $ | 0.36 | | | | 1.56 | % | | | 48.05 | % | | $ | 3,317 | | | | 12.77 | % | | | 12.11 | % | | | 1.06 | % | | | 0.70 | % | | | 5.90 | % | | | 0.72 | % | | | 6.03 | % |
| Median | | | | $ | 0.24 | | | | 1.38 | % | | | 40.74 | % | | $ | 984 | | | | 11.52 | % | | | 11.12 | % | | | 0.88 | % | | | 0.62 | % | | | 5.14 | % | | | 0.65 | % | | | 5.22 | % |
| | | | | | | | | | | | | | | | | | | | | | | | | | | | | | | | | | | | | | | | | | | | | | | |
| All Non-MHC State of LA(6) | | | | | | | | | | | | | | | | | | | | | | | | | | | | | | | | | | | | | | | | | | | | | | |
| Averages | | | | $ | 0.36 | | | | 1.29 | % | | | 18.92 | % | | $ | 390 | | | | 11.29 | % | | | 11.29 | % | | | 0.24 | % | | | 0.92 | % | | | 7.63 | % | | | 0.92 | % | | | 7.63 | % |
| Medians | | | | $ | 0.36 | | | | 1.29 | % | | | 18.92 | % | | $ | 390 | | | | 11.29 | % | | | 11.29 | % | | | 0.24 | % | | | 0.92 | % | | | 7.63 | % | | | 0.92 | % | | | 7.63 | % |
| | | | | | | | | | | | | | | | | | | | | | | | | | | | | | | | | | | | | | | | | | | | | | | |
| State of LA(1) | | | | | | | | | | | | | | | | | | | | | | | | | | | | | | | | | | | | | | | | | | | | | | |
| HFBL | Home Federal Bancorp, Inc. of Louisiana | | LA | | $ | 0.36 | | | | 1.29 | % | | | 18.92 | % | | $ | 390 | | | | 11.29 | % | | | 11.29 | % | | | 0.24 | % | | | 0.92 | % | | | 7.63 | % | | | 0.92 | % | | | 7.63 | % |
| | | | | | | | | | | | | | | | | | | | | | | | | | | | | | | | | | | | | | | | | | | | | | | |
| Comparable Group | | | | | | | | | | | | | | | | | | | | | | | | | | | | | | | | | | | | | | | | | | | | | | |
| Averages | | | | $ | 0.34 | | | | 1.35 | % | | | 26.80 | % | | $ | 403 | | | | 13.58 | % | | | 13.21 | % | | | 1.40 | % | | | 0.58 | % | | | 4.34 | % | | | 0.59 | % | | | 4.43 | % |
| Medians | | | | $ | 0.24 | | | | 1.28 | % | | | 25.69 | % | | $ | 412 | | | | 13.99 | % | | | 13.40 | % | | | 1.25 | % | | | 0.52 | % | | | 4.73 | % | | | 0.54 | % | | | 4.55 | % |
| | | | | | | | | | | | | | | | | | | | | | | | | | | | | | | | | | | | | | | | | | | | | | | |
| Comparable Group | | | | | | | | | | | | | | | | | | | | | | | | | | | | | | | | | | | | | | | | | | | | | | |
| EQFN | Equitable Financial Corp. | | NE | | $ | 0.00 | | | | 0.00 | % | | | 0.00 | % | | $ | 228 | | | | 15.92 | % | | | 15.92 | % | | | 1.93 | % | | | 0.46 | % | | | 3.00 | % | | | 0.47 | % | | | 3.08 | % |
| HBK | Hamilton Bancorp, Inc. | | MD | | $ | 0.00 | | | | 0.00 | % | | | 0.00 | % | | $ | 517 | | | | 11.95 | % | | | 10.32 | % | | | 1.16 | % | | | -0.01 | % | | | -0.04 | % | | | 0.11 | % | | | 0.78 | % |
| HFBL | Home Federal Bancorp, Inc. of Louisiana | | LA | | $ | 0.36 | | | | 1.29 | % | | | 18.92 | % | | $ | 390 | | | | 11.29 | % | | | 11.29 | % | | | 0.24 | % | | | 0.92 | % | | | 7.63 | % | | | 0.92 | % | | | 7.63 | % |
| JXSB | Jacksonville Bancorp, Inc. | | IL | | $ | 0.40 | | | | 1.27 | % | | | 23.53 | % | | $ | 331 | | | | 14.60 | % | | | 13.89 | % | | | 1.33 | % | | | 0.99 | % | | | 6.53 | % | | | 0.92 | % | | | 6.05 | % |
| MSBF | MSB Financial Corp. | | NJ | | $ | 0.00 | | | | 0.00 | % | | | 0.00 | % | | $ | 434 | | | | 16.74 | % | | | 16.74 | % | | | 3.53 | % | | | 0.18 | % | | | 0.90 | % | | | 0.26 | % | | | 1.34 | % |
| PBSK | Poage Bankshares, Inc. | | KY | | $ | 0.24 | | | | 1.19 | % | | | 53.85 | % | | $ | 449 | | | | 15.54 | % | | | 15.09 | % | | | 1.78 | % | | | 0.43 | % | | | 2.68 | % | | | 0.50 | % | | | 3.08 | % |
| UCBA | United Community Bancorp | | IN | | $ | 0.24 | | | | 1.40 | % | | | 30.00 | % | | $ | 528 | | | | 13.38 | % | | | 12.92 | % | | | 1.02 | % | | | 0.68 | % | | | 5.14 | % | | | 0.64 | % | | | 4.84 | % |
| WAYN | Wayne Savings Bancshares, Inc. | | OH | | $ | 0.36 | | | | 1.92 | % | | | 39.13 | % | | $ | 446 | | | | 9.29 | % | | | 8.94 | % | | | 0.96 | % | | | 0.57 | % | | | 6.20 | % | | | 0.57 | % | | | 6.20 | % |
| WBKC | Wolverine Bancorp, Inc. | | MI | | $ | 1.60 | | | | 4.76 | % | | | 74.77 | % | | $ | 369 | | | | 17.20 | % | | | 17.20 | % | | | 1.92 | % | | | 1.13 | % | | | 7.00 | % | | | 1.13 | % | | | 7.00 | % |
| WVFC | WVS Financial Corp. | | PA | | $ | 0.24 | | | | 1.66 | % | | | 27.85 | % | | $ | 335 | | | | 9.85 | % | | | 9.85 | % | | | 0.08 | % | | | 0.42 | % | | | 4.32 | % | | | 0.42 | % | | | 4.26 | % |
| (1) | Core income, on a diluted per-share basis. Core income is net income after taxes and before extraordinary items, less net income attributable to noncontrolling interest, gain on the sale of securities, amortization of intangibles, goodwill and nonrecurring items. Assumed tax rate is 35%. |
| (2) | P/E = Price to earnings; P/B = Price to book; P/A = Price to assets; P/TB = Price to tangible book value; and P/Core = Price to core earnings. P/E and P/Core =NM if the ratio is negative or above 35x. |
| (3) | Indicated 12 month dividend, based on last quarterly dividend declared. |
| (4) | Indicated 12 month dividend as a percent of trailing 12 month earnings. |
| (5) | Equity and tangible equity equal common equity and tangible common equity, respectively. ROAA (return on average assets) and ROAE (return on average equity) are indicated ratios based on trailing 12 month earnings and average equity and assets balances. |
| (6) | Excludes from averages and medians those companies the subject of actual or rumored acquisition activities or unusual operating characteristics. |
| Source: | SNL Financial, LC. and RP Financial, LC. calculations. The information provided in this report has been obtained from sources we believe are reliable, but we cannot guarantee the accuracy or completeness of such information. |
Copyright (c) 2017 by RP® Financial, LC.
| RP® Financial, LC. | VALUATION ANALYSIS |
IV.20
2. Price-to-Book (“P/B”). The application of the P/B valuation method requires calculating the Bank’s pro forma market value by applying a valuation P/B ratio, as derived from the Peer Group’s P/B ratio, to the Bank’s pro forma book value. Based on the $12.5 million midpoint valuation, the Bank’s pro forma P/B and P/TB ratios both equaled 64.89%. In comparison to the average P/B and P/TB ratios for the Peer Group of 108.54% and 112.27%, the Bank’s ratios reflected a discount of 40.22% on a P/B basis and a discount of 42.20% on a P/TB basis. In comparison to the Peer Group’s median P/B and P/TB ratios of 109.85% and 111.74%, respectively, the Bank’s pro forma P/B and P/TB ratios at the midpoint value reflected discounts of 40.93% and 41.93%, respectively. At the top of the super range, the Bank’s P/B and P/TB ratios both equaled 72.52%. In comparison to the Peer Group’s average P/B and P/TB ratios, the Bank’s P/B and P/TB ratios at the top of the super range reflected discounts of 33.18% and 35.41%, respectively. In comparison to the Peer Group’s median P/B and P/TB ratios, the Bank’s P/B and P/TB ratios at the top of the super range reflected discounts of 33.98% and 35.10%, respectively. RP Financial considered the discounts under the P/B approach to be reasonable, given the nature of the calculation of the P/B ratio which mathematically results in a ratio discounted to book value. The discounts reflected under the P/B approach were also supported by the significant premiums reflected in the Bank’s P/E multiples.
3. Price-to-Assets (“P/A”). The P/A valuation methodology determines market value by applying a valuation P/A ratio to the Bank’s pro forma asset base, conservatively assuming no deposit withdrawals are made to fund stock purchases. In all likelihood there will be deposit withdrawals, which results in understating the pro forma P/A ratio which is computed herein. At the $12.5 million midpoint of the valuation range, the Bank’s value equaled 11.59% of pro forma assets. Comparatively, the Peer Group companies exhibited an average P/A ratio of 14.52%, which implies a discount of 20.18% has been applied to the Bank’s pro forma P/A ratio. In comparison to the Peer Group’s median P/A ratio of 14.27%, the Bank’s pro forma P/A ratio at the midpoint value reflects a discount of 18.78%.
Comparison to Recent Offerings
As indicated at the beginning of this chapter, RP Financial’s analysis of recent conversion offering pricing characteristics at closing and in the aftermarket has been limited to a “technical” analysis and, thus, the pricing characteristics of recent conversion offerings can not be a primary determinate of value. Particular focus was placed on the P/TB approach in this
| RP® Financial, LC. | VALUATION ANALYSIS |
IV.21
analysis, since the P/E multiples do not reflect the actual impact of reinvestment and the source of the stock proceeds (i.e., external funds vs. deposit withdrawals). As discussed previously, two standard conversion offerings were completed during the past three months. In comparison to the 63.70% average closing forma P/TB ratio of the recent standard conversions, the Bank’s P/TB ratio of 64.89% at the midpoint value reflects an implied premium of 1.87%. At the top of the super maximum, the Bank’s P/TB ratio of 72.52% reflects an implied premium of 13.85% relative to the recent standard conversions average P/TB ratio at closing. The current average P/TB ratio of the one recent standard conversion that is publicly-traded equaled 98.25%, based on closing stock prices as of February 10, 2017. In comparison to the current P/TB ratio of the recent publicly-traded standard conversion, the Bank’s P/TB ratio at the midpoint value reflects an implied discount of 33.95% and at the top of the super maximum reflects an implied discount of 26.39%.
Valuation Conclusion
Based on the foregoing, it is our opinion that, as of February 10, 2017, the estimated aggregate pro forma market value of the shares to be issued immediately following the conversion equaled $12,500,000 at the midpoint, equal to 1,250,000 shares offered at a per share value of $10.00. Pursuant to conversion guidelines, the 15% offering range indicates a minimum value of $10,625,000 and a maximum value of $14,375,000. Based on the $10.00 per share offering price determined by the Board, this valuation range equates to total shares outstanding of 1,062,500 at the minimum and 1,437,500 at the maximum. In the event the appraised value is subject to an increase, the aggregate pro forma market value may be increased up to a super maximum value of $16,531,250 without a resolicitation. Based on the $10.00 per share offering price, the super range value would result in total shares outstanding of 1,653,125. The pro forma valuation calculations relative to the Peer Group are shown in Table 4.4 and are detailed in Exhibit IV-7 and Exhibit IV-8.
EXHIBITS
LIST OF EXHIBITS
| Exhibit | | |
| Number | | Description |
| | | |
| I-1 | | Map of Office Locations |
| | | |
| I-2 | | Audited Financial Statements |
| | | |
| I-3 | | Key Operating Ratios |
| | | |
| I-4 | | Investment Portfolio Composition |
| | | |
| I-5 | | Yields and Costs |
| | | |
| I-6 | | Loan Loss Allowance Activity |
| | | |
| I-7 | | Interest Rate Risk Analysis |
| | | |
| I-8 | | Fixed and Adjustable Rate Loans |
| | | |
| I-9 | | Loan Portfolio Composition |
| | | |
| I-10 | | Contractual Maturity by Loan Type |
| | | |
| I-11 | | Loan Originations, Purchases, Sales and Repayments |
| | | |
| I-12 | | Non-Performing Assets |
| | | |
| I-13 | | Deposit Composition |
| | | |
| I-14 | | Maturity of Time Deposits |
| | | |
| I-15 | | Borrowing Activity |
| | | |
| II-1 | | Description of Office Properties |
| | | |
| II-2 | | Historical Interest Rates |
LIST OF EXHIBITS (continued)
| Exhibit | | |
| Number | | Description |
| | | |
| III-1 | | General Characteristics of Publicly-Traded Institutions |
| | | |
| III-2 | | Public Market Pricing of Southwest and Southeast Thrift Institutions |
| | | |
| III-3 | | Public Market Pricing of Midwest Thrift Institutions |
| | | |
| III-4 | | Public Market Pricing of Mid-Atlantic Thrift Institutions |
| | | |
| III-5 | | Peer Group Market Area Comparative Analysis |
| | | |
| IV-1 | | Stock Prices: As of February 10, 2017 |
| | | |
| IV-2 | | Historical Stock Price Indices |
| | | |
| IV-3 | | Stock Indices as of February 10, 2017 |
| | | |
| IV-4 | | Market Area Acquisition Activity |
| | | |
| IV-5 | | Director and Senior Management Summary Resumes |
| | | |
| IV-6 | | Pro Forma Regulatory Capital Ratios |
| | | |
| IV-7 | | Pro Forma Analysis Sheet |
| | | |
| IV-8 | | Pro Forma Effect of Conversion Proceeds |
| | | |
| V-1 | | Firm Qualifications Statement |
EXHIBIT I-1
Heritage Bank of St. Tammany
Map of Office Locations
Exhibit I-1
Heritage Bank of St. Tammany
Map of Office Locations
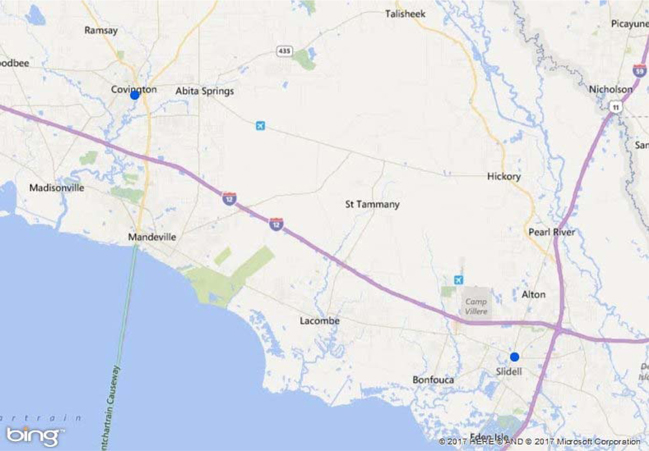
Source: SNL Financial.
EXHIBIT I-2
Heritage Bank of St. Tammany
Audited Financial Statements
[Incorporated by Reference]
EXHIBIT I-3
Heritage Bank of St. Tammany
Key Operating Ratios
Exhibit I-3
Heritage Bank of St. Tammany
Key Operating Ratios
| | | At or For the Years Ended
December 31, | |
| | | 2016 | | | 2015 | |
| | | | | | | |
| Selected Financial Ratios and Other Data: | | | | | | | | |
| | | | | | | | | |
| Performance Ratios: | | | | | | | | |
| Return on average assets | | | 0.16 | % | | | 0.30 | % |
| Return on average equity | | | 1.66 | % | | | 2.99 | % |
| Interest rate spread (1) | | | 3.36 | % | | | 3.20 | % |
| Net interest margin (2) | | | 3.45 | % | | | 3.28 | % |
| Efficiency ratio (3) | | | 86.99 | % | | | 90.57 | % |
| Non-interest expense to average total assets | | | 3.08 | % | | | 3.11 | % |
| Average interest-earning assets to average interest-bearing liabilities | | | 107.59 | % | | | 106.33 | % |
| Average equity to average total assets | | | 9.79 | % | | | 10.14 | % |
| | | | | | | | | |
| Asset Quality Ratios: | | | | | | | | |
| Non-performing assets to total assets | | | 0.62 | % | | | 2.06 | % |
| Non-performing loans to total loans | | | 0.68 | % | | | 1.65 | % |
| Allowance for loan losses to non-performing loans | | | 133.59 | % | | | 48.05 | % |
| Allowance for loan losses to total loans | | | 0.90 | % | | | 0.79 | % |
| | | | | | | | | |
| Capital Ratios: | | | | | | | | |
| Total capital (to risk-weighted assets) | | | 18.59 | % | | | 18.16 | % |
| Common equity Tier 1 capital (to risk-weighted assets) | | | 17.35 | % | | | 17.07 | % |
| Tier 1 capital (to risk-weighted assets) | | | 17.35 | % | | | 17.07 | % |
| Tier 1 capital (to avg assets) (Tier1 Leverage Ratio) | | | 9.79 | % | | | 9.82 | % |
| | | | | | | | | |
| Other Data: | | | | | | | | |
| Number of full service offices | | | 2 | | | | 2 | |
| (1) | Represents the difference between the weighted-average yield on interest-earning assets and the weighted-average cost of interest-bearing liabilities for the year. |
| (2) | The net interest margin represents net interest income as a percent of average interest-earning assets for the year. |
| (3) | The efficiency ratio represents noninterest expense divided by the sum of net interest income and noninterest income. |
Source: Heritage NOLA Bancorp’s prospectus.
EXHIBIT I-4
Heritage Bank of St. Tammany
Investment Portfolio Composition
Exhibit I-4
Heritage Bank of St. Tammany
Investment Portfolio Composition
| | | At December 31, | |
| | | 2016 | | | 2015 | |
| | | Amortized Cost | | | Fair
Value | | | Amortized Cost | | | Fair
Value | |
| | | (In thousands) | |
| | | | | | | | | | | | | |
| Available for sale: | | | | | | | | | | | | | | | | |
| Mortgage-backed securities | | $ | 7,126 | | | $ | 7,175 | | | $ | 6,812 | | | $ | 6,896 | |
| | | | | | | | | | | | | | | | | |
| Held to maturity: | | | | | | | | | | | | | | | | |
| Mortgage-backed securities | | | 832 | | | | 824 | | | | 1,114 | | | | 1,102 | |
| | | | | | | | | | | | | | | | | |
| Total investment securities | | $ | 7,958 | | | $ | 7,999 | | | $ | 7,926 | | | $ | 7,998 | |
Source: Heritage NOLA Bancorp’s prospectus.
EXHIBIT I-5
Heritage Bank of St. Tammany
Yields and Costs
Exhibit I-5
Heritage Bank of St. Tammany
Yields and Costs
| | | At
December
31, | | | For the Year Ended December 31, | |
| | | 2016 | | | 2016 | | | 2015 | |
| | | Yield/ Cost | | | Average
Outstanding
Balance | | | Interest | | | Yield/ Rate
(1) | | | Average
Outstanding
Balance | | | Interest | | | Yield/ Rate
(1) | |
| | | | | | | | | | | | | | | | | | | | | | |
| Interest-earning assets: | | | | | | | | | | | | | | | | | | | | | | | | | | | | |
| Loans, net | | | 4.84 | % | | $ | 72,667 | | | $ | 3,849 | | | | 5.30 | % | | $ | 63,704 | | | $ | 3,387 | | | | 5.32 | % |
| Investment securities | | | 1.97 | | | | 7,523 | | | | 143 | | | | 1.90 | | | | 9,740 | | | | 194 | | | | 1.99 | |
| Other interest-earning assets | | | 1.23 | | | | 9,315 | | | | 93 | | | | 1.00 | | | | 9,979 | | | | 77 | | | | 0.77 | |
| Total interest-earning assets | | | 4.28 | | | | 89,505 | | | | 4,085 | | | | 4.56 | | | | 83,423 | | | | 3,658 | | | | 4.38 | |
| Noninterest-earning assets | | | | | | | 7,650 | | | | | | | | | | | | 7,844 | | | | | | | | | |
| Total assets | | | | | | $ | 97,155 | | | | | | | | | | | $ | 91,267 | | | | | | | | | |
| | | | | | | | | | | | | | | | | | | | | | | | | | | | | |
| Interest-bearing liabilities: | | | | | | | | | | | | | | | | | | | | | | | | | | | | |
| Interest-bearing demand | | | 0.17 | % | | $ | 3,102 | | | | 7 | | | | 0.23 | | | $ | 2,492 | | | | 6 | | | | 0.24 | |
| Savings accounts | | | 0.22 | | | | 16,244 | | | | 40 | | | | 0.25 | | | | 15,967 | | | | 57 | | | | 0.36 | |
| Certificates of deposit | | | 1.55 | | | | 51,538 | | | | 786 | | | | 1.53 | | | | 52,326 | | | | 772 | | | | 1.48 | |
| Total interest-bearing deposits | | | 1.19 | | | | 70,884 | | | | 833 | | | | 1.18 | | | | 70,785 | | | | 835 | | | | 1.18 | |
| Borrowings | | | 1.29 | | | | 12,305 | | | | 160 | | | | 1.30 | | | | 7,672 | | | | 89 | | | | 1.18 | |
| Total interest-bearing liabilities | | | 1.20 | | | | 83,189 | | | | 993 | | | | 1.20 | | | | 78,457 | | | | 924 | | | | 1.18 | |
| Other non-interest bearing liabilities | | | | | | | 4,452 | | | | | | | | | | | | 3,558 | | | | | | | | | |
| Total liabilities | | | | | | | 87,641 | | | | | | | | | | | | 82,015 | | | | | | | | | |
| Equity | | | | | | | 9,514 | | | | | | | | | | | | 9,252 | | | | | | | | | |
| Total liabilities and equity | | | | | | $ | 97,155 | | | | | | | | | | | $ | 91,267 | | | | | | | | | |
| | | | | | | | | | | | | | | | | | | | | | | | | | | | | |
| Net interest income | | | | | | | | | | $ | 3,092 | | | | | | | | | | | $ | 2,734 | | | | | |
| Net interest rate spread(1) | | | 3.08 | % | | | | | | | | | | | 3.36 | % | | | | | | | | | | | 3.20 | % |
| Net interest-earning assets(2) | | | | | | $ | 6,316 | | | | | | | | | | | $ | 4,966 | | | | | | | | | |
| Net interest margin(3) | | | | | | | | | | | | | | | 3.45 | % | | | | | | | | | | | 3.28 | % |
| Average of interest-earning assets to interest-bearing liabilities | | | | | | | 107.59 | % | | | | | | | | | | | 106.33 | % | | | | | | | | |
| (1) | Interest rate spread represents the difference between the yield on average interest-earning assets and the cost of average interest-bearing liabilities. |
| (2) | Net interest-earning assets represents total interest-earning assets less total interest-bearing liabilities. |
| (3) | Net interest margin represents net interest income divided by total interest-earning assets. |
Source: Heritage NOLA Bancorp’s prospectus.
EXHIBIT I-6
Heritage Bank of St. Tammany
Loan Loss Allowance Activity
Exhibit I-6
Heritage Bank of St. Tammany
Loan Loss Allowance Activity
| | | At or For the Years Ended
December 31, | |
| | | 2016 | | | 2015 | |
| | | (Dollars in thousands) | |
| | | | | | | |
| Balance at beginning of year | | $ | 592 | | | $ | 650 | |
| | | | | | | | | |
| Charge-offs: | | | | | | | | |
| Real estate: | | | | | | | | |
| One- to four-family residential: | | | | | | | | |
| Owner-occupied | | | 108 | | | | 54 | |
| Non-owner-occupied | | | ― | | | | 4 | |
| Home equity lines of credit | | | ― | | | | ― | |
| Commercial real estate | | | ― | | | | ― | |
| Land | | | 10 | | | | 21 | |
| Construction | | | ― | | | | ― | |
| Multifamily | | | ― | | | | ― | |
| Consumer | | | ― | | | | ― | |
| Commercial business | | | ― | | | | ― | |
| Total charge-offs | | | 118 | | | | 79 | |
| | | | | | | | | |
| Recoveries: | | | | | | | | |
| Real estate: | | | | | | | | |
| One- to four-family residential: | | | | | | | | |
| Owner-occupied | | | 13 | | | | 1 | |
| Non-owner-occupied | | | 25 | | | | ― | |
| Home equity lines of credit | | | ― | | | | ― | |
| Commercial real estate | | | ― | | | | ― | |
| Land | | | ― | | | | ― | |
| Construction | | | ― | | | | ― | |
| Multifamily | | | ― | | | | ― | |
| Consumer | | | ― | | | | ― | |
| Commercial business | | | ― | | | | ― | |
| Total recoveries | | | 38 | | | | 1 | |
| | | | | | | | | |
| Net charge-offs | | | 80 | | | | 78 | |
| Provision for loan losses | | | 180 | | | | 20 | |
| | | | | | | | | |
| Balance at end of year | | $ | 692 | | | $ | 592 | |
| | | | | | | | | |
| Ratios: | | | | | | | | |
| Net charge-offs to average loans outstanding | | | 0.11 | % | | | 0.12 | % |
| Allowance for loan losses to non-performing loans at end of year | | | 133.59 | % | | | 48.05 | % |
| Allowance for loan losses to total loans at end of year | | | 0.90 | % | | | 0.79 | % |
Source: Heritage NOLA Bancorp’s prospectus.
EXHIBIT I-7
Heritage Bank of St. Tammany
Interest Rate Risk Analysis
Exhibit I-7
Heritage Bank of St. Tammany
Interest Rate Risk Analysis
Change in Interest Rates
(Basis Points) | | Estimated Net Interest
Income(1) | | | Increase (Decrease)
in Estimated Net
Interest Income | |
| | | | | | | |
| +300 | | $ | 2,771 | | | | (5.2 | )% |
| +200 | | | 2,823 | | | | (3.5 | )% |
| +100 | | | 2,874 | | | | (1.7 | )% |
| — | | | 2,924 | | | | — | |
| –100 | | | 3,004 | | | | 2.7 | % |
| (1) | The calculated changes assume an immediate shock of the static yield curve. |
Source: Heritage NOLA Bancorp’s prospectus.
EXHIBIT I-8
Heritage Bank of St. Tammany
Fixed and Adjustable Rate Loans
Exhibit I-8
Heritage Bank of St. Tammany
Fixed and Adjustable Rate Loans
| | | Due After December 31, 2017 | |
| | | Fixed | | | Adjustable | | | Total | |
| | | (In thousands) | |
| Real estate: | | | | | | | | | | | | |
| One- to four-family residential: | | | | | | | | | | | | |
| Owner-occupied | | $ | 42,625 | | | $ | 3,405 | | | $ | 46,030 | |
| Non-owner-occupied | | | 10,647 | | | | 588 | | | | 11,235 | |
| Home equity lines of credit | | | ― | | | | 2,246 | | | | 2,246 | |
| Commercial real estate | | | 5,850 | | | | 567 | | | | 6,417 | |
| Land | | | 1,804 | | | | 1,103 | | | | 2,907 | |
| Construction | | | 3,475 | | | | ― | | | | 3,475 | |
| Multifamily | | | 2,629 | | | | ― | | | | 2,629 | |
| Consumer | | | 39 | | | | 219 | | | | 258 | |
| Commercial business | | | 295 | | | | ― | | | | 295 | |
| Total | | $ | 67,364 | | | $ | 8,128 | | | $ | 75,492 | |
Source: Heritage NOLA Bancorp’s prospectus.
EXHIBIT I-9
Heritage Bank of St. Tammany
Loan Portfolio Composition
Exhibit I-9
Heritage Bank of St. Tammany
Loan Portfolio Composition
| | | At December 31, | |
| | | 2016 | | | 2015 | |
| | | Amount | | | Percent | | | Amount | | | Percent | |
| | | (Dollars in thousands) | |
| | | | | | | | | | | | | |
| Real estate: | | | | | | | | | | | | | | | | |
| One- to four-family residential: | | | | | | | | | | | | | | | | |
| Owner-occupied | | $ | 46,353 | | | | 60.5 | % | | $ | 43,034 | | | | 57.7 | % |
| Non-owner-occupied | | | 11,237 | | | | 14.7 | | | | 11,873 | | | | 15.9 | |
| Home equity lines of credit | | | 2,246 | | | | 2.9 | | | | 2,091 | | | | 2.8 | |
| Commercial real estate | | | 7,234 | | | | 9.4 | | | | 8,024 | | | | 10.8 | |
| Land | | | 2,907 | | | | 3.8 | | | | 2,667 | | | | 3.6 | |
| Construction | | | 3,475 | | | | 4.5 | | | | 4,250 | | | | 5.7 | |
| Multifamily | | | 2,629 | | | | 3.4 | | | | 2,352 | | | | 3.1 | |
| Consumer | | | 285 | | | | 0.4 | | | | 297 | | | | 0.4 | |
| Commercial business | | | 295 | | | | 0.4 | | | | ― | | | | ― | |
| | | | | | | | | | | | | | | | | |
| Total loans receivable | | | 76,661 | | | | 100.0 | % | | | 74,588 | | | | 100.0 | % |
| | | | | | | | | | | | | | | | | |
| Deferred loan costs (fees) | | | (459 | ) | | | | | | | (496 | ) | | | | |
| Loans in process | | | (851 | ) | | | | | | | (1,534 | ) | | | | |
| Allowance for loan losses | | | (692 | ) | | | | | | | (592 | ) | | | | |
| | | | | | | | | | | | | | | | | |
| Total loans receivable, net | | $ | 74,659 | | | | | | | $ | 71,966 | | | | | |
Source: Heritage NOLA Bancorp’s prospectus.
EXHIBIT I-10
Heritage Bank of St. Tammany
Contractual Maturity by Loan Type
Exhibit I-10
Heritage Bank of St. Tammany
Contractual Maturity by Loan Type
| | | One- to four-
family
residential
real estate | | | Commercial
real estate | | | Land | | | Construction | | | Multifamily | | | Consumer | | | Commercial
business | | | Total | |
| | | | | | | | | | | | | | | | | | | | | | | | | |
Due During the Years
Ending December 31, | | | | | | | | | | | | | | | | | | | | | | | | | | | | | | | | |
| 2017 | | $ | 325 | | | $ | 817 | | | $ | ― | | | $ | ― | | | $ | ― | | | $ | 27 | | | $ | ― | | | $ | 1,169 | |
| 2018 | | | 78 | | | | 32 | | | | 17 | | | | ― | | | | ― | | | | 55 | | | | ― | | | | 182 | |
| 2019 | | | 76 | | | | 182 | | | | 136 | | | | ― | | | | ― | | | | 16 | | | | ― | | | | 410 | |
| 2020 to 2021 | | | 849 | | | | 81 | | | | 629 | | | | ― | | | | 1,013 | | | | 145 | | | | ― | | | | 2,717 | |
| 2022 to 2026 | | | 4,149 | | | | 4,167 | | | | 1,271 | | | | ― | | | | 218 | | | | 42 | | | | 295 | | | | 10,142 | |
| 2027 to 2031 | | | 28,967 | | | | 1,425 | | | | 854 | | | | 1,569 | | | | ― | | | | ― | | | | ― | | | | 32,815 | |
| 2032 and beyond | | | 25,392 | | | | 530 | | | | ― | | | | 1,906 | | | | 1,398 | | | | ― | | | | ― | | | | 29,226 | |
| | | | | | | | | | | | | | | | | | | | | | | | | | | | | | | | | |
| Total | | $ | 59,836 | | | $ | 7,234 | | | $ | 2,907 | | | $ | 3,475 | | | $ | 2,629 | | | $ | 285 | | | $ | 295 | | | $ | 76,661 | |
Source: Heritage NOLA Bancorp’s prospectus.
EXHIBIT I-11
Heritage Bank of St. Tammany
Loan Originations, Purchases, Sales and Repayments
Exhibit I-11
Heritage Bank of St. Tammany
Loan Originations, Purchases, Sales and Repayments
| | | Years Ended December 31, | |
| | | 2016 | | | 2015 | |
| | | | | | | |
| Total loans, at beginning of period | | $ | 74,588 | | | $ | 61,632 | |
| | | | | | | | | |
| Loans originated: | | | | | | | | |
| Real estate: | | | | | | | | |
| One- to four-family residential: | | | | | | | | |
| Owner-occupied | | | 13,162 | | | | 15,613 | |
| Non-owner-occupied | | | 939 | | | | 843 | |
| Home equity lines of credit | | | 1,263 | | | | 958 | |
| Commercial real estate | | | 1,220 | | | | 2,003 | |
| Land | | | 942 | | | | 322 | |
| Construction | | | 3,111 | | | | 3,815 | |
| Multifamily | | | ― | | | | 232 | |
| Consumer | | | 239 | | | | 177 | |
| Commercial business | | | ― | | | | ― | |
| Total loans originated | | $ | 20,876 | | | $ | 23,963 | |
| | | | | | | | | |
| Loans purchased: | | | | | | | | |
| Real estate: | | | | | | | | |
| One- to four-family residential: | | | | | | | | |
| Owner-occupied | | | 1,742 | | | | 5,689 | |
| Non-owner-occupied | | | ― | | | | ― | |
| Home equity lines of credit | | | ― | | | | ― | |
| Commercial real estate | | | ― | | | | ― | |
| Land | | | ― | | | | ― | |
| Construction | | | ― | | | | ― | |
| Multifamily | | | 1,400 | | | | ― | |
| Consumer | | | ― | | | | ― | |
| Commercial business | | | 295 | | | | ― | |
| Total loans purchased | | | 3,437 | | | | 5,689 | |
| | | | | | | | | |
| Loans sold: | | | | | | | | |
| Real estate: | | | | | | | | |
| One- to four-family residential: | | | | | | | | |
| Owner-occupied | | | 6,641 | | | | 4,952 | |
| Non-owner-occupied | | | ― | | | | ― | |
| Home equity lines of credit | | | ― | | | | ― | |
| Commercial real estate | | | ― | | | | ― | |
| Land | | | ― | | | | ― | |
| Construction | | | ― | | | | ― | |
| Multifamily | | | ― | | | | ― | |
| Consumer | | | ― | | | | ― | |
| Commercial business | | | ― | | | | ― | |
| Total loans sold | | | 6,641 | | | | 4,952 | |
| | | | | | | | | |
| Other: | | | | | | | | |
| Principal repayments, etc | | | 15,599 | | | | 11,744 | |
| | | | | | | | | |
| Net loan activity | | | 2,073 | | | | 12,956 | |
| Total loans, including loans held for sale, at end of period | | $ | 76,661 | | | $ | 74,588 | |
Source: Heritage NOLA Bancorp’s prospectus.
EXHIBIT I-12
Heritage Bank of St. Tammany
Non-Performing Assets
Exhibit I-12
Heritage Bank of St. Tammany
Non-Performing Assets
| | | At December 31, | |
| | | 2016 | | | 2015 | |
| | | (Dollars in thousands) | |
| | | | | | | |
| Non-accrual loans: | | | | | | | | |
| Real estate: | | | | | | | | |
| One- to four-family residential: | | | | | | | | |
| Owner-occupied | | $ | 96 | | | $ | 238 | |
| Non-owner-occupied | | | 405 | | | | 718 | |
| Home equity lines of credit | | | ― | | | | 23 | |
| Commercial real estate | | | ― | | | | ― | |
| Land | | | 17 | | | | 253 | |
| Construction | | | ― | | | | ― | |
| Multifamily | | | ― | | | | ― | |
| Consumer | | | ― | | | | ― | |
| Commercial business | | | ― | | | | ― | |
| Total | | | 518 | | | | 1,232 | |
| | | | | | | | | |
| Accruing loans 90 days or more past due: | | | | | | | | |
| Real estate: | | | | | | | | |
| One- to four-family residential: | | | | | | | | |
| Owner-occupied | | | ― | | | | ― | |
| Non-owner-occupied | | | ― | | | | ― | |
| Home equity lines of credit | | | ― | | | | ― | |
| Commercial real estate | | | ― | | | | ― | |
| Land | | | ― | | | | ― | |
| Construction | | | ― | | | | ― | |
| Multifamily | | | ― | | | | ― | |
| Consumer | | | ― | | | | ― | |
| Commercial business | | | ― | | | | ― | |
| Total accruing loans 90 days or more past due | | | ― | | | | ― | |
| | | | | | | | | |
| Total non-performing loans | | | 518 | | | | 1,232 | |
| | | | | | | | | |
| Realestate owned | | | 93 | | | | 756 | |
| | | | | | | | | |
| Total non-performing assets | | $ | 611 | | | $ | 1,988 | |
| | | | | | | | | |
| Accruing troubled debt restructurings: | | | | | | | | |
| Real estate: | | | | | | | | |
| One- to four-family residential: | | | | | | | | |
| Owner-occupied | | $ | ― | | | $ | ― | |
| Non-owner-occupied | | | 20 | | | | ― | |
| Home equity lines of credit | | | ― | | | | ― | |
| Commercial real estate | | | ― | | | | ― | |
| Land | | | ― | | | | ― | |
| Construction | | | ― | | | | ― | |
| Multifamily | | | ― | | | | ― | |
| Consumer | | | ― | | | | ― | |
| Commercial business | | | | | | | | |
| Total | | $ | 20 | | | $ | ― | |
| | | | | | | | | |
| Ratios: | | | | | | | | |
| Total non-performing loans to total loans | | | 0.68 | % | | | 1.65 | % |
| Total non-performing assets to total assets | | | 0.62 | % | | | 2.06 | % |
| Total non-performing loans and TDRs to total loans | | | 0.70 | % | | | 1.65 | % |
| Total non-performing assets and TDRs to total assets | | | 0.64 | % | | | 2.06 | % |
Source: Heritage NOLA Bancorp’s prospectus.
EXHIBIT I-13
Heritage Bank of St. Tammany
Deposit Composition
Exhibit I-13
Heritage Bank of St. Tammany
Deposit Composition
| | | For the Years Ended December 31, | |
| | | 2016 | | | 2015 | |
| | | Average
Balance | | | Percent | | | Weighted
Average
Rate | | | Average
Balance | | | Percent | | | Weighted
Average
Rate | |
| | | (Dollars in thousands) | |
| Deposit type: | | | | | | | | | | | | | | | | | | | | | | | | |
| Statement savings | | $ | 16,244 | | | | 21.9 | % | | | 0.25 | % | | $ | 15,967 | | | | 21.9 | % | | | 0.36 | % |
| Non-interest bearing demand | | | 3,162 | | | | 4.3 | | | | ― | | | | 2,215 | | | | 3.0 | | | | ― | |
| NOW | | | 3,102 | | | | 4.2 | | | | 0.23 | | | | 2,492 | | | | 3.4 | | | | 0.24 | |
| Certificates of deposit | | | 51,538 | | | | 69.6 | | | | 1.53 | | | | 52,326 | | | | 71.7 | | | | 1.48 | |
| | | | | | | | | | | | | | | | | | | | | | | | | |
| Total deposits | | $ | 74,046 | | | | 100.0 | % | | | 1.13 | % | | $ | 73,000 | | | | 100.0 | % | | | 1.15 | % |
Source: Heritage NOLA Bancorp’s prospectus.
EXHIBIT I-14
Heritage Bank of St. Tammany
Maturity of Time Deposits
Exhibit I-14
Heritage Bank of St. Tammany
Maturity of Time Deposits
| | | At December 31, 2016 | |
| | | Period to Maturity (1) | |
| | | Less Than
or Equal to
One Year | | | Over One
Year to Two
Years | | | Over Two
Years to
Three Years | | | Over Three
Years | | | Total | | | Percentage
of Total
Certificate
Accounts | |
| | | (Dollars in thousands) | |
| | | | |
| Interest Rate: | | | | | | | | | | | | | | | | | | | | | | | | |
| Less than or equal to1.00% | | $ | 3,621 | | | $ | ― | | | $ | ― | | | $ | 12 | | | $ | 3,633 | | | | 7.1 | % |
| 1.00% - 1.99% | | | 18,201 | | | | 10,124 | | | | 5,073 | | | | 2,043 | | | | 35,441 | | | | 69.5 | |
| 2.00% - 2.99% | | | 2 | | | | 256 | | | | 56 | | | | 7,828 | | | | 8,142 | | | | 16.0 | |
| 3.00% - 3.99% | | | 1,750 | | | | ― | | | | ― | | | | 1,944 | | | | 3,694 | | | | 7.2 | |
| 4.00% - 4.99% | | | ― | | | | ― | | | | ― | | | | ― | | | | ― | | | | ― | |
| 5.00% - 5.99% | | | 99 | | | | ― | | | | ― | | | | ― | | | | 99 | | | | 0.2 | |
| | | | | | | | | | | | | | | | | | | | | | | | | |
| Total | | $ | 23,673 | | | $ | 10,380 | | | $ | 5,129 | | | $ | 11,827 | | | $ | 51,009 | | | | 100.00 | % |
| (1) | Includes $13,000 of certificates of deposit held within individual retirement accounts which have no stated maturity. |
Source: Heritage NOLA Bancorp’s prospectus.
EXHIBIT I-15
Heritage Bank of St. Tammany
Borrowing Activity
Exhibit I-15
Heritage Bank of St. Tammany
Borrowing Activity
| | | At or For the Years Ended December 31, | |
| | | 2016 | | | 2015 | |
| | | (Dollars in thousands) | |
| | | | | | | |
| FHLB: | | | | | | | | |
| Balance at end of period | | $ | 13,273 | | | $ | 12,657 | |
| Average balance during period | | | 12,305 | | | | 7,672 | |
| Maximum outstanding at any month end | | | 13,365 | | | | 12,657 | |
| Weighted average interest rate at end of period | | | 1.29 | % | | | 1.33 | % |
| Average interest rate during period | | | 1.30 | % | | | 1.18 | % |
Source: Heritage NOLA Bancorp’s prospectus.
EXHIBIT II-1
Description of Office Properties
Exhibit II-1
Heritage Bank of St. Tammany
Description of Office Properties
Properties
At December 31, 2016, the net book value of our properties was $3.6 million. We own our two full-service offices located at 205 North Columbia Street, Covington, Louisiana and 200 Gause Boulevard, Slidell, Louisiana, and believe that our current facilities are adequate to meet our present and foreseeable needs, other than modest and customary repair and replacement needs.
Source: Heritage NOLA Bancorp’s prospectus.
EXHIBIT II-2
Historical Interest Rates
Exhibit II-2
Historical Interest Rates(1)
| | | | | Prime | | | 90 Day | | | One Year | | | 10 Year | |
| Year/Qtr. Ended | | Rate | | | T-Note | | | T-Note | | | T-Note | |
| | | | | | | | | | | | | | | |
| 2004: | | Quarter 1 | | | 4.00 | % | | | 0.95 | % | | | 1.20 | % | | | 3.86 | % |
| | | Quarter 2 | | | 4.00 | % | | | 1.33 | % | | | 2.09 | % | | | 4.62 | % |
| | | Quarter 3 | | | 4.75 | % | | | 1.70 | % | | | 2.16 | % | | | 4.12 | % |
| | | Quarter 4 | | | 5.25 | % | | | 2.22 | % | | | 2.75 | % | | | 4.24 | % |
| | | | | | | | | | | | | | | | | | | |
| 2005: | | Quarter 1 | | | 5.75 | % | | | 2.80 | % | | | 3.43 | % | | | 4.51 | % |
| | | Quarter 2 | | | 6.00 | % | | | 3.12 | % | | | 3.51 | % | | | 3.98 | % |
| | | Quarter 3 | | | 6.75 | % | | | 3.55 | % | | | 4.01 | % | | | 4.34 | % |
| | | Quarter 4 | | | 7.25 | % | | | 4.08 | % | | | 4.38 | % | | | 4.39 | % |
| | | | | | | | | | | | | | | | | | | |
| 2006: | | Quarter 1 | | | 7.75 | % | | | 4.63 | % | | | 4.82 | % | | | 4.86 | % |
| | | Quarter 2 | | | 8.25 | % | | | 5.01 | % | | | 5.21 | % | | | 5.15 | % |
| | | Quarter 3 | | | 8.25 | % | | | 4.88 | % | | | 4.91 | % | | | 4.64 | % |
| | | Quarter 4 | | | 8.25 | % | | | 5.02 | % | | | 5.00 | % | | | 4.71 | % |
| | | | | | | | | | | | | | | | | | | |
| 2007: | | Quarter 1 | | | 8.25 | % | | | 5.04 | % | | | 4.90 | % | | | 4.65 | % |
| | | Quarter 2 | | | 8.25 | % | | | 4.82 | % | | | 4.91 | % | | | 5.03 | % |
| | | Quarter 3 | | | 7.75 | % | | | 3.82 | % | | | 4.05 | % | | | 4.59 | % |
| | | Quarter 4 | | | 7.25 | % | | | 3.36 | % | | | 3.34 | % | | | 3.91 | % |
| | | | | | | | | | | | | | | | | | | |
| 2008: | | Quarter 1 | | | 5.25 | % | | | 1.38 | % | | | 1.55 | % | | | 3.45 | % |
| | | Quarter 2 | | | 5.00 | % | | | 1.90 | % | | | 2.36 | % | | | 3.99 | % |
| | | Quarter 3 | | | 5.00 | % | | | 0.92 | % | | | 1.78 | % | | | 3.85 | % |
| | | Quarter 4 | | | 3.25 | % | | | 0.11 | % | | | 0.37 | % | | | 2.25 | % |
| | | | | | | | | | | | | | | | | | | |
| 2009: | | Quarter 1 | | | 3.25 | % | | | 0.21 | % | | | 0.57 | % | | | 2.71 | % |
| | | Quarter 2 | | | 3.25 | % | | | 0.19 | % | | | 0.56 | % | | | 3.53 | % |
| | | Quarter 3 | | | 3.25 | % | | | 0.14 | % | | | 0.40 | % | | | 3.31 | % |
| | | Quarter 4 | | | 3.25 | % | | | 0.06 | % | | | 0.47 | % | | | 3.85 | % |
| | | | | | | | | | | | | | | | | | | |
| 2010: | | Quarter 1 | | | 3.25 | % | | | 0.16 | % | | | 0.41 | % | | | 3.84 | % |
| | | Quarter 2 | | | 3.25 | % | | | 0.18 | % | | | 0.32 | % | | | 2.97 | % |
| | | Quarter 3 | | | 3.25 | % | | | 0.18 | % | | | 0.32 | % | | | 2.97 | % |
| | | Quarter 4 | | | 3.25 | % | | | 0.12 | % | | | 0.29 | % | | | 3.30 | % |
| | | | | | | | | | | | | | | | | | | |
| 2011: | | Quarter 1 | | | 3.25 | % | | | 0.09 | % | | | 0.30 | % | | | 3.47 | % |
| | | Quarter 2 | | | 3.25 | % | | | 0.03 | % | | | 0.19 | % | | | 3.18 | % |
| | | Quarter 3 | | | 3.25 | % | | | 0.02 | % | | | 0.13 | % | | | 1.92 | % |
| | | Quarter 4 | | | 3.25 | % | | | 0.02 | % | | | 0.12 | % | | | 1.89 | % |
| | | | | | | | | | | | | | | | | | | |
| 2012: | | Quarter 1 | | | 3.25 | % | | | 0.07 | % | | | 0.19 | % | | | 2.23 | % |
| | | Quarter 2 | | | 3.25 | % | | | 0.09 | % | | | 0.21 | % | | | 1.67 | % |
| | | Quarter 3 | | | 3.25 | % | | | 0.10 | % | | | 0.17 | % | | | 1.65 | % |
| | | Quarter 4 | | | 3.25 | % | | | 0.05 | % | | | 0.16 | % | | | 1.78 | % |
| | | | | | | | | | | | | | | | | | | |
| 2013: | | Quarter 1 | | | 3.25 | % | | | 0.07 | % | | | 0.14 | % | | | 1.87 | % |
| | | Quarter 2 | | | 3.25 | % | | | 0.04 | % | | | 0.15 | % | | | 2.52 | % |
| | | Quarter 3 | | | 3.25 | % | | | 0.02 | % | | | 0.10 | % | | | 2.64 | % |
| | | Quarter 4 | | | 3.25 | % | | | 0.07 | % | | | 0.13 | % | | | 3.04 | % |
| | | | | | | | | | | | | | | | | | | |
| 2014: | | Quarter 1 | | | 3.25 | % | | | 0.05 | % | | | 0.13 | % | | | 2.73 | % |
| | | Quarter 2 | | | 3.25 | % | | | 0.04 | % | | | 0.11 | % | | | 2.53 | % |
| | | Quarter 3 | | | 3.25 | % | | | 0.02 | % | | | 0.13 | % | | | 2.52 | % |
| | | Quarter 4 | | | 3.25 | % | | | 0.04 | % | | | 0.25 | % | | | 2.17 | % |
| | | | | | | | | | | | | | | | | | | |
| 2015: | | Quarter 1 | | | 3.25 | % | | | 0.03 | % | | | 0.26 | % | | | 1.94 | % |
| | | Quarter 2 | | | 3.25 | % | | | 0.01 | % | | | 0.28 | % | | | 2.35 | % |
| | | Quarter 3 | | | 3.25 | % | | | 0.00 | % | | | 0.33 | % | | | 2.06 | % |
| | | Quarter 4 | | | 3.50 | % | | | 0.16 | % | | | 0.65 | % | | | 2.27 | % |
| | | | | | | | | | | | | | | | | | | |
| 2016: | | Quarter 1 | | | 3.50 | % | | | 0.21 | % | | | 0.59 | % | | | 1.78 | % |
| | | Quarter 2 | | | 3.50 | % | | | 0.26 | % | | | 0.45 | % | | | 1.49 | % |
| | | Quarter 3 | | | 3.50 | % | | | 0.29 | % | | | 0.59 | % | | | 1.60 | % |
| | | Quarter 4 | | | 3.75 | % | | | 0.51 | % | | | 0.85 | % | | | 2.45 | % |
| As of Feb. 10, 2017 | | | 3.75 | % | | | 0.55 | % | | | 0.81 | % | | | 2.41 | % |
(1) End of period data.
Sources: Federal Reserve and The Wall Street Journal.
EXHIBIT III-1
General Characteristics of Publicly-Traded Institutions
Exhibit III-1
Characteristics of Publicly-Traded Thrifts
February 10, 2017
| | | | | | | | | | | | | | | | | | | | | | As of | |
| | | | | | | | | | | | | | | | | | | | | | February 10, 2017 | |
| | | | | | | | | | | | | Total | | | | | Fiscal | | Conv. | | Stock | | | Market | |
| Ticker | | Financial Institution | | Exchange | | Region | | City | | State | | Assets | | | Offices | | Mth End | | Date | | Price | | | Value | |
| | | | | | | | | | | | | ($Mil) | | | | | | | | | ($) | | | ($Mil) | |
| | | | | | | | | | | | | | | | | | | | | | | | | | |
| ANCB | | Anchor Bancorp | | NASDAQ | | WE | | Lacey | | WA | | $ | 436 | | | 10 | | Jun | | 1/26/11 | | $ | 26.85 | | | $ | 67 | |
| ASBB | | ASB Bancorp, Inc. | | NASDAQ | | SE | | Asheville | | NC | | | 797 | | | 13 | | Dec | | 10/12/11 | | | 31.75 | | | | 120 | |
| AF | | Astoria Financial Corporation | | NYSE | | MA | | Lake Success | | NY | | | 14,814 | | | 88 | | Dec | | 11/18/93 | | | 18.66 | | | | 1,889 | |
| BCTF | | Bancorp 34, Inc. | | NASDAQ | | SW | | Alamogordo | | NM | | | 328 | | | 4 | | Dec | | 10/12/16 | | | 12.75 | | | | 44 | |
| BKMU | | Bank Mutual Corporation | | NASDAQ | | MW | | Milwaukee | | WI | | | 2,653 | | | 66 | | Dec | | 10/30/03 | | | 9.85 | | | | 450 | |
| BYBK | | Bay Bancorp, Inc. | | NASDAQ | | MA | | Columbia | | MD | | | 606 | | | 14 | | Dec | | 1/0/00 | | | 7.90 | | | | 83 | |
| BNCL | | Beneficial Bancorp, Inc. | | NASDAQ | | MA | | Philadelphia | | PA | | | 5,580 | | | 64 | | Dec | | 1/13/15 | | | 16.40 | | | | 1,245 | |
| BHBK | | Blue Hills Bancorp, Inc. | | NASDAQ | | NE | | Norwood | | MA | | | 2,314 | | | 11 | | Dec | | 7/22/14 | | | 18.95 | | | | 507 | |
| BOFI | | BofI Holding, Inc. | | NASDAQ | | WE | | San Diego | | CA | | | 7,855 | | | 2 | | Jun | | 3/14/05 | | | 29.56 | | | | 1,873 | |
| BYFC | | Broadway Financial Corporation | | NASDAQ | | WE | | Los Angeles | | CA | | | 413 | | | 3 | | Dec | | 1/9/96 | | | 1.52 | | | | 28 | |
| BLMT | | BSB Bancorp, Inc. | | NASDAQ | | NE | | Belmont | | MA | | | 2,074 | | | 7 | | Dec | | 10/5/11 | | | 28.35 | | | | 258 | |
| CFFN | | Capitol Federal Financial, Inc. | | NASDAQ | | MW | | Topeka | | KS | | | 9,267 | | | 47 | | Sep | | 12/22/10 | | | 15.19 | | | | 2,096 | |
| CARV | | Carver Bancorp, Inc. | | NASDAQ | | MA | | New York | | NY | | | 702 | | | 9 | | Mar | | 10/25/94 | | | 3.25 | | | | 12 | |
| CHFN | | Charter Financial Corporation | | NASDAQ | | SE | | West Point | | GA | | | 1,438 | | | 21 | | Sep | | 4/8/13 | | | 17.40 | | | | 262 | |
| CSBK | | Clifton Bancorp Inc. | | NASDAQ | | MA | | Clifton | | NJ | | | 1,312 | | | 13 | | Mar | | 4/2/14 | | | 15.97 | | | | 368 | |
| CWAY | | Coastway Bancorp, Inc. | | NASDAQ | | NE | | Warwick | | RI | | | 633 | | | 11 | | Dec | | 1/15/14 | | | 16.90 | | | | 74 | |
| DCOM | | Dime Community Bancshares, Inc. | | NASDAQ | | MA | | Brooklyn | | NY | | | 5,822 | | | 26 | | Dec | | 6/26/96 | | | 21.00 | | | | 787 | |
| ESBK | | Elmira Savings Bank | | NASDAQ | | MA | | Elmira | | NY | | | 567 | | | 13 | | Dec | | 3/1/85 | | | 21.50 | | | | 59 | |
| ENFC | | Entegra Financial Corp. | | NASDAQ | | SE | | Franklin | | NC | | | 1,218 | | | 16 | | Dec | | 10/1/14 | | | 22.45 | | | | 145 | |
| EQFN | | Equitable Financial Corp. | | NASDAQ | | MW | | Grand Island | | NE | | | 228 | | | 6 | | Jun | | 7/9/15 | | | 10.15 | | | | 34 | |
| ESSA | | ESSA Bancorp, Inc. | | NASDAQ | | MA | | Stroudsburg | | PA | | | 1,772 | | | 27 | | Sep | | 4/4/07 | | | 15.89 | | | | 183 | |
| FCAP | | First Capital, Inc. | | NASDAQ | | MW | | Corydon | | IN | | | 742 | | | 17 | | Dec | | 1/4/99 | | | 32.95 | | | | 110 | |
| FBNK | | First Connecticut Bancorp, Inc. | | NASDAQ | | NE | | Farmington | | CT | | | 2,832 | | | 27 | | Dec | | 6/30/11 | | | 24.15 | | | | 384 | |
| FDEF | | First Defiance Financial Corp. | | NASDAQ | | MW | | Defiance | | OH | | | 2,450 | | | 35 | | Dec | | 10/2/95 | | | 48.57 | | | | 436 | |
| FNWB | | First Northwest Bancorp | | NASDAQ | | WE | | Port Angeles | | WA | | | 1,049 | | | 11 | | Jun | | 1/30/15 | | | 15.73 | | | | 191 | |
| FBC | | Flagstar Bancorp, Inc. | | NYSE | | MW | | Troy | | MI | | | 14,273 | | | 99 | | Dec | | 4/30/97 | | | 25.74 | | | | 1,463 | |
| FSBW | | FS Bancorp, Inc. | | NASDAQ | | WE | | Mountlake Terrace | | WA | | | 827 | | | 12 | | Dec | | 7/10/12 | | | 38.90 | | | | 119 | |
| FSBC | | FSB Bancorp, Inc. | | NASDAQ | | MA | | Fairport | | NY | | | 260 | | | 5 | | Dec | | 7/14/16 | | | 14.29 | | | | 28 | |
| HBK | | Hamilton Bancorp, Inc. | | NASDAQ | | MA | | Towson | | MD | | | 517 | | | 7 | | Mar | | 10/10/12 | | | 15.45 | | | | 53 | |
| HIFS | | Hingham Institution for Savings | | NASDAQ | | NE | | Hingham | | MA | | | 1,960 | | | 13 | | Dec | | 12/13/88 | | | 188.22 | | | | 401 | |
| HMNF | | HMN Financial, Inc. | | NASDAQ | | MW | | Rochester | | MN | | | 686 | | | 13 | | Dec | | 6/30/94 | | | 18.48 | | | | 83 | |
| HFBL | | Home Federal Bancorp, Inc. of Louisiana | | NASDAQ | | SW | | Shreveport | | LA | | | 390 | | | 7 | | Jun | | 12/22/10 | | | 28.00 | | | | 55 | |
| HVBC | | HV Bancorp, Inc. | | NASDAQ | | MA | | Huntingdon Valley | | PA | | | 177 | | | 6 | | Jun | | 1/12/17 | | | 14.00 | | | | 31 | |
| IROQ | | IF Bancorp, Inc. | | NASDAQ | | MW | | Watseka | | IL | | | 589 | | | 6 | | Jun | | 7/8/11 | | | 19.75 | | | | 78 | |
| ISBC | | Investors Bancorp, Inc. | | NASDAQ | | MA | | Short Hills | | NJ | | | 22,536 | | | 153 | | Dec | | 5/8/14 | | | 14.48 | | | | 4,481 | |
| JXSB | | Jacksonville Bancorp, Inc. | | NASDAQ | | MW | | Jacksonville | | IL | | | 331 | | | 6 | | Dec | | 7/15/10 | | | 31.50 | | | | 57 | |
| KRNY | | Kearny Financial Corp. | | NASDAQ | | MA | | Fairfield | | NJ | | | 4,523 | | | 42 | | Jun | | 5/19/15 | | | 15.15 | | | | 1,337 | |
| MLVF | | Malvern Bancorp, Inc. | | NASDAQ | | MA | | Paoli | | PA | | | 821 | | | 9 | | Sep | | 10/12/12 | | | 21.00 | | | | 138 | |
| MELR | | Melrose Bancorp, Inc. | | NASDAQ | | NE | | Melrose | | MA | | | 267 | | | 1 | | Dec | | 10/22/14 | | | 18.10 | | | | 47 | |
| EBSB | | Meridian Bancorp, Inc. | | NASDAQ | | NE | | Peabody | | MA | | | 4,173 | | | 32 | | Dec | | 7/29/14 | | | 19.35 | | | | 1,037 | |
| CASH | | Meta Financial Group, Inc. | | NASDAQ | | MW | | Sioux Falls | | SD | | | 4,006 | | | 10 | | Sep | | 9/20/93 | | | 87.80 | | | | 821 | |
| MSBF | | MSB Financial Corp. | | NASDAQ | | MA | | Millington | | NJ | | | 434 | | | 5 | | Dec | | 7/17/15 | | | 15.15 | | | | 87 | |
| NYCB | | New York Community Bancorp, Inc. | | NYSE | | MA | | Westbury | | NY | | | 49,463 | | | 259 | | Dec | | 11/23/93 | | | 14.94 | | | | 7,277 | |
| NFBK | | Northfield Bancorp, Inc. | | NASDAQ | | MA | | Woodbridge | | NJ | | | 3,785 | | | 38 | | Dec | | 1/25/13 | | | 17.84 | | | | 866 | |
| NWBI | | Northwest Bancshares, Inc. | | NASDAQ | | MA | | Warren | | PA | | | 9,715 | | | 177 | | Dec | | 12/18/09 | | | 17.31 | | | | 1,760 | |
| OCFC | | OceanFirst Financial Corp. | | NASDAQ | | MA | | Toms River | | NJ | | | 4,151 | | | 62 | | Dec | | 7/3/96 | | | 28.95 | | | | 930 | |
| ORIT | | Oritani Financial Corp. | | NASDAQ | | MA | | Township of Washington | | NJ | | | 3,795 | | | 27 | | Jun | | 6/24/10 | | | 17.00 | | | | 780 | |
| OTTW | | Ottawa Bancorp, Inc. | | NASDAQ | | MW | | Ottawa | | IL | | | 276 | | | 3 | | Dec | | 10/12/16 | | | 12.89 | | | | 45 | |
| PBHC | | Pathfinder Bancorp, Inc. | | NASDAQ | | MA | | Oswego | | NY | | | 717 | | | 17 | | Dec | | 10/17/14 | | | 14.96 | | | | 63 | |
| PBBI | | PB Bancorp, Inc. | | NASDAQ | | NE | | Putnam | | CT | | | 506 | | | 8 | | Jun | | 1/8/16 | | | 10.40 | | | | 82 | |
| PBSK | | Poage Bankshares, Inc. | | NASDAQ | | MW | | Ashland | | KY | | | 449 | | | 10 | | Dec | | 9/13/11 | | | 20.20 | | | | 75 | |
| PROV | | Provident Financial Holdings, Inc. | | NASDAQ | | WE | | Riverside | | CA | | | 1,243 | | | 15 | | Jun | | 6/28/96 | | | 18.69 | | | | 149 | |
Exhibit III-1
Characteristics of Publicly-Traded Thrifts
February 10, 2017
| | | | | | | | | | | | | | | | | | | | | | As of | |
| | | | | | | | | | | | | | | | | | | | | | February 10, 2017 | |
| | | | | | | | | | | | | Total | | | | | Fiscal | | Conv. | | Stock | | | Market | |
| Ticker | | Financial Institution | | Exchange | | Region | | City | | State | | Assets | | | Offices | | Mth End | | Date | | Price | | | Value | |
| | | | | | | | | | | | | ($Mil) | | | | | | | | | ($) | | | ($Mil) | |
| | | | | | | | | | | | | | | | | | | | | | | | | | |
| PFS | | Provident Financial Services, Inc. | | NYSE | | MA | | Iselin | | NJ | | | 9,390 | | | 88 | | Dec | | 1/16/03 | | | 26.15 | | | | 1,728 | |
| PBIP | | Prudential Bancorp, Inc. | | NASDAQ | | MA | | Philadelphia | | PA | | | 559 | | | 11 | | Sep | | 10/10/13 | | | 17.76 | | | | 160 | |
| RNDB | | Randolph Bancorp, Inc. | | NASDAQ | | NE | | Stoughton | | MA | | | 490 | | | 6 | | Dec | | 7/1/16 | | | 14.80 | | | | 87 | |
| RVSB | | Riverview Bancorp, Inc. | | NASDAQ | | WE | | Vancouver | | WA | | | 984 | | | 17 | | Mar | | 10/1/97 | | | 7.78 | | | | 175 | |
| SVBI | | Severn Bancorp, Inc. | | NASDAQ | | MA | | Annapolis | | MD | | | 778 | | | 5 | | Dec | | 1/0/00 | | | 7.50 | | | | 91 | |
| SIFI | | SI Financial Group, Inc. | | NASDAQ | | NE | | Willimantic | | CT | | | 1,538 | | | 25 | | Dec | | 1/13/11 | | | 15.00 | | | | 183 | |
| SBCP | | Sunshine Bancorp, Inc. | | NASDAQ | | SE | | Plant City | | FL | | | 564 | | | 18 | | Dec | | 7/15/14 | | | 18.13 | | | | 145 | |
| TBNK | | Territorial Bancorp Inc. | | NASDAQ | | WE | | Honolulu | | HI | | | 1,849 | | | 29 | | Dec | | 7/13/09 | | | 32.97 | | | | 322 | |
| TSBK | | Timberland Bancorp, Inc. | | NASDAQ | | WE | | Hoquiam | | WA | | | 891 | | | 22 | | Sep | | 1/13/98 | | | 21.93 | | | | 161 | |
| TRST | | TrustCo Bank Corp NY | | NASDAQ | | MA | | Glenville | | NY | | | 4,813 | | | 145 | | Dec | | 1/0/00 | | | 8.25 | | | | 790 | |
| UCBA | | United Community Bancorp | | NASDAQ | | MW | | Lawrenceburg | | IN | | | 528 | | | 8 | | Jun | | 1/10/13 | | | 17.10 | | | | 72 | |
| UCFC | | United Community Financial Corp. | | NASDAQ | | MW | | Youngstown | | OH | | | 2,160 | | | 35 | | Dec | | 7/9/98 | | | 8.66 | | | | 430 | |
| UBNK | | United Financial Bancorp, Inc. | | NASDAQ | | NE | | Glastonbury | | CT | | | 6,545 | | | 54 | | Dec | | 3/4/11 | | | 17.62 | | | | 895 | |
| WSBF | | Waterstone Financial, Inc. | | NASDAQ | | MW | | Wauwatosa | | WI | | | 1,795 | | | 13 | | Dec | | 1/23/14 | | | 18.15 | | | | 533 | |
| WAYN | | Wayne Savings Bancshares, Inc. | | NASDAQ | | MW | | Wooster | | OH | | | 446 | | | 11 | | Dec | | 1/9/03 | | | 18.75 | | | | 52 | |
| WCFB | | WCF Bancorp, Inc. | | NASDAQ | | MW | | Webster City | | IA | | | 124 | | | 2 | | Dec | | 7/14/16 | | | 9.80 | | | | 25 | |
| WEBK | | Wellesley Bancorp, Inc. | | NASDAQ | | NE | | Wellesley | | MA | | | 666 | | | 6 | | Dec | | 1/26/12 | | | 27.75 | | | | 69 | |
| WBB | | Westbury Bancorp, Inc. | | NASDAQ | | MW | | West Bend | | WI | | | 703 | | | 8 | | Sep | | 4/10/13 | | | 22.48 | | | | 92 | |
| WNEB | | Western New England Bancorp, Inc. | | NASDAQ | | NE | | Westfield | | MA | | | 1,378 | | | 23 | | Dec | | 1/4/07 | | | 9.80 | | | | 298 | |
| WBKC | | Wolverine Bancorp, Inc. | | NASDAQ | | MW | | Midland | | MI | | | 369 | | | 3 | | Dec | | 1/20/11 | | | 33.61 | | | | 71 | |
| WSFS | | WSFS Financial Corporation | | NASDAQ | | MA | | Wilmington | | DE | | | 6,628 | | | 64 | | Dec | | 11/26/86 | | | 44.50 | | | | 1,397 | |
| WVFC | | WVS Financial Corp. | | NASDAQ | | MA | | Pittsburgh | | PA | | | 335 | | | 6 | | Jun | | 11/29/93 | | | 14.50 | | | | 29 | |
| GCBC | | Greene County Bancorp, Inc. (MHC) | | NASDAQ | | MA | | Catskill | | NY | | | 893 | | | 15 | | Jun | | 12/30/98 | | | 22.55 | | | | 192 | |
| HONE | | HarborOne Bancorp, Inc. (MHC) | | NASDAQ | | NE | | Brockton | | MA | | | 2,347 | | | 17 | | Dec | | 6/30/16 | | | 19.30 | | | | 620 | |
| KFFB | | Kentucky First Federal Bancorp (MHC) | | NASDAQ | | MW | | Frankfort | | KY | | | 295 | | | 7 | | Jun | | 3/3/05 | | | 9.85 | | | | 84 | |
| LSBK | | Lake Shore Bancorp, Inc. (MHC) | | NASDAQ | | MA | | Dunkirk | | NY | | | 478 | | | 11 | | Dec | | 4/4/06 | | | 15.70 | | | | 96 | |
| MGYR | | Magyar Bancorp, Inc. (MHC) | | NASDAQ | | MA | | New Brunswick | | NJ | | | 584 | | | 6 | | Sep | | 1/24/06 | | | 13.00 | | | | 76 | |
| OFED | | Oconee Federal Financial Corp. (MHC) | | NASDAQ | | SE | | Seneca | | SC | | | 484 | | | 7 | | Jun | | 1/14/11 | | | 22.00 | | | | 127 | |
| PVBC | | Provident Bancorp, Inc. (MHC) | | NASDAQ | | NE | | Amesbury | | MA | | | 768 | | | 8 | | Dec | | 7/16/15 | | | 19.60 | | | | 189 | |
| TFSL | | TFS Financial Corporation (MHC) | | NASDAQ | | MW | | Cleveland | | OH | | | 12,906 | | | 38 | | Sep | | 4/23/07 | | | 17.20 | | | | 4,876 | |
Source: SNL Financial, LC.
EXHIBIT III-2
Public Market Pricing of Southwest and Southeast Thrift Institutions
Exhibit III-2
Public Market Pricing of Southeast and Southwest Institutions
As of February 10, 2017
| | | | | | | Market | | | Per Share Data | | | | | | | | | | | | | | | | |
| | | | | | | Capitalization | | | Core | | | Book | | | | | | | | | | | | | | | | |
| | | | | | | Price/ | | | Market | | | 12 Month | | | Value/ | | | Pricing Ratios(2) | |
| | | | | Share | | | Value | | | EPS(1) | | | Share | | | P/E | | | P/B | | | P/A | | | P/TB | | | P/Core | |
| | | | | | | ($) | | | ($Mil) | | | ($) | | | ($) | | | (x) | | | (%) | | | (%) | | | (%) | | | (x) | |
| | | | | | | | | | | | | | | | | | | | | | | | | | | | | | | | |
| All Non-MHC Public Companies(6) | | | | | | | | | | | | | | | | | | | | | | | | | | | | | | | | | | | | | | |
| Averages | | | | $ | 22.37 | | | $ | 565.71 | | | $ | 1.07 | | | $ | 16.18 | | | | 19.70 | x | | | 130.77 | % | | | 16.09 | % | | | 144.21 | % | | | 20.32 | x |
| Median | | | | $ | 17.80 | | | $ | 154.38 | | | $ | 0.79 | | | $ | 14.60 | | | | 19.18 | x | | | 125.98 | % | | | 15.93 | % | | | 132.12 | % | | | 20.29 | x |
| | | | | | | | | | | | | | | | | | | | | | | | | | | | | | | | | | | | | | | | | |
| Southeast Institutions | | | | | | | | | | | | | | | | | | | | | | | | | | | | | | | | | | | | | | |
| Averages | | | | $ | 22.43 | | | $ | 167.98 | | | $ | 0.70 | | | $ | 18.21 | | | | 22.06 | x | | | 124.38 | % | | | 14.95 | % | | | 138.97 | % | | | 19.91 | x |
| Medians | | | | $ | 20.29 | | | $ | 144.99 | | | $ | 0.95 | | | $ | 17.60 | | | | 22.06 | x | | | 128.21 | % | | | 15.33 | % | | | 141.48 | % | | | 20.56 | x |
| | | | | | | | | | | | | | | | | | | | | | | | | | | | | | | | | | | | | | | | | |
| Comparable Group | | | | | | | | | | | | | | | | | | | | | | | | | | | | | | | | | | | | | | |
| ASBB | | ASB Bancorp, Inc. | | NC | | $ | 31.75 | | | $ | 120.27 | | | $ | 1.21 | | | $ | 24.12 | | | | NM | | | | 131.97 | % | | | 15.11 | % | | | 131.97 | % | | | 22.09 | x |
| CHFN | | Charter Financial Corporation | | GA | | $ | 17.40 | | | $ | 261.66 | | | $ | 0.86 | | | $ | 13.52 | | | | 21.22 | x | | | 127.27 | % | | | 17.89 | % | | | 150.99 | % | | | 17.07 | x |
| ENFC | | Entegra Financial Corp. | | NC | | $ | 22.45 | | | $ | 145.20 | | | $ | 1.04 | | | $ | 21.37 | | | | 22.91 | x | | | 109.11 | % | | | 11.23 | % | | | 111.67 | % | | | 20.56 | x |
| SBCP | | Sunshine Bancorp, Inc. | | FL | | $ | 18.13 | | | $ | 144.79 | | | $ | (0.33 | ) | | $ | 13.82 | | | | NM | | | | 129.16 | % | | | 15.54 | % | | | 161.25 | % | | | NM | |
| | | | | | | | | | | | | | | | | | | | | | | | | | | | | | | | | | | | | | | | | |
| Southwest Institutions | | | | | | | | | | | | | | | | | | | | | | | | | | | | | | | | | | | | | | |
| Averages | | | | $ | 20.37 | | | $ | 49.27 | | | $ | 1.08 | | | $ | 15.73 | | | | 15.14 | x | | | 132.75 | % | | | 13.35 | % | | | 133.44 | % | | | 15.14 | x |
| Medians | | | | $ | 20.37 | | | $ | 49.27 | | | $ | 1.08 | | | $ | 15.73 | | | | 15.14 | x | | | 132.75 | % | | | 13.35 | % | | | 133.44 | % | | | 15.14 | x |
| | | | | | | | | | | | | | | | | | | | | | | | | | | | | | | | | | | | | | | | | |
| Comparable Group | | | | | | | | | | | | | | | | | | | | | | | | | | | | | | | | | | | | | | |
| BCTF | | Bancorp 34, Inc. | | NM | | $ | 12.75 | | | $ | 43.84 | | | $ | 0.35 | | | $ | 9.01 | | | | NM | | | | 141.48 | % | | | 13.36 | % | | | 142.87 | % | | | NM | |
| HFBL | | Home Federal Bancorp, Inc. of Louisiana | | LA | | $ | 28.00 | | | $ | 54.70 | | | $ | 1.80 | | | $ | 22.44 | | | | 15.14 | x | | | 124.02 | % | | | 13.34 | % | | | 124.02 | % | | | 15.14 | x |
| | | | | | | Dividends(3) | | | Financial Characteristics(5) | |
| | | | | | | Amount/ | | | | | | Payout | | | Total | | | Equity/ | | | Tang. Eq./ | | | NPAs/ | | | Reported | | | Core | |
| | | | | Share | | | Yield | | | Ratio(4) | | | Assets | | | Assets | | | T. Assets | | | Assets | | | ROAA | | | ROAE | | | ROAA | | | ROAE | |
| | | | | | | ($) | | | (%) | | | (%) | | | ($Mil) | | | (%) | | | (%) | | | (%) | | | (%) | | | (%) | | | (%) | | | (%) | |
| | | | | | | | | | | | | | | | | | | | | | | | | | | | | | | | | | | | | | |
| All Non-MHC Public Companies(6) | | | | | | | | | | | | | | | | | | | | | | | | | | | | | | | | | | | | | | | | | | | | | | |
| Averages | | | | $ | 0.36 | | | | 1.56 | % | | | 48.05 | % | | $ | 3,274 | | | | 12.70 | % | | | 12.05 | % | | | 1.06 | % | | | 0.70 | % | | | 5.90 | % | | | 0.72 | % | | | 6.03 | % |
| Median | | | | $ | 0.24 | | | | 1.38 | % | | | 40.74 | % | | $ | 938 | | | | 11.51 | % | | | 11.04 | % | | | 0.88 | % | | | 0.62 | % | | | 5.14 | % | | | 0.65 | % | | | 5.22 | % |
| | | | | | | | | | | | | | | | | | | | | | | | | | | | | | | | | | | | | | | | | | | | | | | | | |
| Southeast Institutions | | | | | | | | | | | | | | | | | | | | | | | | | | | | | | | | | | | | | | | | | | | | | | |
| Averages | | | | $ | 0.24 | | | | 1.38 | % | | | 26.22 | % | | $ | 1,004 | | | | 12.45 | % | | | 11.51 | % | | | 1.07 | % | | | 0.49 | % | | | 3.60 | % | | | 0.49 | % | | | 3.58 | % |
| Medians | | | | $ | 0.24 | | | | 1.38 | % | | | 26.22 | % | | $ | 1,008 | | | | 12.17 | % | | | 11.39 | % | | | 1.05 | % | | | 0.62 | % | | | 5.17 | % | | | 0.60 | % | | | 4.96 | % |
| | | | | | | | | | | | | | | | | | | | | | | | | | | | | | | | | | | | | | | | | | | | | | | | | |
| Comparable Group | | | | | | | | | | | | | | | | | | | | | | | | | | | | | | | | | | | | | | | | | | | | | | |
| ASBB | | ASB Bancorp, Inc. | | NC | | | NA | | | | NA | | | | NM | | | $ | 797 | | | | 11.46 | % | | | 11.46 | % | | | 1.33 | % | | | 0.70 | % | | | 5.91 | % | | | 0.57 | % | | | 4.87 | % |
| CHFN | | Charter Financial Corporation | | GA | | $ | 0.24 | | | | 1.38 | % | | | 26.22 | % | | $ | 1,438 | | | | 14.12 | % | | | 12.14 | % | | | 0.77 | % | | | 0.98 | % | | | 5.90 | % | | | 1.07 | % | | | 6.43 | % |
| ENFC | | Entegra Financial Corp. | | NC | | | NA | | | | NA | | | | NM | | | $ | 1,218 | | | | 11.34 | % | | | 11.12 | % | | | 1.78 | % | | | 0.54 | % | | | 4.45 | % | | | 0.62 | % | | | 5.05 | % |
| SBCP | | Sunshine Bancorp, Inc. | | FL | | | NA | | | | NA | | | | NM | | | $ | 564 | | | | 12.89 | % | | | 11.32 | % | | | 0.41 | % | | | -0.26 | % | | | -1.85 | % | | | -0.29 | % | | | -2.04 | % |
| | | | | | | | | | | | | | | | | | | | | | | | | | | | | | | | | | | | | | | | | | | | | | | | | |
| Southwest Institutions | | | | | | | | | | | | | | | | | | | | | | | | | | | | | | | | | | | | | | | | | | | | | | |
| Averages | | | | $ | 0.47 | | | | 0.64 | % | | | 18.92 | % | | $ | 359 | | | | 10.37 | % | | | 10.32 | % | | | 0.31 | % | | | 0.66 | % | | | 5.74 | % | | | 0.67 | % | | | 5.83 | % |
| Medians | | | | $ | 0.47 | | | | 0.64 | % | | | 18.92 | % | | $ | 359 | | | | 10.37 | % | | | 10.32 | % | | | 0.31 | % | | | 0.66 | % | | | 5.74 | % | | | 0.67 | % | | | 5.83 | % |
| | | | | | | | | | | | | | | | | | | | | | | | | | | | | | | | | | | | | | | | | | | | | | | | | |
| Comparable Group | | | | | | | | | | | | | | | | | | | | | | | | | | | | | | | | | | | | | | | | | | | | | | |
| BCTF | | Bancorp 34, Inc. | | NM | | $ | 0.59 | | | | 0.00 | % | | | NM | | | $ | 328 | | | | 9.44 | % | | | 9.36 | % | | | 0.37 | % | | | 0.41 | % | | | 3.85 | % | | | 0.43 | % | | | 4.04 | % |
| HFBL | | Home Federal Bancorp, Inc. of Louisiana | | LA | | $ | 0.36 | | | | 1.29 | % | | | 18.92 | % | | $ | 390 | | | | 11.29 | % | | | 11.29 | % | | | 0.24 | % | | | 0.92 | % | | | 7.63 | % | | | 0.92 | % | | | 7.63 | % |
| (1) | Core income, on a diluted per-share basis. Core income is net income after taxes and before extraordinary items, less net income attributable to noncontrolling interest, gain on the sale of securities, amortization of intangibles, goodwill and nonrecurring items. Assumed tax rate is 35%. |
| (2) | P/E = Price to earnings; P/B = Price to book; P/A = Price to assets; P/TB = Price to tangible book value; and P/Core = Price to core earnings. P/E and P/Core =NM if the ratio is negative or above 35x. |
| (3) | Indicated 12 month dividend, based on last quarterly dividend declared. |
| (4) | Indicated 12 month dividend as a percent of trailing 12 month earnings. |
| (5) | ROAA (return on average assets) and ROAE (return on average equity) are indicated ratios based on trailing 12 month earnings and average equity and assets balances. |
| (6) | Excludes from averages and medians those companies the subject of actual or rumored acquisition activities or unusual operating characteristics. |
| Source: | SNL Financial, LC. and RP Financial, LC. calculations. The information provided in this report has been obtained from sources we believe are reliable, but we cannot guarantee the accuracy or completeness of such information. |
Copyright (c) 2017 by RP® Financial, LC.
EXHIBIT III-3
Public Market Pricing of Midwest Thrift Institutions
Exhibit III-3
Public Market Pricing of Midwest Institutions
As of February 10, 2017
| | | | | | | Market | | | Per Share Data | | | | | | | | | | | | | | | | |
| | | | | | | Capitalization | | | Core | | | Book | | | | | | | | | | | | | | | | |
| | | | | | | Price/ | | | Market | | | 12 Month | | | Value/ | | | Pricing Ratios(2) | |
| | | | | Share | | | Value | | | EPS(1) | | | Share | | | P/E | | | P/B | | | P/A | | | P/TB | | | P/Core | |
| | | | | | | ($) | | | ($Mil) | | | ($) | | | ($) | | | (x) | | | (%) | | | (%) | | | (%) | | | (x) | |
| | | | | | | | | | | | | | | | | | | | | | | | | | | | | | | | |
| All Non-MHC Public Companies(6) | | | | | | | | | | | | | | | | | | | | | | | | | | | | | | | | | | | | | | |
| Averages | | | | $ | 22.37 | | | $ | 565.71 | | | $ | 1.07 | | | $ | 16.18 | | | | 19.70 | x | | | 130.77 | % | | | 16.09 | % | | | 144.21 | % | | | 20.32 | x |
| Median | | | | $ | 17.80 | | | $ | 154.38 | | | $ | 0.79 | | | $ | 14.60 | | | | 19.18 | x | | | 125.98 | % | | | 15.93 | % | | | 132.12 | % | | | 20.29 | x |
| | | | | | | | | | | | | | | | | | | | | | | | | | | | | | | | | | | | | | | | | |
| Midwest Institutions | | | | | | | | | | | | | | | | | | | | | | | | | | | | | | | | | | | | | | |
| Averages | | | | $ | 24.30 | | | $ | 369.53 | | | $ | 1.29 | | | $ | 18.41 | | | | 20.27 | x | | | 125.29 | % | | | 17.07 | % | | | 139.63 | % | | | 22.37 | x |
| Medians | | | | $ | 18.75 | | | $ | 82.94 | | | $ | 0.83 | | | $ | 16.83 | | | | 20.88 | x | | | 116.88 | % | | | 17.31 | % | | | 116.88 | % | | | 21.54 | x |
| | | | | | | | | | | | | | | | | | | | | | | | | | | | | | | | | | | | | | | | | |
| Comparable Group | | | | | | | | | | | | | | | | | | | | | | | | | | | | | | | | | | | | | | |
| BKMU | | Bank Mutual Corporation | | WI | | $ | 9.85 | | | $ | 450.06 | | | $ | 0.38 | | | $ | 6.32 | | | | 26.62 | x | | | 157.01 | % | | | 16.99 | % | | | 157.01 | % | | | 26.62 | x |
| CFFN | | Capitol Federal Financial, Inc. | | KS | | $ | 15.19 | | | $ | 2,095.85 | | | $ | 0.63 | | | $ | 10.13 | | | | 24.50 | x | | | 153.12 | % | | | 22.92 | % | | | 153.12 | % | | | 24.65 | x |
| EQFN | | Equitable Financial Corp. | | NE | | $ | 10.15 | | | $ | 34.42 | | | $ | 0.32 | | | $ | 10.43 | | | | 30.76 | x | | | 96.32 | % | | | 14.89 | % | | | 96.32 | % | | | 30.00 | x |
| FCAP | | First Capital, Inc. | | IN | | $ | 32.95 | | | $ | 109.97 | | | $ | 2.04 | | | $ | 23.55 | | | | 16.07 | x | | | 139.92 | % | | | NA | | | | 155.26 | % | | | 16.15 | x |
| FDEF | | First Defiance Financial Corp. | | OH | | $ | 48.57 | | | $ | 436.38 | | | $ | 3.10 | | | $ | 32.53 | | | | 15.23 | x | | | 148.90 | % | | | 17.62 | % | | | 189.79 | % | | | 14.93 | x |
| FBC | | Flagstar Bancorp, Inc. | | MI | | $ | 25.74 | | | $ | 1,462.67 | | | $ | 2.74 | | | $ | 22.72 | | | | 9.68 | x | | | 109.48 | % | | | 10.41 | % | | | 109.48 | % | | | NM | |
| HMNF | | HMN Financial, Inc. | | MN | | $ | 18.48 | | | $ | 82.94 | | | $ | 1.23 | | | $ | 16.67 | | | | 13.79 | x | | | 109.25 | % | | | 12.16 | % | | | 111.09 | % | | | NM | |
| IROQ | | IF Bancorp, Inc. | | IL | | $ | 19.75 | | | $ | 77.82 | | | $ | 0.98 | | | $ | 21.12 | | | | 16.46 | x | | | 94.59 | % | | | 13.44 | % | | | 94.59 | % | | | 17.55 | x |
| JXSB | | Jacksonville Bancorp, Inc. | | IL | | $ | 31.50 | | | $ | 56.65 | | | $ | 1.57 | | | $ | 26.84 | | | | 18.53 | x | | | 122.62 | % | | | 17.74 | % | | | 130.31 | % | | | 20.26 | x |
| CASH | | Meta Financial Group, Inc. | | SD | | $ | 87.80 | | | $ | 820.56 | | | $ | 4.65 | | | $ | 39.30 | | | | 24.66 | x | | | 219.75 | % | | | 19.39 | % | | | 409.69 | % | | | 20.11 | x |
| OTTW | | Ottawa Bancorp, Inc. | | IL | | $ | 12.89 | | | $ | 44.71 | | | $ | 0.41 | | | $ | 9.23 | | | | NM | | | | 85.99 | % | | | 19.42 | % | | | 87.70 | % | | | NM | |
| PBSK | | Poage Bankshares, Inc. | | KY | | $ | 20.20 | | | $ | 75.01 | | | $ | 0.60 | | | $ | 18.78 | | | | NM | | | | 107.55 | % | | | 16.71 | % | | | 111.33 | % | | | 33.65 | x |
| UCBA | | United Community Bancorp | | IN | | $ | 17.10 | | | $ | 71.70 | | | $ | 0.81 | | | $ | 16.83 | | | | 21.38 | x | | | 104.19 | % | | | 13.65 | % | | | 108.57 | % | | | 21.77 | x |
| UCFC | | United Community Financial Corp. | | OH | | $ | 8.66 | | | $ | 429.70 | | | $ | 0.37 | | | $ | 5.51 | | | | 21.70 | x | | | 161.66 | % | | | 18.41 | % | | | 162.69 | % | | | 21.54 | x |
| WSBF | | Waterstone Financial, Inc. | | WI | | $ | 18.15 | | | $ | 533.35 | | | $ | 0.81 | | | $ | 13.94 | | | | 22.41 | x | | | 130.23 | % | | | 29.71 | % | | | 130.42 | % | | | 22.41 | x |
| WAYN | | Wayne Savings Bancshares, Inc. | | OH | | $ | 18.75 | | | $ | 52.16 | | | $ | 0.92 | | | $ | 14.88 | | | | 20.38 | x | | | 125.98 | % | | | 11.70 | % | | | 131.43 | % | | | 20.38 | x |
| WCFB | | WCF Bancorp, Inc. | | IA | | $ | 9.80 | | | $ | 25.12 | | | $ | 0.07 | | | $ | 11.54 | | | | NM | | | | 84.92 | % | | | 20.25 | % | | | 85.12 | % | | | NM | |
| WBB | | Westbury Bancorp, Inc. | | WI | | $ | 22.48 | | | $ | 91.54 | | | $ | 0.83 | | | $ | 19.43 | | | | 26.44 | x | | | 116.88 | % | | | 12.49 | % | | | 116.88 | % | | | 29.84 | x |
| WBKC | | Wolverine Bancorp, Inc. | | MI | | $ | 33.61 | | | $ | 70.54 | | | $ | 2.14 | | | $ | 29.97 | | | | 15.71 | x | | | 112.15 | % | | | 19.29 | % | | | 112.15 | % | | | 15.71 | x |
| | | | | | | Dividends(3) | | | Financial Characteristics(5) | |
| | | | | | | Amount/ | | | | | | Payout | | | Total | | | Equity/ | | | Tang. Eq./ | | | NPAs/ | | | Reported | | | Core | |
| | | | | Share | | | Yield | | | Ratio(4) | | | Assets | | | Assets | | | T. Assets | | | Assets | | | ROAA | | | ROAE | | | ROAA | | | ROAE | |
| | | | | | | ($) | | | (%) | | | (%) | | | ($Mil) | | | (%) | | | (%) | | | (%) | | | (%) | | | (%) | | | (%) | | | (%) | |
| | | | | | | | | | | | | | | | | | | | | | | | | | | | | | | | | | | | | | |
| All Non-MHC Public Companies(6) | | | | | | | | | | | | | | | | | | | | | | | | | | | | | | | | | | | | | | | | | | | | |
| Averages | | | | $ | 0.36 | | | | 1.56 | % | | | 48.05 | % | | $ | 3,274 | | | | 12.70 | % | | | 12.05 | % | | | 1.06 | % | | | 0.70 | % | | | 5.90 | % | | | 0.72 | % | | | 6.03 | % |
| Median | | | | $ | 0.24 | | | | 1.38 | % | | | 40.74 | % | | $ | 938 | | | | 11.51 | % | | | 11.04 | % | | | 0.88 | % | | | 0.62 | % | | | 5.14 | % | | | 0.65 | % | | | 5.22 | % |
| | | | | | | | | | | | | | | | | | | | | | | | | | | | | | | | | | | | | | | | | | | | | | | | | |
| Midwest Institutions | | | | | | | | | | | | | | | | | | | | | | | | | | | | | | | | | | | | | | | | | | | | | | |
| Averages | | | | $ | 0.40 | | | | 1.59 | % | | | 52.64 | % | | $ | 2,214 | | | | 13.59 | % | | | 13.20 | % | | | 1.13 | % | | | 0.80 | % | | | 6.26 | % | | | 0.80 | % | | | 6.25 | % |
| Medians | | | | $ | 0.24 | | | | 1.40 | % | | | 39.94 | % | | $ | 686 | | | | 11.92 | % | | | 11.81 | % | | | 1.04 | % | | | 0.74 | % | | | 5.95 | % | | | 0.74 | % | | | 5.95 | % |
| | | | | | | | | | | | | | | | | | | | | | | | | | | | | | | | | | | | | | | | | | | | | | | | | |
| Comparable Group | | | | | | | | | | | | | | | | | | | | | | | | | | | | | | | | | | | | | | | | | | | | | | |
| BKMU | | Bank Mutual Corporation | | WI | | $ | 0.22 | | | | 2.23 | % | | | 59.46 | % | | $ | 2,653 | | | | 10.89 | % | | | 10.89 | % | | | 0.54 | % | | | 0.65 | % | | | 5.85 | % | | | 0.66 | % | | | 5.95 | % |
| CFFN | | Capitol Federal Financial, Inc. | | KS | | $ | 0.34 | | | | 2.24 | % | | | 141.94 | % | | $ | 9,267 | | | | 15.03 | % | | | 15.03 | % | | | 0.60 | % | | | 0.74 | % | | | 5.95 | % | | | 0.74 | % | | | 5.91 | % |
| EQFN | | Equitable Financial Corp. | | NE | | | NA | | | | NA | | | | NM | | | $ | 228 | | | | 15.92 | % | | | 15.92 | % | | | NA | | | | 0.46 | % | | | 3.00 | % | | | 0.47 | % | | | 3.08 | % |
| FCAP | | First Capital, Inc. | | IN | | $ | 0.84 | | | | 2.55 | % | | | 40.98 | % | | $ | 742 | | | | 10.61 | % | | | 9.66 | % | | | 1.25 | % | | | 0.89 | % | | | 8.39 | % | | | 0.95 | % | | | 8.90 | % |
| FDEF | | First Defiance Financial Corp. | | OH | | $ | 1.00 | | | | 2.06 | % | | | 28.53 | % | | $ | 2,450 | | | | 11.92 | % | | | 9.59 | % | | | 1.14 | % | | | 1.19 | % | | | 9.93 | % | | | 1.20 | % | | | 10.00 | % |
| FBC | | Flagstar Bancorp, Inc. | | MI | | $ | 0.00 | | | | 0.00 | % | | | NM | | | $ | 14,273 | | | | 9.01 | % | | | 9.01 | % | | | 0.92 | % | | | 1.30 | % | | | 11.55 | % | | | 1.17 | % | | | 10.40 | % |
| HMNF | | HMN Financial, Inc. | | MN | | $ | 0.00 | | | | 0.00 | % | | | NM | | | $ | 686 | | | | 10.91 | % | | | 10.75 | % | | | 1.04 | % | | | 0.89 | % | | | 8.02 | % | | | 0.90 | % | | | 8.10 | % |
| IROQ | | IF Bancorp, Inc. | | IL | | $ | 0.16 | | | | 0.81 | % | | | 13.33 | % | | $ | 589 | | | | 14.23 | % | | | 14.23 | % | | | 0.82 | % | | | 0.70 | % | | | 4.93 | % | | | 0.64 | % | | | 4.46 | % |
| JXSB | | Jacksonville Bancorp, Inc. | | IL | | $ | 0.40 | | | | 1.27 | % | | | 23.53 | % | | $ | 331 | | | | 14.60 | % | | | 13.89 | % | | | 1.33 | % | | | 0.99 | % | | | 6.53 | % | | | 0.92 | % | | | 6.05 | % |
| CASH | | Meta Financial Group, Inc. | | SD | | $ | 0.52 | | | | 0.59 | % | | | 14.61 | % | | $ | 4,006 | | | | 8.36 | % | | | 6.83 | % | | | 0.02 | % | | | 1.10 | % | | | 10.80 | % | | | 1.30 | % | | | 12.80 | % |
| OTTW | | Ottawa Bancorp, Inc. | | IL | | $ | 0.00 | | | | 0.00 | % | | | NM | | | $ | 276 | | | | 11.54 | % | | | 11.21 | % | | | 2.00 | % | | | 0.59 | % | | | 4.15 | % | | | 0.62 | % | | | 4.37 | % |
| PBSK | | Poage Bankshares, Inc. | | KY | | $ | 0.24 | | | | 1.19 | % | | | 53.85 | % | | $ | 449 | | | | 15.54 | % | | | 15.09 | % | | | 1.78 | % | | | 0.43 | % | | | 2.68 | % | | | 0.50 | % | | | 3.08 | % |
| UCBA | | United Community Bancorp | | IN | | $ | 0.24 | | | | 1.40 | % | | | 30.00 | % | | $ | 528 | | | | 13.38 | % | | | 12.92 | % | | | 1.02 | % | | | 0.68 | % | | | 5.14 | % | | | 0.64 | % | | | 4.84 | % |
| UCFC | | United Community Financial Corp. | | OH | | $ | 0.12 | | | | 1.39 | % | | | 28.82 | % | | $ | 2,160 | | | | 11.87 | % | | | 11.81 | % | | | 1.96 | % | | | 0.89 | % | | | 7.33 | % | | | 0.86 | % | | | 7.09 | % |
| WSBF | | Waterstone Financial, Inc. | | WI | | $ | 0.48 | | | | 2.64 | % | | | 40.74 | % | | $ | 1,795 | | | | 22.82 | % | | | 22.79 | % | | | 1.38 | % | | | 1.26 | % | | | 5.59 | % | | | 1.26 | % | | | 5.59 | % |
| WAYN | | Wayne Savings Bancshares, Inc. | | OH | | $ | 0.36 | | | | 1.92 | % | | | 39.13 | % | | $ | 446 | | | | 9.29 | % | | | 8.94 | % | | | 0.96 | % | | | 0.57 | % | | | 6.20 | % | | | 0.57 | % | | | 6.20 | % |
| WCFB | | WCF Bancorp, Inc. | | IA | | $ | 0.20 | | | | 2.04 | % | | | 147.33 | % | | $ | 124 | | | | 23.85 | % | | | 23.80 | % | | | NA | | | | 0.19 | % | | | 1.44 | % | | | 0.13 | % | | | 0.98 | % |
| WBB | | Westbury Bancorp, Inc. | | WI | | | NA | | | | NA | | | | NM | | | $ | 703 | | | | 11.33 | % | | | 11.33 | % | | | 0.52 | % | | | 0.51 | % | | | 4.49 | % | | | 0.46 | % | | | 4.02 | % |
| WBKC | | Wolverine Bancorp, Inc. | | MI | | $ | 1.60 | | | | 4.76 | % | | | 74.77 | % | | $ | 369 | | | | 17.20 | % | | | 17.20 | % | | | 1.92 | % | | | 1.13 | % | | | 7.00 | % | | | 1.13 | % | | | 7.00 | % |
| (1) | Core income, on a diluted per-share basis. Core income is net income after taxes and before extraordinary items, less net income attributable to noncontrolling interest, gain on the sale of securities, amortization of intangibles, goodwill and nonrecurring items. Assumed tax rate is 35%. |
| (2) | P/E = Price to earnings; P/B = Price to book; P/A = Price to assets; P/TB = Price to tangible book value; and P/Core = Price to core earnings. P/E and P/Core =NM if the ratio is negative or above 35x. |
| (3) | Indicated 12 month dividend, based on last quarterly dividend declared. |
| (4) | Indicated 12 month dividend as a percent of trailing 12 month earnings. |
| (5) | ROAA (return on average assets) and ROAE (return on average equity) are indicated ratios based on trailing 12 month earnings and average equity and assets balances. |
| (6) | Excludes from averages and medians those companies the subject of actual or rumored acquisition activities or unusual operating characteristics. |
| Source: | SNL Financial, LC. and RP Financial, LC. calculations. The information provided in this report has been obtained from sources we believe are reliable, but we cannot guarantee the accuracy or completeness of such information. |
Copyright (c) 2017 by RP® Financial, LC.
EXHIBIT III-4
Public Market Pricing of Mid-Atlantic Thrift Institutions
Exhibit III-4
Public Market Pricing of Mid-Atlantic Institutions
As of February 10, 2017
| | | | | | | Market | | | Per Share Data | | | | | | | | | | | | | | | | |
| | | | | | | Capitalization | | | Core | | | Book | | | | | | | | | | | | | | | | |
| | | | | | | Price/ | | | Market | | | 12 Month | | | Value/ | | | Pricing Ratios(2) | |
| | | | | Share | | | Value | | | EPS(1) | | | Share | | | P/E | | | P/B | | | P/A | | | P/TB | | | P/Core | |
| | | | | | | ($) | | | ($Mil) | | | ($) | | | ($) | | | (x) | | | (%) | | | (%) | | | (%) | | | (x) | |
| | | | | | | | | | | | | | | | | | | | | | | | | | | | | | | | |
| All Non-MHC Public Companies(6) | | | | | | | | | | | | | | | | | | | | | | | | | | | | | | | | | | | | | | |
| Averages | | | | $ | 22.37 | | | $ | 565.71 | | | $ | 1.07 | | | $ | 16.18 | | | | 19.70 | x | | | 130.77 | % | | | 16.09 | % | | | 144.21 | % | | | 20.32 | x |
| Median | | | | $ | 17.80 | | | $ | 154.38 | | | $ | 0.79 | | | $ | 14.60 | | | | 19.18 | x | | | 125.98 | % | | | 15.93 | % | | | 132.12 | % | | | 20.29 | x |
| | | | | | | | | | | | | | | | | | | | | | | | | | | | | | | | | | | | | | | | | |
| Mid-Atlantic Institutions | | | | | | | | | | | | | | | | | | | | | | | | | | | | | | | | | | | | | | |
| Averages | | | | $ | 17.03 | | | $ | 986.99 | | | $ | 0.73 | | | $ | 13.22 | | | | 19.92 | x | | | 129.35 | % | | | 16.06 | % | | | 149.07 | % | | | 19.60 | x |
| Medians | | | | $ | 15.89 | | | $ | 367.69 | | | $ | 0.66 | | | $ | 13.66 | | | | 18.95 | x | | | 126.17 | % | | | 15.95 | % | | | 139.44 | % | | | 19.97 | x |
| | | | | | | | | | | | | | | | | | | | | | | | | | | | | | | | | | | | | | | | | |
| | | | | | | | | | | | | | | | | | | | | | | | | | | | | | | | | | | | | | | | | |
| Comparable Group | | | | | | | | | | | | | | | | | | | | | | | | | | | | | | | | | | | | | | |
| AF | | Astoria Financial Corporation | | NY | | $ | 18.66 | | | $ | 1,888.59 | | | $ | 0.67 | | | $ | 15.57 | | | | 30.10 | x | | | 119.21 | % | | | 13.09 | % | | | 134.98 | % | | | 29.30 | x |
| BYBK | | Bay Bancorp, Inc. | | MD | | $ | 7.90 | | | $ | 82.60 | | | $ | 0.18 | | | $ | 6.28 | | | | NM | | | | 126.02 | % | | | 13.32 | % | | | 132.12 | % | | | NM | |
| BNCL | | Beneficial Bancorp, Inc. | | PA | | $ | 16.40 | | | $ | 1,244.99 | | | $ | 0.40 | | | $ | 13.41 | | | | NM | | | | 122.28 | % | | | NA | | | | 147.39 | % | | | NM | |
| CARV | | Carver Bancorp, Inc. | | NY | | $ | 3.25 | | | $ | 12.01 | | | ($ | 0.42 | ) | | $ | 2.51 | | | | NM | | | | 129.23 | % | | | 1.83 | % | | | 129.23 | % | | | NM | |
| CSBK | | Clifton Bancorp Inc. | | NJ | | $ | 15.97 | | | $ | 367.69 | | | $ | 0.19 | | | $ | 13.12 | | | | NM | | | | 121.43 | % | | | 26.84 | % | | | 121.43 | % | | | NM | |
| DCOM | | Dime Community Bancshares, Inc. | | NY | | $ | 21.00 | | | $ | 786.57 | | | $ | 1.05 | | | $ | 14.79 | | | | 10.66 | x | | | 139.00 | % | | | 13.10 | % | | | 154.16 | % | | | 21.74 | x |
| ESBK | | Elmira Savings Bank | | NY | | $ | 21.50 | | | $ | 59.05 | | | $ | 1.23 | | | $ | 16.80 | | | | 17.20 | x | | | 128.46 | % | | | 10.48 | % | | | 175.59 | % | | | 17.69 | x |
| ESSA | | ESSA Bancorp, Inc. | | PA | | $ | 15.89 | | | $ | 182.70 | | | $ | 0.71 | | | $ | 15.48 | | | | 22.07 | x | | | 106.25 | % | | | 10.24 | % | | | 117.28 | % | | | 23.04 | x |
| FSBC | | FSB Bancorp, Inc. | | NY | | $ | 14.29 | | | $ | 27.71 | | | $ | 0.28 | | | $ | 16.20 | | | | 29.16 | x | | | 86.97 | % | | | 10.12 | % | | | 86.97 | % | | | NM | |
| HBK | | Hamilton Bancorp, Inc. | | MD | | $ | 15.45 | | | $ | 52.74 | | | $ | 0.15 | | | $ | 18.10 | | | | NM | | | | 86.92 | % | | | 10.55 | % | | | 102.85 | % | | | NM | |
| HVBC | | HV Bancorp, Inc. | | PA | | $ | 14.00 | | | $ | 30.55 | | | | NA | | | | NA | | | | NM | | | | NA | | | | NA | | | | NA | | | | NM | |
| ISBC | | Investors Bancorp, Inc. | | NJ | | $ | 14.48 | | | $ | 4,480.83 | | | $ | 0.60 | | | $ | 10.03 | | | | 22.63 | x | | | 143.47 | % | | | 19.34 | % | | | 148.52 | % | | | 22.80 | x |
| KRNY | | Kearny Financial Corp. | | NJ | | $ | 15.15 | | | $ | 1,336.84 | | | $ | 0.19 | | | $ | 12.57 | | | | NM | | | | 121.21 | % | | | 29.46 | % | | | 134.34 | % | | | NM | |
| MLVF | | Malvern Bancorp, Inc. | | PA | | $ | 21.00 | | | $ | 137.76 | | | $ | 1.80 | | | $ | 14.42 | | | | 11.41 | x | | | 143.90 | % | | | 15.67 | % | | | 143.90 | % | | | 11.70 | x |
| MSBF | | MSB Financial Corp. | | NJ | | $ | 15.15 | | | $ | 86.57 | | | $ | 0.12 | | | $ | 12.71 | | | | NM | | | | 118.29 | % | | | 18.75 | % | | | 118.29 | % | | | NM | |
| NYCB | | New York Community Bancorp, Inc. | | NY | | $ | 14.94 | | | $ | 7,276.63 | | | $ | 1.20 | | | $ | 12.50 | | | | 14.79 | x | | | 118.82 | % | | | 14.87 | % | | | 197.32 | % | | | 14.60 | x |
| NFBK | | Northfield Bancorp, Inc. | | NJ | | $ | 17.84 | | | $ | 865.72 | | | $ | 0.58 | | | $ | 12.84 | | | | 31.30 | x | | | 139.36 | % | | | 22.49 | % | | | 148.98 | % | | | 28.38 | x |
| NWBI | | Northwest Bancshares, Inc. | | PA | | $ | 17.31 | | | $ | 1,760.42 | | | $ | 0.78 | | | $ | 11.48 | | | | NM | | | | 150.38 | % | | | 18.29 | % | | | 211.89 | % | | | 20.09 | x |
| OCFC | | OceanFirst Financial Corp. | | NJ | | $ | 28.95 | | | $ | 930.36 | | | $ | 1.41 | | | $ | 16.14 | | | | 29.54 | x | | | 162.64 | % | | | 18.01 | % | | | 223.62 | % | | | 19.85 | x |
| ORIT | | Oritani Financial Corp. | | NJ | | $ | 17.00 | | | $ | 779.69 | | | $ | 0.87 | | | $ | 11.94 | | | | 16.83 | x | | | 144.79 | % | | | 19.43 | % | | | 144.79 | % | | | 17.96 | x |
| PBHC | | Pathfinder Bancorp, Inc. | | NY | | $ | 14.96 | | | $ | 63.37 | | | $ | 0.65 | | | $ | 13.91 | | | | 19.18 | x | | | 109.39 | % | | | NA | | | | 119.12 | % | | | 21.88 | x |
| PFS | | Provident Financial Services, Inc. | | NJ | | $ | 26.15 | | | $ | 1,728.05 | | | $ | 1.40 | | | $ | 18.84 | | | | 18.95 | x | | | 138.05 | % | | | 18.19 | % | | | 210.19 | % | | | 19.01 | x |
| PBIP | | Prudential Bancorp, Inc. | | PA | | $ | 17.76 | | | $ | 160.12 | | | $ | 0.35 | | | $ | 14.17 | | | | NM | | | | 126.32 | % | | | 24.21 | % | | | 126.32 | % | | | NM | |
| SVBI | | Severn Bancorp, Inc. | | MD | | $ | 7.50 | | | $ | 90.99 | | | $ | 1.14 | | | $ | 6.90 | | | | 6.30 | x | | | 107.45 | % | | | 11.60 | % | | | 107.88 | % | | | 6.30 | x |
| TRST | | TrustCo Bank Corp NY | | NY | | $ | 8.25 | | | $ | 790.19 | | | $ | 0.43 | | | $ | 4.56 | | | | 18.54 | x | | | 182.62 | % | | | 16.23 | % | | | 182.86 | % | | | 18.87 | x |
| WSFS | | WSFS Financial Corporation | | DE | | $ | 44.50 | | | $ | 1,396.86 | | | $ | 2.22 | | | $ | 22.08 | | | | 21.60 | x | | | 203.23 | % | | | 20.65 | % | | | 268.26 | % | | | 20.33 | x |
| WVFC | | WVS Financial Corp. | | PA | | $ | 14.50 | | | $ | 29.13 | | | $ | 0.73 | | | $ | 16.44 | | | | 18.35 | x | | | 87.40 | % | | | 8.56 | % | | | 87.40 | % | | | NM | |
| | | | | | | | | | | | | | | | | | | | | | | | | | | | | | | | | | | | | | |
| | | | | | | Dividends(3) | | | Financial Characteristics(5) | |
| | | | | | | Amount/ | | | | | | Payout | | | Total | | | Equity/ | | | Tang. Eq./ | | | NPAs/ | | | Reported | | | Core | |
| | | | | Share | | | Yield | | | Ratio(4) | | | Assets | | | Assets | | | T. Assets | | | Assets | | | ROAA | | | ROAE | | | ROAA | | | ROAE | |
| | | | | | | ($) | | | (%) | | | (%) | | | ($Mil) | | | (%) | | | (%) | | | (%) | | | (%) | | | (%) | | | (%) | | | (%) | |
| | | | | | | | | | | | | | | | | | | | | | | | | | | | | | | | | | | | | | |
| All Non-MHC Public Companies(6) | | | | | | | | | | | | | | | | | | | | | | | | | | | | | | | | | | | | | | | | | | | | | | |
| Averages | | | | $ | 0.36 | | | | 1.56 | % | | | 48.05 | % | | $ | 3,274 | | | | 12.70 | % | | | 12.05 | % | | | 1.06 | % | | | 0.70 | % | | | 5.90 | % | | | 0.72 | % | | | 6.03 | % |
| Median | | | | $ | 0.24 | | | | 1.38 | % | | | 40.74 | % | | $ | 938 | | | | 11.51 | % | | | 11.04 | % | | | 0.88 | % | | | 0.62 | % | | | 5.14 | % | | | 0.65 | % | | | 5.22 | % |
| | | | | | | | | | | | | | | | | | | | | | | | | | | | | | | | | | | | | | | | | | | | | | | | | |
| Mid-Atlantic Institutions | | | | | | | | | | | | | | | | | | | | | | | | | | | | | | | | | | | | | | | | | | | | | | |
| Averages | | | | $ | 0.32 | | | | 1.77 | % | | | 55.99 | % | | $ | 5,725 | | | | 12.83 | % | | | 11.75 | % | | | 1.16 | % | | | 0.65 | % | | | 5.44 | % | | | 0.70 | % | | | 5.68 | % |
| Medians | | | | $ | 0.25 | | | | 1.58 | % | | | 52.90 | % | | $ | 1,772 | | | | 11.53 | % | | | 10.27 | % | | | 0.85 | % | | | 0.49 | % | | | 4.36 | % | | | 0.65 | % | | | 4.48 | % |
| | | | | | | | | | | | | | | | | | | | | | | | | | | | | | | | | | | | | | | | | | | | | | | | | |
| | | | | | | | | | | | | | | | | | | | | | | | | | | | | | | | | | | | | | | | | | | | | | | | | |
| Comparable Group | | | | | | | | | | | | | | | | | | | | | | | | | | | | | | | | | | | | | | | | | | | | | | |
| AF | | Astoria Financial Corporation | | NY | | $ | 0.16 | | | | 0.86 | % | | | 25.81 | % | | $ | 14,814 | | | | 11.53 | % | | | 10.41 | % | | | 1.69 | % | | | 0.49 | % | | | 4.41 | % | | | 0.51 | % | | | 4.56 | % |
| BYBK | | Bay Bancorp, Inc. | | MD | | $ | 0.00 | | | | 0.00 | % | | | NM | | | $ | 606 | | | | 10.76 | % | | | 10.27 | % | | | 2.19 | % | | | 0.33 | % | | | 2.50 | % | | | 0.41 | % | | | 3.14 | % |
| BNCL | | Beneficial Bancorp, Inc. | | PA | | $ | 0.24 | | | | 1.46 | % | | | 52.94 | % | | $ | 5,580 | | | | 18.34 | % | | | 15.70 | % | | | 0.30 | % | | | 0.44 | % | | | 2.13 | % | | | 0.56 | % | | | 2.73 | % |
| CARV | | Carver Bancorp, Inc. | | NY | | $ | 0.00 | | | | 0.00 | % | | | NM | | | $ | 702 | | | | 7.75 | % | | | 7.75 | % | | | 2.45 | % | | | -0.06 | % | | | -0.80 | % | | | -0.18 | % | | | -2.36 | % |
| CSBK | | Clifton Bancorp Inc. | | NJ | | $ | 0.24 | | | | 1.50 | % | | | 120.00 | % | | $ | 1,312 | | | | 23.08 | % | | | 23.08 | % | | | 0.38 | % | | | 0.36 | % | | | 1.40 | % | | | 0.36 | % | | | 1.38 | % |
| DCOM | | Dime Community Bancshares, Inc. | | NY | | $ | 0.56 | | | | 2.67 | % | | | 28.43 | % | | $ | 5,822 | | | | 9.54 | % | | | 8.67 | % | | | 0.24 | % | | | 1.57 | % | | | 15.89 | % | | | 0.73 | % | | | 7.42 | % |
| ESBK | | Elmira Savings Bank | | NY | | $ | 0.92 | | | | 4.28 | % | | | 73.60 | % | | $ | 567 | | | | 9.83 | % | | | 7.83 | % | | | NA | | | | 0.77 | % | | | 7.81 | % | | | 0.75 | % | | | 7.67 | % |
| ESSA | | ESSA Bancorp, Inc. | | PA | | $ | 0.36 | | | | 2.27 | % | | | 50.00 | % | | $ | 1,772 | | | | 9.95 | % | | | 9.11 | % | | | 1.26 | % | | | 0.45 | % | | | 4.40 | % | | | 0.44 | % | | | 4.31 | % |
| FSBC | | FSB Bancorp, Inc. | | NY | | | NA | | | | NA | | | | NM | | | $ | 260 | | | | 12.11 | % | | | 12.11 | % | | | 0.01 | % | | | 0.22 | % | | | 2.52 | % | | | 0.21 | % | | | 2.42 | % |
| HBK | | Hamilton Bancorp, Inc. | | MD | | | NA | | | | NA | | | | NM | | | $ | 517 | | | | 11.95 | % | | | 10.32 | % | | | 1.16 | % | | | -0.01 | % | | | -0.04 | % | | | 0.11 | % | | | 0.78 | % |
| HVBC | | HV Bancorp, Inc. | | PA | | | NA | | | | NA | | | | NA | | | $ | 177 | | | | 7.45 | % | | | 7.45 | % | | | 0.93 | % | | | NA | | | | NA | | | | NA | | | | NA | |
| ISBC | | Investors Bancorp, Inc. | | NJ | | $ | 0.32 | | | | 2.21 | % | | | 43.75 | % | | $ | 22,536 | | | | 13.82 | % | | | 13.49 | % | | | 0.49 | % | | | 0.86 | % | | | 5.64 | % | | | 0.86 | % | | | 5.64 | % |
| KRNY | | Kearny Financial Corp. | | NJ | | $ | 0.08 | | | | 0.53 | % | | | 38.10 | % | | $ | 4,523 | | | | 24.75 | % | | | 22.89 | % | | | 0.57 | % | | | 0.39 | % | | | 1.51 | % | | | 0.39 | % | | | 1.52 | % |
| MLVF | | Malvern Bancorp, Inc. | | PA | | $ | 0.11 | | | | 0.00 | % | | | NM | | | $ | 821 | | | | 11.52 | % | | | 11.52 | % | | | 0.45 | % | | | 1.59 | % | | | 14.05 | % | | | 1.54 | % | | | 13.61 | % |
| MSBF | | MSB Financial Corp. | | NJ | | $ | 0.00 | | | | 0.00 | % | | | NM | | | $ | 434 | | | | 16.74 | % | | | 16.74 | % | | | 3.53 | % | | | 0.18 | % | | | 0.90 | % | | | 0.26 | % | | | 1.34 | % |
| NYCB | | New York Community Bancorp, Inc. | | NY | | $ | 0.68 | | | | 4.55 | % | | | 67.33 | % | | $ | 49,463 | | | | 12.31 | % | | | 7.77 | % | | | 0.12 | % | | | -0.05 | % | | | -0.39 | % | | | 1.16 | % | | | 9.57 | % |
| NFBK | | Northfield Bancorp, Inc. | | NJ | | $ | 0.32 | | | | 1.79 | % | | | 56.14 | % | | $ | 3,785 | | | | 16.40 | % | | | 15.50 | % | | | 0.83 | % | | | 0.66 | % | | | 3.93 | % | | | 0.74 | % | | | 4.41 | % |
| NWBI | | Northwest Bancshares, Inc. | | PA | | $ | 0.64 | | | | 3.70 | % | | | 124.49 | % | | $ | 9,715 | | | | 11.97 | % | | | 8.76 | % | | | 1.24 | % | | | 0.46 | % | | | 3.57 | % | | | 0.88 | % | | | 6.79 | % |
| OCFC | | OceanFirst Financial Corp. | | NJ | | $ | 0.60 | | | | 2.07 | % | | | 57.14 | % | | $ | 4,151 | | | | 10.05 | % | | | 8.50 | % | | | 1.25 | % | | | 0.69 | % | | | 6.95 | % | | | 0.91 | % | | | 9.22 | % |
| ORIT | | Oritani Financial Corp. | | NJ | | $ | 0.70 | | | | 4.12 | % | | | 118.81 | % | | $ | 3,795 | | | | 14.22 | % | | | 14.22 | % | | | 0.30 | % | | | 1.37 | % | | | 9.19 | % | | | 1.07 | % | | | 7.19 | % |
| PBHC | | Pathfinder Bancorp, Inc. | | NY | | $ | 0.20 | | | | 1.34 | % | | | 25.64 | % | | $ | 717 | | | | 8.27 | % | | | 7.66 | % | | | 0.89 | % | | | 0.48 | % | | | 4.88 | % | | | 0.43 | % | | | 4.41 | % |
| PFS | | Provident Financial Services, Inc. | | NJ | | $ | 0.76 | | | | 2.91 | % | | | 52.90 | % | | $ | 9,390 | | | | 13.25 | % | | | 9.16 | % | | | 0.76 | % | | | 0.96 | % | | | 7.12 | % | | | 0.98 | % | | | 7.28 | % |
| PBIP | | Prudential Bancorp, Inc. | | PA | | $ | 0.12 | | | | 0.68 | % | | | 29.27 | % | | $ | 559 | | | | 20.38 | % | | | 20.38 | % | | | 3.39 | % | | | 0.51 | % | | | 2.36 | % | | | 0.49 | % | | | 2.29 | % |
| SVBI | | Severn Bancorp, Inc. | | MD | | $ | 0.00 | | | | 0.00 | % | | | NM | | | $ | 778 | | | | 11.16 | % | | | 11.12 | % | | | 4.11 | % | | | 2.00 | % | | | 17.36 | % | | | 2.00 | % | | | 17.36 | % |
| TRST | | TrustCo Bank Corp NY | | NY | | $ | 0.26 | | | | 3.18 | % | | | 58.99 | % | | $ | 4,813 | | | | 9.05 | % | | | 9.04 | % | | | 0.88 | % | | | 0.88 | % | | | 9.92 | % | | | 0.87 | % | | | 9.75 | % |
| WSFS | | WSFS Financial Corporation | | DE | | $ | 0.28 | | | | 0.63 | % | | | 12.62 | % | | $ | 6,628 | | | | 10.44 | % | | | 8.05 | % | | | 0.64 | % | | | 1.04 | % | | | 9.85 | % | | | 1.18 | % | | | 11.12 | % |
| WVFC | | WVS Financial Corp. | | PA | | $ | 0.24 | | | | 1.66 | % | | | 27.85 | % | | $ | 335 | | | | 9.85 | % | | | 9.85 | % | | | 0.08 | % | | | 0.42 | % | | | 4.32 | % | | | 0.42 | % | | | 4.26 | % |
| (1) | Core income, on a diluted per-share basis. Core income is net income after taxes and before extraordinary items, less net income attributable to noncontrolling interest, gain on the sale of securities, amortization of intangibles, goodwill and nonrecurring items. Assumed tax rate is 35%. |
| (2) | P/E = Price to earnings; P/B = Price to book; P/A = Price to assets; P/TB = Price to tangible book value; and P/Core = Price to core earnings. P/E and P/Core =NM if the ratio is negative or above 35x. |
| (3) | Indicated 12 month dividend, based on last quarterly dividend declared. |
| (4) | Indicated 12 month dividend as a percent of trailing 12 month earnings. |
| (5) | ROAA (return on average assets) and ROAE (return on average equity) are indicated ratios based on trailing 12 month earnings and average equity and assets balances. |
| (6) | Excludes from averages and medians those companies the subject of actual or rumored acquisition activities or unusual operating characteristics. |
| Source: | SNL Financial, LC. and RP Financial, LC. calculations. The information provided in this report has been obtained from sources we believe are reliable, but we cannot guarantee the accuracy or completeness of such information. |
Copyright (c) 2017 by RP® Financial, LC.
EXHIBIT III-5
Peer Group Market Area Comparative Analysis
Exhibit III-5
Peer Group Market Area Comparative Analysis
| | | | | | | | | | | Proj. | | | | | | | | | Per Capita Income | | | Deposit | |
| | | | | Population | | | Pop. | | | 2010-2017 | | | 2017-2022 | | | 2017 | | | % State | | | Market | |
| Institution | | County | | 2010 | | | 2017 | | | 2022 | | | % Change | | | % Change | | | Amount | | | Average | | | Share(1) | |
| | | | | | | | | | | | | | | | | | | | | | | | | | | |
| Equitable Financial Corp. - NE | | Hall | | | 58,607 | | | | 62,331 | | | | 64,882 | | | | 0.9 | % | | | 0.8 | % | | | 24,469 | | | | 81.5 | % | | | 5.62 | % |
| Hamilton Bancorp, Inc. - MD | | Baltimore | | | 805,029 | | | | 837,393 | | | | 864,191 | | | | 0.6 | % | | | 0.6 | % | | | 37,687 | | | | 95.6 | % | | | 1.32 | % |
| Home Federal Bancorp - LA | | Caddo | | | 254,969 | | | | 249,365 | | | | 247,969 | | | | -0.3 | % | | | -0.1 | % | | | 26,018 | | | | 96.3 | % | | | 4.32 | % |
| Jaxsonville Bancorp, Inc. - IL | | Morgan | | | 35,547 | | | | 34,630 | | | | 34,215 | | | | -0.4 | % | | | -0.2 | % | | | 28,671 | | | | 87.4 | % | | | 26.52 | % |
| MSB Financial Corp. - NJ | | Morris | | | 492,276 | | | | 500,642 | | | | 507,646 | | | | 0.2 | % | | | 0.3 | % | | | 54,973 | | | | 136.6 | % | | | 0.83 | % |
| Poage Bankshares, Inc. - KY | | Boyd | | | 49,542 | | | | 47,886 | | | | 47,255 | | | | -0.5 | % | | | -0.3 | % | | | 26,760 | | | | 102.8 | % | | | 20.76 | % |
| United Community Bancorp - IN | | Dearborn | | | 50,047 | | | | 49,322 | | | | 49,348 | | | | -0.2 | % | | | 0.0 | % | | | 29,540 | | | | 107.7 | % | | | 40.83 | % |
| Wayne Savings Bancshares - OH | | Wayne | | | 114,520 | | | | 116,591 | | | | 118,259 | | | | 0.3 | % | | | 0.3 | % | | | 25,572 | | | | 87.0 | % | | | 12.83 | % |
| Wolverine Bancorp, Inc. - MI | | Midland | | | 83,629 | | | | 83,685 | | | | 84,018 | | | | 0.0 | % | | | 0.1 | % | | | 31,329 | | | | 107.7 | % | | | 16.04 | % |
| WVS Financial Corp. - PA | | Allegheny | | | 1,223,348 | | | | 1,229,961 | | | | 1,235,805 | | | | 0.1 | % | | | 0.1 | % | | | 35,897 | | | | 112.1 | % | | | 0.13 | % |
| | | Averages: | | | 316,751 | | | | 321,181 | | | | 325,359 | | | | 0.1 | % | | | 0.2 | % | | | 32,092 | | | | 101.5 | % | | | 12.92 | % |
| | | Medians: | | | 99,075 | | | | 100,138 | | | | 101,139 | | | | 0.0 | % | | | 0.1 | % | | | 29,106 | | | | 99.5 | % | | | 9.23 | % |
| | | | | | | | | | | | | | | | | | | | | | | | | | | | | | | | | | | |
| Heritage Bank - LA | | St. Tammany | | | 233,740 | | | | 255,480 | | | | 270,013 | | | | 1.8 | % | | | 1.1 | % | | | 33,772 | | | | 125.0 | % | | | 1.38 | % |
(1) Total institution deposits in headquarters county as percent of total county deposits as of June 30, 2016.
Sources: SNL Financial LC, FDIC.
EXHIBIT IV-1
Stock Prices:
As of February 10, 2017
RP® Financial, LC.
Exhibit IV-1A
Weekly Thrift Market Line - Part One
Prices As of February 10, 2017
| | | | | | | Market Capitalization | | | Price Change Data | |
| | | | | | | Price/ | | | Shares | | | Market | | | 52 Week (1) | | | | | | % Change From | |
| | | | | Share(1) | | | Outstanding | | | Capitalization | | | High | | | Low | | | Last Wk | | | Last Wk | | | 52 Wks (2) | | | MRY (2) | |
| | | | | | | ($) | | | (000) | | | ($Mil) | | | ($) | | | ($) | | | ($) | | | (%) | | | (%) | | | (%) | |
| Companies |
| ANCB | | Anchor Bancorp | | WA | | | 26.85 | | | | 2,505 | | | | 67.3 | | | | 27.50 | | | | 22.61 | | | | 26.80 | | | | 0.19 | | | | 15.63 | | | | -1.29 | |
| ASBB | | ASB Bancorp, Inc. | | NC | | | 31.75 | | | | 3,788 | | | | 120.3 | | | | 31.80 | | | | 24.07 | | | | 31.25 | | | | 1.60 | | | | 28.33 | | | | 6.72 | |
| AF | | Astoria Financial Corporation | | NY | | | 18.66 | | | | 101,210 | | | | 1,888.6 | | | | 19.26 | | | | 14.11 | | | | 18.78 | | | | -0.64 | | | | 25.07 | | | | 0.05 | |
| BCTF | | Bancorp 34, Inc. | | NM | | | 12.75 | | | | 3,438 | | | | 43.8 | | | | 13.45 | | | | 7.91 | | | | 12.85 | | | | -0.78 | | | | 43.03 | | | | 1.27 | |
| BKMU | | Bank Mutual Corporation | | WI | | | 9.85 | | | | 45,692 | | | | 450.1 | | | | 9.95 | | | | 7.17 | | | | 9.75 | | | | 1.03 | | | | 33.47 | | | | 4.23 | |
| BYBK | | Bay Bancorp, Inc. | | MD | | | 7.90 | | | | 10,456 | | | | 82.6 | | | | 8.25 | | | | 4.70 | | | | 7.75 | | | | 1.94 | | | | 64.58 | | | | 19.70 | |
| BNCL | | Beneficial Bancorp, Inc. | | PA | | | 16.40 | | | | 75,914 | | | | 1,245.0 | | | | 19.00 | | | | 12.33 | | | | 16.90 | | | | -2.96 | | | | 30.06 | | | | -10.87 | |
| BHBK | | Blue Hills Bancorp, Inc. | | MA | | | 18.95 | | | | 26,760 | | | | 507.1 | | | | 19.73 | | | | 13.22 | | | | 19.50 | | | | -2.82 | | | | 38.73 | | | | 1.07 | |
| BOFI | | BofI Holding, Inc. | | CA | | | 29.56 | | | | 63,362 | | | | 1,873.0 | | | | 30.60 | | | | 13.47 | | | | 29.15 | | | | 1.41 | | | | 103.72 | | | | 3.54 | |
| BYFC | | Broadway Financial Corporation | | CA | | | 1.52 | | | | 27,301 | | | | 41.5 | | | | 2.50 | | | | 1.37 | | | | 1.55 | | | | -1.82 | | | | -0.65 | | | | -7.03 | |
| BLMT | | BSB Bancorp, Inc. | | MA | | | 28.35 | | | | 9,110 | | | | 258.3 | | | | 30.05 | | | | 20.72 | | | | 27.95 | | | | 1.43 | | | | 31.86 | | | | -2.07 | |
| CFFN | | Capitol Federal Financial, Inc. | | KS | | | 15.19 | | | | 137,976 | | | | 2,095.8 | | | | 17.04 | | | | 11.91 | | | | 15.42 | | | | -1.49 | | | | 25.54 | | | | -7.72 | |
| CARV | | Carver Bancorp, Inc. | | NY | | | 3.25 | | | | 3,696 | | | | 12.0 | | | | 5.99 | | | | 2.99 | | | | 3.41 | | | | -4.69 | | | | 6.21 | | | | 0.79 | |
| CHFN | | Charter Financial Corporation | | GA | | | 17.40 | | | | 15,038 | | | | 261.7 | | | | 17.50 | | | | 12.36 | | | | 17.30 | | | | 0.58 | | | | 33.03 | | | | 4.38 | |
| CSBK | | Clifton Bancorp Inc. | | NJ | | | 15.97 | | | | 23,024 | | | | 367.7 | | | | 17.49 | | | | 13.75 | | | | 16.11 | | | | -0.87 | | | | 14.23 | | | | -5.61 | |
| CWAY | | Coastway Bancorp, Inc. | | RI | | | 16.90 | | | | 4,403 | | | | 74.4 | | | | 17.05 | | | | 12.10 | | | | 16.80 | | | | 0.60 | | | | 35.42 | | | | 7.99 | |
| DCOM | | Dime Community Bancshares, Inc. | | NY | | | 21.00 | | | | 37,456 | | | | 786.6 | | | | 22.48 | | | | 16.10 | | | | 21.10 | | | | -0.47 | | | | 27.27 | | | | 4.48 | |
| ESBK | | Elmira Savings Bank | | NY | | | 21.50 | | | | 2,747 | | | | 59.1 | | | | 22.25 | | | | 16.83 | | | | 21.00 | | | | 2.38 | | | | 15.28 | | | | 5.13 | |
| ENFC | | Entegra Financial Corp. | | NC | | | 22.45 | | | | 6,468 | | | | 145.2 | | | | 22.50 | | | | 16.11 | | | | 22.20 | | | | 1.13 | | | | 33.47 | | | | 8.98 | |
| EQFN | | Equitable Financial Corp. | | NE | | | 10.15 | | | | 3,391 | | | | 34.4 | | | | 10.15 | | | | 8.15 | | | | 10.10 | | | | 0.50 | | | | 20.12 | | | | 2.53 | |
| ESSA | | ESSA Bancorp, Inc. | | PA | | | 15.89 | | | | 11,498 | | | | 182.7 | | | | 16.84 | | | | 12.69 | | | | 15.51 | | | | 2.45 | | | | 19.12 | | | | 1.08 | |
| FCAP | | First Capital, Inc. | | IN | | | 32.95 | | | | 3,338 | | | | 110.0 | | | | 35.00 | | | | 24.50 | | | | 32.00 | | | | 2.97 | | | | 34.49 | | | | 1.63 | |
| FBNK | | First Connecticut Bancorp, Inc. | | CT | | | 24.15 | | | | 15,898 | | | | 383.9 | | | | 25.00 | | | | 15.49 | | | | 22.85 | | | | 5.69 | | | | 50.09 | | | | 6.62 | |
| FDEF | | First Defiance Financial Corp. | | OH | | | 48.57 | | | | 8,984 | | | | 436.4 | | | | 52.31 | | | | 34.80 | | | | 48.90 | | | | -0.67 | | | | 28.94 | | | | -4.28 | |
| FNWB | | First Northwest Bancorp | | WA | | | 15.73 | | | | 12,154 | | | | 191.2 | | | | 16.75 | | | | 11.99 | | | | 15.09 | | | | 4.24 | | | | 29.47 | | | | 0.83 | |
| FBC | | Flagstar Bancorp, Inc. | | MI | | | 25.74 | | | | 56,825 | | | | 1,462.7 | | | | 29.29 | | | | 17.90 | | | | 26.46 | | | | -2.72 | | | | 39.74 | | | | -4.45 | |
| FSBW | | FS Bancorp, Inc. | | WA | | | 38.90 | | | | 3,060 | | | | 119.0 | | | | 39.70 | | | | 23.50 | | | | 37.12 | | | | 4.80 | | | | 61.21 | | | | 8.21 | |
| FSBC | | FSB Bancorp, Inc. | | NY | | | 14.29 | | | | 1,939 | | | | 27.7 | | | | 14.90 | | | | 9.19 | | | | 14.24 | | | | 0.35 | | | | 35.25 | | | | 0.63 | |
| HBK | | Hamilton Bancorp, Inc. | | MD | | | 15.45 | | | | 3,414 | | | | 52.7 | | | | 15.45 | | | | 13.19 | | | | 15.20 | | | | 1.64 | | | | 9.83 | | | | 8.42 | |
| HIFS | | Hingham Institution for Savings | | MA | | | 188.22 | | | | 2,133 | | | | 401.4 | | | | 203.01 | | | | 115.80 | | | | 190.30 | | | | -1.09 | | | | 54.41 | | | | -4.35 | |
| HMNF | | HMN Financial, Inc. | | MN | | | 18.48 | | | | 4,489 | | | | 82.9 | | | | 18.70 | | | | 10.85 | | | | 18.01 | | | | 2.62 | | | | 64.24 | | | | 5.58 | |
| HFBL | | Home Federal Bancorp, Inc. of Louisiana | | LA | | | 28.00 | | | | 1,954 | | | | 54.7 | | | | 29.85 | | | | 21.20 | | | | 27.90 | | | | 0.36 | | | | 23.35 | | | | 4.24 | |
| HVBC | | HV Bancorp, Inc. | | PA | | | 14.00 | | | | 2,182 | | | | 30.5 | | | | 14.58 | | | | 13.08 | | | | 14.05 | | | | -0.36 | | | | NA | | | | NA | |
| IROQ | | IF Bancorp, Inc. | | IL | | | 19.75 | | | | 3,940 | | | | 77.8 | | | | 19.96 | | | | 17.25 | | | | 19.80 | | | | -0.25 | | | | 14.49 | | | | 6.76 | |
| ISBC | | Investors Bancorp, Inc. | | NJ | | | 14.48 | | | | 309,449 | | | | 4,480.8 | | | | 14.93 | | | | 10.67 | | | | 14.46 | | | | 0.14 | | | | 29.29 | | | | 3.80 | |
| JXSB | | Jacksonville Bancorp, Inc. | | IL | | | 31.50 | | | | 1,798 | | | | 56.6 | | | | 37.20 | | | | 23.20 | | | | 31.00 | | | | 1.61 | | | | 21.62 | | | | 5.00 | |
| KRNY | | Kearny Financial Corp. | | NJ | | | 15.15 | | | | 88,240 | | | | 1,336.8 | | | | 16.10 | | | | 11.60 | | | | 15.25 | | | | -0.66 | | | | 29.27 | | | | -2.57 | |
| MLVF | | Malvern Bancorp, Inc. | | PA | | | 21.00 | | | | 6,560 | | | | 137.8 | | | | 21.50 | | | | 15.00 | | | | 20.30 | | | | 3.45 | | | | 26.13 | | | | -0.71 | |
| MELR | | Melrose Bancorp, Inc. | | MA | | | 18.10 | | | | 2,602 | | | | 47.1 | | | | 18.10 | | | | 14.60 | | | | 17.24 | | | | 4.98 | | | | 20.67 | | | | 0.84 | |
| EBSB | | Meridian Bancorp, Inc. | | MA | | | 19.35 | | | | 53,596 | | | | 1,037.1 | | | | 20.55 | | | | 13.14 | | | | 18.80 | | | | 2.93 | | | | 43.33 | | | | 2.38 | |
| CASH | | Meta Financial Group, Inc. | | SD | | | 87.80 | | | | 9,346 | | | | 820.6 | | | | 106.90 | | | | 37.06 | | | | 97.15 | | | | -9.62 | | | | 125.30 | | | | -14.67 | |
| MSBF | | MSB Financial Corp. | | NJ | | | 15.15 | | | | 5,714 | | | | 86.6 | | | | 15.40 | | | | 12.25 | | | | 14.50 | | | | 4.48 | | | | 20.72 | | | | 3.06 | |
| NYCB | | New York Community Bancorp, Inc. | | NY | | | 14.94 | | | | 487,057 | | | | 7,276.6 | | | | 17.68 | | | | 13.74 | | | | 14.97 | | | | -0.20 | | | | -1.39 | | | | -6.10 | |
| NFBK | | Northfield Bancorp, Inc. | | NJ | | | 17.84 | | | | 48,527 | | | | 865.7 | | | | 20.59 | | | | 14.31 | | | | 18.13 | | | | -1.60 | | | | 16.98 | | | | -10.67 | |
| NWBI | | Northwest Bancshares, Inc. | | PA | | | 17.31 | | | | 101,699 | | | | 1,760.4 | | | | 19.10 | | | | 11.78 | | | | 17.04 | | | | 1.58 | | | | 43.41 | | | | -3.99 | |
| OCFC | | OceanFirst Financial Corp. | | NJ | | | 28.95 | | | | 32,137 | | | | 930.4 | | | | 30.70 | | | | 16.26 | | | | 29.37 | | | | -1.43 | | | | 75.35 | | | | -3.60 | |
| ORIT | | Oritani Financial Corp. | | NJ | | | 17.00 | | | | 45,864 | | | | 779.7 | | | | 19.00 | | | | 15.18 | | | | 17.20 | | | | -1.16 | | | | 9.54 | | | | -9.33 | |
| OTTW | | Ottawa Bancorp, Inc. | | IL | | | 12.89 | | | | 3,467 | | | | 44.7 | | | | 12.98 | | | | 8.39 | | | | 12.71 | | | | 1.45 | | | | 53.71 | | | | 1.29 | |
| PBHC | | Pathfinder Bancorp, Inc. | | NY | | | 14.96 | | | | 4,237 | | | | 63.4 | | | | 14.96 | | | | 10.76 | | | | 14.27 | | | | 4.81 | | | | 24.41 | | | | 10.87 | |
| PBBI | | PB Bancorp, Inc. | | CT | | | 10.40 | | | | 7,880 | | | | 82.0 | | | | 10.45 | | | | 8.20 | | | | 10.15 | | | | 2.46 | | | | 21.64 | | | | 5.09 | |
| PBSK | | Poage Bankshares, Inc. | | KY | | | 20.20 | | | | 3,714 | | | | 75.0 | | | | 20.90 | | | | 15.50 | | | | 19.95 | | | | 1.25 | | | | 16.63 | | | | 7.45 | |
| PROV | | Provident Financial Holdings, Inc. | | CA | | | 18.69 | | | | 7,953 | | | | 148.6 | | | | 20.66 | | | | 16.73 | | | | 18.60 | | | | 0.48 | | | | 10.99 | | | | -7.57 | |
| PFS | | Provident Financial Services, Inc. | | NJ | | | 26.15 | | | | 66,082 | | | | 1,728.1 | | | | 28.92 | | | | 17.71 | | | | 26.55 | | | | -1.51 | | | | 43.92 | | | | -7.60 | |
| PBIP | | Prudential Bancorp, Inc. | | PA | | | 17.76 | | | | 9,016 | | | | 160.1 | | | | 17.90 | | | | 13.80 | | | | 17.56 | | | | 1.14 | | | | 15.70 | | | | 3.74 | |
| RNDB | | Randolph Bancorp, Inc. | | MA | | | 14.80 | | | | 5,869 | | | | 86.9 | | | | 16.50 | | | | 12.06 | | | | 14.96 | | | | -1.07 | | | | NA | | | | -8.19 | |
| RVSB | | Riverview Bancorp, Inc. | | WA | | | 7.78 | | | | 22,511 | | | | 175.1 | | | | 8.16 | | | | 4.15 | | | | 7.74 | | | | 0.52 | | | | 78.44 | | | | 11.14 | |
| SVBI | | Severn Bancorp, Inc. | | MD | | | 7.50 | | | | 12,131 | | | | 91.0 | | | | 8.08 | | | | 4.99 | | | | 7.35 | | | | 2.04 | | | | 48.51 | | | | -5.06 | |
| SIFI | | SI Financial Group, Inc. | | CT | | | 15.00 | | | | 12,211 | | | | 183.2 | | | | 16.23 | | | | 12.30 | | | | 14.85 | | | | 1.01 | | | | 9.17 | | | | -2.60 | |
| SBCP | | Sunshine Bancorp, Inc. | | FL | | | 18.13 | | | | 7,986 | | | | 144.8 | | | | 18.99 | | | | 13.85 | | | | 18.14 | | | | -0.06 | | | | 26.78 | | | | 5.78 | |
| TBNK | | Territorial Bancorp Inc. | | HI | | | 32.97 | | | | 9,779 | | | | 322.4 | | | | 34.00 | | | | 24.87 | | | | 32.26 | | | | 2.20 | | | | 31.46 | | | | 0.40 | |
| TSBK | | Timberland Bancorp, Inc. | | WA | | | 21.93 | | | | 7,345 | | | | 161.1 | | | | 22.70 | | | | 12.14 | | | | 21.25 | | | | 3.20 | | | | 77.57 | | | | 6.15 | |
| TRST | | TrustCo Bank Corp NY | | NY | | | 8.25 | | | | 95,780 | | | | 790.2 | | | | 9.00 | | | | 5.32 | | | | 8.35 | | | | -1.20 | | | | 51.10 | | | | -5.71 | |
| UCBA | | United Community Bancorp | | IN | | | 17.10 | | | | 4,193 | | | | 71.7 | | | | 17.20 | | | | 12.95 | | | | 16.85 | | | | 1.48 | | | | 26.67 | | | | 2.40 | |
| UCFC | | United Community Financial Corp. | | OH | | | 8.66 | | | | 49,619 | | | | 429.7 | | | | 9.50 | | | | 5.47 | | | | 8.73 | | | | -0.80 | | | | 49.05 | | | | -3.13 | |
| UBNK | | United Financial Bancorp, Inc. | | CT | | | 17.62 | | | | 50,803 | | | | 895.1 | | | | 18.66 | | | | 10.79 | | | | 17.77 | | | | -0.84 | | | | 58.31 | | | | -2.97 | |
| WSBF | | Waterstone Financial, Inc. | | WI | | | 18.15 | | | | 29,386 | | | | 533.4 | | | | 19.30 | | | | 13.30 | | | | 18.30 | | | | -0.82 | | | | 34.84 | | | | -1.36 | |
| WAYN | | Wayne Savings Bancshares, Inc. | | OH | | | 18.75 | | | | 2,782 | | | | 52.2 | | | | 18.75 | | | | 11.90 | | | | 18.35 | | | | 2.18 | | | | 46.48 | | | | 13.64 | |
| WCFB | | WCF Bancorp, Inc. | | IA | | | 9.80 | | | | 2,563 | | | | 25.1 | | | | 10.97 | | | | 8.15 | | | | 10.30 | | | | -4.85 | | | | 10.45 | | | | -2.00 | |
| WEBK | | Wellesley Bancorp, Inc. | | MA | | | 27.75 | | | | 2,485 | | | | 69.0 | | | | 28.00 | | | | 18.30 | | | | 27.57 | | | | 0.66 | | | | 52.31 | | | | 0.00 | |
| WBB | | Westbury Bancorp, Inc. | | WI | | | 22.48 | | | | 4,073 | | | | 91.5 | | | | 23.00 | | | | 18.25 | | | | 22.10 | | | | 1.70 | | | | 22.22 | | | | 8.58 | |
| WNEB | | Western New England Bancorp, Inc. | | MA | | | 9.80 | | | | 30,380 | | | | 297.7 | | | | 9.95 | | | | 7.35 | | | | 9.55 | | | | 2.62 | | | | 26.78 | | | | 4.81 | |
| | | | | | | Current Per Share Financials | |
| | | | | | | LTM | | | LTM Core | | | BV/ | | | TBV/ | | | Assets/ | |
| | | | | EPS (3) | | | EPS (3) | | | Share | | | Share (4) | | | Share | |
| | | | | | | ($) | | | ($) | | | ($) | | | ($) | | | ($) | |
| Companies |
| ANCB | | Anchor Bancorp | | WA | | | 0.29 | | | | 0.29 | | | | 25.46 | | | | 25.46 | | | | 174.06 | |
| ASBB | | ASB Bancorp, Inc. | | NC | | | 1.47 | | | | 1.21 | | | | 24.12 | | | | 24.12 | | | | 210.46 | |
| AF | | Astoria Financial Corporation | | NY | | | 0.64 | | | | 0.67 | | | | 15.57 | | | | 13.74 | | | | 146.37 | |
| BCTF | | Bancorp 34, Inc. | | NM | | | 0.34 | | | | 0.35 | | | | 9.01 | | | | 8.92 | | | | 95.43 | |
| BKMU | | Bank Mutual Corporation | | WI | | | 0.37 | | | | 0.38 | | | | 6.32 | | | | 6.32 | | | | 58.07 | |
| BYBK | | Bay Bancorp, Inc. | | MD | | | 0.14 | | | | 0.18 | | | | 6.28 | | | | 5.96 | | | | 57.99 | |
| BNCL | | Beneficial Bancorp, Inc. | | PA | | | 0.31 | | | | 0.40 | | | | 13.41 | | | | 11.13 | | | | 73.51 | |
| BHBK | | Blue Hills Bancorp, Inc. | | MA | | | 0.28 | | | | 0.27 | | | | 14.43 | | | | 14.03 | | | | 86.46 | |
| BOFI | | BofI Holding, Inc. | | CA | | | 1.91 | | | | 1.89 | | | | 11.32 | | | | 11.32 | | | | 123.97 | |
| BYFC | | Broadway Financial Corporation | | CA | | | 0.23 | | | | 0.23 | | | | 1.63 | | | | 1.63 | | | | 15.14 | |
| BLMT | | BSB Bancorp, Inc. | | MA | | | 1.19 | | | | NA | | | | 17.23 | | | | 17.23 | | | | 227.63 | |
| CFFN | | Capitol Federal Financial, Inc. | | KS | | | 0.63 | | | | 0.63 | | | | 10.13 | | | | 10.13 | | | | 67.17 | |
| CARV | | Carver Bancorp, Inc. | | NY | | | -0.19 | | | | -0.42 | | | | 2.51 | | | | 2.51 | | | | 189.86 | |
| CHFN | | Charter Financial Corporation | | GA | | | 0.79 | | | | 0.86 | | | | 13.52 | | | | 11.36 | | | | 95.65 | |
| CSBK | | Clifton Bancorp Inc. | | NJ | | | 0.19 | | | | 0.19 | | | | 13.12 | | | | 13.12 | | | | 56.99 | |
| CWAY | | Coastway Bancorp, Inc. | | RI | | | 0.79 | | | | 0.79 | | | | 15.52 | | | | 15.52 | | | | 143.75 | |
| DCOM | | Dime Community Bancshares, Inc. | | NY | | | 2.26 | | | | 1.05 | | | | 14.79 | | | | 13.31 | | | | 155.43 | |
| ESBK | | Elmira Savings Bank | | NY | | | 1.26 | | | | 1.23 | | | | 16.80 | | | | 12.29 | | | | 206.60 | |
| ENFC | | Entegra Financial Corp. | | NC | | | 0.92 | | | | 1.04 | | | | 21.37 | | | | 20.90 | | | | 188.38 | |
| EQFN | | Equitable Financial Corp. | | NE | | | 0.31 | | | | 0.32 | | | | 10.43 | | | | 10.43 | | | | 67.21 | |
| ESSA | | ESSA Bancorp, Inc. | | PA | | | 0.73 | | | | 0.71 | | | | 15.48 | | | | 14.05 | | | | 154.15 | |
| FCAP | | First Capital, Inc. | | IN | | | 1.91 | | | | 2.04 | | | | 23.55 | | | | 21.22 | | | | 222.34 | |
| FBNK | | First Connecticut Bancorp, Inc. | | CT | | | 0.89 | | | | 0.87 | | | | 16.17 | | | | 16.17 | | | | 178.14 | |
| FDEF | | First Defiance Financial Corp. | | OH | | | 3.08 | | | | 3.10 | | | | 32.53 | | | | 25.49 | | | | 272.70 | |
| FNWB | | First Northwest Bancorp | | WA | | | 0.29 | | | | 0.27 | | | | 14.60 | | | | 14.60 | | | | 86.27 | |
| FBC | | Flagstar Bancorp, Inc. | | MI | | | 2.60 | | | | 2.74 | | | | 22.72 | | | | 22.72 | | | | 251.18 | |
| FSBW | | FS Bancorp, Inc. | | WA | | | 3.35 | | | | 3.58 | | | | 26.02 | | | | 24.65 | | | | 270.46 | |
| FSBC | | FSB Bancorp, Inc. | | NY | | | 0.30 | | | | 0.28 | | | | 16.20 | | | | 16.20 | | | | 133.95 | |
| HBK | | Hamilton Bancorp, Inc. | | MD | | | -0.01 | | | | 0.15 | | | | 18.10 | | | | 15.34 | | | | 151.50 | |
| HIFS | | Hingham Institution for Savings | | MA | | | 10.41 | | | | 10.31 | | | | 72.35 | | | | 72.35 | | | | 919.15 | |
| HMNF | | HMN Financial, Inc. | | MN | | | 1.22 | | | | 1.23 | | | | 16.67 | | | | 16.39 | | | | 152.75 | |
| HFBL | | Home Federal Bancorp, Inc. of Louisiana | | LA | | | 1.80 | | | | 1.80 | | | | 22.44 | | | | 22.44 | | | | 199.40 | |
| HVBC | | HV Bancorp, Inc. | | PA | | | NA | | | | NA | | | | NA | | | | NA | | | | 0.00 | |
| IROQ | | IF Bancorp, Inc. | | IL | | | 1.08 | | | | 0.98 | | | | 21.12 | | | | 21.12 | | | | 149.40 | |
| ISBC | | Investors Bancorp, Inc. | | NJ | | | 0.60 | | | | 0.60 | | | | 10.03 | | | | 9.75 | | | | 72.83 | |
| JXSB | | Jacksonville Bancorp, Inc. | | IL | | | 1.70 | | | | 1.57 | | | | 26.84 | | | | 25.33 | | | | 183.90 | |
| KRNY | | Kearny Financial Corp. | | NJ | | | 0.19 | | | | 0.19 | | | | 12.57 | | | | 11.34 | | | | 51.26 | |
| MLVF | | Malvern Bancorp, Inc. | | PA | | | 1.86 | | | | 1.80 | | | | 14.42 | | | | 14.42 | | | | 125.19 | |
| MELR | | Melrose Bancorp, Inc. | | MA | | | 0.41 | | | | 0.28 | | | | 16.61 | | | | 16.61 | | | | 102.50 | |
| EBSB | | Meridian Bancorp, Inc. | | MA | | | 0.56 | | | | 0.56 | | | | 11.12 | | | | 10.86 | | | | 77.86 | |
| CASH | | Meta Financial Group, Inc. | | SD | | | 3.92 | | | | 4.65 | | | | 39.30 | | | | 31.57 | | | | 428.69 | |
| MSBF | | MSB Financial Corp. | | NJ | | | 0.12 | | | | 0.12 | | | | 12.71 | | | | 12.71 | | | | 75.89 | |
| NYCB | | New York Community Bancorp, Inc. | | NY | | | -0.08 | | | | 1.20 | | | | 12.50 | | | | 7.50 | | | | 101.55 | |
| NFBK | | Northfield Bancorp, Inc. | | NJ | | | 0.52 | | | | 0.58 | | | | 12.84 | | | | 12.00 | | | | 77.99 | |
| NWBI | | Northwest Bancshares, Inc. | | PA | | | 0.41 | | | | 0.78 | | | | 11.48 | | | | 8.11 | | | | 95.52 | |
| OCFC | | OceanFirst Financial Corp. | | NJ | | | 1.07 | | | | 1.41 | | | | 16.14 | | | | 13.42 | | | | 129.17 | |
| ORIT | | Oritani Financial Corp. | | NJ | | | 1.12 | | | | 0.87 | | | | 11.94 | | | | 11.94 | | | | 82.74 | |
| OTTW | | Ottawa Bancorp, Inc. | | IL | | | 0.39 | | | | 0.41 | | | | 9.23 | | | | 8.93 | | | | 79.62 | |
| PBHC | | Pathfinder Bancorp, Inc. | | NY | | | 0.73 | | | | 0.65 | | | | 13.91 | | | | 12.79 | | | | 169.26 | |
| PBBI | | PB Bancorp, Inc. | | CT | | | 0.12 | | | | 0.12 | | | | 10.85 | | | | 9.97 | | | | 64.27 | |
| PBSK | | Poage Bankshares, Inc. | | KY | | | 0.52 | | | | 0.60 | | | | 18.78 | | | | 18.14 | | | | 120.88 | |
| PROV | | Provident Financial Holdings, Inc. | | CA | | | 0.80 | | | | 0.81 | | | | 16.70 | | | | 16.70 | | | | 156.23 | |
| PFS | | Provident Financial Services, Inc. | | NJ | | | 1.37 | | | | 1.40 | | | | 18.84 | | | | 12.44 | | | | 142.10 | |
| PBIP | | Prudential Bancorp, Inc. | | PA | | | 0.36 | | | | 0.35 | | | | 14.17 | | | | 14.17 | �� | | | 62.05 | |
| RNDB | | Randolph Bancorp, Inc. | | MA | | | NA | | | | NA | | | | 14.63 | | | | 14.61 | | | | 83.42 | |
| RVSB | | Riverview Bancorp, Inc. | | WA | | | 0.29 | | | | 0.30 | | | | 4.93 | | | | 3.79 | | | | 43.71 | |
| SVBI | | Severn Bancorp, Inc. | | MD | | | 1.14 | | | | 1.14 | | | | 6.90 | | | | 6.87 | | | | 64.11 | |
| SIFI | | SI Financial Group, Inc. | | CT | | | 0.53 | | | | NA | | | | 13.08 | | | | 11.64 | | | | 125.96 | |
| SBCP | | Sunshine Bancorp, Inc. | | FL | | | -0.35 | | | | -0.33 | | | | 13.82 | | | | 11.92 | | | | 70.62 | |
| TBNK | | Territorial Bancorp Inc. | | HI | | | 1.69 | | | | 1.66 | | | | 23.39 | | | | 23.39 | | | | 189.04 | |
| TSBK | | Timberland Bancorp, Inc. | | WA | | | 1.43 | | | | 1.42 | | | | 13.95 | | | | 13.13 | | | | 121.35 | |
| TRST | | TrustCo Bank Corp NY | | NY | | | 0.44 | | | | 0.43 | | | | 4.56 | | | | 4.55 | | | | 50.25 | |
| UCBA | | United Community Bancorp | | IN | | | 0.86 | | | | 0.81 | | | | 16.83 | | | | 16.17 | | | | 125.95 | |
| UCFC | | United Community Financial Corp. | | OH | | | 0.38 | | | | 0.37 | | | | 5.51 | | | | 5.48 | | | | 43.54 | |
| UBNK | | United Financial Bancorp, Inc. | | CT | | | 0.90 | | | | 1.02 | | | | 13.00 | | | | 10.60 | | | | 128.83 | |
| WSBF | | Waterstone Financial, Inc. | | WI | | | 0.81 | | | | 0.81 | | | | 13.94 | | | | 13.92 | | | | 61.08 | |
| WAYN | | Wayne Savings Bancshares, Inc. | | OH | | | 0.92 | | | | 0.92 | | | | 14.88 | | | | 14.27 | | | | 160.25 | |
| WCFB | | WCF Bancorp, Inc. | | IA | | | 0.10 | | | | 0.07 | | | | 11.54 | | | | 11.51 | | | | 48.40 | |
| WEBK | | Wellesley Bancorp, Inc. | | MA | | | 1.33 | | | | 1.32 | | | | 22.52 | | | | 22.52 | | | | 268.13 | |
| WBB | | Westbury Bancorp, Inc. | | WI | | | 0.93 | | | | 0.83 | | | | 19.43 | | | | 19.43 | | | | 172.51 | |
| WNEB | | Western New England Bancorp, Inc. | | MA | | | 0.25 | | | | 0.30 | | | | 7.92 | | | | 7.92 | | | | 45.35 | |
RP® Financial, LC.
Exhibit IV-1A
Weekly Thrift Market Line - Part One
Prices As of February 10, 2017
| | | | | | | Market Capitalization | | | Price Change Data | |
| | | | | | | Price/ | | | Shares | | | Market | | | 52 Week (1) | | | | | | % Change From | |
| | | | | Share(1) | | | Outstanding | | | Capitalization | | | High | | | Low | | | Last Wk | | | Last Wk | | | 52 Wks (2) | | | MRY (2) | |
| | | | | | | ($) | | | (000) | | | ($Mil) | | | ($) | | | ($) | | | ($) | | | (%) | | | (%) | | | (%) | |
| Companies | | | | | | | | | | | | | | | | | | | | | | | | | | | | | |
| WBKC | | Wolverine Bancorp, Inc. | | MI | | | 33.61 | | | | 2,099 | | | | 70.5 | | | | 34.00 | | | | 25.26 | | | | 33.25 | | | | 1.08 | | | | 31.80 | | | | 6.36 | |
| WSFS | | WSFS Financial Corporation | | DE | | | 44.50 | | | | 31,390 | | | | 1,396.9 | | | | 47.65 | | | | 26.40 | | | | 44.80 | | | | -0.67 | | | | 62.41 | | | | -3.99 | |
| WVFC | | WVS Financial Corp. | | PA | | | 14.50 | | | | 2,009 | | | | 29.1 | | | | 15.40 | | | | 10.73 | | | | 14.50 | | | | 0.00 | | | | 25.22 | | | | -1.53 | |
| | | | | | | | | | | | | | | | | | | | | | | | | | | | | | | | | | | | | | | | | |
| MHCs | | | | | | | | | | | | | | | | | | | | | | | | | | | | | | | | | | | | | | |
| GCBC | | Greene County Bancorp, Inc. (MHC) | | NY | | | 22.55 | | | | 8,503 | | | | 191.7 | | | | 25.20 | | | | 15.40 | | | | 22.95 | | | | -1.74 | | | | 36.63 | | | | -1.53 | |
| HONE | | HarborOne Bancorp, Inc. (MHC) | | MA | | | 19.30 | | | | 32,121 | | | | 619.9 | | | | 20.19 | | | | 12.53 | | | | 18.73 | | | | 3.04 | | | | NA | | | | -0.21 | |
| KFFB | | Kentucky First Federal Bancorp (MHC) | | KY | | | 9.85 | | | | 8,484 | | | | 83.6 | | | | 9.85 | | | | 8.00 | | | | 9.55 | | | | 3.14 | | | | 7.65 | | | | 9.61 | |
| LSBK | | Lake Shore Bancorp, Inc. (MHC) | | NY | | | 15.70 | | | | 6,098 | | | | 95.7 | | | | 16.59 | | | | 12.97 | | | | 15.85 | | | | -0.95 | | | | 18.45 | | | | -3.49 | |
| MGYR | | Magyar Bancorp, Inc. (MHC) | | NJ | | | 13.00 | | | | 5,821 | | | | 75.7 | | | | 13.24 | | | | 9.51 | | | | 12.90 | | | | 0.78 | | | | 34.58 | | | | 8.34 | |
| OFED | | Oconee Federal Financial Corp. (MHC) | | SC | | | 22.00 | | | | 5,791 | | | | 127.4 | | | | 24.25 | | | | 18.21 | | | | 23.84 | | | | -7.72 | | | | 13.40 | | | | -6.38 | |
| PVBC | | Provident Bancorp, Inc. (MHC) | | MA | | | 19.60 | | | | 9,652 | | | | 189.2 | | | | 19.95 | | | | 12.88 | | | | 19.70 | | | | -0.51 | | | | 51.94 | | | | 9.50 | |
| TFSL | | TFS Financial Corporation (MHC) | | OH | | | 17.20 | | | | 283,468 | | | | 4,875.7 | | | | 19.89 | | | | 15.62 | | | | 17.19 | | | | 0.06 | | | | 8.04 | | | | -9.66 | |
| | | | | | | | | | | | | | | | | | | | | | | | | | | | | | | | | | | | | | | | | |
| Under Acquisition | | | | | | | | | | | | | | | | | | | | | | | | | | | | | | | | | | | | | | |
| EVER | | EverBank Financial Corp | | FL | | | 19.43 | | | | 127,037 | | | | 2,468.3 | | | | 19.49 | | | | 12.32 | | | | 19.44 | | | | -0.05 | | | | 49.69 | | | | -0.10 | |
| GTWN | | Georgetown Bancorp, Inc. | | MA | | | 25.90 | | | | 1,841 | | | | 47.7 | | | | 26.00 | | | | 19.15 | | | | 25.65 | | | | 0.97 | | | | 33.51 | | | | 0.19 | |
| | | | | | | Current Per Share Financials | |
| | | | | | | LTM | | | LTM Core | | | BV/ | | | TBV/ | | | Assets/ | |
| | | | | EPS (3) | | | EPS (3) | | | Share | | | Share (4) | | | Share | |
| | | | | | | ($) | | | ($) | | | ($) | | | ($) | | | ($) | |
| Companies | | | | | | | | | | | | | | | | | |
| WBKC | | Wolverine Bancorp, Inc. | | MI | | | 2.14 | | | | 2.14 | | | | 29.97 | | | | 29.97 | | | | 175.88 | |
| WSFS | | WSFS Financial Corporation | | DE | | | 1.97 | | | | 2.22 | | | | 22.08 | | | | 16.59 | | | | 211.14 | |
| WVFC | | WVS Financial Corp. | | PA | | | 0.74 | | | | 0.73 | | | | 16.44 | | | | 16.44 | | | | 166.80 | |
| | | | | | | | | | | | | | | | | | | | | | | | | |
| MHCs | | | | | | | | | | | | | | | | | | | | | | |
| GCBC | | Greene County Bancorp, Inc. (MHC) | | NY | | | 1.10 | | | | 1.10 | | | | 9.00 | | | | 9.00 | | | | 105.04 | |
| HONE | | HarborOne Bancorp, Inc. (MHC) | | MA | | | NA | | | | NA | | | | 10.21 | | | | 9.79 | | | | 73.07 | |
| KFFB | | Kentucky First Federal Bancorp (MHC) | | KY | | | 0.16 | | | | 0.16 | | | | 7.96 | | | | 6.25 | | | | 34.79 | |
| LSBK | | Lake Shore Bancorp, Inc. (MHC) | | NY | | | 0.71 | | | | 0.51 | | | | 12.68 | | | | 12.68 | | | | 78.46 | |
| MGYR | | Magyar Bancorp, Inc. (MHC) | | NJ | | | 0.19 | | | | 0.18 | | | | 8.20 | | | | 8.20 | | | | 100.40 | |
| OFED | | Oconee Federal Financial Corp. (MHC) | | SC | | | 0.87 | | | | 0.86 | | | | 14.70 | | | | 14.13 | | | | 83.62 | |
| PVBC | | Provident Bancorp, Inc. (MHC) | | MA | | | NA | | | | NA | | | | 11.41 | | | | 11.41 | | | | 79.59 | |
| TFSL | | TFS Financial Corporation (MHC) | | OH | | | 0.28 | | | | NA | | | | 5.84 | | | | 5.81 | | | | 45.53 | |
| | | | | | | | | | | | | | | | | | | | | | | | | |
| Under Acquisition | | | | | | | | | | | | | | | | | | | | | | |
| EVER | | EverBank Financial Corp | | FL | | | 0.96 | | | | NA | | | | 13.92 | | | | 13.53 | | | | 225.94 | |
| GTWN | | Georgetown Bancorp, Inc. | | MA | | | 0.43 | | | | 0.46 | | | | 17.62 | | | | 17.62 | | | | 171.09 | |
| (1) | Average of High/Low or Bid/Ask price per share. |
| (2) | Or since offering price if converted of first listed in the past 52 weeks. Percent change figures are actual year-to-date and are not annualized. |
| (3) | EPS (earnings per share) is based on actual trailing 12 month data and is not shown on a pro forma basis. |
| (4) | Excludes intangibles (such as goodwill, value of core deposits, etc.). |
| (5) | ROA (return on assets) and ROE (return on equity) are indicated ratios based on trailing 12 month common earnings and average common equity and total assets balances. |
| (6) | Annualized based on last regular quarterly cash dividend announcement. |
| (7) | Indicated dividend as a percent of trailing 12 month earnings. |
| (8) | Excluded from averages due to actual or rumored acquisition activities or unusual operating characteristics. |
| (9) | For MHC institutions, market value reflects share price multiplied by public (non-MHC) shares. |
Source: SNL Financial, LC. and RP® Financial, LC. calculations. The information provided in this table has been obtained from sources we believe are reliable, but we cannot guarantee the accuracy or completeness of such information.
Copyright (c) 2017 by RP® Financial, LC.
RP® Financial, LC.
Exhibit IV-1B
Weekly Thrift Market Line - Part Two
Prices As of February 10, 2017
| | | | | | | Key Financial Ratios | | | Asset Quality Ratios | |
| | | | | | | Equity/ | | | Tang Equity/ | | | Reported Earnings | | | Core Earnings | | | NPAs/ | | | Rsvs/ | |
| | | | | Assets(1) | | | Assets(1) | | | ROA(5) | | | ROE(5) | | | ROA(5) | | | ROE(5) | | | Assets | | | NPLs | |
| | | | | | | (%) | | | (%) | | | (%) | | | (%) | | | (%) | | | (%) | | | (%) | | | (%) | |
| Companies | | | | | | | | | | | | | | | | | | | | | | | | | | | | | | | | | | |
| ANCB | | Anchor Bancorp | | WA | | | 14.63 | | | | 14.63 | | | | 0.17 | | | | 1.14 | | | | 0.17 | | | | 1.14 | | | | NA | | | | 39.88 | |
| ASBB | | ASB Bancorp, Inc. | | NC | | | 11.46 | | | | 11.46 | | | | 0.70 | | | | 5.91 | | | | 0.57 | | | | 4.87 | | | | 1.33 | | | | 114.00 | |
| AF | | Astoria Financial Corporation | | NY | | | 11.53 | | | | 10.41 | | | | 0.49 | | | | 4.41 | | | | 0.51 | | | | 4.56 | | | | 1.69 | | | | 37.20 | |
| BCTF | | Bancorp 34, Inc. | | NM | | | 9.44 | | | | 9.36 | | | | 0.41 | | | | 3.85 | | | | 0.43 | | | | 4.04 | | | | 0.37 | | | | 179.30 | |
| BKMU | | Bank Mutual Corporation | | WI | | | 10.89 | | | | 10.89 | | | | 0.65 | | | | 5.85 | | | | 0.66 | | | | 5.95 | | | | 0.54 | | | | 164.11 | |
| BYBK | | Bay Bancorp, Inc. | | MD | | | 10.76 | | | | 10.27 | | | | 0.33 | | | | 2.50 | | | | 0.41 | | | | 3.14 | | | | 2.19 | | | | 21.03 | |
| BNCL | | Beneficial Bancorp, Inc. | | PA | | | 18.34 | | | | 15.70 | | | | 0.44 | | | | 2.13 | | | | 0.56 | | | | 2.73 | | | | 0.30 | | | | 286.82 | |
| BHBK | | Blue Hills Bancorp, Inc. | | MA | | | 16.84 | | | | 16.45 | | | | 0.33 | | | | 1.78 | | | | 0.32 | | | | 1.73 | | | | 0.35 | | | | 221.90 | |
| BOFI | | BofI Holding, Inc. | | CA | | | 9.19 | | | | 9.19 | | | | 1.70 | | | | 18.81 | | | | 1.68 | | | | 18.63 | | | | 0.56 | | | | 89.01 | |
| BYFC | | Broadway Financial Corporation | | CA | | | 11.50 | | | | 11.50 | | | | 1.74 | | | | 15.02 | | | | 1.71 | | | | 14.81 | | | | 2.91 | | | | 38.17 | |
| BLMT | | BSB Bancorp, Inc. | | MA | | | 7.56 | | | | 7.56 | | | | 0.57 | | | | 7.15 | | | | NA | | | | NA | | | | 0.41 | | | | 152.33 | |
| CFFN | | Capitol Federal Financial, Inc. | | KS | | | 15.03 | | | | 15.03 | | | | 0.74 | | | | 5.95 | | | | 0.74 | | | | 5.91 | | | | 0.60 | | | | 16.33 | |
| CARV | | Carver Bancorp, Inc. | | NY | | | 7.75 | | | | 7.75 | | | | -0.06 | | | | -0.80 | | | | -0.18 | | | | -2.36 | | | | 2.45 | | | | 29.93 | |
| CHFN | | Charter Financial Corporation | | GA | | | 14.12 | | | | 12.14 | | | | 0.98 | | | | 5.90 | | | | 1.07 | | | | 6.43 | | | | 0.77 | | | | 124.65 | |
| CSBK | | Clifton Bancorp Inc. | | NJ | | | 23.08 | | | | 23.08 | | | | 0.36 | | | | 1.40 | | | | 0.36 | | | | 1.38 | | | | 0.38 | | | | 129.90 | |
| CWAY | | Coastway Bancorp, Inc. | | RI | | | 10.95 | | | | 10.95 | | | | 0.59 | | | | 4.83 | | | | 0.59 | | | | 4.83 | | | | 2.20 | | | | 18.19 | |
| DCOM | | Dime Community Bancshares, Inc. | | NY | | | 9.54 | | | | 8.67 | | | | 1.57 | | | | 15.89 | | | | 0.73 | | | | 7.42 | | | | 0.24 | | | | 158.94 | |
| ESBK | | Elmira Savings Bank | | NY | | | 9.83 | | | | 7.83 | | | | 0.77 | | | | 7.81 | | | | 0.75 | | | | 7.67 | | | | NA | | | | NA | |
| ENFC | | Entegra Financial Corp. | | NC | | | 11.34 | | | | 11.12 | | | | 0.54 | | | | 4.45 | | | | 0.62 | | | | 5.05 | | | | 1.78 | | | | 53.29 | |
| EQFN | | Equitable Financial Corp. | | NE | | | 15.92 | | | | 15.92 | | | | 0.46 | | | | 3.00 | | | | 0.47 | | | | 3.08 | | | | NA | | | | NA | |
| ESSA | | ESSA Bancorp, Inc. | | PA | | | 9.95 | | | | 9.11 | | | | 0.45 | | | | 4.40 | | | | 0.44 | | | | 4.31 | | | | 1.26 | | | | 45.86 | |
| FCAP | | First Capital, Inc. | | IN | | | 10.61 | | | | 9.66 | | | | 0.89 | | | | 8.39 | | | | 0.95 | | | | 8.90 | | | | 1.25 | | | | 65.73 | |
| FBNK | | First Connecticut Bancorp, Inc. | | CT | | | 9.03 | | | | 9.03 | | | | 0.49 | | | | 5.34 | | | | 0.48 | | | | 5.22 | | | | 1.01 | | | | 73.97 | |
| FDEF | | First Defiance Financial Corp. | | OH | | | 11.92 | | | | 9.59 | | | | 1.19 | | | | 9.93 | | | | 1.20 | | | | 10.00 | | | | 1.14 | | | | 94.92 | |
| FNWB | | First Northwest Bancorp | | WA | | | 18.05 | | | | 18.05 | | | | 0.34 | | | | 1.79 | | | | 0.32 | | | | 1.67 | | | | 0.83 | | | | 89.70 | |
| FBC | | Flagstar Bancorp, Inc. | | MI | | | 9.01 | | | | 9.01 | | | | 1.30 | | | | 11.55 | | | | 1.17 | | | | 10.40 | | | | 0.92 | | | | 123.28 | |
| FSBW | | FS Bancorp, Inc. | | WA | | | 9.61 | | | | 9.16 | | | | 1.32 | | | | 13.33 | | | | 1.41 | | | | 14.26 | | | | 0.08 | | | | NM | |
| FSBC | | FSB Bancorp, Inc. | | NY | | | 12.11 | | | | 12.11 | | | | 0.22 | | | | 2.52 | | | | 0.21 | | | | 2.42 | | | | 0.01 | | | | NM | |
| HBK | | Hamilton Bancorp, Inc. | | MD | | | 11.95 | | | | 10.32 | | | | -0.01 | | | | -0.04 | | | | 0.11 | | | | 0.78 | | | | 1.16 | | | | 34.98 | |
| HIFS | | Hingham Institution for Savings | | MA | | | 7.86 | | | | 7.86 | | | | 1.21 | | | | 15.48 | | | | 1.20 | | | | 15.32 | | | | 0.28 | | | | 193.31 | |
| HMNF | | HMN Financial, Inc. | | MN | | | 10.91 | | | | 10.75 | | | | 0.89 | | | | 8.02 | | | | 0.90 | | | | 8.10 | | | | 1.04 | | | | 162.38 | |
| HFBL | | Home Federal Bancorp, Inc. of Louisiana | | LA | | | 11.29 | | | | 11.29 | | | | 0.92 | | | | 7.63 | | | | 0.92 | | | | 7.63 | | | | 0.24 | | | | 331.61 | |
| HVBC | | HV Bancorp, Inc. | | PA | | | 7.45 | | | | 7.45 | | | | NA | | | | NA | | | | NA | | | | NA | | | | 0.93 | | | | 41.67 | |
| IROQ | | IF Bancorp, Inc. | | IL | | | 14.23 | | | | 14.23 | | | | 0.70 | | | | 4.93 | | | | 0.64 | | | | 4.46 | | | | 0.82 | | | | 118.60 | |
| ISBC | | Investors Bancorp, Inc. | | NJ | | | 13.82 | | | | 13.49 | | | | 0.86 | | | | 5.64 | | | | 0.86 | | | | 5.64 | | | | 0.49 | | | | 210.34 | |
| JXSB | | Jacksonville Bancorp, Inc. | | IL | | | 14.60 | | | | 13.89 | | | | 0.99 | | | | 6.53 | | | | 0.92 | | | | 6.05 | | | | 1.33 | | | | 71.34 | |
| KRNY | | Kearny Financial Corp. | | NJ | | | 24.75 | | | | 22.89 | | | | 0.39 | | | | 1.51 | | | | 0.39 | | | | 1.52 | | | | 0.57 | | | | 102.49 | |
| MLVF | | Malvern Bancorp, Inc. | | PA | | | 11.52 | | | | 11.52 | | | | 1.59 | | | | 14.05 | | | | 1.54 | | | | 13.61 | | | | 0.45 | | | | 148.63 | |
| MELR | | Melrose Bancorp, Inc. | | MA | | | 16.23 | | | | 16.23 | | | | 0.42 | | | | 2.26 | | | | 0.29 | | | | 1.55 | | | | 0.00 | | | | NM | |
| EBSB | | Meridian Bancorp, Inc. | | MA | | | 14.31 | | | | 14.03 | | | | 0.80 | | | | 5.05 | | | | 0.79 | | | | 5.02 | | | | 0.69 | | | | 134.22 | |
| CASH | | Meta Financial Group, Inc. | | SD | | | 8.36 | | | | 6.83 | | | | 1.10 | | | | 10.80 | | | | 1.30 | | | | 12.80 | | | | 0.02 | | | | 945.47 | |
| MSBF | | MSB Financial Corp. | | NJ | | | 16.74 | | | | 16.74 | | | | 0.18 | | | | 0.90 | | | | 0.26 | | | | 1.34 | | | | 3.53 | | | | 26.42 | |
| NYCB | | New York Community Bancorp, Inc. | | NY | | | 12.31 | | | | 7.77 | | | | -0.05 | | | | -0.39 | | | | 1.16 | | | | 9.57 | | | | 0.12 | | | | 380.89 | |
| NFBK | | Northfield Bancorp, Inc. | | NJ | | | 16.40 | | | | 15.50 | | | | 0.66 | | | | 3.93 | | | | 0.74 | | | | 4.41 | | | | 0.83 | | | | 77.25 | |
| NWBI | | Northwest Bancshares, Inc. | | PA | | | 11.97 | | | | 8.76 | | | | 0.46 | | | | 3.57 | | | | 0.88 | | | | 6.79 | | | | 1.24 | | | | 54.76 | |
| OCFC | | OceanFirst Financial Corp. | | NJ | | | 10.05 | | | | 8.50 | | | | 0.69 | | | | 6.95 | | | | 0.91 | | | | 9.22 | | | | 1.25 | | | | 36.40 | |
| ORIT | | Oritani Financial Corp. | | NJ | | | 14.22 | | | | 14.22 | | | | 1.37 | | | | 9.19 | | | | 1.07 | | | | 7.19 | | | | 0.30 | | | | 273.73 | |
| OTTW | | Ottawa Bancorp, Inc. | | IL | | | 11.54 | | | | 11.21 | | | | 0.59 | | | | 4.15 | | | | 0.62 | | | | 4.37 | | | | 2.00 | | | | 42.36 | |
| PBHC | | Pathfinder Bancorp, Inc. | | NY | | | 8.27 | | | | 7.66 | | | | 0.48 | | | | 4.88 | | | | 0.43 | | | | 4.41 | | | | 0.89 | | | | 106.87 | |
| PBBI | | PB Bancorp, Inc. | | CT | | | 16.87 | | | | 15.72 | | | | 0.18 | | | | 1.23 | | | | 0.19 | | | | 1.27 | | | | NA | | | | NA | |
| PBSK | | Poage Bankshares, Inc. | | KY | | | 15.54 | | | | 15.09 | | | | 0.43 | | | | 2.68 | | | | 0.50 | | | | 3.08 | | | | 1.78 | | | | 33.13 | |
| PROV | | Provident Financial Holdings, Inc. | | CA | | | 10.72 | | | | 10.72 | | | | 0.56 | | | | 4.88 | | | | 0.57 | | | | 4.93 | | | | 1.09 | | | | 87.14 | |
| PFS | | Provident Financial Services, Inc. | | NJ | | | 13.25 | | | | 9.16 | | | | 0.96 | | | | 7.12 | | | | 0.98 | | | | 7.28 | | | | 0.76 | | | | 99.95 | |
| PBIP | | Prudential Bancorp, Inc. | | PA | | | 20.38 | | | | 20.38 | | | | 0.51 | | | | 2.36 | | | | 0.49 | | | | 2.29 | | | | 3.39 | | | | 17.79 | |
| RNDB | | Randolph Bancorp, Inc. | | MA | | | 17.54 | | | | 17.52 | | | | NA | | | | 2.73 | | | | NA | | | | 3.81 | | | | 1.41 | | | | 47.29 | |
| RVSB | | Riverview Bancorp, Inc. | | WA | | | 11.28 | | | | 8.91 | | | | 0.71 | | | | 5.94 | | | | 0.74 | | | | 6.22 | | | | 1.48 | | | | 71.92 | |
| SVBI | | Severn Bancorp, Inc. | | MD | | | 11.16 | | | | 11.12 | | | | 2.00 | | | | 17.36 | | | | 2.00 | | | | 17.36 | | | | 4.11 | | | | 29.33 | |
| SIFI | | SI Financial Group, Inc. | | CT | | | 10.39 | | | | 9.35 | | | | 0.42 | | | | 3.98 | | | | NA | | | | NA | | | | 1.13 | | | | 72.00 | |
| SBCP | | Sunshine Bancorp, Inc. | | FL | | | 12.89 | | | | 11.32 | | | | -0.26 | | | | -1.85 | | | | -0.29 | | | | -2.04 | | | | 0.41 | | | | 126.26 | |
| TBNK | | Territorial Bancorp Inc. | | HI | | | 12.36 | | | | 12.36 | | | | 0.85 | | | | 7.00 | | | | 0.84 | | | | 6.86 | | | | 0.38 | | | | 39.11 | |
| TSBK | | Timberland Bancorp, Inc. | | WA | | | 10.86 | | | | 10.29 | | | | 1.19 | | | | 11.00 | | | | 1.19 | | | | 10.94 | | | | 1.72 | | | | 93.56 | |
| TRST | | TrustCo Bank Corp NY | | NY | | | 9.05 | | | | 9.04 | | | | 0.88 | | | | 9.92 | | | | 0.87 | | | | 9.75 | | | | 0.88 | | | | 117.51 | |
| UCBA | | United Community Bancorp | | IN | | | 13.38 | | | | 12.92 | | | | 0.68 | | | | 5.14 | | | | 0.64 | | | | 4.84 | | | | 1.02 | | | | 84.53 | |
| UCFC | | United Community Financial Corp. | | OH | | | 11.87 | | | | 11.81 | | | | 0.89 | | | | 7.33 | | | | 0.86 | | | | 7.09 | | | | 1.96 | | | | 45.00 | |
| UBNK | | United Financial Bancorp, Inc. | | CT | | | 10.03 | | | | 8.32 | | | | 0.72 | | | | 7.12 | | | | 0.82 | | | | 8.08 | | | | 0.84 | | | | 78.87 | |
| WSBF | | Waterstone Financial, Inc. | | WI | | | 22.82 | | | | 22.79 | | | | 1.26 | | | | 5.59 | | | | 1.26 | | | | 5.59 | | | | 1.38 | | | | 90.49 | |
| WAYN | | Wayne Savings Bancshares, Inc. | | OH | | | 9.29 | | | | 8.94 | | | | 0.57 | | | | 6.20 | | | | 0.57 | | | | 6.20 | | | | 0.96 | | | | 68.18 | |
| WCFB | | WCF Bancorp, Inc. | | IA | | | 23.85 | | | | 23.80 | | | | 0.19 | | | | 1.44 | | | | 0.13 | | | | 0.98 | | | | NA | | | | 105.80 | |
| WEBK | | Wellesley Bancorp, Inc. | | MA | | | 8.31 | | | | 8.31 | | | | 0.50 | | | | 5.81 | | | | 0.50 | | | | 5.79 | | | | NA | | | | NA | |
| WBB | | Westbury Bancorp, Inc. | | WI | | | 11.33 | | | | 11.33 | | | | 0.51 | | | | 4.49 | | | | 0.46 | | | | 4.02 | | | | 0.52 | | | | 146.36 | |
| WNEB | | Western New England Bancorp, Inc. | | MA | | | 10.54 | | | | 10.54 | | | | 0.33 | | | | 3.11 | | | | 0.39 | | | | 3.71 | | | | 0.59 | | | | 122.46 | |
| | | | | | | Pricing Ratios | | | Dividend Data (6) | |
| | | | | | | Price/ | | | Price/ | | | Price/ | | | Price/ | | | Price/ | | | Div/ | | | Dividend | | | Payout | |
| | | | | Earnings | | | Book | | | Assets | | | Tang Book | | | Core Earnings | | | Share | | | Yield | | | Ratio (7) | |
| | | | | | | (x) | | | (%) | | | (%) | | | (%) | | | (x) | | | ($) | | | (%) | | | (%) | |
| Companies | | | | | | | | | | | | | | | | | | | | | | | | | | | | | | | | | | |
| ANCB | | Anchor Bancorp | | WA | | | 46.29 | | | | 104.95 | | | | 15.25 | | | | 104.95 | | | | 46.29 | | | | NA | | | | NA | | | | NM | |
| ASBB | | ASB Bancorp, Inc. | | NC | | | NM | | | | 131.97 | | | | 15.11 | | | | 131.97 | | | | 22.09 | | | | NA | | | | NA | | | | NM | |
| AF | | Astoria Financial Corporation | | NY | | | 30.10 | | | | 119.21 | | | | 13.09 | | | | 134.98 | | | | 29.30 | | | | 0.16 | | | | 0.86 | | | | 25.81 | |
| BCTF | | Bancorp 34, Inc. | | NM | | | 37.29 | | | | 141.48 | | | | 13.36 | | | | 142.87 | | | | 36.00 | | | | 0.59 | | | | 0.00 | | | | NM | |
| BKMU | | Bank Mutual Corporation | | WI | | | 26.62 | | | | 157.01 | | | | 16.99 | | | | 157.01 | | | | 26.62 | | | | 0.22 | | | | 2.23 | | | | 59.46 | |
| BYBK | | Bay Bancorp, Inc. | | MD | | | 49.38 | | | | 126.02 | | | | 13.32 | | | | 132.12 | | | | 41.16 | | | | 0.00 | | | | 0.00 | | | | NM | |
| BNCL | | Beneficial Bancorp, Inc. | | PA | | | 48.24 | | | | 122.28 | | | | NA | | | | 147.39 | | | | 39.11 | | | | 0.24 | | | | 1.46 | | | | 52.94 | |
| BHBK | | Blue Hills Bancorp, Inc. | | MA | | | 54.14 | | | | 131.07 | | | | 20.53 | | | | 134.74 | | | | 56.53 | | | | 0.20 | | | | 1.06 | | | | 45.71 | |
| BOFI | | BofI Holding, Inc. | | CA | | | 15.01 | | | | 250.18 | | | | 22.94 | | | | 250.18 | | | | 15.10 | | | | NA | | | | NA | | | | NM | |
| BYFC | | Broadway Financial Corporation | | CA | | | 6.61 | | | | 93.00 | | | | 10.69 | | | | 93.00 | | | | 6.70 | | | | 0.04 | | | | 0.00 | | | | NM | |
| BLMT | | BSB Bancorp, Inc. | | MA | | | 21.32 | | | | 160.50 | | | | 11.96 | | | | 160.50 | | | | NA | | | | NA | | | | NA | | | | NM | |
| CFFN | | Capitol Federal Financial, Inc. | | KS | | | 24.50 | | | | 153.12 | | | | 22.92 | | | | 153.12 | | | | 24.65 | | | | 0.34 | | | | 2.24 | | | | 141.94 | |
| CARV | | Carver Bancorp, Inc. | | NY | | | NM | | | | 129.23 | | | | 1.83 | | | | 129.23 | | | | NM | | | | 0.00 | | | | 0.00 | | | | NM | |
| CHFN | | Charter Financial Corporation | | GA | | | 21.22 | | | | 127.27 | | | | 17.89 | | | | 150.99 | | | | 17.07 | | | | 0.24 | | | | 1.38 | | | | 26.22 | |
| CSBK | | Clifton Bancorp Inc. | | NJ | | | NM | | | | 121.43 | | | | 26.84 | | | | 121.43 | | | | 80.72 | | | | 0.24 | | | | 1.50 | | | | 120.00 | |
| CWAY | | Coastway Bancorp, Inc. | | RI | | | 20.61 | | | | 108.52 | | | | 11.55 | | | | 108.52 | | | | 20.61 | | | | NA | | | | NA | | | | NM | |
| DCOM | | Dime Community Bancshares, Inc. | | NY | | | 10.66 | | | | 139.00 | | | | 13.10 | | | | 154.16 | | | | 21.74 | | | | 0.56 | | | | 2.67 | | | | 28.43 | |
| ESBK | | Elmira Savings Bank | | NY | | | 17.20 | | | | 128.46 | | | | 10.48 | | | | 175.59 | | | | 17.69 | | | | 0.92 | | | | 4.28 | | | | 73.60 | |
| ENFC | | Entegra Financial Corp. | | NC | | | 22.91 | | | | 109.11 | | | | 11.23 | | | | 111.67 | | | | 20.56 | | | | NA | | | | NA | | | | NM | |
| EQFN | | Equitable Financial Corp. | | NE | | | 30.76 | | | | 96.32 | | | | 14.89 | | | | 96.32 | | | | 30.00 | | | | NA | | | | NA | | | | NM | |
| ESSA | | ESSA Bancorp, Inc. | | PA | | | 22.07 | | | | 106.25 | | | | 10.24 | | | | 117.28 | | | | 23.04 | | | | 0.36 | | | | 2.27 | | | | 50.00 | |
| FCAP | | First Capital, Inc. | | IN | | | 16.07 | | | | 139.92 | | | | NA | | | | 155.26 | | | | 16.15 | | | | 0.84 | | | | 2.55 | | | | 40.98 | |
| FBNK | | First Connecticut Bancorp, Inc. | | CT | | | 24.15 | | | | 147.57 | | | | 13.53 | | | | 147.57 | | | | 24.23 | | | | 0.36 | | | | 1.49 | | | | 31.00 | |
| FDEF | | First Defiance Financial Corp. | | OH | | | 15.23 | | | | 148.90 | | | | 17.62 | | | | 189.79 | | | | 14.93 | | | | 1.00 | | | | 2.06 | | | | 28.53 | |
| FNWB | | First Northwest Bancorp | | WA | | | 46.26 | | | | 108.08 | | | | 18.32 | | | | 108.08 | | | | 48.66 | | | | NA | | | | NA | | | | NM | |
| FBC | | Flagstar Bancorp, Inc. | | MI | | | 9.68 | | | | 109.48 | | | | 10.41 | | | | 109.48 | | | | NA | | | | 0.00 | | | | 0.00 | | | | NM | |
| FSBW | | FS Bancorp, Inc. | | WA | | | 11.08 | | | | 146.87 | | | | 14.38 | | | | 154.56 | | | | 10.58 | | | | 0.40 | | | | 1.03 | | | | 11.40 | |
| FSBC | | FSB Bancorp, Inc. | | NY | | | 29.16 | | | | 86.97 | | | | 10.12 | | | | 86.97 | | | | NA | | | | NA | | | | NA | | | | NM | |
| HBK | | Hamilton Bancorp, Inc. | | MD | | | NM | | | | 86.92 | | | | 10.55 | | | | 102.85 | | | | NA | | | | NA | | | | NA | | | | NM | |
| HIFS | | Hingham Institution for Savings | | MA | | | 17.28 | | | | 249.30 | | | | 19.93 | | | | 249.30 | | | | 17.45 | | | | 1.28 | | | | 0.68 | | | | 14.33 | |
| HMNF | | HMN Financial, Inc. | | MN | | | 13.79 | | | | 109.25 | | | | 12.16 | | | | 111.09 | | | | NA | | | | 0.00 | | | | 0.00 | | | | NM | |
| HFBL | | Home Federal Bancorp, Inc. of Louisiana | | LA | | | 15.14 | | | | 124.02 | | | | 13.34 | | | | 124.02 | | | | 15.14 | | | | 0.36 | | | | 1.29 | | | | 18.92 | |
| HVBC | | HV Bancorp, Inc. | | PA | | | NA | | | | NA | | | | NA | | | | NA | | | | NA | | | | NA | | | | NA | | | | NA | |
| IROQ | | IF Bancorp, Inc. | | IL | | | 16.46 | | | | 94.59 | | | | 13.44 | | | | 94.59 | | | | 17.55 | | | | 0.16 | | | | 0.81 | | | | 13.33 | |
| ISBC | | Investors Bancorp, Inc. | | NJ | | | 22.63 | | | | 143.47 | | | | 19.34 | | | | 148.52 | | | | 22.80 | | | | 0.32 | | | | 2.21 | | | | 43.75 | |
| JXSB | | Jacksonville Bancorp, Inc. | | IL | | | 18.53 | | | | 122.62 | | | | 17.74 | | | | 130.31 | | | | 20.26 | | | | 0.40 | | | | 1.27 | | | | 23.53 | |
| KRNY | | Kearny Financial Corp. | | NJ | | | NM | | | | 121.21 | | | | 29.46 | | | | 134.34 | | | | 71.82 | | | | 0.08 | | | | 0.53 | | | | 38.10 | |
| MLVF | | Malvern Bancorp, Inc. | | PA | | | 11.41 | | | | 143.90 | | | | 15.67 | | | | 143.90 | | | | 11.70 | | | | 0.11 | | | | 0.00 | | | | NM | |
| MELR | | Melrose Bancorp, Inc. | | MA | | | 44.15 | | | | 108.98 | | | | 17.68 | | | | 108.98 | | | | 64.61 | | | | NA | | | | NA | | | | NM | |
| EBSB | | Meridian Bancorp, Inc. | | MA | | | 29.77 | | | | 170.77 | | | | 23.38 | | | | 174.71 | | | | 31.58 | | | | 0.12 | | | | 0.62 | | | | 18.46 | |
| CASH | | Meta Financial Group, Inc. | | SD | | | 24.66 | | | | 219.75 | | | | 19.39 | | | | 409.69 | | | | 20.11 | | | | 0.52 | | | | 0.59 | | | | 14.61 | |
| MSBF | | MSB Financial Corp. | | NJ | | | NM | | | | 118.29 | | | | 18.75 | | | | 118.29 | | | | 75.75 | | | | 0.00 | | | | 0.00 | | | | NM | |
| NYCB | | New York Community Bancorp, Inc. | | NY | | | 14.79 | | | | 118.82 | | | | 14.87 | | | | 197.32 | | | | 14.60 | | | | 0.68 | | | | 4.55 | | | | 67.33 | |
| NFBK | | Northfield Bancorp, Inc. | | NJ | | | 31.30 | | | | 139.36 | | | | 22.49 | | | | 148.98 | | | | 28.38 | | | | 0.32 | | | | 1.79 | | | | 56.14 | |
| NWBI | | Northwest Bancshares, Inc. | | PA | | | 35.33 | | | | 150.38 | | | | 18.29 | | | | 211.89 | | | | 20.09 | | | | 0.64 | | | | 3.70 | | | | 124.49 | |
| OCFC | | OceanFirst Financial Corp. | | NJ | | | 29.54 | | | | 162.64 | | | | 18.01 | | | | 223.62 | | | | 19.85 | | | | 0.60 | | | | 2.07 | | | | 57.14 | |
| ORIT | | Oritani Financial Corp. | | NJ | | | 16.83 | | | | 144.79 | | | | 19.43 | | | | 144.79 | | | | 17.96 | | | | 0.70 | | | | 4.12 | | | | 118.81 | |
| OTTW | | Ottawa Bancorp, Inc. | | IL | | | 36.60 | | | | 85.99 | | | | 19.42 | | | | 87.70 | | | | 35.01 | | | | 0.00 | | | | 0.00 | | | | NM | |
| PBHC | | Pathfinder Bancorp, Inc. | | NY | | | 19.18 | | | | 109.39 | | | | NA | | | | 119.12 | | | | 21.88 | | | | 0.20 | | | | 1.34 | | | | 25.64 | |
| PBBI | | PB Bancorp, Inc. | | CT | | | NM | | | | 95.90 | | | | 16.18 | | | | 104.33 | | | | 83.98 | | | | 0.12 | | | | 1.15 | | | | 95.83 | |
| PBSK | | Poage Bankshares, Inc. | | KY | | | 38.85 | | | | 107.55 | | | | 16.71 | | | | 111.33 | | | | 33.65 | | | | 0.24 | | | | 1.19 | | | | 53.85 | |
| PROV | | Provident Financial Holdings, Inc. | | CA | | | 21.48 | | | | 111.60 | | | | 12.41 | | | | 111.60 | | | | 21.28 | | | | 0.52 | | | | 2.78 | | | | 58.62 | |
| PFS | | Provident Financial Services, Inc. | | NJ | | | 18.95 | | | | 138.05 | | | | 18.19 | | | | 210.19 | | | | 19.01 | | | | 0.76 | | | | 2.91 | | | | 52.90 | |
| PBIP | | Prudential Bancorp, Inc. | | PA | | | 43.32 | | | | 126.32 | | | | 24.21 | | | | 126.32 | | | | 44.35 | | | | 0.12 | | | | 0.68 | | | | 29.27 | |
| RNDB | | Randolph Bancorp, Inc. | | MA | | | NA | | | | 101.17 | | | | 17.74 | | | | 101.30 | | | | NA | | | | NA | | | | NA | | | | NA | |
| RVSB | | Riverview Bancorp, Inc. | | WA | | | 25.93 | | | | 160.09 | | | | 17.77 | | | | 208.92 | | | | 24.50 | | | | 0.08 | | | | 1.03 | | | | 26.67 | |
| SVBI | | Severn Bancorp, Inc. | | MD | | | 6.30 | | | | 107.45 | | | | 11.60 | | | | 107.88 | | | | 6.30 | | | | 0.00 | | | | 0.00 | | | | NM | |
| SIFI | | SI Financial Group, Inc. | | CT | | | 15.79 | | | | 111.19 | | | | 11.81 | | | | 124.41 | | | | NA | | | | 0.20 | | | | 1.33 | | | | 17.89 | |
| SBCP | | Sunshine Bancorp, Inc. | | FL | | | NM | | | | 129.16 | | | | 15.54 | | | | 161.25 | | | | 56.62 | | | | NA | | | | NA | | | | NM | |
| TBNK | | Territorial Bancorp Inc. | | HI | | | 18.73 | | | | 140.31 | | | | 17.17 | | | | 140.31 | | | | 19.01 | | | | 0.80 | | | | 2.43 | | | | 53.41 | |
| TSBK | | Timberland Bancorp, Inc. | | WA | | | 14.52 | | | | 153.12 | | | | 16.52 | | | | 162.32 | | | | 14.60 | | | | 0.44 | | | | 2.01 | | | | 24.50 | |
| TRST | | TrustCo Bank Corp NY | | NY | | | 18.54 | | | | 182.62 | | | | 16.23 | | | | 182.86 | | | | 18.87 | | | | 0.26 | | | | 3.18 | | | | 58.99 | |
| UCBA | | United Community Bancorp | | IN | | | 21.38 | | | | 104.19 | | | | 13.65 | | | | 108.57 | | | | 21.77 | | | | 0.24 | | | | 1.40 | | | | 30.00 | |
| UCFC | | United Community Financial Corp. | | OH | | | 21.70 | | | | 161.66 | | | | 18.41 | | | | 162.69 | | | | 21.54 | | | | 0.12 | | | | 1.39 | | | | 28.82 | |
| UBNK | | United Financial Bancorp, Inc. | | CT | | | 17.80 | | | | 136.48 | | | | 13.56 | | | | 167.42 | | | | 16.39 | | | | 0.48 | | | | 2.72 | | | | 48.48 | |
| WSBF | | Waterstone Financial, Inc. | | WI | | | 22.41 | | | | 130.23 | | | | 29.71 | | | | 130.42 | | | | 22.41 | | | | 0.48 | | | | 2.64 | | | | 40.74 | |
| WAYN | | Wayne Savings Bancshares, Inc. | | OH | | | 20.38 | | | | 125.98 | | | | 11.70 | | | | 131.43 | | | | 20.38 | | | | 0.36 | | | | 1.92 | | | | 39.13 | |
| WCFB | | WCF Bancorp, Inc. | | IA | | | NM | | | | 84.92 | | | | 20.25 | | | | 85.12 | | | | 141.09 | | | | 0.20 | | | | 2.04 | | | | 147.33 | |
| WEBK | | Wellesley Bancorp, Inc. | | MA | | | 22.38 | | | | 124.89 | | | | 9.92 | | | | 124.89 | | | | NA | | | | 0.16 | | | | 0.58 | | | | 12.10 | |
| WBB | | Westbury Bancorp, Inc. | | WI | | | 26.44 | | | | 116.88 | | | | 12.49 | | | | 116.88 | | | | 29.84 | | | | NA | | | | NA | | | | NM | |
| WNEB | | Western New England Bancorp, Inc. | | MA | | | 40.83 | | | | 124.89 | | | | 14.34 | | | | 135.20 | | | | 29.34 | | | | 0.12 | | | | 1.22 | | | | 50.00 | |
RP® Financial, LC.
Exhibit IV-1B
Weekly Thrift Market Line - Part Two
Prices As of February 10, 2017
| | | | | | | Key Financial Ratios | | | Asset Quality Ratios | |
| | | | | | | Equity/ | | | Tang Equity/ | | | Reported Earnings | | | Core Earnings | | | NPAs/ | | | Rsvs/ | |
| | | | | Assets(1) | | | Assets(1) | | | ROA(5) | | | ROE(5) | | | ROA(5) | | | ROE(5) | | | Assets | | | NPLs | |
| | | | | | | (%) | | | (%) | | | (%) | | | (%) | | | (%) | | | (%) | | | (%) | | | (%) | |
| Companies | | | | | | | | | | | | | | | | | | | | | | | | | | | | | | | | | | |
| WBKC | | Wolverine Bancorp, Inc. | | MI | | | 17.20 | | | | 17.20 | | | | 1.13 | | | | 7.00 | | | | 1.13 | | | | 7.00 | | | | 1.92 | | | | 132.93 | |
| WSFS | | WSFS Financial Corporation | | DE | | | 10.44 | | | | 8.05 | | | | 1.04 | | | | 9.85 | | | | 1.18 | | | | 11.12 | | | | 0.64 | | | | 100.10 | |
| WVFC | | WVS Financial Corp. | | PA | | | 9.85 | | | | 9.85 | | | | 0.42 | | | | 4.32 | | | | 0.42 | | | | 4.26 | | | | 0.08 | | | | 149.21 | |
| | | | | | | | | | | | | | | | | | | | | | | | | | | | | | | | | | | | | |
| MHCs | | | | | | | | | | | | | | | | | | | | | | | | | | | | | | | | | | |
| GCBC | | Greene County Bancorp, Inc. (MHC) | | NY | | | 8.56 | | | | 8.56 | | | | 1.12 | | | | 12.84 | | | | 1.12 | | | | 12.84 | | | | 0.61 | | | | 193.63 | |
| HONE | | HarborOne Bancorp, Inc. (MHC) | | MA | | | 13.97 | | | | 13.47 | | | | 0.20 | | | | 1.99 | | | | 0.34 | | | | 3.29 | | | | 2.17 | | | | 32.29 | |
| KFFB | | Kentucky First Federal Bancorp (MHC) | | KY | | | 22.87 | | | | 18.88 | | | | 0.43 | | | | 1.86 | | | | 0.43 | | | | 1.86 | | | | NA | | | | NA | |
| LSBK | | Lake Shore Bancorp, Inc. (MHC) | | NY | | | 16.16 | | | | 16.16 | | | | 0.88 | | | | 5.56 | | | | 0.64 | | | | 4.03 | | | | 1.38 | | | | 36.15 | |
| MGYR | | Magyar Bancorp, Inc. (MHC) | | NJ | | | 8.17 | | | | 8.17 | | | | 0.19 | | | | 2.28 | | | | 0.18 | | | | 2.19 | | | | 3.69 | | | | 32.31 | |
| OFED | | Oconee Federal Financial Corp. (MHC) | | SC | | | 17.59 | | | | 17.03 | | | | 1.05 | | | | 6.21 | | | | 1.04 | | | | 6.16 | | | | 1.15 | | | | 19.69 | |
| PVBC | | Provident Bancorp, Inc. (MHC) | | MA | | | 14.10 | | | | 14.10 | | | | 0.82 | | | | 5.71 | | | | 0.78 | | | | 5.42 | | | | 0.65 | | | | 168.33 | |
| TFSL | | TFS Financial Corporation (MHC) | | OH | | | 12.87 | | | | 12.80 | | | | 0.65 | | | | 4.73 | | | | NA | | | | NA | | | | 1.58 | | | | 31.39 | |
| | | | | | | | | | | | | | | | | | | | | | | | | | | | | | | | | | | | | |
| Under Acquisition | | | | | | | | | | | | | | | | | | | | | | | | | | | | | | | | | | |
| EVER | | EverBank Financial Corp | | FL | | | 6.60 | | | | 6.45 | | | | 0.49 | | | | 7.07 | | | | NA | | | | NA | | | | 0.74 | | | | 45.16 | |
| GTWN | | Georgetown Bancorp, Inc. | | MA | | | 10.30 | | | | 10.30 | | | | 0.25 | | | | 2.39 | | | | 0.27 | | | | 2.55 | | | | NA | | | | NA | |
| | | | | | | Pricing Ratios | | | Dividend Data (6) | |
| | | | | | | Price/ | | | Price/ | | | Price/ | | | Price/ | | | Price/ | | | Div/ | | | Dividend | | | Payout | |
| | | | | Earnings | | | Book | | | Assets | | | Tang Book | | | Core Earnings | | | Share | | | Yield | | | Ratio (7) | |
| | | | | | | (x) | | | (%) | | | (%) | | | (%) | | | (x) | | | ($) | | | (%) | | | (%) | |
| Companies | | | | | | | | | | | | | | | | | | | | | | | | | | | | | | | | | | |
| WBKC | | Wolverine Bancorp, Inc. | | MI | | | 15.71 | | | | 112.15 | | | | 19.29 | | | | 112.15 | | | | 15.71 | | | | 1.60 | | | | 4.76 | | | | 74.77 | |
| WSFS | | WSFS Financial Corporation | | DE | | | 21.60 | | | | 203.23 | | | | 20.65 | | | | 268.26 | | | | 20.33 | | | | 0.28 | | | | 0.63 | | | | 12.62 | |
| WVFC | | WVS Financial Corp. | | PA | | | 18.35 | | | | 87.40 | | | | 8.56 | | | | 87.40 | | | | NA | | | | 0.24 | | | | 1.66 | | | | 27.85 | |
| | | | | | | | | | | | | | | | | | | | | | | | | | | | | | | | | | | | | |
| MHCs | | | | | | | | | | | | | | | | | | | | | | | | | | | | | | | | | | |
| GCBC | | Greene County Bancorp, Inc. (MHC) | | NY | | | 19.27 | | | | 244.62 | | | | 20.57 | | | | 244.62 | | | | NA | | | | 0.38 | | | | 1.69 | | | | 32.26 | |
| HONE | | HarborOne Bancorp, Inc. (MHC) | | MA | | | NA | | | | 188.21 | | | | 25.32 | | | | 196.31 | | | | NA | | | | NA | | | | NA | | | | NA | |
| KFFB | | Kentucky First Federal Bancorp (MHC) | | KY | | | NM | | | | 123.87 | | | | 27.32 | | | | 157.80 | | | | NA | | | | 0.40 | | | | 4.06 | | | | 285.71 | |
| LSBK | | Lake Shore Bancorp, Inc. (MHC) | | NY | | | 27.07 | | | | 123.81 | | | | NA | | | | 123.81 | | | | NA | | | | 0.32 | | | | 2.04 | | | | 50.00 | |
| MGYR | | Magyar Bancorp, Inc. (MHC) | | NJ | | | 68.43 | | | | 157.96 | | | | 12.88 | | | | 157.96 | | | | NA | | | | NA | | | | NA | | | | NM | |
| OFED | | Oconee Federal Financial Corp. (MHC) | | SC | | | 23.40 | | | | 151.84 | | | | 26.43 | | | | 157.97 | | | | 23.70 | | | | 0.40 | | | | 1.82 | | | | 42.55 | |
| PVBC | | Provident Bancorp, Inc. (MHC) | | MA | | | 28.41 | | | | 173.33 | | | | 23.78 | | | | 173.33 | | | | 30.57 | | | | NA | | | | NA | | | | NM | |
| TFSL | | TFS Financial Corporation (MHC) | | OH | | | 59.31 | | | | 292.82 | | | | 36.97 | | | | 294.54 | | | | NA | | | | 0.50 | | | | 2.91 | | | | 155.17 | |
| | | | | | | | | | | | | | | | | | | | | | | | | | | | | | | | | | | | | |
| Under Acquisition | | | | | | | | | | | | | | | | | | | | | | | | | | | | | | | | | | |
| EVER | | EverBank Financial Corp | | FL | | | 18.33 | | | | 132.26 | | | | 8.91 | | | | 135.74 | | | | NA | | | | 0.24 | | | | 1.24 | | | | 22.64 | |
| GTWN | | Georgetown Bancorp, Inc. | | MA | | | NM | | | | 148.40 | | | | 14.97 | | | | 148.40 | | | | NA | | | | 0.20 | | | | 0.77 | | | | 181.82 | |
| (1) | Average of High/Low or Bid/Ask price per share. |
| (2) | Or since offering price if converted of first listed in the past 52 weeks. Percent change figures are actual year-to-date and are not annualized. |
| (3) | EPS (earnings per share) is based on actual trailing 12 month data and is not shown on a pro forma basis. |
| (4) | Exludes intangibles (such as goodwill, value of core deposits, etc.). |
| (5) | ROA (return on assets) and ROE (return on equity) are indicated ratios based on trailing 12 month common earnings and average common equity and total assets balances. |
| (6) | Annualized based on last regular quarterly cash dividend announcement. |
| (7) | Indicated dividend as a percent of trailing 12 month earnings. |
| (8) | Excluded from averages due to actual or rumored acquisition activities or unusual operating characteristics. |
| (9) | For MHC institutions, market value reflects share price multiplied by public (non-MHC) shares. |
Source: SNL Financial, LC. and RP® Financial, LC. calculations. The information provided in this table has been obtained from sources we believe are reliable, but we cannot guarantee the accuracy or completeness of such information.
Copyright (c) 2017 by RP® Financial, LC.
EXHIBIT IV-2
Historical Stock Price Indices
Exhibit IV-2
Historical Stock Price Indices(1)
| | | | | | | | | | | | | | SNL | | | SNL | |
| | | | | | | | | | | NASDAQ | | | Thrift | | | Bank | |
| Year/Qtr. Ended | | DJIA | | | S&P 500 | | | Composite | | | Index | | | Index | |
| | | | | | | | | | | | | | | | | | |
| 2004: | | Quarter 1 | | | 10357.7 | | | | 1126.2 | | | | 1994.2 | | | | 1585.3 | | | | 562.20 | |
| | | Quarter 2 | | | 10435.5 | | | | 1140.8 | | | | 2047.8 | | | | 1437.8 | | | | 546.62 | |
| | | Quarter 3 | | | 10080.3 | | | | 1114.6 | | | | 1896.8 | | | | 1495.1 | | | | 556.00 | |
| | | Quarter 4 | | | 10783.0 | | | | 1211.9 | | | | 2175.4 | | | | 1605.6 | | | | 595.10 | |
| | | | | | | | | | | | | | | | | | | | | | | |
| 2005: | | Quarter 1 | | | 10503.8 | | | | 1180.6 | | | | 1999.2 | | | | 1516.6 | | | | 551.00 | |
| | | Quarter 2 | | | 10275.0 | | | | 1191.3 | | | | 2057.0 | | | | 1577.1 | | | | 563.27 | |
| | | Quarter 3 | | | 10568.7 | | | | 1228.8 | | | | 2151.7 | | | | 1527.2 | | | | 546.30 | |
| | | Quarter 4 | | | 10717.5 | | | | 1248.3 | | | | 2205.3 | | | | 1616.4 | | | | 582.80 | |
| | | | | | | | | | | | | | | | | | | | | | | |
| 2006: | | Quarter 1 | | | 11109.3 | | | | 1294.8 | | | | 2339.8 | | | | 1661.1 | | | | 595.50 | |
| | | Quarter 2 | | | 11150.2 | | | | 1270.2 | | | | 2172.1 | | | | 1717.9 | | | | 601.14 | |
| | | Quarter 3 | | | 11679.1 | | | | 1335.9 | | | | 2258.4 | | | | 1727.1 | | | | 634.00 | |
| | | Quarter 4 | | | 12463.2 | | | | 1418.3 | | | | 2415.3 | | | | 1829.3 | | | | 658.60 | |
| | | | | | | | | | | | | | | | | | | | | | | |
| 2007: | | Quarter 1 | | | 12354.4 | | | | 1420.9 | | | | 2421.6 | | | | 1703.6 | | | | 634.40 | |
| | | Quarter 2 | | | 13408.6 | | | | 1503.4 | | | | 2603.2 | | | | 1645.9 | | | | 622.63 | |
| | | Quarter 3 | | | 13895.6 | | | | 1526.8 | | | | 2701.5 | | | | 1523.3 | | | | 595.80 | |
| | | Quarter 4 | | | 13264.8 | | | | 1468.4 | | | | 2652.3 | | | | 1058.0 | | | | 492.85 | |
| | | | | | | | | | | | | | | | | | | | | | | |
| 2008: | | Quarter 1 | | | 12262.9 | | | | 1322.7 | | | | 2279.1 | | | | 1001.5 | | | | 442.5 | |
| | | Quarter 2 | | | 11350.0 | | | | 1280.0 | | | | 2293.0 | | | | 822.6 | | | | 332.2 | |
| | | Quarter 3 | | | 10850.7 | | | | 1166.4 | | | | 2082.3 | | | | 760.1 | | | | 414.8 | |
| | | Quarter 4 | | | 8776.4 | | | | 903.3 | | | | 1577.0 | | | | 653.9 | | | | 268.3 | |
| | | | | | | | | | | | | | | | | | | | | | | |
| 2009: | | Quarter 1 | | | 7608.9 | | | | 797.9 | | | | 1528.6 | | | | 542.8 | | | | 170.1 | |
| | | Quarter 2 | | | 8447.0 | | | | 919.3 | | | | 1835.0 | | | | 538.8 | | | | 227.6 | |
| | | Quarter 3 | | | 9712.3 | | | | 1057.1 | | | | 2122.4 | | | | 561.4 | | | | 282.9 | |
| | | Quarter 4 | | | 10428.1 | | | | 1115.1 | | | | 2269.2 | | | | 587.0 | | | | 260.8 | |
| | | | | | | | | | | | | | | | | | | | | | | |
| 2010: | | Quarter 1 | | | 10856.6 | | | | 1169.4 | | | | 2398.0 | | | | 626.3 | | | | 301.1 | |
| | | Quarter 2 | | | 9744.0 | | | | 1030.7 | | | | 2109.2 | | | | 564.5 | | | | 257.2 | |
| | | Quarter 3 | | | 9744.0 | | | | 1030.7 | | | | 2109.2 | | | | 564.5 | | | | 257.2 | |
| | | Quarter 4 | | | 11577.5 | | | | 1257.6 | | | | 2652.9 | | | | 592.2 | | | | 290.1 | |
| | | | | | | | | | | | | | | | | | | | | | | |
| 2011: | | Quarter 1 | | | 12319.7 | | | | 1325.8 | | | | 2781.1 | | | | 578.1 | | | | 293.1 | |
| | | Quarter 2 | | | 12414.3 | | | | 1320.6 | | | | 2773.5 | | | | 540.8 | | | | 266.8 | |
| | | Quarter 3 | | | 10913.4 | | | | 1131.4 | | | | 2415.4 | | | | 443.2 | | | | 198.9 | |
| | | Quarter 4 | | | 12217.6 | | | | 1257.6 | | | | 2605.2 | | | | 481.4 | | | | 221.3 | |
| | | | | | | | | | | | | | | | | | | | | | | |
| 2012: | | Quarter 1 | | | 13212.0 | | | | 1408.5 | | | | 3091.6 | | | | 529.3 | | | | 284.9 | |
| | | Quarter 2 | | | 12880.1 | | | | 1362.2 | | | | 2935.1 | | | | 511.6 | | | | 257.3 | |
| | | Quarter 3 | | | 13437.1 | | | | 1440.7 | | | | 3116.2 | | | | 557.6 | | | | 276.8 | |
| | | Quarter 4 | | | 13104.1 | | | | 1426.2 | | | | 3019.5 | | | | 565.8 | | | | 292.7 | |
| | | | | | | | | | | | | | | | | | | | | | | |
| 2013: | | Quarter 1 | | | 14578.5 | | | | 1569.2 | | | | 3267.5 | | | | 602.3 | | | | 318.9 | |
| | | Quarter 2 | | | 14909.6 | | | | 1606.3 | | | | 3404.3 | | | | 625.3 | | | | 346.7 | |
| | | Quarter 3 | | | 15129.7 | | | | 1681.6 | | | | 3771.5 | | | | 650.8 | | | | 354.4 | |
| | | Quarter 4 | | | 16576.7 | | | | 1848.4 | | | | 4176.6 | | | | 706.5 | | | | 394.4 | |
| | | | | | | | | | | | | | | | | | | | | | | |
| 2014: | | Quarter 1 | | | 16457.7 | | | | 1872.3 | | | | 4199.0 | | | | 718.9 | | | | 410.8 | |
| | | Quarter 2 | | | 16826.6 | | | | 1960.2 | | | | 4408.2 | | | | 723.9 | | | | 405.2 | |
| | | Quarter 3 | | | 17042.9 | | | | 1972.3 | | | | 4493.4 | | | | 697.7 | | | | 411.0 | |
| | | Quarter 4 | | | 17823.1 | | | | 2058.9 | | | | 4736.1 | | | | 738.7 | | | | 432.8 | |
| | | | | | | | | | | | | | | | | | | | | | | |
| 2015: | | Quarter 1 | | | 17776.1 | | | | 2067.9 | | | | 4900.9 | | | | 749.3 | | | | 418.8 | |
| | | Quarter 2 | | | 17619.5 | | | | 2063.1 | | | | 4986.9 | | | | 795.7 | | | | 448.4 | |
| | | Quarter 3 | | | 16284.7 | | | | 1920.0 | | | | 4620.2 | | | | 811.7 | | | | 409.4 | |
| | | Quarter 4 | | | 17425.0 | | | | 2043.9 | | | | 5007.4 | | | | 809.1 | | | | 431.5 | |
| | | | | | | | | | | | | | | | | | | | | | | |
| 2016: | | Quarter 1 | | | 17685.1 | | | | 2059.7 | | | | 4869.9 | | | | 788.1 | | | | 381.4 | |
| | | Quarter 2 | | | 17930.0 | | | | 2098.9 | | | | 4842.7 | | | | 780.9 | | | | 385.6 | |
| | | Quarter 3 | | | 18308.2 | | | | 2168.3 | | | | 5312.0 | | | | 827.2 | | | | 413.7 | |
| | | Quarter 4 | | | 19762.6 | | | | 2238.8 | | | | 5383.1 | | | | 966.7 | | | | 532.7 | |
| As of Feb. 10, 2017 | | | 20269.4 | | | | 2316.1 | | | | 5734.1 | | | | 934.8 | | | | 538.8 | |
(1) End of period data.
Sources: SNL Financial and The Wall Street Journal.
EXHIBIT IV-3
Stock Indices as of February 10, 2017
| Industry: | Banking |
| Geography: | United States and Canada |
| | |
| | | | | | | | | | | Day's | | | | |
| | | Index | | | Last | | Day's | | | Change | | | Market Breadth | |
| | | Value | | | Update | | Change | | | (%) | | |  | | |  | | |  | |
| | | | | | | | | | | | | | | | | | | | | |
| SNL Custom** Indexes | | | | | | | | | | | | | | | | | | | | | | | | | | |
| | | | | | | | | | | | | | | | | | | | | | | | | | | |
| SNL Banking Indexes | | | | | | | | | | | | | | | | | | | | | | | | | | |
| | | | | | | | | | | | | | | | | | | | | | | | | | | |
| SNL U.S. Bank and Thrift | | | 516.08 | * | | 2/10/2017 | | | 1.09 | * | | | 0.21 | * | | | 291 | * | | | 86 | * | | | 32 | * |
| | | | | | | | | | | | | | | | | | | | | | | | | | | |
| SNL U.S. Bank | | | 538.82 | * | | 2/10/2017 | | | 1.11 | * | | | 0.21 | * | | | 243 | * | | | 61 | * | | | 22 | * |
| | | | | | | | | | | | | | | | | | | | | | | | | | | |
| SNL U.S. Thrift | | | 934.75 | * | | 2/10/2017 | | | 4.05 | * | | | 0.44 | * | | | 48 | * | | | 25 | * | | | 10 | * |
| | | | | | | | | | | | | | | | | | | | | | | | | | | |
| SNL TARP Participants | | | 92.24 | * | | 2/10/2017 | | | (0.29 | )* | | | (0.31 | )* | | | 2 | * | | | 3 | * | | | 5 | * |
| | | | | | | | | | | | | | | | | | | | | | | | | | | |
| KBW Nasdaq Bank | | | 93.14 | * | | 2/10/2017 | | | 0.22 | * | | | 0.24 | * | | | NA | * | | | NA | * | | | NA | * |
| | | | | | | | | | | | | | | | | | | | | | | | | | | |
| KBW Nasdaq Regional Bank | | | 110.21 | * | | 2/10/2017 | | | 0.48 | * | | | 0.44 | * | | | NA | * | | | NA | * | | | NA | * |
| | | | | | | | | | | | | | | | | | | | | | | | | | | |
| S&P 500 Bank | | | 289.87 | * | | 2/10/2017 | | | 0.43 | * | | | 0.15 | * | | | NA | * | | | NA | * | | | NA | * |
| | | | | | | | | | | | | | | | | | | | | | | | | | | |
| NASDAQ Bank | | | 3,815.31 | * | | 2/10/2017 | | | 22.42 | * | | | 0.59 | * | | | NA | * | | | NA | * | | | NA | * |
| | | | | | | | | | | | | | | | | | | | | | | | | | | |
| S&P 500 Commercial Banks | | | 414.13 | * | | 2/10/2017 | | | 0.62 | * | | | 0.15 | * | | | NA | * | | | NA | * | | | NA | * |
| | | | | | | | | | | | | | | | | | | | | | | | | | | |
| S&P 500 Diversified Banks | | | 489.95 | * | | 2/10/2017 | | | 0.30 | * | | | 0.06 | * | | | NA | * | | | NA | * | | | NA | * |
| | | | | | | | | | | | | | | | | | | | | | | | | | | |
| S&P 500 Regional Banks | | | 106.21 | * | | 2/10/2017 | | | 0.55 | * | | | 0.52 | * | | | NA | * | | | NA | * | | | NA | * |
| | | | | | | | | | | | | | | | | | | | | | | | | | | |
| S&P 500 Thrifts & Mortgage Finance | | | 4.56 | * | | 11/2/2015 | | | (0.01 | )* | | | (0.31 | )* | | | NA | * | | | NA | * | | | NA | * |
| | | | | | | | | | | | | | | | | | | | | | | | | | | |
| SNL Asset Size Indexes | | | | | | | | | | | | | | | | | | | | | | | | | | |
| | | | | | | | | | | | | | | | | | | | | | | | | | | |
| SNL U.S. Bank < $250M | | | 30.58 | * | | 2/10/2017 | | | (0.02 | )* | | | (0.06 | )* | | | 0 | * | | | 2 | * | | | 0 | * |
| | | | | | | | | | | | | | | | | | | | | | | | | | | |
| SNL U.S. Bank $250M-$500M | | | 435.48 | * | | 2/10/2017 | | | 4.42 | * | | | 1.03 | * | | | 6 | * | | | 1 | * | | | 1 | * |
| | | | | | | | | | | | | | | | | | | | | | | | | | | |
| SNL U.S. Thrift < $250M | | | 1,210.07 | * | | 2/10/2017 | | | (3.59 | )* | | | (0.30 | )* | | | 1 | * | | | 1 | * | | | 1 | * |
| | | | | | | | | | | | | | | | | | | | | | | | | | | |
| SNL U.S. Thrift $250M-$500M | | | 5,982.54 | * | | 2/10/2017 | | | (44.14 | )* | | | (0.73 | )* | | | 5 | * | | | 8 | * | | | 5 | * |
| | | | | | | | | | | | | | | | | | | | | | | | | | | |
| SNL U.S. Bank < $500M | | | 829.47 | * | | 2/10/2017 | | | 7.73 | * | | | 0.94 | * | | | 6 | * | | | 3 | * | | | 1 | * |
| | | | | | | | | | | | | | | | | | | | | | | | | | | |
| SNL U.S. Thrift < $500M | | | 2,036.84 | * | | 2/10/2017 | | | (14.26 | )* | | | (0.70 | )* | | | 6 | * | | | 9 | * | | | 6 | * |
| | | | | | | | | | | | | | | | | | | | | | | | | | | |
| SNL U.S. Bank $500M-$1B | | | 963.63 | * | | 2/10/2017 | | | 5.30 | * | | | 0.55 | * | | | 29 | * | | | 8 | * | | | 7 | * |
| | | | | | | | | | | | | | | | | | | | | | | | | | | |
| SNL U.S. Thrift $500M-$1B | | | 2,939.96 | * | | 2/10/2017 | | | 18.62 | * | | | 0.64 | * | | | 12 | * | | | 9 | * | | | 2 | * |
| | | | | | | | | | | | | | | | | | | | | | | | | | | |
| SNL U.S. Bank $1B-$5B | | | 1,140.89 | * | | 2/10/2017 | | | 10.40 | * | | | 0.92 | * | | | 113 | * | | | 31 | * | | | 9 | * |
| | | | | | | | | | | | | | | | | | | | | | | | | | | |
| SNL U.S. Thrift $1B-$5B | | | 3,532.84 | * | | 2/10/2017 | | | 14.13 | * | | | 0.40 | * | | | 17 | * | | | 6 | * | | | 1 | * |
| | | | | | | | | | | | | | | | | | | | | | | | | | | |
| SNL U.S. Bank $5B-$10B | | | 1,350.08 | * | | 2/10/2017 | | | 7.81 | * | | | 0.58 | * | | | 44 | * | | | 3 | * | | | 2 | * |
| | | | | | | | | | | | | | | | | | | | | | | | | | | |
| SNL U.S. Thrift $5B-$10B | | | 1,041.54 | * | | 2/10/2017 | | | 3.94 | * | | | 0.38 | * | | | 8 | * | | | 1 | * | | | 0 | * |
| | | | | | | | | | | | | | | | | | | | | | | | | | | |
| SNL U.S. Bank > $10B | | | 466.26 | * | | 2/10/2017 | | | 0.75 | * | | | 0.16 | * | | | 51 | * | | | 16 | * | | | 3 | * |
| | | | | | | | | | | | | | | | | | | | | | | | | | | |
| SNL U.S. Thrift > $10B | | | 165.36 | * | | 2/10/2017 | | | 0.86 | * | | | 0.53 | * | | | 5 | * | | | 0 | * | | | 1 | * |
| | | | | | | | | | | | | | | | | | | | | | | | | | | |
| SNL Market Cap Indexes | | | | | | | | | | | | | | | | | | | | | | | | | | |
| | | | | | | | | | | | | | | | | | | | | | | | | | | |
| SNL Micro Cap U.S. Bank | | | 604.89 | * | | 2/10/2017 | | | 1.84 | * | | | 0.30 | * | | | 142 | * | | | 82 | * | | | 341 | * |
| | | | | | | | | | | | | | | | | | | | | | | | | | | |
| SNL Micro Cap U.S. Thrift | | | 1,040.27 | * | | 2/10/2017 | | | 3.00 | * | | | 0.29 | * | | | 35 | * | | | 27 | * | | | 61 | * |
| | | | | | | | | | | | | | | | | | | | | | | | | | | |
| SNL Micro Cap U.S. Bank & Thrift | | | 703.77 | * | | 2/10/2017 | | | 2.12 | * | | | 0.30 | * | | | 177 | * | | | 109 | * | | | 402 | * |
| | | | | | | | | | | | | | | | | | | | | | | | | | | |
| SNL Small Cap U.S. Bank | | | 652.79 | * | | 2/10/2017 | | | 4.43 | * | | | 0.68 | * | | | 87 | * | | | 19 | * | | | 19 | * |
| | | | | | | | | | | | | | | | | | | | | | | | | | | |
| SNL Small Cap U.S. Thrift | | | 782.12 | * | | 2/10/2017 | | | 3.23 | * | | | 0.41 | * | | | 15 | * | | | 5 | * | | | 1 | * |
| | | | | | | | | | | | | | | | | | | | | | | | | | | |
| SNL Small Cap U.S. Bank & Thrift | | | 678.19 | * | | 2/10/2017 | | | 4.33 | * | | | 0.64 | * | | | 102 | * | | | 24 | * | | | 20 | * |
| | | | | | | | | | | | | | | | | | | | | | | | | | | |
| SNL Mid Cap U.S. Bank | | | 428.33 | * | | 2/10/2017 | | | 1.97 | * | | | 0.46 | * | | | 69 | * | | | 13 | * | | | 3 | * |
| | | | | | | | | | | | | | | | | | | | | | | | | | | |
| SNL Mid Cap U.S. Thrift | | | 364.27 | * | | 2/10/2017 | | | 1.24 | * | | | 0.34 | * | | | 11 | * | | | 1 | * | | | 1 | * |
| | | | | | | | | | | | | | | | | | | | | | | | | | | |
| SNL Mid Cap U.S. Bank & Thrift | | | 425.79 | * | | 2/10/2017 | | | 1.90 | * | | | 0.45 | * | | | 80 | * | | | 14 | * | | | 4 | * |
| | | | | | | | | | | | | | | | | | | | | | | | | | | |
| SNL Large Cap U.S. Bank | | | 331.87 | * | | 2/10/2017 | | | 0.47 | * | | | 0.14 | * | | | 25 | * | | | 7 | * | | | 1 | * |
| | | | | | | | | | | | | | | | | | | | | | | | | | | |
| SNL Large Cap U.S. Thrift | | | 153.39 | * | | 2/10/2017 | | | 1.33 | * | | | 0.88 | * | | | 1 | * | | | 0 | * | | | 0 | * |
| | | | | | | | | | | | | | | | | | | | | | | | | | | |
| SNL Large Cap U.S. Bank & Thrift | | | 333.95 | * | | 2/10/2017 | | | 0.49 | * | | | 0.15 | * | | | 26 | * | | | 7 | * | | | 1 | * |
| | Source: S&P Global Market Intelligence | Page 1 of 3 | |
| SNL Geographic Indexes | | | | | | | | | | | | | | | | | | | | | | | | | | |
| | | | | | | | | | | | | | | | | | | | | | | | | | | |
| SNL Mid-Atlantic U.S. Bank | | | 486.09 | * | | 2/10/2017 | | | 0.78 | * | | | 0.16 | * | | | 48 | * | | | 14 | * | | | 7 | * |
| | | | | | | | | | | | | | | | | | | | | | | | | | | |
| SNL Mid-Atlantic U.S. Thrift | | | 3,529.66 | * | | 2/10/2017 | | | 22.20 | * | | | 0.63 | * | | | 19 | * | | | 7 | * | | | 3 | * |
| | | | | | | | | | | | | | | | | | | | | | | | | | | |
| SNL Midwest U.S. Bank | | | 643.10 | * | | 2/10/2017 | | | 2.71 | * | | | 0.42 | * | | | 60 | * | | | 11 | * | | | 3 | * |
| | | | | | | | | | | | | | | | | | | | | | | | | | | |
| SNL Midwest U.S. Thrift | | | 3,148.14 | * | | 2/10/2017 | | | 6.02 | * | | | 0.19 | * | | | 11 | * | | | 7 | * | | | 3 | * |
| | | | | | | | | | | | | | | | | | | | | | | | | | | |
| SNL New England U.S. Bank | | | 581.20 | * | | 2/10/2017 | | | 1.89 | * | | | 0.33 | * | | | 16 | * | | | 3 | * | | | 1 | * |
| | | | | | | | | | | | | | | | | | | | | | | | | | | |
| SNL New England U.S. Thrift | | | 3,066.15 | * | | 2/10/2017 | | | 14.99 | * | | | 0.49 | * | | | 10 | * | | | 5 | * | | | 1 | * |
| | | | | | | | | | | | | | | | | | | | | | | | | | | |
| SNL Southeast U.S. Bank | | | 333.58 | * | | 2/10/2017 | | | 0.23 | * | | | 0.07 | * | | | 65 | * | | | 16 | * | | | 5 | * |
| | | | | | | | | | | | | | | | | | | | | | | | | | | |
| SNL Southeast U.S. Thrift | | | 407.92 | * | | 2/10/2017 | | | (1.37 | )* | | | (0.34 | )* | | | 2 | * | | | 2 | * | | | 2 | * |
| | | | | | | | | | | | | | | | | | | | | | | | | | | |
| SNL Southwest U.S. Bank | | | 1,122.28 | * | | 2/10/2017 | | | 6.93 | * | | | 0.62 | * | | | 20 | * | | | 7 | * | | | 1 | * |
| | | | | | | | | | | | | | | | | | | | | | | | | | | |
| SNL Southwest U.S. Thrift | | | 811.05 | * | | 2/10/2017 | | | 0.28 | * | | | 0.03 | * | | | 1 | * | | | 0 | * | | | 1 | * |
| | | | | | | | | | | | | | | | | | | | | | | | | | | |
| SNL Western U.S. Bank | | | 1,467.28 | * | | 2/10/2017 | | | 3.21 | * | | | 0.22 | * | | | 34 | * | | | 10 | * | | | 5 | * |
| | | | | | | | | | | | | | | | | | | | | | | | | | | |
| SNL Western U.S. Thrift | | | 148.45 | * | | 2/10/2017 | | | 0.59 | * | | | 0.40 | * | | | 5 | * | | | 4 | * | | | 0 | * |
| | | | | | | | | | | | | | | | | | | | | | | | | | | |
| SNL Stock Exchange Indexes | | | | | | | | | | | | | | | | | | | | | | | | | | |
| | | | | | | | | | | | | | | | | | | | | | | | | | | |
| SNL U.S. Bank NYSE | | | 459.83 | * | | 2/10/2017 | | | 0.60 | * | | | 0.13 | * | | | 34 | * | | | 11 | * | | | 3 | * |
| | | | | | | | | | | | | | | | | | | | | | | | | | | |
| SNL U.S. Thrift NYSE | | | 143.54 | * | | 2/10/2017 | | | 0.88 | * | | | 0.62 | * | | | 4 | * | | | 0 | * | | | 1 | * |
| | | | | | | | | | | | | | | | | | | | | | | | | | | |
| SNL U.S. Bank NYSE MKT | | | 872.11 | * | | 2/10/2017 | | | 4.63 | * | | | 0.53 | * | | | 5 | * | | | 1 | * | | | 0 | * |
| | | | | | | | | | | | | | | | | | | | | | | | | | | |
| SNL U.S. Bank NASDAQ | | | 914.54 | * | | 2/10/2017 | | | 5.01 | * | | | 0.55 | * | | | 204 | * | | | 49 | * | | | 19 | * |
| | | | | | | | | | | | | | | | | | | | | | | | | | | |
| SNL U.S. Thrift NASDAQ | | | 2,790.96 | * | | 2/10/2017 | | | 9.98 | * | | | 0.36 | * | | | 44 | * | | | 25 | * | | | 9 | * |
| | | | | | | | | | | | | | | | | | | | | | | | | | | |
| SNL U.S. Bank Pink | | | 373.47 | * | | 2/10/2017 | | | (0.43 | )* | | | (0.12 | )* | | | 80 | * | | | 61 | * | | | 348 | * |
| | | | | | | | | | | | | | | | | | | | | | | | | | | |
| SNL U.S. Thrift Pink | | | 303.75 | * | | 2/10/2017 | | | 0.58 | * | | | 0.19 | * | | | 14 | * | | | 8 | * | | | 53 | * |
| | | | | | | | | | | | | | | | | | | | | | | | | | | |
| SNL Bank TSX | | | 1,148.47 | * | | 2/10/2017 | | | 5.57 | * | | | 0.49 | * | | | 10 | * | | | 1 | * | | | 0 | * |
| | | | | | | | | | | | | | | | | | | | | | | | | | | |
| SNL Other Indexes | | | | | | | | | | | | | | | | | | | | | | | | | | |
| | | | | | | | | | | | | | | | | | | | | | | | | | | |
| SNL U.S. Thrift MHCs | | | 5,977.63 | * | | 2/10/2017 | | | 0.46 | * | | | 0.01 | * | | | 3 | * | | | 3 | * | | | 2 | * |
| | | | | | | | | | | | | | | | | | | | | | | | | | | |
| SNL Pink Asset Size Indexes | | | | | | | | | | | | | | | | | | | | | | | | | | |
| | | | | | | | | | | | | | | | | | | | | | | | | | | |
| SNL U.S. Bank Pink < $100M | | | 206.15 | * | | 2/10/2017 | | | (5.62 | )* | | | (2.65 | )* | | | 1 | * | | | 2 | * | | | 21 | * |
| | | | | | | | | | | | | | | | | | | | | | | | | | | |
| SNL U.S. Bank Pink $100M-$500M | | | 405.90 | * | | 2/10/2017 | | | 0.77 | * | | | 0.19 | * | | | 40 | * | | | 29 | * | | | 221 | * |
| | | | | | | | | | | | | | | | | | | | | | | | | | | |
| SNL U.S. Bank Pink > $500M | | | 327.53 | * | | 2/10/2017 | | | (0.64 | )* | | | (0.19 | )* | | | 39 | * | | | 30 | * | | | 106 | * |
| | | | | | | | | | | | | | | | | | | | | | | | | | | |
| Broad Market Indexes | | | | | | | | | | | | | | | | | | | | | | | | | | |
| | | | | | | | | | | | | | | | | | | | | | | | | | | |
| DJIA | | | 20,269.37 | * | | 2/10/2017 | | | 96.97 | * | | | 0.48 | * | | | | | | | | | | | | |
| | | | | | | | | | | | | | | | | | | | | | | | | | | |
| S&P 500 | | | 2,316.10 | * | | 2/10/2017 | | | 8.22 | * | | | 0.36 | * | | | | | | | | | | | | |
| | | | | | | | | | | | | | | | | | | | | | | | | | | |
| S&P Mid-Cap | | | 1,720.84 | * | | 2/10/2017 | | | 9.43 | * | | | 0.55 | * | | | | | | | | | | | | |
| | | | | | | | | | | | | | | | | | | | | | | | | | | |
| S&P Small-Cap | | | 849.64 | * | | 2/10/2017 | | | 6.87 | * | | | 0.81 | * | | | | | | | | | | | | |
| | | | | | | | | | | | | | | | | | | | | | | | | | | |
| S&P 500 Financials | | | 394.13 | * | | 2/10/2017 | | | 0.94 | * | | | 0.24 | * | | | | | | | | | | | | |
| | | | | | | | | | | | | | | | | | | | | | | | | | | |
| SNL U.S. Financial Institutions | | | 862.99 | * | | 2/10/2017 | | | 2.21 | * | | | 0.26 | * | | | | | | | | | | | | |
| | | | | | | | | | | | | | | | | | | | | | | | | | | |
| MSCI US IMI Financials | | | 1,472.57 | * | | 2/10/2017 | | | 4.16 | * | | | 0.28 | * | | | | | | | | | | | | |
| | | | | | | | | | | | | | | | | | | | | | | | | | | |
| NASDAQ | | | 5,734.13 | * | | 2/10/2017 | | | 18.95 | * | | | 0.33 | * | | | | | | | | | | | | |
| | | | | | | | | | | | | | | | | | | | | | | | | | | |
| NASDAQ Finl | | | 4,055.17 | * | | 2/10/2017 | | | 16.35 | * | | | 0.40 | * | | | | | | | | | | | | |
| | | | | | | | | | | | | | | | | | | | | | | | | | | |
| NYSE | | | 11,377.72 | * | | 2/10/2017 | | | 50.04 | * | | | 0.44 | * | | | | | | | | | | | | |
| | | | | | | | | | | | | | | | | | | | | | | | | | | |
| Russell 1000 | | | 1,286.62 | * | | 2/10/2017 | | | 4.58 | * | | | 0.36 | * | | | | | | | | | | | | |
| | | | | | | | | | | | | | | | | | | | | | | | | | | |
| Russell 2000 | | | 1,388.84 | * | | 2/10/2017 | | | 10.32 | * | | | 0.75 | * | | | | | | | | | | | | |
| | | | | | | | | | | | | | | | | | | | | | | | | | | |
| Russell 3000 | | | 1,378.58 | * | | 2/10/2017 | | | 5.33 | * | | | 0.39 | * | | | | | | | | | | | | |
| | | | | | | | | | | | | | | | | | | | | | | | | | | |
| S&P TSX Composite | | | 15,729.12 | * | | 2/10/2017 | | | 111.82 | * | | | 0.72 | * | | | | | | | | | | | | |
| | | | | | | | | | | | | | | | | | | | | | | | | | | |
| MSCI AC World (USD) | | | 439.01 | * | | 2/10/2017 | | | 1.78 | * | | | 0.41 | * | | | | | | | | | | | | |
| | | | | | | | | | | | | | | | | | | | | | | | | | | |
| MSCI World (USD) | | | 1,814.71 | * | | 2/10/2017 | | | 7.16 | * | | | 0.40 | * | | | | | | | | | | | | |
| | | | | | | | | | | | | | | | | | | | | | | | | | | |
| Bermuda Royal Gazette/BSX | | | 1,962.15 | * | | 2/10/2017 | | | (0.38 | )* | | | (0.02 | )* | | | | | | | | | | | | |
Intraday data is available for certain exchanges. In all cases, the data is at least 15 minutes delayed.
| | Source: S&P Global Market Intelligence | Page 2 of 3 | |
* - Intraday data is not currently available. Data is as of the previous close.
** - Non-publicly traded institutions and institutions outside of your current subscription are not included in custom indexes. Custom indexes including foreign institutions do not take into account currency translations. Data is as of the previous close.
All SNL indexes are market-value weighted; i.e., an institution's effect on an index is proportional to that institution's market capitalization.
Source: MSCI. MSCI makes no express or implied warranties or representations and shall have no liability whatsoever with respect to any MSCI data contained herein. The MSCI data may not be further redistributed or used as a basis for other indices or any securities or financial products.
| Mid-Atlantic: DE, DC, MD, NJ, NY, PA, PR |
| |
| New England: CT, ME, MA, NH, RI, VT |
| |
| Southwest: CO, LA, NM, OK, TX, UT |
| |
| Midwest: IA, IN, IL, KS, KY, MI, MN, MO, ND, NE, OH, SD, WI |
| |
| Southeast: AL, AR, FL, GA, MS, NC, SC, TN, VA, WV |
| |
| West: AZ, AK, CA, HI, ID, MT, NV, OR, WA, WY |
| | Source: S&P Global Market Intelligence | Page 3 of 3 | |
EXHIBIT IV-4
Market Area Acquisition Activity
Exhibit IV-4
Louisiana Bank and Thrift Acquisitions 2013-Present
| | | | | | | | | | | | | Target Financials at Announcement | |
| | | | | | | | | | | | | Total | | | | | | | | | LTM | | | LTM | | | NPAs/ | | | Rsrvs/ | |
| Announce | | Complete | | �� | | | | | | | | Assets | | | E/A | | | TE/A | | | ROAA | | | ROAE | | | Assets | | | NPLs | |
| Date | | Date | | Buyer Short Name | | | | Target Name | | | | ($000) | | | (%) | | | (%) | | | (%) | | | (%) | | | (%) | | | (%) | |
| | | | | | | | | | | | | | | | | | | | | | | | | | | | | | | | |
| 10/14/2016 | | 01/01/2017 | | First Bancshares Inc. | | MS | | Iberville Bank | | LA | | | 258,497 | | | | 10.13 | | | | 9.90 | | | | 0.44 | | | | 4.54 | | | | 1.54 | | | | 48.25 | |
| 06/18/2015 | | 09/15/2015 | | Home Bancorp Inc. | | LA | | Louisiana Bancorp, Inc. | | LA | | | 330,738 | | | | 17.82 | | | | 17.82 | | | | 0.88 | | | | 4.94 | | | | 0.46 | | | | 155.08 | |
| 12/30/2014 | | 11/30/2015 | | First NBC Bank Holding Co. | | LA | | State Investors Bancorp, Inc. | | LA | | | 268,880 | | | | 15.44 | | | | 15.44 | | | | 0.39 | | | | 2.45 | | | | 1.14 | | | | 46.18 | |
| 07/30/2014 | | 10/31/2014 | | Saint Martin Bancshares Inc. | | LA | | CPB Bancshares, Inc. | | LA | | | 46,706 | | | | 10.14 | | | | 10.14 | | | | 0.13 | | | | 1.34 | | | | 0.22 | | | | NM | |
| 07/24/2014 | | 03/31/2015 | | Bus. First Bancshares Inc. | | LA | | American Gateway Financial Corporation | | LA | | | 367,456 | | | | 11.83 | | | | 11.83 | | | | 0.50 | | | | 4.43 | | | | 2.91 | | | | 24.45 | |
| 01/13/2014 | | 05/31/2014 | | IBERIABANK Corp. | | LA | | Teche Holding Company | | LA | | | 856,664 | | | | 10.40 | | | | 10.01 | | | | 1.03 | | | | 9.96 | | | | 0.74 | | | | 139.80 | |
| 01/08/2014 | | Pending | | BancorpSouth Inc. | | MS | | Ouachita Bancshares Corp. | | LA | | | 664,161 | | | | 7.68 | | | | 7.68 | | | | 1.73 | | | | 21.80 | | | | 1.12 | | | | 77.70 | |
| 01/28/2013 | | 05/01/2013 | | Investar Bank | | LA | | First Community Bank | | LA | | | 106,282 | | | | 6.28 | | | | 11.79 | | | | -0.15 | | | | -1.29 | | | | 5.33 | | | | 32.25 | |
| | | | | | | | | | | | | | | | | | | | | | | | | | | | | | | | | | | | | | | |
| | | | | | | | | Average: | | | | | 362,423 | | | | 11.22 | | | | 11.83 | | | | 0.62 | | | | 6.02 | | | | 1.68 | | | | 74.82 | |
| | | | | | | | | Median: | | | | | 299,809 | | | | 10.27 | | | | 10.97 | | | | 0.47 | | | | 4.49 | | | | 1.13 | | | | 48.25 | |
| | | | | | | | | | | | | Deal Terms and Pricing at Announcement | |
| | | | | | | | | | | | | Deal | | | Value/ | | | | | | | | | | | | | | | Prem/ | |
| Announce | | Complete | | | | | | | | | | Value | | | Share | | | P/B | | | P/TB | | | P/E | | | P/A | | | Cdeps | |
| Date | | Date | | Buyer Short Name | | | | Target Name | | | | ($M) | | | ($) | | | (%) | | | (%) | | | (x) | | | (%) | | | (%) | |
| | | | | | | | | | | | | | | | | | | | | | | | | | | | | | | | |
| 10/14/2016 | | 01/01/2017 | | First Bancshares Inc. | | MS | | Iberville Bank | | LA | | | 31.1 | | | | NA | | | | 118.71 | | | | 121.89 | | | | 42.19 | | | | 12.03 | | | | 2.55 | |
| 06/18/2015 | | 09/15/2015 | | Home Bancorp Inc. | | LA | | Louisiana Bancorp, Inc. | | LA | | | 74.6 | | | | 24.250 | | | | 119.58 | | | | 119.58 | | | | 22.45 | | | | 22.54 | | | | 10.01 | |
| 12/30/2014 | | 11/30/2015 | | First NBC Bank Holding Co. | | LA | | State Investors Bancorp, Inc. | | LA | | | 51.1 | | | | 21.250 | | | | 118.11 | | | | 118.11 | | | | 51.83 | | | | 18.99 | | | | 8.23 | |
| 07/30/2014 | | 10/31/2014 | | Saint Martin Bancshares Inc. | | LA | | CPB Bancshares, Inc. | | LA | | | 6.1 | | | | 132.140 | | | | 134.06 | | | | 134.06 | | | | NM | | | | 12.99 | | | | 4.27 | |
| 07/24/2014 | | 03/31/2015 | | Bus. First Bancshares Inc. | | LA | | American Gateway Financial Corporation | | LA | | | 46.8 | | | | 214.750 | | | | 113.12 | | | | 113.12 | | | | 24.71 | | | | 12.74 | | | | 2.49 | |
| 01/13/2014 | | 05/31/2014 | | IBERIABANK Corp. | | LA | | Teche Holding Company | | LA | | | 157.8 | | | | 72.160 | | | | 166.01 | | | | 173.11 | | | | 17.10 | | | | 18.42 | | | | 12.45 | |
| 01/08/2014 | | Pending | | BancorpSouth Inc. | | MS | | Ouachita Bancshares Corp. | | LA | | | 112.0 | | | | NA | | | | 219.72 | | | | 219.72 | | | | 15.83 | | | | 16.86 | | | | 12.76 | |
| 01/28/2013 | | 05/01/2013 | | Investar Bank | | LA | | First Community Bank | | LA | | | 4.6 | | | | NA | | | | 68.92 | | | | 68.92 | | | | NM | | | | 4.33 | | | | -3.17 | |
| | | | | | | | | | | | | | | | | | | | | | | | | | | | | | | | | | | | | | | |
| | | | | | | | | Average: | | | | | | | | | | | | | 132.28 | | | | 133.56 | | | | 29.02 | | | | 14.86 | | | | 6.20 | |
| | | | | | | | | Median: | | | | | | | | | | | | | 119.15 | | | | 120.74 | | | | 23.58 | | | | 14.93 | | | | 6.25 | |
Source: SNL Financial, LC.
EXHIBIT IV-5
Heritage Bank of St. Tammany
Director and Senior Management Summary Resumes
Exhibit IV-5
Heritage Bank of St. Tammany
Director and Senior Management Summary Resumes
Directors
W. David Crumhornis our President and Chief Executive Officer, positions he has held since 1994. Mr. Crumhorn has been employed with the Bank since 1992 and has over 40 years of experience in the banking profession. Mr. Crumhorn’s experience provides the board with a perspective on the day-to-day operations of Heritage Bank, and assists the board in assessing the trends and developments in the financial institutions industry on a local and national basis. Additionally, Mr. Crumhorn has extensive ties to the communities that support our business generation.
W. Thomas Ballantine, Jr.is retired. Prior to his retirement in 2007, Mr. Ballantine was President and Chief Operating Officer of Newpark Resources, a publicly traded oil services company headquartered in New Orleans, Louisiana. Mr. Ballantine has over 40 years of managerial and business experience. This experience provides the board with broad knowledge of corporate responsibilities and oversight of management.
Salvatore A. Caruso, Jr. is Director of Business Development, Marketing and Strategic Planning for Slidell Memorial Hospital, located in Slidell, Louisiana. Mr. Caruso’s experience leading fundraising and business development and municipal government relations provides the board of directors with insight into the growth efforts being made in Heritage Bank’s market area.
Elizabeth M. Eustisis a commercial real estate agent and, since 2010, has held the position of Director of Commercial Real Estate for Keller Williams Realty, located in Mandeville, Louisiana. Ms. Eustis previously was a residential real estate agent. Ms. Eustis extensive knowledge of both the residential and commercial real estate markets in our market area provide the board with insight and expertise with respect to the Bank’s lending operations.
Jason S. Huntis the Chief Executive Officer and co-founder of Hunt Telecommunications, LLC, Louisiana’s largest privately owned telecom and data provider that specializes in fiber optics, cloud-based computing, internet and next generation telecommunication services. Mr. Hunt’s business experience as a business owner provides the board with valuable business and leadership skills and financial acumen.
Julian J. Rodrigue, Jr. is an attorney at the law firm Rodrigue & Rodrigue. Mr. Rodrigue has practiced law in Covington, Louisiana for over 30 years with a specialty in real estate law. Mr. Rodrigue’s knowledge of real estate law provides the board with valuable business acumen and knowledge of the real estate market in Heritage Bank’s market area.
Executive Officers who are not Directors
Dana Whitakeris our Executive Vice President and Chief Credit Officer, positions she has held since 2009. Ms. Whitaker has been employed by Heritage Bank since 1989 and has held positions of increased responsibility during her tenure at the Bank.
Lisa Hughesis our Senior Vice President and Chief Financial Officer, positions she has held since 2010. She began her employment with Heritage Bank in 2007 and has over 30 years of experience in community banking.
Source: Heritage NOLA Bancorp’s prospectus.
EXHIBIT IV-6
Heritage Bank of St. Tammany
Pro Forma Regulatory Capital Ratios
Exhibit IV-6
Heritage Bank of St. Tammany
Pro Forma Regulatory Capital Ratios
| | | Heritage Bank of St.
Tammany Historical at | | | Pro Forma at December 31, 2016, Based Upon the Sale in the Offering of (1) | |
| | | December 31, 2016 | | | 1,062,500 shares | | | 1,250,000 shares | | | 1,437,500 shares | | | 1,653,125 shares (2) | |
| | | Amount | | | Percent of
Assets (3) | | | Amount | | | Percent of
Assets (3) | | | Amount | | | Percent of
Assets (3) | | | Amount | | | Percent of Assets (3) | | | Amount | | | Percent of
Assets (3) | |
| | | (Dollars in thousands) | |
| | | | |
| Equity | | $ | 9,460 | | | | 9.65 | % | | $ | 12,898 | | | | 12.56 | % | | $ | 13,610 | | | | 13.13 | % | | $ | 14,323 | | | | 13.69 | % | | $ | 15,142 | | | | 14.33 | % |
| | | | | | | | | | | | | | | | | | | | | | | | | | | | | | | | | | | | | | | | | |
| Tier 1 leverage capital | | $ | 9,418 | | | | 9.79 | % | | $ | 12,856 | | | | 12.74 | % | | $ | 13,568 | | | | 13.32 | % | | $ | 14,281 | | | | 13.89 | % | | $ | 15,100 | | | | 14.54 | % |
| Tier 1 leverage capital requirement | | | 4,811 | | | | 5.00 | | | | 5,046 | | | | 5.00 | | | | 5,093 | | | | 5.00 | | | | 5,140 | | | | 5.00 | | | | 5,194 | | | | 5.00 | |
| Excess | | $ | 4,607 | | | | 4.79 | % | | $ | 7,810 | | | | 7.74 | % | | $ | 8,475 | | | | 8.32 | % | | $ | 9,141 | | | | 8.89 | % | | $ | 9,906 | | | | 9.54 | % |
| | | | | | | | | | | | | | | | | | | | | | | | | | | | | | | | | | | | | | | | | |
| Tier 1 risk-based capital (4) | | $ | 9,418 | | | | 17.35 | % | | $ | 12,856 | | | | 23.27 | % | | $ | 13,568 | | | | 24.48 | % | | $ | 14,281 | | | | 25.68 | % | | $ | 15,100 | | | | 27.05 | % |
| Risk-based requirement | | | 4,344 | | | | 8.00 | | | | 4,419 | | | | 8.00 | | | | 4,434 | | | | 8.00 | | | | 4,449 | | | | 8.00 | | | | 4,466 | | | | 8.00 | |
| Excess | | $ | 5,074 | | | | 9.35 | % | | $ | 8,437 | | | | 15.27 | % | | $ | 9,134 | | | | 16.48 | % | | $ | 9,832 | | | | 17.68 | % | | $ | 10,634 | | | | 19.05 | % |
| | | | | | | | | | | | | | | | | | | | | | | | | | | | | | | | | | | | | | | | | |
| Total risk-based capital (4) | | $ | 10,096 | | | | 18.59 | % | | $ | 13,534 | | | | 24.50 | % | | $ | 14,246 | | | | 25.70 | % | | $ | 14,959 | | | | 26.90 | % | | $ | 15,778 | | | | 28.26 | % |
| Risk-based requirement | | | 5,430 | | | | 10.00 | | | | 5,524 | | | | 10.00 | | | | 5,543 | | | | 10.00 | | | | 5,562 | | | | 10.00 | | | | 5,583 | | | | 10.00 | |
| Excess | | $ | 4,666 | | | | 8.59 | % | | $ | 8,010 | | | | 14.50 | % | | $ | 8,703 | | | | 15.70 | % | | $ | 9,397 | | | | 16.90 | % | | $ | 10,195 | | | | 18.26 | % |
| | | | | | | | | | | | | | | | | | | | | | | | | | | | | | | | | | | | | | | | | |
| Common equity Tier 1 risk-based capital (4) | | $ | 9,418 | | | | 17.35 | % | | $ | 12,856 | | | | 23.27 | % | | $ | 13,568 | | | | 24.48 | % | | $ | 14,281 | | | | 25.68 | % | | $ | 15,100 | | | | 27.05 | % |
| Risk-based requirement | | | 3,529 | | | | 6.50 | | | | 3,591 | | | | 6.50 | | | | 3,603 | | | | 6.50 | | | | 3,615 | | | | 6.50 | | | | 3,629 | | | | 6.50 | |
| Excess | | $ | 5,889 | | | | 10.85 | % | | $ | 9,265 | | | | 16.77 | % | | $ | 9,965 | | | | 17.98 | % | | $ | 10,666 | | | | 19.18 | % | | $ | 11,471 | | | | 20.55 | % |
| | | | | | | | | | | | | | | | | | | | | | | | | | | | | | | | | | | | | | | | | |
| Reconciliation of capital infused into Heritage Bank of St. Tammany: | | | | | | | | | | | | | | | | | | | | | | | | | | | | | | | | | | | | | | | | |
| Proceeds to Heritage Bank of St. Tammany | | | | | | | | | | $ | 4,713 | | | | | | | $ | 5,650 | | | | | | | $ | 6,588 | | | | | | | $ | 7,666 | | | | | |
| Less: Common stock acquired by employee stock ownership plan | | | | | | | | | | | (850 | ) | | | | | | | (1,000 | ) | | | | | | | (1,150 | ) | | | | | | | (1,323 | ) | | | | |
| Less: Common stock acquired by stock-based incentive plan | | | | | | | | | | | (425 | ) | | | | | | | (500 | ) | | | | | | | (575 | ) | | | | | | | (661 | ) | | | | |
| Pro forma increase | | | | | | | | | | $ | 3,438 | | | | | | | $ | 4,150 | | | | | | | $ | 4,863 | | | | | | | $ | 5,682 | | | | | |
| (1) | Pro forma capital levels assume that the employee stock ownership plan purchases 8% of the shares of common stock sold in the stock offering with funds we lend and that our stock-based equity plan purchases 4% of the shares sold in the offering for restricted stock awards. Pro forma capital calculated under generally accepted accounting principles (“GAAP”) and regulatory capital have been reduced by the amount required to fund these plans. See “Management” for a discussion of the employee stock ownership plan. |
| (2) | As adjusted to give effect to an increase in the number of shares which could occur due to a 15% increase in the offering range to reflect demand for the shares or changes in market conditions following the commencement of the offering. |
| (3) | Tier 1 leverage capital levels are shown as a percentage of total adjusted assets. Risk-based capital levels are shown as a percentage of risk-weighted assets. |
| (4) | Pro forma amounts and percentages assume net proceeds are invested in assets that carry a 20% risk weighting. |
Source: Heritage NOLA Bancorp’s prospectus.
EXHIBIT IV-7
Heritage Bank of St. Tammany
Pro Forma Analysis Sheet
Exhibit IV-7
PRO FORMA ANALYSIS SHEET
Heritage Bank of St. Tammany
Prices as of February 10, 2017
| | | | | | | | Peer Group | | | Louisiana Companies | | | All Publicly-Traded | |
| Price Multiple | | Symbol | | Subject (1) | | | Average | | | Median | | | Average | | | Median | | | Average | | | Median | |
| Price-earnings ratio (x) | | P/E | | | 1,611.88 | x | | | 20.03 | x | | | 18.53 | x | | | 15.14 | x | | | 15.14 | x | | | 19.70 | x | | | 19.18 | x |
| Price-core earnings ratio (x) | | P/Core | | | 306.71 | x | | | 22.41 | x | | | 20.38 | x | | | 15.14 | x | | | 15.14 | x | | | 20.32 | x | | | 20.29 | x |
| Price-book ratio (%) | = | | P/B | | | 64.89 | % | | | 108.54 | % | | | 109.85 | % | | | 124.02 | % | | | 124.02 | % | | | 130.77 | % | | | 125.98 | % |
| Price-tangible book ratio (%) | = | | P/TB | | | 64.89 | % | | | 112.27 | % | | | 111.74 | % | | | 124.02 | % | | | 124.02 | % | | | 144.21 | % | | | 132.12 | % |
| Price-assets ratio (%) | = | | P/A | | | 11.59 | % | | | 14.52 | % | | | 14.27 | % | | | 13.34 | % | | | 13.34 | % | | | 16.09 | % | | | 15.93 | % |
Valuation Parameters
| Pre-Conversion Earnings (Y) | | $ | 158,000 | | | ESOP Stock Purchases (E) | | | 8.00 | % | | (5) |
| Pre-Conversion Earnings (CY) | | $ | 191,000 | | | Cost of ESOP Borrowings (S) | | | 0.00 | % | | (4) |
| Pre-Conversion Book Value (B) | | $ | 9,461,000 | | | ESOP Amortization (T) | | | 25.00 | | | years |
| Pre-Conv. Tang. Book Val. (TB) | | $ | 9,461,000 | | | RRP Amount (M) | | | 4.00 | % | | |
| Pre-Conversion Assets (A) | | $ | 98,015,000 | | | RRP Vesting (N) | | | 5.00 | | | years (5) |
| Reinvestment Rate (2)(R) | | | 1.93 | % | | Foundation (F) | | | 0.00 | % | | |
| Est. Conversion Expenses (3)(X) | | | 9.60 | % | | Tax Benefit (Z) | | | 0 | | | |
| Tax Rate (TAX) | | | 34.00 | % | | Percentage Sold (PCT) | | | 100.00 | % | | |
| Louisiana Shares/Franchise Tax | | $ | 120,000 | | | Option (O1) | | | 10.00 | % | | (6) |
| | | | | | | Estimated Option Value (O2) | | | 27.40 | % | | (6) |
| | | | | | | Option vesting (O3) | | | 5.00 | | | (6) |
| | | | | | | Option pct taxable (O4) | | | 25.00 | % | | (6) |
Calculation of Pro Forma Value After Conversion
| 1. V= | | P/E * (Y) | | V= | | $ | 12,500,000 | |
| | | 1 - P/E * PCT * ((1-X-E-M-F)*R*(1-TAX) - (1-TAX)*E/T - (1-TAX)*M/N) - (1-(TAX*O4))*(O1*O2)/O3) | | | | | | |
| | | | | | | | | |
| 2. V= | | P/Core * (Y) | | V= | | $ | 12,500,000 | |
| | | 1 - P/core * PCT * ((1-X-E-M-F)*R*(1-TAX) - (1-TAX)*E/T - (1-TAX)*M/N) - (1-(TAX*O4))*(O1*O2)/O3) | | | | | | |
| | | | | | | | | |
| 3. V= | | P/B * (B+Z) | | V= | | $ | 12,500,000 | |
| | | 1 - P/B * PCT * (1-X-E-M-F) | | | | | | |
| | | | | | | | | |
| 4. V= | | P/TB * (TB+Z) | | V= | | $ | 12,500,000 | |
| | | 1 - P/TB * PCT * (1-X-E-M-F) | | | | | | |
| | | | | | | | | |
| 5. V= | | P/A * (A+Z) | | V= | | $ | 12,500,000 | |
| | | 1 - P/A * PCT * (1-X-E-M-F) | | | | | | |
| | | | | | | | | | | | Shares | | | | | | Aggregate | |
| | | Shares Issued | | | Price Per | | | Gross Offering | | | Issued To | | | Total Shares | | | Market Value | |
| Conclusion | | To the Public | | | Share | | | Proceeds | | | Foundation | | | Issued | | | of Shares Issued | |
| Supermaximum | | | 1,653,125 | | | | 10.00 | | | $ | 16,531,250 | | | | 0 | | | | 1,653,125 | | | $ | 16,531,250 | |
| Maximum | | | 1,437,500 | | | | 10.00 | | | | 14,375,000 | | | | 0 | | | | 1,437,500 | | | | 14,375,000 | |
| Midpoint | | | 1,250,000 | | | | 10.00 | | | | 12,500,000 | | | | 0 | | | | 1,250,000 | | | | 12,500,000 | |
| Minimum | | | 1,062,500 | | | | 10.00 | | | | 10,625,000 | | | | 0 | | | | 1,062,500 | | | | 10,625,000 | |
| (1) | Pricing ratios shown reflect the midpoint value. |
| (2) | Net return reflects a reinvestment rate of 1.93 percent and a tax rate of 34.0 percent. |
| (3) | Offering expenses shown at estimated midpoint value. |
| (4) | No cost is applicable since holding company will fund the ESOP loan. |
| (5) | ESOP and MRP amortize over 25 years and 5 years, respectively; amortization expenses tax effected at 34.0 percent. |
| (6) | 10 percent option plan with an estimated Black-Scholes valuation of 27.40 percent of the exercise price, including a 5 year vesting with 25 percent of the options (granted to directors) tax effected at 34.0 percent. |
EXHIBIT IV-8
Heritage Bank of St. Tammany
Pro Forma Effect of Conversion Proceeds
Exhibit IV-8
PRO FORMA EFFECT OF CONVERSION PROCEEDS
Heritage Bank of St. Tammany
At the Minimum
| 1. | | Pro Forma Market Capitalization | | $ | 10,625,000 | |
| | | Less: Foundation Shares | | | - | |
| 2. | | Offering Proceeds | | $ | 10,625,000 | |
| | | Less: Estimated Offering Expenses | | | 1,200,000 | |
| | | Net Conversion Proceeds | | $ | 9,425,000 | |
| | | | | | | |
| 3. | | Estimated Additional Income from Conversion Proceeds | | | | |
| | | | | | | |
| | | Net Conversion Proceeds | | $ | 9,425,000 | |
| | | Less: Cash Contribution to Foundation | | | 0 | |
| | | Less: Non-Cash Stock Purchases (1) | | | 1,275,000 | |
| | | Net Proceeds Reinvested | | $ | 8,150,000 | |
| | | Estimated net incremental rate of return | | | 1.27 | % |
| | | Reinvestment Income | | $ | 103,815 | |
| | | Less: Louisiana Shares/Franchise Tax | | | 111,000 | |
| | | Less: Estimated cost of ESOP borrowings (2) | | | 0 | |
| | | Less: Amortization of ESOP borrowings (3) | | | 22,440 | |
| | | Less: Amortization of Options (4) | | | 53,276 | |
| | | Less: Recognition Plan Vesting (5) | | | 56,100 | |
| | | Net Earnings Impact | | $ | (139,001 | ) |
| | | | | | | | Net | | | | |
| | | | | Before | | | Earnings | | | After | |
| 4. | | Pro Forma Earnings | | Conversion | | | Increase | | | Conversion | |
| | | | | | | | | | | | |
| | 12 Months ended December 31, 2016 (reported) | | $ | 158,000 | | | $ | (139,001 | ) | | $ | 18,999 | |
| | | 12 Months ended December 31, 2016 (core) | | $ | 191,000 | | | $ | (139,001 | ) | | $ | 51,999 | |
| | | | | Before | | | Net Cash | | | Tax Benefit | | | After | |
| 5. | | Pro Forma Net Worth | | Conversion | | | Proceeds | | | Of Contribution | | | Conversion | |
| | | | | | | | | | | | | | | |
| | December 31, 2016 | | $ | 9,461,000 | | | $ | 8,150,000 | | | $ | 0 | | | $ | 17,611,000 | |
| | | December 31, 2016 (Tangible) | | $ | 9,461,000 | | | $ | 8,150,000 | | | $ | 0 | | | $ | 17,611,000 | |
| | | | | Before | | | Net Cash | | | Tax Benefit | | | After | |
| 6. | | Pro Forma Assets | | Conversion | | | Proceeds | | | Of Contribution | | | Conversion | |
| | | | | | | | | | | | | | | |
| | December 31, 2016 | | $ | 98,015,000 | | | $ | 8,150,000 | | | $ | 0 | | | $ | 106,165,000 | |
| (1) | Includes ESOP and RRP stock purchases equal to 8.0 and 4.0 percent of total shares issued, respectively. |
| (2) | ESOP stock purchases are internally financed by a loan from the holding company. |
| (3) | ESOP borrowings are amortized over 25 years, amortization expense is tax-effected at a 34.0 percent rate. |
| (4) | Option valuation based on Black-Scholes model, 5 year vesting, and assumes 25 percent is taxable. |
| (5) | RRP is amortized over 5 years, and amortization expense is tax effected at 34.0 percent. |
Exhibit IV-8
PRO FORMA EFFECT OF CONVERSION PROCEEDS
Heritage Bank of St. Tammany
At the Midpoint
| 1. | | Pro Forma Market Capitalization | | $ | 12,500,000 | |
| | | Less: Foundation Shares | | | - | |
| 2. | | Offering Proceeds | | $ | 12,500,000 | |
| | | Less: Estimated Offering Expenses | | | 1,200,000 | |
| | | Net Conversion Proceeds | | $ | 11,300,000 | |
| | | | | | | |
| 3. | | Estimated Additional Income from Conversion Proceeds | | | | |
| | | | | | | |
| | | Net Conversion Proceeds | | $ | 11,300,000 | |
| | | Less: Cash Contribution to Foundation | | | 0 | |
| | | Less: Non-Cash Stock Purchases (1) | | | 1,500,000 | |
| | | Net Proceeds Reinvested | | $ | 9,800,000 | |
| | | Estimated net incremental rate of return | | | 1.27 | % |
| | | Reinvestment Income | | $ | 124,832 | |
| | | Less: Louisiana Shares/Franchise Tax | | | 120,000 | |
| | | Less: Estimated cost of ESOP borrowings (2) | | | 0 | |
| | | Less: Amortization of ESOP borrowings (3) | | | 26,400 | |
| | | Less: Amortization of Options (4) | | | 62,678 | |
| | | Less: Recognition Plan Vesting (5) | | | 66,000 | |
| | | Net Earnings Impact | | $ | (150,245 | ) |
| | | | | | | | Net | | | | |
| | | | | Before | | | Earnings | | | After | |
| 4. | | Pro Forma Earnings | | Conversion | | | Increase | | | Conversion | |
| | | | | | | | | | | | |
| | 12 Months ended December 31, 2016 (reported) | | $ | 158,000 | | | $ | (150,245 | ) | | $ | 7,755 | |
| | | 12 Months ended December 31, 2016 (core) | | $ | 191,000 | | | $ | (150,245 | ) | | $ | 40,755 | |
| | | | | Before | | | Net Cash | | | Tax Benefit | | | After | |
| 5. | | Pro Forma Net Worth | | Conversion | | | Proceeds | | | Of Contribution | | | Conversion | |
| | | | | | | | | | | | | | | |
| | December 31, 2016 | | $ | 9,461,000 | | | $ | 9,800,000 | | | $ | 0 | | | $ | 19,261,000 | |
| | | December 31, 2016 (Tangible) | | $ | 9,461,000 | | | $ | 9,800,000 | | | $ | 0 | | | $ | 19,261,000 | |
| | | | | Before | | | Net Cash | | | Tax Benefit | | | After | |
| 6. | | Pro Forma Assets | | Conversion | | | Proceeds | | | Of Contribution | | | Conversion | |
| | | | | | | | | | | | | | | |
| | December 31, 2016 | | $ | 98,015,000 | | | $ | 9,800,000 | | | $ | 0 | | | $ | 107,815,000 | |
| (1) | Includes ESOP and RRP stock purchases equal to 8.0 and 4.0 percent of total shares issued, respectively. |
| (2) | ESOP stock purchases are internally financed by a loan from the holding company. |
| (3) | ESOP borrowings are amortized over 25 years, amortization expense is tax-effected at a 34.0 percent rate. |
| (4) | Option valuation based on Black-Scholes model, 5 year vesting, and assumes 25 percent is taxable. |
| (5) | RRP is amortized over 5 years, and amortization expense is tax effected at 34.0 percent. |
Exhibit IV-8
PRO FORMA EFFECT OF CONVERSION PROCEEDS
Heritage Bank of St. Tammany
At the Maximum Value
| 1. | | Pro Forma Market Capitalization | | $ | 14,375,000 | |
| | | Less: Foundation Shares | | | - | |
| 2. | | Offering Proceeds | | $ | 14,375,000 | |
| | | Less: Estimated Offering Expenses | | | 1,200,000 | |
| | | Net Conversion Proceeds | | $ | 13,175,000 | |
| | | | | | | |
| 3. | | Estimated Additional Income from Conversion Proceeds | | | | |
| | | | | | | |
| | | Net Conversion Proceeds | | $ | 13,175,000 | |
| | | Less: Cash Contribution to Foundation | | | 0 | |
| | | Less: Non-Cash Stock Purchases (1) | | | 1,725,000 | |
| | | Net Proceeds Reinvested | | $ | 11,450,000 | |
| | | Estimated net incremental rate of return | | | 1.27 | % |
| | | Reinvestment Income | | $ | 145,850 | |
| | | Less: Louisiana Shares/Franchise Tax | | | 129,000 | |
| | | Less: Estimated cost of ESOP borrowings (2) | | | 0 | |
| | | Less: Amortization of ESOP borrowings (3) | | | 30,360 | |
| | | Less: Amortization of Options (4) | | | 72,079 | |
| | | Less: Recognition Plan Vesting (5) | | | 75,900 | |
| | | Net Earnings Impact | | $ | (161,489 | ) |
| | | | | | | | Net | | | | |
| | | | | Before | | | Earnings | | | After | |
| 4. | | Pro Forma Earnings | | Conversion | | | Increase | | | Conversion | |
| | | | | | | | | | | | |
| | 12 Months ended December 31, 2016 (reported) | | $ | 158,000 | | | $ | (161,489 | ) | | $ | (3,489 | ) |
| | 12 Months ended December 31, 2016 (core) | | $ | 191,000 | | | $ | (161,489 | ) | | $ | 29,511 | |
| | | | | Before | | | Net Cash | | | Tax Benefit | | | After | |
| 5. | | Pro Forma Net Worth | | Conversion | | | Proceeds | | | Of Contribution | | | Conversion | |
| | | | | | | | | | | | | | | |
| | December 31, 2016 | | $ | 9,461,000 | | | $ | 11,450,000 | | | $ | 0 | | | $ | 20,911,000 | |
| | | December 31, 2016 (Tangible) | | $ | 9,461,000 | | | $ | 11,450,000 | | | $ | 0 | | | $ | 20,911,000 | |
| | | | | Before | | | Net Cash | | | Tax Benefit | | | After | |
| 6. | | Pro Forma Assets | | Conversion | | | Proceeds | | | Of Contribution | | | Conversion | |
| | | | | | | | | | | | | | | |
| | December 31, 2016 | | $ | 98,015,000 | | | $ | 11,450,000 | | | $ | 0 | | | $ | 109,465,000 | |
| (1) | Includes ESOP and RRP stock purchases equal to 8.0 and 4.0 percent of total shares issued, respectively. |
| (2) | ESOP stock purchases are internally financed by a loan from the holding company. |
| (3) | ESOP borrowings are amortized over 25 years, amortization expense is tax-effected at a 34.0 percent rate. |
| (4) | Option valuation based on Black-Scholes model, 5 year vesting, and assumes 25 percent is taxable. |
| (5) | RRP is amortized over 5 years, and amortization expense is tax effected at 34.0 percent. |
Exhibit IV-8
PRO FORMA EFFECT OF CONVERSION PROCEEDS
Heritage Bank of St. Tammany
At the Supermaximum Value
| 1. | | Pro Forma Market Capitalization | | $ | 16,531,250 | |
| | | Less: Foundation Shares | | | - | |
| 2. | | Offering Proceeds | | $ | 16,531,250 | |
| | | Less: Estimated Offering Expenses | | | 1,200,000 | |
| | | Net Conversion Proceeds | | $ | 15,331,250 | |
| | | | | | | |
| 3. | | Estimated Additional Income from Conversion Proceeds | | | | |
| | | | | | | |
| | | Net Conversion Proceeds | | $ | 15,331,250 | |
| | | Less: Cash Contribution to Foundation | | | 0 | |
| | | Less: Non-Cash Stock Purchases (1) | | | 1,983,750 | |
| | | Net Proceeds Reinvested | | $ | 13,347,500 | |
| | | Estimated net incremental rate of return | | | 1.27 | % |
| | | Reinvestment Income | | $ | 170,020 | |
| | | Less: Louisiana Shares/Franchise Tax | | | 139,000 | |
| | | Less: Estimated cost of ESOP borrowings (2) | | | 0 | |
| | | Less: Amortization of ESOP borrowings (3) | | | 34,914 | |
| | | Less: Amortization of Options (4) | | | 82,891 | |
| | | Less: Recognition Plan Vesting (5) | | | 87,285 | |
| | | Net Earnings Impact | | $ | (174,070 | ) |
| | | | | | | | Net | | | | |
| | | | | Before | | | Earnings | | | After | |
| 4. | | Pro Forma Earnings | | Conversion | | | Increase | | | Conversion | |
| | | | | | | | | | | | |
| | 12 Months ended December 31, 2016 (reported) | | $ | 158,000 | | | $ | (174,070 | ) | | $ | (16,070 | ) |
| | | 12 Months ended December 31, 2016 (core) | | $ | 191,000 | | | $ | (174,070 | ) | | $ | 16,930 | |
| | | | | Before | | | Net Cash | | | Tax Benefit | | | After | |
| 5. | | Pro Forma Net Worth | | Conversion | | | Proceeds | | | Of Contribution | | | Conversion | |
| | | | | | | | | | | | | | | |
| | December 31, 2016 | | $ | 9,461,000 | | | $ | 13,347,500 | | | $ | 0 | | | $ | 22,808,500 | |
| | | December 31, 2016 (Tangible) | | $ | 9,461,000 | | | $ | 13,347,500 | | | $ | 0 | | | $ | 22,808,500 | |
| | | | | Before | | | Net Cash | | | Tax Benefit | | | After | |
| 6. | | Pro Forma Assets | | Conversion | | | Proceeds | | | Of Contribution | | | Conversion | |
| | | | | | | | | | | | | | | |
| | December 31, 2016 | | $ | 98,015,000 | | | $ | 13,347,500 | | | $ | 0 | | | $ | 111,362,500 | |
| (1) | Includes ESOP and RRP stock purchases equal to 8.0 and 4.0 percent of total shares issued, respectively. |
| (2) | ESOP stock purchases are internally financed by a loan from the holding company. |
| (3) | ESOP borrowings are amortized over 25 years, amortization expense is tax-effected at a 34.0 percent rate. |
| (4) | Option valuation based on Black-Scholes model, 5 year vesting, and assumes 25 percent is taxable. |
| (5) | RRP is amortized over 5 years, and amortization expense is tax effected at 34.0 percent. |
EXHIBIT V-1
RP® Financial, LC.
Firm Qualifications Statement
RP FINANCIAL, LC.
Advisory | Planning | Valuation
| FIRM QUALIFICATION STATEMENT |
RP® Financial, LC. ("RP Financial") provides financial and management consulting, merger advisory and valuation services to the financial services companies, including banks, thrifts, credit unions, insurance companies, mortgage companies and others. We offer a broad array of services, high quality and prompt service, hands-on involvement by our senior staff, careful structuring of strategic initiatives and sophisticated valuation and other analyses consistent with industry practices and regulatory requirements. Our staff has extensive consulting, valuation, financial advisory and industry backgrounds.
| STRATEGIC PLANNING SERVICES |
RP Financial’s strategic planning services, for established or de novo banking companies, provide effective feasible plans with quantifiable results to enhance shareholder value, achieve regulatory approval or realize other objectives. We conduct situation analyses; establish mission/vision statements, develope strategic goals and objectives; and identify strategies to enhance value, address capital, increase earnings, manage risk and tackle operational or organizational matters. Our proprietary financial simulation models facilitate the evaluation of the feasibility, impact and merit of alternative financial strategies.
RP Financial’s merger advisory services include targeting buyers and sellers, assessing acquisition merit, conducting due diligence, negotiating and structuring deal terms, preparing merger business plans and financial simulations, rendering fairness opinions, preparing fair valuation analyses and supporting post-merger strategies. RP Financial is also expert in de novo charters, shelf charters and failed bank deals with loss sharing or other assistance. Through financial simulations, valuation proficiency and regulatory familiarity, RP Financial's merger advisory services center on enhancing shareholder returns.
RP Financial’s extensive valuation practice includes mergers, thrift stock conversions, insurance company demutualizations, merger valuation and goodwill impairment, ESOPs, going private, secondary offerings and other purposes. We are highly experienced in performing appraisals conforming with regulatory guidelines and appraisal standards. RP Financial is the nation’s leading valuation firm for thrift stock conversions, with offerings ranging up to $4 billion.
RP Financial provides effective organizational planning, and we are often engaged to prepare independent management studies required for regulatory enforcement actions. We evaluate Board, management and staffing needs, assess existing talent and capabilities and make strategic recommendations for new positions, replacement, succession and other organizational matters.
| ENTERPRISE RISK ASSESSMENT SERVICES |
RP Financial provides effective enterprise risk assessment consulting services to assist our clients in evaluating the degree to which they have properly identified, understood, measured, monitored and controlled enterprise risk as part of a deliberate risk/reward strategy and to help them implement strategies to mitigate risk, enhance performance, ensure effective reporting and compliance with laws and regulations and avoid potential future damage to their reputation and associated consequences and to mitigate residual risk and unanticipated losses.
| OTHER CONSULTING SERVICES |
RP Financial provides other consulting services including evaluating regulatory changes, development diversification and branching strategies, conducting feasibility studies and other research, and preparing management studies in response to regulatory enforcement actions. We assist clients with CRA plans and revising policies and procedures. Our other consulting services are aided by proprietary valuation and financial simulation models.
| KEY PERSONNEL (Years of Relevant Experience & Contact Information) |
| | | |
| Ronald S. Riggins, Managing Director (36) | (703) 647-6543 | rriggins@rpfinancial.com |
| William E. Pommerening, Managing Director (33) | (703) 647-6546 | wpommerening@rpfinancial.com |
| Marcus Faust, Director (29) | (703) 647-6553 | mfaust@rpfinancial.com |
| Gregory E. Dunn, Director (34) | (703) 647-6548 | gdunn@rpfinancial.com |
| James P. Hennessey, Director (31) | (703) 647-6544 | jhennessey@rpfinancial.com |
| James J. Oren, Director (30) | (703) 647-6549 | joren@rpfinancial.com |
| Carla H. Pollard, Senior Vice President (28) | (703) 647-6556 | cpollard@rpfinancial.com |
| RP Financial, LC. | | Phone: (703) 528-1700 |
| 1100 North Glebe Road, Suite 600 | | Fax: (703) 528-1788 |
| Arlington, VA 22201 | 1 | www.rpfinancial.com |