Exhibit 99.2

Lender Presentation July 2017
Disclaimer This presentation is based on information provided by Canyon Holdings S.a.r.l and its subsidiaries (“Cision” or the "Company”). The information contained in this presentation (the "Information") is being furnished on a confidential basis solely for use by the recipient in making its own evaluation of the Company and its business, assets, financial condition and prospects. This Information does not purport to contain all of the information that may be required or desired by a recipient to evaluate the Company. In all cases, interested parties should conduct their own independent investigation and analysis of the Company and its business, assets, financial condition and prospects. By accepting this Information, the recipient agrees that neither it nor its agents, representatives, directors, officers, affiliates or employees will copy, reproduce or distribute to others this Information, in whole or in part, at any time without the prior written consent of the Company and that it will keep permanently confidential all information contained herein not already in the public domain. The recipient should become familiar with this and other obligations to which the recipient is subject. Upon request, the recipient will promptly return all material received from the Company (including this Information) without retaining any copies thereof. The financial projections and other estimates contained herein are forward-looking statements with respect to the anticipated performance of the Company and its affiliates. Such financial projections and estimates are as to future events and are not to be viewed as facts, and reflect various assumptions of management of the Company concerning the future performance of the Company and are subject to significant business, financial, economic, operating, competitive and other risks and uncertainties and contingencies (many of which are difficult to predict and beyond the control of the Company) that could cause actual results to differ materially from the statements included herein. In addition, such financial projections and estimates were not prepared with a view to public disclosure or compliance with published guidelines of the U.S. Securities and Exchange Commission, the guidelines established by the American Institute of Certified Public Accountants or U.S. generally accepted accounting principles (U.S. GAAP). Accordingly, although the Company's management believes the financial projections and estimates contained herein represent a reasonable estimate of the Company's projected financial condition and results of operations based on assumptions that the Company’s management believes to be reasonable at the time such estimates are made and at the time the related financial projections and estimates are delivered, there can be no assurance as to the reliability or correctness of such financial projections and estimates, nor should any assurances be inferred, and actual results may vary materially from those projected. Neither the Company nor any of its affiliates, employees, representatives or advisors assumes any responsibility for, or makes any representation or warranty (express or implied) as to, the reasonableness, completeness, accuracy or reliability of the financial projections, estimates and other information contained herein, which speak only as of the date identified on the cover page of this presentation. In addition, certain of Cision’s financial information and data contained herein does not conform to Regulation S-X in that it includes certain financial information (such as Adjusted EBITDA and Pro Forma Revenue) not derived in accordance with U.S. GAAP. Accordingly, such information and data has been reconciled to the most directly comparable GAAP financial measure. Cision believes that the presentation of non-GAAP measures provides information that is useful to investors as it indicates, for example, the ability of Cision to meet capital expenditures and working capital requirements and otherwise meet its obligations as they become due. The Company and its affiliates, employees, representatives and advisors expressly disclaim any and all liability based, in whole or in part, on such information, errors therein or omissions therefrom. This presentation speaks only as of the date identified on the cover page of this presentation. Neither the Company nor any of its affiliates, employees, representatives or advisors intends to update or otherwise revise the financial projections, estimates and other information contained herein to reflect circumstances existing after the date identified on the cover page of this presentation to reflect the occurrence of future events even if any or all of the assumptions, judgments and estimates on which the information contained herein is based are shown to be in error. Readers are cautioned not to place undue reliance on the financial projections and non-GAAP measures presented herein. 1
Presenters Kevin Akeroyd Chief Executive Officer Jack Pearlstein Executive VP & Chief Financial Officer 2
Table of Contents 1. Transaction Overview 2. Cision Overview 3. Key Credit Highlights 4. M&A Integration Update 5. Financial Overview Appendix 3

Transaction Overview

Transaction Overview Cision is the go-to global SaaS platform for communications professionals, helping brands communicate with key constituents and both understand and influence public perception in an increasingly complex media landscape The Company generated $609 million of revenue and $266 million of Adjusted EBITDA for the twelve months ended June 30, 2017(1) On June 29th, Cision completed its merger with Capitol Acquisition Corp III (“Capitol”), a $325 million publicly traded investment vehicle, to facilitate a public listing on the New York Stock Exchange (NYSE: “CISN”) with an initial enterprise value of approximately $2.4 billion - In connection with the merger, Cision repaid $294 million of the Company’s Second Lien Term Loan and is seeking to syndicate a $1,250 million First Lien Senior Secured Term Loan Pro forma for this transaction, the Company will de-lever by 1.0x, from 5.7x to 4.7x LTM PF Adj. EBITDA GTCR retained 100% of its investment in connection with the merger and its current ownership is 57% of the combined company (1) Represents actual results through March 31, 2017 and the midpoint of guidance for Q2 2017 5
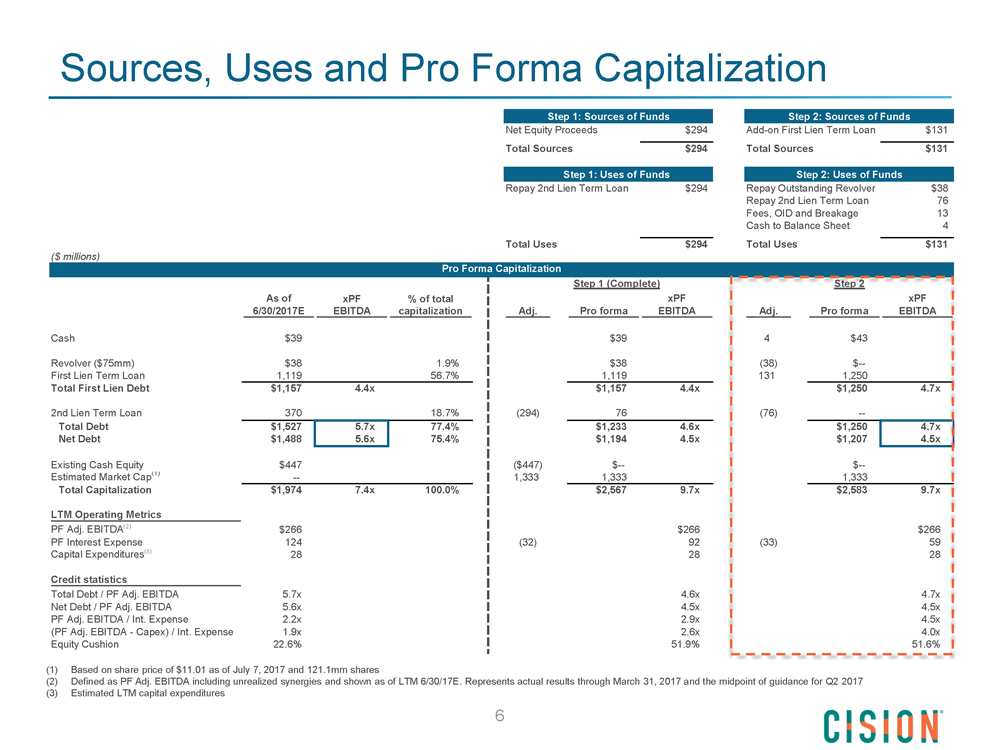
Sources, Uses and Pro Forma Capitalization Step 1: Sources of Funds Step 2: Sources of Funds Net Equity Proceeds $294 Add-on First Lien Term Loan $131 Total Sources $294 Total Sources $131 Step 1: Uses of Funds Step 2: Uses of Funds Repay 2nd Lien Term Loan $294 Repay Outstanding Revolver $38 Repay 2nd Lien Term Loan 76 Fees, OID and Breakage 13 Cash to Balance Sheet 4 Total Uses $294 Total Uses $131 ($ millions) Pro Forma Capitalization Step 1 (Complete) Step 2 As of xPF % of total xPF xPF ' 6/30/2017E EBITDA capitalization Adj. Pro forma EBITDA Adj. Pro forma EBITDA Cash $39 $39 $43 Revolver ($75mm) $38 1.9% $38 (38) $-- First Lien Term Loan 1,119 56.7% 1,119 131 1,250 Total First Lien Debt $1,157 4.4x $1,157 4.4x $1,250 4.7x 2nd Lien Term Loan 370 18.7% | (294) 76 (76) - Total Debt $1,527 5.7x 77.4% $1,233 4.6x $1,250 4.7x Net Debt $1,488 5.6x 75.4% $1,194 4.5x $1,207 4.5x Existing Cash Equity $447 1 ($447) $-- $-- Estimated Market Cap(1) -- 1 1,333 1,333 1,333 Total Capitalization $1,974 7.4x 100.0% $2,567 9.7x $2,583 9.7x LTM Operating Metrics PF Adj. EBITDA(2) $266 $266 $266 PF Interest Expense 124 | (32) 92 (33) 59 Capital Expenditures(3) 28 28 28 Credit statistics Total Debt / PF Adj. EBITDA 5.7x 4.6x 4.7x Net Debt / PF Adj. EBITDA 5.6x 4.5x 4.5x PF Adj. EBITDA / Int. Expense 2.2x 2.9x 4.5x (PF Adj. EBITDA - Capex) / Int. Expense 1.9x 2.6x 4.0x Equity Cushion 22.6% ! 51.9% 51.6% 1 (1) Based on share price of $11.01 as of July 7, 2017 and 121.1mm shares (2) Defined as PF Adj. EBITDA including unrealized synergies and shown as of LTM 6/30/17E. Represents actual results through March 31, 2017 and the midpoint of guidance for Q2 2017 (3) Estimated LTM capital expenditures
Cision Overview
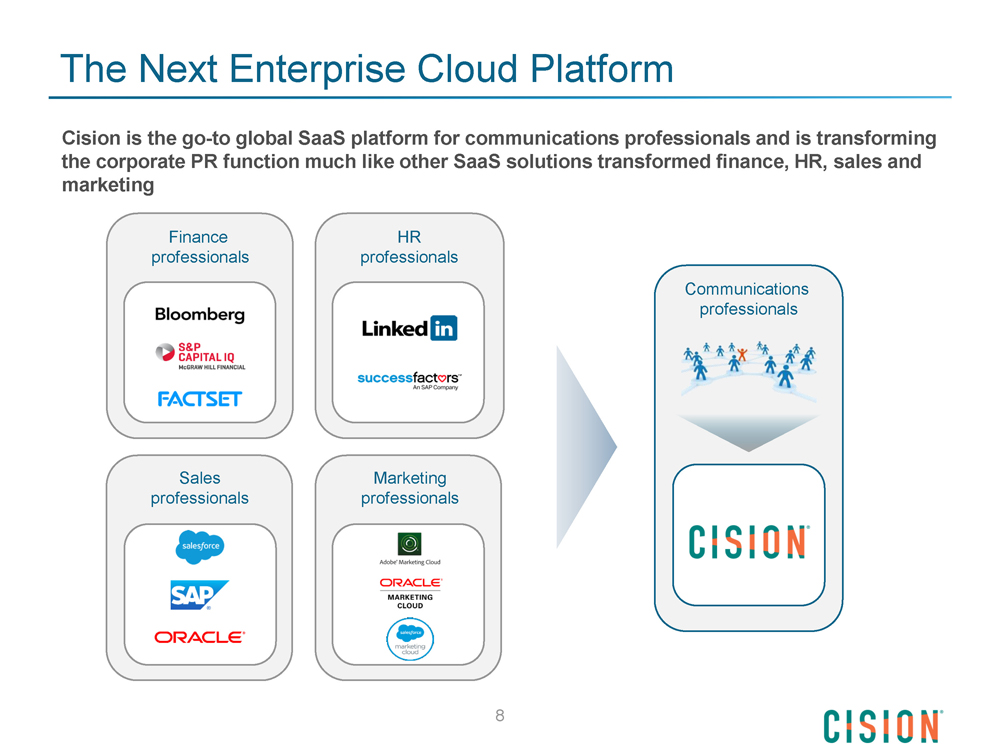
The Next Enterprise Cloud Platform Cision is the go-to global SaaS platform for communications professionals and is transforming the corporate PR function much like other SaaS solutions transformed finance, HR, sales and marketing Finance HR professionals professionals Communications professionals Sales Marketing professionals professionals 8
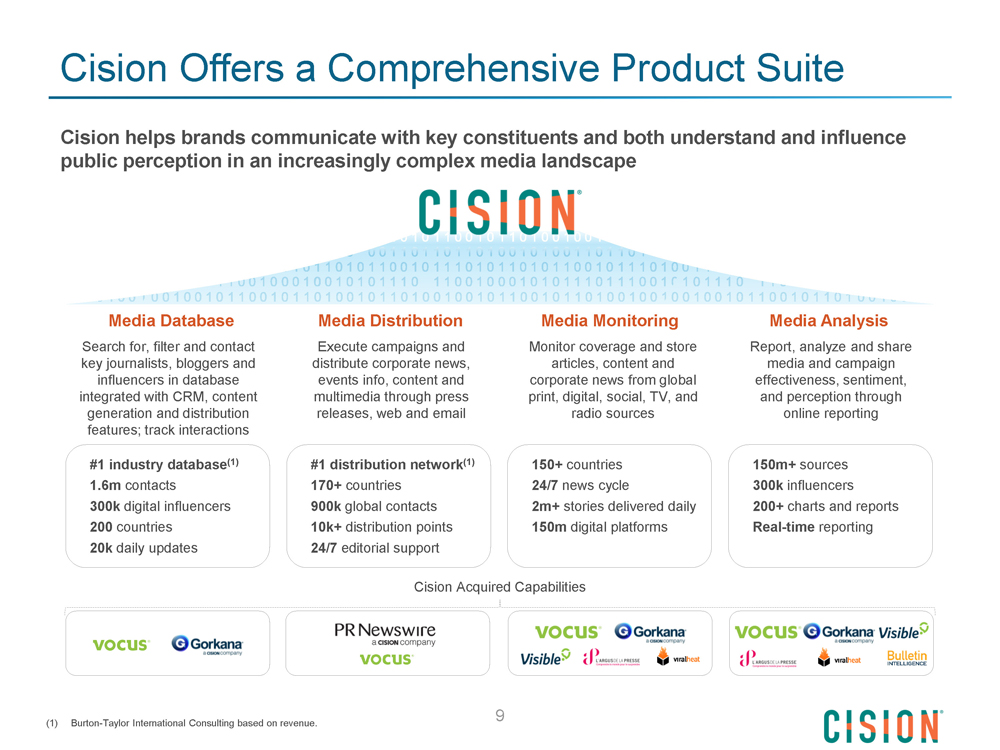
Cision Offers a Comprehensive Product Suite Cision helps brands communicate with key constituents and both understand and influence public perception in an increasingly complex media landscape Media Database Media Distribution Media Monitoring Media Analysis Search for, filter and contact Execute campaigns and Monitor coverage and store Report, analyze and share key journalists, bloggers and distribute corporate news, articles, content and media and campaign influencers in database events info, content and corporate news from global effectiveness, sentiment, integrated with CRM, content multimedia through press print, digital, social, TV, and and perception through generation and distribution releases, web and email radio sources online reporting features; track interactions #1 industry database(1) #1 distribution network(1) 150+ countries 150m+ sources 1.6m contacts 170+ countries 24/7 news cycle 300k influencers 300k digital influencers 900k global contacts 2m+ stories delivered daily 200+ charts and reports 200 countries 10k+ distribution points 150m digital platforms Real-time reporting 20k daily updates 24/7 editorial support Cision Acquired Capabilities 9 (1) Burton-Taylor International Consulting based on revenue.
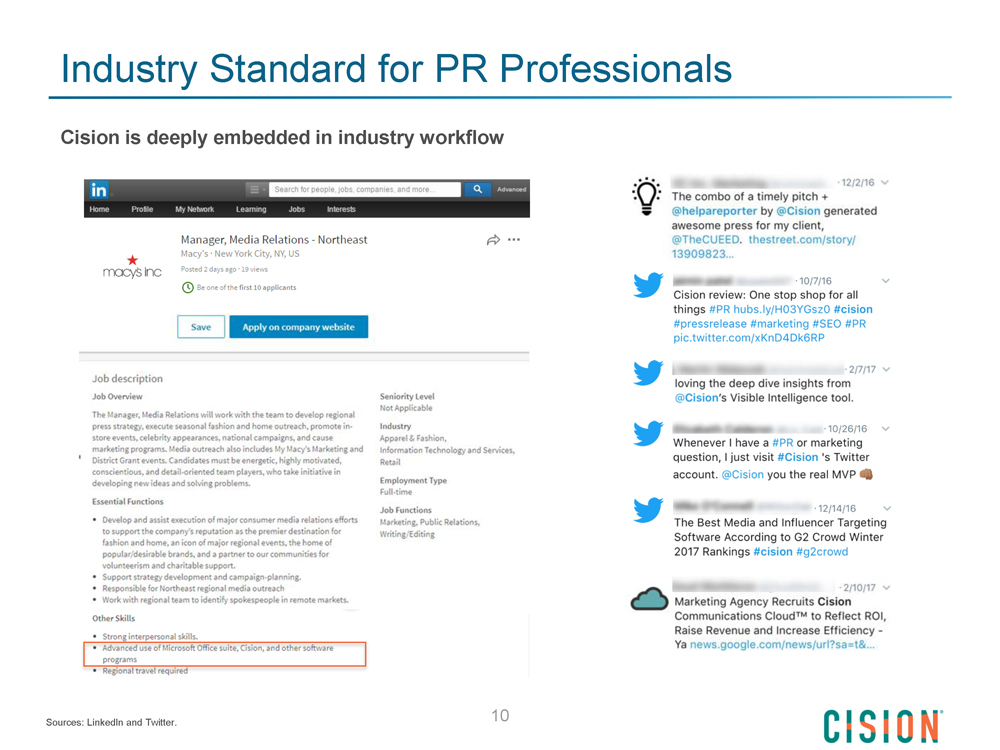
Industry Standard for PR Professionals Cision is deeply embedded in industry workflow 10 Sources: LinkedIn and Twitter.
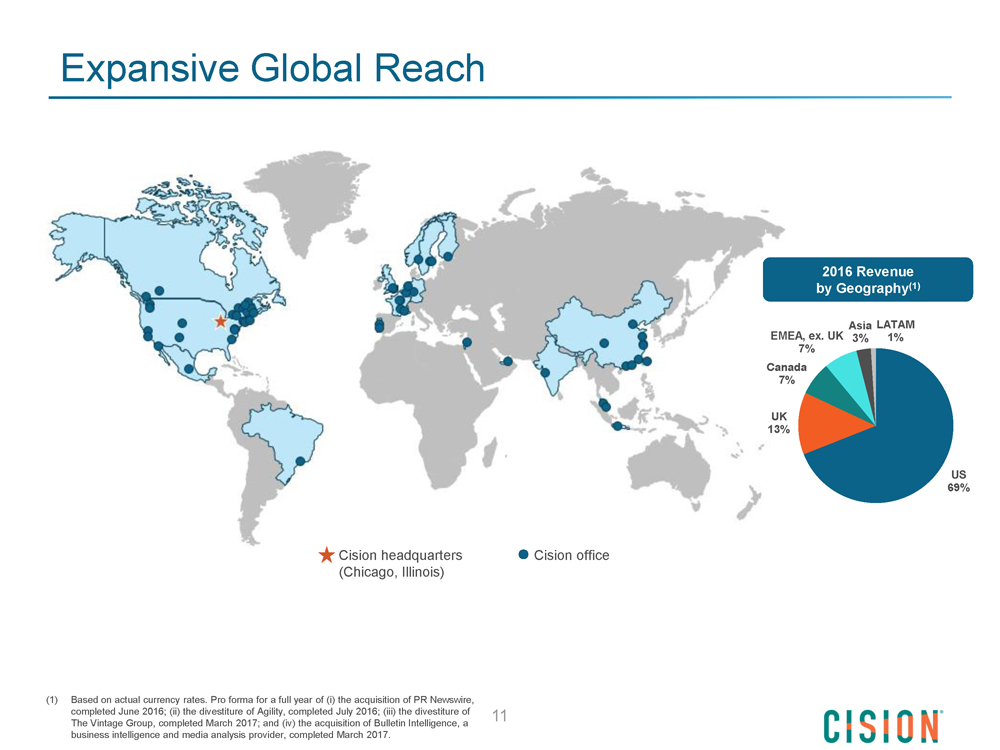
Expansive Global Reach 2016 Revenue by Geography(1) Asia LATAM EMEA, ex. UK 3% 1% 7% Canada 7% UK 13% US 69% Cision headquarters Cision office (Chicago, Illinois) (1) Based on actual currency rates. Pro forma for a full year of (i) the acquisition of PR Newswire, completed June 2016; (ii) the divestiture of Agility, completed July 2016; (iii) the divestiture of 11 The Vintage Group, completed March 2017; and (iv) the acquisition of Bulletin Intelligence, a business intelligence and media analysis provider, completed March 2017.

Key Credit Highlights
Key Credit Highlights 1 Leading Player in the Industry 2 Significant Industry Tailwinds 3 Diversified, Recurring Business Model 4 Blue-Chip Customer Base 5 Increasing Revenue Retention Rates 6 Strong Free Cash Flow Conversion 7 Compelling Near-Term Opportunity 8 Experienced Management Team 13
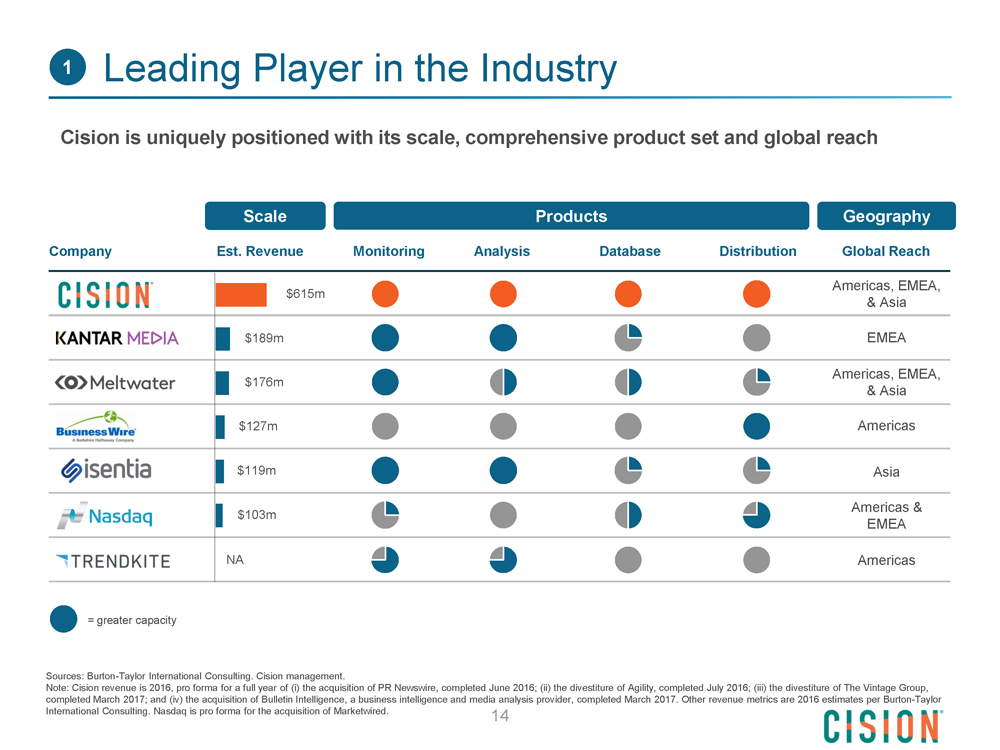
1 Leading Player in the Industry Cision is uniquely positioned with its scale, comprehensive product set and global reach Scale Products Geography Company Est. Revenue Monitoring Analysis Database Distribution Global Reach Americas, EMEA, $615m & Asia $189m EMEA Americas, EMEA, $176m & Asia $127m Americas $119m Asia Americas & $103m EMEA NA Americas = greater capacity Sources: Burton-Taylor International Consulting. Cision management. Note: Cision revenue is 2016, pro forma for a full year of (i) the acquisition of PR Newswire, completed June 2016; (ii) the divestiture of Agility, completed July 2016; (iii) the divestiture of The Vintage Group, completed March 2017; and (iv) the acquisition of Bulletin Intelligence, a business intelligence and media analysis provider, completed March 2017. Other revenue metrics are 2016 estimates per Burton-Taylor International Consulting. Nasdaq is pro forma for the acquisition of Marketwired. 14
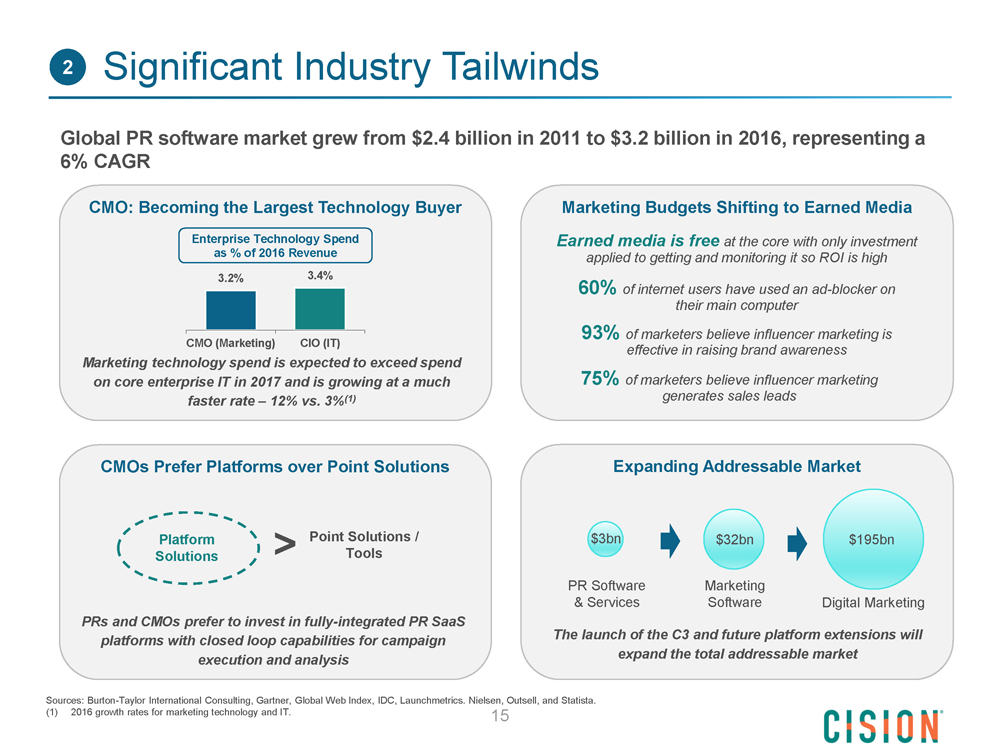
2 Significant Industry Tailwinds Global PR software market grew from $2.4 billion in 2011 to $3.2 billion in 2016, representing a 6% CAGR CMO: Becoming the Largest Technology Buyer Enterprise Technology Spend as % of 2016 Revenue 3.2% 3.4% CMO (Marketing) CIO (IT) Marketing technology spend is expected to exceed spend on core enterprise IT in 2017 and is growing at a much faster rate - 12% vs. 3%(1) Marketing Budgets Shifting to Earned Media Earned media is free at the core with only investment applied to getting and monitoring it so ROI is high 60% of internet users have used an ad-blocker on their main computer 93% of marketers believe influencer marketing is effective in raising brand awareness 75% of marketers believe influencer marketing generates sales leads CMOs Prefer Platforms over Point Solutions Platform Solutions > Point Solutions /Tools PRs and CMOs prefer to invest in fully-integrated PR SaaS platforms with closed loop capabilities for campaign execution and analysis Expanding Addressable Market $3bn $32bn $195bn PR Software Marketing & Services Software Digital Marketing The launch of the C3 and future platform extensions will expand the total addressable market Sources: Burton-Taylor International Consulting, Gartner, Global Web Index, IDC, Launchmetrics. Nielsen, Outsell, and Statista. (1) 2016 growth rates for marketing technology and IT. 15
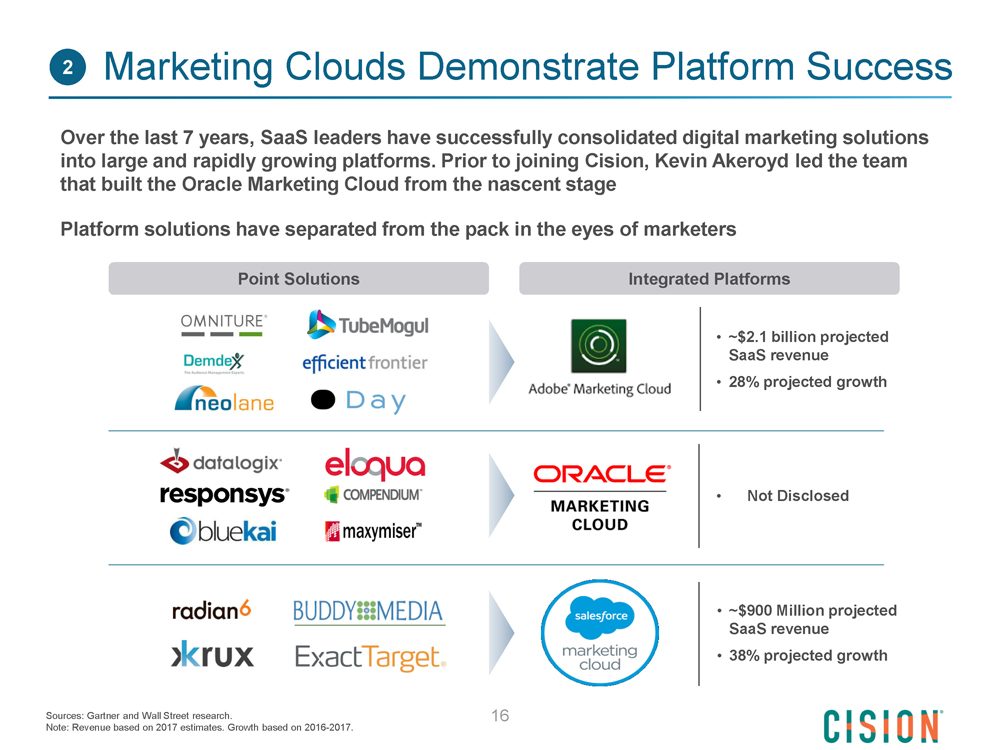
2 Marketing Clouds Demonstrate Platform Success Over the last 7 years, SaaS leaders have successfully consolidated digital marketing solutions into large and rapidly growing platforms. Prior to joining Cision, Kevin Akeroyd led the team that built the Oracle Marketing Cloud from the nascent stage Platform solutions have separated from the pack in the eyes of marketers Point Solutions Integrated Platforms ~$2.1 billion projected SaaS revenue 28% projected growth Not Disclosed ~$900 Million projected SaaS revenue 38% projected growth Sources: Gartner and Wall Street research. 16 Note: Revenue based on 2017 estimates. Growth based on 2016-2017.
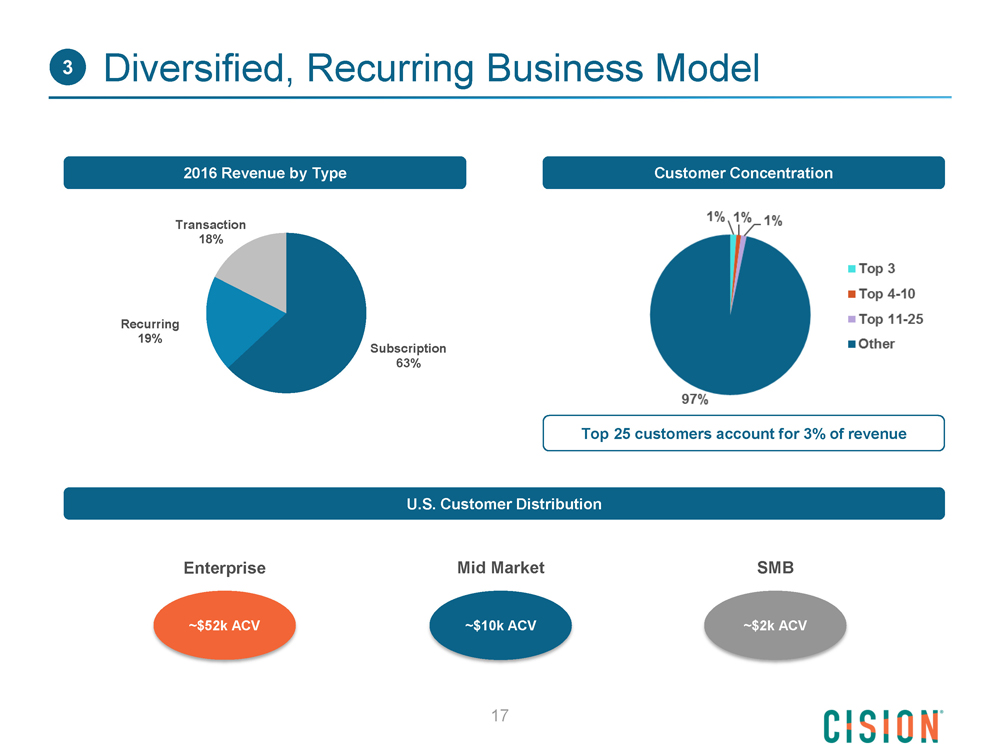
3 Diversified, Recurring Business Model 2016 Revenue by Type Customer Concentration Transaction 18% Recurring 19% Subscription 63% Top 25 customers account for 3% of revenue U.S. Customer Distribution Enterprise Mid Market SMB ~$52k ACV ~$10k ACV ~$2k ACV 1% 1% 1% 97% Top 3 Top 4-10 Top 11-25 other 17
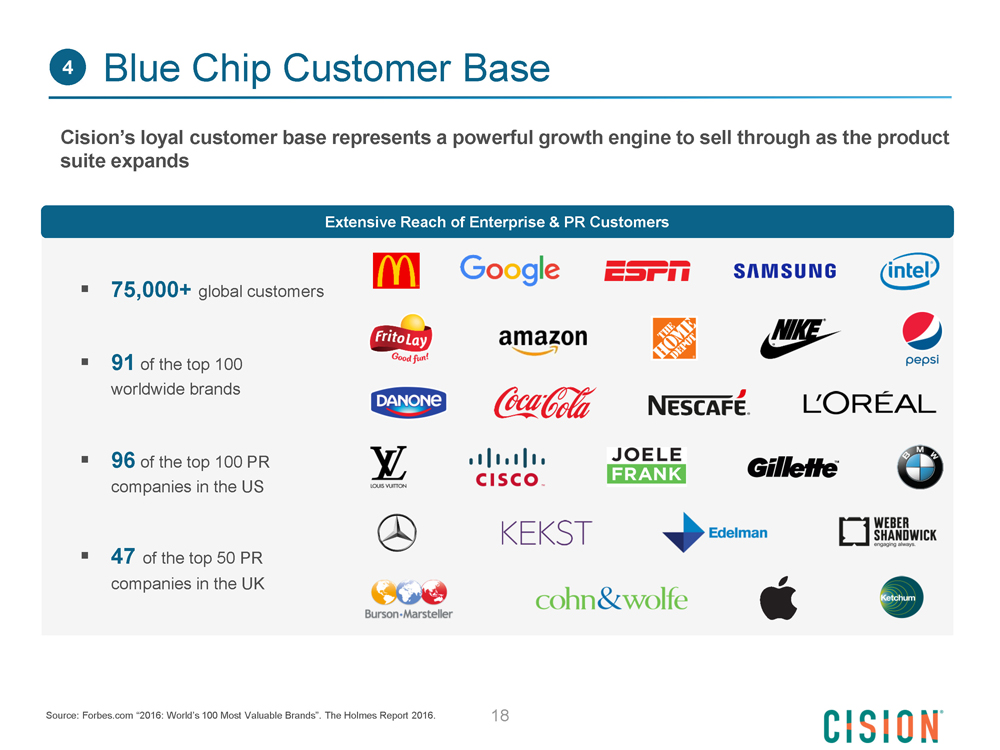
4 Blue Chip Customer Base Cision’s loyal customer base represents a powerful growth engine to sell through as the product suite expands Extensive Reach of Enterprise & PR Customers 75,000+ global customers 91 of the top 100 worldwide brands 96 of the top 100 PR companies in the US 47 of the top 50 PR companies in the UK Source: Forbes.com “2016: World’s 100 Most Valuable Brands”. The Holmes Report 2016. 18
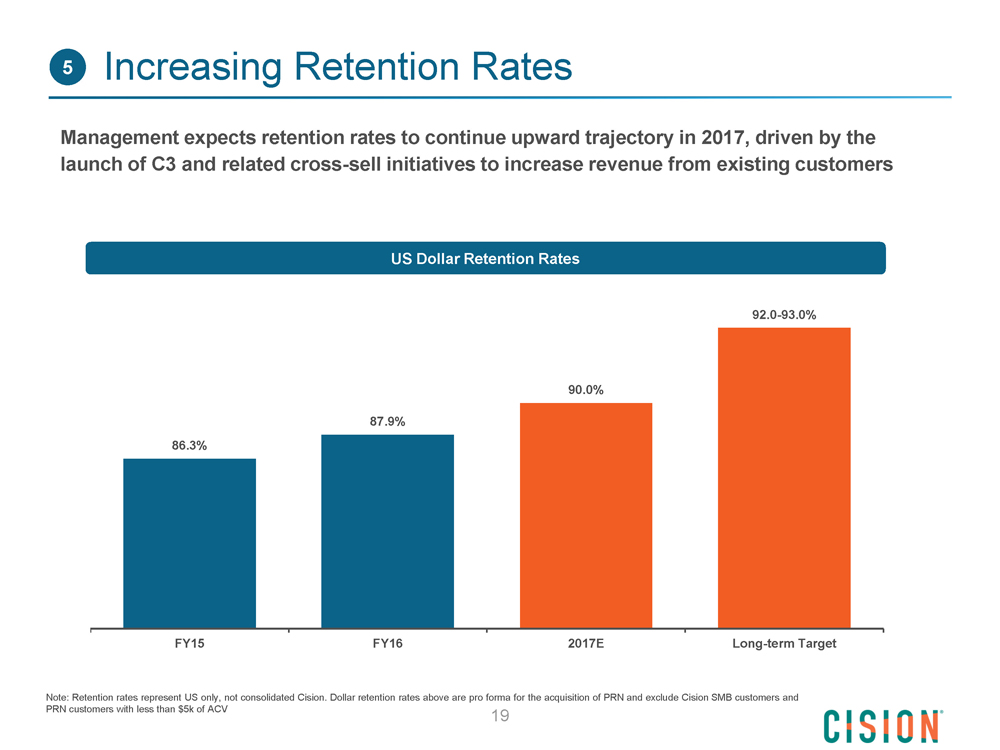
5 Increasing Retention Rates Management expects retention rates to continue upward trajectory in 2017, driven by the launch of C3 and related cross-sell initiatives to increase revenue from existing customers US Dollar Retention Rates 92.0-93.0% 90.0% 87.9% 86.3% FY15 FY16 2017E Long-term Target Note: Retention rates represent US only, not consolidated Cision. Dollar retention rates above are pro forma for the acquisition of PRN and exclude Cision SMB customers and PRN customers with less than $5k of ACV 19
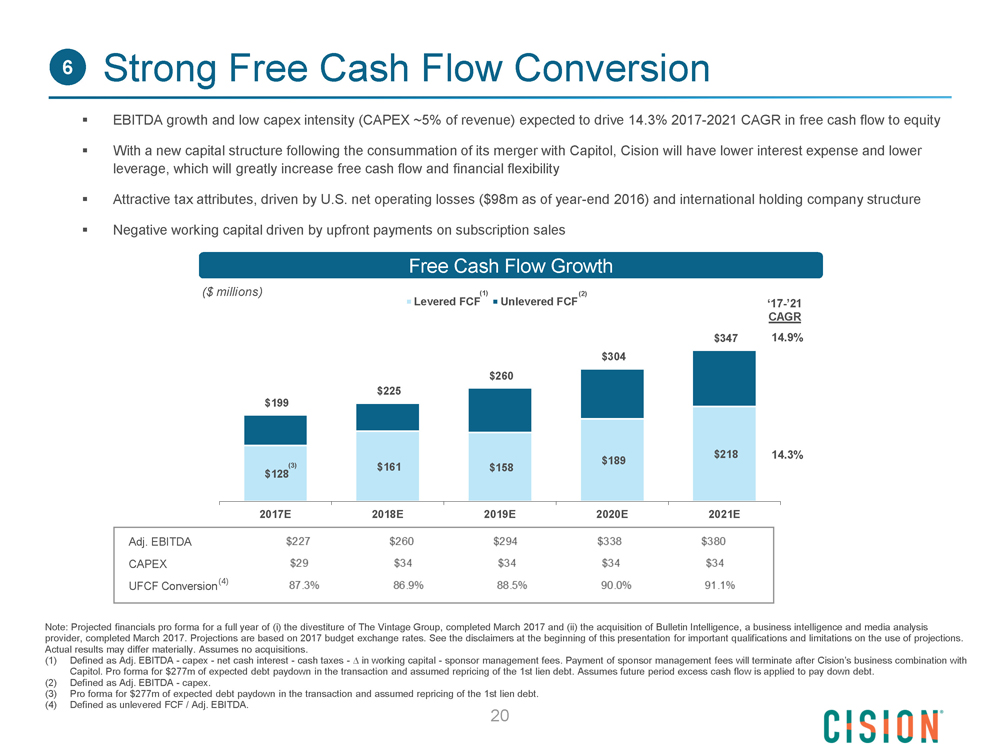
6 Strong Free Cash Flow Conversion EBITDA growth and low capex intensity (CAPEX ~5% of revenue) expected to drive 14.3% 2017-2021 CAGR in free cash flow to equity With a new capital structure following the consummation of its merger with Capitol, Cision will have lower interest expense and lower leverage, which will greatly increase free cash flow and financial flexibility Attractive tax attributes, driven by U.S. net operating losses ($98m as of year-end 2016) and international holding company structure Negative working capital driven by upfront payments on subscription sales Free Cash Flow Growth ($ millions) (1) (2) Levered FCF Unlevered FCF ‘17-’21 CAGR $347 14.9% $304 $260 $225 $199 $218 14.3% $189 (3) $161 $158 $128 2017E 2018E 2019E 2020E 2021E Adj. EBITDA $227 $260 $294 $338 $380 CAPEX $29 $34 $34 $34 $34 UFCF Conversion(4) 87.3% 86.9% 88.5% 90.0% 91.1% Note: Projected financials pro forma for a full year of (i) the divestiture of The Vintage Group, completed March 2017 and (ii) the acquisition of Bulletin Intelligence, a business intelligence and media analysis provider, completed March 2017. Projections are based on 2017 budget exchange rates. See the disclaimers at the beginning of this presentation for important qualifications and limitations on the use of projections. Actual results may differ materially. Assumes no acquisitions. (1) Defined as Adj. EBITDA - capex - net cash interest - cash taxes - in working capital - sponsor management fees. Payment of sponsor management fees will terminate after Cision’s business combination with Capitol. Pro forma for $277m of expected debt paydown in the transaction and assumed repricing of the 1st lien debt. Assumes future period excess cash flow is applied to pay down debt. (2) Defined as Adj. EBITDA - capex. (3) Pro forma for $277m of expected debt paydown in the transaction and assumed repricing of the 1st lien debt. (4) Defined as unlevered FCF / Adj. EBITDA. 20
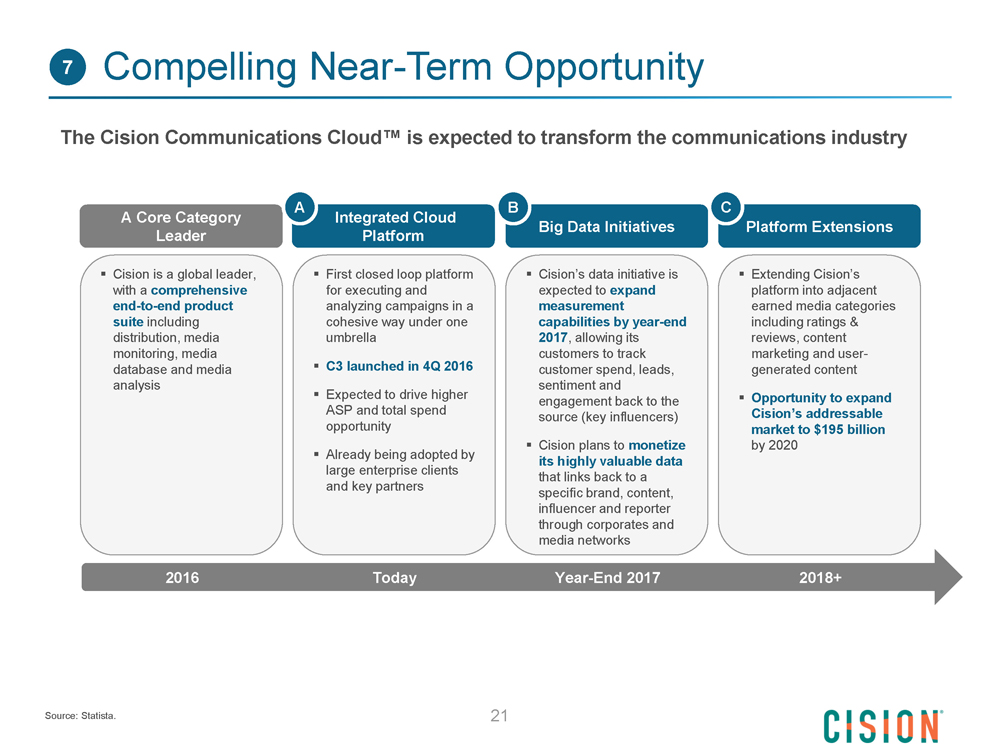
7 Compelling Near-Term Opportunity TM The Cision Communications Cloud is expected to transform the communications industry A Core Category Leader Cision is a global leader, with a comprehensive end-to-end product suite including distribution, media monitoring, media database and media analysis 2016 A Integrated Cloud Platform First closed loop platform for executing and analyzing campaigns in a cohesive way under one umbrella C3 launched in 4Q 2016 Expected to drive higher ASP and total spend opportunity Already being adopted by large enterprise clients and key partners Today B Big Data Initiatives Cision’s data initiative is expected to expand measurement capabilities by year-end 2017, allowing its customers to track customer spend, leads, sentiment and engagement back to the source (key influencers) Cision plans to monetize its highly valuable data that links back to a specific brand, content, influencer and reporter through corporates and media networks Year-End 2017 C Platform Extensions Extending Cision’s platform into adjacent earned media categories including ratings & reviews, content marketing and user-generated content Opportunity to expand Cision’s addressable market to $195 billion by 2020 2018+ Source: Statista. 21
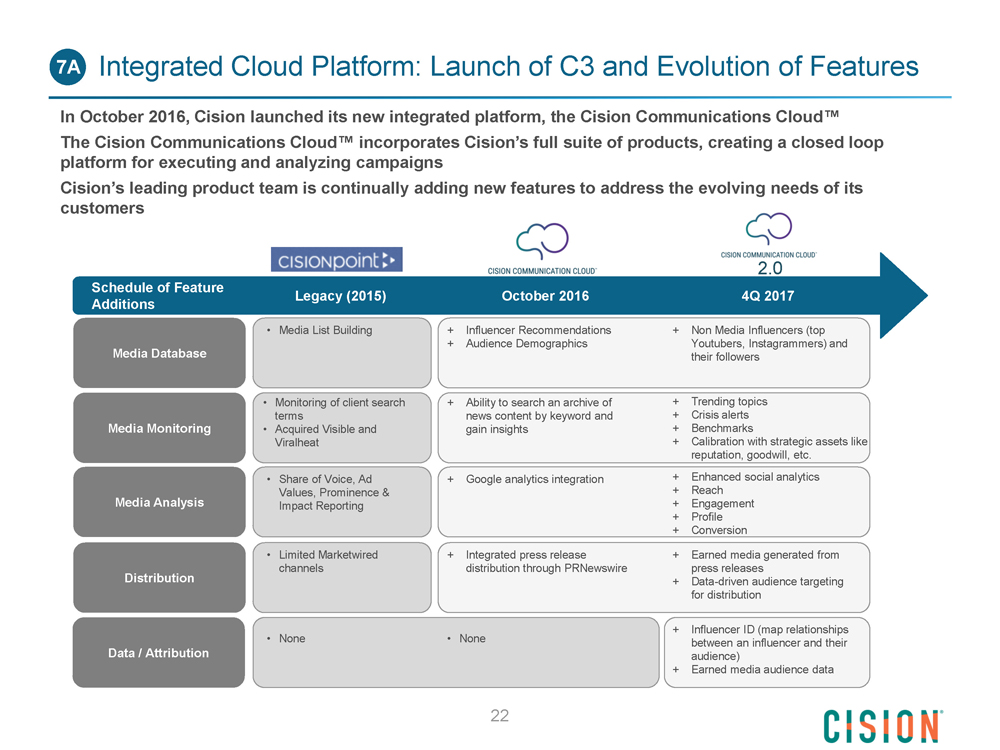
7A Integrated Cloud Platform: Launch of C3 and Evolution of Features In October 2016, Cision launched its new integrated platform, the Cision Communications Cloud TM The Cision Communications Cloud TM incorporates Cision’s full suite of products, creating a closed loop platform for executing and analyzing campaigns Cision’s leading product team is continually adding new features to address the evolving needs of its customers 2.0 Schedule of Feature Legacy (2015) October 2016 4Q 2017 Additions Media List Building + Influencer Recommendations + Non Media Influencers (top + Audience Demographics Youtubers, Instagrammers) and Media Database their followers Monitoring of client search + Ability to search an archive of + Trending topics terms news content by keyword and + Crisis alerts Media Monitoring Acquired Visible and gain insights + Benchmarks Viralheat + Calibration with strategic assets like reputation, goodwill, etc. Share of Voice, Ad + Google analytics integration + Enhanced social analytics Values, Prominence & + Reach Media Analysis Impact Reporting + Engagement + Profile + Conversion Limited Marketwired + Integrated press release + Earned media generated from channels distribution through PRNewswire press releases Distribution + Data-driven audience targeting for distribution + Influencer ID (map relationships None None between an influencer and their Data / Attribution audience) + Earned media audience data 22
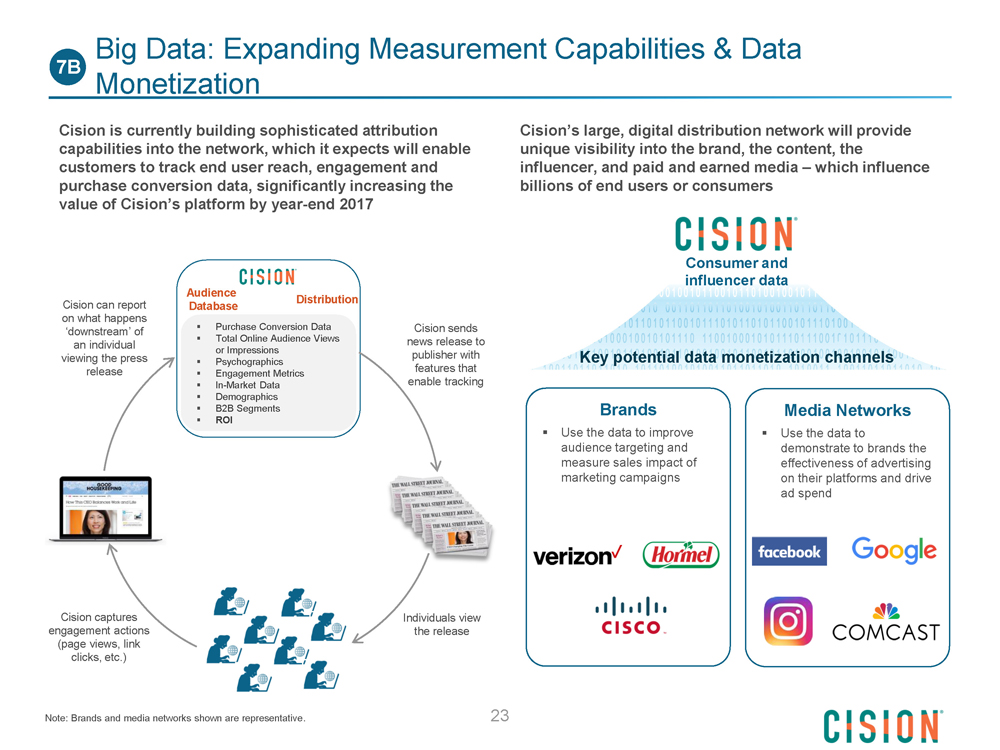
Big Data: Expanding Measurement Capabilities & Data 7B Monetization Cision is currently building sophisticated attribution capabilities into the network, which it expects will enable customers to track end user reach, engagement and purchase conversion data, significantly increasing the value of Cision’s platform by year-end 2017 Audience Distribution Cision can report Database on what happens Purchase Conversion Data Cision sends ‘downstream’ of Total Online Audience Views news release to an individual or Impressions publisher with viewing the press Psychographics release features that Engagement Metrics In-Market Data enable tracking DemographicsB2B Segments ROI Cision captures Individuals view engagement actions the release (page views, link clicks, etc.) Note: Brands and media networks shown are representative. 23 Cision’s large, digital distribution network will provide unique visibility into the brand, the content, the influencer, and paid and earned media which influence billions of end users or consumers Consumer and influencer data Key potential data monetization channels Brands Media Networks Use the data to improve Use the data to audience targeting and demonstrate to brands the measure sales impact of effectiveness of advertising marketing campaigns on their platforms and drive ad spend
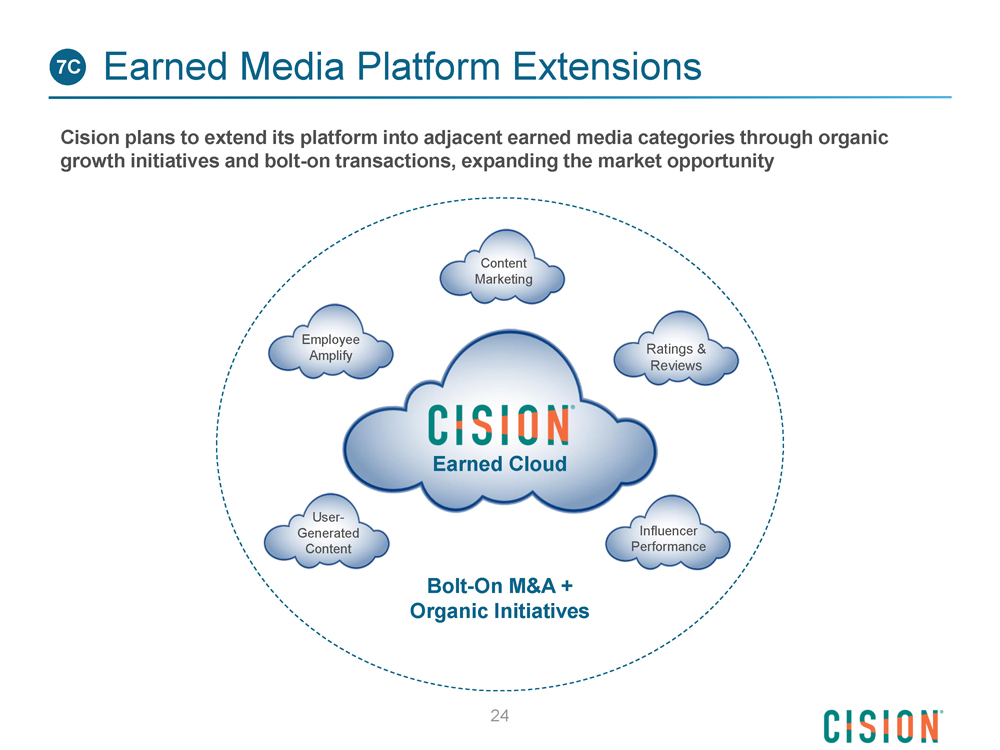
7C Earned Media Platform Extensions Cision plans to extend its platform into adjacent earned media categories through organic growth initiatives and bolt-on transactions, expanding the market opportunity Content Marketing Employee Ratings & Amplify Reviews Earned Cloud User- Generated Influencer Content Performance Bolt-On M&A + Organic Initiatives 24
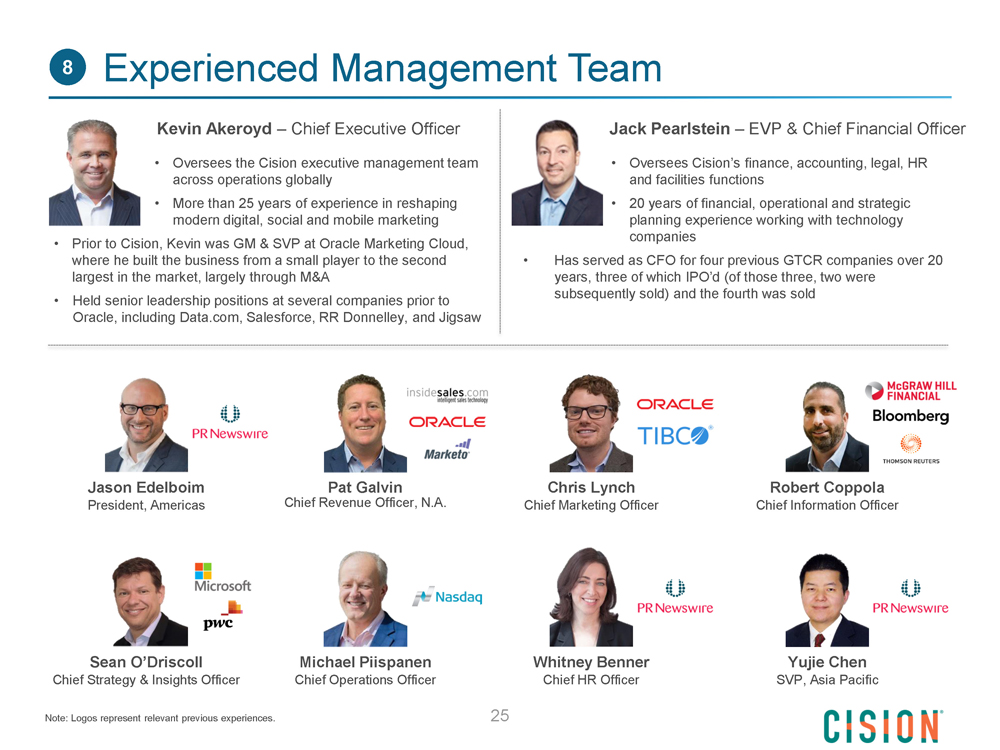
8 Experienced Management Team Kevin Akeroyd — Chief Executive Officer Oversees the Cision executive management team across operations globally More than 25 years of experience in reshaping modern digital, social and mobile marketing Prior to Cision, Kevin was GM & SVP at Oracle Marketing Cloud, where he built the business from a small player to the second largest in the market, largely through M&A Held senior leadership positions at several companies prior to Oracle, including Data.com, Salesforce, RR Donnelley, and Jigsaw Jack Pearlstein — EVP & Chief Financial Officer Oversees Cision’s finance, accounting, legal, HR and facilities functions 20 years of financial, operational and strategic planning experience working with technology companies Has served as CFO for four previous GTCR companies over 20 years, three of which IPO’d (of those three, two were subsequently sold) and the fourth was sold Jason Edelboim Pat Galvin Chris Lynch Robert Coppola President, Americas Chief Revenue Officer, N.A. Chief Marketing Officer Chief Information Officer Sean ODriscoll Michael Piispanen Whitney Benner Yujie Chen Chief Strategy & Insights Officer Chief Operations Officer Chief HR Officer SVP, Asia Pacific Note: Logos represent relevant previous experiences. 25
M&A Integration Update
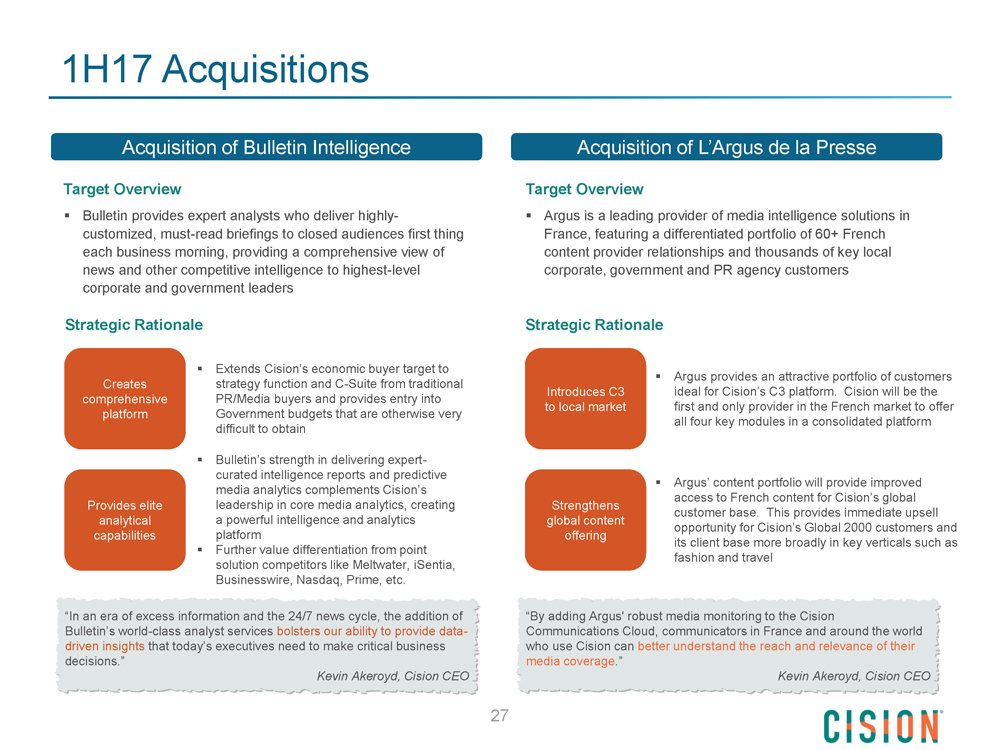
1H17 Acquisitions Acquisition of Bulletin Intelligence Target Overview Bulletin provides expert analysts who deliver highly-customized, must-read briefings to closed audiences first thing each business morning, providing a comprehensive view of news and other competitive intelligence to highest-level corporate and government leaders Strategic Rationale Extends Cision’s economic buyer target to Creates strategy function and C-Suite from traditional comprehensive PR/Media buyers and provides entry into platform Government budgets that are otherwise very difficult to obtain Bulletin’s strength in delivering expert-curated intelligence reports and predictive media analytics complements Cision’s Provides elite leadership in core media analytics, creating analytical a powerful intelligence and analytics capabilities platformFurther value differentiation from point solution competitors like Meltwater, iSentia, Businesswire, Nasdaq, Prime, etc. “In an era of excess information and the 24/7 news cycle, the addition of Bulletin’s world-class analyst services bolsters our ability to provide data-driven insights that today’s executives need to make critical business decisions.” Kevin Akeroyd, Cision CEO Acquisition of L’Argus de la Presse Target Overview Argus is a leading provider of media intelligence solutions in France, featuring a differentiated portfolio of 60+ French content provider relationships and thousands of key local corporate, government and PR agency customers Strategic Rationale Argus provides an attractive portfolio of customers Introduces C3 ideal for Cision’s C3 platform. Cision will be the to local market first and only provider in the French market to offer all four key modules in a consolidated platform Argus’ content portfolio will provide improved access to French content for Cision’s global Strengthens customer base. This provides immediate upsell global content opportunity for Cision’s Global 2000 customers and offering its client base more broadly in key verticals such as fashion and travel “By adding Argus' robust media monitoring to the Cision Communications Cloud, communicators in France and around the world who use Cision can better understand the reach and relevance of their media coverage.” Kevin Akeroyd, Cision CEO 27
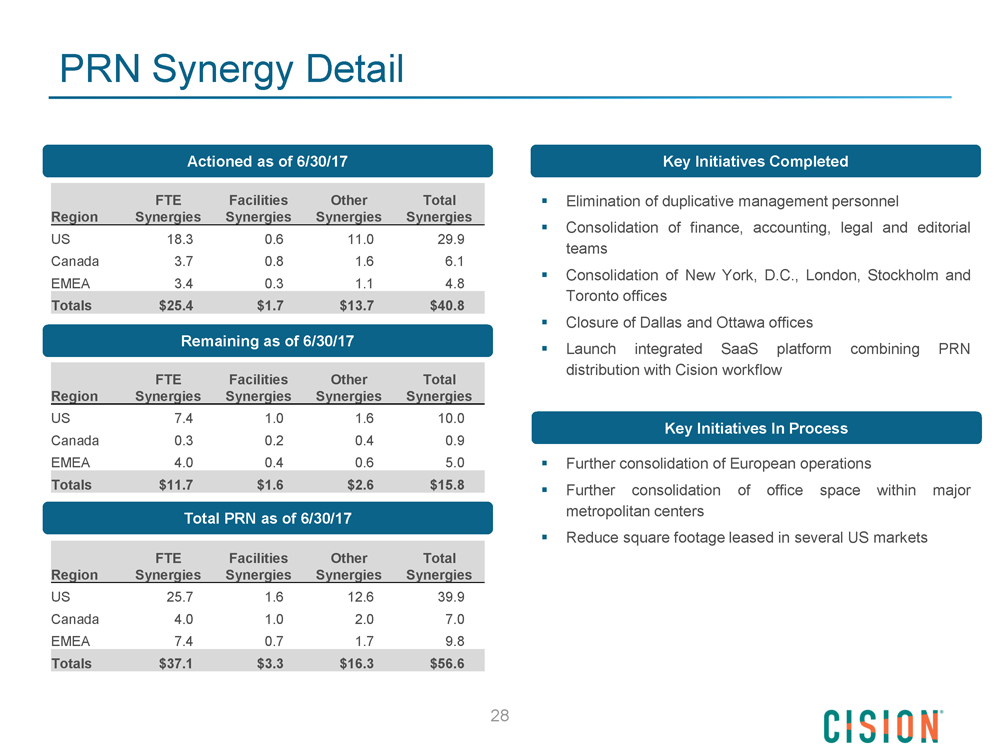
PRN Synergy Detail Actioned as of 6/30/17 FTE Facilities Other Total Region Synergies Synergies Synergies Synergies US 18.3 0.6 11.0 29.9 Canada 3.7 0.8 1.6 6.1 EMEA 3.4 0.3 1.1 4.8 Totals $25.4 $1.7 $13.7 $40.8 Remaining as of 6/30/17 FTE Facilities Other Total Region Synergies Synergies Synergies Synergies US 7.4 1.0 1.6 10.0 Canada 0.3 0.2 0.4 0.9 EMEA 4.0 0.4 0.6 5.0 Totals $11.7 $1.6 $2.6 $15.8 Total PRN as of 6/30/17 FTE Facilities Other Total Region Synergies Synergies Synergies Synergies US 25.7 1.6 12.6 39.9 Canada 4.0 1.0 2.0 7.0 EMEA 7.4 0.7 1.7 9.8 Totals $37.1 $3.3 $16.3 $56.6 28 Key Initiatives Completed Elimination of duplicative management personnel Consolidation of finance, accounting, legal and editorial teamsConsolidation of New York, D.C., London, Stockholm and Toronto officesClosure of Dallas and Ottawa officesLaunch integrated SaaS platform combining PRN distribution with Cision workflow Key Initiatives In Process Further consolidation of European operations Further consolidation of office space within major metropolitan centersReduce square footage leased in several US markets
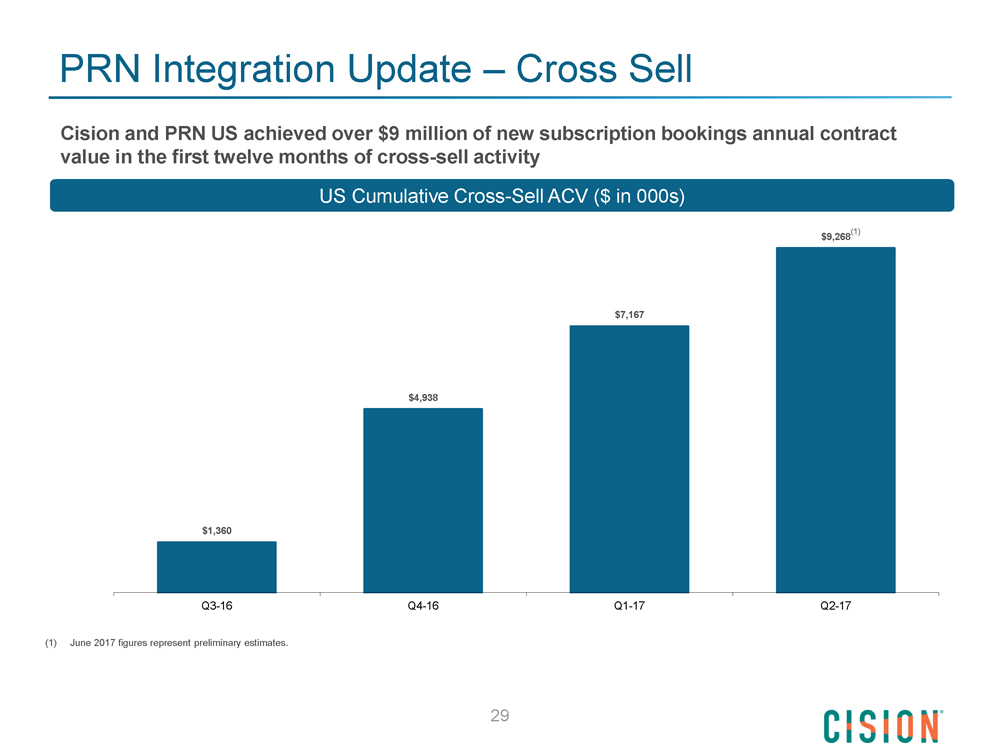
PRN Integration Update — Cross Sell Cision and PRN US achieved over $9 million of new subscription bookings annual contract value in the first twelve months of cross-sell activity US Cumulative Cross-Sell ACV ($ in 000s) $1,360 (1) $9,268 $7,167 $4,938 Q3-16 Q4-16 Q1-17 Q2-17 (1) June 2017 figures represent preliminary estimates. 29

Financial Overview
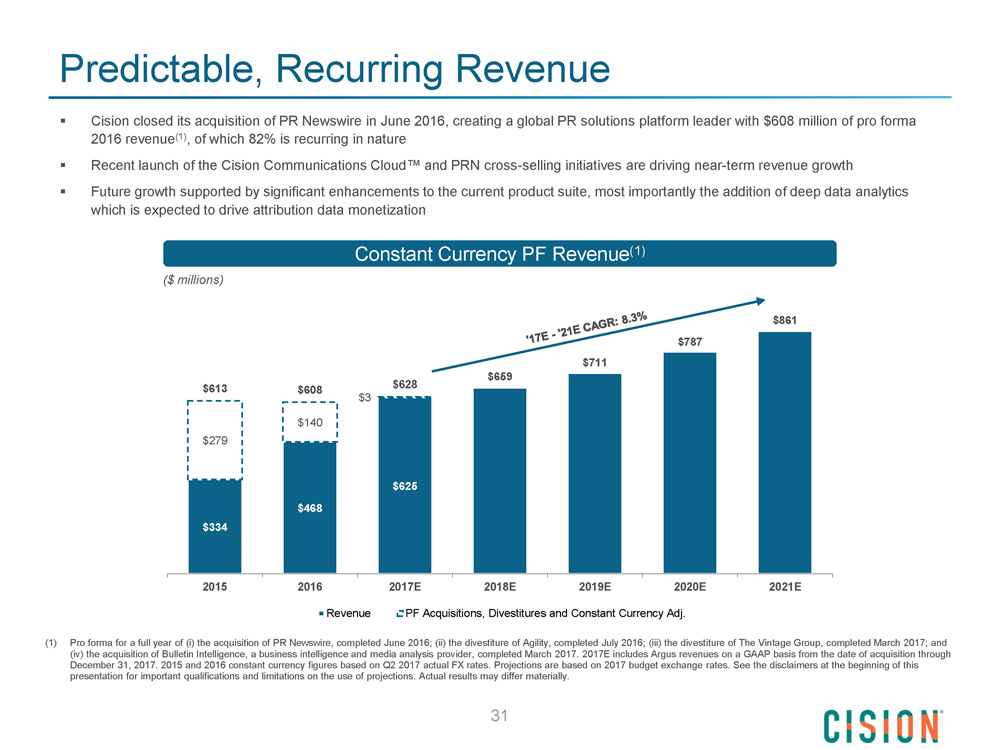
Predictable, Recurring Revenue Cision closed its acquisition of PR Newswire in June 2016, creating a global PR solutions platform leader with $608 million of pro forma 2016 revenue(1), of which 82% is recurring in natureRecent launch of the Cision Communications Cloud and PRN cross-selling initiatives are driving near-term revenue growth Future growth supported by significant enhancements to the current product suite, most importantly the addition of deep data analytics which is expected to drive attribution data monetization Constant Currency PF Revenue(1) ($ millions) $861 $787 $711 $659 $613 $628 $608 $3 $140 $279 $625 $468 $334 2015 2016 2017E 2018E 2019E 2020E 2021E Revenue PF Acquisitions, Divestitures and Constant Currency Adj. (1) Pro forma for a full year of (i) the acquisition of PR Newswire, completed June 2016; (ii) the divestiture of Agility, completed July 2016; (iii) the divestiture of The Vintage Group, completed March 2017; and (iv) the acquisition of Bulletin Intelligence, a business intelligence and media analysis provider, completed March 2017. 2017E includes Argus revenues on a GAAP basis from the date of acquisition through December 31, 2017. 2015 and 2016 constant currency figures based on Q2 2017 actual FX rates. Projections are based on 2017 budget exchange rates. See the disclaimers at the beginning of this presentation for important qualifications and limitations on the use of projections. Actual results may differ materially. 31
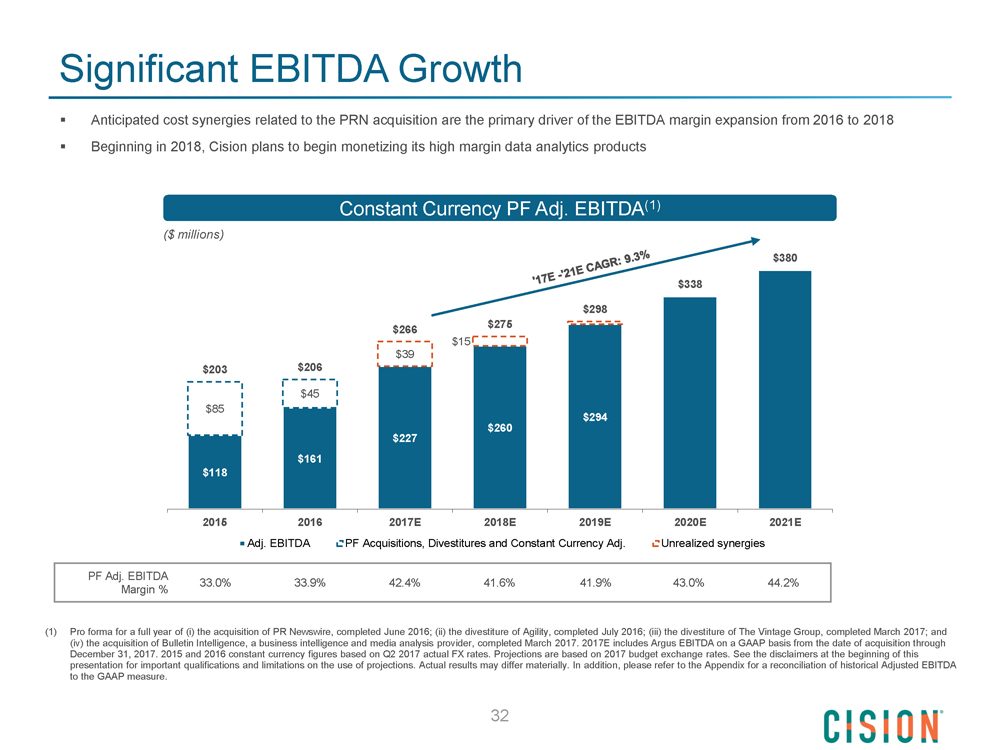
Significant EBITDA Growth Anticipated cost synergies related to the PRN acquisition are the primary driver of the EBITDA margin expansion from 2016 to 2018Beginning in 2018, Cision plans to begin monetizing its high margin data analytics products Constant Currency PF Adj. EBITDA(1) ($ millions) $380 $338 $298 $275 $266 $15 $39 $203 $206 $45 $85 $294 $260 $227 $161 $118 2015 2016 2017E 2018E 2019E 2020E 2021E Adj. EBITDA PF Acquisitions, Divestitures and Constant Currency Adj. Unrealized synergies PF Adj. EBITDA 33.0% 33.9% 42.4% 41.6% 41.9% 43.0% 44.2% Margin % (1) Pro forma for a full year of (i) the acquisition of PR Newswire, completed June 2016; (ii) the divestiture of Agility, completed July 2016; (iii) the divestiture of The Vintage Group, completed March 2017; and (iv) the acquisition of Bulletin Intelligence, a business intelligence and media analysis provider, completed March 2017. 2017E includes Argus EBITDA on a GAAP basis from the date of acquisition through December 31, 2017. 2015 and 2016 constant currency figures based on Q2 2017 actual FX rates. Projections are based on 2017 budget exchange rates. See the disclaimers at the beginning of this presentation for important qualifications and limitations on the use of projections. Actual results may differ materially. In addition, please refer to the Appendix for a reconciliation of historical Adjusted EBITDA to the GAAP measure. 32
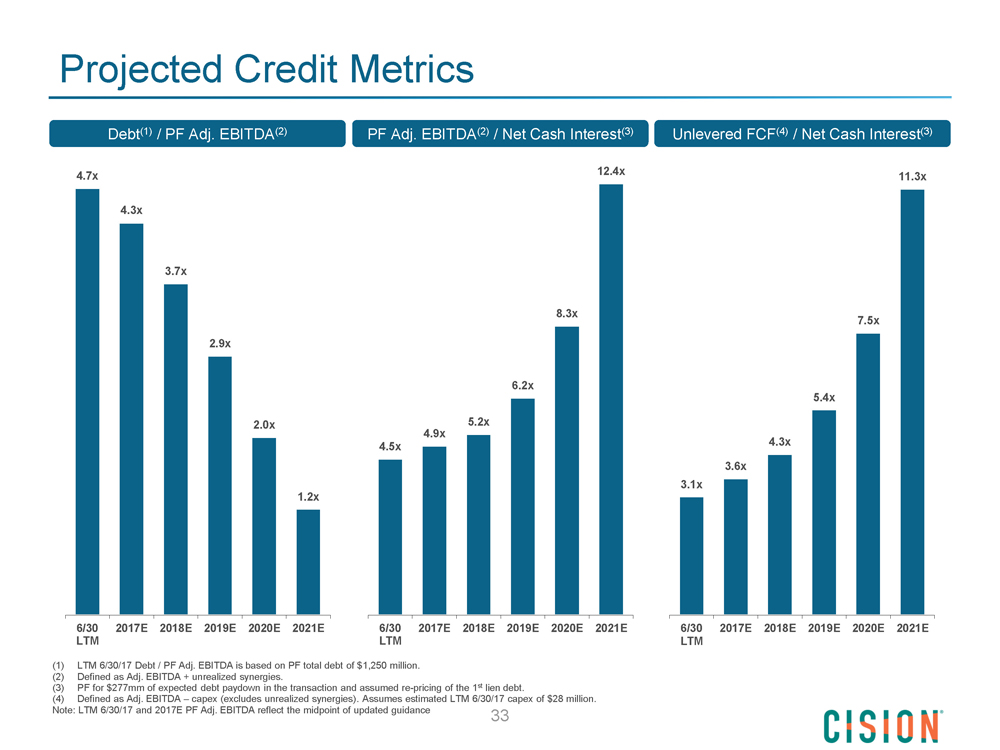
Projected Credit Metrics Debt(1) / PF Adj. EBITDA(2) PF Adj. EBITDA(2) / Net Cash Interest(3) Unlevered FCF(4) / Net Cash Interest(3) 4.7x 12.4x 11.3x 4.3x 3.7x 8.3x 7.5x 2.9x 6.2x 5.4x 2.0x 5.2x 4.9x 4.5x 4.3x 3.6x 3.1x 1.2x 6/30 2017E 2018E 2019E 2020E 2021E 6/30 2017E 2018E 2019E 2020E 2021E 6/30 2017E 2018E 2019E 2020E 2021E LTM LTM LTM (1) LTM 6/30/17 Debt / PF Adj. EBITDA is based on PF total debt of $1,250 million. (2) Defined as Adj. EBITDA + unrealized synergies. (3) PF for $277mm of expected debt paydown in the transaction and assumed re-pricing of the 1st lien debt. (4) Defined as Adj. EBITDA — capex (excludes unrealized synergies). Assumes estimated LTM 6/30/17 capex of $28 million. Note: LTM 6/30/17 and 2017E PF Adj. EBITDA reflect the midpoint of updated guidance 33
Appendix
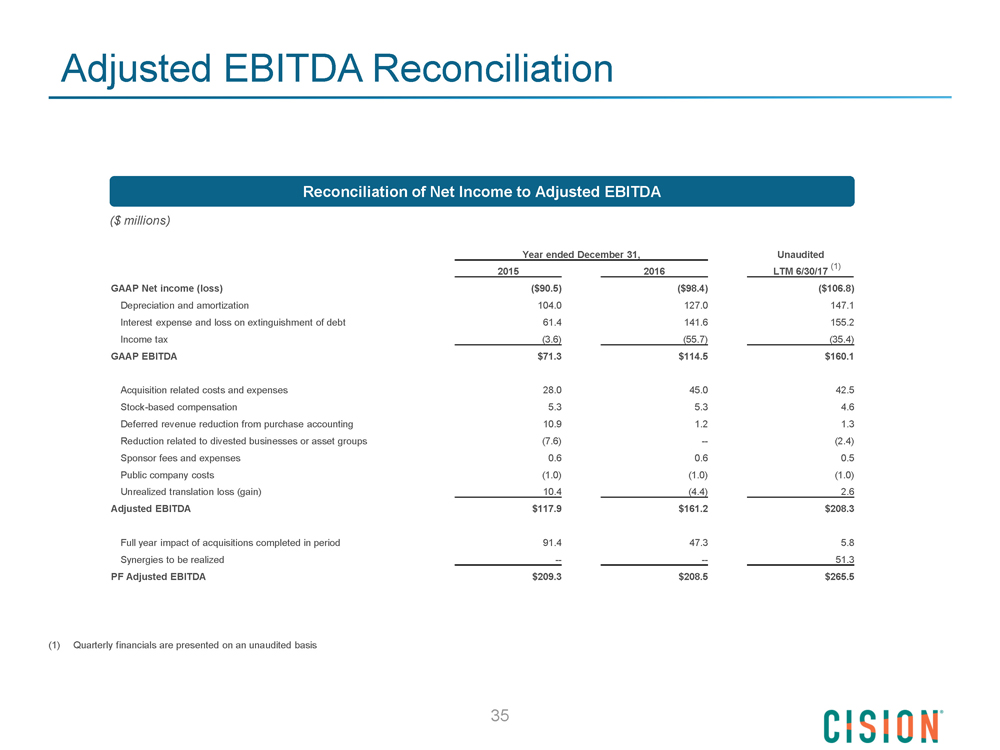
Adjusted EBITDA Reconciliation Reconciliation of Net Income to Adjusted EBITDA ($ millions) Year ended December 31, Unaudited (1) 2015 2016 LTM 6/30/17 GAAP Net income (loss) ($90.5) ($98.4) ($106.8) Depreciation and amortization 104.0 127.0 147.1 Interest expense and loss on extinguishment of debt 61.4 141.6 155.2 Income tax (3.6) (55.7) (35.4) GAAP EBITDA $71.3 $114.5 $160.1 Acquisition related costs and expenses 28.0 45.0 42.5 Stock-based compensation 5.3 5.3 4.6 Deferred revenue reduction from purchase accounting 10.9 1.2 1.3 Reduction related to divested businesses or asset groups (7.6) -- (2.4) Sponsor fees and expenses 0.6 0.6 0.5 Public company costs (1.0) (1.0) (1.0) Unrealized translation loss (gain) 10.4 (4.4) 2.6 Adjusted EBITDA $117.9 $161.2 $208.3 Full year impact of acquisitions completed in period 91.4 47.3 5.8 Synergies to be realized -- -- 51.3 PF Adjusted EBITDA $209.3 $208.5 $265.5 (1) Quarterly financials are presented on an unaudited basis 35
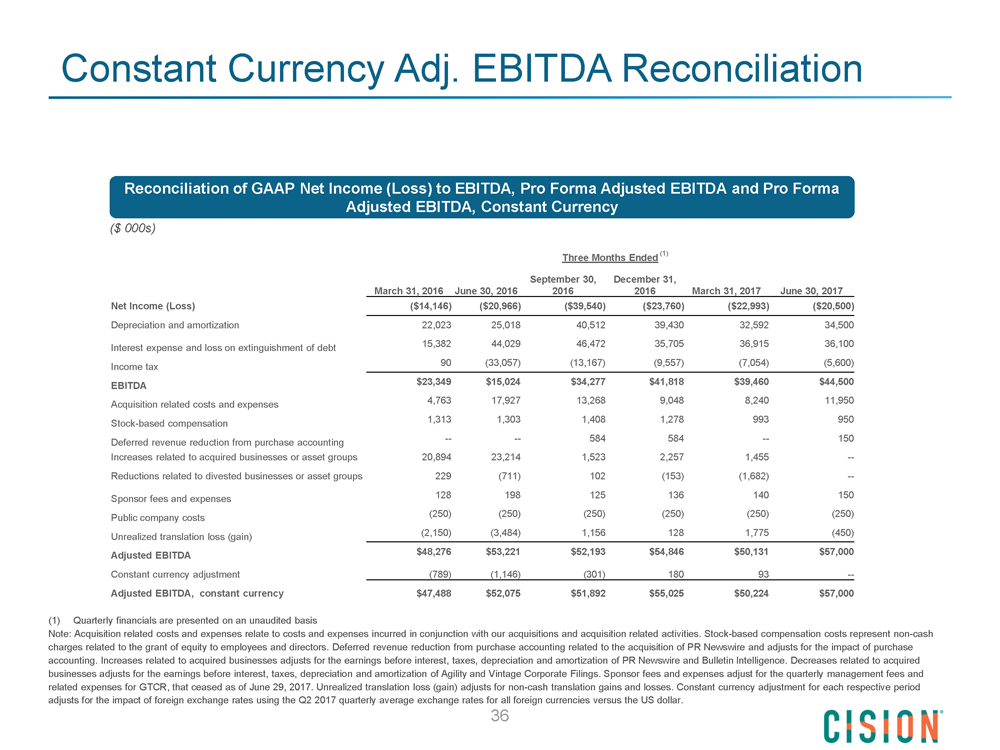
Constant Currency Adj. EBITDA Reconciliation Reconciliation of GAAP Net Income (Loss) to EBITDA, Pro Forma Adjusted EBITDA and Pro Forma Adjusted EBITDA, Constant Currency ($ 000s) Three Months Ended (1) September 30, December 31, March 31, 2016 June 30, 2016 2016 2016 March 31, 2017 June 30, 2017 Net Income (Loss) ($14,146) ($20,966) ($39,540) ($23,760) ($22,993) ($20,500) Depreciation and amortization 22,023 25,018 40,512 39,430 32,592 34,500 Interest expense and loss on extinguishment of debt 15,382 44,029 46,472 35,705 36,915 36,100 Income tax 90 (33,057) (13,167) (9,557) (7,054) (5,600) EBITDA $23,349 $15,024 $34,277 $41,818 $39,460 $44,500 Acquisition related costs and expenses 4,763 17,927 13,268 9,048 8,240 11,950 Stock-based compensation 1,313 1,303 1,408 1,278 993 950 Deferred revenue reduction from purchase accounting -- -- 584 584 -- 150 Increases related to acquired businesses or asset groups 20,894 23,214 1,523 2,257 1,455 -- Reductions related to divested businesses or asset groups 229 (711) 102 (153) (1,682) -- Sponsor fees and expenses 128 198 125 136 140 150 Public company costs (250) (250) (250) (250) (250) (250) Unrealized translation loss (gain) (2,150) (3,484) 1,156 128 1,775 (450) Adjusted EBITDA $48,276 $53,221 $52,193 $54,846 $50,131 $57,000 Constant currency adjustment (789) (1,146) (301) 180 93 -- Adjusted EBITDA, constant currency $47,488 $52,075 $51,892 $55,025 $50,224 $57,000 (1) Quarterly financials are presented on an unaudited basis Note: Acquisition related costs and expenses relate to costs and expenses incurred in conjunction with our acquisitions and acquisition related activities. Stock-based compensation costs represent non-cash charges related to the grant of equity to employees and directors. Deferred revenue reduction from purchase accounting related to the acquisition of PR Newswire and adjusts for the impact of purchase accounting. Increases related to acquired businesses adjusts for the earnings before interest, taxes, depreciation and amortization of PR Newswire and Bulletin Intelligence. Decreases related to acquired businesses adjusts for the earnings before interest, taxes, depreciation and amortization of Agility and Vintage Corporate Filings. Sponsor fees and expenses adjust for the quarterly management fees and related expenses for GTCR, that ceased as of June 29, 2017. Unrealized translation loss (gain) adjusts for non-cash translation gains and losses. Constant currency adjustment for each respective period adjusts for the impact of foreign exchange rates using the Q2 2017 quarterly average exchange rates for all foreign currencies versus the US dollar. 36
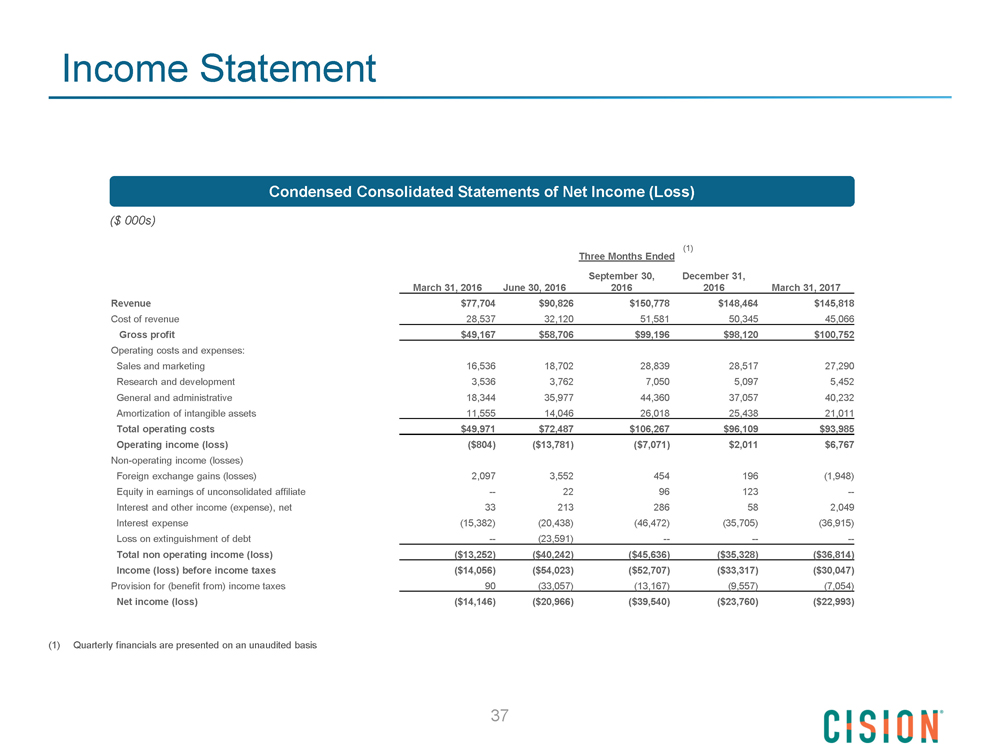
Income Statement Condensed Consolidated Statements of Net Income (Loss) ($ 000s) (1) Three Months Ended September 30, December 31, March 31, 2016 June 30, 2016 2016 2016 March 31, 2017 Revenue $77,704 $90,826 $150,778 $148,464 $145,818 Cost of revenue 28,537 32,120 51,581 50,345 45,066 Gross profit $49,167 $58,706 $99,196 $98,120 $100,752 Operating costs and expenses: Sales and marketing 16,536 18,702 28,839 28,517 27,290 Research and development 3,536 3,762 7,050 5,097 5,452 General and administrative 18,344 35,977 44,360 37,057 40,232 Amortization of intangible assets 11,555 14,046 26,018 25,438 21,011 Total operating costs $49,971 $72,487 $106,267 $96,109 $93,985 Operating income (loss) ($804) ($13,781) ($7,071) $2,011 $6,767 Non-operating income (losses) Foreign exchange gains (losses) 2,097 3,552 454 196 (1,948) Equity in earnings of unconsolidated affiliate -- 22 96 123 -- Interest and other income (expense), net 33 213 286 58 2,049 Interest expense (15,382) (20,438) (46,472) (35,705) (36,915) Loss on extinguishment of debt -- (23,591) -- -- -- Total non operating income (loss) ($13,252) ($40,242) ($45,636) ($35,328) ($36,814) Income (loss) before income taxes ($14,056) ($54,023) ($52,707) ($33,317) ($30,047) Provision for (benefit from) income taxes 90 (33,057) (13,167) (9,557) (7,054) Net income (loss) ($14,146) ($20,966) ($39,540) ($23,760) ($22,993) (1) Quarterly financials are presented on an unaudited basis 37
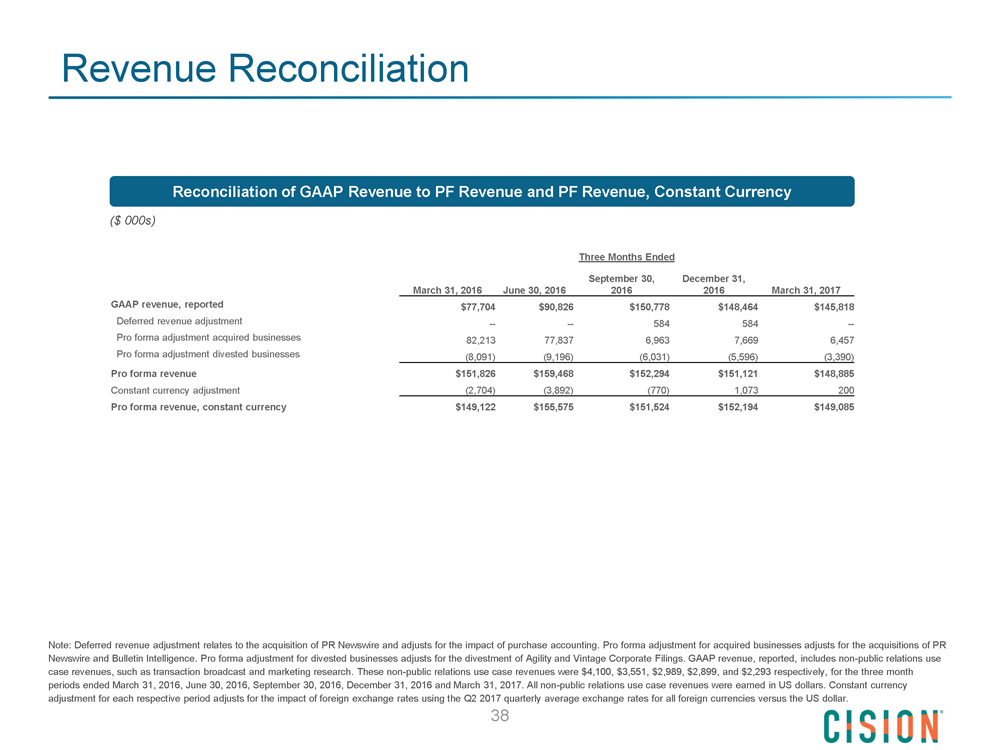
Revenue Reconciliation Reconciliation of GAAP Revenue to PF Revenue and PF Revenue, Constant Currency ($ 000s) Three Months Ended September 30, December 31, March 31, 2016 June 30, 2016 2016 2016 March 31, 2017 GAAP revenue, reported $77,704 $90,826 $150,778 $148,464 $145,818 Deferred revenue adjustment -- -- 584 584 -- Pro forma adjustment acquired businesses 82,213 77,837 6,963 7,669 6,457 Pro forma adjustment divested businesses (8,091) (9,196) (6,031) (5,596) (3,390) Pro forma revenue $151,826 $159,468 $152,294 $151,121 $148,885 Constant currency adjustment (2,704) (3,892) (770) 1,073 200 Pro forma revenue, constant currency $149,122 $155,575 $151,524 $152,194 $149,085 Note: Deferred revenue adjustment relates to the acquisition of PR Newswire and adjusts for the impact of purchase accounting. Pro forma adjustment for acquired businesses adjusts for the acquisitions of PR Newswire and Bulletin Intelligence. Pro forma adjustment for divested businesses adjusts for the divestment of Agility and Vintage Corporate Filings. GAAP revenue, reported, includes non-public relations use case revenues, such as transaction broadcast and marketing research. These non-public relations use case revenues were $4,100, $3,551, $2,989, $2,899, and $2,293 respectively, for the three month periods ended March 31, 2016, June 30, 2016, September 30, 2016, December 31, 2016 and March 31, 2017. All non-public relations use case revenues were earned in US dollars. Constant currency adjustment for each respective period adjusts for the impact of foreign exchange rates using the Q2 2017 quarterly average exchange rates for all foreign currencies versus the US dollar. 38
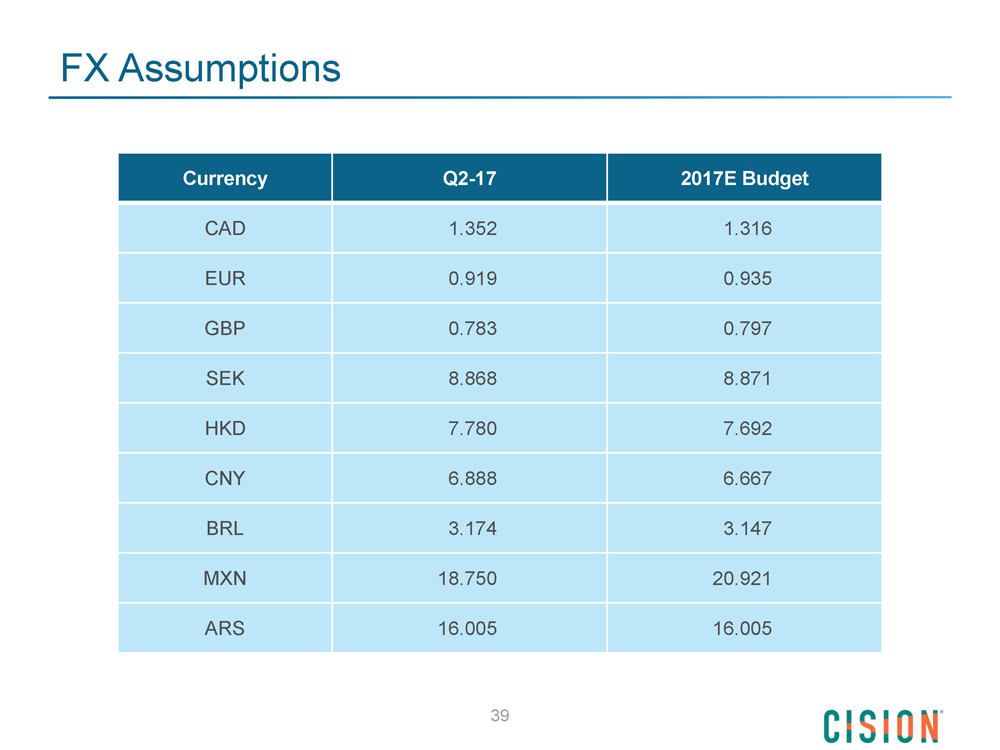
FX Assumptions Currency Q2-17 2017E Budget CAD 1.352 1.316 EUR 0.919 0.935 GBP 0.783 0.797 SEK 8.868 8.871 HKD 7.780 7.692 CNY 6.888 6.667 BRL 3.174 3.147 MXN 18.750 20.921 ARS 16.005 16.005 39