UNITED STATES
SECURITIES AND EXCHANGE COMMISSION
Washington, D.C. 20549
Form N-CSR
CERTIFIED SHAREHOLDER REPORT OF REGISTERED
MANAGEMENT INVESTMENT COMPANIES
Investment Company Act File Number: 811-23240
Eaton Vance Floating-Rate 2022 Target Term Trust
(Exact Name of Registrant as Specified in Charter)
Two International Place, Boston, Massachusetts 02110
(Address of Principal Executive Offices)
Deidre E. Walsh
Two International Place, Boston, Massachusetts 02110
(Name and Address of Agent for Services)
(617) 482-8260
(Registrant’s Telephone Number)
June 30
Date of Fiscal Year End
June 30, 2021
Date of Reporting Period
| Item 1. | Reports to Stockholders |

Eaton Vance
Floating-Rate 2022 Target Term Trust (EFL)
Annual Report
June 30, 2021

Commodity Futures Trading Commission Registration. The Commodity Futures Trading Commission (“CFTC”) has adopted regulations that subject registered investment companies and advisers to regulation by the CFTC if a fund invests more than a prescribed level of its assets in certain CFTC-regulated instruments (including futures, certain options and swap agreements) or markets itself as providing investment exposure to such instruments. The investment adviser has claimed an exclusion from the definition of “commodity pool operator” under the Commodity Exchange Act with respect to its management of the Fund. Accordingly, neither the Fund nor the adviser with respect to the operation of the Fund is subject to CFTC regulation. Because of its management of other strategies, the Fund’s adviser is registered with the CFTC as a commodity pool operator. The adviser is also registered as a commodity trading advisor.
Fund shares are not insured by the FDIC and are not deposits or other obligations of, or guaranteed by, any depository institution. Shares are subject to investment risks, including possible loss of principal invested.
Annual Report June 30, 2021
Eaton Vance
Floating-Rate 2022 Target Term Trust
| 2 | ||||
| 3 | ||||
| 4 | ||||
The Fund’s Investment Objectives, Principal Strategies and Principal Risks | 5 | |||
| 9 | ||||
| 10 | ||||
| 34 | ||||
| 35 | ||||
| 36 | ||||
| 37 | ||||
| 38 | ||||
| 40 | ||||
| 43 | ||||
| 45 | ||||
| 50 |
Eaton Vance
Floating-Rate 2022 Target Term Trust
June 30, 2021
Management’s Discussion of Fund Performance1
Economic and Market Conditions
Amid a global recovery from the pandemic-induced sell-off that had engulfed equity and credit markets in March 2020, senior loans displayed their value as a portfolio diversifier by outperforming the majority of U.S. fixed-income asset classes — including government debt and investment-grade corporate bonds — for the 12-month period ended June 30, 2021.
As the period opened on July 1, 2020, senior loans were in the midst of a rally that had begun the last week of March, as central banks around the world stepped in to support capital markets. The U.S. Federal Reserve (the Fed) had cut its benchmark federal funds rate to 0.00%-0.25%, initiated a significant bond-buying program, and announced other policy measures to help credit markets worldwide.
The loan rally continued through the summer and fall of 2020, as senior loans offered attractive spreads versus other asset classes in a yield-starved environment. In the closing months of the year, the easing of political uncertainties with the election of Joe Biden as president, coupled with the emergency use approval and initial rollout of two COVID-19 vaccines, added further fuel to the rally.
Except for a pause in March 2021, when returns were flat, the loan rally continued into the new year. A massive fiscal stimulus package passed by the U.S. Congress, a still-accommodative set of monetary policies at the Fed, the ongoing rollout of vaccines, and the re-opening of U.S. businesses all provided tailwinds for the asset class through the end of the period.
Technical factors also bolstered loan performance as demand outpaced supply for much of the period. Contributing factors included an increase in institutional demand for structured loan products and a return to net monthly inflows for retail funds in December 2020, for the first time since the previous January. Retail funds continued to experience monthly net inflows from the beginning of 2021 through the end of the period on June 30.
Issuer fundamentals improved during the period as well, with the trailing 12-month default rate falling from 3.23% at the beginning of the period — approximately the market’s long-term average — to 1.25% at period-end. Reflecting the improved economic environment, the average price of loans rose from $89.90 at the start of the period to $98.37 at period-end on June 30, 2021.
For the period as a whole, lower-quality loans outperformed higher-quality issues, with BBB, BB, B, CCC and D-rated (defaulted) loans in the S&P/LSTA Leveraged Loan Index (the Index), a broad measure of the asset class, returning 6.18%, 7.17%, 11.68%, 30.37% and 8.71%, respectively, and the Index overall returning 11.65% for the one-year period.
Fund Performance
For the 12-month period ended June 30, 2021, Eaton Vance Floating-Rate 2022 Target Term Trust (the Fund) returned 13.56% at net asset value of its common shares (NAV), outperforming the 11.65% return of the Index. The Fund is managed against the stated objectives of delivering high current income and returning the initial NAV of $9.85 (before deduction of offering costs) per common share to shareholders after five years. At period end, the Fund’s NAV was $9.33.
The Fund’s employment of investment leverage was the largest contributor to performance versus the Index during the period. The use of leverage has the effect of achieving additional exposure to the loan market, and thus magnifying exposure to the Fund’s underlying investments in both up and down market environments. The use of leverage helped performance versus the Index, which does not employ leverage, as leverage amplified the price increases and coupon payments of loans in the Fund’s underlying portfolio during the period.
Loan selection within the drugs sector also contributed to Fund performance versus the Index, as did an underweight position, relative to the Index, in the weak-performing utilities sector. During a period when lower-rated loans generally outperformed higher-rated loans, the Fund’s underweight position in BBB rated loans helped relative returns as well.
In contrast, the Fund’s underweight position in CCC rated loans detracted from Fund performance versus the Index, as did loan selections in the electronics/electrical, business equipment and services, and health care sectors and underweight positions in the retailers (except food and drug) and air transport sectors. The retailers (except food and drug) and air transport sectors performed strongly in the latter half of the period, as pandemic restrictions eased and Americans began to shop and travel again.
See Endnotes and Additional Disclosures in this report.
Past performance is no guarantee of future results. Returns are historical and are calculated net of management fees and other expenses by determining the percentage change in net asset value (NAV) or market price (as applicable) with all distributions reinvested in accordance with the Fund’s Dividend Reinvestment Plan. Performance at market price will differ from performance at NAV due to variations in the Fund’s market price versus NAV, which may reflect factors such as fluctuations in supply and demand for Fund shares, changes in Fund distributions, shifting market expectations for the Fund’s future returns and distribution rates, and other considerations affecting the trading prices of closed-end funds. Investment return and principal value will fluctuate so that shares, when sold, may be worth more or less than their original cost. Performance for periods less than or equal to one year is cumulative. Performance is for the stated time period only; due to market volatility, current Fund performance may be lower or higher than the quoted return. For performance as of the most recent month-end, please refer to eatonvance.com.
| 2 |
Eaton Vance
Floating-Rate 2022 Target Term Trust
June 30, 2021
Portfolio Managers Craig P. Russ, Andrew N. Sveen, CFA, Catherine C. McDermott, William E. Holt, CFA and Daniel P. McElaney, CFA
| % Average Annual Total Returns | Inception Date | One Year | Five Years | Since Inception | ||||||||||||
Fund at NAV | 07/31/2017 | 13.56 | % | — | 3.98 | % | ||||||||||
Fund at Market Price | — | 22.01 | — | 4.27 | ||||||||||||
| ||||||||||||||||
S&P/LSTA Leveraged Loan Index | — | 11.65 | % | 4.98 | % | 4.30 | % | |||||||||
| % Premium/Discount to NAV4 | ||||||||||||||||
| 1.07 | % | |||||||||||||||
| Distributions5 | ||||||||||||||||
Total Distributions per share for the period | $ | 0.421 | ||||||||||||||
Distribution Rate at NAV | 4.24 | % | ||||||||||||||
Distribution Rate at Market Price | 4.20 | |||||||||||||||
| % Total Leverage6 | ||||||||||||||||
Borrowings | 22.89 | % | ||||||||||||||
Variable Rate Term Preferred Shares (VRTP Shares) | 9.77 | |||||||||||||||
Growth of $10,000
This graph shows the change in value of a hypothetical investment of $10,000 in the Fund for the period indicated. For comparison, the same investment is shown in the indicated index.
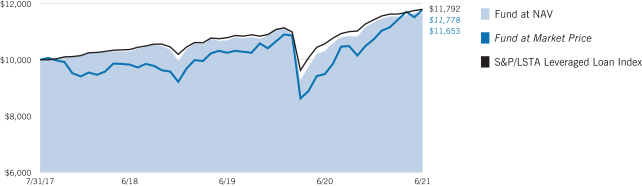
See Endnotes and Additional Disclosures in this report.
Past performance is no guarantee of future results. Returns are historical and are calculated net of management fees and other expenses by determining the percentage change in net asset value (NAV) or market price (as applicable) with all distributions reinvested in accordance with the Fund’s Dividend Reinvestment Plan. Performance at market price will differ from performance at NAV due to variations in the Fund’s market price versus NAV, which may reflect factors such as fluctuations in supply and demand for Fund shares, changes in Fund distributions, shifting market expectations for the Fund’s future returns and distribution rates, and other considerations affecting the trading prices of closed-end funds. Investment return and principal value will fluctuate so that shares, when sold, may be worth more or less than their original cost. Performance for periods less than or equal to one year is cumulative. Performance is for the stated time period only; due to market volatility, current Fund performance may be lower or higher than the quoted return. For performance as of the most recent month-end, please refer to eatonvance.com.
| 3 |
Eaton Vance
Floating-Rate 2022 Target Term Trust
June 30, 2021
Top 10 Issuers (% of total investments)7
TransDigm, Inc. | 1.2 | % | ||
Hyland Software, Inc. | 1.1 | |||
Applied Systems, Inc. | 1.1 | |||
Virgin Media Bristol, LLC | 1.1 | |||
Epicor Software Corporation | 1.1 | |||
Uber Technologies, Inc. | 1.0 | |||
Golden Nugget, Inc. | 0.9 | |||
Mallinckrodt International Finance S.A. | 0.9 | |||
Four Seasons Hotels Limited | 0.9 | |||
PPD, Inc. | 0.8 | |||
Total | 10.1 | % | ||
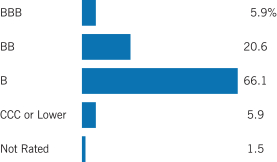
Credit Quality (% of bonds and loans)8
Top 10 Sectors (% of total investments)7
Electronics/Electrical | 19.7 | % | ||
Health Care | 9.6 | |||
Business Equipment and Services | 7.3 | |||
Chemicals and Plastics | 4.5 | |||
Insurance | 4.0 | |||
Building and Development | 4.0 | |||
Lodging and Casinos | 3.6 | |||
Telecommunications | 3.6 | |||
Drugs | 3.5 | |||
Cable and Satellite Television | 3.5 | |||
Total | 63.3 | % | ||
See Endnotes and Additional Disclosures in this report.
| 4 |
Eaton Vance
Floating-Rate 2022 Target Term Trust
June 30, 2021
The Fund’s Investment Objectives, Principal Strategies and Principal Risks9
Investment Objectives. The Fund’s investment objectives are high current income and to return $9.85 per share, the original net asset value per common share before deducting offering costs of $0.02 per common share (“Original NAV”), to holders of common shares of record on or about October 31, 2022 (the “Termination Date”). Although the Fund has an investment objective of returning Original NAV to common shareholders of record on or about the Termination Date, the Fund may not be successful in achieving this objective. The return of Original NAV is not an express or implied guarantee obligation of the Fund. See “Term Structure” below.
Principal Strategies. The Fund seeks to achieve its investment objectives by investing under normal circumstances at least 80% of its managed assets in senior floating-rate loans (“Senior Loans”) of any maturity (“80% Policy”). Managed assets is the total assets of the Fund, minus the sum of its accrued liabilities (other than Fund liabilities incurred for the express purpose of creating leverage) (“Managed Assets”). As it nears the Termination Date, the Fund may deviate from its 80% Policy and invest in higher credit quality instruments with maturities extending beyond the Termination Date to seek to enhance the liquidity of its portfolio and reduce investment risk.
Senior Loans are made to U.S. and non-U.S. corporations, partnerships and other business entities which operate in various industries and geographical regions, including entities in emerging market countries. Senior Loans generally hold one of the most senior positions in the capital structure of a business entity (referred to as the “borrower” or “issuer”), are secured with first lien priority on specific collateral and have a claim on the assets and/or stock of the borrower that is senior to that held by unsecured creditors, subordinated debt holders and stockholders of the borrower. Senior Loans held by the Fund typically have a dollar weighted average period until the next interest rate adjustment of approximately 90 days or less.
Loans are typically rated below investment grade (i.e., rated lower than BBB- by S&P Global Ratings (“S&P”). The Fund’s investments in below investment grade securities are commonly referred to as “junk” or “high yield” investments and are considered speculative with respect to the issuer’s capacity to pay interest and repay principal. Under normal market conditions, no more than 15% of the Fund’s Managed Assets may be invested in securities rated CCC+ or lower by S&P or Fitch Ratings, or Caa1 or lower by Moody’s Investor Services, Inc. at time of purchase, or comparably rated by another nationally recognized statistical rating organization or, if unrated, determined by the Fund’s investment adviser to be of comparable credit quality.
The Fund may use certain credit derivatives to take on additional credit risk and obtain exposure to Senior Loans. The Fund’s use of total return swaps, credit default swaps (including credit default swaps on high yield bonds or high yield bond indices) and other derivative transactions other than for hedging purposes, as measured by the total notional amount of such instruments, will not exceed 20% of the Fund’s Managed Assets. The Fund may also use certain derivatives for hedging purposes (e.g., to hedge credit risk, foreign currency risk or interest rate risk). Such derivatives include futures contracts and options thereon, foreign currency exchange contracts and other currency hedging strategies, and interest rate swaps. There is no limit on the use of derivatives for hedging purposes.
Under normal conditions, the Fund may invest up to 20% of its Managed Assets in (1) income producing securities (including, without limitation, U.S. government and U.S. government agency backed debt securities and investment grade and below investment grade corporate debt securities
(commonly referred to as “junk” or “high yield” securities, collectively “High Yield Bonds”)), (2) loan interests that have a lower than first lien priority on collateral or that are not secured by any specific collateral of the borrower (“Junior Loans”), (3) warrants and equity securities, including common stock and preferred stock, issued by a borrower or its affiliates and (4) investment companies. The longest maturity for any high yield securities in which the Fund invests will be not more than six months beyond the Termination Date. The Fund will not invest more than 5% of its Managed Assets in securities issued by a single issuer, other than securities issued by the U.S. government.
The Fund employs leverage to seek opportunities for additional income. Leverage may amplify the effect on the Fund’s NAV of any increase or decrease in the value of investments held. There can be no assurance that the use of borrowings will be successful. The Fund has issued preferred shares and borrowed to establish leverage. Investments in derivative instruments may result in economic leverage for the Fund.
Term Structure. In accordance with its Declaration of Trust, the Fund will terminate at the close of business on or about the Termination Date. The Fund intends, on or about the Termination Date, to cease its investment operations, liquidate its portfolio (to the extent possible), retire or redeem its leverage facilities, and distribute all its liquidated net assets to common shareholders of record. However, if the Fund’s Board of Trustees determines it is in the best interest of the shareholders to do so, upon provision of at least 60 days’ prior written notice to shareholders but without shareholder approval, the Fund’s term may be extended, and the Termination Date deferred, for one period of up to twelve months and one period of up to six months by a vote of the Board of Trustees.
Principal Risks
Market Risk. The value of investments held by the Fund may increase or decrease in response to economic, political, financial, public health crises (such as epidemics or pandemics) or other disruptive events (whether real, expected or perceived) in the U.S. and global markets. These events may negatively impact broad segments of businesses and populations and may exacerbate pre-existing risks to the Fund. The frequency and magnitude of resulting changes in the value of the Fund’s investments cannot be predicted. Certain securities and other investments held by the Fund may experience increased volatility, illiquidity, or other potentially adverse effects in reaction to changing market conditions. Monetary and/or fiscal actions taken by U.S. or foreign governments to stimulate or stabilize the global economy may not be effective and could lead to high market volatility. No active trading market may exist for certain investments held by the Fund, which may impair the ability of the Fund to sell or to realize the current valuation of such investments in the event of the need to liquidate such assets.
Five Year Term Risk. Because the assets of the Fund will be liquidated in connection with its termination, the Fund may be required to sell portfolio securities when it otherwise would not, including at times when market conditions are not favorable, or at a time when a particular security is in default or bankruptcy, or otherwise in severe distress, which may cause the Fund to lose money. Expenses associated with liquidation of the Fund’s assets may also be substantial during this period. In addition, during the life of the Fund, the value of the Fund’s assets could change significantly, and the Fund could incur substantial losses prior to or at liquidation. Although the Fund has an investment objective of returning Original NAV to common shareholders of record on or about the Termination Date, the Fund
See Endnotes and Additional Disclosures in this report.
| 5 |
Eaton Vance
Floating-Rate 2022 Target Term Trust
June 30, 2021
The Fund’s Investment Objectives, Principal Strategies and Principal Risks9 — continued
may not be successful in achieving this objective. The return of Original NAV is not an express or implied guarantee obligation of the Fund. There can be no assurance that the Fund will be able to return Original NAV to shareholders of record, and such return is not backed or otherwise guaranteed by the adviser or any other entity.
The Fund’s ability to return Original NAV to common shareholders of record on or about the Termination Date will depend on market conditions, the presence or absence of defaulted or distressed securities in the Fund’s portfolio that may prevent those securities from being sold in a timely manner at a reasonable price, and the performance of the Fund’s portfolio investments and cash flow management. The Fund currently intends to set aside and retain in its net assets (and therefore its NAV) a portion of its net investment income, and possibly all or a portion of its gains, in pursuit of its objective to return Original NAV to shareholders upon termination. This will reduce the amounts otherwise available for distribution prior to the liquidation of the Fund. In addition, the Fund’s investment in higher quality and lower yielding securities, especially as the Fund nears its Termination Date, may reduce investment income and, therefore, the monthly dividends during the period closely prior to termination. To the extent that lower distribution rates may negatively impact common share price, such reduced yield and monthly dividends may cause a reduction of common share price. The Fund may invest less than 80% of its Managed Assets in Senior Loans shortly prior to the original Termination Date and during any extension of the Termination Date. During such time, the Fund may not earn as much income as it would in Senior Loans.
Credit Risk. Investments in fixed income and other debt obligations, including loans, (referred to below as “debt instruments”) are subject to the risk of non-payment of scheduled principal and interest. Changes in economic conditions or other circumstances may reduce the capacity of the party obligated to make principal and interest payments on such instruments and may lead to defaults. Such non-payments and defaults may reduce the value of Fund shares and income distributions. The value of debt instruments also may decline because of concerns about the issuer’s ability to make principal and interest payments. In addition, the credit ratings of debt instruments may be lowered if the financial condition of the party obligated to make payments with respect to such instruments deteriorates. In the event of bankruptcy of the issuer of a debt instrument, the Fund could experience delays or limitations with respect to its ability to realize the benefits of any collateral securing the instrument. In order to enforce its rights in the event of a default, bankruptcy or similar situation, the Fund may be required to retain legal or similar counsel, which may increase the Fund’s operating expenses and adversely affect net asset value. Due to their lower place in the borrower’s capital structure, Junior Loans involve a higher degree of overall risk than Senior Loans to the same borrower.
Additional Risks of Loans. Loans are traded in a private, unregulated inter-dealer or inter-bank resale market and are generally subject to contractual restrictions that must be satisfied before a loan can be bought or sold. These restrictions may impede the Fund’s ability to buy or sell loans (thus affecting their liquidity) and may negatively impact the transaction price. See also “Market Risk” above. It also may take longer than seven days for transactions in loans to settle. The types of covenants included in loan agreements generally vary depending on market conditions, the creditworthiness of the issuer, the nature of the collateral securing the loan and possibly other factors. Loans with fewer covenants that restrict activities of the borrower may provide the borrower with more flexibility to
take actions that may be detrimental to the loan holders and provide fewer investor protections in the event of such actions or if covenants are breached. The Fund may experience relatively greater realized or unrealized losses or delays and expense in enforcing its rights with respect to loans with fewer restrictive covenants. Loans to entities located outside of the U.S. may have substantially different lender protections and covenants as compared to loans to U.S. entities and may involve greater risks. The Fund may have difficulties and incur expense enforcing its rights with respect to non-U.S. loans and such loans could be subject to bankruptcy laws that are materially different than in the U.S. Loans may be structured such that they are not securities under securities law, and in the event of fraud or misrepresentation by a borrower, lenders may not have the protection of the anti-fraud provisions of the federal securities laws. Loans are also subject to risks associated with other types of income investments, including credit risk and risks of lower rated investments.
Lower Rated Investments Risk. Investments rated below investment grade and comparable unrated investments (sometimes referred to as “junk”) have speculative characteristics because of the credit risk associated with their issuers. Changes in economic conditions or other circumstances typically have a greater effect on the ability of issuers of lower rated investments to make principal and interest payments than they do on issuers of higher rated investments. An economic downturn generally leads to a higher non-payment rate, and a lower rated investment may lose significant value before a default occurs. Lower rated investments typically are subject to greater price volatility and illiquidity than higher rated investments.
Interest Rate Risk. In general, the value of debt instruments will fluctuate based on changes in interest rates. The value of these securities is likely to increase when interest rates fall and decline when interest rates rise. Duration measures the time-weighted expected cash flows of a fixed-income security, while maturity refers to the amount of time until a fixed-income security matures. Generally, securities with longer durations or maturities are more sensitive to changes in interest rates than securities with shorter durations or maturities, causing them to be more volatile. Conversely, fixed-income securities with shorter durations or maturities will be less volatile but may provide lower returns than fixed-income securities with longer durations or maturities. The impact of interest rate changes is significantly less for floating-rate instruments that have relatively short periodic rate resets (e.g., ninety days or less). In a rising interest rate environment, the duration of income securities that have the ability to be prepaid or called by the issuer may be extended. In a declining interest rate environment, the proceeds from prepaid or maturing instruments may have to be reinvested at a lower interest rate.
LIBOR Risk. The London Interbank Offered Rate or LIBOR is used throughout global banking and financial industries to determine interest rates for a variety of financial instruments (such as debt instruments and derivatives) and borrowing arrangements. The ICE Benchmark Administration Limited, the administrator of LIBOR, is expected to cease publishing certain LIBOR settings on December 31, 2021, and the remaining LIBOR settings on June 30, 2023. The Fund has exposure to LIBOR-based instruments. Although the transition process away from LIBOR is expected to be defined in advance of the anticipated discontinuation, there remains uncertainty regarding the future utilization of LIBOR and the nature of any replacement rate or rates. The transition process may involve, among other things, increased volatility or illiquidity in markets for instruments that currently rely on LIBOR, such as floating-rate
See Endnotes and Additional Disclosures in this report.
| 6 |
Eaton Vance
Floating-Rate 2022 Target Term Trust
June 30, 2021
The Fund’s Investment Objectives, Principal Strategies and Principal Risks9 — continued
debt obligations. Since the usefulness of LIBOR as a benchmark could deteriorate during the transition period, these effects may occur prior to the discontinuation date. Any such effects of the transition away from LIBOR and the adoption of alternative reference rates, as well as other unforeseen effects, could result in losses to the Fund.
Leverage Risk. Leverage, including leverage from the issuance of preferred shares and borrowings, creates risks, including the likelihood of greater volatility of NAV and market price of, and distributions from, the common shares and the risk that fluctuations in dividend rates on preferred shares and in the costs of borrowings may affect the return to common shareholders. To the extent the income derived from investments purchased with funds received from leverage exceeds the cost of leverage, the Fund’s distributions will be greater than if leverage had not been used. Conversely, if the income from the investments purchased with such funds is not sufficient to cover the cost of leverage, the amount of income available for distribution to common shareholders will be less than if leverage had not been used. In the latter case, the investment adviser, may nevertheless determine to maintain the Fund’s leveraged position if it deems such action to be appropriate. While the Fund has preferred shares or borrowings outstanding, an increase in short-term rates would also result in an increased cost of leverage, which would adversely affect the Fund’s income available for distribution. In connection with its borrowings and preferred shares, the Fund will be required to maintain specified asset coverage by applicable federal securities laws and (as applicable) the terms of the preferred shares and its credit facility. The Fund may be required to dispose of portfolio investments on unfavorable terms if market fluctuations or other factors cause the required asset coverage to be less than the prescribed amount. There can be no assurance that a leveraging strategy will be successful.
Foreign Investment Risk. Foreign investments can be adversely affected by political, economic and market developments abroad, including the imposition of economic and other sanctions by the United States or another country. There may be less publicly available information about foreign issuers because they may not be subject to reporting practices, requirements or regulations comparable to those to which U.S. companies are subject. Foreign markets may be smaller, less liquid and more volatile than the major markets in the United States, and as a result, Fund share values may be more volatile. Trading in foreign markets typically involves higher expense than trading in the United States. The Fund may have difficulties enforcing its legal or contractual rights in a foreign country.
Emerging Markets Investment Risk. Investment markets within emerging market countries are typically smaller, less liquid, less developed and more volatile than those in more developed markets like the United States, and may be focused in certain sectors. Emerging market securities often involve greater risks than developed market securities. The information available about an emerging market issuer may be less reliable than for comparable issuers in more developed capital markets.
Currency Risk. Exchange rates for currencies fluctuate daily. The value of foreign investments may be affected favorably or unfavorably by changes in currency exchange rates in relation to the U.S. dollar. Currency markets generally are not as regulated as securities markets and currency transactions are subject to settlement, custodial and other operational risks.
Derivatives Risk. The Fund’s exposure to derivatives involves risks different from, or possibly greater than, the risks associated with investing directly in securities and other investments. The use of derivatives can lead to losses
because of adverse movements in the price or value of the security, instrument, index, currency, commodity, economic indicator or event underlying a derivative (“reference instrument”), due to failure of a counterparty or due to tax or regulatory constraints. Derivatives may create leverage in the Fund, which represents a non-cash exposure to the underlying reference instrument. Leverage can increase both the risk and return potential of the Fund. Derivatives risk may be more significant when derivatives are used to enhance return or as a substitute for a cash investment position, rather than solely to hedge the risk of a position held by the Fund. Use of derivatives involves the exercise of specialized skill and judgment, and a transaction may be unsuccessful in whole or in part because of market behavior or unexpected events. Changes in the value of a derivative (including one used for hedging) may not correlate perfectly with the underlying reference instrument. Derivative instruments traded in over-the-counter markets may be difficult to value, may be illiquid, and may be subject to wide swings in valuation caused by changes in the value of the underlying reference instrument. If a derivative’s counterparty is unable to honor its commitments, the value of Fund shares may decline and the Fund could experience delays in the return of collateral or other assets held by the counterparty. The loss on derivative transactions may substantially exceed the initial investment, particularly when there is no stated limit on the Fund’s use of derivatives. A derivative investment also involves the risks relating to the reference instrument underlying the investment.
U.S. Government Securities Risk. Although certain U.S. Government sponsored agencies (such as the Federal Home Loan Mortgage Corporation and the Federal National Mortgage Association) may be chartered or sponsored by acts of Congress, their securities are neither issued nor guaranteed by the U.S. Treasury. U.S. Treasury securities generally have a lower return than other obligations because of their higher credit quality and market liquidity.
Equity Securities Risk. The value of equity securities and related instruments may decline in response to adverse changes in the economy or the economic outlook; deterioration in investor sentiment; interest rate, currency, and commodity price fluctuations; adverse geopolitical, social or environmental developments; issuer and sector-specific considerations; unexpected trading activity among retail investors; or other factors. Market conditions may affect certain types of stocks to a greater extent than other types of stocks. If the stock market declines in value, the value of the Fund’s equity securities will also likely decline. Although prices can rebound, there is no assurance that values will return to previous levels.
Liquidity Risk. The Fund is exposed to liquidity risk when trading volume, lack of a market maker or trading partner, large position size, market conditions, or legal restrictions impair its ability to sell particular investments or to sell them at advantageous market prices. Consequently, the Fund may have to accept a lower price to sell an investment or continue to hold it or keep the position open, sell other investments to raise cash or abandon an investment opportunity, any of which could have a negative effect on the Fund’s performance. These effects may be exacerbated during times of financial or political stress.
Market Discount Risk. The shares of closed-end management investment companies often trade at a discount from their NAV, and the common shares may likewise trade at a discount from NAV. This risk is separate and distinct from the risk that the Fund’s NAV could decrease as a result of its investment activities. The trading price of the Fund’s common shares may be less than the public offering price.
See Endnotes and Additional Disclosures in this report.
| 7 |
Eaton Vance
Floating-Rate 2022 Target Term Trust
June 30, 2021
The Fund’s Investment Objectives, Principal Strategies and Principal Risks9 — continued
Risks Associated with Active Management. The success of the Fund’s investment strategy depends on portfolio management’s successful application of analytical skills and investment judgment. Active management involves subjective decisions.
Recent Market Conditions. An outbreak of respiratory disease caused by a novel coronavirus was first detected in China in late 2019 and subsequently spread internationally. This coronavirus has resulted in closing borders, enhanced health screenings, changes to healthcare service preparation and delivery, quarantines, cancellations, disruptions to supply chains and customer activity, as well as general concern and uncertainty. The impact of this coronavirus has resulted in a substantial economic downturn, which may continue for an extended period of time. Health crises caused by outbreaks of disease, such as the coronavirus outbreak, may exacerbate other pre-existing political, social and economic risks and disrupt normal market conditions and operations. The impact of this outbreak has negatively affected the worldwide economy, as well as the economies of individual countries and industries, and could continue to affect the market in significant and unforeseen ways. Other epidemics and pandemics that may arise in the future may have similar effects. For example, a global pandemic or other widespread health crisis could cause substantial market volatility and exchange trading suspensions and closures. In addition, the increasing interconnectedness of markets around the world may result in many markets being affected by events or conditions in a single country or region or events affecting a single or small number of issuers. The coronavirus outbreak and public and private sector responses thereto have led to large portions of the populations of many countries working from home for indefinite periods of time, temporary or permanent layoffs, disruptions in supply chains, and lack of availability of certain goods. The impact of such responses could adversely affect the information technology and operational systems upon which the Fund and the Fund’s service providers rely, and could otherwise disrupt the ability of the employees of the Fund’s service providers to perform critical tasks relating to the Fund. Any such impact could adversely affect the Fund’s performance, or the performance of the securities in which the Fund invests and may lead to losses on your investment in the Fund.
Cybersecurity Risk. With the increased use of technologies by Fund service providers to conduct business, such as the Internet, the Fund is susceptible to operational, information security and related risks. In general, cyber incidents can result from deliberate attacks or unintentional events. Cybersecurity failures by or breaches of the Fund’s investment adviser or administrator and other service providers (including, but not limited to, the custodian or transfer agent), and the issuers of securities in which the Fund invests, have the ability to cause disruptions and impact business operations potentially resulting in financial losses, interference with the Fund’s ability to calculate its net asset value, impediments to trading, the inability of Fund shareholders to transact business, violations of applicable privacy and other laws, regulatory fines, penalties, reputational damage, reimbursement or other compensation costs, or additional compliance costs.
General Fund Investing Risks. The Fund is not a complete investment program and there is no guarantee that the Fund will achieve its investment objective. It is possible to lose money by investing in the Fund. An investment in the Fund is not a deposit in a bank and is not insured or guaranteed by the Federal Deposit Insurance Corporation or any other government agency.
See Endnotes and Additional Disclosures in this report.
| 8 |
Eaton Vance
Floating-Rate 2022 Target Term Trust
June 30, 2021
Endnotes and Additional Disclosures
| 1 | The views expressed in this report are those of the portfolio manager(s) and are current only through the date stated at the top of this page. These views are subject to change at any time based upon market or other conditions, and Eaton Vance and the Fund(s) disclaim any responsibility to update such views. These views may not be relied upon as investment advice and, because investment decisions are based on many factors, may not be relied upon as an indication of trading intent on behalf of any Eaton Vance fund. This commentary may contain statements that are not historical facts, referred to as “forward-looking statements.” The Fund’s actual future results may differ significantly from those stated in any forward-looking statement, depending on factors such as changes in securities or financial markets or general economic conditions, the volume of sales and purchases of Fund shares, the continuation of investment advisory, administrative and service contracts, and other risks discussed from time to time in the Fund’s filings with the Securities and Exchange Commission. |
| 2 | S&P/LSTA Leveraged Loan Index is an unmanaged index of the institutional leveraged loan market. S&P/LSTA Leveraged Loan indices are a product of S&P Dow Jones Indices LLC (“S&P DJI”) and have been licensed for use. S&P® is a registered trademark of S&P DJI; Dow Jones® is a registered trademark of Dow Jones Trademark Holdings LLC (“Dow Jones”); LSTA is a trademark of Loan Syndications and Trading Association, Inc. S&P DJI, Dow Jones, their respective affiliates and their third party licensors do not sponsor, endorse, sell or promote the Fund, will not have any liability with respect thereto and do not have any liability for any errors, omissions, or interruptions of the S&P Dow Jones Indices. Unless otherwise stated, index returns do not reflect the effect of any applicable sales charges, commissions, expenses, taxes or leverage, as applicable. It is not possible to invest directly in an index. |
| 3 | Performance results reflect the effects of leverage. Performance since inception for an index, if presented, is the performance since the Fund’s or oldest share class’ inception, as applicable. |
| 4 | The shares of the Fund often trade at a discount or premium to their net asset value. The discount or premium may vary over time and may be higher or lower than what is quoted in this report. For up-to-date premium/discount information, please refer to https://funds.eatonvance.com/closed-end-fund-prices.php. |
| 5 | The Distribution Rate is based on the Fund’s last regular distribution per share in the period (annualized) divided by the Fund’s NAV or market price at the end of the period. The Fund’s distributions may be comprised of amounts characterized for federal income tax purposes as qualified and non-qualified ordinary dividends, capital gains and nondividend distributions, also known as return of capital. For additional information about nondividend distributions, please refer to Eaton Vance Closed-End Fund Distribution Notices (19a) posted on our website, eatonvance. com. The Fund will determine the federal income tax character of distributions paid to a shareholder after the end of the calendar year. This is reported on the IRS form 1099-DIV and provided to the shareholder shortly after each year-end. For information about the tax character of distributions made in prior calendar years, please refer to Performance-Tax Character of Distributions on the Fund’s webpage available at eatonvance.com. The Fund’s distributions are determined by the investment adviser based on its current assessment of the Fund’s long-term return potential. |
| Fund distributions may be affected by numerous factors including changes in Fund performance, the cost of financing for leverage, portfolio holdings, realized and projected returns, and other factors. As portfolio and market conditions change, the rate of distributions paid by the Fund could change. |
| 6 | Leverage represents the liquidation value of the Fund’s VRTP Shares and borrowings outstanding as a percentage of Fund net assets applicable to common shares plus VRTP Shares and borrowings outstanding. Use of leverage creates an opportunity for income, but creates risks including greater price volatility. The cost of leverage rises and falls with changes in short-term interest rates. The Fund may be required to maintain prescribed asset coverage for its leverage and may be required to reduce its leverage at an inopportune time. |
| 7 | Excludes cash and cash equivalents. |
| 8 | Credit ratings are categorized using S&P Global Ratings (“S&P”). Ratings, which are subject to change, apply to the creditworthiness of the issuers of the underlying securities and not to the Fund or its shares. Credit ratings measure the quality of a bond based on the issuer’s creditworthiness, with ratings ranging from AAA, being the highest, to D, being the lowest based on S&P’s measures. Ratings of BBB or higher by S&P are considered to be investment-grade quality. Credit ratings are based largely on the ratings agency’s analysis at the time of rating. The rating assigned to any particular security is not necessarily a reflection of the issuer’s current financial condition and does not necessarily reflect its assessment of the volatility of a security’s market value or of the liquidity of an investment in the security. Holdings designated as “Not Rated” (if any) are not rated by S&P. |
| 9 | The information contained herein is provided for informational purposes only and does not constitute a solicitation of an offer to buy or sell Fund shares. Common shares of the Fund are available for purchase and sale only at current market prices in secondary market trading. There is no assurance that the Fund will achieve its investment objective. The Fund is subject to numerous risks, including investment risks. Shares of closed-end funds often trade at a discount from their NAV. The Fund is not a complete investment program and you may lose money investing in the Fund. |
Fund profile subject to change due to active management.
| 9 |
Eaton Vance
Floating-Rate 2022 Target Term Trust
June 30, 2021
| Common Stocks — 0.1% |
| |||||||
| Security | Shares | Value | ||||||
| Telecommunications — 0.1% | ||||||||
GEE Acquisition Holdings Corp.(1)(2)(3) | 12,919 | $ | 264,581 | |||||
Total Common Stocks |
| $ | 264,581 | |||||
| Corporate Bonds — 5.7% |
| |||||||
| Security | Principal Amount (000’s omitted) | Value | ||||||
| Aerospace and Defense — 0.3% | ||||||||
American Airlines Group, Inc., 5.00%, 6/1/22(4) | $ | 500 | $ | 501,260 | ||||
United Airlines Holdings, Inc., 4.25%, 10/1/22 | 250 | 256,250 | ||||||
| $ | 757,510 | |||||||
| Automotive — 0.3% | ||||||||
ZF North America Capital, Inc., 4.50%, | $ | 545 | $ | 559,007 | ||||
| $ | 559,007 | |||||||
| Building and Development — 0.2% | ||||||||
Taylor Morrison Communities, Inc./Taylor Morrison Holdings II, Inc., 5.875%, 4/15/23(4) | $ | 500 | $ | 535,623 | ||||
| $ | 535,623 | |||||||
| Cable and Satellite Television — 0.4% | ||||||||
CSC Holdings, LLC, 5.875%, 9/15/22 | $ | 925 | $ | 973,595 | ||||
| $ | 973,595 | |||||||
| Financial Intermediaries — 1.5% | ||||||||
Ally Financial, Inc., 4.625%, 5/19/22 | $ | 1,000 | $ | 1,036,042 | ||||
Ford Motor Credit Co., LLC: | ||||||||
3.087%, 1/9/23 | 925 | 944,656 | ||||||
5.875%, 8/2/21 | 321 | 323,038 | ||||||
Navient Corp., 5.50%, 1/25/23 | 1,007 | 1,063,357 | ||||||
| $ | 3,367,093 | |||||||
| Food/Drug Retailers — 0.0%(5) | ||||||||
Safeway, Inc., 4.75%, 12/1/21 | $ | 9 | $ | 9,137 | ||||
| $ | 9,137 | |||||||
| Internet Software & Services — 0.5% | ||||||||
Netflix, Inc., 5.50%, 2/15/22 | $ | 1,000 | $ | 1,027,695 | ||||
| $ | 1,027,695 | |||||||
| Security | Principal Amount (000’s omitted) | Value | ||||||
| Lodging and Casinos — 0.2% | ||||||||
MGM Resorts International, 6.00%, 3/15/23 | $ | 310 | $ | 332,219 | ||||
| $ | 332,219 | |||||||
| Oil and Gas — 0.5% | ||||||||
Energy Transfer, L.P., 4.25%, 3/15/23 | $ | 1,000 | $ | 1,049,690 | ||||
| $ | 1,049,690 | |||||||
| Real Estate Investment Trusts (REITs) — 0.4% | ||||||||
Service Properties Trust, 5.00%, 8/15/22 | $ | 770 | $ | 779,625 | ||||
| $ | 779,625 | |||||||
| Surface Transport — 0.5% | ||||||||
DAE Funding, LLC, 5.25%, 11/15/21(4) | $ | 1,000 | $ | 1,008,710 | ||||
| $ | 1,008,710 | |||||||
| Telecommunications — 0.7% | ||||||||
Sprint Communications, Inc., 6.00%, 11/15/22 | $ | 1,500 | $ | 1,590,000 | ||||
| $ | 1,590,000 | |||||||
| Utilities — 0.2% | ||||||||
TerraForm Power Operating, LLC, 4.25%, 1/31/23(4) | $ | 525 | $ | 539,514 | ||||
| $ | 539,514 | |||||||
Total Corporate Bonds |
| $ | 12,529,418 | |||||
| Senior Floating-Rate Loans — 141.2%(6) |
| |||||||
| Borrower/Description | Principal Amount (000’s omitted) | Value | ||||||
| Aerospace and Defense — 2.6% | ||||||||
AI Convoy (Luxembourg) S.a.r.l., Term Loan, 4.50%, (USD LIBOR + 3.50%, Floor 1.00%), 1/17/27(7) | $ | 271 | $ | 271,002 | ||||
Dynasty Acquisition Co., Inc.: | ||||||||
Term Loan, 3.647%, (3 mo. USD LIBOR + 3.50%), 4/6/26 | 354 | 344,905 | ||||||
Term Loan, 3.647%, (3 mo. USD LIBOR + 3.50%), 4/6/26 | 658 | 641,524 | ||||||
Spirit Aerosystems, Inc., Term Loan, 6.00%, (1 mo. USD LIBOR + 5.25%, Floor 0.75%), 1/15/25 | 174 | 175,757 | ||||||
| 10 | See Notes to Financial Statements. |
Eaton Vance
Floating-Rate 2022 Target Term Trust
June 30, 2021
Portfolio of Investments — continued
| Borrower/Description | Principal Amount (000’s omitted) | Value | ||||||
| Aerospace and Defense (continued) | ||||||||
TransDigm, Inc.: | ||||||||
Term Loan, 2.354%, (1 mo. USD LIBOR + 2.25%), 8/22/24 | $ | 1,183 | $ | 1,170,462 | ||||
Term Loan, 2.354%, (1 mo. USD LIBOR + 2.25%), 12/9/25 | 2,881 | 2,841,906 | ||||||
WP CPP Holdings, LLC, Term Loan, 4.75%, (3 mo. USD LIBOR + 3.75%, Floor 1.00%), 4/30/25 | 244 | 238,912 | ||||||
| $ | 5,684,468 | |||||||
| Air Transport — 0.5% | ||||||||
Mileage Plus Holdings, LLC, Term Loan, 6.25%, (3 mo. USD LIBOR + 5.25%, Floor 1.00%), 6/21/27 | $ | 300 | $ | 320,649 | ||||
SkyMiles IP, Ltd., Term Loan, 4.75%, (3 mo. USD LIBOR + 3.75%, Floor 1.00%), 10/20/27 | 825 | 872,334 | ||||||
| $ | 1,192,983 | |||||||
| Automotive — 4.9% | ||||||||
Adient US, LLC, Term Loan, 3.604%, (1 mo. USD LIBOR + 3.50%), 4/8/28 | $ | 375 | $ | 375,977 | ||||
Autokiniton US Holdings, Inc., Term Loan, 5.00%, (3 mo. USD LIBOR + 4.50%, Floor 0.50%), 4/6/28 | 500 | 504,063 | ||||||
Belron Finance US, LLC, Term Loan, 3.25%, (3 mo. USD LIBOR + 2.75%, Floor 0.50%), 4/13/28 | 349 | 348,398 | ||||||
Bright Bidco B.V., Term Loan, 4.50%, (USD LIBOR + 3.50%, Floor 1.00%), 6/30/24(7) | 731 | 614,840 | ||||||
Chassix, Inc., Term Loan, 6.50%, (USD LIBOR + 5.50%, Floor 1.00%), 11/15/23(7) | 241 | 240,144 | ||||||
Clarios Global, L.P., Term Loan, 3.354%, (1 mo. USD LIBOR + 3.25%), 4/30/26 | 1,295 | 1,285,661 | ||||||
Garrett LX I S.a.r.l., Term Loan, 3.75%, (3 mo. USD LIBOR + 3.00%, Floor 0.75%), 4/30/28 | 275 | 276,547 | ||||||
Gates Global, LLC, Term Loan, 3.50%, (1 mo. USD LIBOR + 2.75%, Floor 0.75%), 3/31/27 | 2,323 | 2,321,426 | ||||||
Les Schwab Tire Centers, Term Loan, 4.25%, (6 mo. USD LIBOR + 3.50%, Floor 0.75%), 11/2/27 | 2,042 | 2,047,349 | ||||||
MajorDrive Holdings IV, LLC, Term Loan, 4.50%, (3 mo. USD LIBOR + 4.00%, Floor 0.50%), 5/12/28 | 250 | 250,664 | ||||||
Tenneco, Inc., Term Loan, 3.104%, (1 mo. USD LIBOR + 3.00%), 10/1/25 | 1,389 | 1,378,607 | ||||||
Thor Industries, Inc., Term Loan, 3.125%, (1 mo. USD LIBOR + 3.00%), 2/1/26 | 409 | 409,773 | ||||||
Truck Hero, Inc., Term Loan, 4.50%, (1 mo. USD LIBOR + 3.75%, Floor 0.75%), 1/31/28 | 474 | 474,471 | ||||||
Wheel Pros, LLC, Term Loan, 5.25%, (1 mo. USD LIBOR + 4.50%, Floor 0.75%), 4/23/28 | 325 | 326,196 | ||||||
| $ | 10,854,116 | |||||||
| Borrower/Description | Principal Amount (000’s omitted) | Value | ||||||
| Beverage and Tobacco — 0.3% | ||||||||
Arterra Wines Canada, Inc., Term Loan, 4.25%, (3 mo. USD LIBOR + 3.50%, Floor 0.75%), 11/24/27 | $ | 398 | $ | 399,306 | ||||
City Brewing Company, LLC, Term Loan, 4.25%, (3 mo. USD LIBOR + 3.50%, Floor 0.75%), 4/5/28 | 325 | 326,625 | ||||||
| $ | 725,931 | |||||||
| Brokerage/Securities Dealers/Investment Houses — 0.6% | ||||||||
Advisor Group, Inc., Term Loan, 4.604%, (1 mo. USD LIBOR + 4.50%), 7/31/26 | $ | 419 | $ | 420,076 | ||||
Hudson River Trading, LLC, Term Loan, 3.104%, (1 mo. USD LIBOR + 3.00%), 3/20/28 | 823 | 821,051 | ||||||
| $ | 1,241,127 | |||||||
| Building and Development — 5.7% | ||||||||
ACProducts, Inc., Term Loan, 4.75%, (6 mo. USD LIBOR + 4.25%, Floor 0.50%), 5/5/28 | $ | 750 | $ | 747,422 | ||||
Advanced Drainage Systems, Inc., Term Loan, 2.375%, (1 mo. USD LIBOR + 2.25%), 7/31/26 | 78 | 78,875 | ||||||
Aegion Corporation, Term Loan, 5.50%, (3 mo. USD LIBOR + 4.75%, Floor 0.75%), 5/17/28 | 200 | 202,500 | ||||||
American Builders & Contractors Supply Co., Inc., Term Loan, 2.104%, (1 mo. USD LIBOR + 2.00%), 1/15/27 | 933 | 927,753 | ||||||
American Residential Services, LLC, Term Loan, 4.25%, (3 mo. USD LIBOR + 3.50%, Floor 0.75%), 10/15/27 | 224 | 224,015 | ||||||
APi Group DE, Inc., Term Loan, 2.604%, (1 mo. USD LIBOR + 2.50%), 10/1/26 | 546 | 545,977 | ||||||
Brookfield Property REIT, Inc., Term Loan, 2.604%, (1 mo. USD LIBOR + 2.50%), 8/27/25 | 365 | 356,664 | ||||||
Core & Main L.P., Term Loan, 3.75%, (USD LIBOR + 2.75%, Floor 1.00%), 8/1/24(7) | 1,619 | 1,619,934 | ||||||
Cornerstone Building Brands, Inc., Term Loan, 3.75%, (1 mo. USD LIBOR + 3.25%, Floor 0.50%), 4/12/28 | 324 | 324,593 | ||||||
CP Atlas Buyer, Inc., Term Loan, 4.25%, (1 mo. USD LIBOR + 3.75%, Floor 0.50%), 11/23/27 | 474 | 473,220 | ||||||
Cushman & Wakefield U.S. Borrower, LLC, Term Loan, 2.854%, (1 mo. USD LIBOR + 2.75%), 8/21/25 | 2,145 | 2,130,326 | ||||||
Foundation Building Materials Holding Company, LLC, Term Loan, 3.75%, (3 mo. USD LIBOR + 3.25%, Floor 0.50%), 2/3/28 | 475 | 472,370 | ||||||
MI Windows and Doors, LLC, Term Loan, 4.50%, (1 mo. USD LIBOR + 3.75%, Floor 0.75%), 12/18/27 | 174 | 174,814 | ||||||
Park River Holdings, Inc., Term Loan, 4.00%, (3 mo. USD LIBOR + 3.25%, Floor 0.75%), 12/28/27 | 250 | 249,037 | ||||||
Quikrete Holdings, Inc., Term Loan, 2.604%, (1 mo. USD LIBOR + 2.50%), 2/1/27 | 1,904 | 1,888,400 | ||||||
SRS Distribution, Inc., Term Loan, 4.25%, (1 mo. USD LIBOR + 3.75%, Floor 0.50%), 6/2/28 | 425 | 425,166 | ||||||
| 11 | See Notes to Financial Statements. |
Eaton Vance
Floating-Rate 2022 Target Term Trust
June 30, 2021
Portfolio of Investments — continued
| Borrower/Description | Principal Amount (000’s omitted) | Value | ||||||
| Building and Development (continued) | ||||||||
Werner FinCo L.P., Term Loan, 5.00%, (3 mo. USD LIBOR + 4.00%, Floor 1.00%), 7/24/24 | $ | 842 | $ | 844,595 | ||||
White Cap Buyer, LLC, Term Loan, 4.50%, (3 mo. USD LIBOR + 4.00%, Floor 0.50%), 10/19/27 | 871 | 872,937 | ||||||
| $ | 12,558,598 | |||||||
| Business Equipment and Services — 10.9% | ||||||||
Adtalem Global Education, Inc., Term Loan, 3.104%, (1 mo. USD LIBOR + 3.00%), 4/11/25 | $ | 146 | $ | 144,894 | ||||
AlixPartners, LLP, Term Loan, 3.25%, (1 mo. USD LIBOR + 2.75%, Floor 0.50%), 2/4/28 | 599 | 596,588 | ||||||
Allied Universal Holdco, LLC, Term Loan, 4.25%, (1 mo. USD LIBOR + 3.75%, Floor 0.50%), 5/12/28 | 1,308 | 1,313,939 | ||||||
Amentum Government Services Holdings, LLC, Term Loan, 3.604%, (1 mo. USD LIBOR + 3.50%), 1/29/27 | 371 | 370,786 | ||||||
AppLovin Corporation, Term Loan, 3.354%, (1 mo. USD LIBOR + 3.25%), 8/15/25 | 1,837 | 1,836,939 | ||||||
ASGN Incorporated, Term Loan, 1.854%, (1 mo. USD LIBOR + 1.75%), 4/2/25 | 104 | 104,612 | ||||||
Asplundh Tree Expert, LLC, Term Loan, 1.854%, (1 mo. USD LIBOR + 1.75%), 9/7/27 | 471 | 470,586 | ||||||
Belfor Holdings, Inc., Term Loan, 3.854%, (1 mo. USD LIBOR + 3.75%), 4/6/26 | 196 | 196,245 | ||||||
Bracket Intermediate Holding Corp., Term Loan, 4.444%, (3 mo. USD LIBOR + 4.25%), 9/5/25 | 340 | 340,517 | ||||||
Camelot U.S. Acquisition 1 Co.: | ||||||||
Term Loan, 3.104%, (1 mo. USD LIBOR + 3.00%), 10/30/26 | 714 | 712,340 | ||||||
Term Loan, 4.00%, (1 mo. USD LIBOR + 3.00%, Floor 1.00%), 10/30/26 | 448 | 448,534 | ||||||
CCC Information Services, Inc., Term Loan, 4.00%, (1 mo. USD LIBOR + 3.00%, Floor 1.00%), 4/29/24 | 2,403 | 2,405,620 | ||||||
Ceridian HCM Holding, Inc., Term Loan, 2.594%, (1 week USD LIBOR + 2.50%), 4/30/25 | 559 | 551,848 | ||||||
Deerfield Dakota Holding, LLC, Term Loan, 4.75%, (1 mo. USD LIBOR + 3.75%, Floor 1.00%), 4/9/27 | 792 | 796,686 | ||||||
EAB Global, Inc., Term Loan, 4.75%, (3 mo. USD LIBOR + 3.75%, Floor 1.00%), 11/15/24 | 532 | 532,291 | ||||||
Endure Digital, Inc., Term Loan, 4.25%, (3 mo. USD LIBOR + 3.50%, Floor 0.75%), 2/10/28 | 1,175 | 1,171,696 | ||||||
First Advantage Holdings, LLC, Term Loan, 2.854%, (1 mo. USD LIBOR + 2.75%), 1/31/27 | 257 | 256,270 | ||||||
Garda World Security Corporation, Term Loan, 4.35%, (1 mo. USD LIBOR + 4.25%), 10/30/26 | 532 | 535,566 | ||||||
Grab Holdings, Inc., Term Loan, 5.50%, (6 mo. USD LIBOR + 4.50%, Floor 1.00%), 1/29/26 | 898 | 915,705 | ||||||
Greeneden U.S. Holdings II, LLC, Term Loan, 4.75%, (1 mo. USD LIBOR + 4.00%, Floor 0.75%), 12/1/27 | 349 | 350,372 | ||||||
| Borrower/Description | Principal Amount (000’s omitted) | Value | ||||||
| Business Equipment and Services (continued) | ||||||||
IG Investment Holdings, LLC, Term Loan, 4.75%, (3 mo. USD LIBOR + 3.75%, Floor 1.00%), 5/23/25 | $ | 170 | $ | 170,309 | ||||
Intrado Corporation, Term Loan, 5.00%, (3 mo. USD LIBOR + 4.00%, Floor 1.00%), 10/10/24 | 344 | 337,219 | ||||||
IRI Holdings, Inc., Term Loan, 4.354%, (1 mo. USD LIBOR + 4.25%), 12/1/25 | 609 | 610,327 | ||||||
Iron Mountain, Inc., Term Loan, 1.854%, (1 mo. USD LIBOR + 1.75%), 1/2/26 | 339 | 332,699 | ||||||
Ivanti Software, Inc.: | ||||||||
Term Loan, 4.75%, (3 mo. USD LIBOR + 4.00%, Floor 0.75%), 12/1/27 | 274 | 273,541 | ||||||
Term Loan, 5.75%, (3 mo. USD LIBOR + 4.75%, Floor 1.00%), 12/1/27 | 1,047 | 1,049,993 | ||||||
KAR Auction Services, Inc., Term Loan, 2.375%, (1 mo. USD LIBOR + 2.25%), 9/19/26 | 246 | 243,476 | ||||||
KUEHG Corp., Term Loan, 4.75%, (3 mo. USD LIBOR + 3.75%, Floor 1.00%), 2/21/25 | 1,369 | 1,350,320 | ||||||
Loire Finco Luxembourg S.a.r.l., Term Loan, 3.104%, (1 mo. USD LIBOR + 3.00%), 4/21/27 | 124 | 121,950 | ||||||
Magnite, Inc., Term Loan, 5.75%, (3 mo. USD LIBOR + 5.00%, Floor 0.75%), 4/1/28 | 275 | 275,000 | ||||||
MedAssets Software Intermediate Holdings, Inc., Term Loan, 4.50%, (6 mo. USD LIBOR + 3.75%, Floor 0.75%), 1/28/28 | 175 | 175,109 | ||||||
Nielsen Consumer, Inc., Term Loan, 4.08%, (1 mo. USD LIBOR + 4.00%), 3/6/28 | 274 | 275,170 | ||||||
Packaging Coordinators Midco, Inc., Term Loan, 4.25%, (3 mo. USD LIBOR + 3.50%, Floor 0.75%), 11/30/27 | 474 | 474,760 | ||||||
Pike Corporation, Term Loan, 3.11%, (1 mo. USD LIBOR + 3.00%), 1/21/28 | 168 | 167,715 | ||||||
Prime Security Services Borrower, LLC, Term Loan, 3.50%, (USD LIBOR + 2.75%, Floor 0.75%), 9/23/26(7) | 993 | 993,105 | ||||||
Red Ventures, LLC, Term Loan, 2.604%, (1 mo. USD LIBOR + 2.50%), 11/8/24 | 297 | 293,074 | ||||||
Sabre GLBL, Inc., Term Loan, 4.75%, (1 mo. USD LIBOR + 4.00%, Floor 0.75%), 12/17/27 | 149 | 150,509 | ||||||
Skopima Merger Sub, Inc., Term Loan, 4.50%, (1 mo. USD LIBOR + 4.00%, Floor 0.50%), 4/30/28 | 425 | 425,000 | ||||||
SMG US Midco 2, Inc., Term Loan, 2.662%, (USD LIBOR + 2.50%), 1/23/25(7) | 97 | 93,954 | ||||||
Sotheby’s, Term Loan, 5.50%, (3 mo. USD LIBOR + 4.75%, Floor 0.75%), 1/15/27 | 246 | 247,984 | ||||||
Spin Holdco, Inc., Term Loan, 4.75%, (3 mo. USD LIBOR + 4.00%, Floor 0.75%), 3/1/28 | 1,671 | 1,673,945 | ||||||
Vestcom Parent Holdings, Inc., Term Loan, 5.00%, (1 mo. USD LIBOR + 4.00%, Floor 1.00%), 12/19/23 | 99 | 99,605 | ||||||
West Corporation, Term Loan, 4.50%, (3 mo. USD LIBOR + 3.50%, Floor 1.00%), 10/10/24 | 108 | 105,015 | ||||||
| $ | 23,991,813 | |||||||
| 12 | See Notes to Financial Statements. |
Eaton Vance
Floating-Rate 2022 Target Term Trust
June 30, 2021
Portfolio of Investments — continued
| Borrower/Description | Principal Amount (000’s omitted) | Value | ||||||
| Cable and Satellite Television — 4.8% | ||||||||
Altice France S.A.: | ||||||||
Term Loan, 3.871%, (3 mo. USD LIBOR + 3.69%), 1/31/26 | $ | 1,255 | $ | 1,246,435 | ||||
Term Loan, 4.155%, (3 mo. USD LIBOR + 4.00%), 8/14/26 | 490 | 489,848 | ||||||
Charter Communications Operating, LLC, Term Loan, 1.86%, (1 mo. USD LIBOR + 1.75%), 2/1/27 | 1,279 | 1,270,557 | ||||||
CSC Holdings, LLC: | ||||||||
Term Loan, 2.323%, (1 mo. USD LIBOR + 2.25%), 1/15/26 | 391 | 386,296 | ||||||
Term Loan, 2.573%, (1 mo. USD LIBOR + 2.50%), 4/15/27 | 463 | 459,677 | ||||||
Telenet Financing USD, LLC, Term Loan, 2.073%, (1 mo. USD LIBOR + 2.00%), 4/30/28 | 1,500 | 1,480,664 | ||||||
UPC Broadband Holding B.V., Term Loan, 2.323%, (1 mo. USD LIBOR + 2.25%), 4/30/28 | 325 | 321,460 | ||||||
UPC Financing Partnership, Term Loan, 3.073%, (1 mo. USD LIBOR + 3.00%), 1/31/29 | 1,275 | 1,268,890 | ||||||
Virgin Media Bristol, LLC: | ||||||||
Term Loan, 2.573%, (1 mo. USD LIBOR + 2.50%), 1/31/28 | 3,100 | 3,076,266 | ||||||
Term Loan, 3.353%, (1 mo. USD LIBOR + 3.25%), 1/31/29 | 475 | 474,814 | ||||||
| $ | 10,474,907 | |||||||
| Chemicals and Plastics — 6.8% | ||||||||
Aruba Investments, Inc., Term Loan, 4.75%, (6 mo. USD LIBOR + 4.00%, Floor 0.75%), 11/24/27 | $ | 299 | $ | 300,746 | ||||
Atotech B.V., Term Loan, 3.00%, (3 mo. USD LIBOR + 2.50%, Floor 0.50%), 3/18/28 | 400 | 398,438 | ||||||
Axalta Coating Systems US Holdings, Inc., Term Loan, 1.897%, (3 mo. USD LIBOR + 1.75%), 6/1/24 | 2,475 | 2,462,118 | ||||||
Charter NEX US, Inc., Term Loan, 4.50%, (1 mo. USD LIBOR + 3.75%, Floor 0.75%), 12/1/27 | 175 | 175,326 | ||||||
CPC Acquisition Corp., Term Loan, 3.897%, (3 mo. USD LIBOR + 3.75%), 12/29/27 | 299 | 299,437 | ||||||
Ferro Corporation: | ||||||||
Term Loan, 2.397%, (3 mo. USD LIBOR + 2.25%), 2/14/24 | 59 | 59,385 | ||||||
Term Loan, 2.397%, (3 mo. USD LIBOR + 2.25%), 2/14/24 | 61 | 60,676 | ||||||
Gemini HDPE, LLC, Term Loan, 3.50%, (3 mo. USD LIBOR + 3.00%, Floor 0.50%), 12/31/27 | 296 | 296,046 | ||||||
Hexion, Inc., Term Loan, 3.71%, (3 mo. USD LIBOR + 3.50%), 7/1/26 | 294 | 294,490 | ||||||
Illuminate Buyer, LLC, Term Loan, 3.604%, (1 mo. USD LIBOR + 3.50%), 6/30/27 | 323 | 321,827 | ||||||
| Borrower/Description | Principal Amount (000’s omitted) | Value | ||||||
| Chemicals and Plastics (continued) | ||||||||
INEOS Enterprises Holdings US Finco, LLC, Term Loan, 4.50%, (3 mo. USD LIBOR + 3.50%, Floor 1.00%), 8/28/26 | $ | 81 | $ | 81,062 | ||||
INEOS Styrolution US Holding, LLC, Term Loan, 3.25%, (1 mo. USD LIBOR + 2.75%, Floor 0.50%), 1/29/26 | 975 | 974,238 | ||||||
INEOS US Finance, LLC, Term Loan, 2.104%, (1 mo. USD LIBOR + 2.00%), 4/1/24 | 1,255 | 1,245,483 | ||||||
Lonza Group AG, Term Loan, 4/29/28(8) | 525 | 525,919 | ||||||
LSF11 Skyscraper Holdco S.a.r.l., Term Loan, 4.25%, (3 mo. USD LIBOR + 3.50%, Floor 0.75%), 9/29/27 | 324 | 325,403 | ||||||
Messer Industries GmbH, Term Loan, 2.647%, (3 mo. USD LIBOR + 2.50%), 3/1/26 | 911 | 905,791 | ||||||
Momentive Performance Materials, Inc., Term Loan, 3.36%, (1 mo. USD LIBOR + 3.25%), 5/15/24 | 662 | 658,330 | ||||||
PMHC II, Inc., Term Loan, 4.50%, (USD LIBOR + 3.50%, Floor 1.00%), 3/31/25(7) | 730 | 725,601 | ||||||
PQ Corporation, Term Loan, 2.436%, (3 mo. USD LIBOR + 2.25%), 2/7/27 | 397 | 396,773 | ||||||
Pregis TopCo Corporation, Term Loan, 4.104%, (1 mo. USD LIBOR + 4.00%), 7/31/26 | 246 | 246,365 | ||||||
Rohm Holding GmbH, Term Loan, 4.978%, (6 mo. USD LIBOR + 4.75%), 7/31/26 | 148 | 148,206 | ||||||
Starfruit Finco B.V., Term Loan, 3.133%, (USD LIBOR + 2.75%), 10/1/25(7) | 1,037 | 1,030,991 | ||||||
Tronox Finance, LLC, Term Loan, 2.63%, (USD LIBOR + 2.50%), 3/13/28(7) | 1,716 | 1,707,362 | ||||||
Venator Materials Corporation, Term Loan, 3.104%, (1 mo. USD LIBOR + 3.00%), 8/8/24 | 1,251 | 1,244,212 | ||||||
| $ | 14,884,225 | |||||||
| Conglomerates — 0.9% | ||||||||
Conair Holdings, LLC, Term Loan, 4.25%, (3 mo. USD LIBOR + 3.75%, Floor 0.50%), 5/17/28 | $ | 675 | $ | 677,278 | ||||
Penn Engineering & Manufacturing Corp., Term Loan, 3.50%, (1 mo. USD LIBOR + 2.50%, Floor 1.00%), 6/27/24 | 1,333 | 1,336,777 | ||||||
| $ | 2,014,055 | |||||||
| Containers and Glass Products — 4.5% | ||||||||
BWAY Holding Company, Term Loan, 3.354%, (1 mo. USD LIBOR + 3.25%), 4/3/24 | $ | 720 | $ | 703,993 | ||||
Flex Acquisition Company, Inc.: | ||||||||
Term Loan, 3.452%, (3 mo. USD LIBOR + 3.25%), 6/29/25 | 580 | 575,379 | ||||||
Term Loan, 4.00%, (3 mo. USD LIBOR + 3.50%, Floor 0.50%), 2/23/28 | 2,106 | 2,100,603 | ||||||
| 13 | See Notes to Financial Statements. |
Eaton Vance
Floating-Rate 2022 Target Term Trust
June 30, 2021
Portfolio of Investments — continued
| Borrower/Description | Principal Amount (000’s omitted) | Value | ||||||
| Containers and Glass Products (continued) | ||||||||
Libbey Glass, Inc., Term Loan, 9.00%, (6 mo. USD LIBOR + 8.00%, Floor 1.00%), 11/13/25 | $ | 1,390 | $ | 1,447,448 | ||||
Proampac PG Borrower, LLC, Term Loan, 4.50%, (USD LIBOR + 3.75%, Floor 0.75%), 11/3/25(7) | 814 | 815,485 | ||||||
Reynolds Consumer Products, LLC, Term Loan, 1.854%, (1 mo. USD LIBOR + 1.75%), 2/4/27 | 801 | 795,995 | ||||||
Reynolds Group Holdings, Inc.: | ||||||||
Term Loan, 2.854%, (1 mo. USD LIBOR + 2.75%), 2/5/23 | 1,661 | 1,659,624 | ||||||
Term Loan, 3.354%, (1 mo. USD LIBOR + 3.25%), 2/5/26 | 572 | 569,145 | ||||||
Ring Container Technologies Group, LLC, Term Loan, 2.854%, (1 mo. USD LIBOR + 2.75%), 10/31/24 | 338 | 336,318 | ||||||
TricorBraun Holdings, Inc.: | ||||||||
Term Loan, 3.267%, (3 mo. USD LIBOR + 3.25%, Floor 0.50%), 3/3/28(9) | 46 | 45,616 | ||||||
Term Loan, 3.75%, (6 mo. USD LIBOR + 3.25%, Floor 0.50%), 3/3/28 | 204 | 202,802 | ||||||
Trident TPI Holdings, Inc., Term Loan, 4.00%, (3 mo. USD LIBOR + 3.00%, Floor 1.00%), 10/17/24 | 752 | 750,818 | ||||||
| $ | 10,003,226 | |||||||
| Cosmetics/Toiletries — 0.2% | ||||||||
Kronos Acquisition Holdings, Inc., Term Loan, 4.25%, (3 mo. USD LIBOR + 3.75%, Floor 0.50%), 12/22/26 | $ | 498 | $ | 494,657 | ||||
| $ | 494,657 | |||||||
| Drugs — 5.2% | ||||||||
Akorn, Inc., Term Loan, 8.50%, (3 mo. USD LIBOR + 7.50%, Floor 1.00%), 10/1/25 | $ | 223 | $ | 230,726 | ||||
Albany Molecular Research, Inc.: | ||||||||
Term Loan, 4.25%, (3 mo. USD LIBOR + 3.25%, Floor 1.00%), 8/30/24 | 722 | 723,454 | ||||||
Term Loan, 4.50%, (3 mo. USD LIBOR + 3.50%, Floor 1.00%), 8/30/24 | 100 | 99,799 | ||||||
Amneal Pharmaceuticals, LLC, Term Loan, 3.625%, (1 mo. USD LIBOR + 3.50%), 5/4/25 | 1,350 | 1,330,836 | ||||||
Bausch Health Companies, Inc., Term Loan, 3.104%, (1 mo. USD LIBOR + 3.00%), 6/2/25 | 379 | 378,207 | ||||||
Cambrex Corporation, Term Loan, 4.25%, (1 mo. USD LIBOR + 3.50%, Floor 0.75%), 12/4/26 | 124 | 124,893 | ||||||
Catalent Pharma Solutions, Inc., Term Loan, 2.50%, (1 mo. USD LIBOR + 2.00%, Floor 0.50%), 2/22/28 | 319 | 319,709 | ||||||
Elanco Animal Health Incorporated, Term Loan, 1.842%, (1 mo. USD LIBOR + 1.75%), 8/2/27 | 751 | 740,793 | ||||||
Grifols Worldwide Operations USA, Inc., Term Loan, 2.088%, (1 week USD LIBOR + 2.00%), 11/15/27 | 345 | 341,714 | ||||||
| Borrower/Description | Principal Amount (000’s omitted) | Value | ||||||
| Drugs (continued) | ||||||||
Horizon Therapeutics USA, Inc., Term Loan, 2.50%, (1 mo. USD LIBOR + 2.00%, Floor 0.50%), 3/15/28 | $ | 823 | $ | 819,852 | ||||
Jazz Financing Lux S.a.r.l., Term Loan, 4.00%, (1 mo. USD LIBOR + 3.50%, Floor 0.50%), 4/21/28 | 700 | 703,438 | ||||||
Mallinckrodt International Finance S.A.: | ||||||||
Term Loan, 6.00%, (6 mo. USD LIBOR + 5.25%, Floor 0.75%), 9/24/24 | 2,807 | 2,724,019 | ||||||
Term Loan, 6.25%, (6 mo. USD LIBOR + 5.50%, Floor 0.75%), 2/24/25 | 202 | 196,542 | ||||||
PPD, Inc., Term Loan, 2.75%, (1 mo. USD LIBOR + 2.25%, Floor 0.50%), 1/13/28 | 2,793 | 2,792,827 | ||||||
| $ | 11,526,809 | |||||||
| Ecological Services and Equipment — 0.8% | ||||||||
EnergySolutions, LLC, Term Loan, 4.75%, (3 mo. USD LIBOR + 3.75%, Floor 1.00%), 5/9/25 | $ | 624 | $ | 622,136 | ||||
GFL Environmental, Inc., Term Loan, 3.50%, (1 mo. USD LIBOR + 3.00%, Floor 0.50%), 5/30/25 | 787 | 788,945 | ||||||
TruGreen Limited Partnership, Term Loan, 4.75%, (1 mo. USD LIBOR + 4.00%, Floor 0.75%), 11/2/27 | 224 | 225,589 | ||||||
US Ecology Holdings, Inc., Term Loan, 2.604%, (1 mo. USD LIBOR + 2.50%), 11/1/26 | 99 | 98,736 | ||||||
| $ | 1,735,406 | |||||||
| Electronics/Electrical — 29.5% | ||||||||
Allegro Microsystems, Inc., Term Loan, 4.25%, (3 mo. USD LIBOR + 3.75%, Floor 0.50%), 9/30/27 | $ | 17 | $ | 17,308 | ||||
Applied Systems, Inc.: | ||||||||
Term Loan, 3.75%, (3 mo. USD LIBOR + 3.25%, Floor 0.50%), 9/19/24 | 3,427 | 3,424,210 | ||||||
Term Loan - Second Lien, 6.25%, (3 mo. USD LIBOR + 5.50%, Floor 0.75%), 9/19/25 | 173 | 176,010 | ||||||
Aptean, Inc., Term Loan, 4.354%, (1 mo. USD LIBOR + 4.25%), 4/23/26 | 269 | 269,114 | ||||||
AQA Acquisition Holding, Inc., Term Loan, 4.75%, (3 mo. USD LIBOR + 4.25%, Floor 0.50%), 3/3/28 | 350 | 351,458 | ||||||
Astra Acquisition Corp., Term Loan, 5.50%, (1 mo. USD LIBOR + 4.75%, Floor 0.75%), 3/1/27 | 322 | 322,158 | ||||||
Banff Merger Sub, Inc., Term Loan, 3.854%, (1 mo. USD LIBOR + 3.75%), 10/2/25 | 2,146 | 2,136,106 | ||||||
Barracuda Networks, Inc., Term Loan, 4.50%, (3 mo. USD LIBOR + 3.75%, Floor 0.75%), 2/12/25 | 1,100 | 1,104,356 | ||||||
Buzz Merger Sub, Ltd., Term Loan, 2.854%, (1 mo. USD LIBOR + 2.75%), 1/29/27 | 222 | 221,771 | ||||||
Cambium Learning Group, Inc., Term Loan, 5.25%, (3 mo. USD LIBOR + 4.50%, Floor 0.75%), 12/18/25 | 520 | 523,582 | ||||||
| 14 | See Notes to Financial Statements. |
Eaton Vance
Floating-Rate 2022 Target Term Trust
June 30, 2021
Portfolio of Investments — continued
| Borrower/Description | Principal Amount (000’s omitted) | Value | ||||||
| Electronics/Electrical (continued) | ||||||||
Celestica, Inc., Term Loan, 2.595%, (1 mo. USD LIBOR + 2.50%), 6/27/25 | $ | 73 | $ | 72,409 | ||||
CentralSquare Technologies, LLC, Term Loan, 3.897%, (3 mo. USD LIBOR + 3.75%), 8/29/25 | 317 | 297,387 | ||||||
Cloudera, Inc., Term Loan, 3.25%, (1 mo. USD LIBOR + 2.50%, Floor 0.75%), 12/22/27 | 249 | 249,500 | ||||||
Cohu, Inc., Term Loan, 3.172%, (6 mo. USD LIBOR + 3.00%), 10/1/25 | 100 | 99,521 | ||||||
CommScope, Inc., Term Loan, 3.354%, (1 mo. USD LIBOR + 3.25%), 4/6/26 | 688 | 685,601 | ||||||
Constant Contact, Inc.: | ||||||||
Term Loan, 4.75%, 2/10/28(9) | 154 | 153,193 | ||||||
Term Loan, 4.75%, (6 mo. USD LIBOR + 4.00%, Floor 0.75%), 2/10/28 | 571 | 570,220 | ||||||
Cornerstone OnDemand, Inc., Term Loan, 3.341%, (1 mo. USD LIBOR + 3.25%), 4/22/27 | 591 | 590,986 | ||||||
CPI International, Inc., Term Loan, 4.50%, (1 mo. USD LIBOR + 3.50%, Floor 1.00%), 7/26/24 | 683 | 682,620 | ||||||
Delta TopCo, Inc., Term Loan, 4.50%, (3 mo. USD LIBOR + 3.75%, Floor 0.75%), 12/1/27 | 575 | 576,977 | ||||||
E2open, LLC, Term Loan, 4.00%, (3 mo. USD LIBOR + 3.50%, Floor 0.50%), 2/4/28 | 1,850 | 1,854,048 | ||||||
ECI Macola Max Holdings, LLC, Term Loan, 4.50%, (3 mo. USD LIBOR + 3.75%, Floor 0.75%), 11/9/27 | 1,445 | 1,450,663 | ||||||
Electro Rent Corporation, Term Loan, 6.00%, (3 mo. USD LIBOR + 5.00%, Floor 1.00%), 1/31/24 | 868 | 874,036 | ||||||
Energizer Holdings, Inc., Term Loan, 2.75%, (1 mo. USD LIBOR + 2.25%, Floor 0.50%), 12/22/27 | 433 | 432,606 | ||||||
Epicor Software Corporation, Term Loan, 4.00%, (1 mo. USD LIBOR + 3.25%, Floor 0.75%), 7/30/27 | 3,512 | 3,511,620 | ||||||
EXC Holdings III Corp., Term Loan, 4.50%, (3 mo. USD LIBOR + 3.50%, Floor 1.00%), 12/2/24 | 662 | 663,723 | ||||||
Finastra USA, Inc., Term Loan, 4.50%, (6 mo. USD LIBOR + 3.50%, Floor 1.00%), 6/13/24 | 2,612 | 2,574,213 | ||||||
Fiserv Investment Solutions, Inc., Term Loan, 4.155%, (3 mo. USD LIBOR + 4.00%), 2/18/27 | 223 | 223,585 | ||||||
Gainwell Acquisition Corp., Term Loan, 4.75%, (3 mo. USD LIBOR + 4.00%, Floor 0.75%), 10/1/27 | 2,341 | 2,351,423 | ||||||
GlobalLogic Holdings, Inc.: | ||||||||
Term Loan, 2.854%, (1 mo. USD LIBOR + 2.75%), 8/1/25 | 171 | 170,443 | ||||||
Term Loan, 4.50%, (1 mo. USD LIBOR + 3.75%, Floor 0.75%), 9/14/27 | 298 | 298,634 | ||||||
Go Daddy Operating Company, LLC, Term Loan, 2.104%, (1 mo. USD LIBOR + 2.00%), 8/10/27 | 446 | 443,396 | ||||||
Hyland Software, Inc., Term Loan, 4.25%, (1 mo. USD LIBOR + 3.50%, Floor 0.75%), 7/1/24 | 3,652 | 3,663,925 | ||||||
| Borrower/Description | Principal Amount (000’s omitted) | Value | ||||||
| Electronics/Electrical (continued) | ||||||||
Imperva, Inc., Term Loan, 5.00%, (3 mo. USD LIBOR + 4.00%, Floor 1.00%), 1/12/26 | $ | 248 | $ | 249,231 | ||||
Imprivata, Inc., Term Loan, 4.00%, (3 mo. USD LIBOR + 3.50%, Floor 0.50%), 12/1/27 | 474 | 475,195 | ||||||
Informatica, LLC, Term Loan, 3.354%, (1 mo. USD LIBOR + 3.25%), 2/25/27 | 2,345 | 2,334,726 | ||||||
Liftoff Mobile, Inc., Term Loan, 4.25%, (3 mo. USD LIBOR + 3.50%, Floor 0.75%), 3/17/28 | 199 | 198,876 | ||||||
LogMeIn, Inc., Term Loan, 4.827%, (1 mo. USD LIBOR + 4.75%), 8/31/27 | 771 | 770,563 | ||||||
MA FinanceCo., LLC: | ||||||||
Term Loan, 2.854%, (1 mo. USD LIBOR + 2.75%), 6/21/24 | 241 | 238,589 | ||||||
Term Loan, 5.25%, (3 mo. USD LIBOR + 4.25%, Floor 1.00%), 6/5/25 | 711 | 721,929 | ||||||
MACOM Technology Solutions Holdings, Inc., Term Loan, 2.354%, (1 mo. USD LIBOR + 2.25%), 5/17/24 | 103 | 103,274 | ||||||
Magenta Buyer, LLC, Term Loan, 5/3/28(8) | 1,650 | 1,651,767 | ||||||
Marcel LUX IV S.a.r.l.: | ||||||||
Term Loan, 3.354%, (1 mo. USD LIBOR + 3.25%), 3/15/26 | 589 | 588,737 | ||||||
Term Loan, 4.75%, (1 mo. USD LIBOR + 4.00%, Floor 0.75%), 12/31/27 | 39 | 39,127 | ||||||
Mirion Technologies, Inc., Term Loan, 4.147%, (3 mo. USD LIBOR + 4.00%), 3/6/26 | 298 | 298,414 | ||||||
NCR Corporation, Term Loan, 2.69%, (3 mo. USD LIBOR + 2.50%), 8/28/26 | 367 | 364,042 | ||||||
Panther Commercial Holdings L.P., Term Loan, 5.00%, (3 mo. USD LIBOR + 4.50%, Floor 0.50%), 1/7/28 | 250 | 250,781 | ||||||
PointClickCare Technologies, Inc., Term Loan, 3.75%, (USD LIBOR + 3.00%, Floor 0.75%), 12/29/27(7) | 249 | 249,531 | ||||||
Polaris Newco, LLC, Term Loan, 4.50%, (6 mo. USD LIBOR + 4.00%, Floor 0.50%), 6/2/28 | 1,050 | 1,054,176 | ||||||
Proofpoint, Inc., Term Loan, 6/9/28(8) | 1,100 | 1,095,359 | ||||||
ProQuest, LLC, Term Loan, 3.354%, (1 mo. USD LIBOR + 3.25%), 10/23/26 | 1,034 | 1,034,234 | ||||||
Rackspace Technology Global, Inc., Term Loan, 3.50%, (3 mo. USD LIBOR + 2.75%, Floor 0.75%), 2/15/28 | 574 | 571,322 | ||||||
RealPage, Inc., Term Loan, 3.75%, (1 mo. USD LIBOR + 3.25%, Floor 0.50%), 4/24/28 | 1,900 | 1,896,912 | ||||||
Recorded Books, Inc., Term Loan, 4.08%, (1 mo. USD LIBOR + 4.00%), 8/29/25 | 94 | 94,328 | ||||||
Renaissance Holding Corp., Term Loan, 3.343%, (1 mo. USD LIBOR + 3.25%), 5/30/25 | 794 | 786,453 | ||||||
Seattle Spinco, Inc., Term Loan, 2.854%, (1 mo. USD LIBOR + 2.75%), 6/21/24 | 1,626 | 1,611,250 | ||||||
| 15 | See Notes to Financial Statements. |
Eaton Vance
Floating-Rate 2022 Target Term Trust
June 30, 2021
Portfolio of Investments — continued
| Borrower/Description | Principal Amount (000’s omitted) | Value | ||||||
| Electronics/Electrical (continued) | ||||||||
SkillSoft Corporation: | ||||||||
Term Loan, 8.50%, (3 mo. USD LIBOR + 7.50%, Floor 1.00%), 12/27/24 | $ | 177 | $ | 179,157 | ||||
Term Loan - Second Lien, 8.50%, (3 mo. USD LIBOR + 7.50%, Floor 1.00%), 4/27/25 | 585 | 586,777 | ||||||
SolarWinds Holdings, Inc., Term Loan, 2.854%, (1 mo. USD LIBOR + 2.75%), 2/5/24 | 1,414 | 1,398,922 | ||||||
Sophia L.P., Term Loan, 4.50%, (3 mo. USD LIBOR + 3.75%, Floor 0.75%), 10/7/27 | 2,169 | 2,173,631 | ||||||
SS&C European Holdings S.a.r.l., Term Loan, 1.854%, (1 mo. USD LIBOR + 1.75%), 4/16/25 | 265 | 262,758 | ||||||
SS&C Technologies, Inc., Term Loan, 1.854%, (1 mo. USD LIBOR + 1.75%), 4/16/25 | 349 | 345,842 | ||||||
Symplr Software, Inc., Term Loan, 5.25%, (6 mo. USD LIBOR + 4.50%, Floor 0.75%), 12/22/27 | 324 | 324,917 | ||||||
Tech Data Corporation, Term Loan, 3.604%, (1 mo. USD LIBOR + 3.50%), 6/30/25 | 471 | 472,734 | ||||||
Thoughtworks, Inc., Term Loan, 3.75%, (1 mo. USD LIBOR + 3.25%, Floor 0.50%), 3/23/28 | 175 | 174,912 | ||||||
Tibco Software, Inc., Term Loan, 3.86%, (1 mo. USD LIBOR + 3.75%), 6/30/26 | 1,634 | 1,629,756 | ||||||
TTM Technologies, Inc., Term Loan, 2.592%, (1 mo. USD LIBOR + 2.50%), 9/28/24 | 54 | 53,437 | ||||||
Uber Technologies, Inc.: | ||||||||
Term Loan, 3.604%, (1 mo. USD LIBOR + 3.50%), 4/4/25 | 1,324 | 1,325,293 | ||||||
Term Loan, 3.604%, (1 mo. USD LIBOR + 3.50%), 2/16/27 | 1,919 | 1,921,966 | ||||||
Ultimate Software Group, Inc. (The): | ||||||||
Term Loan, 3.854%, (1 mo. USD LIBOR + 3.75%), 5/4/26 | 639 | 639,734 | ||||||
Term Loan, 4.00%, (3 mo. USD LIBOR + 3.25%, Floor 0.75%), 5/4/26 | 1,762 | 1,765,324 | ||||||
Ultra Clean Holdings, Inc., Term Loan, 3.854%, (1 mo. USD LIBOR + 3.75%), 8/27/25 | 495 | 497,083 | ||||||
Valkyr Purchaser, LLC, Term Loan, 4.75%, (3 mo. USD LIBOR + 4.00%, Floor 0.75%), 10/29/27 | 299 | 300,746 | �� | |||||
Verifone Systems, Inc., Term Loan, 4.147%, (3 mo. USD LIBOR + 4.00%), 8/20/25 | 1,097 | 1,081,101 | ||||||
Veritas US, Inc., Term Loan, 6.00%, (3 mo. USD LIBOR + 5.00%, Floor 1.00%), 9/1/25 | 1,042 | 1,051,517 | ||||||
VS Buyer, LLC, Term Loan, 3.104%, (1 mo. USD LIBOR + 3.00%), 2/28/27 | 444 | 442,778 | ||||||
Vungle, Inc., Term Loan, 5.604%, (1 mo. USD LIBOR + 5.50%), 9/30/26 | 270 | 271,370 | ||||||
Western Digital Corporation, Term Loan, 1.843%, (1 mo. USD LIBOR + 1.75%), 4/29/23 | 479 | 479,212 | ||||||
| $ | 65,094,585 | |||||||
| Borrower/Description | Principal Amount (000’s omitted) | Value | ||||||
| Equipment Leasing — 0.8% | ||||||||
Avolon TLB Borrower 1 (US), LLC: | ||||||||
Term Loan, 2.50%, (1 mo. USD LIBOR + 1.75%, Floor 0.75%), 1/15/25 | $ | 1,044 | $ | 1,042,806 | ||||
Term Loan, 3.25%, (1 mo. USD LIBOR + 2.50%, Floor 0.75%), 12/1/27 | 746 | 747,229 | ||||||
| $ | 1,790,035 | |||||||
| Financial Intermediaries — 3.3% | ||||||||
Aretec Group, Inc., Term Loan, 4.354%, (1 mo. USD LIBOR + 4.25%), 10/1/25 | $ | 1,492 | $ | 1,493,207 | ||||
CoreLogic, Inc., Term Loan, 4.00%, (1 mo. USD LIBOR + 3.50%, Floor 0.50%), 6/2/28 | 2,150 | 2,148,992 | ||||||
EIG Management Company, LLC, Term Loan, 4.50%, (1 mo. USD LIBOR + 3.75%, Floor 0.75%), 2/22/25 | 97 | 96,629 | ||||||
Focus Financial Partners, LLC, Term Loan, 2.104%, (1 mo. USD LIBOR + 2.00%), 7/3/24 | 1,119 | 1,109,799 | ||||||
Franklin Square Holdings, L.P., Term Loan, 2.375%, (1 mo. USD LIBOR + 2.25%), 8/1/25 | 194 | 193,284 | ||||||
Greenhill & Co., Inc., Term Loan, 3.354%, (1 mo. USD LIBOR + 3.25%), 4/12/24 | 450 | 449,521 | ||||||
GreenSky Holdings, LLC: | ||||||||
Term Loan, 3.375%, (1 mo. USD LIBOR + 3.25%), 3/31/25 | 1,306 | 1,280,002 | ||||||
Term Loan, 5.50%, (1 mo. USD LIBOR + 4.50%, Floor 1.00%), 3/29/25 | 198 | 197,505 | ||||||
Victory Capital Holdings, Inc., Term Loan, 2.444%, (3 mo. USD LIBOR + 2.25%), 7/1/26 | 361 | 359,352 | ||||||
Virtus Investment Partners, Inc., Term Loan, 3.00%, (6 mo. USD LIBOR + 2.25%, Floor 0.75%), 6/1/24 | 42 | 41,717 | ||||||
| $ | 7,370,008 | |||||||
| Food Products — 3.1% | ||||||||
Alphabet Holding Company, Inc., Term Loan, 3.604%, (1 mo. USD LIBOR + 3.50%), 9/26/24 | $ | 1,348 | $ | 1,347,454 | ||||
B&G Foods, Inc., Term Loan, 2.604%, (1 mo. USD LIBOR + 2.50%), 10/10/26 | 158 | 157,837 | ||||||
Badger Buyer Corp., Term Loan, 4.50%, (1 mo. USD LIBOR + 3.50%, Floor 1.00%), 9/30/24 | 484 | 472,484 | ||||||
CHG PPC Parent, LLC, Term Loan, 2.854%, (1 mo. USD LIBOR + 2.75%), 3/31/25 | 194 | 192,303 | ||||||
Froneri International, Ltd., Term Loan, 2.354%, (1 mo. USD LIBOR + 2.25%), 1/29/27 | 817 | 805,672 | ||||||
H Food Holdings, LLC: | ||||||||
Term Loan, 3.792%, (1 mo. USD LIBOR + 3.69%), 5/23/25 | 657 | 653,467 | ||||||
Term Loan, 4.104%, (1 mo. USD LIBOR + 4.00%), 5/23/25 | 171 | 170,412 | ||||||
| 16 | See Notes to Financial Statements. |
Eaton Vance
Floating-Rate 2022 Target Term Trust
June 30, 2021
Portfolio of Investments — continued
| Borrower/Description | Principal Amount (000’s omitted) | Value | ||||||
| Food Products (continued) | ||||||||
HLF Financing S.a.r.l., Term Loan, 2.604%, (1 mo. USD LIBOR + 2.50%), 8/18/25 | $ | 413 | $ | 411,827 | ||||
JBS USA LUX S.A., Term Loan, 2.104%, (1 mo. USD LIBOR + 2.00%), 5/1/26 | 2,079 | 2,076,548 | ||||||
Nomad Foods Europe Midco Limited, Term Loan, 2.323%, (1 mo. USD LIBOR + 2.25%), 5/15/24 | 242 | 241,600 | ||||||
Shearer’s Foods, Inc., Term Loan, 4.25%, (3 mo. USD LIBOR + 3.50%, Floor 0.75%), 9/23/27 | 174 | 174,124 | ||||||
Simply Good Foods USA, Inc., Term Loan, 4.75%, (1 mo. USD LIBOR + 3.75%, Floor 1.00%), 7/7/24 | 116 | 116,640 | ||||||
| $ | 6,820,368 | |||||||
| Food Service — 2.2% | ||||||||
1011778 B.C. Unlimited Liability Company, Term Loan, 1.854%, (1 mo. USD LIBOR + 1.75%), 11/19/26 | $ | 1,798 | $ | 1,775,155 | ||||
Aramark Services, Inc., Term Loan, 1.854%, (1 mo. USD LIBOR + 1.75%), 3/11/25 | 326 | 323,644 | ||||||
IRB Holding Corp.: | ||||||||
Term Loan, 3.75%, (3 mo. USD LIBOR + 2.75%, Floor 1.00%), 2/5/25 | 802 | 800,849 | ||||||
Term Loan, 4.25%, (3 mo. USD LIBOR + 3.25%, Floor 1.00%), 12/15/27 | 647 | 647,087 | ||||||
Sovos Brands Intermediate, Inc., Term Loan, 5.00%, (1 mo. USD LIBOR + 4.25%, Floor 0.75%), 6/8/28 | 275 | 276,031 | ||||||
US Foods, Inc.: | ||||||||
Term Loan, 1.854%, (1 mo. USD LIBOR + 1.75%), 6/27/23 | 284 | 281,917 | ||||||
Term Loan, 2.104%, (1 mo. USD LIBOR + 2.00%), 9/13/26 | 639 | 630,110 | ||||||
| $ | 4,734,793 | |||||||
| Forest Products — 0.5% | ||||||||
Journey Personal Care Corp., Term Loan, 5.00%, (3 mo. USD LIBOR + 4.25%, Floor 0.75%), 3/1/28 | $ | 450 | $ | 451,547 | ||||
Neenah, Inc., Term Loan, 3.50%, (3 mo. USD LIBOR + 3.00%, Floor 0.50%), 4/6/28 | 547 | 548,556 | ||||||
| $ | 1,000,103 | |||||||
| Health Care — 14.4% | ||||||||
Accelerated Health Systems, LLC, Term Loan, 3.591%, (1 mo. USD LIBOR + 3.50%), 10/31/25 | $ | 219 | $ | 219,101 | ||||
ADMI Corp., Term Loan, 2.854%, (1 mo. USD LIBOR + 2.75%), 4/30/25 | 1,173 | 1,160,154 | ||||||
athenahealth, Inc., Term Loan, 4.41%, (3 mo. USD LIBOR + 4.25%), 2/11/26 | 959 | 965,766 | ||||||
| Borrower/Description | Principal Amount (000’s omitted) | Value | ||||||
| Health Care (continued) | ||||||||
Avantor Funding, Inc.: | ||||||||
Term Loan, 3.00%, (1 mo. USD LIBOR + 2.00%, Floor 1.00%), 11/21/24 | $ | 96 | $ | 96,280 | ||||
Term Loan, 3.25%, (1 mo. USD LIBOR + 2.25%, Floor 1.00%), 11/8/27 | 174 | 174,430 | ||||||
Bayou Intermediate II, LLC, Term Loan, 5/13/28(8) | 325 | 326,625 | ||||||
BW NHHC Holdco, Inc., Term Loan, 5.155%, (3 mo. USD LIBOR + 5.00%), 5/15/25 | 388 | 357,849 | ||||||
Cano Health, LLC, Term Loan, 5.50%, (6 mo. USD LIBOR + 4.75%, Floor 0.75%), 11/19/27 | 193 | 193,860 | ||||||
CCRR Parent, Inc., Term Loan, 5.00%, (3 mo. USD LIBOR + 4.25%, Floor 0.75%), 3/6/28 | 200 | 200,934 | ||||||
Certara L.P., Term Loan, 3.604%, (1 mo. USD LIBOR + 3.50%), 8/14/26 | 962 | 964,490 | ||||||
Change Healthcare Holdings, LLC, Term Loan, 3.50%, (1 mo. USD LIBOR + 2.50%, Floor 1.00%), 3/1/24 | 1,741 | 1,740,784 | ||||||
CHG Healthcare Services, Inc., Term Loan, 4.00%, (3 mo. USD LIBOR + 3.00%, Floor 1.00%), 6/7/23 | 2,270 | 2,270,582 | ||||||
CryoLife, Inc., Term Loan, 4.50%, (3 mo. USD LIBOR + 3.50%, Floor 1.00%), 12/1/24 | 169 | 169,086 | ||||||
Ensemble RCM, LLC, Term Loan, 3.936%, (3 mo. USD LIBOR + 3.75%), 8/3/26 | 545 | 545,636 | ||||||
Envision Healthcare Corporation, Term Loan, 3.854%, (1 mo. USD LIBOR + 3.75%), 10/10/25 | 2,465 | 2,117,080 | ||||||
eResearchTechnology, Inc., Term Loan, 5.50%, (1 mo. USD LIBOR + 4.50%, Floor 1.00%), 2/4/27 | 125 | 125,416 | ||||||
Gentiva Health Services, Inc., Term Loan, 2.875%, (1 mo. USD LIBOR + 2.75%), 7/2/25 | 793 | 792,315 | ||||||
GHX Ultimate Parent Corporation, Term Loan, 4.00%, (3 mo. USD LIBOR + 3.00%, Floor 1.00%), 6/28/24 | 1,345 | 1,347,159 | ||||||
Greatbatch, Ltd., Term Loan, 3.50%, (1 mo. USD LIBOR + 2.50%, Floor 1.00%), 10/27/22 | 520 | 521,855 | ||||||
Hanger, Inc., Term Loan, 3.604%, (1 mo. USD LIBOR + 3.50%), 3/6/25 | 411 | 411,380 | ||||||
Inovalon Holdings, Inc., Term Loan, 2.875%, (1 mo. USD LIBOR + 2.75%), 4/2/25 | 461 | 458,683 | ||||||
IQVIA, Inc., Term Loan, 1.854%, (1 mo. USD LIBOR + 1.75%), 3/7/24 | 1,344 | 1,338,901 | ||||||
Medical Solutions, LLC, Term Loan, 5.50%, (1 mo. USD LIBOR + 4.50%, Floor 1.00%), 6/14/24 | 147 | 147,974 | ||||||
Midwest Physician Administrative Services, LLC, Term Loan, 3.75%, (3 mo. USD LIBOR + 3.00%, Floor 0.75%), 3/12/28 | 200 | 199,292 | ||||||
MPH Acquisition Holdings, LLC, Term Loan, 3.75%, (3 mo. USD LIBOR + 2.75%, Floor 1.00%), 6/7/23 | 1,557 | 1,553,814 | ||||||
National Mentor Holdings, Inc.: | ||||||||
Term Loan, 3.75%, 3/2/28(9) | 37 | 36,636 | ||||||
Term Loan, 4.50%, (USD LIBOR + 3.75%, Floor 0.75%), 2/18/28(7) | 787 | 789,168 | ||||||
Term Loan, 4.50%, (3 mo. USD LIBOR + 3.75%, Floor 0.75%), 3/2/28 | 25 | 24,855 | ||||||
| 17 | See Notes to Financial Statements. |
Eaton Vance
Floating-Rate 2022 Target Term Trust
June 30, 2021
Portfolio of Investments — continued
| Borrower/Description | Principal Amount (000’s omitted) | Value | ||||||
| Health Care (continued) | ||||||||
Navicure, Inc., Term Loan, 4.104%, (1 mo. USD LIBOR + 4.00%), 10/22/26 | $ | 1,566 | $ | 1,571,177 | ||||
Ortho-Clinical Diagnostics S.A., Term Loan, 3.089%, (1 mo. USD LIBOR + 3.00%), 6/30/25 | 1,026 | 1,026,280 | ||||||
Pacific Dental Services, LLC, Term Loan, 4.25%, (1 mo. USD LIBOR + 3.50%, Floor 0.75%), 5/5/28 | 225 | 225,984 | ||||||
Parexel International Corporation, Term Loan, 2.845%, (1 mo. USD LIBOR + 2.75%), 9/27/24 | 835 | 831,109 | ||||||
Phoenix Guarantor, Inc.: | ||||||||
Term Loan, 3.341%, (1 mo. USD LIBOR + 3.25%), 3/5/26 | 735 | 730,922 | ||||||
Term Loan, 3.573%, (1 mo. USD LIBOR + 3.50%), 3/5/26 | 548 | 544,932 | ||||||
Project Ruby Ultimate Parent Corp., Term Loan, 4.00%, (1 mo. USD LIBOR + 3.25%, Floor 0.75%), 3/3/28 | 449 | 448,434 | ||||||
Radiology Partners, Inc., Term Loan, 4.325%, (1 mo. USD LIBOR + 4.25%), 7/9/25 | 480 | 480,669 | ||||||
RadNet, Inc., Term Loan, 3.75%, (3 mo. USD LIBOR + 3.00%, Floor 0.75%), 4/22/28 | 425 | 425,000 | ||||||
Select Medical Corporation, Term Loan, 2.36%, (1 mo. USD LIBOR + 2.25%), 3/6/25 | 2,144 | 2,132,244 | ||||||
Sotera Health Holdings, LLC, Term Loan, 3.25%, (3 mo. USD LIBOR + 2.75%, Floor 0.50%), 12/11/26 | 225 | 224,508 | ||||||
Sound Inpatient Physicians, Term Loan, 2.854%, (1 mo. USD LIBOR + 2.75%), 6/27/25 | 194 | 193,495 | ||||||
Sunshine Luxembourg VII S.a.r.l., Term Loan, 4.50%, (3 mo. USD LIBOR + 3.75%, Floor 0.75%), 10/1/26 | 449 | 450,842 | ||||||
Surgery Center Holdings, Inc., Term Loan, 4.50%, (1 mo. USD LIBOR + 3.75%, Floor 0.75%), 8/31/26 | 716 | 719,865 | ||||||
Team Health Holdings, Inc., Term Loan, 3.75%, (1 mo. USD LIBOR + 2.75%, Floor 1.00%), 2/6/24 | 727 | 707,732 | ||||||
U.S. Anesthesia Partners, Inc., Term Loan, 4.00%, (6 mo. USD LIBOR + 3.00%, Floor 1.00%), 6/23/24 | 707 | 703,032 | ||||||
US Radiology Specialists, Inc., Term Loan, 6.25%, (3 mo. USD LIBOR + 5.50%, Floor 0.75%), 12/10/27 | 323 | 325,800 | ||||||
Verscend Holding Corp., Term Loan, 4.104%, (1 mo. USD LIBOR + 4.00%), 8/27/25 | 860 | 863,581 | ||||||
| $ | 31,855,711 | |||||||
| Home Furnishings — 1.3% | ||||||||
Mattress Firm, Inc., Term Loan, 6.25%, (6 mo. USD LIBOR + 5.25%, Floor 1.00%), 11/26/27 | $ | 309 | $ | 314,346 | ||||
Serta Simmons Bedding, LLC: | ||||||||
Term Loan, 8.50%, (1 mo. USD LIBOR + 7.50%, Floor 1.00%), 8/10/23 | 619 | 626,288 | ||||||
Term Loan - Second Lien, 8.50%, (1 mo. USD LIBOR + 7.50%, Floor 1.00%), 8/10/23 | 2,050 | 1,962,464 | ||||||
| $ | 2,903,098 | |||||||
| Borrower/Description | Principal Amount (000’s omitted) | Value | ||||||
| Industrial Equipment — 4.8% | ||||||||
Alliance Laundry Systems, LLC, Term Loan, 4.25%, (3 mo. USD LIBOR + 3.50%, Floor 0.75%), 10/8/27 | $ | 443 | $ | 443,967 | ||||
Altra Industrial Motion Corp., Term Loan, 2.104%, (1 mo. USD LIBOR + 2.00%), 10/1/25 | 219 | 218,827 | ||||||
American Trailer World Corp., Term Loan, 4.50%, (1 mo. USD LIBOR + 3.75%, Floor 0.75%), 3/3/28 | 225 | 224,953 | ||||||
Apex Tool Group, LLC, Term Loan, 6.50%, (1 mo. USD LIBOR + 5.25%, Floor 1.25%), 8/1/24 | 892 | 896,530 | ||||||
CFS Brands, LLC, Term Loan, 4.00%, (6 mo. USD LIBOR + 3.00%, Floor 1.00%), 3/20/25 | 97 | 95,287 | ||||||
CPM Holdings, Inc., Term Loan, 3.592%, (1 mo. USD LIBOR + 3.50%), 11/17/25 | 122 | 121,174 | ||||||
Delachaux Group S.A., Term Loan, 4.686%, (3 mo. USD LIBOR + 4.50%), 4/16/26 | 172 | 171,071 | ||||||
DXP Enterprises, Inc., Term Loan, 5.75%, (1 mo. USD LIBOR + 4.75%, Floor 1.00%), 12/16/27 | 249 | 250,149 | ||||||
Dynacast International, LLC: | ||||||||
Term Loan, 5.75%, (3 mo. USD LIBOR + 4.75%, Floor 1.00%), 7/19/25 | 641 | 643,341 | ||||||
Term Loan, 10.25%, (3 mo. USD LIBOR + 9.25%, Floor 1.00%), 10/25/25 | 247 | 257,905 | ||||||
Engineered Machinery Holdings, Inc., Term Loan, 4.25%, (3 mo. USD LIBOR + 3.25%, Floor 1.00%), 7/19/24 | 1,093 | 1,093,379 | ||||||
Filtration Group Corporation: | ||||||||
Term Loan, 3.104%, (1 mo. USD LIBOR + 3.00%), 3/29/25 | 1,094 | 1,086,922 | ||||||
Term Loan, 4.50%, (1 mo. USD LIBOR + 3.75%, Floor 0.75%), 3/29/25 | 149 | 149,232 | ||||||
Gardner Denver, Inc., Term Loan, 1.854%, (1 mo. USD LIBOR + 1.75%), 3/1/27 | 437 | 432,882 | ||||||
GrafTech Finance, Inc., Term Loan, 3.50%, (1 mo. USD LIBOR + 3.00%, Floor 0.50%), 2/12/25 | 389 | 390,875 | ||||||
Granite Holdings US Acquisition Co., Term Loan, 4.147%, (3 mo. USD LIBOR + 4.00%), 9/30/26 | 423 | 423,408 | ||||||
Harsco Corporation, Term Loan, 2.75%, (1 mo. USD LIBOR + 2.25%, Floor 0.50%), 3/5/28 | 175 | 173,961 | ||||||
Hillman Group, Inc. (The): | ||||||||
Term Loan, 2/24/28(8) | 30 | 29,505 | ||||||
Term Loan, 2/24/28(8) | 145 | 145,313 | ||||||
Ingersoll-Rand Services Company, Term Loan, 1.854%, (1 mo. USD LIBOR + 1.75%), 3/1/27 | 518 | 513,299 | ||||||
LTI Holdings, Inc.: | ||||||||
Term Loan, 3.604%, (1 mo. USD LIBOR + 3.50%), 9/6/25 | 170 | 168,113 | ||||||
Term Loan, 4.854%, (1 mo. USD LIBOR + 4.75%), 7/24/26 | 74 | 73,780 | ||||||
Term Loan, 7/24/26(8) | 75 | 75,000 | ||||||
Term Loan, 7/24/26(8) | 150 | 150,000 | ||||||
| 18 | See Notes to Financial Statements. |
Eaton Vance
Floating-Rate 2022 Target Term Trust
June 30, 2021
Portfolio of Investments — continued
| Borrower/Description | Principal Amount (000’s omitted) | Value | ||||||
| Industrial Equipment (continued) | ||||||||
Robertshaw US Holding Corp., Term Loan, 4.50%, (1 mo. USD LIBOR + 3.50%, Floor 1.00%), 2/28/25 | $ | 387 | $ | 374,423 | ||||
Thermon Industries, Inc., Term Loan, 4.75%, (1 mo. USD LIBOR + 3.75%, Floor 1.00%), 10/30/24 | 74 | 73,984 | ||||||
Tiger Acquisition, LLC, Term Loan, 3.75%, (3 mo. USD LIBOR + 3.25%, Floor 0.50%), 6/1/28 | 225 | 224,672 | ||||||
Titan Acquisition Limited, Term Loan, 3.147%, (3 mo. USD LIBOR + 3.00%), 3/28/25 | 1,137 | 1,118,763 | ||||||
Vertical Midco GmbH, Term Loan, 4.478%, (6 mo. USD LIBOR + 4.25%), 7/30/27 | 521 | 522,665 | ||||||
| $ | 10,543,380 | |||||||
| Insurance — 6.0% | ||||||||
Alliant Holdings Intermediate, LLC: | ||||||||
Term Loan, 3.354%, (1 mo. USD LIBOR + 3.25%), 5/9/25 | $ | 172 | $ | 169,946 | ||||
Term Loan, 3.354%, (1 mo. USD LIBOR + 3.25%), 5/9/25 | 868 | 859,735 | ||||||
Term Loan, 4.25%, (1 mo. USD LIBOR + 3.75%, Floor 0.50%), 10/8/27 | 248 | 249,083 | ||||||
AmWINS Group, Inc., Term Loan, 3.00%, (1 mo. USD LIBOR + 2.25%, Floor 0.75%), 2/19/28 | 1,617 | 1,608,699 | ||||||
AssuredPartners Capital, Inc., Term Loan, 5.50%, (1 mo. USD LIBOR + 4.50%, Floor 1.00%), 2/12/27 | 198 | 198,282 | ||||||
AssuredPartners, Inc., Term Loan, 3.604%, (1 mo. USD LIBOR + 3.50%), 2/12/27 | 566 | 563,948 | ||||||
Asurion, LLC: | ||||||||
Term Loan, 3.345%, (1 mo. USD LIBOR + 3.25%), 7/31/27 | 748 | 740,488 | ||||||
Term Loan, 3.354%, (1 mo. USD LIBOR + 3.25%), 12/23/26 | 1,075 | 1,063,603 | ||||||
Term Loan - Second Lien, 5.354%, (1 mo. USD LIBOR + 5.25%), 1/31/28 | 920 | 928,740 | ||||||
Hub International Limited: | ||||||||
Term Loan, 2.926%, (3 mo. USD LIBOR + 2.75%), 4/25/25 | 1,867 | 1,848,383 | ||||||
Term Loan, 4.00%, (6 mo. USD LIBOR + 3.25%, Floor 0.75%), 4/25/25 | 690 | 690,489 | ||||||
NFP Corp., Term Loan, 3.354%, (1 mo. USD LIBOR + 3.25%), 2/15/27 | 1,370 | 1,353,006 | ||||||
Ryan Specialty Group, LLC, Term Loan, 3.75%, (1 mo. USD LIBOR + 3.00%, Floor 0.75%), 9/1/27 | 720 | 720,822 | ||||||
Sedgwick Claims Management Services, Inc., Term Loan, 3.354%, (1 mo. USD LIBOR + 3.25%), 12/31/25 | 463 | 458,725 | ||||||
| Borrower/Description | Principal Amount (000’s omitted) | Value | ||||||
| Insurance (continued) | ||||||||
USI, Inc.: | ||||||||
Term Loan, 3.147%, (3 mo. USD LIBOR + 3.00%), 5/16/24 | $ | 1,251 | $ | 1,241,419 | ||||
Term Loan, 3.397%, (3 mo. USD LIBOR + 3.25%), 12/2/26 | 542 | 537,546 | ||||||
| $ | 13,232,914 | |||||||
| Leisure Goods / Activities / Movies — 4.8% | ||||||||
AMC Entertainment Holdings, Inc., Term Loan, 3.086%, (1 mo. USD LIBOR + 3.00%), 4/22/26 | $ | 709 | $ | 668,528 | ||||
Bombardier Recreational Products, Inc., Term Loan, 2.104%, (1 mo. USD LIBOR + 2.00%), 5/24/27 | 198 | 196,461 | ||||||
Carnival Corporation, Term Loan, 8.50%, (1 mo. USD LIBOR + 7.50%, Floor 1.00%), 6/30/25 | 545 | 558,282 | ||||||
ClubCorp Holdings, Inc., Term Loan, 2.897%, (3 mo. USD LIBOR + 2.75%), 9/18/24 | 650 | 625,550 | ||||||
Crown Finance US, Inc.: | ||||||||
Term Loan, 2.917%, (3 mo. USD LIBOR + 2.75%), 9/30/26 | 566 | 496,071 | ||||||
Term Loan, 3.50%, (6 mo. USD LIBOR + 2.50%, Floor 1.00%), 2/28/25 | 603 | 532,723 | ||||||
Term Loan, 15.25%, (7.00% cash, 8.25% PIK), 5/23/24(10) | 163 | 206,857 | ||||||
Delta 2 (LUX) S.a.r.l., Term Loan, 3.50%, (1 mo. USD LIBOR + 2.50%, Floor 1.00%), 2/1/24 | 1,175 | 1,171,971 | ||||||
Live Nation Entertainment, Inc., Term Loan, 1.875%, (1 mo. USD LIBOR + 1.75%), 10/17/26 | 2,651 | 2,604,632 | ||||||
Match Group, Inc., Term Loan, 1.906%, (3 mo. USD LIBOR + 1.75%), 2/13/27 | 275 | 272,135 | ||||||
Playtika Holding Corp., Term Loan, 2.854%, (1 mo. USD LIBOR + 2.75%), 3/13/28 | 836 | 833,825 | ||||||
Steinway Musical Instruments, Inc., Term Loan, 4.75%, (1 mo. USD LIBOR + 3.75%, Floor 1.00%), 2/14/25 | 75 | 74,541 | ||||||
Travel Leaders Group, LLC, Term Loan, 4.104%, (1 mo. USD LIBOR + 4.00%), 1/25/24 | 364 | 351,095 | ||||||
UFC Holdings, LLC, Term Loan, 3.75%, (6 mo. USD LIBOR + 3.00%, Floor 0.75%), 4/29/26 | 2,006 | 2,005,888 | ||||||
| $ | 10,598,559 | |||||||
| Lodging and Casinos — 5.3% | ||||||||
Boyd Gaming Corporation, Term Loan, 2.338%, (1 week USD LIBOR + 2.25%), 9/15/23 | $ | 1,813 | $ | 1,813,202 | ||||
CityCenter Holdings, LLC, Term Loan, 3.00%, (1 mo. USD LIBOR + 2.25%, Floor 0.75%), 4/18/24 | 1,181 | 1,172,902 | ||||||
Four Seasons Hotels Limited, Term Loan, 2.104%, (1 mo. USD LIBOR + 2.00%), 11/30/23 | 2,879 | 2,874,799 | ||||||
| 19 | See Notes to Financial Statements. |
Eaton Vance
Floating-Rate 2022 Target Term Trust
June 30, 2021
Portfolio of Investments — continued
| Borrower/Description | Principal Amount (000’s omitted) | Value | ||||||
| Lodging and Casinos (continued) | ||||||||
Golden Nugget, Inc., Term Loan, 3.25%, (2 mo. USD LIBOR + 2.50%, Floor 0.75%), 10/4/23 | $ | 2,954 | $ | 2,935,012 | ||||
GVC Holdings (Gibraltar) Limited, Term Loan, 3.00%, (6 mo. USD LIBOR + 2.00%, Floor 1.00%), 3/29/24 | 905 | 901,841 | ||||||
Hilton Grand Vacations Borrower, LLC, Term Loan, 5/19/28(8) | 400 | 400,688 | ||||||
Playa Resorts Holding B.V., Term Loan, 3.75%, (1 mo. USD LIBOR + 2.75%, Floor 1.00%), 4/29/24 | 446 | 429,348 | ||||||
Stars Group Holdings B.V. (The), Term Loan, 3.647%, (3 mo. USD LIBOR + 3.50%), 7/10/25 | 664 | 666,301 | ||||||
Wyndham Hotels & Resorts, Inc., Term Loan, 1.854%, (1 mo. USD LIBOR + 1.75%), 5/30/25 | 486 | 482,704 | ||||||
| $ | 11,676,797 | |||||||
| Nonferrous Metals/Minerals — 0.1% | ||||||||
American Consolidated Natural Resources, Inc., Term Loan, 17.00%, (3 mo. USD LIBOR + 16.00%, Floor 1.00%), 14.00% cash, 3.00% PIK, 9/16/25 | $ | 1 | $ | 1,329 | ||||
Oxbow Carbon, LLC, Term Loan, 5.00%, (1 mo. USD LIBOR + 4.25%, Floor 0.75%), 10/13/25 | 120 | 120,613 | ||||||
| $ | 121,942 | |||||||
| Oil and Gas — 2.2% | ||||||||
Apergy Corporation, Term Loan, 2.625%, (1 mo. USD LIBOR + 2.50%), 5/9/25 | $ | 51 | $ | 50,476 | ||||
Buckeye Partners L.P., Term Loan, 2.354%, (1 mo. USD LIBOR + 2.25%), 11/1/26 | 1,037 | 1,030,794 | ||||||
Centurion Pipeline Company, LLC: | ||||||||
Term Loan, 3.354%, (1 mo. USD LIBOR + 3.25%), 9/29/25 | 98 | 96,403 | ||||||
Term Loan, 4.095%, (1 mo. USD LIBOR + 4.00%), 9/28/25 | 100 | 98,132 | ||||||
CITGO Holding, Inc., Term Loan, 8.00%, (6 mo. USD LIBOR + 7.00%, Floor 1.00%), 8/1/23 | 98 | 97,759 | ||||||
CITGO Petroleum Corporation, Term Loan, 7.25%, (6 mo. USD LIBOR + 6.25%, Floor 1.00%), 3/28/24 | 869 | 876,972 | ||||||
Delek US Holdings, Inc.: | ||||||||
Term Loan, 2.354%, (1 mo. USD LIBOR + 2.25%), 3/31/25 | 73 | 71,690 | ||||||
Term Loan, 6.50%, (1 mo. USD LIBOR + 5.50%, Floor 1.00%), 3/31/25 | 222 | 223,437 | ||||||
Fieldwood Energy, LLC: | ||||||||
DIP Loan, 3.675%, (1 mo. USD LIBOR + 8.75%, Floor 1.00%), 8/4/21(9) | 222 | 224,923 | ||||||
Term Loan, 0.00%, 4/11/22(11) | 1,500 | 780,000 | ||||||
Prairie ECI Acquiror L.P., Term Loan, 4.854%, (1 mo. USD LIBOR + 4.75%), 3/11/26 | 543 | 529,407 | ||||||
| Borrower/Description | Principal Amount (000’s omitted) | Value | ||||||
| Oil and Gas (continued) | ||||||||
PSC Industrial Holdings Corp., Term Loan, 4.75%, (1 mo. USD LIBOR + 3.75%, Floor 1.00%), 10/11/24 | $ | 290 | $ | 287,450 | ||||
UGI Energy Services, LLC, Term Loan, 3.854%, (1 mo. USD LIBOR + 3.75%), 8/13/26 | 392 | 393,102 | ||||||
| $ | 4,760,545 | |||||||
| Publishing — 1.1% | ||||||||
Adevinta ASA, Term Loan, 4/20/28(8) | $ | 125 | $ | 125,254 | ||||
Alchemy Copyrights, LLC, Term Loan, 3.50%, (1 mo. USD LIBOR + 3.00%, Floor 0.50%), 3/10/28 | 199 | 198,750 | ||||||
Ascend Learning, LLC: | ||||||||
Term Loan, 4.00%, (1 mo. USD LIBOR + 3.00%, Floor 1.00%), 7/12/24 | 1,251 | 1,251,837 | ||||||
Term Loan, 4.75%, (1 mo. USD LIBOR + 3.75%, Floor 1.00%), 7/12/24 | 149 | 149,201 | ||||||
Getty Images, Inc., Term Loan, 4.625%, (1 mo. USD LIBOR + 4.50%), 2/19/26 | 701 | 701,186 | ||||||
| $ | 2,426,228 | |||||||
| Radio and Television — 3.5% | ||||||||
Cumulus Media New Holdings, Inc., Term Loan, 4.75%, (3 mo. USD LIBOR + 3.75%, Floor 1.00%), 3/31/26 | $ | 136 | $ | 135,965 | ||||
Diamond Sports Group, LLC, Term Loan, 3.36%, (1 mo. USD LIBOR + 3.25%), 8/24/26 | 1,646 | 1,019,739 | ||||||
Entercom Media Corp., Term Loan, 2.595%, (1 mo. USD LIBOR + 2.50%), 11/18/24 | 661 | 656,477 | ||||||
Entravision Communications Corporation, Term Loan, 2.854%, (1 mo. USD LIBOR + 2.75%), 11/29/24 | 303 | 300,668 | ||||||
Gray Television, Inc., Term Loan, 2.592%, (1 mo. USD LIBOR + 2.50%), 1/2/26 | 234 | 232,808 | ||||||
Hubbard Radio, LLC, Term Loan, 5.25%, (3 mo. USD LIBOR + 4.25%, Floor 1.00%), 3/28/25 | 1,085 | 1,077,093 | ||||||
iHeartCommunications, Inc.: | ||||||||
Term Loan, 3.104%, (1 mo. USD LIBOR + 3.00%), 5/1/26 | 862 | 855,680 | ||||||
Term Loan, 4.75%, (1 mo. USD LIBOR + 4.00%, Floor 0.75%), 5/1/26 | 173 | 173,358 | ||||||
Nexstar Broadcasting, Inc.: | ||||||||
Term Loan, 2.345%, (1 mo. USD LIBOR + 2.25%), 1/17/24 | 471 | 469,560 | ||||||
Term Loan, 2.592%, (1 mo. USD LIBOR + 2.50%), 9/18/26 | 173 | 172,334 | ||||||
Sinclair Television Group, Inc., Term Loan, 2.61%, (1 mo. USD LIBOR + 2.50%), 9/30/26 | 246 | 243,752 | ||||||
Terrier Media Buyer, Inc., Term Loan, 3.604%, (1 mo. USD LIBOR + 3.50%), 12/17/26 | 690 | 687,141 | ||||||
| 20 | See Notes to Financial Statements. |
Eaton Vance
Floating-Rate 2022 Target Term Trust
June 30, 2021
Portfolio of Investments — continued
| Borrower/Description | Principal Amount (000’s omitted) | Value | ||||||
| Radio and Television (continued) | ||||||||
Univision Communications, Inc., Term Loan, 3.75%, (1 mo. USD LIBOR + 2.75%, Floor 1.00%), 3/15/24 | $ | 1,661 | $ | 1,660,937 | ||||
| $ | 7,685,512 | |||||||
| Retailers (Except Food and Drug) — 2.2% | ||||||||
BJ’s Wholesale Club, Inc., Term Loan, 2.073%, (1 mo. USD LIBOR + 2.00%), 2/3/24 | $ | 503 | $ | 504,069 | ||||
CNT Holdings I Corp., Term Loan, 4.50%, (6 mo. USD LIBOR + 3.75%, Floor 0.75%), 11/8/27 | 299 | 299,834 | ||||||
Great Outdoors Group, LLC, Term Loan, 5.00%, (6 mo. USD LIBOR + 4.25%, Floor 0.75%), 3/6/28 | 1,045 | 1,052,306 | ||||||
Harbor Freight Tools USA, Inc., Term Loan, 3.75%, (1 mo. USD LIBOR + 3.00%, Floor 0.75%), 10/19/27 | 1,594 | 1,596,669 | ||||||
Hoya Midco, LLC, Term Loan, 4.50%, (1 mo. USD LIBOR + 3.50%, Floor 1.00%), 6/30/24 | 720 | 717,195 | ||||||
PetSmart, Inc., Term Loan, 4.50%, (6 mo. USD LIBOR + 3.75%, Floor 0.75%), 2/12/28 | 550 | 551,031 | ||||||
Protective Industrial Products, Inc., Term Loan, 4.75%, (1 week USD LIBOR + 4.00%, Floor 0.75%), 1/20/28 | 225 | 225,492 | ||||||
| $ | 4,946,596 | |||||||
| Steel — 0.9% | ||||||||
Phoenix Services International, LLC, Term Loan, 4.75%, (1 mo. USD LIBOR + 3.75%, Floor 1.00%), 3/1/25 | $ | 339 | $ | 338,202 | ||||
TMS International Corp., Term Loan, 3.75%, (USD LIBOR + 2.75%, Floor 1.00%), | 100 | 99,251 | ||||||
Zekelman Industries, Inc., Term Loan, 2.092%, (1 mo. USD LIBOR + 2.00%), 1/24/27 | 1,505 | 1,490,750 | ||||||
| $ | 1,928,203 | |||||||
| Surface Transport — 0.4% | ||||||||
Kenan Advantage Group, Inc., Term Loan, 4.50%, (1 mo. USD LIBOR + 3.75%, Floor 0.75%), 3/24/26 | $ | 945 | $ | 947,849 | ||||
| $ | 947,849 | |||||||
| Telecommunications — 4.5% | ||||||||
CenturyLink, Inc., Term Loan, 2.354%, (1 mo. USD LIBOR + 2.25%), 3/15/27 | $ | 2,733 | $ | 2,701,129 | ||||
Cyxtera DC Holdings, Inc., Term Loan, 4.00%, (6 mo. USD LIBOR + 3.00%, Floor 1.00%), 5/1/24 | 720 | 703,500 | ||||||
GEE Holdings 2, LLC: | ||||||||
Term Loan, 9.00%, (3 mo. USD LIBOR + 8.00%, Floor 1.00%), 3/24/25 | 114 | 114,227 | ||||||
Term Loan - Second Lien, 9.25%, (3 mo. USD LIBOR + 8.25%, Floor 1.00%), 3/23/26 | 223 | 206,658 | ||||||
Intelsat Jackson Holdings S.A.: | ||||||||
DIP Loan, 6.50%, (3 mo. USD LIBOR + 5.50%, Floor 1.00%), 7/13/22 | 267 | 269,969 | ||||||
Term Loan, 8.00%, (USD Prime + 4.75%), 11/27/23 | 900 | 914,250 | ||||||
| Borrower/Description | Principal Amount (000’s omitted) | Value | ||||||
| Telecommunications (continued) | ||||||||
Onvoy, LLC, Term Loan, 5.50%, (1 mo. USD LIBOR + 4.50%, Floor 1.00%), 2/10/24 | $ | 731 | $ | 731,884 | ||||
Plantronics, Inc., Term Loan, 2.604%, (1 mo. USD LIBOR + 2.50%), 7/2/25 | 450 | 443,463 | ||||||
Syniverse Holdings, Inc., Term Loan, 6.00%, (3 mo. USD LIBOR + 5.00%, Floor 1.00%), 3/9/23 | 363 | 360,016 | ||||||
Zayo Group Holdings, Inc., Term Loan, 3.104%, (1 mo. USD LIBOR + 3.00%), 3/9/27 | 919 | 909,526 | ||||||
Ziggo Financing Partnership, Term Loan, 2.573%, (1 mo. USD LIBOR + 2.50%), 4/30/28 | 2,650 | 2,627,549 | ||||||
| $ | 9,982,171 | |||||||
| Utilities — 1.6% | ||||||||
Brookfield WEC Holdings, Inc., Term Loan, 3.25%, (1 mo. USD LIBOR + 2.75%, Floor 0.50%), 8/1/25 | $ | 1,269 | $ | 1,258,073 | ||||
Calpine Corporation, Term Loan, 2.61%, (1 mo. USD LIBOR + 2.50%), 12/16/27 | 1,269 | 1,262,734 | ||||||
USIC Holdings, Inc., Term Loan, 4.25%, (1 mo. USD LIBOR + 3.50%, Floor 0.75%), 5/12/28 | 1,107 | 1,107,282 | ||||||
| $ | 3,628,089 | |||||||
Total Senior Floating-Rate Loans |
| $ | 311,429,807 | |||||
| Short-Term Investments — 2.9% |
| |||||||
| Description | Units | Value | ||||||
Eaton Vance Cash Reserves Fund, LLC, 0.05%(12) | 6,441,904 | $ | 6,441,904 | |||||
Total Short-Term Investments |
| $ | 6,441,904 | |||||
Total Investments — 149.9% |
| $ | 330,665,710 | |||||
Less Unfunded Loan Commitments — (0.2)% |
| $ | (433,873 | ) | ||||
Net Investments — 149.7% |
| $ | 330,231,837 | |||||
Notes Payable — (34.0)% |
| $ | (75,000,000 | ) | ||||
Variable Rate Term Preferred Shares, at Liquidation Value — (14.5)% |
| $ | (32,000,000 | ) | ||||
Other Assets, Less Liabilities — (1.2)% |
| $ | (2,578,637 | ) | ||||
Net Assets Applicable to Common Shares — 100.0% | $ | 220,653,200 | ||||||
| 21 | See Notes to Financial Statements. |
Eaton Vance
Floating-Rate 2022 Target Term Trust
June 30, 2021
Portfolio of Investments — continued
The percentage shown for each investment category in the Portfolio of Investments is based on net assets applicable to common shares.
| (1) | For fair value measurement disclosure purposes, security is categorized as Level 3 (see Note 9). |
| (2) | Security was acquired in connection with a restructuring of a Senior Loan and may be subject to restrictions on resale. |
| (3) | Non-income producing security. |
| (4) | Security exempt from registration under Rule 144A of the Securities Act of 1933, as amended. These securities may be sold in certain transactions in reliance on an exemption from registration (normally to qualified institutional buyers). At June 30, 2021, the aggregate value of these securities is $3,144,114 or 1.4% of the Trust’s net assets applicable to common shares. |
| (5) | Amount is less than 0.05%. |
| (6) | Senior floating-rate loans (Senior Loans) often require prepayments from excess cash flows or permit the borrowers to repay at their election. The degree to which borrowers repay, whether as a contractual requirement or at their election, cannot be predicted with accuracy. As a result, the actual remaining maturity may be substantially less than the stated maturities shown. However, Senior Loans will typically have an expected average life of approximately two to four years. Senior Loans typically have rates of interest which are redetermined periodically by reference to a base lending rate, plus a spread. These base lending rates are primarily the London Interbank Offered Rate (“LIBOR”) and secondarily, the prime rate offered by one or more major United States banks (the “Prime Rate”). Base lending rates may be subject to a floor, or a minimum rate. Senior Loans are generally subject to contractual restrictions that must be satisfied before they can be bought or sold. |
| (7) | The stated interest rate represents the weighted average interest rate at June 30, 2021 of contracts within the senior loan facility. Interest rates on contracts are primarily redetermined either weekly, monthly or quarterly by reference to the indicated base lending rate and spread and the reset period. |
| (8) | This Senior Loan will settle after June 30, 2021, at which time the interest rate will be determined. |
| (9) | Unfunded or partially unfunded loan commitments. The stated interest rate reflects the weighted average of the reference rate and spread for the funded portion, if any, and the commitment fees on the portion of the loan that is unfunded. At June 30, 2021, the total value of unfunded loan commitments is $436,355. See Note 1E for description. |
| (10) | Fixed-rate loan. |
| (11) | Issuer is in default with respect to interest and/or principal payments. For a variable rate security, interest rate has been adjusted to reflect non-accrual status. |
| (12) | Affiliated investment company, available to Eaton Vance portfolios and funds, which invests in high quality, U.S. dollar denominated money market instruments. The rate shown is the annualized seven-day yield as of June 30, 2021. |
Abbreviations:
| DIP | – | Debtor In Possession | ||
| LIBOR | – | London Interbank Offered Rate | ||
| PIK | – | Payment In Kind | ||
Currency Abbreviations:
| USD | – | United States Dollar | ||
| 22 | See Notes to Financial Statements. |
Eaton Vance
Floating-Rate 2022 Target Term Trust
June 30, 2021
Statement of Assets and Liabilities
| Assets | June 30, 2021 | |||
Unaffiliated investments, at value (identified cost, $324,826,346) | $ | 323,789,933 | ||
Affiliated investment, at value (identified cost, $6,441,891) | 6,441,904 | |||
Cash | 3,286,486 | |||
Interest receivable | 755,423 | |||
Dividends receivable from affiliated investment | 471 | |||
Receivable for investments sold | 2,737,768 | |||
Prepaid upfront fees on notes payable | 35,341 | |||
Prepaid expenses | 9,955 | |||
Total assets | $ | 337,057,281 | ||
| Liabilities |
| |||
Notes payable | $ | 75,000,000 | ||
Variable rate term preferred shares, at liquidation value | 32,000,000 | |||
Payable for investments purchased | 8,780,611 | |||
Payable to affiliates: | ||||
Investment adviser and administration fee | 191,161 | |||
Trustees’ fees | 4,125 | |||
Interest expense and fees payable | 263,359 | |||
Accrued expenses | 164,825 | |||
Total liabilities | $ | 116,404,081 | ||
Net assets applicable to common shares | $ | 220,653,200 | ||
| Sources of Net Assets |
| |||
Common shares, $0.01 par value, unlimited number of shares authorized, 23,640,638 shares issued and outstanding | $ | 236,406 | ||
Additional paid-in capital | 232,239,960 | |||
Accumulated loss | (11,823,166 | ) | ||
Net assets applicable to common shares | $ | 220,653,200 | ||
| Net Asset Value Per Common Share | ||||
($220,653,200 ÷ 23,640,638 common shares issued and outstanding) | $ | 9.33 | ||
| 23 | See Notes to Financial Statements. |
Eaton Vance
Floating-Rate 2022 Target Term Trust
June 30, 2021
Statement of Operations
| Investment Income | Year Ended June 30, 2021 | |||
Interest and other income | $ | 13,628,783 | ||
Dividends from affiliated investment | 7,647 | |||
Total investment income | $ | 13,636,430 | ||
| Expenses | ||||
Investment adviser and administration fee | $ | 2,283,877 | ||
Trustees’ fees and expenses | 21,086 | |||
Custodian fee | 151,305 | |||
Transfer and dividend disbursing agent fees | 21,607 | |||
Legal and accounting services | 96,638 | |||
Printing and postage | 35,368 | |||
Interest expense and fees | 1,655,736 | |||
Miscellaneous | 56,844 | |||
Total expenses | $ | 4,322,461 | ||
Net investment income | $ | 9,313,969 | ||
| Realized and Unrealized Gain (Loss) | ||||
Net realized gain (loss) — | ||||
Investment transactions | $ | (3,073,340 | ) | |
Investment transactions — affiliated investment | (171 | ) | ||
Net realized loss | $ | (3,073,511 | ) | |
Change in unrealized appreciation (depreciation) — | ||||
Investments | $ | 20,820,606 | ||
Investments — affiliated investment | 13 | |||
Foreign currency | (170 | ) | ||
Net change in unrealized appreciation (depreciation) | $ | 20,820,449 | ||
Net realized and unrealized gain | $ | 17,746,938 | ||
Net increase in net assets from operations | $ | 27,060,907 | ||
| 24 | See Notes to Financial Statements. |
Eaton Vance
Floating-Rate 2022 Target Term Trust
June 30, 2021
Statements of Changes in Net Assets
| Year Ended June 30, | ||||||||
| Increase (Decrease) in Net Assets | 2021 | 2020 | ||||||
From operations — | ||||||||
Net investment income | $ | 9,313,969 | $ | 11,070,683 | ||||
Net realized loss | (3,073,511 | ) | (3,762,601 | ) | ||||
Net change in unrealized appreciation (depreciation) | 20,820,449 | (15,848,659 | ) | |||||
Net increase (decrease) in net assets from operations | $ | 27,060,907 | $ | (8,540,577 | ) | |||
Distributions to common shareholders | $ | (9,945,706 | ) | $ | (12,350,732 | ) | ||
Capital share transactions — | ||||||||
Reinvestment of distributions to common shareholders | $ | 177,035 | $ | 94,119 | ||||
Net increase in net assets from capital share transactions | $ | 177,035 | $ | 94,119 | ||||
Net increase (decrease) in net assets | $ | 17,292,236 | $ | (20,797,190 | ) | |||
| Net Assets Applicable to Common Shares |
| |||||||
At beginning of year | $ | 203,360,964 | $ | 224,158,154 | ||||
At end of year | $ | 220,653,200 | $ | 203,360,964 | ||||
| 25 | See Notes to Financial Statements. |
Eaton Vance
Floating-Rate 2022 Target Term Trust
June 30, 2021
Statement of Cash Flows
| Cash Flows From Operating Activities | Year Ended June 30, 2021 | |||
Net increase in net assets from operations | $ | 27,060,907 | ||
Adjustments to reconcile net increase in net assets from operations to net cash provided by operating activities: | ||||
Investments purchased | (104,540,426 | ) | ||
Investments sold and principal repayments | 113,216,441 | |||
Increase in short-term investments, net | (3,397,369 | ) | ||
Net amortization/accretion of premium (discount) | (346,336 | ) | ||
Amortization of prepaid upfront fees on variable rate term preferred shares | 10,263 | |||
Amortization of deferred debt issuance costs on variable rate term preferred shares | 7,063 | |||
Amortization of prepaid upfront fees on notes payable | 53,259 | |||
Decrease in interest receivable | 372,153 | |||
Decrease in dividends receivable from affiliated investment | 834 | |||
Decrease in prepaid expenses | 4,418 | |||
Increase in payable to affiliate for investment adviser and administration fee | 10,589 | |||
Decrease in payable to affiliate for Trustees’ fees | (270 | ) | ||
Decrease in interest expense and fees payable | (104,927 | ) | ||
Increase in accrued expenses | 18,346 | |||
Increase in unfunded loan commitments | 83,356 | |||
Net change in unrealized (appreciation) depreciation from investments | (20,820,619 | ) | ||
Net realized loss from investments | 3,073,511 | |||
Net cash provided by operating activities | $ | 14,701,193 | ||
| Cash Flows From Financing Activities |
| |||
Cash distributions paid to common shareholders | $ | (9,768,671 | ) | |
Proceeds from notes payable | 18,000,000 | |||
Repayments of notes payable | (22,500,000 | ) | ||
Payment of upfront fees on notes payable | (50,000 | ) | ||
Net cash used in financing activities | $ | (14,318,671 | ) | |
Net increase in cash | $ | 382,522 | ||
Cash at beginning of year | $ | 2,903,964 | ||
Cash at end of year | $ | 3,286,486 | ||
| Supplemental disclosure of cash flow information: |
| |||
Noncash financing activities not included herein consist of: | ||||
Reinvestment of dividends and distributions | $ | 177,035 | ||
Cash paid for interest and fees on borrowings and variable rate term preferred shares | 1,740,078 | |||
| 26 | See Notes to Financial Statements. |
Eaton Vance
Floating-Rate 2022 Target Term Trust
June 30, 2021
Financial Highlights
Selected data for a common share outstanding during the periods stated
| Year Ended June 30, | Period Ended June 30, 2018(1) | |||||||||||||||
| 2021 | 2020 | 2019 | ||||||||||||||
Net asset value — Beginning of period (Common shares) | $ | 8.610 | $ | 9.490 | $ | 9.680 | $ | 9.850 | (2) | |||||||
| Income (Loss) From Operations | ||||||||||||||||
Net investment income(3) | $ | 0.394 | $ | 0.469 | $ | 0.502 | $ | 0.404 | ||||||||
Net realized and unrealized gain (loss) | 0.747 | (0.826 | ) | (0.159 | ) | (0.152 | ) | |||||||||
Total income (loss) from operations | $ | 1.141 | $ | (0.357 | ) | $ | 0.343 | $ | 0.252 | |||||||
| Less Distributions to Common Shareholders | ||||||||||||||||
From net investment income | $ | (0.421 | ) | $ | (0.523 | ) | $ | (0.533 | ) | $ | (0.406 | ) | ||||
Total distributions to common shareholders | $ | (0.421 | ) | $ | (0.523 | ) | $ | (0.533 | ) | $ | (0.406 | ) | ||||
Offering costs charged to paid-in capital(3) | $ | — | $ | — | $ | — | $ | (0.020 | ) | |||||||
Premium related to exercise of underwriters’ over-allotment option(3) | $ | — | $ | — | $ | — | $ | 0.004 | ||||||||
Net asset value — End of period (Common shares) | $ | 9.330 | $ | 8.610 | $ | 9.490 | $ | 9.680 | ||||||||
Market value — End of period (Common shares) | $ | 9.430 | $ | 8.100 | $ | 9.290 | $ | 9.440 | ||||||||
Total Investment Return on Net Asset Value(4) | 13.56 | % | (3.65 | )% | 3.86 | % | 2.55 | %(5)(6) | ||||||||
Total Investment Return on Market Value(4) | 22.01 | % | (7.36 | )% | 4.20 | % | 0.01 | %(5)(6) | ||||||||
| 27 | See Notes to Financial Statements. |
Eaton Vance
Floating-Rate 2022 Target Term Trust
June 30, 2021
Financial Highlights — continued
Selected data for a common share outstanding during the periods stated
| Year Ended June 30, | Period Ended June 30, 2018(1) | |||||||||||||||
| Ratios/Supplemental Data | 2021 | 2020 | 2019 | |||||||||||||
Net assets applicable to common shares, end of period (000’s omitted) | $ | 220,653 | $ | 203,361 | $ | 224,158 | $ | 228,461 | ||||||||
Ratios (as a percentage of average daily net assets applicable to common shares):† | ||||||||||||||||
Expenses excluding interest and fees | 1.23 | % | 1.24 | % | 1.25 | % | 1.24 | %(7) | ||||||||
Interest and fee expense(8) | 0.77 | % | 1.68 | % | 2.12 | % | 1.53 | %(7) | ||||||||
Total expenses | 2.00 | % | 2.92 | % | 3.37 | % | 2.77 | %(7) | ||||||||
Net investment income | 4.31 | % | 5.16 | % | 5.25 | % | 4.50 | %(7) | ||||||||
Portfolio Turnover | 33 | % | 32 | % | 22 | % | 30 | %(5) | ||||||||
Senior Securities: |
| |||||||||||||||
Total notes payable outstanding (in 000’s) | $ | 75,000 | $ | 79,500 | $ | 92,000 | $ | 100,000 | ||||||||
Asset coverage per $1,000 of notes payable(9) | $ | 4,369 | $ | 3,961 | $ | 3,784 | $ | 3,605 | ||||||||
Total variable rate term preferred shares outstanding | 320 | 320 | 320 | 320 | ||||||||||||
Asset coverage per variable rate term preferred share(10) | $ | 306,218 | $ | 282,387 | $ | 280,773 | $ | 273,077 | ||||||||
Involuntary liquidation preference per variable rate term preferred share(11) | $ | 100,000 | $ | 100,000 | $ | 100,000 | $ | 100,000 | ||||||||
Approximate market value per variable rate term preferred share(11) | $ | 100,000 | $ | 100,000 | $ | 100,000 | $ | 100,000 | ||||||||
| (1) | For the period from the start of business, July 31, 2017, to June 30, 2018. |
| (2) | Net asset value at beginning of period reflects the deduction of the sales charge of $0.15 per share paid by the shareholders from the $10.00 offering price. |
| (3) | Computed using average common shares outstanding. |
| (4) | Returns are historical and are calculated by determining the percentage change in net asset value or market value with all distributions reinvested. Distributions are assumed to be reinvested at prices obtained under the Trust’s dividend reinvestment plan. |
| (5) | Not annualized. |
| (6) | Total investment return on net asset value is calculated assuming a purchase at the offering price of $10.00 less the sales load of $0.15 per share paid by the shareholder on the first day and a sale at the net asset value on the last day of the period reported with all distributions reinvested. Total investment return on market value is calculated assuming a purchase at the offering price of $10.00 less the sales load of $0.15 per share paid by the shareholder on the first day and a sale at the current market price on the last day of the period reported with all distributions reinvested. |
| (7) | Annualized. |
| (8) | Interest and fee expense relates to the variable rate term preferred shares (see Note 2) and the notes payable (see Note 7) for the purpose of financial leverage. |
| (9) | Calculated by subtracting the Trust’s total liabilities (not including the notes payable and variable rate term preferred shares) from the Trust’s total assets, and dividing the result by the notes payable balance in thousands. |
| (10) | Calculated by subtracting the Trust’s total liabilities (not including the notes payable and variable rate term preferred shares) from the Trust’s total assets, dividing the result by the sum of the value of the notes payable and liquidation value of the variable rate term preferred shares, and multiplying the result by the liquidation value of one variable rate term preferred share. Such amount equates to 306%, 282%, 281% and 273% at June 30, 2021, 2020, 2019 and 2018, respectively. |
| (11) | Plus accumulated and unpaid dividends. |
| † | Ratios based on net assets applicable to common shares plus variable rate term preferred shares and borrowings are presented below. Ratios for periods less than one year are annualized. |
| Year Ended June 30, | Period Ended June 30, 2018(1) | |||||||||||||||
| 2021 | 2020 | 2019 | ||||||||||||||
Expenses excluding interest and fees | 0.81 | % | 0.80 | % | 0.80 | % | 0.83 | % | ||||||||
Interest and fee expense | 0.51 | % | 1.08 | % | 1.35 | % | 1.02 | % | ||||||||
Total expenses | 1.32 | % | 1.88 | % | 2.15 | % | 1.85 | % | ||||||||
Net investment income | 2.85 | % | 3.32 | % | 3.35 | % | 3.00 | % | ||||||||
| (1) | For the period from the start of business, July 31, 2017, to June 30, 2018. |
| 28 | See Notes to Financial Statements. |
Eaton Vance
Floating-Rate 2022 Target Term Trust
June 30, 2021
Notes to Financial Statements
1 Significant Accounting Policies
Eaton Vance Floating-Rate 2022 Target Term Trust (the Trust) is a Massachusetts business trust registered under the Investment Company Act of 1940, as amended (the 1940 Act), as a diversified, closed-end management investment company. The Trust’s investment objectives are high current income and to return $9.85 per share, the original net asset value per common share before deducting offering costs of $0.02 per common share (“Original NAV”), to holders of common shares of record on or about October 31, 2022 (the “Termination Date”). On or about the Termination Date, the Trust intends to cease its investment operations, liquidate its portfolio, retire or redeem its leverage facilities, and seek to return Original NAV to common shareholders, unless the term is extended for one period of up to twelve months and one additional period of up to six months by a vote of the Trust’s Board of Trustees.
The following is a summary of significant accounting policies of the Trust. The policies are in conformity with accounting principles generally accepted in the United States of America (U.S. GAAP). The Trust is an investment company and follows accounting and reporting guidance in the Financial Accounting Standards Board (FASB) Accounting Standards Codification Topic 946.
A Investment Valuation — The following methodologies are used to determine the market value or fair value of investments.
Senior Floating-Rate Loans. Interests in senior floating-rate loans (Senior Loans) for which reliable market quotations are readily available are valued generally at the average mean of bid and ask quotations obtained from a third party pricing service. Other Senior Loans are valued at fair value by the investment adviser under procedures approved by the Trustees. In fair valuing a Senior Loan, the investment adviser utilizes one or more of the valuation techniques described in (i) through (iii) below to assess the likelihood that the borrower will make a full repayment of the loan underlying such Senior Loan relative to yields on other Senior Loans issued by companies of comparable credit quality. If the investment adviser believes that there is a reasonable likelihood of full repayment, the investment adviser will determine fair value using a matrix pricing approach that considers the yield on the Senior Loan. If the investment adviser believes there is not a reasonable likelihood of full repayment, the investment adviser will determine fair value using analyses that include, but are not limited to: (i) a comparison of the value of the borrower’s outstanding equity and debt to that of comparable public companies; (ii) a discounted cash flow analysis; or (iii) when the investment adviser believes it is likely that a borrower will be liquidated or sold, an analysis of the terms of such liquidation or sale. In certain cases, the investment adviser will use a combination of analytical methods to determine fair value, such as when only a portion of a borrower’s assets are likely to be sold. In conducting its assessment and analyses for purposes of determining fair value of a Senior Loan, the investment adviser will use its discretion and judgment in considering and appraising relevant factors. Fair value determinations are made by the portfolio managers of the Trust based on information available to such managers. The portfolio managers of other funds managed by the investment adviser that invest in Senior Loans may not possess the same information about a Senior Loan borrower as the portfolio managers of the Trust. At times, the fair value of a Senior Loan determined by the portfolio managers of other funds managed by the investment adviser that invest in Senior Loans may vary from the fair value of the same Senior Loan determined by the portfolio managers of the Trust. The fair value of each Senior Loan is periodically reviewed and approved by the investment adviser’s Valuation Committee and by the Trustees based upon procedures approved by the Trustees. Junior Loans (i.e., subordinated loans and second lien loans) are valued in the same manner as Senior Loans.
Debt Obligations. Debt obligations are generally valued on the basis of valuations provided by third party pricing services, as derived from such services’ pricing models. Inputs to the models may include, but are not limited to, reported trades, executable bid and ask prices, broker/dealer quotations, prices or yields of securities with similar characteristics, interest rates, anticipated prepayments, benchmark curves or information pertaining to the issuer, as well as industry and economic events. The pricing services may use a matrix approach, which considers information regarding securities with similar characteristics to determine the valuation for a security. Short-term debt obligations purchased with a remaining maturity of sixty days or less for which a valuation from a third party pricing service is not readily available may be valued at amortized cost, which approximates fair value.
Equity Securities. Equity securities listed on a U.S. securities exchange generally are valued at the last sale or closing price on the day of valuation or, if no sales took place on such date, at the mean between the closing bid and ask prices on the exchange where such securities are principally traded. Equity securities listed on the NASDAQ Global or Global Select Market generally are valued at the NASDAQ official closing price. Unlisted or listed securities for which closing sales prices or closing quotations are not available are valued at the mean between the latest available bid and ask prices or, in the case of preferred equity securities that are not listed or traded in the over-the-counter market, by a third party pricing service that uses various techniques that consider factors including, but not limited to, prices or yields of securities with similar characteristics, benchmark yields, broker/dealer quotes, quotes of underlying common stock, issuer spreads, as well as industry and economic events.
Affiliated Fund. The Trust may invest in Eaton Vance Cash Reserves Fund, LLC (Cash Reserves Fund), an affiliated investment company managed by Eaton Vance Management (EVM). While Cash Reserves Fund is not a registered money market mutual fund, it conducts all of its investment activities in accordance with the requirements of Rule 2a-7 under the 1940 Act. Investments in Cash Reserves Fund are valued at the closing net asset value per unit on the valuation day. Cash Reserves Fund generally values its investment securities based on available market quotations provided by a third party pricing service.
Fair Valuation. Investments for which valuations or market quotations are not readily available or are deemed unreliable are valued at fair value using methods determined in good faith by or at the direction of the Trustees of the Trust in a manner that most fairly reflects the security’s “fair value”, which is the amount that the Trust might reasonably expect to receive for the security upon its current sale in the ordinary course. Each such determination is based on a consideration of relevant factors, which are likely to vary from one pricing context to another. These factors may include, but are not limited to, the type of security, the existence of any contractual restrictions on the security’s disposition, the price and extent of public trading in similar securities of the issuer or of comparable companies or entities, quotations or relevant information obtained from broker/dealers or other market participants, information
| 29 |
Eaton Vance
Floating-Rate 2022 Target Term Trust
June 30, 2021
Notes to Financial Statements — continued
obtained from the issuer, analysts, and/or the appropriate stock exchange (for exchange-traded securities), an analysis of the company’s or entity’s financial statements, and an evaluation of the forces that influence the issuer and the market(s) in which the security is purchased and sold.
B Investment Transactions — Investment transactions for financial statement purposes are accounted for on a trade date basis. Realized gains and losses on investments sold are determined on the basis of identified cost.
C Income — Interest income is recorded on the basis of interest accrued, adjusted for amortization of premium or accretion of discount. Fees associated with loan amendments are recognized immediately. Dividend income is recorded on the ex-dividend date for dividends received in cash and/or securities.
D Federal Taxes — The Trust intends to make monthly distributions of net investment income and any net realized capital gains in amounts necessary to maintain its taxation as a regulated investment company for U.S. federal income tax purposes. For the purpose of pursuing its investment objective of returning Original NAV, the Trust may retain a portion of its net investment income and some or all of its net capital gains, which would result in the Trust paying U.S. federal excise and corporate income taxes.
As of June 30, 2021, the Trust had no uncertain tax positions that would require financial statement recognition, de-recognition, or disclosure. The Trust files a U.S. federal income tax return annually after its fiscal year-end, which is subject to examination by the Internal Revenue Service for a period of three years from the date of filing.
E Unfunded Loan Commitments — The Trust may enter into certain loan agreements all or a portion of which may be unfunded. The Trust is obligated to fund these commitments at the borrower’s discretion. These commitments are disclosed in the accompanying Portfolio of Investments. At June 30, 2021, the Trust had sufficient cash and/or securities to cover these commitments.
F Use of Estimates — The preparation of the financial statements in conformity with U.S. GAAP requires management to make estimates and assumptions that affect the reported amounts of assets and liabilities at the date of the financial statements and the reported amounts of income and expense during the reporting period. Actual results could differ from those estimates.
G Indemnifications — Under the Trust’s organizational documents, its officers and Trustees may be indemnified against certain liabilities and expenses arising out of the performance of their duties to the Trust. Under Massachusetts law, if certain conditions prevail, shareholders of a Massachusetts business trust (such as the Trust) could be deemed to have personal liability for the obligations of the Trust. However, the Trust’s Declaration of Trust contains an express disclaimer of liability on the part of Trust shareholders and the By-laws provide that the Trust shall assume, upon request by the shareholder, the defense on behalf of any Trust shareholders. Moreover, the By-laws also provide for indemnification out of Trust property of any shareholder held personally liable solely by reason of being or having been a shareholder for all loss or expense arising from such liability. Additionally, in the normal course of business, the Trust enters into agreements with service providers that may contain indemnification clauses. The Trust’s maximum exposure under these arrangements is unknown as this would involve future claims that may be made against the Trust that have not yet occurred.
2 Variable Rate Term Preferred Shares
Variable rate term preferred shares are a form of preferred shares that represent stock of the Trust. They have a par value of $0.01 per share and a liquidation preference of $100,000 per share.
On September 6, 2017, the Trust issued 320 shares of Series C-1 Variable Rate Term Preferred Shares (VRTP Shares) in a private offering to a commercial paper conduit sponsored by a large financial institution (the Conduit), with a mandatory redemption date of September 8, 2020, unless extended. The Trust and Conduit agreed to extend the mandatory redemption date of the VRTP Shares for two years from September 8, 2020 through September 8, 2022 upon approval by the Trust’s Board of Trustees. The Conduit may elect at any time to revise the redemption date to an earlier date provided the Conduit gives notice to the Trust no less than 365 days prior to the proposed revised redemption date and the proposed revised redemption date is no earlier than September 8, 2021. The Trust and Conduit also agreed to a reduction to the spread to three-month LIBOR used to calculate the dividends on the VRTP Shares from 1.85% to 1.75%, effective August 13, 2020. Such spread is determined based on the current credit rating of the VRTP Shares, which is provided by Moody’s Investor Service. Dividends on the VRTP Shares are determined each day.
The VRTP Shares are redeemable at the option of the Trust at a redemption price equal to $100,000 per share, plus accumulated and unpaid dividends, on any business day and solely for the purpose of reducing the leverage of the Trust. The VRTP Shares are also subject to mandatory redemption at a redemption price equal to $100,000 per share, plus accumulated and unpaid dividends, if the Trust is in default for an extended period on its asset maintenance or leverage ratio requirements with respect to the VRTP Shares. Six months prior to the mandatory redemption date, the Trust is required to segregate in a liquidity account with its custodian investments equal to 110% of the VRTP Shares’ redemption price, and over the six-month period execute a series of liquidation transactions to assure sufficient liquidity to redeem the VRTP Shares. The holders of the VRTP Shares, voting as a class, are entitled to elect two Trustees of the Trust. If the dividends on the VRTP Shares remain unpaid in an amount equal to two full years’ dividends, the holders of the VRTP Shares as a class have the right to elect a majority of the Board of Trustees.
For financial reporting purposes, the liquidation value of the VRTP Shares is presented as a liability on the Statement of Assets and Liabilities and unpaid dividends are included in interest expense and fees payable. Dividends accrued on VRTP Shares are treated as interest payments for financial reporting purposes and are included in interest expense and fees on the Statement of Operations. In connection with the issuance of the VRTP Shares, the Trust paid
| 30 |
Eaton Vance
Floating-Rate 2022 Target Term Trust
June 30, 2021
Notes to Financial Statements — continued
an upfront fee of $160,000 and debt issuance costs of $110,112, both of which were amortized to interest expense and fees over a period of three years to the original mandatory redemption date of September 8, 2020.
The carrying amount of the VRTP Shares at June 30, 2021 represents its liquidation value, which approximates fair value. If measured at fair value, the VRTP Shares would have been considered as Level 2 in the fair value hierarchy (see Note 9) at June 30, 2021. The average liquidation preference of the VRTP Shares during the year ended June 30, 2021 was $32,000,000.
3 Distributions to Shareholders and Income Tax Information
The Trust intends to make monthly distributions of net investment income to common shareholders, after payment of any dividends on any outstanding VRTP Shares. The Trust may also distribute net realized capital gains, if any, generally not more than once per year. Distributions to common shareholders are recorded on the ex-dividend date. Dividends to variable rate term preferred shareholders are accrued daily and payable quarterly. The dividend rate on
the VRTP Shares at June 30, 2021 was 1.95%. The amount of dividends accrued and the average dividend rate of the VRTP Shares during the year ended June 30, 2021 were $654,669 and 2.05%, respectively.
Distributions to shareholders are determined in accordance with income tax regulations, which may differ from U.S. GAAP. As required by U.S. GAAP, only distributions in excess of tax basis earnings and profits are reported in the financial statements as a return of capital. Permanent differences between book and tax accounting relating to distributions are reclassified to paid-in capital. For tax purposes, distributions from short-term capital gains are considered to be from ordinary income.
The tax character of distributions declared, including distributions on VRTP Shares that are treated as interest expense for financial reporting purposes, for the years ended June 30, 2021 and June 30, 2020 was as follows:
| Year Ended June 30, | ||||||||
| 2021 | 2020 | |||||||
Ordinary income | $ | 10,600,375 | $ | 13,584,372 | ||||
During the year ended June 30, 2021, accumulated loss was increased by $77,078 and paid-in capital was increased by $77,078 due to differences between book and tax accounting, primarily for non-deductible expenses and offering costs. These reclassifications had no effect on the net assets or net asset value per share of the Trust.
As of June 30, 2021, the components of distributable earnings (accumulated loss) on a tax basis were as follows:
Undistributed ordinary income | $ | 126,886 | ||
Deferred capital losses | (10,172,346 | ) | ||
Net unrealized depreciation | (1,614,676 | ) | ||
Distributions payable | (163,030 | ) | ||
Accumulated loss | $ | (11,823,166 | ) | |
At June 30, 2021, the Trust, for federal income tax purposes, had deferred capital losses of $10,172,346 which would reduce its taxable income arising from future net realized gains on investment transactions, if any, to the extent permitted by the Internal Revenue Code, and thus would reduce the amount of distributions to shareholders, which would otherwise be necessary to relieve the Trust of any liability for federal income or excise tax. The deferred capital losses are treated as arising on the first day of the Trust’s next taxable year and retain the same short-term or long-term character as when originally deferred. Of the deferred capital losses at June 30, 2021, $385,268 are short-term and $9,787,078 are long-term.
The cost and unrealized appreciation (depreciation) of investments of the Trust at June 30, 2021, as determined on a federal income tax basis, were as follows:
Aggregate cost | $ | 331,846,344 | ||
Gross unrealized appreciation | $ | 1,802,337 | ||
Gross unrealized depreciation | (3,416,844 | ) | ||
Net unrealized depreciation | $ | (1,614,507 | ) | |
| 31 |
Eaton Vance
Floating-Rate 2022 Target Term Trust
June 30, 2021
Notes to Financial Statements — continued
4 Investment Adviser and Administration Fee and Other Transactions with Affiliates
The investment adviser and administration fee is earned by EVM as compensation for investment advisory and administrative services rendered to the Trust. On March 1, 2021, Morgan Stanley acquired Eaton Vance Corp. (the “Transaction”) and EVM became an indirect, wholly-owned subsidiary of Morgan Stanley. In connection with the Transaction, the Trust entered into a new investment advisory and administrative agreement (the “New Agreement”) with EVM, which took effect on March 1, 2021. Pursuant to the New Agreement (and the Trust’s investment advisory and administrative agreement with EVM in effect prior to March 1, 2021), the fee is computed at an annual rate of 0.70% of the Trust’s average daily total managed assets and is payable monthly. During any extension period of the Trust’s term, the fee will be reduced to 0.35% of the Trust’s average daily total managed assets. Total managed assets as referred to herein represent total assets of the Trust (including assets attributable to borrowings, any outstanding preferred shares, or other forms of leverage) less accrued liabilities (other than liabilities representing borrowings or such other forms of leverage). For the year ended June 30, 2021, the Trust’s investment adviser and administration fee amounted to $2,283,877. The Trust may invest its cash in Cash Reserves Fund. EVM does not currently receive a fee for advisory services provided to Cash Reserves Fund.
Trustees and officers of the Trust who are members of EVM’s organization receive remuneration for their services to the Trust out of the investment adviser and administration fee. Trustees of the Trust who are not affiliated with EVM may elect to defer receipt of all or a percentage of their annual fees in accordance with the terms of the Trustees Deferred Compensation Plan. For the year ended June 30, 2021, no significant amounts have been deferred. Certain officers and Trustees of the Trust are officers of EVM.
5 Purchases and Sales of Investments
Purchases and sales of investments, other than short-term obligations and including maturities, paydowns and principal repayments on Senior Loans, aggregated $107,038,848 and $115,157,634, respectively, for the year ended June 30, 2021.
6 Common Shares of Beneficial Interest
Common shares issued by the Trust pursuant to its dividend reinvestment plan for the years ended June 30, 2021 and June 30, 2020 were 19,026 and 9,872, respectively.
7 Credit Agreement
The Trust has entered into a Credit Agreement, as amended (the Agreement) with a bank to borrow up to a limit of $100 million ($109 million prior to March 16, 2021). Borrowings under the Agreement are secured by the assets of the Trust. Interest is charged at a rate above the London Interbank Offered Rate (LIBOR) and is payable monthly. Under the terms of the Agreement, in effect through March 15, 2022, the Trust pays a facility fee of 0.15% on the borrowing limit. In connection with the renewal of the Agreement on March 16, 2021, the Trust paid an upfront fee of $50,000, which is being amortized to interest expense over a period of one year. The unamortized balance at June 30, 2021 is approximately $35,000 and is included in prepaid upfront fees on notes payable on the Statement of Assets and Liabilities. The Trust is required to maintain certain net asset levels during the term of the Agreement. At June 30, 2021, the Trust had borrowings outstanding under the Agreement of $75,000,000 at an annual interest rate of 0.93%. Based on the short-term nature of the borrowings under the Agreement and the variable interest rate, the carrying amount of the borrowings at June 30, 2021 approximated its fair value. If measured at fair value, borrowings under the Agreement would have been considered as Level 2 in the fair value hierarchy (see Note 9) at June 30, 2021. For the year ended June 30, 2021, the average borrowings under the Agreement and the average annual interest rate (excluding fees) were $78,360,274 and 0.97%, respectively.
8 Investments in Affiliated Funds
At June 30, 2021, the value of the Trust’s investment in affiliated funds was $6,441,904, which represents 2.9% of the Trust’s net assets applicable to common shares. Transactions in affiliated funds by the Trust for the year ended June 30, 2021 were as follows:
| Name of affiliated fund | Value, beginning of period | Purchases | Sales proceeds | Net realized gain (loss) | Change in unrealized appreciation (depreciation) | Value, end of period | Dividend income | Units, end | ||||||||||||||||||||||||
Short-Term Investments |
| |||||||||||||||||||||||||||||||
Eaton Vance Cash Reserves Fund, LLC | $ | 3,044,693 | $ | 138,319,626 | $ | (134,922,257 | ) | $ | (171 | ) | $ | 13 | $ | 6,441,904 | $ | 7,647 | 6,441,904 | |||||||||||||||
| 32 |
Eaton Vance
Floating-Rate 2022 Target Term Trust
June 30, 2021
Notes to Financial Statements — continued
9 Fair Value Measurements
Under generally accepted accounting principles for fair value measurements, a three-tier hierarchy to prioritize the assumptions, referred to as inputs, is used in valuation techniques to measure fair value. The three-tier hierarchy of inputs is summarized in the three broad levels listed below.
| • | Level 1 – quoted prices in active markets for identical investments |
| • | Level 2 – other significant observable inputs (including quoted prices for similar investments, interest rates, prepayment speeds, credit risk, etc.) |
| • | Level 3 – significant unobservable inputs (including a fund’s own assumptions in determining the fair value of investments) |
In cases where the inputs used to measure fair value fall in different levels of the fair value hierarchy, the level disclosed is determined based on the lowest level input that is significant to the fair value measurement in its entirety. The inputs or methodology used for valuing securities are not necessarily an indication of the risk associated with investing in those securities.
At June 30, 2021, the hierarchy of inputs used in valuing the Trust’s investments, which are carried at value, were as follows:
| Asset Description | Level 1 | Level 2 | Level 3 | Total | ||||||||||||
Common Stocks | $ | — | $ | — | $ | 264,581 | $ | 264,581 | ||||||||
Corporate Bonds | — | 12,529,418 | — | 12,529,418 | ||||||||||||
Senior Floating-Rate Loans (Less Unfunded Loan Commitments) | — | 310,995,934 | — | 310,995,934 | ||||||||||||
Short-Term Investments | — | 6,441,904 | — | 6,441,904 | ||||||||||||
Total Investments | $ | — | $ | 329,967,256 | $ | 264,581 | $ | 330,231,837 | ||||||||
| * | None of the unobservable inputs for Level 3 assets, individually or collectively, had a material impact on the Trust. |
Level 3 investments at the beginning and/or end of the period in relation to net assets were not significant and accordingly, a reconciliation of Level 3 assets for the year ended June 30, 2021 is not presented.
10 Risks and Uncertainties
Credit Risk
The Trust invests primarily in below investment grade floating-rate loans, which are considered speculative because of the credit risk of their issuers. Changes in economic conditions or other circumstances are more likely to reduce the capacity of issuers of these securities to make principal and interest payments. Such companies are more likely to default on their payments of interest and principal owed than issuers of investment grade bonds. An economic downturn generally leads to a higher non-payment rate, and a loan or other debt obligation may lose significant value before a default occurs. Lower rated investments also may be subject to greater price volatility than higher rated investments. Moreover, the specific collateral used to secure a loan may decline in value or become illiquid, which would adversely affect the loan’s value.
LIBOR Transition Risk
Certain instruments held by the Trust may pay an interest rate based on the LIBOR, which is the average offered rate for various maturities of short-term loans between certain major international banks. LIBOR is used throughout global banking and financial industries to determine interest rates for a variety of financial instruments (such as debt instruments and derivatives) and borrowing arrangements. The ICE Benchmark Administration Limited, the administrator of LIBOR, is expected to cease publishing certain LIBOR settings on December 31, 2021, and the remaining LIBOR settings on June 30, 2023. Although the transition process away from LIBOR is expected to be defined in advance of the anticipated discontinuation, there remains uncertainty regarding the future utilization of LIBOR and the nature of any replacement rate or rates. The phase-out of LIBOR may result in, among other things, increased volatility or illiquidity in markets for instruments based on LIBOR and changes in the value of such instruments.
Pandemic Risk
An outbreak of respiratory disease caused by a novel coronavirus was first detected in China in late 2019 and subsequently spread internationally. This coronavirus has resulted in closing borders, enhanced health screenings, changes to healthcare service preparation and delivery, quarantines, cancellations, disruptions to supply chains and customer activity, as well as general concern and uncertainty. Health crises caused by outbreaks, such as the coronavirus outbreak, may exacerbate other pre-existing political, social and economic risks and disrupt normal market conditions and operations. The impact of this outbreak has negatively affected the worldwide economy, the economies of individual countries, individual companies, and the market in general, and may continue to do so in significant and unforeseen ways, as may other epidemics and pandemics that may arise in the future. Any such impact could adversely affect the Trust’s performance, or the performance of the securities in which the Trust invests.
| 33 |
Eaton Vance
Floating-Rate 2022 Target Term Trust
June 30, 2021
Report of Independent Registered Public Accounting Firm
To the Trustees and Shareholders of Eaton Vance Floating-Rate 2022 Target Term Trust:
Opinion on the Financial Statements and Financial Highlights
We have audited the accompanying statement of assets and liabilities of Eaton Vance Floating-Rate 2022 Target Term Trust (the “Trust”), including the portfolio of investments, as of June 30, 2021, the related statements of operations and cash flows for the year then ended, the statements of changes in net assets for each of the two years in the period then ended, the financial highlights for each of the three years in the period then ended and for the period from the start of business, July 31, 2017 to June 30, 2018, and the related notes. In our opinion, the financial statements and financial highlights present fairly, in all material respects, the financial position of the Trust as of June 30, 2021, and the results of its operations and its cash flows for the year then ended, the changes in its net assets for each of the two years in the period then ended, and the financial highlights for each of the three years in the period then ended and for the period from the start of business, July 31, 2017 to June 30, 2018, in conformity with accounting principles generally accepted in the United States of America.
Basis for Opinion
These financial statements and financial highlights are the responsibility of the Trust’s management. Our responsibility is to express an opinion on the Trust’s financial statements and financial highlights based on our audits. We are a public accounting firm registered with the Public Company Accounting Oversight Board (United States) (PCAOB) and are required to be independent with respect to the Trust in accordance with the U.S. federal securities laws and the applicable rules and regulations of the Securities and Exchange Commission and the PCAOB.
We conducted our audits in accordance with the standards of the PCAOB. Those standards require that we plan and perform the audit to obtain reasonable assurance about whether the financial statements and financial highlights are free of material misstatement, whether due to error or fraud. The Trust is not required to have, nor were we engaged to perform, an audit of its internal control over financial reporting. As part of our audits we are required to obtain an understanding of internal control over financial reporting but not for the purpose of expressing an opinion on the effectiveness of the Trust’s internal control over financial reporting. Accordingly, we express no such opinion.
Our audits included performing procedures to assess the risks of material misstatement of the financial statements and financial highlights, whether due to error or fraud, and performing procedures that respond to those risks. Such procedures included examining, on a test basis, evidence regarding the amounts and disclosures in the financial statements and financial highlights. Our audits also included evaluating the accounting principles used and significant estimates made by management, as well as evaluating the overall presentation of the financial statements and financial highlights. Our procedures included confirmation of securities and senior loans owned as of June 30, 2021, by correspondence with the custodian, brokers and selling or agent banks; when replies were not received from brokers and selling or agent banks, we performed other auditing procedures. We believe that our audits provide a reasonable basis for our opinion.
/s/ Deloitte & Touche LLP
Boston, Massachusetts
August 18, 2021
We have served as the auditor of one or more Eaton Vance investment companies since 1959.
| 34 |
Eaton Vance
Floating-Rate 2022 Target Term Trust
June 30, 2021
Federal Tax Information (Unaudited)
The Form 1099-DIV you receive in February 2022 will show the tax status of all distributions paid to your account in calendar year 2021. Shareholders are advised to consult their own tax adviser with respect to the tax consequences of their investment in the Trust. As required by the Internal Revenue Code and/or regulations, shareholders must be notified regarding the status of 163(j) interest dividends.
163(j) Interest Dividends. For the fiscal year ended June 30, 2021, the Trust designates 96.40% of distributions from net investment income as a 163(j) interest dividend.
| 35 |
Eaton Vance
Floating-Rate 2022 Target Term Trust
June 30, 2021
Joint Special Meeting of Shareholders (Unaudited)
The Fund held a Joint Special Meeting of Shareholders (the “Special Meeting”) with certain other Eaton Vance closed-end funds on January 7, 2021. In order to solicit additional votes to achieve a required quorum, the Special Meeting was adjourned several times, with the vote being taken on February 23, 2021 for the following purpose: approval of a new investment advisory agreement with EVM (“Proposal 1”). The shareholder meeting results are as follows:
| Number of Shares(1) | ||||||||||||||||
| For | Against | Abstain(2) | Broker Non-Votes(2) | |||||||||||||
Proposal 1 | 10,559,987 | 355,245 | 900,345 | 0 | ||||||||||||
| (1) | Fractional shares were voted proportionately. |
| (2) | All shares that were voted and votes to abstain were counted towards establishing a quorum, as were broker non-votes. (Broker non-votes are shares for which a broker returns a proxy but for which (i) the beneficial owner has not voted and (ii) the broker holding the shares does not have discretionary authority to vote on the particular matter.) Abstentions and broker non-votes had the effect of a negative vote on the Proposal. Broker non-votes were not expected with respect to the Proposal because brokers are required to receive instructions from the beneficial owners or persons entitled to vote in order to submit proxies. |
| 36 |
Eaton Vance
Floating-Rate 2022 Target Term Trust
June 30, 2021
Annual Meeting of Shareholders (Unaudited)
The Trust held its Annual Meeting of Shareholders on April 15, 2021. The following actions were taken by the shareholders.
Proposal 1a: The election of Thomas E. Faust Jr., Mark R. Fetting and Keith Quinton as Class I Trustees of the Trust, each for a three-year term ending in 2024.
The following votes were cast by the Trust’s common and VRTP shareholders, voting together as a single class:
| Nominees for Trustee | Number of Shares | |||||||
| For | Withheld | |||||||
Thomas E. Faust Jr. | 20,443,976 | 413,901 | ||||||
Mark R. Fetting | 12,196,265 | 8,661,612 | ||||||
Keith Quinton | 12,204,880 | 8,652,997 | ||||||
Proposal 1b: The election of George J. Gorman as a Class I Trustee of the Trust, for a three-year term ending in 2024.
The following votes were cast by the Trust’s VRTP shareholders, voting separately as a single class:
| Nominee for Trustee | Number of Shares | |||||||
| For | Withheld | |||||||
George J. Gorman | 0 | 1 | 320 | |||||
| 1 | Pursuant to the Trust’s Declaration of Trust and Amended and Restated By-Laws, Mr. Gorman will continue to serve on the Board of Trustees for a three-year term ending in 2024 and until a successor has been elected and qualified. |
| 37 |
Eaton Vance
Floating-Rate 2022 Target Term Trust
June 30, 2021
The Trust offers a dividend reinvestment plan (Plan) pursuant to which shareholders automatically have distributions reinvested in common shares (Shares) of the Trust unless they elect otherwise through their investment dealer. On the distribution payment date, if the NAV per Share is equal to or less than the market price per Share plus estimated brokerage commissions, then new Shares will be issued. The number of Shares shall be determined by the greater of the NAV per Share or 95% of the market price. Otherwise, Shares generally will be purchased on the open market by American Stock Transfer & Trust Company, LLC, the Plan agent (Agent). Distributions subject to income tax (if any) are taxable whether or not Shares are reinvested.
If your Shares are in the name of a brokerage firm, bank, or other nominee, you can ask the firm or nominee to participate in the Plan on your behalf. If the nominee does not offer the Plan, you will need to request that the Trust’s transfer agent re-register your Shares in your name or you will not be able to participate.
The Agent’s service fee for handling distributions will be paid by the Trust. Plan participants will be charged their pro rata share of brokerage commissions on all open-market purchases.
Plan participants may withdraw from the Plan at any time by writing to the Agent at the address noted on the following page. If you withdraw, you will receive Shares in your name for all Shares credited to your account under the Plan. If a participant elects by written notice to the Agent to sell part or all of his or her Shares and remit the proceeds, the Agent is authorized to deduct a $5.00 fee plus brokerage commissions from the proceeds.
If you wish to participate in the Plan and your Shares are held in your own name, you may complete the form on the following page and deliver it to the Agent. Any inquiries regarding the Plan can be directed to the Agent at 1-866-439-6787.
| 38 |
Eaton Vance
Floating-Rate 2022 Target Term Trust
June 30, 2021
Application for Participation in Dividend Reinvestment Plan
This form is for shareholders who hold their common shares in their own names. If your common shares are held in the name of a brokerage firm, bank, or other nominee, you should contact your nominee to see if it will participate in the Plan on your behalf. If you wish to participate in the Plan, but your brokerage firm, bank, or nominee is unable to participate on your behalf, you should request that your common shares be re-registered in your own name which will enable your participation in the Plan.
The following authorization and appointment is given with the understanding that I may terminate it at any time by terminating my participation in the Plan as provided in the terms and conditions of the Plan.
Please print exact name on account
Shareholder signature Date
Shareholder signature Date
Please sign exactly as your common shares are registered. All persons whose names appear on the share certificate must sign.
YOU SHOULD NOT RETURN THIS FORM IF YOU WISH TO RECEIVE YOUR DISTRIBUTIONS IN CASH. THIS IS NOT A PROXY.
This authorization form, when signed, should be mailed to the following address:
Eaton Vance Floating-Rate 2022 Target Term Trust
c/o American Stock Transfer & Trust Company, LLC
P.O. Box 922
Wall Street Station
New York, NY 10269-0560
| 39 |
Eaton Vance
Floating-Rate 2022 Target Term Trust
June 30, 2021
Fund Management. The Trustees of Eaton Vance Floating-Rate 2022 Target Term Trust (the Trust) are responsible for the overall management and supervision of the Trust’s affairs. The Trustees and officers of the Trust are listed below. Except as indicated, each individual has held the office shown or other offices in the same company for the last five years. The “Noninterested Trustees” consist of those Trustees who are not “interested persons” of the Trust, as that term is defined under the 1940 Act. The business address of each Trustee and officer is Two International Place, Boston, Massachusetts 02110. As used below, “EVC” refers to Eaton Vance Corp., “EV” refers to EV LLC, “EVM” refers to Eaton Vance Management, “BMR” refers to Boston Management and Research and “EVD” refers to Eaton Vance Distributors, Inc. EV is the trustee of each of EVM and BMR. Effective March 1, 2021, each of EVM, BMR, EVD and EV are indirect, wholly owned subsidiaries of Morgan Stanley. Each officer affiliated with EVM may hold a position with other EVM affiliates that is comparable to his or her position with EVM listed below. Each Trustee oversees 139 portfolios (with the exception of Messrs. Faust and Wennerholm and Ms. Frost who oversee 138 portfolios) in the Eaton Vance Complex (including all master and feeder funds in a master feeder structure). Each officer serves as an officer of certain other Eaton Vance funds.
| Name and Year of Birth | Position(s) with the | Term Expiring. Trustee Since(1) | Principal Occupation(s) and Other Directorships During Past Five Years and Other Relevant Experience | |||
| Interested Trustee | ||||||
Thomas E. Faust Jr. 1958 | Class I Trustee | Until 2024. Trustee since 2007. | Chairman of Morgan Stanley Investment Management, Inc. (MSIM), member of the Board of Managers and President of EV, Chief Executive Officer of EVM and BMR, and Director of EVD. Formerly, Chairman, Chief Executive Officer and President of EVC. Trustee and/or officer of 138 registered investment companies. Mr. Faust is an interested person because of his positions with MSIM, BMR, EVM, EVD, and EV, which are affiliates of the Trust, and his former position with EVC, which was an affiliate of the Trust prior to March 1, 2021. Directorships in the Last Five Years. Formerly, Director of EVC (2007-2021) and Hexavest Inc. (2012-2021) (investment management firm (2012-2021). | |||
| Noninterested Trustees | ||||||
Mark R. Fetting 1954 | Class I Trustee | Until 2024. Trustee since 2016. | Private investor. Formerly held various positions at Legg Mason, Inc. (investment management firm) (2000-2012), including President, Chief Executive Officer, Director and Chairman (2008-2012), Senior Executive Vice President (2004-2008) and Executive Vice President (2001-2004). Formerly, President of Legg Mason family of funds (2001-2008). Formerly, Division President and Senior Officer of Prudential Financial Group, Inc. and related companies (investment management firm) (1991-2000). Other Directorships in the Last Five Years. None. | |||
Cynthia E. Frost 1961 | Class II Trustee | Until 2022. Trustee since 2014. | Private investor. Formerly, Chief Investment Officer of Brown University (university endowment) (2000-2012). Formerly, Portfolio Strategist for Duke Management Company (university endowment manager) (1995-2000). Formerly, Managing Director, Cambridge Associates (investment consulting company) (1989-1995). Formerly, Consultant, Bain and Company (management consulting firm) (1987-1989). Formerly, Senior Equity Analyst, BA Investment Management Company (1983-1985). Other Directorships in the Last Five Years. None. | |||
George J. Gorman 1952 | Chairperson of the Board and Class I Trustee(2) | Until 2024. Chairperson of the Board since 2021 and Trustee since 2014. | Principal at George J. Gorman LLC (consulting firm). Formerly, Senior Partner at Ernst & Young LLP (a registered public accounting firm) (1974-2009). Other Directorships in the Last Five Years. None. | |||
Valerie A. Mosley 1960 | Class II Trustee(2) | Until 2022. Trustee since 2014. | Chairwoman and Chief Executive Officer of Valmo Ventures (a consulting and investment firm). Founder of Upward Wealth, Inc., dba BrightUP, a fintech platform. Formerly, Partner and Senior Vice President, Portfolio Manager and Investment Strategist at Wellington Management Company, LLP (investment management firm) (1992-2012). Formerly, Chief Investment Officer, PG Corbin Asset Management (1990-1992). Formerly worked in institutional corporate bond sales at Kidder Peabody (1986-1990). Other Directorships in the Last Five Years. Director of DraftKings, Inc. (digital sports entertainment and gaming company) (since September 2020). Director of Groupon, Inc. (e-commerce provider) (since April 2020). Director of Envestnet, Inc. (provider of intelligent systems for wealth management and financial wellness) (since 2018). Formerly, Director of Dynex Capital, Inc. (mortgage REIT) (2013-2020). | |||
| 40 |
Eaton Vance
Floating-Rate 2022 Target Term Trust
June 30, 2021
Management and Organization — continued
| Name and Year of Birth | Position(s) with the | Term Expiring. Trustee Since(1) | Principal Occupation(s) and Other Directorships During Past Five Years and Other Relevant Experience | |||
| Noninterested Trustees (continued) | ||||||
William H. Park 1947 | Class II Trustee | Until 2022. Trustee since 2003. | Private investor. Formerly, Consultant (management and transactional) (2012-2014). Formerly, Chief Financial Officer, Aveon Group L.P. (investment management firm) (2010-2011). Formerly, Vice Chairman, Commercial Industrial Finance Corp. (specialty finance company) (2006-2010). Formerly, President and Chief Executive Officer, Prizm Capital Management, LLC (investment management firm) (2002-2005). Formerly, Executive Vice President and Chief Financial Officer, United Asset Management Corporation (investment management firm) (1982-2001). Formerly, Senior Manager, Price Waterhouse (now PricewaterhouseCoopers) (a registered public accounting firm) (1972-1981). Other Directorships in the Last Five Years. None. | |||
Helen Frame Peters 1948 | Class II Trustee | Until 2022. Trustee since 2008. | Professor of Finance, Carroll School of Management, Boston College. Formerly, Dean, Carroll School of Management, Boston College (2000-2002). Formerly, Chief Investment Officer, Fixed Income, Scudder Kemper Investments (investment management firm) (1998-1999). Formerly, Chief Investment Officer, Equity and Fixed Income, Colonial Management Associates (investment management firm) (1991-1998). Other Directorships in the Last Five Years. None. | |||
Keith Quinton 1958 | Class I Trustee | Until 2024. Trustee since 2018. | Private investor, researcher and lecturer. Formerly, Independent Investment Committee Member at New Hampshire Retirement System (2017-2021). Formerly, Portfolio Manager and Senior Quantitative Analyst at Fidelity Investments (investment management firm) (2001-2014). Other Directorships in the Last Five Years. Formerly, Director (2016-2021) and Chairman (2019-2021) of New Hampshire Municipal Bond Bank. | |||
Marcus L. Smith 1966 | Class III Trustee | Until 2023. Trustee since 2018. | Private investor. Formerly, Portfolio Manager at MFS Investment Management (investment management firm) (1994-2017). Other Directorships in the Last Five Years. Director of First Industrial Realty Trust, Inc. (an industrial REIT) (since 2021). Director of MSCI Inc. (global provider of investment decision support tools) (since 2017). Formerly, Director of DCT Industrial Trust Inc. (logistics real estate company) (2017-2018). | |||
Susan J. Sutherland 1957 | Class III Trustee | Until 2023. Trustee since 2015. | Private investor. Director of Ascot Group Limited and certain of its subsidiaries (insurance and reinsurance) (since 2017). Formerly, Director of Hagerty Holding Corp. (insurance) (2015-2018) and Montpelier Re Holdings Ltd. (insurance and reinsurance) (2013-2015). Formerly, Associate, Counsel and Partner at Skadden, Arps, Slate, Meagher & Flom LLP (law firm) (1982-2013). Other Directorships in the Last Five Years. Director of Kairos Acquisition Corp. (insurance/InsurTech acquisition company) (since 2021). | |||
Scott E. Wennerholm 1959 | Class III Trustee | Until 2023. Trustee since 2016. | Private investor. Formerly, Trustee at Wheelock College (postsecondary institution) (2012-2018). Formerly, Consultant at GF Parish Group (executive recruiting firm) (2016-2017). Formerly, Chief Operating Officer and Executive Vice President at BNY Mellon Asset Management (investment management firm) (2005-2011). Formerly, Chief Operating Officer and Chief Financial Officer at Natixis Global Asset Management (investment management firm) (1997-2004). Formerly, Vice President at Fidelity Investments Institutional Services (investment management firm) (1994-1997). Other Directorships in the Last Five Years. None. | |||
| 41 |
Eaton Vance
Floating-Rate 2022 Target Term Trust
June 30, 2021
Management and Organization — continued
| Name and Year of Birth | Position(s) with the | Officer Since(3) | Principal Occupation(s) During Past Five Years | |||
| Principal Officers who are not Trustees | ||||||
Eric A. Stein 1980 | President | 2020 | Vice President and Chief Investment Officer, Fixed Income of EVM and BMR. Prior to November 1, 2020, Mr. Stein was a co-Director of Eaton Vance’s Global Income Investments. Also Vice President of Calvert Research and Management (“CRM”). | |||
Deidre E. Walsh 1971 | Vice President and Chief Legal Officer | 2009 | Vice President of EVM and BMR. Also Vice President of CRM. | |||
James F. Kirchner 1967 | Treasurer | 2007 | Vice President of EVM and BMR. Also Vice President of CRM. | |||
Kimberly M. Roessiger 1985 | Secretary | 2021 | Vice President of EVM and BMR. | |||
Richard F. Froio 1968 | Chief Compliance Officer | 2017 | Vice President of EVM and BMR since 2017. Formerly, Deputy Chief Compliance Officer (Adviser/Funds) and Chief Compliance Officer (Distribution) at PIMCO (2012-2017) and Managing Director at BlackRock/Barclays Global Investors (2009-2012). | |||
| (1) | Year first appointed to serve as Trustee for a fund in the Eaton Vance family of funds. Each Trustee has served continuously since appointment unless indicated otherwise. |
| (2) | VRTP Trustee. |
| (3) | Year first elected to serve as officer of a fund in the Eaton Vance family of funds when the officer has served continuously. Otherwise, year of most recent election as an officer of a fund in the Eaton Vance family of funds. Titles may have changed since initial election. Each officer serves until his or her successor is elected. |
| 42 |
Eaton Vance Funds
| Privacy Notice | April 2021 |
| FACTS | WHAT DOES EATON VANCE DO WITH YOUR PERSONAL INFORMATION? | |
| Why? | Financial companies choose how they share your personal information. Federal law gives consumers the right to limit some but not all sharing. Federal law also requires us to tell you how we collect, share, and protect your personal information. Please read this notice carefully to understand what we do. | |
| What? | The types of personal information we collect and share depend on the product or service you have with us. This information can include:
∎ Social Security number and income ∎ investment experience and risk tolerance ∎ checking account number and wire transfer instructions | |
| How? | All financial companies need to share customers’ personal information to run their everyday business. In the section below, we list the reasons financial companies can share their customers’ personal information; the reasons Eaton Vance chooses to share; and whether you can limit this sharing. | |
| Reasons we can share your personal information | Does Eaton Vance share? | Can you limit this sharing? | ||
| For our everyday business purposes — such as to process your transactions, maintain your account(s), respond to court orders and legal investigations, or report to credit bureaus | Yes | No | ||
| For our marketing purposes — to offer our products and services to you | Yes | No | ||
| For joint marketing with other financial companies | No | We don’t share | ||
| For our investment management affiliates’ everyday business purposes — information about your transactions, experiences, and creditworthiness | Yes | Yes | ||
| For our affiliates’ everyday business purposes — information about your transactions and experiences | Yes | No | ||
| For our affiliates’ everyday business purposes — information about your creditworthiness | No | We don’t share | ||
| For our investment management affiliates to market to you | Yes | Yes | ||
| For our affiliates to market to you | No | We don’t share | ||
| For nonaffiliates to market to you | No | We don’t share |
| To limit our sharing | Call toll-free 1-800-262-1122 or email: EVPrivacy@eatonvance.com
Please note:
If you are a new customer, we can begin sharing your information 30 days from the date we sent this notice. When you are no longer our customer, we continue to share your information as described in this notice. However, you can contact us at any time to limit our sharing. | |
| Questions? | Call toll-free 1-800-262-1122 or email: EVPrivacy@eatonvance.com | |
| 43 |
Eaton Vance Funds
| Privacy Notice — continued | April 2021 |
| Page 2 |
| Who we are | ||
| Who is providing this notice? | Eaton Vance Management, Eaton Vance Distributors, Inc., Eaton Vance Trust Company, Eaton Vance Management (International) Limited, Eaton Vance Advisers International Ltd., Eaton Vance Global Advisors Limited, Eaton Vance Management’s Real Estate Investment Group, Boston Management and Research, Calvert Research and Management, Eaton Vance and Calvert Fund Families and our investment advisory affiliates (“Eaton Vance”) (see Investment Management Affiliates definition below) | |
| What we do | ||
| How does Eaton Vance protect my personal information? | To protect your personal information from unauthorized access and use, we use security measures that comply with federal law. These measures include computer safeguards and secured files and buildings. We have policies governing the proper handling of customer information by personnel and requiring third parties that provide support to adhere to appropriate security standards with respect to such information. | |
| How does Eaton Vance collect my personal information? | We collect your personal information, for example, when you
∎ open an account or make deposits or withdrawals from your account ∎ buy securities from us or make a wire transfer ∎ give us your contact information
We also collect your personal information from others, such as credit bureaus, affiliates, or other companies. | |
| Why can’t I limit all sharing? | Federal law gives you the right to limit only
∎ sharing for affiliates’ everyday business purposes — information about your creditworthiness ∎ affiliates from using your information to market to you ∎ sharing for nonaffiliates to market to you
State laws and individual companies may give you additional rights to limit sharing. See below for more on your rights under state law. | |
| Definitions | ||
| Investment Management Affiliates | Eaton Vance Investment Management Affiliates include registered investment advisers, registered broker-dealers, and registered and unregistered funds. Investment Management Affiliates does not include entities associated with Morgan Stanley Wealth Management, such as Morgan Stanley Smith Barney LLC and Morgan Stanley & Co. | |
| Affiliates | Companies related by common ownership or control. They can be financial and nonfinancial companies.
∎ Our affiliates include companies with a Morgan Stanley name and financial companies such as Morgan Stanley Smith Barney LLC and Morgan Stanley & Co. | |
| Nonaffiliates | Companies not related by common ownership or control. They can be financial and nonfinancial companies.
∎ Eaton Vance does not share with nonaffiliates so they can market to you. | |
| Joint marketing | A formal agreement between nonaffiliated financial companies that together market financial products or services to you.
∎ Eaton Vance doesn’t jointly market. | |
| Other important information | ||
Vermont: Except as permitted by law, we will not share personal information we collect about Vermont residents with Nonaffiliates unless you provide us with your written consent to share such information.
California: Except as permitted by law, we will not share personal information we collect about California residents with Nonaffiliates and we will limit sharing such personal information with our Affiliates to comply with California privacy laws that apply to us. | ||
| 44 |
Eaton Vance
Floating-Rate 2022 Target Term Trust
June 30, 2021
Potential Conflicts of Interest
As a diversified global financial services firm, Morgan Stanley engages in a broad spectrum of activities, including financial advisory services, investment management activities, lending, commercial banking, sponsoring and managing private investment funds, engaging in broker-dealer transactions and principal securities, commodities and foreign exchange transactions, research publication and other activities. In the ordinary course of its business, Morgan Stanley is a full-service investment banking and financial services firm and therefore engages in activities where Morgan Stanley’s interests or the interests of its clients may conflict with the interests of a Fund or Portfolio, if applicable, (collectively for the purposes of this section, “Fund” or “Funds”). Morgan Stanley advises clients and sponsors, manages or advises other investment funds and investment programs, accounts and businesses (collectively, together with the Funds, any new or successor funds, programs, accounts or businesses, the ‘‘Affiliated Investment Accounts’’) with a wide variety of investment objectives that in some instances may overlap or conflict with a Fund’s investment objectives and present conflicts of interest. In addition, Morgan Stanley may also from time to time create new or successor Affiliated Investment Accounts that may compete with a Fund and present similar conflicts of interest. The discussion below enumerates certain actual, apparent and potential conflicts of interest. There is no assurance that conflicts of interest will be resolved in favor of Fund shareholders and, in fact, they may not be. Conflicts of interest not described below may also exist.
Material Non-public and Other Information. It is expected that confidential or material non-public information regarding an investment or potential investment opportunity may become available to the investment adviser. If such information becomes available, the investment adviser may be precluded (including by applicable law or internal policies or procedures) from pursuing an investment or disposition opportunity with respect to such investment or investment opportunity.
The investment adviser may also from time to time be subject to contractual ‘‘stand-still’’ obligations and/or confidentiality obligations that may restrict its ability to trade in certain investments on a Fund’s behalf. In addition, the investment adviser may be precluded from disclosing such information to an investment team, even in circumstances in which the information would be beneficial if disclosed. Therefore, the investment team may not be provided access to material non-public information in the possession of Morgan Stanley that might be relevant to an investment decision to be made on behalf of a Fund, and the investment team may initiate a transaction or sell an investment that, if such information had been known to it, may not have been undertaken. In addition, certain members of the investment team may be recused from certain investment-related discussions so that such members do not receive information that would limit their ability to perform functions of their employment with the investment adviser or its affiliates unrelated to that of a Fund. Furthermore, access to certain parts of Morgan Stanley may be subject to third party confidentiality obligations and to information barriers established by Morgan Stanley in order to manage potential conflicts of interest and regulatory restrictions, including without limitation joint transaction restrictions pursuant to the 1940 Act. Accordingly, the investment adviser’s ability to source investments from other business units within Morgan Stanley may be limited and there can be no assurance that the investment adviser will be able to source any investments from any one or more parts of the Morgan Stanley network.
The investment adviser may restrict its investment decisions and activities on behalf of the Funds in various circumstances, including because of applicable regulatory requirements or information held by the investment adviser or Morgan Stanley. The investment adviser might not engage in transactions or other activities for, or enforce certain rights in favor of, a Fund due to Morgan Stanley’s activities outside the Funds. In instances where trading of an investment is restricted, the investment adviser may not be able to purchase or sell such investment on behalf of a Fund, resulting in the Fund’s inability to participate in certain desirable transactions. This inability to buy or sell an investment could have an adverse effect on a Fund’s portfolio due to, among other things, changes in an investment’s value during the period its trading is restricted. Also, in situations where the investment adviser is required to aggregate its positions with those of other Morgan Stanley business units for position limit calculations, the investment adviser may have to refrain from making investments due to the positions held by other Morgan Stanley business units or their clients. There may be other situations where the investment adviser refrains from making an investment due to additional disclosure obligations, regulatory requirements, policies, and reputational risk, or the investment adviser may limit purchases or sales of securities in respect of which Morgan Stanley is engaged in an underwriting or other distribution capacity.
Morgan Stanley has established certain information barriers and other policies to address the sharing of information between different businesses within Morgan Stanley. As a result of information barriers, the investment adviser generally will not have access, or will have limited access, to certain information and personnel in other areas of Morgan Stanley relating to business transactions for clients (including transactions in investing, banking, prime brokerage and certain other areas), and generally will not manage the Funds with the benefit of the information held by such other areas. Morgan Stanley, due to its access to and knowledge of funds, markets and securities based on its prime brokerage and other businesses, may make decisions based on information or take (or refrain from taking) actions with respect to interests in investments of the kind held (directly or indirectly) by the Funds in a manner that may be adverse to the Funds, and will not have any obligation or other duty to share information with the investment adviser.
In limited circumstances, however, including for purposes of managing business and reputational risk, and subject to policies and procedures, Morgan Stanley personnel, including personnel of the investment adviser, on one side of an information barrier may have access to information and personnel on the other side of the information barrier through “wall crossings.” The investment adviser faces conflicts of interest in determining whether to engage in such wall crossings. Information obtained in connection with such wall crossings may limit or restrict the ability of the investment adviser to engage in or otherwise effect transactions on behalf of the Funds (including purchasing or selling securities that the investment adviser may otherwise have purchased or sold for a Fund in the absence of a wall crossing). In managing conflicts of interest that arise because of the foregoing, the investment adviser generally will be subject to fiduciary requirements. The investment adviser may also implement internal information barriers or ethical walls, and the conflicts described herein with respect to information barriers and otherwise with respect to Morgan Stanley and the investment adviser will also apply internally within the investment adviser. As a result, a Fund may not be permitted to transact in (e.g., dispose of a security in whole or in part) during periods when it otherwise would have been able to do so, which could adversely affect a Fund. Other investors in the security that are not subject to such restrictions may be able to transact in the security during such periods. There may also be circumstances in which, as a result of information held by certain portfolio
| 45 |
Eaton Vance
Floating-Rate 2022 Target Term Trust
June 30, 2021
Potential Conflicts of Interest — continued
management teams in the investment adviser, the investment adviser limits an activity or transaction for a Fund, including if the Fund is managed by a portfolio management team other than the team holding such information.
Investments by Morgan Stanley and its Affiliated Investment Accounts. In serving in multiple capacities to Affiliated Investment Accounts, Morgan Stanley, including the investment adviser and its investment teams, may have obligations to other clients or investors in Affiliated Investment Accounts, the fulfillment of which may not be in the best interests of a Fund or its shareholders. A Fund’s investment objectives may overlap with the investment objectives of certain Affiliated Investment Accounts. As a result, the members of an investment team may face conflicts in the allocation of suitable investment opportunities among a Fund and other investment funds, programs, accounts and businesses advised by or affiliated with the investment adviser. Certain Affiliated Investment Accounts may provide for higher management or incentive fees or greater expense reimbursements or overhead allocations, all of which may contribute to this conflict of interest and create an incentive for the investment adviser to favor such other accounts.
Morgan Stanley currently invests and plans to continue to invest on its own behalf and on behalf of its Affiliated Investment Accounts in a wide variety of investment opportunities globally. Morgan Stanley and its Affiliated Investment Accounts, to the extent consistent with applicable law and policies and procedures, will be permitted to invest in investment opportunities without making such opportunities available to a Fund beforehand. Subject to the foregoing, Morgan Stanley may offer investments that fall into the investment objectives of an Affiliated Investment Account to such account or make such investment on its own behalf, even though such investment also falls within a Fund’s investment objectives. A Fund may invest in opportunities that Morgan Stanley and/or one or more Affiliated Investment Accounts has declined, and vice versa. All of the foregoing may reduce the number of investment opportunities available to a Fund and may create conflicts of interest in allocating investment opportunities. Investors should note that the conflicts inherent in making such allocation decisions may not always be resolved to a Fund’s advantage. There can be no assurance that a Fund will have an opportunity to participate in certain opportunities that fall within their investment objectives.
To seek to reduce potential conflicts of interest and to attempt to allocate such investment opportunities in a fair and equitable manner, the investment adviser has implemented allocation policies and procedures. These policies and procedures are intended to give all clients of the investment adviser, including the Funds, fair access to investment opportunities consistent with the requirements of organizational documents, investment strategies, applicable laws and regulations, and the fiduciary duties of the investment adviser. Each client of the investment adviser that is subject to the allocation policies and procedures, including each Fund, is assigned an investment team and portfolio manager(s) by the investment adviser. The investment team and portfolio managers review investment opportunities and will decide with respect to the allocation of each opportunity considering various factors and in accordance with the allocation policies and procedures. The allocation policies and procedures are subject to change. Investors should note that the conflicts inherent in making such allocation decisions may not always be resolved to the advantage of a Fund.
It is possible that Morgan Stanley or an Affiliated Investment Account, including another Eaton Vance fund, will invest in or advise a company that is or becomes a competitor of a company of which a Fund holds an investment. Such investment could create a conflict between the Fund, on the one hand, and Morgan Stanley or the Affiliated Investment Account, on the other hand. In such a situation, Morgan Stanley may also have a conflict in the allocation of its own resources to the portfolio investment. Furthermore, certain Affiliated Investment Accounts will be focused primarily on investing in other funds which may have strategies that overlap and/or directly conflict and compete with a Fund.
In addition, certain investment professionals who are involved in a Fund’s activities remain responsible for the investment activities of other Affiliated Investment Accounts managed by the investment adviser and its affiliates, and they will devote time to the management of such investments and other newly created Affiliated Investment Accounts (whether in the form of funds, separate accounts or other vehicles), as well as their own investments. In addition, in connection with the management of investments for other Affiliated Investment Accounts, members of Morgan Stanley and its affiliates may serve on the boards of directors of or advise companies which may compete with a Fund’s portfolio investments. Moreover, these Affiliated Investment Accounts managed by Morgan Stanley and its affiliates may pursue investment opportunities that may also be suitable for a Fund.
It should be noted that Morgan Stanley may, directly or indirectly, make large investments in certain of its Affiliated Investment Accounts, and accordingly Morgan Stanley’s investment in a Fund may not be a determining factor in the outcome of any of the foregoing conflicts. Nothing herein restricts or in any way limits the activities of Morgan Stanley, including its ability to buy or sell interests in, or provide financing to, equity and/or debt instruments, funds or portfolio companies, for its own accounts or for the accounts of Affiliated Investment Accounts or other investment funds or clients in accordance with applicable law.
Different clients of the investment adviser, including a Fund, may invest in different classes of securities of the same issuer, depending on the respective clients’ investment objectives and policies. As a result, the investment adviser and its affiliates, at times, will seek to satisfy fiduciary obligations to certain clients owning one class of securities of a particular issuer by pursuing or enforcing rights on behalf of those clients with respect to such class of securities, and those activities may have an adverse effect on another client which owns a different class of securities of such issuer. For example, if one client holds debt securities of an issuer and another client holds equity securities of the same issuer, if the issuer experiences financial or operational challenges, the investment adviser and its affiliates may seek a liquidation of the issuer on behalf of the client that holds the debt securities, whereas the client holding the equity securities may benefit from a reorganization of the issuer. Thus, in such situations, the actions taken by the investment adviser or its affiliates on behalf of one client can negatively impact securities held by another client. These conflicts also exist as between the investment adviser’s clients, including the Funds, and the Affiliated Investment Accounts managed by Morgan Stanley.
The investment adviser and its affiliates may give advice and recommend securities to other clients which may differ from advice given to, or securities recommended or bought for, a Fund even though such other clients’ investment objectives may be similar to those of the Fund.
| 46 |
Eaton Vance
Floating-Rate 2022 Target Term Trust
June 30, 2021
Potential Conflicts of Interest — continued
The investment adviser and its affiliates manage long and short portfolios. The simultaneous management of long and short portfolios creates conflicts of interest in portfolio management and trading in that opposite directional positions may be taken in client accounts managed by the same investment team, and creates risks such as: (i) the risk that short sale activity could adversely affect the market value of long positions in one or more portfolios (and vice versa) and (ii) the risks associated with the trading desk receiving opposing orders in the same security simultaneously. The investment adviser and its affiliates have adopted policies and procedures that are reasonably designed to mitigate these conflicts. In certain circumstances, the investment adviser invests on behalf of itself in securities and other instruments that would be appropriate for, held by, or may fall within the investment guidelines of its clients, including a Fund. At times, the investment adviser will give advice or take action for its own accounts that differs from, conflicts with, or is adverse to advice given or action taken for any client.
From time to time, conflicts also arise due to the fact that certain securities or instruments may be held in some client accounts, including a Fund, but not in others, or the client accounts may have different levels of holdings in certain securities or instruments, and because the accounts pay different levels of fees to the investment adviser. In addition, at times an investment adviser investment team will give advice or take action with respect to the investments of one or more clients that is not given or taken with respect to other clients with similar investment programs, objectives, and strategies. Accordingly, clients with similar strategies will not always hold the same securities or instruments or achieve the same performance. The investment adviser’s investment teams also advise clients with conflicting programs, objectives or strategies. These conflicts also exist as between the investment adviser’s clients, including the Funds, and the Affiliated Investment Accounts managed by Morgan Stanley.
The investment adviser maintains separate trading desks by investment team and generally based on asset class, including two trading desks trading equity securities. These trading desks operate independently of one another. The two equity trading desks do not share information. The separate equity trading desks may result in one desk competing against the other desk when implementing buy and sell transactions, possibly causing certain accounts to pay more or receive less for a security than other accounts. In addition, Morgan Stanley and its affiliates maintain separate trading desks that operate independently of each other and do not share information with the investment adviser. The Morgan Stanley and affiliate trading desks may compete against the investment adviser trading desks when implementing buy and sell transactions, possibly causing certain Affiliated Investment Accounts to pay more or receive less for a security than other Affiliated Investment Accounts.
Payments to Broker-Dealers and Other Financial Intermediaries. The investment adviser and/or EVD may pay compensation, out of their own funds and not as an expense of the Funds, to certain financial intermediaries (which may include affiliates of the investment adviser and EVD), including recordkeepers and administrators of various deferred compensation plans, in connection with the sale, distribution, marketing and retention of shares of the Funds and/or shareholder servicing. For example, the investment adviser or EVD may pay additional compensation to a financial intermediary for, among other things, promoting the sale and distribution of Fund shares, providing access to various programs, mutual fund platforms or preferred or recommended mutual fund lists that may be offered by a financial intermediary, granting EVD access to a financial intermediary’s financial advisors and consultants, providing assistance in the ongoing education and training of a financial intermediary’s financial personnel, furnishing marketing support, maintaining share balances and/or for sub-accounting, recordkeeping, administrative, shareholder or transaction processing services. Such payments are in addition to any distribution fees, shareholder servicing fees and/or transfer agency fees that may be payable by the Funds. The additional payments may be based on various factors, including level of sales (based on gross or net sales or some specified minimum sales or some other similar criteria related to sales of the Funds and/or some or all other Eaton Vance funds), amount of assets invested by the financial intermediary’s customers (which could include current or aged assets of the Funds and/or some or all other Eaton Vance funds), a Fund’s advisory fee, some other agreed upon amount or other measures as determined from time to time by the investment adviser and/or EVD. The amount of these payments may be different for different financial intermediaries.
The prospect of receiving, or the receipt of, additional compensation, as described above, by financial intermediaries may provide such financial intermediaries and their financial advisors and other salespersons with an incentive to favor sales of shares of the Funds over other investment options with respect to which these financial intermediaries do not receive additional compensation (or receive lower levels of additional compensation). These payment arrangements, however, will not change the price that an investor pays for shares of the Funds or the amount that the Funds receive to invest on behalf of an investor. Investors may wish to take such payment arrangements into account when considering and evaluating any recommendations relating to Fund shares and should review carefully any disclosures provided by financial intermediaries as to their compensation.
Morgan Stanley Trading and Principal Investing Activities. Notwithstanding anything to the contrary herein, Morgan Stanley will generally conduct its sales and trading businesses, publish research and analysis, and render investment advice without regard for a Fund’s holdings, although these activities could have an adverse impact on the value of one or more of the Fund’s investments, or could cause Morgan Stanley to have an interest in one or more portfolio investments that is different from, and potentially adverse to that of a Fund. Furthermore, from time to time, the investment adviser or its affiliates may invest “seed” capital in a Fund, typically to enable the Fund to commence investment operations and/or achieve sufficient scale. The investment adviser and its affiliates may hedge such seed capital exposure by investing in derivatives or other instruments expected to produce offsetting exposure. Such hedging transactions, if any, would occur outside of a Fund.
Morgan Stanley’s sales and trading, financing and principal investing businesses (whether or not specifically identified as such, and including Morgan Stanley’s trading and principal investing businesses) will not be required to offer any investment opportunities to a Fund. These businesses may encompass, among other things, principal trading activities as well as principal investing.
Morgan Stanley’s sales and trading, financing and principal investing businesses have acquired or invested in, and in the future may acquire or invest in, minority and/or majority control positions in equity or debt instruments of diverse public and/or private companies. Such activities may put Morgan Stanley
| 47 |
Eaton Vance
Floating-Rate 2022 Target Term Trust
June 30, 2021
Potential Conflicts of Interest — continued
in a position to exercise contractual, voting or creditor rights, or management or other control with respect to securities or loans of portfolio investments or other issuers, and in these instances Morgan Stanley may, in its discretion and subject to applicable law, act to protect its own interests or interests of clients, and not a Fund’s interests.
Subject to the limitations of applicable law, a Fund may purchase from or sell assets to, or make investments in, companies in which Morgan Stanley has or may acquire an interest, including as an owner, creditor or counterparty.
Morgan Stanley’s Investment Banking Activities. Morgan Stanley advises clients on a variety of mergers, acquisitions, restructuring, bankruptcy and financing transactions. Morgan Stanley may act as an advisor to clients, including other investment funds that may compete with a Fund and with respect to investments that a Fund may hold. Morgan Stanley may give advice and take action with respect to any of its clients or proprietary accounts that may differ from the advice given, or may involve an action of a different timing or nature than the action taken, by a Fund. Morgan Stanley may give advice and provide recommendations to persons competing with a Fund and/or any of a Fund’s investments that are contrary to the Fund’s best interests and/or the best interests of any of its investments.
Morgan Stanley could be engaged in financial advising, whether on the buy-side or sell-side, or in financing or lending assignments that could result in Morgan Stanley’s determining in its discretion or being required to act exclusively on behalf of one or more third parties, which could limit a Fund’s ability to transact with respect to one or more existing or potential investments. Morgan Stanley may have relationships with third-party funds, companies or investors who may have invested in or may look to invest in portfolio companies, and there could be conflicts between a Fund’s best interests, on the one hand, and the interests of a Morgan Stanley client or counterparty, on the other hand.
To the extent that Morgan Stanley advises creditor or debtor companies in the financial restructuring of companies either prior to or after filing for protection under Chapter 11 of the U.S. Bankruptcy Code or similar laws in other jurisdictions, the investment adviser’s flexibility in making investments in such restructurings on a Fund’s behalf may be limited. Morgan Stanley could provide investment banking services to competitors of portfolio companies, as well as to private equity and/or private credit funds; such activities may present Morgan Stanley with a conflict of interest vis-a-vis a Fund’s investment and may also result in a conflict in respect of the allocation of investment banking resources to portfolio companies.
To the extent permitted by applicable law, Morgan Stanley may provide a broad range of financial services to companies in which a Fund invests, including strategic and financial advisory services, interim acquisition financing and other lending and underwriting or placement of securities, and Morgan Stanley generally will be paid fees (that may include warrants or other securities) for such services. Morgan Stanley will not share any of the foregoing interest, fees and other compensation received by it (including, for the avoidance of doubt, amounts received by the investment adviser) with a Fund, and any advisory fees payable will not be reduced thereby.
Morgan Stanley may be engaged to act as a financial advisor to a company in connection with the sale of such company, or subsidiaries or divisions thereof, may represent potential buyers of businesses through its mergers and acquisition activities and may provide lending and other related financing services in connection with such transactions. Morgan Stanley’s compensation for such activities is usually based upon realized consideration and is usually contingent, in substantial part, upon the closing of the transaction. Under these circumstances, a Fund may be precluded from participating in a transaction with or relating to the company being sold or participating in any financing activity related to merger or acquisition.
To meet applicable regulatory requirements, there are periods when the investment adviser will not engage in certain types of transactions in the securities of companies for which a broker-dealer affiliated with Morgan Stanley is performing investment banking services. Fund shareholders will not receive notice of such instances. In particular, when a broker-dealer affiliated with Morgan Stanley is engaged in an underwriting or other distribution of securities of a company, the investment adviser may be prohibited from purchasing such securities on behalf of a Fund. In addition, under certain circumstances, the investment adviser generally will not initiate transactions in the securities of companies with respect to which affiliates of the investment adviser may have controlling interests or are affiliated.
The investment adviser believes that the nature and range of clients to whom Morgan Stanley and its subsidiaries render investment banking and other services is such that it would be inadvisable to exclude these companies from the Fund’s portfolio.
Morgan Stanley’s Marketing Activities. Morgan Stanley is engaged in the business of underwriting, syndicating, brokering, administering, servicing, arranging and advising on the distribution of a wide variety of securities and other investments in which a Fund may invest. Subject to the restrictions of the 1940 Act, including Sections 10(f) and 17(e) thereof, a Fund may invest in transactions in which Morgan Stanley acts as underwriter, placement agent, syndicator, broker, administrative agent, servicer, advisor, arranger or structuring agent and receives fees or other compensation from the sponsors of such products or securities. Any fees earned by Morgan Stanley in such capacity will not be shared with the investment adviser or the Funds. Certain conflicts of interest, in addition to the receipt of fees or other compensation, would be inherent in these transactions. Moreover, the interests of one of Morgan Stanley’s clients with respect to an issuer of securities in which a Fund has an investment may be adverse to the investment adviser’s or a Fund’s best interests. In conducting the foregoing activities, Morgan Stanley will be acting for its other clients and will have no obligation to act in the investment adviser’s or a Fund’s best interests.
Client Relationships. Morgan Stanley has existing and potential relationships with a significant number of corporations, institutions and individuals. In providing services to its clients, Morgan Stanley may face conflicts of interest with respect to activities recommended to or performed for such clients, on
| 48 |
Eaton Vance
Floating-Rate 2022 Target Term Trust
June 30, 2021
Potential Conflicts of Interest — continued
the one hand, and a Fund, its shareholders or the entities in which the Fund invests, on the other hand. In addition, these client relationships may present conflicts of interest in determining whether to offer certain investment opportunities to a Fund.
In acting as principal or in providing advisory and other services to its other clients, Morgan Stanley may engage in or recommend activities with respect to a particular matter that conflict with or are different from activities engaged in or recommended by the investment adviser on a Fund’s behalf.
Principal Investments. To the extent permitted by applicable law, there may be situations in which a Fund’s interests may conflict with the interests of one or more general accounts of Morgan Stanley and its affiliates or accounts managed by Morgan Stanley or its affiliates. This may occur because these accounts hold public and private debt and equity securities of many issuers which may be or become portfolio companies, or from whom portfolio companies may be acquired.
Transactions with Portfolio Companies of Affiliated Investment Accounts. The companies in which a Fund may invest may be counterparties to or participants in agreements, transactions or other arrangements with portfolio companies or other entities of portfolio investments of Affiliated Investment Accounts (for example, a company in which a Fund invests may retain a company in which an Affiliated Investment Account invests to provide services or may acquire an asset from such company or vice versa). Certain of these agreements, transactions and arrangements involve fees, servicing payments, rebates and/or other benefits to Morgan Stanley or its affiliates. For example, portfolio entities may, including at the encouragement of Morgan Stanley, enter into agreements regarding group procurement and/or vendor discounts. Morgan Stanley and its affiliates may also participate in these agreements and may realize better pricing or discounts as a result of the participation of portfolio entities. To the extent permitted by applicable law, certain of these agreements may provide for commissions or similar payments and/or discounts or rebates to be paid to a portfolio entity of an Affiliated Investment Account, and such payments or discounts or rebates may also be made directly to Morgan Stanley or its affiliates. Under these arrangements, a particular portfolio company or other entity may benefit to a greater degree than the other participants, and the funds, investment vehicles and accounts (which may or may not include a Fund) that own an interest in such entity will receive a greater relative benefit from the arrangements than the Eaton Vance funds, investment vehicles or accounts that do not own an interest therein. Fees and compensation received by portfolio companies of Affiliated Investment Accounts in relation to the foregoing will not be shared with a Fund or offset advisory fees payable.
Investments in Portfolio Investments of Other Funds. To the extent permitted by applicable law, when a Fund invests in certain companies or other entities, other funds affiliated with the investment adviser may have made or may be making an investment in such companies or other entities. Other funds that have been or may be managed by the investment adviser may invest in the companies or other entities in which a Fund has made an investment. Under such circumstances, a Fund and such other funds may have conflicts of interest (e.g., over the terms, exit strategies and related matters, including the exercise of remedies of their respective investments). If the interests held by a Fund are different from (or take priority over) those held by such other funds, the investment adviser may be required to make a selection at the time of conflicts between the interests held by such other funds and the interests held by a Fund.
Allocation of Expenses. Expenses may be incurred that are attributable to a Fund and one or more other Affiliated Investment Accounts (including in connection with issuers in which a Fund and such other Affiliated Investment Accounts have overlapping investments). The allocation of such expenses among such entities raises potential conflicts of interest. The investment adviser and its affiliates intend to allocate such common expenses among a Fund and any such other Affiliated Investment Accounts on a pro rata basis or in such other manner as the investment adviser deems to be fair and equitable or in such other manner as may be required by applicable law.
Temporary Investments. To more efficiently invest short-term cash balances held by a Fund, the investment adviser may invest such balances on an overnight “sweep” basis in shares of one or more money market funds or other short-term vehicles. It is anticipated that the investment adviser to these money market funds or other short-term vehicles may be the investment adviser (or an affiliate) to the extent permitted by applicable law, including Rule 12d1-1 under the 1940 Act. Each Fund may invest in Eaton Vance Cash Reserves Fund, LLC (Cash Reserves Fund), an affiliated investment company managed by Eaton Vance, for this purpose. Eaton Vance does not currently receive a fee for advisory services provided to Cash Reserves Fund.
Transactions with Affiliates. The investment adviser and any investment sub-adviser might purchase securities from underwriters or placement agents in which a Morgan Stanley affiliate is a member of a syndicate or selling group, as a result of which an affiliate might benefit from the purchase through receipt of a fee or otherwise. Neither the investment adviser nor any investment sub-adviser will purchase securities on behalf of a Fund from an affiliate that is acting as a manager of a syndicate or selling group. Purchases by the investment adviser on behalf of a Fund from an affiliate acting as a placement agent must meet the requirements of applicable law. Furthermore, Morgan Stanley may face conflicts of interest when the Funds use service providers affiliated with Morgan Stanley because Morgan Stanley receives greater overall fees when they are used.
General Process for Potential Conflicts. All of the transactions described above involve the potential for conflicts of interest between the investment adviser, related persons of the investment adviser and/or their clients. The Advisers Act, the 1940 Act and ERISA impose certain requirements designed to decrease the possibility of conflicts of interest between an investment adviser and its clients. In some cases, transactions may be permitted subject to fulfillment of certain conditions. Certain other transactions may be prohibited. In addition, the investment adviser has instituted policies and procedures designed to prevent conflicts of interest from arising and, when they do arise, to ensure that it effects transactions for clients in a manner that is consistent with its fiduciary duty to its clients and in accordance with applicable law. The investment adviser seeks to ensure that potential or actual conflicts of interest are appropriately resolved taking into consideration the overriding best interests of the client.
| 49 |
Eaton Vance Funds
Delivery of Shareholder Documents. The Securities and Exchange Commission (SEC) permits funds to deliver only one copy of shareholder documents, including prospectuses, proxy statements and shareholder reports, to fund investors with multiple accounts at the same residential or post office box address. This practice is often called “householding” and it helps eliminate duplicate mailings to shareholders. American Stock Transfer & Trust Company, LLC (“AST”), the closed-end funds transfer agent, or your financial intermediary, may household the mailing of your documents indefinitely unless you instruct AST, or your financial intermediary, otherwise. If you would prefer that your Eaton Vance documents not be householded, please contact AST or your financial intermediary. Your instructions that householding not apply to delivery of your Eaton Vance documents will typically be effective within 30 days of receipt by AST or your financial intermediary.
Portfolio Holdings. Each Eaton Vance Fund and its underlying Portfolio(s) (if applicable) files a schedule of portfolio holdings on Part F to Form N-PORT with the SEC. Certain information filed on Form N-PORT may be viewed on the Eaton Vance website at www.eatonvance.com, by calling Eaton Vance at 1-800-262-1122 or in the EDGAR database on the SEC’s website at www.sec.gov.
Proxy Voting. From time to time, funds are required to vote proxies related to the securities held by the funds. The Eaton Vance Funds or their underlying Portfolios (if applicable) vote proxies according to a set of policies and procedures approved by the Funds’ and Portfolios’ Boards. You may obtain a description of these policies and procedures and information on how the Funds or Portfolios voted proxies relating to portfolio securities during the most recent 12-month period ended June 30, without charge, upon request, by calling 1-800-262-1122 and by accessing the SEC’s website at www.sec.gov.
Additional Notice to Shareholders. If applicable, a Fund may also redeem or purchase its outstanding preferred shares in order to maintain compliance with regulatory requirements, borrowing or rating agency requirements or for other purposes as it deems appropriate or necessary.
Closed-End Fund Information. Eaton Vance closed-end funds make fund performance data and certain information about portfolio characteristics available on the Eaton Vance website shortly after the end of each month. Other information about the funds is available on the website. The funds’ net asset value per share is readily accessible on the Eaton Vance website. Portfolio holdings for the most recent month-end are also posted to the website approximately 30 days following the end of the month. This information is available at www.eatonvance.com on the fund information pages under “Individual Investors — Closed-End Funds”.
| 50 |
This Page Intentionally Left Blank
This Page Intentionally Left Blank
Investment Adviser and Administrator
Eaton Vance Management
Two International Place
Boston, MA 02110
Custodian
State Street Bank and Trust Company
State Street Financial Center, One Lincoln Street
Boston, MA 02111
Transfer Agent
American Stock Transfer & Trust Company, LLC
6201 15th Avenue
Brooklyn, NY 11219
Independent Registered Public Accounting Firm
Deloitte & Touche LLP
200 Berkeley Street
Boston, MA 02116-5022
Fund Offices
Two International Place
Boston, MA 02110

27978 6.30.21
| Item 2. | Code of Ethics |
The registrant (sometimes referred to as the “Fund”) has adopted a code of ethics applicable to its Principal Executive Officer, Principal Financial Officer and Principal Accounting Officer. The registrant undertakes to provide a copy of such code of ethics to any person upon request, without charge, by calling 1-800-262-1122. The registrant has not amended the code of ethics as described in Form N-CSR during the period covered by this report. The registrant has not granted any waiver, including an implicit waiver, from a provision of the code of ethics as described in Form N-CSR during the period covered by this report.
| Item 3. | Audit Committee Financial Expert |
The registrant’s Board of Trustees (the “Board”) has designated George J. Gorman and William H. Park, each an independent trustee, as audit committee financial experts. Mr. Gorman is a certified public accountant who is the Principal at George J. Gorman LLC (a consulting firm). Previously, Mr. Gorman served in various capacities at Ernst & Young LLP (a registered public accounting firm), including as Senior Partner.
Mr. Gorman also has experience serving as an independent trustee and audit committee financial expert of other mutual fund complexes. Mr. Park is a certified public accountant who is a private investor. Previously, he served as a consultant, as the Chief Financial Officer of Aveon Group, L.P. (an investment management firm), as the Vice Chairman of Commercial Industrial Finance Corp. (specialty finance company), as President and Chief Executive Officer of Prizm Capital Management, LLC (investment management firm), as Executive Vice President and Chief Financial Officer of United Asset Management Corporation (an institutional investment management firm) and as a Senior Manager at Price Waterhouse (now PricewaterhouseCoopers) (a registered public accounting firm).
| Item 4. | Principal Accountant Fees and Services |
(a)-(d)
The following table presents the aggregate fees billed to the registrant for the registrant’s fiscal years ended June 30, 2020 and June 30, 2021 by the registrant’s principal accountant, Deloitte & Touche LLP (“D&T”), for professional services rendered for the audit of the registrant’s annual financial statements and fees billed for other services rendered by D&T during such period.
Eaton Vance Floating-Rate 2022 Target Term Trust
Fiscal Periods Ended | 06/30/20 | 6/30/21 | ||||||
Audit Fees | $ | 40,850 | $ | 39,325 | ||||
Audit-Related Fees(1) | $ | 0 | $ | 0 | ||||
Tax Fees(2) | $ | 16,360 | $ | 16,710 | ||||
All Other Fees(3) | $ | 0 | $ | 0 | ||||
|
|
|
| |||||
Total | $ | 57,210 | $ | 56,035 | ||||
|
|
|
| |||||
| (1) | Audit-related fees consist of the aggregate fees billed for assurance and related services that are reasonably related to the performance of the audit of the registrant’s financial statements and are not reported under the category of audit fees and specifically includes fees for the performance of certain agreed upon procedures relating to the registrant’s revolving credit agreement. |
| (2) | Tax fees consist of the aggregate fees billed for professional services rendered by the principal accountant relating to tax compliance, tax advice, and tax planning and specifically include fees for tax return preparation and other related tax compliance/planning matters. |
| (3) | All other fees consist of the aggregate fees billed for products and services provided by the registrant’s principal accountant other than audit, audit-related, and tax services. |
(e)(1) The registrant’s audit committee has adopted policies and procedures relating to the pre-approval of services provided by the registrant’s principal accountant (the “Pre-Approval Policies”). The Pre-Approval Policies establish a framework intended to assist the audit committee in the proper discharge of its pre-approval responsibilities. As a general matter, the Pre-Approval Policies (i) specify certain types of audit, audit-related, tax, and other services determined to be pre-approved by the audit committee; and (ii) delineate specific procedures governing the mechanics of the pre-approval process, including the approval and monitoring of audit and non-audit service fees. Unless a service is specifically pre-approved under the Pre-Approval Policies, it must be separately pre-approved by the audit committee.
The Pre-Approval Policies and the types of audit and non-audit services pre-approved therein must be reviewed and ratified by the registrant’s audit committee at least annually. The registrant’s audit committee maintains full responsibility for the appointment, compensation, and oversight of the work of the registrant’s principal accountant.
(e)(2) No services described in paragraphs (b)-(d) above were approved by the registrant’s audit committee pursuant to the “de minimis exception” set forth in Rule 2-01 (c)(7)(i)(C) of Regulation S-X.
(f) Not applicable.
(g) The following table presents (i) the aggregate non-audit fees (i.e., fees for audit-related, tax, and other services) billed to the registrant by D&T for the registrant’s last two fiscal years; and (ii) the aggregate non-audit fees (i.e., fees for audit-related, tax, and other services) billed to the Eaton Vance organization by D&T for the same time period.
Fiscal Periods Ended | 06/30/20 | 06/30/21 | ||||||
Registrant | $ | 16,360 | $ | 16,710 | ||||
Eaton Vance(1) | $ | 103,703 | $ | 98,500 | ||||
| (1) | The investment adviser to the registrant, as well as any of its affiliates that provide ongoing services to the registrant, are subsidiaries of Morgan Stanley. |
(h) The registrant’s audit committee has considered whether the provision by the registrant’s principal accountant of non-audit services to the registrant’s investment adviser and any entity controlling, controlled by, or under common control with the adviser that provides ongoing services to the registrant that were not pre-approved pursuant to Rule 2-01(c)(7)(ii) of Regulation S-X is compatible with maintaining the principal accountant’s independence.
| Item 5. | Audit Committee of Listed registrants |
The registrant has a separately-designated standing audit committee established in accordance with Section 3(a)(58)(A) of the Securities and Exchange Act of 1934, as amended. George J. Gorman, William H. Park, Helen Frame Peters and Scott E. Wennerholm (Chair) are the members of the registrant’s audit committee.
| Item 6. | Schedule of Investments |
Please see schedule of investments contained in the Report to Stockholders included under Item 1 of this Form N-CSR.
| Item 7. | Disclosure of Proxy Voting Policies and Procedures for Closed-End Management Investment Companies |
The Board of the Fund has adopted a proxy voting policy and procedure (the “Fund Policy”), pursuant to which the trustees have delegated proxy voting responsibility to the Fund’s investment adviser and adopted the investment adviser’s proxy voting policies and procedures (the “Policies”) which are described below. The trustees will review the Policies annually. In the event that a conflict of interest arises between the Fund’s shareholders and the investment adviser, the administrator, or any of their affiliates or any affiliate of the Fund, the investment adviser will generally refrain from voting the proxies related to the companies giving rise to such conflict until it consults with the Board, or any committee, sub-committee or group of independent trustees identified by the Board, which will instruct the investment adviser on the appropriate course of action. If the Board Members are unable to meet and the failure to vote a proxy would have a material adverse impact on the Fund, the investment adviser may vote such proxy, provided that it discloses the existence of the material conflict to the Chairperson of the Fund’s Board as soon as practicable and to the Board at its next meeting.
The Policies are designed to promote accountability of a company’s management to its shareholders and to align the interests of management with those shareholders. An independent proxy voting service (“Agent”), currently Institutional Shareholder Services, Inc., has been retained to assist in the voting of proxies through the provision of vote analysis, implementation and recordkeeping and disclosure services. The investment adviser will generally vote proxies through the Agent. The Agent is required to vote all proxies in accordance with customized proxy voting guidelines (the “Guidelines”) and/or refer them back to the investment adviser pursuant to the Policies.
The Agent is required to establish and maintain adequate internal controls and policies in connection with the provision of proxy voting services, including methods to reasonably ensure that its analysis and recommendations are not influenced by a conflict of interest. The Guidelines include voting guidelines for matters relating to, among other things, the election of directors, approval of independent auditors, executive compensation, corporate structure and anti-takeover defenses. The investment adviser may cause the Fund to abstain from voting from time to time where it determines that the costs associated with voting a proxy outweigh the benefits derived from exercising the right to vote or it is unable to access or access timely ballots or other proxy information, among other stated reasons. The Agent will refer Fund proxies to the investment adviser for instructions under circumstances where, among others: (1) the application of the Guidelines is unclear; (2) a particular proxy question is not covered by the Guidelines; or (3) the Guidelines require input from the investment adviser. When a proxy voting issue has been referred to the investment adviser, the analyst (or portfolio manager if applicable) covering the company subject to the proxy proposal determines the final vote (or decision not to vote) and the investment adviser’s Proxy Administrator (described below) instructs the Agent to vote accordingly for securities held by the Fund. Where more than one analyst covers a particular company and the recommendations of such analysts voting a proposal conflict, the investment adviser’s Global Proxy Group (described below) will review such recommendations and any other available information related to the proposal and determine the manner in which it should be voted, which may result in different recommendations for the Fund that may differ from other clients of the investment adviser.
The investment adviser has appointed a Proxy Administrator to assist in the coordination of the voting of client proxies (including the Fund’s) in accordance with the Guidelines and the Policies. The investment adviser and its affiliates have also established a Global Proxy Group. The Global Proxy Group develops the investment adviser’s positions on all major corporate issues, creates the Guidelines and oversees the proxy voting process. The Proxy Administrator maintains a record of all proxy questions that have been referred by the Agent, all applicable recommendations, analysis and research received and any resolution of the matter. Before instructing the Agent to vote contrary to the Guidelines or the recommendation of the Agent, the Proxy Administrator will provide the Global Proxy Group with the Agent’s recommendation for the proposal along with any other relevant materials, including the basis for the analyst’s recommendation. The Proxy Administrator will then instruct the Agent to vote the proxy in the manner determined by the Global Proxy Group. A similar process will be followed if the Agent has a conflict of interest with respect to a proxy. The investment adviser will report to the Fund’s Board any votes cast contrary to the Guidelines or Agent recommendations, as applicable, no less than annually.
The investment adviser’s Global Proxy Group is responsible for monitoring and resolving possible material conflicts with respect to proxy voting. Because the Guidelines are predetermined and designed to be in the best interests of shareholders, application of the Guidelines to vote client proxies should, in most cases, adequately address any possible conflict of interest. The investment adviser will monitor situations that may result in a conflict of interest between any of its clients and the investment adviser or any of its affiliates by maintaining a list of significant existing and prospective corporate clients. The Proxy Administrator will compare such list with the names of companies of which he or she has been referred a proxy statement (the “Proxy Companies”). If a company on the list is also a Proxy Company, the Proxy Administrator will report that fact to the Global Proxy Group. If the Proxy Administrator intends to instruct the Agent to vote in a manner inconsistent with the Guidelines, the Global Proxy Group will first determine, in consultation with legal counsel if necessary,
whether a material conflict exists. If it is determined that a material conflict exists, the investment adviser will seek instruction on how the proxy should be voted from the Fund’s Board, or any committee or subcommittee identified by the Board. If a matter is referred to the Global Proxy Group, the decision made and basis for the decision will be documented by the Proxy Administrator and/or Global Proxy Group.
In addition, the investment adviser will monitor situations that may result in a conflict of interest between the Fund’s shareholders and the investment adviser, the administrator, or any of their affiliates or any affiliate of the Fund by maintaining a list of significant existing and prospective corporate clients. The investment adviser’s personnel responsible for reviewing and voting proxies on behalf of the Fund will report any proxy received or expected to be received from a company included on that list to the personnel of the investment adviser identified in the Policies. If such personnel expects to instruct the Agent to vote such proxies in a manner inconsistent with the guidelines of the Policies or the recommendation of the Agent, the personnel will consult with members of senior management of the investment adviser to determine if a material conflict of interests exists. If it is determined that a material conflict does exist, the investment adviser will seek instruction on how to vote from the Special Committee.
Information on how the Fund voted proxies relating to portfolio securities during the most recent 12 month period ended June 30 is available (1) without charge, upon request, by calling 1-800-262-1122, and (2) on the Securities and Exchange Commission’s website at http://www.sec.gov.
| Item 8. | Portfolio Managers of Closed-End Management Investment Companies |
Eaton Vance Management (“EVM” or “Eaton Vance”) is the investment adviser of the Trust. William E. Holt, Catherine C. McDermott, Daniel P. McElaney, Craig P. Russ and Andrew N. Sveen comprise the investment team responsible for the overall and day-to-day management of the Trust’s investments.
Messrs. Holt, McElaney and Sveen and Ms. McDermott are Vice Presidents of EVM and have been portfolio managers of the Trust since March 2019. Mr. Russ is a Vice President of EVM and has been a portfolio manager of the Trust since July 2017. Messrs. Russ and Sveen and Ms. McDermott have managed other Eaton Vance portfolios for more than five years. This information is provided as of the date of filing this report.
The following table shows, as of the Trust’s most recent fiscal year end, the number of accounts each portfolio manager managed in each of the listed categories and the total assets (in millions of dollars) in the accounts managed within each category. The table also shows the number of accounts with respect to which the advisory fee is based on the performance of the account, if any, and the total assets (in millions of dollars) in those accounts.
| Number of All Accounts | Total Assets of All Accounts | Number of Accounts Paying a Performance Fee | Total Assets of Accounts Paying a Performance Fee | |||||||||||||
William E. Holt | ||||||||||||||||
Registered Investment Companies | 5 | $ | 2,574.3 | 0 | $ | 0 | ||||||||||
Other Pooled Investment Vehicles | 0 | $ | 0 | 0 | $ | 0 | ||||||||||
Other Accounts | 0 | $ | 0 | 0 | $ | 0 | ||||||||||
Catherine C. McDermott | ||||||||||||||||
Registered Investment Companies | 8 | $ | 5,757.7 | 0 | $ | 0 | ||||||||||
Other Pooled Investment Vehicles | 0 | $ | 0 | 0 | $ | 0 | ||||||||||
Other Accounts | 0 | $ | 0 | 0 | $ | 0 | ||||||||||
Daniel P. McElaney | ||||||||||||||||
Registered Investment Companies | 5 | $ | 2,574.3 | 0 | $ | 0 | ||||||||||
Other Pooled Investment Vehicles | 0 | $ | 0 | 0 | $ | 0 | ||||||||||
Other Accounts | 0 | $ | 0 | 0 | $ | 0 | ||||||||||
Craig P. Russ | ||||||||||||||||
Registered Investment Companies | 11 | $ | 36,755.8 | 0 | $ | 0 | ||||||||||
Other Pooled Investment Vehicles | 5 | $ | 5,935.7 | 0 | $ | 0 | ||||||||||
Other Accounts | 7 | $ | 3,652.4 | 0 | $ | 0 | ||||||||||
Andrew N. Sveen | ||||||||||||||||
Registered Investment Companies | 13 | $ | 38,120.4 | 0 | $ | 0 | ||||||||||
Other Pooled Investment Vehicles | 0 | $ | 0 | 0 | $ | 0 | ||||||||||
Other Accounts | 0 | $ | 0 | 0 | $ | 0 | ||||||||||
The following table shows the dollar range of Trust shares beneficially owned by each portfolio manager as of the Trust’s most recent fiscal year end.
Portfolio Manager | Dollar Range of Equity Securities Beneficially Owned in the Trust | |
William E. Holt | None | |
Catherine C. McDermott | None | |
Daniel P. McElaney | None | |
Craig P. Russ | None | |
Andrew N. Sveen | None |
Potential for Conflicts of Interest. It is possible that conflicts of interest may arise in connection with a portfolio manager’s management of the Fund’s investments on the one hand and the investments of other accounts for which a portfolio manager is responsible on the other. For example, a portfolio manager may have conflicts of interest in allocating management time, resources and investment opportunities among the Fund and other accounts he or she advises. In addition, due to differences in the investment strategies or restrictions between the Fund and the other accounts, the portfolio manager may take action with respect to another account that differs from the action taken with respect to the Fund. In some cases, another account managed by a portfolio manager may compensate the investment adviser based on the performance of the securities held by that account. The existence of such a performance based fee may create additional conflicts of interest for the portfolio manager in the allocation of management time, resources and investment opportunities. Whenever conflicts of interest arise, the portfolio manager will endeavor to exercise his or her discretion in a manner that he or she believes is equitable to all interested persons. EVM has adopted several policies and procedures designed to address these potential conflicts including a code of ethics and policies that govern the investment adviser’s trading practices, including among other things the aggregation and allocation of trades among clients, brokerage allocations, cross trades and best execution.
Compensation Structure for EVM
Compensation of EVM’s portfolio managers and other investment professionals has the following primary components: (1) a base salary, (2) an annual cash bonus, and (3) annual non-cash compensation consisting of restricted shares of Morgan Stanley stock that are subject to a fixed vesting and distribution schedule. EVM’s investment professionals also receive certain retirement, insurance and other benefits that are broadly available to EVM’s employees. Compensation of EVM’s investment professionals is reviewed primarily on an annual basis. Cash bonuses, stock-based compensation awards, and adjustments in base salary are typically paid or put into effect at or shortly after the December 31st fiscal year end of Morgan Stanley.
Method to Determine Compensation. EVM compensates its portfolio managers based primarily on the scale and complexity of their portfolio responsibilities and the total return performance of managed funds and accounts versus the benchmark(s) stated in the prospectus, as well as an appropriate peer group (as described below). In addition to rankings within peer groups of funds on the basis of absolute performance, consideration may also be given to relative risk-adjusted performance. Risk-adjusted performance measures include, but are not limited to the Sharpe ratio, which uses standard deviation and excess return to determine reward per unit of risk. Performance is normally based on periods ending on the September 30th preceding fiscal year end. Fund performance is normally evaluated primarily versus peer groups of funds as determined by Lipper Inc. and/or Morningstar, Inc. When a fund’s peer group as determined by Lipper or Morningstar is deemed by EVM’s management not to provide a fair comparison, performance may instead be evaluated primarily against a custom peer group or market index. In evaluating the performance of a fund and its manager, primary emphasis is normally placed on three-year performance, with secondary consideration of performance over longer and shorter periods. For funds that are tax-managed or otherwise have an objective of after-tax returns, performance is measured net of taxes. For other funds, performance is evaluated on a pre-tax basis. For funds with an investment objective other than total return (such as current income), consideration will also be given to the
fund’s success in achieving its objective. For managers responsible for multiple funds and accounts, investment performance is evaluated on an aggregate basis, based on averages or weighted averages among managed funds and accounts. Funds and accounts that have performance-based advisory fees are not accorded disproportionate weightings in measuring aggregate portfolio manager performance.
The compensation of portfolio managers with other job responsibilities (such as heading an investment group or providing analytical support to other portfolios) will include consideration of the scope of such responsibilities and the managers’ performance in meeting them.
EVM seeks to compensate portfolio managers commensurate with their responsibilities and performance, and competitive with other firms within the investment management industry. EVM participates in investment-industry compensation surveys and utilizes survey data as a factor in determining salary, bonus and stock-based compensation levels for portfolio managers and other investment professionals. Salaries, bonuses and stock-based compensation are also influenced by the operating performance of EVM and its parent company. The overall annual cash bonus pool is generally based on a substantially fixed percentage of pre-bonus adjusted operating income. While the salaries of EVM’s portfolio managers are comparatively fixed, cash bonuses and stock-based compensation may fluctuate significantly from year to year, based on changes in manager performance and other factors as described herein. For a high performing portfolio manager, cash bonuses and stock-based compensation may represent a substantial portion of total compensation.
| Item 9. | Purchases of Equity Securities by Closed-End Management Investment Company and Affiliated Purchasers |
No such purchases this period.
| Item 10. | Submission of Matters to a Vote of Security Holders |
No material changes.
| Item 11. | Controls and Procedures |
(a) It is the conclusion of the registrant’s principal executive officer and principal financial officer that the effectiveness of the registrant’s current disclosure controls and procedures (such disclosure controls and procedures having been evaluated within 90 days of the date of this filing) provide reasonable assurance that the information required to be disclosed by the registrant has been recorded, processed, summarized and reported within the time period specified in the Commission’s rules and forms and that the information required to be disclosed by the registrant has been accumulated and communicated to the registrant’s principal executive officer and principal financial officer in order to allow timely decisions regarding required disclosure.
(b) There have been no changes in the registrant’s internal controls over financial reporting during the period covered by this report that has materially affected, or is reasonably likely to materially affect, the registrant’s internal control over financial reporting.
| Item 12. | Disclosure of Securities Lending Activities for Closed-End Management Investment Companies |
No activity to report for the registrant’s most recent fiscal year end.
| Item 13. | Exhibits |
| (a)(1) | Registrant’s Code of Ethics – Not applicable (please see Item 2). | |
| (a)(2)(i) | Treasurer’s Section 302 certification. | |
| (a)(2)(ii) | President’s Section 302 certification. | |
| (b) | Combined Section 906 certification. | |
Signatures
Pursuant to the requirements of the Securities Exchange Act of 1934 and the Investment Company Act of 1940, the registrant has duly caused this report to be signed on its behalf by the undersigned, thereunto duly authorized.
Eaton Vance Floating-Rate 2022 Target Term Trust
| By: | /s/ Eric A. Stein | |
| Eric A. Stein | ||
| President | ||
| Date: | August 19, 2021 | |
Pursuant to the requirements of the Securities Exchange Act of 1934 and the Investment Company Act of 1940, this report has been signed below by the following persons on behalf of the registrant and in the capacities and on the dates indicated.
| By: | /s/ James F. Kirchner | |
| James F. Kirchner | ||
| Treasurer | ||
| Date: | August 19, 2021 | |
| By: | /s/ Eric A. Stein | |
| Eric A. Stein | ||
| President | ||
| Date: | August 19, 2021 | |