UNITED STATES
SECURITIES AND EXCHANGE COMMISSION
Washington, D.C. 20549
FORM N-CSR
CERTIFIED SHAREHOLDER REPORT OF REGISTERED
MANAGEMENT INVESTMENT COMPANIES
Investment Company Act file number 811-23241
Virtus Convertible & Income 2024 Target Term Fund
(Exact name of registrant as specified in charter)
101 Munson Street
Greenfield, MA 01301-9683
(Address of principal executive offices) (Zip code)
Jennifer Fromm, Esq.
Vice President, Chief Legal Officer, Counsel and Secretary for Registrant
One Financial Plaza
Hartford, CT 06103-2608
(Name and address of agent for service)
Registrant’s telephone number, including area code: 1-866-270-7788
Date of fiscal year end: January 31
Date of reporting period: January 31, 2023
Form N-CSR is to be used by management investment companies to file reports with the Commission not later than 10 days after the transmission to stockholders of any report that is required to be transmitted to stockholders under Rule 30e-1 under the Investment Company Act of 1940 (17 CFR 270.30e-1). The Commission may use the information provided on Form N-CSR in its regulatory, disclosure review, inspection, and policymaking roles.
A registrant is required to disclose the information specified by Form N-CSR, and the Commission will make this information public. A registrant is not required to respond to the collection of information contained in Form N-CSR unless the Form displays a currently valid Office of Management and Budget (“OMB”) control number. Please direct comments concerning the accuracy of the information collection burden estimate and any suggestions for reducing the burden to Secretary, Securities and Exchange Commission, 450 Fifth Street, NW, Washington, DC 20549-0609. The OMB has reviewed this collection of information under the clearance requirements of 44 U.S.C. § 3507.
| Item 1. | Reports to Stockholders. |
| (a) | The Report to Shareholders is attached herewith. |

| Virtus Artificial Intelligence & Technology Opportunities Fund (AIO) |
| Virtus Convertible & Income 2024 Target Term Fund (CBH) |
| Virtus Convertible & Income Fund (NCV) |
| Virtus Convertible & Income Fund II (NCZ) |
| Virtus Diversified Income & Convertible Fund (ACV) |
| Virtus Dividend, Interest & Premium Strategy Fund (NFJ) |
| Virtus Equity & Convertible Income Fund (NIE) |
https://www.virtus.com/ACV
https://www.virtus.com/NFJ
https://www.virtus.com/NIE
| 1 | |
| 2 | |
| Manager’s Discussion of Fund Performance: | |
| 3 | |
| 5 | |
| 7 | |
| 9 | |
| 11 | |
| 13 | |
| 15 | |
| 17 | |
| 19 | |
| Schedules of Investments: | |
| 22 | |
| 27 | |
| 32 | |
| 40 | |
| 48 | |
| 58 | |
| 65 | |
| 71 | |
| 73 | |
| 75 | |
| 81 | |
| 82 | |
| 89 | |
| 103 | |
| 105 | |
| 107 | |
| 121 | |
| 124 | |
| 126 | |
| 130 |


President and Chief Executive Officer, Virtus Closed-End Funds
March 2023
| 1 Year | Since Inception 10/31/19 | |
| Net Asset Value1,2 | -10.03% | 11.94% |
| Market Value1,2 | -18.42% | 8.19% |
| Composite: 50% MSCI All Country World Index (net)/ 50% ICE BofA U.S. Convertibles Index1,3,4 | -7.85% | 9.64% 5 |
| MSCI All Country World Index (net)1,3 | -7.99% | 7.84% 5 |
| ICE BofA U.S. Convertibles Index1,3 | -7.96% | 11.22% 5 |
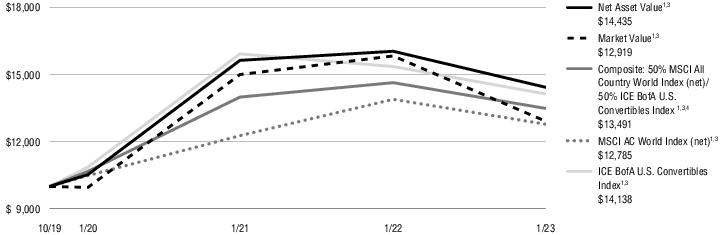
| 1 | Past performance is not indicative of future results. Current performance may be lower or higher than performance in historical periods. |
| 2 | Total return on market value is calculated assuming a purchase of common shares on the opening of the first day and sale on the closing of the last day of each period reported. Dividends and distributions are assumed, for purposes of this calculation, to be reinvested at prices obtained under the Fund’s Automatic Reinvestment and Cash Purchase Plan. Total return on market value is not annualized for periods of less than one year. Brokerage commissions that a shareholder may pay are not reflected. Total return on market value does not reflect the deduction of taxes that a shareholder may pay on fund distributions or the sale of fund shares. Total return on net asset value uses the same methodology, but with use of net asset value for the beginning and ending values. |
| 3 | The index is unmanaged and not available for direct investment; therefore, its performance does not reflect the expenses associated with active management of an actual portfolio. |
| 4 | During the reporting period, the benchmark was changed from the MSCI All Country World Index (net) to the composite benchmark to better align with the Fund’s asset class weightings. |
| 5 | The since inception index return is from the Fund’s inception date. |
| 1 Year | 5 Years | Since Inception 6/29/17 | |
| Net Asset Value1,2 | 1.51% 3 | 5.57% | 5.52% |
| Market Value1,2 | -2.18% | 6.87% | 4.87% |
| Composite: 40% ICE BofA U.S. Convertibles/ 45% ICE BofA U.S. High Yield BB-B Constrained/ 15% Credit Suisse Leveraged Loan Index 1,4 | -5.03% | 5.89% | 6.21% |
| ICE BofA U.S. Convertibles Index1,4 | -7.96% | 9.85% | 10.39% 5 |
| ICE BofA U.S. High Yield BB-B Constrained Index1,4 | -4.64% | 2.95% | 3.13% 5 |
| Credit Suisse Leveraged Loan Index1,4 | 1.12% | 3.54% | 3.77% 5 |

| 1 | Past performance is not indicative of future results. Current performance may be lower or higher than performance in historical periods. |
| 2 | Total return on market value is calculated assuming a purchase of common shares on the opening of the first day and sale on the closing of the last day of each period reported. Dividends and distributions are assumed, for purposes of this calculation, to be reinvested at prices obtained under the Fund’s Automatic Reinvestment and Cash Purchase Plan. Total return on market value is not annualized for periods of less than one year. Brokerage commissions that a shareholder may pay are not reflected. Total return on market value does not reflect the deduction of taxes that a shareholder may pay on fund distributions or the sale of fund shares. Total return on net asset value uses the same methodology, but with use of net asset value for the beginning and ending values. |
| 3 | Total Return for the report period presented in the table differs from the return in the Financial Highlights. The total return presented in the above table is calculated based on the NAV at which shareholder transactions were processed. The total return presented in the Financial Highlights section of the report is calculated in the same manner, but also takes into account certain adjustments that are necessary under generally accepted accounting principles required in the annual report and semiannual report. |
| 4 | The index is unmanaged and not available for direct investment; therefore, its performance does not reflect the expenses associated with active management of an actual portfolio. |
| 5 | The since inception index return is from the Fund’s inception date. |
| 1 Year | 5 Years | 10 Years | |
| Net Asset Value1,2 | -17.30% | 0.97% | 3.84% |
| Market Value1,2 | -15.20% | -0.45% | 3.28% |
| Composite: 60% ICE BofA U.S. Convertibles/ 40% ICE BofA U.S. High Yield Index1,3,4 | -6.78% | 7.08% | 7.84% |
| ICE BofA U.S. Convertibles Index1,3 | -7.96% | 9.85% | 10.21% |
| ICE BofA U.S. High Yield Index1,3 | -5.14% | 2.77% | 4.20% |
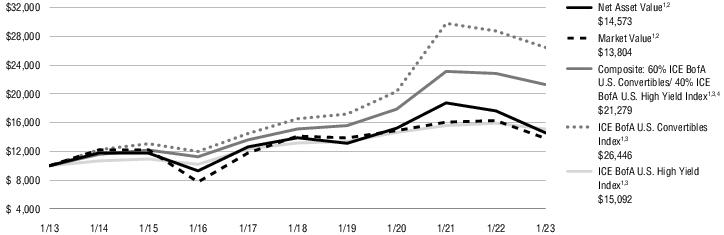
| 1 | Past performance is not indicative of future results. Current performance may be lower or higher than performance in historical periods. |
| 2 | Total return on market value is calculated assuming a purchase of common shares on the opening of the first day and sale on the closing of the last day of each period reported. Dividends and distributions are assumed, for purposes of this calculation, to be reinvested at prices obtained under the Fund’s Automatic Reinvestment and Cash Purchase Plan. Total return on market value is not annualized for periods of less than one year. Brokerage commissions that a shareholder may pay are not reflected. Total return on market value does not reflect the deduction of taxes that a shareholder may pay on fund distributions or the sale of fund shares. Total return on net asset value uses the same methodology, but with use of net asset value for the beginning and ending values. |
| 3 | The index is unmanaged and not available for direct investment; therefore, its performance does not reflect the expenses associated with active management of an actual portfolio. |
| 4 | During the reporting period, the benchmark was changed from 50% ICE BofA U.S. Convertibles Index and 50% ICE BofA U.S. High Yield Index to 60% ICE BofA U.S. Convertibles Index and 40% ICE BofA U.S. High Yield Index to better align with the Fund’s asset class weightings. |
| 1 Year | 5 Years | 10 Years | |
| Net Asset Value1,2 | -17.84% | 0.53% | 3.64% |
| Market Value1,2 | -17.85% | -1.33% | 2.35% |
| Composite: 60% ICE BofA U.S. Convertibles Index/ 40% ICE BofA U.S. High Yield Index1,3,4 | -6.78% | 7.08% | 7.84% |
| ICE BofA U.S. Convertibles Index1,3 | -7.96% | 9.85% | 10.21% |
| ICE BofA U.S. High Yield Index1,3 | -5.14% | 2.77% | 4.20% |
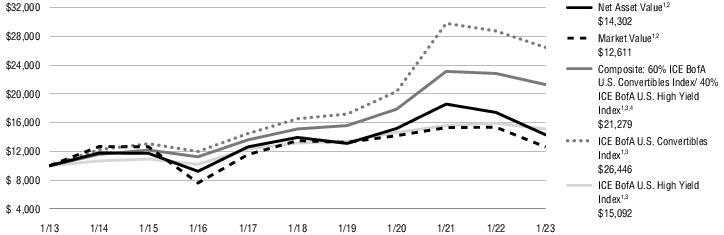
| 1 | Past performance is not indicative of future results. Current performance may be lower or higher than performance in historical periods. |
| 2 | Total return on market value is calculated assuming a purchase of common shares on the opening of the first day and sale on the closing of the last day of each period reported. Dividends and distributions are assumed, for purposes of this calculation, to be reinvested at prices obtained under the Fund’s Automatic Reinvestment and Cash Purchase Plan. Total return on market value is not annualized for periods of less than one year. Brokerage commissions that a shareholder may pay are not reflected. Total return on market value does not reflect the deduction of taxes that a shareholder may pay on fund distributions or the sale of fund shares. Total return on net asset value uses the same methodology, but with use of net asset value for the beginning and ending values. |
| 3 | The index is unmanaged and not available for direct investment; therefore, its performance does not reflect the expenses associated with active management of an actual portfolio. |
| 4 | During the reporting period, the benchmark was changed from 50% ICE BofA U.S. Convertibles Index and 50% ICE BofA U.S. High Yield Index to 60% ICE BofA U.S. Convertibles Index and 40% ICE BofA U.S. High Yield Index to better align with the Fund’s asset class weightings. |
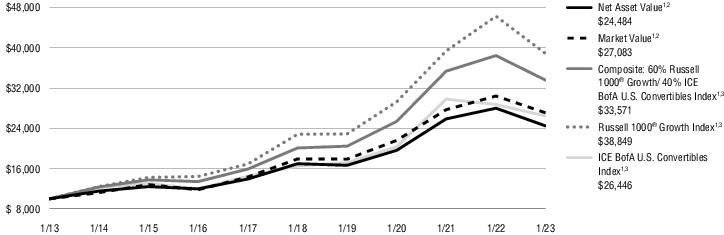
| 1 Year | 5 Years | Since Inception 5/26/15 | |
| Net Asset Value1,2 | -13.49% 3 | 10.01% | 9.82% |
| Market Value1,2 | -9.06% | 12.92% | 10.43% |
| Composite: 50% ICE BofA U.S. Convertibles/ 25% ICE BofA U.S. High Yield/ 25% Russell 1000® Growth Index1,4 | -9.15% | 8.58% | 8.56% |
| ICE BofA U.S. Convertibles Index1,4 | -7.96% | 9.85% | 8.62% 5 |
| ICE BofA U.S. High Yield Index1,4 | -5.14% | 2.77% | 3.84% 5 |
| Russell 1000® Growth Index1,4 | -16.02% | 11.22% | 12.73% 5 |
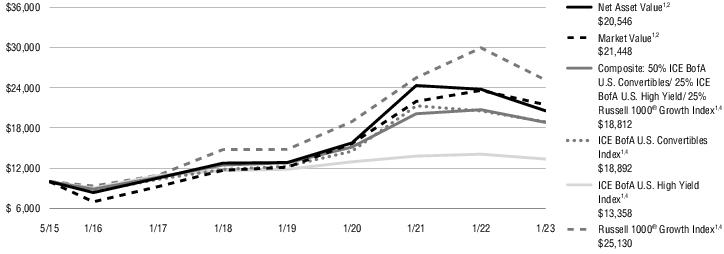
| 1 | Past performance is not indicative of future results. Current performance may be lower or higher than performance in historical periods. |
| 2 | Total return on market value is calculated assuming a purchase of common shares on the opening of the first day and sale on the closing of the last day of each period reported. Dividends and distributions are assumed, for purposes of this calculation, to be reinvested at prices obtained under the Fund’s Automatic Reinvestment and Cash Purchase Plan. Total return on market value is not annualized for periods of less than one year. Brokerage commissions that a shareholder may pay are not reflected. Total return on market value does not reflect the deduction of taxes that a shareholder may pay on fund distributions or the sale of fund shares. Total return on net asset value uses the same methodology, but with use of net asset value for the beginning and ending values. |
| 3 | Total Return for the report period presented in the table differs from the return in the Financial Highlights. The total return presented in the above table is calculated based on the NAV at which shareholder transactions were processed. The total return presented in the Financial Highlights section of the report is calculated in the same manner, but also takes into account certain adjustments that are necessary under generally accepted accounting principles required in the annual report and semiannual report. |
| 4 | The index is unmanaged and not available for direct investment; therefore, its performance does not reflect the expenses associated with active management of an actual portfolio. |
| 5 | The since inception index return is from the Fund’s inception date. |
| 1 Year | 5 Years | 10 Years | |
| Net Asset Value1,2 | -6.71% | 5.02% | 5.64% |
| Market Value1,2 | -9.24% | 5.56% | 5.76% |
| Composite: 75% Russell 1000® Value/ 25% ICE BofA U.S. Convertibles Index1,3 | -2.25% | 7.78% | 10.25% |
| Russell 1000® Value Index1,3 | -0.43% | 6.94% | 10.15% |
| ICE BofA U.S. Convertibles Index1,3 | -7.96% | 9.85% | 10.21% |

| 1 | Past performance is not indicative of future results. Current performance may be lower or higher than performance in historical periods. |
| 2 | Total return on market value is calculated assuming a purchase of common shares on the opening of the first day and sale on the closing of the last day of each period reported. Dividends and distributions are assumed, for purposes of this calculation, to be reinvested at prices obtained under the Fund’s Automatic Reinvestment and Cash Purchase Plan. Total return on market value is not annualized for periods of less than one year. Brokerage commissions that a shareholder may pay are not reflected. Total return on market value does not reflect the deduction of taxes that a shareholder may pay on fund distributions or the sale of fund shares. Total return on net asset value uses the same methodology, but with use of net asset value for the beginning and ending values. |
| 3 | The index is unmanaged and not available for direct investment; therefore, its performance does not reflect the expenses associated with active management of an actual portfolio. |
| 1 Year | 5 Years | 10 Years | |
| Net Asset Value1,2 | -12.54% | 7.60% | 9.37% |
| Market Value1,2 | -10.96% | 8.60% | 10.48% |
| Composite: 60% Russell 1000® Growth/ 40% ICE BofA U.S. Convertibles 1,3 | -12.69% | 10.80% | 12.87% |
| Russell 1000® Growth Index1,3 | -16.02% | 11.22% | 14.53% |
| ICE BofA U.S. Convertibles Index1,3 | -7.96% | 9.85% | 10.21% |
| 1 | Past performance is not indicative of future results. Current performance may be lower or higher than performance in historical periods. |
| 2 | Total return on market value is calculated assuming a purchase of common shares on the opening of the first day and sale on the closing of the last day of each period reported. Dividends and distributions are assumed, for purposes of this calculation, to be reinvested at prices obtained under the Fund’s Automatic Reinvestment and Cash Purchase Plan. Total return on market value is not annualized for periods of less than one year. Brokerage commissions that a shareholder may pay are not reflected. Total return on market value does not reflect the deduction of taxes that a shareholder may pay on fund distributions or the sale of fund shares. Total return on net asset value uses the same methodology, but with use of net asset value for the beginning and ending values. |
| 3 | The index is unmanaged and not available for direct investment; therefore, its performance does not reflect the expenses associated with active management of an actual portfolio. |
| Common Stocks | 45% | |
| Semiconductors & Semiconductor Equipment | 6% | |
| Healthcare Providers & Services | 6 | |
| Software | 5 | |
| All other Common Stocks | 28 | |
| Convertible Bonds and Notes | 34 | |
| Software | 9 | |
| Internet | 7 | |
| Semiconductors | 4 | |
| All other Convertible Bonds and Notes | 14 | |
| Corporate Bonds and Notes | 14 | |
| Internet | 2 | |
| Lodging | 2 | |
| Electronic Equipment, Instruments & Components | 1 | |
| All other Corporate Bonds and Notes | 9 | |
| Short-Term Investment | 3 | |
| Convertible Preferred Stocks | 2 | |
| Securities Lending Collateral | 2 | |
| Total | 100% | |
| Convertible Bonds and Notes | 42% | |
| Software | 13% | |
| Biotechnology | 7 | |
| Media | 6 | |
| All other Convertible Bonds and Notes | 16 | |
| Corporate Bonds and Notes | 31 | |
| Media | 5 | |
| Entertainment | 3 | |
| Healthcare-Services | 3 | |
| All other Corporate Bonds and Notes | 20 | |
| Leveraged Loans | 23 | |
| Short-Term Investment | 3 | |
| Common Stocks | 1 | |
| Banks | 1 | |
| Securities Lending Collateral | 0 | |
| Total | 100% | |
| Convertible Bonds and Notes | 52% | |
| Software | 8% | |
| Internet | 7 | |
| Biotechnology | 4 | |
| All other Convertible Bonds and Notes | 33 | |
| Corporate Bonds and Notes | 35 | |
| Media | 4 | |
| Oil, Gas & Consumable Fuels | 3 | |
| Entertainment | 3 | |
| All other Corporate Bonds and Notes | 25 | |
| Convertible Preferred Stocks | 7 | |
| Short-Term Investment | 5 | |
| Common Stocks | 1 | |
| Banks | 1 | |
| Total | 100% | |
| Convertible Bonds and Notes | 54% | |
| Software | 8% | |
| Internet | 7 | |
| Biotechnology | 4 | |
| All other Convertible Bonds and Notes | 35 | |
| Corporate Bonds and Notes | 34 | |
| Media | 4 | |
| Oil, Gas & Consumable Fuels | 3 | |
| Entertainment | 2 | |
| All other Corporate Bonds and Notes | 25 | |
| Convertible Preferred Stocks | 7 | |
| Short-Term Investment | 4 | |
| Common Stocks | 1 | |
| Banks | 1 | |
| Total | 100% | |
| Convertible Bonds and Notes | 54% | |
| Software | 8% | |
| Internet | 8 | |
| Biotechnology | 4 | |
| All other Convertible Bonds and Notes | 34 | |
| Common Stocks | 23 | |
| Software | 3 | |
| Semiconductors & Semiconductor Equipment | 2 | |
| Technology Hardware, Storage & Peripherals | 1 | |
| All other Common Stocks | 17 | |
| Corporate Bonds and Notes | 13 | |
| Media | 2 | |
| Oil, Gas & Consumable Fuels | 1 | |
| Entertainment | 1 | |
| All other Corporate Bonds and Notes | 9 | |
| Convertible Preferred Stocks | 7 | |
| Short-Term Investment | 3 | |
| Total | 100% | |
| Common Stocks | 77% | |
| Software | 8% | |
| Banks | 7 | |
| Semiconductors & Semiconductor Equipment | 6 | |
| All other Common Stocks | 56 | |
| Convertible Bonds and Notes | 18 | |
| Software | 3 | |
| Internet | 3 | |
| Biotechnology | 1 | |
| All other Convertible Bonds and Notes | 11 | |
| Short-Term Investment | 3 | |
| Convertible Preferred Stocks | 2 | |
| Total | 100% | |
| Common Stocks | 62% | |
| Software | 7% | |
| Semiconductors & Semiconductor Equipment | 5 | |
| Technology Hardware, Storage & Peripherals | 4 | |
| All other Common Stocks | 46 | |
| Convertible Bonds and Notes | 32 | |
| Software | 5 | |
| Internet | 5 | |
| Biotechnology | 2 | |
| All other Convertible Bonds and Notes | 20 | |
| Convertible Preferred Stocks | 4 | |
| Short-Term Investment | 2 | |
| Total | 100% | |
| Par Value | Value | ||
| Convertible Bonds and Notes—41.5% | |||
| Auto Manufacturers—1.1% | |||
| Ford Motor Co. 0.000%, 3/15/26(1) | $ 7,520 | $ 7,633 | |
| Biotechnology—0.5% | |||
| Alnylam Pharmaceuticals, Inc. 144A 1.000%, 9/15/27(1)(2) | 3,000 | 3,199 | |
| Commercial Services—2.1% | |||
| Block, Inc. 0.125%, 3/1/25(1) | 5,000 | 5,075 | |
| Shift4 Payments, Inc. | |||
| 0.000%, 12/15/25(1) | 6,090 | 6,501 | |
| 0.500%, 8/1/27(1)(3) | 3,075 | 2,744 | |
| 14,320 | |||
| Computers—1.6% | |||
| Lumentum Holdings, Inc. 0.500%, 12/15/26(1) | 9,000 | 8,167 | |
| Pure Storage, Inc. 0.125%, 4/15/23(1) | 655 | 730 | |
| Zscaler, Inc. 0.125%, 7/1/25(1) | 1,825 | 1,994 | |
| 10,891 | |||
| Diversified Financial Services—1.1% | |||
| Goldman Sachs Finance Corp. 0.500%, 12/29/27(4) | 7,315 | 7,647 | |
| Energy-Alternate Sources—3.0% | |||
| Enphase Energy, Inc. | |||
| 0.000%, 3/1/26(1) | 5,500 | 5,792 | |
| 0.000%, 3/1/28(1) | 4,500 | 4,839 | |
| SolarEdge Technologies, Inc. 0.000%, 9/15/25(1) | 4,515 | 6,061 | |
| Stem, Inc. 144A 0.500%, 12/1/28(2) | 6,000 | 4,033 | |
| 20,725 | |||
| Entertainment—2.2% | |||
| Live Nation Entertainment, Inc. 2.000%, 2/15/25(1) | 7,320 | 7,536 | |
| Vail Resorts, Inc. 0.000%, 1/1/26(1)(3) | 8,000 | 7,570 | |
| 15,106 | |||
| Healthcare-Products—2.2% | |||
| Exact Sciences Corp. 0.375%, 3/15/27(1) | 7,265 | 6,847 | |
| Insulet Corp. 0.375%, 9/1/26(1) | 5,850 | 8,076 | |
| 14,923 | |||
| Internet—8.3% | |||
| Airbnb, Inc. 0.000%, 3/15/26(1) | 8,500 | 7,297 | |
| Etsy, Inc. 0.125%, 9/1/27(1) | 5,725 | 5,886 | |
| Par Value | Value | ||
| Internet—continued | |||
| Expedia Group, Inc. 0.000%, 2/15/26(1) | $ 9,355 | $ 8,513 | |
| Match Group Financeco 3, Inc. 144A 2.000%, 1/15/30(1)(2) | 8,000 | 7,816 | |
| Okta, Inc. 0.375%, 6/15/26(1) | 9,250 | 7,844 | |
| Palo Alto Networks, Inc. 0.750%, 7/1/23 | 4,600 | 8,239 | |
| Shopify, Inc. 0.125%, 11/1/25(1) | 3,605 | 3,160 | |
| Snap, Inc. | |||
| 0.750%, 8/1/26(1) | 5,000 | 4,610 | |
| 144A 0.125%, 3/1/28(2) | 5,000 | 3,602 | |
| 56,967 | |||
| Leisure Time—1.1% | |||
| NCL Corp., Ltd. | |||
| 1.125%, 2/15/27 | 3,000 | 2,288 | |
| 144A 2.500%, 2/15/27(2) | 6,450 | 5,079 | |
| 7,367 | |||
| Pharmaceuticals—1.5% | |||
| Dexcom, Inc. 0.250%, 11/15/25(1)(3) | 9,740 | 10,256 | |
| Retail—0.9% | |||
| Burlington Stores, Inc. 2.250%, 4/15/25(1) | 5,000 | 6,194 | |
| Semiconductors—4.7% | |||
| MACOM Technology Solutions Holdings, Inc. 0.250%, 3/15/26(1) | 7,200 | 7,430 | |
| Microchip Technology, Inc. 0.125%, 11/15/24(3) | 10,457 | 11,601 | |
| ON Semiconductor Corp. 0.000%, 5/1/27(1) | 4,135 | 6,200 | |
| Wolfspeed, Inc. 144A 0.250%, 2/15/28(1)(2) | 7,500 | 6,844 | |
| 32,075 | |||
| Software—11.2% | |||
| Akamai Technologies, Inc. 0.125%, 5/1/25(1) | 6,000 | 6,429 | |
| Bentley Systems, Inc. 0.125%, 1/15/26(1) | 10,900 | 10,072 | |
| Bill.com Holdings, Inc. 0.000%, 4/1/27 | 11,500 | 9,223 | |
| Cloudflare, Inc. 0.000%, 8/15/26(1) | 10,860 | 9,028 | |
| Coupa Software, Inc. 0.375%, 6/15/26(1) | 5,300 | 5,154 | |
| DigitalOcean Holdings, Inc. 0.000%, 12/1/26 | 8,670 | 6,654 | |
| Five9, Inc. 0.500%, 6/1/25(1) | 6,750 | 6,375 | |
| Nutanix, Inc. 0.250%, 10/1/27(1) | 10,370 | 8,999 | |
| Splunk, Inc. | |||
| 1.125%, 9/15/25(1) | 2,000 | 1,948 | |
| Par Value | Value | ||
| Software—continued | |||
| 1.125%, 6/15/27(1) | $ 7,480 | $ 6,437 | |
| Unity Software, Inc. 0.000%, 11/15/26 | 8,350 | 6,438 | |
| 76,757 | |||
| Total Convertible Bonds and Notes (Identified Cost $304,660) | 284,060 | ||
| Corporate Bonds and Notes—17.1% | |||
| Commercial Services—0.9% | |||
| ADT Security Corp. (The) 144A 4.125%, 8/1/29(1)(2) | 7,000 | 6,232 | |
| Computers—0.6% | |||
| NCR Corp. 144A 5.125%, 4/15/29(1)(2) | 4,815 | 4,194 | |
| Cosmetics & Personal Care—1.0% | |||
| Coty, Inc. 144A 6.500%, 4/15/26(2)(3) | 7,000 | 6,901 | |
| Electronic Equipment, Instruments & Components—1.1% | |||
| WESCO Distribution, Inc. 144A 7.250%, 6/15/28(1)(2) | 7,000 | 7,173 | |
| Entertainment—0.9% | |||
| Caesars Entertainment, Inc. 144A 4.625%, 10/15/29(1)(2) | 7,000 | 5,985 | |
| Equity Real Estate Investment Trusts (REITs)—0.9% | |||
| Iron Mountain, Inc. 144A 5.250%, 7/15/30(1)(2) | 7,000 | 6,335 | |
| Healthcare-Services—1.0% | |||
| Tenet Healthcare Corp. 6.125%, 10/1/28(2)(3) | 7,000 | 6,546 | |
| Internet—3.1% | |||
| Go Daddy Operating Co., LLC 144A 5.250%, 12/1/27(1)(2) | 7,000 | 6,774 | |
| Match Group Holdings II LLC 144A 5.000%, 12/15/27(1)(2) | 7,000 | 6,712 | |
| Uber Technologies, Inc. 144A 6.250%, 1/15/28(1)(2)(3) | 8,000 | 7,828 | |
| 21,314 | |||
| Lodging—2.9% | |||
| Boyd Gaming Corp. 144A 4.750%, 6/15/31(1)(2)(3) | 7,000 | 6,299 | |
| Hilton Grand Vacations Borrower Escrow LLC 144A 5.000%, 6/1/29(1)(2) | 7,000 | 6,260 | |
| MGM Resorts International | |||
| 5.500%, 4/15/27(1) | 4,000 | 3,857 | |
| 4.750%, 10/15/28(1)(3) | 4,000 | 3,627 | |
| 20,043 | |||
| Par Value | Value | ||
| Machinery-Diversified—1.0% | |||
| Chart Industries, Inc. 144A 9.500%, 1/1/31(2) | $ 6,350 | $ 6,626 | |
| Media—0.9% | |||
| Sirius XM Radio, Inc. 144A 4.000%, 7/15/28(1)(2) | 7,000 | 6,231 | |
| Pharmaceuticals—0.9% | |||
| Jazz Securities DAC 144A 4.375%, 1/15/29(1)(2) | 7,000 | 6,386 | |
| Semiconductors—1.0% | |||
| Entegris Escrow Corp. 144A 5.950%, 6/15/30(1)(2) | 7,000 | 6,722 | |
| Software—0.9% | |||
| Clarivate Science Holdings Corp. 144A 4.875%, 7/1/29(2)(3) | 7,000 | 6,159 | |
| Total Corporate Bonds and Notes (Identified Cost $123,810) | 116,847 | ||
| Shares | ||
| Convertible Preferred Stocks—2.5% | ||
| Life Sciences Tools & Services—0.9% | ||
| Danaher Corp. Series B, 5.000%(3) | 4,695 | 6,310 |
| Telecommunications—1.6% | ||
| T-Mobile U.S. 2020 Cash Mandatory Exchangeable Trust 144A, 5.250%(2) | 8,920 | 10,759 |
| Total Convertible Preferred Stocks (Identified Cost $16,775) | 17,069 | |
| Common Stocks—54.6% | ||
| Air Freight & Logistics—0.2% | ||
| United Parcel Service, Inc. Class B | 7,500 | 1,389 |
| Auto Components—0.7% | ||
| Aptiv plc(1)(5) | 42,035 | 4,754 |
| Banks—1.6% | ||
| Bank of America Corp. | 148,205 | 5,258 |
| JPMorgan Chase & Co. | 43,090 | 6,031 |
| 11,289 | ||
| Biotechnology—0.5% | ||
| Amgen, Inc. | 12,605 | 3,181 |
| Capital Markets—1.8% | ||
| Charles Schwab Corp. (The) | 78,450 | 6,073 |
| Morgan Stanley | 60,820 | 5,920 |
| 11,993 | ||
| Communications Equipment—1.8% | ||
| Arista Networks, Inc.(1)(5) | 49,935 | 6,293 |
| Shares | Value | ||
| Communications Equipment—continued | |||
| Motorola Solutions, Inc. | 22,580 | $ 5,803 | |
| 12,096 | |||
| Consumer Finance—0.9% | |||
| American Express Co. | 36,360 | 6,360 | |
| Electrical Equipment—0.3% | |||
| Rockwell Automation, Inc.(3) | 7,445 | 2,100 | |
| Electronic Equipment, Instruments & Components—1.8% | |||
| Flex Ltd.(3)(5) | 514,470 | 12,013 | |
| Energy Equipment & Services—2.9% | |||
| Baker Hughes Co. | 160,820 | 5,105 | |
| Schlumberger Ltd. | 260,695 | 14,854 | |
| 19,959 | |||
| Entertainment—0.5% | |||
| Netflix, Inc.(5) | 8,940 | 3,163 | |
| Healthcare Equipment & Supplies—1.0% | |||
| Boston Scientific Corp.(5) | 89,815 | 4,154 | |
| Intuitive Surgical, Inc.(1)(5) | 10,485 | 2,576 | |
| 6,730 | |||
| Healthcare Providers & Services—6.9% | |||
| Cigna Corp. | 22,945 | 7,266 | |
| Elevance Health, Inc. | 23,895 | 11,947 | |
| McKesson Corp. | 20,370 | 7,714 | |
| UnitedHealth Group, Inc.(1) | 40,055 | 19,995 | |
| 46,922 | |||
| Hotels, Restaurants & Leisure—4.7% | |||
| Hilton Worldwide Holdings, Inc. | 75,340 | 10,931 | |
| Marriott International, Inc. Class A | 54,700 | 9,528 | |
| McDonald’s Corp. | 44,795 | 11,978 | |
| 32,437 | |||
| Industrial Conglomerates—0.2% | |||
| Honeywell International, Inc. | 7,865 | 1,640 | |
| Insurance—2.4% | |||
| Chubb Ltd. | 48,630 | 11,063 | |
| Progressive Corp. (The) | 40,405 | 5,509 | |
| 16,572 | |||
| Interactive Media & Services—0.4% | |||
| Alphabet, Inc. Class A(5) | 27,660 | 2,734 | |
| Internet & Direct Marketing Retail—0.8% | |||
| Alibaba Group Holding Ltd. Sponsored ADR(5) | 51,820 | 5,711 | |
| IT Services—1.7% | |||
| Mastercard, Inc. Class A | 15,165 | 5,620 | |
| Shares | Value | ||
| IT Services—continued | |||
| Visa, Inc. Class A(3) | 27,300 | $ 6,285 | |
| 11,905 | |||
| Life Sciences Tools & Services—2.0% | |||
| Charles River Laboratories International, Inc.(5) | 13,820 | 3,362 | |
| IQVIA Holdings, Inc.(1)(5) | 36,362 | 8,342 | |
| Thermo Fisher Scientific, Inc. | 3,395 | 1,936 | |
| 13,640 | |||
| Machinery—3.8% | |||
| Caterpillar, Inc. | 21,015 | 5,302 | |
| Deere & Co. | 48,536 | 20,523 | |
| 25,825 | |||
| Metals & Mining—0.9% | |||
| Freeport-McMoRan, Inc. | 130,652 | 5,830 | |
| Pharmaceuticals—3.5% | |||
| AstraZeneca plc Sponsored ADR | 130,315 | 8,519 | |
| Bristol-Myers Squibb Co. | 74,625 | 5,422 | |
| Eli Lilly & Co. | 9,110 | 3,135 | |
| Merck & Co., Inc. | 64,300 | 6,906 | |
| 23,982 | |||
| Semiconductors & Semiconductor Equipment—7.5% | |||
| Analog Devices, Inc. | 50,080 | 8,587 | |
| Applied Materials, Inc. | 55,305 | 6,166 | |
| GlobalFoundries, Inc.(3)(5) | 98,923 | 5,864 | |
| Lam Research Corp. | 7,880 | 3,941 | |
| Marvell Technology, Inc. | 195,040 | 8,416 | |
| Monolithic Power Systems, Inc.(3) | 9,130 | 3,894 | |
| NXP Semiconductors N.V. | 65,145 | 12,007 | |
| Taiwan Semiconductor Manufacturing Co., Ltd. Sponsored ADR | 25,890 | 2,401 | |
| 51,276 | |||
| Software—5.8% | |||
| Cadence Design Systems, Inc.(1)(5) | 58,735 | 10,739 | |
| Intuit, Inc. | 15,010 | 6,344 | |
| Microsoft Corp. | 23,835 | 5,907 | |
| Oracle Corp. | 142,875 | 12,639 | |
| ServiceNow, Inc.(1)(5) | 9,550 | 4,346 | |
| 39,975 | |||
| Total Common Stocks (Identified Cost $320,545) | 373,476 | ||
| Total Long-Term Investments—115.7% (Identified Cost $765,790) | 791,452 | ||
| Shares | Value | ||
| Short-Term Investment—4.0% | |||
| Money Market Mutual Fund—4.0% | |||
| BlackRock Liquidity FedFund - Institutional Shares (seven-day effective yield 4.066%)(6) | 27,405,337 | $ 27,405 | |
| Total Short-Term Investment (Identified Cost $27,405) | 27,405 | ||
| Securities Lending Collateral—1.9% | |||
| Dreyfus Government Cash Management Fund - Institutional Shares (seven-day effective yield 4.227%)(6)(7) | 13,000,004 | 13,000 | |
| Total Securities Lending Collateral (Identified Cost $13,000) | 13,000 | ||
| TOTAL INVESTMENTS—121.6% (Identified Cost $806,195) | $ 831,857 | ||
| Other assets and liabilities, net—(21.6)% | (147,734) | ||
| NET ASSETS—100.0% | $ 684,123 | ||
| Abbreviations: | |
| ADR | American Depositary Receipt |
| LLC | Limited Liability Company |
| REIT | Real Estate Investment Trust |
| Footnote Legend: | |
| (1) | All or a portion of securities is segregated as collateral for the Liquidity Facility. The value of securities segregated as collateral is $167,344. |
| (2) | Security exempt from registration under Rule 144A of the Securities Act of 1933. These securities may be resold in transactions exempt from registration, normally to qualified institutional buyers. At January 31, 2023, these securities amounted to a value of $150,695 or 22.0% of net assets. |
| (3) | All or a portion of security is on loan pursuant to the Liquidity Facility and/or securities lending. |
| (4) | The value of this security was determined using significant unobservable inputs and is reported as a Level 3 security in the Fair Value Hierarchy table located after the Schedule of Investments. |
| (5) | Non-income producing. |
| (6) | Shares of this fund are publicly offered, and its prospectus and annual report are publicly available. |
| (7) | Represents security purchased with cash collateral received for securities on loan. |
| Country Weightings (Unaudited)† | |
| United States | 89% |
| Curaçao | 2 |
| United Kingdom | 2 |
| Singapore | 1 |
| Netherlands | 1 |
| Switzerland | 1 |
| Bermuda | 1 |
| Other | 3 |
| Total | 100% |
| † % of total investments as of January 31, 2023. | |
| Total Value at January 31, 2023 | Level 1 Quoted Prices | Level 2 Significant Observable Inputs | Level 3 Significant Unobservable Inputs | ||||
| Assets: | |||||||
| Debt Instruments: | |||||||
| Corporate Bonds and Notes | $116,847 | $ — | $116,847 | $ — | |||
| Convertible Bonds and Notes | 284,060 | — | 276,413 | 7,647 | |||
| Equity Securities: | |||||||
| Common Stocks | 373,476 | 373,476 | — | — | |||
| Convertible Preferred Stocks | 17,069 | 6,310 | 10,759 | — | |||
| Money Market Mutual Fund | 27,405 | 27,405 | — | — | |||
| Securities Lending Collateral | 13,000 | 13,000 | — | — | |||
| Total Investments | $831,857 | $420,191 | $404,019 | $7,647 |
are based on unobservable inputs. A significant change in third party information could result in a significantly lower or higher value of Level 3 investments.
| Total | Convertible Bonds And Notes | ||
| Investments in Securities | |||
| Balance as of January 31, 2022: | $ — | $ — | |
| Net change in unrealized appreciation (depreciation) (a) | 149 | 149 | |
| Purchases | 7,498 | 7,498 | |
| Balance as of January 31, 2023 | $7,647 | $7,647 |
| Par Value | Value | ||
| Convertible Bonds and Notes—59.9% | |||
| Auto Manufacturers—6.4% | |||
| NIO, Inc. 0.000%, 2/1/26 | $ 11,800 | $ 10,885 | |
| Biotechnology—10.3% | |||
| Insmed, Inc. 1.750%, 1/15/25(1) | 5,500 | 5,220 | |
| Ionis Pharmaceuticals, Inc. 0.125%, 12/15/24(1) | 8,000 | 7,390 | |
| Ligand Pharmaceuticals, Inc. 0.750%, 5/15/23 | 5,000 | 4,869 | |
| 17,479 | |||
| Diversified Financial Services—2.5% | |||
| Hannon Armstrong Sustainable Infrastructure Capital, Inc. 0.000%, 8/15/23 | 4,220 | 4,167 | |
| Equity Real Estate Investment Trusts (REITs)—2.8% | |||
| Redwood Trust, Inc. 5.625%, 7/15/24 | 5,000 | 4,731 | |
| Healthcare-Products—2.3% | |||
| NuVasive, Inc. 1.000%, 6/1/23(1) | 4,000 | 3,943 | |
| Internet—6.5% | |||
| Pinduoduo, Inc. 0.000%, 12/1/25 | 7,000 | 6,748 | |
| Wayfair, Inc. 1.125%, 11/1/24 | 4,500 | 4,176 | |
| 10,924 | |||
| Media—8.5% | |||
| DISH Network Corp. 2.375%, 3/15/24(1) | 7,500 | 6,949 | |
| Liberty Broadband Corp. 144A 2.750%, 9/30/50(1)(2) | 7,500 | 7,350 | |
| 14,299 | |||
| Pharmaceuticals—2.2% | |||
| Jazz Investments I Ltd. 1.500%, 8/15/24(1) | 3,855 | 3,785 | |
| Software—18.4% | |||
| Alteryx, Inc. 0.500%, 8/1/24(1) | 7,000 | 6,475 | |
| Benefitfocus, Inc. 1.250%, 12/15/23 | 3,000 | 2,912 | |
| DocuSign, Inc. 0.000%, 1/15/24(1) | 4,000 | 3,802 | |
| Everbridge, Inc. 0.125%, 12/15/24 | 4,000 | 3,592 | |
| i3 Verticals LLC 1.000%, 2/15/25 | 9,000 | 8,764 | |
| LivePerson, Inc. 0.750%, 3/1/24 | 1,000 | 952 | |
| PROS Holdings, Inc. 1.000%, 5/15/24 | 4,000 | 3,700 | |
| Par Value | Value | ||
| Software—continued | |||
| RingCentral, Inc. 0.000%, 3/1/25(1) | $ 1,160 | $ 1,014 | |
| 31,211 | |||
| Total Convertible Bonds and Notes (Identified Cost $104,831) | 101,424 | ||
| Corporate Bonds and Notes—44.9% | |||
| Aerospace & Defense—2.1% | |||
| Triumph Group, Inc. | |||
| 144A 8.875%, 6/1/24(1)(2) | 1,720 | 1,746 | |
| 144A 6.250%, 9/15/24(2) | 1,850 | 1,786 | |
| 3,532 | |||
| Airlines—2.2% | |||
| Delta Air Lines, Inc. 2.900%, 10/28/24(1)(3) | 4,000 | 3,815 | |
| Auto Manufacturers—0.3% | |||
| Ford Motor Credit Co. LLC 4.063%, 11/1/24(1)(3) | 500 | 484 | |
| Building Materials—2.0% | |||
| Koppers, Inc. 144A 6.000%, 2/15/25(1)(2) | 3,420 | 3,369 | |
| Commercial Services—1.8% | |||
| ADT Security Corp. (The) 4.125%, 6/15/23(1) | 3,000 | 2,986 | |
| Containers & Packaging—3.0% | |||
| Owens-Brockway Glass Container, Inc. | |||
| 144A 5.875%, 8/15/23(1)(2)(3) | 2,610 | 2,600 | |
| 144A 5.375%, 1/15/25(1)(2) | 2,610 | 2,532 | |
| 5,132 | |||
| Diversified Financial Services—3.5% | |||
| Navient Corp. 7.250%, 9/25/23(1) | 2,800 | 2,829 | |
| OneMain Finance Corp. 8.250%, 10/1/23(1) | 3,000 | 3,034 | |
| 5,863 | |||
| Entertainment—4.6% | |||
| Live Nation Entertainment, Inc. 144A 4.875%, 11/1/24(1)(2) | 4,000 | 3,885 | |
| Six Flags Entertainment Corp. 144A 4.875%, 7/31/24(1)(2)(3) | 4,000 | 3,915 | |
| 7,800 | |||
| Equity Real Estate Investment Trusts (REITs)—2.3% | |||
| Service Properties Trust 4.350%, 10/1/24(1) | 4,170 | 3,932 | |
| Par Value | Value | ||
| Food & Beverage—2.3% | |||
| Albertsons Cos., Inc. 144A 3.500%, 2/15/23(1)(2) | $ 4,000 | $ 3,995 | |
| Healthcare-Services—3.9% | |||
| HCA, Inc. 5.375%, 2/1/25(1) | 3,000 | 3,011 | |
| Tenet Healthcare Corp. 4.625%, 7/15/24(1) | 3,716 | 3,665 | |
| 6,676 | |||
| Internet—2.4% | |||
| Netflix, Inc. 5.875%, 2/15/25(1) | 4,000 | 4,058 | |
| Leisure Time—1.7% | |||
| NCL Corp., Ltd. 144A 3.625%, 12/15/24(1)(2)(3) | 3,000 | 2,816 | |
| Lodging—2.0% | |||
| Wynn Las Vegas LLC 144A 5.500%, 3/1/25(1)(2)(3) | 3,500 | 3,401 | |
| Media—6.8% | |||
| CCO Holdings LLC 144A 4.000%, 3/1/23(1)(2) | 4,000 | 3,994 | |
| CSC Holdings LLC 5.250%, 6/1/24(1)(3) | 4,000 | 3,916 | |
| DISH DBS Corp. 5.875%, 11/15/24(1) | 3,785 | 3,572 | |
| 11,482 | |||
| Oil, Gas & Consumable Fuels—2.2% | |||
| Occidental Petroleum Corp. 6.950%, 7/1/24(1) | 3,600 | 3,665 | |
| Telecommunications—1.8% | |||
| Sprint LLC 7.125%, 6/15/24(1) | 3,000 | 3,064 | |
| Total Corporate Bonds and Notes (Identified Cost $77,644) | 76,070 | ||
| Leveraged Loans—32.5% | |||
| Advertising—0.5% | |||
| Advantage Sales & Marketing, Inc. Tranche B-1 (3 month LIBOR + 4.500%) 9.288%, 10/28/27 (4) | 980 | 817 | |
| Airlines—0.9% | |||
| American Airlines, Inc. (3 month LIBOR + 4.750%) 9.558%, 4/20/28 (4) | 1,000 | 1,026 | |
| Delta Air Lines, Inc. (3 month LIBOR + 3.750%) 8.558%, 10/20/27 (4) | 475 | 491 | |
| 1,517 | |||
| Auto Components—0.6% | |||
| Adient U.S. LLC Tranche B-1 (1 month LIBOR + 3.250%) 7.820%, 4/10/28 (4) | 985 | 981 | |
| Par Value | Value | ||
| Chemicals—0.6% | |||
| Ecovyst Catalyst Technologies LLC (3 month LIBOR + 2.500%) 7.325%, 6/9/28 (4) | $ 982 | $ 980 | |
| Commercial Services—3.0% | |||
| Allied Universal Holdco LLC (1 month Term SOFR + 3.750%) 8.311%, 5/12/28 (4) | 988 | 951 | |
| Avis Budget Car Rental LLC Tranche B (1 month LIBOR + 1.750%) 6.320%, 8/6/27 (4) | 997 | 983 | |
| Hertz Corp. (The) | |||
| Tranche B (1 month LIBOR + 3.250%) 7.820%, 6/30/28 (4) | 1,248 | 1,242 | |
| Tranche C (1 month LIBOR + 3.250%) 7.820%, 6/30/28 (4) | 239 | 238 | |
| Travelport Finance (Luxembourg) S.a.r.l. First Lien (3 month LIBOR + 5.000%) 0.000%, 5/29/26 (4) | 967 | 725 | |
| WEX, Inc. Tranche B (1 month LIBOR + 2.250%) 6.820%, 3/31/28 (4) | 983 | 979 | |
| 5,118 | |||
| Computers—2.7% | |||
| Conduent Business Services LLC Tranche B (1 month LIBOR + 4.250%) 8.767%, 10/16/28 (4) | 990 | 972 | |
| KBR, Inc. Tranche B (1 month LIBOR + 2.750%) 7.320%, 2/5/27 (4) | 998 | 997 | |
| McAfee Corp. Tranche B-1 (1 month Term SOFR + 3.850%) 8.184%, 3/1/29 (4) | 1,194 | 1,124 | |
| NCR Corp. (3 month LIBOR + 2.500%) 7.330%, 8/28/26 (4) | 1,445 | 1,436 | |
| 4,529 | |||
| Containers & Packaging—0.9% | |||
| Pactiv Evergreen Group Holdings, Inc. Tranche B-3 (1 month LIBOR + 3.250%) 7.820%, 9/25/28 (4) | 1,484 | 1,476 | |
| Cosmetics & Personal Care—0.6% | |||
| Coty, Inc. Tranche B (1 month LIBOR + 2.250%) 6.645%, 4/7/25 (4) | 958 | 954 | |
| Electronics—0.6% | |||
| II-VI, Inc. Tranche B (1 month LIBOR + 2.750%) 7.320%, 7/2/29 (4) | 980 | 975 | |
| Entertainment—2.4% | |||
| AMC Entertainment Holdings, Inc. Tranche B-1 (1 month LIBOR + 3.000%) 7.430%, 4/22/26 (4) | 963 | 568 | |
| Penn National Gaming, Inc. Tranche B (1 month Term SOFR + 2.850%) 0.000%, 5/3/29 (4) | 1,000 | 999 | |
| SeaWorld Parks & Entertainment, Inc. Tranche B (1 month LIBOR + 3.000%) 7.625%, 8/25/28 (4) | 997 | 994 | |
| Par Value | Value | ||
| Entertainment—continued | |||
| Stars Group Holdings B.V. 2021 (3 month LIBOR + 2.250%) 6.980%, 7/21/26 (4) | $ 1,610 | $ 1,606 | |
| 4,167 | |||
| Environmental Services—0.3% | |||
| GFL Environmental, Inc. 2020 (3 month LIBOR + 3.000%) 0.000%, 5/30/25 (4) | 500 | 501 | |
| Food Service—0.9% | |||
| Aramark Services, Inc. Tranche B-5 (1 month LIBOR + 2.500%) 7.070%, 4/6/28 (4) | 1,500 | 1,495 | |
| Internet—1.2% | |||
| Go Daddy Operating Co. LLC Tranche B-5 (3 month LIBOR+ 1.750%) 0.000%, 11/9/29 (4)(5) | 1,000 | 1,003 | |
| Match Group, Inc. Tranche B-1 (3 month LIBOR + 1.750%) 6.488%, 2/13/27 (4) | 1,000 | 987 | |
| 1,990 | |||
| Leisure Time—1.1% | |||
| Callaway Golf Co. (1 month LIBOR + 4.500%) 9.070%, 1/2/26 (4) | 902 | 903 | |
| Carnival Corp. 2021, Tranche B (1 month LIBOR + 3.250%) 7.820%, 10/18/28 (4) | 993 | 967 | |
| 1,870 | |||
| Lodging—1.4% | |||
| Caesars Resort Collection LLC Tranche B (1 month LIBOR + 2.750%) 7.320%, 12/23/24 (4) | 1,101 | 1,100 | |
| Hilton Grand Vacations Borrower LLC (1 month LIBOR + 3.000%) 7.570%, 8/2/28 (4) | 1,234 | 1,234 | |
| 2,334 | |||
| Machinery-Diversified—0.9% | |||
| Gardner Denver, Inc. Tranche B-1 (1 month Term SOFR + 1.850%) 6.411%, 3/1/27 (4) | 1,581 | 1,575 | |
| Media—3.6% | |||
| Charter Communications Operating LLC Tranche B-2 (1 month LIBOR + 1.750%) 6.320%, 2/1/27 (4) | 985 | 981 | |
| DIRECTV Financing LLC (1 month LIBOR + 5.000%) 9.570%, 8/2/27 (4) | 887 | 871 | |
| Gray Television, Inc. Tranche B-2 (1 month LIBOR + 2.500%) 6.884% - 6.869%, 2/7/24 (4) | 710 | 710 | |
| Nexstar Broadcasting, Inc. Tranche B-4 (1 month LIBOR + 2.500%) 7.070%, 9/18/26 (4) | 775 | 774 | |
| Par Value | Value | ||
| Media—continued | |||
| Sinclair Television Group, Inc. Tranche B-3 (1 month LIBOR + 3.000%) 7.570%, 4/1/28 (4) | $ 1,231 | $ 1,205 | |
| Virgin Media Bristol LLC Tranche N (1 month LIBOR + 2.500%) 6.959%, 1/31/28 (4) | 1,500 | 1,491 | |
| 6,032 | |||
| Metal Fabricate/Hardware—0.3% | |||
| Advanced Drainage Systems, Inc. (3 month Term SOFR + 5.000%) 5.220%, 7/31/26 (4) | 610 | 611 | |
| Miscellaneous Manufacturing—0.6% | |||
| Gates Global LLC Tranche B-3 (1 month LIBOR + 2.500%) 7.070%, 3/31/27 (4) | 992 | 988 | |
| Oil, Gas & Consumable Fuels—0.0% | |||
| Lealand Finance Co. B.V. (1 month LIBOR + 4.000%) 8.600%, 6/30/25 (4) | 174 | 93 | |
| Pharmaceuticals—1.7% | |||
| Horizon Therapeutics USA, Inc. Tranche B-2 (1 month LIBOR + 1.750%) 6.313%, 3/15/28 (4) | 1,481 | 1,481 | |
| Organon & Co. (3 month LIBOR + 3.000%) 7.750%, 6/2/28 (4) | 1,448 | 1,444 | |
| 2,925 | |||
| Retail—2.7% | |||
| Academy Ltd. (1 month LIBOR + 3.750%) 8.119%, 11/5/27 (4) | 654 | 653 | |
| Burlington Coat Factory Warehouse Corp. Tranche B-6 (1 month LIBOR + 2.000%) 6.570%, 6/24/28 (4) | 1,344 | 1,330 | |
| Petco Health & Wellness Co., Inc. First Lien (3 month Term SOFR + 3.512%) 8.092%, 3/3/28 (4) | 1,160 | 1,146 | |
| Restoration Hardware, Inc. (1 month LIBOR + 2.500%) 7.070%, 10/20/28 (4) | 1,481 | 1,423 | |
| 4,552 | |||
| Semiconductors—0.2% | |||
| Cohu, Inc. Tranche B (3 month LIBOR + 3.000%) 6.371%, 10/1/25 (4) | 423 | 423 | |
| Software—2.3% | |||
| BMC Software 2021 (1 month LIBOR + 3.750%) 8.320%, 10/2/25 (4) | 865 | 849 | |
| Camelot U.S. Acquisition I Co. (1 month LIBOR + 3.000%) 7.517%, 10/30/26 (4) | 1,061 | 1,058 | |
| Ceridian HCM Holding, Inc. (1 month LIBOR + 2.500%) 7.070%, 4/30/25 (4) | 992 | 986 | |
| Par Value | Value | ||
| Software—continued | |||
| Open Text Corp. Tranche B (3 month LIBOR + 4.750%) 0.000%, 11/16/29 (4) | $ 1,000 | $ 998 | |
| 3,891 | |||
| Telecommunications—2.5% | |||
| CenturyLink, Inc. Tranche B (1 month LIBOR + 2.250%) 6.820%, 3/15/27 (4) | 969 | 936 | |
| Ciena Corp. 2020 (1 month LIBOR + 1.750%) 6.236%, 9/26/25 (4) | 982 | 979 | |
| Commscope, Inc. (1 month LIBOR + 3.250%) 7.820%, 4/6/26 (4) | 1,455 | 1,423 | |
| Frontier Communications Corp. Tranche B (3 month LIBOR + 3.750%) 8.500%, 5/1/28 (4) | 985 | 964 | |
| 4,302 | |||
| Total Leveraged Loans (Identified Cost $56,277) | 55,096 | ||
| Shares | ||
| Common Stocks—0.6% | ||
| Banks—0.6% | ||
| CCF Holdings LLC (6)(7) | 1,369,231 | 835 |
| CCF Holdings LLC Class M(6)(7) | 293,320 | 179 |
| 1,014 | ||
| Construction & Engineering—0.0% | ||
| McDermott International Ltd.(7) | 71,796 | 28 |
| Total Common Stocks (Identified Cost $3,272) | 1,042 | |
| Warrant—0.1% | ||
| Banks—0.1% | ||
| CCF Holdings LLC(6)(7) | 485,227 | 184 |
| Total Warrant (Identified Cost $—) | 184 | |
| Total Long-Term Investments—138.0% (Identified Cost $242,024) | 233,816 | |
| Short-Term Investment—4.6% | ||
| Money Market Mutual Fund—4.6% | ||
| BlackRock Liquidity FedFund - Institutional Shares (seven-day effective yield 4.066%)(8) | 7,735,581 | 7,736 |
| Total Short-Term Investment (Identified Cost $7,736) | 7,736 | |
| Shares | Value | ||
| Securities Lending Collateral—0.6% | |||
| Dreyfus Government Cash Management Fund - Institutional Shares (seven-day effective yield 4.227%)(8)(9) | 999,927 | $ 1,000 | |
| Total Securities Lending Collateral (Identified Cost $1,000) | 1,000 | ||
| TOTAL INVESTMENTS—143.2% (Identified Cost $250,760) | $242,552 | ||
| Other assets and liabilities, net—(43.2)% | (73,177) | ||
| NET ASSETS—100.0% | $169,375 | ||
| Abbreviations: | |
| EV | Enterprise Value |
| LIBOR | London Interbank Offered Rate |
| LLC | Limited Liability Company |
| REIT | Real Estate Investment Trust |
| SOFR | Secured Overnight Financing Rate |
| Footnote Legend: | |
| (1) | All or a portion of securities is segregated as collateral for the Liquidity Facility. The value of securities segregated as collateral is $100,101. |
| (2) | Security exempt from registration under Rule 144A of the Securities Act of 1933. These securities may be resold in transactions exempt from registration, normally to qualified institutional buyers. At January 31, 2023, these securities amounted to a value of $41,389 or 24.4% of net assets. |
| (3) | All or a portion of security is on loan pursuant to the Liquidity Facility and/or securities lending. |
| (4) | Variable rate security. Rate disclosed is as of January 31, 2023. Information in parenthesis represents benchmark and reference rate for each security. Certain variable rate securities are not based on a published reference rate and spread but are determined by the issuer or agent and are based on current market conditions, or, for mortgage-backed securities, are impacted by the individual mortgages which are paying off over time. These securities do not indicate a reference rate and spread in their descriptions. |
| (5) | This loan will settle after January 31, 2023, at which time the interest rate, calculated on the base lending rate and the agreed upon spread on trade date, will be reflected. |
| (6) | The value of this security was determined using significant unobservable inputs and is reported as a Level 3 security in the Fair Value Hierarchy table located after the Schedule of Investments. |
| (7) | Non-income producing. |
| (8) | Shares of this fund are publicly offered, and its prospectus and annual report are publicly available. |
| (9) | Represents security purchased with cash collateral received for securities on loan. |
| Country Weightings (Unaudited)† | |
| United States | 87% |
| Cayman Islands | 7 |
| Bermuda | 3 |
| Luxembourg | 1 |
| Netherlands | 1 |
| Canada | 1 |
| Total | 100% |
| † % of total investments as of January 31, 2023. | |
| Total Value at January 31, 2023 | Level 1 Quoted Prices | Level 2 Significant Observable Inputs | Level 3 Significant Unobservable Inputs | ||||
| Assets: | |||||||
| Debt Instruments: | |||||||
| Corporate Bonds and Notes | $ 76,070 | $ — | $ 76,070 | $ — | |||
| Leveraged Loans | 55,096 | — | 55,096 | — | |||
| Convertible Bonds and Notes | 101,424 | — | 101,424 | — | |||
| Equity Securities: | |||||||
| Common Stocks | 1,042 | 28 | — | 1,014 | |||
| Warrant | 184 | — | — | 184 | |||
| Money Market Mutual Fund | 7,736 | 7,736 | — | — | |||
| Securities Lending Collateral | 1,000 | 1,000 | — | — | |||
| Total Investments | $242,552 | $8,764 | $232,590 | $1,198 |
| Total | Common Stocks | Warrants | |||
| Investments in Securities | |||||
| Balance as of January 31, 2022: | $ 842 | $ 731 | $ 111 | ||
| Net change in unrealized appreciation (depreciation)(a) | 356 | 283 | 73 | ||
| Balance as of January 31, 2023 | $ 1,198 | $ 1,014 | $ 184 |
| Investments in Securities – Assets | Ending Balance at January 31, 2023 | Valuation Technique Used | Unobservable Inputs | Input Values | ||||
| Common Stocks: | ||||||||
| CCF Holdings LLC | $835 | Market and Company Comparables | EV Multiples | 1.09x (0.68x - 1.48x) | ||||
| 6.72x (5.50x - 9.08x) | ||||||||
| 0.64x (0.45x - 0.77x) | ||||||||
| Illiquidity Discount | 25% | |||||||
| CCF Holdings LLC Class M | $179 | Market and Company Comparables | EV Multiples | 1.09x (0.68x - 1.48x) | ||||
| 6.72x (5.50x - 9.08x) | ||||||||
| 0.64x (0.45x - 0.77x) | ||||||||
| Illiquidity Discount | 25% | |||||||
| Warrant: | ||||||||
| CCF Holdings LLC | $184 | Market and Company Comparables | EV Multiples | 1.09x (0.68x - 1.48x) | ||||
| 6.72x (5.50x - 9.08x) | ||||||||
| 0.64x (0.45x - 0.77x) | ||||||||
| Illiquidity Discount | 25% | |||||||
| Black-Scholes Model | Volatility | 55.94% | ||||||
| Par Value | Value | ||
| Convertible Bonds and Notes—91.1% | |||
| Airlines—1.2% | |||
| American Airlines Group, Inc. 6.500%, 7/1/25(1) | $ 2,040 | $ 2,499 | |
| Southwest Airlines Co. 1.250%, 5/1/25(1) | 1,670 | 2,002 | |
| 4,501 | |||
| Auto Manufacturers—0.9% | |||
| Lucid Group, Inc. 144A 1.250%, 12/15/26(2) | 5,250 | 3,396 | |
| Banks—1.8% | |||
| Barclays Bank plc 0.000%, 2/18/25(1) | 4,085 | 4,363 | |
| BofA Finance LLC 0.600%, 5/25/27(1) | 2,135 | 2,400 | |
| 6,763 | |||
| Biotechnology—7.1% | |||
| Alnylam Pharmaceuticals, Inc. 144A 1.000%, 9/15/27(1)(2) | 3,060 | 3,263 | |
| BioMarin Pharmaceutical, Inc. 1.250%, 5/15/27 | 4,165 | 4,686 | |
| Bridgebio Pharma, Inc. 2.250%, 2/1/29 | 2,860 | 976 | |
| Cytokinetics, Inc. 144A 3.500%, 7/1/27(1)(2) | 2,190 | 2,395 | |
| Halozyme Therapeutics, Inc. | |||
| 0.250%, 3/1/27(1) | 2,435 | 2,280 | |
| 144A 1.000%, 8/15/28(1)(2) | 2,425 | 2,693 | |
| Insmed, Inc. | |||
| 1.750%, 1/15/25(1) | 2,805 | 2,662 | |
| 0.750%, 6/1/28(1) | 1,370 | 1,216 | |
| Sarepta Therapeutics, Inc. 144A 1.250%, 9/15/27(1)(2) | 5,225 | 5,938 | |
| 26,109 | |||
| Chemicals—0.6% | |||
| Livent Corp. 4.125%, 7/15/25(1) | 710 | 2,181 | |
| Commercial Services—6.2% | |||
| Block, Inc. | |||
| 0.125%, 3/1/25(1) | 4,100 | 4,161 | |
| 0.000%, 5/1/26(1) | 2,385 | 2,008 | |
| Euronet Worldwide, Inc. 0.750%, 3/15/49(1) | 1,915 | 1,868 | |
| Repay Holdings Corp. 144A 0.000%, 2/1/26(2) | 4,120 | 3,304 | |
| Shift4 Payments, Inc. | |||
| 0.000%, 12/15/25(1) | 2,800 | 2,989 | |
| 0.500%, 8/1/27(1) | 4,860 | 4,338 | |
| Stride, Inc. 1.125%, 9/1/27(1) | 3,825 | 3,995 | |
| 22,663 | |||
| Par Value | Value | ||
| Computers—4.7% | |||
| 3D Systems Corp. 0.000%, 11/15/26 | $ 4,540 | $ 3,368 | |
| CyberArk Software Ltd. 0.000%, 11/15/24(1) | 1,835 | 2,017 | |
| KBR, Inc. 2.500%, 11/1/23(1) | 1,495 | 3,053 | |
| Lumentum Holdings, Inc. | |||
| 0.500%, 12/15/26(1) | 535 | 485 | |
| 144A 0.500%, 6/15/28(2) | 2,580 | 2,072 | |
| Parsons Corp. 0.250%, 8/15/25(1) | 2,070 | 2,265 | |
| Pure Storage, Inc. 0.125%, 4/15/23(1) | 180 | 201 | |
| Rapid7, Inc. 0.250%, 3/15/27 | 2,450 | 2,009 | |
| Zscaler, Inc. 0.125%, 7/1/25(1) | 1,545 | 1,688 | |
| 17,158 | |||
| Cosmetics & Personal Care—1.0% | |||
| Beauty Health Co. (The) 144A 1.250%, 10/1/26(1)(2) | 4,630 | 3,788 | |
| Diversified Financial Services—3.8% | |||
| Coinbase Global, Inc. 0.500%, 6/1/26 | 2,975 | 2,015 | |
| Goldman Sachs Finance Corp. 0.500%, 12/29/27(3) | 5,940 | 6,210 | |
| JPMorgan Chase Financial Co., LLC 0.500%, 6/15/27(1) | 4,490 | 5,738 | |
| 13,963 | |||
| Energy-Alternate Sources—3.6% | |||
| Enphase Energy, Inc. | |||
| 0.000%, 3/1/26(1) | 3,325 | 3,501 | |
| 0.000%, 3/1/28 | 570 | 613 | |
| Plug Power, Inc. 3.750%, 6/1/25 | 325 | 1,104 | |
| SolarEdge Technologies, Inc. 0.000%, 9/15/25 | 1,345 | 1,806 | |
| Stem, Inc. 144A 0.500%, 12/1/28(2) | 4,545 | 3,055 | |
| Sunnova Energy International, Inc. 144A 2.625%, 2/15/28(1)(2) | 3,755 | 3,161 | |
| 13,240 | |||
| Entertainment—2.8% | |||
| DraftKings Holdings, Inc. 0.000%, 3/15/28 | 5,875 | 3,995 | |
| Live Nation Entertainment, Inc. 144A 3.125%, 1/15/29(2) | 1,720 | 1,845 | |
| Vail Resorts, Inc. 0.000%, 1/1/26(1) | 4,650 | 4,400 | |
| 10,240 | |||
| Food & Beverage—1.0% | |||
| Post Holdings, Inc. 144A 2.500%, 8/15/27(1)(2) | 3,385 | 3,684 | |
| Par Value | Value | ||
| Healthcare-Products—4.7% | |||
| CONMED Corp. 144A 2.250%, 6/15/27(1)(2) | $ 2,110 | $ 2,008 | |
| Exact Sciences Corp. | |||
| 0.375%, 3/15/27(1) | 150 | 141 | |
| 0.375%, 3/1/28(1) | 5,575 | 4,976 | |
| Insulet Corp. 0.375%, 9/1/26 | 2,250 | 3,106 | |
| Natera, Inc. 2.250%, 5/1/27(1) | 1,520 | 2,069 | |
| Novocure Ltd. 0.000%, 11/1/25(1) | 3,120 | 3,019 | |
| Repligen Corp. 0.375%, 7/15/24(1) | 1,280 | 2,166 | |
| 17,485 | |||
| Healthcare-Services—0.5% | |||
| Elevance Health, Inc. 2.750%, 10/15/42 | 245 | 1,746 | |
| Internet—12.5% | |||
| Booking Holdings, Inc. 0.750%, 5/1/25 | 3,120 | 4,442 | |
| Etsy, Inc. | |||
| 0.125%, 9/1/27(1) | 2,595 | 2,668 | |
| 0.250%, 6/15/28 | 4,325 | 3,890 | |
| Farfetch Ltd. 3.750%, 5/1/27 | 1,920 | 1,681 | |
| Match Group Financeco 2, Inc. 144A 0.875%, 6/15/26(1)(2) | 2,385 | 2,287 | |
| Palo Alto Networks, Inc. | |||
| 0.750%, 7/1/23 | 1,135 | 2,033 | |
| 0.375%, 6/1/25 | 3,620 | 5,933 | |
| Snap, Inc. | |||
| 0.750%, 8/1/26(1) | 3,090 | 2,849 | |
| 144A 0.125%, 3/1/28(2) | 3,345 | 2,410 | |
| Uber Technologies, Inc. 0.000%, 12/15/25(1) | 7,050 | 6,195 | |
| Wayfair, Inc. | |||
| 1.125%, 11/1/24 | 3,615 | 3,355 | |
| 1.000%, 8/15/26 | 985 | 749 | |
| 144A 3.250%, 9/15/27(2) | 1,360 | 1,632 | |
| Zillow Group, Inc. 2.750%, 5/15/25(1) | 5,920 | 6,065 | |
| 46,189 | |||
| Leisure Time—3.1% | |||
| NCL Corp., Ltd. 1.125%, 2/15/27 | 8,405 | 6,409 | |
| Royal Caribbean Cruises Ltd. 144A 6.000%, 8/15/25(1)(2) | 1,750 | 2,671 | |
| Topgolf Callaway Brands Corp. 2.750%, 5/1/26(1) | 1,510 | 2,302 | |
| 11,382 | |||
| Machinery-Diversified—0.6% | |||
| Middleby Corp. (The) 1.000%, 9/1/25(1) | 1,565 | 2,042 | |
| Par Value | Value | ||
| Media—6.0% | |||
| DISH Network Corp. | |||
| 0.000%, 12/15/25 | $ 3,640 | $ 2,400 | |
| 3.375%, 8/15/26 | 4,580 | 2,997 | |
| Liberty Media Corp. | |||
| 1.375%, 10/15/23 | 3,580 | 4,681 | |
| 144A 0.500%, 12/1/50(1)(2) | 4,755 | 4,990 | |
| Liberty Media Corp.-Liberty Formula One 144A 2.250%, 8/15/27(1)(2) | 4,120 | 4,301 | |
| World Wrestling Entertainment, Inc. 3.375%, 12/15/23(1) | 840 | 2,850 | |
| 22,219 | |||
| Mining—1.2% | |||
| Lithium Americas Corp. 1.750%, 1/15/27 | 2,575 | 2,217 | |
| MP Materials Corp. 144A 0.250%, 4/1/26(1)(2) | 2,200 | 2,200 | |
| 4,417 | |||
| Miscellaneous Manufacturing—0.9% | |||
| Axon Enterprise, Inc. 144A 0.500%, 12/15/27(1)(2) | 3,180 | 3,415 | |
| Oil, Gas & Consumable Fuels—2.6% | |||
| EQT Corp. 1.750%, 5/1/26(1) | 845 | 1,896 | |
| Northern Oil & Gas, Inc. 144A 3.625%, 4/15/29(2) | 2,725 | 3,091 | |
| Pioneer Natural Resources Co. 0.250%, 5/15/25(1) | 1,925 | 4,529 | |
| 9,516 | |||
| Pharmaceuticals—4.9% | |||
| Dexcom, Inc. 0.250%, 11/15/25(1) | 9,330 | 9,825 | |
| Jazz Investments I Ltd. 2.000%, 6/15/26(1) | 4,675 | 5,487 | |
| Revance Therapeutics, Inc. 1.750%, 2/15/27(1) | 2,145 | 2,764 | |
| 18,076 | |||
| Retail—1.6% | |||
| Burlington Stores, Inc. 2.250%, 4/15/25(1) | 2,625 | 3,252 | |
| Shake Shack, Inc. 0.000%, 3/1/28 | 3,450 | 2,565 | |
| 5,817 | |||
| Semiconductors—3.6% | |||
| MACOM Technology Solutions Holdings, Inc. 0.250%, 3/15/26(1) | 1,430 | 1,476 | |
| Microchip Technology, Inc. 0.125%, 11/15/24 | 2,350 | 2,607 | |
| ON Semiconductor Corp. 0.000%, 5/1/27(1) | 1,635 | 2,452 | |
| Silicon Laboratories, Inc. 0.625%, 6/15/25(1) | 790 | 1,096 | |
| Par Value | Value | ||
| Semiconductors—continued | |||
| Wolfspeed, Inc. | |||
| 144A 0.250%, 2/15/28(1)(2) | $ 4,545 | $ 4,147 | |
| 144A 1.875%, 12/1/29(2) | 1,655 | 1,607 | |
| 13,385 | |||
| Software—13.9% | |||
| Akamai Technologies, Inc. 0.125%, 5/1/25(1) | 2,560 | 2,743 | |
| Bentley Systems, Inc. 0.125%, 1/15/26(1) | 4,260 | 3,936 | |
| Bill.com Holdings, Inc. 0.000%, 4/1/27 | 8,745 | 7,014 | |
| Box, Inc. 0.000%, 1/15/26(1) | 1,580 | 2,118 | |
| Cloudflare, Inc. 0.000%, 8/15/26(1) | 5,920 | 4,921 | |
| Confluent, Inc. 0.000%, 1/15/27 | 2,735 | 2,121 | |
| Coupa Software, Inc. 0.375%, 6/15/26(1) | 2,815 | 2,738 | |
| DigitalOcean Holdings, Inc. 0.000%, 12/1/26 | 4,755 | 3,649 | |
| Envestnet, Inc. 144A 2.625%, 12/1/27(1)(2) | 1,195 | 1,335 | |
| Evolent Health, Inc. 1.500%, 10/15/25 | 2,245 | 2,613 | |
| Five9, Inc. 0.500%, 6/1/25(1) | 4,395 | 4,151 | |
| HubSpot, Inc. 0.375%, 6/1/25(1) | 980 | 1,355 | |
| PagerDuty, Inc. 1.250%, 7/1/25 | 1,845 | 1,947 | |
| Splunk, Inc. 1.125%, 6/15/27(1) | 4,595 | 3,954 | |
| Tyler Technologies, Inc. 0.250%, 3/15/26(1) | 1,600 | 1,519 | |
| Unity Software, Inc. 0.000%, 11/15/26 | 2,360 | 1,820 | |
| Workiva, Inc. 1.125%, 8/15/26(1) | 2,575 | 3,242 | |
| 51,176 | |||
| Transportation—0.3% | |||
| Air Transport Services Group, Inc. 1.125%, 10/15/24(1) | 865 | 914 | |
| Total Convertible Bonds and Notes (Identified Cost $347,928) | 335,465 | ||
| Corporate Bonds and Notes—61.5% | |||
| Aerospace & Defense—2.2% | |||
| Bombardier, Inc. 144A 7.500%, 2/1/29(1)(2) | 1,830 | 1,828 | |
| Spirit AeroSystems, Inc. 144A 9.375%, 11/30/29(2) | 925 | 1,006 | |
| TransDigm, Inc. 5.500%, 11/15/27(1) | 3,135 | 2,994 | |
| Par Value | Value | ||
| Aerospace & Defense—continued | |||
| Triumph Group, Inc. 144A 8.875%, 6/1/24(1)(2) | $ 2,217 | $ 2,250 | |
| 8,078 | |||
| Airlines—1.0% | |||
| American Airlines, Inc. 144A 11.750%, 7/15/25(1)(2) | 2,080 | 2,315 | |
| Delta Air Lines, Inc. 7.375%, 1/15/26(1) | 1,395 | 1,452 | |
| 3,767 | |||
| Auto Components—1.8% | |||
| American Axle & Manufacturing, Inc. 6.500%, 4/1/27(1) | 1,280 | 1,181 | |
| Clarios Global LP 144A 8.500%, 5/15/27(2) | 3,010 | 2,998 | |
| Goodyear Tire & Rubber Co. (The) | |||
| 9.500%, 5/31/25(1) | 1,270 | 1,311 | |
| 5.250%, 7/15/31 | 1,395 | 1,178 | |
| 6,668 | |||
| Auto Manufacturers—1.4% | |||
| Ford Motor Co. | |||
| 9.625%, 4/22/30(1) | 2,205 | 2,595 | |
| 7.450%, 7/16/31 | 1,700 | 1,824 | |
| 6.100%, 8/19/32 | 605 | 594 | |
| 5,013 | |||
| Building Materials—1.1% | |||
| Builders FirstSource, Inc. 144A 6.375%, 6/15/32(1)(2) | 2,445 | 2,394 | |
| Griffon Corp. 5.750%, 3/1/28(1) | 1,900 | 1,798 | |
| 4,192 | |||
| Chemicals—0.3% | |||
| Chemours Co. (The) 144A 5.750%, 11/15/28(1)(2) | 1,340 | 1,221 | |
| Commercial Services—2.9% | |||
| ADT Security Corp. (The) 144A 4.125%, 8/1/29(1)(2) | 2,050 | 1,825 | |
| Avis Budget Car Rental LLC 144A 5.375%, 3/1/29(1)(2) | 2,060 | 1,842 | |
| Deluxe Corp. 144A 8.000%, 6/1/29(1)(2) | 1,430 | 1,225 | |
| Herc Holdings, Inc. 144A 5.500%, 7/15/27(1)(2) | 1,315 | 1,259 | |
| Hertz Corp. (The) 144A 5.000%, 12/1/29(2) | 1,490 | 1,218 | |
| NESCO Holdings II, Inc. 144A 5.500%, 4/15/29(1)(2) | 2,000 | 1,796 | |
| United Rentals North America, Inc. 5.250%, 1/15/30(1) | 1,530 | 1,480 | |
| 10,645 | |||
| Par Value | Value | ||
| Computers—0.6% | |||
| McAfee Corp. 144A 7.375%, 2/15/30(2) | $ 1,390 | $ 1,154 | |
| NCR Corp. 144A 5.125%, 4/15/29(1)(2) | 1,375 | 1,198 | |
| 2,352 | |||
| Containers & Packaging—1.8% | |||
| Berry Global, Inc. 144A 5.625%, 7/15/27(1)(2) | 1,330 | 1,307 | |
| Mauser Packaging Solutions Holding Co. 144A 7.875%, 8/15/26(2) | 1,215 | 1,225 | |
| Owens-Brockway Glass Container, Inc. 144A 6.625%, 5/13/27(1)(2) | 2,460 | 2,412 | |
| Trivium Packaging Finance B.V. 144A 8.500%, 8/15/27(2) | 1,830 | 1,760 | |
| 6,704 | |||
| Cosmetics & Personal Care—0.9% | |||
| Coty, Inc. 144A 6.500%, 4/15/26(2) | 2,165 | 2,134 | |
| Edgewell Personal Care Co. 144A 5.500%, 6/1/28(1)(2) | 1,430 | 1,354 | |
| 3,488 | |||
| Diversified Financial Services—1.5% | |||
| Nationstar Mortgage Holdings, Inc. | |||
| 144A 5.500%, 8/15/28(1)(2) | 1,400 | 1,223 | |
| 144A 5.750%, 11/15/31(2) | 730 | 588 | |
| Navient Corp. 6.750%, 6/15/26(1) | 1,790 | 1,763 | |
| OneMain Finance Corp. 8.250%, 10/1/23(1) | 565 | 572 | |
| PRA Group, Inc. 144A 8.375%, 2/1/28(2) | 1,205 | 1,211 | |
| 5,357 | |||
| Electric Utilities—0.5% | |||
| PG&E Corp. 5.250%, 7/1/30 | 1,975 | 1,817 | |
| Electronic Equipment, Instruments & Components—0.7% | |||
| WESCO Distribution, Inc. 144A 7.250%, 6/15/28(1)(2) | 2,560 | 2,623 | |
| Electronics—0.8% | |||
| Coherent Corp. 144A 5.000%, 12/15/29(2) | 1,980 | 1,798 | |
| Sensata Technologies B.V. 144A 5.875%, 9/1/30(2) | 1,210 | 1,187 | |
| 2,985 | |||
| Entertainment—4.3% | |||
| Caesars Entertainment, Inc. | |||
| 144A 8.125%, 7/1/27(1)(2) | 4,165 | 4,228 | |
| 144A 7.000%, 2/15/30(2) | 1,215 | 1,236 | |
| CDI Escrow Issuer, Inc. 144A 5.750%, 4/1/30(2) | 1,840 | 1,743 | |
| Par Value | Value | ||
| Entertainment—continued | |||
| International Game Technology plc 144A 6.250%, 1/15/27(1)(2) | $ 1,185 | $ 1,185 | |
| Lions Gate Capital Holdings LLC 144A 5.500%, 4/15/29(1)(2) | 2,720 | 1,768 | |
| Live Nation Entertainment, Inc. 144A 6.500%, 5/15/27(1)(2) | 1,915 | 1,926 | |
| Scientific Games International, Inc. 144A 7.000%, 5/15/28(1)(2) | 1,215 | 1,203 | |
| SeaWorld Parks & Entertainment, Inc. 144A 5.250%, 8/15/29(1)(2) | 2,825 | 2,553 | |
| 15,842 | |||
| Environmental Services—0.7% | |||
| GFL Environmental, Inc. 144A 4.750%, 6/15/29(1)(2) | 2,770 | 2,500 | |
| Equity Real Estate Investment Trusts (REITs)—1.9% | |||
| Iron Mountain, Inc. 144A 5.250%, 7/15/30(1)(2) | 2,820 | 2,552 | |
| Park Intermediate Holdings LLC | |||
| 144A 5.875%, 10/1/28(1)(2) | 1,340 | 1,240 | |
| 144A 4.875%, 5/15/29(1)(2) | 1,450 | 1,253 | |
| Service Properties Trust 7.500%, 9/15/25(1) | 1,855 | 1,824 | |
| 6,869 | |||
| Food & Beverage—1.8% | |||
| Performance Food Group, Inc. 144A 5.500%, 10/15/27(1)(2) | 2,750 | 2,647 | |
| Post Holdings, Inc. 144A 5.500%, 12/15/29(1)(2) | 2,625 | 2,434 | |
| Simmons Foods, Inc. 144A 4.625%, 3/1/29(1)(2) | 2,000 | 1,696 | |
| 6,777 | |||
| Food Service—0.2% | |||
| Aramark Services, Inc. 144A 5.000%, 2/1/28(1)(2) | 925 | 872 | |
| Healthcare-Products—0.4% | |||
| Medline Borrower LP 144A 5.250%, 10/1/29(2) | 1,590 | 1,331 | |
| Healthcare-Services—1.2% | |||
| Select Medical Corp. 144A 6.250%, 8/15/26(1)(2) | 1,255 | 1,226 | |
| Tenet Healthcare Corp. | |||
| 6.125%, 10/1/28(2) | 2,800 | 2,618 | |
| 144A 6.125%, 6/15/30(2) | 625 | 607 | |
| 4,451 | |||
| Housewares—0.5% | |||
| Newell Brands, Inc. 6.625%, 9/15/29(1) | 1,750 | 1,769 | |
| Internet—1.8% | |||
| Gen Digital, Inc. 144A 7.125%, 9/30/30(1)(2) | 2,350 | 2,386 | |
| Par Value | Value | ||
| Internet—continued | |||
| Uber Technologies, Inc. | |||
| 144A 8.000%, 11/1/26(1)(2) | $ 1,125 | $ 1,152 | |
| 144A 7.500%, 9/15/27(1)(2) | 1,900 | 1,929 | |
| 144A 6.250%, 1/15/28(1)(2) | 1,295 | 1,267 | |
| 6,734 | |||
| Investment Companies—0.7% | |||
| Compass Group Diversified Holdings LLC 144A 5.250%, 4/15/29(1)(2) | 2,710 | 2,438 | |
| Leisure Time—2.4% | |||
| Carnival Corp. 144A 10.500%, 2/1/26(1)(2) | 3,390 | 3,546 | |
| NCL Corp., Ltd. 144A 8.375%, 2/1/28(2) | 1,820 | 1,850 | |
| Royal Caribbean Cruises Ltd. | |||
| 144A 11.500%, 6/1/25(1)(2) | 545 | 585 | |
| 144A 11.625%, 8/15/27(1)(2) | 2,545 | 2,701 | |
| 8,682 | |||
| Lodging—1.5% | |||
| Hilton Domestic Operating Co., Inc. 4.875%, 1/15/30 | 645 | 608 | |
| Hilton Grand Vacations Borrower Escrow LLC 144A 5.000%, 6/1/29(1)(2) | 2,645 | 2,366 | |
| MGM Resorts International 4.750%, 10/15/28(1) | 1,480 | 1,342 | |
| Travel + Leisure Co. 144A 6.625%, 7/31/26(1)(2) | 1,170 | 1,161 | |
| 5,477 | |||
| Machinery-Construction & Mining—0.6% | |||
| Terex Corp. 144A 5.000%, 5/15/29(1)(2) | 2,215 | 2,068 | |
| Machinery-Diversified—0.7% | |||
| Chart Industries, Inc. 144A 7.500%, 1/1/30(1)(2) | 2,385 | 2,439 | |
| Media—6.4% | |||
| CCO Holdings LLC | |||
| 144A 6.375%, 9/1/29(1)(2) | 2,445 | 2,359 | |
| 144A 7.375%, 3/1/31(2) | 3,045 | 3,053 | |
| CSC Holdings LLC 144A 7.500%, 4/1/28(1)(2) | 2,245 | 1,642 | |
| DirecTV Financing LLC 144A 5.875%, 8/15/27(1)(2) | 2,160 | 1,957 | |
| DISH Network Corp. 144A 11.750%, 11/15/27(1)(2) | 2,935 | 3,050 | |
| Gray Television, Inc. 144A 7.000%, 5/15/27(1)(2) | 2,620 | 2,383 | |
| Nexstar Media, Inc. 144A 5.625%, 7/15/27(1)(2) | 2,120 | 2,019 | |
| Scripps Escrow II, Inc. 144A 5.375%, 1/15/31(2) | 1,555 | 1,255 | |
| Sirius XM Radio, Inc. 144A 4.000%, 7/15/28(1)(2) | 2,240 | 1,994 | |
| TEGNA, Inc. 5.000%, 9/15/29(1) | 1,415 | 1,333 | |
| Par Value | Value | ||
| Media—continued | |||
| Virgin Media Secured Finance plc 144A 5.500%, 5/15/29(1)(2) | $ 2,605 | $ 2,417 | |
| 23,462 | |||
| Mining—0.5% | |||
| Hudbay Minerals, Inc. 144A 6.125%, 4/1/29(1)(2) | 2,115 | 1,953 | |
| Oil, Gas & Consumable Fuels—5.6% | |||
| Antero Resources Corp. 144A 7.625%, 2/1/29(1)(2) | 1,724 | 1,763 | |
| Callon Petroleum Co. 144A 8.000%, 8/1/28(1)(2) | 1,710 | 1,709 | |
| CITGO Petroleum Corp. 144A 6.375%, 6/15/26(2) | 2,340 | 2,293 | |
| CNX Resources Corp. 144A 7.375%, 1/15/31(1)(2) | 2,335 | 2,271 | |
| Comstock Resources, Inc. | |||
| 144A 6.750%, 3/1/29(1)(2) | 1,250 | 1,153 | |
| 144A 5.875%, 1/15/30(2) | 700 | 600 | |
| Occidental Petroleum Corp. 6.625%, 9/1/30 | 1,720 | 1,826 | |
| SM Energy Co. 6.500%, 7/15/28(1) | 2,360 | 2,245 | |
| Southwestern Energy Co. 5.375%, 3/15/30 | 1,405 | 1,308 | |
| Sunoco LP 4.500%, 4/30/30 | 730 | 650 | |
| USA Compression Partners LP 6.875%, 9/1/27(1) | 2,285 | 2,217 | |
| Weatherford International Ltd. 144A 8.625%, 4/30/30(1)(2) | 2,440 | 2,463 | |
| 20,498 | |||
| Paper & Forest Products—0.5% | |||
| Mercer International, Inc. | |||
| 5.125%, 2/1/29(1) | 645 | 552 | |
| 144A 5.125%, 2/1/29(1)(2) | 1,470 | 1,257 | |
| 1,809 | |||
| Pharmaceuticals—1.3% | |||
| Jazz Securities DAC 144A 4.375%, 1/15/29(1)(2) | 2,480 | 2,263 | |
| Organon & Co. 144A 5.125%, 4/30/31(1)(2) | 2,720 | 2,455 | |
| 4,718 | |||
| Pipelines—3.0% | |||
| Antero Midstream Partners LP 144A 5.375%, 6/15/29(1)(2) | 1,405 | 1,305 | |
| Crestwood Midstream Partners LP 144A 6.000%, 2/1/29(1)(2) | 3,155 | 2,993 | |
| EQM Midstream Partners LP 144A 7.500%, 6/1/30(1)(2) | 2,355 | 2,352 | |
| NGL Energy Operating LLC 144A 7.500%, 2/1/26(1)(2) | 2,150 | 2,042 | |
| Par Value | Value | ||
| Pipelines—continued | |||
| NuStar Logistics LP 6.375%, 10/1/30(1) | $ 2,500 | $ 2,408 | |
| 11,100 | |||
| Real Estate—0.4% | |||
| Kennedy-Wilson, Inc. 5.000%, 3/1/31 | 1,990 | 1,623 | |
| Retail—2.6% | |||
| Asbury Automotive Group, Inc. 144A 4.625%, 11/15/29(2) | 725 | 640 | |
| Bath & Body Works, Inc. 144A 6.625%, 10/1/30(1)(2) | 3,100 | 3,029 | |
| Macy’s Retail Holdings LLC | |||
| 144A 5.875%, 3/15/30(2) | 680 | 621 | |
| 144A 6.125%, 3/15/32(2) | 1,390 | 1,244 | |
| New Red Finance, Inc. 144A 4.000%, 10/15/30(1)(2) | 2,765 | 2,354 | |
| Yum! Brands, Inc. 5.375%, 4/1/32 | 1,735 | 1,646 | |
| 9,534 | |||
| Semiconductors—0.8% | |||
| Amkor Technology, Inc. 144A 6.625%, 9/15/27(1)(2) | 1,170 | 1,175 | |
| Entegris Escrow Corp. 144A 5.950%, 6/15/30(2) | 1,925 | 1,848 | |
| 3,023 | |||
| Software—1.4% | |||
| Clarivate Science Holdings Corp. 144A 4.875%, 7/1/29(2) | 1,910 | 1,681 | |
| Consensus Cloud Solutions, Inc. 144A 6.500%, 10/15/28(1)(2) | 1,480 | 1,385 | |
| SS&C Technologies, Inc. 144A 5.500%, 9/30/27(1)(2) | 2,310 | 2,222 | |
| 5,288 | |||
| Telecommunications—2.4% | |||
| CommScope, Inc. 144A 6.000%, 3/1/26(1)(2) | 1,655 | 1,584 | |
| Frontier Communications Holdings LLC | |||
| 144A 5.000%, 5/1/28(1)(2) | 1,295 | 1,177 | |
| 144A 8.750%, 5/15/30(1)(2) | 2,330 | 2,415 | |
| Hughes Satellite Systems Corp. 6.625%, 8/1/26(1) | 2,610 | 2,524 | |
| Lumen Technologies, Inc. 144A 5.375%, 6/15/29(1)(2) | 1,575 | 1,091 | |
| 8,791 | |||
| Transportation—0.4% | |||
| Fortress Transportation & Infrastructure Investors LLC 144A 9.750%, 8/1/27(1)(2) | 1,500 | 1,542 | |
| Total Corporate Bonds and Notes (Identified Cost $236,212) | 226,500 | ||
| Shares | Value | ||
| Convertible Preferred Stocks—11.9% | |||
| Auto Components—0.5% | |||
| Aptiv plc Series A, 5.500% | 14,020 | $ 1,766 | |
| Banks—3.9% | |||
| Wells Fargo & Co. Series L, 7.500% | 11,440 | 14,391 | |
| Capital Markets—0.7% | |||
| KKR & Co., Inc. Series C, 6.000% | 35,220 | 2,380 | |
| Commercial Services & Supplies—0.7% | |||
| GFL Environmental, Inc., 6.000% | 39,480 | 2,711 | |
| Diversified Financial Services—0.7% | |||
| Chewy, Inc. 2020 Mandatory Exchangeable Trust 144A, 6.500%(2) | 2,505 | 2,604 | |
| Electric Utilities—2.3% | |||
| NextEra Energy, Inc. | |||
| 5.279% | 78,590 | 3,929 | |
| 6.926% | 38,420 | 1,842 | |
| PG&E Corp., 5.500% | 19,785 | 2,795 | |
| 8,566 | |||
| Healthcare Equipment & Supplies—1.1% | |||
| Boston Scientific Corp. Series A, 5.500% | 34,990 | 3,993 | |
| Life Sciences Tools & Services—0.9% | |||
| Danaher Corp. Series B, 5.000% | 2,325 | 3,125 | |
| Telecommunications—1.1% | |||
| T-Mobile U.S. 2020 Cash Mandatory Exchangeable Trust 144A, 5.250%(2) | 3,430 | 4,137 | |
| Total Convertible Preferred Stocks (Identified Cost $34,315) | 43,673 | ||
| Preferred Stock—0.2% | |||
| Entertainment—0.2% | |||
| LiveStyle, Inc. Series B (3)(4)(5)(6) | 12,300 | 925 | |
| Total Preferred Stock (Identified Cost $1,206) | 925 | ||
| Common Stocks—1.5% | |||
| Banks—1.4% | |||
| CCF Holdings LLC (3)(5) | 7,808,320 | 4,763 | |
| CCF Holdings LLC Class M(3)(5) | 879,959 | 537 | |
| 5,300 | |||
| Consumer Finance—0.1% | |||
| Erickson, Inc.(3)(5) | 8,295 | 296 | |
| Shares | Value | ||
| Entertainment—0.0% | |||
| LiveStyle, Inc. (3)(4)(5)(6) | 90,407 | $ —(7) | |
| Total Common Stocks (Identified Cost $30,173) | 5,596 | ||
| Warrants—0.1% | |||
| Banks—0.1% | |||
| CCF Holdings LLC(3)(5) | 1,455,681 | 553 | |
| Media—0.0% | |||
| Tenerity, Inc.(3)(5)(6) | 15,602 | — | |
| Total Warrants (Identified Cost $3,080) | 553 | ||
| Total Long-Term Investments—166.3% (Identified Cost $652,914) | 612,712 | ||
| Short-Term Investment—8.3% | |||
| Money Market Mutual Fund—8.3% | |||
| BlackRock Liquidity FedFund - Institutional Shares (seven-day effective yield 4.066%)(8) | 30,556,680 | 30,557 | |
| Total Short-Term Investment (Identified Cost $30,557) | 30,557 | ||
| TOTAL INVESTMENTS—174.6% (Identified Cost $683,471) | $ 643,269 | ||
| Other assets and liabilities, net—(47.5)% | (174,860) | ||
| Preferred Shares—(27.1)% | (100,000) | ||
| NET ASSETS—100.0% | $ 368,409 | ||
| Abbreviations: | |
| EV | Enterprise Value |
| LLC | Limited Liability Company |
| LP | Limited Partnership |
| REIT | Real Estate Investment Trust |
| Footnote Legend: | |
| (1) | All or a portion of securities is segregated as collateral for the Liquidity Facility. The value of securities segregated as collateral is $288,105. |
| (2) | Security exempt from registration under Rule 144A of the Securities Act of 1933. These securities may be resold in transactions exempt from registration, normally to qualified institutional buyers. At January 31, 2023, these securities amounted to a value of $263,495 or 71.5% of net assets. |
| (3) | The value of this security was determined using significant unobservable inputs and is reported as a Level 3 security in the Fair Value Hierarchy table located after the Schedule of Investments. |
| (4) | For the period of February 1, 2022 through March 1, 2022, a member of the Fund’s portfolio management team was a member of the board of directors of LiveStyle, Inc. |
| (5) | Non-income producing. |
| (6) | Security is restricted from resale. |
| (7) | Amount is less than $500. |
| (8) | Shares of this fund are publicly offered, and its prospectus and annual report are publicly available. |
| Country Weightings (Unaudited)† | |
| United States | 91% |
| Bermuda | 3 |
| Canada | 2 |
| United Kingdom | 2 |
| Liberia | 1 |
| Panama | 1 |
| Total | 100% |
| † % of total investments as of January 31, 2023. | |
| Total Value at January 31, 2023 | Level 1 Quoted Prices | Level 2 Significant Observable Inputs | Level 3 Significant Unobservable Inputs | ||||
| Assets: | |||||||
| Debt Instruments: | |||||||
| Corporate Bonds and Notes | $226,500 | $ — | $226,500 | $ — | |||
| Convertible Bonds and Notes | 335,465 | — | 329,255 | 6,210 | |||
| Equity Securities: | |||||||
| Convertible Preferred Stocks | 43,673 | 36,932 | 6,741 | — | |||
| Common Stocks | 5,596 | — | — | 5,596 | |||
| Preferred Stock | 925 | — | — | 925 | |||
| Warrants | 553 | — | — | 553 (1) | |||
| Money Market Mutual Fund | 30,557 | 30,557 | — | — | |||
| Total Investments | $643,269 | $67,489 | $562,496 | $13,284 |
| (1) | Includes internally fair valued securities currently priced at zero ($0). |
| Total | Convertible Bonds and Notes | Common Stocks | Preferred Stocks | Warrants | |||||
| Investments in Securities | |||||||||
| Balance as of January 31, 2022: | $ 6,885 | — | $ 4,031 | $ 2,519(a) | $ 335 (a) | ||||
| Net realized gain (loss) | (6,725) | — | — | (6,725) | — | ||||
| Net change in unrealized appreciation (depreciation)(b) | 8,324 | 121 | 1,565 | 6,420 | 218 | ||||
| Purchases | 6,089 | 6,089 | — | — | — | ||||
| Sales (c) | (1,289) | — | — | (1,289) | — | ||||
| Balance as of January 31, 2023 | $ 13,284 | $ 6,210 | $ 5,596 | $ 925 | $ 553 (a) |
| Investments in Securities – Assets | Ending Balance at January 31, 2023 | Valuation Technique Used | Unobservable Inputs | Input Values | ||||
| Preferred Stocks: | ||||||||
| LiveStyle, Inc. Series B | $ 925 | Discounted cash flows liquidation approach | Discount rate | 23.85% (23.70% - 24.03%) | ||||
| Common Stocks: | ||||||||
| CCF Holdings LLC | $4,763 | Market and Company Comparables | EV Multiples | 1.09x (0.68x - 1.48x) | ||||
| 6.72x (5.50x - 9.08x) | ||||||||
| 0.64x (0.45x - 0.77x) | ||||||||
| Illiquidity Discount | 25% | |||||||
| CCF Holdings LLC Class M | $ 537 | Market and Company Comparables | EV Multiples | 1.09x (0.68x - 1.48x) | ||||
| 6.72x (5.50x - 9.08x) | ||||||||
| 0.64x (0.45x - 0.77x) | ||||||||
| Illiquidity Discount | 25% | |||||||
| Erickson, Inc. | $ 296 | Market and Company Comparables | EV Multiples | 1.35x (0.73x - 3.06x) | ||||
| 14.78x (12.21x - 18.99x) | ||||||||
| 1.00x (0.54x - 1.74x) | ||||||||
| M&A Transaction Multiples | 0.96x (0.41x - 1.96x) | |||||||
| Illiquidity Discount | 20% | |||||||
| LiveStyle, Inc. | $ —(1) | Discounted cash flows liquidation approach | Discount rate | 23.85% (23.70% - 24.03%) | ||||
| Warrants: | ||||||||
| CCF Holdings LLC | $ 553 | Market and Company Comparables | EV Multiples | 1.09x (0.68x - 1.48x) | ||||
| 6.72x (5.50x - 9.08x) | ||||||||
| 0.64x (0.45x - 0.77x) | ||||||||
| Illiquidity Discount | 25% | |||||||
| Black-Scholes Model | Volatility | 55.94% | ||||||
| (1) Amount is less than $500. | ||||||||
| Par Value | Value | ||
| Convertible Bonds and Notes—94.1% | |||
| Airlines—1.3% | |||
| American Airlines Group, Inc. 6.500%, 7/1/25(1) | $ 1,565 | $ 1,917 | |
| Southwest Airlines Co. 1.250%, 5/1/25(1) | 1,285 | 1,541 | |
| 3,458 | |||
| Auto Manufacturers—0.9% | |||
| Lucid Group, Inc. 144A 1.250%, 12/15/26(2) | 3,960 | 2,562 | |
| Banks—1.9% | |||
| Barclays Bank plc 0.000%, 2/18/25(1) | 3,140 | 3,353 | |
| BofA Finance LLC 0.600%, 5/25/27(1) | 1,640 | 1,844 | |
| 5,197 | |||
| Biotechnology—7.3% | |||
| Alnylam Pharmaceuticals, Inc. 144A 1.000%, 9/15/27(1)(2) | 2,375 | 2,532 | |
| BioMarin Pharmaceutical, Inc. 1.250%, 5/15/27 | 3,200 | 3,600 | |
| Bridgebio Pharma, Inc. 2.250%, 2/1/29 | 2,150 | 734 | |
| Cytokinetics, Inc. 144A 3.500%, 7/1/27(1)(2) | 1,680 | 1,837 | |
| Halozyme Therapeutics, Inc. | |||
| 0.250%, 3/1/27(1) | 1,835 | 1,718 | |
| 144A 1.000%, 8/15/28(1)(2) | 1,840 | 2,044 | |
| Insmed, Inc. | |||
| 1.750%, 1/15/25(1) | 2,255 | 2,140 | |
| 0.750%, 6/1/28 | 1,050 | 932 | |
| Sarepta Therapeutics, Inc. 144A 1.250%, 9/15/27(1)(2) | 4,015 | 4,563 | |
| 20,100 | |||
| Chemicals—0.6% | |||
| Livent Corp. 4.125%, 7/15/25(1) | 545 | 1,674 | |
| Commercial Services—6.3% | |||
| Block, Inc. | |||
| 0.125%, 3/1/25(1) | 3,150 | 3,197 | |
| 0.000%, 5/1/26 | 1,855 | 1,562 | |
| Euronet Worldwide, Inc. 0.750%, 3/15/49(1) | 1,480 | 1,444 | |
| Repay Holdings Corp. 144A 0.000%, 2/1/26(2) | 3,185 | 2,554 | |
| Shift4 Payments, Inc. | |||
| 0.000%, 12/15/25(1) | 2,155 | 2,300 | |
| 0.500%, 8/1/27 | 3,735 | 3,334 | |
| Stride, Inc. 1.125%, 9/1/27(1) | 2,940 | 3,071 | |
| 17,462 | |||
| Par Value | Value | ||
| Computers—4.8% | |||
| 3D Systems Corp. 0.000%, 11/15/26 | $ 3,460 | $ 2,567 | |
| CyberArk Software Ltd. 0.000%, 11/15/24(1) | 1,410 | 1,550 | |
| KBR, Inc. 2.500%, 11/1/23(1) | 1,150 | 2,348 | |
| Lumentum Holdings, Inc. | |||
| 0.500%, 12/15/26(1) | 415 | 377 | |
| 144A 0.500%, 6/15/28(2) | 1,995 | 1,602 | |
| Parsons Corp. 0.250%, 8/15/25(1) | 1,590 | 1,740 | |
| Pure Storage, Inc. 0.125%, 4/15/23(1) | 140 | 156 | |
| Rapid7, Inc. 0.250%, 3/15/27 | 1,875 | 1,537 | |
| Zscaler, Inc. 0.125%, 7/1/25(1) | 1,195 | 1,306 | |
| 13,183 | |||
| Cosmetics & Personal Care—1.1% | |||
| Beauty Health Co. (The) 144A 1.250%, 10/1/26(1)(2) | 3,710 | 3,035 | |
| Diversified Financial Services—3.9% | |||
| Coinbase Global, Inc. 0.500%, 6/1/26 | 2,285 | 1,548 | |
| Goldman Sachs Finance Corp. 0.500%, 12/29/27(3) | 4,570 | 4,777 | |
| JPMorgan Chase Financial Co., LLC 0.500%, 6/15/27(1) | 3,460 | 4,422 | |
| 10,747 | |||
| Energy-Alternate Sources—3.7% | |||
| Enphase Energy, Inc. | |||
| 0.000%, 3/1/26(1) | 2,555 | 2,690 | |
| 0.000%, 3/1/28(1) | 440 | 473 | |
| Plug Power, Inc. 3.750%, 6/1/25 | 250 | 849 | |
| SolarEdge Technologies, Inc. 0.000%, 9/15/25(1) | 1,035 | 1,390 | |
| Stem, Inc. 144A 0.500%, 12/1/28(2) | 3,645 | 2,450 | |
| Sunnova Energy International, Inc. 144A 2.625%, 2/15/28(2) | 2,900 | 2,442 | |
| 10,294 | |||
| Entertainment—2.8% | |||
| DraftKings Holdings, Inc. 0.000%, 3/15/28 | 4,435 | 3,016 | |
| Live Nation Entertainment, Inc. 144A 3.125%, 1/15/29(2) | 1,325 | 1,421 | |
| Vail Resorts, Inc. 0.000%, 1/1/26(1) | 3,570 | 3,378 | |
| 7,815 | |||
| Food & Beverage—1.0% | |||
| Post Holdings, Inc. 144A 2.500%, 8/15/27(1)(2) | 2,600 | 2,830 | |
| Par Value | Value | ||
| Healthcare-Products—4.9% | |||
| CONMED Corp. 144A 2.250%, 6/15/27(1)(2) | $ 1,620 | $ 1,541 | |
| Exact Sciences Corp. | |||
| 0.375%, 3/15/27 | 115 | 108 | |
| 0.375%, 3/1/28(1) | 4,275 | 3,816 | |
| Insulet Corp. 0.375%, 9/1/26(1) | 1,735 | 2,395 | |
| Natera, Inc. 2.250%, 5/1/27 | 1,165 | 1,586 | |
| Novocure Ltd. 0.000%, 11/1/25(1) | 2,405 | 2,327 | |
| Repligen Corp. 0.375%, 7/15/24(1) | 980 | 1,659 | |
| 13,432 | |||
| Healthcare-Services—0.5% | |||
| Elevance Health, Inc. 2.750%, 10/15/42 | 190 | 1,354 | |
| Internet—13.0% | |||
| Booking Holdings, Inc. 0.750%, 5/1/25 | 2,400 | 3,417 | |
| Etsy, Inc. | |||
| 0.125%, 9/1/27(1) | 1,960 | 2,015 | |
| 0.250%, 6/15/28 | 3,335 | 3,000 | |
| Farfetch Ltd. 3.750%, 5/1/27 | 1,545 | 1,353 | |
| Match Group Financeco 2, Inc. 144A 0.875%, 6/15/26(1)(2) | 1,830 | 1,755 | |
| Palo Alto Networks, Inc. | |||
| 0.750%, 7/1/23 | 955 | 1,710 | |
| 0.375%, 6/1/25 | 2,730 | 4,474 | |
| Snap, Inc. | |||
| 0.750%, 8/1/26(1) | 2,475 | 2,282 | |
| 144A 0.125%, 3/1/28(2) | 2,585 | 1,862 | |
| Uber Technologies, Inc. 0.000%, 12/15/25(1) | 5,635 | 4,952 | |
| Wayfair, Inc. | |||
| 1.125%, 11/1/24 | 2,895 | 2,687 | |
| 1.000%, 8/15/26 | 755 | 574 | |
| 144A 3.250%, 9/15/27(2) | 1,045 | 1,254 | |
| Zillow Group, Inc. 2.750%, 5/15/25(1) | 4,550 | 4,661 | |
| 35,996 | |||
| Leisure Time—3.2% | |||
| NCL Corp., Ltd. 1.125%, 2/15/27 | 6,465 | 4,930 | |
| Royal Caribbean Cruises Ltd. 144A 6.000%, 8/15/25(1)(2) | 1,350 | 2,061 | |
| Topgolf Callaway Brands Corp. 2.750%, 5/1/26(1) | 1,160 | 1,768 | |
| 8,759 | |||
| Machinery-Diversified—0.6% | |||
| Middleby Corp. (The) 1.000%, 9/1/25(1) | 1,200 | 1,565 | |
| Par Value | Value | ||
| Media—6.2% | |||
| DISH Network Corp. | |||
| 0.000%, 12/15/25 | $ 2,745 | $ 1,810 | |
| 3.375%, 8/15/26 | 3,455 | 2,261 | |
| Liberty Media Corp. | |||
| 1.375%, 10/15/23 | 2,870 | 3,753 | |
| 144A 0.500%, 12/1/50(1)(2) | 3,585 | 3,762 | |
| Liberty Media Corp.-Liberty Formula One 144A 2.250%, 8/15/27(1)(2) | 3,310 | 3,456 | |
| World Wrestling Entertainment, Inc. 3.375%, 12/15/23(1) | 645 | 2,188 | |
| 17,230 | |||
| Mining—1.3% | |||
| Lithium Americas Corp. 1.750%, 1/15/27 | 2,075 | 1,787 | |
| MP Materials Corp. 144A 0.250%, 4/1/26(1)(2) | 1,690 | 1,690 | |
| 3,477 | |||
| Miscellaneous Manufacturing—1.0% | |||
| Axon Enterprise, Inc. 144A 0.500%, 12/15/27(2) | 2,450 | 2,631 | |
| Oil, Gas & Consumable Fuels—2.7% | |||
| EQT Corp. 1.750%, 5/1/26(1) | 655 | 1,469 | |
| Northern Oil & Gas, Inc. 144A 3.625%, 4/15/29(2) | 2,090 | 2,371 | |
| Pioneer Natural Resources Co. 0.250%, 5/15/25(1) | 1,480 | 3,482 | |
| 7,322 | |||
| Pharmaceuticals—5.0% | |||
| Dexcom, Inc. 0.250%, 11/15/25(1) | 7,175 | 7,555 | |
| Jazz Investments I Ltd. 2.000%, 6/15/26(1) | 3,615 | 4,243 | |
| Revance Therapeutics, Inc. 1.750%, 2/15/27(1) | 1,650 | 2,127 | |
| 13,925 | |||
| Retail—1.6% | |||
| Burlington Stores, Inc. 2.250%, 4/15/25(1) | 2,025 | 2,508 | |
| Shake Shack, Inc. 0.000%, 3/1/28 | 2,665 | 1,982 | |
| 4,490 | |||
| Semiconductors—3.8% | |||
| MACOM Technology Solutions Holdings, Inc. 0.250%, 3/15/26(1) | 1,155 | 1,192 | |
| Microchip Technology, Inc. 0.125%, 11/15/24 | 1,805 | 2,002 | |
| ON Semiconductor Corp. 0.000%, 5/1/27(1) | 1,265 | 1,897 | |
| Silicon Laboratories, Inc. 0.625%, 6/15/25(1) | 610 | 846 | |
| Par Value | Value | ||
| Semiconductors—continued | |||
| Wolfspeed, Inc. | |||
| 144A 0.250%, 2/15/28(1)(2) | $ 3,510 | $ 3,203 | |
| 144A 1.875%, 12/1/29(2) | 1,275 | 1,238 | |
| 10,378 | |||
| Software—14.5% | |||
| Akamai Technologies, Inc. 0.125%, 5/1/25(1) | 1,970 | 2,111 | |
| Bentley Systems, Inc. 0.125%, 1/15/26(1) | 3,275 | 3,026 | |
| Bill.com Holdings, Inc. 0.000%, 4/1/27 | 7,040 | 5,646 | |
| Box, Inc. 0.000%, 1/15/26(1) | 1,215 | 1,629 | |
| Cloudflare, Inc. 0.000%, 8/15/26(1) | 4,550 | 3,782 | |
| Confluent, Inc. 0.000%, 1/15/27 | 2,105 | 1,633 | |
| Coupa Software, Inc. 0.375%, 6/15/26 | 2,165 | 2,105 | |
| DigitalOcean Holdings, Inc. 0.000%, 12/1/26 | 3,825 | 2,936 | |
| Envestnet, Inc. 144A 2.625%, 12/1/27(2) | 925 | 1,034 | |
| Evolent Health, Inc. 1.500%, 10/15/25 | 1,730 | 2,014 | |
| Five9, Inc. 0.500%, 6/1/25(1) | 3,395 | 3,206 | |
| HubSpot, Inc. 0.375%, 6/1/25(1) | 755 | 1,044 | |
| PagerDuty, Inc. 1.250%, 7/1/25 | 1,425 | 1,503 | |
| Splunk, Inc. 1.125%, 6/15/27 | 3,730 | 3,210 | |
| Tyler Technologies, Inc. 0.250%, 3/15/26(1) | 1,180 | 1,120 | |
| Unity Software, Inc. 0.000%, 11/15/26 | 1,815 | 1,399 | |
| Workiva, Inc. 1.125%, 8/15/26(1) | 2,030 | 2,556 | |
| 39,954 | |||
| Transportation—0.2% | |||
| Air Transport Services Group, Inc. 1.125%, 10/15/24(1) | 655 | 692 | |
| Total Convertible Bonds and Notes (Identified Cost $269,202) | 259,562 | ||
| Corporate Bonds and Notes—59.7% | |||
| Aerospace & Defense—1.7% | |||
| Bombardier, Inc. 144A 7.500%, 2/1/29(1)(2) | 1,305 | 1,304 | |
| Spirit AeroSystems, Inc. 144A 9.375%, 11/30/29(2) | 680 | 739 | |
| TransDigm, Inc. 5.500%, 11/15/27(1) | 2,275 | 2,173 | |
| Par Value | Value | ||
| Aerospace & Defense—continued | |||
| Triumph Group, Inc. 144A 8.875%, 6/1/24(1)(2) | $ 497 | $ 504 | |
| 4,720 | |||
| Airlines—1.0% | |||
| American Airlines, Inc. 144A 11.750%, 7/15/25(1)(2) | 1,510 | 1,681 | |
| Delta Air Lines, Inc. 7.375%, 1/15/26(1) | 1,085 | 1,129 | |
| 2,810 | |||
| Auto Components—1.9% | |||
| American Axle & Manufacturing, Inc. 6.500%, 4/1/27(1) | 1,000 | 922 | |
| Clarios Global LP 144A 8.500%, 5/15/27(2) | 2,325 | 2,316 | |
| Goodyear Tire & Rubber Co. (The) | |||
| 9.500%, 5/31/25(1) | 975 | 1,006 | |
| 5.250%, 7/15/31 | 1,085 | 917 | |
| 5,161 | |||
| Auto Manufacturers—1.4% | |||
| Ford Motor Co. | |||
| 9.625%, 4/22/30(1) | 1,705 | 2,007 | |
| 7.450%, 7/16/31 | 1,250 | 1,341 | |
| 6.100%, 8/19/32 | 440 | 432 | |
| 3,780 | |||
| Building Materials—1.1% | |||
| Builders FirstSource, Inc. 144A 6.375%, 6/15/32(1)(2) | 1,790 | 1,753 | |
| Griffon Corp. 5.750%, 3/1/28(1) | 1,470 | 1,391 | |
| 3,144 | |||
| Chemicals—0.4% | |||
| Chemours Co. (The) 144A 5.750%, 11/15/28(1)(2) | 1,045 | 952 | |
| Commercial Services—2.9% | |||
| ADT Security Corp. (The) 144A 4.125%, 8/1/29(2) | 1,595 | 1,420 | |
| Avis Budget Car Rental LLC 144A 5.375%, 3/1/29(2) | 1,595 | 1,426 | |
| Deluxe Corp. 144A 8.000%, 6/1/29(2) | 1,105 | 946 | |
| Herc Holdings, Inc. 144A 5.500%, 7/15/27(1)(2) | 1,015 | 972 | |
| Hertz Corp. (The) 144A 5.000%, 12/1/29(2) | 1,165 | 952 | |
| NESCO Holdings II, Inc. 144A 5.500%, 4/15/29(2) | 1,470 | 1,320 | |
| United Rentals North America, Inc. 5.250%, 1/15/30(1) | 1,110 | 1,074 | |
| 8,110 | |||
| Par Value | Value | ||
| Computers—0.7% | |||
| McAfee Corp. 144A 7.375%, 2/15/30(2) | $ 1,085 | $ 901 | |
| NCR Corp. 144A 5.125%, 4/15/29(2) | 1,065 | 928 | |
| 1,829 | |||
| Containers & Packaging—1.8% | |||
| Berry Global, Inc. 144A 5.625%, 7/15/27(1)(2) | 1,030 | 1,012 | |
| Mauser Packaging Solutions Holding Co. 144A 7.875%, 8/15/26(2) | 880 | 888 | |
| Owens-Brockway Glass Container, Inc. 144A 6.625%, 5/13/27(1)(2) | 1,785 | 1,750 | |
| Trivium Packaging Finance B.V. 144A 8.500%, 8/15/27(2) | 1,415 | 1,361 | |
| 5,011 | |||
| Cosmetics & Personal Care—1.0% | |||
| Coty, Inc. 144A 6.500%, 4/15/26(2) | 1,675 | 1,651 | |
| Edgewell Personal Care Co. 144A 5.500%, 6/1/28(1)(2) | 1,105 | 1,047 | |
| 2,698 | |||
| Diversified Financial Services—1.5% | |||
| Nationstar Mortgage Holdings, Inc. | |||
| 144A 5.500%, 8/15/28(1)(2) | 1,080 | 944 | |
| 144A 5.750%, 11/15/31(2) | 565 | 455 | |
| Navient Corp. 6.750%, 6/15/26(1) | 1,375 | 1,354 | |
| OneMain Finance Corp. 8.250%, 10/1/23(1) | 440 | 445 | |
| PRA Group, Inc. 144A 8.375%, 2/1/28(2) | 875 | 879 | |
| 4,077 | |||
| Electric Utilities—0.5% | |||
| PG&E Corp. 5.250%, 7/1/30 | 1,455 | 1,339 | |
| Electronic Equipment, Instruments & Components—0.7% | |||
| WESCO Distribution, Inc. 144A 7.250%, 6/15/28(1)(2) | 1,980 | 2,029 | |
| Electronics—0.6% | |||
| Coherent Corp. 144A 5.000%, 12/15/29(2) | 975 | 885 | |
| Sensata Technologies B.V. 144A 5.875%, 9/1/30(2) | 880 | 864 | |
| 1,749 | |||
| Entertainment—3.9% | |||
| Caesars Entertainment, Inc. | |||
| 144A 8.125%, 7/1/27(1)(2) | 3,025 | 3,070 | |
| 144A 7.000%, 2/15/30(2) | 880 | 896 | |
| CDI Escrow Issuer, Inc. 144A 5.750%, 4/1/30(2) | 1,420 | 1,346 | |
| Par Value | Value | ||
| Entertainment—continued | |||
| Lions Gate Capital Holdings LLC 144A 5.500%, 4/15/29(2) | $ 2,105 | $ 1,368 | |
| Live Nation Entertainment, Inc. 144A 6.500%, 5/15/27(1)(2) | 1,495 | 1,503 | |
| Scientific Games International, Inc. 144A 7.000%, 5/15/28(1)(2) | 685 | 678 | |
| SeaWorld Parks & Entertainment, Inc. 144A 5.250%, 8/15/29(1)(2) | 2,180 | 1,970 | |
| 10,831 | |||
| Environmental Services—0.7% | |||
| GFL Environmental, Inc. 144A 4.750%, 6/15/29(1)(2) | 2,140 | 1,931 | |
| Equity Real Estate Investment Trusts (REITs)—1.9% | |||
| Iron Mountain, Inc. 144A 5.250%, 7/15/30(1)(2) | 2,180 | 1,973 | |
| Park Intermediate Holdings LLC | |||
| 144A 5.875%, 10/1/28(1)(2) | 1,035 | 958 | |
| 144A 4.875%, 5/15/29(2) | 1,125 | 972 | |
| Service Properties Trust 7.500%, 9/15/25(1) | 1,430 | 1,406 | |
| 5,309 | |||
| Food & Beverage—1.7% | |||
| Performance Food Group, Inc. 144A 5.500%, 10/15/27(1)(2) | 2,135 | 2,055 | |
| Post Holdings, Inc. 144A 5.500%, 12/15/29(1)(2) | 1,535 | 1,424 | |
| Simmons Foods, Inc. 144A 4.625%, 3/1/29(2) | 1,550 | 1,314 | |
| 4,793 | |||
| Food Service—0.2% | |||
| Aramark Services, Inc. 144A 5.000%, 2/1/28(1)(2) | 680 | 641 | |
| Healthcare-Products—0.4% | |||
| Medline Borrower LP 144A 5.250%, 10/1/29(2) | 1,160 | 971 | |
| Healthcare-Services—1.2% | |||
| Select Medical Corp. 144A 6.250%, 8/15/26(1)(2) | 925 | 903 | |
| Tenet Healthcare Corp. | |||
| 6.125%, 10/1/28(2) | 2,170 | 2,029 | |
| 144A 6.125%, 6/15/30(2) | 485 | 471 | |
| 3,403 | |||
| Housewares—0.5% | |||
| Newell Brands, Inc. 6.625%, 9/15/29(1) | 1,270 | 1,284 | |
| Internet—1.9% | |||
| Gen Digital, Inc. 144A 7.125%, 9/30/30(1)(2) | 1,705 | 1,731 | |
| Uber Technologies, Inc. | |||
| 144A 8.000%, 11/1/26(1)(2) | 865 | 885 | |
| Par Value | Value | ||
| Internet—continued | |||
| 144A 7.500%, 9/15/27(1)(2) | $ 1,485 | $ 1,508 | |
| 144A 6.250%, 1/15/28(1)(2) | 1,000 | 979 | |
| 5,103 | |||
| Investment Companies—0.6% | |||
| Compass Group Diversified Holdings LLC 144A 5.250%, 4/15/29(1)(2) | 1,970 | 1,773 | |
| Leisure Time—2.1% | |||
| Carnival Corp. 144A 10.500%, 2/1/26(1)(2) | 1,760 | 1,841 | |
| NCL Corp., Ltd. 144A 8.375%, 2/1/28(2) | 1,320 | 1,342 | |
| Royal Caribbean Cruises Ltd. | |||
| 144A 11.500%, 6/1/25(1)(2) | 425 | 456 | |
| 144A 11.625%, 8/15/27(1)(2) | 1,975 | 2,096 | |
| 5,735 | |||
| Lodging—1.5% | |||
| Hilton Domestic Operating Co., Inc. 4.875%, 1/15/30 | 500 | 471 | |
| Hilton Grand Vacations Borrower Escrow LLC 144A 5.000%, 6/1/29(1)(2) | 1,925 | 1,722 | |
| MGM Resorts International 4.750%, 10/15/28(1) | 1,145 | 1,038 | |
| Travel + Leisure Co. 144A 6.625%, 7/31/26(1)(2) | 855 | 849 | |
| 4,080 | |||
| Machinery-Construction & Mining—0.6% | |||
| Terex Corp. 144A 5.000%, 5/15/29(1)(2) | 1,715 | 1,601 | |
| Machinery-Diversified—0.6% | |||
| Chart Industries, Inc. 144A 7.500%, 1/1/30(1)(2) | 1,730 | 1,769 | |
| Media—6.3% | |||
| CCO Holdings LLC | |||
| 144A 6.375%, 9/1/29(1)(2) | 1,770 | 1,708 | |
| 144A 7.375%, 3/1/31(2) | 2,210 | 2,216 | |
| CSC Holdings LLC 144A 7.500%, 4/1/28(1)(2) | 1,640 | 1,199 | |
| DirecTV Financing LLC 144A 5.875%, 8/15/27(1)(2) | 1,670 | 1,513 | |
| DISH Network Corp. 144A 11.750%, 11/15/27(1)(2) | 2,130 | 2,214 | |
| Gray Television, Inc. 144A 7.000%, 5/15/27(1)(2) | 1,900 | 1,728 | |
| Nexstar Media, Inc. 144A 5.625%, 7/15/27(1)(2) | 1,640 | 1,562 | |
| Scripps Escrow II, Inc. 144A 5.375%, 1/15/31(2) | 1,135 | 916 | |
| Sirius XM Radio, Inc. 144A 4.000%, 7/15/28(1)(2) | 1,735 | 1,544 | |
| TEGNA, Inc. 5.000%, 9/15/29 | 1,095 | 1,032 | |
| Par Value | Value | ||
| Media—continued | |||
| Virgin Media Secured Finance plc 144A 5.500%, 5/15/29(1)(2) | $ 2,015 | $ 1,869 | |
| 17,501 | |||
| Mining—0.6% | |||
| Hudbay Minerals, Inc. 144A 6.125%, 4/1/29(1)(2) | 1,635 | 1,510 | |
| Oil, Gas & Consumable Fuels—5.1% | |||
| Antero Resources Corp. 144A 7.625%, 2/1/29(1)(2) | 1,333 | 1,363 | |
| Callon Petroleum Co. 144A 8.000%, 8/1/28(1)(2) | 1,325 | 1,324 | |
| CITGO Petroleum Corp. 144A 6.375%, 6/15/26(2) | 1,725 | 1,690 | |
| CNX Resources Corp. 144A 7.375%, 1/15/31(1)(2) | 1,715 | 1,668 | |
| Comstock Resources, Inc. | |||
| 144A 6.750%, 3/1/29(2) | 905 | 835 | |
| 144A 5.875%, 1/15/30(2) | 545 | 467 | |
| Occidental Petroleum Corp. 6.625%, 9/1/30 | 1,135 | 1,205 | |
| SM Energy Co. 6.500%, 7/15/28(1) | 1,725 | 1,641 | |
| Sunoco LP 4.500%, 4/30/30 | 565 | 503 | |
| USA Compression Partners LP 6.875%, 9/1/27(1) | 1,750 | 1,698 | |
| Weatherford International Ltd. 144A 8.625%, 4/30/30(1)(2) | 1,770 | 1,787 | |
| 14,181 | |||
| Paper & Forest Products—0.5% | |||
| Mercer International, Inc. | |||
| 5.125%, 2/1/29(1) | 495 | 423 | |
| 144A 5.125%, 2/1/29(1)(2) | 1,135 | 971 | |
| 1,394 | |||
| Pharmaceuticals—1.3% | |||
| Jazz Securities DAC 144A 4.375%, 1/15/29(1)(2) | 1,925 | 1,756 | |
| Organon & Co. 144A 5.125%, 4/30/31(1)(2) | 1,985 | 1,792 | |
| 3,548 | |||
| Pipelines—2.9% | |||
| Antero Midstream Partners LP 144A 5.375%, 6/15/29(2) | 1,090 | 1,012 | |
| Crestwood Midstream Partners LP 144A 6.000%, 2/1/29(1)(2) | 2,290 | 2,172 | |
| EQM Midstream Partners LP 144A 7.500%, 6/1/30(1)(2) | 1,835 | 1,833 | |
| NGL Energy Operating LLC 144A 7.500%, 2/1/26(1)(2) | 1,665 | 1,581 | |
| NuStar Logistics LP 6.375%, 10/1/30 | 1,400 | 1,349 | |
| 7,947 | |||
| Par Value | Value | ||
| Real Estate—0.5% | |||
| Kennedy-Wilson, Inc. 5.000%, 3/1/31 | $ 1,545 | $ 1,260 | |
| Retail—2.6% | |||
| Asbury Automotive Group, Inc. 144A 4.625%, 11/15/29(2) | 560 | 494 | |
| Bath & Body Works, Inc. 144A 6.625%, 10/1/30(1)(2) | 2,245 | 2,194 | |
| Macy’s Retail Holdings LLC | |||
| 144A 5.875%, 3/15/30(2) | 525 | 479 | |
| 144A 6.125%, 3/15/32(2) | 1,015 | 908 | |
| New Red Finance, Inc. 144A 4.000%, 10/15/30(1)(2) | 2,140 | 1,822 | |
| Yum! Brands, Inc. 5.375%, 4/1/32 | 1,265 | 1,200 | |
| 7,097 | |||
| Semiconductors—0.8% | |||
| Amkor Technology, Inc. 144A 6.625%, 9/15/27(1)(2) | 850 | 854 | |
| Entegris Escrow Corp. 144A 5.950%, 6/15/30(2) | 1,485 | 1,426 | |
| 2,280 | |||
| Software—1.5% | |||
| Clarivate Science Holdings Corp. 144A 4.875%, 7/1/29(2) | 1,485 | 1,307 | |
| Consensus Cloud Solutions, Inc. 144A 6.500%, 10/15/28(1)(2) | 1,145 | 1,072 | |
| SS&C Technologies, Inc. 144A 5.500%, 9/30/27(1)(2) | 1,770 | 1,702 | |
| 4,081 | |||
| Telecommunications—2.2% | |||
| CommScope, Inc. 144A 6.000%, 3/1/26(1)(2) | 765 | 733 | |
| Frontier Communications Holdings LLC | |||
| 144A 5.000%, 5/1/28(1)(2) | 1,010 | 918 | |
| 144A 8.750%, 5/15/30(1)(2) | 1,690 | 1,751 | |
| Hughes Satellite Systems Corp. 6.625%, 8/1/26(1) | 2,010 | 1,944 | |
| Lumen Technologies, Inc. 144A 5.375%, 6/15/29(2) | 1,220 | 845 | |
| 6,191 | |||
| Transportation—0.4% | |||
| Fortress Transportation & Infrastructure Investors LLC 144A 9.750%, 8/1/27(1)(2) | 1,160 | 1,192 | |
| Total Corporate Bonds and Notes (Identified Cost $172,247) | 164,815 | ||
| Shares | ||
| Convertible Preferred Stocks—11.8% | ||
| Auto Components—0.5% | ||
| Aptiv plc Series A, 5.500% | 10,775 | 1,358 |
| Shares | Value | ||
| Banks—3.8% | |||
| Wells Fargo & Co. Series L, 7.500% | 8,375 | $ 10,536 | |
| Capital Markets—0.7% | |||
| KKR & Co., Inc. Series C, 6.000% | 27,070 | 1,829 | |
| Commercial Services & Supplies—0.8% | |||
| GFL Environmental, Inc., 6.000% | 30,340 | 2,083 | |
| Diversified Financial Services—0.7% | |||
| Chewy, Inc. 2020 Mandatory Exchangeable Trust 144A, 6.500%(2) | 1,925 | 2,001 | |
| Electric Utilities—2.2% | |||
| NextEra Energy, Inc. | |||
| 5.279% | 49,355 | 2,467 | |
| 6.926% | 29,530 | 1,416 | |
| PG&E Corp., 5.500% | 15,220 | 2,150 | |
| 6,033 | |||
| Healthcare Equipment & Supplies—1.1% | |||
| Boston Scientific Corp. Series A, 5.500% | 26,885 | 3,068 | |
| Life Sciences Tools & Services—0.9% | |||
| Danaher Corp. Series B, 5.000% | 1,790 | 2,406 | |
| Telecommunications—1.1% | |||
| T-Mobile U.S. 2020 Cash Mandatory Exchangeable Trust 144A, 5.250%(2) | 2,640 | 3,184 | |
| Total Convertible Preferred Stocks (Identified Cost $25,284) | 32,498 | ||
| Preferred Stock—0.3% | |||
| Entertainment—0.3% | |||
| LiveStyle, Inc. Series B (3)(4)(5)(6) | 12,300 | 925 | |
| Total Preferred Stock (Identified Cost $1,206) | 925 | ||
| Common Stocks—1.7% | |||
| Banks—1.6% | |||
| CCF Holdings LLC (3)(5) | 6,367,079 | 3,884 | |
| CCF Holdings LLC Class M(3)(5) | 879,959 | 536 | |
| 4,420 | |||
| Consumer Finance—0.1% | |||
| Erickson, Inc.(3)(5) | 6,354 | 227 | |
| Entertainment—0.0% | |||
| LiveStyle, Inc. (3)(4)(5)(6) | 90,407 | — (7) | |
| Total Common Stocks (Identified Cost $22,668) | 4,647 | ||
| Shares | Value | ||
| Warrants—0.2% | |||
| Banks—0.2% | |||
| CCF Holdings LLC(3)(5) | 1,455,681 | $ 553 | |
| Media—0.0% | |||
| Tenerity, Inc.(3)(5)(6) | 12,009 | — | |
| Total Warrants (Identified Cost $2,371) | 553 | ||
| Total Long-Term Investments—167.8% (Identified Cost $492,978) | 463,000 | ||
| Short-Term Investment—7.4% | |||
| Money Market Mutual Fund—7.4% | |||
| BlackRock Liquidity FedFund - Institutional Shares (seven-day effective yield 4.066%)(8) | 20,477,785 | 20,478 | |
| Total Short-Term Investment (Identified Cost $20,478) | 20,478 | ||
| TOTAL INVESTMENTS—175.2% (Identified Cost $513,456) | $ 483,478 | ||
| Other assets and liabilities, net—(35.7)% | (98,476) | ||
| Preferred Shares—(39.5)% | (109,000) | ||
| NET ASSETS—100.0% | $ 276,002 | ||
| Abbreviations: | |
| EV | Enterprise Value |
| LLC | Limited Liability Company |
| LP | Limited Partnership |
| REIT | Real Estate Investment Trust |
| Footnote Legend: | |
| (1) | All or a portion of securities is segregated as collateral for the Liquidity Facility. The value of securities segregated as collateral is $161,029. |
| (2) | Security exempt from registration under Rule 144A of the Securities Act of 1933. These securities may be resold in transactions exempt from registration, normally to qualified institutional buyers. At January 31, 2023, these securities amounted to a value of $195,746 or 70.9% of net assets. |
| (3) | The value of this security was determined using significant unobservable inputs and is reported as a Level 3 security in the Fair Value Hierarchy table located after the Schedule of Investments. |
| (4) | For the period of February 1, 2022 through March 1, 2022, a member of the Fund’s portfolio management team was a member of the board of directors of LiveStyle, Inc. |
| (5) | Non-income producing. |
| (6) | Security is restricted from resale. |
| (7) | Amount is less than $500. |
| (8) | Shares of this fund are publicly offered, and its prospectus and annual report are publicly available. |
| Country Weightings (Unaudited)† | |
| United States | 91% |
| Bermuda | 3 |
| Canada | 2 |
| United Kingdom | 2 |
| Liberia | 1 |
| Netherlands | 1 |
| Total | 100% |
| † % of total investments as of January 31, 2023. | |
| Total Value at January 31, 2023 | Level 1 Quoted Prices | Level 2 Significant Observable Inputs | Level 3 Significant Unobservable Inputs | ||||
| Assets: | |||||||
| Debt Instruments: | |||||||
| Corporate Bonds and Notes | $164,815 | $ — | $164,815 | $ — | |||
| Convertible Bonds and Notes | 259,562 | — | 254,785 | 4,777 | |||
| Equity Securities: | |||||||
| Convertible Preferred Stocks | 32,498 | 27,313 | 5,185 | — | |||
| Common Stocks | 4,647 | — | — | 4,647 | |||
| Preferred Stock | 925 | — | — | 925 | |||
| Warrants | 553 | — | — | 553 (1) | |||
| Money Market Mutual Fund | 20,478 | 20,478 | — | — | |||
| Total Investments | $483,478 | $47,791 | $424,785 | $10,902 |
| (1) | Includes internally fair valued securities currently priced at zero ($0). |
| Total | Common Stocks | Preferred Stocks | Warrants | Corporate Bonds And Notes | |||||
| Investments in Securities | |||||||||
| Balance as of January 31, 2022: | $ 6,202 | $ 3,348 | $ 2,519(a) | $ 335 (a) | $ — | ||||
| Net realized gain (loss) | (4,975) | — | (4,975) | — | — | ||||
| Net change in unrealized appreciation (depreciation)(b) | 6,281 | 1,299 | 4,671 | 218 | 93 | ||||
| Purchases | 4,684 | — | — | — | 4,684 | ||||
| Sales (c) | (1,290) | — | (1,290) | — | — | ||||
| Balance as of January 31, 2023 | $ 10,902 | $ 4,647 | $ 925 | $ 553 (a) | $ 4,777 |
| Investments in Securities – Assets | Ending Balance at January 31, 2023 | Valuation Technique Used | Unobservable Inputs | Input Values | ||||
| Preferred Stock: | ||||||||
| LiveStyle, Inc. Series B | $ 925 | Discounted cash flows liquidation approach | Discount rate | 23.85% (23.70% - 24.03%) | ||||
| Common Stocks: | ||||||||
| CCF Holdings LLC | $3,884 | Market and Company Comparables | EV Multiples | 1.09x (0.68x - 1.48x) | ||||
| 6.72x (5.50x - 9.08x) | ||||||||
| 0.64x (0.45x - 0.77x) | ||||||||
| Illiquidity Discount | 25% | |||||||
| CCF Holdings LLC Class M | $ 536 | Market and Company Comparables | EV Multiples | 1.09x (0.68x - 1.48x) | ||||
| 6.72x (5.50x - 9.08x) | ||||||||
| 0.64x (0.45x - 0.77x) | ||||||||
| Illiquidity Discount | 25% | |||||||
| Erickson, Inc. | $ 227 | Market and Company Comparables | EV Multiples | 1.35x (0.73x - 3.06x) | ||||
| 14.78x (12.21x - 18.99x) | ||||||||
| 1.00x (0.54x - 1.74x) | ||||||||
| M&A Transaction Multiples | 0.96x (0.41x - 1.96x) | |||||||
| Illiquidity Discount | 20% | |||||||
| LiveStyle, Inc. | $ —(1) | Discounted cash flows liquidation approach | Discount rate | 23.85% (23.70% - 24.03%) | ||||
| Warrants: | ||||||||
| CCF Holdings LLC | $ 553 | Market and Company Comparables | EV Multiples | 1.09x (0.68x - 1.48x) | ||||
| 6.72x (5.50x - 9.08x) | ||||||||
| 0.64x (0.45x - 0.77x) | ||||||||
| Illiquidity Discount | 25% | |||||||
| Black-Scholes Model | Volatility | 55.94% | ||||||
| (1) Amount is less than $500. | ||||||||
| Par Value | Value | ||
| Convertible Bonds and Notes—80.2% | |||
| Airlines—1.0% | |||
| American Airlines Group, Inc. 6.500%, 7/1/25 | $ 1,015 | $ 1,243 | |
| Southwest Airlines Co. 1.250%, 5/1/25(1) | 860 | ��1,031 | |
| 2,274 | |||
| Auto Manufacturers—0.3% | |||
| Lucid Group, Inc. 144A 1.250%, 12/15/26(2) | 1,060 | 686 | |
| Banks—1.6% | |||
| Barclays Bank plc 0.000%, 2/18/25 | 2,105 | 2,248 | |
| BofA Finance LLC 0.600%, 5/25/27 | 1,095 | 1,231 | |
| 3,479 | |||
| Biotechnology—5.9% | |||
| Alnylam Pharmaceuticals, Inc. 144A 1.000%, 9/15/27(2) | 1,580 | 1,685 | |
| BioMarin Pharmaceutical, Inc. 1.250%, 5/15/27 | 2,140 | 2,408 | |
| Cytokinetics, Inc. 144A 3.500%, 7/1/27(2) | 1,130 | 1,236 | |
| Halozyme Therapeutics, Inc. | |||
| 0.250%, 3/1/27 | 2,590 | 2,425 | |
| 144A 1.000%, 8/15/28(2) | 390 | 433 | |
| Insmed, Inc. | |||
| 1.750%, 1/15/25 | 1,275 | 1,210 | |
| 0.750%, 6/1/28 | 700 | 621 | |
| Sarepta Therapeutics, Inc. 144A 1.250%, 9/15/27(2) | 2,595 | 2,949 | |
| 12,967 | |||
| Chemicals—0.5% | |||
| Livent Corp. 4.125%, 7/15/25 | 355 | 1,090 | |
| Commercial Services—4.6% | |||
| Block, Inc. | |||
| 0.125%, 3/1/25 | 2,100 | 2,131 | |
| 0.250%, 11/1/27 | 540 | 433 | |
| Repay Holdings Corp. 144A 0.000%, 2/1/26(2) | 2,120 | 1,700 | |
| Shift4 Payments, Inc. | |||
| 0.000%, 12/15/25(1) | 1,435 | 1,532 | |
| 0.500%, 8/1/27 | 2,490 | 2,222 | |
| Stride, Inc. 1.125%, 9/1/27(1) | 1,960 | 2,047 | |
| 10,065 | |||
| Computers—3.9% | |||
| 3D Systems Corp. 0.000%, 11/15/26 | 1,270 | 942 | |
| CyberArk Software Ltd. 0.000%, 11/15/24 | 945 | 1,039 | |
| Par Value | Value | ||
| Computers—continued | |||
| KBR, Inc. 2.500%, 11/1/23 | $ 770 | $ 1,572 | |
| Lumentum Holdings, Inc. | |||
| 0.500%, 12/15/26 | 275 | 250 | |
| 144A 0.500%, 6/15/28(2) | 1,330 | 1,068 | |
| Parsons Corp. 0.250%, 8/15/25 | 1,065 | 1,165 | |
| Pure Storage, Inc. 0.125%, 4/15/23(1) | 560 | 624 | |
| Rapid7, Inc. 0.250%, 3/15/27 | 1,260 | 1,033 | |
| Zscaler, Inc. 0.125%, 7/1/25(1) | 795 | 869 | |
| 8,562 | |||
| Cosmetics & Personal Care—0.8% | |||
| Beauty Health Co. (The) 144A 1.250%, 10/1/26(2) | 2,100 | 1,718 | |
| Diversified Financial Services—3.6% | |||
| Coinbase Global, Inc. 0.500%, 6/1/26 | 1,525 | 1,033 | |
| Goldman Sachs Finance Corp. 0.500%, 12/29/27(3) | 3,015 | 3,152 | |
| Hannon Armstrong Sustainable Infrastructure Capital, Inc. 0.000%, 8/15/23 | 1,445 | 1,427 | |
| JPMorgan Chase Financial Co., LLC 0.500%, 6/15/27 | 1,850 | 2,364 | |
| 7,976 | |||
| Energy-Alternate Sources—3.1% | |||
| Enphase Energy, Inc. | |||
| 0.000%, 3/1/26(1) | 1,700 | 1,790 | |
| 0.000%, 3/1/28(1) | 300 | 323 | |
| Plug Power, Inc. 3.750%, 6/1/25 | 195 | 662 | |
| SolarEdge Technologies, Inc. 0.000%, 9/15/25 | 690 | 926 | |
| Stem, Inc. 144A 0.500%, 12/1/28(2) | 2,295 | 1,543 | |
| Sunnova Energy International, Inc. 144A 2.625%, 2/15/28(2) | 1,935 | 1,629 | |
| 6,873 | |||
| Entertainment—3.0% | |||
| DraftKings Holdings, Inc. 0.000%, 3/15/28 | 1,690 | 1,149 | |
| Live Nation Entertainment, Inc. | |||
| 2.000%, 2/15/25(1) | 2,185 | 2,250 | |
| 144A 3.125%, 1/15/29(2) | 885 | 949 | |
| Vail Resorts, Inc. 0.000%, 1/1/26(1) | 2,385 | 2,257 | |
| 6,605 | |||
| Food & Beverage—0.9% | |||
| Post Holdings, Inc. 144A 2.500%, 8/15/27(2) | 1,745 | 1,899 | |
| Par Value | Value | ||
| Healthcare-Products—4.1% | |||
| CONMED Corp. 144A 2.250%, 6/15/27(2) | $ 1,075 | $ 1,023 | |
| Exact Sciences Corp. | |||
| 0.375%, 3/15/27 | 2,665 | 2,512 | |
| 0.375%, 3/1/28 | 250 | 223 | |
| Insulet Corp. 0.375%, 9/1/26(1) | 1,160 | 1,601 | |
| Natera, Inc. 2.250%, 5/1/27 | 775 | 1,055 | |
| Novocure Ltd. 0.000%, 11/1/25 | 1,575 | 1,524 | |
| Repligen Corp. 0.375%, 7/15/24 | 655 | 1,109 | |
| 9,047 | |||
| Healthcare-Services—0.4% | |||
| Elevance Health, Inc. 2.750%, 10/15/42 | 125 | 891 | |
| Internet—11.7% | |||
| Booking Holdings, Inc. 0.750%, 5/1/25(1) | 1,600 | 2,278 | |
| Etsy, Inc. 0.250%, 6/15/28(1) | 3,905 | 3,512 | |
| Farfetch Ltd. 3.750%, 5/1/27 | 900 | 788 | |
| Match Group Financeco 2, Inc. 144A 0.875%, 6/15/26(2) | 1,225 | 1,175 | |
| Palo Alto Networks, Inc. | |||
| 0.750%, 7/1/23(1) | 1,075 | 1,925 | |
| 0.375%, 6/1/25(1) | 1,470 | 2,409 | |
| Perficient, Inc. 0.125%, 11/15/26 | 1,525 | 1,234 | |
| Snap, Inc. | |||
| 0.750%, 8/1/26 | 1,045 | 964 | |
| 144A 0.125%, 3/1/28(2) | 1,920 | 1,383 | |
| TechTarget, Inc. 0.000%, 12/15/26 | 1,375 | 1,095 | |
| Uber Technologies, Inc. 0.000%, 12/15/25 | 3,320 | 2,918 | |
| Wayfair, Inc. | |||
| 1.125%, 11/1/24 | 1,985 | 1,842 | |
| 1.000%, 8/15/26 | 505 | 384 | |
| 144A 3.250%, 9/15/27(2) | 695 | 834 | |
| Zillow Group, Inc. 2.750%, 5/15/25 | 2,985 | 3,058 | |
| 25,799 | |||
| Leisure Time—2.7% | |||
| NCL Corp., Ltd. 1.125%, 2/15/27(1) | 4,305 | 3,282 | |
| Royal Caribbean Cruises Ltd. 144A 6.000%, 8/15/25(2) | 890 | 1,359 | |
| Topgolf Callaway Brands Corp. 2.750%, 5/1/26 | 770 | 1,174 | |
| 5,815 | |||
| Par Value | Value | ||
| Machinery-Diversified—0.5% | |||
| Middleby Corp. (The) 1.000%, 9/1/25(1) | $ 800 | $ 1,044 | |
| Media—5.4% | |||
| DISH Network Corp. 0.000%, 12/15/25(1) | 3,830 | 2,526 | |
| Liberty Broadband Corp. | |||
| 144A 1.250%, 9/30/50(2) | 2,925 | 2,819 | |
| 144A 2.750%, 9/30/50(2) | 1,000 | 980 | |
| Liberty Media Corp. 1.375%, 10/15/23(1) | 1,620 | 2,118 | |
| Liberty Media Corp.-Liberty Formula One 144A 2.250%, 8/15/27(2) | 2,005 | 2,093 | |
| World Wrestling Entertainment, Inc. 3.375%, 12/15/23 | 415 | 1,408 | |
| 11,944 | |||
| Mining—1.1% | |||
| Lithium Americas Corp. 1.750%, 1/15/27 | 1,605 | 1,382 | |
| MP Materials Corp. 144A 0.250%, 4/1/26(1)(2) | 1,070 | 1,070 | |
| 2,452 | |||
| Miscellaneous Manufacturing—0.8% | |||
| Axon Enterprise, Inc. 144A 0.500%, 12/15/27(2) | 1,635 | 1,756 | |
| Oil, Gas & Consumable Fuels—2.2% | |||
| EQT Corp. 1.750%, 5/1/26(1) | 435 | 976 | |
| Northern Oil & Gas, Inc. 144A 3.625%, 4/15/29(2) | 1,360 | 1,543 | |
| Pioneer Natural Resources Co. 0.250%, 5/15/25(1) | 990 | 2,329 | |
| 4,848 | |||
| Pharmaceuticals—4.2% | |||
| Dexcom, Inc. 0.250%, 11/15/25(1) | 4,785 | 5,038 | |
| Jazz Investments I Ltd. 2.000%, 6/15/26(1) | 2,415 | 2,835 | |
| Revance Therapeutics, Inc. 1.750%, 2/15/27 | 1,100 | 1,418 | |
| 9,291 | |||
| Retail—1.4% | |||
| Burlington Stores, Inc. 2.250%, 4/15/25 | 1,350 | 1,672 | |
| Shake Shack, Inc. 0.000%, 3/1/28 | 1,765 | 1,313 | |
| 2,985 | |||
| Semiconductors—3.9% | |||
| Impinj, Inc. 1.125%, 5/15/27 | 845 | 1,157 | |
| MACOM Technology Solutions Holdings, Inc. 0.250%, 3/15/26(1) | 1,065 | 1,099 | |
| Par Value | Value | ||
| Semiconductors—continued | |||
| Microchip Technology, Inc. 0.125%, 11/15/24(1) | $ 1,210 | $ 1,342 | |
| ON Semiconductor Corp. 0.000%, 5/1/27(1) | 840 | 1,260 | |
| Silicon Laboratories, Inc. 0.625%, 6/15/25 | 525 | 728 | |
| Wolfspeed, Inc. | |||
| 144A 0.250%, 2/15/28(2) | 2,340 | 2,135 | |
| 144A 1.875%, 12/1/29(2) | 850 | 825 | |
| 8,546 | |||
| Software—12.0% | |||
| Akamai Technologies, Inc. 0.125%, 5/1/25 | 1,325 | 1,420 | |
| Bentley Systems, Inc. 0.125%, 1/15/26 | 2,190 | 2,024 | |
| Bill.com Holdings, Inc. 0.000%, 4/1/27 | 3,970 | 3,184 | |
| Box, Inc. 0.000%, 1/15/26 | 810 | 1,086 | |
| Cloudflare, Inc. 0.000%, 8/15/26 | 3,035 | 2,523 | |
| Confluent, Inc. 0.000%, 1/15/27 | 1,380 | 1,070 | |
| DigitalOcean Holdings, Inc. 0.000%, 12/1/26 | 2,165 | 1,662 | |
| Envestnet, Inc. 144A 2.625%, 12/1/27(2) | 1,510 | 1,687 | |
| Evolent Health, Inc. 1.500%, 10/15/25 | 1,155 | 1,344 | |
| Five9, Inc. 0.500%, 6/1/25 | 2,265 | 2,139 | |
| HubSpot, Inc. 0.375%, 6/1/25 | 505 | 698 | |
| PagerDuty, Inc. 1.250%, 7/1/25 | 945 | 997 | |
| Splunk, Inc. | |||
| 1.125%, 9/15/25 | 760 | 740 | |
| 1.125%, 6/15/27 | 1,770 | 1,523 | |
| Tyler Technologies, Inc. 0.250%, 3/15/26(1) | 1,785 | 1,695 | |
| Unity Software, Inc. 0.000%, 11/15/26(1) | 1,185 | 914 | |
| Workiva, Inc. 1.125%, 8/15/26 | 1,335 | 1,681 | |
| 26,387 | |||
| Transportation—0.6% | |||
| Air Transport Services Group, Inc. 1.125%, 10/15/24 | 1,225 | 1,294 | |
| Total Convertible Bonds and Notes (Identified Cost $182,553) | 176,293 | ||
| Corporate Bonds and Notes—19.8% | |||
| Aerospace & Defense—0.6% | |||
| Bombardier, Inc. 144A 7.500%, 2/1/29(2) | 340 | 340 | |
| Par Value | Value | ||
| Aerospace & Defense—continued | |||
| Spirit AeroSystems, Inc. 144A 9.375%, 11/30/29(2) | $ 175 | $ 190 | |
| TransDigm, Inc. 5.500%, 11/15/27 | 600 | 573 | |
| Triumph Group, Inc. | |||
| 144A 8.875%, 6/1/24(1)(2) | 143 | 145 | |
| 144A 6.250%, 9/15/24(1)(2) | 175 | 169 | |
| 1,417 | |||
| Airlines—0.3% | |||
| American Airlines, Inc. 144A 11.750%, 7/15/25(1)(2) | 300 | 334 | |
| Delta Air Lines, Inc. 7.375%, 1/15/26(1) | 275 | 286 | |
| 620 | |||
| Auto Components—0.7% | |||
| American Axle & Manufacturing, Inc. 6.500%, 4/1/27(1) | 250 | 230 | |
| Clarios Global LP 144A 8.500%, 5/15/27(1)(2) | 645 | 642 | |
| Goodyear Tire & Rubber Co. (The) | |||
| 9.500%, 5/31/25 | 250 | 258 | |
| 5.250%, 4/30/31(1) | 265 | 227 | |
| 5.250%, 7/15/31 | 305 | 258 | |
| 1,615 | |||
| Auto Manufacturers—0.4% | |||
| Ford Motor Co. | |||
| 9.625%, 4/22/30(1) | 460 | 541 | |
| 7.450%, 7/16/31(1) | 250 | 268 | |
| 6.100%, 8/19/32 | 115 | 113 | |
| 922 | |||
| Building Materials—0.3% | |||
| Builders FirstSource, Inc. 144A 6.375%, 6/15/32(2) | 245 | 240 | |
| Griffon Corp. 5.750%, 3/1/28 | 370 | 350 | |
| 590 | |||
| Chemicals—0.1% | |||
| Chemours Co. (The) 144A 5.750%, 11/15/28(2) | 265 | 242 | |
| Commercial Services—1.1% | |||
| ADT Security Corp. (The) 144A 4.125%, 8/1/29(2) | 400 | 356 | |
| Avis Budget Car Rental LLC 144A 5.375%, 3/1/29(2) | 420 | 376 | |
| Deluxe Corp. 144A 8.000%, 6/1/29(1)(2) | 285 | 244 | |
| Herc Holdings, Inc. 144A 5.500%, 7/15/27(2) | 470 | 450 | |
| Hertz Corp. (The) 144A 5.000%, 12/1/29(1)(2) | 295 | 241 | |
| NESCO Holdings II, Inc. 144A 5.500%, 4/15/29(1)(2) | 390 | 350 | |
| Par Value | Value | ||
| Commercial Services—continued | |||
| United Rentals North America, Inc. 5.250%, 1/15/30(1) | $ 310 | $ 300 | |
| 2,317 | |||
| Computers—0.2% | |||
| McAfee Corp. 144A 7.375%, 2/15/30(2) | 275 | 228 | |
| NCR Corp. 144A 5.125%, 4/15/29(1)(2) | 330 | 288 | |
| 516 | |||
| Containers & Packaging—0.6% | |||
| Berry Global, Inc. 144A 5.625%, 7/15/27(1)(2) | 270 | 265 | |
| Mauser Packaging Solutions Holding Co. 144A 7.875%, 8/15/26(2) | 230 | 232 | |
| Owens-Brockway Glass Container, Inc. 144A 6.625%, 5/13/27(1)(2) | 485 | 476 | |
| Trivium Packaging Finance B.V. 144A 8.500%, 8/15/27(1)(2) | 355 | 341 | |
| 1,314 | |||
| Cosmetics & Personal Care—0.3% | |||
| Coty, Inc. 144A 6.500%, 4/15/26(2) | 475 | 468 | |
| Edgewell Personal Care Co. 144A 5.500%, 6/1/28(1)(2) | 300 | 284 | |
| 752 | |||
| Diversified Financial Services—0.5% | |||
| Nationstar Mortgage Holdings, Inc. | |||
| 144A 5.500%, 8/15/28(1)(2) | 290 | 253 | |
| 144A 5.750%, 11/15/31(1)(2) | 145 | 117 | |
| Navient Corp. 6.750%, 6/15/26(1) | 375 | 370 | |
| OneMain Finance Corp. 8.250%, 10/1/23(1) | 110 | 111 | |
| PRA Group, Inc. 144A 8.375%, 2/1/28(2) | 225 | 226 | |
| 1,077 | |||
| Electric Utilities—0.2% | |||
| PG&E Corp. 5.250%, 7/1/30 | 375 | 345 | |
| Electronic Equipment, Instruments & Components—0.2% | |||
| WESCO Distribution, Inc. 144A 7.250%, 6/15/28(1)(2) | 500 | 512 | |
| Electronics—0.3% | |||
| Coherent Corp. 144A 5.000%, 12/15/29(2) | 400 | 363 | |
| Sensata Technologies B.V. 144A 5.875%, 9/1/30(2) | 230 | 226 | |
| 589 | |||
| Par Value | Value | ||
| Entertainment—1.5% | |||
| Caesars Entertainment, Inc. | |||
| 144A 8.125%, 7/1/27(2) | $ 785 | $ 797 | |
| 144A 4.625%, 10/15/29(2) | 425 | 364 | |
| 144A 7.000%, 2/15/30(2) | 230 | 234 | |
| CDI Escrow Issuer, Inc. 144A 5.750%, 4/1/30(2) | 490 | 464 | |
| Cedar Fair LP 5.375%, 4/15/27(1) | 240 | 232 | |
| Lions Gate Capital Holdings LLC 144A 5.500%, 4/15/29(1)(2) | 410 | 267 | |
| Live Nation Entertainment, Inc. 144A 6.500%, 5/15/27(2) | 375 | 377 | |
| Scientific Games International, Inc. 144A 7.000%, 5/15/28(2) | 180 | 178 | |
| SeaWorld Parks & Entertainment, Inc. 144A 5.250%, 8/15/29(1)(2) | 425 | 384 | |
| 3,297 | |||
| Environmental Services—0.2% | |||
| GFL Environmental, Inc. 144A 4.750%, 6/15/29(1)(2) | 545 | 492 | |
| Equity Real Estate Investment Trusts (REITs)—0.6% | |||
| Iron Mountain, Inc. 144A 5.250%, 7/15/30(1)(2) | 425 | 385 | |
| Park Intermediate Holdings LLC | |||
| 144A 5.875%, 10/1/28(2) | 260 | 240 | |
| 144A 4.875%, 5/15/29(1)(2) | 290 | 251 | |
| Service Properties Trust 7.500%, 9/15/25 | 360 | 354 | |
| 1,230 | |||
| Food & Beverage—0.4% | |||
| Post Holdings, Inc. | |||
| 144A 5.500%, 12/15/29(2) | 250 | 232 | |
| 144A 4.500%, 9/15/31(1)(2) | 300 | 259 | |
| Simmons Foods, Inc. 144A 4.625%, 3/1/29(1)(2) | 390 | 330 | |
| 821 | |||
| Healthcare-Products—0.1% | |||
| Medline Borrower LP 144A 5.250%, 10/1/29(1)(2) | 305 | 255 | |
| Healthcare-Services—0.4% | |||
| Select Medical Corp. 144A 6.250%, 8/15/26(1)(2) | 245 | 239 | |
| Tenet Healthcare Corp. | |||
| 6.125%, 10/1/28(1)(2) | 550 | 514 | |
| 144A 6.125%, 6/15/30(2) | 120 | 117 | |
| 870 | |||
| Housewares—0.2% | |||
| Newell Brands, Inc. 6.625%, 9/15/29 | 340 | 344 | |
| Par Value | Value | ||
| Internet—0.6% | |||
| Gen Digital, Inc. 144A 7.125%, 9/30/30(2) | $ 450 | $ 457 | |
| Uber Technologies, Inc. | |||
| 144A 8.000%, 11/1/26(1)(2) | 235 | 240 | |
| 144A 7.500%, 9/15/27(1)(2) | 370 | 376 | |
| 144A 6.250%, 1/15/28(2) | 360 | 352 | |
| 1,425 | |||
| Investment Companies—0.2% | |||
| Compass Group Diversified Holdings LLC 144A 5.250%, 4/15/29(1)(2) | 435 | 391 | |
| Leisure Time—0.8% | |||
| Carnival Corp. 144A 10.500%, 2/1/26(1)(2) | 650 | 680 | |
| NCL Corp., Ltd. 144A 8.375%, 2/1/28(2) | 340 | 346 | |
| Royal Caribbean Cruises Ltd. | |||
| 144A 11.500%, 6/1/25(1)(2) | 105 | 113 | |
| 144A 11.625%, 8/15/27(2) | 495 | 525 | |
| 1,664 | |||
| Lodging—0.5% | |||
| Hilton Domestic Operating Co., Inc. | |||
| 4.875%, 1/15/30 | 125 | 118 | |
| 144A 4.000%, 5/1/31(1)(2) | 225 | 195 | |
| Hilton Grand Vacations Borrower Escrow LLC 144A 5.000%, 6/1/29(2) | 415 | 371 | |
| MGM Resorts International 4.750%, 10/15/28(1) | 305 | 277 | |
| Travel + Leisure Co. 144A 6.625%, 7/31/26(2) | 225 | 223 | |
| 1,184 | |||
| Machinery-Construction & Mining—0.2% | |||
| Terex Corp. 144A 5.000%, 5/15/29(1)(2) | 370 | 346 | |
| Machinery-Diversified—0.2% | |||
| Chart Industries, Inc. 144A 7.500%, 1/1/30(2) | 455 | 465 | |
| Media—2.2% | |||
| CCO Holdings LLC | |||
| 144A 6.375%, 9/1/29(2) | 475 | 458 | |
| 144A 7.375%, 3/1/31(2) | 575 | 576 | |
| CSC Holdings LLC 144A 7.500%, 4/1/28(1)(2) | 415 | 304 | |
| DirecTV Financing LLC 144A 5.875%, 8/15/27(1)(2) | 575 | 521 | |
| DISH Network Corp. 144A 11.750%, 11/15/27(2) | 555 | 577 | |
| Gray Television, Inc. | |||
| 144A 7.000%, 5/15/27(2) | 450 | 409 | |
| 144A 4.750%, 10/15/30(1)(2) | 295 | 218 | |
| Nexstar Media, Inc. 144A 5.625%, 7/15/27(1)(2) | 445 | 424 | |
| Scripps Escrow II, Inc. 144A 5.375%, 1/15/31(2) | 300 | 242 | |
| Par Value | Value | ||
| Media—continued | |||
| Sirius XM Radio, Inc. 144A 4.000%, 7/15/28(1)(2) | $ 450 | $ 401 | |
| TEGNA, Inc. 5.000%, 9/15/29(1) | 280 | 264 | |
| Virgin Media Secured Finance plc 144A 5.500%, 5/15/29(1)(2) | 395 | 366 | |
| 4,760 | |||
| Mining—0.2% | |||
| Hudbay Minerals, Inc. 144A 6.125%, 4/1/29(2) | 415 | 383 | |
| Oil, Gas & Consumable Fuels—1.9% | |||
| Antero Resources Corp. 144A 7.625%, 2/1/29(2) | 331 | 338 | |
| Callon Petroleum Co. 144A 8.000%, 8/1/28(2) | 355 | 355 | |
| CITGO Petroleum Corp. 144A 6.375%, 6/15/26(1)(2) | 445 | 436 | |
| CNX Resources Corp. | |||
| 144A 7.250%, 3/14/27(1)(2) | 255 | 254 | |
| 144A 7.375%, 1/15/31(2) | 230 | 224 | |
| Comstock Resources, Inc. | |||
| 144A 6.750%, 3/1/29(1)(2) | 240 | 221 | |
| 144A 5.875%, 1/15/30(2) | 285 | 244 | |
| Occidental Petroleum Corp. 6.625%, 9/1/30 | 220 | 234 | |
| SM Energy Co. 6.500%, 7/15/28(1) | 530 | 504 | |
| Southwestern Energy Co. 5.375%, 3/15/30(1) | 235 | 219 | |
| Sunoco LP | |||
| 5.875%, 3/15/28(1) | 260 | 255 | |
| 4.500%, 4/30/30 | 145 | 129 | |
| USA Compression Partners LP 6.875%, 9/1/27(1) | 415 | 403 | |
| Weatherford International Ltd. 144A 8.625%, 4/30/30(1)(2) | 465 | 469 | |
| 4,285 | |||
| Paper & Forest Products—0.1% | |||
| Mercer International, Inc. 144A 5.125%, 2/1/29(1)(2) | 300 | 257 | |
| Pharmaceuticals—0.4% | |||
| Jazz Securities DAC 144A 4.375%, 1/15/29(1)(2) | 555 | 506 | |
| Organon & Co. 144A 5.125%, 4/30/31(1)(2) | 520 | 470 | |
| 976 | |||
| Pipelines—0.8% | |||
| Antero Midstream Partners LP 144A 5.375%, 6/15/29(2) | 290 | 269 | |
| Crestwood Midstream Partners LP 144A 6.000%, 2/1/29(1)(2) | 605 | 574 | |
| EQM Midstream Partners LP 144A 7.500%, 6/1/30(2) | 455 | 455 | |
| Par Value | Value | ||
| Pipelines—continued | |||
| NGL Energy Operating LLC 144A 7.500%, 2/1/26(1)(2) | $ 290 | $ 275 | |
| NuStar Logistics LP 6.375%, 10/1/30(1) | 305 | 294 | |
| 1,867 | |||
| Real Estate—0.1% | |||
| Kennedy-Wilson, Inc. 5.000%, 3/1/31(1) | 395 | 322 | |
| Retail—0.8% | |||
| Asbury Automotive Group, Inc. | |||
| 4.750%, 3/1/30(1) | 422 | 369 | |
| 144A 4.625%, 11/15/29(2) | 145 | 128 | |
| Bath & Body Works, Inc. 144A 6.625%, 10/1/30(1)(2) | 590 | 577 | |
| Macy’s Retail Holdings LLC | |||
| 144A 5.875%, 3/15/30(2) | 135 | 123 | |
| 144A 6.125%, 3/15/32(2) | 265 | 237 | |
| New Red Finance, Inc. 144A 4.000%, 10/15/30(2) | 300 | 255 | |
| 1,689 | |||
| Semiconductors—0.3% | |||
| Amkor Technology, Inc. 144A 6.625%, 9/15/27(1)(2) | 225 | 226 | |
| Entegris Escrow Corp. 144A 5.950%, 6/15/30(2) | 505 | 485 | |
| 711 | |||
| Software—0.4% | |||
| Clarivate Science Holdings Corp. 144A 4.875%, 7/1/29(2) | 300 | 264 | |
| Consensus Cloud Solutions, Inc. 144A 6.500%, 10/15/28(2) | 295 | 276 | |
| SS&C Technologies, Inc. 144A 5.500%, 9/30/27(1)(2) | 245 | 236 | |
| 776 | |||
| Telecommunications—0.7% | |||
| CommScope, Inc. 144A 6.000%, 3/1/26(2) | 190 | 182 | |
| Frontier Communications Holdings LLC | |||
| 144A 5.000%, 5/1/28(1)(2) | 265 | 241 | |
| 144A 8.750%, 5/15/30(2) | 445 | 461 | |
| Hughes Satellite Systems Corp. 6.625%, 8/1/26(1) | 400 | 387 | |
| Lumen Technologies, Inc. 144A 5.375%, 6/15/29(1)(2) | 315 | 218 | |
| 1,489 | |||
| Transportation—0.2% | |||
| Fortress Transportation & Infrastructure Investors LLC | |||
| 144A 9.750%, 8/1/27(1)(2) | 350 | 360 | |
| Par Value | Value | ||
| Transportation—continued | |||
| 144A 5.500%, 5/1/28(1)(2) | $ 150 | $ 132 | |
| 492 | |||
| Total Corporate Bonds and Notes (Identified Cost $45,831) | 43,619 | ||
| Shares | ||
| Convertible Preferred Stocks—10.1% | ||
| Auto Components—0.4% | ||
| Aptiv plc Series A, 5.500%(1) | 7,215 | 909 |
| Banks—2.3% | ||
| Wells Fargo & Co. Series L, 7.500% | 4,060 | 5,107 |
| Capital Markets—0.6% | ||
| KKR & Co., Inc. Series C, 6.000%(1) | 18,035 | 1,219 |
| Commercial Services & Supplies—0.7% | ||
| GFL Environmental, Inc., 6.000%(1) | 20,330 | 1,396 |
| Diversified Financial Services—0.6% | ||
| Chewy, Inc. 2020 Mandatory Exchangeable Trust 144A, 6.500%(2) | 1,285 | 1,336 |
| Electric Utilities—3.0% | ||
| NextEra Energy, Inc. | ||
| 5.279% (1) | 84,730 | 4,236 |
| 6.926% | 19,695 | 944 |
| PG&E Corp., 5.500% | 9,900 | 1,399 |
| 6,579 | ||
| Healthcare Equipment & Supplies—0.9% | ||
| Boston Scientific Corp. Series A, 5.500%(1) | 17,965 | 2,050 |
| Life Sciences Tools & Services—0.7% | ||
| Danaher Corp. Series B, 5.000% | 1,195 | 1,606 |
| Telecommunications—0.9% | ||
| T-Mobile U.S. 2020 Cash Mandatory Exchangeable Trust 144A, 5.250%(1)(2) | 1,690 | 2,038 |
| Total Convertible Preferred Stocks (Identified Cost $22,592) | 22,240 | |
| Preferred Stock—0.1% | ||
| Entertainment—0.1% | ||
| LiveStyle, Inc. Series B (3)(4)(5)(6) | 1,848 | 139 |
| Total Preferred Stock (Identified Cost $181) | 139 | |
| Common Stocks—34.9% | ||
| Air Freight & Logistics—0.2% | ||
| United Parcel Service, Inc. Class B | 2,920 | 541 |
| Automobiles—0.9% | ||
| Tesla, Inc.(5) | 11,988 | 2,077 |
| Shares | Value | ||
| Banks—1.9% | |||
| CCF Holdings LLC (3)(5) | 1,026,972 | $ 626 | |
| CCF Holdings LLC Class M(3)(5) | 219,990 | 134 | |
| JPMorgan Chase & Co. | 12,660 | 1,772 | |
| Wells Fargo & Co. | 34,255 | 1,606 | |
| 4,138 | |||
| Biotechnology—1.3% | |||
| AbbVie, Inc. | 14,875 | 2,198 | |
| Vertex Pharmaceuticals, Inc.(5) | 1,955 | 631 | |
| 2,829 | |||
| Capital Markets—0.9% | |||
| CME Group, Inc. Class A | 4,690 | 828 | |
| Moody’s Corp. | 3,810 | 1,230 | |
| 2,058 | |||
| Chemicals—0.8% | |||
| DuPont de Nemours, Inc. | 15,740 | 1,164 | |
| Sherwin-Williams Co. (The) | 2,935 | 694 | |
| 1,858 | |||
| Commercial Services & Supplies—0.6% | |||
| Waste Management, Inc.(7) | 8,915 | 1,379 | |
| Communications Equipment—0.4% | |||
| Cisco Systems, Inc. | 16,520 | 804 | |
| Consumer Finance—0.3% | |||
| Capital One Financial Corp. | 4,829 | 575 | |
| Electric Utilities—1.0% | |||
| Exelon Corp. | 51,310 | 2,165 | |
| Electrical Equipment—0.3% | |||
| Generac Holdings, Inc.(5) | 2,070 | 249 | |
| Plug Power, Inc.(5) | 18,725 | 319 | |
| 568 | |||
| Energy Equipment & Services—0.7% | |||
| Schlumberger Ltd. | 28,550 | 1,627 | |
| Entertainment—0.0% | |||
| LiveStyle, Inc. (3)(4)(5)(6) | 13,574 | — (8) | |
| Equity Real Estate Investment—0.5% | |||
| American Tower Corp. | 4,875 | 1,089 | |
| Food & Staples Retailing—0.7% | |||
| Costco Wholesale Corp.(7) | 2,960 | 1,513 | |
| Healthcare Equipment & Supplies—1.0% | |||
| Abbott Laboratories | 7,550 | 835 | |
| Dexcom, Inc.(5) | 2,680 | 287 | |
| Intuitive Surgical, Inc.(5)(7) | 4,435 | 1,089 | |
| 2,211 | |||
| Shares | Value | ||
| Healthcare Providers & Services—0.5% | |||
| UnitedHealth Group, Inc. | 2,182 | $ 1,089 | |
| Hotels, Restaurants & Leisure—1.7% | |||
| Booking Holdings, Inc.(5) | 700 | 1,704 | |
| Chipotle Mexican Grill, Inc. Class A(5) | 605 | 996 | |
| MGM Resorts International | 23,125 | 958 | |
| 3,658 | |||
| Insurance—0.5% | |||
| Aon plc Class A | 3,175 | 1,012 | |
| Interactive Media & Services—2.1% | |||
| Alphabet, Inc. Class A(5) | 37,300 | 3,687 | |
| Meta Platforms, Inc. Class A(5) | 6,135 | 914 | |
| 4,601 | |||
| Internet & Direct Marketing Retail—1.3% | |||
| Amazon.com, Inc.(5) | 26,945 | 2,779 | |
| IT Services—1.9% | |||
| Accenture plc Class A | 5,020 | 1,401 | |
| EPAM Systems, Inc.(5) | 1,062 | 353 | |
| Mastercard, Inc. Class A(7) | 6,535 | 2,422 | |
| 4,176 | |||
| Life Sciences Tools & Services—1.2% | |||
| IQVIA Holdings, Inc.(5) | 4,935 | 1,132 | |
| Thermo Fisher Scientific, Inc.(7) | 2,765 | 1,577 | |
| 2,709 | |||
| Machinery—0.3% | |||
| Deere & Co. | 1,565 | 662 | |
| Multiline Retail—0.2% | |||
| Target Corp. | 2,770 | 477 | |
| Oil, Gas & Consumable Fuels—1.0% | |||
| ConocoPhillips | 8,780 | 1,070 | |
| Devon Energy Corp. | 18,215 | 1,152 | |
| 2,222 | |||
| Pharmaceuticals—1.2% | |||
| Eli Lilly & Co. | 4,370 | 1,504 | |
| Zoetis, Inc. Class A | 6,940 | 1,148 | |
| 2,652 | |||
| Road & Rail—0.8% | |||
| Union Pacific Corp. | 9,060 | 1,850 | |
| Semiconductors & Semiconductor Equipment—2.8% | |||
| Broadcom, Inc. | 4,040 | 2,363 | |
| Lam Research Corp.(7) | 2,035 | 1,018 | |
| Marvell Technology, Inc. | 10,735 | 463 | |
| Micron Technology, Inc. | 16,235 | 979 | |
| Shares | Value | ||
| Semiconductors & Semiconductor Equipment—continued | |||
| NVIDIA Corp. | 6,255 | $ 1,222 | |
| 6,045 | |||
| Software—4.0% | |||
| Adobe, Inc. (5) | 720 | 267 | |
| Atlassian Corp. Class A(5) | 2,720 | 439 | |
| Crowdstrike Holdings, Inc. Class A(5) | 5,615 | 595 | |
| Intuit, Inc. | 2,970 | 1,255 | |
| Microsoft Corp. | 17,281 | 4,282 | |
| Salesforce, Inc.(5) | 2,320 | 390 | |
| ServiceNow, Inc.(5) | 3,320 | 1,511 | |
| 8,739 | |||
| Specialty Retail—1.1% | |||
| Home Depot, Inc. (The) | 5,100 | 1,653 | |
| TJX Cos., Inc. (The) | 9,490 | 777 | |
| 2,430 | |||
| Technology Hardware, Storage & Peripherals—2.2% | |||
| Apple, Inc. | 33,805 | 4,878 | |
| Textiles, Apparel & Luxury Goods—0.6% | |||
| NIKE, Inc. Class B | 10,765 | 1,371 | |
| Total Common Stocks (Identified Cost $90,830) | 76,782 | ||
| Warrant—0.1% | |||
| Banks—0.1% | |||
| CCF Holdings LLC(3)(5) | 363,920 | 138 | |
| Total Warrant (Identified Cost $—) | 138 | ||
| Total Long-Term Investments—145.2% (Identified Cost $341,987) | 319,211 | ||
| Short-Term Investment—3.9% | |||
| Money Market Mutual Fund—3.9% | |||
| BlackRock Liquidity FedFund - Institutional Shares (seven-day effective yield 4.066%)(9) | 8,687,411 | 8,687 | |
| Total Short-Term Investment (Identified Cost $8,687) | 8,687 | ||
| TOTAL INVESTMENTS, BEFORE WRITTEN OPTIONS—149.1% (Identified Cost $350,674) | 327,898 | ||
| Value | ||
| Written Options—(0.0)% | ||
| (See open written options schedule) | ||
| Total Written Options (Premiums Received $8) | $ (4) | |
| TOTAL INVESTMENTS, NET OF WRITTEN OPTIONS—149.1% (Identified Cost $350,666) | $ 327,894 | |
| Other assets and liabilities, net—(49.1)% | (108,041) | |
| NET ASSETS—100.0% | $ 219,853 | |
| Abbreviations: | |
| EV | Enterprise Value |
| LLC | Limited Liability Company |
| LP | Limited Partnership |
| REIT | Real Estate Investment Trust |
| Footnote Legend: | |
| (1) | All or a portion of the security is segregated as collateral for margin loan financing. The value of securities segregated as collateral is $65,062. |
| (2) | Security exempt from registration under Rule 144A of the Securities Act of 1933. These securities may be resold in transactions exempt from registration, normally to qualified institutional buyers. At January 31, 2023, these securities amounted to a value of $76,235 or 34.7% of net assets. |
| (3) | The value of this security was determined using significant unobservable inputs and is reported as a Level 3 security in the Fair Value Hierarchy table located after the Schedule of Investments. |
| (4) | For the period of February 1, 2022 through March 1, 2022, a member of the Fund’s former portfolio management team was a member of the board of directors of LiveStyle, Inc. |
| (5) | Non-income producing. |
| (6) | Security is restricted from resale. |
| (7) | All or a portion of the security is segregated as collateral for written options. The value of securities segregated as collateral is $3,762. |
| (8) | Amount is less than $500. |
| (9) | Shares of this fund are publicly offered, and its prospectus and annual report are publicly available. |
| Country Weightings (Unaudited)† | |
| United States | 93% |
| Bermuda | 2 |
| United Kingdom | 2 |
| Canada | 1 |
| Liberia | 1 |
| Israel | 1 |
| Total | 100% |
| † % of total investments, net of written options, as of January 31, 2023. | |
| Open written options contracts as of January 31, 2023 were as follows: | |||||
| Description of Options | Number of Contracts | Contract Notional Amount | Strike Price(1) | Expiration Date | Value |
| Call Options(2) | |||||
| Costco Wholesale Corp. | (7) | $ (378) | $540.00 | 02/17/23 | $ (1) |
| Intuitive Surgical, Inc. | (18) | (522) | 290.00 | 02/17/23 | (—) (3) |
| Lam Research Corp. | (10) | (655) | 655.00 | 03/17/23 | (1) |
| Open written options contracts as of January 31, 2023 were as follows (continued): | |||||
| Description of Options | Number of Contracts | Contract Notional Amount | Strike Price(1) | Expiration Date | Value |
| Call Options(2) (continued) | |||||
| Mastercard, Inc. | (35) | $(1,452) | $415.00 | 02/17/23 | $ (—) (3) |
| Thermo Fisher Scientific, Inc. | (15) | (938) | 625.00 | 02/17/23 | (1) |
| Waste Management, Inc. | (20) | (325) | 162.50 | 02/17/23 | (1) |
| Total Written Options | $ (4) | ||||
| Footnote Legend: | |
| (1) | Strike price not reported in thousands. |
| (2) | Exchange-traded options. |
| (3) | Amount is less than $500. |
| Total Value at January 31, 2023 | Level 1 Quoted Prices | Level 2 Significant Observable Inputs | Level 3 Significant Unobservable Inputs | ||||
| Assets: | |||||||
| Debt Instruments: | |||||||
| Corporate Bonds and Notes | $ 43,619 | $ — | $ 43,619 | $ — | |||
| Convertible Bonds and Notes | 176,293 | — | 173,141 | 3,152 | |||
| Equity Securities: | |||||||
| Common Stocks | 76,782 | 76,022 | — | 760 | |||
| Convertible Preferred Stocks | 22,240 | 18,866 | 3,374 | — | |||
| Preferred Stock | 139 | — | — | 139 | |||
| Warrant | 138 | — | — | 138 | |||
| Money Market Mutual Fund | 8,687 | 8,687 | — | — | |||
| Total Assets | 327,898 | 103,575 | 220,134 | 4,189 | |||
| Liabilities: | |||||||
| Other Financial Instruments: | |||||||
| Written Options | (4) | (3) | (1) | — | |||
| Total Investments, Net of Written Options | $327,894 | $103,572 | $220,133 | $4,189 |
| Total | Convertible Bonds and Notes | Common Stocks | Preferred Stocks | Warrants | |||||
| Investments in Securities | |||||||||
| Balance as of January 31, 2022: | $ 1,011 | $ — | $ 549 | $ 378(a) | $ 84 | ||||
| Net realized gain (loss) | (1,245) | 1 | — | (1,246) | — | ||||
| Net change in unrealized appreciation (depreciation)(b) | 1,528 | 62 | 211 | 1,201 | 54 | ||||
| Purchases | 3,131 | 3,131 | — | — | — | ||||
| Sales (c) | (236) | (42) | — | (194) | — | ||||
| Balance as of January 31, 2023 | $ 4,189 | $ 3,152 | $ 760 | $ 139 | $ 138 |
| Investments in Securities – Assets | Ending Balance at January 31, 2023 | Valuation Technique Used | Unobservable Inputs | Input Values | ||||
| Preferred Stocks: | ||||||||
| LiveStyle, Inc. Series B | $139 | Discounted cash flows liquidation approach | Discount rate | 23.85% (23.70% - 24.03%) | ||||
| Common Stocks: | ||||||||
| CCF Holdings LLC | $626 | Market and Company Comparables | EV Multiples | 1.09x (0.68x - 1.48x) | ||||
| 6.72x (5.50x - 9.08x) | ||||||||
| 0.64x (0.45x - 0.77x) | ||||||||
| Illiquidity Discount | 25% | |||||||
| CCF Holdings LLC Class M | $134 | Market and Company Comparables | EV Multiples | 1.09x (0.68x - 1.48x) | ||||
| 6.72x (5.50x - 9.08x) | ||||||||
| 0.64x (0.45x - 0.77x) | ||||||||
| Illiquidity Discount | 25% | |||||||
| LiveStyle, Inc. | $ —(1) | Discounted cash flows liquidation approach | Discount rate | 23.85% (23.70% - 24.03%) | ||||
| Warrant: | ||||||||
| CCF Holdings LLC | $138 | Market and Company Comparables | EV Multiples | 1.09x (0.68x - 1.48x) | ||||
| 6.72x (5.50x - 9.08x) | ||||||||
| 0.64x (0.45x - 0.77x) | ||||||||
| Illiquidity Discount | 25% | |||||||
| Black-Scholes Model | Volatility | 55.94% | ||||||
| (1) Amount is less than $500. | ||||||||
| Par Value | Value | ||
| Convertible Bonds and Notes—17.8% | |||
| Airlines—0.2% | |||
| American Airlines Group, Inc. 6.500%, 7/1/25 | $ 1,450 | $ 1,776 | |
| Southwest Airlines Co. 1.250%, 5/1/25 | 1,180 | 1,415 | |
| 3,191 | |||
| Auto Manufacturers—0.1% | |||
| Lucid Group, Inc. 144A 1.250%, 12/15/26(1) | 1,470 | 951 | |
| Banks—0.4% | |||
| Barclays Bank plc 0.000%, 2/18/25 | 2,955 | 3,156 | |
| BofA Finance LLC 0.600%, 5/25/27 | 1,515 | 1,703 | |
| 4,859 | |||
| Biotechnology—1.4% | |||
| Alnylam Pharmaceuticals, Inc. 144A 1.000%, 9/15/27(1) | 2,205 | 2,351 | |
| BioMarin Pharmaceutical, Inc. 1.250%, 5/15/27 | 2,960 | 3,330 | |
| Bridgebio Pharma, Inc. 2.250%, 2/1/29 | 1,970 | 672 | |
| Cytokinetics, Inc. 144A 3.500%, 7/1/27(1) | 1,580 | 1,728 | |
| Halozyme Therapeutics, Inc. | |||
| 0.250%, 3/1/27 | 2,845 | 2,664 | |
| 144A 1.000%, 8/15/28(1) | 540 | 600 | |
| Insmed, Inc. | |||
| 1.750%, 1/15/25 | 1,775 | 1,684 | |
| 0.750%, 6/1/28 | 980 | 870 | |
| Sarepta Therapeutics, Inc. 144A 1.250%, 9/15/27(1) | 3,700 | 4,205 | |
| 18,104 | |||
| Chemicals—0.1% | |||
| Livent Corp. 4.125%, 7/15/25 | 505 | 1,551 | |
| Commercial Services—1.0% | |||
| Block, Inc. | |||
| 0.125%, 3/1/25 | 2,915 | 2,959 | |
| 0.250%, 11/1/27 | 800 | 641 | |
| Repay Holdings Corp. 144A 0.000%, 2/1/26(1) | 2,960 | 2,373 | |
| Shift4 Payments, Inc. | |||
| 0.000%, 12/15/25 | 1,990 | 2,124 | |
| 0.500%, 8/1/27 | 3,455 | 3,084 | |
| Stride, Inc. 1.125%, 9/1/27 | 2,720 | 2,841 | |
| 14,022 | |||
| Computers—0.8% | |||
| 3D Systems Corp. 0.000%, 11/15/26 | 1,770 | 1,313 | |
| Par Value | Value | ||
| Computers—continued | |||
| CyberArk Software Ltd. 0.000%, 11/15/24 | $ 1,310 | $ 1,440 | |
| KBR, Inc. 2.500%, 11/1/23 | 1,060 | 2,165 | |
| Lumentum Holdings, Inc. | |||
| 0.500%, 12/15/26 | 385 | 349 | |
| 144A 0.500%, 6/15/28(1) | 1,855 | 1,490 | |
| Parsons Corp. 0.250%, 8/15/25 | 1,465 | 1,603 | |
| Pure Storage, Inc. 0.125%, 4/15/23 | 130 | 145 | |
| Rapid7, Inc. 0.250%, 3/15/27 | 1,765 | 1,447 | |
| Zscaler, Inc. 0.125%, 7/1/25 | 1,115 | 1,218 | |
| 11,170 | |||
| Cosmetics & Personal Care—0.2% | |||
| Beauty Health Co. (The) 144A 1.250%, 10/1/26(1) | 2,965 | 2,426 | |
| Diversified Financial Services—0.7% | |||
| Coinbase Global, Inc. 0.500%, 6/1/26 | 2,115 | 1,433 | |
| Goldman Sachs Finance Corp. 0.500%, 12/29/27(2) | 4,235 | 4,427 | |
| JPMorgan Chase Financial Co., LLC 0.500%, 6/15/27 | 2,620 | 3,348 | |
| 9,208 | |||
| Energy-Alternate Sources—0.7% | |||
| Enphase Energy, Inc. | |||
| 0.000%, 3/1/26 | 2,365 | 2,491 | |
| 0.000%, 3/1/28 | 405 | 436 | |
| Plug Power, Inc. 3.750%, 6/1/25 | 275 | 934 | |
| SolarEdge Technologies, Inc. 0.000%, 9/15/25 | 955 | 1,282 | |
| Stem, Inc. 144A 0.500%, 12/1/28(1) | 3,175 | 2,134 | |
| Sunnova Energy International, Inc. 144A 2.625%, 2/15/28(1) | 2,705 | 2,277 | |
| 9,554 | |||
| Entertainment—0.7% | |||
| DraftKings Holdings, Inc. 0.000%, 3/15/28 | 2,730 | 1,856 | |
| Live Nation Entertainment, Inc. | |||
| 2.000%, 2/15/25 | 3,005 | 3,094 | |
| 144A 3.125%, 1/15/29(1) | 1,225 | 1,314 | |
| Vail Resorts, Inc. 0.000%, 1/1/26 | 3,310 | 3,132 | |
| 9,396 | |||
| Food & Beverage—0.2% | |||
| Post Holdings, Inc. 144A 2.500%, 8/15/27(1) | 2,410 | 2,623 | |
| Par Value | Value | ||
| Healthcare-Products—0.9% | |||
| CONMED Corp. 144A 2.250%, 6/15/27(1) | $ 1,505 | $ 1,432 | |
| Exact Sciences Corp. | |||
| 0.375%, 3/15/27 | 3,730 | 3,516 | |
| 0.375%, 3/1/28 | 350 | 312 | |
| Insulet Corp. 0.375%, 9/1/26 | 1,605 | 2,216 | |
| Natera, Inc. 2.250%, 5/1/27 | 1,080 | 1,470 | |
| Novocure Ltd. 0.000%, 11/1/25 | 2,220 | 2,148 | |
| Repligen Corp. 0.375%, 7/15/24 | 910 | 1,540 | |
| 12,634 | |||
| Healthcare-Services—0.1% | |||
| Elevance Health, Inc. 2.750%, 10/15/42 | 175 | 1,247 | |
| Internet—2.6% | |||
| Booking Holdings, Inc. 0.750%, 5/1/25 | 2,220 | 3,161 | |
| Etsy, Inc. | |||
| 0.125%, 9/1/27 | 2,790 | 2,868 | |
| 0.250%, 6/15/28 | 2,435 | 2,190 | |
| Farfetch Ltd. 3.750%, 5/1/27 | 1,255 | 1,099 | |
| Match Group Financeco 2, Inc. 144A 0.875%, 6/15/26(1) | 1,695 | 1,625 | |
| Palo Alto Networks, Inc. | |||
| 0.750%, 7/1/23 | 1,520 | 2,722 | |
| 0.375%, 6/1/25 | 2,075 | 3,401 | |
| Snap, Inc. | |||
| 0.750%, 8/1/26 | 1,870 | 1,724 | |
| 144A 0.125%, 3/1/28(1) | 2,700 | 1,945 | |
| TechTarget, Inc. 0.000%, 12/15/26 | 1,925 | 1,533 | |
| Uber Technologies, Inc. 0.000%, 12/15/25 | 4,625 | 4,064 | |
| Wayfair, Inc. | |||
| 1.125%, 11/1/24 | 2,315 | 2,149 | |
| 1.000%, 8/15/26 | 700 | 532 | |
| 144A 3.250%, 9/15/27(1) | 970 | 1,164 | |
| Zillow Group, Inc. 2.750%, 5/15/25 | 4,220 | 4,323 | |
| 34,500 | |||
| Leisure Time—0.6% | |||
| NCL Corp., Ltd. 1.125%, 2/15/27 | 5,980 | 4,560 | |
| Royal Caribbean Cruises Ltd. 144A 6.000%, 8/15/25(1) | 1,240 | 1,893 | |
| Topgolf Callaway Brands Corp. 2.750%, 5/1/26 | 1,075 | 1,638 | |
| 8,091 | |||
| Machinery-Diversified—0.1% | |||
| Middleby Corp. (The) 1.000%, 9/1/25 | 1,110 | 1,448 | |
| Par Value | Value | ||
| Media—0.9% | |||
| DISH Network Corp. | |||
| 0.000%, 12/15/25 | $ 2,230 | $ 1,471 | |
| 3.375%, 8/15/26 | 2,785 | 1,822 | |
| Liberty Broadband Corp. 144A 2.750%, 9/30/50(1) | 1,405 | 1,377 | |
| Liberty Media Corp. 1.375%, 10/15/23 | 2,250 | 2,942 | |
| Liberty Media Corp.-Liberty Formula One 144A 2.250%, 8/15/27(1) | 2,845 | 2,970 | |
| World Wrestling Entertainment, Inc. 3.375%, 12/15/23 | 605 | 2,053 | |
| 12,635 | |||
| Mining—0.3% | |||
| Lithium Americas Corp. 1.750%, 1/15/27 | 2,225 | 1,916 | |
| MP Materials Corp. 144A 0.250%, 4/1/26(1) | 1,565 | 1,565 | |
| 3,481 | |||
| Miscellaneous Manufacturing—0.2% | |||
| Axon Enterprise, Inc. 144A 0.500%, 12/15/27(1) | 2,300 | 2,470 | |
| Oil, Gas & Consumable Fuels—0.5% | |||
| EQT Corp. 1.750%, 5/1/26 | 605 | 1,357 | |
| Northern Oil & Gas, Inc. 144A 3.625%, 4/15/29(1) | 1,940 | 2,201 | |
| Pioneer Natural Resources Co. 0.250%, 5/15/25 | 1,360 | 3,200 | |
| 6,758 | |||
| Pharmaceuticals—1.0% | |||
| Dexcom, Inc. 0.250%, 11/15/25 | 6,635 | 6,987 | |
| Jazz Investments I Ltd. 2.000%, 6/15/26 | 3,375 | 3,961 | |
| Revance Therapeutics, Inc. 1.750%, 2/15/27 | 1,525 | 1,965 | |
| 12,913 | |||
| Retail—0.3% | |||
| Burlington Stores, Inc. 2.250%, 4/15/25 | 1,890 | 2,341 | |
| Shake Shack, Inc. 0.000%, 3/1/28 | 2,465 | 1,833 | |
| 4,174 | |||
| Semiconductors—0.7% | |||
| MACOM Technology Solutions Holdings, Inc. 0.250%, 3/15/26 | 1,100 | 1,135 | |
| Microchip Technology, Inc. 0.125%, 11/15/24 | 1,675 | 1,858 | |
| ON Semiconductor Corp. 0.000%, 5/1/27 | 1,175 | 1,762 | |
| Silicon Laboratories, Inc. 0.625%, 6/15/25 | 565 | 784 | |
| Par Value | Value | ||
| Semiconductors—continued | |||
| Wolfspeed, Inc. | |||
| 144A 0.250%, 2/15/28(1) | $ 3,270 | $ 2,984 | |
| 144A 1.875%, 12/1/29(1) | 1,180 | 1,146 | |
| 9,669 | |||
| Software—3.0% | |||
| Akamai Technologies, Inc. 0.125%, 5/1/25 | 1,855 | 1,988 | |
| Alteryx, Inc. 0.500%, 8/1/24 | 2,170 | 2,007 | |
| Bentley Systems, Inc. 0.125%, 1/15/26 | 3,080 | 2,846 | |
| Bill.com Holdings, Inc. 0.000%, 4/1/27 | 5,550 | 4,451 | |
| Box, Inc. 0.000%, 1/15/26 | 1,125 | 1,508 | |
| Cloudflare, Inc. 0.000%, 8/15/26 | 4,210 | 3,499 | |
| Confluent, Inc. 0.000%, 1/15/27 | 1,935 | 1,501 | |
| DigitalOcean Holdings, Inc. 0.000%, 12/1/26 | 3,010 | 2,310 | |
| Envestnet, Inc. 144A 2.625%, 12/1/27(1) | 860 | 961 | |
| Evolent Health, Inc. 1.500%, 10/15/25 | 1,600 | 1,862 | |
| Five9, Inc. 0.500%, 6/1/25 | 3,170 | 2,994 | |
| HubSpot, Inc. 0.375%, 6/1/25 | 700 | 968 | |
| Nutanix, Inc. 0.250%, 10/1/27 | 1,765 | 1,532 | |
| PagerDuty, Inc. 1.250%, 7/1/25 | 1,315 | 1,387 | |
| Splunk, Inc. | |||
| 1.125%, 9/15/25 | 1,515 | 1,476 | |
| 1.125%, 6/15/27 | 2,860 | 2,461 | |
| Tyler Technologies, Inc. 0.250%, 3/15/26 | 2,495 | 2,369 | |
| Unity Software, Inc. 0.000%, 11/15/26 | 1,665 | 1,284 | |
| Workiva, Inc. 1.125%, 8/15/26 | 1,860 | 2,342 | |
| 39,746 | |||
| Transportation—0.1% | |||
| Air Transport Services Group, Inc. 1.125%, 10/15/24 | 1,690 | 1,785 | |
| Total Convertible Bonds and Notes (Identified Cost $252,545) | 238,606 | ||
| Shares | ||
| Convertible Preferred Stocks—2.1% | ||
| Auto Components—0.1% | ||
| Aptiv plc Series A, 5.500% | 9,985 | 1,258 |
| Banks—0.5% | ||
| Wells Fargo & Co. Series L, 7.500% | 5,650 | 7,108 |
| Shares | Value | ||
| Capital Markets—0.1% | |||
| KKR & Co., Inc. Series C, 6.000% | 25,045 | $ 1,692 | |
| Commercial Services & Supplies—0.2% | |||
| GFL Environmental, Inc., 6.000% | 27,975 | 1,921 | |
| Diversified Financial Services—0.1% | |||
| Chewy, Inc. 2020 Mandatory Exchangeable Trust 144A, 6.500%(1) | 1,780 | 1,850 | |
| Electric Utilities—0.5% | |||
| NextEra Energy, Inc. | |||
| 5.279% | 66,795 | 3,339 | |
| 6.926% | 27,325 | 1,310 | |
| PG&E Corp., 5.500% | 13,995 | 1,977 | |
| 6,626 | |||
| Healthcare Equipment & Supplies—0.2% | |||
| Boston Scientific Corp. Series A, 5.500% | 24,910 | 2,843 | |
| Life Sciences Tools & Services—0.2% | |||
| Danaher Corp. Series B, 5.000% | 1,650 | 2,217 | |
| Telecommunications—0.2% | |||
| T-Mobile U.S. 2020 Cash Mandatory Exchangeable Trust 144A, 5.250%(1) | 2,425 | 2,925 | |
| Total Convertible Preferred Stocks (Identified Cost $28,533) | 28,440 | ||
| Common Stocks—76.8% | |||
| Air Freight & Logistics—0.8% | |||
| United Parcel Service, Inc. Class B | 55,497 | 10,280 | |
| Automobiles—0.5% | |||
| Ferrari N.V. | 24,357 | 6,121 | |
| Banks—7.2% | |||
| Bank of America Corp. | 889,735 | 31,568 | |
| First Republic Bank | 85,309 | 12,018 | |
| JPMorgan Chase & Co.(3) | 297,969 | 41,704 | |
| Truist Financial Corp. | 223,088 | 11,018 | |
| 96,308 | |||
| Building Products—1.0% | |||
| Lennox International, Inc. | 52,914 | 13,790 | |
| Capital Markets—3.8% | |||
| Intercontinental Exchange, Inc. | 104,716 | 11,263 | |
| MarketAxess Holdings, Inc. | 42,573 | 15,490 | |
| Morgan Stanley | 127,824 | 12,441 | |
| MSCI, Inc. Class A | 23,256 | 12,362 | |
| 51,556 | |||
| Chemicals—2.7% | |||
| Air Products & Chemicals, Inc. | 43,013 | 13,786 | |
| Shares | Value | ||
| Chemicals—continued | |||
| Celanese Corp. | 184,807 | $ 22,768 | |
| 36,554 | |||
| Consumer Finance—0.9% | |||
| Capital One Financial Corp. | 105,528 | 12,558 | |
| Containers & Packaging—0.8% | |||
| Ball Corp. | 186,336 | 10,852 | |
| Distributors—0.8% | |||
| Pool Corp. | 29,192 | 11,257 | |
| Diversified Telecommunication Services—0.8% | |||
| Verizon Communications, Inc. | 242,552 | 10,083 | |
| Electrical Equipment—0.9% | |||
| AMETEK, Inc. | 86,021 | 12,466 | |
| Equity Real Estate Investment—5.0% | |||
| Alexandria Real Estate Equities, Inc. | 73,336 | 11,788 | |
| American Tower Corp. | 47,808 | 10,680 | |
| Digital Realty Trust, Inc. | 196,473 | 22,520 | |
| Medical Properties Trust, Inc. | 862,872 | 11,174 | |
| Sun Communities, Inc. | 69,734 | 10,938 | |
| 67,100 | |||
| Food & Staples Retailing—1.2% | |||
| Costco Wholesale Corp. | 10,226 | 5,227 | |
| Walmart, Inc. | 80,239 | 11,544 | |
| 16,771 | |||
| Healthcare Equipment & Supplies—3.8% | |||
| IDEXX Laboratories, Inc.(4) | 26,879 | 12,915 | |
| Medtronic plc | 116,256 | 9,729 | |
| Stryker Corp. | 36,880 | 9,361 | |
| Teleflex, Inc. | 76,366 | 18,589 | |
| 50,594 | |||
| Healthcare Technology—0.8% | |||
| Veeva Systems, Inc. Class A(4) | 59,238 | 10,103 | |
| Hotels, Restaurants & Leisure—1.9% | |||
| Domino’s Pizza, Inc. | 29,658 | 10,469 | |
| Starbucks Corp. | 137,088 | 14,962 | |
| 25,431 | |||
| Household Durables—1.0% | |||
| DR Horton, Inc. | 134,978 | 13,321 | |
| Industrial Conglomerates—0.7% | |||
| Honeywell International, Inc. | 41,788 | 8,712 | |
| Insurance—0.8% | |||
| Willis Towers Watson plc | 44,320 | 11,266 | |
| Shares | Value | ||
| Interactive Media & Services—2.9% | |||
| Alphabet, Inc. Class A(4) | 102,760 | $ 10,157 | |
| Alphabet, Inc. Class C(4) | 87,540 | 8,742 | |
| Meta Platforms, Inc. Class A(4) | 134,906 | 20,097 | |
| 38,996 | |||
| Internet & Direct Marketing Retail—0.9% | |||
| Amazon.com, Inc.(3)(4) | 115,712 | 11,933 | |
| IT Services—0.9% | |||
| Visa, Inc. Class A | 51,287 | 11,807 | |
| Life Sciences Tools & Services—2.6% | |||
| Danaher Corp. | 38,458 | 10,168 | |
| Thermo Fisher Scientific, Inc.(3) | 18,977 | 10,823 | |
| West Pharmaceutical Services, Inc. | 51,920 | 13,790 | |
| 34,781 | |||
| Machinery—3.0% | |||
| Cummins, Inc. | 36,549 | 9,120 | |
| Stanley Black & Decker, Inc. | 248,127 | 22,160 | |
| Toro Co. (The) | 83,427 | 9,304 | |
| 40,584 | |||
| Metals & Mining—1.1% | |||
| Kinross Gold Corp. | 3,038,664 | 14,099 | |
| Oil, Gas & Consumable Fuels—1.0% | |||
| Phillips 66 | 133,368 | 13,373 | |
| Personal Products—0.9% | |||
| Estee Lauder Cos., Inc. (The) Class A | 44,802 | 12,414 | |
| Pharmaceuticals—2.4% | |||
| Zoetis, Inc. Class A | 198,049 | 32,775 | |
| Professional Services—1.7% | |||
| TransUnion | 317,332 | 22,769 | |
| Road & Rail—0.8% | |||
| Norfolk Southern Corp. | 44,249 | 10,877 | |
| Semiconductors & Semiconductor Equipment—5.9% | |||
| Advanced Micro Devices, Inc.(4) | 111,060 | 8,346 | |
| Broadcom, Inc. | 17,502 | 10,239 | |
| Lam Research Corp. | 44,825 | 22,417 | |
| NVIDIA Corp. | 79,940 | 15,618 | |
| Taiwan Semiconductor Manufacturing Co., Ltd. Sponsored ADR | 124,218 | 11,519 | |
| Texas Instruments, Inc. | 65,470 | 11,602 | |
| 79,741 | |||
| Software—7.9% | |||
| Adobe, Inc. (4) | 121,678 | 45,062 | |
| Intuit, Inc. | 25,618 | 10,828 | |
| Microsoft Corp.(3) | 156,910 | 38,884 | |
| Shares | Value | ||
| Software—continued | |||
| ServiceNow, Inc.(4) | 26,223 | $ 11,935 | |
| 106,709 | |||
| Specialty Retail—4.2% | |||
| Best Buy Co., Inc. | 143,033 | 12,690 | |
| Home Depot, Inc. (The)(3) | 104,852 | 33,990 | |
| Ross Stores, Inc. | 82,859 | 9,793 | |
| 56,473 | |||
| Technology Hardware, Storage & Peripherals—2.8% | |||
| Apple, Inc.(3) | 264,633 | 38,184 | |
| Textiles, Apparel & Luxury Goods—1.6% | |||
| Lululemon Athletica, Inc.(4) | 33,987 | 10,430 | |
| NIKE, Inc. Class B(3) | 92,072 | 11,724 | |
| 22,154 | |||
| Water Utilities—0.8% | |||
| American Water Works Co., Inc. | 67,451 | 10,555 | |
| Total Common Stocks (Identified Cost $944,771) | 1,033,347 | ||
| Warrant—0.0% | |||
| Oil, Gas & Consumable Fuels—0.0% | |||
| Nabors Industries Ltd.(4) | 876 | 27 | |
| Total Warrant (Identified Cost $—) | 27 | ||
| Total Long-Term Investments—96.7% (Identified Cost $1,225,849) | 1,300,420 | ||
| Short-Term Investment—2.8% | |||
| Money Market Mutual Fund—2.8% | |||
| BlackRock Liquidity FedFund - Institutional Shares (seven-day effective yield 4.066%)(5) | 38,405,405 | 38,405 | |
| Total Short-Term Investment (Identified Cost $38,405) | 38,405 | ||
| TOTAL INVESTMENTS, BEFORE WRITTEN OPTIONS—99.5% (Identified Cost $1,264,254) | 1,338,825 | ||
| Value | ||
| Written Options—(0.1)% | ||
| (See open written options schedule) | ||
| Total Written Options (Premiums Received $856) | $ (1,791) | |
| TOTAL INVESTMENTS, NET OF WRITTEN OPTIONS—99.4% (Identified Cost $1,263,398) | $1,337,034 | |
| Other assets and liabilities, net—0.6% | 8,277 | |
| NET ASSETS—100.0% | $1,345,311 | |
| Abbreviations: | |
| ADR | American Depositary Receipt |
| LLC | Limited Liability Company |
| MSCI | Morgan Stanley Capital International |
| Footnote Legend: | |
| (1) | Security exempt from registration under Rule 144A of the Securities Act of 1933. These securities may be resold in transactions exempt from registration, normally to qualified institutional buyers. At January 31, 2023, these securities amounted to a value of $52,980 or 3.9% of net assets. |
| (2) | The value of this security was determined using significant unobservable inputs and is reported as a Level 3 security in the Fair Value Hierarchy table located after the Schedule of Investments. |
| (3) | All or a portion of the security is segregated as collateral for written options. The value of securities segregated as collateral is $59,755. |
| (4) | Non-income producing. |
| (5) | Shares of this fund are publicly offered, and its prospectus and annual report are publicly available. |
| Country Weightings (Unaudited)† | |
| United States | 94% |
| Canada | 2 |
| Ireland | 2 |
| Taiwan | 1 |
| Bermuda | 1 |
| Total | 100% |
| † % of total investments, net of written options, as of January 31, 2023. | |
| Open written options contracts as of January 31, 2023 were as follows: | |||||
| Description of Options | Number of Contracts | Contract Notional Amount | Strike Price(1) | Expiration Date | Value |
| Call Options(2) | |||||
| Adobe, Inc. | (182) | $ (6,916) | $380.00 | 02/17/23 | $ (126) |
| Adobe, Inc. | (182) | (7,189) | 395.00 | 02/17/23 | (48) |
| Advanced Micro Devices, Inc. | (333) | (2,664) | 80.00 | 02/17/23 | (69) |
| Alphabet, Inc. | (262) | (2,751) | 105.00 | 02/17/23 | (48) |
| Alphabet, Inc. | (308) | (3,388) | 110.00 | 02/17/23 | (19) |
| Amazon.com, Inc. | (115) | (1,208) | 105.00 | 02/17/23 | (51) |
| Amazon.com, Inc. | (231) | (2,541) | 110.00 | 02/17/23 | (60) |
| Open written options contracts as of January 31, 2023 were as follows (continued): | |||||
| Description of Options | Number of Contracts | Contract Notional Amount | Strike Price(1) | Expiration Date | Value |
| Call Options(2) (continued) | |||||
| American Water Works Co., Inc. | (236) | $ (3,894) | $165.00 | 02/17/23 | $ (15) |
| Apple, Inc. | (396) | (5,940) | 150.00 | 02/17/23 | (88) |
| Apple, Inc. | (529) | (8,200) | 155.00 | 02/17/23 | (52) |
| Best Buy Co., Inc. | (429) | (3,968) | 92.50 | 02/17/23 | (34) |
| Broadcom, Inc. | (52) | (3,172) | 610.00 | 02/17/23 | (26) |
| Celanese Corp. | (554) | (7,479) | 135.00 | 02/17/23 | (31) |
| Costco Wholesale Corp. | (30) | (1,560) | 520.00 | 02/17/23 | (19) |
| Cummins, Inc. | (127) | (3,302) | 260.00 | 02/17/23 | (29) |
| Danaher Corp. | (96) | (2,880) | 300.00 | 02/17/23 | (1) |
| Digital Realty Trust, Inc. | (196) | (2,254) | 115.00 | 02/17/23 | (67) |
| Digital Realty Trust, Inc. | (491) | (5,892) | 120.00 | 02/17/23 | (47) |
| DR Horton, Inc. | (404) | (4,242) | 105.00 | 02/17/23 | (20) |
| Home Depot, Inc. (The) | (209) | (7,211) | 345.00 | 02/17/23 | (24) |
| Home Depot, Inc. (The) | (209) | (7,420) | 355.00 | 02/17/23 | (8) |
| Intuit, Inc. | (76) | (3,344) | 440.00 | 02/17/23 | (54) |
| JPMorgan Chase & Co. | (744) | (10,788) | 145.00 | 02/17/23 | (57) |
| JPMorgan Chase & Co. | (297) | (4,604) | 155.00 | 03/17/23 | (7) |
| Lam Research Corp. | (67) | (3,618) | 540.00 | 02/17/23 | (29) |
| Lam Research Corp. | (67) | (3,518) | 525.00 | 02/17/23 | (47) |
| Lululemon Athletica, Inc. | (51) | (1,785) | 350.00 | 02/17/23 | (2) |
| Medtronic plc | (348) | (3,045) | 87.50 | 02/17/23 | (14) |
| Meta Platforms, Inc. | (404) | (6,666) | 165.00 | 02/17/23 | (146) |
| Microsoft Corp. | (156) | (4,134) | 265.00 | 02/17/23 | (12) |
| Microsoft Corp. | (313) | (8,608) | 275.00 | 02/17/23 | (6) |
| Microsoft Corp. | (156) | (4,368) | 280.00 | 03/17/23 | (11) |
| Morgan Stanley | (447) | (4,694) | 105.00 | 02/17/23 | (5) |
| NIKE, Inc. | (276) | (3,864) | 140.00 | 02/17/23 | (5) |
| Norfolk Southern Corp. | (128) | (3,456) | 270.00 | 02/17/23 | (2) |
| NVIDIA Corp. | (79) | (1,580) | 200.00 | 02/17/23 | (56) |
| NVIDIA Corp. | (199) | (4,179) | 210.00 | 02/17/23 | (72) |
| Ross Stores, Inc. | (248) | (3,100) | 125.00 | 02/17/23 | (16) |
| ServiceNow, Inc. | (26) | (1,274) | 490.00 | 02/17/23 | (12) |
| ServiceNow, Inc. | (52) | (2,652) | 510.00 | 02/17/23 | (9) |
| Stanley Black & Decker, Inc. | (124) | (1,116) | 90.00 | 02/17/23 | (41) |
| Stanley Black & Decker, Inc. | (496) | (4,712) | 95.00 | 02/17/23 | (70) |
| Starbucks Corp. | (479) | (5,509) | 115.00 | 02/17/23 | (53) |
| Taiwan Semiconductor Manufacturing Co. Ltd. | (186) | (1,860) | 100.00 | 02/17/23 | (8) |
| Taiwan Semiconductor Manufacturing Co. Ltd. | (186) | (1,953) | 105.00 | 02/17/23 | (2) |
| Texas Instruments, Inc. | (196) | (3,822) | 195.00 | 02/17/23 | (4) |
| Thermo Fisher Scientific, Inc. | (56) | (3,640) | 650.00 | 02/17/23 | (2) |
| TransUnion | (950) | (7,125) | 75.00 | 02/17/23 | (121) |
| United Parcel Service, Inc. | (166) | (3,320) | 200.00 | 02/17/23 | (4) |
| Veeva Systems, Inc. | (148) | (2,738) | 185.00 | 02/17/23 | (14) |
| Visa, Inc. | (153) | (3,749) | 245.00 | 02/17/23 | (4) |
| Walmart, Inc. | (240) | (3,600) | 150.00 | 02/17/23 | (9) |
| Zoetis, Inc. | (495) | (9,405) | 190.00 | 02/17/23 | (15) |
| Total Written Options | $(1,791) | ||||
| Footnote Legend: | |
| (1) | Strike price not reported in thousands. |
| (2) | Exchange-traded options. |
| Total Value at January 31, 2023 | Level 1 Quoted Prices | Level 2 Significant Observable Inputs | Level 3 Significant Unobservable Inputs | ||||
| Assets: | |||||||
| Debt Instruments: | |||||||
| Convertible Bonds and Notes | $ 238,606 | $ — | $234,179 | $4,427 | |||
| Equity Securities: | |||||||
| Common Stocks | 1,033,347 | 1,033,347 | — | — | |||
| Convertible Preferred Stocks | 28,440 | 23,665 | 4,775 | — | |||
| Warrant | 27 | 27 | — | — | |||
| Money Market Mutual Fund | 38,405 | 38,405 | — | — | |||
| Total Assets | 1,338,825 | 1,095,444 | 238,954 | 4,427 | |||
| Liabilities: | |||||||
| Other Financial Instruments: | |||||||
| Written Options | (1,791) | (1,637) | (154) | — | |||
| Total Investments, Net of Written Options | $1,337,034 | $1,093,807 | $238,800 | $4,427 |
| Par Value | Value | ||
| Convertible Bonds and Notes—32.3% | |||
| Airlines—0.4% | |||
| American Airlines Group, Inc. 6.500%, 7/1/25 | $ 1,190 | $ 1,458 | |
| Southwest Airlines Co. 1.250%, 5/1/25 | 945 | 1,133 | |
| 2,591 | |||
| Auto Manufacturers—0.1% | |||
| Lucid Group, Inc. 144A 1.250%, 12/15/26(1) | 1,205 | 779 | |
| Banks—0.7% | |||
| Barclays Bank plc 0.000%, 2/18/25 | 2,645 | 2,825 | |
| BofA Finance LLC 0.600%, 5/25/27 | 1,240 | 1,394 | |
| 4,219 | |||
| Biotechnology—2.4% | |||
| Alnylam Pharmaceuticals, Inc. 144A 1.000%, 9/15/27(1) | 1,970 | 2,101 | |
| BioMarin Pharmaceutical, Inc. 1.250%, 5/15/27 | 2,420 | 2,723 | |
| Cytokinetics, Inc. 144A 3.500%, 7/1/27(1) | 1,405 | 1,537 | |
| Halozyme Therapeutics, Inc. | |||
| 0.250%, 3/1/27 | 2,330 | 2,181 | |
| 144A 1.000%, 8/15/28(1) | 445 | 494 | |
| Insmed, Inc. | |||
| 1.750%, 1/15/25 | 1,585 | 1,504 | |
| 0.750%, 6/1/28 | 805 | 714 | |
| Sarepta Therapeutics, Inc. 144A 1.250%, 9/15/27(1) | 3,015 | 3,427 | |
| 14,681 | |||
| Chemicals—0.2% | |||
| Livent Corp. 4.125%, 7/15/25 | 410 | 1,260 | |
| Commercial Services—2.0% | |||
| Block, Inc. 0.125%, 3/1/25 | 3,690 | 3,745 | |
| Repay Holdings Corp. 144A 0.000%, 2/1/26(1) | 2,650 | 2,125 | |
| Shift4 Payments, Inc. | |||
| 0.000%, 12/15/25 | 1,630 | 1,740 | |
| 0.500%, 8/1/27 | 2,825 | 2,521 | |
| Stride, Inc. 1.125%, 9/1/27 | 2,220 | 2,319 | |
| 12,450 | |||
| Computers—1.5% | |||
| 3D Systems Corp. 0.000%, 11/15/26 | 1,580 | 1,172 | |
| CyberArk Software Ltd. 0.000%, 11/15/24 | 1,070 | 1,176 | |
| KBR, Inc. 2.500%, 11/1/23 | 870 | 1,777 | |
| Par Value | Value | ||
| Computers—continued | |||
| Lumentum Holdings, Inc. | |||
| 0.500%, 12/15/26 | $ 345 | $ 313 | |
| 144A 0.500%, 6/15/28(1) | 1,660 | 1,333 | |
| Parsons Corp. 0.250%, 8/15/25 | 1,190 | 1,302 | |
| Pure Storage, Inc. 0.125%, 4/15/23 | 115 | 128 | |
| Rapid7, Inc. 0.250%, 3/15/27 | 1,585 | 1,300 | |
| Zscaler, Inc. 0.125%, 7/1/25 | 995 | 1,087 | |
| 9,588 | |||
| Cosmetics & Personal Care—0.3% | |||
| Beauty Health Co. (The) 144A 1.250%, 10/1/26(1) | 2,595 | 2,123 | |
| Diversified Financial Services—1.2% | |||
| Coinbase Global, Inc. 0.500%, 6/1/26 | 1,770 | 1,199 | |
| Goldman Sachs Finance Corp. 0.500%, 12/29/27(2) | 3,445 | 3,601 | |
| JPMorgan Chase Financial Co., LLC 0.500%, 6/15/27 | 2,135 | 2,729 | |
| 7,529 | |||
| Energy-Alternate Sources—1.3% | |||
| Enphase Energy, Inc. | |||
| 0.000%, 3/1/26 | 1,935 | 2,038 | |
| 0.000%, 3/1/28 | 335 | 360 | |
| Plug Power, Inc. 3.750%, 6/1/25 | 245 | 832 | |
| SolarEdge Technologies, Inc. 0.000%, 9/15/25 | 785 | 1,054 | |
| Stem, Inc. 144A 0.500%, 12/1/28(1) | 2,675 | 1,798 | |
| Sunnova Energy International, Inc. 144A 2.625%, 2/15/28(1) | 2,415 | 2,033 | |
| 8,115 | |||
| Entertainment—1.2% | |||
| DraftKings Holdings, Inc. 0.000%, 3/15/28 | 2,390 | 1,625 | |
| Live Nation Entertainment, Inc. | |||
| 2.000%, 2/15/25 | 2,450 | 2,522 | |
| 144A 3.125%, 1/15/29(1) | 990 | 1,062 | |
| Vail Resorts, Inc. 0.000%, 1/1/26 | 2,720 | 2,574 | |
| 7,783 | |||
| Food & Beverage—0.3% | |||
| Post Holdings, Inc. 144A 2.500%, 8/15/27(1) | 1,965 | 2,139 | |
| Healthcare-Products—1.7% | |||
| CONMED Corp. 144A 2.250%, 6/15/27(1) | 1,220 | 1,161 | |
| Par Value | Value | ||
| Healthcare-Products—continued | |||
| Exact Sciences Corp. | |||
| 0.375%, 3/15/27 | $ 3,030 | $ 2,856 | |
| 0.375%, 3/1/28 | 285 | 254 | |
| Insulet Corp. 0.375%, 9/1/26 | 1,310 | 1,809 | |
| Natera, Inc. 2.250%, 5/1/27 | 880 | 1,198 | |
| Novocure Ltd. 0.000%, 11/1/25 | 1,810 | 1,751 | |
| Repligen Corp. 0.375%, 7/15/24 | 745 | 1,261 | |
| 10,290 | |||
| Healthcare-Services—0.2% | |||
| Elevance Health, Inc. 2.750%, 10/15/42 | 145 | 1,033 | |
| Internet—5.0% | |||
| Booking Holdings, Inc. 0.750%, 5/1/25 | 1,815 | 2,584 | |
| Etsy, Inc. | |||
| 0.125%, 9/1/27 | 2,115 | 2,174 | |
| 0.250%, 6/15/28 | 2,500 | 2,249 | |
| Farfetch Ltd. 3.750%, 5/1/27 | 1,120 | 981 | |
| Match Group Financeco 2, Inc. 144A 0.875%, 6/15/26(1) | 1,450 | 1,390 | |
| Palo Alto Networks, Inc. | |||
| 0.750%, 7/1/23 | 1,235 | 2,212 | |
| 0.375%, 6/1/25 | 1,690 | 2,770 | |
| Perficient, Inc. 0.125%, 11/15/26 | 1,730 | 1,400 | |
| Snap, Inc. 0.750%, 8/1/26 | 3,630 | 3,347 | |
| TechTarget, Inc. 0.000%, 12/15/26 | 1,725 | 1,373 | |
| Uber Technologies, Inc. 0.000%, 12/15/25 | 4,135 | 3,634 | |
| Wayfair, Inc. | |||
| 1.125%, 11/1/24 | 2,045 | 1,898 | |
| 1.000%, 8/15/26 | 570 | 433 | |
| 144A 3.250%, 9/15/27(1) | 790 | 948 | |
| Zillow Group, Inc. 2.750%, 5/15/25 | 3,435 | 3,519 | |
| 30,912 | |||
| Leisure Time—1.1% | |||
| NCL Corp., Ltd. 1.125%, 2/15/27 | 4,885 | 3,725 | |
| Royal Caribbean Cruises Ltd. 144A 6.000%, 8/15/25(1) | 1,020 | 1,557 | |
| Topgolf Callaway Brands Corp. 2.750%, 5/1/26 | 875 | 1,334 | |
| 6,616 | |||
| Machinery-Diversified—0.2% | |||
| Middleby Corp. (The) 1.000%, 9/1/25 | 910 | 1,187 | |
| Par Value | Value | ||
| Media—1.8% | |||
| DISH Network Corp. 0.000%, 12/15/25 | $ 4,755 | $ 3,136 | |
| Liberty Broadband Corp. 144A 2.750%, 9/30/50(1) | 1,260 | 1,235 | |
| Liberty Media Corp. 1.375%, 10/15/23 | 2,010 | 2,628 | |
| Liberty Media Corp.-Liberty Formula One 144A 2.250%, 8/15/27(1) | 2,315 | 2,417 | |
| World Wrestling Entertainment, Inc. 3.375%, 12/15/23 | 495 | 1,679 | |
| 11,095 | |||
| Mining—0.5% | |||
| Lithium Americas Corp. 1.750%, 1/15/27 | 1,820 | 1,567 | |
| MP Materials Corp. 144A 0.250%, 4/1/26(1) | 1,275 | 1,275 | |
| 2,842 | |||
| Miscellaneous Manufacturing—0.4% | |||
| Axon Enterprise, Inc. 144A 0.500%, 12/15/27(1) | 2,060 | 2,212 | |
| Oil, Gas & Consumable Fuels—0.9% | |||
| EQT Corp. 1.750%, 5/1/26 | 495 | 1,110 | |
| Northern Oil & Gas, Inc. 144A 3.625%, 4/15/29(1) | 1,590 | 1,804 | |
| Pioneer Natural Resources Co. 0.250%, 5/15/25 | 1,220 | 2,870 | |
| 5,784 | |||
| Pharmaceuticals—1.7% | |||
| Dexcom, Inc. 0.250%, 11/15/25 | 5,425 | 5,712 | |
| Jazz Investments I Ltd. 2.000%, 6/15/26 | 3,015 | 3,539 | |
| Revance Therapeutics, Inc. 1.750%, 2/15/27 | 1,190 | 1,534 | |
| 10,785 | |||
| Retail—0.6% | |||
| Burlington Stores, Inc. 2.250%, 4/15/25 | 1,690 | 2,093 | |
| Shake Shack, Inc. 0.000%, 3/1/28 | 2,020 | 1,502 | |
| 3,595 | |||
| Semiconductors—1.3% | |||
| MACOM Technology Solutions Holdings, Inc. 0.250%, 3/15/26 | 965 | 996 | |
| Microchip Technology, Inc. 0.125%, 11/15/24 | 1,365 | 1,514 | |
| ON Semiconductor Corp. 0.000%, 5/1/27 | 1,050 | 1,575 | |
| Silicon Laboratories, Inc. 0.625%, 6/15/25 | 460 | 638 | |
| Par Value | Value | ||
| Semiconductors—continued | |||
| Wolfspeed, Inc. | |||
| 144A 0.250%, 2/15/28(1) | $ 2,925 | $ 2,669 | |
| 144A 1.875%, 12/1/29(1) | 965 | 937 | |
| 8,329 | |||
| Software—5.0% | |||
| Akamai Technologies, Inc. 0.125%, 5/1/25 | 1,665 | 1,784 | |
| Bentley Systems, Inc. 0.125%, 1/15/26 | 2,755 | 2,546 | |
| Bill.com Holdings, Inc. 0.000%, 4/1/27 | 4,960 | 3,978 | |
| Box, Inc. 0.000%, 1/15/26 | 920 | 1,233 | |
| Cloudflare, Inc. 0.000%, 8/15/26 | 3,440 | 2,859 | |
| Confluent, Inc. 0.000%, 1/15/27 | 1,580 | 1,225 | |
| DigitalOcean Holdings, Inc. 0.000%, 12/1/26 | 2,690 | 2,065 | |
| Envestnet, Inc. 144A 2.625%, 12/1/27(1) | 770 | 860 | |
| Evolent Health, Inc. 1.500%, 10/15/25 | 1,310 | 1,525 | |
| Five9, Inc. 0.500%, 6/1/25 | 2,830 | 2,673 | |
| HubSpot, Inc. 0.375%, 6/1/25 | 575 | 795 | |
| PagerDuty, Inc. 1.250%, 7/1/25 | 1,075 | 1,134 | |
| Splunk, Inc. | |||
| 1.125%, 9/15/25 | 1,355 | 1,320 | |
| 1.125%, 6/15/27 | 2,190 | 1,885 | |
| Tyler Technologies, Inc. 0.250%, 3/15/26 | 2,220 | 2,108 | |
| Unity Software, Inc. 0.000%, 11/15/26 | 1,360 | 1,049 | |
| Workiva, Inc. 1.125%, 8/15/26 | 1,665 | 2,096 | |
| 31,135 | |||
| Transportation—0.3% | |||
| Air Transport Services Group, Inc. 1.125%, 10/15/24 | 1,515 | 1,600 | |
| Total Convertible Bonds and Notes (Identified Cost $207,413) | 200,672 | ||
| Shares | ||
| Convertible Preferred Stocks—3.7% | ||
| Auto Components—0.2% | ||
| Aptiv plc Series A, 5.500% | 8,135 | 1,025 |
| Banks—1.0% | ||
| Wells Fargo & Co. Series L, 7.500% | 5,050 | 6,353 |
| Capital Markets—0.2% | ||
| KKR & Co., Inc. Series C, 6.000% | 20,495 | 1,385 |
| Shares | Value | ||
| Commercial Services & Supplies—0.2% | |||
| GFL Environmental, Inc., 6.000% | 22,790 | $ 1,565 | |
| Diversified Financial Services—0.2% | |||
| Chewy, Inc. 2020 Mandatory Exchangeable Trust 144A, 6.500%(1) | 1,460 | 1,517 | |
| Electric Utilities—0.8% | |||
| NextEra Energy, Inc. | |||
| 5.279% | 45,920 | 2,296 | |
| 6.926% | 22,345 | 1,071 | |
| PG&E Corp., 5.500% | 11,405 | 1,611 | |
| 4,978 | |||
| Healthcare Equipment & Supplies—0.4% | |||
| Boston Scientific Corp. Series A, 5.500% | 20,375 | 2,325 | |
| Life Sciences Tools & Services—0.3% | |||
| Danaher Corp. Series B, 5.000% | 1,340 | 1,801 | |
| Telecommunications—0.4% | |||
| T-Mobile U.S. 2020 Cash Mandatory Exchangeable Trust 144A, 5.250%(1) | 1,975 | 2,382 | |
| Total Convertible Preferred Stocks (Identified Cost $23,273) | 23,331 | ||
| Common Stocks—62.0% | |||
| Air Freight & Logistics—0.5% | |||
| United Parcel Service, Inc. Class B | 15,590 | 2,888 | |
| Automobiles—1.8% | |||
| Tesla, Inc.(3) | 64,276 | 11,134 | |
| Banks—2.7% | |||
| JPMorgan Chase & Co. | 59,175 | 8,282 | |
| Wells Fargo & Co. | 183,690 | 8,610 | |
| 16,892 | |||
| Biotechnology—2.3% | |||
| AbbVie, Inc. | 74,040 | 10,939 | |
| Vertex Pharmaceuticals, Inc.(3) | 10,430 | 3,370 | |
| 14,309 | |||
| Capital Markets—1.7% | |||
| CME Group, Inc. Class A | 25,110 | 4,436 | |
| Moody’s Corp. | 19,435 | 6,272 | |
| 10,708 | |||
| Chemicals—1.6% | |||
| DuPont de Nemours, Inc. | 84,070 | 6,217 | |
| Sherwin-Williams Co. (The) | 15,295 | 3,619 | |
| 9,836 | |||
| Commercial Services & Supplies—1.2% | |||
| Waste Management, Inc.(4) | 47,715 | 7,383 | |
| Shares | Value | ||
| Communications Equipment—0.7% | |||
| Cisco Systems, Inc. | 89,020 | $ 4,333 | |
| Consumer Finance—0.5% | |||
| Capital One Financial Corp. | 24,631 | 2,931 | |
| Electric Utilities—1.9% | |||
| Exelon Corp. | 275,110 | 11,607 | |
| Electrical Equipment—0.5% | |||
| Generac Holdings, Inc.(3) | 11,105 | 1,339 | |
| Plug Power, Inc.(3) | 97,632 | 1,662 | |
| 3,001 | |||
| Energy Equipment & Services—1.4% | |||
| Schlumberger Ltd. | 149,945 | 8,544 | |
| Equity Real Estate Investment—0.9% | |||
| American Tower Corp. | 25,300 | 5,652 | |
| Food & Staples Retailing—1.3% | |||
| Costco Wholesale Corp.(4) | 15,850 | 8,101 | |
| Healthcare Equipment & Supplies—1.8% | |||
| Abbott Laboratories | 34,870 | 3,855 | |
| Dexcom, Inc.(3) | 14,095 | 1,509 | |
| Intuitive Surgical, Inc.(3)(4) | 22,600 | 5,553 | |
| 10,917 | |||
| Healthcare Providers & Services—0.9% | |||
| UnitedHealth Group, Inc. | 11,273 | 5,627 | |
| Hotels, Restaurants & Leisure—2.8% | |||
| Booking Holdings, Inc.(3) | 3,440 | 8,373 | |
| Chipotle Mexican Grill, Inc. Class A(3) | 3,275 | 5,392 | |
| MGM Resorts International | 93,225 | 3,861 | |
| 17,626 | |||
| Insurance—0.9% | |||
| Aon plc Class A | 17,025 | 5,425 | |
| Interactive Media & Services—3.7% | |||
| Alphabet, Inc. Class A(3) | 194,440 | 19,219 | |
| Meta Platforms, Inc. Class A(3) | 27,095 | 4,036 | |
| 23,255 | |||
| Internet & Direct Marketing Retail—2.1% | |||
| Amazon.com, Inc.(3) | 129,105 | 13,315 | |
| IT Services—3.3% | |||
| Accenture plc Class A | 21,110 | 5,891 | |
| EPAM Systems, Inc.(3) | 5,722 | 1,903 | |
| Mastercard, Inc. Class A(4) | 34,115 | 12,643 | |
| 20,437 | |||
| Life Sciences Tools & Services—2.3% | |||
| IQVIA Holdings, Inc.(3) | 26,450 | 6,068 | |
| Shares | Value | ||
| Life Sciences Tools & Services—continued | |||
| Thermo Fisher Scientific, Inc.(4) | 14,095 | $ 8,039 | |
| 14,107 | |||
| Machinery—0.6% | |||
| Deere & Co. | 8,265 | 3,495 | |
| Multiline Retail—0.4% | |||
| Target Corp. | 14,865 | 2,559 | |
| Oil, Gas & Consumable Fuels—1.8% | |||
| ConocoPhillips | 46,205 | 5,631 | |
| Devon Energy Corp. | 89,245 | 5,644 | |
| 11,275 | |||
| Pharmaceuticals—2.2% | |||
| Eli Lilly & Co. | 22,255 | 7,659 | |
| Zoetis, Inc. Class A | 36,685 | 6,071 | |
| 13,730 | |||
| Road & Rail—1.4% | |||
| Union Pacific Corp. | 43,305 | 8,842 | |
| Semiconductors & Semiconductor Equipment—4.8% | |||
| Broadcom, Inc. | 19,690 | 11,519 | |
| Lam Research Corp.(4) | 9,360 | 4,681 | |
| Marvell Technology, Inc. | 55,930 | 2,413 | |
| Micron Technology, Inc. | 86,925 | 5,242 | |
| NVIDIA Corp. | 32,075 | 6,266 | |
| 30,121 | |||
| Software—7.0% | |||
| Atlassian Corp. Class A(3) | 14,445 | 2,335 | |
| Crowdstrike Holdings, Inc. Class A(3) | 27,545 | 2,917 | |
| Intuit, Inc. | 14,765 | 6,241 | |
| Microsoft Corp. | 89,696 | 22,227 | |
| Salesforce, Inc.(3) | 12,441 | 2,090 | |
| ServiceNow, Inc.(3) | 16,915 | 7,698 | |
| 43,508 | |||
| Specialty Retail—2.0% | |||
| Home Depot, Inc. (The) | 25,285 | 8,196 | |
| TJX Cos., Inc. (The) | 49,485 | 4,051 | |
| 12,247 | |||
| Technology Hardware, Storage & Peripherals—3.9% | |||
| Apple, Inc. | 169,450 | 24,450 | |
| Textiles, Apparel & Luxury Goods—1.1% | |||
| NIKE, Inc. Class B | 54,950 | 6,997 | |
| Total Common Stocks (Identified Cost $432,870) | 385,252 | ||
| Total Long-Term Investments—98.0% (Identified Cost $663,556) | 609,255 | ||
| Shares | Value | ||
| Short-Term Investment—1.6% | |||
| Money Market Mutual Fund—1.6% | |||
| BlackRock Liquidity FedFund - Institutional Shares (seven-day effective yield 4.066%)(5) | 10,060,519 | $ 10,061 | |
| Total Short-Term Investment (Identified Cost $10,061) | 10,061 | ||
| TOTAL INVESTMENTS, BEFORE WRITTEN OPTIONS—99.6% (Identified Cost $673,617) | 619,316 | ||
| Written Options—(0.0)% | ||
| (See open written options schedule) | ||
| Total Written Options (Premiums Received $41) | (22) | |
| TOTAL INVESTMENTS, NET OF WRITTEN OPTIONS—99.6% (Identified Cost $673,576) | $619,294 | |
| Other assets and liabilities, net—0.4% | 2,350 | |
| NET ASSETS—100.0% | $621,644 | |
| Abbreviation: | |
| LLC | Limited Liability Company |
| Footnote Legend: | |
| (1) | Security exempt from registration under Rule 144A of the Securities Act of 1933. These securities may be resold in transactions exempt from registration, normally to qualified institutional buyers. At January 31, 2023, these securities amounted to a value of $43,315 or 7.0% of net assets. |
| (2) | The value of this security was determined using significant unobservable inputs and is reported as a Level 3 security in the Fair Value Hierarchy table located after the Schedule of Investments. |
| (3) | Non-income producing. |
| (4) | All or a portion of the security is segregated as collateral for written options. The value of securities segregated as collateral is $19,103. |
| (5) | Shares of this fund are publicly offered, and its prospectus and annual report are publicly available. |
| Open written options contracts as of January 31, 2023 were as follows: | |||||
| Description of Options | Number of Contracts | Contract Notional Amount | Strike Price(1) | Expiration Date | Value |
| Call Options(2) | |||||
| Costco Wholesale Corp. | (45) | $(2,430) | $540.00 | 02/17/23 | $ (8) |
| Intuitive Surgical, Inc. | (85) | (2,465) | 290.00 | 02/17/23 | (—) (3) |
| Lam Research Corp. | (55) | (3,603) | 655.00 | 03/17/23 | (2) |
| Mastercard, Inc. | (165) | (6,847) | 415.00 | 02/17/23 | (1) |
| Thermo Fisher Scientific, Inc. | (70) | (4,375) | 625.00 | 02/17/23 | (5) |
| Waste Management, Inc. | (120) | (1,950) | 162.50 | 02/17/23 | (6) |
| Total Written Options | $ (22) | ||||
| Footnote Legend: | |
| (1) | Strike price not reported in thousands. |
| (2) | Exchange-traded options. |
| (3) | Amount is less than $500. |
| Total Value at January 31, 2023 | Level 1 Quoted Prices | Level 2 Significant Observable Inputs | Level 3 Significant Unobservable Inputs | ||||
| Assets: | |||||||
| Debt Instruments: | |||||||
| Convertible Bonds and Notes | $200,672 | $ — | $197,071 | $3,601 | |||
| Equity Securities: | |||||||
| Common Stocks | 385,252 | 385,252 | — | — | |||
| Convertible Preferred Stocks | 23,331 | 19,432 | 3,899 | — | |||
| Money Market Mutual Fund | 10,061 | 10,061 | — | — | |||
| Total Assets | 619,316 | 414,745 | 200,970 | 3,601 | |||
| Liabilities: | |||||||
| Other Financial Instruments: | |||||||
| Written Options | (22) | (20) | (2) | — | |||
| Total Investments, Net of Written Options | $619,294 | $414,725 | $200,968 | $3,601 |
| Total | Convertible Bonds And Notes | Corporate Bonds And Notes | |||
| Investments in Securities | |||||
| Balance as of January 31, 2022: | $ 36 | $ — | $ 36 | ||
| Net realized gain (loss) | (1,093) | 11 | (1,104) | ||
| Net change in unrealized appreciation (depreciation)(a) | 1,140 | 70 | 1,070 | ||
| Purchases | 3,941 | 3,941 | — | ||
| Sales (b) | (423) | (421) | (2) | ||
| Balance as of January 31, 2023 | $ 3,601 | $ 3,601 | $ — |
| AIO | CBH | NCV | NCZ | ||||
| Assets | |||||||
Investment in securities at value(1)(2) | $ 831,857 | $ 242,552 | $ 643,269 | $ 483,478 | |||
Cash | 100 | 128 | 103 | 131 | |||
| Receivables | |||||||
Investment securities sold | — | 987 | 8,161 | 6,203 | |||
Dividends and interest | 2,122 | 1,583 | 4,975 | 3,574 | |||
Other receivables | 47 | 12 | 25 | 19 | |||
Securities lending income | 43 | — | — | — | |||
Prepaid Trustees’ retainer | 27 | 7 | 14 | 11 | |||
Prepaid expenses and other assets (Note 4) | 37 | 28 | 166 | 127 | |||
Total assets | 834,233 | 245,297 | 656,713 | 493,543 | |||
| Liabilities | |||||||
Loan Payable (Note 9) | 130,000 | 69,700 | 170,000 | 95,000 | |||
| Payables | |||||||
Collateral on securities loaned (Note 9) | 13,000 | 1,000 | — | — | |||
Dividend distributions | 5,151 | 840 | 4,319 | 3,363 | |||
Loan interest payable (Note 9) | 869 | 488 | 783 | 437 | |||
Investment advisory fees (Note 4) | 775 | 140 | 321 | 249 | |||
Professional fees | 94 | 91 | 143 | 163 | |||
Administration and accounting fees | 74 | 22 | 58 | 44 | |||
Trustee deferred compensation plan (Note 4) | 37 | 28 | 166 | 127 | |||
Investment securities purchased | — | 3,489 | 12,432 | 9,078 | |||
Other accrued expenses | 110 | 124 | 82 | 80 | |||
Total liabilities | 150,110 | 75,922 | 188,304 | 108,541 | |||
Cumulative Preferred Shares ($25.00 liquidation preference per share applicable to an aggregate of 4,000,000 and 4,360,000 shares issued and outstanding, respectively) | — | — | 100,000 | 109,000 | |||
Net Assets Applicable to Common Shareholders | $ 684,123 | $ 169,375 | $ 368,409 | $ 276,002 | |||
| Net Assets Applicable to Common Shareholders Consist of: | |||||||
Common shares par value ($0.00001 per share) | $ —(a) | $ —(a) | $ 1 | $ 1 | |||
Capital paid in on shares of beneficial interest | 671,836 | 178,376 | 681,639 | 521,050 | |||
Total distributable earnings (accumulated losses) | 12,287 | (9,001) | (313,231) | (245,049) | |||
Net Assets Applicable to Common Shareholders | $ 684,123 | $ 169,375 | $ 368,409 | $ 276,002 | |||
Common Shares Issued and Outstanding | 34,340,972 | 18,263,597 | 90,373,569 | 76,115,749 | |||
Net Asset Value Per Common Share(b) | $ 19.92 | $ 9.27 | $ 4.08 | $ 3.63 | |||
(1)Investment in securities at cost | $ 806,195 | $ 250,760 | $ 683,471 | $ 513,456 | |||
(2) Market value of securities on loan | $ 42,377 | $ 7,715 | $ — | $ — |
| (a) | Amount is less than $500. |
| (b) | Net Asset Value Per Common Share is calculated using unrounded net assets. |
| ACV | NFJ | NIE | |||
| Assets | |||||
Investment in securities at value(1) | $ 327,898 | $ 1,338,825 | $ 619,316 | ||
Cash | 101 | 502 | 101 | ||
Deposits with broker for written options | 18 | — | 97 | ||
| Receivables | |||||
Investment securities sold | 2,912 | 10,450 | 5,209 | ||
Dividends and interest | 1,326 | 1,270 | 758 | ||
Other receivables | 16 | 88 | 48 | ||
Tax reclaims | — | 157 | — | ||
Prepaid Trustees’ retainer | 8 | 51 | 27 | ||
Prepaid expenses and other assets (Note 4) | 53 | 295 | 134 | ||
Total assets | 332,332 | 1,351,638 | 625,690 | ||
| Liabilities | |||||
Loan Payable (Note 10 and 11) | 75,000 | — | — | ||
Mandatory redeemable preferred shares (Note 10) | 30,000 | — | — | ||
Written options at value (Note 3)(3) | 4 | 1,791 | 22 | ||
| Payables | |||||
Investment securities purchased | 4,082 | 3,085 | 3,238 | ||
Dividend distributions | 1,865 | — | — | ||
Loan interest payable (Note 10 and 11) | 942 | — | — | ||
Investment advisory fees (Note 4) | 251 | 808 | 439 | ||
Dividend on mandatory redeemable preferred shares (Note 10) | 110 | — | — | ||
Professional fees | 89 | 110 | 91 | ||
Trustee deferred compensation plan (Note 4) | 53 | 295 | 134 | ||
Administration and accounting fees | 30 | 118 | 55 | ||
Other accrued expenses | 53 | 120 | 67 | ||
Total liabilities | 112,479 | 6,327 | 4,046 | ||
Net Assets Applicable to Common Shareholders | $ 219,853 | $ 1,345,311 | $ 621,644 | ||
| Net Assets Applicable to Common Shareholders Consist of: | |||||
Common shares par value ($0.00001 per share) | $ —(a) | $ 1 | $ —(a) | ||
Capital paid in on shares of beneficial interest | 252,312 | 1,276,956 | 670,598 | ||
Total distributable earnings (accumulated losses) | (32,459) | 68,354 | (48,954) | ||
Net Assets Applicable to Common Shareholders | $ 219,853 | $ 1,345,311 | $ 621,644 | ||
Common Shares Issued and Outstanding | 10,362,954 | 94,801,581 | 27,708,965 | ||
Net Asset Value Per Common Share(b) | $ 21.22 | $ 14.19 | $ 22.43 | ||
(1)Investment in securities at cost | $ 350,674 | $ 1,264,254 | $ 673,617 | ||
(3) Written options premiums received | $ 8 | $ 856 | $ 41 |
| (a) | Amount is less than $500. |
| (b) | Net Asset Value Per Common Share is calculated using unrounded net assets. |
| AIO | CBH | NCV | NCZ | ||||
| Investment Income | |||||||
Interest | $ 8,581 | $ 8,820 | $ 20,553 | $ 15,384 | |||
Dividends | 5,187 | 162 | 4,835 | 4,104 | |||
Security lending, net of fees | 345 | 29 | 132 | — | |||
Foreign taxes withheld | (53) | — | — | — | |||
Total investment income | 14,060 | 9,011 | 25,520 | 19,488 | |||
| Expenses | |||||||
Investment advisory fees | 10,313 | 1,792 | 5,018 | 3,862 | |||
Administration and accounting fees | 891 | 263 | 774 | 598 | |||
Excise tax | — | 94 | — | — | |||
Printing fees and expenses | 258 | 25 | 65 | 55 | |||
Trustees’ fees and expenses | 167 | 40 | 104 | 78 | |||
Professional fees | 144 | 74 | 235 | 218 | |||
Transfer agent fees and expenses | 13 | 13 | 18 | 19 | |||
Auction agent and commissions | — | — | 182 | 143 | |||
Miscellaneous expenses | 56 | 23 | 289 | 310 | |||
Total expenses before interest expense | 11,842 | 2,324 | 6,685 | 5,283 | |||
Loan interest (Note 9) | 3,429 | 1,873 | 2,257 | 1,185 | |||
Total expenses after interest expense | 15,271 | 4,197 | 8,942 | 6,468 | |||
Less expenses reimbursed and/or waived by investment adviser (Note 4D) | (894) | (117) | (720) | (535) | |||
Net expenses | 14,377 | 4,080 | 8,222 | 5,933 | |||
Net investment income (loss) | (317) | 4,931 | 17,298 | 13,555 | |||
| Net Realized and Unrealized Gain (Loss) on Investments | |||||||
| Net realized gain (loss) from: | |||||||
Unaffiliated Investments | (6,358) | (247) | (57,150) | (43,000) | |||
Affiliated investments | — | — | (6,724) | (4,975) | |||
| Net change in unrealized appreciation (depreciation) on: | |||||||
Unaffiliated Investments | (77,872) | (2,571) | (41,361) | (32,226) | |||
Affiliated investments | — | — | 6,700 | 4,950 | |||
Net realized and unrealized gain (loss) on investments | (84,230) | (2,818) | (98,535) | (75,251) | |||
Dividends on preferred shares from net investment income | — | — | (10,076) | (9,239) | |||
Net increase (decrease) in net assets applicable to common shareholders resulting from operations | $(84,547) | $ 2,113 | $(91,313) | $(70,935) |
| ACV | NFJ | NIE | |||
| Investment Income | |||||
Interest | $ 5,437 | $ 2,512 | $ 2,391 | ||
Dividends | 2,282 | 18,208 | 8,119 | ||
Foreign taxes withheld | — | (97) | — | ||
Total investment income | 7,719 | 20,623 | 10,510 | ||
| Expenses | |||||
Investment advisory fees | 3,395 | 12,044 | 7,085 | ||
Administration and accounting fees | 371 | 1,439 | 765 | ||
Printing fees and expenses | 99 | 246 | 135 | ||
Professional fees | 99 | 235 | 141 | ||
Trustees’ fees and expenses | 63 | 327 | 179 | ||
Transfer agent fees and expenses | 21 | 13 | 13 | ||
Miscellaneous expenses | 70 | 134 | 47 | ||
Total expenses before interest expense | 4,118 | 14,438 | 8,365 | ||
Dividends on mandatory redeemable preferred shares (Note 10) | 1,302 | — | — | ||
Loan interest (Note 10 and 11) | 2,772 | — | — | ||
Total expenses after interest expense | 8,192 | 14,438 | 8,365 | ||
Less expenses reimbursed and/or waived by investment adviser (Note 4D) | (302) | (1,590) | (783) | ||
Net expenses | 7,890 | 12,848 | 7,582 | ||
Net investment income (loss) | (171) | 7,775 | 2,928 | ||
| Net Realized and Unrealized Gain (Loss) on Investments | |||||
| Net realized gain (loss) from: | |||||
Unaffiliated Investments | (5,138) | (5,101) | 2,023 | ||
Affiliated investments | (1,246) | — | — | ||
Foreign currency transactions | — | — (1) | — | ||
Written options | 575 | 2,417 | 3,350 | ||
| Net change in unrealized appreciation (depreciation) on: | |||||
Unaffiliated Investments | (33,394) | (112,608) | (116,963) | ||
Affiliated investments | 1,243 | — | — | ||
Written options | 36 | (1,074) | 234 | ||
Net realized and unrealized gain (loss) on investments | (37,924) | (116,366) | (111,356) | ||
Net increase (decrease) in net assets resulting from operations | $(38,095) | $(108,591) | $(108,428) |
| (1) | Amount is less than $500. |
| AIO | |||||
| Year Ended January 31, 2023 | Fiscal Period Ended January 31, 2022* | Year Ended February 28, 2021 | |||
| Increase (Decrease) In Net Assets From Operations | |||||
Net investment income (loss) | $ (317) | $ (6,058) | $ (2,703) | ||
Net realized gain (loss) | (6,358) | 109,142 | 171,687 | ||
Net change in unrealized appreciation (depreciation) | (77,872) | (108,970) | 236,027 | ||
Increase (decrease) in net assets resulting from operations | (84,547) | (5,886) | 405,011 | ||
| From Dividends and Distributions to Shareholders | |||||
Net investment income and net realized gains | (47,652) | (166,532) | (85,439) | ||
Return of capital | (14,157) | — | — | ||
Dividends and Distributions to Shareholders | (61,809) | (166,532) | (85,439) | ||
| From Capital Share Transactions | |||||
Reinvestment of distributions resulting in the issuance of common stock (0, 2,290 and 15,547 shares, respectively) | — | 59 | 450 | ||
Increase (decrease) in net assets from capital transactions | — | 59 | 450 | ||
Net increase (decrease) in net assets | (146,356) | (172,359) | 320,022 | ||
| Net Assets | |||||
Beginning of period | 830,479 | 1,002,838 | 682,816 | ||
End of period | $ 684,123 | $ 830,479 | $1,002,838 | ||
| * | Period from March 1, 2021 to January 31, 2022. The Fund had a fiscal year end change from February 28 to January 31. |
| CBH | |||||
| Year Ended January 31, 2023 | Fiscal Period Ended January 31, 2022* | Year Ended February 28, 2021 | |||
| Increase (Decrease) In Net Assets From Operations | |||||
Net investment income (loss) | $ 4,931 | $ 4,522 | $ 7,409 | ||
Net realized gain (loss) | (247) | 4,870 | 11,108 | ||
Net change in unrealized appreciation (depreciation) | (2,571) | (9,826) | 7,246 | ||
Increase (decrease) in net assets resulting from operations | 2,113 | (434) | 25,763 | ||
| From Dividends and Distributions to Shareholders | |||||
Net investment income and net realized gains | (11,741) | (16,220) | (10,078) | ||
Dividends and Distributions to Shareholders | (11,741) | (16,220) | (10,078) | ||
| From Capital Share Transactions | |||||
Reinvestment of distributions resulting in the issuance of common stock (506, 4,575 and 1,504 shares, respectively) | 5 | 46 | 14 | ||
Increase (decrease) in net assets from capital transactions | 5 | 46 | 14 | ||
Net increase (decrease) in net assets | (9,623) | (16,608) | 15,699 | ||
| Net Assets | |||||
Beginning of period | 178,998 | 195,606 | 179,907 | ||
End of period | $169,375 | $178,998 | $195,606 | ||
| * | Period from March 1, 2021 to January 31, 2022. The Fund had a fiscal year end change from February 28 to January 31. |
| NCV | |||||
| Year Ended January 31, 2023 | Fiscal Period Ended January 31, 2022* | Year Ended February 28, 2021 | |||
| Increase (Decrease) In Net Assets From Operations | |||||
Net investment income (loss) | $ 17,298 | $ 19,202 | $ 33,510 | ||
Net realized gain (loss) | (63,874) | 34,593 | 3,663 | ||
Net change in unrealized appreciation (depreciation) | (34,661) | (88,808) | 118,355 | ||
Increase (decrease) in net assets resulting from operations | (81,237) | (35,013) | 155,528 | ||
Dividends on Preferred Shares from Net Investment Income | (10,076) | (5,432) | (6,245) | ||
Net increase (decrease) in net assets applicable to common shareholders resulting from operations | (91,313) | (40,445) | 149,283 | ||
| From Dividends and Distributions to Common Shareholders | |||||
Net investment income and net realized gains | (9,639) | (14,537) | (28,244) | ||
Return of capital | (36,451) | (27,712) | (18,750) | ||
Dividends and Distributions to Common Shareholders | (46,090) | (42,249) | (46,994) | ||
| Preferred Share Transactions: | |||||
Net increase resulting from tender of Auction-Rate Preferred Shares (see Note 8) | 4,562 | — | — | ||
Increase (decrease) in net assets from preferred share transactions | 4,562 | — | — | ||
| From Capital Share Transactions | |||||
Reinvestment of distributions resulting in the issuance of common stock (0, 0, and 3,988 shares, respectively) | — | — | 22 | ||
Increase (decrease) in net assets from capital transactions | — | — | 22 | ||
Net increase (decrease) in net assets | (132,841) | (82,694) | 102,311 | ||
| Net Assets | |||||
Beginning of period | 501,250 | 583,944 | 481,633 | ||
End of period | $ 368,409 | $501,250 | $583,944 | ||
| * | Period from March 1, 2021 to January 31, 2022. The Fund had a fiscal year end change from February 28 to January 31. |
| NCZ | |||||
| Year Ended January 31, 2023 | Fiscal Period Ended January 31, 2022* | Year Ended February 28, 2021 | |||
| Increase (Decrease) In Net Assets From Operations | |||||
Net investment income (loss) | $ 13,555 | $ 14,662 | $ 25,827 | ||
Net realized gain (loss) | (47,975) | 26,021 | 2,875 | ||
Net change in unrealized appreciation (depreciation) | (27,276) | (66,698) | 89,181 | ||
Increase (decrease) in net assets resulting from operations | (61,696) | (26,015) | 117,883 | ||
Dividends on Preferred Shares from Net Investment Income | (9,239) | (5,699) | (6,448) | ||
Net increase (decrease) in net assets applicable to common shareholders resulting from operations | (70,935) | (31,714) | 111,435 | ||
| From Dividends and Distributions to Common Shareholders | |||||
Net investment income and net realized gains | (6,136) | (9,409) | (20,132) | ||
Return of capital | (28,116) | (21,989) | (14,691) | ||
Dividends and Distributions to Common Shareholders | (34,252) | (31,398) | (34,823) | ||
| Preferred Share Transactions: | |||||
Net increase resulting from tender of Auction-Rate Preferred Shares (see Note 8) | 3,307 | — | — | ||
Increase (decrease) in net assets from preferred share transactions | 3,307 | — | — | ||
Net increase (decrease) in net assets | (101,880) | (63,112) | 76,612 | ||
| Net Assets | |||||
Beginning of period | 377,882 | 440,994 | 364,382 | ||
End of period | $ 276,002 | $377,882 | $440,994 | ||
| * | Period from March 1, 2021 to January 31, 2022. The Fund had a fiscal year end change from February 28 to January 31. |
| ACV | NFJ | ||||||
| Year Ended January 31, 2023 | Year Ended January 31, 2022 | Year Ended January 31, 2023 | Year Ended January 31, 2022 | ||||
| Increase (Decrease) In Net Assets From Operations | |||||||
Net investment income (loss) | $ (171) | $ (1,760) | $ 7,775 | $ 4,380 | |||
Net realized gain (loss) | (5,809) | 69,849 | (2,684) | 168,577 | |||
Net change in unrealized appreciation (depreciation) | (32,115) | (68,996) | (113,682) | 19,070 | |||
Increase (decrease) in net assets resulting from operations | (38,095) | (907) | (108,591) | 192,027 | |||
| From Dividends and Distributions to Shareholders | |||||||
Net investment income and net realized gains | (24,415) | (80,923) | (94,470) | (85,321) | |||
Dividends and Distributions to Shareholders | (24,415) | (80,923) | (94,470) | (85,321) | |||
| From Capital Share Transactions | |||||||
Reinvestment of distributions resulting in the issuance of common stock (561 and 8,473 shares, respectively) | 15 | 279 | — | — | |||
Increase (decrease) in net assets from capital transactions | 15 | 279 | — | — | |||
Net increase (decrease) in net assets | (62,495) | (81,551) | (203,061) | 106,706 | |||
| Net Assets | |||||||
Beginning of period | 282,348 | 363,899 | 1,548,372 | 1,441,666 | |||
End of period | $219,853 | $282,348 | $1,345,311 | $1,548,372 | |||
| NIE | |||
| Year Ended January 31, 2023 | Year Ended January 31, 2022 | ||
| Increase (Decrease) In Net Assets From Operations | |||
Net investment income (loss) | $ 2,928 | $ (2,565) | |
Net realized gain (loss) | 5,373 | 175,497 | |
Net change in unrealized appreciation (depreciation) | (116,729) | (98,405) | |
Increase (decrease) in net assets resulting from operations | (108,428) | 74,527 | |
| From Dividends and Distributions to Shareholders | |||
Net investment income and net realized gains | (110,185) | (90,719) | |
Dividends and Distributions to Shareholders | (110,185) | (90,719) | |
Net increase (decrease) in net assets | (218,613) | (16,192) | |
| Net Assets | |||
Beginning of period | 840,257 | 856,449 | |
End of period | $ 621,644 | $840,257 | |
| AIO | CBH | NCV | ACV | ||||
| Increase (Decrease) in cash | |||||||
| Cash Flows provided by (Used for) Operating Activities: | |||||||
Net increase (decrease) in net assets resulting from operations | $ (84,547) | $ 2,113 | $ (91,313) | $ (38,095) | |||
| Adjustments to reconcile net increase (decrease) in net assets resulting from operations to net cash provided by (used for) operating activities: | |||||||
Proceeds from sales and paydowns of long-term investments | 416,628 | 50,352 | 601,509 | 317,181 | |||
(Increase) Decrease in investment securities sold receivable | 1,163 | (720) | (5,792) | 278 | |||
Purchases of long-term investments | (471,354) | (40,818) | (489,964) | (305,137) | |||
Increase (Decrease) in investment securities purchased payable | (2,931) | (570) | 8,066 | 2,057 | |||
Net (purchases) or sales of short-term investments | 20,114 | (377) | 12,753 | 11,023 | |||
Net purchases or (sales) in written options | — | — | — | 546 | |||
Net change in unrealized (appreciation)/depreciation on long-term unaffiliated investments | 77,872 | 2,571 | 41,360 | 33,394 | |||
Net change in unrealized (appreciation)/depreciation on affiliated investments | — | — | (6,700) | (1,243) | |||
Net change in unrealized (appreciation)/depreciation on written options | — | — | — | (36) | |||
Net realized (gain)/loss from unaffiliated investments | 6,358 | 247 | 57,150 | 5,138 | |||
Net realized (gain)/loss from investments affiliated investments | — | — | 6,724 | 1,246 | |||
Net realized (gain)/loss from written options | — | — | — | (575) | |||
Amortization of premium and accretion of discounts on investments | (513) | (274) | (2,231) | (1,122) | |||
Return of capital distribution on investments | — | — | — | (16) | |||
Proceeds from litigation settlements | — | — | — | 2 | |||
(Increase) Decrease in dividends and interest receivable | (1,165) | (15) | 93 | (92) | |||
(Increase) Decrease in security lending receivable | (24) | 2 | 22 | — | |||
Increase) Decrease in other receivables | (47) | (12) | (25) | (16) | |||
(Increase) Decrease in prepaid trustees’ retainer | 13 | 3 | 16 | 12 | |||
(Increase) Decrease in prepaid expenses and other assets | — | — | 10 | 12 | |||
Increase (Decrease) in loan interest payable | 809 | 420 | 734 | 92 | |||
Increase (Decrease) in payable for collateral securities on loan | — | (922) | (11,127) | — | |||
Increase (Decrease) in affiliated expenses payable | (21) | (14) | (175) | (73) | |||
Increase (Decrease) in non-affiliated expenses payable | (546) | (225) | (24) | (161) | |||
Cash provided by (used for) operating activities | (38,191) | 11,761 | 121,086 | 24,415 | |||
| Cash provided (used for) financing activities: | |||||||
Cash received from borrowings | 100,000 | — | 170,000 | — | |||
Cash payments to reduce borrowings | — | — | (28,852) | — | |||
Cash distributions paid to shareholders | (61,809) | (11,736) | (46,095) | (24,400) | |||
Tender and redemption of auction-rate preferred shares (Note 8) | — | — | (218,713) | — | |||
Cash provided (used for) financing activities: | 38,191 | (11,736) | (123,660) | (24,400) | |||
| Net increase/decrease in cash | |||||||
Net increase (decrease) in cash | — | 25 | (2,574) | 15 | |||
Restricted and unrestricted cash at beginning of period | 100 | 103 | 2,677 | 104 | |||
Restricted and unrestricted cash at end of period | $ 100 | $ 128 | $ 103 | $ 119 | |||
| Supplemental cash flow information: | |||||||
| Cash paid during the period for interest expense on loan payable | $ 2,620 | $ 1,453 | $ 1,523 | $ 2,680 | |||
| Cash paid during the period for dividends to mandatory redeemable preferred shares | $ — | $ — | $ — | $ 1,302 | |||
| Reinvestment of dividends and distributions | $ — | $ 5 | $ — | $ 15 | |||
| Reconciliation of restricted and unrestricted cash at the end of period to the statement of assets and liabilities | |||||||
| Cash | $ 100 | $ 128 | $ 103 | $ 101 | |||
| Deposits with broker for written options | — | — | — | 18 | |||
| $ 100 | $ 128 | $ 103 | $ 119 |
| Year Ended January 31, 2023 | Fiscal Period March 1, 2021 to January 31, 2022 (1) | Year Ended February 28, 2021 | From Inception October 31, 2019(2) to February 29, 2020 | ||||
| PER SHARE DATA: | |||||||
Net asset value, beginning of period | $ 24.18 | $ 29.20 | $ 19.89 | $ 20.00 | |||
| Income (loss) from investment operations: | |||||||
Net investment income (loss)(3) | (0.01) | (0.18) | (0.08) | (0.01) | |||
Net realized and unrealized gain (loss) | (2.45) | 0.01 | 11.88 | 0.23 | |||
Total from investment operations | (2.46) | (0.17) | 11.80 | 0.22 | |||
| Dividends and Distributions to Shareholders: | |||||||
Net investment income(3) | (1.39) | (1.40) | — | — | |||
Net realized gains | — | (3.45) | (2.49) | (0.33) | |||
Return of capital | (0.41) | — | — | — | |||
Total dividends and distributions to shareholders | (1.80) | (4.85) | (2.49) | (0.33) | |||
Net asset value, end of period | $ 19.92 | $ 24.18 | $ 29.20 | $ 19.89 | |||
Market value, end of period | $ 17.42 | $ 23.58 | $ 27.41 | $ 17.72 | |||
Total return, net asset value(4), (5) | (10.03)% | (1.85)% | —% (6) | —% (6) | |||
Total return, market value(4), (5) | (18.42)% | 2.75% | 71.09% | (9.92)% | |||
| RATIOS/SUPPLEMENTAL DATA: | |||||||
Ratio of net expenses after interest expense to average net assets(7), (8) | 2.04% | 1.47% (9), (10) | 1.42% (9) | 1.34% (10) | |||
Ratio of total expenses after interest expense to average net assets(7) | 2.17% | 1.56% (9), (10) | 1.43% (9) | 1.34% (10) | |||
Ratio of net investment income (loss) to average net assets(7) | (0.04)% | (0.66)% (9), (10) | (0.33)% (9) | (0.15)% (10) | |||
Portfolio turnover rate(4) | 53% | 53% | 103% | 56% | |||
Net assets, end of period (000’s) | $684,123 | $ 830,479 | $1,002,838 | $682,816 | |||
Loan payable, end of period (000’s) | $130,000 | $ 30,000 | $ 30,000 | $ 30,000 | |||
Asset coverage, per $1,000 principal amount of loan payable | $ 6,262 | $ 28,683 | $ 34,428 | $ 23,761 |
| (1) | The Fund had a fiscal year end change from February 28 to January 31. |
| (2) | Commencement of operations. |
| (3) | Calculated using average shares outstanding. |
| (4) | Not annualized for periods less than one year. |
| (5) | Total return on market value is calculated assuming a purchase of common shares on the opening of the first day and sale on the closing of the last day of each period reported. Dividends and distributions are assumed, for purposes of this calculation, to be reinvested at prices obtained under the Fund’s Automatic Reinvestment and Cash Purchase Plan. Total return on market value is not annualized for periods of less than one year. Brokerage commissions that a shareholder may pay are not reflected. Total return on market value does not reflect the deduction of taxes that a shareholder may pay on fund distributions or the sale of fund shares. Total return on net asset value uses the same methodology, but with use of net asset value for the beginning, ending and reinvestment values. |
| (6) | Return not disclosed. |
| (7) | Annualized for periods less than one year. |
| (8) | Ratio of net expenses, before interest expense, was 1.55% for the year ended January 31, 2023, and 1.43%, 1.40% and 1.34% for the period ended January 31, 2022, year ended February 28, 2021 and period ended February 29, 2020 respectively. |
| (9) | Inclusive of excise tax expense of 0.06%(4) and 0.05% for the period ended January 31, 2022 and year ended February 28, 2021. |
| (10) | Certain expenses incurred by the Fund were not annualized. |
SELECTED PER SHARE DATA AND RATIOS FOR A SHARE OUTSTANDING
| Year Ended January 31, 2023 | Fiscal Period March 1, 2021 to January 31, 2022 (1) | Year Ended February 28/29 | From Inception June 30, 2017(2) to February 28 2018 | |||||||||
| 2021 | 2020 | 2019 | ||||||||||
| PER SHARE DATA: | ||||||||||||
Net asset value, beginning of period | $ 9.80 | $ 10.71 | $ 9.85 | $ 9.71 | $ 9.79 | $ 9.84(3) | ||||||
| Income (loss) from investment operations: | ||||||||||||
Net investment income (loss)(4) | 0.27 | 0.25 | 0.41 | 0.43 | 0.48 | 0.35 | ||||||
Net realized and unrealized gain (loss) | (0.16) | (0.27) | 1.00 | 0.26 | (0.01) | (0.06) | ||||||
Total from investment operations | 0.11 | (0.02) | 1.41 | 0.69 | 0.47 | 0.29 | ||||||
| Dividends and Distributions to Shareholders: | ||||||||||||
Net investment income | (0.55) | (0.51) | (0.39) | (0.44) | (0.50) | (0.32) | ||||||
Net realized gains | (0.09) | (0.38) | (0.16) | (0.11) | (0.05) | — | ||||||
Total dividends and distributions to shareholders | (0.64) | (0.89) | (0.55) | (0.55) | (0.55) | (0.32) | ||||||
Capital change resulting from issuance of common shares and related offering costs | — | — | — | — | — | (0.02) | ||||||
Net asset value, end of period | $ 9.27 | $ 9.80 | $ 10.71 | $ 9.85 | $ 9.71 | $ 9.79 | ||||||
Market value, end of period | $ 9.00 | $ 9.88 | $ 10.04 | $ 9.14 | $ 9.00 | $ 9.22 | ||||||
Total return, net asset value(5), (6) | 1.40% | (0.28)% | —% (7) | —% (7) | —% (7) | —% (7) | ||||||
Total return, market value(5), (6) | (2.18)% | 7.33% | 16.68% | 7.63% | 3.72% | (4.59)% | ||||||
| RATIOS/SUPPLEMENTAL DATA: | ||||||||||||
Ratio of net expenses after interest expense to average net assets(8), (9), (10) | 2.41% | 1.62% (11) | 1.72% | 2.38% | 2.60% | 2.14% (11) | ||||||
Ratio of total expenses after interest expense to average net assets(8), (9) | 2.48% | 1.72% (11) | 1.73% | 2.38% | 2.60% | 2.14% (11) | ||||||
Ratio of net investment income (loss) to average net assets(8), (9) | 2.91% | 2.58% (11) | 4.24% | 4.34% | 4.94% | 5.47% (11) | ||||||
Portfolio turnover rate(5) | 18% | 56% | 101% | 86% | 116% | 66% | ||||||
Net assets, end of period (000’s) | $169,375 | $178,998 | $195,606 | $179,907 | $177,319 | $178,760 | ||||||
Loan payable, end of period (000’s) | $ 69,700 | $ 69,700 | $ 69,700 | $ 69,700 | $ 69,700 | $ 69,700 | ||||||
Asset coverage, per $1,000 principal amount of loan payable | $ 3,430 | $ 3,568 | $ 3,806 | $ 3,581 | $ 3,544 | $ 3,565 | ||||||
| (1) | The Fund had a fiscal year end change from February 28 to January 31. |
| (2) | Commencement of operations. |
| (3) | Initial public offering price of $10.00 per share less sales load of 1.65% of the offering price. |
| (4) | Calculated using average shares outstanding. |
| (5) | Not annualized for periods less than one year. |
| (6) | Total return on market value is calculated assuming a purchase of common shares on the opening of the first day and sale on the closing of the last day of each period reported. Dividends and distributions are assumed, for purposes of this calculation, to be reinvested at prices obtained under the Fund’s Automatic Reinvestment and Cash Purchase Plan. Total return on market value is not annualized for periods of less than one year. Brokerage commissions that a shareholder may pay are not reflected. Total return on market value does not reflect the deduction of taxes that a shareholder may pay on fund distributions or the sale of fund shares. Total return on net asset value uses the same methodology, but with use of net asset value for the beginning, ending and reinvestment values. |
| (7) | Return not disclosed. |
| (8) | Annualized for periods less than one year. |
| (9) | Inclusive of excise tax expense of 0.06%, 0.15%(5), 0.08%, 0.07%, 0.08% and 0.02%(5) for the year ended January 31, 2023, period ended January 31, 2022, years ended February 28/29, 2021, 2020, 2019 and period ended February 28, 2018, respectively. |
| (10) | Ratio of net expenses, before interest expense, was 1.30%, 1.37%, 1.33%, 1.31%, 1.36% and 1.23% for the year ended January 31, 2023, period ended January 31, 2022, years ended February 28/29, 2021, 2020 and 2019 and period ended 2018, respectively. |
| (11) | Certain expenses incurred by the Fund were not annualized. |
SELECTED PER SHARE DATA AND RATIOS FOR A COMMON SHARE
| Year Ended January 31, 2023 | Fiscal Period March 1, 2021 to January 31, 2022 (1) | Year Ended February 28/29 | |||||||||
| 2021 | 2020 | 2019 | 2018 | ||||||||
| PER SHARE DATA: | |||||||||||
Net asset value, beginning of period | $ 5.55 | $ 6.46 | $ 5.33 | $ 5.61 | $ 6.54 | $ 6.86 | |||||
| Income (loss) from investment operations: | |||||||||||
Net investment income (loss)(2) | 0.19 | 0.21 | 0.37 | 0.52 | 0.56 | 0.69 | |||||
Net realized and unrealized gain (loss) | (1.09) | (0.59) | 1.35 | (0.02) | (0.64) | (0.16) | |||||
Total from investment operations | (0.90) | (0.38) | 1.72 | 0.50 | (0.08) | 0.53 | |||||
| Dividends on Preferred Shares from Net Investment Income: | (0.11) | (0.06) | (0.07) | (0.14) | (0.12) | (0.07) | |||||
Net increase (decrease) in net assets applicable to common shareholders resulting from investment operations | (1.01) | (0.44) | 1.65 | 0.36 | (0.20) | 0.46 | |||||
| Dividends and Distributions to Shareholders: | |||||||||||
Net investment income | (0.11) | (0.16) | (0.31) | (0.42) | (0.50) | (0.77) | |||||
Return of capital | (0.40) | (0.31) | (0.21) | (0.22) | (0.28) | (0.01) | |||||
Total dividends and distributions to shareholders | (0.51) | (0.47) | (0.52) | (0.64) | (0.78) | (0.78) | |||||
| Preferred Shares Transactions: | |||||||||||
Accretion to net asset value, resulting from tender offer of Auction-Rate Preferred shares | 0.05 | — | — | — | 0.09 | — | |||||
Capital change resulting from issuance of Cumulative Preferred Shares and related offering costs | — | — | — | — | (0.04) | — | |||||
Net asset value, end of period | $ 4.08 | $ 5.55 | $ 6.46 | $ 5.33 | $ 5.61 | $ 6.54 | |||||
Market value, end of period | $ 3.96 | $ 5.31 | $ 5.68 | $ 5.10 | $ 6.24 | $ 6.93 | |||||
Total return, net asset value(3), (4) | (17.30)% | (7.41)% | —% (5) | —% (5) | —% (5) | —% (5) | |||||
Total return, market value(3), (4) | (15.20)% | 1.14% | 24.29% | (8.51)% | 2.00% | 12.22% | |||||
| RATIOS/SUPPLEMENTAL DATA: | |||||||||||
Ratio of net expenses after interest expense to average net assets(6), (7), (8) | 2.08% (9) | 1.39% | 1.45% | 1.53% | 1.56% (9) | 1.28% | |||||
Ratio of total expenses after interest expense to average net assets(6), (7) | 2.27% (9) | 1.55% | 1.48% | 1.53% | 1.56% (9) | 1.28% | |||||
Ratio of net investment income (loss) to average net assets(6), (7) | 4.38% | 3.69% | 7.04% | 9.30% | 9.22% | 10.32% | |||||
Portfolio turnover rate(3) | 71% | 54% | 73% | 35% | 41% | 34% | |||||
Net assets, end of period (000’s) | $368,409 | $501,250 | $583,944 | $481,633 | $502,648 | $580,867 | |||||
Loan payable, end of period (000’s) | $170,000 | $ 28,852 | $ 28,852 | $ 28,852 | $ 28,852 | $ — | |||||
Asset coverage, per $1,000 principal amount of loan payable | $ 3,755 | $ 29,578 | $ 32,444 | $ 28,898 | $ 29,627 | $ — | |||||
Asset coverage, per $25 liquidation preference per share of cumulative preferred shares | $ 59 | $ 61 | $ 70 | $ 62 | $ 64 | $ — | |||||
Asset coverage per $25,000 liquidation preference per share of auction-rate preferred shares | $ — | $ 60,587 | $ 70,027 | $ 62,132 | $ 63,572 | $ 65,668 | |||||
Cumulative Preferred shares average market value(10) | $ 23.64 | $ 24.23 | $ 25.91 | $ 25.81 | $ 24.46 | $ — | |||||
| (1) | The Fund had a fiscal year end change from February 28 to January 31. |
| (2) | Calculated using average shares outstanding. |
| (3) | Not annualized for periods less than one year. |
| (4) | Total return on market value is calculated assuming a purchase of common shares on the opening of the first day and sale on the closing of the last day of each period reported. Dividends and distributions are assumed, for purposes of this calculation, to be reinvested at prices obtained under the Fund’s Automatic Reinvestment and Cash Purchase Plan. Total return on market value is not annualized for periods of less than one year. Brokerage commissions that a shareholder may pay are not reflected. Total return on market value does not reflect the deduction of taxes that a shareholder may pay on fund distributions or the sale of fund shares. Total return on net asset value uses the same methodology, but with use of net asset value for the beginning, ending and reinvestment values. |
| (5) | Return not disclosed. |
| (6) | Calculated on the basis of income and expenses applicable to both common and preferred shares relative to average net assets of common shareholders. |
| (7) | Annualized for periods less than one year. |
| (8) | Ratio of net expenses, before interest expense and auction agent fees and commissions, was 1.46%, 1.31%, 1.35%, 1.33%, 1.34% and 1.21% for the year ended January 31, 2023, period ended January 31, 2022, years ended February 28/29, 2021, 2020, 2019 and 2018, respectively. |
| (9) | Inclusive of tender offer expenses of 0.03% for the years ended January 31, 2023 and February 28, 2019. |
| (10) | Based on daily closing market prices. |
SELECTED PER SHARE DATA AND RATIOS FOR A COMMON SHARE
| Year Ended January 31, 2023 | Fiscal Period March 1, 2021 to January 31, 2022 (1) | Year Ended February 28/29 | |||||||||
| 2021 | 2020 | 2019 | 2018 | ||||||||
| PER SHARE DATA: | |||||||||||
Net asset value, beginning of period | $ 4.96 | $ 5.79 | $ 4.79 | $ 5.03 | $ 5.87 | $ 6.14 | |||||
| Income (loss) from investment operations: | |||||||||||
Net investment income (loss)(2) | 0.18 | 0.19 | 0.34 | 0.48 | 0.50 | 0.62 | |||||
Net realized and unrealized gain (loss) | (0.98) | (0.54) | 1.20 | (0.03) | (0.57) | (0.14) | |||||
Total from investment operations | (0.80) | (0.35) | 1.54 | 0.45 | (0.07) | 0.48 | |||||
| Dividends on Preferred Shares from Net Investment Income: | (0.12) | (0.07) | (0.08) | (0.14) | (0.12) | (0.06) | |||||
Net increase (decrease) in net assets applicable to common shareholders resulting from investment operations | (0.92) | (0.42) | 1.46 | 0.31 | (0.19) | 0.42 | |||||
| Dividends and Distributions to Shareholders: | |||||||||||
Net investment income | (0.08) | (0.12) | (0.27) | (0.36) | (0.45) | (0.61) | |||||
Return of capital | (0.37) | (0.29) | (0.19) | (0.19) | (0.24) | (0.08) | |||||
Total dividends and distributions to shareholders | (0.45) | (0.41) | (0.46) | (0.55) | (0.69) | (0.69) | |||||
| Preferred Shares Transactions: | |||||||||||
Accretion to net asset value, resulting from tender offer of Auction-Rate Preferred shares | 0.04 | — | — | — | 0.09 | — | |||||
Capital change resulting from issuance of Cumulative Preferred Shares and related offering costs | — | — | — | — | (0.05) | — | |||||
Net asset value, end of period | $ 3.63 | $ 4.96 | $ 5.79 | $ 4.79 | $ 5.03 | $ 5.87 | |||||
Market value, end of period | $ 3.33 | $ 4.62 | $ 5.01 | $ 4.54 | $ 5.44 | $ 6.10 | |||||
Total return, net asset value(3), (4) | (17.84)% | (7.95)% | —% (5) | —% (5) | —% (5) | —% (5) | |||||
Total return, market value(3), (4) | (17.85)% | (0.19)% | 22.81% | (6.98)% | 1.14% | 10.84% | |||||
| RATIOS/SUPPLEMENTAL DATA: | |||||||||||
Ratio of net expenses after interest expense to average net assets(6), (7), (8) | 2.00% (9) | 1.40% | 1.44% | 1.41% | 1.53% (9) | 1.32% | |||||
Ratio of total expenses after interest expense to average net assets(6), (7) | 2.18% (9) | 1.55% | 1.47% | 1.41% | 1.53% (9) | 1.32% | |||||
Ratio of net investment income (loss) to average net assets(6), (7) | 4.57% | 3.73% | 7.18% | 9.48% | 9.28% | 10.31% | |||||
Portfolio turnover rate(3) | 72% | 54% | 73% | 35% | 41% | 33% | |||||
Net assets, end of period (000’s) | $276,002 | $377,882 | $440,994 | $364,382 | $379,901 | $440,106 | |||||
Loan payable, end of period (000’s) | $ 95,000 | $ — | $ — | $ — | $ — | $ — | |||||
Asset coverage, per $1,000 principal amount of loan payable | $ 5,053 | $ — | $ — | $ — | $ — | $ — | |||||
Asset coverage, per $25 liquidation preference per share of cumulative preferred shares | $ 59 | $ 60 | $ 65 | $ 58 | $ 60 | $ — | |||||
Asset coverage per $25,000 liquidation preference per share of auction-rate preferred shares | $ — | $ 59,793 | $ 65,454 | $ 58,421 | $ 59,845 | $ 65,147 | |||||
Cumulative Preferred shares average market value(10) | $ 23.53 | $ 23.92 | $ 25.64 | $ 25.39 | $ 24.04 | $ — | |||||
| (1) | The Fund had a fiscal year end change from February 28 to January 31. |
| (2) | Calculated using average shares outstanding. |
| (3) | Not annualized for periods less than one year. |
| (4) | Total return on market value is calculated assuming a purchase of common shares on the opening of the first day and sale on the closing of the last day of each period reported. Dividends and distributions are assumed, for purposes of this calculation, to be reinvested at prices obtained under the Fund’s Automatic Reinvestment and Cash Purchase Plan. Total return on market value is not annualized for periods of less than one year. Brokerage commissions that a shareholder may pay are not reflected. Total return on market value does not reflect the deduction of taxes that a shareholder may pay on fund distributions or the sale of fund shares. Total return on net asset value uses the same methodology, but with use of net asset value for the beginning, ending and reinvestment values. |
| (5) | Return not disclosed. |
| (6) | Calculated on the basis of income and expenses applicable to both common and preferred shares relative to average net assets of common shareholders. |
| (7) | Annualized for periods less than one year. |
| (8) | Ratio of net expenses, before interest expense and auction agent fees and commissions, was 1.53%, 1.35%, 1.39%, 1.36%, 1.39% and 1.24% for the year ended January 31, 2023, period ended January 31, 2022, and years ended February 28/29, 2021, 2020, 2019 and 2018, respectively. |
| (9) | Inclusive of tender offer expenses of 0.04% for the years ended January 31, 2023 and February 28, 2019. |
| (10) | Based on daily closing market prices. |
SELECTED PER SHARE DATA AND RATIOS FOR A COMMON SHARE OUTSTANDING
| Year Ended January 31, | |||||||||
| 2023 | 2022 | 2021 | 2020 | 2019 | |||||
| PER SHARE DATA: | |||||||||
Net asset value, beginning of period | $ 27.25 | $ 35.15 | $ 24.81 | $ 22.05 | $ 23.88 | ||||
| Income (loss) from investment operations: | |||||||||
Net investment income (loss)(1) | (0.02) | (0.17) | 0.01 | 0.11 | 0.16 | ||||
Net realized and unrealized gain (loss) | (3.65) | 0.09 | 12.71 | 4.65 | 0.01 | ||||
Total from investment operations | (3.67) | (0.08) | 12.72 | 4.76 | 0.17 | ||||
| Dividends and Distributions to Common Shareholders: | |||||||||
Net investment income | (2.16) | (2.02) | (1.19) | (0.42) | (0.95) | ||||
Net realized gains | (0.20) | (5.80) | (1.19) | (1.58) | (1.05) | ||||
Total dividends and distributions to common shareholders | (2.36) | (7.82) | (2.38) | (2.00) | (2.00) | ||||
Net asset value, end of period | $ 21.22 | $ 27.25 | $ 35.15 | $ 24.81(2) | $ 22.05 | ||||
Market value, end of period | $ 22.62 | $ 27.75 | $ 32.25 | $ 25.22 | $ 21.29 | ||||
Total return, net asset value(3) | (13.45)% | (2.32)% | —% (4) | —% (4) | —% (4) | ||||
Total return, market value(3) | (9.06)% | 7.46% | 40.11% | 29.04% | 3.89% | ||||
| RATIOS/SUPPLEMENTAL DATA: | |||||||||
Ratio of net expenses after interest expense to average net assets(5) | 3.36% | 2.47% (6) | 2.84% (6) | 3.32% | 3.40% (6) | ||||
Ratio of total expenses after interest expense to average net assets | 3.49% | 2.55% (6) | 2.84% (6) | 3.32% | 3.40% (6) | ||||
Ratio of net investment income (loss) to average net assets | (0.07)% | (0.48)% (6) | 0.05% (6) | 0.47% | 0.72% (6) | ||||
Portfolio turnover rate | 94% | 108% | 128% | 120% | 105% | ||||
Net assets, end of period (000’s) | $219,853 | $282,348 | $363,899 | $256,724 | $227,320 | ||||
Loan payable, end of period (000’s) | $ 75,000 | $ 75,000 | $ 75,000 | $ 75,000 | $ 75,000 | ||||
Mandatory redeemable preferred shares, end of period (000’s) | $ 30,000 | $ 30,000 | $ 30,000 | $ 30,000 | $ 30,000 | ||||
Asset coverage, per $1,000 principal amount of loan payable(7) | $ 4,331 | $ 5,165 | $ 6,252 | $ 4,823 | $ 4,431 | ||||
Asset coverage ratio on total leverage (8) | 309% | 369% | 447% | 344% | 316% | ||||
Asset coverage, per $25 liquidation preference per share of mandatory redeemable preferred shares(9) | $ 77 | $ 92 | $ 112 | $ 86 | $ 79 | ||||
| (1) | Calculated using average shares outstanding. |
| (2) | Payment from affiliate increased the net asset value by less than $0.01. |
| (3) | Total return on market value is calculated assuming a purchase of common shares on the opening of the first day and sale on the closing of the last day of each period reported. Dividends and distributions are assumed, for purposes of this calculation, to be reinvested at prices obtained under the Fund’s Automatic Reinvestment and Cash Purchase Plan. Total return on market value is not annualized for periods of less than one year. Brokerage commissions that a shareholder may pay are not reflected. Total return on market value does not reflect the deduction of taxes that a shareholder may pay on fund distributions or the sale of fund shares. Total return on net asset value uses the same methodology, but with use of net asset value for the beginning, ending and reinvestment values. |
| (4) | Return not disclosed. |
| (5) | Ratio of net expenses, before interest expense to average net assets was 2.17%, 1.85%, 2.03%, 2.14%, and 2.20% for the years ended January 31, 2023, 2022, 2021, 2020 and 2019, respectively. |
| (6) | Inclusive of excise tax expense of 0.04%, 0.05%, 0.06% and 0.07% for the years ended January 31, 2022, 2021, 2019 and 2018, respectively. |
| (7) | Represents value of net assets applicable to common stock plus the loan payable and mandatory redeemable preferred shares at the end of the period divided by the borrowings at the end of the period multiplied by $1,000. |
| (8) | Represents value of net assets applicable to common stock plus the loan payable and mandatory redeemable preferred shares at the end of the period divided by the loan payable and mandatory redeemable preferred shares at the end of the period. |
| (9) | Represents value of net assets applicable to common stock plus the loan payable and mandatory redeemable preferred shares at the end of the period divided by the loan payable and mandatory redeemable preferred shares at the end of the period multiplied by $25. |
SELECTED PER SHARE DATA AND RATIOS FOR A SHARE OUTSTANDING
| Year Ended January 31, | |||||||||
| 2023 | 2022 | 2021 | 2020 | 2019 | |||||
| PER SHARE DATA: | |||||||||
Net asset value, beginning of period | $ 16.33 | $ 15.21 | $ 14.34 | $ 13.52 | $ 15.32 | ||||
| Income (loss) from investment operations: | |||||||||
Net investment income (loss)(1) | 0.08 | 0.05 | 0.13 | 0.24 | 0.27 | ||||
Net realized and unrealized gain (loss) | (1.22) | 1.97 | 1.64 | 1.48 | (1.17) | ||||
Total from investment operations | (1.14) | 2.02 | 1.77 | 1.72 | (0.90) | ||||
| Dividends and Distributions to Shareholders: | |||||||||
Net investment income | (0.98) | (0.90) | (0.13) | (0.26) | (0.71) | ||||
Net realized gains | (0.02) | — | (0.48) | (0.64) | — | ||||
Return of capital | — | — | (0.29) | — | (0.19) | ||||
Total dividends and distributions to shareholders | (1.00) | (0.90) | (0.90) | (0.90) | (0.90) | ||||
Net asset value, end of period | $ 14.19 | $ 16.33 | $ 15.21 | $ 14.34 | $ 13.52 | ||||
Market value, end of period | $ 12.31 | $ 14.73 | $ 13.28 | $ 13.09 | $ 11.90 | ||||
Total return, net asset value(2) | (6.71)% | 13.39% | —% (3) | —% (3) | —% (3) | ||||
Total return, market value(2) | (9.24)% | 17.77% | 9.71% | 18.17% | (5.42)% | ||||
| RATIOS/SUPPLEMENTAL DATA: | |||||||||
Ratio of net expenses to average net assets | 0.96% | 0.96% | 0.96% | 0.96% | 0.95% | ||||
Ratio of total expenses to average net assets | 1.08% | 1.06% | 0.96% | 0.96% | 0.95% | ||||
Ratio of net investment income (loss) to average net assets | 0.58% | 0.28% | 0.94% | 1.73% | 1.87% | ||||
Portfolio turnover rate | 60% | 63% | 104% | 76% | 50% | ||||
Net assets, end of period (000’s) | $1,345,311 | $1,548,372 | $1,441,666 | $1,359,815 | $1,281,712 | ||||
| (1) | Calculated using average shares outstanding. |
| (2) | Total return on market value is calculated assuming a purchase of common shares on the opening of the first day and sale on the closing of the last day of each period reported. Dividends and distributions are assumed, for purposes of this calculation, to be reinvested at prices obtained under the Fund’s Automatic Reinvestment and Cash Purchase Plan. Total return on market value is not annualized for periods of less than one year. Brokerage commissions that a shareholder may pay are not reflected. Total return on market value does not reflect the deduction of taxes that a shareholder may pay on fund distributions or the sale of fund shares. Total return on net asset value uses the same methodology, but with use of net asset value for the beginning, ending and reinvestment values. |
| (3) | Return not disclosed. |
SELECTED PER SHARE DATA AND RATIOS FOR A SHARE OUTSTANDING
| Year Ended January 31, | |||||||||
| 2023 | 2022 | 2021 | 2020 | 2019 | |||||
| PER SHARE DATA: | |||||||||
Net asset value, beginning of period | $ 30.32 | $ 30.91 | $ 24.89 | $ 22.53 | $ 24.51 | ||||
| Income (loss) from investment operations: | |||||||||
Net investment income (loss)(1) | 0.11 | (0.09) | 0.06 | 0.18 | 0.19 | ||||
Net realized and unrealized gain (loss) | (4.02) | 2.77 | 7.48 | 3.70 | (0.65) | ||||
Total from investment operations | (3.91) | 2.68 | 7.54 | 3.88 | (0.46) | ||||
| Dividends and Distributions to Shareholders: | |||||||||
Net investment income | (2.00) | (1.52) | (0.09) | (0.20) | (0.93) | ||||
Net realized gains | (1.98) | (1.75) | (1.43) | (1.32) | (0.59) | ||||
Total dividends and distributions to shareholders | (3.98) | (3.27) | (1.52) | (1.52) | (1.52) | ||||
Net asset value, end of period | $ 22.43 | $ 30.32 | $ 30.91 | $ 24.89(2) | $ 22.53 | ||||
Market value, end of period | $ 20.28 | $ 27.33 | $ 27.78 | $ 23.14 | $ 20.52 | ||||
Total return, net asset value(3) | (12.54)% | 8.22% | —% (4) | —% (4) | —% (4) | ||||
Total return, market value(3) | (10.96)% | 9.80% | 28.21% | 20.83% | (0.25)% | ||||
| RATIOS/SUPPLEMENTAL DATA: | |||||||||
Ratio of net expenses to average net assets | 1.07% | 1.12% (5) | 1.07% | 1.07% | 1.13% (5) | ||||
Ratio of total expenses to average net assets | 1.18% | 1.22% (5) | 1.07% | 1.07% | 1.13% (5) | ||||
Ratio of net investment income (loss) to average net assets | 0.41% | (0.28)% (5) | 0.24% | 0.74% | 0.83% (5) | ||||
Portfolio turnover rate | 76% | 71% | 85% | 50% | 81% | ||||
Net assets, end of period (000’s) | $621,644 | $840,257 | $856,449 | $689,650 | $624,315 | ||||
| (1) | Calculated using average shares outstanding. |
| (2) | Payment from affiliate increased the net asset value by less than $0.01. |
| (3) | Total return on market value is calculated assuming a purchase of common shares on the opening of the first day and sale on the closing of the last day of each period reported. Dividends and distributions are assumed, for purposes of this calculation, to be reinvested at prices obtained under the Fund’s Automatic Reinvestment and Cash Purchase Plan. Total return on market value is not annualized for periods of less than one year. Brokerage commissions that a shareholder may pay are not reflected. Total return on market value does not reflect the deduction of taxes that a shareholder may pay on fund distributions or the sale of fund shares. Total return on net asset value uses the same methodology, but with use of net asset value for the beginning, ending and reinvestment values. |
| (4) | Return not disclosed. |
| (5) | Inclusive of excise tax expense of 0.05% and 0.07% for the years ended January 31, 2022 and 2019, respectively. |
| A. | Security Valuation |
| Each Fund utilizes a fair value hierarchy which prioritizes the inputs to valuation techniques used to measure fair value into three broad levels. The Funds’ policy is to recognize transfers into or out of Level 3 at the end of the reporting period. |
| B. | Security Transactions and Investment Income |
| Security transactions are recorded on the trade date. Realized gains and losses from the sale of securities are determined on the identified cost basis. Dividend income and capital gain distributions are recognized on the ex-dividend date, or in the case of certain foreign securities, as soon as a Fund is notified. Interest income is recorded on the accrual basis. Each Fund amortizes premiums and accretes discounts using the effective interest method. Premiums on callable debt instruments are amortized to interest income to the earliest call date using the effective interest method. Conversion premium is not amortized. Any distributions from underlying funds are recorded in accordance with the character of the distributions as designated by the underlying funds. | |
| Dividend income from Real Estate Investment Trusts (“REITs”) and Master Limited Partnerships (“MLPs”) investments is recorded using management’s estimate of the percentage of income included in distributions received from such investments based on historical information and other industry sources. The return of capital portion of the estimate is a reduction to investment income and a reduction in the cost basis of each investment which increases net realized gain (loss) and net change in unrealized appreciation (depreciation). If the return of capital distributions exceed their cost basis, the distributions are treated as realized gains. The actual amounts of income, return of capital, and capital gains are only determined by each REIT after its fiscal year-end, and may differ from the estimated amounts. | |
| C. | Income Taxes |
| Each Fund is treated as a separate taxable entity. It is the intention of each Fund to comply with the requirements of Subchapter M of the Internal Revenue Code of 1986, as amended (the “Code”) and to distribute substantially all of its taxable income and capital gains, if any, to its shareholders. Therefore, no provision for federal income taxes or excise taxes has been made. | |
| Certain Funds may be subject to foreign taxes on income, gains on investments or currency repatriation, a portion of which may be recoverable. Each Fund will accrue such taxes and recoveries as applicable based upon current interpretations of the tax rules and regulations that exist in the markets in which it invests. | |
| Management of the Funds has concluded that there are no significant uncertain tax positions that would require recognition in the financial statements. Each Fund’s U.S. federal income tax return is generally subject to examination by the Internal Revenue Service for a period of three years after it is filed. State, local and/or non-U.S. tax returns and/or other filings may be subject to examination for different periods, depending upon the tax rules of each applicable jurisdiction. | |
| D. | Distributions to Shareholders |
| AIO, CBH, NCV, NCZ and ACV declare distributions on a monthly basis. NFJ and NIE declare distributions on a quarterly basis. Distributions are recorded by the Funds on the ex-dividend date. Income and capital gain distributions are determined in accordance with income tax regulations which may differ from U.S. GAAP. | |
| AIO and ACV have a Managed Distribution Plan which currently provides for the Funds to make a monthly distribution of $0.15 per share and $0.18 per share, respectively. Also, NFJ and NIE have a Managed Distribution Plan which currently provides for the Funds to make a quarterly distribution of $0.245 per share and $0.50 per share, respectively. Distributions may represent earnings from net investment income, realized capital gains, or, if necessary, return of capital. Shareholders should not draw any conclusions about the Funds’ investment performance from the terms of the Funds’ Managed Distribution Plan. | |
| E. | Expenses |
| Expenses incurred together by a Fund and other affiliated mutual funds are allocated in proportion to the net assets of each such fund, except where allocation of direct expenses to each such fund or an alternative allocation method can be more appropriately used. | |
| In addition to the net annual operating expenses that a Fund bears directly, the shareholders of a Fund indirectly bear the pro-rata expenses of any underlying mutual funds in which the Fund invests. | |
| F. | Foreign Currency Transactions |
| Non-U.S. investment securities and other assets and liabilities denominated in foreign currencies are translated into U.S. dollar amounts at the foreign currency exchange rate effective at the end of the reporting period. Cost of investments is translated at the currency exchange rate effective at the trade date. The gain or loss resulting from a change in currency exchange rates between the trade and settlement date of a portfolio transaction is treated as a gain or loss on foreign currency. Likewise, the gain or loss resulting from a change in currency exchange rates between the date income is accrued and the date it is paid is treated as a gain or loss on foreign currency. For fixed income instruments, the Funds bifurcate that portion of the results of operations arising from changes in foreign exchange rates on investments from the fluctuations arising from changes in the market prices of securities held and such fluctuations are included with the net realized and unrealized gain or loss on foreign currency transactions. For equity securities, the Funds do not isolate that portion of the results of operations arising from changes in foreign exchange rates on investments from the fluctuations arising from changes in the market prices of securities held and such fluctuations are included with the net realized and unrealized gain or loss on investments. | |
| G. | Convertible Securities |
| The Funds may invest a portion of their assets in convertible securities. Although convertible securities derive part of their value from that of the securities into which they are convertible, they are not considered derivative financial instruments. However, certain of the Funds’ investments in |
| convertible securities include features which render them sensitive to price changes in their underlying securities. The value of structured/synthetic convertible securities can be affected by interest rate changes and credit risks of the issuer. Such securities may be structured in ways that limit their potential for capital appreciation, and the entire value of the security may be at risk of loss depending on the performance of the underlying equity security. Consequently, the Funds are exposed to greater downside risk than traditional convertible securities, but typically still less than that of the underlying stock. | |
| H. | Payment-In-Kind Securities |
| The Funds may invest in payment-in-kind securities, which are debt or preferred stock securities that require or permit payment of interest in the form of additional securities. Payment-in-kind securities allow the issuer to avoid or delay the need to generate cash to meet current interest payments and, as a result, may involve greater risk than securities that pay interest currently or in cash. | |
| I. | When-issued Purchases and Forward Commitments (Delayed Delivery) |
| Certain Funds may engage in when-issued or forward commitment transactions. Securities purchased on a when-issued or forward commitment basis are also known as delayed delivery transactions. Delayed delivery transactions involve a commitment by a Fund to purchase or sell a security at a future date (ordinarily up to 90 days later). When-issued or forward commitments enable the Funds to lock in what is believed to be an attractive price or yield on a particular security for a period of time, regardless of future changes in interest rates. Each Fund records when-issued and forward commitment securities on the trade date. Each Fund maintains collateral for the securities purchased. Securities purchased on a when-issued or forward commitment basis begin earning interest on the settlement date. | |
| J. | Leveraged Loans |
| Certain Funds may invest in direct debt instruments which are interests in amounts owed by a corporate, governmental, or other borrower to lenders or lending syndicates. Leveraged loans are generally non-investment grade and often involve borrowers that are highly leveraged. The Funds may invest in obligations of borrowers who are in bankruptcy proceedings. Leveraged loans are typically senior in the corporate capital structure of the borrower. A loan is often administered by a bank or other financial institution (the “lender”) that acts as agent for all holders. The agent administers the terms of the loan, as specified in the leveraged loan. A Fund’s investments in loans may be in the form of participations in loans or assignments of all or a portion of loans from third parties. When investing in loan participations, a Fund has the right to receive payments of principal, interest and any fees to which it is entitled only from the lender selling the loan participation and only upon receipt by the lender of payments from the borrower. A Fund generally has no right to enforce compliance with the terms of the leveraged loan with the borrower. As a result, a Fund may be subject to the credit risk of both the borrower and the lender that is selling the leveraged loan. When a Fund purchases assignments from lenders it acquires direct rights against the borrower on the loan. | |
| A Fund may invest in multiple series or tranches of a loan, which may have varying terms and carry different associated risks. Leveraged loans may involve foreign borrowers and investments may be denominated in foreign currencies. Direct indebtedness of emerging countries involves a risk that the government entities responsible for the repayment of the debt may be unable, or unwilling, to pay the principal and interest when due. | |
| The leveraged loans have floating rate loan interests which generally pay interest at rates that are periodically determined by reference to a base lending rate plus a premium. The base lending rates are generally LIBOR, SOFR, the prime rate offered by one or more U.S. banks or the certificate of deposit rate. When a leveraged loan is purchased a Fund may pay an assignment fee. On an ongoing basis, a Fund may receive a commitment fee based on the undrawn portion of the underlying line of credit portion of a leveraged loan. Prepayment penalty fees are received upon the prepayment of a leveraged loan by a borrower. Prepayment penalty, facility, commitment, consent and amendment fees are recorded to income as earned or paid. | |
| A Fund may invest in both secured loans and “covenant lite” loans which have few or no financial maintenance covenants that would require a borrower to maintain certain financial metrics. The lack of financial maintenance covenants in covenant lite loans increases the risk that the applicable Fund will experience difficulty or delays in enforcing its rights on its holdings of such loans, which may result in losses, especially during a downturn in the credit cycle. | |
| K. | Warrants |
| The Funds may receive warrants. Warrants are securities that are usually issued together with a debt instrument or preferred stock and that give the holder the right to buy a proportionate amount of common stock at a specified price. Warrants may be freely transferable and are often traded on major exchanges. Warrants normally have a life that is measured in years and entitle the holder to buy common stock of a company at a price that is usually higher than the market price at the time the warrant is issued. Warrants may entail greater risks than certain other types of investments. Generally, warrants do not carry the right to receive dividends or exercise voting rights with respect to the underlying securities, and they do not represent any rights in the assets of the issuer. In addition, their value does not necessarily change with the value of the underlying securities, and they cease to have value if they are not exercised on or before their expiration date. If the market price of the underlying stock does not exceed the exercise price during the life of the warrant, the warrant will expire worthless. Warrants may increase the potential profit or loss to be realized from the investment as compared with investing the same amount in the underlying securities. Similarly, the percentage increase or decrease in the value of an equity security warrant may be greater than the percentage increase or decrease in the value of the underlying common stock. Warrants may relate to the purchase of equity or debt instruments. Debt obligations with warrants attached to purchase equity securities have many characteristics of convertible securities and their prices may, to some degree, reflect the performance of the underlying stock. Debt obligations also may be issued with warrants attached to purchase additional debt instruments at the same coupon rate. A decline in interest rates would permit a Fund to sell such warrants at a profit. If interest rates rise, these warrants would generally expire with no value. |
| L. | Cash and Cash Equivalents |
| Cash and cash equivalents include deposits held at financial institutions, and are inclusive of dollar denominated cash, foreign currency, and deposit with brokers for written options. |
| A. | Options Contracts |
| The Funds may write (sell) put and call options on securities and indices to earn premiums, for hedging purposes, risk management purposes or otherwise as part of their investment strategies. An options contract provides the purchaser with the right, but not the obligation, to buy (call option) or sell (put option) a financial instrument at an agreed upon price. | |
| When a Fund writes an option, it receives a premium and an amount equal to that premium is recorded as a liability. The liability is adjusted daily to reflect the current market value of the option. Holdings of the Fund designated to cover outstanding written options are noted in the Schedules of Investments. Written options are reported as a liability within “Written options at value.” Changes in value of written options are included in “Net change in unrealized appreciation (depreciation) from written options” in the Statements of Operations. | |
| If an option expires unexercised, the Fund realizes a gain to the extent of the premium received. If a written call option is exercised, the premium received is recorded as an adjustment to the proceeds from the sale. If a written put option is exercised, the premium reduces the cost basis of the security. The difference between the premium and the amount paid on effecting a closing purchase transaction is also treated as a realized gain or loss. Gain or loss on written options is presented separately as “Net realized gain (loss) from written options” in the Statements of Operations. | |
| The risk in writing call options is that the Fund gives up the opportunity for profit if the market price of the referenced security increases and the option is exercised. The risk in writing put options is that the Fund may incur a loss if the market price of the referenced security decreases and the option is exercised. The risk in buying options is that the Fund pays a premium whether or not the option is exercised. The use of such instruments may involve certain additional risks as a result of unanticipated movements in the market. Writers (sellers) of options are subject to unlimited risk of loss, as the seller will be obligated to deliver or take delivery of the security at a predetermined price which may, upon exercise of the option, be significantly different from the then-market value. As the writer of a covered call option, the Fund forgoes, during the option’s life, the opportunity to profit from increases in the market value of the security covering the call option above the sum of the premium and the strike price of the call, but retains the risk of loss should the price of the underlying security decline. | |
| During the year ended January 31, 2023, the ACV, NFJ and NIE invested in written covered call options contracts in an attempt to manage equity price risk and with the purpose of generating realized gains. | |
| The following is a summary of derivative instruments categorized by primary risk exposure, and location as presented in the Statements of Assets and Liabilities at January 31, 2023: |
| Statement Line Description | Primary Risk | ACV | NFJ | NIE | ||
| Liability Derivatives | ||||||
| Written options at value | Equity contracts | $(4) | $(1,791) | $(22) | ||
| Total | $(4) | $(1,791) | $(22) | |||
| Statement Line Description | Primary Risk | ACV | NFJ | NIE | ||
| Net Realized Gain (Loss) From | ||||||
| Written options | Equity contracts | $575 | $ 2,417 | $3,350 | ||
| Total | $575 | $ 2,417 | $3,350 | |||
| Net Change in Unrealized Appreciation (Depreciation) on | ||||||
| Written options | Equity contracts | $ 36 | $ (1,074) | $ 234 | ||
| Total | $ 36 | $ (1,074) | $ 234 | |||
| ACV | NFJ | NIE | |||
Written Options(1) | $55 | $1,097 | $323 |
| (1) Average premium amount. |
| A. | Investment Adviser |
| Virtus Investment Advisers, Inc. (“VIA” or the “Adviser”), an indirect, wholly-owned subsidiary of Virtus Investment Partners, Inc. (“Virtus”), is the investment adviser to the Funds. The Adviser manages the Funds’ investment programs and general operations of the Funds, including oversight of the Funds’ subadviser. | |
| As compensation for its services to the Funds, the Adviser is entitled to a fee, which is calculated daily and paid monthly based upon the following annual rates as a percentage of the average daily total managed assets of each Fund: |
| Fund | Advisory Fee | |||
AIO | 1.25% | |||
CBH | 0.75 | |||
NCV | 0.70 | |||
NCZ | 0.70 | |||
ACV | 1.00 | |||
NFJ | 0.90 | |||
NIE | 1.00 | |||
| B. | Subadvisers |
| The subadvisers manage the investments of each Fund for which they are paid a fee by the Adviser. A list of the subadvisers and the Funds they serve as of the end of the period is as follows: |
| Fund | Subadviser | |
AIO | Voya IM(1) | |
CBH | Voya IM(1) | |
NCV | Voya IM(1) | |
NCZ | Voya IM(1) | |
ACV | Voya IM(1) | |
NFJ (Equity and Options Portfolios) | NFJ Investment Group(2) | |
NFJ (Fixed Income Portfolio) | Voya IM(1) | |
NIE | Voya IM(1) | |
| C. | Expense Limitations |
| The Adviser has contractually agreed to limit each Fund’s annual total operating expenses, subject to the exclusions listed below, so that such expenses do not exceed, on an annualized basis, the following respective percentages of average daily net assets through February 1, 2023. |
| Following the contractual period, the Adviser may discontinue these expense limitation arrangements at any time. The reimbursements are accrued daily and received monthly. |
| Fund | Expense Limitation | |
AIO | 0.09 % | |
CBH | 0.19 | |
NCV | 0.13 | |
NCZ | 0.15 | |
ACV | 0.17 | |
NFJ | 0.06 | |
NIE | 0.07 |
| D. | Expense Recapture |
| Under certain conditions, the Adviser may recapture operating expenses reimbursed or fees waived under these arrangements within three years after the date on which such amounts were incurred or waived. A Fund must pay its ordinary operating expenses before the Adviser is entitled to any reimbursement and must remain in compliance with any applicable expense limitations or, if none, the expense limitation in effect at the time of the waiver or reimbursement. All or a portion of the following Adviser reimbursed expenses may be recaptured by the year ending December 31: |
| Expiration | ||||||||
| Fund | 2024 | 2025 | 2026 | Total | ||||
AIO | $ 22 | $ 836 | $ 894 | $ 1,752 | ||||
CBH | 25 | 175 | 117 | 317 | ||||
NCV | 107 | 794 | 720 | 1,621 | ||||
NCZ | 97 | 595 | 535 | 1,227 | ||||
ACV | — | 279 | 302 | 581 | ||||
NFJ | — | 1,598 | 1,590 | 3,188 | ||||
NIE | — | 888 | 783 | 1,671 | ||||
| E. | Administration Services |
| Virtus Fund Services, LLC (“VFS”), an indirect, wholly-owned subsidiary of Virtus, serves as administrator to the Funds. For the services provided by the administrator under the Administration Agreement, the Funds pay the administrator an asset-based fee calculated on each Fund’s average daily Managed Assets. This fee is calculated daily and paid monthly. | |
| For the year ended January 31, 2023, the Funds incurred administration fees totaling $4,719 which are included in the Statements of Operations within the line item “Administration and accounting fees”. | |
| F. | Trustees’ Fees |
| For the year ended January 31, 2023, the Funds incurred Trustees’ fees totaling $935 which are included in the Statements of Operations within the line item “Trustees’ fees and expenses”. | |
| G. | Investments with Affiliates |
| The Funds are permitted to purchase assets from or sell assets to certain affiliates under specified conditions outlined in procedures adopted by the Board. The procedures have been designed to ensure that any purchase or sale of assets by the Funds from or to another fund or portfolio that is, or could be, considered an affiliate by virtue of having a common investment adviser (or affiliated investment advisers), common Trustees and/or common officers comply with Rule 17a-7 under the 1940 Act. Further, as defined under the procedures, each transaction is effected at the current market price. During the year ended January 31, 2023, the Funds did not engage in any transactions pursuant to Rule 17a-7 under the 1940 Act. | |
| Outside of Rule 17a-7 transactions, other investments with affiliated issuers are separately reported in this footnote. An affiliated issuer includes any company in which the Fund held 5% or more of a company’s outstanding voting shares at any point during the period, as well as other circumstances where an investment adviser or subadviser to a Fund is deemed to exercise, directly or indirectly, a certain level of control over the company. A summary of the Funds’ total long-term and short-term purchases and sales of the securities of affiliated issuers during the period ended January 31, 2023, is as follows: |
| Value, beginning of period | Purchases | Sales proceeds | Net realized gain (loss) on affiliated securities | Net change in unrealized appreciation (depreciation) on affiliated securities | Value, end of period | Shares | |||||||
| NCV | |||||||||||||
| Preferred Stocks—0.0% | |||||||||||||
LiveStyle, Inc. Series B(1),(2),(3),(4),(5) | $2,519 | $— | $1,289 | $ 25 | $ (50) | $— | — | ||||||
LiveStyle, Inc. Series B (1),(4),(6) | — (7) | — | — (8) | (6,750) | 6,750 | — | — | ||||||
| $2,519 | $— | $1,289 | $(6,725) | $6,700 | $— | ||||||||
| Common Stocks—0.0% | |||||||||||||
LiveStyle, Inc.(1),(2),(3),(4),(5) | — (8) | — | — | — | — | — | — | ||||||
| Total | $2,519 | $— | $1,289 | $(6,725) | $6,700 | $— | |||||||
| Value, beginning of period | Purchases | Sales proceeds | Net realized gain (loss) on affiliated securities | Net change in unrealized appreciation (depreciation) on affiliated securities | Value, end of period | Shares | |||||||
| NCZ | |||||||||||||
| Preferred Stocks—0.0% | |||||||||||||
LiveStyle, Inc. Series B(1),(2),(3),(4),(5) | $2,519 | $— | $1,289 | $ 25 | $ (50) | $— | — | ||||||
LiveStyle, Inc. Series B (1),(4),(6) | — (7) | — | — (8) | (5,000) | 5,000 | — | — | ||||||
| $2,519 | $— | $1,289 | $(4,975) | $4,950 | $— | ||||||||
| Common Stocks—0.0% | |||||||||||||
LiveStyle, Inc.(1),(2),(3),(4),(5) | — (8) | — | — | — | — | — | — | ||||||
| Total | $2,519 | $— | $1,289 | $(4,975) | $4,950 | $— | |||||||
| Value, beginning of period | Purchases | Sales proceeds | Net realized gain (loss) on affiliated securities | Net change in unrealized appreciation (depreciation) on affiliated securities | Value, end of period | Shares | |||||||
| ACV | |||||||||||||
| Preferred Stocks—0.0% | |||||||||||||
LiveStyle Inc. Series B(1),(4),(6) | $ —(7) | $— | $ —(8) | $(1,250) | $1,250 | $— | — | ||||||
LiveStyle, Inc. Series B (1),(2),(3),(4),(5) | 378 | — | 194 | 4 | (7) | — | — | ||||||
| $378 | $— | $194 | $(1,246) | $1,243 | $— | ||||||||
| Common Stocks—0.0% | |||||||||||||
LiveStyle, Inc.(1),(2),(3),(4),(5) | — (8) | — | — | — | — | — | — | ||||||
| Total | $378 | $— | $194 | $(1,246) | $1,243 | $— | |||||||
| (1) | For the period of February 1, 2022 through March 1, 2022, a member of the Fund’s portfolio management team was a member of the board of directors of LiveStyle, Inc. |
| (2) | Issuer is not an affiliated investment of the Fund at January 31, 2023. |
| (3) | The value of this security was determined using significant unobservable inputs and is reported as a Level 3 security in the Fair Value Hierarchy table located after the Schedule of Investments. |
| (4) | Non-income producing. |
| (5) | Security is restricted from resale. |
| (6) | Security was not an investment of the Fund at January 31, 2023. |
| (7) | Includes internally fair valued securities currently priced at zero ($0). |
| (8) | Amount is less than $500. |
| H. | Trustee Deferred Compensation Plan |
| The Trustees do not currently receive any pension or retirement benefits from the Funds. In calendar year 2018 and certain prior periods, the Funds maintained a deferred compensation plan pursuant to which each Independent Trustee had the opportunity to elect not to receive all or a portion of his or her fees from the respective Fund on a current basis, but instead to receive in a subsequent period chosen by the Independent Trustee an amount equal to the value of such compensation if such compensation had been invested in one or more series of Virtus Investment Trust (formerly known as Allianz Funds) and Virtus Strategy Trust (formerly known as Allianz Funds Multi-Strategy Trust) selected by the Independent Trustees from and after the normal payment dates for such compensation. The deferred compensation program was closed to new deferrals effective January 1, 2019, and all Trustee fees earned with respect to service in calendar years 2019 and 2020 were paid in cash, on a current basis. The Funds still have obligations with respect to Independent Trustee fees deferred in 2018 and in prior periods, and will continue to have such obligations until all deferred Trustee fees are paid out pursuant to the terms of the deferred compensation plan. | |
| Effective March 2021, each Fund provides a new deferred compensation plan (“New Plan”) for its Trustees who receive compensation from the Funds. Under the New Plan, Trustees may elect to defer all or a portion of their compensation. Amounts deferred are retained by the Funds, and then, to the extent permitted by the 1940 Act, in turn, may be invested in the shares of affiliated or unaffiliated mutual funds selected by the participating Trustees. Investments in such instruments are included in “Prepaid expenses and other assets” in the Statements of Assets and Liabilities at January 31, 2023. |
| Purchases | Sales | ||
AIO | $471,354 | $416,628 | |
CBH | 40,818 | 50,352 | |
NCV | 489,964 | 601,509 | |
NCZ | 375,505 | 464,662 | |
ACV | 305,137 | 317,181 | |
NFJ | 787,436 | 884,534 | |
NIE | 520,165 | 617,106 |
| Fund | Federal Tax Cost | Unrealized Appreciation | Unrealized (Depreciation) | Net Unrealized Appreciation (Depreciation) | ||||
AIO | $ 807,136 | $ 71,931 | $ (47,210) | $ 24,721 | ||||
CBH | 253,097 | 1,284 | (11,829) | (10,545) | ||||
NCV | 687,736 | 27,276 | (71,743) | (44,467) | ||||
NCZ | 516,476 | 21,311 | (54,309) | (32,998) | ||||
ACV | 352,066 | 8,709 | (32,877) | (24,168) | ||||
ACV (Written options) | (8) | 5 | (1) | 4 | ||||
NFJ | 1,272,347 | 124,922 | (58,444) | 66,478 |
| Fund | Federal Tax Cost | Unrealized Appreciation | Unrealized (Depreciation) | Net Unrealized Appreciation (Depreciation) | ||||
NFJ (Written options) | $ (856) | $ 76 | $ (1,011) | $ (935) | ||||
NIE | 675,431 | 19,002 | (75,117) | (56,115) | ||||
NIE (Written options) | (41) | 26 | (7) | 19 |
| Fund | Short-Term | Long-Term | ||
AIO | $ 5,164 | $ — | ||
CBH | 355 | 210 | ||
NCV | 81,526 | 174,007 | ||
NCZ | 61,957 | 139,814 | ||
ACV | 5,671 | — | ||
NFJ | 5,706 | — |
| Fund | Undistributed Ordinary Income | Undistributed Long-Term Capital Gains | Late Year Ordinary Losses Deferred | Post-October Capital Loss Deferred | Capital Loss Deferred | |||||
AIO | $ — | $ — | $ 168 | $ 1,914 | $ 5,164 | |||||
CBH | 3,299 | — | — | 321 | 565 | |||||
NCV | — | — | — | 9,518 | 255,533 | |||||
NCZ | — | — | — | 7,381 | 201,771 | |||||
ACV | 154 | — | — | 861 | 5,671 | |||||
NFJ | 8,812 | — | — | — | 5,706 | |||||
NIE | 3,825 | 3,452 | — | — | — |
| Ordinary Income | Long-Term Capital Gains | Return of Capital | Total | ||||
AIO | |||||||
1/31/23 | $ 17,655 | $ 29,997 | $ 14,157 | $ 61,809 | |||
1/31/22 | 108,455 | 58,077 | — | 166,532 | |||
2/28/21 | 85,439 | — | — | 85,439 | |||
CBH | |||||||
1/31/23 | 10,083 | 1,659 | — | 11,742 | |||
1/31/22 | 16,220 | — | — | 16,220 | |||
2/28/21 | 10,078 | — | — | 10,078 | |||
NCV | |||||||
1/31/23 | 19,715 | — | 36,451 | 56,166 | |||
1/31/22 | 19,969 | — | 27,712 | 47,681 | |||
2/28/21 | 34,490 | — | 18,750 | 53,240 | |||
NCZ | |||||||
1/31/23 | 15,376 | — | 28,116 | 43,492 | |||
1/31/22 | 15,108 | — | 21,989 | 37,097 | |||
2/28/21 | 26,580 | — | 14,691 | 41,271 |
| Ordinary Income | Long-Term Capital Gains | Return of Capital | Total | ||||
ACV | |||||||
1/31/23 | $ 6,837 | $17,578 | $ — | $ 24,415 | |||
1/31/22 | 58,639 | 22,284 | — | 80,923 | |||
NFJ | |||||||
1/31/23 | 31,698 | 62,772 | — | 94,470 | |||
1/31/22 | 85,321 | — | — | 85,321 | |||
NIE | |||||||
1/31/23 | 60,478 | 49,707 | — | 110,185 | |||
1/31/22 | 42,118 | 48,601 | — | 90,719 |
| High | Low | ||
Series A | 6.164% | 0.160% | |
Series B | 6.384 | 0.160 | |
Series C | 8.668 | 0.120 | |
Series D | 7.246 | 0.160 | |
Series E | 6.164 | 0.120 |
| Fund | Value of Securities on Loan | Cash Collateral Invested in Short-Term Money Market Fund(3) | Cash Collateral used for Borrowing(1) | Net Amount(2) | ||||
AIO | $ 42,377 | $13,000 | $29,377 | $ — | ||||
CBH | 7,715 | 1,000 | 6,715 | — |
| (1) | Collateral received in excess of the market value of securities on loan is not presented in this table. Amount represents the cash collateral received in connection with securities lending transactions that has been used for the purchase of long-term securities as disclosed in the Fund’s Schedule of Investments. |
| (2) | Net amount represents the net amount receivable/due from the counterparty in the event of default. |
| (3) | Amount invested in a Money Market Mutual Fund with an Overnight and Continuous contractual maturity. |
| Fund | Outstanding Borrowings | Average Borrowing | Weighted Average Interest Rate | Days Outstanding | Loan Interest Expense | |||||
AIO | $ 130,000 (a) | $120,932 | 2.80% | 365 | 3,429 | |||||
CBH | 69,700 (b) | 69,700 | 2.65 | 365 | 1,873 | |||||
NCV | 170,000 (c) | 82,370 | 4.11 | 240 | 2,257 | |||||
NCZ | 95,000 (c) | 95,000 | 4.94 | 91 | 1,185 |
| (a) | Represents $30,000 received through the SLAA and $100,000 received through the MMLA |
| (b) | Represents $7,000 received through the SLAA and $62,700 received through the MMLA |
| (c) | Full amount received through the MMLA and the temporary MMLA. |
| Mandatory Redemption Date | Annual Dividend Rate | Aggregate Liquidation Preference | Estimated Fair Value | ||||
| October 2, 2025 | 4.34% | $30,000 | $30,000 |
| Maturity Date | Interest Rate | Notional/ Carrying Amount | Estimated Fair Value | ||||
| November 22, 2029 | 3.94% | $50,000 | $50,000 |
| Outstanding Borrowings | Interest Rate | |
| $25,000 | 5.39% |
| Fund | Investment | Date of Acquisition | Cost | Value | Percentage of Net Assets | |||||
| NCV | ||||||||||
| LiveStyle, Inc. | 2/3/16-11/30/16 | $ — | $ — (1) | 0.0% | ||||||
| LiveStyle, Inc. Series B | 2/3/16-11/30/16 | 1,206 | 925 | 0.2 | ||||||
| Tenerity, Inc. | 11/9/15-11/12/15 | 3,080 | — | 0.0 | ||||||
| NCZ | ||||||||||
| LiveStyle, Inc. | 2/3/16-11/30/16 | $ — | $ — (1) | 0.0 | ||||||
| LiveStyle, Inc. Series B | 2/3/16-11/30/16 | 1,206 | 925 | 0.3 | ||||||
| Tenerity, Inc. | 11/9/15-11/12/15 | 2,371 | — | 0.0 | ||||||
| ACV | ||||||||||
| LiveStyle, Inc. | 2/3/16-11/30/16 | $ — | $ — (1) | 0.0 | ||||||
| LiveStyle, Inc. Series B | 2/3/16-11/30/16 | 181 | 139 | 0.1 |
| (1) | Amount is less than $500. |

| Fund Name | Statements of Operations | Statements of Changes in Net Assets | Statements of Cash Flows |
| Virtus Artificial Intelligence & Technology Opportunities Fund Virtus Convertible & Income Fund Virtus Convertible & Income 2024 Target Term Fund | For the year ended January 31, 2023 | For the year ended January 31, 2023, the fiscal period from March 1, 2021 through January 31, 2022 and the year ended February 28, 2021 | For the year ended January 31, 2023 |
| Virtus Convertible & Income Fund II | For the year ended January 31, 2023 | For the year ended January 31, 2023, the fiscal period from March 1, 2021 through January 31, 2022 and the year ended February 28, 2021 | Not applicable |
| Virtus Equity & Convertible Income Fund Virtus Dividend, Interest & Premium Strategy Fund | For the year ended January 31, 2023 | For the years ended January 31, 2023 and 2022 | Not applicable |
| Virtus Diversified Income & Convertible Fund | For the year ended January 31, 2023 | For the years ended January 31, 2023 and 2022 | For the year ended January 31, 2023 |
Philadelphia, Pennsylvania
March 29, 2023
| Fund | Qualified Dividend Income % (non-corporate shareholder) | Dividend Received Deduction % (corporate shareholders) | Long-Term Capital Gain Distributions ($) | |||
AIO | 100.00 % | 100.00 % | $ — | |||
CBH | 0.00 | 0.00 | — | |||
NCV | 23.16 | 20.63 | — | |||
NCZ | 23.90 | 21.43 | — | |||
ACV | 100.00 | 93.21 | — | |||
NFJ | 100.00 | 100.00 | — | |||
NIE | 100.00 | 100.00 | 3,454 |
| Votes For | Votes Against | Abstain | |
| To approve a new subadvisory agreement by and among the Fund, Virtus Investment Advisers, Inc. (“VIA”) and Voya Investment Management Co. LLC (“Voya”) | 13,590,960.107 | 447,655.000 | 2,992,328.530 |
| Votes For | Votes Against | Abstain | |
| To approve a new subadvisory agreement by and among the Fund, VIA and Voya | 8,676,332.200 | 132,508.997 | 362,298.000 |
| Votes For | Votes Against | Abstain | |
| To approve a new subadvisory agreement by and among the Fund, VIA and Voya | 40,487,164.324 | 1,415,297.631 | 2,676,197.000 |
| Votes For | Votes Against | Abstain | |
| To approve a new subadvisory agreement by and among the Fund, VIA and Voya | 39,627,041.419 | 1,704,550.874 | 1,837,549.000 |
| Votes For | Votes Against | Abstain | |
| To approve a new subadvisory agreement by and among the Fund, VIA and Voya | 5,464,332.437 | 165,151.879 | 211,614.250 |
| Votes For | Votes Against | Abstain | |
| To approve a new subadvisory agreement by and among the Fund, VIA and Voya | 12,292,838.444 | 424,609.601 | 802,490.631 |
| Votes For | Votes Against | Abstain | |
| To approve a new subadvisory agreement by and among the Fund, VIA and Voya | 46,859,772.402 | 3,469,962.000 | 1,220,036.490 |
| Name, Year of Birth, Length of Time Served, and Number of Portfolios in Fund Complex Overseen by Trustee | Principal Occupation(s) During Past 5 Years | Other Directorships Held by Trustee During Past 5 Years |
| McLoughlin, Philip R.(2) YOB: 1946 Trustee and Chairman of the Board Served Since: AIO, NCZ, ACV, NFJ and NIE (Trustee since 2021; Chairman since 2023) CBH and NCV (Trustee since 2022; Chairman since 2023) 106 Portfolios | Private investor since 2010. | Trustee (since 2022), Virtus Stone Harbor Emerging Markets Income Fund and Virtus Stone Harbor Emerging Markets Total Income Fund; Trustee (since 2021), The Merger Fund®, The Merger Fund® VL, Virtus Event Opportunities Trust (2 portfolios), Virtus Investment Trust (13 portfolios), Virtus Strategy Trust (8 portfolios), Virtus Artificial Intelligence & Technology Opportunities Fund, Virtus Convertible & Income Fund II, Virtus Diversified Income & Convertible Fund, Virtus Equity & Convertible Income Fund and Virtus Dividend, Interest & Premium Strategy Fund; Trustee (since 2022) and Advisory Board Member (2021), Virtus Convertible & Income 2024 Target Term Fund and Virtus Convertible & Income Fund; Director and Chairman (since 2016), Virtus Total Return Fund Inc.; Director and Chairman (2016 to 2019), the former Virtus Total Return Fund Inc.; Director and Chairman (2014 to 2021), Duff & Phelps Select MLP and Midstream Energy Fund Inc.; Trustee and Chairman (since 2013), Virtus Alternative Solutions Trust (2 portfolios); Trustee and Chairman (since 2011), Virtus Global Multi-Sector Income Fund; Chairman and Trustee (since 2003), Virtus Variable Insurance Trust (8 portfolios); Director (since 1995), closed-end funds managed by Duff & Phelps Investment Management Co. (3 funds); Director (1991 to 2019) and Chairman (2010 to 2019), Lazard World Trust Fund (closed-end investment firm in Luxembourg); and Trustee (since 1989) and Chairman (since 2002), Virtus Mutual Fund Family (57 portfolios). |
| Cogan, Sarah E. YOB: 1956 Served Since: 2019 (all Funds) 103 Portfolios | Retired Partner, Simpson Thacher & Bartlett LLP (“STB”) (law firm) (since 2019); Director, Girl Scouts of Greater New York (since 2016); Trustee, Natural Resources Defense Council, Inc. (since 2013); and formerly, Partner, STB (1989 to 2018). | Trustee (since 2022) and Advisory Board Member (2021 to 2022), Virtus Alternative Solutions Trust (2 portfolios), Virtus Mutual Fund Family (57 portfolios) and Virtus Variable Insurance Trust (8 portfolios); Trustee (since 2022), Virtus Stone Harbor Emerging Markets Income Fund and Virtus Stone Harbor Emerging Markets Total Income Fund; Trustee (since 2021), The Merger Fund®, The Merger Fund® VL, Virtus Event Opportunities Trust (2 portfolios) and Virtus Global Multi-Sector Income Fund; Advisory Board Member (February 2021 to June 2021), Duff & Phelps Select MLP and Midstream Energy Fund Inc.; Director (since 2021), Virtus Total Return Fund Inc.; Trustee (since 2019), Virtus Investment Trust (13 portfolios) and Virtus Strategy Trust (8 portfolios); Trustee (since 2019), Virtus Artificial Intelligence & Technology Opportunities Fund, Virtus Convertible & Income 2024 Target Term Fund, Virtus Convertible & Income Fund, Virtus Convertible & Income Fund II, Virtus Diversified Income & Convertible Fund, Virtus Equity & Convertible Income Fund, and Virtus Dividend, Interest & Premium Strategy Fund; and Trustee (since 2019), PIMCO Closed-End Funds(3) (26 portfolios). |
| DeCotis, Deborah A. YOB: 1952 Served Since: NCV, NCZ, NFJ and NIE (since 2011) ACV (since 2015) CBH (since 2017) AIO (since 2019) 103 Portfolios | Director, Cadre Holdings Inc. (since 2022); Advisory Director, Morgan Stanley & Co., Inc. (since 1996); Member, Circle Financial Group (since 2009); Member, Council on Foreign Relations (since 2013); and Trustee, Smith College (since 2017). Formerly, Director, Watford Re (2017 to 2021); Co-Chair Special Projects Committee, Memorial Sloan Kettering (2005 to 2015); and Trustee, Stanford University (2010 to 2015). | Trustee (since 2022) and Advisory Board Member (2021 to 2022), Virtus Alternative Solutions Trust (2 portfolios), Virtus Mutual Fund Family (57 portfolios) and Virtus Variable Insurance Trust (8 portfolios); Trustee (since 2022), Virtus Stone Harbor Emerging Markets Income Fund and Virtus Stone Harbor Emerging Markets Total Income Fund; Trustee (since 2021), The Merger Fund®, The Merger Fund® VL, Virtus Event Opportunities Trust (2 portfolios), and Virtus Global Multi-Sector Income Fund; Advisory Board Member (February 2021 to June 2021), Duff & Phelps Select MLP and Midstream Energy Fund Inc.; Director (since 2021), Virtus Total Return Fund Inc.; Trustee (since 2019), Virtus Artificial Intelligence Technology Opportunities Fund; Trustee (since 2017), Virtus Convertible & Income 2024 Target Term Fund; Trustee (since 2015), Virtus Diversified Income Convertible Fund; Trustee (since 2014), Virtus Investment Trust (13 portfolios); Trustee (since 2011), Virtus Strategy Trust (8 portfolios); Trustee (since 2011), Virtus Convertible Income Fund, Virtus Convertible Income Fund II, Virtus Equity Convertible Income Fund, and Virtus Dividend, Interest Premium Strategy Fund; and Trustee (since 2011), PIMCO Closed-End Funds(3) (26 portfolios). |
| Name, Year of Birth, Length of Time Served, and Number of Portfolios in Fund Complex Overseen by Trustee | Principal Occupation(s) During Past 5 Years | Other Directorships Held by Trustee During Past 5 Years |
| Drummond, F. Ford YOB: 1962 Served Since: NIE, NFJ, ACV, NCV and NCZ (since 2015) CBH (since 2017) AIO (since (2019) 103 Portfolios | President (since 1998), F.G. Drummond Ranches, Inc.; and Director (since 2015), Texas and Southwestern Cattle Raisers Association. Formerly, Chairman, Oklahoma Nature Conservancy (2019 to 2020); Board Member (2006 to 2020) and Chairman (2016 to 2018), Oklahoma Water Resources Board; Trustee (since 2014), Frank Phillips Foundation; Director (1998 to 2008), The Cleveland Bank; and General Counsel (1998 to 2008), BMIHealth Plans (benefits administration). | Trustee (since 2022) and Advisory Board Member (2021 to 2022), Virtus Alternative Solutions Trust (2 portfolios), Virtus Mutual Fund Family (57 portfolios), and Virtus Variable Insurance Trust (8 portfolios); Trustee (since 2022), Virtus Stone Harbor Emerging Markets Income Fund and Virtus Stone Harbor Emerging Markets Total Income Fund; Trustee (since 2021), The Merger Fund®, The Merger Fund® VL, and Virtus Event Opportunities Trust (2 portfolios); Advisory Board Member (February 2021 to June 2021), Duff & Phelps Select MLP and Midstream Energy Fund Inc.; Trustee (since 2021), Virtus Global Multi-Sector Income Fund; Director (since 2021),Virtus Total Return Fund Inc.; Trustee (since 2019), Virtus Artificial Intelligence & Technology Opportunities Fund; Trustee (since 2017), Virtus Convertible & Income 2024 Target Term Fund; Trustee (since 2015), Virtus Convertible & Income Fund, Virtus Convertible & Income Fund II, Virtus Diversified Income & Convertible Fund, Virtus Dividend, Interest & Premium Strategy Fund and Virtus Equity & Convertible Income Fund; Trustee (since 2014), Virtus Strategy Trust (8 portfolios); Director (since 2011), Bancfirst Corporation; and Trustee (since 2006), Virtus Investment Trust (13 portfolios). |
| McNamara, Geraldine M.(4) YOB: 1951 Served Since: AIO and NIE (Trustee since 2023) CBH, NCV, NCZ, ACV and NFJ (Advisory Member since 2023) 106 Portfolios | Private investor (since 2006); and Managing Director, U.S. Trust Company of New York (1982 to 2006). | Trustee (since 2023), Virtus Artificial Intelligence & Technology Opportunities Fund and Virtus Equity & Convertible Income Fund; Advisory Board Member (since 2023), Virtus Convertible & Income 2024 Target Term Fund, Virtus Convertible & Income Fund, Virtus Convertible & Income Fund II, Virtus Diversified Income & Convertible Fund, and Virtus Dividend, Interest & Premium Strategy Fund; Trustee (since 2022), Virtus Stone Harbor Emerging Markets Income Fund and Virtus Stone Harbor Emerging Markets Total Income Fund; Trustee (since 2021), The Merger Fund®, The Merger Fund® VL, Virtus Event Opportunities Trust (2 portfolios), Virtus Investment Trust (13 portfolios) and Virtus Strategy Trust (8 portfolios); Director (2020 to 2021), Duff & Phelps Select MLP and Midstream Energy Fund Inc.; Director (since 2020), Virtus Total Return Fund Inc.; Trustee (since 2020), Virtus Global Multi-Sector Income Fund; Trustee (since 2016) Virtus Alternative Solutions Trust (2 portfolios); Trustee (since 2015), Virtus Variable Insurance Trust (8 portfolios); Director (since 2003), closed-end funds managed by Duff & Phelps Investment Management Co. (3 funds); and Trustee (since 2001), Virtus Mutual Fund Family (57 portfolios). |
| Rappaport, Alan(2) YOB: 1953 Trustee (for the dates listed below) and former Chairman of the Board (2019 to 2023) Served Since: NIE and NFJ (since 2010) ACV (since 2015) NCV and NCZ (since 2010) CBH (since2017) AIO (since 2019) 7 Portfolios | Director (since 2013), Victory Capital Holdings, Inc., an asset management firm. Formerly, Adjunct Professor (2011 to 2020), New York University Stern School of Business; Lecturer (2013 to 2020), Stanford University Graduate School of Business; Trustee (2005-2015), American Museum of Natural History; and Trustee and Member of Board of Overseers (2007-2015), NYU Langone Medical Center; and Advisory Director (formerly, Vice Chairman) (2009-2018), Roundtable Investment Partners. | Trustee (since 2019), Virtus Artificial Intelligence & Technology Opportunities Fund; Trustee (since 2017), Virtus Convertible & Income 2024 Target Term Fund; Trustee (since 2015), Virtus Diversified Income & Convertible Fund; Trustee (since 2010), Virtus Convertible & Income Fund, Virtus Convertible & Income Fund II, Virtus Equity & Convertible Income Fund, and Virtus Dividend, Interest & Premium Strategy Fund; and Trustee (since 2010), PIMCO Closed-End Funds(3) (26 portfolios). |
| Name, Year of Birth, Length of Time Served, and Number of Portfolios in Fund Complex Overseen by Trustee | Principal Occupation(s) During Past 5 Years | Other Directorships Held by Trustee During Past 5 Years |
| Walton, R. Keith(5) YOB: 1964 Served Since: AIO, NCV, ACV and NIE (Trustee since 2022) CBH, NCZ and NFJ (Advisory Member since 2022) 103 Portfolios | Senior Adviser (since 2022), Brightwood Capital LLC; Venture and Operating Partner (since 2020), Plexo Capital, LLC; Venture Partner (since 2019) and Senior Adviser (2018 to 2019), Plexo, LLC; and Partner (since 2006), Global Infrastructure Partners. Formerly, Managing Director (2020 to 2021), Lafayette Square Holding Company LLC; Senior Adviser (2018 to 2019), Vatic Labs, LLC; Executive Vice President, Strategy (2017 to 2019), Zero Mass Water, LLC; and Vice President, Strategy (2013 to 2017), Arizona State University. | Trustee (since 2022) and Advisory Board Member (January 2022 to July 2022), Virtus Artificial Intelligence & Technology Opportunities Fund, Virtus Convertible & Income Fund and Virtus Equity & Convertible Income Fund; Trustee (since 2022), Virtus Stone Harbor Emerging Markets Income Fund and Virtus Stone Harbor Emerging Markets Total Income Fund; Trustee (since 2022), Virtus Diversified Income & Convertible Fund; Advisory Board Member (since 2022), Virtus Convertible & Income 2024 Target Term Fund, Virtus Convertible & Income Fund II and Virtus Dividend, Interest & Premium Strategy Fund; Trustee (since 2021), The Merger Fund®, The Merger Fund® VL, Virtus Event Opportunities Trust (2 portfolios), Virtus Investment Trust (13 portfolios) and Virtus Strategy Trust (8 portfolios); Trustee (since 2020) Virtus Alternative Solutions Trust (2 portfolios), Virtus Variable Insurance Trust (8 portfolios) and Virtus Mutual Fund Family (57 portfolios); Director (since 2017), certain funds advised by Bessemer Investment Management LLC; Director (2016 to 2021), Duff & Phelps Select MLP and Midstream Energy Fund Inc.; Trustee (since 2016), Virtus Global Multi-Sector Income Fund; Director (2006 to 2019), Systematica Investments Limited Funds; Director (2006 to 2017), BlueCrest Capital Management Funds; Trustee (2014 to 2017), AZ Service; Director (since 2004), Virtus Total Return Fund Inc.; and Director (2004 to 2019), the former Virtus Total Return Fund Inc. |
| Zino, Brian T. YOB: 1952 Served Since: 2022 (all funds) 103 Portfolios | Retired. Various roles (1982 to 2009), J. & W. Seligman & Co. Incorporated, including President (1994 to 2009). | Trustee (since 2022), Virtus Stone Harbor Emerging Markets Income Fund and Virtus Stone Harbor Emerging Markets Total Income Fund; Trustee (since 2021), The Merger Fund®, The Merger Fund® VL, Virtus Event Opportunities Trust (2 portfolios), Virtus Investment Trust (13 portfolios) and Virtus Strategy Trust (8 portfolios); Trustee (since 2022) and Advisory Board Member (2021), Virtus Artificial Intelligence & Technology Opportunities Fund, Virtus Convertible & Income 2024 Target Term Fund, Virtus Convertible & Income Fund, Virtus Convertible & Income Fund II, Virtus Diversified Income & Convertible Fund, Virtus Equity & Convertible Income Fund, and Virtus Dividend, Interest & Premium Strategy Fund; Trustee (since 2020) Virtus Alternative Solutions Trust (2 portfolios), Virtus Variable Insurance Trust (8 portfolios) and Virtus Mutual Fund Family (57 portfolios); Director (2016 to 2021), Duff & Phelps Select MLP and Midstream Energy Fund Inc.; Trustee (since 2016), Virtus Global Multi-Sector Income Fund; Director (since 2014), Virtus Total Return Fund Inc.; Director (2014 to 2019), the former Virtus Total Return Fund Inc.; Trustee (since 2011), Bentley University; Director (1986 to 2009) and President (1994 to 2009), J&W Seligman Co. Inc.; Director (1998 to 2009), Chairman (2002 to 2004) and Vice Chairman (2000 to 2002), ICI Mutual Insurance Company; Member, Board of Governors of ICI (1998 to 2008). |
| Name, Year of Birth, Length of Time Served, and Number of Funds Overseen by Trustee | Principal Occupation(s) During Past 5 Years | Principal Occupation(s) During Past 5 Years and Other Directorships Held by Trustee |
| Aylward, George R.* Trustee and President YOB: 1964 Served Since: 2021 (all funds) 109 Portfolios | Director, President and Chief Executive Officer (since 2008), Virtus Investment Partners, Inc. and/or certain of its subsidiaries; and various senior officer positions with Virtus affiliates (since 2005). | Trustee, President and Chief Executive Officer (since 2022), Virtus Stone Harbor Emerging Markets Income Fund and Virtus Stone Harbor Emerging Markets Total Income Fund; Member, Board of Governors of the Investment Company Institute (since 2021); Trustee and President (since 2021), The Merger Fund®, The Merger Fund® VL, Virtus Event Opportunities Trust (2 portfolios), Virtus Investment Trust (13 portfolios) and Virtus Strategy Trust (8 portfolios); Trustee, President and Chief Executive Officer (since 2021), Virtus Artificial Intelligence & Technology Opportunities Fund, Virtus Convertible & Income 2024 Target Term Fund, Virtus Convertible & Income Fund, Virtus Convertible & Income Fund II, Virtus Diversified Income & Convertible Fund, Virtus Equity & Convertible Income Fund, and Virtus Dividend, Interest & Premium Strategy Fund; Chairman and Trustee (since 2015), Virtus ETF Trust II (6 portfolios); Director, President and Chief Executive Officer (2014 to 2021), Duff & Phelps Select MLP and Midstream Energy Fund Inc.; Trustee and President (since 2013), Virtus Alternative Solutions Trust (2 portfolios); Director (since 2013), Virtus Global Funds, PLC (5 portfolios); Trustee (since 2012) and President (since 2010), Virtus Variable Insurance Trust (8 portfolios); Trustee, President and Chief Executive Officer (since 2011), Virtus Global Multi-Sector Income Fund; Trustee and President (since 2006) and Executive Vice President (2004 to 2006), Virtus Mutual Fund Family (57 portfolios); Director, President and Chief Executive Officer (since 2006), Virtus Total Return Fund Inc.; and Director, President and Chief Executive Officer (2006 to 2019), the former Virtus Total Return Fund Inc. |
| Name and Year of Birth | Position(s) Held with Fund and Length of Time Served | Principal Occupation(s) During Past 5 Years |
| Batchelar, Peter J. YOB: 1970 | Senior Vice President (since 2021). | Senior Vice President, Product Development (since 2017), Vice President, Product Development (2008 to 2017) and various officer positions (since 2008), Virtus Investment Partners, Inc. and/or certain of its subsidiaries; and various officer positions (since 2008) of various registered funds advised by subsidiaries of Virtus Investment Partners, Inc. |
| Bradley, W. Patrick YOB: 1972 | Executive Vice President, Chief Financial Officer and Treasurer (since 2021). | Executive Vice President, Fund Services (since 2016), Senior Vice President, Fund Services (2010 to 2016) and various officer positions (since 2004), Virtus Investment Partners, Inc. and/or certain of its subsidiaries; various officer positions (since 2006) of various registered funds advised by subsidiaries of Virtus Investment Partners, Inc.; and Member (since 2022), BNY Mellon Asset Servicing Client Advisory Board. |
| Branigan, Timothy YOB: 1976 | Vice President and Fund Chief Compliance Officer (since 2022) and Assistant Vice President and Deputy Fund Chief Compliance Officer (March to May 2022). | Various officer positions (since 2019) of various registered funds advised by subsidiaries of Virtus Investment Partners, Inc. |
| Fromm, Jennifer YOB: 1973 | Vice President, Chief Legal Officer, Counsel and Secretary (since 2022) and Vice President and Assistant Secretary (2021 to 2022). | Vice President (since 2016) and Senior Counsel, Legal (since 2007) and various officer positions (since 2008), Virtus Investment Partners, Inc. and/or certain of its subsidiaries; and various officer positions (since 2008) of various registered funds advised by subsidiaries of Virtus Investment Partners, Inc. |
| Hackett, Amy YOB: 1968 | Vice President and Assistant Treasurer (since 2021). | Vice President, Fund Services (since 2010) and Assistant Vice President, Fund Services (2007 to 2010), Virtus Investment Partners, Inc. and/or certain of its subsidiaries; and various officer positions (since 2007) of various registered funds advised by subsidiaries of Virtus Investment Partners, Inc. |
| Krishnan, Suneeta YOB: 1965 | Vice President and Assistant Treasurer (since 2021) | Vice President, Mutual Fund Administration (since 2017), and Assistant Treasurer, Mutual Fund Administration (since 2007), Virtus Investment Partners, Inc. and/or certain of its subsidiaries; and various officer positions (since 2009) of various registered funds advised by subsidiaries of Virtus Investment Partners, Inc. |
| Rahman, Mahmood YOB: 1967 | Assistant Vice President (since 2021). | Assistant Vice President and Tax Director, Fund Administration (since 2020), Virtus Investment Partners, Inc.; Assistant Vice President (since 2021) of various registered funds advised by subsidiaries of Virtus Investment Partners, Inc.; and Assistant Treasurer and Tax Director, Grantham, Mayo, Van Otterloo & Co. LLC (2007 to 2019). |
| Short, Julia R. YOB: 1972 | Senior Vice President (since 2021). | Senior Vice President, Product Development (since 2017), Virtus Investment Partners, Inc. and/or certain of its subsidiaries; Senior Vice President (since 2017) of various registered funds advised by subsidiaries of Virtus Investment Partners, Inc.; and Managing Director, Product Manager, RidgeWorth Investments (2004 to 2017). |
| Smirl, Richard W. YOB: 1967 | Executive Vice President (since 2021). | Chief Operating Officer (since 2021), Virtus Investment Partners, Inc.; Executive Vice President (since 2021), Virtus Investment Partners, Inc. and/or certain of its subsidiaries; Executive Vice President (since 2021) of various registered funds advised by subsidiaries of Virtus Investment Partners, Inc.; Chief Operating Officer (2018 to 2021), Russell Investments; Executive Director (Jan. to July 2018), State of Wisconsin Investment Board; and Partner and Chief Operating Officer (2004 to 2018), William Blair Investment Management. |
| Thaker, Nikita K. YOB: 1978 | Vice President, Controller and Assistant Treasurer (since 2021) | Vice President, Mutual Fund Administration (since 2021) and Assistant Vice President, Mutual Fund Administration (2016 to 2021), Virtus Investment Partners, Inc. and/or certain of its subsidiaries; and various officer positions (since 2013) of various registered funds advised by subsidiaries of Virtus Investment Partners, Inc. |
Accounting Firm
| Shareholder Services | 1-866-270-7788 |
| Website | Virtus.com |
The Securities and Exchange Commission has modified mailing regulations for semiannual and annual shareholder fund reports to allow mutual fund companies to send a single copy of these reports to shareholders who share the same mailing address. If you would like additional copies, please call Mutual Fund Services at 1-866-270-7788.

please contact us at 1-866-270-7788 or closedendfunds@virtus.com, or visit Virtus.com.
| 8559 | 03-23 |
| (b) | Not applicable. |
| Item 2. | Code of Ethics. |
| (a) | The registrant, as of the end of the period covered by this report, has adopted a code of ethics that applies to the registrant’s principal executive officer, principal financial officer, principal accounting officer or controller, or persons performing similar functions, regardless of whether these individuals are employed by the registrant or a third party. |
| (c) | There have been no amendments, during the period covered by this report, to a provision of the code of ethics that applies to the registrant’s principal executive officer, principal financial officer, principal accounting officer or controller, or persons performing similar functions, regardless of whether these individuals are employed by the registrant or a third party, and that relates to any element of the code of ethics described in Item 2(b) of the instructions for completion of Form N-CSR. |
| (d) | The registrant has not granted any waivers, including an implicit waiver, from a provision of the code of ethics that applies to the registrant’s principal executive officer, principal financial officer, principal accounting officer or controller, or persons performing similar functions, regardless of whether these individuals are employed by the registrant or a third party, that relates to one or more of the items set forth in paragraph (b) of this item’s instructions. |
| Item 3. | Audit Committee Financial Expert. |
| (a)(1) | The Registrant’s Board of Trustees has determined that the Registrant has an “audit committee financial expert” serving on its Audit Committee. |
| (a)(2) | As of the end of the period covered by the report, the Registrant’s Board of Trustees had determined that Brian T. Zino possesses the technical attributes identified in Instruction 2(b) of Item 3 to Form N-CSR to qualify as an “audit committee financial expert.” Mr. Zino is an “independent” trustee pursuant to paragraph (a)(2) of Item 3 to Form N-CSR. |
| (a)(3) | Not Applicable. |
| Item 4. | Principal Accountant Fees and Services. |
Audit Fees
| (a) | The aggregate fees billed for each of the last two fiscal years for professional services rendered by the principal accountant for the audit of the registrant’s annual financial statements or services that are normally provided by the accountant in connection with statutory and regulatory filings or engagements for those fiscal years are $46,200 for 2023 and $44,000 for 2022. |
Audit-Related Fees
| (b) | The aggregate fees billed in each of the last two fiscal years for assurance and related services by the principal accountant that are reasonably related to the performance of the audit of the registrant’s financial statements and are not reported under paragraph (a) of this Item are $1,424 for 2023 and $2,158 for 2022. Such audit-related fees include out of pocket expenses. |
Tax Fees
| (c) | The aggregate fees billed in each of the last two fiscal years for professional services rendered by the principal accountant for tax compliance, tax advice, and tax planning are $10,668 for 2023 and $14,950 for 2022. |
“Tax Fees” are those primarily associated with review of the Fund’s tax provision and qualification as a regulated investment company (RIC) in connection with audits of the Fund’s financial statement, review of year-end distributions by the Fund to avoid excise tax for the Fund, periodic discussion with management on tax issues affecting the Fund, and reviewing and signing the Fund’s federal income tax returns.
All Other Fees
| (d) | The aggregate fees billed in each of the last two fiscal years for products and services provided by the principal accountant, other than the services reported in paragraphs (a) through (c) of this Item are $0 for 2023 and $0 for 2022. |
| (e)(1) | Disclose the audit committee’s pre-approval policies and procedures described in paragraph (c)(7) of Rule 2-01 of Regulation S-X. |
Virtus Convertible & Income 2024 Target Term Fund (the “Fund”) Board has adopted policies and procedures with regard to the pre-approval of services provided by PricewaterhouseCoopers LLP. Audit, audit-related and tax compliance services provided to the Fund on an annual basis require specific pre-approval by the Audit Committee. The Audit Committee must also approve other non-audit services provided to the Fund and those non-audit services provided to the Fund’s Affiliate Service Providers that related directly to the operations and financial reporting of the Fund. Certain of these non-audit services that the Audit Committee believes are a) consistent with the SEC’s auditor independence rules and b) routine and recurring services that will not impair the independence of the independent auditors may be approved by the Audit Committee without consideration on a specific case-by-case basis (“general pre-approval”).
The Audit Committee has determined that the Chair of the Audit Committee may provide pre-approval for such services that meet the above requirements but are not included in the general pre-approval in the event such approval is sought between regularly scheduled meetings. In any event, the Audit Committee is informed of, and ratifies, each service approved at the next regularly scheduled in-person Audit = Committee meeting.
| (e)(2) | The percentage of services described in each of paragraphs (b) through (d) of this Item that were approved by the audit committee pursuant to paragraph (c)(7)(i)(C) of Rule 2-01 of Regulation S-X are as follows: |
(b) 0%
(c) 0%
(d) N/A
| (f) | The percentage of hours expended on the principal accountant’s engagement to audit the registrant’s financial statements for the most recent fiscal year that were attributed to work performed by persons other than the principal accountant’s full-time, permanent employees was less than fifty percent. |
| (g) | The aggregate non-audit fees billed by the registrant’s accountant for services rendered to the registrant, and rendered to the registrant’s investment adviser (not including any sub-adviser whose role is primarily portfolio management and is subcontracted with or overseen by another investment adviser), and any entity controlling, controlled by, or under common control with the adviser that provides ongoing services to the registrant for each of the last two fiscal years of the registrant was $10,668 for 2023 and $17,108 for 2022. |
| (h) | The registrant’s audit committee of the board of directors has considered whether the provision of non-audit services that were rendered to the registrant’s investment adviser (not including any sub-adviser whose role is primarily portfolio management and is subcontracted with or overseen by another investment adviser), and any entity controlling, controlled by, or under common control with the investment adviser that provides ongoing services to the registrant that were not pre-approved pursuant to paragraph (c)(7)(ii) of Rule 2-01 of Regulation S-X is compatible with maintaining the principal accountant’s independence. |
| (i) | Not applicable. |
| (j) | Not applicable. |
| Item 5. | Audit Committee of Listed Registrants. |
| (a) | The registrant has a separately designated audit committee. Effective January 1, 2023, the members of the audit committee were Sarah E. Cogan, Deborah A. DeCotis, F. Ford Drummond, Philip R. McLoughlin, Alan Rappaport, and Brian T. Zino. From January 1, 2022 to December 31, 2022, the members of the audit committee were Sarah E. Cogan, Deborah A. DeCotis, F. Ford Drummond, James S. MacLeod, Philip R. McLoughlin, William B. Ogden, IV, Alan Rappaport, and Brian T. Zino. R. Keith Walton also served as an advisory member of the audit committee during the period covered by the report. Geraldine M. McNamara also served as an advisory member of the audit committee effective January 1, 2023. |
| (b) | Not applicable. |
| Item 6. | Investments. |
| (a) | Schedule of Investments in securities of unaffiliated issuers as of the close of the reporting period is included as part of the report to shareholders filed under Item 1(a) of this form. |
| (b) | Not applicable. |
| Item 7. | Disclosure of Proxy Voting Policies and Procedures for Closed-End Management Investment Companies. |
The Fund has adopted a Policy Regarding Proxy Voting (the “Policy”) stating the Fund’s intention to exercise stock ownership rights with respect to portfolio securities in a manner that is reasonably anticipated to further the best economic interests of shareholders of the Fund. The Fund or its voting delegates will endeavor to analyze and vote all proxies that are likely to have financial implications, and where appropriate, to participate in corporate governance, shareholder proposals, management communications and legal proceedings. The Fund or its voting delegates must also identify potential or actual conflicts of interest in voting proxies and must address any such conflict of interest in accordance with the Policy.
In the absence of a specific direction to the contrary from the Board, the Adviser or the subadviser that is managing the Fund is responsible for voting proxies for such fund, or for delegating such responsibility to a qualified, independent organization engaged by the Adviser or respective subadviser to vote proxies on its behalf. The applicable voting party will vote proxies in accordance with the Policy or its own policies and procedures, which must be reasonably designed to further the best economic interests of the affected fund shareholders. Because the Policy and the applicable voting party’s policies and procedures used to vote proxies for the funds both are designed to further the best economic interests of the affected fund shareholders, they are not expected to conflict with one another although the types of factors considered by the applicable voting party under its own policies and procedures may be in addition to or different from the ones listed below for the Policy.
The Policy specifies the types of factors to be considered when analyzing and voting proxies on certain issues when voting in accordance with the Policy, including, but not limited to:
| • | Anti-takeover measures – the overall long-term financial performance of the target company relative to its industry competition. |
| • | Corporate Governance Matters – tax and economic benefits of changes in the state of incorporation; dilution or improved accountability associated with changes in capital structure. |
| • | Contested elections – the qualifications of all nominees; independence and attendance record of board and key committee members; entrenchment devices in place that may reduce accountability. |
| • | Stock Option and Other Management Compensation Issues—executive pay and spending on perquisites, particularly in conjunction with sub-par performance and employee layoffs. |
| • | Shareholder proposals – whether the proposal is likely to enhance or protect shareholder value; whether identified issues are more appropriately or effectively addressed by legal or regulatory changes; whether the issuer has already appropriately addressed the identified issues; whether the proposal is unduly burdensome or prescriptive; whether the issuer’s existing approach to the identified issues is comparable to industry best practice. |
The Fund and its voting delegates seek to avoid actual or perceived conflicts of interest of Fund shareholders, on the one hand, and those of the Adviser, subadviser, other voting delegate, Distributor, or any affiliated person of the Fund, on the other hand.
Depending on the type and materiality, the Board or its delegates may take the following actions, among others, in addressing any material conflicts of interest that arise with respect to voting (or directing voting delegates to vote): (i) rely on the recommendations of an established, independent third party proxy voting vendor; (ii) vote pursuant to the recommendation of the proposing delegate; (iii) abstain; (iv) where two or more delegates provide conflicting requests, vote shares in proportion to the assets under management of each proposing delegate; (v) vote shares in the same proportion as the vote of all other shareholders of such issuer; or (vi) the Adviser may vote proxies where the subadviser has a direct conflict of interest. The Policy requires each Adviser/subadviser that is a voting delegate to notify the Chief Compliance Officer of the Fund (or, in the case of a subadviser, the Chief Compliance Officer of the Adviser) of any actual or potential conflict of interest that is identified, and provide a recommended course of action for protecting the best interests of the affected fund’s shareholders. No Adviser/subadviser or other voting delegate may waive any conflict of interest or vote any conflicted proxies without the prior written approval of the Board (or the Executive Committee thereof) or the Chief Compliance Officer of the Fund.
The Policy further imposes certain record-keeping and reporting requirements on each Adviser/subadviser or other voting delegate.
Information regarding how the funds voted proxies relating to portfolio securities during the most recent 12-month period ended September 30 will be available, no later than August 31 of each year, free of charge by calling, toll-free, 800.243.1574, or on the SEC’s Web site at www.sec.gov.
Following is information about the policies and procedures followed by the subadviser to the Fund in voting proxies for the Fund.
Voya Investment Management Co. LLC (“Voya Investment Management”) has been delegated the authority to vote proxies for the Fund. Voya Investment Management has adopted proxy voting policies, procedures and guidelines in an effort to ensure proxies are voted in the best interests of its clients and the value of the investment, and to address any real or perceived conflicts of interest in proxy voting. Proxies of the Funds will be voted subject to Voya Investment Management’s policy. Voya Investment Management’s Proxy Committee oversees the implementation of Voya Investment Management’s proxy voting procedures and guidelines including potential conflicts of interest. An independent proxy voting service has been retained to assist in the voting of Fund proxies through the provision of vote analysis, implementation and recordkeeping and disclosure services. In addition, Voya Investment Management’s Compliance Committee oversees the implementation of the Fund’s proxy voting procedures and guidelines.
| Item 8. | Portfolio Managers of Closed-End Management Investment Companies. |
(a)(1) As of the date of filing this report, the Fund’s sub-adviser is Voya Investment Management. The names, titles and length of service of the person(s) employed by or associated with the registrant or an investment adviser of the registrant who is primarily responsible for the day-to-day management of the registrant’s portfolio (“Portfolio Manager”) and each Portfolio Manager’s business experience during the past 5 years as of the date of filing this report:
Justin M. Kass, CFA
Senior Managing Director, Chief Investment Officer, Co-Head of Income & Growth
Industry start date: 1998
Start date as fund Portfolio Manager: 2017
Justin Kass is chief investment officer, co-head of income and growth at Voya Investment Management. Prior to joining Voya, he was a portfolio manager, managing director, CIO and co-head of U.S. income and growth strategies at Allianz Global Investors, where he held portfolio management, research, and trading responsibilities for the income and growth strategies team.
Prior to that at Allianz Global Investors, Mr. Kass held portfolio manager responsibilities for the U.S. convertible strategy and was a lead portfolio manager for the income and growth strategy since its inception. In that role, he was responsible for managing multiple closed-end and open-end mutual funds.
Mr. Kass earned a B.S. from the University of California, Davis, and an M.B.A. from the UCLA Anderson School of Management. He is a CFA® Charterholder. He began his career in the investment industry in 1998.
David J. Oberto
Senior Vice President, Lead Portfolio Manager – Income & Growth
Industry start date: 2003
Start date as fund Portfolio Manager: 2017
David Oberto is a lead portfolio manager, income and growth at Voya Investment Management. Prior to joining Voya, he was a portfolio manager and director at Allianz Global Investors, where he held portfolio management, research and trading responsibilities for the income and growth strategies team. and served as portfolio manager for the U.S. High Yield Bond strategy and was also responsible for managing multiple closed-end and open-end mutual funds.
Prior to that, he was a portfolio administrator, a credit default swaps (CDS) account manager and a trade-closer at Bain Capital.
Mr. Oberto earned a B.S.B.A. with a concentration in finance and a minor in economics from Fordham University and an M.S. in finance from the D’Amore-McKim School of Business at Northeastern University. He began his career in the investment industry in 2003.
William (Brit) L. Stickney
Senior Managing Director, Co-Head of Income & Growth
Industry start date: 1989
Start date as fund Portfolio Manager: 2017
William (Brit) Stickney is co-head of income and growth at Voya Investment Management. Prior to joining Voya, he was a portfolio manager, managing director and co-head at Allianz Global Investors, where he held portfolio management and research responsibilities for the income and growth strategies team.
Prior to that, he was a vice president of institutional fixed-income sales with ABN AMRO, Inc., where his primary focus was on high yield corporate securities. Previously, he worked for Cowen & Company and Wayne Hummer & Company.
Mr. Stickney earned a B.S. in finance from Miami University, Ohio and an M.B.A. from the Kellogg School of Management, Northwestern University. He began his career in the investment industry in 1989.
Ethan Turner, CFA
Vice President, Portfolio Manager – Income & Growth
Industry start date: 2005
Start date as fund Portfolio Manager: 2023
Ethan Turner is a portfolio manager, income and growth, at Voya Investment Management. Mr. Turner joined the firm following Voya’s acquisition of the substantial majority of Allianz Global Investors U.S. business, where he was an analyst and vice president with research responsibilities for the income and growth strategies team. Prior to that at Allianz, he was a trading assistant.
Prior to joining Allianz, Mr. Turner was a lead analyst covering the financial sector at Relational Investors and a financial analyst at Sunstone Hotel Investors.
Mr. Turner earned a B.S. from San Diego State University and an M.B.A. from the Anderson School of Management at the University of California, Los Angeles. He is a CFA® charterholder. Mr. Turner began working in the investment industry in 2005.
(a) (2) Voya Investment Management
The following summarizes information regarding each of the accounts, excluding the Fund, that were managed by the Portfolio Managers as of January 31, 2023 including accounts managed by a team, committee, or other group that includes the Portfolio Managers.
Name of Portfolio Manager or Team Member | Type of Accounts | Total No. of Accounts Managed | Total Assets (in millions) | No. of Accounts where Advisory Fee is Based on Performance | Total Assets in Accounts where Advisory Fee is Based on Performance (in millions) | |||||||||||||
Justin M. Kass | Registered Investment Companies: | 8 | 10,019 | 0 | 0 | |||||||||||||
| Other Pooled Investment Vehicles: | 11 | 45,991 | 0 | 0 | ||||||||||||||
| Other Accounts: | 7 | 1,496 | 0 | 0 | ||||||||||||||
David Oberto | Registered Investment Companies: | 7 | 9,732 | 0 | 0 | |||||||||||||
| Other Pooled Investment Vehicles: | 10 | 44,331 | 0 | 0 | ||||||||||||||
| Other Accounts: | 6 | 1,399 | 0 | 0 | ||||||||||||||
William L. Stickney | Registered Investment Companies: | 5 | 7,298 | 0 | 0 | |||||||||||||
| Other Pooled Investment Vehicles: | 8 | 44,058 | 0 | 0 | ||||||||||||||
| Other Accounts: | 7 | 1,496 | 0 | 0 | ||||||||||||||
Ethan Turner | Registered Investment Companies: | 8 | 9,629 | 0 | 0 | |||||||||||||
| Other Pooled Investment Vehicles: | 1 | 89 | 0 | 0 | ||||||||||||||
| Other Accounts: | 4 | 1,144 | 0 | 0 | ||||||||||||||
Voya Investment Management
Potential Conflicts of Interest
(a)(3) As of January 31, 2023, the following explains the compensation structure of each individual employed by Voya Investment Management who share primary responsibility for day-to-day portfolio management of the Fund:
Compensation Structure for Voya Investment Management
Voya Investment Management’s compensation philosophy is to align compensation closely with performance and to leverage the variable side of the compensation equation. Annually, Voya Investment Management participates in comprehensive industry surveys and compares the relevant data to ensure that its compensation plans remain competitive. Key investment professionals such as portfolio managers and traders are paid competitive base salaries, are eligible for discretionary bonuses, and generally participate in Voya Investment Management’s long-term compensation program.
Bonus Program. The overall design of the annual incentive plan for investment professionals was developed to tie pay to both portfolio performance and profitability and is structured to drive performance and promote retention of top talent. Individual bonus target awards are based on external market data and internal comparators.
Investment performance is measured on both relative and absolute performance in all areas, and performance goals are set to appropriately reflect requirements for the investment team. The results for overall Voya IM LLC include a review of firm profitability, team performance and the investment professional’s individual performance, all of which influence the outcome of the discretionary bonus award recommendation process. The measures for each team are reviewed annually by Voya Investment Management’s executive management, and include the measures of investment performance versus benchmark and peer groups over one-, three- and five-year periods, as well as contributions to Voya Investment Management’s revenue growth and profitability.
Discretionary bonuses for non-investment professionals are structured similarly. The annual incentive bonus may be subject to deferral into a long-term compensation plan, as determined by the plan in effect at the time of payment.
Long-term Compensation. Voya Investment Management’s long-term incentive plan is designed to provide ownership-like incentives to reward continued employment and to link long-term compensation to the financial performance of the business. Based on job function, internal comparators and external market data, employees may be granted long-term awards. All senior investment professionals participate in the long-term compensation plan. Participants are eligible to receive annual awards determined by the Executive Leadership Team based largely on investment performance and their contribution to firm performance. Plan awards are based on the current year’s performance as defined by Voya Investment Management’s component of the annual incentive plan. Awards may include a combination of performance share units, restricted stock units, and/or a notional investment in a predefined set of Voya mutual funds. Awards are subject to a time-based vesting schedule.
(a)(4) The following summarizes the dollar range of securities each portfolio manager for the Fund beneficially owned of the Fund that he managed as of January 31, 2023.
Virtus Convertible & Income 2024 Target Term Fund
| PM Ownership | ||
Justin Kass, CFA | Over $1,000,000 | |
David J. Oberto | $10,001 - $50,000 | |
William L. Stickney | None | |
Ethan Turner | None |
| Item 9. | Purchases of Equity Securities by Closed-End Management Investment Company and Affiliated Purchasers. |
Not Applicable.
| Item 10. | Submission of Matters to a Vote of Security Holders. |
There have been no material changes to the procedures by which the shareholders may recommend nominees to the registrant’s board of directors, where those changes were implemented after the registrant last provided disclosure in response to the requirements of Item 407(c)(2)(iv) of Regulation S-K (17 CFR 229.407) (as required by Item 22(b)(15) of Schedule 14A (17 CFR 240.14a-101)), or this Item.
| Item 11. | Controls and Procedures. |
| (a) | The registrant’s principal executive and principal financial officers, or persons performing similar functions, have concluded that the registrant’s disclosure controls and procedures (as defined in Rule 30a-3(c) under the Investment Company Act of 1940, as amended (the “1940 Act”) (17 CFR 270.30a-3(c))) are effective, as of a date within 90 days of the filing date of the report that includes the disclosure required by this paragraph, based on their evaluation of these controls and procedures required by Rule 30a-3(b) under the 1940 Act (17 CFR 270.30a-3(b)) and Rules 13a-15(b) or 15d-15(b) under the Securities Exchange Act of 1934, as amended (17 CFR 240.13a-15(b) or 240.15d-15(b)). |
| (b) | There were no changes in the registrant’s internal control over financial reporting (as defined in Rule 30a-3(d) under the 1940 Act (17 CFR 270.30a-3(d))) that occurred during the period covered by this report that has materially affected, or is reasonably likely to materially affect, the registrant’s internal control over financial reporting. |
| Item 12. | Disclosure of Securities Lending Activities for Closed-End Management Investment Companies. |
(a) SECURITIES LENDING ACTIVITIES
Gross income from securities lending activities | $ | 191,000 | ||
Fees paid to securities lending agent * | (162,000 | ) | ||
Net Income from securities lending activities | $ | 29,000 |
| * | Includes revenue split, rebates and collateral management fees |
(b) As of the end of the fiscal year, the Registrant had entered into a Master Margin Loan Agreement and a Securities Lending Authorization Agreement (“SLAA”) with a commercial bank. The SLAA allows the Registrant to loan securities to qualified brokers. The bank shares with the Registrant a portion of the revenue it receives from lending those securities. In connection with those borrowing and lending activities, the bank is responsible for the administration and management for the Registrant’s securities lending program, including:
| • | negotiation, preparation, and execution of an agreement with each approved borrower governing the terms and conditions of any securities loan, |
| • | credit review and monitoring of approved borrowers, |
| • | loan negotiation, |
| • | ensuring that securities loans are properly coordinated and documented with the Funds’ custodian, sub custodians/depositories, |
| • | daily marking to market of loans, |
| • | monitoring and maintaining cash collateral levels, |
| • | arranging for the investment of cash collateral received from borrowers in accordance with each Fund’s investment guidelines, |
| • | initiating and monitoring loan terminations/recalls, |
| • | ensuring that all dividends and other distributions from corporate actions with respect to loaned securities are credited to the relevant Funds, and |
| • | maintaining records relating to the Fund’s securities lending activity and providing monthly/quarterly statements. |
| Item 13. | Exhibits. |
| (a)(1) | Code of ethics, or any amendment thereto, that is the subject of disclosure required by Item 2 is attached hereto. | |
| (a)(2) | Certifications pursuant to Rule 30a-2(a) under the 1940 Act and Section 302 of the Sarbanes-Oxley Act of 2002 are attached hereto. | |
| (a)(2)(1) | There were no written solicitations to purchase securities under Rule 23c-1 under the Act sent or given during the period covered by the report by or on behalf of the Registrant to 10 or more persons. | |
| (a)(2)(2) | There was no change in the Registrant’s independent public accountant during the period covered by the report. | |
| (b) | Certifications pursuant to Rule 30a-2(b) under the 1940 Act and Section 906 of the Sarbanes-Oxley Act of 2002 are attached hereto. | |
SIGNATURES
Pursuant to the requirements of the Securities Exchange Act of 1934 and the Investment Company Act of 1940, the registrant has duly caused this report to be signed on its behalf by the undersigned, thereunto duly authorized.
| (Registrant) | Virtus Convertible & Income 2024 Target Term Fund | |
| By (Signature and Title)* | /s/ George R. Aylward | |
George R. Aylward, President and Chief Executive Officer (principal executive officer) | ||
| Date | 4/5/23 | |
Pursuant to the requirements of the Securities Exchange Act of 1934 and the Investment Company Act of 1940, this report has been signed below by the following persons on behalf of the registrant and in the capacities and on the dates indicated.
| By (Signature and Title)* | /s/ George R. Aylward | |
George R. Aylward, President and Chief Executive Officer (principal executive officer) | ||
| Date | 4/5/23 | |
| By (Signature and Title)* | /s/ W. Patrick Bradley | |
W. Patrick Bradley, Executive Vice President, Chief Financial Officer, and Treasurer | ||
| (principal financial officer) | ||
| Date | 4/5/23 | |
| * | Print the name and title of each signing officer under his or her signature. |