| FREE WRITING PROSPECTUS | ||
| FILED PURSUANT TO RULE 433 | ||
| REGISTRATION FILE NO.: 333-206705-08 | ||
April 24, 2017
FREE WRITING PROSPECTUS
STRUCTURAL AND COLLATERAL TERM SHEET
$900,450,312
(Approximate Total Mortgage Pool Balance)
$745,291,000
(Approximate Offered Certificates)
CD 2017-CD4 |
Deutsche Mortgage & Asset Receiving Corporation
Depositor
German American Capital Corporation
Citi Real Estate Funding Inc.
Citigroup Global Markets Realty Corp.
Sponsors and Mortgage Loan Sellers
| Deutsche Bank Securities | Citigroup |
| Co-Lead Managers and Joint Bookrunners | |
| J.P. Morgan | Academy Securities |
| Co-Managers | |
The depositor has filed a registration statement (including the prospectus) with the Securities and Exchange Commission (File No. 333-206705) for the offering to which this communication relates. Before you invest, you should read the prospectus in the registration statement and other documents the depositor has filed with the Securities and Exchange Commission for more complete information about the depositor, the issuing entity and this offering. You may get these documents for free by visiting EDGAR on the SEC website at www.sec.gov. Alternatively, the depositor or Deutsche Bank Securities Inc., any other underwriter, or any dealer participating in this offering will arrange to send you the prospectus if you request it by calling toll-free 1-800-503-4611 or by email to the following address: prospectus.cpdg@db.com. The offered certificates referred to in these materials, and the asset pool backing them, are subject to modification or revision (including the possibility that one or more classes of certificates may be split, combined or eliminated at any time prior to issuance or availability of a final prospectus) and are offered on a “when, as and if issued” basis. You understand that, when you are considering the purchase of these certificates, a contract of sale will come into being no sooner than the date on which the relevant class has been priced and we have verified the allocation of certificates to be made to you; any “indications of interest” expressed by you, and any “soft circles” generated by us, will not create binding contractual obligations for you or us.
CD 2017-CD4 Mortgage Trust
Capitalized terms used but not defined herein have the meanings assigned to them in the Preliminary Prospectus expected to be dated April 25, 2017 relating to the offered certificates (hereinafter referred to as the “Preliminary Prospectus”).
|
| KEY FEATURES OF SECURITIZATION |
| Offering Terms: | ||
| Co-Lead Managers and Joint Bookrunners: | Deutsche Bank Securities Inc. and Citigroup Global Markets Inc. | |
| Co-Managers: | J.P. Morgan Securities LLC and Academy Securities, Inc. | |
| Mortgage Loan Sellers: | German American Capital Corporation* (“GACC”) (64.5%), Citi Real Estate Funding Inc. (“CREFI”) (32.5%) and Citigroup Global Markets Realty Corp. (“CGMRC”) (3.0%)*An indirect wholly owned subsidiary of Deutsche Bank AG | |
| Master Servicer: | Midland Loan Services, a Division of PNC Bank, National Association | |
| Operating Advisor: | Park Bridge Lender Services LLC | |
| Asset Representations Reviewer: | Park Bridge Lender Services LLC | |
| Special Servicer: | Rialto Capital Advisors, LLC | |
| Trustee and Certificate Administrator: | Wells Fargo Bank, National Association | |
| Rating Agencies: | Moody’s Investors Service, Inc., S&P Global Ratings, a Standard & Poor’s Financial Services LLC business, Fitch Ratings, Inc. and DBRS, Inc. | |
| Risk Retention Consultation Parties: | Deutsche Bank AG, New York Branch (“DBNY”) and CREFI | |
| U.S. Credit Risk Retention | This securitization transaction will be subject to the credit risk retention rules of Section 15G of the Securities Exchange Act of 1934, as amended. An economic interest in the credit risk of the mortgage loans in this transaction is expected to be retained pursuant to Regulation RR promulgated under Section 15G (“Regulation RR”), as an “eligible vertical interest” in the form of the VRR Interest. GACC will act as retaining sponsor under Regulation RR and is expected on the closing date to (i) offset a portion of its risk retention obligation by transferring approximately 67.53% of the VRR Interest to a “majority-owned affiliate”, DBNY, an originator, and (ii) offset the remaining portion of its risk retention obligation by transferring approximately 32.47% of the VRR Interest to CREFI, an originator, a sponsor, and a mortgage loan seller (which portion of the VRR Interest CREFI is expected to transfer to a “majority-owned affiliate”, CGMRC, a sponsor and a mortgage loan seller). For a discussion of the manner in which the credit risk retention requirements are expected to be satisfied by GACC, as retaining sponsor, see “Credit Risk Retention” in the Preliminary Prospectus. | |
| Determination Date: | 6thday of each month, or if such 6th day is not a business day, the immediately following business day, commencing in June 2017. | |
| Distribution Date: | 4thbusiness day following the Determination Date in each month, commencing in June 2017. | |
| Cut-off Date: | With respect to each mortgage loan, the later of the related payment date of such mortgage loan in May 2017 (or, in the case of any mortgage loan that has its first payment date after May 2017, the date that would have been its payment date in May 2017 under the terms of that mortgage loan if a monthly payment were scheduled to be due in that month) and the related origination date. Unless otherwise noted, all Mortgage Loan statistics are based on balances as of the Cut-off Date. | |
| Closing Date: | On or about May 17, 2017 | |
| Settlement Terms: | DTC, Euroclear and Clearstream, same day funds, with accrued interest. | |
| ERISA Eligible: | All of the Offered Certificates are expected to be ERISA eligible. | |
| SMMEA Eligible: | None of the Offered Certificates will be SMMEA eligible. | |
| Day Count: | 30/360 | |
| Tax Treatment: | REMIC | |
| Rated Final Distribution Date: | May 2050 | |
| Minimum Denominations: | $10,000 and in each case in multiples of $1 thereafter. | |
| Clean-up Call: | 1% (with certain exceptions described under“Pooling and Servicing Agreement—Termination; Retirement of Certificates”in the Preliminary Prospectus) | |
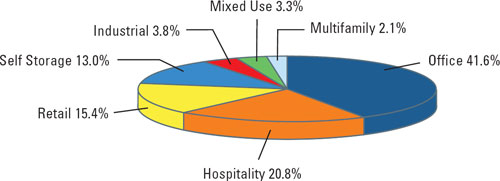
| Distribution of Collateral by Property Type |
THE INFORMATION IN THIS STRUCTURAL AND COLLATERAL TERM SHEET IS NOT COMPLETE AND MAY BE AMENDED PRIOR TO THE TIME OF SALE. THIS TERM SHEET IS NOT AN OFFER TO SELL THESE SECURITIES AND IT IS NOT A SOLICITATION OF AN OFFER TO BUY THESE SECURITIES IN ANY JURISDICTION WHERE THE OFFER OR SALE IS NOT PERMITTED.
3
CD 2017-CD4 Mortgage Trust |
| TRANSACTION HIGHLIGHTS |
| Mortgage Loan Sellers | Number of Mortgage Loans | Number of Mortgaged Properties | Aggregate Cut-off Date Balance | % of Outstanding Pool Balance | |
| German American Capital Corporation | 29 | 31 | $581,181,544 | 64.5% | |
| Citi Real Estate Funding Inc. | 16 | 20 | $292,345,006 | 32.5% | |
| Citigroup Global Markets Realty Corp. | 2 | 2 | $26,923,763 | 3.0% | |
| Total: | 47 | 53 | $900,450,312 | 100.0% | |
Pooled Collateral Facts: | |||||
| Initial Outstanding Pool Balance: | $900,450,312 | ||||
| Number of Mortgage Loans: | 47 | ||||
| Number of Mortgaged Properties: | 53 | ||||
| Average Mortgage Loan Cut-off Date Balance: | $19,158,517 | ||||
| Average Mortgaged Property Cut-off Date Balance: | $16,989,629 | ||||
| Weighted Average Mortgage Rate: | 4.6647% | ||||
| Weighted Average Mortgage Loan Original Term to Maturity Date or ARD (months): | 114 | ||||
| Weighted Average Mortgage Loan Remaining Term to Maturity Date or ARD (months): | 111 | ||||
| Weighted Average Mortgage Loan Seasoning (months): | 3 | ||||
| % of Mortgaged Properties Leased to a Single Tenant: | 19.1% | ||||
Credit Statistics(1): | |||||
| Weighted Average Mortgage Loan U/W NCF DSCR(2): | 1.95x | ||||
| Weighted Average Mortgage Loan Cut-off Date LTV(3)(4): | 57.1% | ||||
| Weighted Average Mortgage Loan Maturity Date or ARD LTV(3): | 50.9% | ||||
| Weighted Average U/W NOI Debt Yield(4): | 11.8% | ||||
Amortization Overview: | |||||
| % Mortgage Loans with Amortization through Maturity Date or ARD: | 27.1% | ||||
| % Mortgage Loans which pay Interest Only through Maturity Date or ARD: | 28.4% | ||||
| % Mortgage Loans which pay Interest Only followed by Amortization through Maturity Date or ARD: | 44.5% | ||||
| Weighted Average Remaining Amortization Term (months)(5): | 356 | ||||
Loan Structural Features: | |||||
| % Mortgage Loans with Upfront or Ongoing Tax Reserves: | 85.8% | ||||
| % Mortgage Loans with Upfront or Ongoing Replacement Reserves(6): | 67.6% | ||||
| % Mortgage Loans with Upfront or Ongoing Insurance Reserves: | 26.5% | ||||
| % Mortgage Loans with Upfront or Ongoing TI/LC Reserves(7): | 70.7% | ||||
| % Mortgage Loans with Upfront Engineering Reserves: | 40.0% | ||||
| % Mortgage Loans with Upfront or Ongoing Other Reserves: | 68.5% | ||||
| % Mortgage Loans with In Place Hard Lockboxes: | 66.3% | ||||
| % Mortgage Loans with Cash Traps Triggered at DSCR Levels ≥ 1.05x: | 92.9% | ||||
| % of Mortgage Loans with Cash Traps Triggered at Debt Yield ≥ 7.0%: | 6.3% | ||||
| % Mortgage Loans with Defeasance Only After a Lockout Period and Prior to an Open Period: | 89.4% | ||||
| Mortgage Loans with Prepayment Only After a Lockout Period and Prior to an Open Period with a Yield Maintenance Charge: | 4.3% | ||||
| Mortgage Loans with Prepayment Only After a Lockout Period and Prior to an Open Period with Defeasance or a Yield Maintenance Charge: | 6.3% | ||||
| (1) | With respect to the 95 Morton Street Mortgage Loan, Moffett Place Google Mortgage Loan, Hilton Hawaiian Village Mortgage Loan, Uovo Art Storage Mortgage Loan, Key Center Cleveland Mortgage Loan, 111 Livingston Street Mortgage Loan and Hamilton Crossing Mortgage Loan, the LTV, DSCR and Debt Yield calculations include any relatedpari passu companion loan(s) and exclude any related subordinate companion loan(s) and/or mezzanine loan(s). |
| (2) | With respect to the Moffett Place Google Mortgage Loan, the U/W NCF DSCR is calculated based on the aggregate debt service of the 12-month period commencing February 2022 of the respective mortgage loan and the relatedpari passu companion loans as set forth in the respective non-standard amortization schedule set forth in Annex F to the Preliminary Prospectus. |
| (3) | With respect to the 95 Morton Street Mortgage Loan, the Moffett Place Google Mortgage Loan, the Los Angeles Corporate Center Mortgage Loan and the Malibu Office Mortgage Loan in aggregate, collectively representing approximately 26.7% of the Initial Outstanding Pool Balance, the Cut-off Date LTVs and Maturity Date or ARD LTVs have been calculated based on the “As Stabilized” appraised value. With respect to the Midwest Embassy Suites Portfolio Mortgage Loan and the Key Center Cleveland Mortgage Loan, in aggregate, representing approximately 10.6% of the Initial Outstanding Pool Balance, the Cut-off Date LTVs and Maturity Date or ARD LTVs have been calculated based on the “As Complete” appraised value. For additional information please see the footnotes to Annex A-1 in the Preliminary Prospectus. |
| (4) | With respect to the Amsdell Gateway Self Storage Mortgage Loan representing approximately 0.5% of the Initial Outstanding Pool Balance, the Cut-off Date LTV and U/W NOI Debt Yield are calculated based on the Cut-off Balance net of a related holdback reserve. |
| (5) | Excludes loans which are interest only for the full loan term. |
| (6) | Includes FF&E Reserves. |
| (7) | Represents the percent of the allocated Initial Outstanding Pool Balance of office, retail, mixed use and industrial properties only. |
THE INFORMATION IN THIS STRUCTURAL AND COLLATERAL TERM SHEET IS NOT COMPLETE AND MAY BE AMENDED PRIOR TO THE TIME OF SALE. THIS TERM SHEET IS NOT AN OFFER TO SELL THESE SECURITIES AND IT IS NOT A SOLICITATION OF AN OFFER TO BUY THESE SECURITIES IN ANY JURISDICTION WHERE THE OFFER OR SALE IS NOT PERMITTED.
4
CD 2017-CD4 Mortgage Trust |
| STRUCTURE OVERVIEW |
OFFERED CERTIFICATES
| Class(1) | Ratings (Moody’s/S&P/Fitch/DBRS) | Initial Certificate Balance or Notional Amount(2) | Initial Subordination | Weighted Average Life (years)(5) | Principal Window (months)(5) | Certificate Principal to Value Ratio(6) | Underwritten NOI Debt Yield(7) |
| Class A-1 | Aaa(sf)/AAA(sf)/AAAsf/AAA(sf) | $28,964,000 | 30.000%(8) | 3.00 | 1 – 59 | 40.0% | 16.9% |
| Class A-2 | Aaa(sf)/AAA(sf)/AAAsf/AAA(sf) | $90,250,000 | 30.000%(8) | 4.90 | 59 – 59 | 40.0% | 16.9% |
| Class A-SB | Aaa(sf)/AAA(sf)/AAAsf/AAA(sf) | $53,102,000 | 30.000%(8) | 7.36 | 59 – 116 | 40.0% | 16.9% |
| Class A-3 | Aaa(sf)/AAA(sf)/AAAsf/AAA(sf) | $192,000,000 | 30.000%(8) | 9.52 | 103 – 116 | 40.0% | 16.9% |
| Class A-4 | Aaa(sf)/AAA(sf)/AAAsf/AAA(sf) | $234,483,000 | 30.000%(8) | 9.77 | 116 – 119 | 40.0% | 16.9% |
| Class X-A(9) | Aa1(sf)/AA+(sf)/AAAsf/AAA(sf) | $669,372,000(10) | N/A | N/A | N/A | N/A | N/A |
| Class A-M | Aa2(sf)/AA+(sf)/AAAsf/AAA(sf) | $70,573,000 | 21.750% | 9.90 | 119 – 119 | 44.7% | 15.1% |
| Class B | NR/AA-(sf)/AA-sf/AA(high)(sf) | $36,355,000 | 17.500% | 9.90 | 119 – 119 | 47.1% | 14.3% |
| Class C | NR/A-(sf)/A-sf/A(high)(sf) | $39,564,000 | 12.875% | 9.90 | 119 – 119 | 49.7% | 13.5% |
NON-OFFERED CERTIFICATES
| Class(1) | Ratings (Moody’s/S&P/Fitch/DBRS) | Initial Certificate Balance or Notional Amount(2) | Initial Subordination Levels(4) | Weighted Average Life (years)(5) | Principal Window (months)(5) | Certificate Principal to Value Ratio(6) | Underwritten NOI Debt Yield(7) | |
| Class X-B(9) | NR/A-(sf)/A-sf/AA(low)(sf) | $75,919,000(10) | N/A | N/A | N/A | N/A | N/A | |
| Class X-D(9) | NR/NR/BBB-sf/BBB(high)(sf) | $44,910,000(10) | N/A | N/A | N/A | N/A | N/A | |
| Class X-E(9) | NR/NR/BB-sf/BBB(low)(sf) | $21,386,000(10) | N/A | N/A | N/A | N/A | N/A | |
| Class X-F(9) | NR/NR/B-sf/BB(sf) | $8,554,000(10) | N/A | N/A | N/A | N/A | N/A | |
| Class X-G(9) | NR/NR/NR/NR | $35,286,789(10) | N/A | N/A | N/A | N/A | N/A | |
| Class D | NR/NR/BBB-sf/BBB(sf) | $44,910,000 | 7.625% | 9.90 | 119 – 119 | 52.7% | 12.8% | |
| Class E | NR/NR/BB-sf/BB(high)(sf) | $21,386,000 | 5.125% | 9.90 | 119 – 120 | 54.2% | 12.4% | |
| Class F | NR/NR/B-sf/BB(low)(sf) | $8,554,000 | 4.125% | 9.98 | 120 – 120 | 54.7% | 12.3% | |
| Class G | NR/NR/NR/NR | $35,286,789 | 0.000% | 9.98 | 120 – 120 | 57.1% | 11.8% | |
NON-OFFERED VERTICAL RISK RETENTION INTEREST
| Non-Offered Eligible Vertical Interest | Ratings (Moody’s/S&P/Fitch/DBRS) | Initial Retained Certificate Balance or Notional Amount(3) | Initial Subordination | Weighted Average Life (years)(5) | Principal Window (months)(5) | Certificate Principal to Value Ratio(6) | Underwritten NOI Debt Yield(7) |
| VRR Interest(11) | NR/NR/NR/NR | $45,022,522 | N/A | 8.86 | 1 – 120 | N/A | N/A |
| (1) | The pass-through rates applicable to the Class A-1, Class A-2, Class A-SB, Class A-3, Class A-4, Class A-M, Class B, Class C, Class D, Class E, Class F and Class G certificates (the “Principal Balance Certificates”) will equal one of: (i) a fixedper annum rate, (ii) the weighted average of the net mortgage rates on the mortgage loans (in each case, adjusted, if necessary, to accrue on the basis of a 360-day year consisting of twelve 30-day months) as of their respective due dates in the month preceding the month in which the related Distribution Date occurs, (iii) a rate equal to the lesser of a specified pass-through rate and the rate specified in clause (ii) or (iv) the rate specified in clause (ii) less a specified rate. |
| (2) | Approximate; subject to a permitted variance of plus or minus 5%. |
| (3) | On the Closing Date, the certificates with the initial Certificate Balances or Notional Amounts set forth in the table under “Initial Retained Certificate Balance or Notional Amount” are expected to be sold directly from the depositor to DBNY and CREFI as described in“Credit Risk Retention” in the Preliminary Prospectus. |
| (4) | The initial subordination levels are calculated based on the initial Certificate Balance. The approximate initial credit support percentages shown in the table above do not take into account the VRR Interest. However, losses incurred on the mortgage loans will be allocated between the VRR Interest, on the one hand, and the Non-Risk Retained Certificates (exclusive of the Class X, Class S and Class R certificates), on the other hand,pro rata in accordance with their respective outstanding certificate balances. See “Credit Risk Retention” and “Description of the Certificates” in the Preliminary Prospectus. |
| (5) | The weighted average life and principal window during which distributions of principal would be received as set forth in the table with respect to each class of certificates with a Certificate Balance is based on (i) modeling assumptions described in the Preliminary Prospectus, (ii) assumptions that there are no prepayments, delinquencies or losses on the mortgage loans and (iii) assumptions that there are no extensions of maturity dates and mortgage loans with anticipated repayment dates, if any, are repaid on the respective anticipated repayment dates. |
| (6) | “Certificate Principal to Value Ratio” for any class with a Certificate Balance is calculated as the product of (a) the weighted average Mortgage Loan Cut-off Date LTV of the mortgage pool, multiplied by (b) a fraction, the numerator of which is the total initial Certificate Balance of the related class of certificates and all other classes with a Certificate Balance, if any, that are senior to such class, and the denominator of which is the total initial Certificate Balance of all certificates. The Certificate Principal to Value Ratios of the Class A-1, Class A-2, Class A-SB, Class A-3 and Class A-4 certificates are calculated in the aggregate for those classes as if they were a single class. |
| (7) | “Underwritten NOI Debt Yield” for any class with a Certificate Balance is calculated as the product of (a) the weighted average U/W NOI Debt Yield for the mortgage pool, multiplied by (b) a fraction, the numerator of which is the total initial Certificate Balance of all certificates and the denominator of which is the total initial Certificate Balance of the related class of certificates and all other classes with a Certificate Balance, if any, that are senior to such class. The Underwritten NOI Debt Yields of the Class A-1, Class A-2, Class A-SB, Class A-3 and Class A-4 certificates are calculated in the aggregate for those classes as if they were a single class. |
| (8) | The initial subordination levels for the Class A-1, Class A-2, Class A-SB, Class A-3 and Class A-4 certificates are represented in the aggregate. |
| (9) | As further described in the Preliminary Prospectus, the pass-through rate applicable to the Class X-A, Class X-B, Class X-D, Class X-E, Class X-F and Class X-G certificates (collectively, the Class X Certificates”) for each Distribution Date will generally be equal to the excess of (i) the weighted average of the net mortgage rates on the mortgage loans (in each case, adjusted, if necessary, to accrue on the basis of a 360-day year consisting of twelve 30-day months) as of their respective due dates in the month preceding the month in which such Distribution Date occurs over (ii)(A) with respect to the Class X-A certificates, the weighted average of the pass-through rates of the Class A-1, Class A-2, Class A-SB, Class A-3, Class A-4 and Class A-M certificates (based on their Certificate Balances), (B) with respect to the Class X-B certificates, the pass-through rates of the Class B and Class C certificates, (C) with respect to the Class X-D certificates, the pass-through rate of the Class D certificates, (D) with respect to the Class X-E certificates, the pass-through rate of the Class E certificates, (E) with respect to the Class X-F certificates, the pass-through rate of the Class F certificates and (F) with respect to the Class X-G certificates, the pass-through rate of the Class G certificates. |
| (10) | The Class X Certificates will not have Certificate Balances. None of the Class X Certificates will be entitled to distributions of principal. The interest accrual amounts on the Class X-A certificates will be calculated by reference to a notional amount equal to the sum of the Certificate Balances of each of the Class A-1, Class A-2, Class A-SB, Class A-3, Class A-4 and Class A-M certificates. The interest accrual amounts on the Class X-B certificates will be calculated by reference to a notional amount equal to the sum of the Certificate Balances of the Class B and Class C certificates. The interest accrual amounts on the Class X-D certificates will be calculated by reference to a notional amount equal to the Certificate Balance of the Class D certificates. The interest accrual amounts on the Class X-E certificates will be calculated by reference to a notional amount equal to the Certificate |
THE INFORMATION IN THIS STRUCTURAL AND COLLATERAL TERM SHEET IS NOT COMPLETE AND MAY BE AMENDED PRIOR TO THE TIME OF SALE. THIS TERM SHEET IS NOT AN OFFER TO SELL THESE SECURITIES AND IT IS NOT A SOLICITATION OF AN OFFER TO BUY THESE SECURITIES IN ANY JURISDICTION WHERE THE OFFER OR SALE IS NOT PERMITTED.
5
CD 2017-CD4 Mortgage Trust |
| STRUCTURE OVERVIEW |
| Balance of the Class E certificates. The interest accrual amounts on the Class X-F certificates will be calculated by reference to a notional amount equal to the Certificate Balance of the Class F certificates. The interest accrual amounts on the Class X-G certificates will be calculated by reference to a notional amount equal to the Certificate Balance of the Class G certificates. The notional amount of each class of the Class X Certificates is subject to change depending upon the final pricing of the Principal Balance Certificates, as follows: (1) if as a result of such pricing the pass-through rate of any class of Principal Balance Certificates whose certificate balance comprises such notional amount is equal to the weighted average of the net mortgage rates on the mortgage loans (in each case, adjusted, if necessary, to accrue on the basis of a 360-day year consisting of twelve 30-day months), the certificate balance of such class of Principal Balance Certificates may not be part of, and reduce accordingly, such notional amount of the related Class X Certificates (or, if as a result of such pricing the pass-through rate of the related Class X Certificates is equal to zero, such Class X Certificates may not be issued on the Closing Date), and/or (2) if as a result of such pricing the pass-through rate of any class of Principal Balance Certificates that does not comprise such notional amount of the related Class X Certificates is equal to less than the weighted average of the net mortgage rates on the mortgage loans (in each case, adjusted, if necessary, to accrue on the basis of a 360-day year consisting of twelve 30-day months), such class of Principal Balance Certificates may become a part of, and increase accordingly, such notional amount of the related Class X Certificates. |
| (11) | German American Capital Corporation, as the retaining sponsor, is expected to purchase from the depositor, on the Closing Date, an “eligible vertical interest” (as such term is defined in Regulation RR, the “VRR Interest”) in the form of a single vertical security with an aggregate initial certificate balance of approximately $45,022,522, which is expected to represent approximately 5.0% of the aggregate initial certificate balance of all of the ABS interests issued by the issuing entity The VRR Interest will be retained by certain retaining parties in accordance with the credit risk retention rules applicable to this securitization transaction. See “Credit Risk Retention” in the Preliminary Prospectus. The VRR Interest is a class of certificates. |
THE INFORMATION IN THIS STRUCTURAL AND COLLATERAL TERM SHEET IS NOT COMPLETE AND MAY BE AMENDED PRIOR TO THE TIME OF SALE. THIS TERM SHEET IS NOT AN OFFER TO SELL THESE SECURITIES AND IT IS NOT A SOLICITATION OF AN OFFER TO BUY THESE SECURITIES IN ANY JURISDICTION WHERE THE OFFER OR SALE IS NOT PERMITTED.
6
CD 2017-CD4 Mortgage Trust |
| STRUCTURE OVERVIEW |
| Class A-2 Principal Paydown(1) |
| Class | Mortgage Loan Seller | Mortgage Loan | Property Type | Cut-off Date Balance | Remaining Term to Maturity (Mos.) | Cut-off Date LTV Ratio | U/W NCF DSCR | U/W NOI Debt Yield | |
| A-2 | CREFI | 95 Morton Street | Office | $95,000,000 | 59 | 42.6% | 2.34x | 10.7% | |
| (1) | This table reflects the Mortgage Loan whose balloon payments will be applied to pay down the Class A-2 certificates, assuming (i) that none of the mortgage loans experience prepayments, defaults or losses, (ii) there are no extensions of maturity dates and (iii) each mortgage loan is paid in full on its stated maturity date. See “Yield and Maturity Considerations—Yield Considerations” in the Preliminary Prospectus. |
THE INFORMATION IN THIS STRUCTURAL AND COLLATERAL TERM SHEET IS NOT COMPLETE AND MAY BE AMENDED PRIOR TO THE TIME OF SALE. THIS TERM SHEET IS NOT AN OFFER TO SELL THESE SECURITIES AND IT IS NOT A SOLICITATION OF AN OFFER TO BUY THESE SECURITIES IN ANY JURISDICTION WHERE THE OFFER OR SALE IS NOT PERMITTED.
7
CD 2017-CD4 Mortgage Trust |
| STRUCTURE OVERVIEW |
| Allocation between VRR Interest and the Non-Risk Retained Certificates: | The aggregate amount available for distribution to holders of the certificates (including the VRR Interest) on each Distribution Date will be: (i) the gross amount of interest, principal, yield maintenance charges and prepayment premiums collected with respect to the Mortgage Loans in the applicable one-month collection period, net of specified expenses of the issuing entity, including fees payable therefrom to, and losses, liabilities, costs and expenses reimbursable or indemnifiable therefrom to, the Master Servicer, the Special Servicer, the Certificate Administrator, the Trustee, the Operating Advisor, the Asset Representations Reviewer and CREFC®; and (ii) allocated to amounts available for distribution to the holders of the VRR Interest, on the one hand, and amounts available for distribution to the holders of the remaining certificates (the “Non-Risk Retained Certificates”), on the other hand. On each Distribution Date, the portion of such aggregate available funds allocable to: (a) the VRR Interest will be the product of such aggregate available funds multiplied by a fraction, expressed as a percentage, the numerator of which is the initial Certificate Balance of the VRR Interest, and the denominator of which is the aggregate initial Certificate Balances of the Principal Balance Certificates and the initial Certificate Balance of the VRR interest (the “Risk Retained Percentage”); and (b) the Non-Risk Retained Certificates will at all times be the product of such aggregate available funds multiplied by the difference between 100% and the Risk Retained Percentage (such difference, the “Non-Risk Retained Percentage”). See “Credit Risk Retention” and “Description of the Certificates” in the Preliminary Prospectus.
| ||||
| Principal Payments: | Payments in respect of the Non-Risk Retained Percentage of principal on the Non-Risk Retained Certificates will be distributed,first, to the Class A-SB certificates, until the Certificate Balance of such class is reduced to the planned principal balance for the related Distribution Date set forth on Annex E to the Preliminary Prospectus,then, to the Class A-1, Class A-2, Class A-SB, Class A-3, Class A-4, Class A-M, Class B, Class C, Class D, Class E, Class F and Class G certificates, in that order until the Certificate Balance of each such class is reduced to zero. Notwithstanding the foregoing, if the total Certificate Balance of the Class A-M, Class B, Class C, Class D, Class E, Class F and Class G certificates have been reduced to zero as a result of loss allocation, payments in respect of principal of the certificates will be distributed,first, to the Class A-1, Class A-2, Class A-SB, Class A-3, and Class A-4 certificates, on apro rata basis, based on the Certificate Balance of each such class,then, to the extent of any recoveries on realized losses, to the Class A-M, Class B, Class C, Class D, Class E, Class F and Class G certificates, in that order, in each case until the Certificate Balance of each such class is reduced to zero (or previously allocated realized losses have been fully reimbursed).
Each class of Class X Certificates will not be entitled to receive distributions of principal; however, (i) the notional amount of the Class X-A certificates will be reduced by the aggregate amount of principal distributions and realized losses allocated to the Class A-1, Class A-2, Class A-SB, Class A-3, Class A-4 and Class A-M certificates; (ii) the notional amount of the Class X-B certificates will be reduced by the aggregate amount of principal distributions and realized losses allocated to the Class B and Class C certificates; (iii) the notional amount of the Class X-D certificates will be reduced by the principal distributions and realized losses allocated to the Class D certificates; (iv) the notional amount of the Class X-E certificates will be reduced by the principal distributions and realized losses allocated to the Class E certificates; (v) the notional amount of the Class X-F certificates will be reduced by the principal distributions and realized losses allocated to the Class F certificates and (vi) the notional amount of the Class X-G certificates will be reduced by the principal distributions and realized losses allocated to the Class G certificates.
| ||||
| Interest Payments: | On each Distribution Date, interest accrued for each class of the Non-Risk Retained Certificates at the applicable pass-through rate will be distributed in the following order of priority, to the extent of the Non-Risk Retained Percentage of the aggregate available funds (exclusive of any portion thereof that represents the Non-Risk Retained Percentage of (i) any yield maintenance charges and prepayment premiums and/or (ii) any excess interest accrued after the related anticipated repayment date on any mortgage loan with an anticipated repayment date):first, to the Class A-1, Class A-2, Class A-SB, Class A-3, Class A-4, Class X-A, Class X-B, Class X-D, Class X-E, Class X-F and Class X-G certificates, on apro rata basis, based on the accrued and unpaid interest on each such class andthen, to the Class A-M, Class B, Class C, Class D, Class E, Class F and Class G certificates, in that order, in each case until the interest payable to each such class is paid in full. | ||||
THE INFORMATION IN THIS STRUCTURAL AND COLLATERAL TERM SHEET IS NOT COMPLETE AND MAY BE AMENDED PRIOR TO THE TIME OF SALE. THIS TERM SHEET IS NOT AN OFFER TO SELL THESE SECURITIES AND IT IS NOT A SOLICITATION OF AN OFFER TO BUY THESE SECURITIES IN ANY JURISDICTION WHERE THE OFFER OR SALE IS NOT PERMITTED.
8
CD 2017-CD4 Mortgage Trust |
| STRUCTURE OVERVIEW |
The pass-through rates applicable to the Class A-1, Class A-2, Class A-SB, Class A-3, Class A-4, Class A-M, Class B, Class C, Class D, Class E, Class F and Class G certificates for each Distribution Date will equal one of: (i) a fixedper annum rate, (ii) the weighted average of the net mortgage rates on the mortgage loans (in each case, adjusted, if necessary, to accrue on the basis of a 360-day year consisting of twelve 30-day months) as of their respective due dates in the month preceding the month in which such Distribution Date occurs, (iii) a rate equal to the lesser of a specified pass-through rate and the rate specified in clause, (ii) or (iv) the rate specified in clause (ii) less a specified rate.
As further described in the Preliminary Prospectus, the pass-through rates applicable to the Class X Certificates for each Distribution Date will generally be equal to the excess of (i) the weighted average of the net mortgage rates on the mortgage loans (in each case, adjusted, if necessary, to accrue on the basis of a 360-day year consisting of twelve 30-day months) as of their respective due dates in the month preceding the month in which such Distribution Date occurs over (ii) (A) with respect to the Class X-A certificates, the weighted average of the pass-through rates of the Class A-1, Class A-2, Class A-SB, Class A-3, Class A-4 and Class A-M certificates (based on their Certificate Balances), (B) with respect to the Class X-B certificates, the weighted average of the pass-through rate of the Class B and Class C certificates, (C) with respect to the Class X-D certificates, the pass-through rate of the Class D certificates, (D) with respect to the Class X-E certificates, the pass-through rate of the Class E certificates, (E) with respect to the Class X-F certificates, the pass-through rate of the Class F certificates and (F) with respect to the Class X-G certificates, the pass-through rate of the Class G certificates.
| |||||
| Prepayment Interest Shortfalls: | Prepayment interest shortfalls will be allocatedpro rata based on interest entitlements, in reduction of the interest otherwise payable with respect to each of the interest-bearing classes of certificates.
| ||||
| Loss Allocation: | The Non-Risk Retained Percentage of losses will be allocated to each class of Non-Risk Retained Certificates entitled to principal in reverse alphabetical order starting with Class G through and including Class A-M andthen to Class A-1, Class A-2, Class A-SB, Class A-3 and Class A-4 certificates on apro ratabasis based on the Certificate Balance of each such class. The notional amount of any class of Class X Certificates will be reduced by the aggregate amount of realized losses allocated to the class(es) of certificates that are component(s) of the notional amount of such class of Class X Certificates.
| ||||
Prepayment Premiums:
| A percentage of the Non-Risk Retained Percentage of all prepayment premiums (either fixed prepayment premiums or yield maintenance amounts) collected on the Mortgage Loans will be allocated to each of the Class A-1, Class A-2, Class A-SB, Class A-3, Class A-4, Class A-M, Class B, Class C and Class D certificates (the “YM P&I Certificates”) then entitled to principal distributions, which percentage will be equal to the product of (a) a fraction, not greater than one, the numerator of which is the amount of principal distributed to such class on such Distribution Date and the denominator of which is the total amount of principal distributed to the holders of the Class A-1, Class A-2, Class A-SB, Class A-3, Class A-4, Class A-M, Class B, Class C, Class D, Class E, Class F and Class G certificates on such Distribution Date, and (b) a fraction (expressed as a percentage which can be no greater than 100% nor less than 0%), the numerator of which is the excess of the pass-through rate of each such class of certificates currently receiving principal over the relevant Discount Rate, and the denominator of which is the excess of the Mortgage Rate of the related Mortgage Loan over the relevant Discount Rate.
Prepayment Premium Allocation Percentage for all YM P&I Certificates =
| ||||
| (Pass-Through Rate - Discount Rate) | X | The percentage of the principal distribution amount to such class as described in (a) above | ||
| (Mortgage Rate - Discount Rate) | |||||
The remaining percentage of the Non-Risk Retained Percentage of the prepayment premiums will be allocated to the Class X-A, Class X-B, Class X-D, Class X-E, Class X-F and Class X-G certificates in the manner described in the Preliminary Prospectus. In general, this formula provides for an increase in the percentage of prepayment premiums allocated to the YM P&I Certificates then entitled to principal distributions relative to the Class X-A, Class X-B, Class X-D, Class X-E, Class X-F and Class X-G certificates as Discount Rates decrease and a decrease in the percentage allocated to such classes as Discount Rates rise. | |||||
THE INFORMATION IN THIS STRUCTURAL AND COLLATERAL TERM SHEET IS NOT COMPLETE AND MAY BE AMENDED PRIOR TO THE TIME OF SALE. THIS TERM SHEET IS NOT AN OFFER TO SELL THESE SECURITIES AND IT IS NOT A SOLICITATION OF AN OFFER TO BUY THESE SECURITIES IN ANY JURISDICTION WHERE THE OFFER OR SALE IS NOT PERMITTED.
9
CD 2017-CD4 Mortgage Trust |
| STRUCTURE OVERVIEW |
| Whole Loans: | The mortgaged properties identified on Annex A-1 to the Preliminary Prospectus as Moffett Place Google, Hilton Hawaiian Village, Uovo Art Storage, Key Center Cleveland, 111 Livingston Street and Hamilton Crossing, each secure both a mortgage loan to be included in the trust fund and one or more other companion loans that will not be included in the trust fund, each of which will bepari passu and/or subordinate in right of payment with the mortgage loan included in the trust fund. We refer to each such group of related loans as a “whole loan”.
The Moffett Place Google whole loan and the 111 Livingston Street whole loan will be principally serviced under the pooling and servicing agreement for the CD 2017-CD3 securitization. The Hilton Hawaiian Village whole loan will be principally serviced under the pooling and servicing agreement for the Hilton USA Trust 2016 HHV securitization. The Uovo Art Storage whole loan will be principally serviced under the pooling and servicing agreement for this securitization. The Key Center Cleveland whole loan and the Hamilton Crossing whole loan will be principally serviced under the pooling and servicing agreement for the CGCMT 2017-P7 securitization.
As of the Closing Date, thepari passu companion loans or the subordinate companion loans in the whole loans are expected to be held by the party identified below under “Companion Loan Summary”.
| ||||
| Control Rights and Directing Certificateholder: | Controlling Class Certificateholders will generally have certain control rights over servicing matters with respect to each Serviced Mortgage Loan and any related Serviced Companion Loans. The majority owner or appointed representative of the class of Control Eligible Certificates that is the Controlling Class (such owner or representative, the “Directing Certificateholder”) will be entitled to direct the Special Servicer to take, or refrain from taking certain actions with respect to each Serviced Mortgage Loan and any related Serviced Companion Loans. Furthermore, the Directing Certificateholder will also have the right to receive notice and consent to certain material actions that the Master Servicer and the Special Servicer proposes to take with respect to each Serviced Mortgage Loan and any related Serviced Companion Loans.
It is expected that RREF III-D AIV RR, LLC or another affiliate of Rialto Capital Advisors, LLC will be the initial Directing Certificateholder with respect to each Serviced Mortgage Loan and any related Serviced Companion Loans.
For a description of the directing holder for each Non-Serviced Whole Loan, see“Description of the Mortgage Pool—The Whole Loans” and “Pooling and Servicing Agreement—The Directing Certificateholder”in the Preliminary Prospectus.
| ||||
| Control Eligible Certificates: | Class E, Class F and Class G certificates.
| ||||
| Controlling Class: | The Controlling Class will be the most subordinate class of Control Eligible Certificates then outstanding that has an aggregate Certificate Balance, as notionally reduced by any appraisal reduction amounts and any collateral deficiency amounts allocable to such class, equal to at least 25% of the initial Certificate Balance of such class;provided that if at any time the Certificate Balances of all Control Eligible Certificates, as notionally reduced by any appraisal reduction amounts (but without regard to any collateral deficiency amounts) allocable to such classes, have been reduced to zero, then the “Controlling Class” will be the most subordinate class of Control Eligible Certificates that has an aggregate principal balance greater than zero;provided,further that if at any time the Certificate Balances of the Class A-1, Class A-2, Class A-SB, Class A-3, Class A-4, Class A-M, Class B, Class C and Class D certificates have been reduced to zero as a result of the allocation of principal payments on the Mortgage Loans, then the “Controlling Class” will be the most subordinate class of Control Eligible Certificates that has an aggregate Certificate Balance greater than zero (without regard to the application of appraisal reduction amounts or any collateral deficiency amounts to notionally reduce the Certificate Balance of such class).
The Controlling Class as of the Closing Date will be the Class G certificates.
| ||||
| Appraised-Out Class: | Any class of Control Eligible Certificates that has been determined, as a result of appraisal reductions amounts and collateral deficiency amounts allocable to such class, to no longer be the Controlling Class.
| ||||
| |||||
THE INFORMATION IN THIS STRUCTURAL AND COLLATERAL TERM SHEET IS NOT COMPLETE AND MAY BE AMENDED PRIOR TO THE TIME OF SALE. THIS TERM SHEET IS NOT AN OFFER TO SELL THESE SECURITIES AND IT IS NOT A SOLICITATION OF AN OFFER TO BUY THESE SECURITIES IN ANY JURISDICTION WHERE THE OFFER OR SALE IS NOT PERMITTED.
10
CD 2017-CD4 Mortgage Trust |
| STRUCTURE OVERVIEW |
| Remedies Available to Holders of an Appraised-Out Class: | Holders of the majority of any class of Control Eligible Certificates that is determined at any time of determination to no longer be the Controlling Class as a result of an allocation of appraisal reduction amounts and collateral deficiency amounts in respect of such class will have the right, at their sole expense, to require the Special Servicer to order a second appraisal for any Serviced Mortgage Loan for which an Appraisal Reduction Event has occurred or as to which there exists a collateral deficiency amount. Upon receipt of the second appraisal, the Special Servicer will be required to determine, in accordance with the Servicing Standard, whether, based on its assessment of the second appraisal, a recalculation of the appraisal reduction amount or collateral deficiency amount is warranted. If warranted, the Special Servicer will direct the Master Servicer to recalculate the appraisal reduction amount or collateral deficiency amount based on the second appraisal, and if required by such recalculation, the Special Servicer will reinstate the Appraised-Out Class as the Controlling Class. The Holders of an Appraised-Out Class requesting a second appraisal will not be entitled to exercise any rights of the Controlling Class until such time, if any, as the class is reinstated as the Controlling Class.
| ||||
| Control Termination Event: | Will occur when (i) the Class E certificates have a Certificate Balance (taking into account the application of any appraisal reduction amounts and collateral deficiency amounts to notionally reduce the Certificate Balance of such class) of less than 25% of the initial Certificate Balance of that class or (ii) a holder of the Class E certificates is the majority Controlling Class Certificateholder and has irrevocably waived its right, in writing, to exercise any of the rights of the Controlling Class Certificateholder and such rights have not been reinstated to a successor Controlling Class Certificateholder (subject to “—Controlling Class” above).
Upon the occurrence and the continuance of a Control Termination Event, the Directing Certificateholder will no longer have any control rights. The Directing Certificateholder will no longer have the right to direct certain actions of the Special Servicer and will no longer have consent rights with respect to certain material actions that the Master Servicer or Special Servicer proposes to take with respect to a Serviced Mortgage Loan and any related Serviced Companion Loans.
Upon the occurrence and continuation of a Control Termination Event, the Directing Certificateholder will retain non-binding consultation rights with respect to certain material actions that the Special Servicer proposes to take with respect to a Serviced Mortgage Loan and any related Serviced Companion Loans. Such consultation rights will continue until the occurrence of a Consultation Termination Event.
| ||||
| Consultation Termination Event: | Will occur when (i) there is no class of Control Eligible Certificates that has a then-outstanding Certificate Balance at least equal to 25% of the initial Certificate Balance of such class, in each case, without regard to the application of any appraisal reduction amounts and collateral deficiency amounts; or (ii) a holder of the Class E certificates is the majority Controlling Class Certificateholder and has irrevocably waived its right, in writing, to exercise any of the rights of the Controlling Class Certificateholder and such rights have not been reinstated to a successor Controlling Class Certificateholder (subject to “—Controlling Class” above).
Upon the occurrence and continuance of a Consultation Termination Event, the Directing Certificateholder will have no rights under the PSA other than those rights that all Certificateholders have.
| ||||
| Risk Retention Consultation Parties: | Each risk retention consultation party will have certain non-binding consultation rights with respect to certain material servicing actions. The holder (or group of affiliated holders) of the majority of each of the respective portions of the VRR Interest transferred on the Closing Date by GACC to DBNY and CREFI (by Certificate Balance) will be entitled to appoint a risk retention consultation party. DBNY and CREFI are expected to be appointed as the initial risk retention consultation parties.
| ||||
| Appointment and Replacement of Special Servicer: | The Directing Certificateholder will appoint the initial Special Servicer with respect to each Serviced Mortgage Loan and any related Serviced Companion Loans as of the Closing Date. Prior to the occurrence and continuance of a Control Termination Event, the Directing Certificateholder generally may replace the Special Servicer with respect to each Serviced Mortgage Loan and any related Serviced Companion Loans with or without cause at any time.
Upon the occurrence and during the continuance of a Control Termination Event, the Directing Certificateholder will no longer have the right to replace the Special Servicer and such | ||||
THE INFORMATION IN THIS STRUCTURAL AND COLLATERAL TERM SHEET IS NOT COMPLETE AND MAY BE AMENDED PRIOR TO THE TIME OF SALE. THIS TERM SHEET IS NOT AN OFFER TO SELL THESE SECURITIES AND IT IS NOT A SOLICITATION OF AN OFFER TO BUY THESE SECURITIES IN ANY JURISDICTION WHERE THE OFFER OR SALE IS NOT PERMITTED.
11
CD 2017-CD4 Mortgage Trust |
| STRUCTURE OVERVIEW |
replacement (other than with respect to the Non-Serviced Whole Loans) will occur based on a vote of holders of all voting eligible classes of certificates as described below. See “Description of the Mortgage Pool—The Whole Loans” and “Pooling and Servicing Agreement” in the Preliminary Prospectus for a description of the special servicer appointment and replacement rights with respect to Non-Serviced Whole Loans.
| |||||
| Replacement of Special Servicer by Vote of Certificateholders: | Other than with respect to Non-Serviced Whole Loans, if a Control Termination Event has occurred and is continuing, upon (i) the written direction of holders of certificates evidencing not less than 25% of the voting rights of all classes of certificates entitled to principal (taking into account the application of appraisal reduction amounts to notionally reduce the Certificate Balances of classes to which such appraisal reduction amounts are allocable) requesting a vote to replace the Special Servicer with a replacement special servicer, (ii) payment by such requesting holders to the Certificate Administrator of all reasonable fees and expenses to be incurred by the Certificate Administrator in connection with administering such vote and (iii) delivery by such holders to the Certificate Administrator and Trustee of written confirmations from each Rating Agency that the appointment of the replacement Special Servicer will not result in a downgrade of the certificates, the Certificate Administrator will be required to promptly post notice of such request on the Certificate Administrator’s website and concurrently provide written notice of such request by mail to all certificateholders of such request and conduct the solicitation of votes of all certificates in such regard. Upon the written direction (within 180 days) of Holders of at least 66-2/3% of a Certificateholder Quorum the Trustee will immediately replace the Special Servicer with the replacement Special Servicer (other than with respect to Non-Serviced Whole Loans).
“Certificateholder Quorum” means, in connection with any solicitation of votes in connection with the replacement of the Special Servicer as described above or the Asset Representations Reviewer as described below, the holders of certificates evidencing at least 50% of the aggregate voting rights (taking into account Realized Losses and, other than with respect to the termination of the Asset Representations Reviewer, the application of any appraisal reduction amounts to notionally reduce the Certificate Balance of the certificates) of all classes of certificates entitled to principal, on an aggregate basis.
In addition, after the occurrence of a Consultation Termination Event, if the Operating Advisor determines that the Special Servicer is not performing its duties in accordance with the Servicing Standard, the Operating Advisor will have the right to recommend the replacement of the Special Servicer (other than with respect to the Non-Serviced Whole Loans). The Operating Advisor’s recommendation to replace the Special Servicer (other than with respect Non-Serviced Whole Loans) must be confirmed by a majority of the voting rights of all classes of certificates entitled to principal (taking into account the application of appraisal reduction amounts to notionally reduce the Certificate Balances of classes to which such appraisal reduction amounts are allocable) within 180 days from the time such recommendation is posted to the Certificate Administrator website and is subject to the receipt of written confirmations from each Rating Agency that the appointment of the replacement Special Servicer will not result in a downgrade of the certificates.
See“Description of the Mortgage Pool—The Whole Loans”and“Pooling and Servicing Agreement”in the Preliminary Prospectus for a description of the special servicer appointment and replacement rights with respect to Non-Serviced Whole Loans.
| ||||
| Cap on Workout and Liquidation Fees: | The workout fees and liquidation fees payable to a Special Servicer under the PSA will be an amount equal to the lesser of: (1) 1.0% of each collection of interest and principal following a workout or liquidation and (2) $1,000,000 per workout or liquidation. All Modification Fees actually paid to the Special Servicer in connection with a workout or liquidation or in connection with any prior workout or partial liquidation that occurred within the prior 18 months will be deducted from the total workout fee and/or liquidation fees payable (other than Modification Fees earned while the Mortgage Loan was not in special servicing). In addition, the total amount of workout and liquidation fees actually payable by the Trust under the PSA will be capped in the aggregate at $1,000,000 for each related Mortgage Loan. If a new special servicer begins servicing the related Mortgage Loan, all amounts paid to the prior special servicer will be disregarded for purposes of calculating the cap.
| ||||
| Special Servicer Compensation: | The special servicing fee will equal the greater of (i) 0.25%per annum of the stated principal balance of the related specially serviced loan or REO property, as applicable, and (ii) $3,500 | ||||
THE INFORMATION IN THIS STRUCTURAL AND COLLATERAL TERM SHEET IS NOT COMPLETE AND MAY BE AMENDED PRIOR TO THE TIME OF SALE. THIS TERM SHEET IS NOT AN OFFER TO SELL THESE SECURITIES AND IT IS NOT A SOLICITATION OF AN OFFER TO BUY THESE SECURITIES IN ANY JURISDICTION WHERE THE OFFER OR SALE IS NOT PERMITTED.
12
CD 2017-CD4 Mortgage Trust |
| STRUCTURE OVERVIEW |
(or, with respect to any specially serviced loan or REO loan with respect to which the risk retention consultation parties consulted with the special servicer after the occurrence and during the continuance of a consultation termination event, $5,000 for the month in which such consultation occurred). The Special Servicer and its affiliates will be prohibited from receiving or retaining any compensation or any other remuneration under the PSA (including, without limitation, in the form of commissions, brokerage fees, rebates, or as a result of any other fee-sharing arrangement) from any person (including, without limitation, the issuing entity, any borrower, any manager, any guarantor or indemnitor in respect of a Serviced Mortgage Loan and any related Serviced Companion Loans, if any, and any purchaser of any Serviced Mortgage Loan and any related Serviced Companion Loan or REO Property) in connection with the disposition, workout or foreclosure of any Serviced Mortgage Loan and any related Serviced Companion Loans, the management or disposition of any REO Property, or the performance of any other special servicing duties under the PSA, other than as expressly permitted in the PSA and other than commercially reasonable treasury management fees, banking fees, customary title agent fees and insurance commissions or fees received or retained by the Special Servicer or any of its Affiliates in connection with any services performed by such party with respect to any Mortgage Loan. Subject to certain limited exceptions, the Special Servicer will also be required to report any compensation or other remuneration the Special Servicer or its affiliates have received from any person and such information will be disclosed in the Certificateholders’ monthly distribution date statement.
| |||||
| Operating Advisor: | With respect to the Serviced Mortgage Loan and any related Serviced Companion Loans and prior to the occurrence of a Control Termination Event, the Operating Advisor will have access to any final asset status report and all information available with respect to the transaction on the Certificate Administrator’s website but will not have any approval or consultation rights. After the occurrence and during the continuance of a Control Termination Event, the Operating Advisor will have consultation rights with respect to certain major decisions and will have additional monitoring responsibilities on behalf of the entire trust.
The Operating Advisor will be subject to termination if holders of at least 15% of the aggregate voting rights of the certificates (in connection with termination and replacement relating to the Mortgage Loans) vote to terminate and replace the Operating Advisor and such vote is approved by holders of more than 50% of the applicable voting rights that exercise their right to vote (in the case of each of such vote and approval, taking into account Realized Losses and the application of any appraisal reduction amounts to notionally reduce the Certificate Balance of the certificates), provided that holders of at least 50% of the applicable voting rights have exercised their right to vote. The holders initiating such vote will be responsible for the fees and expenses in connection with the vote and replacement.
The Operating Advisor will not have consultation rights in respect of Non-Serviced Mortgage Loans.
| ||||
| Asset Representations Reviewer: | The Asset Representations Reviewer will be required to review certain delinquent Mortgage Loans after a specified delinquency threshold has been exceeded and the required percentage of certificateholders vote to direct a review of such delinquent Mortgage Loans. An asset review will occur when either (1) Mortgage Loans with an aggregate outstanding principal balance of 25% or more of the aggregate outstanding principal balance of all of the Mortgage Loans (including any REO loans (or a portion of any REO loan in the case of a whole loan)) held by the issuing entity as of the end of the applicable collection period are delinquent loans or (2)(A) prior to and including the second anniversary of the Closing Date, at least 10 Mortgage Loans are delinquent loans as of the end of the applicable collection period and the outstanding principal balance of such delinquent loans in the aggregate constitutes at least 15% of the aggregate outstanding principal balance of all of the Mortgage Loans (including any REO loans (or a portion of any REO loan in the case of a whole loan)) held by the issuing entity as of the end of the applicable collection period, or (B) after the second anniversary of the Closing Date, at least 15 Mortgage Loans are delinquent loans as of the end of the applicable collection period and the outstanding principal balance of such delinquent loans in the aggregate constitutes at least 20% of the aggregate outstanding principal balance of all of the Mortgage Loans (including any REO loans (or a portion of any REO loan in the case of a whole loan)) held by the issuing entity as of the end of the applicable collection period.
The Asset Representations Reviewer may be terminated and replaced without cause. Upon (i) the written direction of Certificateholders evidencing not less than 25% of the voting rights (taking into account Realized Losses, but without regard to the application of any appraisal | ||||
THE INFORMATION IN THIS STRUCTURAL AND COLLATERAL TERM SHEET IS NOT COMPLETE AND MAY BE AMENDED PRIOR TO THE TIME OF SALE. THIS TERM SHEET IS NOT AN OFFER TO SELL THESE SECURITIES AND IT IS NOT A SOLICITATION OF AN OFFER TO BUY THESE SECURITIES IN ANY JURISDICTION WHERE THE OFFER OR SALE IS NOT PERMITTED.
13
CD 2017-CD4 Mortgage Trust |
| STRUCTURE OVERVIEW |
reduction amounts to notionally reduce the Certificate Balance of the certificates) requesting a vote to terminate and replace the Asset Representations Reviewer with a proposed successor asset representations reviewer that is an eligible asset representations reviewer, and (ii) payment by such holders to the Certificate Administrator of the reasonable fees and expenses to be incurred by the Certificate Administrator in connection with administering such vote, the Certificate Administrator will promptly provide notice to all Certificateholders and the Asset Representations Reviewer of such request by posting such notice on its internet website, and by mailing such notice to all Certificateholders and the Asset Representations Reviewer. Upon the written direction of Certificateholders evidencing at least 75% of a Certificateholder Quorum, the Trustee will terminate all of the rights and obligations of the Asset Representations Reviewer under the PSA by written notice to the Asset Representations Reviewer, and the proposed successor Asset Representations Reviewer will be appointed. See “Pooling and Servicing Agreement—The Asset Representations Reviewer” in the Preliminary Prospectus.
| |||||
| Dispute Resolution Provisions: | Each Mortgage Loan Seller will be subject to the dispute resolution provisions set forth in the PSA to the extent those provisions are triggered with respect to any Mortgage Loan sold to the depositor by such Mortgage Loan Seller and such Mortgage Loan Seller will be obligated under the related mortgage loan purchase agreement to comply with all applicable provisions and to take part in any mediation or arbitration proceedings that may result.
Generally, in the event that a repurchase request as described in the Preliminary Prospectus is not “Resolved” within 180 days after the related Mortgage Loan Seller receives such Repurchase Request, then the enforcing servicer will be required to send a notice to the initial requesting certificateholder (if any) indicating the enforcing servicer’s intended course of action with respect to the Repurchase Request. If (a) the enforcing servicer’s intended course of action with respect to the Repurchase Request does not involve pursuing further action to exercise rights against the related Mortgage Loan Seller with respect to the Repurchase Request and the initial requesting certificateholder, if any, or any other Certificateholder or Certificate Owner wishes to exercise its right to refer the matter to mediation (including nonbinding arbitration) or arbitration, or (b) the enforcing servicer’s intended course of action is to pursue further action to exercise rights against the related Mortgage Loan Seller with respect to the Repurchase Request but the initial requesting certificateholder, if any, or any other Certificateholder or Certificate Owner does not agree with the dispute resolution method selected by the enforcing servicer, then the initial requesting certificateholder, if any, or such other Certificateholder or Certificate Owner may deliver a written notice to the enforcing servicer indicating its intent to exercise its right to refer the matter to either mediation or arbitration.
“Resolved” means, with respect to a Repurchase Request, (i) that the related material defect has been cured, (ii) the related Mortgage Loan has been repurchased in accordance with the related mortgage loan purchase agreement, (iii) a mortgage loan has been substituted for the related Mortgage Loan in accordance with the related mortgage loan purchase agreement, (iv) the applicable Mortgage Loan Seller made the loss of value payment, (v) a contractually binding agreement is entered into between the enforcing servicer, on behalf of the issuing entity, and the related Mortgage Loan Seller that settles the related Mortgage Loan Seller’s obligations under the related mortgage loan purchase agreement, or (vi) the related Mortgage Loan is no longer property of the issuing entity as a result of a sale or other disposition in accordance with the PSA. See “Pooling and Servicing Agreement—Dispute Resolution Provisions” in the Preliminary Prospectus. | ||||
| Liquidated Loan Waterfall: | On liquidation of any Mortgage Loan, all net liquidation proceeds will be applied according to the PSA, so that amounts allocated as a recovery of accrued and unpaid interest will not, in the first instance, include (a) any amount by which the interest portion of P&I Advances previously made was reduced as a result of appraisal reduction amounts and (b) Accrued AB Loan Interest. After the adjusted interest amount is so allocated, any remaining net liquidation proceeds will be allocated to pay principal on the Mortgage Loan until the unpaid principal amount of the Mortgage Loan has been reduced to zero. Any remaining liquidation proceeds would then be allocated as a recovery of (a) accrued and unpaid interest corresponding to the amount by which the interest portion of P&I Advances previously made was reduced as a result of appraisal reduction amounts and (b) any Accrued AB Loan Interest. |
THE INFORMATION IN THIS STRUCTURAL AND COLLATERAL TERM SHEET IS NOT COMPLETE AND MAY BE AMENDED PRIOR TO THE TIME OF SALE. THIS TERM SHEET IS NOT AN OFFER TO SELL THESE SECURITIES AND IT IS NOT A SOLICITATION OF AN OFFER TO BUY THESE SECURITIES IN ANY JURISDICTION WHERE THE OFFER OR SALE IS NOT PERMITTED.
14
CD 2017-CD4 Mortgage Trust
|
| OVERVIEW OF MORTGAGE POOL CHARACTERISTICS |
Distribution of Cut-off Date Balances(1) |
| Range of Cut-off Date Balances | Number of Mortgage Loans | Aggregate Cut-off Date Balance | % of Initial Pool | Weighted Averages | ||||||
| Mortgage Rate | Stated Remaining Term (Mos.) | U/W NCF DSCR(2) | Cut-off Date LTV Ratio(3)(4) | Maturity Date or ARD LTV(3) | ||||||
| $3,185,000 | - | $7,499,999 | 13 | $67,951,807 | 7.5% | 4.8299% | 119 | 1.76x | 63.6% | 56.6% |
| $7,500,000 | - | $14,999,999 | 15 | $164,720,033 | 18.3% | 4.7249% | 119 | 1.76x | 62.4% | 53.5% |
| $15,000,000 | - | $24,999,999 | 12 | $237,625,125 | 26.4% | 4.7638% | 117 | 1.71x | 62.0% | 55.4% |
| $25,000,000 | - | $49,999,999 | 2 | $79,803,347 | 8.9% | 4.9512% | 117 | 1.57x | 55.6% | 45.5% |
| $50,000,000 | - | $74,999,999 | 3 | $180,350,000 | 20.0% | 4.5501% | 117 | 2.74x | 50.4% | 45.5% |
| $75,000,000 | - | $95,000,000 | 2 | $170,000,000 | 18.9% | 4.3890% | 84 | 1.92x | 50.1% | 48.0% |
| Total/Weighted Average | 47 | $900,450,312 | 100.0% | 4.6647% | 111 | 1.95x | 57.1% | 50.9% | ||
Distribution of Mortgage Rates(1) |
| Range of Mortgage Rates | Number of Mortgage Loans | Aggregate Cut-off Date Balance | % of Initial Outstanding Pool Balance | Weighted Averages | ||||||
| Mortgage Rate | Stated Remaining Term (Mos.) | U/W NCF DSCR(2) | Cut-off Date LTV Ratio(3)(4) | Maturity Date or ARD LTV(3) | ||||||
| 4.1995% | - | 4.4999% | 10 | $247,084,147 | 27.4% | 4.2815% | 95 | 2.72x | 43.8% | 42.8% |
| 4.5000% | - | 4.7499% | 13 | $382,532,052 | 42.5% | 4.6603% | 117 | 1.69x | 59.6% | 53.0% |
| 4.7500% | - | 5.5000% | 24 | $270,834,112 | 30.1% | 5.0205% | 118 | 1.62x | 65.5% | 55.3% |
| Total/Weighted Average | 47 | $900,450,312 | 100.0% | 4.6647% | 111 | 1.95x | 57.1% | 50.9% | ||
Property Type Distribution(1)(5) |
| Property Type | Number of Mortgaged Properties | Aggregate Cut-off Date Balance | % of Initial Outstanding Pool Balance | Number of Rooms/Units/NRA | Weighted Averages | ||||||
Cut-off Date Room/Unit/NRA | Mortgage Rate | Stated Term | Occupancy | U/W NCF DSCR(2) | Cut-off Ratio(3)(4) | Maturity Date or ARD LTV(3) | |||||
| Office | 13 | $374,941,763 | 41.6% | 2,499,123 | $357 | 4.5105% | 103 | 97.7% | 1.85x | 56.2% | 52.4% |
| CBD | 5 | $225,000,000 | 25.0% | 1,113,354 | $444 | 4.4372% | 92 | 99.0% | 1.85x | 51.6% | 49.6% |
| Suburban | 7 | $138,741,763 | 15.4% | 1,330,551 | $230 | 4.6358% | 119 | 95.5% | 1.75x | 64.2% | 57.4% |
| Medical | 1 | $11,200,000 | 1.2% | 55,218 | $203 | 4.4300% | 120 | 100.0% | 2.85x | 48.5% | 48.5% |
| Hospitality | 8 | $186,876,869 | 20.8% | 4,400 | $134,570 | 4.6845% | 116 | 81.0% | 2.84x | 49.1% | 43.7% |
| Full Service | 8 | $186,876,869 | 20.8% | 4,400 | $134,570 | 4.6845% | 116 | 81.0% | 2.84x | 49.1% | 43.7% |
| Retail | 14 | $139,104,578 | 15.4% | 1,094,823 | $229 | 4.8233% | 116 | 95.9% | 1.50x | 67.4% | 56.9% |
| Anchored(6) | 10 | $115,458,744 | 12.8% | 934,642 | $244 | 4.8143% | 116 | 96.3% | 1.49x | 66.4% | 56.4% |
| Unanchored | 4 | $23,645,834 | 2.6% | 160,181 | $156 | 4.8675% | 119 | 94.1% | 1.56x | 71.9% | 58.9% |
| Self Storage | 12 | $116,881,364 | 13.0% | 1,000,936 | $208 | 4.6870% | 118 | 82.7% | 1.70x | 54.1% | 46.5% |
| Art Storage | 2 | $64,784,716 | 7.2% | 380,130 | $275 | 4.7547% | 117 | 77.1% | 1.64x | 50.0% | 40.9% |
| Self Storage | 10 | $52,096,647 | 5.8% | 620,806 | $125 | 4.6029% | 119 | 89.8% | 1.78x | 59.2% | 53.4% |
| Industrial | 3 | $33,850,000 | 3.8% | 822,533 | $42 | 4.7586% | 119 | 100.0% | 1.62x | 66.2% | 59.5% |
| Mixed Use | 1 | $30,000,000 | 3.3% | 2,389,441 | $92 | 5.3100% | 117 | 92.9% | 1.59x | 60.8% | 49.6% |
| Office/Hospitality | 1 | $30,000,000 | 3.3% | 2,389,441 | $92 | 5.3100% | 117 | 92.9% | 1.59x | 60.8% | 49.6% |
| Multifamily | 2 | $18,795,738 | 2.1% | 282 | $66,676 | 5.0326% | 118 | 97.2% | 1.38x | 73.4% | 60.5% |
| Garden | 1 | $10,487,149 | 1.2% | 160 | $65,545 | 4.9000% | 119 | 98.8% | 1.36x | 72.3% | 59.3% |
| Mid-Rise | 1 | $8,308,589 | 0.9% | 122 | $68,103 | 5.2000% | 116 | 95.1% | 1.41x | 74.7% | 62.0% |
| 53 | $900,450,312 | 100.0% | 4.6647% | 111 | 92.0% | 1.95x | 57.1% | 50.9% | |||
Geographic Distribution(1)(5) |
| State/Location | Number of Properties | Aggregate Cut-off Date Balance | % of Initial Outstanding Pool Balance | Weighted Averages | ||||
| Mortgage Rate | Stated Remaining Term (Mos.) | U/W NCF DSCR(2) | Cut-off Date LTV Ratio(3)(4) | Maturity Date or ARD LTV(3) | ||||
| New York | 8 | $242,992,389 | 27.0% | 4.5280% | 95 | 1.94x | 49.6% | 46.1% |
| New York City | 5 | $200,803,347 | 22.3% | 4.4612% | 90 | 1.98x | 47.7% | 45.4% |
| New York State | 3 | $42,189,042 | 4.7% | 4.8459% | 119 | 1.74x | 58.4% | 49.6% |
| California | 8 | $217,434,147 | 24.1% | 4.5586% | 118 | 1.64x | 60.9% | 55.3% |
| Southern(7) | 7 | $142,434,147 | 15.8% | 4.5633% | 119 | 1.78x | 61.6% | 55.5% |
| Northern(7) | 1 | $75,000,000 | 8.3% | 4.5498% | 116 | 1.38x | 59.5% | 54.8% |
| Ohio | 4 | $80,478,871 | 8.9% | 4.9720% | 117 | 1.91x | 56.7% | 48.3% |
| Hawaii | 2 | $74,655,000 | 8.3% | 4.3119% | 111 | 3.71x | 39.8% | 37.8% |
| Florida | 8 | $46,326,160 | 5.1% | 4.7788% | 119 | 1.44x | 70.7% | 60.3% |
| Other | 23 | $238,563,744 | 26.5% | 4.8852% | 118 | 1.82x | 64.0% | 54.9% |
| Total/Weighted Average | 53 | $900,450,312 | 100.0% | 4.6647% | 111 | 1.95x | 57.1% | 50.9% |
THE INFORMATION IN THIS STRUCTURAL AND COLLATERAL TERM SHEET IS NOT COMPLETE AND MAY BE AMENDED PRIOR TO THE TIME OF SALE. THIS TERM SHEET IS NOT AN OFFER TO SELL THESE SECURITIES AND IT IS NOT A SOLICITATION OF AN OFFER TO BUY THESE SECURITIES IN ANY JURISDICTION WHERE THE OFFER OR SALE IS NOT PERMITTED.
15
CD 2017-CD4 Mortgage Trust
|
| OVERVIEW OF MORTGAGE POOL CHARACTERISTICS |
Distribution of Cut-off Date LTV Ratios(1)(3)(4) |
| Range of Cut-off Date LTV Ratios | Number of Mortgage Loans | Aggregate Cut-off Date Balance | % of Initial Outstanding Pool Balance | Weighted Averages | ||||||
| Mortgage Rate | Stated Remaining Term (Mos.) | U/W NCF DSCR(2) | Cut-off Date LTV Ratio | Maturity Date or ARD LTV | ||||||
| 31.2% | - | 54.9% | 13 | $392,151,864 | 43.6% | 4.4608% | 103 | 2.40x | 46.1% | 43.1% |
| 55.0% | - | 59.9% | 4 | $123,894,196 | 13.8% | 4.7398% | 117 | 1.70x | 59.3% | 53.4% |
| 60.0% | - | 64.9% | 6 | $70,573,450 | 7.8% | 5.0341% | 118 | 1.71x | 62.0% | 54.5% |
| 65.0% | - | 69.9% | 13 | $205,962,980 | 22.9% | 4.7645% | 117 | 1.56x | 66.7% | 57.9% |
| 70.0% | - | 74.9% | 10 | $100,367,822 | 11.1% | 4.9169% | 118 | 1.53x | 72.5% | 60.5% |
| 75.0% | - | 75.0% | 1 | $7,500,000 | 0.8% | 4.4900% | 120 | 1.50x | 75.0% | 60.6% |
| Total/Weighted Average | 47 | $900,450,312 | 100.0% | 4.6647% | 111 | 1.95x | 57.1% | 50.9% | ||
Distribution of Maturity Date or ARD LTV Ratios(1)(3) |
| Range of Maturity Date or ARD LTV Ratios | Number of Mortgage Loans | Aggregate Cut-off Date Balance | % of Initial Outstanding Pool Balance | Weighted Averages | ||||||
| Mortgage Rate | Stated Remaining Term (Mos.) | U/W NCF DSCR(2) | Cut-off Date LTV Ratio | Maturity Date or ARD LTV | ||||||
| 31.2% | - | 49.9% | 12 | $374,651,864 | 41.6% | 4.5110% | 102 | 2.43x | 46.3% | 42.3% |
| 50.0% | - | 54.9% | 9 | $207,856,017 | 23.1% | 4.7428% | 117 | 1.62x | 59.4% | 53.4% |
| 55.0% | - | 59.9% | 13 | $199,638,495 | 22.2% | 4.7962% | 117 | 1.68x | 67.2% | 58.2% |
| 60.0% | - | 64.0% | 13 | $118,303,936 | 13.1% | 4.7923% | 119 | 1.51x | 69.8% | 61.2% |
| Total/Weighted Average | 47 | $900,450,312 | 100.0% | 4.6647% | 111 | 1.95x | 57.1% | 50.9% | ||
Distribution of Underwritten NCF Debt Service Coverage Ratios(1) |
| Range of Underwritten NCF Debt Service Coverage Ratios | Number of Mortgage Loans | Aggregate Cut-off Date Balance | % of Initial Outstanding Pool Balance | Weighted Averages | ||||||
| Mortgage Rate | Stated Remaining Term (Mos.) | U/W NCF DSCR(2) | Cut-off Date LTV Ratio(3)(4) | Maturity Date or ARD LTV(3) | ||||||
| 1.23x | - | 1.39x | 9 | $177,238,751 | 19.7% | 4.7306% | 116 | 1.35x | 64.2% | 57.2% |
| 1.40x | - | 1.44x | 5 | $30,429,222 | 3.4% | 5.0422% | 118 | 1.42x | 70.0% | 59.5% |
| 1.45x | - | 1.54x | 3 | $23,544,741 | 2.6% | 4.6589% | 119 | 1.47x | 69.0% | 56.1% |
| 1.55x | - | 1.99x | 19 | $364,632,599 | 40.5% | 4.8041% | 118 | 1.70x | 61.1% | 52.7% |
| 2.00x | - | 2.49x | 8 | $231,780,000 | 25.7% | 4.4776% | 94 | 2.27x | 49.3% | 46.5% |
| 2.50x | - | 2.87x | 2 | $16,200,000 | 1.8% | 4.4084% | 120 | 2.83x | 47.9% | 47.9% |
| 2.88x | - | 4.47x | 1 | $56,625,000 | 6.3% | 4.1995% | 114 | 4.47x | 31.2% | 31.2% |
| Total/Weighted Average | 47 | $900,450,312 | 100.0% | 4.6647% | 111 | 1.95x | 57.1% | 50.9% | ||
Original Terms to Maturity or ARD(1) |
| Original Terms to Maturity or ARD | Number of Mortgage Loans | Aggregate Cut-off Date Balance | % of Initial Outstanding Pool Balance | Weighted Averages | ||||||
| Mortgage Rate | Stated Remaining Term (Mos.) | U/W NCF DSCR(2) | Cut-off Date LTV Ratio(3)(4) | Maturity Date or ARD LTV(3) | ||||||
| 60 | 1 | $95,000,000 | 10.6% | 4.2620% | 59 | 2.34x | 42.6% | 42.6% | ||
| 120 | 46 | $805,450,312 | 89.4% | 4.7122% | 117 | 1.91x | 58.8% | 51.9% | ||
| Total/Weighted Average | 47 | $900,450,312 | 100.0% | 4.6647% | 111 | 1.95x | 57.1% | 50.9% | ||
Distribution of Remaining Terms to Maturity or ARD(1) |
| Range of Remaining Terms to Maturity or ARD | Number of Mortgage Loans | Aggregate Cut-off Date Balance | % of Initial Outstanding Pool Balance | Weighted Averages | ||||||
| Mortgage Rate | Stated Remaining Term (Mos.) | U/W NCF DSCR(2) | Cut-off Date LTV Ratio(3)(4) | Maturity Date or ARD LTV(3) | ||||||
| 59 | - | 59 | 1 | $95,000,000 | 10.6% | 4.2620% | 59 | 2.34x | 42.6% | 42.6% |
| 103 | - | 117 | 12 | $403,512,062 | 44.8% | 4.7546% | 116 | 2.06x | 54.9% | 48.5% |
| 118 | - | 120 | 34 | $401,938,251 | 44.6% | 4.6696% | 119 | 1.76x | 62.6% | 55.3% |
| Total/Weighted Average | 47 | $900,450,312 | 100.0% | 4.6647% | 111 | 1.95x | 57.1% | 50.9% | ||
THE INFORMATION IN THIS STRUCTURAL AND COLLATERAL TERM SHEET IS NOT COMPLETE AND MAY BE AMENDED PRIOR TO THE TIME OF SALE. THIS TERM SHEET IS NOT AN OFFER TO SELL THESE SECURITIES AND IT IS NOT A SOLICITATION OF AN OFFER TO BUY THESE SECURITIES IN ANY JURISDICTION WHERE THE OFFER OR SALE IS NOT PERMITTED.
16
CD 2017-CD4 Mortgage Trust
|
| OVERVIEW OF MORTGAGE POOL CHARACTERISTICS |
Distribution of Underwritten NOI Debt Yields(1)(4) |
| Range of Underwritten NOI Debt Yields | Number of Mortgage Loans | Aggregate Cut-off Date Balance | % of Initial Outstanding Pool Balance | Weighted Averages | ||||||
| Mortgage Rate | Stated Remaining Term (Mos.) | U/W NCF DSCR(2) | Cut-off Date LTV Ratio(3) | Maturity Date or ARD LTV(3) | ||||||
| 8.1% | - | 8.9% | 9 | $194,824,437 | 21.6% | 4.6591% | 116 | 1.43x | 61.1% | 56.5% |
| 9.0% | - | 9.9% | 9 | $128,088,425 | 14.2% | 4.7328% | 118 | 1.60x | 58.0% | 49.7% |
| 10.0% | - | 12.4% | 18 | $321,067,280 | 35.7% | 4.5859% | 101 | 1.89x | 58.5% | 52.0% |
| 12.5% | - | 14.9% | 6 | $79,450,974 | 8.8% | 4.8561% | 118 | 1.94x | 60.2% | 52.1% |
| 15.0% | - | 21.2% | 5 | $177,019,196 | 19.7% | 4.6786% | 116 | 2.91x | 47.9% | 43.0% |
| Total/Weighted Average | 47 | $900,450,312 | 100.0% | 4.6647% | 111 | 1.95x | 57.1% | 50.9% | ||
Amortization Types(1) |
| Amortization Type | Number of Mortgage Loans | Aggregate Cut-off Date Balance | % of Initial Outstanding Pool Balance | Weighted Averages | ||||
| Mortgage Rate | Stated Remaining Term (Mos.) | U/W NCF DSCR(2) | Cut-off Date LTV Ratio(3)(4) | Maturity Date or ARD LTV(3) | ||||
| Interest Only, then Amortizing | 17 | $383,185,500 | 42.6% | 4.7457% | 117 | 1.69x | 61.7% | 54.7% |
| Interest Only | 10 | $255,605,000 | 28.4% | 4.3294% | 95 | 2.70x | 43.8% | 43.8% |
| Amortizing Balloon | 19 | $244,309,812 | 27.1% | 4.8717% | 118 | 1.62x | 62.9% | 51.6% |
| Interest Only, then Amortizing, ARD | 1 | $17,350,000 | 1.9% | 4.9000% | 119 | 1.62x | 66.3% | 58.6% |
| Total/Weighted Average | 47 | $900,450,312 | 100.0% | 4.6647% | 111 | 1.95x | 57.1% | 50.9% |
Footnotes:
| (1) | With respect to the 95 Morton Street Mortgage Loan, Moffett Place Google Mortgage Loan, Hilton Hawaiian Village Mortgage Loan, Uovo Art Storage Mortgage Loan, 111 Livingston Street Mortgage Loan, Key Center Cleveland Mortgage Loan, Hamilton Crossing Mortgage Loan, the LTV, DSCR and Debt Yield calculations include any relatedpari passu companion loan(s) and exclude any related subordinate companion loan(s) and/or mezzanine loan(s). |
| (2) | With respect to the Moffett Place Google Mortgage Loan, the U/W NCF DSCR is calculated based on the on the aggregate debt service of the 12-month period commencing February 2022 of the respective mortgage loan and the relatedpari passu companion loans as set forth in the respective non-standard amortization schedule set forth in Annex F to the Preliminary Prospectus. |
| (3) | With respect to the 95 Morton Street Mortgage Loan, the Moffett Place Google Mortgage Loan, Los Angeles Corporate Center Mortgage Loan and the Malibu Office Mortgage Loan, in aggregate, representing approximately 26.7% of the Initial Outstanding Pool Balance, the Cut-off Date LTV and Maturity Date or ARD LTV has been calculated based on the “As Stabilized” appraised value. With respect to the Midwest Embassy Suites Portfolio Mortgage Loan and the Key Center Cleveland Mortgage Loan, in aggregate, representing approximately 10.6% of the Initial Outstanding Pool Balance, the Cut-off Date LTV and Maturity Date or ARD LTV has been calculated based on the “As Complete” appraised value. For additional information please see the “Description of the Mortgage Pool — Appraised Value” in the Preliminary Prospectus. |
| (4) | With respect to the Amsdell Gateway Self Storage Mortgage Loan representing approximately 0.5% of the Initial Outstanding Pool Balance, the Cut-off Date LTV and U/W NOI Debt Yield are calculated based on the Cut-off Balance net of a related holdback reserve. |
| (5) | Reflects allocated loan amount for properties securing multi-property Mortgage Loans. |
| (6) | Anchored retail also includes single tenant properties. |
| (7) | Northern California properties have a zip code greater than 93600. Southern California properties have a zip code less than or equal to 93600. |
THE INFORMATION IN THIS STRUCTURAL AND COLLATERAL TERM SHEET IS NOT COMPLETE AND MAY BE AMENDED PRIOR TO THE TIME OF SALE. THIS TERM SHEET IS NOT AN OFFER TO SELL THESE SECURITIES AND IT IS NOT A SOLICITATION OF AN OFFER TO BUY THESE SECURITIES IN ANY JURISDICTION WHERE THE OFFER OR SALE IS NOT PERMITTED.
17
CD 2017-CD4 Mortgage Trust
|
| OVERVIEW OF MORTGAGE POOL CHARACTERISTICS |
| Ten Largest Mortgage Loans(1) |
Mortgage Loan | Mortgage Loan | City, State | Property Type | Cut-off Date Balance | % of Initial Outstanding Pool Balance | Cut-off Date NRA(1) | Cut-off Date Ratio(1) | U/W NCF DSCR | U/W NOI Debt Yield(1) |
| 95 Morton Street(2) | CREFI | New York, NY | Office | $95,000,000 | 10.6% | 217,084 | 42.6% | 2.34x | 10.7% |
| Moffett Place Google(2)(3) | GACC | Sunnyvale, CA | Office | $75,000,000 | 8.3% | 314,352 | 59.5% | 1.38x | 8.3% |
| Midwest Embassy Suites Portfolio(2) | GACC | Various | Hospitality | $65,000,000 | 7.2% | 782 | 52.1% | 2.17x | 15.9% |
| Los Angeles Corporate Center(2) | CREFI | Monterey Park, CA | Office | $58,725,000 | 6.5% | 394,893 | 66.9% | 1.69x | 11.8% |
| Hilton Hawaiian Village | GACC | Honolulu, HI | Hospitality | $56,625,000 | 6.3% | 2,860 | 31.2% | 4.47x | 21.2% |
| Uovo Art Storage | GACC | Long Island City, NY | Self Storage | $49,803,347 | 5.5% | 275,000 | 52.5% | 1.55x | 9.8% |
| Key Center Cleveland | CREFI | Cleveland, OH | Mixed Use | $30,000,000 | 3.3% | 2,389,441 | 60.8% | 1.59x | 12.8% |
| 111 Livingston Street | GACC | Brooklyn, NY | Office | $24,000,000 | 2.7% | 434,000 | 54.8% | 1.56x | 8.1% |
| Marriott Spartanburg | GACC | Spartanburg, SC | Hospitality | $23,894,196 | 2.7% | 247 | 59.6% | 1.94x | 16.3% |
| 260 W 36th Street | GACC | New York, NY | Office | $23,500,000 | 2.6% | 85,145 | 52.2% | 1.82x | 8.7% |
| Total/Weighted Average | $501,547,544 | 55.7% | 51.8% | 2.13x | 12.4% |
| (1) | With respect to the 95 Morton Street Mortgage Loan, Moffett Place Google Mortgage Loan, Hilton Hawaiian Village Mortgage Loan, Uovo Art Storage Mortgage Loan, Key Center Cleveland Mortgage Loan, 111 Livingston Street Mortgage Loan, the balance per Room/NRA, LTV, DSCR and Debt Yield calculations include any relatedpari passu companion loan(s) and exclude any related subordinate companion loan(s) and/or mezzanine loan(s). |
| (2) | With respect to the 95 Morton Street Mortgage Loan, the Moffett Place Google Mortgage Loan and the Los Angeles Corporate Center Mortgage Loan, the Cut-off Date LTV Ratio has been calculated based on the “As Stabilized” appraised value. With respect to the Midwest Embassy Suites Portfolio Mortgage Loan and the Key Center Cleveland Mortgage Loan, the Cut-off Date LTV Ratio has been calculated based on the “As Complete” appraised value. For additional information please see the “Description of the Mortgage Pool — Appraised Value” in the Preliminary Prospectus. |
| (3) | With respect to the Moffett Place Google Mortgage Loan, the U/W NCF DSCR after IO is calculated based on the aggregate debt service of the 12-month period commencing February 2022 of the respective mortgage loan and the relatedpari passu companion loans as set forth in the respective non-standard amortization schedule set forth in Annex F to the Preliminary Prospectus. |
| Existing Mezzanine Debt Summary |
| Mortgage Loan | Mortgage Loan Cut-off Date | Mezzanine Debt Cut-off Date Balance | Trust U/W NCF DSCR | Total Debt U/W NCF DSCR(1) | Trust Cut-off Date LTV Ratio | Total Debt Cut-off Date LTV Ratio(1) | Trust U/W NOI Debt Yield | Total Debt U/W NOI Debt Yield(1) | |
| 95 Morton Street(2)(3) | $95,000,000 | $77,000,000 | 2.34x | 1.10x | 42.6% | 77.1% | 10.7% | 5.9% | |
| Moffett Place Google(3)(4) | $75,000,000 | $40,000,000 | 1.38x | 1.07x | 59.5% | 72.3% | 8.3% | 6.9% | |
| Key Center Cleveland | $30,000,000 | $42,500,000 | 1.59x | 1.17x | 60.8% | 72.5% | 12.8% | 10.7% | |
| (1) | Total Debt U/W NCF DSCR, Total Debt Cut-off Date LTV Ratio and Total Debt U/W NOI Debt Yield calculations include any relatedpari passu companion loan(s), related subordinate companion loan(s) and/or related mezzanine loan(s). |
| (2) | The related mezzanine loans consist of a $52.0 million mezzanine A loan and a $25.0 million mezzanine B loan, which (x) with respect to the mezzanine A loan, was originated by Citigroup Global Markets Realty Corp. and is secured by the mezzanine A borrower’s interest in the related mortgage borrower and (y) with respect to the mezzanine B loan, was originated by 95 Morton Mezz Funding LLC and is secured by the mezzanine B borrower’s interest in the related mezzanine A borrower. |
| (3) | With respect to the 95 Morton Street Mortgage Loan and the Moffett Place Google Mortgage Loan, the Cut-off Date LTV Ratio has been calculated based on the “As Stabilized” appraised value. For additional information please see the “Description of the Mortgage Pool — Appraised Value” in the Preliminary Prospectus. |
| (4) | With respect to the Moffett Place Google Mortgage Loan, the Total Debt U/W NCF DSCR is calculated based on the aggregate debt service of the 12-month period commencing February 2022 of the respective mortgage loan and the relatedpari passu companion loans as set forth in the respective non-standard amortization schedule set forth in Annex F to the Preliminary Prospectus. |
| Subordinate Debt Summary |
| Mortgage Loan | Mortgage Cut-off Date Balance | Pari Passu | Subordinate Debt Cut-off Date Balance | Trust U/W NCF DSCR | Total Debt U/W NCF DSCR | Trust Cut-off Date LTV Ratio | Total Debt Cut-off Date LTV Ratio | Trust U/W NOI Debt Yield | Total Debt U/W NOI Debt Yield | |
| Hilton Hawaiian Village | $56,625,000 | $639,975,000 | $578,400,000 | 4.47x | 2.44x | 31.2% | 57.2% | 21.2% | 11.6% | |
THE INFORMATION IN THIS STRUCTURAL AND COLLATERAL TERM SHEET IS NOT COMPLETE AND MAY BE AMENDED PRIOR TO THE TIME OF SALE. THIS TERM SHEET IS NOT AN OFFER TO SELL THESE SECURITIES AND IT IS NOT A SOLICITATION OF AN OFFER TO BUY THESE SECURITIES IN ANY JURISDICTION WHERE THE OFFER OR SALE IS NOT PERMITTED.
18
CD 2017-CD4 Mortgage Trust
|
| OVERVIEW OF MORTGAGE POOL CHARACTERISTICS |
| Pari Passu Companion Loan Summary |
| Mortgage Loan | Note(s) | Original Balance | Holder of Note | Lead Servicer for Whole Loan (Y/N) | Master Servicer Under Lead Securitization | Special Servicer Under Lead Securitization |
| Moffett Place Google | Notes A-1, A-3 | $70,000,000 | CD 2017-CD3 | Yes | Midland Loan Services, a Division of PNC Bank National Association | Midland Loan Services, a Division of PNC Bank National Association |
| Note A-2 | $40,000,000 | DBNY | No | |||
| Notes A-4, A-5, A-6 | $75,000,000 | CD 2017-CD4 | No | |||
| Hilton Hawaiian Village(1) | Notes A-1-A, A-1-B, A-1-C, A-1-D, A-1-E, B-1, B-2, B-3, B-4 and B-5 | $171,600,000 | Hilton USA Trust 2016-HHV | Yes | Wells Fargo Bank, National Association | AEGON USA Realty Advisors, LLC |
| Note A-2-A-1 | $94,000,000 | JPMCC 2016-JP4 | No | |||
| Note A-2-B-3 | $56,625,000 | CFCRE 2016-C7 | No | |||
| Notes A-2-E-1, A-2-E-2 | $52,500,000 | WFCM 2016-C37 | No | |||
| Notes A-2-D-1, A-2-D-2 | $63,000,000 | MSBAM 2016-C32 | No | |||
| Note A-2-B-1 | $60,000,000 | CD 2017-CD3 | No | |||
| Note A-2-A-2 | $80,000,000 | JPMCC 2017-JP5 | No | |||
| Note A-2-B-2 | $56,625,000 | CD 2017-CD4 | No | |||
| Notes A-2-A-3, A-2-A-4 | $62,250,000 | JPMDB 2017-C5 | No | |||
| Uovo Art Storage | Notes A-1, A-4 | $50,000,000 | CD 2017-CD4 | Yes | Midland Loan Services, a Division of PNC Bank National Association | Rialto Capital Advisors, LLC |
| Notes A-2, A-3 | $37,000,000 | JPMDB 2017-C5 | No | |||
| Key Center Cleveland | Note A-1 | $50,000,000 | CGCMT 2017-P7 | Yes | Wells Fargo Bank, National Association | Rialto Capital Advisors, LLC |
| Note A-4 | $30,000,000 | CD 2017-CD4 | No | |||
| Note A-3, A-6 | $60,000,000 | JPMDB 2017-C5 | No | |||
| Note A-2 | $40,000,000 | BANK 2017-BNK4 | No | |||
| Note A-5 | $40,000,000 | BANA | No | |||
| 111 Livingston Street | Notes A-1, A-3 | $67,000,000 | CD 2017-CD3 | Yes | Midland Loan Services, a Division of PNC Bank National Association | Midland Loan Services, a Division of PNC Bank National Association |
| Note A-2 | $29,000,000 | CGCMT 2017-P7 | No | |||
| Note A-4 | $24,000,000 | CD 2017-CD4 | No | |||
| Hamilton Crossing | Note A-1 | $35,125,000 | CGCMT 2017-P7 | Yes | Wells Fargo Bank, National Association | Rialto Capital Advisors, LLC |
| Note A-2 | $20,000,000 | CD 2017-CD4 | No |
| (1) | With respect to the Hilton Hawaiian Village Mortgage Loan, Notes B-1, B-2, B-3, B-4 and B-5 are related subordinate companion loans. |
THE INFORMATION IN THIS STRUCTURAL AND COLLATERAL TERM SHEET IS NOT COMPLETE AND MAY BE AMENDED PRIOR TO THE TIME OF SALE. THIS TERM SHEET IS NOT AN OFFER TO SELL THESE SECURITIES AND IT IS NOT A SOLICITATION OF AN OFFER TO BUY THESE SECURITIES IN ANY JURISDICTION WHERE THE OFFER OR SALE IS NOT PERMITTED.
19
95 Morton Street New York, NY 10014 | Collateral Asset Summary – Loan No. 1 95 Morton Street | Cut-off Date Balance: Cut-off Date LTV: U/W NCF DSCR: U/W NOI Debt Yield: | $95,000,000 42.6% 2.34x 10.7% |
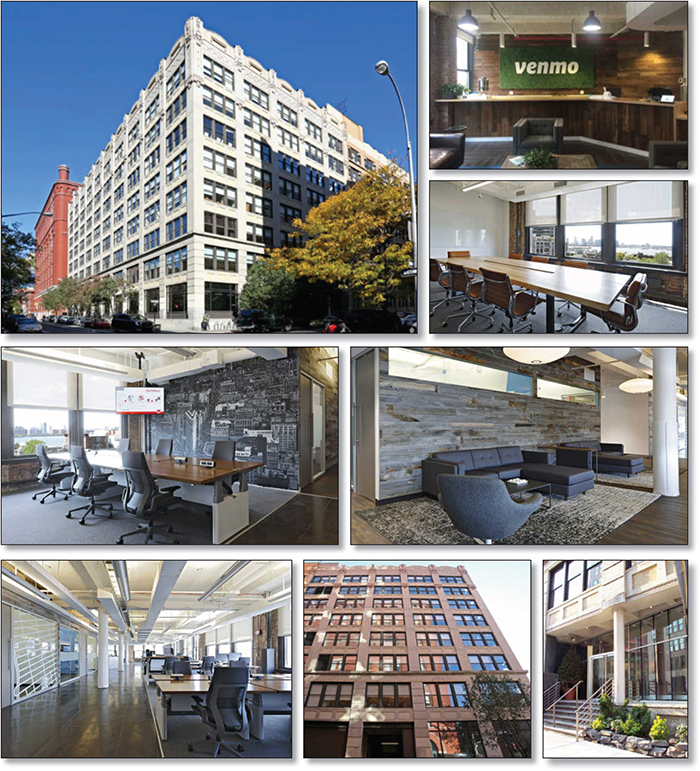
THE INFORMATION IN THIS STRUCTURAL AND COLLATERAL TERM SHEET IS NOT COMPLETE AND MAY BE AMENDED PRIOR TO THE TIME OF SALE. THIS TERM SHEET IS NOT AN OFFER TO SELL THESE SECURITIES AND IT IS NOT A SOLICITATION OF AN OFFER TO BUY THESE SECURITIES IN ANY JURISDICTION WHERE THE OFFER OR SALE IS NOT PERMITTED.
20
95 Morton Street New York, NY 10014 | Collateral Asset Summary – Loan No. 1 95 Morton Street | Cut-off Date Balance: Cut-off Date LTV: U/W NCF DSCR: U/W NOI Debt Yield: | $95,000,000 42.6% 2.34x 10.7% |
| Mortgage Loan Information | |
| Loan Seller: | CREFI |
| Loan Purpose: | Acquisition |
Credit Assessment (DBRS)(1) | BBB(low) |
| Sponsors: | Aby Rosen; Michael Fuchs |
| Borrower: | 95 Morton LLC |
| Original Balance: | $95,000,000 |
| Cut-off Date Balance: | $95,000,000 |
| % by Initial UPB: | 10.6% |
| Interest Rate: | 4.2620% |
| Payment Date: | 6thof each month |
| First Payment Date: | May 6, 2017 |
| Maturity Date: | April 6, 2022 |
| Amortization: | Interest Only |
| Additional Debt(2): | $77,000,000 Mezzanine Debt |
| Call Protection: | L(25), D(31), O(4) |
| Lockbox / Cash Management: | Hard / In Place |
| Reserves(3) | ||
| Initial | Monthly | |
| Taxes: | $1,193,540 | $238,708 |
| Insurance: | $0 | Springing |
| Replacement: | $0 | $3,618 |
| Unfunded Obligations(4): | $12,175,629 | $0 |
| Financial Information | ||||
| Mortgage Loan(5) | Total Debt(6) | |||
| Cut-off Date Balance / Sq. Ft.: | $438 | $792 | ||
| Balloon Balance / Sq. Ft.: | $438 | $792 | ||
| Cut-off Date LTV(7): | 42.6% | 77.1% | ||
| Balloon LTV(7): | 42.6% | 77.1% | ||
| Underwritten NOI DSCR: | 2.47x | 1.16x | ||
| Underwritten NCF DSCR: | 2.34x | 1.10x | ||
| Underwritten NOI Debt Yield: | 10.7% | 5.9% | ||
| Underwritten NCF Debt Yield: | 10.1% | 5.6% | ||
| Underwritten NOI Debt Yield at Balloon: | 10.7% | 5.9% | ||
| Underwritten NCF Debt Yield at Balloon: | 10.1% | 5.6% | ||
| (1) | DBRS provided the above investment grade rating for the 95 Morton Street Loan in the context of its inclusion in the mortgage pool. |
| (2) | See “Current Mezzanine or Subordinate Indebtedness” herein. |
| (3) | See “Initial Reserves” and “Ongoing Reserves” herein. |
| (4) | Unfunded Obligations consist of $3,907,286 for free rent associated with the PayPal, Inc. (“PayPal”) lease and $8,268,343 for unfunded tenant improvement costs for PayPal, Integral Ad Science, Inc. (“Integral Ad Science”) and VSA Partners, Inc. (“VSA Partners”). |
| (5) | DSCR, LTV, Debt Yield and Balance / Sq. Ft. calculations are based on the 95 Morton Street Loan (as defined below), which has a principal balance as of the Cut-off Date of $95.0 million. |
| (6) | DSCR, LTV, Debt Yield and Balance / Sq. Ft. calculations are based on the 95 Morton Street Loan and two related mezzanine loans which have principal balances as of the Cut-off Date of $52.0 million and $25.0 million, respectively, resulting in total debt with an aggregate principal balance as of the Cut-off Date of $172.0 million (collectively, the “95 Morton Street Total Debt”). |
| Property Information | |
| Single Asset / Portfolio: | Single Asset |
| Property Type: | CBD Office |
| Collateral: | Fee Simple |
| Location: | New York, NY |
| Year Built / Renovated: | 1911 / 2000 |
| Total Sq. Ft.: | 217,084 |
| Property Management: | RFR Realty LLC; Brickman MGR LLC |
| Underwritten NOI(8): | $10,140,092 |
| Underwritten NCF: | $9,621,746 |
| Appraised Value(7): | $223,000,000 |
| Appraisal Date(7): | September 1, 2017 |
| Historical NOI | |
| Most Recent NOI(8): | $6,571,395 (December 31, 2016) |
| 2015 NOI: | $4,944,682 (December 31, 2015) |
| 2014 NOI: | $5,354,254 (December 31, 2014) |
| 2013 NOI(9): | NAV |
| 2012 NOI(9): | NAV |
| 2011 NOI(9): | NAV |
| Historical Occupancy | |
| Most Recent Occupancy(10): | 100.0% (February 15, 2017) |
| 2016 Occupancy: | 100.0% (December 31, 2016) |
| 2015 Occupancy: | 100.0% (December 31, 2015) |
| 2014 Occupancy: | 88.5% (December 31, 2014) |
| 2013 Occupancy: | 100.0% (December 31, 2013) |
| 2012 Occupancy: | 100.0% (December 31, 2012) |
| (7) | The Cut-off Date LTV and Balloon LTV are based on, and the Appraised Value reflects, the “As Stabilized” appraised value of $223.0 million as of September 1, 2017. The “As Stabilized” appraised value assumes that economic stabilization is achieved and outstanding leasing costs associated with recently signed leases are paid off. At loan origination, $12,175,629 was reserved for unfunded tenant obligations. Based on the “As-is” appraised value of $210.0 million as of February 22, 2017, the Cut-off Date LTV and Balloon LTV of the 95 Morton Street Loan are each 45.2% and the Cut-off Date LTV and Balloon LTV of the 95 Morton Street Total Debt are each 81.9%. |
| (8) | The increase in Underwritten NOI over Most Recent NOI is due to U/W Base Rent being higher than base rent for prior years primarily due to historical numbers being comprised of actual collections. U/W Base Rent is based on actual, in-place leases which assume all free rent periods have expired. All free rent was reserved by the lender at loan origination. Underwritten NOI also includes contractual rent steps of $264,184 for PayPal which represents the difference between PayPal’s current rents and the average rents over the term of the loan and $37,275 of rent steps for VSA Partners through May 1, 2017. |
| (9) | Historical Information for the 2013 NOI is not available as the 95 Morton Street Property (as defined below) was solely under the ownership of a previous sponsor unrelated to the borrower. |
| (10) | Most Recent Occupancy includes 25,158 sq. ft. which Venmo, Inc. (“Venmo”), a subsidiary of PayPal, currently occupies pursuant to a sublease from Fab.com, Inc. through January 15, 2018. PayPal has executed a lease to retain occupancy of the space commencing on January 16, 2018. |
THE INFORMATION IN THIS STRUCTURAL AND COLLATERAL TERM SHEET IS NOT COMPLETE AND MAY BE AMENDED PRIOR TO THE TIME OF SALE. THIS TERM SHEET IS NOT AN OFFER TO SELL THESE SECURITIES AND IT IS NOT A SOLICITATION OF AN OFFER TO BUY THESE SECURITIES IN ANY JURISDICTION WHERE THE OFFER OR SALE IS NOT PERMITTED.
21
95 Morton Street New York, NY 10014 | Collateral Asset Summary – Loan No. 1 95 Morton Street | Cut-off Date Balance: Cut-off Date LTV: U/W NCF DSCR: U/W NOI Debt Yield: | $95,000,000 42.6% 2.34x 10.7% |
| Tenant Summary(1) | |||||||
Tenant | Ratings | Net Rentable | % of Net | U/W Base | % of Total | Lease | |
| PayPal(4)(5) | BBB+/NR/BBB | 120,800 | 55.6% | $74.44 | 61.5% | 10/31/2027 | |
| Integral Ad Science(6) | NR/NR/NR | 50,264 | 23.2% | $69.29 | 23.8% | 3/31/2027 | |
| VSA Partners(7) | NR/NR/NR | 25,080 | 11.6% | $60.94 | 10.5% | 4/30/2026 | |
| Xerox | BBB-/Baa3/BBB- | 20,940 | 9.6% | $29.28 | 4.2% | 9/15/2020 | |
| Subtotal / Wtd. Avg. | 217,084 | 100.0% | $67.33 | 100.0% | |||
| Vacant | 0 | 0.0% | |||||
| Total / Wtd. Avg. | 217,084 | 100.0% | |||||
| (1) | Based on the underwritten rent roll dated February 15, 2017. All tenant spaces are subject to re-measurement when leases expire. |
| (2) | Certain ratings are those of the parent company whether or not the parent company guarantees the lease. |
| (3) | Includes $264,184 in contractual rent steps for PayPal which represents the difference between PayPal’s current rents and the average rents over the term of the loan and $37,275 in contractual rent steps for VSA Partners through May 1, 2017. |
| (4) | PayPal has one, five-year extension option at fair market value (subject to cumulative annual increases of 0.75%), provided that written notice is given to the borrower not less than nine months prior to the lease expiration date. |
| (5) | Includes 25,158 sq. ft. which Venmo, a subsidiary of PayPal, currently occupies pursuant to a sublease from Fab.com, Inc. through January 15, 2018. PayPal has executed a lease to retain occupancy of the space commencing on January 16, 2018. |
| (6) | Integral Ad Science has one, five-year extension option at fair market value, provided that written notice is given to the borrower not less than nine months and not more than 12 months prior to the lease expiration date. Integral Ad Science has a one-time right to terminate its lease effective January 31, 2021 by giving 12 months prior notice to the borrower and paying a termination fee equal to $2,915,021. |
| (7) | VSA Partners has one, five-year extension option with renewal rent equal to the greater of (i) the fixed rent in effect at the time of the lease expiration, subject to 2.5% annual escalation, or (ii) the fair market value of comparable space in the market at such time. |
| Lease Rollover Schedule(1)(2) | ||||||||
| Year | # of Leases Expiring | Total Expiring Sq. Ft. | % of Total Sq. Ft. Expiring | Cumulative Sq. Ft. Expiring | Cumulative % of Sq. Ft. Expiring | Annual U/W Base Rent PSF(3) | % U/W Base Rent Rolling(3) | Cumulative % of U/W Base Rent(3) |
| MTM | 0 | 0 | 0.0% | 0 | 0.0% | $0.00 | 0.0% | 0.0% |
| 2017 | 0 | 0 | 0.0% | 0 | 0.0% | $0.00 | 0.0% | 0.0% |
| 2018 | 0 | 0 | 0.0% | 0 | 0.0% | $0.00 | 0.0% | 0.0% |
| 2019 | 0 | 0 | 0.0% | 0 | 0.0% | $0.00 | 0.0% | 0.0% |
| 2020 | 1 | 20,940 | 9.6% | 20,940 | 9.6% | $29.28 | 4.2% | 4.2% |
| 2021 | 0 | 0 | 0.0% | 20,940 | 9.6% | $0.00 | 0.0% | 4.2% |
| 2022 | 0 | 0 | 0.0% | 20,940 | 9.6% | $0.00 | 0.0% | 4.2% |
| 2023 | 0 | 0 | 0.0% | 20,940 | 9.6% | $0.00 | 0.0% | 4.2% |
| 2024 | 0 | 0 | 0.0% | 20,940 | 9.6% | $0.00 | 0.0% | 4.2% |
| 2025 | 0 | 0 | 0.0% | 20,940 | 9.6% | $0.00 | 0.0% | 4.2% |
| 2026 | 1 | 25,080 | 11.6% | 46,020 | 21.2% | $60.94 | 10.5% | 14.7% |
| 2027 | 2 | 171,064 | 78.8% | 217,084 | 100.0% | $72.93 | 85.3% | 100.0% |
| Thereafter | 0 | 0 | 0.0% | 217,084 | 100.0% | $0.00 | 0.0% | 100.0% |
| Vacant | NAP | 0 | 0.0% | 217,084 | 100.0% | NAP | NAP | |
| Total / Wtd. Avg. | 4 | 217,084 | 100.0% | $67.33 | 100.0% | |||
| (1) | Based on the underwritten rent roll dated February 15, 2017. All tenant spaces are subject to re-measurement when leases expire. |
| (2) | Certain tenants have lease termination options that may become exercisable prior to the originally stated expiration date of the tenant lease that are not considered in the lease rollover schedule. |
| (3) | Includes $264,184 in contractual rent steps for PayPal which represents the difference between PayPal’s current rents and the average rents over the term of the loan and $37,275 in contractual rent steps for VSA Partners through May 1, 2017. |
THE INFORMATION IN THIS STRUCTURAL AND COLLATERAL TERM SHEET IS NOT COMPLETE AND MAY BE AMENDED PRIOR TO THE TIME OF SALE. THIS TERM SHEET IS NOT AN OFFER TO SELL THESE SECURITIES AND IT IS NOT A SOLICITATION OF AN OFFER TO BUY THESE SECURITIES IN ANY JURISDICTION WHERE THE OFFER OR SALE IS NOT PERMITTED.
22
95 Morton Street New York, NY 10014 | Collateral Asset Summary – Loan No. 1 95 Morton Street | Cut-off Date Balance: Cut-off Date LTV: U/W NCF DSCR: U/W NOI Debt Yield: | $95,000,000 42.6% 2.34x 10.7% |
The Loan. The 95 Morton Street loan (the “95 Morton Street Loan”) is a fixed rate loan secured by the borrower’s fee simple interest in an eight-story, 217,084 sq. ft., Class A office building located at 95 Morton Street in New York, New York (the “95 Morton Street Property”). The 95 Morton Street Loan, with an original principal balance of $95.0 million, has a 5-year term and is interest only for the term of the loan. The 95 Morton Street Loan accrues interest at a fixed rate equal to 4.2620% and has a Cut-off Date Balance of $95.0 million. The 95 Morton Street Loan proceeds were used to acquire the 95 Morton Street Property, fund upfront reserves of approximately $13.4 million and pay closing costs of approximately $2.8 million. Based on the “As Stabilized” appraised value of $223.0 million as of September 1, 2017, the Cut-off Date LTV for the 95 Morton Street Loan is 42.6%. The most recent prior financing of the 95 Morton Street Property was not included in a securitization.
| Sources and Uses | ||||||
| Sources | Proceeds | % of Total | Uses | Proceeds | % of Total | |
| Loan Amount | $95,000,000 | 42.9% | Purchase Price(1) | $205,357,649 | 92.7% | |
| Mezzanine Loan | $77,000,000 | 34.8% | Reserves | $13,369,169 | 6.0% | |
| Borrower Equity | $49,486,607 | 22.3% | Closing Costs | $2,759,788 | 1.2% | |
| Total Sources | $221,486,607 | 100.0% | Total Uses | $221,486,607 | 100.0% | |
| (1) | The Purchase Price consists of an economic purchase price of $215.0 million, less seller credits of approximately $9.6 million for outstanding tenant improvements . |
The Borrower / Sponsors.The borrower, 95 Morton LLC, is a single purpose Delaware limited liability company structured to be bankruptcy-remote with two independent directors in its organizational structure. The non-recourse carve-out guarantors are Aby Rosen and Michael Fuchs. The borrower is an affiliate of RFR Realty LLC (“RFR”) which is owned and controlled by Aby Rosen and Michael Fuchs. RFR is a real estate investment firm based in New York City with a core focus on select urban markets in the United States and Germany.
The Property.The 95 Morton Street Property is an eight-story, 217,084 sq. ft., Class A office building, situated at the northeast corner of Morton and Washington Streets, in the West Village neighborhood in New York, New York. The 95 Morton Street Property was originally built in 1911 and fully renovated and converted to an office building in 2000. The 95 Morton Street Property serves as PayPal’s east coast headquarters. The ground floor area of the 95 Morton Street Property includes a general entrance for the tenants at the building as well as a portion that is used as a dedicated lobby for PayPal, which includes two elevators that are used to access PayPal’s space on the upper floors. PayPal recently signed a new lease for a portion of the first floor and the entirety of the second, third, fifth and sixth floors of the 95 Morton Street Property and is currently in the process of renovating and customizing its space to PayPal’s build-out and technology standards. Other renovations include PayPal’s build-out of the roof deck, which is currently ongoing. Due to the on-going renovations at the 95 Morton Street Property, the borrower does not have a temporary or permanent certificate of occupancy for the sixth floor of the building; however, the borrower is required to obtain a temporary or permanent certificate of occupancy for the sixth floor of the building within thirty days of the origination date, which date will be extended as long as the borrower is diligently pursuing the same.
As of February 15, 2017, the 95 Morton Street Property was 100.0% leased by four tenants, including PayPal, which is currently renovating a portion of its space. Other office tenants at the 95 Morton Street Property include Integral Ad Science, Inc. and VSA Partners, Inc.
Major Tenants.
PayPal(rated BBB+/BBB by Fitch/S&P; 120,800 sq. ft.; 55.6% of NRA; 61.5% of U/W Base Rent; $8,992,205 U/W Base Rent per annum):PayPal is an American company operating a worldwide online payments system that supports online money transfers and serves as an electronic alternative to traditional paper methods like checks and money orders with nearly 200 million active account holders. Founded by Peter Thiel, Elon Musk, Max Levchin, Luke Nosek, and Ken Howery, PayPal is one of the world’s largest internet payment companies. The company operates as a payment processor for online vendors, auction sites and other commercial users, for which it charges a fee. Established in 1998, PayPal had its initial public offering in 2002, and became a wholly owned subsidiary of eBay later that year. In 2014, PayPal moved $228 billion in 26 currencies across more than 190 nations, generating total revenue of $7.9 billion. Also in 2014, eBay announced plans to spin-off PayPal into an independent company by mid-2015, which was completed on July 18, 2015. On July 20, 2015, PayPal had its second initial public offering that valued the company at $46.6 billion. As of April 20, 2017, PayPal has a reported market capitalization of $52.7 billion.
PayPal, which first began occupying space at the 95 Morton Street Property in April 2015, recently signed a new 11-year lease at the 95 Morton Street Property for a portion of the first floor and the entirety of the second, third, fifth and sixth floors of the building at a starting rent of $72.00 PSF, with 0.75% annual escalations (plus a $5.00 PSF rent step in 2022). The rent for the ground floor/private lobby area leased by PayPal (which is still under construction and as to which rent has not yet commenced) will be $30.00 PSF. PayPal is in the process of building out its private entrance on the ground floor and a private roof deck. PayPal is not yet in occupancy of its space on floors one and two. With respect to PayPal’s lease for the third floor of the building, PayPal has taken possession of the space, but will not occupy the space immediately. According to the borrower, PayPal plans to grow into the space as needed, and may look to sublease the space on a short-term basis in the interim. PayPal currently occupies the sixth floor and, with respect to PayPal’s
THE INFORMATION IN THIS STRUCTURAL AND COLLATERAL TERM SHEET IS NOT COMPLETE AND MAY BE AMENDED PRIOR TO THE TIME OF SALE. THIS TERM SHEET IS NOT AN OFFER TO SELL THESE SECURITIES AND IT IS NOT A SOLICITATION OF AN OFFER TO BUY THESE SECURITIES IN ANY JURISDICTION WHERE THE OFFER OR SALE IS NOT PERMITTED.
23
95 Morton Street New York, NY 10014 | Collateral Asset Summary – Loan No. 1 95 Morton Street | Cut-off Date Balance: Cut-off Date LTV: U/W NCF DSCR: U/W NOI Debt Yield: | $95,000,000 42.6% 2.34x 10.7% |
space on the fifth floor, Venmo, a PayPal subsidiary, currently occupies 25,158 sq. ft. pursuant to a sublease with Fab.com, Inc. through January 15, 2018. PayPal has executed a lease to retain occupancy of the space commencing on January 16, 2018. PayPal has a free rent period through November 2018 for its space on the fifth floor. Additionally, PayPal has various free rent periods for other space at the 95 Morton Street Property commencing in May 2017 and ending anywhere from June 2017 to December 2017 for different portions of its space at the 95 Morton Street Property. All free rent was reserved by lender at loan origination.
Integral Ad Science, Inc.(50,264 sq. ft.; 23.2% of NRA; 23.8% of U/W Base Rent; $1,672,830 U/W Base Rent per annum) Integral Ad Science is a global technology and data company that enables digital buyers and sellers to assess the quality of digital media, across channels and screens, and provides tools for optimization. Founded in 2009, Integral Ad Science is headquartered at the 95 Morton Street Property. In 2016, Integral Ad Science expanded to take over the entire fourth floor of the 95 Morton Street Property.
VSA Partners, Inc.(25,080 sq. ft.; 11.6% of NRA; 10.5% of U/W Base Rent; $1,528,281 U/W Base Rent per annum) VSA Partners is a digital advertising company which is headquartered at the 95 Morton Street Property.
Xerox Corporation (“Xerox”)(rated Baa3/BBB-/BBB- by Moody’s/S&P/Fitch; 20,940 sq. ft.; 9.6% of NRA; 4.2% of U/W Base Rent; $613,123 U/W Base Rent per annum)Xerox has been a tenant at the 95 Morton Street Property since 2000 and uses this location as a base station for their repair and maintenance operations. Xerox has a small ground floor loading dock space and a large basement area functioning as storage space for in-demand parts provided to customers and vendors around Manhattan. Xerox is the smallest tenant by gross income and the only tenant on the rent roll whose lease expires during the 95 Morton Street Loan term.
Environmental Matters.The Phase I environmental report dated March 3, 2017 recommended a vapor intrusion investigation at the 95 Morton Street Property to determine if a recognized environmental condition exists. The testing has been completed and the environmental consultant determined that chemicals of concern that would be associated with dry cleaning were not detected in any of the indoor samples. Based on the satisfactory results, it has been determined that no recognized environmental condition exists at this time.
The Market.The 95 Morton Street Property is located in the West Village neighborhood of Manhattan on the northeast corner of Morton and Washington Streets. The 95 Morton Street Property occupies a half-block parcel fronting Washington Street between Barrow and Morton Streets on the northern edge of the Hudson Square neighborhood (Hudson Square/Tribeca office submarket) of Midtown South Manhattan. The 95 Morton Street Property is bordered by the West Village/Greenwich Village neighborhoods to the north, SoHo to the east and Tribeca to the south. According to the appraisal, as of fourth quarter 2016, the Midtown South office market contains 72.8 million sq. ft. of inventory in 279 buildings with an average asking rent of $68.36 PSF and a vacancy rate of 6.5%. The Hudson Square/Tribeca submarket, where the 95 Morton Street Property is located, has a total of 15.2 million sq. ft. of office inventory in 35 buildings with an average asking rent of $73.73 PSF and a vacancy rate of 9.3%.
The appraiser analyzed eight recent office leases with sizes ranging from 217,084 to 485,577 sq. ft., lease terms of approximately five years and rents ranging from $71.00 to $82.00 PSF. Based on the comparable office lease data, the appraiser concluded to a rate of $72.00 PSF for floors 1 through 4 and $76.00 PSF for floors 5 through 8.
| Directly Competitive Buildings(1) | |||||||
| Property | Year Built / Renovated | Office Area (Sq. Ft.) | Occupancy | Tenant Name | Floor Size (Sq. Ft.) | Lease Term | Base Rent PSF |
| 95 Morton Street Property | 1911 / 2000 | 217,084(2) | 100.0%(2) | NAP | NAP | NAP | $65.94(2) |
| 250 Hudson Street | 1932 / 2008 | 394,424 | 97.0% | Bed, Bath & Beyond | 27,778 | 5 years | $71.00 |
| 315 Hudson Street | 1907 / 2012 | 485,577 | 89.4% | One Kings Lane | 51,576 | 5 years | $71.00 |
| 233 Spring Street – One SoHo Square West | 1903 / NAV | 341,134 | 50.1% | DoubleVerify | 31,753 | 5.3 years | $75.00 |
| 100 Avenue of the Americas | 1930 / NAV | 382,689 | 83.2% | Two Sigma Investments | 25,493 | 5.6 years | $71.50 |
| 435 Hudson Street | 1937 / NAV | 288,802 | 85.7% | K. Hovnanian Homes | 8,076 | 5 years | $82.00 |
| 330 Hudson Street – 6 Hudson Square | 1910 / 2013 | 466,738 | 87.1% | Biotronix | 17,480 | 5.3 years | $80.00 |
| (1) | Source: Appraisal. |
| (2) | Source: Underwritten rent roll dated February 15, 2017. |
| Historical Average Base Rent PSF(1) | ||||
| 2014 | 2015 | 2016 | U/W(2) | |
| Base Rent PSF | $41.00 | $35.16 | $45.88 | $65.94 |
| (1) | Base Rent PSF calculations are based on borrower provided rental figures and total occupied square footage of 192,119 (2014), 217,084 (2015), 217,084 (2016) and 217,084 (as of February 15, 2017). |
| (2) | Source: Underwritten rent roll date February 15, 2017. |
THE INFORMATION IN THIS STRUCTURAL AND COLLATERAL TERM SHEET IS NOT COMPLETE AND MAY BE AMENDED PRIOR TO THE TIME OF SALE. THIS TERM SHEET IS NOT AN OFFER TO SELL THESE SECURITIES AND IT IS NOT A SOLICITATION OF AN OFFER TO BUY THESE SECURITIES IN ANY JURISDICTION WHERE THE OFFER OR SALE IS NOT PERMITTED.
24
95 Morton Street New York, NY 10014 | Collateral Asset Summary – Loan No. 1 95 Morton Street | Cut-off Date Balance: Cut-off Date LTV: U/W NCF DSCR: U/W NOI Debt Yield: | $95,000,000 42.6% 2.34x 10.7% |
Cash Flow Analysis.
| Cash Flow Analysis | |||||||
| 2012(1) | 2013(1) | 2014 | 2015 | 2016 | U/W | U/W (PSF) | |
| Base Rent(2) | $7,877,748 | $7,632,937 | $9,959,752 | $14,315,132 | $65.94 | ||
| Step Rents(3) | 0 | 0 | 0 | 301,459 | 1.39 | ||
| Reimbursements(4) | 1,243,338 | 813,702 | 226,745 | 131,975 | 0.61 | ||
| Gross Potential Rent | $9,121,086 | $8,446,639 | $10,186,497 | $14,748,566 | $67.94 | ||
| Total Other Income(5) | 1,005,357 | 1,328,260 | 1,135,173 | 949,762 | 4.38 | ||
| Less: Vacancy(6) | 0 | 0 | 0 | (737,428) | (3.40) | ||
| Effective Gross Income | $10,126,443 | $9,774,899 | $11,321,670 | $14,960,899 | $68.92 | ||
| Total Variable Expenses | 2,019,783 | 1,984,719 | 1,922,818 | 1,998,217 | 9.20 | ||
| Total Fixed Expenses | 2,752,406 | 2,845,498 | 2,827,457 | 2,822,590 | 13.00 | ||
| Net Operating Income | $5,354,254 | $4,944,682 | $6,571,395 | $10,140,092 | $46.71 | ||
| TI/LC | 0 | 0 | 0 | 474,930 | 2.19 | ||
| Capital Expenditures | 0 | 0 | 0 | 43,417 | 0.20 | ||
| Net Cash Flow | NAV | NAV | $5,354,254 | $4,944,682 | $6,571,395 | $9,621,746 | $44.32 |
| (1) | Historical Information prior to 2014 is not available as the 95 Morton Street Property was solely under the ownership of a previous sponsor unrelated to the borrower. |
| (2) | U/W Base Rent is higher than base rent for prior years primarily due to historical numbers being comprised of actual collections. U/W Base Rent is based on actual, in-place leases which assume all free rent periods have expired. All free rent was reserved by the lender at loan origination. |
| (3) | U/W Rent Steps include $264,184 for PayPal which represents the difference between PayPal’s current rents and the average rents over the term of the loan and $37,275 for VSA Partners for rent steps through May 1, 2017.’ |
| (4) | U/W Reimbursements are lower than historical figures due to lease renewals with base year resets and replacement leases commencing with base years set to year-one of the lease term. |
| (5) | Total Other Income includes HVAC overtime, cleaning and sprinkler service and miscellaneous other tenant reimbursements. |
| (6) | U/W Vacancy represents an economic vacancy of 5.0%. |
Property Management. The 95 Morton Street Property is managed by RFR Realty LLC, an affiliated manager and Brickman MGR LLC, a non-affiliated manager. Upon the termination of the property management agreement or the termination of Brickman MGR LLC as manager, Brickman MGR LLC is owed its full management fee, regardless of whether the property management agreement or Brickman MGR LLC is terminated for cause. The Brickman MGR LLC management fee is not subordinate to the 95 Morton Street Loan, but the non-recourse carve-out guarantor is liable for all unpaid fees and expenses owed to Brickman MGR LLC, including the management fee.
Lockbox / Cash Management.The 95 Morton Street Loan is structured with a hard lockbox which is currently in place, and into which the borrower and property manager direct all tenants to directly pay rents. The 95 Morton Street Loan also requires the borrower or property manager to deposit into the lockbox account no later than two business days after receipt all rents and other revenue of any kind from the 95 Morton Street Property received by the borrower or the property manager. All funds in the lockbox account are required to be swept daily to a cash management account under the control of the lender and applied and disbursed in accordance with the loan documents (including for the payment of mezzanine loan debt service). Upon the occurrence and during the continuance of a Trigger Period (as defined below) all excess cash flow funds remaining in the cash management account after the application of such funds in accordance with the loan documents (including the payment of default interest to the 95 Morton Mezzanine A Loan (as defined below) lender and/or the 95 Morton Mezzanine B Loan (as defined below) lender, as applicable, if a Trigger Period exists solely as a result of the occurrence of a default under the 95 Morton Mezzanine A Loan and/or the 95 Morton Mezzanine B Loan, as applicable) are required to be held by lender in an excess cash flow reserve account as additional collateral for the 95 Morton Street Loan. To the extent that no Trigger Period is continuing, all excess cash flow funds are required to be disbursed to the borrower.
A “Trigger Period” means a period (A) commencing upon the earliest of (i) the occurrence and continuance of an event of default under the 95 Morton Street Loan or under the 95 Morton Mezzanine A Loan or 95 Morton Mezzanine B Loan (each as defined below), (ii) the combined debt service coverage ratio falling below 1.10x (calculated within 45 days of the end of each calendar quarter) and (iii) the occurrence of a Specified Tenant Trigger Period (as defined below); and (B) expiring upon (x) with regard to any Trigger Period commenced in connection with clause (A)(i) above, the cure of such event of default (as evidenced, with respect to the 95 Morton Mezzanine A Loan or 95 Morton Mezzanine B Loan, by the lender’s receipt of written notice of such cure from the applicable mezzanine lender), (y) with regard to any Trigger Period commenced in connection with clause (A)(ii) above, the debt service coverage ratio being equal to or greater than 1.10x for one calendar quarter, and (z) with regard to any Trigger Period commenced in connection with clause (A)(iii) above, a Specified Tenant Trigger Period ceasing to exist in accordance with the terms of the 95 Morton Street Loan documents.
A “Specified Tenant Trigger Period” means a period (A) commencing upon the first to occur of (i) a Specified Tenant (as defined below) being in default under its lease beyond any applicable notice and cure periods, (ii) a Specified Tenant failing to have accepted the Specified Tenant space (or applicable portion thereof), (iii) following a Specified Tenant giving notice that it is terminating its lease for all or any portion of its space (or applicable portion thereof), the date 12 months prior to the effective date of such termination, (iv) any
THE INFORMATION IN THIS STRUCTURAL AND COLLATERAL TERM SHEET IS NOT COMPLETE AND MAY BE AMENDED PRIOR TO THE TIME OF SALE. THIS TERM SHEET IS NOT AN OFFER TO SELL THESE SECURITIES AND IT IS NOT A SOLICITATION OF AN OFFER TO BUY THESE SECURITIES IN ANY JURISDICTION WHERE THE OFFER OR SALE IS NOT PERMITTED.
25
95 Morton Street New York, NY 10014 | Collateral Asset Summary – Loan No. 1 95 Morton Street | Cut-off Date Balance: Cut-off Date LTV: U/W NCF DSCR: U/W NOI Debt Yield: | $95,000,000 42.6% 2.34x 10.7% |
termination or cancellation of any Specified Tenant Lease (as defined below) (including, without limitation, rejection in any bankruptcy or similar insolvency proceeding) and/or any Specified Tenant Lease failing to otherwise be in full force and effect, (v) any bankruptcy or similar insolvency of any Specified Tenant, and (vi) a Specified Tenant failing to extend or renew its Specified Tenant Lease for a minimum renewal or extension term of five years on or prior to the earlier to occur of (a) the date occurring 12 months prior to the expiration of the then applicable term of the applicable Specified Tenant Lease or (b) the date by which the Specified Tenant is required to give notice of renewal under the applicable Specified Tenant Lease; and (B) expiring upon the first to occur of the lender’s receipt of evidence reasonably acceptable to the lender (which such evidence includes a duly executed estoppel certificate from the applicable Specified Tenant in form and substance acceptable to the lender) of: (i) the satisfaction of the Specified Tenant Cure Conditions (as defined below) or (ii) the borrower leasing 90% of the Specified Tenant space (or applicable portion thereof) in accordance with the applicable terms and conditions of the 95 Morton Street Loan documents and the applicable tenant under such lease paying the full amount of the rent due under its lease.
“Specified Tenant Cure Conditions” means each of the following, as applicable (i) the applicable Specified Tenant has cured all defaults under the applicable Specified Tenant Lease, (ii) the applicable Specified Tenant has accepted the Specified Tenant’s space (or applicable portion thereof), (iii) the applicable Specified Tenant has revoked or rescinded all termination or cancellation notices with respect to the applicable Specified Tenant Lease and has re-affirmed the applicable Specified Tenant Lease as being in full force and effect, (iv) in the event the Specified Tenant Trigger Period is due to the applicable Specified Tenant’s failure to extend or renew the applicable Specified Tenant Lease in accordance with clause (A)(vi) of the definition of Specified Tenant Trigger Period, the applicable Specified Tenant has renewed or extended the applicable Specified Tenant Lease in accordance with the terms of the 95 Morton Street Loan documents for a term of at least five years or a replacement Specified Tenant has executed a lease in accordance with the terms of the 95 Morton Street Loan documents, (v) with respect to any applicable bankruptcy or insolvency proceedings involving the applicable Specified Tenant and/or the applicable Specified Tenant Lease, the applicable Specified Tenant is no longer insolvent or subject to any bankruptcy or insolvency proceedings and has affirmed the applicable Specified Tenant Lease pursuant to final, non-appealable order of a court of competent jurisdiction, and (vi) the applicable Specified Tenant is paying full, unabated rent under the applicable Specified Tenant Lease.
A “Specified Tenant” means (i) PayPal (ii) Integral Ad Science, (iii) any tenant that leases 20% or more of the total rentable area for the 95 Morton Street Property, (iv) any tenant under a lease that accounts for 20% or more of the total rental income for the 95 Morton Street Property, and (v) any other lessee of the Specified Tenant space (or any portion thereof) and any guarantor(s) of the related Specified Tenant Lease.
“Specified Tenant Lease” means, collectively and/or individually (as the context requires), each lease at the 95 Morton Street Property with a Specified Tenant (including, without limitation, any guaranty or similar instrument furnished thereunder), as the same may have been or may hereafter be amended, restated, extended, renewed, replaced and/or otherwise modified.
Initial Reserves.At loan origination, the borrower deposited (i) $1,193,540 into a tax reserve account and (ii) $12,175,629 into an unfunded obligations account which consisted of $3,907,286 for free rent associated with the PayPal lease (which free rent amounts and timing of disbursements vary across the different spaces that PayPal occupies at the 95 Morton Street Property) and $8,268,343 for tenant improvements and other obligations of the borrower to PayPal, Integral Ad Science and VSA Partners that were outstanding as of the origination date.
Ongoing Reserves.On a monthly basis, the borrower is required to deposit reserves of (i) 1/12 of the estimated annual real estate taxes, which currently equates to $238,708, into a tax reserve account, (ii) 1/12 of annual insurance premiums to the extent an approved blanket insurance policy is not in effect, into an insurance reserve account and (iii) $3,618 into a replacement reserve account.
Current Mezzanine or Subordinate Indebtedness. A $52,000,000 mezzanine A loan (the “95 Morton Mezzanine A Loan”) was made by Citigroup Global Markets Realty Corp. to 95 Morton Mezz A LLC, the owner of 100% of the limited liability company interests of the borrower. The 95 Morton Mezzanine A Loan is secured by a pledge of 100% of the limited liability company interests in the borrower. A $25,000,000 mezzanine B loan (the “95 Morton Mezzanine B Loan”) was made by 95 Morton Mezz Funding LLC (an entity 100% owned by SL Green Funding LLC) to 95 Morton Mezz B LLC, the owner of 100% of the limited liability company interests in 95 Morton Mezz A LLC. The 95 Morton Mezzanine B Loan is secured by a pledge of 100% of the limited liability company interests in 95 Morton Mezz A LLC. The 95 Morton Mezzanine A Loan accrues interest at a rate of 5.1500% per annum and the 95 Morton Mezzanine B Loan accrues interest at a rate of 7.6300% per annum. The scheduled maturity date for the 95 Morton Mezzanine A Loan and the 95 Morton Mezzanine B Loan is co-terminous with the scheduled maturity date of the 95 Morton Street Loan.
Future Mezzanine or Subordinate Indebtedness Permitted. None.
THE INFORMATION IN THIS STRUCTURAL AND COLLATERAL TERM SHEET IS NOT COMPLETE AND MAY BE AMENDED PRIOR TO THE TIME OF SALE. THIS TERM SHEET IS NOT AN OFFER TO SELL THESE SECURITIES AND IT IS NOT A SOLICITATION OF AN OFFER TO BUY THESE SECURITIES IN ANY JURISDICTION WHERE THE OFFER OR SALE IS NOT PERMITTED.
26
95 Morton Street New York, NY 10014 | Collateral Asset Summary – Loan No. 1 95 Morton Street | Cut-off Date Balance: Cut-off Date LTV: U/W NCF DSCR: U/W NOI Debt Yield: | $95,000,000 42.6% 2.34x 10.7% |

THE INFORMATION IN THIS STRUCTURAL AND COLLATERAL TERM SHEET IS NOT COMPLETE AND MAY BE AMENDED PRIOR TO THE TIME OF SALE. THIS TERM SHEET IS NOT AN OFFER TO SELL THESE SECURITIES AND IT IS NOT A SOLICITATION OF AN OFFER TO BUY THESE SECURITIES IN ANY JURISDICTION WHERE THE OFFER OR SALE IS NOT PERMITTED.
27
95 Morton Street New York, NY 10014 | Collateral Asset Summary – Loan No. 1 95 Morton Street | Cut-off Date Balance: Cut-off Date LTV: U/W NCF DSCR: U/W NOI Debt Yield: | $95,000,000 42.6% 2.34x 10.7% |
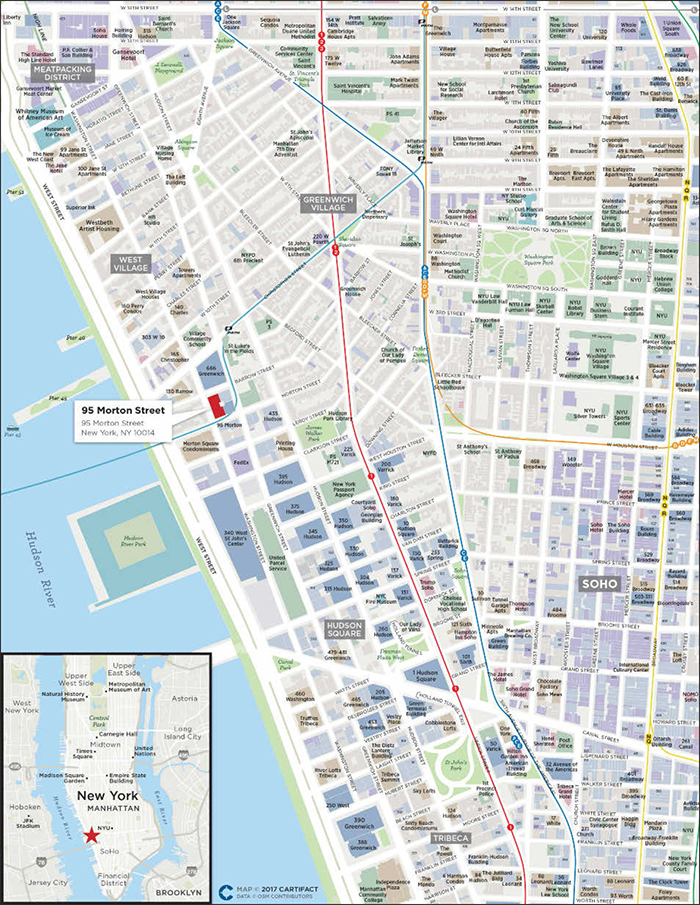
THE INFORMATION IN THIS STRUCTURAL AND COLLATERAL TERM SHEET IS NOT COMPLETE AND MAY BE AMENDED PRIOR TO THE TIME OF SALE. THIS TERM SHEET IS NOT AN OFFER TO SELL THESE SECURITIES AND IT IS NOT A SOLICITATION OF AN OFFER TO BUY THESE SECURITIES IN ANY JURISDICTION WHERE THE OFFER OR SALE IS NOT PERMITTED.
28
(THIS PAGE INTENTIONALLY LEFT BLANK)
THE INFORMATION IN THIS STRUCTURAL AND COLLATERAL TERM SHEET IS NOT COMPLETE AND MAY BE AMENDED PRIOR TO THE TIME OF SALE. THIS TERM SHEET IS NOT AN OFFER TO SELL THESE SECURITIES AND IT IS NOT A SOLICITATION OF AN OFFER TO BUY THESE SECURITIES IN ANY JURISDICTION WHERE THE OFFER OR SALE IS NOT PERMITTED.
29
1170 Bordeaux Drive Sunnyvale, CA 94089 | Collateral Asset Summary – Loan No. 2 Moffett Place Google | Cut-off Date Balance: Cut-off Date LTV: U/W NCF DSCR: U/W NOI Debt Yield: | $75,000,000 59.5% 1.38x 8.3% |
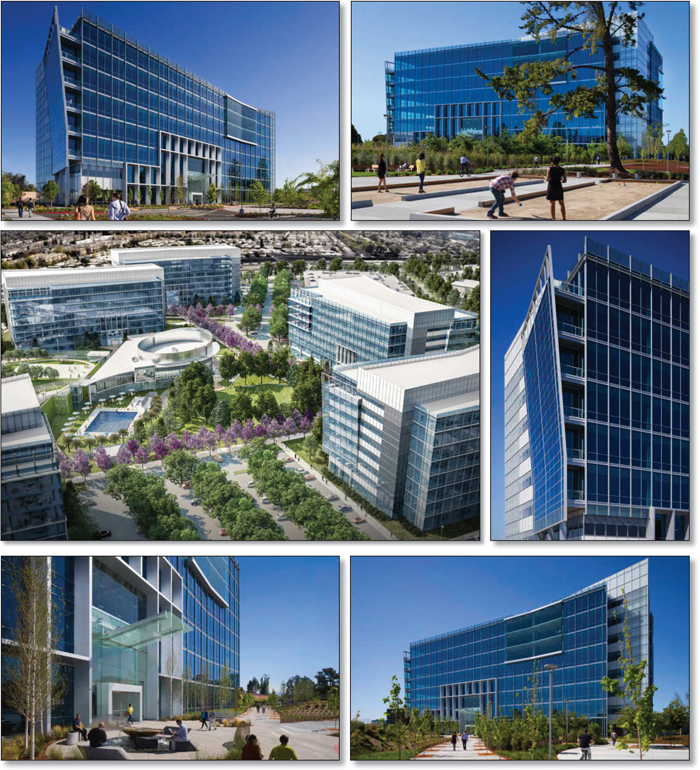
THE INFORMATION IN THIS STRUCTURAL AND COLLATERAL TERM SHEET IS NOT COMPLETE AND MAY BE AMENDED PRIOR TO THE TIME OF SALE. THIS TERM SHEET IS NOT AN OFFER TO SELL THESE SECURITIES AND IT IS NOT A SOLICITATION OF AN OFFER TO BUY THESE SECURITIES IN ANY JURISDICTION WHERE THE OFFER OR SALE IS NOT PERMITTED.
30
1170 Bordeaux Drive Sunnyvale, CA 94089 | Collateral Asset Summary – Loan No. 2 Moffett Place Google | Cut-off Date Balance: Cut-off Date LTV: U/W NCF DSCR: U/W NOI Debt Yield: | $75,000,000 59.5% 1.38x 8.3% |
| Mortgage Loan Information | |
| Loan Seller: | GACC |
| Loan Purpose: | Refinance |
| Sponsor: | Joseph K. Paul (A/K/A Jay Paul) |
| Borrower: | MP B3 LLC |
| Original Balance(1): | $75,000,000 |
| Cut-off Date Balance(1): | $75,000,000 |
| % by Initial UPB: | 8.3% |
| Interest Rate(2): | 4.549797% |
| Payment Date: | 6thof each month |
| First Payment Date: | February 6, 2017 |
| Maturity Date: | January 6, 2027 |
| Amortization: | Interest only for first 60 months, 360 months thereafter |
| Additional Debt(1)(3): | $110,000,000Pari Passu Debt; $40,000,000 Mezzanine Debt |
| Call Protection(4): | L(28), D(85), O(7) |
| Lockbox / Cash Management: | Hard / In Place |
| Reserves(5) | ||
| Initial | Monthly | |
| Taxes: | $253,015 | $84,338 |
| Insurance: | $0 | Springing |
| Replacement: | $0 | $0 |
| TI/LC: | $12,312,957 | $0 |
| Free Rent: | $17,051,831 | $0 |
| Lease Sweep: | $0 | Springing |
| Low Debt Service: | $0 | Springing |
| Financial Information | ||||
| Mortgage Loan(6) | Total Debt(7) | |||
| Cut-off Date Balance / Sq. Ft.: | $589 | $716 | ||
| Balloon Balance / Sq. Ft.: | $542 | $659 | ||
| Cut-off Date LTV: | 59.5% | 72.3% | ||
| Balloon LTV: | 54.8% | 66.6% | ||
| Underwritten NOI DSCR(8): | 1.39x | 1.08x | ||
| Underwritten NCF DSCR(8): | 1.38x | 1.07x | ||
| Underwritten NOI Debt Yield: | 8.3% | 6.9% | ||
| Underwritten NCF Debt Yield: | 8.3% | 6.8% | ||
| Underwritten NOI Debt Yield at Balloon: | 9.1% | 7.5% | ||
| Underwritten NCF Debt Yield at Balloon: | 9.0% | 7.4% | ||
| (1) | The Original Balance and Cut-off Date Balance of $75.0 million represents the non-controlling Note A-4, non-controlling Note A-5 and non-controlling Note A-6 which, together with thepari passu Note A-1, Note A-2 and Note A-3, with an aggregate original principal balance of $110.0 million, comprises the Moffett Place Google Whole Loan with an aggregate original principal balance of $185.0 million. For additional information regarding thepari passu notes, see “The Loan” herein. |
| (2) | The Moffett Place Google Whole Loan has a 10-year term and pays interest only for the first 60 months of the loan term and amortizes on a fixed 30-year schedule thereafter. See “Annex F – Moffett Place Google Mortgage Loan Amortization Schedule” in the Preliminary Prospectus. |
| (3) | See “Current Mezzanine or Subordinate Indebtedness” herein. |
| (4) | The lockout period will be at least 28 payment dates beginning with and including the first payment date of February 6, 2017. Defeasance of the full $185.0 million Moffett Place Google Whole Loan is permitted after the date that is the earlier to occur of (i) two years after the closing date of the securitization that includes the lastpari passunote to be securitized and (ii) December 30, 2019. The assumed lockout period of 28 payments is based on the expected CD 2017-CD4 securitization closing date in May 2017. The actual lockout period may be longer. |
| Property Information | |
| Single Asset / Portfolio: | Single Asset |
| Property Type: | CBD Office |
| Collateral: | Fee Simple |
| Location: | Sunnyvale, CA |
| Year Built / Renovated: | 2016 / NAP |
| Total Sq. Ft.: | 314,352 |
| Property Management: | Paul Holdings, Inc. dba Jay Paul Company |
| Underwritten NOI: | $15,436,076 |
| Underwritten NCF: | $15,373,206 |
| Appraised Value(9): | $311,100,000 |
| Appraisal Date: | March 1, 2018 |
| Historical NOI(10) | |
| Most Recent NOI: | NAP |
| 2016 NOI: | NAP |
| 2015 NOI: | NAP |
| 2014 NOI: | NAP |
| Historical Occupancy(10) | |
| Most Recent Occupancy: | 100.0% (May 6, 2017) |
| 2016 Occupancy: | NAP |
| 2015 Occupancy: | NAP |
| 2014 Occupancy: | NAP |
| (5) | See “Initial Reserves” and “Ongoing Reserves” herein. |
| (6) | DSCR, LTV, Debt Yield and Balance / Sq. Ft. calculations are based on the Moffett Place Google Whole Loan only, which has an aggregate principal balance of $185.0 million. LTV calculations are based on the “As Stabilized” Appraised Value of $311.1 million. Based on the “As-Is” Appraised Value of $272.5 million, the Cut-off Date LTV and the Balloon LTV for the Moffett Place Google Whole Loan would be 67.9% and 62.5%, respectively. |
| (7) | DSCR, LTV, Debt Yield and Balance / Sq. Ft. calculations are based on the Total Debt in the aggregate amount of $225.0 million, which includes a mezzanine loan with an original principal balance of $40.0 million. LTV calculations are based on the “As Stabilized” Appraised Value of $311.1 million. Based on the “As-Is” Appraised Value of $272.5 million, the combined Cut-off Date LTV and Balloon LTV for the Moffett Place Google Whole Loan and the mezzanine loan would be 82.6% and 76.0%, respectively. |
| (8) | Based on amortizing debt service payments. Based on the current interest only payments, the Underwritten NOI DSCR and Underwritten NCF DSCR are 1.81x and 1.80x, respectively. |
| (9) | Represents the appraiser’s “As Stabilized” Appraised Value which assumes that the borrower’s contractual tenant improvement and leasing commission obligations have been fulfilled, that there is no outstanding free rent, that payment of rent has commenced and that the Moffett Place Google Property is leased at a market rent level as of the effective date of value. At closing, the borrower reserved approximately $29.3 million in tenant improvements and free rent associated with the Google, Inc. lease. The “As-Is” Appraised Value is $272.5 million, which represents a Cut-off Date LTV and Balloon LTV of 67.9% and 62.5%, respectively. |
| (10) | The Moffett Place Google Property was constructed in 2016; accordingly historical operating information and occupancy are not available. |
THE INFORMATION IN THIS STRUCTURAL AND COLLATERAL TERM SHEET IS NOT COMPLETE AND MAY BE AMENDED PRIOR TO THE TIME OF SALE. THIS TERM SHEET IS NOT AN OFFER TO SELL THESE SECURITIES AND IT IS NOT A SOLICITATION OF AN OFFER TO BUY THESE SECURITIES IN ANY JURISDICTION WHERE THE OFFER OR SALE IS NOT PERMITTED.
31
1170 Bordeaux Drive Sunnyvale, CA 94089 | Collateral Asset Summary – Loan No. 2 Moffett Place Google | Cut-off Date Balance: Cut-off Date LTV: U/W NCF DSCR: U/W NOI Debt Yield: | $75,000,000 59.5% 1.38x 8.3% |
| Tenant Summary | |||||||
Tenant | Ratings (Fitch/Moody’s/S&P)(1) | Net Rentable Area (Sq. Ft.) | % of Net Rentable Area | U/W Base Rent PSF | % of Total U/W Base Rent | Lease Expiration | |
| Google Inc.(2) | NR/Aa2/AA | 314,352 | 100.0% | $45.84 | 100.0% | 11/30/2028 | |
| Vacant | 0 | 0.0% | |||||
| Total / Wtd. Avg. | 314,352 | 100.0% | |||||
| (1) | Certain ratings are those of the parent company whether or not the parent guarantees the lease. The ratings above are those of Alphabet, which does not guarantee the lease. |
| (2) | Google Inc. (“Google”) accepted possession of its space at the Moffett Place Google Property on December 1, 2016 but is not yet required to pay rent. The rent payment obligation under the Google lease commences on February 11, 2018. At loan origination, the borrower reserved $17,051,831 for the purpose of simulating payments of rent prior to the date that rent is payable under the Google lease. Google has two, seven-year extension options and no early termination rights. |
| Lease Rollover Schedule(1) | ||||||||
| Year | # of Leases Expiring | Total Expiring Sq. Ft. | % of Total Sq. Ft. Expiring | Cumulative Sq. Ft. Expiring | Cumulative % of Sq. Ft. Expiring | Annual U/W PSF | % U/W Rolling | Cumulative % of U/W Base Rent |
| MTM | 0 | 0 | 0.0% | 0 | 0.0% | $0.00 | 0.0% | 0.0% |
| 2017 | 0 | 0 | 0.0% | 0 | 0.0% | $0.00 | 0.0% | 0.0% |
| 2018 | 0 | 0 | 0.0% | 0 | 0.0% | $0.00 | 0.0% | 0.0% |
| 2019 | 0 | 0 | 0.0% | 0 | 0.0% | $0.00 | 0.0% | 0.0% |
| 2020 | 0 | 0 | 0.0% | 0 | 0.0% | $0.00 | 0.0% | 0.0% |
| 2021 | 0 | 0 | 0.0% | 0 | 0.0% | $0.00 | 0.0% | 0.0% |
| 2022 | 0 | 0 | 0.0% | 0 | 0.0% | $0.00 | 0.0% | 0.0% |
| 2023 | 0 | 0 | 0.0% | 0 | 0.0% | $0.00 | 0.0% | 0.0% |
| 2024 | 0 | 0 | 0.0% | 0 | 0.0% | $0.00 | 0.0% | 0.0% |
| 2025 | 0 | 0 | 0.0% | 0 | 0.0% | $0.00 | 0.0% | 0.0% |
| 2026 | 0 | 0 | 0.0% | 0 | 0.0% | $0.00 | 0.0% | 0.0% |
| 2027 | 0 | 0 | 0.0% | 0 | 0.0% | $0.00 | 0.0% | 0.0% |
| Thereafter | 1 | 314,352 | 100.0% | 314,352 | 100.0% | $45.84 | 100.0% | 100.0% |
| Vacant | NAP | 0 | 0.0% | 314,352 | 100.0% | NAP | NAP | |
| Total / Wtd. Avg. | 1 | 314,352 | 100.0% | $45.84 | 100.0% | |||
| (1) | Based on the underwritten rent roll as of May 6, 2017. |
The Loan. The Moffett Place Google loan (the Moffett Place Google Loan”) is a fixed rate loan secured by the borrower’s fee simple interest in a 314,352 sq. ft. office building located in Sunnyvale, California (the “Moffett Place Google Property”) with an Original and Cut-Off Date Balance of $75.0 million and is part of a $185.0 million whole loan (the “Moffett Place Google Whole Loan”). The Moffett Place Google Loan is evidenced by the non-controlling Note A-4, non-controlling Note A-5 and non-controlling Note A-6, with an aggregate original principal balance of $75.0 million, which will be included in the CD 2017-CD4 mortgage trust. Thepari passu controlling Note A-1 and non-controlling Note A-3, with an aggregate original principal balance of $70.0 million, were contributed to the CD 2017-CD3 mortgage trust and the pari-passu non-controlling Note A-2, with an original principal balance of $40.0 million, is currently held by Deutsche Bank AG, New York Branch (“DBNY”) and is expected to be included in one or more future securitizations.
The relationship between the holders of the Moffett Place Google Whole Loan is governed by a co-lender agreement as described under “Description of the Mortgage Pool–The Whole Loans–The Non-Serviced Pari Passu Whole Loans—Moffett Place Google Whole Loan” in the Preliminary Prospectus.
| Whole Loan Summary | |||||
| Note | Original Balance | Cut-off Date Balance | Note Holder | Controlling Piece | |
| A-4, A-5, A-6 | $75,000,000 | $75,000,000 | CD 2017-CD4 | No | |
| A-1, A-3 | $70,000,000 | $70,000,000 | CD 2017-CD3 | Yes | |
| A-2 | $40,000,000 | $40,000,000 | DBNY | No | |
| Total | $185,000,000 | $185,000,000 | |||
The Moffett Place Google Whole Loan has a 10-year term and pays interest only for the first 60 months of the loan term and amortizes on a fixed 30-year schedule thereafter. See “Annex F – Moffett Place Google Mortgage Loan Amortization Schedule” in the Preliminary Prospectus. The Moffett Place Google Whole Loan accrues interest at a fixed rate equal to 4.549797%. The Moffett Place Google Whole Loan proceeds, along with $40.0 million of mezzanine debt, were used to refinance existing debt of approximately $134.9 million, fund approximately $29.6 million in upfront reserves, pay transaction costs of approximately $6.1 million and return
THE INFORMATION IN THIS STRUCTURAL AND COLLATERAL TERM SHEET IS NOT COMPLETE AND MAY BE AMENDED PRIOR TO THE TIME OF SALE. THIS TERM SHEET IS NOT AN OFFER TO SELL THESE SECURITIES AND IT IS NOT A SOLICITATION OF AN OFFER TO BUY THESE SECURITIES IN ANY JURISDICTION WHERE THE OFFER OR SALE IS NOT PERMITTED.
32
1170 Bordeaux Drive Sunnyvale, CA 94089 | Collateral Asset Summary – Loan No. 2 Moffett Place Google | Cut-off Date Balance: Cut-off Date LTV: U/W NCF DSCR: U/W NOI Debt Yield: | $75,000,000 59.5% 1.38x 8.3% |
approximately $54.3 million of borrower equity. Based on the “As Stabilized” appraised value of $311.1 million as of March 1, 2018, the Cut-off Date LTV is 59.5% and based on the “As-is” appraised value of $272.5 million the Cut-off Date LTV is 67.9%. The most recent prior financing of the Moffett Place Google Property was not included in a securitization.
| Sources and Uses | ||||||
| Sources | Proceeds | % of Total | Uses | Proceeds | % of Total | |
| Whole Loan | $185,000,000 | 82.2% | Loan Payoff | $134,943,058 | 60.0% | |
| Mezzanine Loan | $40,000,000 | 17.8% | Return of Equity | $54,305,554 | 24.1% | |
| Reserves | $29,617,804 | 13.2% | ||||
| Closing Costs | $6,133,584 | 2.7% | ||||
| Total Sources | $225,000,000 | 100.0% | Total Uses | $225,000,000 | 100.0% | |
The Borrower / Sponsor.The borrower, MP B3 LLC, is a single purpose Delaware limited liability company structured to be bankruptcy-remote with two independent directors in its organizational structure. The nonrecourse carve-out guarantors are Joseph K. Paul (A/K/A Jay Paul), Jay Paul Revocable Living Trust Dated November 9, 1999, As Amended and Restated On March 19, 2010 and As Further Amended From Time to Time and Paul Guarantor LLC (“Jay Paul and the trust”), on a joint and several basis. The borrower is permitted to obtain release of Jay Paul and the trust from the guaranty and environmental indemnity upon satisfaction of certain conditions in the loan documents, which include, without limitation, Paul Guarantor LLC maintaining a net worth of not less than $300.0 million and liquidity of not less than $20.0 million.
The sponsor of the borrower is Joseph K. Paul, the founder of Jay Paul Company. Jay Paul Company is a privately-held real estate firm based in San Francisco, California that concentrates on the acquisition, development and management of commercial properties throughout California with a specific focus on creating projects for technology firms. Jay Paul Company has developed or acquired over 8.5 million sq. ft., of institutional quality space with an additional 6.0 million sq. ft. under development, much of which is located near the Moffett Place Google Property in Sunnyvale. In addition, Jay Paul Company owns 21 buildings in Moffett Park totaling 5.0 million sq. ft. Jay Paul Company has built projects for many companies including Apple, Google, Amazon, Motorola, Microsoft, Boeing, Philips Electronics, HP and DreamWorks, among others.
The Property.The Moffett Place Google Property is comprised of a 314,352 sq. ft., newly-constructed, Class A, single tenant office building located in Sunnyvale, California. The Moffett Place Google Property is 100.0% leased, as of May 6, 2017, to Google Inc. (“Google”) through November 2028, with two seven-year extension options and no early termination rights. Google accepted possession of its space at the Moffett Place Google Property on December 1, 2016 but is not yet required to pay rent. The rent payment obligation under the Google lease commences on February 11, 2018. At loan origination, the borrower reserved $17,051,831 for the purpose of simulating payments of rent prior to the date that rent is payable under the Google lease. See “Initial Reserves” below.
The Moffett Place Google Property is part of a larger planned development (“Moffett Place Campus”), which currently includes three additional non-collateral identical office buildings totaling 943,056 sq. ft., which are 100.0% leased to Google through August 2027 and three additional non-collateral parking garages. The Moffett Place Campus is anticipated to include two additional non-collateral office buildings totaling 628,704 sq. ft. The two non-collateral buildings yet to be built are also leased to Google through November 2028 and, according to the borrower sponsors, are anticipated to be delivered in August 2017 and April 2020, respectively. The borrower sponsor assembled the land for Moffett Place Campus between 2011 and 2012 for approximately $27.5 million and has spent approximately $126.3 million ($401.65 PSF) on the development of the Moffett Place Google Property. Additionally, the borrower sponsor has spent approximately $24.3 million ($77.18 PSF) in tenant improvements and leasing commission costs. The borrower sponsor’s total cost basis is approximately $178.1 million ($566.64 PSF).
The Moffett Place Google Property features access to a 52,500 sq. ft., non-collateral two-story fitness/amenities facility and three separate non-collateral parking garages. To govern access to the non-collateral common areas, fitness/amenities facility and parking garages (the “Common Area Spaces”), the Moffett Place Google Property is subject to a declaration of covenants, conditions and restrictions (the “CCR”) with Moffett Place LLC (an affiliate of the borrower sponsor and an affiliate of the owner of the three non-collateral buildings at Moffett Place Campus), which grants the borrower non-exclusive easement rights over the Common Area Spaces and contemplates that the Common Area Spaces that it governs will be expanded over time as the remaining portions of the Moffett Place Campus are completed. Ownership of the Common Area Spaces governed by the CCR is held by Moffett Place Association LLC (the “Association”). The Association is owned by Moffett Place LLC (an entity wholly owned by Joseph K. Paul), as declarant, until the remaining buildings are completed, and by the borrower and MP 521 LLC (as owners of the completed buildings). The Association is obligated to maintain insurance coverage over the Common Area Spaces and is also responsible for maintenance of the Common Area Spaces, subject to the terms of the Google leases. The CCR delineates shares of the voting interest in the Association based on the number of completed buildings at the Moffett Place Campus, with each completed building entitled to a proportionate share of the voting interest. The borrower currently has a 25.0% voting interest in the Association and will have a 16.7% voting interest in the Association upon the full development of the Moffett Place Campus. The borrower is required to pay taxes and insurance for the Common Area Spaces under the CCR.
THE INFORMATION IN THIS STRUCTURAL AND COLLATERAL TERM SHEET IS NOT COMPLETE AND MAY BE AMENDED PRIOR TO THE TIME OF SALE. THIS TERM SHEET IS NOT AN OFFER TO SELL THESE SECURITIES AND IT IS NOT A SOLICITATION OF AN OFFER TO BUY THESE SECURITIES IN ANY JURISDICTION WHERE THE OFFER OR SALE IS NOT PERMITTED.
33
1170 Bordeaux Drive Sunnyvale, CA 94089 | Collateral Asset Summary – Loan No. 2 Moffett Place Google | Cut-off Date Balance: Cut-off Date LTV: U/W NCF DSCR: U/W NOI Debt Yield: | $75,000,000 59.5% 1.38x 8.3% |
Environmental Matters.The Phase I environmental report dated December 1, 2016 recommended no further action at the Moffett Place Google Property.
Major Tenant.Google Inc. (“Google”, 314,352 sq. ft.; 100.0% of NRA; 100.0% of U/W Base Rent) On October 2, 2015, Google implemented a holding company reorganization in which Alphabet became the successor issuer to Google. At that time, Alphabet recognized the assets and liabilities of Google at carryover basis. Alphabet, through its subsidiaries, provides online advertising services in the United States, the United Kingdom and rest of the world. Alphabet (NASDAQ: GOOG) is rated Aa2 and AA by Moody’s and S&P, respectively. Google represents approximately 99.1% of Alphabet’s total revenues, based on Alphabet’s 2016 annual report. Google’s core products such as Search, Android, Maps, Chrome, YouTube, Google Play and Gmail each have over one billion monthly active users.
The Market.The Moffett Place Google Property is located in northern Sunnyvale, California within Moffett Park. Moffett Park comprises approximately 519 acres of land of which approximately 85% is improved with recently developed one and two-story, research and development buildings. Moffett Park is home to notable high technology firms including Lab 126 (an Amazon.com subsidiary), Hewlett Packard, Juniper Networks, Lockheed-Martin, Microsoft and Yahoo!.
Jay Paul Company is re-developing over 55 acres in Moffett Park, with Moffett Place, a new, Class A office development to contain about 1.87 million sq. ft. of net rentable building area, in six, eight-story buildings. The development also includes a 52,500-square foot amenities building and parking structures. In October 2014, Google pre-leased the entire project with a staged occupancy. Phase I, which includes Buildings 1, 2, and 5, was completed in late-2016. The Moffett Place Google Property is the first building in Phase II.
Moffett Park sits alongside the State Highway 237 corridor near the intersection of U.S. Highway 101 in Silicon Valley. State Highway 237 forms the southern border of the Moffett Park area and provides access from Interstate 680 and Interstate 280 to the northeast and U.S. Highway 101 in Sunnyvale to the southwest. The Santa Clara County Transit System provides bus service county-wide and has four stops near the Moffett Place Google Property. In addition, a Santa Clara Light Rail station is located one block from the Moffett Google Place Property to the northwest and services the surrounding residential communities.
The Moffett Place Google Property is in the Sunnyvale submarket within Silicon Valley. According to the appraisal, overall vacancy in Silicon Valley and the Sunnyvale submarket was 8.6% and 3.1%, respectively as of third quarter of 2016. In the first three quarters of 2016, 612,796 sq. ft. of office space was delivered to the submarket, with 619,986 sq. ft. of absorption. According to the appraisal, as of the third quarter 2016, new supply under construction in Silicon Valley stood at approximately 5.3 million sq. ft., which consisted of approximately 3.0 million sq. ft. of build-to-suit construction and 2.3 million sq. ft. of speculative construction. As of the third quarter of 2016, the total office asking rent for the Sunnyvale submarket was $51.24 PSF, which is in-line with the Silicon Valley total office average asking rent of $51.48 PSF. Within the Sunnyvale submarket, the average asking rent for Class A office properties is $53.76 PSF.
Office Building Sales Comparables(1) | ||||
| Property Name | Property Location | Rentable Area (sq. ft.) | Sale Date | Sale Price (in millions) |
| Moffett Place Google Property | Sunnyvale, CA | 314,352(2) | NA | $311.1(3) |
| Campus @ 3333, Phase 1 | Santa Clara, CA | 459,655 | Dec. 2015 | $305.1 |
| Sunnyvale Town Center | Sunnyvale, CA | 313,920 | Dec. 2015 | $270.0 |
| Castro Station | Mountain View, CA | 114,809 | Nov. 2015 | $148.5 |
| Netflix | Los Gatos, CA | 260,830 | Oct. 2015 | $193.1 |
| Cupertino Gateway | Cupertino, CA | 220,672 | Aug. 2015 | $165.0 |
| (1) | Source: Appraisal. |
| (2) | Based on the underwritten rent roll dated May 6, 2017. |
| (3) | Represents the “As Stabilized” Appraised Value as of March 1, 2018. |
THE INFORMATION IN THIS STRUCTURAL AND COLLATERAL TERM SHEET IS NOT COMPLETE AND MAY BE AMENDED PRIOR TO THE TIME OF SALE. THIS TERM SHEET IS NOT AN OFFER TO SELL THESE SECURITIES AND IT IS NOT A SOLICITATION OF AN OFFER TO BUY THESE SECURITIES IN ANY JURISDICTION WHERE THE OFFER OR SALE IS NOT PERMITTED.
34
1170 Bordeaux Drive Sunnyvale, CA 94089 | Collateral Asset Summary – Loan No. 2 Moffett Place Google | Cut-off Date Balance: Cut-off Date LTV: U/W NCF DSCR: U/W NOI Debt Yield: | $75,000,000 59.5% 1.38x 8.3% |
| Directly Competitive Buildings(1) | |||||||
| Property Name | Property Location | Tenant Name | Lease Date | GLA | Lease Term (years) | Base Rent PSF | Lease Type |
| Moffett Place Google Property | Sunnyvale, CA | Google(2) | 12/2016(2) | 314,352(2) | 12.0(2) | $45.84(2) | Net |
| Moffett Towers II, Building 2 | Sunnyvale, CA | Confidential | 12/2016 | 362,600 | 10.0 | $48.00 | Net |
| Sunnyvale City Center | Sunnyvale, CA | Red Hat | 11/2016 | 28,389 | 7.2 | $70.80 | Net |
| Moffett Gateway | Sunnyvale, CA | Google Inc. | 7/2016 | 612,691 | 10.0 | $44.40 | Net |
| Sunnyvale Business Park | Sunnyvale, CA | Raytheon | 7/2016 | 162,550 | 3.0 | $47.40 | Net |
| Santa Clara Square | Santa Clara, CA | AMD | 8/2016 | 220,156 | 10.0 | $42.60 | Net |
| Santa Clara Square | Santa Clara, CA | Cambridge Industries | 5/2016 | 220,156 | 7.4 | $43.80 | Net |
| Moffett Towers I | Sunnyvale, CA | Google Inc. | 4/2016 | 238,602 | 10.0 | $44.40 | Net |
| (1) | Source: Appraisal. |
| (2) | Based on the underwritten rent roll dated May 6, 2017. |
Cash Flow Analysis.
| Cash Flow Analysis(1) | ||
| U/W | U/W PSF | |
| Base Rent | $14,409,896 | $45.84 |
| Credit Tenant Step Rents(2) | 1,916,870 | 6.10 |
| Value of Vacant Space | 0 | 0.00 |
| Gross Potential Rent | $16,326,766 | $51.94 |
| Total Recoveries | 1,970,759 | 6.27 |
| Total Other Income(3) | 459,269 | 1.46 |
| Less: Vacancy(4) | (937,840) | (2.98) |
| Effective Gross Income | $17,818,954 | $56.68 |
| Total Variable Expenses | 1,021,504 | 3.25 |
| Total Fixed Expenses | 1,361,374 | 4.33 |
| Net Operating Income | $15,436,076 | $49.10 |
| TI/LC | 0 | 0.00 |
| Capital Expenditures | 62,870 | 0.20 |
| Net Cash Flow | $15,373,206 | $48.90 |
| (1) | The Moffett Place Google Property was constructed in 2016; accordingly historical operating information is not available. |
| (2) | Credit Tenant Step Rents are the straight line average of contractual steps through lease expiration. |
| (3) | Total Other Income reflects the amenities use fee including contractual rent steps through February 2018 and a straight line average of contractual rent steps of the amenities use fee through lease expiration. |
| (4) | U/W Vacancy is underwritten to a vacancy rate of 5.0% of all revenue. The Moffett Place Google Property is currently 100.0% occupied. |
Property Management. The Moffett Place Google Property is managed by Paul Holdings, Inc. dba Jay Paul Company, a borrower affiliate.
Lockbox / Cash Management.The Moffett Place Google Whole Loan is structured with a hard lockbox with in-place cash management. All rents are required to be directly deposited by the tenants of the Moffett Place Google Property into a clearing account controlled by the lender. All amounts in the lockbox account are required to be swept to a lender-controlled cash management account every business day and applied on each payment date to the payment of debt service, the funding of required reserves, budgeted monthly operating expenses, common charges under various reciprocal easement agreements, including the CCR, approved extraordinary operating expenses, debt service on the mezzanine loan (see “Current Mezzanine or Subordinate Indebtedness” below) and, during a Lease Sweep Period (as defined below), all excess cash flow in a minimum amount equal to $261,960 to fund a lease sweep reserve account (the “Lease Sweep Reserve Account”) until the aggregate funds swept in the Lease Sweep Reserve Account during such lease sweep equals the Lease Sweep Reserve Threshold (as defined below) and then to a debt service reserve account (the “Debt Service Reserve Account”) until the aggregate funds transferred to the Lease Sweep Reserve Account and the Debt Service Reserve Account during such lease sweep equals the Lease Sweep and Debt Service Reserve Cap. Provided no Trigger Period (as defined below) is continuing, excess cash in the deposit account is required to be disbursed to the borrower in accordance with the Moffett Place Google Loan documents. If a Trigger Period is continuing (other than a Trigger Period due to a Lease Sweep Period),
THE INFORMATION IN THIS STRUCTURAL AND COLLATERAL TERM SHEET IS NOT COMPLETE AND MAY BE AMENDED PRIOR TO THE TIME OF SALE. THIS TERM SHEET IS NOT AN OFFER TO SELL THESE SECURITIES AND IT IS NOT A SOLICITATION OF AN OFFER TO BUY THESE SECURITIES IN ANY JURISDICTION WHERE THE OFFER OR SALE IS NOT PERMITTED.
35
1170 Bordeaux Drive Sunnyvale, CA 94089 | Collateral Asset Summary – Loan No. 2 Moffett Place Google | Cut-off Date Balance: Cut-off Date LTV: U/W NCF DSCR: U/W NOI Debt Yield: | $75,000,000 59.5% 1.38x 8.3% |
excess cash in the deposit account is required to be transferred to an account held by the lender as additional collateral for the Moffett Place Google Whole Loan.
A “Trigger Period” will commence upon the occurrence of (i) an event of default under the Moffett Place Google Whole Loan, (ii) a Low Debt Service Period (as defined below), (iii) a mezzanine loan default or (iv) a Lease Sweep Period (as defined below) and will end upon (a) with respect to clause (i), the date on which such event of default is cured, (b) with respect to clause (ii), the Low Debt Service Period has ended, (c) with respect to clause (iii), the date on which such mezzanine loan default is cured and (d) with respect to clause, (iv) such Lease Sweep Period has ended.
A “Low Debt Service Period” will commence if (i) as of any calculation date, the credit rating of a tenant (or the parent entity of such tenant) under a Lease Sweep Lease (as defined below) by Fitch, Moody’s or S&P is less than “BBB-”, “Baa3” or “BBB-”, respectively and (ii) the debt service coverage ratio, as of any calculation date, falls below 1.41x based on the Moffett Place Google Whole Loan balance or 1.10x based on the total debt (including the mezzanine loan balance), respectively, and will end when the debt service coverage ratio is at least 1.41x based on the Moffett Place Google Whole Loan balance and 1.10x based on the total debt (including the mezzanine loan balance) for two consecutive calendar quarters.
The debt service coverage ratio tests are calculated using straight-lined rents under the Google lease (or that of any successor tenant that is investment grade).
A “Lease Sweep Period” will commence upon the first monthly payment date following the earliest to occur of (a) July 6, 2023; (b) the date on which, with respect to a Lease Sweep Lease, (i) the tenant cancels or terminates its Lease Sweep Lease with respect to all or a Material Termination Portion (as defined below) of the space under its Lease Sweep Lease prior to the then current expiration date or (ii) the tenant delivers notice that it is canceling all or a Material Termination Portion of the space under the Lease Sweep Lease; (c) the date on which a tenant under a Lease Sweep Lease goes dark at 20% or more of its space under a Lease Sweep Lease; provided, however, that if the tenant under a Lease Sweep Lease is either (x) an investment grade entity or (y) has subleased the dark space portion of its premises to an investment grade entity that has accepted delivery thereof and is paying unabated rent at a rate no less than required under the Lease Sweep Lease, the tenant under a Lease Sweep Lease will not be deemed to have gone dark; (d) a default by the tenant under a Lease Sweep Lease that continues beyond the cure period; (e) the occurrence of an insolvency proceeding of a tenant under a Lease Sweep Lease or (f) the date on which, with respect to the Google lease, neither Google nor Google’s parent company is an investment grade entity. A Lease Sweep Period (other than a Lease Sweep Period triggered by an insolvency proceeding of a tenant under a Lease Sweep Lease) will not be triggered (or, if already triggered, may be terminated) if the borrower delivers to the lender an acceptable letter of credit in an amount equal to $11,002,320 ($35.00 PSF) provided, if such Lease Sweep Period is triggered by clause (c) or (f) above, such acceptable letter of credit will be in an amount equal to $15,717,600 ($50.00 PSF).
A Lease Sweep Period will end on the earliest to occur of (1), with respect to clauses (a) or (b) above, (A) with respect to the space under each Lease Sweep Lease, the tenant under a Lease Sweep Lease has exercised a renewal or extension, provided that the tenant under the Lease Sweep Lease is under a qualified lease, as described in the loan documents and satisfied the occupancy conditions, as described in the loan documents, (B) one or more replacement tenants acceptable to the lender execute and deliver replacement leases covering at least 75% of the sq. ft. demised under the Google lease, provided that the leases are qualified leases and the occupancy conditions, as described in the loan documents, are satisfied or (C) a combination of sub clause (A) and (B) above occurs; (2) with respect to clauses (c) or (f) above, the date on which either (A) one or more replacement tenants execute and deliver replacement leases covering at least 75% of the sq. ft. demised under the Google lease provided that the leases are qualified leases and the occupancy conditions, as described in the loan documents, are satisfied or (B) the Google tenant (or its parent) is restored as an investment grade entity or the entirety of the Lease Sweep Lease has been sublet to an investment grade entity that has accepted delivery thereof and is paying fully unabated rent at a contract rate not less than that required under a Lease Sweep Lease; (3) with respect to clause (d) above, the date on which the default has been cured and no other default under such Lease Sweep Lease occurs for three consecutive months following such cure; (4) with respect to clause (e) above, the applicable insolvency proceeding has been terminated and the applicable Lease Sweep Lease has been affirmed, assumed or assigned in a manner satisfactory to the lender, and (5) with respect to clauses (a), (b), (c), (d) and (f) above, the date on which the aggregate amount of funds transferred into the Lease Sweep Reserve Account and the Debt Service Reserve Account equals the applicable Lease Sweep and Debt Reserve Cap (as defined below) and if a Lease Sweep Period is continuing due to the occurrence of more than one Lease Sweep Event, the aggregate amount of funds required to be transferred over the course of the Lease Sweep Period shall be equal to the amount of the largest Lease Sweep And Debt Service Reserve Cap applicable to all then-continuing Lease Sweep Periods, such that each Lease Sweep Period shall be treated as concurrent and not duplicative or independent of another.
The “Lease Sweep and Debt Service Reserve Cap” means (i) with respect to a Lease Sweep Period continuing solely pursuant to clauses (a) and/or (d) above, $11,002,320 ($35.00 PSF); (ii) with respect to a Lease Sweep Period continuing solely pursuant to clause (b) above, $35.00 PSF of the terminated space; (iii) with respect to a Lease Sweep Period continuing pursuant to clause (c) above, whether or not a Lease Sweep Period pursuant to clauses (a), (b) and or/(d) above is concurrently continuing, $50.00 PSF of dark
THE INFORMATION IN THIS STRUCTURAL AND COLLATERAL TERM SHEET IS NOT COMPLETE AND MAY BE AMENDED PRIOR TO THE TIME OF SALE. THIS TERM SHEET IS NOT AN OFFER TO SELL THESE SECURITIES AND IT IS NOT A SOLICITATION OF AN OFFER TO BUY THESE SECURITIES IN ANY JURISDICTION WHERE THE OFFER OR SALE IS NOT PERMITTED.
36
1170 Bordeaux Drive Sunnyvale, CA 94089 | Collateral Asset Summary – Loan No. 2 Moffett Place Google | Cut-off Date Balance: Cut-off Date LTV: U/W NCF DSCR: U/W NOI Debt Yield: | $75,000,000 59.5% 1.38x 8.3% |
space; or (iv) with respect to clause (f) above, whether or not a Lease Sweep Period pursuant to clauses (a), (b), (c) and/or (d) above is concurrently continuing, $15,717,600 ($50.00 PSF).
The “Lease Sweep Reserve Threshold” means (i) with respect to a Lease Sweep Period continuing solely pursuant to clauses (a), (d) and/or (f) above, $9,430,560 ($30.00 PSF) or (ii) with respect to a Lease Sweep Period continuing solely pursuant to clause (b) or (c) above, $30.00 PSF of the dark or terminated space.
A “Lease Sweep Lease” is the Google lease or any replacement lease or leases which cover at least 75% of the rentable sq. ft. demised under the Google lease as of December 30, 2016.
A “Material Termination Portion” is, with respect to any space under a Lease Sweep Lease, if the tenant under a Lease Sweep Lease cancels or terminates its Lease Sweep Lease with respect to at least 40,000 or more sq. ft. of space (or, if a full floor of space is less than 40,000 sq. ft., a full floor of space) but less than the entirety of the space under such Lease Sweep Lease, the amount of space under the Lease Sweep Lease affected by such cancellation or termination.
Initial Reserves.At loan origination, the borrower deposited (i) $253,015 for into a tax reserve account; (ii) $12,312,957 for outstanding approved leasing expenses in connection with the Google lease and (iii) $17,051,831 to cover gap rent and rent concessions under the Google Inc. lease ($6,964,903 of which is for gap rent which covers full rent under the Google lease until the additional rent commencement date on June 1, 2017).
Ongoing Reserves.The borrower is required to deposit on a monthly basis (i) 1/12 of the estimated annual real estate taxes, which currently equates to $84,338, into the tax reserve account and (ii) unless an acceptable blanket insurance policy is in place, 1/12 of the estimated insurance premiums into an insurance account. Additionally, during a Lease Sweep Period, all excess cash flow in a minimum amount equal to $261,960 is required to be swept into the lease sweep reserve account.
Current Mezzanine or Subordinate Indebtedness. A mezzanine loan, with an original principal balance of $40,000,000, was funded concurrently with the funding of the Moffett Place Google Whole Loan. The mezzanine loan accrues interest at a rate of 6.50000%, is coterminous with the Moffett Place Google Whole Loan and is interest only for the first 60 months of its term, with principal and interest payments thereafter based on a fixed 30-year amortization schedule. The mezzanine loan is held by KDF REIT Investments, LLC.
Future Mezzanine or Subordinate Indebtedness Permitted. None.
THE INFORMATION IN THIS STRUCTURAL AND COLLATERAL TERM SHEET IS NOT COMPLETE AND MAY BE AMENDED PRIOR TO THE TIME OF SALE. THIS TERM SHEET IS NOT AN OFFER TO SELL THESE SECURITIES AND IT IS NOT A SOLICITATION OF AN OFFER TO BUY THESE SECURITIES IN ANY JURISDICTION WHERE THE OFFER OR SALE IS NOT PERMITTED.
37
1170 Bordeaux Drive Sunnyvale, CA 94089 | Collateral Asset Summary – Loan No. 2 Moffett Place Google | Cut-off Date Balance: Cut-off Date LTV: U/W NCF DSCR: U/W NOI Debt Yield: | $75,000,000 59.5% 1.38x 8.3% |
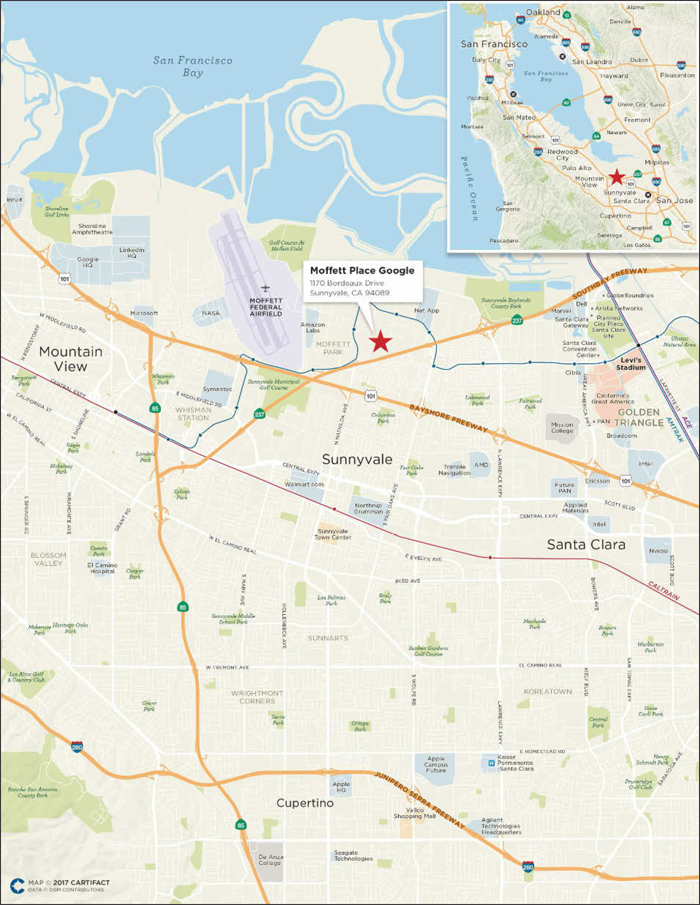
THE INFORMATION IN THIS STRUCTURAL AND COLLATERAL TERM SHEET IS NOT COMPLETE AND MAY BE AMENDED PRIOR TO THE TIME OF SALE. THIS TERM SHEET IS NOT AN OFFER TO SELL THESE SECURITIES AND IT IS NOT A SOLICITATION OF AN OFFER TO BUY THESE SECURITIES IN ANY JURISDICTION WHERE THE OFFER OR SALE IS NOT PERMITTED.
38
(THIS PAGE INTENTIONALLY LEFT BLANK)
THE INFORMATION IN THIS STRUCTURAL AND COLLATERAL TERM SHEET IS NOT COMPLETE AND MAY BE AMENDED PRIOR TO THE TIME OF SALE. THIS TERM SHEET IS NOT AN OFFER TO SELL THESE SECURITIES AND IT IS NOT A SOLICITATION OF AN OFFER TO BUY THESE SECURITIES IN ANY JURISDICTION WHERE THE OFFER OR SALE IS NOT PERMITTED.
39
Various | Collateral Asset Summary – Loan No. 3 Midwest Embassy Suites Portfolio | Cut-off Date Balance: Cut-off Date LTV: U/W NCF DSCR: U/W NOI Debt Yield: | $65,000,000 52.1% 2.17x 15.9% |

THE INFORMATION IN THIS STRUCTURAL AND COLLATERAL TERM SHEET IS NOT COMPLETE AND MAY BE AMENDED PRIOR TO THE TIME OF SALE. THIS TERM SHEET IS NOT AN OFFER TO SELL THESE SECURITIES AND IT IS NOT A SOLICITATION OF AN OFFER TO BUY THESE SECURITIES IN ANY JURISDICTION WHERE THE OFFER OR SALE IS NOT PERMITTED.
40
Various | Collateral Asset Summary – Loan No. 3 Midwest Embassy Suites Portfolio | Cut-off Date Balance: Cut-off Date LTV: U/W NCF DSCR: U/W NOI Debt Yield: | $65,000,000 52.1% 2.17x 15.9% |
| Mortgage Loan Information | |
| Loan Seller: | GACC |
| Loan Purpose: | Acquisition |
| Sponsor(1): | American Hotel Income Properties REIT Inc. |
| Borrower(2): | Various |
| Original Balance: | $65,000,000 |
| Cut-off Date Balance: | $65,000,000 |
| % by Initial UPB: | 7.2% |
| Interest Rate: | 4.7200% |
| Payment Date: | 6thof each month |
| First Payment Date: | March 6, 2017 |
| Maturity Date: | February 6, 2027 |
| Amortization: | Interest only for first 36 months, 360 months thereafter |
| Additional Debt: | None |
| Call Protection: | L(27), D(89), O(4) |
| Lockbox / Cash Management: | Hard / Springing |
| Reserves(3) | ||
| Initial | Monthly | |
| Taxes: | $100,000 | $123,073 |
| Insurance: | $0 | Springing |
| FF&E: | $0 | Springing |
| PIP: | $6,750,000 | NAP |
| Ground Rent Reserve: | $125,667 | $21,167 |
| Financial Information | ||
| Cut-off Date Balance / Room: | $83,120 | |
| Balloon Balance / Room: | $73,124 | |
| Cut-off Date LTV(4): | 52.1% | |
| Balloon LTV(4): | 45.9% | |
| Underwritten NOI DSCR: | 2.55x | |
| Underwritten NCF DSCR: | 2.17x | |
| Underwritten NOI Debt Yield: | 15.9% | |
| Underwritten NCF Debt Yield: | 13.5% | |
| Underwritten NOI Debt Yield at Balloon: | 18.1% | |
| Underwritten NCF Debt Yield at Balloon: | 15.4% | |
| Property Information | |
| Single Asset / Portfolio: | Portfolio of three properties |
| Property Type: | Full Service Hospitality |
| Collateral(5): | Fee Simple / Leasehold |
| Location: | Various |
| Year Built / Renovated: | Various / 2017 |
| Total Rooms: | 782 |
| Property Management(6): | Various |
| Underwritten NOI: | $10,322,965 |
| Underwritten NCF: | $8,801,837 |
| Appraised Value(4): | $124,700,000 |
| Appraisal Date(7): | December 2017 |
| Historical NOI | |
| Most Recent NOI: | $11,497,557 (T-12 February 28, 2017) |
| 2016 NOI(8): | $11,419,734 (December 31, 2016) |
| 2015 NOI(8): | $12,049,046 (December 31, 2015) |
| 2014 NOI: | $12,046,279 (December 31, 2014) |
| Historical Occupancy | |
| Most Recent Occupancy: | 72.0% (February 28, 2017) |
| 2016 Occupancy(8): | 71.3% (December 31, 2016) |
| 2015 Occupancy: | 73.0% (December 31, 2015) |
| 2014 Occupancy: | 74.5% (December 31, 2014) |
| (1) | The sponsor is also the sponsor of the mortgage loan identified on Annex A-1 to the Preliminary Prospectus as Embassy Suites Tempe, which has a Cut-off Date Balance of $13.5 million. |
| (2) | The borrowers for the Midwest Embassy Suites Portfolio Loan are: AHIP OH Cleveland Properties LLC; AHIP OH Cleveland Enterprises LLC; AHIP OH Columbus Properties LLC; AHIP OH Columbus Enterprises LLC; AHIP KY Covington Properties LLC; AHIP KY Covington Enterprises LLC. Each individual property has two related borrowers comprised of a fee owner and an operating lessee. |
| (3) | See “Initial Reserves” and “Ongoing Reserves” herein. |
| (4) | The Appraised Value, Cut-off Date LTV and Balloon LTV are calculated based on the “As Complete” value for the Midwest Embassy Suites Portfolio properties, which assumes the completion of the required PIP at each property. The estimated cost of each respective PIP was reserved in full at loan origination. Based on the “As Is” appraised value as of December, 2016 of $114,200,000, the loan has a Cut-off Date LTV and Maturity Date LTV of 56.9% and 50.1%, respectively. |
| (5) | The Midwest Embassy Suites Portfolio Loan is secured by a leasehold interest in the Embassy Suites Cincinnati, River Center property and fee interests in the Embassy Suites Columbus, Dublin and Embassy Suites Cleveland, Rockside properties. |
| (6) | The property management for the Midwest Embassy Suites Portfolio properties are: One OH Cleveland ES Management LLC; One OH Columbus ES Management LLC; One KY Covington ES Management LLC |
| (7) | Appraisal Dates for the Midwest Embassy Suites Portfolio properties are 12/19/2017 for the Embassy Suites Cincinnati, River Center property, 12/21/2017 for the Embassy Suites Cleveland, Rockside property and 12/20/2017 for the Embassy Suites Columbus, Dublin property. |
| (8) | There were approximately 3,588 offline room nights from September 2016 through January 2017 as well as renovations between January 2016 and March 2016. |
THE INFORMATION IN THIS STRUCTURAL AND COLLATERAL TERM SHEET IS NOT COMPLETE AND MAY BE AMENDED PRIOR TO THE TIME OF SALE. THIS TERM SHEET IS NOT AN OFFER TO SELL THESE SECURITIES AND IT IS NOT A SOLICITATION OF AN OFFER TO BUY THESE SECURITIES IN ANY JURISDICTION WHERE THE OFFER OR SALE IS NOT PERMITTED.
41
Various | Collateral Asset Summary – Loan No. 3 Midwest Embassy Suites Portfolio | Cut-off Date Balance: Cut-off Date LTV: U/W NCF DSCR: U/W NOI Debt Yield: | $65,000,000 52.1% 2.17x 15.9% |
| Historical Occupancy, ADR, RevPAR(1) | |||||||||
| Midwest Embassy Suites Portfolio | Competitive Set | Penetration Factor | |||||||
| Year | Occupancy | ADR | RevPAR | Occupancy | ADR | RevPAR | Occupancy | ADR | RevPAR |
| 2014(2) | 74.5% | $132.60 | $98.93 | 63.9% | $116.44 | $74.94 | 116.6% | 113.9% | 132.0% |
| 2015(3) | 73.7% | $133.03 | $98.20 | 63.8% | $116.72 | $74.96 | 115.5% | 114.0% | 131.0% |
| 2016(3) | 71.8% | $136.86 | $98.42 | 66.3% | $118.82 | $79.16 | 108.3% | 115.2% | 124.3% |
| T-12 Feb 2017(3) | 71.9% | $139.38 | $100.48 | 65.8% | $120.49 | $80.03 | 109.3% | 115.7% | 125.6% |
| (1) | Occupancy, ADR and RevPAR represent estimates from the hospitality research report. The variances between the underwriting, the appraisal and the above table with respect to Occupancy, ADR and RevPAR at the Midwest Embassy Suites Portfolio properties are attributable to variances in reporting methodologies and/or timing differences. |
| (2) | Source: December 2014 hospitality research report. |
| (3) | Source: February 2017 hospitality research report. |
| Portfolio Summary | |||||||||
Embassy Suites | Rooms | Year Built/ Renov. | Ownership Interest | Allocated Loan Amount ($) | % of Allocated Loan Amount | UW NCF | Appraised Value(1) | 2013-2016 CapEx. (Approx.) | 2017-2018 Reserved PIP |
| Columbus, Dublin | 284 | 1999 / 2017 | Fee Simple | $25,072,173 | 38.6% | $3,352,623 | $48,100,000 | $5,400,000 | $2,380,000 |
| Cleveland, Rockside | 271 | 2001 / 2017 | Fee Simple | $20,537,290 | 31.6% | $2,323,548 | $39,400,000 | $5,600,000 | $2,520,000 |
| Cincinnati, River Center | 227 | 1990 / 2017 | Leasehold | $19,390,537 | 29.8% | $3,125,665 | $37,200,000 | $5,200,000 | $1,850,000 |
| Total | 782 | $65,000,000 | 100.0% | $8,801,837 | $124,700,000 | $16,200,000 | $6,750,000 | ||
| (1) | The Appraised Value is based on the “As Complete” value for the Midwest Embassy Suites Portfolio properties, which assumes the completion of the required PIP at each property. The estimated cost of each respective PIP was reserved in full at loan origination. |
The Loan.The Midwest Embassy Suites Portfolio loan (the “Midwest Embassy Suites Portfolio Loan”) is a fixed rate loan with an Original and Cut-off Date principal balance of $65.0 million secured by the borrowers’ fee simple interest in two and leasehold interest in one full service Embassy Suites hotels totaling 782 rooms (the “Midwest Embassy Suites Portfolio Properties” and individually each a “Midwest Embassy Suites Portfolio Property”) located across three of Ohio’s metropolitan statistical areas (“MSAs”).
The Midwest Embassy Suites Portfolio Loan has a 10-year term and amortizes on a 30-year schedule after an initial 36-month interest only period. The Midwest Embassy Suites Portfolio Loan accrues interest at a fixed rate equal to 4.7200%. Loan proceeds, plus approximately $59.2 million of loan sponsor equity, were used to acquire the Midwest Embassy Suites Portfolio for $116.5 million, fund a $6.75 million PIP Reserve, fund a tax reserve and pay closing costs.
The Appraised Value, Cut-Off Date LTV and Maturity Date LTV of 52.1% and 45.9%, respectively, are calculated based on the “As Complete” value of $124.7 million for the Midwest Embassy Suites Portfolio Properties, which assumes the completion of the required property improvement plan (“PIP”) at each Embassy Suites Portfolio Property, the estimated cost of which was reserved at loan origination. Based on the “As Is” appraised value as of December 2016 of $114.2 million, the Midwest Embassy Suites Portfolio Loan has a Cut-off Date LTV and Maturity Date LTV of 56.9% and 50.1%, respectively. The appraiser also concluded an “As Stabilized” value of $128.1 million as of December 2018, assuming PIP completion, which would result in a Cut-off Date LTV and Maturity Date LTV of 50.7% and 44.6%, respectively.
The “As-is” appraised value of $114.2 million corresponds to the $116.5 million purchase price of the Midwest Embassy Suites Portfolio. Additionally, the “as complete” Appraised Value of $124.7 million corresponds to the loan sponsor’s cost basis for the Midwest Embassy Suites Portfolio, which after the completion of the $6.75 million PIP in December 2018, is expected to be $123.25 million.
The Midwest Embassy Suites Portfolio Loan proceeds, along with $60.0 million of sponsor equity, were used to acquire the Midwest Embassy Suites Portfolio for a purchase price of $116.5 million, fund approximately $7.0 million in upfront reserves and pay closing costs of approximately $1.5 million. The most recent prior financing of the Midwest Embassy Suites Portfolio was included in the CDGJ 2014-BXCH securitization.
THE INFORMATION IN THIS STRUCTURAL AND COLLATERAL TERM SHEET IS NOT COMPLETE AND MAY BE AMENDED PRIOR TO THE TIME OF SALE. THIS TERM SHEET IS NOT AN OFFER TO SELL THESE SECURITIES AND IT IS NOT A SOLICITATION OF AN OFFER TO BUY THESE SECURITIES IN ANY JURISDICTION WHERE THE OFFER OR SALE IS NOT PERMITTED.
42
Various | Collateral Asset Summary – Loan No. 3 Midwest Embassy Suites Portfolio | Cut-off Date Balance: Cut-off Date LTV: U/W NCF DSCR: U/W NOI Debt Yield: | $65,000,000 52.1% 2.17x 15.9% |
| Sources and Uses(1) | ||||||
| Sources | Proceeds | % of Total | Uses | Proceeds | % of Total | |
| Loan Amount | $65,000,000 | 52.0% | Purchase Price | $116,500,000 | 93.2% | |
| Borrower Equity | $60,007,698 | 48.0% | Reserves | $6,975,667 | 5.6% | |
| Closing Costs | $1,532,031 | 1.2% | ||||
| Total Sources | $125,007,698 | 100.0% | Total Uses | $125,007,698 | 100.0% | |
| (1) | The Midwest Embassy Suites Portfolio Properties were part of a 13-hotel portfolio owned by Eagle Hospitality Properties Trust, which was acquired by the seller via foreclosure in 2012. Please see “Description of the Mortgage Pool-Loan Purpose; Default History, Bankruptcy Issues and Other Proceedings” in the Preliminary Prospectus. |
The Borrowers / Sponsors. The borrowers are AHIP OH Cleveland Properties LLC; AHIP OH Cleveland Enterprises LLC; AHIP OH Columbus Properties LLC; AHIP OH Columbus Enterprises LLC; AHIP KY Covington Properties LLC and AHIP KY Covington Enterprises LLC, each a single purpose Delaware limited liability company structured to be bankruptcy-remote, each with two independent directors in its organizational structure. Each individual property has two related borrowers comprised of a fee owner and an operating lessee. The sponsor of the borrowers and the nonrecourse carve-out guarantor is American Hotel Income Properties REIT Inc., which is the United States holding company for all of American Hotel Income Properties REIT LP’s (“AHIP”) United States assets. AHIP is traded on the Toronto Exchange under the symbol HOT.UN and has holdings of 95 hotel properties within 30 states.
The Properties.The Midwest Embassy Suites Portfolio Properties consist of three full service hotels containing 782 rooms situated across three of Ohio’s MSAs: Columbus, Cleveland and Cincinnati. The Midwest Embassy Suites Portfolio Properties were built between 1990 and 2001. The previous owner reportedly spent approximately $16.2 million ($20,700 per room) on renovations at the Midwest Embassy Suites Portfolio Properties between 2013 and 2016, which included building exteriors, public areas and guest room upgrades.
Each of the Midwest Embassy Suites Portfolio Properties operates under a recently renewed 15-year franchise agreement with Hilton Franchise Holding LLC, which expires on January 31, 2032. As part of the franchise renewal, the borrowers are required to complete a $6.75 million ($8,632 per room) PIP by January 2019. The $6.75 million PIP, the estimated cost of which was fully reserved at loan origination, is aimed at enhancing the public areas at each of the Midwest Embassy Suites Portfolio Properties including the atriums, meeting rooms, corridors and public bathrooms, among others.
Embassy Suites Columbus, Dublin: The Embassy Suites Columbus, Dublin is an eight-story full service hotel located in the city of Dublin, Ohio, approximately 17 miles north of the Columbus central business district (“CBD”). The property opened in 1999 and features 284 suites, 12,830 sq. ft. of meeting space, a breakfast buffet area, restaurant and lounge, atrium bar, a fitness center, an indoor pool and a business center. The hotel offers oversized guestrooms relative to its competitive set according to the appraiser. Guest rooms feature a separate living area with a sofa bed, a wet bar, a refrigerator and high-speed internet access.
The Embassy Suites Columbus Dublin property is subject to a tax increment financing agreement (“TIF Agreement”). The TIF Agreement provides certain additional restrictions on the Embassy Suites Columbus Dublin property and adjacent lots. The TIF Agreement also provides that the covenant to make the service payment in lieu of taxes has priority over other liens and encumbrances, which is similar in nature to the priority of real estate taxes. The county confirmed that the amount of tax payments will not change solely due to the TIF Agreement expiring.
From 2013 to 2017, the prior owner reportedly spent approximately $5.4 million ($18,500 per room) on capital improvements at the Embassy Suites Columbus, Dublin property, which included renovation of the ballroom, fitness center, back of the house and guest rooms. In addition, the borrowers are in the process of implementing a $2.38 million ($8,380 per room) PIP at the Embassy Suites Columbus, Dublin property. The PIP is expected to mainly focus on the public areas within the Embassy Suites Columbus, Dublin property, including the atrium and meeting rooms, among others and is required to be finished by January 2019 according to the franchise agreement.
Embassy Suites Cleveland, Rockside: The Embassy Suites Cleveland, Rockside property is an eight-story full service hotel located in Independence, Ohio approximately 7 miles south from downtown Cleveland. The property opened in 2001 and features 271 suites, a restaurant and lounge, a pool, a fitness center and a business center. The hotel also offers approximately 12,792 sq. ft. of meeting space, which is second highest in its competitive set according to the appraiser. Guest rooms feature a sofa bed and a mini-refrigerator.
The city of Independence is proposing a partial condemnation on the Embassy Suites Cleveland, Rockside property consisting of a utility easement with related temporary construction easement for a sanitary sewer line. The new easement is expected to run through a portion of the parking lot and along the outer boundary of the property. It is expected that construction will take place within a period of 21-30 days or less and during times designated to cause the least impact on business operations. The borrower has indicated that the piping has already been placed in the ground, with the final asphalt and landscaping to be completed.
THE INFORMATION IN THIS STRUCTURAL AND COLLATERAL TERM SHEET IS NOT COMPLETE AND MAY BE AMENDED PRIOR TO THE TIME OF SALE. THIS TERM SHEET IS NOT AN OFFER TO SELL THESE SECURITIES AND IT IS NOT A SOLICITATION OF AN OFFER TO BUY THESE SECURITIES IN ANY JURISDICTION WHERE THE OFFER OR SALE IS NOT PERMITTED.
43
Various | Collateral Asset Summary – Loan No. 3 Midwest Embassy Suites Portfolio | Cut-off Date Balance: Cut-off Date LTV: U/W NCF DSCR: U/W NOI Debt Yield: | $65,000,000 52.1% 2.17x 15.9% |
From 2013 to 2017, the prior owner reportedly spent approximately $5.6 million ($20,600 per room) on capital improvements at the Embassy Suites Cleveland, Rockside property, which included renovation of the breakfast area and guest rooms. In addition, the borrowers are in the process of implementing a $2.52 million ($8,782 per room) PIP at the Embassy Suites Cleveland, Rockside property. The PIP is expected to mainly focus on the public areas within the Embassy Suites Columbus, Dublin property, including the lobby and the atrium, among others and is required to be finished by January 2019 according to the franchise agreement.
Embassy Suites Cincinnati, River Center (Covington, KY): Embassy Suites Cincinnati, River Center property is a nine-story full service hotel located in Covington, Kentucky, directly across the Ohio River and approximately three miles south of downtown Cincinnati, Ohio. The property opened for business in 1990 and features 227 suites, a breakfast dining area, a bar and lounge, an indoor pool, a fitness center, a business center and approximately 8,126 sq. ft. of meeting space. The hotel offers oversized guestrooms relative to its competitive set according to the appraiser and certain rooms offer views of the Ohio River and downtown Cincinnati. Guest rooms feature a sofa bed and a mini-refrigerator.
The Embassy Suites Cincinnati, River Center property is comprised of a leasehold interest,as it is built within air rights owned by the city of Covington. The hotel is subject to an air rights lease with the city of Covington, Kentucky Municipal Properties Corporation that commenced in August 1988 and automatically renewed in June 2015 through June 2040. The air rights lease has four additional 25-year automatic renewal options that expire in June 2140. The city of Covington owns the fee simple title to the underlying land and garage and plaza. The Embassy Suites Cincinnati, River Center is built on top of these city-owned and operated structures utilizing air rights. The ground rent is equal to the lesser of 5% of room revenue in excess of $4.5 million or $200,000. Additionally, approximately $50,000 of expense is associated with the air rights lease for costs that are required to be paid by the ground lessee, such as real estate taxes, assessments, other government-related fees, and repairing and maintaining one-third of the adjoining city plaza. In addition, the hotel has the right to 100 parking spaces within the garage under a parking lease for which it pays an additional $54,000 per year. The parking lease had an initial term of 25 years with five, 25-year renewal periods, the first of which was initiated on June 30, 2015.
From 2013 to 2017, the prior owner reportedly spent approximately $5.2 million ($23,100 per room) on capital improvements at the Embassy Suites Cincinnati, River Center property, which included renovation to the building exterior, lobby, restaurants, fitness center, pool, elevators, mechanical systems, meeting rooms and guest rooms. In addition, the borrowers are in the process of implementing a $1.85 million ($8,150 per room) PIP at the Embassy Suites Cincinnati, River Center property. The PIP is expected to mainly focus on the public areas within the Embassy Suites Cincinnati, River Center property, including the lobby and the atrium, among others and is required to be finished by January 2019 according to the franchise agreement.
Environmental Matters.The Phase I environmental reports dated November 18, 2016 for each of Embassy Suites Columbus, Dublin and Embassy Suites Cleveland, Rockside and dated November 21, 2016 for Embassy Suites Cincinnati, River Center recommended no further action at the Midwest Embassy Suites Portfolio properties.
The Market.The Midwest Embassy Suites Portfolio Properties are located in three of Ohio’s MSAs: Columbus, Cleveland and Cincinnati. All three of the Midwest Embassy Suites Portfolio Properties are located proximate to headquarters as well as large regional offices of several companies within their respective CBDs and derive demand from corporate clients in the area, with a weighted average segmentation of 49% for commercial, 33% for meeting and group and 18% for leisure according to the appraisals. The Midwest Embassy Suites Portfolio Properties have outperformed their respective markets and realized a weighted average RevPAR index ranging from 124.3% to 132.0% since 2014 according to hospitality research reports.
Embassy Suites Columbus, Dublin (Dublin, OH): The Embassy Suites Columbus, Dublin property is located in the city of Dublin, Ohio, within the Columbus MSA. The Embassy Suites Columbus, Dublin property is positioned at the convergence of two interstates, including interstate-270 and State Route 161, which provide access to the Columbus CBD, approximately 17 miles to the south. The city of Dublin is home to the headquarters of a number of companies as well as large regional offices, including Cardinal Health, OCLC, Wendy’s Co, CareWorks, Fiserv and Express Scripts, all of which are all located within a 2.5 mile radius of the Embassy Suites Columbus, Dublin property. The Embassy Suites Columbus, Dublin property is also located 1.5 miles west of Bridge Park, a new 30-acre mixed use development that will feature 720 apartment units, 373,000 sq. ft. of office space and 115,000 sq. ft. of entertainment space, Phase I of which was delivered in the fall of 2016. According to the appraisal, the property’s historical estimated demand segmentation was approximately 60% commercial, 30% meeting and group and 10% leisure.
According to the appraisal, there are two hotel developments in the immediate area and each is expected to be approximately 50% competitive with the Embassy Suites Columbus, Dublin property due mainly to their respective proximate location. A 129-key Home2 Suites by Hilton is expected to open by mid-2017 and is expected to primarily target extended-stay travelers. Additionally, a 150-Key AC Hotel by Marriott is being developed with an adjacent 19,000 square foot conference center with construction expected to be completed by the summer of 2017.
According to a February 2017 hospitality report, the Embassy Suites Columbus, Dublin property competes with six other hotels with a total of 1,607 keys. As of the trailing 12 months ended February 2017, the Embassy Suites Columbus, Dublin property reported an occupancy of 74.8%, ADR of $135.88 and RevPAR of $101.66, resulting in a RevPAR index of 149.4% relative to the competitive set.
THE INFORMATION IN THIS STRUCTURAL AND COLLATERAL TERM SHEET IS NOT COMPLETE AND MAY BE AMENDED PRIOR TO THE TIME OF SALE. THIS TERM SHEET IS NOT AN OFFER TO SELL THESE SECURITIES AND IT IS NOT A SOLICITATION OF AN OFFER TO BUY THESE SECURITIES IN ANY JURISDICTION WHERE THE OFFER OR SALE IS NOT PERMITTED.
44
Various | Collateral Asset Summary – Loan No. 3 Midwest Embassy Suites Portfolio | Cut-off Date Balance: Cut-off Date LTV: U/W NCF DSCR: U/W NOI Debt Yield: | $65,000,000 52.1% 2.17x 15.9% |
Embassy Suites Cleveland, Rockside (Independence, OH):The Embassy Suites Cleveland, Rockside property is located in the city of Independence, Ohio, within the Cleveland MSA. The hotel is just east of the intersection of Interstate-77 and 480 near Rockside Road, a major commercial thoroughfare in the area. Prominent employers in the area include Travelers Insurance, Farmers Insurance, Nations Lending Corp, UTC Aerospace Systems and the Internal Revenue Service. Additionally, the Cleveland Clinic, which had approximately 6.62 million patient visits in 2014, is located approximately one mile southwest of the Embassy Suites Cleveland, Rockside property. According to the appraisal, the property’s historical estimated demand segmentation was approximately 46% commercial, 30% meeting and group and 24% leisure, with primary accounts including Airgas and Honeywell as well as Cleveland Clinic.
According to the appraisal, there is one recently opened and one proposed hotel in the submarket. A 105-room, Home2 Suites recently opened in December 2016 and is expected to be 50% competitive with the Embassy Suites Cleveland, Rockside property. Despite targeting extended-stay business, the Home2 Suites is expected to be competitive mainly due to its proximity to the Embassy Suites Cleveland, Rockside property. The proposed 120-key hotel has not begun construction.
According to a February 2017 hospitality report, the Embassy Suites Cleveland, Rockside property competes with five other hotels with a total of 1,005 keys. As of the trailing 12 months ended February 2017, the Embassy Suites Cleveland, Rockside property reported an occupancy of 67.5%, ADR of $126.21 and RevPAR of $85.17, resulting in a RevPAR index of 128.6% relative to the competitive set.
Embassy Suites Cincinnati, River Center (Covington, KY): The Embassy Suites Cincinnati, River Center property is situated along the banks of the Ohio River in Covington. The hotel is situated within the Covington CBD and approximately three miles north of Cincinnati CBD, which is accessible via the John A. Roebling Suspension Bridge adjacent to the Embassy Suites Cincinnati, River Center property. The Embassy Suites Cincinnati, River Center property is located within one mile of Paul Brown Stadium and the Great American Ball Park. The Embassy Suites Cincinnati, River Center property is also less than one mile from the Northern Kentucky Convention Center (110,000 sq. ft. of meeting, exhibition and social function space) and less than two miles from the Duke Energy Convention Center (750,000 sq. ft. of exhibit, meeting and entertainment space). The Embassy Suites Cincinnati, River Center property is within three miles of corporate headquarters for Fifth Third Bancorp, Macy’s, Kroger and Procter & Gamble. According to the appraisal, the property’s historical estimated demand segmentation was approximately 40% commercial, 39% meeting and group and 21% leisure, with primary accounts including Fidelity investments, Aramark, Proctor & Gamble, Ashland, GE, Tier 1 and Net Jets.
According to the appraisal, there are two properties in Cincinnati, Ohio that may compete with the Embassy Suites Cincinnati, River Center property. The first is a 114-key Hotel Covington which opened in September 2016 five blocks away. This property is expected to be 100% competitive. The second is a 144-room Aloft Newport on the Levee which is expected to open January 2017. This hotel is considered to be 25% competitive since it is located on the southern bank of the Ohio River in a mixed-use complex with similar access to downtown Cincinnati.
According to a February 2017 hospitality report, the Embassy Suites Cincinnati, River Center property competes with four other hotels with a total of 1,829 keys. As of the trailing 12 months ended February 2017, the Embassy Suites Cincinnati, River Center property reported an occupancy of 73.5%, ADR of $159.49 and RevPAR of $117.28, resulting in a RevPAR index of 105.2% relative to the competitive set.
THE INFORMATION IN THIS STRUCTURAL AND COLLATERAL TERM SHEET IS NOT COMPLETE AND MAY BE AMENDED PRIOR TO THE TIME OF SALE. THIS TERM SHEET IS NOT AN OFFER TO SELL THESE SECURITIES AND IT IS NOT A SOLICITATION OF AN OFFER TO BUY THESE SECURITIES IN ANY JURISDICTION WHERE THE OFFER OR SALE IS NOT PERMITTED.
45
Various | Collateral Asset Summary – Loan No. 3 Midwest Embassy Suites Portfolio | Cut-off Date Balance: Cut-off Date LTV: U/W NCF DSCR: U/W NOI Debt Yield: | $65,000,000 52.1% 2.17x 15.9% |
Cash Flow Analysis.
| Cash Flow Analysis | ||||||||
| 2013 | 2014 | 2015(1) | 2016(1) | T-12 2/28/2017 | U/W(2) | U/W per Room | ||
| Occupancy | 74.9% | 74.4% | 73.0% | 71.3% | 72.0% | 71.5% | ||
| ADR | $127.97 | $132.70 | $136.67 | $139.30 | $139.40 | $139.16 | ||
| RevPAR | $95.82 | $98.79 | $99.81 | $99.37 | $100.36 | $99.47 | ||
| Room Revenue | $27,350,000 | $28,196,956 | $28,488,533 | $28,440,572 | $28,646,929 | $28,392,875 | $36,308 | |
| F&B Revenue | 8,679,000 | 8,871,648 | 9,128,004 | 8,769,279 | 8,619,256 | 8,855,132 | 11,324 | |
| Other Revenue | 859,000 | 536,878 | 508,908 | 765,284 | 733,059 | 780,209 | 998 | |
| Total Revenue | $36,888,000 | $37,605,482 | $38,125,445 | $37,975,135 | $37,999,244 | $38,028,216 | $48,629 | |
| Operating Expenses | 12,304,000 | 12,225,324 | 12,899,940 | 12,891,472 | 13,040,027 | 12,818,390 | 16,392 | |
| Undistributed Expenses | 10,182,000 | 10,407,786 | 10,263,258 | 10,799,449 | 10,863,450 | 10,515,811 | 13,447 | |
| Gross Operating Profit | $14,402,000 | $14,972,372 | $14,962,247 | $14,284,214 | $14,095,767 | $14,694,016 | $18,790 | |
| Management Fee(3) | 1,107,000 | 865,204 | 848,991 | 838,919 | 866,050 | 1,330,988 | 1,702 | |
| Total Fixed Charges | 2,087,000 | 2,060,889 | 2,064,210 | 2,025,561 | 1,732,160 | 3,040,063 | 3,888 | |
| Net Operating Income | $11,208,000 | $12,046,279 | $12,049,046 | $11,419,734 | $11,497,557 | $10,322,965 | $13,201 | |
| FF&E(4) | 1,476,000 | 1,504,219 | 1,525,018 | 1,519,005 | 1,519,970 | 1,521,129 | 1,945 | |
| Net Cash Flow | $9,732,000 | $10,542,060 | $10,524,028 | $9,900,729 | $9,977,587 | $8,801,837 | $11,256 | |
| (1) | There were approximately 3,588 offline room nights from September 2016 through January 2017 as well as renovations between January 2016 and March 2016. |
| (2) | U/W assumptions are based on the T-12 10/31/2016 figures, which are not represented in the chart above. |
| (3) | U/W Management Fee is 3.5% of gross revenues. |
| (4) | U/W FF&E represents 4.0% of gross revenues. |
Property Management. The Midwest Embassy Suites Portfolio Properties are managed by ONE Lodging Management, an affiliate of the borrowers.
Lockbox / Cash Management.The Midwest Embassy Suites Portfolio Loan is structured with a hard lockbox and springing cash management. All credit card receipts are required to be deposited directly into a clearing account controlled by the lender and the borrowers and property manager are required to deposit all other rent and payments into the clearing account within one day of receipt. Unless a Trigger Period is ongoing, all amounts on deposit in the clearing account are required to be swept daily into the borrowers’ account. During a Trigger Period, all amounts on deposit in the clearing account are required to be swept daily into an account controlled by the lender.
A “Trigger Period” will commence upon (i) an event of default or (ii) the commencement of a Low Debt Service Period (as defined below).
A “Low Debt Service Period” will occur if the debt service coverage ratio for the trailing 12-month period is less than 1.25x on the last day of any calendar quarter and will end if the debt service coverage ratio for the trailing 12-month period is at least 1.30x for two consecutive calendar quarters.
Initial Reserves.At loan origination, the borrowers deposited (i) $100,000 into a tax reserve account (ii) $125,667 into a ground rent reserve and (iii) $6,750,000 into a PIP reserve account.
Ongoing Reserves.On a monthly basis, the borrowers are required to deposit monthly reserves of (i) 1/12 of the estimated annual real estate taxes, which currently equates to $123,073, into a tax reserve account and (ii) $21,167 into a ground rent reserve account, which is capped at $250,000. Beginning February 6, 2019, the borrowers are required to deposit the greater of (x) 1/12 of 4% of the estimated annual rents deposited on a monthly basis and (y) the amount required by the franchise agreement into a reserve for furniture, fixtures and equipment (“FF&E”). In lieu of making such deposits in to the FF&E Reserve, the borrowers may deliver a letter of credit in an amount equal to 4% of rents for the 12 months prior to delivery, to be adjusted annually. In the event an acceptable blanket insurance policy is no longer in place, the borrowers will be required to deposit monthly 1/12th of the annual insurance premiums. The borrowers have a blanket insurance policy in place.
Current Mezzanine or Subordinate Indebtedness. None.
THE INFORMATION IN THIS STRUCTURAL AND COLLATERAL TERM SHEET IS NOT COMPLETE AND MAY BE AMENDED PRIOR TO THE TIME OF SALE. THIS TERM SHEET IS NOT AN OFFER TO SELL THESE SECURITIES AND IT IS NOT A SOLICITATION OF AN OFFER TO BUY THESE SECURITIES IN ANY JURISDICTION WHERE THE OFFER OR SALE IS NOT PERMITTED.
46
Various | Collateral Asset Summary – Loan No. 3 Midwest Embassy Suites Portfolio | Cut-off Date Balance: Cut-off Date LTV: U/W NCF DSCR: U/W NOI Debt Yield: | $65,000,000 52.1% 2.17x 15.9% |
Future Mezzanine or Subordinate Indebtedness Permitted. None.
Partial Release. Following the lockout period, the borrowers are permitted to obtain the release of an individual Embassy Suites Portfolio Property upon a bona fide third-party sale provided, among other things, (i) borrowers defease an amount of principal equal to 110% of the allocated loan amount for the Embassy Suites Portfolio Property being released; (ii) after giving effect to the sale and the defeasance, (a) the debt service coverage ratio for the remaining Embassy Suites Portfolio Properties is no less than the greater of the debt service coverage ratio immediately preceding the sale and 1.89x and (b) the loan to value ratio for the remaining properties is no more than the lesser of the loan to value ratio immediately preceding the sale and 52.1%; provided, that if the debt yield for the remaining Embassy Suites Portfolio Properties is 15.0% or higher, the release is not subject to such loan to value ratio condition; and (iii) there is compliance with REMIC-related requirements.
THE INFORMATION IN THIS STRUCTURAL AND COLLATERAL TERM SHEET IS NOT COMPLETE AND MAY BE AMENDED PRIOR TO THE TIME OF SALE. THIS TERM SHEET IS NOT AN OFFER TO SELL THESE SECURITIES AND IT IS NOT A SOLICITATION OF AN OFFER TO BUY THESE SECURITIES IN ANY JURISDICTION WHERE THE OFFER OR SALE IS NOT PERMITTED.
47
Various | Collateral Asset Summary – Loan No. 3 Midwest Embassy Suites Portfolio | Cut-off Date Balance: Cut-off Date LTV: U/W NCF DSCR: U/W NOI Debt Yield: | $65,000,000 52.1% 2.17x 15.9% |
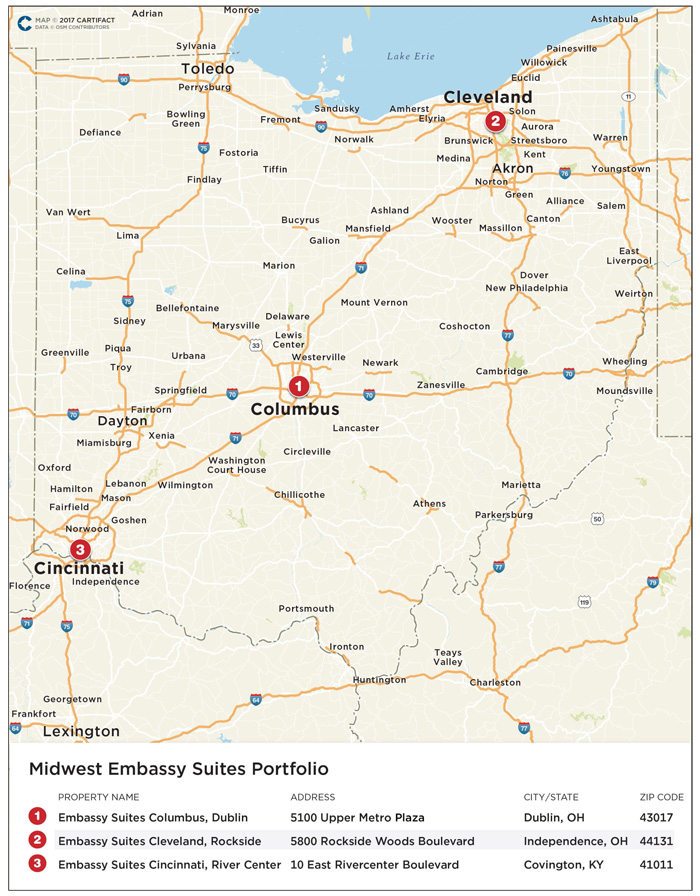
THE INFORMATION IN THIS STRUCTURAL AND COLLATERAL TERM SHEET IS NOT COMPLETE AND MAY BE AMENDED PRIOR TO THE TIME OF SALE. THIS TERM SHEET IS NOT AN OFFER TO SELL THESE SECURITIES AND IT IS NOT A SOLICITATION OF AN OFFER TO BUY THESE SECURITIES IN ANY JURISDICTION WHERE THE OFFER OR SALE IS NOT PERMITTED.
48
(THIS PAGE INTENTIONALLY LEFT BLANK)
THE INFORMATION IN THIS STRUCTURAL AND COLLATERAL TERM SHEET IS NOT COMPLETE AND MAY BE AMENDED PRIOR TO THE TIME OF SALE. THIS TERM SHEET IS NOT AN OFFER TO SELL THESE SECURITIES AND IT IS NOT A SOLICITATION OF AN OFFER TO BUY THESE SECURITIES IN ANY JURISDICTION WHERE THE OFFER OR SALE IS NOT PERMITTED.
49
900, 1000, 1200 & 1255 Corporate Center Drive Monterey Park, CA 91754 | Collateral Asset Summary – Loan No. 4 Los Angeles Corporate | Cut-off Date Balance: Cut-off Date LTV: U/W NCF DSCR: U/W NOI Debt Yield: | $58,725,000 66.9% 1.69x 11.8% |
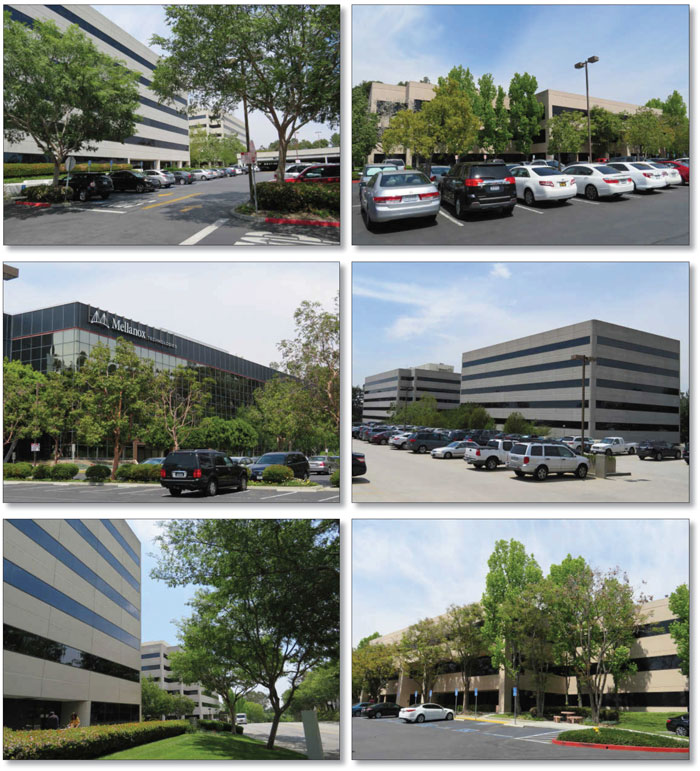
THE INFORMATION IN THIS STRUCTURAL AND COLLATERAL TERM SHEET IS NOT COMPLETE AND MAY BE AMENDED PRIOR TO THE TIME OF SALE. THIS TERM SHEET IS NOT AN OFFER TO SELL THESE SECURITIES AND IT IS NOT A SOLICITATION OF AN OFFER TO BUY THESE SECURITIES IN ANY JURISDICTION WHERE THE OFFER OR SALE IS NOT PERMITTED.
50
900, 1000, 1200 & 1255 Corporate Center Drive Monterey Park, CA 91754 | Collateral Asset Summary – Loan No. 4 Los Angeles Corporate | Cut-off Date Balance: Cut-off Date LTV: U/W NCF DSCR: U/W NOI Debt Yield: | $58,725,000 66.9% 1.69x 11.8% |
| Mortgage Loan Information | |
| Loan Seller: | CREFI |
| Loan Purpose: | Acquisition |
| Sponsors: | Benjamin Nazarian; Neil Kadisha |
| Borrowers: | Omninet LACC, LLC; Omninet LACC Tucson, LLC; Omninet LACC Valencia, LLC |
| Original Balance: | $58,725,000 |
| Cut-off Date Balance: | $58,725,000 |
| % by Initial UPB: | 6.5% |
| Interest Rate: | 4.7000% |
| Payment Date: | 6thof each month |
| First Payment Date: | May 6, 2017 |
| Maturity Date: | April 6, 2027 |
| Amortization: | Interest only for first 36 months; 360 months thereafter |
| Additional Debt: | NAP |
| Call Protection: | L(25), D(88), O(7) |
| Lockbox / Cash Management: | Hard / Springing |
| Reserves(1) | ||
| Initial | Monthly | |
| Taxes: | $0 | $91,347 |
| Insurance: | $11,267 | $5,633 |
| Replacement: | $0 | $6,582 |
| TI/LC: | $0 | $54,298 |
| Free Rent Reserve: | $1,086,963 | $0 |
| Unfunded Obligations Reserve: | $5,286,382 | $0 |
| Deferred Maintenance Reserve: | $373,520 | $0 |
| Fire Department Reserve: | $0 | Springing |
| Lease Sweep Reserve: | $0 | Springing |
| Financial Information | ||||
| Cut-off Date Balance / Sq. Ft.: | $149 | |||
| Balloon Balance / Sq. Ft.: | $131 | |||
| Cut-off Date LTV(2): | 66.9% | |||
| Balloon LTV(2): | 58.8% | |||
| Underwritten NOI DSCR: | 1.89x | |||
| Underwritten NCF DSCR: | 1.69x | |||
| Underwritten NOI Debt Yield: | 11.8% | |||
| Underwritten NCF Debt Yield: | 10.5% | |||
| Underwritten NOI Debt Yield at Balloon: | 13.4% | |||
| Underwritten NCF Debt Yield at Balloon: | 11.9% | |||
| Property Information | |
| Single Asset / Portfolio: | Single Asset |
| Property Type: | Suburban Office |
| Collateral: | Fee Simple |
| Location: | Monterey Park, CA |
| Year Built / Renovated: | 1983-1986 / NAP |
| Total Sq. Ft.: | 394,893 |
| Property Management: | Omninet Property Management, Inc. |
| Underwritten NOI(3): | $6,907,583 |
| Underwritten NCF: | $6,159,021 |
| Appraised Value(2): | $87,750,000 |
| Appraisal Date(2): | August 1, 2017 |
| Historical NOI | |
| Most Recent NOI(3): | $5,380,611 (December 31, 2016) |
| 2015 NOI: | $4,476,519 (December 31, 2015) |
| 2014 NOI: | $4,238,152 (December 31, 2014) |
| 2013 NOI: | $5,292,839 (December 31, 2013) |
| Historical Occupancy | |
| Most Recent Occupancy(4): | 93.2% (February 6, 2017) |
| 2016 Occupancy: | 85.0% (December 31, 2016) |
| 2015 Occupancy: | 77.0% (December 31, 2015) |
| 2014 Occupancy: | 73.6% (December 31, 2014) |
| (1) | See “Initial Reserves” and “Ongoing Reserves” herein. |
| (2) | The Cut-off Date LTV and Balloon LTV are calculated based upon, and the Appraised Value reflects, the Los Angeles Corporate Center Property’s “As Stabilized” value of $87,750,000, which assumes a stabilized occupancy of approximately 93.0% due to recent tenant expansions and renewals that are scheduled to take place no later than August 2017. The appraiser concluded an “As-is” appraised value of $83,600,000. The Cut-off Date LTV and Balloon LTV calculated based on the Los Angeles Corporate Center Property’s “as-is” value are 70.2% and 61.8%, respectively. |
| (3) | The increase in Underwritten NOI over Most Recent NOI is primarily due to the inclusion of several new tenants at the Los Angeles Corporate Center Property accounting for over $1.0 million in base rent and the inclusion of contractual rent steps of $24,171 for various tenants through October 1, 2017, as well as the present value of future rent steps for Department of Social Services ($178,154) and County of Los Angeles Fire Department ($94,868). |
| (4) | Most Recent Occupancy is based on the underwritten rent roll dated February 6, 2017 which includes the County of Los Angeles Fire Department, a tenant with an executed lease that has not taken occupancy of its space and is not paying rent. At closing, seven months of gap rent and 100% of unfunded tenant improvement obligations were escrowed. |
THE INFORMATION IN THIS STRUCTURAL AND COLLATERAL TERM SHEET IS NOT COMPLETE AND MAY BE AMENDED PRIOR TO THE TIME OF SALE. THIS TERM SHEET IS NOT AN OFFER TO SELL THESE SECURITIES AND IT IS NOT A SOLICITATION OF AN OFFER TO BUY THESE SECURITIES IN ANY JURISDICTION WHERE THE OFFER OR SALE IS NOT PERMITTED.
51
900, 1000, 1200 & 1255 Corporate Center Drive Monterey Park, CA 91754 | Collateral Asset Summary – Loan No. 4 Los Angeles Corporate | Cut-off Date Balance: Cut-off Date LTV: U/W NCF DSCR: U/W NOI Debt Yield: | $58,725,000 66.9% 1.69x 11.8% |
| Tenant Summary(1) | ||||||||
Tenant | Ratings (Fitch/Moody’s/S&P)(2) | Net Rentable Area (Sq. Ft.) | % of Net Rentable Area | U/W Base Rent PSF(3) | % of Total U/W Base Rent | Lease Expiration | ||
| State Compensation Insurance Fund(4) | AA-/Aa3/AA- | 83,021 | 21.0% | $32.09 | 23.6% | 3/15/2023 | ||
| Department of Social Services(5) | AA-/Aa3/AA- | 58,207 | 14.7% | $35.48 | 18.3% | 9/30/2024(6) | ||
| SynerMed(7) | NR/NR/NR | 57,960 | 14.7% | $29.31 | 15.0% | 9/30/2022 | ||
| County of Los Angeles Fire Department(8)(9) | AA-/Aa2/AA- | 37,132 | 9.4% | $28.95 | 9.5% | 3/31/2027 | ||
| AT&T Services, Inc. | NR/Baa1/BBB+ | 26,619 | 6.7% | $30.16 | 7.1% | 3/31/2018 | ||
| Subtotal / Wtd. Avg. | 262,939 | 66.6% | $31.59 | 73.5% | ||||
| Other | 105,058 | 26.6% | $28.53 | 26.5% | ||||
| Total / Wtd. Avg. Occupied | 367,997 | 93.2% | $30.71 | 100.0% | ||||
| Vacant | 26,896 | 6.8% | ||||||
| Total / Wtd. Avg. | 394,893 | 100.0% | ||||||
| (1) | Based on the underwritten rent roll dated February 6, 2017. All tenant spaces are subject to re-measurement when leases expire. |
| (2) | Certain ratings are those of the parent company whether or not the parent company guarantees the lease. |
| (3) | Includes contractual rent steps of $24,171 through October 1, 2017 and the present value of future rent steps for Department of Social Services ($178,154) and County of Los Angeles Fire Department ($94,868). |
| (4) | State Compensation Insurance Fund has one, five-year extension option at fair market value and a one-time right to terminate its lease from April 1, 2018 through September 1, 2018 as to the 19,145 sq. ft. space it occupies on the second floor. |
| (5) | Department of Social Services (which is the tenant under 5 separate leases at the property) has the right to terminate (a) 3 of its leases covering 43,893 sq. ft. at any time on or after September 30, 2020, (b) its 4th lease covering 5,667 sq. ft. at any time on or after January 31, 2021, and (c) its 5th Lease covering 8,647 sq. ft. at any time on or after July 31, 2021, in each case subject to a notice period of 90 days. |
| (6) | Department of Social Services currently leases 43,893 sq. ft. of space pursuant to a lease which expires on September 30, 2024 and 5,667 sq. ft. of space pursuant to a lease which expires on January 31, 2025 and has executed a lease to occupy 8,647 sq. ft. which commences on August 1, 2017 and expires on July 31, 2025. |
| (7) | SynerMed has two, three-year extension options at fair market rent and the right to terminate its lease with respect to 28,777 sq. ft. effective April 30, 2020, with written notice being given on or before November 30, 2019. Upon termination of the lease, SynerMed must pay a termination fee of $738,958. |
| (8) | County of Los Angeles Fire Department has an executed lease however the tenant has not taken occupancy of its space and is not paying rent. At closing, seven months of gap rent and 100% of unfunded tenant improvement obligations were escrowed. |
| (9) | County of Los Angeles Fire Department has two, five-year renewal options at fair market value and the right to terminate its lease at any time on or after the seventh year anniversary of the lease commencement date, which is April 1, 2017. |
| Lease Rollover Schedule(1)(2) | ||||||||
| Year | # of Leases Expiring | Total Expiring Sq. Ft. | % of Total Sq. Ft. Expiring | Cumulative Sq. Ft. Expiring | Cumulative % | Annual U/W PSF(3) | % U/W Rolling | Cumulative % Base Rent |
| MTM | 0 | 0 | 0.0% | 0 | 0.0% | $0.00 | 0.0% | 0.0% |
| 2017 | 0 | 0 | 0.0% | 0 | 0.0% | $0.00 | 0.0% | 0.0% |
| 2018 | 4 | 31,017 | 7.9% | 31,017 | 7.9% | $30.13 | 8.3% | 8.3% |
| 2019 | 2 | 3,724 | 0.9% | 34,741 | 8.8% | $28.19 | 0.9% | 9.2% |
| 2020 | 11 | 17,294 | 4.4% | 52,035 | 13.2% | $28.43 | 4.3% | 13.5% |
| 2021 | 4 | 22,037 | 5.6% | 74,072 | 18.8% | $27.11 | 5.3% | 18.8% |
| 2022 | 5 | 65,335 | 16.5% | 139,407 | 35.3% | $29.29 | 16.9% | 35.8% |
| 2023 | 4 | 89,903 | 22.8% | 229,310 | 58.1% | $31.78 | 25.3% | 61.0% |
| 2024 | 4 | 56,295 | 14.3% | 285,605 | 72.3% | $34.13 | 17.0% | 78.0% |
| 2025 | 2 | 14,314 | 3.6% | 299,919 | 75.9% | $37.14 | 4.7% | 82.7% |
| 2026 | 2 | 30,946 | 7.8% | 330,865 | 83.8% | $28.27 | 7.7% | 90.5% |
| 2027 | 1 | 37,132 | 9.4% | 367,997 | 93.2% | $28.95 | 9.5% | 100.0% |
| Thereafter | 0 | 0 | 0.0% | 367,997 | 93.2% | $0.00 | 0.0% | 100.0% |
| Vacant | NAP | 26,896 | 6.8% | 394,893 | 100.0% | NAP | NAP | |
| Total / Wtd. Avg. | 39 | 394,893 | 100.0% | $30.71 | 100.0% | |||
| (1) | Based on the underwritten rent roll dated February 6, 2017. |
| (2) | Certain tenants have lease termination options that may become exercisable prior to the originally stated expiration date of the tenant lease and that are not considered in the lease rollover schedule. |
| (3) | Includes contractual rent steps of $24,171 through October 1, 2017 and the present value of future rent steps for Department of Social Services ($178,154) and County of Los Angeles Fire Department ($94,868). |
THE INFORMATION IN THIS STRUCTURAL AND COLLATERAL TERM SHEET IS NOT COMPLETE AND MAY BE AMENDED PRIOR TO THE TIME OF SALE. THIS TERM SHEET IS NOT AN OFFER TO SELL THESE SECURITIES AND IT IS NOT A SOLICITATION OF AN OFFER TO BUY THESE SECURITIES IN ANY JURISDICTION WHERE THE OFFER OR SALE IS NOT PERMITTED.
52
900, 1000, 1200 & 1255 Corporate Center Drive Monterey Park, CA 91754 | Collateral Asset Summary – Loan No. 4 Los Angeles Corporate | Cut-off Date Balance: Cut-off Date LTV: U/W NCF DSCR: U/W NOI Debt Yield: | $58,725,000 66.9% 1.69x 11.8% |
The Loan. The Los Angeles Corporate Center loan (the “Los Angeles Corporate Center Loan”) is a fixed rate loan secured by the borrowers’ fee simple interests in a 394,893 sq. ft. office campus located in Monterey Park, California (the “Los Angeles Corporate Center Property”). The Los Angeles Corporate Center Loan has an original principal balance of $58.725 million. The Los Angeles Corporate Center Loan has a 10-year term with a three-year interest-only period followed by payments of principal and interest through the remainder of the loan term based on a 30-year amortization schedule. The Los Angeles Corporate Center Loan accrues interest at a fixed rate equal to 4.7000% and has a Cut-off Date Balance of $58.725 million. The Los Angeles Corporate Center Loan proceeds were used to acquire the Los Angeles Corporate Center Property, fund upfront reserves of approximately $6.8 million and pay closing costs of approximately $0.8 million. Based on the “As Stabilized” appraised value of approximately $87.8 million as of August 1, 2017, the Cut-off Date LTV for the Los Angeles Corporate Center Loan is 66.9%. The most recent prior financing of the Los Angeles Corporate Center Property was not included in a securitization.
| Sources and Uses | ||||||
| Sources | Proceeds | % of Total | Uses | Proceeds | % of Total | |
| Loan Amount | $58,725,000 | 70.8% | Purchase Price(1) | $75,352,958 | 90.8% | |
| Borrower Equity | $23,627,386 | 28.5% | Reserves | $6,758,132 | 8.1% | |
| Other Sources | $597,546 | 0.7% | Closing Costs | $838,842 | 1.0% | |
| Total Sources | $82,949,932 | 100.0% | Total Uses | $82,949,932 | 100.0% | |
| (1) | The Purchase Price consists of an economic purchase price of $81.0 million less seller credits for tenant improvements (approximately $3.2 million), landlord work (approximately $2.1 million) and rent abatements ($357,218). |
The Borrowers / Sponsors.The Los Angeles Corporate Center Property is owned by three tenants-in-common, Omninet LACC, LLC, Omninet LACC Tucson, LLC and Omninet LACC Valencia, LLC, each of which is a single purpose Delaware limited liability company structured to be bankruptcy-remote with an independent director in the organizational structure. The sponsors of the borrower and the non-recourse carve-out guarantors are Benjamin Nazarian and Neil Kadisha of Omninet Capital, LLC (“Omninet”). Benjamin Nazarian and Neil Kadisha are jointly and severally obligated under the non-recourse carveout guaranty for the Los Angeles Corporate Center Loan, and they share management of the tenant-in-common borrowers with Andrea Costantini (with respect to 2 of the 3 borrowers) and Michael Danielpour (with respect to all 3 borrowers). Neither Andrea Constantini nor Michael Danielpour has the right to bind the tenant-in-common borrowers without consent from both Benjamin Nazarian and Neil Kadisha.
Omninet, which was founded in 1985, developed the technology platform for Qualcomm and has diversified the company’s investments by investing in real estate. Since 2009, Omninet has acquired over 7.0 million sq. ft. of commercial real estate and over 13,000 multifamily units.
The Property.The Los Angeles Corporate Center Property consists of four individual office buildings totaling 394,893 sq. ft., located within a 1.1 million sq. ft. office park, approximately five miles east of downtown Los Angeles in Monterey Park, California. The individual buildings were constructed between 1983 and 1986 and they feature three to six floors. The Los Angeles Corporate Center Property has a total of 1,515 parking spaces resulting in a ratio of 3.8 spaces per 1,000 sq. ft. of net rentable area. The individual buildings are known as 900 Corporate Center Drive (“Building A”), 1000 Corporate Center Drive (“Building B”), 1200 Corporate Center Drive (“Building C”) and 1255 Corporate Center Drive (“Building D”). As of February 6, 2017, the Los Angeles Corporate Center Property was 93.2% leased by 29 tenants across various industries with the four largest tenants, in each building, occupying a total of 59.8% of the gross leasable area.
| Building Summary | ||||||
| Building | Year Built | Building GLA | Occupancy(1) | UW Base Rent(2) | UW Base Rent PSF(2) | UW NCF |
| Building A | 1985 | 115,962 | 100.0% | $3,595,359 | $31.00 | $2,060,907 |
| Building B | 1983 | 114,924 | 81.1% | $3,110,458 | $33.38 | $1,543,897 |
| Building C | 1986 | 84,579 | 100.0% | $2,501,716 | $29.58 | $1,385,696 |
| Building D | 1983 | 79,428 | 93.5% | $2,095,175 | $28.20 | $1,168,521 |
| Total / Wtd. Avg. | 394,893 | 93.2% | $11,302,708 | $30.71 | $6,159,021 | |
| (1) | Occupancy is based on the underwritten rent roll dated February 6, 2017 which includes the County of Los Angeles Fire Department, a tenant with an executed lease that has not taken occupancy of its space and is not paying rent. |
| (2) | UW Base Rent includes contractual rent steps through October 1, 2017 and the present value of future rent steps for investment grade tenants. |
Environmental Matters.According to four separate Phase I environmental reports, each dated October 31, 2016, there are no recognized environmental conditions or recommendations for further action for Buildings A, B, C and D other than the continued implementation and maintenance of an asbestos operation and maintenance program at each building located at the Los Angeles Corporate Center Property.
THE INFORMATION IN THIS STRUCTURAL AND COLLATERAL TERM SHEET IS NOT COMPLETE AND MAY BE AMENDED PRIOR TO THE TIME OF SALE. THIS TERM SHEET IS NOT AN OFFER TO SELL THESE SECURITIES AND IT IS NOT A SOLICITATION OF AN OFFER TO BUY THESE SECURITIES IN ANY JURISDICTION WHERE THE OFFER OR SALE IS NOT PERMITTED.
53
900, 1000, 1200 & 1255 Corporate Center Drive Monterey Park, CA 91754 | Collateral Asset Summary – Loan No. 4 Los Angeles Corporate | Cut-off Date Balance: Cut-off Date LTV: U/W NCF DSCR: U/W NOI Debt Yield: | $58,725,000 66.9% 1.69x 11.8% |
Major Tenants.
State Compensation Insurance Fund (rated AA-/Aa3/AA- by Fitch/Moody’s/S&P, 83,021 sq. ft.; 21.0% of NRA; 23.6% of U/W Base Rent)The State Compensation Insurance Fund has been a tenant at the Los Angeles Corporate Center Property since 1998 and it currently leases 83,021 sq. ft. in Building A, with a lease expiration date of March 15, 2023 and one five-year extension option. The State Compensation Insurance Fund was established in 1914 by the California Legislature and is California’s largest provider of workers’ compensation insurance, with approximately 130,000 policyholders. The State Compensation Insurance Fund has a one-time right to terminate its lease from April 1, 2018 through September 1, 2018 as to the 19,145 sq. ft. space it occupies on the second floor.
Department of Social Services (rated AA-/Aa3/AA- by Fitch/Moody’s/S&P; 58,207 sq. ft.; 14.7% of NRA; 18.3% of U/W Base Rent)The Department of Social Services has been a tenant at the Los Angeles Corporate Center Property since 2008 and it currently leases 58,207 sq. ft. in Building B with 75.4% of their leased sq. ft. pursuant to a lease expiring as of September 30, 2024, 9.7% of sq. ft. pursuant to a lease expiring as of January 31, 2025 and 14.9% of sq. ft. pursuant to a lease expiring in July 31, 2025. The Department of Social Services is a California state agency, serving more than eight million people across California, that oversees state funds for adoption, foster care, aid to the disabled and many other social services. Department of Social Services (which is the tenant under 5 separate leases at the property) has the right to terminate (a) 3 of its leases covering 43,893 sq. ft. at any time on or after September 30, 2020, (b) its 4th lease covering 5,667 sq. ft. at any time on or after January 31, 2021, and (c) its 5th lease covering 8,647 sq. ft. at any time on or after July 31, 2021, in each case subject to a notice period of 90 days.
SynerMed (57,960 sq. ft.; 14.7% of NRA; 15.0% of U/W Base Rent)SynerMed has been a tenant at the Los Angeles Corporate Center Property since 2014 and currently leases 57,960 sq. ft. in Building C with a lease expiration date of September 30, 2022, with two three-year renewal options. SynerMed provides customized business management solutions for independent physicians. The company was founded in 1995 and has six offices throughout California and Colorado, with the Los Angeles Corporate Center Property serving as SynerMed’s corporate headquarters. SynerMed has two, three-year extension options at fair market rent and the right to terminate its lease with respect to 28,777 sq. ft. effective April 30, 2020, with written notice being given on or before November 30, 2019. Upon termination of the lease, SynerMed must pay a termination fee of $738,958.
The Market.The Los Angeles Corporate Center Property is located in the Los Angeles-Long Beach-Glendale, California Metropolitan Statistical Area (“MSA”), which reported a 2016 population of 10.2 million. The Los Angeles County unemployment rate was 4.8% during the month of November 2016, which was down from 5.8% in November 2015. The appraiser is forecasting that office-using employment will expand 1.6% in Los Angeles County over the next four quarters. The Los Angeles Corporate Center Property is located in the city of Monterey Park, which is located approximately five miles east of the Los Angeles Central Business District (“CBD”), in the Western San Gabriel Valley office submarket. The submarket is bound by the Pomona Freeway (State Highway 60) to the south, the San Gabriel Freeway (Interstate 605) to the east, the city of Pasadena to the north and the San Bernardino Freeway (Interstate 10), which runs through the middle of the submarket, providing convenient access to the major employment hubs of downtown Los Angeles and the Tri-Cities. According to the appraisal, the surrounding area has an average household income, as of year-end 2016, of $71,559, $59,167 and $64,429 within a one-, three- and five-mile radius, respectively. The year-end 2016 population within a one-, three- and five-mile radius was 21,414, 345,197 and 768,604, respectively.
According to a third party report, as of the fourth quarter of 2016, the Western San Gabriel Valley submarket had an overall vacancy of 7.1%. According to the same report, the gross asking rents for the submarket were $25.36 and there has not been any speculative development in the submarket in the last decade. The appraiser analyzed six recent office leases with sizes ranging from 752 to 16,767 sq. ft., lease terms ranging from three to five years and rents ranging from $24.60 to $36.60 PSF. Based on the comparable office lease data, the appraiser concluded to a rate of $30.00 PSF based on a full-service gross basis for Class A office space and $28.80 PSF based on a full-service gross basis for Class B office space at the Los Angeles Corporate Center Property.
| Directly Competitive Buildings(1) | |||||||
| Property | Year Built | Occupancy | Distance from Subject (miles) | Tenant Name | Lease Area (sq. ft.) | Lease Term (Years) | Base Rent (PSF) |
| Los Angeles Corporate Center Property | 1983-1986 | 93.2%(2) | NAP | NAP | NAP | NAP | $29.91(2) |
| Crossroads Atrium | 1988 | 98.0% | 8.0 | Lee & Associates | 6,492 | 3.0 | $28.20 |
| Alhambra Office Park | 1925 | 62.0% | 2.0 | AHMC Healthcare Inc. | 16,767 | 5.3 | $28.80 |
| 901 Corporate Center Drive | 1987 | 90.0% | 0.1 | Whitley International | 4,453 | 3.0 | $24.60 |
| 200 South Los Robles | 1988 | 99.0% | 6.0 | CWG International | 2,664 | 3.2 | $36.60 |
| 800 S. Barranca Street | 1981 | 95.0% | 16.0 | NAV | 1,631 | 5.0 | $28.20 |
| Eastland Center | 1975 | 95.0% | 16.0 | NAV | 752 | 5.0 | $28.20 |
| (1) | Source: Appraisal. |
| (2) | Based on the underwritten rent roll dated February 6, 2017. |
THE INFORMATION IN THIS STRUCTURAL AND COLLATERAL TERM SHEET IS NOT COMPLETE AND MAY BE AMENDED PRIOR TO THE TIME OF SALE. THIS TERM SHEET IS NOT AN OFFER TO SELL THESE SECURITIES AND IT IS NOT A SOLICITATION OF AN OFFER TO BUY THESE SECURITIES IN ANY JURISDICTION WHERE THE OFFER OR SALE IS NOT PERMITTED.
54
900, 1000, 1200 & 1255 Corporate Center Drive Monterey Park, CA 91754 | Collateral Asset Summary – Loan No. 4 Los Angeles Corporate | Cut-off Date Balance: Cut-off Date LTV: U/W NCF DSCR: U/W NOI Debt Yield: | $58,725,000 66.9% 1.69x 11.8% |
Cash Flow Analysis.
| Cash Flow Analysis | |||||||||
| 2013 | 2014 | 2015 | 2016 | U/W | U/W PSF | ||||
| Base Rent | $9,343,765 | $8,023,130 | $8,447,725 | $9,583,987 | $11,005,516 | $27.87 | |||
| Step Rents(1) | 0 | 0 | 0 | 0 | 297,193 | 0.75 | |||
| Gross Up Vacancy | 0 | 0 | 0 | 0 | 800,710 | 2.03 | |||
| Reimbursements | 349,609 | 334,467 | 210,869 | 92,382 | 51,379 | 0.13 | |||
| Gross Potential Rent | $9,693,374 | $8,357,597 | $8,658,594 | $9,676,369 | $12,154,797 | $30.78 | |||
| Total Other Income(2) | 89,002 | 69,576 | 80,466 | 134,477 | 73,513 | 0.19 | |||
| Less: Vacancy(3) | 0 | 0 | 0 | 0 | (800,710) | (2.03) | |||
| Effective Gross Income | $9,782,376 | $8,427,173 | $8,739,060 | $9,810,846 | $11,427,600 | $28.94 | |||
| Total Variable Expenses | 3,386,822 | 3,163,626 | 3,220,683 | 3,394,404 | 3,411,668 | 8.64 | |||
| Total Fixed Expenses | 1,102,716 | 1,025,395 | 1,041,858 | 1,035,831 | 1,108,349 | 2.81 | |||
| Net Operating Income(4) | $5,292,839 | $4,238,152 | $4,476,519 | $5,380,611 | $6,907,583 | $17.49 | |||
| TI/LC | 0 | 0 | 0 | 0 | 669,584 | 1.70 | |||
| Capital Expenditures | 0 | 0 | 0 | 0 | 78,979 | 0.20 | |||
| Net Cash Flow | $5,292,839 | $4,238,152 | $4,476,519 | $5,380,611 | $6,159,021 | $15.60 | |||
| (1) | Consists of contractual rent steps of $24,171 through October 1, 2017 and the present value of future rent steps for the Department of Social Services ($178,154) and the County of Los Angeles Fire Department ($94,868). |
| (2) | Total Other Income includes building service income, overtime HVAC reimbursement, antenna income, and miscellaneous office income. |
| (3) | U/W Vacancy represents an economic vacancy of 6.6%. |
| (4) | The increase in U/W Net Operating Income over 2016 Net Operating Income is primarily due to the inclusion of several new tenants at the Los Angeles Corporate Center Property accounting for over $1.0 million in U/W Base Rent. |
Property Management.The Los Angeles Corporate Center Property is managed by Omninet Property Management, Inc., a borrower affiliate.
Lockbox / Cash Management.The Los Angeles Corporate Center Loan is structured with a hard lockbox and springing cash management. All rents are required to be directly deposited by the tenants of the Los Angeles Corporate Center Property into a clearing account controlled by the lender. In the absence of a Trigger Period (as defined below), the funds in the clearing account are required to be swept daily into an account controlled by the borrower. During a Trigger Period (which may be cured in accordance with the loan documents), funds in the clearing account are required to be swept on each business day into a deposit account controlled by the lender and applied and disbursed in accordance with the loan documents.
A “Trigger Period” will commence upon the earliest of (i) the occurrence and continuance of an event of default, (ii) the debt service coverage ratio falling below 1.20x, (iii) the occurrence of a Specified Tenant Trigger Period (as defined below), and (iv) the occurrence of a Fire Department Trigger Period (as defined below).
A “Specified Tenant Trigger Period” means a period commencing upon the first to occur of (i) a Specified Tenant (as defined below) being in monetary default under its lease beyond any applicable notice and cure periods, (ii) a Specified Tenant failing to be in actual, physical possession of its space (or applicable portion thereof), (iii) a Specified Tenant giving notice that it is terminating its lease for all or any portion of its space (or applicable portion thereof), (iv) any termination or cancellation of any Specified Tenant’s lease (including, without limitation, rejection in any bankruptcy or similar insolvency proceeding) and/or any Specified Tenant’s lease failing to otherwise be in full force and effect, (v) any bankruptcy or similar insolvency of any Specified Tenant, and (vi) a Specified Tenant failing to extend or renew the applicable Specified Tenant’s lease on or prior to the earlier to occur of (a) the date occurring 12 months prior to the expiration of the then applicable term of the applicable Specified Tenant’s lease or (b) the date by which the Specified Tenant is required to give notice of renewal under the applicable Specified Tenant’s lease.
A “Specified Tenant” means (i) SynerMed, (ii) State Compensation Insurance Fund, (iii) Department of Social Services, (iv) any other lessee of the tenant space and (v) any parent company of any such tenant and any affiliate providing credit support for, or guarantor of, any such lease.
A “Fire Department Trigger Period” means a period commencing upon the first to occur of (i) the County of Los Angeles Fire Department giving written notice to the borrower that it is terminating the County of Los Angeles Fire Department’s lease (the “Fire Department Lease”) pursuant to its right (as set forth in the Fire Department Lease) to terminate the Fire Department Lease if the commencement date under such lease has not occurred within 120 days after the date that is 15 weeks after the borrower (or its predecessor in interest as landlord) has obtained all necessary building permits to perform the tenant improvements required under the Fire Department Lease (which termination right is required to be tolled during (a) delays caused by the County of Los Angeles Fire Department’s failure or refusal to give authorizations within the time periods required by the Fire Department Lease and (b) delays caused by lightning, earthquake, fire, storm, tornado, flood, washout, explosion, strike, lockout, labor disturbance, civil disturbance, riot,
THE INFORMATION IN THIS STRUCTURAL AND COLLATERAL TERM SHEET IS NOT COMPLETE AND MAY BE AMENDED PRIOR TO THE TIME OF SALE. THIS TERM SHEET IS NOT AN OFFER TO SELL THESE SECURITIES AND IT IS NOT A SOLICITATION OF AN OFFER TO BUY THESE SECURITIES IN ANY JURISDICTION WHERE THE OFFER OR SALE IS NOT PERMITTED.
55
900, 1000, 1200 & 1255 Corporate Center Drive Monterey Park, CA 91754 | Collateral Asset Summary – Loan No. 4 Los Angeles Corporate | Cut-off Date Balance: Cut-off Date LTV: U/W NCF DSCR: U/W NOI Debt Yield: | $58,725,000 66.9% 1.69x 11.8% |
war, act of a public enemy, sabotage or other similar causes beyond the reasonable control of the borrower (or its predecessor in interest as landlord), or (ii) the County of Los Angeles Fire Department failing to (a) accept the County of Los Angeles Fire Department’s space on or before the date that is eight months after the loan origination date and (b) provide a duly executed estoppel certificate in form and substance acceptable to the lender reflecting, among other things, such acceptance.
Initial Reserves.At loan origination, the borrower deposited (i) $11,267 into an insurance reserve account, (ii) $5,286,382 into an unfunded obligations reserve account, (iii) $1,086,963 into a free rent reserve account relating to the Department of Social Services, SynerMed, the County of Los Angeles Fire Department and other tenant leases at the Los Angeles Corporate Center Property and (iv) $373,520 into a deferred maintenance reserve account, which represents 115% of the recommended amount.
Ongoing Reserves.On a monthly basis, the borrowers are required to deposit reserves of (i) 1/12 of the estimated annual real estate taxes, which currently equates to $91,347, into a tax reserve account, (ii) 1/12 of annual insurance premiums which currently equates to $5,633, (iii) $6,582 into a replacement reserve account subject to a cap of $350,000 and (iv) $54,298 into a tenant improvements and leasing commissions account subject to a cap of $2,000,000.
On a monthly basis, occurring after the occurrence and during the continuance of a Trigger Period that exists solely due to a Specified Tenant Trigger Period, the borrowers are required to deposit an amount equal to the excess cash flow generated by the Los Angeles Corporate Center Property for the immediately preceding interest accrual period into a lease sweep reserve account, subject to a cap of $20 PSF of the portion of the applicable Specified Tenant’s space that is vacant.
On a monthly basis, occurring after the occurrence and during the continuance of a Trigger Period that exists solely due to a Fire Department Trigger Period, the borrowers are required to deposit an amount equal to the excess cash flow generated by the property for the immediately preceding interest accrual period into a fire department reserve account, subject to a cap of $55 PSF of the portion of the County of Los Angeles Fire Department’s space that is vacant.
Current Mezzanine or Subordinate Indebtedness. None.
Future Mezzanine or Subordinate Indebtedness Permitted. None.
Partial Releases. None.
THE INFORMATION IN THIS STRUCTURAL AND COLLATERAL TERM SHEET IS NOT COMPLETE AND MAY BE AMENDED PRIOR TO THE TIME OF SALE. THIS TERM SHEET IS NOT AN OFFER TO SELL THESE SECURITIES AND IT IS NOT A SOLICITATION OF AN OFFER TO BUY THESE SECURITIES IN ANY JURISDICTION WHERE THE OFFER OR SALE IS NOT PERMITTED.
56
900, 1000, 1200 & 1255 Corporate Center Drive Monterey Park, CA 91754 | Collateral Asset Summary – Loan No. 4 Los Angeles Corporate | Cut-off Date Balance: Cut-off Date LTV: U/W NCF DSCR: U/W NOI Debt Yield: | $58,725,000 66.9% 1.69x 11.8% |
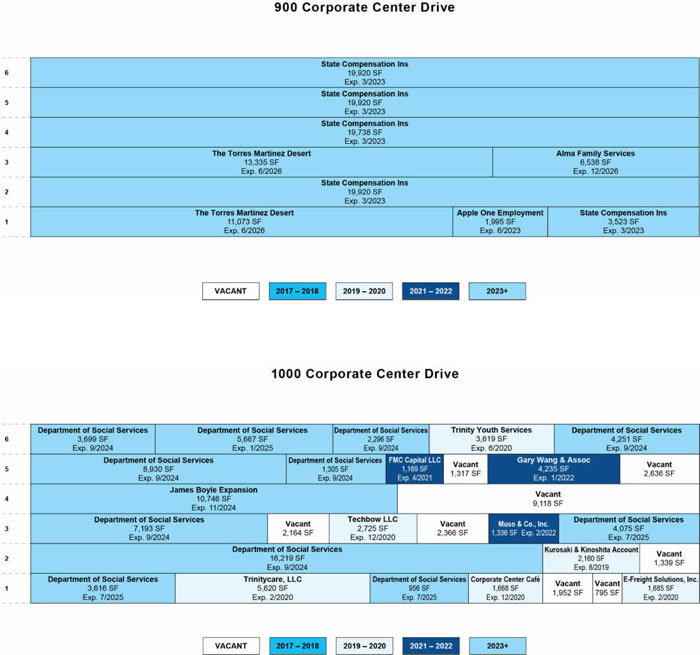
THE INFORMATION IN THIS STRUCTURAL AND COLLATERAL TERM SHEET IS NOT COMPLETE AND MAY BE AMENDED PRIOR TO THE TIME OF SALE. THIS TERM SHEET IS NOT AN OFFER TO SELL THESE SECURITIES AND IT IS NOT A SOLICITATION OF AN OFFER TO BUY THESE SECURITIES IN ANY JURISDICTION WHERE THE OFFER OR SALE IS NOT PERMITTED.
57
900, 1000, 1200 & 1255 Corporate Center Drive Monterey Park, CA 91754 | Collateral Asset Summary – Loan No. 4 Los Angeles Corporate | Cut-off Date Balance: Cut-off Date LTV: U/W NCF DSCR: U/W NOI Debt Yield: | $58,725,000 66.9% 1.69x 11.8% |
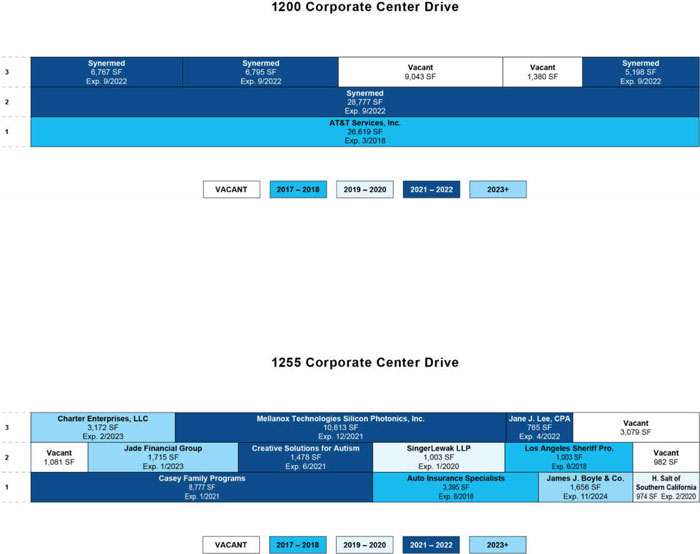
THE INFORMATION IN THIS STRUCTURAL AND COLLATERAL TERM SHEET IS NOT COMPLETE AND MAY BE AMENDED PRIOR TO THE TIME OF SALE. THIS TERM SHEET IS NOT AN OFFER TO SELL THESE SECURITIES AND IT IS NOT A SOLICITATION OF AN OFFER TO BUY THESE SECURITIES IN ANY JURISDICTION WHERE THE OFFER OR SALE IS NOT PERMITTED.
58
900, 1000, 1200 & 1255 Corporate Center Drive Monterey Park, CA 91754 | Collateral Asset Summary – Loan No. 4 Los Angeles Corporate | Cut-off Date Balance: Cut-off Date LTV: U/W NCF DSCR: U/W NOI Debt Yield: | $58,725,000 66.9% 1.69x 11.8% |
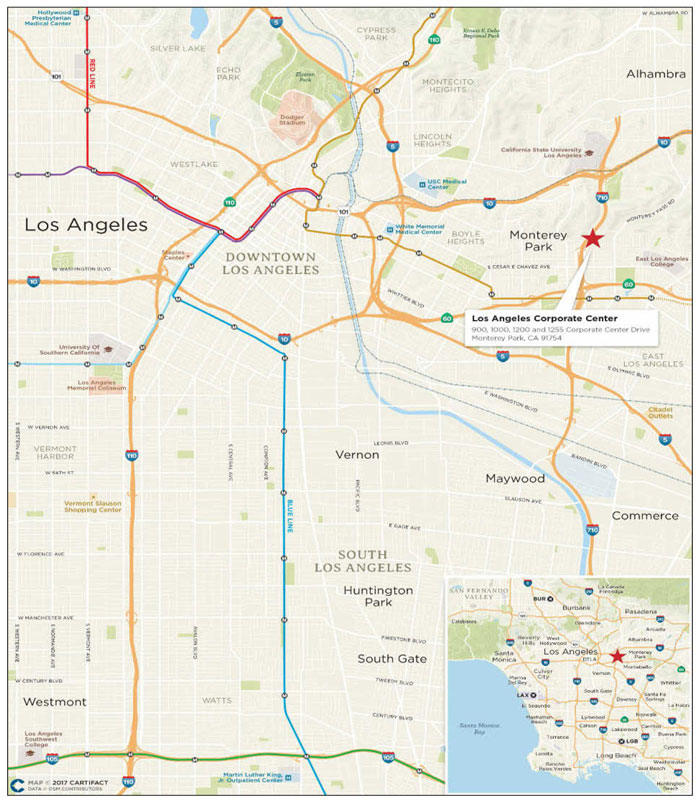
THE INFORMATION IN THIS STRUCTURAL AND COLLATERAL TERM SHEET IS NOT COMPLETE AND MAY BE AMENDED PRIOR TO THE TIME OF SALE. THIS TERM SHEET IS NOT AN OFFER TO SELL THESE SECURITIES AND IT IS NOT A SOLICITATION OF AN OFFER TO BUY THESE SECURITIES IN ANY JURISDICTION WHERE THE OFFER OR SALE IS NOT PERMITTED.
59
2005 Kalia Road Honolulu, HI 96815 | Collateral Asset Summary – Loan No. 5 Hilton Hawaiian Village | Cut-off Date Balance: Cut-off Date LTV: U/W NCF DSCR: U/W NOI Debt Yield: | $56,625,000 31.2% 4.47x 21.2% |

THE INFORMATION IN THIS STRUCTURAL AND COLLATERAL TERM SHEET IS NOT COMPLETE AND MAY BE AMENDED PRIOR TO THE TIME OF SALE. THIS TERM SHEET IS NOT AN OFFER TO SELL THESE SECURITIES AND IT IS NOT A SOLICITATION OF AN OFFER TO BUY THESE SECURITIES IN ANY JURISDICTION WHERE THE OFFER OR SALE IS NOT PERMITTED.
60
2005 Kalia Road Honolulu, HI 96815 | Collateral Asset Summary – Loan No. 5 Hilton Hawaiian Village | Cut-off Date Balance: Cut-off Date LTV: U/W NCF DSCR: U/W NOI Debt Yield: | $56,625,000 31.2% 4.47x 21.2% |
| Mortgage Loan Information | |
| Loan Seller: | GACC |
| Loan Purpose: | Refinance |
Credit Assessment: (Moody’s/Fitch/DBRS)(1) | Aa3/BBB-/BBB(high) |
| Sponsor: | Park Intermediate Holdings LLC |
| Borrower: | Hilton Hawaiian Village LLC |
| Original Balance(2): | $56,625,000 |
| Cut-off Date Balance(2): | $56,625,000 |
| % by Initial UPB: | 6.3% |
| Interest Rate: | 4.1995% |
| Payment Date: | 1stof each month |
| First Payment Date: | December 1, 2016 |
| Maturity Date: | November 1, 2026 |
| Amortization: | Interest Only |
| Additional Debt(3): | $639,975,000Pari PassuDebt; $578,400,000 Subordinate Secured Debt |
| Call Protection: | L(29), DorYM1(84), O(7) |
| Lockbox / Cash Management: | Hard / In Place |
| Reserves(3) | ||
| Initial | Monthly | |
| Taxes: | $0 | Springing |
| Insurance: | $0 | Springing |
| Replacement: | $0 | Springing |
| Financial Information | |||
| Senior Notes(4) | Total Debt(5) | ||
| Cut-off Date Balance / Room: | $243,566 | $445,804 | |
| Balloon Balance / Room: | $243,566 | $445,804 | |
| Cut-off Date LTV: | 31.2% | 57.2% | |
| Balloon LTV: | 31.2% | 57.2% | |
| Underwritten NOI DSCR: | 4.98x | 2.72x | |
| Underwritten NCF DSCR: | 4.47x | 2.44x | |
| Underwritten NOI Debt Yield: | 21.2% | 11.6% | |
| Underwritten NCF Debt Yield: | 19.0% | 10.4% | |
| Underwritten NOI Debt Yield at Balloon: | 21.2% | 11.6% | |
| Underwritten NCF Debt Yield at Balloon: | 19.0% | 10.4% | |
| Property Information | ||
| Single Asset / Portfolio: | Single Asset | |
| Property Type: | Full Service Hospitality | |
| Collateral: | Fee Simple/Leasehold | |
| Location: | Honolulu, HI | |
| Year Built / Renovated: | 1961 / 2016 | |
| Total Rooms: | 2,860 | |
| Property Management: | Hilton Management LLC | |
| Underwritten NOI: | $147,564,484 | |
| Underwritten NCF: | $132,586,975 | |
| Appraised Value: | $2,230,000,000 | |
| Appraisal Date: | August 30, 2016 | |
| Historical NOI | ||
| Most Recent NOI: | $146,972,618 (T-12 September 30, 2016) | |
| 2015 NOI: | $143,409,371 (December 31, 2015) | |
| 2014 NOI: | $133,704,404 (December 31, 2014) | |
| 2013 NOI: | $123,963,830 (December 31, 2013) | |
| Historical Occupancy | ||
| Most Recent Occupancy: | 94.6% (December 31, 2016) | |
| 2015 Occupancy: | 94.4% (December 31, 2015) | |
| 2014 Occupancy: | 90.7% (December 31, 2014) | |
| 2013 Occupancy: | 89.9% (December 31, 2013) | |
| (1) | Moody’s/Fitch/DBRS provided the above investment grade ratings for the Hilton Hawaiian Village Loan in the context of its inclusion in the mortgage pool. |
| (2) | The Original Balance and Cut-off Date Balance of $56.625 million represents the senior non-controlling Note A-2-B-2 which, together with the remainingpari passu senior notes with an aggregate original principal balance of $639.975 million and the subordinate notes with an aggregate original principal balance of $578.4 million, comprises the Hilton Hawaiian Village Whole Loan with an aggregate original principal balance of $1.275 billion. For additional information regarding the pari passu senior notes and subordinate notes, see “The Loan” herein. |
| (3) | See “Initial Reserves” and “Ongoing Reserves” herein. |
| (4) | DSCR, LTV, Debt Yield and Balance / Room calculations are based on the Senior Notes only, which have an aggregate principal balance of $696.6 million. |
| (5) | DSCR, LTV, Debt Yield and Balance / Room calculations are based on the Hilton Hawaiian Village Whole Loan, which has an aggregate principal balance of $1.275 billion, which includes $578.4 million of subordinate notes. |
| Historical Occupancy, ADR, RevPAR(1) | |||||||||
| Hilton Hawaiian Village Property(2) | Competitive Set | Penetration Factor | |||||||
| Year | Occupancy | ADR | RevPAR | Occupancy | ADR | RevPAR | Occupancy | ADR | RevPAR |
| 2014 | 90.7% | $238.34 | $216.26 | 87.6% | $250.07 | $219.01 | 103.6% | 95.3% | 98.7% |
| 2015 | 94.4% | $240.59 | $227.18 | 88.2% | $256.74 | $226.34 | 107.1% | 93.7% | 100.4% |
| 2016 | 94.6% | $248.81 | $235.47 | 89.5% | $260.12 | $232.68 | 105.8% | 95.7% | 101.2% |
| (1) | Source: Hospitality research reports. The competitive set used in the table above consists of seven hotels: the Sheraton Hotel Waikiki, Sheraton Hotel Princess Kaiulani, Moana Surfrider Westin Resort & Spa, Hyatt Regency Waikiki Resort & Spa, Outrigger Waikiki Beach Resort, Outrigger Reef Waikiki Beach Resort and the Marriott Waikiki Beach Resort & Spa. |
| (2) | The variances between the underwriting, the appraisal and the above table with respect to Occupancy, ADR and RevPAR at the Hilton Hawaiian Village Property are attributable to variances in reporting methodologies and/or timing differences. In addition, the Primary Competitive Set table from the appraisal set forth below uses a primary competitive set of four hotels. |
THE INFORMATION IN THIS STRUCTURAL AND COLLATERAL TERM SHEET IS NOT COMPLETE AND MAY BE AMENDED PRIOR TO THE TIME OF SALE. THIS TERM SHEET IS NOT AN OFFER TO SELL THESE SECURITIES AND IT IS NOT A SOLICITATION OF AN OFFER TO BUY THESE SECURITIES IN ANY JURISDICTION WHERE THE OFFER OR SALE IS NOT PERMITTED.
61
2005 Kalia Road Honolulu, HI 96815 | Collateral Asset Summary – Loan No. 5 Hilton Hawaiian Village | Cut-off Date Balance: Cut-off Date LTV: U/W NCF DSCR: U/W NOI Debt Yield: | $56,625,000 31.2% 4.47x 21.2% |
The Loan. The Hilton Hawaiian Village loan (the “Hilton Hawaiian Village Loan”) is a fixed rate loan secured by the borrower’s fee and leasehold interest in a 2,860 room, full service, luxury, beachfront resort located in Waikiki on the Island of Oahu, Hawaii (the “Hilton Hawaiian Village Property”). The Hilton Hawaiian Village Loan is evidenced by the non-controlling Note A-2-B-2, with an original principal balance of $56.625 million, and is part of a $1.275 billion whole loan that is evidenced by 21 promissory notes: 16 senior notes with an aggregate original principal balance of $696.6 million (the “Senior Notes”) and five junior notes with an aggregate original principal balance of $578.4 million (the “Junior Notes” and, together with the Senior Notes, the “Hilton Hawaiian Village Whole Loan”). Only the Hilton Hawaiian Village Loan will be included in the CD 2017-CD4 mortgage trust. The Hilton Hawaiian Village Senior Notes are evidenced by (i) the controlling note A-1-A and the non-controlling notes A-1-B, A-1-C, A-1-D and A-1-E, which have an aggregate outstanding principal balance as of the Cut-off Date of $171.6 million and were contributed to the Hilton USA Trust 2016-HHV securitization transaction, (ii) the non-controlling note A-2-A-1, which has an outstanding principal balance as of the Cut-off Date of $94.0 million and was contributed to the JPMCC 2016-JP4 securitization transaction, (iii) the non-controlling note A-2-A-2, which has an outstanding principal balance as of the Cut-off Date of $80.0 million and was contributed to the JPMCC 2017-JP5 securitization transaction, (iv) the non-controlling notes A-2-A-3 and A-2-A-4 which have an aggregate outstanding principal balance of $62.25 million and were contributed to the JPMDB 2017-C5 securitization transaction, (v) the non-controlling note A-2-B-3, which has an outstanding principal balance as of the Cut-off Date of $56.625 million and was contributed to the CFCRE 2016-C7 securitization transaction, (vi) the non-controlling notes A-2-D-1 and A-2-D-2, which have an aggregate outstanding principal balance as of the Cut-off Date of $63.0 million and were contributed to the MSBAM 2016-C32 securitization transaction and (vii) the non-controlling notes A-2-E-1 and A-2-E-2, which have an aggregate outstanding principal balance as of the Cut-off Date of $52.5 million and were contributed to the WFCM 2016-C37 securitization transaction.
The relationship between the holders of the Hilton Hawaiian Village Whole Loan is governed by a co-lender agreement as described under “Description of the Mortgage Pool– the Whole Loans –the Non-Serviced Pari Passu AB Whole Loan” in the Preliminary Prospectus.
| Whole Loan Summary | |||||
| Note | Original Balance | Cut-off Date Balance | Note Holder | Controlling Piece | |
| A-2-B-2 | $56,625,000 | $56,625,000 | CD 2017-CD4 | No | |
| A-1-A, A-1-B, A-1-C, A-1-D and A-1-E | $171,600,000 | $171,600,000 | Hilton USA Trust 2016-HHV | Yes | |
| B-1, B-2, B-3, B-4 and B-5 | $578,400,000 | $578,400,000 | Hilton USA Trust 2016-HHV | No | |
| A-2-A-3 and A-2-A-4 | $62,250,000 | $62,250,000 | JPMDB 2017-C5 | No | |
| A-2-A-2 | $80,000,000 | $80,000,000 | JPMCC 2017-JP5 | No | |
| A-2-B-1 | $60,000,000 | $60,000,000 | CD 2017-CD3 | No | |
| A-2-B-3 | $56,625,000 | $56,625,000 | CFCRE 2016-C7 | No | |
| A-2-A-1 | $94,000,000 | $94,000,000 | JPMCC 2016-JP4 | No | |
| A-2-D-1 and A-2-D-2 | $63,000,000 | $63,000,000 | MSBAM 2016-C32 | No | |
| A-2-E-1 and A-2-E-2 | $52,500,000 | $52,500,000 | WFCM 2016-C37 | No | |
| Total | $1,275,000,000 | $1,275,000,000 | |||
The Hilton Hawaiian Village Whole Loan has a 10-year term and pays interest only for the term of the loan. The Hilton Hawaiian Village Whole Loan accrues interest at a fixed rate equal to 4.1995%. The Hilton Hawaiian Village Whole Loan proceeds were used to retire existing debt of approximately $1.3 billion, pay closing costs of approximately $8.5 million, and return approximately $10.6 million of equity to the sponsor, which was thereafter utilized by affiliates of the sponsor to prepay other outstanding CMBS loans. Based on the “As-is” appraised value of $2.23 billion as of August 30, 2016, the Cut-off Date LTV ratio of the Senior Notes is 31.2%. The most recent prior financing of the Hilton Hawaiian Village Property was included in the HILT 2013–HLF and HILT 2013–HLT securitizations.
| Sources and Uses | ||||||
| Sources | Proceeds | % of Total | Uses | Proceeds | % of Total | |
| Whole Loan | $1,275,000,000 | 100.0% | Loan Payoff | $1,255,912,700 | 98.5% | |
| Principal Equity Distribution(1) | $10,621,760 | 0.8% | ||||
| Closing Costs | $8,465,540 | 0.7% | ||||
| Total Sources | $1,275,000,000 | 100.0% | Total Uses | $1,275,000,000 | 100.0% | |
| (1) | The principal equity distribution returned equity to the borrower and thereafter utilized by affiliates of Park Hotels & Resorts to prepay other outstanding CMBS loans. |
The Borrower / Sponsor.The borrower, Hilton Hawaiian Village LLC, is a single purpose Hawaii limited liability company structured to be bankruptcy-remote, with two independent directors in its organizational structure. The sponsor of the borrower and non-recourse carve-out guarantor is Park Intermediate Holdings LLC, a wholly owned subsidiary of Park Hotels & Resorts, Inc. (“Park Hotels & Resorts”), provided that any related recourse liability is subject to a cap of 10% of the then outstanding principal balance of the Hilton Hawaiian Village Whole Loan, plus any and all reasonable third party collection costs actually incurred by the lender. In addition, Park Intermediate Holdings LLC is not a party to the environmental indemnity, and in lieu of such indemnity, the borrower obtained environmental insurance.
THE INFORMATION IN THIS STRUCTURAL AND COLLATERAL TERM SHEET IS NOT COMPLETE AND MAY BE AMENDED PRIOR TO THE TIME OF SALE. THIS TERM SHEET IS NOT AN OFFER TO SELL THESE SECURITIES AND IT IS NOT A SOLICITATION OF AN OFFER TO BUY THESE SECURITIES IN ANY JURISDICTION WHERE THE OFFER OR SALE IS NOT PERMITTED.
62
2005 Kalia Road Honolulu, HI 96815 | Collateral Asset Summary – Loan No. 5 Hilton Hawaiian Village | Cut-off Date Balance: Cut-off Date LTV: U/W NCF DSCR: U/W NOI Debt Yield: | $56,625,000 31.2% 4.47x 21.2% |
Park Intermediate Holdings LLC is a wholly owned subsidiary of Park Hotels & Resorts, one of two spin-offs announced by Hilton Worldwide Holdings Inc. (“Hilton”). On February 26, 2016, Hilton announced plans to separate into three independent, publicly traded companies: Park Hotels & Resorts (NYSE: PK), Hilton Grand Vacations Inc. (NYSE: HGV) and Hilton (NYSE: HLT). The spin-offs were completed in January 2017 and Park Hotels & Resorts now owns most of Hilton’s formerly owned and leased real estate properties and, with over 35,000 rooms and 67 hotels, is the second-largest publicly traded real estate investment trust in the lodging industry. Hilton Grand Vacations Inc. owns and operates Hilton’s timeshare business, while Hilton retains its core management and franchise business and continues to trade on the NYSE as a global hospitality company.
The Hilton Hawaiian Village Property is subject to an operating lease with a borrower affiliate (other than with respect to the retail portions of the Hilton Hawaiian Village Property), which affiliate is party to the loan documents.
The Property.The Hilton Hawaiian Village Property is a 2,860-room full service resort situated on an entire city block overlooking Waikiki Beach on the island of Oahu in Hawaii. The resort was initially constructed by Hilton in 1961 and most recently renovated in 2016. The Hilton Hawaiian Village Property is located on 18.95 acres, offers panoramic views of Waikiki Beach, Diamond Head and Downtown Honolulu and is located near attractions such as the Waikiki Beach Walk Shops, Honolulu Convention Center and Ala Wai Golf Course.
The resort is one of Hawaii’s premier urban resort destinations, featuring 2,860 guest rooms spread across five ocean front towers. The Hilton Hawaiian Village Property is the only self-contained destination resort in Waikiki and offers the largest guest room inventory in the state of Hawaii and the most meeting space within its competitive set. The resort offers a variety of resort-style amenities and services, including 20 food and beverage outlets, over 150,000 sq. ft. of flexible indoor and outdoor function space, three conference centers, five swimming pools, a saltwater lagoon, spa grottos, the Mandara Spa and Fitness Center, a chapel and over 100 retail tenants.
Guest rooms are situated across five ocean front towers: the Ali’i Tower (348 rooms), the Diamond Head Tower (380 rooms) and the three Village Towers, comprised of the Rainbow Tower (796 rooms), Kalia Tower (315 rooms) and the Tapa Tower (1,021 rooms). Each guest room features a private balcony, 27-37” flat-screen televisions with cable, in-room controlled air conditioning, and in-room refrigerators.
| Guest Room Mix | |
| Room Type | |
| Resort | 829 |
| Partial Ocean View | 415 |
| Ocean View | 928 |
| Ocean Front | 513 |
| Suites | 175 |
| Total Guest Rooms | 2,860 |
| Kings | 1,078 |
| Doubles | 1,607 |
| Queen | 175 |
The resort also features approximately 130,489 sq. ft. of leased Class A retail and restaurant space, which was 78.5% occupied by over 100 tenants as of September 2016. For the trailing 12-month period ending September 30, 2016, the retail component of the resort generated approximately $20.8 million in retail rental revenue and, net of related expenses, accounted for approximately 13.1% of net cash flow (as estimated by the borrower sponsor), providing diversity to traditional hotel revenue streams. The borrower has the right to obtain the separate release of the retail component of the Hilton Hawaiian Village Property or portions thereof, as described below under “Release of Collateral”.
Since 2008, the Hilton Hawaiian Village Property has undergone approximately $232.2 million ($81,188 per room) in capital improvements. Most recently, the borrower sponsor invested over $17.9 million towards a comprehensive renovation of the 380-room Diamond Head Tower in 2014. The scope of the hard good upgrades included new FF&E, paint, new door hardware and ADA upgrades. Soft upgrades included renovations to the bathrooms. Additionally, the borrower sponsor spent $20.6 million on a full scale renovation of the Ali’i Tower that was completed in 2012.
THE INFORMATION IN THIS STRUCTURAL AND COLLATERAL TERM SHEET IS NOT COMPLETE AND MAY BE AMENDED PRIOR TO THE TIME OF SALE. THIS TERM SHEET IS NOT AN OFFER TO SELL THESE SECURITIES AND IT IS NOT A SOLICITATION OF AN OFFER TO BUY THESE SECURITIES IN ANY JURISDICTION WHERE THE OFFER OR SALE IS NOT PERMITTED.
63
2005 Kalia Road Honolulu, HI 96815 | Collateral Asset Summary – Loan No. 5 Hilton Hawaiian Village | Cut-off Date Balance: Cut-off Date LTV: U/W NCF DSCR: U/W NOI Debt Yield: | $56,625,000 31.2% 4.47x 21.2% |
| Historical Capital Expenditures(1) | ||||||||||
| 2008 | 2009 | 2010 | 2011 | 2012 | 2013 | 2014 | 2015 | YTD 2016(2) | Total | |
| Capital Expenditures(3) | $22,216 | $16,509 | $8,834 | $56,117 | $42,568 | $28,138 | $32,965 | $15,559 | $9,293 | $232,198 |
| Per Room | $7,768 | $5,772 | $3,089 | $19,621 | $14,884 | $9,838 | $11,526 | $5,440 | $3,249 | $81,188 |
| (1) | Based on actual capital expenditures as provided by the borrower sponsor. |
| (2) | YTD 2016 Capital Expenditures are as of September 30, 2016. |
| (3) | Capital Expenditures are presented in (000)’s. |
Environmental Matters.The Phase I environmental report dated October 17, 2016 recommended no further action at the Hilton Hawaiian Village Property other than the continued implementation of an asbestos operations and maintenance plan and lead paint operations and maintenance plan.
The Market.The Hilton Hawaiian Village Property is located on the island of Oahu in the Honolulu market and the Waikiki submarket. The island of Oahu serves as an economic center of the Hawaiian Islands. Oahu is a tourist destination offering many cultural venues, golf courses, restaurants, retail and recreational attractions.
According to the appraisal, Honolulu comprises a strong lodging market in Oahu and among all of the eight Hawaiian islands, a status attributable to a temperate year-round climate, popularity as one of the leading leisure destinations of Hawaii, strong visitor infrastructure and high barriers to new supply. Honolulu encompasses more than 24,000 guest rooms in 74 properties and, between 2009 and 2015, consistently achieved occupancy rates in the mid 70% to 80% range, never dropping below 74%. During this same period, RevPAR in Honolulu increased at an average annual rate of 9.5%, ending 2015 at $190, and the average daily rate achieved a premium of $69 over 2009. The market’s RevPAR in 2009, which represented the trough during the economic downturn, reflects a 14.6% decline relative to 2007.
According to a state government tourism authority, approximately 5.3 million tourists, or 62.4% of Hawaii’s total air tourists, visited the island of Oahu in 2015, making it the most popular destination of the Hawaii islands. Additionally, visitor expenditures in Oahu totaled $7.4 billion, which represents 49.3% of total expenditures by air visitors to Hawaii in 2015
The appraisal identified two hotels either recently opened or currently under construction in the Waikiki submarket that are expected to have some degree of competitive interaction with the Hilton Hawaiian Village Property. The 623-room Hilton Garden Inn (Ohana Waikiki West Redevelopment) opened in June 2016 and the 230-room boutique Hyatt Centric (Waikiki Trade Center Redevelopment) recently opened. Though offered at a competitive price-point with national brand affiliations, the appraisal notes that both options are non-beachfront locations with select-service product offerings.
The primary competitive set for the Hilton Hawaiian Village Property consists of four hotels, which range in size from 791 to 1,636 rooms and contains an aggregate of 4,967 rooms as illustrated in the table below. According to the appraisal, the 2015 weighted average occupancy, ADR and RevPAR of the competitive set are 91.4%, $262.97 and $240.48, respectively.
| Primary Competitive Set(1) | |||||||
| Property | Location | Rooms | Year Opened | YE 2015 Occupancy(2) | YE 2015 ADR(2) | YE 2015 RevPAR(2) | |
| Hilton Hawaiian Village Property | Honolulu - Oahu, HI | 2,860 | 1961 | 94.4% | $240.62 | $227.20 | |
| Sheraton Waikiki | Honolulu - Oahu, HI | 1,636 | 1971 | 90-95% | 300-325 | 280-290 | |
| Marriott Waikiki Beach Resort & Spa | Honolulu - Oahu, HI | 1,310 | 1971 | 85-90% | 210-220 | 180-190 | |
| Hyatt Regency Waikiki Beach Resort & Spa | Honolulu - Oahu, HI | 1,230 | 1976 | 85-90% | 250-260 | 220-230 | |
| Moana Surfrider Westin Resort & Spa | Honolulu - Oahu, HI | 791 | 1989 | 85-90% | 350-375 | 300-325 | |
| Total / Wtd. Avg. | 7,827 | 91.4% | $262.97 | $240.48 | |||
| (1) | Source: Appraisal. The competitive set excludes three secondary competitive properties considered in the hospitality research report. |
| (2) | YE 2015 Occupancy, YE 2015 ADR and YE 2015 RevPAR represent estimates from the appraisal. The minor variances between the underwriting, the hospitality research report and the above table with respect to Occupancy, ADR and RevPAR at the Hilton Hawaiian Village Property are attributable to variances in reporting methodologies and/or timing differences. |
THE INFORMATION IN THIS STRUCTURAL AND COLLATERAL TERM SHEET IS NOT COMPLETE AND MAY BE AMENDED PRIOR TO THE TIME OF SALE. THIS TERM SHEET IS NOT AN OFFER TO SELL THESE SECURITIES AND IT IS NOT A SOLICITATION OF AN OFFER TO BUY THESE SECURITIES IN ANY JURISDICTION WHERE THE OFFER OR SALE IS NOT PERMITTED.
64
2005 Kalia Road Honolulu, HI 96815 | Collateral Asset Summary – Loan No. 5 Hilton Hawaiian Village | Cut-off Date Balance: Cut-off Date LTV: U/W NCF DSCR: U/W NOI Debt Yield: | $56,625,000 31.2% 4.47x 21.2% |
The appraiser determined 2015 market demand segmentation of 48% wholesale, 36% free independent traveler (“FIT”) and 16% meeting and group. The Hilton Hawaiian Village Property had 2015 demand segmentation of 37% wholesale, 44% FIT and 19% meeting and group. The market penetration rates as of YE 2015 are presented in the table below.
| Demand Penetration(1) | |||||
| Property | Rooms | Wholesale | FIT | Meeting & Group | Overall |
| Hilton Hawaiian Village Property | 2,860 | 81% | 127% | 120% | 104% |
| Sheraton Waikiki | 1,636 | 140% | 43% | 124% | 103% |
| Marriott Waikiki Beach Resort & Spa | 1,310 | 41% | 162% | 118% | 97% |
| Hyatt Regency Waikiki Beach Resort & Spa | 1,230 | 124% | 68% | 89% | 98% |
| Moana Surfrider Westin Resort & Spa | 791 | 121% | 80% | 58% | 96% |
| (1) | Source: Appraisal. |
Cash Flow Analysis.
| Cash Flow Analysis | |||||||
| 2013 | 2014 | 2015 | T-12 9/30/2016 | U/W | U/W per Room | ||
| Occupancy | 89.9% | 90.7% | 94.4% | 94.6% | 94.6% | ||
| ADR | $247.48 | $259.85 | $240.62 | $250.09 | $250.09 | ||
| RevPAR | $222.57 | $235.77 | $227.20 | $236.65 | $236.65 | ||
| Room Revenue | $232,345,007 | $246,124,088 | $237,172,233 | $247,711,744 | $247,034,700 | $86,376 | |
| F&B Revenue | 56,844,007 | 62,740,100 | 70,771,369 | 69,023,623 | 68,996,667 | 24,125 | |
| Retail – Store Rentals(1) | 19,071,361 | 20,048,658 | 20,582,018 | 20,786,062 | 19,162,812 | 6,700 | |
| Other Revenue(2) | 16,714,514 | 17,176,781 | 38,265,602 | 39,466,009 | 39,243,564 | 13,722 | |
| Total Revenue | $324,974,888 | $346,089,627 | $366,791,222 | $376,987,438 | $374,437,742 | $130,922 | |
| Operating Expenses | 108,450,526 | 115,746,148 | 126,658,376 | 127,698,731 | 126,780,054 | 44,329 | |
| Undistributed Expenses | 61,997,168 | 64,229,329 | 62,250,540 | 64,897,454 | 62,099,714 | 21,713 | |
| Gross Operating Profit | $154,527,194 | $166,114,150 | $177,882,306 | $184,391,253 | $185,557,974 | $64,880 | |
| Management Fee(3) | 17,783,281 | 19,036,711 | 20,311,371 | 21,868,482 | 21,056,417 | 7,362 | |
| Total Fixed Charges | 12,780,083 | 13,373,036 | 14,161,563 | 15,550,153 | 16,937,073 | 5,922 | |
| Net Operating Income | $123,963,830 | $133,704,404 | $143,409,371 | $146,972,618 | $147,564,484 | $51,596 | |
| FF&E(4) | 12,998,996 | 13,843,585 | 14,671,649 | 15,079,498 | 14,977,510 | 5,237 | |
| Net Cash Flow | $110,964,835 | $119,860,819 | $128,737,723 | $131,893,120 | $132,586,975 | $46,359 | |
| (1) | U/W Retail - Store Rentals is based off of the in-place rent roll as of September 2016 for the leased retail space at the property and includes base rent (with rent steps through November 2017), overage rent and reimbursements for CAM (including insurance), real estate taxes and marketing expense. |
| (2) | Other Revenue consists of telephone revenue, parking revenue, resort fee (beginning in 2015), recreation revenue, health club revenue, water sports, beach and pool revenue and miscellaneous revenue. |
| (3) | U/W Management Fee is 3.0% of Total Revenue less Retail – Store Rentals. |
| (4) | U/W FF&E represents 4.0% of Total Revenue. |
Property Management. The Hilton Hawaiian Village Property is managed by Hilton Management LLC. Pursuant to the management agreement, the property manager is required to apply revenues from the operation of the hotel to the payment of monthly reserves including but not limited to reserves for taxes, insurance, ground rent, management fees, capital expenditures, operating expenses, emergency repairs, TI/LC, working capital, sales and use taxes, custodial funds.
Lockbox / Cash Management.The Hilton Hawaiian Village Whole Loan is structured with a hard lockbox and in place cash management. All rents and other payments are required to be deposited directly into segregated property accounts maintained by the borrower and the operating lessee, as applicable, and controlled by the lender. All revenues in the property accounts (less any property account charges and any required minimum peg balance) are required to be transferred on each business day to operating accounts maintained by the borrower and operating lessee, as applicable, and controlled by the lender. Funds on deposit in the operating accounts are required to be disbursed in accordance with the Hilton Hawaiian Village Whole Loan documents for payments required under the management agreement. On a monthly basis, all remaining funds on deposit in the operating accounts are required to be deposited into a lender controlled cash management account. So long as no event of default or Low Debt Yield Trigger (as defined below) is continuing, all funds in the cash management account are required to be released to operating lessee and/or the borrower, as applicable. Upon the occurrence of an event of default or a Low Debt Yield Trigger, all funds in the cash management account are required to be deposited into the lender controlled excess cash account and applied as provided in the Hilton Hawaiian Village Loan
THE INFORMATION IN THIS STRUCTURAL AND COLLATERAL TERM SHEET IS NOT COMPLETE AND MAY BE AMENDED PRIOR TO THE TIME OF SALE. THIS TERM SHEET IS NOT AN OFFER TO SELL THESE SECURITIES AND IT IS NOT A SOLICITATION OF AN OFFER TO BUY THESE SECURITIES IN ANY JURISDICTION WHERE THE OFFER OR SALE IS NOT PERMITTED.
65
2005 Kalia Road Honolulu, HI 96815 | Collateral Asset Summary – Loan No. 5 Hilton Hawaiian Village | Cut-off Date Balance: Cut-off Date LTV: U/W NCF DSCR: U/W NOI Debt Yield: | $56,625,000 31.2% 4.47x 21.2% |
documents. The borrower and/or the operating lessee, as applicable, has granted a security interest in the manager replacement reserve account, the operating account and the property accounts (and the property manager has consented to the same); provided, that such amounts on deposit in the such accounts will be available for use by the property manager in accordance with the management agreement following an event of default and the lender may not apply such amounts on deposit in such accounts to the Hilton Hawaiian Village Whole Loan.
A “Low Debt Yield Trigger” will commence upon the debt yield falling below 7.0% for two consecutive quarters. A Low Debt Yield Trigger will cease and all funds held by the lender will be released to operating lessee and/or the borrower, as applicable, if (i) no event of default is continuing and (ii) the debt yield exceeds 7.0% for two consecutive quarters.
Following the lockout period, the borrower is permitted to prepay the Hilton Hawaiian Village Whole Loan in part to cure a Low Debt Trigger Period, which is required to be accompanied by the applicable yield maintenance premium if prior to the open period.
Initial Reserves.None.
Ongoing Reserves.The requirement for the borrower to make monthly deposits for replacements reserves is waived so long as the borrower has reserved such amounts with the property manager pursuant to the management agreement. In the event that the borrower is no longer required to reserve such amounts with the property manager, on a monthly basis, the borrower will be required to make monthly deposits of 4.0% of gross income for the calendar month that is two months prior to such payment date. Additionally, during the occurrence of a Low Debt Yield Trigger or if an event of default is continuing, the borrower will be required to make monthly deposits of 1/12 of the estimated annual real estate taxes and insurance premiums, unless such amounts are held in reserve by the property manager.
Current Mezzanine or Subordinate Indebtedness. The Hilton Hawaiian Village Whole Loan includes Junior Notes, with an aggregate principal balance of $578.4 million. The Junior Notes are co-terminus with the Senior Notes and accrue interest at a rate of 4.1995%. The Senior Notes are generally senior in right of payment to the Junior Notes.
Future Mezzanine or Subordinate Indebtedness Permitted. None.
Condominium.The collateral includes the 14 hotel units of a condominium in the Kalia Tower (on floors 5-11 and 19-25). The six timeshare units of the condominium are not part of the collateral, but there are several agreements in place governing shared use of common facilities. The borrower controls the condominium board and is responsible for maintenance of the Kalia Tower.
Ground Lease.The borrower has a leasehold interest in approximately 5,900 sq. ft. that contains a small apartment building with 45 rental units pursuant to a ground lease that expires on July 31, 2035 with no extension options. The ground lease currently requires monthly rent of approximately $12,762 from August 1, 2016 through July 31, 2017, on which date the annual monthly payment will increase by 3% each year through 2035.
Partial Releases.The Hilton Hawaiian Village Loan documents permit, after the expiration of the lockout period, the release from the lien of the mortgage of the ground leased portion of the Hilton Hawaiian Village Property (the “Taran Outparcel”), provided, among other things, the borrower pays a release price of $2,500,000 together with the applicable yield maintenance premium.
In addition, the Hilton Hawaiian Village Loan documents permit, after the expiration of the lockout period, the release of retail and other parcels at the Hilton Hawaiian Village Property provided, among other things the release does not materially and adversely affect the ongoing operations of the Hilton Hawaiian Village Property (other than the lost income associated with the parcels being released) and the borrower pays a release price equal to the product of, (1) with respect to the release of any retail parcels (which are identified in the loan documents) (a) 110% and (b) the product of (i) the greater of (A) 100% of the difference in value of the Hilton Hawaiian Village Property including the release parcel and excluding the release parcel (based on a new appraisal) or (B) the net sales proceeds and (ii) 57.2%, together with the applicable yield maintenance premium and (2) with respect to the release of any other parcels (excluding the Taran Outparcel and excluding any identified retail parcels), (a) 110% and (b) the product of (i) 100% of the difference in value of the Hilton Hawaiian Village Property including the release parcel and excluding the release parcel (based on a new appraisal) and (ii) 57.2%, together with the applicable yield maintenance premium.
With respect to each partial release described above, the borrower is not required to pay a yield maintenance premium during the open period for the Hilton Hawaiian Village Whole Loan. In addition, in the event that after any partial release contemplated above, the loan to value ratio for the Hilton Hawaiian Village Whole Loan is greater than 125%, such release will not be permitted unless the borrower pays down the Hilton Hawaiian Village Whole Loan in accordance with the loan documents or the lender receives an opinion of counsel that the issuing entity will not fail to maintain its status as a REMIC as a result of the release.
THE INFORMATION IN THIS STRUCTURAL AND COLLATERAL TERM SHEET IS NOT COMPLETE AND MAY BE AMENDED PRIOR TO THE TIME OF SALE. THIS TERM SHEET IS NOT AN OFFER TO SELL THESE SECURITIES AND IT IS NOT A SOLICITATION OF AN OFFER TO BUY THESE SECURITIES IN ANY JURISDICTION WHERE THE OFFER OR SALE IS NOT PERMITTED.
66
2005 Kalia Road Honolulu, HI 96815 | Collateral Asset Summary – Loan No. 5 Hilton Hawaiian Village | Cut-off Date Balance: Cut-off Date LTV: U/W NCF DSCR: U/W NOI Debt Yield: | $56,625,000 31.2% 4.47x 21.2% |
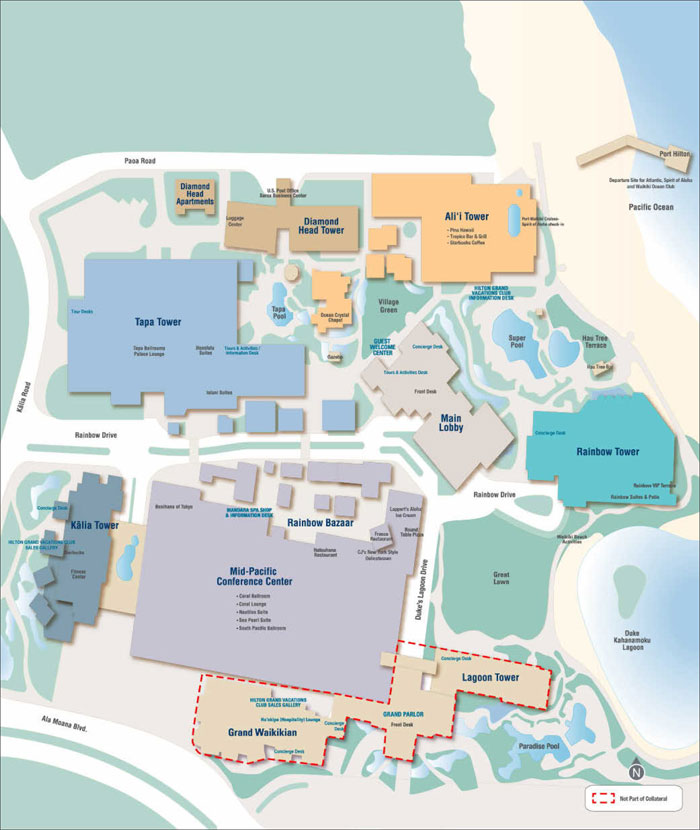
THE INFORMATION IN THIS STRUCTURAL AND COLLATERAL TERM SHEET IS NOT COMPLETE AND MAY BE AMENDED PRIOR TO THE TIME OF SALE. THIS TERM SHEET IS NOT AN OFFER TO SELL THESE SECURITIES AND IT IS NOT A SOLICITATION OF AN OFFER TO BUY THESE SECURITIES IN ANY JURISDICTION WHERE THE OFFER OR SALE IS NOT PERMITTED.
67
2005 Kalia Road Honolulu, HI 96815 | Collateral Asset Summary – Loan No. 5 Hilton Hawaiian Village | Cut-off Date Balance: Cut-off Date LTV: U/W NCF DSCR: U/W NOI Debt Yield: | $56,625,000 31.2% 4.47x 21.2% |
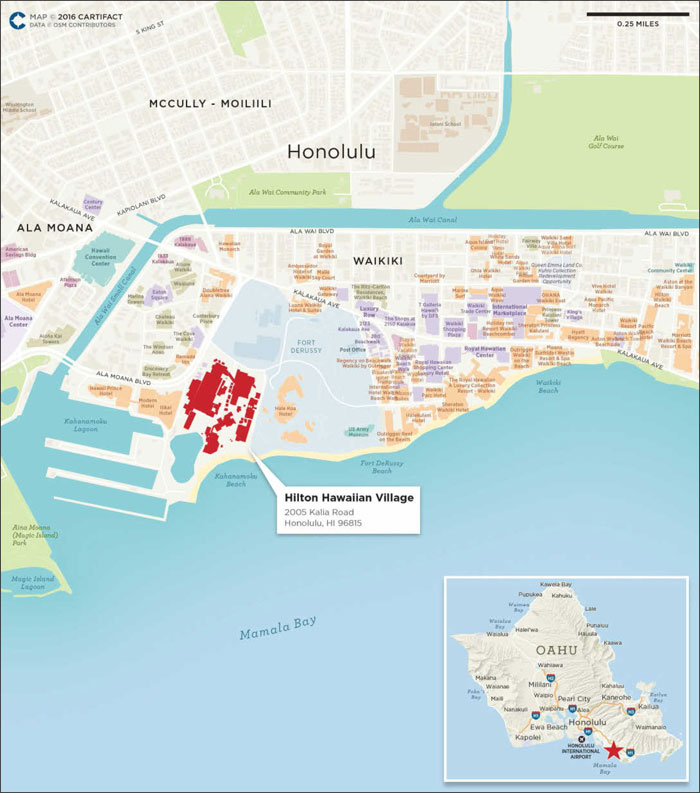
THE INFORMATION IN THIS STRUCTURAL AND COLLATERAL TERM SHEET IS NOT COMPLETE AND MAY BE AMENDED PRIOR TO THE TIME OF SALE. THIS TERM SHEET IS NOT AN OFFER TO SELL THESE SECURITIES AND IT IS NOT A SOLICITATION OF AN OFFER TO BUY THESE SECURITIES IN ANY JURISDICTION WHERE THE OFFER OR SALE IS NOT PERMITTED.
68
(THIS PAGE INTENTIONALLY LEFT BLANK)
THE INFORMATION IN THIS STRUCTURAL AND COLLATERAL TERM SHEET IS NOT COMPLETE AND MAY BE AMENDED PRIOR TO THE TIME OF SALE. THIS TERM SHEET IS NOT AN OFFER TO SELL THESE SECURITIES AND IT IS NOT A SOLICITATION OF AN OFFER TO BUY THESE SECURITIES IN ANY JURISDICTION WHERE THE OFFER OR SALE IS NOT PERMITTED.
69
41-45 21st Street & 41-54 22nd Street Long Island City, NY 11101 | Collateral Asset Summary – Loan No. 6 Uovo Art Storage | Cut-off Date Balance: Cut-off Date LTV: U/W NCF DSCR: U/W NOI Debt Yield: | $49,803,347 52.5% 1.55x 9.8% |

THE INFORMATION IN THIS STRUCTURAL AND COLLATERAL TERM SHEET IS NOT COMPLETE AND MAY BE AMENDED PRIOR TO THE TIME OF SALE. THIS TERM SHEET IS NOT AN OFFER TO SELL THESE SECURITIES AND IT IS NOT A SOLICITATION OF AN OFFER TO BUY THESE SECURITIES IN ANY JURISDICTION WHERE THE OFFER OR SALE IS NOT PERMITTED.
70
41-45 21st Street & 41-54 22nd Street Long Island City, NY 11101 | Collateral Asset Summary – Loan No. 6 Uovo Art Storage | Cut-off Date Balance: Cut-off Date LTV: U/W NCF DSCR: U/W NOI Debt Yield: | $49,803,347 52.5% 1.55x 9.8% |
| Mortgage Loan Information | |
| Loan Seller: | GACC |
| Loan Purpose: | Refinance |
| Sponsor(1): | Steven J. Guttman |
| Borrowers: | QPN 1 DE LLC; QPN 10 DE LLC |
| Original Balance(2): | $50,000,000 |
| Cut-off Date Balance(2): | $49,803,347 |
| % by Initial UPB: | 5.5% |
| Interest Rate: | 4.7350% |
| Payment Date: | 6thof each month |
| First Payment Date: | March 6, 2017 |
| Maturity Date: | February 6, 2027 |
| Amortization: | 360 months |
| Additional Debt(2): | $36,854,477Pari Passu Debt |
| Call Protection: | L(27), D(89), O(4) |
| Lockbox / Cash Management: | Springing Hard / Springing |
| Reserves(3) | ||
| Initial | Monthly | |
| Taxes: | $29,711 | $14,855 |
| Insurance: | $0 | Springing |
| Replacement: | $0 | $2,456 |
| New PCO Repair: | $71,500 | $0 |
| Financial Information(4) | ||||
| Cut-off Date Balance / Sq. Ft.(5): | $315 | |||
| Balloon Balance / Sq. Ft.(5): | $258 | |||
| Cut-off Date LTV: | 52.5% | |||
| Balloon LTV: | 43.0% | |||
| Underwritten NOI DSCR: | 1.56x | |||
| Underwritten NCF DSCR: | 1.55x | |||
| Underwritten NOI Debt Yield: | 9.8% | |||
| Underwritten NCF Debt Yield: | 9.8% | |||
| Underwritten NOI Debt Yield at Balloon: | 12.0% | |||
| Underwritten NCF Debt Yield at Balloon: | 11.9% | |||
| Property Information | |
| Single Asset / Portfolio: | Single Asset |
| Property Type: | Self Storage – Art Storage |
| Collateral: | Fee Simple |
| Location: | Long Island City, NY |
| Year Built / Renovated: | 2014-2015 / NAP |
| Total Sq. Ft.(6): | 275,000 |
| Property Management: | Uovo Management LLC |
| Underwritten NOI(7): | $8,481,117 |
| Underwritten NCF: | $8,451,641 |
| Appraised Value(8): | $165,000,000 |
| Appraisal Date: | January 9, 2017 |
| Historical NOI(9) | |
| Most Recent NOI: | $5,959,509 (December 31, 2016) |
| 2015 NOI: | $892,213 (December 31, 2015) |
| 2014 NOI: | NAP |
| 2013 NOI: | NAP |
| Historical Occupancy(10) | |
| Most Recent Occupancy: | 83.9% (January 10, 2017) |
| 2016 Occupancy: | 83.1% (December 31, 2016) |
| 2015 Occupancy: | 57.7% (December 31, 2015) |
| 2014 Occupancy: | NAP |
| (1) | The sponsor is also the sponsor of the mortgage loan identified on Annex A-1 to the Preliminary Prospectus as 33 Kings Highway, which has a Cut-off Date Balance of $14,981,369. |
| (2) | The Original Balance of $50.0 million represents the controlling Note A-1 and non-controlling Note A-4 which, together with thepari passu Note A-2 and Note A-3 comprise the Uovo Art Storage Whole Loan with an aggregate original principal balance of $87.0 million. For additional information regarding thepari passu notes, see “The Loan” herein. |
| (3) | See “Initial Reserves” and “Ongoing Reserves” herein. |
| (4) | DSCR, LTV, Debt Yield and Balance / Sq. Ft. calculations are based on the Uovo Art Storage Whole Loan, which has an aggregate principal balance of $87.0 million. |
| (5) | The Cut-off Date Balance / Sq. Ft. and Balloon Balance / Sq. Ft. calculations are based on 275,000 gross sq. ft. |
| (6) | Total Sq. Ft. is based on the gross building area of 275,000 sq. ft. between the two buildings. The private storage units total 164,812 sq. ft. and the managed storage units total 162,793 cubic feet. |
| (7) | Underwritten NOI is higher than the Most Recent NOI due to additional lease up of the property. Since the beginning of 2016, new leases have commenced for approximately 111 private storage units, totaling approximately $4.9 million (52.6% of private unit underwritten rents in place). In addition, Underwritten NOI includes $270,525 in rent steps through January 2018. |
| (8) | In addition to the “As-is” appraised value, the appraisal determined an “As Stabilized” appraised value of $180,000,000 which assumes 87.5% occupancy for the private storage units and 70.0% occupancy for the managed storage units. Based on the January 10, 2017 rent roll, the private storage space is 83.9% leased and the managed storage is 48.2% leased. Based on the “As Stabilized” appraised value, the Cut-off Date LTV and the Balloon LTV would be 48.1% and 39.4%, respectively. |
| (9) | Historical NOI is not available as the property was constructed between 2014 and 2015 and was not fully opened until June 2015. |
| (10) | Occupancy represents the occupancy percentage for the private storage space (measured in sq. ft.). The managed storage space is measured in cubic feet and as of the January 10, 2017 rent roll is 48.2% leased. |
THE INFORMATION IN THIS STRUCTURAL AND COLLATERAL TERM SHEET IS NOT COMPLETE AND MAY BE AMENDED PRIOR TO THE TIME OF SALE. THIS TERM SHEET IS NOT AN OFFER TO SELL THESE SECURITIES AND IT IS NOT A SOLICITATION OF AN OFFER TO BUY THESE SECURITIES IN ANY JURISDICTION WHERE THE OFFER OR SALE IS NOT PERMITTED.
71
41-45 21st Street & 41-54 22nd Street Long Island City, NY 11101 | Collateral Asset Summary – Loan No. 6 Uovo Art Storage | Cut-off Date Balance: Cut-off Date LTV: U/W NCF DSCR: U/W NOI Debt Yield: | $49,803,347 52.5% 1.55x 9.8% |
The Loan. The Uovo Art Storage loan (the “Uovo Art Storage Loan”) is a fixed rate loan secured by the borrower’s fee simple interest in two interconnecting art storage buildings totaling 275,000 gross sq. ft. located in Long Island City, New York (the “Uovo Art Storage Property”). The Uovo Art Storage Loan is evidenced by the controlling Note A-1 and non-controlling Note A-4, with an original principal balance of $50.0 million, which will be included in the CD 2017-CD4 mortgage trust and is part of a whole loan which is evidenced by the non-controlling Note A-2 and Note A-3, with an aggregate original principal balance of $37.0 million, which were contributed to the JPMDB 2017-C5 securitization (together with the Uovo Art Storage Loan, the “Uovo Art Storage Whole Loan”).
The relationship between the holders of the Uovo Art Storage Whole Loan will be governed by a co-lender agreement as described under “Description of the Mortgage Pool–The Whole Loans–The Serviced Pari Passu Whole Loans – Uovo Art Storage Whole Loan” in the Preliminary Prospectus.
| Whole Loan Summary | |||||
| Note | Original Balance | Cut-off Date Balance | Note Holder | Controlling Piece | |
| A-1 and A-4 | $50,000,000 | $49,803,347 | CD 2017-CD4 | Yes | |
| A-2 and A-3 | $37,000,000 | $36,854,477 | JPMDB 2017-C5 | No | |
| Total | $87,000,000 | $86,657,824 | |||
The Uovo Art Storage Whole Loan has a 10-year term and amortizes on a 30-year schedule. The Uovo Art Storage Whole Loan accrues interest at a fixed rate equal to 4.7350%. The Uovo Art Storage Whole Loan proceeds were used to refinance existing debt of approximately $75.1 million, fund $101,211 in upfront reserves, pay transaction costs of $0.7 million and return approximately $11.0 million of borrower equity. Based on the “As-is” appraised value of $165.0 million as of January 9, 2017, the Cut-off Date LTV is 52.5%. The most recent prior financing of the Uovo Art Storage Property was not included in a securitization.
| Sources and Uses | ||||||
| Sources | Proceeds | % of Total | Uses | Proceeds | % of Total | |
| Whole Loan | $87,000,000 | 100.0% | Loan Payoff | $75,149,150 | 86.4% | |
| Return of Equity | $11,016,416 | 12.7% | ||||
| Closing Costs | $733,223 | 0.8% | ||||
| Reserves | $101,211 | 0.1% | ||||
| Total Sources | $87,000,000 | 100.0% | Total Uses | $87,000,000 | 100.0% | |
The Borrowers / Sponsor.The borrowers, QPN 1 DE LLC and QPN 10 DE LLC are single purpose Delaware limited liability companies structured to be bankruptcy-remote with two independent directors in their organizational structure. The sponsor of the borrower and the nonrecourse carve-out guarantor is Steven J. Guttman.
Steven J. Guttman is the founder of Storage Deluxe Management Company (“Storage Deluxe”). Founded in 1998, Storage Deluxe has developed and constructed approximately 34 self storage facilities, three fine art storage facilities, and one luxury car storage facility. Altogether, these assets comprise approximately 2.4 million net rentable sq. ft. across approximately 40,000 units. The loan sponsor has since sold 27 of its properties, with the majority being acquired by Cube Smart. Currently, Storage Deluxe manages approximately 10 facilities in New York within Brooklyn, Manhattan, Flushing, Long Island City, Queens, New Hyde Park and The Bronx, with an additional seven properties under construction.
The Property.The Uovo Art Storage Property includes two interconnected fine art storage facilities consisting of a six-story building (“Building 10”) containing 110,000 gross sq. ft. of space and an eight-story building (“Building 1”) containing 165,000 gross sq. ft. of space, for a total 275,000 gross sq. ft. The property was developed by Storage Deluxe between 2014 and 2015 for a total cost of approximately $73.3 million and is located in Long Island City, Queens, at the foot of the 59th Street Bridge. The fine art storage facilities consist of both private storage and managed storage. Private storage totals 164,812 sq. ft. throughout 290 units and is 83.9% leased as of January 2017, while managed storage totals 162,793 cubic feet and is 48.2% leased as of January 10, 2017. First floor amenities include a lobby and reception common areas, nine covered loading docks that can accommodate a tractor-trailer up to 53-feet, seven private viewing rooms, a café for clients, three passenger elevators and two freight elevators capable of moving large artwork. The viewing rooms, ranging in size from 400 sq. ft. to 1,600 sq. ft., are designed to display artwork and can be rented on a half day or a full day basis for an additional fee. The buildings have dock-high and drive-in loading capabilities, with nine loading bays on site, as well as clear ceiling heights, ranging from 10’ to 16’5’’ to accommodate larger items. The property features 24/7 security with integrated key card access controls, individual unit door alarms, two-way intercoms and CCTV cameras. The property also contains an integrated building management system and security systems with motion detectors, glass break sensors, sonic sensors, water sensors and heat detectors that report directly to a central station, the New York Police Department and the Fire Department of New York. Additionally, all artwork is stored a minimum of six inches off the floor.
THE INFORMATION IN THIS STRUCTURAL AND COLLATERAL TERM SHEET IS NOT COMPLETE AND MAY BE AMENDED PRIOR TO THE TIME OF SALE. THIS TERM SHEET IS NOT AN OFFER TO SELL THESE SECURITIES AND IT IS NOT A SOLICITATION OF AN OFFER TO BUY THESE SECURITIES IN ANY JURISDICTION WHERE THE OFFER OR SALE IS NOT PERMITTED.
72
41-45 21st Street & 41-54 22nd Street Long Island City, NY 11101 | Collateral Asset Summary – Loan No. 6 Uovo Art Storage | Cut-off Date Balance: Cut-off Date LTV: U/W NCF DSCR: U/W NOI Debt Yield: | $49,803,347 52.5% 1.55x 9.8% |
Private Storage. The private storage facilities operate similarly to traditional self-storage units and are tailor made for each tenant and include lighting, flooring, racking systems, conservation equipment, and security systems, and allow for tenants to work out of their space. The tenant is responsible for loading and unloading the unit and assumes responsibility for the handling of all items stored. Tenants can access their private storage unit at any time during the property’s hours of operation. Each tenant is only allowed access to the floor and unit in which their private storage is located and requires a new security key each time they enter the property. Private storage tenants sign a standard form lease (similar to a traditional self storage lease) that can go month to month once it expires. As of the January 10, 2017 rent roll, 83.9% of the 290 private storage units are leased with weighted average original and remaining lease terms of 5.0 and 3.8 years, respectively. The private storage units range in size from 30 sq. ft. to 22,000 sq. ft. and are leased by a variety of tenants. The two largest tenants, Metropolitan Museum of Art (“Met”) and Phillip Van Heusen (“PVH Corp.”) (rated Ba2 and BB+ by Moody’s and S&P, respectively), each lease 22,000 sq. ft. (each 13.3% of total private storage sq. ft.). The Met signed a 10-year lease through March 2026 and accounts for 12.1% of private storage base rent. PVH Corp signed a five-year lease through May 2020 and accounts for 8.9% of private storage base rent. No other tenant leases more than 4,000 sq. ft. of private storage space or accounts for more than 4.3% of private storage base rent.
Managed Storage. The managed storage facilities are for customers who do not need full units but want certain items to be stored and managed by the facility. The managed storage units are located on the first and second floors of each building, and consist of open storage areas that are optimized for large and small pieces of artwork. These items are typically catalogued and individually bar-coded, then stored in the managed storage area, which is fitted out with racks. In order to view artwork stored in these spaces, users must request their art to be removed from managed storage and set up in a viewing room for an additional fee. The managed storage tenants lease space based on cubic feet and are structured with month-to-month leases. Each tenant can opt to increase or reduce their space at any given time. As of the January 10, 2017 rent roll, 48.2% of the managed storage space is leased. Both facilities are climate controlled to maintain constant temperatures and humidity.
The subsequent charts provide a breakdown of each building as well as a breakout of the public and private storage units:
| Unit Breakdown(1) | |||||||
| Private Storage Units | Managed Storage Units(2) | ||||||
| Building | Address | Gross Building Area (Sq. Ft.) | Rentable Area (Sq. Ft.) | Number of Units | Rentable Area (Cubic Feet) | ||
| Building 1 | 41-45 21st Street | 165,000 | 111,015 | 181 | 46,519 | ||
| Building 10 | 41-54 22nd Street | 110,000 | 53,797 | 109 | 116,274 | ||
| Total | 275,000 | 164,812 | 290 | 162,793 | |||
| (1) | Source: Appraisal. |
| (2) | Managed storage units are measured and rented upon a per cubic foot basis. |
| Private and Managed Storage Breakdown | |||||||
| Private Storage | Total Sq. Ft. | Units | U/W Base Rent | % of Total U/W Base Rent | Leased Sq. Ft. | Leased Percentage(1) | Avg. Rent PSF(1) |
| Building 1 | 111,015 | 181 | $5,726,857 | 53.8% | 88,180 | 79.4% | $64.95 |
| Building 10 | 53,797 | 109 | $3,282,845 | 30.8% | 50,147 | 93.2% | $65.46 |
| Total | 164,812 | 290 | $9,009,702 | 84.6% | 138,327 | 83.9% | $65.13 |
| Managed Storage | Total Cubic Feet | Units | U/W Base Rent | % of Total U/W Base Rent | Leased Cubic Feet | Leased Percentage(1) | Avg. Rent Per Cubic Foot(1) |
| Building 1 & Building 10 | 162,793 | NAP | $1,634,154 | 15.4% | 78,544 | 48.2% | $20.81 |
| Total | 162,793 | NAP | $1,634,154 | 15.4% | 78,544 | 48.2% | $20.81 |
| (1) | Based on the January 10, 2017 underwritten rent roll. |
The Uovo Art Storage Property was designed to permit use by individual owners, artists, galleries and museums that can both store and showcase artwork. Museum clients use the facility to store and ship pieces back and forth. Galleries can set up private viewings and conduct business in New York, while artists can manage and show their own artwork to individual collectors and galleries. The property’s tenant composition is diversified and, in addition to galleries and museums, includes financial firms, fashion galleries and individuals. Individuals compose the majority of the storage demand in Building 10 and galleries, fashion and museums make up the majority of the storage demand in Building 1.
Environmental Matters.The Phase I environmental report dated January 31, 2017 recommended no further action at the Uovo Art Storage Property.
THE INFORMATION IN THIS STRUCTURAL AND COLLATERAL TERM SHEET IS NOT COMPLETE AND MAY BE AMENDED PRIOR TO THE TIME OF SALE. THIS TERM SHEET IS NOT AN OFFER TO SELL THESE SECURITIES AND IT IS NOT A SOLICITATION OF AN OFFER TO BUY THESE SECURITIES IN ANY JURISDICTION WHERE THE OFFER OR SALE IS NOT PERMITTED.
73
41-45 21st Street & 41-54 22nd Street Long Island City, NY 11101 | Collateral Asset Summary – Loan No. 6 Uovo Art Storage | Cut-off Date Balance: Cut-off Date LTV: U/W NCF DSCR: U/W NOI Debt Yield: | $49,803,347 52.5% 1.55x 9.8% |
The Market.The Uovo Art Storage Property is located in Long Island City, New York, a neighborhood located in the western area of Queens and situated opposite Midtown Manhattan. Long Island City consists of an approximately 2.5 square mile area bound by 34th Avenue to the north, Northern Boulevard and 39th Street to the east, Newtown Creek to the south, the Long Island Expressway to the southeast, and the East River to the west. Long Island City is part of Queens Community District 1 and 2. Long Island City is served by highways, surface streets and public transportation. The Long Island Expressway is located at the southern end of Long Island City, while the Brooklyn Queens Expressway is located along the eastern end of Long Island City. Queens Boulevard, Northern Boulevard and Hunters Point Avenue provide good access through Long Island City and its surrounding neighborhoods. Long Island City is also served by two of the busiest New York City subways and by a public bus service. The 21st Street Queensbridge F train stop is located one block north of the property, the Queensboro Plaza 7 train stop is located three blocks east of the Uovo Art Storage Property, and the Queens Plaza E/M/R train stop is located approximately seven blocks to the east of the Uovo Art Storage Property. These trains provide access to Manhattan and other areas of New York. While the Uovo Art Storage Property draws clientele from the entire New York Metro Area, the majority of the Uovo Art Storage Property’s prospective customers are located in Manhattan (museums, galleries, and private art collectors). The site is located close to Manhattan and the majority of its potential customer base, and it enjoys access via the Long Island Expressway and Brooklyn-Queens Expressway.
According to the appraisal, Long Island City is transforming from a community that is comprised primarily of industrial and commercial districts, with a limited amount of residential uses, to one with a strong residential component with expanding hotel and retail services. The residential communities are comprised primarily of multi-family apartment buildings, with a mix of one-, two-, and three-family dwellings. Retail and commercial districts are located on Queens Boulevard, Northern Boulevard and Jackson Avenue. According to the appraisal, since 2006, at least 9,000 residential units have been completed in the Long Island City neighborhood. There are currently more than 14,000 units under construction in the area, and at least 3,500 more units planned for the future. The 14,000 units under construction will generally be delivered between 2015 and 2018. Over 4,700 rental units are in the process of being converted or have been converted recently.
The Uovo Art Storage Property is a newly built art storage facility. The appraisal identified a set of storage properties that cater to the storage of fine art and collectibles in the New York Metro area, and act as the Uovo Art Storage Property’s most direct competition within the art customer demographic. In total, the competitive art storage properties contain approximately 600,600 sq. ft. The comparable projects were older buildings originally built for purposes other than art storage, and then repurposed over time. Excluding the Uovo Art Storage Property, the comparable art storage projects had occupancy levels ranging from 90.0% to 98.0%, with an average of 93.8%. The subsequent chart is a summary of the comparable properties.
| Competitive Set Summary(1) | |||||||
| Property Name | Location | Year Built | Year Renovated | Total Units | NRA | Average Unit Size (Sq. Ft.) | Occupancy Rate |
| Uovo Art Storage Property(2) | Long Island City, NY | 2014-2015 | NAP | 290 | 164,812 | 568 | 83.9%(3) |
| Atelier 4 | Long Island City, NY | 1955 | 2005 | NAP | 65,000 | NAP | 90.0% |
| Fortress | Long Island City, NY | 1931 | NAP | NAP | 85,000 | NAP | 95.0% |
| Artex Fine Art Services | Long Island City, NY | 1926 | 2003 | 320 | 80,000 | 250 | 95.0% |
| Day & Meyer | Manhattan, NY | 1927 | NAP | 700 | 70,000 | 100 | 95.0% |
| Crozier | Manhattan, NY | 1913 | NAP | 856 | 80,600 | 94 | 98.0% |
| Christies | Brooklyn, NY | 1913 | 2009 | NAP | 220,000 | NAP | 92.0% |
| Total/Wtd. Avg.(4) | 600,600 | 123 | 93.8% | ||||
| (1) | Source: Appraisal. |
| (2) | The information in the above chart represents the private storage units at the Uovo Art Storage Property. |
| (3) | Based on the January 10, 2017 underwritten rent roll. |
| (4) | Total/Wtd. Avg. excludes the Uovo Art Storage Property. |
In addition, the appraisal determined market rent of $22.00 per cubic foot for the managed storage units compared to the weighted average in place rent of $20.81 per cubic foot as of the January 10, 2017 rent roll, and $100.70 PSF for the private storage units compared to the weighted average in place rent of $65.13 PSF as of the January 10, 2017 rent roll.
THE INFORMATION IN THIS STRUCTURAL AND COLLATERAL TERM SHEET IS NOT COMPLETE AND MAY BE AMENDED PRIOR TO THE TIME OF SALE. THIS TERM SHEET IS NOT AN OFFER TO SELL THESE SECURITIES AND IT IS NOT A SOLICITATION OF AN OFFER TO BUY THESE SECURITIES IN ANY JURISDICTION WHERE THE OFFER OR SALE IS NOT PERMITTED.
74
41-45 21st Street & 41-54 22nd Street Long Island City, NY 11101 | Collateral Asset Summary – Loan No. 6 Uovo Art Storage | Cut-off Date Balance: Cut-off Date LTV: U/W NCF DSCR: U/W NOI Debt Yield: | $49,803,347 52.5% 1.55x 9.8% |
Cash Flow Analysis.
| Cash Flow Analysis | ||||||||
| 2015(1) | 2016 | T-6 12/31/2016 | T-3 12/31/2016 | U/W | U/W PSF(2) | |||
| Rents in Place – Private Units(3) | $2,995,208 | $7,265,414 | $8,743,345 | $8,975,923 | $9,280,227 | $33.75 | ||
| Rents in Place – Managed Units(3) | 423,049 | 1,369,086 | 1,607,509 | 1,595,629 | 1,634,154 | 5.94 | ||
| Value of Vacant Space | 0 | 0 | 0 | 0 | 4,521,448 | 16.44 | ||
| Gross Potential Rent | $3,418,257 | $8,634,500 | $10,350,853 | $10,571,552 | $15,435,829 | $56.13 | ||
| Viewing Room Income | 96,670 | 227,350 | 269,050 | 289,100 | 289,100 | 1.05 | ||
| Miscellaneous Income | (7,470) | 77,866 | 185,770 | 120,088 | 120,088 | 0.44 | ||
| Net Rental Income | $3,507,457 | $8,939,716 | $10,805,673 | $10,980,740 | $15,845,017 | $57.62 | ||
| (Vacancy) | 0 | 0 | 0 | 0 | (4,521,448) | (16.44) | ||
| (Concessions/Discounts) | (167,566) | (97,361) | (45,363) | (77,876) | (82,171) | (0.30) | ||
| Effective Gross Income | $3,339,891 | $8,842,355 | $10,760,311 | $10,902,864 | $11,241,398 | $40.88 | ||
| Total Expenses(4) | 2,447,678 | 2,882,846 | 3,448,103 | 3,360,555 | 2,760,281 | 10.04 | ||
| Net Operating Income(5) | $892,213 | $5,959,509 | $7,312,208 | $7,542,309 | $8,481,117 | $30.84 | ||
| Capital Expenditures | 0 | 0 | 0 | 0 | 29,476 | 0.11 | ||
| Net Cash Flow | $892,213 | $5,959,509 | $7,312,208 | $7,542,309 | $8,451,641 | $30.73 | ||
| (1) | Building 10 was completed in November 2014 with lease up beginning in December 2014, and Building 1 was completed in May 2015 with lease up beginning in June 2015. The 2015 operating statement reflects the public and private units available throughout the year. |
| (2) | PSF calculations are based on 275,000 gross sq. ft. |
| (3) | Rents in Place are based on in-place rents as of January 10, 2017 and include $270,525 of rent steps through January 2018. |
| (4) | The property is enrolled in the Industrial & Commercial Abatement Program (“ICAP”), a tax exemption on new construction in designated areas. Properties that qualify for ICAP benefits in a designated special area receive a property tax exemption of the added physical value resulting from the construction for 25 years. The Uovo Art Storage Property will receive 100% of the exemption benefit for the first 15 years, which then decreases each year thereafter by 10%. The physical improvements will be fully taxable in Year 26. Building 1 will begin the tax abatement in the 2017/2018 tax year and Building 10 began its abatement in the 2016/2017 tax year. Taxes have been underwritten based on the 10-year average abated tax amount. |
| (5) | U/W Net Operating Income is higher than the 2016 Net Operating Income due to additional lease up of the property, and includes U/W rent steps of $270,525 through January 2018. Since the beginning of 2016, new leases have commenced for approximately 111 private storage units, totaling approximately $4.9 million (52.6% of private unit U/W rents in place). |
Property Management. The Uovo Art Storage Property is managed by Uovo Management LLC, a borrower affiliate.
Lockbox / Cash Management.The Uovo Art Storage Whole Loan is structured with a springing hard lockbox and springing cash management. Upon a Trigger Period (as defined below), a lender controlled clearing account is required to be established by the borrowers and the borrowers are required to cause all rents to be transmitted directly into the clearing account and, during the continuance of a Trigger Period, funds in such clearing account are required to be transferred on a daily basis to a cash management account controlled by the lender to be applied and disbursed according to the loan documents.
A “Trigger Period” commences upon the occurrence of (i) an event of default or (ii) the debt service coverage ratio, based on underwritten net cash flow, falling below 1.20x at the end of any calendar quarter and ends upon, (a) with respect to clause (i) above, a cure of such default or (b) with respect to clause (ii) above, the property achieving a debt service coverage ratio of at least 1.25x for two consecutive calendar quarters.
Initial Reserves.At loan origination, the borrower deposited (i) $29,711 into a tax reserve account and (ii) $71,500 into the New PCO Repair reserve account, which represents 110% of the estimated cost of required work in order to obtain new permanent certificates of occupancy (“PCO”). The property is currently operating under a temporary certificate of occupancy (“TCO”) and the borrower is required to renew and maintain the TCO at all times until a new PCO has been obtained.
Ongoing Reserves.The borrower is required to deposit on a monthly basis (i) 1/12 of the estimated annual real estate taxes, which currently equates to $14,855, into the tax reserve account, (ii) unless an acceptable blanket insurance policy is in place, 1/12 of the estimated insurance premiums into an insurance reserve account and (iii) $2,456 (approximately $0.15 PSF annually based on 196,505 sq. ft.) into the replacement reserve account. The private storage area is measured on a sq. ft. basis and totals 164,812 sq. ft. The managed storage area is measured on a cubic foot basis. On a sq. ft. basis the managed storage area totals 31,693 sq. ft.
Current Mezzanine or Subordinate Indebtedness. None.
Future Mezzanine or Subordinate Indebtedness Permitted. None.
THE INFORMATION IN THIS STRUCTURAL AND COLLATERAL TERM SHEET IS NOT COMPLETE AND MAY BE AMENDED PRIOR TO THE TIME OF SALE. THIS TERM SHEET IS NOT AN OFFER TO SELL THESE SECURITIES AND IT IS NOT A SOLICITATION OF AN OFFER TO BUY THESE SECURITIES IN ANY JURISDICTION WHERE THE OFFER OR SALE IS NOT PERMITTED.
75
41-45 21st Street & 41-54 22nd Street Long Island City, NY 11101 | Collateral Asset Summary – Loan No. 6 Uovo Art Storage | Cut-off Date Balance: Cut-off Date LTV: U/W NCF DSCR: U/W NOI Debt Yield: | $49,803,347 52.5% 1.55x 9.8% |
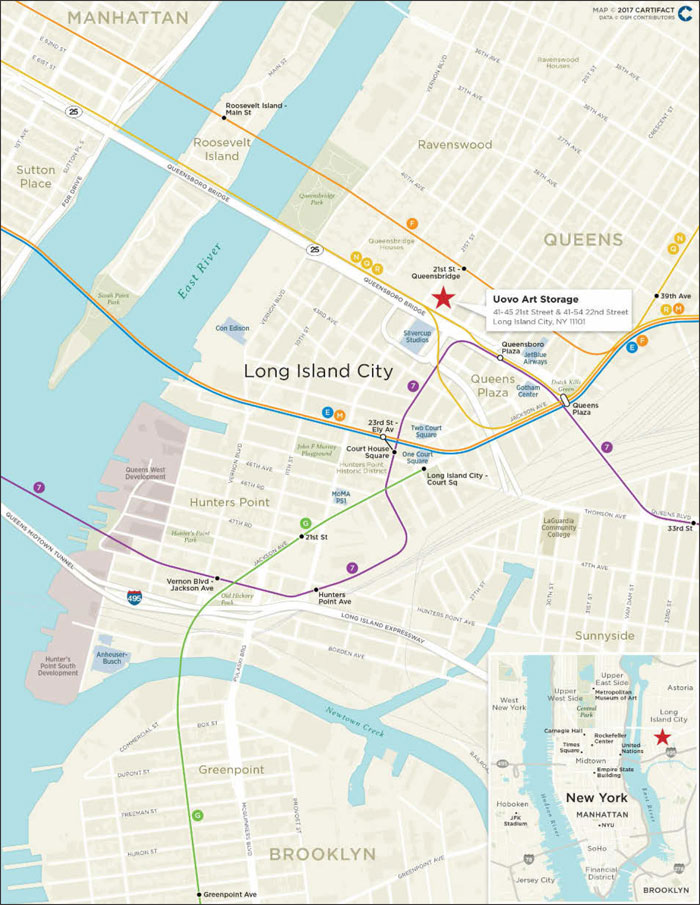
THE INFORMATION IN THIS STRUCTURAL AND COLLATERAL TERM SHEET IS NOT COMPLETE AND MAY BE AMENDED PRIOR TO THE TIME OF SALE. THIS TERM SHEET IS NOT AN OFFER TO SELL THESE SECURITIES AND IT IS NOT A SOLICITATION OF AN OFFER TO BUY THESE SECURITIES IN ANY JURISDICTION WHERE THE OFFER OR SALE IS NOT PERMITTED.
76
(THIS PAGE INTENTIONALLY LEFT BLANK)
THE INFORMATION IN THIS STRUCTURAL AND COLLATERAL TERM SHEET IS NOT COMPLETE AND MAY BE AMENDED PRIOR TO THE TIME OF SALE. THIS TERM SHEET IS NOT AN OFFER TO SELL THESE SECURITIES AND IT IS NOT A SOLICITATION OF AN OFFER TO BUY THESE SECURITIES IN ANY JURISDICTION WHERE THE OFFER OR SALE IS NOT PERMITTED.
77
127 Public Square Cleveland, OH 44114 | Collateral Asset Summary – Loan No. 7 Key Center Cleveland | Cut-off Date Balance: Cut-off Date LTV: U/W NCF DSCR: U/W NOI Debt Yield: | $30,000,000 60.8% 1.59x 12.8% |

THE INFORMATION IN THIS STRUCTURAL AND COLLATERAL TERM SHEET IS NOT COMPLETE AND MAY BE AMENDED PRIOR TO THE TIME OF SALE. THIS TERM SHEET IS NOT AN OFFER TO SELL THESE SECURITIES AND IT IS NOT A SOLICITATION OF AN OFFER TO BUY THESE SECURITIES IN ANY JURISDICTION WHERE THE OFFER OR SALE IS NOT PERMITTED.
78
127 Public Square Cleveland, OH 44114 | Collateral Asset Summary – Loan No. 7 Key Center Cleveland | Cut-off Date Balance: Cut-off Date LTV: U/W NCF DSCR: U/W NOI Debt Yield: | $30,000,000 60.8% 1.59x 12.8% |
| Mortgage Loan Information | |
| Loan Seller: | CREFI |
| Loan Purpose: | Acquisition |
| Sponsor: | Frank T. Sinito |
| Borrower: | 127 PS Fee Owner LLC |
| Original Balance(1): | $30,000,000 |
| Cut-off Date Balance: | $30,000,000 |
| % by Initial UPB: | 3.3% |
| Interest Rate: | 5.3100% |
| Payment Date: | 6thof each month |
| First Payment Date: | March 6, 2017 |
| Maturity Date: | February 6, 2027 |
| Amortization: | Interest Only for first 24 months, 300 months thereafter |
| Additional Debt(1)(2): | $190,000,000Pari PassuDebt; $42,500,000 Mezzanine Debt |
| Call Protection(3): | L(27), D(89), O(4) |
| Lockbox / Cash Management: | Hard / In Place |
| Reserves(4) | ||
| Initial | Monthly | |
| Taxes: | $1,540,363 | $770,181 |
| Insurance: | $55,406 | $27,703 |
| Replacement: | $20,262,985 | $29,284 |
| TI/LC: | $0 | $110,513 |
| Outstanding TI/LC: | $24,069,759 | $0 |
| PIP Renewal: | $4,652,415 | $0 |
| Deferred Maintenance: | $64,625 | $0 |
| Ground Rent: | $0 | $5,000 |
| Financial Information | |||
| Mortgage Loan(5) | Total Debt(6) | ||
| Cut-off Date Balance / Sq. Ft.: | $92 | $110 | |
| Balloon Balance / Sq. Ft.: | $75 | $92 | |
| Cut-off Date LTV(7): | 60.8% | 72.5% | |
| Balloon LTV(7): | 49.6% | 60.7% | |
| Underwritten NOI DSCR(8): | 1.77x | 1.30x | |
| Underwritten NCF DSCR(8): | 1.59x | 1.17x | |
| Underwritten NOI Debt Yield: | 12.8% | 10.7% | |
| Underwritten NCF Debt Yield: | 11.5% | 9.6% | |
| Underwritten NOI Debt Yield at Balloon: | 15.7% | 12.8% | |
| Underwritten NCF Debt Yield at Balloon: | 14.1% | 11.5% | |
| Property Information | ||
| Single Asset / Portfolio: | Single Asset | |
| Property Type: | Office/Hospitality | |
| Collateral: | Fee Simple/Leasehold | |
| Location: | Cleveland, OH | |
| Year Built / Renovated: | 1991 / 2015 | |
| Total Sq. Ft.: | 2,389,441 | |
| Property Management: | Millenia Housing Management, Ltd. and Jacobs Real Estate Services LLC; Marriott Hotel Services, Inc.; SP Plus Corporation | |
| Underwritten NOI(9): | $28,109,323 | |
| Underwritten NCF: | $25,327,136 | |
| Appraised Value(7): | $362,000,000 | |
| Appraisal Date: | December 1, 2017 | |
| Historical NOI | ||
| Most Recent NOI(9): | $20,199,537 (December 31, 2016) | |
| 2015 NOI(9): | $23,451,024 (December 31, 2015) | |
| 2014 NOI(9): | $25,994,402 (December 31, 2014) | |
| 2013 NOI(9): | $26,874,225 (December 31, 2013) | |
| Historical Occupancy(10) | ||
| Most Recent Occupancy(11): | 92.9% (October 19, 2016) | |
| 2015 Occupancy: | 80.3% (December 31, 2015) | |
| 2014 Occupancy: | 86.4% (December 31, 2014) | |
| 2013 Occupancy: | 89.7% (December 31, 2013) | |
| (1) | The Original Balance and Cut-off Date Balance of $30.0 million represents the non-controlling Note A-4 which together with the controlling Note A-1 and remaining non-controllingpari passu notes, with an aggregate original principal balance of $190.0 million, comprise the Key Center Cleveland Whole Loan (as defined below) with an aggregate original principal balance of $220.0 million. See “The Loan” herein. |
| (2) | See “Current Mezzanine or Subordinate Indebtedness” herein. |
| (3) | The lockout period will be at least 27 payment dates beginning with and including the first payment date of March 6, 2017. Defeasance of the full $220.0 million Key Center Cleveland Whole Loan is permitted after the date that is the earlier to occur of (i) July 31, 2020 and (ii) the date that is two years from the closing date of the securitization that includes the lastpari passunote to be securitized. The assumed lockout period of 27 payments is based on the expected CD 2017-CD4 securitization closing date in May 2017. The actual lockout period may be longer. |
| (4) | See “Initial Reserves” and “Ongoing Reserves” herein. |
| (5) | DSCR, LTV, Debt Yield and Balance/Sq. Ft. calculations are based on the Key Center Cleveland Whole Loan, which has a principal balance as of the Cut-off Date of $220.0 million. |
| (6) | DSCR, LTV, Debt Yield and Balance/Sq. Ft. calculations are based on the Key Center Cleveland Whole Loan and one $42.5 million mezzanine loan, resulting in Total Debt with an aggregate principal balance as of the Cut-off Date of $262.5 million. |
| (7) | Represents the appraiser’s “As Complete” appraised value, which is as of the date upon which all capital improvement is expected to be completed at the Key Center Cleveland Property. The Appraised Value of $362.0 million consists of (i) $253.8 million for Key Tower (as defined below), (ii) $77.0 million for Marriott Cleveland Downtown (as defined below), and (iii) $31.2 million for the Key Center Parking Garage Component (as defined below). The combined “As-Is” appraised value of $304.1 million as of December 1, 2016 results in (A) a Mortgage Loan Cut-off Date LTV Ratio and Maturity Date LTV Ratio of 72.3% and 59.0%, respectively and (B) a Total Debt Cut-off Date LTV Ratio and Maturity Date LTV Ratio of 86.3% and 72.3%, respectively. |
| (8) | Based on amortizing payments. Based on the current interest only debt service payments, the Mortgage Loan Underwritten NOI DSCR and Underwritten NCF DSCR are 2.37x and 2.14x, respectively, and the Total Debt Underwritten NOI DSCR and Underwritten NCF DSCR are 1.62x and 1.46x, respectively. |
| (9) | The decline in historical NOI is due primarily to KeyBank downsizing its space at the property. The increase in Underwritten NOI from Most Recent NOI is primarily due to newly executed leases with the Forest City and Millennia tenants (14.1% of NRA and 13.9% of U/W Base Rent). |
| (10) | Historical Occupancy presented is for Key Tower (as defined below) only. See table below for Marriott Cleveland Downtown Historical Occupancy, ADR and RevPAR. |
| (11) | Includes the Forest City and Millennia tenants (14.1% of NRA) that have signed leases but have not yet taken occupancy at the Key Center Cleveland Property. |
THE INFORMATION IN THIS STRUCTURAL AND COLLATERAL TERM SHEET IS NOT COMPLETE AND MAY BE AMENDED PRIOR TO THE TIME OF SALE. THIS TERM SHEET IS NOT AN OFFER TO SELL THESE SECURITIES AND IT IS NOT A SOLICITATION OF AN OFFER TO BUY THESE SECURITIES IN ANY JURISDICTION WHERE THE OFFER OR SALE IS NOT PERMITTED.
79
127 Public Square Cleveland, OH 44114 | Collateral Asset Summary – Loan No. 7 Key Center Cleveland | Cut-off Date Balance: Cut-off Date LTV: U/W NCF DSCR: U/W NOI Debt Yield: | $30,000,000 60.8% 1.59x 12.8% |
| Tenant Summary(1) | |||||||
Tenant | Ratings (Fitch/Moody’s/S&P)(2) | Net Rentable Area (Sq. Ft.) | % of Net Rentable Area | U/W Base Rent PSF | % of Total U/W Base Rent | Lease Expiration | |
| KeyBank(3) | A-/Aa3/A- | 477,781 | 34.9% | $31.60 | 40.1% | 6/30/2030 | |
| Squire Patton Boggs(4) | NR/NR/NR | 150,890 | 11.0% | $33.05 | 13.2% | 4/30/2022 | |
| Forest City(5) | BB-/NR/NR | 147,795 | 10.8% | $27.00 | 10.6% | 3/31/2033 | |
| Thompson Hine LLP(6) | NR/NR/NR | 125,120 | 9.1% | $27.55 | 9.2% | 9/30/2029 | |
| Baker Hostetler LLP(7) | NR/NR/NR | 115,615 | 8.4% | $28.62 | 8.8% | 10/31/2031 | |
| Millennia(8) | NR/NR/NR | 45,360 | 3.3% | $27.50 | 3.3% | 6/30/2032 | |
| Deloitte LLP(9) | NR/NR/NR | 41,718 | 3.0% | $29.25 | 3.2% | 7/31/2024 | |
| PricewaterhouseCoopers(10) | NR/NR/NR | 16,385 | 1.2% | $33.70 | 1.5% | 3/31/2019 | |
| Ogletree(11) | NR/NR/NR | 14,589 | 1.1% | $28.64 | 1.1% | 6/30/2025 | |
| Amin, Turocy & Watson(12) | NR/NR/NR | 13,887 | 1.0% | $34.27 | 1.3% | 11/30/2018 | |
| Subtotal / Wtd. Avg. | 1,149,140 | 83.9% | $30.23 | 92.3% | |||
| Remaining Office Tenants | 123,595 | 9.0% | $23.56 | 7.7% | |||
| Total / Wtd. Avg. Occupied | 1,272,735 | 92.9% | $29.59 | 100.0% | |||
| Vacant | 97,245 | 7.1% | |||||
| Total / Wtd. Avg. | 1,369,980 | 100.0% | |||||
| (1) | Based on the underwritten rent roll as of October 19, 2016. U/W Base Rent includes contractual rent increases through May 1, 2017 and the present value of rent steps for KeyBank and Jones Lang LaSalle GR. |
| (2) | Certain ratings are those of the parent company whether or not the parent company guarantees the lease. |
| (3) | KeyBank has three five-year renewal options and an ongoing option, beginning in July 2020, to contract its space by up to an aggregate amount of 103,000 sq. ft. in three installments; provided that each exercise of a contraction option may not exceed 44,000 sq. ft., and following each exercise of a contraction option, KeyBank may not exercise another contraction option for a period of three years following such exercise. KeyBank must give 12 months’ notice for each contraction option as well as pay a termination fee consisting of unamortized tenant improvement and leasing commissions costs as well as a rent penalty. |
| (4) | Squire Patton Boggs has two, five-year renewal options or one, 10-year extension option. Squire Patton Boggs has the option to reduce the size of its premises to no less than six full floors in Key Tower without a penalty at the time Squire Patton Boggs exercises the first renewal option, the second renewal option or the ten year renewal option. The six full floors must be contiguous and located either at the top or bottom of the stack of floors leased by Squire Patton Boggs at the time the tenant makes such election. |
| (5) | Forest City is not yet in occupancy or paying rent. Forest City is expected to commence paying rent no later than April 1, 2018. At the origination date, the borrower provided the lender a letter of credit in the amount of $4,655,546, in respect of gap rent for Forest City. Forest City has three, five-year renewal options and a one-time option to contract its space by no less than one-half and not more than one full floor on March 31, 2023 upon 12 months prior notice. |
| (6) | Thompson Hine LLP has a one-time right with 12-months’ notice to reduce a contiguous portion of its premises by at least one-half and not more than a full floor of either (i) any single, non-contiguous floor of the premises or (ii) the lower or highest full floor of any contiguous block of floors within Key Tower, as designated by Thompson Hine LLP, provided if such contraction is for less than a full floor, such contraction space has elevator lobby exposure and a marketable configuration as reasonably determined by the landlord, effective upon either October 1, 2023 or October 1, 2025. Thompson Hine LLP has the option to extend the term of its lease for either one year until September 30, 2030 or five years until September 30, 2034. If Thompson Hine LLP exercises its option to extend for five years until September 30, 2034, Thompson Hine LLP will have an additional option to extend the term of its lease for one additional year until either September 30, 2035 or for five additional years until September 30, 2039. |
| (7) | Baker Hostetler LLP has three, five-year renewal options and no termination options. |
| (8) | Millennia is an affiliate of the borrower. Millennia is not yet in occupancy or paying rent and is expected to commence paying rent no later than July 1, 2017. At the origination date, the borrower provided the lender a letter of credit in the amount of $519,750, in respect of gap rent for Millennia. Millenia has two, five-year renewal options and no termination options. |
| (9) | Deloitte LLP has two, five-year renewal options and has a one-time right, exercisable no later than April 30, 2018, to reduce a contiguous portion of its premises located on the lowest or highest of the contiguous portion of its premises including the 33rd and 34th floors of the building, effective on April 30, 2019. |
| (10) | PricewaterhouseCoopers has one five-year renewal option and no termination options. |
| (11) | Ogletree has two five-year renewal options and no termination options. |
| (12) | Amin, Turocy & Watson has two five-year renewal options and no termination options. |
THE INFORMATION IN THIS STRUCTURAL AND COLLATERAL TERM SHEET IS NOT COMPLETE AND MAY BE AMENDED PRIOR TO THE TIME OF SALE. THIS TERM SHEET IS NOT AN OFFER TO SELL THESE SECURITIES AND IT IS NOT A SOLICITATION OF AN OFFER TO BUY THESE SECURITIES IN ANY JURISDICTION WHERE THE OFFER OR SALE IS NOT PERMITTED.
80
127 Public Square Cleveland, OH 44114 | Collateral Asset Summary – Loan No. 7 Key Center Cleveland | Cut-off Date Balance: Cut-off Date LTV: U/W NCF DSCR: U/W NOI Debt Yield: | $30,000,000 60.8% 1.59x 12.8% |
| Lease Rollover Schedule(1)(2) | ||||||||
| Year | # of Leases Expiring | Total Expiring Sq. Ft. | % of Total Sq. Ft. Expring | Cumulative Sq. Ft. Expiring | Cumulative % of Sq. Ft. Expiring | Annual U/W PSF | % U/W Rolling | Cumulative % of U/W Base Rent |
| MTM | 2 | 3,353 | 0.2% | 3,353 | 0.2% | $29.00 | 0.3% | 0.3% |
| 2017 | 11 | 14,240 | 1.0% | 17,593 | 1.3% | $40.34 | 1.5% | 1.8% |
| 2018 | 8 | 35,869 | 2.6% | 53,462 | 3.9% | $32.13 | 3.1% | 4.8% |
| 2019 | 2 | 24,251 | 1.8% | 77,713 | 5.7% | $32.34 | 2.1% | 6.9% |
| 2020 | 3 | 356 | 0.0% | 78,069 | 5.7% | $223.59 | 0.2% | 7.1% |
| 2021 | 3 | 10,705 | 0.8% | 88,774 | 6.5% | $27.28 | 0.8% | 7.9% |
| 2022 | 8 | 167,787 | 12.2% | 256,561 | 18.7% | $32.51 | 14.5% | 22.4% |
| 2023 | 0 | 0 | 0.0% | 256,561 | 18.7% | $0.00 | 0.0% | 22.4% |
| 2024 | 3 | 46,451 | 3.4% | 303,012 | 22.1% | $29.28 | 3.6% | 26.0% |
| 2025 | 3 | 14,589 | 1.1% | 317,601 | 23.2% | $28.64 | 1.1% | 27.1% |
| 2026 | 0 | 0 | 0.0% | 317,601 | 23.2% | $0.00 | 0.0% | 27.1% |
| 2027 | 2 | 37,044 | 2.7% | 354,645 | 25.9% | $9.44 | 0.9% | 28.1% |
| Thereafter | 26 | 918,090 | 67.0% | 1,272,735 | 92.9% | $29.51 | 71.9% | 100.0% |
| Vacant | NAP | 97,245 | 7.1% | 1,369,980 | 100.0% | NAP | NAP | |
| Total / Wtd. Avg. | 71 | 1,369,980 | 100.0% | $29.59 | 100.0% | |||
| (1) | For Key Tower only, based on the underwritten rent roll and includes rent steps. |
| (2) | Certain tenants have lease termination options that may become exercisable prior to the originally stated expiration date of the tenant lease that are not considered in the lease rollover schedule. |
The Loan. The Key Center Cleveland loan (the “Key Center Cleveland Loan”) is a fixed rate loan secured by the borrower’s fee simple interest in a 1,369,980 square foot office building and a 400-room full service hotel and the leasehold interest in an adjacent, 985-space subterranean parking garage, located in Cleveland, Ohio (the “Key Center Cleveland Property”) with an original Cut-off Date Balance of $30.0 million. The Key Center Cleveland Loan is part of the Key Center Cleveland Whole Loan. The “Key Center Cleveland Whole Loan” is evidenced by sixpari passunotes in the aggregate original principal amount of $220.0 million. The Key Center Cleveland Loan is evidenced by the non-controlling Note A-4 with an aggregate original principal balance of $30.0 million, which will be included in the CD 2017-CD4 mortgage trust. Thepari passucontrolling Note A-1 with an original principal balance of $50.0 million was included in the CGCMT 2017-P7 securitization. Thepari passunon-controlling Note A-2 with an original principal balance of $40.0 million was included in the BANK 2017-BNK4 securitization. Thepari passu non-controlling Notes A-3 and A-6 with an aggregate original principal balance of $60.0 million were included in the JPMDB 2017-C5 securitization. The remaining Note A-5 has an original principal balance of $40.0 million and is held by Bank of America, N.A. and is expected to be contributed to one or more future securitizations.
The relationship between the holders of the Key Center Cleveland Whole Loan will be governed by a co-lender agreement as described under “Description of the Mortgage Pool–The Whole Loans– The Non-Serviced Pari Passu Whole Loans—The Key Center Cleveland Whole Loan” in the Preliminary Prospectus.
| Whole Loan Summary | |||||
| Note | Original Balance | Cut-off Date Balance | Note Holder | Controlling Piece | |
| A-1 | $50,000,000 | $50,000,000 | CGCMT 2017-P7 | Yes | |
| A-2 | $40,000,000 | $40,000,000 | BANK 2017-BNK4 | No | |
| A-3, A-6 | $60,000,000 | $60,000,000 | JPMDB 2017-C5 | No | |
| A-4 | $30,000,000 | $30,000,000 | CD 2017-CD4 | No | |
| A-5 | $40,000,000 | $40,000,000 | BANA | No | |
| Total | $220,000,000 | $220,000,000 | |||
THE INFORMATION IN THIS STRUCTURAL AND COLLATERAL TERM SHEET IS NOT COMPLETE AND MAY BE AMENDED PRIOR TO THE TIME OF SALE. THIS TERM SHEET IS NOT AN OFFER TO SELL THESE SECURITIES AND IT IS NOT A SOLICITATION OF AN OFFER TO BUY THESE SECURITIES IN ANY JURISDICTION WHERE THE OFFER OR SALE IS NOT PERMITTED.
81
127 Public Square Cleveland, OH 44114 | Collateral Asset Summary – Loan No. 7 Key Center Cleveland | Cut-off Date Balance: Cut-off Date LTV: U/W NCF DSCR: U/W NOI Debt Yield: | $30,000,000 60.8% 1.59x 12.8% |
The Key Center Cleveland Loan has a 10-year term and subsequent to a 24-month interest only period, amortizes on a 25-year schedule. The Key Center Cleveland Loan accrues interest at a fixed rate equal to 5.3100%. The Key Center Cleveland Loan proceeds were used to acquire the Key Center Cleveland Property, fund upfront reserves of approximately $50.6 million, and pay closing costs of approximately $11.6 million. Based on the “As Complete” appraised value of approximately $362.0 million as of December 1, 2017, the Cut-off Date LTV ratio is 60.8%. Based on the combined “As-is” appraised value of $304,100,000, as of December 1, 2016, the Cut-off Date LTV Ratio is 72.3%. The most recent prior financing of the Key Center Cleveland Property was not included in a securitization.
| Sources and Uses | ||||||
| Sources | Proceeds | % of Total | Uses | Proceeds | % of Total | |
| Whole Loan | $220,000,000 | 66.7% | Purchase Price | $267,500,000 | 81.1% | |
| Sponsor Equity | $60,845,008 | 18.5% | Reserves | $50,645,552 | 15.4% | |
| Mezzanine Loan | $42,500,000 | 12.9% | Closing Costs | $11,588,828 | 3.5% | |
| Other Sources(1) | $6,389,372 | 1.9% | ||||
| Total Sources | $329,734,380 | 100.0% | Total Uses | $329,734,380 | 100.0% | |
| (1) | Other Sources include $5,608,359 of seller credits transferred to the loan sponsor at loan closing which was related to outstanding tenant improvements for the Thompson Hine LLP tenant. |
The Borrower / Sponsor.The borrower is 127 PS Fee Owner LLC, a single-purpose Delaware limited liability company with two independent directors in its organizational structure. The sponsor of the borrower is Frank T. Sinito and the non-recourse carve-out guarantors are Frank T. Sinito and his wife, Malisse J. Sinito, jointly and severally.
Frank T. Sinito is the CEO and President of Millennia Companies which he founded in 1995. Millennia Companies own and manage over 200 multifamily communities totaling over 23,000 residential units across 22 states. The sponsorship includes a joint venture between Frank T. Sinito and Lubert Adler. Frank T. Sinito and Lubert Adler own 38.6% controlling interest and 24.4% non-controlling, limited interest in the borrower, respectively. The sponsors acquired the Key Center property from Columbia Property Trust.
The Property, The Market and Major Tenants.The Key Center Cleveland Property is located in downtown Cleveland, Ohio, within Cuyahoga County and consists of a 1,369,980 sq. ft. office building (“Key Tower”), a 400-room full service hotel (“Marriott Cleveland Downtown”), and a 985 space subterranean parking garage (“Key Center Parking Garage Component”). The Key Center Cleveland Property is located on three separate parcels over a 2.14-acre site at 127 Public Square in Cleveland, Ohio. The Key Center Cleveland Property takes up a full city block and is located between 2 arterials and 2 commercial corridors. The immediate area is urban in nature and has a mix of commercial uses, including retail, office and multifamily developments. Local transportation is provided by the Greater Cleveland Regional Transit Authority (“RTA”). There are several stops in the immediate vicinity located along East 9th Street and St. Clair Avenue. The Key Center Cleveland Property is located approximately 13.5 miles northeast of the Cleveland Hopkins International Airport.
Cleveland has a diversified economy with a large presence in education, technology, finance, biotechnology, and healthcare. The top five employers in the Cleveland area are Cleveland Clinic (34,000 employees), US Office of Personnel Management (15,095), University Hospitals (13,726), Giant Eagle (10,311), and Progressive Corporation (8,612). According to a third party report, the estimated 2016 population within a 1-, 3-, and 5-mile radius of the Key Center Cleveland Property was 11,685, 75,091, and 239,627, respectively. According to a third party report, the estimated 2016 average household income within a 1-, 3-, and 5-mile radius of the Key Center Cleveland Property was $65,299, $41,254, $39,712, respectively.
Key Tower
Key Tower was built in 1991 and contains 1,369,980 sq. ft. over 57 stories. Key Tower was designed by architect Cesar Pelli and is currently the tallest building in Ohio. The building provides views of Lake Erie, FirstEnergy Stadium, City Hall, and the Cleveland Skyline. Key Tower features a spacious and ornate lobby with four separate street entrances and access to the underground parking facilities between Key Tower and the Marriott Cleveland Downtown lobbies.
Key Tower is currently 92.9% leased to approximately 36 tenants and historical occupancy has averaged 90% since 2006. The largest tenant at Key Tower is KeyBank National Association (NYSE: KEY, Fitch/Moody’s/S&P: A-/A3/A-) (“KeyBank”) which has been operating its headquarters there since 1992 and currently occupies 34.9% of the net rentable area (“NRA”). KeyBank is one of the largest bank-based financial services companies in the United States, with $136.5 billion in total assets as of year-end 2016.
THE INFORMATION IN THIS STRUCTURAL AND COLLATERAL TERM SHEET IS NOT COMPLETE AND MAY BE AMENDED PRIOR TO THE TIME OF SALE. THIS TERM SHEET IS NOT AN OFFER TO SELL THESE SECURITIES AND IT IS NOT A SOLICITATION OF AN OFFER TO BUY THESE SECURITIES IN ANY JURISDICTION WHERE THE OFFER OR SALE IS NOT PERMITTED.
82
127 Public Square Cleveland, OH 44114 | Collateral Asset Summary – Loan No. 7 Key Center Cleveland | Cut-off Date Balance: Cut-off Date LTV: U/W NCF DSCR: U/W NOI Debt Yield: | $30,000,000 60.8% 1.59x 12.8% |
KeyBank has reportedly invested approximately $24 million in its space since 2013. KeyBank’s lease expires in June 2030 and provides for three, five-year renewal options as well as an option to contract its space up to 103,000 sq. ft. in three installments over a six-year period beginning in July 2020. KeyBank has an ongoing option, beginning in July 2020, to contract its space by up to an aggregate amount of 103,000 sq. ft.; provided that each exercise of a contraction option may not exceed 44,000 sq. ft., and following each exercise of a contraction option, KeyBank may not exercise another contraction option for a period of three years following such exercise. KeyBank must give 12 months’ notice for each contraction option as well as a pay a termination fee consisting of unamortized tenant improvement and leasing commissions costs as well as a rent penalty.
Other large tenants in the building include law firms such as Squire Patton Boggs, Thompson Hine LLP and Baker Hostetler LLP, as well as accounting and consulting firms such as Deloitte LLP and PricewaterhouseCoopers. The top five tenants by NRA have been at Key Tower on average approximately 18.3 years and have a weighted average remaining lease term of 12.6 years.
Key Tower is located within the Cleveland CBD office submarket which has a total Class A office inventory of 10.9 million sq. ft. and a vacancy rate of 14.9% as of the third quarter of 2016. Over the past four quarters, the CBD Class A office market has experienced no growth of supply. There was also positive net absorption, decrease in vacancy rates and increase of asking rent in the marketplace. The appraiser identified five Class A properties located within the submarket that are the primary competitors of Key Tower. The properties range from 321,311 sq. ft. to 1,270,204 sq. ft. with occupancies ranging from 89.0% to 93.6% with a weighted average of 90.8%. Average asking rents range from $17.00 PSF to $35.00 PSF with a weighted average of $25.00 PSF on a modified gross basis. The appraiser concluded to a general vacancy rate of 7.0% for Key Tower.
| Key Tower – Competitive Set(1) | ||||||
| Property | Location | Distance from Subject | Year Built | Sq. Ft. | Occupancy % | Average Asking Rent PSF |
| Key Tower | Cleveland, OH | — | 1991 | 1,369,980(2) | 92.9%(2) | $29.59(2) |
| Ernst & Young Tower | Cleveland, OH | 0.5 miles | 2013 | 550,000 | 93.6% | $35.00 |
| 200 Public Square | Cleveland, OH | 0.1 miles | 1985 | 1,270,204 | 91.0% | $20.00 – $27.00 |
| Fifth Third Center | Cleveland, OH | 0.2 miles | 1991 | 508,400 | 89.7% | $19.00 – $23.00 |
| One Cleveland Center | Cleveland, OH | 0.4 miles | 1983 | 545,028 | 89.0% | $22.00 |
| Skylight Office Center | Cleveland, OH | 0.2 miles | 1990 | 321,311 | 90.0% | $17.00 – $25.00 |
| (1) | Source: Appraisal. |
| (2) | Based on the October 19, 2016 underwritten rent roll. |
Key Center Parking Garage Component
The Key Center Parking Garage Component contains 985 spaces and is connected to the Key Tower lobby through a separate double elevator bank. The garage features security lighting, video surveillance, and security patrols throughout the day. Valet service is offered at the Marriott Cleveland Downtown entrance. The City of Cleveland owns the land beneath the parking lot and leases it to the borrower through 2059 with one 34-year extension through 2093 (“Parking Ground Lease”). The Parking Ground Lease requires that at least 45% of the parking spaces be reserved for transient parking and hotel guests, and the remainder of the parking spaces may be leased on a monthly basis. Minimum base rent paid to the city under the Parking Ground Lease is $60,000 per year provided that if the revenue exceeds certain breakpoints (based on the percentage of parking space leased on a monthly basis), percentage rent will also be payable. SP Plus Corporation manages the Key Center Parking Garage Component for a 3.0% fee of net revenue. The term of the parking management agreement is month-to-month with automatic renewals.
Marriott Cleveland Downtown
Marriott Cleveland Downtown is a 24-story, 400-room, full service lodging facility built in 1991. Amenities at the Marriott Cleveland Downtown include a sports bar (“Jake’s Lounge”) and a modern American restaurant (“David’s Restaurant”) and a 23,000 sq. ft. private health club which is for use by hotel guests as well as tenants at Key Tower (“Key Club”). Key Club features an indoor pool, sauna, and fitness room. The Marriott Cleveland Downtown also contains approximately 17,000 sq. ft. of meeting space, a ballroom, and a contemporary lobby lounge with TVs. Since 2010 the prior ownership has invested $6.3 million ($15,782/room) in capital expenditures, including over $4.6 million in guestroom upgrades. The Marriott Cleveland Downtown is slated to undergo $13.5 million in capital improvements which includes $3.2 million to update Key Club, $2.6 million to modernize the meeting rooms, $2.0 million to gut renovate David’s Restaurant and $1.4 million to upgrade the hotel lobby.
The Key Center Cleveland Property is within close proximity to the Gateway District and local sports venues, Progressive Field (home to Major League Baseball’s Cleveland Indians) and Quicken Loans Arena (home to the National Basketball Association’s Cleveland Cavaliers), both of which are less than one mile away. Playhouse Square, a not-for-profit performing arts center is located 0.7 miles away and is the largest performing arts center outside of New York and features over 1,000 annual events including Broadway shows, dance, concerts, and speakers. Cleveland State University (over 17,000 students) is located 1.0 miles from the Marriott Cleveland Downtown.
THE INFORMATION IN THIS STRUCTURAL AND COLLATERAL TERM SHEET IS NOT COMPLETE AND MAY BE AMENDED PRIOR TO THE TIME OF SALE. THIS TERM SHEET IS NOT AN OFFER TO SELL THESE SECURITIES AND IT IS NOT A SOLICITATION OF AN OFFER TO BUY THESE SECURITIES IN ANY JURISDICTION WHERE THE OFFER OR SALE IS NOT PERMITTED.
83
127 Public Square Cleveland, OH 44114 | Collateral Asset Summary – Loan No. 7 Key Center Cleveland | Cut-off Date Balance: Cut-off Date LTV: U/W NCF DSCR: U/W NOI Debt Yield: | $30,000,000 60.8% 1.59x 12.8% |
The approximate distribution of demand of the Marriott Cleveland Downtown is 41% group, 28% leisure, 27% commercial, and 4% extended-stay which generally mirrors that of the market. As of July 2016, top accounts at the Marriott Cleveland Downtown included KeyBank (4.2% of room nights), Greater Cleveland Sports Commissions (2.4%), Association of Healthcare Journal (1.3%), Ernst & Young (1.2%), and Deloitte LLP (1.1%).
The following table presents certain information relating to historical occupancy, ADR and RevPAR at the Marriott Cleveland Downtown and its competitive set, as provided in a third-party industry travel research report for the Marriott Cleveland Downtown.
| Marriott Cleveland Downtown Historical Occupancy, ADR, RevPAR(1) | |||||||||
| Marriott Cleveland Downtown | Competitive Set | Penetration | |||||||
| Year | Occupancy | ADR | RevPAR | Occupancy | ADR | RevPAR | Occupancy | ADR | RevPAR |
| 2014 | 65.8% | $159.58 | $104.99 | 67.9% | $161.07 | $109.31 | 96.9% | 99.1% | 96.0% |
| 2015 | 70.2% | $159.52 | $111.95 | 70.4% | $162.80 | $114.68 | 99.6% | 98.0% | 97.6% |
| 2016 | 66.2% | $162.44 | $107.51 | 69.8% | $161.00 | $112.33 | 94.9% | 100.9% | 95.7% |
| (1) | Source: industry travel research report. |
Marriott Cleveland Downtown Competitive Set(1)
| Marriott Cleveland Downtown Competitive Set | ||
| Property | Number of Rooms | Year Built |
| Marriott Cleveland Downtown | 400 | 1991 |
| Wyndham Cleveland at Playhouse Square | 205 | 1995 |
| Hyatt Regency Cleveland at The Arcade | 293 | 2001 |
| InterContinental Hotel Cleveland | 295 | 2003 |
| Total(2) | 793 | |
| (1) | Source: Industry travel research report. |
| (2) | Total excludes the Marriott Cleveland Downtown. |
Environmental Matters.According to a Phase I environmental report dated August 11, 2016 there are no recognized environmental conditions or recommendations for further action at the Key Center Cleveland Property other than a recommendation for an asbestos operations and maintenance plan, which is already in place and continual weekly monitoring of an UST.
Cash Flow Analysis.
Marriott Cleveland Downtown - Cash Flow Analysis | ||||||
| 2013 | 2014 | 2015 | 2016 | U/W | U/W Per Room | |
| Room Revenue | $16,240,749 | $15,328,051 | $16,344,286 | $15,738,880 | $15,511,405 | $38,779 |
| Food & Beverage Revenue | 6,570,035 | 6,684,994 | 6,900,689 | 6,359,302 | 5,996,176 | 14,990 |
| Other Revenue(1) | 944,523 | 880,565 | 807,358 | 825,681 | 584,993 | 1,462 |
| Total Revenue | $23,755,307 | $22,893,610 | $24,052,333 | $22,923,863 | $22,092,574 | $55,231 |
| Room Expense | $4,304,027 | $4,127,235 | $4,491,676 | $4,060,110 | $4,032,965 | $ 10,082 |
| Food & Beverage Expense | 4,861,458 | 4,876,676 | 5,101,971 | 4,744,258 | 4,437,170 | 11,093 |
| Other Expense | 955,052 | 809,103 | 818,316 | 736,237 | 584,993 | 1,462 |
| Total Departmental Expense | $10,120,537 | $9,813,014 | $10,411,963 | $9,540,605 | $9,055,128 | $22,638 |
| Total Undistributed Expense | 6,890,609 | 6,965,054 | 7,394,903 | 7,407,458 | 7,437,569 | 18,594 |
| Total Fixed Charges | 1,205,091 | 1,487,694 | 1,264,250 | 1,312,263 | 1,433,240 | 3,583 |
| Total Operating Expenses | $18,216,237 | $18,265,762 | $19,071,116 | $18,260,326 | $17,925,937 | $44,815 |
| Net Operating Income | $5,539,070 | $4,627,848 | $4,981,217 | $4,663,537 | $4,166,637 | $10,417 |
| FF&E | 1,181,285 | 1,138,580 | 1,197,413 | 1,141,811 | 1,104,629 | 2,762 |
| Net Cash Flow | $4,357,785 | $3,489,268 | $3,783,804 | $3,521,726 | $3,062,008 | $7,655 |
| (1) | Other Revenue consists primarily of vending commissions, guest services, miscellaneous commissions, sales tax discounts, cancellation fees, and attrition fees. |
THE INFORMATION IN THIS STRUCTURAL AND COLLATERAL TERM SHEET IS NOT COMPLETE AND MAY BE AMENDED PRIOR TO THE TIME OF SALE. THIS TERM SHEET IS NOT AN OFFER TO SELL THESE SECURITIES AND IT IS NOT A SOLICITATION OF AN OFFER TO BUY THESE SECURITIES IN ANY JURISDICTION WHERE THE OFFER OR SALE IS NOT PERMITTED.
84
127 Public Square Cleveland, OH 44114 | Collateral Asset Summary – Loan No. 7 Key Center Cleveland | Cut-off Date Balance: Cut-off Date LTV: U/W NCF DSCR: U/W NOI Debt Yield: | $30,000,000 60.8% 1.59x 12.8% |
Key Center Cleveland - Cash Flow Analysis | ||||||||||||
2013 | 2014 | 2015 | 2016 | U/W | U/W PSF / Room | |||||||
| Base Rent(1) | $32,510,214 | $31,608,409 | $29,936,738 | $28,060,735 | $35,952,962 | $26.24(2) | ||||||
| Contractual Rent Steps(3) | 0 | 0 | 0 | 0 | 1,703,202 | 1.24(2) | ||||||
| Gross Up Vacancy | 0 | 0 | 0 | 0 | 2,745,589 | 2.00(2) | ||||||
| Total Reimbursement Revenue | 2,348,968 | 2,690,336 | 1,319,674 | 691,479 | 597,315 | 0.44(2) | ||||||
| Hotel Revenue | 23,755,307 | 22,893,610 | 24,052,333 | 22,923,863 | 22,092,574 | 55,231.44(4) | ||||||
| Parking Revenue | 4,208,945 | 3,784,318 | 3,804,773 | 4,014,186 | 3,953,056 | 12.37(5) | ||||||
| Other Income | 3,122,262 | 3,226,533 | 4,133,442 | 3,550,145 | 3,375,221 | 2.46(2) | ||||||
| Vacancy & Credit Loss | 0 | 0 | 0 | 0 | (3,090,816) | (2.26)(2) | ||||||
| Effective Gross Income | $65,945,696 | $64,203,206 | $63,246,960 | $59,240,408 | $67,329,103 | $28.18(6) | ||||||
| Real Estate Taxes | $7,328,456 | $7,479,510 | $7,521,235 | $7,917,113 | $7,557,705 | $5.52(2) | ||||||
| Insurance | 222,847 | 213,688 | 203,536 | 178,137 | 205,793 | 0.15(2) | ||||||
| Management Fee | 1,175,941 | 1,116,060 | 1,066,322 | 967,260 | 1,357,096 | 0.99(2) | ||||||
| Hotel Expenses | 18,216,237 | 18,265,762 | 19,071,116 | 18,260,326 | 17,925,937 | 44,814.84(4) | ||||||
| Parking Expenses | 1,790,147 | 1,750,452 | 1,660,359 | 1,634,547 | 1,634,547 | 5.11(5) | ||||||
| Parking Ground Rent | 60,000 | 60,000 | 60,000 | 60,000 | 60,000 | 0.19(5) | ||||||
| Other Operating Expenses | 9,096,558 | 9,323,332 | 10,213,368 | 10,023,488 | 10,478,703 | 7.65(2) | ||||||
| Total Operating Expenses | $37,890,186 | $38,208,804 | $39,795,936 | $39,040,871 | $39,219,781 | $16.41(6) | ||||||
| Net Operating Income | $28,055,510 | $25,994,402 | $23,451,024 | $20,199,537 | $28,109,322 | $11.76(6) | ||||||
| TI/LC | 0 | 0 | 0 | 0 | $1,326,153 | 0.97(2) | ||||||
| Capital Expenditures | 0 | 0 | 0 | 0 | $351,405 | 0.26(2) | ||||||
| Hotel FF&E | 1,181,285 | 1,138,580 | 1,197,413 | 1,141,811 | 1,104,629 | 2,761.57(4) | ||||||
| Net Cash Flow | $26,874,225 | $24,855,822 | $22,253,611 | $19,057,726 | $25,327,136 | $10.60(6) | ||||||
| (1) | The decline in historical Base Rent was primarily due to KeyBank downsizing its space at Key Tower in an effort to reconfigure employee workspaces. The increase in Base Rent between Underwritten and 2016 was primarily due to newly executed leases with the Forest City and Millennia tenants. Forest City executed a lease for 147,795 sq. ft. resulting in an increase to the Underwritten Base Rent of $3,990,465 and Millennia executed a lease for 45,360 sq. ft. resulting in an increase to the Underwritten Base Rent of $1,247,400. Both the Forest City and Millennia tenants are not yet in occupancy and have rent commencement dates of no later than April 1, 2018 and July 1, 2017, respectively. The tenant improvement cost, leasing commission cost, and gap rent associated with these tenants were escrowed at loan origination. |
| (2) | Calculated based on the total square footage of Key Tower. |
| (3) | Includes contractual rent increases through May 1, 2017 and the present value of rent steps for investment grade tenants, Jones Lang LaSalle GR and KeyBank. |
| (4) | Calculated based on total rooms at Marriott Cleveland Downtown. |
| (5) | Calculated based on the total square footage of the Key Center Parking Garage Component. |
| (6) | Calculated based on total square footage of the Key Center Cleveland Property. |
Property Management. The portion of the Key Center Cleveland Property identified as Key Tower is currently managed by Millennia Housing Management, Ltd. and Jacobs Real Estate Services LLC, an affiliate of the borrower, pursuant to a management agreement. The Key Center Parking Garage Component is managed by SP Plus Corporation pursuant to a management agreement.
The Marriott Cleveland Downtown is brand-managed by Marriott Hotel Services, Inc. under an agreement which will be expiring in 2021 with three, 10-year renewal periods. The hotel management agreement may be terminated by the borrower if the average operating profit does not equal or exceed $3.3 million for any three consecutive fiscal years.
Lockbox / Cash Management.The Key Center Cleveland Whole Loan is structured with a hard lockbox which is already in place and requires all tenants to pay their rents and (if Marriott Corporation or an affiliate is not the hotel manager) all credit card companies under merchant agreements to pay receipts directly into such lockbox account. All checks and cash received from the hotel manager by the borrower or the property manager are required to be deposited into the lockbox account immediately upon receipt; provided that, so long as Marriott Corporation or its affiliate is the hotel manager, Marriott Corporation is only required to deposit net proceeds payable to the borrower into the lockbox. The funds on deposit in the lockbox account are required to be transferred daily to the cash management account under the control of the lender. On each due date, the Key Center Cleveland Loan documents require that all amounts on deposit in the cash management account will be applied to fund reserves and pay debt service (and mezzanine debt service), and (i) to the extent that a Key Center Cleveland Trigger Period (as defined below) has occurred and is continuing, remaining funds are required to be transferred first, if a PIP reserve is then required under the Key Center Cleveland Loan documents, to the PIP reserve, and then into an excess cash flow account to be held by the lender as additional collateral and (ii) to the extent that no Key Center Cleveland Trigger Period exists, to be disbursed to the borrower in accordance with related loan documents. Upon an event of default under the Key Center Cleveland Loan documents, the lender may apply the funds in the cash management account in such priority as it may determine.
A “Key Center Cleveland Trigger Period” shall mean a period (A) commencing upon the earliest of: (i) the occurrence and continuance of an event of default, (ii) the debt service coverage ratio when including Key Center Cleveland Mezzanine Loan (as defined below) being less than (a) 1.05x through January 31, 2019 or (b) 1.10x at any time thereafter, (iii) the occurrence of a Key Center Cleveland Specified Tenant Trigger Period (as defined below) or (iv) the occurrence of a Hotel Management Trigger Period (as defined below),
THE INFORMATION IN THIS STRUCTURAL AND COLLATERAL TERM SHEET IS NOT COMPLETE AND MAY BE AMENDED PRIOR TO THE TIME OF SALE. THIS TERM SHEET IS NOT AN OFFER TO SELL THESE SECURITIES AND IT IS NOT A SOLICITATION OF AN OFFER TO BUY THESE SECURITIES IN ANY JURISDICTION WHERE THE OFFER OR SALE IS NOT PERMITTED.
85
127 Public Square Cleveland, OH 44114 | Collateral Asset Summary – Loan No. 7 Key Center Cleveland | Cut-off Date Balance: Cut-off Date LTV: U/W NCF DSCR: U/W NOI Debt Yield: | $30,000,000 60.8% 1.59x 12.8% |
and (B) expiring upon: (i) with regard to any Key Center Cleveland Trigger Period commenced in connection with clause (A)(i) above, the cure (if applicable) of such event of default, (ii) with regard to any Key Center Cleveland Trigger Period commenced in connection with clause (A)(ii) above, the date that the debt service coverage ratio is equal to or greater (a) 1.10x for one calendar quarter through January 31, 2019 and (b) 1.15x for one calendar quarter thereafter, (iii) with regard to any Key Center Cleveland Trigger Period commenced in connection with clause (A)(iii) above, a Key Center Cleveland Specified Tenant Trigger Period ceasing to exist and (iv) with regard to any Key Center Cleveland Trigger Period commenced in connection with clause (A)(iv) above, a Hotel Management Trigger Period ceasing to exist.
A “Key Center Cleveland Specified Tenant” means, as applicable, (i) KeyBank, (ii) any other lessee(s) of more than 20,000 sq. ft. of the space occupied by KeyBank at origination (or any portion thereof), and (iii) any guarantor(s) of such lease.
A “Key Center Cleveland Specified Tenant Trigger Period” means a period: (A) commencing upon the first to occur of: (i) any Key Center Cleveland Specified Tenant being in default under its lease beyond applicable grace and cure periods set forth therein, (ii) any Key Center Cleveland Specified Tenant failing to be in actual, physical possession of any portion of the applicable space in excess of 20,000 sq. ft. (except as a result of a qualified casualty event), (iii) any Key Center Cleveland Specified Tenant giving notice that it is terminating its lease for all or any portion of the space (or applicable portion thereof) (other than as a result of an exercise of a contraction option set forth in the lease at origination), (iv) any termination or cancellation of any Key Center Cleveland Specified Tenant lease (including, without limitation, rejection in any bankruptcy or similar insolvency proceeding) and/or any Key Center Cleveland Specified Tenant lease failing to otherwise be in full force and effect, (v) any bankruptcy or similar insolvency of any Key Center Cleveland Specified Tenant, (vi) any Key Center Cleveland Specified Tenant failing to extend or renew its lease on or prior to the earlier to occur of (a) the date occurring one year prior to the expiration of the then applicable term of the applicable Key Center Cleveland Specified Tenant lease or (b) the renewal notice date (if any) set forth in the applicable Key Center Cleveland Specified Tenant lease for a term of at least five years, (vii) any Key Center Cleveland Specified Tenant ceasing to maintain for at least one calendar quarter a long-term unsecured debt rating of at least “BBB-” from S&P and an equivalent rating from each of the other rating agencies which rate such entity, and (viii) any termination or cancellation of the Key Center Cleveland Specified Tenant lease to any portion (but less than all) of the Key Center Cleveland Specified Tenant space; and (B) expiring upon the first to occur of the lender’s receipt of evidence reasonably acceptable to the lender (which such evidence includes a duly executed estoppel certificate from the applicable Key Center Cleveland Specified Tenant in form and substance acceptable to the lender) of: (i) the satisfaction of the Key Center Cleveland Specified Tenant Cure Conditions (as defined below) or (ii) the borrower leasing the entire Key Center Cleveland Specified Tenant space (or applicable portion thereof that was partially terminated) in accordance with the applicable terms and conditions of the Key Center Cleveland Loan documents, the applicable tenant under such lease being in actual, physical occupancy of the space demised under its lease and paying the full amount of the rent due under its lease and the borrower depositing into the leasing reserve account funds (which, to the extent that the excess cash flow account contains sufficient funds therefore, shall be transferred from the excess cash flow account to the leasing reserve account) sufficient to pay any leasing costs as reasonably expected to be incurred by the borrower in connection with re-leasing the applicable Key Center Cleveland Specified Tenant space applicable to the Key Center Cleveland Specified Tenant space.
THE INFORMATION IN THIS STRUCTURAL AND COLLATERAL TERM SHEET IS NOT COMPLETE AND MAY BE AMENDED PRIOR TO THE TIME OF SALE. THIS TERM SHEET IS NOT AN OFFER TO SELL THESE SECURITIES AND IT IS NOT A SOLICITATION OF AN OFFER TO BUY THESE SECURITIES IN ANY JURISDICTION WHERE THE OFFER OR SALE IS NOT PERMITTED.
86
127 Public Square Cleveland, OH 44114 | Collateral Asset Summary – Loan No. 7 Key Center Cleveland | Cut-off Date Balance: Cut-off Date LTV: U/W NCF DSCR: U/W NOI Debt Yield: | $30,000,000 60.8% 1.59x 12.8% |
“Key Center Cleveland Specified Tenant Cure Conditions” means the receipt by the lender of evidence reasonably satisfactory to the lender of the following, as applicable: (i) the applicable Key Center Cleveland Specified Tenant has cured all defaults under the applicable Key Center Cleveland Specified Tenant lease, (ii) the applicable Key Center Cleveland Specified Tenant is in actual, physical possession of the Key Center Cleveland Specified Tenant space (or applicable portion thereof) and the applicable Key Center Cleveland Specified Tenant is paying full, unabated rent under the applicable Key Center Cleveland Specified Tenant lease, (iii) the applicable Key Center Cleveland Specified Tenant has revoked or rescinded all termination or cancellation notices with respect to the applicable Key Center Cleveland Specified Tenant lease and has re-affirmed the applicable Key Center Cleveland Specified Tenant lease as being in full force and effect, (iv) in the event the Key Center Cleveland Specified Tenant Trigger Period is due to the applicable Key Center Cleveland Specified Tenant’s failure to extend or renew the applicable Key Center Cleveland Specified Tenant lease in accordance with clause (A)(vi) of the definition of Key Center Cleveland Specified Tenant Trigger Period, the applicable Key Center Cleveland Specified Tenant has renewed or extended the applicable Key Center Cleveland Specified Tenant lease in accordance with the terms of the Key Center Cleveland Loan documents for a term of at least five years, (v) with respect to any applicable bankruptcy or insolvency proceedings involving the applicable Key Center Cleveland Specified Tenant and/or the applicable Key Center Cleveland Specified Tenant lease, the applicable Key Center Cleveland Specified Tenant is no longer insolvent or subject to any bankruptcy or insolvency proceedings and has affirmed the applicable Key Center Cleveland Specified Tenant lease pursuant to final, non-appealable order of a court of competent jurisdiction, (vi) in the event the Key Center Cleveland Specified Tenant Trigger Period is due to clause (vii) of Key Center Cleveland Specified Tenant Trigger Period, the applicable Key Center Cleveland Specified Tenant with respect to which such trigger occurred satisfies the credit requirements, and (vii) in the event the Key Center Cleveland Specified Tenant Trigger Period is due to a partial termination by a Specified Tenant, the borrower having deposited or caused to be deposited into the reserve account, an amount equal to $50 PSF terminated.
A “Hotel Management Trigger Period” shall mean a period: (A) commencing upon the first to occur of: (i) the occurrence of a default by the borrower or hotel manager under the hotel management agreement, which default continues beyond any applicable grace or cure period, (ii) the borrower or hotel manager giving notice that it is terminating the hotel management agreement or hotel manager failing to renew the hotel management agreement not later than December 31, 2020, (iii) a Property Improvement Plan (“PIP”) being required in connection with any hotel management agreement (including, but not limited to, as a result of the exercise of hotel manager’s rights pursuant to the hotel management agreement to require, from time to time, a PIP), (iv) any notice of termination, non-renewal or cancellation of the hotel management agreement (including, without limitation, rejection in any bankruptcy or similar insolvency proceeding) and/or the hotel management agreement failing to otherwise be in full force and effect, (v) any bankruptcy or similar insolvency of hotel manager, (vi) the hotel failing to be operated, “flagged” and/or branded pursuant to the hotel management agreement, and (vii) any permits required pursuant to the hotel management agreement ceasing to be in full force in effect; and (B) expiring upon the first to occur of the lender’s receipt of evidence reasonably acceptable to the lender (which such evidence includes, without limitation, a duly executed estoppel certificate from the hotel manager in form and substance reasonably acceptable to the lender) of: (1) the satisfaction of the Hotel Management Cure Conditions (as defined below), and (2) the branding, “flagging” and operation of the hotel pursuant to a hotel management agreement entered into in accordance with the terms of the Key Center Cleveland Loan documents (which agreement is in full force and effect with no defaults thereunder) and the deposit into a PIP reserve account of an amount equal to any required PIP deposit (if any).
“Hotel Management Cure Conditions” shall mean each of the following, as applicable: (i) all defaults have been cured under the hotel management agreement to the satisfaction of the non-defaulting party, (ii) the borrower and the applicable hotel manager have re-affirmed in writing the hotel management agreement as being in full force and effect, (iii) with respect to any applicable bankruptcy or insolvency proceedings involving the applicable hotel manager and/or hotel management agreement, such hotel manager is no longer insolvent or subject to any bankruptcy or insolvency proceedings and has affirmed such hotel management agreement pursuant to a final, non-appealable order of a court of competent jurisdiction, (iv) the hotel continues to be operated, “flagged” and branded pursuant to the hotel management agreement, (v) all permits applicable to the related hotel management agreement are in full force and effect, and (vi) any required PIP reserve has been deposited.
Initial Reserves.On the origination date of the Key Center Cleveland Whole Loan, funded escrow reserves were funded of $1,540,363 for real estate taxes, $55,406 for insurance premiums, $20,262,985 for replacement reserve ($1,991,429 of which consists of funds held by Marriott as property manager for the Marriott Cleveland Downtown in an existing reserve maintained by the manager), $64,625 for an immediate repair reserve, $24,069,759 for leasing reserve funds and new lease upfront deposits (of which $5,608,358 is held by a third party escrow agent and for which the borrower is not required to fund a reserve provided that certain conditions of the Key Center Cleveland Loan documents are satisfied) and $4,652,415 for estimated property improvement costs related to Marriott Cleveland Downtown. On the origination date, the borrower also provided two letters of credit in the aggregate amount of $5,175,296 to cover gap rent associated with the Forest City and Millennia tenants. Provided that no event of default has occurred and subject to certain conditions being satisfied under the Key Center Cleveland Loan documents, the letters of credit may be reduced to reflect the burn-off of the respective tenant’s gap rent period.
THE INFORMATION IN THIS STRUCTURAL AND COLLATERAL TERM SHEET IS NOT COMPLETE AND MAY BE AMENDED PRIOR TO THE TIME OF SALE. THIS TERM SHEET IS NOT AN OFFER TO SELL THESE SECURITIES AND IT IS NOT A SOLICITATION OF AN OFFER TO BUY THESE SECURITIES IN ANY JURISDICTION WHERE THE OFFER OR SALE IS NOT PERMITTED.
87
127 Public Square Cleveland, OH 44114 | Collateral Asset Summary – Loan No. 7 Key Center Cleveland | Cut-off Date Balance: Cut-off Date LTV: U/W NCF DSCR: U/W NOI Debt Yield: | $30,000,000 60.8% 1.59x 12.8% |
Ongoing Reserves.On a monthly basis, the borrower is required to fund the following reserves with respect to the Key Center Cleveland Loan: (i) a tax reserve in an amount equal to 1/12 of the amount that the lender estimates will be necessary to pay taxes over the then ensuing twelve month period, initially estimated to be $770,181; (ii) an insurance reserve in an amount equal to one-twelfth of the amount that the lender estimates will be necessary to pay insurance premiums over the then succeeding twelve month period, initially estimated to be $27,703; (iii) a replacement reserve in an amount of $29,284 which amount is capped at $1,757,065, (iv) a tenant improvement and leasing commission reserve in an amount of $110,513, and (v) a ground rent reserve in an amount of $5,000. The borrower is required to fund a monthly FF&E reserve in an amount equal to 1/12 of 5.00% (or if Marriott Corporation or an affiliate is the hotel manager, 4.00%) of gross hotel revenues, unless (a) Marriott Corporation or an affiliate thereof is the hotel manager, (b) the borrower is required to reserve with the hotel manager an amount not less than the FF&E payment required under the Key Center Cleveland Loan documents, and (c) no event of default is continuing.
Current Mezzanine or Subordinate Indebtedness. Concurrently with the funding of the Key Center Cleveland Whole Loan, ACREFI Mortgage Lending, LLC funded a mezzanine loan in the amount of $42,500,000 (the “Key Center Cleveland Mezzanine Loan”) to 127 PS MEZZ BORROWER LLC, as mezzanine borrower, which is the direct owner of 100.0% of the limited liability company interests in the borrower. The Key Center Cleveland Mezzanine Loan is secured by a pledge of the mezzanine borrower’s 100% limited liability company interests in the borrower. The Key Center Cleveland Mezzanine Loan carries an interest rate of 12.75000% per annum and is co-terminous with the Key Center Cleveland Whole Loan. The Key Center Cleveland Mezzanine Loan is subject to an intercreditor agreement.
Future Mezzanine or Subordinate Indebtedness Permitted. None.
THE INFORMATION IN THIS STRUCTURAL AND COLLATERAL TERM SHEET IS NOT COMPLETE AND MAY BE AMENDED PRIOR TO THE TIME OF SALE. THIS TERM SHEET IS NOT AN OFFER TO SELL THESE SECURITIES AND IT IS NOT A SOLICITATION OF AN OFFER TO BUY THESE SECURITIES IN ANY JURISDICTION WHERE THE OFFER OR SALE IS NOT PERMITTED.
88
127 Public Square Cleveland, OH 44114 | Collateral Asset Summary – Loan No. 7 Key Center Cleveland | Cut-off Date Balance: Cut-off Date LTV: U/W NCF DSCR: U/W NOI Debt Yield: | $30,000,000 60.8% 1.59x 12.8% |
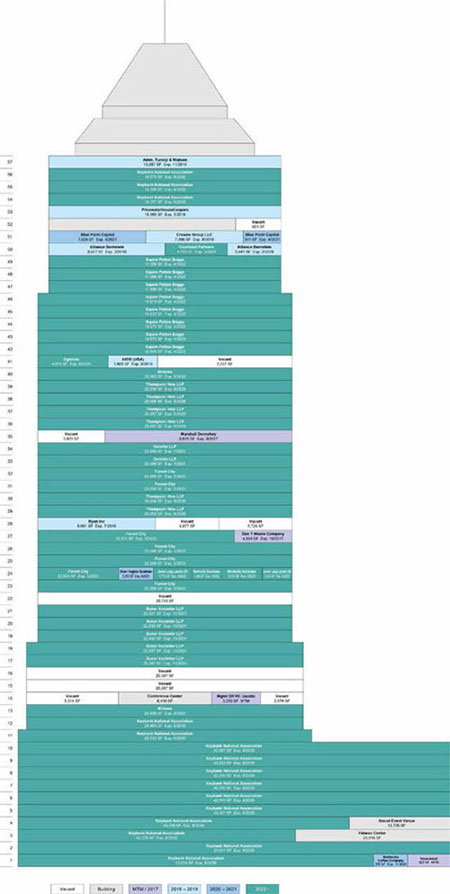
THE INFORMATION IN THIS STRUCTURAL AND COLLATERAL TERM SHEET IS NOT COMPLETE AND MAY BE AMENDED PRIOR TO THE TIME OF SALE. THIS TERM SHEET IS NOT AN OFFER TO SELL THESE SECURITIES AND IT IS NOT A SOLICITATION OF AN OFFER TO BUY THESE SECURITIES IN ANY JURISDICTION WHERE THE OFFER OR SALE IS NOT PERMITTED.
89
127 Public Square Cleveland, OH 44114 | Collateral Asset Summary – Loan No. 7 Key Center Cleveland | Cut-off Date Balance: Cut-off Date LTV: U/W NCF DSCR: U/W NOI Debt Yield: | $30,000,000 60.8% 1.59x 12.8% |
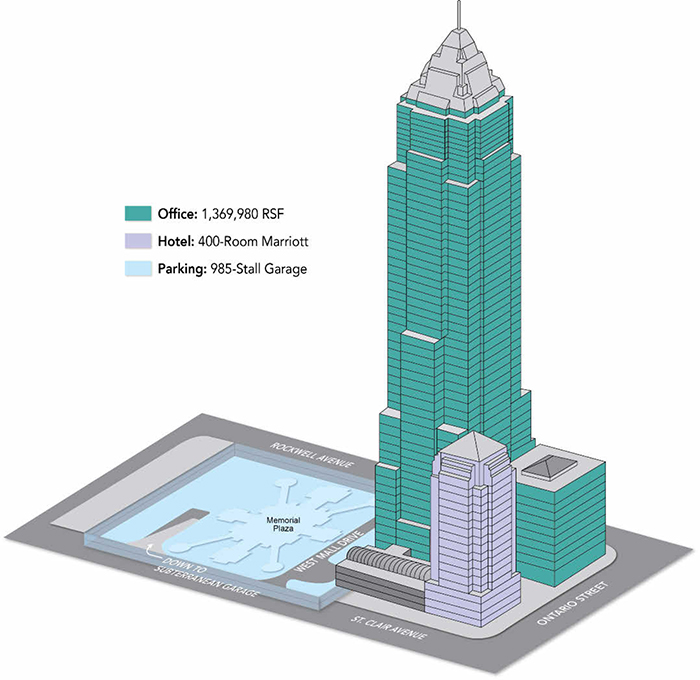
THE INFORMATION IN THIS STRUCTURAL AND COLLATERAL TERM SHEET IS NOT COMPLETE AND MAY BE AMENDED PRIOR TO THE TIME OF SALE. THIS TERM SHEET IS NOT AN OFFER TO SELL THESE SECURITIES AND IT IS NOT A SOLICITATION OF AN OFFER TO BUY THESE SECURITIES IN ANY JURISDICTION WHERE THE OFFER OR SALE IS NOT PERMITTED.
90
127 Public Square Cleveland, OH 44114 | Collateral Asset Summary – Loan No. 7 Key Center Cleveland | Cut-off Date Balance: Cut-off Date LTV: U/W NCF DSCR: U/W NOI Debt Yield: | $30,000,000 60.8% 1.59x 12.8% |
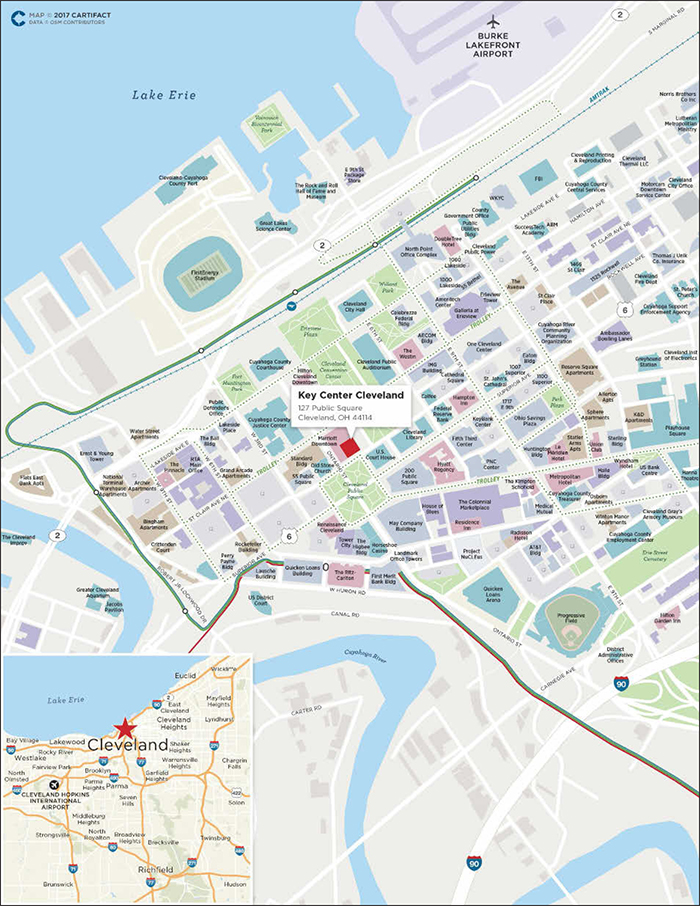
THE INFORMATION IN THIS STRUCTURAL AND COLLATERAL TERM SHEET IS NOT COMPLETE AND MAY BE AMENDED PRIOR TO THE TIME OF SALE. THIS TERM SHEET IS NOT AN OFFER TO SELL THESE SECURITIES AND IT IS NOT A SOLICITATION OF AN OFFER TO BUY THESE SECURITIES IN ANY JURISDICTION WHERE THE OFFER OR SALE IS NOT PERMITTED.
91
111 Livingston Street Brooklyn, NY 11201 | Collateral Asset Summary – Loan No. 8 111 Livingston Street | Cut-off Date Balance: Cut-off Date LTV: U/W NCF DSCR: U/W NOI Debt Yield: | $24,000,000 54.8% 1.56x 8.1% |
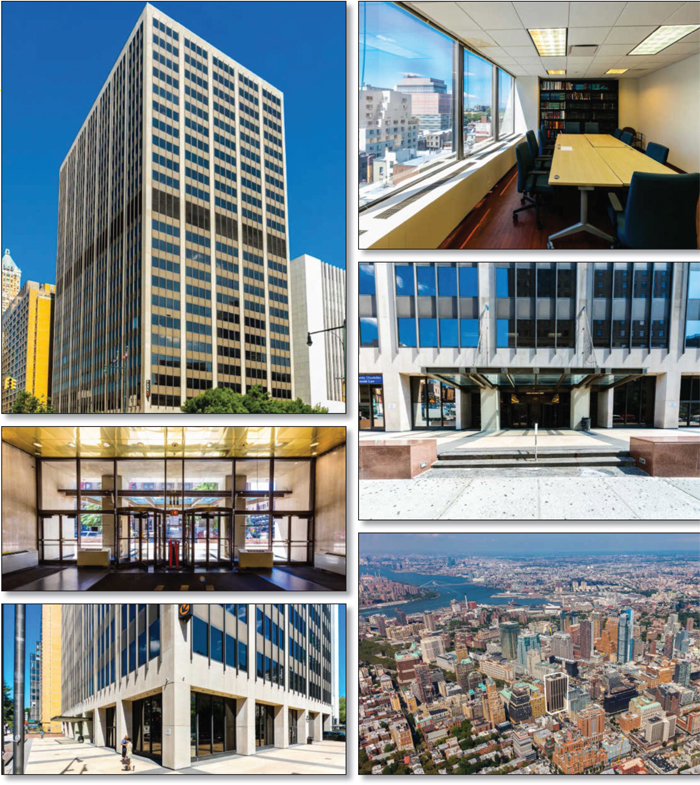
THE INFORMATION IN THIS STRUCTURAL AND COLLATERAL TERM SHEET IS NOT COMPLETE AND MAY BE AMENDED PRIOR TO THE TIME OF SALE. THIS TERM SHEET IS NOT AN OFFER TO SELL THESE SECURITIES AND IT IS NOT A SOLICITATION OF AN OFFER TO BUY THESE SECURITIES IN ANY JURISDICTION WHERE THE OFFER OR SALE IS NOT PERMITTED.
92
111 Livingston Street Brooklyn, NY 11201 | Collateral Asset Summary – Loan No. 8 111 Livingston Street | Cut-off Date Balance: Cut-off Date LTV: U/W NCF DSCR: U/W NOI Debt Yield: | $24,000,000 54.8% 1.56x 8.1% |
| Mortgage Loan Information | |
| Loan Seller: | GACC |
| Loan Purpose: | Refinance |
| Sponsors: | Abraham Leser; Harry Gold; Robert Schachter; Edith Leser |
| Borrower: | 111 Livingston LLC |
| Original Balance(1): | $24,000,000 |
| Cut-off Date Balance(1): | $24,000,000 |
| % by Initial UPB: | 2.7% |
| Interest Rate: | 4.7300% |
| Payment Date: | 6thof each month |
| First Payment Date: | February 6, 2017 |
| Maturity Date: | January 6, 2027 |
| Amortization: | Interest Only |
| Additional Debt(1): | $96,000,000Pari Passu Debt |
| Call Protection: | L(28), D(88), O(4) |
| Lockbox / Cash Management: | Hard / In Place |
| Reserves(2) | ||
| Initial | Monthly | |
| Taxes: | $296,183 | $296,183 |
| Insurance: | $0 | Springing |
| Replacement: | $0 | $7,233 |
| TI/LC: | $0 | $36,167 |
| Required Repairs: | $11,625 | NAP |
| Economic Holdback(3): | $1,500,123 | $0 |
| Unfunded Obligations: | $4,705,472 | $0 |
| CUNY Reserve: | $2,250,000 | $0 |
| Financial Information(4) | ||
| Cut-off Date Balance / Sq. Ft.: | $276 | |
| Balloon Balance / Sq. Ft.: | $276 | |
| Cut-off Date LTV: | 54.8% | |
| Balloon LTV: | 54.8% | |
| Underwritten NOI DSCR: | 1.70x | |
| Underwritten NCF DSCR: | 1.56x | |
| Underwritten NOI Debt Yield: | 8.1% | |
| Underwritten NCF Debt Yield: | 7.5% | |
| Underwritten NOI Debt Yield at Balloon: | 8.1% | |
| Underwritten NCF Debt Yield at Balloon: | 7.5% | |
| Property Information | |
| Single Asset / Portfolio: | Single Asset |
| Property Type: | CBD Office |
| Collateral: | Fee Simple |
| Location: | Brooklyn, NY |
| Year Built / Renovated: | 1969 / 2001 |
| Total Sq. Ft.: | 434,000 |
| Property Management: | 111 Property Manager LLC |
| Underwritten NOI: | $9,763,312 |
| Underwritten NCF: | $8,966,501 |
| Appraised Value: | $219,000,000 |
| Appraisal Date: | October 26, 2016 |
| Historical NOI | |
| Most Recent NOI: | $9,295,180 (T-12 September 30, 2016) |
| 2015 NOI: | $9,062,555 (December 31, 2015) |
| 2014 NOI: | $8,120,648 (December 31, 2014) |
| 2013 NOI: | $8,585,831 (December 31, 2013) |
| Historical Occupancy | |
| Most Recent Occupancy: | 97.6% (November 1, 2016) |
| 2015 Occupancy: | 100.0% (December 31, 2015) |
| 2014 Occupancy: | 100.0% (December 31, 2014) |
| 2013 Occupancy: | 100.0% (December 31, 2013) |
| (1) | The Original Balance and Cut-off Date Balance of $24.0 million represents the non-controlling Note A-4 which, together with the pari passu Note A-1, Note A-2 and Note A-3, with an aggregate original principal balance of $96.0 million, comprises the 111 Livingston Street Whole Loan with an aggregate original principal balance of $120.0 million. For additional information regarding the pari passu notes, see “The Loan” herein. |
| (2) | See “Initial Reserves” and “Ongoing Reserves” herein. |
| (3) | Post loan origination, the borrower delivered a fully executed NYS Workers Comp lease extension that provided for an additional term of at least 2 years beyond the date of execution, subject to a termination option after 12 months with 90 days’ notice. The lender has released $27.99 million to the borrower from the economic holdback reserve account and $1.5 million remains reserved to renew or re-let the NYS Workers Comp premises at the expiration of the 2-year renewal. |
| (4) | DSCR, LTV, Debt Yield and Balance / Sq. Ft. calculations are based on the 111 Livingston Street Whole Loan, which has an aggregate principal balance of $120.0 million. |
THE INFORMATION IN THIS STRUCTURAL AND COLLATERAL TERM SHEET IS NOT COMPLETE AND MAY BE AMENDED PRIOR TO THE TIME OF SALE. THIS TERM SHEET IS NOT AN OFFER TO SELL THESE SECURITIES AND IT IS NOT A SOLICITATION OF AN OFFER TO BUY THESE SECURITIES IN ANY JURISDICTION WHERE THE OFFER OR SALE IS NOT PERMITTED.
93
111 Livingston Street Brooklyn, NY 11201 | Collateral Asset Summary – Loan No. 8 111 Livingston Street | Cut-off Date Balance: Cut-off Date LTV: U/W NCF DSCR: U/W NOI Debt Yield: | $24,000,000 54.8% 1.56x 8.1% |
| Tenant Summary | |||||||
Tenant | Ratings (Fitch/Moody’s/S&P)(1) | Net Rentable Area (Sq. Ft.) | % of Net Rentable Area | U/W Base Rent PSF | % of Total U/W Base Rent | Lease Expiration | |
| NYS Office of Assistance(2) | NR/Aa1/AA+ | 121,545 | 28.0% | $31.44 | 22.7% | 5/31/2020 | |
| The Legal Aid Society(3) | NR/NR/NR | 111,900 | 25.8% | $37.00 | 24.6% | 10/31/2037 | |
| NYS Workers Comp(2)(4) | NR/Aa1/AA+ | 50,225 | 11.6% | $45.00 | 13.4% | 1/31/2019 | |
| City University of NY(2) | NR/Aa1/AA+ | 45,000 | 10.4% | $40.63 | 10.9% | 8/31/2017 | |
| Brooklyn Law School(5) | NR/Baa1/BBB | 41,000 | 9.4% | $51.00 | 12.4% | 1/31/2032 | |
| Total / Wtd. Avg. | 369,670 | 85.2% | $38.26 | 83.9% | |||
| Other(6) | 54,060 | 12.5% | $50.07 | 16.1% | |||
| Vacant | 10,270 | 2.4% | |||||
| Total / Wtd. Avg. | 434,000 | 100.0% | |||||
| (1) | Certain ratings are those of the parent company whether or not the parent guarantees the lease. |
| (2) | The NYS Office of Assistance and City University Of New York are able to terminate their respective leases if sufficient funds are not appropriated to cover the cost of fixed and additional rent. |
| (3) | As part of a lease renewal, the Legal Aid Society is in a free rent period which expires in October 2017. Moreover, as part of two separate lease expansions of 7,450 sq. ft. and 6,000 sq. ft. of space, respectively, in January 2015, the borrower abated rent for The Legal Aid Society. For the lease expansion of 7,450 sq. ft., the borrower abated the first nine months of the lease term, and January and July of 2016, 2017, and 2018. For the lease expansion of 6,000 sq. ft., the borrower abated rent for six months of the first lease year, and for the 4th and 10th months of lease years two through four. |
| (4) | NYS Workers Comp has been located at the 111 Livingston Street Property since January 2001 and, at closing, had been occupying the top floor on a month to month basis since 2010. At closing, the borrower sponsor and the tenant had agreed to a temporary 2-year renewal which had been signed by 2 out of 3 signatories at the state level that were required to effectuate the lease. The 2-year temporary renewal includes a tenant termination option after 12 months. For this reason, the 111 Livingston Street Loan was structured with an economic holdback of $29.49 million, of which $27.99 million was to be released once the NYS Workers Comp temporary renewal lease was fully executed (or an acceptable replacement lease was executed), and the resulting debt yield was 7.0% or greater. Post loan origination, the borrower delivered a fully executed lease extension to NYS Workers Comp which provides for an additional term of at least 2 years beyond the date of execution, subject to the tenant termination option. The lender has released $27.99 million to the borrower and $1.5 million remains reserved to renew or re-let the NYS Workers Comp premises. |
| (5) | Brooklyn Law School has taken possession of its space but is currently in a free rent period which expires in May 2017. |
| (6) | Includes Livingston Street Parking which operates a public parking garage and a rental car facility in the basement of the 111 Livingston Street Property. There is 0 sq. ft. attributed to the Livingston Street Parking tenant but it is currently responsible for annual rent of $1,300,000 through January 31, 2032. |
| Lease Rollover Schedule(1)(2) | ||||||||
| Year | # of Leases Expiring | Total Expiring Sq. Ft. | % of Total Sq. Ft. Expiring | Cumulative Sq. Ft. Expiring | Cumulative % of Sq. Ft. Expiring | Annual U/W PSF | % U/W Rolling | Cumulative % of U/W Base Rent |
| MTM | 2 | 16,869 | 3.9% | 16,869 | 3.9% | $0.00 | 0.0% | 0.0% |
| 2017 | 2 | 49,300 | 11.4% | 66,169 | 15.2% | $40.09 | 11.7% | 11.7% |
| 2018 | 1 | 4,125 | 1.0% | 70,294 | 16.2% | $33.57 | 0.8% | 12.6% |
| 2019 | 3 | 56,116 | 12.9% | 126,410 | 29.1% | $46.10 | 15.4% | 27.9% |
| 2020 | 2 | 121,545 | 28.0% | 247,955 | 57.1% | $31.44 | 22.7% | 50.6% |
| 2021 | 2 | 22,875 | 5.3% | 270,830 | 62.4% | $47.01 | 6.4% | 57.0% |
| 2022 | 0 | 0 | 0.0% | 270,830 | 62.4% | $0.00 | 0.0% | 57.0% |
| 2023 | 0 | 0 | 0.0% | 270,830 | 62.4% | $0.00 | 0.0% | 57.0% |
| 2024 | 0 | 0 | 0.0% | 270,830 | 62.4% | $0.00 | 0.0% | 57.0% |
| 2025 | 0 | 0 | 0.0% | 270,830 | 62.4% | $0.00 | 0.0% | 57.0% |
| 2026 | 0 | 0 | 0.0% | 270,830 | 62.4% | $0.00 | 0.0% | 57.0% |
| 2027 | 0 | 0 | 0.0% | 270,830 | 62.4% | $0.00 | 0.0% | 57.0% |
| Thereafter | 6 | 152,900 | 35.2% | 423,730 | 97.6% | $47.41 | 43.0% | 100.0% |
| Vacant | 0 | 10,270 | 2.4% | 434,000 | 100.0% | $0.00 | 0.0% | |
| Total / Wtd. Avg. | 18 | 434,000 | 100.0% | $39.76 | 100.0% | |||
| (1) | Based on the underwritten rent roll as of November 1, 2016. |
| (2) | Certain tenants may have lease termination options that may become exercisable prior to the originally stated expiration date of the tenant lease and that are not considered in the lease rollover schedule. |
THE INFORMATION IN THIS STRUCTURAL AND COLLATERAL TERM SHEET IS NOT COMPLETE AND MAY BE AMENDED PRIOR TO THE TIME OF SALE. THIS TERM SHEET IS NOT AN OFFER TO SELL THESE SECURITIES AND IT IS NOT A SOLICITATION OF AN OFFER TO BUY THESE SECURITIES IN ANY JURISDICTION WHERE THE OFFER OR SALE IS NOT PERMITTED.
94
111 Livingston Street Brooklyn, NY 11201 | Collateral Asset Summary – Loan No. 8 111 Livingston Street | Cut-off Date Balance: Cut-off Date LTV: U/W NCF DSCR: U/W NOI Debt Yield: | $24,000,000 54.8% 1.56x 8.1% |
The Loan. The 111 Livingston Street loan (the “111 Livingston Street Loan”) is a fixed rate loan secured by the borrower’s fee simple interest in a 434,000 sq. ft. office building located in Brooklyn, New York (the “111 Livingston Street Property”) with an original and cut-off date principal balance of $24.0 million. The 111 Livingston Street Loan is evidenced by the non-controlling Note A-4, with an original principal balance of $24.0 million, which will be included in the CD 2017-CD4 mortgage trust, the controlling Note A-1 and non-controlling Note A-3, with an aggregate original principal balance of $67.0 million, which were contributed to the CD 2017-CD3 mortgage trust and the non-controlling Note A-2 (together with the 111 Livingston Street Loan, the “111 Livingston Street Whole Loan”), with an aggregate original principal balance of $29,000,000, which was included in the CGCMT 2017-P7 mortgage trust.
The relationship between the holders of the 111 Livingston Street Whole Loan will be governed by a co-lender agreement as described under “Description of the Mortgage Pool–The Whole Loans–The Non-Serviced Pari Passu Whole Loans—111 Livingston Street Whole Loan” in the Preliminary Prospectus.
| Whole Loan Summary | |||||
| Note | Original Balance | Cut-off Date Balance | Note Holder | Controlling Piece | |
| A-4 | $24,000,000 | $24,000,000 | CD 2017-CD4 | No | |
| A-1, A-3 | $67,000,000 | $67,000,000 | CD 2017-CD3 | Yes | |
| A-2 | $29,000,000 | $29,000,000 | CGCMT 2017-P7 | No | |
| Total | $120,000,000 | $120,000,000 | |||
The 111 Livingston Street Whole Loan has a 10-year term and pays interest only for the entire term. The 111 Livingston Street Whole Loan accrues interest at a fixed rate equal to 4.7300%. The 111 Livingston Street Loan proceeds, along with $125,000 of other sources, were used to refinance existing debt of approximately $80.5 million, fund approximately $36.8 million in upfront reserves, pay closing costs of approximately $2.8 million and return approximately $63,881 of borrower equity. Based on the appraised value of $219.0 million as of October 26, 2016, the Cut-off Date LTV is 54.8%. The most recent prior financing of the 111 Livingston Street Property was included in the GECMC 2007-C1 securitization.
| Sources and Uses | ||||||
| Sources | Proceeds | % of Total | Uses | Proceeds | % of Total | |
| Whole Loan | $120,000,000 | 99.9% | Loan Payoff(1) | $80,506,976 | 67.0% | |
| Other Sources | $125,000 | 0.1% | Reserves | $36,753,280 | 30.6% | |
| Closing Costs | $2,800,863 | 2.3% | ||||
| Return of Equity | $63,881 | 0.1% | ||||
| Total Sources | $120,125,000 | 100.0% | Total Uses | $120,125,000 | 100.0% | |
| (1) | The prior mortgage loan matured on January 1, 2017, and was refinanced by the 111 Livingston Street Whole Loan on January 5, 2017; the borrower paid default interest on the prior loan for the period between maturity of the prior loan and origination of the 111 Livingston Street Whole Loan. |
The Borrower / Sponsor.The borrower, 111 Livingston LLC, is a single purpose Delaware limited liability company structured to be bankruptcy-remote with two independent directors in its organizational structure. The sponsor of the borrower and the nonrecourse carve-out guarantors are Abraham Leser, Edith Leser, Harry Gold, and Robert Schachter, on a joint and several basis.
The Leser Group is a New York City-based real estate development and property management firm founded by Abraham Leser in 1969. The Leser Group currently manages a portfolio of over 2.0 million sq. ft. throughout New York, Philadelphia and Connecticut, the majority of which are office properties.
The Property.The 111 Livingston Street Property is a 22-story, Class A, multi-tenanted office building totaling 434,000 sq. ft. of NRA, on a 0.75-acre site, in downtown Brooklyn, New York. The improvements were built in 1969 and were last renovated in 2001. The borrower sponsor purchased the 111 Livingston Street Property in 1995. The 111 Livingston Street Property occupies a corner lot fronting the north side of Livingston Street and the west side of Boerum Place. Boerum Place is a two-way, six-lane major arterial while Livingston Street is a two-way, two-lane connector street. The City University of New York, Brooklyn Law School, Long Island University, Borough Hall, Brooklyn Historical Society, the Rotunda Gallery and the New York Transit Museum are all located within the 111 Livingston Street Property’s neighborhood. The 111 Livingston Street Property also has a subterranean garage containing 250 parking spaces for a parking ratio of 0.6 per 1,000 sq. ft..
The property is currently 97.6% leased to 11 office tenants and a parking operator. The 111 Livingston Street Property has a 25,000 sq. ft. floor plate on the ground floor and 20,500 sq. ft. floor plates from floors two through 23. Upper floors offer views of downtown Brooklyn and Manhattan. Top tenants include NYS Office of Assistance (“OTDA”) (Aa1/AA+ by Moody’s/S&P, 28.0% of NRA, 24.1% of gross rent), which has occupied the 111 Livingston Street Property since 1999, The Legal Aid Society (25.8% of NRA, 23.4% of gross rent), Brooklyn Law School (Baa1/BBB by Moody’s/S&P, 9.4% of NRA, 12.3% of gross rent), and NYS Workers Comp (Aa1/AA+ by Moody’s/S&P, 11.6% of NRA, 11.8% of gross rent). The weighted average lease term of the in-place rent roll is 22.4 years.
Environmental Matters.The Phase I environmental report dated November 1, 2016 recommended no further action at the 111 Livingston Street Property except for the continued implementation of an asbestos O&M plan.
THE INFORMATION IN THIS STRUCTURAL AND COLLATERAL TERM SHEET IS NOT COMPLETE AND MAY BE AMENDED PRIOR TO THE TIME OF SALE. THIS TERM SHEET IS NOT AN OFFER TO SELL THESE SECURITIES AND IT IS NOT A SOLICITATION OF AN OFFER TO BUY THESE SECURITIES IN ANY JURISDICTION WHERE THE OFFER OR SALE IS NOT PERMITTED.
95
111 Livingston Street Brooklyn, NY 11201 | Collateral Asset Summary – Loan No. 8 111 Livingston Street | Cut-off Date Balance: Cut-off Date LTV: U/W NCF DSCR: U/W NOI Debt Yield: | $24,000,000 54.8% 1.56x 8.1% |
Major Tenants.
NYS Office of Assistance (28.0% of NRA; 22.7% of U/W Base Rent, rated Aa1/AA+ by Moody’s/S&P). OTDA is responsible for supervising programs that provide assistance and support to eligible families and individuals. OTDA’s functions include, providing temporary cash assistance, providing assistance in paying for food, providing heating assistance, overseeing New York State’s child support enforcement program, determining certain aspects of eligibility for Social Security Disability benefits, supervising homeless housing and services programs and providing assistance to certain immigrant populations. OTDA has been located at the property since June 1999 and expanded into an additional 39,265 sq. ft. at lease renewal in 2009. The NYS Office of Assistance is able to terminate its leases if sufficient funds are not appropriated to cover the cost of fixed and additional rent.
The Legal Aid Society (25.8% of NRA; 24.6% of U/W Base Rent). The Legal Aid Society is a private, not-for-profit legal services organization, the oldest and largest in the nation, which was founded in 1876. The Legal Aid Society provides legal representation to low income New Yorkers. The Legal Aid Society handles approximately 300,000 individual cases and matters annually and provides a range of legal services in three areas: the Civil, Criminal and Juvenile Rights Practices. Unlike the Legal Society’s Criminal and Juvenile Rights Practices, which are constitutionally mandated and supported by government, the Civil Practice relies heavily on private contributions.
NYS Workers Comp (11.6% of NRA; 13.4% of U/W Base Rent, rated Aa1/AA+ by Moody’s/S&P). The NYS Workers’ Compensation Board protects the rights of employees and employers by ensuring the proper delivery of benefits to those who are injured or ill and by promoting compliance with the law. NYS Workers Comp operates service centers throughout the state to provide convenient access for customers and stakeholders. NYS Workers Comp has been located at the 111 Livingston Street Property since January 2001 and has been occupying the top floor on a month to month basis since 2010. The borrower sponsor and tenant have agreed to a temporary 2-year renewal. The 2-year temporary renewal includes a tenant termination option after 12 months with 90 days’ prior notice. $1.5 million has been reserved to renew or re-let the NYS Workers Comp premises.
The Market.The 111 Livingston Street Property is adjacent to the Brooklyn Law School to the north, residential multifamily to the south and west and high rise condominiums and office and mixed retail/commercial to the east. There are numerous subway lines and bus stops within blocks of the 111 Livingston Street Property. The area benefits from its strong transportation attributes, which increase the demand for office and residential space. Major transportation routes that are nearby include I-278 and I-495, Boerum Place/Brooklyn Bridge Boulevard and Court Street/Cadman Plaza West, both primary arterials, and the commercial corridors including Flatbush and Atlantic Avenues. Public transportation is well-located near the 111 Livingston Street Property with Borough Hall and Jay Street Metrotech Stations situated within two blocks of the 111 Livingston Street Property; they provide access to the 2, 3, 4, 5, A, C, F, and R trains.
As of 2014, Brooklyn had 2.62 million residents, making it New York State’s largest county. Since the introduction of significant public initiatives and rezoning in 2004, this area experienced significant redevelopment of commercial and residential space. Between 2006 and 2014 Brooklyn gained more than 186,000 net new residents according to the appraisal. Brooklyn’s population growth has outpaced the rest of the city, state, and country by a significant margin. Brooklyn’s population growth rate between 2006 and 2014 was more than twice the rate of growth of the state of New York. Employment in Brooklyn grew by approximately 28% between 2000 and 2014 according to the appraisal, outperforming both the city and state, led by the healthcare, education, retail trade, tourism, and entertainment industries. According to the appraisal, the 2015 population within a 0.25-, 0.50- and 0.75-mile radius of the 111 Livingston Street Property was 9,150, 41,000 and 83,764, respectively. The estimated 2015 average household income within a 0.25-, 0.50- and 0.75-mile radius of the 111 Livingston Street Property was $144,579, $134,763 and $128,033, respectively. The 111 Livingston Street Property is located in the Downtown Brooklyn Office submarket. According to a third party report as of the second quarter of 2016, the Downtown Brooklyn Office submarket is comprised of over 22.6 million SF of inventory with a 6.0% vacancy rate and average asking rent of $43.23 PSF. The following table describes buildings the appraiser noted as directly competitive with the 111 Livingston Property and recent leases signed at each competitive property:
| Directly Competitive Buildings(1) | ||||||
| Property Name | Distance from subject (miles) | Year Built | Office (Sq. Ft.) | Total Occupancy | Tenant | Base Rent (PSF) |
| 111 Livingston Street Property | NAP | 1969 | 434,000(2) | 97.6%(2) | NAP | $29.81 – $71.79(2) |
| Montague Court | 0.2 | 1928 | 317,625 | 97.9% | Sheet Metal Industry | $50.00 |
| One Pierrepont Plaza | 0.3 | 1988 | 711,000 | 98.2% | Dime Savings Bank | $48.00 |
| Montague Court | 0.2 | 1928 | 317,625 | 97.9% | Maker’s Row | $50.00 |
| One Pierrepont Plaza | 0.3 | 1988 | 711,000 | 98.2% | Graham Windham | $40.00 |
| One Metrotech Center | 0.2 | 1991 | 933,000 | 94.9% | Robert Half International | $50.00 |
| Montague Pavilion Condominium | 0.2 | 1945 | 322,000 | 94.1% | Dept. of Citywide Administrative Services | $37.63 |
| (1) | Source: Appraisal. |
| (2) | Based on the underwritten rent roll dated November 1, 2016. |
THE INFORMATION IN THIS STRUCTURAL AND COLLATERAL TERM SHEET IS NOT COMPLETE AND MAY BE AMENDED PRIOR TO THE TIME OF SALE. THIS TERM SHEET IS NOT AN OFFER TO SELL THESE SECURITIES AND IT IS NOT A SOLICITATION OF AN OFFER TO BUY THESE SECURITIES IN ANY JURISDICTION WHERE THE OFFER OR SALE IS NOT PERMITTED.
96
111 Livingston Street Brooklyn, NY 11201 | Collateral Asset Summary �� Loan No. 8 111 Livingston Street | Cut-off Date Balance: Cut-off Date LTV: U/W NCF DSCR: U/W NOI Debt Yield: | $24,000,000 54.8% 1.56x 8.1% |
Cash Flow Analysis.
| Cash Flow Analysis | ||||||
| 2013 | 2014 | 2015 | T-12 9/30/2016 | U/W | U/W PSF | |
| Base Rent | $13,920,390 | $14,121,372 | $14,328,989 | $15,141,153 | $16,848,456 | $38.82 |
| Contractual Rent Steps(1) | 0 | 0 | 0 | 0 | 590,764 | 1.36 |
| Value of Vacant Space | 0 | 0 | 0 | 0 | 513,500 | 1.18 |
| Gross Potential Rent | $13,920,390 | $14,121,372 | $14,328,989 | $15,141,153 | $17,952,721 | $41.37 |
| Total Recoveries | 1,977,212 | 2,044,084 | 3,178,069 | 2,619,737 | 1,779,361 | 4.10 |
| Total Other Income | 0 | 0 | 0 | 0 | 59,237 | 0.14 |
| Less: Vacancy(2) | 0 | 0 | 0 | 0 | (989,566) | (2.28) |
| Effective Gross Income | $15,897,602 | $16,165,456 | $17,507,058 | $17,760,890 | $18,801,753 | $43.32 |
| Total Expenses | 7,311,771 | 8,044,809 | 8,444,503 | 8,465,711 | 9,038,441 | 20.83 |
| Net Operating Income | $8,585,831 | $8,120,648 | $9,062,555 | $9,295,180 | $9,763,312 | $22.50 |
| TI/LC | 0 | 0 | 0 | 0 | 710,011 | 1.64 |
| Capital Expenditures | 0 | 0 | 0 | 0 | 86,800 | 0.20 |
| Net Cash Flow | $8,585,831 | $8,120,648 | $9,062,555 | $9,295,180 | $8,966,501 | $20.66 |
| (1) | Contractual Rent Steps include contractual rent increases (totaling $290,140) through August 1, 2017 and the present value of scheduled rent increases (totaling $300,624) through the end of the lease terms for credit tenants. |
| (2) | U/W Vacancy is underwritten to a vacancy rate of 5.0% of all revenue. The 111 Livingston Street Property is 97.6% occupied as of the November 1, 2016 rent roll. |
Property Management. The 111 Livingston Street Property is managed by 111 Property Manager LLC, an affiliate of the borrower sponsor.
Lockbox / Cash Management.The 111 Livingston Street Whole Loan is structured with a hard lockbox with in-place cash management. All rents are required to be directly deposited by the tenants of the 111 Livingston Street Property into a clearing account controlled by the lender. All amounts in the lockbox account are required to be swept to a lender-controlled cash management account every business day and applied on each payment date to pay debt service and fund reserves, after which (x) to the extent a Trigger Period (as defined below) has occurred and is ongoing, all excess cash flow is required to be held as additional collateral for the 111 Livingston Street Whole Loan, and (y) to the extent no Trigger Period is continuing, all excess cash flow is required to be disbursed to the borrower.
A “Trigger Period” will commence upon the earlier of (i) the occurrence of an event of default; (ii) the debt service coverage ratio (as calculated in accordance with the 111 Livingston Street Loan documents) being less than 1.30x; or (iii) the occurrence of a Specified Tenant Trigger Period (as defined below). A Trigger Period will expire, with regard to clause (i), upon the cure of such event of default, if applicable; with regard to clause (ii), upon the debt service coverage ratio equaling or exceeding 1.35x for two consecutive calendar quarters; and with respect to clause (iii), upon the Specified Tenant Trigger Period ceasing to exist in accordance with the terms of the 111 Livingston Street Loan documents.
A “Specified Tenant Trigger Period” means a period (a) commencing upon the first to occur of (i) The Legal Aid Society or any future tenant of The Legal Aid Society’s premises (collectively, “Legal Aid Society”) or NYS Office of Assistance or any future tenant of NYS Office of Assistance’s (collectively, “OTDA Tenant”) premises being in default under its lease beyond applicable notice and cure periods, (ii) Legal Aid Society or OTDA Tenant providing notice that it is terminating its lease for all or any portion of its premises such that the remaining space following such termination will be less than 85% of the square footage demised to the applicable tenant as of the closing date of the 111 Livingston Street Whole Loan, (iii) any termination, cancellation or failure to be in full force and effect (including rejection in a bankruptcy or insolvency proceeding) of the Legal Aid Society or OTDA Tenant lease, (iv) any bankruptcy or similar insolvency of Legal Aid Society or OTDA Tenant, and (v) Legal Aid Society or OTDA Tenant failing to extend or renew the applicable lease for the Legal Aid Society or OTDA Tenant space on or prior to the earlier of (x) twelve months before expiration and (y) the date on which notice must be given to the lessor to exercise the applicable extension option (provided, however, no Specified Tenant Trigger Period relating to the OTDA Tenant lease is deemed to exist solely with respect to this clause (v) during any period that the Collateral Cure Conditions (as defined below) are satisfied); and (b) expiring upon the first to occur of the lender’s receipt of reasonably acceptable evidence (including an estoppel certificate) of (1) the matter giving rise to the Specified Tenant Trigger Period has been cured or corrected in accordance with the terms of the 111 Livingston Street Loan documents or (2) the borrower re-leasing 50% or more of the space that was demised pursuant to the applicable tenant’s lease to a new tenant pursuant to a lease entered into in accordance with the applicable terms and conditions under the 111 Livingston Street Loan documents which provides rental terms equal to or greater than the rental terms set forth in the lease being replaced and such replacement tenant is in physical occupancy of the applicable premises, open for business, and paying full, unabated rent under its lease, and any landlord work obligations and free rent periods have been completed or expired.
THE INFORMATION IN THIS STRUCTURAL AND COLLATERAL TERM SHEET IS NOT COMPLETE AND MAY BE AMENDED PRIOR TO THE TIME OF SALE. THIS TERM SHEET IS NOT AN OFFER TO SELL THESE SECURITIES AND IT IS NOT A SOLICITATION OF AN OFFER TO BUY THESE SECURITIES IN ANY JURISDICTION WHERE THE OFFER OR SALE IS NOT PERMITTED.
97
111 Livingston Street Brooklyn, NY 11201 | Collateral Asset Summary – Loan No. 8 111 Livingston Street | Cut-off Date Balance: Cut-off Date LTV: U/W NCF DSCR: U/W NOI Debt Yield: | $24,000,000 54.8% 1.56x 8.1% |
“Collateral Cure Conditions” are deemed to exist upon satisfaction of the following by the borrower: the borrower deposits cash into an account with the lender or delivers to the lender a letter of credit in form and substance that complies with the terms of the 111 Livingston Street Loan agreement which, in either case, serves as additional collateral for the 111 Livingston Street Whole Loan, in an amount equal to the amount that the lender anticipates (in its good faith reasonable discretion) that it would collect in the excess cash flow account during the period commencing with the date of calculation and ending on the date that the OTDA Tenant lease is scheduled to expire (which calculation assumes that OTDA Tenant and all other tenants at the 111 Livingston Street Property continue to make their rental payments during said period).
Leasehold Condominium. The tenant Brooklyn Law School (“BLS”) has the right under the BLS lease to impose a leasehold condominium structure onto the 111 Livingston Street Property in order to take advantage of a potential real estate tax exemption. Upon the request of BLS, which must be made during the first 5 years of its lease, the borrower will ground lease its fee interest in the 111 Livingston Street Property to a newly formed special purpose subsidiary of the borrower (the “Declarant”) for a term of between 30 and 31 years and the Declarant will impose a condominium regime upon its leasehold interest in the 111 Livingston Street Property. The Declarant will own all of the leasehold condominium units upon the consummation of the conversion of its leasehold interest into a leasehold condominium. At the lender’s option, the Declarant is required to become a co-borrower pursuant to the 111 Livingston Street Loan documents and, consequently, the lien of the security instrument will be spread to encumber each of the leasehold condominium units. The leasehold condominium unit covering the premises granted to BLS pursuant to its lease (the “BLS Unit”) will be purchased by BLS pursuant to a purchase and sale agreement providing for a deferred purchase price, the cash flow of which would mirror the lease payments contemplated by the BLS lease (except that such payments will exclude the portion of BLS’s lease payments attributable to real estate taxes that will be abated under BLS’s real estate tax exemption with respect to the BLS Unit), and the BLS lease would terminate and the BLS Unit will be released from the lien of the related mortgage securing the 111 Livingston Street Whole Loan. The obligation of BLS to make the deferred purchase price payments will be secured by a purchase money mortgage in favor of the Declarant that is required to be collaterally assigned to the lender by the Declarant. The lender has agreed that it will not unreasonably withhold its consent to the foregoing actions (collectively, the “Leasehold Condominium Conversion”) provided certain conditions set forth in the 111 Livingston Street Loan documents are satisfied, which include, among other requirements, (i) delivery of rating agency confirmations, (ii) the leasehold condominium conversion and related documents and transactions comply with REMIC requirements and the borrower delivers a REMIC opinion confirming the same and (iii) all documents relating to the Leasehold Condominium Conversion are in form and substance reasonably acceptable to the lender.
Initial Reserves.At loan origination, the borrower deposited (i) $296,183 into a tax reserve account; (ii) $29,490,000 into an economic holdback reserve account relating to the signature of a 2-year extension of the NYS Workers Comp lease, (iii) $4,705,472 into an unfunded obligations reserve account (which includes free rent related to The Legal Aid Society, Brooklyn Law School and Northrop Grumman and tenant improvement obligations related to The Legal Aid Society and Northrop Grumman), (iv) 2,250,000 for the renewal or replacement of a lease at the 111 Livingston Street Property with the City University of NY and (v) $11,625 into a deferred maintenance reserve account, which represents 125.0% of the engineer’s estimated costs .
Post loan origination, the borrower delivered a fully executed NYS Workers Comp lease extension in form and substance reasonably acceptable to the lender and providing for an additional term of at least 2 years beyond the date of execution, subject to a tenant termination option after 12 months. The lender has released $27.99 million to the borrower from the economic holdback reserve account and $1.5 million remains reserved to renew or re-let the NYS Workers Comp premises at the expiration of the 2-year renewal.
Ongoing Reserves.The borrower is required to deposit on a monthly basis (i) 1/12 of the estimated annual real estate taxes, which currently equates to $296,183, into the tax reserve account, (ii) $7,233 into the replacement reserve account, (iii) $36,167 into a tenant improvements and leasing commissions reserve account, subject to a cap of $2,000,000, and (iv) unless an acceptable blanket insurance policy is in place, 1/12 of the estimated insurance premiums into an insurance reserve account.
Current Mezzanine or Subordinate Indebtedness. None.
Future Mezzanine or Subordinate Indebtedness Permitted. None.
THE INFORMATION IN THIS STRUCTURAL AND COLLATERAL TERM SHEET IS NOT COMPLETE AND MAY BE AMENDED PRIOR TO THE TIME OF SALE. THIS TERM SHEET IS NOT AN OFFER TO SELL THESE SECURITIES AND IT IS NOT A SOLICITATION OF AN OFFER TO BUY THESE SECURITIES IN ANY JURISDICTION WHERE THE OFFER OR SALE IS NOT PERMITTED.
98
111 Livingston Street Brooklyn, NY 11201 | Collateral Asset Summary – Loan No. 8 111 Livingston Street | Cut-off Date Balance: Cut-off Date LTV: U/W NCF DSCR: U/W NOI Debt Yield: | $24,000,000 54.8% 1.56x 8.1% |

THE INFORMATION IN THIS STRUCTURAL AND COLLATERAL TERM SHEET IS NOT COMPLETE AND MAY BE AMENDED PRIOR TO THE TIME OF SALE. THIS TERM SHEET IS NOT AN OFFER TO SELL THESE SECURITIES AND IT IS NOT A SOLICITATION OF AN OFFER TO BUY THESE SECURITIES IN ANY JURISDICTION WHERE THE OFFER OR SALE IS NOT PERMITTED.
99
111 Livingston Street Brooklyn, NY 11201 | Collateral Asset Summary – Loan No. 8 111 Livingston Street | Cut-off Date Balance: Cut-off Date LTV: U/W NCF DSCR: U/W NOI Debt Yield: | $24,000,000 54.8% 1.56x 8.1% |
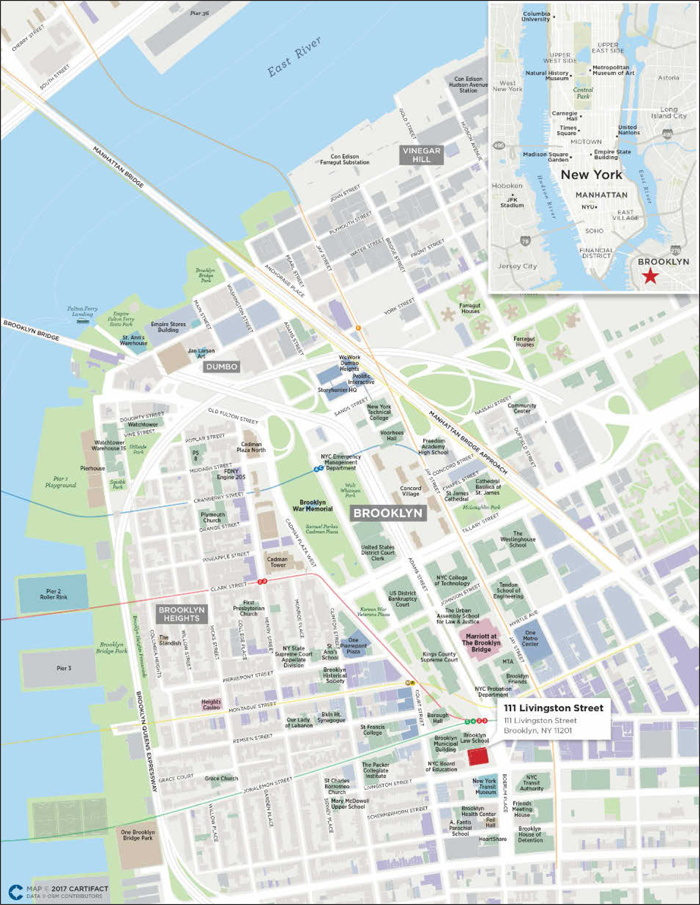
THE INFORMATION IN THIS STRUCTURAL AND COLLATERAL TERM SHEET IS NOT COMPLETE AND MAY BE AMENDED PRIOR TO THE TIME OF SALE. THIS TERM SHEET IS NOT AN OFFER TO SELL THESE SECURITIES AND IT IS NOT A SOLICITATION OF AN OFFER TO BUY THESE SECURITIES IN ANY JURISDICTION WHERE THE OFFER OR SALE IS NOT PERMITTED.
100
(THIS PAGE INTENTIONALLY LEFT BLANK)
THE INFORMATION IN THIS STRUCTURAL AND COLLATERAL TERM SHEET IS NOT COMPLETE AND MAY BE AMENDED PRIOR TO THE TIME OF SALE. THIS TERM SHEET IS NOT AN OFFER TO SELL THESE SECURITIES AND IT IS NOT A SOLICITATION OF AN OFFER TO BUY THESE SECURITIES IN ANY JURISDICTION WHERE THE OFFER OR SALE IS NOT PERMITTED.
101
299 North Church Street Spartanburg, SC 29306 | Collateral Asset Summary – Loan No. 9 Marriott Spartanburg | Cut-off Date Balance: Cut-off Date LTV: U/W NCF DSCR: U/W NOI Debt Yield: | $23,894,196 59.6% 1.94x 16.3% |

THE INFORMATION IN THIS STRUCTURAL AND COLLATERAL TERM SHEET IS NOT COMPLETE AND MAY BE AMENDED PRIOR TO THE TIME OF SALE. THIS TERM SHEET IS NOT AN OFFER TO SELL THESE SECURITIES AND IT IS NOT A SOLICITATION OF AN OFFER TO BUY THESE SECURITIES IN ANY JURISDICTION WHERE THE OFFER OR SALE IS NOT PERMITTED.
102
299 North Church Street Spartanburg, SC 29306 | Collateral Asset Summary – Loan No. 9 Marriott Spartanburg | Cut-off Date Balance: Cut-off Date LTV: U/W NCF DSCR: U/W NOI Debt Yield: | $23,894,196 59.6% 1.94x 16.3% |
| Mortgage Loan Information | |
| Loan Seller(1): | GACC |
| Loan Purpose: | Refinance |
| Sponsors: | Andrew B. Cajka, JR.; Jimmy I. Gibbs |
| Borrower: | SMR Hospitality III, LLC |
| Original Balance: | $24,000,000 |
| Cut-off Date Balance: | $23,894,196 |
| % by Initial UPB: | 2.7% |
| Interest Rate: | 5.5000% |
| Payment Date: | 6thof each month |
| First Payment Date: | February 6, 2017 |
| Maturity Date: | January 6, 2027 |
| Amortization: | 360 months |
| Additional Debt: | None |
| Call Protection: | L(28), D(88), O(4) |
| Lockbox / Cash Management: | Springing Hard / Springing |
| Reserves(2) | ||
| Initial | Monthly | |
| Taxes: | $24,913 | $24,913 |
| Insurance: | $17,012 | $4,253 |
| FF&E Reserve: | $0 | At least 1/12 of 5.0% of the annual gross revenues |
| Deferred Maintenance: | $56,250 | $0 |
| Ground Lease Reserve: | $16,667 | $16,667 |
| Financial Information | ||
| Cut-off Date Balance / Room: | $96,738 | |
| Balloon Balance / Room: | $81,148 | |
| Cut-off Date LTV: | 59.6% | |
| Balloon LTV: | 50.0% | |
| Underwritten NOI DSCR: | 2.38x | |
| Underwritten NCF DSCR: | 1.94x | |
| Underwritten NOI Debt Yield: | 16.3% | |
| Underwritten NCF Debt Yield: | 13.3% | |
| Underwritten NOI Debt Yield at Balloon: | 19.4% | |
| Underwritten NCF Debt Yield at Balloon: | 15.8% | |
| ||
| Property Information | |
| Single Asset / Portfolio: | Single Asset |
| Property Type: | Full Service Hospitality |
| Collateral: | Leasehold |
| Location: | Spartanburg, SC |
| Year Built / Renovated: | 2004 / 2012-2013 |
| Total Rooms: | 247 |
| Property Management: | WHI Spartanburg Management LLC |
| Underwritten NOI: | $3,887,188 |
| Underwritten NCF: | $3,173,077 |
| Appraised Value: | $40,100,000 |
| Appraisal Date: | October 5, 2016 |
| Historical NOI | |
| Most Recent NOI: | $3,885,816 (December 31, 2016) |
| 2015 NOI: | $3,009,676 (December 31, 2015) |
| 2014 NOI: | $2,788,985 (December 31, 2014) |
| 2013 NOI: | $2,263,656 (December 31, 2013) |
| Historical Occupancy | |
| 2016 Occupancy: | 78.5% (December 31, 2016) |
| 2015 Occupancy: | 73.6% (December 31, 2015) |
| 2014 Occupancy: | 71.4% (December 31, 2014) |
| 2013 Occupancy: | 72.0% (December 31, 2013) |
| (1) | The loan was originated by Benefit Street Partners CRE Finance LLC on December 22, 2016 and purchased by GACC on April 20, 2017. |
| (2) | See “Initial Reserves” and “Ongoing Reserves” herein |
THE INFORMATION IN THIS STRUCTURAL AND COLLATERAL TERM SHEET IS NOT COMPLETE AND MAY BE AMENDED PRIOR TO THE TIME OF SALE. THIS TERM SHEET IS NOT AN OFFER TO SELL THESE SECURITIES AND IT IS NOT A SOLICITATION OF AN OFFER TO BUY THESE SECURITIES IN ANY JURISDICTION WHERE THE OFFER OR SALE IS NOT PERMITTED.
103
299 North Church Street Spartanburg, SC 29306 | Collateral Asset Summary – Loan No. 9 Marriott Spartanburg | Cut-off Date Balance: Cut-off Date LTV: U/W NCF DSCR: U/W NOI Debt Yield: | $23,894,196 59.6% 1.94x 16.3% |
| Historical Occupancy, ADR, RevPAR(1) | |||||||||
Marriott Spartanburg Property | Competitive Set | Penetration Factor | |||||||
| Year | Occupancy | ADR | RevPAR | Occupancy | ADR | RevPAR | Occupancy | ADR | RevPAR |
| 2013(2) | 67.7% | $119.12 | $80.56 | 70.1% | $97.31 | $68.19 | 96.4% | 122.4% | 118.1% |
| 2014(3) | 71.2% | $127.03 | $90.45 | 73.0% | $103.19 | $75.35 | 97.5% | 123.1% | 120.0% |
| 2015(3) | 73.3% | $133.25 | $97.73 | 78.6% | $106.96 | $84.04 | 93.4% | 124.6% | 116.3% |
| 2016(3) | 78.5% | $140.83 | $110.51 | 81.5% | $115.70 | $94.33 | 96.2% | 121.7% | 117.2% |
| (1) | Occupancy, ADR and RevPAR represent estimates from a hospitality research report. The competitive set used for the table above includes the 88-room Residence Inn Spartanburg, the 108-room Courtyard Spartanburg, the 86-room Hampton Inn Spartanburg North I 85, the 88-room Holiday Inn Express & Suites I 26 & Highway 29 Westgate, and the 126-room Hampton Inn Suites Spartanburg I 26 Westgate Mall. |
| (2) | Source: December 2013 hospitality research report. The variances between the underwriting, the appraisal and the above table with respect to occupancy, ADR and RevPAR at the Marriott Spartanburg Property are attributable to variances in reporting methodologies and/or timing differences. In addition, the Primary Competitors and Secondary Competitive Set tables below from the appraisal use different competitive sets than the table above. |
| (3) | Source: December 2016 hospitality research report. |
The Loan.The Marriott Spartanburg loan (the “Marriott Spartanburg Loan”) is a fixed rate loan with an original principal balance of $24.0 million and Cut-off Date principal balance of approximately $23.9 million secured by the borrower’s leasehold interest in a 247-room full-service hotel located at 299 North Church Street in downtown Spartanburg, South Carolina (the “Marriott Spartanburg Property”).
The Marriott Spartanburg Loan has a 10-year term and amortizes on a 30-year schedule. The Marriott Spartanburg Loan accrues interest at a fixed rate equal to 5.5000%. Loan proceeds were used to retire existing debt of approximately $16.5 million, fund approximately $1.1 million of defeasance costs, pay closing costs of $736,104, fund reserves of $114,842 and return approximately $5.5 million of equity to the sponsors. The existing debt was previously securitized in the COMM 2014-CCRE15 transaction, and was not delinquent at any point during the term. Based on the appraised value of $40.1 million as of October 5, 2016, the Cut-off Date LTV is 59.6%.
| Sources and Uses | ||||||
| Sources | Proceeds | % of Total | Uses | Proceeds | % of Total | |
| Loan Amount | $24,000,000 | 100.0% | Loan Payoff | $16,497,962 | 68.7% | |
| Defeasance Cost | $1,135,958 | 4.7% | ||||
| Reserves | $114,842 | 0.5% | ||||
| Closing Costs | $736,104 | 3.1% | ||||
| Return of Equity | $5,515,134 | 23.0% | ||||
| Total Sources | $24,000,000 | 100.0% | Total Uses | $24,000,000 | 100.0% | |
The Borrower / Sponsor.The borrower, SMR Hospitality III, LLC, is a single purpose Delaware limited liability company structured to be bankruptcy-remote, with one independent director in its organizational structure. The sponsors of the borrower are Jimmy I. Gibbs of Gibbs International, Inc. and Andrew B. Cajka, JR.
Founded in 1973, Gibbs International, Inc. is a diversified company engaged primarily in five business segments: textiles, energy, real estate, mining, and demolition. Mr. Gibbs is the President and CEO of Gibbs International. Southern Hospitality Group was founded in 1998 and has developed and managed franchised hotels with Hilton, Marriott, Holiday Inn, Hyatt, and Wyndham Corporation throughout the Southeast United States. The principals of the sponsors, Andrew B. Cajka, JR. and John F. Cajka, both have over 25 years of experience owning and operating nationally flagged hotels. Andrew B. Cajka, JR. spent 14 years with Hyatt Hotels Corporation prior to founding Southern Hospitality Group in 1998. While at Hyatt, Andrew B. Cajka, JR. led the opening of 14 Hyatt Hotels & Resorts and served as Executive Manager at the Hyatt New Orleans (1,300 rooms), the Hyatt Nashville (500 rooms), and the Hyatt Greenville (330 rooms).
The Property.The Marriott Spartanburg Property is a 9-story 247-room full-service hotel located in downtown Spartanburg, South Carolina. In a guest satisfaction survey covering 339 Marriotts across North America, the Marriott Spartanburg was ranked #6 overall with a guest satisfaction score of 72.1% and with 77.1% of respondents indicating that they intended to recommend the Marriott Spartanburg Property, per the October 2016 guest satisfaction survey report. The Marriott Spartanburg Property is ranked #2 out of 28 hotels in Spartanburg according to a travel agency website.
The Marriott Spartanburg Property features standard and suite-style guestroom configurations. The Marriott Spartanburg Property’s 247 guestrooms are comprised of 108 king guestrooms, 132 double-queen guestrooms, five one-bedroom suites, one presidential suite and one governors suite. The Marriott Spartanburg Property is improved with one primary restaurant (Sparks Fire-Inspired Grill) that seats 74, a combination evening lounge and coffee bar (MESH) that seats 65 and an outdoor dining venue (The Terrace) that seats 40. Additionally, the Marriott Spartanburg Property is improved with a total of 26,791 sq. ft. of meeting space in a conference center
THE INFORMATION IN THIS STRUCTURAL AND COLLATERAL TERM SHEET IS NOT COMPLETE AND MAY BE AMENDED PRIOR TO THE TIME OF SALE. THIS TERM SHEET IS NOT AN OFFER TO SELL THESE SECURITIES AND IT IS NOT A SOLICITATION OF AN OFFER TO BUY THESE SECURITIES IN ANY JURISDICTION WHERE THE OFFER OR SALE IS NOT PERMITTED.
104
299 North Church Street Spartanburg, SC 29306 | Collateral Asset Summary – Loan No. 9 Marriott Spartanburg | Cut-off Date Balance: Cut-off Date LTV: U/W NCF DSCR: U/W NOI Debt Yield: | $23,894,196 59.6% 1.94x 16.3% |
consisting of 18 facilities ranging in size from 341 sq. ft. to 11,340 sq. ft., which is space leased by the borrower from the City of Spartanburg as described below. The Marriott Spartanburg Property’s amenities include an outdoor swimming pool, outdoor whirlpool, fitness center, 24/7 business center, gift shop, guest laundry facility, and club lounge. The Marriott Spartanburg Property is also improved with a 310-space parking garage, which equates to a parking ratio of 1.3 spaces per room.
The Marriott Spartanburg Property was originally developed in 2003 at a cost of $55 million ($222,672/room), which represents a loan to cost ratio of 43.6%. The sponsors purchased the leasehold interest in the Marriott Spartanburg Property in 2011 for $10.0 million ($40,486/room) as the prior owner was foreclosed upon by its lender and subsequently sold the Marriott Spartanburg Property to the sponsors. In connection with such acquisition, the sponsors obtained a $14.0 million senior loan and $3.0 million mezzanine loan that were refinanced at closing of the Marriott Spartanburg Loan. The sponsors have since spent $6.0 million ($24,176/room) in capital upgrades to the Marriott Spartanburg Property. The sponsors also purchased the adjacent parking garage for $3.2 million, providing guests with 310 parking spaces. In total, the sponsors have a total cost basis of $19.5 million ($78,947/room).
The Marriott Spartanburg Property is comprised of a ground leasehold interest pursuant to a ground lease with the City of Spartanburg (the “City”). The premises leased under the ground lease include the hotel, the parking garage, and the land under the entire 5.5 acre parcel. The ground lease expires January 13, 2061 (44 years remaining) and ground rent payments are fixed at $200,000 per year. The ground lease grants borrower a purchase option for the fee interest in the land under the entire 5.5 acre parcel for $1.5 million, which option can be exercised any time after August 31, 2025. The deed is required to contain restrictive covenants requiring the grantee, its successors and assigns, to continue the operation of the buildings and improvements as a full service hotel and conference center until the expiration of the Conference Center Lease (as defined below). In the event borrower exercises its purchase option under the ground lease, the borrower would own the fee estate to the 5.5 acre parcel. The City would continue to own the conference center, the Conference Center Lease would remain in place, and borrower would be required to continue to operate the Marriott Spartanburg Property as a full service hotel and conference center until 2061. Upon borrower’s exercise of the purchase option, either the City of Spartanburg or borrower has the right to unilaterally submit the entire project to a horizontal property regime (essentially a condominium structure), and the City has agreed to continue to lease the conference center to the borrower until at least 2061 for $1/year. The form of condominium provides for three board seats (two for the borrower and one for the City) with a majority vote (2 of 3 board members) needed for all condominium actions. Pursuant to the Marriott Spartanburg Loan documents, the borrower is prohibited from acquiring additional property without the lender’s consent, and from merging the fee and leasehold interests.
The City of Spartanburg owns the conference center improvements (the 26,791 sq. ft. meeting space described above), which the City built and financed through the issuance of tax-exempt certificates of participation (“COPS”) having a final maturity of April 1, 2025 and subsequently issued tax-exempt bonds (with a final maturity of April 1, 2025) to refund a portion of the COPS. The borrower leases the connected conference center from the City pursuant to a separate space lease (the “Conference Center Lease”), which Conference Center Lease also expires January 13, 2061 (44 years remaining) with rent payments fixed at $1.00 per year. The Conference Center Lease operates as a space lease/license. The ground lease and the conference center lease are cross-defaulted with each other. The conference center is located on the land ground leased by the borrower; however, the lender’s mortgage is not secured by the conference center improvements owned by the City. The borrower and the City executed an estoppel and agreement in favor of the lender with additional lender protections relating to the Conference Center Lease (such as providing the lender notice and an opportunity to cure any defaults under the Conference Center Lease and agreeing to enter into a new lease with the lender if the Conference Center Lease is terminated) and the loan documents contain a full recourse carve out for any modification or termination of the Conference Center Lease without the lender’s prior consent.
The Marriott Spartanburg Property currently operates under a franchise agreement with Marriott International, Inc., a global lodging company with more than 6,000 properties in 122 countries and reported revenues of more than $17.0 billion in fiscal year 2016. The franchise agreement began in January 2011 and expires in January 2031.
Environmental Matters.The Phase I environmental report dated October 31, 2016 recommended no further action at the Marriott Spartanburg Property.
The Market.The Marriott Spartanburg Property is located in the I-85 Corridor that runs through the upstate region of South Carolina. Primary regional access through the area is provided by southwest/northeast Interstate 85, which extends to Montgomery, Alabama to the southwest and Greensboro, North Carolina to the northeast. The other nearest highways are Interstate 385, 585, and 26. Spartanburg County is at the crossroads of two interstate highways, I-85 and I-26; and two southeast rail service providers. Furthermore, the Spartanburg Regional Healthcare System and the Greenville Health System create demand in the hotel segment, as doctors, pharmaceuticals sales representatives, and other medical personnel utilize the hotels in the market area. Major employers in the region includes Greenville Health System, Michelin, GE and BMW.
The City of Spartanburg is part of the largest Metropolitan Statistical Area (MSA) in South Carolina. Spartanburg is within 1.5 days drive of half the nation’s population, within 800 miles of more than half the nation’s current manufacturing establishments, and equidistant from New York and Miami. The Marriott Spartanburg Property, a nine-story building, has good visibility within downtown Spartanburg. Population and average household income within a 5-mile radius of the Marriott Spartanburg Property is 93,178 and $51,058, respectively.
THE INFORMATION IN THIS STRUCTURAL AND COLLATERAL TERM SHEET IS NOT COMPLETE AND MAY BE AMENDED PRIOR TO THE TIME OF SALE. THIS TERM SHEET IS NOT AN OFFER TO SELL THESE SECURITIES AND IT IS NOT A SOLICITATION OF AN OFFER TO BUY THESE SECURITIES IN ANY JURISDICTION WHERE THE OFFER OR SALE IS NOT PERMITTED.
105
299 North Church Street Spartanburg, SC 29306 | Collateral Asset Summary – Loan No. 9 Marriott Spartanburg | Cut-off Date Balance: Cut-off Date LTV: U/W NCF DSCR: U/W NOI Debt Yield: | $23,894,196 59.6% 1.94x 16.3% |
According to the appraisal, the new supply in the Spartanburg market includes two hotels that are in the planning stage and one hotel that is under construction. The two proposed hotels, the 105-room Residence Inn by Marriott at Westgate Mall and the 116-room Hilton Garden Inn at Westgate Mall, are expected to be 40% and 100% competitive, respectively. The 114-room AC by Marriott, which is currently under construction, is expected to be 100% competitive.
The subsequent chart presents the primary and secondary competitive sets to the Marriott Spartanburg Property:
| Primary Competitors(1) | ||||||
| Property | Rooms | Year Open | Distance | 2015 Occupancy | 2015 ADR | 2015 RevPAR |
| Marriott Spartanburg Property(2) | 247 | 2004 | NAP | 73.3% | $133.25 | $97.73 |
| Courtyard by Marriott Spartanburg | 108 | 1990 | 3.1 mile | 72.5% | $102.50 | $72.50 |
| Embassy Suites Greenville | 268 | 1993 | 27.3 mile | 77.5% | $135.00 | $102.50 |
| Primary Total / Wtd. Avg.(3) | 376 | 76.1% | $125.66 | $93.88 | ||
| Secondary Competitive Set(1) | ||||||
| Marriott Greenville | 203 | 1988 | 23.0 mile | 72.5% | $135.00 | $97.50 |
| Residence Inn by Marriott Spartanburg | 88 | 1985 | 4.7 mile | 87.5% | $102.50 | $92.50 |
| Hampton Inn & Suites Westgate Mall | 126 | 2004 | 4.6 mile | 72.5% | $127.50 | $92.50 |
| Hampton Inn Spartanburg | 86 | 1998 | 5.8 mile | 72.5% | $102.50 | $72.50 |
| Holiday Inn Express Hotel & Suites at Westgate Mall | 88 | 2002 | 4.4 mile | 72.5% | $112.50 | $77.50 |
| Hilton Greenville | 256 | 1987 | 27.9 mile | 77.5% | $117.50 | $92.50 |
| Hyatt Regency Greenville | 327 | 1982 | 30.4 mile | 77.5% | $155.50 | $117.50 |
| Secondary Total / Wtd. Avg.(2) | 1,174 | 76.1% | $129.45 | $97.74 | ||
| Total / Wtd. Avg.(3) | 1,550 | 76.1% | $128.53 | $96.80 | ||
| (1) | Source: Appraisal. |
| (2) | Source: December 2016 hospitality research report. |
| (3) | Primary Total / Wtd. Avg. & Total / Wtd. Avg. exclude the Marriott Spartanburg Property. |
The appraiser determined demand segmentation of 7% leisure, 53% commercial, and 40% meeting and group for the Marriott Spartanburg Property, compared to a weighted average of 14% leisure, 55% commercial and 31% meeting and group travel for the primary competitive set.
| 2015 Demand Segmentation(1) | ||||||
| Property | Rooms | Commercial | Meeting and Group | Leisure | ||
| Marriott Spartanburg Property | 247 | 53.0% | 40.0% | 7.0% | ||
| Courtyard by Marriott Spartanburg | 108 | 70.0% | 10.0% | 20.0% | ||
| Embassy Suites Greenville | 268 | 45.0% | 40.0% | 15.0% | ||
| Subtotal / Wtd. Avg.(2) | 376 | 52.2% | 31.4% | 16.4% | ||
| Secondary Competitors | 1,174 | 57.0% | 28.0% | 15.0% | ||
| Total / Wtd. Avg.(2) | 1,550 | 55.8% | 28.8% | 15.3% | ||
| (1) | Source: Appraisal |
| (2) | Subtotal / Wtd. Avg. & Total / Wtd. Avg. exclude the Marriott Spartanburg Property. |
THE INFORMATION IN THIS STRUCTURAL AND COLLATERAL TERM SHEET IS NOT COMPLETE AND MAY BE AMENDED PRIOR TO THE TIME OF SALE. THIS TERM SHEET IS NOT AN OFFER TO SELL THESE SECURITIES AND IT IS NOT A SOLICITATION OF AN OFFER TO BUY THESE SECURITIES IN ANY JURISDICTION WHERE THE OFFER OR SALE IS NOT PERMITTED.
106
299 North Church Street Spartanburg, SC 29306 | Collateral Asset Summary – Loan No. 9 Marriott Spartanburg | Cut-off Date Balance: Cut-off Date LTV: U/W NCF DSCR: U/W NOI Debt Yield: | $23,894,196 59.6% 1.94x 16.3% |
Cash Flow Analysis.
| Cash Flow Analysis(1) | ||||||||
| 2013 | 2014 | 2015 | 2016 | U/W | U/W per Room | |||
| Occupancy | 72.0% | 71.4% | 73.6% | 78.5% | 78.5% | |||
| ADR | $119.08 | $126.85 | $133.04 | $140.41 | $140.41 | |||
| RevPAR | $85.78 | $90.33 | $97.33 | $110.48 | $110.18 | |||
| Room Revenue | $7,302,463 | $8,143,300 | $8,774,342 | $9,960,598 | $9,933,253 | $40,216 | ||
| F&B Revenue | 3,922,326 | 4,053,095 | 4,190,226 | 4,245,176 | 4,245,176 | 17,187 | ||
| Other Revenue | 112,450 | 112,975 | 94,628 | 103,787 | 103,787 | 420 | ||
| Total Revenue | $11,337,239 | $12,309,370 | $13,059,196 | $14,309,561 | $14,282,216 | $57,823 | ||
| Operating Expenses | 4,664,034 | 4,951,294 | 5,262,041 | 5,378,362 | 5,371,992 | 21,749 | ||
| Undistributed Expenses | 3,833,037 | 4,001,140 | 4,218,738 | 4,483,611 | 4,481,404 | 18,143 | ||
| Gross Operating Profit | $2,840,168 | $3,356,936 | $3,578,417 | $4,447,588 | $4,428,820 | 17,930 | ||
| Total Fixed Charges | 576,512 | 567,951 | 568,741 | 561,772 | 541,632 | 2,193 | ||
| Net Operating Income | $2,263,656 | $2,788,985 | $3,009,676 | $3,885,816 | $3,887,188 | $15,738 | ||
| FF&E(2) | 566,862 | 615,469 | 652,960 | 715,478 | 714,111 | 2,891 | ||
| Net Cash Flow | $1,696,794 | $2,173,516 | $2,356,716 | $3,170,338 | $3,173,077 | $12,846 | ||
| (1) | Occupancy, ADR and RevPAR represent estimates from a hospitality research report. The minor variances between the underwriting, the appraisal and the above table with respect to occupancy, ADR and RevPAR at the Marriott Spartanburg Property are attributable to variances in reporting methodologies and/or timing differences. |
| (2) | U/W FF&E represents 5.0% of gross revenues. |
Property Management.The Marriott Spartanburg Property is managed by WHI Spartanburg Management LLC, which is part of the Winegardner and Hammons Group. Winegardner and Hammons Group is based in Cincinnati, Ohio, founded in 1958 and currently manages 20 hotels throughout the United States.
Lockbox / Cash Management.The Marriott Spartanburg Loan is structured with a springing hard lockbox and springing cash management. Following a Trigger Period (as defined herein), all credit card receipts are required to be deposited directly into a clearing account controlled by the lender, and the borrower and property manager are required to deposit all other rent and payments into the clearing account immediately. Unless a Trigger Period is ongoing, all amounts on deposit in the clearing account are required to be swept daily into the borrower’s account. During a Trigger Period, all amounts on deposit in the clearing account are required to be swept daily into an account controlled by the lender and applied as provided in the loan documents.
A “Trigger Period” will commence upon (i) an event of default or (ii) if the debt service coverage ratio for the Marriott Spartanburg Property falls below 1.35x, until the debt service coverage ratio remains at or above 1.40x for two consecutive calendar quarters. During a Trigger Period, all excess cash flow after the payment of debt service and all applicable reserves is required to be held by lender as additional collateral for the Marriott Spartanburg Loan.
Initial Reserves.At loan origination, the borrower deposited (i) $24,913 into a tax reserve account, (ii) $17,012 into an insurance reserve account; (iii) $56,250 into an account for immediate repairs identified by engineer (125% of identified repairs) and (iv) $16,667 into an upfront ground lease reserve.
Ongoing Reserves.On a monthly basis, the borrower is required to deposit monthly reserves of (i) 1/12 of the estimated annual real estate taxes, which currently equates to $24,913, into a tax reserve account; (ii) 1/12 of the estimated annual insurance premiums, which currently equates to $4,253, into an insurance reserve account, (iii) an amount equal to 1/12 of 5.0% of the greater of (a) gross revenues in the preceding calendar year or (b) the projected gross revenues for the current calendar year according to the most recently submitted annual budget, into an FF&E reserve account and (iv) $16,667 into a ground rent reserve account.
Current Mezzanine or Subordinate Indebtedness. None.
Future Mezzanine or Subordinate Indebtedness Permitted. None.
THE INFORMATION IN THIS STRUCTURAL AND COLLATERAL TERM SHEET IS NOT COMPLETE AND MAY BE AMENDED PRIOR TO THE TIME OF SALE. THIS TERM SHEET IS NOT AN OFFER TO SELL THESE SECURITIES AND IT IS NOT A SOLICITATION OF AN OFFER TO BUY THESE SECURITIES IN ANY JURISDICTION WHERE THE OFFER OR SALE IS NOT PERMITTED.
107
299 North Church Street Spartanburg, SC 29306 | Collateral Asset Summary – Loan No. 9 Marriott Spartanburg | Cut-off Date Balance: Cut-off Date LTV: U/W NCF DSCR: U/W NOI Debt Yield: | $23,894,196 59.6% 1.94x 16.3% |
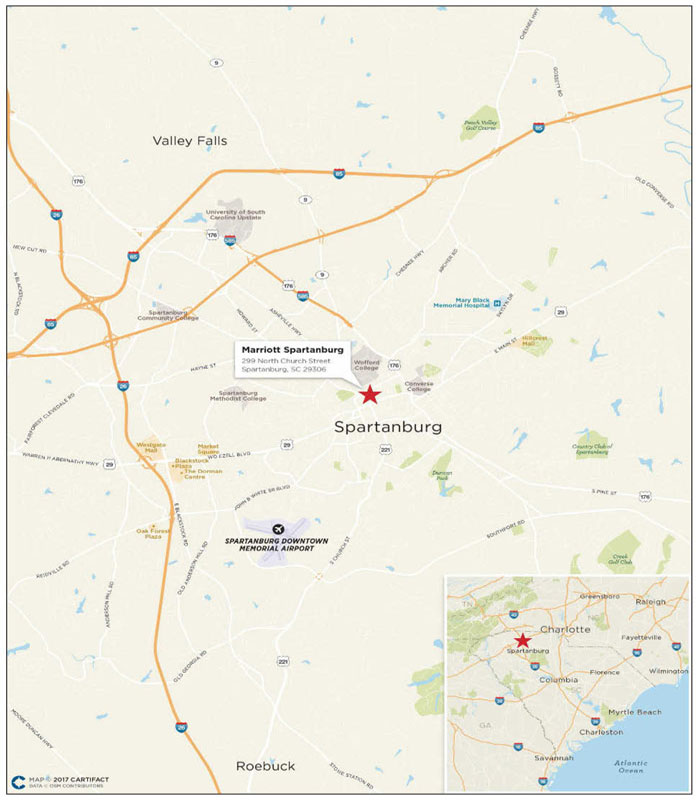
THE INFORMATION IN THIS STRUCTURAL AND COLLATERAL TERM SHEET IS NOT COMPLETE AND MAY BE AMENDED PRIOR TO THE TIME OF SALE. THIS TERM SHEET IS NOT AN OFFER TO SELL THESE SECURITIES AND IT IS NOT A SOLICITATION OF AN OFFER TO BUY THESE SECURITIES IN ANY JURISDICTION WHERE THE OFFER OR SALE IS NOT PERMITTED.
108
(THIS PAGE INTENTIONALLY LEFT BLANK)
THE INFORMATION IN THIS STRUCTURAL AND COLLATERAL TERM SHEET IS NOT COMPLETE AND MAY BE AMENDED PRIOR TO THE TIME OF SALE. THIS TERM SHEET IS NOT AN OFFER TO SELL THESE SECURITIES AND IT IS NOT A SOLICITATION OF AN OFFER TO BUY THESE SECURITIES IN ANY JURISDICTION WHERE THE OFFER OR SALE IS NOT PERMITTED.
109
260 West 36th Street New York, NY 10018 | Collateral Asset Summary – Loan No. 10 260 West 36th Street | Cut-off Date Balance: Cut-off Date LTV: U/W NCF DSCR: U/W NOI Debt Yield: | $23,500,000 52.2% 1.82x 8.7% |

THE INFORMATION IN THIS STRUCTURAL AND COLLATERAL TERM SHEET IS NOT COMPLETE AND MAY BE AMENDED PRIOR TO THE TIME OF SALE. THIS TERM SHEET IS NOT AN OFFER TO SELL THESE SECURITIES AND IT IS NOT A SOLICITATION OF AN OFFER TO BUY THESE SECURITIES IN ANY JURISDICTION WHERE THE OFFER OR SALE IS NOT PERMITTED.
110
260 West 36th Street New York, NY 10018 | Collateral Asset Summary – Loan No. 10 260 West 36th Street | Cut-off Date Balance: Cut-off Date LTV: U/W NCF DSCR: U/W NOI Debt Yield: | $23,500,000 52.2% 1.82x 8.7% |
| Mortgage Loan Information | |
| Loan Seller: | GACC |
| Loan Purpose: | Refinance |
| Sponsors: | Albert Monasebian; Nader Hakakian |
| Borrower: | 260 West 36 Realty, LLC |
| Original Balance: | $23,500,000 |
| Cut-off Date Balance: | $23,500,000 |
| % by Initial UPB: | 2.6% |
| Interest Rate: | 4.4700% |
| Payment Date: | 6th of each month |
| First Payment Date: | April 6, 2017 |
| Maturity Date: | March 6, 2027 |
| Amortization: | Interest Only |
| Additional Debt: | None |
| Call Protection: | L(26), D(90), O(4) |
| Lockbox / Cash Management: | Springing Hard / Springing |
| Reserves(1) | ||
| Initial | Monthly | |
| Taxes: | $119,310 | $39,770 |
| Insurance: | $0 | Springing |
| Replacement: | $0 | $1,419 |
| TI/LC: | $0 | $7,095 |
| Amended CofO Reserve: | $100,000 | $0 |
| Financial Information | ||||
| Cut-off Date Balance / Sq. Ft.: | $276 | |||
| Balloon Balance / Sq. Ft.: | $276 | |||
| Cut-off Date LTV: | 52.2% | |||
| Balloon LTV: | 52.2% | |||
| Underwritten NOI DSCR: | 1.92x | |||
| Underwritten NCF DSCR: | 1.82x | |||
| Underwritten NOI Debt Yield: | 8.7% | |||
| Underwritten NCF Debt Yield: | 8.3% | |||
| Underwritten NOI Debt Yield at Balloon: | 8.7% | |||
| Underwritten NCF Debt Yield at Balloon: | 8.3% | |||
| Property Information | |
| Single Asset / Portfolio: | Single Asset |
| Property Type(2): | CBD Office |
| Collateral: | Fee Simple |
| Location: | New York, NY |
| Year Built / Renovated: | 1907 / 1986 |
| Total Sq. Ft.: | 85,145 |
| Property Management: | Quartz Technology Inc. d/b/a Quartz Realty |
| Underwritten NOI(3): | $2,043,719 |
| Underwritten NCF: | $1,941,545 |
| Appraised Value: | $45,000,000 |
| Appraisal Date: | January 13, 2017 |
| Historical NOI | |
| Most Recent NOI(3): | $1,657,819 (December 31, 2016) |
| 2015 NOI: | $1,551,977 (December 31, 2015) |
| 2014 NOI: | $1,100,092 (December 31, 2014) |
| 2013 NOI: | $1,406,625 (December 31, 2013) |
| Historical Occupancy | |
| Most Recent Occupancy: | 96.8% (January 31, 2017) |
| 2015 Occupancy: | 97.8% (December 31, 2015) |
| 2014 Occupancy: | 98.4% (December 31, 2014) |
| 2013 Occupancy: | 100.0% (December 31, 2013) |
| (1) | See “Initial Reserves” and “Ongoing Reserves” herein. |
| (2) | The borrower has represented in the 260 West 36th Street Loan documents that 60.3% of the 260 West 36th Street Property is used for manufacturing purposes, 29.0% for office use, 8.4% for retail and 2.3% for storage. |
| (3) | The increase from Most Recent NOI to Underwritten NOI is due primarily to recent leasing at the 260 West 36th Street Property (as defined below). Since June 2016, recent leasing has totaled approximately 22.7% of the net rentable area. |
THE INFORMATION IN THIS STRUCTURAL AND COLLATERAL TERM SHEET IS NOT COMPLETE AND MAY BE AMENDED PRIOR TO THE TIME OF SALE. THIS TERM SHEET IS NOT AN OFFER TO SELL THESE SECURITIES AND IT IS NOT A SOLICITATION OF AN OFFER TO BUY THESE SECURITIES IN ANY JURISDICTION WHERE THE OFFER OR SALE IS NOT PERMITTED.
111
260 West 36th Street New York, NY 10018 | Collateral Asset Summary – Loan No. 10 260 West 36th Street | Cut-off Date Balance: Cut-off Date LTV: U/W NCF DSCR: U/W NOI Debt Yield: | $23,500,000 52.2% 1.82x 8.7% |
| Tenant Summary(1) | ||||||||
Tenant | Ratings (Fitch/Moody’s/S&P)(2) | Net Rentable Area (Sq. Ft.) | % of Net Rentable Area | U/W Base Rent PSF | % of Total U/W Base Rent | Lease Expiration | ||
| Type | ||||||||
| Major Tenants | ||||||||
| David Wolfson & Associates | Office | NR/NR/NR | 7,500 | 8.8% | $32.62 | 8.3% | 8/31/2017 | |
| Riazee Boutique, Inc. | Office | NR/NR/NR | 7,500 | 8.8% | $30.96 | 7.9% | 10/31/2017 | |
| Quick fusing Inc. | Basement / Storage | NR/NR/NR | 6,900 | 8.1% | $15.12 | 3.5% | MTM | |
| Bestcare, Inc. | Office | NR/NR/NR | 5,000 | 5.9% | $32.78 | 5.6% | 4/30/2018 | |
| Wear Abouts Apparel, Inc. | Office | NR/NR/NR | 4,275 | 5.0% | $35.00 | 5.1% | 7/31/2019 | |
| Total Major Tenants | 31,175 | 36.6% | $28.70 | 30.3% | ||||
| Other | Office | 42,070 | 49.4% | $37.06 | 52.9% | |||
| Other | Retail | 7,150 | 8.4% | $50.48 | 12.2% | |||
| Other | Basement / Storage | 2,000 | 2.4% | $12.48 | 0.9% | |||
| Other | Miscellaneous(3) | NAP | NAP | NAP | 3.7% | |||
| Total / Wtd. Avg. | 82,395 | 96.8% | $35.80 | 100.0% | ||||
| Total Vacant | 2,750 | 3.2% | ||||||
| Total / Wtd. Avg.(4) | 85,145 | 100.0% | ||||||
| (1) | The borrower has represented in the 260 West 36th Street Loan documents that 60.3% of the 260 West 36th Street Property is used for manufacturing purposes, 29.0% for office use, 8.4% for retail and 2.3% for storage. Additionally, approximately 53.3% of the space identified as office and 77.5% of the space identified as basement above is used for garment manufacturing or other light manufacturing. |
| (2) | Certain ratings are those of the parent company whether or not the parent company guarantees the lease. |
| (3) | Miscellaneous includes an antenna tenant with a $42,000 U/W annual rent and a billboard tenant with a $66,000 U/W annual rent. |
| (4) | 15.2% of tenants lease their spaces on a month to month basis. |
| Lease Rollover Schedule(1)(2) | ||||||||
| Year | # of Leases Expiring | Total Expiring Sq. Ft. | % of Total Sq. Ft. Expiring | Cumulative Sq. Ft. Expiring | Cumulative % of Sq. Ft. Expiring | Annual U/W Base Rent PSF | % U/W Base Rent Rolling | Cumulative % of U/W Base Rent |
| MTM | 5 | 12,900 | 15.2% | 12,900 | 15.2% | $23.26 | 10.2% | 10.2% |
| 2017 | 5 | 22,225 | 26.1% | 35,125 | 41.3% | $31.30 | 23.6% | 33.8% |
| 2018 | 4 | 10,015 | 11.8% | 45,140 | 53.0% | $33.97 | 11.5% | 45.3% |
| 2019 | 7 | 13,243 | 15.6% | 58,383 | 68.6% | $40.43 | 18.2% | 63.4% |
| 2020 | 4 | 8,982 | 10.5% | 67,365 | 79.1% | $39.80 | 12.1% | 75.6% |
| 2021 | 4 | 7,100 | 8.3% | 74,465 | 87.5% | $55.38 | 13.3% | 88.9% |
| 2022 | 2 | 7,930 | 9.3% | 82,395 | 96.8% | $41.32 | 11.1% | 100.0% |
| 2023 | 0 | 0 | 0.0% | 82,395 | 96.8% | $0.00 | 0.0% | 100.0% |
| 2024 | 0 | 0 | 0.0% | 82,395 | 96.8% | $0.00 | 0.0% | 100.0% |
| 2025 | 0 | 0 | 0.0% | 82,395 | 96.8% | $0.00 | 0.0% | 100.0% |
| 2026 | 0 | 0 | 0.0% | 82,395 | 96.8% | $0.00 | 0.0% | 100.0% |
| 2027 | 0 | 0 | 0.0% | 82,395 | 96.8% | $0.00 | 0.0% | 100.0% |
| Thereafter | 0 | 0 | 0.0% | 82,395 | 96.8% | $0.00 | 0.0% | 100.0% |
| Vacant | NAP | 2,750 | 3.2% | 85,145 | 100.0% | NAP | NAP | |
| Total / Wtd. Avg. | 31 | 85,145 | 100.0% | $35.80 | 100.0% | |||
| (1) | Based on the underwritten rent roll as of January 31, 2017. All tenant spaces are subject to re-measurement when leases expire. |
| (2) | Certain tenants have lease termination options that may become exercisable prior to the originally stated expiration date of the tenant lease that are not considered in the lease rollover schedule. |
The Loan. The 260 West 36th Street loan (the “260 West 36th Street Loan”) is a fixed rate loan secured by the borrower’s fee simple interest in an 85,145 sq. ft. Class C office/loft, manufacturing and retail building located at 260 West 36th Street in New York, New York (the “260 West 36th Street Property”) with an original and cut-off date principal balance of $23.5 million. The 260 West 36th Street Loan pays interest only for the term of the loan and accrues interest at a fixed rate equal to 4.4700%. The 260 West 36th Street proceeds were used to retire existing debt of approximately $15.1 million, fund reserves of $219,310, pay closing costs of $799,606 and return approximately $7.4 million of equity back to the borrower sponsor. Based on the “As-is” appraised value of $45,000,000 as of January 13, 2017, the Cut-off Date LTV is 52.2%. The most recent financing of the 260 West 36th Street Property was included in the JPMCC 2007-LDPX securitization.
THE INFORMATION IN THIS STRUCTURAL AND COLLATERAL TERM SHEET IS NOT COMPLETE AND MAY BE AMENDED PRIOR TO THE TIME OF SALE. THIS TERM SHEET IS NOT AN OFFER TO SELL THESE SECURITIES AND IT IS NOT A SOLICITATION OF AN OFFER TO BUY THESE SECURITIES IN ANY JURISDICTION WHERE THE OFFER OR SALE IS NOT PERMITTED.
112
260 West 36th Street New York, NY 10018 | Collateral Asset Summary – Loan No. 10 260 West 36th Street | Cut-off Date Balance: Cut-off Date LTV: U/W NCF DSCR: U/W NOI Debt Yield: | $23,500,000 52.2% 1.82x 8.7% |
| Sources and Uses | ||||||
| Sources | Proceeds | % of Total | Uses | Proceeds | % of Total | |
| Loan Amount | $23,500,000 | 100.0% | Loan Payoff | $15,087,928 | 64.2% | |
| Return of Equity | $7,393,157 | 31.5% | ||||
| Closing Costs | $799,606 | 3.4% | ||||
| Upfront Reserves | $219,310 | 0.9% | ||||
| Total Sources | $23,500,000 | 100.0% | Total Uses | $23,500,000 | 100.0% | |
The Borrower / Sponsors.The borrower, 260 West 36 Realty, LLC, is a single purpose Delaware limited liability company structured to be bankruptcy-remote with one independent director in its organizational structure. The sponsors of the borrower and the non-recourse carve-out guarantors are Albert Monasebian and Nader Hakakian, on a joint and several basis.
Albert Monasebian is an operating member of The Monasebian Group, which owns and operates numerous properties in New York City and Greater New York. His New York City holdings include: 261 West 35th Street, a 116,000 sq. ft. office building, 1041 Madison Avenue, a 6,300 sq. ft. mixed use building and 16 East 40th Street, a 96,182 sq. ft. office building.
Nader Hakakian is owner and founder of Domus Design Collection, a furniture company with locations in New York, Los Angeles and Miami. In addition to Domus Design Collection, Mr. Hakakian owns a 10.0% interest in Metropolitan Warehouse Inc., a warehouse operator and a 25.0% ownership interest in Nader & Sons, LLC, an investment vehicle.
The Property.The 260 West 36th Street Property is a 10-story (plus basement), 85,145. ft. Class C office building with 7,150 sq. ft. of ground floor retail with frontage along West 36th Street between 7th and 8th Avenues within the Penn Plaza / Garment office submarket of Manhattan. The 260 West 36th Street Property was built in 1907 and renovated in 1986. The sponsors acquired the 260 West 36th Street Property in 1997 and have reportedly invested approximately $92,000 ($1.08 PSF) in capital improvements since 2014.
The 260 West 36th Street Property is 96.8% leased as of January 31, 2017 to 31 tenants in diverse industries, including light garment manufacturing, retail/whole sale, financial services, business services and medical industries, with no single tenant occupying more than 8.8% of the space. The average occupancy at the 260 West 36th Street Property over that past ten years is 95.9%, with no single year below 86.0%.
Environmental Matters.The Phase I environmental report dated October 19, 2016 recommended the development and implementation of an asbestos operation and maintenance program at the 260 West 36th Street Property, which was obtained prior to loan closing.
Major Tenants.
David Wolfson & Associates (7,500 sq. ft.; 8.8% of NRA; 8.3% of U/W Base Rent) David Wolfson & Associates (d.b.a. David Wolfson Design) was founded in 1990 and is a full-service sample production company providing design consulting and development, patternmaking, production and tailoring services. David Wolfson & Associates clients include over fifty brands including Burberry, Coach, Marc by Marc Jacobs, Tommy Hilfiger and POLO Ralph Lauren.
David Wolfson & Associates executed its lease at the 260 West 36th Street Property in September 1998. The tenant occupies the entire 7th floor and has no termination options or extension options remaining in its lease, expiring on August 31, 2017. The David Wolfson & Associates in-place rent of $32.62 PSF is approximately 28.8% below market rent of $42.00 PSF per the appraisal.
Riazee Boutique, Inc. (7,500 sq. ft.; 8.8% of NRA; 7.9% of U/W Base Rent)Riazee Boutique, Inc. (d.b.a. Naeem Khan Ltd.) was founded by fashion designer Naeem Khan. Khan launched his fashion line in 2003 and began selling at Bergdorf Goodman, Neiman Marcus and Saks Fifth Avenue. Riazee Boutique, Inc. executed its lease at the 260 West 36th Street Property in November 2007 and has reportedly invested approximately $1.0 million ($133 PSF) into its space to serve as a showroom and design studio. The tenant occupies the entire 10th floor space and has no termination options or extension options remaining in its lease expiring on October 31, 2017. The Riazee Boutique, Inc. in-place rent of $30.96 PSF is approximately 22.3% below market rent of $44.00 PSF per the appraisal. According to the borrower, the tenant is in negotiations to renew its lease at the 260 West 36th Street Property. However, there is no assurance that such lease will be renewed.
Quick fusing Inc. (6,900 sq. ft.; 8.1% of NRA; 3.5% of U/W Base Rent)Quick fusing Inc. is a family run apparel business founded 25 years ago that offers sample cutting, bonding and sewing. Quick fusing Inc. executed its lease at the 260 West 36th Street Property in February 2011. The tenant has occupied the majority of the basement space under a month to month lease, subsequent to its lease expiration in December 2014. The Quick fusing Inc. in-place rent of $15.12 PSF is approximately 24.4% below market rent of $20.00 PSF per the appraisal.
THE INFORMATION IN THIS STRUCTURAL AND COLLATERAL TERM SHEET IS NOT COMPLETE AND MAY BE AMENDED PRIOR TO THE TIME OF SALE. THIS TERM SHEET IS NOT AN OFFER TO SELL THESE SECURITIES AND IT IS NOT A SOLICITATION OF AN OFFER TO BUY THESE SECURITIES IN ANY JURISDICTION WHERE THE OFFER OR SALE IS NOT PERMITTED.
113
260 West 36th Street New York, NY 10018 | Collateral Asset Summary – Loan No. 10 260 West 36th Street | Cut-off Date Balance: Cut-off Date LTV: U/W NCF DSCR: U/W NOI Debt Yield: | $23,500,000 52.2% 1.82x 8.7% |
The Market.
The 260 West 36th Street Property is situated along West 36th Street between 7th and 8th Avenues in the Penn Plaza / Garment submarket of the Midtown West market in Manhattan. The 260 West 36th Street Property is two blocks south from Penn Station, one of the largest transportation hubs in New York City which provides access to the A, C, E, 1, 2, 3, NJ Transit, LIRR and Amtrak train lines. Much of the supply in the Midtown West district is limited to older, renovated and non-renovated office, loft, and manufacturing space. The market caters to creative businesses such as fashion, art, advertising and high-tech because many of the buildings are old industrial loft spaces with open floor plans that facilitate creating an open work environment.
According to an industry market report, as of the fourth quarter of 2016, the Penn Plaza / Garment submarket had 18.0 million sq. ft. of class C office space, a vacancy rate of 5.1% and an average asking rent of $47.99 PSF. The appraisal identified six directly comparable office properties ranging in size from 65,000 to 207,000 sq. ft. with direct occupancy rates between 87.7% and 99.4%. Direct asking rents for the comparable office properties ranged from $40.00 to $46.00 PSF. Weighted average in place rent of $35.80 PSF at the 260 West 36th Street Property is approximately 13.9% below the $41.56 PSF rent determined by the appraisal and approximately 24.7% below the $45.36 PSF rent of the recent seven leases (21.1% of the NRA) executed in 2016 and 2017 at the 260 West 36th Street Property.
| Directly Competitive Buildings(1) | |||||||
| Property | Office Area (NRA) | Available Sq. Ft. (Direct) | Available Sq. Ft. (Sublease) | Direct Occupancy | Total Occupancy | Direct Asking (Low) | Direct Asking Rent (High) |
| 260 West 36th Street Property(2) | 85,145 | 2,750 | 0 | 96.8% | 96.8% | N/A | N/A |
| 224 West 35th Street | 160,000 | 19,700 | 0 | 87.7% | 87.7% | $40.00 | $45.00 |
| 330 West 38th Street | 207,605 | 7,355 | 0 | 96.5% | 96.5% | $44.00 | $44.00 |
| 253 West 35th Street | 140,000 | 9,341 | 0 | 93.3% | 93.3% | $45.00 | $45.00 |
| 255 West 36th Street | 121,000 | 7,750 | 0 | 93.6% | 93.6% | $46.00 | $46.00 |
| 247 West 35th Street | 97,500 | 2,800 | 0 | 97.1% | 97.1% | N/A | N/A |
| 252 West 38th Street | 65,000 | 375 | 670 | 99.4% | 98.4% | $40.00 | $44.00 |
| Total / Wtd. Avg.(3) | 791,105 | 47,321 | 670 | 94.0% | 93.9% | ||
| (1) | Source: Appraisal. |
| (2) | Based on the underwritten rent roll dated January 31, 2017. |
| (3) | Total / Wtd. Avg. calculations exclude the 260 West 36th Street Property. |
The following table details the appraisal’s rent conclusions by type and location:
| Market Rent Conclusion(1) | |
| Type | Market Rent PSF |
| Office Floors 2-8 | $42.00 |
| Office Floors 9-10 | $44.00 |
| (1) | Source: Appraisal. |
THE INFORMATION IN THIS STRUCTURAL AND COLLATERAL TERM SHEET IS NOT COMPLETE AND MAY BE AMENDED PRIOR TO THE TIME OF SALE. THIS TERM SHEET IS NOT AN OFFER TO SELL THESE SECURITIES AND IT IS NOT A SOLICITATION OF AN OFFER TO BUY THESE SECURITIES IN ANY JURISDICTION WHERE THE OFFER OR SALE IS NOT PERMITTED.
114
260 West 36th Street New York, NY 10018 | Collateral Asset Summary – Loan No. 10 260 West 36th Street | Cut-off Date Balance: Cut-off Date LTV: U/W NCF DSCR: U/W NOI Debt Yield: | $23,500,000 52.2% 1.82x 8.7% |
Cash Flow Analysis.
| Cash Flow Analysis | |||||
| 2014 | 2015 | 2016(3) | U/W(3) | U/W PSF | |
| Base Rent | $2,251,180 | $2,623,126 | $2,822,982 | $2,949,664 | $34.64 |
| Step Rents(1) | 0 | 0 | 0 | 55,525 | 0.65 |
| Value of Vacant Space | 0 | 0 | 0 | 115,500 | 1.36 |
| Gross Potential Rent | $2,251,180 | $2,623,126 | $2,822,982 | $3,120,689 | $36.65 |
| Total Recoveries | 0 | 0 | 0 | 221,685 | 2.60 |
| Total Other Income | 0 | 0 | 0 | 0 | 0.00 |
| Less: Vacancy(2) | 0 | 0.00 | 0 | (167,118.73) | (1.96) |
| Effective Gross Income | $2,251,180 | $2,623,126 | $2,822,982 | $3,175,256 | $37.29 |
| Total Variable Expenses | 709,563 | 609,102 | 686,149 | 623,818 | 7.33 |
| Total Fixed Expenses | 441,525 | 462,047 | 479,013 | 507,719 | 5.96 |
| Net Operating Income | $1,100,092 | $1,551,977 | $1,657,819 | $2,043,719 | $24.00 |
| TI/LC | 0 | 0 | 0 | 85,145 | 1.00 |
| Capital Expenditures | 0 | 0 | 0 | 17,029 | 0.20 |
| Net Cash Flow | $1,100,092 | $1,551,977 | $1,657,819 | $1,941,545 | $22.80 |
| (1) | Step Rents include rent increases through March 2018. |
| (2) | U/W Vacancy is underwritten to a vacancy rate of 5.0% of all revenue. The 260 West 36th Street Property is currently 96.8% occupied as of the underwritten rent roll dated January 31, 2017. |
| (3) | The increase from 2016 NOI to U/W NOI is due primarily to recent leasing at the 260 West 36th Street Property. Since June 2016, recent leasing has totaled approximately 22.7% of the net rentable area. |
Property Management. The 260 West 36th Street Property is managed by Quartz Technology Inc. d/b/a Quartz Realty, a borrower affiliate.
Lockbox / Cash Management.The 260 West 36th Street Loan is structured with a springing hard lockbox and springing cash management. Upon the occurrence of a Trigger Period (as defined below) and at all times thereafter, all rents are required to be directly deposited by the tenants of the 260 West 36th Street Property into a clearing account controlled by the lender. In the absence of a Trigger Period, the funds in the clearing account are required to be swept daily into the borrower’s operating account. During a Trigger Period, any transfers to the borrower’s operating account are required to cease and sums on deposit in the clearing account are required to be transferred on a daily basis to a cash management account controlled by the lender and applied to payment of all monthly amounts due under the loan documents.
A “Trigger Period” will commence upon the occurrence of (i) an event of default or (ii) the commencement of a Low Debt Service Period (as defined below); and will end if, (A) with respect to clause (i), the event of default commencing the Trigger Period has been cured and such cure has been accepted by the lender (and no other event of default is then continuing) and (B) with respect to clause (ii), the Low Debt Service Period has ended.
A “Low Debt Service Period” will commence upon the debt service coverage ratio falling below 1.35x on the last day of any calendar quarter and will end upon the 260 West 36th Street Property achieving a debt service coverage ratio of at least 1.40x for two consecutive calendar quarters.
Initial Reserves.At loan origination, the borrower deposited (i) $119,310 into an tax reserve account and (ii) $100,000 into an amended CofO reserve account. The certificate of occupancy for the 260 West 36th Street Property (the “CofO”) does not reflect the current uses of the 260 West 36th Street Property. The borrower has represented that under current law, the borrower may, as of right, amend its CofO to reflect the current uses, provided that at least 50% of the 260 West 36th Street Property is used for manufacturing. The borrower has represented in the 260 West 36th Street Loan documents that 60.3% of the 260 West 36th Street Property is used for manufacturing purposes, 29.0% for office use, 8.4% for retail and 2.3% for storage. If a violation is issued, the borrower is required to seek and diligently pursue an amended CofO, and funds in the amended CofO reserve may be used for such purpose.
Ongoing Reserves.The borrower is required to deposit on a monthly basis (i) 1/12 of the estimated annual real estate taxes, which currently equates to $39,770, into the tax reserve account, (ii) unless an acceptable blanket insurance policy is in place, 1/12 of the estimated insurance premiums into an insurance account, (iii) $1,419 into the replacement reserve account and (iv) $7,095 into the rollover reserve account, subject to cap of $255,435.
Current Mezzanine or Subordinate Indebtedness. None.
Future Mezzanine or Subordinate Indebtedness Permitted.None.
THE INFORMATION IN THIS STRUCTURAL AND COLLATERAL TERM SHEET IS NOT COMPLETE AND MAY BE AMENDED PRIOR TO THE TIME OF SALE. THIS TERM SHEET IS NOT AN OFFER TO SELL THESE SECURITIES AND IT IS NOT A SOLICITATION OF AN OFFER TO BUY THESE SECURITIES IN ANY JURISDICTION WHERE THE OFFER OR SALE IS NOT PERMITTED.
115
260 West 36th Street New York, NY 10018 | Collateral Asset Summary – Loan No. 10 260 West 36th Street | Cut-off Date Balance: Cut-off Date LTV: U/W NCF DSCR: U/W NOI Debt Yield: | $23,500,000 52.2% 1.82x 8.7% |

THE INFORMATION IN THIS STRUCTURAL AND COLLATERAL TERM SHEET IS NOT COMPLETE AND MAY BE AMENDED PRIOR TO THE TIME OF SALE. THIS TERM SHEET IS NOT AN OFFER TO SELL THESE SECURITIES AND IT IS NOT A SOLICITATION OF AN OFFER TO BUY THESE SECURITIES IN ANY JURISDICTION WHERE THE OFFER OR SALE IS NOT PERMITTED.
116
(THIS PAGE INTENTIONALLY LEFT BLANK)
THE INFORMATION IN THIS STRUCTURAL AND COLLATERAL TERM SHEET IS NOT COMPLETE AND MAY BE AMENDED PRIOR TO THE TIME OF SALE. THIS TERM SHEET IS NOT AN OFFER TO SELL THESE SECURITIES AND IT IS NOT A SOLICITATION OF AN OFFER TO BUY THESE SECURITIES IN ANY JURISDICTION WHERE THE OFFER OR SALE IS NOT PERMITTED.
117
1540-1914 West Rosecrans Avenue Compton, CA 90220 | Collateral Asset Summary – Loan No. 11 Gateway Plaza | Cut-off Date Balance: Cut-off Date LTV: U/W NCF DSCR: U/W NOI Debt Yield: | $21,000,000 70.0% 1.34x 8.8% |
| Mortgage Loan Information | |
| Loan Seller: | GACC |
| Loan Purpose: | Refinance |
| Sponsor: | A.S. Abbasi |
| Borrowers: | Lake Plaza Gateway, LLC |
| Original Balance: | $21,000,000 |
| Cut-off Date Balance: | $21,000,000 |
| % by Initial UPB: | 2.3% |
| Interest Rate: | 4.7900% |
| Payment Date: | 6thof each month |
| First Payment Date: | April 6, 2017 |
| Maturity Date: | March 6, 2027 |
| Amortization: | Interest only for first 24 months; 360 months thereafter |
| Additional Debt: | None |
| Call Protection: | L(26), D(90), O(4) |
| Lockbox / Cash Management(1): | Springing Hard / Springing |
| Reserves | ||
| Initial | Monthly | |
| Taxes: | $0 | $22,324 |
| Insurance: | $33,638 | $2,588 |
| Replacement(2): | $0 | $2,653 |
| TI/LC(3): | $0 | $7,917 |
| Required Repairs: | $3,125 | NAP |
| Environmental(4): | $781,250 | $0 |
| Seismic(5): | $165,000 | $0 |
| Lease Sweep(6): | $0 | Springing |
| Financial Information | ||
| Cut-off Date Balance / Sq. Ft.: | $165 | |
| Balloon Balance / Sq. Ft.: | $142 | |
| Cut-off Date LTV: | 70.0% | |
| Balloon LTV: | 60.3% | |
| Underwritten NOI DSCR(7): | 1.41x | |
| Underwritten NCF DSCR(7): | 1.34x | |
| Underwritten NOI Debt Yield: | 8.8% | |
| Underwritten NCF Debt Yield: | 8.4% | |
| (1) | A hard lockbox and in place cash management is triggered upon (i) an event of default, (ii) bankruptcy or insolvency of the borrower, property manager or guarantor, (iii) the debt service coverage ratio falling below 1.20x or (iv) during a Lease Sweep Period (defined below). The borrower may avoid a debt service coverage ratio trigger by posting cash or a letter of credit in the amount of $200,000, which is required to increase by an additional $200,000 for each additional annual period on which a debt service coverage ratio trigger would otherwise occur, which may be released if a debt service coverage ratio trigger (calculated without regard to such security) no longer exists. |
| Property Information | |
| Single Asset / Portfolio: | Single Asset |
| Property Type: | Anchored Retail |
| Collateral: | Fee Simple |
| Location: | Compton, CA |
| Year Built / Renovated: | 1962, 1991 / NAP |
| Total Sq. Ft.: | 127,523 |
| Property Management: | RTI Properties, Inc. |
| Underwritten NOI: | $1,857,798 |
| Underwritten NCF: | $1,769,503 |
| Appraised Value: | $30,000,000 |
| Appraisal Date: | November 20, 2016 |
| Historical NOI | |
| Most Recent NOI: | $1,790,197 (December 31, 2016) |
| 2015 NOI: | $1,701,106 (December 31, 2015) |
| 2014 NOI: | $1,632,765 (December 31, 2014) |
| 2013 NOI: | NAV |
| Historical Occupancy | |
| Most Recent Occupancy: | 94.2% (March 1, 2017) |
| 2015 Occupancy: | 92.3% (December 31, 2015) |
| 2014 Occupancy: | 100.0% (December 31, 2014) |
| 2013 Occupancy: | NAV |
| (2) | Replacement reserves are subject to a cap of $200,000. |
| (3) | TI/LC reserves are subject to a cap of $175,000. |
| (4) | The Environmental Reserve represents 125% of the environmental consultant’s estimated costs to complete an outstanding Remedial Action Plan and, upon completion, to obtain a “No Further Action” letter from the applicable governmental authority. |
| (5) | The Seismic Reserve represents 110% of the engineer’s estimated cost to retrofit structure that was recommended to reduce the probable maximum loss of seismic damage. Within six months of loan closing, the borrower is required to complete the retrofitting work which includes providing positive direct connections between concrete tilt-up walls and roof framing, providing continuous seismic ties between roof diaphragm chord members, reinforcing the anchorage of girders on the pilasters and providing continuity collectors at reentrant corners. |
| (6) | On each monthly payment date during a Lease Sweep Period, all excess cash flow will be deposited into the lease sweep account. A “Lease Sweep Period” will commence upon (i) the earlier of (a) February 28, 2026 with respect to the Food 4 Less lease or, with respect to another Lease Sweep Lease (as defined below) 12 months prior to the earliest stated expiration, or (b) the date the Lease Sweep Lease is required under its lease to give notice of its exercise of a renewal option, (ii) the date that Lease Sweep Lease is surrendered, cancelled or terminated prior to its then current expiration date, (iii) the date that the tenant under the Lease Sweep Lease discontinues its business, (iv) a default under a Lease Sweep Lease beyond any applicable notice and cure period or (v) a bankruptcy or insolvency proceeding of any tenant under a Lease Sweep Lease. A “Lease Sweep Lease” is (i) the Food 4 Less lease or (ii) any replacement lease or leases which collectively cover a majority of the Lease Sweep Lease space. |
| (7) | Based on amortizing debt service payments. Based on the current interest only payments, Underwritten NOI DSCR and Underwritten NCF DSCR are 1.82x and 1.74x, respectively. |
TRANSACTION HIGHLIGHTS |
| ■ | Property / Location.Gateway Plaza is a 127,523 sq. ft. grocery anchored retail center located in Compton, Los Angeles County, CA. The property is 94.2% occupied as of March 1, 2017 and is anchored by a Food 4 Less Store (“Food 4 Less”). The property is located at the signalized intersection of West Rosecrans Avenue and North Central Avenue, which have combined average traffic counts of 46,090 vehicles per day according to the appraisal and approximately two miles north of Highway 91, two miles south of Interstate 105, and two miles east of Interstate 110. Large monument signs are positioned on both North Central Avenue and West Rosecrans Avenue, providing visibility to the property along both thoroughfares. |
| ■ | Tenancy.The property is anchored by Food 4 Less (37.0% NRA, 31.4% of U/W Base Rent), which is owned by Kroger (Fitch/Moody’s/S&P: BBB/Baa1/BBB). Food 4 Less reported sales of $36.5mn ($810 PSF) for the period ending October 2016 and recently executed an early 10-year renewal in February 2017, two years prior to their previous expiration date of October 2019. Additionally, Food 4 Less recently spent approximately $1.1 million on capital improvements in 2015. Additional national and regional tenants at the Gateway Plaza property include Wells Fargo Bank, N.A., Metro PCS, DaVita Inc., Gen-X Clothing, H&R Block, Subway, Little Caesar’s Pizza, Baskin Robbins, and Taco Bell. |
| ■ | Demographics.According to the appraisal, within a 3-mile radius of the Gateway Plaza Property there are 285,482 people and 70,624 households with an average household income of $52,575. According to the appraisal, the population is projected to grow approximately 0.7% over the next five years. |
THE INFORMATION IN THIS STRUCTURAL AND COLLATERAL TERM SHEET IS NOT COMPLETE AND MAY BE AMENDED PRIOR TO THE TIME OF SALE. THIS TERM SHEET IS NOT AN OFFER TO SELL THESE SECURITIES AND IT IS NOT A SOLICITATION OF AN OFFER TO BUY THESE SECURITIES IN ANY JURISDICTION WHERE THE OFFER OR SALE IS NOT PERMITTED.
118
12650, 12722-12802 and 13085 Hamilton Crossing Boulevard and 12800, 12900 and 13000 North Meridian Street Carmel, IN 46032 | Collateral Asset Summary – Loan No. 12 Hamilton Crossing | Cut-off Date Balance: Cut-off Date LTV: U/W NCF DSCR: U/W NOI Debt Yield: | $19,923,763 72.2% 1.68x 12.1% |
| Mortgage Loan Information | |
| Loan Seller: | CGMRC |
| Loan Purpose: | Acquisition |
| Sponsor: | Raymond Massa |
| Borrower: | Hamilton Crossing Indianapolis Realty LP |
| Original Balance(1): | $20,000,000 |
| Cut-off Date Balance(1): | $19,923,763 |
| % by Initial UPB: | 2.2% |
| Interest Rate: | 4.9200% |
| Payment Date: | 6thof each month |
| First Payment Date: | March 6, 2017 |
| Maturity Date: | February 6, 2027 |
| Amortization: | 360 months |
| Additional Debt(1): | $34,991,108Pari Passu Debt |
| Call Protection: | L(27), D(89), O(4) |
| Lockbox / Cash Management(2): | Hard / Springing |
| Reserves | ||
| Initial | Monthly | |
| Taxes: | $366,426 | $91,607 |
| Insurance: | $65,414 | $7,268 |
| Replacement: | $0 | $10,341 |
| TI/LC(3): | $500,000 | $49,243 |
| Engineering Reserve: | $147,785 | $0 |
| Unfunded Tenant Obligations: | $805,224 | $0 |
| ADESA Reserve(4): | $1,500,000 | $0 |
| Financial Information(5) | ||
| Cut-off Date Balance / Sq. Ft.: | $93 | |
| Balloon Balance / Sq. Ft.: | $76 | |
| Cut-off Date LTV: | 72.2% | |
| Balloon LTV: | 59.4% | |
| Underwritten NOI DSCR: | 1.89x | |
| Underwritten NCF DSCR: | 1.68x | |
| Underwritten NOI Debt Yield: | 12.1% | |
| Underwritten NCF Debt Yield: | 10.7% | |
| (1) | The Hamilton Crossing Whole Loan is evidenced by twopari passu notes in an aggregate original principal amount of $55.125 million. The non-controlling Note A-2, with an original principal amount of $20.0 million, will be included in the CD 2017-CD4 mortgage trust. The controlling Note A-1, with an original principal balance of $35.125 million, was contributed to the CGCMT 2017-P7 mortgage trust. |
| Property Information | |
| Single Asset / Portfolio: | Single Asset |
| Property Type: | Suburban Office |
| Collateral: | Fee Simple |
| Location: | Carmel, IN |
| Year Built / Renovated(6): | Various / 2000 |
| Total Sq. Ft.: | 590,917 |
| Property Management: | Cushman & Wakefield U.S., Inc. |
| Underwritten NOI: | $6,633,451 |
| Underwritten NCF: | $5,903,080 |
| Appraised Value: | $76,100,000 |
| Appraisal Date: | December 2, 2016 |
| Historical NOI | |
| Most Recent NOI: | $6,644,721 (December 31, 2016) |
| 2015 NOI: | $6,558,015 (December 31, 2015) |
| 2014 NOI: | $6,387,112 (December 31, 2014) |
| 2013 NOI: | $6,360,935 (December 31, 2013) |
| Historical Occupancy(7) | |
| Most Recent Occupancy: | 88.8% (Various) |
| 2015 Occupancy: | 98.7% (December 31, 2015) |
| 2014 Occupancy: | 99.0% (December 31, 2014) |
| 2013 Occupancy: | 93.9% (December 31, 2013) |
| (2) | In place cash management is triggered (i) upon an event of default, (ii) if the debt service coverage ratio falls below 1.20x until such time that the debt service coverage ratio is at least 1.25x for two consecutive calendar quarters or (iii) the occurrence of a Specified Tenant Trigger Period. A “Specified Tenant Trigger Period” will commence upon (i) a Specified Tenant (as defined below) being in default under its lease, (ii) a Specified Tenant failing to be in actual, physical possession of at least 80% of the Specified Tenant’s space and utilizing that space to be open to the public for business or going dark in at least 20% of the specified tenant space, (iii) a Specified Tenant giving notice that its terminating its lease for all or a portion equal to 10% or more of the Specified Tenant’s space, (iv) any termination or cancellation of any Specified Tenant’s Lease, (v) the bankruptcy or insolvency of a Specified Tenant, (vi) a Specified Tenant failing to extend or renew its lease on or prior to the applicable deadline. “Specified Tenant” means (i) ADESA Corporation, (ii) any tenant that, together with any affiliates, leases space at the mortgaged property that comprises more than 20% or more of either (a) the mortgaged property’s gross leasable area or (b) the total rental income for the mortgaged property, (iii) any other lessee of the specified tenant space and (iv) Allete, Inc. |
| (3) | The TI/LC reserve account is subject to a $2,000,000 cap. |
| (4) | The ADESA Reserve is for tenant improvements and leasing commissions that may be incurred following the occurrence of either (i) an acceptable ADESA Corporation lease extension or (ii) an acceptable ADESA Corporation re-tenanting event. |
| (5) | DSCR, LTV, Debt Yield and Balance / Sq. Ft. calculations are based on the aggregate Cut-off Date Balance of the Hamilton Crossing Whole Loan. |
| (6) | The Hamilton Crossing building I was built in 1989 and renovated in 2000. The Hamilton Crossing building II was built in 1997. The Hamilton Crossing building III was built in 2000. The Hamilton Crossing building IV was built in 1999. The Hamilton Crossing building V was built in 2003. The Hamilton Crossing building VI was built in 2002. |
| (7) | The decrease in Most Recent Occupancy is primarily due to the fact that historical occupancy figures exclude building V. The Hamilton Crossing Property consists of six buildings in total, five of which have achieved historical occupancy of 95.1% since 2006. Building V was constructed for ITT (as defined below) in 2003 and is currently vacant due to ITT filing bankruptcy in September 2016. |
TRANSACTION HIGHLIGHTS |
| ■ | Property.The Hamilton Crossing property is a 590,917 sq. ft., Class B office complex located in Carmel, Indiana. The Hamilton Crossing property consists of six separate buildings ranging in size from 32,694 sq. ft. to 181,427 sq. ft. The buildings were constructed between 1989 and 2003 and have an average occupancy rate of 95.1% from 2006 through October 2016. The sponsor acquired five of the six office buildings from Duke Realty Limited Partnership and one building, Hamilton Crossing V, which is vacant, from the bankruptcy estate of ITT Educational Services, Inc. (“ITT”). The current occupancy for the Hamilton Crossing property, excluding and including the Hamilton Crossing V building, is 95.8% and 88.8%, respectively. The largest tenant at the Hamilton Crossing property is ADESA Corporation (expiring July 31, 2019) which occupied a total of 172,210 sq. ft. in the Hamilton Crossing VI building until September 2016 when it leased an additional 5,632 sq. ft. in the Hamilton Crossing I building. ADESA Corporation is a wholly-owned subsidiary of KAR Auction Services, Inc., a Fortune 1000 company, and is headquartered at the Hamilton Crossing VI building. |
| ■ | Market.The Hamilton Crossing property is located in the Meridian Corporate Corridor of Carmel, Indiana which is approximately 15 miles north of downtown Indianapolis. As the largest employment center in the suburbs of Indianapolis, the Meridian Corporate Corridor is home to more than 40 national and regional headquarters and it is the only location in metropolitan Indianapolis where there are facilities for all four major hospital systems in the area. According to the appraisal, Carmel is the fifth largest city in Indiana and has been in the top two-percent of counties, nationwide, in job growth since 2010. Major employers in the Indianapolis Metropolitan Statistical Area (MSA) include: Wal-Mart, the US Government, Indiana University Health, the State of Indiana and Indiana University. . As of year-end 2016, the population within a 1-, 3- and 5-mile radius of the Hamilton Crossing property was 6,058, 59,624 and 144,101, respectively. For year-end 2016, the estimated average annual household income within a 1-, 3- and 5-mile radius of the Hamilton Crossing property was $123,679, $130,598 and $125,778, respectively. As of the third quarter of 2016, the Carmel office submarket had a total office inventory of approximately 6.3 million sq. ft., with 7.0% vacancy and average asking rents of $19.80 per sq. ft. Net absorption in the submarket has been positive since 2010. The appraiser identified eight comparable properties within approximately four miles of the Hamilton Crossing property with sizes ranging from 9,703 sq. ft. to 202,068 sq. ft. and averaging 84,467 sq. ft. The comparable properties were built between 1983 and 2017 with a weighted average occupancy of 93.3%. |
THE INFORMATION IN THIS STRUCTURAL AND COLLATERAL TERM SHEET IS NOT COMPLETE AND MAY BE AMENDED PRIOR TO THE TIME OF SALE. THIS TERM SHEET IS NOT AN OFFER TO SELL THESE SECURITIES AND IT IS NOT A SOLICITATION OF AN OFFER TO BUY THESE SECURITIES IN ANY JURISDICTION WHERE THE OFFER OR SALE IS NOT PERMITTED.
119
3105-3225 Alderwood Mall Boulevard Lynnwood, WA 98036 | Collateral Asset Summary – Loan No. 13 Lynnwood Town Center | Cut-off Date Balance: Cut-off Date LTV: U/W NCF DSCR: U/W NOI Debt Yield: | $19,427,166 65.2% 1.32x 9.2% |
| Mortgage Loan Information | |
| Loan Seller(1): | GACC |
| Loan Purpose: | Refinance |
| Sponsor: | Alan C. Fox |
| Borrower: | Alderwood Shopping Center 04 E, LLC |
| Original Balance: | $19,500,000 |
| Cut-off Date Balance: | $19,427,166 |
| % by Initial UPB: | 2.2% |
| Interest Rate: | 5.0400% |
| Payment Date: | 6thof each month |
| First Payment Date: | March 6, 2017 |
| Maturity Date: | February 6, 2027 |
| Amortization: | 360 months |
| Additional Debt: | None |
| Call Protection: | L(27), D(89), O(4) |
| Lockbox / Cash Management(2): | Springing Hard / Springing |
| Reserves | ||
| Initial | Monthly | |
| Taxes: | $99,835 | $19,967 |
| Insurance(3): | $0 | Springing |
| Replacement: | $276,563 | $1,317 |
| Immediate Repairs: | $22,769 | $0 |
| TI/LC(4): | $0 | $9,219 |
| Gap Rent Reserve(5): | $71,178 | $0 |
| Unfunded Obligations Reserve(6): | $411,609 | $0 |
| Financial Information | ||
| Cut-off Date Balance / Sq. Ft.: | $184 | |
| Balloon Balance / Sq. Ft.: | $152 | |
| Cut-off Date LTV: | 65.2% | |
| Balloon LTV: | 53.9% | |
| Underwritten NOI DSCR: | 1.42x | |
| Underwritten NCF DSCR: | 1.32x | |
| Underwritten NOI Debt Yield: | 9.2% | |
| Underwritten NCF Debt Yield: | 8.6% | |
| Property Information | |||
| Single Asset / Portfolio: | Single Asset | ||
| Property Type: | Anchored Retail | ||
| Collateral: | Fee Simple | ||
| Location: | Lynnwood, WA | ||
| Year Built / Renovated: | 1986 / NAP | ||
| Total Sq. Ft.: | 105,357 | ||
| Property Management: | ACF Property Management, Inc. | ||
| Underwritten NOI(7): | $1,790,512 | ||
| Underwritten NCF: | $1,664,084 | ||
| Appraised Value: | $29,800,000 | ||
| Appraisal Date: | October 8, 2016 | ||
| Historical NOI | |||
| Most Recent NOI: | $1,554,424 (December 31, 2016) | ||
| 2015 NOI: | $1,461,575 (December 31, 2015) | ||
| 2014 NOI: | $1,274,556 (December 31, 2014) | ||
| 2013 NOI: | $1,238,513 (December 31, 2013) | ||
| Historical Occupancy | |||
| Most Recent Occupancy: | 97.2% (February 1, 2017) | ||
| 2016 Occupancy: | 90.0% (December 31, 2016) | ||
| 2015 Occupancy: | 90.0% (December 31, 2015) | ||
| 2014 Occupancy: | 87.0% (December 31, 2014) | ||
| (1) | The loan was originated by Benefit Street Partners CRE Finance LLC on January 31, 2017 and purchased by GACC. |
| (2) | A hard lockbox and in place cash management is triggered upon (i) an event of default, (ii) the debt service coverage ratio falling below 1.15x or (iii) Michael’s Stores, Inc or Marshall’s (either, a “Specified Tenant”) (a) fail to give notice to renew or extend its lease 12 months prior to lease maturity for a term of not less than five years at not less than 95% of the current rent; (b) any Specified Tenant “goes dark” or (c) any Specified Tenant (or its parent company) is involved with bankruptcy or similar insolvency proceedings; provided, however, with respect to clause (iii)(a) and (iii)(b), the borrower can prevent cash management from being triggered if, prior to the occurrence of such trigger event, the borrower deposits with the lender (as cash or letter of credit) the sum of $510,000 for each Specified Tenant that causes such trigger event, to be used to re-tenant the space previously occupied by each such Specified Tenant. |
| (3) | The lender is not required to make monthly deposits into the insurance escrow so long as, among other things, an acceptable blanket insurance policy is in place. |
| (4) | The TI/LC reserve is subject to a cap of $440,000. |
| (5) | The lender will be required to disburse the Gap Rent Reserve on the monthly dates specified in the loan documents to the borrower if no cash sweep period then exists or into the cash management account is a cash sweep period then exists, provided no event of default has occurred and is continuing. |
| (6) | The lender reserved $411,609 for outstanding landlord obligations for five tenants: Life Uniform Company, Molly Maids, Penzey’s Spice Company, Dau Park Family Dental and ATI-Physical Therapy. All five of these tenants are either open and operating or have accepted delivery of their space. |
| (7) | The increase in Underwritten NOI over Most Recent NOI is driven by an increase in overall occupancy at the Lynwood Town Center property. |
TRANSACTION HIGHLIGHTS |
| ■ | Property/Amenities.The Lynnwood Town Center property is a 105,357 sq. ft. anchored shopping center located in Lynnwood, Washington. The property was constructed in 1986, 97.2% occupied as of February 1, 2017 by a diversified roster of 19 retail tenants and anchored by national tenants Marshall’s (23.7% NRA, 15.3% of underwriting base rent, lease expiration date: January 31, 2022) and Michael’s Stores, Inc (23.7% of NRA, 24.6% of underwriting base rent, lease expiration date: January 31, 2021). The property includes three one-floor buildings and consists of 605 parking spaces, which equates to a parking ratio of 5.74 per 1,000 sq. ft. |
| ■ | Location/Market.The Lynnwood Town Center property is located at Lynnwood, Washington, the fourth largest city in Snohomish County, within the Seattle MSA. Primary highway access to the area is via Interstate 5 (181,000 vehicles per day), which runs in parallel to the property, and is accessed via Alderwood Mall Parkway. Per the appraisal, the competitive set has occupancy ranging from 97.2% to 100% and asking rent ranging from $18.00 to $28.00. The area surrounding the property is suburban in character and approximately 90% developed. Land uses immediately surrounding the property are predominantly commercial along arterials and residential removed from the main retail corridor. |
| ■ | Sponsorship/Management.The sponsor and carve-out guarantor is Alan C. Fox, the principal of ACF Property Management, Inc. ACF Property Management, Inc. was formed in 1968 and currently owns and controls 76 properties in 15 states totaling over 7.2 million sq. ft. ACF Property Management, Inc. is based in Studio City, California and manages properties located in California, Colorado, Arizona, Texas, Kansas and Washington. Since 1968, Mr. Fox was responsible for the acquisition, management and sale of approximately 75 assets which total approximately 8 million sq. ft. |
THE INFORMATION IN THIS STRUCTURAL AND COLLATERAL TERM SHEET IS NOT COMPLETE AND MAY BE AMENDED PRIOR TO THE TIME OF SALE. THIS TERM SHEET IS NOT AN OFFER TO SELL THESE SECURITIES AND IT IS NOT A SOLICITATION OF AN OFFER TO BUY THESE SECURITIES IN ANY JURISDICTION WHERE THE OFFER OR SALE IS NOT PERMITTED.
120
75-1027 Henry Street Kailua-Kona, HI 96740 | Collateral Asset Summary – Loan No. 14 Kona Crossroads | Cut-off Date Balance: Cut-off Date LTV: U/W NCF DSCR: U/W NOI Debt Yield: | $18,030,000 66.7% 1.34x 8.9% |
| Mortgage Loan Information | |
| Loan Seller: | GACC |
| Loan Purpose: | Refinance |
| Sponsor: | National Credit Tenant Investments, LLC |
| Borrower: | Konasafe, LLC |
| Original Balance: | $18,030,000 |
| Cut-off Date Balance: | $18,030,000 |
| % by Initial UPB: | 2.0% |
| Interest Rate: | 4.6650% |
| Payment Date: | 6thof each month |
| First Payment Date: | January 6, 2016 |
| Maturity Date: | December 6, 2025 |
| Amortization: | Interest only for first 36 months; 360 months thereafter |
| Additional Debt(1): | Future Mezzanine Debt Permitted |
| Call Protection(2): | L(35), D(81), O(4) |
| Lockbox / Cash Management(3): | Springing Hard / Springing |
| Reserves(4) | ||
| Initial | Monthly | |
| Taxes: | $57,978 | $15,157 |
| Insurance(5): | $0 | Springing |
| Replacement(6): | $0 | $1,249 |
| TI/LC(7): | $901,645 | $7,561 |
| Required Repairs: | $292,446 | NAP |
| Free Rent: | $114,457 | NAP |
| Ground Rent(8): | $58,594 | Springing |
| Holdback(9): | $0 | NAP |
| Lease Sweep(10): | $0 | Springing |
| Financial Information | ||
| Cut-off Date Balance / Sq. Ft.: | $241 | |
| Balloon Balance / Sq. Ft.: | $212 | |
| Cut-off Date LTV: | 66.7% | |
| Balloon LTV: | 58.6% | |
| Underwritten NOI DSCR(11): | 1.44x | |
| Underwritten NCF DSCR(11): | 1.34x | |
| Underwritten NOI Debt Yield: | 8.9% | |
| Underwritten NCF Debt Yield: | 8.3% | |
| (1) | Mezzanine debt is permitted provided, among other things, (i) a combined loan to value ratio of less than or equal to 75.0%, (ii) a combined debt service coverage ratio greater than or equal to 1.25x and (iii) a combined debt yield of no less than 7.5%. |
| (2) | The borrower is permitted to obtain the release of a release parcel to be reasonably agreed by the borrower and lender, provided that the following conditions, among others, are satisfied, (i) such release is either (x) in connection with an expansion by the tenant Safeway, or an affiliate, or (y) has been reasonably consented to by the lender, (ii) the release parcel is vacant, non-income producing property which is not necessary for the operation or use of the mortgaged property and may be readily separated without a material diminution in the value of the mortgaged property, (iii) such release complies with the terms of all leases, reciprocal easement agreements and similar agreements and is consented to by the ground lessor, (iv) the release parcel is transferred from the borrower, removed from the ground lease, and constitutes a separate tax parcel and zoning lot, and (v) there is compliance with REMIC related requirements. |
| Property Information | |
| Single Asset / Portfolio: | Single Asset |
| Property Type: | Anchored Retail |
| Collateral(12): | Leasehold |
| Location: | Kailua-Kona, HI |
| Year Built / Renovated: | 1996 / NAP |
| Total Sq. Ft.: | 74,896 |
| Property Management: | Evolution West Management Services, LLC |
| Underwritten NOI(13): | $1,604,906 |
| Underwritten NCF: | $1,496,333 |
| Appraised Value: | $27,040,000 |
| Appraisal Date: | January 23, 2017 |
| Historical NOI | |
| Most Recent NOI: | $1,146,209 (December 31, 2016) |
| 2015 NOI: | $942,628 (December 31, 2015) |
| 2014 NOI: | $915,521 (December 31, 2014) |
| 2013 NOI: | $703,640 (December 31, 2013) |
| Historical Occupancy | |
| Most Recent Occupancy: | 97.6% (December 31, 2016) |
| 2015 Occupancy: | 93.4% (December 31, 2015) |
| 2014 Occupancy: | 83.4% (December 31, 2014) |
| 2013 Occupancy: | 84.2% (December 31, 2013) |
| (3) | A hard lockbox and cash management is triggered upon (i) an event of default, (ii) the failure by the borrower to maintain a debt service coverage ratio of at least 1.10x or (iii) the occurrence of a Lease Sweep Period (as defined below). |
| (4) | The current balances of the reserves as of April 24, 2017 are $47,150 in the tax reserve account, $10,291 in the replacement reserve account, $410,799 in the TI/LC reserve account, $0 in the required repairs reserve account, $0 in the free rent reserve account and $58,594 in the ground rent reserve account. |
| (5) | The borrower will be required to deposit 1/12 of the annual insurance premiums into the insurance reserve if an acceptable blanket policy is no longer in place. |
| (6) | The Replacement reserve is subject to a cap of $45,000. |
| (7) | The TI/LC reserve is subject to a cap of $272,197. |
| (8) | The borrower will be required to deposit the ground rent payable under the ground lease for each month upon (i) the borrower not paying the ground rent due and payable, (ii) the borrower failing to provide evidence of payment of the ground rent and (iii) funds on deposit in the ground rent account fall below 3/12 of what the lender estimates will be payable during the next 12 months (initially $58,594). |
| (9) | The Holdback was required to be released so long as, among other things, (i) the Kona Crossroads property achieved a debt yield of 7.6% for three consecutive months, (ii) the borrower entered into one or more qualifying leases and (iii) the tenant under such qualifying lease is in occupancy. The $1.03 million Holdback reserve was recently released to the borrower. |
| (10) | Excess cash is required to be deposited in the lease sweep reserve during a Lease Sweep Period. A “Lease Sweep Period” will commence upon (i) the earlier of (a) 12 months prior to the maturity date and (b) the date on which Safeway is required to give notice of its exercise of a renewal option, (ii) the date the Safeway lease is surrendered, cancelled, or terminated prior to its then current expiration date, (iii) the date Safeway goes dark at substantially all of its space or gives notice of its intention to do so, (iv) a default under the Safeway lease or (v) the occurrence of a Safeway lease insolvency proceeding. |
| (11) | Based on amortizing debt service payments. Based on the current interest only payments, the Underwritten NOI DSCR and the Underwritten NCF DSCR are 1.88x and 1.75x, respectively. |
| (12) | The Kona Crossroads property consists of a ground lease with an expiration of March 1, 2056 and three, ten year extension options. The ground lessors are Clarence Stanley Rapoza, Julie Ann Viloria and Barbara June Bohnenkamp, as trustees of various trusts. |
| (13) | The increase from Most Recent NOI to Underwritten NOI is due primarily to recent leasing at the Kona Crossroads property, including AutoZone which commenced in July 2016 and Island Heart Care which commenced in April 2016. |
TRANSACTION HIGHLIGHTS |
| ■ | Property/Tenant Mix.The property is a 74,896 sq. ft. Safeway-anchored regional shopping center located in Kailua-Kona on the west coast of the Island of Hawaii. The Kona Crossroads property is located on Henry Street, a major thoroughfare with a traffic count of 25,817 cars daily. Built in 1996, the center is 97.6% leased to 14 tenants including nationally recognized tenants such as Safeway, Inc. (“Safeway”), Domino’s Pizza, Subway, Autozone (Moody’s/S&P: Baa1/BBB) and Denny’s. Safeway (61.6% of net rentable area) has been in occupancy at the property since it opened in 1996, renewed its lease in 2005 and has a current lease expiration of February 2026. As of the most recent reporting period in 2015, Safeway had sales of $883 PSF and an occupancy cost of 2.3%. The center has 395 parking spaces which equates to a parking ratio of 5.27 spaces per 1,000 sq. ft. |
| ■ | Ground Lease. The property consists of a ground lease which commenced on February 12, 1991 and has an initial term that expires in March 2056. The ground lease is subject to fair market ground rent renegotiations with respect to ground rent resets in February 2016 and every 10 years thereafter. After loan closing, the lender was informed by the sponsor that there was a disagreement with the ground lessor regarding the calculation of the fair market ground rent reset, set to increase on February 2016. The disagreement ultimately led to the sponsor and the ground lessor entering into arbitration proceedings (pursuant to the lease) to determine the new ground rent. On December 12, 2016 the arbitration was completed and annual ground rent was set to $250,000 for the next ten years, which is an 11% increase from the prior $225,000 ground rent payment. |
THE INFORMATION IN THIS STRUCTURAL AND COLLATERAL TERM SHEET IS NOT COMPLETE AND MAY BE AMENDED PRIOR TO THE TIME OF SALE. THIS TERM SHEET IS NOT AN OFFER TO SELL THESE SECURITIES AND IT IS NOT A SOLICITATION OF AN OFFER TO BUY THESE SECURITIES IN ANY JURISDICTION WHERE THE OFFER OR SALE IS NOT PERMITTED.
121
4444 Havana Street Denver, CO 80239 | Collateral Asset Summary – Loan No. 15 Embassy Suites Denver | Cut-off Date Balance: Cut-off Date LTV: U/W NCF DSCR: U/W NOI Debt Yield: | $18,000,000 59.0% 2.44x 17.3% |
| Mortgage Loan Information | |
| Loan Seller: | GACC |
| Loan Purpose: | Refinance |
| Sponsor: | Westplace Modesto Investors, LLC |
| Borrower: | Aurora Hospitality, LLC |
| Original Balance: | $18,000,000 |
| Cut-off Date Balance: | $18,000,000 |
| % by Initial UPB: | 2.0% |
| Interest Rate: | 4.6000% |
| Payment Date: | 6thof each month |
| First Payment Date: | May 6, 2017 |
| Maturity Date: | April 6, 2027 |
| Amortization: | Interest only for first 24 months; 360 months thereafter |
| Additional Debt: | None |
| Call Protection: | L(25), D(91), O(4) |
| Lockbox / Cash Management(1): | Hard / Springing |
| Reserves | ||
| Initial | Monthly | |
| Taxes: | $116,644 | $24,174 |
| Insurance(2): | $0 | Springing |
| FF&E(3): | $0 | At least 4% of second prior month’s gross revenues |
| PIP(4): | $0 | Springing |
| Financial Information | ||
| Cut-off Date Balance / Room: | $85,714 | |
| Balloon Balance / Room: | $73,406 | |
| Cut-off Date LTV: | 59.0% | |
| Balloon LTV: | 50.5% | |
| Underwritten NOI DSCR(5): | 2.82x | |
| Underwritten NCF DSCR(5): | 2.44x | |
| Underwritten NOI Debt Yield: | 20.2% | |
| Underwritten NCF Debt Yield: | 17.5% | |
| Property Information | ||
| Single Asset / Portfolio: | Single Asset | |
| Property Type: | Full Service Hospitality | |
| Collateral: | Fee Simple | |
| Location: | Denver, CO | |
| Year Built / Renovated: | 1985 / 2013 | |
| Total Rooms: | 210 | |
| Property Management: | Denver Management, Inc. | |
| Underwritten NOI: | $3,118,207 | |
| Underwritten NCF: | $2,699,335 | |
| Appraised Value: | $30,500,000 | |
| Appraisal Date: | January 31, 2017 | |
| Historical NOI(6) | ||
| Most Recent NOI: | $2,952,969 (December 31, 2016) | |
| 2015 NOI: | $2,749,291 (December 31, 2015) | |
| 2014 NOI: | $2,191,568 (December 31, 2014) | |
| 2013 NOI: | $443,622 (December 31, 2013) | |
| Historical Occupancy/ADR/RevPAR(6) | ||
| 2016 Occupancy/ADR/RevPAR: | 80.0%/$142.50/$114.06 (December 31, 2016) | |
| 2015 Occupancy/ADR/RevPAR: | 82.4%/$134.38/$110.73 (December 31, 2015) | |
| 2014 Occupancy/ADR/RevPAR: | 80.0%/$127.13/$101.73 (December 31, 2014) | |
| 2013 Occupancy/ADR/RevPAR: | 53.7%/$123.49/$66.37 (December 31, 2013) | |
| (1) | In place cash management is triggered (i) upon an event of default, (ii) if the debt service coverage ratio falls below 1.25x during any calendar quarter or (iii) the date on which the borrower receives notice from the franchisor that a PIP will be required under the franchise agreement. |
| (2) | If an acceptable blanket insurance policy is no longer in place, borrower is required to deposit 1/12 of the annual insurance premiums into the insurance reserve account. |
| (3) | The borrower is required to deposit the greater of (i) 4.0% of the second prior month’s gross revenues or (ii) any amount required under the Management Agreement or Franchise Agreement for FF&E Work. |
| (4) | If the franchisor of the property requires a PIP under the franchise agreement, then on each monthly payment date, the borrower is required to deposit all excess cash into the PIP reserve until the funds in the PIP reserve (taken together with any funds in the FF&E reserve, other than those reasonably deemed necessary by lender to cover projected FF&E expenses not covered in the PIP) equal 100% of the estimated costs of the PIP, as reasonably determined by the lender. |
| (5) | Based on amortizing debt service payments. Based on the current interest only payments, the Underwritten NOI DSCR and Underwritten NCF DSCR are 3.71x and 3.22x, respectively. |
| (6) | The Embassy Suites Denver property was closed between August and December 2013 for a full renovation before fully re-opening in May 2014. |
TRANSACTION HIGHLIGHTS |
| ■ | Property.The Embassy Suites Denver is a 210-room full service hotel located in Denver, Colorado approximately 9 miles from downtown Denver and 16 miles from Denver International Airport. The Embassy Suites Denver was developed under the Embassy Suites brand and opened in 1985 as one of the first Embassy Suites. The Embassy Suites Denver Property underwent an approximately $7.2 million renovation between August and December 2013 during which the entire lobby was redone, the carpeting throughout the public areas was replaced, the guestroom sitting area case goods were updated and the meeting space, fitness center, restaurant/lounge area, and the made-to-order breakfast area were fully renovated. The property features 210 guestrooms, all of which are two-room suites, offered in single king, ADA-single king, double double, and suite configurations. Property amenities include a lobby with front desk, 5,000 sq. ft. of meeting space, a breakfast area, room service, Northfield’s restaurant and lounge, a fitness room, an indoor swimming pool and spa, a business center, guest laundry, a complimentary shuttle to the airport and area attractions within a five-mile radius of the hotel and wireless high-speed internet. The property contains a breakfast/evening snacks area located in the lobby and complimentary made-to-order breakfast and evening appetizers and beverages are served daily. The property provides 208 parking spaces, which equates to a parking ratio of 0.99 spaces per room. The Embassy Suites Denver property operates under a franchise agreement with Hilton Franchise Holding LLC, which expires in July 2028. |
| ■ | Location.The Embassy Suites Denver property is located in the Northeast section of the City of Denver along the Stapleton neighborhood and Montbello neighborhood border. The Embassy Suites Denver property is accessed via Interstate 70 via exits 280 through 285 and the area surrounding the property is primarily industrial buildings with some office space and residential. The Embassy Suites Denver property is located nearby many demand drivers including, the National Western Stock Show Complex, the Anschutz Medical Campus, Dick’s Sporting Goods Park and Rocky Mountain Arsenal National Wildlife Refuge, a roughly 16,000 acre refuge home to more than 330 species of wildlife. Additional demand drivers in the area include, Shops at Northfield Stapleton, a 1.2 million sq. ft. retail center which includes approximately 50 restaurants, specialty shops and retailers as well as an 18-screen Harkins theater. The complex is anchored by Macy’s, Bass Pro Shops, and a SuperTarget. Moreover, as Denver has continued to experience significant expansion and development, the Stapleton area has been the recent focus of ongoing commercial real estate development and investment according to the appraisal. This area is served by Denver Regional Transportation District Light Rail System’s A-line connecting Denver International Airport to downtown Denver. |
| ■ | Sponsorship.The Westmont Hospitality Group (“Westmont”) has owned the Embassy Suites Denver Property for more than 20 years. Westmont was founded in 1975 and has had an ownership interest in and operated over 1,100 hotels across the world. Westmont currently has interests in over 500 hotels across three continents across brands such as Fairmont, InterContinental Hotels Group, Hilton, Accor, Starwood, Wyndham, Choice Hotels, Renaissance, Radisson, and Best Western. Westmont maintains a diversified portfolio ranging from budget and aparthotels to mid-market business and large conference hotels to boutique hotels and luxury resorts. |
THE INFORMATION IN THIS STRUCTURAL AND COLLATERAL TERM SHEET IS NOT COMPLETE AND MAY BE AMENDED PRIOR TO THE TIME OF SALE. THIS TERM SHEET IS NOT AN OFFER TO SELL THESE SECURITIES AND IT IS NOT A SOLICITATION OF AN OFFER TO BUY THESE SECURITIES IN ANY JURISDICTION WHERE THE OFFER OR SALE IS NOT PERMITTED.
122
4685 Investment Drive & 1441 West Long Lake Road Troy, MI 48098 | Collateral Asset Summary – Loan No. 16 Troy Office Portfolio | Cut-off Date Balance: Cut-off Date LTV: U/W NCF DSCR: U/W NOI Debt Yield: | $18,000,000 67.0% 1.74x 12.5% |
| Mortgage Loan Information | |
| Loan Seller: | GACC |
| Loan Purpose: | Refinance |
| Sponsor: | Cyrus Sakhai |
| Borrower: | Long Lake 2, LLC |
| Original Balance: | $18,000,000 |
| Cut-off Date Balance: | $18,000,000 |
| % by Initial UPB: | 2.0% |
| Interest Rate: | 4.5400% |
| Payment Date: | 6thof each month |
| First Payment Date: | May 6, 2017 |
| Maturity Date: | April 6, 2027 |
| Amortization: | Interest only for first 36 months; 360 months thereafter |
| Additional Debt: | None |
| Call Protection: | L(25), D(90), O(5) |
| Lockbox / Cash Management(1): | Hard / Springing |
| Reserves | ||
| Initial | Monthly | |
| Taxes: | $264,912 | $28,879 |
| Insurance(2): | $0 | Springing |
| Replacement: | $0 | $3,858 |
| TI/LC(3): | $0 | $15,431 |
| Required Repairs: | $62,500 | NAP |
| Lease Sweep(4): | $0 | Springing |
| Financial Information | ||
| Cut-off Date Balance / Sq. Ft.: | $97 | |
| Balloon Balance / Sq. Ft.: | $85 | |
| Cut-off Date LTV: | 67.0% | |
| Balloon LTV: | 58.7% | |
| Underwritten NOI DSCR(5): | 2.05x | |
| Underwritten NCF DSCR(5): | 1.74x | |
| Underwritten NOI Debt Yield: | 12.5% | |
| Underwritten NCF Debt Yield: | 10.6% | |
| Property Information | |
| Single Asset / Portfolio: | Single Asset |
| Property Type: | Suburban Office |
| Collateral: | Fee Simple |
| Location: | Troy, MI |
| Year Built / Renovated: | 1999, 2001 / 2013 |
| Total Sq. Ft.: | 185,173 |
| Property Management: | Troy Managers 2, LLC |
| Underwritten NOI(6): | $2,255,505 |
| Underwritten NCF: | $1,911,457 |
| Appraised Value: | $26,850,000 |
| Appraisal Date: | March 8, 2017 |
| Historical NOI(7) | |
| Most Recent NOI: | $1,932,737 (December 31, 2016) |
| 2015 NOI: | $2,089,084 (December 31, 2015) |
| 2014 NOI: | $2,056,901 (December 31, 2014) |
| 2013 NOI: | NAV |
| Historical Occupancy(7) | |
| Most Recent Occupancy: | 99.7% (April 1, 2017) |
| 2015 Occupancy: | 97.7% (December 31, 2015) |
| 2014 Occupancy: | 96.2% (December 31, 2014) |
| 2013 Occupancy: | NAV |
| (1) | In place cash management is triggered (i) upon an event of default, (ii) if the debt service coverage ratio falls below 1.20x until such time that the debt service coverage ratio is at least 1.25x for two consecutive calendar quarters or (iii) during a Lease Sweep Period. A “Lease Sweep Period” will commence upon (i) the earlier of (a) (1) the date that is nine months prior to the earliest stated expiration of a Minor Lease Sweep Lease (as defined below), or 18 months prior if there is another Lease Sweep Lease that expires within 12 months after the Minor Lease Sweep Lease and (2) the date that is 12 months prior to the earliest stated expiration of a Major Lease Sweep Lease (as defined below) or 18 months prior if there is another Lease Sweep Lease that expires within 12 months after the Major Lease Sweep Lease or (b) the date the Lease Sweep Lease is required under its lease to give notice of its exercise of a renewal option, (ii) the earlier of (a) the date by which the Lease Sweep Lease is required to give notice of its exercise of a termination option, (b) the date that Lease Sweep Lease is surrendered, cancelled or terminated prior to its then current expiration date or (c) receipt by the borrower of notice from any tenant under a Lease Sweep Lease that it intends to surrender, cancel or terminate its lease, (iii) the date that the tenant under the Lease Sweep Lease discontinues its business unless the tenant is rated above “BBB-” by S&P (or an equivalent by another national rating agency), (iv) a monetary default for failure to pay base rent or a material, non-monetary default under a Lease Sweep Lease beyond any applicable notice and cure period or (v) a bankruptcy or insolvency proceeding of any tenant under a Lease Sweep Lease. A “Major Lease Sweep Lease” is (i) the Continental Automotive Systems lease or (ii) any replacement lease or leases which collectively cover a majority of the Lease Sweep Lease space. A “Minor Lease Sweep Lease” is (i) The Travelers Indemnity Company lease and the Rockwell Automation, Inc. lease. A “Lease Sweep Lease” is a (i) Major Lease Sweep Lease and (ii) Minor Lease Sweep Lease. |
| (2) | The borrower will be required to deposit an amount equal to 1/12 of the annual insurance premiums into the insurance reserve if an acceptable blanket policy is no longer in place. |
| (3) | The TI/LC reserve is subject to a cap of $500,000. |
| (4) | On each monthly payment date during a Lease Sweep Period, the borrower is required to deposit all excess cash into the Lease Sweep reserve. The Lease Sweep reserve is generally capped at $20.00 PSF of the space leased under the applicable Lease Sweep Lease. |
| (5) | Based on amortizing debt service payments. Based on the current interest only payments, Underwritten NOI DSCR and Underwritten NCF DSCR are 2.72x and 2.31x, respectively. |
| (6) | The increase from Most Recent NOI to Underwritten NOI is attributed to the Integrated Design Solutions, LLC expansion. |
| (7) | The sponsor acquired the Troy Office Portfolio in 2014, therefore Historical NOI and Historical Occupancy for 2013 are not available. |
TRANSACTION HIGHLIGHTS |
| ■ | Property.The Troy Office Portfolio properties consist of two Class A office buildings totaling 185,173 sq. ft. located in Troy, Michigan. The Troy Office Portfolio includes a three-story building located at 1441 West Long Lake Road which contains 108,119 sq. ft. and as of April 1, 2017, is 99.5% occupied by 12 tenants. The 1441 West Long Lake Road property was built in 2001 and includes a lower level parking garage. The building provides 445 parking stalls (356 surface and 89 below-grade) equating to 4.12 spaces per 1,000 sq. ft. The second building is located at 4685 Investment Drive which consists of three stories totaling 77,054 sq. ft and is 100% occupied by a single tenant. The 4685 Investment Drive property was built in 1999 and includes 326 surface parking spaces equating to 4.23 spaces per 1,000 sq. ft. Since acquisition in 2014, the sponsor has invested approximately $1.1 million in capital improvements and tenant improvements including the addition of a café and conference room, the installation of a putting green, and upgrades to the common areas, fitness center, lobby HVAC system, parking lot/garage and signage |
| ■ | Tenancy.The Troy Office Portfolio properties’ tenants consist of approximately 78.1% investment grade tenants including Continental Automotive Systems (41.6% of NRA, 32.3% of U/W Base Rent, rated BBB+/Baa1/BBB+ by Fitch/Moody’s/S&P), The Travelers Indemnity Company (15.2% of NRA, 17.7% of U/W Base Rent, rated A/A2/A by Fitch/Moody’s/S&P), Rockwell Automation, Inc. (13.3% of NRA, 15.4% of U/W Base Rent, rated A/A3/A by Fitch/Moody’s/S&P), Ameriprise Holdings, Inc (6.4% of NRA, 7.5% of U/W Base Rent, rated A3/A by Moody’s/S&P) and The Prudential Insurance Company (1.7% of NRA, 2.0% of U/W Base Rent, rated A-/Baa1/A by Fitch/Moody’s/S&P). The largest tenant, Continental Automotive Systems recently signed a 10-year lease extension in 2013 through 2023 (subject to a termination option in March 31, 2021) and has invested approximately $1.5 million ($19.50 PSF) of their own capital on improvements to their premises. With the exception of Continental Automotive Systems, no tenant makes up more than 15.2% of the NRA. The Troy Office Portfolio historical occupancy since 2013 is 95.2% |
| ■ | Submarket.The Troy Office Portfolio is located in the North Troy Office submarket and considered Class A office space. According to the appraiser, as of Q1 2017, the total submarket vacancy rate was 14.7% with average asking rents equal to $18.56 PSF. In recognition of the property’s reasonably low age, the appraiser examined trends for newer mulit-tenant inventory in the North Troy Office submarket, which concluded in a 4.7% vacancy rate and average asking rents equal to $19.60 PSF. The Troy Office Portfolio’s average rent PSF of $16.73 is approximately 9.9% and 14.6% below the total submarket and newer inventory average asking rents, respectively. |
THE INFORMATION IN THIS STRUCTURAL AND COLLATERAL TERM SHEET IS NOT COMPLETE AND MAY BE AMENDED PRIOR TO THE TIME OF SALE. THIS TERM SHEET IS NOT AN OFFER TO SELL THESE SECURITIES AND IT IS NOT A SOLICITATION OF AN OFFER TO BUY THESE SECURITIES IN ANY JURISDICTION WHERE THE OFFER OR SALE IS NOT PERMITTED.
123
22761 Pacific Coast Highway Malibu, CA 90265 | Collateral Asset Summary – Loan No. 17 Malibu Vista | Cut-off Date Balance: Cut-off Date LTV: U/W NCF DSCR: U/W NOI Debt Yield: | $18,000,000 49.3% 2.12x 9.8% |
| Mortgage Loan Information | |
| Loan Seller: | CREFI |
| Loan Purpose: | Refinance |
| Sponsor: | Kambiz Hakim |
| Borrower: | ASK Associates, LLC |
| Original Balance: | $18,000,000 |
| Cut-off Date Balance: | $18,000,000 |
| % by Initial UPB: | 2.0% |
| Interest Rate: | 4.2100% |
| Payment Date: | 6thof each month |
| First Payment Date: | June 6, 2017 |
| Maturity Date: | May 6, 2027 |
| Amortization: | Interest only |
| Additional Debt: | None |
| Call Protection(1): | L(24), D(92), O(4) |
| Lockbox / Cash Management(1): | Springing Hard / Springing |
| Reserves | ||
| Initial | Monthly | |
| Taxes(2): | $0 | Springing |
| Insurance(3): | $0 | Springing |
| Replacement(4): | $0 | Springing |
| TI/LC(5): | $0 | Springing |
| Immediate Repairs(6): | $7,500 | $0 |
| Dun & Bradstreet Renewal(7): | $0 | Springing |
| Financial Information | ||
| Cut-off Date Balance / Sq. Ft.: | $552 | |
| Balloon Balance / Sq. Ft.: | $552 | |
| Cut-off Date LTV: | 49.3% | |
| Balloon LTV: | 49.3% | |
| Underwritten NOI DSCR: | 2.29x | |
| Underwritten NCF DSCR: | 2.12x | |
| Underwritten NOI Debt Yield: | 9.8% | |
| Underwritten NCF Debt Yield: | 9.0% | |
| (1) | A hard lockbox and in place cash management will be triggered upon the occurrence of a Trigger Period (as defined below) or Guarantor Net Worth and Liquidity Trigger (as defined below). A “Trigger Period” means the period commencing upon the first to occur of (i) an event of default, (ii) the debt service coverage ratio falling below 1.20x until such time that the debt service coverage ratio is at least 1.25x for two consecutive calendar quarters, (iii) a Specified Tenant Trigger Period (as defined below) and (iv) a TI Allowance Trigger Period (as defined below). A “Guarantor Net Worth and Liquidity Trigger” means (i) the guarantor’s net worth is less than $75,000,000 (excluding any equity attributable to the Malibu Vista property and any assets located outside of the United States), (ii) the guarantor’s liquidity is less than $3,000,000 and (iii) Kambiz Hakim no longer remains the guarantor. A “Specified Tenant Trigger Period” means, including but not limited to, a period commencing upon the first to occur of (a) a Specified Tenant (as defined below) being in default under its lease, (b) a Specified Tenant failing to be in actual physical possession of at least 50% of the Specified Tenant’s space, failing to be open to the public for business and/or “going dark” in 50% or more of the Specified Tenant’s space, (c) Specified Tenant giving notice that it is terminating its lease for all or any portion of the Specified Tenant’s space (or applicable portion thereof), (d) any termination or cancellation of any Specified Tenant’s lease (including, without limitation, rejection in any bankruptcy or similar insolvency proceeding) and/or any Specified Tenant’s lease failing to otherwise be in full force and effect, (e) any bankruptcy or similar insolvency of a Specified Tenant, (f) a Specified Tenant failing to extend or renew the applicable Specified Tenant’s lease on or prior to the date that is 12 months prior to the expiration of that lease for a minimum renewal term of five |
| Property Information | |
| Single Asset / Portfolio: | Single Asset |
| Property Type: | Suburban Office |
| Collateral: | Fee Simple |
| Location: | Malibu, CA |
| Year Built / Renovated: | 1980 / 2013 |
| Total Sq. Ft.: | 32,583 |
| Property Management: | Quantumprime Realty Inc. |
| Underwritten NOI(8): | $1,759,814 |
| Underwritten NCF: | $1,628,714 |
| Appraised Value: | $36,500,000 |
| Appraisal Date: | March 2, 2017 |
| Historical NOI(8) | |
| Most Recent NOI: | $1,509,752 (December 31, 2016) |
| 2015 NOI: | $1,689,483 (December 31, 2015) |
| 2014 NOI: | $2,229,390 (December 31, 2014) |
| Historical Occupancy(9) | |
| Most Recent Occupancy: | 100.0% (May 6, 2017) |
| 2016 Occupancy: | 96.0% (December 31, 2016) |
| 2015 Occupancy: | 96.0% (December 31, 2015) |
| 2014 Occupancy: | 97.0% (December 31, 2014) |
years (a “Specified Tenant Renewal Trigger Event”) (provided, however, that notwithstanding the foregoing, no Specified Tenant Renewal Trigger Event shall be deemed to have occurred if the borrower deposits with the lender, into the Dun & Bradstreet Renewal reserve account, in the form of cash or a letter of credit, (x) an amount equal to $500,000 within ten business days of the occurrence of such Specified Tenant Renewal Trigger Event and (y) an additional amount equal to $500,000 on or prior to the date that is six months prior to the expiration of the then applicable term of the applicable Specified Tenant’s lease (such deposits being at the borrower’s option)), and (vii) the senior unsecured credit rating (or the equivalent thereof) of a Specified Tenant falling below investment grade. A “Specified Tenant” means (i) Dun & Bradstreet Emerging Business Corp. (“DBEBC”), (ii) any other lessee of the specified tenant space and (iii) any parent company of any such Specified Tenant, and any affiliate providing credit support for, or guarantor of, any such Specified Tenant lease. A “TI Allowance Trigger Period” means a period commencing on the date that is 60 days after the filing of a lawsuit by the sole tenant DBEBC against the borrower to compel payment of any unpaid tenant improvement allowance owed to DBEBC pursuant to such tenant’s lease. In the event that a cash sweep is in effect due solely to the occurrence of a Trigger Period caused by a TI Allowance Trigger Period, the excess cash flow deposits will be capped at an amount equal to $75,000.
| (2) | The borrower will be required to deposit 1/12 of the annual real estate taxes into the tax reserve on each monthly payment date where a Trigger Period has occurred and is continuing or the DBEBC lease is not in full force and effect. |
| (3) | The borrower will be required to deposit 1/12 of the annual insurance premiums into the insurance reserve on each monthly payment date where a Trigger Period has occurred and is continuing or a Guarantor Net Worth and Liquidity Trigger exists, or if the borrower cannot deliver evidence that the insurance policies are in full force and effect. |
| (4) | The borrower will be required to deposit $1,140 into the Replacement reserve on each monthly payment date on which a Guarantor Net Worth and Liquidity Trigger exists. The replacement reserve account is subject to a $150,000 cap. |
| (5) | The borrower will be required to deposit $2,715 into the TI/LC reserve on each monthly payment date on which a Guarantor Net Worth and Liquidity Trigger exists. |
| (6) | The immediate repairs reserve is equal to 125% of the estimated costs of immediate repairs. |
| (7) | On the first monthly payment date during the continuance of a Trigger Period that exists solely due to the continuance of a Specified Tenant Trigger Period and on the succeeding 11 monthly payment dates, the borrower will be required to deposit all excess cash generated by the Malibu Vista property for the immediately preceding interest accrual period into the Dun & Bradstreet Renewal reserve. |
| (8) | The decrease in NOI after 2014 is primarily attributable to declining rents due to expired leases at higher rents and downtime as vacant space was held off of the market for DBEBC build-out and occupancy. The increase in Underwritten NOI over Most Recent NOI is primarily due to the inclusion of $170,825 in rent steps, which represents an average increase of 3.5% for contractual annual rent steps for the investment grade tenant. |
| (9) | The sole tenant at the Mortgaged Property, Dun & Bradstreet Emerging Business Corporation, subleased its space in one of the three buildings at the Mortgaged Property, totaling 5,712 sq. ft., to Bryant Stibel & Co. |
TRANSACTION HIGHLIGHTS |
| ■ | Property.The Malibu Vista property is a 32,583 sq. ft. office property located on a 1.5 acre site along the Pacific Coast Highway. The Malibu Vista site slopes to the south, providing ocean views and serves as the corporate headquarters for Dun & Bradstreet Emerging Business Corp. The Malibu Vista property consists of three buildings, with two on the lower level facing the plaza and one on the upper level. Site improvements on the Malibu Vista property include an open gathering area with chairs, tables, and an outdoor heater, and a water fountain located at the center of the plaza level. The sole tenant, DBEBC, was formed as a result of the May 2015 acquisition by Dun & Bradstreet Corp. (“DNB”) of Dun & Bradstreet Credibility Corp. (“DBCC”) to combine the technology and data solutions of DBCC with the small and mid-sized operations of DNB. Founded in 1841, DNB provides commercial data, analytics and insights on businesses worldwide. |
| ■ | Market.The Malibu Vista property is located in western Los Angeles County, which is approximately 25 miles west of downtown Los Angeles, and includes the incorporated cities of Malibu, Santa Monica, Culver City, West Hollywood and Beverly Hills. Land uses surrounding the Malibu Vista property include primarily residential developments, undeveloped land and commercial use. According to the appraisal, the estimated average household incomes within a 1-, 3- and 5-mile radius of the Malibu Vista property are estimated to be $170,474, $182,166 and $192,192, respectively. The Malibu Vista property is also a part of the Los Angeles-Long Beach-Glendale, CA MSA which reported a 2016 population of approximately 10.2 million. As of the fourth quarter of 2016, the West Los Angeles office submarket consisted of approximately 53.5 million sq. ft. with a 8.0% vacancy rate and asking rents of $55.92 PSF. |
THE INFORMATION IN THIS STRUCTURAL AND COLLATERAL TERM SHEET IS NOT COMPLETE AND MAY BE AMENDED PRIOR TO THE TIME OF SALE. THIS TERM SHEET IS NOT AN OFFER TO SELL THESE SECURITIES AND IT IS NOT A SOLICITATION OF AN OFFER TO BUY THESE SECURITIES IN ANY JURISDICTION WHERE THE OFFER OR SALE IS NOT PERMITTED.
124
6826 NY-12 Norwich, NY 13815 | Collateral Asset Summary – Loan No. 18 Alvogen Pharma US | Cut-off Date Balance: Cut-off Date LTV: U/W NCF DSCR: U/W NOI Debt Yield: | $17,350,000 66.3% 1.62x 10.7% |
| Mortgage Loan Information | |
| Loan Seller: | GACC |
| Loan Purpose: | Recapitalization |
| Sponsors(1): | AG Net Lease III Corp.; AG Net Lease III (SO) Corp. |
| Borrower: | AGNL RX, L.L.C. |
| Original Balance: | $17,350,000 |
| Cut-off Date Balance: | $17,350,000 |
| % by Initial UPB: | 1.9% |
| Interest Rate: | 4.9000% |
| Payment Date: | 6thof each month |
| First Payment Date: | May 6, 2017 |
| Anticipated Repayment Date(2): | April 6, 2027 |
| Final Maturity Date: | April 6, 2035 |
| Amortization: | Interest only for first 36 months; 360 months thereafter |
| Additional Debt(3): | Future Mezzanine Debt Permitted |
| Call Protection: | L(25), YM1(89), O(6) |
| Lockbox / Cash Management(4): | Hard / In Place |
| Reserves | ||
| Initial | Monthly | |
| Taxes(5): | $0 | Springing |
| Insurance(5): | $0 | Springing |
| Replacement(6): | $0 | Springing |
| Lease Sweep(7): | $0 | Springing |
| Financial Information | ||||
| Cut-off Date Balance / Sq. Ft.: | $45 | |||
| Balloon Balance / Sq. Ft.: | $40 | |||
| Cut-off Date LTV: | 66.3% | |||
| Balloon LTV: | 58.6% | |||
| Underwritten NOI DSCR(8): | 1.68x | |||
| Underwritten NCF DSCR(8): | 1.62x | |||
| Underwritten NOI Debt Yield: | 10.7% | |||
| Underwritten NCF Debt Yield: | 10.3% | |||
| Underwritten NOI Debt Yield at Balloon: | 12.1% | |||
| Underwritten NCF Debt Yield at Balloon: | 11.7% | |||
| (1) | The sponsors are also the sponsors of the mortgage loan identified on Annex A-1 to the Preliminary Prospectus as SG 360 Portfolio, which has a Cut-off Date Balance of $16,500,000. |
| (2) | From and after the Anticipated Repayment Date, the Alvogen Pharma US mortgage loan accrues at a fixed interest rate (the “Revised Rate”) that is equal to the sum of (i) 2.0000% plus (ii) the greater of (a) 4.9000% and (b) the sum of the (A) the bid side yield to maturity for the “on the run” 10 year U.S. Treasury Note and (B) the 10-year swap spread as of the Anticipated Repayment Date plus 2.5000%. Interest accrued a the excess of the Revised Rate over the initial Interest Rate is deferred and payable only after all principal has been paid in full. |
| (3) | Provided it is at least two years prior to the Anticipated Repayment Date, the Alvogen Pharma US mortgage loan permits future mezzanine debt provided, among other things, (i) based on the combined mortgage and mezzanine balances (A) the combined loan to value ratio is no more than 66.3%, (B) the combined debt service coverage ratio is no less than 1.62x and (C) the combined debt yield is no less than 10.3%, (ii) such future indebtedness is coterminous with the Alvogen Phama US whole loan, (iii) has an initial outstanding principal balance less than $4.0 million and (iv) the related mezzanine loan lender has entered into an intercreditor agreement acceptable to the mortgage lender. |
| Property Information | |
| Single Asset / Portfolio: | Single Asset |
| Property Type: | Manufacturing/Warehouse Industrial |
| Collateral(9): | Fee Simple / Leasehold |
| Location: | Norwich, NY |
| Year Built / Renovated: | 1976 / 2016 |
| Total Sq. Ft.: | 385,000 |
| Property Management: | Self-managed |
| Underwritten NOI: | $1,852,004 |
| Underwritten NCF: | $1,794,254 |
| Appraised Value: | $26,150,000 |
| Appraisal Date: | March 2, 2017 |
| Historical NOI(10) | |
| Most Recent NOI: | NAV |
| 2015 NOI: | NAV |
| 2014 NOI: | NAV |
| 2013 NOI: | NAV |
| Historical Occupancy | |
| Most Recent Occupancy: | 100.0% (May 6, 2017) |
| 2015 Occupancy: | 100.0% (December 31, 2015) |
| 2014 Occupancy: | 100.0% (December 31, 2014) |
| 2013 Occupancy: | 100.0% (December 31, 2013) |
| (4) | Norwich Pharmaceuticals, Inc. (“Norwich”), the sole tenant, pays rent quarterly into the lockbox, and after payments of amounts due to the current month of such payment, the lender retains two additional months of taxes, insurance, capital expenditures and three months of debt service in the cash management account. On the day immediately prior to each monthly payment date in the first month of each calendar quarter during the term of the loan, the lender is required to release back to borrower the two months of retained taxes, insurance and capital expenditures all of which is required to be replenished by the next installment of quarterly rent paid. |
| (5) | The borrower will be required to deposit an amount equal to 1/12 of the annual real estate taxes and annual insurance premiums if (i) the Norwich lease is no longer in full force and effect, (ii) the Norwich lease does not require the tenant to pay for all real estate taxes or insurance premiums, (iii) if the Norwich tenant fails to provide receipt of such payment and (iv) with respect to the insurance premiums, an acceptable blanket policy is no longer in place. |
| (6) | The borrower will be required to deposit $12,833 into the Replacement reserve account if (i) the Norwich lease is no longer in full force and effect, (ii) the Norwich tenant lease does not require the tenant to pay for all capital expenditures when such payments are due or (iii) Norwich fails to perform such obligations. |
| (7) | On each monthly payment date during a Lease Sweep Period, the borrower will be required to deposit all excess cash into the lease sweep reserve. A “Lease Sweep Period” will commence upon (i) the date that the tenant under a Lease Sweep Lease (or any portion thereof exceeding 75.0% of the total NRA under the Lease Sweep Lease) is surrendered, cancelled or terminated, (ii) the date that a tenant under a Lease Sweep Lease discontinues its business, (iii) the occurrence of an event of default under the Lease Sweep Lease due to the failure by the tenant under a Lease Sweep Lease to make any basic rent payments that continue beyond any applicable notice and cure periods or (iv) an insolvency proceeding of any tenant under a Lease Sweep Lease. A “Lease Sweep Lease” means (i) the Norwich lease or any replacement leases or (ii) any replacement lease or leases which collectively cover at least 75.0% of the Lease Sweep Lease space. |
| (8) | Based on amortizing debt service payments. Based on the current interest only payments, the Underwritten NOI DSCR and the Underwritten NCF DSCR are 2.15x and 2.08x, respectively. |
| (9) | The borrower owns a portion of the mortgaged property in fee and a portion in leasehold, pursuant to an IDA lease (the “IDA Lease”) with the County of Chenango Industrial Development Agency. The IDA Lease expires on February 29, 2032 and rent payments are $140,000, payable in ten annual installments of $14,000, payable March 1 of each year commencing on March 1, 2017, plus an additional one-time payment of $14,000 payable on March 1, 2017. For additional information, see “Description of the Mortgage Pool – Real Estate and Other Tax Considerations” in the Preliminary Prospectus, |
| (10) | Historical financial information is not available because the Alvogen Pharma US property has been leased pursuant to an absolute triple net lease to the existing tenant, Norwich since delivery in 1976. Accordingly, historical financials are not available. |
TRANSACTION HIGHLIGHTS |
| ■ | Tenancy.The Alvogen Pharma US property is 100.0% leased and subleased to Norwich, a subsidiary of Alvogen Pharma US (S&P Rated: B; Moody’s Rated: B2). Alvogen Lux Holdings S.a.r.l., the global parent of the tenant, was formed in 2009, with roots tracing back to the 1800s. Founded in 1887, Norwich is engaged in the manufacturing, packaging, and distribution of prescription drugs and over the counter products, and created Pepto-Bismol in 1901. The tenant represents all of Alvogen Lux Holdings’ United States operations and is responsible for 55.0% of its revenue. The tenant has operated in the market for over 130 years, including 40 years at the Alvogen Pharma US property. The tenant built and delivered the Alvogen Pharma US property in 1976. In 2015, the tenant invested approximately $26.0 million into the renovation and expansion of the Alvogen Pharma US property including, approximately $10.3 million in build-out costs and more than $7.0 million in product-specific build-out for future production of a new drug. |
THE INFORMATION IN THIS STRUCTURAL AND COLLATERAL TERM SHEET IS NOT COMPLETE AND MAY BE AMENDED PRIOR TO THE TIME OF SALE. THIS TERM SHEET IS NOT AN OFFER TO SELL THESE SECURITIES AND IT IS NOT A SOLICITATION OF AN OFFER TO BUY THESE SECURITIES IN ANY JURISDICTION WHERE THE OFFER OR SALE IS NOT PERMITTED.
125
1351 Wheeling Road, Wheeling, IL 60090 1900 South 25th Avenue, Broadview, IL | Collateral Asset Summary – Loan No. 19 SG360 Portfolio | Cut-off Date Balance: Cut-off Date LTV: U/W NCF DSCR: U/W NOI Debt Yield: | $16,500,000 66.0% 1.62x 10.0% |
| Mortgage Loan Information | |
| Loan Seller: | CREFI |
| Loan Purpose: | Acquisition |
| Sponsor(1): | AG Net Lease III Corp.; AG Net Lease III (SO) Corp. |
| Borrower: | AGNL Mail, L.L.C. |
| Original Balance: | $16,500,000 |
| Cut-off Date Balance: | $16,500,000 |
| % by Initial UPB: | 1.8% |
| Interest Rate: | 4.6100% |
| Payment Date: | 6thof each month |
| First Payment Date: | May 6, 2017 |
| Maturity Date: | April 6, 2027 |
| Amortization: | Interest only for first 60 months; 360 months thereafter |
| Additional Debt(2): | Future Mezzanine Debt Permitted |
| Call Protection: | L(25), YM1(90), O(5) |
| Lockbox / Cash Management(3): | Hard / Springing |
| Reserves | ||
| Initial | Monthly | |
| Taxes(4): | $0 | Springing |
| Insurance(5): | $0 | Springing |
| Replacement(6): | $0 | Springing |
| TI/LC: | $0 | $0 |
| Deferred Maintenance(7): | $0 | $0 |
| Financial Information | ||
| Cut-off Date Balance / Sq. Ft.: | $38 | |
| Balloon Balance / Sq. Ft.: | $35 | |
| Cut-off Date LTV: | 66.0% | |
| Balloon LTV: | 60.5% | |
| Underwritten NOI DSCR: | 1.62x | |
| Underwritten NCF DSCR: | 1.62x | |
| Underwritten NOI Debt Yield: | 10.0% | |
| Underwritten NCF Debt Yield: | 10.0% | |
| (1) | The sponsors are also the sponsors of the mortgage loan identified on Annex A-1 to the Preliminary Prospectus as Alvogen Pharma US, which has a Cut-off Date Balance of $17,350,000. |
| (2) | Mezzanine debt is permitted provided, among other things, (a) such mezzanine debt, together with the SG360 Portfolio mortgage loan, has (i) a combined loan to value ratio of less than or equal to 66.0%, (ii) a combined debt service coverage ratio greater than or equal to 1.62x and (iii) a combined debt yield of no less than 9.97%, (b) the term of the mezzanine debt is co-terminous with the term of the SG360 Portfolio mortgage loan and (c) an intercreditor agreement acceptable to the mortgage lender is executed and delivered. |
| (3) | In place cash management is triggered (i) upon an event of default, (ii) if the debt service coverage ratio falls below 1.20x until such time that the debt service coverage ratio is at least 1.20x for two consecutive calendar quarters or (iii) upon the occurrence of a Specified Tenant Trigger Period (the period commencing upon (i), (ii), or (iii), a “Trigger Period”). A “Specified Tenant Trigger Period” commences upon the first to occur of (i) an event of default under a Specified Tenant’s lease arising directly as a result of Specified Tenant’s failure to be in actual, physical possession of, or abandoning, the mortgaged properties, (ii) any termination or cancellation of any Specified Tenant’s lease and/or any Specified Tenant’s lease failing to be in full force and effect, and (iii) any bankruptcy or similar insolvency of a Specified Tenant. A “Specified Tenant” means (a) the Segerdahl Corporation (the “Segerdahl Corp.”), together with any parent or affiliate providing credit support or a guaranty under the lease or (b) any replacement tenant of the Segerdahl Corp. approved in accordance with the mortgage loan documents. |
| Property Information | |
| Single Asset / Portfolio: | Portfolio of two properties |
| Property Type(8): | Industrial/Flex |
| Collateral: | Fee Simple |
| Location(9): | Various, IL |
| Year Built / Renovated(10): | Various / Various |
| Total Sq. Ft.: | 437,533 |
| Property Management: | Self-managed |
| Underwritten NOI: | $1,644,877 |
| Underwritten NCF: | $1,644,877 |
| Appraised Value(11): | $25,000,000 |
| Appraisal Date: | March 1, 2017 |
| Historical NOI(11) | |
| Most Recent NOI: | NAV |
| 2014 NOI: | NAV |
| 2013 NOI: | NAV |
| Historical Occupancy(12) | |
| Most Recent Occupancy: | 100.0% (May 6, 2017) |
| 2014 Occupancy: | NAV |
| 2013 Occupancy: | NAV |
| (4) | The borrower will be required to deposit 1/12 of the annual real estate taxes provided that (i) a Trigger Period is then continuing and (ii) neither the borrower nor the Specified Tenant has (a) timely paid the taxes directly to the appropriate taxing authority and (b) provided evidence of such payment to lender. |
| (5) | The borrower will be required to deposit 1/12 of the annual insurance premiums provided that (i) a Trigger Period is then continuing and (ii) neither the borrower nor the Specified Tenant has (a) timely paid the insurance premiums due on the policies to the issuer of the policies and (b) provided evidence of such payment to lender. |
| (6) | The borrower will be required to deposit $18,231 on each monthly payment date on which (i) a Trigger Period is then continuing and (ii) neither the borrower nor the Specified Tenant has diligently made the required replacements. The Replacement reserve account is subject to a cap of $1,093,832. |
| (7) | A holdback escrow agreement was executed in connection with the sale of the mortgaged properties to the borrower pursuant to which the seller deposited $637,395 into an account with Chicago Title and Trust Company for immediate repairs associated with both properties, which must be completed by December 31, 2017. |
| (8) | The Wheeling Facility property consists of 215,038 sq. ft. of industrial manufacturing, warehouse and distribution space and 30,000 sq. ft. of office space. The Broadview Facility property consists of 172,495 sq. ft. of industrial manufacturing, warehouse and distribution space and 20,000 sq. ft. of office space. |
| (9) | The Wheeling Facility property is located at 1351 Wheeling Road in Wheeling, IL 60090. The Broadview Facility property is located at 1900 South 25th Avenue in Broadview, IL 60155. |
| (10) | The Wheeling Facility property was built in 1960 and last renovated in 2009. The Broadview Facility property was built in 1958 and last renovated in 1967. |
| (11) | The Wheeling Facility property has an “As-is” Appraised Value of $14,900,000 and the Broadview Facility property has an “As-is” Appraised Value of $10,100,000. |
| (12) | Historical NOI and Historical Occupancy figures were unavailable due to the borrower’s recent acquisition of the properties. |
TRANSACTION HIGHLIGHTS |
| ■ | Property.The SG360 Portfolio mortgage loan is secured by two properties located in Wheeling and Broadview, Illinois. Both properties are occupied by the Segerdahl Corp, a company that offers printing and producing of direct mail marketing within the luxury and casual clothing retailers, big box, food, electronic, and home and hardware retailers, as well as delivery logistics and market research. The Wheeling Facility property serves as the Segerdahl Corp’s corporate headquarters and is the company’s largest manufacturing site by size and revenue. The Wheeling Facility property has a clear height of 16 to 24 feet, 27 loading docks and 279 surface parking spaces. The Wheeling Facility property houses nine printing presses including a newly acquired printing press that runs Costco’s latest advertisement orders of approximately 28 million orders per month. The Broadview Facility property is the company’s second largest manufacturing site by size and revenue and is located 12 miles from downtown Chicago. The Broadview Facility property has clear heights of 14-23 feet, has 11 loading docks and 195 surface parking spaces. The Broadview Facility property houses eight printing presses as well as a secured analytics server room which houses significant customer data. |
| ■ | Market.The two properties are located in the greater Chicago Metropolitan Statistical Area (“MSA”), which is comprised of 14 counties and reported a 2016 population of approximately 12.8 million. The Chicago MSA is the third largest in the United States and is home to the corporate headquarters of 57 Fortune 1000 companies, including Boeing, McDonald’s, Motorola, Discover Financial Services, Walgreens and Aon. The Chicago industrial market encompasses approximately 1.26 billion sq. ft. and is the largest industrial market in the United States. According to the appraisal, as of the fourth quarter of 2016, Chicago’s industrial market reports a vacancy rate of 6.5% and an average rental rate of $5.60 PSF. For the Wheeling Facility property, the 2016 demographics within a 5- mile radius feature a population of 299,209 and an estimated average household income of $109,917. For the Broadview Facility property, the 2016 demographics within a 5-mile radius feature a population of 467,942 and an estimated average household income of $90,391. |
THE INFORMATION IN THIS STRUCTURAL AND COLLATERAL TERM SHEET IS NOT COMPLETE AND MAY BE AMENDED PRIOR TO THE TIME OF SALE. THIS TERM SHEET IS NOT AN OFFER TO SELL THESE SECURITIES AND IT IS NOT A SOLICITATION OF AN OFFER TO BUY THESE SECURITIES IN ANY JURISDICTION WHERE THE OFFER OR SALE IS NOT PERMITTED.
126
33 Kings Highway Orangeburg, NY 10962 | Collateral Asset Summary – Loan No. 20 33 Kings Highway | Cut-off Date Balance: Cut-off Date LTV: U/W NCF DSCR: U/W NOI Debt Yield: | $14,981,369 41.6% 1.92x 12.3% |
| Mortgage Loan Information | |
| Loan Seller: | GACC |
| Loan Purpose: | Refinance |
| Sponsor(1): | Steven J. Guttman |
| Borrower: | Uovo Kings Hwy LLC |
| Original Balance: | $15,000,000 |
| Cut-off Date Balance: | $14,981,369 |
| % by Initial UPB: | 1.7% |
| Interest Rate: | 4.8200% |
| Payment Date: | 6thof each month |
| First Payment Date: | May 6, 2017 |
| Maturity Date: | April 6, 2027 |
| Amortization: | 360 months |
| Additional Debt: | None |
| Call Protection: | L(25), D(91), O(4) |
| Lockbox / Cash Management(2): | Springing Hard / Springing |
| Reserves | ||
| Initial | Monthly | |
| Taxes: | $151,492 | $23,089 |
| Insurance(3): | $0 | Springing |
| Replacement: | $0 | $1,314 |
| Required Repairs: | $15,600 | $0 |
| Financial Information | ||||
| Cut-off Date Balance / Sq. Ft.(4): | $143 | |||
| Balloon Balance / Sq. Ft.(4): | $117 | |||
| Cut-off Date LTV: | 41.6% | |||
| Balloon LTV: | 34.1% | |||
| Underwritten NOI DSCR: | 1.94x | |||
| Underwritten NCF DSCR: | 1.92x | |||
| Underwritten NOI Debt Yield: | 12.3% | |||
| Underwritten NCF Debt Yield: | 12.2% | |||
| Underwritten NOI Debt Yield at Balloon: | 15.0% | |||
| Underwritten NCF Debt Yield at Balloon: | 14.9% | |||
| (1) | The sponsor is also the sponsor of the mortgage loan identified on Annex A-1 to the Preliminary Prospectus as Uovo Art Storage, which has a Cut-off Date Balance of $49,803,347. |
| (2) | A hard lockbox and in-place cash management is triggered upon the occurrence of (i) an event of default or (ii) the debt service coverage ratio falling below 1.20x. |
| (3) | Unless an acceptable blanket insurance policy is in place, 1/12 of the estimated insurance premiums into an insurance account. |
| Property Information | |
| Single Asset / Portfolio: | Single Asset |
| Property Type: | Art Storage Self-Storage |
| Collateral(5): | Fee Simple |
| Location: | Orangeburg, NY |
| Year Built / Renovated: | 1972, 1982 / 2014-2016 |
| Total Sq. Ft.(6): | 105,130 |
| Property Management: | Uovo Management LLC |
| Underwritten NOI: | $1,837,694 |
| Underwritten NCF: | $1,821,925 |
| Appraised Value: | $36,000,000 |
| Appraisal Date: | February 3, 2017 |
| Historical NOI(7) | |
| Most Recent NOI: | $1,592,864 (T-3 February 28, 2017) |
| Second Most Recent NOI: | $1,519,620 (T-6 February 28, 2017) |
| 2016 NOI: | $1,080,768 (December 31, 2016) |
| Historical Occupancy(8) | |
| Most Recent Occupancy: | 54.4% (February 28, 2017) |
| 2015 Occupancy: | NAV |
| 2014 Occupancy: | NAV |
| 2013 Occupancy: | NAV |
| (4) | The Cut-off Date Balance / Sq. Ft. and Balloon Balance / Sq. Ft. calculations are based on 105,130 gross sq. ft. |
| (5) | The 33 Kings Highway borrower leases its fee interest to the County of Rockland industrial development agency (the “IDA”), which subleases the 33 Kings Highway property back to the borrower at rent of $1.00. The borrower is obligated to terminate such arrangement at the end of its term in 2024. The IDA is a party to the lender’s mortgage and a foreclosure of the mortgage will wipe out both the lease and the IDA sublease. Any losses that are incurred by the lender as a result of any recapture of the benefits that are contained in the IDA sublease is recourse to the loan guarantor. The effect of the arrangement is to provide the 33 Kings Highway borrower an exemption from mortgage recording tax ($196,000 of benefits) and sales tax ($201,000 of benefits). The sales tax exemption expires on the earlier of (i) September 2017, (ii) the completion of the acquisition, renovation and equipping of the facility, (iii) a default under the lease with the County of Rockland industrial development agency, and (iv) such time as the borrower has received a total of $201,000 of sales and use tax exemption for purchases of no more than $2,400,000. |
| (6) | Total Sq. Ft. is based on the gross building area of 105,130 sq. ft. The private storage units total 2,915 sq. ft. and the managed storage units total 400,000 cubic feet. |
| (7) | Historical NOI is not available as the property was converted from a traditional warehouse to an art storage facility between 2014 and 2015 and was not fully opened until October 2015. |
| (8) | Most Recent Occupancy is based on the managed storage space of 400,000 cubic feet. |
TRANSACTION HIGHLIGHTS |
| ■ | Property.33 Kings Highway property is located in Orangeburg, New York, approximately 18 miles outside of Manhattan, New York on a 12.78-acre campus. The 33 Kings Highway property was converted from a traditional warehouse to an art storage facility by Storage Deluxe between 2014 and 2015 and contains 400,000 cubic feet of managed storage space and 2,915 sq. ft. of private storage space. The 33 Kings Highway property includes a 500 sq. ft. viewing room that tenants can rent to showcase their artwork and has three conference rooms/offices that tenants can rent on a daily basis. There is also a 5,055 sq. ft. room with 24 to 30 foot ceilings and a loading dock, which can be rented by tenants as a workspace for large pieces. The 33 Kings Highway property’s conversion from warehouse space to art storage space was completed in two phases, the first phase included renovation of the temperature controlled space which was completed in December 2014 and the climate controlled space which was completed in October 2015. As of the February 28, 2017 rent roll, the 33 Kings Highway property’s seven private storage units were 37.0% occupied and the managed storage units were 60.7% occupied. |
| ■ | Sponsorship.Steven J. Guttman is the founder of Storage Deluxe Management Company (“Storage Deluxe”). Founded in 1998, Storage Deluxe has developed and constructed approximately 34 self storage facilities, three fine art storage facilities, and one luxury car storage facility. Altogether, these assets comprise approximately 2.4 million net rentable sq. ft. across approximately 40,000 units. The borrower sponsor has since sold 27 of its properties, with the majority being acquired by Cube Smart. Currently, Storage Deluxe manages approximately 10 facilities in New York within Brooklyn, Manhattan, Flushing, Long Island City, Queens, New Hyde Park and The Bronx, with an additional seven properties under construction. The sponsor is constructing an additional art storage facility approximately two miles from the 33 Kings Highway Facility. See “Description of the Mortgage Pool-Mortgage Pool Characteristics—Property Types—Self Storage Properties” in the Preliminary Prospectus. |
THE INFORMATION IN THIS STRUCTURAL AND COLLATERAL TERM SHEET IS NOT COMPLETE AND MAY BE AMENDED PRIOR TO THE TIME OF SALE. THIS TERM SHEET IS NOT AN OFFER TO SELL THESE SECURITIES AND IT IS NOT A SOLICITATION OF AN OFFER TO BUY THESE SECURITIES IN ANY JURISDICTION WHERE THE OFFER OR SALE IS NOT PERMITTED.
127
The depositor has filed a registration statement (including the prospectus) with the Securities and Exchange Commission (File No. 333-206705) for the offering to which this communication relates. Before you invest, you should read the prospectus in the registration statement and other documents the depositor has filed with the Securities and Exchange Commission for more complete information about the depositor, the issuing entity and this offering. You may get these documents for free by visiting EDGAR on the Securities and Exchange Commission website at www.sec.gov. Alternatively, the depositor or Deutsche Bank Securities Inc., any other underwriter, or any dealer participating in this offering will arrange to send you the prospectus if you request it by calling toll-free 1-800-503-4611 or by emailing: prospectus.cpdg@db.com. The offered certificates referred to in these materials, and the asset pool backing them, are subject to modification or revision (including the possibility that one or more classes of certificates may be split, combined or eliminated at any time prior to issuance or availability of a final prospectus) and are offered on a “when, as and if issued” basis. You understand that, when you are considering the purchase of these certificates, a contract of sale will come into being no sooner than the date on which the relevant class has been priced and we have verified the allocation of certificates to be made to you; any “indications of interest” expressed by you, and any “soft circles” generated by us, will not create binding contractual obligations for you or us.
This free writing prospectus does not contain all information that is required to be included in the prospectus.
STATEMENT REGARDING ASSUMPTIONS AS TO SECURITIES, PRICING ESTIMATES AND OTHER INFORMATION
This material is for your information, and none of Deutsche Bank Securities Inc., Citigroup Global Markets Inc., J.P. Morgan Securities LLC, Academy Securities, Inc. or any other underwriter (the “Underwriters”) are soliciting any action based upon it. This material is not to be construed as an offer to sell or the solicitation of any offer to buy any security in any jurisdiction where such an offer or solicitation would be illegal.
Neither this document nor anything contained herein shall form the basis for any contract or commitment whatsoever. The information contained herein is preliminary as of the date hereof. These materials are subject to change, completion or amendment from time to time. The information contained herein will be superseded by similar information delivered to you as part of the preliminary prospectus relating to the CD 2017-CD4 Mortgage Trust, Commercial Mortgage Pass-Through Certificates, Series 2017-CD4 (the “Offering Document”). The information contained herein supersedes any such information previously delivered and should be reviewed only in conjunction with the entire Offering Document. All of the information contained herein is subject to the same limitations and qualifications contained in the Offering Document. The information contained herein does not contain all relevant information relating to the underlying mortgage loans or mortgaged properties. Such information is described elsewhere in the Offering Document. The information contained herein will be more fully described elsewhere in the Offering Document. The information contained herein should not be viewed as projections, forecasts, predictions or opinions with respect to value. Prior to making any investment decision, prospective investors are strongly urged to read the Offering Document its entirety. Neither the Securities and Exchange Commission nor any state securities commission has approved or disapproved of these securities or determined if this free writing prospectus is truthful or complete. Any representation to the contrary is a criminal offense.
The attached information contains certain tables and other statistical analyses (the “Computational Materials”) which have been prepared in reliance upon information furnished by the Mortgage Loan Sellers. Numerous assumptions were used in preparing the Computational Materials, which may or may not be reflected herein. As such, no assurance can be given as to the Computational Materials’ accuracy, appropriateness or completeness in any particular context; or as to whether the Computational Materials and/or the assumptions upon which they are based reflect present market conditions or future market performance. The Computational Materials should not be construed as either projections or predictions or as legal, tax, financial or accounting advice. You should consult your own counsel, accountant and other advisors as to the legal, tax, business, financial and related aspects of a purchase of these securities. Any weighted average lives, yields and principal payment periods shown in the Computational Materials are based on prepayment and/or loss assumptions, and changes in such prepayment and/or loss assumptions may dramatically affect such weighted average lives, yields and principal payment periods. In addition, it is possible that prepayments or losses on the underlying assets will occur at rates higher or lower than the rates shown in the attached Computational Materials. The specific characteristics of the securities may differ from those shown in the Computational Materials due to differences between the final underlying assets and the preliminary underlying assets used in preparing the Computational Materials. The principal amount and designation of any security described in the Computational Materials are subject to change prior to issuance. None of Underwriters or any of their respective affiliates makes any representation or warranty as to the actual rate or timing of payments or losses on any of the underlying assets or the payments or yield on the securities.
This document contains forward-looking statements. Those statements are subject to certain risks and uncertainties that could cause the success of collections and the actual cash flow generated to differ materially from the information set forth herein. While such information reflects projections prepared in good faith based upon methods and data that are believed to be reasonable and accurate as of the dates thereof, the depositor undertakes no obligation to revise these forward-looking statements to reflect subsequent events or circumstances. Individuals should not place undue reliance on forward-looking statements and are advised to make their own independent analysis and determination with respect to the forecasted periods, which reflect the issuer’s view only as of the date hereof.
IMPORTANT NOTICE RELATING TO AUTOMATICALLY GENERATED EMAIL DISCLAIMERS
Any legends, disclaimers or other notices that may appear at the bottom of the email communication to which this free writing prospectus is attached relating to (1) these materials not constituting an offer (or a solicitation of an offer), (2) no representation being made that these materials are accurate or complete and may not be updated or (3) these materials possibly being confidential, are not applicable to these materials and should be disregarded. Such legends, disclaimers or other notices have been automatically generated as a result of these materials having been sent via Bloomberg or another system.
128