
Q3 2021 Conference Call Exhibit 99.2
Forward-Looking Statements This communication contains forward-looking statements within the meaning of the U.S. federal securities laws. Forward-looking statements include, without limitation, statements concerning plans, estimates, calculations, forecasts and projections with respect to the anticipated future performance of the Company. These statements are often, but not always, made through the use of words or phrases such as ‘‘may’’, ‘‘might’’, ‘‘should’’, ‘‘could’’, ‘‘predict’’, ‘‘potential’’, ‘‘believe’’, ‘‘expect’’, ‘‘continue’’, ‘‘will’’, ‘‘anticipate’’, ‘‘seek’’, ‘‘estimate’’, ‘‘intend’’, ‘‘plan’’, ‘‘projection’’, ‘‘would’’, ‘‘annualized’’, “target” and ‘‘outlook’’, or the negative version of those words or other comparable words or phrases of a future or forward-looking nature. Forward-looking statements involve estimates and known and unknown risks, and reflect various assumptions and involve elements of subjective judgement and analysis, which may or may not prove to be correct, and which are subject to uncertainties and contingencies outside the control of Byline and its respective affiliates, directors, employees and other representatives, which could cause actual results to differ materially from those presented in this communication. The COVID-19 pandemic is adversely affecting us, our employees, customers, counterparties and third-party service providers, and the ultimate extent of the impacts on our business, financial position, results of operations, liquidity, and prospects is uncertain. Deterioration in general business and economic conditions, including increases in unemployment rates or turbulence in U.S. or global financial markets, could adversely affect our revenues and the values of our assets and liabilities, reduce the availability of funding, and lead to a tightening of credit and further increase stock price volatility. In addition, changes to statutes, regulations, or regulatory policies or practices as a result of, or in response to COVID-19, could affect us in substantial and unpredictable ways. No representations, warranties or guarantees are or will be made by Byline as to the reliability, accuracy or completeness of any forward-looking statements contained in this communication or that such forward-looking statements are or will remain based on reasonable assumptions. You should not place undue reliance on any forward-looking statements contained in this communication. Certain risks and important factors that could affect Byline’s future results are identified in our Annual Report on Form 10-K and other reports we file with the Securities and Exchange Commission, including among other things under the heading “Risk Factors” in our Annual Report on Form 10-K for the year ended December 31, 2020. Any forward-looking statement speaks only as of the date on which it is made, and Byline undertakes no obligation to update any forward-looking statement, whether to reflect events or circumstances after the date on which the statement is made, to reflect new information or the occurrence of unanticipated events, or otherwise unless required under the federal securities laws. Due to rounding, numbers presented throughout this document may not add up precisely to the totals provided and percentages may not precisely reflect the absolute figures.
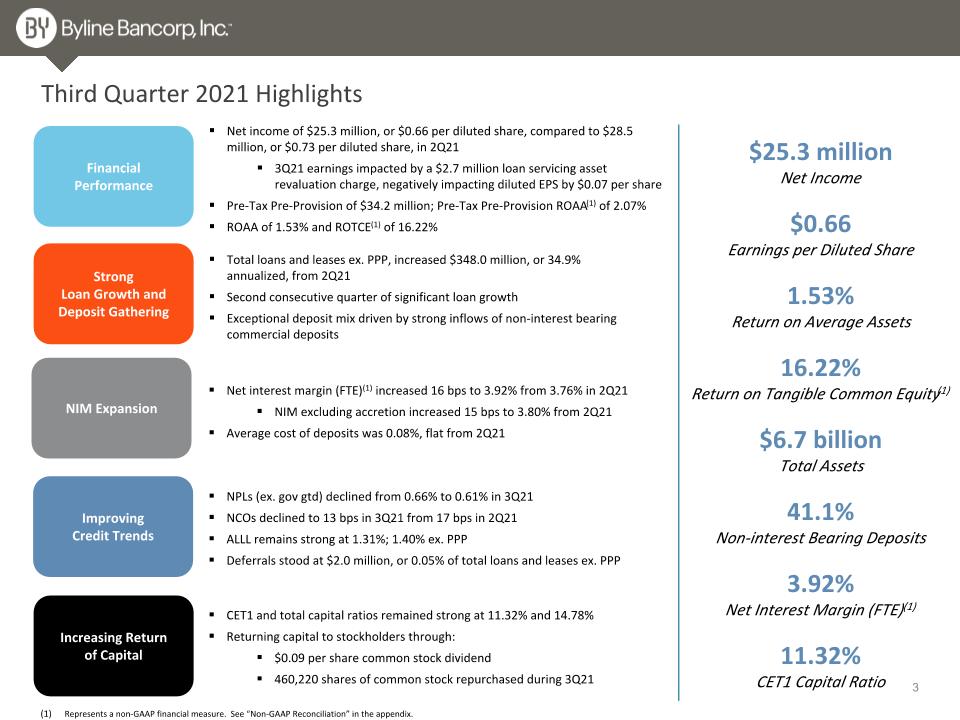
Third Quarter 2021 Highlights Strong Loan Growth and Deposit Gathering Financial Performance Improving Credit Trends Increasing Return of Capital Represents a non-GAAP financial measure. See “Non-GAAP Reconciliation” in the appendix. Net income of $25.3 million, or $0.66 per diluted share, compared to $28.5 million, or $0.73 per diluted share, in 2Q21 3Q21 earnings impacted by a $2.7 million loan servicing asset revaluation charge, negatively impacting diluted EPS by $0.07 per share Pre-Tax Pre-Provision of $34.2 million; Pre-Tax Pre-Provision ROAA(1) of 2.07% ROAA of 1.53% and ROTCE(1) of 16.22% Total loans and leases ex. PPP, increased $348.0 million, or 34.9% annualized, from 2Q21 Second consecutive quarter of significant loan growth Exceptional deposit mix driven by strong inflows of non-interest bearing commercial deposits NIM Expansion $25.3 million Net Income $0.66 Earnings per Diluted Share 1.53% Return on Average Assets 16.22% Return on Tangible Common Equity(1) $6.7 billion Total Assets 41.1% Non-interest Bearing Deposits 3.92% Net Interest Margin (FTE)(1) 11.32% CET1 Capital Ratio Net interest margin (FTE)(1) increased 16 bps to 3.92% from 3.76% in 2Q21 NIM excluding accretion increased 15 bps to 3.80% from 2Q21 Average cost of deposits was 0.08%, flat from 2Q21 NPLs (ex. gov gtd) declined from 0.66% to 0.61% in 3Q21 NCOs declined to 13 bps in 3Q21 from 17 bps in 2Q21 ALLL remains strong at 1.31%; 1.40% ex. PPP Deferrals stood at $2.0 million, or 0.05% of total loans and leases ex. PPP CET1 and total capital ratios remained strong at 11.32% and 14.78% Returning capital to stockholders through: $0.09 per share common stock dividend 460,220 shares of common stock repurchased during 3Q21
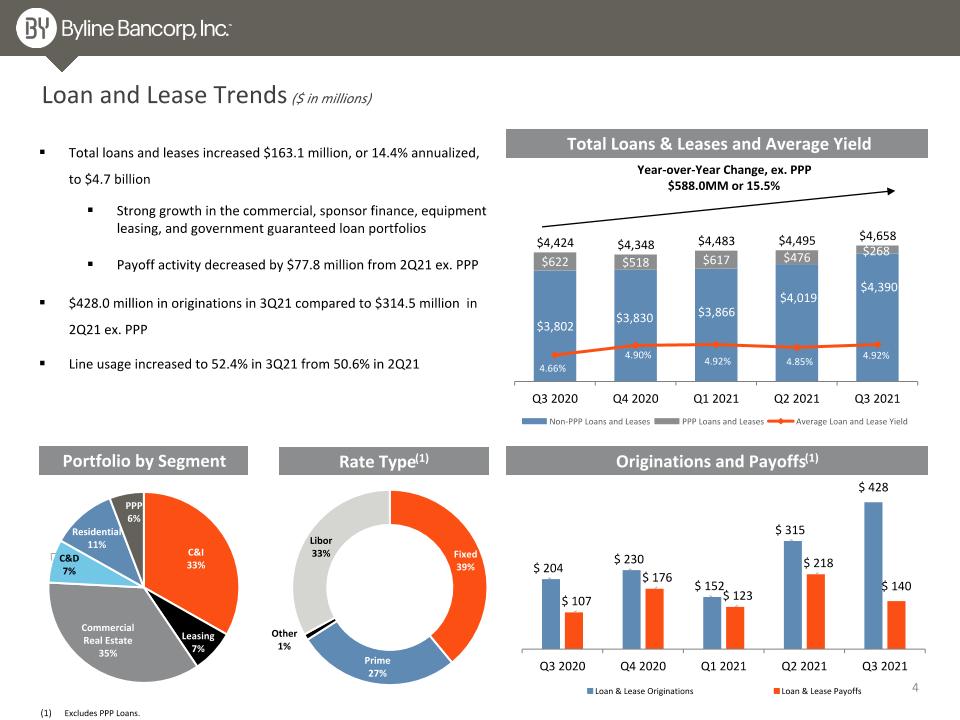
Loan and Lease Trends ($ in millions) Originations and Payoffs(1) Portfolio by Segment Total Loans & Leases and Average Yield Total loans and leases increased $163.1 million, or 14.4% annualized, to $4.7 billion Strong growth in the commercial, sponsor finance, equipment leasing, and government guaranteed loan portfolios Payoff activity decreased by $77.8 million from 2Q21 ex. PPP $428.0 million in originations in 3Q21 compared to $314.5 million in 2Q21 ex. PPP Line usage increased to 52.4% in 3Q21 from 50.6% in 2Q21 Rate Type(1) Year-over-Year Change, ex. PPP $588.0MM or 15.5% Excludes PPP Loans.
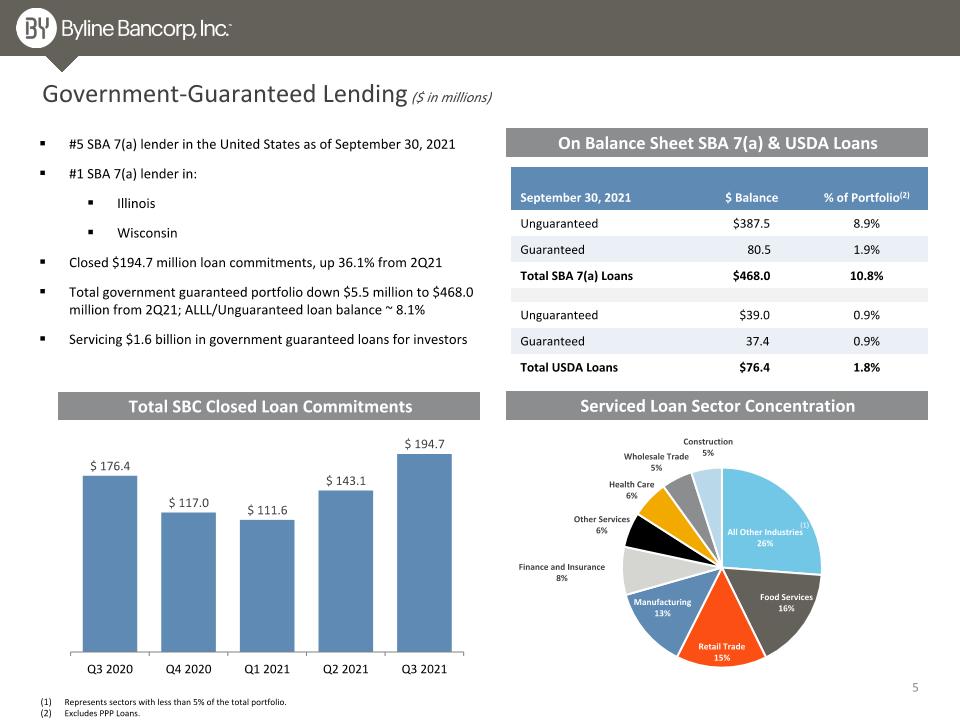
Government-Guaranteed Lending ($ in millions) On Balance Sheet SBA 7(a) & USDA Loans #5 SBA 7(a) lender in the United States as of September 30, 2021 #1 SBA 7(a) lender in: Illinois Wisconsin Closed $194.7 million loan commitments, up 36.1% from 2Q21 Total government guaranteed portfolio down $5.5 million to $468.0 million from 2Q21; ALLL/Unguaranteed loan balance ~ 8.1% Servicing $1.6 billion in government guaranteed loans for investors Serviced Loan Sector Concentration Total SBC Closed Loan Commitments September 30, 2021 $ Balance % of Portfolio(2) Unguaranteed $387.5 8.9% Guaranteed 80.5 1.9% Total SBA 7(a) Loans $468.0 10.8% Unguaranteed $39.0 0.9% Guaranteed 37.4 0.9% Total USDA Loans $76.4 1.8% (1) (1) Represents sectors with less than 5% of the total portfolio. Excludes PPP Loans.
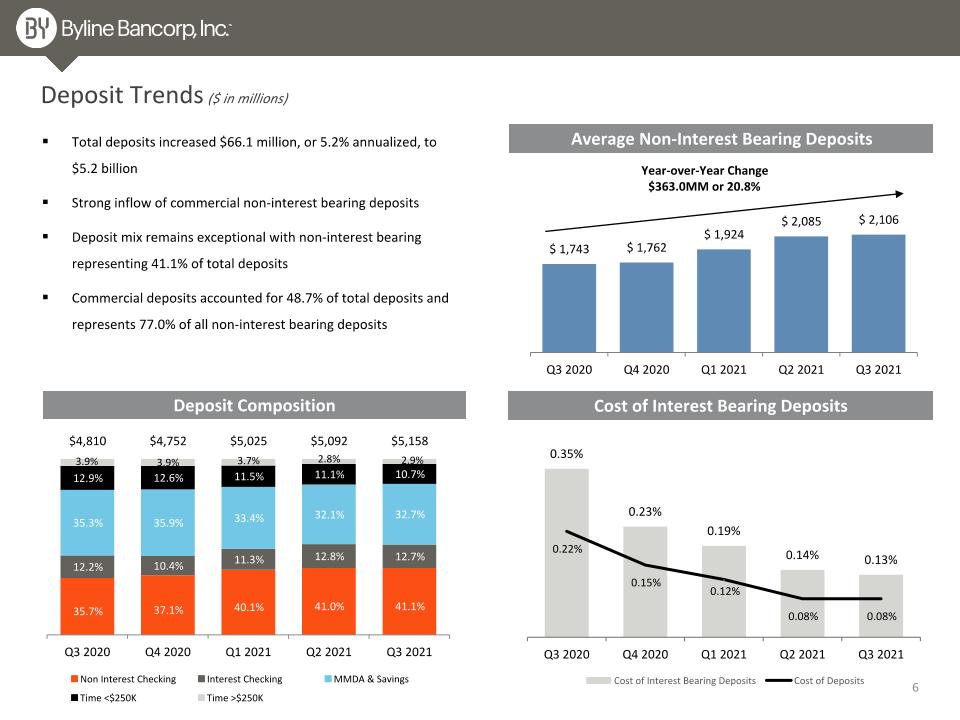
Total deposits increased $66.1 million, or 5.2% annualized, to $5.2 billion Strong inflow of commercial non-interest bearing deposits Deposit mix remains exceptional with non-interest bearing representing 41.1% of total deposits Commercial deposits accounted for 48.7% of total deposits and represents 77.0% of all non-interest bearing deposits Deposit Trends ($ in millions) Average Non-Interest Bearing Deposits Deposit Composition Cost of Interest Bearing Deposits Year-over-Year Change $363.0MM or 20.8%
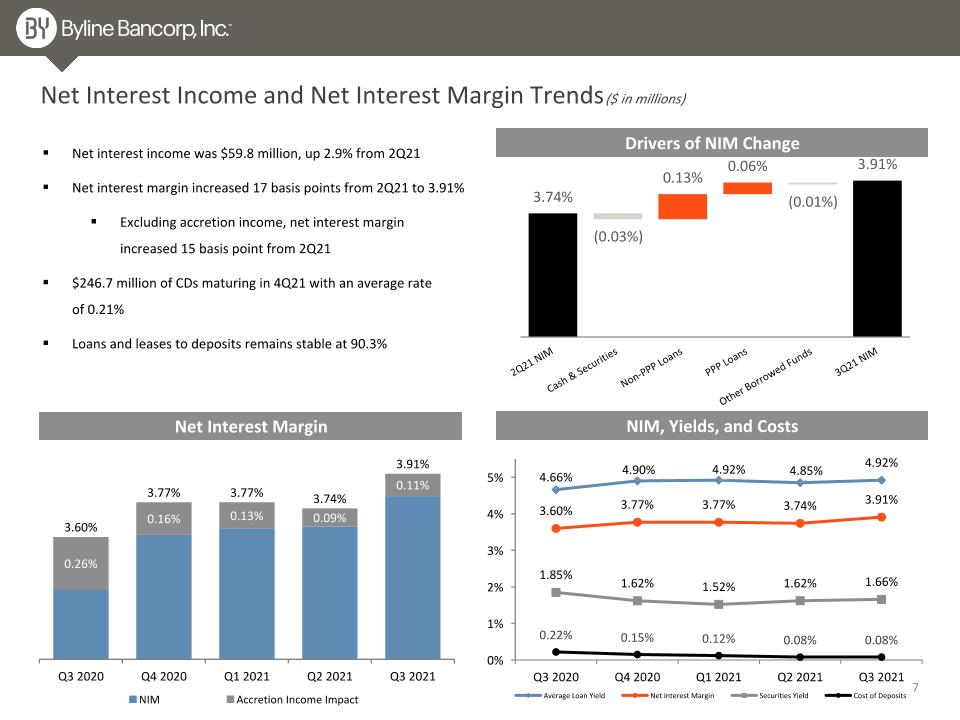
Net Interest Income and Net Interest Margin Trends ($ in millions) Net interest income was $59.8 million, up 2.9% from 2Q21 Net interest margin increased 17 basis points from 2Q21 to 3.91% Excluding accretion income, net interest margin increased 15 basis point from 2Q21 $246.7 million of CDs maturing in 4Q21 with an average rate of 0.21% Loans and leases to deposits remains stable at 90.3% Net Interest Margin Drivers of NIM Change NIM, Yields, and Costs
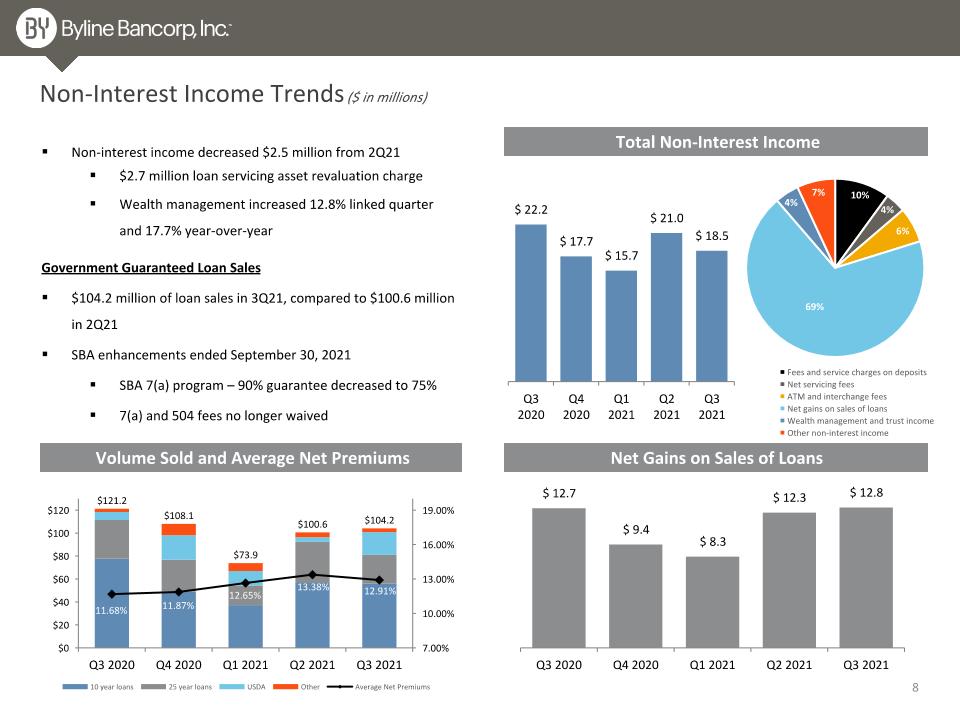
Total Non-Interest Income Non-Interest Income Trends ($ in millions) Non-interest income decreased $2.5 million from 2Q21 $2.7 million loan servicing asset revaluation charge Wealth management increased 12.8% linked quarter and 17.7% year-over-year Volume Sold and Average Net Premiums Net Gains on Sales of Loans Government Guaranteed Loan Sales $104.2 million of loan sales in 3Q21, compared to $100.6 million in 2Q21 SBA enhancements ended September 30, 2021 SBA 7(a) program – 90% guarantee decreased to 75% 7(a) and 504 fees no longer waived
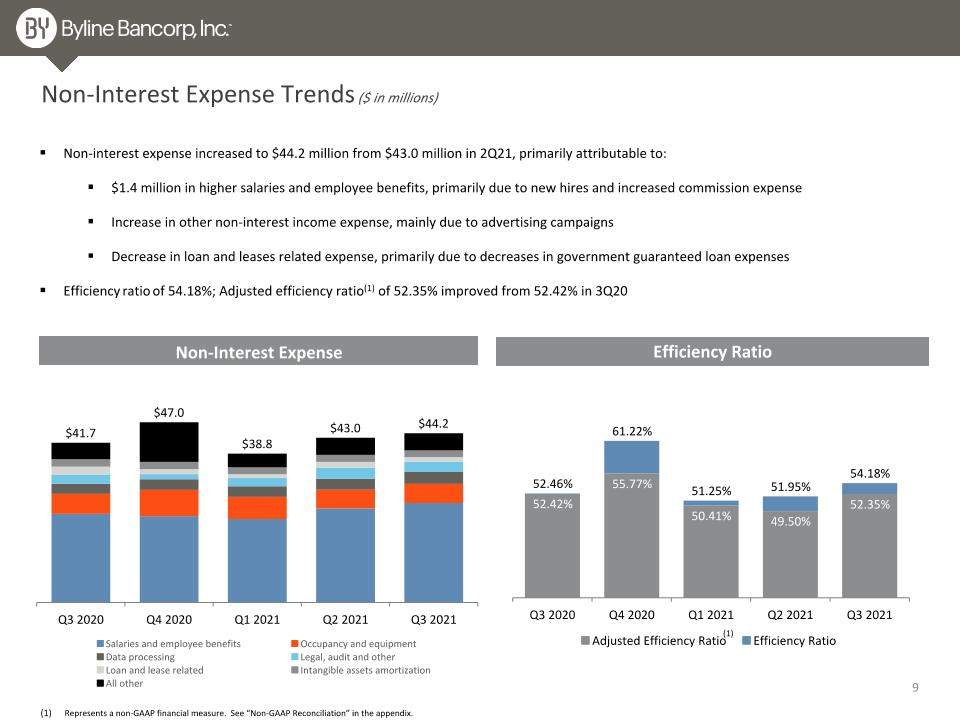
Non-Interest Expense Trends ($ in millions) Non-interest expense increased to $44.2 million from $43.0 million in 2Q21, primarily attributable to: $1.4 million in higher salaries and employee benefits, primarily due to new hires and increased commission expense Increase in other non-interest income expense, mainly due to advertising campaigns Decrease in loan and leases related expense, primarily due to decreases in government guaranteed loan expenses Efficiency ratio of 54.18%; Adjusted efficiency ratio(1) of 52.35% improved from 52.42% in 3Q20 Efficiency Ratio Non-Interest Expense (1) Represents a non-GAAP financial measure. See “Non-GAAP Reconciliation” in the appendix.
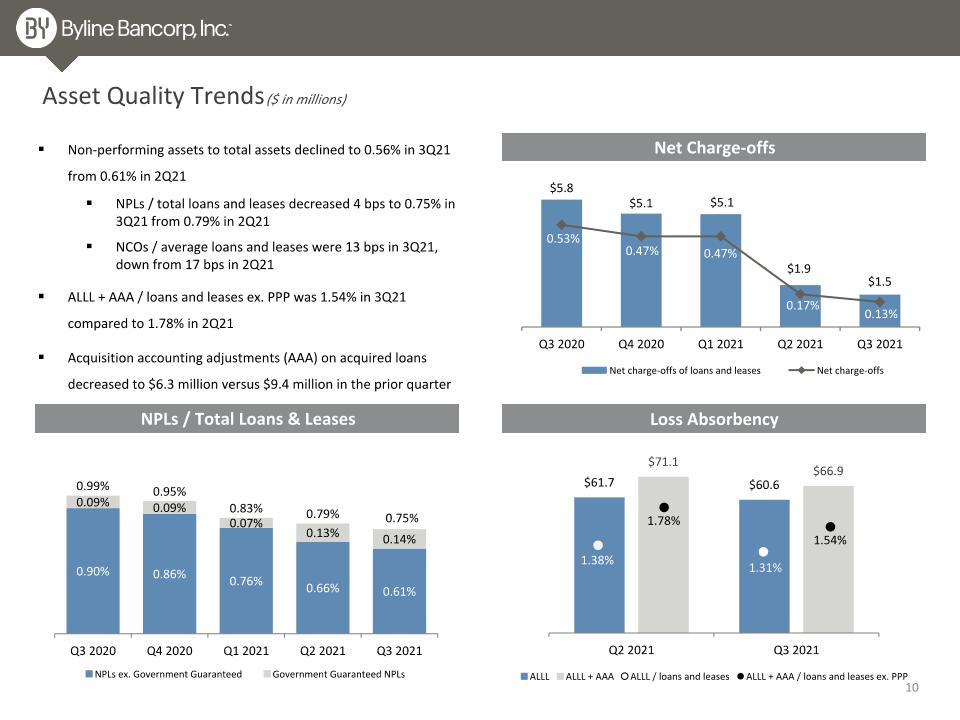
Asset Quality Trends ($ in millions) NPLs / Total Loans & Leases Loss Absorbency 1.31% 1.54% 1.38% 1.78% Net Charge-offs Non-performing assets to total assets declined to 0.56% in 3Q21 from 0.61% in 2Q21 NPLs / total loans and leases decreased 4 bps to 0.75% in 3Q21 from 0.79% in 2Q21 NCOs / average loans and leases were 13 bps in 3Q21, down from 17 bps in 2Q21 ALLL + AAA / loans and leases ex. PPP was 1.54% in 3Q21 compared to 1.78% in 2Q21 Acquisition accounting adjustments (AAA) on acquired loans decreased to $6.3 million versus $9.4 million in the prior quarter
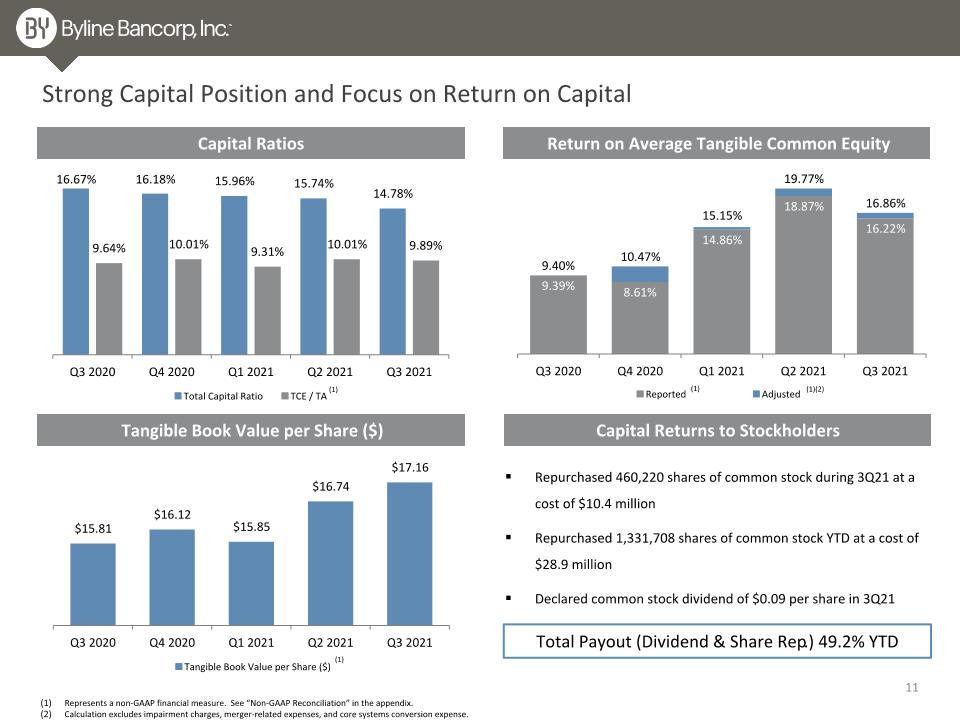
Project Sox Offer Migration Strong Capital Position and Focus on Return on Capital Capital Ratios Return on Average Tangible Common Equity (1) Tangible Book Value per Share ($) (1) (1) Repurchased 460,220 shares of common stock during 3Q21 at a cost of $10.4 million Repurchased 1,331,708 shares of common stock YTD at a cost of $28.9 million Declared common stock dividend of $0.09 per share in 3Q21 Total Payout (Dividend & Share Rep.) 49.2% YTD (1)(2) Represents a non-GAAP financial measure. See “Non-GAAP Reconciliation” in the appendix. Calculation excludes impairment charges, merger-related expenses, and core systems conversion expense. Capital Returns to Stockholders
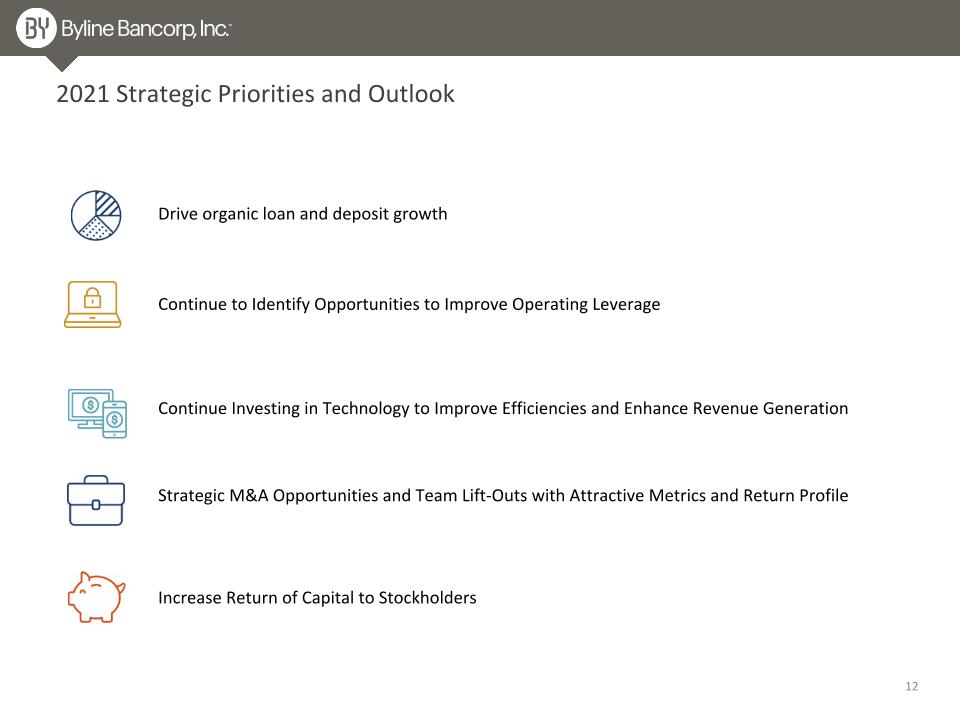
2021 Strategic Priorities and Outlook Drive organic loan and deposit growth Continue Investing in Technology to Improve Efficiencies and Enhance Revenue Generation Strategic M&A Opportunities and Team Lift-Outs with Attractive Metrics and Return Profile Increase Return of Capital to Stockholders Continue to Identify Opportunities to Improve Operating Leverage
Appendix
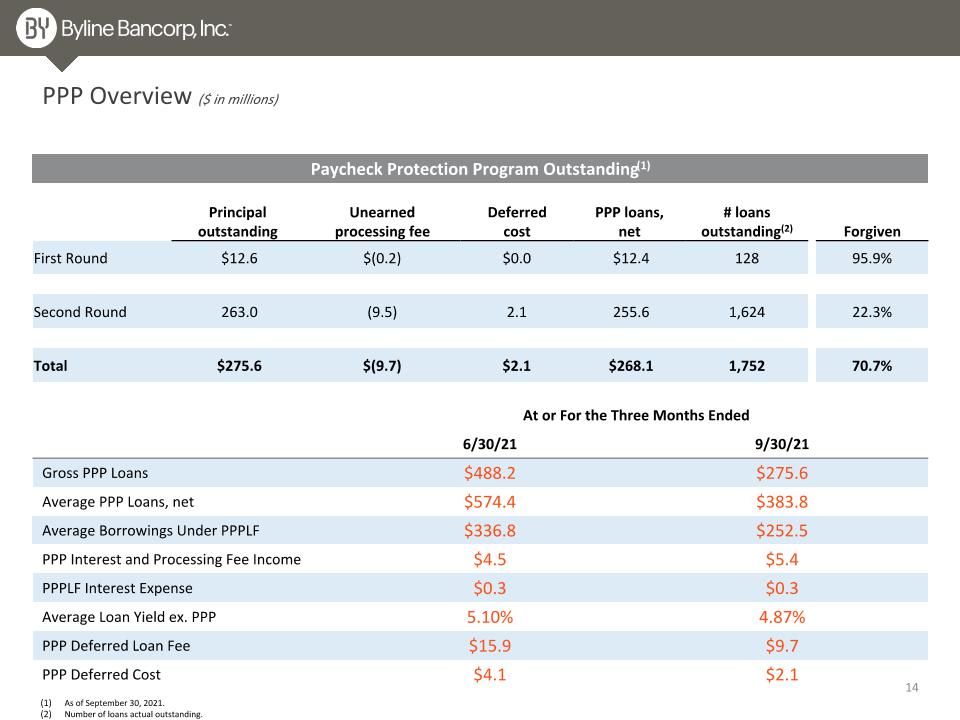
At or For the Three Months Ended 6/30/21 9/30/21 Gross PPP Loans $488.2 $275.6 Average PPP Loans, net $574.4 $383.8 Average Borrowings Under PPPLF $336.8 $252.5 PPP Interest and Processing Fee Income $4.5 $5.4 PPPLF Interest Expense $0.3 $0.3 Average Loan Yield ex. PPP 5.10% 4.87% PPP Deferred Loan Fee $15.9 $9.7 PPP Deferred Cost $4.1 $2.1 Project Sox Offer Migration Paycheck Protection Program Outstanding(1) Principal outstanding Unearned processing fee Deferred cost PPP loans, net # loans outstanding(2) Forgiven First Round $12.6 $(0.2) $0.0 $12.4 128 95.9% Second Round 263.0 (9.5) 2.1 255.6 1,624 22.3% Total $275.6 $(9.7) $2.1 $268.1 1,752 70.7% As of September 30, 2021. Number of loans actual outstanding. PPP Overview ($ in millions)
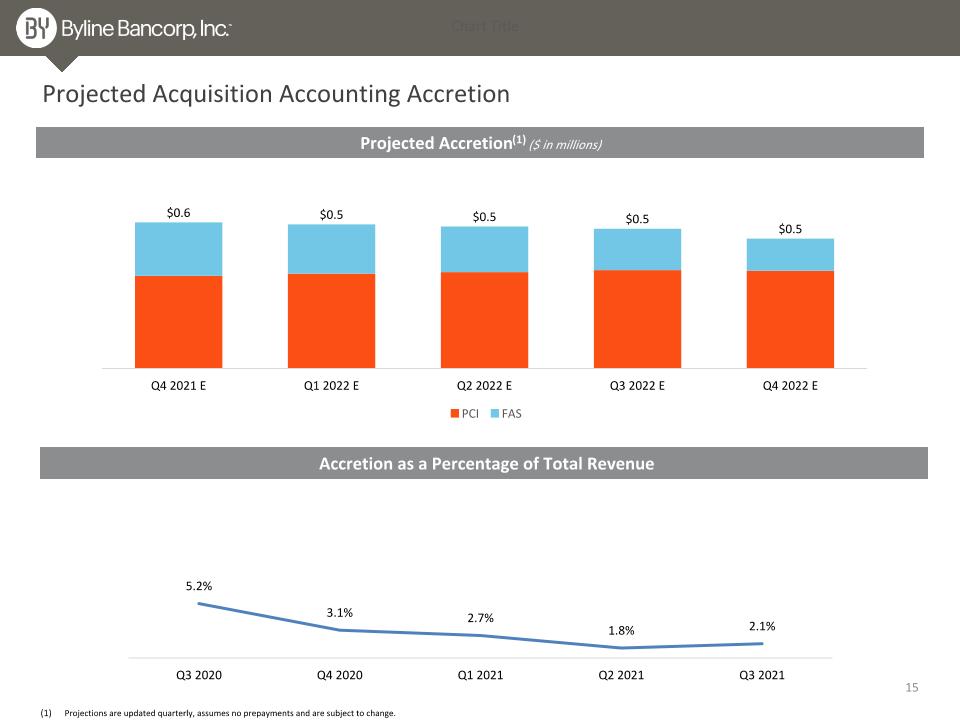
Projected Acquisition Accounting Accretion Projected Accretion(1) ($ in millions) Accretion as a Percentage of Total Revenue Projections are updated quarterly, assumes no prepayments and are subject to change.
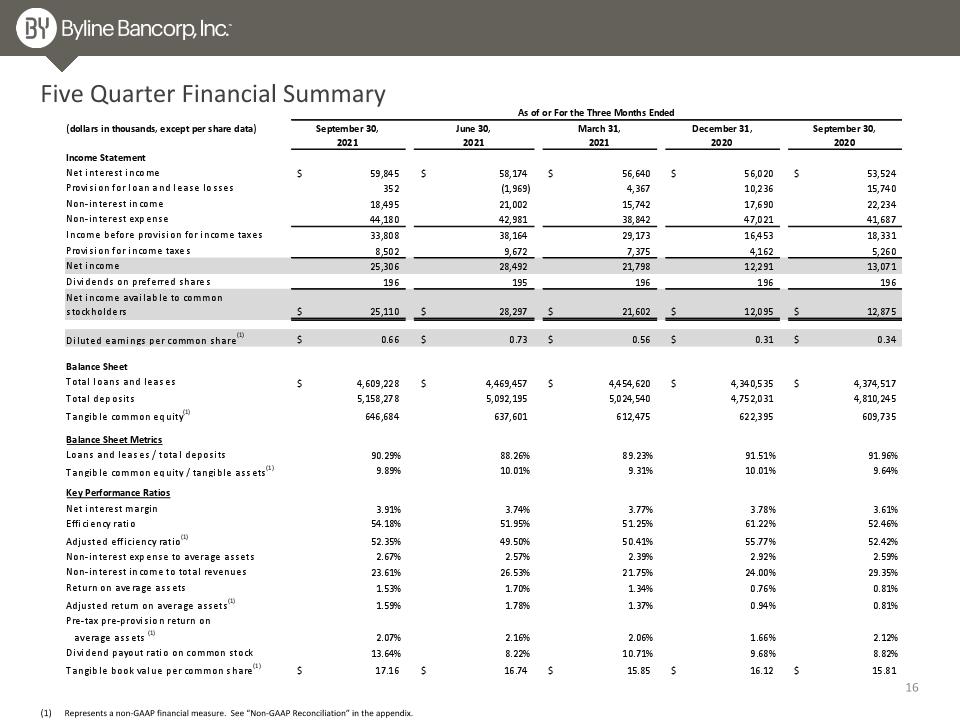
Five Quarter Financial Summary Represents a non-GAAP financial measure. See “Non-GAAP Reconciliation” in the appendix.
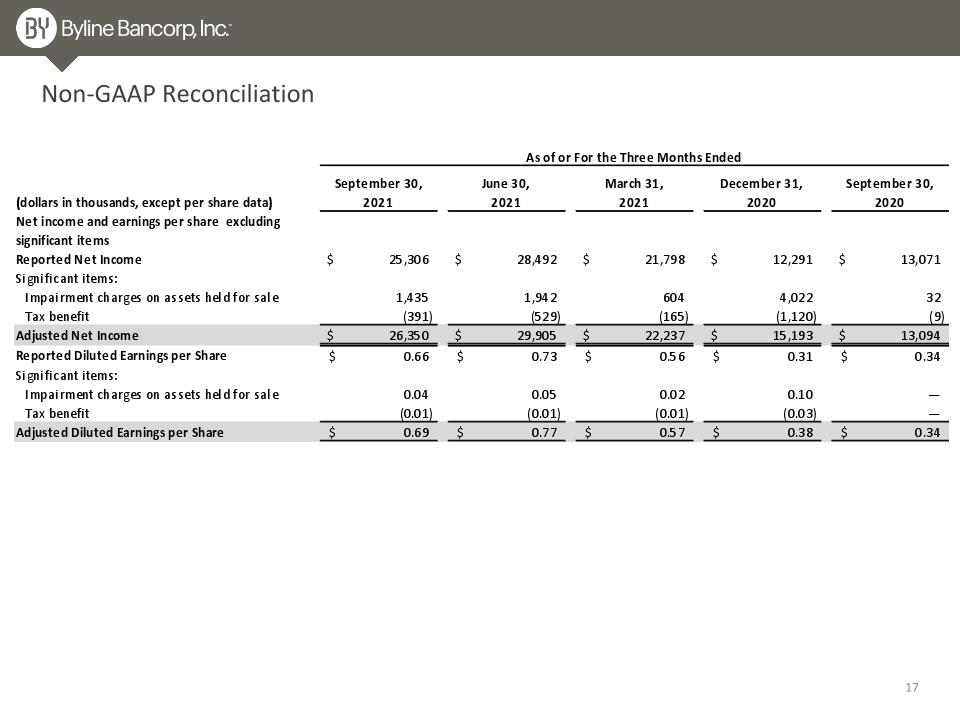
Non-GAAP Reconciliation
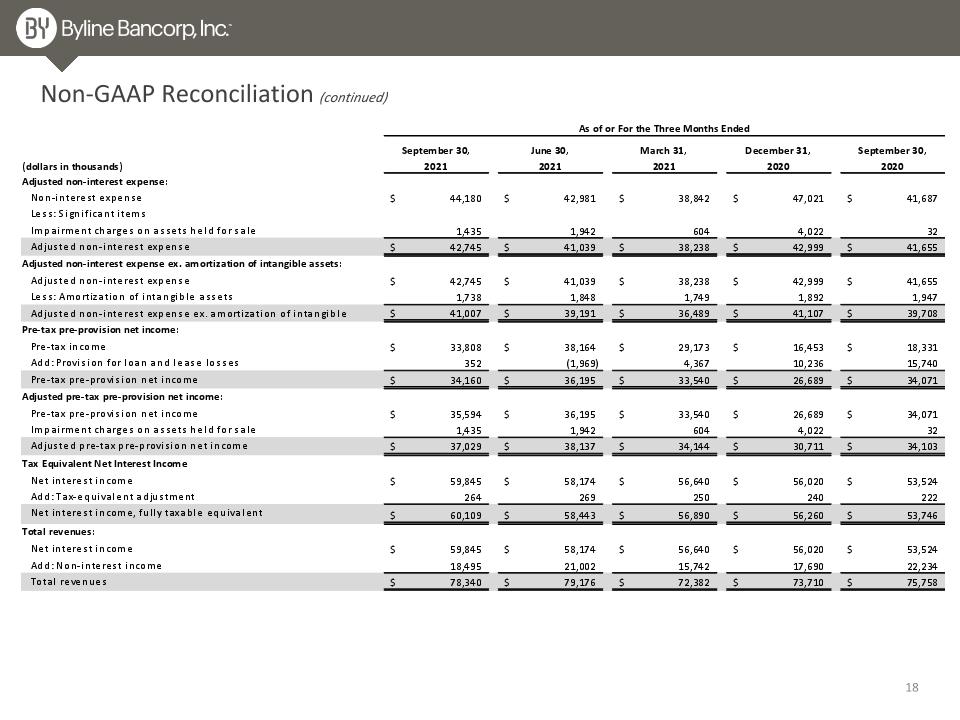
Non-GAAP Reconciliation (continued)
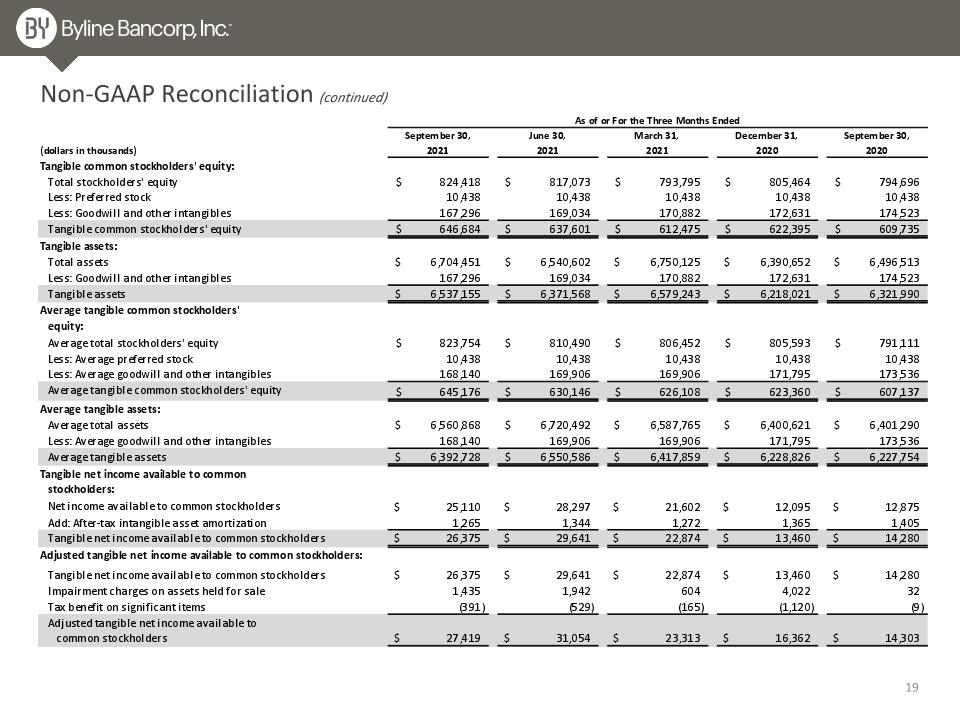
Non-GAAP Reconciliation (continued)
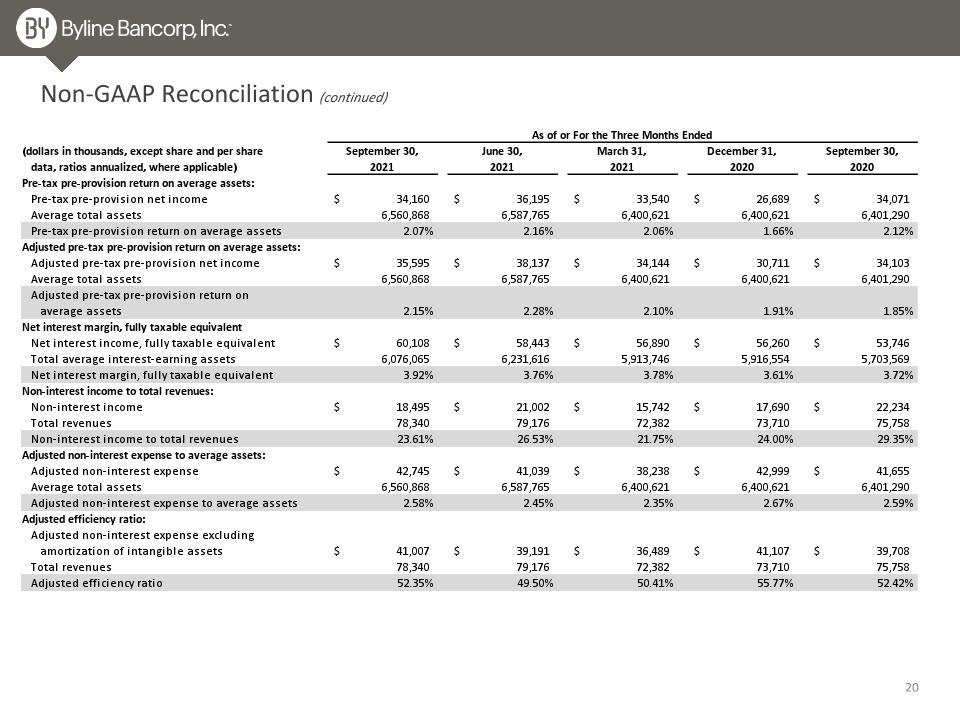
Non-GAAP Reconciliation (continued)
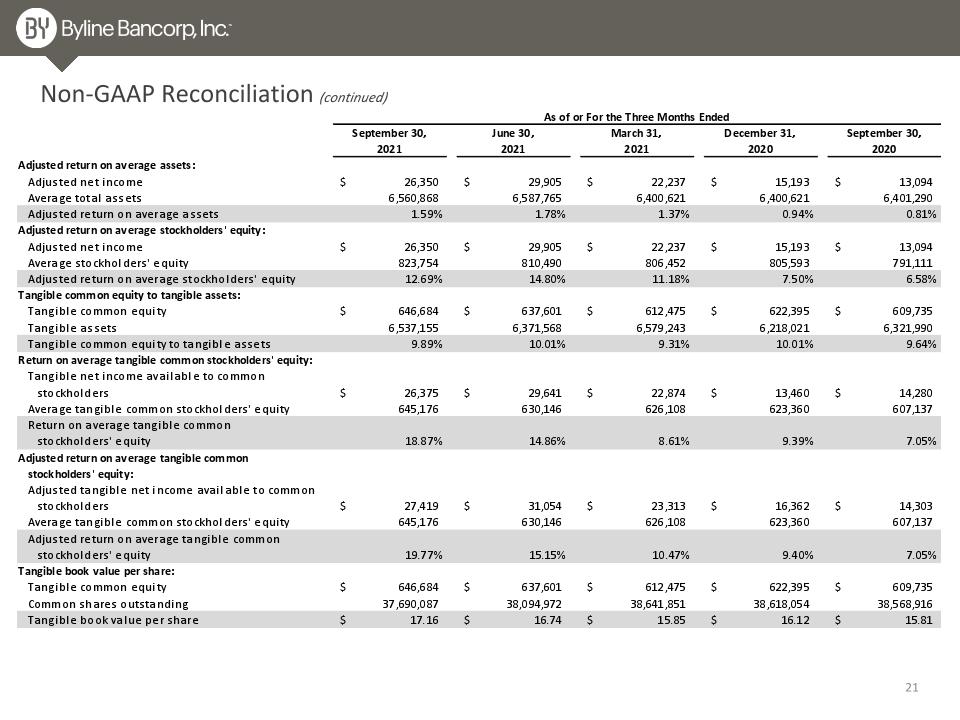
Non-GAAP Reconciliation (continued)
