
Investor Presentation – June 2022 Exhibit 99.1
Forward-Looking Statements This communication contains forward-looking statements within the meaning of the U.S. federal securities laws. Forward-looking statements include, without limitation, statements concerning plans, estimates, calculations, forecasts and projections with respect to the anticipated future performance of the Company. These statements are often, but not always, made through the use of words or phrases such as ‘‘may’’, ‘‘might’’, ‘‘should’’, ‘‘could’’, ‘‘predict’’, ‘‘potential’’, ‘‘believe’’, ‘‘expect’’, ‘‘continue’’, ‘‘will’’, ‘‘anticipate’’, ‘‘seek’’, ‘‘estimate’’, ‘‘intend’’, ‘‘plan’’, ‘‘projection’’, ‘‘would’’, ‘‘annualized’’, “target” and ‘‘outlook’’, or the negative version of those words or other comparable words or phrases of a future or forward-looking nature. Forward-looking statements involve estimates and known and unknown risks, and reflect various assumptions and involve elements of subjective judgement and analysis, which may or may not prove to be correct, and which are subject to uncertainties and contingencies outside the control of Byline and its respective affiliates, directors, employees and other representatives, which could cause actual results to differ materially from those presented in this communication. No representations, warranties or guarantees are or will be made by Byline as to the reliability, accuracy or completeness of any forward-looking statements contained in this communication or that such forward-looking statements are or will remain based on reasonable assumptions. You should not place undue reliance on any forward-looking statements contained in this communication. Certain risks and important factors that could affect Byline’s future results are identified in our Annual Report on Form 10-K and other reports we file with the Securities and Exchange Commission, including among other things under the heading “Risk Factors” in our Annual Report on Form 10-K for the year ended December 31, 2021. Any forward-looking statement speaks only as of the date on which it is made, and Byline undertakes no obligation to update any forward-looking statement, whether to reflect events or circumstances after the date on which the statement is made, to reflect new information or the occurrence of unanticipated events, or otherwise unless required under the federal securities laws. Due to rounding, numbers presented throughout this document may not add up precisely to the totals provided and percentages may not precisely reflect the absolute figures.
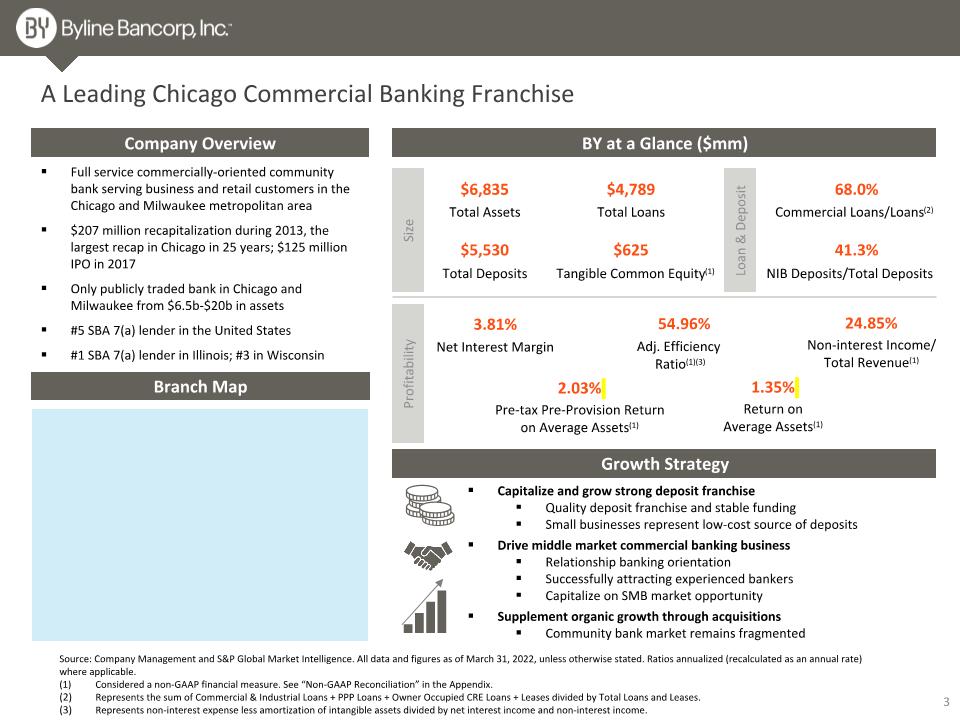
A Leading Chicago Commercial Banking Franchise Loan & Deposit BY at a Glance ($mm) Tangible Common Equity(1) Total Loans $625 $4,789 Total Deposits Total Assets $6,835 $5,530 68.0% Commercial Loans/Loans(2) 41.3% NIB Deposits/Total Deposits Adj. Efficiency Ratio(1)(3) 54.96% Size Company Overview Branch Map Full service commercially-oriented community bank serving business and retail customers in the Chicago and Milwaukee metropolitan area $207 million recapitalization during 2013, the largest recap in Chicago in 25 years; $125 million IPO in 2017 Only publicly traded bank in Chicago and Milwaukee from $6.5b-$20b in assets #5 SBA 7(a) lender in the United States #1 SBA 7(a) lender in Illinois; #3 in Wisconsin Profitability Growth Strategy Capitalize and grow strong deposit franchise Quality deposit franchise and stable funding Small businesses represent low-cost source of deposits Drive middle market commercial banking business Relationship banking orientation Successfully attracting experienced bankers Capitalize on SMB market opportunity Supplement organic growth through acquisitions Community bank market remains fragmented Net Interest Margin 3.81% 24.85% Non-interest Income/ Total Revenue(1) 2.03% Pre-tax Pre-Provision Return on Average Assets(1) 1.35% Return on Average Assets(1) Source: Company Management and S&P Global Market Intelligence. All data and figures as of March 31, 2022, unless otherwise stated. Ratios annualized (recalculated as an annual rate) where applicable. (1) Considered a non-GAAP financial measure. See “Non-GAAP Reconciliation” in the Appendix. Represents the sum of Commercial & Industrial Loans + PPP Loans + Owner Occupied CRE Loans + Leases divided by Total Loans and Leases. Represents non-interest expense less amortization of intangible assets divided by net interest income and non-interest income.
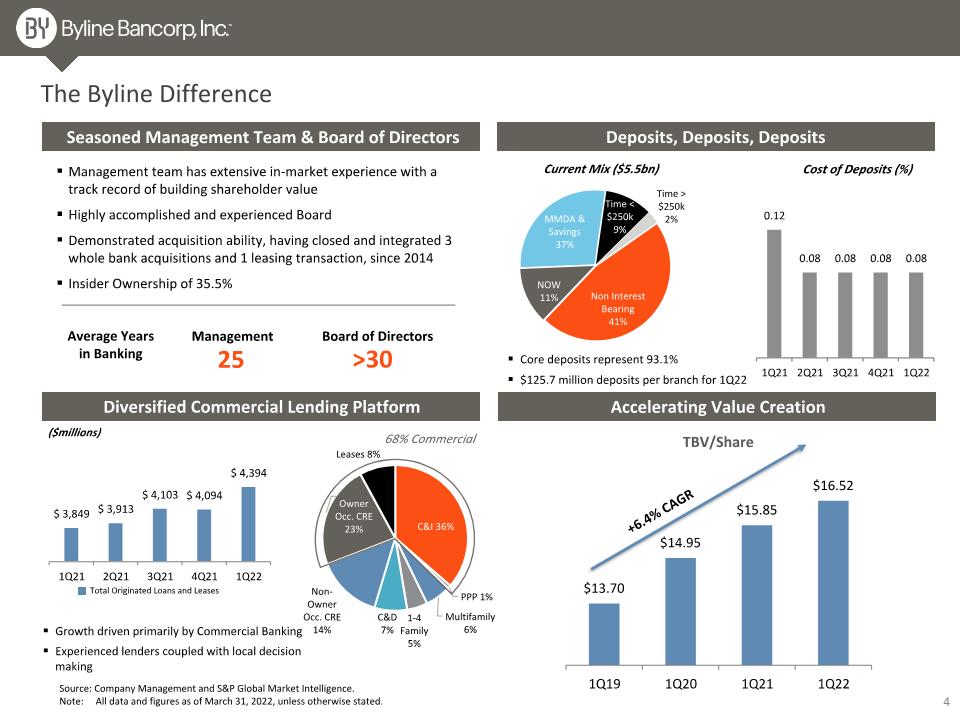
Seasoned Management Team & Board of Directors Deposits, Deposits, Deposits Accelerating Value Creation Diversified Commercial Lending Platform Management team has extensive in-market experience with a track record of building shareholder value Highly accomplished and experienced Board Demonstrated acquisition ability, having closed and integrated 3 whole bank acquisitions and 1 leasing transaction, since 2014 Insider Ownership of 35.5% Total Originated Loans and Leases The Byline Difference Core deposits represent 93.1% $125.7 million deposits per branch for 1Q22 Growth driven primarily by Commercial Banking Experienced lenders coupled with local decision making ($millions) Current Mix ($5.5bn) Cost of Deposits (%) Average Years in Banking Management Board of Directors 68% Commercial 25 >30 +6.4% CAGR Source: Company Management and S&P Global Market Intelligence. Note: All data and figures as of March 31, 2022, unless otherwise stated.
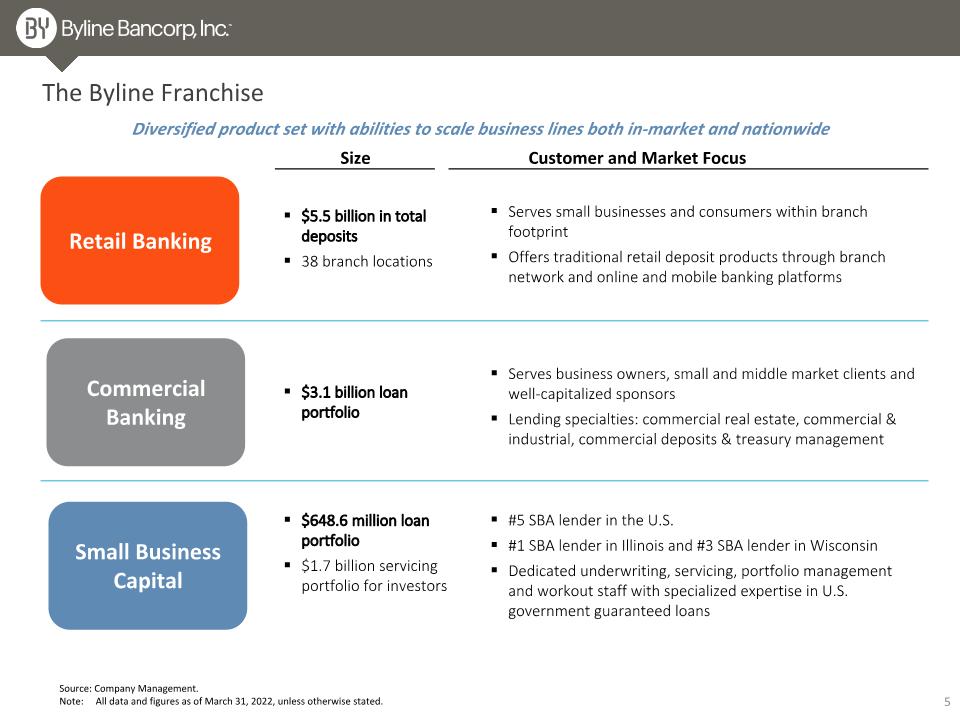
The Byline Franchise Size Customer and Market Focus $5.5 billion in total deposits 38 branch locations Serves small businesses and consumers within branch footprint Offers traditional retail deposit products through branch network and online and mobile banking platforms $3.1 billion loan portfolio Serves business owners, small and middle market clients and well-capitalized sponsors Lending specialties: commercial real estate, commercial & industrial, commercial deposits & treasury management $648.6 million loan portfolio $1.7 billion servicing portfolio for investors #5 SBA lender in the U.S. #1 SBA lender in Illinois and #3 SBA lender in Wisconsin Dedicated underwriting, servicing, portfolio management and workout staff with specialized expertise in U.S. government guaranteed loans Source: Company Management. Note: All data and figures as of March 31, 2022, unless otherwise stated. Diversified product set with abilities to scale business lines both in-market and nationwide Retail Banking Commercial Banking Small Business �Capital
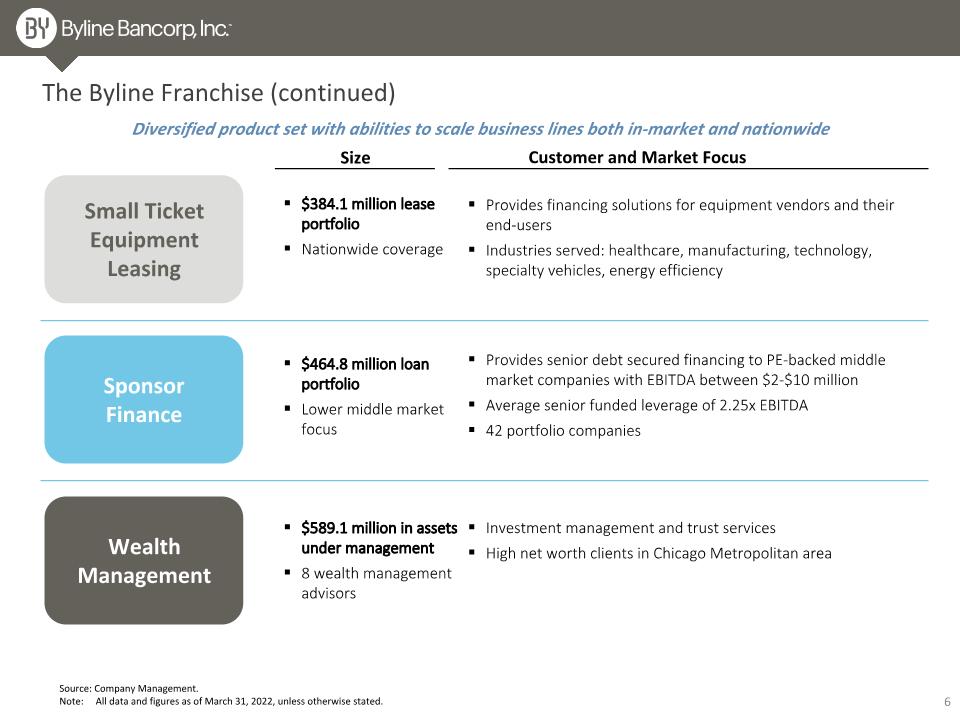
Size Customer and Market Focus $384.1 million lease portfolio Nationwide coverage Provides financing solutions for equipment vendors and their end-users Industries served: healthcare, manufacturing, technology, specialty vehicles, energy efficiency $464.8 million loan portfolio Lower middle market focus Provides senior debt secured financing to PE-backed middle market companies with EBITDA between $2-$10 million Average senior funded leverage of 2.25x EBITDA 42 portfolio companies $589.1 million in assets under management 8 wealth management advisors Investment management and trust services High net worth clients in Chicago Metropolitan area Diversified product set with abilities to scale business lines both in-market and nationwide Small Ticket�Equipment Leasing Sponsor �Finance Wealth Management The Byline Franchise (continued) Source: Company Management. Note: All data and figures as of March 31, 2022, unless otherwise stated.
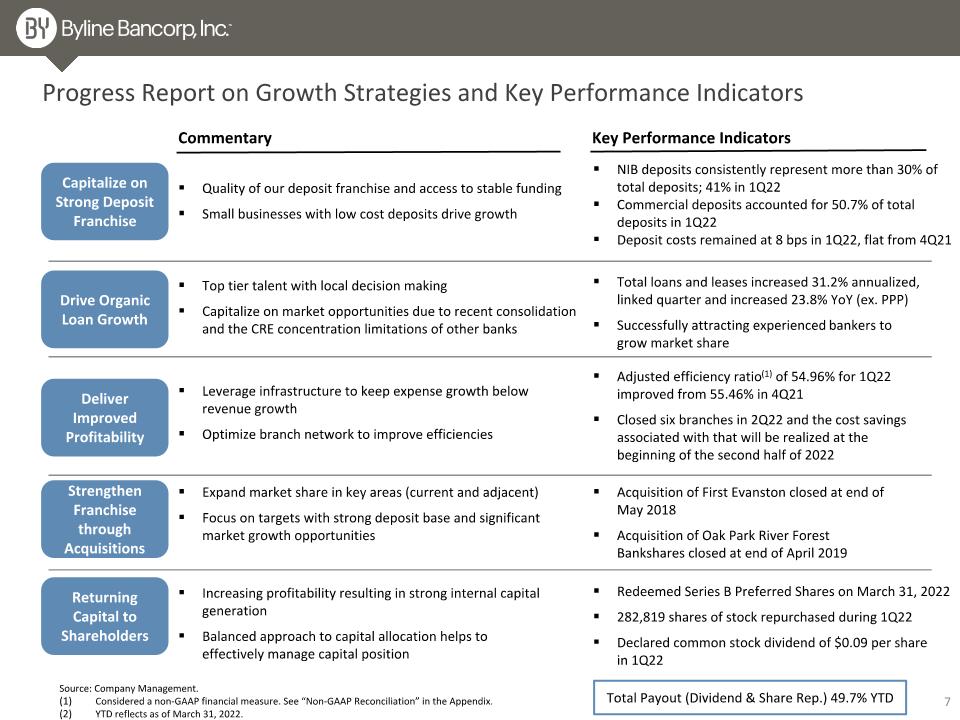
Drive Organic Loan Growth Deliver Improved Profitability Strengthen Franchise through Acquisitions Top tier talent with local decision making Capitalize on market opportunities due to recent consolidation and the CRE concentration limitations of other banks Leverage infrastructure to keep expense growth below revenue growth Optimize branch network to improve efficiencies Expand market share in key areas (current and adjacent) Focus on targets with strong deposit base and significant market growth opportunities Capitalize on Strong Deposit Franchise Quality of our deposit franchise and access to stable funding Small businesses with low cost deposits drive growth Progress Report on Growth Strategies and Key Performance Indicators Commentary Key Performance Indicators NIB deposits consistently represent more than 30% of total deposits; 41% in 1Q22 Commercial deposits accounted for 50.7% of total deposits in 1Q22 Deposit costs remained at 8 bps in 1Q22, flat from 4Q21 Total loans and leases increased 31.2% annualized, linked quarter and increased 23.8% YoY (ex. PPP) Successfully attracting experienced bankers to grow market share Adjusted efficiency ratio(1) of 54.96% for 1Q22 improved from 55.46% in 4Q21 Closed six branches in 2Q22 and the cost savings associated with that will be realized at the beginning of the second half of 2022 Acquisition of First Evanston closed at end of May 2018 Acquisition of Oak Park River Forest Bankshares closed at end of April 2019 Returning Capital to Shareholders Increasing profitability resulting in strong internal capital generation Balanced approach to capital allocation helps to effectively manage capital position Redeemed Series B Preferred Shares on March 31, 2022 282,819 shares of stock repurchased during 1Q22 Declared common stock dividend of $0.09 per share in 1Q22 Total Payout (Dividend & Share Rep.) 49.7% YTD Source: Company Management. Considered a non-GAAP financial measure. See “Non-GAAP Reconciliation” in the Appendix. YTD reflects as of March 31, 2022.
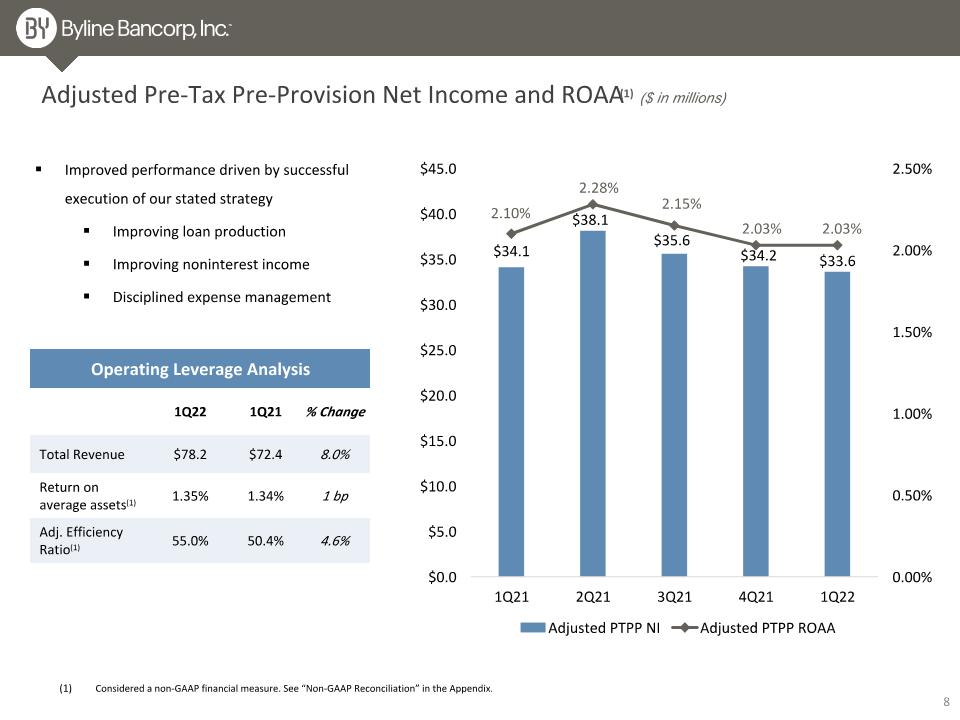
Adjusted Pre-Tax Pre-Provision Net Income and ROAA(1) ($ in millions) Improved performance driven by successful execution of our stated strategy Improving loan production Improving noninterest income Disciplined expense management Operating Leverage Analysis 1Q22 1Q21 % Change Total Revenue $78.2 $72.4 8.0% Return on average assets(1) 1.35% 1.34% 1 bp Adj. Efficiency Ratio(1) 55.0% 50.4% 4.6% Considered a non-GAAP financial measure. See “Non-GAAP Reconciliation” in the Appendix.
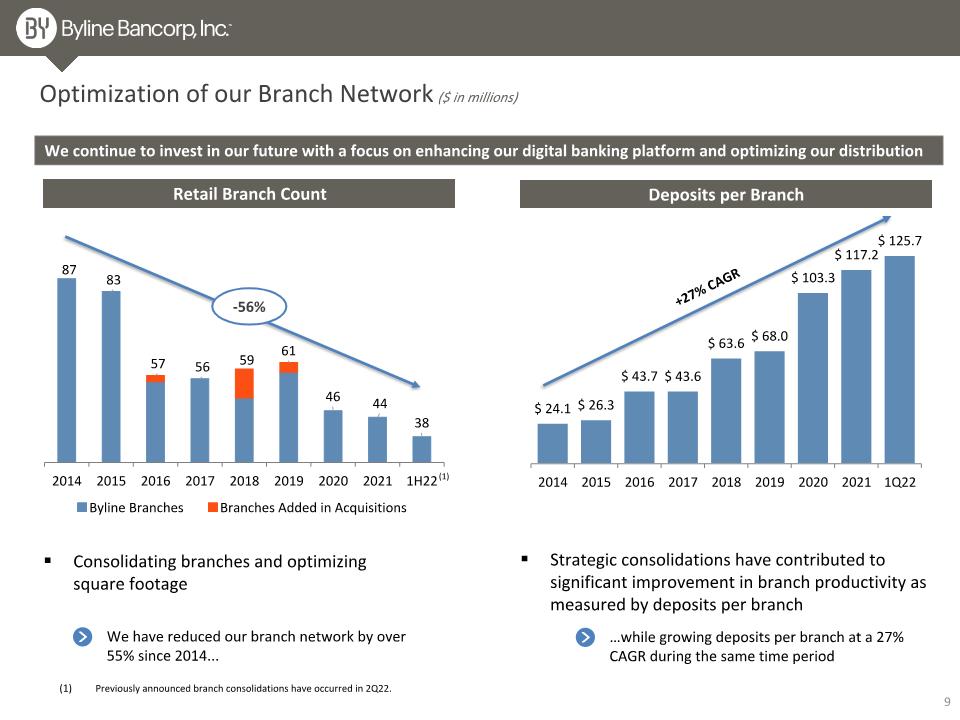
We have reduced our branch network by over 55% since 2014... Optimization of our Branch Network ($ in millions) Retail Branch Count Deposits per Branch -56% Consolidating branches and optimizing square footage Strategic consolidations have contributed to significant improvement in branch productivity as measured by deposits per branch +27% CAGR …while growing deposits per branch at a 27% CAGR during the same time period Previously announced branch consolidations have occurred in 2Q22. (1) We continue to invest in our future with a focus on enhancing our digital banking platform and optimizing our distribution
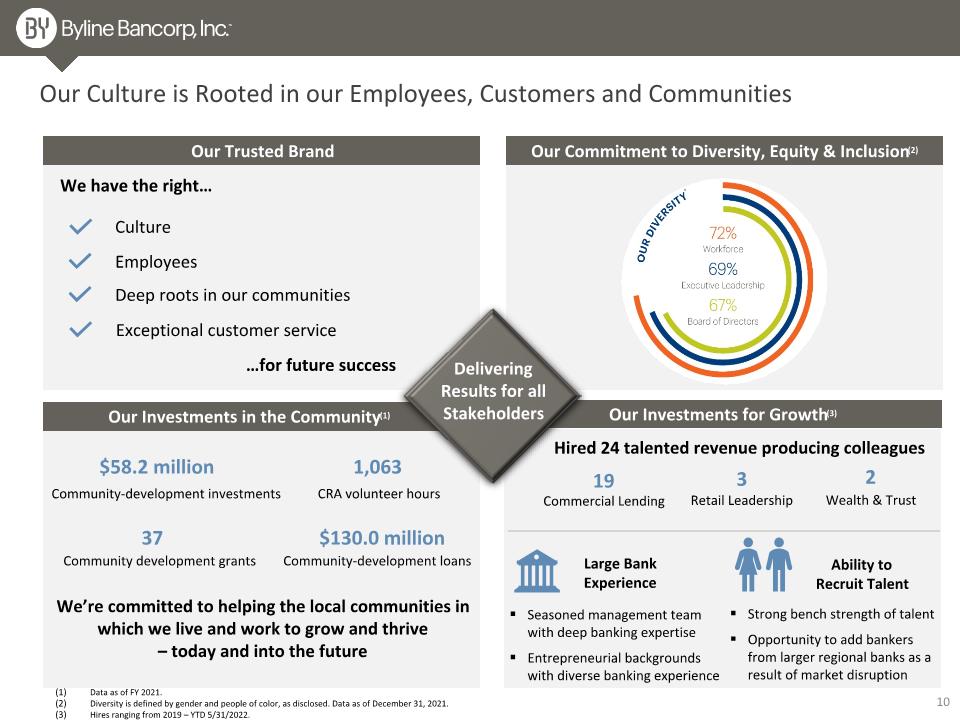
Data as of FY 2021. Diversity is defined by gender and people of color, as disclosed. Data as of December 31, 2021. Hires ranging from 2019 – YTD 5/31/2022. Our Investments in the Community(1) Our Culture is Rooted in our Employees, Customers and Communities Our Trusted Brand Our Commitment to Diversity, Equity & Inclusion(2) Culture We have the right… Employees Deep roots in our communities …for future success Exceptional customer service We’re committed to helping the local communities in which we live and work to grow and thrive – today and into the future Community-development loans CRA volunteer hours $130.0 million 1,063 Community development grants Community-development investments $58.2 million 37 Large Bank Experience Seasoned management team with deep banking expertise Entrepreneurial backgrounds with diverse banking experience Ability to Recruit Talent Our Investments for Growth(3) Delivering Results for all Stakeholders Hired 24 talented revenue producing colleagues Strong bench strength of talent Opportunity to add bankers from larger regional banks as a result of market disruption Commercial Lending 19 Retail Leadership 3 Wealth & Trust 2
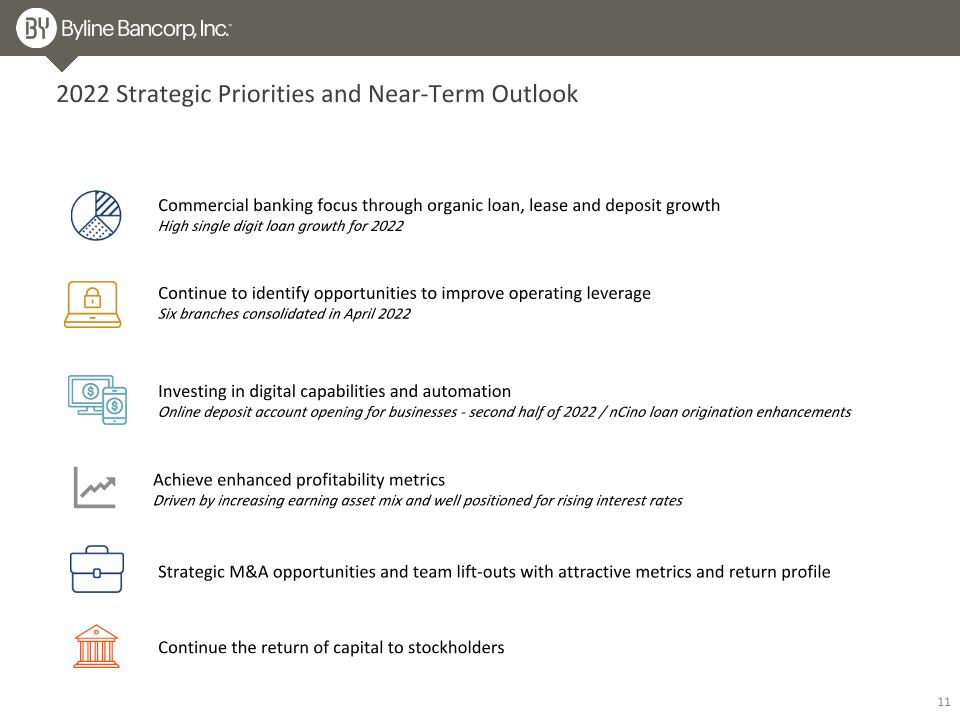
2022 Strategic Priorities and Near-Term Outlook Commercial banking focus through organic loan, lease and deposit growth High single digit loan growth for 2022 Investing in digital capabilities and automation Online deposit account opening for businesses - second half of 2022 / nCino loan origination enhancements Strategic M&A opportunities and team lift-outs with attractive metrics and return profile Continue the return of capital to stockholders Continue to identify opportunities to improve operating leverage Six branches consolidated in April 2022 Achieve enhanced profitability metrics Driven by increasing earning asset mix and well positioned for rising interest rates
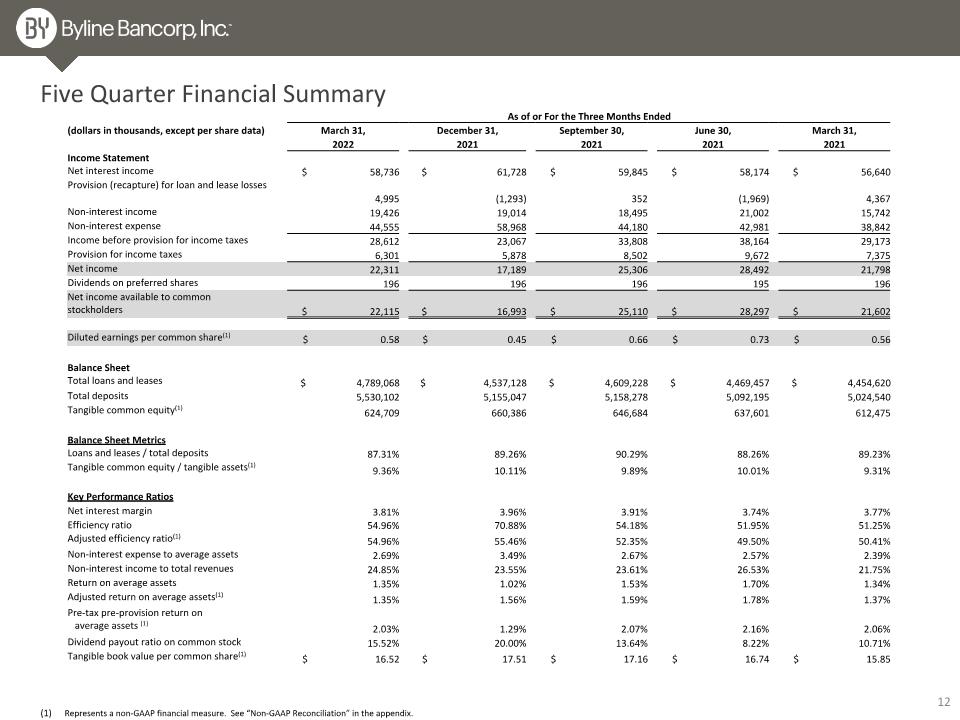
As of or For the Three Months Ended (dollars in thousands, except per share data) March 31, December 31, September 30, June 30, March 31, 2022 2021 2021 2021 2021 Income Statement Net interest income $ 58,736 $ 61,728 $ 59,845 $ 58,174 $ 56,640 Provision (recapture) for loan and lease losses 4,995 (1,293) 352 (1,969) 4,367 Non-interest income 19,426 19,014 18,495 21,002 15,742 Non-interest expense 44,555 58,968 44,180 42,981 38,842 Income before provision for income taxes 28,612 23,067 33,808 38,164 29,173 Provision for income taxes 6,301 5,878 8,502 9,672 7,375 Net income 22,311 17,189 25,306 28,492 21,798 Dividends on preferred shares 196 196 196 195 196 Net income available to common stockholders $ 22,115 $ 16,993 $ 25,110 $ 28,297 $ 21,602 Diluted earnings per common share(1) $ 0.58 $ 0.45 $ 0.66 $ 0.73 $ 0.56 Balance Sheet Total loans and leases $ 4,789,068 $ 4,537,128 $ 4,609,228 $ 4,469,457 $ 4,454,620 Total deposits 5,530,102 5,155,047 5,158,278 5,092,195 5,024,540 Tangible common equity(1) 624,709 660,386 646,684 637,601 612,475 Balance Sheet Metrics Loans and leases / total deposits 87.31% 89.26% 90.29% 88.26% 89.23% Tangible common equity / tangible assets(1) 9.36% 10.11% 9.89% 10.01% 9.31% Key Performance Ratios Net interest margin 3.81% 3.96% 3.91% 3.74% 3.77% Efficiency ratio 54.96% 70.88% 54.18% 51.95% 51.25% Adjusted efficiency ratio(1) 54.96% 55.46% 52.35% 49.50% 50.41% Non-interest expense to average assets 2.69% 3.49% 2.67% 2.57% 2.39% Non-interest income to total revenues 24.85% 23.55% 23.61% 26.53% 21.75% Return on average assets 1.35% 1.02% 1.53% 1.70% 1.34% Adjusted return on average assets(1) 1.35% 1.56% 1.59% 1.78% 1.37% Pre-tax pre-provision return on � average assets (1) 2.03% 1.29% 2.07% 2.16% 2.06% Dividend payout ratio on common stock 15.52% 20.00% 13.64% 8.22% 10.71% Tangible book value per common share(1) $ 16.52 $ 17.51 $ 17.16 $ 16.74 $ 15.85 Five Quarter Financial Summary Represents a non-GAAP financial measure. See “Non-GAAP Reconciliation” in the appendix.
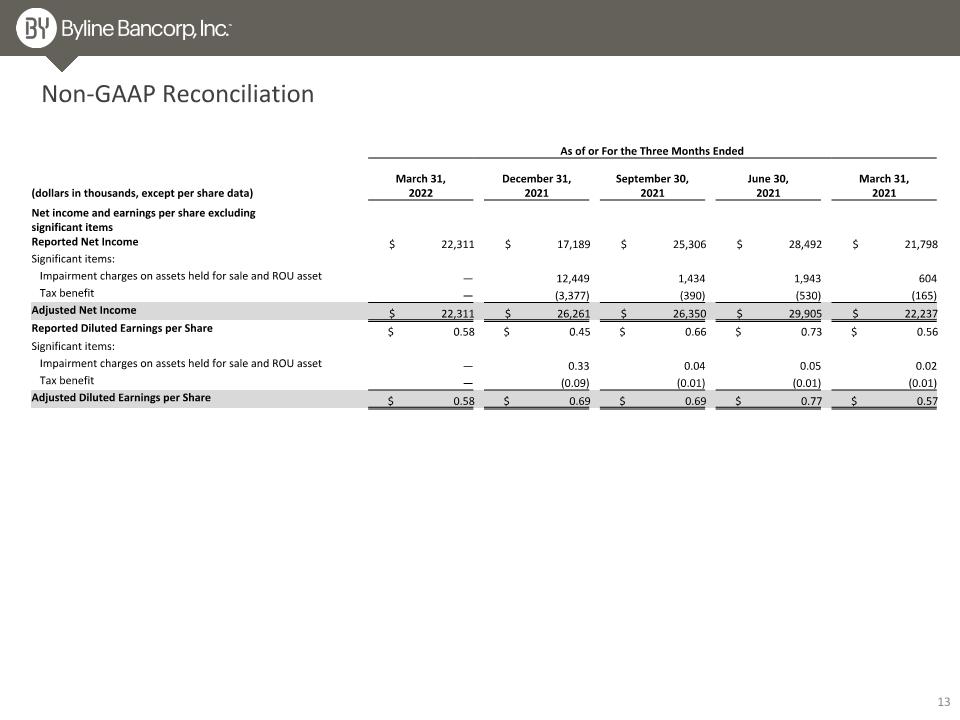
As of or For the Three Months Ended (dollars in thousands, except per share data) March 31, �2022 December 31, �2021 September 30, �2021 June 30, �2021 March 31, �2021 Net income and earnings per share excluding significant items Reported Net Income $ 22,311 $ 17,189 $ 25,306 $ 28,492 $ 21,798 Significant items: Impairment charges on assets held for sale and ROU asset — 12,449 1,434 1,943 604 Tax benefit — (3,377) (390) (530) (165) Adjusted Net Income $ 22,311 $ 26,261 $ 26,350 $ 29,905 $ 22,237 Reported Diluted Earnings per Share $ 0.58 $ 0.45 $ 0.66 $ 0.73 $ 0.56 Significant items: Impairment charges on assets held for sale and ROU asset — 0.33 0.04 0.05 0.02 Tax benefit — (0.09) (0.01) (0.01) (0.01) Adjusted Diluted Earnings per Share $ 0.58 $ 0.69 $ 0.69 $ 0.77 $ 0.57 Non-GAAP Reconciliation
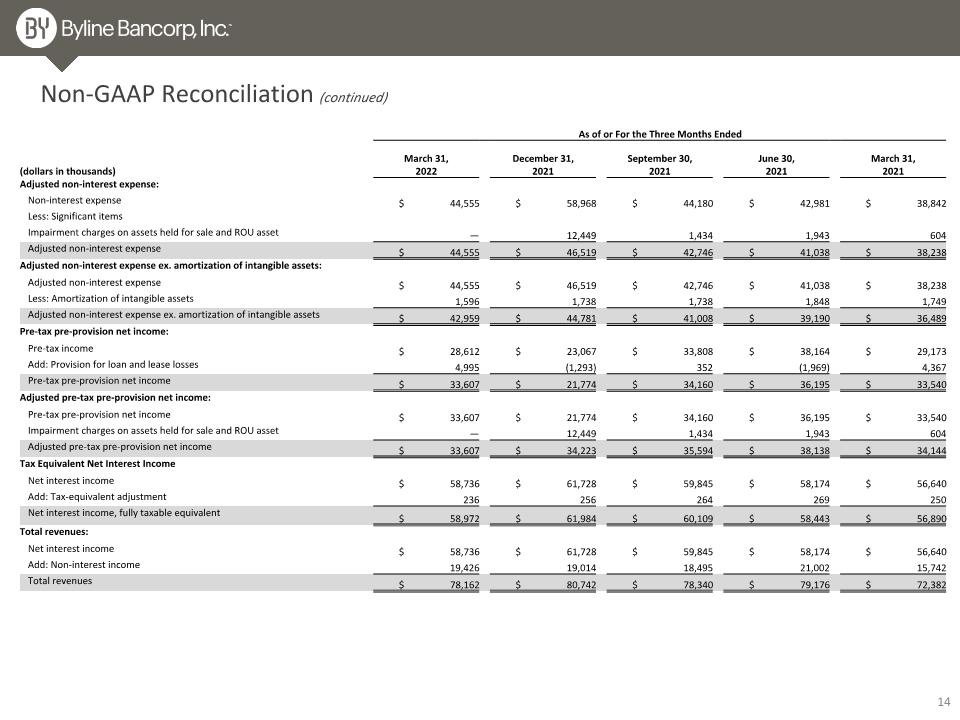
As of or For the Three Months Ended (dollars in thousands) March 31, �2022 December 31, �2021 September 30, �2021 June 30, �2021 March 31, �2021 Adjusted non-interest expense: Non-interest expense $ 44,555 $ 58,968 $ 44,180 $ 42,981 $ 38,842 Less: Significant items Impairment charges on assets held for sale and ROU asset — 12,449 1,434 1,943 604 Adjusted non-interest expense $ 44,555 $ 46,519 $ 42,746 $ 41,038 $ 38,238 Adjusted non-interest expense ex. amortization of intangible assets: Adjusted non-interest expense $ 44,555 $ 46,519 $ 42,746 $ 41,038 $ 38,238 Less: Amortization of intangible assets 1,596 1,738 1,738 1,848 1,749 Adjusted non-interest expense ex. amortization of intangible assets $ 42,959 $ 44,781 $ 41,008 $ 39,190 $ 36,489 Pre-tax pre-provision net income: Pre-tax income $ 28,612 $ 23,067 $ 33,808 $ 38,164 $ 29,173 Add: Provision for loan and lease losses 4,995 (1,293) 352 (1,969) 4,367 Pre-tax pre-provision net income $ 33,607 $ 21,774 $ 34,160 $ 36,195 $ 33,540 Adjusted pre-tax pre-provision net income: Pre-tax pre-provision net income $ 33,607 $ 21,774 $ 34,160 $ 36,195 $ 33,540 Impairment charges on assets held for sale and ROU asset — 12,449 1,434 1,943 604 Adjusted pre-tax pre-provision net income $ 33,607 $ 34,223 $ 35,594 $ 38,138 $ 34,144 Tax Equivalent Net Interest Income Net interest income $ 58,736 $ 61,728 $ 59,845 $ 58,174 $ 56,640 Add: Tax-equivalent adjustment 236 256 264 269 250 Net interest income, fully taxable equivalent $ 58,972 $ 61,984 $ 60,109 $ 58,443 $ 56,890 Total revenues: Net interest income $ 58,736 $ 61,728 $ 59,845 $ 58,174 $ 56,640 Add: Non-interest income 19,426 19,014 18,495 21,002 15,742 Total revenues $ 78,162 $ 80,742 $ 78,340 $ 79,176 $ 72,382 Non-GAAP Reconciliation (continued)
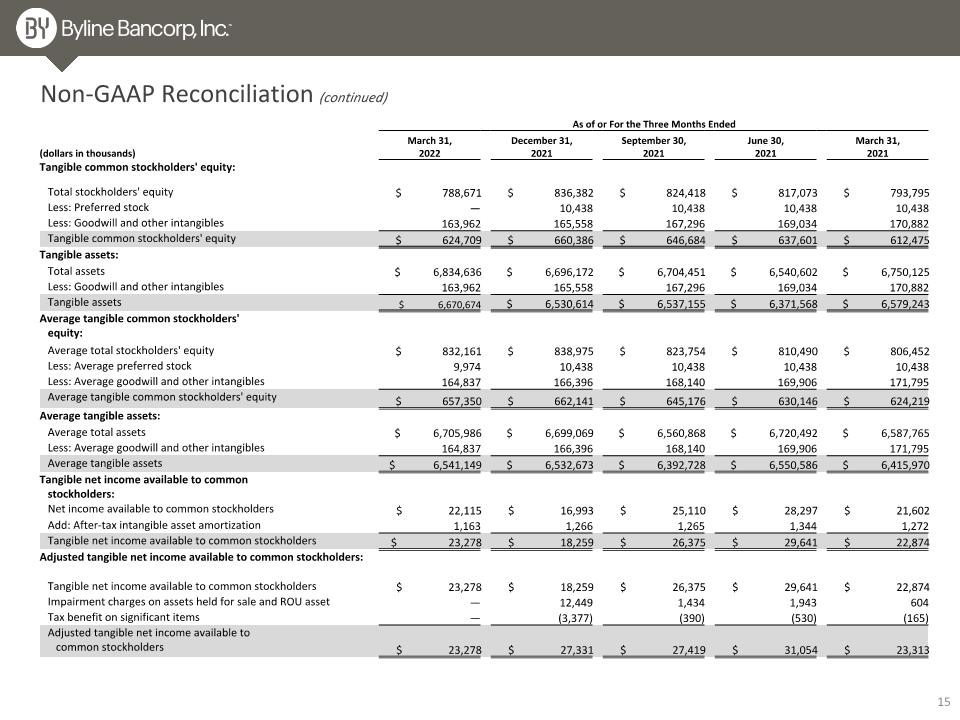
As of or For the Three Months Ended (dollars in thousands) March 31, �2022 December 31, �2021 September 30, �2021 June 30, �2021 March 31, �2021 Tangible common stockholders' equity: Total stockholders' equity $ 788,671 $ 836,382 $ 824,418 $ 817,073 $ 793,795 Less: Preferred stock — 10,438 10,438 10,438 10,438 Less: Goodwill and other intangibles 163,962 165,558 167,296 169,034 170,882 Tangible common stockholders' equity $ 624,709 $ 660,386 $ 646,684 $ 637,601 $ 612,475 Tangible assets: Total assets $ 6,834,636 $ 6,696,172 $ 6,704,451 $ 6,540,602 $ 6,750,125 Less: Goodwill and other intangibles 163,962 165,558 167,296 169,034 170,882 Tangible assets $ 6,670,674 $ 6,530,614 $ 6,537,155 $ 6,371,568 $ 6,579,243 Average tangible common stockholders' � equity: Average total stockholders' equity $ 832,161 $ 838,975 $ 823,754 $ 810,490 $ 806,452 Less: Average preferred stock 9,974 10,438 10,438 10,438 10,438 Less: Average goodwill and other intangibles 164,837 166,396 168,140 169,906 171,795 Average tangible common stockholders' equity $ 657,350 $ 662,141 $ 645,176 $ 630,146 $ 624,219 Average tangible assets: Average total assets $ 6,705,986 $ 6,699,069 $ 6,560,868 $ 6,720,492 $ 6,587,765 Less: Average goodwill and other intangibles 164,837 166,396 168,140 169,906 171,795 Average tangible assets $ 6,541,149 $ 6,532,673 $ 6,392,728 $ 6,550,586 $ 6,415,970 Tangible net income available to common � stockholders: Net income available to common stockholders $ 22,115 $ 16,993 $ 25,110 $ 28,297 $ 21,602 Add: After-tax intangible asset amortization 1,163 1,266 1,265 1,344 1,272 Tangible net income available to common stockholders $ 23,278 $ 18,259 $ 26,375 $ 29,641 $ 22,874 Adjusted tangible net income available to common stockholders: Tangible net income available to common stockholders $ 23,278 $ 18,259 $ 26,375 $ 29,641 $ 22,874 Impairment charges on assets held for sale and ROU asset — 12,449 1,434 1,943 604 Tax benefit on significant items — (3,377) (390) (530) (165) Adjusted tangible net income available to � common stockholders $ 23,278 $ 27,331 $ 27,419 $ 31,054 $ 23,313 Non-GAAP Reconciliation (continued)
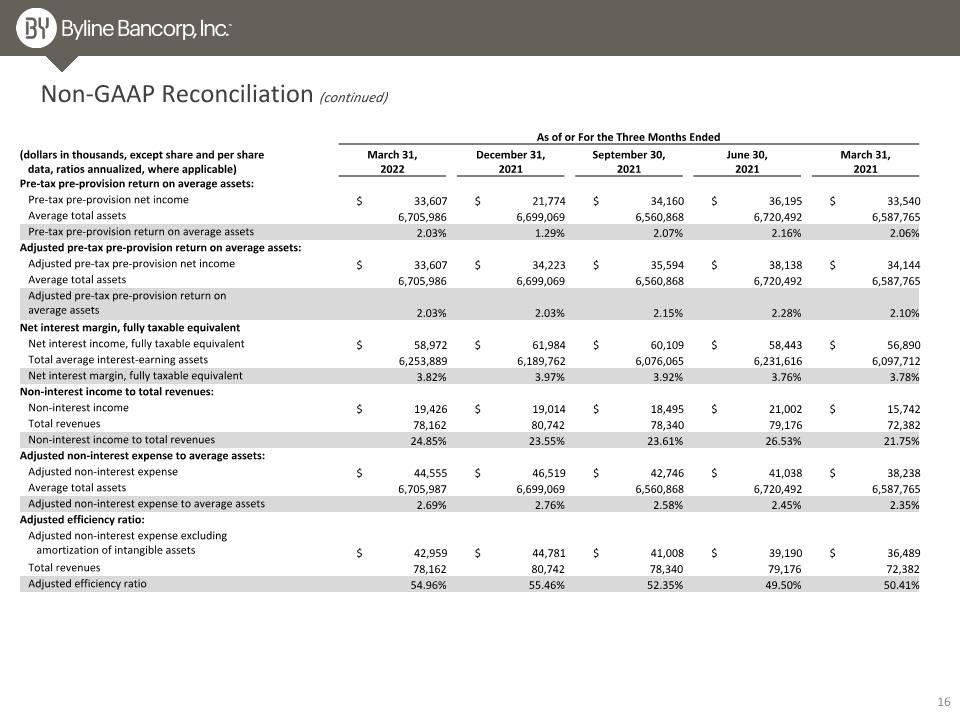
As of or For the Three Months Ended (dollars in thousands, except share and per share � data, ratios annualized, where applicable) March 31, �2022 December 31, �2021 September 30, �2021 June 30, �2021 March 31, �2021 Pre-tax pre-provision return on average assets: Pre-tax pre-provision net income $ 33,607 $ 21,774 $ 34,160 $ 36,195 $ 33,540 Average total assets 6,705,986 6,699,069 6,560,868 6,720,492 6,587,765 Pre-tax pre-provision return on average assets 2.03% 1.29% 2.07% 2.16% 2.06% Adjusted pre-tax pre-provision return on average assets: Adjusted pre-tax pre-provision net income $ 33,607 $ 34,223 $ 35,594 $ 38,138 $ 34,144 Average total assets 6,705,986 6,699,069 6,560,868 6,720,492 6,587,765 Adjusted pre-tax pre-provision return on average assets 2.03% 2.03% 2.15% 2.28% 2.10% Net interest margin, fully taxable equivalent Net interest income, fully taxable equivalent $ 58,972 $ 61,984 $ 60,109 $ 58,443 $ 56,890 Total average interest-earning assets 6,253,889 6,189,762 6,076,065 6,231,616 6,097,712 Net interest margin, fully taxable equivalent 3.82% 3.97% 3.92% 3.76% 3.78% Non-interest income to total revenues: Non-interest income $ 19,426 $ 19,014 $ 18,495 $ 21,002 $ 15,742 Total revenues 78,162 80,742 78,340 79,176 72,382 Non-interest income to total revenues 24.85% 23.55% 23.61% 26.53% 21.75% Adjusted non-interest expense to average assets: Adjusted non-interest expense $ 44,555 $ 46,519 $ 42,746 $ 41,038 $ 38,238 Average total assets 6,705,987 6,699,069 6,560,868 6,720,492 6,587,765 Adjusted non-interest expense to average assets 2.69% 2.76% 2.58% 2.45% 2.35% Adjusted efficiency ratio: Adjusted non-interest expense excluding � amortization of intangible assets $ 42,959 $ 44,781 $ 41,008 $ 39,190 $ 36,489 Total revenues 78,162 80,742 78,340 79,176 72,382 Adjusted efficiency ratio 54.96% 55.46% 52.35% 49.50% 50.41% Non-GAAP Reconciliation (continued)
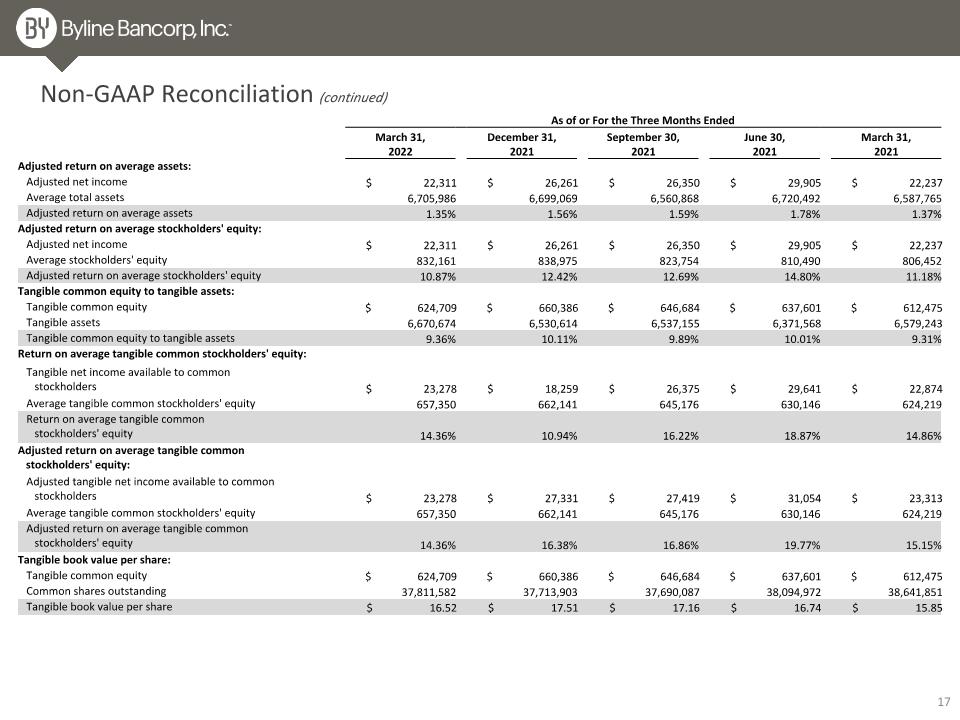
As of or For the Three Months Ended March 31, �2022 December 31, �2021 September 30, �2021 June 30, �2021 March 31, �2021 Adjusted return on average assets: Adjusted net income $ 22,311 $ 26,261 $ 26,350 $ 29,905 $ 22,237 Average total assets 6,705,986 6,699,069 6,560,868 6,720,492 6,587,765 Adjusted return on average assets 1.35% 1.56% 1.59% 1.78% 1.37% Adjusted return on average stockholders' equity: Adjusted net income $ 22,311 $ 26,261 $ 26,350 $ 29,905 $ 22,237 Average stockholders' equity 832,161 838,975 823,754 810,490 806,452 Adjusted return on average stockholders' equity 10.87% 12.42% 12.69% 14.80% 11.18% Tangible common equity to tangible assets: Tangible common equity $ 624,709 $ 660,386 $ 646,684 $ 637,601 $ 612,475 Tangible assets 6,670,674 6,530,614 6,537,155 6,371,568 6,579,243 Tangible common equity to tangible assets 9.36% 10.11% 9.89% 10.01% 9.31% Return on average tangible common stockholders' equity: Tangible net income available to common � stockholders $ 23,278 $ 18,259 $ 26,375 $ 29,641 $ 22,874 Average tangible common stockholders' equity 657,350 662,141 645,176 630,146 624,219 Return on average tangible common � stockholders' equity 14.36% 10.94% 16.22% 18.87% 14.86% Adjusted return on average tangible common � stockholders' equity: Adjusted tangible net income available to common � stockholders $ 23,278 $ 27,331 $ 27,419 $ 31,054 $ 23,313 Average tangible common stockholders' equity 657,350 662,141 645,176 630,146 624,219 Adjusted return on average tangible common � stockholders' equity 14.36% 16.38% 16.86% 19.77% 15.15% Tangible book value per share: Tangible common equity $ 624,709 $ 660,386 $ 646,684 $ 637,601 $ 612,475 Common shares outstanding 37,811,582 37,713,903 37,690,087 38,094,972 38,641,851 Tangible book value per share $ 16.52 $ 17.51 $ 17.16 $ 16.74 $ 15.85 Non-GAAP Reconciliation (continued)
