
Q3 2022 Conference Call
Forward-Looking Statements This communication contains forward-looking statements within the meaning of the U.S. federal securities laws. Forward-looking statements include, without limitation, statements concerning plans, estimates, calculations, forecasts and projections with respect to the anticipated future performance of the Company. These statements are often, but not always, made through the use of words or phrases such as ‘‘may’’, ‘‘might’’, ‘‘should’’, ‘‘could’’, ‘‘predict’’, ‘‘potential’’, ‘‘believe’’, ‘‘expect’’, ‘‘continue’’, ‘‘will’’, ‘‘anticipate’’, ‘‘seek’’, ‘‘estimate’’, ‘‘intend’’, ‘‘plan’’, ‘‘projection’’, ‘‘would’’, ‘‘annualized’’, “target” and ‘‘outlook’’, or the negative version of those words or other comparable words or phrases of a future or forward-looking nature. Forward-looking statements involve estimates and known and unknown risks, and reflect various assumptions and involve elements of subjective judgement and analysis, which may or may not prove to be correct, and which are subject to uncertainties and contingencies outside the control of Byline and its respective affiliates, directors, employees and other representatives, which could cause actual results to differ materially from those presented in this communication. No representations, warranties or guarantees are or will be made by Byline as to the reliability, accuracy or completeness of any forward-looking statements contained in this communication or that such forward-looking statements are or will remain based on reasonable assumptions. You should not place undue reliance on any forward-looking statements contained in this communication. Certain risks and important factors that could affect Byline’s future results are identified in our Annual Report on Form 10-K and other reports we file with the Securities and Exchange Commission, including among other things under the heading “Risk Factors” in our Annual Report on Form 10-K for the year ended December 31, 2021. Any forward-looking statement speaks only as of the date on which it is made, and Byline undertakes no obligation to update any forward-looking statement, whether to reflect events or circumstances after the date on which the statement is made, to reflect new information or the occurrence of unanticipated events, or otherwise unless required under the federal securities laws. Due to rounding, numbers presented throughout this document may not add up precisely to the totals provided and percentages may not precisely reflect the absolute figures.
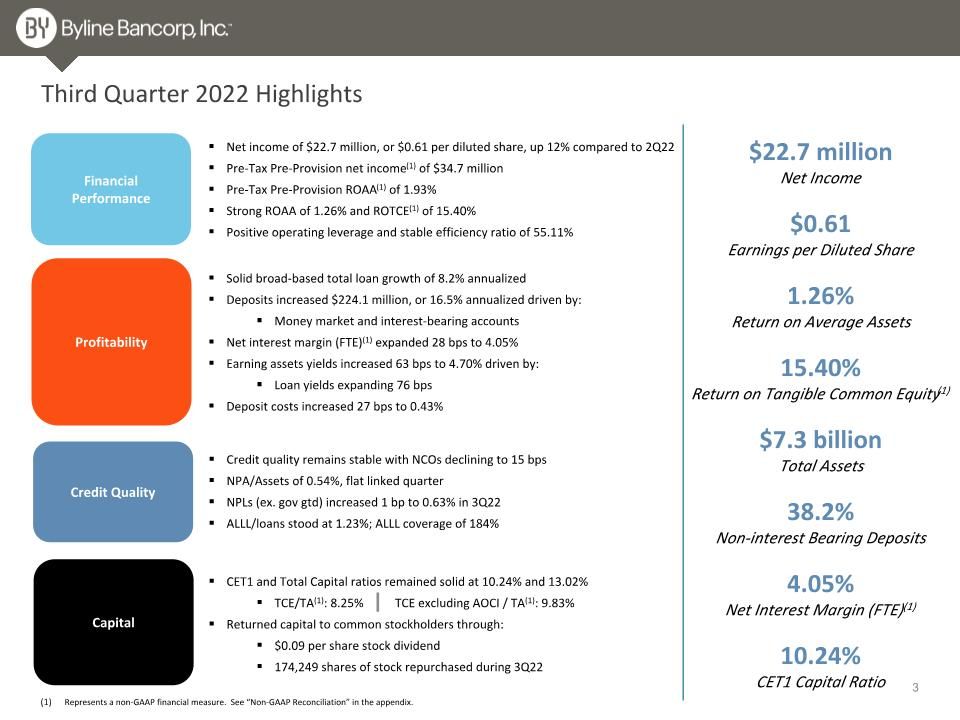
$22.7 million Net Income $0.61 Earnings per Diluted Share 1.26% Return on Average Assets 15.40% Return on Tangible Common Equity(1) $7.3 billion Total Assets 38.2% Non-interest Bearing Deposits 4.05% Net Interest Margin (FTE)(1) 10.24% CET1 Capital Ratio Third Quarter 2022 Highlights Profitability Financial Performance Credit Quality Capital Net income of $22.7 million, or $0.61 per diluted share, up 12% compared to 2Q22 Pre-Tax Pre-Provision net income(1) of $34.7 million Pre-Tax Pre-Provision ROAA(1) of 1.93% Strong ROAA of 1.26% and ROTCE(1) of 15.40% Positive operating leverage and stable efficiency ratio of 55.11% Solid broad-based total loan growth of 8.2% annualized Deposits increased $224.1 million, or 16.5% annualized driven by: Money market and interest-bearing accounts Net interest margin (FTE)(1) expanded 28 bps to 4.05% Earning assets yields increased 63 bps to 4.70% driven by: Loan yields expanding 76 bps Deposit costs increased 27 bps to 0.43% Credit quality remains stable with NCOs declining to 15 bps NPA/Assets of 0.54%, flat linked quarter NPLs (ex. gov gtd) increased 1 bp to 0.63% in 3Q22 ALLL/loans stood at 1.23%; ALLL coverage of 184% CET1 and Total Capital ratios remained solid at 10.24% and 13.02% TCE/TA(1): 8.25% Returned capital to common stockholders through: $0.09 per share stock dividend 174,249 shares of stock repurchased during 3Q22 TCE excluding AOCI / TA(1): 9.83% Represents a non-GAAP financial measure. See “Non-GAAP Reconciliation” in the appendix.
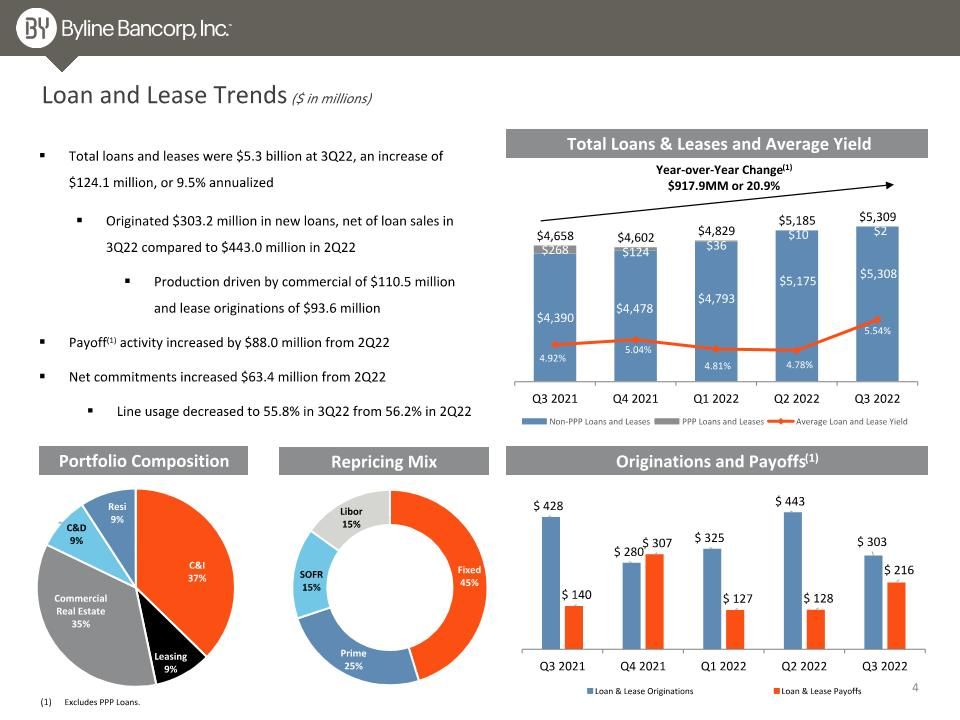
Loan and Lease Trends ($ in millions) Originations and Payoffs(1) Portfolio Composition Total Loans & Leases and Average Yield Repricing Mix Year-over-Year Change(1) $917.9MM or 20.9% Total loans and leases were $5.3 billion at 3Q22, an increase of $124.1 million, or 9.5% annualized Originated $303.2 million in new loans, net of loan sales in 3Q22 compared to $443.0 million in 2Q22 Production driven by commercial of $110.5 million and lease originations of $93.6 million Payoff(1) activity increased by $88.0 million from 2Q22 Net commitments increased $63.4 million from 2Q22 Line usage decreased to 55.8% in 3Q22 from 56.2% in 2Q22 Excludes PPP Loans.
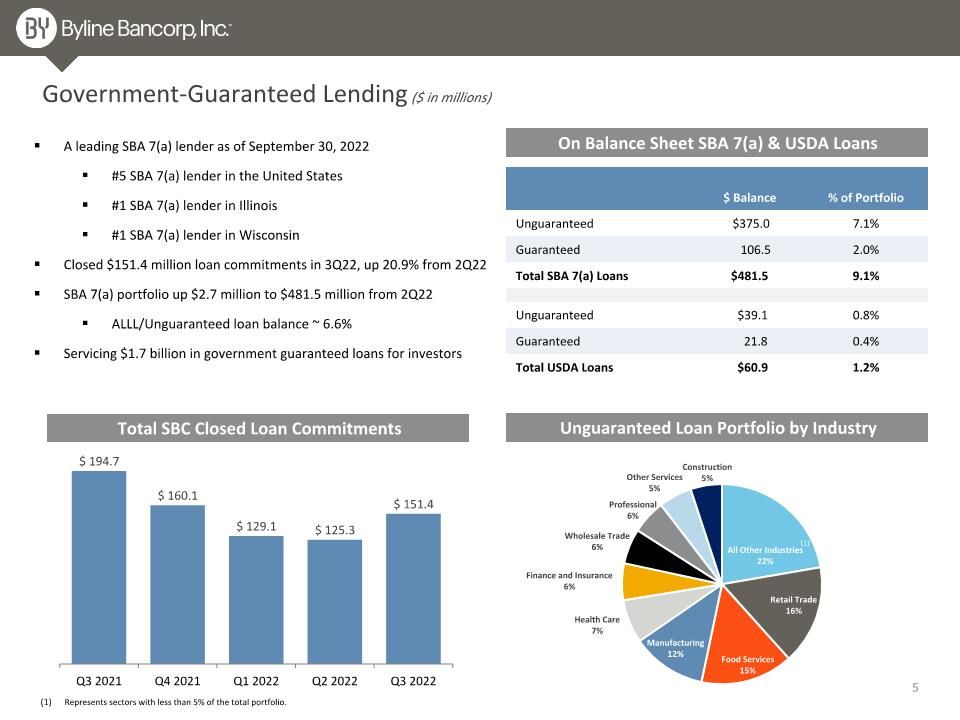
Government-Guaranteed Lending ($ in millions) On Balance Sheet SBA 7(a) & USDA Loans A leading SBA 7(a) lender as of September 30, 2022 #5 SBA 7(a) lender in the United States #1 SBA 7(a) lender in Illinois #1 SBA 7(a) lender in Wisconsin Closed $151.4 million loan commitments in 3Q22, up 20.9% from 2Q22 SBA 7(a) portfolio up $2.7 million to $481.5 million from 2Q22 ALLL/Unguaranteed loan balance ~ 6.6% Servicing $1.7 billion in government guaranteed loans for investors Unguaranteed Loan Portfolio by Industry Total SBC Closed Loan Commitments $ Balance % of Portfolio Unguaranteed $375.0 7.1% Guaranteed 106.5 2.0% Total SBA 7(a) Loans $481.5 9.1% Unguaranteed $39.1 0.8% Guaranteed 21.8 0.4% Total USDA Loans $60.9 1.2% (1) (1) Represents sectors with less than 5% of the total portfolio.
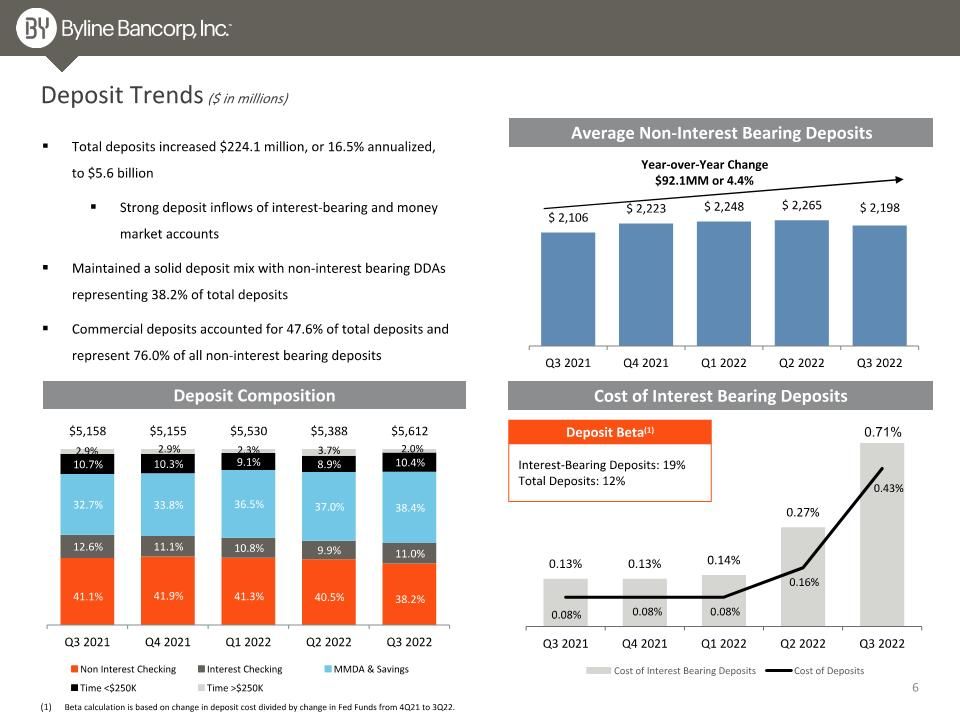
0.71% Total deposits increased $224.1 million, or 16.5% annualized, to $5.6 billion Strong deposit inflows of interest-bearing and money market accounts Maintained a solid deposit mix with non-interest bearing DDAs representing 38.2% of total deposits Commercial deposits accounted for 47.6% of total deposits and represent 76.0% of all non-interest bearing deposits Deposit Trends ($ in millions) Average Non-Interest Bearing Deposits Deposit Composition Cost of Interest Bearing Deposits Year-over-Year Change $92.1MM or 4.4% Deposit Beta(1) Interest-Bearing Deposits: 19% Total Deposits: 12% Beta calculation is based on change in deposit cost divided by change in Fed Funds from 4Q21 to 3Q22.
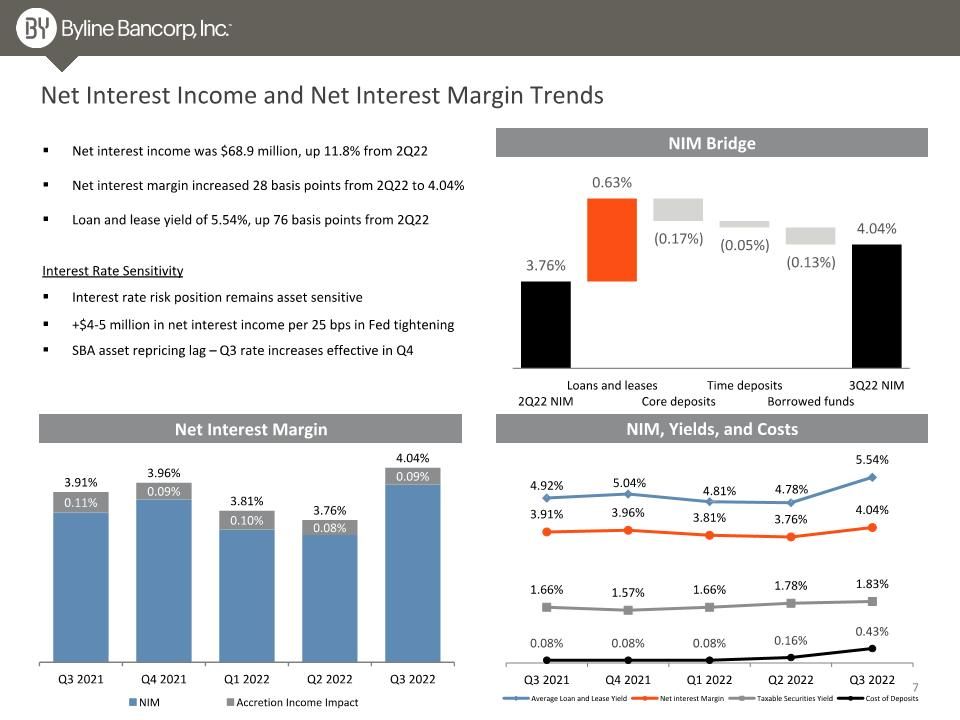
Net Interest Income and Net Interest Margin Trends Net interest income was $68.9 million, up 11.8% from 2Q22 Net interest margin increased 28 basis points from 2Q22 to 4.04% Loan and lease yield of 5.54%, up 76 basis points from 2Q22 Net Interest Margin NIM Bridge NIM, Yields, and Costs Interest Rate Sensitivity Interest rate risk position remains asset sensitive +$4-5 million in net interest income per 25 bps in Fed tightening SBA asset repricing lag – Q3 rate increases effective in Q4
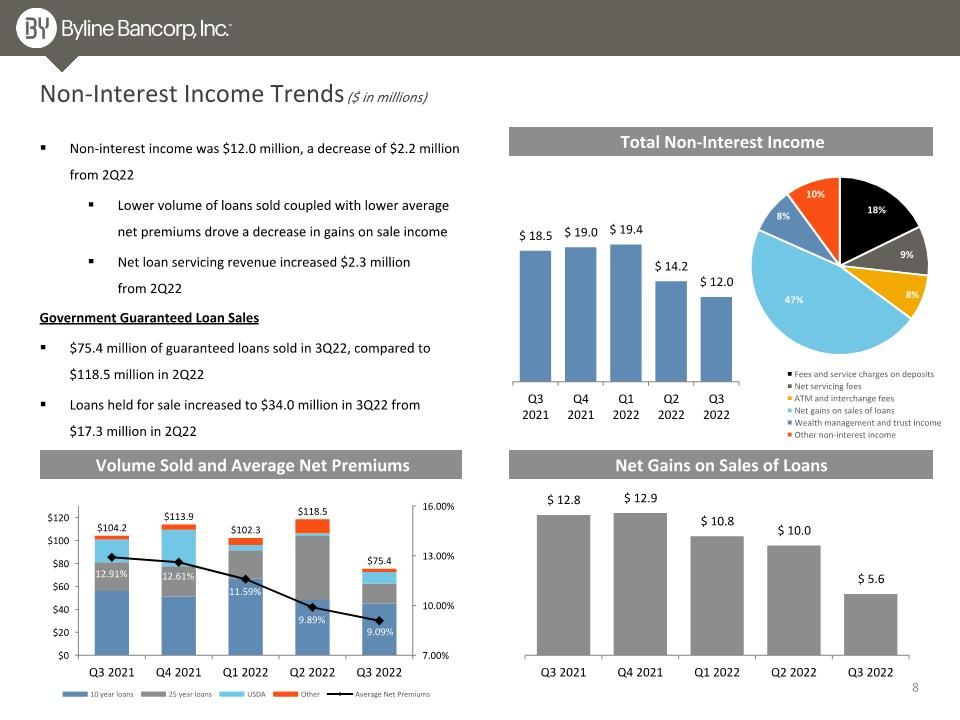
Total Non-Interest Income Non-Interest Income Trends ($ in millions) Non-interest income was $12.0 million, a decrease of $2.2 million from 2Q22 Lower volume of loans sold coupled with lower average net premiums drove a decrease in gains on sale income Net loan servicing revenue increased $2.3 million from 2Q22 Volume Sold and Average Net Premiums Net Gains on Sales of Loans Government Guaranteed Loan Sales $75.4 million of guaranteed loans sold in 3Q22, compared to $118.5 million in 2Q22 Loans held for sale increased to $34.0 million in 3Q22 from $17.3 million in 2Q22 8
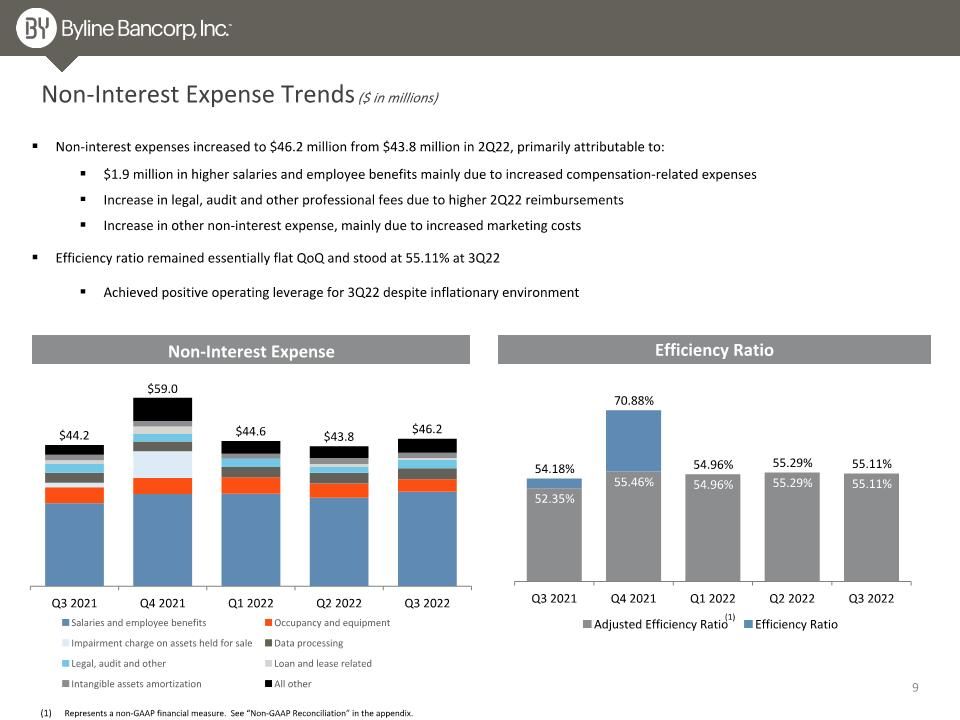
Non-Interest Expense Trends ($ in millions) Non-interest expenses increased to $46.2 million from $43.8 million in 2Q22, primarily attributable to: $1.9 million in higher salaries and employee benefits mainly due to increased compensation-related expenses Increase in legal, audit and other professional fees due to higher 2Q22 reimbursements Increase in other non-interest expense, mainly due to increased marketing costs Efficiency ratio remained essentially flat QoQ and stood at 55.11% at 3Q22 Achieved positive operating leverage for 3Q22 despite inflationary environment Efficiency Ratio Non-Interest Expense (1) Represents a non-GAAP financial measure. See “Non-GAAP Reconciliation” in the appendix.
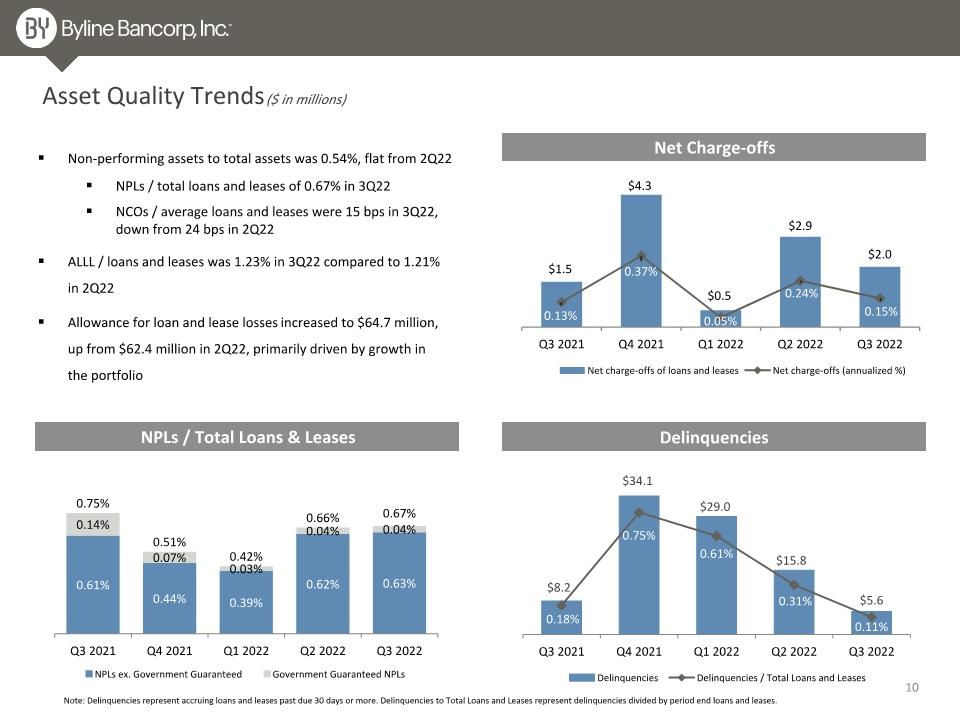
Asset Quality Trends ($ in millions) NPLs / Total Loans & Leases Delinquencies Net Charge-offs Non-performing assets to total assets was 0.54%, flat from 2Q22 NPLs / total loans and leases of 0.67% in 3Q22 NCOs / average loans and leases were 15 bps in 3Q22, down from 24 bps in 2Q22 ALLL / loans and leases was 1.23% in 3Q22 compared to 1.21% in 2Q22 Allowance for loan and lease losses increased to $64.7 million, up from $62.4 million in 2Q22, primarily driven by growth in the portfolio Note: Delinquencies represent accruing loans and leases past due 30 days or more. Delinquencies to Total Loans and Leases represent delinquencies divided by period end loans and leases.
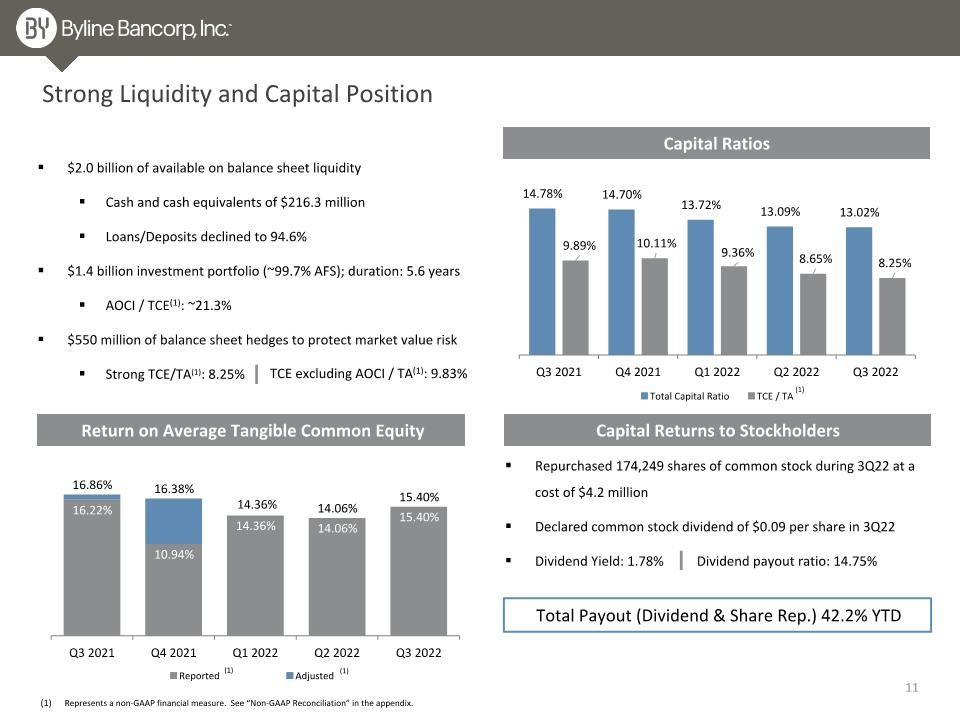
Project Sox Offer Migration Strong Liquidity and Capital Position Capital Ratios Return on Average Tangible Common Equity Repurchased 174,249 shares of common stock during 3Q22 at a cost of $4.2 million Declared common stock dividend of $0.09 per share in 3Q22 Dividend Yield: 1.78% Dividend payout ratio: 14.75% Total Payout (Dividend & Share Rep.) 42.2% YTD Represents a non-GAAP financial measure. See “Non-GAAP Reconciliation” in the appendix. Capital Returns to Stockholders $2.0 billion of available on balance sheet liquidity Cash and cash equivalents of $216.3 million Loans/Deposits declined to 94.6% $1.4 billion investment portfolio (~99.7% AFS); duration: 5.6 years AOCI / TCE(1): ~21.3% $550 million of balance sheet hedges to protect market value risk Strong TCE/TA(1): 8.25% (1) (1) (1) TCE excluding AOCI / TA(1): 9.83%
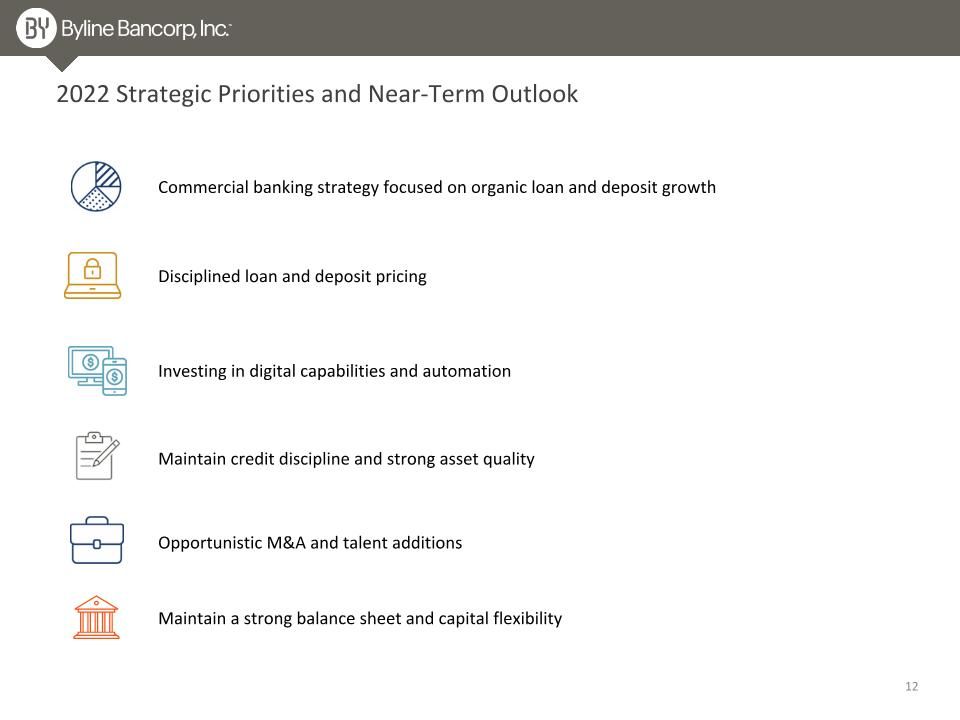
2022 Strategic Priorities and Near-Term Outlook Commercial banking strategy focused on organic loan and deposit growth Investing in digital capabilities and automation Opportunistic M&A and talent additions Maintain a strong balance sheet and capital flexibility Disciplined loan and deposit pricing Maintain credit discipline and strong asset quality
Appendix
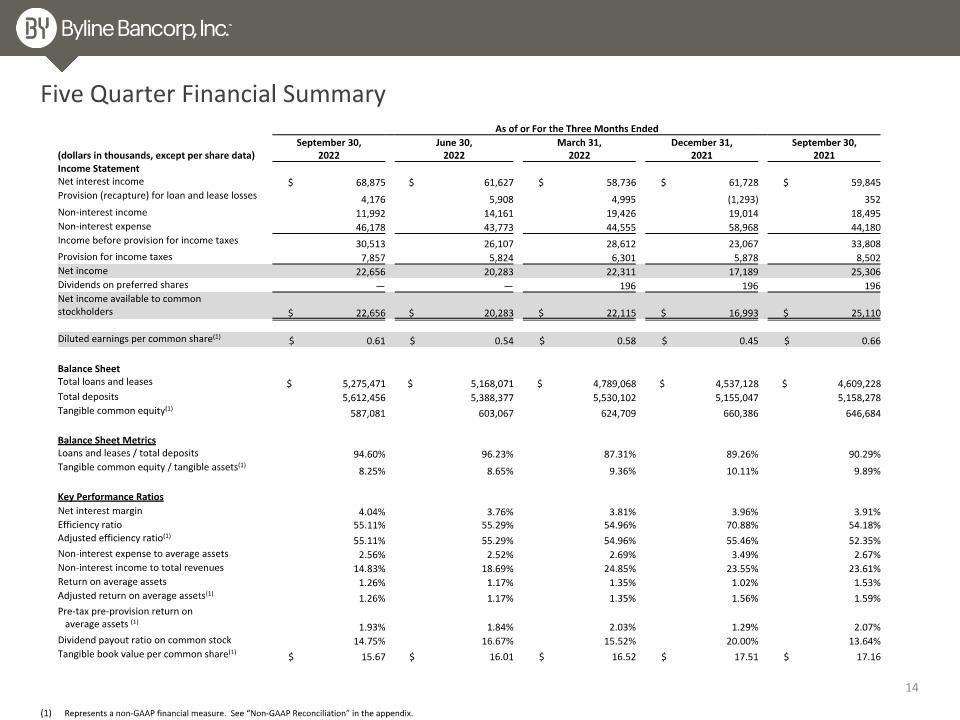
Five Quarter Financial Summary Represents a non-GAAP financial measure. See “Non-GAAP Reconciliation” in the appendix. As of or For the Three Months Ended September 30, June 30, March 31, December 31, September 30, (dollars in thousands, except per share data) 2022 2022 2022 2021 2021 Income Statement Net interest income $ 68,875 $ 61,627 $ 58,736 $ 61,728 $ 59,845 Provision (recapture) for loan and lease losses 4,176 5,908 4,995 (1,293) 352 Non-interest income 11,992 14,161 19,426 19,014 18,495 Non-interest expense 46,178 43,773 44,555 58,968 44,180 Income before provision for income taxes 30,513 26,107 28,612 23,067 33,808 Provision for income taxes 7,857 5,824 6,301 5,878 8,502 Net income 22,656 20,283 22,311 17,189 25,306 Dividends on preferred shares — — 196 196 196 Net income available to common stockholders $ 22,656 $ 20,283 $ 22,115 $ 16,993 $ 25,110 Diluted earnings per common share(1) $ 0.61 $ 0.54 $ 0.58 $ 0.45 $ 0.66 Balance Sheet Total loans and leases $ 5,275,471 $ 5,168,071 $ 4,789,068 $ 4,537,128 $ 4,609,228 Total deposits 5,612,456 5,388,377 5,530,102 5,155,047 5,158,278 Tangible common equity(1) 587,081 603,067 624,709 660,386 646,684 Balance Sheet Metrics Loans and leases / total deposits 94.60% 96.23% 87.31% 89.26% 90.29% Tangible common equity / tangible assets(1) 8.25% 8.65% 9.36% 10.11% 9.89% Key Performance Ratios Net interest margin 4.04% 3.76% 3.81% 3.96% 3.91% Efficiency ratio 55.11% 55.29% 54.96% 70.88% 54.18% Adjusted efficiency ratio(1) 55.11% 55.29% 54.96% 55.46% 52.35% Non-interest expense to average assets 2.56% 2.52% 2.69% 3.49% 2.67% Non-interest income to total revenues 14.83% 18.69% 24.85% 23.55% 23.61% Return on average assets 1.26% 1.17% 1.35% 1.02% 1.53% Adjusted return on average assets(1) 1.26% 1.17% 1.35% 1.56% 1.59% Pre-tax pre-provision return on � average assets (1) 1.93% 1.84% 2.03% 1.29% 2.07% Dividend payout ratio on common stock 14.75% 16.67% 15.52% 20.00% 13.64% Tangible book value per common share(1) $ 15.67 $ 16.01 $ 16.52 $ 17.51 $ 17.16
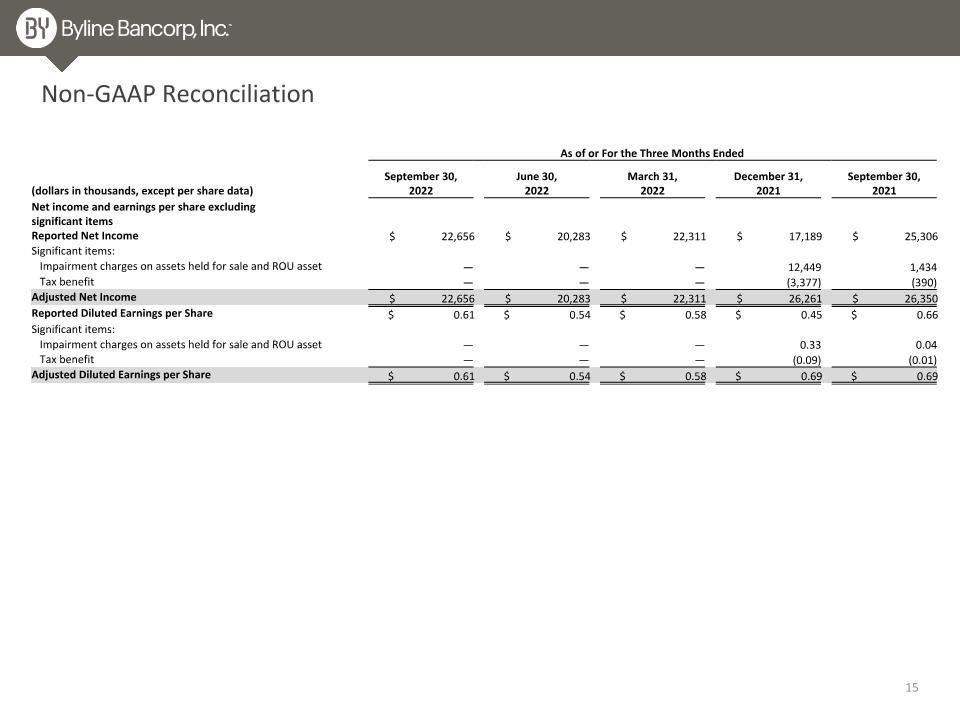
Non-GAAP Reconciliation As of or For the Three Months Ended (dollars in thousands, except per share data) September 30, �2022 June 30, �2022 March 31, �2022 December 31, �2021 September 30, �2021 Net income and earnings per share excluding significant items Reported Net Income $ 22,656 $ 20,283 $ 22,311 $ 17,189 $ 25,306 Significant items: Impairment charges on assets held for sale and ROU asset — — — 12,449 1,434 Tax benefit — — — (3,377) (390) Adjusted Net Income $ 22,656 $ 20,283 $ 22,311 $ 26,261 $ 26,350 Reported Diluted Earnings per Share $ 0.61 $ 0.54 $ 0.58 $ 0.45 $ 0.66 Significant items: Impairment charges on assets held for sale and ROU asset — — — 0.33 0.04 Tax benefit — — — (0.09) (0.01) Adjusted Diluted Earnings per Share $ 0.61 $ 0.54 $ 0.58 $ 0.69 $ 0.69
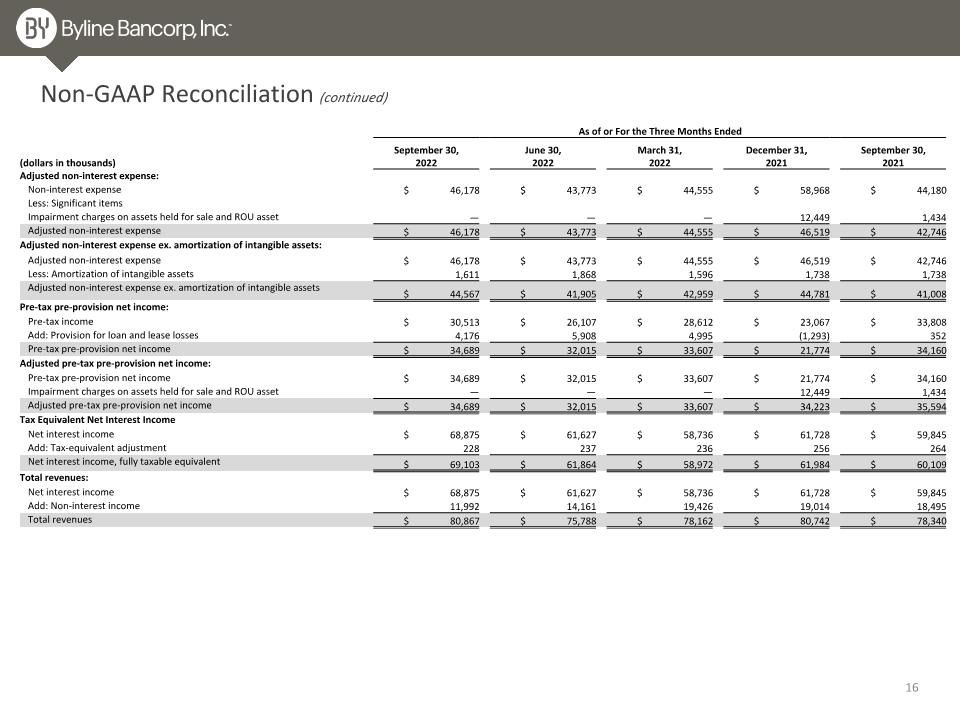
Non-GAAP Reconciliation (continued) As of or For the Three Months Ended (dollars in thousands) September 30, �2022 June 30, �2022 March 31, �2022 December 31, �2021 September 30, �2021 Adjusted non-interest expense: Non-interest expense $ 46,178 $ 43,773 $ 44,555 $ 58,968 $ 44,180 Less: Significant items Impairment charges on assets held for sale and ROU asset — — — 12,449 1,434 Adjusted non-interest expense $ 46,178 $ 43,773 $ 44,555 $ 46,519 $ 42,746 Adjusted non-interest expense ex. amortization of intangible assets: Adjusted non-interest expense $ 46,178 $ 43,773 $ 44,555 $ 46,519 $ 42,746 Less: Amortization of intangible assets 1,611 1,868 1,596 1,738 1,738 Adjusted non-interest expense ex. amortization of intangible assets $ 44,567 $ 41,905 $ 42,959 $ 44,781 $ 41,008 Pre-tax pre-provision net income: Pre-tax income $ 30,513 $ 26,107 $ 28,612 $ 23,067 $ 33,808 Add: Provision for loan and lease losses 4,176 5,908 4,995 (1,293) 352 Pre-tax pre-provision net income $ 34,689 $ 32,015 $ 33,607 $ 21,774 $ 34,160 Adjusted pre-tax pre-provision net income: Pre-tax pre-provision net income $ 34,689 $ 32,015 $ 33,607 $ 21,774 $ 34,160 Impairment charges on assets held for sale and ROU asset — — — 12,449 1,434 Adjusted pre-tax pre-provision net income $ 34,689 $ 32,015 $ 33,607 $ 34,223 $ 35,594 Tax Equivalent Net Interest Income Net interest income $ 68,875 $ 61,627 $ 58,736 $ 61,728 $ 59,845 Add: Tax-equivalent adjustment 228 237 236 256 264 Net interest income, fully taxable equivalent $ 69,103 $ 61,864 $ 58,972 $ 61,984 $ 60,109 Total revenues: Net interest income $ 68,875 $ 61,627 $ 58,736 $ 61,728 $ 59,845 Add: Non-interest income 11,992 14,161 19,426 19,014 18,495 Total revenues $ 80,867 $ 75,788 $ 78,162 $ 80,742 $ 78,340
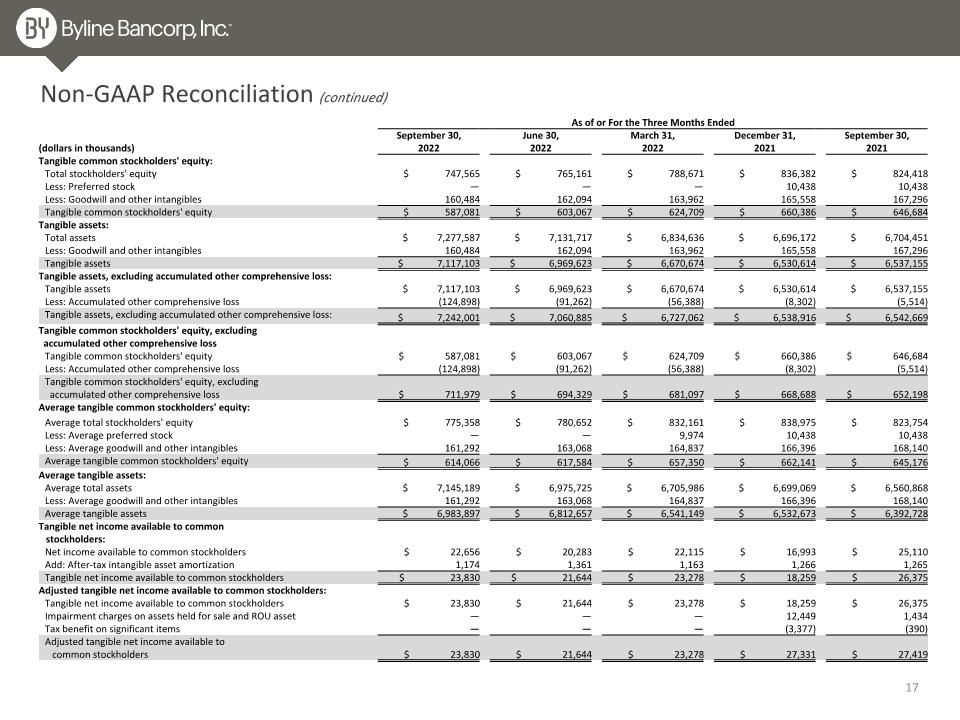
Non-GAAP Reconciliation (continued) As of or For the Three Months Ended (dollars in thousands) September 30, �2022 June 30, �2022 March 31, �2022 December 31, �2021 September 30, �2021 Tangible common stockholders' equity: Total stockholders' equity $ 747,565 $ 765,161 $ 788,671 $ 836,382 $ 824,418 Less: Preferred stock — — — 10,438 10,438 Less: Goodwill and other intangibles 160,484 162,094 163,962 165,558 167,296 Tangible common stockholders' equity $ 587,081 $ 603,067 $ 624,709 $ 660,386 $ 646,684 Tangible assets: Total assets $ 7,277,587 $ 7,131,717 $ 6,834,636 $ 6,696,172 $ 6,704,451 Less: Goodwill and other intangibles 160,484 162,094 163,962 165,558 167,296 Tangible assets $ 7,117,103 $ 6,969,623 $ 6,670,674 $ 6,530,614 $ 6,537,155 Tangible assets, excluding accumulated other comprehensive loss: Tangible assets $ 7,117,103 $ 6,969,623 $ 6,670,674 $ 6,530,614 $ 6,537,155 Less: Accumulated other comprehensive loss (124,898) (91,262) (56,388) (8,302) (5,514) Tangible assets, excluding accumulated other comprehensive loss: $ 7,242,001 $ 7,060,885 $ 6,727,062 $ 6,538,916 $ 6,542,669 Tangible common stockholders' equity, excluding � accumulated other comprehensive loss Tangible common stockholders' equity $ 587,081 $ 603,067 $ 624,709 $ 660,386 $ 646,684 Less: Accumulated other comprehensive loss (124,898) (91,262) (56,388) (8,302) (5,514) Tangible common stockholders' equity, excluding � accumulated other comprehensive loss $ 711,979 $ 694,329 $ 681,097 $ 668,688 $ 652,198 Average tangible common stockholders' equity: Average total stockholders' equity $ 775,358 $ 780,652 $ 832,161 $ 838,975 $ 823,754 Less: Average preferred stock — — 9,974 10,438 10,438 Less: Average goodwill and other intangibles 161,292 163,068 164,837 166,396 168,140 Average tangible common stockholders' equity $ 614,066 $ 617,584 $ 657,350 $ 662,141 $ 645,176 Average tangible assets: Average total assets $ 7,145,189 $ 6,975,725 $ 6,705,986 $ 6,699,069 $ 6,560,868 Less: Average goodwill and other intangibles 161,292 163,068 164,837 166,396 168,140 Average tangible assets $ 6,983,897 $ 6,812,657 $ 6,541,149 $ 6,532,673 $ 6,392,728 Tangible net income available to common � stockholders: Net income available to common stockholders $ 22,656 $ 20,283 $ 22,115 $ 16,993 $ 25,110 Add: After-tax intangible asset amortization 1,174 1,361 1,163 1,266 1,265 Tangible net income available to common stockholders $ 23,830 $ 21,644 $ 23,278 $ 18,259 $ 26,375 Adjusted tangible net income available to common stockholders: Tangible net income available to common stockholders $ 23,830 $ 21,644 $ 23,278 $ 18,259 $ 26,375 Impairment charges on assets held for sale and ROU asset — — — 12,449 1,434 Tax benefit on significant items — — — (3,377) (390) Adjusted tangible net income available to � common stockholders $ 23,830 $ 21,644 $ 23,278 $ 27,331 $ 27,419
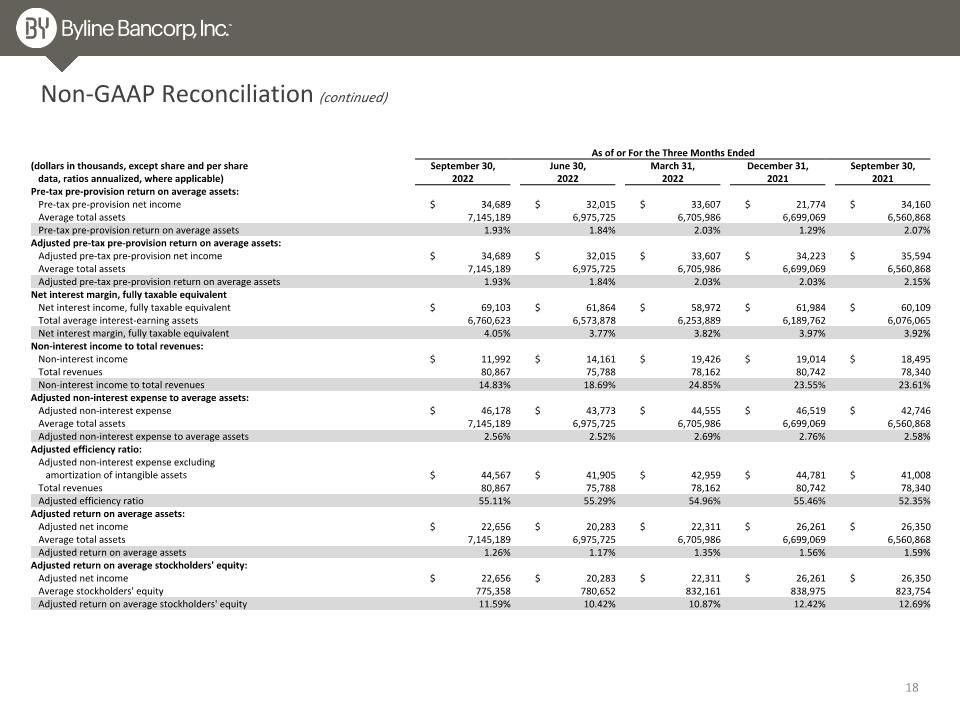
Non-GAAP Reconciliation (continued) As of or For the Three Months Ended (dollars in thousands, except share and per share � data, ratios annualized, where applicable) September 30, �2022 June 30, �2022 March 31, �2022 December 31, �2021 September 30, �2021 Pre-tax pre-provision return on average assets: Pre-tax pre-provision net income $ 34,689 $ 32,015 $ 33,607 $ 21,774 $ 34,160 Average total assets 7,145,189 6,975,725 6,705,986 6,699,069 6,560,868 Pre-tax pre-provision return on average assets 1.93% 1.84% 2.03% 1.29% 2.07% Adjusted pre-tax pre-provision return on average assets: Adjusted pre-tax pre-provision net income $ 34,689 $ 32,015 $ 33,607 $ 34,223 $ 35,594 Average total assets 7,145,189 6,975,725 6,705,986 6,699,069 6,560,868 Adjusted pre-tax pre-provision return on average assets 1.93% 1.84% 2.03% 2.03% 2.15% Net interest margin, fully taxable equivalent Net interest income, fully taxable equivalent $ 69,103 $ 61,864 $ 58,972 $ 61,984 $ 60,109 Total average interest-earning assets 6,760,623 6,573,878 6,253,889 6,189,762 6,076,065 Net interest margin, fully taxable equivalent 4.05% 3.77% 3.82% 3.97% 3.92% Non-interest income to total revenues: Non-interest income $ 11,992 $ 14,161 $ 19,426 $ 19,014 $ 18,495 Total revenues 80,867 75,788 78,162 80,742 78,340 Non-interest income to total revenues 14.83% 18.69% 24.85% 23.55% 23.61% Adjusted non-interest expense to average assets: Adjusted non-interest expense $ 46,178 $ 43,773 $ 44,555 $ 46,519 $ 42,746 Average total assets 7,145,189 6,975,725 6,705,986 6,699,069 6,560,868 Adjusted non-interest expense to average assets 2.56% 2.52% 2.69% 2.76% 2.58% Adjusted efficiency ratio: Adjusted non-interest expense excluding � amortization of intangible assets $ 44,567 $ 41,905 $ 42,959 $ 44,781 $ 41,008 Total revenues 80,867 75,788 78,162 80,742 78,340 Adjusted efficiency ratio 55.11% 55.29% 54.96% 55.46% 52.35% Adjusted return on average assets: Adjusted net income $ 22,656 $ 20,283 $ 22,311 $ 26,261 $ 26,350 Average total assets 7,145,189 6,975,725 6,705,986 6,699,069 6,560,868 Adjusted return on average assets 1.26% 1.17% 1.35% 1.56% 1.59% Adjusted return on average stockholders' equity: Adjusted net income $ 22,656 $ 20,283 $ 22,311 $ 26,261 $ 26,350 Average stockholders' equity 775,358 780,652 832,161 838,975 823,754 Adjusted return on average stockholders' equity 11.59% 10.42% 10.87% 12.42% 12.69%
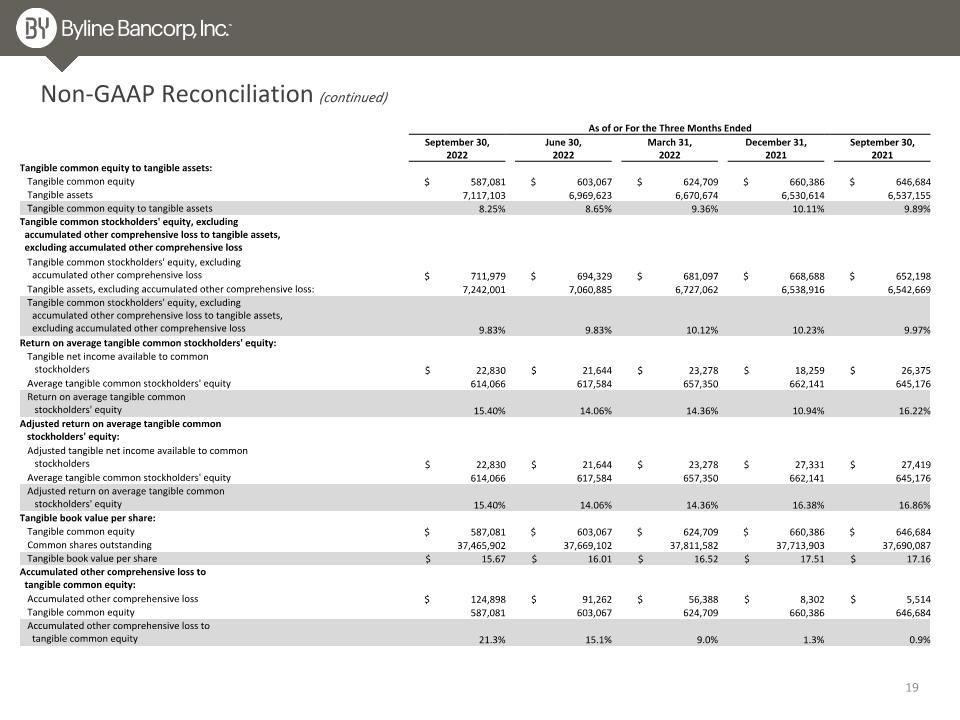
Non-GAAP Reconciliation (continued) As of or For the Three Months Ended September 30, �2022 June 30, �2022 March 31, �2022 December 31, �2021 September 30, �2021 Tangible common equity to tangible assets: Tangible common equity $ 587,081 $ 603,067 $ 624,709 $ 660,386 $ 646,684 Tangible assets 7,117,103 6,969,623 6,670,674 6,530,614 6,537,155 Tangible common equity to tangible assets 8.25% 8.65% 9.36% 10.11% 9.89% Tangible common stockholders' equity, excluding � accumulated other comprehensive loss to tangible assets, � excluding accumulated other comprehensive loss Tangible common stockholders' equity, excluding � accumulated other comprehensive loss $ 711,979 $ 694,329 $ 681,097 $ 668,688 $ 652,198 Tangible assets, excluding accumulated other comprehensive loss: 7,242,001 7,060,885 6,727,062 6,538,916 6,542,669 Tangible common stockholders' equity, excluding � accumulated other comprehensive loss to tangible assets, � excluding accumulated other comprehensive loss 9.83% 9.83% 10.12% 10.23% 9.97% Return on average tangible common stockholders' equity: Tangible net income available to common � stockholders $ 22,830 $ 21,644 $ 23,278 $ 18,259 $ 26,375 Average tangible common stockholders' equity 614,066 617,584 657,350 662,141 645,176 Return on average tangible common � stockholders' equity 15.40% 14.06% 14.36% 10.94% 16.22% Adjusted return on average tangible common � stockholders' equity: Adjusted tangible net income available to common � stockholders $ 22,830 $ 21,644 $ 23,278 $ 27,331 $ 27,419 Average tangible common stockholders' equity 614,066 617,584 657,350 662,141 645,176 Adjusted return on average tangible common � stockholders' equity 15.40% 14.06% 14.36% 16.38% 16.86% Tangible book value per share: Tangible common equity $ 587,081 $ 603,067 $ 624,709 $ 660,386 $ 646,684 Common shares outstanding 37,465,902 37,669,102 37,811,582 37,713,903 37,690,087 Tangible book value per share $ 15.67 $ 16.01 $ 16.52 $ 17.51 $ 17.16 Accumulated other comprehensive loss to � tangible common equity: Accumulated other comprehensive loss $ 124,898 $ 91,262 $ 56,388 $ 8,302 $ 5,514 Tangible common equity 587,081 603,067 624,709 660,386 646,684 Accumulated other comprehensive loss to � tangible common equity 21.3% 15.1% 9.0% 1.3% 0.9%
