
2Q24 Earnings Presentation Exhibit 99.2

2 Forward-Looking Statements Forward-Looking Statements This communication contains forward-looking statements within the meaning of the U.S. federal securities laws. Forward-looking statements include, without limitation, statements concerning plans, estimates, calculations, forecasts and projections with respect to the anticipated future performance of the Company. These statements are often, but not always, made through the use of words or phrases such as ‘‘may’’, ‘‘might’’, ‘‘should’’, ‘‘could’’, ‘‘predict’’, ‘‘potential’’, ‘‘believe’’, ‘‘expect’’, ‘‘continue’’, ‘‘will’’, ‘‘anticipate’’, ‘‘seek’’, ‘‘estimate’’, ‘‘intend’’, ‘‘plan’’, ‘‘projection’’, ‘‘would’’, ‘‘annualized’’, “target” and ‘‘outlook’’, or the negative version of those words or other comparable words or phrases of a future or forward-looking nature. Forward-looking statements involve estimates and known and unknown risks, and reflect various assumptions and involve elements of subjective judgement and analysis, which may or may not prove to be correct, and which are subject to uncertainties and contingencies outside the control of Byline and its respective affiliates, directors, employees and other representatives, which could cause actual results to differ materially from those presented in this communication. No representations, warranties or guarantees are or will be made by Byline as to the reliability, accuracy or completeness of any forward-looking statements contained in this communication or that such forward-looking statements are or will remain based on reasonable assumptions. You should not place undue reliance on any forward-looking statements contained in this communication. Certain risks and important factors that could affect Byline’s future results are identified in our Annual Report on Form 10-K and other reports we file with the Securities and Exchange Commission, including among other things under the heading “Risk Factors” in our Annual Report on Form 10-K for the year ended December 31, 2023. Any forward-looking statement speaks only as of the date on which it is made, and Byline undertakes no obligation to update any forward-looking statement, whether to reflect events or circumstances after the date on which the statement is made, to reflect new information or the occurrence of unanticipated events, or otherwise unless required under the federal securities laws. Due to rounding, numbers presented throughout this document may not add up precisely to the totals provided and percentages may not precisely reflect the absolute figures.

2.03% Reported(1)(2) 15.27% Reported(1)(2) ROTCE $0.68 Reported 1.31% Reported(2) ROAA $29.7 million $29.7 million Reported 52.19% Reported Efficiency Ratio Second Quarter 2024 Highlights 3 Represents a non-GAAP financial measure. See “Non-GAAP Reconciliation” in the appendix. Annualized. Strong Financial Performance Net Income Diluted EPS PTPP ROAA 10.84% Common Equity Tier 1 +8% Increase in Tangible Book Value / Share YoY 15.27% Return on Avg. Tangible Common Equity +6% Increase in Loans and Leases(2) -1% Decrease in Non-interest Expense Net Income of $29.7 million; GAAP EPS of $0.68 Pre-Tax Pre-Provision income (1) of $46.2 million; Pre-Tax Pre-Provision ROAA(1) of 2.03% Revenue of $99.4 million, up 10% YoY Net interest income of $86.5 million, up 14% YoY Consolidated two branches, have reduced branch footprint ~60% since 2013 Credit rating reaffirmed by Kroll at BBB with positive outlook Net interest margin (FTE)(1) of 3.99% Loan and lease yields stood at 7.47%; cost of deposits of 2.63% Non-interest expenses remained well managed at $53.2 million Efficiency ratio(1): 52.19% TCE/TA(1): 8.82%; up 6 bps NIE/AA: 2.34%, down 33 bps YoY Total Capital ratio: 13.86%; up 20 bps

Loan Portfolio Trends ($ in millions) Total Loan Portfolio and Average Yield Portfolio Composition Total loan portfolio was $6.9 billion at 2Q24, an increase of $102.8 million, or 6.1% annualized from 1Q24 Originated $300.0 million in new loans, net of loan sales in 2Q24 Production driven by commercial banking and leasing originations of $129.8 million and $76.7 million, respectively Payoff activity increased by $21.2 million from 1Q24 to $235.4 million Cumulative Loan Beta(1): 42% Highlights Utilization Rates 56% LTM Average Originations and Payoffs Cumulative Loan Beta excluding loan accretion is calculated as the change in yield on loans and leases from 4Q21 to 2Q24 divided by the change in average Fed Funds from 4Q21 to 2Q24. 4
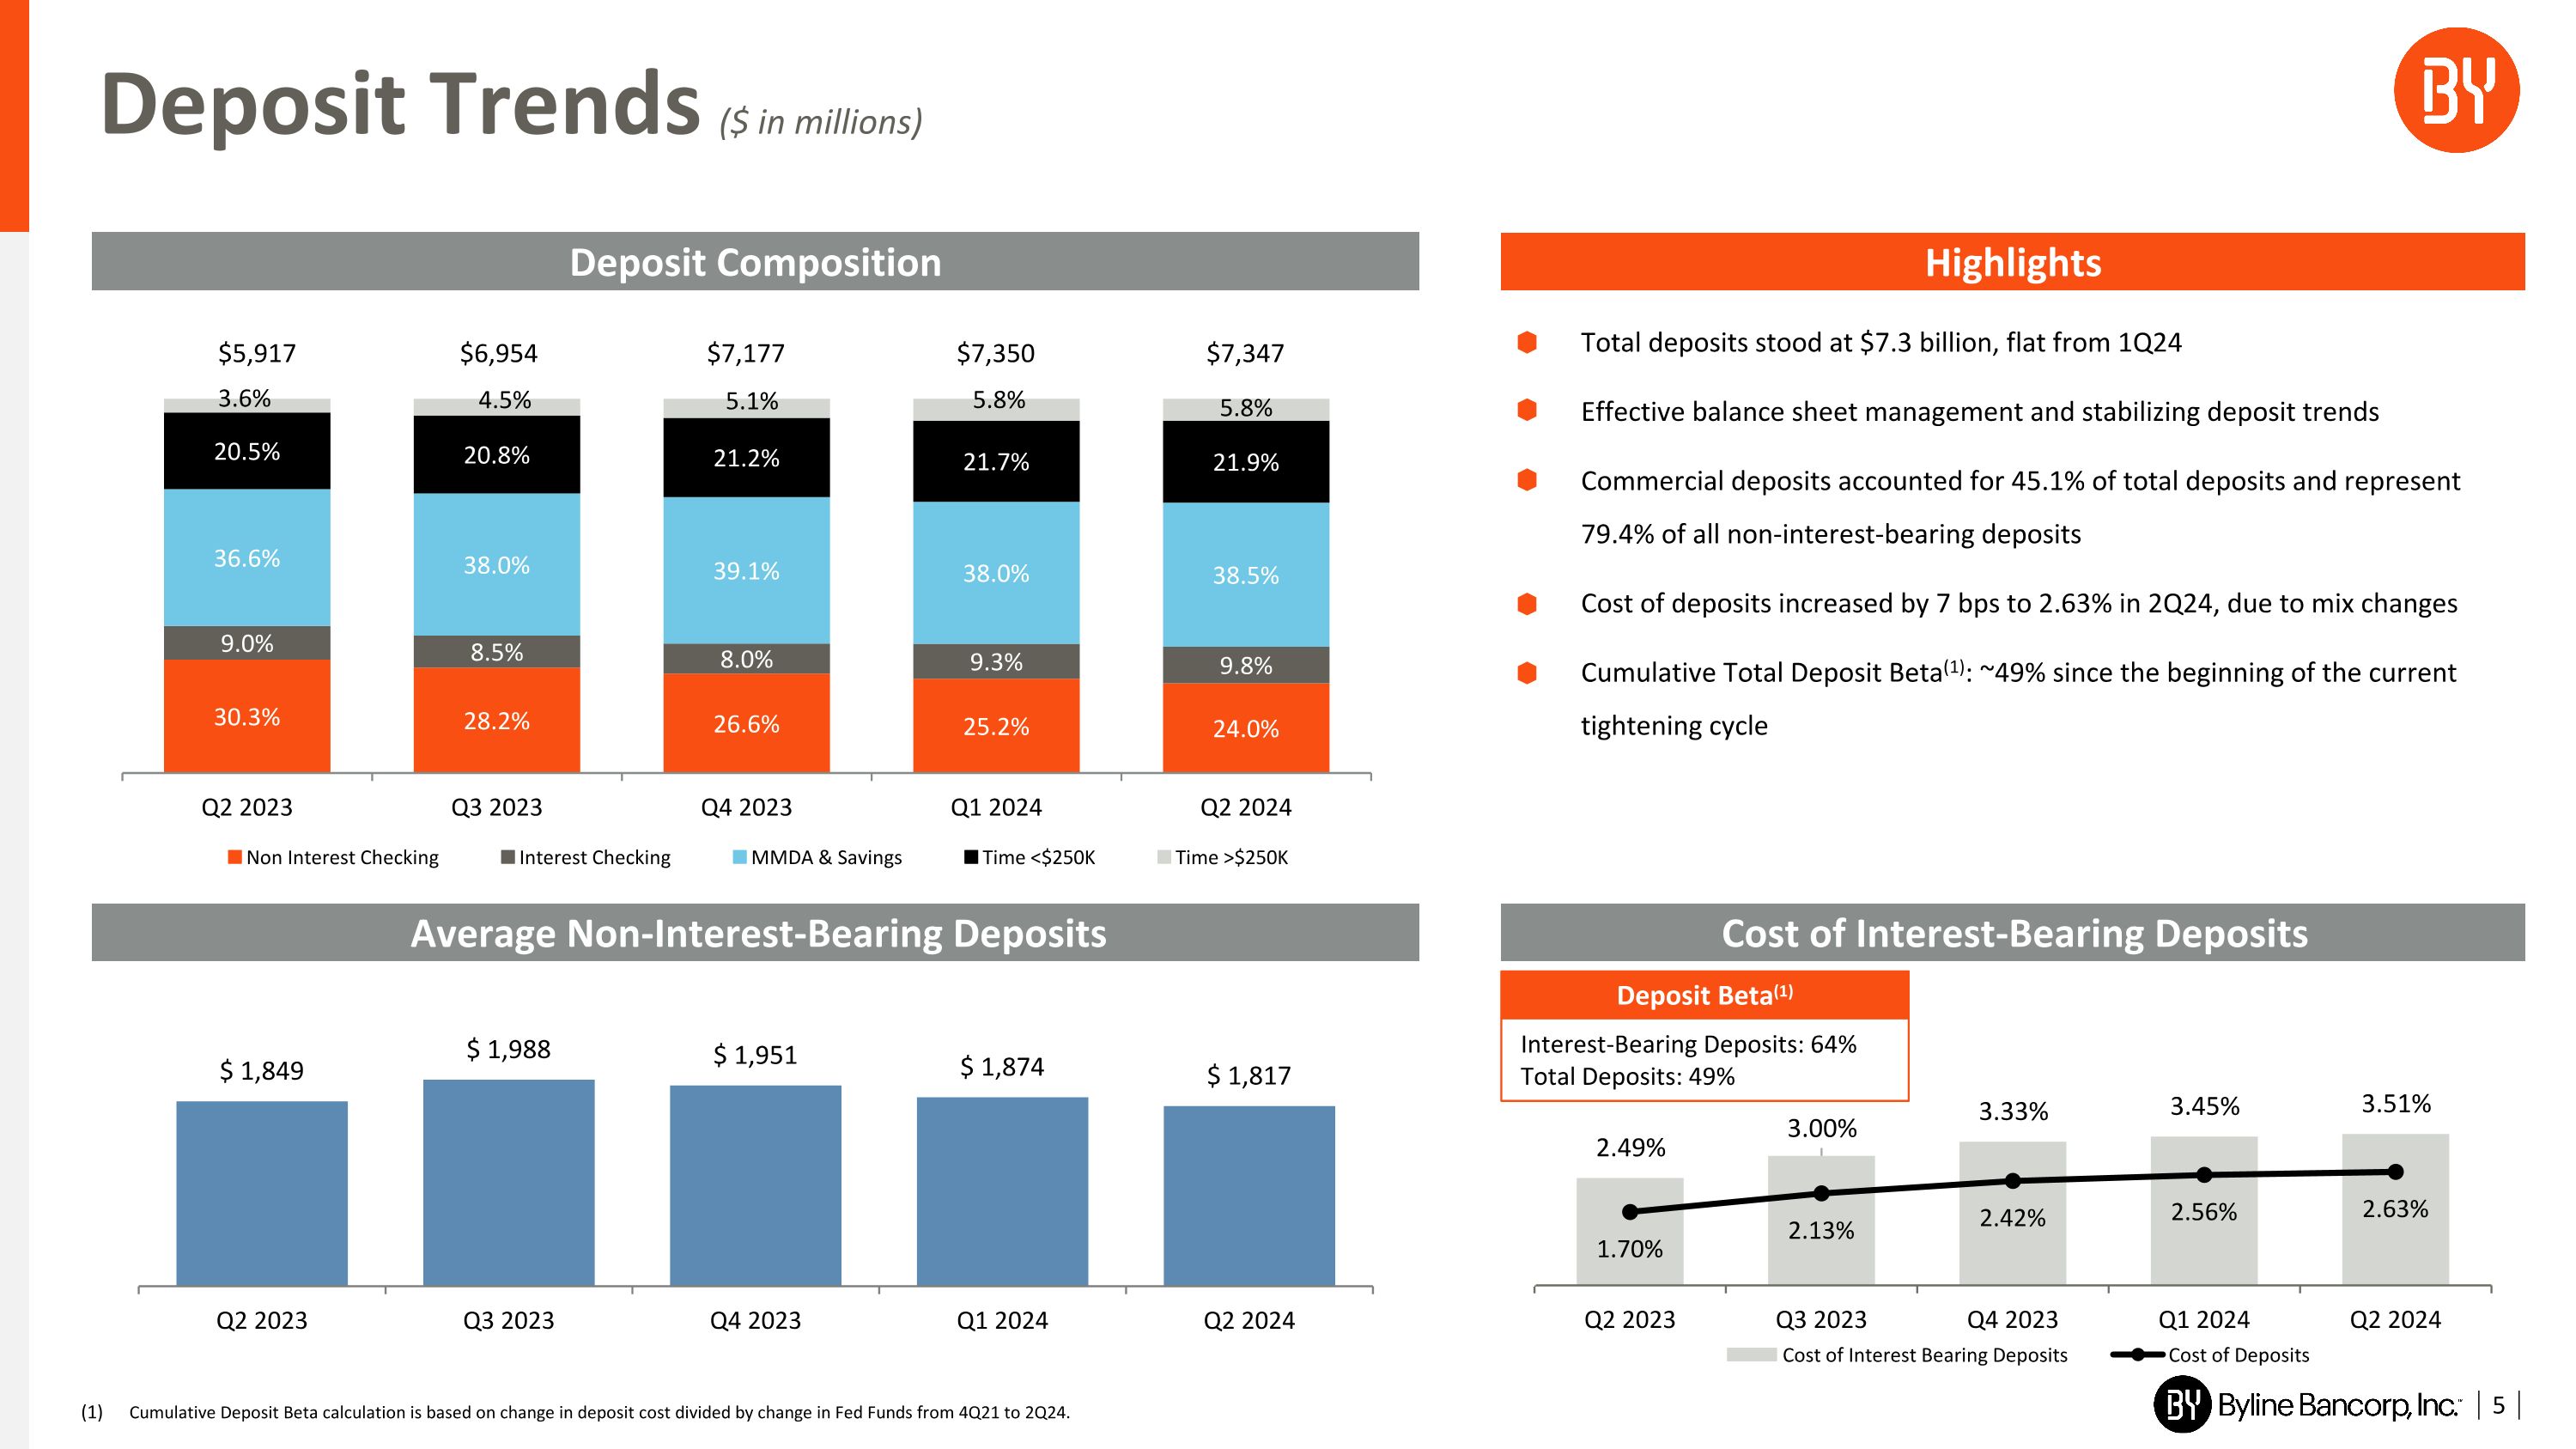
Cost of Interest-Bearing Deposits Total deposits stood at $7.3 billion, flat from 1Q24 Effective balance sheet management and stabilizing deposit trends Commercial deposits accounted for 45.1% of total deposits and represent 79.4% of all non-interest-bearing deposits Cost of deposits increased by 7 bps to 2.63% in 2Q24, due to mix changes Cumulative Total Deposit Beta(1): ~49% since the beginning of the current tightening cycle Deposit Trends ($ in millions) Deposit Composition Highlights Average Non-Interest-Bearing Deposits Deposit Beta(1) Interest-Bearing Deposits: 64% Total Deposits: 49% 5 Cumulative Deposit Beta calculation is based on change in deposit cost divided by change in Fed Funds from 4Q21 to 2Q24.
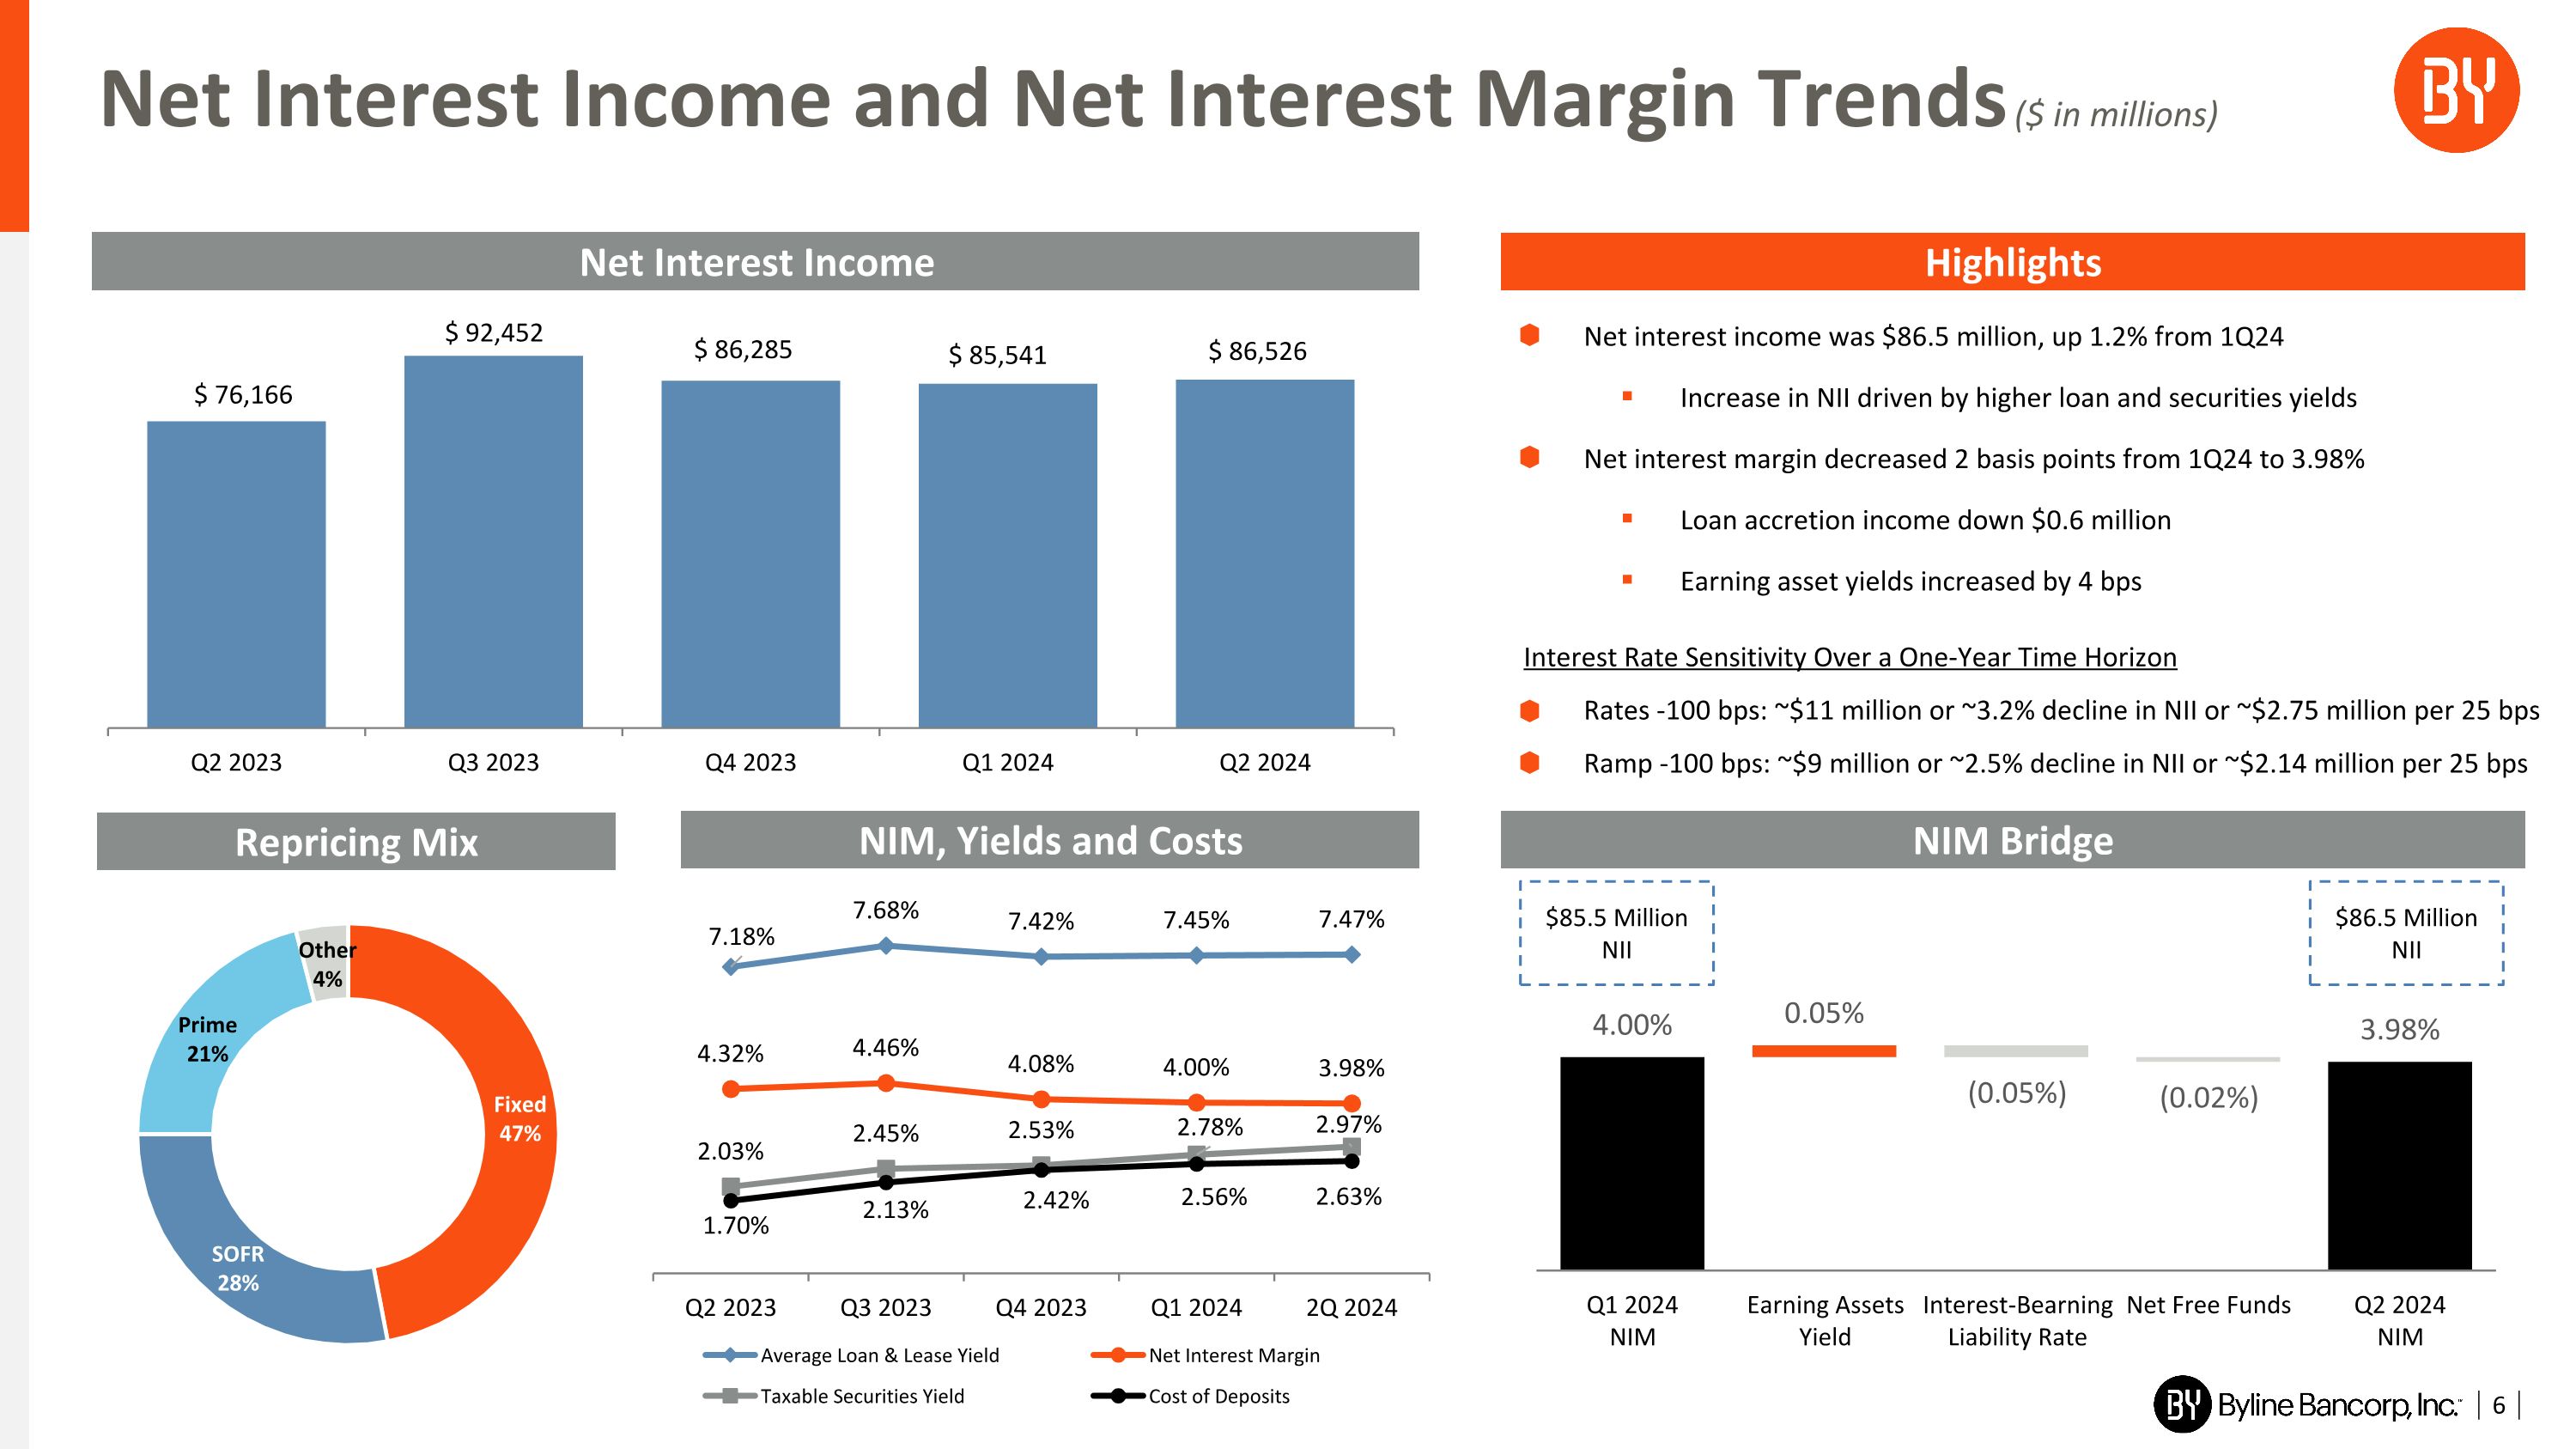
Net interest income was $86.5 million, up 1.2% from 1Q24 Increase in NII driven by higher loan and securities yields Net interest margin decreased 2 basis points from 1Q24 to 3.98% Loan accretion income down $0.6 million Earning asset yields increased by 4 bps Interest Rate Sensitivity Over a One-Year Time Horizon Rates -100 bps: ~$11 million or ~3.2% decline in NII or ~$2.75 million per 25 bps Ramp -100 bps: ~$9 million or ~2.5% decline in NII or ~$2.14 million per 25 bps NIM Bridge Net Interest Income and Net Interest Margin Trends ($ in millions) Net Interest Income Highlights NIM, Yields and Costs 6 Repricing Mix $85.5 Million NII $86.5 Million NII

Government Guaranteed Loan Sales $73.9 million of guaranteed loans sold in 2Q24 Loans held for sale decreased to $13.4 million in 2Q24 Non-interest income was $12.8 million, down 17.0% from 1Q24 $2.5 million FV mark on loan servicing asset charge due to a decrease in loans serviced Non-interest income remained stable QoQ, excluding FV marks on loan servicing asset and equity securities Gain on sale up 9.1%, driven by higher premiums Volume Sold and Average Net Premiums Non-Interest Income Trends ($ in millions) Total Non-Interest Income Highlights Net Gains on Sales of Loans 7 (1) Other includes net servicing losses in 3Q23.
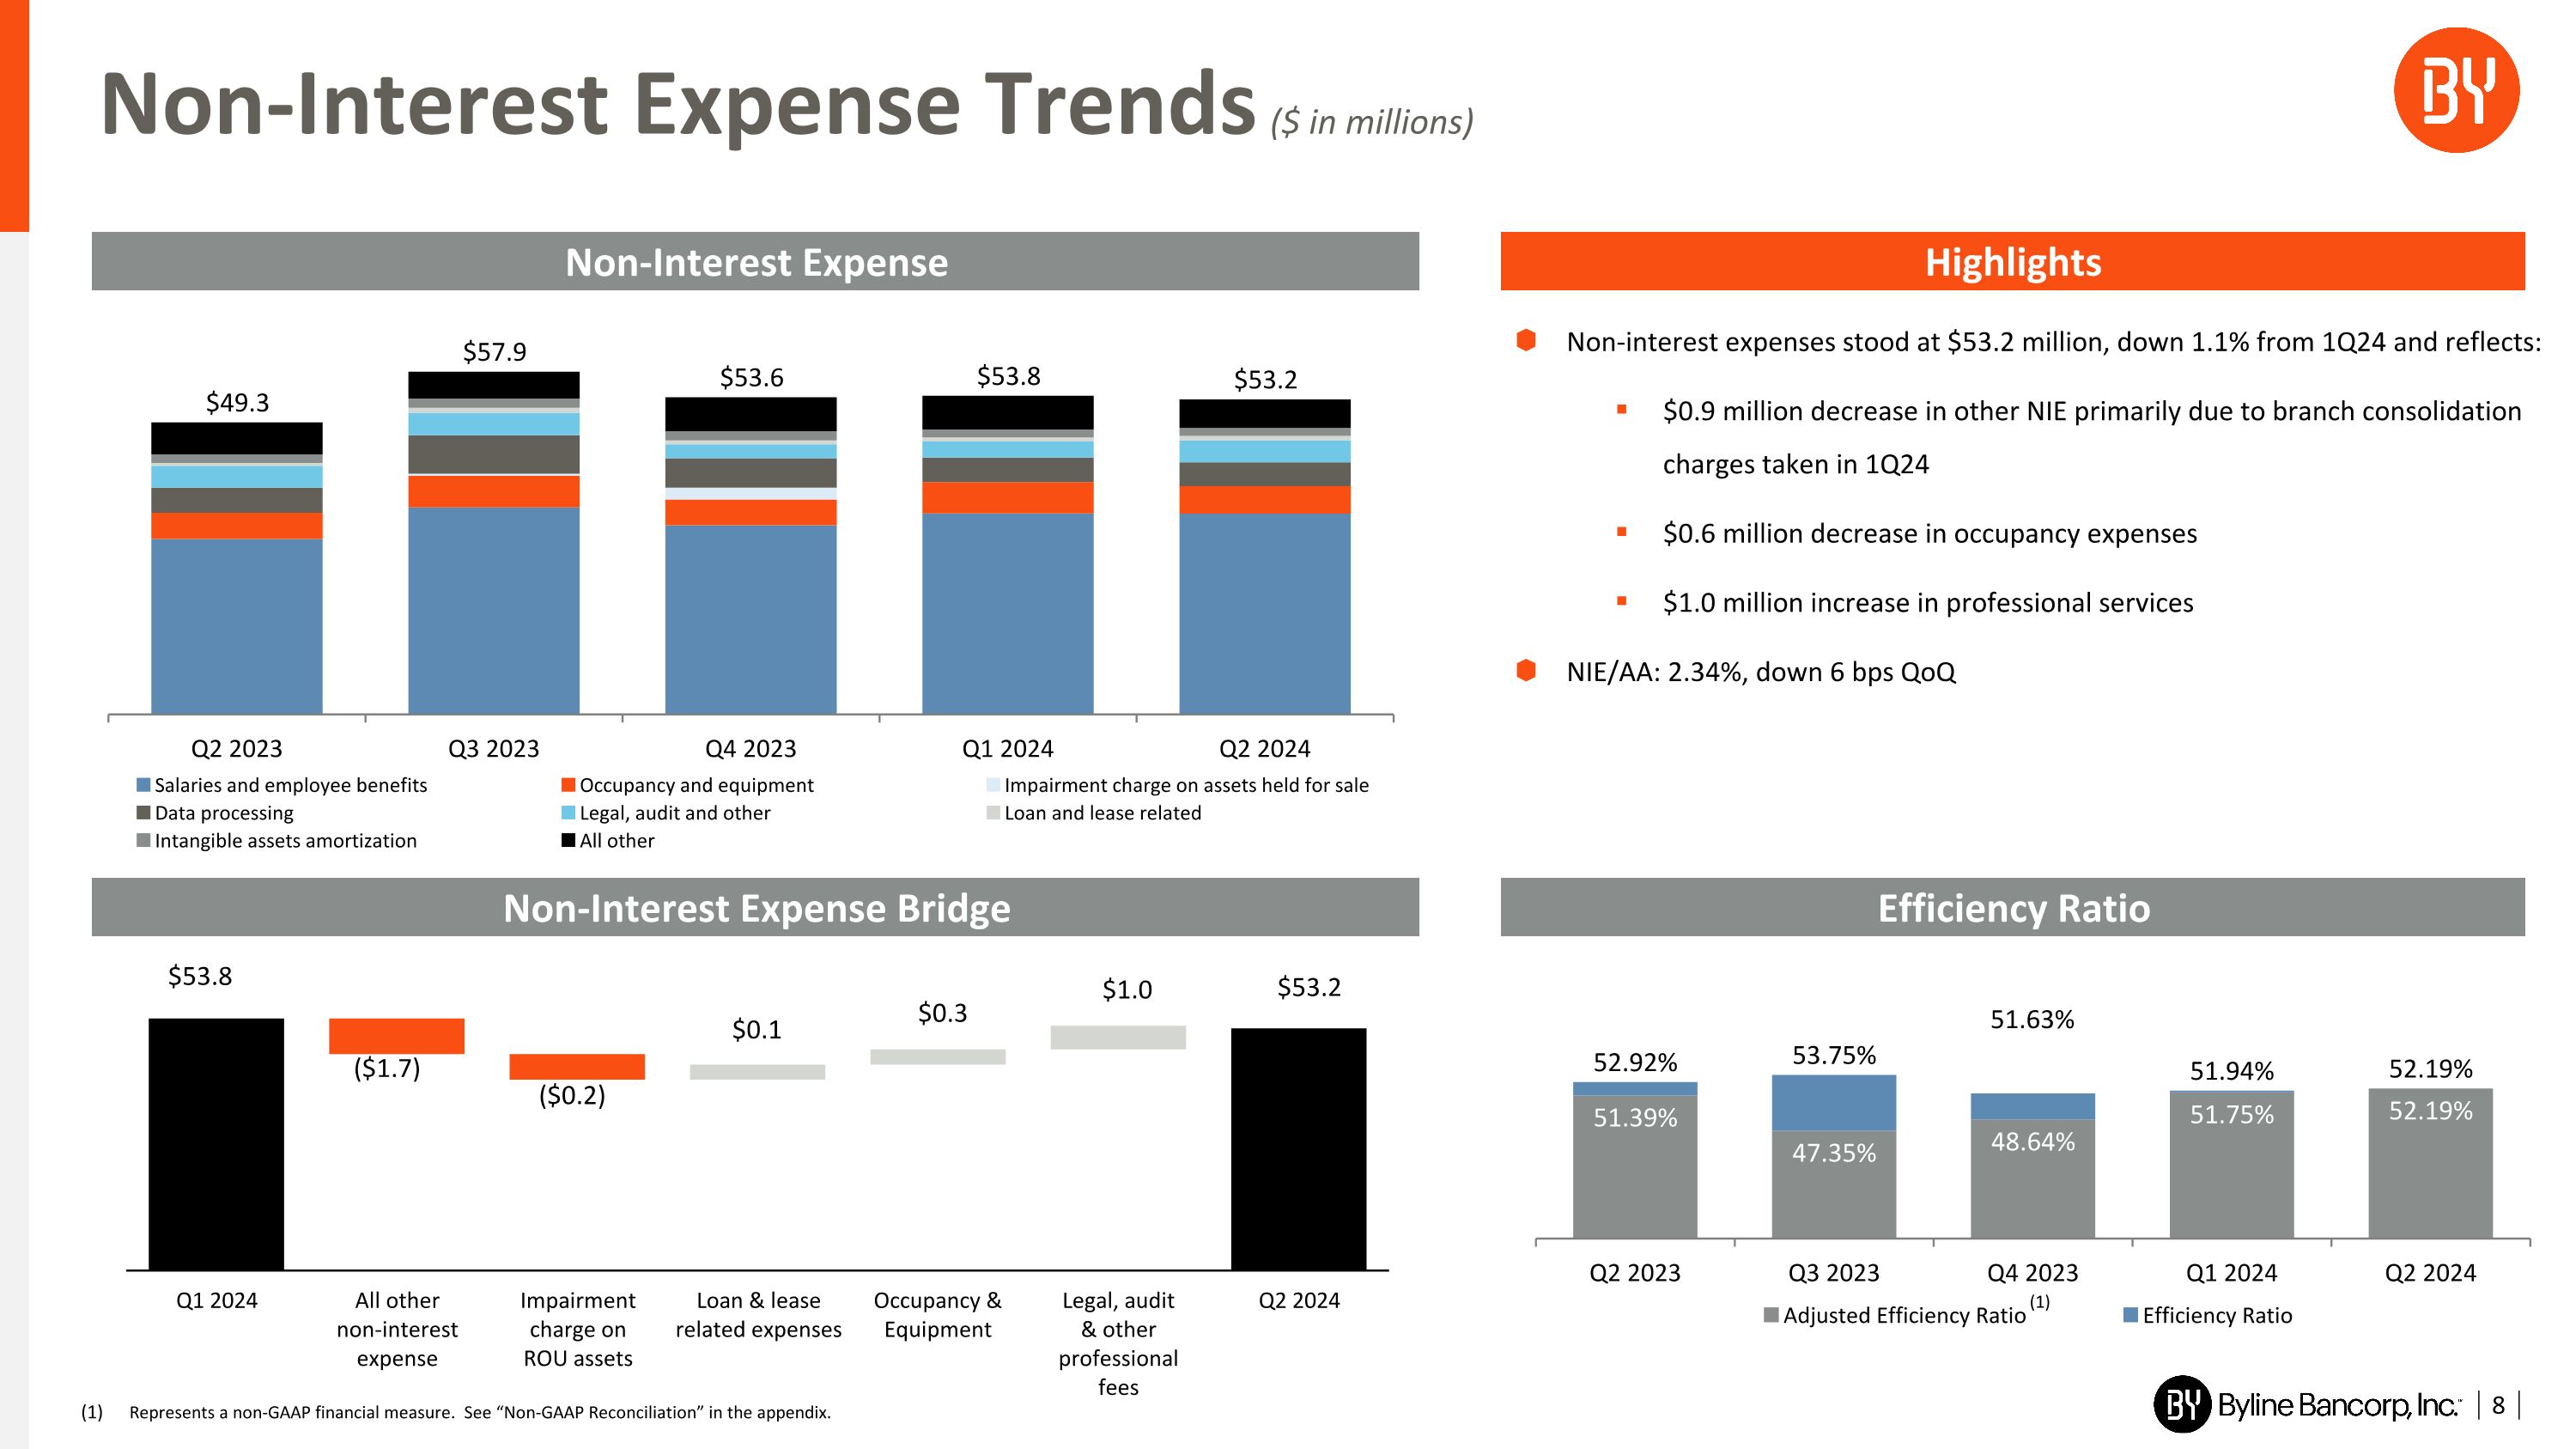
(1) Non-interest expenses stood at $53.2 million, down 1.1% from 1Q24 and reflects: $0.9 million decrease in other NIE primarily due to branch consolidation charges taken in 1Q24 $0.6 million decrease in occupancy expenses $1.0 million increase in professional services NIE/AA: 2.34%, down 6 bps QoQ Efficiency Ratio Non-Interest Expense Trends ($ in millions) Non-Interest Expense Highlights Non-Interest Expense Bridge 8 Represents a non-GAAP financial measure. See “Non-GAAP Reconciliation” in the appendix. ($1.7) ($0.2) $0.3 $0.1 $1.0 $53.8 $53.2

Note: Delinquencies represent accruing loans and leases past due 30 days or more. Delinquencies to Total Loans and Leases represent delinquencies divided by period end loans and leases. Delinquencies Asset Quality Trends ($ in millions) Net Charge-offs NPLs / Total Loans & Leases 9 Allowance for Credit Losses (ACL) Excluding Government Guaranteed loans, NPLs were 83 bps

Percent of Insured Deposits(2) Median: 63% Liquidity Position Strong Liquidity and Securities Portfolio Cash and cash equivalents of $730.5 million $1.4 billion investment portfolio (~99.9% AFS) $1.7 billion of available borrowing capacity Liquidity coverage of uninsured deposits ~106% as of quarter end Loans/Deposits ratio stood at 93.98% Uninsured Deposits stood at 28.0% and trends well below all peer bank averages % of Uninsured Deposits Industry Comparisons(1) >$500B $250B - $500B $100B - $250B $50B - $100B $10B - $50B $1B - $10B Median 42.0% 32.7% 36.2% 42.1% 38.0% 30.0% Byline Bank 28.0% 28.0% 28.0% 28.0% 28.0% 28.0% 10 Source: SNL Financial, and company filings. Financial data as of quarter ended March 31, 2024 or most recent available. Source: Company’s 1Q24 Form 10-Q | Calculation: (total deposits uninsured deposits) / total consolidated deposits | Byline 2024 Proxy Peer Group. Represents a non-GAAP financial measure. See “Non-GAAP Reconciliation” in the appendix. AFS Portfolio by Type HTM portfolio of ~$0.6 million ($5,000 in unrealized losses) Securities portfolio duration: 4.8 years; net of hedges: ~4.5 years Securities portfolio annual cash flow: ~$185 million Taxable securities yield of 2.97%, up 19 basis points from 1Q24 AOCI / TCE(3): ~13.4% Highlights
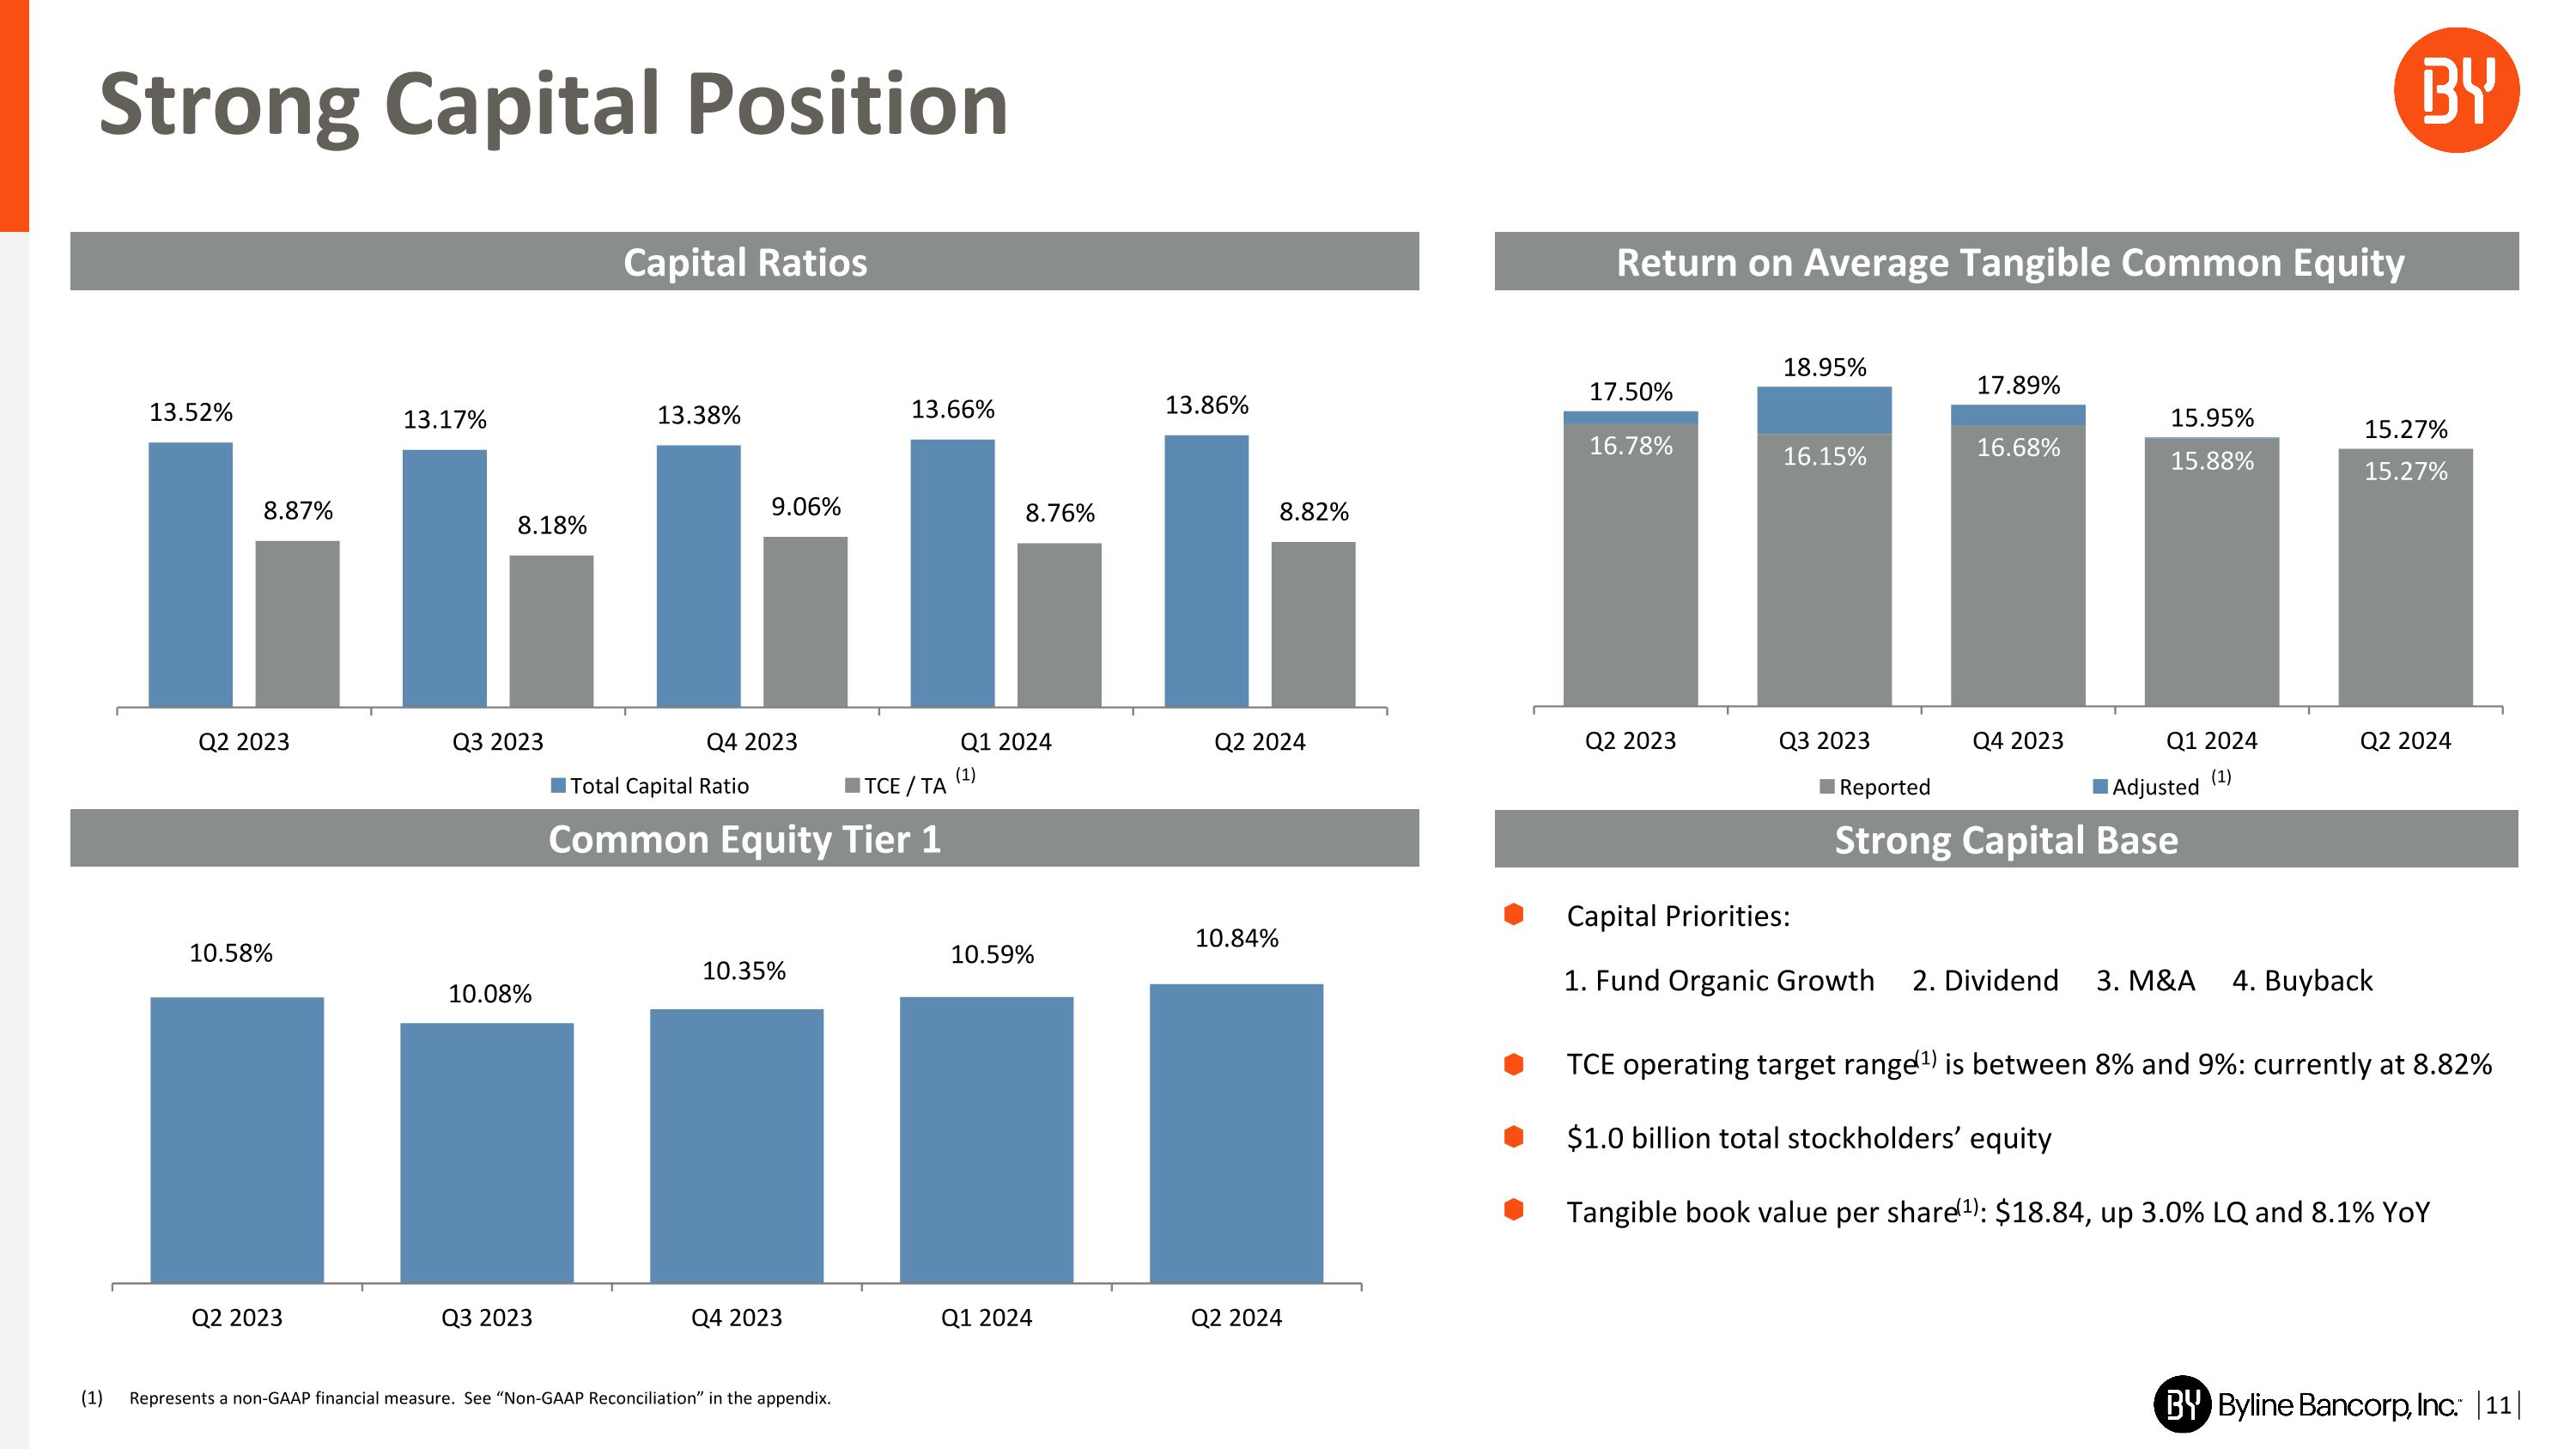
(1) Return on Average Tangible Common Equity Strong Capital Position Capital Ratios 11 Represents a non-GAAP financial measure. See “Non-GAAP Reconciliation” in the appendix. Strong Capital Base Common Equity Tier 1 Capital Priorities: TCE operating target range(1) is between 8% and 9%: currently at 8.82% $1.0 billion total stockholders’ equity Tangible book value per share(1): $18.84, up 3.0% LQ and 8.1% YoY 1. Fund Organic Growth 2. Dividend 3. M&A 4. Buyback (1)
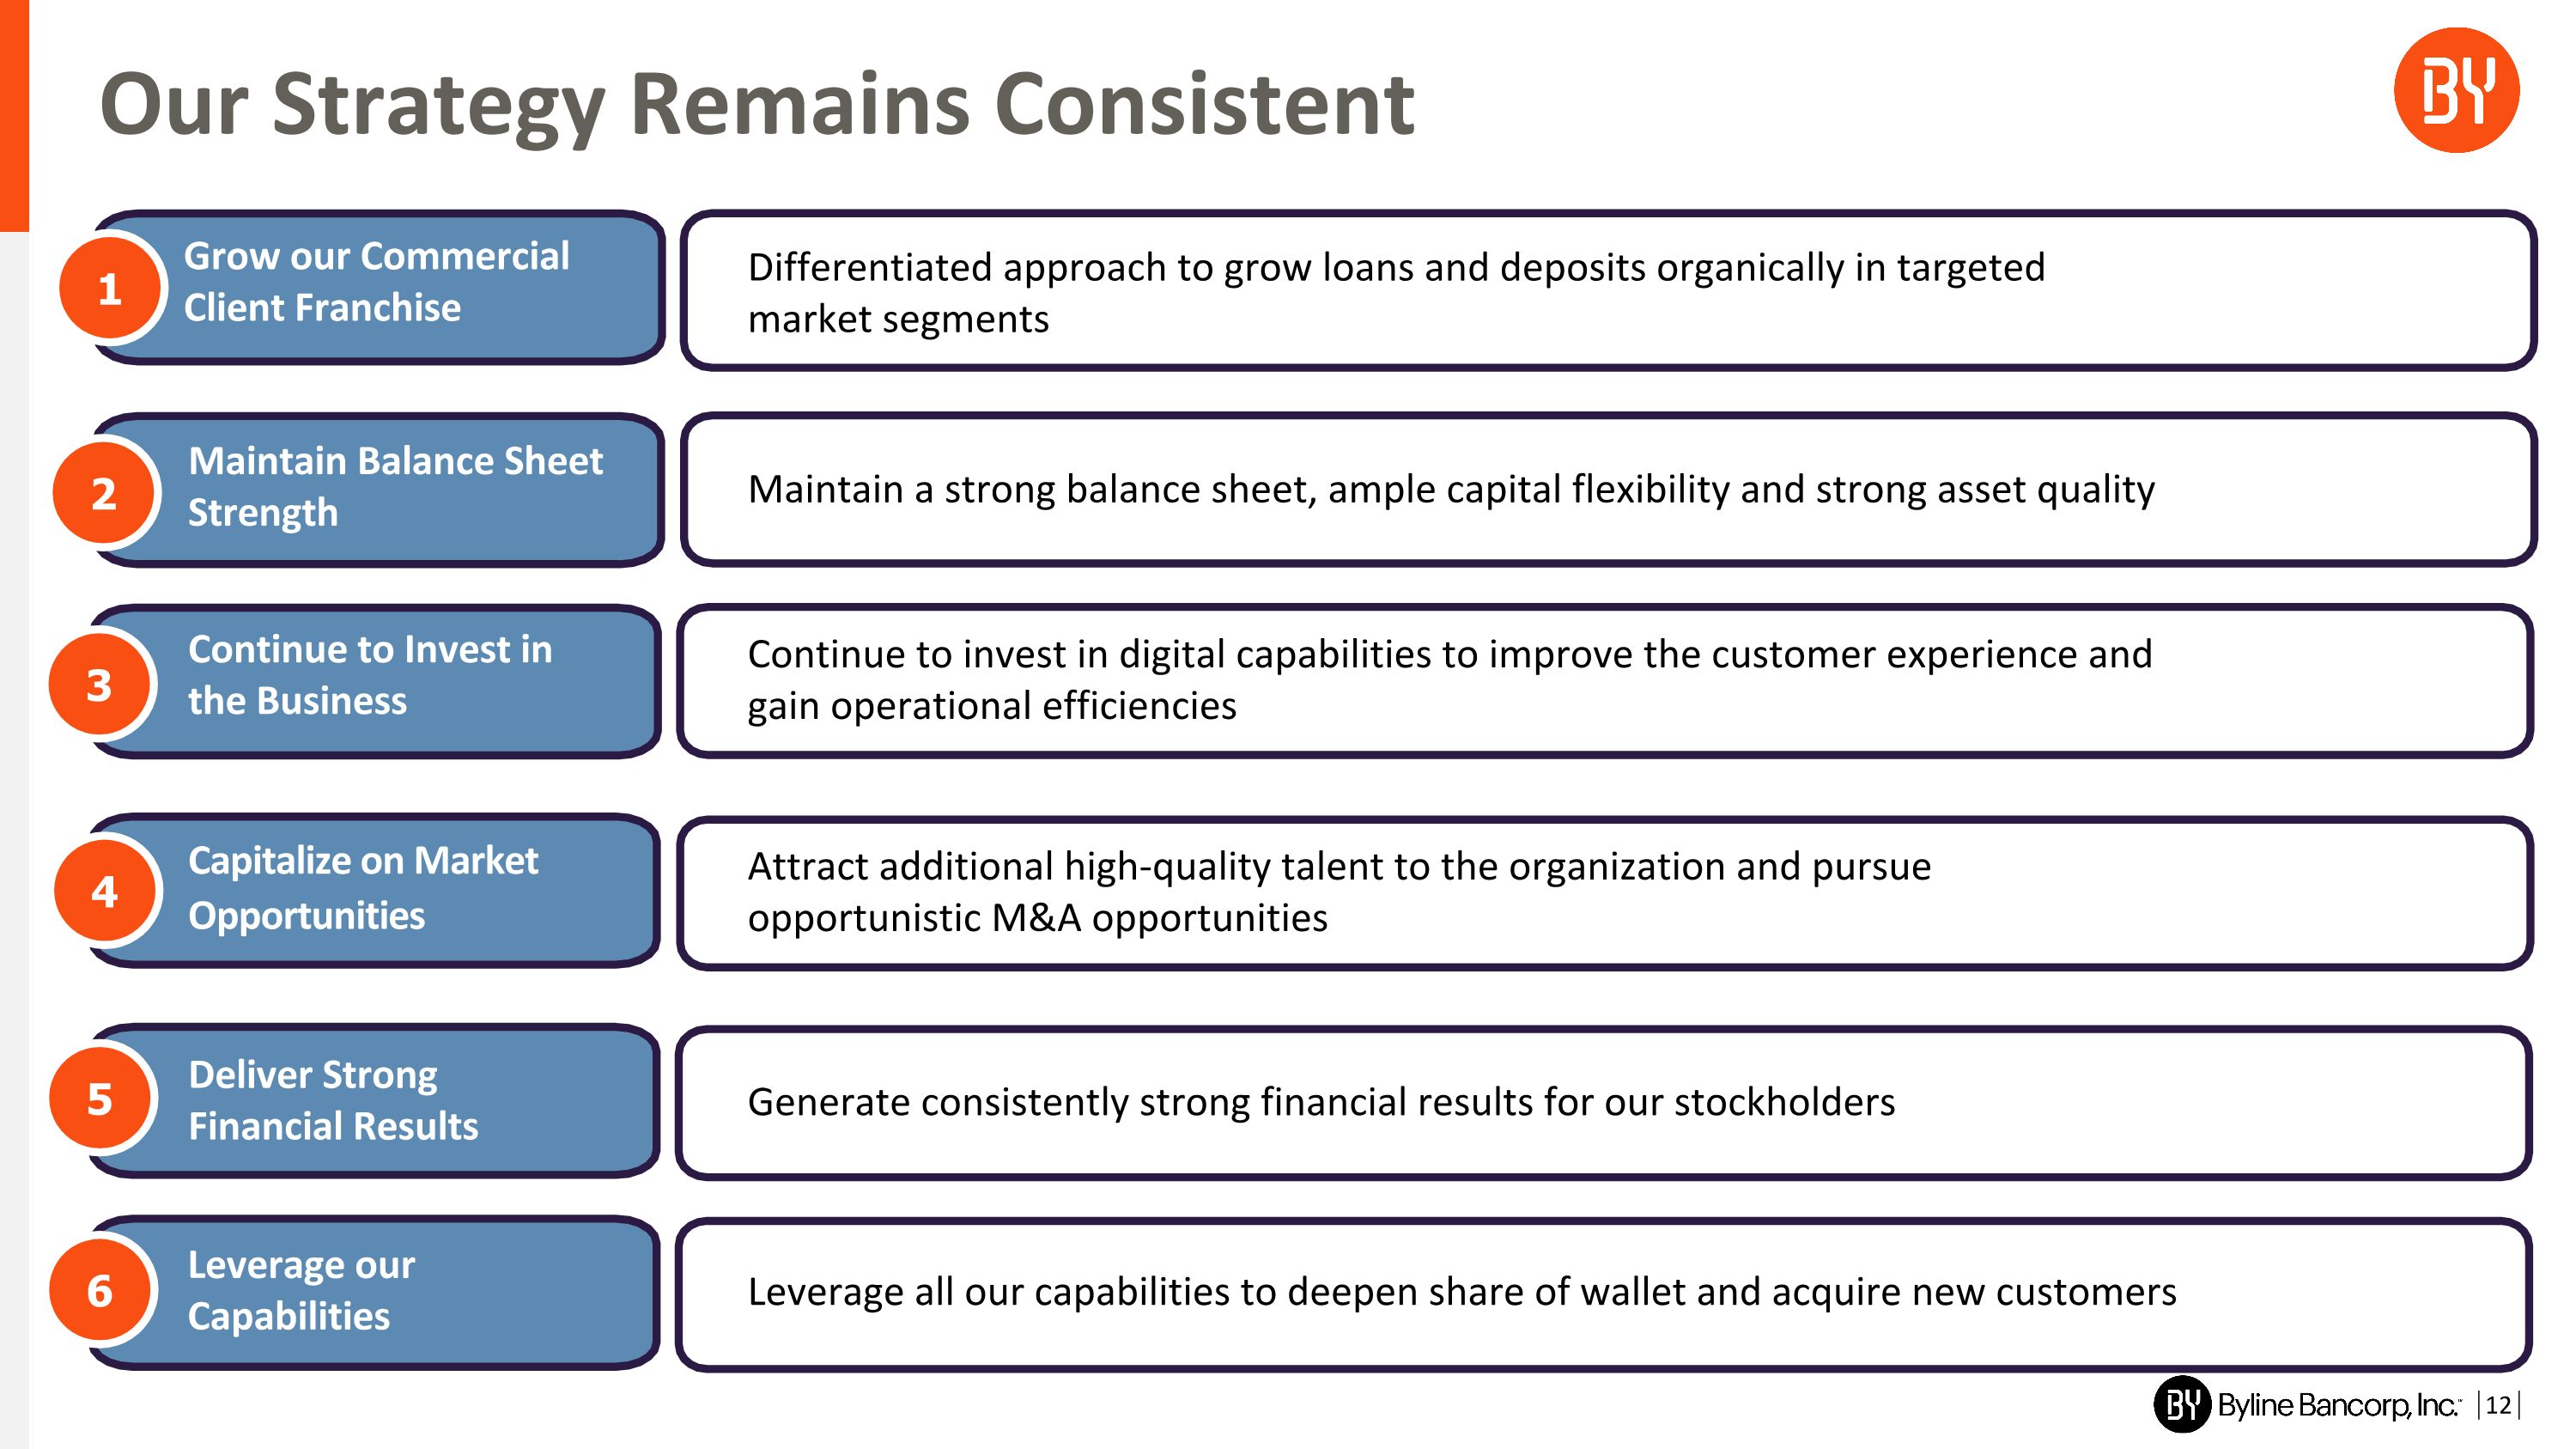
Our Strategy Remains Consistent 12 Maintain Balance Sheet Strength Continue to Invest in the Business Capitalize on Market Opportunities Deliver Strong Financial Results Grow our Commercial Client Franchise 1 2 3 4 5 Leverage our Capabilities 6 Differentiated approach to grow loans and deposits organically in targeted market segments Maintain a strong balance sheet, ample capital flexibility and strong asset quality Continue to invest in digital capabilities to improve the customer experience and gain operational efficiencies Attract additional high-quality talent to the organization and pursue opportunistic M&A opportunities Generate consistently strong financial results for our stockholders Leverage all our capabilities to deepen share of wallet and acquire new customers

2Q24 Earnings Presentation Appendix

Granular Deposit Base 14 Consumer Deposits, $3.1 billion Commercial Deposits, $2.8 billion ~72% of Total Deposits are FDIC Insured …with limited concentration and granular customer base providing a stable source of funding Consumer Deposits(1) $4.0 billion at 6/30/24 Granular Deposit Base ~$28,000 Average Account Balance Customer Base ~125,000 Consumer Accounts Total Franchise 46 Branches Commercial Deposits $3.3 billion at 6/30/24 Granular Deposit Base ~$121,000 Average Account Balance Customer Base ~29,000 Commercial Accounts Consumer Deposits, $4.0 billion Commercial Deposits, $3.3 billion Uninsured 8% d Total Deposits $7.3 Billion as of 6/30/24 Core banking footprint in key urban MSAs in Wisconsin and a broad footprint in Chicago, IL A strength of our franchise is our well diversified deposit base… Excludes brokered deposits.

CRE Portfolio: NOO Office Represents 2.9% of Total Loans 15 Non-Owner Occupied Commercial Real Estate Portfolio ($ in millions) 6/30/24 Industrial / Warehouse $609.9 8.9% Multi-family 527.3 7.7% Retail 227.7 3.3% Office 196.7 2.9% Hotel / Motel 38.1 0.5% Mixed Use 35.0 0.5% Senior Housing / Healthcare 31.0 0.4% Other 281.6 4.1% Total $1,947.3 28.3% % of Total Loans Note: Non-Owner Occupied CRE Portfolio includes construction, land, multi-family and non-owner occupied (NOO). CRE portfolio includes owner occupied, non-owner occupied, non-farm, non-residential, construction, and multi-family loans. d Total Loans & Leases $6.9 Billion as of 6/30/24

6/30/24 3/31/24 Avg. Commitment $3.6 million $3.6 million ACL % 1.8% 2.8% NCO %(1) 2.70% 3.06% 30+ DLQ % 5.0% 5.6% NPL % 5.0% 5.6% Criticized % 20% 24% Office CRE Portfolio: Diversified Tenants and Markets NCOs / Average loans represents net charge-offs to average loans for the last twelve-month period. Tenant Classification ($ in millions) 6/30/24 Illinois $121.8 North Carolina 24.4 Wisconsin 14.4 New Jersey 11.0 Florida 7.0 Ohio 6.3 Iowa 3.6 Minnesota 3.2 New Mexico 2.2 West Virginia 1.1 Michigan 0.9 Tennessee 0.8 Total Office $196.7 CRE Office: Geographic Mix by State Office Portfolio Metrics Office Portfolio Market Type 16

(1) ($ in millions) $ Balance % of Portfolio Unguaranteed $377.6 5.6% Guaranteed 73.8 1.1% Total SBA 7(a) Loans $451.4 6.7% Unguaranteed $36.8 0.5% Guaranteed 21.0 0.3% Total USDA Loans $57.8 0.8% Unguaranteed Loan Portfolio by Industry One of the top SBA and USDA lenders in the United States Closed $87.6 million in SBC loan commitments in 2Q24 SBA 7(a) portfolio $451.4 million, down $13.4 million from 1Q24 ACL/Unguaranteed loan balance ~8.1% $1.7 billion in serviced government guaranteed loans for investors in 2Q24 Since 2016, the unguaranteed government-guaranteed exposure has decreased from 14.6% down to 6.1% in 2024 Unguaranteed Government-Guaranteed Exposure Represents 6.1% of Total Loans ($ in millions) On Balance Sheet SBA 7(a) & USDA Loans SBA 7(a) & USDA Closed Loan Commitments Highlights Represents sectors with less than 5% of the total portfolio. 17 $122.3 $107.3 $129.2 $108.3 $82.3

Projected Acquisition Accounting Accretion Projections are updated quarterly, assumes no prepayments and are subject to change. 18 Projected Accretion(1) ($ in millions)

Financial Summary 19 Represents a non-GAAP financial measure. See “Non-GAAP Reconciliation” in the appendix. As of or For the Three Months Ended (dollars in thousands, except per share data) June 30, March 31, June 30, 2024 2024 2023 Income Statement Net interest income $ 86,526 $ 85,541 $ 76,166 Provision for credit losses 6,045 6,643 5,790 Non-interest income 12,844 15,473 14,291 Non-interest expense 53,210 53,809 49,328 Income before provision for income taxes 40,115 40,562 35,339 Provision for income taxes 10,444 10,122 9,232 Net income $ 29,671 $ 30,440 $ 26,107 Diluted earnings per common share(1) $ 0.68 $ 0.70 $ 0.70 Balance Sheet Total loans and leases HFI $ 6,891,204 $ 6,778,214 $ 5,570,517 Total deposits 7,347,181 7,350,202 5,917,092 Tangible common equity(1) 832,226 806,916 657,965 Balance Sheet Metrics Loans and leases / total deposits 93.98% 92.54% 94.58% Tangible common equity / tangible assets(1) 8.82% 8.76% 8.87% Key Performance Ratios Net interest margin 3.98% 4.00% 4.32% Efficiency ratio 52.19% 51.94% 52.92% Adjusted efficiency ratio(1) 52.19% 51.75% 51.39% Non-interest income to total revenues 12.93% 15.32% 15.80% Non-interest expense to average assets 2.34% 2.40% 2.67% Return on average assets 1.31% 1.36% 1.41% Adjusted return on average assets(1) 1.31% 1.36% 1.48% Pre-tax pre-provision return on average assets (1) 2.03% 2.10% 2.23% Dividend payout ratio on common stock 13.24% 12.86% 12.86% Tangible book value per common share(1) $ 18.84 $ 18.29 $ 17.43

Non-GAAP Reconciliation 20 As of or For the Three Months Ended (dollars in thousands, except per share data) June 30, �2024 March 31, �2024 June 30, �2023 Net income and earnings per share excluding significant items Reported Net Income $ 29,671 $ 30,440 $ 26,107 Significant items: Impairment charges on ROU asset — 194 — Merger-related expenses — — 1,391 Tax benefit — (52) (230) Adjusted Net Income $ 29,671 $ 30,582 $ 27,268 Reported Diluted Earnings per Share $ 0.68 $ 0.70 $ 0.70 Significant items: Impairment charges on ROU asset — — — Merger-related expenses — — 0.04 Tax benefit — — (0.01) Adjusted Diluted Earnings per Share $ 0.68 $ 0.70 $ 0.70
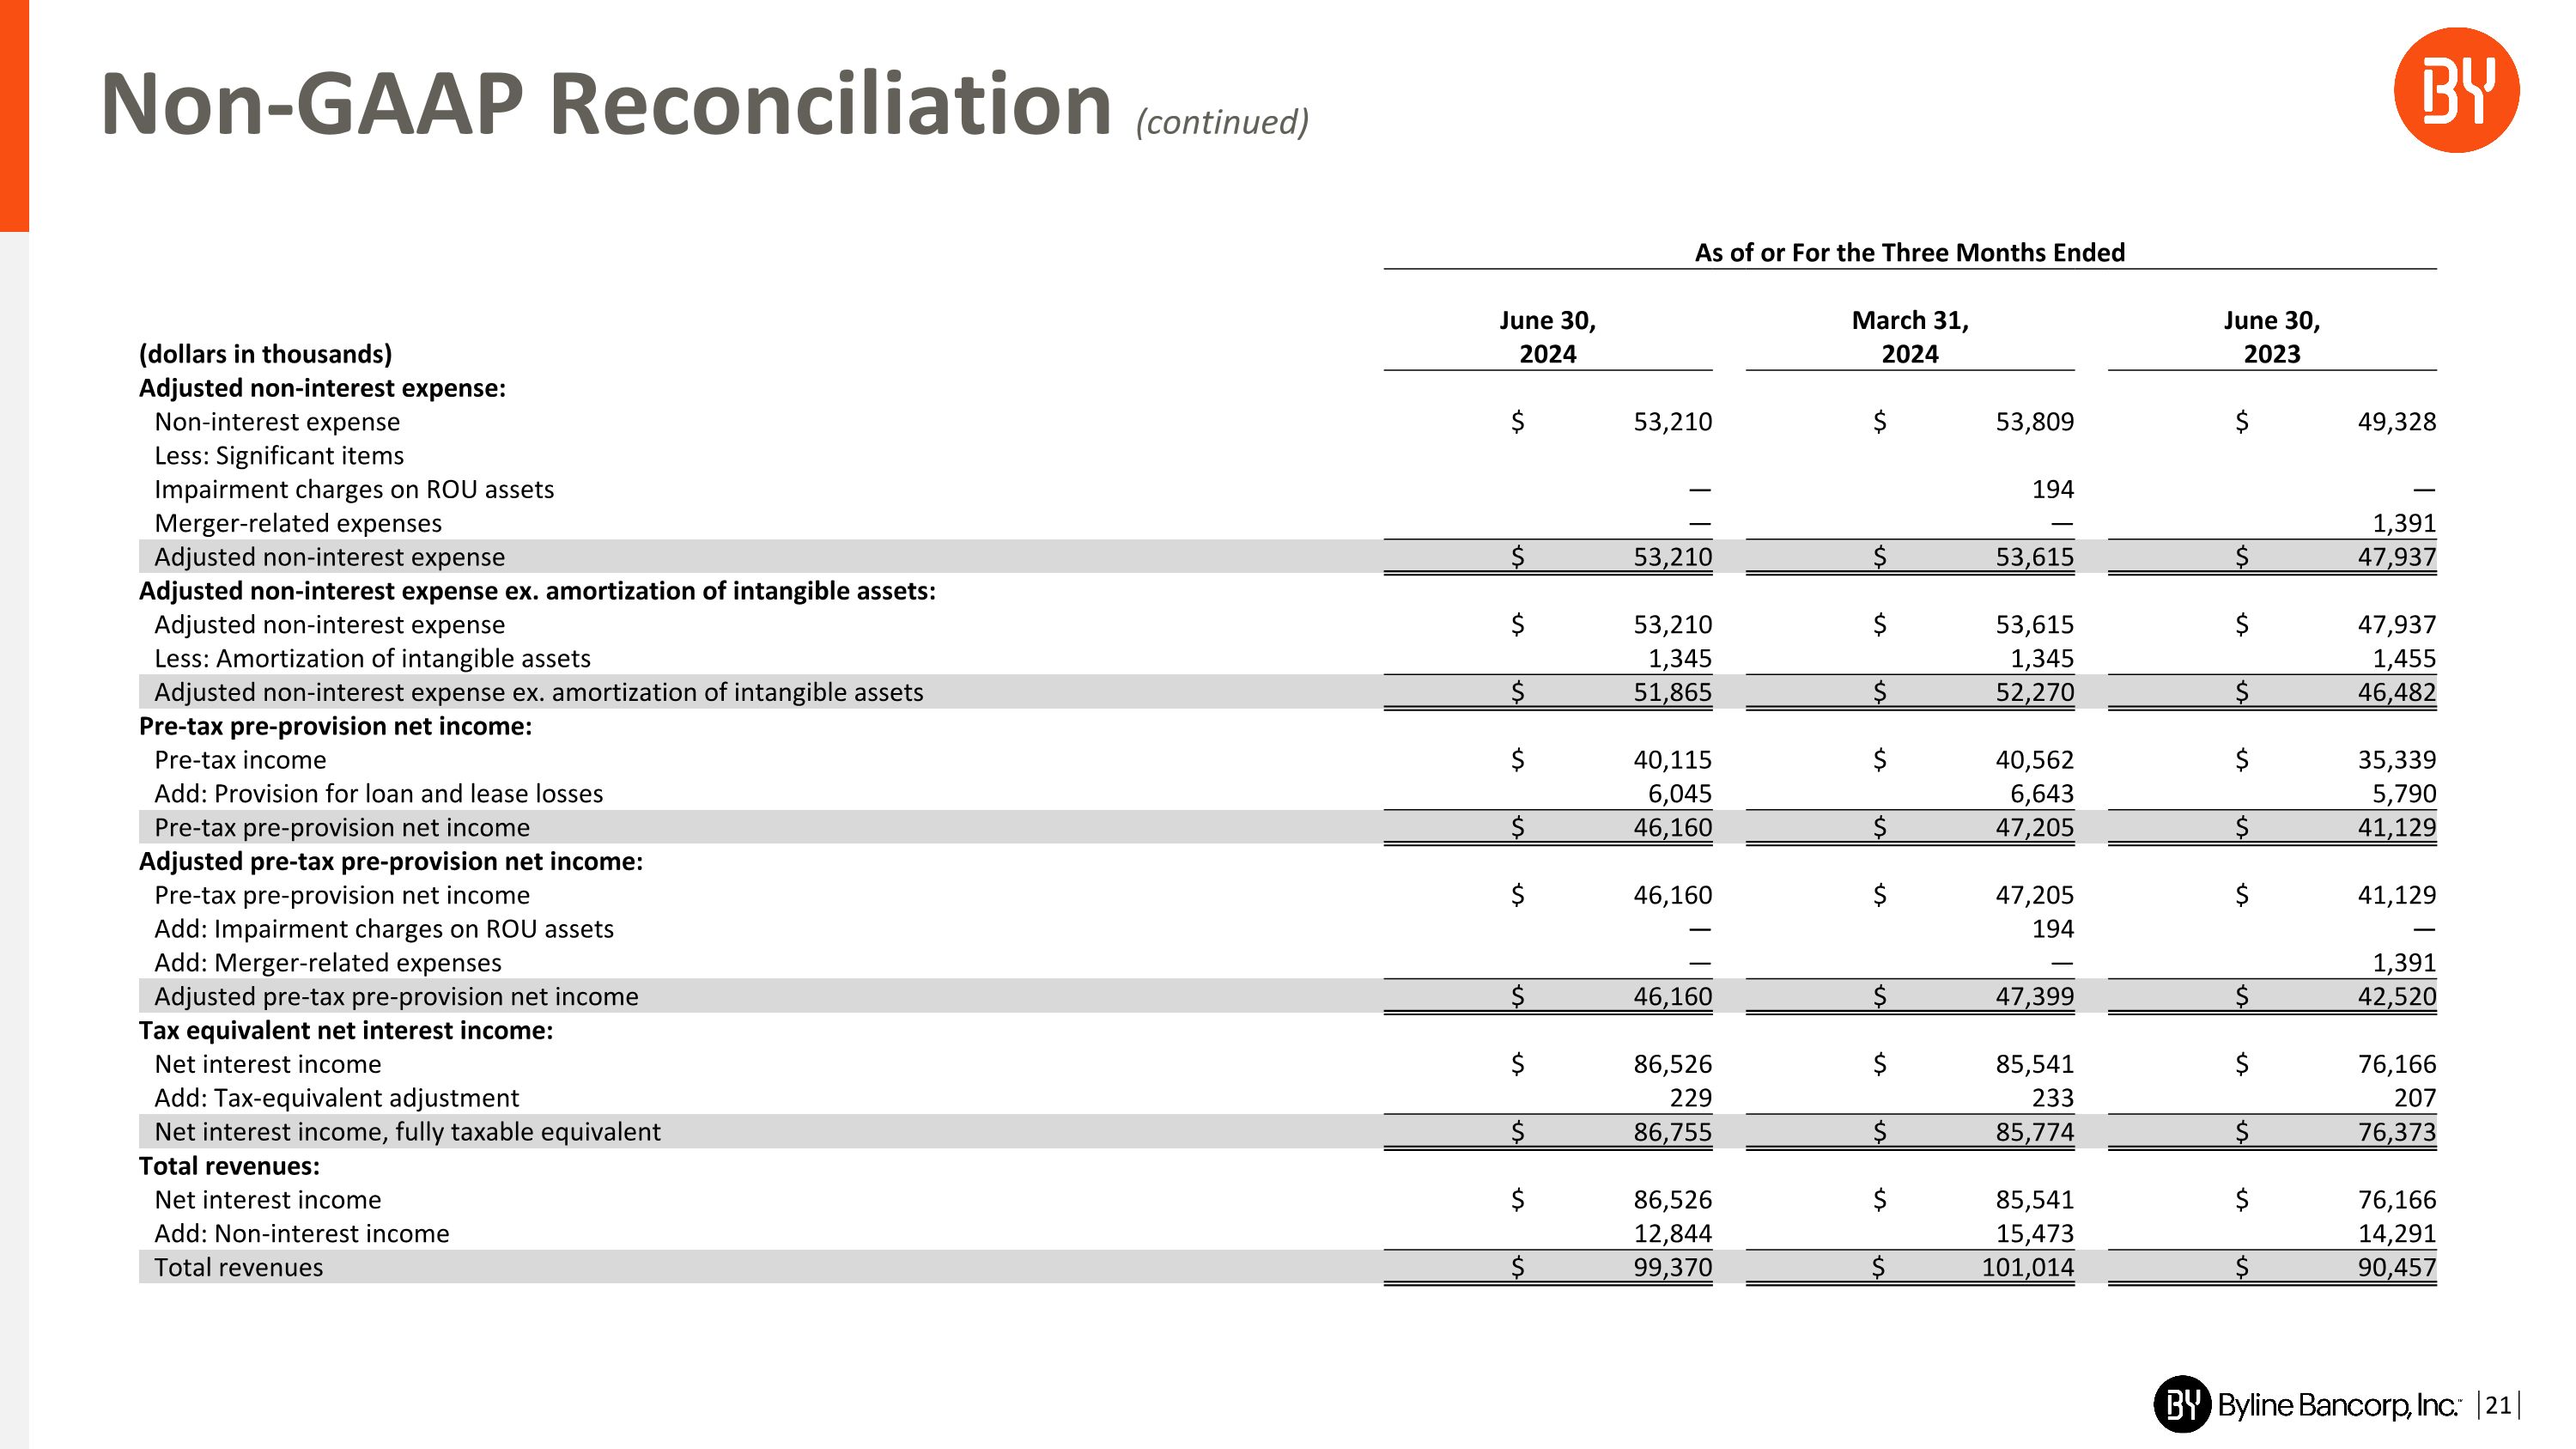
Non-GAAP Reconciliation (continued) 21 As of or For the Three Months Ended (dollars in thousands) June 30, �2024 March 31, �2024 June 30, �2023 Adjusted non-interest expense: Non-interest expense $ 53,210 $ 53,809 $ 49,328 Less: Significant items Impairment charges on ROU assets — 194 — Merger-related expenses — — 1,391 Adjusted non-interest expense $ 53,210 $ 53,615 $ 47,937 Adjusted non-interest expense ex. amortization of intangible assets: Adjusted non-interest expense $ 53,210 $ 53,615 $ 47,937 Less: Amortization of intangible assets 1,345 1,345 1,455 Adjusted non-interest expense ex. amortization of intangible assets $ 51,865 $ 52,270 $ 46,482 Pre-tax pre-provision net income: Pre-tax income $ 40,115 $ 40,562 $ 35,339 Add: Provision for loan and lease losses 6,045 6,643 5,790 Pre-tax pre-provision net income $ 46,160 $ 47,205 $ 41,129 Adjusted pre-tax pre-provision net income: Pre-tax pre-provision net income $ 46,160 $ 47,205 $ 41,129 Add: Impairment charges on ROU assets — 194 — Add: Merger-related expenses — — 1,391 Adjusted pre-tax pre-provision net income $ 46,160 $ 47,399 $ 42,520 Tax equivalent net interest income: Net interest income $ 86,526 $ 85,541 $ 76,166 Add: Tax-equivalent adjustment 229 233 207 Net interest income, fully taxable equivalent $ 86,755 $ 85,774 $ 76,373 Total revenues: Net interest income $ 86,526 $ 85,541 $ 76,166 Add: Non-interest income 12,844 15,473 14,291 Total revenues $ 99,370 $ 101,014 $ 90,457

Non-GAAP Reconciliation (continued) 22 As of or For the Three Months Ended (dollars in thousands) June 30, �2024 March 31, �2024 June 30, �2023 Tangible common stockholders' equity: Total stockholders' equity $ 1,033,014 $ 1,009,049 $ 813,942 Less: Goodwill and other intangibles 200,788 202,133 155,977 Tangible common stockholders' equity $ 832,226 $ 806,916 $ 657,965 Tangible assets: Total assets $ 9,633,815 $ 9,410,503 $ 7,575,690 Less: Goodwill and other intangibles 200,788 202,133 155,977 Tangible assets $ 9,433,027 $ 9,208,370 $ 7,419,713 Tangible assets, excluding accumulated other comprehensive loss: Tangible assets $ 9,433,027 $ 9,208,370 $ 7,419,713 Less: Accumulated other comprehensive loss (111,469) (106,910) (114,862) Tangible assets, excluding accumulated other comprehensive loss: $ 9,544,496 $ 9,315,280 $ 7,534,575 Tangible common stockholders' equity, excluding accumulated other comprehensive loss: Tangible common stockholders' equity $ 832,226 $ 806,916 $ 657,965 Less: Accumulated other comprehensive loss (111,469) (106,910) (114,862) Tangible common stockholders' equity, excluding accumulated other comprehensive loss $ 943,695 $ 913,826 $ 772,827 Average tangible common stockholders' equity: Average total stockholders' equity $ 1,008,802 $ 998,806 $ 806,272 Less: Average goodwill and other intangibles 201,428 202,773 156,766 Average tangible common stockholders' equity $ 807,374 $ 796,033 $ 649,506 Average tangible assets: Average total assets $ 9,140,736 $ 9,030,941 $ 7,403,899 Less: Average goodwill and other intangibles 201,428 202,773 156,766 Average tangible assets $ 8,939,308 $ 8,828,168 $ 7,247,133 Tangible net income available to common stockholders: Net income available to common stockholders $ 29,671 $ 30,440 $ 26,107 Add: After-tax intangible asset amortization 987 986 1,067 Tangible net income available to common stockholders $ 30,658 $ 31,426 $ 27,174 Adjusted tangible net income available to common stockholders: Tangible net income available to common stockholders $ 30,658 $ 31,426 $ 27,174 Impairment charges on ROU assets — 194 — Merger-related expenses — — 1,391 Tax benefit on significant items — (52) (230) Adjusted tangible net income available to common stockholders $ 30,658 $ 31,568 $ 28,335

Non-GAAP Reconciliation (continued) 23 As of or For the Three Months Ended (dollars in thousands, except share and per share � data, ratios annualized, where applicable) June 30, �2024 March 31, �2024 June 30, �2023 Pre-tax pre-provision return on average assets: Pre-tax pre-provision net income $ 46,160 $ 47,205 $ 41,129 Average total assets 9,140,736 9,030,941 7,403,899 Pre-tax pre-provision return on average assets 2.03% 2.10% 2.23% Adjusted pre-tax pre-provision return on average assets: Adjusted pre-tax pre-provision net income $ 46,160 $ 47,399 $ 42,520 Average total assets 9,140,736 9,030,941 7,403,899 Adjusted pre-tax pre-provision return on average assets 2.03% 2.11% 2.30% Net interest margin, fully taxable equivalent: Net interest income, fully taxable equivalent $ 86,755 $ 85,774 $ 76,373 Total average interest-earning assets 8,743,462 8,603,582 7,072,581 Net interest margin, fully taxable equivalent 3.99% 4.01% 4.33% Non-interest income to total revenues: Non-interest income $ 12,844 $ 15,473 $ 14,291 Total revenues 99,370 101,014 90,457 Non-interest income to total revenues 12.93% 15.32% 15.80% Adjusted non-interest expense to average assets: Adjusted non-interest expense $ 53,210 $ 53,615 $ 47,937 Average total assets 9,140,736 9,030,941 7,403,899 Adjusted non-interest expense to average assets 2.34% 2.39% 2.60% Adjusted efficiency ratio: Adjusted non-interest expense excluding � amortization of intangible assets $ 51,865 $ 52,270 $ 46,482 Total revenues 99,370 101,014 90,457 Adjusted efficiency ratio 52.19% 51.75% 51.39% Adjusted return on average assets: Adjusted net income $ 29,671 $ 30,582 $ 27,268 Average total assets 9,140,736 9,030,941 7,403,899 Adjusted return on average assets 1.31% 1.36% 1.48% Adjusted return on average stockholders' equity: Adjusted net income $ 29,671 $ 30,582 $ 27,268 Average stockholders' equity 1,008,802 998,806 806,272 Adjusted return on average stockholders' equity 11.83% 12.31% 13.56%

Non-GAAP Reconciliation (continued) 24 As of or For the Three Months Ended June 30, �2024 March 31, �2024 June 30, �2023 (dollars in thousands, except share and per share data) Tangible common equity to tangible assets: Tangible common equity $ 832,226 $ 806,916 $ 657,965 Tangible assets 9,433,027 9,208,370 7,419,713 Tangible common equity to tangible assets 8.82% 8.76% 8.87% Tangible common stockholders' equity, excluding accumulated other comprehensive loss to tangible assets, excluding accumulated other comprehensive loss: Tangible common stockholders' equity, excluding � accumulated other comprehensive loss $ 943,695 $ 913,826 $ 772,827 Tangible assets, excluding accumulated other comprehensive loss: 9,544,496 9,315,280 7,534,575 Tangible common stockholders' equity, excluding accumulated other comprehensive loss to tangible assets, excluding accumulated other comprehensive loss 9.89% 9.81% 10.26% Return on average tangible common stockholders' equity: Tangible net income available to common stockholders $ 30,658 $ 31,426 $ 27,174 Average tangible common stockholders' equity 807,374 796,033 649,506 Return on average tangible common stockholders' equity 15.27% 15.88% 16.78% Adjusted return on average tangible common stockholders' equity: Adjusted tangible net income available to common stockholders $ 30,658 $ 31,568 $ 28,335 Average tangible common stockholders' equity 807,374 796,033 649,506 Adjusted return on average tangible common stockholders' equity 15.27% 15.95% 17.50% Tangible book value per share: Tangible common equity $ 832,226 $ 806,916 $ 657,965 Common shares outstanding 44,180,829 44,108,387 37,752,002 Tangible book value per share $ 18.84 $ 18.29 $ 17.43 Accumulated other comprehensive loss to tangible common equity: Accumulated other comprehensive loss $ 111,469 $ 106,910 $ 114,862 Tangible common equity 832,226 806,916 657,965 Accumulated other comprehensive loss to tangible common equity 13.39% 13.25% 17.46%


