Q4 2017 Financial Results Exhibit 99.1
Forward Looking Statements This communication contains forward-looking statements within the meaning of the U.S. federal securities laws. Forward-looking statements include, without limitation, statements concerning plans, estimates, calculations, forecasts and projections with respect to the anticipated future performance of the Company. These statements are often, but not always, made through the use of words or phrases such as ‘‘may’’, ‘‘might’’, ‘‘should’’, ‘‘could’’, ‘‘predict’’, ‘‘potential’’, ‘‘believe’’, ‘‘expect’’, ‘‘continue’’, ‘‘will’’, ‘‘anticipate’’, ‘‘seek’’, ‘‘estimate’’, ‘‘intend’’, ‘‘plan’’, ‘‘projection’’, ‘‘would’’, ‘‘annualized’’, “target” and ‘‘outlook’’, or the negative version of those words or other comparable words or phrases of a future or forward-looking nature. Forward-looking statements reflect various assumptions and involve elements of subjective judgment and analysis, which may or may not prove to be correct, and which are subject to uncertainties and contingencies outside the control of Byline and its respective affiliates, directors, employees and other representatives, which could cause actual results to differ materially from those presented in this communication. No representations, warranties or guarantees are or will be made by Byline as to the reliability, accuracy or completeness of any forward-looking statements contained in this communication or that such forward-looking statements are or will remain based on reasonable assumptions. You should not place undue reliance on any forward-looking statements contained in this communication. Forward-looking statements speak only as of the date they are made, and we assume no obligation to update any of these statements in light of new information, future events or otherwise unless required under the federal securities laws. Additional Information The information included herein does not constitute an offer to sell or a solicitation of an offer to buy any securities or a solicitation of any vote or approval. Byline will file a registration statement on Form S-4 with the SEC in connection with its proposed acquisition of First Evanston Bancorp, Inc. (“First Evanston”), and First Evanston’s wholly-owned subsidiary, First Bank & Trust. The registration statement will include a joint proxy statement of Byline and First Evanston, which also will constitute a prospectus of Byline, that will be sent to the stockholders of Byline and the shareholders of First Evanston. INVESTORS, STOCKHOLDERS OF BYLINE AND SHAREHOLDERS OF FIRST EVANSTON ARE ADVISED TO READ THE JOINT PROXY STATEMENT/PROSPECTUS WHEN IT BECOMES AVAILABLE BECAUSE IT WILL CONTAIN IMPORTANT INFORMATION ABOUT BYLINE, FIRST EVANSTON AND THE PROPOSED TRANSACTION. When filed, the joint proxy statement/prospectus and other documents relating to the merger filed by Byline with the SEC can be obtained free of charge from the SEC’s website at www.sec.gov. These documents also can be obtained free of charge by accessing Byline’s website at www.bylinebancorp.com under the tab “About Us-Investor Relations.” Alternatively, these documents, when available, can be obtained free of charge from Byline upon written request to Byline Bancorp, Inc., Attn: Corporate Secretary, 180 North LaSalle Street, Suite 300, Chicago, Illinois 60601, 60018 or by calling (773) 244-7000, or from First Evanston upon written request to First Evanston Bancorp, Inc., Attn: Corporate Secretary, 820 Church Street, Evanston, Illinois 60201 or by calling (847) 733-7400. Participants in this Transaction Byline, First Evanston, their respective directors and executive officers and certain of their other members of management and employees may be deemed to be participants in the solicitation of proxies from Byline’s stockholders and First Evanston’s shareholders in connection with the proposed transaction. Information about the directors and executive officers of Byline may be found in the prospectus of Byline relating to its initial public offering of common stock filed with the SEC on July 3, 2017, a copy of which can be obtained free of charge from Byline or from the SEC’s website as indicated above. In addition, information about the directors and executive officers of Byline and First Evanston and other persons who may be deemed participants in the transaction will be included in the joint proxy statement/prospectus and other relevant materials when filed with the SEC.
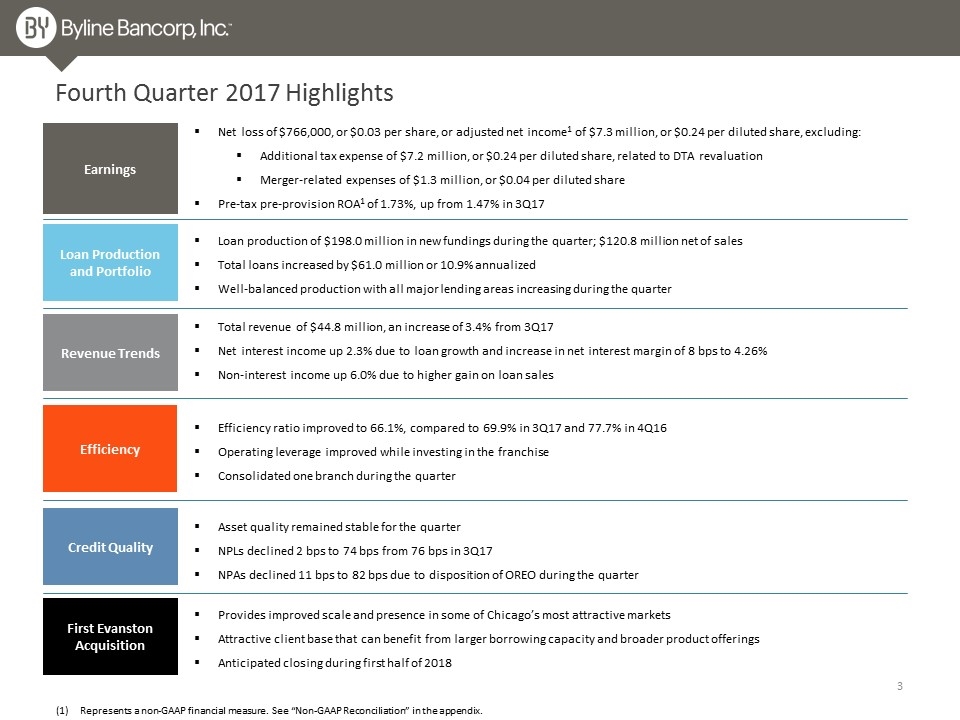
Fourth Quarter 2017 Highlights Earnings Efficiency Loan Production and Portfolio Revenue Trends Credit Quality Net loss of $766,000, or $0.03 per share, or adjusted net income1 of $7.3 million, or $0.24 per diluted share, excluding: Additional tax expense of $7.2 million, or $0.24 per diluted share, related to DTA revaluation Merger-related expenses of $1.3 million, or $0.04 per diluted share Pre-tax pre-provision ROA1 of 1.73%, up from 1.47% in 3Q17 Efficiency ratio improved to 66.1%, compared to 69.9% in 3Q17 and 77.7% in 4Q16 Operating leverage improved while investing in the franchise Consolidated one branch during the quarter Total revenue of $44.8 million, an increase of 3.4% from 3Q17 Net interest income up 2.3% due to loan growth and increase in net interest margin of 8 bps to 4.26% Non-interest income up 6.0% due to higher gain on loan sales Asset quality remained stable for the quarter NPLs declined 2 bps to 74 bps from 76 bps in 3Q17 NPAs declined 11 bps to 82 bps due to disposition of OREO during the quarter First Evanston Acquisition Loan production of $198.0 million in new fundings during the quarter; $120.8 million net of sales Total loans increased by $61.0 million or 10.9% annualized Well-balanced production with all major lending areas increasing during the quarter Provides improved scale and presence in some of Chicago’s most attractive markets Attractive client base that can benefit from larger borrowing capacity and broader product offerings Anticipated closing during first half of 2018 Represents a non-GAAP financial measure. See “Non-GAAP Reconciliation” in the appendix.
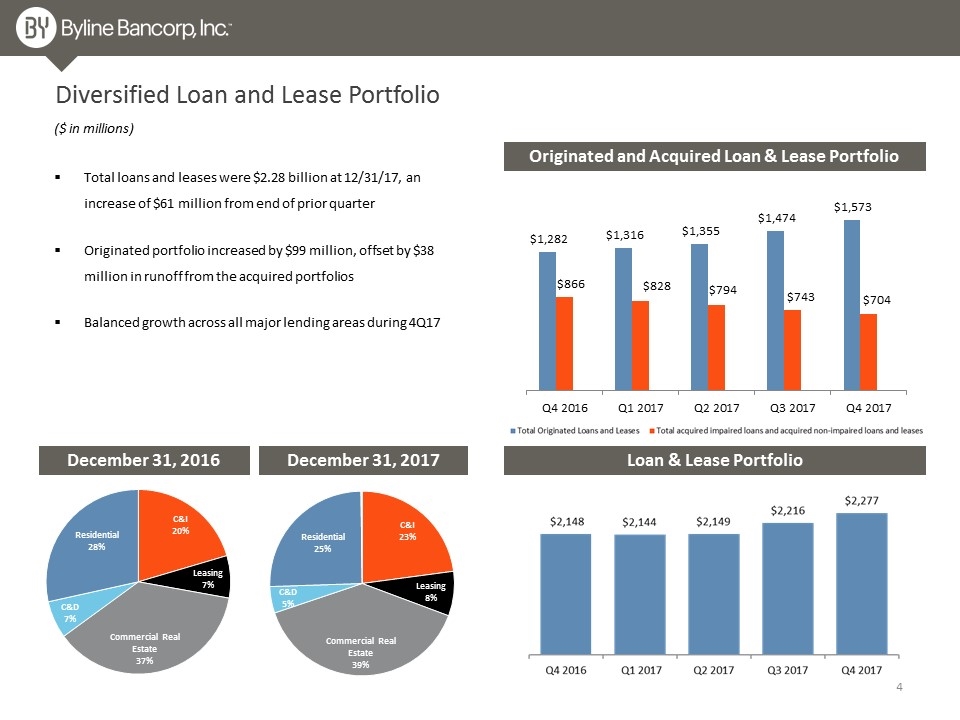
Diversified Loan and Lease Portfolio Loan & Lease Portfolio December 31, 2016 December 31, 2017 ($ in millions) Originated and Acquired Loan & Lease Portfolio Total loans and leases were $2.28 billion at 12/31/17, an increase of $61 million from end of prior quarter Originated portfolio increased by $99 million, offset by $38 million in runoff from the acquired portfolios Balanced growth across all major lending areas during 4Q17
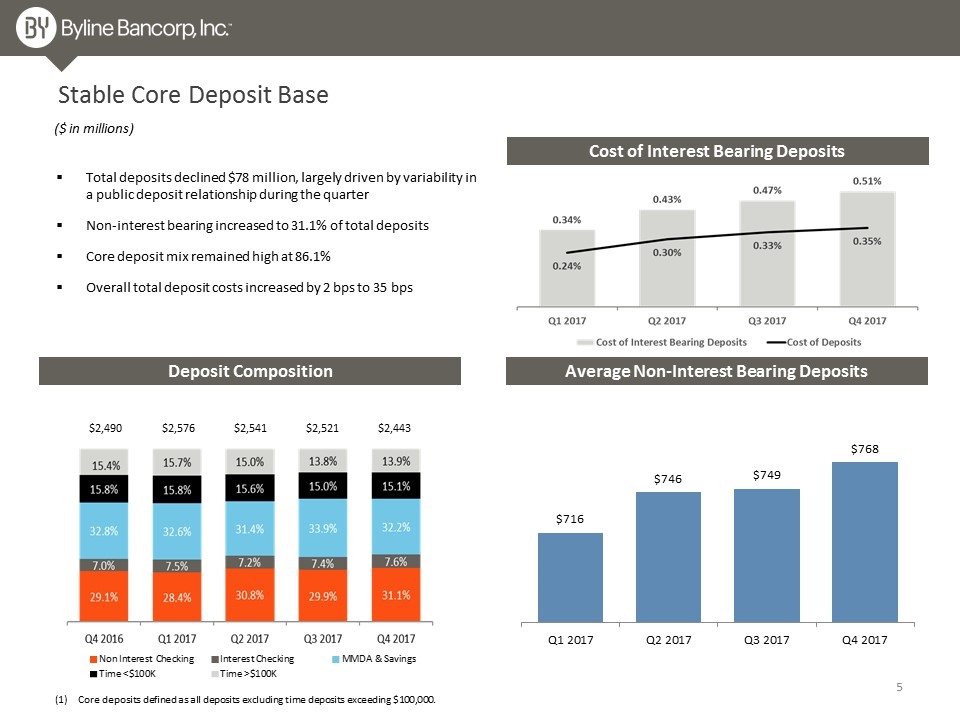
Total deposits declined $78 million, largely driven by variability in a public deposit relationship during the quarter Non-interest bearing increased to 31.1% of total deposits Core deposit mix remained high at 86.1% Overall total deposit costs increased by 2 bps to 35 bps Stable Core Deposit Base Average Non-Interest Bearing Deposits ($ in millions) Deposit Composition (1) Core deposits defined as all deposits excluding time deposits exceeding $100,000. $2,541 $2,521 $2,490 $2,576 Cost of Interest Bearing Deposits $2,443

Expanding Net Interest Margin Net interest margin improved 8 basis points linked quarter to 4.26% Net interest margin, excluding accretion income1, increased 7 bps to 3.96% during the quarter Improved mix of earning assets resulting from continued growth of loan and lease portfolio Loan and lease yields increased to 5.66% for the fourth quarter versus 5.60% for the third quarter Total cost of funds increased 2 basis points to 0.53% Net Interest Margin Net Interest Income Represents a non-GAAP financial measure. See “Non-GAAP Reconciliation” in the appendix. ($ in millions)

Total Non-Interest Income Non-Interest Income Noninterest income of $12.6 million for the quarter Noninterest income increased by 5.9% from 3Q17 primarily due to higher gains on sales of loans ($ in millions) Total SBC Closed Loan Commitments Net Gains on Sales of Loans $132.3 million in closed loan commitments in 4Q17, compared to $106.9 million in 3Q17 $87.9 million of loan sales in 4Q17, compared to $71.8 million in 3Q17 Average premium on loan sales remained steady Small Business Capital
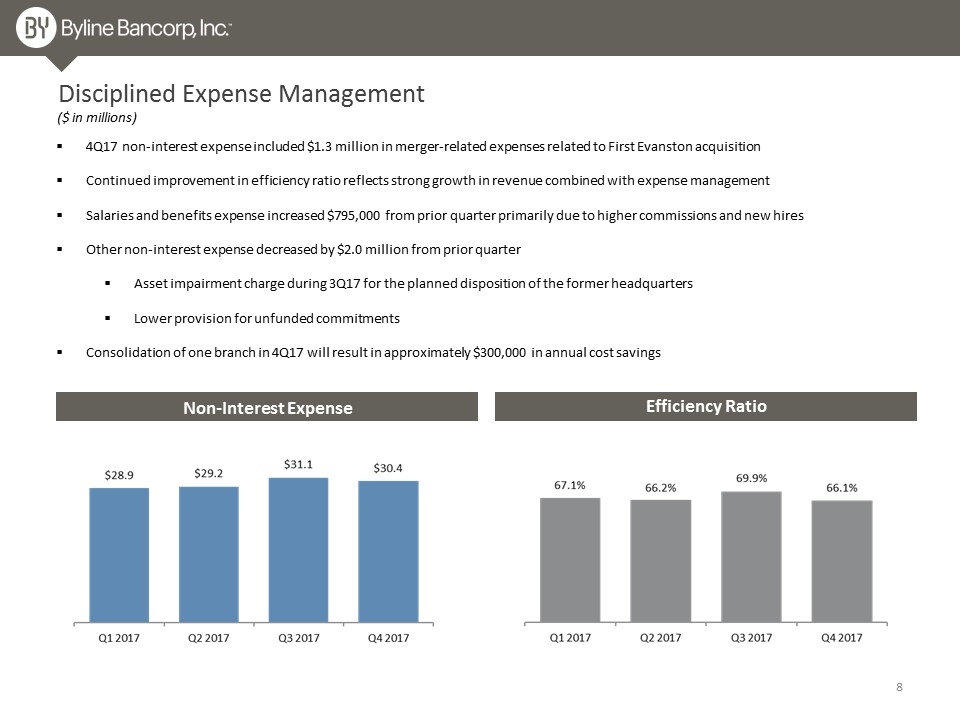
Disciplined Expense Management 4Q17 non-interest expense included $1.3 million in merger-related expenses related to First Evanston acquisition Continued improvement in efficiency ratio reflects strong growth in revenue combined with expense management Salaries and benefits expense increased $795,000 from prior quarter primarily due to higher commissions and new hires Other non-interest expense decreased by $2.0 million from prior quarter Asset impairment charge during 3Q17 for the planned disposition of the former headquarters Lower provision for unfunded commitments Consolidation of one branch in 4Q17 will result in approximately $300,000 in annual cost savings ($ in millions) Efficiency Ratio Non-Interest Expense
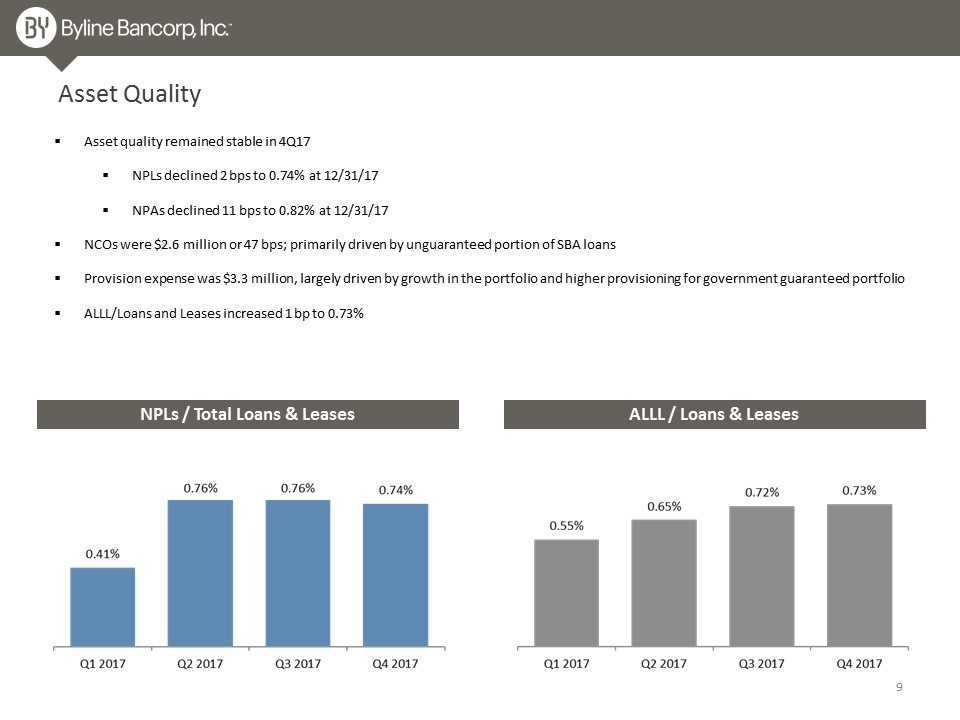
Asset Quality Asset quality remained stable in 4Q17 NPLs declined 2 bps to 0.74% at 12/31/17 NPAs declined 11 bps to 0.82% at 12/31/17 NCOs were $2.6 million or 47 bps; primarily driven by unguaranteed portion of SBA loans Provision expense was $3.3 million, largely driven by growth in the portfolio and higher provisioning for government guaranteed portfolio ALLL/Loans and Leases increased 1 bp to 0.73% NPLs / Total Loans & Leases ALLL / Loans & Leases
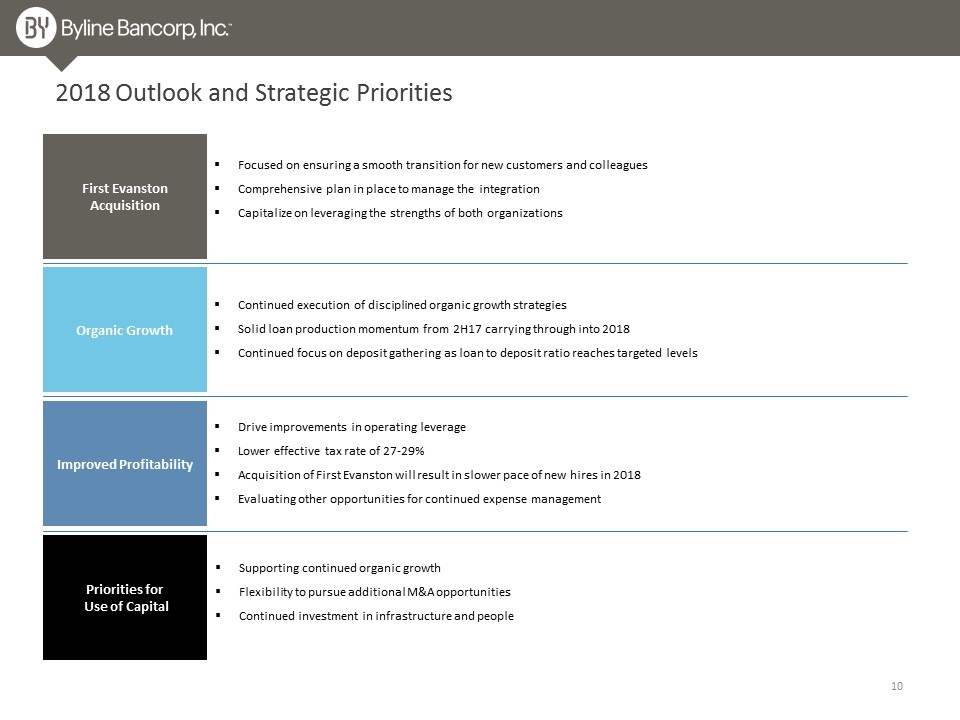
2018 Outlook and Strategic Priorities First Evanston Acquisition Organic Growth Improved Profitability Focused on ensuring a smooth transition for new customers and colleagues Comprehensive plan in place to manage the integration Capitalize on leveraging the strengths of both organizations Drive improvements in operating leverage Lower effective tax rate of 27-29% Acquisition of First Evanston will result in slower pace of new hires in 2018 Evaluating other opportunities for continued expense management Priorities for Use of Capital Continued execution of disciplined organic growth strategies Solid loan production momentum from 2H17 carrying through into 2018 Continued focus on deposit gathering as loan to deposit ratio reaches targeted levels Supporting continued organic growth Flexibility to pursue additional M&A opportunities Continued investment in infrastructure and people

Appendix
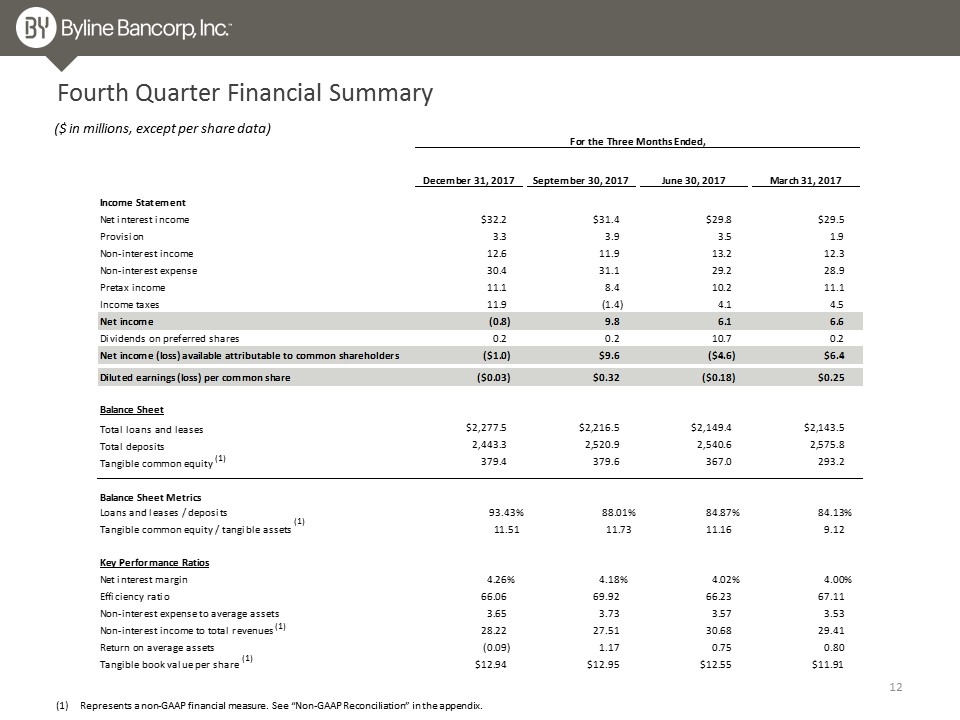
Fourth Quarter Financial Summary ($ in millions, except per share data) Represents a non-GAAP financial measure. See “Non-GAAP Reconciliation” in the appendix. (1) (1) (1) (1)
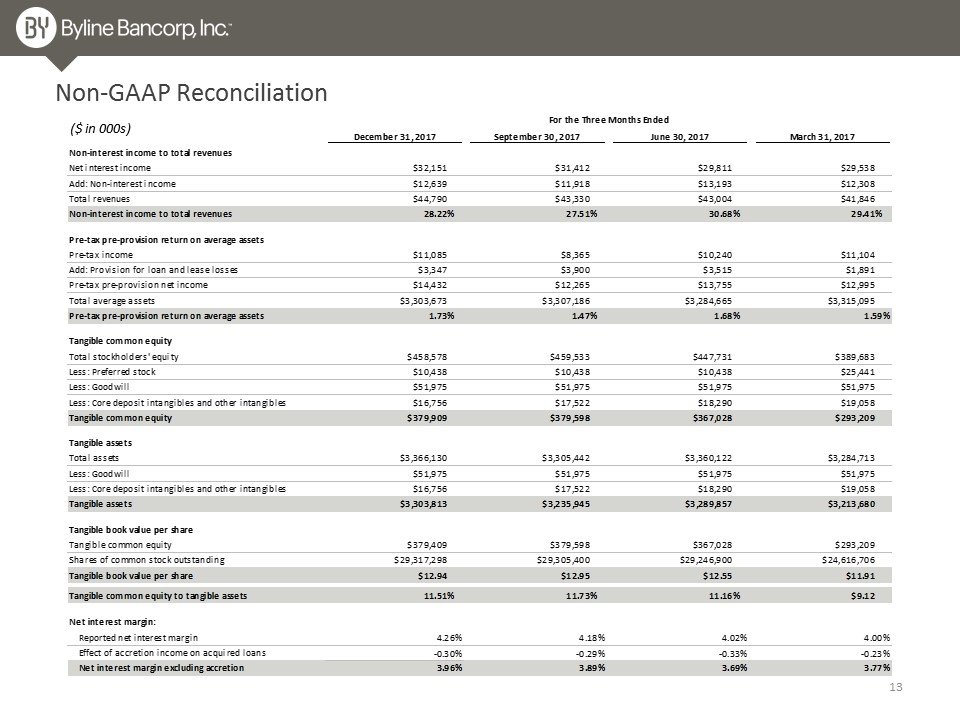
Non-GAAP Reconciliation ($ in 000s)
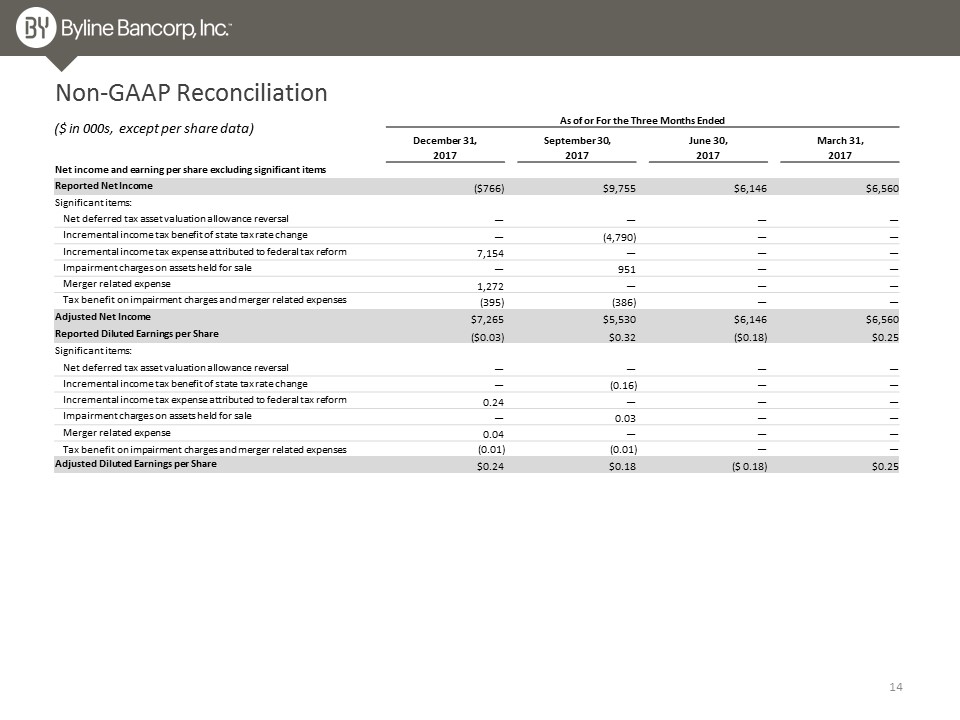
Non-GAAP Reconciliation ($ in 000s, except per share data) As of or For the Three Months Ended December 31, September 30, June 30, March 31, 2017 2017 2017 2017 Net income and earning per share excluding significant items Reported Net Income ($766) $9,755 $6,146 $6,560 Significant items: Net deferred tax asset valuation allowance reversal — — — — Incremental income tax benefit of state tax rate change — (4,790) — — Incremental income tax expense attributed to federal tax reform 7,154 — — — Impairment charges on assets held for sale — 951 — — Merger related expense 1,272 — — — Tax benefit on impairment charges and merger related expenses (395) (386) — — Adjusted Net Income $7,265 $5,530 $6,146 $6,560 Reported Diluted Earnings per Share ($0.03) $0.32 ($0.18) $0.25 Significant items: Net deferred tax asset valuation allowance reversal — — — — Incremental income tax benefit of state tax rate change — (0.16) — — Incremental income tax expense attributed to federal tax reform 0.24 — — — Impairment charges on assets held for sale — 0.03 — — Merger related expense 0.04 — — — Tax benefit on impairment charges and merger related expenses (0.01) (0.01) — — Adjusted Diluted Earnings per Share $0.24 $0.18 ($ 0.18) $0.25


