
Investor Presentation – November 2018 Exhibit 99.1
Forward-Looking Statements The information included herein may contain “forward-looking statements” within the meaning of the U.S. Private Securities Litigation Reform Act of 1995. Any statements about Byline’s expectations, beliefs, plans, strategies, predictions, forecasts, objectives or assumptions of future events or performance are not historical facts and may be forward-looking. These statements include, but are not limited to, the expected completion date, financial benefits and other effects of the proposed merger of Byline and Oak Park River Forest Bankshares, Inc. These statements are often, but not always, made through the use of words or phrases such as “anticipates,” “believes,” “expects,” “can,” “could,” “may,” “predicts,” “potential,” “opportunity,” “should,” “will,” “estimate,” “plans,” “projects,” “continuing,” “ongoing,” “expects,” “seeks,” “intends” and similar words or phrases. Accordingly, these statements involve estimates, known and unknown risks, assumptions and uncertainties that could cause actual strategies, actions or results to differ materially from those expressed in them, and are not guarantees of timing, future results or other events or performance. Because forward-looking statements are necessarily only estimates of future strategies, actions or results, based on management’s current expectations, assumptions and estimates on the date hereof, and there can be no assurance that actual strategies, actions or results will not differ materially from expectations, readers are cautioned not to place undue reliance on such statements. Factors that may cause such a difference include, but are not limited to, the reaction to the transaction of the companies’ customers, employees and counterparties; customer disintermediation; inflation; expected synergies, cost savings and other financial benefits of the proposed transaction might not be realized within the expected timeframes or might be less than projected; the requisite stockholder and regulatory approvals for the proposed transaction might not be obtained; credit and interest rate risks associated with Byline’s and Oak Park River Forest Bankshares’, Inc. respective businesses, customers, borrowings, repayment, investment, and deposit practices; general economic conditions, either nationally or in the market areas in which Byline and Oak Park River Forest Bankshares, Inc. operate or anticipate doing business, are less favorable than expected; new regulatory or legal requirements or obligations; and other risks. Certain risks and important factors that could affect Byline’s future results are identified in its Annual Report on Form 10-K for the year ended December 31, 2017 and other reports filed with the Securities and Exchange Commission, including among other things under the heading “Risk Factors” in such Annual Report on Form 10-K. Any forward-looking statement speaks only as of the date on which it is made, and Byline undertakes no obligation to update any forward-looking statement, whether to reflect events or circumstances after the date on which the statement is made, to reflect new information or the occurrence of unanticipated events, or otherwise. Important Additional Information and Where to Find It This communication contains information about the proposed merger transaction involving Byline and Oak Park River Forest Bankshares, Inc. Byline intends to file a registration statement on Form S-4 with the SEC, which will include a proxy statement of Oak Park River Forest Bankshares, Inc. and a prospectus of Byline, and Byline will file other documents regarding the proposed transaction with the SEC. A definitive proxy statement/prospectus will also be sent to Oak Park River Forest Bankshares, Inc. stockholders seeking the required stockholder approval of the proposed transaction. Before making any voting or investment decision, investors and security holders of Oak Park River Forest Bankshares, Inc. are urged to carefully read the entire registration statement and proxy statement/prospectus, when they become available, as well as any amendments or supplements to these documents, because they will contain important information about the proposed transaction. The documents filed by Byline with the SEC may be obtained free of charge at the SEC’s website at www.sec.gov. In addition, the documents filed by Byline may be obtained free of charge at its website at http://www.bylinebancorp.com/Docs. Alternatively, these documents, when available, can be obtained free of charge from Byline upon written request to Byline Bancorp, Inc., Attn: Corporate Secretary, 180 North LaSalle Street, 3rd Floor, Chicago, Illinois 60601, or by calling (773)-475-2979. Information regarding the interests of certain of Bankshares’ directors and executive officers and a description of their direct and indirect interests, by security holdings or otherwise, will be included in the registration statement on Form S-4 regarding the proposed transaction when it becomes available. Participants in the Solicitation Byline, Oak Park River Forest Bankshares, Inc., their respective directors and executive officers and certain of their other members of management and employees may be deemed to be participants in the solicitation of proxies from Oak Park River Forest Bankshares’, Inc. stockholders in connection with the proposed transaction. Information about the directors and executive officers of Byline may be found in Byline’s Annual Report on Form 10-K for the year ended December 31, 2017, as amended by its Form 10-K/A filed with the SEC on April 30, 2018, a copy of which can be obtained free of charge from Byline or from the SEC’s website as indicated above. In addition, information about the directors and executive officers of Byline and Oak Park River Forest Bankshares, Inc. and other persons who may be deemed participants in the transaction will be included in the proxy statement/prospectus and other relevant materials when filed with the SEC.
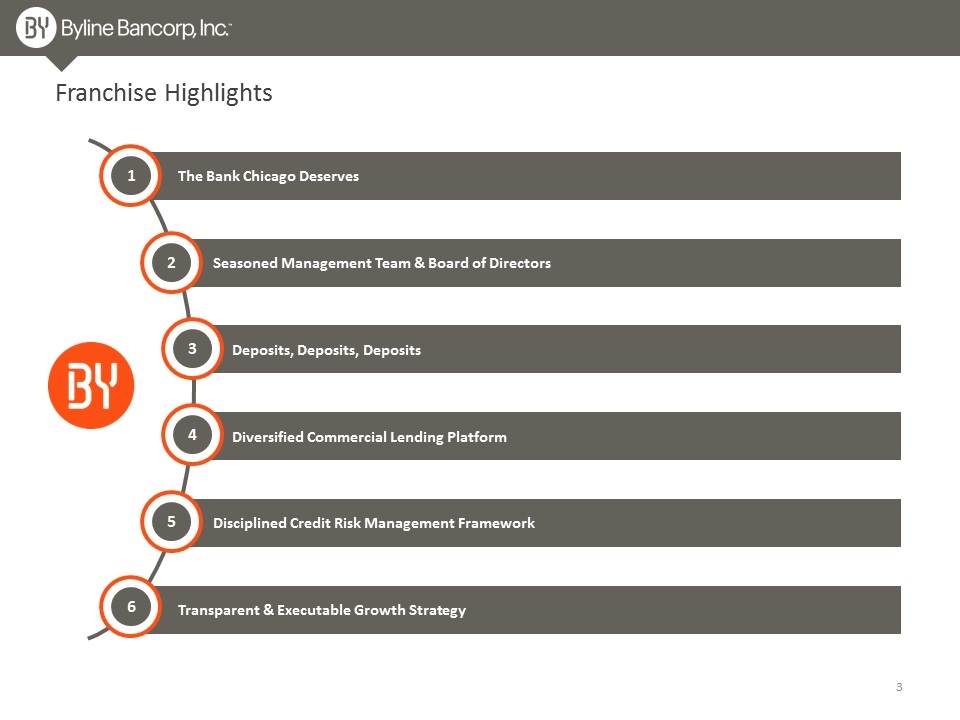
Transparent & Executable Growth Strategy The Bank Chicago Deserves Seasoned Management Team & Board of Directors Diversified Commercial Lending Platform Disciplined Credit Risk Management Framework Deposits, Deposits, Deposits Franchise Highlights 1 2 3 4 5 6
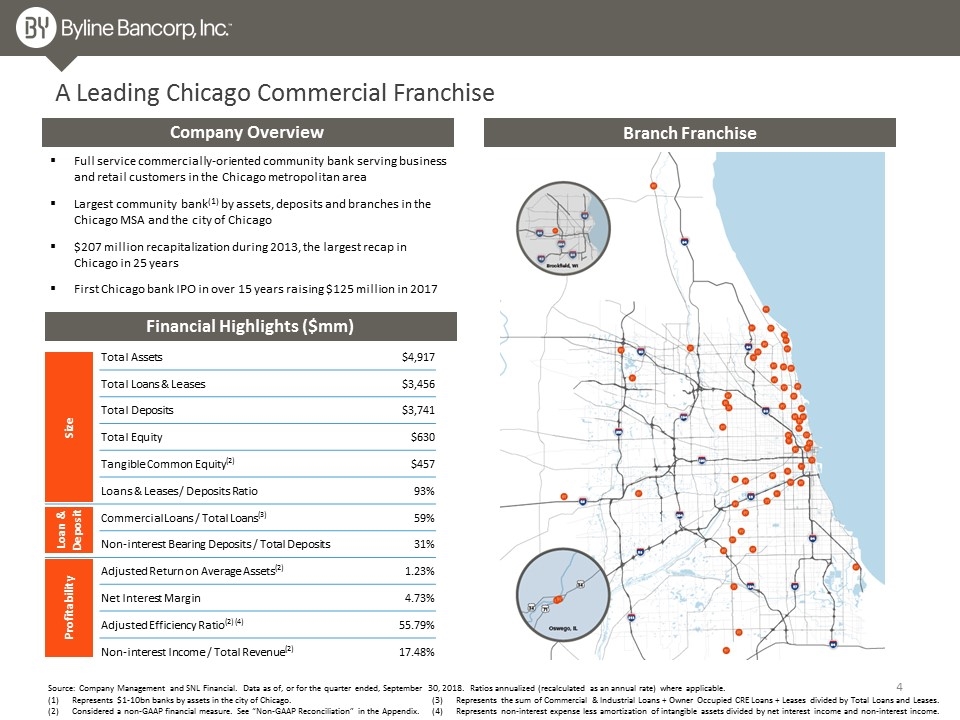
Total Assets $4,917 Total Loans & Leases $3,456 Total Deposits $3,741 Total Equity $630 Tangible Common Equity(2) $457 Loans & Leases / Deposits Ratio 93% Commercial Loans / Total Loans(3) 59% Non-interest Bearing Deposits / Total Deposits 31% Adjusted Return on Average Assets(2) 1.23% Net Interest Margin 4.73% Adjusted Efficiency Ratio(2) (4) 55.79% Non-interest Income / Total Revenue(2) 17.48% A Leading Chicago Commercial Franchise Company Overview Full service commercially-oriented community bank serving business and retail customers in the Chicago metropolitan area Largest community bank(1) by assets, deposits and branches in the Chicago MSA and the city of Chicago $207 million recapitalization during 2013, the largest recap in Chicago in 25 years First Chicago bank IPO in over 15 years raising $125 million in 2017 Source: Company Management and SNL Financial. Data as of, or for the quarter ended, September 30, 2018. Ratios annualized (recalculated as an annual rate) where applicable. Financial Highlights ($mm) Size Loan & Deposit Profitability (2) (2) (3) Branch Franchise Represents the sum of Commercial & Industrial Loans + Owner Occupied CRE Loans + Leases divided by Total Loans and Leases. Represents non-interest expense less amortization of intangible assets divided by net interest income and non-interest income. Represents $1-10bn banks by assets in the city of Chicago. Considered a non-GAAP financial measure. See “Non-GAAP Reconciliation” in the Appendix.
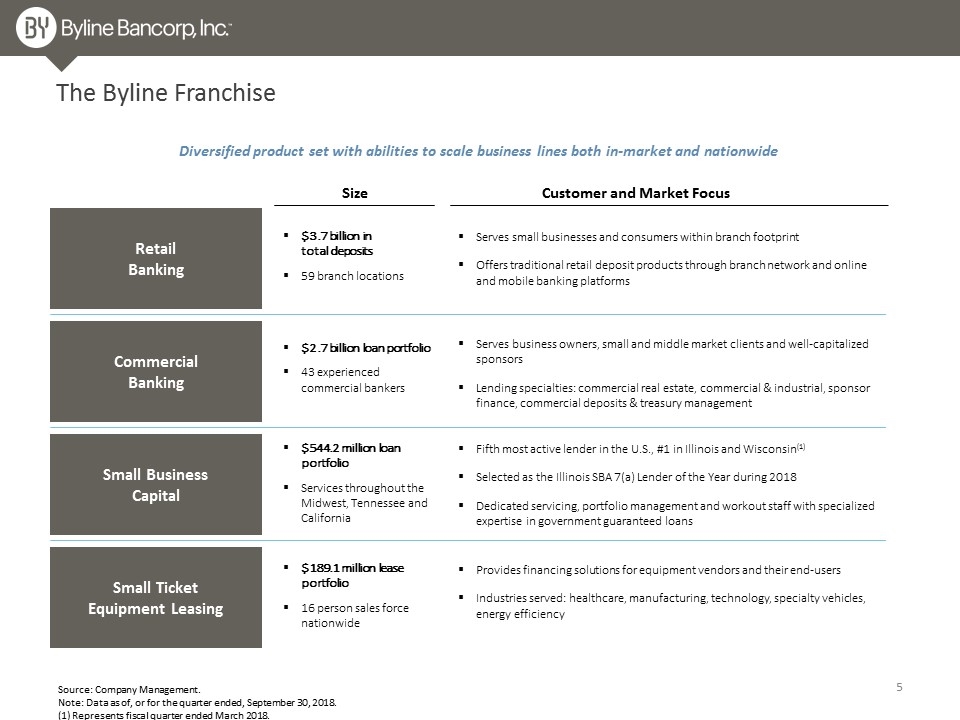
The Byline Franchise Retail Banking Commercial Banking Small Business Capital Small Ticket Equipment Leasing Diversified product set with abilities to scale business lines both in-market and nationwide Size Customer and Market Focus $3.7 billion in total deposits 59 branch locations Serves small businesses and consumers within branch footprint Offers traditional retail deposit products through branch network and online and mobile banking platforms $2.7 billion loan portfolio 43 experienced commercial bankers Serves business owners, small and middle market clients and well-capitalized sponsors Lending specialties: commercial real estate, commercial & industrial, sponsor finance, commercial deposits & treasury management $544.2 million loan portfolio Services throughout the Midwest, Tennessee and California Fifth most active lender in the U.S., #1 in Illinois and Wisconsin(1) Selected as the Illinois SBA 7(a) Lender of the Year during 2018 Dedicated servicing, portfolio management and workout staff with specialized expertise in government guaranteed loans $189.1 million lease portfolio 16 person sales force nationwide Provides financing solutions for equipment vendors and their end-users Industries served: healthcare, manufacturing, technology, specialty vehicles, energy efficiency Source: Company Management. Note: Data as of, or for the quarter ended, September 30, 2018. (1) Represents fiscal quarter ended March 2018.
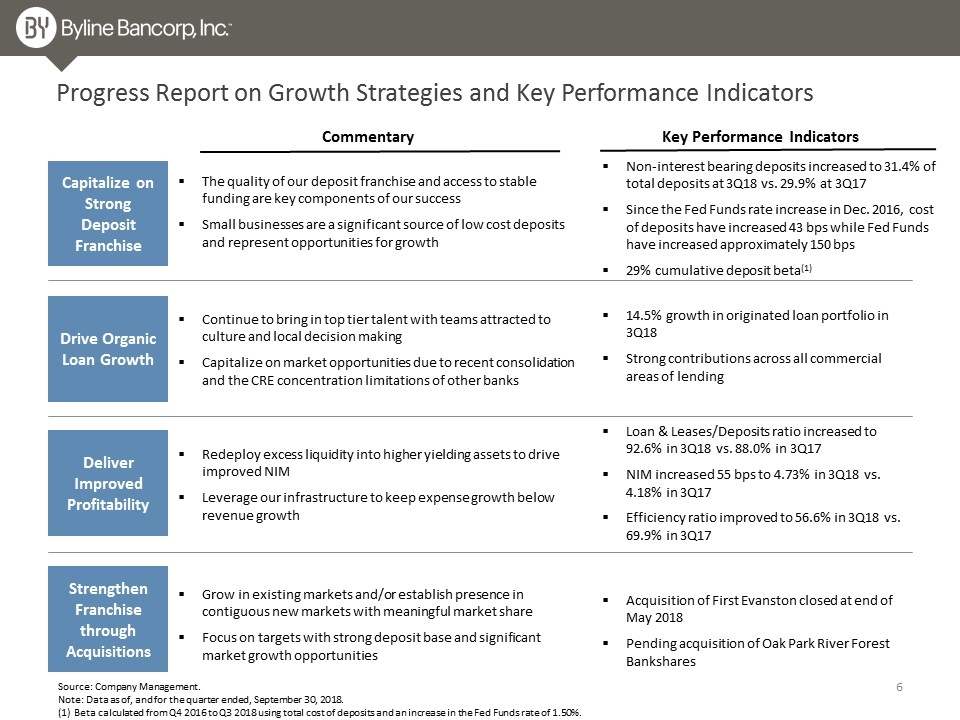
Drive Organic Loan Growth Deliver Improved Profitability Strengthen Franchise through Acquisitions Continue to bring in top tier talent with teams attracted to culture and local decision making Capitalize on market opportunities due to recent consolidation and the CRE concentration limitations of other banks Redeploy excess liquidity into higher yielding assets to drive improved NIM Leverage our infrastructure to keep expense growth below revenue growth Grow in existing markets and/or establish presence in contiguous new markets with meaningful market share Focus on targets with strong deposit base and significant market growth opportunities Capitalize on Strong Deposit Franchise The quality of our deposit franchise and access to stable funding are key components of our success Small businesses are a significant source of low cost deposits and represent opportunities for growth Progress Report on Growth Strategies and Key Performance Indicators Commentary Key Performance Indicators Non-interest bearing deposits increased to 31.4% of total deposits at 3Q18 vs. 29.9% at 3Q17 Since the Fed Funds rate increase in Dec. 2016, cost of deposits have increased 43 bps while Fed Funds have increased approximately 150 bps 29% cumulative deposit beta(1) 14.5% growth in originated loan portfolio in 3Q18 Strong contributions across all commercial areas of lending Loan & Leases/Deposits ratio increased to 92.6% in 3Q18 vs. 88.0% in 3Q17 NIM increased 55 bps to 4.73% in 3Q18 vs. 4.18% in 3Q17 Efficiency ratio improved to 56.6% in 3Q18 vs. 69.9% in 3Q17 Acquisition of First Evanston closed at end of May 2018 Pending acquisition of Oak Park River Forest Bankshares Source: Company Management. Note: Data as of, and for the quarter ended, September 30, 2018. (1) Beta calculated from Q4 2016 to Q3 2018 using total cost of deposits and an increase in the Fed Funds rate of 1.50%.

Third Quarter 2018 Results
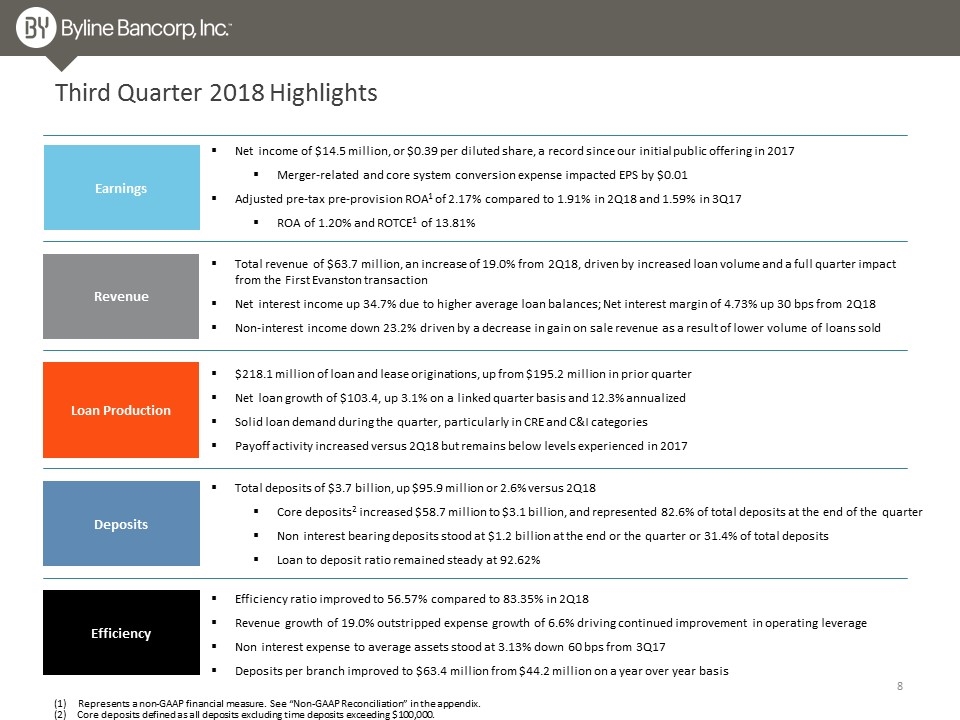
Third Quarter 2018 Highlights Loan Production Earnings Revenue Deposits $218.1 million of loan and lease originations, up from $195.2 million in prior quarter Net loan growth of $103.4, up 3.1% on a linked quarter basis and 12.3% annualized Solid loan demand during the quarter, particularly in CRE and C&I categories Payoff activity increased versus 2Q18 but remains below levels experienced in 2017 Total revenue of $63.7 million, an increase of 19.0% from 2Q18, driven by increased loan volume and a full quarter impact from the First Evanston transaction Net interest income up 34.7% due to higher average loan balances; Net interest margin of 4.73% up 30 bps from 2Q18 Non-interest income down 23.2% driven by a decrease in gain on sale revenue as a result of lower volume of loans sold Total deposits of $3.7 billion, up $95.9 million or 2.6% versus 2Q18 Core deposits2 increased $58.7 million to $3.1 billion, and represented 82.6% of total deposits at the end of the quarter Non interest bearing deposits stood at $1.2 billion at the end or the quarter or 31.4% of total deposits Loan to deposit ratio remained steady at 92.62% Efficiency Net income of $14.5 million, or $0.39 per diluted share, a record since our initial public offering in 2017 Merger-related and core system conversion expense impacted EPS by $0.01 Adjusted pre-tax pre-provision ROA1 of 2.17% compared to 1.91% in 2Q18 and 1.59% in 3Q17 ROA of 1.20% and ROTCE1 of 13.81% Efficiency ratio improved to 56.57% compared to 83.35% in 2Q18 Revenue growth of 19.0% outstripped expense growth of 6.6% driving continued improvement in operating leverage Non interest expense to average assets stood at 3.13% down 60 bps from 3Q17 Deposits per branch improved to $63.4 million from $44.2 million on a year over year basis Represents a non-GAAP financial measure. See “Non-GAAP Reconciliation” in the appendix. (2) Core deposits defined as all deposits excluding time deposits exceeding $100,000.
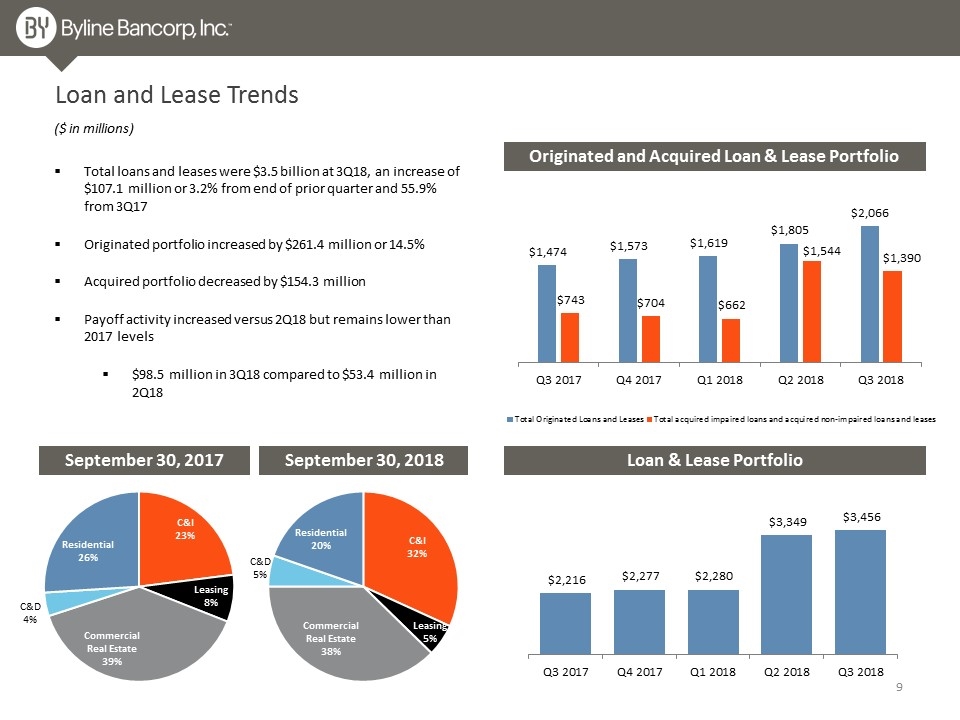
Loan and Lease Trends Loan & Lease Portfolio September 30, 2017 September 30, 2018 ($ in millions) Originated and Acquired Loan & Lease Portfolio Total loans and leases were $3.5 billion at 3Q18, an increase of $107.1 million or 3.2% from end of prior quarter and 55.9% from 3Q17 Originated portfolio increased by $261.4 million or 14.5% Acquired portfolio decreased by $154.3 million Payoff activity increased versus 2Q18 but remains lower than 2017 levels $98.5 million in 3Q18 compared to $53.4 million in 2Q18
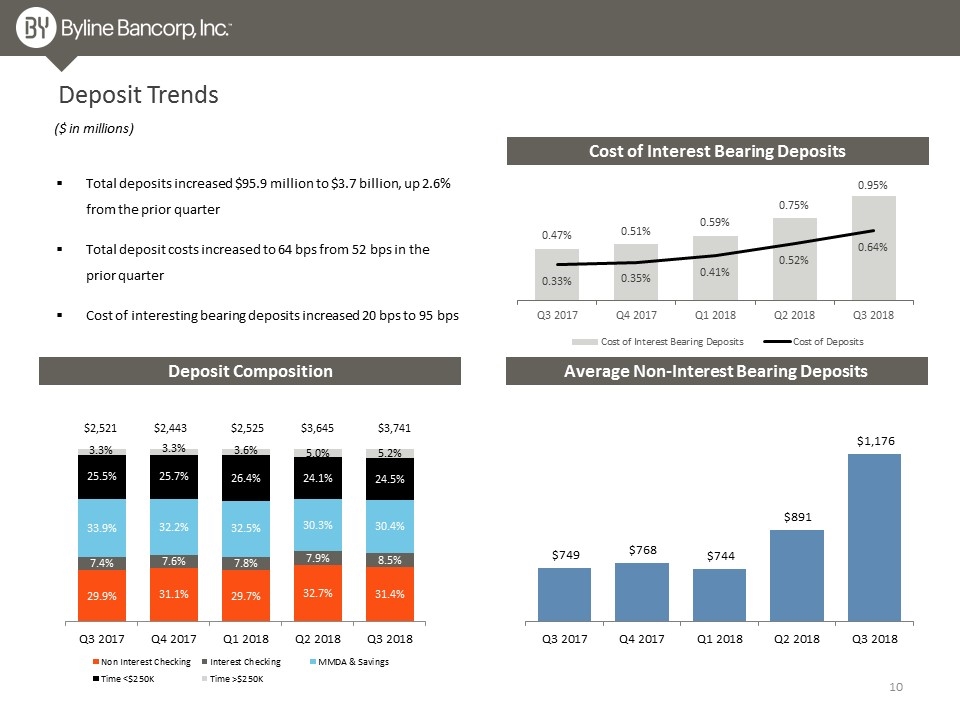
Total deposits increased $95.9 million to $3.7 billion, up 2.6% from the prior quarter Total deposit costs increased to 64 bps from 52 bps in the prior quarter Cost of interesting bearing deposits increased 20 bps to 95 bps Deposit Trends Average Non-Interest Bearing Deposits ($ in millions) Deposit Composition $2,521 $2,443 $3,645 $3,741 Cost of Interest Bearing Deposits $2,525
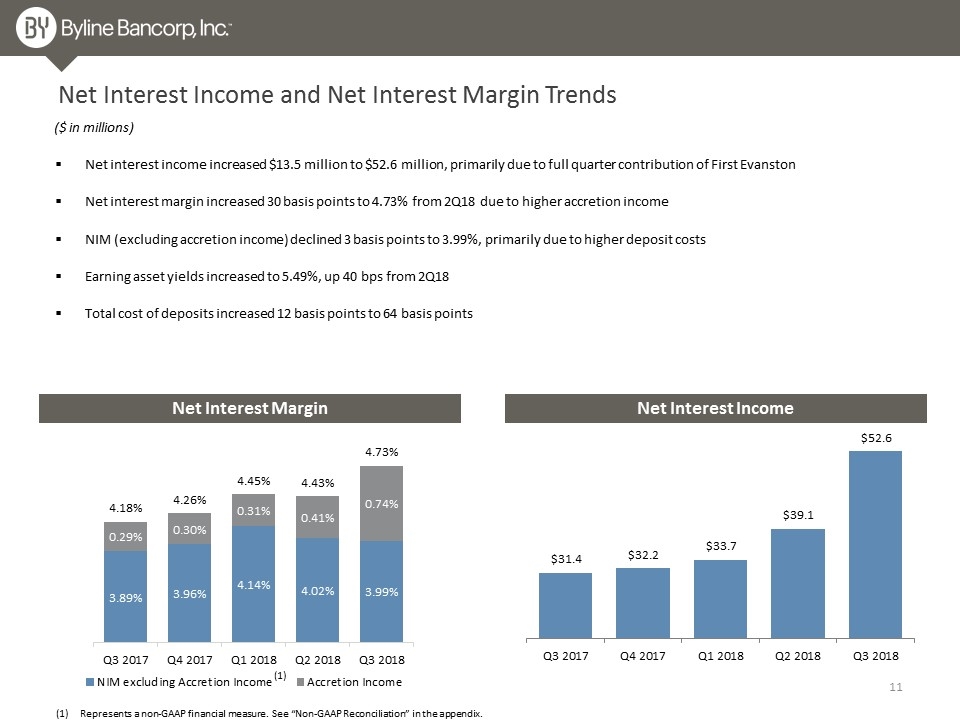
Net Interest Income and Net Interest Margin Trends Net interest income increased $13.5 million to $52.6 million, primarily due to full quarter contribution of First Evanston Net interest margin increased 30 basis points to 4.73% from 2Q18 due to higher accretion income NIM (excluding accretion income) declined 3 basis points to 3.99%, primarily due to higher deposit costs Earning asset yields increased to 5.49%, up 40 bps from 2Q18 Total cost of deposits increased 12 basis points to 64 basis points Net Interest Margin Net Interest Income Represents a non-GAAP financial measure. See “Non-GAAP Reconciliation” in the appendix. ($ in millions) (1)
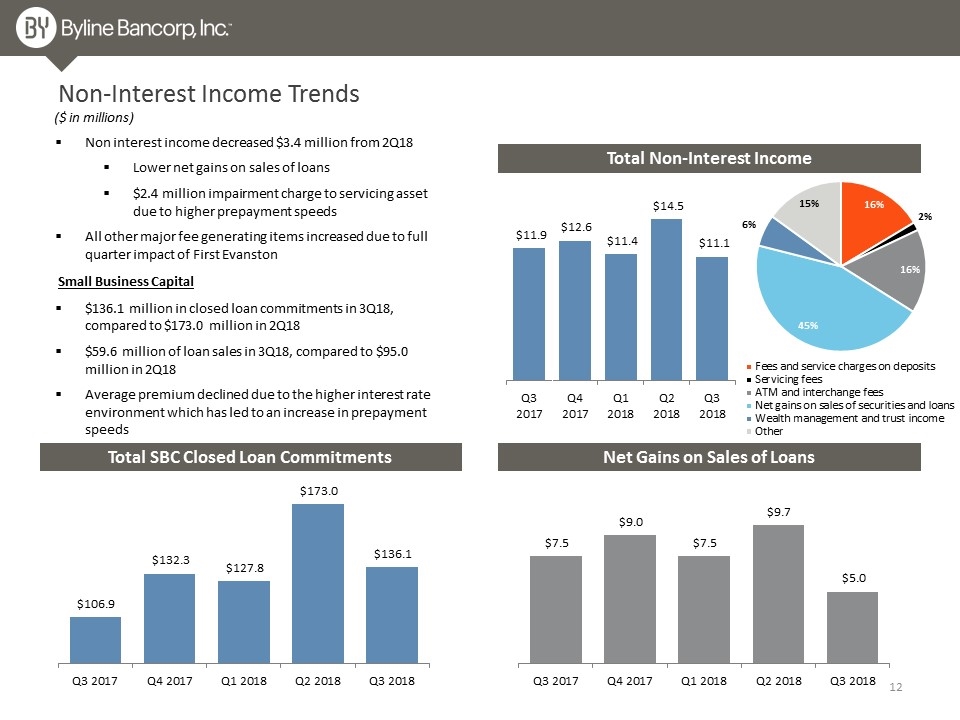
Total Non-Interest Income Non-Interest Income Trends Non interest income decreased $3.4 million from 2Q18 Lower net gains on sales of loans $2.4 million impairment charge to servicing asset due to higher prepayment speeds All other major fee generating items increased due to full quarter impact of First Evanston ($ in millions) Total SBC Closed Loan Commitments Net Gains on Sales of Loans $136.1 million in closed loan commitments in 3Q18, compared to $173.0 million in 2Q18 $59.6 million of loan sales in 3Q18, compared to $95.0 million in 2Q18 Average premium declined due to the higher interest rate environment which has led to an increase in prepayment speeds Small Business Capital
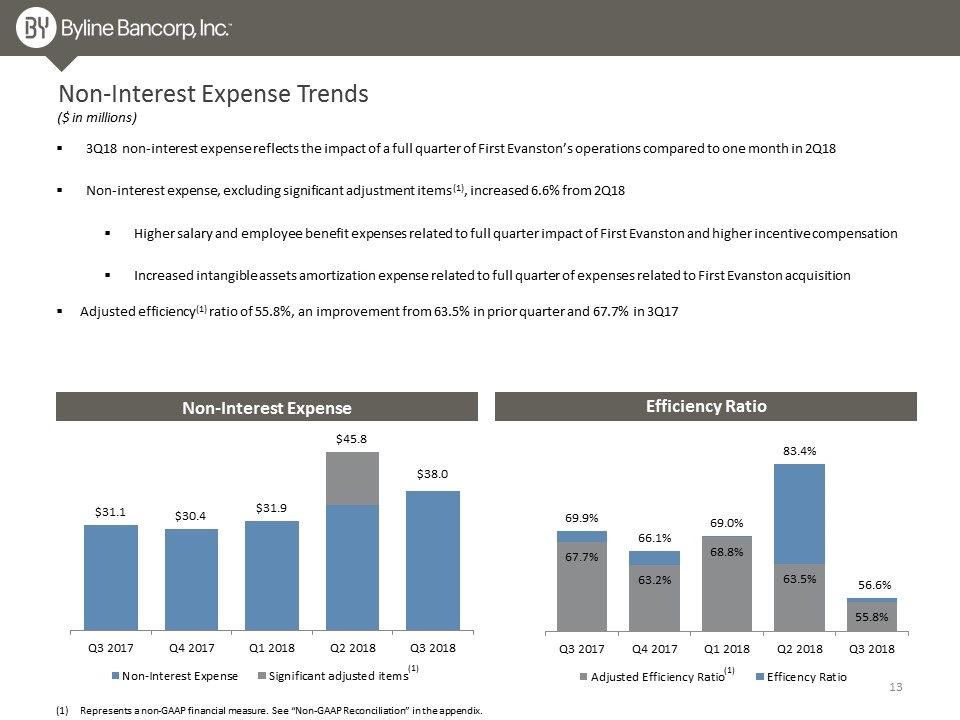
Non-Interest Expense Trends 3Q18 non-interest expense reflects the impact of a full quarter of First Evanston’s operations compared to one month in 2Q18 Non-interest expense, excluding significant adjustment items (1), increased 6.6% from 2Q18 Higher salary and employee benefit expenses related to full quarter impact of First Evanston and higher incentive compensation Increased intangible assets amortization expense related to full quarter of expenses related to First Evanston acquisition Adjusted efficiency(1) ratio of 55.8%, an improvement from 63.5% in prior quarter and 67.7% in 3Q17 ($ in millions) Efficiency Ratio Non-Interest Expense Represents a non-GAAP financial measure. See “Non-GAAP Reconciliation” in the appendix. (1) (1)
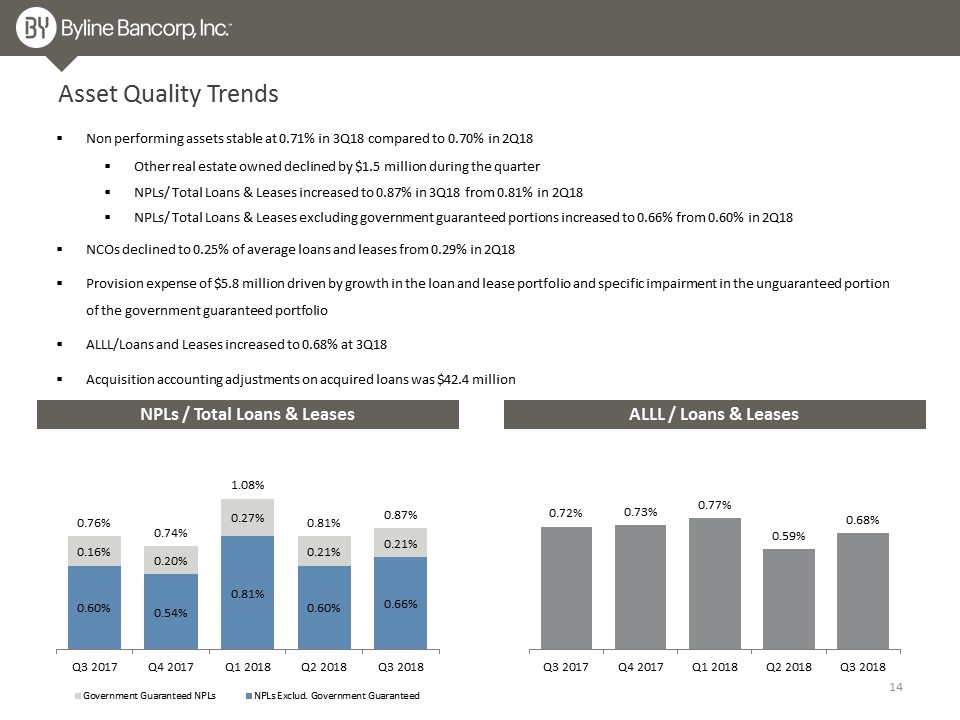
Asset Quality Trends Non performing assets stable at 0.71% in 3Q18 compared to 0.70% in 2Q18 Other real estate owned declined by $1.5 million during the quarter NPLs/ Total Loans & Leases increased to 0.87% in 3Q18 from 0.81% in 2Q18 NPLs/ Total Loans & Leases excluding government guaranteed portions increased to 0.66% from 0.60% in 2Q18 NCOs declined to 0.25% of average loans and leases from 0.29% in 2Q18 Provision expense of $5.8 million driven by growth in the loan and lease portfolio and specific impairment in the unguaranteed portion of the government guaranteed portfolio ALLL/Loans and Leases increased to 0.68% at 3Q18 Acquisition accounting adjustments on acquired loans was $42.4 million NPLs / Total Loans & Leases ALLL / Loans & Leases
Acquisition of Oak Park River Forest Bankshares, Inc. Strategically enhancing our deposit franchise
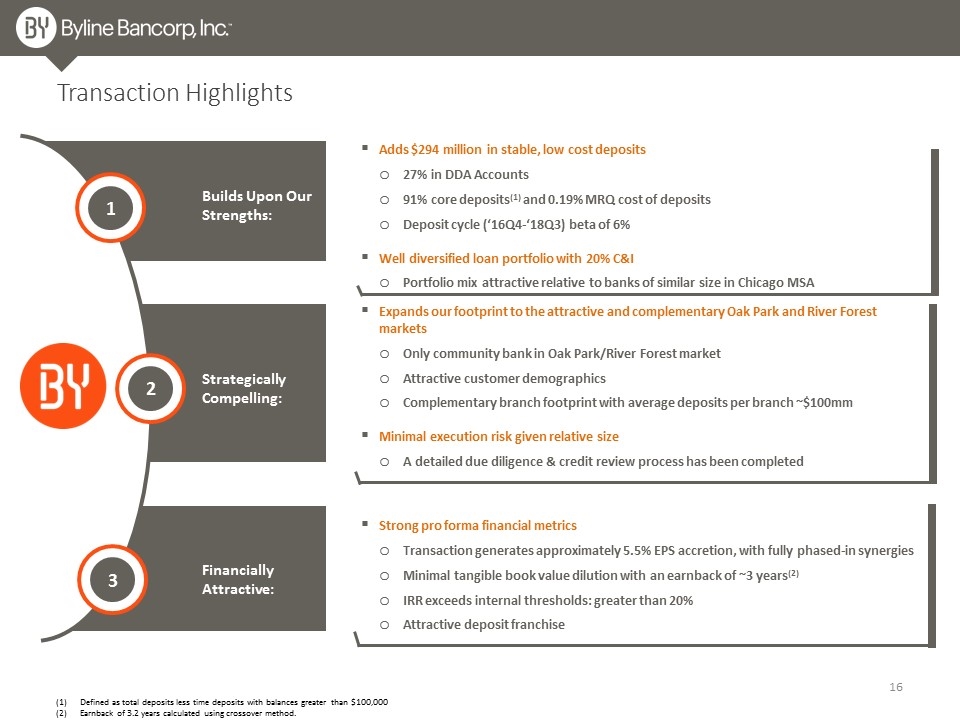
Builds Upon Our Strengths: Transaction Highlights 1 2 3 Expands our footprint to the attractive and complementary Oak Park and River Forest markets Only community bank in Oak Park/River Forest market Attractive customer demographics Complementary branch footprint with average deposits per branch ~$100mm Minimal execution risk given relative size A detailed due diligence & credit review process has been completed Strong pro forma financial metrics Transaction generates approximately 5.5% EPS accretion, with fully phased-in synergies Minimal tangible book value dilution with an earnback of ~3 years(2) IRR exceeds internal thresholds: greater than 20% Attractive deposit franchise Defined as total deposits less time deposits with balances greater than $100,000 Earnback of 3.2 years calculated using crossover method. Adds $294 million in stable, low cost deposits 27% in DDA Accounts 91% core deposits(1) and 0.19% MRQ cost of deposits Deposit cycle (‘16Q4-‘18Q3) beta of 6% Well diversified loan portfolio with 20% C&I Portfolio mix attractive relative to banks of similar size in Chicago MSA Strategically Compelling: Financially Attractive:
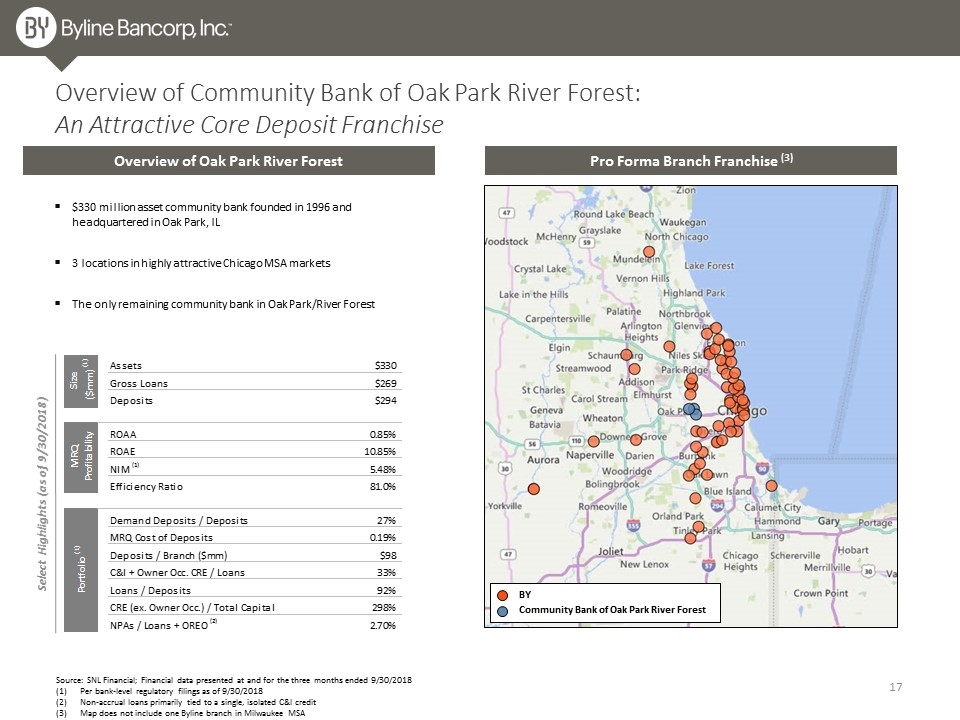
Source: SNL Financial; Financial data presented at and for the three months ended 9/30/2018 Per bank-level regulatory filings as of 9/30/2018 Non-accrual loans primarily tied to a single, isolated C&I credit Map does not include one Byline branch in Milwaukee MSA Overview of Community Bank of Oak Park River Forest: An Attractive Core Deposit Franchise $330 million asset community bank founded in 1996 and headquartered in Oak Park, IL 3 locations in highly attractive Chicago MSA markets The only remaining community bank in Oak Park/River Forest BY Community Bank of Oak Park River Forest Pro Forma Branch Franchise (3) Overview of Oak Park River Forest Select Highlights (as of 9/30/2018)
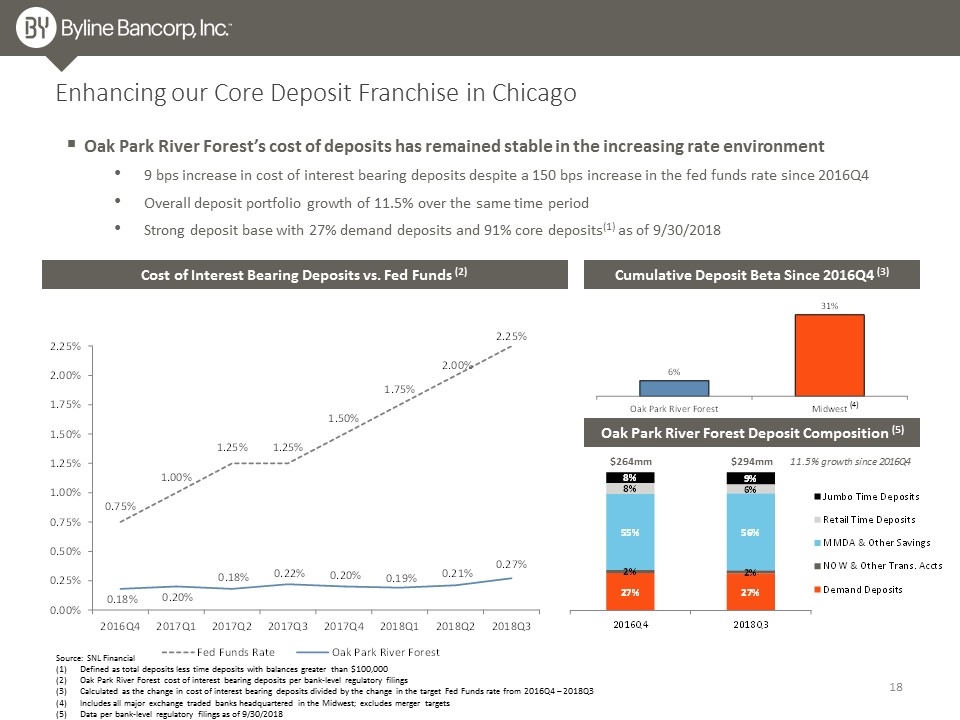
Source: SNL Financial Defined as total deposits less time deposits with balances greater than $100,000 Oak Park River Forest cost of interest bearing deposits per bank-level regulatory filings Calculated as the change in cost of interest bearing deposits divided by the change in the target Fed Funds rate from 2016Q4 – 2018Q3 Includes all major exchange traded banks headquartered in the Midwest; excludes merger targets Data per bank-level regulatory filings as of 9/30/2018 Enhancing our Core Deposit Franchise in Chicago Cost of Interest Bearing Deposits vs. Fed Funds (2) Cumulative Deposit Beta Since 2016Q4 (3) Oak Park River Forest Deposit Composition (5) Oak Park River Forest’s cost of deposits has remained stable in the increasing rate environment 9 bps increase in cost of interest bearing deposits despite a 150 bps increase in the fed funds rate since 2016Q4 Overall deposit portfolio growth of 11.5% over the same time period Strong deposit base with 27% demand deposits and 91% core deposits(1) as of 9/30/2018 (4) 11.5% growth since 2016Q4 $264mm $294mm
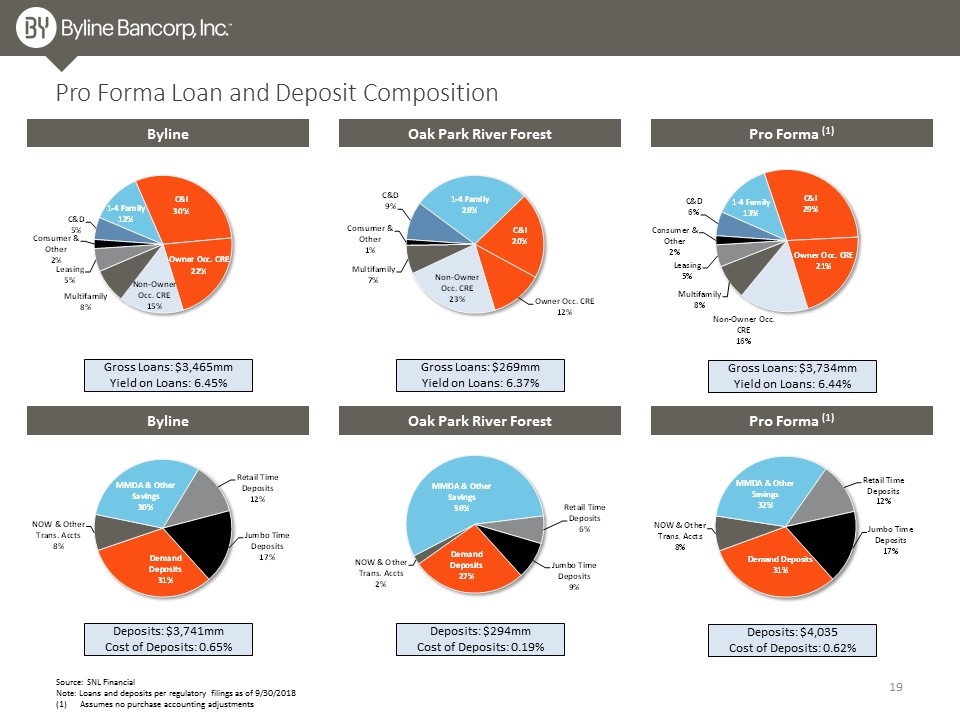
Source: SNL Financial Note: Loans and deposits per regulatory filings as of 9/30/2018 Assumes no purchase accounting adjustments Pro Forma Loan and Deposit Composition Byline Oak Park River Forest Pro Forma (1) Byline Oak Park River Forest Pro Forma (1) Gross Loans: $3,465mm Yield on Loans: 6.45% Gross Loans: $269mm Yield on Loans: 6.37% Gross Loans: $3,734mm Yield on Loans: 6.44% Deposits: $3,741mm Cost of Deposits: 0.65% Deposits: $294mm Cost of Deposits: 0.19% Deposits: $4,035 Cost of Deposits: 0.62%
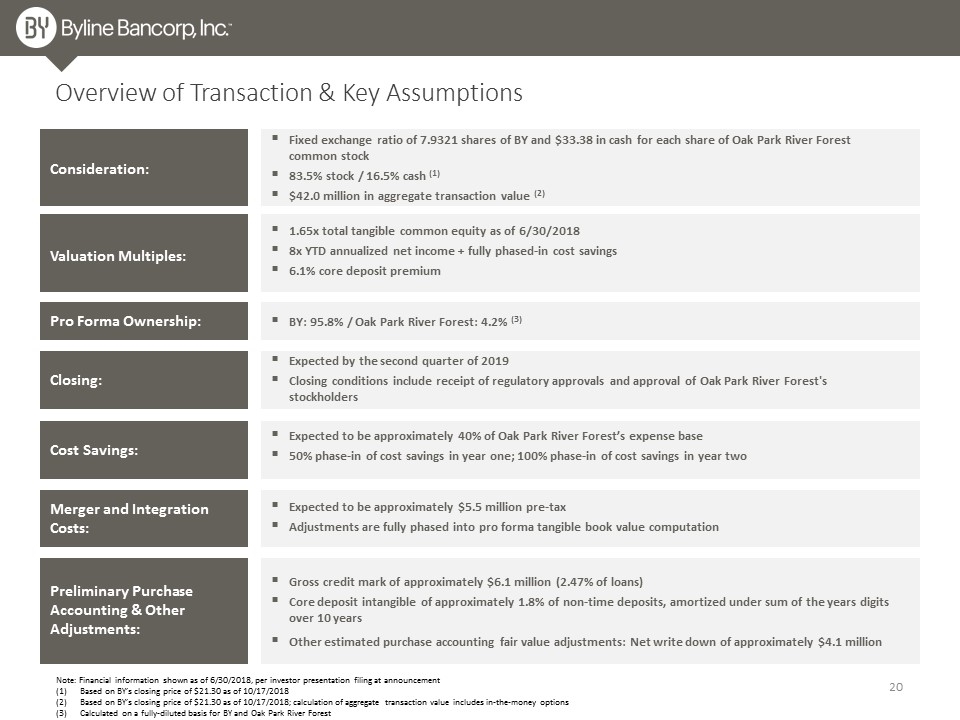
Note: Financial information shown as of 6/30/2018, per investor presentation filing at announcement Based on BY’s closing price of $21.30 as of 10/17/2018 Based on BY’s closing price of $21.30 as of 10/17/2018; calculation of aggregate transaction value includes in-the-money options Calculated on a fully-diluted basis for BY and Oak Park River Forest Overview of Transaction & Key Assumptions Consideration: Fixed exchange ratio of 7.9321 shares of BY and $33.38 in cash for each share of Oak Park River Forest common stock 83.5% stock / 16.5% cash (1) $42.0 million in aggregate transaction value (2) Closing: Expected by the second quarter of 2019 Closing conditions include receipt of regulatory approvals and approval of Oak Park River Forest's stockholders Valuation Multiples: 1.65x total tangible common equity as of 6/30/2018 8x YTD annualized net income + fully phased-in cost savings 6.1% core deposit premium Pro Forma Ownership: BY: 95.8% / Oak Park River Forest: 4.2% (3) Expected to be approximately 40% of Oak Park River Forest’s expense base 50% phase-in of cost savings in year one; 100% phase-in of cost savings in year two Cost Savings: Merger and Integration Costs: Expected to be approximately $5.5 million pre-tax Adjustments are fully phased into pro forma tangible book value computation Preliminary Purchase Accounting & Other Adjustments: Gross credit mark of approximately $6.1 million (2.47% of loans) Core deposit intangible of approximately 1.8% of non-time deposits, amortized under sum of the years digits over 10 years Other estimated purchase accounting fair value adjustments: Net write down of approximately $4.1 million

Appendix
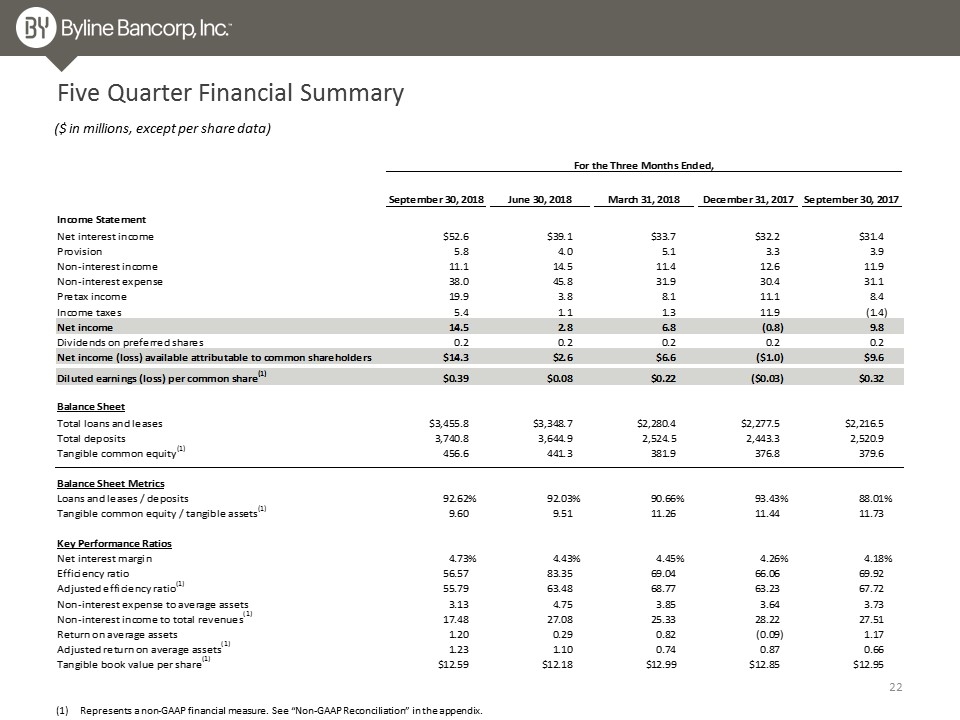
Five Quarter Financial Summary ($ in millions, except per share data) Represents a non-GAAP financial measure. See “Non-GAAP Reconciliation” in the appendix.
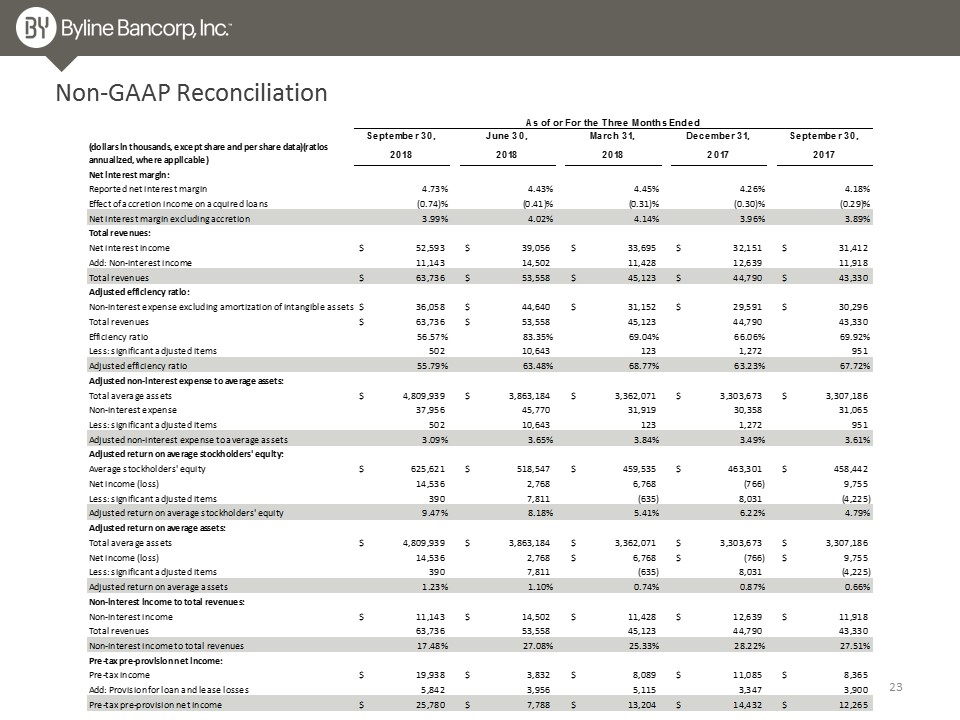
Non-GAAP Reconciliation
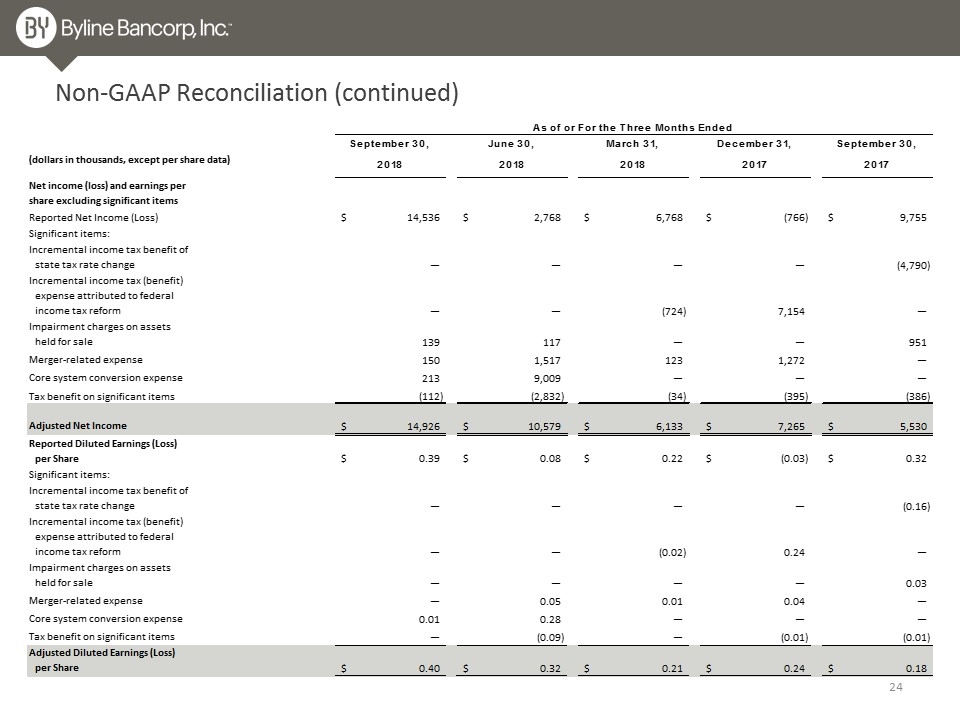
Non-GAAP Reconciliation (continued)
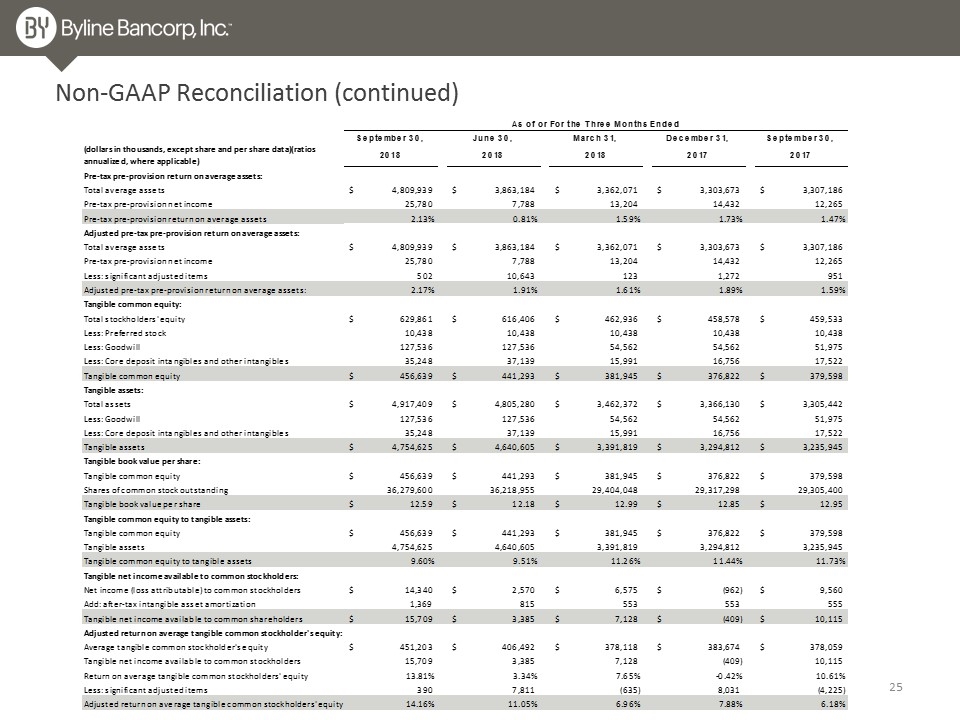
Non-GAAP Reconciliation (continued)


