Investor Presentation – May 2020 Exhibit 99.1
Forward-Looking Statements This communication contains forward-looking statements within the meaning of the U.S. federal securities laws. Forward-looking statements include, without limitation, statements concerning plans, estimates, calculations, forecasts and projections with respect to the anticipated future performance of the Company. These statements are often, but not always, made through the use of words or phrases such as ‘‘may’’, ‘‘might’’, ‘‘should’’, ‘‘could’’, ‘‘predict’’, ‘‘potential’’, ‘‘believe’’, ‘‘expect’’, ‘‘continue’’, ‘‘will’’, ‘‘anticipate’’, ‘‘seek’’, ‘‘estimate’’, ‘‘intend’’, ‘‘plan’’, ‘‘projection’’, ‘‘would’’, ‘‘annualized’’, “target” and ‘‘outlook’’, or the negative version of those words or other comparable words or phrases of a future or forward-looking nature. Forward-looking statements involve estimates and known and unknown risks, and reflect various assumptions and involve elements of subjective judgement and analysis, which may or may not prove to be correct, and which are subject to uncertainties and contingencies outside the control of Byline and its respective affiliates, directors, employees and other representatives, which could cause actual results to differ materially from those presented in this communication. The COVID-19 pandemic is adversely affecting us, our employees, customers, counterparties and third-party service providers, and the ultimate extent of the impacts on our business, financial position, results of operations, liquidity, and prospects is uncertain. Continued deterioration in general business and economic conditions, including further increases in unemployment rates, or turbulence in U.S. or global financial markets could adversely affect our revenues and the values of our assets and liabilities, reduce the availability of funding, lead to a tightening of credit, and further increase stock price volatility. In addition, changes to statutes, regulations, or regulatory policies or practices as a result of, or in response to COVID-19, could affect us in substantial and unpredictable ways. No representations, warranties or guarantees are or will be made by Byline as to the reliability, accuracy or completeness of any forward-looking statements contained in this communication or that such forward-looking statements are or will remain based on reasonable assumptions. You should not place undue reliance on any forward-looking statements contained in this communication. Certain risks and important factors that could affect Byline’s future results are identified in its Annual Report on Form 10-K and other reports filed with the Securities and Exchange Commission, including under the heading “Risk Factors” in such Annual Report on Form 10-K as well as in Byline’s Quarterly Report on Form 10-Q for the quarter ended March 31, 2020 . Any forward-looking statement speaks only as of the date on which it is made, and Byline undertakes no obligation to update any forward-looking statement, whether to reflect events or circumstances after the date on which the statement is made, to reflect new information or the occurrence of unanticipated events, or otherwise unless required under the federal securities laws.
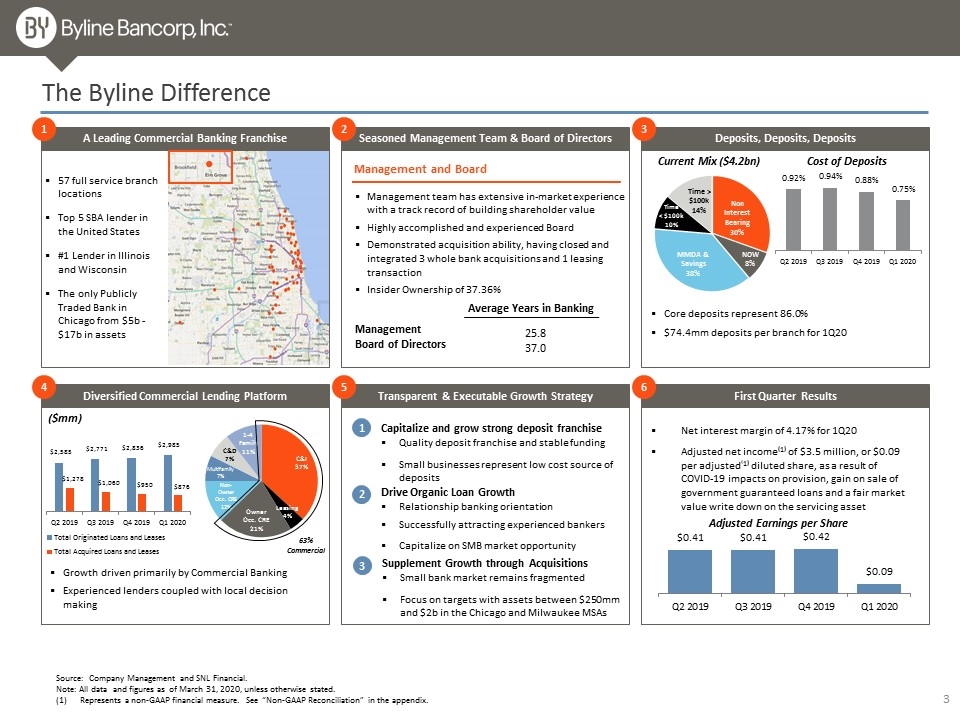
Management team has extensive in-market experience with a track record of building shareholder value Highly accomplished and experienced Board Demonstrated acquisition ability, having closed and integrated 3 whole bank acquisitions and 1 leasing transaction Insider Ownership of 37.36% Supplement Growth through Acquisitions Small bank market remains fragmented Focus on targets with assets between $250mm and $2b in the Chicago and Milwaukee MSAs Total Acquired Loans and Leases Total Originated Loans and Leases The Byline Difference Source: Company Management and SNL Financial. Note: All data and figures as of March 31, 2020, unless otherwise stated. Represents a non-GAAP financial measure. See “Non-GAAP Reconciliation” in the appendix. A Leading Commercial Banking Franchise Deposits, Deposits, Deposits Diversified Commercial Lending Platform Transparent & Executable Growth Strategy First Quarter Results 1 3 4 5 6 57 full service branch locations Top 5 SBA lender in the United States #1 Lender in Illinois and Wisconsin The only Publicly Traded Bank in Chicago from $5b - $17b in assets Core deposits represent 86.0% $74.4mm deposits per branch for 1Q20 Growth driven primarily by Commercial Banking Experienced lenders coupled with local decision making ($mm) Current Mix ($4.2bn) Cost of Deposits Seasoned Management Team & Board of Directors Management and Board Average Years in Banking Management Board of Directors 25.8 37.0 2 63% Commercial 1 2 Capitalize and grow strong deposit franchise Quality deposit franchise and stable funding Small businesses represent low cost source of deposits Drive Organic Loan Growth Relationship banking orientation Successfully attracting experienced bankers Capitalize on SMB market opportunity Net interest margin of 4.17% for 1Q20 Adjusted net income⁽1⁾ of $3.5 million, or $0.09 per adjusted⁽1⁾ diluted share, as a result of COVID-19 impacts on provision, gain on sale of government guaranteed loans and a fair market value write down on the servicing asset 3 Adjusted Earnings per Share
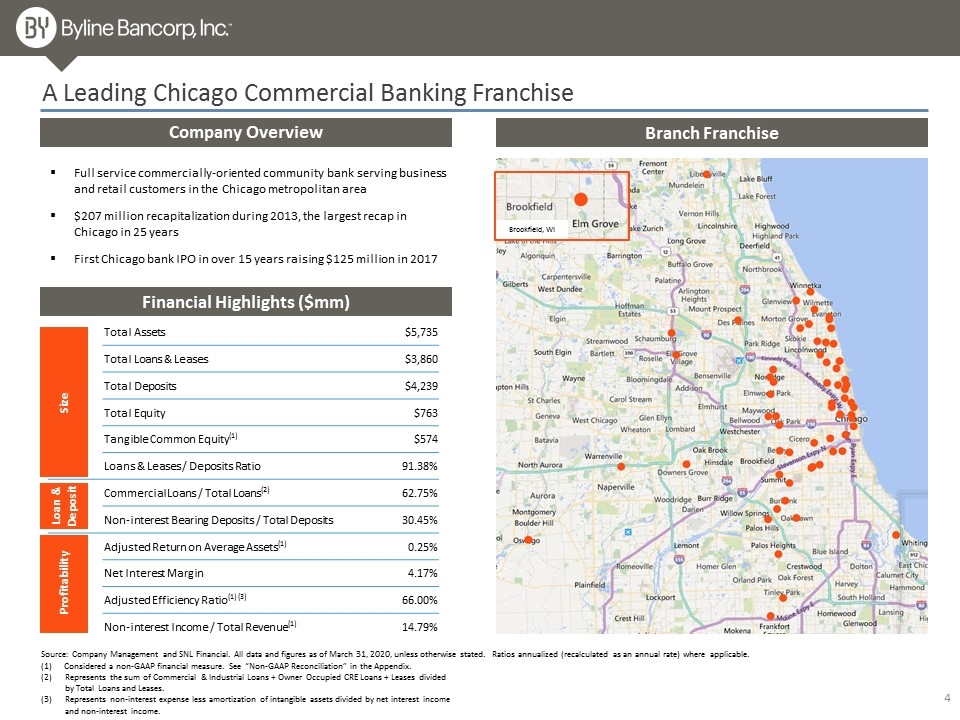
Total Assets $5,735 Total Loans & Leases $3,860 Total Deposits $4,239 Total Equity $763 Tangible Common Equity(1) $574 Loans & Leases / Deposits Ratio 91.38% Commercial Loans / Total Loans(2) 62.75% Non-interest Bearing Deposits / Total Deposits 30.45% Adjusted Return on Average Assets(1) 0.25% Net Interest Margin 4.17% Adjusted Efficiency Ratio(1) (3) 66.00% Non-interest Income / Total Revenue(1) 14.79% A Leading Chicago Commercial Banking Franchise Company Overview Full service commercially-oriented community bank serving business and retail customers in the Chicago metropolitan area $207 million recapitalization during 2013, the largest recap in Chicago in 25 years First Chicago bank IPO in over 15 years raising $125 million in 2017 Source: Company Management and SNL Financial. All data and figures as of March 31, 2020, unless otherwise stated. Ratios annualized (recalculated as an annual rate) where applicable. Financial Highlights ($mm) Size Loan & Deposit Profitability Branch Franchise (1) Considered a non-GAAP financial measure. See “Non-GAAP Reconciliation” in the Appendix. Represents the sum of Commercial & Industrial Loans + Owner Occupied CRE Loans + Leases divided by Total Loans and Leases. Represents non-interest expense less amortization of intangible assets divided by net interest income and non-interest income. Brookfield, WI
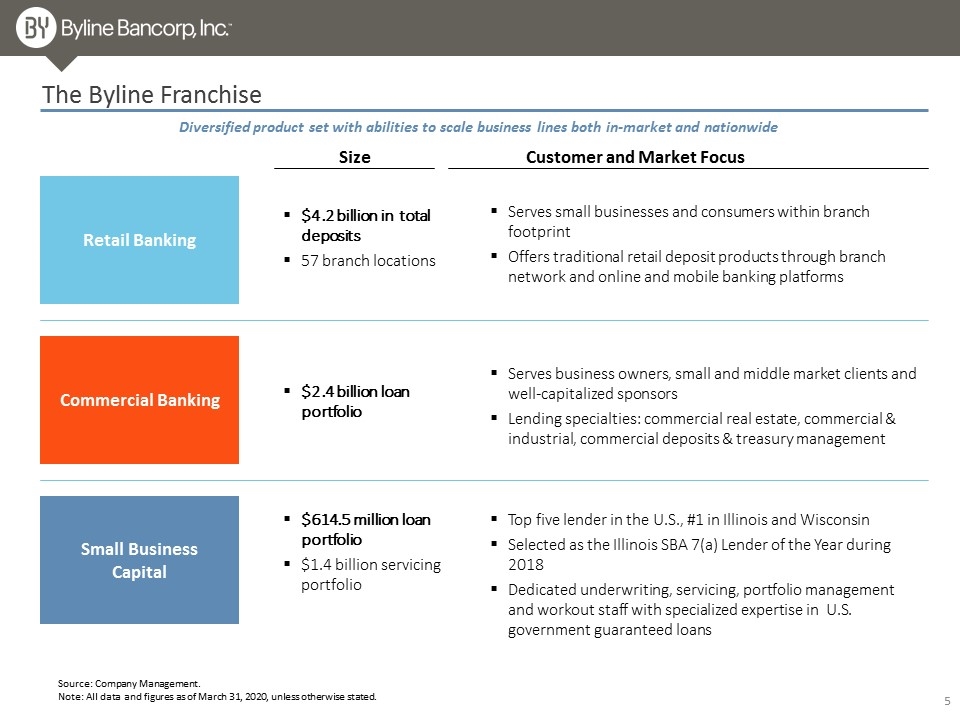
The Byline Franchise Commercial Banking Small Business Capital Size Customer and Market Focus $4.2 billion in total deposits 57 branch locations Serves small businesses and consumers within branch footprint Offers traditional retail deposit products through branch network and online and mobile banking platforms $2.4 billion loan portfolio Serves business owners, small and middle market clients and well-capitalized sponsors Lending specialties: commercial real estate, commercial & industrial, commercial deposits & treasury management $614.5 million loan portfolio $1.4 billion servicing portfolio Top five lender in the U.S., #1 in Illinois and Wisconsin Selected as the Illinois SBA 7(a) Lender of the Year during 2018 Dedicated underwriting, servicing, portfolio management and workout staff with specialized expertise in U.S. government guaranteed loans Source: Company Management. Note: All data and figures as of March 31, 2020, unless otherwise stated. Retail Banking Diversified product set with abilities to scale business lines both in-market and nationwide
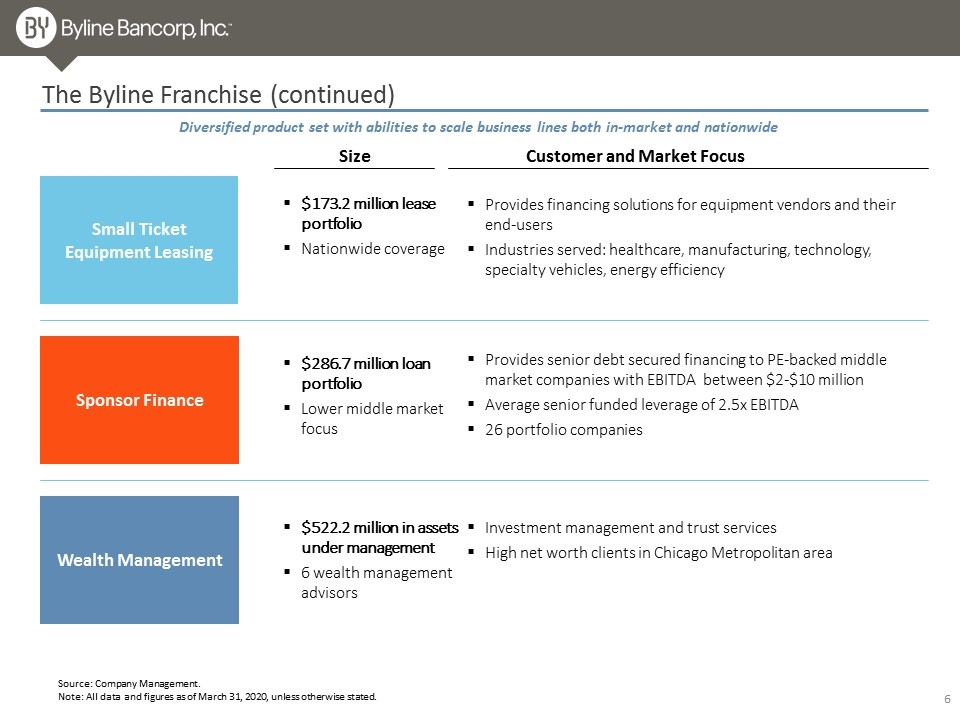
The Byline Franchise (continued) Sponsor Finance Wealth Management Size Customer and Market Focus $173.2 million lease portfolio Nationwide coverage Provides financing solutions for equipment vendors and their end-users Industries served: healthcare, manufacturing, technology, specialty vehicles, energy efficiency $286.7 million loan portfolio Lower middle market focus Provides senior debt secured financing to PE-backed middle market companies with EBITDA between $2-$10 million Average senior funded leverage of 2.5x EBITDA 26 portfolio companies $522.2 million in assets under management 6 wealth management advisors Investment management and trust services High net worth clients in Chicago Metropolitan area Source: Company Management. Note: All data and figures as of March 31, 2020, unless otherwise stated. Small Ticket Equipment Leasing Diversified product set with abilities to scale business lines both in-market and nationwide
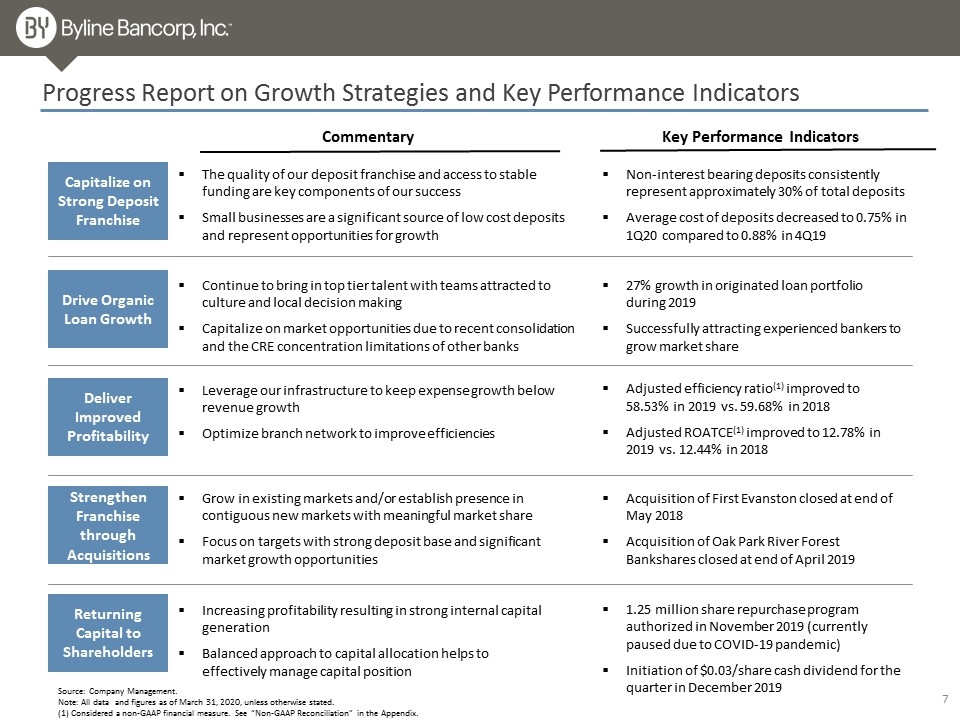
Drive Organic Loan Growth Deliver Improved Profitability Strengthen Franchise through Acquisitions Continue to bring in top tier talent with teams attracted to culture and local decision making Capitalize on market opportunities due to recent consolidation and the CRE concentration limitations of other banks Leverage our infrastructure to keep expense growth below revenue growth Optimize branch network to improve efficiencies Grow in existing markets and/or establish presence in contiguous new markets with meaningful market share Focus on targets with strong deposit base and significant market growth opportunities Capitalize on Strong Deposit Franchise The quality of our deposit franchise and access to stable funding are key components of our success Small businesses are a significant source of low cost deposits and represent opportunities for growth Progress Report on Growth Strategies and Key Performance Indicators Commentary Key Performance Indicators Non-interest bearing deposits consistently represent approximately 30% of total deposits Average cost of deposits decreased to 0.75% in 1Q20 compared to 0.88% in 4Q19 27% growth in originated loan portfolio during 2019 Successfully attracting experienced bankers to grow market share Adjusted efficiency ratio(1) improved to 58.53% in 2019 vs. 59.68% in 2018 Adjusted ROATCE(1) improved to 12.78% in 2019 vs. 12.44% in 2018 Acquisition of First Evanston closed at end of May 2018 Acquisition of Oak Park River Forest Bankshares closed at end of April 2019 Source: Company Management. Note: All data and figures as of March 31, 2020, unless otherwise stated. (1) Considered a non-GAAP financial measure. See “Non-GAAP Reconciliation” in the Appendix. Returning Capital to Shareholders Increasing profitability resulting in strong internal capital generation Balanced approach to capital allocation helps to effectively manage capital position 1.25 million share repurchase program authorized in November 2019 (currently paused due to COVID-19 pandemic) Initiation of $0.03/share cash dividend for the quarter in December 2019
Positioned to Manage Through the COVID-19 Environment
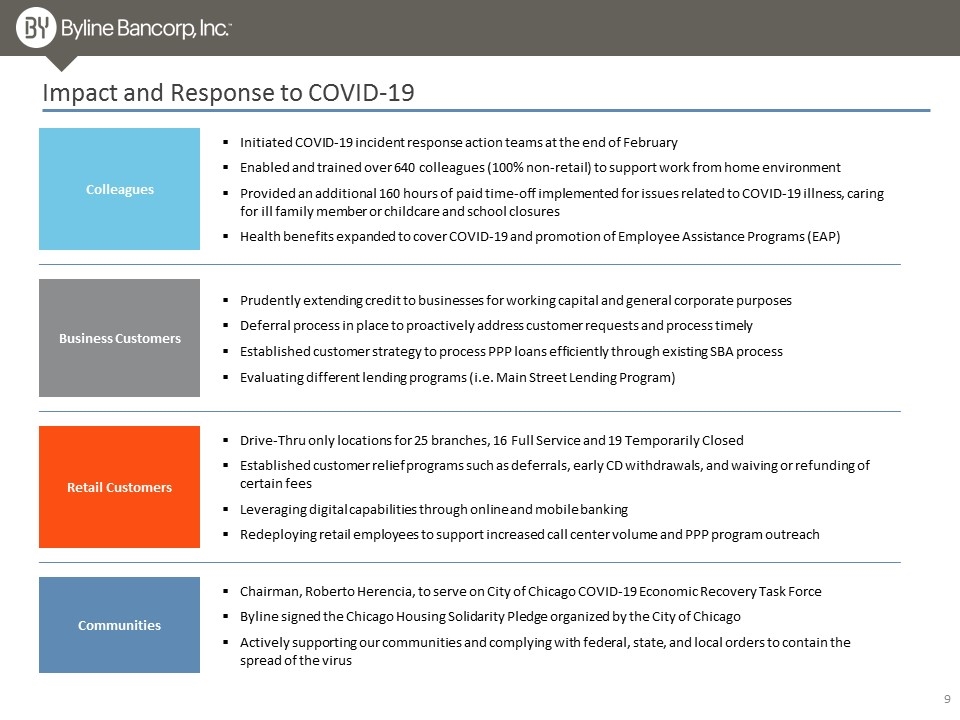
Impact and Response to COVID-19 Colleagues Initiated COVID-19 incident response action teams at the end of February Enabled and trained over 640 colleagues (100% non-retail) to support work from home environment Provided an additional 160 hours of paid time-off implemented for issues related to COVID-19 illness, caring for ill family member or childcare and school closures Health benefits expanded to cover COVID-19 and promotion of Employee Assistance Programs (EAP) Business Customers Prudently extending credit to businesses for working capital and general corporate purposes Deferral process in place to proactively address customer requests and process timely Established customer strategy to process PPP loans efficiently through existing SBA process Evaluating different lending programs (i.e. Main Street Lending Program) Retail Customers Drive-Thru only locations for 25 branches, 16 Full Service and 19 Temporarily Closed Established customer relief programs such as deferrals, early CD withdrawals, and waiving or refunding of certain fees Leveraging digital capabilities through online and mobile banking Redeploying retail employees to support increased call center volume and PPP program outreach Communities Chairman, Roberto Herencia, to serve on City of Chicago COVID-19 Economic Recovery Task Force Byline signed the Chicago Housing Solidarity Pledge organized by the City of Chicago Actively supporting our communities and complying with federal, state, and local orders to contain the spread of the virus
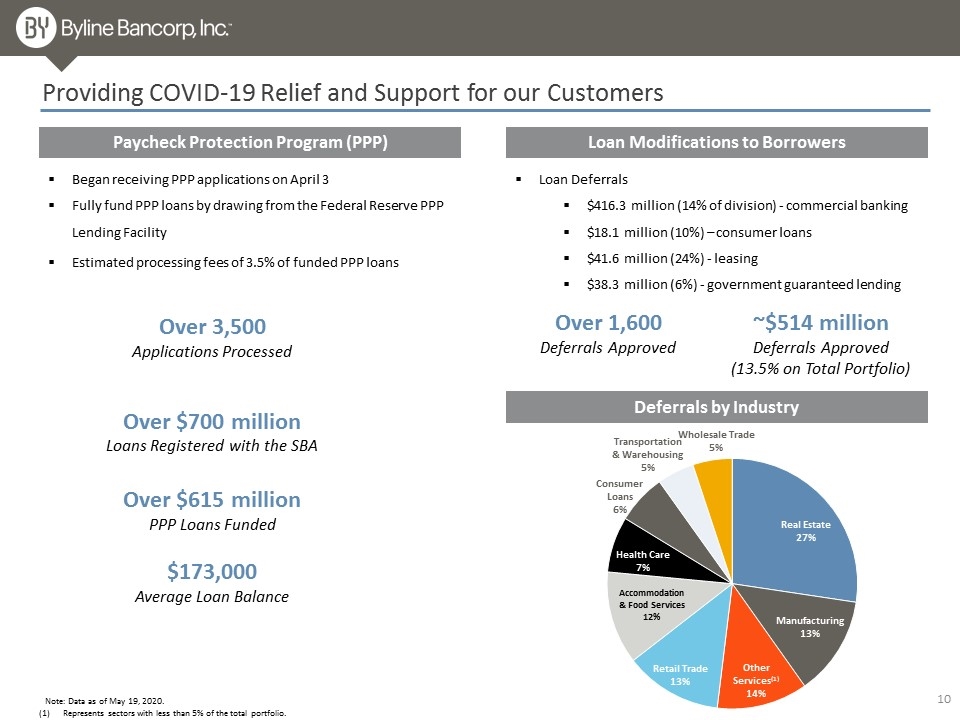
Providing COVID-19 Relief and Support for our Customers Paycheck Protection Program (PPP) Loan Modifications to Borrowers Began receiving PPP applications on April 3 Fully fund PPP loans by drawing from the Federal Reserve PPP Lending Facility Estimated processing fees of 3.5% of funded PPP loans Over 3,500 Applications Processed Over $700 million Loans Registered with the SBA Over $615 million PPP Loans Funded $173,000 Average Loan Balance Loan Deferrals $416.3 million (14% of division) - commercial banking $18.1 million (10%) – consumer loans $41.6 million (24%) - leasing $38.3 million (6%) - government guaranteed lending Over 1,600 Deferrals Approved ~$514 million Deferrals Approved (13.5% on Total Portfolio) Deferrals by Industry Note: Data as of May 19, 2020. Represents sectors with less than 5% of the total portfolio. Wholesale Trade5%
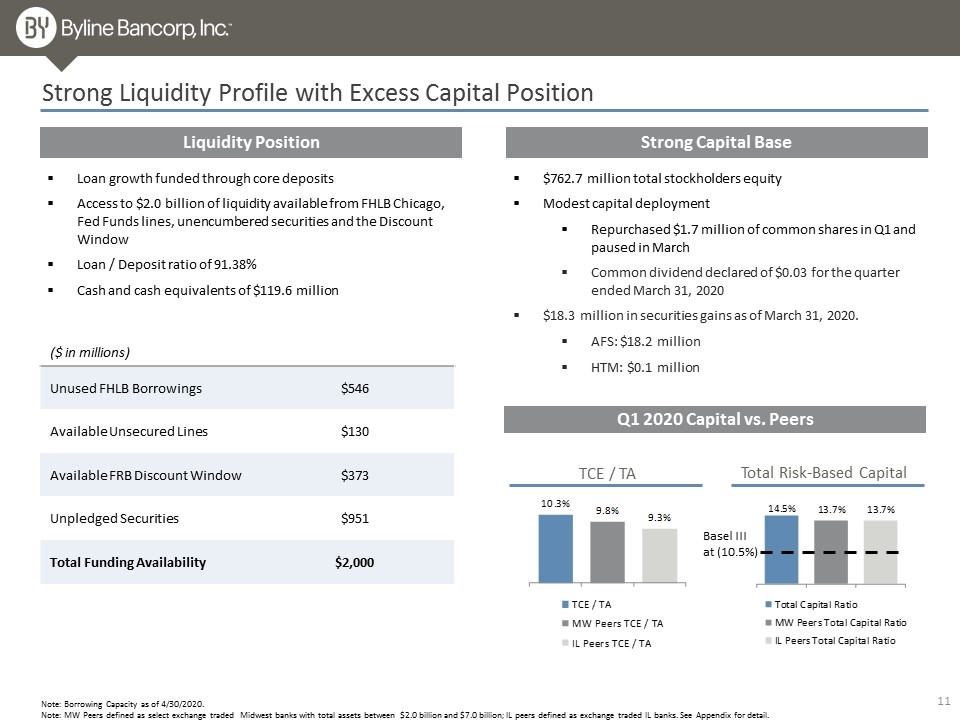
$762.7 million total stockholders equity Modest capital deployment Repurchased $1.7 million of common shares in Q1 and paused in March Common dividend declared of $0.03 for the quarter ended March 31, 2020 $18.3 million in securities gains as of March 31, 2020. AFS: $18.2 million HTM: $0.1 million Project Sox Offer Migration Strong Liquidity Profile with Excess Capital Position Liquidity Position Strong Capital Base Loan growth funded through core deposits Access to $2.0 billion of liquidity available from FHLB Chicago, Fed Funds lines, unencumbered securities and the Discount Window Loan / Deposit ratio of 91.38% Cash and cash equivalents of $119.6 million ($ in millions) Unused FHLB Borrowings $546 Available Unsecured Lines $130 Available FRB Discount Window $373 Unpledged Securities $951 Total Funding Availability $2,000 Note: Borrowing Capacity as of 4/30/2020. Note: MW Peers defined as select exchange traded Midwest banks with total assets between $2.0 billion and $7.0 billion; IL peers defined as exchange traded IL banks. See Appendix for detail. TCE / TA Total Risk-Based Capital Basel III at (10.5%) Q1 2020 Capital vs. Peers
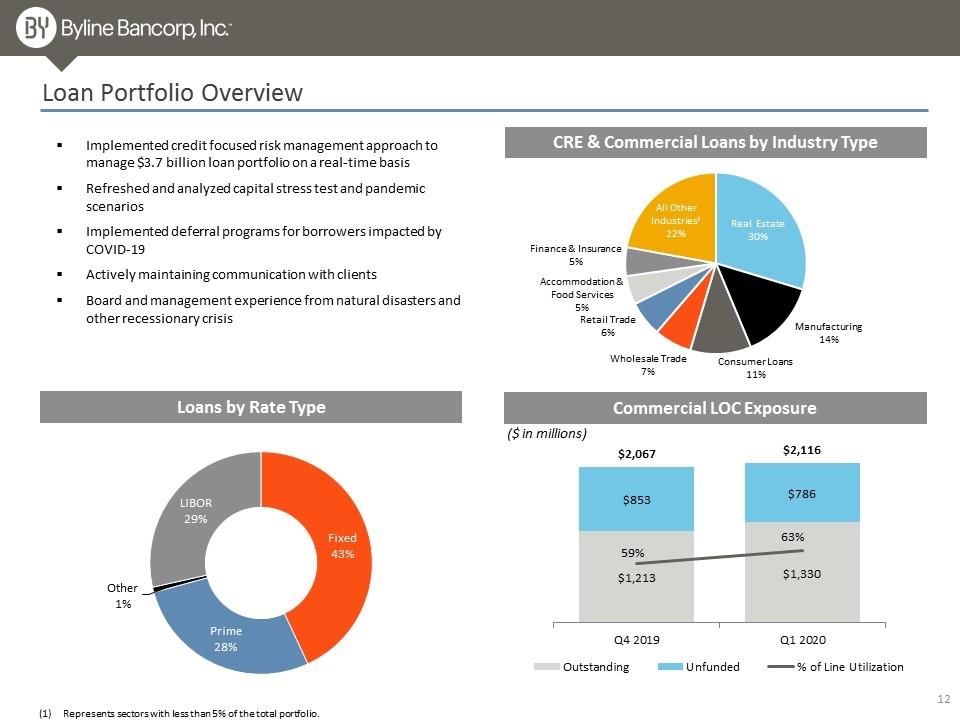
Project Sox Offer Migration Loan Portfolio Overview Commercial LOC Exposure ($ in millions) Loans by Rate Type CRE & Commercial Loans by Industry Type Implemented credit focused risk management approach to manage $3.7 billion loan portfolio on a real-time basis Refreshed and analyzed capital stress test and pandemic scenarios Implemented deferral programs for borrowers impacted by COVID-19 Actively maintaining communication with clients Board and management experience from natural disasters and other recessionary crisis Represents sectors with less than 5% of the total portfolio.
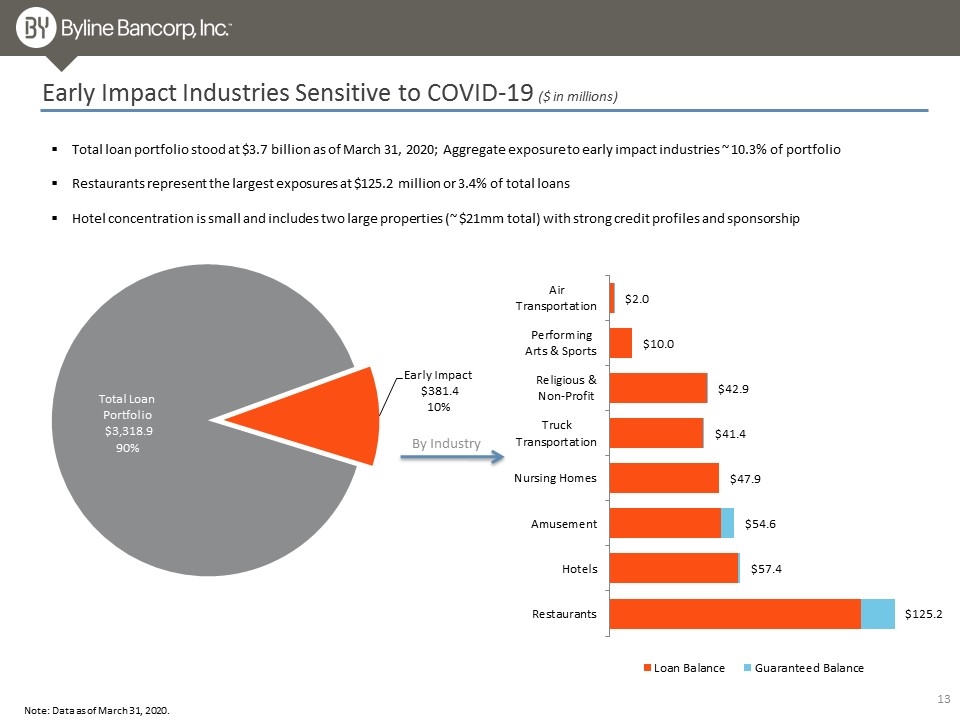
Early Impact Industries Sensitive to COVID-19 ($ in millions) Total loan portfolio stood at $3.7 billion as of March 31, 2020; Aggregate exposure to early impact industries ~ 10.3% of portfolio Restaurants represent the largest exposures at $125.2 million or 3.4% of total loans Hotel concentration is small and includes two large properties (~ $21mm total) with strong credit profiles and sponsorship By Industry Note: Data as of March 31, 2020.
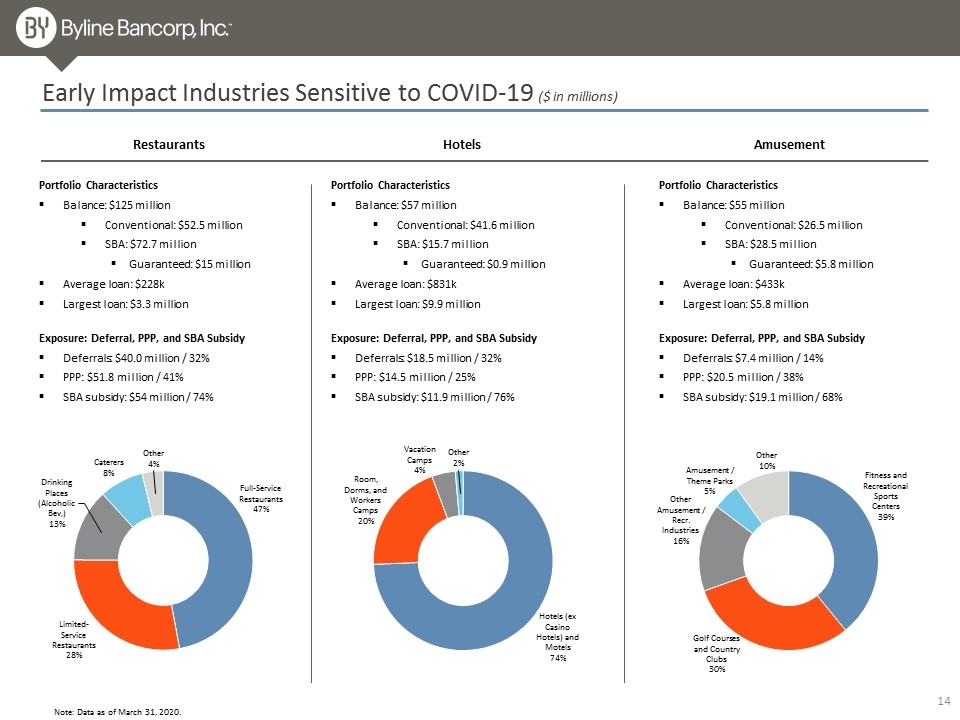
Hotels Portfolio Characteristics Balance: $57 million Conventional: $41.6 million SBA: $15.7 million Guaranteed: $0.9 million Average loan: $831k Largest loan: $9.9 million Exposure: Deferral, PPP, and SBA Subsidy Deferrals: $18.5 million / 32% PPP: $14.5 million / 25% SBA subsidy: $11.9 million / 76% Early Impact Industries Sensitive to COVID-19 ($ in millions) Restaurants Portfolio Characteristics Balance: $125 million Conventional: $52.5 million SBA: $72.7 million Guaranteed: $15 million Average loan: $228k Largest loan: $3.3 million Exposure: Deferral, PPP, and SBA Subsidy Deferrals: $40.0 million / 32% PPP: $51.8 million / 41% SBA subsidy: $54 million / 74% Amusement Portfolio Characteristics Balance: $55 million Conventional: $26.5 million SBA: $28.5 million Guaranteed: $5.8 million Average loan: $433k Largest loan: $5.8 million Exposure: Deferral, PPP, and SBA Subsidy Deferrals: $7.4 million / 14% PPP: $20.5 million / 38% SBA subsidy: $19.1 million / 68% Note: Data as of March 31, 2020.
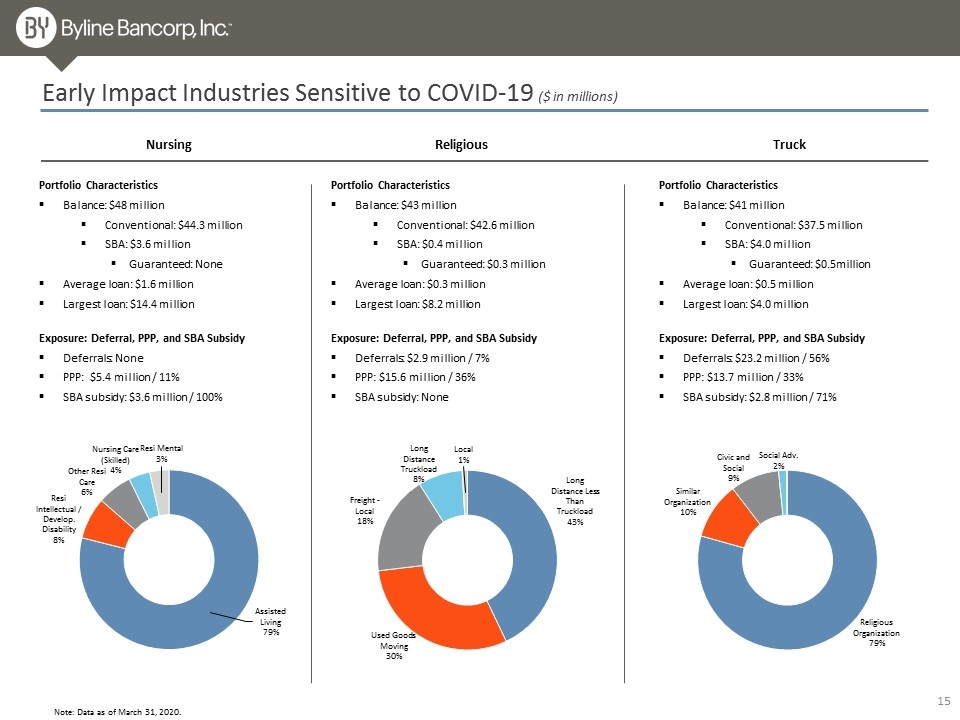
Religious Portfolio Characteristics Balance: $43 million Conventional: $42.6 million SBA: $0.4 million Guaranteed: $0.3 million Average loan: $0.3 million Largest loan: $8.2 million Exposure: Deferral, PPP, and SBA Subsidy Deferrals: $2.9 million / 7% PPP: $15.6 million / 36% SBA subsidy: None Early Impact Industries Sensitive to COVID-19 ($ in millions) Note: Data as of March 31, 2020. Nursing Portfolio Characteristics Balance: $48 million Conventional: $44.3 million SBA: $3.6 million Guaranteed: None Average loan: $1.6 million Largest loan: $14.4 million Exposure: Deferral, PPP, and SBA Subsidy Deferrals: None PPP: $5.4 million / 11% SBA subsidy: $3.6 million / 100% Truck Portfolio Characteristics Balance: $41 million Conventional: $37.5 million SBA: $4.0 million Guaranteed: $0.5million Average loan: $0.5 million Largest loan: $4.0 million Exposure: Deferral, PPP, and SBA Subsidy Deferrals: $23.2 million / 56% PPP: $13.7 million / 33% SBA subsidy: $2.8 million / 71%
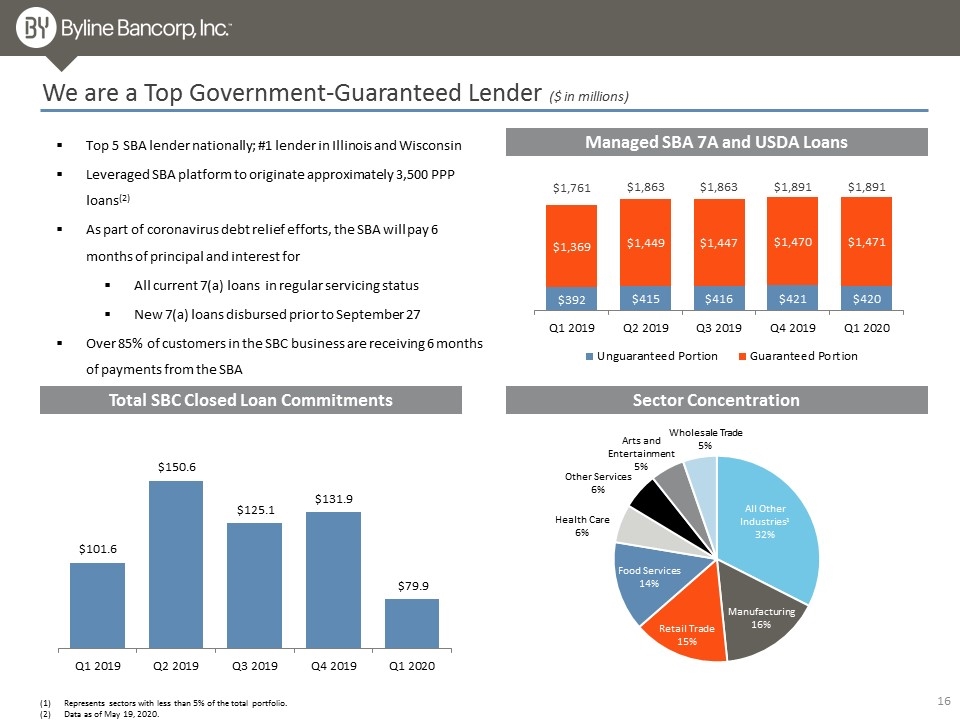
We are a Top Government-Guaranteed Lender ($ in millions) Managed SBA 7A and USDA Loans Top 5 SBA lender nationally; #1 lender in Illinois and Wisconsin Leveraged SBA platform to originate approximately 3,500 PPP loans(2) As part of coronavirus debt relief efforts, the SBA will pay 6 months of principal and interest for All current 7(a) loans in regular servicing status New 7(a) loans disbursed prior to September 27 Over 85% of customers in the SBC business are receiving 6 months of payments from the SBA Sector Concentration Represents sectors with less than 5% of the total portfolio. Data as of May 19, 2020. Total SBC Closed Loan Commitments
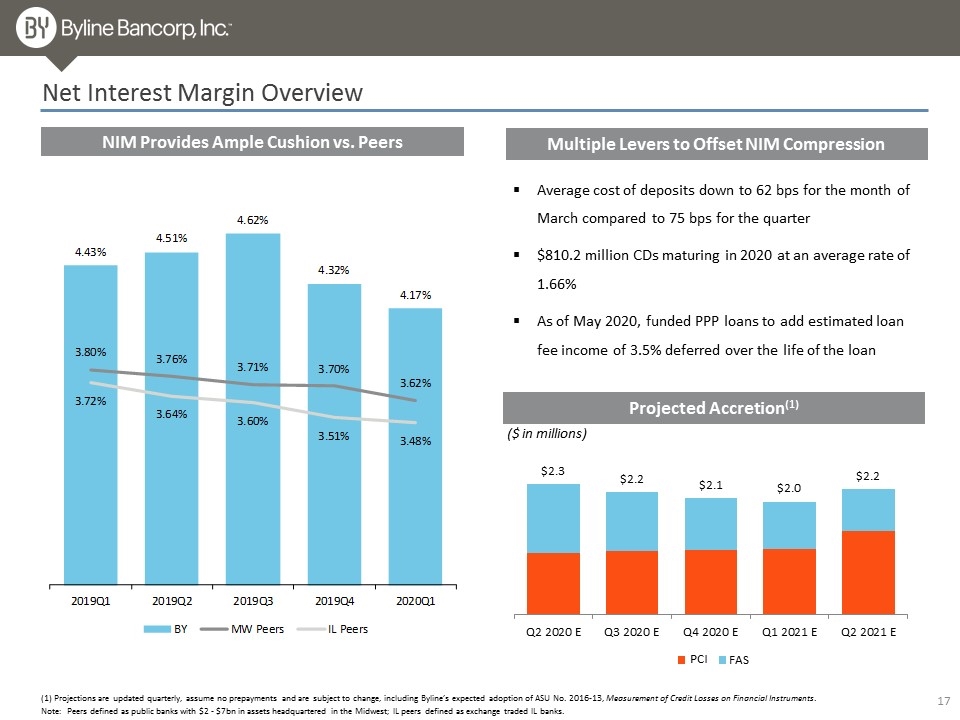
Project Sox Offer Migration Net Interest Margin Overview Average cost of deposits down to 62 bps for the month of March compared to 75 bps for the quarter $810.2 million CDs maturing in 2020 at an average rate of 1.66% As of May 2020, funded PPP loans to add estimated loan fee income of 3.5% deferred over the life of the loan NIM Provides Ample Cushion vs. Peers Multiple Levers to Offset NIM Compression Note: Peers defined as public banks with $2 - $7bn in assets headquartered in the Midwest; IL peers defined as exchange traded IL banks. 1 Projected Accretion(1) (1) Projections are updated quarterly, assume no prepayments and are subject to change, including Byline’s expected adoption of ASU No. 2016-13, Measurement of Credit Losses on Financial Instruments. ($ in millions)
Actively protect the safety and financial health of our employees, customers and communities During the crisis and beyond, work diligently with customers to understand its impact on their business and help them manage it in a constructive fashion Operate our business with the utmost focus on safety and soundness Support prudent balance sheet growth while maintaining a keen focus on capital and liquidity Maintain focus on disciplined expense management Areas of Focus
First Quarter 2020 Financial Review
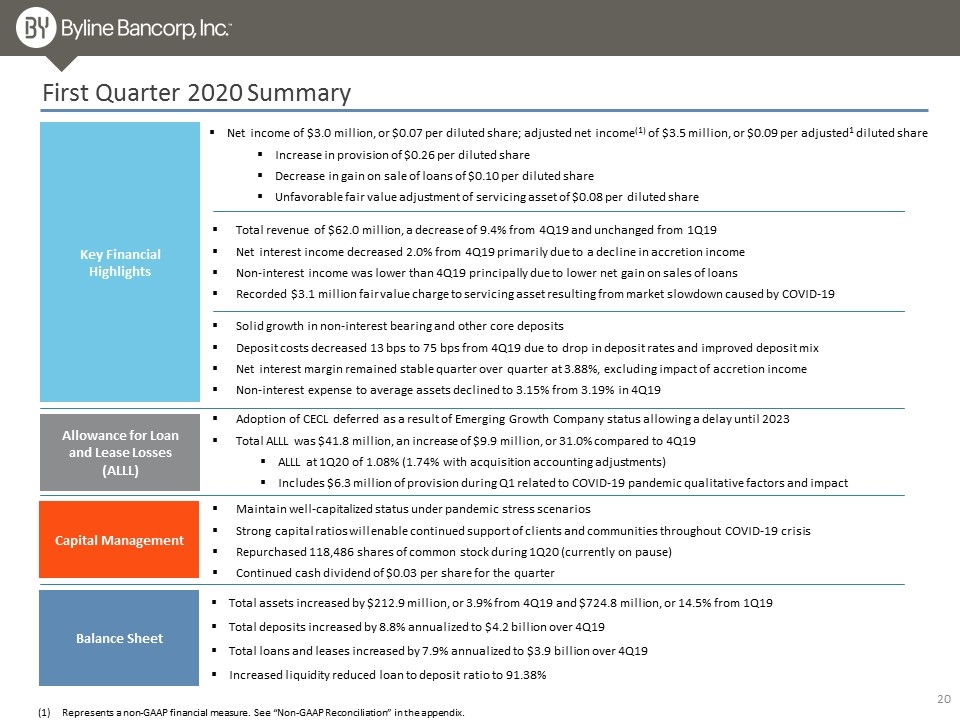
Total revenue of $62.0 million, a decrease of 9.4% from 4Q19 and unchanged from 1Q19 Net interest income decreased 2.0% from 4Q19 primarily due to a decline in accretion income Non-interest income was lower than 4Q19 principally due to lower net gain on sales of loans Recorded $3.1 million fair value charge to servicing asset resulting from market slowdown caused by COVID-19 Solid growth in non-interest bearing and other core deposits Deposit costs decreased 13 bps to 75 bps from 4Q19 due to drop in deposit rates and improved deposit mix Net interest margin remained stable quarter over quarter at 3.88%, excluding impact of accretion income Non-interest expense to average assets declined to 3.15% from 3.19% in 4Q19 Net income of $3.0 million, or $0.07 per diluted share; adjusted net income(1) of $3.5 million, or $0.09 per adjusted1 diluted share Increase in provision of $0.26 per diluted share Decrease in gain on sale of loans of $0.10 per diluted share Unfavorable fair value adjustment of servicing asset of $0.08 per diluted share First Quarter 2020 Summary Balance Sheet Key Financial Highlights Capital Management Maintain well-capitalized status under pandemic stress scenarios Strong capital ratios will enable continued support of clients and communities throughout COVID-19 crisis Repurchased 118,486 shares of common stock during 1Q20 (currently on pause) Continued cash dividend of $0.03 per share for the quarter Represents a non-GAAP financial measure. See “Non-GAAP Reconciliation” in the appendix. Total assets increased by $212.9 million, or 3.9% from 4Q19 and $724.8 million, or 14.5% from 1Q19 Total deposits increased by 8.8% annualized to $4.2 billion over 4Q19 Total loans and leases increased by 7.9% annualized to $3.9 billion over 4Q19 Increased liquidity reduced loan to deposit ratio to 91.38% Allowance for Loan and Lease Losses (ALLL) Adoption of CECL deferred as a result of Emerging Growth Company status allowing a delay until 2023 Total ALLL was $41.8 million, an increase of $9.9 million, or 31.0% compared to 4Q19 ALLL at 1Q20 of 1.08% (1.74% with acquisition accounting adjustments) Includes $6.3 million of provision during Q1 related to COVID-19 pandemic qualitative factors and impact
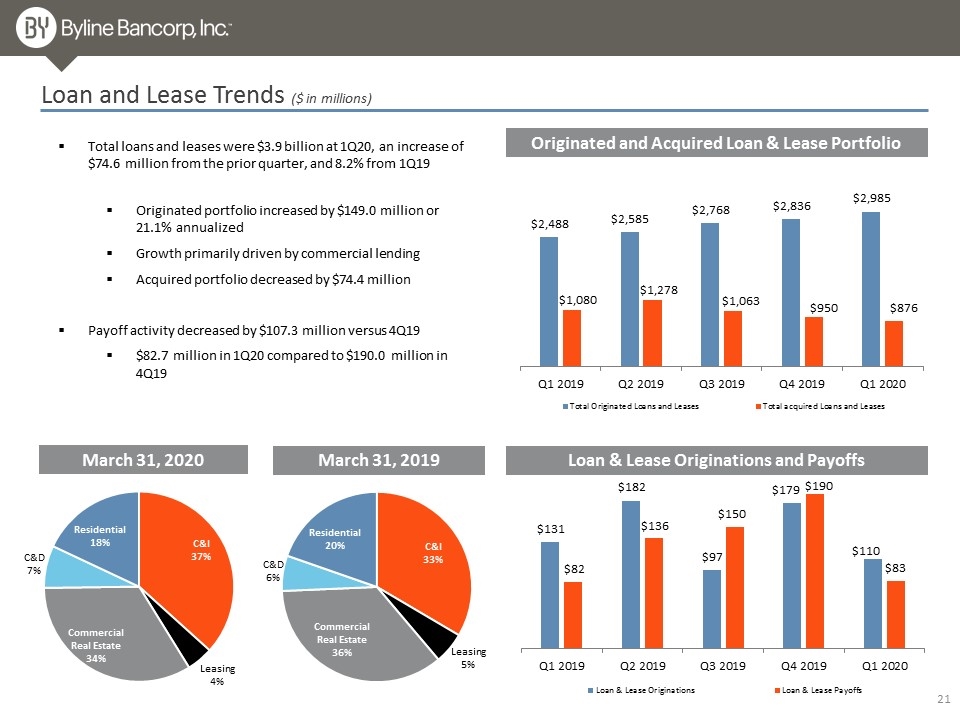
Loan and Lease Trends ($ in millions) Loan & Lease Originations and Payoffs March 31, 2019 March 31, 2020 Originated and Acquired Loan & Lease Portfolio Total loans and leases were $3.9 billion at 1Q20, an increase of $74.6 million from the prior quarter, and 8.2% from 1Q19 Originated portfolio increased by $149.0 million or 21.1% annualized Growth primarily driven by commercial lending Acquired portfolio decreased by $74.4 million Payoff activity decreased by $107.3 million versus 4Q19 $82.7 million in 1Q20 compared to $190.0 million in 4Q19
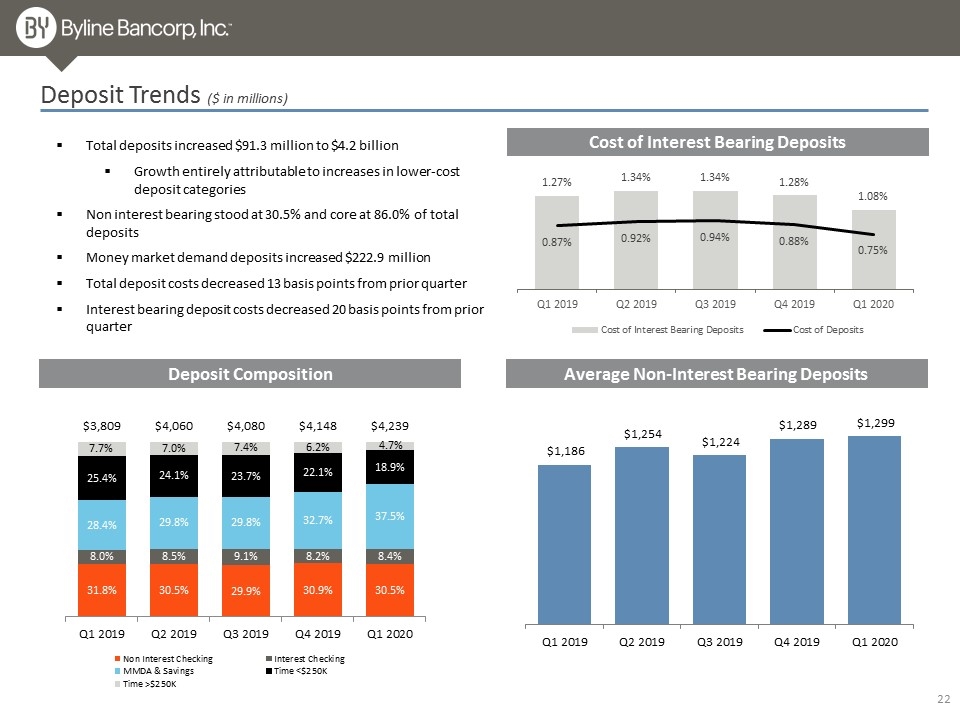
Total deposits increased $91.3 million to $4.2 billion Growth entirely attributable to increases in lower-cost deposit categories Non interest bearing stood at 30.5% and core at 86.0% of total deposits Money market demand deposits increased $222.9 million Total deposit costs decreased 13 basis points from prior quarter Interest bearing deposit costs decreased 20 basis points from prior quarter Deposit Trends ($ in millions) Average Non-Interest Bearing Deposits Deposit Composition Cost of Interest Bearing Deposits
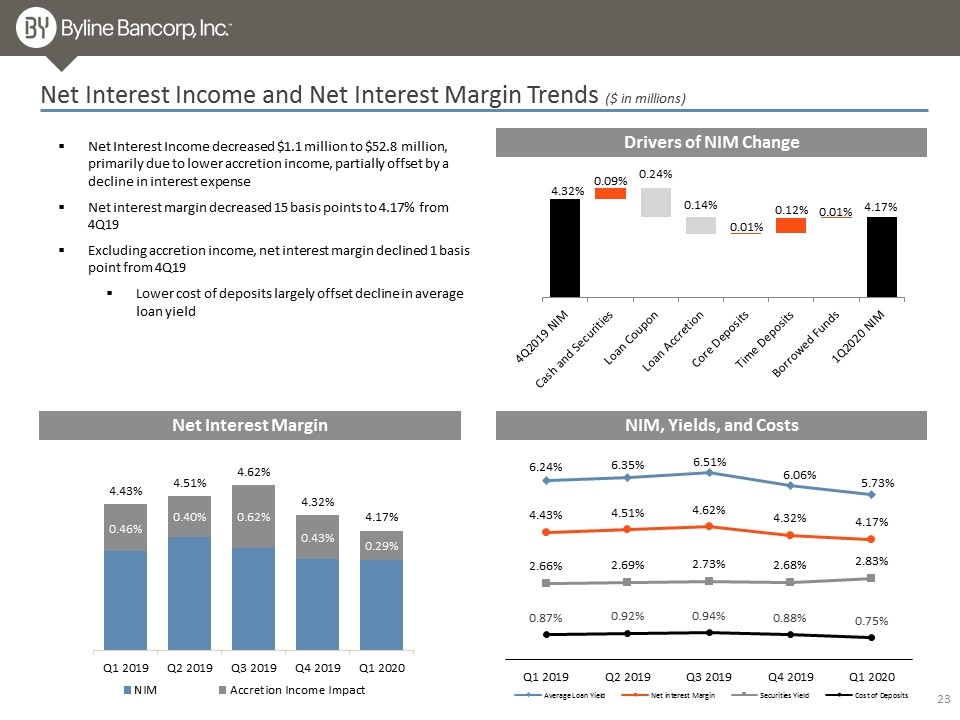
Net Interest Income and Net Interest Margin Trends ($ in millions) Net Interest Income decreased $1.1 million to $52.8 million, primarily due to lower accretion income, partially offset by a decline in interest expense Net interest margin decreased 15 basis points to 4.17% from 4Q19 Excluding accretion income, net interest margin declined 1 basis point from 4Q19 Lower cost of deposits largely offset decline in average loan yield Net Interest Margin Drivers of NIM Change NIM, Yields, and Costs
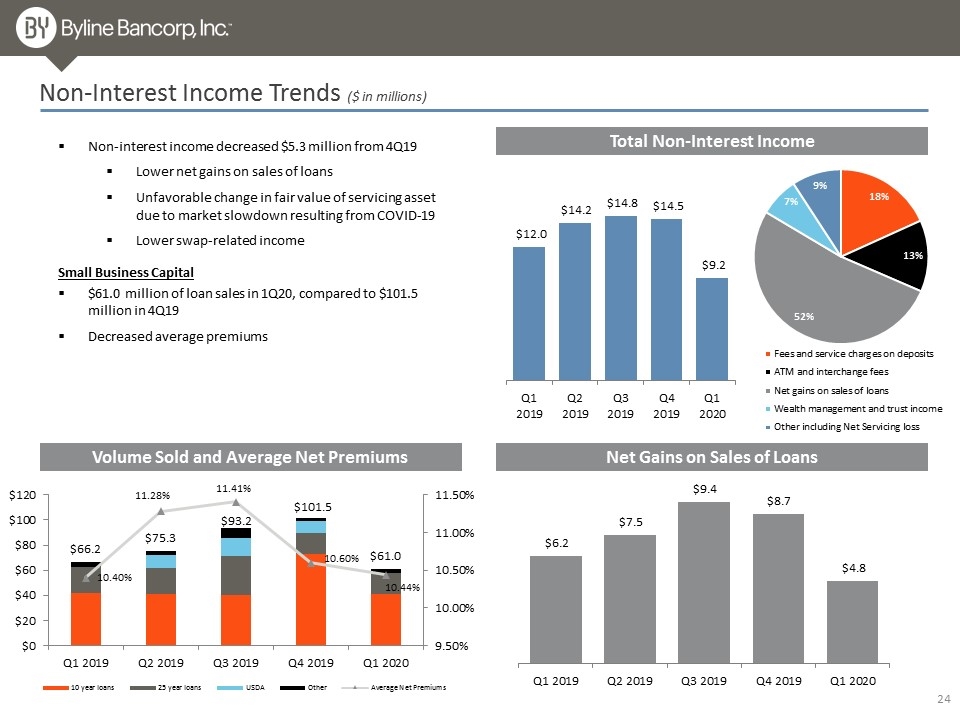
Total Non-Interest Income Non-Interest Income Trends ($ in millions) Non-interest income decreased $5.3 million from 4Q19 Lower net gains on sales of loans Unfavorable change in fair value of servicing asset due to market slowdown resulting from COVID-19 Lower swap-related income Volume Sold and Average Net Premiums Net Gains on Sales of Loans $61.0 million of loan sales in 1Q20, compared to $101.5 million in 4Q19 Decreased average premiums Small Business Capital
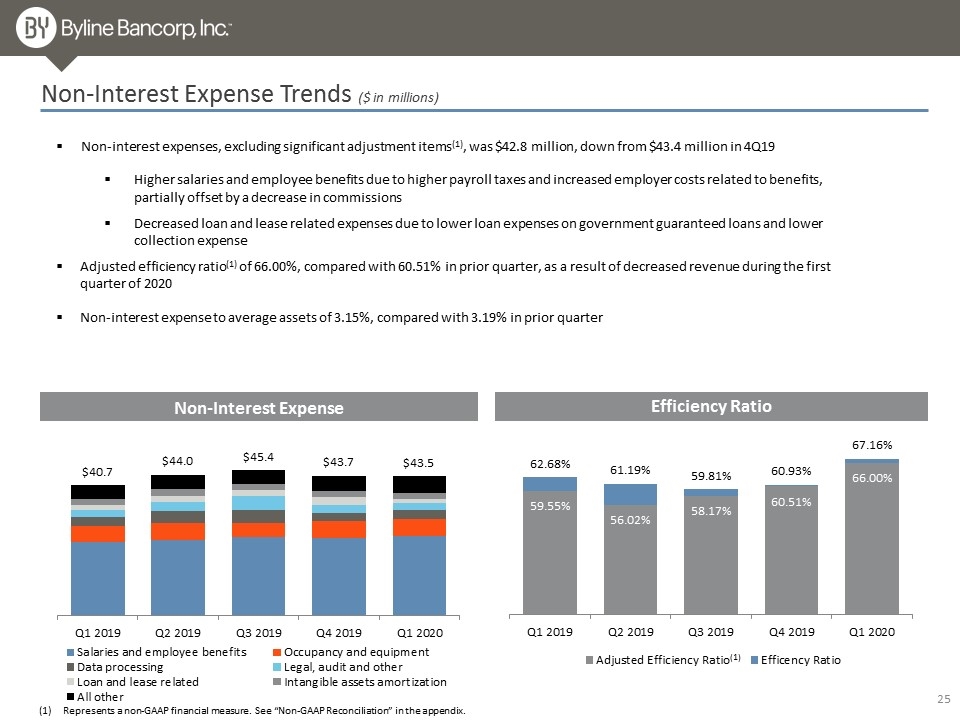
Non-Interest Expense Trends ($ in millions) Non-interest expenses, excluding significant adjustment items(1), was $42.8 million, down from $43.4 million in 4Q19 Higher salaries and employee benefits due to higher payroll taxes and increased employer costs related to benefits, partially offset by a decrease in commissions Decreased loan and lease related expenses due to lower loan expenses on government guaranteed loans and lower collection expense Adjusted efficiency ratio(1) of 66.00%, compared with 60.51% in prior quarter, as a result of decreased revenue during the first quarter of 2020 Non-interest expense to average assets of 3.15%, compared with 3.19% in prior quarter Efficiency Ratio Non-Interest Expense Represents a non-GAAP financial measure. See “Non-GAAP Reconciliation” in the appendix. (1)
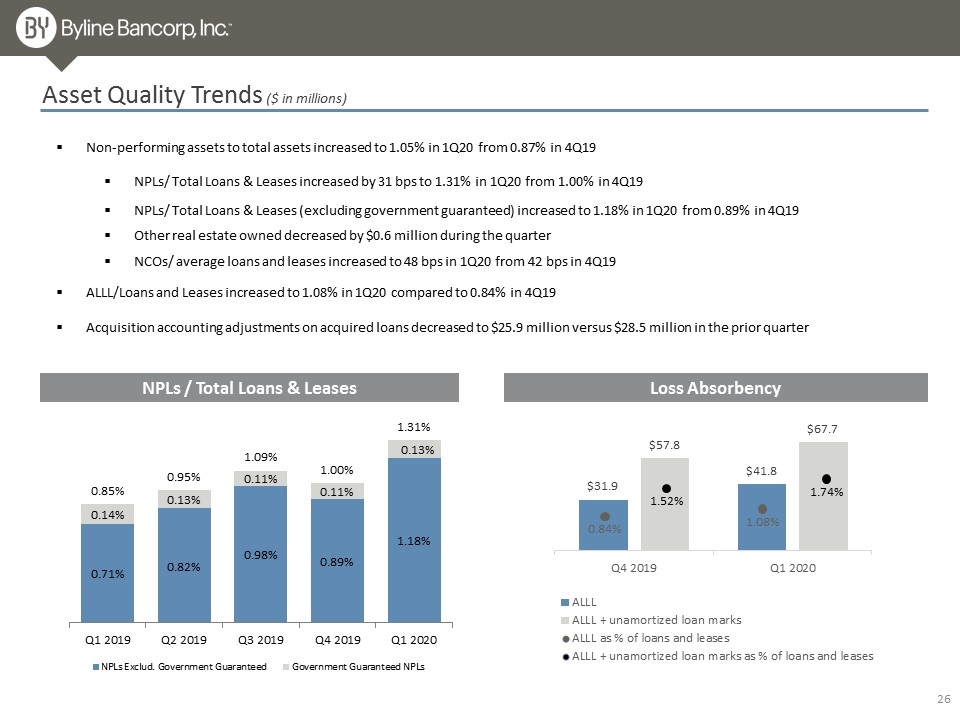
Asset Quality Trends ($ in millions) Non-performing assets to total assets increased to 1.05% in 1Q20 from 0.87% in 4Q19 NPLs/ Total Loans & Leases increased by 31 bps to 1.31% in 1Q20 from 1.00% in 4Q19 NPLs/ Total Loans & Leases (excluding government guaranteed) increased to 1.18% in 1Q20 from 0.89% in 4Q19 Other real estate owned decreased by $0.6 million during the quarter NCOs/ average loans and leases increased to 48 bps in 1Q20 from 42 bps in 4Q19 ALLL/Loans and Leases increased to 1.08% in 1Q20 compared to 0.84% in 4Q19 Acquisition accounting adjustments on acquired loans decreased to $25.9 million versus $28.5 million in the prior quarter NPLs / Total Loans & Leases Loss Absorbency 1.08% 1.74% 0.84% 1.52%
Appendix
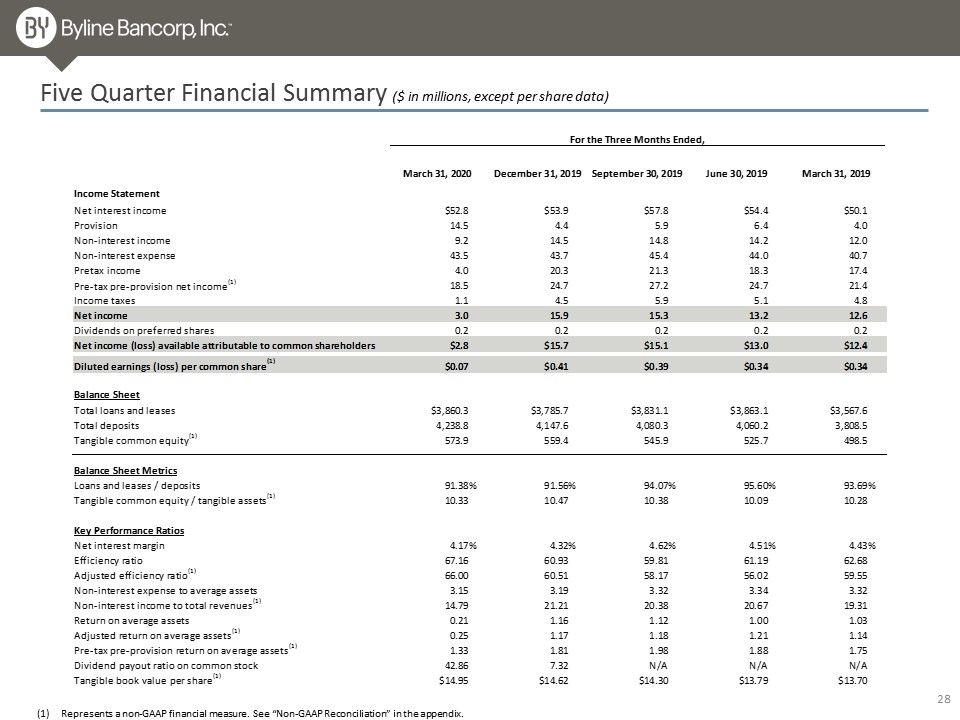
Five Quarter Financial Summary ($ in millions, except per share data) Represents a non-GAAP financial measure. See “Non-GAAP Reconciliation” in the appendix.
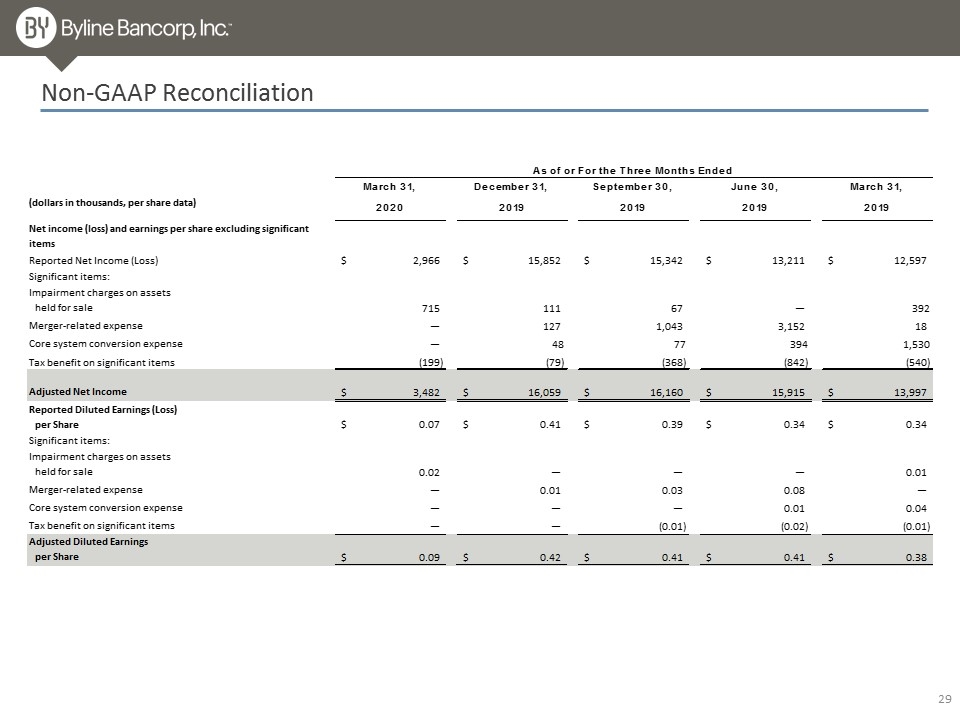
Non-GAAP Reconciliation
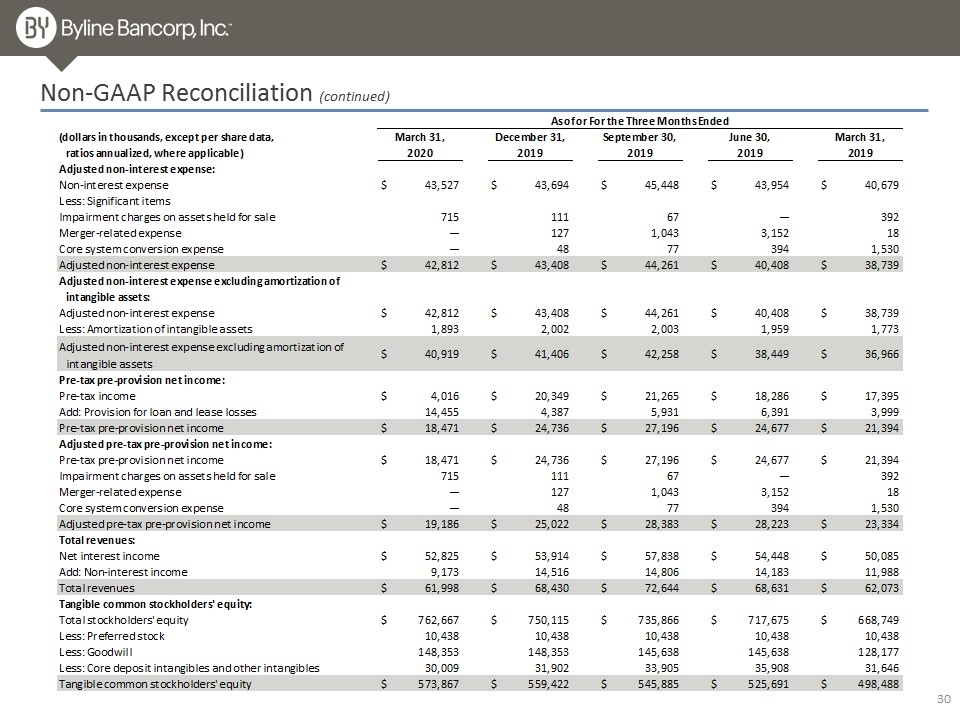
Non-GAAP Reconciliation (continued)
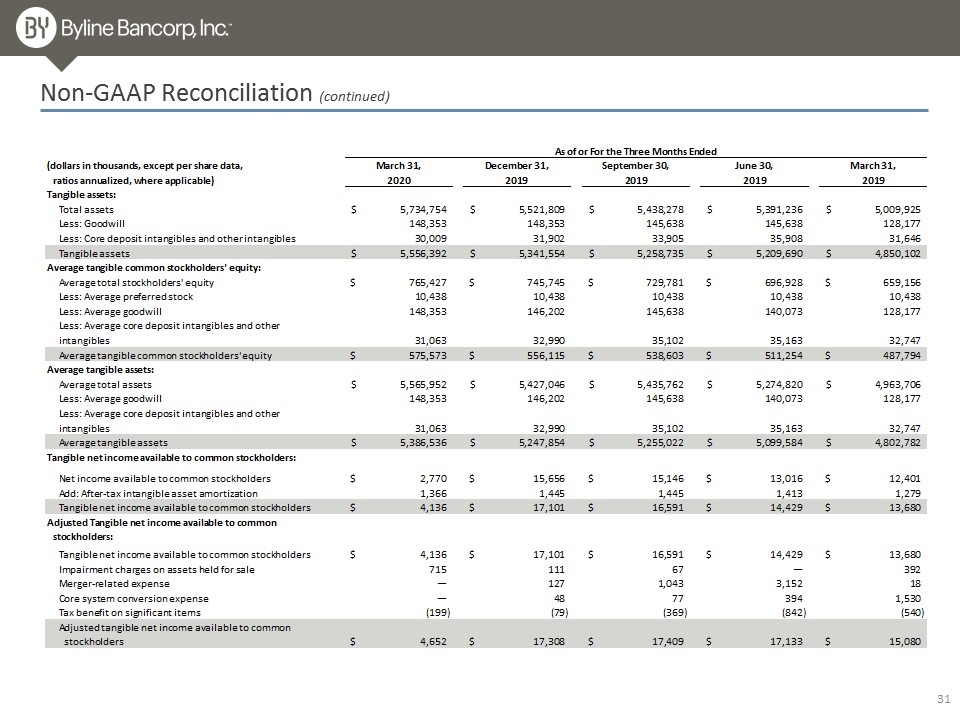
Non-GAAP Reconciliation (continued)
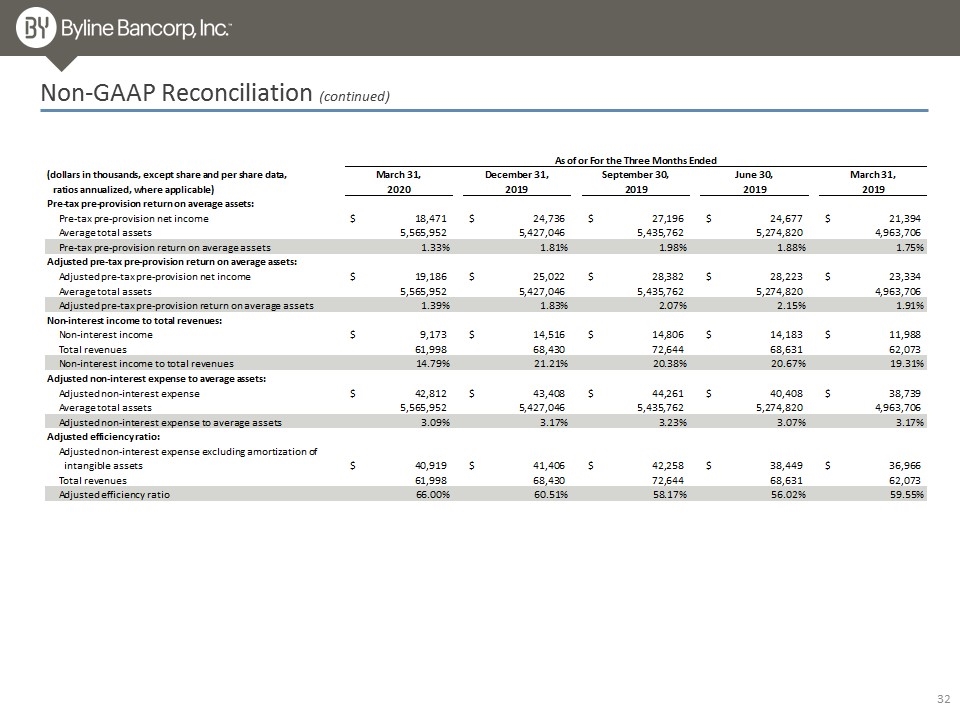
Non-GAAP Reconciliation (continued)
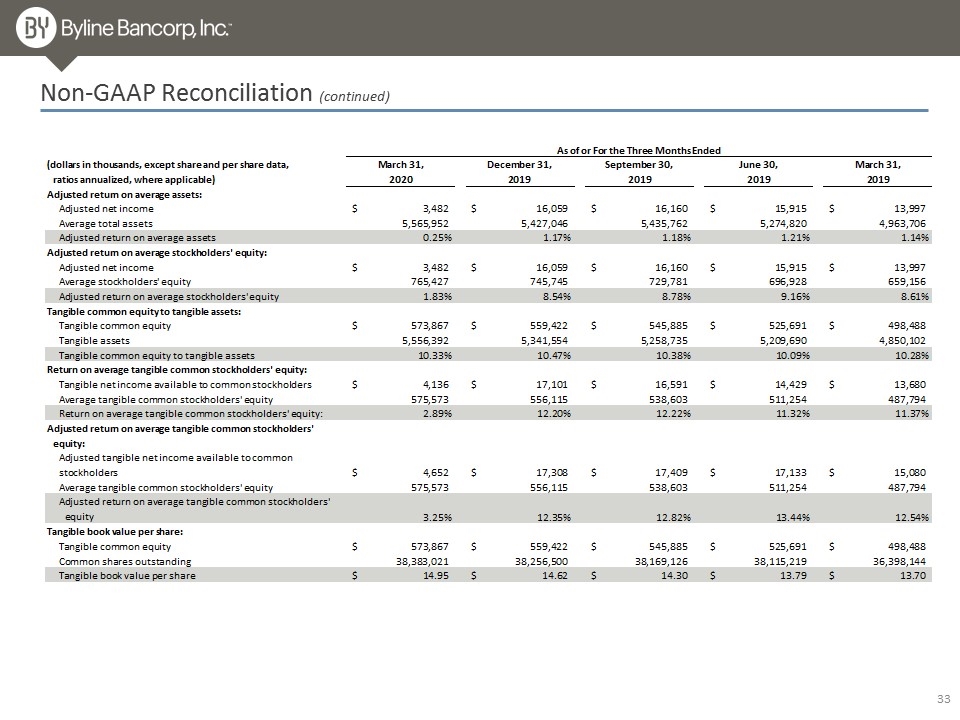
Non-GAAP Reconciliation (continued)
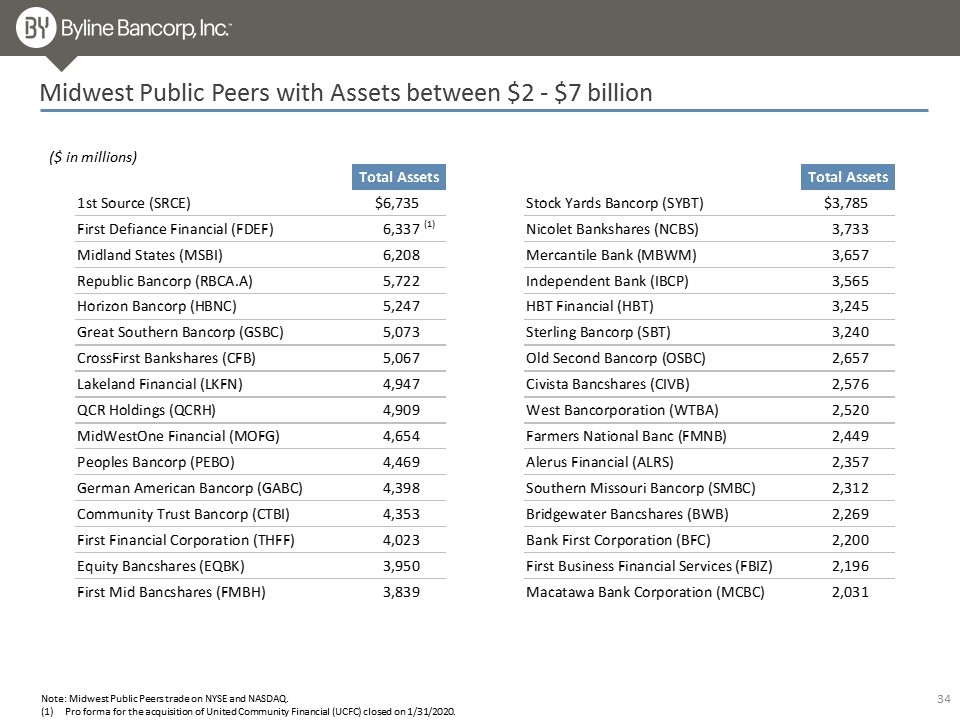
Midwest Public Peers with Assets between $2 - $7 billion (1) Note: Midwest Public Peers trade on NYSE and NASDAQ. Pro forma for the acquisition of United Community Financial (UCFC) closed on 1/31/2020. ($ in millions)
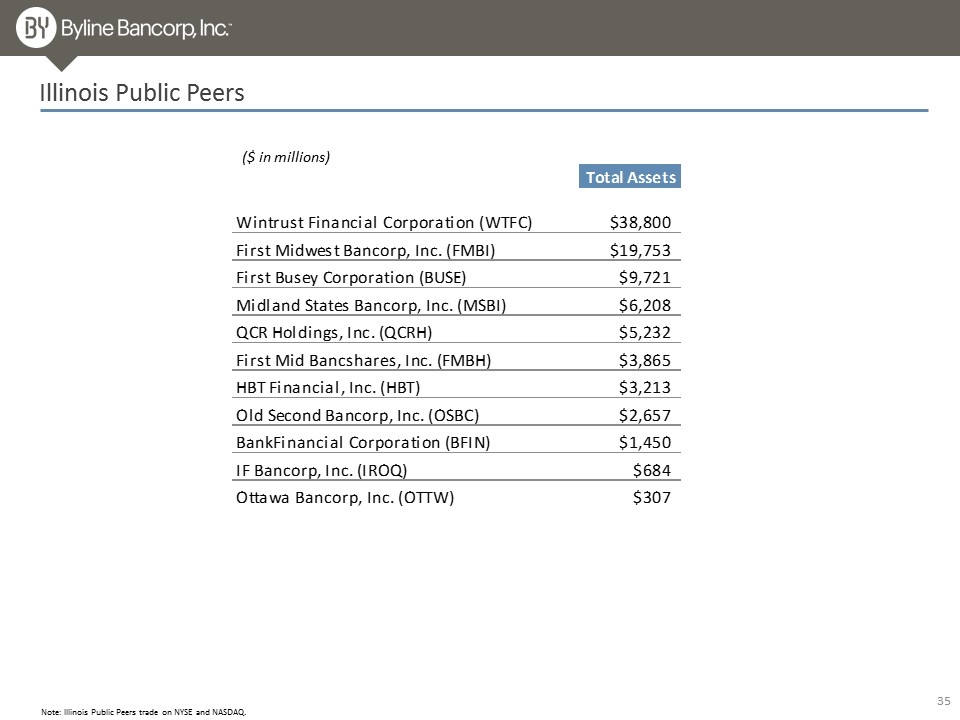
Illinois Public Peers Note: Illinois Public Peers trade on NYSE and NASDAQ. ($ in millions)


