
Investor Presentation September 2018 Exhibit 99.1
Forward Looking Statements & Non-GAAP Measures ADT has made statements in this presentation and other reports, filings, and other public written and verbal announcements that are forward-looking and therefore subject to risks and uncertainties. All statements, other than statements of historical fact, included in this document are, or could be, “forward-looking statements” within the meaning of the Private Securities Litigation Reform Act of 1995 and are made in reliance on the safe harbor protections provided thereunder. These forward-looking statements relate to anticipated financial performance, management’s plans and objectives for future operations, business prospects, outcome of regulatory proceedings, market conditions and other matters. Any forward-looking statement made in this presentation speaks only as of the date on which it is made. ADT undertakes no obligation to publicly update or revise any forward-looking statement, whether as a result of new information, future developments or otherwise. Forward-looking statements can be identified by various words such as “expects,” “intends,” “will,” “anticipates,” “believes,” “confident,” “continue,” “propose,” “seeks,” “could,” “may,” “should,” “estimates,” “forecasts,” “might,” “goals,” “objectives,” “targets,” “planned,” “projects,” and similar expressions. These forward-looking statements are based on management’s current beliefs and assumptions and on information currently available to management. ADT cautions that these statements are subject to risks and uncertainties, many of which are outside of ADT’s control, and could cause future events or results to be materially different from those stated or implied in this document, including among others, risk factors that are described in the Company’s Annual Report on Form 10-K and other filings with the Securities and Exchange Commission, including the sections entitled “Risk Factors” and “Management’s Discussion and Analysis of Financial Condition and Results of Operations” contained therein. Adjusted EBITDA, Adjusted EBITDA margin, Free Cash Flow, Free Cash Flow before special items, Unlevered Free Cash Flow before special items, Historical Combined Free Cash Flow, Unlevered Historical Combined Free Cash Flow before special items, and Supplemental Pro Forma Financial Information are non-GAAP financial measures. Reconciliations from GAAP to non-GAAP financial measures can be found in appendix. Amounts on subsequent pages may not add due to rounding. Forward Looking Statements Non-GAAP Measures
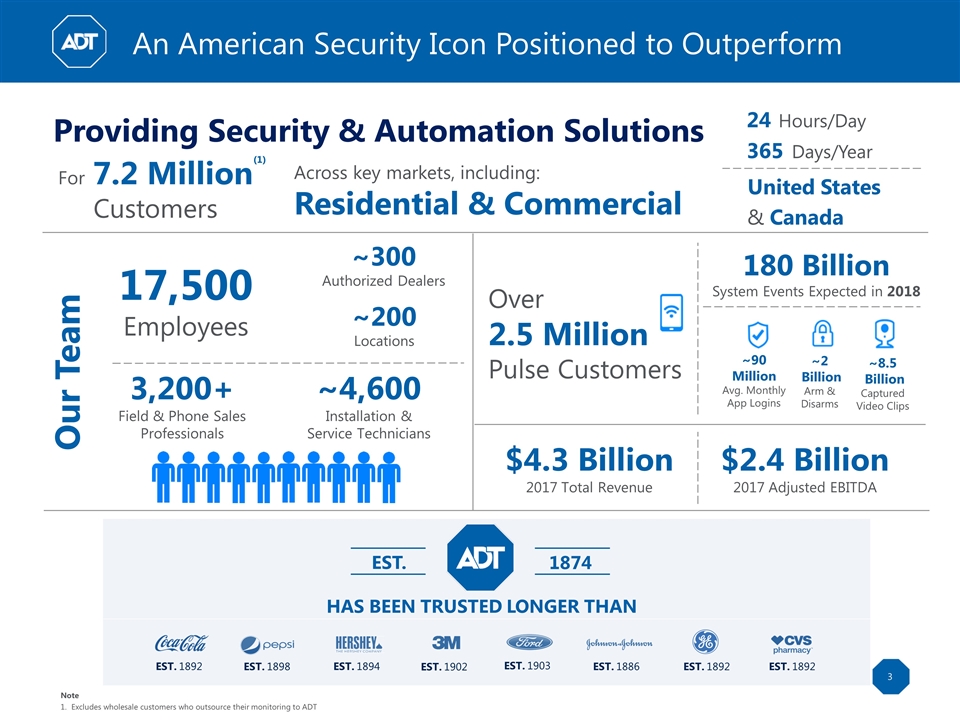
Over 2.5 Million Pulse Customers For 7.2 Million Customers An American Security Icon Positioned to Outperform HAS BEEN TRUSTED LONGER THAN EST. 1892 EST. 1898 EST. 1903 EST. 1894 EST. 1886 EST. 1902 EST. 1892 EST. 1892 180 Billion System Events Expected in 2018 3,200+ Field & Phone Sales Professionals ~300 Authorized Dealers ~4,600 Installation & Service Technicians Our Team ~200 Locations Providing Security & Automation Solutions 24 Hours/Day 365 Days/Year ~8.5 Billion Captured Video Clips United States 17,500 Employees ~90 Million Avg. Monthly App Logins ~2 Billion Arm & Disarms EST. 1874 Across key markets, including: Residential & Commercial & Canada $4.3 Billion 2017 Total Revenue $2.4 Billion 2017 Adjusted EBITDA (1) Note Excludes wholesale customers who outsource their monitoring to ADT
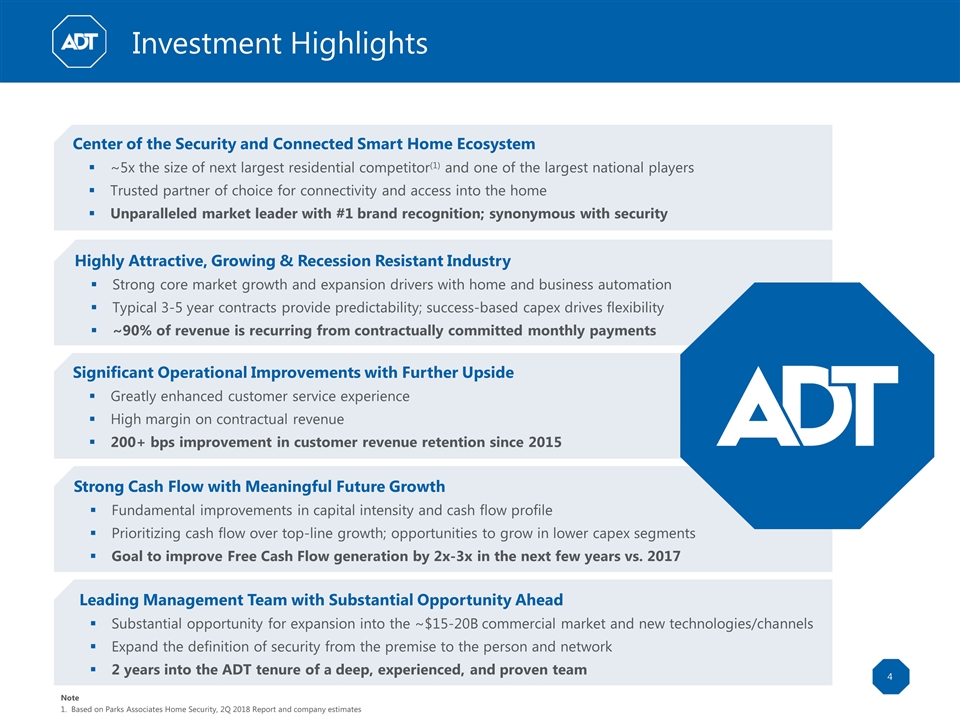
Investment Highlights Center of the Security and Connected Smart Home Ecosystem ~5x the size of next largest residential competitor(1) and one of the largest national players Trusted partner of choice for connectivity and access into the home Unparalleled market leader with #1 brand recognition; synonymous with security Significant Operational Improvements with Further Upside Greatly enhanced customer service experience High margin on contractual revenue 200+ bps improvement in customer revenue retention since 2015 Highly Attractive, Growing & Recession Resistant Industry Strong core market growth and expansion drivers with home and business automation Typical 3-5 year contracts provide predictability; success-based capex drives flexibility ~90% of revenue is recurring from contractually committed monthly payments Strong Cash Flow with Meaningful Future Growth Fundamental improvements in capital intensity and cash flow profile Prioritizing cash flow over top-line growth; opportunities to grow in lower capex segments Goal to improve Free Cash Flow generation by 2x-3x in the next few years vs. 2017 Leading Management Team with Substantial Opportunity Ahead Substantial opportunity for expansion into the ~$15-20B commercial market and new technologies/channels Expand the definition of security from the premise to the person and network 2 years into the ADT tenure of a deep, experienced, and proven team Note Based on Parks Associates Home Security, 2Q 2018 Report and company estimates
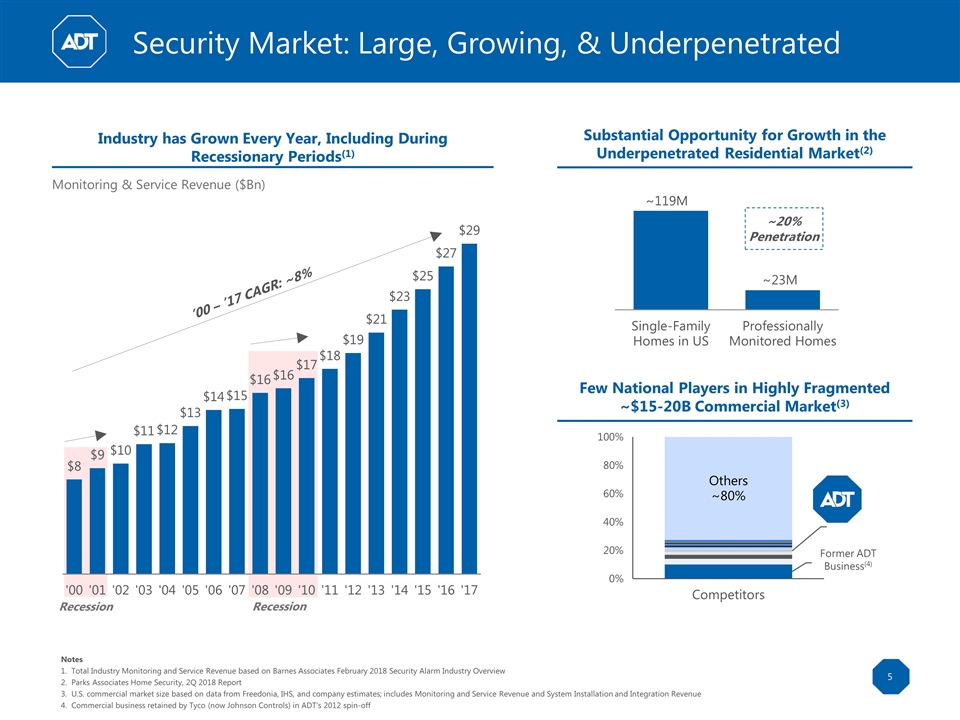
Substantial Opportunity for Growth in the Underpenetrated Residential Market(2) ~20% Penetration Notes Total Industry Monitoring and Service Revenue based on Barnes Associates February 2018 Security Alarm Industry Overview Parks Associates Home Security, 2Q 2018 Report U.S. commercial market size based on data from Freedonia, IHS, and company estimates; includes Monitoring and Service Revenue and System Installation and Integration Revenue Commercial business retained by Tyco (now Johnson Controls) in ADT’s 2012 spin-off Recession ’00 – ’17 CAGR: ~8% Recession Security Market: Large, Growing, & Underpenetrated Few National Players in Highly Fragmented ~$15-20B Commercial Market(3) Former ADT Business(4) Monitoring & Service Revenue ($Bn) Industry has Grown Every Year, Including During Recessionary Periods(1)
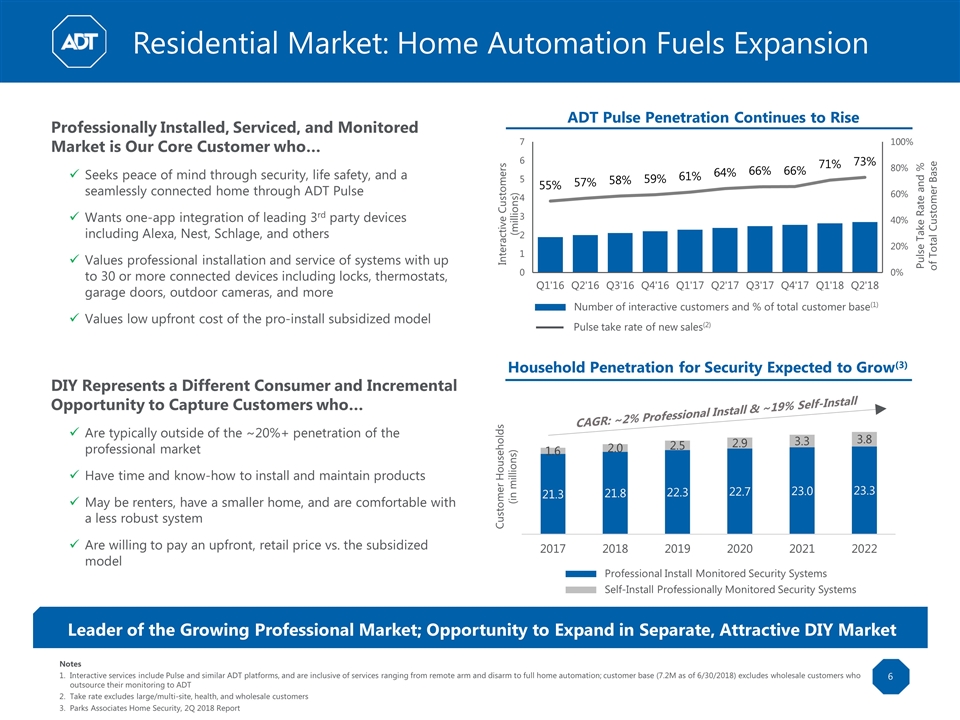
Professionally Installed, Serviced, and Monitored Market is Our Core Customer who… Seeks peace of mind through security, life safety, and a seamlessly connected home through ADT Pulse Wants one-app integration of leading 3rd party devices including Alexa, Nest, Schlage, and others Values professional installation and service of systems with up to 30 or more connected devices including locks, thermostats, garage doors, outdoor cameras, and more Values low upfront cost of the pro-install subsidized model DIY Represents a Different Consumer and Incremental Opportunity to Capture Customers who… Are typically outside of the ~20%+ penetration of the professional market Have time and know-how to install and maintain products May be renters, have a smaller home, and are comfortable with a less robust system Are willing to pay an upfront, retail price vs. the subsidized model ADT Pulse Penetration Continues to Rise Number of interactive customers and % of total customer base(1) Pulse take rate of new sales(2) Notes Interactive services include Pulse and similar ADT platforms, and are inclusive of services ranging from remote arm and disarm to full home automation; customer base (7.2M as of 6/30/2018) excludes wholesale customers who outsource their monitoring to ADT Take rate excludes large/multi-site, health, and wholesale customers Parks Associates Home Security, 2Q 2018 Report Customer Households (in millions) Household Penetration for Security Expected to Grow(3) Professional Install Monitored Security Systems Self-Install Professionally Monitored Security Systems Leader of the Growing Professional Market; Opportunity to Expand in Separate, Attractive DIY Market Residential Market: Home Automation Fuels Expansion CAGR: ~2% Professional Install & ~19% Self-Install Pulse Take Rate and % of Total Customer Base
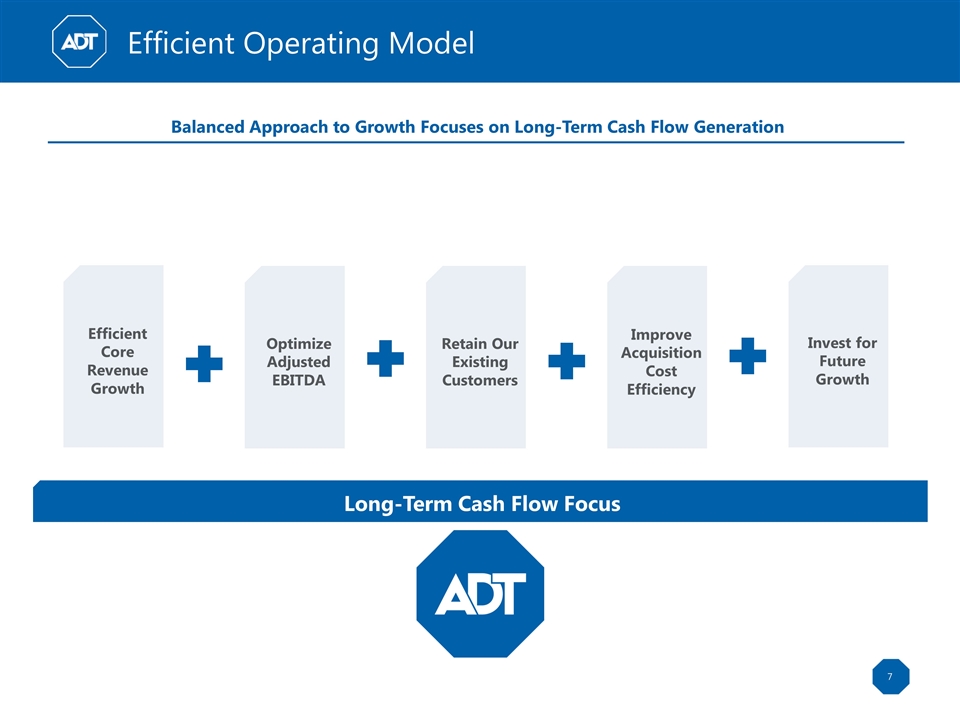
Long-Term Cash Flow Focus Retain Our Existing Customers Optimize Adjusted EBITDA Improve Acquisition Cost Efficiency Efficient Core Revenue Growth Invest for Future Growth Efficient Operating Model Balanced Approach to Growth Focuses on Long-Term Cash Flow Generation
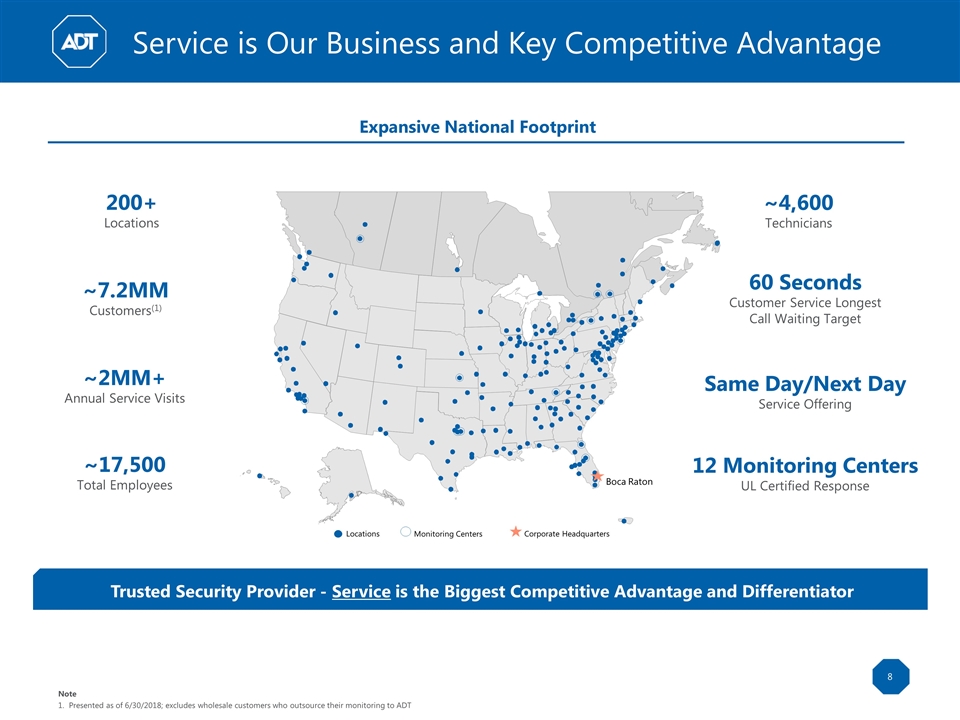
Service is Our Business and Key Competitive Advantage Trusted Security Provider - Service is the Biggest Competitive Advantage and Differentiator Expansive National Footprint Distribution Center National Account Center Boca Raton Disaster Recovery Center Locations Monitoring Centers Corporate Headquarters 200+ Locations ~7.2MM Customers(1) ~2MM+ Annual Service Visits ~17,500 Total Employees ~4,600 Technicians Same Day/Next Day Service Offering 60 Seconds Customer Service Longest Call Waiting Target 12 Monitoring Centers UL Certified Response Note Presented as of 6/30/2018; excludes wholesale customers who outsource their monitoring to ADT
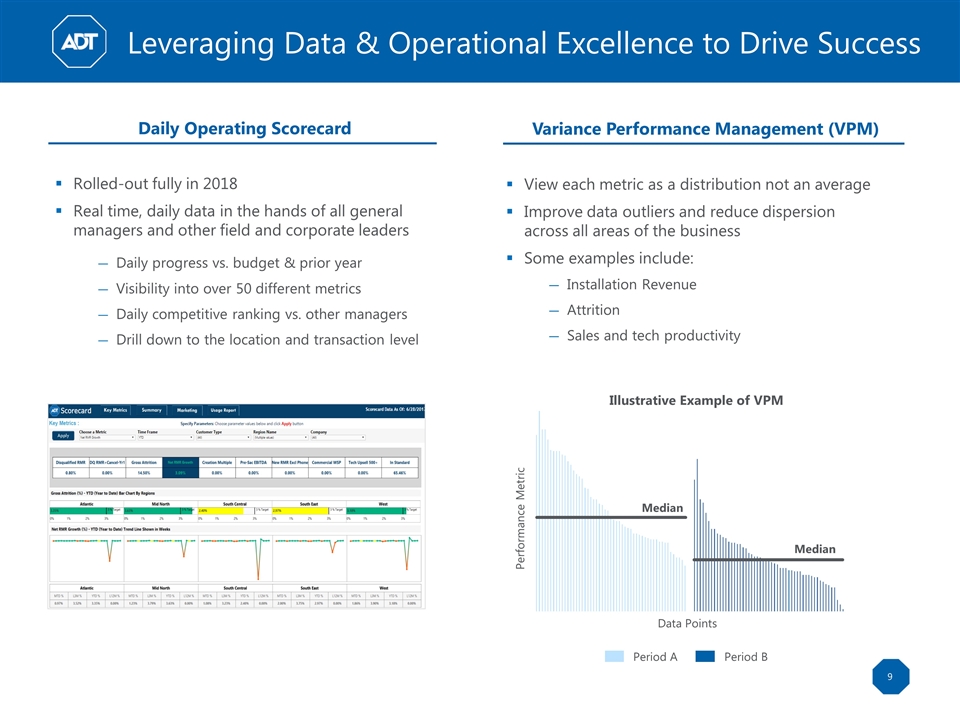
Daily Operating Scorecard Rolled-out fully in 2018 Real time, daily data in the hands of all general managers and other field and corporate leaders Daily progress vs. budget & prior year Visibility into over 50 different metrics Daily competitive ranking vs. other managers Drill down to the location and transaction level Performance Metric Period B Period A Median Median Variance Performance Management (VPM) View each metric as a distribution not an average Improve data outliers and reduce dispersion across all areas of the business Some examples include: Installation Revenue Attrition Sales and tech productivity Leveraging Data & Operational Excellence to Drive Success Illustrative Example of VPM Data Points
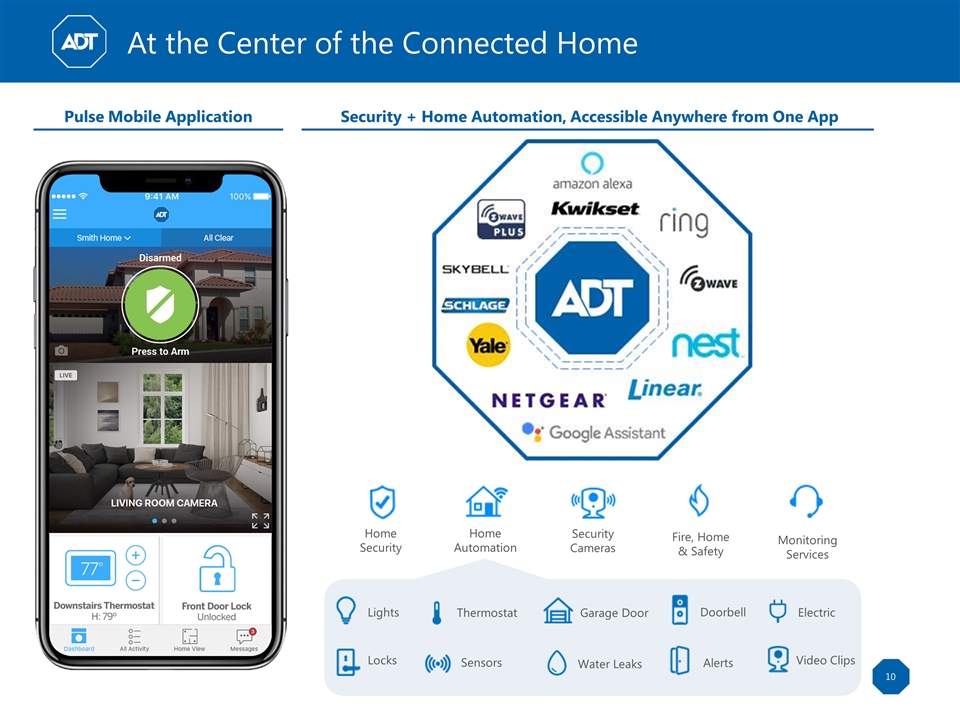
Pulse Mobile Application Security + Home Automation, Accessible Anywhere from One App Home Security Home Automation Security Cameras Fire, Home & Safety Monitoring Services Lights Thermostat Garage Door Doorbell Electric Locks Sensors Water Leaks Alerts Video Clips At the Center of the Connected Home
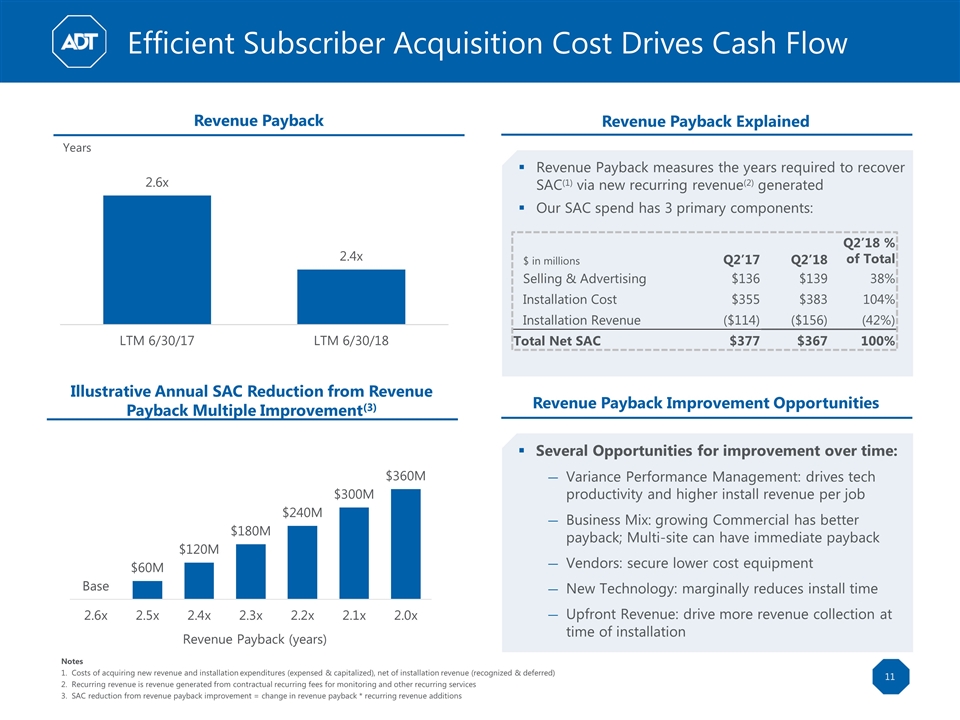
Illustrative Annual SAC Reduction from Revenue Payback Multiple Improvement(3) Revenue Payback (years) Notes Costs of acquiring new revenue and installation expenditures (expensed & capitalized), net of installation revenue (recognized & deferred) Recurring revenue is revenue generated from contractual recurring fees for monitoring and other recurring services SAC reduction from revenue payback improvement = change in revenue payback * recurring revenue additions Efficient Subscriber Acquisition Cost Drives Cash Flow Revenue Payback measures the years required to recover SAC(1) via new recurring revenue(2) generated Our SAC spend has 3 primary components: $ in millions Q2’17 Q2’18 Q2’18 % of Total Selling & Advertising $136 $139 38% Installation Cost $355 $383 104% Installation Revenue ($114) ($156) (42%) Total Net SAC $377 $367 100% Revenue Payback Explained Revenue Payback Improvement Opportunities Revenue Payback Several Opportunities for improvement over time: Variance Performance Management: drives tech productivity and higher install revenue per job Business Mix: growing Commercial has better payback; Multi-site can have immediate payback Vendors: secure lower cost equipment New Technology: marginally reduces install time Upfront Revenue: drive more revenue collection at time of installation Years
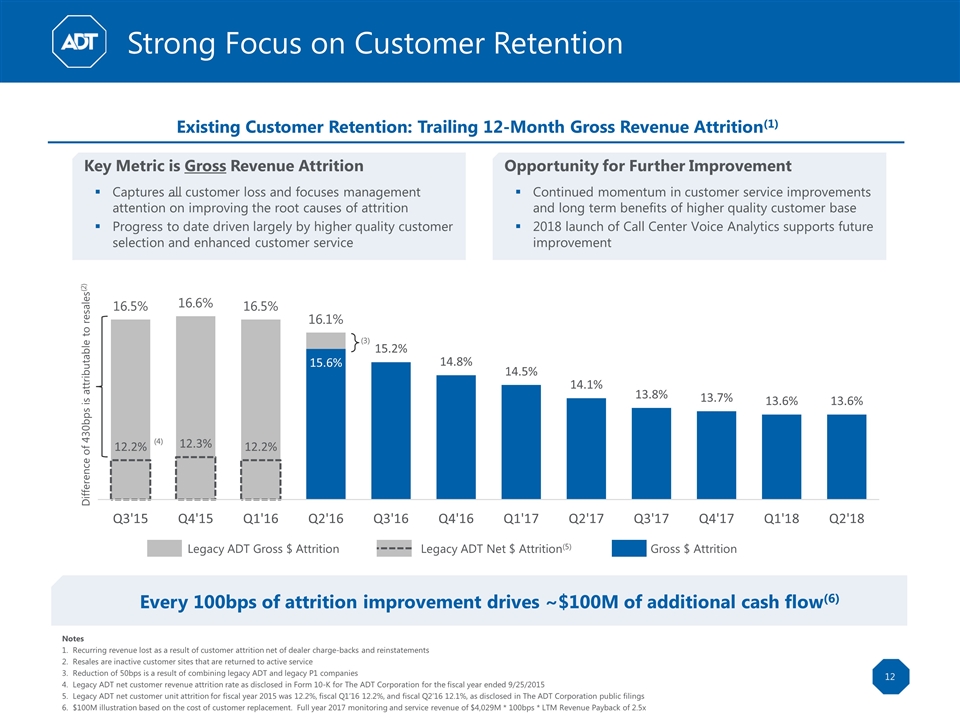
Notes Recurring revenue lost as a result of customer attrition net of dealer charge-backs and reinstatements Resales are inactive customer sites that are returned to active service Reduction of 50bps is a result of combining legacy ADT and legacy P1 companies Legacy ADT net customer revenue attrition rate as disclosed in Form 10-K for The ADT Corporation for the fiscal year ended 9/25/2015 Legacy ADT net customer unit attrition for fiscal year 2015 was 12.2%, fiscal Q1’16 12.2%, and fiscal Q2’16 12.1%, as disclosed in The ADT Corporation public filings $100M illustration based on the cost of customer replacement. Full year 2017 monitoring and service revenue of $4,029M * 100bps * LTM Revenue Payback of 2.5x Key Metric is Gross Revenue Attrition Captures all customer loss and focuses management attention on improving the root causes of attrition Progress to date driven largely by higher quality customer selection and enhanced customer service Opportunity for Further Improvement Continued momentum in customer service improvements and long term benefits of higher quality customer base 2018 launch of Call Center Voice Analytics supports future improvement Gross $ Attrition Legacy ADT Net $ Attrition(5) Legacy ADT Gross $ Attrition Every 100bps of attrition improvement drives ~$100M of additional cash flow(6) Strong Focus on Customer Retention (3) (4) Difference of 430bps is attributable to resales(2) Existing Customer Retention: Trailing 12-Month Gross Revenue Attrition(1)
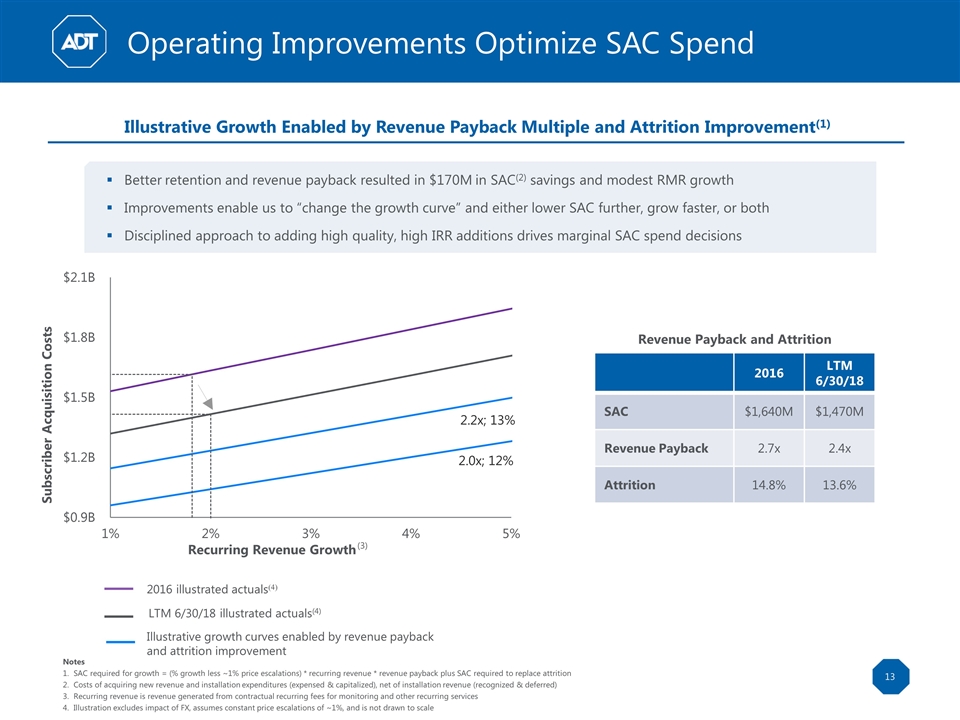
Notes SAC required for growth = (% growth less ~1% price escalations) * recurring revenue * revenue payback plus SAC required to replace attrition Costs of acquiring new revenue and installation expenditures (expensed & capitalized), net of installation revenue (recognized & deferred) Recurring revenue is revenue generated from contractual recurring fees for monitoring and other recurring services Illustration excludes impact of FX, assumes constant price escalations of ~1%, and is not drawn to scale Better retention and revenue payback resulted in $170M in SAC(2) savings and modest RMR growth Improvements enable us to “change the growth curve” and either lower SAC further, grow faster, or both Disciplined approach to adding high quality, high IRR additions drives marginal SAC spend decisions Recurring Revenue Growth Subscriber Acquisition Costs 2016 illustrated actuals(4) Illustrative growth curves enabled by revenue payback and attrition improvement Revenue Payback and Attrition 2.2x; 13% 2.0x; 12% 2016 LTM 6/30/18 SAC $1,640M $1,470M Revenue Payback 2.7x 2.4x Attrition 14.8% 13.6% Operating Improvements Optimize SAC Spend Illustrative Growth Enabled by Revenue Payback Multiple and Attrition Improvement(1) LTM 6/30/18 illustrated actuals(4) (3)
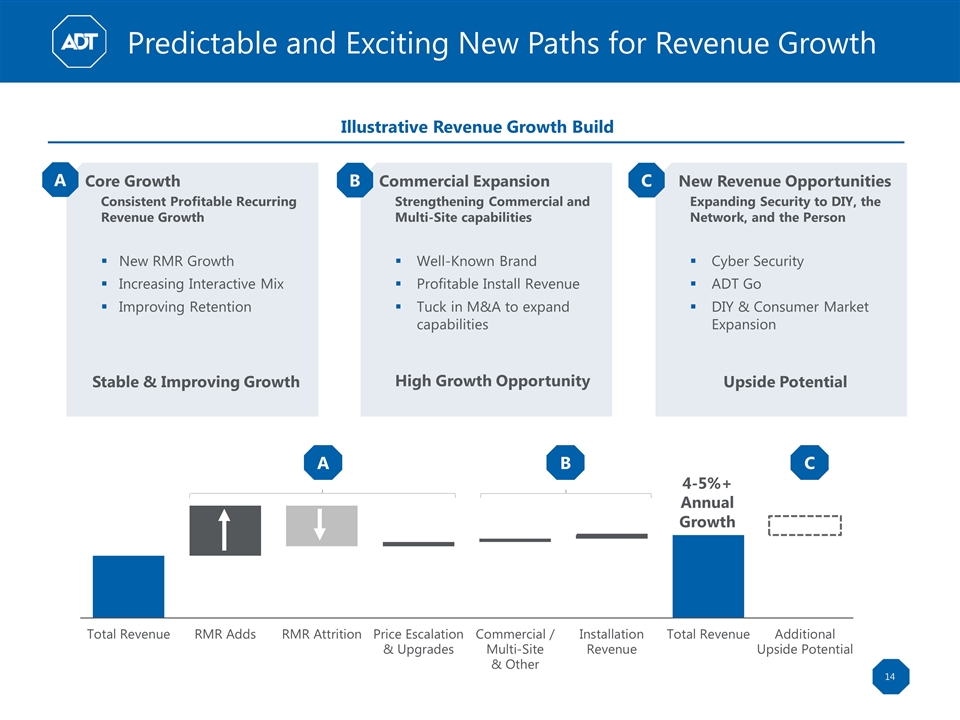
A B C Core Growth Consistent Profitable Recurring Revenue Growth New RMR Growth Increasing Interactive Mix Improving Retention Stable & Improving Growth A Commercial Expansion Strengthening Commercial and Multi-Site capabilities Well-Known Brand Profitable Install Revenue Tuck in M&A to expand capabilities High Growth Opportunity B New Revenue Opportunities Expanding Security to DIY, the Network, and the Person Cyber Security ADT Go DIY & Consumer Market Expansion Upside Potential C 4-5%+ Annual Growth Predictable and Exciting New Paths for Revenue Growth Illustrative Revenue Growth Build
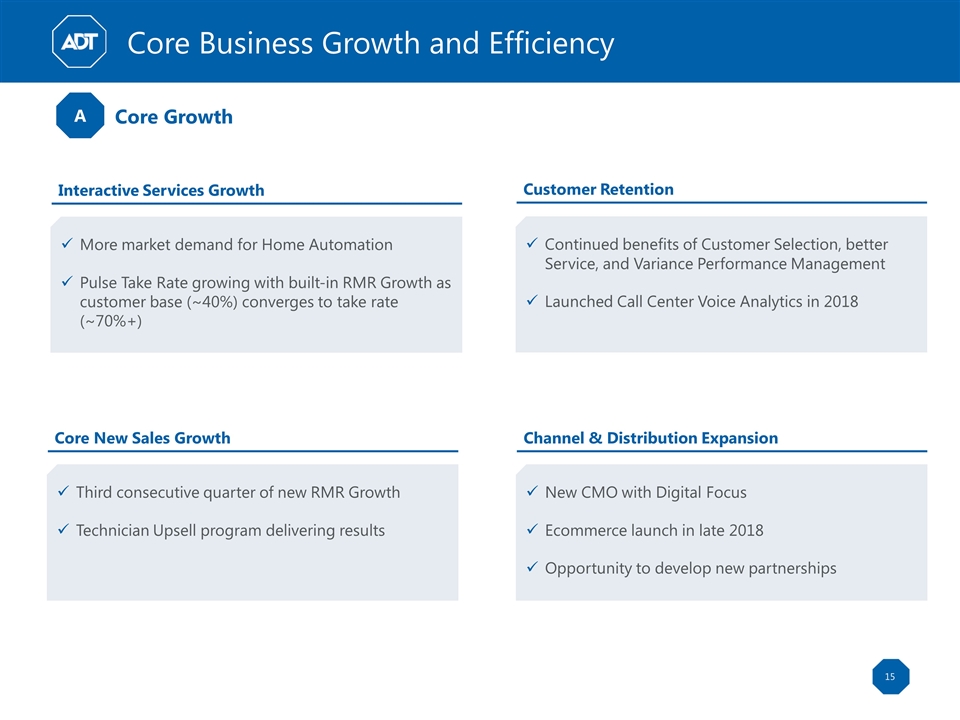
A Interactive Services Growth More market demand for Home Automation Pulse Take Rate growing with built-in RMR Growth as customer base (~40%) converges to take rate (~70%+) Customer Retention Continued benefits of Customer Selection, better Service, and Variance Performance Management Launched Call Center Voice Analytics in 2018 Core New Sales Growth Third consecutive quarter of new RMR Growth Technician Upsell program delivering results Channel & Distribution Expansion New CMO with Digital Focus Ecommerce launch in late 2018 Opportunity to develop new partnerships Core Growth Core Business Growth and Efficiency
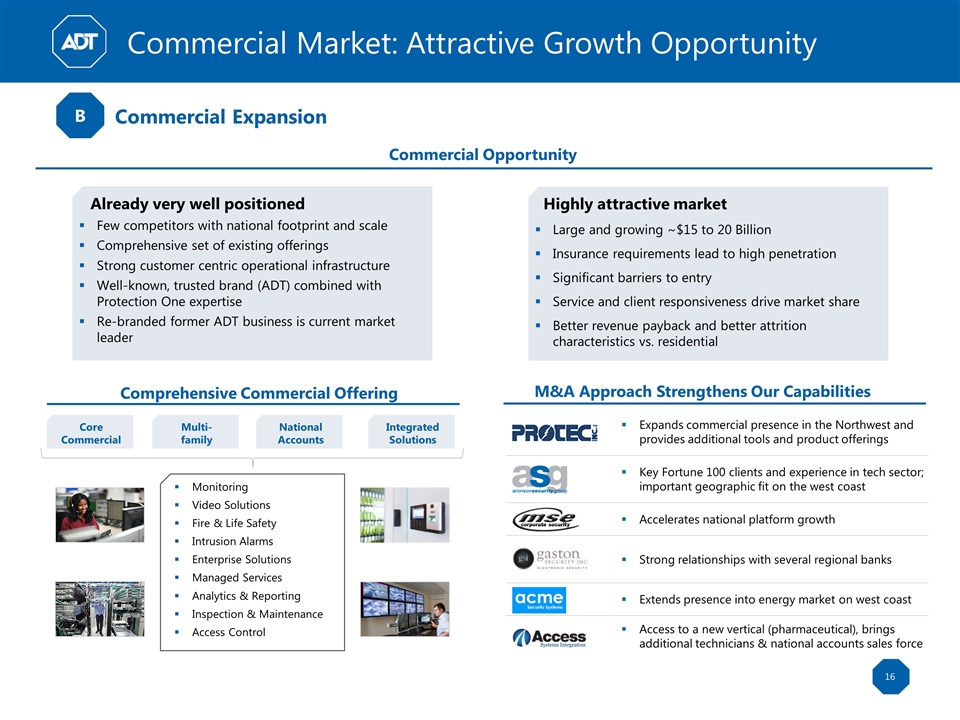
Commercial Market: Attractive Growth Opportunity Comprehensive Commercial Offering Core Commercial Multi- family National Accounts Integrated Solutions Monitoring Video Solutions Fire & Life Safety Intrusion Alarms Enterprise Solutions Managed Services Analytics & Reporting Inspection & Maintenance Access Control Commercial Opportunity Already very well positioned Few competitors with national footprint and scale Comprehensive set of existing offerings Strong customer centric operational infrastructure Well-known, trusted brand (ADT) combined with Protection One expertise Re-branded former ADT business is current market leader Highly attractive market Large and growing ~$15 to 20 Billion Insurance requirements lead to high penetration Significant barriers to entry Service and client responsiveness drive market share Better revenue payback and better attrition characteristics vs. residential M&A Approach Strengthens Our Capabilities Strong relationships with several regional banks Extends presence into energy market on west coast Access to a new vertical (pharmaceutical), brings additional technicians & national accounts sales force Key Fortune 100 clients and experience in tech sector; important geographic fit on the west coast Accelerates national platform growth Expands commercial presence in the Northwest and provides additional tools and product offerings B Commercial Expansion
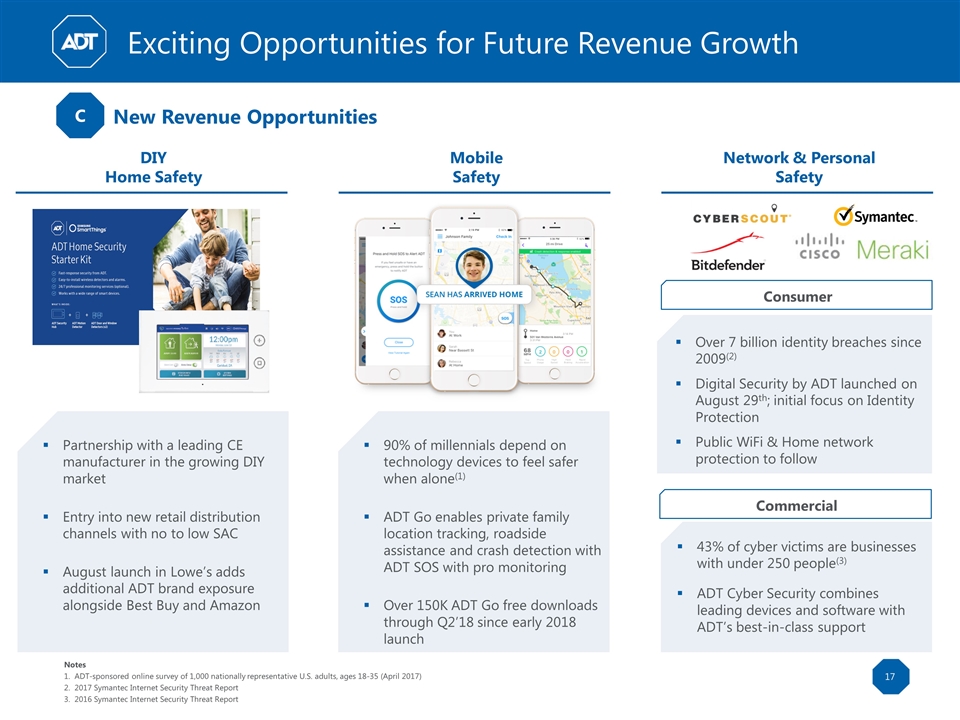
C New Revenue Opportunities Notes ADT-sponsored online survey of 1,000 nationally representative U.S. adults, ages 18-35 (April 2017) 2017 Symantec Internet Security Threat Report 2016 Symantec Internet Security Threat Report Exciting Opportunities for Future Revenue Growth DIY Home Safety Partnership with a leading CE manufacturer in the growing DIY market Entry into new retail distribution channels with no to low SAC August launch in Lowe’s adds additional ADT brand exposure alongside Best Buy and Amazon 90% of millennials depend on technology devices to feel safer when alone(1) ADT Go enables private family location tracking, roadside assistance and crash detection with ADT SOS with pro monitoring Over 150K ADT Go free downloads through Q2’18 since early 2018 launch Mobile Safety Network & Personal Safety 43% of cyber victims are businesses with under 250 people(3) ADT Cyber Security combines leading devices and software with ADT’s best-in-class support Consumer Commercial Over 7 billion identity breaches since 2009(2) Digital Security by ADT launched on August 29th; initial focus on Identity Protection Public WiFi & Home network protection to follow
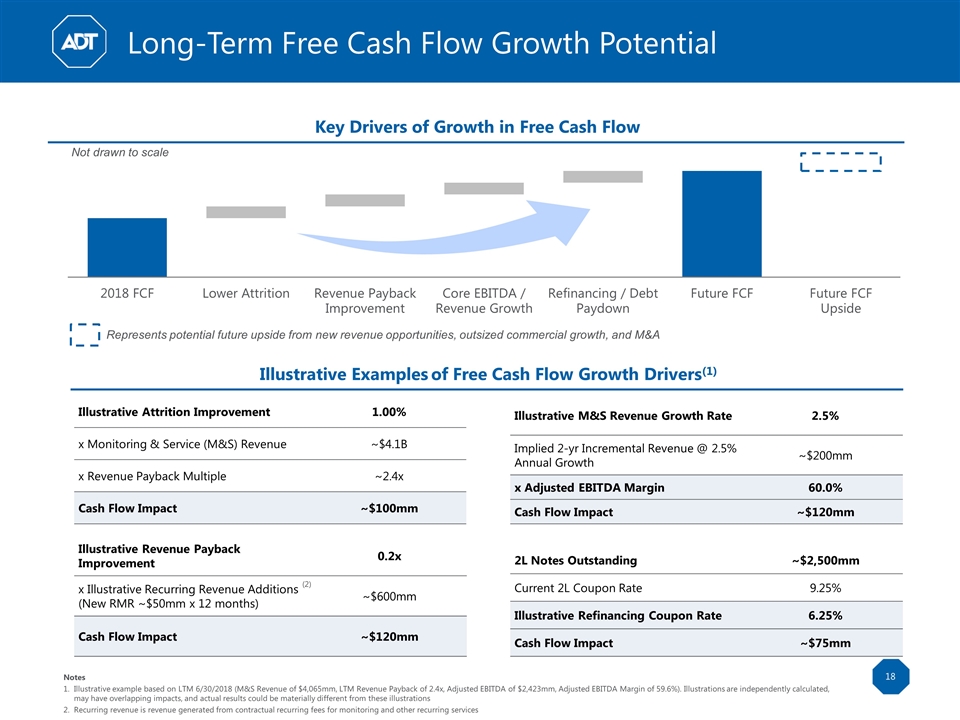
Not drawn to scale Illustrative Revenue Payback Improvement 0.2x x Illustrative Recurring Revenue Additions (New RMR ~$50mm x 12 months) ~$600mm Cash Flow Impact ~$120mm Illustrative M&S Revenue Growth Rate 2.5% Implied 2-yr Incremental Revenue @ 2.5% Annual Growth ~$200mm x Adjusted EBITDA Margin 60.0% Cash Flow Impact ~$120mm Illustrative Attrition Improvement 1.00% x Monitoring & Service (M&S) Revenue ~$4.1B x Revenue Payback Multiple ~2.4x Cash Flow Impact ~$100mm 2L Notes Outstanding ~$2,500mm Current 2L Coupon Rate 9.25% Illustrative Refinancing Coupon Rate 6.25% Cash Flow Impact ~$75mm Illustrative Examples of Free Cash Flow Growth Drivers(1) Long-Term Free Cash Flow Growth Potential Represents potential future upside from new revenue opportunities, outsized commercial growth, and M&A Key Drivers of Growth in Free Cash Flow (2) Notes Illustrative example based on LTM 6/30/2018 (M&S Revenue of $4,065mm, LTM Revenue Payback of 2.4x, Adjusted EBITDA of $2,423mm, Adjusted EBITDA Margin of 59.6%). Illustrations are independently calculated, may have overlapping impacts, and actual results could be materially different from these illustrations Recurring revenue is revenue generated from contractual recurring fees for monitoring and other recurring services
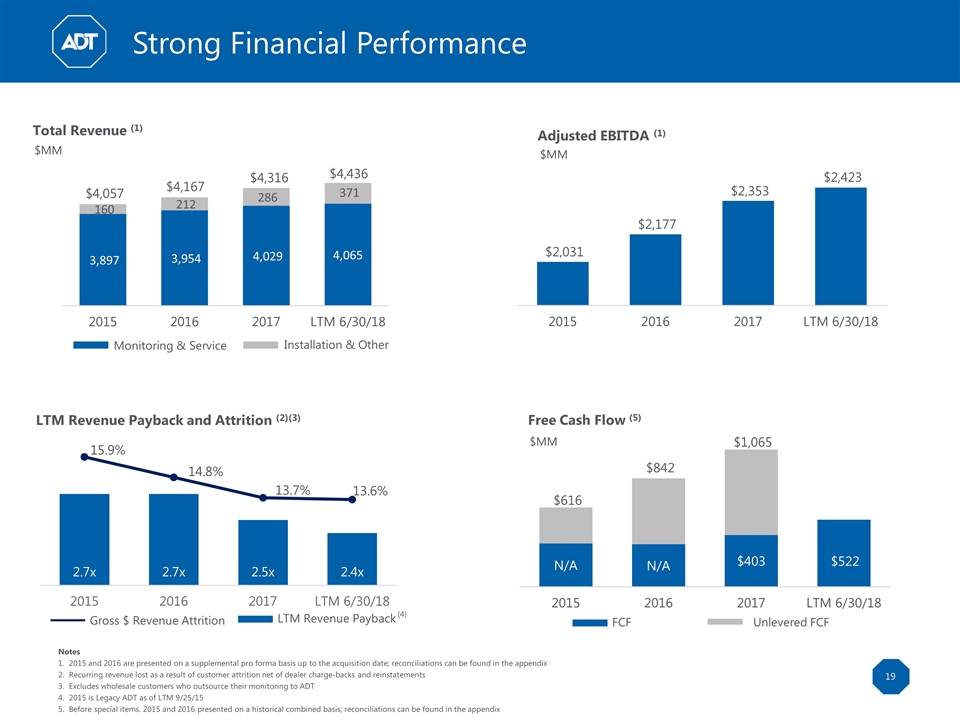
Notes 2015 and 2016 are presented on a supplemental pro forma basis up to the acquisition date; reconciliations can be found in the appendix Recurring revenue lost as a result of customer attrition net of dealer charge-backs and reinstatements Excludes wholesale customers who outsource their monitoring to ADT 2015 is Legacy ADT as of LTM 9/25/15 Before special items. 2015 and 2016 presented on a historical combined basis; reconciliations can be found in the appendix Total Revenue (1) $MM LTM Revenue Payback and Attrition (2)(3) Adjusted EBITDA (1) $MM Free Cash Flow (5) $MM Unlevered FCF FCF Installation & Other Monitoring & Service $4,057 $4,167 $4,316 $4,436 Strong Financial Performance LTM Revenue Payback Gross $ Revenue Attrition (4)
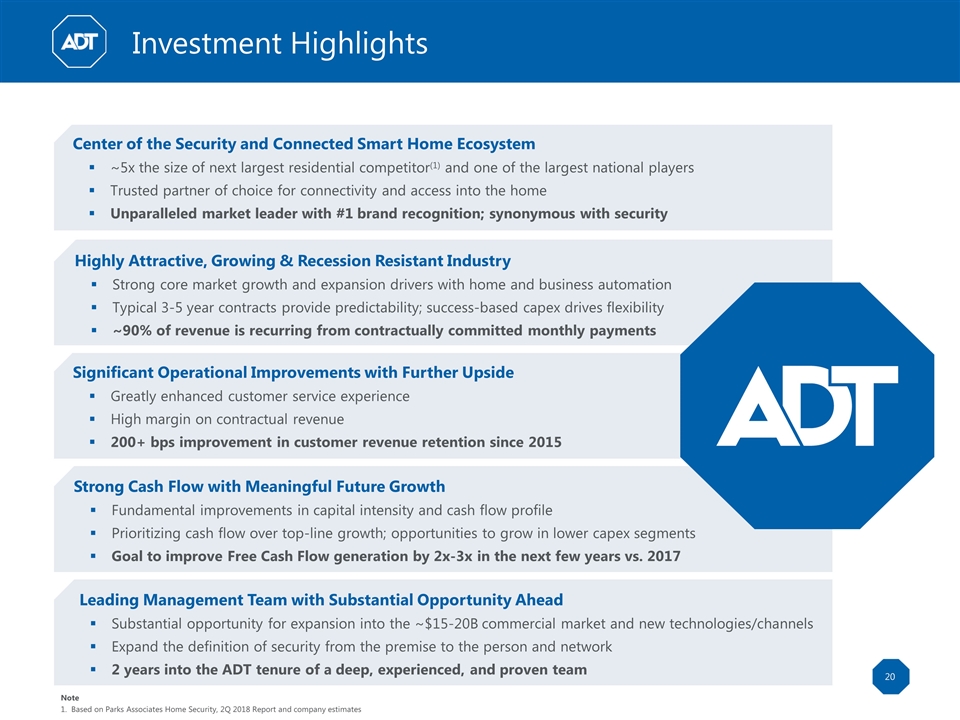
Investment Highlights Center of the Security and Connected Smart Home Ecosystem ~5x the size of next largest residential competitor(1) and one of the largest national players Trusted partner of choice for connectivity and access into the home Unparalleled market leader with #1 brand recognition; synonymous with security Significant Operational Improvements with Further Upside Greatly enhanced customer service experience High margin on contractual revenue 200+ bps improvement in customer revenue retention since 2015 Highly Attractive, Growing & Recession Resistant Industry Strong core market growth and expansion drivers with home and business automation Typical 3-5 year contracts provide predictability; success-based capex drives flexibility ~90% of revenue is recurring from contractually committed monthly payments Strong Cash Flow with Meaningful Future Growth Fundamental improvements in capital intensity and cash flow profile Prioritizing cash flow over top-line growth; opportunities to grow in lower capex segments Goal to improve Free Cash Flow generation by 2x-3x in the next few years vs. 2017 Leading Management Team with Substantial Opportunity Ahead Substantial opportunity for expansion into the ~$15-20B commercial market and new technologies/channels Expand the definition of security from the premise to the person and network 2 years into the ADT tenure of a deep, experienced, and proven team Note Based on Parks Associates Home Security, 2Q 2018 Report and company estimates

Appendix: GAAP to Non-GAAP Reconciliations
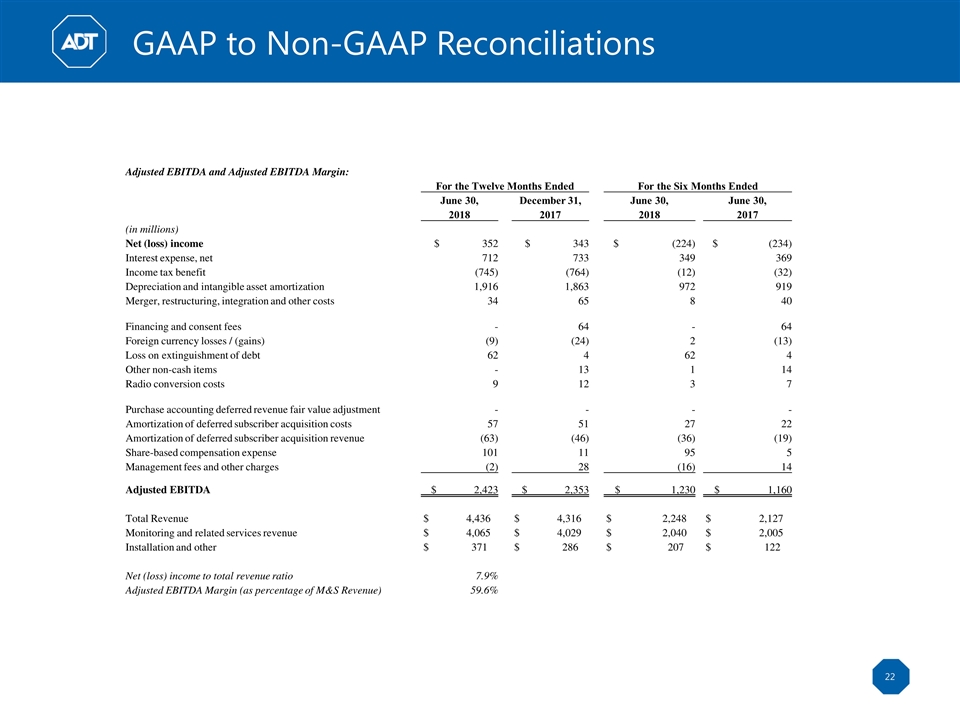
GAAP to Non-GAAP Reconciliations Adjusted EBITDA and Adjusted EBITDA Margin: For the Twelve Months Ended For the Six Months Ended June 30, December 31, June 30, June 30, 2018 2017 2018 2017 (in millions) Net (loss) income $ 352 $ 343 $ (224) $ (234) Interest expense, net 712 733 349 369 Income tax benefit (745) (764) (12) (32) Depreciation and intangible asset amortization 1,916 1,863 972 919 Merger, restructuring, integration and other costs 34 65 8 40 Financing and consent fees - 64 - 64 Foreign currency losses / (gains) (9) (24) 2 (13) Loss on extinguishment of debt 62 4 62 4 Other non-cash items - 13 1 14 Radio conversion costs 9 12 3 7 Purchase accounting deferred revenue fair value adjustment - - - - Amortization of deferred subscriber acquisition costs 57 51 27 22 Amortization of deferred subscriber acquisition revenue (63) (46) (36) (19) Share-based compensation expense 101 11 95 5 Management fees and other charges (2) 28 (16) 14 Adjusted EBITDA $ 2,423 $ 2,353 $ 1,230 $ 1,160 Total Revenue $ 4,436 $ 4,316 $ 2,248 $ 2,127 Monitoring and related services revenue $ 4,065 $ 4,029 $ 2,040 $ 2,005 Installation and other $ 371 $ 286 $ 207 $ 122 Net (loss) income to total revenue ratio 7.9% Adjusted EBITDA Margin (as percentage of M&S Revenue) 59.6%
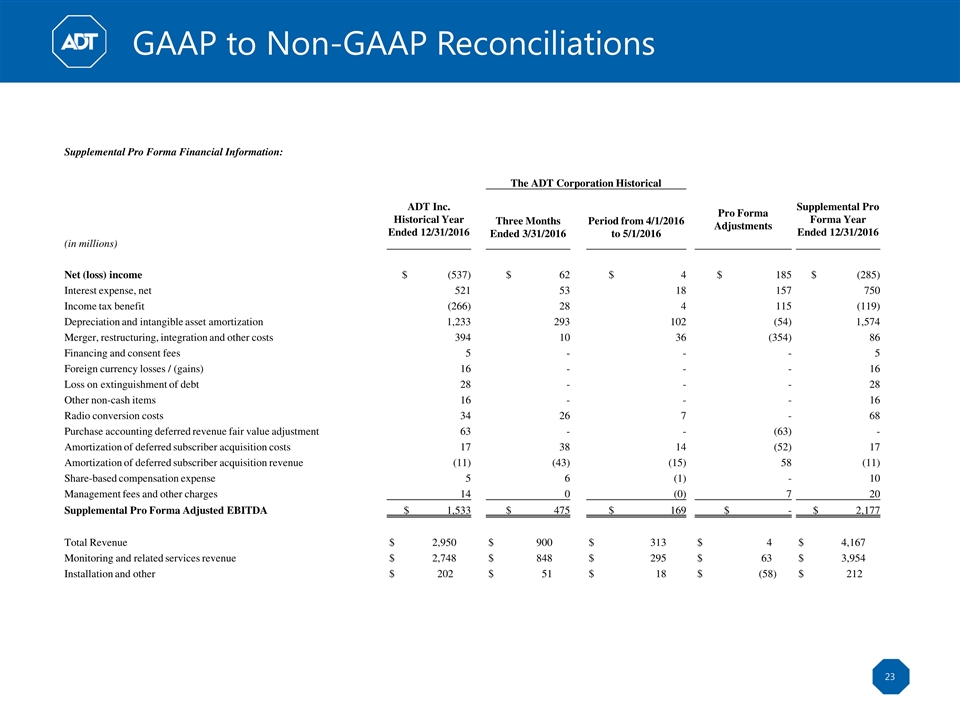
GAAP to Non-GAAP Reconciliations Supplemental Pro Forma Financial Information: The ADT Corporation Historical ADT Inc. Historical Year Ended 12/31/2016 Pro Forma Adjustments Supplemental Pro Forma Year Ended 12/31/2016 Three Months Ended 3/31/2016 Period from 4/1/2016 to 5/1/2016 (in millions) Net (loss) income $ (537) $ 62 $ 4 $ 185 $ (285) Interest expense, net 521 53 18 157 750 Income tax benefit (266) 28 4 115 (119) Depreciation and intangible asset amortization 1,233 293 102 (54) 1,574 Merger, restructuring, integration and other costs 394 10 36 (354) 86 Financing and consent fees 5 - - - 5 Foreign currency losses / (gains) 16 - - - 16 Loss on extinguishment of debt 28 - - - 28 Other non-cash items 16 - - - 16 Radio conversion costs 34 26 7 - 68 Purchase accounting deferred revenue fair value adjustment 63 - - (63) - Amortization of deferred subscriber acquisition costs 17 38 14 (52) 17 Amortization of deferred subscriber acquisition revenue (11) (43) (15) 58 (11) Share-based compensation expense 5 6 (1) - 10 Management fees and other charges 14 0 (0) 7 20 Supplemental Pro Forma Adjusted EBITDA $ 1,533 $ 475 $ 169 $ - $ 2,177 Total Revenue $ 2,950 $ 900 $ 313 $ 4 $ 4,167 Monitoring and related services revenue $ 2,748 $ 848 $ 295 $ 63 $ 3,954 Installation and other $ 202 $ 51 $ 18 $ (58) $ 212
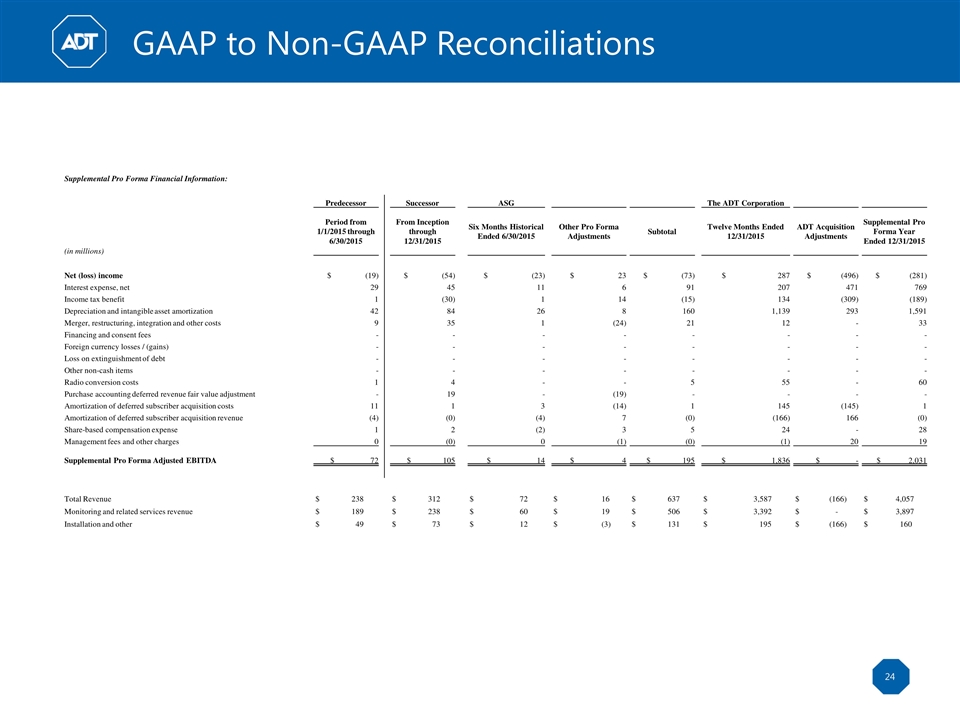
GAAP to Non-GAAP Reconciliations Supplemental Pro Forma Financial Information: Predecessor Successor ASG The ADT Corporation (in millions) Period from 1/1/2015 through 6/30/2015 From Inception through 12/31/2015 Six Months Historical Ended 6/30/2015 Other Pro Forma Adjustments Subtotal Twelve Months Ended 12/31/2015 ADT Acquisition Adjustments Supplemental Pro Forma Year Ended 12/31/2015 Net (loss) income $ (19) $ (54) $ (23) $ 23 $ (73) $ 287 $ (496) $ (281) Interest expense, net 29 45 11 6 91 207 471 769 Income tax benefit 1 (30) 1 14 (15) 134 (309) (189) Depreciation and intangible asset amortization 42 84 26 8 160 1,139 293 1,591 Merger, restructuring, integration and other costs 9 35 1 (24) 21 12 - 33 Financing and consent fees - - - - - - - - Foreign currency losses / (gains) - - - - - - - - Loss on extinguishment of debt - - - - - - - - Other non-cash items - - - - - - - - Radio conversion costs 1 4 - - 5 55 - 60 Purchase accounting deferred revenue fair value adjustment - 19 - (19) - - - - Amortization of deferred subscriber acquisition costs 11 1 3 (14) 1 145 (145) 1 Amortization of deferred subscriber acquisition revenue (4) (0) (4) 7 (0) (166) 166 (0) Share-based compensation expense 1 2 (2) 3 5 24 - 28 Management fees and other charges 0 (0) 0 (1) (0) (1) 20 19 Supplemental Pro Forma Adjusted EBITDA $ 72 $ 105 $ 14 $ 4 $ 195 $ 1,836 $ - $ 2,031 Total Revenue $ 238 $ 312 $ 72 $ 16 $ 637 $ 3,587 $ (166) $ 4,057 Monitoring and related services revenue $ 189 $ 238 $ 60 $ 19 $ 506 $ 3,392 $ - $ 3,897 Installation and other $ 49 $ 73 $ 12 $ (3) $ 131 $ 195 $ (166) $ 160
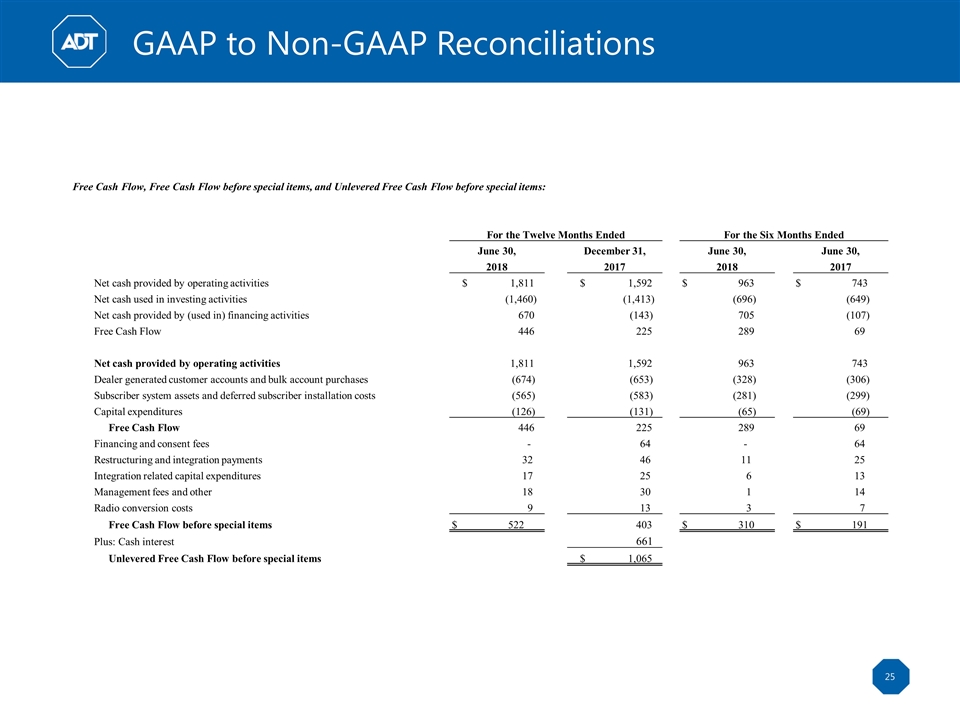
GAAP to Non-GAAP Reconciliations Free Cash Flow, Free Cash Flow before special items, and Unlevered Free Cash Flow before special items: For the Twelve Months Ended For the Six Months Ended June 30, December 31, June 30, June 30, 2018 2017 2018 2017 Net cash provided by operating activities $ 1,811 $ 1,592 $ 963 $ 743 Net cash used in investing activities (1,460) (1,413) (696) (649) Net cash provided by (used in) financing activities 670 (143) 705 (107) Free Cash Flow 446 225 289 69 Net cash provided by operating activities 1,811 1,592 963 743 Dealer generated customer accounts and bulk account purchases (674) (653) (328) (306) Subscriber system assets and deferred subscriber installation costs (565) (583) (281) (299) Capital expenditures (126) (131) (65) (69) Free Cash Flow 446 225 289 69 Financing and consent fees - 64 - 64 Restructuring and integration payments 32 46 11 25 Integration related capital expenditures 17 25 6 13 Management fees and other 18 30 1 14 Radio conversion costs 9 13 3 7 Free Cash Flow before special items $ 522 403 $ 310 $ 191 Plus: Cash interest 661 Unlevered Free Cash Flow before special items $ 1,065
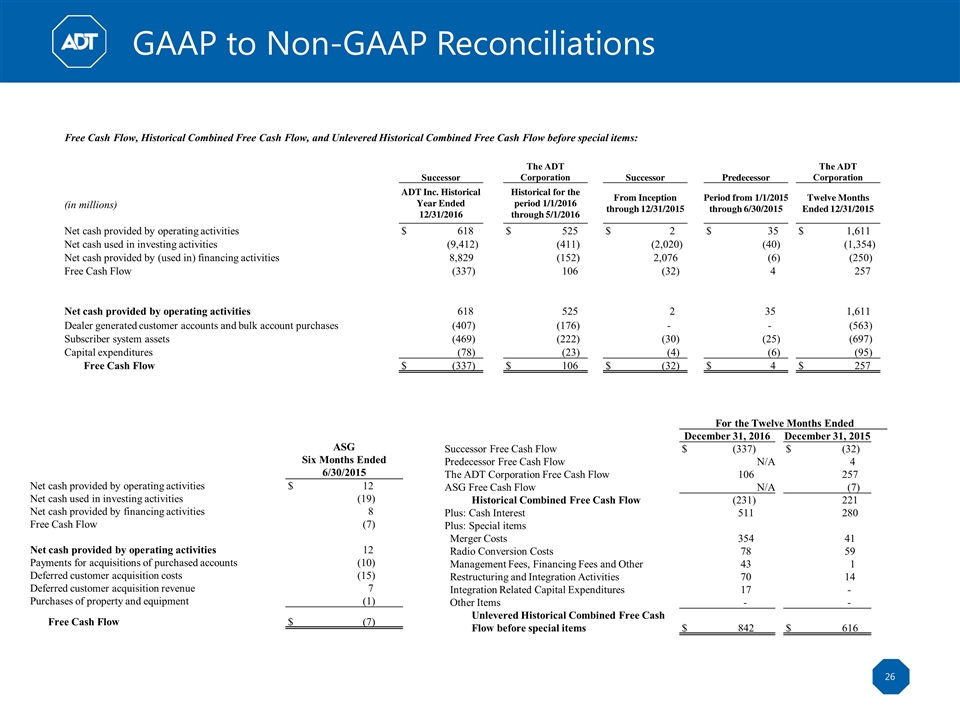
GAAP to Non-GAAP Reconciliations For the Twelve Months Ended December 31, 2016 December 31, 2015 Successor Free Cash Flow $ (337) $ (32) Predecessor Free Cash Flow N/A 4 The ADT Corporation Free Cash Flow 106 257 ASG Free Cash Flow N/A (7) Historical Combined Free Cash Flow (231) 221 Plus: Cash Interest 511 280 Plus: Special items Merger Costs 354 41 Radio Conversion Costs 78 59 Management Fees, Financing Fees and Other 43 1 Restructuring and Integration Activities 70 14 Integration Related Capital Expenditures 17 - Other Items - - Unlevered Historical Combined Free Cash Flow before special items $ 842 $ 616 ASG Six Months Ended 6/30/2015 Net cash provided by operating activities $ 12 Net cash used in investing activities (19) Net cash provided by financing activities 8 Free Cash Flow (7) Net cash provided by operating activities 12 Payments for acquisitions of purchased accounts (10) Deferred customer acquisition costs (15) Deferred customer acquisition revenue 7 Purchases of property and equipment (1) Free Cash Flow $ (7) Free Cash Flow, Historical Combined Free Cash Flow, and Unlevered Historical Combined Free Cash Flow before special items: Successor The ADT Corporation Successor Predecessor The ADT Corporation (in millions) ADT Inc. Historical Year Ended 12/31/2016 Historical for the period 1/1/2016 through 5/1/2016 From Inception through 12/31/2015 Period from 1/1/2015 through 6/30/2015 Twelve Months Ended 12/31/2015 Net cash provided by operating activities $ 618 $ 525 $ 2 $ 35 $ 1,611 Net cash used in investing activities (9,412) (411) (2,020) (40) (1,354) Net cash provided by (used in) financing activities 8,829 (152) 2,076 (6) (250) Free Cash Flow (337) 106 (32) 4 257 Net cash provided by operating activities 618 525 2 35 1,611 Dealer generated customer accounts and bulk account purchases (407) (176) - - (563) Subscriber system assets (469) (222) (30) (25) (697) Capital expenditures (78) (23) (4) (6) (95) Free Cash Flow $ (337) $ 106 $ (32) $ 4 $ 257
Non-GAAP Measures To provide investors with additional information in connection with our results as determined by generally accepted accounting principles in the United States (“GAAP”), we disclose the following non-GAAP financial measures: Adjusted EBITDA, Adjusted EBITDA margin, Free Cash Flow, Free Cash Flow before special items, Unlevered Free Cash Flow before special items, Historical Combined Free Cash Flow, Unlevered Historical Combined Free Cash Flow before special items, and Supplemental Pro Forma Financial Information. These measures are not financial measures calculated in accordance with GAAP, and should not be considered as a substitute for net income, operating income, or any other measure calculated in accordance with GAAP, and may not be comparable to a similarly titled measure reported by other companies. Adjusted EBITDA and Adjusted EBITDA margin We believe that the presentation of Adjusted EBITDA is appropriate to provide additional information to investors about certain non-cash items and about unusual items that we do not expect to continue at the same level in the future, as well as other items. Further, we believe Adjusted EBITDA provides a meaningful measure of operating profitability because we use it for evaluating our business performance, making budgeting decisions, and comparing our performance against that of other peer companies using similar measures. We define Adjusted EBITDA as net income or loss adjusted for (i) interest, (ii) taxes, (iii) depreciation and amortization, including depreciation of subscriber system assets and other fixed assets and amortization of dealer and other intangible assets, (iv) amortization of deferred costs and deferred revenue associated with subscriber acquisitions, (v) share-based compensation expense, (vi) purchase accounting adjustments under GAAP, (vii) merger, restructuring, integration, and other costs, (viii) financing and consent fees, (ix) foreign currency gains/losses, (x) losses on extinguishment of debt, (xi) radio conversion costs, (xii) management fees and other charges, and (xiii) other non-cash items. There are material limitations to using Adjusted EBITDA. Adjusted EBITDA does not take into account certain significant items, including depreciation and amortization, interest expense, income tax expense, and other adjustments which directly affect our net income or loss. These limitations are best addressed by considering the economic effects of the excluded items independently, and by considering Adjusted EBITDA in conjunction with net income or loss as calculated in accordance with GAAP. The Adjusted EBITDA discussion above is also applicable to its margin measure, which is calculated as Adjusted EBITDA as a percentage of monitoring and related services revenue. Free Cash Flow We define Free Cash Flow as cash from operating activities less cash outlays related to capital expenditures. We define capital expenditures to include purchases of property, plant, and equipment; subscriber system asset additions; and accounts purchased through our network of authorized dealers or third parties outside of our authorized dealer network. In arriving at Free Cash Flow, we subtract cash outlays related to capital expenditures from cash from operating activities because they represent long-term investments that are required for normal business activities. As a result, subject to the limitations described below, Free Cash Flow is useful measure of our cash available to repay debt, make other investments, and pay dividends. Free Cash Flow adjusts for cash items that are ultimately within management’s discretion to direct, and therefore, may imply that there is less or more cash that is available than the most comparable GAAP measure. Free Cash Flow is not intended to represent residual cash flow for discretionary expenditures since debt repayment requirements and other non-discretionary expenditures are not deducted. These limitations are best addressed by using Free Cash Flow in combination with the GAAP cash flow numbers. Free Cash Flow before special items We define Free Cash Flow before special items as Free Cash Flow adjusted for charges and gains related to (i) acquisitions, (ii) integrations, (iii) restructuring, (iv) impairments, and (v) other income or charges that may mask the operating results or business trends of the Company. As a result, subject to the limitations described below, Free Cash Flow before special items is useful measure of our cash available to repay debt, make other investments, and pay dividends. Free Cash Flow before special items adjusts for cash items that are ultimately within management’s discretion to direct, and therefore, may imply that there is less or more cash that is available than the most comparable GAAP measure. Free Cash Flow before special items is not intended to represent residual cash flow for discretionary expenditures since debt repayment requirements and other non-discretionary expenditures are not deducted. These limitations are best addressed by using Free Cash Flow before special items in combination with the GAAP cash flow numbers. Unlevered Free Cash Flow before special items We define Unlevered Free Cash Flow before special items as Free Cash Flow before special items adjusted for cash interest paid. As a result, subject to the limitations described below, Unlevered Free Cash Flow before special items is a useful measure of our cash available to service debt, make other investments, and pay dividends. Unlevered Free Cash Flow before special items adjusts for contractual interest payments as well as cash items that are ultimately within management’s discretion to direct, and therefore, may imply that there is less or more cash that is available than the most comparable GAAP measure. Unlevered Free Cash Flow before special items is not intended to represent residual cash flow for discretionary expenditures since debt service requirements and other non-discretionary expenditures are not deducted. These limitations are best addressed by using Unlevered Free Cash Flow before special items in combination with the GAAP cash flow numbers. Historical Combined Free Cash Flow and Unlevered Historical Combined Free Cash Flow before special items We have presented Free Cash Flow and Unlevered Free Cash Flow before special items on a Historical Combined basis for the 2015 and 2016 periods presented in this appendix, which represents the mathematical additions of Free Cash Flow and Unlevered Free Cash Flow before special items of the Company, The ADT Corporation, Protection One, and ASG. Historical Combined Free Cash Flow and Unlevered Historical Combined Free Cash Flow before special items adjust cash items that are ultimately within management’s discretion to direct, and therefore, may imply that there is less or more cash that is available than the most comparable GAAP measure. Historical Combined Free Cash Flow and Unlevered Historical Combined Free Cash Flow before special items are not intended to represent residual cash flow for discretionary expenditures since debt service requirements and other non-discretionary expenditures are not deducted. These limitations are best addressed by using Historical Combined Free Cash Flow and Unlevered Historical Combined Free Cash Flow before special items in combination with the GAAP cash flow numbers. Supplemental Pro Forma Financial Information We have presented supplemental pro forma financial information for the 2015 and 2016 periods presented in this appendix, which includes pro forma adjustments necessary to reflect the ADT Acquisition and the Formation Transactions as if they had occurred on January 1, 2015. We believe that Supplemental Pro Forma financial information is appropriate to illustrate the effect that the ADT Acquisition and the Formation Transactions had on our financial performance, assuming that such transactions took place on January 1, 2015. Financial Outlook The Company is not providing a quantitative reconciliation of our financial outlook for Adjusted EBITDA and Free Cash Flow before special items to net income (loss) and net cash provided by operating activities, which are their corresponding GAAP measures because these GAAP measures that we exclude from our non-GAAP financial outlook are difficult to reliably predict or estimate without unreasonable effort due to their dependence on future uncertainties, such as special items discussed above under the heading — Non-GAAP Measures “Adjusted EBITDA” and “Free Cash Flow before special items.” Additionally, information that is currently not available to the Company could have a potentially unpredictable and potentially significant impact on its future GAAP financial results.


