
Lender Presentation September 5th, 2019 Exhibit 99.1
Disclaimer This presentation (the “Presentation”) has been prepared by ADT Inc. (the “Company”) on behalf of Prime Security Services Borrower, LLC (the “Borrower”), an indirect wholly owned subsidiary of the Company, in connection with the Borrower’s amended and extended 1st Lien Senior Secured Term Loan Facility (the “Facility”), solely for informational purposes. The information contained in this Presentation has been prepared to assist prospective lenders in conducting their own evaluation of the Company and the Facility and does not purport to be complete or to contain all of the information that a prospective lender may require. Prospective lenders should conduct their own investigation and analysis of the Company and of the information set forth in this Presentation. The Company makes no representation or warranty as to the accuracy, reliability, reasonableness or completeness of this information and shall not have any liability for any representations regarding information contained in, or for any omission from, this Presentation or any other written or oral communications transmitted to the recipient in the course of its evaluation of the Company and the Facility. The Company and its affiliates, representatives and advisors expressly disclaim any and all liability based, in whole or in part, on the information contained in this Presentation (which only speak as of the date of this Presentation), errors therein or omissions therefrom. Neither the Company nor any of its affiliates, representatives or advisors intends to update or otherwise revise the information contained herein to reflect circumstances existing after the date of this Presentation or to reflect the occurrence of future events even if any or all of the assumptions, judgments and estimates on which the information contained herein is based are shown to be in error. This Presentation does not constitute an offering of any securities. The offerings of securities discussed herein relate to prospective transactions that the Company is considering. Any such offering of securities would be made pursuant to an offering memorandum, prospectus or similar document and not the Presentation. Should an offering of securities be made, you should refer only to the offering memorandum, prospectus or similar document described in connection with such offering and not to the Presentation.
Forward Looking Statements & Non-GAAP Measures The Company has made statements in this Presentation and other reports, filings, and other public written and verbal announcements that are forward-looking and therefore subject to risks and uncertainties. All statements, other than statements of historical fact, included in this document are, or could be, “forward-looking statements” within the meaning of the Private Securities Litigation Reform Act of 1995 and are made in reliance on the safe harbor protections provided thereunder. These forward-looking statements relate to anticipated financial performance, management’s plans and objectives for future operations, business prospects, outcome of regulatory proceedings, market conditions, use of proceeds of the Facility and other matters. Any forward-looking statement made in this presentation speaks only as of the date on which it is made. The Company undertakes no obligation to publicly update or revise any forward-looking statement, whether as a result of new information, future developments or otherwise. Forward-looking statements can be identified by various words such as “expects,” “intends,” “will,” “anticipates,” “believes,” “confident,” “continue,” “propose,” “seeks,” “could,” “may,” “should,” “estimates,” “forecasts,” “might,” “goals,” “objectives,” “targets,” “planned,” “projects,” and similar expressions. These forward-looking statements are based on management’s current beliefs and assumptions and on information currently available to management. The Company cautions that these statements are subject to risks and uncertainties, many of which are outside of the Company’s control, and could cause future events or results to be materially different from those stated or implied in this document, including among others, risk factors that are described in the Company’s Annual Report on Form 10-K and other filings with the Securities and Exchange Commission, including the sections entitled “Risk Factors” and “Management’s Discussion and Analysis of Financial Condition and Results of Operations” contained therein. To provide investors with additional information in connection with our results as determined by generally accepted accounting principles in the United States (“GAAP”), we disclose Adjusted EBITDA, Adjusted EBITDA margin, Covenant Adjusted EBITDA (Pre-SAC), Free Cash Flow, Free Cash Flow before special items, Unlevered Free Cash Flow before special items, Historical Combined Free Cash Flow, Unlevered Historical Combined Free Cash Flow before special items, Supplemental Pro Forma Financial Information, Commercial Organic Revenue Growth, Net Income (Loss) before special items, Diluted Earnings Per Share (“EPS”) before special items, and various leverage ratios as non-GAAP measures. These non-GAAP measures as well as the operating metrics of Gross Revenue Attrition, Unit Count, RMR, RMR additions, and Revenue Payback are approximated as there may be variations to reported results in each period due to certain adjustments we might make in connection with the integration over several periods of acquired companies that calculated these metrics differently, or otherwise, including periodic reassessments and refinements in the ordinary course of business. These refinements, for example, may include changes due to systems conversion or historical methodology differences in legacy systems. Amounts on subsequent pages may not add due to rounding. Reconciliations from GAAP to non-GAAP financials measures can be found in the appendix. Forward Looking Statements Non-GAAP Measures This presentation includes industry and trade data, forecasts and information that was prepared based, in part, upon data, forecasts and information obtained from independent trade associations, industry publications and surveys and other independent sources available to the Company. Some data also are based on the Company’s good faith estimates, which are derived from our knowledge of the industry and from independent sources. These third-party publications and surveys generally state that the information included therein has been obtained from sources believed to be reliable, but that the publications and surveys can give no assurance as to the accuracy or completeness of such information. The Company has not independently verified any of the data from third-party sources nor has it ascertained the underlying economic assumptions on which such data are based. Market and Industry Data
Non-GAAP Measures Adjusted EBITDA and Covenant Adjusted EBITDA (Pre-SAC) We believe that the presentation of Adjusted EBITDA is appropriate to provide additional information to investors about our operating profitability adjusted for certain non-cash items, non-routine items that we do not expect to continue at the same level in the future, as well as other items that are not core to our operations. Further, we believe Adjusted EBITDA provides a meaningful measure of operating profitability because we use it for evaluating our business performance, making budgeting decisions, and comparing our performance against that of other peer companies using similar measures. We define Adjusted EBITDA as net income or loss adjusted for (i) interest, (ii) taxes, (iii) depreciation and amortization, including depreciation of subscriber system assets and other fixed assets and amortization of dealer and other intangible assets, (iv) amortization of deferred costs and deferred revenue associated with subscriber acquisitions, (v) share-based compensation expense, (vi) merger, restructuring, integration, and other, (vii) losses on extinguishment of debt, (viii) radio conversion costs, (ix) financing and consent fees, (x) foreign currency gains/losses, (xi) acquisition related adjustments, and (xii) other charges and non-cash items. Covenant Adjusted EBITDA (Pre-SAC) also is adjusted for costs in our statement of operations associated with the acquisition of customers, net of revenue associated with the sale of equipment (Expensed Net SAC). There are material limitations to using Adjusted EBITDA and Covenant Adjusted EBITDA (Pre-SAC). Adjusted EBITDA and Covenant Adjusted EBITDA (Pre-SAC) do not take into account certain significant items, including depreciation and amortization, interest, taxes, and other adjustments which directly affect our net income or loss. These limitations are best addressed by considering the economic effects of the excluded items independently, and by considering Adjusted EBITDA and Covenant Adjusted EBITDA (Pre-SAC) in conjunction with net income as calculated in accordance with GAAP. The Adjusted EBITDA discussion above is also applicable to its margin measure, which is calculated as Adjusted EBITDA as a percentage of monitoring and related services revenue. Free Cash Flow We believe that the presentation of Free Cash Flow is appropriate to provide additional information to investors about our ability to repay debt, make other investments, and pay dividends. We define Free Cash Flow as cash flows from operating activities less cash outlays related to capital expenditures. We define capital expenditures to include purchases of property, plant, and equipment; subscriber system asset additions; and accounts purchased through our network of authorized dealers or third parties outside of our authorized dealer network. These items are subtracted from cash flows from operating activities because they represent long-term investments that are required for normal business activities. Free Cash Flow adjusts for cash items that are ultimately within management’s discretion to direct, and therefore, may imply that there is less or more cash that is available than the most comparable GAAP measure. Free Cash Flow is not intended to represent residual cash flow for discretionary expenditures since debt repayment requirements and other non-discretionary expenditures are not deducted. These limitations are best addressed by using Free Cash Flow in combination with the cash flows as calculated in accordance with GAAP. Free Cash Flow before special items We define Free Cash Flow before special items as Free Cash Flow adjusted for payments related to (i) financing and consent fees, (ii) restructuring and integration, (iii) integration related capital expenditures, (iv) radio conversion costs, and (v) other payments or receipts that may mask the operating results or business trends of the Company. As a result, subject to the limitations described below, Free Cash Flow before special items is a useful measure of our cash available to repay debt, make other investments, and pay dividends. Free Cash Flow before special items adjusts for cash items that are ultimately within management’s discretion to direct, and therefore, may imply that there is less or more cash that is available than the most comparable GAAP measure. Free Cash Flow before special items is not intended to represent residual cash flow for discretionary expenditures since debt repayment requirements and other non-discretionary expenditures are not deducted. These limitations are best addressed by using Free Cash Flow before special items in combination with the GAAP cash flow numbers. Unlevered Free Cash Flow before special items We define Unlevered Free Cash Flow before special items as Free Cash Flow before special items adjusted for cash interest paid. As a result, subject to the limitations described below, Unlevered Free Cash Flow before special items is a useful measure of our cash available to service debt, make other investments, and pay dividends. Unlevered Free Cash Flow before special items adjusts for contractual interest payments as well as cash items that are ultimately within management’s discretion to direct, and therefore, may imply that there is less or more cash that is available than the most comparable GAAP measure. Unlevered Free Cash Flow before special items is not intended to represent residual cash flow for discretionary expenditures since debt service requirements and other non-discretionary expenditures are not deducted. These limitations are best addressed by using Unlevered Free Cash Flow before special items in combination with the GAAP cash flow numbers. Historical Combined Free Cash Flow and Unlevered Historical Combined Free Cash Flow before special items We have presented Free Cash Flow and Unlevered Free Cash Flow before special items on a Historical Combined basis for the 2015 and 2016 periods, which represents the mathematical additions of Free Cash Flow and Unlevered Free Cash Flow before special items of the Company, The ADT Corporation, Protection One, and ASG. Historical Combined Free Cash Flow and Unlevered Historical Combined Free Cash Flow before special items adjust cash items that are ultimately within management’s discretion to direct, and therefore, may imply that there is less or more cash that is available than the most comparable GAAP measure. Historical Combined Free Cash Flow and Unlevered Historical Combined Free Cash Flow before special items are not intended to represent residual cash flow for discretionary expenditures since debt service requirements and other non-discretionary expenditures are not deducted. These limitations are best addressed by using Historical Combined Free Cash Flow and Unlevered Historical Combined Free Cash Flow before special items in combination with the GAAP cash flow numbers. Supplemental Pro Forma Financial Information We have presented supplemental pro forma financial information for the 2015 and 2016 periods, which includes pro forma adjustments necessary to reflect the ADT Acquisition and the Formation Transactions as if they had occurred on January 1, 2015. We believe that Supplemental Pro Forma financial information is appropriate to illustrate the effect that the ADT Acquisition and the Formation Transactions had on our financial performance, assuming that such transactions took place on January 1, 2015. Net Income (Loss) and Diluted EPS before special items Net Income (Loss) before special items is defined as net income (loss) adjusted for (i) merger, restructuring, integration, and other, (ii) financing and consent fees, (iii) foreign currency gains/losses, (iv) losses on extinguishment of debt, (v) radio conversion costs, (vi) share-based compensation expense, (vii) the change in the fair value of interest rate swaps not designated as hedges, (viii) acquisition related adjustments, (ix) other charges and non-cash items, and (x) the impact these adjusted items have on taxes. Diluted EPS before special items is diluted EPS adjusted for the items above. The difference between Net Income (Loss) before special items and Diluted EPS before special items, and net income (loss) and diluted EPS (the most comparable GAAP measures) consists of the impact of the special items noted above on the applicable GAAP measure. The Company believes that Net Income (Loss) and Diluted EPS both before special items are benchmarks used by analysts and investors who follow the industry for comparison of its performance with other companies in the industry, although our measures may not be directly comparable to similar measures reported by other companies. The limitation of these measures is that they exclude the impact (which may be material) of items that increase or decrease our reported operating income, operating margin, net income or loss, and EPS. This limitation is best addressed by using the non-GAAP measures in combination with the most comparable GAAP measures in order to better understand the amounts, character, and impact of any increase or decrease on reported results. Leverage Ratios Leverage ratios include net first lien debt and net total debt, both compared to Covenant Adjusted EBITDA (Pre-SAC). Net first lien debt and net total debt are calculated as first lien debt and total debt, respectively, less cash and cash equivalents. The Company also presents Covenant Adjusted EBITDA (Pre-SAC) to cash interest excluding the redemption of the Koch Preferred Securities. Cash interest excluding the redemption of the Koch Preferred Securities excludes amounts associated with the redemption of the Koch Preferred Securities on July 2, 2018. Leverage ratios are useful measures of the Company’s credit position and progress towards leverage targets. Refer to discussion on Adjusted EBITDA and Covenant Adjusted EBITDA (Pre-SAC) for a description of the differences between the most comparable GAAP measure. The calculation is limited in that the Company may not always be able to use cash to repay debt on a dollar-for-dollar basis. Finally, the leverage ratios discussed herein may be presented on a pro forma basis. Commercial Organic Revenue Growth We believe that the presentation of commercial organic revenue growth is appropriate to provide additional information to investors about the periodic growth of our business on a consistent basis. We define commercial organic growth as total revenue growth associated with commercial and national accounts adjusted for the timing and impact of business acquisitions. Commercial organic revenue growth excludes incremental revenue associated with commercial and national accounts from acquisitions until there is a full twelve-month overlap from the date of acquisition. There are material limitations to using commercial organic revenue growth. Commercial organic revenue growth does not take into account all revenue from commercial and national accounts in a given period. These limitations are best addressed by considering the economic effects of the excluded items independently, and by considering commercial organic revenue growth in conjunction with GAAP revenue numbers.
Deepika Yelamanchi Vice President & Treasurer, ADT Jeff Likosar Chief Financial Officer, ADT Bradford Aston Managing Director, Barclays Jim DeVries President and Chief Executive Officer, ADT Call Participants
Transaction Overview
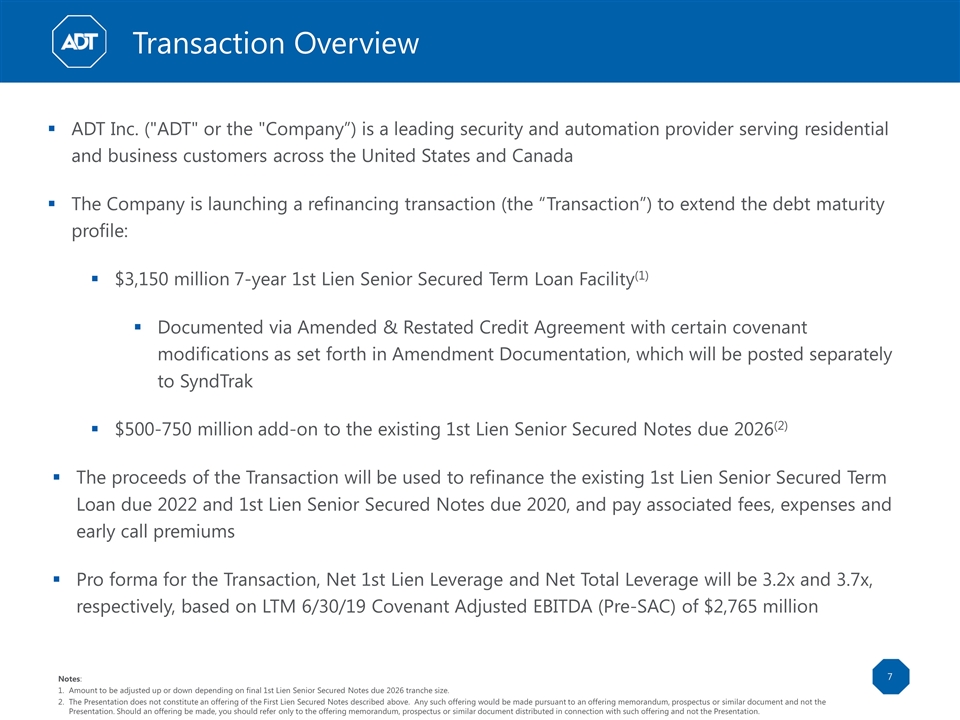
ADT Inc. ("ADT" or the "Company”) is a leading security and automation provider serving residential and business customers across the United States and Canada The Company is launching a refinancing transaction (the “Transaction”) to extend the debt maturity profile: $3,150 million 7-year 1st Lien Senior Secured Term Loan Facility(1) Documented via Amended & Restated Credit Agreement with certain covenant modifications as set forth in Amendment Documentation, which will be posted separately to SyndTrak $500-750 million add-on to the existing 1st Lien Senior Secured Notes due 2026(2) The proceeds of the Transaction will be used to refinance the existing 1st Lien Senior Secured Term Loan due 2022 and 1st Lien Senior Secured Notes due 2020, and pay associated fees, expenses and early call premiums Pro forma for the Transaction, Net 1st Lien Leverage and Net Total Leverage will be 3.2x and 3.7x, respectively, based on LTM 6/30/19 Covenant Adjusted EBITDA (Pre-SAC) of $2,765 million Transaction Overview Notes: Amount to be adjusted up or down depending on final 1st Lien Senior Secured Notes due 2026 tranche size. The Presentation does not constitute an offering of the First Lien Secured Notes described above. Any such offering would be made pursuant to an offering memorandum, prospectus or similar document and not the Presentation. Should an offering be made, you should refer only to the offering memorandum, prospectus or similar document distributed in connection with such offering and not the Presentation.
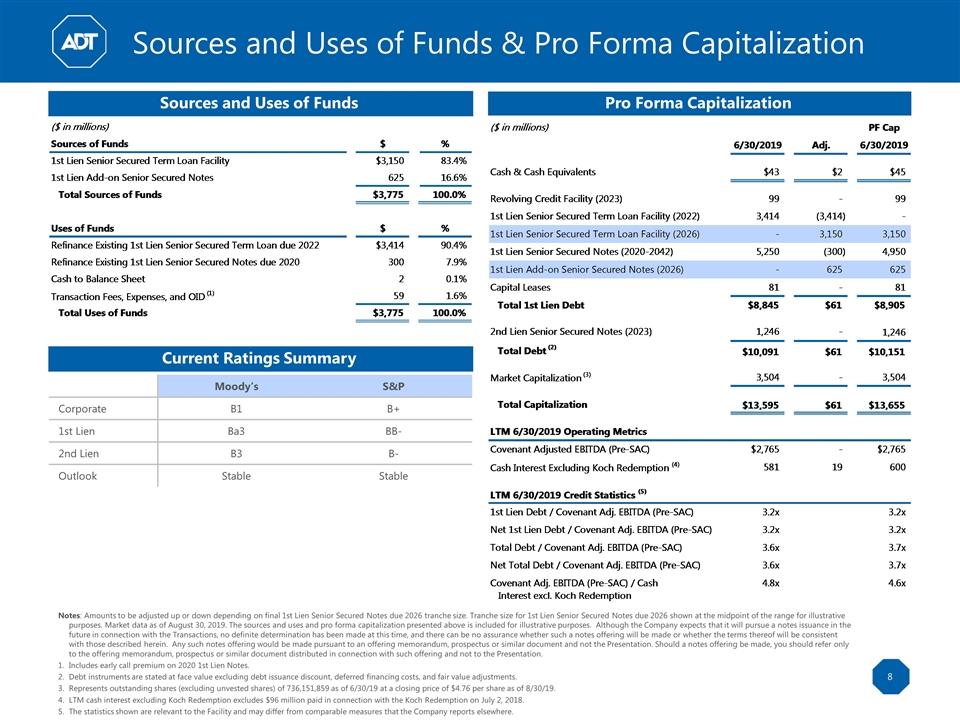
Pro Forma Capitalization Sources and Uses of Funds Notes: Amounts to be adjusted up or down depending on final 1st Lien Senior Secured Notes due 2026 tranche size. Tranche size for 1st Lien Senior Secured Notes due 2026 shown at the midpoint of the range for illustrative purposes. Market data as of August 30, 2019. The sources and uses and pro forma capitalization presented above is included for illustrative purposes. Although the Company expects that it will pursue a notes issuance in the future in connection with the Transactions, no definite determination has been made at this time, and there can be no assurance whether such a notes offering will be made or whether the terms thereof will be consistent with those described herein. Any such notes offering would be made pursuant to an offering memorandum, prospectus or similar document and not the Presentation. Should a notes offering be made, you should refer only to the offering memorandum, prospectus or similar document distributed in connection with such offering and not to the Presentation. Includes early call premium on 2020 1st Lien Notes. Debt instruments are stated at face value excluding debt issuance discount, deferred financing costs, and fair value adjustments. Represents outstanding shares (excluding unvested shares) of 736,151,859 as of 6/30/19 at a closing price of $4.76 per share as of 8/30/19. LTM cash interest excluding Koch Redemption excludes $96 million paid in connection with the Koch Redemption on July 2, 2018. The statistics shown are relevant to the Facility and may differ from comparable measures that the Company reports elsewhere. Sources and Uses of Funds & Pro Forma Capitalization Current Ratings Summary Moody’s S&P Corporate B1 B+ 1st Lien Ba3 BB- 2nd Lien B3 B- Outlook Stable Stable
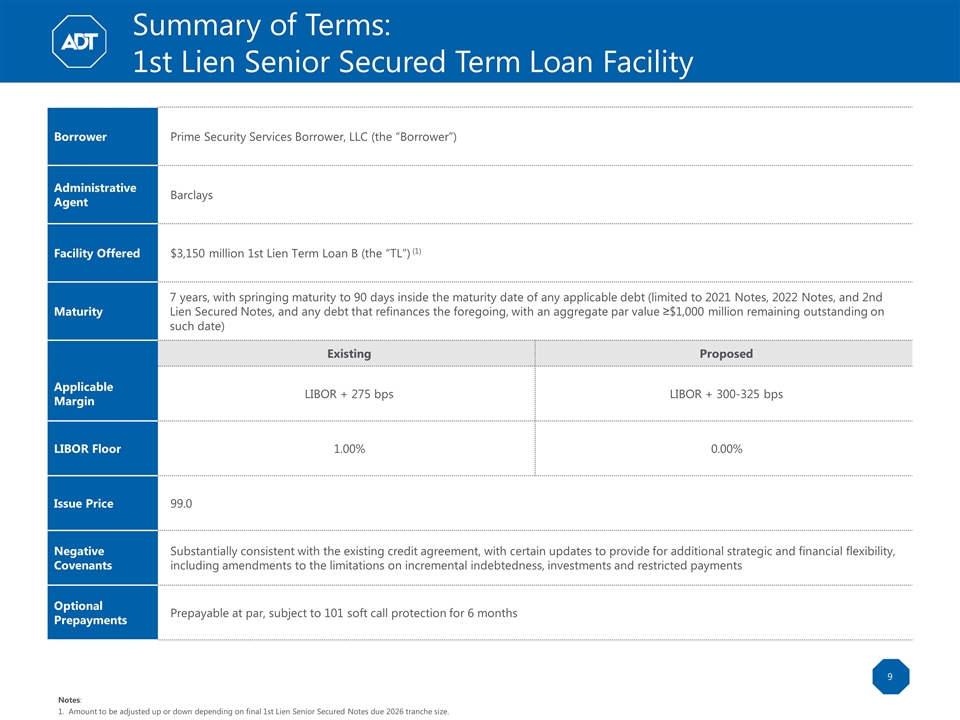
Borrower Prime Security Services Borrower, LLC (the “Borrower”) Administrative Agent Barclays Facility Offered $3,150 million 1st Lien Term Loan B (the “TL”) (1) Maturity 7 years, with springing maturity to 90 days inside the maturity date of any applicable debt (limited to 2021 Notes, 2022 Notes, and 2nd Lien Secured Notes, and any debt that refinances the foregoing, with an aggregate par value ≥$1,000 million remaining outstanding on such date) Existing Proposed Applicable Margin LIBOR + 275 bps LIBOR + 300-325 bps LIBOR Floor 1.00% 0.00% Issue Price 99.0 Negative Covenants Substantially consistent with the existing credit agreement, with certain updates to provide for additional strategic and financial flexibility, including amendments to the limitations on incremental indebtedness, investments and restricted payments Optional Prepayments Prepayable at par, subject to 101 soft call protection for 6 months Summary of Terms: 1st Lien Senior Secured Term Loan Facility Notes: Amount to be adjusted up or down depending on final 1st Lien Senior Secured Notes due 2026 tranche size.
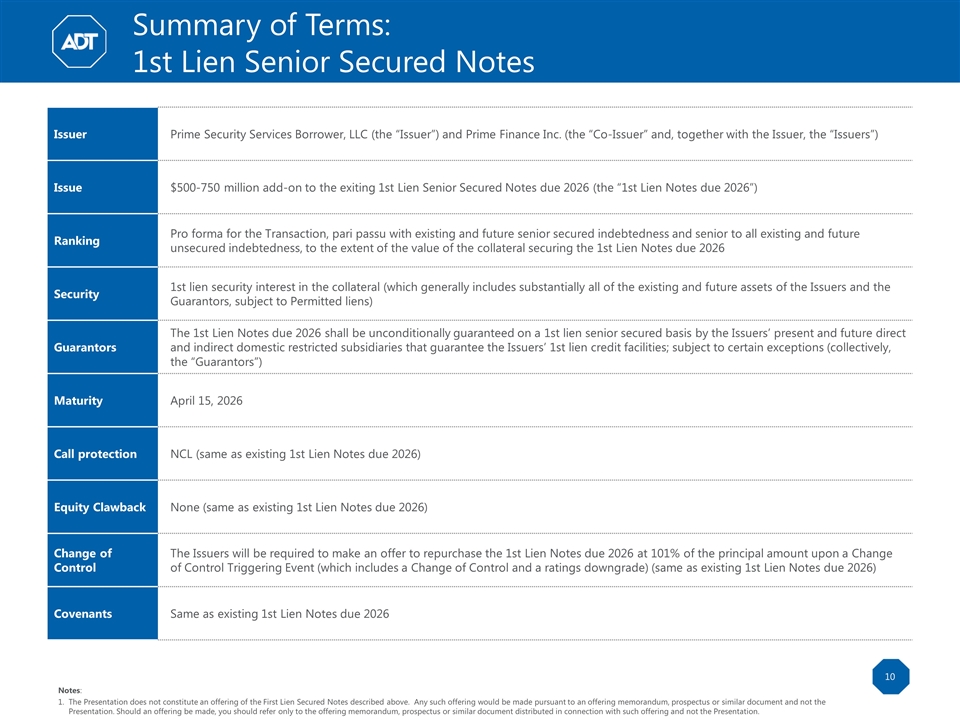
Issuer Prime Security Services Borrower, LLC (the “Issuer”) and Prime Finance Inc. (the “Co-Issuer” and, together with the Issuer, the “Issuers”) Issue $500-750 million add-on to the exiting 1st Lien Senior Secured Notes due 2026 (the “1st Lien Notes due 2026”) Ranking Pro forma for the Transaction, pari passu with existing and future senior secured indebtedness and senior to all existing and future unsecured indebtedness, to the extent of the value of the collateral securing the 1st Lien Notes due 2026 Security 1st lien security interest in the collateral (which generally includes substantially all of the existing and future assets of the Issuers and the Guarantors, subject to Permitted liens) Guarantors The 1st Lien Notes due 2026 shall be unconditionally guaranteed on a 1st lien senior secured basis by the Issuers’ present and future direct and indirect domestic restricted subsidiaries that guarantee the Issuers’ 1st lien credit facilities; subject to certain exceptions (collectively, the “Guarantors”) Maturity April 15, 2026 Call protection NCL (same as existing 1st Lien Notes due 2026) Equity Clawback None (same as existing 1st Lien Notes due 2026) Change of Control The Issuers will be required to make an offer to repurchase the 1st Lien Notes due 2026 at 101% of the principal amount upon a Change of Control Triggering Event (which includes a Change of Control and a ratings downgrade) (same as existing 1st Lien Notes due 2026) Covenants Same as existing 1st Lien Notes due 2026 Notes: The Presentation does not constitute an offering of the First Lien Secured Notes described above. Any such offering would be made pursuant to an offering memorandum, prospectus or similar document and not the Presentation. Should an offering be made, you should refer only to the offering memorandum, prospectus or similar document distributed in connection with such offering and not the Presentation. Summary of Terms: 1st Lien Senior Secured Notes
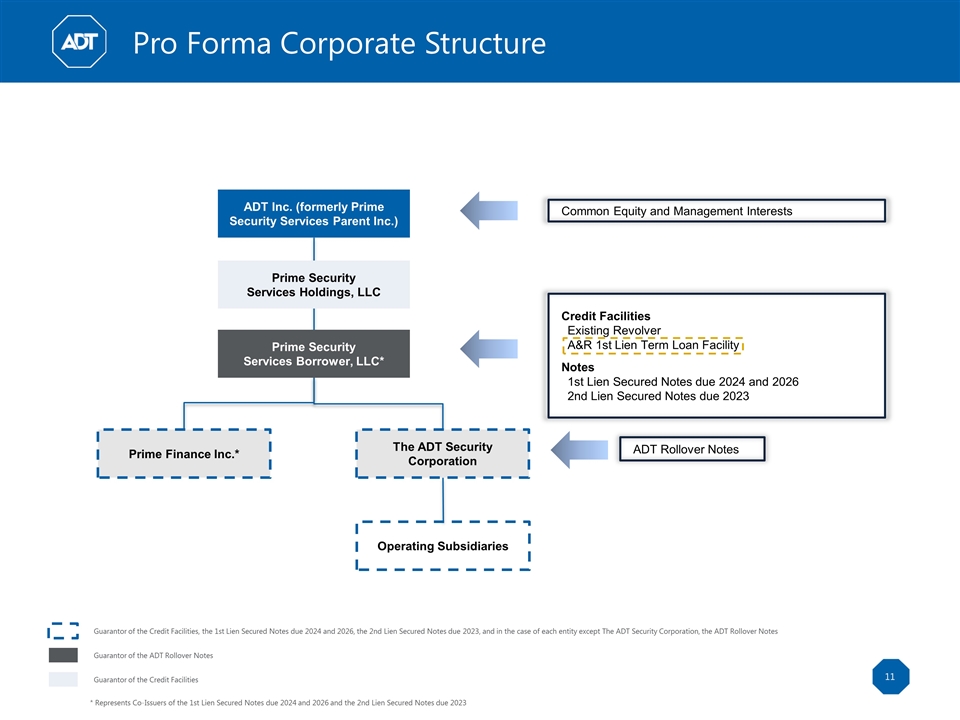
ADT Inc. (formerly Prime Security Services Parent Inc.) Common Equity and Management Interests Prime Security Services Holdings, LLC Credit Facilities Existing Revolver A&R 1st Lien Term Loan Facility Notes 1st Lien Secured Notes due 2024 and 2026 2nd Lien Secured Notes due 2023 Prime Security Services Borrower, LLC* Operating Subsidiaries Guarantor of the Credit Facilities, the 1st Lien Secured Notes due 2024 and 2026, the 2nd Lien Secured Notes due 2023, and in the case of each entity except The ADT Security Corporation, the ADT Rollover Notes Guarantor of the ADT Rollover Notes Guarantor of the Credit Facilities Prime Finance Inc.* The ADT Security Corporation ADT Rollover Notes * Represents Co-Issuers of the 1st Lien Secured Notes due 2024 and 2026 and the 2nd Lien Secured Notes due 2023 Pro Forma Corporate Structure

September 2019 S M T W T F S 1 2 3 4 5 6 7 8 9 10 11 12 13 14 15 16 17 18 19 20 21 22 23 24 25 26 27 28 29 30 Date Event September 3rd, 2019 Announce Transaction September 5th, 2019 Lender Call September 13th, 2019 TL Commitments Due at 12:00 PM ET Shortly Thereafter Close and Fund Market Holiday Key Transaction Date Execution Timeline

Business Overview
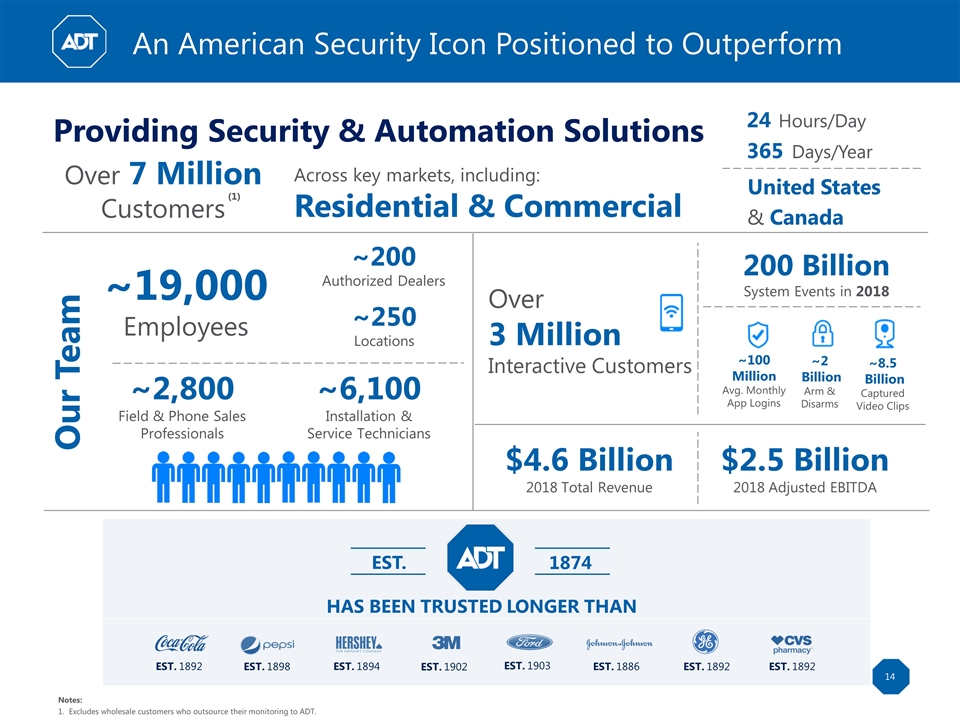
An American Security Icon Positioned to Outperform Over 3 Million Interactive Customers Over 7 Million Customers HAS BEEN TRUSTED LONGER THAN EST. 1892 EST. 1898 EST. 1903 EST. 1894 EST. 1886 EST. 1902 EST. 1892 EST. 1892 200 Billion System Events in 2018 ~2,800 Field & Phone Sales Professionals ~200 Authorized Dealers ~6,100 Installation & Service Technicians Our Team ~250 Locations Providing Security & Automation Solutions 24 Hours/Day 365 Days/Year ~8.5 Billion Captured Video Clips United States ~19,000 Employees ~100 Million Avg. Monthly App Logins ~2 Billion Arm & Disarms EST. 1874 Across key markets, including: Residential & Commercial & Canada $4.6 Billion 2018 Total Revenue $2.5 Billion 2018 Adjusted EBITDA (1) Notes: Excludes wholesale customers who outsource their monitoring to ADT.
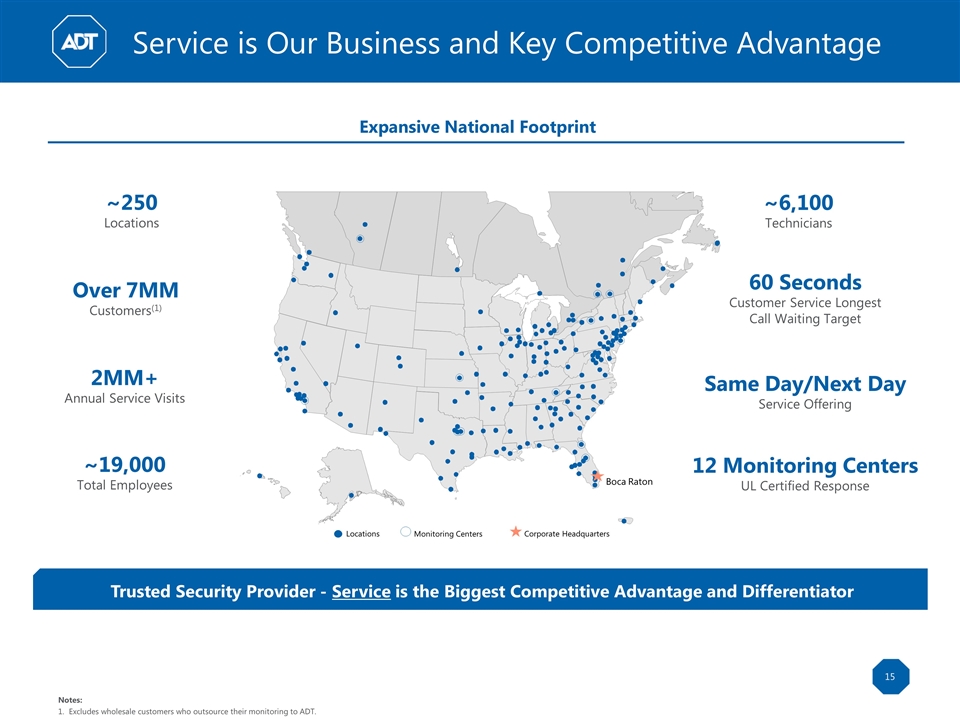
Service is Our Business and Key Competitive Advantage Trusted Security Provider - Service is the Biggest Competitive Advantage and Differentiator Expansive National Footprint Distribution Center National Account Center Boca Raton Disaster Recovery Center Locations Monitoring Centers Corporate Headquarters ~250 Locations Over 7MM Customers(1) 2MM+ Annual Service Visits ~19,000 Total Employees ~6,100 Technicians Same Day/Next Day Service Offering 60 Seconds Customer Service Longest Call Waiting Target 12 Monitoring Centers UL Certified Response Notes: Excludes wholesale customers who outsource their monitoring to ADT.
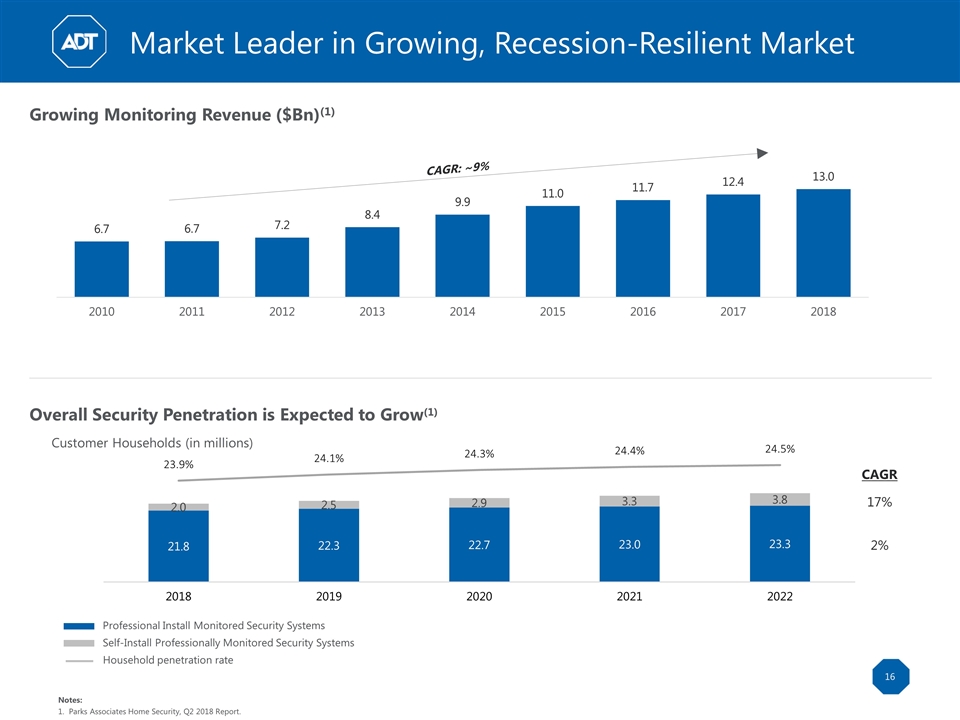
Market Leader in Growing, Recession-Resilient Market Growing Monitoring Revenue ($Bn)(1) Overall Security Penetration is Expected to Grow(1) Professional Install Monitored Security Systems Self-Install Professionally Monitored Security Systems Household penetration rate CAGR 17% 2% Notes: Parks Associates Home Security, Q2 2018 Report.
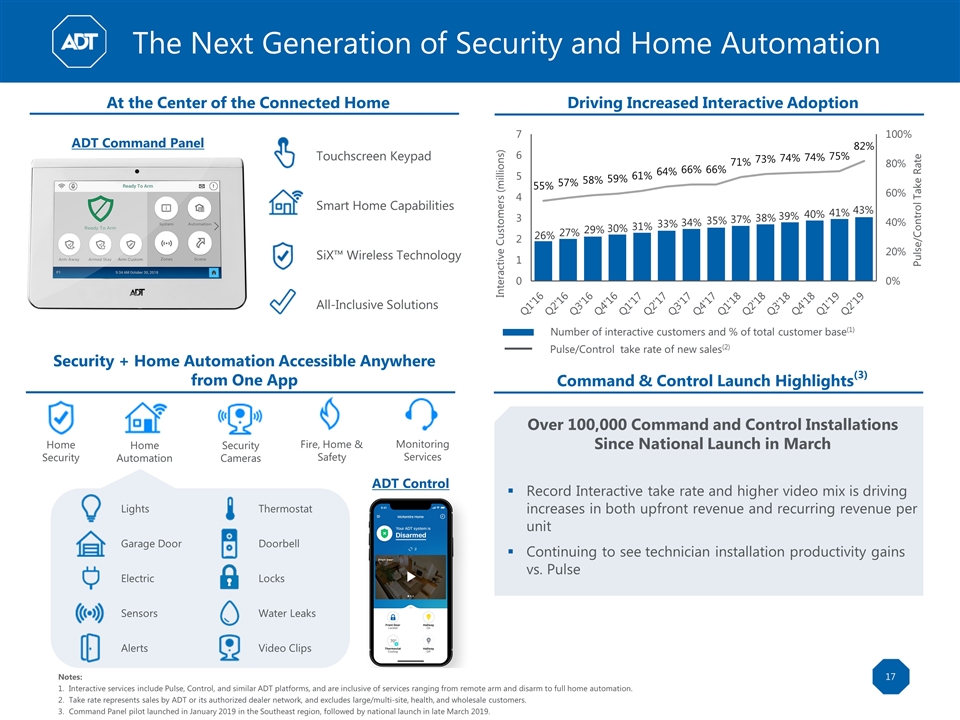
The Next Generation of Security and Home Automation Home Security Home Automation Security Cameras Fire, Home & Safety Monitoring Services Lights Thermostat Garage Door Doorbell Electric Locks Sensors Water Leaks Alerts Video Clips ADT Control Security + Home Automation Accessible Anywhere from One App Command & Control Launch Highlights(3) Notes: Interactive services include Pulse, Control, and similar ADT platforms, and are inclusive of services ranging from remote arm and disarm to full home automation. Take rate represents sales by ADT or its authorized dealer network, and excludes large/multi-site, health, and wholesale customers. Command Panel pilot launched in January 2019 in the Southeast region, followed by national launch in late March 2019. Over 100,000 Command and Control Installations Since National Launch in March Record Interactive take rate and higher video mix is driving increases in both upfront revenue and recurring revenue per unit Continuing to see technician installation productivity gains vs. Pulse At the Center of the Connected Home Smart Home Capabilities All-Inclusive Solutions SiX™ Wireless Technology Touchscreen Keypad ADT Command Panel Number of interactive customers and % of total customer base(1) Pulse/Control Take Rate Driving Increased Interactive Adoption Pulse/Control take rate of new sales(2)
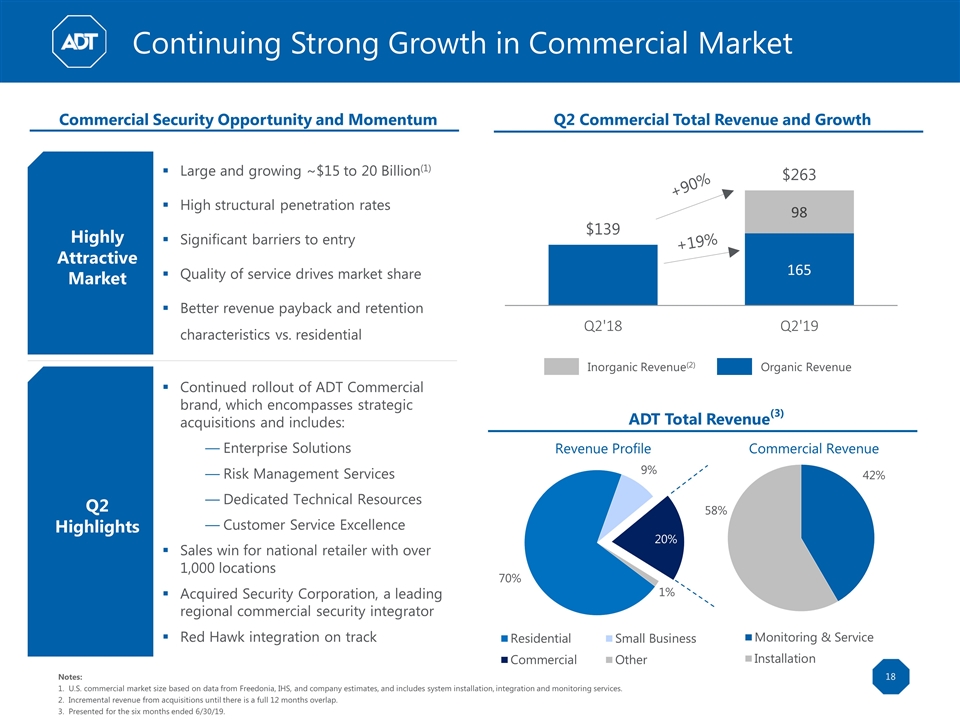
Notes: U.S. commercial market size based on data from Freedonia, IHS, and company estimates, and includes system installation, integration and monitoring services. Incremental revenue from acquisitions until there is a full 12 months overlap. Presented for the six months ended 6/30/19. ADT Total Revenue(3) Q2 Commercial Total Revenue and Growth Organic Revenue Inorganic Revenue(2) +90% +19% Continuing Strong Growth in Commercial Market Commercial Security Opportunity and Momentum Highly Attractive Market Large and growing ~$15 to 20 Billion(1) High structural penetration rates Significant barriers to entry Quality of service drives market share Better revenue payback and retention characteristics vs. residential Q2 Highlights Continued rollout of ADT Commercial brand, which encompasses strategic acquisitions and includes: Enterprise Solutions Risk Management Services Dedicated Technical Resources Customer Service Excellence Sales win for national retailer with over 1,000 locations Acquired Security Corporation, a leading regional commercial security integrator Red Hawk integration on track Commercial Revenue Revenue Profile

Long-Term Cash Flow Focus Retain Our Existing Customers Optimize Adjusted EBITDA Improve Acquisition Cost Efficiency Efficient Core Revenue Growth Invest for Future Growth Efficient Operating Model Balanced Approach to Growth Focuses on Long-Term Cash Flow Generation
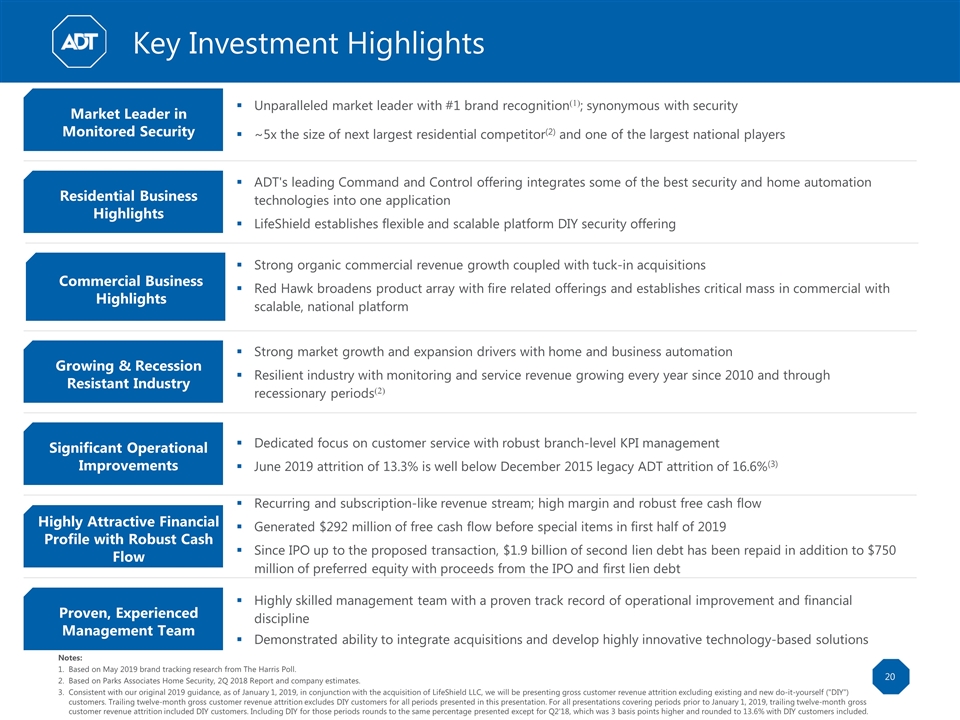
Key Investment Highlights Notes: Based on May 2019 brand tracking research from The Harris Poll. Based on Parks Associates Home Security, 2Q 2018 Report and company estimates. Consistent with our original 2019 guidance, as of January 1, 2019, in conjunction with the acquisition of LifeShield LLC, we will be presenting gross customer revenue attrition excluding existing and new do-it-yourself ("DIY") customers. Trailing twelve-month gross customer revenue attrition excludes DIY customers for all periods presented in this presentation. For all presentations covering periods prior to January 1, 2019, trailing twelve-month gross customer revenue attrition included DIY customers. Including DIY for those periods rounds to the same percentage presented except for Q2'18, which was 3 basis points higher and rounded to 13.6% with DIY customers included. Market Leader in Monitored Security Unparalleled market leader with #1 brand recognition(1); synonymous with security ~5x the size of next largest residential competitor(2) and one of the largest national players Residential Business Highlights Growing & Recession Resistant Industry Strong market growth and expansion drivers with home and business automation Resilient industry with monitoring and service revenue growing every year since 2010 and through recessionary periods(2) Significant Operational Improvements Dedicated focus on customer service with robust branch-level KPI management June 2019 attrition of 13.3% is well below December 2015 legacy ADT attrition of 16.6%(3) Highly Attractive Financial Profile with Robust Cash Flow Recurring and subscription-like revenue stream; high margin and robust free cash flow Generated $292 million of free cash flow before special items in first half of 2019 Since IPO up to the proposed transaction, $1.9 billion of second lien debt has been repaid in addition to $750 million of preferred equity with proceeds from the IPO and first lien debt Proven, Experienced Management Team Highly skilled management team with a proven track record of operational improvement and financial discipline Demonstrated ability to integrate acquisitions and develop highly innovative technology-based solutions Commercial Business Highlights Strong organic commercial revenue growth coupled with tuck-in acquisitions Red Hawk broadens product array with fire related offerings and establishes critical mass in commercial with scalable, national platform ADT's leading Command and Control offering integrates some of the best security and home automation technologies into one application LifeShield establishes flexible and scalable platform DIY security offering
Financial Overview
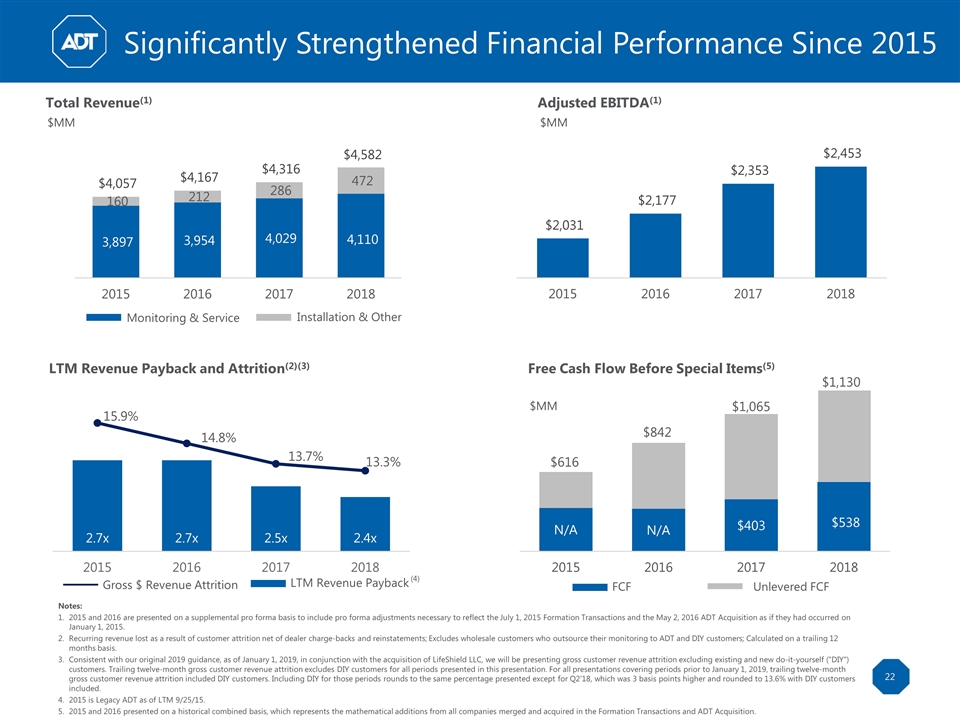
Significantly Strengthened Financial Performance Since 2015 Notes: 2015 and 2016 are presented on a supplemental pro forma basis to include pro forma adjustments necessary to reflect the July 1, 2015 Formation Transactions and the May 2, 2016 ADT Acquisition as if they had occurred on January 1, 2015. Recurring revenue lost as a result of customer attrition net of dealer charge-backs and reinstatements; Excludes wholesale customers who outsource their monitoring to ADT and DIY customers; Calculated on a trailing 12 months basis. Consistent with our original 2019 guidance, as of January 1, 2019, in conjunction with the acquisition of LifeShield LLC, we will be presenting gross customer revenue attrition excluding existing and new do-it-yourself ("DIY") customers. Trailing twelve-month gross customer revenue attrition excludes DIY customers for all periods presented in this presentation. For all presentations covering periods prior to January 1, 2019, trailing twelve-month gross customer revenue attrition included DIY customers. Including DIY for those periods rounds to the same percentage presented except for Q2'18, which was 3 basis points higher and rounded to 13.6% with DIY customers included. 2015 is Legacy ADT as of LTM 9/25/15. 2015 and 2016 presented on a historical combined basis, which represents the mathematical additions from all companies merged and acquired in the Formation Transactions and ADT Acquisition. Total Revenue(1) $MM LTM Revenue Payback and Attrition(2)(3) Adjusted EBITDA(1) $MM Free Cash Flow Before Special Items(5) $MM Unlevered FCF FCF Installation & Other Monitoring & Service LTM Revenue Payback Gross $ Revenue Attrition (4) $1,130
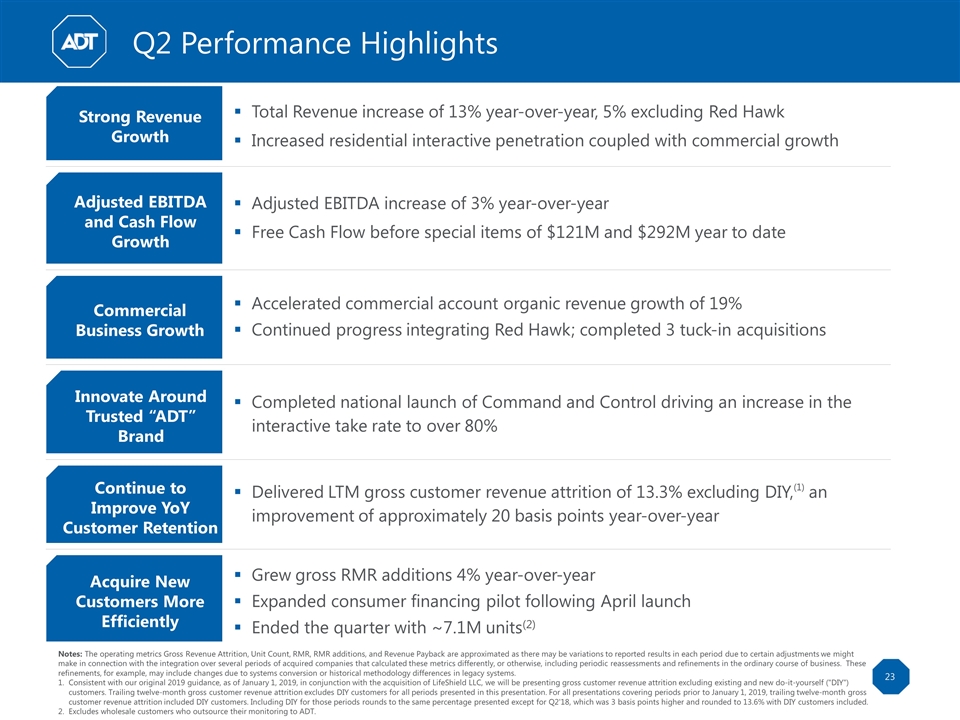
Q2 Performance Highlights Notes: The operating metrics Gross Revenue Attrition, Unit Count, RMR, RMR additions, and Revenue Payback are approximated as there may be variations to reported results in each period due to certain adjustments we might make in connection with the integration over several periods of acquired companies that calculated these metrics differently, or otherwise, including periodic reassessments and refinements in the ordinary course of business. These refinements, for example, may include changes due to systems conversion or historical methodology differences in legacy systems. Consistent with our original 2019 guidance, as of January 1, 2019, in conjunction with the acquisition of LifeShield LLC, we will be presenting gross customer revenue attrition excluding existing and new do-it-yourself ("DIY") customers. Trailing twelve-month gross customer revenue attrition excludes DIY customers for all periods presented in this presentation. For all presentations covering periods prior to January 1, 2019, trailing twelve-month gross customer revenue attrition included DIY customers. Including DIY for those periods rounds to the same percentage presented except for Q2'18, which was 3 basis points higher and rounded to 13.6% with DIY customers included. Excludes wholesale customers who outsource their monitoring to ADT. Completed national launch of Command and Control driving an increase in the interactive take rate to over 80% Strong Revenue Growth Adjusted EBITDA and Cash Flow Growth Commercial Business Growth Total Revenue increase of 13% year-over-year, 5% excluding Red Hawk Increased residential interactive penetration coupled with commercial growth Adjusted EBITDA increase of 3% year-over-year Free Cash Flow before special items of $121M and $292M year to date Accelerated commercial account organic revenue growth of 19% Continued progress integrating Red Hawk; completed 3 tuck-in acquisitions Innovate Around Trusted “ADT” Brand Continue to Improve YoY Customer Retention Acquire New Customers More Efficiently Delivered LTM gross customer revenue attrition of 13.3% excluding DIY,(1) an improvement of approximately 20 basis points year-over-year Grew gross RMR additions 4% year-over-year Expanded consumer financing pilot following April launch Ended the quarter with ~7.1M units(2)
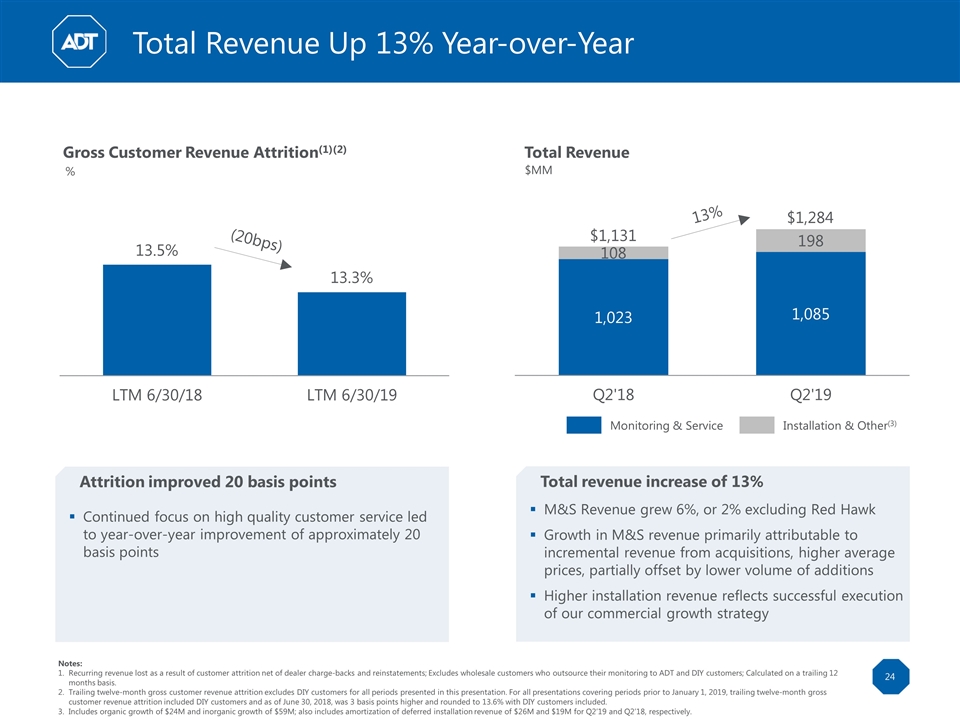
24 Total Revenue Up 13% Year-over-Year Notes: Recurring revenue lost as a result of customer attrition net of dealer charge-backs and reinstatements; Excludes wholesale customers who outsource their monitoring to ADT and DIY customers; Calculated on a trailing 12 months basis. Trailing twelve-month gross customer revenue attrition excludes DIY customers for all periods presented in this presentation. For all presentations covering periods prior to January 1, 2019, trailing twelve-month gross customer revenue attrition included DIY customers and as of June 30, 2018, was 3 basis points higher and rounded to 13.6% with DIY customers included. Includes organic growth of $24M and inorganic growth of $59M; also includes amortization of deferred installation revenue of $26M and $19M for Q2’19 and Q2’18, respectively. Attrition improved 20 basis points Continued focus on high quality customer service led to year-over-year improvement of approximately 20 basis points Total revenue increase of 13% M&S Revenue grew 6%, or 2% excluding Red Hawk Growth in M&S revenue primarily attributable to incremental revenue from acquisitions, higher average prices, partially offset by lower volume of additions Higher installation revenue reflects successful execution of our commercial growth strategy Total Revenue Gross Customer Revenue Attrition(1)(2) $MM Installation & Other(3) Monitoring & Service 13% $1,284 $1,131 (20bps) %
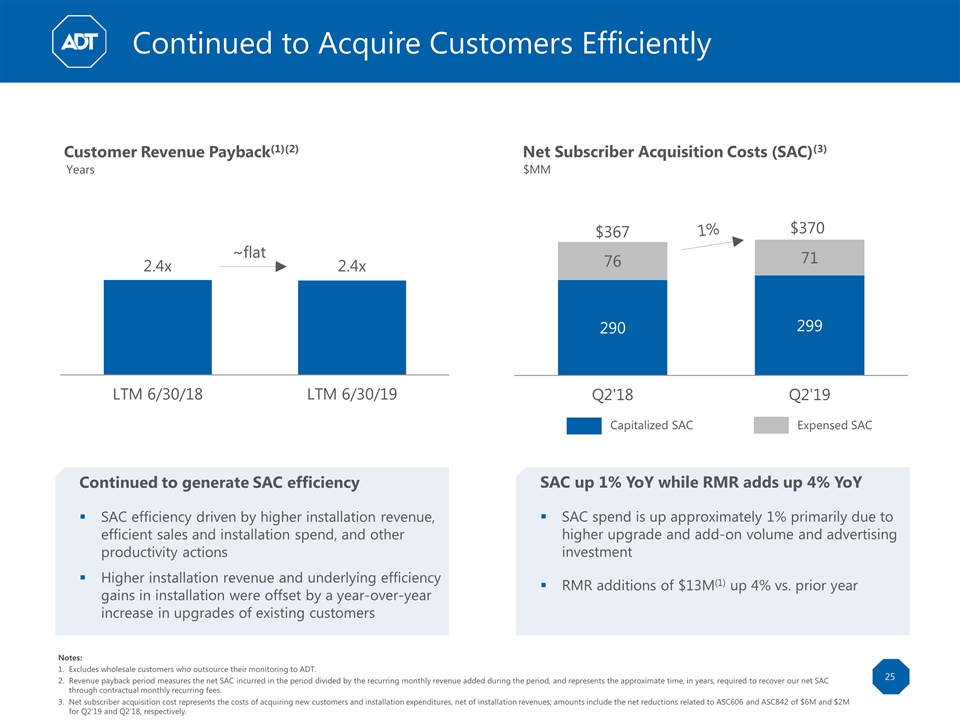
25 Continued to Acquire Customers Efficiently Notes: Excludes wholesale customers who outsource their monitoring to ADT. Revenue payback period measures the net SAC incurred in the period divided by the recurring monthly revenue added during the period, and represents the approximate time, in years, required to recover our net SAC through contractual monthly recurring fees. Net subscriber acquisition cost represents the costs of acquiring new customers and installation expenditures, net of installation revenues; amounts include the net reductions related to ASC606 and ASC842 of $6M and $2M for Q2’19 and Q2’18, respectively. Continued to generate SAC efficiency SAC efficiency driven by higher installation revenue, efficient sales and installation spend, and other productivity actions Higher installation revenue and underlying efficiency gains in installation were offset by a year-over-year increase in upgrades of existing customers SAC up 1% YoY while RMR adds up 4% YoY SAC spend is up approximately 1% primarily due to higher upgrade and add-on volume and advertising investment RMR additions of $13M(1) up 4% vs. prior year Net Subscriber Acquisition Costs (SAC)(3) Customer Revenue Payback(1)(2) Years $MM Expensed SAC Capitalized SAC 1% ~flat $370 $367
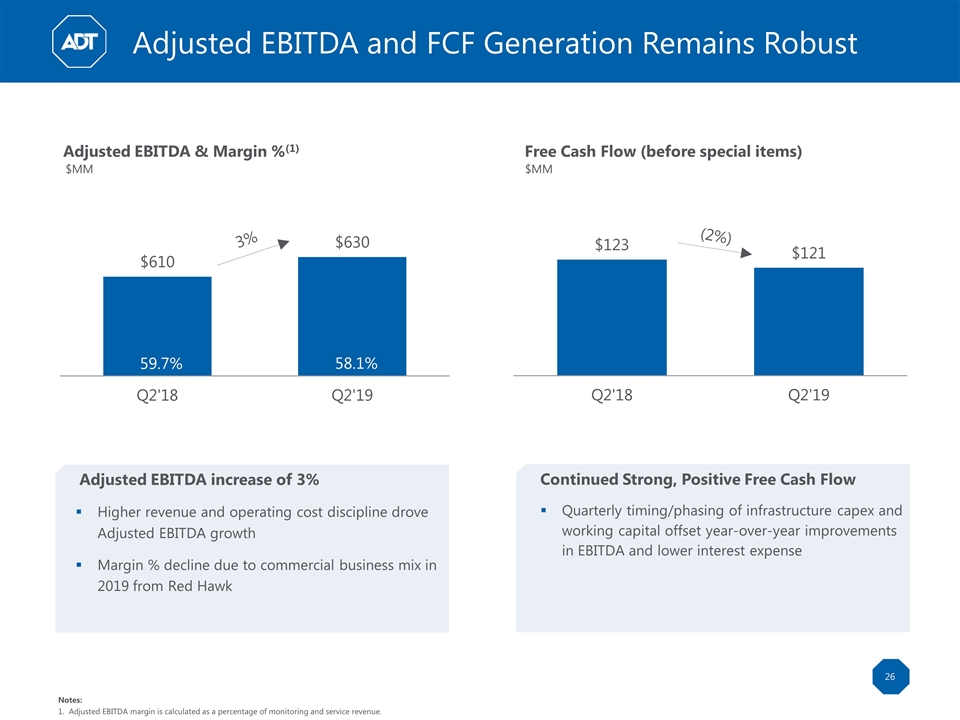
26 Adjusted EBITDA and FCF Generation Remains Robust Notes: Adjusted EBITDA margin is calculated as a percentage of monitoring and service revenue. Continued Strong, Positive Free Cash Flow Quarterly timing/phasing of infrastructure capex and working capital offset year-over-year improvements in EBITDA and lower interest expense Adjusted EBITDA increase of 3% Higher revenue and operating cost discipline drove Adjusted EBITDA growth Margin % decline due to commercial business mix in 2019 from Red Hawk Free Cash Flow (before special items) Adjusted EBITDA & Margin %(1) $MM $MM (2%) 3% 59.7% 58.1%
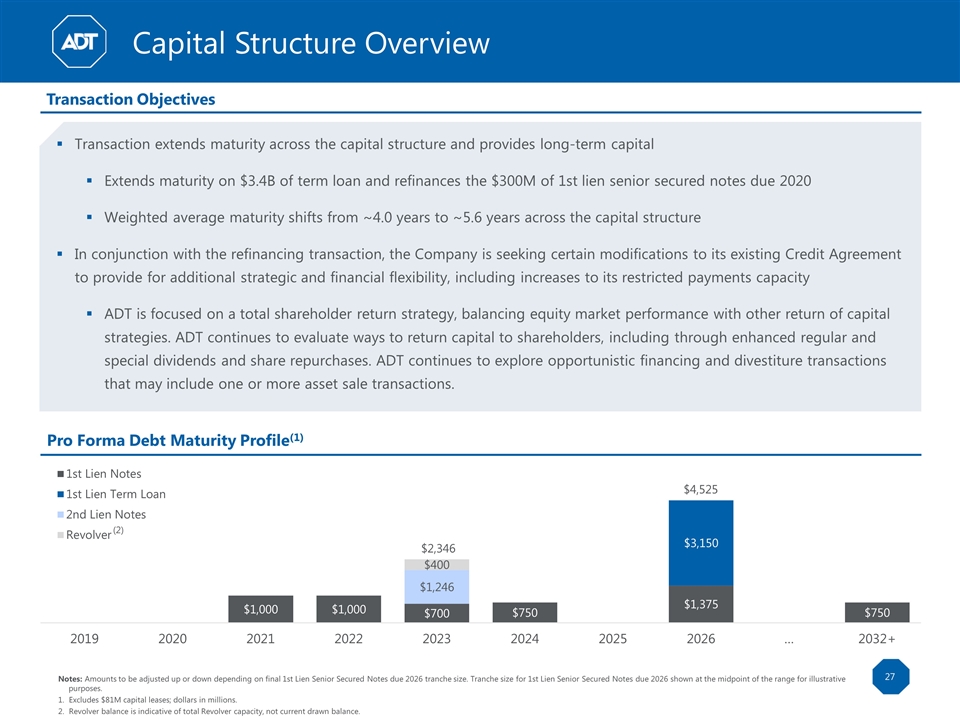
Capital Structure Overview 27 Pro Forma Debt Maturity Profile(1) Transaction Objectives Notes: Amounts to be adjusted up or down depending on final 1st Lien Senior Secured Notes due 2026 tranche size. Tranche size for 1st Lien Senior Secured Notes due 2026 shown at the midpoint of the range for illustrative purposes. Excludes $81M capital leases; dollars in millions. Revolver balance is indicative of total Revolver capacity, not current drawn balance. (2) Transaction extends maturity across the capital structure and provides long-term capital Extends maturity on $3.4B of term loan and refinances the $300M of 1st lien senior secured notes due 2020 Weighted average maturity shifts from ~4.0 years to ~5.6 years across the capital structure In conjunction with the refinancing transaction, the Company is seeking certain modifications to its existing Credit Agreement to provide for additional strategic and financial flexibility, including increases to its restricted payments capacity ADT is focused on a total shareholder return strategy, balancing equity market performance with other return of capital strategies. ADT continues to evaluate ways to return capital to shareholders, including through enhanced regular and special dividends and share repurchases. ADT continues to explore opportunistic financing and divestiture transactions that may include one or more asset sale transactions.
Q&A 28

Appendix
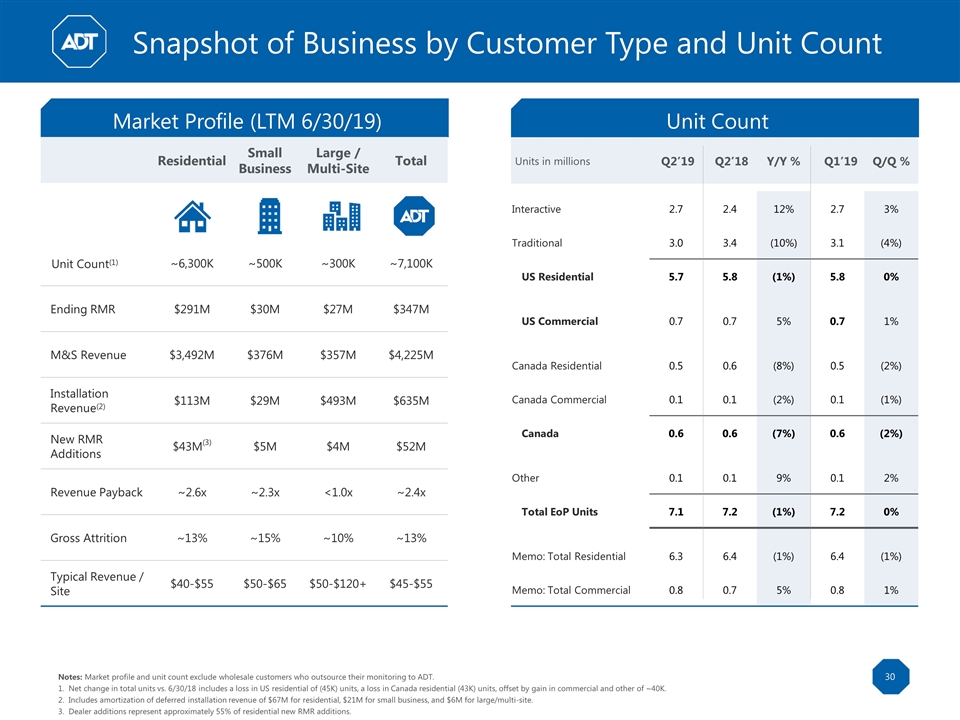
30 Notes: Market profile and unit count exclude wholesale customers who outsource their monitoring to ADT. Net change in total units vs. 6/30/18 includes a loss in US residential of (45K) units, a loss in Canada residential (43K) units, offset by gain in commercial and other of ~40K. Includes amortization of deferred installation revenue of $67M for residential, $21M for small business, and $6M for large/multi-site. Dealer additions represent approximately 55% of residential new RMR additions. Snapshot of Business by Customer Type and Unit Count Market Profile (LTM 6/30/19) Residential Small Business Large / Multi-Site Total Unit Count(1) ~6,300K ~500K ~300K ~7,100K Ending RMR $291M $30M $27M $347M M&S Revenue $3,492M $376M $357M $4,225M Installation Revenue(2) $113M $29M $493M $635M New RMR Additions $43M(3) $5M $4M $52M Revenue Payback ~2.6x ~2.3x <1.0x ~2.4x Gross Attrition ~13% ~15% ~10% ~13% Typical Revenue / Site $40-$55 $50-$65 $50-$120+ $45-$55 Units in millions Q2’19 Q2’18 Y/Y % Q1’19 Q/Q % Interactive 2.7 2.4 12% 2.7 3% Traditional 3.0 3.4 (10%) 3.1 (4%) US Residential 5.7 5.8 (1%) 5.8 0% US Commercial 0.7 0.7 5% 0.7 1% Canada Residential 0.5 0.6 (8%) 0.5 (2%) Canada Commercial 0.1 0.1 (2%) 0.1 (1%) Canada 0.6 0.6 (7%) 0.6 (2%) Other 0.1 0.1 9% 0.1 2% Total EoP Units 7.1 7.2 (1%) 7.2 0% Memo: Total Residential 6.3 6.4 (1%) 6.4 (1%) Memo: Total Commercial 0.8 0.7 5% 0.8 1% Unit Count
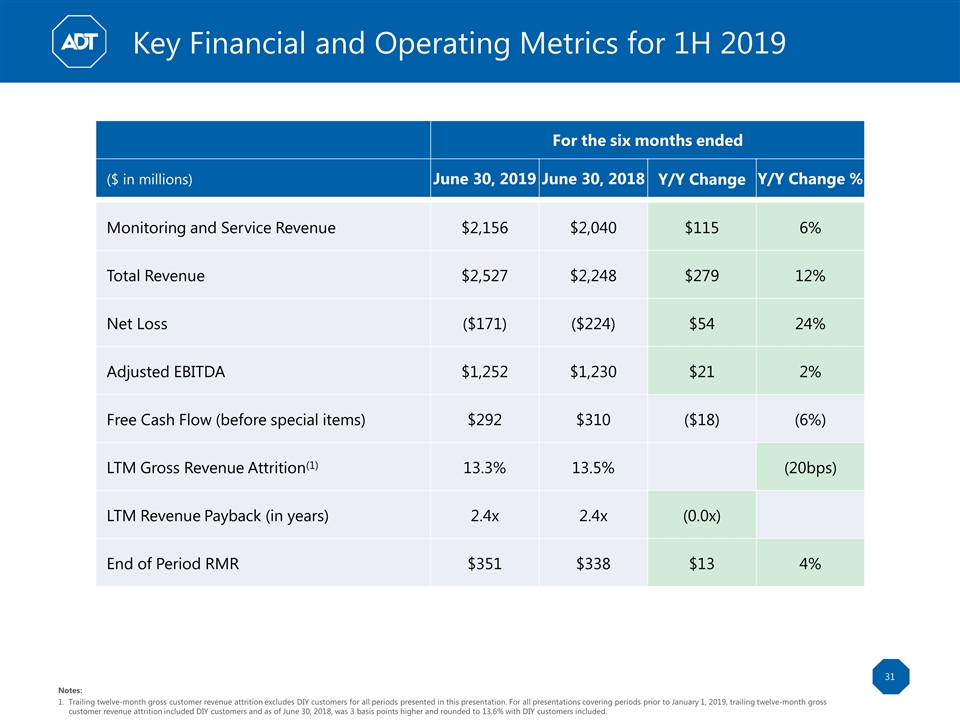
31 Notes: Trailing twelve-month gross customer revenue attrition excludes DIY customers for all periods presented in this presentation. For all presentations covering periods prior to January 1, 2019, trailing twelve-month gross customer revenue attrition included DIY customers and as of June 30, 2018, was 3 basis points higher and rounded to 13.6% with DIY customers included. Key Financial and Operating Metrics for 1H 2019 For the six months ended ($ in millions) June 30, 2019 June 30, 2018 Y/Y Change Y/Y Change % Monitoring and Service Revenue $2,156 $2,040 $115 6% Total Revenue $2,527 $2,248 $279 12% Net Loss ($171) ($224) $54 24% Adjusted EBITDA $1,252 $1,230 $21 2% Free Cash Flow (before special items) $292 $310 ($18) (6%) LTM Gross Revenue Attrition(1) 13.3% 13.5% (20bps) LTM Revenue Payback (in years) 2.4x 2.4x (0.0x) End of Period RMR $351 $338 $13 4%
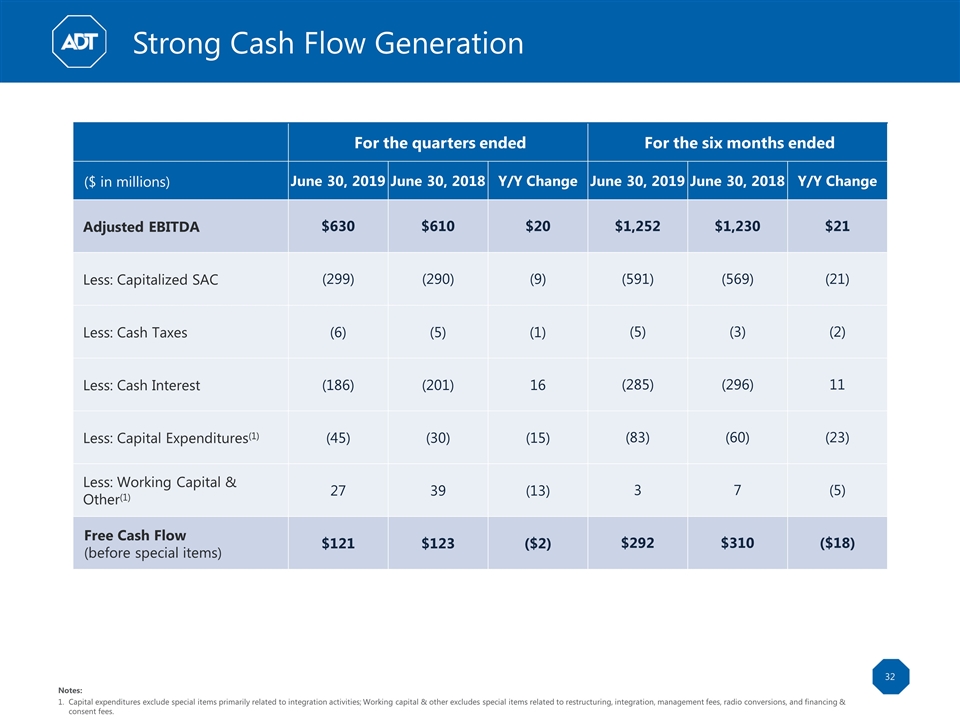
Strong Cash Flow Generation 32 Notes: Capital expenditures exclude special items primarily related to integration activities; Working capital & other excludes special items related to restructuring, integration, management fees, radio conversions, and financing & consent fees. For the quarters ended For the six months ended ($ in millions) June 30, 2019 June 30, 2018 Y/Y Change June 30, 2019 June 30, 2018 Y/Y Change Adjusted EBITDA $630 $610 $20 $1,252 $1,230 $21 Less: Capitalized SAC (299) (290) (9) (591) (569) (21) Less: Cash Taxes (6) (5) (1) (5) (3) (2) Less: Cash Interest (186) (201) 16 (285) (296) 11 Less: Capital Expenditures(1) (45) (30) (15) (83) (60) (23) Less: Working Capital & Other(1) 27 39 (13) 3 7 (5) Free Cash Flow (before special items) $121 $123 ($2) $292 $310 ($18)
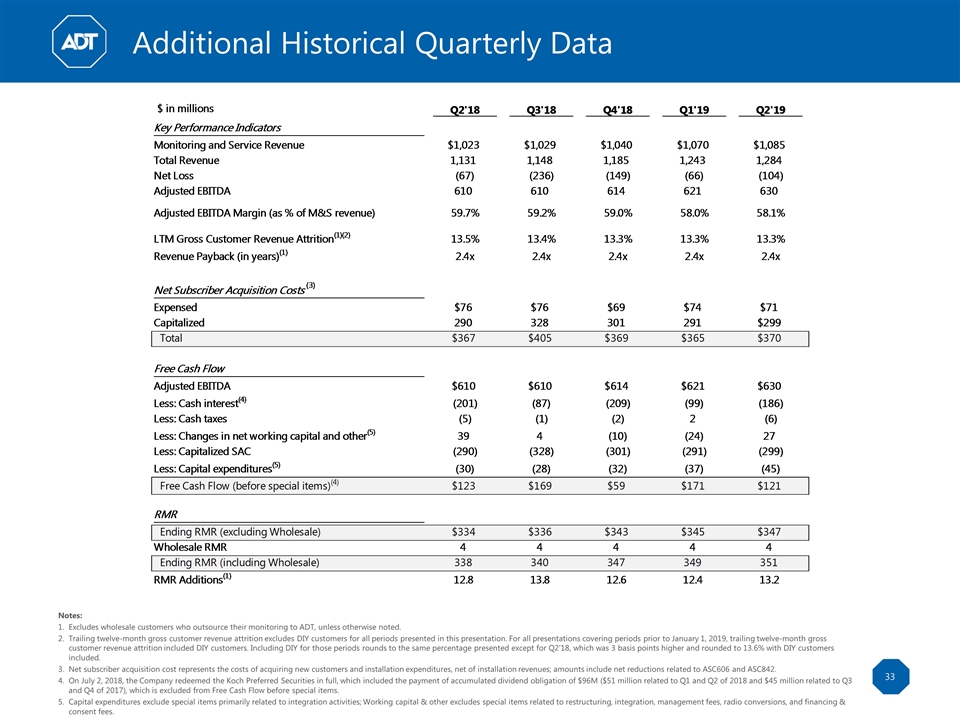
Additional Historical Quarterly Data 33 Notes: Excludes wholesale customers who outsource their monitoring to ADT, unless otherwise noted. Trailing twelve-month gross customer revenue attrition excludes DIY customers for all periods presented in this presentation. For all presentations covering periods prior to January 1, 2019, trailing twelve-month gross customer revenue attrition included DIY customers. Including DIY for those periods rounds to the same percentage presented except for Q2'18, which was 3 basis points higher and rounded to 13.6% with DIY customers included. Net subscriber acquisition cost represents the costs of acquiring new customers and installation expenditures, net of installation revenues; amounts include net reductions related to ASC606 and ASC842. On July 2, 2018, the Company redeemed the Koch Preferred Securities in full, which included the payment of accumulated dividend obligation of $96M ($51 million related to Q1 and Q2 of 2018 and $45 million related to Q3 and Q4 of 2017), which is excluded from Free Cash Flow before special items. Capital expenditures exclude special items primarily related to integration activities; Working capital & other excludes special items related to restructuring, integration, management fees, radio conversions, and financing & consent fees.
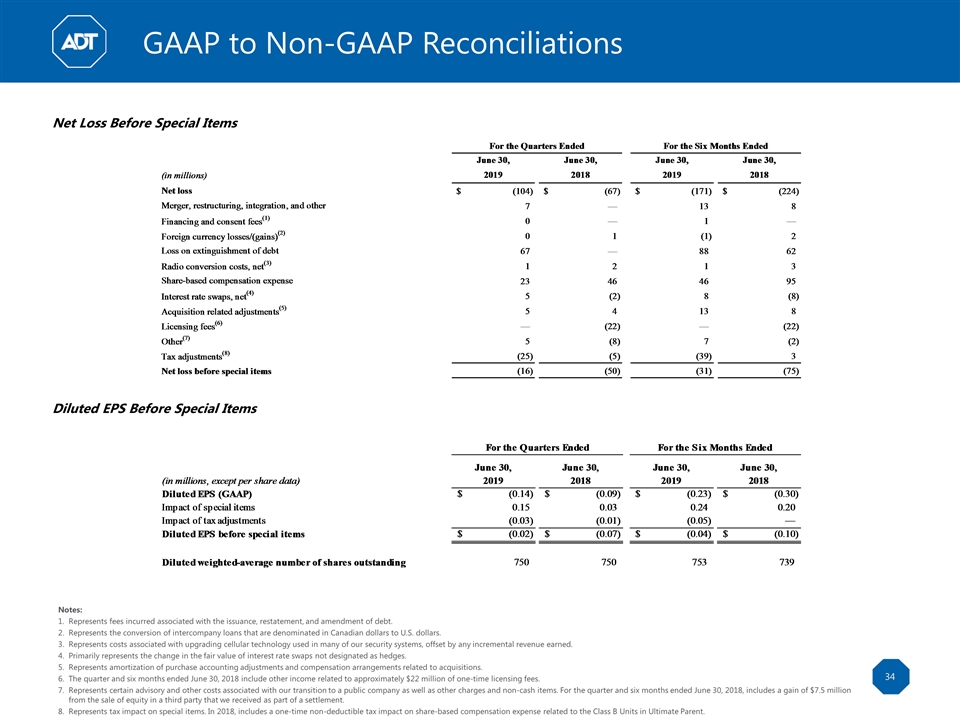
GAAP to Non-GAAP Reconciliations 34 Net Loss Before Special Items Diluted EPS Before Special Items Notes: Represents fees incurred associated with the issuance, restatement, and amendment of debt. Represents the conversion of intercompany loans that are denominated in Canadian dollars to U.S. dollars. Represents costs associated with upgrading cellular technology used in many of our security systems, offset by any incremental revenue earned. Primarily represents the change in the fair value of interest rate swaps not designated as hedges. Represents amortization of purchase accounting adjustments and compensation arrangements related to acquisitions. The quarter and six months ended June 30, 2018 include other income related to approximately $22 million of one-time licensing fees. Represents certain advisory and other costs associated with our transition to a public company as well as other charges and non-cash items. For the quarter and six months ended June 30, 2018, includes a gain of $7.5 million from the sale of equity in a third party that we received as part of a settlement. Represents tax impact on special items. In 2018, includes a one-time non-deductible tax impact on share-based compensation expense related to the Class B Units in Ultimate Parent.
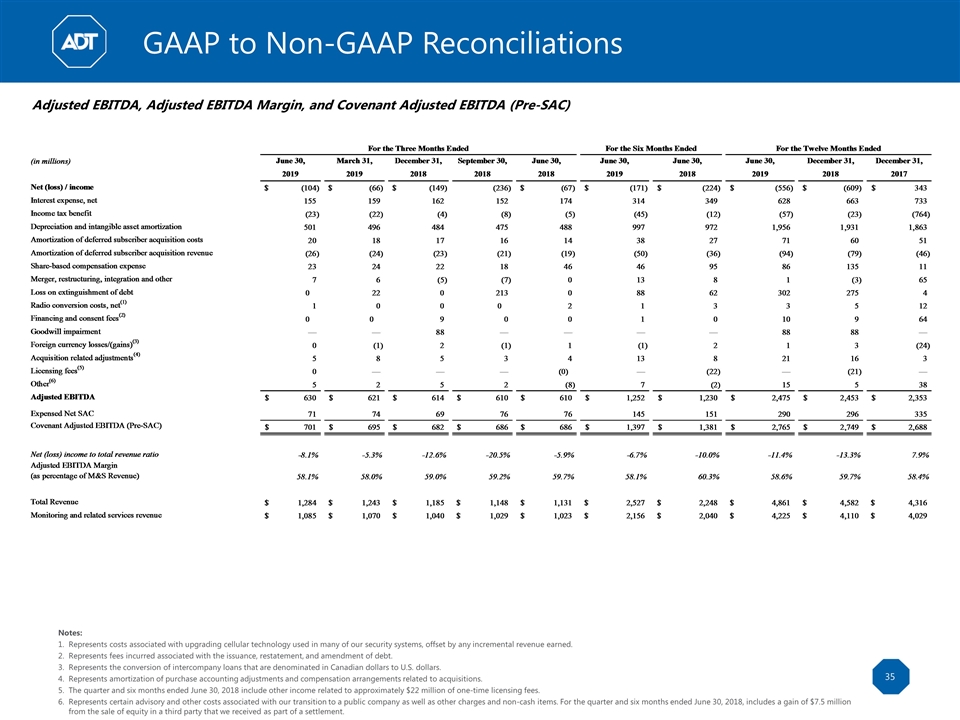
35 Adjusted EBITDA, Adjusted EBITDA Margin, and Covenant Adjusted EBITDA (Pre-SAC) Notes: Represents costs associated with upgrading cellular technology used in many of our security systems, offset by any incremental revenue earned. Represents fees incurred associated with the issuance, restatement, and amendment of debt. Represents the conversion of intercompany loans that are denominated in Canadian dollars to U.S. dollars. Represents amortization of purchase accounting adjustments and compensation arrangements related to acquisitions. The quarter and six months ended June 30, 2018 include other income related to approximately $22 million of one-time licensing fees. Represents certain advisory and other costs associated with our transition to a public company as well as other charges and non-cash items. For the quarter and six months ended June 30, 2018, includes a gain of $7.5 million from the sale of equity in a third party that we received as part of a settlement. GAAP to Non-GAAP Reconciliations
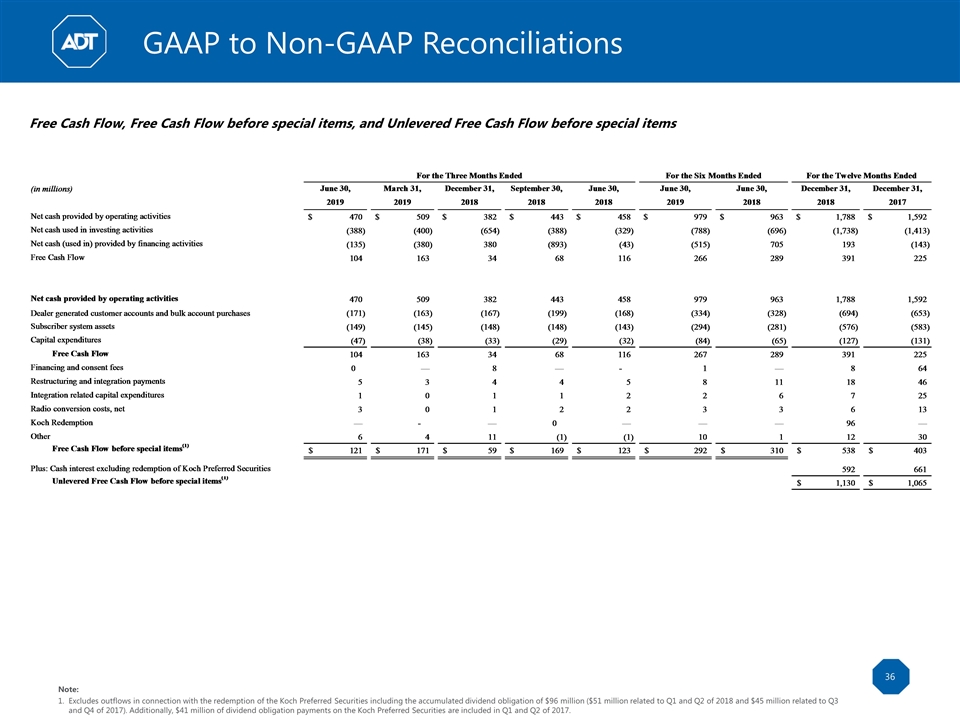
36 Free Cash Flow, Free Cash Flow before special items, and Unlevered Free Cash Flow before special items Note: Excludes outflows in connection with the redemption of the Koch Preferred Securities including the accumulated dividend obligation of $96 million ($51 million related to Q1 and Q2 of 2018 and $45 million related to Q3 and Q4 of 2017). Additionally, $41 million of dividend obligation payments on the Koch Preferred Securities are included in Q1 and Q2 of 2017. GAAP to Non-GAAP Reconciliations
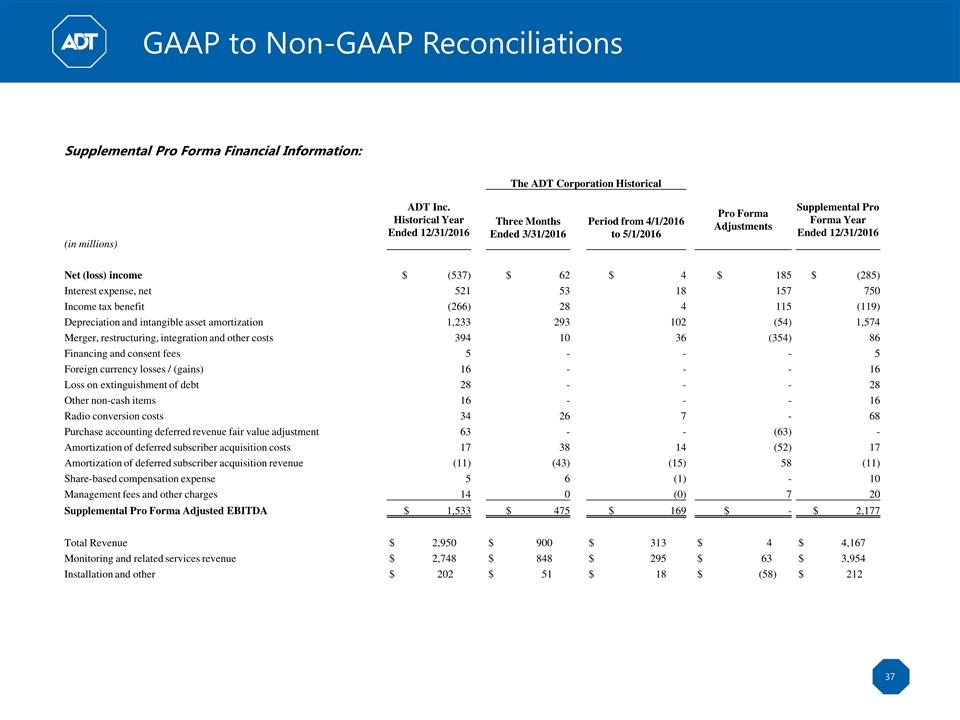
37 Supplemental Pro Forma Financial Information: The ADT Corporation Historical ADT Inc. Historical Year Ended 12/31/2016 Pro Forma Adjustments Supplemental Pro Forma Year Ended 12/31/2016 Three Months Ended 3/31/2016 Period from 4/1/2016 to 5/1/2016 (in millions) Net (loss) income $ (537) $ 62 $ 4 $ 185 $ (285) Interest expense, net 521 53 18 157 750 Income tax benefit (266) 28 4 115 (119) Depreciation and intangible asset amortization 1,233 293 102 (54) 1,574 Merger, restructuring, integration and other costs 394 10 36 (354) 86 Financing and consent fees 5 - - - 5 Foreign currency losses / (gains) 16 - - - 16 Loss on extinguishment of debt 28 - - - 28 Other non-cash items 16 - - - 16 Radio conversion costs 34 26 7 - 68 Purchase accounting deferred revenue fair value adjustment 63 - - (63) - Amortization of deferred subscriber acquisition costs 17 38 14 (52) 17 Amortization of deferred subscriber acquisition revenue (11) (43) (15) 58 (11) Share-based compensation expense 5 6 (1) - 10 Management fees and other charges 14 0 (0) 7 20 Supplemental Pro Forma Adjusted EBITDA $ 1,533 $ 475 $ 169 $ - $ 2,177 Total Revenue $ 2,950 $ 900 $ 313 $ 4 $ 4,167 Monitoring and related services revenue $ 2,748 $ 848 $ 295 $ 63 $ 3,954 Installation and other $ 202 $ 51 $ 18 $ (58) $ 212 GAAP to Non-GAAP Reconciliations
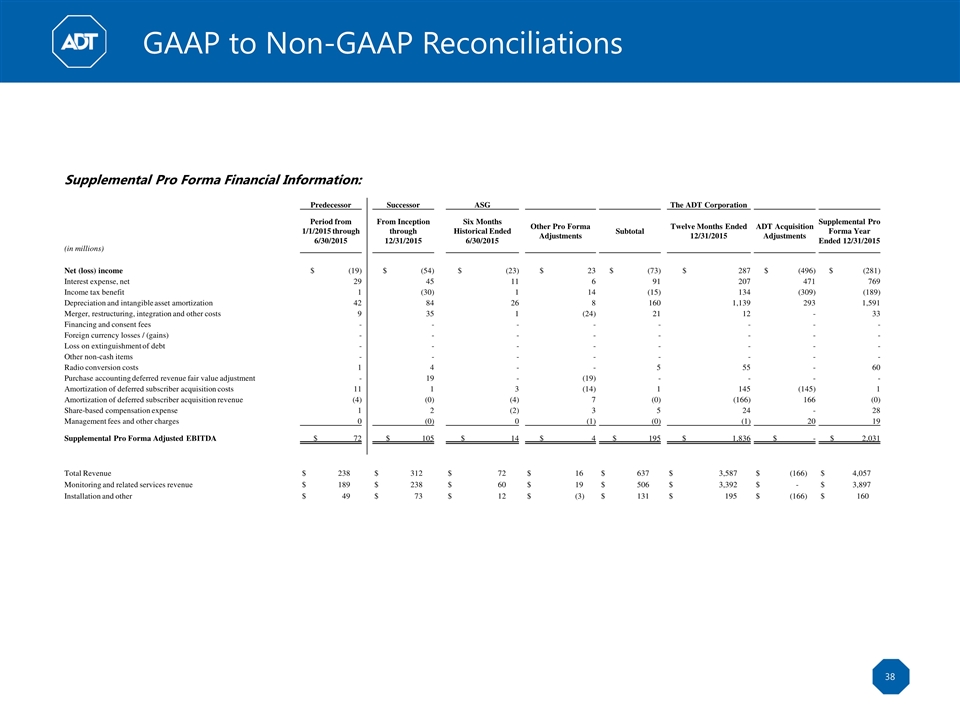
38 Supplemental Pro Forma Financial Information: Predecessor Successor ASG The ADT Corporation (in millions) Period from 1/1/2015 through 6/30/2015 From Inception through 12/31/2015 Six Months Historical Ended 6/30/2015 Other Pro Forma Adjustments Subtotal Twelve Months Ended 12/31/2015 ADT Acquisition Adjustments Supplemental Pro Forma Year Ended 12/31/2015 Net (loss) income $ (19) $ (54) $ (23) $ 23 $ (73) $ 287 $ (496) $ (281) Interest expense, net 29 45 11 6 91 207 471 769 Income tax benefit 1 (30) 1 14 (15) 134 (309) (189) Depreciation and intangible asset amortization 42 84 26 8 160 1,139 293 1,591 Merger, restructuring, integration and other costs 9 35 1 (24) 21 12 - 33 Financing and consent fees - - - - - - - - Foreign currency losses / (gains) - - - - - - - - Loss on extinguishment of debt - - - - - - - - Other non-cash items - - - - - - - - Radio conversion costs 1 4 - - 5 55 - 60 Purchase accounting deferred revenue fair value adjustment - 19 - (19) - - - - Amortization of deferred subscriber acquisition costs 11 1 3 (14) 1 145 (145) 1 Amortization of deferred subscriber acquisition revenue (4) (0) (4) 7 (0) (166) 166 (0) Share-based compensation expense 1 2 (2) 3 5 24 - 28 Management fees and other charges 0 (0) 0 (1) (0) (1) 20 19 Supplemental Pro Forma Adjusted EBITDA $ 72 $ 105 $ 14 $ 4 $ 195 $ 1,836 $ - $ 2,031 Total Revenue $ 238 $ 312 $ 72 $ 16 $ 637 $ 3,587 $ (166) $ 4,057 Monitoring and related services revenue $ 189 $ 238 $ 60 $ 19 $ 506 $ 3,392 $ - $ 3,897 Installation and other $ 49 $ 73 $ 12 $ (3) $ 131 $ 195 $ (166) $ 160 GAAP to Non-GAAP Reconciliations
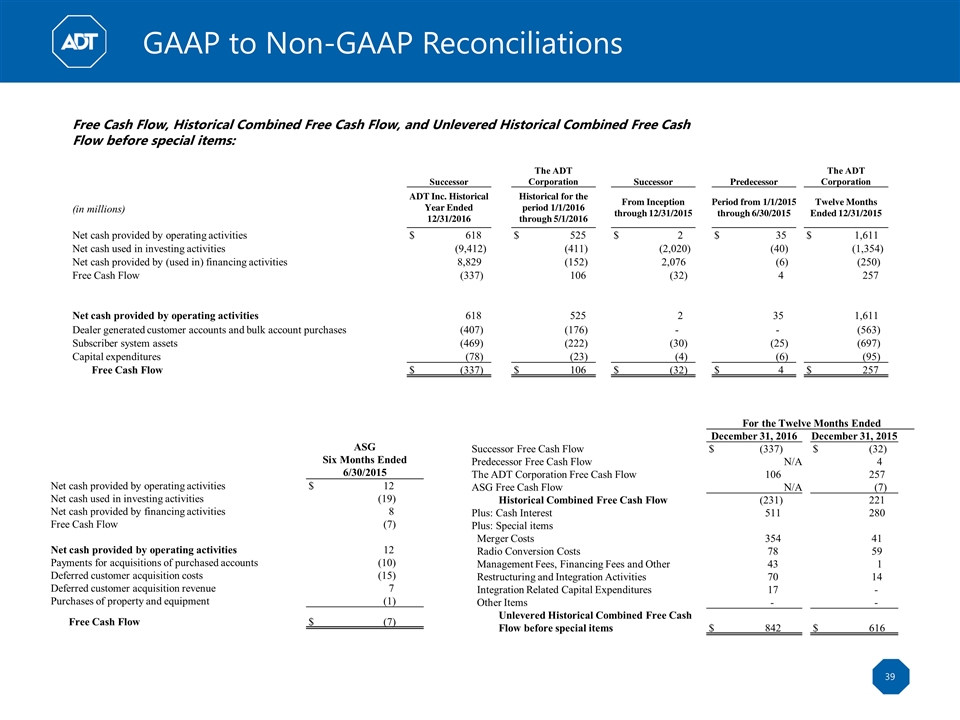
39 For the Twelve Months Ended December 31, 2016 December 31, 2015 Successor Free Cash Flow $ (337) $ (32) Predecessor Free Cash Flow N/A 4 The ADT Corporation Free Cash Flow 106 257 ASG Free Cash Flow N/A (7) Historical Combined Free Cash Flow (231) 221 Plus: Cash Interest 511 280 Plus: Special items Merger Costs 354 41 Radio Conversion Costs 78 59 Management Fees, Financing Fees and Other 43 1 Restructuring and Integration Activities 70 14 Integration Related Capital Expenditures 17 - Other Items - - Unlevered Historical Combined Free Cash Flow before special items $ 842 $ 616 ASG Six Months Ended 6/30/2015 Net cash provided by operating activities $ 12 Net cash used in investing activities (19) Net cash provided by financing activities 8 Free Cash Flow (7) Net cash provided by operating activities 12 Payments for acquisitions of purchased accounts (10) Deferred customer acquisition costs (15) Deferred customer acquisition revenue 7 Purchases of property and equipment (1) Free Cash Flow $ (7) Free Cash Flow, Historical Combined Free Cash Flow, and Unlevered Historical Combined Free Cash Flow before special items: Successor The ADT Corporation Successor Predecessor The ADT Corporation (in millions) ADT Inc. Historical Year Ended 12/31/2016 Historical for the period 1/1/2016 through 5/1/2016 From Inception through 12/31/2015 Period from 1/1/2015 through 6/30/2015 Twelve Months Ended 12/31/2015 Net cash provided by operating activities $ 618 $ 525 $ 2 $ 35 $ 1,611 Net cash used in investing activities (9,412) (411) (2,020) (40) (1,354) Net cash provided by (used in) financing activities 8,829 (152) 2,076 (6) (250) Free Cash Flow (337) 106 (32) 4 257 Net cash provided by operating activities 618 525 2 35 1,611 Dealer generated customer accounts and bulk account purchases (407) (176) - - (563) Subscriber system assets (469) (222) (30) (25) (697) Capital expenditures (78) (23) (4) (6) (95) Free Cash Flow $ (337) $ 106 $ (32) $ 4 $ 257 GAAP to Non-GAAP Reconciliations

Debt to Net Income Ratio Net Leverage Ratio Notes: Pro Forma financial information represents the preliminary estimated impact associated with the proposed refinancing transaction on debt and cash interest. LTM cash interest of $677 million is comprised of $183 million in Q3'18, $209 million in Q4'18, $99 million in Q1'19, and $186 million in Q2'19. Debt instruments are stated at face value excluding debt issuance discount, deferred financing costs, and fair value adjustments. LTM cash interest excluding Koch Redemption excludes $96 million paid in connection with the Koch redemption on July 2, 2018. 40 GAAP to Non-GAAP Reconciliations
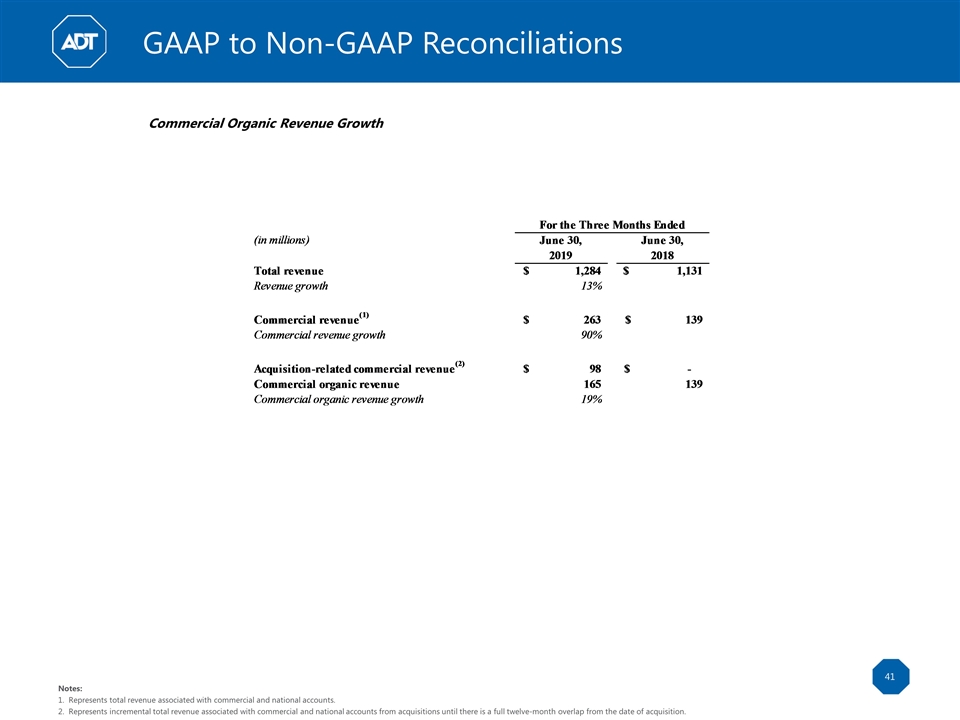
41 Commercial Organic Revenue Growth Notes: Represents total revenue associated with commercial and national accounts. Represents incremental total revenue associated with commercial and national accounts from acquisitions until there is a full twelve-month overlap from the date of acquisition. GAAP to Non-GAAP Reconciliations


