UNITED STATES
SECURITIES AND EXCHANGE COMMISSION
WASHINGTON, D.C. 20549
SCHEDULE 14A
Proxy Statement Pursuant to Section 14(a) of the
Securities Exchange Act of 1934
(Amendment No. )
| Filed by the Registrant | ☒ | Filed by a Party other than the Registrant | ☐ |
Check the appropriate box:
| ☐ | Preliminary Proxy Statement |
| ☐ | Confidential, for Use of the Commission Only (as permitted by Rule 14a-6(e)(2)) |
| ☐ | Definitive Proxy Statement |
| ☒ | Definitive Additional Materials |
| ☐ | Soliciting Material Pursuant to §240.14a-12 |
XAI Octagon Floating Rate & Alternative Income Term Trust
(Name of Registrant as Specified in Its Charters)
(Name of Person(s) Filing Proxy Statement, if other than the Registrant)
Payment of Filing Fee (Check the appropriate box):
| ☐ | Fee computed on table below per Exchange Act Rules 14a-6(i)(1) and 0-11. |
| | (1) | Title of each class of securities to which transaction applies: |
| | | |
| | (2) | Aggregate number of securities to which transaction applies: |
| | | |
| | (3) | Per unit price or other underlying value of transaction computed pursuant to Exchange Act Rule 0-11 (set forth the amount on which the filing fee is calculated and state how it was determined): |
| | | |
| | (4) | Proposed maximum aggregate value of transaction: |
| | | |
| | (5) | Total fee paid: |
| | | |
| ☐ | Fee paid previously with preliminary materials: |
| ☐ | Check box if any part of the fee is offset as provided by Exchange Act Rule 0-11(a)(2) and identify the filing for which the offsetting fee was paid previously. Identify the previous filing by registration statement number, or the Form or Schedule and the date of its filing. |
| | (1) | Amount Previously Paid: |
| | | |
| | (2) | Form, Schedule or Registration Statement No.: |
| | | |
| | (3) | Filing Party: |
| | | |
| | (4) | Date Filed: |
| | | |
XAI Octagon Floating Rate & Alternative Income Term Trust (the “Trust” or “XFLT”) Quarterly Webinar November 30, 2023, at 10:30am Eastern Time This presentation has been prepared by XA Investments LLC (“XAI” or the “Adviser”) in conjunction with Octagon Credit Investors, LLC (“Octagon” or the “Sub - adviser”) solely for information purposes and is not an offer to sell or the solicitation of an offer to buy an interest in any security. XAI serves as the investment adviser to the Trust and is responsible for overseeing the Trust’s overall investment strategy and its implementation. Octagon serves as the investment sub - adviser of the Trust and is responsible for investing the Trust’s assets. XAI is affiliated with XMS Capital Partners, LLC, a FINRA member and SIPC member. Consider the investment objective, risks, charges and expenses of the Trust carefully before investing. An investment in the Trust involves risks and is not appropriate for all investors and is not intended to be a complete investment program. For a summary of the risks associated with an investment in the Trust please see the “XFLT Risk Considerations" beginning on page 39 of this presentation. The Trust is a diversified, closed - end management investment company with limited history of operation. The Trust began operation on September 27, 2017. Shares of closed - end investment companies frequently trade at a discount from their net asset value. Investors should read XFLT’s prospectus and SEC filings (which are publicly available on the EDGAR Database on the SEC website at http://www.sec.gov) carefully before investing in XFLT. Foreside Fund Services, LLC - Distributor
General Disclosures This presentation is intended to be educational in nature and is not for the purpose of recommending a particular investment. The investments discussed may or may not be suitable for the audience of this presentation. Neither XAI nor Octagon is acting as an adviser to the audience members, and audience members should consult their own investment adviser prior to making investment decisions. XA INVESTMENTS LLC | XAI Octagon Floating Rate & Alternative Income Term Trust (XFLT) QUARTERLY WEBINAR | 2 From time to time, the Company may have a registration statement relating to one or more of its securities on file with the Securities and Exchange Commission (“SEC”). Any registration statement that has not yet been declared effective by the SEC, and any prospectus relating thereto, is not complete and may be changed. Any securities that are the subject of such a registration statement may not be sold until the registration statement filed with the SEC is effective. Some information in this presentation reflects proprietary research based upon various data sources. In addition, some inform ation cited in this presentation has been taken from third - party sources that are believed to be reliable but which have not been verified for accuracy or completeness. Neither XAI or Octagon, nor their respective affiliates (collectively, the “Investment Managers”), is responsible for errors or omissions from these sources. No representation is made with respect to the accuracy, completeness or timeliness of information and the Investment Managers assume no obligation to update or otherwise revise such information. The Investment Managers make no representation that the information contained in this presentation is accurate or complete, nor do they review or assume any responsibility for any information received from, or created by, any third parties, including the performance data of indexes and benchmarks. Views expressed herein are subject to change without notice. All data concerning returns and satisfaction of performance tests are historical and based on the Investment Managers’ knowledge; as such, they do not represent current performance levels, some or all of which may have changed since the dates referenced herein. This document does not constitute investment, tax, legal, regulatory or accounting advice. Under no circumstances should this document be used or considered as an offer to sell or a solicitation of an offer to buy any security, financial instrument or investment vehicle. Investors are advised to make an independent review regarding the economic benefits and risks of purchasing or selling the financial instruments mentioned in this document and reach their own conclusions regarding the legal, tax, regulatory, accounting and other aspects of any transaction in the financial instrument in relation to their particular circumstances. Investments described herein carry a risk of loss, which could be significant, and that investors should be prepared to bear. Octagon and/or its affiliated companies may make a market or deal as principal in the financial instruments mentioned in this document or in related securities, options or other derivative instruments based on them. In addition, the Investment Managers, their affiliated companies, shareholders, directors, officers and/or employees, may from time to time have long or short positions in the financial instruments, including loans, securities or in options, futures or other derivative instruments based on them. Performance achieved prior to December 31, 2021 is predominantly based on investments that use USD LIBOR as a reference rate. Overnight and 12 - month US dollar LIBOR permanently ceased as of June 30, 2023. 1 - , 3 - , and 6 - month U.S. dollar LIBOR settings will continue to be published using a synthetic methodology until September 2024. As an alternative to LIBOR, the Financial Reporting Council, in conjunction with the Alternative Reference Rates Committee, a steering committee comprised of large U.S. financial institutions, recommended replacing U.S. dollar LIBOR with Secured Overnight Financing Rate (“SOFR”), a new index calculated by reference to short - term repurchase agreements, backed by Treasury securities. There is no guarantee that the performance of individual investments or the syndicated debt and CLO securities markets as a whole during or after the transition period will be consistent with performance achieved during the LIBOR era. Performance data quoted represents past performance. Past performance does not guarantee future results. Current performance may be lower or higher than the performance data quoted. Similar investments likely would produce different results under different economic and market conditions. These materials contain forward - looking statements. Investors should not place undue reliance on forward - looking statements. Actual results could differ materially from those referenced in forward - looking statements for many reasons. Forward - looking statements are necessarily speculative in nature, and it can be expected that some or all of the assumptions underlying any forward - looking statements will not materialize or will vary significantly from actual results. Variations of assumptions and results may be material. Without limiting the generality of the foregoing, the inclusion of forward - looking statements herein should not be regarded as a representation by the Investment Managers or any of their respective affiliates or any other person of the results that will actually be achieved by the Trust. None of the foregoing persons has any obligation to update or otherwise revise any forward - looking statements, including any revision to reflect changes in any circumstances arising after the date hereof relating to any assumptions or otherwise.
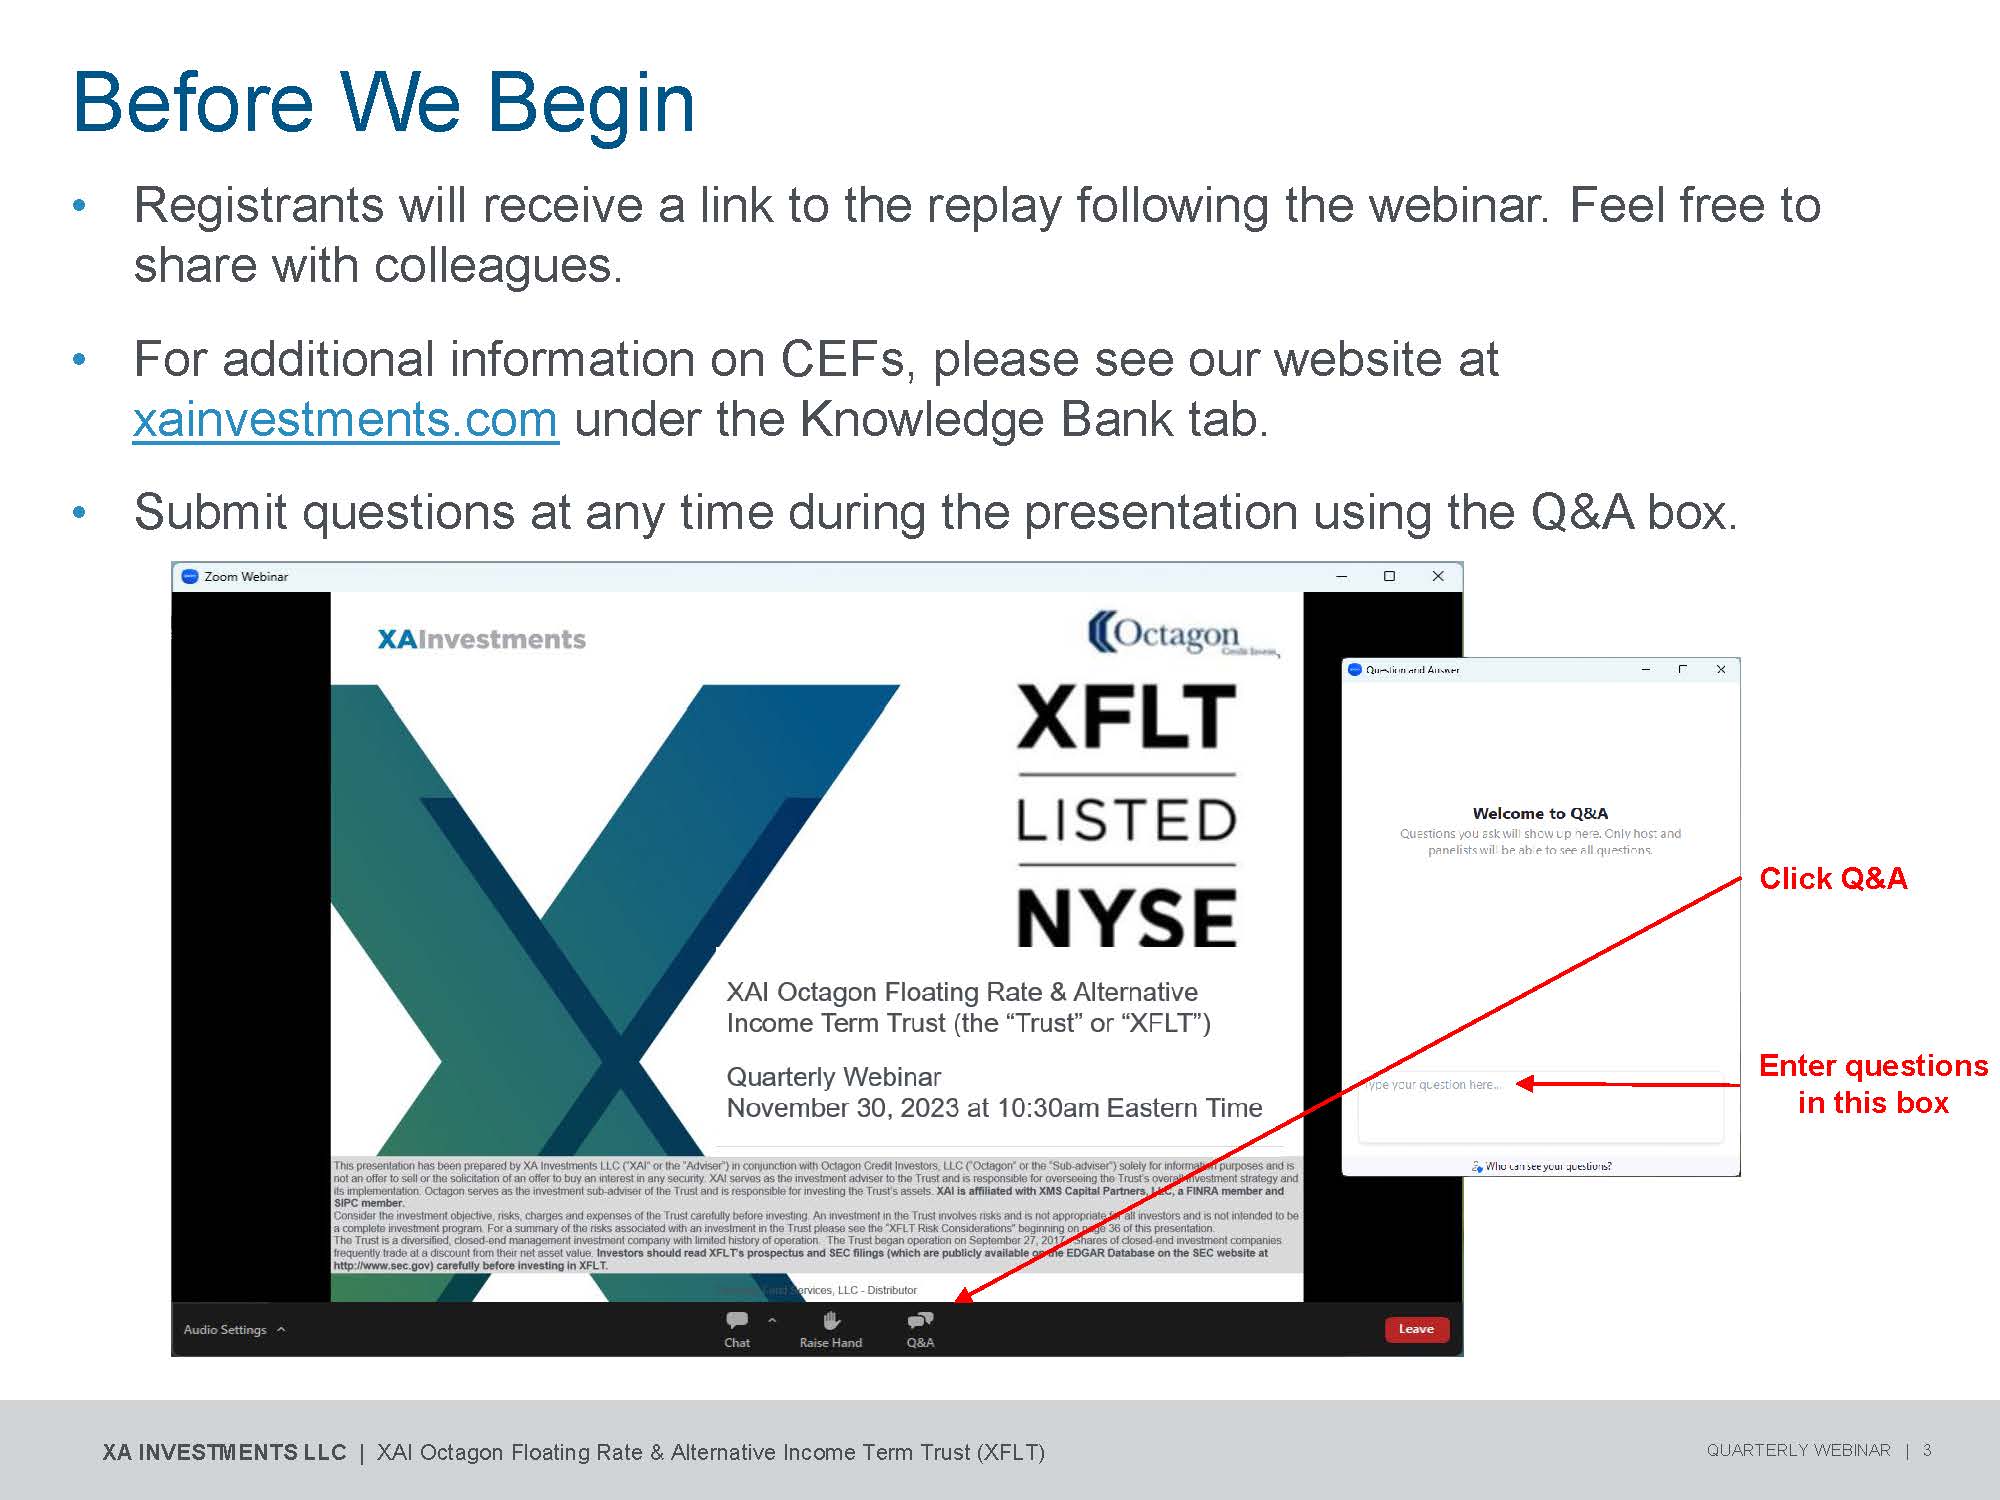
Before We Begin XA INVESTMENTS LLC | XAI Octagon Floating Rate & Alternative Income Term Trust (XFLT) QUARTERLY WEBINAR | 3 • Registrants will receive a link to the replay following the webinar. Feel free to share with colleagues. • For additional information on CEFs, please see our website at xainvestments.com under the Knowledge Bank tab. • Submit questions at any time during the presentation using the Q&A box. Click Q&A Enter questions in this box

Steven Perry Vice President XA Investments LLC Kimberly Flynn Managing Director XA Investments LLC Lauren Law Portfolio Manager Octagon Credit Investors, LLC Gr e tchen Lam Senior Portfolio Manager Octagon Credit Investors, LLC Steven Perry is a Vice President at XA Investments focused on product and business development. Steven is responsible for overseeing XFLT’s product management decisions. Previously, Steven worked consulting lenders across the country in the government guarantee lending space at Windsor Advantage. Under his management, he oversaw a portfolio of more than 1,100 loans totaling over $1.3bn. Also, Steven was responsible for building the Portfolio Management and Construction Management Departments at Windsor Advantage. Prior to working at Windsor Advantage, he played five years of professional soccer. Steven received his B.B.A. in Finance from the University of Notre Dame. Kimberly Flynn serves as Managing Director at XA Investments. She is a partner in the firm and responsible for all product and business development activities. Kim is responsible for the firm’s proprietary fund platform and consulting practice. Previously, Kim was Senior Vice President and Head of Product Development for Nuveen Investments’ Global Structured Products Group. In her leadership role at Nuveen, Kim was responsible for asset raising activities through the development of new traditional and alternative investment funds including CEFs, ETFs, UITs and commodity pools. Kim received her M.B.A. degree from Harvard University and her B.B.A. in Finance and Business Economics, Summa Cum Laude, from the University of Notre Dame in 1999. She received her CFA charter in 2005. Ms. Law is a member of Octagon’s Investment Committee and serves as a Portfolio Manager across CLOs, Separately Managed Accounts and Commingled Funds. Ms. Law joined Octagon in 2004. In addition, she helps oversee the Firm’s Structured Credit (CLO debt and equity) investment strategies. Prior to becoming a Portfolio Manager, Ms. Law was an Investment Team Principal whose coverage areas included healthcare, industrials, financials, business services, and the Firm’s CLO debt and equity investments. She holds a Bachelor of Science from Babson College, where she graduated Magna Cum Laude . She received her CFA charter in 2009 . Ms. Lam is a member of Octagon’s Investment Committee and serves as a Portfolio Manager across CLOs, Separately Managed Accounts and Commingled Funds. Ms. Lam oversees the Firm’s Structured Credit (CLO debt & equity) investment strategies. Ms. Lam is also a member of the Firm’s ESG Committee. Prior to becoming a Portfolio Manager, Ms. Lam oversaw Octagon's investments in the software, business services, finance & insurance, paper & packaging, gaming & lodging, homebuilding and real estate industries. She was also responsible for the structured credit exposure held in Octagon’s CLO vehicles. Prior to joining Octagon in 1999, Ms. Lam attended Babson College where she graduated Summa Cum Laude with a B.S. in Investments. She received her CFA charter in 2006. Today’s Speakers XA INVESTMENTS LLC | XAI Octagon Floating Rate & Alternative Income Term Trust (XFLT) QUARTERLY WEBINAR | 4
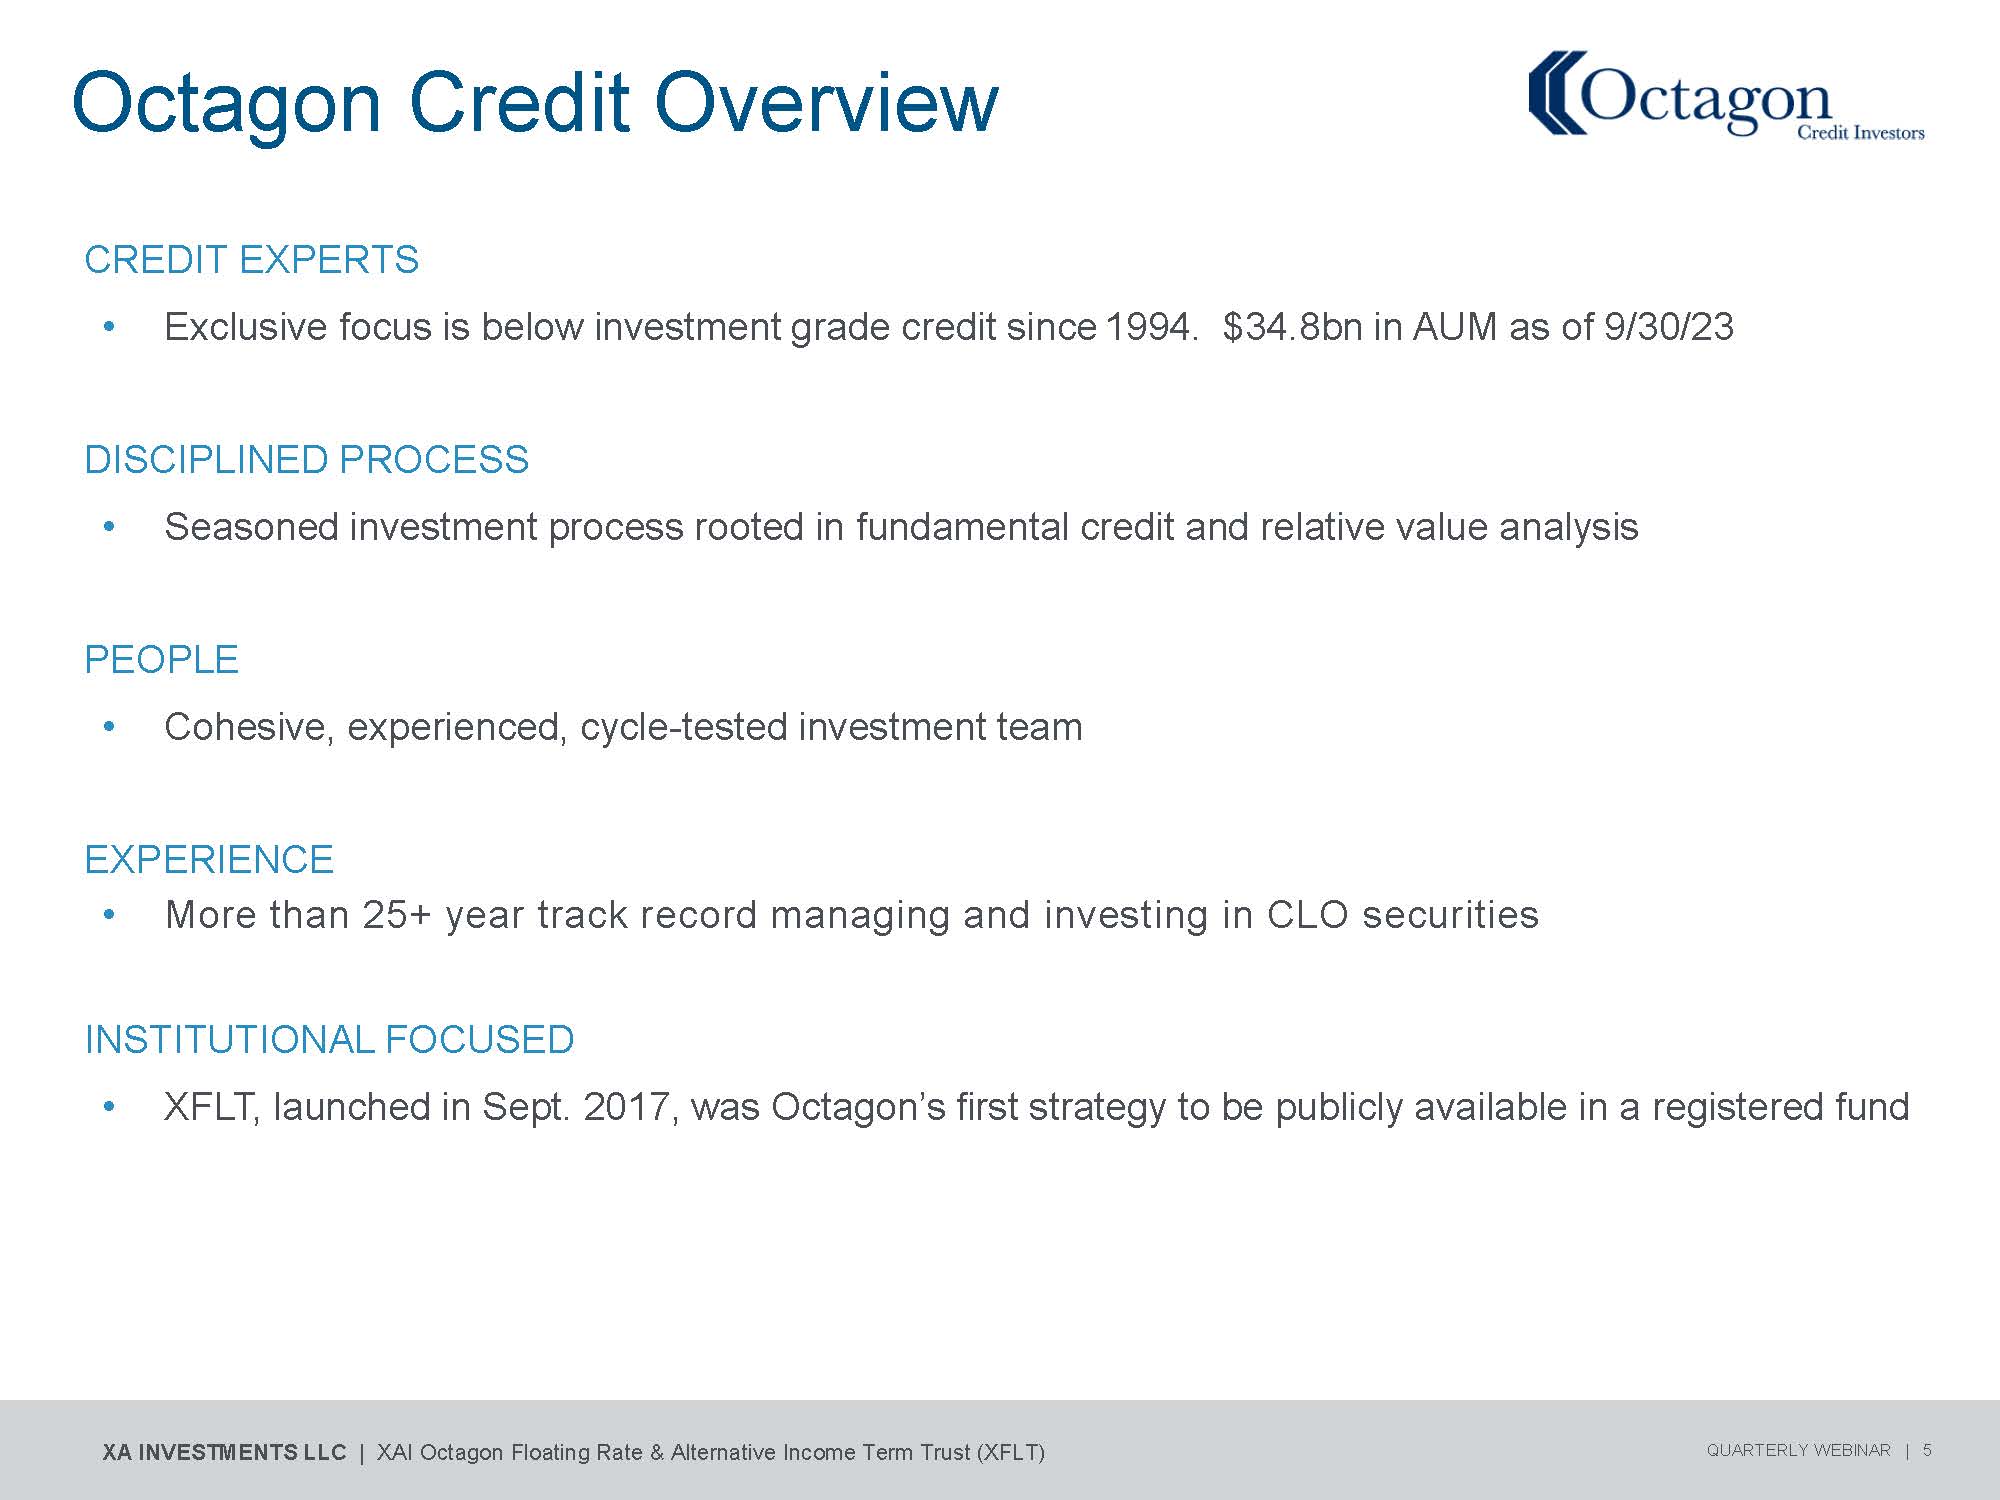
Octagon Credit Overview CREDIT EXPERTS • Exclusive focus is below investment grade credit since 1994. $34.8bn in AUM as of 9/30/23 DISCIPLINED PROCESS • Seasoned investment process rooted in fundamental credit and relative value analysis PEOPLE • Cohesive, experienced, cycle - tested investment team EXPERIENCE • More than 25+ year track record managing and investing in CLO securities I N S T I TUT IO N AL F O CU SED • XFLT, launched in Sept. 2017, was Octagon’s first strategy to be publicly available in a registered fund XA INVESTMENTS LLC | XAI Octagon Floating Rate & Alternative Income Term Trust (XFLT) QUARTERLY WEBINAR | 5

Summary of XFLT Proxy Proposals XA INVESTMENTS LLC | XAI Octagon Floating Rate & Alternative Income Term Trust (XFLT) QUARTERLY WEBINAR | 6 • On October 25, 2023, the Board of Trustees (the “Board”) of the Trust unanimously approved two proposals (collectively referred to as the “Proposals”), as summarized below. • The Board unanimously recommends that shareholders vote to approve each Proposal at the special meeting of shareholders of the Trust, to be held on December 19, 2023. Shareholders of record at the close of business on October 25, 2023 are entitled to vote at the meeting. Proposal 1 - Approval of Sub - Advisory Agreement • To approve a new investment sub - advisory agreement among the Trust, XAI, and Octagon, to become effective upon the closing of a transaction by Octagon’s parent company that will result in the automatic termination of the current sub - advisory agreement. The terms of the new sub - advisory agreement are substantially identical to the current sub - advisory agreement. Proposal 2 - Amendment of Declaration of Trust to Remove Termination Date • To approve an amendment to the Trust’s Agreement and Declaration of Trust to cause the Trust to become a perpetual fund by eliminating the requirement that it terminate operations on or about December 31, 2029, unless extended as permitted by the Declaration of Trust. Please Vote Your Shares The Trust has filed a proxy statement related to the shareholder meeting with the Securities and Exchange Commission (“SEC”). Because the proxy statement contains important information about the Proposals, the Trust’s shareholders are urged to read the proxy statement and accompanying materials carefully. Shareholders can obtain, free of charge, copies of these documents at the SEC’s website at www.sec.gov and can obtain copies by calling (800) 431 - 9645 or by writing the Trust at 321 North Clark Street, Suite 2430, Chicago, Illinois 60654.

Questions & Topics for the Speakers XA INVESTMENTS LLC | XAI Octagon Floating Rate & Alternative Income Term Trust (XFLT) QUARTERLY WEBINAR | 7 1. Please discuss the XFLT financial highlights for the quarter. 2. What has Board governance looked like in the last 12 months? 3. Describe the methods XFLT can use to grow its common share base. 4. Discuss XFLT’s current distribution rate. What percentage of the distributions comprised a return of capital? 5. Can you describe the impact of interest rate increases on XFLT’s portfolio and the trust’s use of leverage? 6. How has the financial performance of loan borrowers trended in the 3Q23? How has this translated into CLO performance? 7. Are any particular loan market industries outperforming or underperforming? What are Octagon’s expectations for loan defaults going forward? 8. Recession fears eased in 3Q23 as inflation came off its peak and GDP remained resilient. How have the loan and CLO tranche markets reacted? Where are loans and CLO debt/equity trading today? 9. New CLO issuance was lower in 2023, in part due to challenging CLO arbitrage for new deals. How has that evolved over the course of the year and what is your outlook for primary CLO issuance and CLO arbitrage in 2024? 10. What is your outlook for the CLO market going forward?

XFLT Financial Highlights XA INVESTMENTS LLC | XAI Octagon Floating Rate & Alternative Income Term Trust (XFLT) QUARTERLY WEBINAR | 8 • XFLT has a fiscal year end of September 30 th . Please see XFLT’s Annual Report, Semi - annual Report and quarterly financials at www.XAInvestments.com for more details. • For the fiscal year ended September 30, 2023, net investment income (“NII”) was $0.92 and net realized and unrealized gain on investments was $0.30 per weighted average common share. The total income from investment operations was $1.22. • For the fiscal year ended September 30, 2023, the ratio of NII to average net assets was 14.30% • For the third quarter, XFLT issued 3,296,106 shares of common stock pursuant to the Company’s “at - the - market” offering program for total net proceeds of approximately $22.3mm. • Monthly distributions for the quarter were payable on July 3, August 1, and September 1 in the amounts of $0.085, $0.085 and $0.085, respectively. • $500 m m A U M m ilestone on September 19, 2023. • Weighted Average Current Yields (price) as of 9/30/2023 1 : CLO Equity: 23.52% CLO Debt: 13.01% Loans: 10.33% Bonds: 6.92% Notes: 1. Based on prices sourced by Markit, a third - party pricing service, and are subject to change. Octagon makes no assurances that the prices reflected herein represent the prices at which the Trust’s investments will be liquidated. Any fluctuations in market prices may impact Trust returns. Past performance is not necessarily indicative of future results. Current Yield for CLO equity positions is calculated by Octagon as the sum of all cash distributions paid by the CLO within the past 12 months as of the respective date shown (i.e. LTM), divided by the total purchase price or mark price value of the Trust’s CLO equity positions as of the respective date. Based on this calculation methodology, the Current Yield of these positions, as included in the calculation of Total Portfolio Current Yield, is zero. Total LTM quarterly cash distributions received by the Trust excludes: i) any CLO Equity positions that have been called; and, ii) any CLO Equity position(s) that did not receive a cash distribution at the CLO’s most recent quarterly payment date, however, the purchase cost amount and market value of any such CLO Equity position(s) is reflected in the total purchase cost amount and market value of the Trust’s CLO Equity positions used to calculate the Current Yield. As of September 30, 2023, no Trust holdings qualify for this treatment. Total LTM quarterly cash distributions also excludes outsized par flush distributions executed upon a deal’s reset or refinancing. These distributions and the Current Yield are subject to change on a prospective basis. Yield is not a projection or guarantee of future returns, due to expected changes in asset prices and changing market factors. Performance achieved prior to December 31, 2021 is predominantly based on investments that use USD LIBOR as a reference rate. Overnight and 12 - month US dollar LIBOR permanently ceased as of June 30, 2023. 1 - , 3 - , and 6 - month U.S. dollar LIBOR settings will continue to be published using a synthetic methodology until September 2024. As an alternative to LIBOR, the Financial Reporting Council, in conjunction with the Alternative Reference Rates Committee, recommended replacing LIBOR with SOFR. There is no guarantee that the performance of individual investments or the syndicated debt and CLO securities markets as a whole during or after the transition period will be consistent with performance achieved during the LIBOR era. Performance data quoted represents past performance. Past performance does not guarantee future results. Current performance may be lower or higher than the performance data quoted.
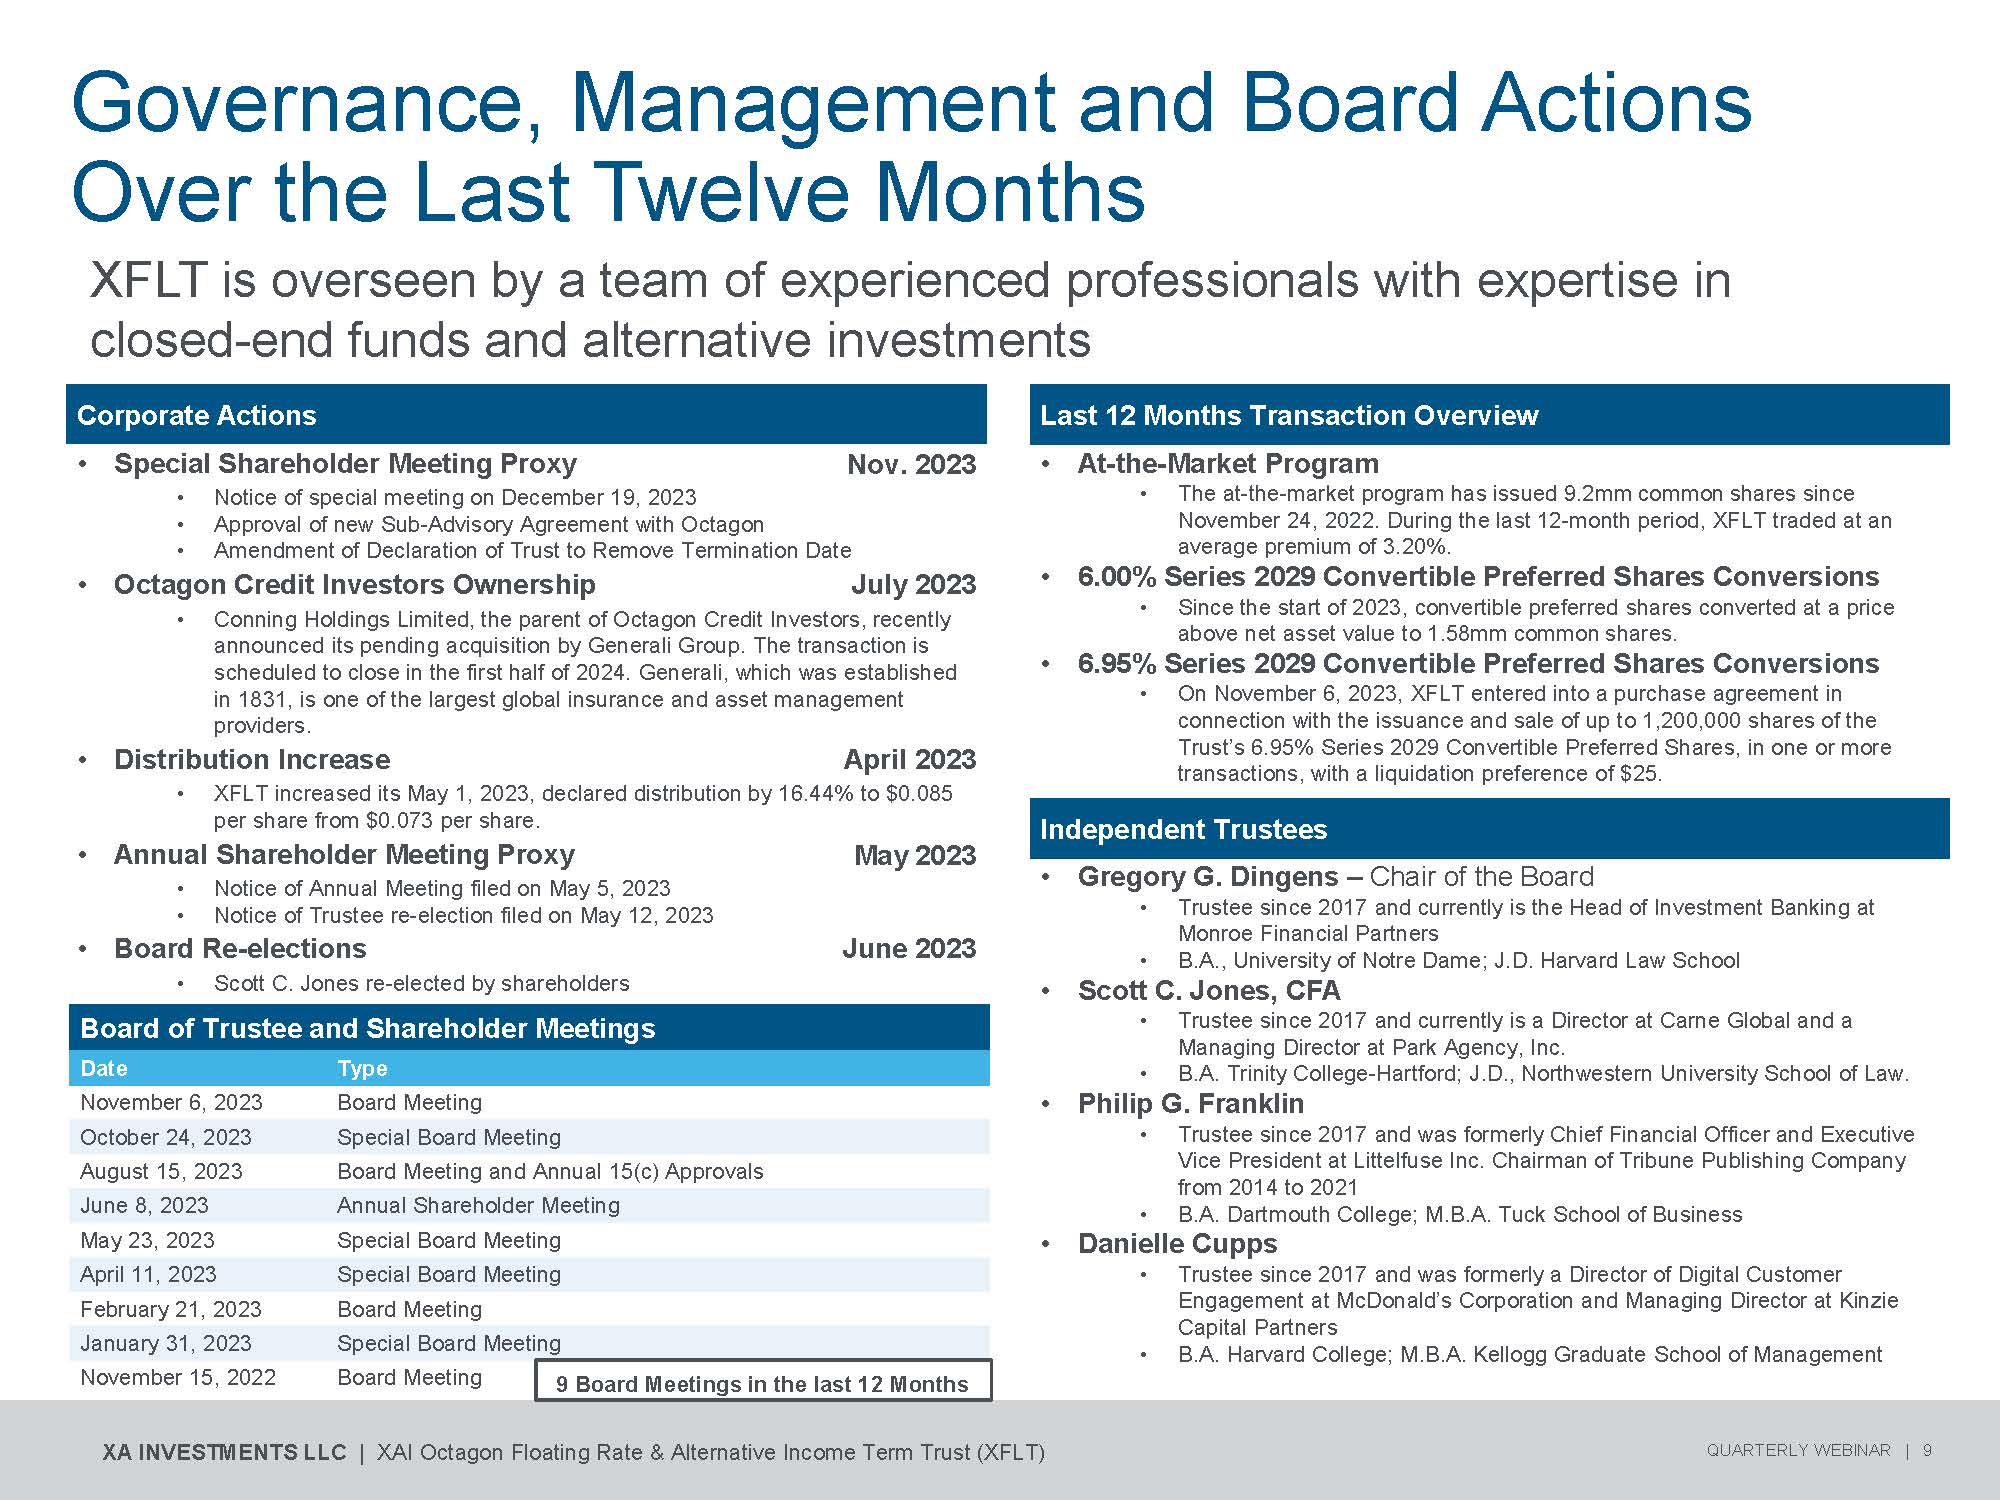
Governance, Management and Board Actions Over the Last Twelve Months XFLT is overseen by a team of experienced professionals with expertise in closed - end funds and alternative investments Last 12 Months Transaction Overview • At - the - Market Program • The at - the - market program has issued 9.2mm common shares since November 24, 2022. During the last 12 - month period, XFLT traded at an average premium of 3.20%. • 6.00% Series 2029 Convertible Preferred Shares Conversions • Since the start of 2023, convertible preferred shares converted at a price above net asset value to 1.58mm common shares. • 6.95% Series 2029 Convertible Preferred Shares Conversions • On November 6, 2023, XFLT entered into a purchase agreement in connection with the issuance and sale of up to 1,200,000 shares of the Trust’s 6.95% Series 2029 Convertible Preferred Shares, in one or more transactions, with a liquidation preference of $25. Independent Trustees • Gregory G. Dingens – Chair of the Board • Trustee since 2017 and currently is the Head of Investment Banking at Monroe Financial Partners • B.A., University of Notre Dame; J.D. Harvard Law School • Scott C. Jones, CFA • Trustee since 2017 and currently is a Director at Carne Global and a Managing Director at Park Agency, Inc. • B.A. Trinity College - Hartford; J.D., Northwestern University School of Law. • Philip G. Franklin • Trustee since 2017 and was formerly Chief Financial Officer and Executive Vice President at Littelfuse Inc. Chairman of Tribune Publishing Company from 2014 to 2021 • B.A. Dartmouth College; M.B.A. Tuck School of Business • Danielle Cupps • Trustee since 2017 and was formerly a Director of Digital Customer Engagement at McDonald’s Corporation and Managing Director at Kinzie Capital Partners • B.A. Harvard College; M.B.A. Kellogg Graduate School of Management Corporate Actions Nov. 2023 • Special Shareholder Meeting Proxy • Notice of special meeting on December 19, 2023 • Approval of new Sub - Advisory Agreement with Octagon • Amendment of Declaration of Trust to Remove Termination Date July 2023 • Octagon Credit Investors Ownership • Conning Holdings Limited, the parent of Octagon Credit Investors, recently announced its pending acquisition by Generali Group. The transaction is scheduled to close in the first half of 2024. Generali, which was established in 1831, is one of the largest global insurance and asset management providers. April 2023 • Distribution Increase • XFLT increased its May 1, 2023, declared distribution by 16.44% to $0.085 per share from $0.073 per share. May 2023 • Annual Shareholder Meeting Proxy • Notice of Annual Meeting filed on May 5, 2023 • Notice of Trustee re - election filed on May 12, 2023 June 2023 • Board Re - elections • Scott C. Jones re - elected by shareholders Board of Trustee and Shareholder Meetings Type Date Board Meeting November 6, 2023 Special Board Meeting October 24, 2023 Board Meeting and Annual 15(c) Approvals August 15, 2023 Annual Shareholder Meeting June 8, 2023 Special Board Meeting May 23, 2023 Special Board Meeting April 11, 2023 Board Meeting February 21, 2023 Special Board Meeting January 31, 2023 s in the last 12 Months Board Meeting 9 Board Meeting November 15, 2022 XA INVESTMENTS LLC | XAI Octagon Floating Rate & Alternative Income Term Trust (XFLT) QUARTERLY WEBINAR | 9

XFLT Overview and Top 10 Holdings As of 9/30/2023 Unaudited. Source: XA Investments LLC; ALPS. 1. Quarter - to - date figures ending on 9/30/2023. 2. Holdings are measured as a percentage of market value over the Trust’s total portfolio investments as of 9/30/2023. Holdings may vary and are subject to change without notice. 3. Distribution rates are not performance and are calculated by summing the monthly distributions per share over twelve months and dividing by the NAV or market price, as applicable, as of the latest month - end. Distributions may be comprised of ordinary income, net capital gains, and/or a return of capital (ROC) of your investment in the Trust. To date, a portion of common stock distributions has been estimated to be a return of capital as noted under the Investor Relations section on the Trust’s website. The actual components of the Trust’s distributions for U.S. tax reporting purposes can only be finally determined as of the end of each fiscal year of the Trust and are thereafter reported on Form 1099 - DIV. The Trust’s distributions for fiscal year ended 2023 comprised 100% net income and 0.00% return of capital. The Trust’s distributions for fiscal year ending 2024 will be made available and reported to investors after the end of fiscal year 2024. A distribution comprised in whole or in part by a return of capital does not necessarily reflect the company’s investment performance and should not be confused with “yield” or “income.” Future distributions may consist of a return of capital. Performance data quoted represents past performance. Past performance does not guarantee future results. Current performance may be lower or higher than the performance data quoted. % Portfolio Asset Type Top 10 Holdings 1.59% CLO Equity Elmwood CLO 14 Ltd. 1.38% CLO Equity CARLYLE US CLO 2019 - 4 Ltd. 1.28% CLO Equity Elmwood CLO VII Ltd. 1.08% CLO Equity Rockland Park CLO Ltd. 1.07% CLO Equity Regatta XIX Funding Ltd. 0.97% CLO Equity Elmwood CLO II Ltd. 0.94% CLO Equity Regatta XVIII Funding Ltd. 0.81% CLO Equity Anchorage Capital CLO 13 LLC 0.80% CLO Equity Benefit Street Partners CLO XXV Ltd. 0.80% CLO Equity Elmwood CLO I Ltd. 10.71% Total Top 10 Holdings 2 Summary Trust Characteristics $0.085 Current Distribution (monthly) $507,891,533 Total Managed Assets 15.29% Distribution Rate on NAV 44,653,181 Common Shares Outstanding 14.68% Distribution Rate on Market Price 271,537 Average Daily Volume (in shares) 1 511 Number of Holdings (count) 2 41.40% Total Regulatory Leverage % 87.03% Avg. Asset Price (% of par) 2 6.52% Average Cost of Leverage % 1 7.43 Avg. Effective Maturity (years) 2 $6.67 NAV 9/26/2017 Fund Inception Date $6.95 Market Price Asset Allocation % 2 46.07% 17.00% 1.54% 3.65% 0.06% 2.09% High Yield Secured Second Lien Loans Common Stock Cash & Equivalents 29.59% Senior Secured First Lien Loans CLO Equity CLO Debt XA INVESTMENTS LLC | XAI Octagon Floating Rate & Alternative Income Term Trust (XFLT) QUARTERLY WEBINAR | 10

9/30/2 0 23 12/31/ 2 022 3/31/2 0 23 Source: Octagon Credit Investors, LLC; ALPS; Paralel; data as of 9/30/2023. Performance achieved prior to December 31, 2021 is predominantly based on investments that use USD LIBOR as a reference rate. Overnight and 12 - month US dollar LIBOR permanently ceased as of June 30, 2023. 1 - , 3 - , and 6 - month U.S. dollar LIBOR settings will continue to be published using a synthetic methodology until September 2024. As an alternative to LIBOR, the Financial Reporting Council, in conjunction with the Alternative Reference Rates Committee, recommended replacing LIBOR with SOFR. There is no guarantee that the performance of individual investments or the syndicated debt and CLO securities markets as a whole during or after the transition period will be consistent with performance achieved during the LIBOR era. Performance data quoted represents past performance. Past performance does not guarantee future results. Current performance may be lower or higher than the performance data quoted. XFLT Portfolio Composition Over Time 9/30/2023 6/30/2023 3/31/2023 12/31/2022 Asset Allocation 46.07% 43.0% 43.1% 45.6% Senior Secured First Lien Loans 29.59% 32.2% 34.8% 35.2% CLO Equity 17.00% 16.2% 15.7% 14.0% CLO Debt 1.54% 1.8% 2.3% 2.8% Secured Second Lien Loans 3.65% 4.0% 4.1% 2.4% High Yield Bonds 0.06% 0.1% 0.1% 0.1% Common Stock 2.09% 2.8% 0.0% 0.0% Cash & Equivalents Senior Secured First Lien Loans CLO Equity CLO Debt Secured Second Lien Loans High Yield Bonds C o m mon Stock Cash & Equivalents 6/30/2 0 23 XA INVESTMENTS LLC | XAI Octagon Floating Rate & Alternative Income Term Trust (XFLT) QUARTERLY WEBINAR | 11
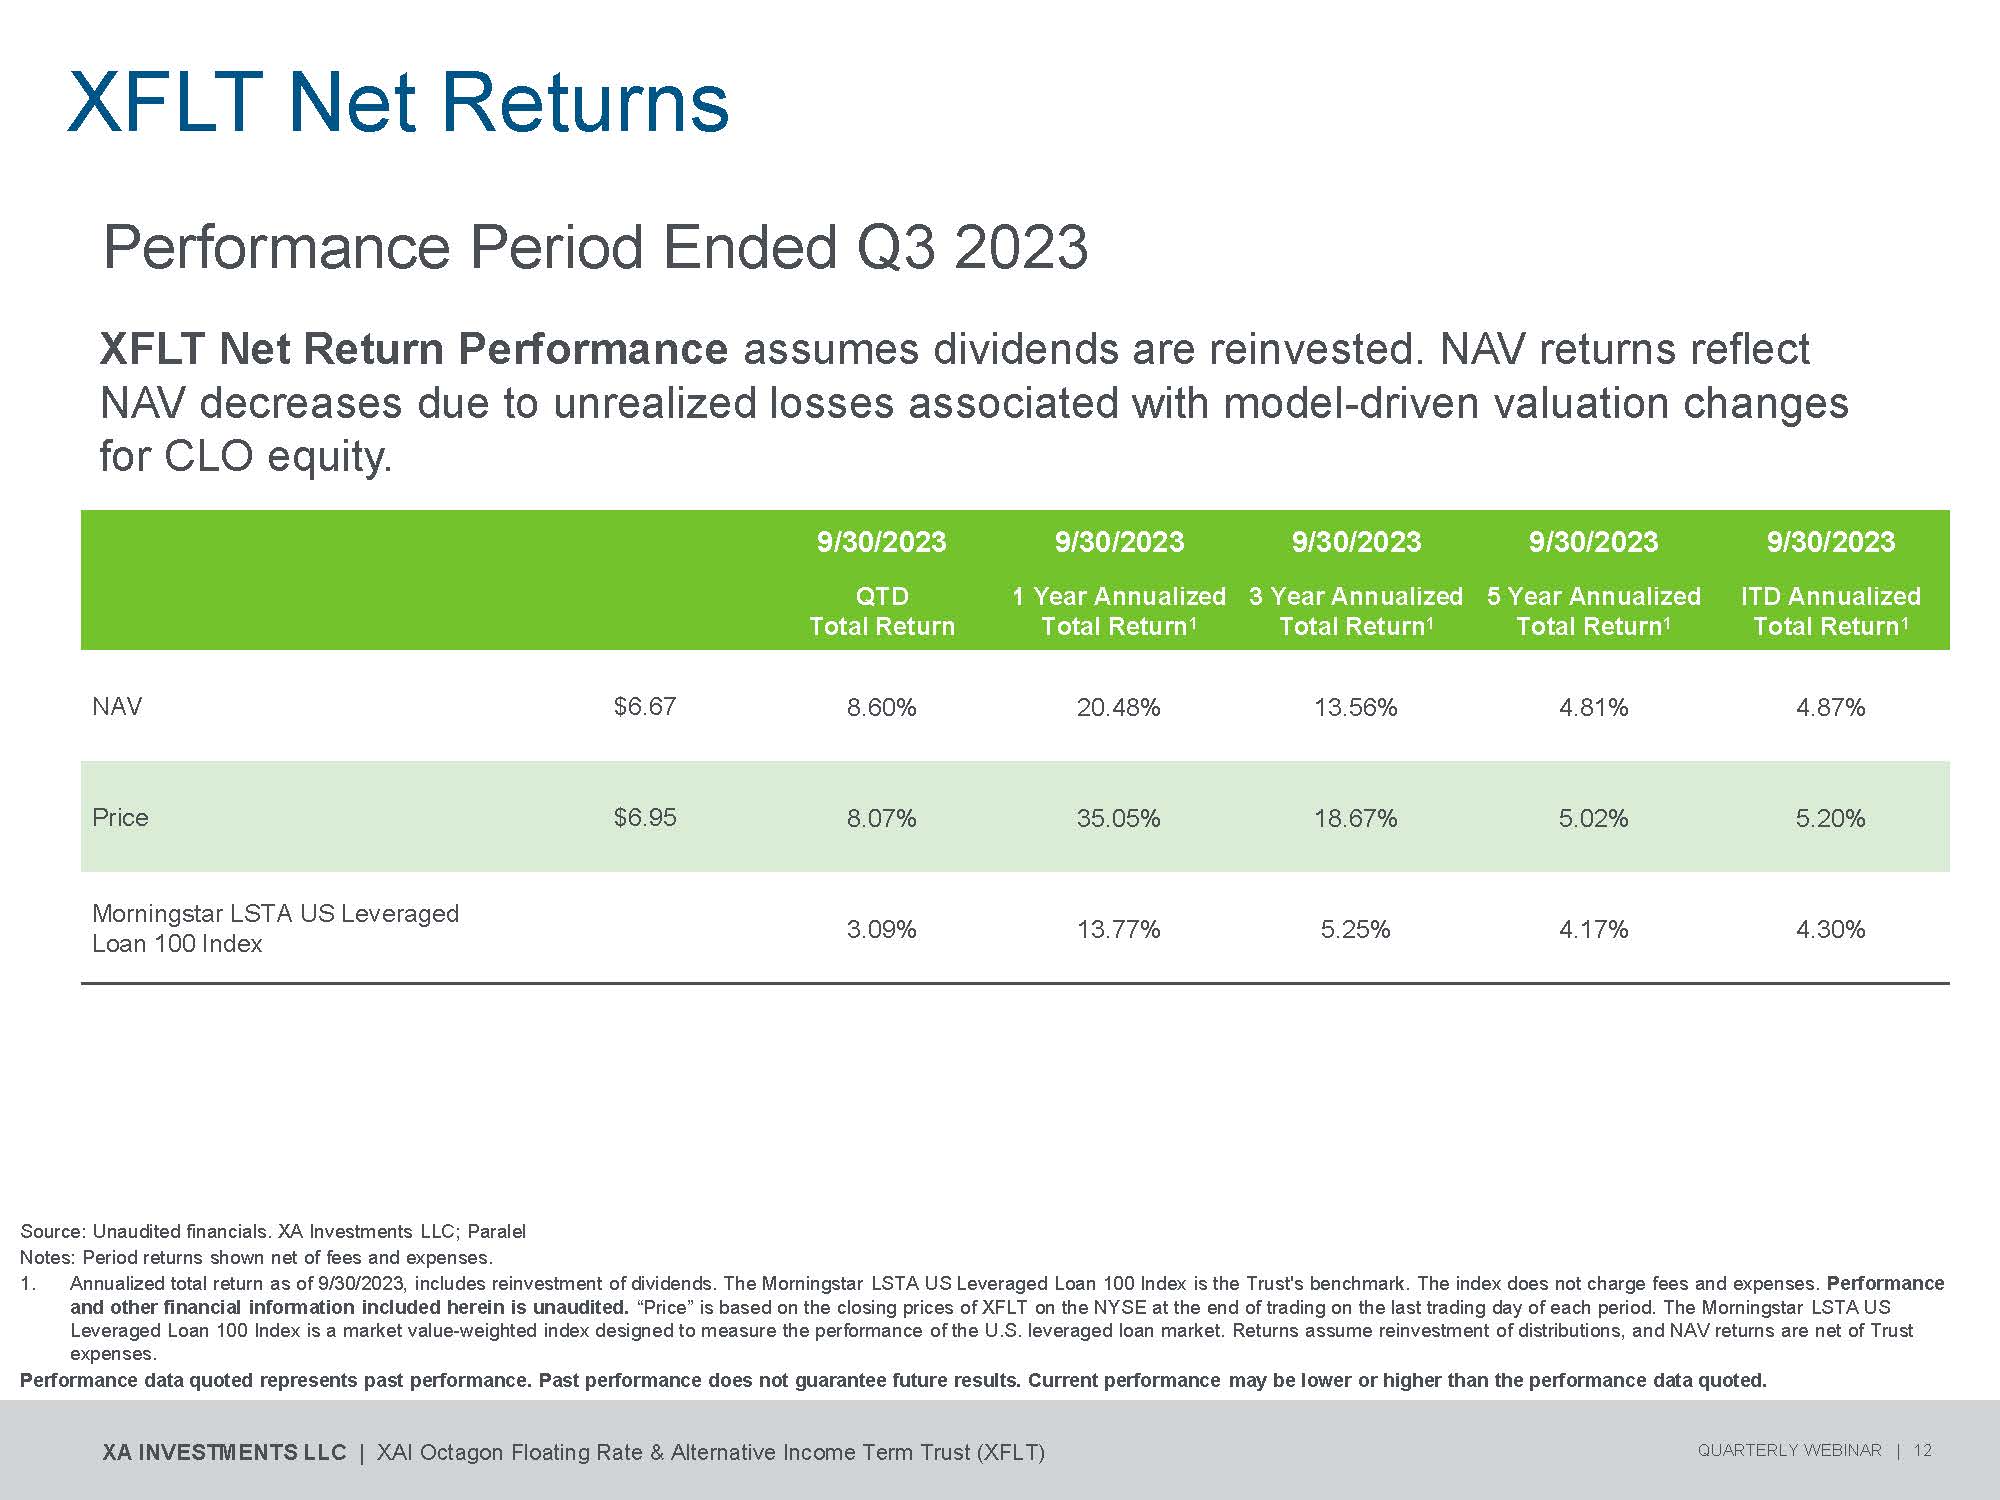
XFLT Net Returns XFLT N et Ret urns Source: Unaudited financials. XA Investments LLC; Paralel Notes: Period returns shown net of fees and expenses. 1. Annualized total return as of 9/30/2023, includes reinvestment of dividends. The Morningstar LSTA US Leveraged Loan 100 Index is the Trust's benchmark. The index does not charge fees and expenses. Performance and other financial information included herein is unaudited. “Price” is based on the closing prices of XFLT on the NYSE at the end of trading on the last trading day of each period. The Morningstar LSTA US Leveraged Loan 100 Index is a market value - weighted index designed to measure the performance of the U.S. leveraged loan market. Returns assume reinvestment of distributions, and NAV returns are net of Trust expenses. Performance data quoted represents past performance. Past performance does not guarantee future results. Current performance may be lower or higher than the performance data quoted. Performance Period Ended Q3 2023 XFLT Net Return Performance assumes dividends are reinvested. NAV returns reflect NAV decreases due to unrealized losses associated with model - driven valuation changes for CLO equity. 9/30/2023 9/30/2023 9/30/2023 9/30/2023 9/30/2023 ITD Annualized Total Return 1 5 Year Annualized Total Return 1 3 Year Annualized Total Return 1 1 Year Annualized Total Return 1 QTD Total Return 4.87% 4.81% 13.56% 20.48% 8.60% $6.67 NAV 5.20% 5.02% 18.67% 35.05% 8.07% $6.95 Price 4.30% 4.17% 5.25% 13.77% 3.09% Morningstar LSTA US Leveraged Loan 100 Index XA INVESTMENTS LLC | XAI Octagon Floating Rate & Alternative Income Term Trust (XFLT) QUARTERLY WEBINAR | 12
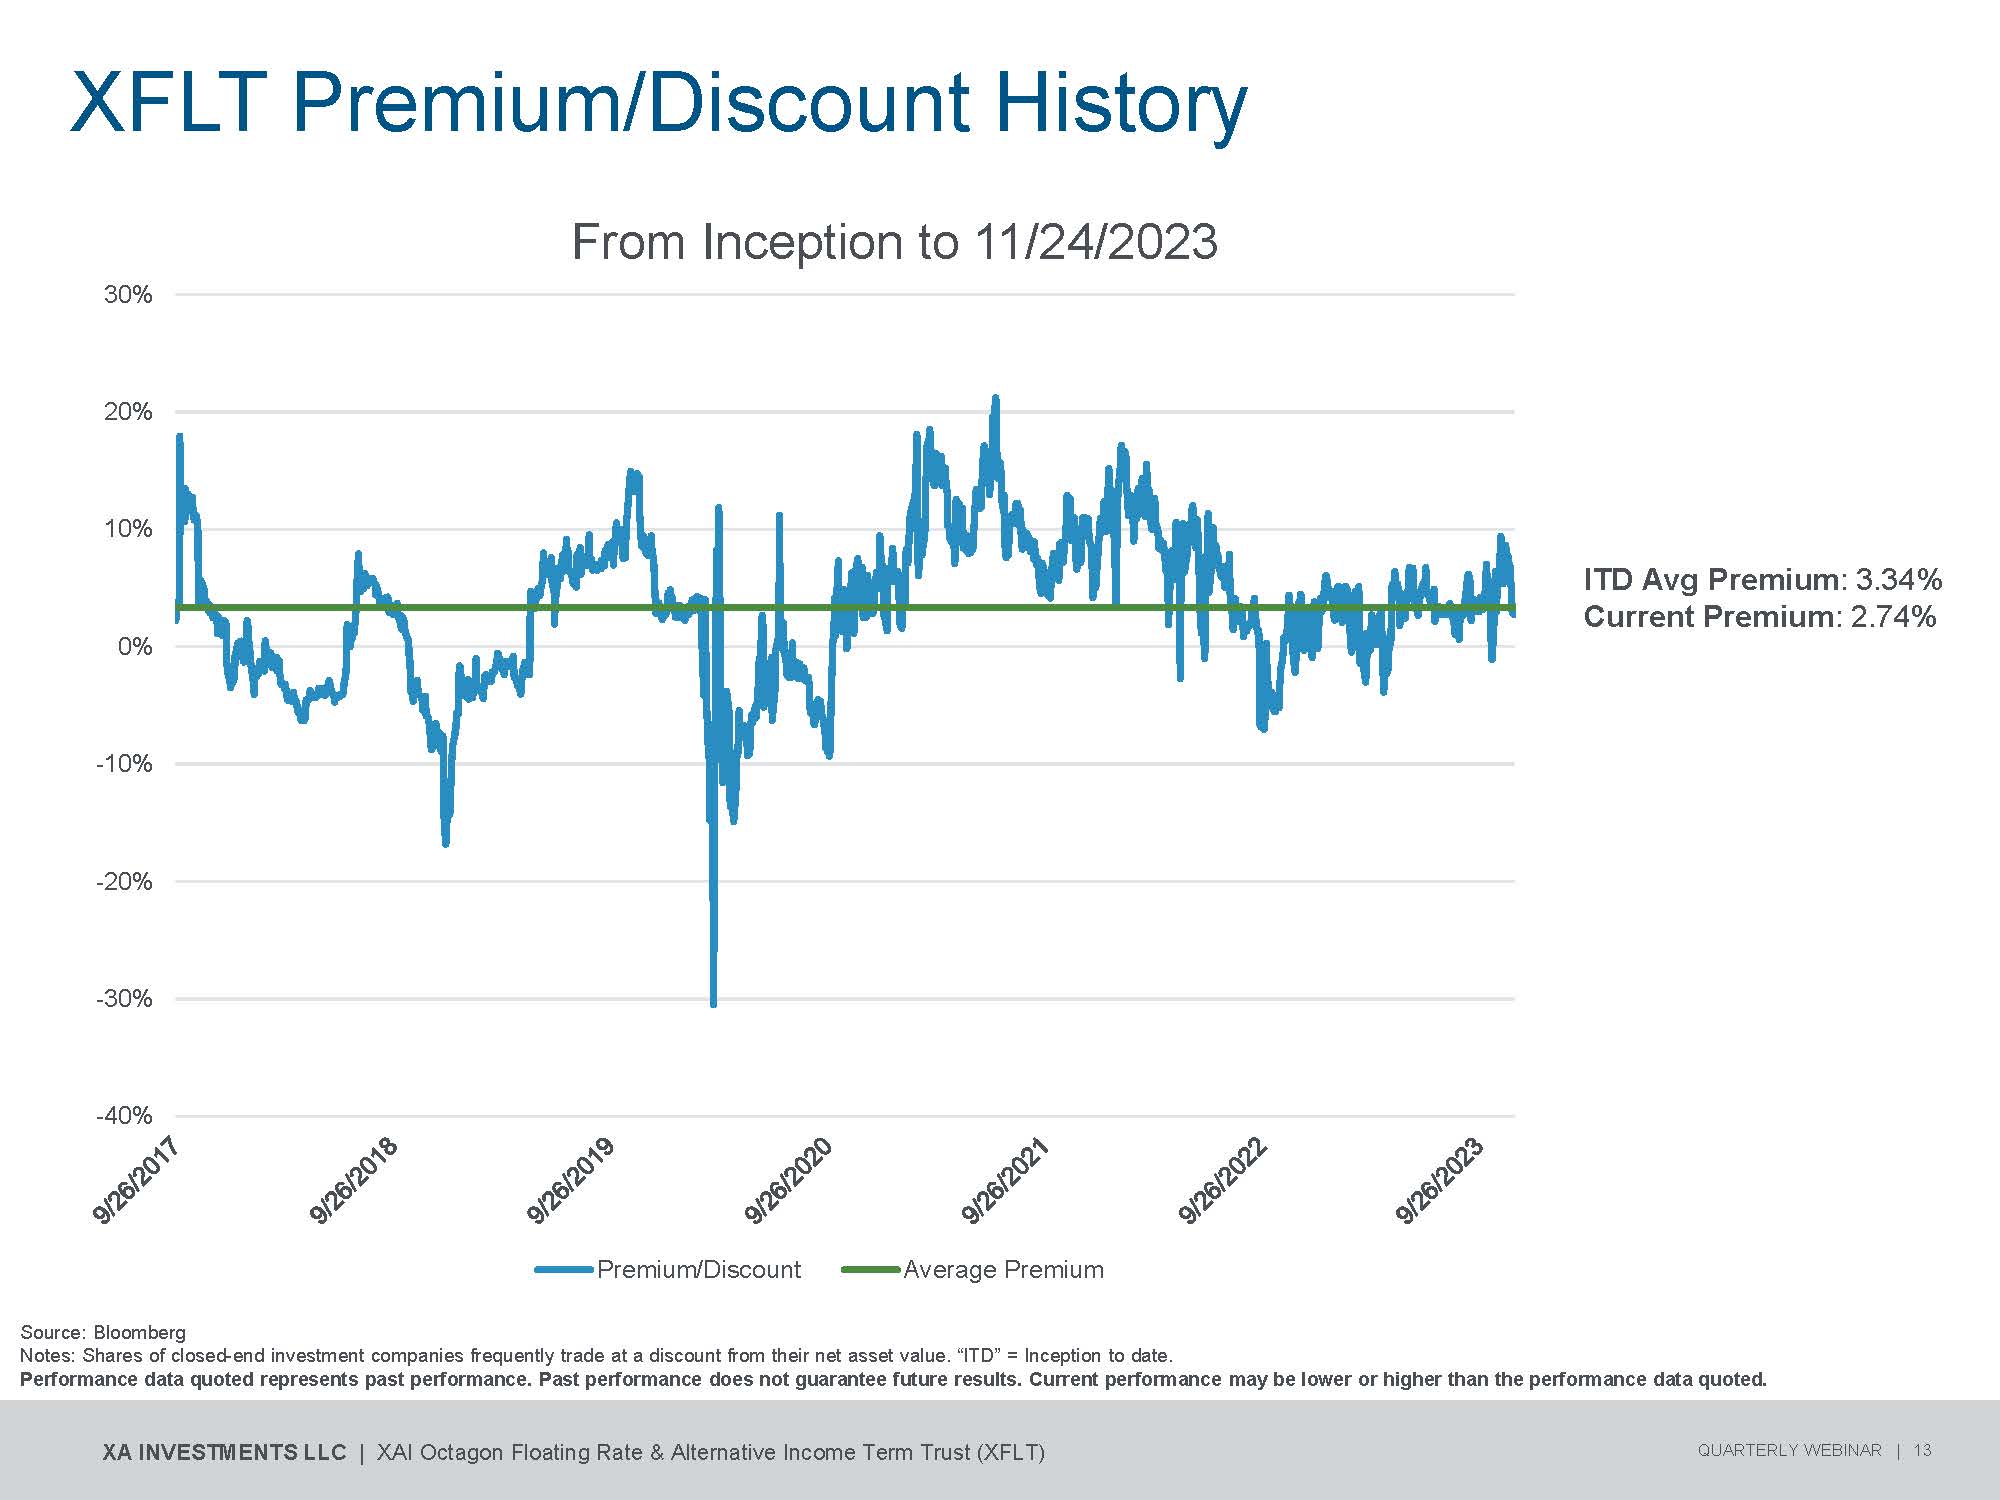
ITD Avg Premium : 3.34% Current Premium : 2.74% XFLT Premium/Discount History From Inception to 11/24/2023 - 4 0 % - 3 0 % - 2 0 % - 1 0 % 0% 1 0 % 2 0 % 3 0 % Premium/Discount Average Premium Source: Bloomberg Notes: Shares of closed - end investment companies frequently trade at a discount from their net asset value. “ITD” = Inception to date. Performance data quoted represents past performance. Past performance does not guarantee future results. Current performance may be lower or higher than the performance data quoted. XA INVESTMENTS LLC | XAI Octagon Floating Rate & Alternative Income Term Trust (XFLT) QUARTERLY WEBINAR | 13
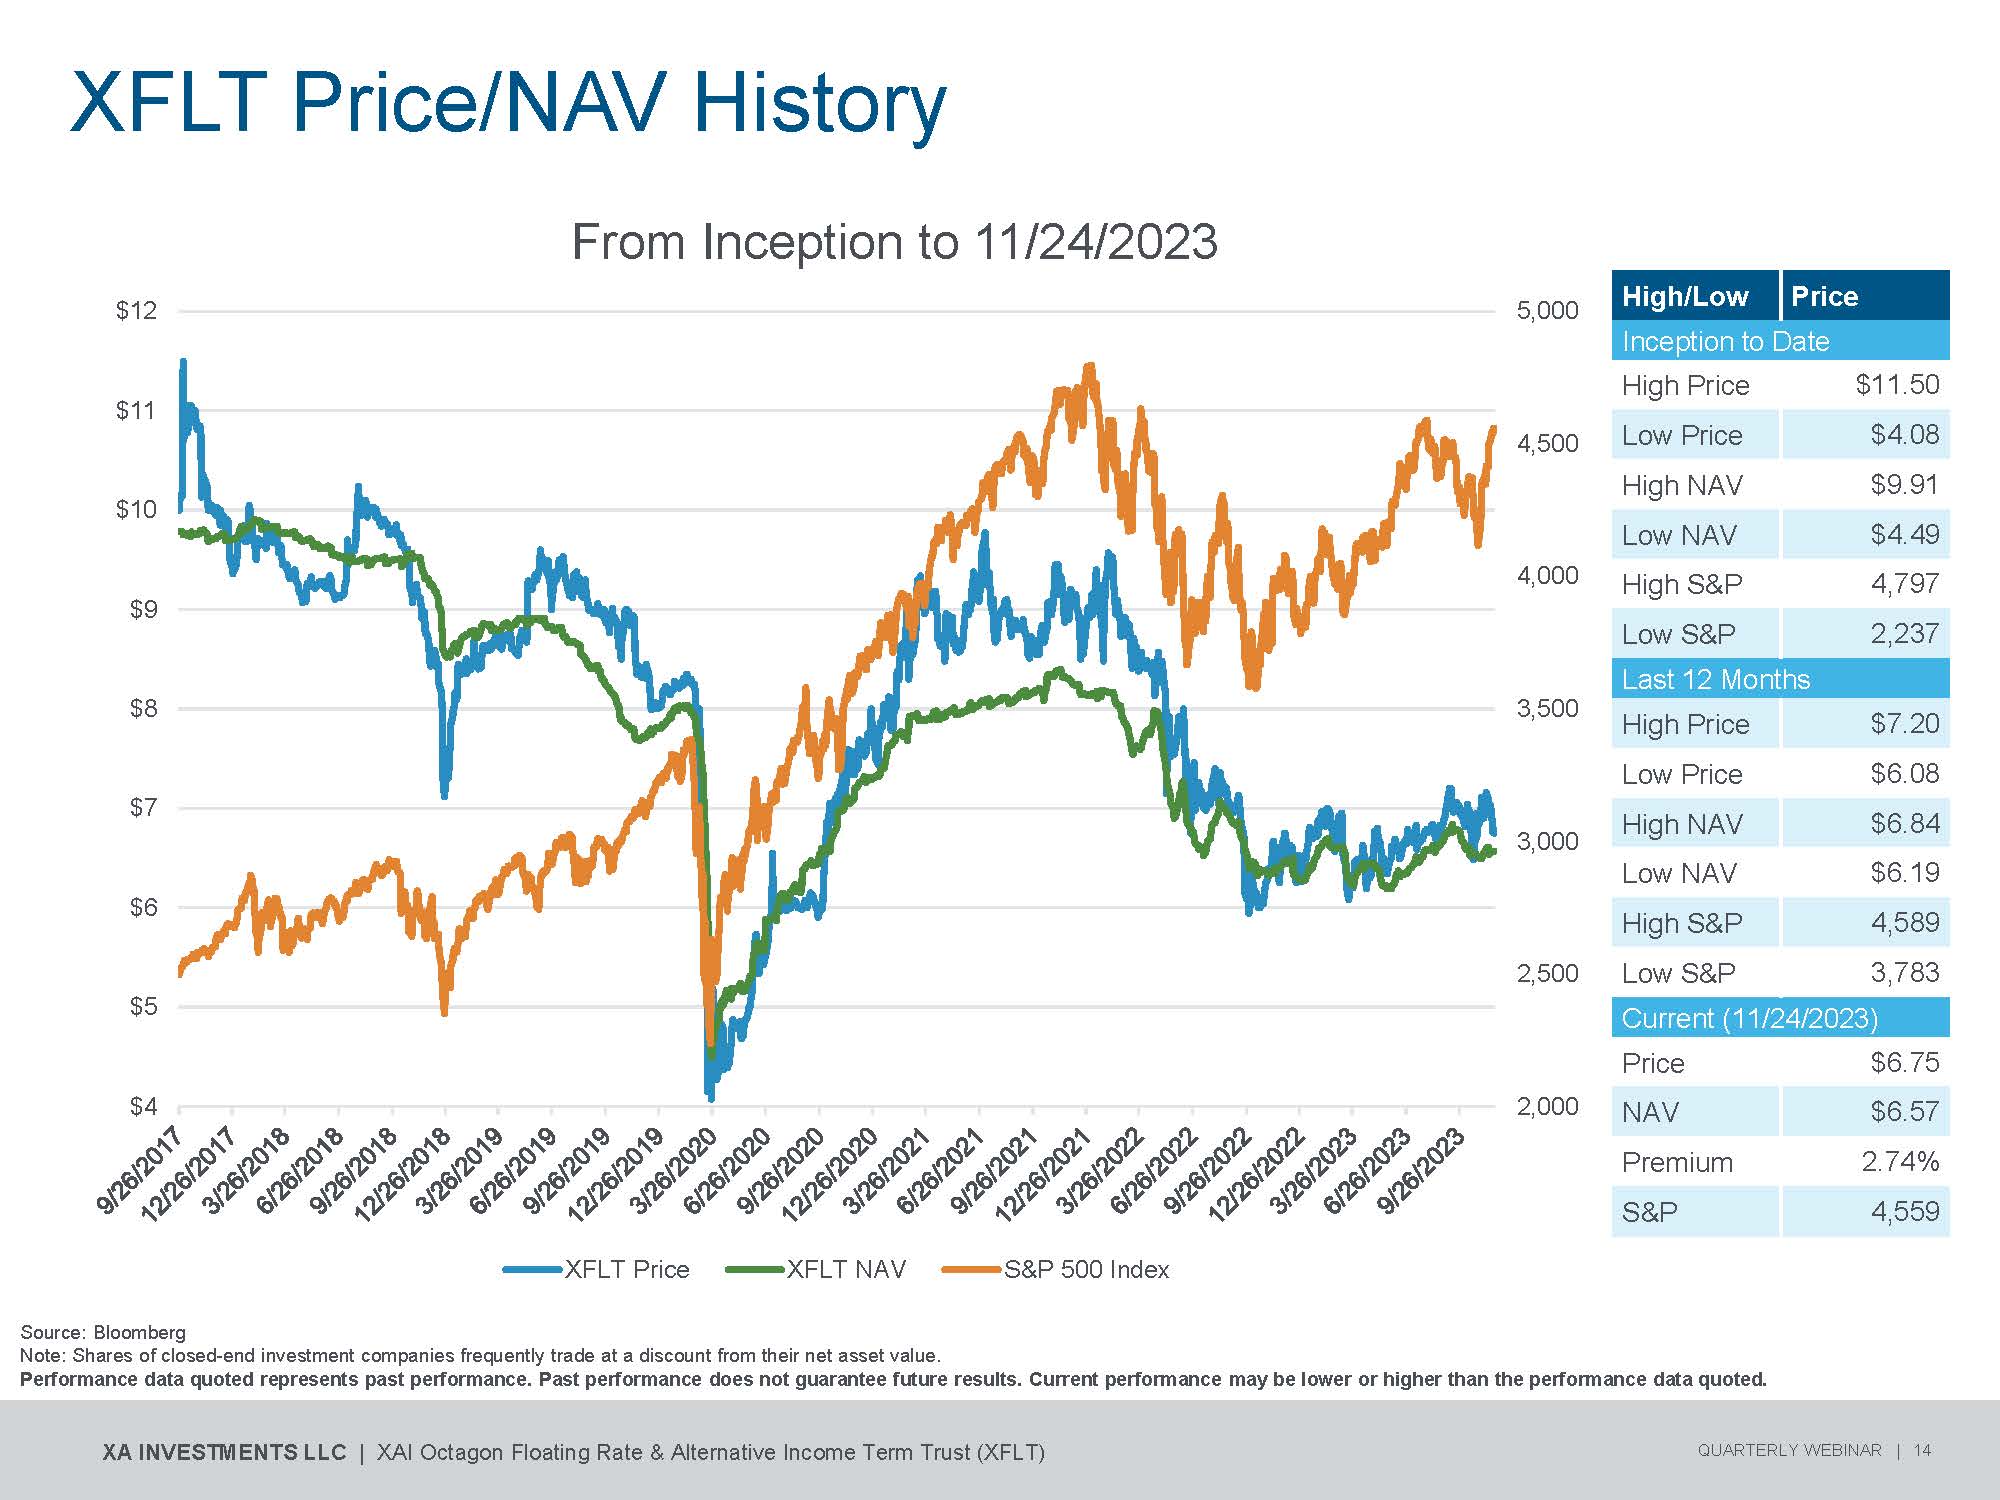
2 , 0 00 2 , 5 00 3 , 0 00 3 , 5 00 4 , 0 00 4 , 5 00 5 , 0 00 $4 $5 $6 $7 $8 $9 $ 1 0 $ 1 1 $ 1 2 XFLT Price XFLT NAV S&P 500 Index Source: Bloomberg Note: Shares of closed - end investment companies frequently trade at a discount from their net asset value. Performance data quoted represents past performance. Past performance does not guarantee future results. Current performance may be lower or higher than the performance data quoted. XA INVESTMENTS LLC | XAI Octagon Floating Rate & Alternative Income Term Trust (XFLT) QUARTERLY WEBINAR | 14 From Inception to 11/24/2023 XFLT Price/NAV History Price High/Low Inception to Date $11.50 High Price $4.08 Low Price $9.91 High NAV $4.49 Low NAV 4,797 High S&P 2,237 Low S&P Last 12 Months $7.20 High Price $6.08 Low Price $6.84 High NAV $6.19 Low NAV 4,589 High S&P 3,783 Low S&P Current (11/24/2023) $6.75 Price $6.57 NAV 2.74% Premium 4,559 S&P
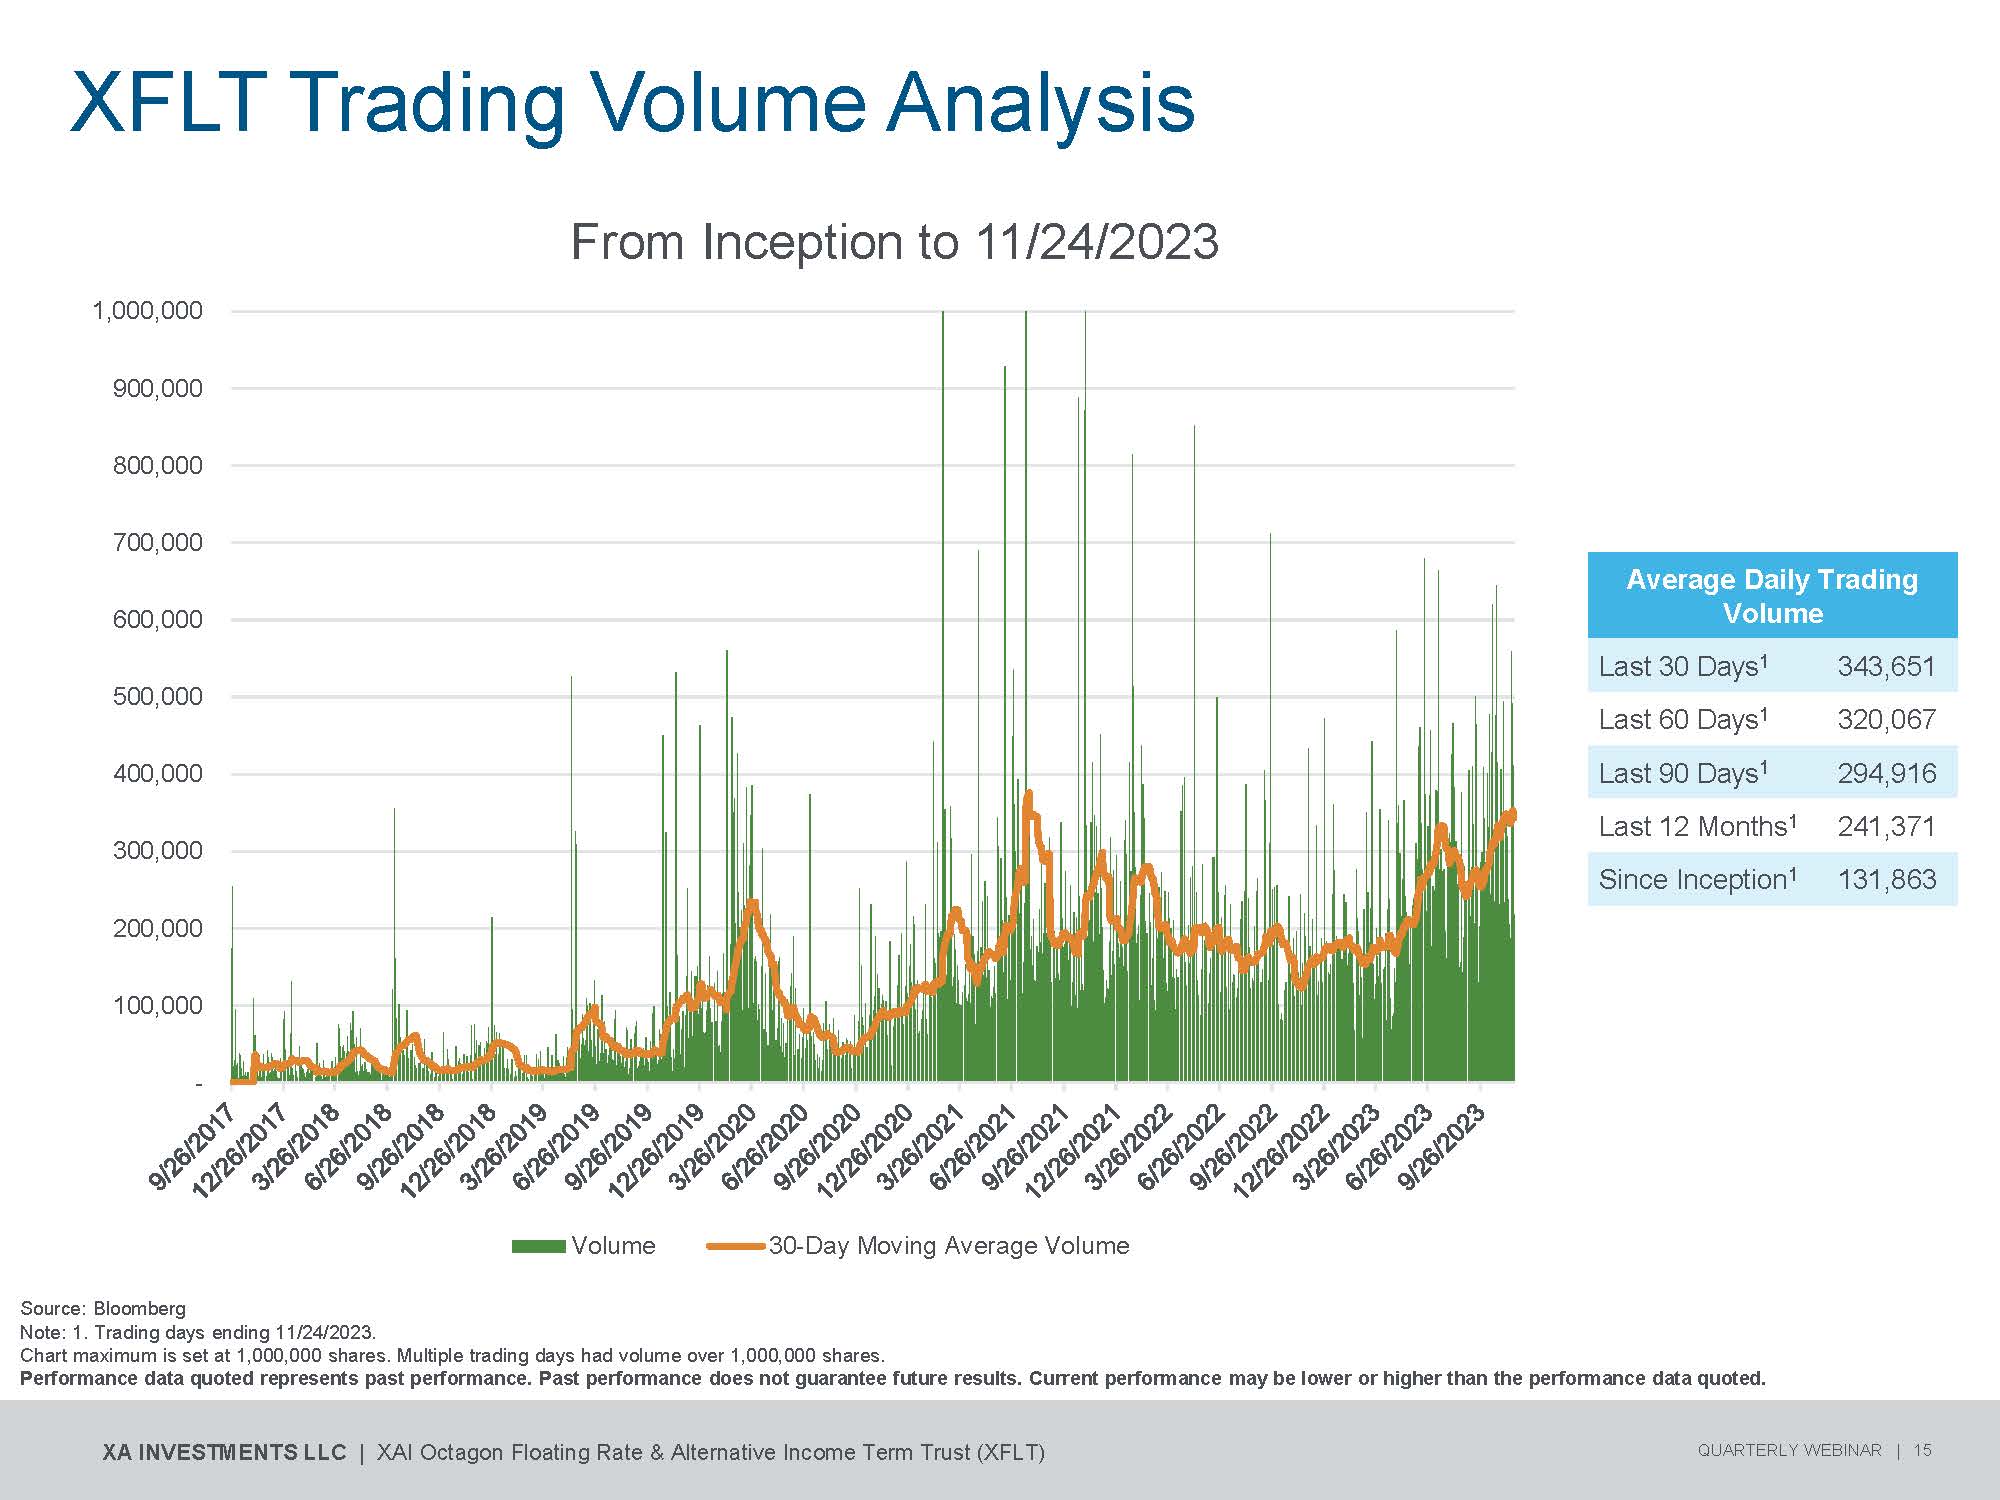
From Inception to 11/24/2023 XF L T T rading V olume Analysis Average Daily Trading Volume 343,651 Last 30 Days 1 320,067 Last 60 Days 1 294,916 Last 90 Days 1 241,371 Last 12 Months 1 131,863 Since Inception 1 1,000,000 900,000 800,000 700,000 600,000 500,000 400,000 300,000 200,000 100,000 - Volume 30 - Day Moving Average Volume Source: Bloomberg Note: 1. Trading days ending 11/24/2023. Chart maximum is set at 1,000,000 shares. Multiple trading days had volume over 1,000,000 shares. Performance data quoted represents past performance. Past performance does not guarantee future results. Current performance may be lower or higher than the performance data quoted. XA INVESTMENTS LLC | XAI Octagon Floating Rate & Alternative Income Term Trust (XFLT) QUARTERLY WEBINAR | 15
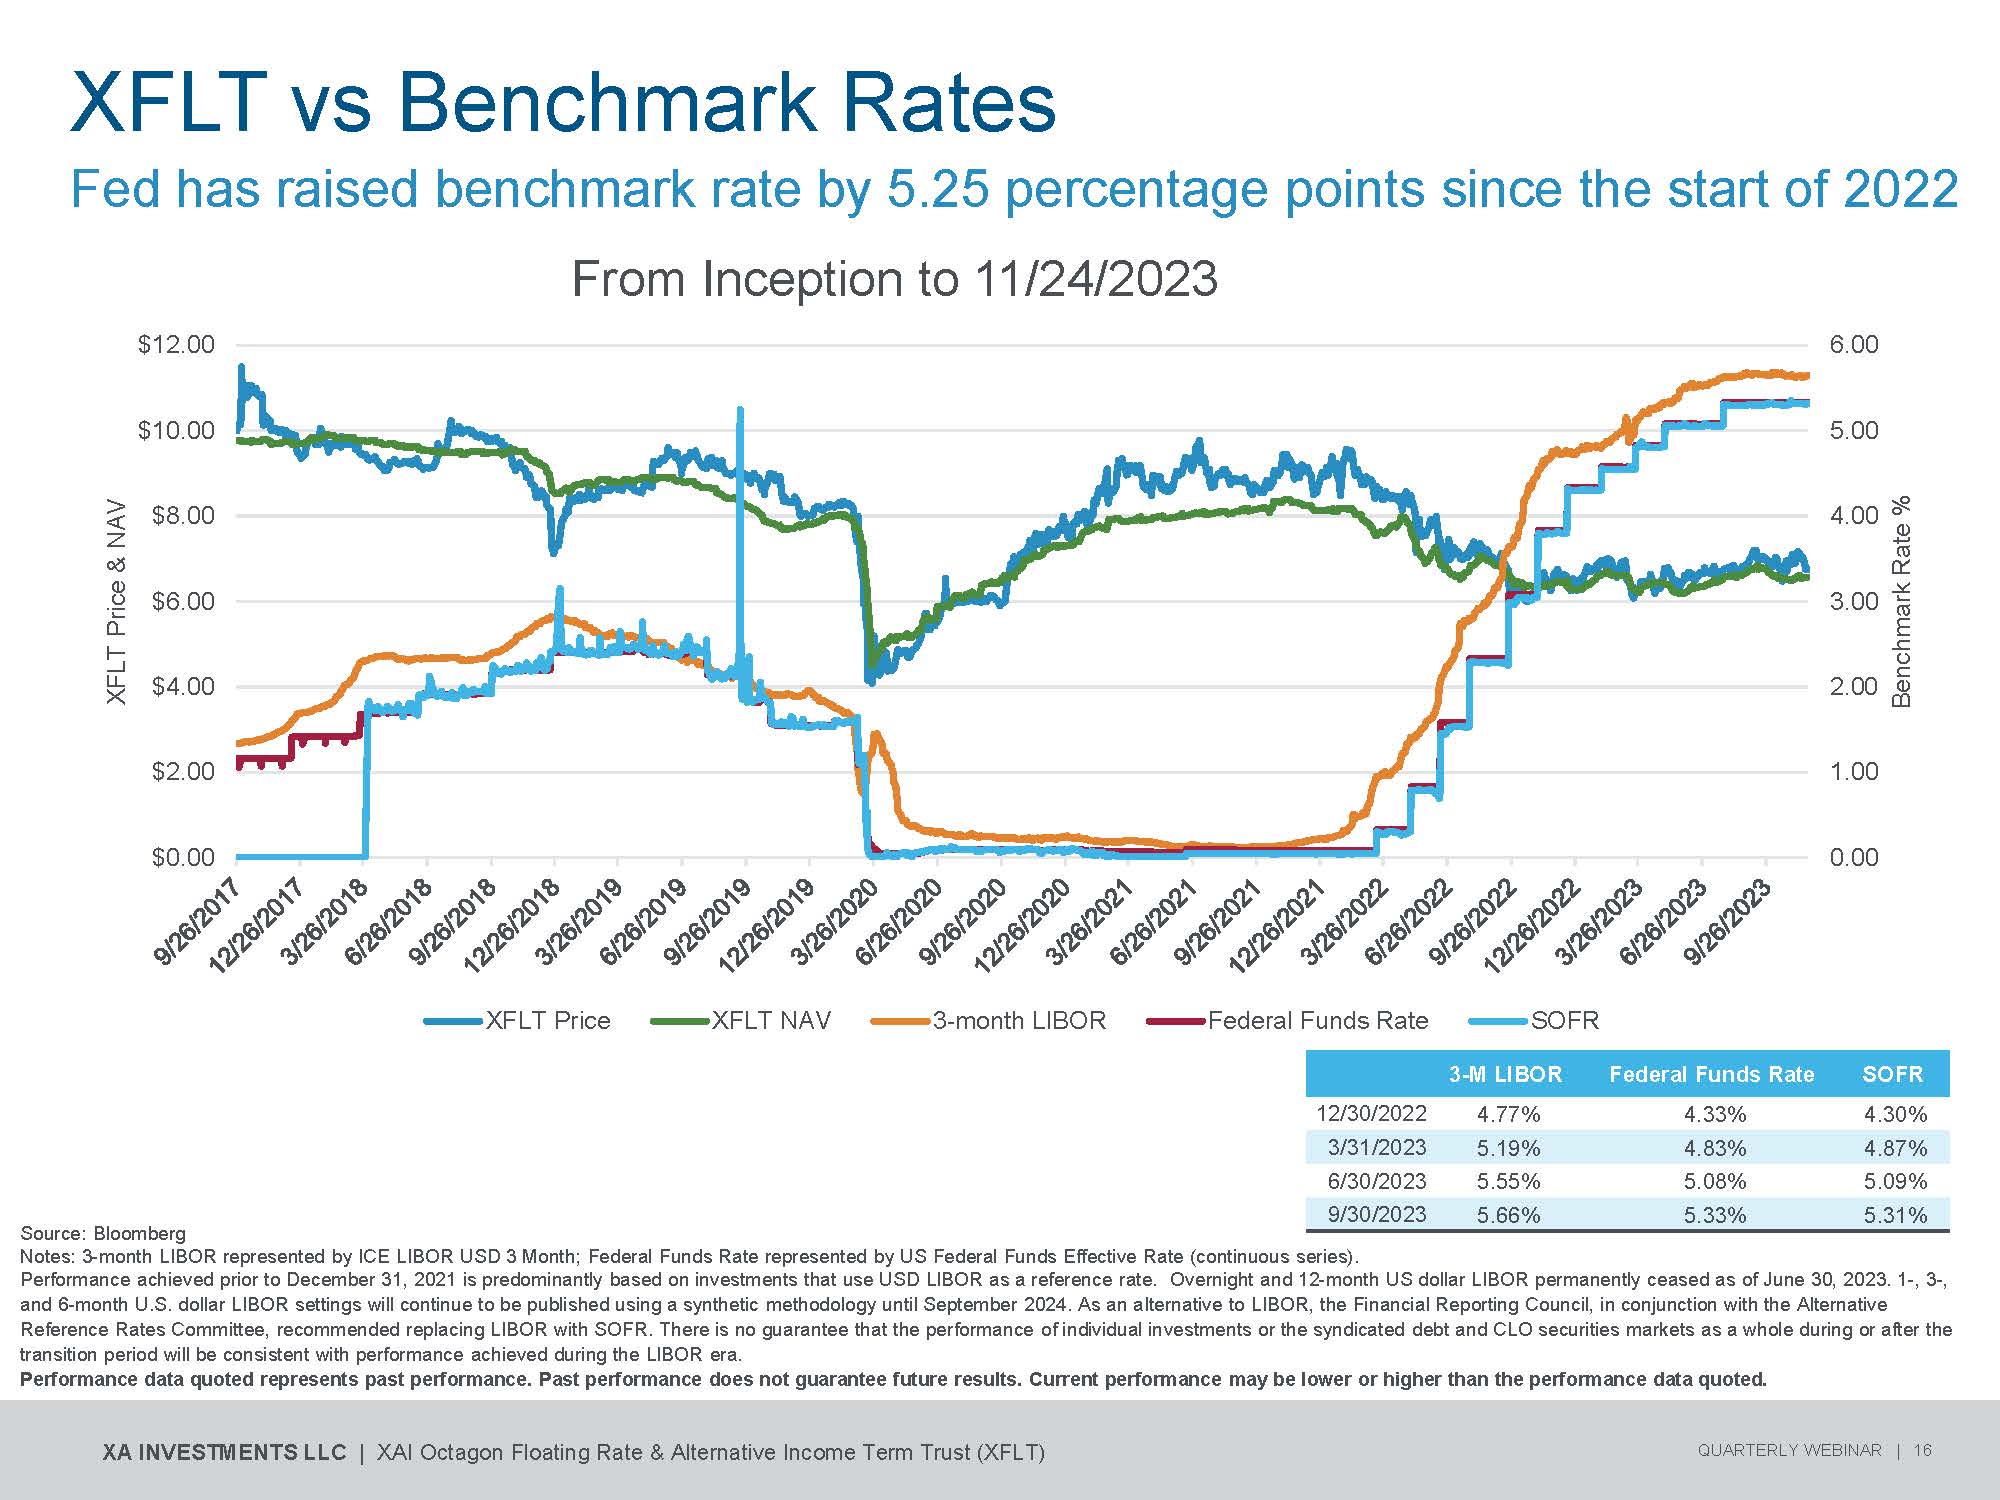
XFLT vs Benchmark Rates Source: Bloomberg Notes: 3 - month LIBOR represented by ICE LIBOR USD 3 Month; Federal Funds Rate represented by US Federal Funds Effective Rate (continuous series). Performance achieved prior to December 31, 2021 is predominantly based on investments that use USD LIBOR as a reference rate. Overnight and 12 - month US dollar LIBOR permanently ceased as of June 30, 2023. 1 - , 3 - , and 6 - month U.S. dollar LIBOR settings will continue to be published using a synthetic methodology until September 2024. As an alternative to LIBOR, the Financial Reporting Council, in conjunction with the Alternative Reference Rates Committee, recommended replacing LIBOR with SOFR. There is no guarantee that the performance of individual investments or the syndicated debt and CLO securities markets as a whole during or after the transition period will be consistent with performance achieved during the LIBOR era. Performance data quoted represents past performance. Past performance does not guarantee future results. Current performance may be lower or higher than the performance data quoted. SOFR Federal Funds Rate 3 - M LIBOR 4.30% 4.33% 4.77% 12/30/2022 4.87% 4.83% 5.19% 3/31/2023 5.09% 5.08% 5.55% 6/30/2023 5.31% 5.33% 5.66% 9/30/2023 Fed has raised benchmark rate by 5.25 percentage points since the start of 2022 From Inception to 11/24/2023 $12.00 6.00 0 . 0 0 1 . 0 0 2. 0 0 3 . 0 0 4 . 0 0 5 . 0 0 $ 0 .0 0 $ 2 .0 0 $ 4 .00 $ 6 .0 0 $ 8 .0 0 $ 1 0 .0 0 Benchmark Rate % XFLT Price & NAV XFLT Pr i c e XFLT NAV 3 - month LIBOR Federal Funds Rate XA INVESTMENTS LLC | XAI Octagon Floating Rate & Alternative Income Term Trust (XFLT) QUARTERLY WEBINAR | 16 S O FR
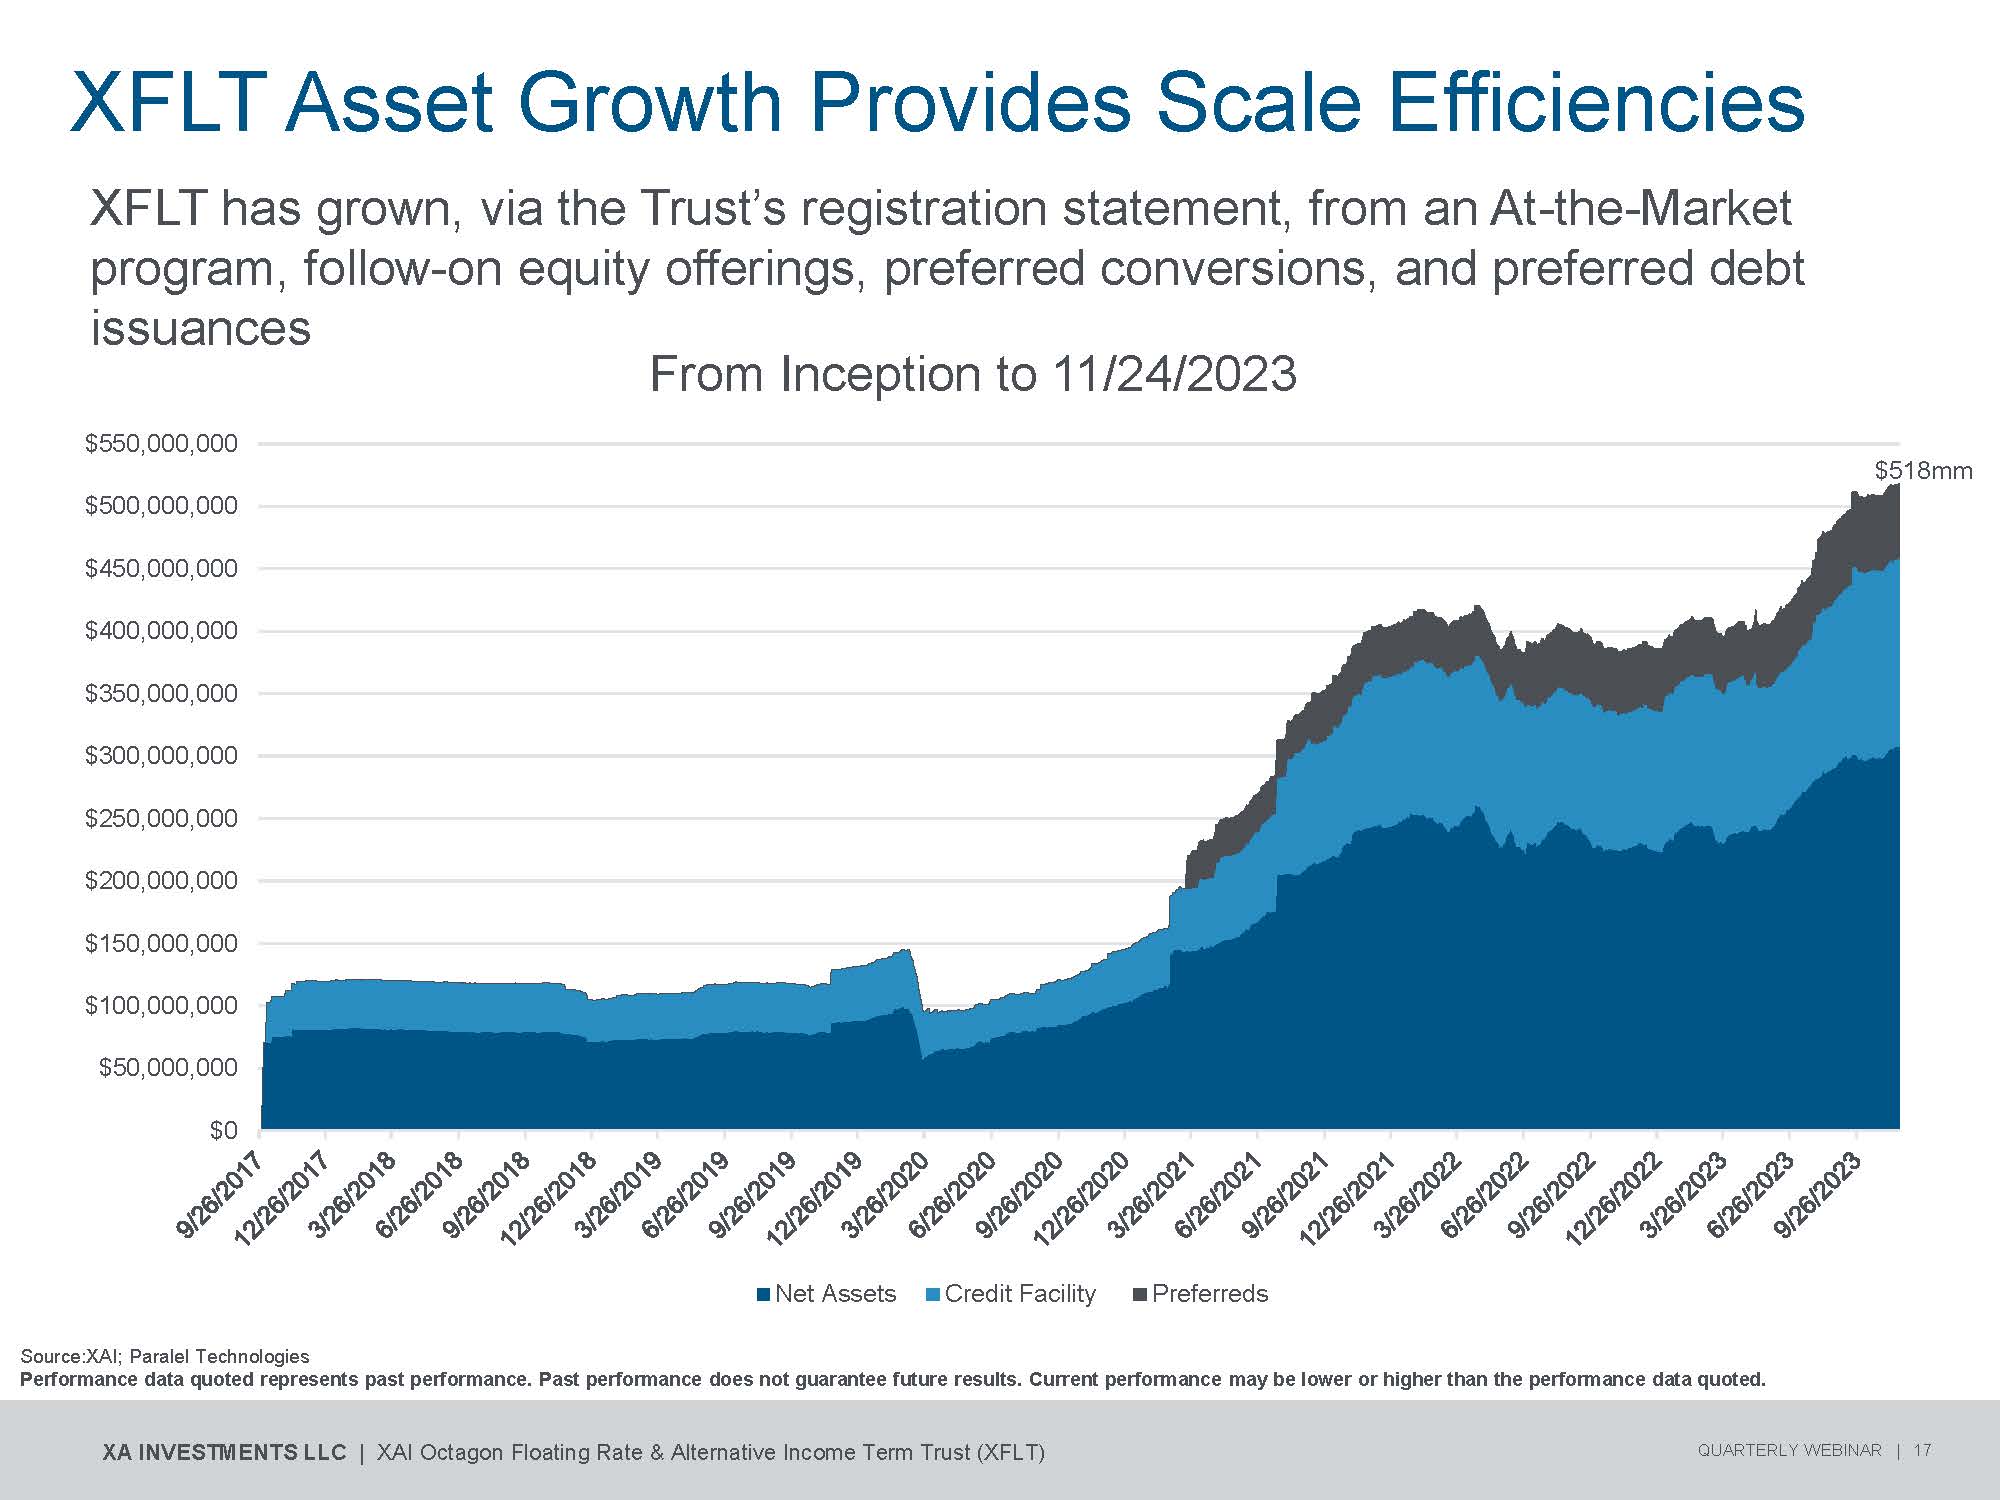
XFLT has grown, via the Trust’s registration statement, from an At - the - Market program, follow - on equity offerings, preferred conversions, and preferred debt issuances From Inception to 11 / 24 / 2023 XF L T Asset G rowth Provides Scale E f ficiencies $518 m m $500,000,000 $450,000,000 $400,000,000 $350,000,000 $300,000,000 $250,000,000 $200,000,000 $150,000,000 $100,000,000 $50,000,000 $0 $550,000,000 Net Assets Credit Facility Preferreds Source:XAI; Paralel Technologies Performance data quoted represents past performance. Past performance does not guarantee future results. Current performance may be lower or higher than the performance data quoted. XA INVESTMENTS LLC | XAI Octagon Floating Rate & Alternative Income Term Trust (XFLT) QUARTERLY WEBINAR | 17

XFLT Leverage Sources (as of September 30, 2023) Note 1. As a percent of total managed assets as of 9/30/2023. 2. With a combination of Bank Borrowings and Preferreds, the Trust is allowed to a total leverage limit of up to 50%. 3. Based on Q2 2023 and Q3 2023 average cost of bank borrowings. Preferred Stock Overview 2029 Convertible Preferreds 2 0 26 R etail Preferreds N/A XFLT - PRA NYSE Ticker 6.00% Series 2029 Convertible Preferred Shares 6.50% Series 2026 T erm P re f e r red S h a res Description $20mm $39.9mm Principal $25.00 $24.68 Current Price Per Share 6.00% 6.50% Coupon 6.00% 6.58% Current Yield Quarterly Quarterly Payment Frequency s: Cost of Leverage in Q2 Cost of Leverage in Q3 Regulatory Limit Leverage $ Leverage % 1 Type of Leverage 6.34% 3 6.55% 3 150,350,000 29.60% Bank Borrowings 6.50% 6.50% 39,900,000 7.86% Preferreds (Retail) 6.00% 6.00% 20,000,000 3.94% Preferreds (Convertible) 6.34% 4 6.52% 4 50% 2 210,250,000 41.40% Total Retail Preferred Share Institutional Ownership 21.82% 348,303 Eagle Point Credit Management 16.79% 267,897 Karpus Investment Management 16.03% 255,824 RiverNorth Capital Management 5.01% 80,000 Putnam Investments 4. Represents a weighted average cost of leverage. Performance data quoted represents past performance. Past performance does not guarantee future results. Current performance may be lower or higher than the performance data quoted. XA INVESTMENTS LLC | XAI Octagon Floating Rate & Alternative Income Term Trust (XFLT) QUARTERLY WEBINAR | 18 59.65% 952,024 Total Institutional Ownership 100 % 1,596,000 Total Shares Outstanding
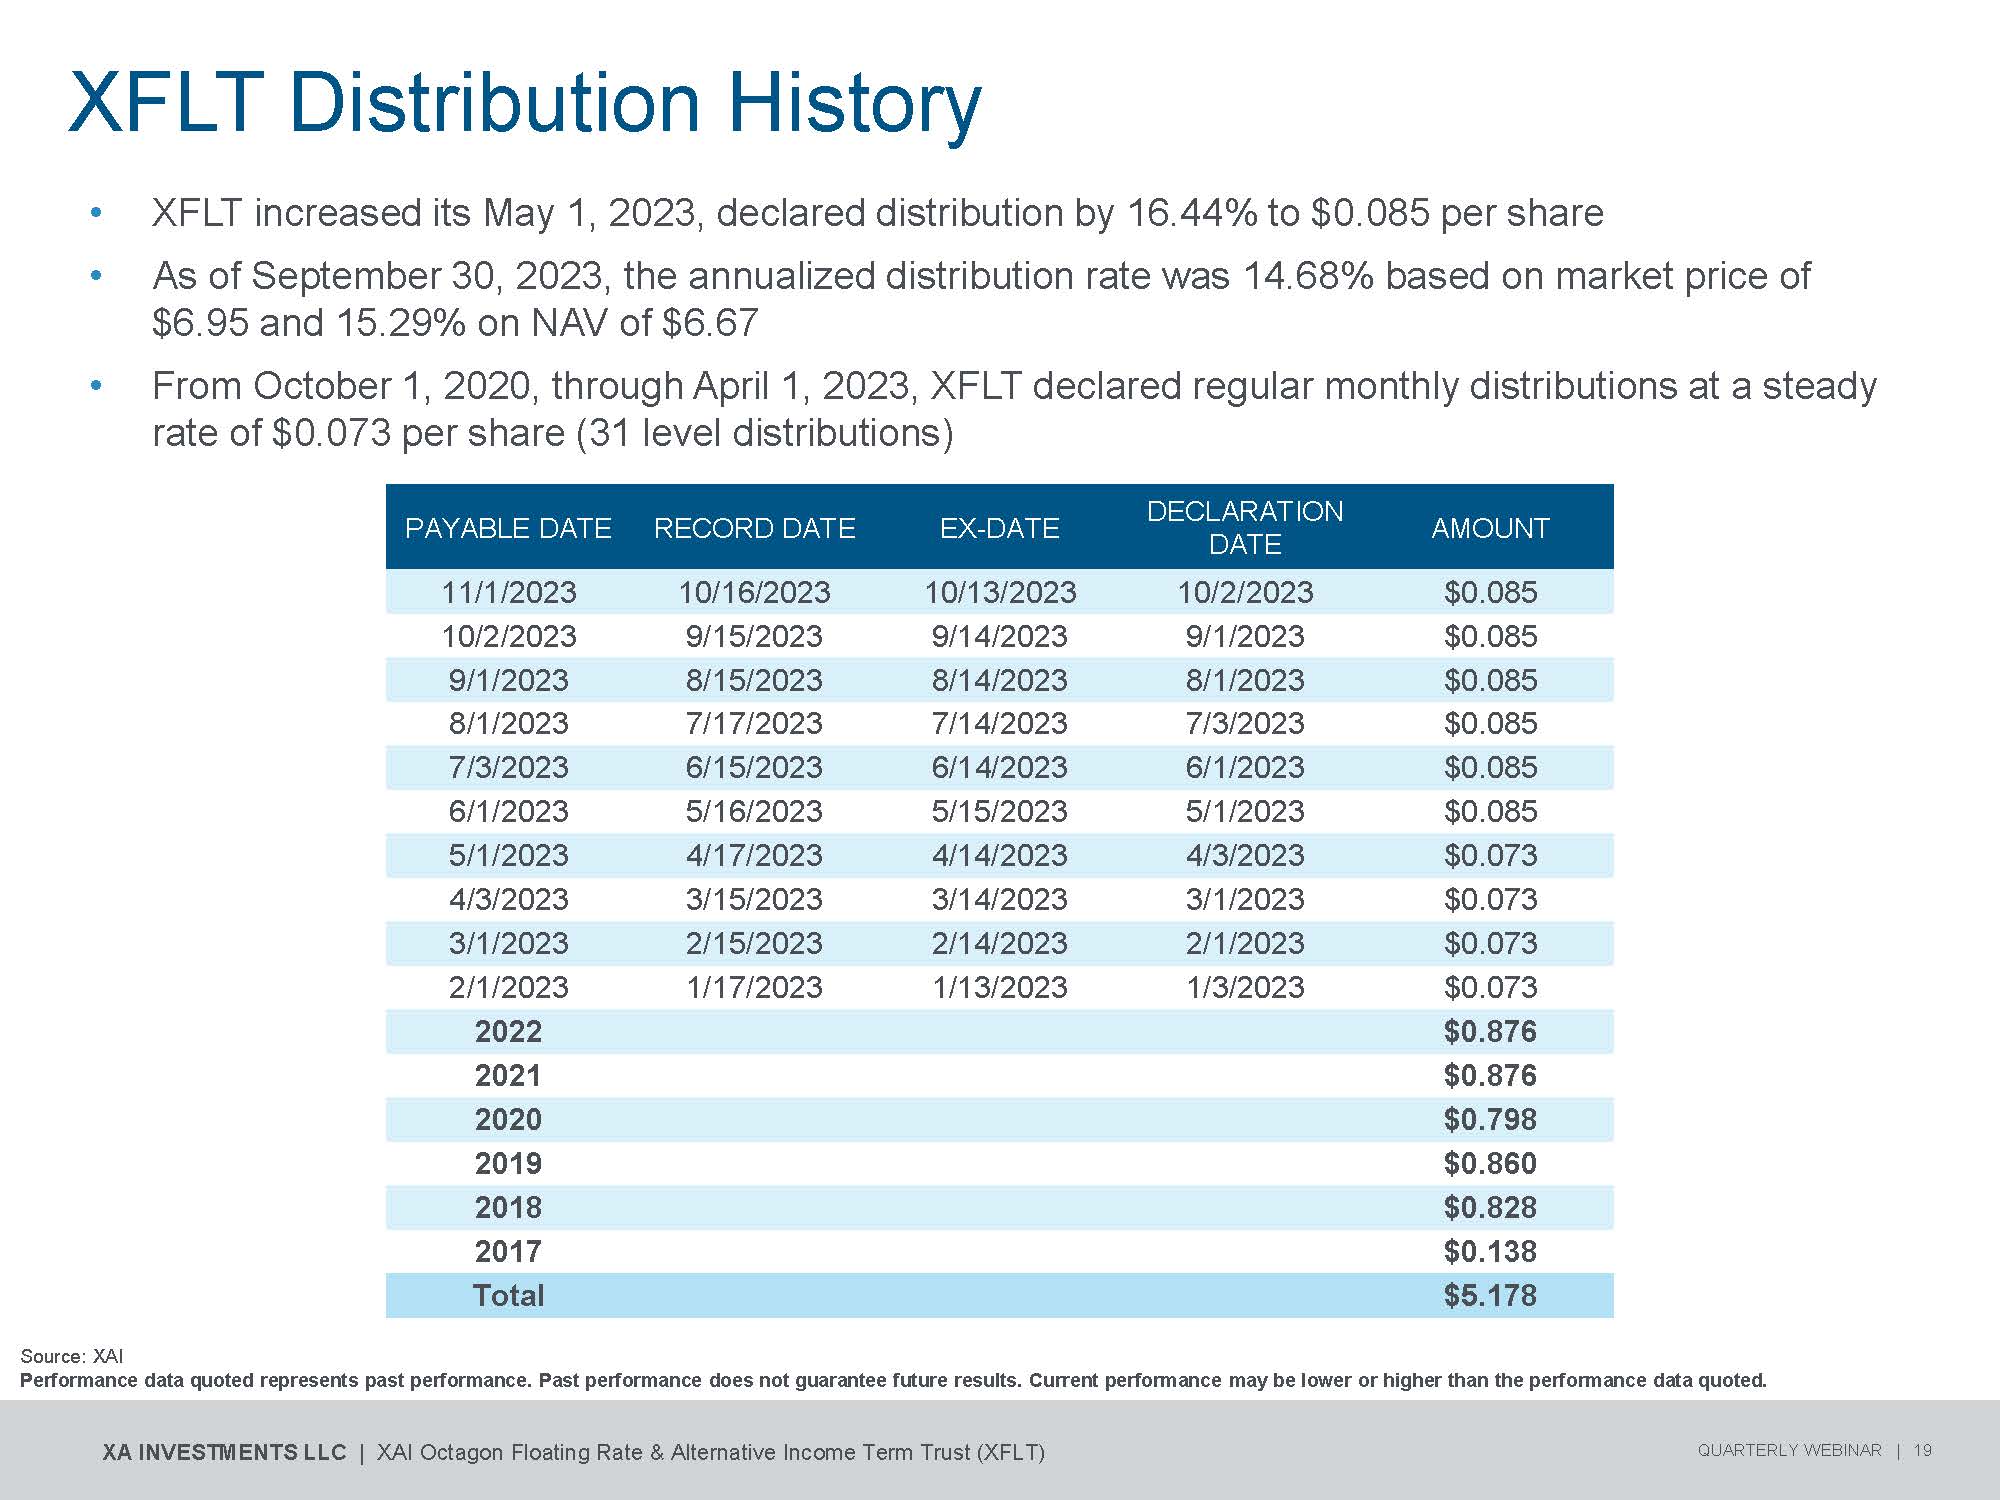
• XFLT increased its May 1, 2023, declared distribution by 16.44% to $0.085 per share • As of September 30, 2023, the annualized distribution rate was 14.68% based on market price of $6.95 and 15.29% on NAV of $6.67 • From October 1, 2020, through April 1, 2023, XFLT declared regular monthly distributions at a steady rate of $0.073 per share (31 level distributions) Source: XAI Performance data quoted represents past performance. Past performance does not guarantee future results. Current performance may be lower or higher than the performance data quoted. XA INVESTMENTS LLC | XAI Octagon Floating Rate & Alternative Income Term Trust (XFLT) QUARTERLY WEBINAR | 19 XFLT Distribution History AMOUNT DECLARATION DATE EX - DATE RECORD DATE PAYABLE DATE $0.085 10/2/2023 10/13/2023 10/16/2023 11/1/2023 $0.085 9/1/2023 9/14/2023 9/15/2023 10/2/2023 $0.085 8/1/2023 8/14/2023 8/15/2023 9/1/2023 $0.085 7/3/2023 7/14/2023 7/17/2023 8/1/2023 $0.085 6/1/2023 6/14/2023 6/15/2023 7/3/2023 $0.085 5/1/2023 5/15/2023 5/16/2023 6/1/2023 $0.073 4/3/2023 4/14/2023 4/17/2023 5/1/2023 $0.073 3/1/2023 3/14/2023 3/15/2023 4/3/2023 $0.073 2/1/2023 2/14/2023 2/15/2023 3/1/2023 $0.073 1/3/2023 1/13/2023 1/17/2023 2/1/2023 $0.876 2022 $0.876 2021 $0.798 2020 $0.860 2019 $0.828 2018 $0.138 2017 $5.178 Total

CLO Focused CEFs 1 XFLT Higher, Mainly Preferred Leverage (5 - 8.75%) Combination of Credit Facility and Preferreds (6.52% as of 9/30/2023) Leverage Cost Monthly Estimates; Quarterly Audited Daily NAV Internal, Monthly Estimates; Quarterly Official NAV Independent Third - party Valuations Valuation ~95%+ CLOs ~50% Loans / ~50% CLOs Portfolio Allocation Performance Fees / Higher Management fees 2 No Performance Fee Fees 20.66% (Average of 4 Funds) 14.68% Distribution Rate on M a r k e t Pr ice (9 / 30 / 2023 ) 8.07% (Average of 4 Funds) 2.18% Average Premium LTM (as of 9/30/2023) performance of individual investments or the syndicated debt and CLO securities markets as a whole during or after the transition period will be consistent with performance achieved during the LIBOR era. Performance data quoted represents past performance. Past performance does not guarantee future results. Current performance may be lower or higher than the performance data quoted. XA INVESTMENTS LLC | XAI Octagon Floating Rate & Alternative Income Term Trust (XFLT) QUARTERLY WEBINAR | 20 Source: Bloomberg; Company Websites; Adviser ADVs. Notes: 1. Comps include tickers ECC, EIC, OXLC, and OCCI. 2. EIC invests in a mix of CLO debt and equity and has a lower management fee than XFLT and does not charge a performance fee. Distribution rates are not performance and are calculated by summing the monthly distributions per share over twelve months and dividing by the NAV or market price, as applicable, as of the latest month end. Distributions may be comprised of ordinary income, net capital gains, and/or a return of capital (ROC) of your investment in the Trust. To date, a portion of common stock distributions has been estimated to be a return of capital as noted under the Investor Relations section on the Trust’s website. The actual components of the Trust’s distributions for U.S. tax reporting purposes can only be finally determined as of the end of each fiscal year of the Trust and are thereafter reported on Form 1099 - DIV. The Trust’s distributions for fiscal year ended 2023 comprised 100% net income and 0.00% return of capital. The Trust’s distributions for fiscal year ending 2024 will be made available and reported to investors subsequent to the end of fiscal year 2024. A distribution comprised in whole or in part by a return of capital does not necessarily reflect the company’s investment performance and should not be confused with “yield” or “income.” Future distributions may consist of a return of capital. Performance achieved prior to December 31, 2021 is predominantly based on investments that use USD LIBOR as a reference rate. Overnight and 12 - month US dollar LIBOR permanently ceased as of June 30, 2023. 1 - , 3 - , and 6 - month U.S. dollar LIBOR settings will continue to be published using a synthetic methodology until September 2024. As an alternative to LIBOR, the Financial Reporting Council, in conjunction with the Alternative Reference Rates Committee, recommended replacing LIBOR with SOFR. There is no guarantee that the XFLT Comparison with CLO Focused CEFs

4 . 73 % 0% 10% 20% 30% 40% Credit Fundamentals 1. Source: Pitchbook LCD, LLI Default Rates (September 30, 2023). Data for loans represents metrics for the Morningstar LSTA US Leveraged Loan Index (formerly the S&P/LSTA Leveraged Loan Index, the “LLI”). 2. Source: Pitchbook LCD, Morningstar LSTA US Leveraged Loan Index: Current Credit Statistics (June 30, 2023). Data for loans represents metrics for the LLI. 3. Includes issuers with EBITDA greater than $50mm. A VE R A G E L EVE R A G E R A T I O S FO R N E W I SS U E LO A N S 2 , 3 AVERAGE INTEREST COVERAGE OF PUBLIC ISSUERS’ OUTSTANDING LOANS 2,4 D OW N G R A D E PE RC E N T A G E FO R LO A N S ( R OLL IN G 3 - MONTHS) 1 EBITDA GROWTH OF PUBLIC LEVERAGED LOAN ISSUERS 2,4 • EBITDA growth of public companies (weighted toward better - quality BB rated credits) remains positive • Interest coverage and leverage ratios for publicly reporting companies remain healthy by historical standards, though the rapid increase in interest rates poses a heightened risk of earnings deterioration 0 . 0 x 2 . 0 x 4 . 0 x 6 . 0 x 8 . 0 x First Lien Debt/EBITDA Other Sr Debt/EBITDA Second Lien Debt/EBITDA Subordinated Debt/EBITDA 4.1 3.6 4.2 4 .6 4.1 3.9 3.8 4.3 4.6 4.8 5.5 5.8 5.7 5.4 5.6 5.5 5.0 4.6 4 .1 7 . 0 x 6 . 0 x 5 . 0 x 4 . 0 x 3 . 0 x 2 . 0 x 1 . 0 x 0 . 0 x 2015 2016 2017 2018 2019 1 Q 2 0 2 Q 2 0 3 Q 2 0 4 Q 2 0 1 Q 2 1 2 Q 2 1 3 Q 2 1 4 Q 2 1 1 Q 2 2 2 Q 2 2 3Q22 4 Q 2 2 1 Q 2 3 2 Q 2 3 Weighted Average 30% 20% 10% 0% - 10% - 20% - 30% Weighted Average 4. The sample for the latest quarter includes 168 issuers within the LLI that file results publicly, or 14% of the Index. For this analysis, LCD draws its performance metrics and total debt levels from S&P Capital IQ. Performance data quoted represents past performance. Past performance does not guarantee future results. Current performance may be lower or higher than the performance data quoted. XA INVESTMENTS LLC | XAI Octagon Floating Rate & Alternative Income Term Trust (XFLT) QUARTERLY WEBINAR | 21

Technical Dynamics R E T A I L LO A N F UN D FLOW S 3 VS . 2 - 10 Y U S T SP R E A D S IN S T I T U T I O N A L N E W I SS U E L EVE R A G E D LO A N V OL U M E 4 QUARTERLY US CLO TOTAL VOLUME 2 Supply and demand outlook appears steady $120B $100B $80B $60B $40B $20B $0B Ne w i s s u e s Re fin an c in g s Re s e t s 300 250 200 150 100 50 0 - 50 - 100 - 150 - $20 - $15 - $10 - $5 $0 $5 $10 $15 2 - 10 Year Treasury Spread (bps) Mutual Fund Flows ($B) $0B $50B $100B $150B $200B M&A Refinancing Dividend Recap 1. Source: Pitchbook LCD, “September Wrap: Loans continue to rally despite losses in other asset classes” (October 2, 2023). 2. Source: Pitchbook LCD, LCD Global CLO Databank (September 30, 2023). 3. Source: Pitchbook LCD, Lipper, Standard & Poor’s Structured Finance Group, JP Morgan, Merrill Lynch, Citigroup, Morningstar LSTA US Leveraged Loan Index (September 30, 2023). O t h e r 4. Source: Pitchbook LCD, “LCD Quarterly Review: Third Quarter 2023, Commentary Charts” (September 30, 2023). Data for loans represents metrics for the Morningstar LSTA US Leveraged Loan Index. Performance data quoted represents past performance. Past performance does not guarantee future results. Current performance may be lower or higher than the performance data quoted. XA INVESTMENTS LLC | XAI Octagon Floating Rate & Alternative Income Term Trust (XFLT) QUARTERLY WEBINAR | 22

Strong YTD Performance for Loans Source : Bloomberg, JPMorgan Markets from January 1 , 2023 to September 30 , 2023 . Senior secured loans are represented by the Morningstar LSTA US Leveraged Loan Index, high yield bonds are represented by the ICE/BofA US High Yield Bond Index, TIPS are represented by the Bloomberg US Treasury TIPS 0 - 5 Years Total Return Index, Aggregate Bonds are represented by the Bloomberg US Aggregate Bond Index, which encompasses Investment Grade, taxable fixed - rate bonds, corporate bonds are represented by ICE/BofA US Corporate Index, Municipal Bonds are represented by the Bloomberg Municipal Bond Index 22 + Yr and U . S . Treasury 10.16% 5.97% 1.92% 0.45% - 7.16% - 1.21% - 2.03% - 10% Bonds are represented by the Bloomberg US Treasury Bond 10 - 20 Year Index. An investment cannot be made directly in an index. Holdings in any relevant index may differ materially from holdings in XFLT. Performance data quoted represents past performance. Past performance does not guarantee future results. Current performance may be lower or higher than the performance data quoted. XA INVESTMENTS LLC | XAI Octagon Floating Rate & Alternative Income Term Trust (XFLT) QUARTERLY WEBINAR | 23 - 5% 0% 5% 10% As of 9/30/2023, loans are outpacing other credit asset classes on both a YTD and LTM basis YTD PERFORMANCE AS OF 9/30/2023 15% Morningstar LSTA ICE/BofA US High Yield Bloomberg US Treasury ICE/BofA US Corporate Bloomberg US Leveraged Loan Index Index TIPS 0 - 5 Year Index Index Aggregate Bond Index Bloomberg Municipal Bloomberg US Treasury Bond Index Index 10 - 20 Year

XFLT CLO Debt & CLO Equity Portfolio Characteristics 1 1. Represents CLO Debt and CLO Equity positions as of September 30, 2023. 2. Portfolio Statistics are based upon par value. Excludes the following CLO equity position, which has been called: THL Credit Wind River 2016 - 1 CLO, LTD. Totals may not foot to 100% due to rounding. 3. Statistics presented above are calculated on a weighted average basis across the aggregate collateral pools, and reflect the weighted average notional value of underlying collateral as of September 30, 2023. Sources: PORTFOLIO STATISTICS 2 September 2017 Account Inception Date 150 # of Positions 27 # of Collateral Managers 3.7% Average Manager Exposure 12.4% par / 13.3% cost Largest Manager Exposure ORIGINAL RATING % of Cost % of Par 0.4% 0.3% BBB 29.2% 23.2% BB 1.6% 1.3% B 68.8% 75.1% Equity ORIGINAL DEAL VINTAGE % of Cost % of Par 0.4% 0.3% 2013 4.8% 8.1% 2015 3.3% 3.5% 2016 6.4% 6.8% 2017 10.8% 10.6% 2018 19.5% 17.7% 2019 12.5% 10.9% 2020 29.9% 31.5% 2021 11.8% 10.1% 2022 0.6% 0.5% 2023 TOP 10 INDUSTRIES IN UNDERLYING PORTFOLIO: 68.5% 3 TOP 10 OBLIGORS IN UNDERLYING PORTFOLIO: 5.2% 3 13 . 4 % 11 . 2 % 9 . 5 % 9 . 4 % 4.5% 4.5% 4 . 2 % 4 . 0 % 4.0% 3 . 8 % H igh T e ch Healthcare & Pharmaceuticals Banking, Finance, Insurance & Real Estate Services: Business Telecommunications Hotels, Gaming & Leisure Chemicals, Plastics & Rubber Media: Broadcasting & Subscription Construction & Building Services: Consumer 0 . 6 % 0 . 6 % 0 . 6 % 0 . 5 % 0 . 5 % 0 . 5 % 0 . 5 % 0 . 5 % 0 . 5 % 0 . 5 % 1. Medline Industries 2. Altice France 3. UKG 4. Peraton 5. Athenahealth 6. Acrisure 7. TransDigm 8. IRB Holding 9. AssuredPartners Capital 10. Asurion Kanerai / Intex (calculated on October 13, 2023), which utilizes data from the most recent trustee reports for each underlying collateral portfolio comprising the above statistics. Performance data quoted represents past performance. Past performance does not guarantee future results. Current performance may be lower or higher than the performance data quoted. XA INVESTMENTS LLC | XAI Octagon Floating Rate & Alternative Income Term Trust (XFLT) QUARTERLY WEBINAR | 24
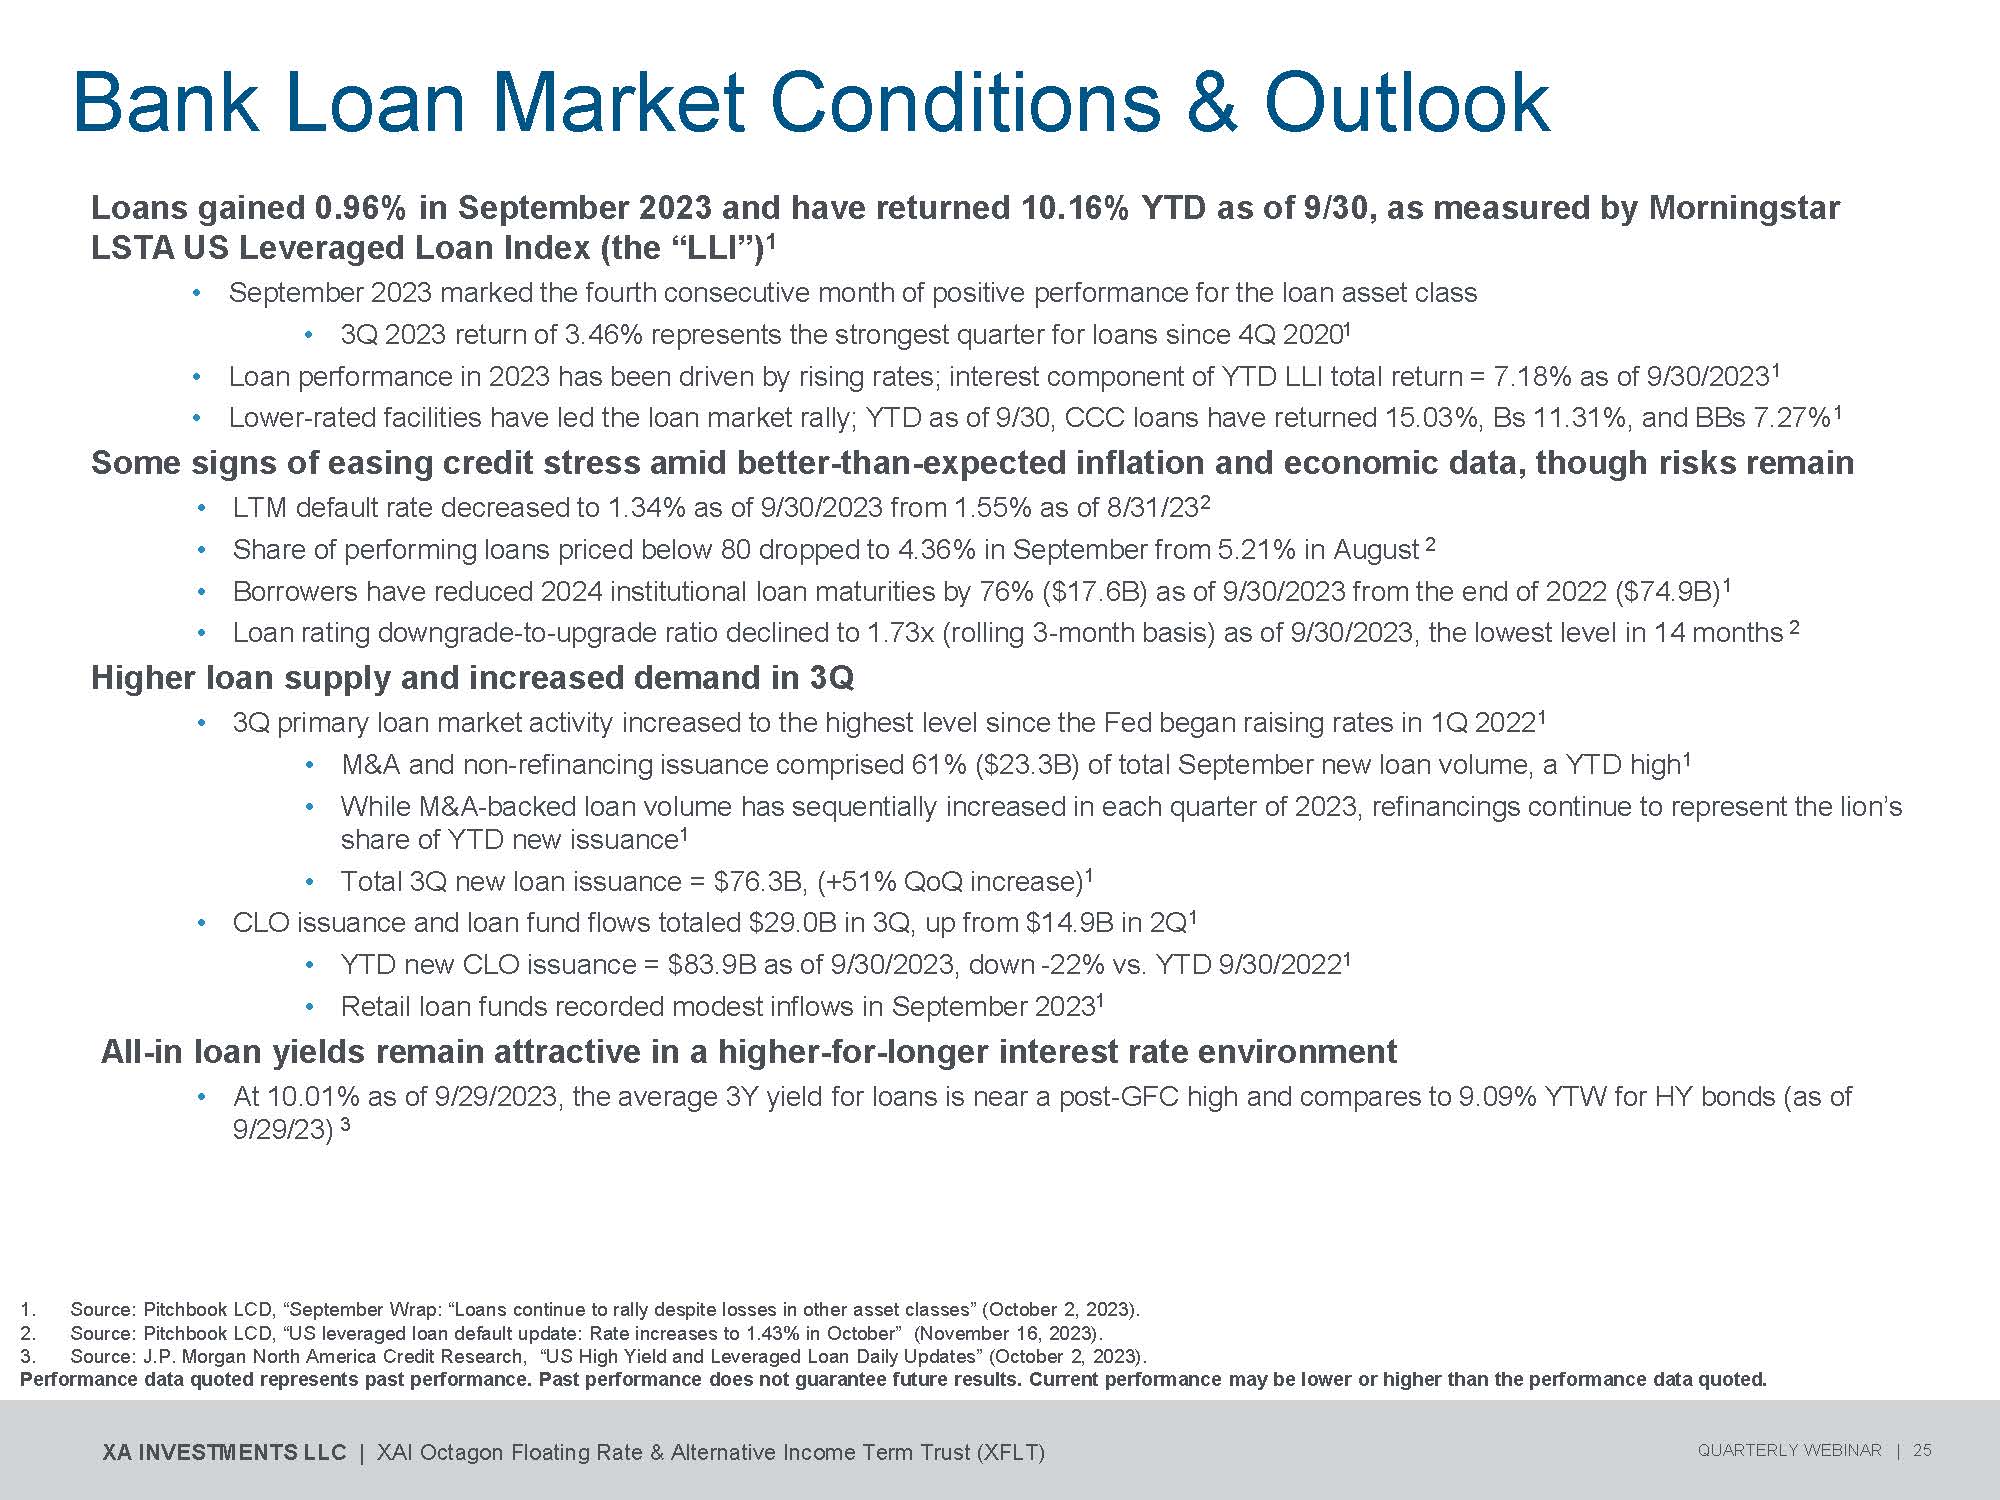
Bank Loan Market Conditions & Outlook 3. Source: J.P. Morgan North America Credit Research, “US High Yield and Leveraged Loan Daily Updates” (October 2, 2023). Performance data quoted represents past performance. Past performance does not guarantee future results. Current performance may be lower or higher than the performance data quoted. XA INVESTMENTS LLC | XAI Octagon Floating Rate & Alternative Income Term Trust (XFLT) QUARTERLY WEBINAR | 25 1. Source: Pitchbook LCD, “September Wrap: “Loans continue to rally despite losses in other asset classes” (October 2, 2023). 2. Source: Pitchbook LCD, “US leveraged loan default update: Rate increases to 1.43% in October” (November 16, 2023). Loans gained 0.96% in September 2023 and have returned 10.16% YTD as of 9/30, as measured by Morningstar LSTA US Leveraged Loan Index (the “LLI”) 1 • September 2023 marked the fourth consecutive month of positive performance for the loan asset class • 3Q 2023 return of 3.46% represents the strongest quarter for loans since 4Q 2020 1 • Loan performance in 2023 has been driven by rising rates; interest component of YTD LLI total return = 7.18% as of 9/30/2023 1 • Lower - rated facilities have led the loan market rally; YTD as of 9/30, CCC loans have returned 15.03%, Bs 11.31%, and BBs 7.27% 1 Some signs of easing credit stress amid better - than - expected inflation and economic data, though risks remain • LTM default rate decreased to 1.34% as of 9/30/2023 from 1.55% as of 8/31/23 2 • Share of performing loans priced below 80 dropped to 4.36% in September from 5.21% in August 2 • Borrowers have reduced 2024 institutional loan maturities by 76% ($17.6B) as of 9/30/2023 from the end of 2022 ($74.9B) 1 • Loan rating downgrade - to - upgrade ratio declined to 1.73x (rolling 3 - month basis) as of 9/30/2023, the lowest level in 14 months 2 Higher loan supply and increased demand in 3Q • 3Q primary loan market activity increased to the highest level since the Fed began raising rates in 1Q 2022 1 • M&A and non - refinancing issuance comprised 61% ($23.3B) of total September new loan volume, a YTD high 1 • While M&A - backed loan volume has sequentially increased in each quarter of 2023, refinancings continue to represent the lion’s share of YTD new issuance 1 • Total 3Q new loan issuance = $76.3B, (+51% QoQ increase) 1 • CLO issuance and loan fund flows totaled $29.0B in 3Q, up from $14.9B in 2Q 1 • YTD new CLO issuance = $83.9B as of 9/30/2023, down - 22% vs. YTD 9/30/2022 1 • Retail loan funds recorded modest inflows in September 2023 1 All - in loan yields remain attractive in a higher - for - longer interest rate environment • At 10.01% as of 9/29/2023, the average 3Y yield for loans is near a post - GFC high and compares to 9.09% YTW for HY bonds (as of 9/29/23) 3
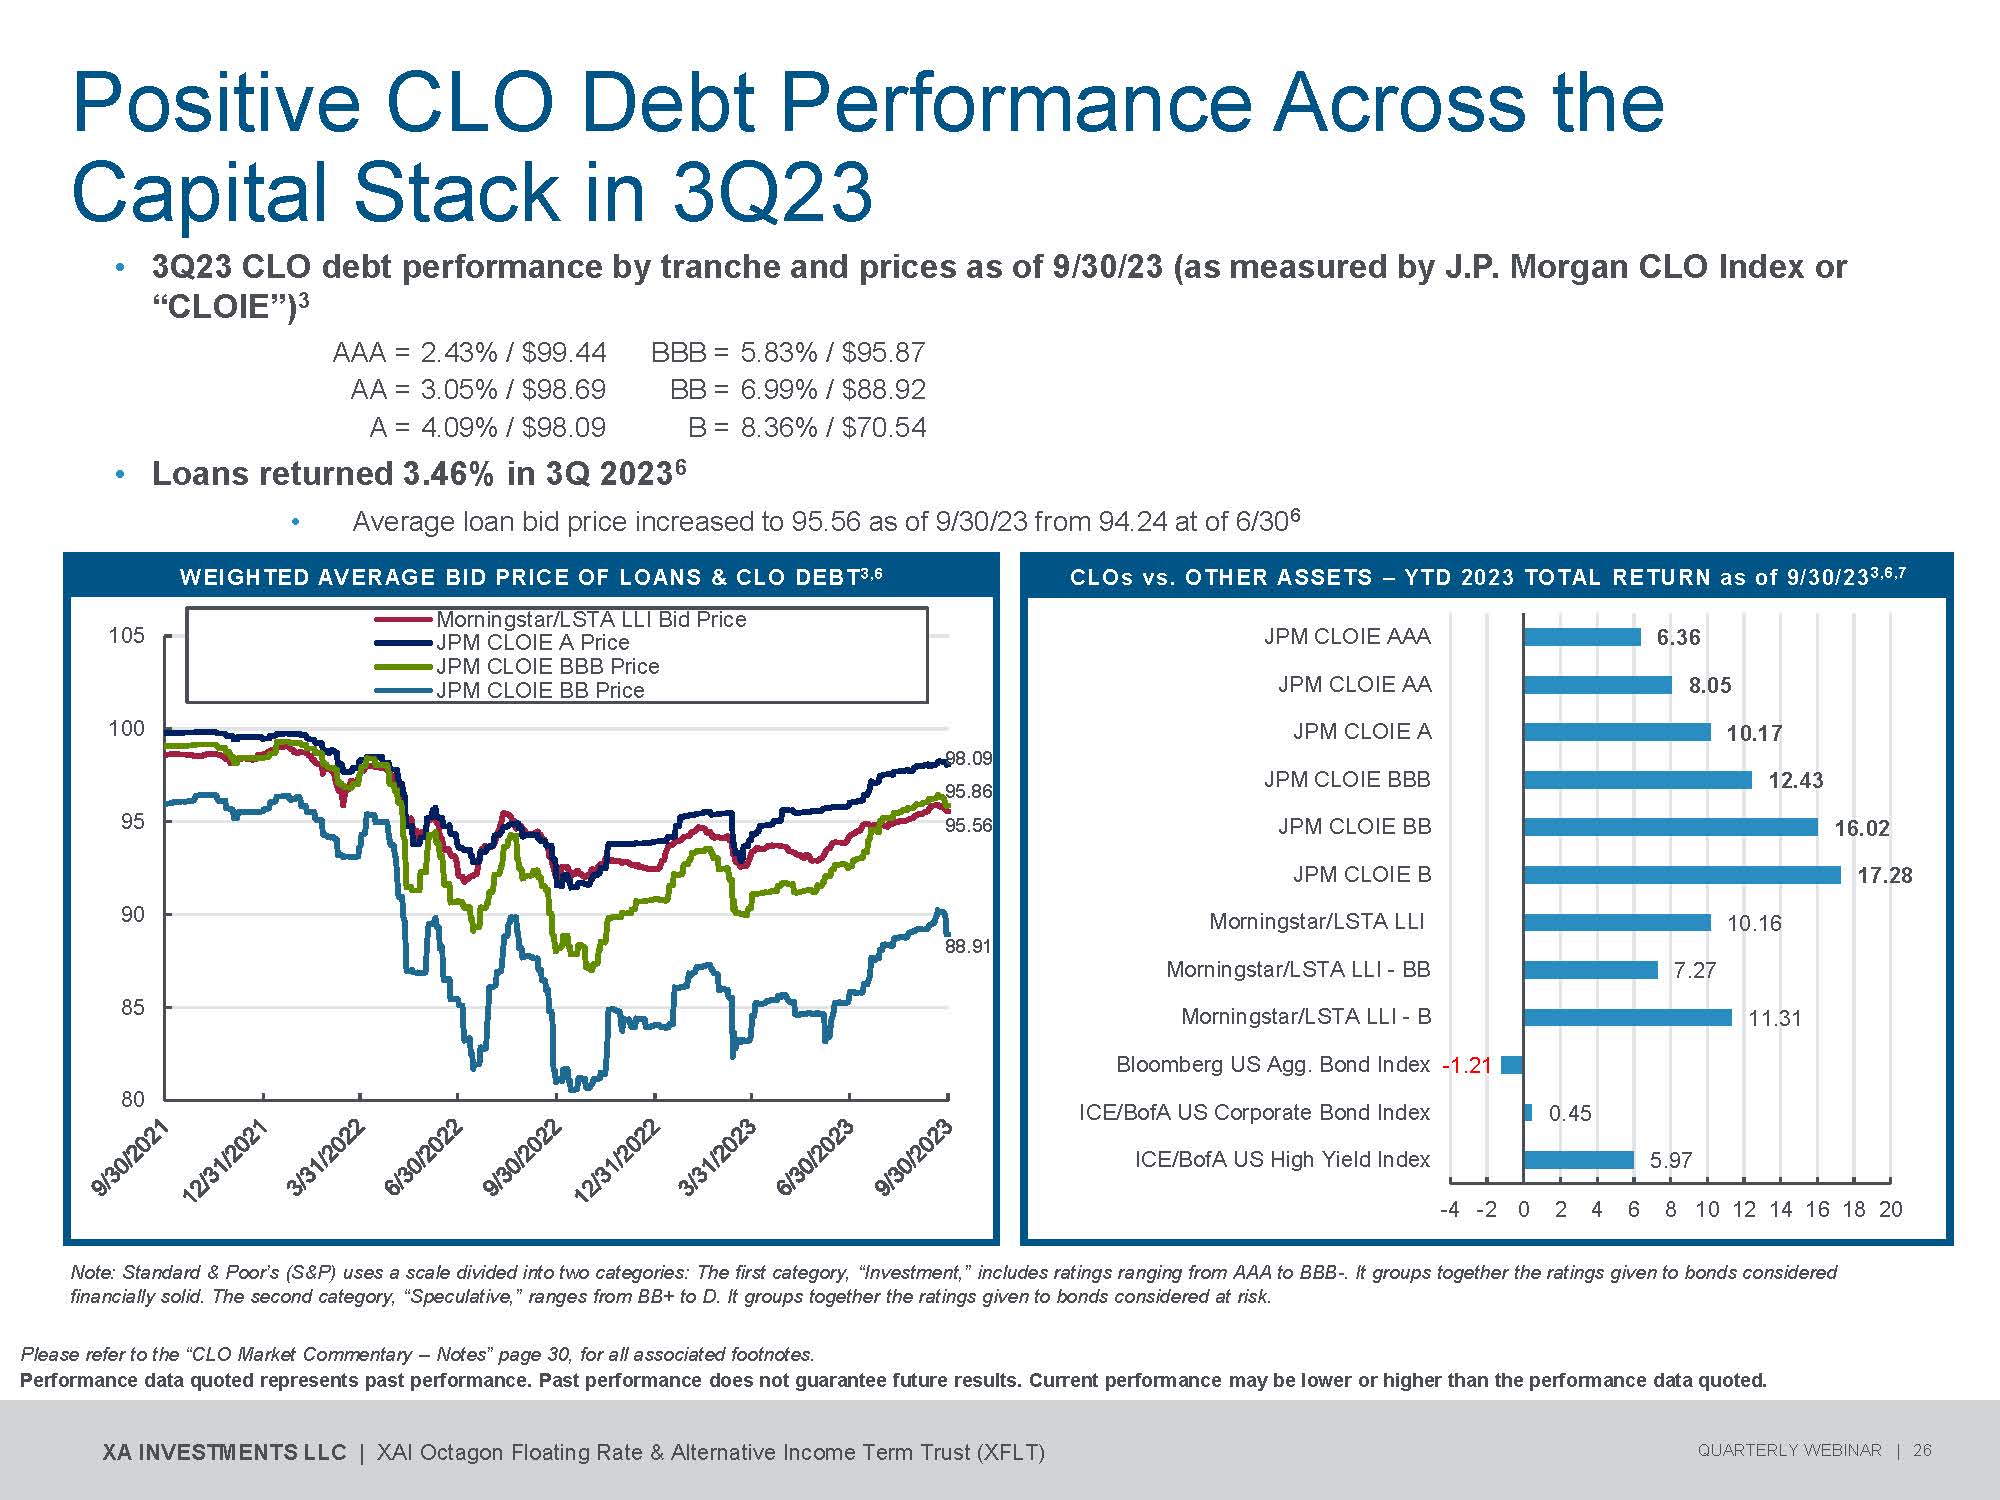
Positive CLO Debt Performance Across the Capital Stack in 3Q23 • 3Q23 CLO debt performance by tranche and prices as of 9/30/23 (as measured by J.P. Morgan CLO Index or “CLOIE”) 3 • Loans returned 3.46% in 3Q 2023 6 • Average loan bid price increased to 95.56 as of 9/30/23 from 94.24 at of 6/30 6 WEIGHTED AVERAGE BID PRICE OF LOANS & CLO DEBT 3,6 CLOs vs. OTHER ASSETS – YTD 2023 TOTAL RETURN as of 9/30/23 3,6,7 5.83% / $95.87 BBB = 2.43% / $99.44 AAA = 6.99% / $88.92 BB = 3.05% / $98.69 AA = 8.36% / $70.54 B = 4.09% / $98.09 A = 80 85 90 95 100 105 Morningstar/LSTA LLI Bid Price JPM CLOIE A Price JPM CLOIE BBB Price JPM CLOIE BB Price 5 . 9 7 Please refer to the “CLO Market Commentary – Notes” page 30, for all associated footnotes. Performance data quoted represents past performance. Past performance does not guarantee future results. Current performance may be lower or higher than the performance data quoted. XA INVESTMENTS LLC | XAI Octagon Floating Rate & Alternative Income Term Trust (XFLT) QUARTERLY WEBINAR | 26 0 . 4 5 11 . 3 1 7 . 2 7 10 . 1 6 17 . 2 8 16 . 0 2 ICE/BofA US High Yield Index ICE/BofA US Corporate Bond Index Bloomberg US Agg. Bond Index - 1.21 Morningstar/LSTA LLI - B JPM CLOIE B Morningstar/LSTA LLI Morningstar/LSTA LLI - BB JPM CLOIE AAA 6.36 JPM CLOIE AA 8.05 JPM CLOIE A 10.17 JPM CLOIE BBB 12.43 JPM CLOIE BB - 4 - 2 0 2 4 6 8 10 12 14 16 18 20 Note: Standard & Poor’s (S&P) uses a scale divided into two categories: The first category, “Investment,” includes ratings ranging from AAA to BBB - . It groups together the ratings given to bonds considered financially solid. The second category, “Speculative,” ranges from BB+ to D. It groups together the ratings given to bonds considered at risk. 98 . 0 9 95.8 6 95 . 5 6 88 . 9 1
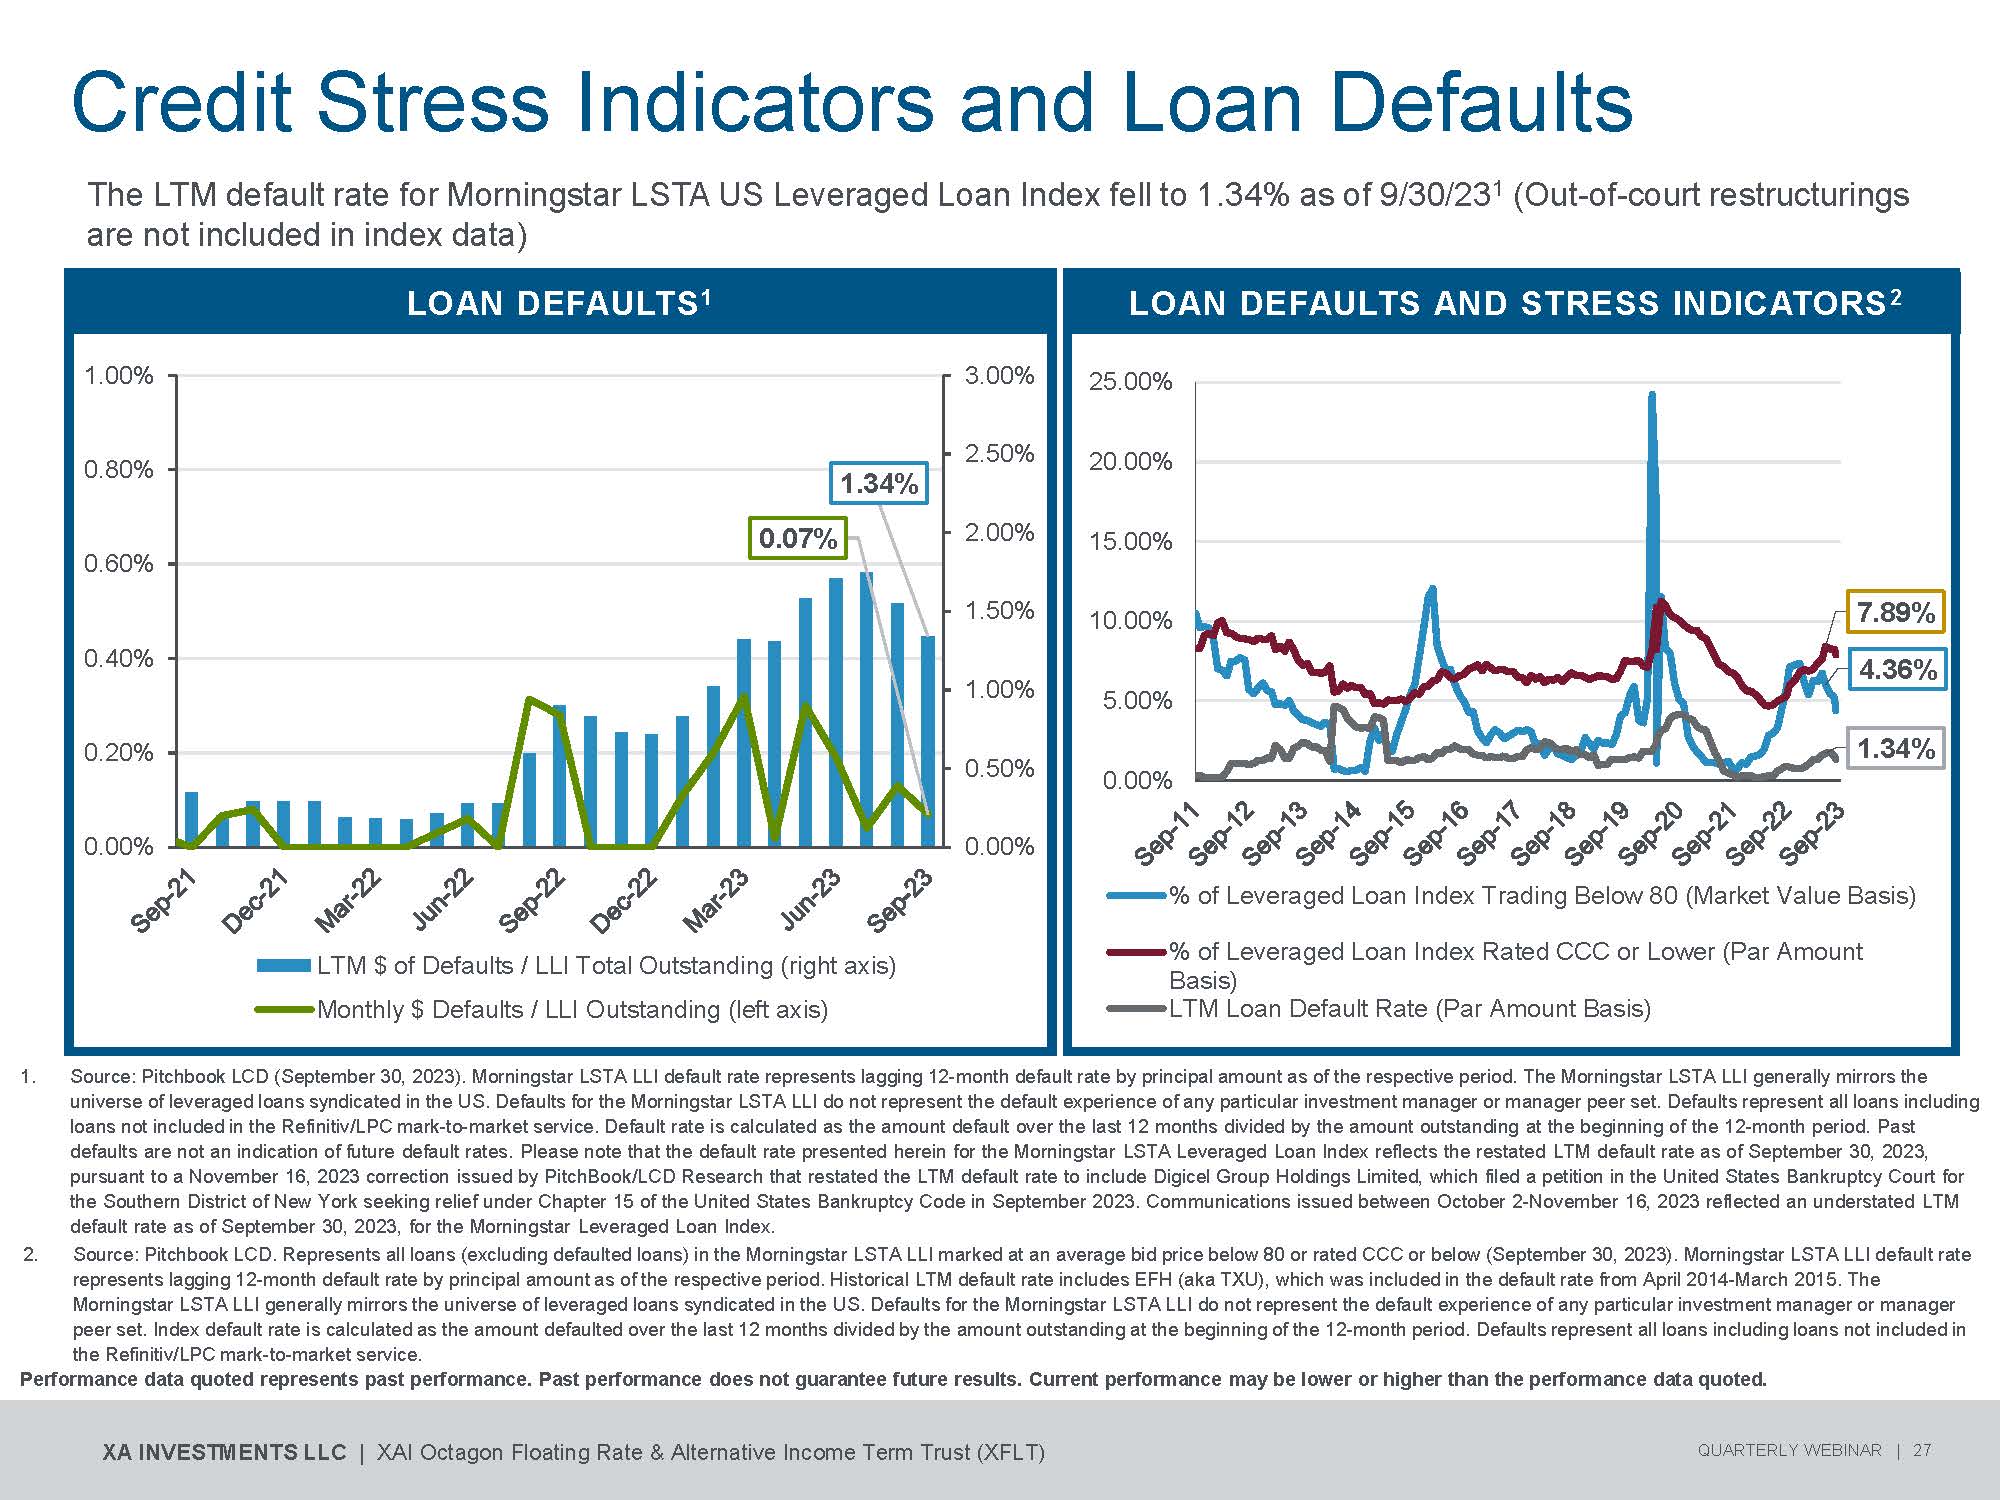
Credit Stress Indicators and Loan Defaults 1. Source: Pitchbook LCD (September 30, 2023). Morningstar LSTA LLI default rate represents lagging 12 - month default rate by principal amount as of the respective period. The Morningstar LSTA LLI generally mirrors the universe of leveraged loans syndicated in the US. Defaults for the Morningstar LSTA LLI do not represent the default experience of any particular investment manager or manager peer set. Defaults represent all loans including loans not included in the Refinitiv/LPC mark - to - market service. Default rate is calculated as the amount default over the last 12 months divided by the amount outstanding at the beginning of the 12 - month period. Past defaults are not an indication of future default rates. Please note that the default rate presented herein for the Morningstar LSTA Leveraged Loan Index reflects the restated LTM default rate as of September 30, 2023, pursuant to a November 16, 2023 correction issued by PitchBook/LCD Research that restated the LTM default rate to include Digicel Group Holdings Limited, which filed a petition in the United States Bankruptcy Court for the Southern District of New York seeking relief under Chapter 15 of the United States Bankruptcy Code in September 2023. Communications issued between October 2 - November 16, 2023 reflected an understated LTM default rate as of September 30, 2023, for the Morningstar Leveraged Loan Index. 2. Source: Pitchbook LCD. Represents all loans (excluding defaulted loans) in the Morningstar LSTA LLI marked at an average bid price below 80 or rated CCC or below (September 30, 2023). Morningstar LSTA LLI default rate represents lagging 12 - month default rate by principal amount as of the respective period. Historical LTM default rate includes EFH (aka TXU), which was included in the default rate from April 2014 - March 2015. The Morningstar LSTA LLI generally mirrors the universe of leveraged loans syndicated in the US. Defaults for the Morningstar LSTA LLI do not represent the default experience of any particular investment manager or manager peer set. Index default rate is calculated as the amount defaulted over the last 12 months divided by the amount outstanding at the beginning of the 12 - month period. Defaults represent all loans including loans not included in The LTM default rate for Morningstar LSTA US Leveraged Loan Index fell to 1.34% as of 9/30/23 1 (Out - of - court restructurings are not included in index data) LOAN DEFAULTS AND STRESS INDICATORS 2 25.00% 20.00% 15.00% 10.00% 7.89% 4.36% 5.00% 1.34% 0.00% % of Leveraged Loan Index Trading Below 80 (Market Value Basis) % of Leveraged Loan Index Rated CCC or Lower (Par Amount Basis) LTM Loan Default Rate (Par Amount Basis) LOAN DEFAULTS 1 1.00% 3.00% 2.50% 0.80% 1.34% 0.07% 2.00% 0.60% 1.50% 0.40% 1.00% 0.20% 0.50% 0.00% 0.00% LTM $ of Defaults / LLI Total Outstanding (right axis) Monthly $ Defaults / LLI Outstanding (left axis) t h e R e fi n itiv/ L P C m ar k - to - m ar k e t s er vice. Performance data quoted represents past performance. Past performance does not guarantee future results. Current performance may be lower or higher than the performance data quoted. XA INVESTMENTS LLC | XAI Octagon Floating Rate & Alternative Income Term Trust (XFLT) QUARTERLY WEBINAR | 27

Current Loan Yields are Above Historical Median, Trailing Defaults Remain Low 1. Represents the Yield to Maturity for the Morningstar LSTA LLI. “Long Term Median Yield to Maturity” represents the median of Yield to Maturity at month - end starting January 31, 2010. 2. Represents lagging 12 - month default rate for the Morningstar LSTA Leveraged Loan Index (LLI) by principal amount as of September 30, 2023. Default rate is calculated as the amount default over the last 12 months divided by the amount outstanding at the beginning of the 12 - month period. Represents all loans including loans not included in the Refinitiv/LPC mark - to - market service. Source: LCD News (September 30, 2023). Past defaults are not an indication of future default rates. Please note that the default rate presented herein for the Morningstar LSTA Leveraged Loan Index reflects the restated LTM default rate as of October 31, 2023, pursuant to a November 16, 2023 correction issued by PitchBook/LCD Research that restated the LTM default rate to include Digicel Group Holdings Limited, which filed a petition in the United States Bankruptcy Court for the Southern District of New York seeking relief under Chapter 15 of the United States Bankruptcy Code in September 2023. Communications issued between October 2 - November 16, 2023 reflected an understated LTM default rate as of September 30, 2023, for the Morningstar Leveraged Loan Index. 3. Represents the long - term historical average (beginning in January 2000 ) of the lagging 12 - month default rate for the Morningstar LSTA Leveraged Loan Index by principal amount as of September 30 , 2023 . Default rate is calculated as the amount of default over the last 12 months divided by the amount outstanding at the beginning of the 12 - month period . Represents all loans including loans not included in the Refinitiv/LPC mark - to - market service . Source : LCD News (September 30 , 2023 ) . Past defaults are not an indication of future default rates . 4. Represents the 3 Year Discount Margin for the Morningstar LSTA LLI . “Long Term Median Loan 3 Yr Discount Margin” represents the median of 3 Year Discount Margins at month - end starting January 31 , 2010 . 5. Represents the average of all outstanding 1 and 3 Month LIBOR/SOFR contracts tracked by Markit . Performance data quoted represents past performance. Past performance does not guarantee future results. Current performance may be lower or higher than the performance data quoted. • Average loan yield - to - maturity as of 9/30/2023 = 10.30% vs. long - term median of 5.59% 1 • LTM loan default rate = 1.34% as of 9/30/2023 2 vs. long - term average of 2.6% 3 HISTORICAL LOAN YIELDS AND DEFAULT RATE 1,2,4,5 0 . 00 % 2 . 00 % 4 . 00 % 6 . 00 % 8 . 00 % 10 . 00 % 0 bp s 20 0 bp s 40 0 bp s 60 0 bp s 80 0 bp s 100 0 bp s 1200 bps 12.00% S e p - 1 1 S e p - 1 2 S e p - 2 3 S e p - 1 3 S e p - 1 4 S e p - 1 5 S e p - 1 6 S e p - 1 7 S e p - 1 8 S e p - 1 9 S e p - 2 0 S e p - 2 1 S e p - 2 2 LTM Loan Default Rate 3 Year DM Yield to Maturity LIBOR/SOFR avg. Base Rate XA INVESTMENTS LLC | XAI Octagon Floating Rate & Alternative Income Term Trust (XFLT) QUARTERLY WEBINAR | 28

CLO Market Themes & Outlook XA INVESTMENTS LLC | XAI Octagon Floating Rate & Alternative Income Term Trust (XFLT) QUARTERLY WEBINAR | 29 Please refer to the “CLO Market Commentary – Notes” page 30, for all associated footnotes. Performance data quoted represents past performance. Past performance does not guarantee future results. Current performance may be lower or higher than the performance data quoted. Pace of new CLO formation accelerated in 3Q 2023; $28B of deals priced during the quarter (vs. $22B in 2Q) 1 • YTD new CLO issuance = $83.9B as of 9/30/2023, down - 22% vs. YTD 9/30/2022 1 • Current forward pipeline suggests primary CLO issuance may remain stable through year - end • Shifting CLO AAA demand may constrain new deal issuance over the near - term Primary CLO spreads broadly tightened in 3Q, 2 though new issue arbitrage remains challenged • Primary CLO liability spreads generally lagged secondary spread levels in 3Q • Average new issue CLO AAA spread tightened to S+189bps in 3Q from S+198bps in 2Q (vs. S+231bps at YE 2022) 2 • Primary AAA spreads for top - tier managers narrowed to YTD tights (inside S+170bps) during 3Q 2 • Primary AAA spread basis between top - tier managers and lower - tier managers compressed in 3Q to 26bps, from 32 bps in 2Q 2 • In 3Q, the weighted average cost of liabilities across the CLO capital stack (S+260bps) compressed by 15bps QoQ 2 • Primary CLO liability spreads have since widened from tights observed in 3Q Risk assets continued to outperform through 3Q, which provided some support for CLO collateral portfolios, though negative loan ratings actions persist • Rate volatility caught up with the loan market towards quarter - end, as returns trended downward towards in the last week of September 2023, particularly for lower - rated assets CLO debt tranches posted positive 3Q returns, and continue to outpace other comparably rated assets on a YTD basis 3,4,5 • CLO AAA tranches have returned 6.36% YTD as of 9/30 3 vs. - 1.43% for AAA corporate bonds 4 • CLO BB tranches have returned 16.02% YTD as of 9/30 3 vs. 4.40% for BB HY bonds 5 • CLO mezzanine tranches (BB, B) have posted the strongest YTD performance of credit assets 3,6,7 “Higher - for longer” expectations should support above - average returns for CLO tranches over the intermediate term • CLO debt yields are currently near historic wides due to elevated base rates
CLO Market Commentary - Notes XA INVESTMENTS LLC | XAI Octagon Floating Rate & Alternative Income Term Trust (XFLT) QUARTERLY WEBINAR | 30 1. Source: Pitchbook LCD, “CLO Global Databank” (retrieved from www.lcdcomps.com, October 10, 2023). 2. Source: Pitchbook LCD, “3Q US CLO Wrap: Issuance picks up as arbitrage conditions improve” (September 28, 2023). 3. Source: J.P. Morgan Data Query, as of the stated period/date. Represents the post - crisis J.P. Morgan Collateralized Loan Obligation Index (“CLOIE”). The CLOIE is a benchmark to track the market for US dollar denominated broadly syndicated, arbitrage CLOs. The CLOIE is divided by origination (pre - versus post - crisis) and is broken out further into six original rating classes (AAA, AA, A, BBB, BB, B). It is impossible to invest directly in the index. Past performance is not a predictor of future market performance. 4. Source: J.P. Morgan Data Query (October 17, 2023). Represents performance for JPMorgan JULI US AAA Index from January 1 - September 30, 2023. 5. Source: J.P. Morgan High Yield Bond and Leveraged Loan Market Monitor (October 2, 2023). 6. Sources: Pitchbook Leveraged Commentary & Data (Pitchbook LCD), Morningstar LSTA US Leveraged Loan Index. Represents metrics for the Morningstar LSTA US Leveraged Loan Index (“Morningstar LSTA LLI”) as of the stated date. In conjunction with LCD, the Leveraged Syndications & Trading Association (“LSTA”) developed the Morningstar LSTA LLI, a market - value weighted index designed to measure the performance of the US leveraged loan market, the index universe comprises syndicated, senior secured, US - dollar denominated leveraged loans covered by Morningstar PitchBook/LCD, a Morningstar Company. Loan facilities included in the LLI must have a one year (at inception) minimum term, an initial minimum spread of L/S+125 bps, and a minimum size of $50mm (initially funded). Refinitiv/LPC Mark - to - Market Pricing is used to price each loan in the index. Refinitiv/LPC Mark - to - Market Pricing is based on bid/ask quotes gathered from dealers and is not based upon derived pricing models. The index uses the average bid for its market value calculation. It is not possible to invest directly in this index. Past performance is not a predictor of future market performance. Please note that the performance information presented herein for the Morningstar LSTA US Leveraged Loan Index reflects restated returns for the period June 25, 2022 – February 27, 2023, pursuant to a recent notification issued by PitchBook/LCD Research that a technical error in the calculation of accrued interest for certain securities within the Morningstar Leveraged Loan Indexes dating back to June 25, 2022 had been identified and corrected. Previous communications reflected overstated Morningstar Leveraged Loan Index returns. 7. Bloomberg US Agg Bond Index, ICE BofA US Corporate Bond Index, ICE BofA US HY Index returns sourced from Bloomberg (October 16, 2023). 8. Source: Citi Research, “Global CLO Markets Q4’23 Outlook” (October 4, 2023). 9. Source: J.P. Morgan CLO Research (September 2023). 10. Source: BofA Global Research, “CLO Weekly” (October 16, 2023). 11. Source: Barclays Credit Research, “Equity distributions remained strong during July payment cycle” (August 11, 2023). 12. Source: BofA Global Research, “CLO Weekly” (October 6, 2023).
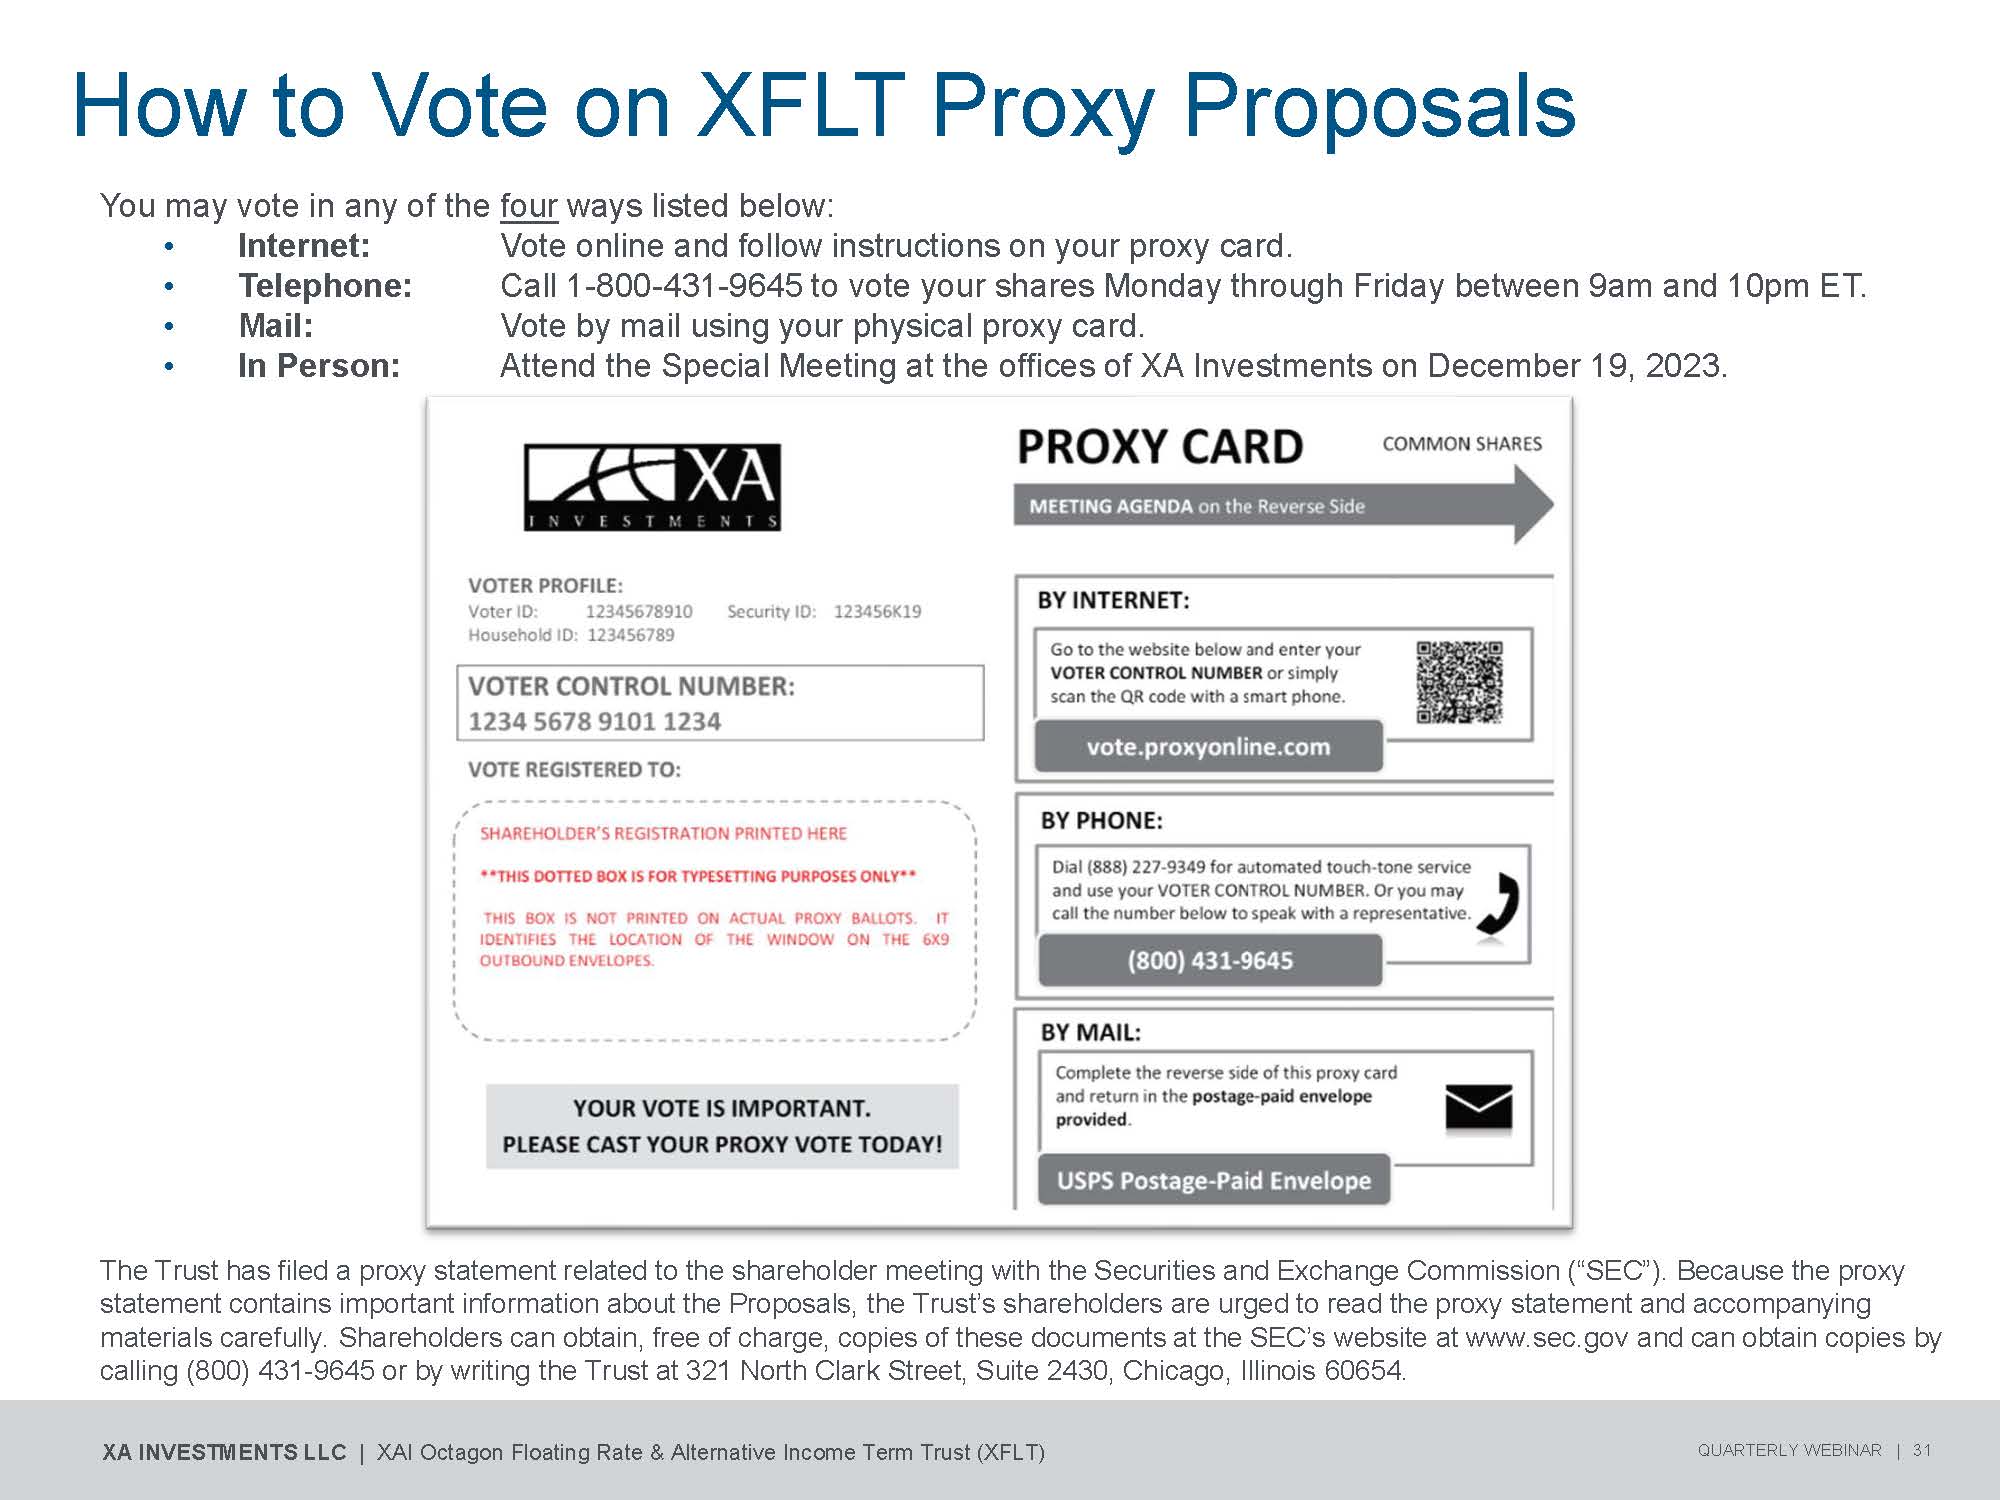
How to Vote on XFLT Proxy Proposals You may vote in any of the four ways listed below: • Internet: • T e l e pho ne : • Mail: • In Person: Vote online and follow instructions on your proxy card. Call 1 - 800 - 431 - 9645 to vote your shares Monday through Friday between 9am and 10pm ET. Vote by mail using your physical proxy card. Attend the Special Meeting at the offices of XA Investments on December 19, 2023. The Trust has filed a proxy statement related to the shareholder meeting with the Securities and Exchange Commission (“SEC”). Because the proxy statement contains important information about the Proposals, the Trust’s shareholders are urged to read the proxy statement and accompanying materials carefully. Shareholders can obtain, free of charge, copies of these documents at the SEC’s website at www.sec.gov and can obtain copies by calling (800) 431 - 9645 or by writing the Trust at 321 North Clark Street, Suite 2430, Chicago, Illinois 60654. XA INVESTMENTS LLC | XAI Octagon Floating Rate & Alternative Income Term Trust (XFLT) QUARTERLY WEBINAR | 31

Webinar Questions? Please use the Q&A dropdown indicated below to submit your questions XA INVESTMENTS LLC | XAI Octagon Floating Rate & Alternative Income Term Trust (XFLT) QUARTERLY WEBINAR | 32 XAInvestments.com | (888) 903 - 3358 321 North Clark Street Suite 2430 Chicago, IL 60654 Click Q&A Enter questions in this box

Contact Our Team with Questions XAInvestments.com | (888) 903 - 3358 321 North Clark Street Suite 2430 Chicago, IL 60654 Steven Perry X A In v est m ents Vice President, Product Management Kimb e rly Fl y nn X A In v est m ents Managing Director, Alternative Investments Sperry@XAInvestments.com (312) 374 - 6933 Kflynn@XAInvestments.com (312) 374 - 6931 Performance data quoted represents past performance. Past performance does not guarantee future results. Current performance may be lower or higher than the performance data quoted. XA INVESTMENTS LLC | XAI Octagon Floating Rate & Alternative Income Term Trust (XFLT) QUARTERLY WEBINAR | 33

XFLT Total Portfolio Holdings and Financials Performance data quoted represents past performance. Past performance does not guarantee future results. Current performance may be lower or higher than the performance data quoted. XA INVESTMENTS LLC | XAI Octagon Floating Rate & Alternative Income Term Trust (XFLT) QUARTERLY WEBINAR | 34 Below Investment Grade Securities Risk. The Trust invests primarily in below investment grade credit instruments, which are commonly referred to as “high - yield” securities or “junk” bonds. S&P uses a scale divided into two categories: The first category, “Investment,” includes ratings ranging from AAA to BBB - . It groups together the ratings given to bonds considered financially solid. The second category, “Speculative,” ranges from BB+ to D. S&P groups together the ratings given to bonds considered at risk. Moody’s also uses a two - scale rating approach for long - term obligations: “Investment Grade” rating range from Aaa to Baa3, while “Non - Investment Grade” rating range from Ba1 to C. Moody’s does not rate credit investments below C. A credit instrument is considered below investment grade quality if it is rated below investment grade (that is, below Baa3 by Moody’s or below BBB - by S&P or Fitch) or, if unrated, judged to be below investment grade quality by the Sub - Adviser. Below investment grade credit instruments are often referred to as “high yield” securities or “junk bonds.” Below investment grade credit instruments are regarded as having predominantly speculative characteristics with respect to capacity to pay interest and to repay principal. Rating agencies, such as Moody’s, S&P or Fitch, are private services that provide ratings of the credit quality of debt obligations. Ratings assigned by a rating agency are not absolute standards of credit quality but represent the opinion of the rating agency as to the quality of the obligation. Rating agencies may fail to make timely changes in credit ratings and an issuer’s current financial condition may be better or worse than a rating indicates. To the extent that the issuer of a security pays a rating agency for the analysis of its security, an inherent conflict of interest may exist that could affect the reliability of the rating. Ratings are relative and subjective and, although ratings may be useful in evaluating the safety of interest and principal payments, they do not evaluate the market value risk or liquidity of such obligations. To the extent that the Trust invests in unrated lower grade securities, the Trust’s ability to achieve its investment objective will be more dependent on the Sub - Adviser’s credit analysis than would be the case when the Trust invests in rated securities. Full portfolio holdings and financials are available at: https://xainvestments.com/funds/funds - floating - rate - alternative - income - term - trust - xflt

APPE ND IX APPENDIX: Additional Information, Glossary and Risk Considerations

CLO Considerations Performance data quoted represents past performance. Past performance does not guarantee future results. Current performance may be lower or higher than the performance data quoted. XA INVESTMENTS LLC | XAI Octagon Floating Rate & Alternative Income Term Trust (XFLT) QUARTERLY WEBINAR | 36 Is there a CLO equity benchmark index? Currently, no CLO equity index exists and none is expected since CLO equity returns differ by vintage (year of issuance), making index creation challenging. As such, there are no historical returns for the CLO equity marketplace. There are two fairly new CLO debt indices (J.P. Morgan CLO Index and Palmer Square CLO Debt Index) which provide historical post - crisis index return information. What is XFLT’s performance benchmark? Because there is no CLO equity index, XFLT uses the leading senior loan benchmark which is the Morningstar LSTA US Leveraged Loan 100 Index as its performance benchmark. What does the life of a typical CLO look like? What does it mean to reset or refinance a CLO? When refinancing a CLO, the CLO capital stack is replaced at lower spreads, which reduces equity - tranche holders’ cost of leverage and thus increases their return. The portfolio can be refinanced either partially or in full. In a CLO reset, the original deal, including the loans it owns, remains in place and its reinvestment period or maturity is extended to allow the deal to remain outstanding longer. CLOs typically have a four - year reinvestment and once that timeframe is up, there may be restrictions on buying new loans. A CLO can only be reset or refinanced after its non - call period. Life of the Typical CLO Warehouse Period: Underwriting bank provides CLO manager with financing to begin acquiring assets in advance of CLO closing. Equity investors provide first loss capital during the warehouse period Month 1 to Month 6 Pre - closing CLO comes into legal existence Closing Ramp - Up Period: Post - closing, proceeds from CLO debt issuance used to repay warehouse and purchase additional assets Month 1 to Month 3 Post - closing Non - Call Period: Post Year 2, the equity investor(s) may direct original CLO liabilities to be refinanced (prepaid at par) and replaced with new liabilities in order to reduce interest expense Month 4 to Year 4 Reinvestment Period: Collateral manager permitted to actively trade underlying assets to maximize value and ensure portfolio remains in compliance with collateral quality tests. Principal cash flows from underlying loan/bond assets used by the Collateral Manager to purchase new assets Amortization Period: A portion of cash flows from asset amortization, prepayments/repayments, and sales are used to pay down outstanding CLO debt in order of seniority Year 5 to Maturity
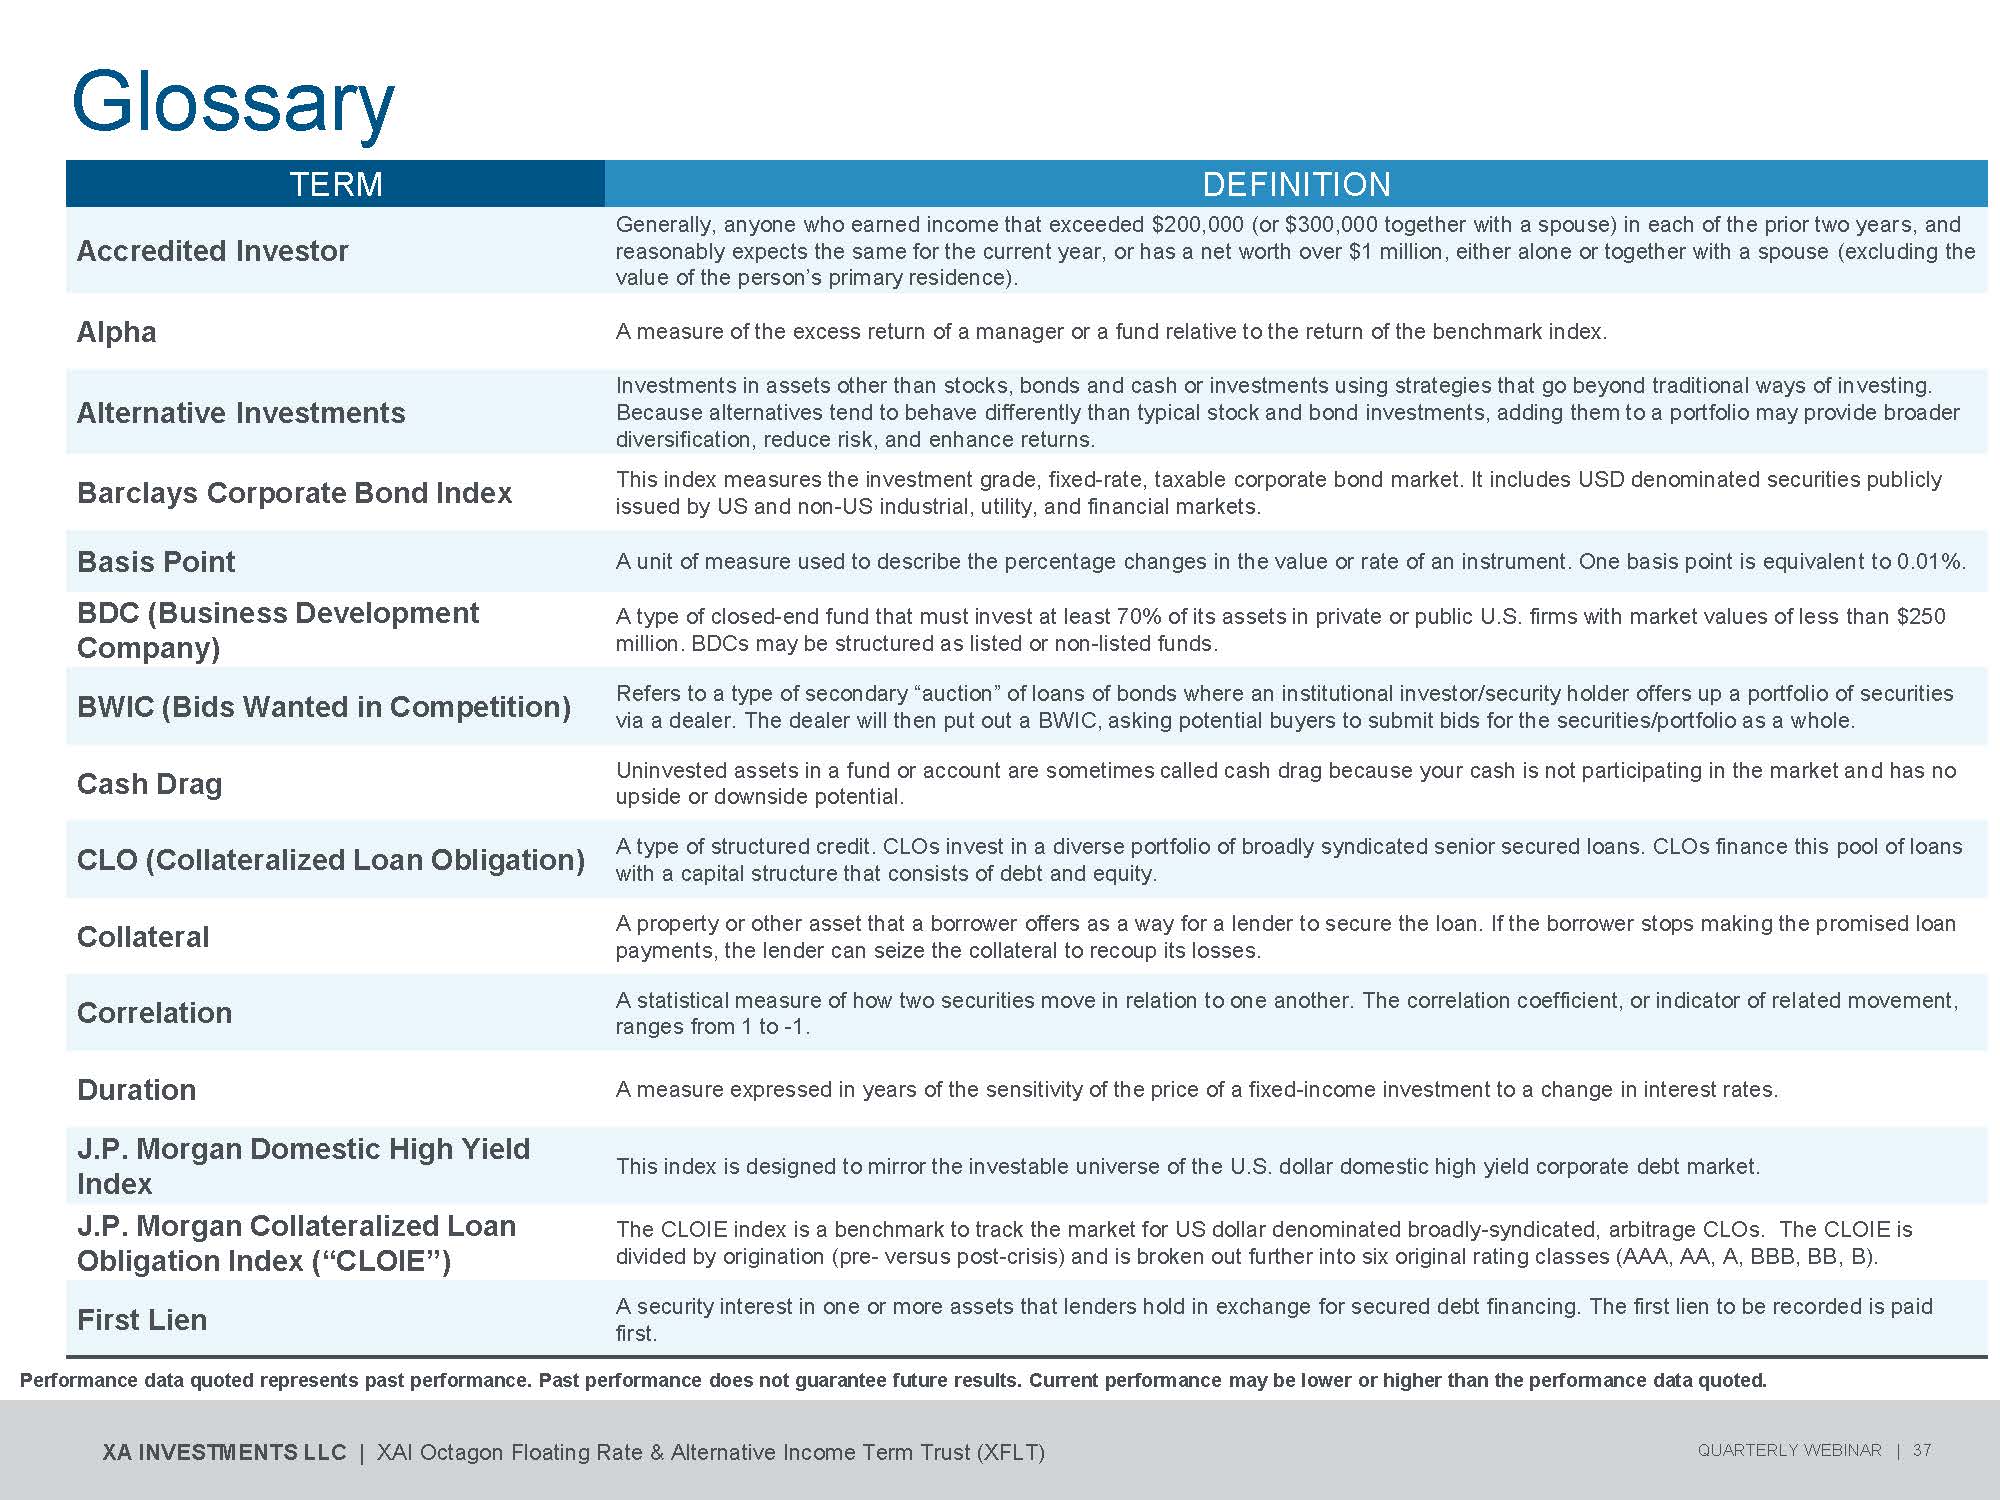
Glossary Performance data quoted represents past performance. Past performance does not guarantee future results. Current performance may be lower or higher than the performance data quoted. XA INVESTMENTS LLC | XAI Octagon Floating Rate & Alternative Income Term Trust (XFLT) QUARTERLY WEBINAR | 37 DEFINITION TERM Generally, anyone who earned income that exceeded $200,000 (or $300,000 together with a spouse) in each of the prior two years, and reasonably expects the same for the current year, or has a net worth over $1 million, either alone or together with a spouse (excluding the value of the person’s primary residence). Accredited Investor A measure of the excess return of a manager or a fund relative to the return of the benchmark index. Alpha Investments in assets other than stocks, bonds and cash or investments using strategies that go beyond traditional ways of investing. Because alternatives tend to behave differently than typical stock and bond investments, adding them to a portfolio may provide broader diversification, reduce risk, and enhance returns. Alternative Investments This index measures the investment grade, fixed - rate, taxable corporate bond market. It includes USD denominated securities publicly issued by US and non - US industrial, utility, and financial markets. Barclays Corporate Bond Index A unit of measure used to describe the percentage changes in the value or rate of an instrument. One basis point is equivalent to 0.01%. Basis Point A type of closed - end fund that must invest at least 70% of its assets in private or public U.S. firms with market values of less than $250 million. BDCs may be structured as listed or non - listed funds. BDC (Business Development Company) Refers to a type of secondary “auction” of loans of bonds where an institutional investor/security holder offers up a portfolio of securities via a dealer. The dealer will then put out a BWIC, asking potential buyers to submit bids for the securities/portfolio as a whole. BWIC (Bids Wanted in Competition) Uninvested assets in a fund or account are sometimes called cash drag because your cash is not participating in the market and has no upside or downside potential. Cash Drag A type of structured credit. CLOs invest in a diverse portfolio of broadly syndicated senior secured loans. CLOs finance this pool of loans with a capital structure that consists of debt and equity. CLO (Collateralized Loan Obligation) A property or other asset that a borrower offers as a way for a lender to secure the loan. If the borrower stops making the promised loan payments, the lender can seize the collateral to recoup its losses. Collateral A statistical measure of how two securities move in relation to one another. The correlation coefficient, or indicator of related movement, ranges from 1 to - 1. Correlation A measure expressed in years of the sensitivity of the price of a fixed - income investment to a change in interest rates. Duration This index is designed to mirror the investable universe of the U.S. dollar domestic high yield corporate debt market. J.P. Morgan Domestic High Yield Index The CLOIE index is a benchmark to track the market for US dollar denominated broadly - syndicated, arbitrage CLOs. The CLOIE is divided by origination (pre - versus post - crisis) and is broken out further into six original rating classes (AAA, AA, A, BBB, BB, B). J.P. Morgan Collateralized Loan Obligation Index (“CLOIE”) A security interest in one or more assets that lenders hold in exchange for secured debt financing. The first lien to be recorded is paid first. First Lien
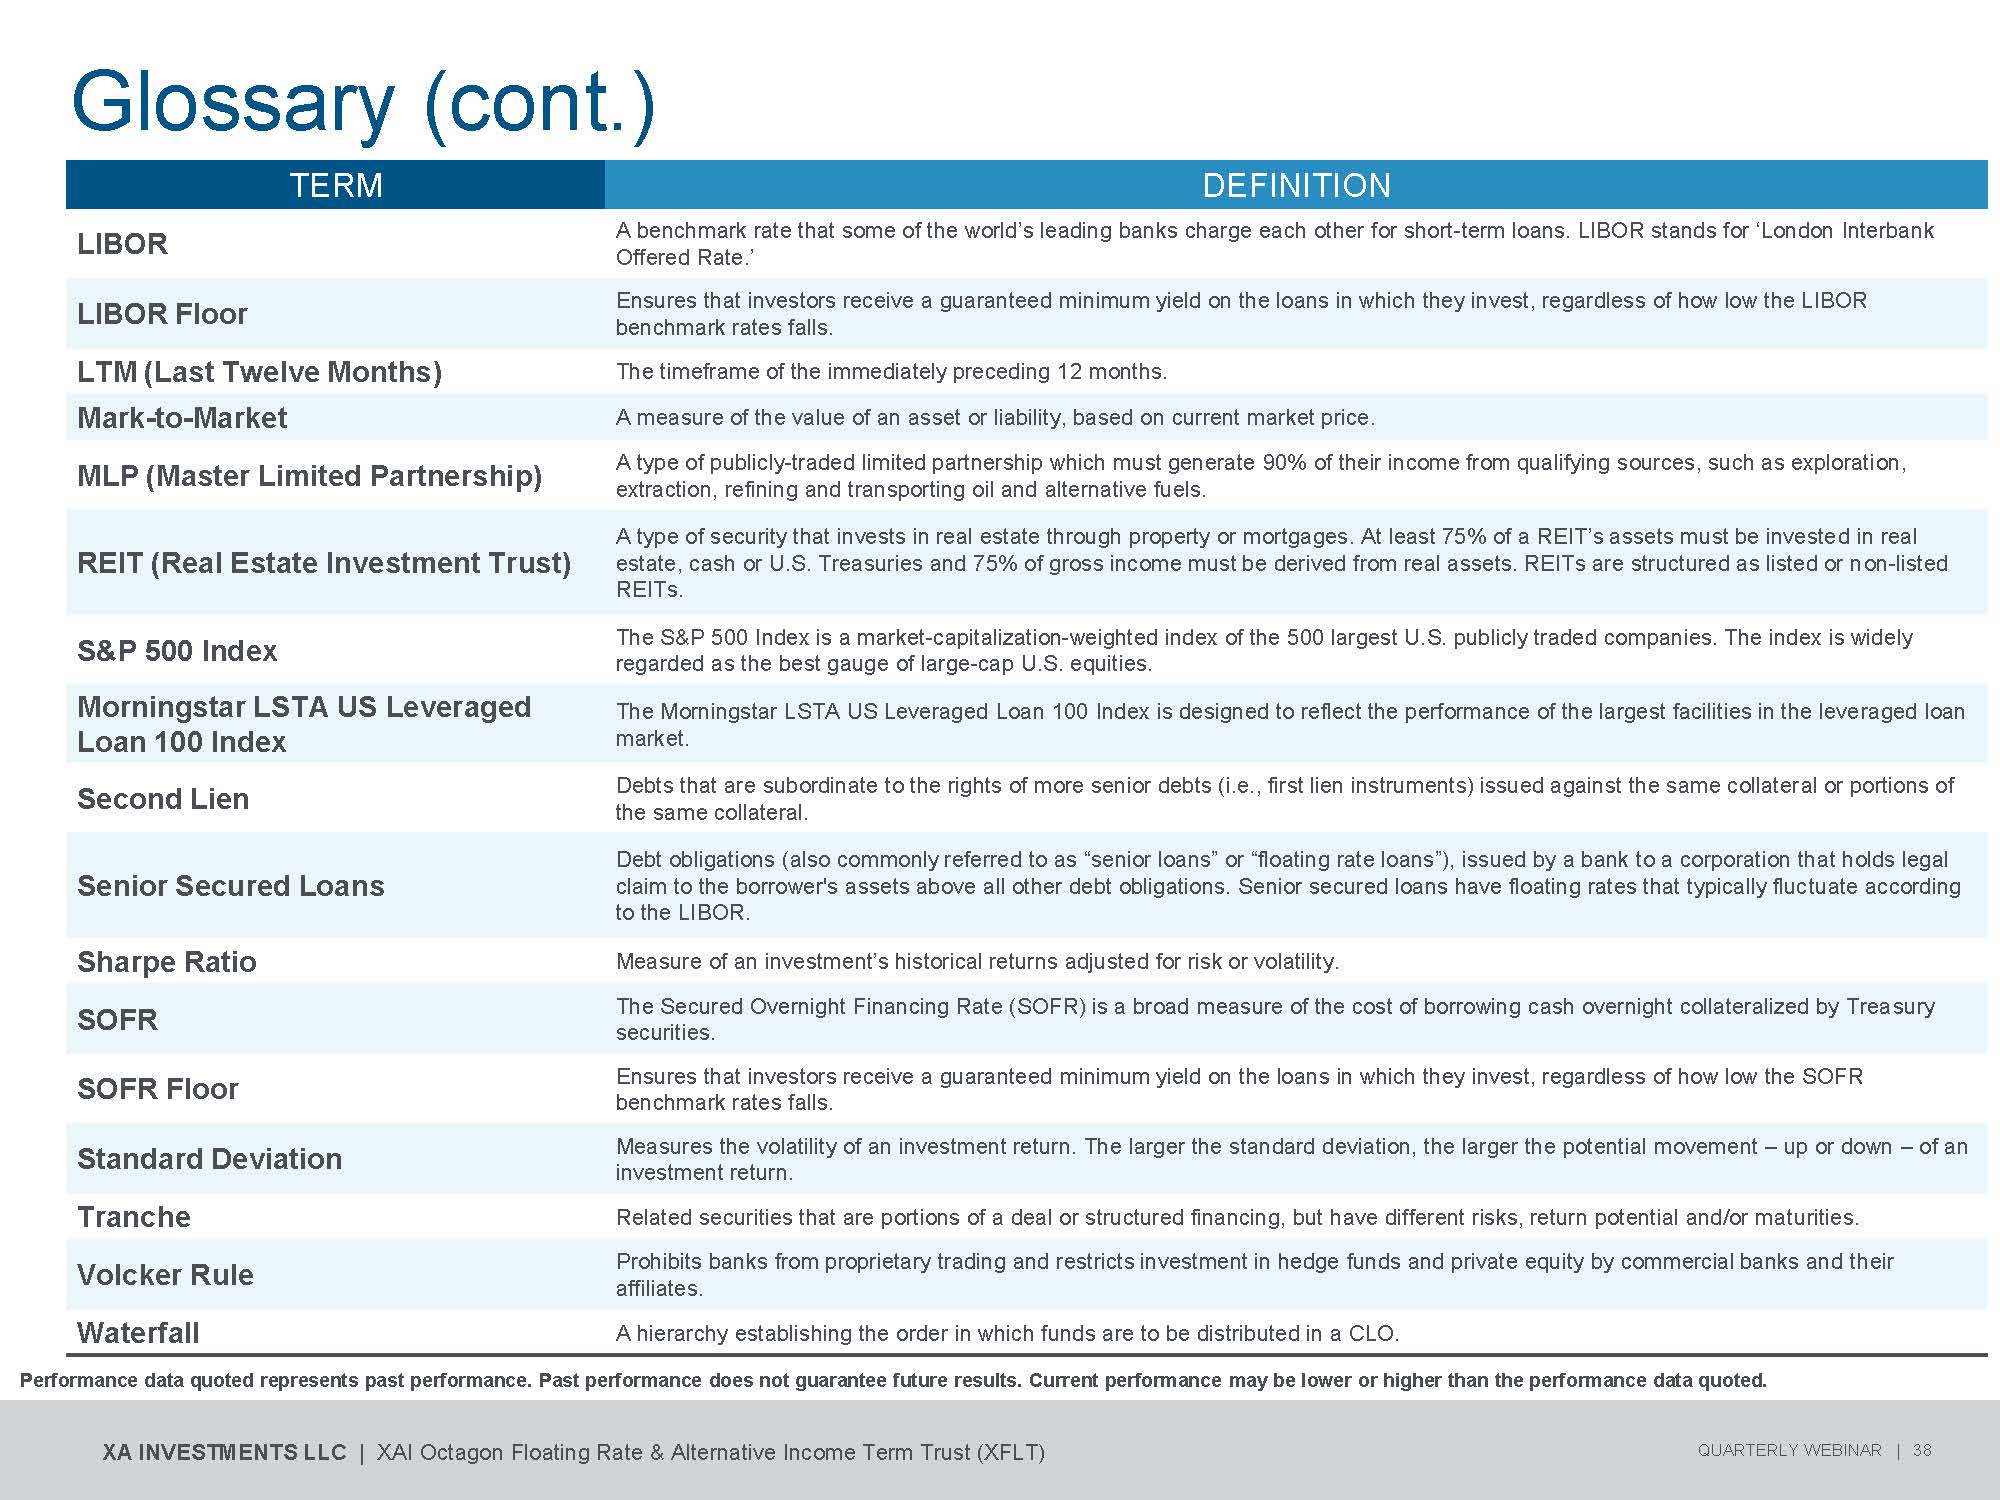
Glossary (cont.) Performance data quoted represents past performance. Past performance does not guarantee future results. Current performance may be lower or higher than the performance data quoted. XA INVESTMENTS LLC | XAI Octagon Floating Rate & Alternative Income Term Trust (XFLT) QUARTERLY WEBINAR | 38 DEFINITION TERM A benchmark rate that some of the world’s leading banks charge each other for short - term loans. LIBOR stands for ‘London Interbank Offered Rate.’ LIBOR Ensures that investors receive a guaranteed minimum yield on the loans in which they invest, regardless of how low the LIBOR benchmark rates falls. LIBOR Floor The timeframe of the immediately preceding 12 months. LTM (Last Twelve Months) A measure of the value of an asset or liability, based on current market price. Mark - to - Market A type of publicly - traded limited partnership which must generate 90% of their income from qualifying sources, such as exploration, extraction, refining and transporting oil and alternative fuels. MLP (Master Limited Partnership) A type of security that invests in real estate through property or mortgages. At least 75% of a REIT’s assets must be invested in real estate, cash or U.S. Treasuries and 75% of gross income must be derived from real assets. REITs are structured as listed or non - listed REITs. REIT (Real Estate Investment Trust) The S&P 500 Index is a market - capitalization - weighted index of the 500 largest U.S. publicly traded companies. The index is widely regarded as the best gauge of large - cap U.S. equities. S&P 500 Index The Morningstar LSTA US Leveraged Loan 100 Index is designed to reflect the performance of the largest facilities in the leveraged loan market. Morningstar LSTA US Leveraged Loan 100 Index Debts that are subordinate to the rights of more senior debts (i.e., first lien instruments) issued against the same collateral or portions of the same collateral. Second Lien Debt obligations (also commonly referred to as “senior loans” or “floating rate loans”), issued by a bank to a corporation that holds legal claim to the borrower's assets above all other debt obligations. Senior secured loans have floating rates that typically fluctuate according to the LIBOR. Senior Secured Loans Measure of an investment’s historical returns adjusted for risk or volatility. Sharpe Ratio The Secured Overnight Financing Rate (SOFR) is a broad measure of the cost of borrowing cash overnight collateralized by Treasury securities. SOFR Ensures that investors receive a guaranteed minimum yield on the loans in which they invest, regardless of how low the SOFR benchmark rates falls. SOFR Floor Measures the volatility of an investment return. The larger the standard deviation, the larger the potential movement – up or down – of an investment return. Standard Deviation Related securities that are portions of a deal or structured financing, but have different risks, return potential and/or maturities. Tranche Prohibits banks from proprietary trading and restricts investment in hedge funds and private equity by commercial banks and their affiliates. Volcker Rule A hierarchy establishing the order in which funds are to be distributed in a CLO. Waterfall

• Limited Prior History • Investment and Market Risk • Structured Credit Instruments Risk • Below Investment Grade Securities Risk • Market Discount Risk • CLO Risk • CLO Subordinated Note Risk • Corporate Credit Investments Risk • Senior Loan Risk • Second Lien Loans Risk • Unsecured Loan Risk • Loan Participation and Assignment Risk • Illiquid Investments Risk • Stressed and Distressed Investments Risk • Leverage Risk • Other Investment Companies Risk • Exchange - Traded Fund Risk • Short Sales Risk • LIBOR/SOFR Risk XA INVESTMENTS LLC | XAI Octagon Floating Rate & Alternative Income Term Trust (XFLT) QUARTERLY WEBINAR | 39 XFLT Summary Risks Investment in the Trust involves special risk considerations, which are summarized below. The Trust is designed as a long - term investment and not as a trading vehicle. The Trust is not intended to be a complete investment program. The Trust’s performance and the value of its investments will vary in response to changes in interest rates, inflation and other market factors. • Derivatives Risk • Off - Exchange Derivatives Risk • Options R i s k • Fut u res R i sk • Swaps Risk • Credit Default Swaps Risk • Hedging Transactions Risk • Counterparty Risk • Synthetic Investment Risk • Segregation and Cover Risk • Interest Rate Risk • Prepayment Risk • Inflation/Deflation Risk • Duration and Maturity Risk • Credit Risk • Non - U.S. Investments Risk • Equity Investments Risk • Limited Term Risk Performance achieved prior to December 31, 2021 is predominantly based on investments that use USD LIBOR as a reference rate. Overnight and 12 - month US dollar LIBOR permanently ceased as of June 30, 2023. 1 - , 3 - , and 6 - month U.S. dollar LIBOR settings will continue to be published using a synthetic methodology until September 2024. As an alternative to LIBOR, the Financial Reporting Council, in conjunction with the Alternative Reference Rates Committee, recommended replacing LIBOR with SOFR. There is no guarantee that the performance of individual investments or the syndicated debt and CLO securities markets as a whole during or after the transition period will be consistent with performance achieved during the LIBOR era. Performance data quoted represents past performance. Past performance does not guarantee future results. Current performance may be lower or higher than the performance data quoted. For additional risks relating to investments in the Trust, please see “Risks” in the Trust’s Annual Report on Form N - CSR, which is publicly available on the EDGAR Database on the SEC website at http://www.sec.gov .

Investment in the Trust involves special risk considerations, which are summarized below. The Trust is designed as a long - term investment and not as a trading vehicle. The Trust is not intended to be a complete investment program. The Trust’s performance and the value of its investments will vary in response to changes in interest rates, inflation and other market factors. Investors should see the “Risks” section in the Trust’s most recent Annual Report on Form N - CSR for a detailed discussion of factors investors should consider carefully before deciding to invest in the Trust’s Shares. Investment and Market Risk. An investment in Common Shares is subject to investment risk, including the possible loss of the entire principal amount that you invest. Your investment in Common Shares represents an indirect investment in the securities owned by the Trust. Your Common Shares at any point in time may be worth less than your original investment, even after taking into account the reinvestment of distributions. A prospective investor should invest in the Common Shares only if the investor can sustain a complete loss in its investment. Structured Credit Instruments Risk. Holders of structured credit instruments bear risks of the underlying investments, index or reference obligation as well as risks associated with the issuer of the instrument, which is often a special purpose vehicle, and may also be subject to counterparty risk. Below Investment Grade Securities Risk. The Trust intends to invest primarily in below investment grade credit instruments, which are commonly referred to as “high - yield” securities or “junk” bonds. Investment in securities of below investment grade quality involves substantial risk of loss. Securities of below investment grade quality are considered predominantly speculative with respect to the issuer’s capacity to pay interest and repay principal when due and therefore involve a greater risk of default or decline in market value due to adverse economic and issuer - specific developments. Issuers of below investment grade securities are not perceived to be as strong financially as those with higher credit ratings. These issuers face ongoing uncertainties and exposure to adverse business, financial or economic conditions and are more vulnerable to financial setbacks and recession than more creditworthy issuers, which may impair their ability to make interest and principal payments. Securities of below investment grade quality display increased price sensitivity to changing interest rates and to a deteriorating economic environment. The market values of certain below investment grade securities tend to reflect individual issuer developments to a greater extent than do higher - rated securities, which react primarily to fluctuations in the general level of interest rates. The market values for securities of below investment grade quality tend to be more volatile and such securities tend to be less liquid than investment grade debt securities, which could result in the Trust being unable to sell such securities for an extended period of time, if at all. To the extent that a secondary market does exist for certain below investment grade securities, the market for them may be subject to irregular trading activity, wide bid/ask spreads and extended trade settlement periods. Because of the substantial risks associated with investments in below investment grade securities, you could have an increased risk of losing money on your investment in Common Shares, both in the short - term and the long - term. To the extent that the Trust invests in below investment grade securities that are unrated, the Trust’s ability to achieve its investment objectives will be more dependent on the Sub - Adviser’s credit analysis than would be the case when the Trust invests in rated securities. Market Discount Risk. Shares of closed - end management investment companies frequently trade at a discount from their net asset value, which is a risk separate and distinct from the risk that the Trust’s net asset value could decrease as a result of its investment activities. Although the value of the Trust’s net assets is generally considered by market participants in determining whether to purchase or sell Common Shares, whether investors will realize gains or losses upon the sale of Common Shares will depend entirely upon whether the market price of Common Shares at the time of sale is above or below the investor’s purchase price for Common Shares. Because the market price of Common Shares will be determined by factors such as net asset value, dividend and distribution levels (which are dependent, in part, on expenses), supply of and demand for Common Shares, stability of dividends or distributions, trading volume of Common Shares, general market and economic conditions and other factors beyond the control of the Trust, the Trust cannot predict whether Common Shares will trade at, below or above net asset value or at, below or above the initial public offering price. This risk may be greater for investors expecting to sell their Common Shares soon after the completion of the public offering, as the net asset value of the Common Shares will be reduced immediately following the offering as a result of the payment of certain offering costs. Common Shares of the Trust are designed primarily for long - term investors; investors in Common Shares should not view the Trust as a vehicle for trading purposes. CLO Risk. CLOs often involve risks that are different from or more acute than risks associated with other types of credit instruments. For instance, due to their often complicated structures, various CLOs may be difficult to value and may constitute illiquid investments. In addition, there can be no assurance that a liquid market will exist in any CLO when the Trust seeks to sell its interest therein. Moreover, the value of CLOs may decrease if the ratings agencies reviewing such securities revise their ratings criteria and, as a result, lower their original rating of a CLO in which the Trust has invested. Restructuring of Investments Held by CLOs. The manager of a CLO has broad authority to direct and supervise the investment and reinvestment of the investments held by the CLO, which may include the execution of amendments, waivers, modifications and other changes to the investment documentation in accordance with the collateral management agreement. During periods of economic uncertainty and recession, the incidence of amendments, waivers, modifications and restructurings of investments may increase. Such amendments, waivers, modifications and other restructurings will change the terms of the investments and in some cases may result in the CLO holding assets not meeting its criteria for investments. This could adversely impact the coverage tests under an indenture governing the notes issued by the CLO. If as a result of any such restructurings, the Sub - Adviser determines that continuing to hold instruments issued by such CLO is no longer in the best interest of the Trust, the Sub - Adviser may dispose of such CLO instruments. In certain instances, the Trust may be unable to dispose of such investments at advantageous prices and/or may be required to reinvest the proceeds of such disposition in lower - yielding investments. CLO Management Risk. The activities of any CLO in which the Trust may invest will generally be directed by a collateral manager. In the Trust’s capacity as holder of subordinated notes, the Trust is generally not able to make decisions with respect to the management, disposition or other realization of any investment, or other decisions regarding the business and affairs, of that CLO. XA INVESTMENTS LLC | XAI Octagon Floating Rate & Alternative Income Term Trust (XFLT) QUARTERLY WEBINAR | 40 XFLT Risk Considerations
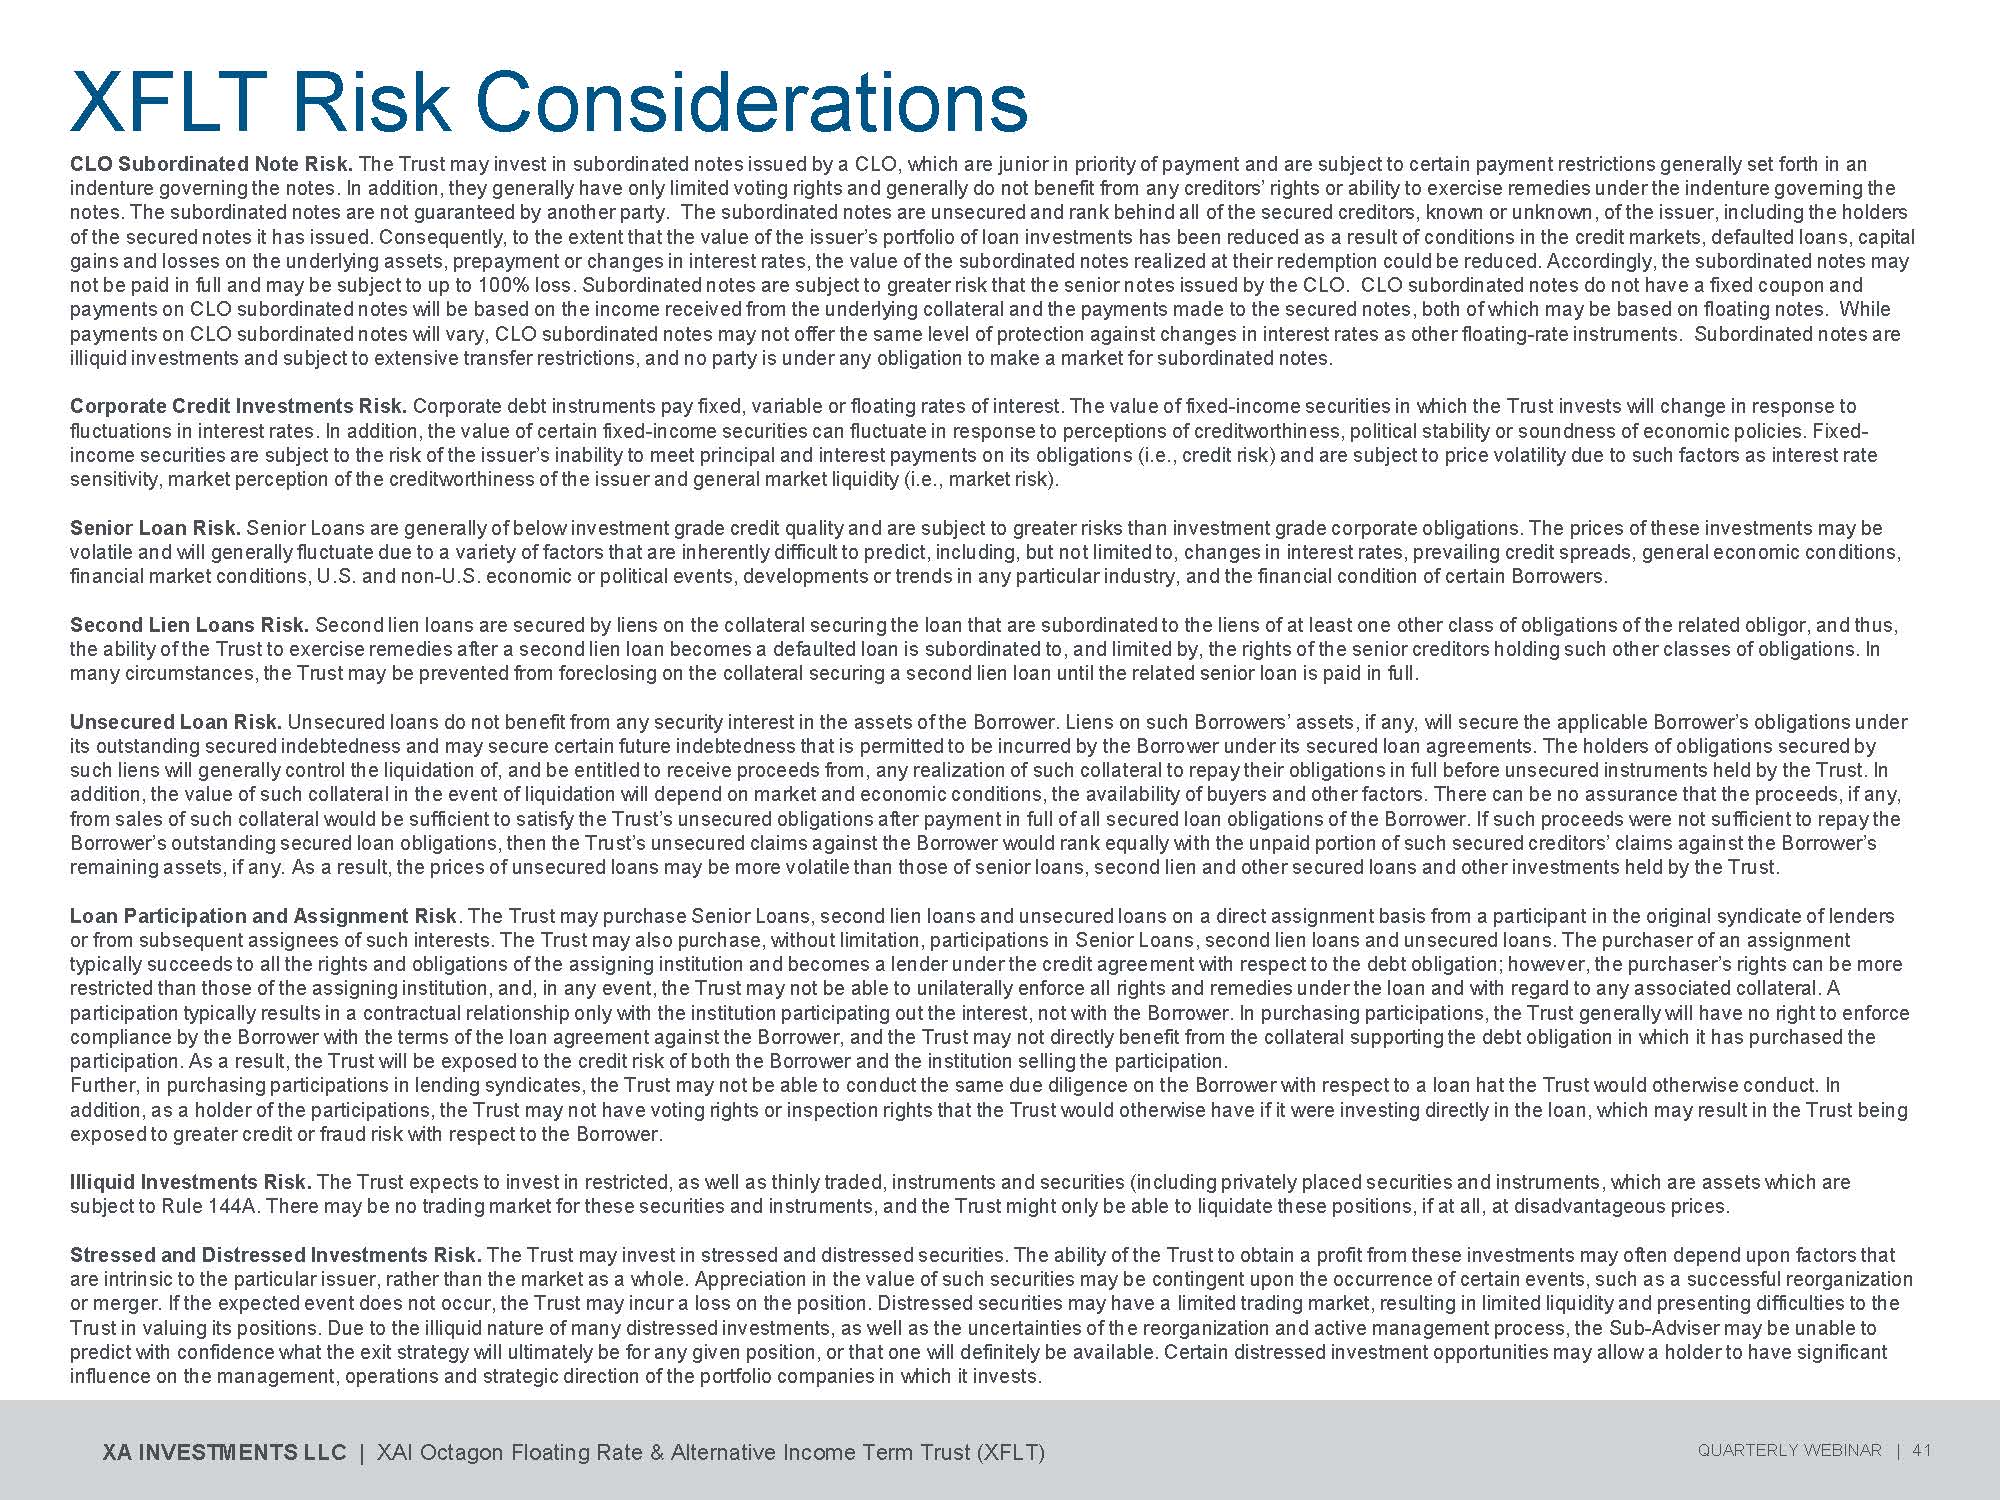
CLO Subordinated Note Risk. The Trust may invest in subordinated notes issued by a CLO, which are junior in priority of payment and are subject to certain payment restrictions generally set forth in an indenture governing the notes. In addition, they generally have only limited voting rights and generally do not benefit from any creditors’ rights or ability to exercise remedies under the indenture governing the notes. The subordinated notes are not guaranteed by another party. The subordinated notes are unsecured and rank behind all of the secured creditors, known or unknown, of the issuer, including the holders of the secured notes it has issued. Consequently, to the extent that the value of the issuer’s portfolio of loan investments has been reduced as a result of conditions in the credit markets, defaulted loans, capital gains and losses on the underlying assets, prepayment or changes in interest rates, the value of the subordinated notes realized at their redemption could be reduced. Accordingly, the subordinated notes may not be paid in full and may be subject to up to 100% loss. Subordinated notes are subject to greater risk that the senior notes issued by the CLO. CLO subordinated notes do not have a fixed coupon and payments on CLO subordinated notes will be based on the income received from the underlying collateral and the payments made to the secured notes, both of which may be based on floating notes. While payments on CLO subordinated notes will vary, CLO subordinated notes may not offer the same level of protection against changes in interest rates as other floating - rate instruments. Subordinated notes are illiquid investments and subject to extensive transfer restrictions, and no party is under any obligation to make a market for subordinated notes. Corporate Credit Investments Risk. Corporate debt instruments pay fixed, variable or floating rates of interest. The value of fixed - income securities in which the Trust invests will change in response to fluctuations in interest rates. In addition, the value of certain fixed - income securities can fluctuate in response to perceptions of creditworthiness, political stability or soundness of economic policies. Fixed - income securities are subject to the risk of the issuer’s inability to meet principal and interest payments on its obligations (i.e., credit risk) and are subject to price volatility due to such factors as interest rate sensitivity, market perception of the creditworthiness of the issuer and general market liquidity (i.e., market risk). Senior Loan Risk. Senior Loans are generally of below investment grade credit quality and are subject to greater risks than investment grade corporate obligations. The prices of these investments may be volatile and will generally fluctuate due to a variety of factors that are inherently difficult to predict, including, but not limited to, changes in interest rates, prevailing credit spreads, general economic conditions, financial market conditions, U.S. and non - U.S. economic or political events, developments or trends in any particular industry, and the financial condition of certain Borrowers. Second Lien Loans Risk. Second lien loans are secured by liens on the collateral securing the loan that are subordinated to the liens of at least one other class of obligations of the related obligor, and thus, the ability of the Trust to exercise remedies after a second lien loan becomes a defaulted loan is subordinated to, and limited by, the rights of the senior creditors holding such other classes of obligations. In many circumstances, the Trust may be prevented from foreclosing on the collateral securing a second lien loan until the related senior loan is paid in full. Unsecured Loan Risk. Unsecured loans do not benefit from any security interest in the assets of the Borrower. Liens on such Borrowers’ assets, if any, will secure the applicable Borrower’s obligations under its outstanding secured indebtedness and may secure certain future indebtedness that is permitted to be incurred by the Borrower under its secured loan agreements. The holders of obligations secured by such liens will generally control the liquidation of, and be entitled to receive proceeds from, any realization of such collateral to repay their obligations in full before unsecured instruments held by the Trust. In addition, the value of such collateral in the event of liquidation will depend on market and economic conditions, the availability of buyers and other factors. There can be no assurance that the proceeds, if any, from sales of such collateral would be sufficient to satisfy the Trust’s unsecured obligations after payment in full of all secured loan obligations of the Borrower. If such proceeds were not sufficient to repay the Borrower’s outstanding secured loan obligations, then the Trust’s unsecured claims against the Borrower would rank equally with the unpaid portion of such secured creditors’ claims against the Borrower’s remaining assets, if any. As a result, the prices of unsecured loans may be more volatile than those of senior loans, second lien and other secured loans and other investments held by the Trust. Loan Participation and Assignment Risk . The Trust may purchase Senior Loans, second lien loans and unsecured loans on a direct assignment basis from a participant in the original syndicate of lenders or from subsequent assignees of such interests. The Trust may also purchase, without limitation, participations in Senior Loans, second lien loans and unsecured loans. The purchaser of an assignment typically succeeds to all the rights and obligations of the assigning institution and becomes a lender under the credit agreement with respect to the debt obligation; however, the purchaser’s rights can be more restricted than those of the assigning institution, and, in any event, the Trust may not be able to unilaterally enforce all rights and remedies under the loan and with regard to any associated collateral. A participation typically results in a contractual relationship only with the institution participating out the interest, not with the Borrower. In purchasing participations, the Trust generally will have no right to enforce compliance by the Borrower with the terms of the loan agreement against the Borrower, and the Trust may not directly benefit from the collateral supporting the debt obligation in which it has purchased the participation. As a result, the Trust will be exposed to the credit risk of both the Borrower and the institution selling the participation. Further, in purchasing participations in lending syndicates, the Trust may not be able to conduct the same due diligence on the Borrower with respect to a loan hat the Trust would otherwise conduct. In addition, as a holder of the participations, the Trust may not have voting rights or inspection rights that the Trust would otherwise have if it were investing directly in the loan, which may result in the Trust being exposed to greater credit or fraud risk with respect to the Borrower. Illiquid Investments Risk. The Trust expects to invest in restricted, as well as thinly traded, instruments and securities (including privately placed securities and instruments, which are assets which are subject to Rule 144A. There may be no trading market for these securities and instruments, and the Trust might only be able to liquidate these positions, if at all, at disadvantageous prices. Stressed and Distressed Investments Risk. The Trust may invest in stressed and distressed securities. The ability of the Trust to obtain a profit from these investments may often depend upon factors that are intrinsic to the particular issuer, rather than the market as a whole. Appreciation in the value of such securities may be contingent upon the occurrence of certain events, such as a successful reorganization or merger. If the expected event does not occur, the Trust may incur a loss on the position. Distressed securities may have a limited trading market, resulting in limited liquidity and presenting difficulties to the Trust in valuing its positions. Due to the illiquid nature of many distressed investments, as well as the uncertainties of the reorganization and active management process, the Sub - Adviser may be unable to predict with confidence what the exit strategy will ultimately be for any given position, or that one will definitely be available. Certain distressed investment opportunities may allow a holder to have significant influence on the management, operations and strategic direction of the portfolio companies in which it invests. XA INVESTMENTS LLC | XAI Octagon Floating Rate & Alternative Income Term Trust (XFLT) QUARTERLY WEBINAR | 41 XFLT Risk Considerations
Leverage Risk. The Trust uses leverage to seek to enhance total return and income. The Trust may use leverage through (i) the issuance of senior securities representing indebtedness, including through borrowing from financial institutions or issuance of debt securities, including notes or commercial paper (collectively, “Indebtedness”), (ii) the issuance of preferred shares (“Preferred Shares”) and/or (iii) reverse repurchase agreements, securities lending, short sales or derivatives, such as swaps, futures or forward contracts, that have the effect of leverage (“portfolio leverage”). The Trust may utilize leverage to the maximum extent permitted under the Investment Company Act of 1940. The Trust has entered into a revolving credit facility and any borrowings through the credit facility are secured by eligible securities held in the Trust’s portfolio of investments. The Trust has also issued preferred shares, which are senior securities that constitute shares of beneficial interest of the Trust. Preferred shares rank senior to the Trust’s Common Shares in priority of payment of dividends and as to the distribution of assets upon dissolution, liquidation or winding up of the Trust’s affairs; equal in priority with all other future series of preferred shares the Trust may issue as to priority of payment of dividends and as to distributions of assets upon dissolution, liquidation or the winding - up of the Trust’s affairs; and subordinate in right of payment to amounts owed under the Trust’s existing credit facility, and to the holder of any future senior indebtedness, which may be issued without the vote or consent of preferred shareholders. The use of leverage is a speculative technique that involves special risks. The Trust currently anticipates utilizing leverage to seek to enhance total return and income. There can be no assurance that the Advisor’s and the Sub - Adviser’s expectations will be realized or that a leveraging strategy will be successful in any particular time period. Use of leverage creates an opportunity for increased income and capital appreciation but, at the same time, creates special risks. Leverage is a speculative technique that exposes the Trust to greater risk and increased costs than if it were not implemented. The more leverage that is utilized by the Trust, the more exposed the Trust will be to the risks of leverage. The use of leverage by the Trust causes the net asset value of the common shares to fluctuate significantly in response to changes in interest rates and other economic indicators. As a result, the net asset value, market price and dividend rate of the common shares is likely to be more volatile than those of a fund that is not exposed to leverage. Leverage increases operating costs, which may reduce total return. The Trust pays interest on its borrowings, which may reduce the Trust’s return. Increases in interest rates that the Trust must pay on its borrowings will increase the cost of leverage and may reduce the return to common shareholders. The risk of increases in interest rates may be greater in the current market environment because interest rates are near historically low levels. During the time in which the Trust is utilizing leverage, the amount of the investment advisory fee paid by the Trust will be higher than if the Trust did not utilize leverage because the fees paid will be calculated based on the Trust’s Managed Assets, including proceeds of leverage. Common shareholders bear the portion of the management fee attributable to assets purchased with the proceeds of leverage, which means that common shareholders effectively bear the entire management fee. Other Investment Companies Risk. Investments in other investment companies present certain special considerations and risks not present in making direct investments in securities in which the Trust may invest. Investments in other investment companies involve operating expenses and fees that are in addition to the expenses and fees borne by the Trust. Such expenses and fees attributable to the Trust’s investments in other investment companies are borne indirectly by Common Shareholders. Accordingly, investment in such entities involves expense and fee layering. Exchange - Traded Fund Risk. For ETFs tracking an index of securities, the cumulative percentage increase or decrease in the net asset value of the shares of an ETF may over time diverge significantly from the cumulative percentage increase or decrease in the relevant index due to the compounding effect experienced by an ETF which results from a number of factors, including, leverage (if applicable), daily rebalancing, fees, expenses and interest income, which in turn results in greater non - correlation between the return of an ETF and its corresponding index. Short Sales Risk. Short sales involve selling securities of an issuer short in the expectation of covering the short sale with securities purchased in the open market at a price lower than that received in the short sale. If the price of the issuer’s securities declines, the Trust may then cover the short position with securities purchased in the market. The profit realized on a short sale will be the difference between the price received in the sale and the cost of the securities purchased to cover the sale. The possible losses from selling short a security differ from losses that could be incurred from a cash investment in the security; the former may be unlimited, whereas the latter can only equal the total amount of the cash investment. Short selling activities are also subject to restrictions imposed by the federal securities laws and the various national and regional securities exchanges, which restrictions could limit the Trust’s investment activities. There can be no assurance that securities necessary to cover a short position will be available for purchase. Derivatives Risk. Derivatives are financial contracts in which the value depends on, or is derived from, the value of an underlying asset, reference rate or index. The Trust may, but is not required to, engage in various derivatives transactions for hedging and risk management purposes, to facilitate portfolio management and to seek to enhance total return of earn income. The Trust’s use of derivative instruments involves risks different from, or possibly greater than, the risks associated with investing directly in securities and other traditional investments. Derivatives are subject to a number of risks, such as interest rate risk, market risk, counterparty risk, and credit risk. Off - Exchange Derivatives Risk . The Trust may invest a portion of its assets in investments which are not traded on organized exchanges and as such are not standardized . Such transactions may include forward contracts, swaps or options . While some markets for such derivatives are highly liquid, transactions in off - exchange derivatives may involve greater risk than investing in exchange - traded derivatives because there is no exchange market on which to close out an open position . Options Risk . Trading in options involves a number of risks . Specific market movements of the option and the instruments underlying an option cannot be predicted . No assurance can be given that a liquid offset market will exist for any particular option or at any particular time . If no liquid offset market exists, the Trust might not be able to effect an offsetting transaction in a particular option . Futures Risk. Futures contracts markets are highly volatile and are influenced by a variety of factors, including national and international political and economic developments. In addition, because of the low margin deposits normally required in futures trading, a high degree of leverage is typical of a futures trading account. As a result, a relatively small price movement in a futures contract may result in substantial losses to the trader. XA INVESTMENTS LLC | XAI Octagon Floating Rate & Alternative Income Term Trust (XFLT) QUARTERLY WEBINAR | 42 XFLT Risk Considerations
Swaps Risk. The Trust may utilize swap agreements including, without limitation, interest rate, index and currency swap agreements. The use of swaps is a highly specialized activity that involves investment techniques and risks different from those associated with ordinary securities transactions. There are risks relating to the financial soundness and creditworthiness of the counterparty to swap agreements. Credit Default Swaps Risk. The Trust may enter into credit default swap agreements. The “buyer” in a credit default contract is obligated to pay the “seller” a periodic stream of payments over the term of the contract provided that no event of default on an underlying reference obligation has occurred. The Trust may be either the buyer or seller in a credit default swap transaction. Credit default swap transactions involve greater risks than if a Trust had invested in the reference obligation directly. Credit default swaps are subject to the risk of non - performance by the swap counterparty, including risks relating to the financial soundness and creditworthiness of the swap counterparty. Hedging Transactions Risk. The success of any hedging strategy utilized by the Trust’s will be subject to the Sub - Adviser’s ability to correctly assess the degree of correlation between the performance of the instruments used in the hedging strategy and the performance of the investments in the portfolio being hedged. Since the characteristics of many securities change as markets change or time passes, the success of the Trust’s hedging strategy will also be subject to the Sub - Adviser’s ability to continually recalculate, readjust, and execute hedges in an efficient and timely manner. Counterparty Risk. The Trust will be subject to credit risk with respect to the counterparties to the derivative contracts entered into by the Trust. Synthetic Investment Risk . The Trust may be exposed to certain additional risks should the Sub - Adviser uses derivatives transactions as a means to synthetically implement the Trust’s investment strategies . Customized derivative instruments will likely be highly illiquid, and it is possible that the Trust will not be able to terminate such derivative instruments prior to their expiration date or that the penalties associated with such a termination might impact the Trust’s performance in a materially adverse manner . Segregation and Cover Risk. In connection with certain derivatives transactions, the Trust may be required to segregate liquid assets or otherwise cover such transactions and/or to deposit amounts as premiums or to be held in margin accounts. Such amounts may not otherwise be available to the Trust for investment purposes. The Trust may earn a lower return on its portfolio than it might otherwise earn if it did not have to segregate assets in respect of, or otherwise cover, its derivatives transactions positions. Interest Rate Risk. Interest rate risk is the risk that credit securities will decline in value because of changes in market interest rates. When market interest rates rise, the market value of fixed income credit securities generally will fall. These risks may be greater in the current market environment because while interest rates were historically low in recent years, the Federal Reserve has been increasing the Federal Funds rate to address inflation. Prevailing interest rates may be adversely impacted by market and economic factors. If interest rates rise the markets may experience increased volatility, which may adversely affect the value and/or liquidity of certain of the Trust’s investments. The prices of longer - term securities fluctuate more than prices of shorter - term securities as interest rates change. The Trust’s use of leverage will tend to increase the interest rate risk to which its Common Shares are subject. The Trust invests primarily in variable and floating rate credit instruments and other structured credit investments, which generally are less sensitive to interest rate changes than fixed rate instruments, but generally will not increase in value if interest rates decline. Prepayment Risk. The frequency at which prepayments (including voluntary prepayments by the obligors and accelerations due to defaults) occur on bonds and loans will be affected by a variety of factors including the prevailing level of interest rates and spreads as well as economic, demographic, tax, social, legal and other factors. The adverse effects of prepayments may impact the Trust’s portfolio in several ways. During periods of declining interest rates, when the issuer of a security exercises its option to prepay principal earlier than scheduled, the Trust may be required to reinvest the proceeds of such prepayment in lower - yielding securities. Particular investments may experience outright losses, as in the case of an interest - only security in an environment of faster actual or anticipated prepayments. In addition, particular investments may underperform relative to hedges that the Sub - Adviser may have constructed for these investments, resulting in a loss to the Trust’s overall portfolio. Inflation/Deflation Risk. Inflation risk is the risk that the value of assets or income from investments will be worth less in the future as inflation decreases the value of money. As inflation increases, the real value of the Common Shares and distributions can decline. Deflation risk is the risk that prices throughout the economy decline over time — the opposite of inflation. Deflation may have an adverse effect on the creditworthiness of issuers and may make issuer default more likely, which may result in a decline in the value of the Trust’s portfolio. Duration and Maturity Risk. The Trust has no set policy regarding maturity or duration of credit instruments in which it may invest or of the Trust’s portfolio generally. The price of fixed rate securities with longer maturities or duration generally is more significantly impacted by changes in interest rates than those of fixed rate securities with shorter maturities or duration. Therefore, generally speaking, the longer the duration of the Trust’s portfolio, the more exposure the Trust will have to interest rate risk described above. The Sub - Adviser may seek to adjust the portfolio’s duration or maturity based on its assessment of current and projected market conditions and all factors that the Sub - Adviser deems relevant. The Trust may incur costs in seeking to adjust the portfolio average duration or maturity. There can be no assurance that the Sub - Adviser’s assessment of current and projected market conditions will be correct or that any strategy to adjust the portfolio’s duration or maturity will be successful at any given time. Credit Risk. Credit risk is the risk that an issuer of securities will be unable to pay principal and interest when due, or that the value of the security will suffer because investors believe the issuer is less able to pay. Non - U.S. Investments Risk. The risk of loss associated with investments in securities of foreign issuers include currency exchange risks, expropriation, or limits on repatriating an investment, government intervention, confiscatory taxation, political, economic or social instability, illiquidity, less efficient markets, price volatility and market manipulation. XA INVESTMENTS LLC | XAI Octagon Floating Rate & Alternative Income Term Trust (XFLT) QUARTERLY WEBINAR | 43 XFLT Risk Considerations
Equity Investments Risk. Incidental to the Trust’s investments in credit instruments, the Trust may acquire or hold equity securities, or warrants to purchase equity securities, of a Borrower or issuer. Common equity securities prices fluctuate for a number of reasons, including changes in investors’ perceptions of the financial condition of an issuer, the general condition of the relevant stock market and broader domestic and international political and economic events. Limited Term Risk. Unless the Trust completes an Eligible Tender Offer, and converts to perpetual existence, the Trust will terminate on or about the Termination Date. The Trust should not be confused with a so called “target date” or “life cycle” fund whose asset allocation becomes more conservative over time as the fund’s target date, often associated with retirement, approaches, and does not typically terminate on the target date. In addition, the Trust should not be confused with a “target term” fund whose investment objective is to return the fund’s original net asset value on the termination date. The Trust’s investment objective and policies are not designed to seek to return to investors that purchase Common Shares their initial investment on the Termination Date or in an Eligible Tender Offer, and investors may receive more or less than their original investment upon termination or in an Eligible Tender Offer. Because the assets of the Trust will be liquidated in connection with the termination, the Trust will incur transaction costs in connection with dispositions of portfolio securities. The Trust does not limit its investments to securities having a maturity date prior to the Termination Date and may be required to sell portfolio securities when it otherwise would not, including at times when market conditions are not favorable, which may cause the Trust to lose money. In particular, the Trust’s portfolio may still have significant remaining average maturity and duration, and large exposures to below investment grade securities, as the Termination Date approaches, losses due to portfolio liquidation may be significant. Beginning one year before the Termination Date (the “wind - down period”), the Trust may begin liquidating all or a portion of the Trust’s portfolio, and may deviate from its investment policies, including its policy of investing at least 80% of its Managed Assets in floating rate credit instruments and other structured credit investments and may not achieve its investment objective. During the wind - down period, the Trust’s portfolio composition may change as more of its portfolio holdings are called or sold and portfolio holdings are disposed of in anticipation of liquidation. Rather than reinvesting the proceeds of matured, called or sold securities, the Trust may invest such proceeds in short - term or other lower yielding securities or hold the proceeds in cash, which may adversely affect its performance. The Trust may distribute the proceeds in one or more liquidating distributions prior to the final liquidation, which may cause fixed expenses to increase when expressed as a percentage of assets under management Upon a termination, it is anticipated that the Trust will have distributed substantially all of its net assets to shareholders, although securities for which no market exists or securities trading at depressed prices, if any, may be placed in a liquidating trust. Common Shareholders will bear the costs associated with establishing and maintaining a liquidating trust, if necessary. Securities placed in a liquidating trust may be held for an indefinite period of time until they can be sold or pay out all of their cash flows. The Trust cannot predict the amount, if any, of securities that will be required to be placed in a liquidating trust. If the Trust conducts an Eligible Tender Offer, the Trust anticipates that funds to pay the aggregate purchase price of Common Shares accepted for purchase pursuant to the tender offer will be first derived from any cash on hand and then from the proceeds from the sale of portfolio investments held by the Trust. In addition, the Trust may be required to dispose of portfolio investments in connection with any reduction in the Trust’s outstanding leverage necessary in order to maintain the Trust’s desired leverage ratios following a tender offer. The disposition of portfolio investments by the Trust could cause market prices of such instruments, and hence the net asset value of the Common Shares, to decline. In addition, disposition of portfolio investments will cause the Trust to incur increased brokerage and related transaction expenses. The Trust may receive proceeds from the disposition of portfolio investments that are less than the valuations of such investments by the Trust. It is likely that during the pendency of a tender offer, and possibly for a time thereafter, the Trust will hold a greater than normal percentage of its total assets in cash and cash equivalents, which may impede the Trust’s ability to achieve its investment objective and decrease returns to shareholders. If the Trust’s tax basis for the investments sold is less than the sale proceeds, the Trust will recognize capital gains, which the Trust will be required to distribute to shareholders. In addition, the Trust’s purchase of tendered Common Shares pursuant to a tender offer will have tax consequences for tendering shareholders and may have tax consequences for non - tendering shareholders. The purchase of Common Shares by the Trust pursuant to a tender offer will have the effect of increasing the proportionate interest in the Trust of non - tendering shareholders. All shareholders remaining after a tender offer will be subject to proportionately higher expenses due to the reduction in the Trust’s total assets resulting from payment for the tendered Common Shares. Such reduction in the Trust’s total assets may also result in less investment flexibility, reduced diversification and greater volatility for the Trust, and may have an adverse effect on the Trust’s investment performance. The Trust is not required to conduct an Eligible Tender Offer. If the Trust conducts an Eligible Tender Offer, there can be no assurance that tendered Common Shares will not exceed the Termination Threshold, in which case the Eligible Tender Offer will be terminated, no Common Shares will be repurchased pursuant to the Eligible Tender Offer and the Trust will terminate on or before the Termination Date (subject to possible extensions). Following the completion of an Eligible Tender Offer in which the tendered Common Shares do not exceed the Termination Threshold, the Board of Trustees may eliminate the Termination Date upon the affirmative vote of a majority of the Board of Trustees and without a shareholder vote. Thereafter, the Trust will have a perpetual existence. The Trust is not required to conduct additional tender offers following an Eligible Tender Offer and conversion to perpetual existence. Therefore, remaining shareholders may not have another opportunity to participate in a tender offer. Shares of closed - end management investment companies frequently trade at a discount from their net asset value, and as a result remaining shareholders may only be able to sell their Common Shares at a discount to net asset value. LIBOR/SOFR TRANSITION RISK. CLO debt and bank syndicated loans historically used LIBOR as an interest rate benchmark. Overnight and 12 - month US dollar LIBOR permanently ceased as of June 30, 2023. 1 - , 3 - , and 6 - month U.S. dollar LIBOR settings will continue to be published using a synthetic methodology until September 2024. As an alternative to LIBOR, the Financial Reporting Council, in conjunction with the Alternative Reference Rates Committee, a steering committee comprised of large U.S. financial institutions, recommended replacing U.S. dollar LIBOR with Secured Overnight Financing Rate (“SOFR”), a new index calculated by reference to short - term repurchase agreements, backed by Treasury securities. There is no guarantee that the performance of individual investments or the syndicated loan and CLO securities markets as a whole during or after the transition period will be consistent with performance achieved during the LIBOR era. Neither the effect of the LIBOR transition process nor its ultimate success can yet be known, and the transition process might lead to increased volatility and illiquidity in markets for, and reduce the effectiveness of, new hedges placed against instruments whose terms currently include LIBOR. XA INVESTMENTS LLC | XAI Octagon Floating Rate & Alternative Income Term Trust (XFLT) QUARTERLY WEBINAR | 44 Additional Risks. For additional risks relating to investments in the Trust, please see “Risks” in the Trust’s Annual Report on Form N - CSR, which is publicly available on the EDGAR Database on the SEC website at http://www.sec.gov . XFLT Risk Considerations

Risks of the Proposal to Amend the Declaration of Trust to Remove the Termination Date . If shareholders approve the proposal to amend the Declaration of Trust to eliminate the Termination Date (the “Term Amendment”), the Trust will not terminate and liquidate its assets on or before December 31 , 2029 and will not conduct an Eligible Tender Offer, and a continued investment in the Trust will involve the same types of risks currently associated with an investment in the Trust . There is no guarantee that the Trust’s investment objective will be achieved . While the Common Shares have historically traded at an average premium to NAV, over time the Common Shares have traded both at a premium and at a discount to NAV. There can be no assurance that the Common Shares will continue to trade at a premium in the future nor that the Common Shares will not trade at a discount in the future. Shares of closed - end investment companies frequently trade at a discount to NAV. The elimination of the term structure may result in Common Shares being subject to increased market discount risk (i.e., that the Common Shares trade at a market price that represents a discount to the then current market price), which the term structure is intended to mitigate by providing a fixed date at which shareholders would realize the then current NAV. Market discount risk is a risk separate and distinct from the risk that the Trust’s NAV could decline as a result of investment activities. The elimination of the Trust’s term could have a negative impact on the market price of the Common Shares, which would adversely impact shareholders seeking to sell their Common Shares. Because the market price of the Common Shares will be determined by factors such as relative supply of and demand for the Common Shares in the market, general market and economic circumstances, and other factors beyond the control of the Trust, the Trust cannot predict whether the Common Shares will trade at, below or above NAV or the precise impact that the elimination of the term structure will have on the market price of the Common Shares initially or over time. The Common Shares are designed primarily for long - term investors, and you should not view the Trust as a vehicle for short - term trading purposes. Trust management has a conflict of interest in recommending the perpetual existence provided for in the Term Amendment because the Adviser and Sub - Adviser will receive fees for a longer period of time than if the Trust’s Declaration of Trust was not amended to eliminate the term of the Trust. XA INVESTMENTS LLC | XAI Octagon Floating Rate & Alternative Income Term Trust (XFLT) QUARTERLY WEBINAR | 45 This presentation is not a solicitation of any vote, consent or proxy from any Trust shareholder, which will be made only pursuant to separate proxy materials filed by the Trust with the SEC. Because the proxy statement contains important information about the Proposals, the Trust’s shareholders are urged to read the proxy statement and accompanying materials carefully. Shareholders can obtain, free of charge, copies of these documents at the SEC’s website at www.sec.gov and can obtain copies by calling (800) 431 - 9645 or by writing the Trust at 321 North Clark Street, Suite 2430, Chicago, Illinois 60654. Additional Risks. For additional risks relating to investments in the Trust, please see “Risks” in the Trust’s Annual Report on Form N - CSR, which is publicly available on the EDGAR Database on the SEC website at http://www.sec.gov . Risks of XFLT Proxy Proposals
Webinar Transcript
Kim Flynn:
Welcome everyone to the XFLT Quarterly webinar. We're really pleased to be in front of you. It's been a good quarter. I'm going to cover off on a few disclosures, and then we'll welcome our speakers. Today we're going to talk about A number of forward-looking matters, and in the materials presented.
There are forward-looking statements. Investors should not place undue reliance upon those forward-looking statements and actual results can differ materially. The presentation is intended to be educational in nature and any of the investments or opportunities discussed here today may or may not be suitable for the audience.
Neither XAI or Octagon is acting as an advisor to audience members and investors should consult, consult with their own investment advisors or tax advisers prior to making any investment decisions. Just a note about performance. We do quote past performance and past performance does not guarantee future results. As you know, the current performance may be lower or higher than any of the historical performance presented here. With that. Let's talk about some of the housekeeping matters we would love your questions, and there's a Q and A box at the bottom of the screen, and you can enter questions. Throughout the webinar. We'll integrate those and have our speakers address them at the right moment. If you have any other questions you'd like to take offline. You can contact me. Kimberly Flynn, you can contact my colleague, Stephen Perry, at Xa investments. We're always happy to help.
There's also additional information, financials and fund information at info@xainvestments.com. So please send us your questions and look forward to addressing those on today's webinar. We're really pleased to have a new Speaker another member of the Octagon Investment Committee. Lauren Law is joining us today; Lauren and Gretchen have worked closely together on the Octagon Investment Committee for a number of years. So, we're going to hear Lauren's perspective on the loan market and the CLO market. In a little bit.
My colleague, Steven Perry, who runs product management for XFLT, some of you probably chatted with Steven. He's going to talk about the state of the fund and some of the fund management topics that we usually cover things like leverage and whatnot. So, we'll get into that Octagon, as you probably know, is one of the you know, seasoned time-tested teams. The team has a 25-year track record. XFLT is the only way for investors in a registered fund format to be able to access Octagon strategy and Octagon is focused entirely on below investment grade credit which is where XFLT invests. So we're obviously happy to have them on the webinar today, and they're they'll share their insights on the credit markets with us.
We do have another important matter that I wanted to cover with current investors. You may have received proxy proposal materials. Either electronically or in the mail. We would ask you to look for those materials and please vote your shares. Your vote is very important. I'd like to briefly, just cover what the proxy is all about, and we'll let you all make your own decisions with respect to the votes.
Basically, in October of this year the Board met, and they unanimously approved 2 different proposals, the first being the approval of a new subadvisory agreement with Octagon. Who has been the Funds subadvisor since inception. Octagon's parent company has a new parent, and that does require a vote of shareholders. And so, we would ask you to consider proposal number one, the second proposal is an amendment to the declaration of the Funds. Trust to remove a termination date. the fund, you know, when it was brought to market. Like many other listed closing funds, had a term the term date is December 31, 2029, and management has proposed, and the Board has approved an amendment to the declaration of Trust to remove that term and allow the fund to continue on as a perpetual fund. So those are the matters in front of shareholders. And we would once again ask you to consider voting your shares. Your vote counts, and it matters, and we'd appreciate you doing that.
We've got a number of planned questions and topics for Gretchen and Lauren and Steven. We're going to get right into it. Remember that you can enter your own questions in the QA. Function, and we'll make sure we get to those questions. So, keep them coming. I'll start out first with A discussion with respect to the financials for the quarter. So, Stephen, if you could take it away.
Steven Perry:
Absolutely great to be here, thanks for having us, and thanks for joining the webinar. I'll go over a couple of brief financial highlights for XFLT for the fiscal year ended September thirtieth as always, you can find the in your report on our website or at sec.gov.
If there are any questions, please don't hesitate to contact us. So, for the fiscal year end, September thirtieth. Net investment income was 92 cents per share and realized. And the unrealized gain was 30 cents per weighted average common share. Total income was $1.22 and the ratio of net investment income to average net assets was 14.3%. Additionally, the fund was able to grow and scale. XFLT issued 3.2 million common shares at the market through the at the market program for approximately 22 million in net proceeds.
Additionally, you may recall back in May the fund increased. Its distribution rate to 8.5 cents per share throughout the quarter. Those 3 distributions maintained that level 8.5 cents. We also celebrate a 500 million dollars mark in total managed assets on September nineteenth you may recall if you're a long-term investor in the fund. The fund started out around 100 million dollars back in 2,017.
Lastly, the weighted average current yields for the different assets. In the portfolio deal. Equity is 23.5 below debt, 13 loans above 10 and a quarter percent, and the bonds almost 7.
Kim Flynn:
Great Steven, could you talk about board governance? I know the board has been really active. I think there have been 9 board meetings in the last 12 months. So, give us an update with respect to governance. And let us know what shareholders should be thinking about here.
Steven Perry:
Yeah. So, every year the Board has 4 regularly scheduled meetings, the board has also met for shareholder meeting and a couple other special board meetings those meetings include the 4 Independent Trustees. And they will. They'll talk on matters special meetings or special matters. Distribution matters reelections. I do want to highlight the last 12 months. This transaction overview I briefly touched on at the market program. But there are a couple of other matters that the board is very involved in. And that's the 6% series 2029 convertible preferreds and a new 6.9 5 series 2029 convertible prefers that closed on November sixth. So that's a new update for the fund. This past it was subsequent to quarter end. But that's also a new update for the fund. So, the Board continues to be very active. Management continues to have discussions with members of the Board, and we're very pleased with their relationship with them. And how things are going.
Kim Flynn:
Stephen, could you just tell us where we sit today in terms of the fun? Sort of summary characteristics, and where the fund has been trading in the secondary market. Yeah, I'll go through a few basics and feel free to jump in, add to or interrupt and ask questions.
Steven Perry:
But here we have the typical slide that that you're used to seeing. We have $507 million in total managed assets across 44.6 million shares. You'll note the current distribution rate of 8.5 cents of note. You'll note in the footnote there that 100% of the fiscal year ended 2023 distribution characteristics. We're 100% net income and 0% return of capital. That's something that we focus on a lot, and we try and set the distribution rate appropriate for the level of income coming into the fund. Additionally, a as is typical. You'll note the top. 10 holdings are our CLO equity positions. Those are typically chunkier buys for the portfolio than individual loans.
going over the portfolio composition over time You'll note it's relatively consistent of note, you'll see that Clo debt is a higher percentage of the portfolio than in times past. But you know we can. We can talk about how Octagon has seen opportunities with CLO debt versus CLO equity, and how those dynamics play out in the marketplace later on, in the webinar from a net return perspective, a total return perspective. The fund has performed well. beating the benchmark on quarter to date, one year 3, 5, and inception to date. It's been a very good year for the fund. It's been a very good 3 years, and the quarter was also very positive. What we saw this quarter is, we saw prices rebound, and so not only did was there interest and fees coming into the fund. But there was also an appreciation of the market price of loans and CLO Debt and equity. Let's see here, what else do we have? I'll move to premium discount history. XFLT has had the benefit of trading at an average premium since inception in the secondary market inception to date average was 3.3. And when we updated the deck, as of last Friday the current premium was 2.74. here we just like to overlay how the price and nav perform in relation to each other, and we overlay that with a broader picture the orange line is the S. And P. 500 index. Last Friday, price closed at 6.75 nav at 6.57 dot and the S&P Has had a little bit of a good run last week or so. What you'll note here is the daily trading volume for XFLT. Of note. The last 90 days have seen a large uptick in volume. It's consistently higher than in prior quarters and prior years. We view this as a very positive thing. We know that there are more shares issued so obviously volumes are going to increase, but this allows for very good shareholder liquidity.
So, Kim, with that I'll kick it back to you. II know we have some other talks to cover and some questions to cover.
Kim Flynn:
Sure, Stephen, I I'd love to talk about. The growth of XFLT over time you mentioned the at the market program. But can you talk about the different methods that the fund has used to grow the common share base. I think that'd be great.
Steven Perry:
Yeah. So here is a picture of total managed assets in the fund, we break it up into net assets, credit, facility and preference. So just a good graphic for you here. In terms of growing the fund. We mentioned that XFLT trades at a premium to its net asset value that allows the trust to issue shares via the at the market program. Those shares are issued at a price that is above net asset value. So, it's accretive to the fund. that program is pretty consistent, ongoing throughout the year. As long as the fund has positive trading dynamics. Additionally, we have in the past been able to do follow on equity offerings in the form of overnight offerings. We have not seen any of those recently or done any of those recently. But what we have seen is the convertible preferred. Those have converted to common shares. Pretty consistently over time.
There were no conversions in the most recent quarter. But we like this form of leverage for a variety of reasons that we can get into. But those conversions, in conjunction with that at the market program, help the fund scale and provide some scale efficiencies to fix costs on the font for the fund.
Kim Flynn:
Steven, we do have a question that's come in with respect to the funds use of leverage. So, if you could just talk about, we've been in a rising rate environment. And so obviously the funds cost of leverage has moved up. But the fund is a floating rate, asset the assets and the fund or floating rate also. So, we're benefiting from those higher interest rates. Can you just talk about?
What the rate increases have done to the cost of leverage, but also how the fund’s portfolio has responded. I think that'd be helpful to cover now absolutely so. So here, on, on the screen. Now we show we overlay various
Steven Perry:
rates. We have the 3-month live war fed funds rate. And so, for and, as you can see, and, as you're aware, the fed has been raising interest rates pretty consistently since the start of 2022. Now, what that means for the fund is that means borrowers and the fund have typically it's tied to their interest. Payments are tied to a base rate and a spread so as base rates rise, the level of interest paid to the fund and paid by borrowers increases. There are a lot of various dynamics. That I'll let the Octagon team get into if it comes up. That affects the amount of interest that's coming into the fund. But overall, as rates rise, we do see more interest income coming into the fund now what it means from a leverage perspective and let me get to that slide. Here is interesting because we have the credit facility, and we have the fixed rate preferred. The retail preferred that 6.50, and a convertible preference at 6. Now, what you won't see on here is the 6 95 prefers. None of those are drawn at this time. So that it does not affect the leverage sources as of September thirtieth for the bank borrowings, the credit facility that is tied to a base, the base rate of SOFR plus a spread of 1, 45. And so, as we've seen interest rates rise, we've seen that cost of leverage rise. What we've what the fund has been able to do is toggle between bank borrowings and fixed rate preferred. That allows the trust to be more dynamic in its use of leverage, keeping costs of leverage down. But as you'll see, the main portion of that is still floating rate leverage and you'll be able to compare the cost of leveraging to the cost. The weight average cost in it's up about 18 basis points to 6.52% We like the retail preferreds. We have a large institution ownership. In. In those the convertible prefers are privately placed and on the left of that you can see how the retail preferred have traded in the secondary market. They've traded down from par a little bit. However, we've seen them consistently Trade around par. Any other points, Kim. You'd like to hit on in terms of rates and leverage that that I missed?
Kim Flynn:
No, I think you covered. I mean the fund has assets and liabilities which, with both are floating rates. So, the fund is behaving as you would expect that they move in lock steps. So, I think the fund is built and designed to you know, handle a rising rate environment and benefit from that. Maybe, Gretchen, if you'd like to comment just in terms of the impact of rising rates at the portfolio level that might bring additional color to the conversation.
Gretchen Lam:
Sure, Kim, happy to you know the way that we think about it as portfolio managers is, you know, if we look at all of the assets held in XFLT about 2 thirds of the assets are truly floating directly floating rate assets, and that is comprised of both the CLO tranche debt and the floating rate loans that the trust holds. XFLT’s CLO equity allocation which represents the lion's share of the other third of the trust assets is what I would describe as hedged floating rate, meaning both the assets and liabilities of the CLO itself are predominantly floating rate, and so CLO equity is relatively indifferent to movements in in base rates. Very modestly exposed to rates, but predominantly indifferent and if you look at the quantum of the assets that are again considered floating rate that totals as of 9, 30, about 330 million and notional value. And these are the assets that have really greatly benefited from rates rising over the last 2 years, you know, base rates back in January of 2,021 were 25 basis points. And today they are, you know, just shy of 5 and a half, you know, as Steven mentioned. We do have the revolver, which, of course, is, is floating rate, as of 9 30. The balance on the revolver was 150 million, and so well, clearly. There is some incremental cost in leverage cost as rates rise net, net, net. The trust is still a strong beneficiary of the rates Moving up given the fact that the value of the assets that are floating rate and the fund is far greater than the revolver balance and in addition. And importantly, you know, just note that we do have the ability as rates Move to adjust. Of course, the revolver balance and adjust the proportion of revolver debt versus the fixed rate preferred. Based on our views of both expectations of movements and rates, as well as market or credit risk on a go forward basis.
Kim Flynn:
Thanks, Gretchen. Lauren. I'd love to. Have you speak to the loan market. So how has the financial performance of loan borrowers trended this quarter? And then, what does that mean for CLO performance?
Lauren Law:
Sure, Kim, 2023 has been a very interesting year for the loan market. The fundamental performance of borrowers has by and large exceeded what the market was expecting at the outset of the year, and this is evident in the total return performance of the loan market. During the third quarter both revenue and EBITDA grew across Loan market borrowers. We are seeing a deceleration in that rate of revenue growth. But we're seeing margin expansion, and EBITDA, actually outpacing what we're seeing in terms of revenue. On average, we're seeing, you know, strong growth and profitability driven by this low single digit revenue growth A and the margin expansion I mentioned.
I think it's important to note, though, that focusing only on averages can mask some underlying issues. You know, we continue to see similar to previous quarters, a fair amount of dispersion of performance across loan market borrowers. And while the average statistics look quite good, there are still some sectors, some subsectors, and just some borrowers that have experienced under performance. And in some instances, this underperformance has occurred to a meaningful degree. In this interest rate environment highly levered borrowers simply have less margin for error and missed performance. Expectations can quickly turn into an issue.
So, what does this mean for CLO performance? You know, for the better part of the last year and a half CLOs have outperformed by minimizing credit losses. And I think this continues to be the winning strategy in 2024, just as it has been in 2023, and the managers who have outperformed have done so by selectively taking risk, avoiding major losses and capitalizing on the increased spread available in the market today. We're looking for managers that actively manage the riskiest loans in their CLO. We want them to be nimble. In identifying deteriorating credit performance. We want them to be early and doing this and also opportunistic when it comes to identifying opportunities for some outsized returns on the other side. In short, we want our managers to take risks in a disciplined way. I think one important thing to note here is that it is very difficult for managers to do what we want them to do to be nimble once the reinvestment period of the CLO comes to its conclusion. So, post reinvestment period CLOs are simply prohibited from engaging in the type of active training, we think, is necessary in the current environment. And so, for this reason, you know, in XFLT, we have been reducing exposure to post reinvestment period deals, and we'll continue to do this. We think the longer equity is simply going to outperform, and as we buy additional assets, you know, we're looking for deals with runway to the end or the reinvestment period, so that managers have the time to manage the credit risk in the portfolio, capture the higher spreads available on new issue loans and repair some of the inevitable losses associated with those you know, idiosyncratic credit issues that continue to pop up from time to time.
Kim Flynn:
So, Lauren, could you speak to specific industries within the loan market? Are you seeing certain parts of the market outperform or underperform? Are you avoiding anything today? And what are Octagon’s expectations for loan defaults going forward? We're starting to, I mean, loan defaults have been so low, historically low. So, what does Octagon expect in 2024?
Lauren Law:
Sure. You know what's really interesting about the loan market? This year. And even last year is that it hasn't been one particular sector. That has been under assault. So, in previous default cycles, you know, we've seen, you know, 80% or so of the default to actually be associated 1 one sector. We saw this in oil and gas. We saw this in retail. And it's really been different. This cycle where performance, as I, as I noted earlier, appears to be more idiosyncratic in nature. That being said, we are seeing, you know, weakness more prevalent in some sectors versus others.
Health care is an example of a sector that has been struggling really, since covid with higher labor costs as well as the lower availability of labor. In many cases health care borrowers have limited pricing power. So this dramatic cost increase has led to pretty significant margin contraction. Given that health care, historically, has been viewed as a defensive sector. You know, not tied to a typical economic cycle and really prone to growth due to the demographics that drive their revenue performance. These healthcare borrowers have tended to be very highly levered. So, the combination of this, you know, margin contraction pressure on the cost side with highly levered capital structures has led to some stress within this sector. We are starting to see the labor challenges abate somewhat, but it is still a highly levered sector that is running you know, at operating margins that are that are nowhere near their normalized levels and cash flows remain constrained. So that's a sector where we have been very selective.
Real estate is another sector, which I think will come as a surprise to no one that has been under a bit of pressure. Specifically commercial, real estate related borrowers. Are seeing weakness, particularly those exposed to the office sector. I think. It is noteworthy, however, that this is a relatively small sector within the loan market.
Another good example of an area where we're seeing weakness is the telecom sector. This weakness is both as a function of top line under performance, as well as the burden of high Capex needs, and relatively full debt loads as rates have risen on the outperform our side. We continue to be pretty constructive on a lot of our software exposure as well as some of the business service providers, both of these and markets really benefit from oftentimes recurring subscription levels. The ability to raise prices and better than average growth versus some of the other names in the loan market as we look forward into 2024 on the default side. Our expectation for def for defaults remains relatively unchanged with what we have communicated in past quarters on an Ltm basis. The LSTA is calculating a 1.34% loan default rate. So that's much better than what the market had been anticipating. At the beginning of 2023. And while this rate does understate the level of credit stress in the market, as this rate generally excludes distressed exchanges, it still represents dramatic outperformance versus expectation. Most strategies predicted a 3 to 4% default rate at the beginning of the year with some outliers actually predicting default rates into the double digits. We would expect defaults to remain elevated in 2024 as some loan borrowers contend with performance headwinds such as those maybe in the health care. Telecom sectors, as mentioned early, others deal with challenging refinancing needs, or simply unable to continue to service their significantly higher interest burden in light of the current interest rate regime.
Kim Flynn:
Great, thank you, Lauren. So, we had some good news this quarter, I think, with some of the recession fears easing as inflation came off its peak. and GDP seems resilient the Equity market has reacted positively. How have the loan, the CLO markets reacted and where are loans, CLO debts, and CLO equity trading today?
Lauren Law:
Yeah, during the third quarter performance in both markets. Certainly, reflected the using of both inflationary and recessionary fears. You know we spoke last quarter about how, as the Mac Review has improved throughout the year, and loan borrower performance exceeded expectations. Risk assets have outperformed in the loan market. So, this trend continued into the third quarter with triple C rated loans outperforming both the single B and double b components of the market.
This out performance has been rather meaningful with triple Cs on a year-to-date basis rallying roughly 5 points in contrast, double b loans have moved only a point. So, it's significant.
Turning to CLO tranches. Mezzanine and equity tranches have also exhibited strong performance in 2023, both rallying significantly through the second and third quarters. Clo, double bees are actually one of the best returning asset classes and all of fixed income, hosting a 16 total return on a year-to-date basis through 9 30, so very compelling, compelling return. This year at 9.30 the CLOIE BB Index is trading to yield in excess of 13, and at an 88.92 price.
And lastly, turning to equity. While there is no CLO equity index that we can reference specifically, CLO equity has also experienced robust performance in 2023, and is currently trading to yields in the mid to high teens context.
All of this is to say that, despite strong performance, year to date, the loan market as well as the CLO Mezzanine and equity markets are still trading at very compelling levels, both in terms of future price. Upside as well as current, yield
Kim Flynn:
Great. Gretchen, so new CLO issuance was lower in 2023, I think, in part due to challenging Co. Our for new deals. How is that evolved over the course of the year. And what is Octagon's outlook for Primary CLO issuance and CLO Arbitrage in 2024?
Gretchen Lam:
Yeah. So maybe just to take a step back. Know the Us. Clo market is plus or minus a trillion-dollar market today, and total size and the size of the market has grown dramatically in the last decade or so, and it continues to grow today. Now, the pace of new CLO issuance, the pace of growth. Is indeed lower in 2023 and you can see that here on slide 22 we'll probably end the year at about 90 billion in in new issuance for us broadly syndicated CLOs, and many of our research friends expect approximately 100 billion in issuance for 2024. Now, as we look forward to 2024, we are perhaps a bit more hopeful than that in terms of the issuance outlook. You know it's. It's certainly true that the arbitrage, or said differently, that the net interest margin inherent in a newly issued CLO is low relative to history. This is not because the coupons on the loans are low. Quite the opposite. They're historically high right now. It's because the spreads on the CLO liabilities are historically high, and in particular the spreads on CLO triple A's which comprise almost 2 thirds of the CLO capitalization. And it is the CEO liabilities, the cost of financing. Not the loan assets that that is causing the arbitrage to really be challenged in the current environment.
And now, as an aside, this dynamic makes existing CLOs that were issued, you know, years before which likely have relatively cheaper financing in place very attractive for CLO equity investors. And this is why within XFLT, we have not purchased a CLO equity position in the primary market in almost 2 years. All of our purchases over the course of the last couple of years have been in the secondary market because of that fact. So, you know, what? What do we expect for 2024, then? There are a number of reasons why triple a spreads have remained persistently high driven in large part by both regulatory and currency, related challenges among the largest buyers of the triple, a tranche and we are starting to see some early signs that some of these challenges may be abating. Still early days. But if this continues to play out, we believe that triple Aaa spreads may start to revert back down to their long-term levels which should help support higher CLO issuance in the future. So, we do think there is again risk to the upside, perhaps with that 100 billion dollar number for 2024 issuance.
Kim Flynn:
Lauren, could you speak to just the outlook for the CLO market. It covers sort of CLO debt, CLO equity as an investor. Steven mentioned that Octagon has liked Co debt. And it's increased slightly the allocation of co debt. What is your expectation for CLO markets in the year to come?
Lauren Law:
You know we feel pretty constructive about the CLO market in the year to come. You know. I think there are some things you need to consider, you know, while the economy continues to be resilient challenges for leverage, credit do persist. Octagon continues to sit in the higher for longer camp. And this is certainly helping our CLO mez exposure. But I think you have to consider that while it is great to be an owner of floating rate assets in a rising rate environment. This dynamic may present challenges for companies that borrowed floating. So, we expect that we will continue to see some challenges at the bottom end of the credit spectrum in the loan market. so low rated borrowers with capital structures that were conceived in a near 0 interest rate environment, main counter challenges in the event of fundamental and performance, you know, said differently. Highly levered borrowers are operating within margin for error, and some will err. You know, and I think it's important to highlight. You know that that risk in the market. But I definitely don't want to leave investors with a dire view of the outlook for levered credit. I think it's important to note that most loans and most clos and CLOs to an even degraded greater degree. Are well positioned to weather this higher interest rate environment CLO over collateralization cushions are well positioned to withstand credit losses from both defaults and trading losses. As well as the headwind of increased triple C downgrades, which is something that CLOs have been contending with. This means equity distributions will continue and likely at robust levels.
Another thing I think to consider is that the current yields on both loans and CO. Debt at almost 13 respectively, are very high versus levels. We have experienced historically, from a technical standpoint, technicals are very supportive, and both alone, and CLO tranche markets with, you know, modest CLO issuance supporting historically low net loan issuance. And as we look forward, we are focused, you know, both on avoiding credit losses in the loan book, and positioning the CLO tranche exposure within XFLT. With the managers that are skilled at doing that in their portfolios as well.
Kim Flynn:
Thank you. Lauren. Gretchen. Anything to add there.
Gretchen Lam:
Nope.
Kim Flynn:
Awesome. Well, we do have time for audience questions. So, look to the bottom of the screen. There's a Q&A function. Type your question in there. We do have one or 2 that have come in. So, we'll get to those shortly.
Just a quick reminder on how to vote your XFLT. Proxy. You can vote in a number of ways by Internet, by phone, by mail or in person at the special meeting votes need to be in before that meeting date, which is December nineteenth. Please let us know if you have any questions, or if for some reason you haven't received your proxy card.
Great. So, let's move. Now. Steven, this is going to be a question, I think, for the 2 of us to tackle, because it's more in the fund management. We've got 2 related questions actually from some of our regular webinar participants. So, thank you so much for those questions. And this is with respect to the funds, distribution, rate, distribution, policy.
And I know you talked about the funds 2023 distribution was a hundred percent net investment income, and there was no return of capital. And so, one of the things that I think the question is getting at is, you know, is it the Fund Board's goal to set a dividend rate that can be covered by net investment income going forward.
Yes, absolutely. That is the goal. That is the philosophy that the XFLT Fund Board has had since inception the Fund Board is very disciplined with respect to distribution setting the board requires frequent not only reports from Stephen and from the team, but also dialogue in between board meetings with respect to dividend coverage. So, we've always had an income-based distribution policy. And we expect to have going forward the same the same income-based distribution policy. And that's really important.
One of the questions was with respect to do you just focus on distribution coverage by net investment income alone? Or do you also factor in expected capital gains, and I think this is sort of a nuanced question, but I'll try to address it.
So, we have you know the forecast that we do from that investment income and estimates that we make and we adjust throughout the year. Now, capital gains are a little bit harder to predict, a little bit harder to estimate, and from time to time the Octagon team will produce short term capital gains sometimes from trading activity, from repositioning the portfolio. And so, we do factor those in not ahead of time, but we will adjust our estimates. Real time reflecting any of the gains that do come in, because obviously that can be. Those gains can be distributed as part of a net investment income. And so, I would say that the philosophy the approach is more the former than the latter. We're focused on estimates of net investment income as opposed to trying to predict or estimate what capital gains are going to be you know, and when and if the portfolio managers might sell those. So that doesn't really factor in the, you know, those capital gains in advance. It is something that we do think about real time and adjust as we go. But, Steven, maybe if you could cover the distribution history and add it any other color in from the discussions that you have regularly with our fund board, I think that'd be helpful.
Steven Perry:
Yeah, awesome. Good. Great explanation. And as you see here, we see the increase from 7.3 cents to 8.5 cents earlier this year. There are. There are a couple of factors that we talk about internally and with the board on distribution, and those go into gap accounting and tax accounting. And so right now we've talked about the gap accounting and the income into the fund. But there is also a, a tax consideration with an asset class like CLO equity. We don't need to get deep into that but what the what the management tries to do is to thread that needle between any differences between gap income and taxable income. And we strive to have that income-based distribution policy still, like you said Kim.
Kim Flynn:
Yes, and I think that XFLT Is uniquely positioned to be able to navigate potential gap and tax differences because of its composition. The fact that the fund invests in loans and CLO debt as well as CLO equity. Because of the tax reporting that's done. That lag can create some frankly, problems for fund sponsors who invest heavily in CLO equity. For XFLT, CLO equity has always been less than 50%, and so that allows us to set distributions on a gap basis using that investment income, and it allows us to make the required tax payments. And so, we you don't see from XFLT a history therefore, of making special distributions to meet our tax requirements, we're better able to manage the differences. The small differences that can from time to time appear between gap and tax. Now, some of the CLO equity focused competitor funds which are heavily allocated to co equity. I will just acknowledge that they have a harder time with that, and meeting some of their tax obligations. Sometimes you'll see those CLO equity focus funds make special distributions at year end to meet those tax obligations so hopefully, that's helpful in explaining the XFLT distribution history and explaining the philosophy that the Fund board uses in terms of guiding the approach to declaring our monthly distributions.
Steven, do you see any more questions from the audience? I think we've addressed the ones that have come in. If not, we appreciate shareholders who've already taken the time to vote. It's very quick and easy. So please remember to do so. Your vote is important to us. And then, if you have any other questions, you can contact Steven. You can contact me directly. We're always happy to take your calls or emails. It was a pleasure thanks so much to Lauren for joining us on today's webinar, and, thanks to Gretchen as well.