Investor Day 2019 EXHIBIT 99.1
Disclaimer This presentation contains forward-looking statements within the meaning of the Private Securities Litigation Reform Act of 1995 and other federal securities laws. When used in this presentation, the words “estimate,” “anticipate,” “expect,” “believe,” “intend,” “may,” “will,” “should,” “seek,” “approximately” or “plan,” or the negative of these words or similar words or phrases that are predictions of future events or trends and which do not relate solely to historical matters are intended to identify forward-looking statements. You can also identify forward-looking statements by discussions of strategy, plans or intentions of management. Forward-looking statements involve numerous risks and uncertainties and you should not rely on them as predictions of future events. Forward-looking statements depend on assumptions, data or methods that may be incorrect or imprecise, and Spirit Realty Capital, Inc. (“Spirit,” the “Company,” “we,” “our” or “us”) may not be able to realize them. Spirit does not guarantee that the transactions and events described will happen as described herein (or that they will happen at all). The following risks and uncertainties, among others, could cause actual results and future events to differ materially from those set forth or contemplated in the forward-looking statements: industry and economic conditions; volatility and uncertainty in the financial markets, including potential fluctuations in the Consumer Price Index; Spirit's success in implementing its business strategy and its ability to identify, underwrite, finance, consummate, integrate and manage diversifying investments; the financial performance of Spirit's retail tenants and the demand for retail space, particularly with respect to challenges being experienced by general merchandise retailers and challenges resulting from an evolving e-commerce landscape; Spirit's ability to diversify its tenant base; Spirit’s ability to develop and maintain relationships with tenants, developers, brokers, and other third party transaction sources; the nature and extent of future competition; Spirit’s ability to obtain favourable lease provisions; increases in Spirit's costs of borrowing as a result of changes in interest rates and other factors; Spirit's ability to access debt and equity capital markets; Spirit's ability to pay down, refinance, restructure and/or extend its indebtedness as it becomes due; Spirit's ability and willingness to renew its leases upon their expiration and to reposition its properties on the same or better terms upon lease expiration in the event such properties are not renewed by tenants or Spirit exercises its rights to replace existing tenants upon default; the impact of any financial, accounting, legal or regulatory issues or litigation that may affect Spirit or its major tenants; Spirit's ability to manage its expanded operations; Spirit's ability and willingness to maintain its qualification as a real estate investment trust (“REIT”); and other risks inherent in the real estate business, including tenant defaults, potential liability relating to environmental matters, illiquidity of real estate investments and potential damages from natural disasters discussed in Spirit's most recent filings with the Securities and Exchange Commission (“SEC”), including its Annual Report on Form 10-K for the year ended December 31, 2018 and subsequent Quarterly Reports on Form 10-Q. You are cautioned not to place undue reliance on forward-looking statements, which speak only as of the date of this presentation. While forward-looking statements reflect Spirit's good faith beliefs, they are not guarantees of future performance. Spirit disclaims any obligation to publicly update or revise any forward-looking statement to reflect changes in underlying assumptions or factors, new information, data or methods, future events or other changes, except as required by law. This presentation shall not constitute an offer to sell or the solicitation of an offer to buy securities nor shall there be any sale of any securities in any state in which such solicitation or sale would be unlawful prior to registration or qualification of these securities under the laws of any such state. Certain information contained herein is preliminary and subject to change and may be superseded in its entirety by further updated materials. We do not make any representation as to the accuracy or completeness of the information contained herein. Certain data set forth herein has been obtained from third parties, the accuracy of which we have not independently verified. This information is not intended to provide and should not be relied upon for accounting, legal or tax advice or investment recommendations. You should consult your own counsel, tax, accountant, regulatory and other advisors as to such matters.
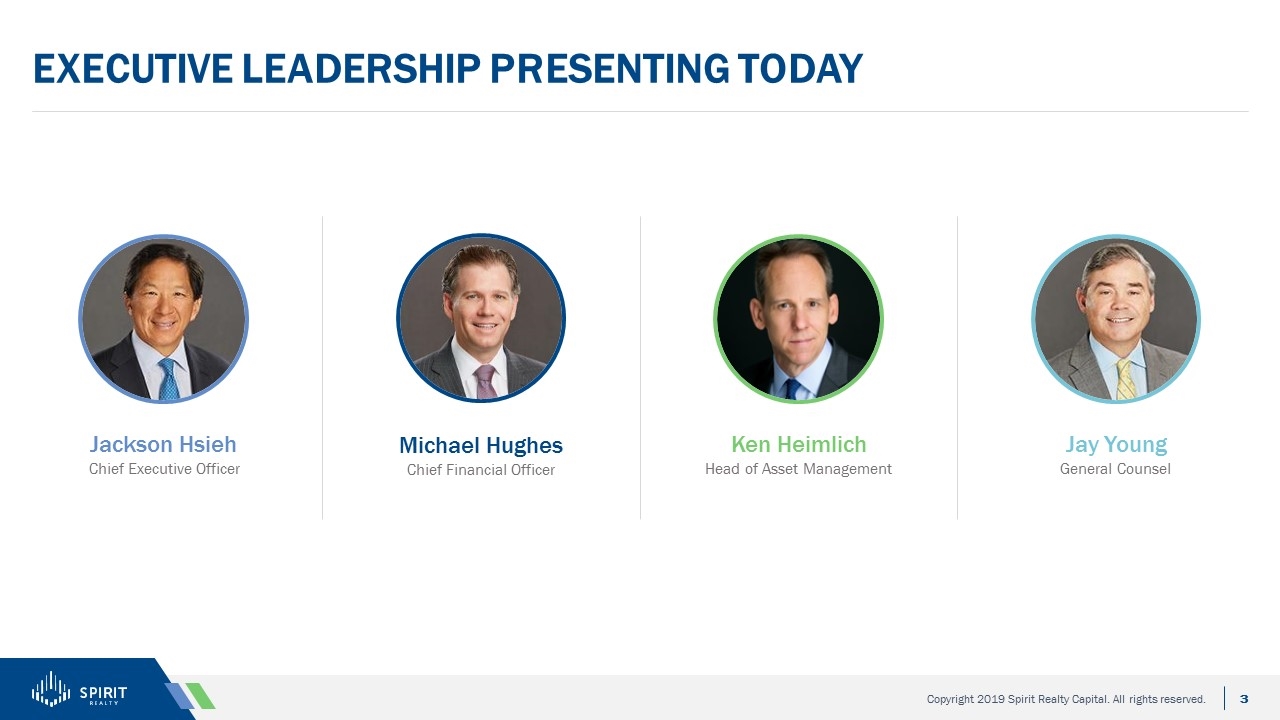
Executive leadership presenting today Ken Heimlich Head of Asset Management Jay Young General Counsel Michael Hughes Chief Financial Officer Jackson Hsieh Chief Executive Officer
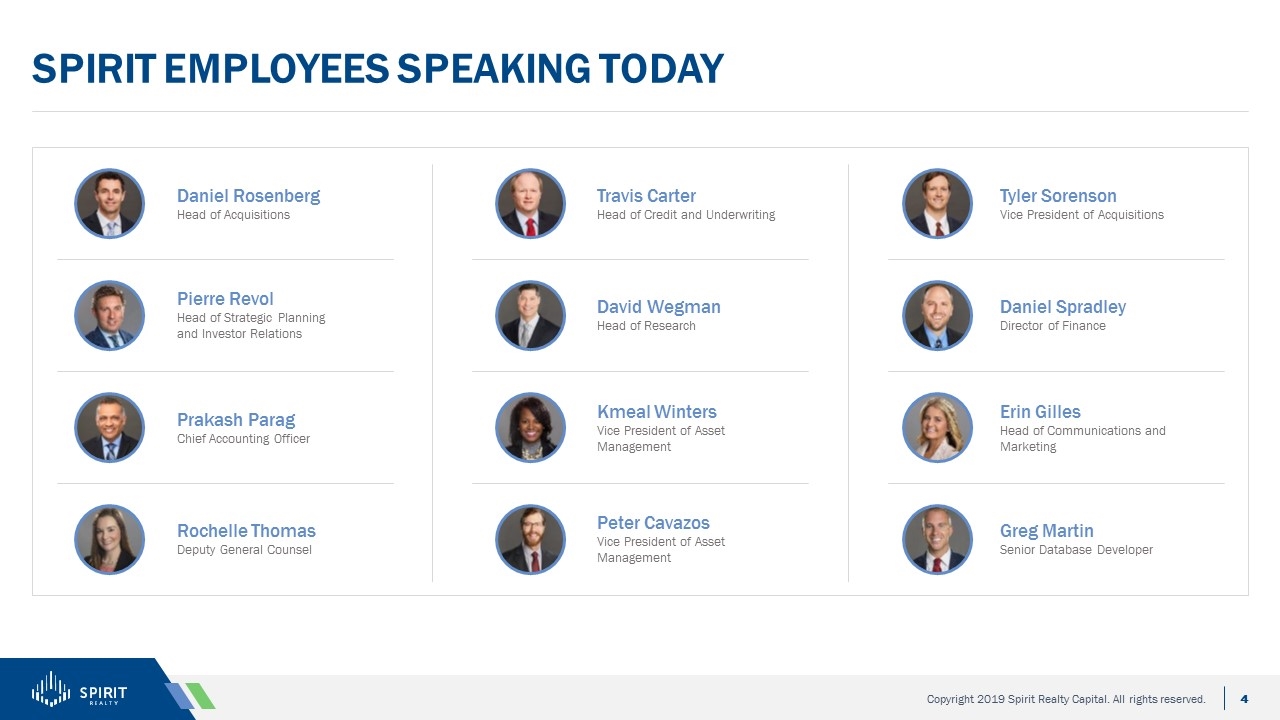
Spirit Employees Speaking Today David Wegman Head of Research Kmeal Winters Vice President of Asset Management Peter Cavazos Vice President of Asset Management Tyler Sorenson Vice President of Acquisitions Daniel Spradley Director of Finance Erin Gilles Head of Communications and Marketing Greg Martin Senior Database Developer Daniel Rosenberg Head of Acquisitions Pierre Revol Head of Strategic Planning and Investor Relations Rochelle Thomas Deputy General Counsel Travis Carter Head of Credit and Underwriting Prakash Parag Chief Accounting Officer
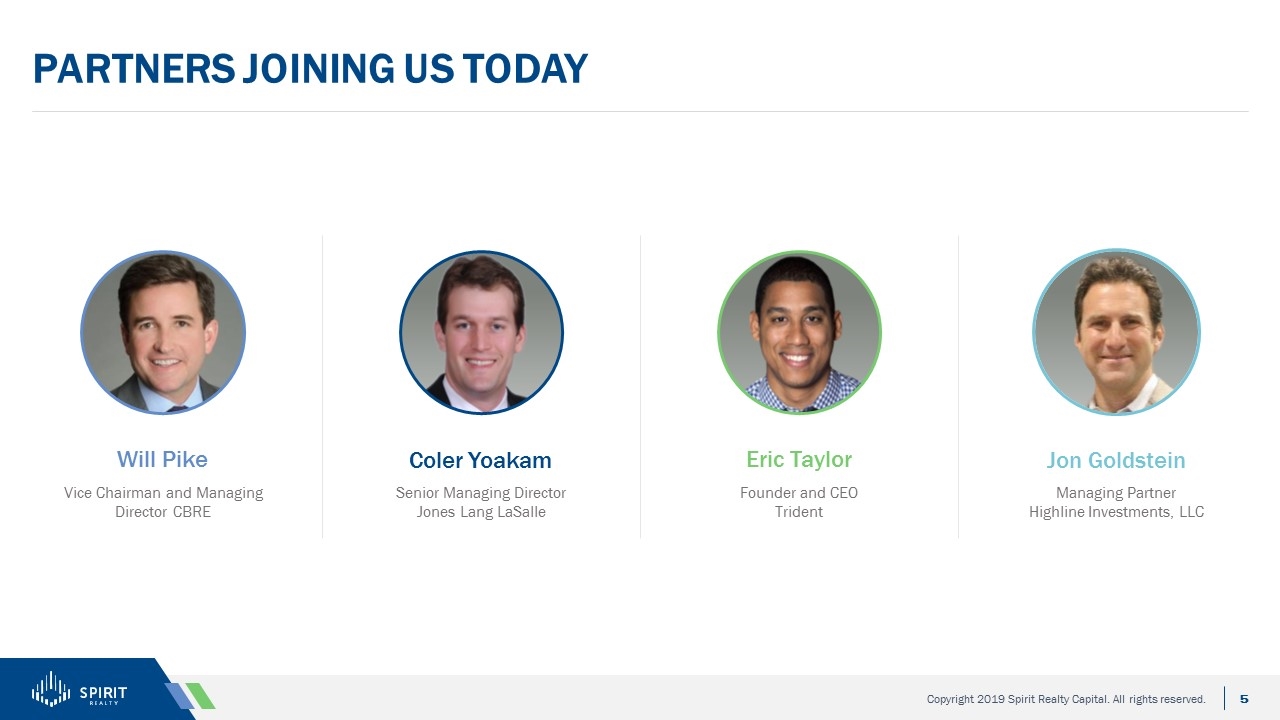
Partners Joining us Today Eric Taylor Founder and CEO Trident Jon Goldstein Managing Partner Highline Investments, LLC Coler Yoakam Senior Managing Director Jones Lang LaSalle Will Pike Vice Chairman and Managing Director CBRE
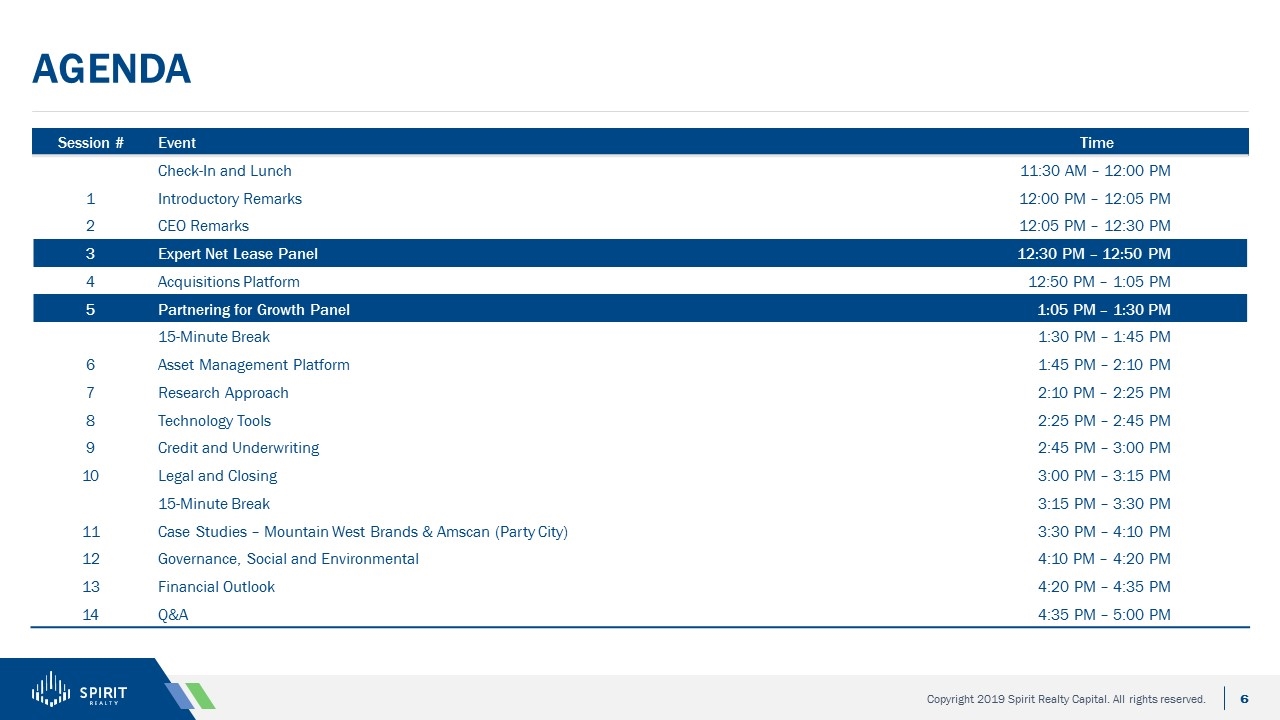
agenda Session # Event Time Check-In and Lunch 11:30 AM – 12:00 PM 1 Introductory Remarks 12:00 PM – 12:05 PM 2 CEO Remarks 12:05 PM – 12:30 PM 3 Expert Net Lease Panel 12:30 PM – 12:50 PM 4 Acquisitions Platform 12:50 PM – 1:05 PM 5 Partnering for Growth Panel 1:05 PM – 1:30 PM 15-Minute Break 1:30 PM – 1:45 PM 6 Asset Management Platform 1:45 PM – 2:10 PM 7 Research Approach 2:10 PM – 2:25 PM 8 Technology Tools 2:25 PM – 2:45 PM 9 Credit and Underwriting 2:45 PM – 3:00 PM 10 Legal and Closing 3:00 PM – 3:15 PM 15-Minute Break 3:15 PM – 3:30 PM 11 Case Studies – Mountain West Brands & Amscan (Party City) 3:30 PM – 4:10 PM 12 Governance, Social and Environmental 4:10 PM – 4:20 PM 13 Financial Outlook 4:20 PM – 4:35 PM 14 Q&A 4:35 PM – 5:00 PM
Welcome to Spirit
CEO Remarks Investor Day 2019
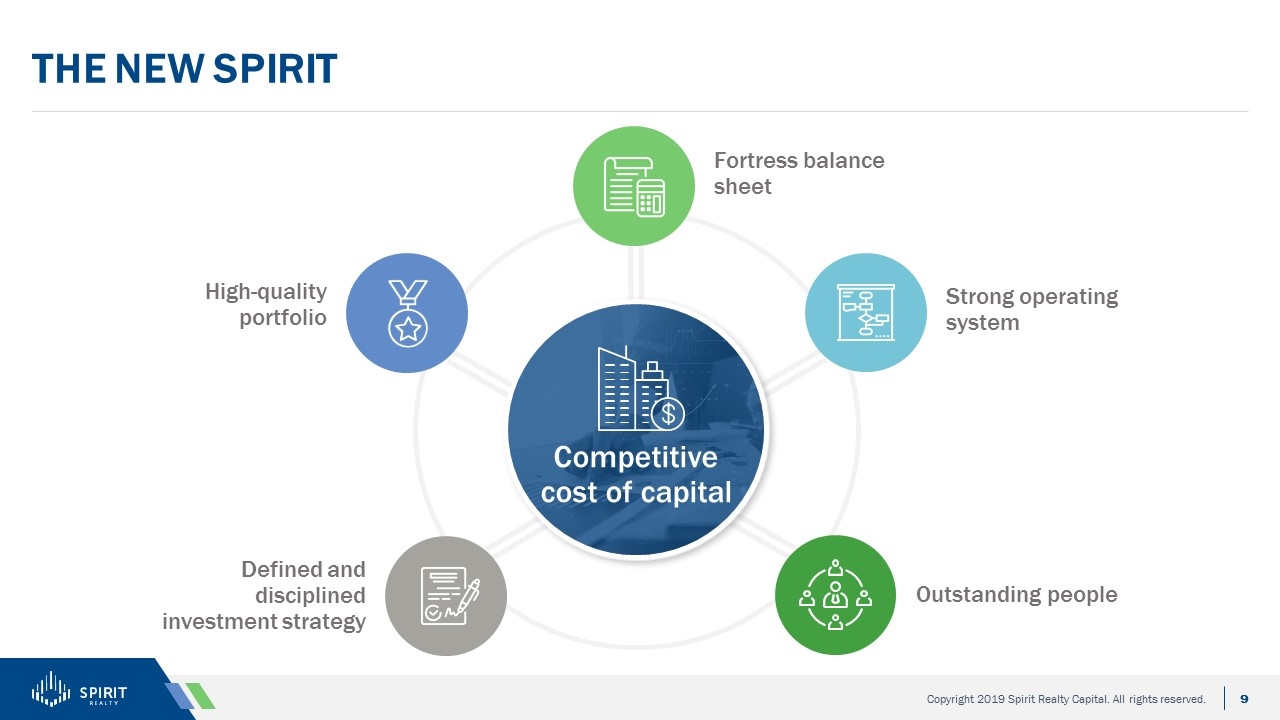
The New Spirit High-quality portfolio Defined and disciplined investment strategy Outstanding people Strong operating system Competitive cost of capital Fortress balance sheet
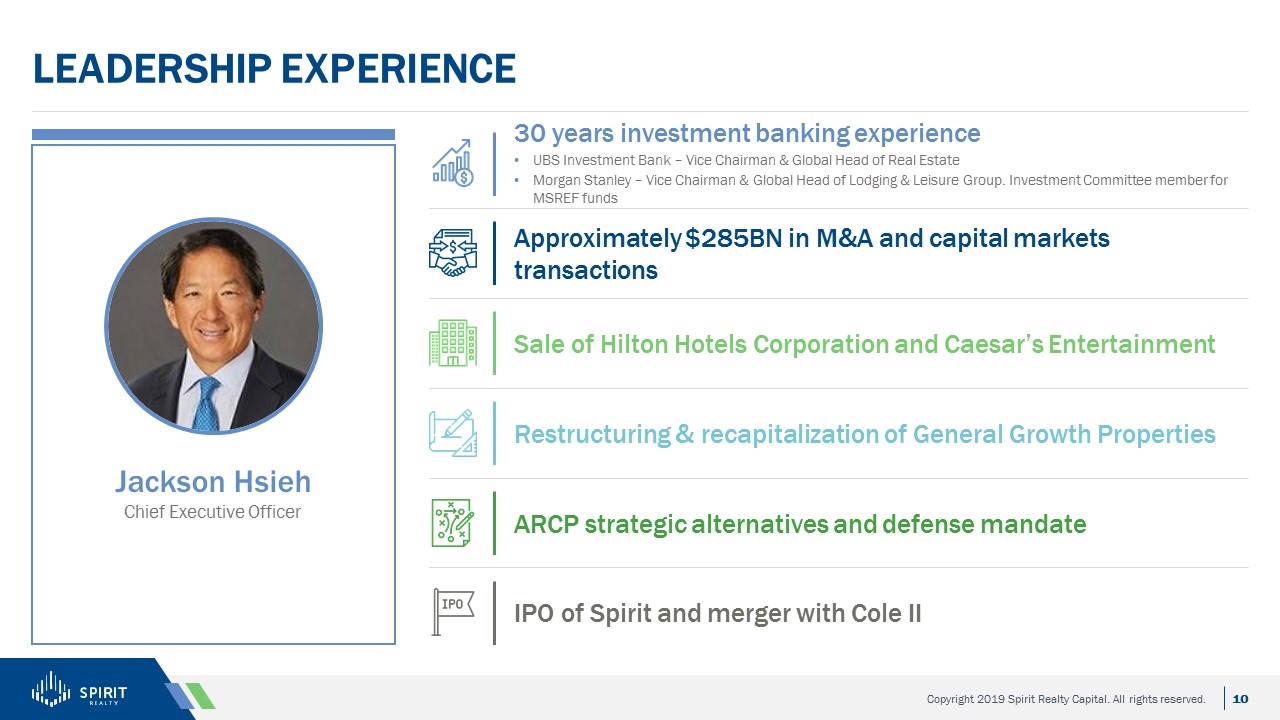
LEADERSHIP EXPERIENCE Jackson Hsieh Chief Executive Officer 30 years investment banking experience UBS Investment Bank – Vice Chairman & Global Head of Real Estate Morgan Stanley – Vice Chairman & Global Head of Lodging & Leisure Group. Investment Committee member for MSREF funds Approximately $285BN in M&A and capital markets transactions Sale of Hilton Hotels Corporation and Caesar’s Entertainment Restructuring & recapitalization of General Growth Properties ARCP strategic alternatives and defense mandate IPO of Spirit and merger with Cole II
Misconceived notions of a good triple-net reit Outsource operations and servicing Tenants do what they say Just buy from brokers Rents are mailed in
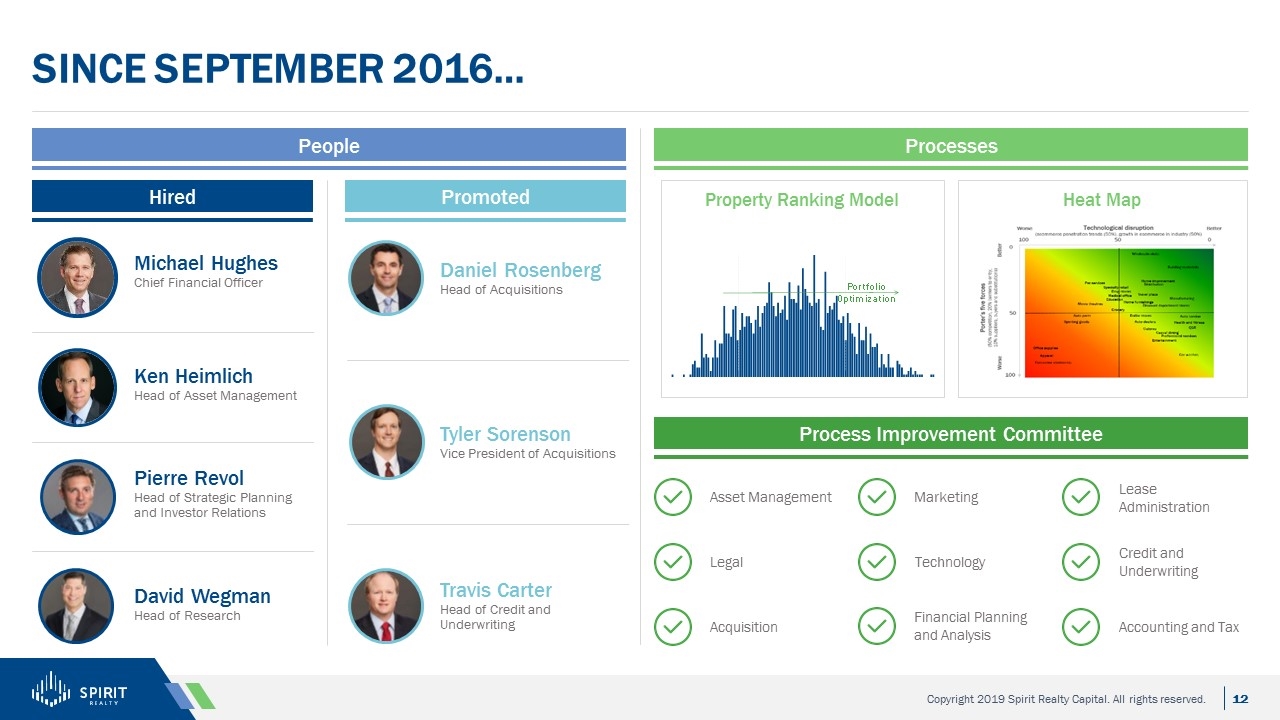
Hired Since September 2016… David Wegman Head of Research Pierre Revol Head of Strategic Planning and Investor Relations Michael Hughes Chief Financial Officer Ken Heimlich Head of Asset Management Travis Carter Head of Credit and Underwriting Daniel Rosenberg Head of Acquisitions Tyler Sorenson Vice President of Acquisitions Property Ranking Model Heat Map Legal Acquisition Technology Financial Planning and Analysis Credit and Underwriting Asset Management Marketing Lease Administration People Processes Promoted Process Improvement Committee Accounting and Tax
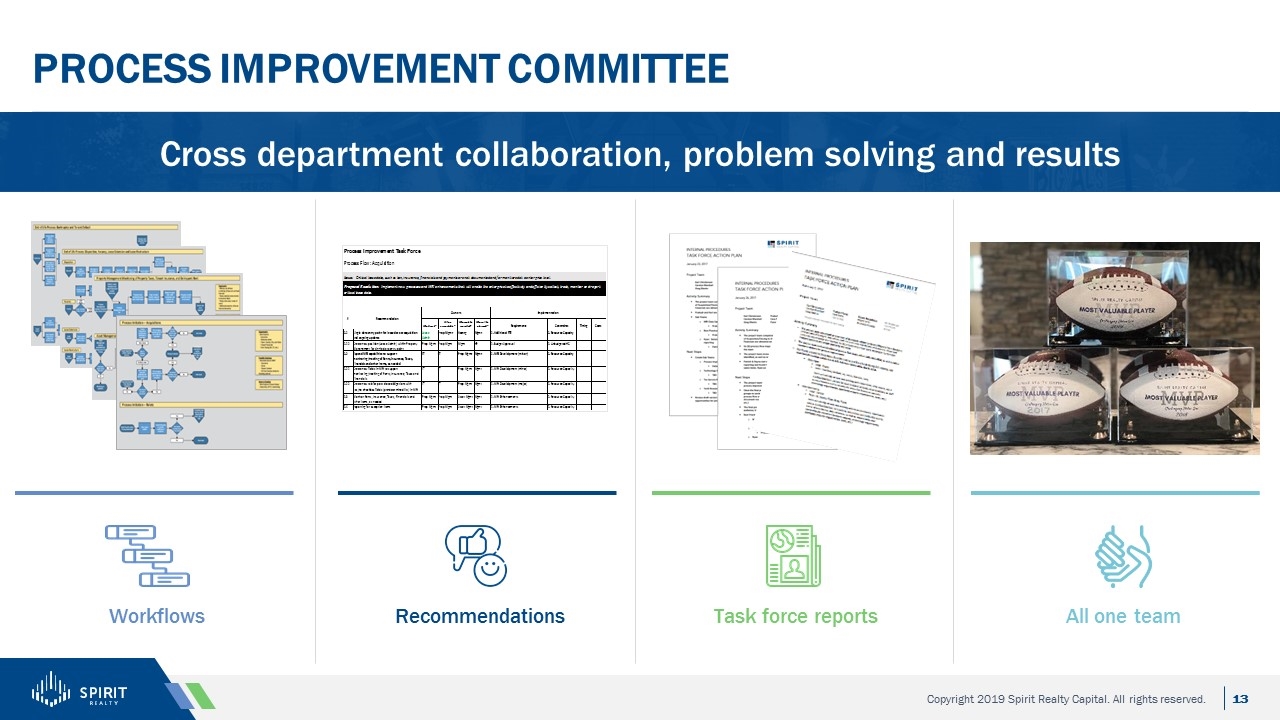
Process improvement committee Cross department collaboration, problem solving and results Workflows Recommendations Task force reports All one team
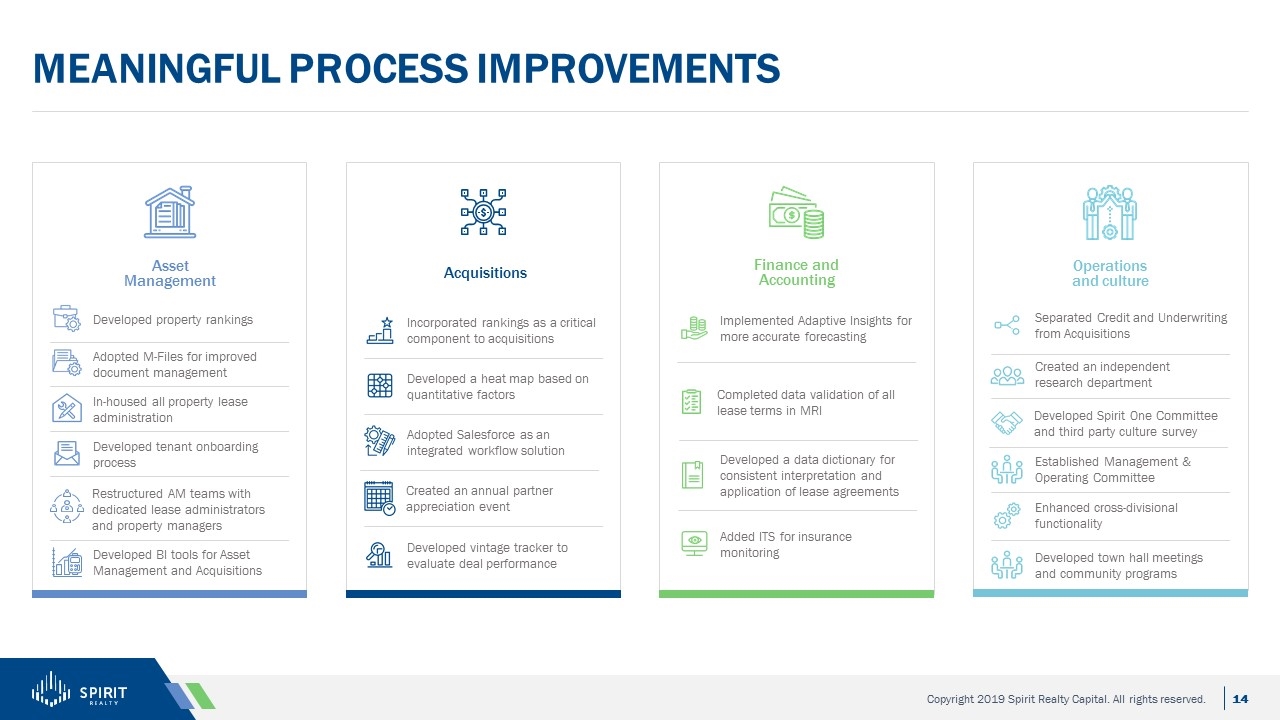
Meaningful Process Improvements Asset Management Finance and Accounting Acquisitions Operations and culture Developed property rankings Adopted M-Files for improved document management In-housed all property lease administration Developed tenant onboarding process Created an annual partner appreciation event Incorporated rankings as a critical component to acquisitions Developed a heat map based on quantitative factors Adopted Salesforce as an integrated workflow solution Developed vintage tracker to evaluate deal performance Implemented Adaptive Insights for more accurate forecasting Completed data validation of all lease terms in MRI Added ITS for insurance monitoring Separated Credit and Underwriting from Acquisitions Developed town hall meetings and community programs Enhanced cross-divisional functionality Established Management & Operating Committee Developed Spirit One Committee and third party culture survey Created an independent research department Developed BI tools for Asset Management and Acquisitions Restructured AM teams with dedicated lease administrators and property managers Developed a data dictionary for consistent interpretation and application of lease agreements
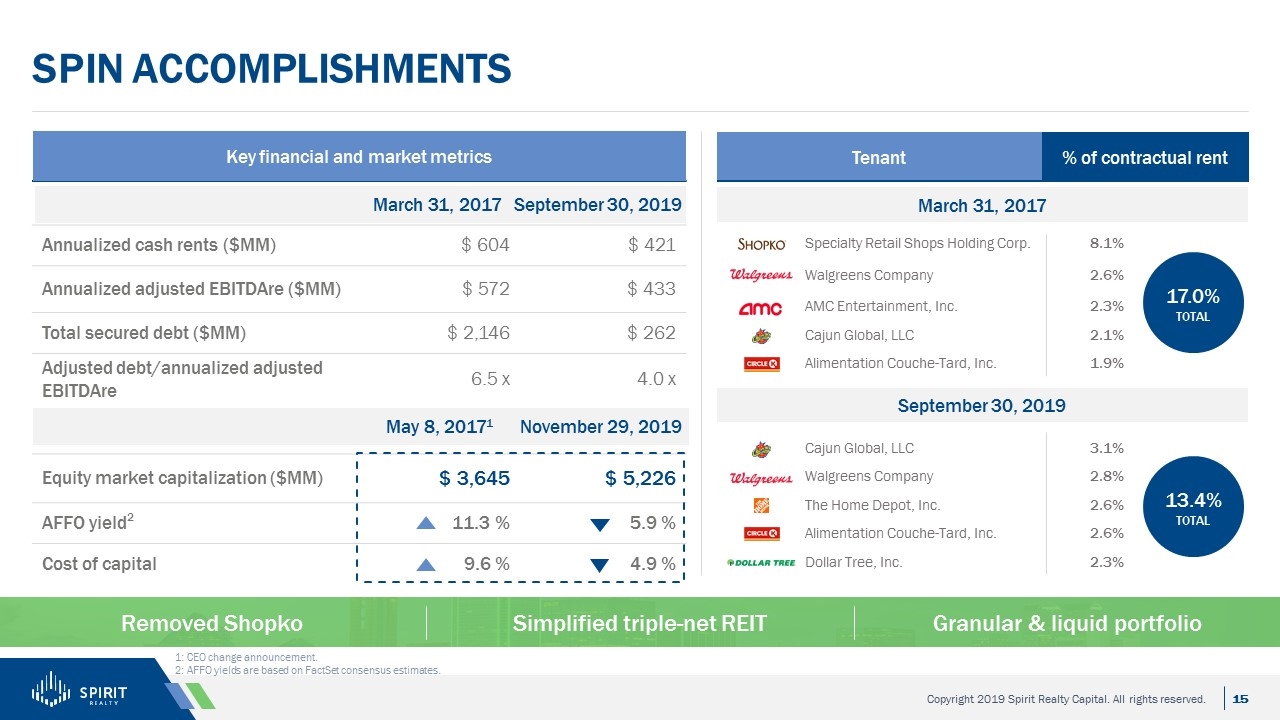
Spin accomplishments Removed Shopko Simplified triple-net REIT Granular & liquid portfolio Annualized cash rents ($MM) $ 604 $ 421 Annualized adjusted EBITDAre ($MM) $ 572 $ 433 Total secured debt ($MM) $ 2,146 $ 262 Adjusted debt/annualized adjusted EBITDAre 6.5 x 4.0 x Equity market capitalization ($MM) $ 3,645 $ 5,226 AFFO yield2 11.3 % 5.9 % Cost of capital 9.6 % 4.9 % March 31, 2017 September 30, 2019 % of contractual rent Tenant Specialty Retail Shops Holding Corp. 8.1% Walgreens Company 2.6% AMC Entertainment, Inc. 2.3% Cajun Global, LLC 2.1% Alimentation Couche-Tard, Inc. 1.9% March 31, 2017 September 30, 2019 Cajun Global, LLC 3.1% Walgreens Company 2.8% The Home Depot, Inc. 2.6% Alimentation Couche-Tard, Inc. 2.6% Dollar Tree, Inc. 2.3% 17.0% TOTAL 13.4% TOTAL 1: CEO change announcement. 2: AFFO yields are based on FactSet consensus estimates. Key financial and market metrics May 8, 20171 November 29, 2019
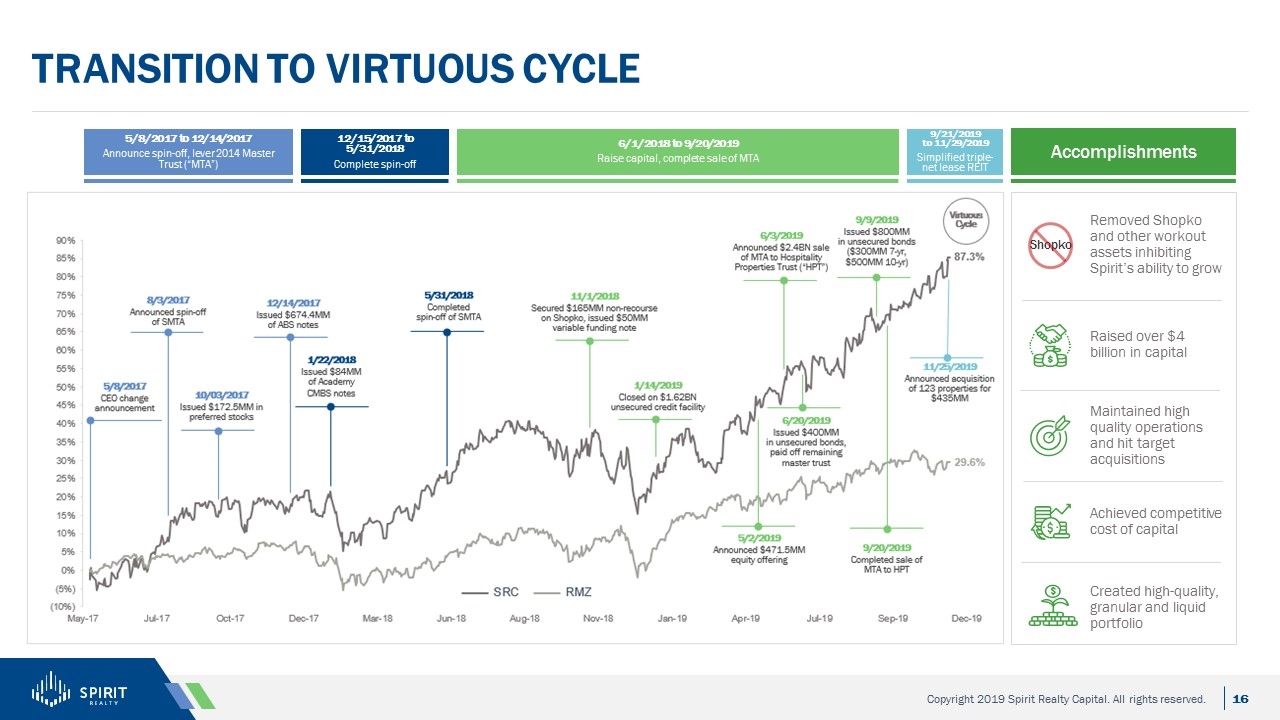
Transition to Virtuous Cycle Accomplishments Shopko Removed Shopko and other workout assets inhibiting Spirit’s ability to grow Created high-quality, granular and liquid portfolio Maintained high quality operations and hit target acquisitions Achieved competitive cost of capital Raised over $4 billion in capital 5/8/2017 to 12/14/2017 Announce spin-off, lever 2014 Master Trust (“MTA”) 6/1/2018 to 9/20/2019 Raise capital, complete sale of MTA 12/15/2017 to 5/31/2018 Complete spin-off 9/21/2019 to 11/29/2019 Simplified triple-net lease REIT
Our operating Strategy Provide predictable earnings and dividend growth Operational excellence Steady and high-quality acquisitions Organic rent growth Conservative balance sheet maintenance
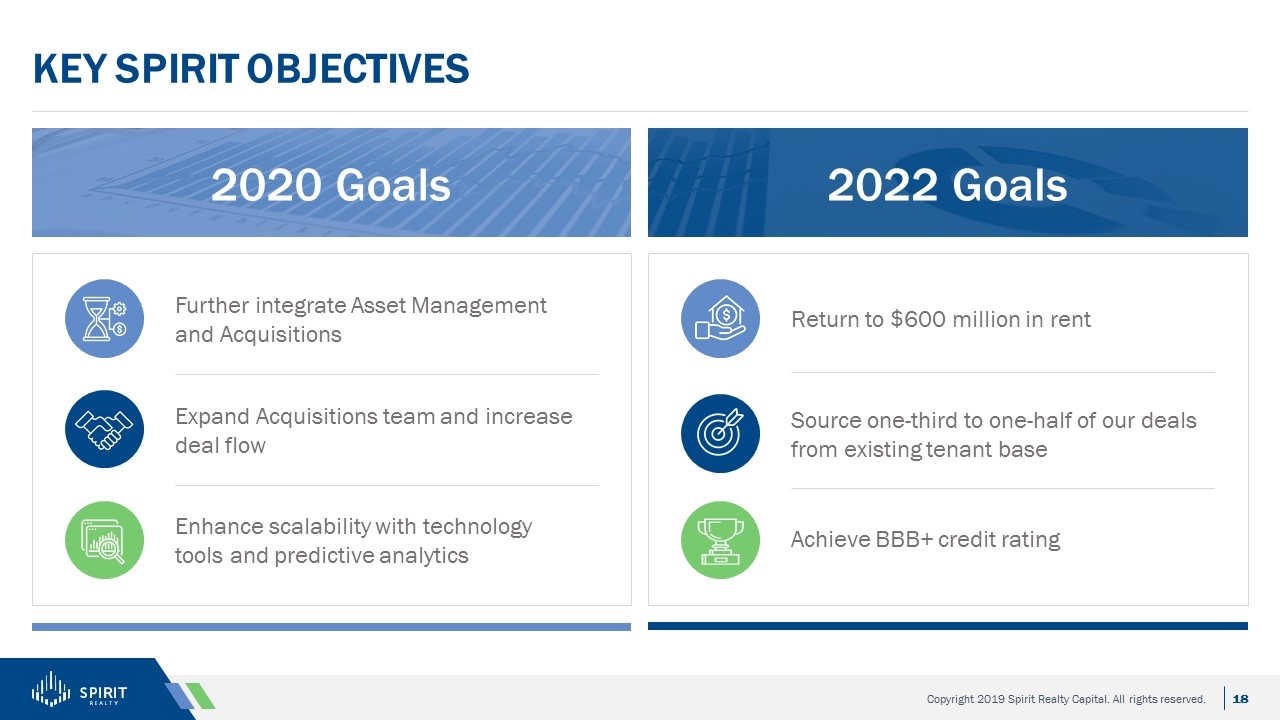
Key spirit Objectives 2020 Goals 2022 Goals Further integrate Asset Management and Acquisitions Enhance scalability with technology tools and predictive analytics Expand Acquisitions team and increase deal flow Return to $600 million in rent Source one-third to one-halfof our deals from existing tenant base Achieve BBB+ credit rating

Medium term portfolio targets 80% retail Maintain liquidity and granularity Acquisitions aligned with Heat Map 20% non-retail Favor public credits
Continuing to Enhance Culture and Values Spirit’s mottos for success Stakeholders Employees Tenants Community Shareholders Challenge the norm We are the backstop Ask 6 questions Do what you say Always be closing Funding the heart of America’s business All one team

Spirit’s approach to the Asset Lifecycle Source Pipeline Pre-screen Investment Committee Market PSA Close Documentation/diligence Close Asset Management Identify for disposition Acquisitions Leadership Team Asset Management Credit and Underwriting Legal Research
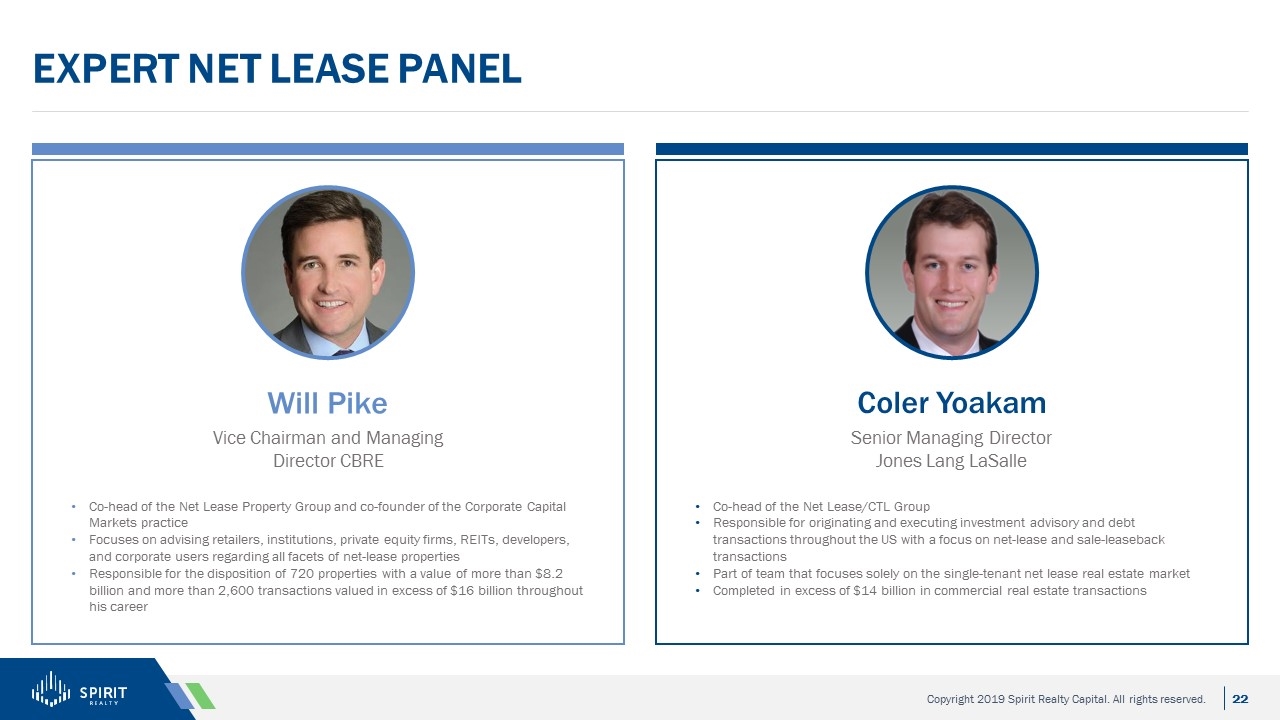
Expert Net Lease Panel Coler Yoakam Senior Managing Director Jones Lang LaSalle Will Pike Vice Chairman and Managing Director CBRE Co-head of the Net Lease Property Group and co-founder of the Corporate Capital Markets practice Focuses on advising retailers, institutions, private equity firms, REITs, developers, and corporate users regarding all facets of net-lease properties Responsible for the disposition of 720 properties with a value of more than $8.2 billion and more than 2,600 transactions valued in excess of $16 billion throughout his career Co-head of the Net Lease/CTL Group Responsible for originating and executing investment advisory and debt transactions throughout the US with a focus on net-lease and sale-leaseback transactions Part of team that focuses solely on the single-tenant net lease real estate market Completed in excess of $14 billion in commercial real estate transactions
Acquisitions Platform Investor Day 2019
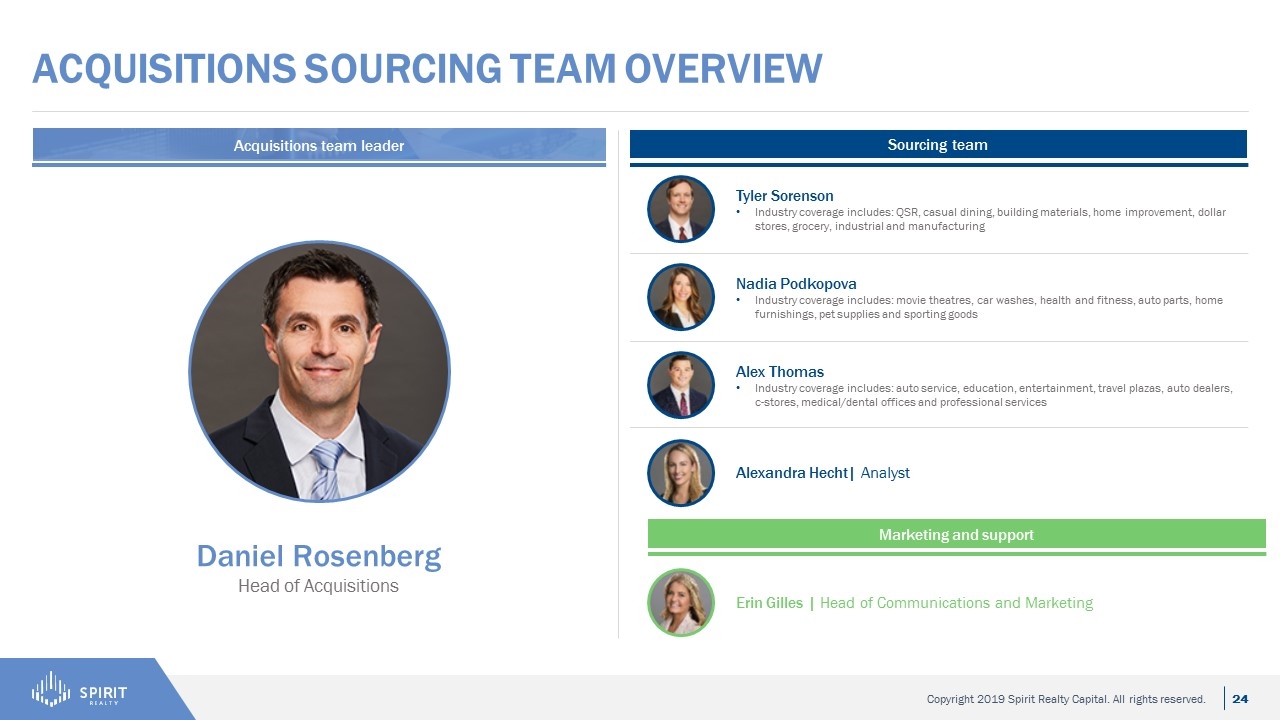
Acquisitions sourcing team overview Tyler Sorenson Industry coverage includes: QSR, casual dining, building materials, home improvement, dollar stores, grocery, industrial and manufacturing Nadia Podkopova Industry coverage includes: movie theatres, car washes, health and fitness, auto parts, home furnishings, pet supplies and sporting goods Alex Thomas Industry coverage includes: auto service, education, entertainment, travel plazas, auto dealers, c-stores, medical/dental offices and professional services Erin Gilles | Head of Communications and Marketing Alexandra Hecht| Analyst Marketing and support Sourcing team Acquisitions team leader Daniel Rosenberg Head of Acquisitions
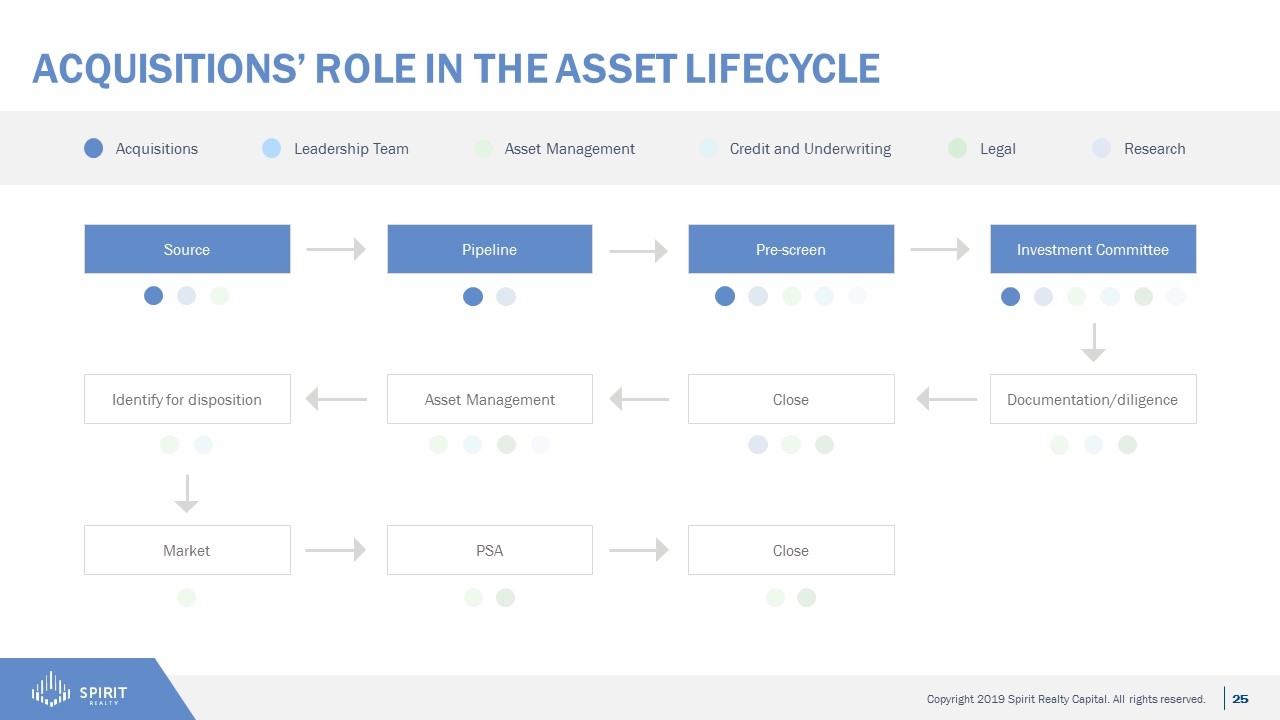
Acquisitions’ role in the Asset Lifecycle Source Pipeline Pre-screen Investment Committee Market PSA Close Documentation/diligence Close Asset Management Identify for disposition Acquisitions Leadership Team Asset Management Credit and Underwriting Legal Research
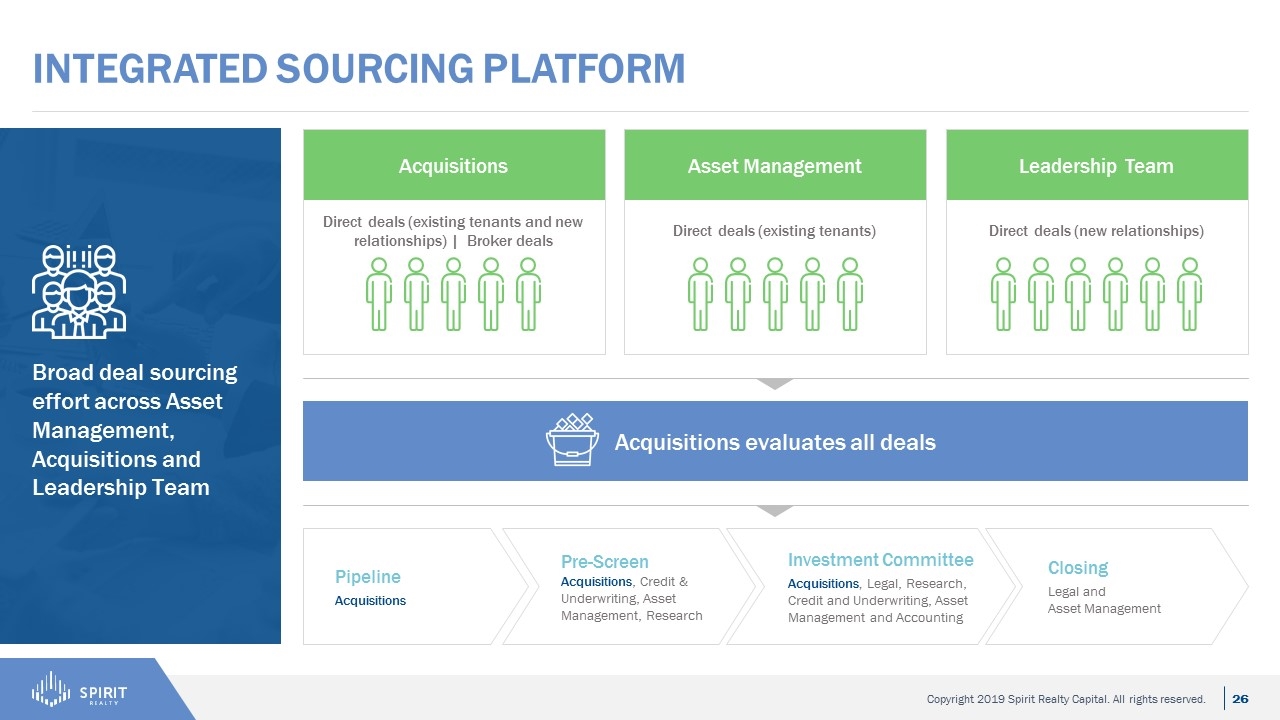
Acquisitions Direct deals (existing tenants and new relationships) | Broker deals Asset Management Direct deals (existing tenants) Leadership Team Direct deals (new relationships) Integrated sourcing platform Acquisitions evaluates all deals Pipeline Acquisitions Pre-Screen Acquisitions, Credit & Underwriting, Asset Management, Research Investment Committee Acquisitions, Legal, Research, Credit and Underwriting, Asset Management and Accounting Closing Legal and Asset Management Broad deal sourcing effort across Asset Management, Acquisitions and Leadership Team
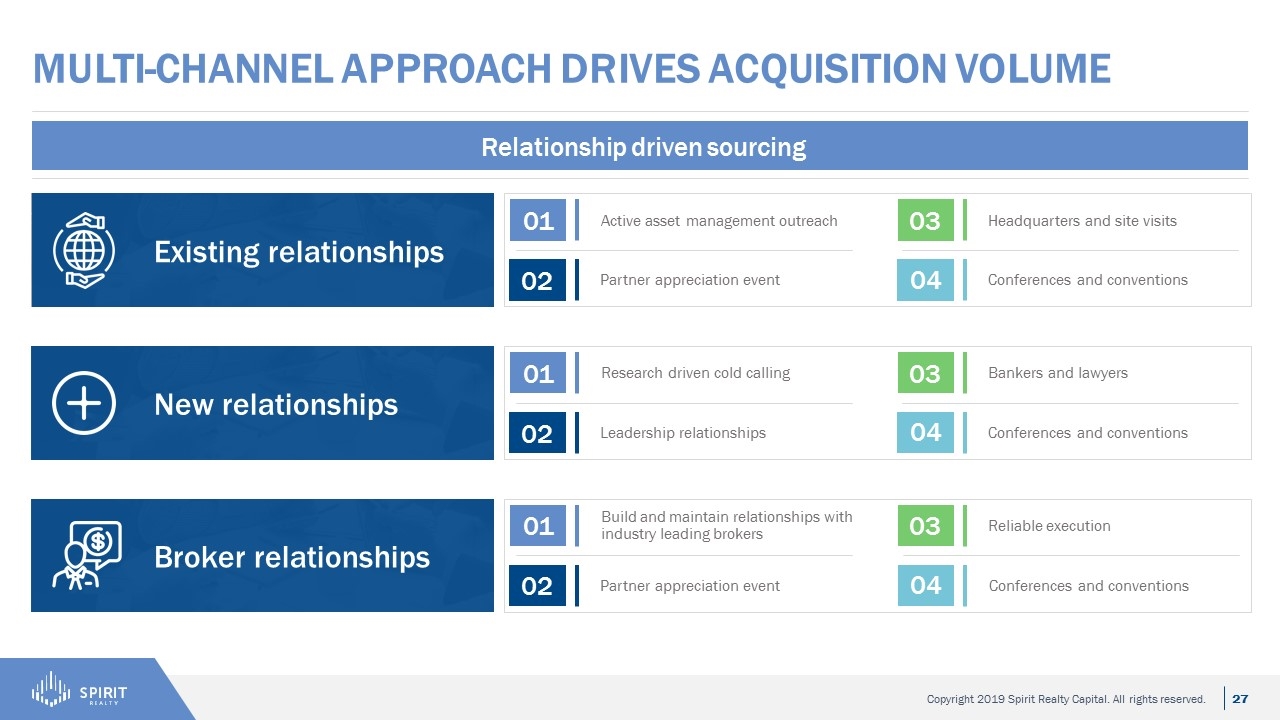
Multi-channel Approach drives Acquisition volume Relationship driven sourcing Existing relationships Partner appreciation event 02 Active asset management outreach 01 Conferences and conventions 04 Headquarters and site visits 03 New relationships Leadership relationships 02 Research driven cold calling 01 Conferences and conventions 04 Bankers and lawyers 03 Broker relationships Partner appreciation event 02 Build and maintain relationships with industry leading brokers 01 Reliable execution 03 Conferences and conventions 04
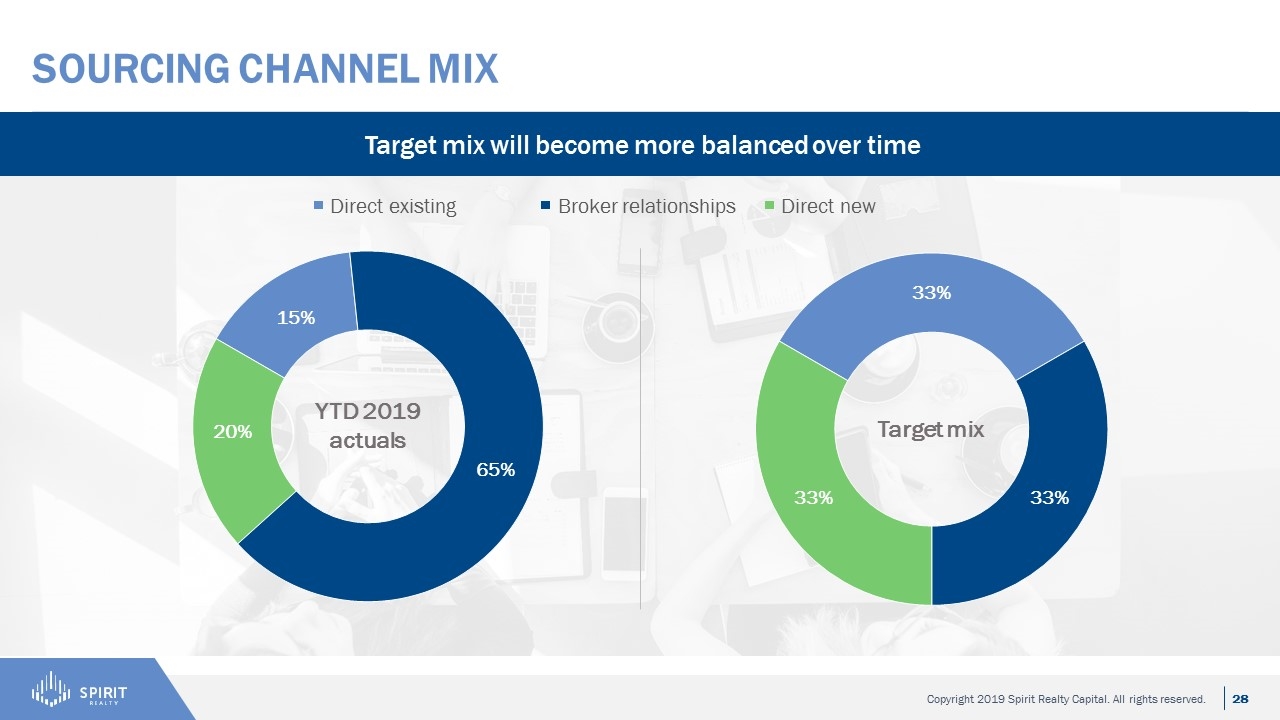
Sourcing Channel mix Target mix will become more balanced over time Target mix YTD 2019 actuals Direct existing Broker relationships Direct new
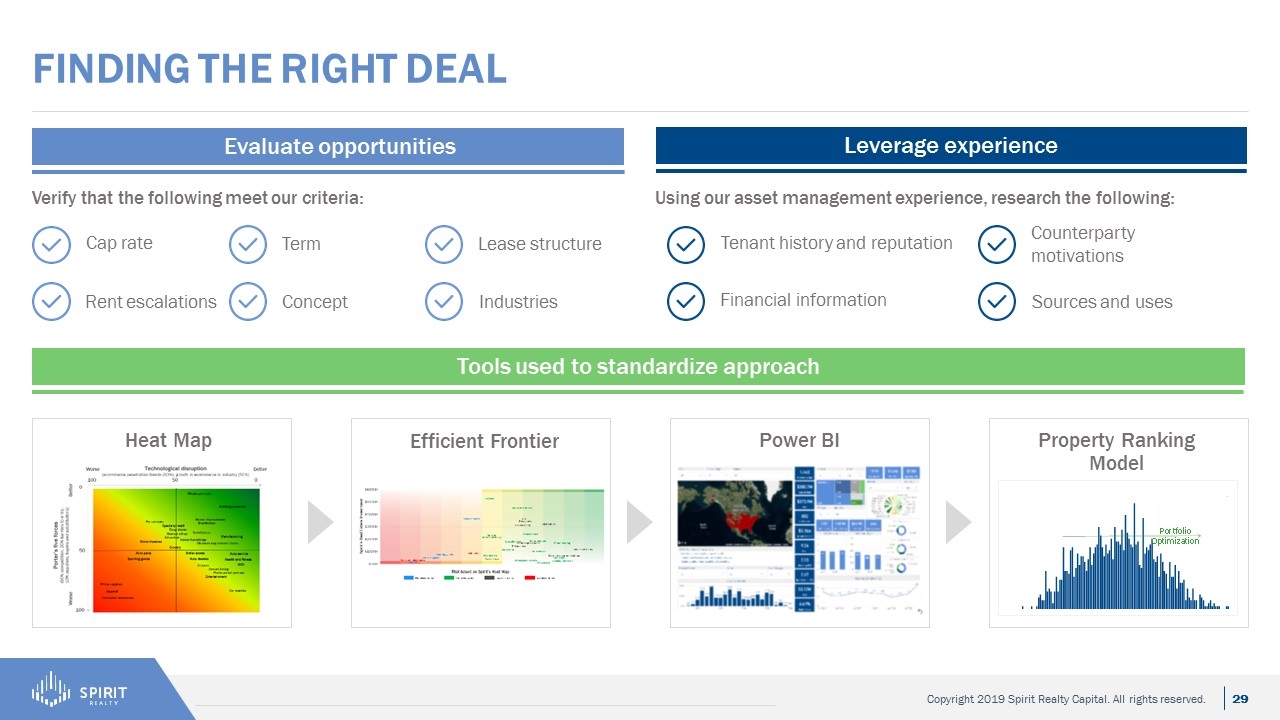
Finding the Right Deal Heat Map Power BI Efficient Frontier Property Ranking Model Evaluate opportunities Cap rate Rent escalations Term Concept Verify that the following meet our criteria: Leverage experience Using our asset management experience, research the following: Tools used to standardize approach Lease structure Industries Tenant history and reputation Financial information Counterparty motivations Sources and uses
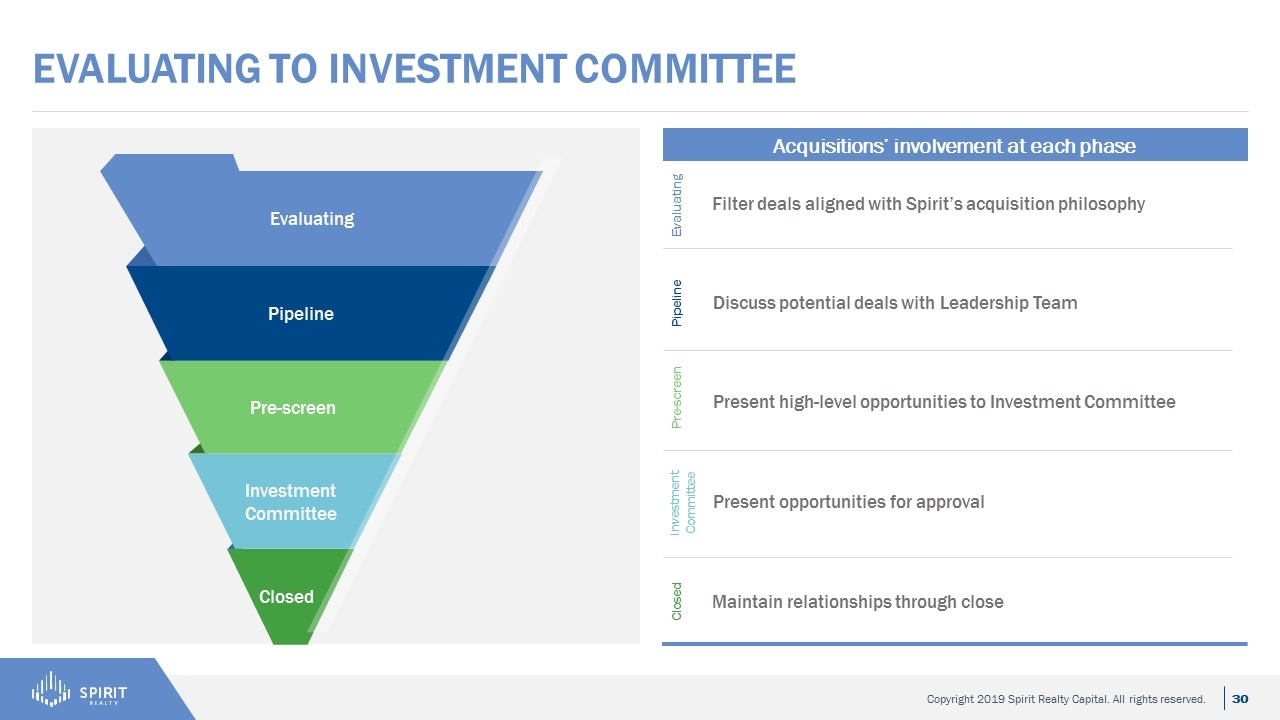
Evaluating to Investment Committee Acquisitions’ involvement at each phase Filter deals aligned with Spirit’s acquisition philosophy Evaluating Discuss potential deals with Leadership Team Pipeline Present high-level opportunities to Investment Committee Pre-screen Present opportunities for approval Investment Committee Maintain relationships through close Closed Closed Investment Committee Pre-screen Pipeline Evaluating
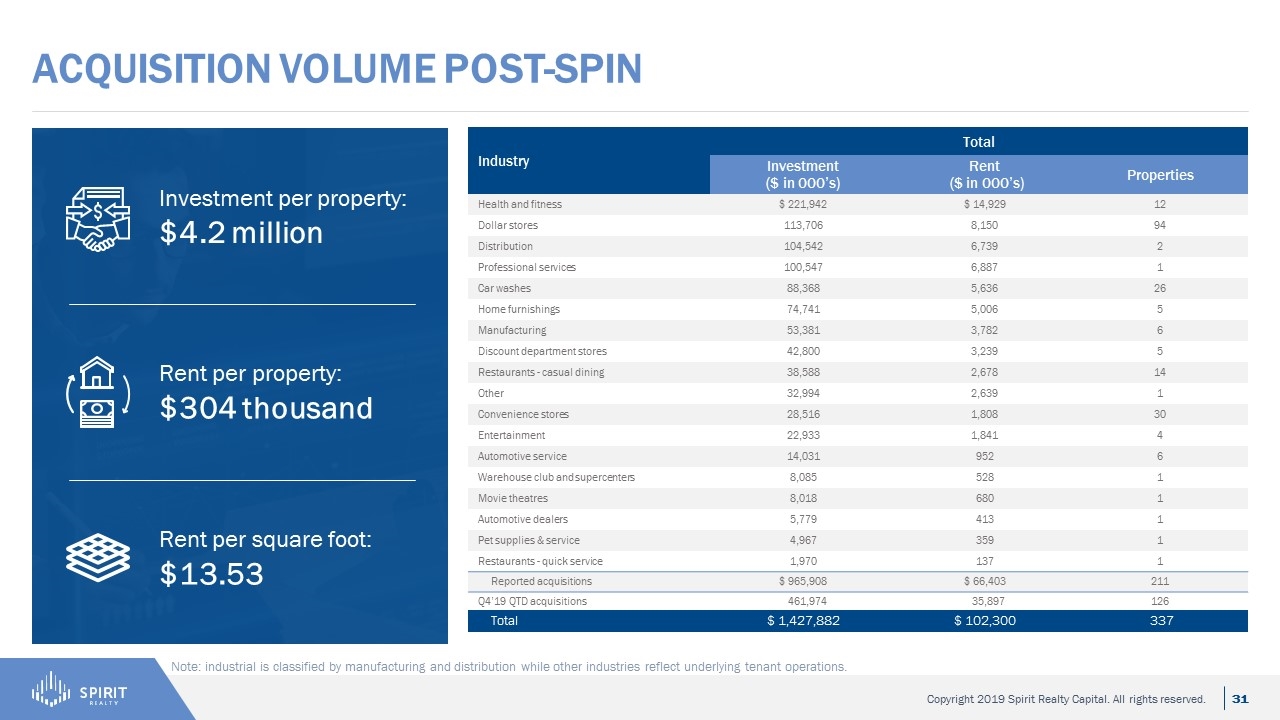
Acquisition volume Post-Spin Investment per property: $4.2 million Rent per property: $304 thousand Rent per square foot: $13.53 Note: industrial is classified by manufacturing and distribution while other industries reflect underlying tenant operations. Industry Total Investment ($ in 000’s) Rent ($ in 000’s) Properties Health and fitness $ 221,942 $ 14,929 12 Dollar stores 113,706 8,150 94 Distribution 104,542 6,739 2 Professional services 100,547 6,887 1 Car washes 88,368 5,636 26 Home furnishings 74,741 5,006 5 Manufacturing 53,381 3,782 6 Discount department stores 42,800 3,239 5 Restaurants - casual dining 38,588 2,678 14 Other 32,994 2,639 1 Convenience stores 28,516 1,808 30 Entertainment 22,933 1,841 4 Automotive service 14,031 952 6 Warehouse club and supercenters 8,085 528 1 Movie theatres 8,018 680 1 Automotive dealers 5,779 413 1 Pet supplies & service 4,967 359 1 Restaurants - quick service 1,970 137 1 Reported acquisitions $ 965,908 $ 66,403 211 Q4’19 QTD acquisitions 461,974 35,897 126 Total $ 1,427,882 $ 102,300 337
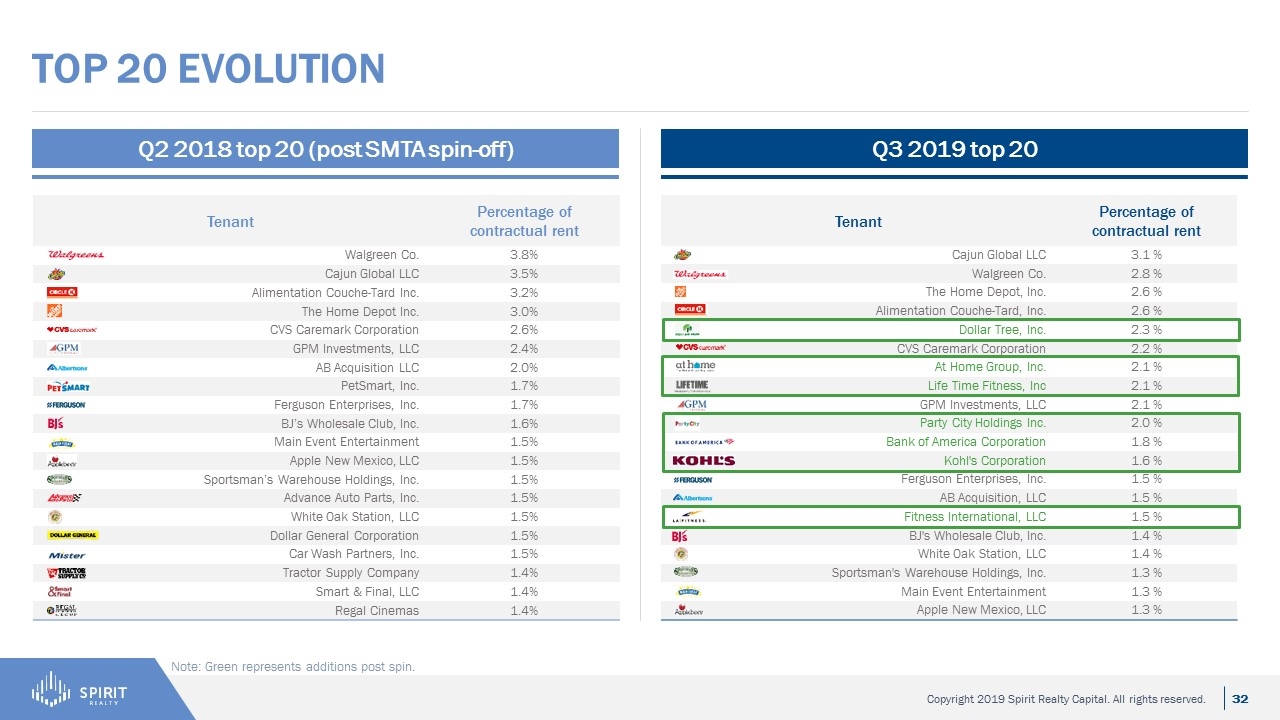
Top 20 evolution Note: Green represents additions post spin. Q2 2018 top 20 (post SMTA spin-off) Q3 2019 top 20 Tenant Percentage of contractual rent Cajun Global LLC 3.1 % Walgreen Co. 2.8 % The Home Depot, Inc. 2.6 % Alimentation Couche-Tard, Inc. 2.6 % Dollar Tree, Inc. 2.3 % CVS Caremark Corporation 2.2 % At Home Group, Inc. 2.1 % Life Time Fitness, Inc 2.1 % GPM Investments, LLC 2.1 % Party City Holdings Inc. 2.0 % Bank of America Corporation 1.8 % Kohl's Corporation 1.6 % Ferguson Enterprises, Inc. 1.5 % AB Acquisition, LLC 1.5 % Fitness International, LLC 1.5 % BJ's Wholesale Club, Inc. 1.4 % White Oak Station, LLC 1.4 % Sportsman's Warehouse Holdings, Inc. 1.3 % Main Event Entertainment 1.3 % Apple New Mexico, LLC 1.3 % Tenant Percentage of contractual rent Walgreen Co. 3.8% Cajun Global LLC 3.5% Alimentation Couche-Tard Inc. 3.2% The Home Depot Inc. 3.0% CVS Caremark Corporation 2.6% GPM Investments, LLC 2.4% AB Acquisition LLC 2.0% PetSmart, Inc. 1.7% Ferguson Enterprises, Inc. 1.7% BJ’s Wholesale Club, Inc. 1.6% Main Event Entertainment 1.5% Apple New Mexico, LLC 1.5% Sportsman’s Warehouse Holdings, Inc. 1.5% Advance Auto Parts, Inc. 1.5% White Oak Station, LLC 1.5% Dollar General Corporation 1.5% Car Wash Partners, Inc. 1.5% Tractor Supply Company 1.4% Smart & Final, LLC 1.4% Regal Cinemas 1.4%
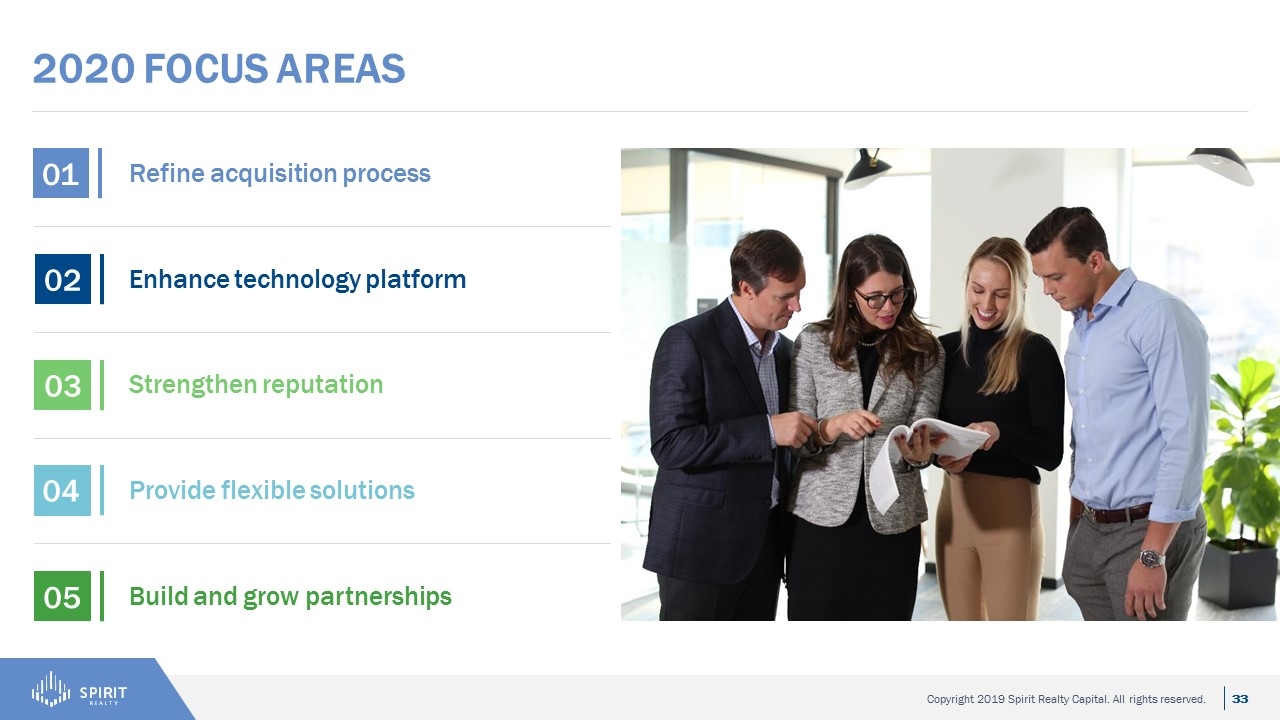
2020 focus areas Build and grow partnerships 01 Provide flexible solutions 02 Strengthen reputation 03 Enhance technology platform 04 Refine acquisition process 05
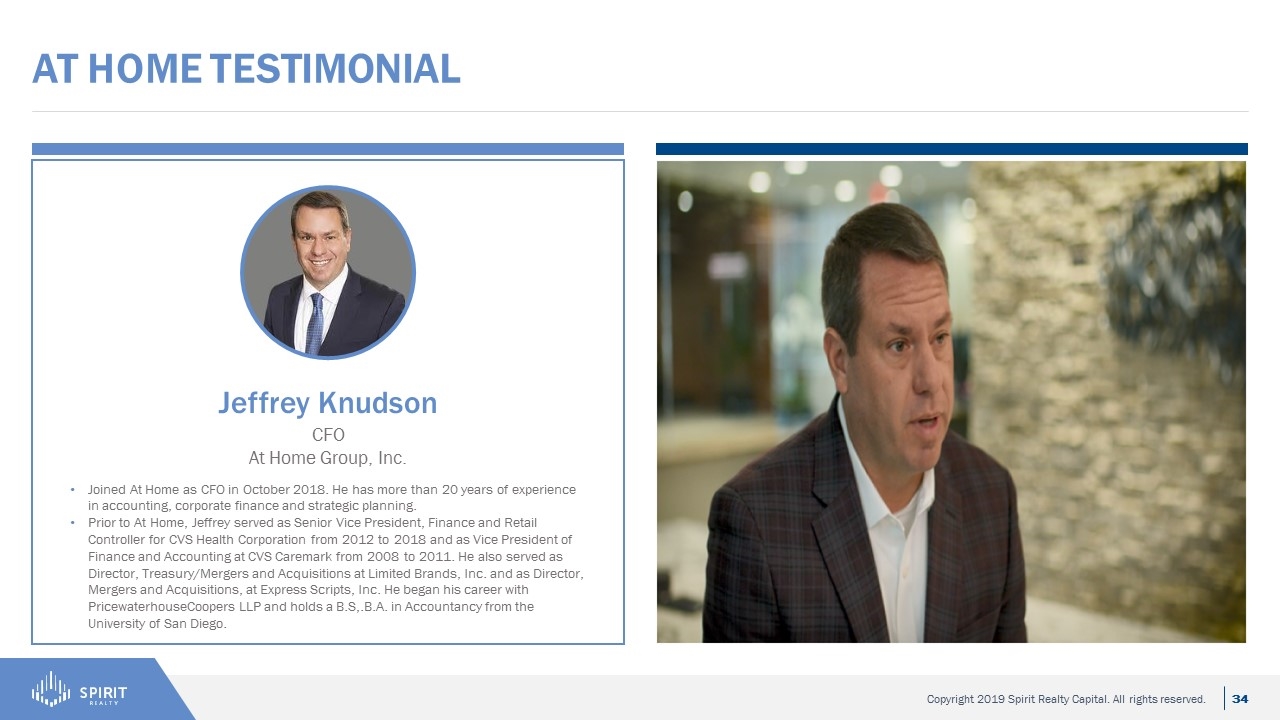
AT Home testimonial Jeffrey Knudson CFO At Home Group, Inc. Joined At Home as CFO in October 2018. He has more than 20 years of experience in accounting, corporate finance and strategic planning. Prior to At Home, Jeffrey served as Senior Vice President, Finance and Retail Controller for CVS Health Corporation from 2012 to 2018 and as Vice President of Finance and Accounting at CVS Caremark from 2008 to 2011. He also served as Director, Treasury/Mergers and Acquisitions at Limited Brands, Inc. and as Director, Mergers and Acquisitions, at Express Scripts, Inc. He began his career with PricewaterhouseCoopers LLP and holds a B.S,.B.A. in Accountancy from the University of San Diego.
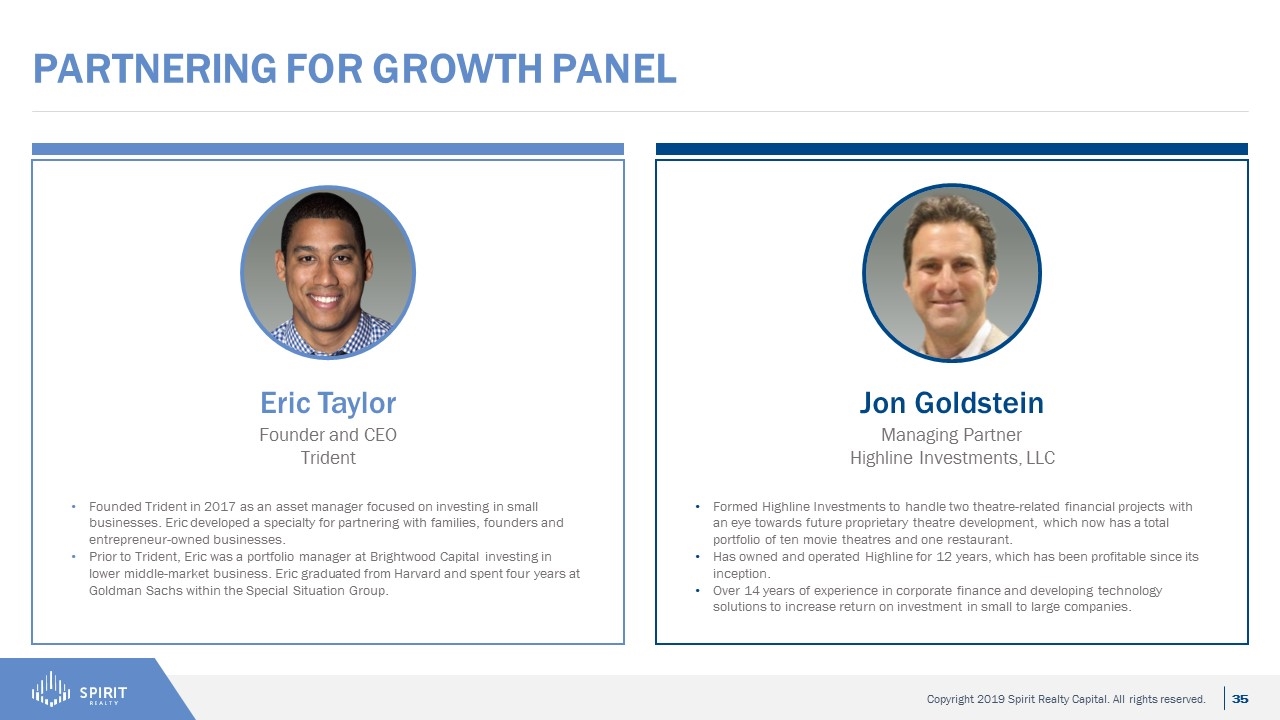
Partnering for growth panel Jon Goldstein Managing Partner Highline Investments, LLC Eric Taylor Founder and CEO Trident Founded Trident in 2017 as an asset manager focused on investing in small businesses. Eric developed a specialty for partnering with families, founders and entrepreneur-owned businesses. Prior to Trident, Eric was a portfolio manager at Brightwood Capital investing in lower middle-market business. Eric graduated from Harvard and spent four years at Goldman Sachs within the Special Situation Group. Formed Highline Investments to handle two theatre-related financial projects with an eye towards future proprietary theatre development, which now has a total portfolio of ten movie theatres and one restaurant. Has owned and operated Highline for 12 years, which has been profitable since its inception. Over 14 years of experience in corporate finance and developing technology solutions to increase return on investment in small to large companies.
15-minute break Investor Day 2019
Asset Management Platform Investor Day 2019
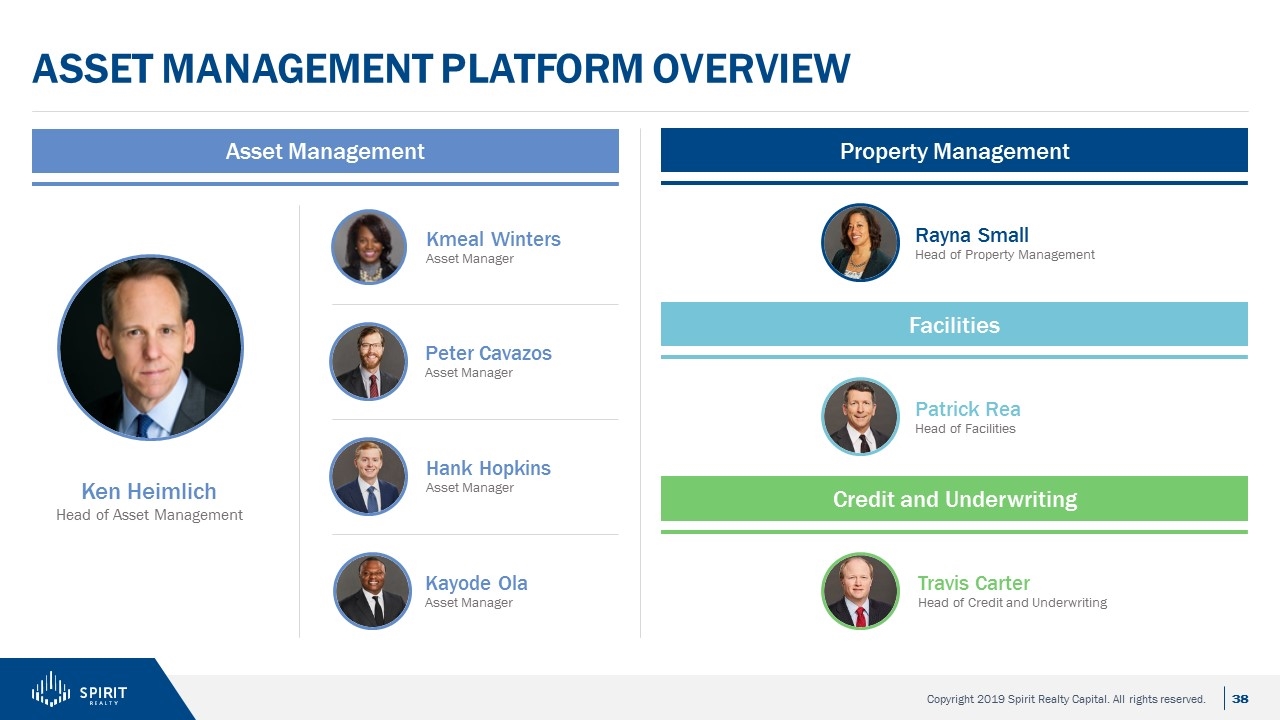
Kmeal Winters Asset Manager Asset Management platform overview Asset Management Ken Heimlich Head of Asset Management Kayode Ola Asset Manager Hank Hopkins Asset Manager Peter Cavazos Asset Manager Property Management Rayna Small Head of Property Management Facilities Patrick Rea Head of Facilities Credit and Underwriting Travis Carter Head of Credit and Underwriting
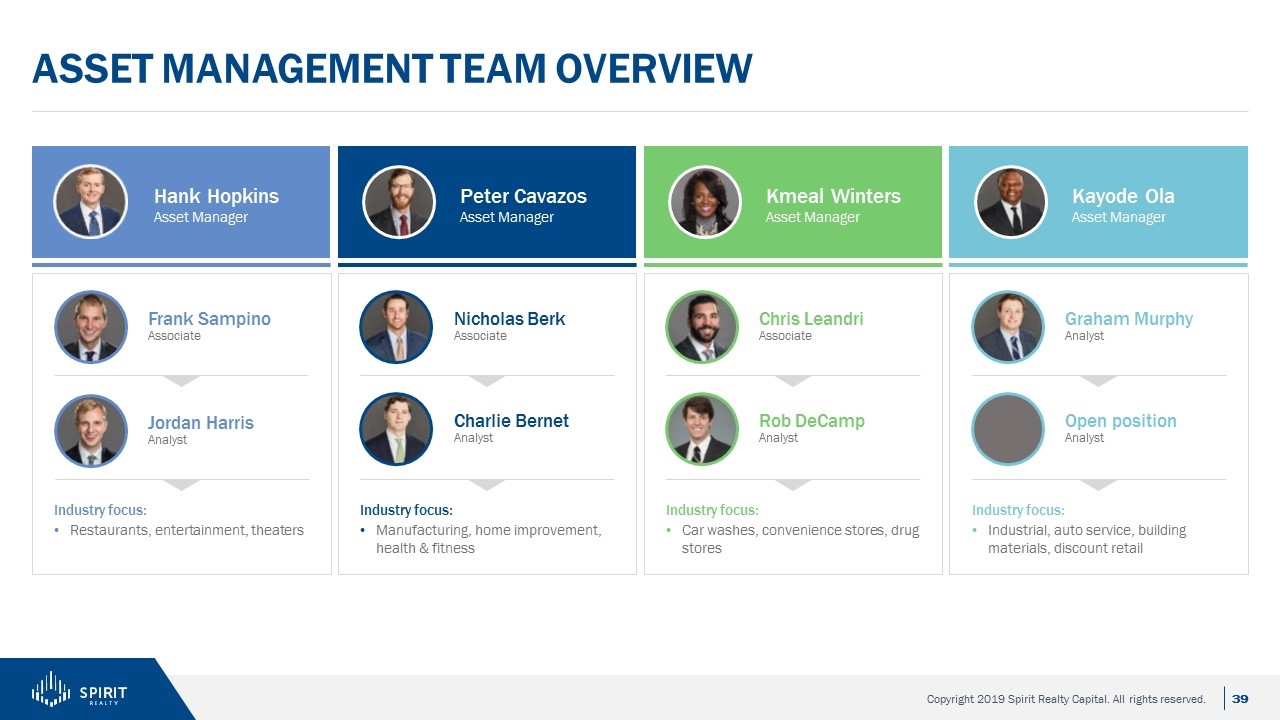
Asset Management team Overview Hank Hopkins Asset Manager Peter Cavazos Asset Manager Kmeal Winters Asset Manager Kayode Ola Asset Manager Frank Sampino Associate Jordan Harris Analyst Industry focus: Restaurants, entertainment, theaters Nicholas Berk Associate Charlie Bernet Analyst Industry focus: Manufacturing, home improvement, health & fitness Chris Leandri Associate Rob DeCamp Analyst Industry focus: Car washes, convenience stores, drug stores Graham Murphy Analyst Industry focus: Industrial, auto service, building materials, discount retail Open position Analyst
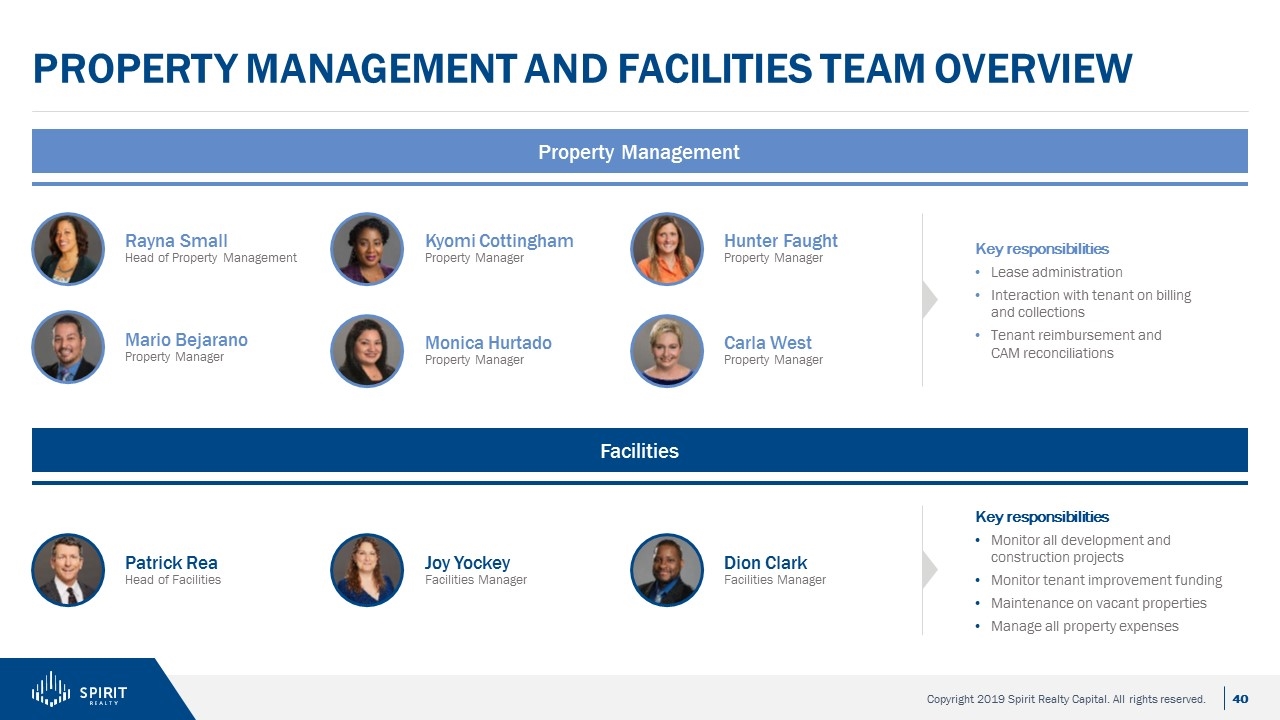
Property management and facilities team overview Property Management Rayna Small Head of Property Management Hunter Faught Property Manager Monica Hurtado Property Manager Kyomi Cottingham Property Manager Mario Bejarano Property Manager Carla West Property Manager Key responsibilities Lease administration Interaction with tenant on billing and collections Tenant reimbursement and CAM reconciliations Facilities Patrick Rea Head of Facilities Joy Yockey Facilities Manager Key responsibilities Monitor all development and construction projects Monitor tenant improvement funding Maintenance on vacant properties Manage all property expenses Dion Clark Facilities Manager
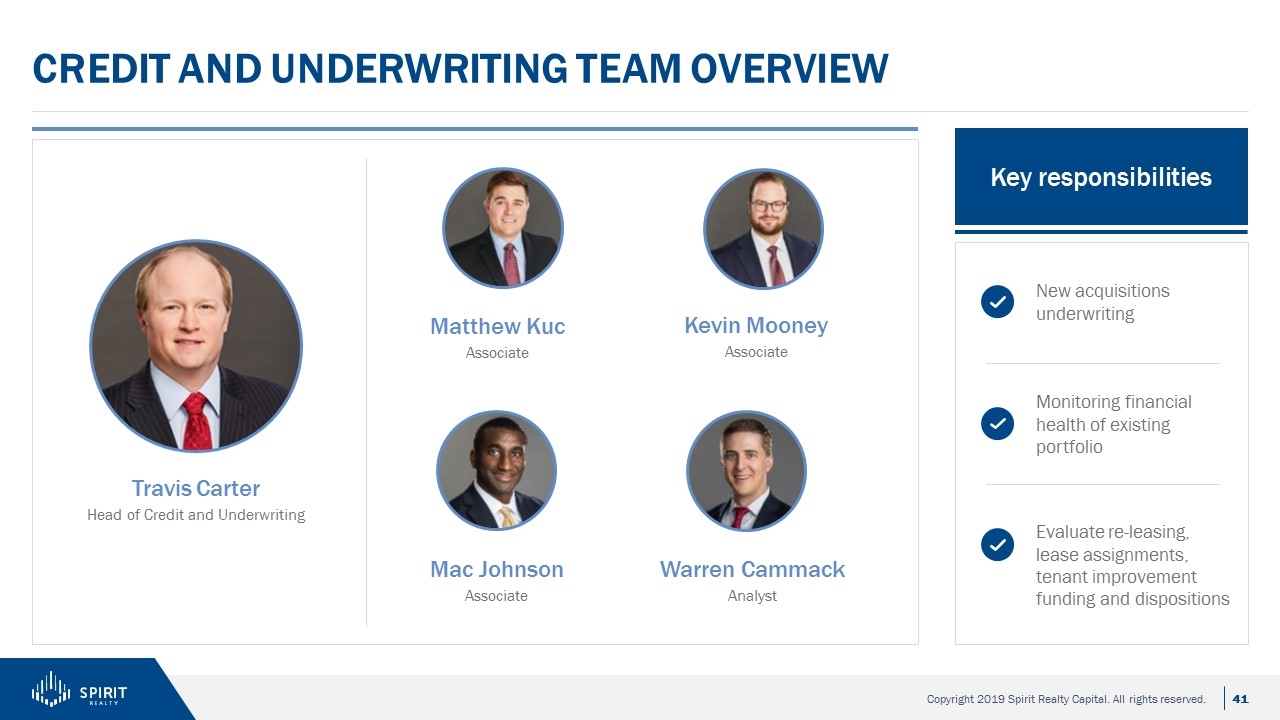
Credit and Underwriting Team Overview Key responsibilities Travis Carter Head of Credit and Underwriting Matthew Kuc Associate Kevin Mooney Associate Mac Johnson Associate Warren Cammack Analyst New acquisitions underwriting Monitoring financial health of existing portfolio Evaluate re-leasing, lease assignments, tenant improvement funding and dispositions
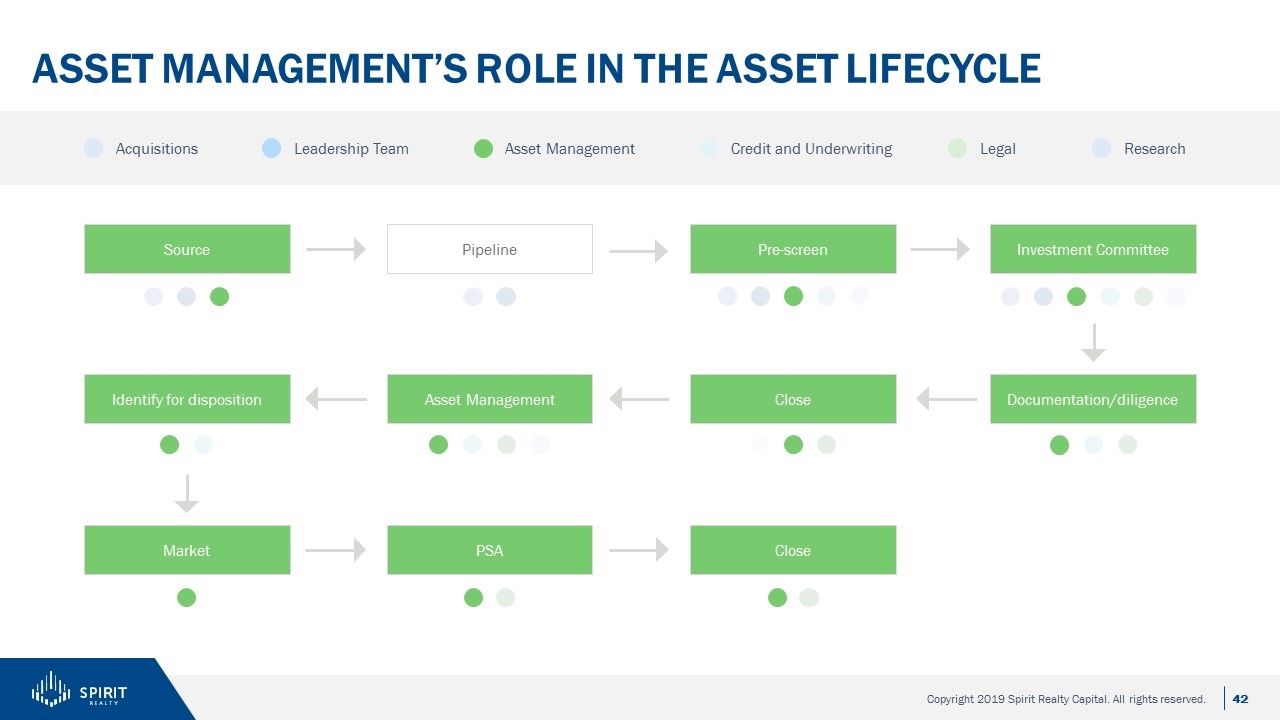
Asset management’s role in the Asset Lifecycle Source Pipeline Pre-screen Investment Committee Market PSA Close Documentation/diligence Close Asset Management Identify for disposition Acquisitions Leadership Team Asset Management Credit and Underwriting Legal Research
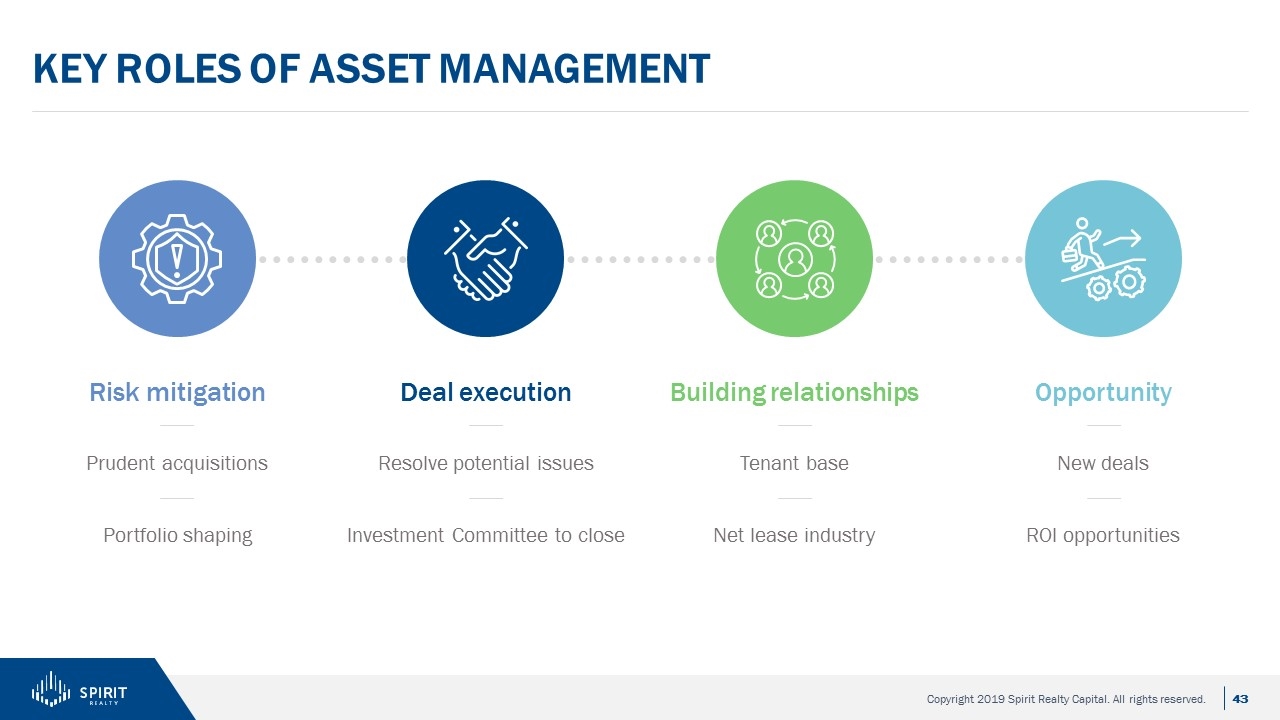
Key Roles of Asset Management Risk mitigation Deal execution Building relationships Opportunity Prudent acquisitions Portfolio shaping Resolve potential issues Investment Committee to close Tenant base Net lease industry New deals ROI opportunities
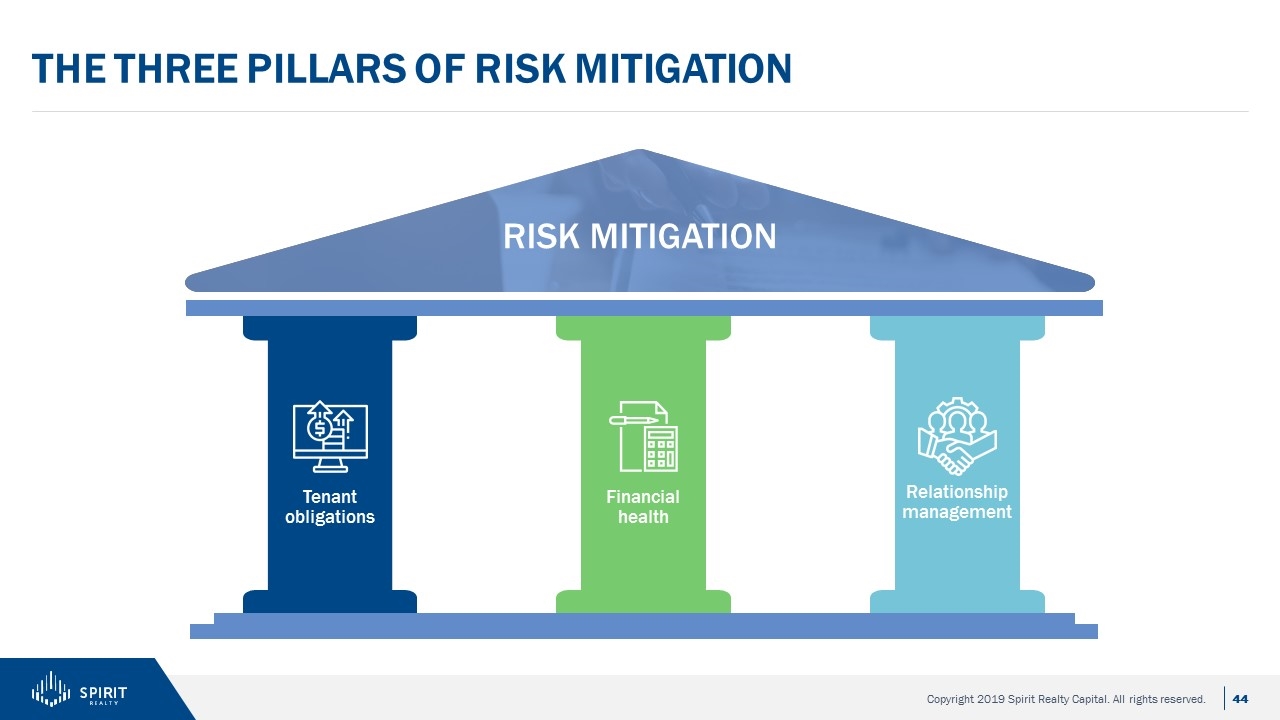
The THREE pillars Of risk mitigation RISK MITIGATION Tenant obligations Financial health Relationship management
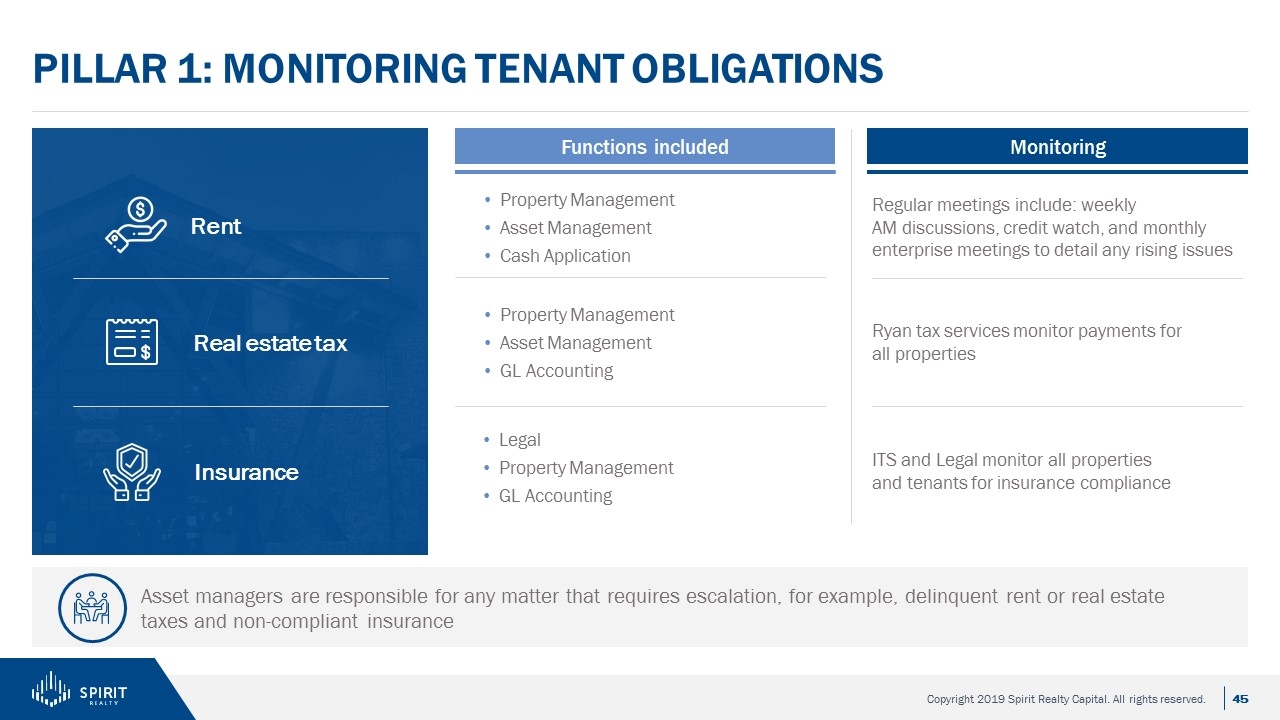
PILLAR 1: Monitoring Tenant obligations Functions included Monitoring Regular meetings include: weekly AM discussions, credit watch, and monthly enterprise meetings to detail any rising issues Ryan tax services monitor payments for all properties ITS and Legal monitor all properties and tenants for insurance compliance Property Management Asset Management GL Accounting Legal Property Management GL Accounting Property Management Asset Management Cash Application Rent Real estate tax Insurance Asset managers are responsible for any matter that requires escalation, for example, delinquent rent or real estate taxes and non-compliant insurance
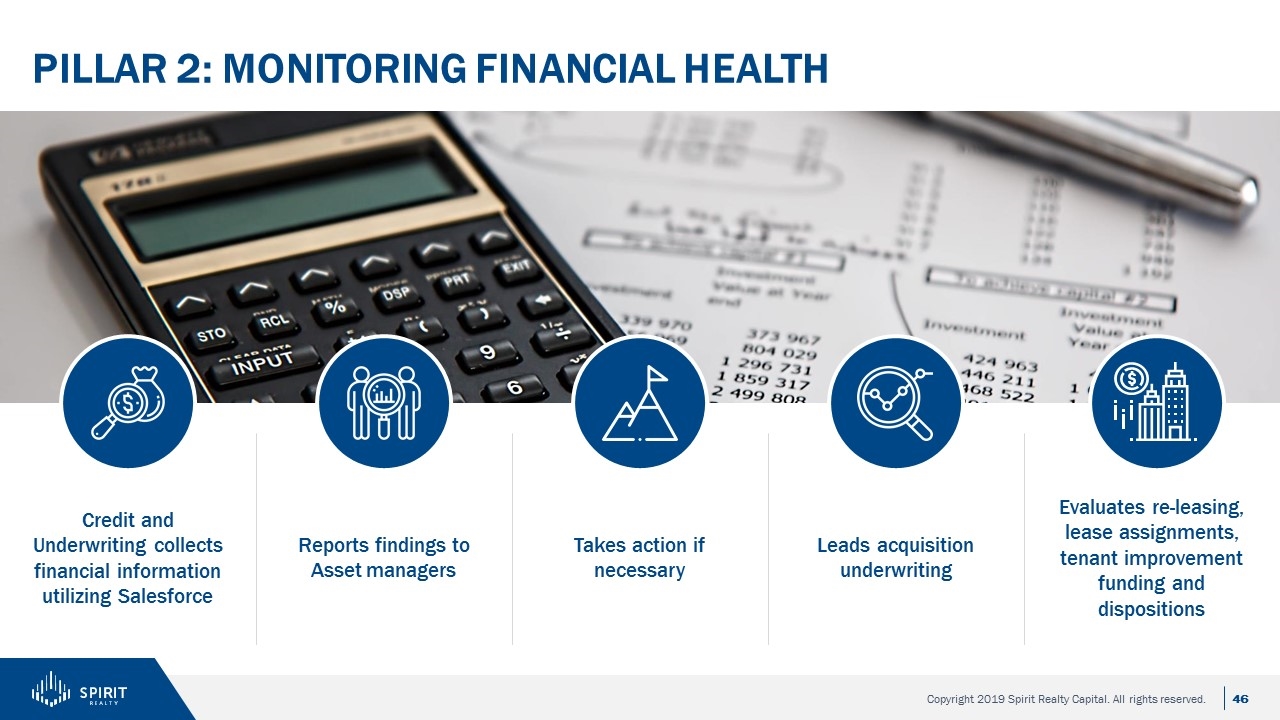
PILLAR 2: Monitoring Financial health Takes action if necessary Reports findings to Asset managers Credit and Underwriting collects financial information utilizing Salesforce Leads acquisition underwriting Evaluates re-leasing, lease assignments, tenant improvement funding and dispositions
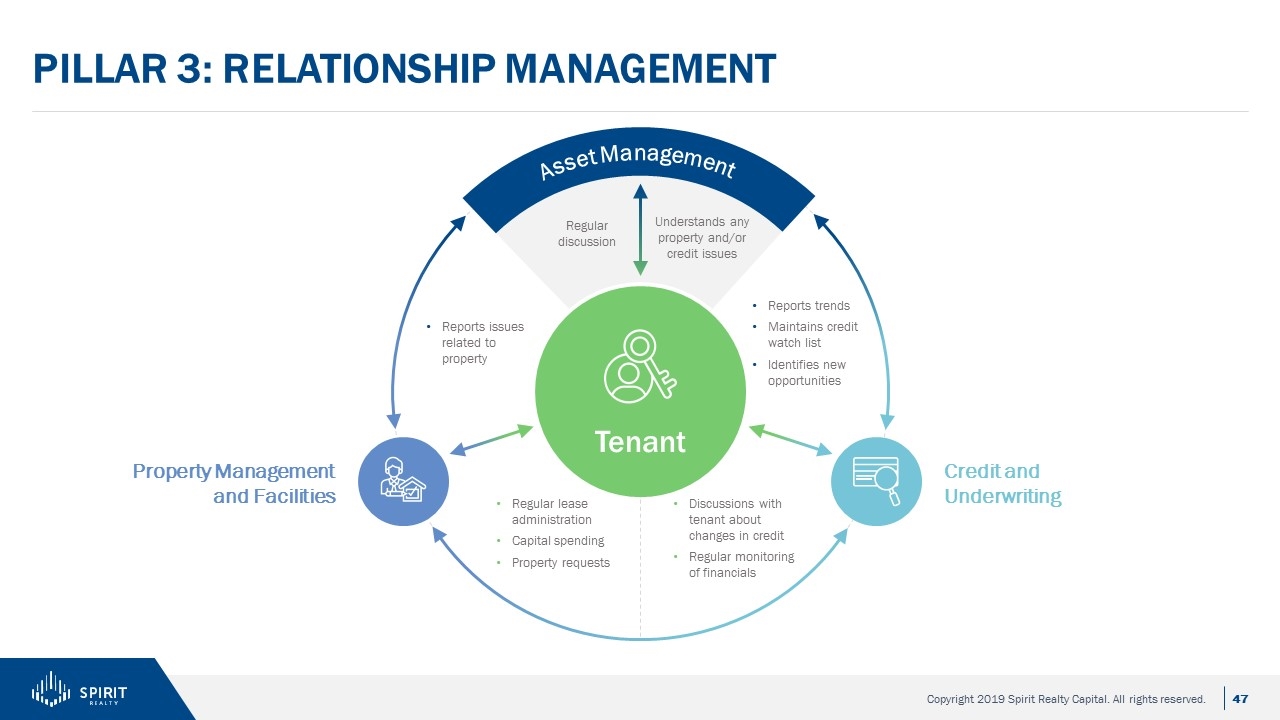
PILLAR 3: Relationship management Credit and Underwriting Property Management and Facilities Reports issues related to property Reports trends Maintains credit watch list Identifies new opportunities Regular lease administration Capital spending Property requests Discussions with tenant about changes in credit Regular monitoring of financials Understands any property and/or credit issues Tenant Regular discussion Asset Management
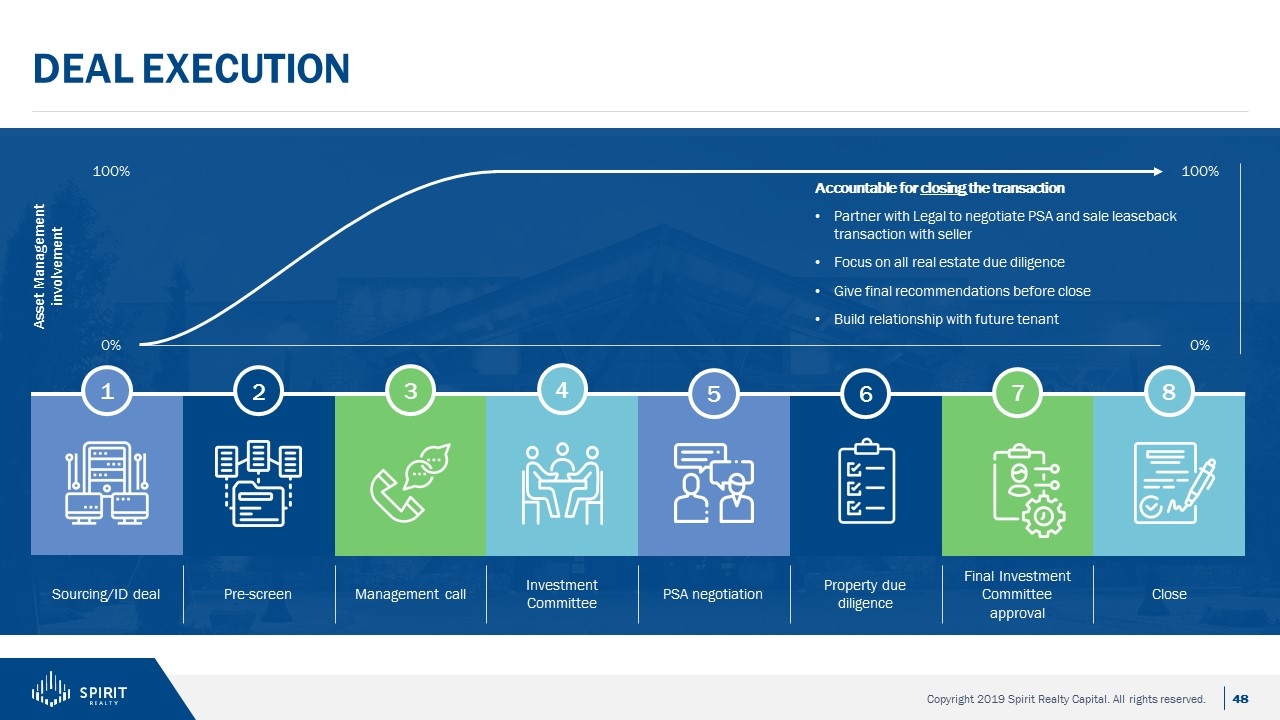
Deal execution 6 5 4 3 2 1 7 8 Asset Management involvement 100% 0% Sourcing/ID deal Pre-screen Management call Investment Committee PSA negotiation Property due diligence Final Investment Committee approval Close 100% 0% Accountable for closing the transaction Partner with Legal to negotiate PSA and sale leaseback transaction with seller Focus on all real estate due diligence Give final recommendations before close Build relationship with future tenant
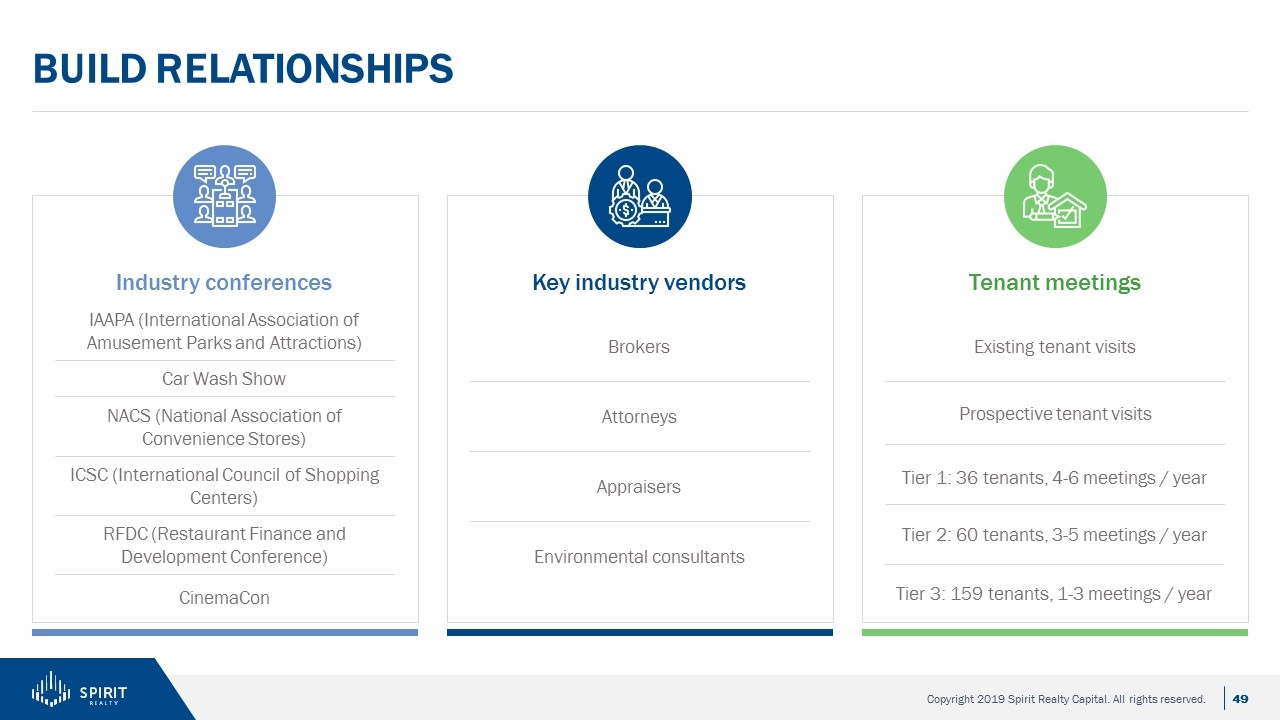
Build relationships Industry conferences Key industry vendors Tenant meetings IAAPA (International Association of Amusement Parks and Attractions) Car Wash Show NACS (National Association of Convenience Stores) ICSC (International Council of Shopping Centers) RFDC (Restaurant Finance and Development Conference) CinemaCon Brokers Attorneys Appraisers Environmental consultants Existing tenant visits Prospective tenant visits Tier 1: 36 tenants, 4-6 meetings / year Tier 2: 60 tenants, 3-5 meetings / year Tier 3: 159 tenants, 1-3 meetings / year
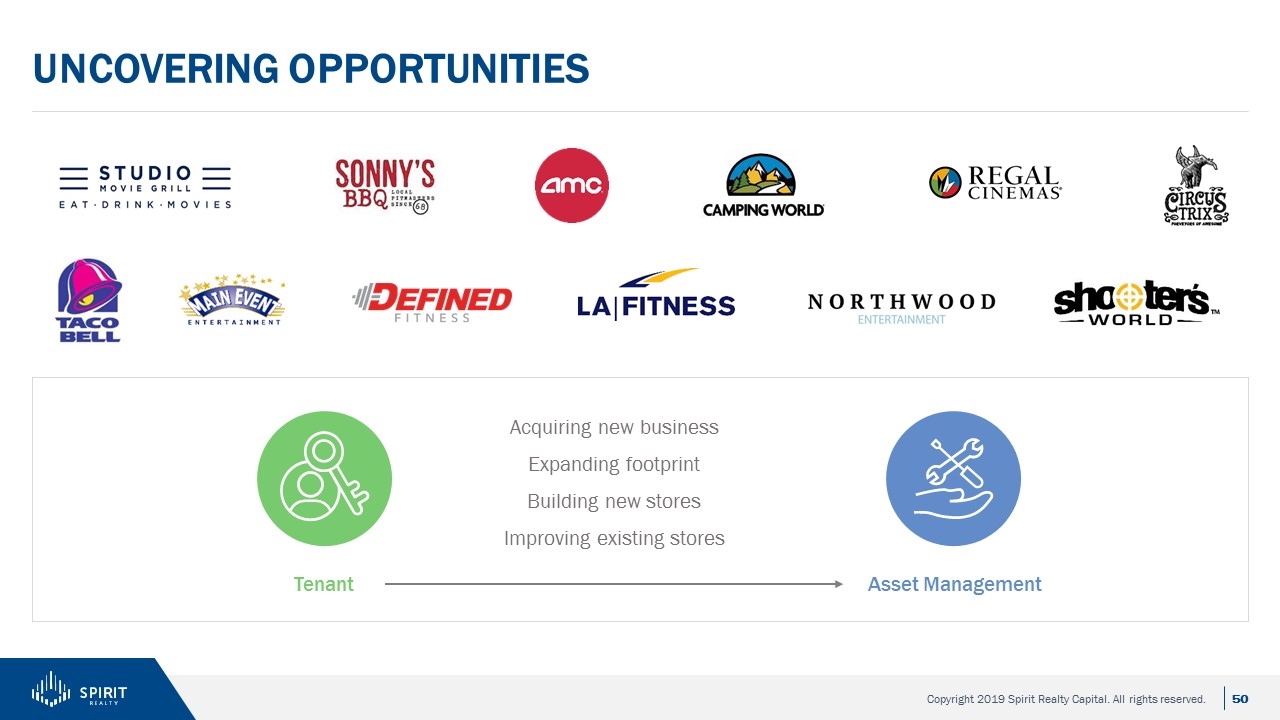
Uncovering opportunities Tenant Asset Management Acquiring new business Expanding footprint Building new stores Improving existing stores
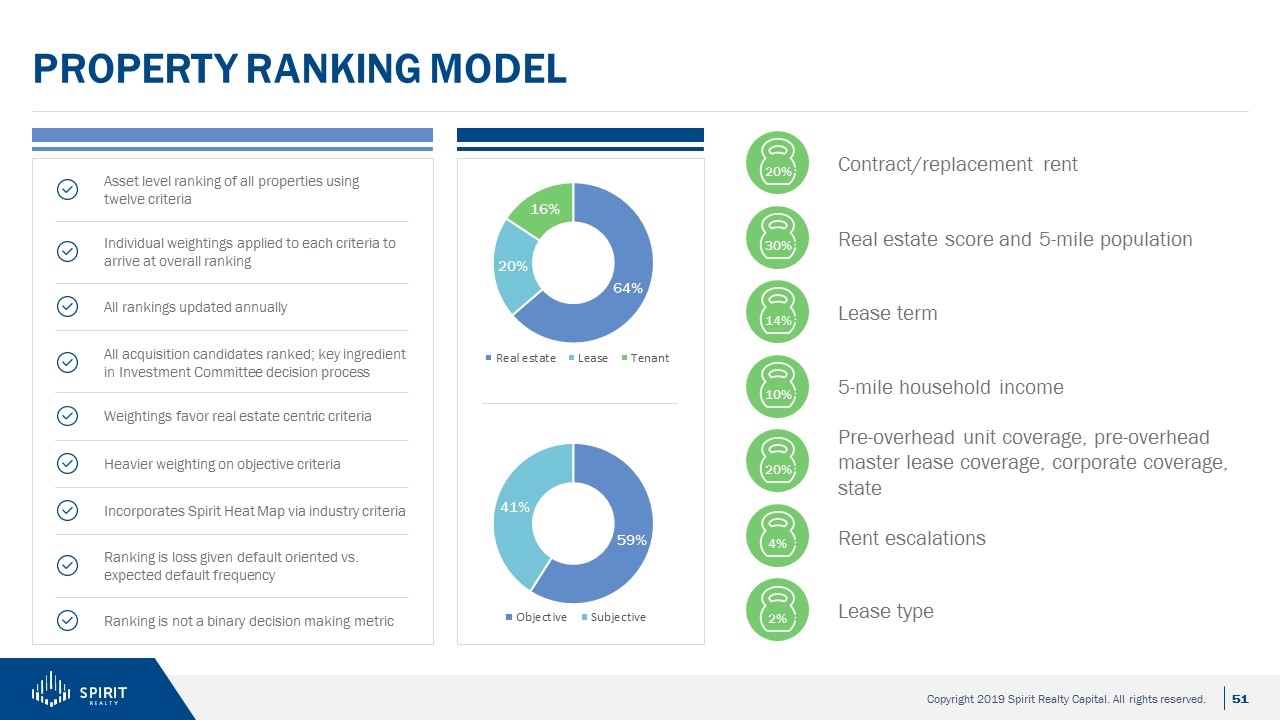
property ranking model Asset level ranking of all properties using twelve criteria Individual weightings applied to each criteria to arrive at overall ranking All rankings updated annually All acquisition candidates ranked; key ingredient in Investment Committee decision process Weightings favor real estate centric criteria Heavier weighting on objective criteria Incorporates Spirit Heat Map via industry criteria Ranking is loss given default oriented vs. expected default frequency Ranking is not a binary decision making metric Contract/replacement rent Real estate score and 5-mile population 20% 30% 14% 10% 20% 4% 2% Lease term 5-mile household income Pre-overhead unit coverage, pre-overhead master lease coverage, corporate coverage, state Rent escalations Lease type
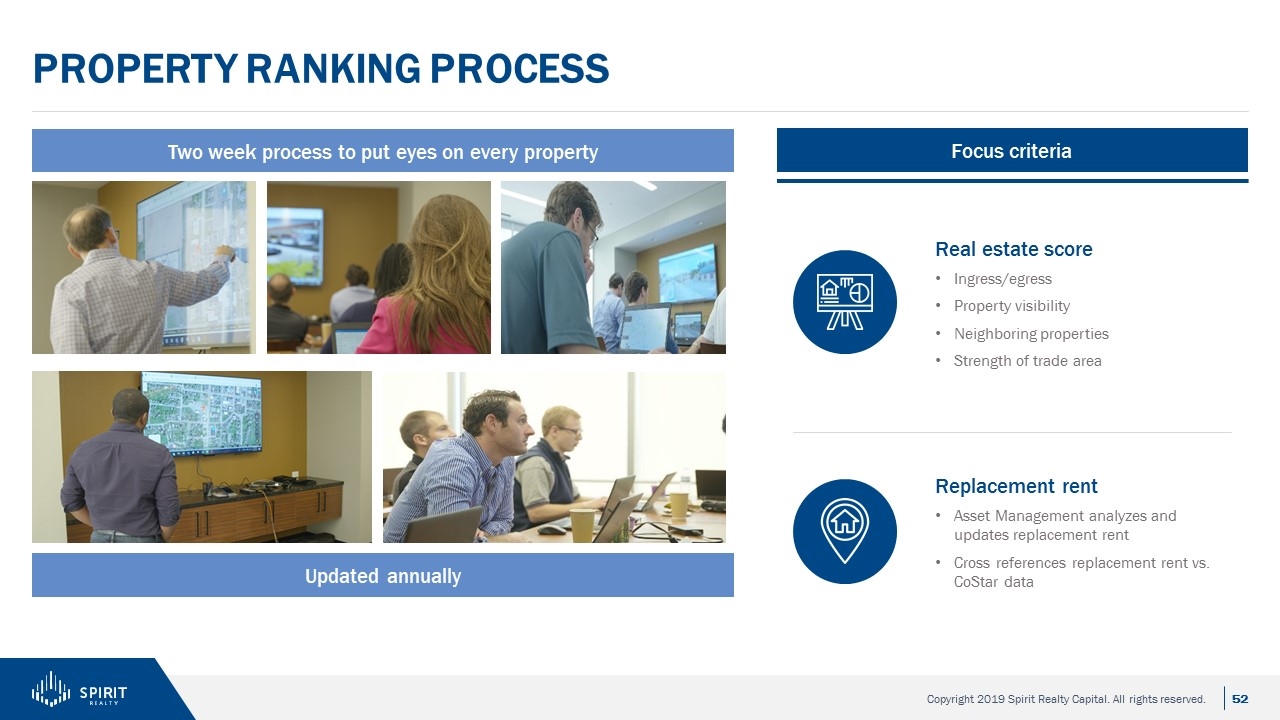
Property Ranking Process Focus criteria Updated annually Two week process to put eyes on every property Real estate score Ingress/egress Property visibility Neighboring properties Strength of trade area Replacement rent Asset Management analyzes and updates replacement rent Cross references replacement rent vs. CoStar data
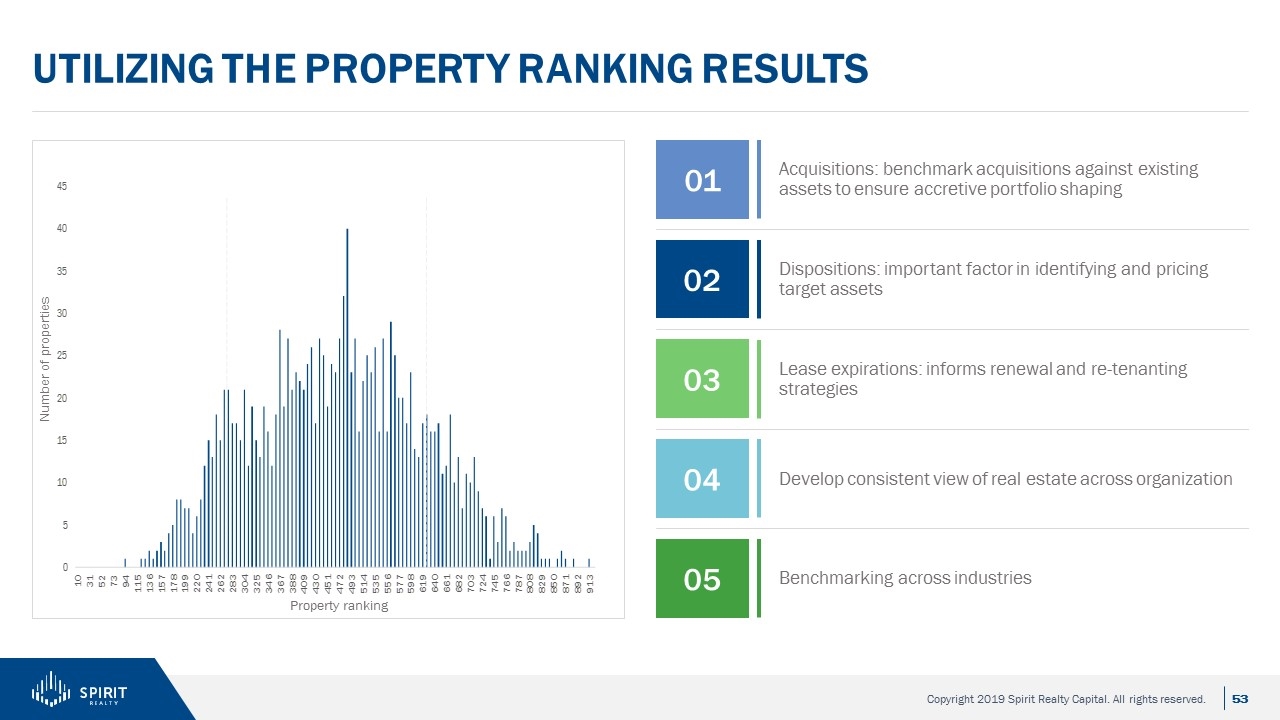
Utilizing the Property Ranking Results Acquisitions: benchmark acquisitions against existing assets to ensure accretive portfolio shaping 01 Dispositions: important factor in identifying and pricing target assets 02 Lease expirations: informs renewal and re-tenanting strategies 03 Develop consistent view of real estate across organization 04 Benchmarking across industries 05 Property ranking Number of properties
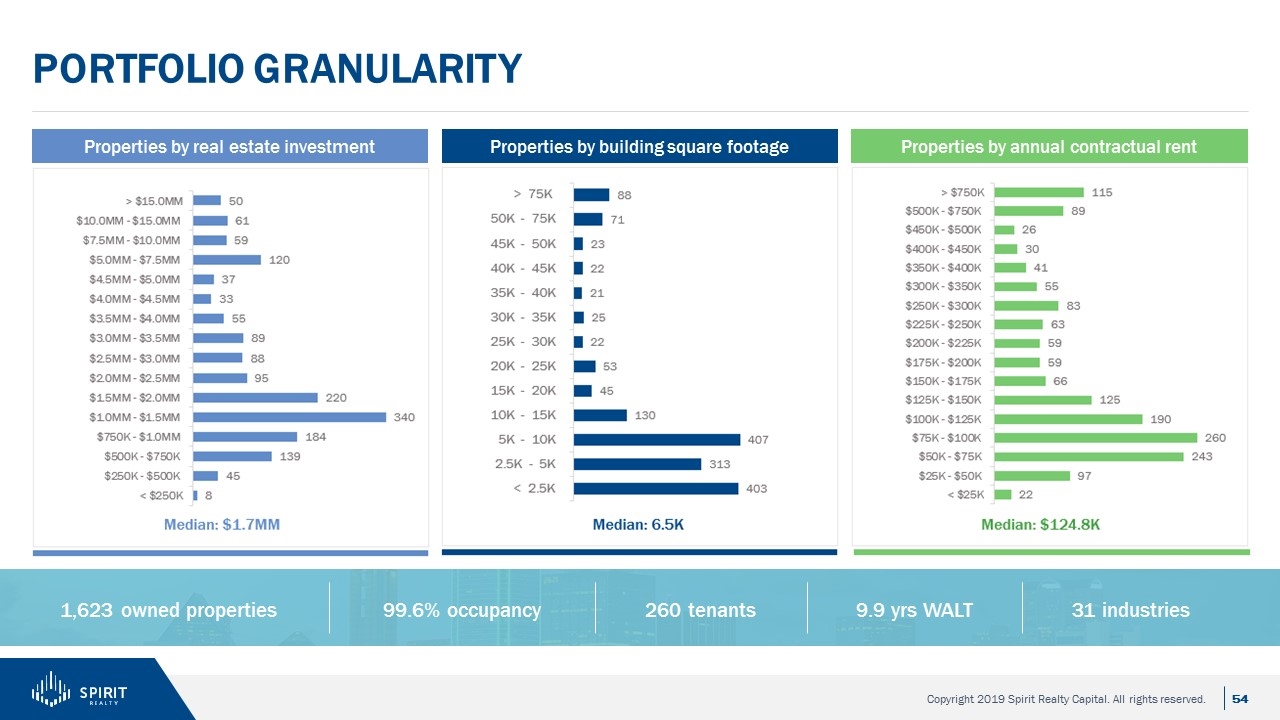
Portfolio Granularity Properties by real estate investment Properties by building square footage Properties by annual contractual rent 9.9 yrs WALT 1,623 owned properties 99.6% occupancy 260 tenants 31 industries
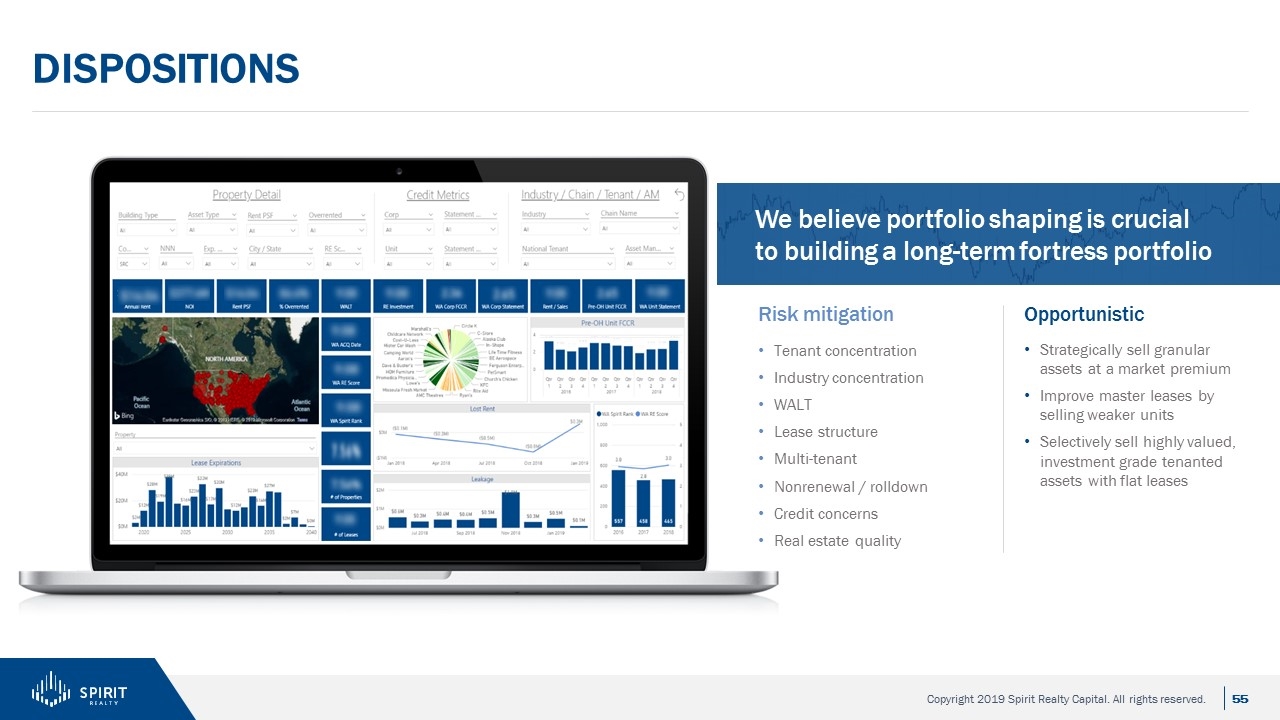
We believe portfolio shaping is crucial to building a long-term fortress portfolio Dispositions Risk mitigation Tenant concentration Industry concentration WALT Lease structure Multi-tenant Nonrenewal / rolldown Credit concerns Real estate quality Opportunistic Strategically sell granular assets at a market premium Improve master leases by selling weaker units Selectively sell highly valued, investment grade tenanted assets with flat leases
Asset Management key takeaways Risk mitigation Deal execution Building relationships Opportunity
Research Approach Investor Day 2019
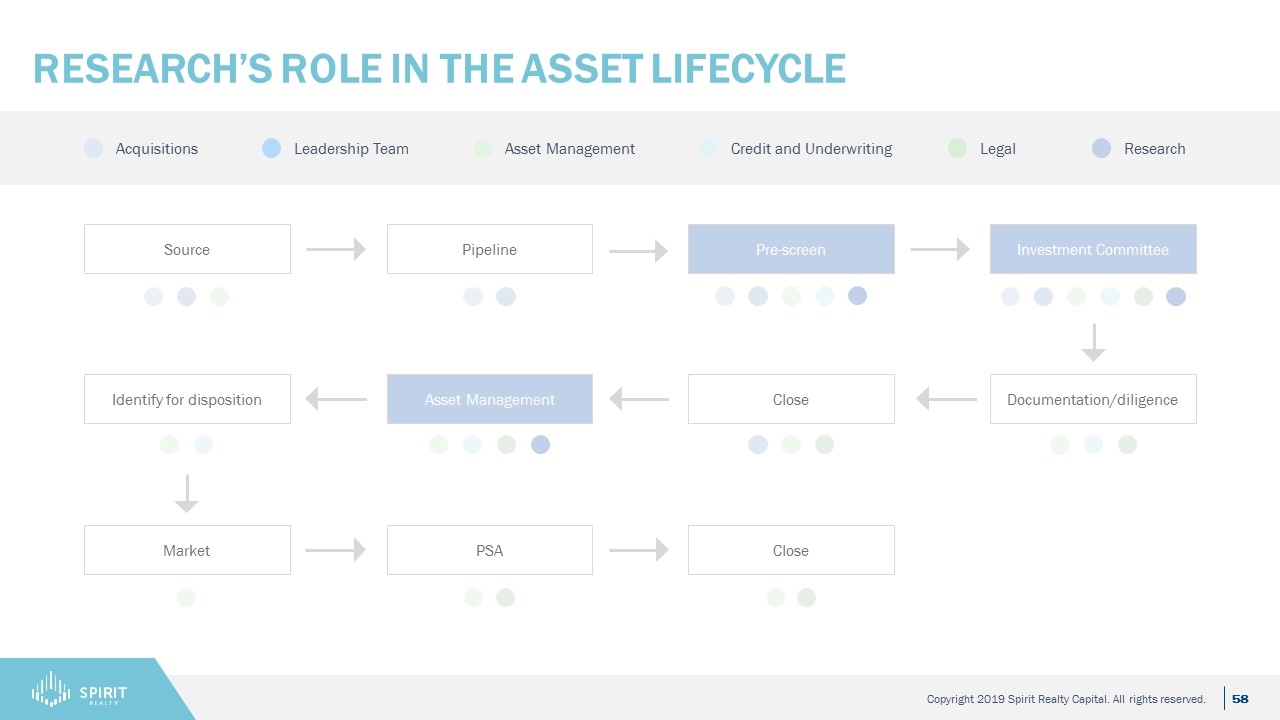
Research’s role in the Asset Lifecycle Source Pipeline Pre-screen Investment Committee Market PSA Close Documentation/diligence Close Asset Management Identify for disposition Acquisitions Leadership Team Asset Management Credit and Underwriting Legal Research
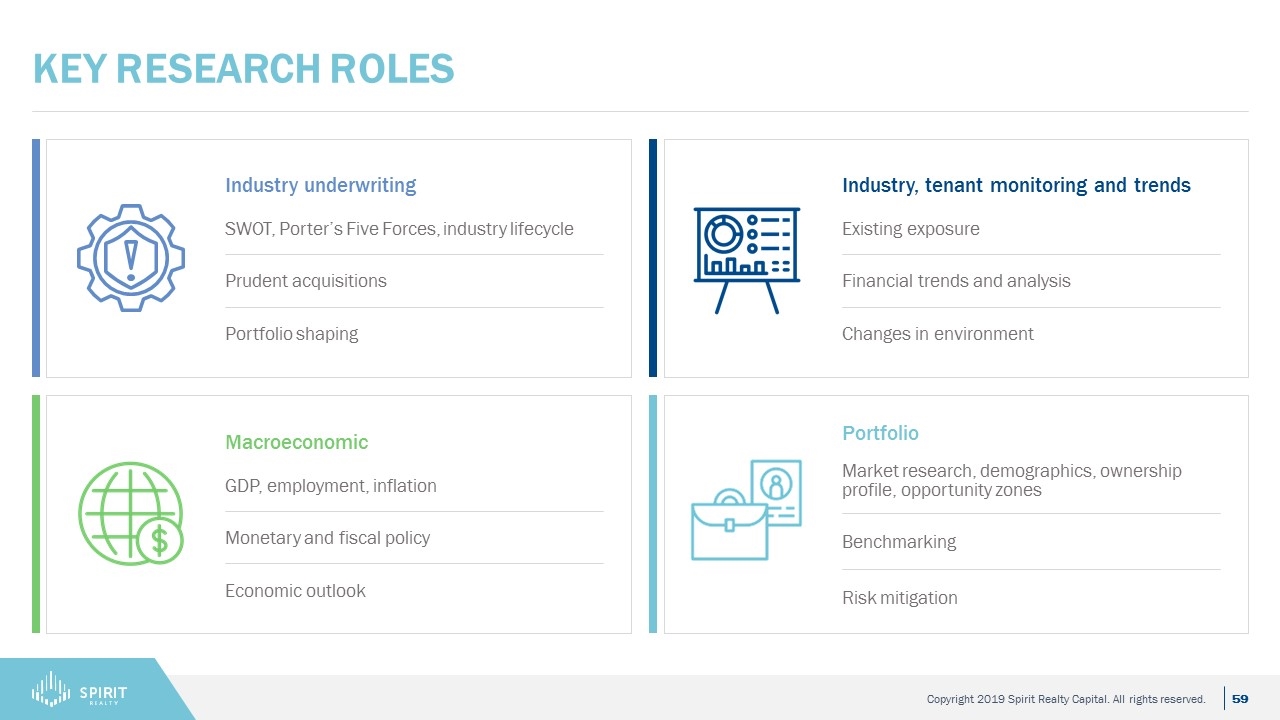
Key research roles Industry underwriting SWOT, Porter’s Five Forces, industry lifecycle Prudent acquisitions Portfolio shaping Industry, tenant monitoring and trends Existing exposure Financial trends and analysis Changes in environment Macroeconomic GDP, employment, inflation Monetary and fiscal policy Economic outlook Portfolio Market research, demographics, ownership profile, opportunity zones Benchmarking Risk mitigation
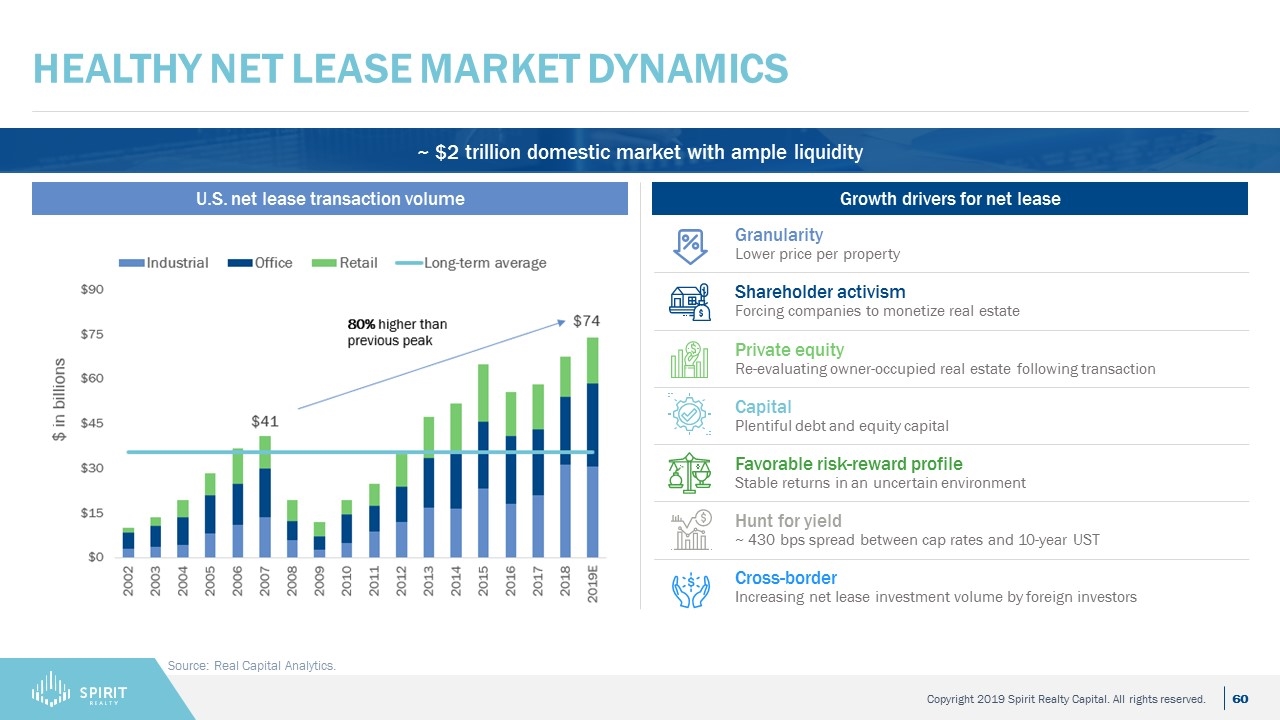
Healthy Net Lease Market Dynamics Source: Real Capital Analytics. U.S. net lease transaction volume Growth drivers for net lease ~ $2 trillion domestic market with ample liquidity Granularity Lower price per property Shareholder activism Forcing companies to monetize real estate Private equity Re-evaluating owner-occupied real estate following transaction Capital Plentiful debt and equity capital Favorable risk-reward profile Stable returns in an uncertain environment Hunt for yield ~ 430 bps spread between cap rates and 10-year UST Cross-border Increasing net lease investment volume by foreign investors
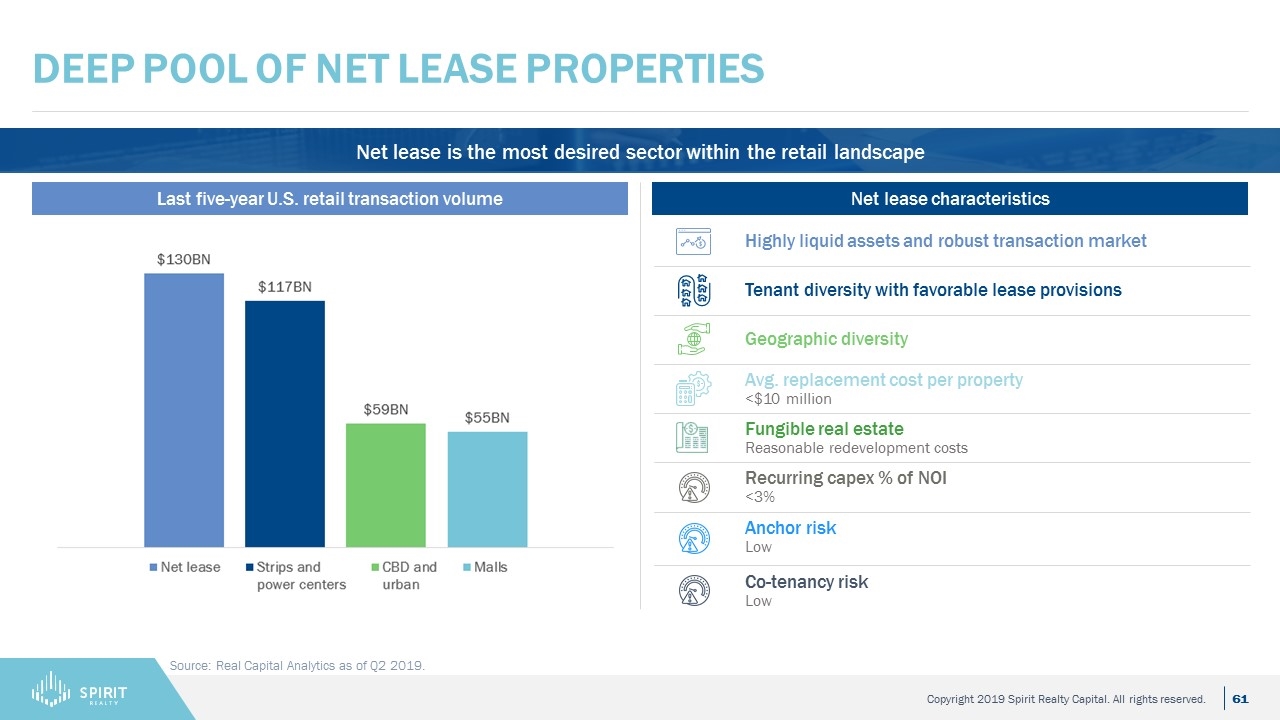
Deep Pool of Net Lease Properties Source: Real Capital Analytics as of Q2 2019. Net lease is the most desired sector within the retail landscape Last five-year U.S. retail transaction volume Net lease characteristics Highly liquid assets and robust transaction market Tenant diversity with favorable lease provisions Geographic diversity Avg. replacement cost per property <$10 million Fungible real estate Reasonable redevelopment costs Recurring capex % of NOI <3% Anchor risk Low Co-tenancy risk Low
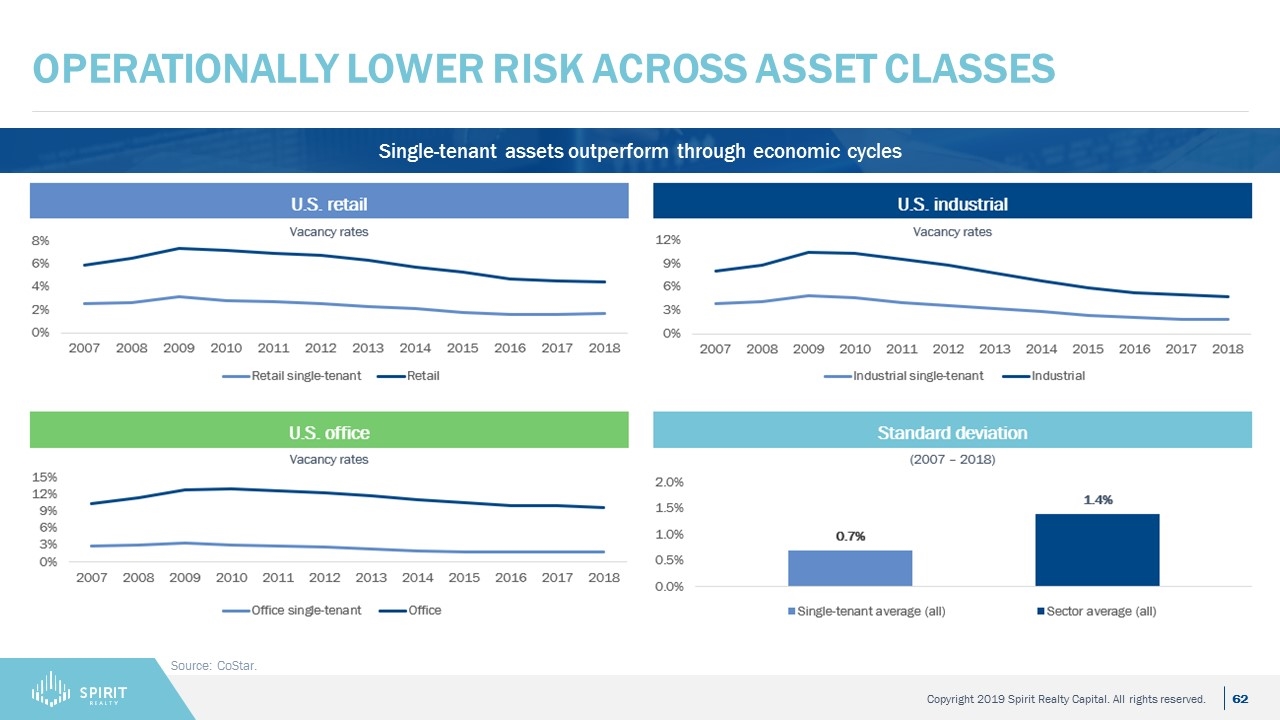
Operationally Lower Risk Across Asset Classes Source: CoStar. Single-tenant assets outperform through economic cycles
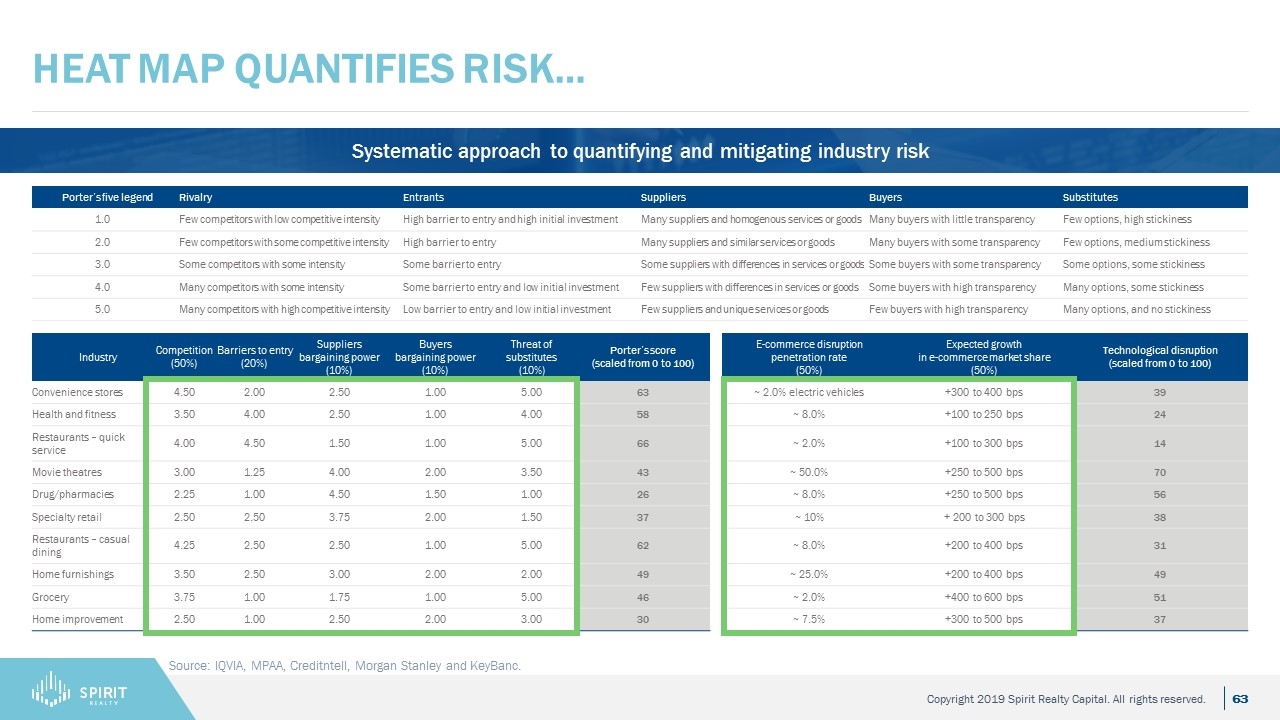
Heat Map quantifies risk… Source: IQVIA, MPAA, Creditntell, Morgan Stanley and KeyBanc. Systematic approach to quantifying and mitigating industry risk Industry Competition (50%) Barriers to entry (20%) Suppliers bargaining power (10%) Buyers bargaining power (10%) Threat of substitutes (10%) Porter’s score (scaled from 0 to 100) E-commerce disruption penetration rate (50%) Expected growth in e-commerce market share (50%) Technological disruption (scaled from 0 to 100) Convenience stores 4.50 2.00 2.50 1.00 5.00 63 ~ 2.0% electric vehicles +300 to 400 bps 39 Health and fitness 3.50 4.00 2.50 1.00 4.00 58 ~ 8.0% +100 to 250 bps 24 Restaurants – quick service 4.00 4.50 1.50 1.00 5.00 66 ~ 2.0% +100 to 300 bps 14 Movie theatres 3.00 1.25 4.00 2.00 3.50 43 ~ 50.0% +250 to 500 bps 70 Drug/pharmacies 2.25 1.00 4.50 1.50 1.00 26 ~ 8.0% +250 to 500 bps 56 Specialty retail 2.50 2.50 3.75 2.00 1.50 37 ~ 10% + 200 to 300 bps 38 Restaurants – casual dining 4.25 2.50 2.50 1.00 5.00 62 ~ 8.0% +200 to 400 bps 31 Home furnishings 3.50 2.50 3.00 2.00 2.00 49 ~ 25.0% +200 to 400 bps 49 Grocery 3.75 1.00 1.75 1.00 5.00 46 ~ 2.0% +400 to 600 bps 51 Home improvement 2.50 1.00 2.50 2.00 3.00 30 ~ 7.5% +300 to 500 bps 37 Porter’s five legend Rivalry Entrants Suppliers Buyers Substitutes 1.0 Few competitors with low competitive intensity High barrier to entry and high initial investment Many suppliers and homogenous services or goods Many buyers with little transparency Few options, high stickiness 2.0 Few competitors with some competitive intensity High barrier to entry Many suppliers and similar services or goods Many buyers with some transparency Few options, medium stickiness 3.0 Some competitors with some intensity Some barrier to entry Some suppliers with differences in services or goods Some buyers with some transparency Some options, some stickiness 4.0 Many competitors with some intensity Some barrier to entry and low initial investment Few suppliers with differences in services or goods Some buyers with high transparency Many options, some stickiness 5.0 Many competitors with high competitive intensity Low barrier to entry and low initial investment Few suppliers and unique services or goods Few buyers with high transparency Many options, and no stickiness
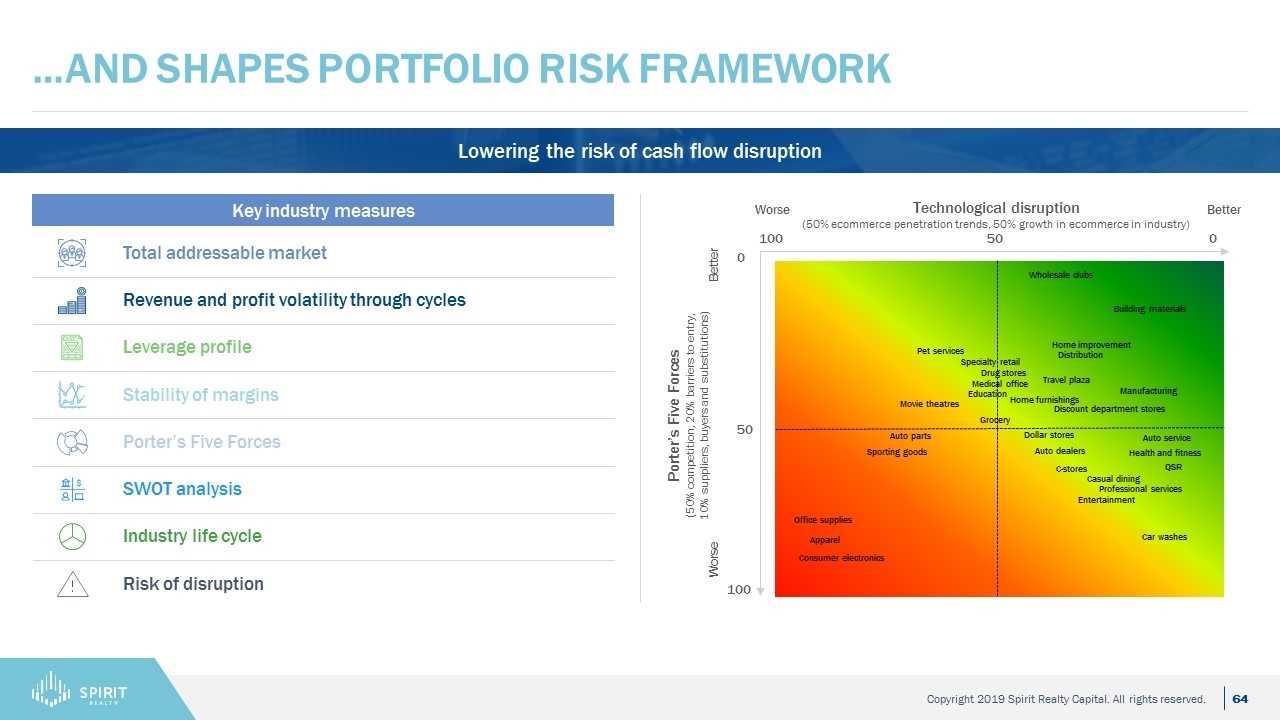
…And Shapes Portfolio risk framework Lowering the risk of cash flow disruption Key industry measures Total addressable market Revenue and profit volatility through cycles Leverage profile Stability of margins Porter’s Five Forces SWOT analysis Industry life cycle Risk of disruption Porter’s Five Forces (50% competition, 20% barriers to entry, 10% suppliers, buyers and substitutions) Casual dining QSR Movie theatres C-stores Auto service Drug stores Medical office Health and fitness Home furnishings Education Building materials Apparel Specialty retail Home improvement Car washes Manufacturing Auto parts Consumer electronics Pet services Wholesale clubs Office supplies Professional services Technological disruption (50% ecommerce penetration trends, 50% growth in ecommerce in industry) 100 100 50 50 0 0 Sporting goods Auto dealers Dollar stores Grocery Worse Better Better t Travel plaza Worse Discount department stores Entertainment Distribution
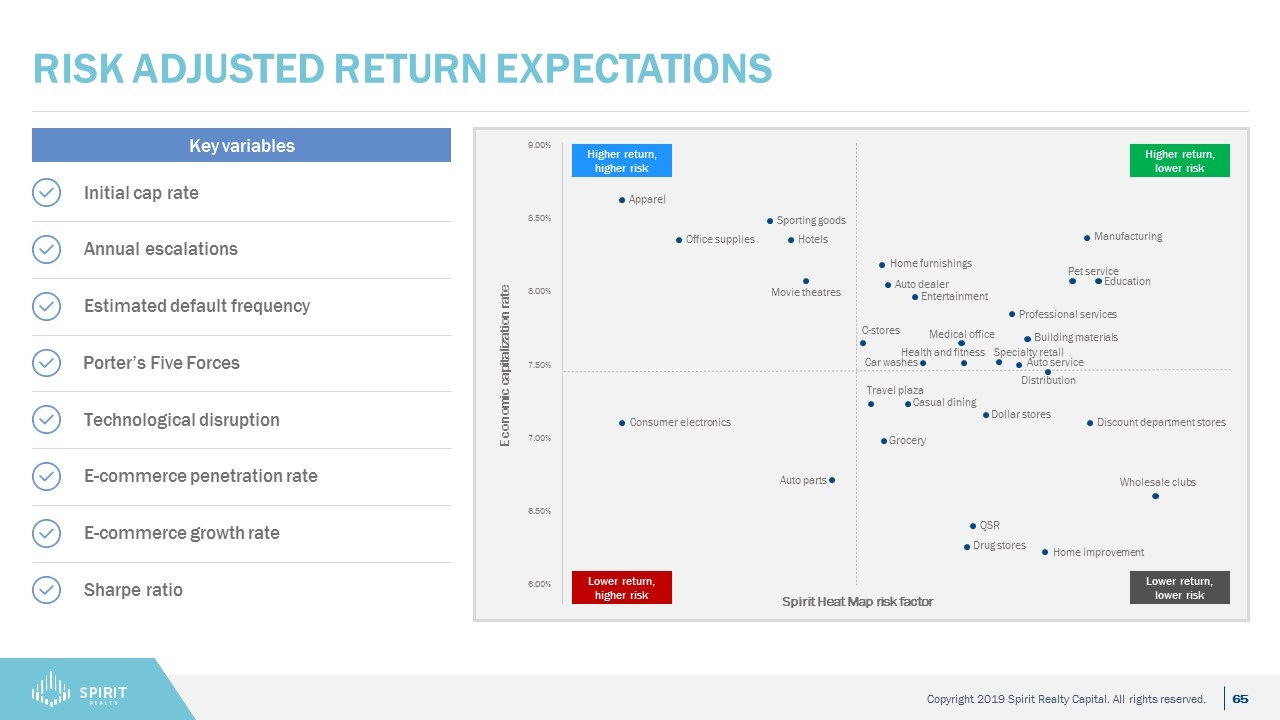
Risk Adjusted Return Expectations Key variables Initial cap rate Annual escalations Estimated default frequency Porter’s Five Forces Technological disruption E-commerce penetration rate E-commerce growth rate Sharpe ratio Spirit Heat Map risk factor Economic capitalization rate Home furnishings Auto dealer C-stores Medical office Health and fitness Building materials Professional services Manufacturing Education Discount department stores Wholesale clubs Home improvement QSR Consumer electronics Grocery Dollar stores Travel plaza Apparel Office supplies Sporting goods Hotels Movie theatres Drug stores Auto service Casual dining Car washes Distribution Specialty retail Entertainment Pet service 9.00% 8.50% 8.00% 7.50% 7.00% 6.50% 6.00% Auto parts Lower return, higher risk Lower return, lower risk Higher return, higher risk Higher return, lower risk
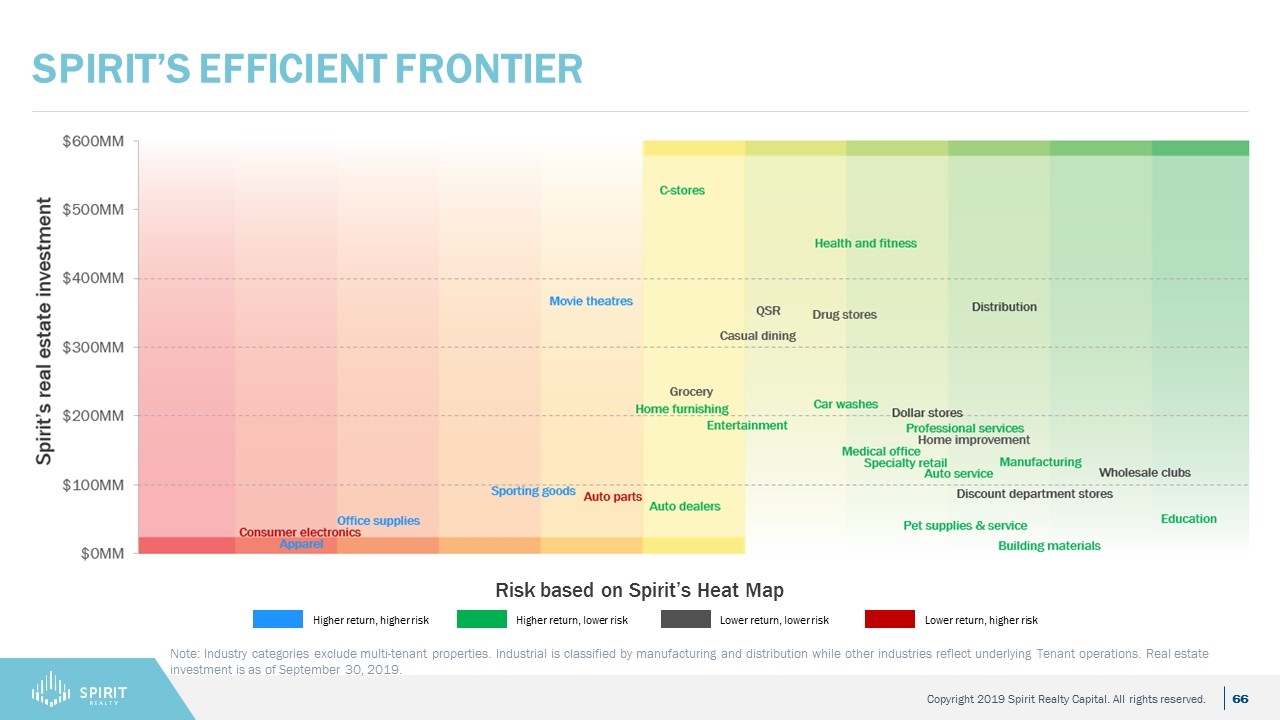
Spirit’s Efficient frontier Note: Industry categories exclude multi-tenant properties. Industrial is classified by manufacturing and distribution while other industries reflect underlying Tenant operations. Real estate investment is as of September 30, 2019. Risk based on Spirit’s Heat Map Higher return, higher risk Higher return, lower risk Lower return, lower risk Lower return, higher risk
Technology tools Investor Day 2019

Technology at spirit
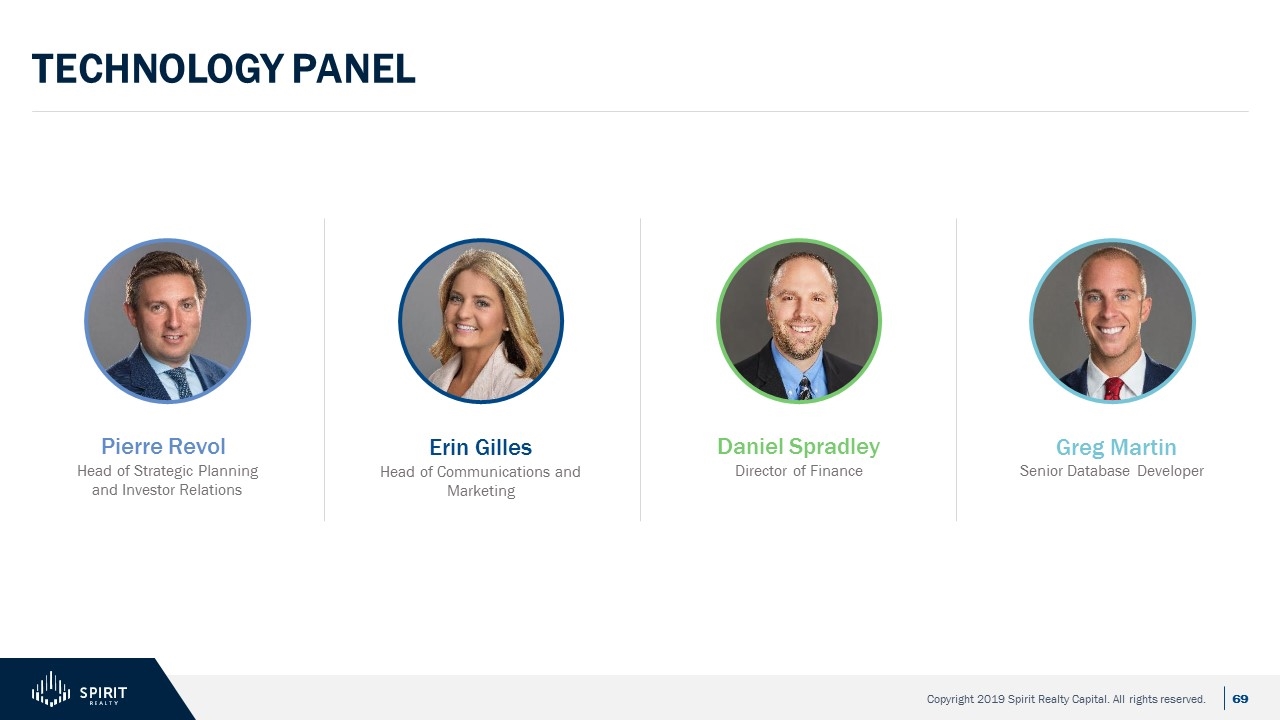
Technology panel Daniel Spradley Director of Finance Greg Martin Erin Gilles Head of Communications and Marketing Pierre Revol Head of Strategic Planning and Investor Relations Senior Database Developer
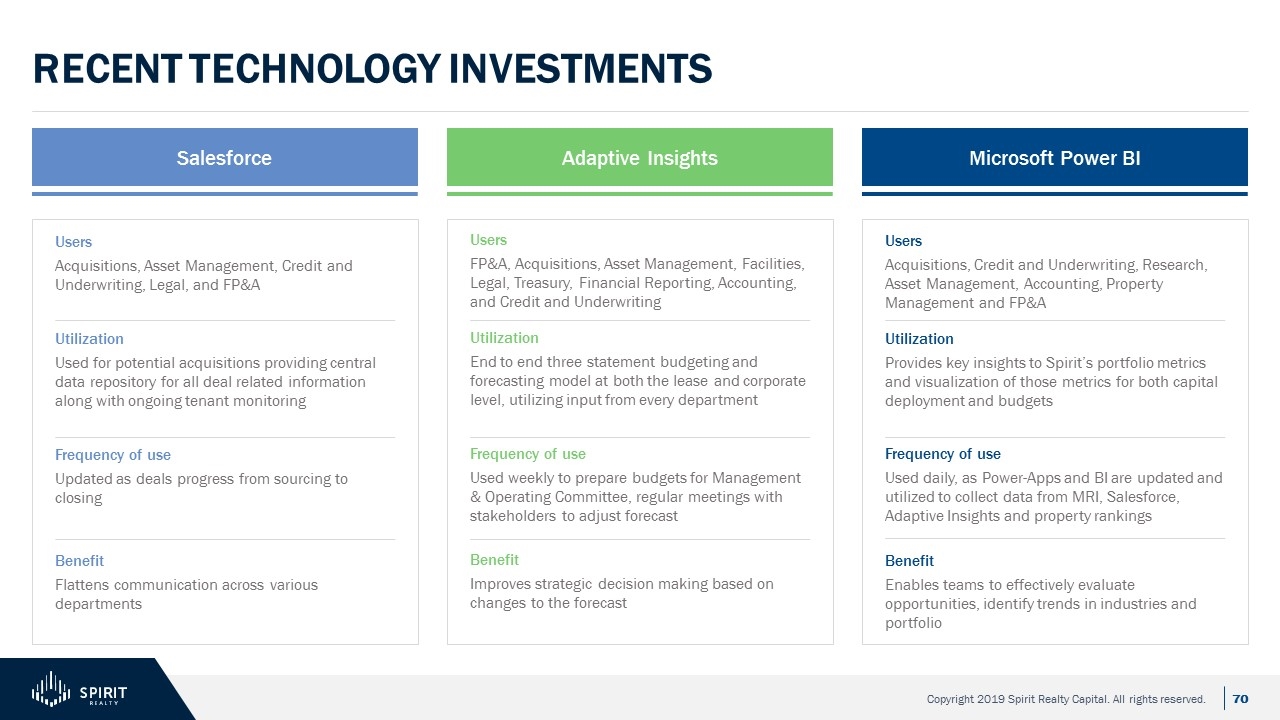
Recent technology investments Salesforce Adaptive Insights Users Acquisitions, Asset Management, Credit and Underwriting, Legal, and FP&A Utilization Used for potential acquisitions providing central data repository for all deal related information along with ongoing tenant monitoring Frequency of use Updated as deals progress from sourcing to closing Benefit Flattens communication across various departments Users FP&A, Acquisitions, Asset Management, Facilities, Legal, Treasury, Financial Reporting, Accounting, and Credit and Underwriting Utilization End to end three statement budgeting and forecasting model at both the lease and corporate level, utilizing input from every department Frequency of use Used weekly to prepare budgets for Management & Operating Committee, regular meetings with stakeholders to adjust forecast Benefit Improves strategic decision making based on changes to the forecast Microsoft Power BI Users Acquisitions, Credit and Underwriting, Research, Asset Management, Accounting, Property Management and FP&A Utilization Provides key insights to Spirit’s portfolio metrics and visualization of those metrics for both capital deployment and budgets Frequency of use Used daily, as Power-Apps and BI are updated and utilized to collect data from MRI, Salesforce, Adaptive Insights and property rankings Benefit Enables teams to effectively evaluate opportunities, identify trends in industries and portfolio
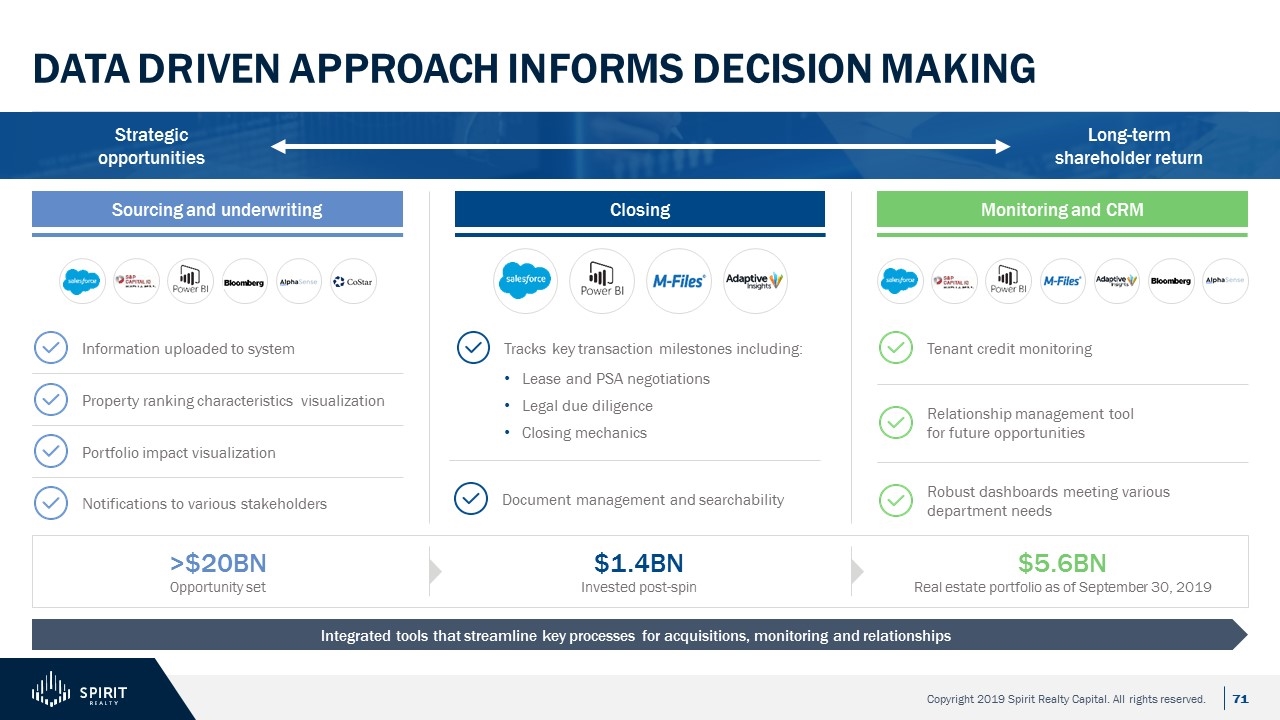
Data driven approach informs decision making Integrated tools that streamline key processes for acquisitions, monitoring and relationships Strategic opportunities Long-term shareholder return Closing Monitoring and CRM Sourcing and underwriting $1.4BN Invested post-spin $5.6BN Real estate portfolio as of September 30, 2019 >$20BN Opportunity set Information uploaded to system Tenant credit monitoring Property ranking characteristics visualization Tracks key transaction milestones including: Lease and PSA negotiations Legal due diligence Closing mechanics Portfolio impact visualization Notifications to various stakeholders Relationship management tool for future opportunities Robust dashboards meeting various department needs Document management and searchability
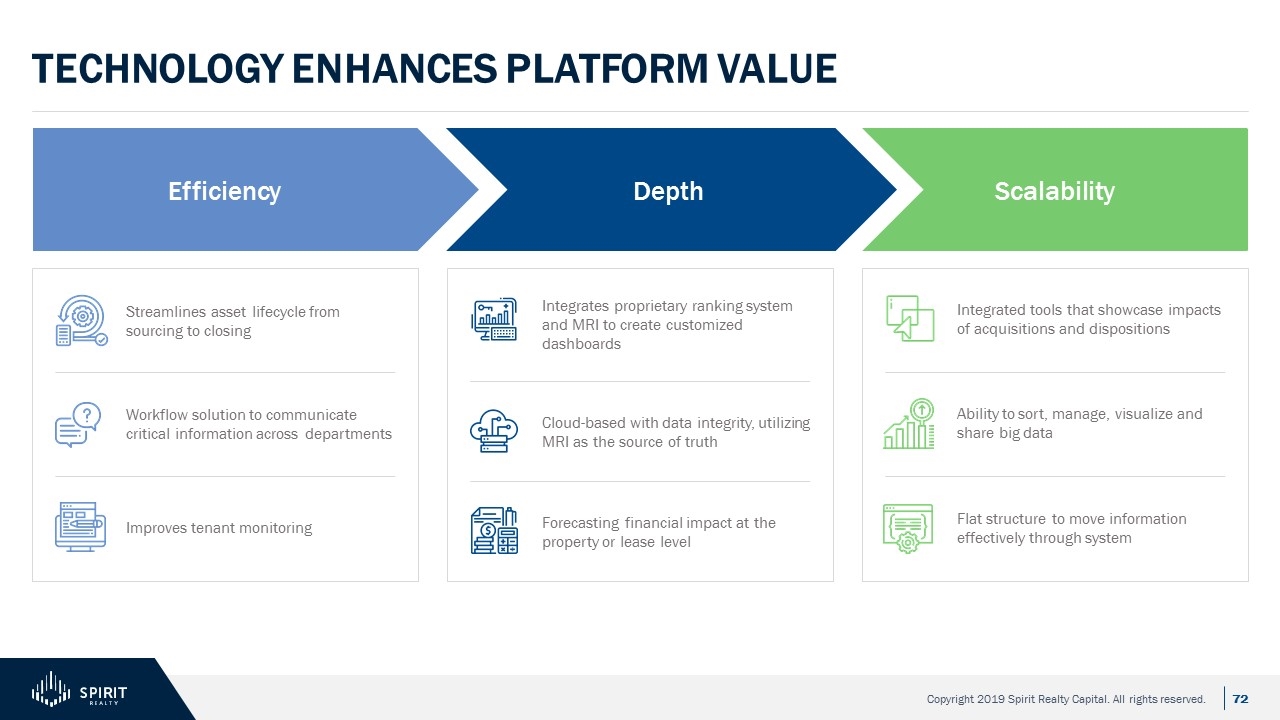
Workflow solution to communicate critical information across departments Technology enhances PLATFORM VALUE Streamlines asset lifecycle from sourcing to closing Efficiency Depth Scalability Integrates proprietary ranking system and MRI to create customized dashboards Cloud-based with data integrity, utilizing MRI as the source of truth Forecasting financial impact at the property or lease level Integrated tools that showcase impacts of acquisitions and dispositions Ability to sort, manage, visualize and share big data Flat structure to move information effectively through system Improves tenant monitoring
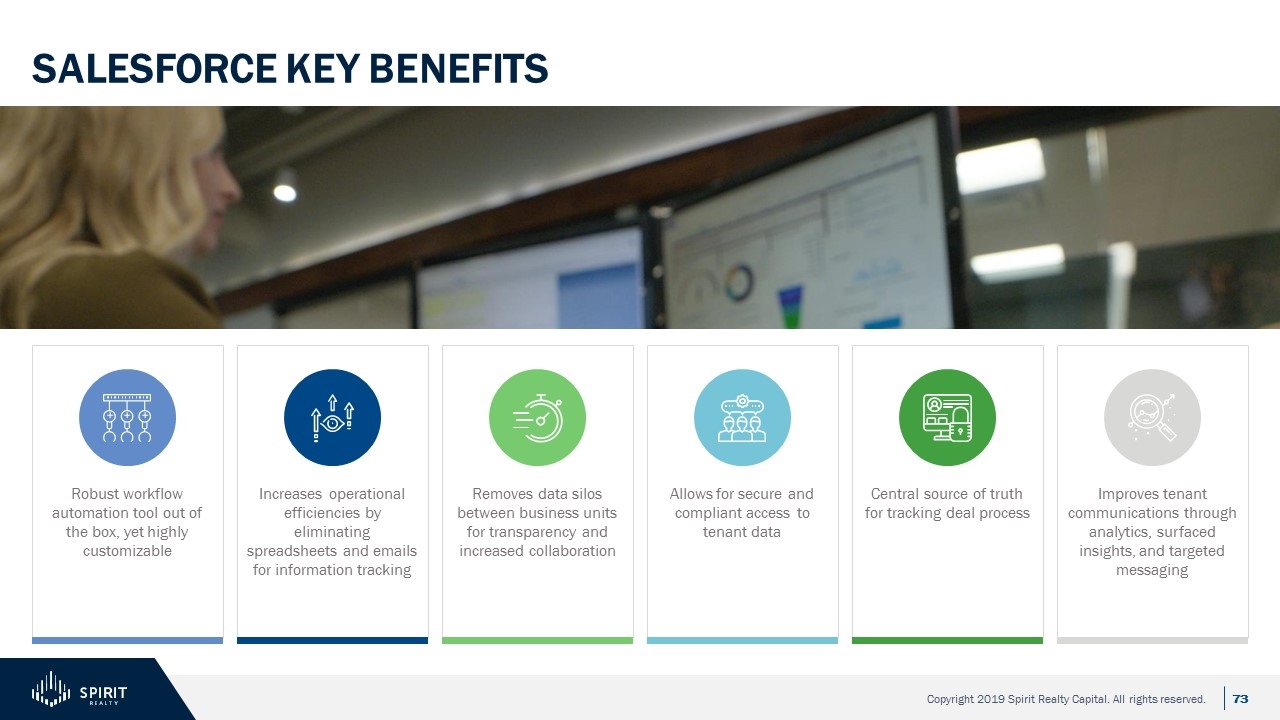
Salesforce key benefits Robust workflow automation tool out of the box, yet highly customizable Increases operational efficiencies by eliminating spreadsheets and emails for information tracking Removes data silos between business units for transparency and increased collaboration Allows for secure and compliant access to tenant data Central source of truth for tracking deal process Improves tenant communications through analytics, surfaced insights, and targeted messaging
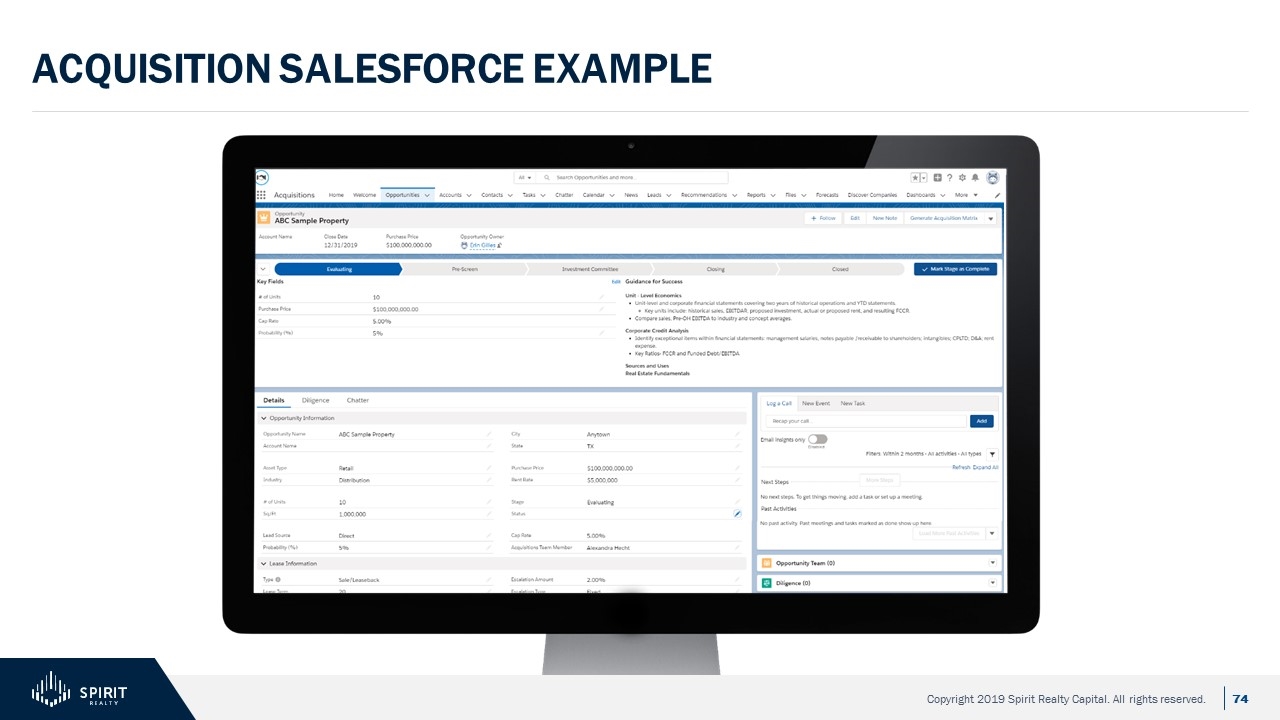
Acquisition salesforce example
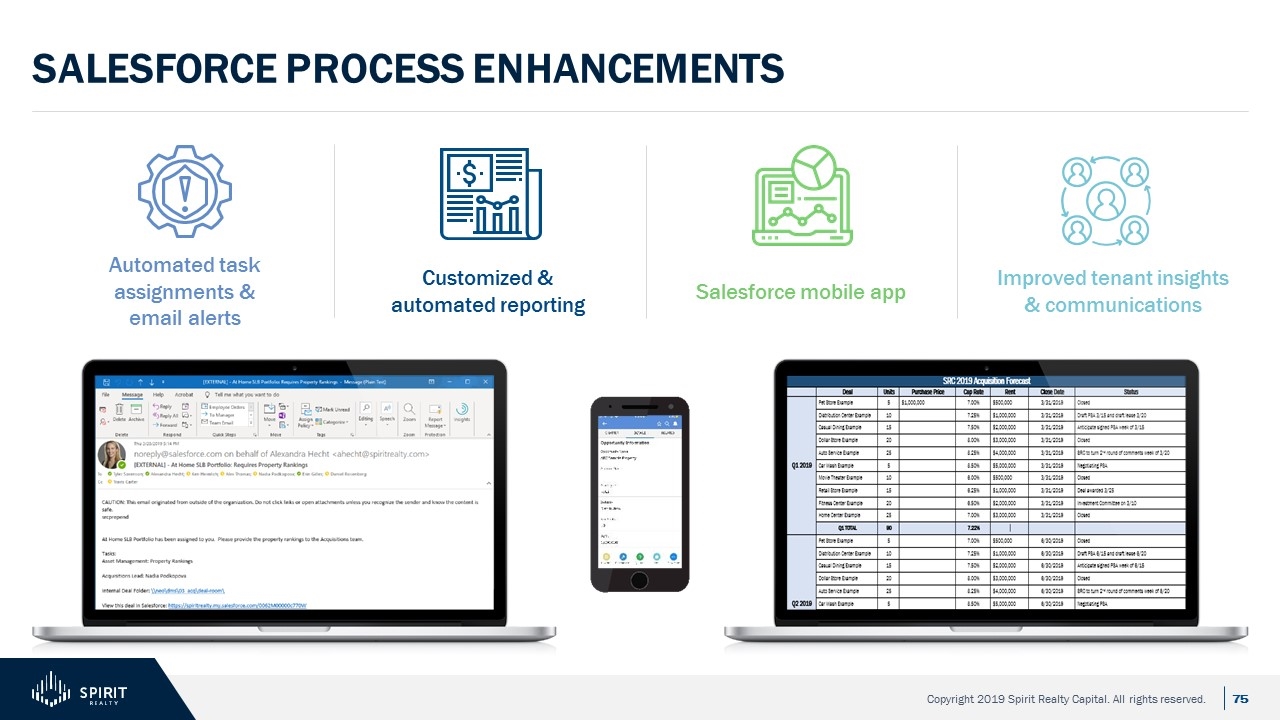
Salesforce process enhancements Automated task assignments & email alerts Customized & automated reporting Salesforce mobile app Improved tenant insights & communications
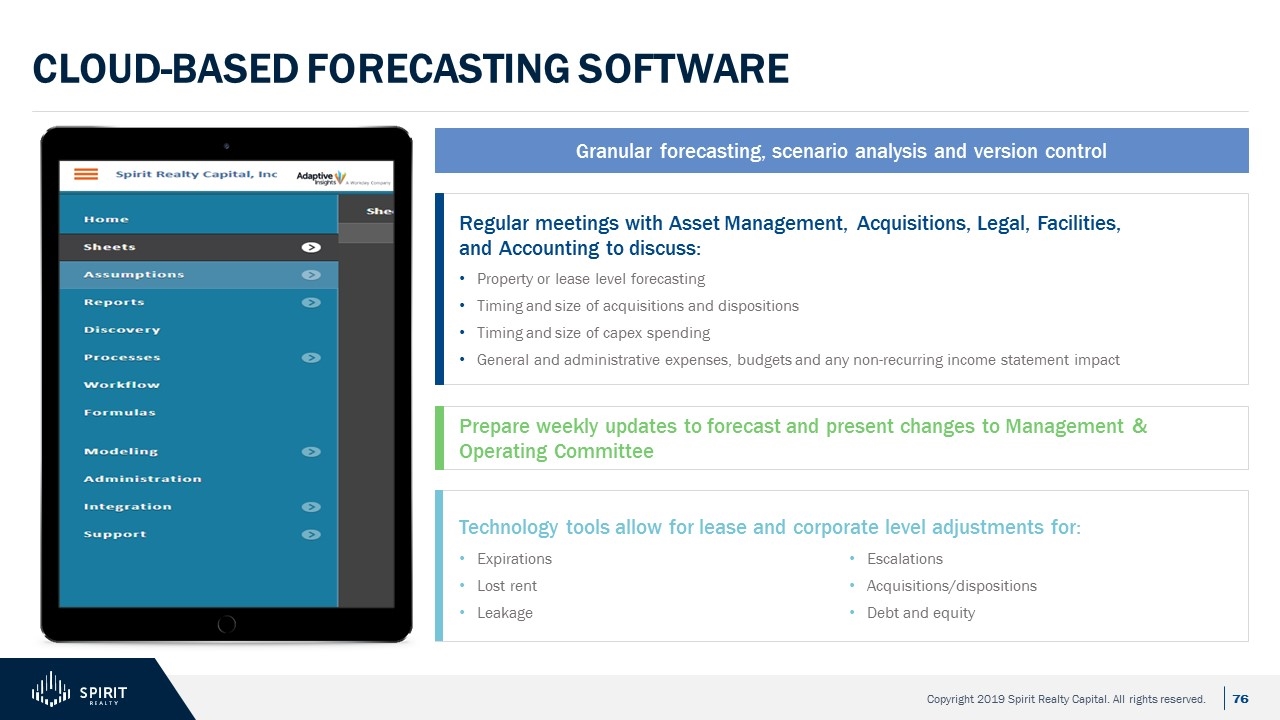
Cloud-based forecasting software Granular forecasting, scenario analysis and version control Regular meetings with Asset Management, Acquisitions, Legal, Facilities, and Accounting to discuss: Property or lease level forecasting Timing and size of acquisitions and dispositions Timing and size of capex spending General and administrative expenses, budgets and any non-recurring income statement impact Prepare weekly updates to forecast and present changes to Management & Operating Committee Technology tools allow for lease and corporate level adjustments for: Expirations Lost rent Leakage Escalations Acquisitions/dispositions Debt and equity
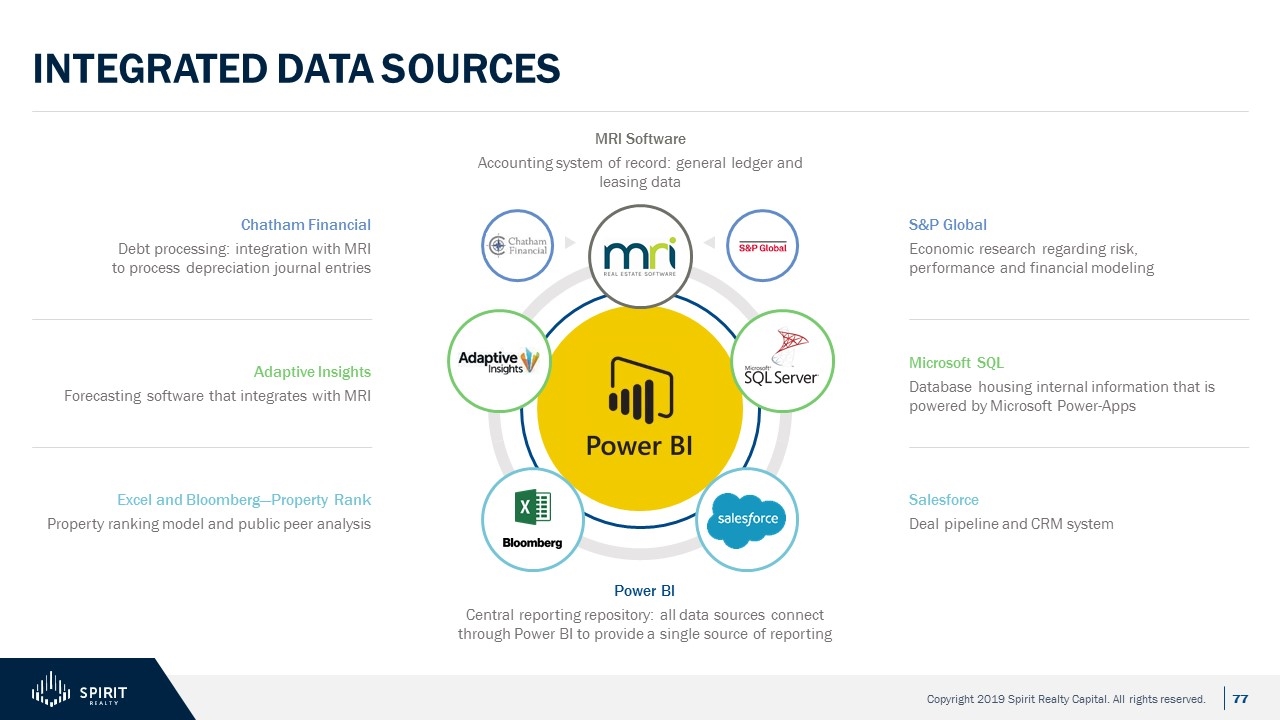
Integrated data sources Power BI Central reporting repository: all data sources connect through Power BI to provide a single source of reporting MRI Software Accounting system of record: general ledger and leasing data Chatham Financial Debt processing: integration with MRI to process depreciation journal entries S&P Global Economic research regarding risk, performance and financial modeling Microsoft SQL Database housing internal information that is powered by Microsoft Power-Apps Adaptive Insights Forecasting software that integrates with MRI Salesforce Deal pipeline and CRM system Excel and Bloomberg—Property Rank Property ranking model and public peer analysis
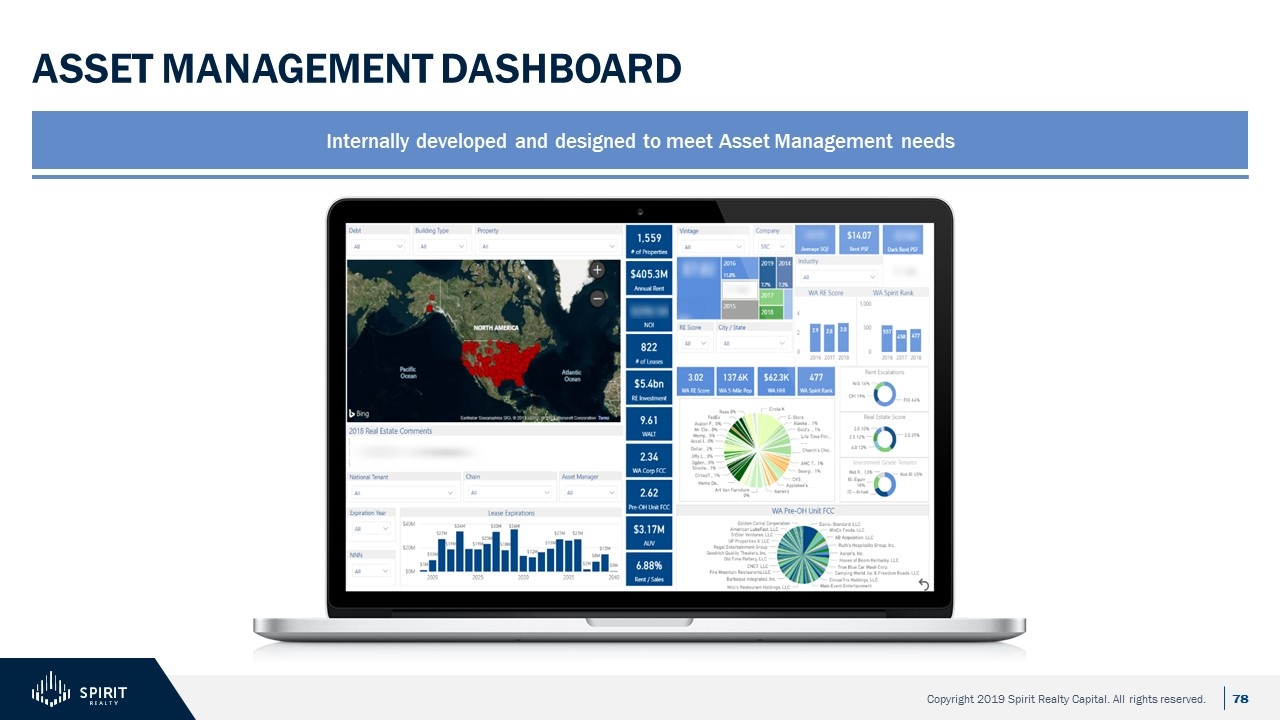
Asset management dashboard Internally developed and designed to meet Asset Management needs
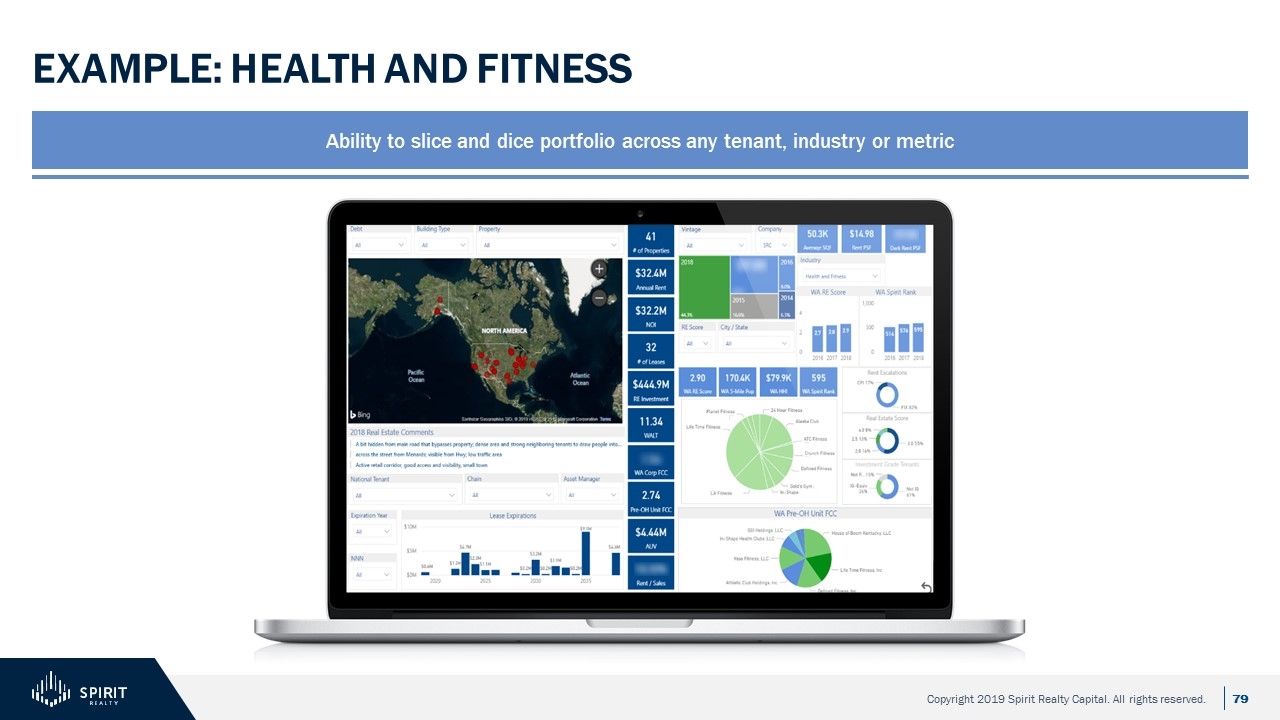
Example: Health and fitness Ability to slice and dice portfolio across any tenant, industry or metric
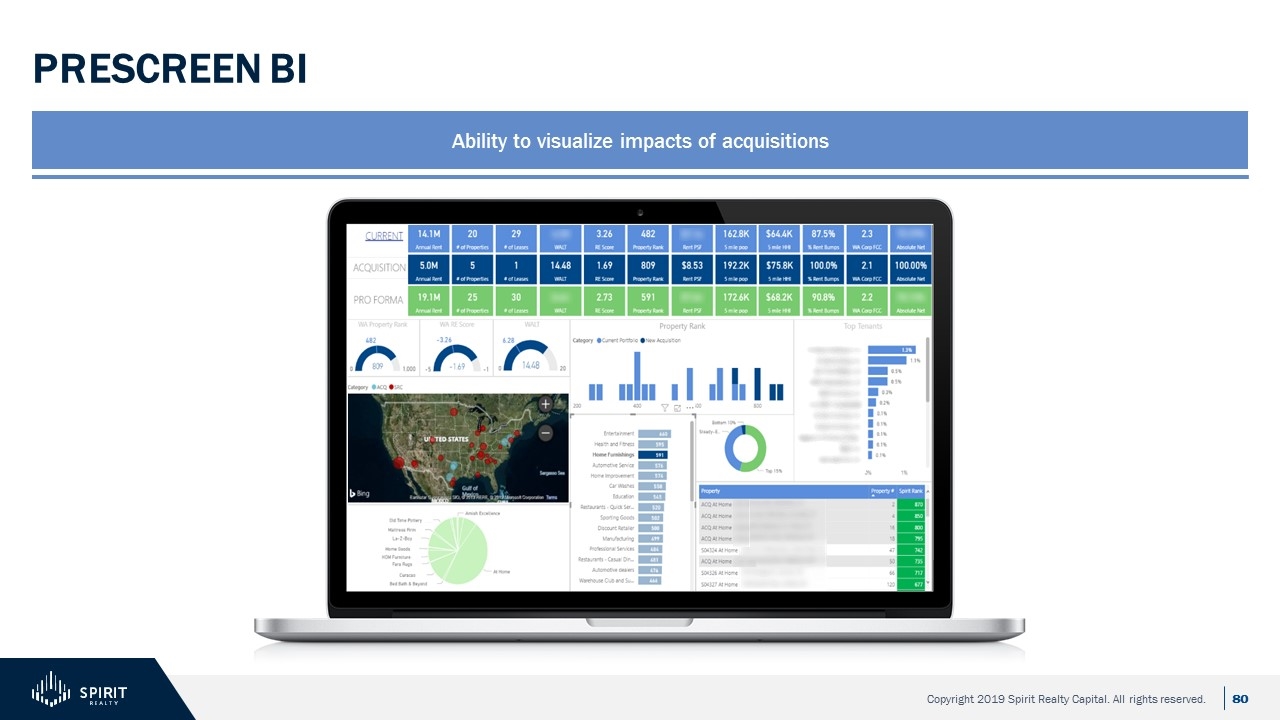
prescreen bi Ability to visualize impacts of acquisitions
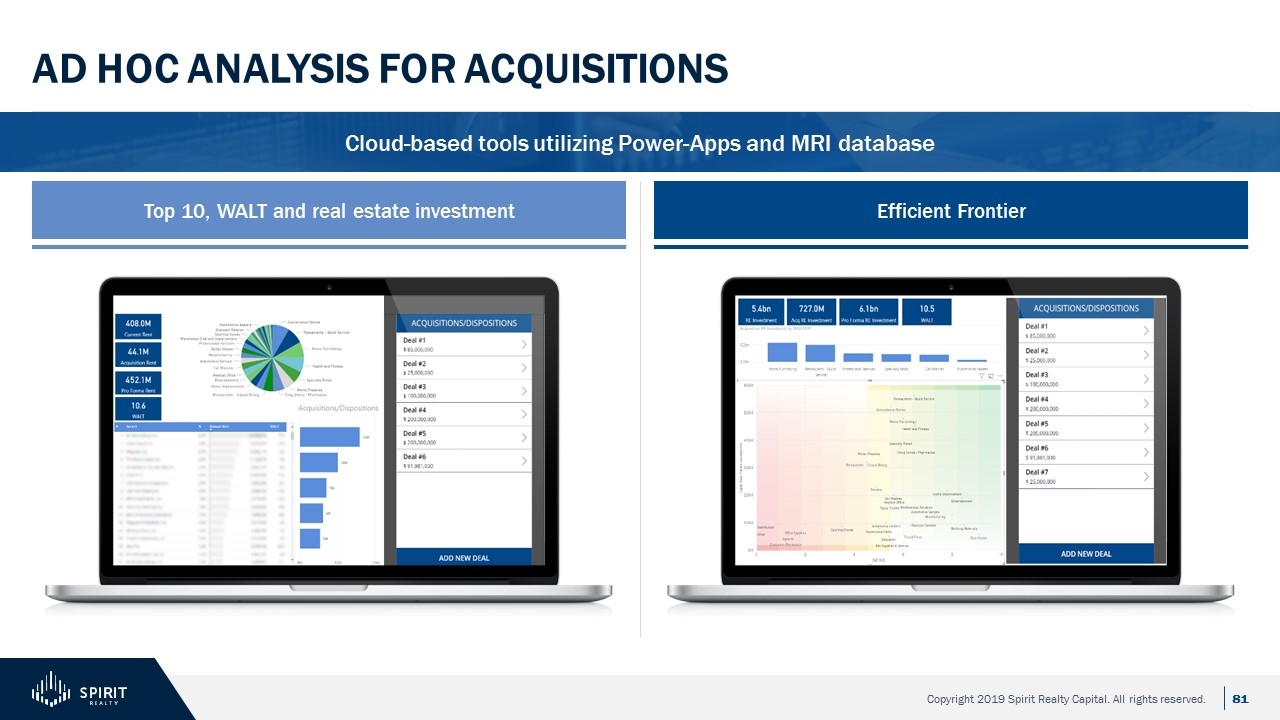
Ad Hoc analysis for acquisitions Top 10, WALT and real estate investment Efficient Frontier Cloud-based tools utilizing Power-Apps and MRI database
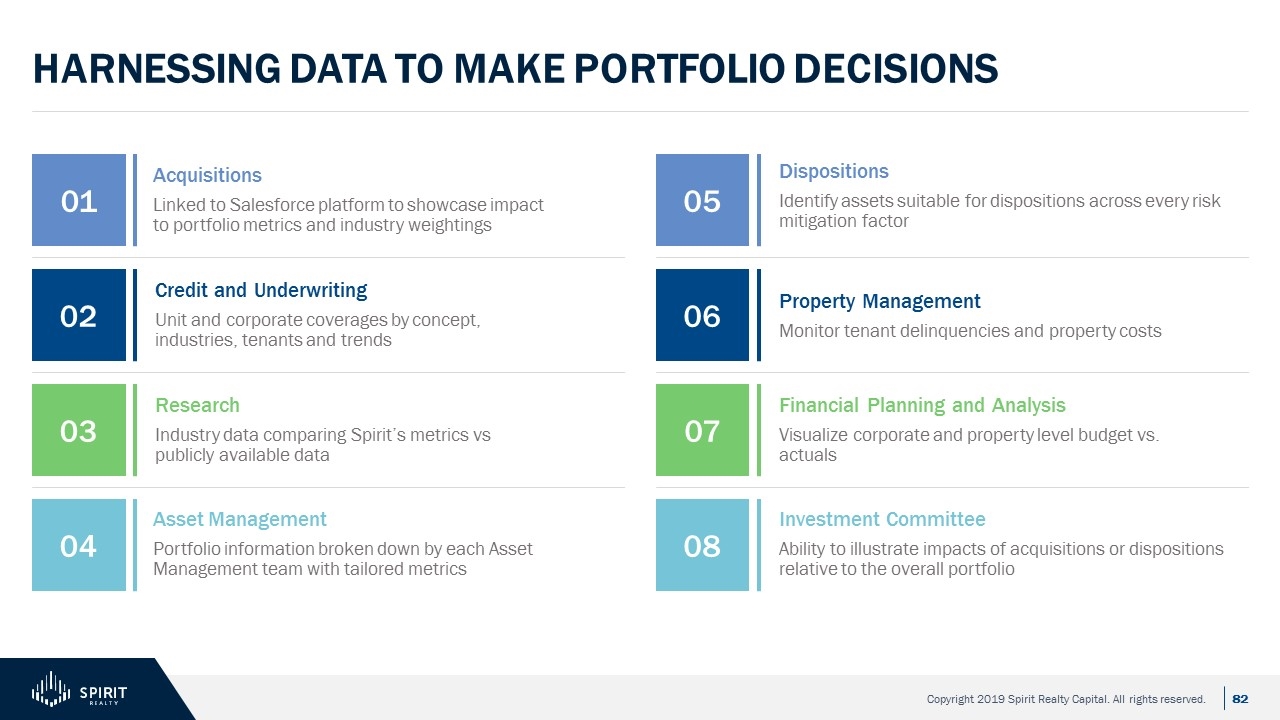
Harnessing data to make portfolio decisions Asset Management Portfolio information broken down by each Asset Management team with tailored metrics 01 Credit and Underwriting Unit and corporate coverages by concept, industries, tenants and trends 02 Research Industry data comparing Spirit’s metrics vs publicly available data 03 Acquisitions Linked to Salesforce platform to showcase impact to portfolio metrics and industry weightings 04 Dispositions Identify assets suitable for dispositions across every risk mitigation factor Financial Planning and Analysis Visualize corporate and property level budget vs. actuals Property Management Monitor tenant delinquencies and property costs Investment Committee Ability to illustrate impacts of acquisitions or dispositions relative to the overall portfolio 05 06 07 08
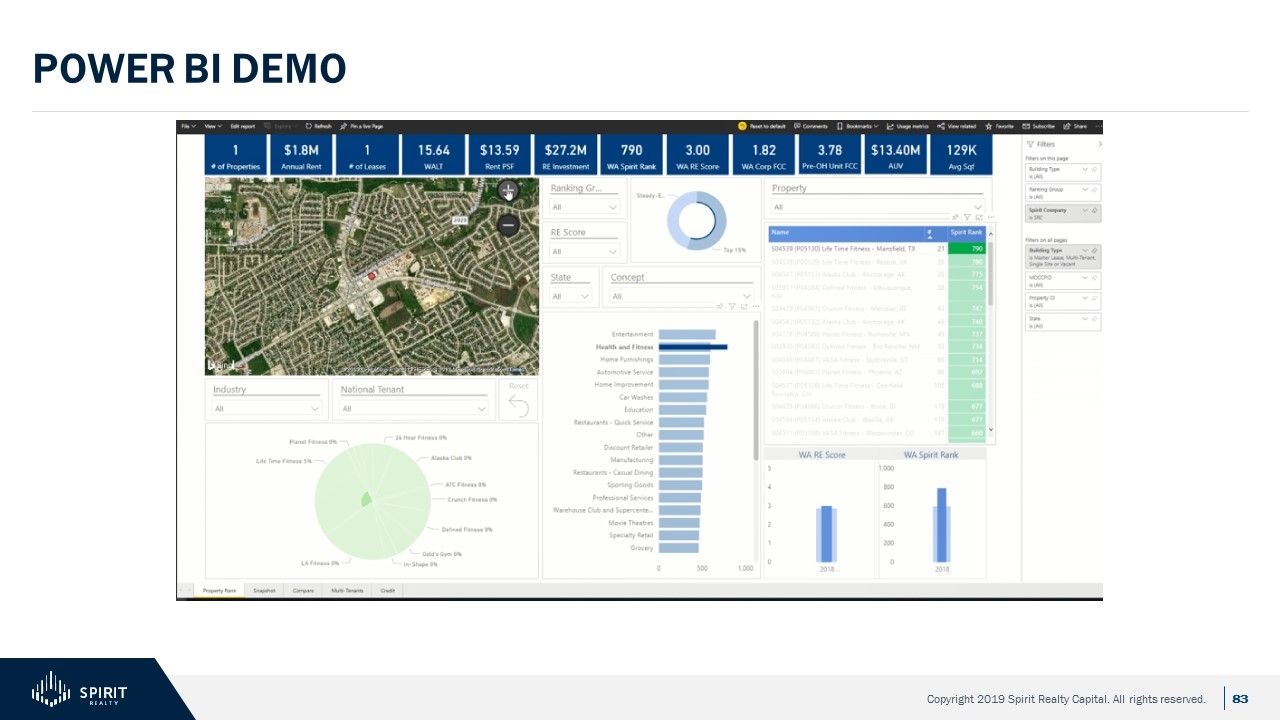
Power bi demo
Credit and Underwriting Investor Day 2019
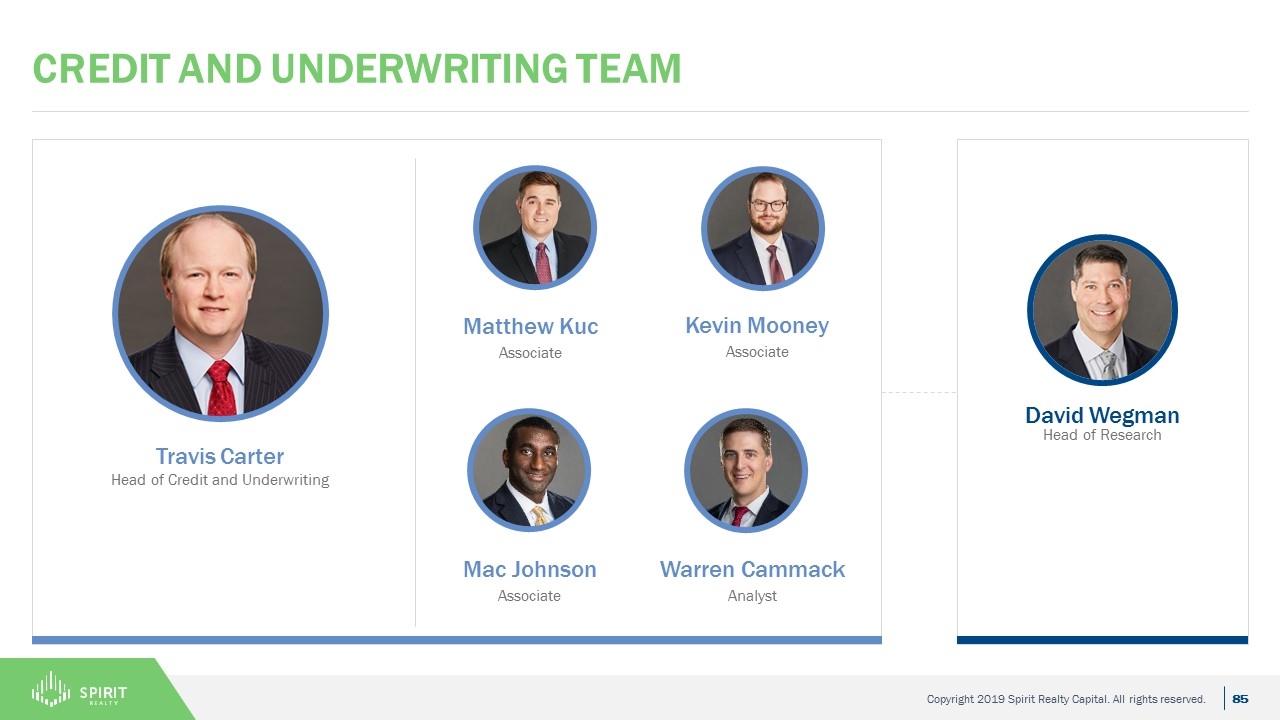
Credit and Underwriting team Travis Carter Head of Credit and Underwriting Matthew Kuc Associate Kevin Mooney Associate Mac Johnson Associate Warren Cammack Analyst David Wegman Head of Research
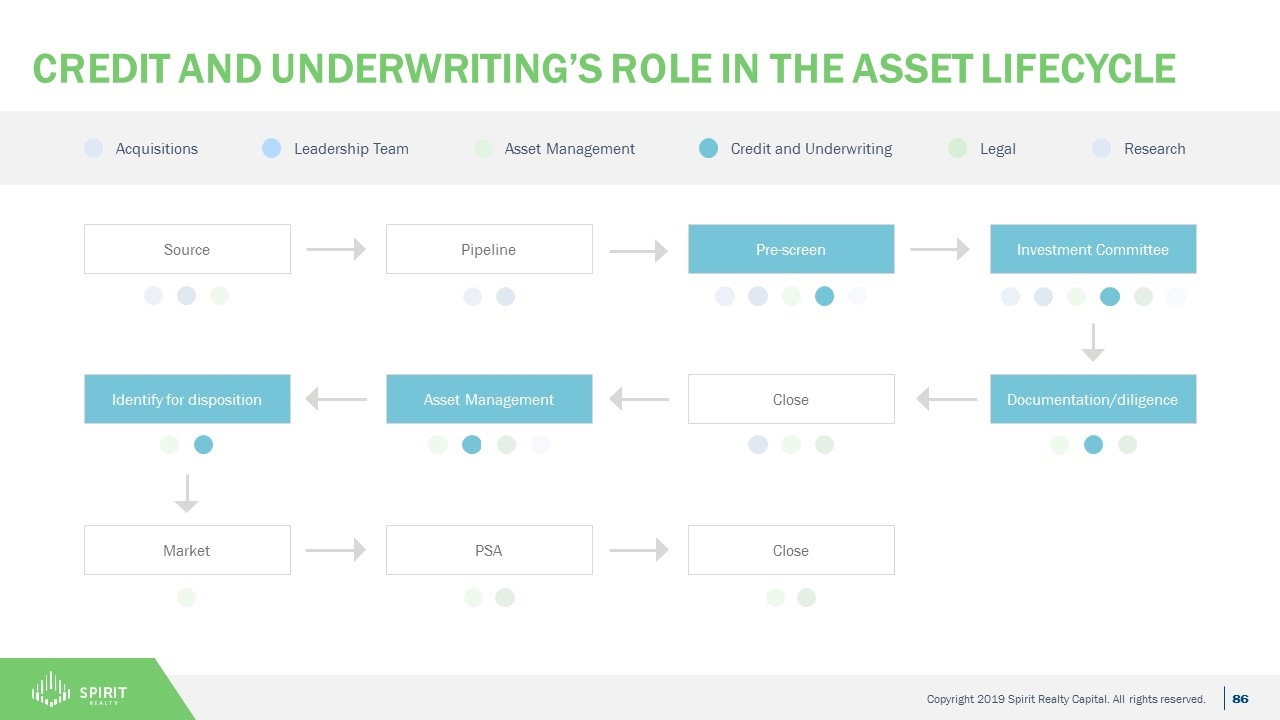
Credit and underwriting’s role in the Asset Lifecycle Source Pipeline Pre-screen Investment Committee Market PSA Close Documentation/diligence Close Asset Management Identify for disposition Acquisitions Leadership Team Asset Management Credit and Underwriting Legal Research
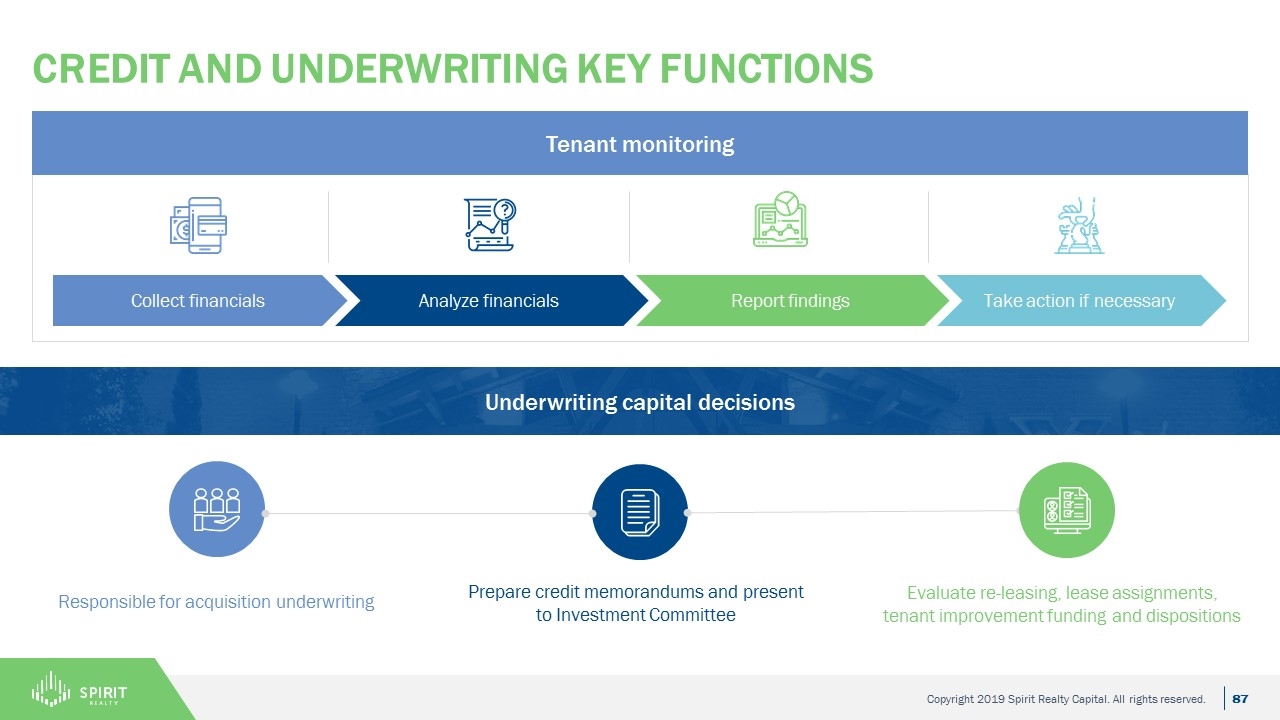
credit and underwriting key functions Responsible for acquisition underwriting Evaluate re-leasing, lease assignments, tenant improvement funding and dispositions Collect financials Analyze financials Report findings Take action if necessary Underwriting capital decisions Tenant monitoring Prepare credit memorandums and present to Investment Committee
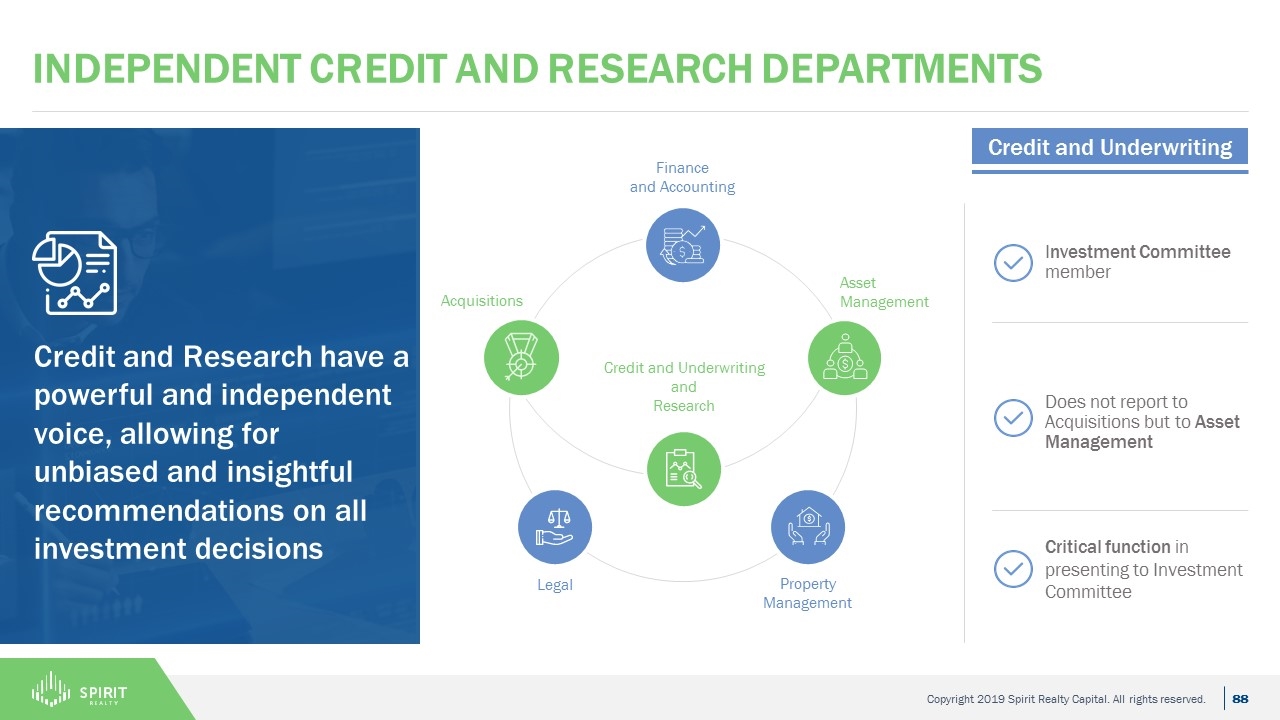
Credit and Research have a powerful and independent voice, allowing for unbiased and insightful recommendations on all investment decisions Independent credit and research departments Legal Property Management Acquisitions Asset Management Credit and Underwriting and Research Finance and Accounting Investment Committee member Does not report to Acquisitions but to Asset Management Critical function in presenting to Investment Committee Credit and Underwriting
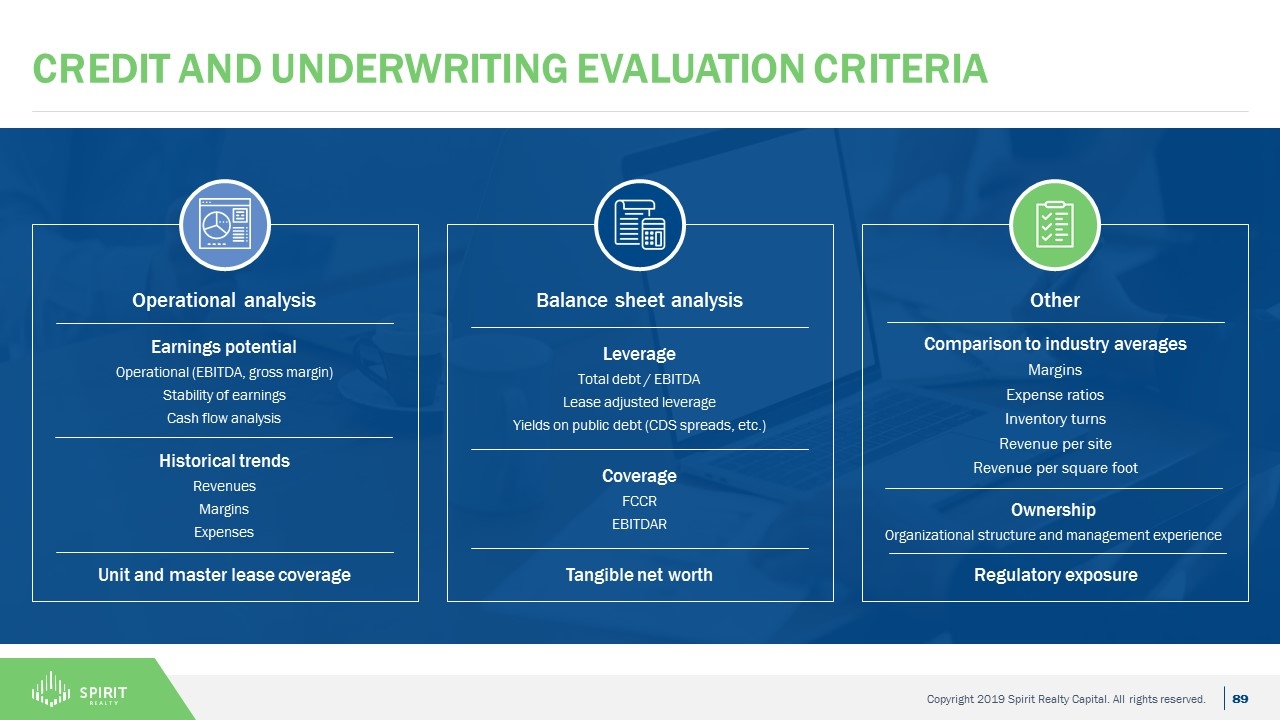
Credit and underwriting Evaluation criteria Operational analysis Earnings potential Operational (EBITDA, gross margin) Stability of earnings Cash flow analysis Historical trends Revenues Margins Expenses Unit and master lease coverage Balance sheet analysis Leverage Total debt / EBITDA Lease adjusted leverage Yields on public debt (CDS spreads, etc.) Coverage FCCR EBITDAR Tangible net worth Other Comparison to industry averages Margins Expense ratios Inventory turns Revenue per site Revenue per square foot Ownership Organizational structure and management experience Regulatory exposure
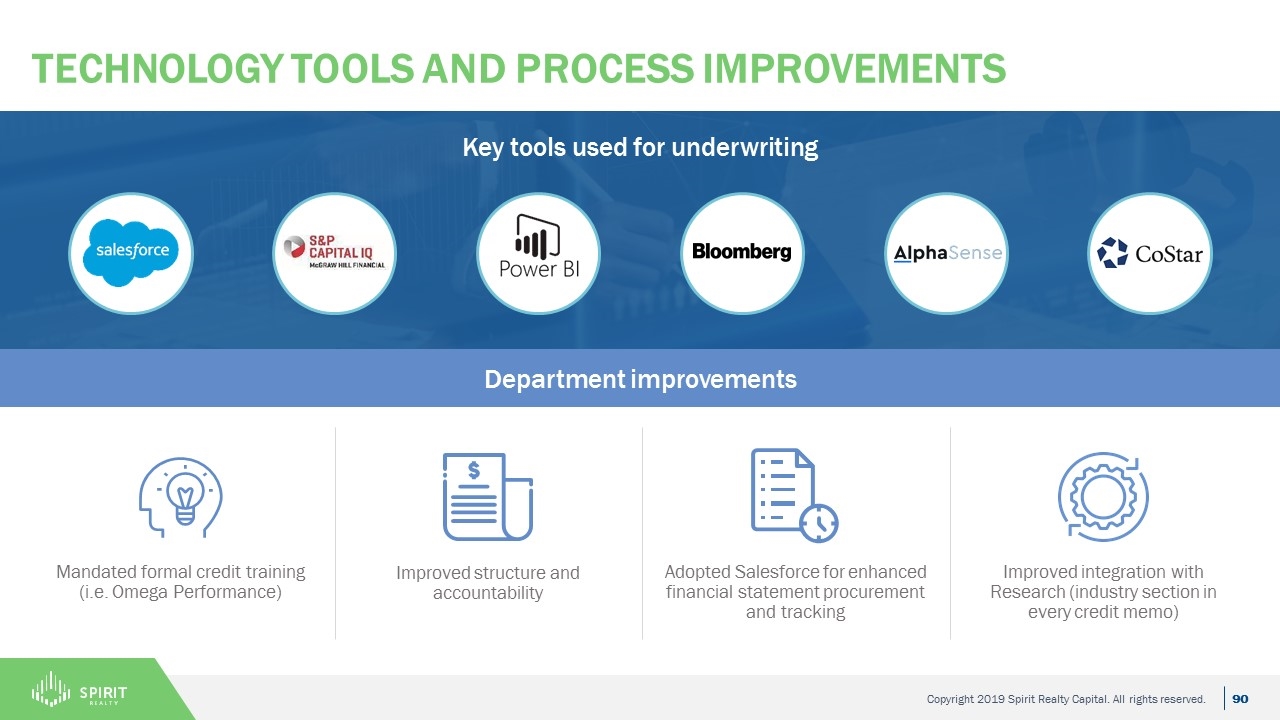
Technology tools and Process improvements Key tools used for underwriting Department improvements Mandated formal credit training (i.e. Omega Performance) Improved structure and accountability Adopted Salesforce for enhanced financial statement procurement and tracking Improved integration with Research (industry section in every credit memo)
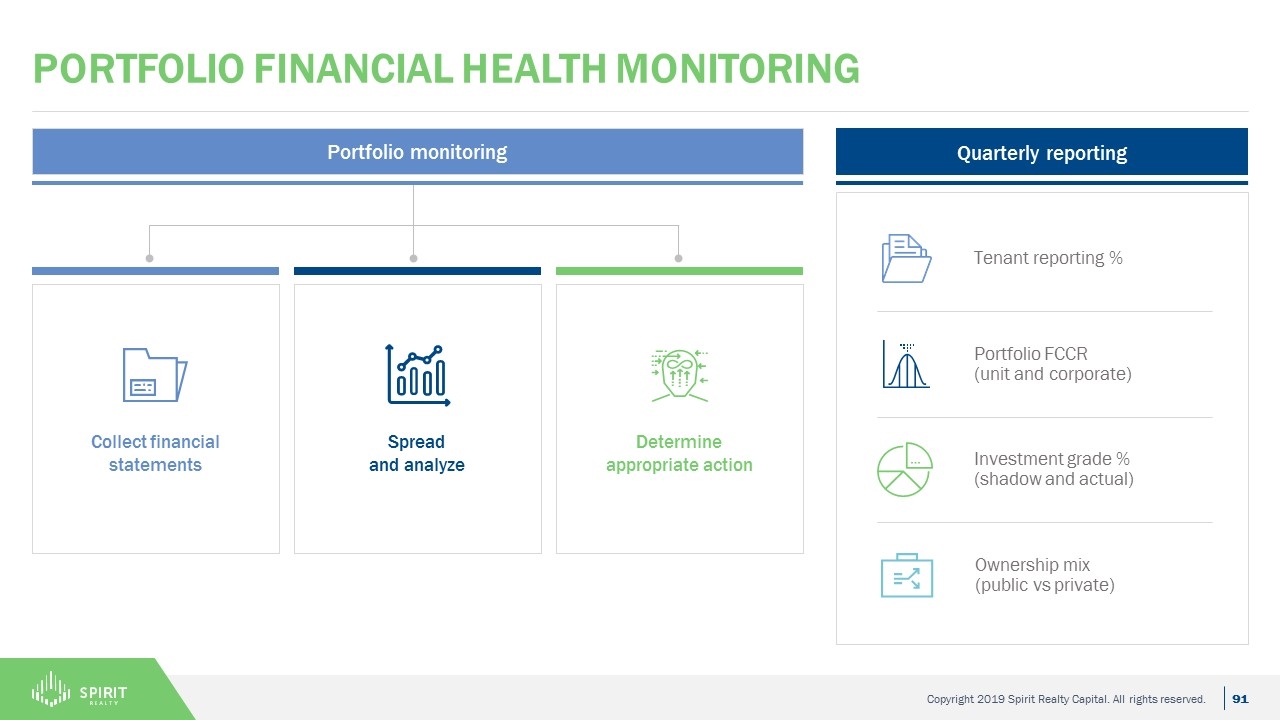
Quarterly reporting Portfolio financial health monitoring Collect financial statements Spread and analyze Determine appropriate action Portfolio monitoring Tenant reporting % Portfolio FCCR (unit and corporate) Investment grade % (shadow and actual) Ownership mix (public vs private)
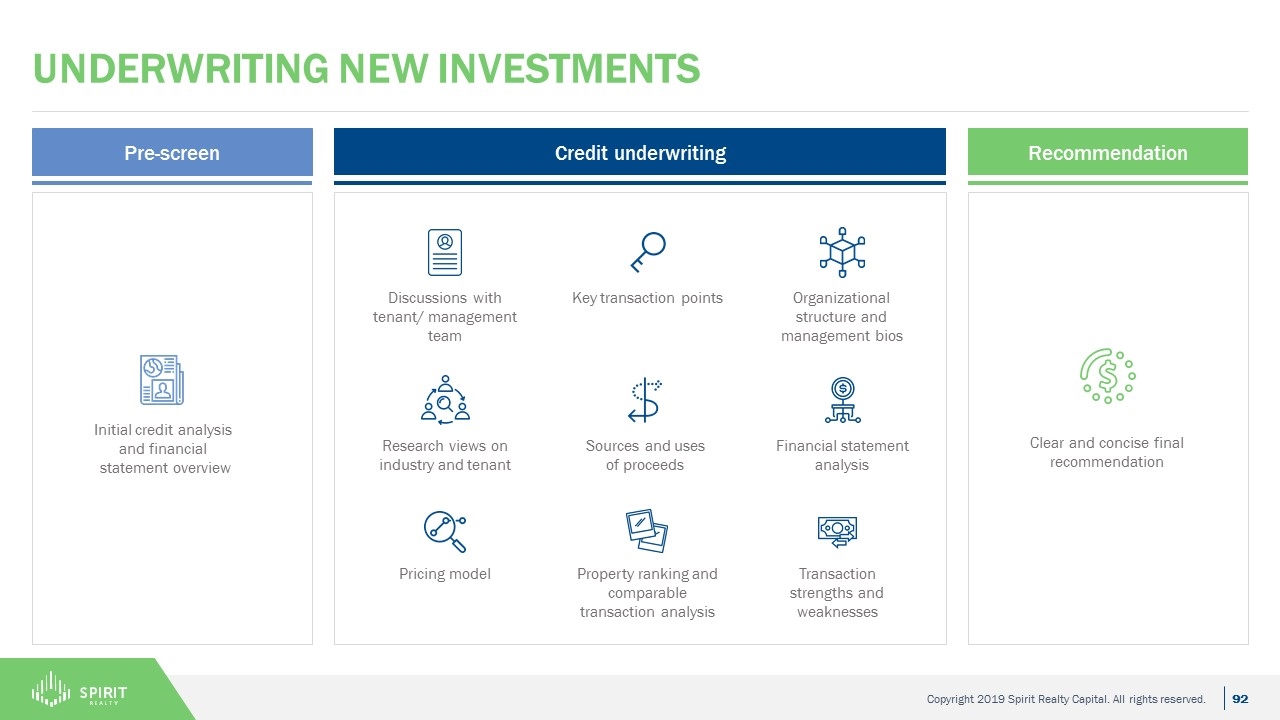
Underwriting New investments Pre-screen Credit underwriting Recommendation Clear and concise final recommendation Initial credit analysis and financial statement overview Financial statement analysis Pricing model Organizational structure and management bios Transaction strengths and weaknesses Research views on industry and tenant Property ranking and comparable transaction analysis Sources and uses of proceeds Discussions with tenant/ management team Key transaction points
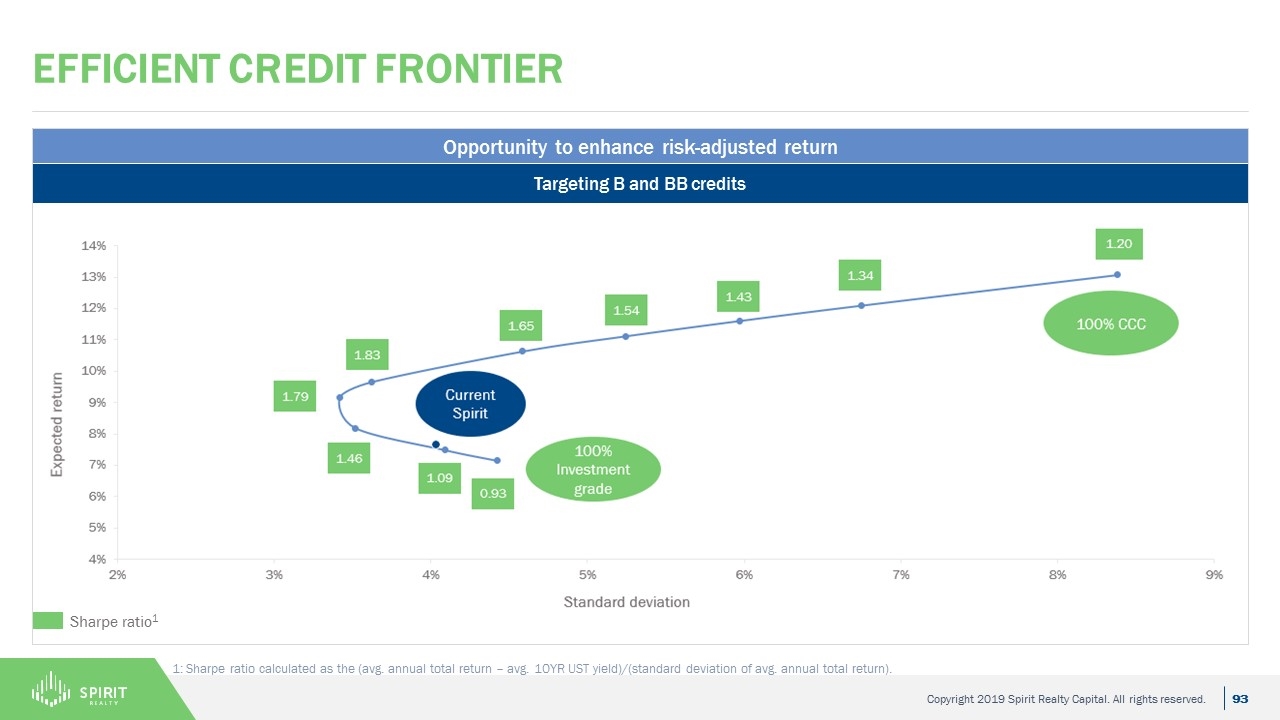
Efficient credit frontier Opportunity to enhance risk-adjusted return Targeting B and BB credits Sharpe ratio1 1: Sharpe ratio calculated as the (avg. annual total return – avg. 10YR UST yield)/(standard deviation of avg. annual total return).
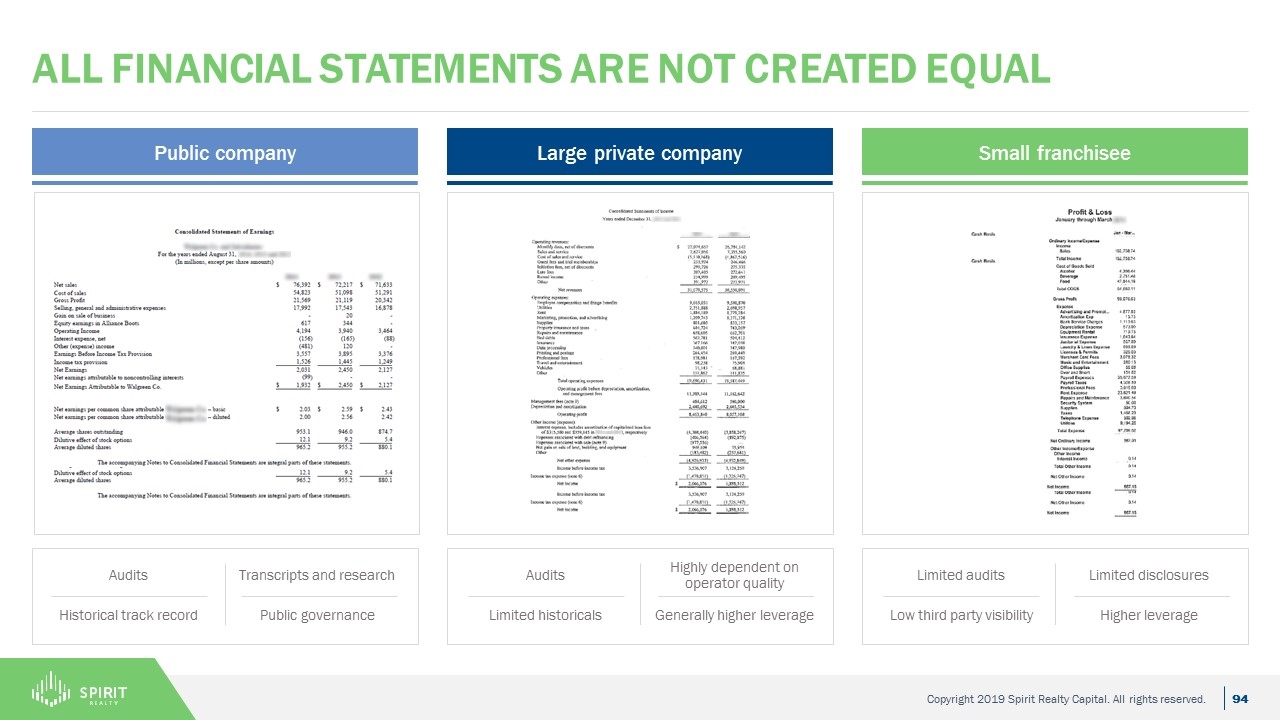
All financial statements are not created equal Public company Large private company Small franchisee Transcripts and research Public governance Audits Historical track record Highly dependent on operator quality Generally higher leverage Audits Limited historicals Limited disclosures Higher leverage Limited audits Low third party visibility
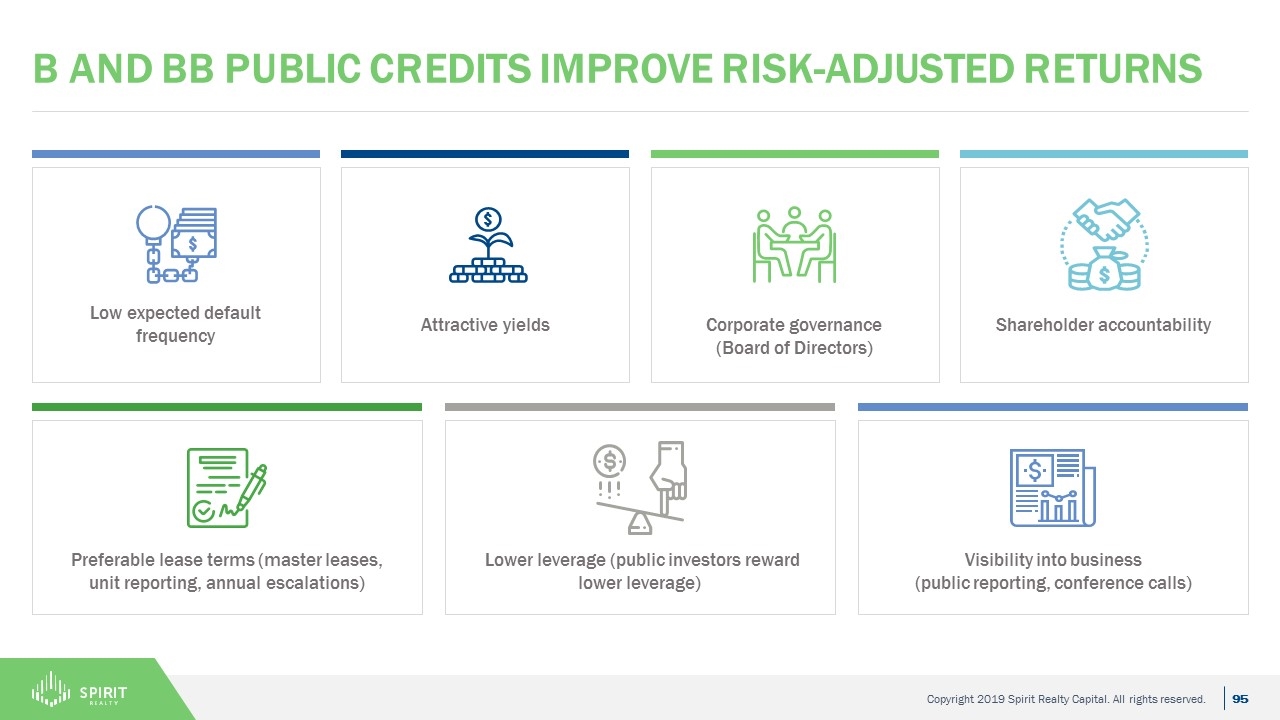
B and BB public credits improve risk-adjusted returns Low expected default frequency Shareholder accountability Corporate governance (Board of Directors) Attractive yields Preferable lease terms (master leases, unit reporting, annual escalations) Visibility into business (public reporting, conference calls) Lower leverage (public investors reward lower leverage)
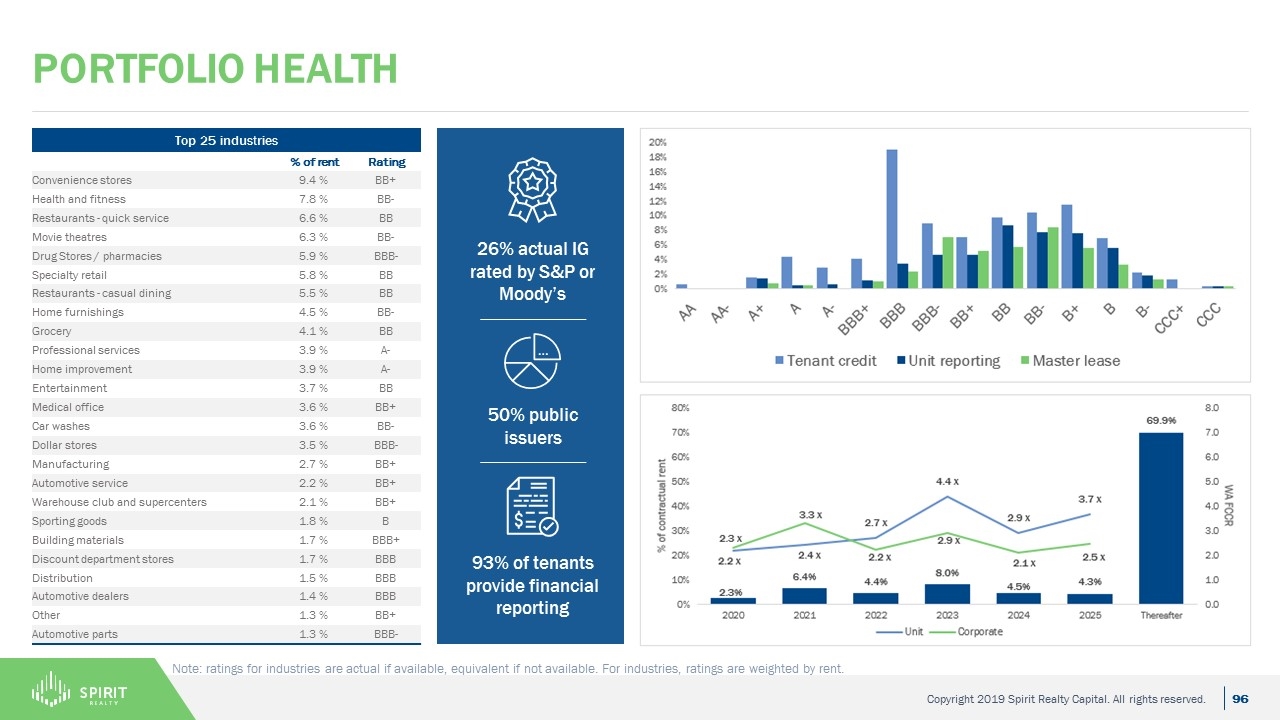
Portfolio health Top 25 industries % of rent Rating Convenience stores 9.4 % BB+ Health and fitness 7.8 % BB- Restaurants - quick service 6.6 % BB Movie theatres 6.3 % BB- Drug Stores / pharmacies 5.9 % BBB- Specialty retail 5.8 % BB Restaurants - casual dining 5.5 % BB Home furnishings 4.5 % BB- Grocery 4.1 % BB Professional services 3.9 % A- Home improvement 3.9 % A- Entertainment 3.7 % BB Medical office 3.6 % BB+ Car washes 3.6 % BB- Dollar stores 3.5 % BBB- Manufacturing 2.7 % BB+ Automotive service 2.2 % BB+ Warehouse club and supercenters 2.1 % BB+ Sporting goods 1.8 % B Building materials 1.7 % BBB+ Discount department stores 1.7 % BBB Distribution 1.5 % BBB Automotive dealers 1.4 % BBB Other 1.3 % BB+ Automotive parts 1.3 % BBB- 26% actual IG rated by S&P or Moody’s 50% public issuers Note: ratings for industries are actual if available, equivalent if not available. For industries, ratings are weighted by rent. 93% of tenants provide financial reporting
Legal and closing Investor Day 2019
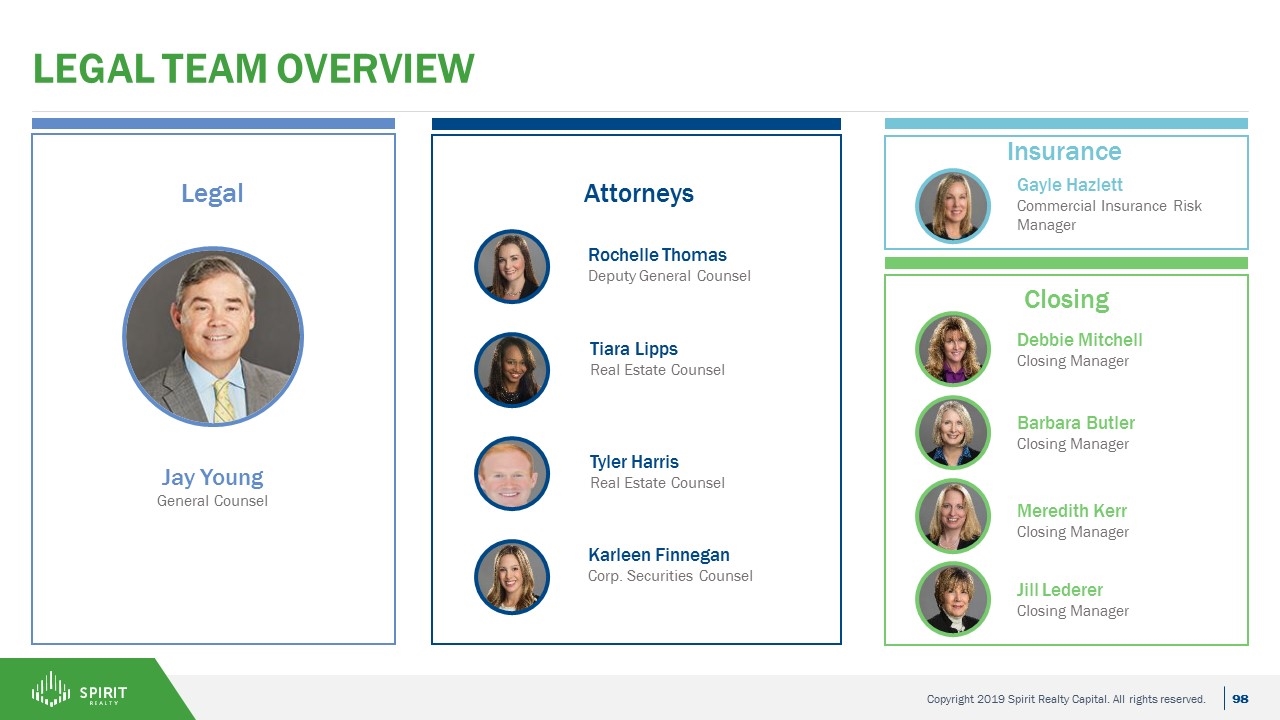
Legal team overview Attorneys Rochelle Thomas Deputy General Counsel Tiara Lipps Real Estate Counsel Karleen Finnegan Corp. Securities Counsel Closing Legal Jay Young General Counsel Insurance Gayle Hazlett Commercial Insurance Risk Manager Debbie Mitchell Closing Manager Barbara Butler Closing Manager Meredith Kerr Closing Manager Jill Lederer Closing Manager Tyler Harris Real Estate Counsel
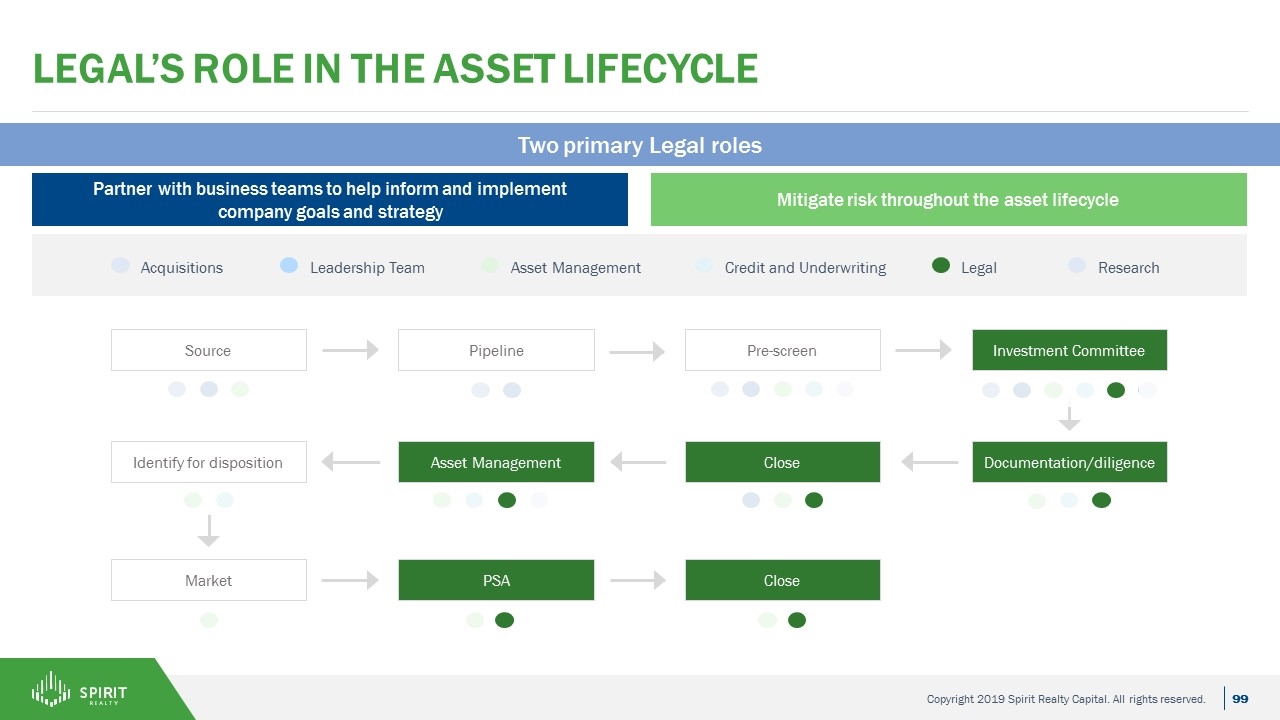
Legal’s role in the Asset Lifecycle Source Pipeline Pre-screen Investment Committee Market PSA Close Documentation/diligence Close Asset Management Identify for disposition Acquisitions Leadership Team Asset Management Credit and Underwriting Legal Research Partner with business teams to help inform and implement company goals and strategy Mitigate risk throughout the asset lifecycle Two primary Legal roles
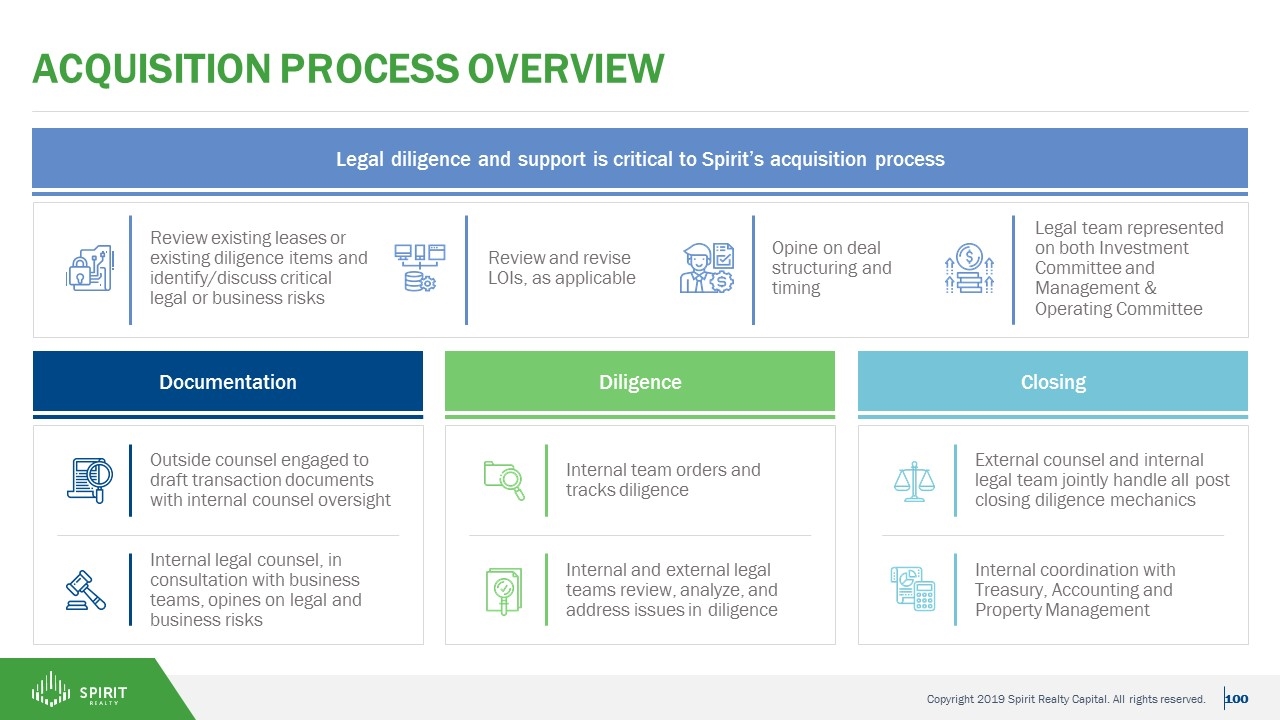
Acquisition Process Overview Legal diligence and support is critical to Spirit’s acquisition process Review existing leases or existing diligence items and identify/discuss critical legal or business risks Review and revise LOIs, as applicable Opine on deal structuring and timing Legal team represented on both Investment Committee and Management & Operating Committee Documentation Diligence Closing Outside counsel engaged to draft transaction documents with internal counsel oversight Internal legal counsel, in consultation with business teams, opines on legal and business risks Internal team orders and tracks diligence Internal and external legal teams review, analyze, and address issues in diligence External counsel and internal legal team jointly handle all post closing diligence mechanics Internal coordination with Treasury, Accounting and Property Management
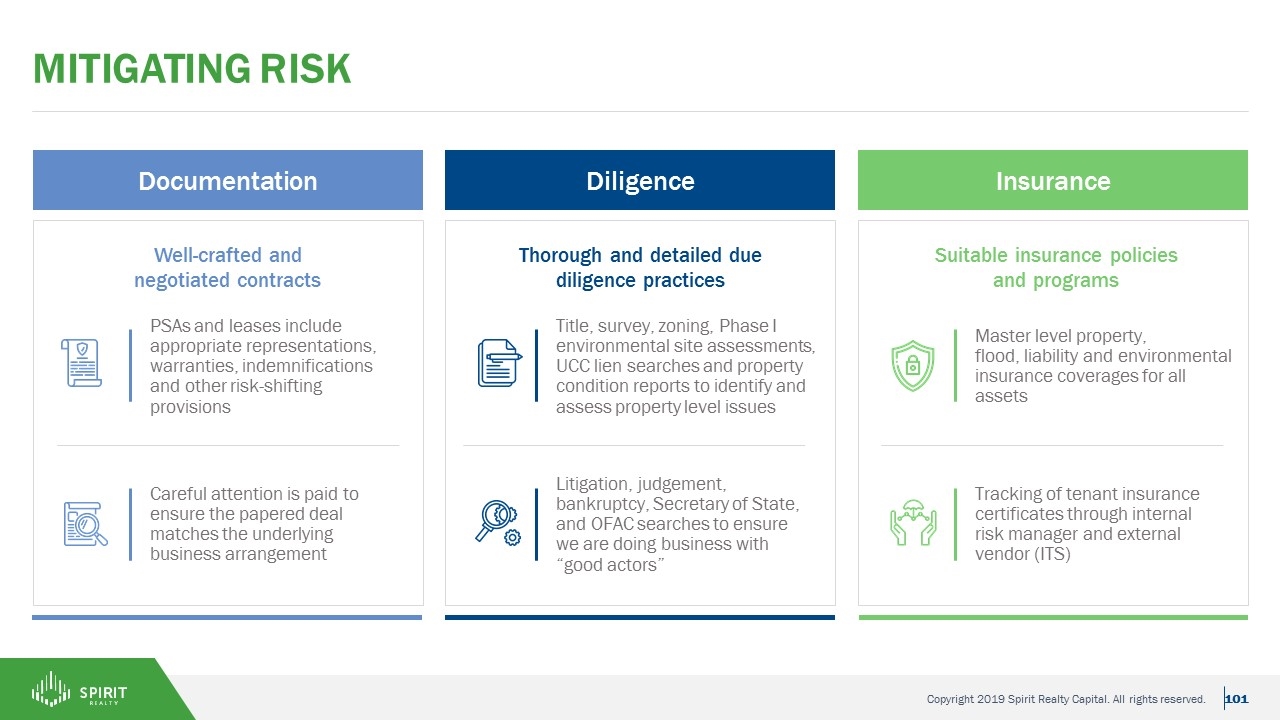
Mitigating risk Well-crafted and negotiated contracts Thorough and detailed due diligence practices Suitable insurance policies and programs PSAs and leases include appropriate representations, warranties, indemnifications and other risk-shifting provisions Careful attention is paid to ensure the papered deal matches the underlying business arrangement Title, survey, zoning, Phase I environmental site assessments, UCC lien searches and property condition reports to identify and assess property level issues Litigation, judgement, bankruptcy, Secretary of State, and OFAC searches to ensure we are doing business with “good actors” Master level property, flood, liability and environmental insurance coverages for all assets Tracking of tenant insurance certificates through internal risk manager and external vendor (ITS) Documentation Diligence Insurance
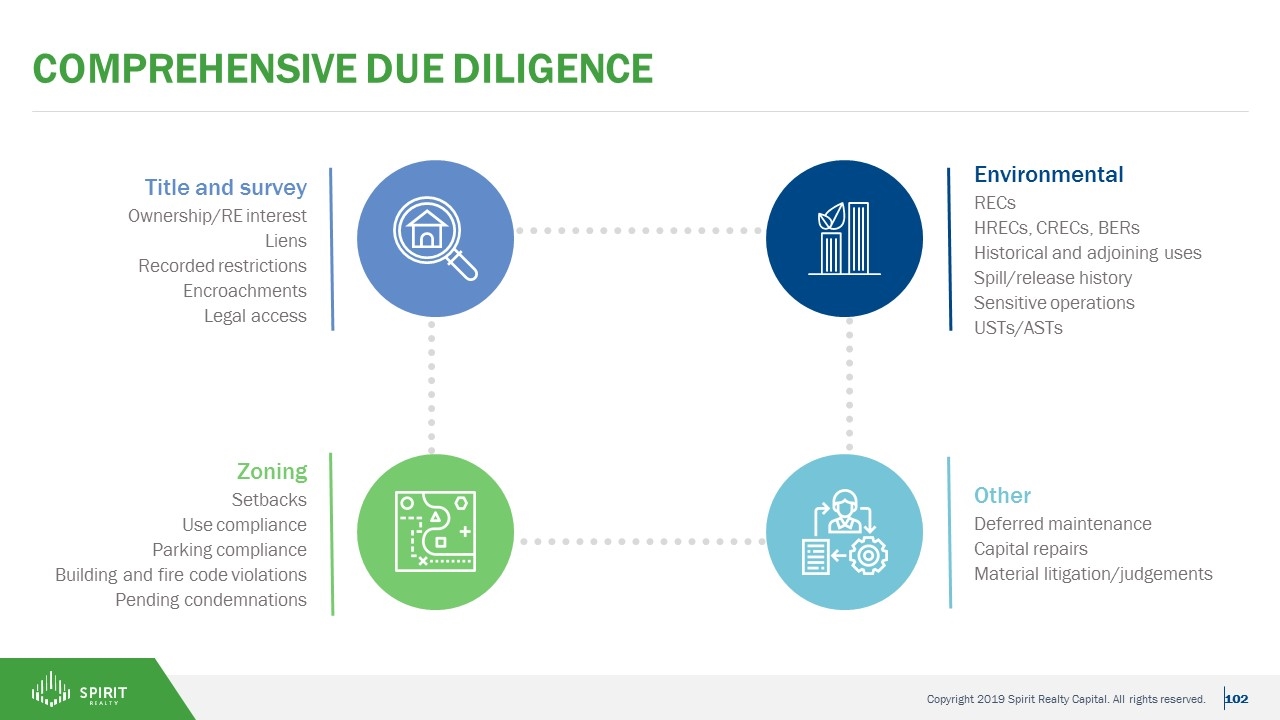
comprehensive Due Diligence Other Deferred maintenance Capital repairs Material litigation/judgements Environmental RECs HRECs, CRECs, BERs Historical and adjoining uses Spill/release history Sensitive operations USTs/ASTs Title and survey Ownership/RE interest Liens Recorded restrictions Encroachments Legal access Zoning Setbacks Use compliance Parking compliance Building and fire code violations Pending condemnations
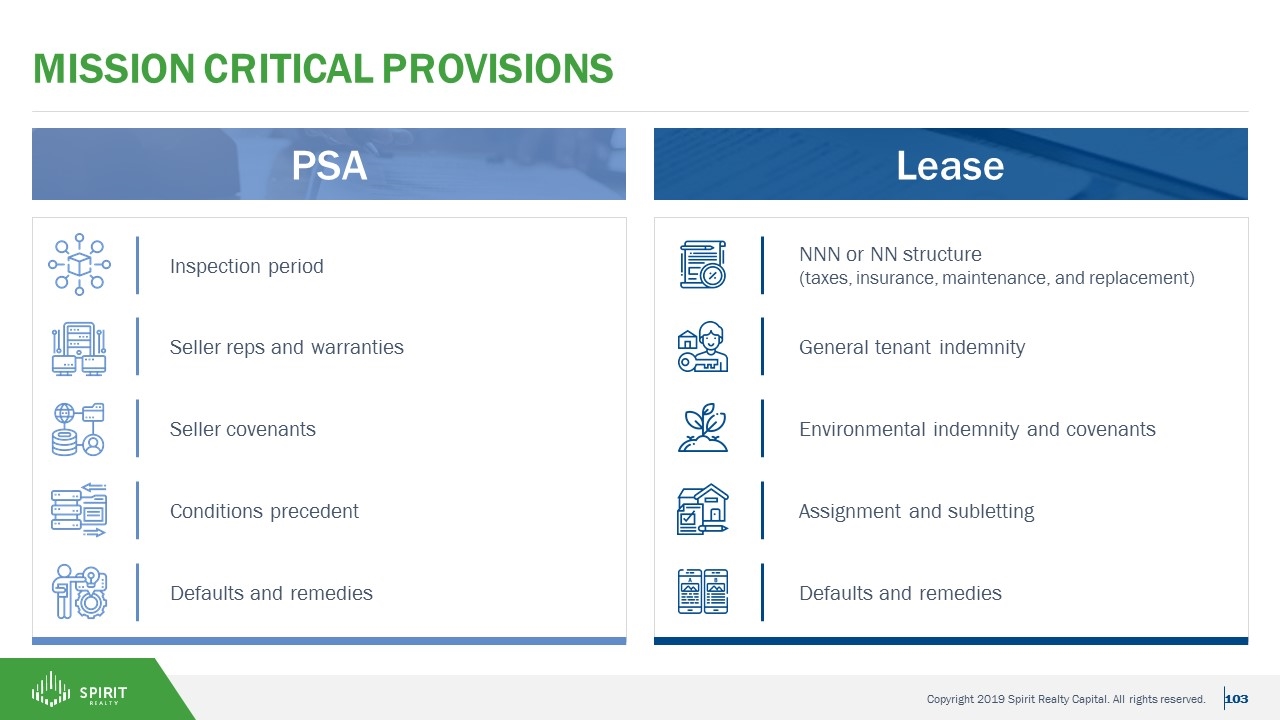
PSA mission critical provisions Inspection period Lease Defaults and remedies Conditions precedent Seller covenants Seller reps and warranties NNN or NN structure (taxes, insurance, maintenance, and replacement) Defaults and remedies Assignment and subletting Environmental indemnity and covenants General tenant indemnity
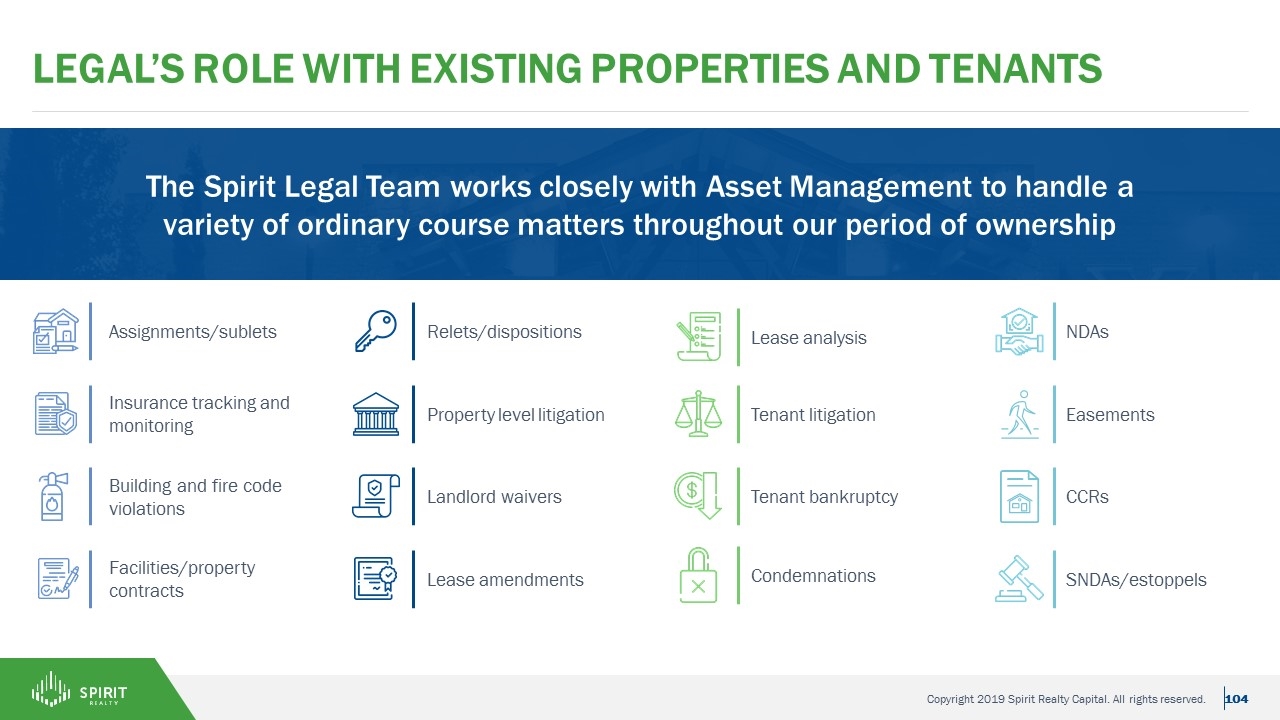
Legal’s role with existing properties and tenants The Spirit Legal Team works closely with Asset Management to handle a variety of ordinary course matters throughout our period of ownership Insurance tracking and monitoring Assignments/sublets Building and fire code violations Facilities/property contracts Property level litigation Relets/dispositions Landlord waivers Lease amendments Tenant litigation Tenant bankruptcy Condemnations Lease analysis Easements NDAs CCRs SNDAs/estoppels
15-minute break Investor Day 2019
Case Study mountain west brands Investor Day 2019
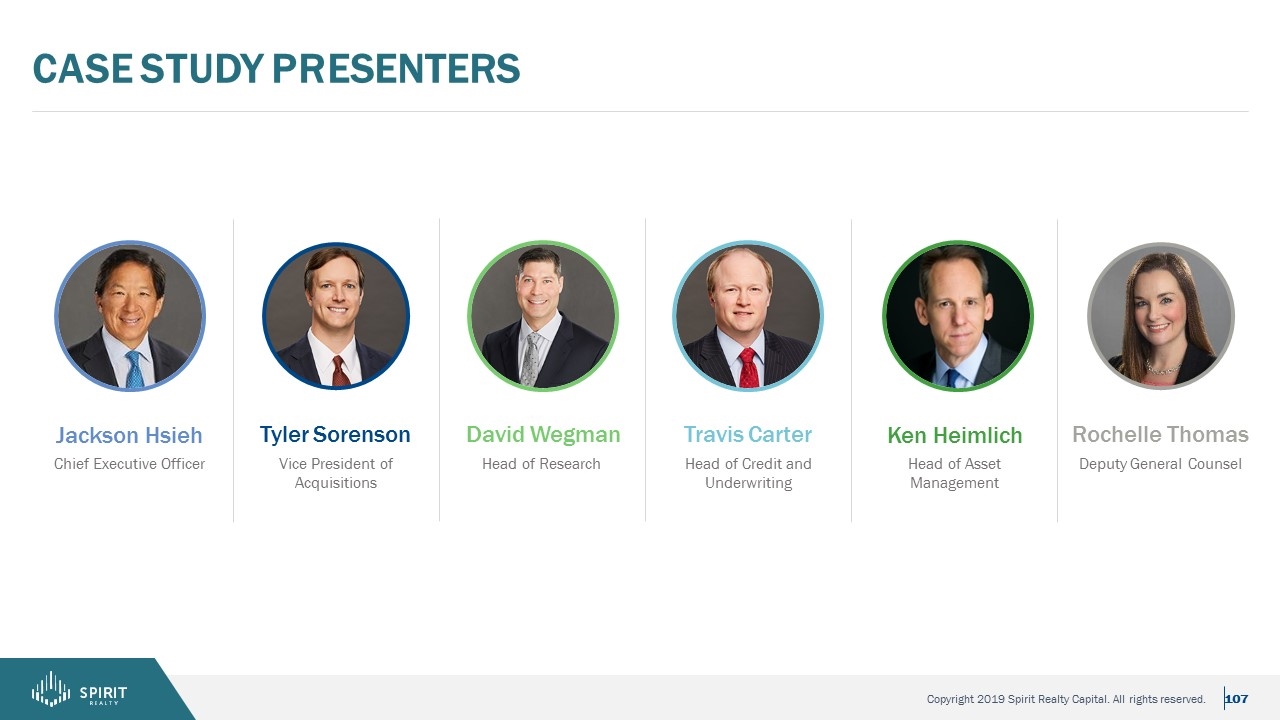
Case Study Presenters Jackson Hsieh Travis Carter David Wegman Rochelle Thomas Ken Heimlich Tyler Sorenson Chief Executive Officer Head of Credit and Underwriting Head of Research Deputy General Counsel Head of Asset Management Vice President of Acquisitions
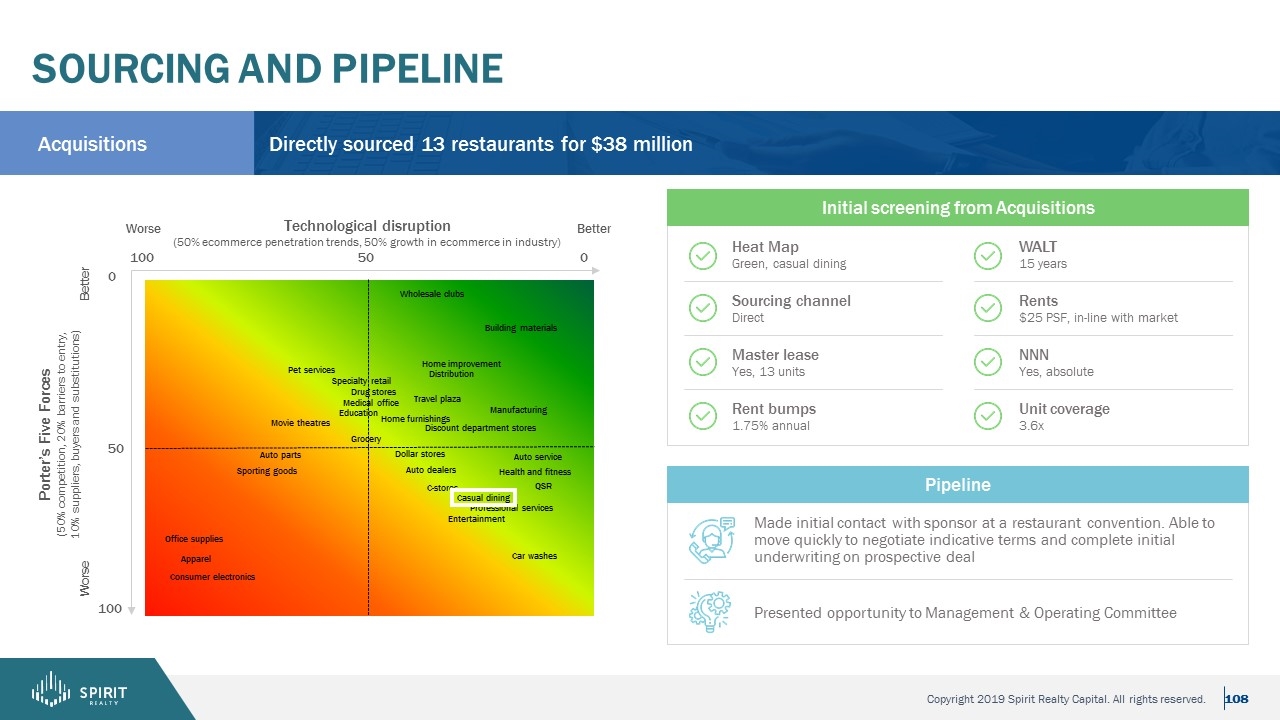
Sourcing and Pipeline Pipeline Made initial contact with sponsor at a restaurant convention. Able to move quickly to negotiate indicative terms and complete initial underwriting on prospective deal Presented opportunity to Management & Operating Committee Initial screening from Acquisitions Acquisitions Directly sourced 13 restaurants for $38 million Heat Map Green, casual dining Sourcing channel Direct Master lease Yes, 13 units Rent bumps 1.75% annual WALT 15 years Rents $25 PSF, in-line with market NNN Yes, absolute Unit coverage 3.6x Porter’s Five Forces (50% competition, 20% barriers to entry, 10% suppliers, buyers and substitutions) Casual dining QSR Movie theatres C-stores Auto service Drug stores Medical office Health and fitness Home furnishings Education Building materials Apparel Specialty retail Home improvement Car washes Manufacturing Auto parts Consumer electronics Pet services Wholesale clubs Office supplies Professional services Technological disruption (50% ecommerce penetration trends, 50% growth in ecommerce in industry) 100 100 50 50 0 0 Sporting goods Auto dealers Dollar stores Grocery Worse Better Better t Travel plaza Worse Discount department stores Entertainment Distribution
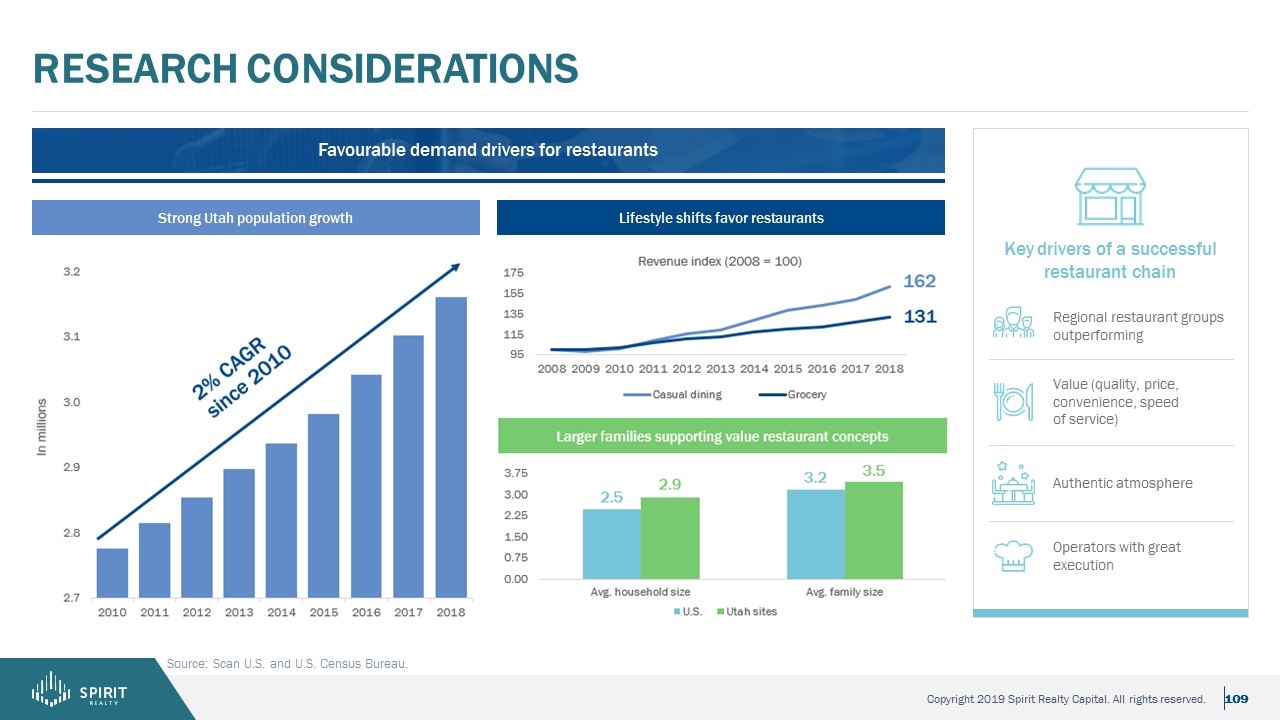
research Considerations Source: Scan U.S. and U.S. Census Bureau. Strong Utah population growth Lifestyle shifts favor restaurants Key drivers of a successful restaurant chain Favourable demand drivers for restaurants Regional restaurant groups outperforming Value (quality, price, convenience, speed of service) Authentic atmosphere Operators with great execution
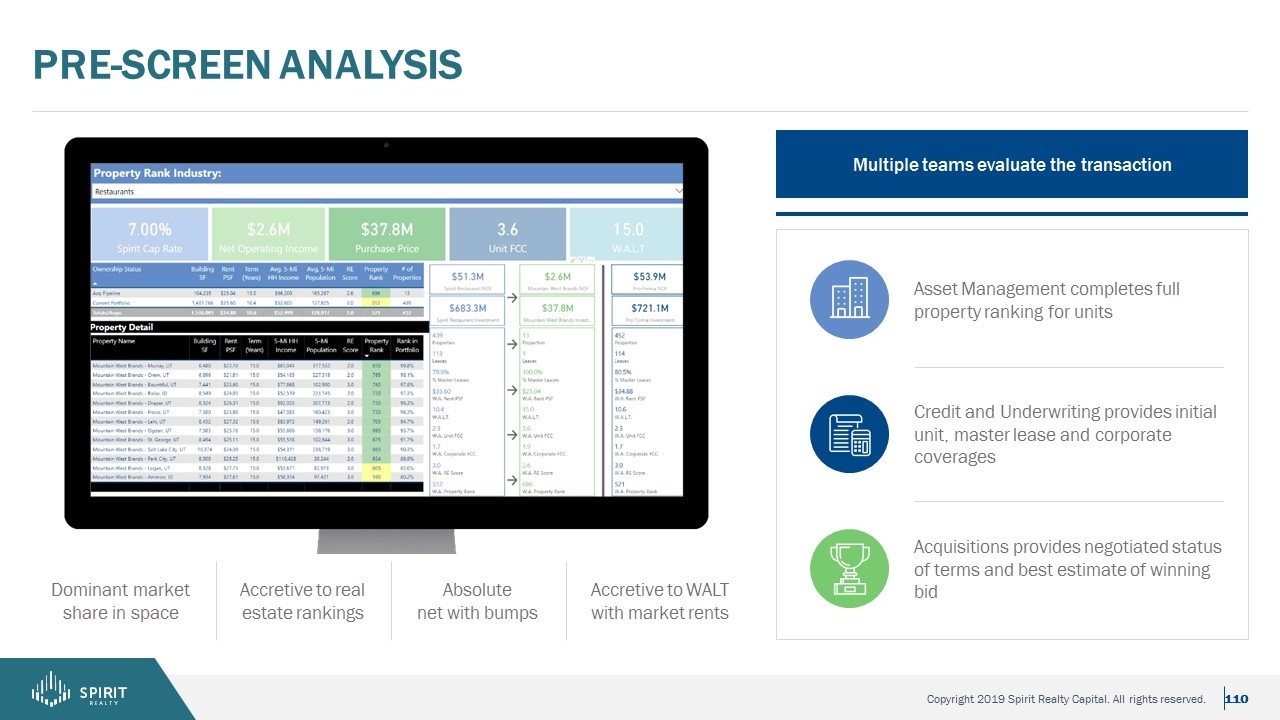
Pre-Screen Analysis Multiple teams evaluate the transaction Asset Management completes full property ranking for units Acquisitions provides negotiated status of terms and best estimate of winning bid Credit and Underwriting provides initial unit, master lease and corporate coverages Dominant market share in space Accretive to real estate rankings Absolute net with bumps Accretive to WALT with market rents
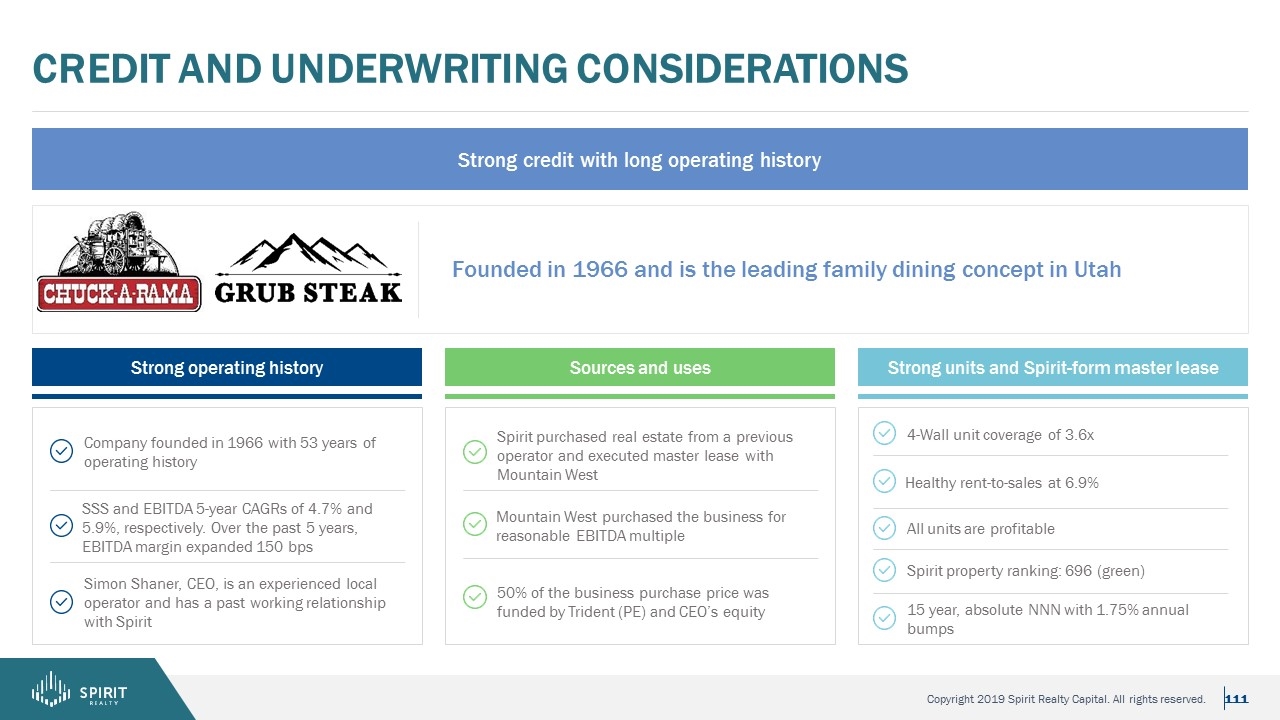
Credit and underwriting Considerations Strong credit with long operating history Founded in 1966 and is the leading family dining concept in Utah Strong operating history Sources and uses Strong units and Spirit-form master lease Company founded in 1966 with 53 years of operating history Simon Shaner, CEO, is an experienced local operator and has a past working relationship with Spirit Spirit purchased real estate from a previous operator and executed master lease with Mountain West 50% of the business purchase price was funded by Trident (PE) and CEO’s equity SSS and EBITDA 5-year CAGRs of 4.7% and 5.9%, respectively. Over the past 5 years, EBITDA margin expanded 150 bps Mountain West purchased the business for reasonable EBITDA multiple 4-Wall unit coverage of 3.6x All units are profitable Healthy rent-to-sales at 6.9% Spirit property ranking: 696 (green) 15 year, absolute NNN with 1.75% annual bumps
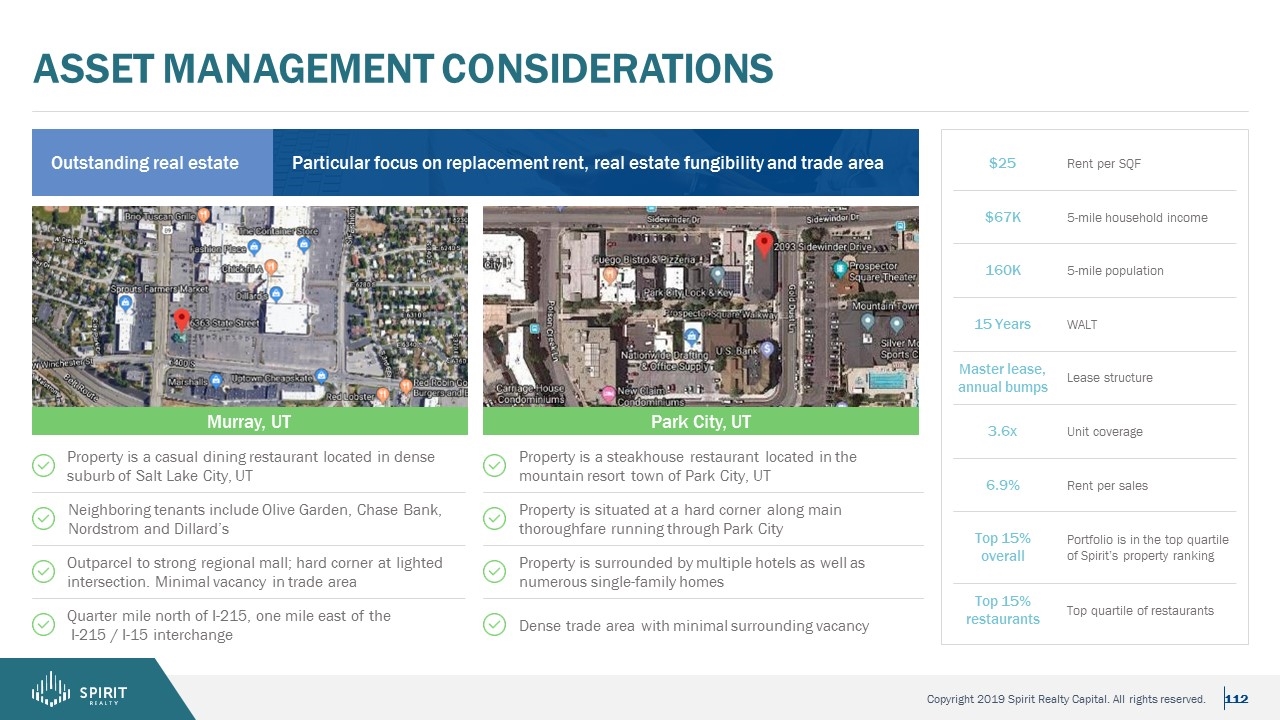
asset management considerations Particular focus on replacement rent, real estate fungibility and trade area Outstanding real estate Rent per SQF 5-mile household income 5-mile population WALT Lease structure Unit coverage Rent per sales Portfolio is in the top quartile of Spirit’s property ranking Top quartile of restaurants Murray, UT Park City, UT Property is a casual dining restaurant located in dense suburb of Salt Lake City, UT Outparcel to strong regional mall; hard corner at lighted intersection. Minimal vacancy in trade area Neighboring tenants include Olive Garden, Chase Bank, Nordstrom and Dillard’s Quarter mile north of I-215, one mile east of the I-215 / I-15 interchange Property is a steakhouse restaurant located in the mountain resort town of Park City, UT Property is situated at a hard corner along main thoroughfare running through Park City Property is surrounded by multiple hotels as well as numerous single-family homes Dense trade area with minimal surrounding vacancy $25 $67K 160K 15 Years Master lease, annual bumps 3.6x 6.9% Top 15% overall Top 15% restaurants
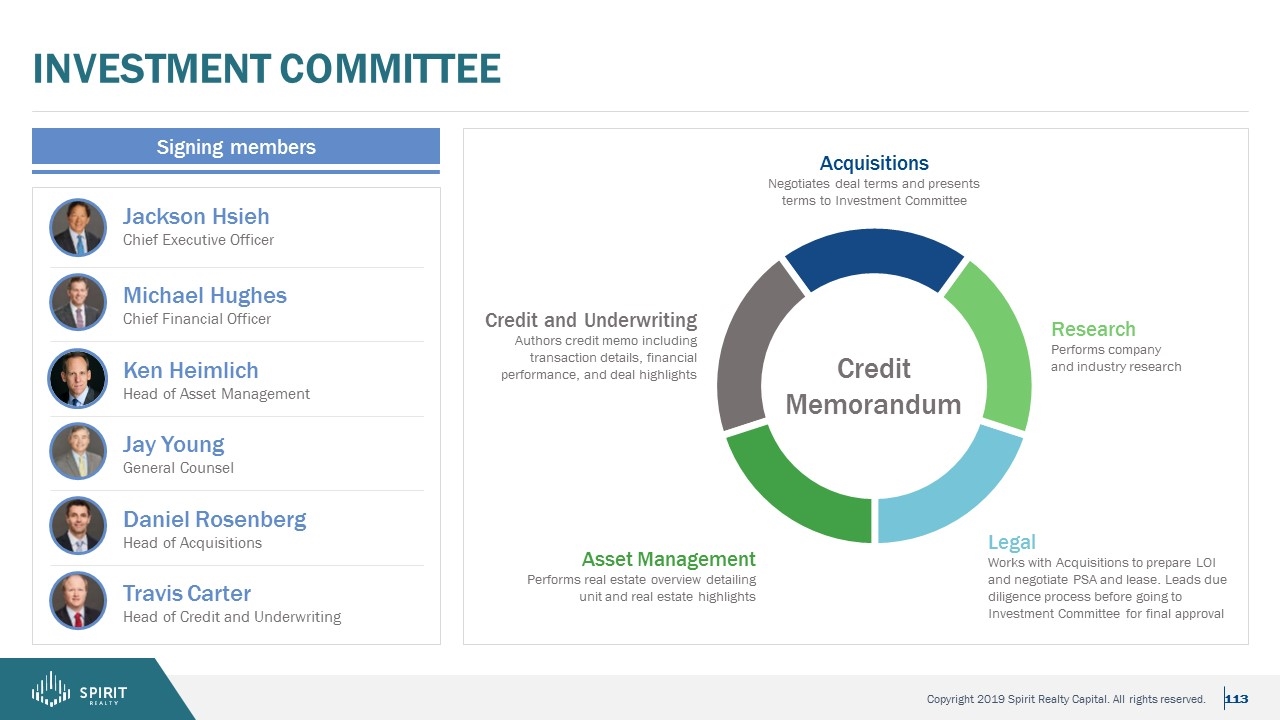
Investment Committee Signing members Jackson Hsieh Chief Executive Officer Michael Hughes Chief Financial Officer Ken Heimlich Head of Asset Management Jay Young General Counsel Daniel Rosenberg Head of Acquisitions Travis Carter Head of Credit and Underwriting Credit Memorandum Acquisitions Negotiates deal terms and presents terms to Investment Committee Research Performs company and industry research Credit and Underwriting Authors credit memo including transaction details, financial performance, and deal highlights Asset Management Performs real estate overview detailing unit and real estate highlights Legal Works with Acquisitions to prepare LOI and negotiate PSA and lease. Leads due diligence process before going to Investment Committee for final approval
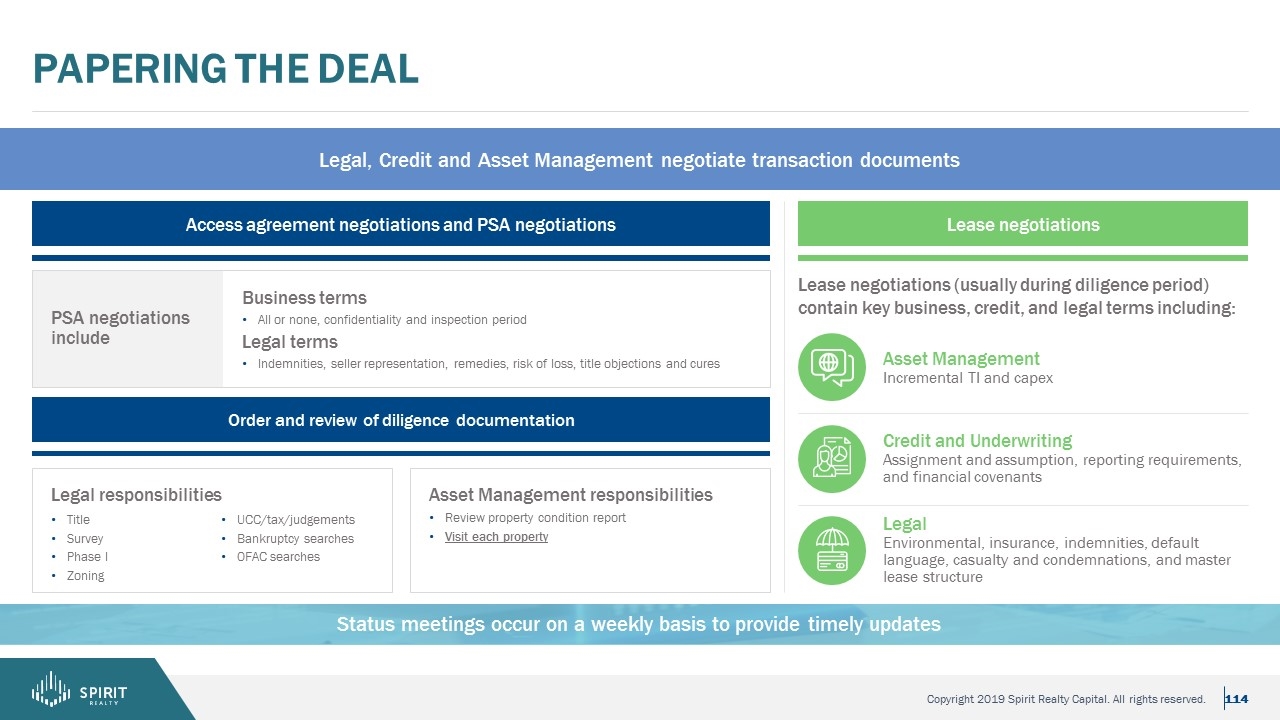
Papering the deal Status meetings occur on a weekly basis to provide timely updates Legal, Credit and Asset Management negotiate transaction documents Access agreement negotiations and PSA negotiations Lease negotiations PSA negotiations include Business terms All or none, confidentiality and inspection period Legal terms Indemnities, seller representation, remedies, risk of loss, title objections and cures Order and review of diligence documentation Legal responsibilities Title Survey Phase I Zoning UCC/tax/judgements Bankruptcy searches OFAC searches Asset Management responsibilities Review property condition report Visit each property Lease negotiations (usually during diligence period) contain key business, credit, and legal terms including: Asset Management Incremental TI and capex Credit and Underwriting Assignment and assumption, reporting requirements, and financial covenants Legal Environmental, insurance, indemnities, default language, casualty and condemnations, and master lease structure
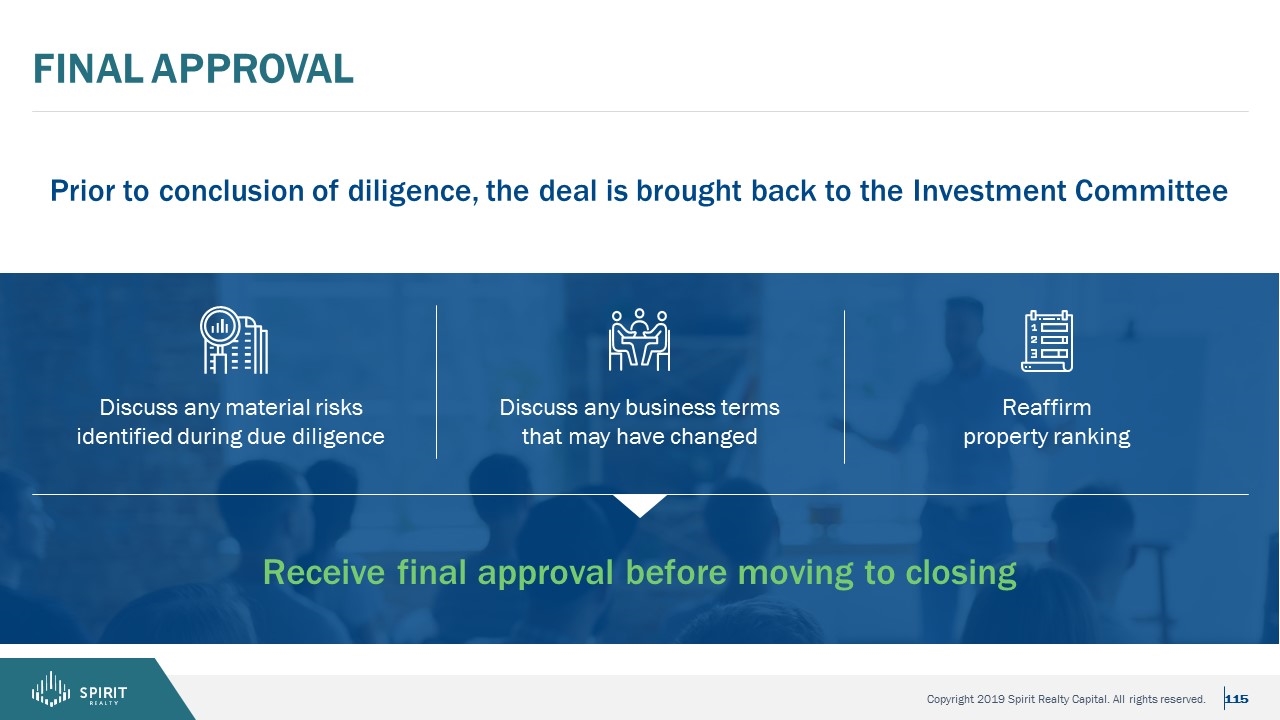
Final approval Discuss any material risks identified during due diligence Discuss any business terms that may have changed Reaffirm property ranking Prior to conclusion of diligence, the deal is brought back to the Investment Committee Receive final approval before moving to closing
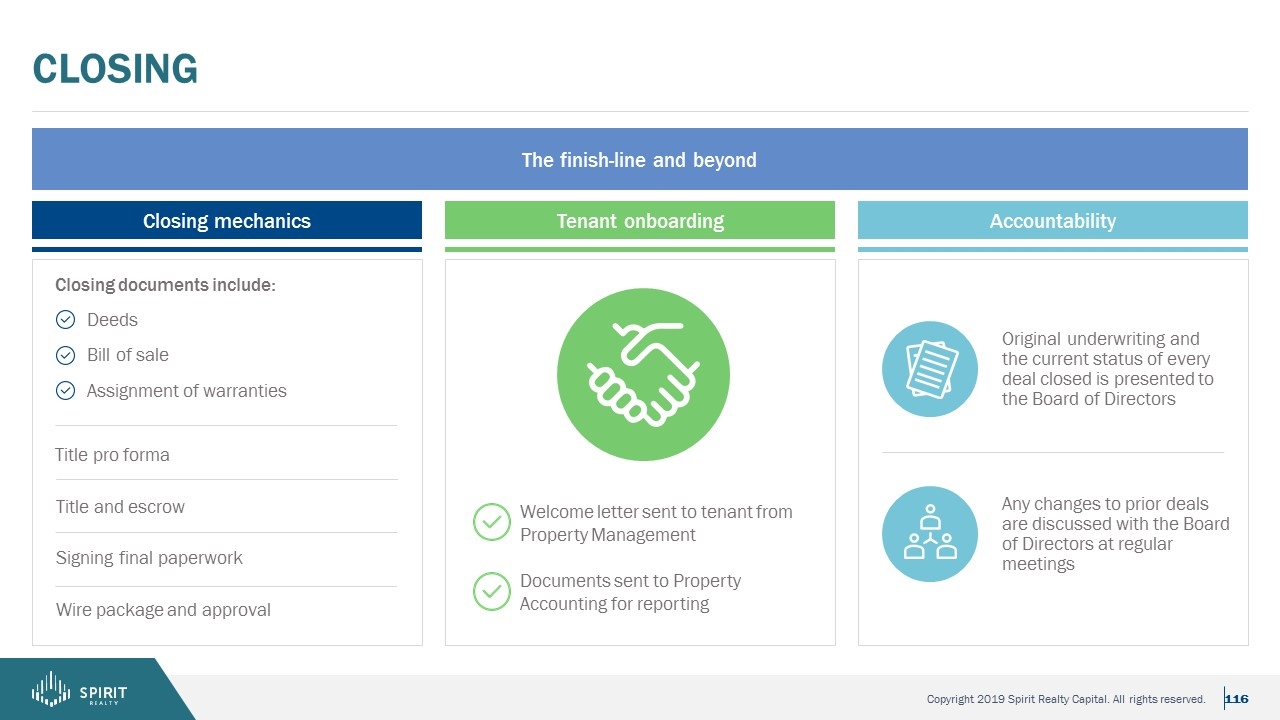
Original underwriting and the current status of every deal closed is presented to the Board of Directors Any changes to prior deals are discussed with the Board of Directors at regular meetings Closing Closing mechanics Tenant onboarding Accountability Deeds Closing documents include: Bill of sale Assignment of warranties Wire package and approval Title and escrow Title pro forma Signing final paperwork Welcome letter sent to tenant from Property Management Documents sent to Property Accounting for reporting The finish-line and beyond
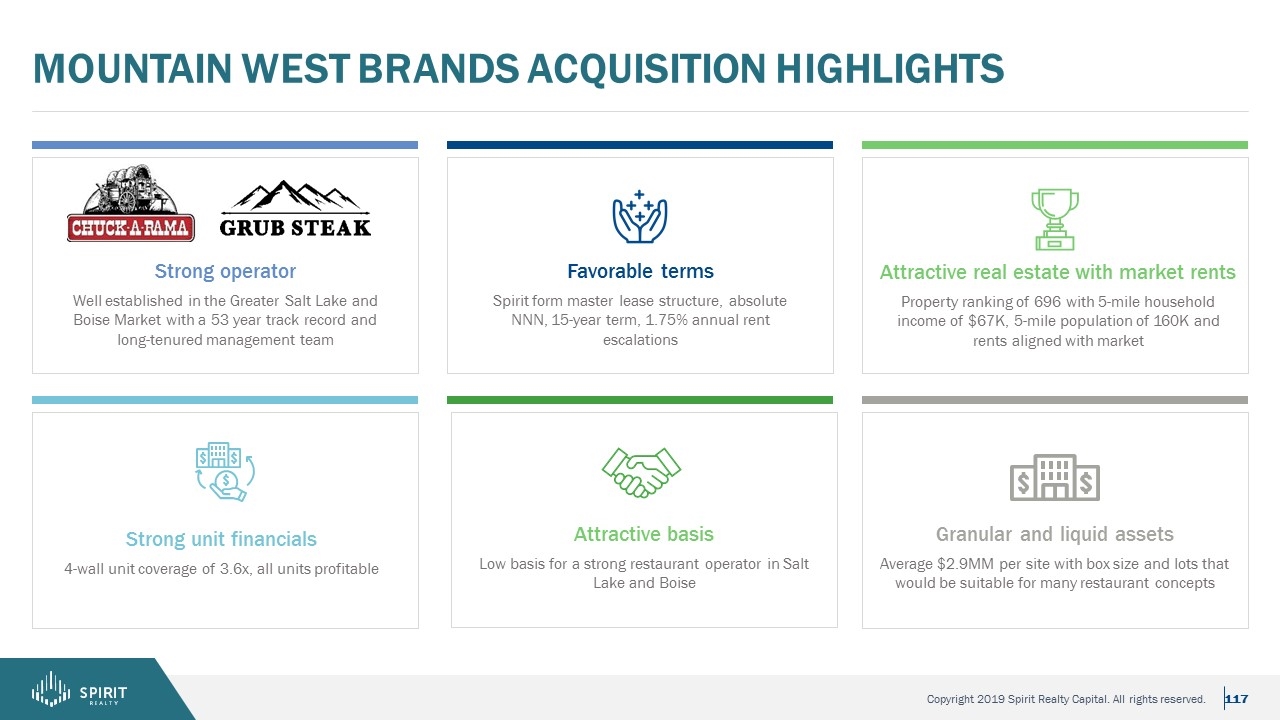
Strong operator Well established in the Greater Salt Lake and Boise Market with a 53 year track record and long-tenured management team mountain west brands acquisition highlights Favorable terms Spirit form master lease structure, absolute NNN, 15-year term, 1.75% annual rent escalations Attractive real estate with market rents Property ranking of 696 with 5-mile household income of $67K, 5-mile population of 160K and rents aligned with market Strong unit financials 4-wall unit coverage of 3.6x, all units profitable Granular and liquid assets Average $2.9MM per site with box size and lots that would be suitable for many restaurant concepts Attractive basis Low basis for a strong restaurant operator in Salt Lake and Boise
Case Study Amscan (PARTY CITY) Investor Day 2019
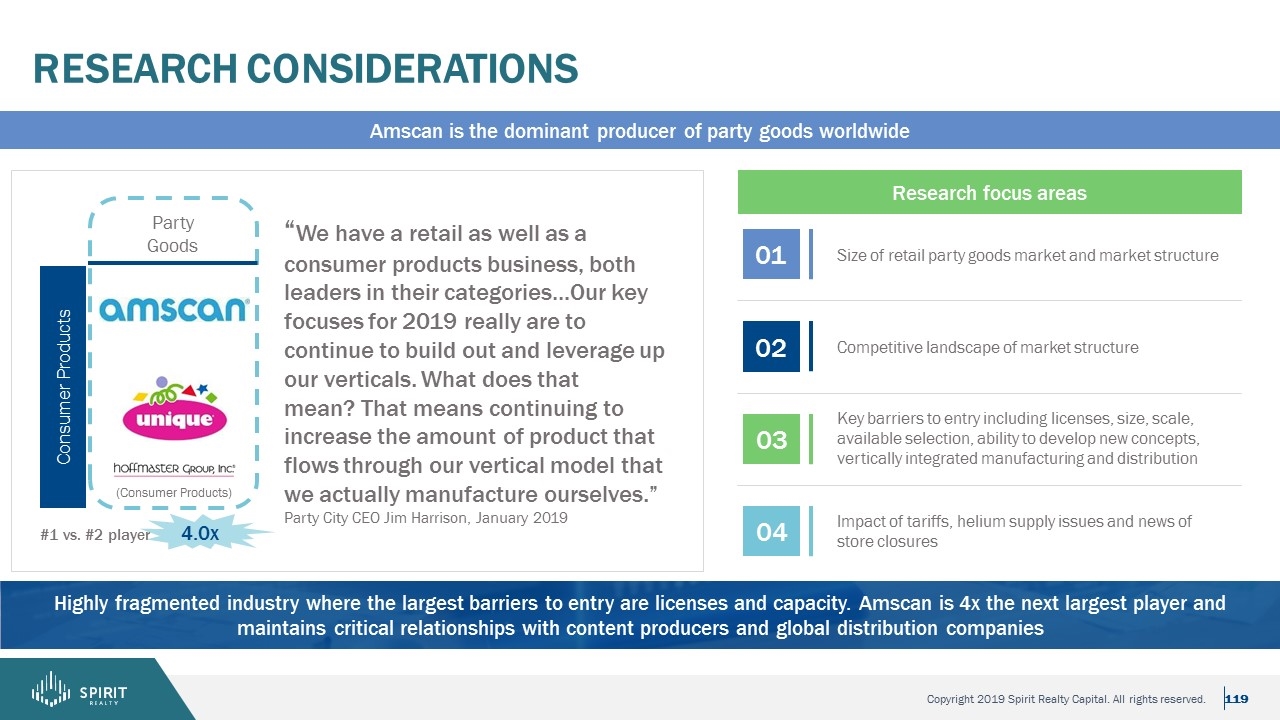
Research Considerations Size of retail party goods market and market structure Competitive landscape of market structure Key barriers to entry including licenses, size, scale, available selection, ability to develop new concepts, vertically integrated manufacturing and distribution 01 02 03 Research focus areas Highly fragmented industry where the largest barriers to entry are licenses and capacity. Amscan is 4x the next largest player and maintains critical relationships with content producers and global distribution companies Amscan is the dominant producer of party goods worldwide Impact of tariffs, helium supply issues and news of store closures 04 “We have a retail as well as a consumer products business, both leaders in their categories…Our key focuses for 2019 really are to continue to build out and leverage up our verticals. What does that mean? That means continuing to increase the amount of product that flows through our vertical model that we actually manufacture ourselves.” Party City CEO Jim Harrison, January 2019 Party Goods Consumer Products (Consumer Products) #1 vs. #2 player 4.0x
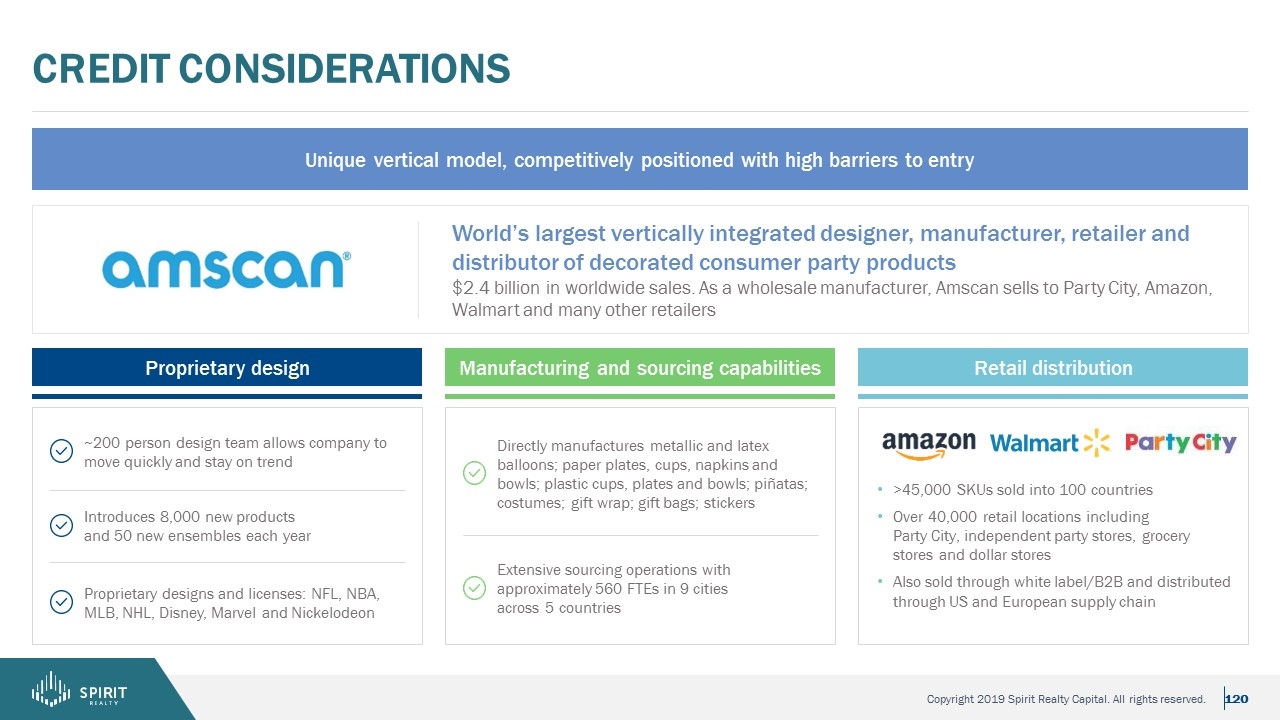
Credit considerations Unique vertical model, competitively positioned with high barriers to entry World’s largest vertically integrated designer, manufacturer, retailer and distributor of decorated consumer party products $2.4 billion in worldwide sales. As a wholesale manufacturer, Amscan sells to Party City, Amazon, Walmart and many other retailers Proprietary design Manufacturing and sourcing capabilities Retail distribution >45,000 SKUs sold into 100 countries Over 40,000 retail locations including Party City, independent party stores, grocery stores and dollar stores Also sold through white label/B2B and distributed through US and European supply chain ~200 person design team allows company to move quickly and stay on trend Introduces 8,000 new products and 50 new ensembles each year Proprietary designs and licenses: NFL, NBA, MLB, NHL, Disney, Marvel and Nickelodeon Directly manufactures metallic and latex balloons; paper plates, cups, napkins and bowls; plastic cups, plates and bowls; piñatas; costumes; gift wrap; gift bags; stickers Extensive sourcing operations with approximately 560 FTEs in 9 cities across 5 countries
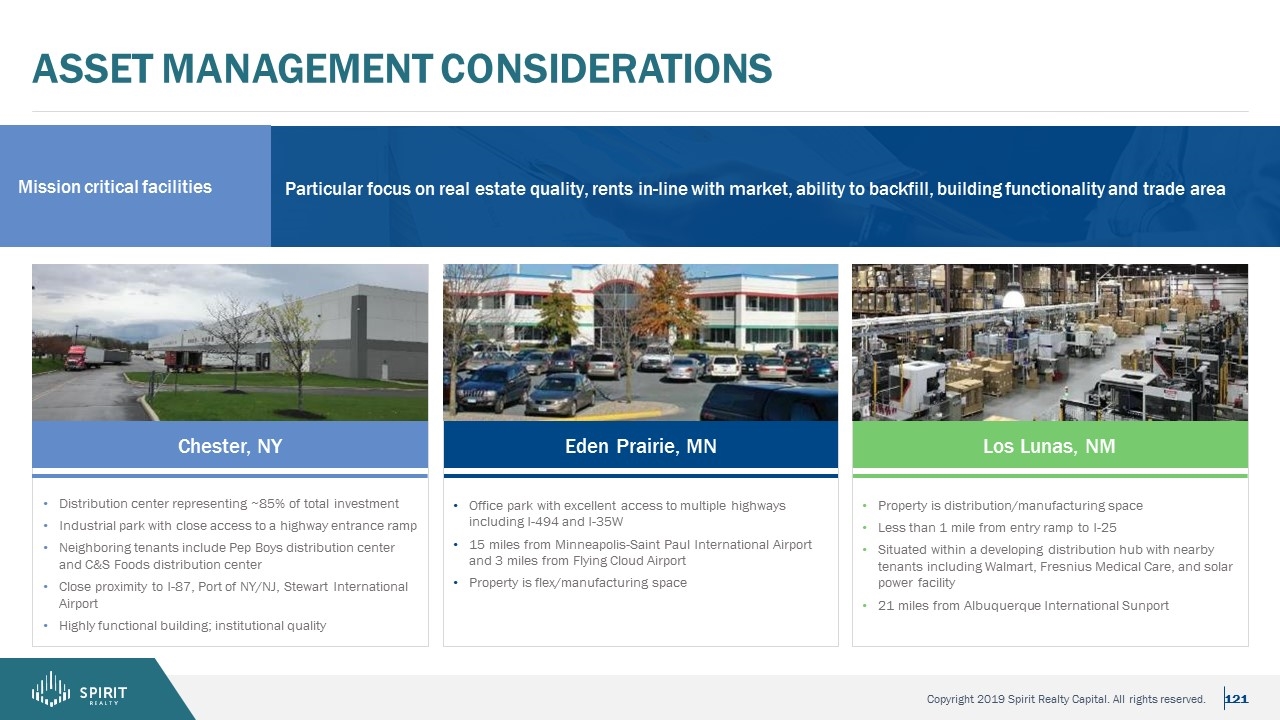
Distribution center representing ~85% of total investment Industrial park with close access to a highway entrance ramp Neighboring tenants include Pep Boys distribution center and C&S Foods distribution center Close proximity to I-87, Port of NY/NJ, Stewart International Airport Highly functional building; institutional quality Asset Management Considerations Particular focus on real estate quality, rents in-line with market, ability to backfill, building functionality and trade area Chester, NY Eden Prairie, MN Los Lunas, NM Office park with excellent access to multiple highways including I-494 and I-35W 15 miles from Minneapolis-Saint Paul International Airport and 3 miles from Flying Cloud Airport Property is flex/manufacturing space Property is distribution/manufacturing space Less than 1 mile from entry ramp to I-25 Situated within a developing distribution hub with nearby tenants including Walmart, Fresnius Medical Care, and solar power facility 21 miles from Albuquerque International Sunport Mission critical facilities
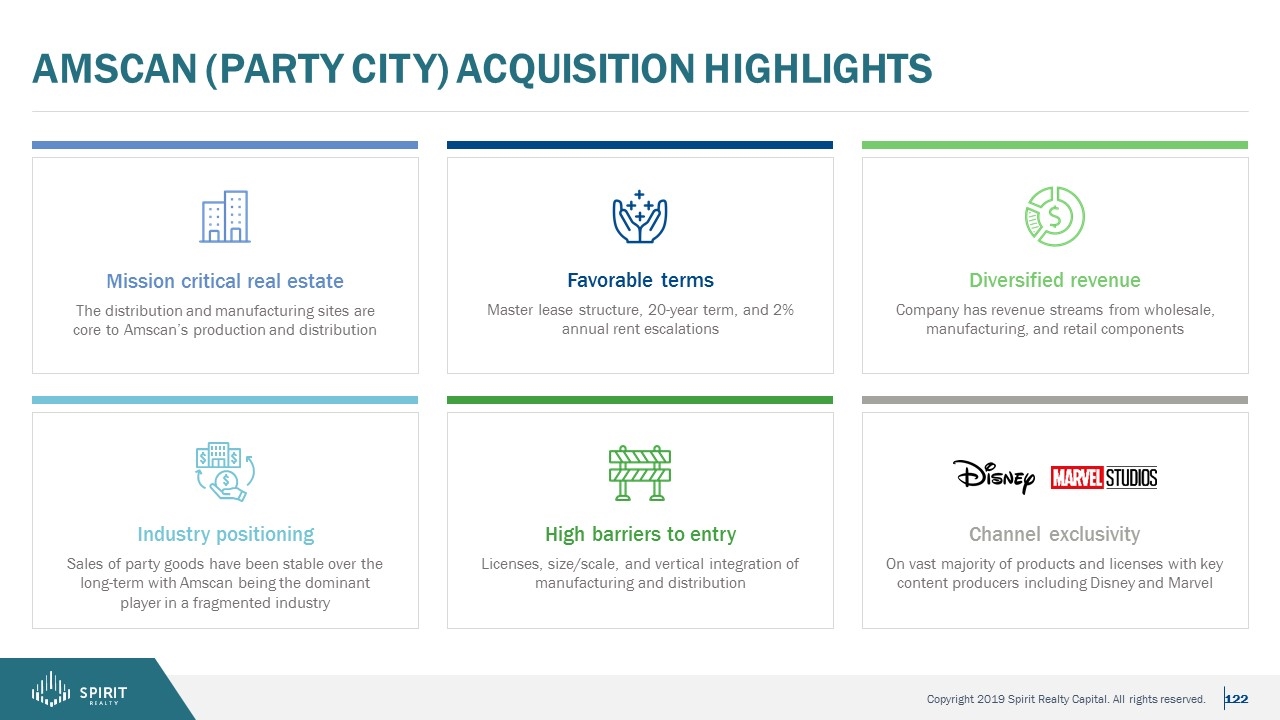
Mission critical real estate The distribution and manufacturing sites are core to Amscan’s production and distribution Amscan (Party City) acquisition highlights Favorable terms Master lease structure, 20-year term, and 2% annual rent escalations Diversified revenue Company has revenue streams from wholesale, manufacturing, and retail components Industry positioning Sales of party goods have been stable over the long-term with Amscan being the dominant player in a fragmented industry High barriers to entry Licenses, size/scale, and vertical integration of manufacturing and distribution Channel exclusivity On vast majority of products and licenses with key content producers including Disney and Marvel
governance, social and environmental Investor Day 2019
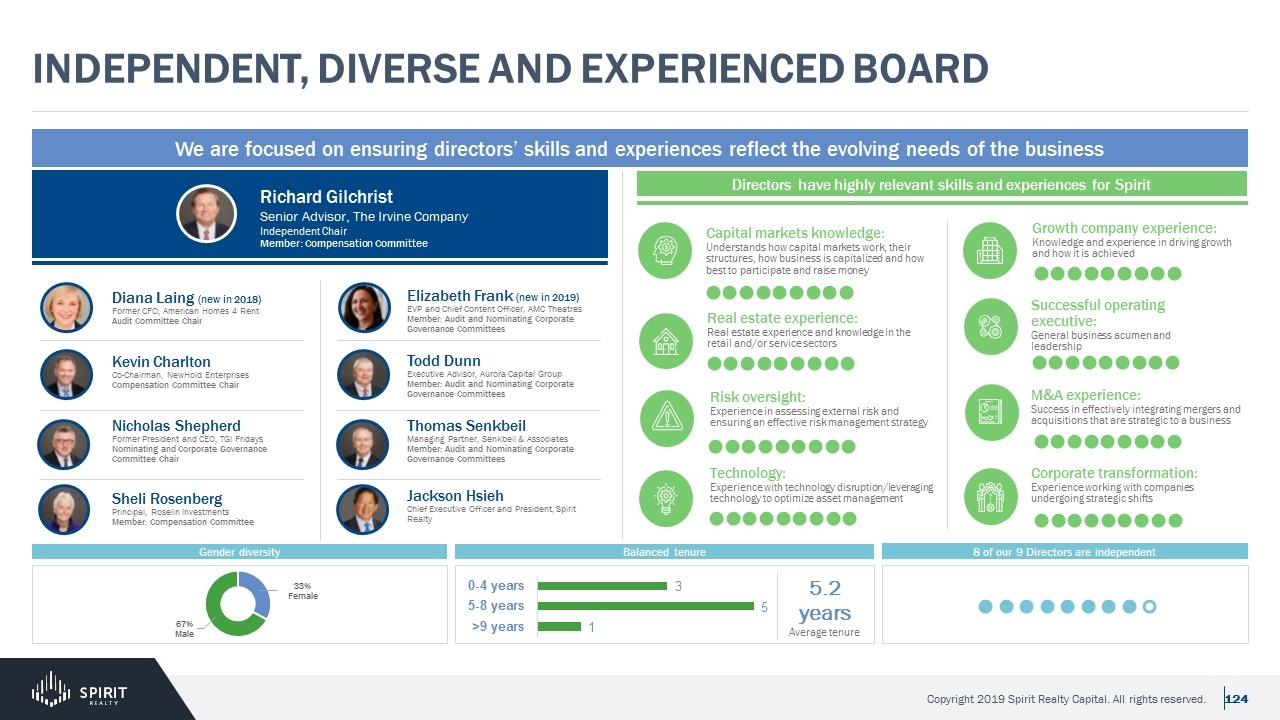
Independent, Diverse and Experienced Board Richard Gilchrist Senior Advisor, The Irvine Company Independent Chair Member: Compensation Committee Diana Laing (new in 2018) Former CFO, American Homes 4 Rent Audit Committee Chair Todd Dunn Executive Advisor, Aurora Capital Group Member: Audit and Nominating Corporate Governance Committees Jackson Hsieh Chief Executive Officer and President, Spirit Realty Elizabeth Frank (new in 2019) EVP and Chief Content Officer, AMC Theatres Member: Audit and Nominating Corporate Governance Committees Thomas Senkbeil Managing Partner, Senkbeil & Associates Member: Audit and Nominating Corporate Governance Committees Kevin Charlton Co-Chairman, NewHold Enterprises Compensation Committee Chair Sheli Rosenberg Principal, Roselin Investments Member: Compensation Committee Nicholas Shepherd Former President and CEO, TGI Fridays Nominating and Corporate Governance Committee Chair We are focused on ensuring directors’ skills and experiences reflect the evolving needs of the business Balanced tenure 8 of our 9 Directors are independent Gender diversity 5.2 years Average tenure Directors have highly relevant skills and experiences for Spirit Successful operating executive: General business acumen and leadership Real estate experience: Real estate experience and knowledge in the retail and/or service sectors M&A experience: Success in effectively integrating mergers and acquisitions that are strategic to a business Risk oversight: Experience in assessing external risk and ensuring an effective risk management strategy Technology: Experience with technology disruption/leveraging technology to optimize asset management Corporate transformation: Experience working with companies undergoing strategic shifts Growth company experience: Knowledge and experience in driving growth and how it is achieved Capital markets knowledge: Understands how capital markets work, their structures, how business is capitalized and how best to participate and raise money
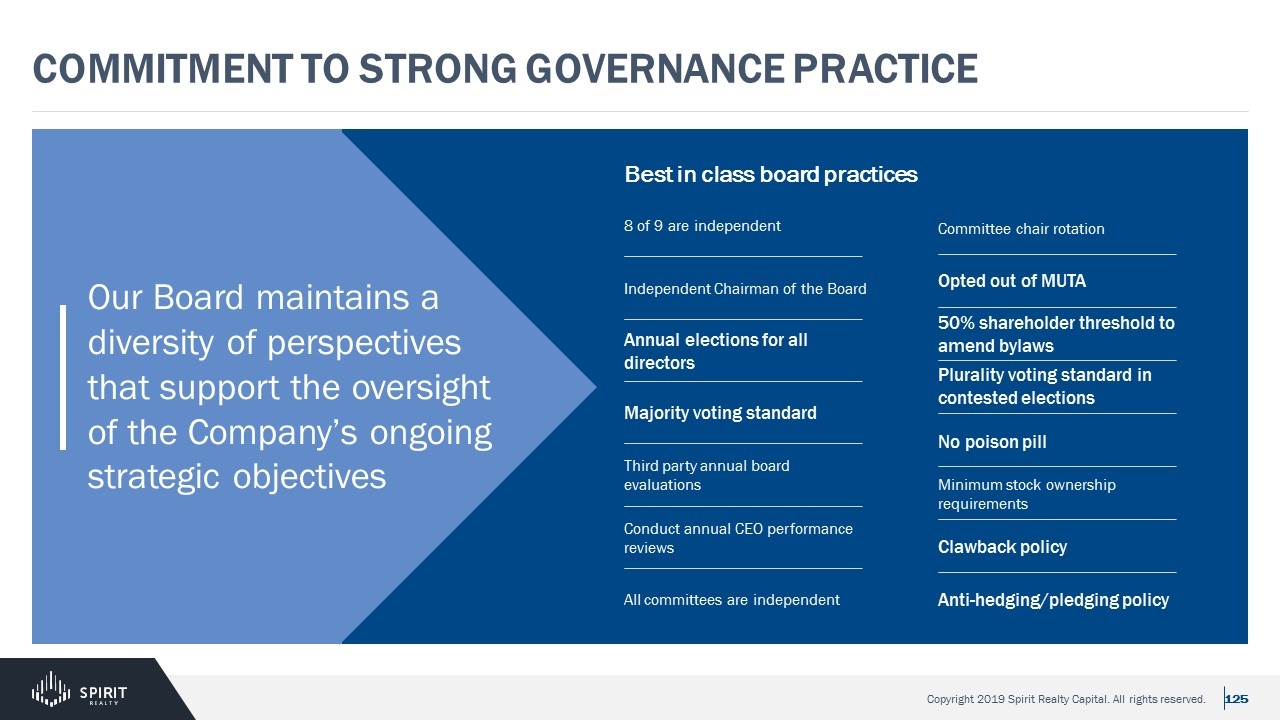
Commitment to strong governance practice Our Board maintains a diversity of perspectives that support the oversight of the Company’s ongoing strategic objectives Best in class board practices 8 of 9 are independent Independent Chairman of the Board Annual elections for all directors Majority voting standard Third party annual board evaluations Conduct annual CEO performance reviews All committees are independent Committee chair rotation Opted out of MUTA 50% shareholder threshold to amend bylaws No poison pill Minimum stock ownership requirements Plurality voting standard in contested elections Clawback policy Anti-hedging/pledging policy
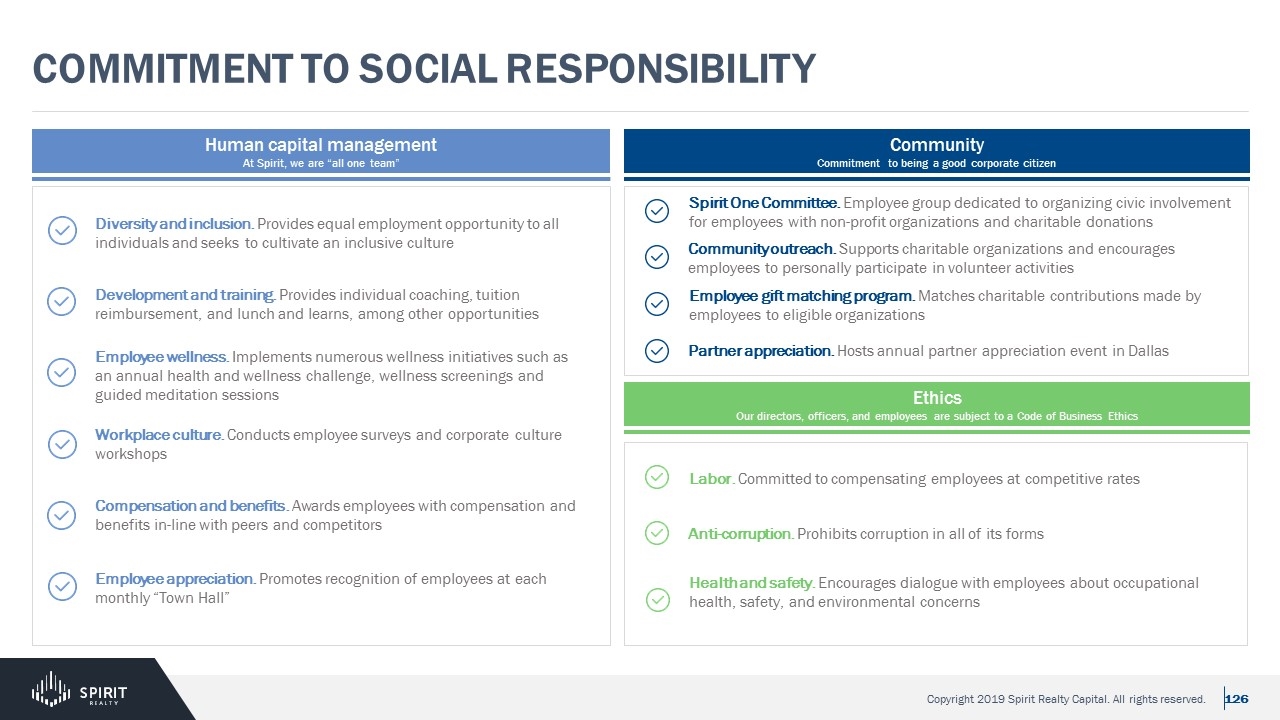
Commitment to Social Responsibility Community Commitment to being a good corporate citizen Workplace culture. Conducts employee surveys and corporate culture workshops Diversity and inclusion. Provides equal employment opportunity to all individuals and seeks to cultivate an inclusive culture Development and training. Provides individual coaching, tuition reimbursement, and lunch and learns, among other opportunities Employee wellness. Implements numerous wellness initiatives such as an annual health and wellness challenge, wellness screenings and guided meditation sessions Compensation and benefits. Awards employees with compensation and benefits in-line with peers and competitors Employee appreciation. Promotes recognition of employees at each monthly “Town Hall” Human capital management At Spirit, we are “all one team” Ethics Our directors, officers, and employees are subject to a Code of Business Ethics Spirit One Committee. Employee group dedicated to organizing civic involvement for employees with non-profit organizations and charitable donations Community outreach. Supports charitable organizations and encourages employees to personally participate in volunteer activities Employee gift matching program. Matches charitable contributions made by employees to eligible organizations Partner appreciation. Hosts annual partner appreciation event in Dallas Labor. Committed to compensating employees at competitive rates Anti-corruption. Prohibits corruption in all of its forms Health and safety. Encourages dialogue with employees about occupational health, safety, and environmental concerns
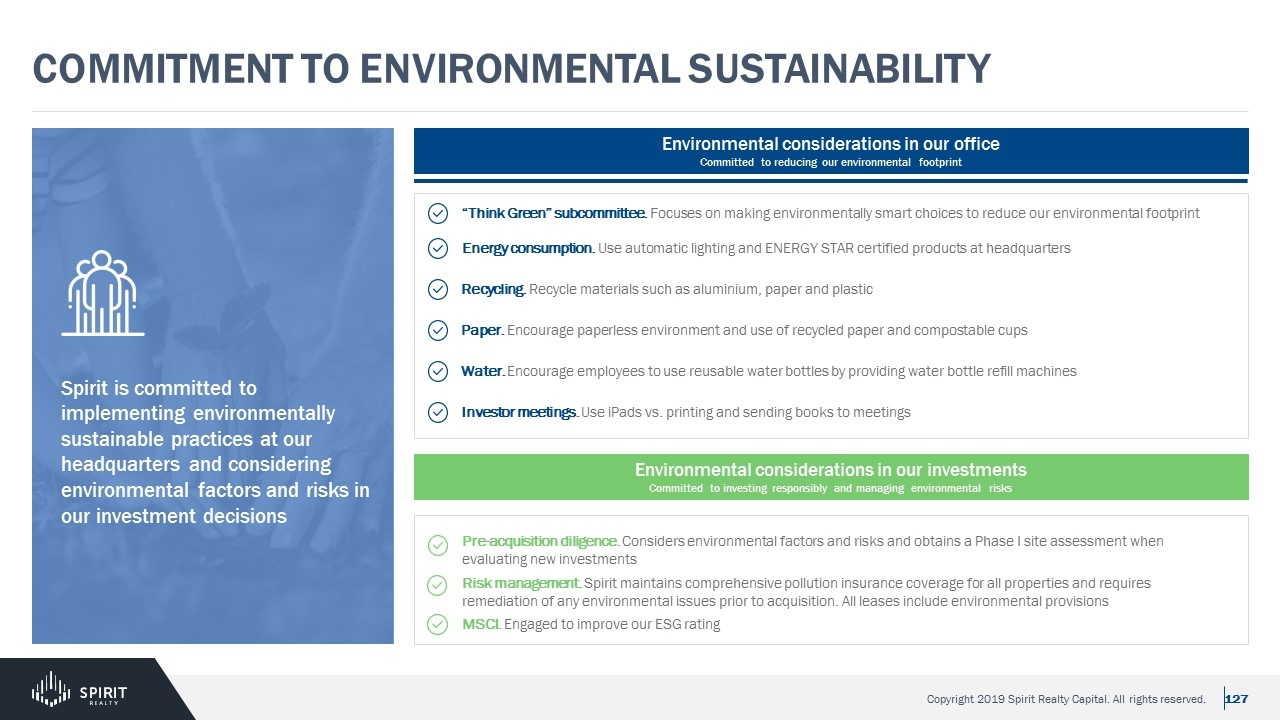
Commitment to Environmental Sustainability Spirit is committed to implementing environmentally sustainable practices at our headquarters and considering environmental factors and risks in our investment decisions Environmental considerations in our office Committed to reducing our environmental footprint “Think Green” subcommittee. Focuses on making environmentally smart choices to reduce our environmental footprint Energy consumption. Use automatic lighting and ENERGY STAR certified products at headquarters Pre-acquisition diligence. Considers environmental factors and risks and obtains a Phase I site assessment when evaluating new investments Risk management. Spirit maintains comprehensive pollution insurance coverage for all properties and requires remediation of any environmental issues prior to acquisition. All leases include environmental provisions MSCI. Engaged to improve our ESG rating Recycling. Recycle materials such as aluminium, paper and plastic Paper. Encourage paperless environment and use of recycled paper and compostable cups Water. Encourage employees to use reusable water bottles by providing water bottle refill machines Investor meetings. Use iPads vs. printing and sending books to meetings Environmental considerations in our investments Committed to investing responsibly and managing environmental risks
Financial Outlook Investor Day 2019

Finance and Accounting Team Michael Hughes Chief Financial Officer Pierre Revol Head of Strategic Planning and Investor Relations Finance Colin Lane Head of IT Information Technology Carl Wade Treasurer Treasury Prakash Parag Chief Accounting Officer Accounting Pam Golden Head of Tax Tax
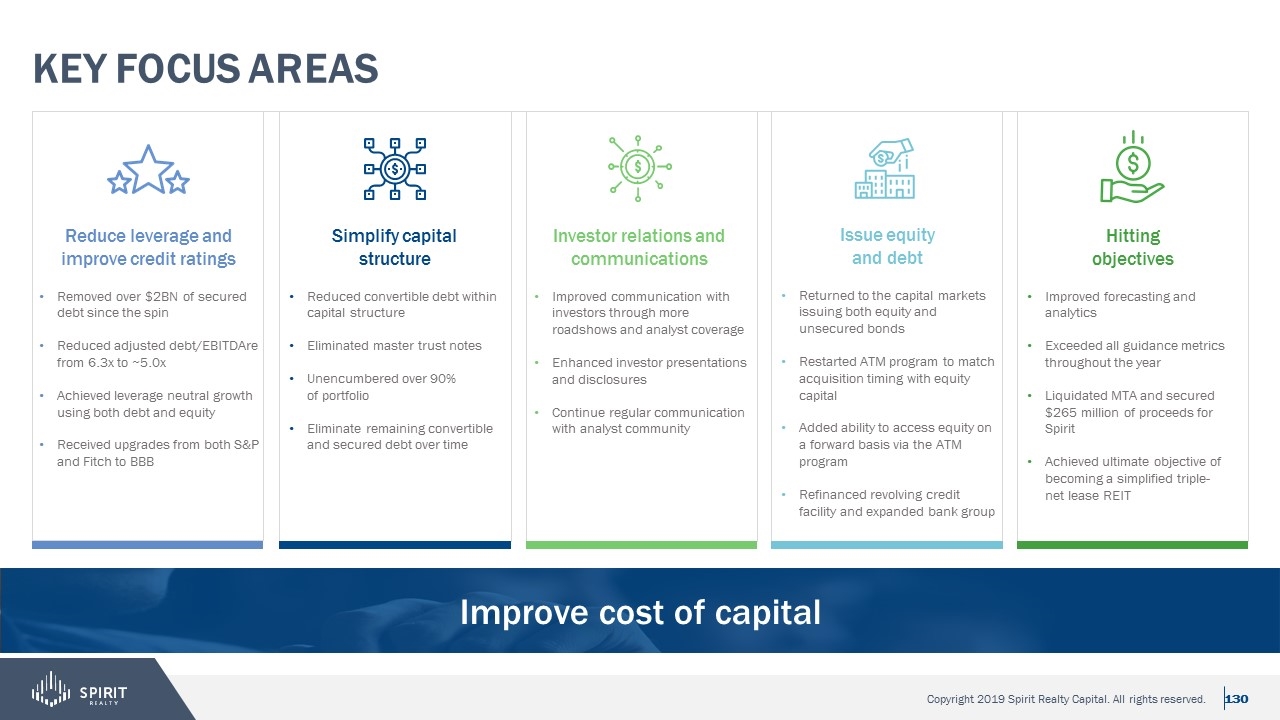
Key focus areas Reduce leverage and improve credit ratings Issue equity and debt Simplify capital structure Hitting objectives Removed over $2BN of secured debt since the spin Reduced adjusted debt/EBITDAre from 6.3x to ~5.0x Achieved leverage neutral growth using both debt and equity Received upgrades from both S&P and Fitch to BBB Returned to the capital markets issuing both equity and unsecured bonds Restarted ATM program to match acquisition timing with equity capital Added ability to access equity on a forward basis via the ATM program Refinanced revolving credit facility and expanded bank group Reduced convertible debt within capital structure Eliminated master trust notes Unencumbered over 90% of portfolio Eliminate remaining convertible and secured debt over time Improved forecasting and analytics Exceeded all guidance metrics throughout the year Liquidated MTA and secured $265 million of proceeds for Spirit Achieved ultimate objective of becoming a simplified triple-net lease REIT Investor relations and communications Improved communication with investors through more roadshows and analyst coverage Enhanced investor presentations and disclosures Continue regular communication with analyst community Improve cost of capital
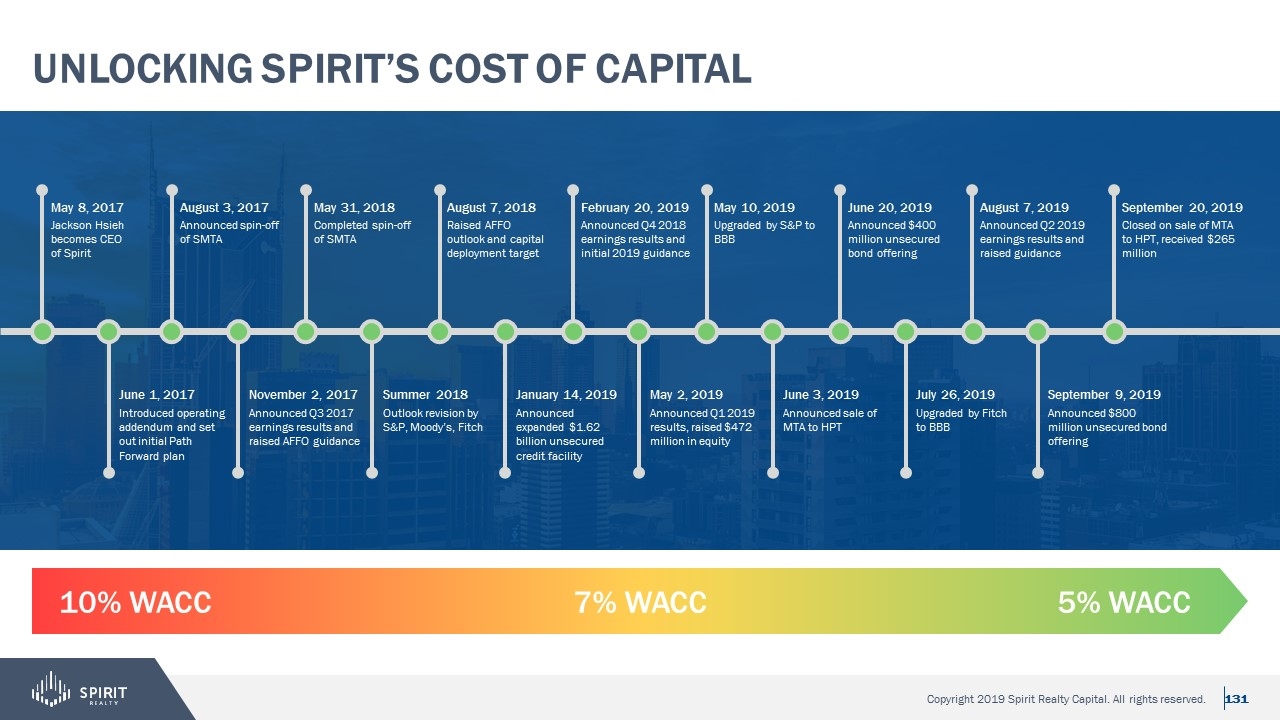
Unlocking Spirit’s Cost of Capital 10% WACC 7% WACC 5% WACC May 8, 2017 Jackson Hsieh becomes CEO of Spirit June 1, 2017 Introduced operating addendum and set out initial Path Forward plan August 3, 2017 Announced spin-off of SMTA November 2, 2017 Announced Q3 2017 earnings results and raised AFFO guidance May 31, 2018 Completed spin-off of SMTA Summer 2018 Outlook revision by S&P, Moody’s, Fitch August 7, 2018 Raised AFFO outlook and capital deployment target January 14, 2019 Announced expanded $1.62 billion unsecured credit facility February 20, 2019 Announced Q4 2018 earnings results and initial 2019 guidance May 2, 2019 Announced Q1 2019 results, raised $472 million in equity May 10, 2019 Upgraded by S&P to BBB June 3, 2019 Announced sale of MTA to HPT June 20, 2019 Announced $400 million unsecured bond offering July 26, 2019 Upgraded by Fitch to BBB August 7, 2019 Announced Q2 2019 earnings results and raised guidance September 9, 2019 Announced $800 million unsecured bond offering September 20, 2019 Closed on sale of MTA to HPT, received $265 million
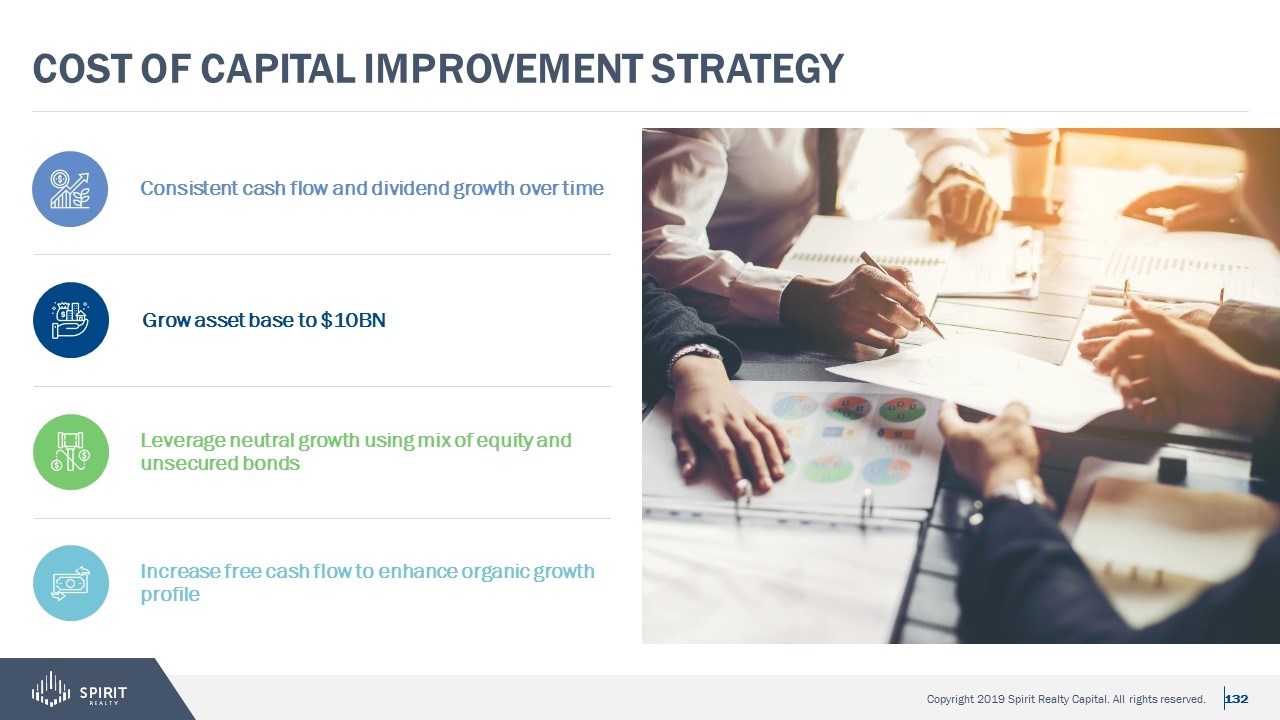
Cost of capital improvement Strategy Consistent cash flow and dividend growth over time Grow asset base to $10BN Leverage neutral growth using mix of equity and unsecured bonds Increase free cash flow to enhance organic growth profile
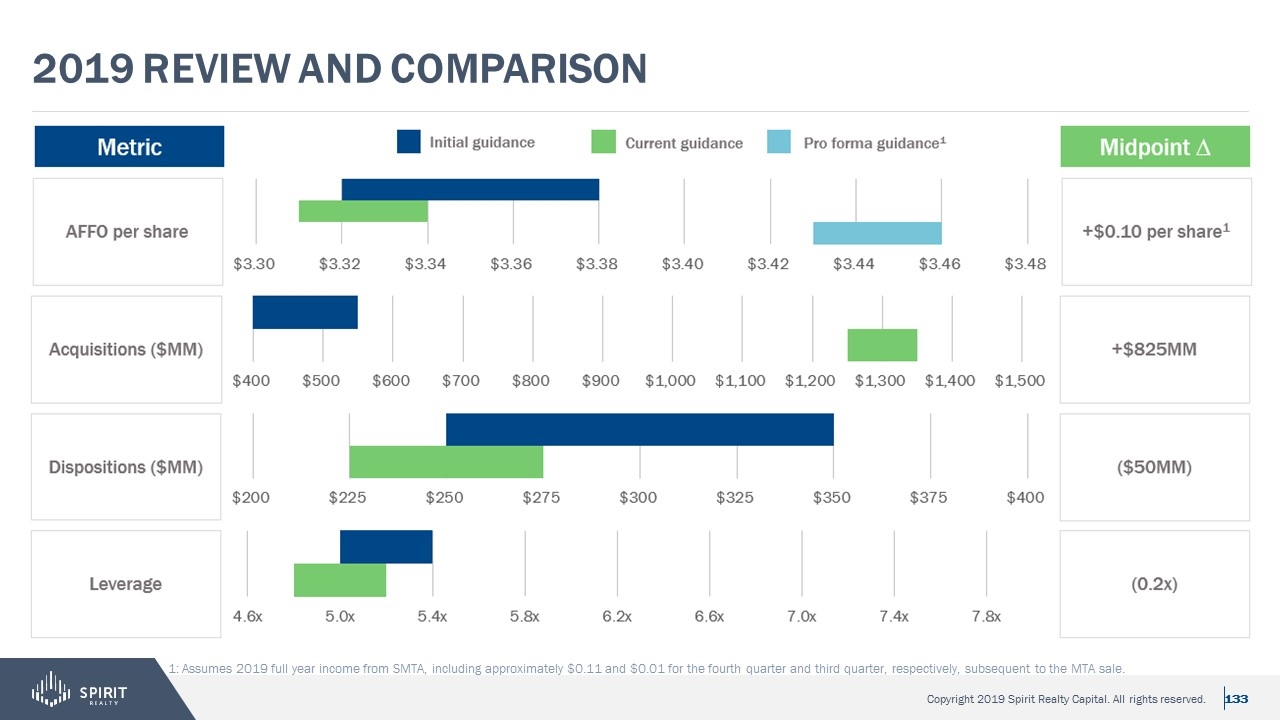
2019 review and comparison 1: Assumes 2019 full year income from SMTA, including approximately $0.11 and $0.01 for the fourth quarter and third quarter, respectively, subsequent to the MTA sale.
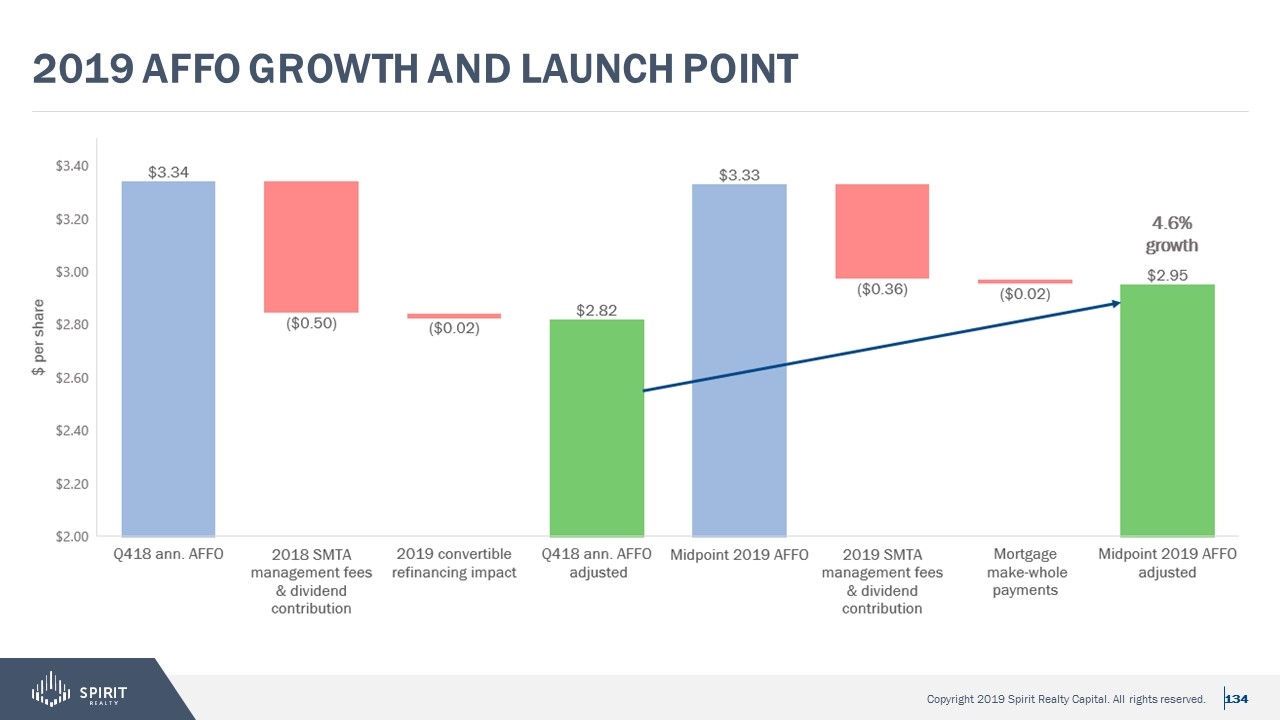
2019 affo growth and launch point
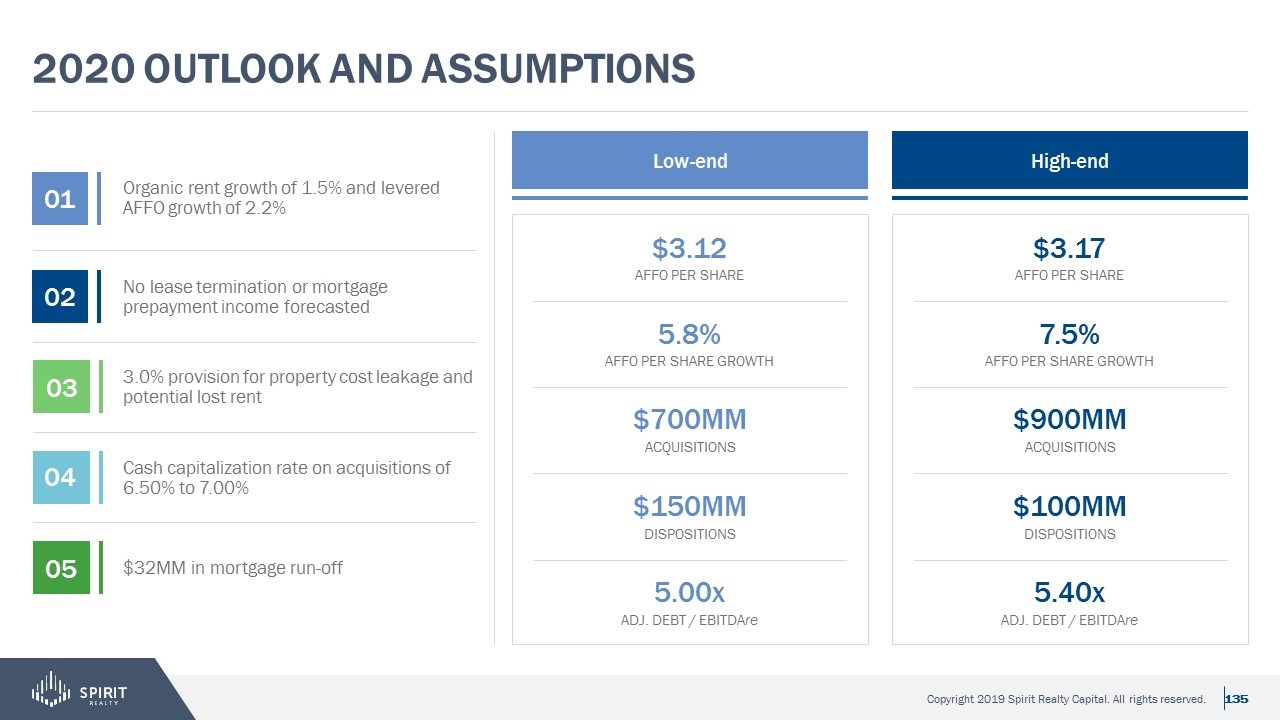
2020 outlook and Assumptions Low-end AFFO PER SHARE $3.12 ACQUISITIONS $700MM AFFO PER SHARE GROWTH 5.8% DISPOSITIONS $150MM ADJ. DEBT / EBITDAre 5.00x High-end AFFO PER SHARE $3.17 ACQUISITIONS $900MM AFFO PER SHARE GROWTH 7.5% DISPOSITIONS $100MM ADJ. DEBT / EBITDAre 5.40x Organic rent growth of 1.5% and levered AFFO growth of 2.2% 01 02 No lease termination or mortgage prepayment income forecasted 03 3.0% provision for property cost leakage and potential lost rent 04 Cash capitalization rate on acquisitions of 6.50% to 7.00% 05 $32MM in mortgage run-off
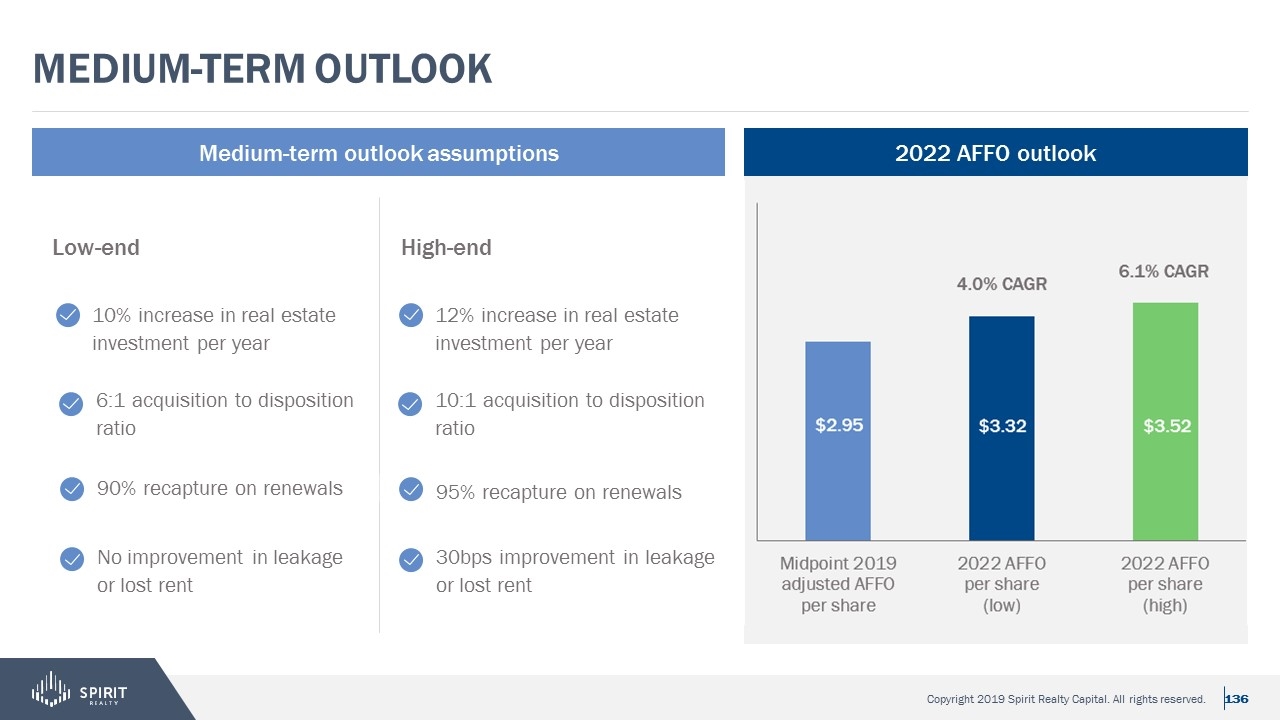
Medium-term outlook 2022 AFFO outlook Medium-term outlook assumptions Low-end 10% increase in real estate investment per year 6:1 acquisition to disposition ratio 90% recapture on renewals No improvement in leakage or lost rent 12% increase in real estate investment per year 10:1 acquisition to disposition ratio 95% recapture on renewals High-end 30bps improvement in leakage or lost rent
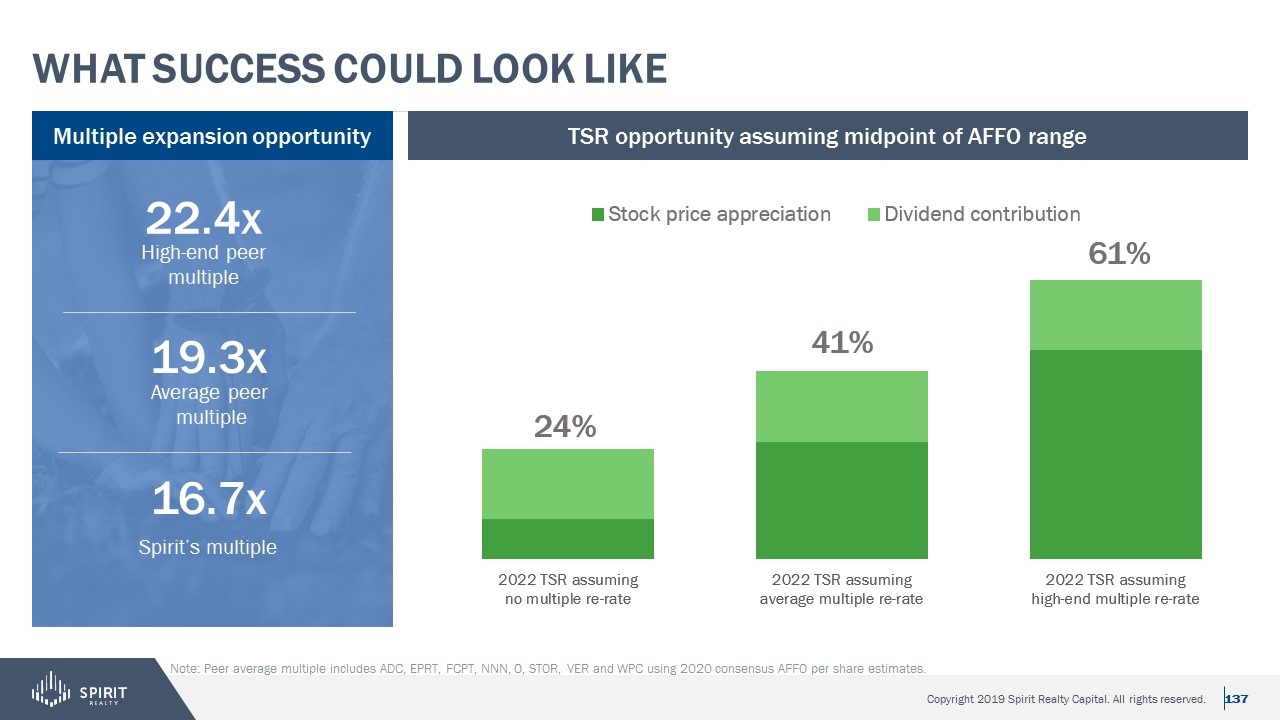
What success could look like TSR opportunity assuming midpoint of AFFO range Multiple expansion opportunity Spirit’s multiple 16.7x Average peer multiple 19.3x High-end peer multiple 22.4x Note: Peer average multiple includes ADC, EPRT, FCPT, NNN, O, STOR, VER and WPC using 2020 consensus AFFO per share estimates.

Q&A
Appendix Investor Day 2019
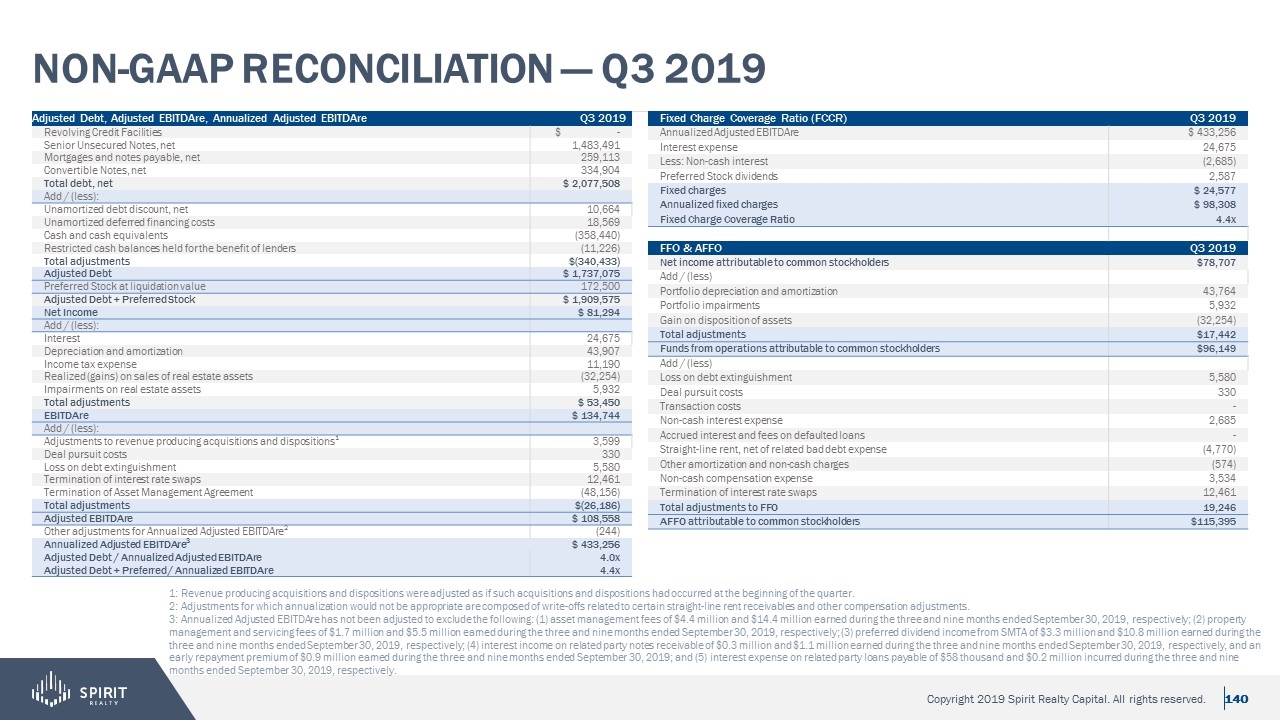
Fixed Charge Coverage Ratio (FCCR) Q3 2019 Annualized Adjusted EBITDAre $ 433,256 Interest expense 24,675 Less: Non-cash interest (2,685) Preferred Stock dividends 2,587 Fixed charges $ 24,577 Annualized fixed charges $ 98,308 Fixed Charge Coverage Ratio 4.4x FFO & AFFO Q3 2019 Net income attributable to common stockholders $78,707 Add / (less) Portfolio depreciation and amortization 43,764 Portfolio impairments 5,932 Gain on disposition of assets (32,254) Total adjustments $17,442 Funds from operations attributable to common stockholders $96,149 Add / (less) Loss on debt extinguishment 5,580 Deal pursuit costs 330 Transaction costs - Non-cash interest expense 2,685 Accrued interest and fees on defaulted loans - Straight-line rent, net of related bad debt expense (4,770) Other amortization and non-cash charges (574) Non-cash compensation expense 3,534 Termination of interest rate swaps 12,461 Total adjustments to FFO 19,246 AFFO attributable to common stockholders $115,395 Non-GAAP Reconciliation — Q3 2019 1: Revenue producing acquisitions and dispositions were adjusted as if such acquisitions and dispositions had occurred at the beginning of the quarter. 2: Adjustments for which annualization would not be appropriate are composed of write-offs related to certain straight-line rent receivables and other compensation adjustments. 3: Annualized Adjusted EBITDAre has not been adjusted to exclude the following: (1) asset management fees of $4.4 million and $14.4 million earned during the three and nine months ended September 30, 2019, respectively; (2) property management and servicing fees of $1.7 million and $5.5 million earned during the three and nine months ended September 30, 2019, respectively; (3) preferred dividend income from SMTA of $3.3 million and $10.8 million earned during the three and nine months ended September 30, 2019, respectively; (4) interest income on related party notes receivable of $0.3 million and $1.1 million earned during the three and nine months ended September 30, 2019, respectively, and an early repayment premium of $0.9 million earned during the three and nine months ended September 30, 2019; and (5) interest expense on related party loans payable of $58 thousand and $0.2 million incurred during the three and nine months ended September 30, 2019, respectively. Adjusted Debt, Adjusted EBITDAre, Annualized Adjusted EBITDAre Q3 2019 Revolving Credit Facilities $ - Senior Unsecured Notes, net 1,483,491 Mortgages and notes payable, net 259,113 Convertible Notes, net 334,904 Total debt, net $ 2,077,508 Add / (less): Unamortized debt discount, net 10,664 Unamortized deferred financing costs 18,569 Cash and cash equivalents (358,440) Restricted cash balances held for the benefit of lenders (11,226) Total adjustments $(340,433) Adjusted Debt $ 1,737,075 Preferred Stock at liquidation value 172,500 Adjusted Debt + Preferred Stock $ 1,909,575 Net Income $ 81,294 Add / (less): Interest 24,675 Depreciation and amortization 43,907 Income tax expense 11,190 Realized (gains) on sales of real estate assets (32,254) Impairments on real estate assets 5,932 Total adjustments $ 53,450 EBITDAre $ 134,744 Add / (less): Adjustments to revenue producing acquisitions and dispositions1 3,599 Deal pursuit costs 330 Loss on debt extinguishment 5,580 Termination of interest rate swaps 12,461 Termination of Asset Management Agreement (48,156) Total adjustments $(26,186) Adjusted EBITDAre $ 108,558 Other adjustments for Annualized Adjusted EBITDAre2 (244) Annualized Adjusted EBITDAre3 $ 433,256 Adjusted Debt / Annualized Adjusted EBITDAre 4.0x Adjusted Debt + Preferred / Annualized EBITDAre 4.4x


