Exhibit 99.3

Falcon Minerals Investor Presentation June 2018

1 Important notice and disclaimer FORWARD - LOOKING STATEMENTS Certain statements contained in this Presentation, which reflect the current views of Osprey and Royal with respect to future ev ents and financial performance, and any other statements of a future or forward - looking nature, constitute “forward - looking statements” for the pur poses of federal securities laws. These forward - looking statements include, but are not limited to, statements with respect to the completion of the transac tions contemplated by the definitive agreement between Osprey and Royal and the future operating and financial performance, business plans and prospect s o f the combined company. In addition, any statements that refer to projections, forecasts or other characterizations of future events or circumstances , i ncluding any underlying assumptions, are forward - looking statements. The forward - looking statements contained in this Presentation are based on Osprey’s and Royal’s current expectations and beliefs concerning future developments and their potential effects on Osprey and Royal. There can be no assu ran ce that future developments affecting us will be those that we have anticipated. These forward - looking statements involve a number of risks, un certainties (some of which are beyond Osprey’s or Royal’s control) or other assumptions that may cause actual results or performance to be materially di ffe rent from those expressed or implied by these forward - looking statements. A description of certain risks and uncertainties and factors that could cause actual results to differ materially from past r esu lts and future plans and projected and estimated future results can be found in Osprey’s Annual Report on Form 10 - K for the fiscal year ended December 31, 2017 and in subsequent reports on Form 10 - Q, including in the sections thereof captioned “Risk Factors” and “Cautionary Note Regarding Forward - Looking Statemen ts,” as well as in its subsequent reports on Form 8 - K, all of which are filed with the SEC and available free of charge at www.sec.gov. None of Osprey, Royal or their respective affiliates or representatives assumes any obligation to update or correct any forwa rd - looking statements or other information contained in this Presentation . RESERVE INFORMATION Reserve engineering is a process of estimating underground accumulations of hydrocarbons that cannot be measured in an exact way . The accuracy of any reserve estimate depends on the quality of available data, the interpretation of such data and price and cost assumptions mad e b y reserve engineers. In addition, the results of drilling, testing and production activities may justify revisions of estimates that were made previo usl y. If significant, such revisions could impact Osprey’s strategy and change the schedule of any further production and development drilling. Accordingly, rese rve estimates may differ significantly from the quantities of oil and natural gas that are ultimately recovered. Estimated Ultimate Recoveries, or “E URs ,” refers to estimates of the sum of total gross remaining proved reserves per well as of a given date and cumulative production prior to such given date f or developed wells. These quantities do not necessarily constitute or represent reserves as defined by the SEC and are not intended to be representativ e o f all anticipated future well results. ADDITIONAL INFORMATION This Presentation is for informational purposes only and shall not constitute an offer to sell or the solicitation of an offer to buy any securiti es pursuant to the proposed business combination or otherwise, nor shall there be any sale of securities in any jurisdiction in which the offer, so licitation or sale would be unlawful prior to the registration or qualification under the securities laws of any such jurisdiction. No offer of securiti es shall be made except by means of a prospectus meeting the requirements of Section 10 of the Securities Act. In connection with the proposed business combination, Osprey intends to file a proxy statement with the SEC. The definitive proxy statement and other relevant documents will be sent or given to the stock hol ders of Osprey and will contain important information about the proposed business combination and related matters. Osprey stockholders and other int ere sted persons are advised to read, when available, the proxy statement in connection with Osprey's solicitation of proxies for the meeting of stockhold ers to be held to approve the business combination because the proxy statement will contain important information about the proposed business combination. Wh en available, the definitive proxy statement will be mailed to the Osprey stockholders as of a record date to be established for voting on the bus iness combination. Stockholders will also be able to obtain copies of the proxy statement, without charge, once available, at the SEC's website at www.sec.gov. PARTICIPANTS IN THE SOLICITATION Osprey and its directors and officers may be deemed participants in the solicitation of proxies of Osprey's stockholders in c onn ection with the proposed business combination. Osprey stockholders and other interested persons may obtain, without charge, more detailed information re garding the directors and officers of Osprey in Osprey's Registration Statement on Form S - 1 initially filed with the SEC on June 28, 2017. Other informat ion regarding the participants in the proxy solicitation and a description of their direct and indirect interests, by security holdings or otherwise, will b e c ontained in the definitive proxy statement and other relevant materials to be filed with the SEC regarding the proposed business combination if and when they bec ome available .

Executive Summary

Falcon Minerals highlights Highly attractive absolute and relative value High quality core Eagle Ford, 80% oil - weighted, significant free cash flow assets ~ 90% margins with lower sensitivity to commodity prices Significant long - term and sustainable growth Proven track record of accretive acquisitions Low leverage and ample liquidity Compelling total shareholder returns 3 Deal offers: x x x x Unique partnership between Osprey and Blackstone x x x x
4 Osprey Energy Acquisition Corp. (“Osprey”) raised $275mm through an IPO as a special purpose acquisition company (“SPAC”) in July 2017 − Osprey was established to acquire a unique energy investment opportunity with an attractive return profile Osprey will acquire the assets of Royal Resources L.P. (“Royal”), a core - of - the - core Eagle Ford shale ( Karnes, DeWitt and Gonzales counties) minerals company, creating a company with an enterprise value of $894 million (1 ) − Attractive entry multiples provide management a platform for significant growth at a discount to peers − 8.3x 2019E EV/EBITDA (~28% below peer average (2) ) and 2019E free cash flow yield of ~11.6% − 10.2x 2018E EV/EBITDA (~ 17% below peer average (2) ) and 2018E free cash flow yield of ~ 9.3% Osprey has raised a $ 115 million PIPE of common equity at $10.00 per share in connection with the transaction and all PIPE investors who already hold common equity have agreed to retain their shares (which constitute approximately $75 million of Osprey common stock in the aggregate) at least through closing and not redeem their shares for cash This transaction will create Falcon Minerals Corp. (“Falcon Minerals” or “Falcon”), the first public minerals company with assets concentrated in the core - of - the - core of the Eagle Ford shale, an area with well - capitalized industry - leading operators, stacked pay zones, positive oil price differentials and over 3,000 undeveloped locations with IRRs to the operators of >100 % (3) Assets expected to produce substantial free cash flow and have visible sustainable growth Osprey’s management and Blackstone have successful track records building companies and creating value for investors − Osprey’s management successfully took 6 companies public and has executed over $23 billion of acquisitions and divestitures in the oil and gas industry − Blackstone is one of the largest independent managers of private capital in the world with an extensive energy investment platform; since 1997, Blackstone has committed ~$15 billion of private equity capital to the energy sector (4 ) Transaction overview (1) See slide 24 (Sources, uses and pro forma valuation) for purchase price details. (2) Peers include BSM, FRU, KRP and VNOM. (3) As of First Call pricing on 4/2/18 (~$60 WTI and ~$3 HHub in 2018 and 2019), the d ate on which Osprey and Blackstone agreed to preliminary terms of the transaction. (4) As of March 31, 2018.

5 Introduction to Falcon Minerals SPAC formed by Jonathan Cohen, Edward Cohen and Daniel Herz to acquire unique energy investment opportunity that can deliver substantial value to shareholders $275 million equity raised in July/August 2017 OSPREY ENERGY Acquisition Corp. Mineral and royalty business formed by Blackstone in 2011 with mineral, royalty and ORRI interests in the core - of - the - core Eagle Ford in Karnes, DeWitt and Gonzales counties >95% of acreage leased to well - capitalized best - in - class operators Osprey will acquire the assets of Royal Resources L.P., creating a company with an enterprise value of $894 million (1) − Blackstone to retain a $400 million equity interest (2) − PIPE investors acquiring a $ 115 million equity interest − $ 35 million drawn on revolving credit facility ($500 million facility size with $115 million initial borrowing base) Attractive entry multiple of 8.3x 2019E EV/EBITDA, attractive 2019E FCF yield of ~11.6% and pro forma 2018E leverage of ~0.4x ( 1 ) See slide 23 (Sources, uses and pro forma valuation) for purchase price details. (2) Transaction structure allows for Blackstone to possibly receive additional equity through an earn - out tied to stock price apprec iation. Falcon Minerals will issue an additional 10 million shares to Blackstone if Falcon Minerals stock price reaches $12.50/share and an additional 10 million shares if Falco n M inerals stock price reaches $15.00/share on a 30 calendar day volume - weighted average trading price within the next seven years post close of transaction (with the amount of sha res and the earn - out thresholds subject to potential adjustment in the event that the Falcon Minerals dividends exceed $0.50 per share per year). Transaction Falcon Minerals Corp. Osprey Energy O

6 Advantaged, differentiated high - margin oil - weighted assets with high - FCF conversion and no capex Reduced sensitivity to commodity prices Consistent high margins in excess of 90% No direct exposure to oilfield services cost inflation Limited legal and environmental liabilities No direct operating costs or capital expenditures E&P operator Falcon Minerals x x x x x
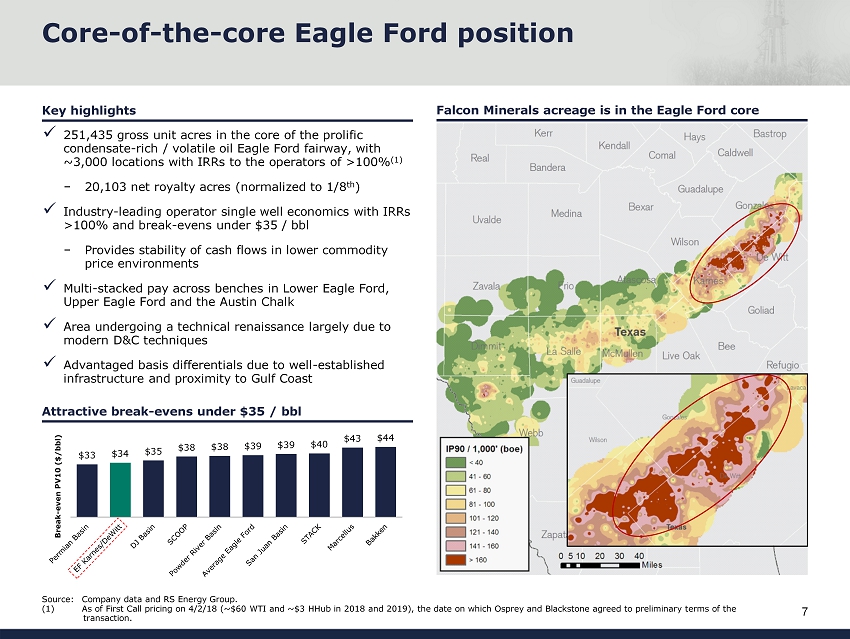
$33 $34 $35 $38 $38 $39 $39 $40 $43 $44 Break - even PV10 ($/bbl) Attractive break - evens under $35 / bbl 7 Core - of - the - core Eagle Ford position Key highlights x 251,435 gross unit acres in the core of the prolific condensate - rich / volatile oil Eagle Ford fairway, with ~3,000 locations with IRRs to the operators of >100 % (1) − 20,103 net royalty acres (normalized to 1/8 th ) x Industry - leading operator single well economics with IRRs >100% and break - evens under $35 / bbl − Provides stability of cash flows in lower commodity price environments x Multi - stacked pay across benches in Lower Eagle Ford, Upper Eagle Ford and the Austin Chalk x Area undergoing a technical renaissance largely due to modern D&C techniques x Advantaged basis differentials due to well - established infrastructure and proximity to Gulf Coast Source: Company data and RS Energy Group. (1) As of First Call pricing on 4/2/18 (~$60 WTI and ~$3 HHub in 2018 and 2019), the d ate on which Osprey and Blackstone agreed to preliminary terms of the transaction. Falcon Minerals acreage is in the Eagle Ford core
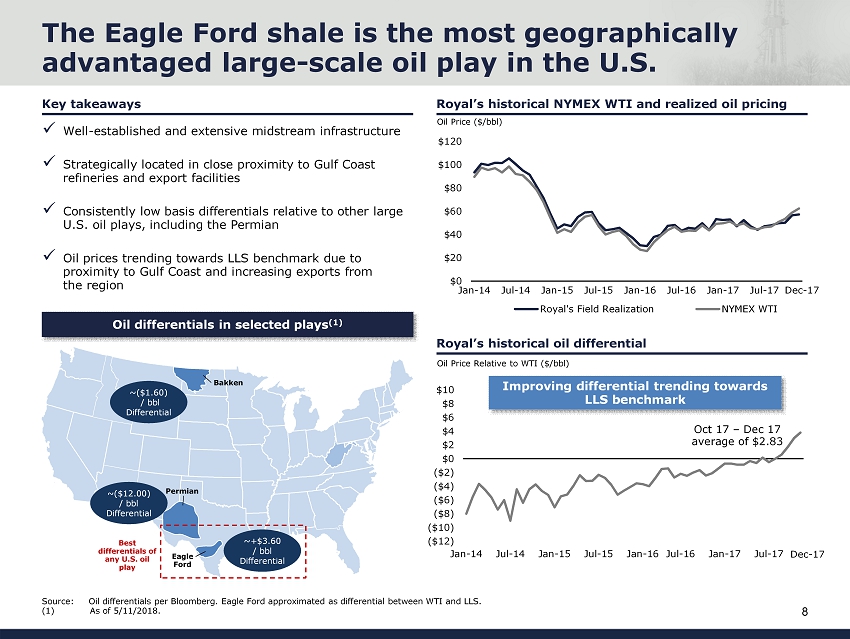
8 The Eagle Ford shale is the most geographically advantaged large - scale oil play in the U.S. x Well - established and extensive midstream infrastructure x Strategically located in close proximity to Gulf Coast refineries and export facilities x Consistently low basis differentials relative to other large U.S. oil plays, including the Permian x Oil prices trending towards LLS benchmark due to proximity to Gulf Coast and increasing exports from the region Royal’s historical NYMEX WTI and realized oil pricing Key takeaways Royal’s historical oil differential $0 $20 $40 $60 $80 $100 $120 Jan-14 Jul-14 Jan-15 Jul-15 Jan-16 Jul-16 Jan-17 Jul-17 Royal's Field Realization NYMEX WTI Oil Price ($/bbl) ($12) ($10) ($8) ($6) ($4) ($2) $0 $2 $4 $6 $8 $10 Jan-14 Jul-14 Jan-15 Jul-15 Jan-16 Jul-16 Jan-17 Jul-17 Oil Price Relative to WTI ($/bbl) Bakken Eagle Ford Permian ~($1.60) / bbl Differential ~($12.00) / bbl Differential ~+$3.60 / bbl Differential Best differentials of any U.S. oil play Oil differentials in selected plays (1) Source: Oil differentials per Bloomberg. Eagle Ford approximated as differential between WTI and LLS. (1) As of 5/11/2018. Dec - 17 Dec - 17 Improving differential trending towards LLS benchmark Oct 17 – Dec 17 average of $2.83
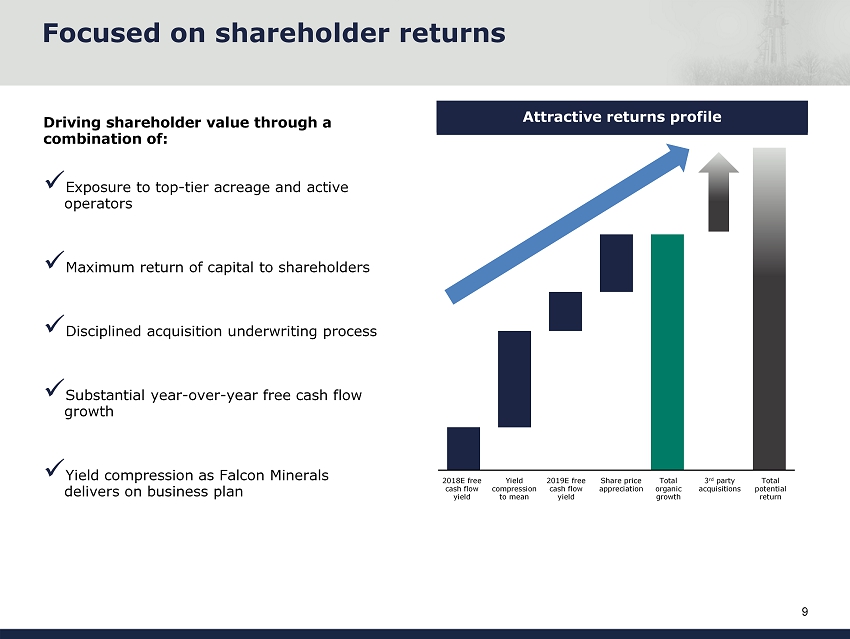
9 Focused on shareholder returns IPO yield Dividend Yr 2 Total organic growth Total potential return Driving shareholder value through a combination of: Attractive returns profile Total organic growth 3 rd party acquisitions Total potential return Yield compression to mean Share price appreciation 2018E free cash flow yield 2019E free cash flow yield x Exposure to top - tier acreage and active operators x Maximum return of capital to shareholders x Disciplined acquisition underwriting process x Substantial year - over - year free cash flow growth x Yield compression as Falcon Minerals delivers on business plan

23.0x 14.8x 12.4x 11.3x 10.8x 10.2x PSK VNOM KRP BSM FRU Falcon Minerals Peer Average 14.5x 22.1x 12.4x 12.0x 10.9x 10.5x 8.3x PSK VNOM KRP FRU BSM Falcon Minerals Peer Average 13.6x 11.6% 10.4% 10.1% 9.9% 7.9% 4.3% Falcon Minerals FRU BSM KRP VNOM PSK Peer Average 8.5% 9.9% 9.3% 9.0% 8.8% 6.7% 4.0% FRU Falcon Minerals KRP BSM VNOM PSK Peer Average 7.7% 10 Attractive entry point into the minerals segment Source: Peers based on publicly available information and FactSet as of 6/1/2018. Note: Free cash flow yield equivalent to distributable cash flow yield for MLP peers. ( 1) Falcon Minerals reflects management projections run at ~$60 WTI / ~$3 HHub for 2018 and 2019, which reflects pricing as of date Osprey and Blackstone agreed to preliminary terms of the transaction. (2) Pro forma for announced Haymaker acquisition. Assumes 2018E EBITDA equals annualized pro forma Q1 2018 actual EBITDA as disclosed in KRP presentation as of 5/29/2018 . 2018E FCF per share calculated as 1.2 multiplied by the annualized Q1 2018 standalone actual distributable cash flow per share as disclosed in KRP presentation as of 5/29/2018. 2019E FCF per share and EBITDA per RBC research as of 5/29/2018. 2018E 2019E Free cash flow yield (1) (1) 2018E 2019E (1) EV / EBITDA (1) (2) (2) (2) (2)

Falcon Minerals Overview

12 Falcon Minerals investment thesis Falcon Minerals intends to acquire core - of - the - core acreage minerals assets in leading plays with visible operator plans for significant production growth Initial merger expected to be followed by additional acquisitions – driving growth, distributions and generating outsized shareholder returns on accretive acquisitions Key highlights x x x x ─ Core Eagle Ford position offers ~3,000 undeveloped locations with IRRs to the operators of >100 % (1) ─ Additional upside from core - of - the - core Marcellus Shale minerals and additional Eagle Ford zones ─ 100 % conversion of permits to PDP ─ 149 line - of - sight wells ─ 8.3x 2019E EV/EBITDA (~28% below peer average (2) ) and 2019E FCF yield of ~11.6% ─ 10.2x 2018E EV/EBITDA (~17% below peer average (2) ) and 2018E FCF yield of ~9.3% ─ ~90 % full - cycle cash margin ( 1 ) As of First Call pricing on 4/2/18 (~$60 WTI and ~$3 HHub in 2018 and 2019), the d ate on which Osprey and Blackstone agreed to preliminary terms of the transaction. (2) Peers include BSM, FRU, KRP and VNOM . * BHP or future BHP asset acquirer controls drilling decisions on Royal’s acreage operated by the BHP/Devon JV. Core - of - the - core positions Tier 1 operators Active development Attractive entry multiples and valuation Osprey management expertise ─ Osprey management has a successful track record of building energy companies organically and through third party acquisitions ─ Over $5.3bn of minerals assets acquisition opportunities identified by Osprey management x 1 2 3 4 5 * * Royal Resources checks all the boxes
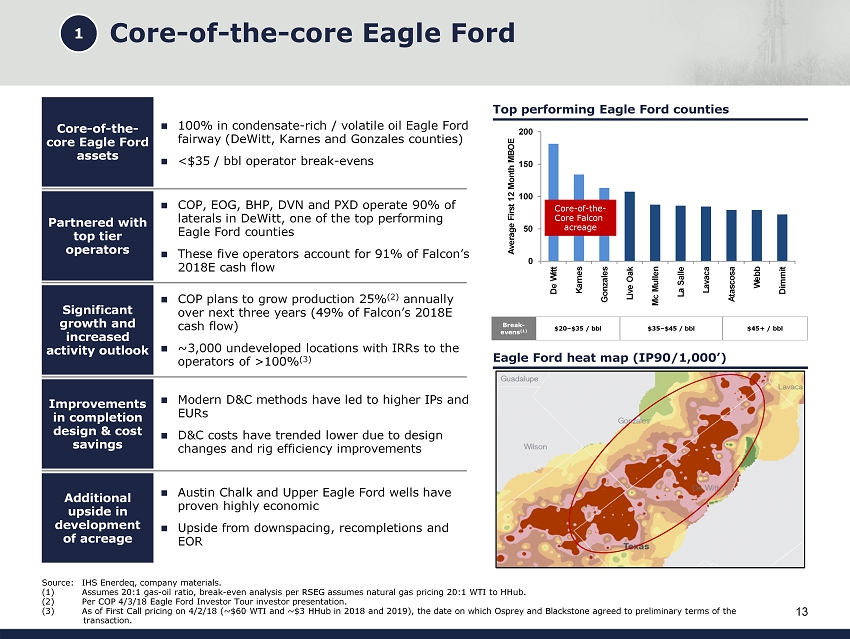
0 50 100 150 200 De Witt Karnes Gonzales Live Oak Mc Mullen La Salle Lavaca Atascosa Webb Dimmit Average First 12 Month MBOE 13 Core - of - the - core Eagle Ford 100% in condensate - rich / volatile oil Eagle Ford fairway (DeWitt, Karnes and Gonzales counties) <$35 / bbl operator break - evens COP, EOG, BHP, DVN and PXD operate 90% of laterals in DeWitt, one of the top performing Eagle Ford counties These five operators account for 91% of Falcon’s 2018E cash flow COP plans to grow production 25% (2) annually over next three years (49% of Falcon’s 2018E cash flow) ~3,000 undeveloped locations with IRRs to the operators of >100 % (3) Modern D&C methods have led to higher IPs and EURs D&C costs have trended lower due to design changes and rig efficiency improvements Austin Chalk and Upper Eagle Ford wells have proven highly economic Upside from downspacing, recompletions and EOR Top performing Eagle Ford counties Eagle Ford heat map (IP90/1,000’) Source: IHS Enerdeq, company materials. (1) Assumes 20:1 gas - oil ratio, break - even analysis per RSEG assumes natural gas pricing 20:1 WTI to HHub . (2) Per COP 4/3/18 Eagle Ford Investor Tour investor presentation. (3) As of First Call pricing on 4/2/18 (~$60 WTI and ~$3 HHub in 2018 and 2019), the d ate on which Osprey and Blackstone agreed to preliminary terms of the transaction. Core - of - the - core Eagle Ford assets Partnered with top tier operators Significant growth and increased activity outlook Improvements in completion design & cost savings Additional upside in development of acreage Core - of - the - C ore Falcon acreage 1 Break - evens (1) $20 – $35 / bbl $35 – $45 / bbl $45+ / bbl

Operator TEV ($bn) Net debt / 2018E EBITDA Credit rating (Moody's / S&P) 2018E EF capex Active EF rigs % of Falcon's 2018 cash flow BHP $201 0.7x A3 / A NA 2 20% DVN 35 2.1x Ba1 / BBB $250mm 2 20% COP 93 0.8x Baa1 / A- Majority of L48 budget 6 49% EOG 75 0.7x Baa1 / BBB+ Significant portion of L48 budget 11 21% PXD 34 0.3x Baa2 / BBB NA NA Under 1% 14 Tier 1 operators on Falcon Minerals acreage Source: Company investor presentations and Royal Resources. (1) FactSet as of 6/1/18. (2) BHP and Devon share rigs through joint venture. BHP and Devon represent 2 active Eagle Ford rigs combined and 20% of Falcon’ s 2018 cash flow combined. * BHP or future BHP asset acquirer controls drilling decisions on Royal’s acreage operated by the BHP/Devon JV. Best - in - class operators on Falcon Minerals acreage Operator acreage locator Royal’s permit timing database is used as predictive indicator of near - term development Royal’s tracking data dates back to 2010 Well life cycle history combined with current market intelligence is used as a predictive indicator of near - term development 2017 permits realized an average life cycle of 157 days from permit grant to first production 47 2 (2) (2) * 70 149 Total: * 7 25 (2) (2) (1) (1)

1,005 1,223 597 729 823 1,101 1,071 1,209 1,286 1,673 1,327 1,420 Conocophillips Devon EOG Pioneer Rscs DVN/BHP 20% COP 49% EOG 21% PXD <1% Others 9% 399 194 99 41 33 25 20 Wells drilled 15 Top tier assets paired with top tier operators Falcon’s 2018E FCF by operator COP Eagle Ford guidance (2) Top DeWitt operators by wells (2014+) (1) Falcon Minerals operator 130 245 2017 2018 2019 2020 (Production in MBOED) Source: IHS Enerdeq. (1) Per PLS PetroScout E&P Database, includes active producing horizontal wells since Jan 2014. (2) Per COP investor presentation. * BHP or future BHP asset acquirer controls drilling decisions on Royal’s acreage operated by the BHP/Devon JV. 2 Sustaining production Growth production IP30 progression by operator (Boe/d) 1,680 2009 - 2011 2012 - 2014 2015 - 2017 Hooks Ranch April 2018 Avg. * * *
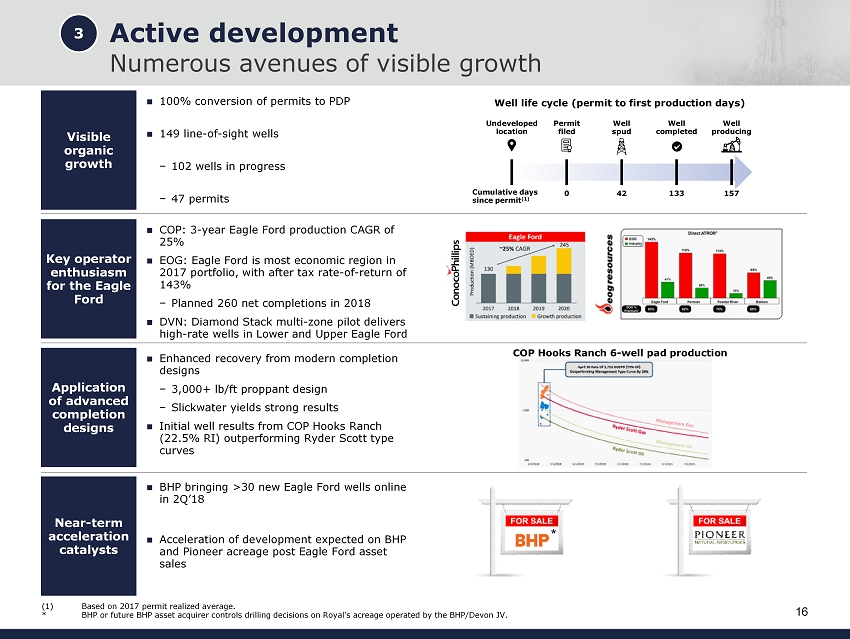
16 Active development Numerous avenues of visible growth Visible organic growth 100% conversion of permits to PDP 149 line - of - sight wells − 102 wells in progress − 47 permits Key operator enthusiasm for the Eagle Ford COP: 3 - year Eagle Ford production CAGR of 25% EOG: Eagle Ford is most economic region in 2017 portfolio, with after tax rate - of - return of 143% − Planned 260 net completions in 2018 DVN: Diamond Stack multi - zone pilot delivers high - rate wells in Lower and Upper Eagle Ford Application of advanced completion designs Enhanced recovery from modern completion designs − 3 ,000+ lb/ft proppant design − Slickwater yields strong results Initial well results from COP Hooks Ranch (22.5% RI) outperforming Ryder Scott type curves Well life cycle (permit to first production days) COP Hooks Ranch 6 - well pad production ( 1 ) Based on 2017 permit realized average. * BHP or future BHP asset acquirer controls drilling decisions on Royal’s acreage operated by the BHP/Devon JV. Undeveloped location Cumulative days since permit (1) Permit filed Well spud Well completed Well producing 0 42 133 157 3 Near - term acceleration catalysts BHP bringing >30 new Eagle Ford wells online in 2Q’18 Acceleration of development expected on BHP and Pioneer acreage post Eagle Ford asset sales *
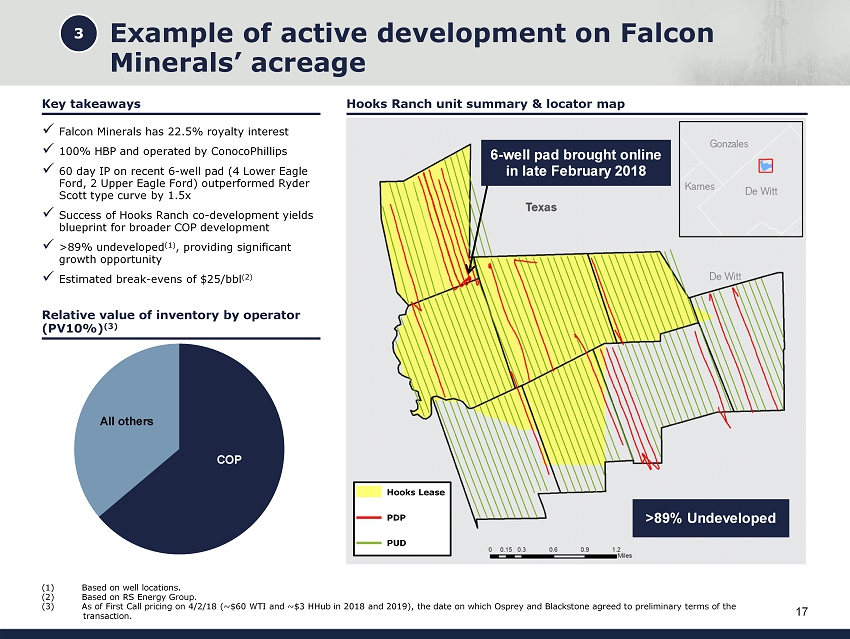
17 Key takeaways Hooks Ranch unit summary & locator map Example of active development on Falcon Minerals’ acreage x Falcon Minerals has 22.5% royalty interest x 100% HBP and operated by ConocoPhillips x 60 day IP on recent 6 - well pad (4 Lower Eagle Ford, 2 Upper Eagle Ford) outperformed Ryder Scott type curve by 1.5x x Success of Hooks Ranch co - development yields blueprint for broader COP development x > 89% undeveloped (1) , providing significant growth opportunity x Estimated break - evens of $ 25/bbl (2 ) Relative value of inventory by operator (PV10%) (3) >89% Undeveloped 3 (1) Based on well locations. (2) Based on RS Energy Group. (3) As of First Call pricing on 4/2/18 (~$60 WTI and ~$3 HHub in 2018 and 2019), the d ate on which Osprey and Blackstone agreed to preliminary terms of the transaction. 6 - well pad brought online in late February 2018 Hooks Lease PDP PUD All others COP
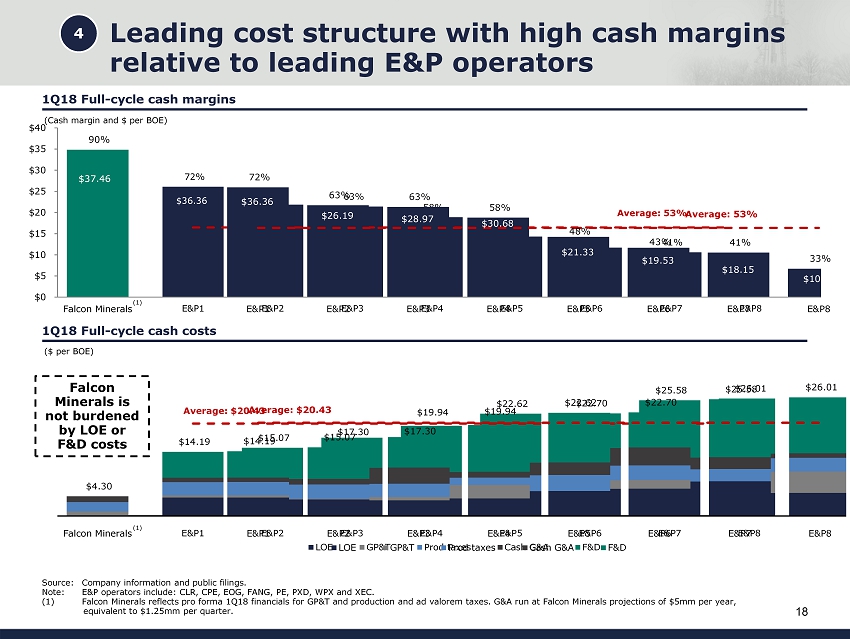
90% 72% 63% 63% 58% 48% 43% 41% 33% $37.46 $36.36 $26.19 $28.97 $30.68 $21.33 $19.53 $18.15 $10.01 $0 $5 $10 $15 $20 $25 $30 $35 $40 Osprey Minerals E&P1 E&P2 E&P3 E&P4 E&P5 E&P6 E&P7 E&P8 20% 30% 40% 50% 60% 70% 80% 90% 100% Average: 53% $4.30 $14.19 $15.07 $17.30 $19.94 $22.62 $22.70 $25.58 $26.01 Falcon Minerals E&P1 E&P2 E&P3 E&P4 E&P5 E&P6 E&P7 E&P8 LOE GP&T Prod taxes Cash G&A F&D Average: $20.43 18 Leading cost structure with high cash margins relative to leading E&P operators 1Q18 Full - cycle cash margins Source: Company information and public filings. Note: E&P operators include: CLR, CPE, EOG, FANG, PE, PXD, WPX and XEC. (1) Falcon Minerals reflects pro forma 1Q18 financials for GP&T and production and ad valorem taxes. G&A run at Falcon Minerals p roj ections of $5mm per year, equivalent to $1.25mm per quarter. (Cash margin and $ per BOE) ($ per BOE) 1Q18 Full - cycle cash costs 4 (1) Falcon Minerals is not burdened by LOE or F&D costs $4.30 $14.19 $15.07 $17.30 $19.94 $22.62 $22.70 $25.58 $26.01 Falcon Minerals E&P1 E&P2 E&P3 E&P4 E&P5 E&P6 E&P7 E&P8 LOE GP&T Prod taxes Cash G&A F&D Average: $20.43 90% 72% 63% 63% 58% 48% 43% 41% 33% $37.46 $36.36 $26.19 $28.97 $30.68 $21.33 $19.53 $18.15 $10.01 $0 $5 $10 $15 $20 $25 $30 $35 $40 Falcon Minerals E&P1 E&P2 E&P3 E&P4 E&P5 E&P6 E&P7 E&P8 20% 30% 40% 50% 60% 70% 80% 90% 100% Average: 53% (1)
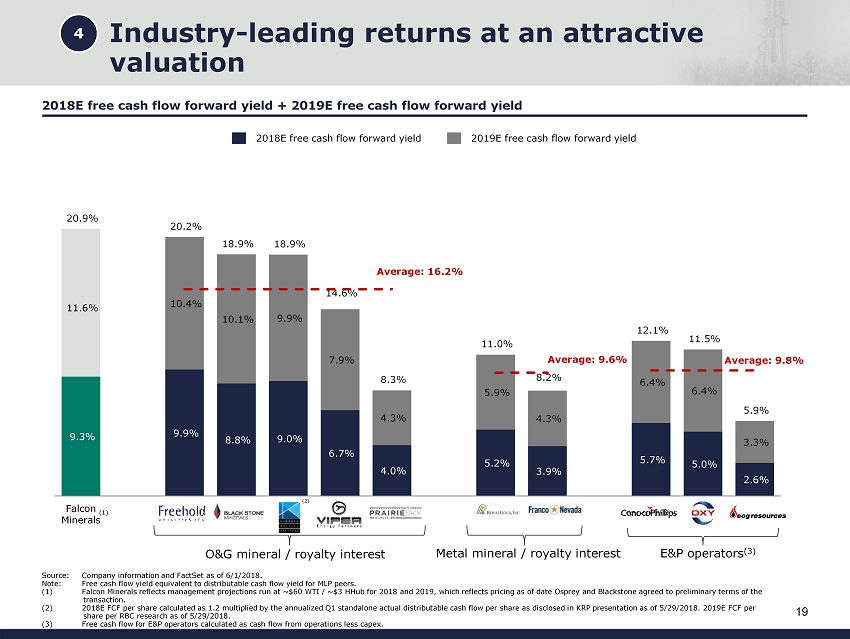
9.3% 9.9% 8.8% 9.0% 6.7% 4.0% 5.2% 3.9% 5.7% 5.0% 2.6% 11.6% 10.4% 10.1% 9.9% 7.9% 4.3% 5.9% 4.3% 6.4% 6.4% 3.3% 20.9% 20.2% 18.9% 18.9% 14.6% 8.3% 11.0% 8.2% 12.1% 11.5% 5.9% Average: 9.8% Falcon Minerals FRU BSM KRP VNOM PSK RGLD FNV COP OXY EOG Average: 16.2% Average: 9.6% 19 Industry - leading returns at an attractive valuation 2018E free cash flow forward yield + 2019E free cash flow forward yield Source: Company information and FactSet as of 6 /1/2018. Note: Free cash flow yield equivalent to distributable cash flow yield for MLP peers. (1) Falcon Minerals reflects management projections run at ~$60 WTI / ~$3 HHub for 2018 and 2019, which reflects pricing as of da te Osprey and Blackstone agreed to preliminary terms of the transaction. (2) 2018E FCF per share calculated as 1.2 multiplied by the annualized Q1 standalone actual distributable cash flow per share as disclosed in KRP presentation as of 5/29/2018. 2019E FCF per share per RBC research as of 5/29/2018. (3) Free cash flow for E&P operators calculated as cash flow from operations less capex. 2018E free cash flow forward yield 2019E free cash flow f orward y ield (1) O&G mineral / royalty interest Metal mineral / royalty interest 4 E&P operators (3) (2)

20 Leverage Osprey’s management expertise to make accretive minerals acquisitions Osprey management team has the expertise and proven track record to deliver immense value to shareholders through future minerals acquisitions x Proven ability to execute strategic transactions with a variety of buyers and sellers − Effectuated $23 billion in oil and gas acquisitions and divestitures − Employed organic acquisition strategy at Atlas Energy, acquiring over 250,000 acres in the Marcellus Shale and generating total shareholder returns of over 930% for IPO investors − Executed successful buy and build strategy at Atlas Pipeline Partners, acquiring $4 billion of assets and generating total shareholder returns of over 420% for IPO investors x Strategic foresight – identified potential for outsized economic returns in the Marcellus Shale and Permian Basin while others were departing 5
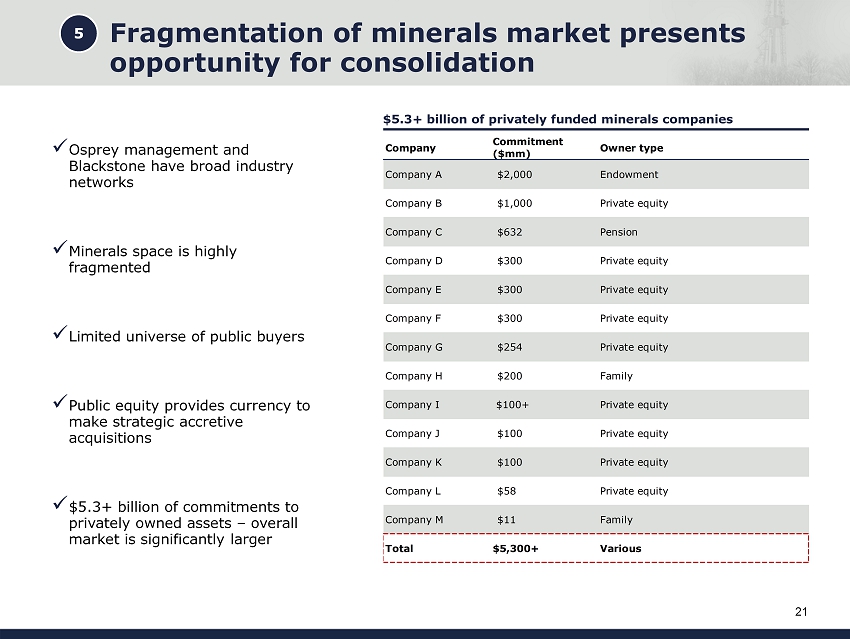
21 Fragmentation of minerals market presents opportunity for consolidation x Osprey management and Blackstone have broad industry networks x Minerals space is highly fragmented x Limited universe of public buyers x Public equity provides currency to make strategic accretive acquisitions x $5.3+ billion of commitments to privately owned assets – overall market is significantly larger 5 $5.3+ billion of privately funded minerals companies Company Commitment ($mm) Owner type Company A $2,000 Endowment Company B $1,000 Private equity Company C $632 Pension Company D $300 Private equity Company E $300 Private equity Company F $300 Private equity Company G $254 Private equity Company H $200 Family Company I $100+ Private equity Company J $100 Private equity Company K $100 Private equity Company L $58 Private equity Company M $11 Family Total $5,300+ Various

Financial Overview

23 Conservative and disciplined f inancial philosophy Strong balance sheet capable of funding accretive acquisitions Target Debt / EBITDA of <1.0x (with initial leverage under 0.5x) Flexibility through commodity cycles due to strong liquidity and low leverage profile Committed to delivering exceptional corporate level returns − Disciplined underwriting standards for acquisitions − IRR focused investment decisions − Focus on increasing distributions to investors while maintaining ample liquidity
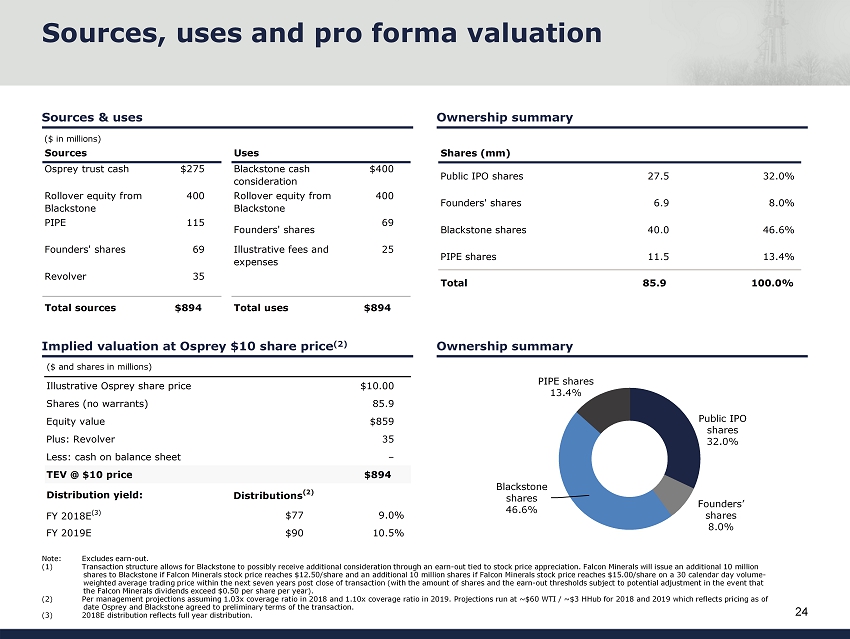
Illustrative Osprey share price $10.00 Shares (no warrants) 85.9 Equity value $859 Plus: Revolver 35 Less: cash on balance sheet – TEV @ $10 price $894 Distribution yield: Distributions (2) FY 2018E (3) $77 9.0% FY 2019E $90 10.5% Shares (mm) Public IPO shares 27.5 32.0% Founders' shares 6.9 8.0% Blackstone shares 40.0 46.6% PIPE shares 11.5 13.4% Total 85.9 100.0% 24 Ownership summary Implied valuation at Osprey $10 share price (2) Ownership summary Sources & uses Sources, uses and pro forma valuation Sources Uses Osprey trust cash $275 Blackstone cash consideration $400 Rollover equity from Blackstone 400 Rollover equity from Blackstone 400 PIPE 115 Founders' shares 69 Founders' shares 69 Illustrative fees and expenses 25 Revolver 35 Total sources $894 Total uses $894 ($ in millions) ($ and shares in millions) Public IPO shares 32.0% Founders’ shares 8.0% Blackstone shares 46.6% PIPE shares 13.4% Note: Excludes earn - out. ( 1 ) Transaction structure allows for Blackstone to possibly receive additional consideration through an earn - out tied to stock pri ce appreciation. Falcon Minerals will issue an additional 10 million shares to Blackstone if Falcon Minerals stock price reaches $12.50/share and an additional 10 million shares if Falcon Minera ls stock price reaches $15.00/share on a 30 calendar day volume - weighted average trading price within the next seven years post close of transaction (with the amount of shares and the earn - out thresholds subject to potential adjustment in the event that the Falcon Minerals dividends exceed $0.50 per share per year). (2) Per management projections assuming 1.03x coverage ratio in 2018 and 1.10x coverage ratio in 2019. P rojections run at ~$60 WTI / ~$3 HHub for 2018 and 2019 which reflects pricing as of date Osprey and Blackstone agreed to preliminary terms of the transaction. ( 3 ) 2018E distribution reflects full year distribution.

Development plan constructed by aggregating individual operators − Averages 8 gross rigs in 2018 and 2019 First Call pricing as of 4/2/18: − NGL: ~44% of WTI Differentials based on last 3 months historical data Production and ad valorem taxes of 5.7% of revenue in 2018 and 2019 Income taxes based on a 21% corporate tax rate 25 Projected cash flow summary Financial assumptions Financial projections – beginning of buying process First Call pricing – 4/2/2018 (6) (1) Pro forma for asset divestitures in 2017. Production NYMEX and realized pricing based on preliminary pro forma LOS. Revenues and expenses based on preliminary pro forma unaudited financial statements. (2) Inclusive of 1H18 interest attributable to outstanding Royal debt. ( 3 ) 2017 pro forma free cash flow based on asset level cash flow – G&A – interest for illustrative purposes, but excludes certain non - asset level items that are not available pro forma for asset divestitures in 2017. (4) 2017 coverage ratio not pro forma for asset divestitures in 2017. (5) Represented on a fully converted basis. Excludes earn - out . (6) Date on which Osprey and Blackstone agreed to preliminary terms of the transaction. 2018E 2019E WTI crude oil ($/bbl) $60.08 $59.75 Natural gas ($/mcf) 2.99 2.95 ($ in millions unless otherwise specified) 2017A (1) 2018E 2019E Net production Oil + Cond (Mbbls) 859 1,284 1,599 Gas (Mmcf) 3,010 4,346 5,436 NGL (Mbbls) 286 311 279 Total (MBoe) 1,647 2,318 2,785 MBoepd 4.5 6.4 7.6 Y-o-Y growth % 40.7% 20.1% % Liquids 69.5% 68.8% 67.5% Operating metrics WTI oil price - First Call 4/2/18 $50.95 $60.08 $59.75 HH gas price - First Call 4/2/18 3.11 2.99 2.95 Realized pricing Oil $50.72 $62.13 $62.22 Gas 2.68 2.96 3.02 NGL 20.88 26.30 26.19 Total revenue $62 $101 $123 Expenses Production & ad valorem taxes ($3) ($6) ($7) Gathering & transportation (3) (3) (3) G&A (6) (5) (5) Total Expenses ($12) ($14) ($15) EBITDA $50 $87 $108 Interest expense (2) (1) (2) (1) Income taxes – (5) (8) Free cash flow (3) $48 $80 $99 Coverage ratio (4) 1.00x 1.03x 1.10x Distributed cash flow $48 $77 $90 Shares outstanding (5) 85.9 85.9 Distribution per share $0.90 $1.05 Balance sheet Cash – – Revolver balance 34 25 Net debt $34 $25 Net debt / EBITDA 0.4x 0.2x

Development plan constructed by aggregating individual operators − Averages 8 gross rigs in 2018 and 2019 Strip pricing as of 6/1/18: − NGL: ~44% of WTI Differentials based on last 3 months historical data Production and ad valorem taxes of 5.7% of revenue in 2018 and 2019 Income taxes based on a 21% corporate tax rate 26 Projected cash flow summary Financial assumptions Financial projections – current pricing environment NYMEX Strip pricing – 6/1/2018 (1) Pro forma for asset divestitures in 2017. Production NYMEX and realized pricing based on preliminary pro forma LOS. Revenues and expenses based on preliminary pro forma unaudited financial statements. (2) Inclusive of 1H18 interest attributable to outstanding Royal debt. ( 3 ) 2017 pro forma free cash flow based on asset level cash flow – G&A – interest for illustrative purposes, but excludes certain non - asset level items that are not available pro forma for asset divestitures in 2017. (4) 2017 coverage ratio not pro forma for asset divestitures in 2017. (5) Represented on a fully converted basis. Excludes earn - out. 2018E 2019E WTI crude oil ($/bbl) $65.30 $62.80 Natural gas ($/mcf) 2.92 2.81 ($ in millions unless otherwise specified) 2017A (1) 2018E 2019E Net production Oil + Cond (Mbbls) 859 1,284 1,599 Gas (Mmcf) 3,010 4,346 5,436 NGL (Mbbls) 286 311 279 Total (MBoe) 1,647 2,318 2,785 MBoepd 4.5 6.4 7.6 Y-o-Y growth % 40.7% 20.1% % Liquids 69.5% 68.8% 67.5% Operating metrics WTI oil price - Strip 06/01/2018 $50.95 $65.30 $62.80 HH gas price - Strip 06/01/2018 3.11 2.92 2.81 Realized pricing Oil $50.72 $67.95 $65.39 Gas 2.68 2.89 2.87 NGL 20.88 28.61 27.53 Total revenue $62 $109 $128 Expenses Production & ad valorem taxes ($3) ($6) ($7) Gathering & transportation (3) (3) (3) G&A (6) (5) (5) Total Expenses ($12) ($14) ($15) EBITDA $50 $95 $113 Interest expense (2) (1) (2) (1) Income taxes – (7) (9) Free cash flow (3) $48 $86 $103 Coverage ratio (4) 1.00x 1.11x 1.10x Distributed cash flow $48 $77 $93 Shares outstanding (5) 85.9 85.9 Distribution per share $0.90 $1.09 Balance sheet Cash – – Revolver balance 33 24 Net debt $33 $24 Net debt / EBITDA 0.3x 0.2x

Falcon Minerals highlights Highly attractive absolute and relative value High quality core Eagle Ford, 80% oil - weighted, significant free cash flow assets ~ 90% margins with lower sensitivity to commodity prices Significant long - term and sustainable growth Proven track record of accretive acquisitions Low leverage and ample liquidity Compelling total shareholder returns 27 Deal offers: x x x x Unique partnership between Osprey and Blackstone x x x x
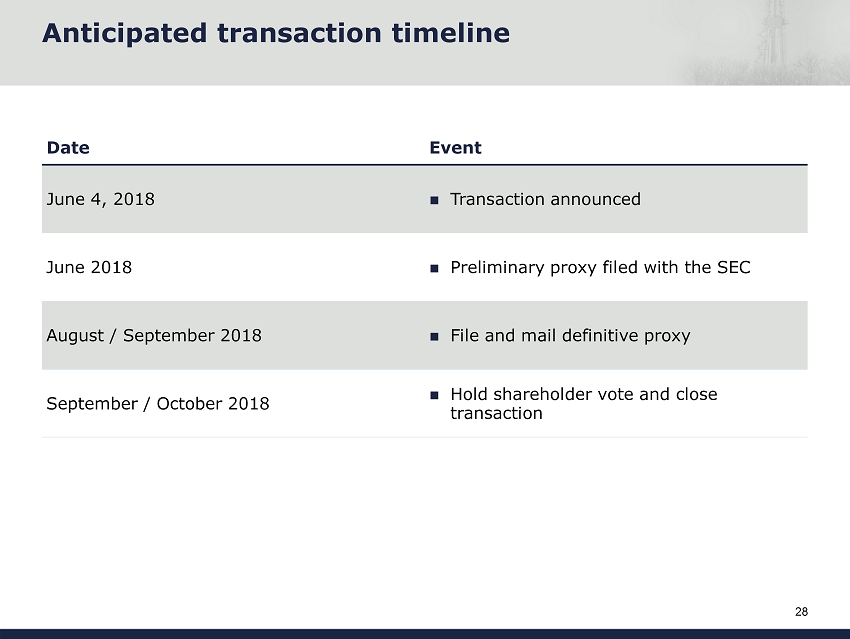
28 Anticipated transaction timeline Date Event June 4, 2018 Transaction announced June 2018 Preliminary proxy filed with the SEC August / September 2018 File and mail definitive proxy September / October 2018 Hold shareholder vote and close transaction
Appendix

Edward E. Cohen Executive Chairman Mr. Edward Cohen co - founded the Atlas Group in 1998 and has been intimately involved in the energy industry since the late 1970s − Edward Cohen named Energy Executive of the Year by Hart Energy publication in 2011 − Messrs. Cohen led the IPO of Atlas Pipeline Partners, L.P . in 2000 and Atlas Energy, Inc. in 2004 − Under the team’s leadership Atlas Energy pioneered shale energy in the Marcellus Basin between 2005 and 2010, drilling more wells in Southwestern Pennsylvania than any other Company − Industry leading experience in the Permian Basin with Atlas Pipeline Partners, Pioneer’s principal processor 30 Background of Osprey management team Jonathan Z. Cohen Chief Executive Officer Daniel C. Herz President Mr. Herz has been with the Atlas Group since 2004 and has headed various Atlas entities Mr. Jonathan Cohen co - founded the Atlas Group in 1998, leading the organization in various roles since its inception − Oversaw the growth of Atlas Pipeline Partners from a $40 million enterprise to its collective sale to Targa Resources for $7.7 billion in 2015 − Organically built Atlas Energy up from its $31 million IPO to the Company’s ultimate sale to Chevron for $4.3 billion − Effectuated $23 billion in acquisitions and divestitures in upstream and midstream assets − The team maintains active relationships with over 25 banks worldwide, providing billions of committed capital to Atlas’ portfolio companies
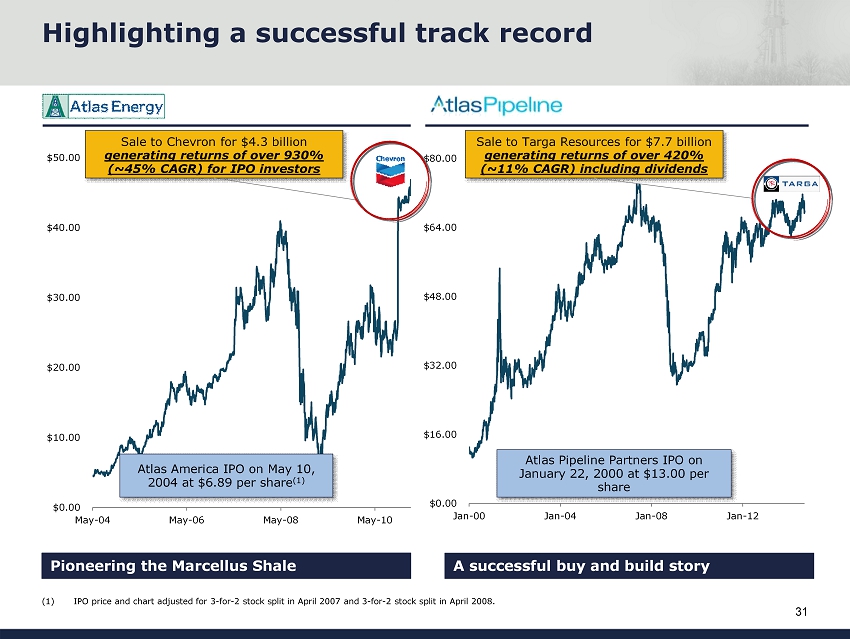
$0.00 $10.00 $20.00 $30.00 $40.00 $50.00 May-04 May-06 May-08 May-10 $0.00 $16.00 $32.00 $48.00 $64.00 $80.00 Jan-00 Jan-04 Jan-08 Jan-12 31 Sale to Targa Resources for $7.7 billion generating returns of over 420% (~11% CAGR) including dividends Highlighting a successful track record Sale to Chevron for $4.3 billion generating returns of over 930% (~45% CAGR) for IPO investors (1) IPO price and chart adjusted for 3 - for - 2 stock split in April 2007 and 3 - for - 2 stock split in April 2008. Atlas Pipeline Partners IPO on January 22, 2000 at $13.00 per share Pioneering the Marcellus Shale Atlas America IPO on May 10, 2004 at $6.89 per share (1) A successful buy and build story

32 Illustrative fully diluted share count and ownership (1) Assumes treasury share method for warrants . (2) 7.5mm OSPR founder warrants and 13.75mm OSPR public warrants issued at IPO with a $11.50 strike price . (3) Includes Blackstone and Riverbend equity stake. (4) Transaction structure allows for Blackstone to possibly receive additional consideration through an earn - out tied to stock price appreciation. Falcon Minerals will issue an additional 10 million shares to Blackstone if Falcon Minerals stock price reaches $12.50/share and an additional 10 mil lion shares if Falcon Minerals stock price reaches $15.00/share on a 30 calendar day volume - weighted average trading price within the next seven years post close of transaction (with the amount of shares and the earn - out thresholds subject to potential adjustment in the event that the Falcon Minerals dividends exceed $0.50 per share per year). Illustrative share price Share counts in millions $10.00 $11.00 $12.00 $13.00 $14.00 $15.00 $16.00 $17.00 $18.00 Osprey - Public IPO shares 27.5 27.5 27.5 27.5 27.5 27.5 27.5 27.5 27.5 Osprey - Founders' shares 6.9 6.9 6.9 6.9 6.9 6.9 6.9 6.9 6.9 Osprey - PIPE shares 11.5 11.5 11.5 11.5 11.5 11.5 11.5 11.5 11.5 Osprey - Warrants (1)(2) – – 0.9 2.5 3.8 5.0 6.0 6.9 7.7 Blackstone shares (3) 40.0 40.0 40.0 40.0 40.0 40.0 40.0 40.0 40.0 Earn-out shares (4) – – – 10.0 10.0 20.0 20.0 20.0 20.0 Total 85.9 85.9 86.7 98.3 99.6 110.8 111.8 112.7 113.5