Exhibit 99.2
Investor Presentation August 2020
Disclaimer FORWARD - LOOKING STATEMENTS This document contains forward - looking statements that involve a number of assumptions, risks and uncertainties that could cause actual results to differ materially from those contained in the forward - looking statements . Falcon cautions readers not to place any undue reliance on these forward - looking statements as forward - looking information is not a guarantee of future performance . Such forward - looking statements include, but are not limited to, statements about future financial and operating results, future dividends paid, resource and production potential, Falcon’s plans, objectives, expectations and intentions and other statements that are not historical facts . Risks, assumptions and uncertainties that could cause actual results to materially differ from the forward - looking statements include, but are not limited to, those associated with general economic and business conditions ; the COVID - 19 pandemic and its impact on Falcon and on the oil and gas industry as a whole ; Falcon’s ability to realize the anticipated benefits of its acquisitions ; changes in commodity prices ; uncertainties about estimates of reserves and resource potential ; inability to obtain capital needed for operations ; Falcon’s ability to meet financial covenants under its credit agreement or its ability to obtain amendments or waivers to effect such compliance ; changes in government environmental policies and other environmental risks ; the availability of drilling equipment and the timing of production in Falcon’s regions ; tax consequences of business transactions ; and other risks, assumptions and uncertainties detailed from time to time in Falcon’s reports filed with the U . S . Securities and Exchange Commission, including under the heading “Risk Factors” in Falcon’s most recent annual report on Form 10 - K as well as any subsequently filed quarterly reports on Form 10 - Q and current reports on Form 8 - K . Forward - looking statements speak only as of the date hereof, and Falcon assumes no obligation to update such statements, except as may be required by applicable law . RESERVE INFORMATION Reserve engineering is a process of estimating underground accumulations of hydrocarbons that cannot be measured in an exact way . The accuracy of any reserve estimate depends on the quality of available data, the interpretation of such data and price and cost assumptions made by reserve engineers . In addition, the results of drilling, testing and production activities may justify revisions of estimates that were made previously . If significant, such revisions could impact Falcon’s strategy and change the schedule of any further production and development drilling . Accordingly, reserve estimates may differ significantly from the quantities of oil and natural gas that are ultimately recovered . Estimated Ultimate Recoveries, or “EURs,” refers to estimates of the sum of total gross remaining proved reserves per well as of a given date and cumulative production prior to such given date for developed wells . These quantities do not necessarily constitute or represent reserves as defined by the SEC and are not intended to be representative of all anticipated future well results . 2
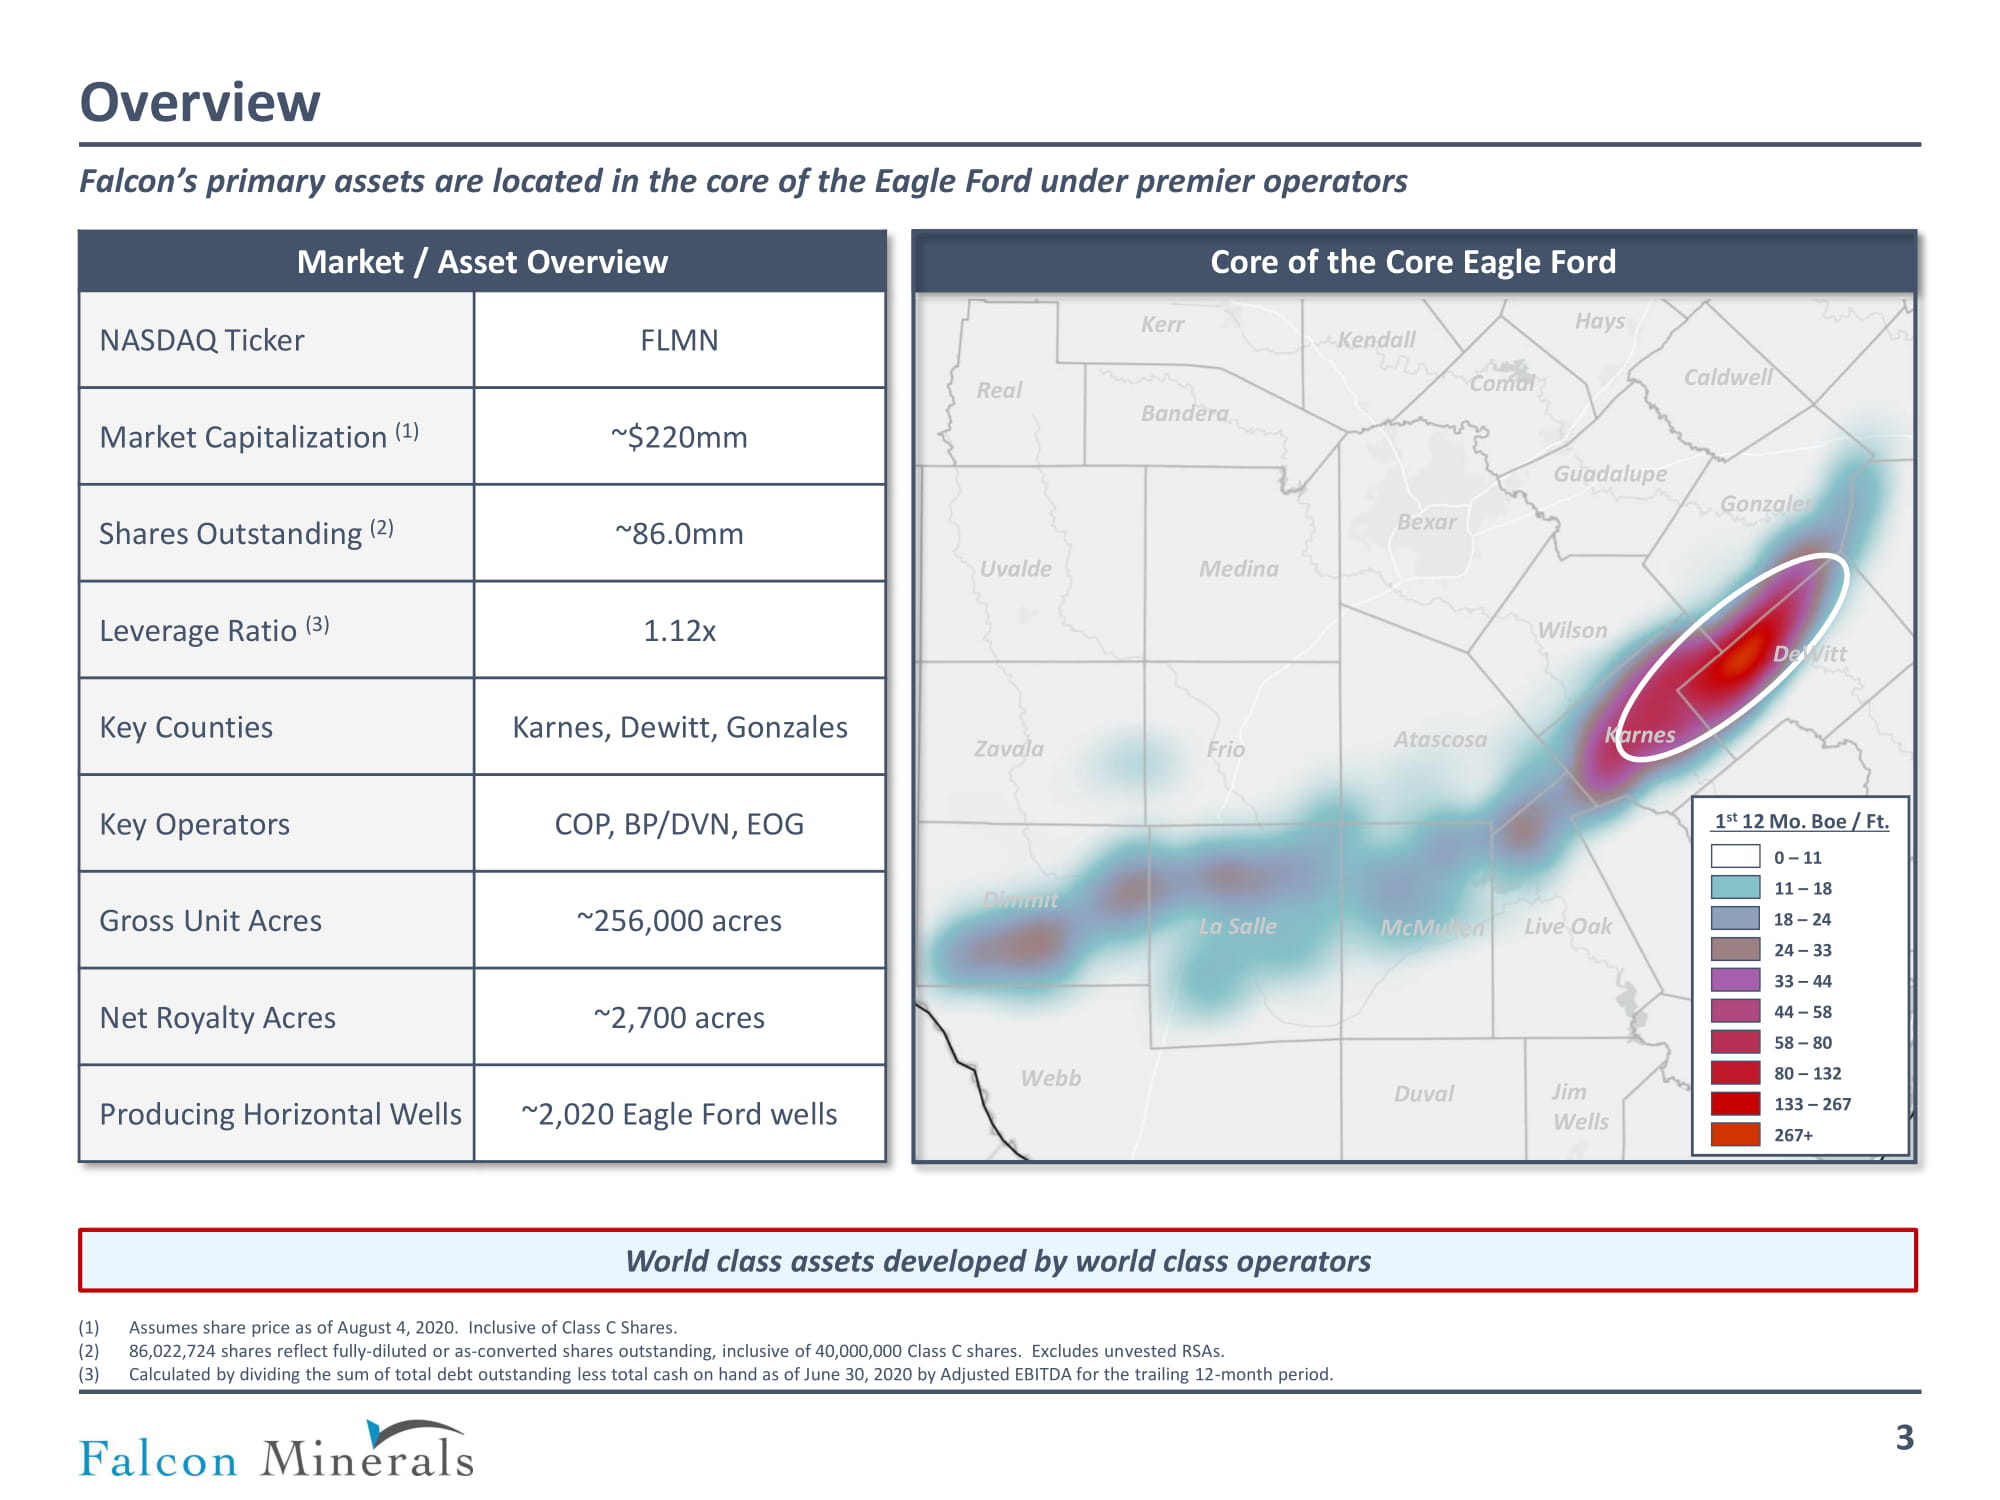
Goliad Bee Core of the Core Eagle Ford Falcon’s primary assets are located in the core of the Eagle Ford under premier operators Overview 3 World class assets developed by world class operators Market / Asset Overview NASDAQ Ticker FLMN Market Capitalization (1) ~$220mm Shares Outstanding (2) ~86.0mm Leverage Ratio (3) 1.12x Key Counties Karnes, Dewitt, Gonzales Key Operators COP, BP/DVN, EOG Gross Unit Acres ~256,000 acres Net Royalty Acres ~2,700 acres Producing Horizontal Wells ~2,020 Eagle Ford wells (1) Assumes share price as of August 4, 2020. Inclusive of Class C Shares. (2) 86,022,724 shares reflect fully - diluted or as - converted shares outstanding, inclusive of 40,000,000 Class C shares. Excludes un vested RSAs. (3) Calculated by dividing the sum of total debt outstanding less total cash on hand as of June 30, 2020 by Adjusted EBITDA for t he trailing 12 - month period. Real Bandera Bexar Medina Uvalde Zavala Frio Atascosa Wilson Comal Guadalupe DeWitt Gonzales Kendall Kerr Hays Caldwell Live Oak McMullen La Salle Dimmit Webb Duval Jim Wells 1 st 12 Mo. Boe / Ft. 0 – 11 24 – 33 80 – 132 133 – 267 267+ 33 – 44 44 – 58 58 – 80 11 – 18 18 – 24 Karnes

Operational Overview □ World class operators prosecuting decade long plans on Falcon’s Eagle Ford position □ Karnes Trough is characterized by some of the lowest breakeven returns to operators in North American shale □ EOG and COP have both discussed 10% - 30% returns at ~$25 - $30 oil prices □ Q2 ’20 production of ~4,450 Boe /d (~51% oil) □ ~0.12 net (20 gross) wells TIL during Q2 ’20 ~1.57 net (83 gross) wells TIL in 1H 2020 □ Averaged three rigs on Eagle Ford position during Q2 ’20 two rigs currently on Falcon’s Eagle Ford position □ Approximately 25% of production curtailed during low oil price months of May and June majority of production back online at higher oil prices, with all production expected back online by the end of August Q2 ‘20 Financial Overview □ Adjusted EBITDA of $3.4 million for Q2 ‘20 □ Announced Q2 ‘20 dividend of $0.03 on August 5, 2020; free cash flow per share of $0.033 for Q2 ’20 □ Inception to date aggregate dividends of $0.945 per share □ Maintained low leverage profile 1.12 x net debt / LTM EBITDA at Q2 ’20 (1) □ Established crude oil swap program for third quarter 2020 through first quarter 2021 ~1,230 Bbls /d (approximately 55% of Q2 ’20 oil production) at ~$40 / Bbl Line of Sight Development (August 2020) □ 212 gross line of sight wells (2.52 net) ~ 1.62 net wells with ongoing development activity □ 94 gross permitted wells (0.90 net wells) □ 98 gross wells waiting on completion (1.57 net wells) □ 20 gross wells waiting on connection (0.06 net wells) Falcon Highlights □ Zero capex requirements □ Ability to generate free cash flow in challenged commodity price environment □ Management focused on maintaining a low - cost structure □ Conservative balance sheet and disciplined acquisition strategy Investment Highlights 4 (1) Calculated by dividing the sum of total debt outstanding less total cash on hand as of June 30, 2020 by Adjusted EBITDA for t he trailing 12 month period.

Recent Operator Commentary 5 Key Operators □ Eagle Ford Outlook – 10 - year commitment to Eagle Ford □ ~3,800 top - tier locations remaining □ Maintaining 4 rigs across the Eagle Ford for the remainder of 2020 with 1 or 2 frac crews expected □ Planning to build substantial DUC inventory of ~130 wells in Lower 48 with modest activity ramp in 2H ‘20 □ COP has observed flush production from curtailed wells recently brought back online □ Expect all Lower 48 production to be online by September □ Average cost of supply in Lower 48 below ~$30 / Bbl (10% IRR threshold) □ Upside – ~300 refracs in 10 - year plan, ~75% EUR increase from mechanical isolation refracs □ Eagle Ford Outlook – 10+ years of inventory life in the Eagle Ford □ Eagle Ford net production increased 7% Q - o - Q includes impacts of curtailments during Q2 ‘20 □ No plans to curtail production in 2H ‘20 □ 13 wells turned in line on Falcon’s Eagle Ford position during Q2 ’20 with average IP - 30s of ~2,300 Boe /d □ DUC inventory includes 22 high - impact wells as of July 2020 □ Successful redevelopment appraisal program during 1H ‘20 confirms resource upside and additional highly economic inventory □ Upside – ~700+ potential refrac locations along with additional redevelopment / infill inventory □ Eagle Ford Outlook – bellwether asset in “growth phase” with 10+ years of inventory remaining □ Maintaining 3 rig / 3 frac crew program across the Eagle Ford in 2020 □ ~200 net Eagle Ford wells expected to TIL in 2020 ( 82 net wells TIL in Q1 ’20) □ ~1,900 net undrilled premium locations in the Eagle Ford □ ~7% reduction in Eagle Ford well costs expected in 2020 compared to 2019 levels □ Upside – targeting Enhanced Oil Recovery (EOR) program with over 200 wells identified 10 - year commitment to the Eagle Ford across key operators Note: EOG commentary reflects disclosure prior to Q2 ‘20 earnings release scheduled for August 7, 2020.
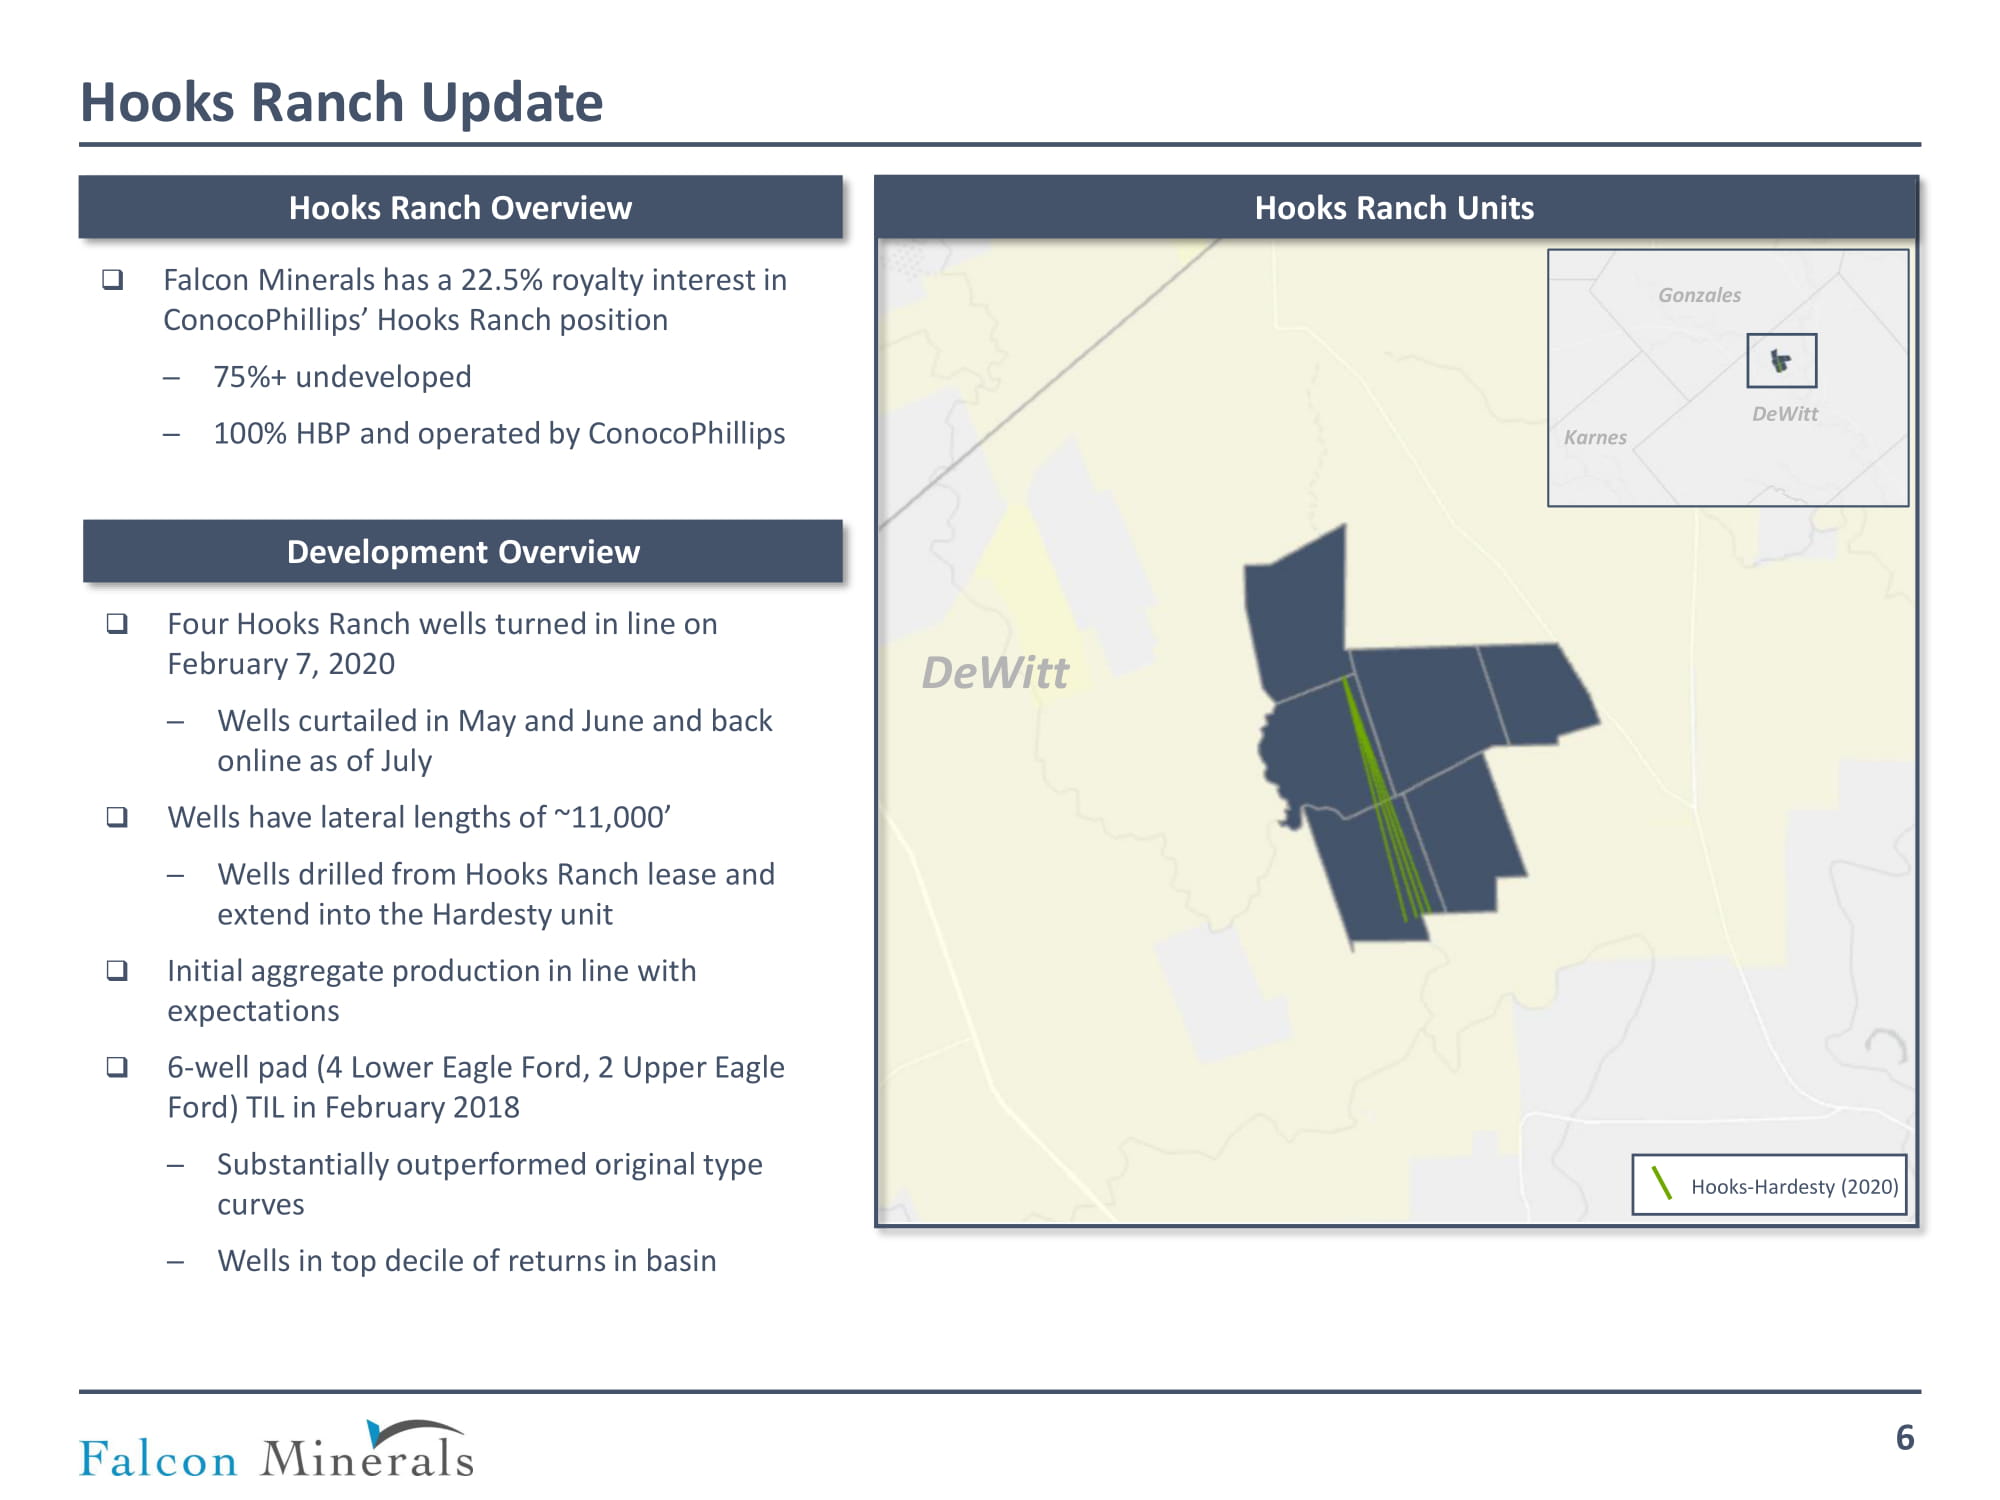
Hooks Ranch Update 6 □ Falcon Minerals has a 22.5% royalty interest in ConocoPhillips’ Hooks Ranch position ─ 75%+ undeveloped ─ 100% HBP and operated by ConocoPhillips Hooks Ranch Overview □ Four Hooks Ranch wells turned in line on February 7, 2020 ─ Wells curtailed in May and June and back online as of July □ Wells have lateral lengths of ~11,000’ ─ Wells drilled from Hooks Ranch lease and extend into the Hardesty unit □ Initial aggregate production in line with expectations □ 6 - well pad (4 Lower Eagle Ford, 2 Upper Eagle Ford) TIL in February 2018 ─ Substantially outperformed original type curves ─ Wells in top decile of returns in basin Development Overview Hooks Ranch Units DeWitt DeWitt Gonzales Karnes Hooks - Hardesty (2020)

Development Activity Q2 ‘20 Development □ 3 rigs on Falcon’s position during second quarter 2020 □ ~0.12 net wells TIL during second quarter 2020 Eagle Ford Line of Sight Development (August 2020) □ 212 gross Eagle Ford wells (2.52 net) ─ 94 gross (0.90 net) permitted wells ─ 98 gross (1.57 net) waiting on completion wells ─ 20 gross (0.06 net) waiting on connection wells 7 Gross Wells Average NRI Net Wells Permitted 94 0.96% 0.90 Waiting on Completion 98 1.60% 1.57 Waiting on Connection 20 0.28% 0.06 Total 212 1.19% 2.52 Active Rigs Gross TIL Average NRI Net TIL 2019 Total 7 194 0.79% 1.54 2019 Development Eagle Ford Line of Sight Development (August 2020) Active Rigs Gross TIL Average NRI Net TIL Q1 ’20 7 63 ~2.30% ~1.45 Q2 ’20 3 20 ~0.60% ~0.12 2020 YTD Development
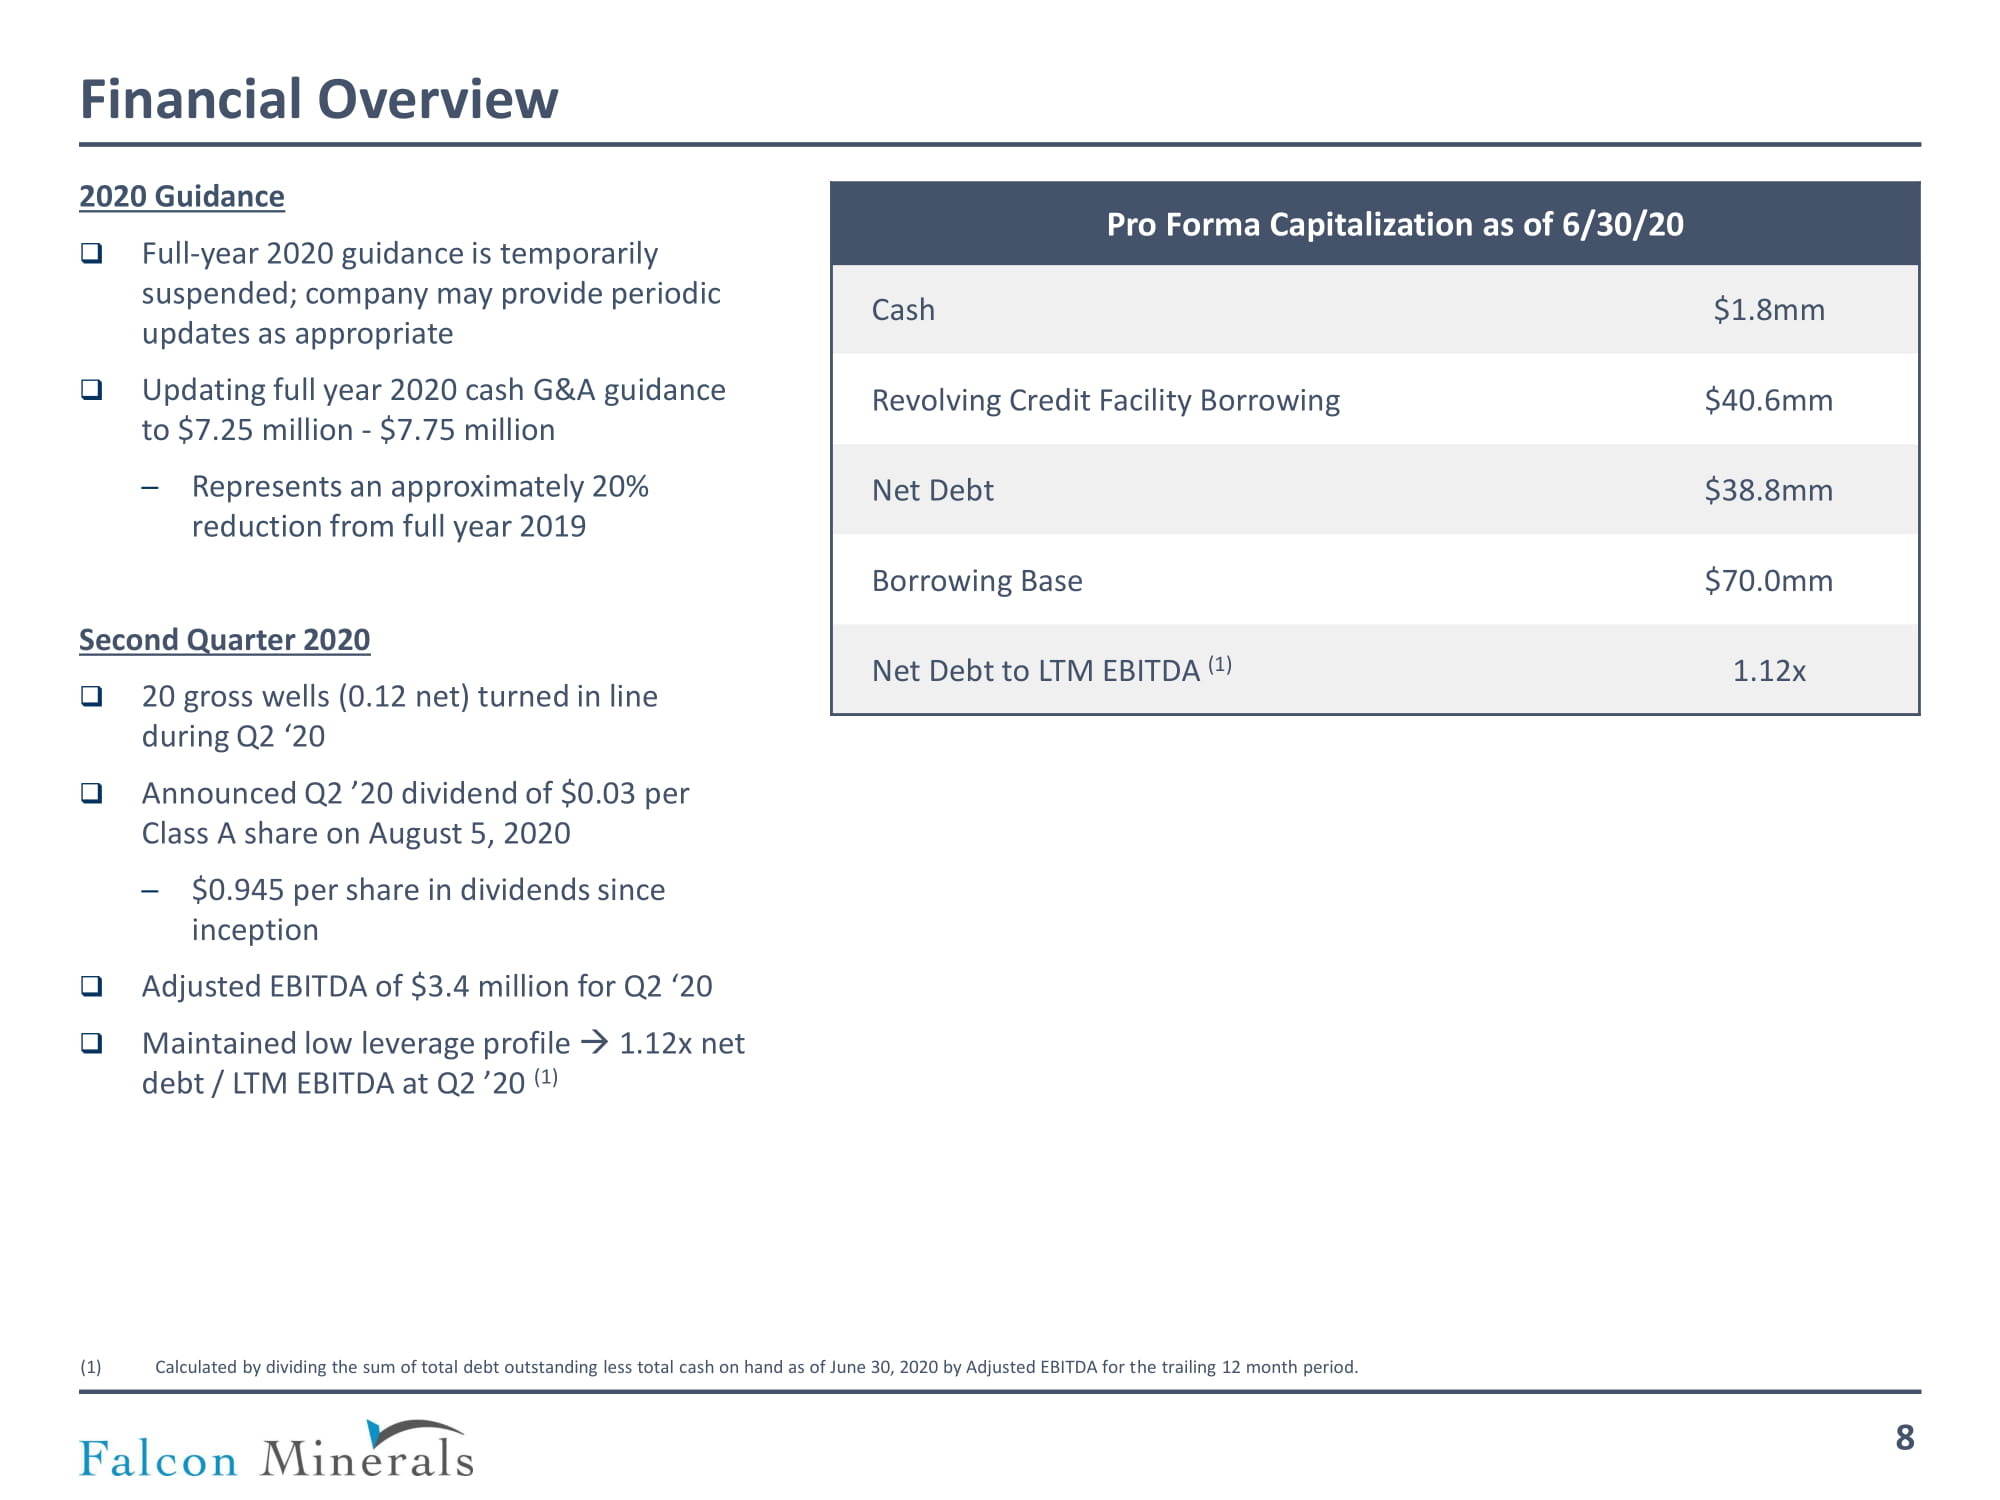
Financial Overview 8 Pro Forma Capitalization as of 6/30/20 Cash $1.8mm Revolving Credit Facility Borrowing $40.6mm Net Debt $38.8mm Borrowing Base $70.0mm Net Debt to LTM EBITDA (1) 1.12x 2020 Guidance □ Full - year 2020 guidance is temporarily suspended; company may provide periodic updates as appropriate □ Updating full year 2020 cash G&A guidance to $7.25 million - $7.75 million ─ Represents an approximately 20% reduction from full year 2019 Second Quarter 2020 □ 20 gross wells (0.12 net) turned in line during Q2 ‘20 □ Announced Q2 ’20 dividend of $0.03 per Class A share on August 5, 2020 ─ $0.945 per share in dividends since inception □ Adjusted EBITDA of $3.4 million for Q2 ‘20 □ Maintained low leverage profile 1.12x net debt / LTM EBITDA at Q2 ’20 (1) (1) Calculated by dividing the sum of total debt outstanding less total cash on hand as of June 30, 2020 by Adjusted EBITDA for t he trailing 12 month period.
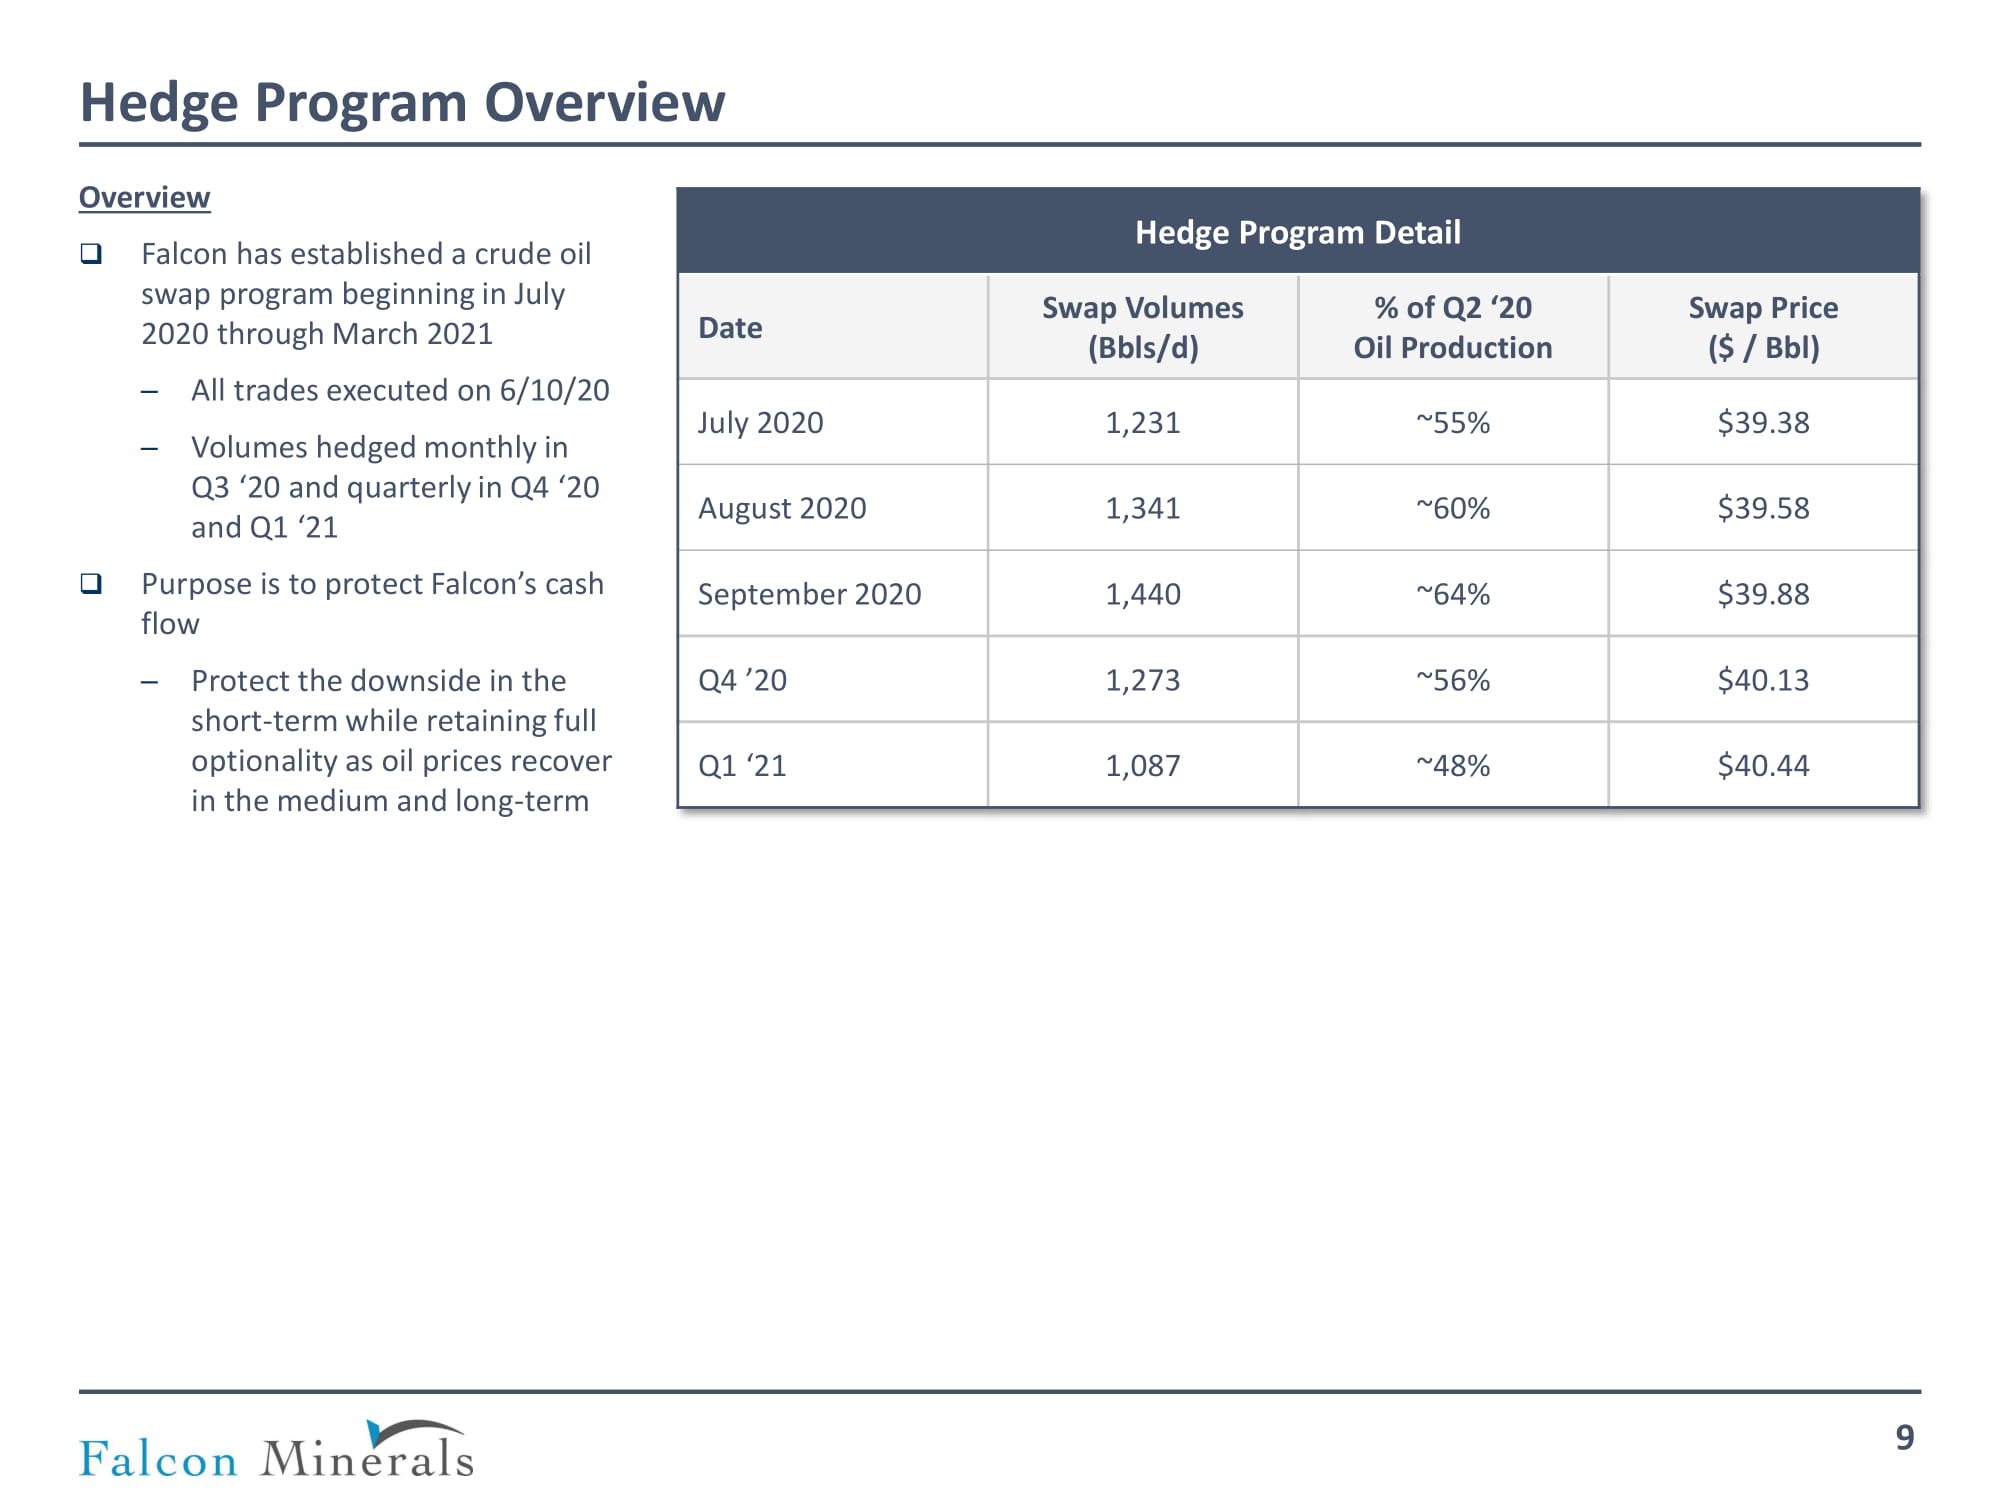
Hedge Program Overview 9 Overview □ Falcon has established a crude oil swap program beginning in July 2020 through March 2021 ─ All trades executed on 6/10/20 ─ Volumes hedged monthly in Q3 ‘20 and quarterly in Q4 ‘20 and Q1 ‘21 □ Purpose is to protect Falcon’s cash flow ─ Protect the downside in the short - term while retaining full optionality as oil prices recover in the medium and long - term Hedge Program Detail Date Swap Volumes ( Bbls /d) % of Q2 ‘20 Oil Production Swap Price ($ / Bbl ) July 2020 1,231 ~55% $39.38 August 2020 1,341 ~60% $39.58 September 2020 1,440 ~64% $39.88 Q4 ’20 1,273 ~56% $40.13 Q1 ‘21 1,087 ~48% $40.44
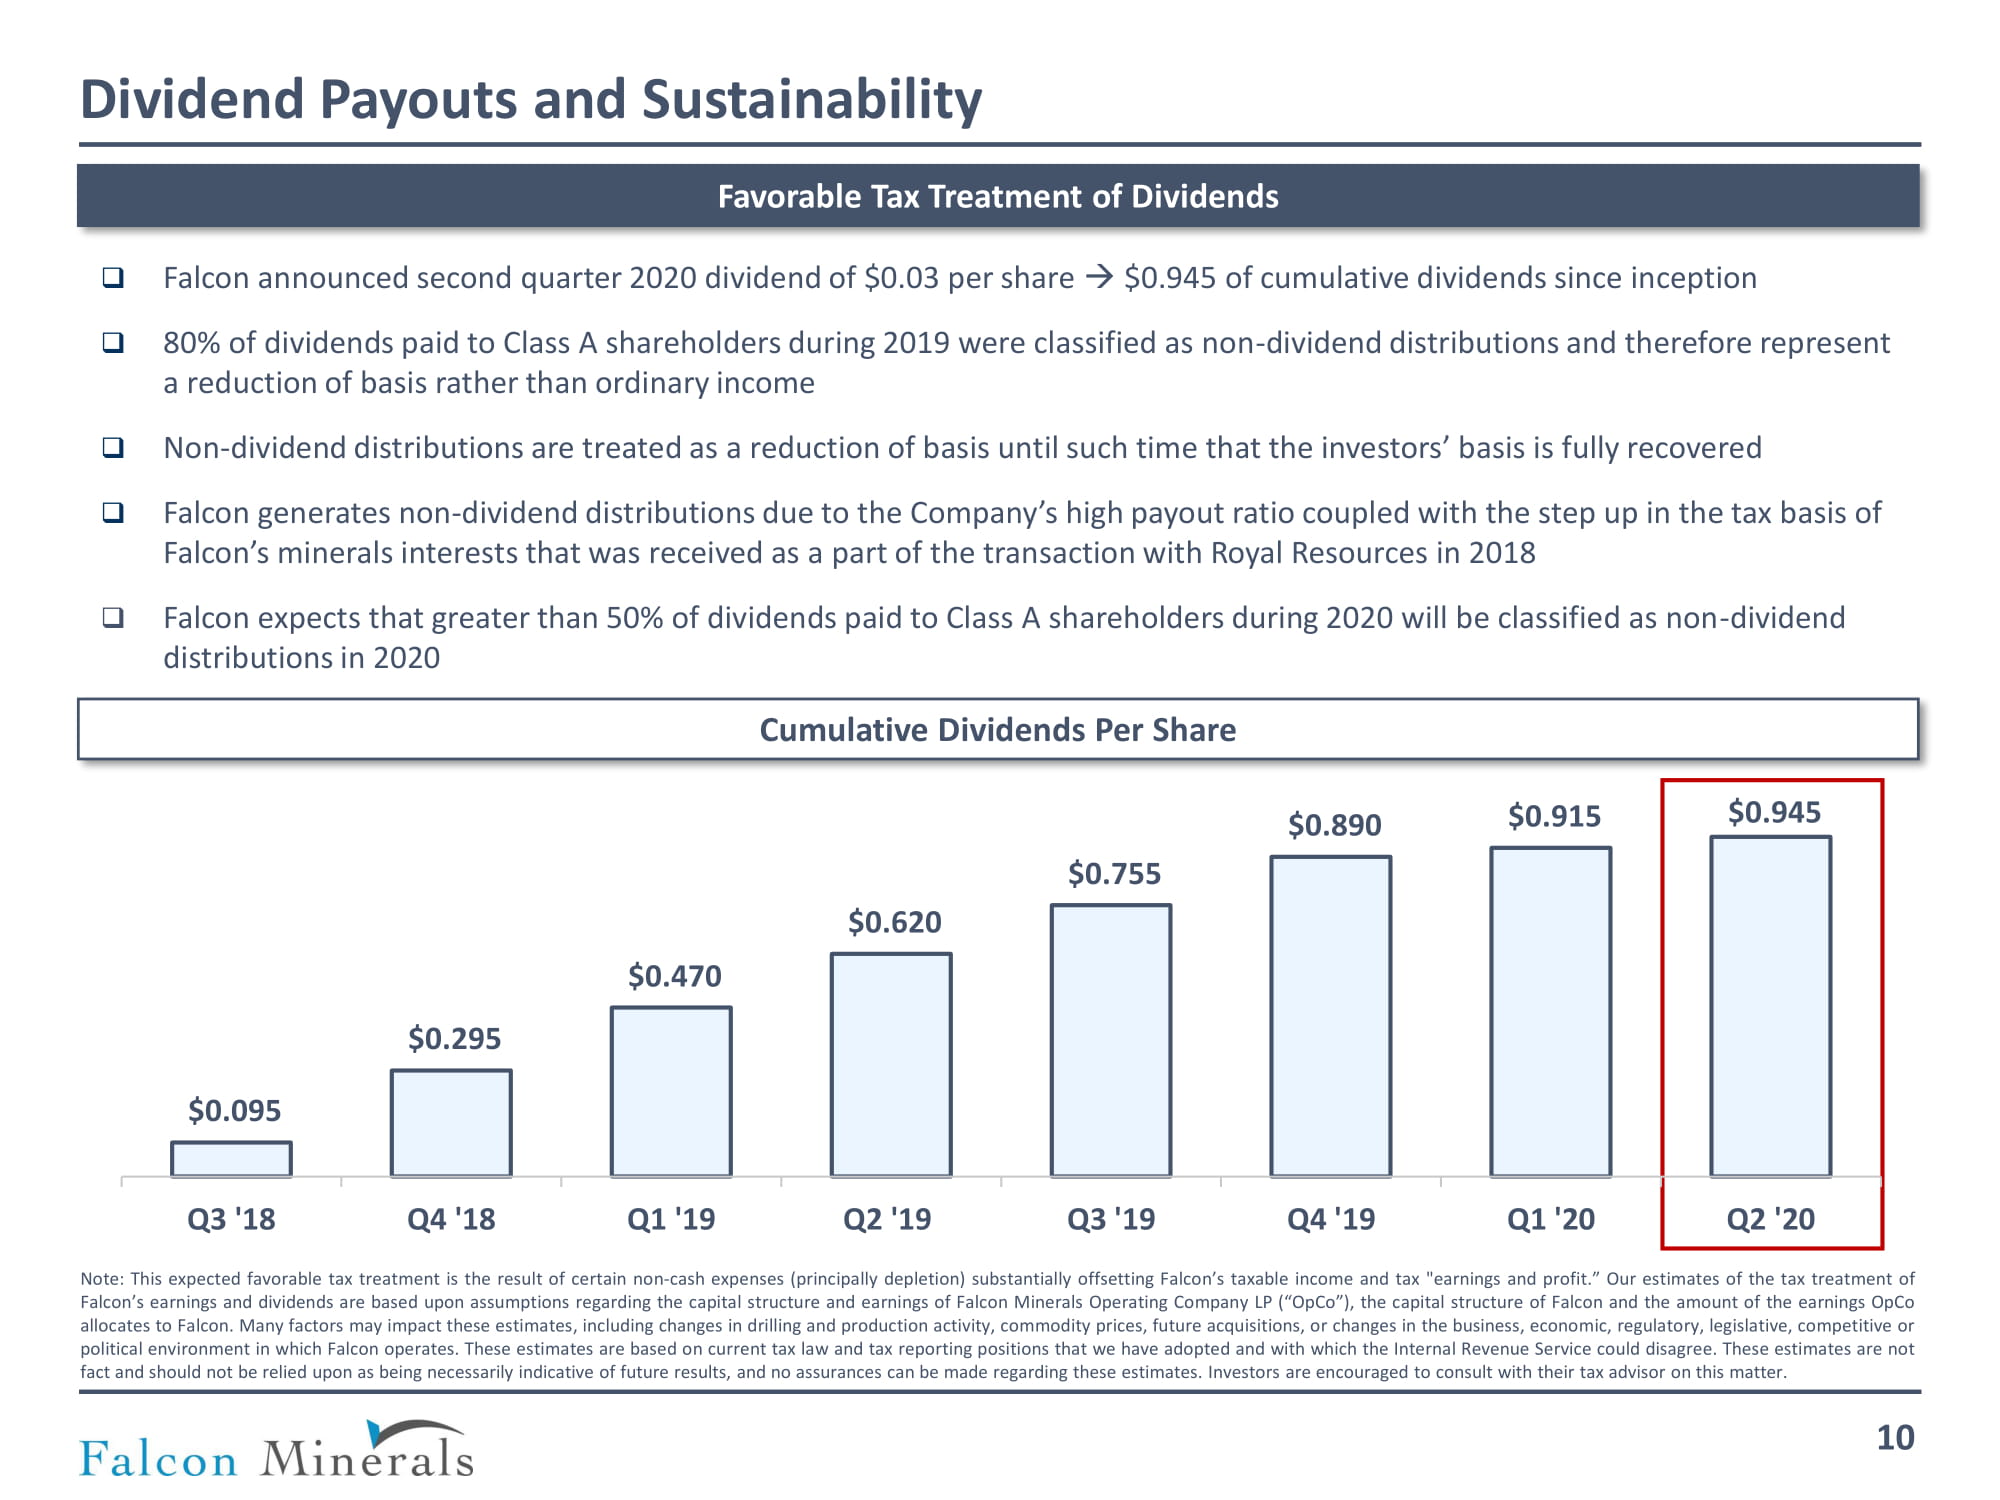
Dividend Payouts and Sustainability 10 Favorable Tax Treatment of Dividends Cumulative Dividends Per Share □ Falcon announced second quarter 2020 dividend of $0.03 per share $0.945 of cumulative dividends since inception □ 80% of dividends paid to Class A shareholders during 2019 were classified as non - dividend distributions and therefore represent a reduction of basis rather than ordinary income □ Non - dividend distributions are treated as a reduction of basis until such time that the investors’ basis is fully recovered □ Falcon generates non - dividend distributions due to the Company’s high payout ratio coupled with the step up in the tax basis of Falcon’s minerals interests that was received as a part of the transaction with Royal Resources in 2018 □ Falcon expects that greater than 50% of dividends paid to Class A shareholders during 2020 will be classified as non - dividend distributions in 2020 Note : This expected favorable tax treatment is the result of certain non - cash expenses (principally depletion) substantially offsetting Falcon’s taxable income and tax "earnings and profit . ” Our estimates of the tax treatment of Falcon’s earnings and dividends are based upon assumptions regarding the capital structure and earnings of Falcon Minerals Operating Company LP (“ OpCo ”), the capital structure of Falcon and the amount of the earnings OpCo allocates to Falcon . Many factors may impact these estimates, including changes in drilling and production activity, commodity prices, future acquisitions, or changes in the business, economic, regulatory, legislative, competitive or political environment in which Falcon operates . These estimates are based on current tax law and tax reporting positions that we have adopted and with which the Internal Revenue Service could disagree . These estimates are not fact and should not be relied upon as being necessarily indicative of future results, and no assurances can be made regarding these estimates . Investors are encouraged to consult with their tax advisor on this matter . $0.095 $0.295 $0.470 $0.620 $0.755 $0.890 $0.915 $0.945 Q3 '18 Q4 '18 Q1 '19 Q2 '19 Q3 '19 Q4 '19 Q1 '20 Q2 '20
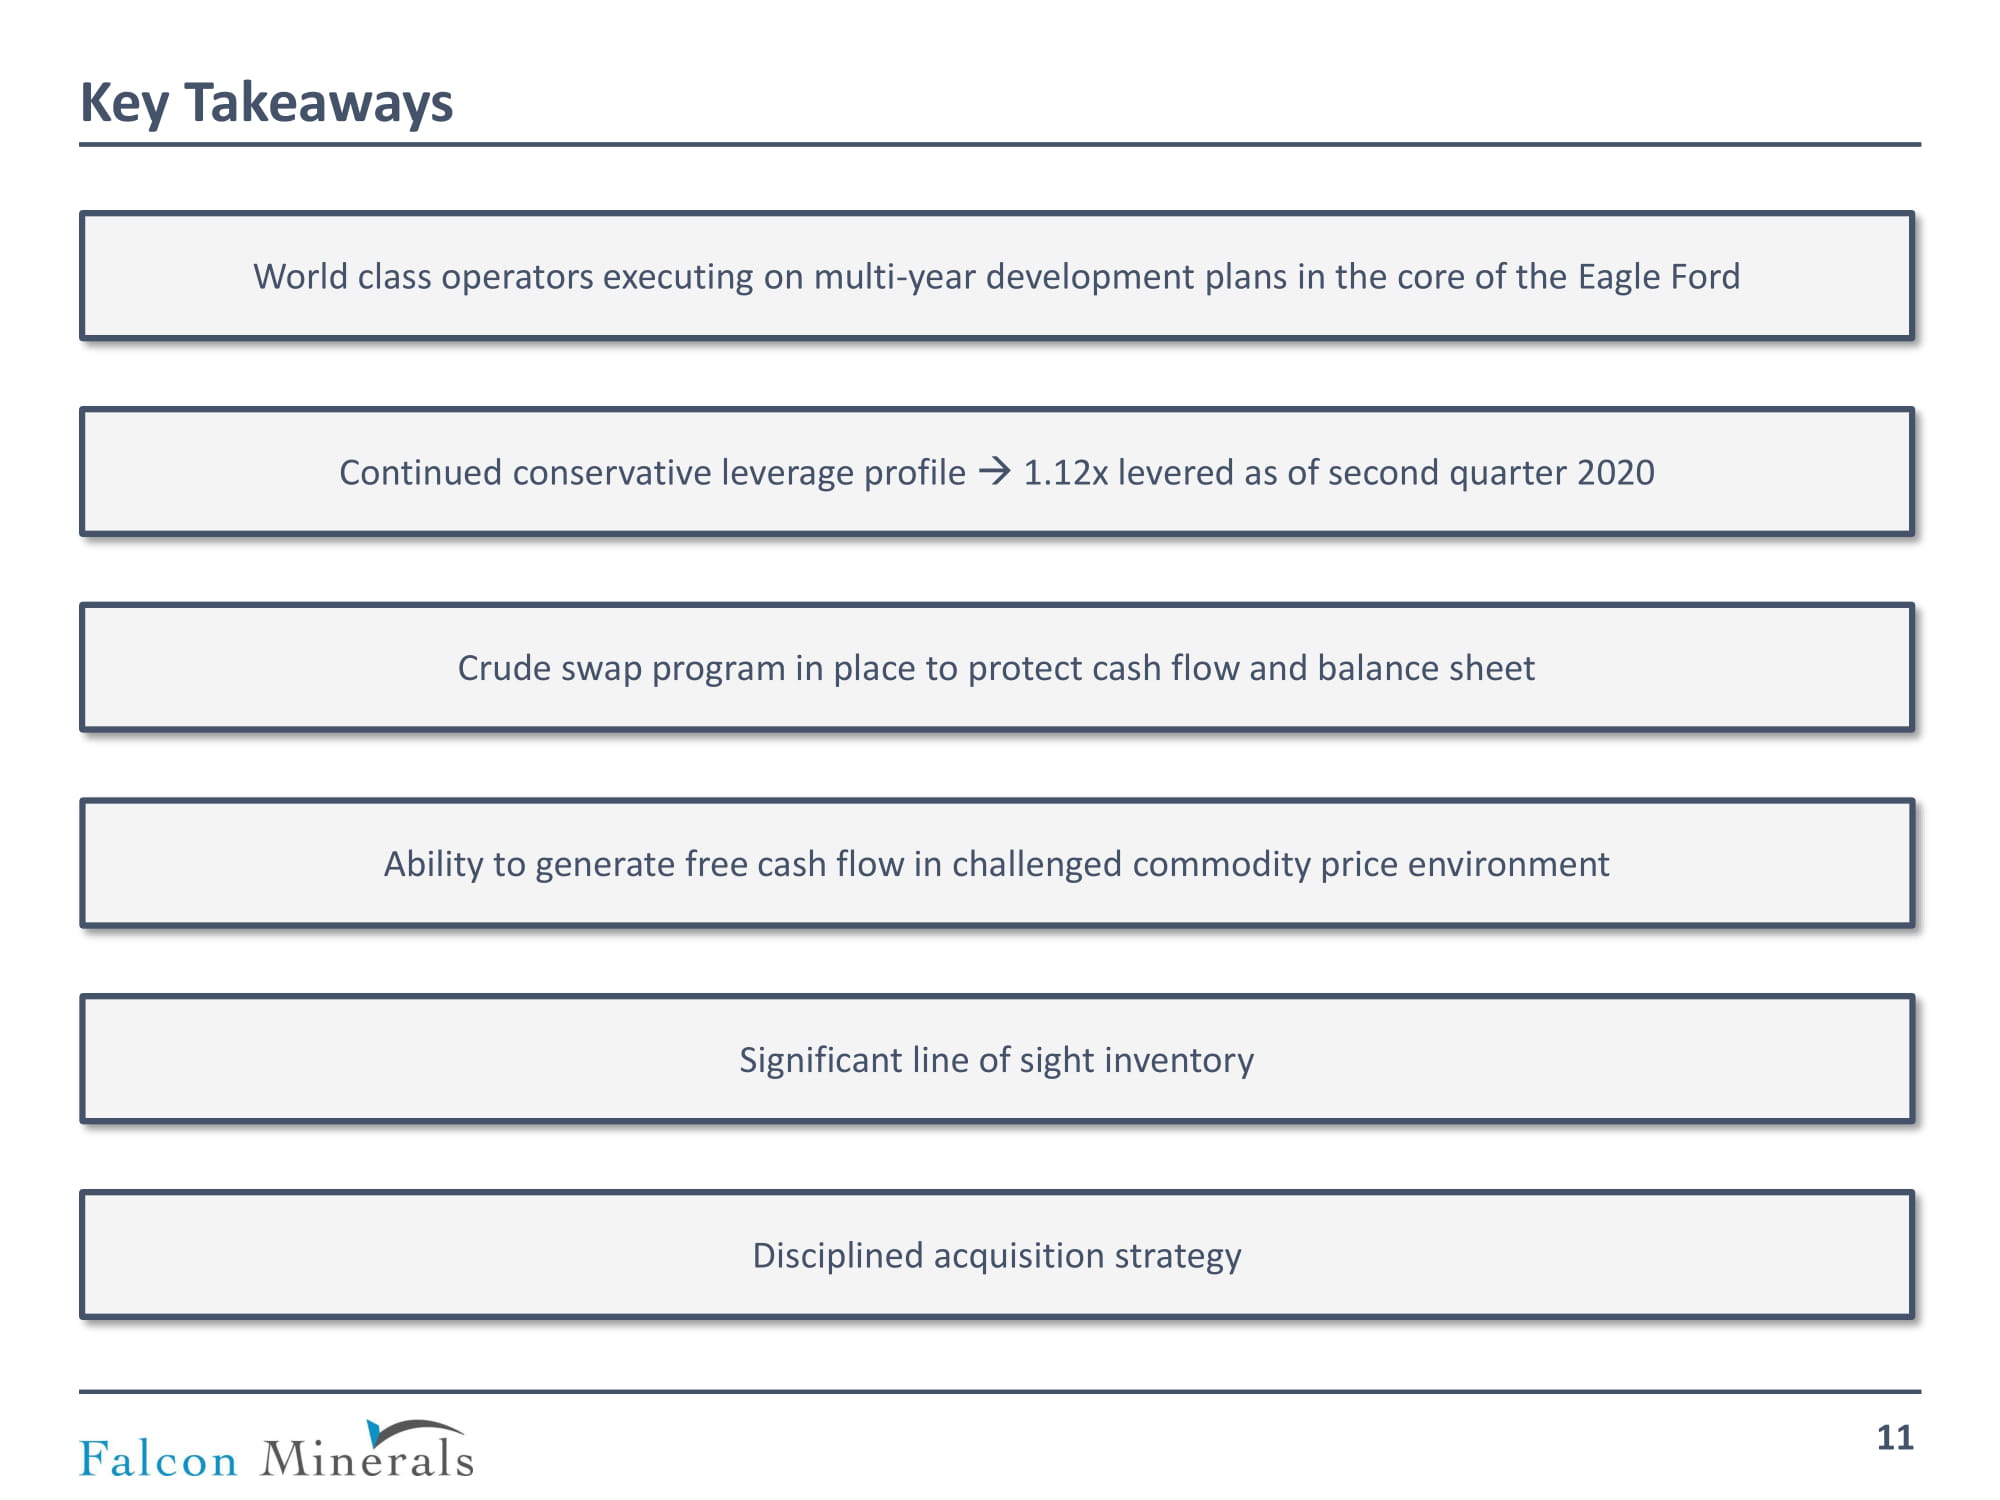
Key Takeaways 11 World class operators executing on multi - year development plans in the core of the Eagle Ford Disciplined acquisition strategy Continued conservative leverage profile 1.12x levered as of second quarter 2020 Ability to generate free cash flow in challenged commodity price environment Significant line of sight inventory Crude swap program in place to protect cash flow and balance sheet